Embed Size (px)
Citation preview
Howard County, Maryland
Comprehensive Annual Financial Report
for the Fiscal Year Ended
June 30, 2014

Howard County, Maryland 3430 Court House Drive Ellicott City, Maryland 21043 Telephone (410) 313-2195 Fax (410) 313-4433 www.howardcountymd.gov Certain Appointed Officials Lonnie R. Robbins Chief Administrative Officer Stanley J. Milesky Director of Finance James M. Irvin Director of Public Works Margaret A. Nolan County Solicitor Marsha S. McLaughlin Director of Planning and Zoning Raymond S. Wacks Budget Administrator Craig Glendenning County Auditor Financial Advisor Public Financial Management, Inc. Two Logan Square, Suite 1600 18th and Arch Street Philadelphia, PA 19103 Telephone (215) 567-6100 Fax (215) 567-4180 www.pfm.com Bond Counsel McKennon Shelton & Henn LLP 401 East Pratt Street, Suite 2315 Baltimore, Maryland 21202 Telephone (410) 843-3500 Fax (410) 843-3501 www.mshllp.com Independent Auditor CohnReznick 500 East Pratt Street, Suite 200 Baltimore, Maryland 21202-3100 Telephone (410) 783-4900 Fax (410) 727-0460 www.cohnreznick.com
County Executive Ken Ulman
County Council
Calvin Bell
Chairperson Courtney Watson Vice Chairperson Greg Fox Council Member Mary Kay Sigaty Council Member Jennifer Terrasa Council Member
Comprehensive Annual
Financial Report
For the Fiscal Year Ended June 30, 2014
Prepared by the Department of Finance
Howard County, Maryland

i
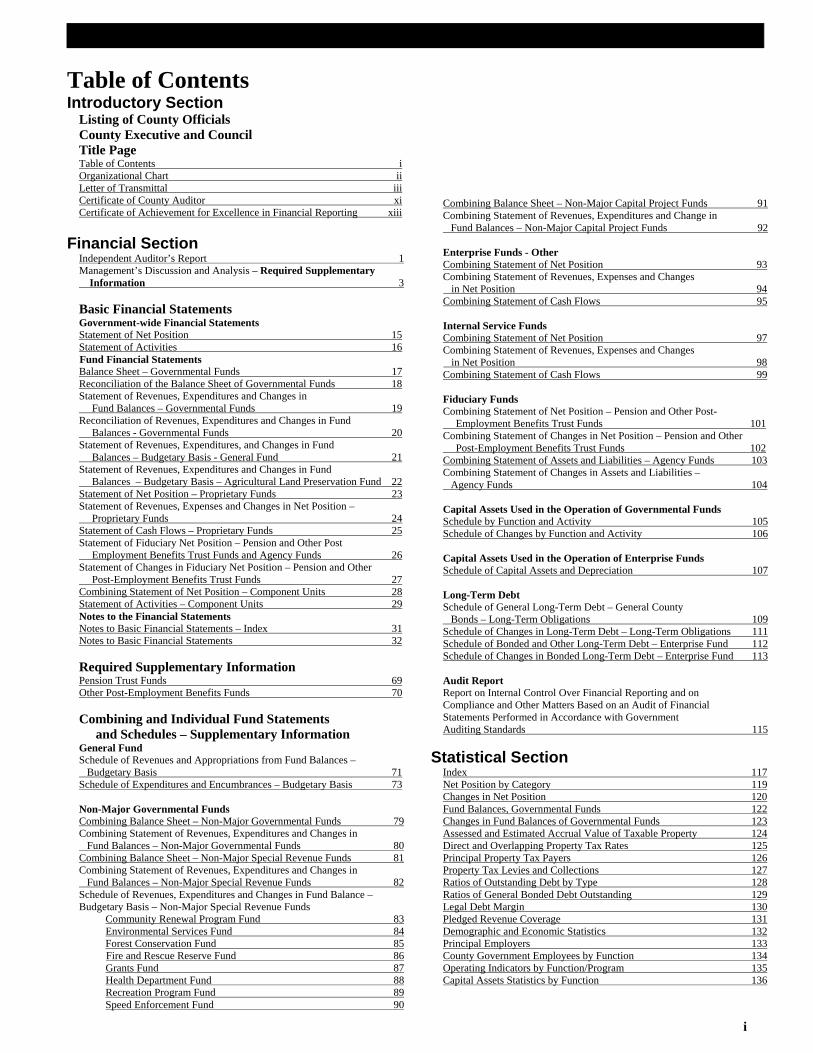
Table of Contents Introductory Section
Listing of County Officials County Executive and Council Title Page Table of Contents i Organizational Chart ii Letter of Transmittal iii Certificate of County Auditor xi Certificate of Achievement for Excellence in Financial Reporting xiii
Financial Section Independent Auditor’s Report 1 Management’s Discussion and Analysis – Required Supplementary Information 3 Basic Financial Statements Government-wide Financial Statements Statement of Net Position 15 Statement of Activities 16 Fund Financial Statements Balance Sheet – Governmental Funds 17 Reconciliation of the Balance Sheet of Governmental Funds 18 Statement of Revenues, Expenditures and Changes in Fund Balances – Governmental Funds 19 Reconciliation of Revenues, Expenditures and Changes in Fund Balances - Governmental Funds 20 Statement of Revenues, Expenditures, and Changes in Fund Balances – Budgetary Basis - General Fund 21 Statement of Revenues, Expenditures and Changes in Fund Balances – Budgetary Basis – Agricultural Land Preservation Fund 22 Statement of Net Position – Proprietary Funds 23 Statement of Revenues, Expenses and Changes in Net Position – Proprietary Funds 24 Statement of Cash Flows – Proprietary Funds 25 Statement of Fiduciary Net Position – Pension and Other Post Employment Benefits Trust Funds and Agency Funds 26 Statement of Changes in Fiduciary Net Position – Pension and Other Post-Employment Benefits Trust Funds 27 Combining Statement of Net Position – Component Units 28 Statement of Activities – Component Units 29 Notes to the Financial Statements Notes to Basic Financial Statements – Index 31 Notes to Basic Financial Statements 32 Required Supplementary Information Pension Trust Funds 69 Other Post-Employment Benefits Funds 70 Combining and Individual Fund Statements and Schedules – Supplementary Information General Fund Schedule of Revenues and Appropriations from Fund Balances – Budgetary Basis 71 Schedule of Expenditures and Encumbrances – Budgetary Basis 73 Non-Major Governmental Funds Combining Balance Sheet – Non-Major Governmental Funds 79 Combining Statement of Revenues, Expenditures and Changes in Fund Balances – Non-Major Governmental Funds 80 Combining Balance Sheet – Non-Major Special Revenue Funds 81 Combining Statement of Revenues, Expenditures and Changes in Fund Balances – Non-Major Special Revenue Funds 82 Schedule of Revenues, Expenditures and Changes in Fund Balance – Budgetary Basis – Non-Major Special Revenue Funds Community Renewal Program Fund 83 Environmental Services Fund 84 Forest Conservation Fund 85 Fire and Rescue Reserve Fund 86 Grants Fund 87 Health Department Fund 88 Recreation Program Fund 89 Speed Enforcement Fund 90
Combining Balance Sheet – Non-Major Capital Project Funds 91 Combining Statement of Revenues, Expenditures and Change in Fund Balances – Non-Major Capital Project Funds 92 Enterprise Funds - Other Combining Statement of Net Position 93 Combining Statement of Revenues, Expenses and Changes in Net Position 94 Combining Statement of Cash Flows 95 Internal Service Funds Combining Statement of Net Position 97 Combining Statement of Revenues, Expenses and Changes in Net Position 98 Combining Statement of Cash Flows 99 Fiduciary Funds Combining Statement of Net Position – Pension and Other Post- Employment Benefits Trust Funds 101 Combining Statement of Changes in Net Position – Pension and Other Post-Employment Benefits Trust Funds 102 Combining Statement of Assets and Liabilities – Agency Funds 103 Combining Statement of Changes in Assets and Liabilities – Agency Funds 104 Capital Assets Used in the Operation of Governmental Funds Schedule by Function and Activity 105 Schedule of Changes by Function and Activity 106 Capital Assets Used in the Operation of Enterprise Funds Schedule of Capital Assets and Depreciation 107 Long-Term Debt Schedule of General Long-Term Debt – General County Bonds – Long-Term Obligations 109 Schedule of Changes in Long-Term Debt – Long-Term Obligations 111 Schedule of Bonded and Other Long-Term Debt – Enterprise Fund 112 Schedule of Changes in Bonded Long-Term Debt – Enterprise Fund 113 Audit Report Report on Internal Control Over Financial Reporting and on Compliance and Other Matters Based on an Audit of Financial Statements Performed in Accordance with Government Auditing Standards 115
Statistical Section Index 117 Net Position by Category 119 Changes in Net Position 120 Fund Balances, Governmental Funds 122 Changes in Fund Balances of Governmental Funds 123 Assessed and Estimated Accrual Value of Taxable Property 124 Direct and Overlapping Property Tax Rates 125 Principal Property Tax Payers 126 Property Tax Levies and Collections 127 Ratios of Outstanding Debt by Type 128 Ratios of General Bonded Debt Outstanding 129 Legal Debt Margin 130 Pledged Revenue Coverage 131 Demographic and Economic Statistics 132 Principal Employers 133 County Government Employees by Function 134 Operating Indicators by Function/Program 135 Capital Assets Statistics by Function 136
ii
Circuit
Court
Board
of
Appeals
County
Executive
Economic
Development
Authority
County
Council
County
Auditor
District
Court
Tax
Appeals
Board
Orphan's
Court
Personnel Board
Department of
County
Administration
Office of LawDepartment of
Finance
Department of
Planning and
Zoning
Planning Board
State’s Attorney
Department
of
Fire and Rescue
Department of
Recreation
and Parks
Department
of
Corrections
Police
Department
Department
of
Citizen Services
Department of
Inspections,
Licenses and
Permits
Department
of
Public Works
Department of
Technology
and
Communication
Services
Sheriff Fire Board
Departments under state law partially or wholly funded by County appropriations
Community
College
Board
of
Elections
Board
of
Education
Department
of
Libraries
Department
of
Health
Soil
Conservation
Services
Department
of
Social
Services
Cooperative
Extension
Services
Department of
Housing &
Community
Development
Judicial
Appeals Boards
Executive Legislative
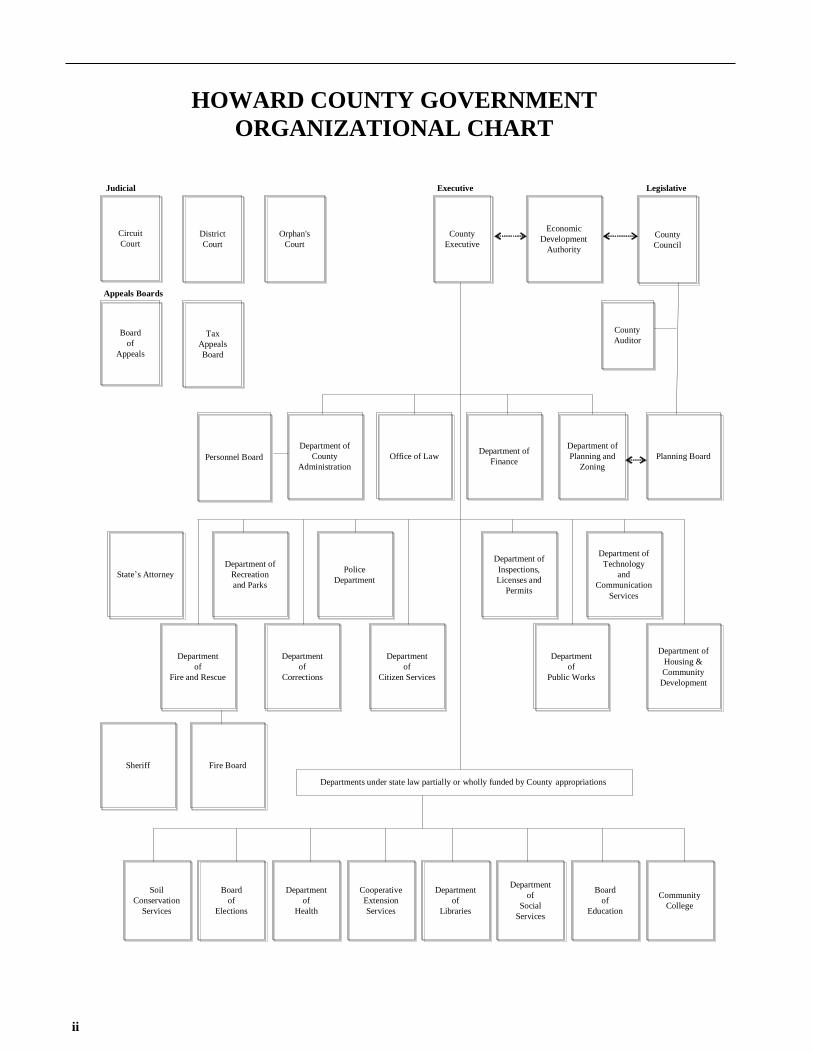
HOWARD COUNTY GOVERNMENT
ORGANIZATIONAL CHART
HOWARD COUNTY DEPARTMENT OF FINANCE 3430 Court House Drive Ellicott City, Maryland 21043 410-313-2195 Stanley J. Milesky, Director FAX 410-313-4433 [email protected] TDD 410-313-2323
Letter of Transmittal iii
November 24, 2014 Honorable County Executive, Honorable Members of the County Council and Citizens of Howard County Ladies and Gentlemen: FORMAL TRANSMITTAL OF THE CAFR The audited Comprehensive Annual Financial Report (CAFR) of Howard County, Maryland (the County) prepared by the Department of Finance for the fiscal year ended June 30, 2014, is hereby submitted in compliance with Howard County Charter, Section 212 and includes the auditor’s opinion issued by the independent public accounting firm of CohnReznick LLP, hired by the County Council. The annual report was prepared by the Howard County Department of Finance in cooperation with the finance departments of the County’s component units. Management assumes full responsibility for the completeness and reliability of the information contained in this report, based upon a comprehensive framework of internal control that it has established for this purpose. Because the cost of internal control should not exceed anticipated benefits, the objective is to provide reasonable, rather than absolute, assurance that the financial statements are free of any material misstatements. CohnReznick LLP licensed certified public accountants performed an independent audit and issued an unmodified (“clean”) opinion on the County’s financial statements for the fiscal year ended June 30, 2014. The Independent Auditor’s Report is presented as the first element of the Financial Section of this report. Management’s Discussion and Analysis (MD&A) immediately follows the Independent Auditor’s Report and provides a narrative introduction, overview, and analysis to accompany the basic financial statements. The MD&A is designed to complement this letter of transmittal and should be read in conjunction with it. PROFILE OF THE GOVERNMENT Howard County, Maryland was formed in 1851 and was named for the fifth Governor of Maryland, Colonel John Eager Howard. Under a home rule charter adopted in 1968, the County’s executive functions are vested in the elected County Executive. The County Council consists of five members elected by district. Located directly between Baltimore, Maryland and Washington, D.C. and at its closest point is less than four miles from the former and 13 miles from the latter, the County is 251 square miles
iv Letter of Transmittal
in area. The County was predominantly agricultural in character until 1966, when construction
began on the planned community of Columbia. Columbia is unique for its purposeful goal to be
an integrated community at a time before the Fair Housing Act of 1968 made it illegal to
discriminate in housing based on race, color, national origin or religion. Howard County is home
to approximately 301,624 residents based on estimates by the Department of Planning and
Zoning. According to the U.S. Census Bureau, American Community Survey, 2012, Howard
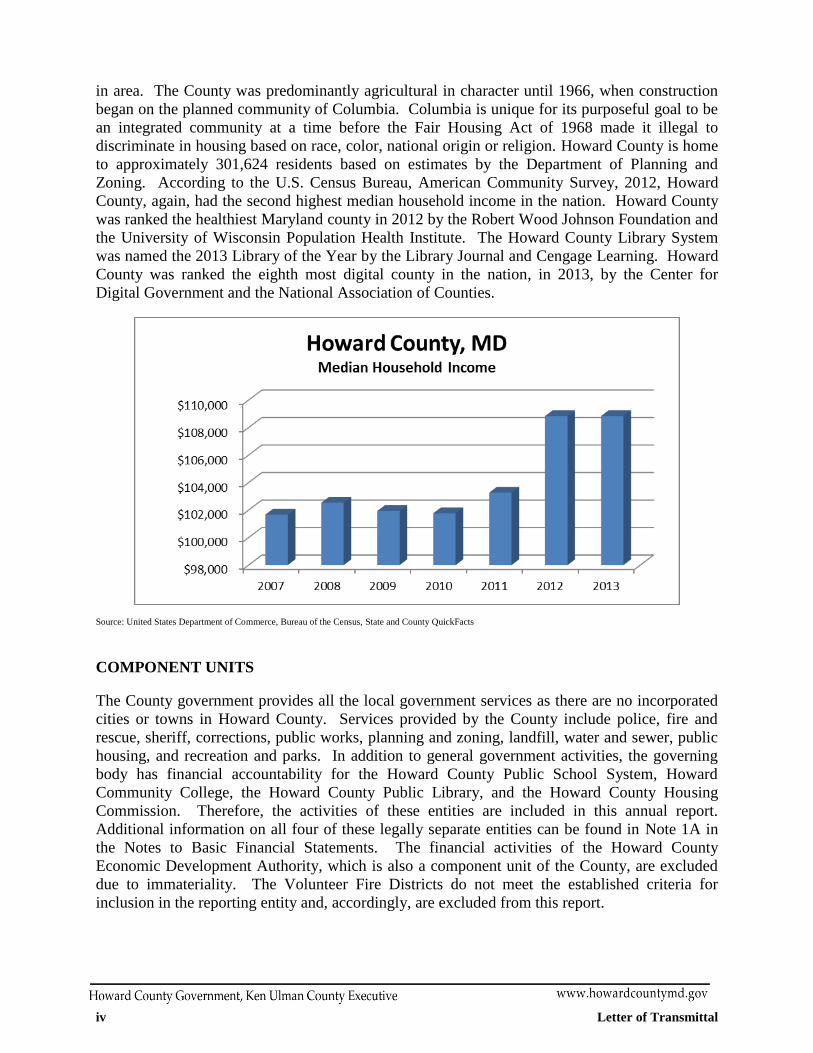
County, again, had the second highest median household income in the nation. Howard County
was ranked the healthiest Maryland county in 2012 by the Robert Wood Johnson Foundation and
the University of Wisconsin Population Health Institute. The Howard County Library System
was named the 2013 Library of the Year by the Library Journal and Cengage Learning. Howard
County was ranked the eighth most digital county in the nation, in 2013, by the Center for
Digital Government and the National Association of Counties.
Source: United States Department of Commerce, Bureau of the Census, State and County QuickFacts
COMPONENT UNITS
The County government provides all the local government services as there are no incorporated
cities or towns in Howard County. Services provided by the County include police, fire and
rescue, sheriff, corrections, public works, planning and zoning, landfill, water and sewer, public
housing, and recreation and parks. In addition to general government activities, the governing
body has financial accountability for the Howard County Public School System, Howard
Community College, the Howard County Public Library, and the Howard County Housing
Commission. Therefore, the activities of these entities are included in this annual report.
Additional information on all four of these legally separate entities can be found in Note 1A in
the Notes to Basic Financial Statements. The financial activities of the Howard County
Economic Development Authority, which is also a component unit of the County, are excluded
due to immateriality. The Volunteer Fire Districts do not meet the established criteria for
inclusion in the reporting entity and, accordingly, are excluded from this report.
Letter of Transmittal v
BUDGET
The Howard County budget is a comprehensive plan of all monies spent by County departments
and agencies. As required by County law, the budget consists of the current operating
expenditure and revenue budget (with five year spending projections), the capital budget and
capital program, and the budget message. The annual budget includes all revenues, all
expenditures and the projected surplus or deficit in the general fund and all other funds. Funds in
the operating budget include appropriations for the following functional areas: education, public
safety, public works, community services, general government, legislative and judicial, and
capital, debt and reserves. The capital budget includes funds to construct major government
facilities such as roads, bridges, schools, libraries, water and sewer infrastructure and fire
stations. Capital projects usually take more than a year to complete, unlike the operating budget
which covers only one year.
The budget process begins each fall when the County Executive appoints a Spending
Affordability Advisory Committee. The committee advises the Executive and provides
guidelines for setting debt affordability levels for the upcoming year. County departments and
agencies submit budget requests to the Executive in late January or early February. After a public
process that involves two public hearings, and a thorough review of departmental requests, the
County Executive submits a proposed capital budget not later than ninety days prior to the end of
the fiscal year. The Executive must submit a proposed operating budget to the County Council
not later than seventy days prior to the end of the fiscal year. The County Council then conducts
a series of public hearings and work sessions in April and May to review the Executive’s
proposed budget. The County Council cannot change the form of the budget as submitted by the
Executive to alter the revenue estimates or to increase any expenditure recommended by the
Executive for current or capital purposes, unless expressly provided in State law or to correct
mathematical errors. The County Council can reduce the Executive’s budget, but not increase it,
except in the case of the Department of Education School Board’s budget. The County Council
may restore funds back to the level requested by the School Board. After its review, the County
Council finalizes the entire budget and sets tax rates, fees and charges needed to generate enough
revenue to balance the budget. The Annual Budget must be adopted by the County Council by
the first day of the last month of the fiscal year currently ending. Expenditure authority for the
operating budget is at the fund and department level in major categories including personnel
costs, various operating expenses and capital costs. Appropriations in the capital budget are
determined at the project level on an annual basis.
Once the budget is approved, the County Council can only amend it at the request of the County
Executive. The operating budget is amended during the year through the use of supplemental
budget appropriation ordinances (SAOs). The County Executive may request at any time during
the fiscal year the approval of an SAO by transferring funds from the County’s budgeted
contingency reserves. The capital budget may be amended through the use of Transfer
Appropriation Ordinances (TAOs). The County Executive may request, at any time during the
fiscal year that a TAO be approved by transferring funds from one capital project to another. At
no time may the bottom line of the capital budget be increased. The County maintains an
encumbrance system for budgetary control. All unencumbered appropriations of the operating
budget lapse at year-end. Unencumbered capital appropriations continue until the specific
capital project is closed.
vi Letter of Transmittal
ECONOMIC CONDITION AND OUTLOOK
Howard County continues to have a diverse economic base, taking advantage of a friendly
business climate, a highly educated workforce and superb quality of life. It is located in the heart
of the corridor between Washington, D.C. and Baltimore, which combined comprise the fourth
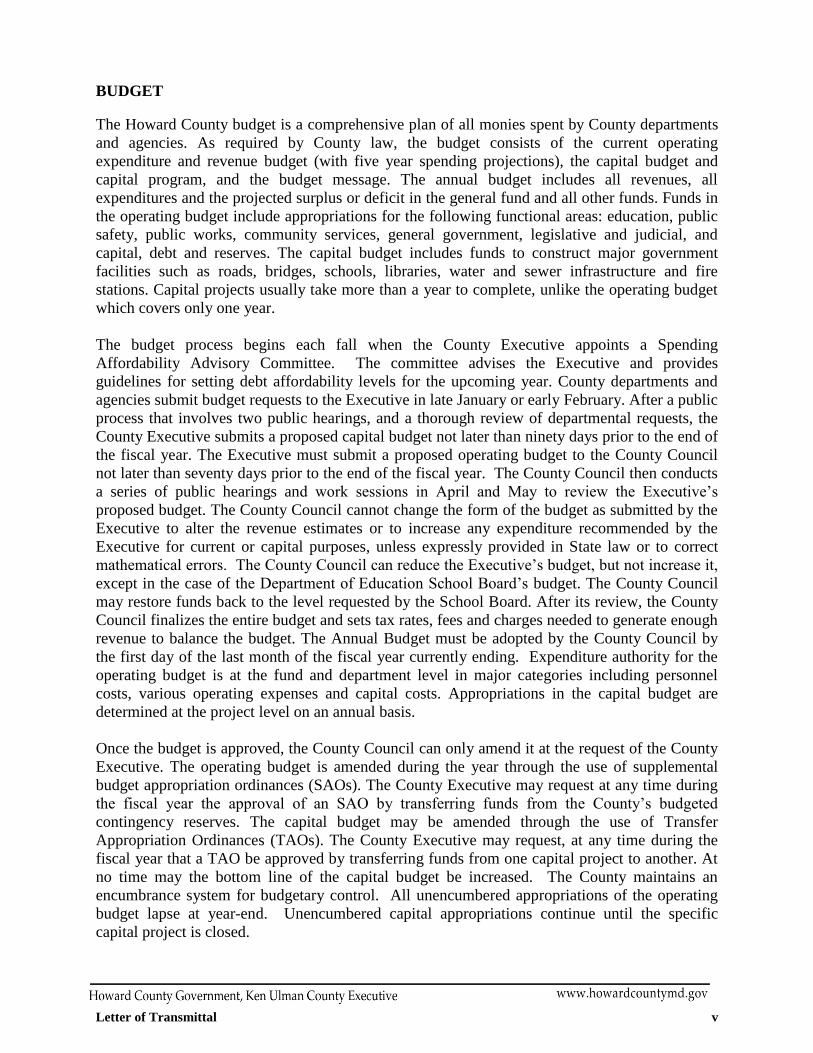
largest market in the United States. Employment is expected to remain stable and the
unemployment rate should continue to remain below the state (6.2%) and national (6.1%) levels
as evidenced by the June 2014 rate of 4%.
0.00%
2.00%
4.00%
6.00%
8.00%
10.00%
12.00%
Dec-09 Jun-10 Dec-10 Jun-11 Dec-11 Jun-12 Dec-12 Jun-13 Dec-13 Jun-14
Unemployment Rate
Howard County Maryland United States
Source: United States Department of Labor, Bureau of Labor Statistics.
LOCAL ECONOMY
Howard County’s ideal geographic location, has contributed to substantial growth in a wide
variety of industries. Over 9441 businesses in Howard County employ 160,324 workers in
industries such as technology, telecommunications, biotechnology, research and development,
wholesale distribution, manufacturing and in multinational corporations. The service sector is
the largest industry in the County, employing 87% of the workforce. In the service industry,
government contracts are generating new business opportunities for start-ups providing technical
labor through the much anticipated Base Realignment & Closure (BRAC) program. Fort George
Meade is less than two miles outside the County border and 5,800 highly skilled positions were
transferred there directly under BRAC. In addition, it is estimated that through 2015 another
21,000 new jobs will be created due to expansion at Fort Meade including the activation of the
United States Cyber Command on May 21, 2010.
Commercial real estate vacancy rates continued to decline despite an increase of over 13 million
square feet of space, or 22%, in the past 5 years to accommodate Fort Meade related growth.
The average rental rate per square foot has continued to rebound and is now at pre-recession
rates. The September 2013 vacancy rate was 9.4% which is nearly 3% less than the vacancy rate
5 years ago.
Letter of Transmittal vii
Fiscal Year (FY) 2014 property tax collections increased 3.1% above the previous fiscal year. In
its FY 2015 budget, Howard County projects a 2.6% increase in property tax collections. One-
third of property in the County is assessed each year, with increases in assessed values phased in
over 3 years. This triennial assessment of property, the phasing in of assessment increases, and
the County’s 5% Homestead Property Tax Credit rate help to stabilize the tax base and tax
revenues.
Local income tax is the County’s other main revenue source. Income tax collection increased by
11.2% when compared to the actual for FY 2013. Due to increases in the number of employed
residents and median incomes, the FY 2015 projection for income tax collections represents a
10.5% increase from what was budgeted in FY 2014.
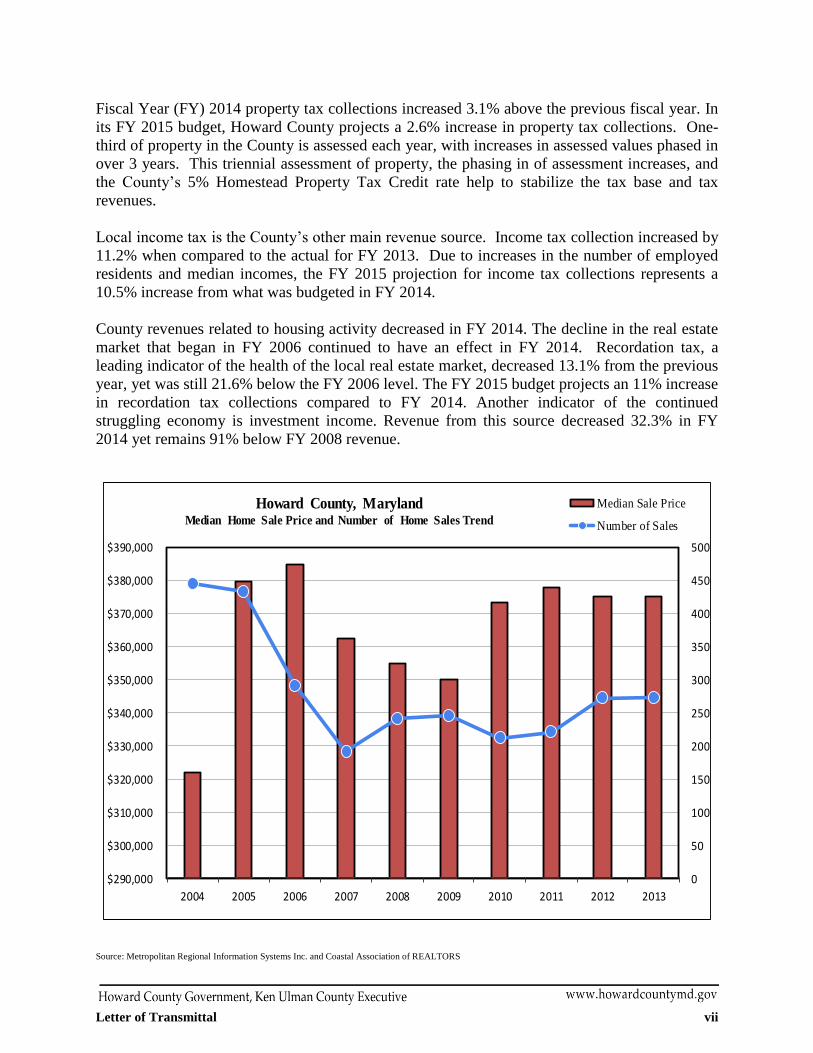
County revenues related to housing activity decreased in FY 2014. The decline in the real estate
market that began in FY 2006 continued to have an effect in FY 2014. Recordation tax, a
leading indicator of the health of the local real estate market, decreased 13.1% from the previous
year, yet was still 21.6% below the FY 2006 level. The FY 2015 budget projects an 11% increase
in recordation tax collections compared to FY 2014. Another indicator of the continued
struggling economy is investment income. Revenue from this source decreased 32.3% in FY
2014 yet remains 91% below FY 2008 revenue.
0
50
100
150
200
250
300
350
400
450
500
$290,000
$300,000
$310,000
$320,000
$330,000
$340,000
$350,000
$360,000
$370,000
$380,000
$390,000
2004 2005 2006 2007 2008 2009 2010 2011 2012 2013
Howard County, MarylandMedian Home Sale Price and Number of Home Sales Trend
Median Sale Price
Number of Sales
Source: Metropolitan Regional Information Systems Inc. and Coastal Association of REALTORS
Letter of Transmittal ix
As a result of continued focus on opportunities to reduce spending and increase efficiencies, the
County had a surplus at the end of FY 2014. The County was able to provide its employees with
their first cost of living increase in 5 years.
Looking forward, overall economic performance is expected to improve slightly in FY 2015. It
is anticipated that the FY 2015 gross assessable base of Howard County will increase by 1.2%.
Due to decreasing Homestead Tax Credits, the net taxable assessment will increase by
approximately 18.9%. This is because the Homestead Tax Credit limits taxable increases on
homeowner occupied properties to 5% per year, and despite the decrease in home values most
residential properties are still phasing in the pre-2006 housing market increases. Approximately
43% of homeowner occupying properties in Howard County received this credit in FY 2014. The
demand for real estate remains strong, especially in the residential resale market, where the
average days on market increased from 46 to 53 days between September 2013 and 2014.
MAJOR INITIATIVES
The County will continue the strong fiscal management policies which have led to Triple-A
ratings from all three credit rating agencies. The County will take advantage of opportunities to
expand the diverse local economy created by the location of the U.S. Cyber Command at nearby
Fort Meade through the new Maryland Center for Entrepreneurship, operated by the Howard
County Economic Development Authority. In order to maintain our highly educated workforce,
the County continues to invest in our top-ranked school system. Recognizing our responsibility
to the environment and the health of the Chesapeake Bay, the County has created a program to
create partnerships with residents, businesses, and institutions to address storm water pollution
on a County-wide basis.
LONG TERM FINANCIAL PLANNING
Rainy Day Fund County voters approved an amendment to the County Charter to establish a budget stabilization
account, also known as a Rainy Day Fund, to provide a financial safety net for the County
effective December 3, 1992. The amendment requires all surplus funds in the County be placed
in this fund until it reaches 7% of the prior year’s audited expenditures. The funds may be used
if an emergency exists pursuant to the County Charter, or if the County Executive determines
that actual revenues will be substantially below the revenues budgeted and reasonable
expenditure reduction will not offset the anticipated loss. See Note 1Q in the Notes to Basic
Financial Statements for a discussion of the status of the Rainy Day Fund. The Rainy Day
Fund’s balance is currently at the target level.
Capital Projects and Debt Administration
The County funds its capital programs based on the requirements of the General Plan and
supporting master plans for schools, recreation and parks, human services, water and sewer, solid
waste, libraries, fire stations and public facilities.
The County plans long and short-term debt issuance to finance its capital budget based on cash
flow needs, sources of revenue, capital construction periods, available financing instruments and
market conditions. The County finances its capital needs on a regular basis dictated by its capital
Letter of Transmittal ix
spending pattern. External financial specialists assist the County in developing a bond issuance
strategy, preparing bond documents, and marketing bonds to investors. Bonds issued by the
County mature over a term that does not exceed the economic life of the improvements that they
finance.
The County consolidates general County improvements into Consolidated Public Improvement
bonds with a term of up to 20 years and water and sewer improvements into Metropolitan
District Bonds with a term of up to 30 years. Debt obligations are generally issued through a
competitive sale. However, the County may use a negotiated sale process when it will provide
significant savings and/or if the terms of the offering are sufficiently complex that the bond issue
might be compromised in a competitive sale.
Spending Affordability Advisory Committee
The Spending Affordability Advisory Committee was established by Executive Order in 1987 to
provide recommendations and projections for the upcoming budget year. Specifically, the
Committee is charged to review in detail the status and projections of revenues and expenditures
for the County for the next budget year and subsequent five years; to evaluate future County
revenue levels and consider the impact of economic indicators such as changes in residential
personal income, assessable base growth; and to evaluate expenditure levels with consideration
of County long-term obligations and the best way to pay for them.
The Committee recommends revenue projections and the amount of new County debt
authorization for the upcoming fiscal year. The Committee report includes the effect its
recommendations will have on future budgets. This Committee also assesses the County’s
ability to repay bond debt and issues an annual report defining debt capacity of the County.
FINANCIAL POLICIES
The financial policies and management practices of Howard County were recognized by all three
major rating agencies with a continued Triple-A credit rating, the highest possible rating.
Debt Management Policy
The County adopted an updated debt management policy on October 7, 2009 that establishes the
processes employed to manage its debt. The policy sets the parameters for issuing debt and
managing outstanding debt. It provides guidance to decision makers regarding the timing and
purposes for which debt may be issued, types and amounts of permissible debt, method of sale
that may be used and structural features that may be incorporated. By establishing a debt policy,
the County has recognized the binding commitment to full and timely repayment of all debt. The
policy ensures that the County maintains a sound debt position and that credit quality is
protected.
Investment Policy
The County’s investment policy provides for the safety and liquidity of public funds by
minimizing credit and market risk while maintaining a competitive yield on the investment
portfolio. All deposits at June 30, 2014 were either insured by federal depository insurance or
collateralized with the collateral held by an independent third party in the County’s name.
Investment activities are governed by State laws. Accordingly, the County invests in: certificates
of deposit (Maryland State banks only); repurchase agreements; banker’s acceptances;
U.S. Government and Federal agency obligations; Treasury and other government mutual funds;
x Letter of Transmittal
and the State of Maryland investment pool. Repurchase agreements and certificates of deposit
are subject to the County’s collateralization policy.
The investment policies for the two Howard County retirement plans establish asset allocation
targets, investment manager selection, and investment performance guidelines.
AWARDS AND ACKNOWLEDGMENTS
The Government Finance Officers Association (GFOA) awarded a Certificate of Achievement
for Excellence in Financial Reporting to Howard County, Maryland for its Comprehensive
Annual Financial Report (CAFR) for the fiscal year ended June 30, 2013. This was the thirty-
eighth consecutive year that the County received this prestigious award. In order to be awarded
a Certificate of Achievement, the County published an easily readable and efficiently organized
CAFR. This report satisfied both Generally Accepted Accounting Principles (GAAP) and
applicable legal requirements.
A Certificate of Achievement is valid for a period of one year only. We believe that our current
CAFR continues to meet the Certificate of Achievement Program’s requirements and we are
submitting it to the GFOA to determine its eligibility for another certificate.
In addition, the County also received the GFOA’s Distinguished Budget Presentation Award for
its annual budget document dated July 1, 2014. This was the twenty first consecutive year the
County has received this award. In order to qualify for the Distinguished Budget Presentation
Award, the County’s budget document was judged as proficient in several categories, including
as a policy document, a financial plan, an operations guide and a communications device.
A very special thank you to Charisse Antonio, Salomey Awuku, Lori Buchman, Dawit
Gebregiorgis, Paul German, Verda Hall, Sean Hollywood, Rafiu Ighile, Anne Keyes, Marvin
Miller, Angela Moore, Diamond Okojie, Angela Price, Sima Taghavi, Thomas Wall, Mimi Xu,
and Sean Zepp for their efforts in preparing and publishing this document. Credit also must be
given to the County Executive and the County Council for their unwavering support for
maintaining the highest standards of professionalism in the management of Howard County’s
finances.
Respectfully submitted,
Stanley J. Milesky
Director of Finance
OFFICE OF THE COUNTY AUDITOR
Craig Glendenning, CPACounty Auditor
November 24, 2014
CERTIFICATE OF THE COUNTY AUDITOR
The Honorable Ken UlmanCounty Executive
Honorable Members of the County Council
Calvin Ball, ChairpersonCourtney Watson, Vice ChairpersonGreg FoxMary Kay SigatyJennifer Terrasa
Article II, Section 212 of the Howard County Charter, requires that a complete audit of all offices,departments, institutions, boards, commissions, corporations, courts, and other agencies of the County Government
be prepared for the preceding fiscal year, and submitted to the County Council and to the County Executive, no laterthan November 30th of each year.
The independent certified public accounting firm of CohnReznick LLP has been retained by the CountyCouncil to assist the County Auditor in the discharge of this responsibility. I hereby certify that the auditingrequirements of Article II, Section 212 of the Howard County Charter have been satisfied for the fiscal year endedJune 30, 2014. Also, in accordance with the Charter Amendment approved by the voters of Howard County, I willmake copies of this report available to the public at the County Auditor's Office and at the Howard County publiclibraries.
Respectfully submitted,
Craig Glendenning, CPACounty Auditor
Certificate of the County Auditor Xl

Students Help Reduce Waste by Launching School-Based Food Scrap Collection Program On the first day of the Howard County Public School System 2014-2015 school year, County Executive Ken Ulman helped welcome students back to school by unveiling the County's first school-based food scrap collection program. The program comes after fourth-grade students at Pointers Run Elementary School in Clarksville wrote a series of persuasive letters to the County and School System officials, asking for the County's composting program to include their school. As a result of those letters, Pointers Run joined the 10,000 homes participating in the County’s food scrap curbside collection program. An additional 5,000 homes are to be added to the program by the end of 2014.
A
Government Finance Officers Association
Certificate ofAchievementfor Excellence
in FinancialReporting
Presented to
Howard County
Maryland
For its Comprehensive Annual
Financial Report
for the Fiscal Year Ended
June 30,2013
Executive Director/CEO
attK&ifflatfiait m»iaBttitawN8»!W«m»w»f(i^^

Page left intentionally blank
Financial Section
• Basic Financial Statements
• Notes to Financial Statements
• Combining and Individual Fund Statements and Schedules

Independent Auditor's Report. 1
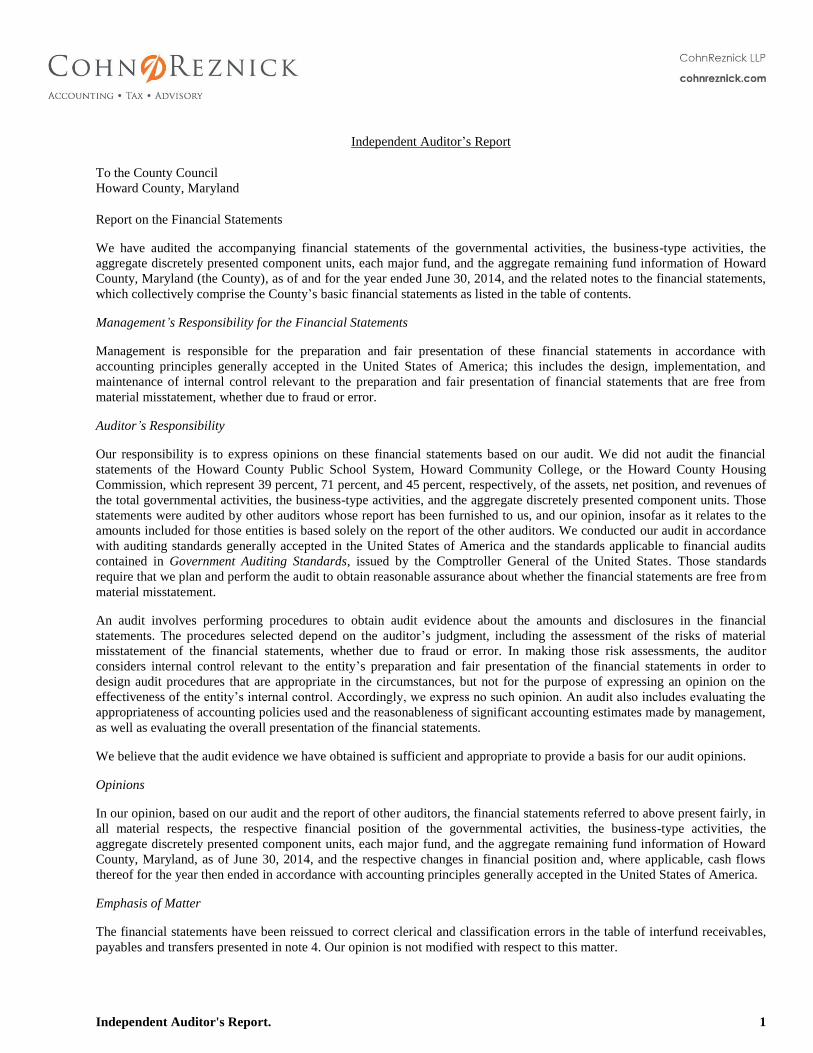
Independent Auditor’s Report
To the County Council
Howard County, Maryland
Report on the Financial Statements
We have audited the accompanying financial statements of the governmental activities, the business-type activities, the
aggregate discretely presented component units, each major fund, and the aggregate remaining fund information of Howard
County, Maryland (the County), as of and for the year ended June 30, 2014, and the related notes to the financial statements,
which collectively comprise the County’s basic financial statements as listed in the table of contents.
Management’s Responsibility for the Financial Statements
Management is responsible for the preparation and fair presentation of these financial statements in accordance with
accounting principles generally accepted in the United States of America; this includes the design, implementation, and
maintenance of internal control relevant to the preparation and fair presentation of financial statements that are free from
material misstatement, whether due to fraud or error.
Auditor’s Responsibility
Our responsibility is to express opinions on these financial statements based on our audit. We did not audit the financial
statements of the Howard County Public School System, Howard Community College, or the Howard County Housing
Commission, which represent 39 percent, 71 percent, and 45 percent, respectively, of the assets, net position, and revenues of
the total governmental activities, the business-type activities, and the aggregate discretely presented component units. Those
statements were audited by other auditors whose report has been furnished to us, and our opinion, insofar as it relates to the
amounts included for those entities is based solely on the report of the other auditors. We conducted our audit in accordance
with auditing standards generally accepted in the United States of America and the standards applicable to financial audits
contained in Government Auditing Standards, issued by the Comptroller General of the United States. Those standards
require that we plan and perform the audit to obtain reasonable assurance about whether the financial statements are free from
material misstatement.
An audit involves performing procedures to obtain audit evidence about the amounts and disclosures in the financial
statements. The procedures selected depend on the auditor’s judgment, including the assessment of the risks of material
misstatement of the financial statements, whether due to fraud or error. In making those risk assessments, the auditor
considers internal control relevant to the entity’s preparation and fair presentation of the financial statements in order to
design audit procedures that are appropriate in the circumstances, but not for the purpose of expressing an opinion on the
effectiveness of the entity’s internal control. Accordingly, we express no such opinion. An audit also includes evaluating the
appropriateness of accounting policies used and the reasonableness of significant accounting estimates made by management,
as well as evaluating the overall presentation of the financial statements.
We believe that the audit evidence we have obtained is sufficient and appropriate to provide a basis for our audit opinions.
Opinions
In our opinion, based on our audit and the report of other auditors, the financial statements referred to above present fairly, in
all material respects, the respective financial position of the governmental activities, the business-type activities, the
aggregate discretely presented component units, each major fund, and the aggregate remaining fund information of Howard
County, Maryland, as of June 30, 2014, and the respective changes in financial position and, where applicable, cash flows
thereof for the year then ended in accordance with accounting principles generally accepted in the United States of America.
Emphasis of Matter
The financial statements have been reissued to correct clerical and classification errors in the table of interfund receivables,
payables and transfers presented in note 4. Our opinion is not modified with respect to this matter.
2 Independent Auditor's Report.
Other Matters
Required Supplementary Information
Accounting principles generally accepted in the United States of America require that the management’s discussion and
analysis, required supplemental schedules of funding progress of Pension Trust Funds and Other Post Employment Benefit
(OPEB) Trust, and the required schedule of employer contributions for OPEB Trust Fund on pages 3 through 13 and 69
through 70 be presented to supplement the basic financial statements. Such information, although not a part of the basic
financial statements, is required by the Governmental Accounting Standards Board, who considers it to be an essential part of
financial reporting for placing the basic financial statements in an appropriate operational, economic, or historical context.
We and other auditors have applied certain limited procedures to the required supplementary information in accordance with
auditing standards generally accepted in the United States of America, which consisted of inquiries of management about the
methods of preparing the information and comparing the information for consistency with management’s responses to our
inquiries, the basic financial statements, and other knowledge we obtained during our audit of the basic financial statements.
We do not express an opinion or provide any assurance on the information because the limited procedures do not provide us
with sufficient evidence to express an opinion or provide any assurance.
Supplementary and Other Information
Our audit was conducted for the purpose of forming opinions on the financial statements that collectively comprise the
Howard County, Maryland’s basic financial statements. The introductory section, combining and individual nonmajor fund
financial statements, budgetary comparison schedules, capital assets schedules, long-term debt schedules and statistical
section are presented for purposes of additional analysis and are not a required part of the basic financial statements.
The combining and individual nonmajor fund financial statements, budgetary comparison schedules, capital asset schedules
and long-term debt schedules are the responsibility of management and were derived from and relate directly to the
underlying accounting and other records used to prepare the basic financial statements. Such information has been subjected
to the auditing procedures applied in the audit of the basic financial statements and certain additional procedures, including
comparing and reconciling such information directly to the underlying accounting and other records used to prepare the basic
financial statements or to the basic financial statements themselves, and other additional procedures in accordance with
auditing standards generally accepted in the United States of America by us and other auditors. In our opinion, based on our
audit, the procedures performed as described above, and the report of the other auditors, the combining and individual
nonmajor fund financial statements, budgetary comparison schedules, capital asset schedules, and long-term debt schedules
are fairly stated, in all material respects, in relation to the basic financial statements as a whole.
The introductory and statistical sections have not been subjected to the auditing procedures applied in the audit of the basic
financial statements and, accordingly, we do not express an opinion or provide any assurance on them.
Other Reporting Required by Government Auditing Standards
In accordance with Government Auditing Standards, we have also issued our report dated November 24, 2014, on our
consideration of Howard County, Maryland’s internal control over financial reporting and on our tests of its compliance with
certain provisions of laws regulations, contracts, and grant agreements and other matters. The purpose of that report is to
describe the scope of our testing of internal control over financial reporting and compliance and the results of that testing, and
not to provide an opinion on internal control over financial reporting or on compliance. That report is an integral part of an
audit performed in accordance with Government Auditing Standards and should be considered in assessing results of our
audit.
Baltimore, Maryland
November 24, 2014 (except for note 4 as to which
the date is December 12, 2014)
Management’s Discussion and Analysis 3
Management’s Discussion and Analysis As management of Howard County, Maryland (the County), we offer readers of the County’s financial statements this narrative overview and analysis of the financial activities of the County for the fiscal year ended June 30, 2014. We encourage readers to consider the information presented here in conjunction with additional information furnished in our letter of transmittal (found on pages iii to x of this report). The discussion focuses on the County’s primary gov-ernment and, unless otherwise noted, does not include component units reported separately from the primary government. Financial Highlights
The assets of the County exceeded its liabilities at the close of the most recent fiscal year by $551.2 million. That amount is net of a $700.6 million unrestricted deficit. The unrestricted deficit occurs because the County issues debt to fund construction costs for the Public School System and the Community College, two of its component units, but does not own the corresponding assets. Debt outstanding for education projects is $457.8 million and for college projects is $84.6 million. Public School System ownership of buildings transfers to the County if the assets are no longer needed for educational purposes. The current net value of the Public School System’s buildings and improvements and construction in progress is $1.039 billion.
The $68.5 million decrease in the government’s total net position is primarily due to an increase of $17.9 mil-
lion in the County’s funding of education expenses (Public School System 3.1% and Community College 7.5%), an overall decrease in grant funding of $31.5 million, mostly due to completion of capital projects such as the Inter-County Broadband Network (ICBN) project, an increase in the County’s contribution to the Other Post-Employment Benefits (OPEB) Trust of $8.2 million, and a decrease of $2.9 million in recordation tax revenue due to a decline in the number of transactions.
The County’s property tax revenues increased this year by $16.5 million or 3.1%, due to rising property values.
Approximately 58.5% of the total governmental fund balance, $160.9 million, is available to meet the County’s
current and future needs as mandated by the appropriate level of authority within the County and are properly designated as committed, assigned and unassigned. Available fund balance for the General Fund is $126.3 mil-lion, or 13.7% of total General Fund expenditures.
At the end of the fiscal year, the County’s governmental funds reported combined ending fund balances of $275.2 million, a decrease of about $1.4 million in comparison with the prior year. Specifically, the fund bal-ance of the General Fund decreased by $7.4 million due to an increase in education expenditures of $17.9 million. In addition, the fund balance of the Agricultural Land Preservation Fund decreased by $5.0 million primarily due to cash payments for several easements totaling $4.5 million.
The reserve for the budget stabilization account balance is $59.3 million, an increase of $2.1 million or 6.4% of fiscal year 2014 general fund expenditures. That balance meets the target set by the County Charter (7% of fiscal year 2012 expenditures). We have reached that target and assigned $4.9 million for subsequent years’ budget stabilization. The County is committed to meeting this mandated target in future years.
The County’s total long-term debt increased by $62.7 million (5.0%) during the current fiscal year. The major
factors in this increase were the issuance of $117.1 million in Consolidated Public Improvement (CPI) Project Bonds, $17.0 million in Tax Increment Financing Bonds, and $22.1 million in Metropolitan (Metro) District Project Bonds. The County refunded $18.5 million in CPI bonds and $6.0 million in Metro bonds and retired $58.4, $9.2, and $3.2 million of CPI, Metro, and Water Quality Bonds, respectively. The County also retired $439,000 of Special Facility Revenue bonds.
4 Management’s Discussion and Analysis
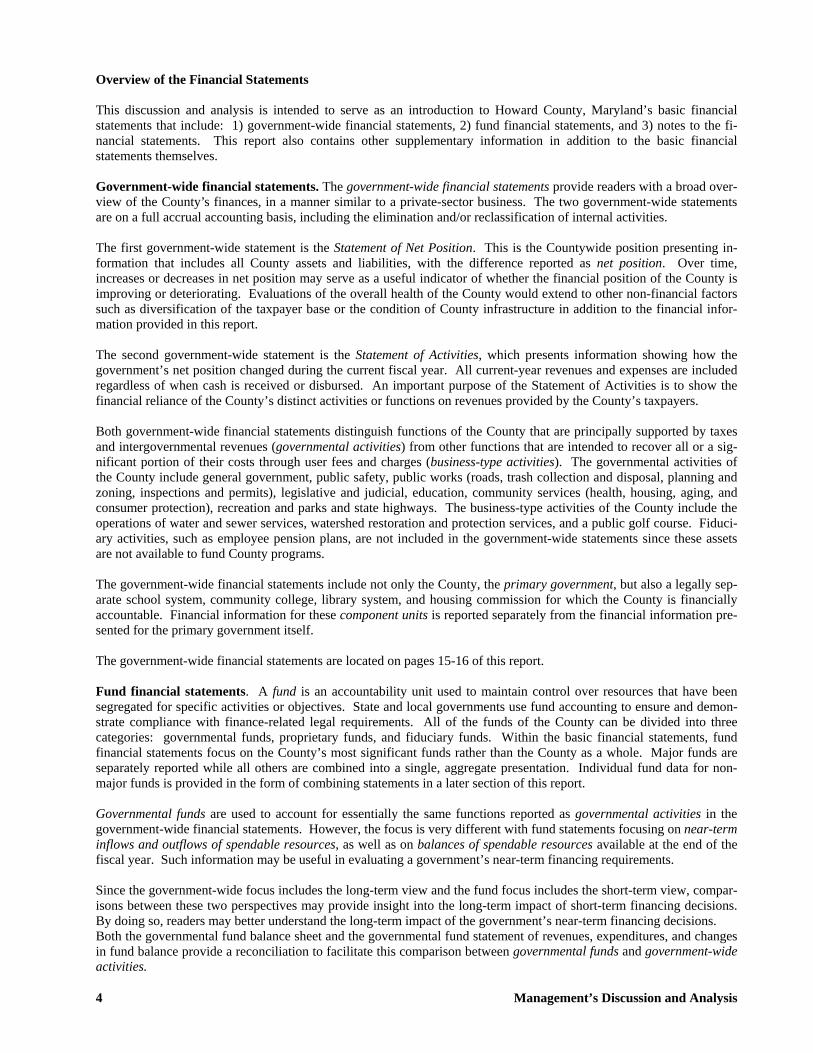
Overview of the Financial Statements
This discussion and analysis is intended to serve as an introduction to Howard County, Maryland’s basic financial statements that include: 1) government-wide financial statements, 2) fund financial statements, and 3) notes to the fi-nancial statements. This report also contains other supplementary information in addition to the basic financial statements themselves. Government-wide financial statements. The government-wide financial statements provide readers with a broad over-view of the County’s finances, in a manner similar to a private-sector business. The two government-wide statements are on a full accrual accounting basis, including the elimination and/or reclassification of internal activities. The first government-wide statement is the Statement of Net Position. This is the Countywide position presenting in-formation that includes all County assets and liabilities, with the difference reported as net position. Over time, increases or decreases in net position may serve as a useful indicator of whether the financial position of the County is improving or deteriorating. Evaluations of the overall health of the County would extend to other non-financial factors such as diversification of the taxpayer base or the condition of County infrastructure in addition to the financial infor-mation provided in this report. The second government-wide statement is the Statement of Activities, which presents information showing how the government’s net position changed during the current fiscal year. All current-year revenues and expenses are included regardless of when cash is received or disbursed. An important purpose of the Statement of Activities is to show the financial reliance of the County’s distinct activities or functions on revenues provided by the County’s taxpayers. Both government-wide financial statements distinguish functions of the County that are principally supported by taxes and intergovernmental revenues (governmental activities) from other functions that are intended to recover all or a sig-nificant portion of their costs through user fees and charges (business-type activities). The governmental activities of the County include general government, public safety, public works (roads, trash collection and disposal, planning and zoning, inspections and permits), legislative and judicial, education, community services (health, housing, aging, and consumer protection), recreation and parks and state highways. The business-type activities of the County include the operations of water and sewer services, watershed restoration and protection services, and a public golf course. Fiduci-ary activities, such as employee pension plans, are not included in the government-wide statements since these assets are not available to fund County programs. The government-wide financial statements include not only the County, the primary government, but also a legally sep-arate school system, community college, library system, and housing commission for which the County is financially accountable. Financial information for these component units is reported separately from the financial information pre-sented for the primary government itself. The government-wide financial statements are located on pages 15-16 of this report. Fund financial statements. A fund is an accountability unit used to maintain control over resources that have been segregated for specific activities or objectives. State and local governments use fund accounting to ensure and demon-strate compliance with finance-related legal requirements. All of the funds of the County can be divided into three categories: governmental funds, proprietary funds, and fiduciary funds. Within the basic financial statements, fund financial statements focus on the County’s most significant funds rather than the County as a whole. Major funds are separately reported while all others are combined into a single, aggregate presentation. Individual fund data for non-major funds is provided in the form of combining statements in a later section of this report. Governmental funds are used to account for essentially the same functions reported as governmental activities in the government-wide financial statements. However, the focus is very different with fund statements focusing on near-term inflows and outflows of spendable resources, as well as on balances of spendable resources available at the end of the fiscal year. Such information may be useful in evaluating a government’s near-term financing requirements. Since the government-wide focus includes the long-term view and the fund focus includes the short-term view, compar-isons between these two perspectives may provide insight into the long-term impact of short-term financing decisions. By doing so, readers may better understand the long-term impact of the government’s near-term financing decisions. Both the governmental fund balance sheet and the governmental fund statement of revenues, expenditures, and changes in fund balance provide a reconciliation to facilitate this comparison between governmental funds and government-wide activities.
Management’s Discussion and Analysis 5
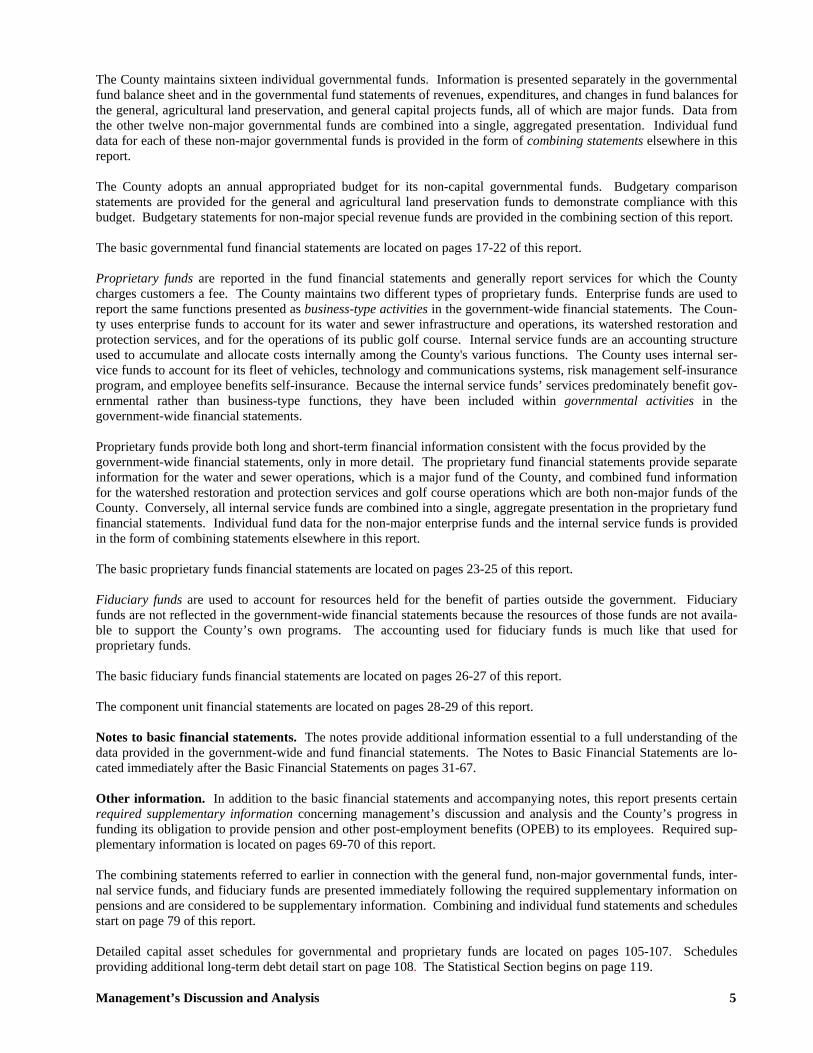
The County maintains sixteen individual governmental funds. Information is presented separately in the governmental fund balance sheet and in the governmental fund statements of revenues, expenditures, and changes in fund balances for the general, agricultural land preservation, and general capital projects funds, all of which are major funds. Data from the other twelve non-major governmental funds are combined into a single, aggregated presentation. Individual fund data for each of these non-major governmental funds is provided in the form of combining statements elsewhere in this report. The County adopts an annual appropriated budget for its non-capital governmental funds. Budgetary comparison statements are provided for the general and agricultural land preservation funds to demonstrate compliance with this budget. Budgetary statements for non-major special revenue funds are provided in the combining section of this report. The basic governmental fund financial statements are located on pages 17-22 of this report. Proprietary funds are reported in the fund financial statements and generally report services for which the County charges customers a fee. The County maintains two different types of proprietary funds. Enterprise funds are used to report the same functions presented as business-type activities in the government-wide financial statements. The Coun-ty uses enterprise funds to account for its water and sewer infrastructure and operations, its watershed restoration and protection services, and for the operations of its public golf course. Internal service funds are an accounting structure used to accumulate and allocate costs internally among the County's various functions. The County uses internal ser-vice funds to account for its fleet of vehicles, technology and communications systems, risk management self-insurance program, and employee benefits self-insurance. Because the internal service funds’ services predominately benefit gov-ernmental rather than business-type functions, they have been included within governmental activities in the government-wide financial statements. Proprietary funds provide both long and short-term financial information consistent with the focus provided by the government-wide financial statements, only in more detail. The proprietary fund financial statements provide separate information for the water and sewer operations, which is a major fund of the County, and combined fund information for the watershed restoration and protection services and golf course operations which are both non-major funds of the County. Conversely, all internal service funds are combined into a single, aggregate presentation in the proprietary fund financial statements. Individual fund data for the non-major enterprise funds and the internal service funds is provided in the form of combining statements elsewhere in this report. The basic proprietary funds financial statements are located on pages 23-25 of this report. Fiduciary funds are used to account for resources held for the benefit of parties outside the government. Fiduciary funds are not reflected in the government-wide financial statements because the resources of those funds are not availa-ble to support the County’s own programs. The accounting used for fiduciary funds is much like that used for proprietary funds. The basic fiduciary funds financial statements are located on pages 26-27 of this report. The component unit financial statements are located on pages 28-29 of this report. Notes to basic financial statements. The notes provide additional information essential to a full understanding of the data provided in the government-wide and fund financial statements. The Notes to Basic Financial Statements are lo-cated immediately after the Basic Financial Statements on pages 31-67. Other information. In addition to the basic financial statements and accompanying notes, this report presents certain required supplementary information concerning management’s discussion and analysis and the County’s progress in funding its obligation to provide pension and other post-employment benefits (OPEB) to its employees. Required sup-plementary information is located on pages 69-70 of this report. The combining statements referred to earlier in connection with the general fund, non-major governmental funds, inter-nal service funds, and fiduciary funds are presented immediately following the required supplementary information on pensions and are considered to be supplementary information. Combining and individual fund statements and schedules start on page 79 of this report. Detailed capital asset schedules for governmental and proprietary funds are located on pages 105-107. Schedules providing additional long-term debt detail start on page 108. The Statistical Section begins on page 119.
6 Management’s Discussion and Analysis
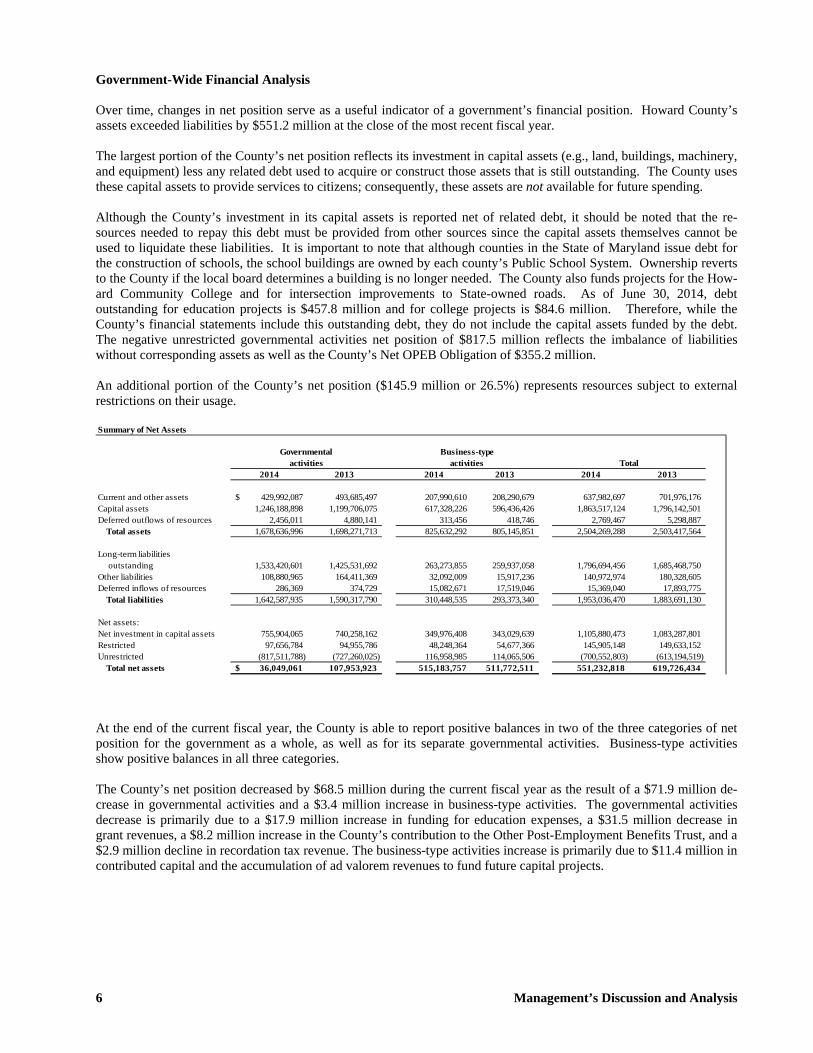
Government-Wide Financial Analysis Over time, changes in net position serve as a useful indicator of a government’s financial position. Howard County’s assets exceeded liabilities by $551.2 million at the close of the most recent fiscal year. The largest portion of the County’s net position reflects its investment in capital assets (e.g., land, buildings, machinery, and equipment) less any related debt used to acquire or construct those assets that is still outstanding. The County uses these capital assets to provide services to citizens; consequently, these assets are not available for future spending. Although the County’s investment in its capital assets is reported net of related debt, it should be noted that the re-sources needed to repay this debt must be provided from other sources since the capital assets themselves cannot be used to liquidate these liabilities. It is important to note that although counties in the State of Maryland issue debt for the construction of schools, the school buildings are owned by each county’s Public School System. Ownership reverts to the County if the local board determines a building is no longer needed. The County also funds projects for the How-ard Community College and for intersection improvements to State-owned roads. As of June 30, 2014, debt outstanding for education projects is $457.8 million and for college projects is $84.6 million. Therefore, while the County’s financial statements include this outstanding debt, they do not include the capital assets funded by the debt. The negative unrestricted governmental activities net position of $817.5 million reflects the imbalance of liabilities without corresponding assets as well as the County’s Net OPEB Obligation of $355.2 million. An additional portion of the County’s net position ($145.9 million or 26.5%) represents resources subject to external restrictions on their usage. Summary of Net Assets
2014 2013 2014 2013 2014 2013
Current and other assets 429,992,087$ 493,685,497 207,990,610 208,290,679 637,982,697 701,976,176Capital assets 1,246,188,898 1,199,706,075 617,328,226 596,436,426 1,863,517,124 1,796,142,501Deferred outflows of resources 2,456,011 4,880,141 313,456 418,746 2,769,467 5,298,887
Total assets 1,678,636,996 1,698,271,713 825,632,292 805,145,851 2,504,269,288 2,503,417,564
Long-term liabilities outstanding 1,533,420,601 1,425,531,692 263,273,855 259,937,058 1,796,694,456 1,685,468,750Other liabilities 108,880,965 164,411,369 32,092,009 15,917,236 140,972,974 180,328,605Deferred inflows of resources 286,369 374,729 15,082,671 17,519,046 15,369,040 17,893,775
Total liabilities 1,642,587,935 1,590,317,790 310,448,535 293,373,340 1,953,036,470 1,883,691,130
Net assets:Net investment in capital assets 755,904,065 740,258,162 349,976,408 343,029,639 1,105,880,473 1,083,287,801Restricted 97,656,784 94,955,786 48,248,364 54,677,366 145,905,148 149,633,152Unrestricted (817,511,788) (727,260,025) 116,958,985 114,065,506 (700,552,803) (613,194,519)
Total net assets 36,049,061$ 107,953,923 515,183,757 511,772,511 551,232,818 619,726,434
Governmentalactivities Total
Business-typeactivities
At the end of the current fiscal year, the County is able to report positive balances in two of the three categories of net position for the government as a whole, as well as for its separate governmental activities. Business-type activities show positive balances in all three categories. The County’s net position decreased by $68.5 million during the current fiscal year as the result of a $71.9 million de-crease in governmental activities and a $3.4 million increase in business-type activities. The governmental activities decrease is primarily due to a $17.9 million increase in funding for education expenses, a $31.5 million decrease in grant revenues, a $8.2 million increase in the County’s contribution to the Other Post-Employment Benefits Trust, and a $2.9 million decline in recordation tax revenue. The business-type activities increase is primarily due to $11.4 million in contributed capital and the accumulation of ad valorem revenues to fund future capital projects.
Management’s Discussion and Analysis 7
Changes in Net Position
2014 2013 2014 2013 2014 2013
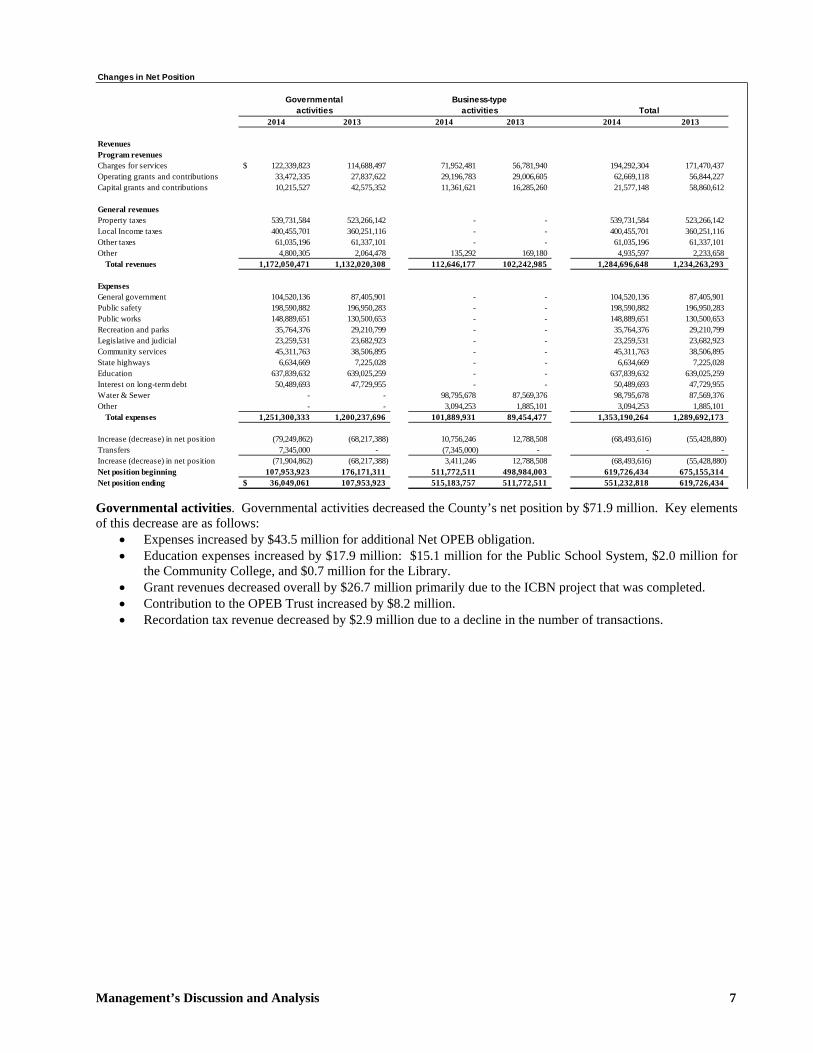
RevenuesProgram revenuesCharges for services 122,339,823$ 114,688,497 71,952,481 56,781,940 194,292,304 171,470,437Operating grants and contributions 33,472,335 27,837,622 29,196,783 29,006,605 62,669,118 56,844,227Capital grants and contributions 10,215,527 42,575,352 11,361,621 16,285,260 21,577,148 58,860,612
General revenuesProperty taxes 539,731,584 523,266,142 - - 539,731,584 523,266,142Local Income taxes 400,455,701 360,251,116 - - 400,455,701 360,251,116Other taxes 61,035,196 61,337,101 - - 61,035,196 61,337,101Other 4,800,305 2,064,478 135,292 169,180 4,935,597 2,233,658
Total revenues 1,172,050,471 1,132,020,308 112,646,177 102,242,985 1,284,696,648 1,234,263,293
ExpensesGeneral government 104,520,136 87,405,901 - - 104,520,136 87,405,901Public safety 198,590,882 196,950,283 - - 198,590,882 196,950,283Public works 148,889,651 130,500,653 - - 148,889,651 130,500,653Recreation and parks 35,764,376 29,210,799 - - 35,764,376 29,210,799Legislative and judicial 23,259,531 23,682,923 - - 23,259,531 23,682,923Community services 45,311,763 38,506,895 - - 45,311,763 38,506,895State highways 6,634,669 7,225,028 - - 6,634,669 7,225,028Education 637,839,632 639,025,259 - - 637,839,632 639,025,259Interest on long-term debt 50,489,693 47,729,955 - - 50,489,693 47,729,955Water & Sewer - - 98,795,678 87,569,376 98,795,678 87,569,376Other - - 3,094,253 1,885,101 3,094,253 1,885,101
Total expenses 1,251,300,333 1,200,237,696 101,889,931 89,454,477 1,353,190,264 1,289,692,173
Increase (decrease) in net position (79,249,862) (68,217,388) 10,756,246 12,788,508 (68,493,616) (55,428,880)Transfers 7,345,000 - (7,345,000) - - - Increase (decrease) in net position (71,904,862) (68,217,388) 3,411,246 12,788,508 (68,493,616) (55,428,880)Net position beginning 107,953,923 176,171,311 511,772,511 498,984,003 619,726,434 675,155,314Net position ending 36,049,061$ 107,953,923 515,183,757 511,772,511 551,232,818 619,726,434
Governmentalactivities
Business-typeactivities Total
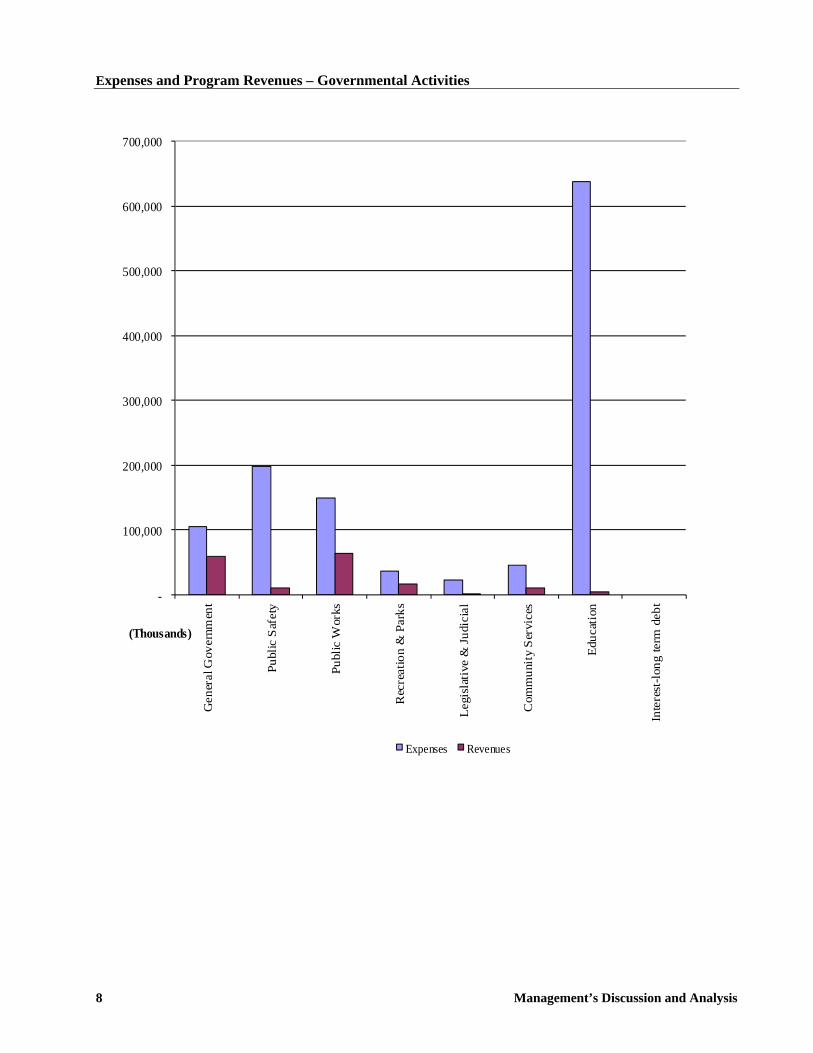
Governmental activities. Governmental activities decreased the County’s net position by $71.9 million. Key elements of this decrease are as follows:
Expenses increased by $43.5 million for additional Net OPEB obligation. Education expenses increased by $17.9 million: $15.1 million for the Public School System, $2.0 million for
the Community College, and $0.7 million for the Library. Grant revenues decreased overall by $26.7 million primarily due to the ICBN project that was completed. Contribution to the OPEB Trust increased by $8.2 million. Recordation tax revenue decreased by $2.9 million due to a decline in the number of transactions.
8 Management’s Discussion and Analysis
Expenses and Program Revenues – Governmental Activities
-
100,000
200,000
300,000
400,000
500,000
600,000
700,000
Gen
eral
Gov
ernm
ent
Publ
ic S
afet
y
Publ
ic W
orks
Rec
reat
ion
& P
arks
Legi
slat
ive
& Ju
dici
al
Com
mun
ity S
ervi
ces
Educ
atio
n
Inte
rest
-long
term
deb
t
(Thousands)
Expenses Revenues
Management’s Discussion and Analysis 9
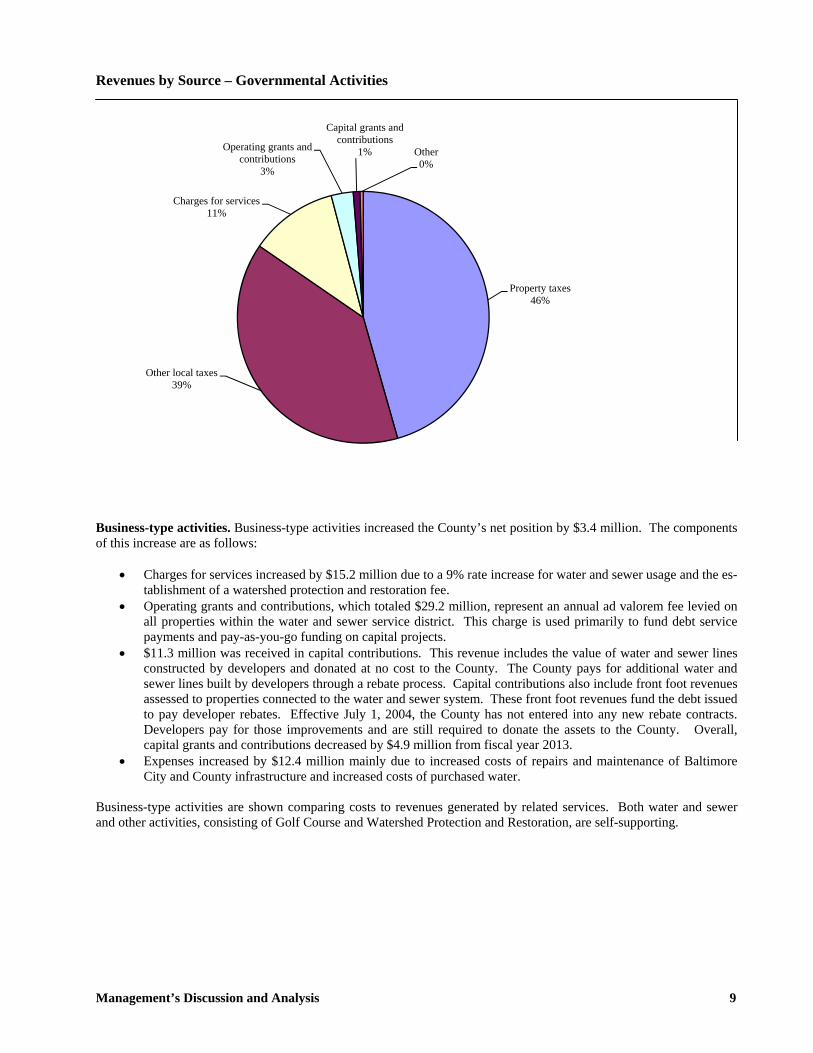
Revenues by Source – Governmental Activities
Business-type activities. Business-type activities increased the County’s net position by $3.4 million. The components of this increase are as follows:
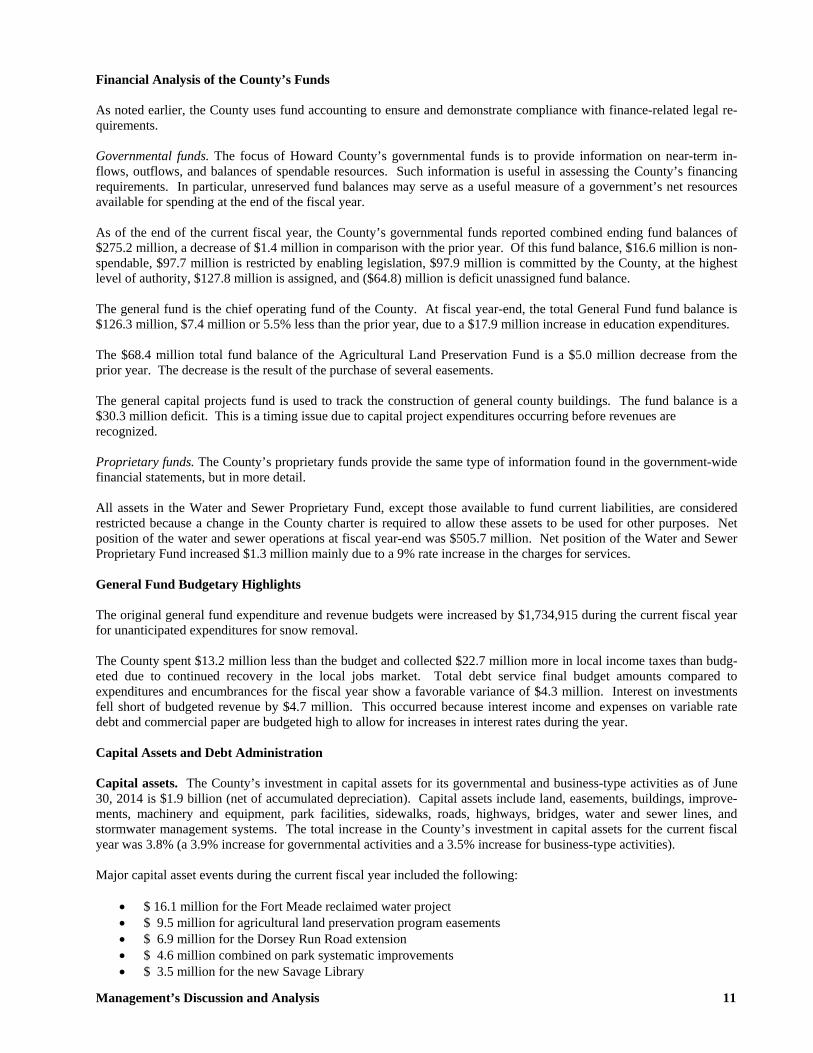
Charges for services increased by $15.2 million due to a 9% rate increase for water and sewer usage and the es-tablishment of a watershed protection and restoration fee.
Operating grants and contributions, which totaled $29.2 million, represent an annual ad valorem fee levied on all properties within the water and sewer service district. This charge is used primarily to fund debt service payments and pay-as-you-go funding on capital projects.
$11.3 million was received in capital contributions. This revenue includes the value of water and sewer lines constructed by developers and donated at no cost to the County. The County pays for additional water and sewer lines built by developers through a rebate process. Capital contributions also include front foot revenues assessed to properties connected to the water and sewer system. These front foot revenues fund the debt issued to pay developer rebates. Effective July 1, 2004, the County has not entered into any new rebate contracts. Developers pay for those improvements and are still required to donate the assets to the County. Overall, capital grants and contributions decreased by $4.9 million from fiscal year 2013.
Expenses increased by $12.4 million mainly due to increased costs of repairs and maintenance of Baltimore City and County infrastructure and increased costs of purchased water.
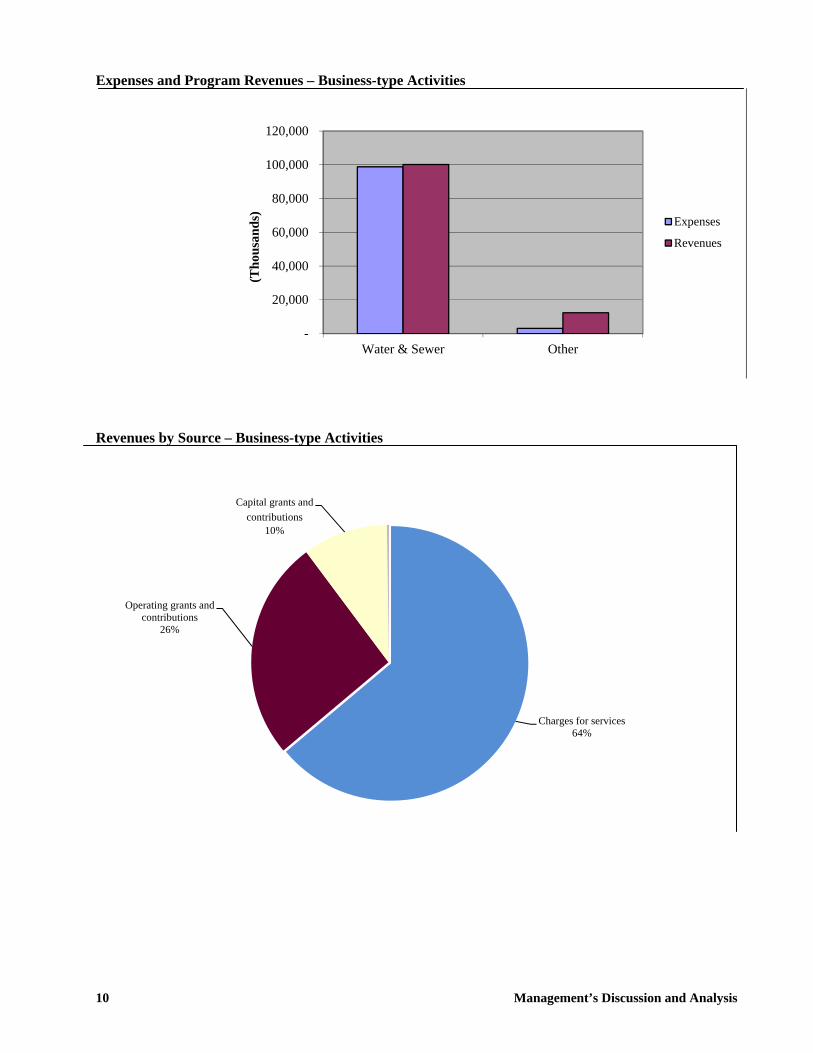
Business-type activities are shown comparing costs to revenues generated by related services. Both water and sewer and other activities, consisting of Golf Course and Watershed Protection and Restoration, are self-supporting.
Property taxes46%
Other local taxes39%
Charges for services11%
Operating grants and contributions
3%
Capital grants and contributions
1% Other0%
10 Management’s Discussion and Analysis
Expenses and Program Revenues – Business-type Activities
Revenues by Source – Business-type Activities
-
20,000
40,000
60,000
80,000
100,000
120,000
Water & Sewer Other
(Tho
usan
ds)
Expenses
Revenues
Charges for services64%
Operating grants and contributions
26%
Capital grants and contributions
10%
Management’s Discussion and Analysis 11
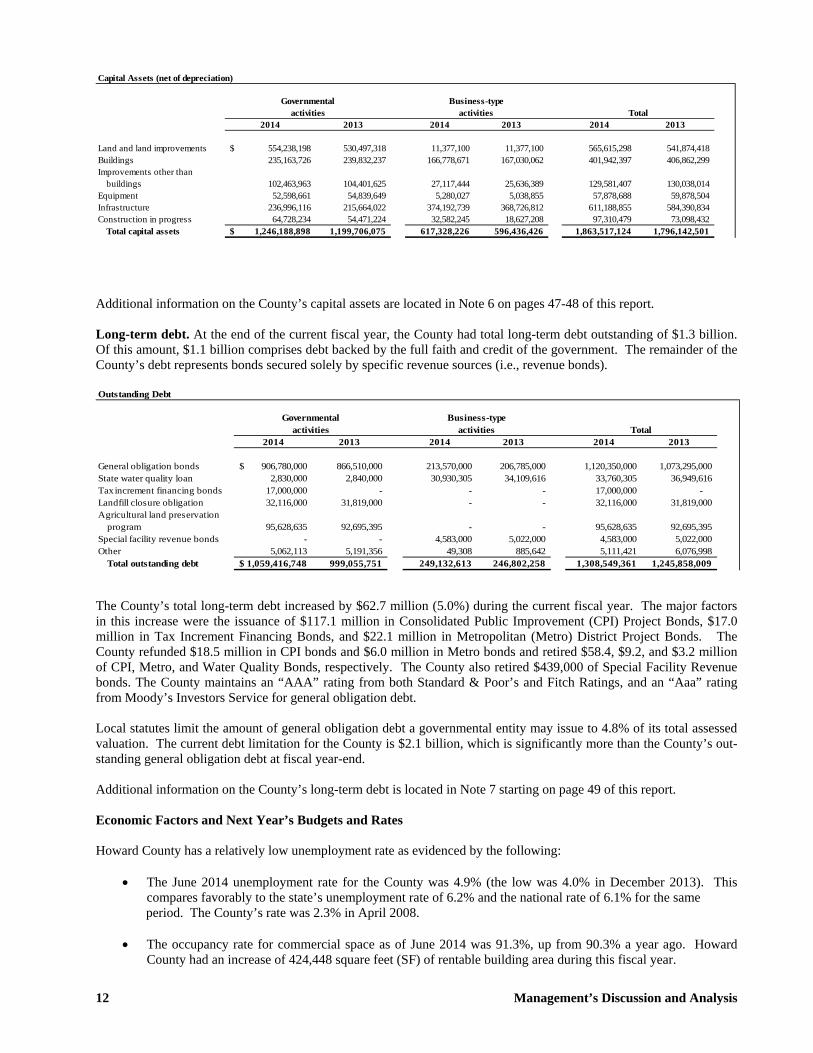
Financial Analysis of the County’s Funds As noted earlier, the County uses fund accounting to ensure and demonstrate compliance with finance-related legal re-quirements. Governmental funds. The focus of Howard County’s governmental funds is to provide information on near-term in-flows, outflows, and balances of spendable resources. Such information is useful in assessing the County’s financing requirements. In particular, unreserved fund balances may serve as a useful measure of a government’s net resources available for spending at the end of the fiscal year. As of the end of the current fiscal year, the County’s governmental funds reported combined ending fund balances of $275.2 million, a decrease of $1.4 million in comparison with the prior year. Of this fund balance, $16.6 million is non-spendable, $97.7 million is restricted by enabling legislation, $97.9 million is committed by the County, at the highest level of authority, $127.8 million is assigned, and ($64.8) million is deficit unassigned fund balance. The general fund is the chief operating fund of the County. At fiscal year-end, the total General Fund fund balance is $126.3 million, $7.4 million or 5.5% less than the prior year, due to a $17.9 million increase in education expenditures. The $68.4 million total fund balance of the Agricultural Land Preservation Fund is a $5.0 million decrease from the prior year. The decrease is the result of the purchase of several easements. The general capital projects fund is used to track the construction of general county buildings. The fund balance is a $30.3 million deficit. This is a timing issue due to capital project expenditures occurring before revenues are recognized. Proprietary funds. The County’s proprietary funds provide the same type of information found in the government-wide financial statements, but in more detail. All assets in the Water and Sewer Proprietary Fund, except those available to fund current liabilities, are considered restricted because a change in the County charter is required to allow these assets to be used for other purposes. Net position of the water and sewer operations at fiscal year-end was $505.7 million. Net position of the Water and Sewer Proprietary Fund increased $1.3 million mainly due to a 9% rate increase in the charges for services. General Fund Budgetary Highlights The original general fund expenditure and revenue budgets were increased by $1,734,915 during the current fiscal year for unanticipated expenditures for snow removal. The County spent $13.2 million less than the budget and collected $22.7 million more in local income taxes than budg-eted due to continued recovery in the local jobs market. Total debt service final budget amounts compared to expenditures and encumbrances for the fiscal year show a favorable variance of $4.3 million. Interest on investments fell short of budgeted revenue by $4.7 million. This occurred because interest income and expenses on variable rate debt and commercial paper are budgeted high to allow for increases in interest rates during the year. Capital Assets and Debt Administration Capital assets. The County’s investment in capital assets for its governmental and business-type activities as of June 30, 2014 is $1.9 billion (net of accumulated depreciation). Capital assets include land, easements, buildings, improve-ments, machinery and equipment, park facilities, sidewalks, roads, highways, bridges, water and sewer lines, and stormwater management systems. The total increase in the County’s investment in capital assets for the current fiscal year was 3.8% (a 3.9% increase for governmental activities and a 3.5% increase for business-type activities). Major capital asset events during the current fiscal year included the following:
$ 16.1 million for the Fort Meade reclaimed water project $ 9.5 million for agricultural land preservation program easements $ 6.9 million for the Dorsey Run Road extension $ 4.6 million combined on park systematic improvements $ 3.5 million for the new Savage Library
12 Management’s Discussion and Analysis
Capital Assets (net of depreciation)
2014 2013 2014 2013 2014 2013
Land and land improvements 554,238,198$ 530,497,318 11,377,100 11,377,100 565,615,298 541,874,418 Buildings 235,163,726 239,832,237 166,778,671 167,030,062 401,942,397 406,862,299 Improvements other than
buildings 102,463,963 104,401,625 27,117,444 25,636,389 129,581,407 130,038,014 Equipment 52,598,661 54,839,649 5,280,027 5,038,855 57,878,688 59,878,504 Infrastructure 236,996,116 215,664,022 374,192,739 368,726,812 611,188,855 584,390,834 Construction in progress 64,728,234 54,471,224 32,582,245 18,627,208 97,310,479 73,098,432
Total capital assets 1,246,188,898$ 1,199,706,075 617,328,226 596,436,426 1,863,517,124 1,796,142,501
Governmentalactivities
Business-typeactivities Total
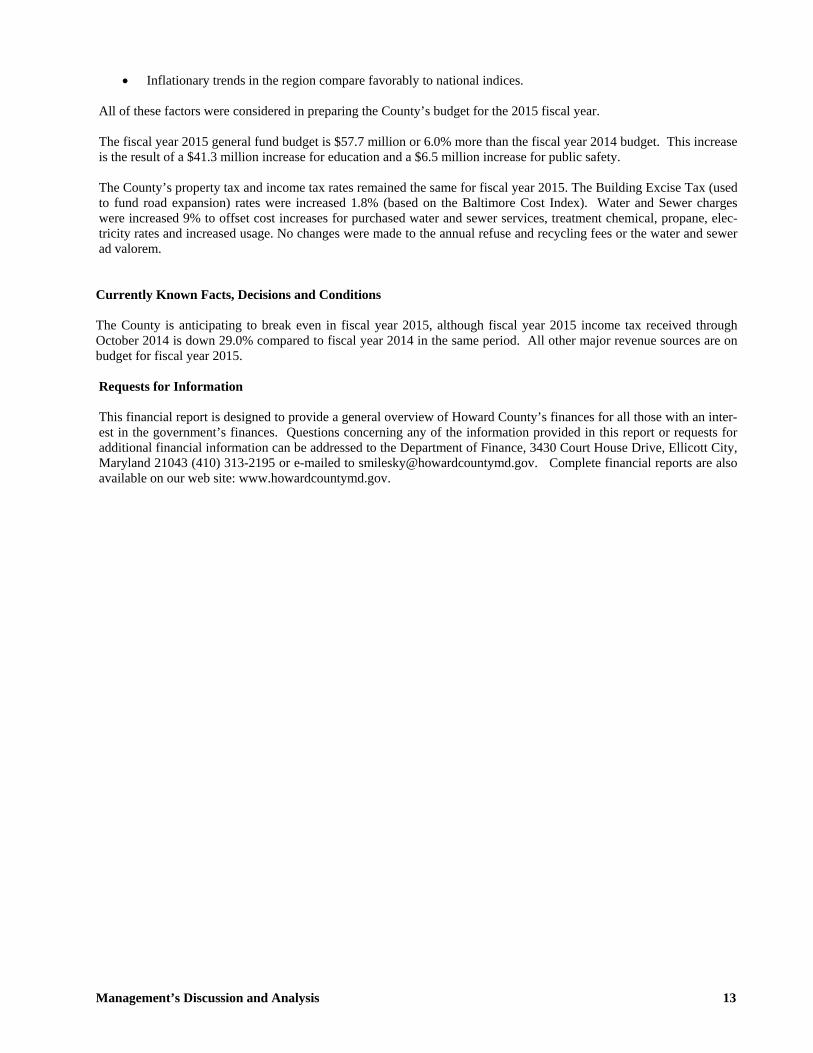
Additional information on the County’s capital assets are located in Note 6 on pages 47-48 of this report. Long-term debt. At the end of the current fiscal year, the County had total long-term debt outstanding of $1.3 billion. Of this amount, $1.1 billion comprises debt backed by the full faith and credit of the government. The remainder of the County’s debt represents bonds secured solely by specific revenue sources (i.e., revenue bonds). Outstanding Debt
2014 2013 2014 2013 2014 2013
General obligation bonds 906,780,000$ 866,510,000 213,570,000 206,785,000 1,120,350,000 1,073,295,000 State water quality loan 2,830,000 2,840,000 30,930,305 34,109,616 33,760,305 36,949,616 Tax increment financing bonds 17,000,000 - - - 17,000,000 - Landfill closure obligation 32,116,000 31,819,000 - - 32,116,000 31,819,000 Agricultural land preservation
program 95,628,635 92,695,395 - - 95,628,635 92,695,395 Special facility revenue bonds - - 4,583,000 5,022,000 4,583,000 5,022,000 Other 5,062,113 5,191,356 49,308 885,642 5,111,421 6,076,998
Total outstanding debt 1,059,416,748$ 999,055,751 249,132,613 246,802,258 1,308,549,361 1,245,858,009
Governmentalactivities
Business-typeactivities Total
The County’s total long-term debt increased by $62.7 million (5.0%) during the current fiscal year. The major factors in this increase were the issuance of $117.1 million in Consolidated Public Improvement (CPI) Project Bonds, $17.0 million in Tax Increment Financing Bonds, and $22.1 million in Metropolitan (Metro) District Project Bonds. The County refunded $18.5 million in CPI bonds and $6.0 million in Metro bonds and retired $58.4, $9.2, and $3.2 million of CPI, Metro, and Water Quality Bonds, respectively. The County also retired $439,000 of Special Facility Revenue bonds. The County maintains an “AAA” rating from both Standard & Poor’s and Fitch Ratings, and an “Aaa” rating from Moody’s Investors Service for general obligation debt. Local statutes limit the amount of general obligation debt a governmental entity may issue to 4.8% of its total assessed valuation. The current debt limitation for the County is $2.1 billion, which is significantly more than the County’s out-standing general obligation debt at fiscal year-end. Additional information on the County’s long-term debt is located in Note 7 starting on page 49 of this report. Economic Factors and Next Year’s Budgets and Rates Howard County has a relatively low unemployment rate as evidenced by the following:
The June 2014 unemployment rate for the County was 4.9% (the low was 4.0% in December 2013). This compares favorably to the state’s unemployment rate of 6.2% and the national rate of 6.1% for the same
period. The County’s rate was 2.3% in April 2008.
The occupancy rate for commercial space as of June 2014 was 91.3%, up from 90.3% a year ago. Howard County had an increase of 424,448 square feet (SF) of rentable building area during this fiscal year.
Management’s Discussion and Analysis 13
Inflationary trends in the region compare favorably to national indices. All of these factors were considered in preparing the County’s budget for the 2015 fiscal year. The fiscal year 2015 general fund budget is $57.7 million or 6.0% more than the fiscal year 2014 budget. This increase is the result of a $41.3 million increase for education and a $6.5 million increase for public safety. The County’s property tax and income tax rates remained the same for fiscal year 2015. The Building Excise Tax (used to fund road expansion) rates were increased 1.8% (based on the Baltimore Cost Index). Water and Sewer charges were increased 9% to offset cost increases for purchased water and sewer services, treatment chemical, propane, elec-tricity rates and increased usage. No changes were made to the annual refuse and recycling fees or the water and sewer ad valorem. Currently Known Facts, Decisions and Conditions The County is anticipating to break even in fiscal year 2015, although fiscal year 2015 income tax received through October 2014 is down 29.0% compared to fiscal year 2014 in the same period. All other major revenue sources are on budget for fiscal year 2015. Requests for Information This financial report is designed to provide a general overview of Howard County’s finances for all those with an inter-est in the government’s finances. Questions concerning any of the information provided in this report or requests for additional financial information can be addressed to the Department of Finance, 3430 Court House Drive, Ellicott City, Maryland 21043 (410) 313-2195 or e-mailed to [email protected]. Complete financial reports are also available on our web site: www.howardcountymd.gov.
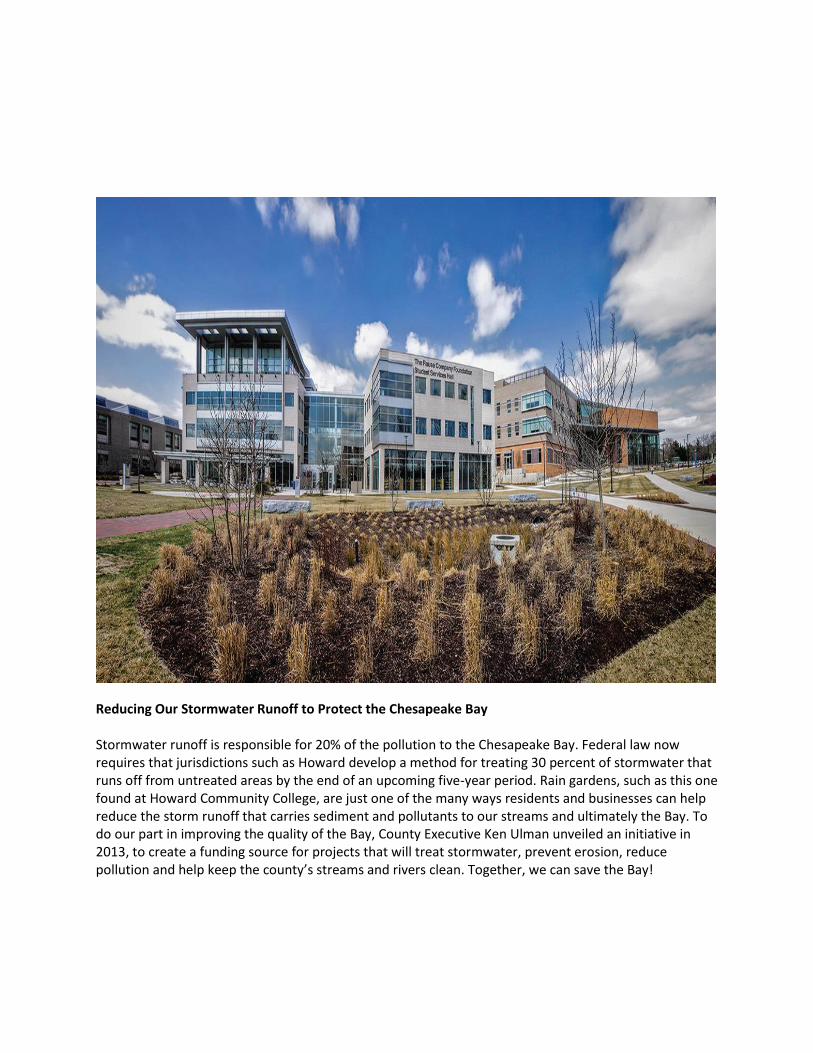
Reducing Our Stormwater Runoff to Protect the Chesapeake Bay Stormwater runoff is responsible for 20% of the pollution to the Chesapeake Bay. Federal law now requires that jurisdictions such as Howard develop a method for treating 30 percent of stormwater that runs off from untreated areas by the end of an upcoming five-year period. Rain gardens, such as this one found at Howard Community College, are just one of the many ways residents and businesses can help reduce the storm runoff that carries sediment and pollutants to our streams and ultimately the Bay. To do our part in improving the quality of the Bay, County Executive Ken Ulman unveiled an initiative in 2013, to create a funding source for projects that will treat stormwater, prevent erosion, reduce pollution and help keep the county’s streams and rivers clean. Together, we can save the Bay!
Basic Financial Statements
Government-wide financial statements combine all of Howard County’s governmental and business-type activities, as well as its discretely presented component units. Fund financial statements show the financial position and the operating results by fund.

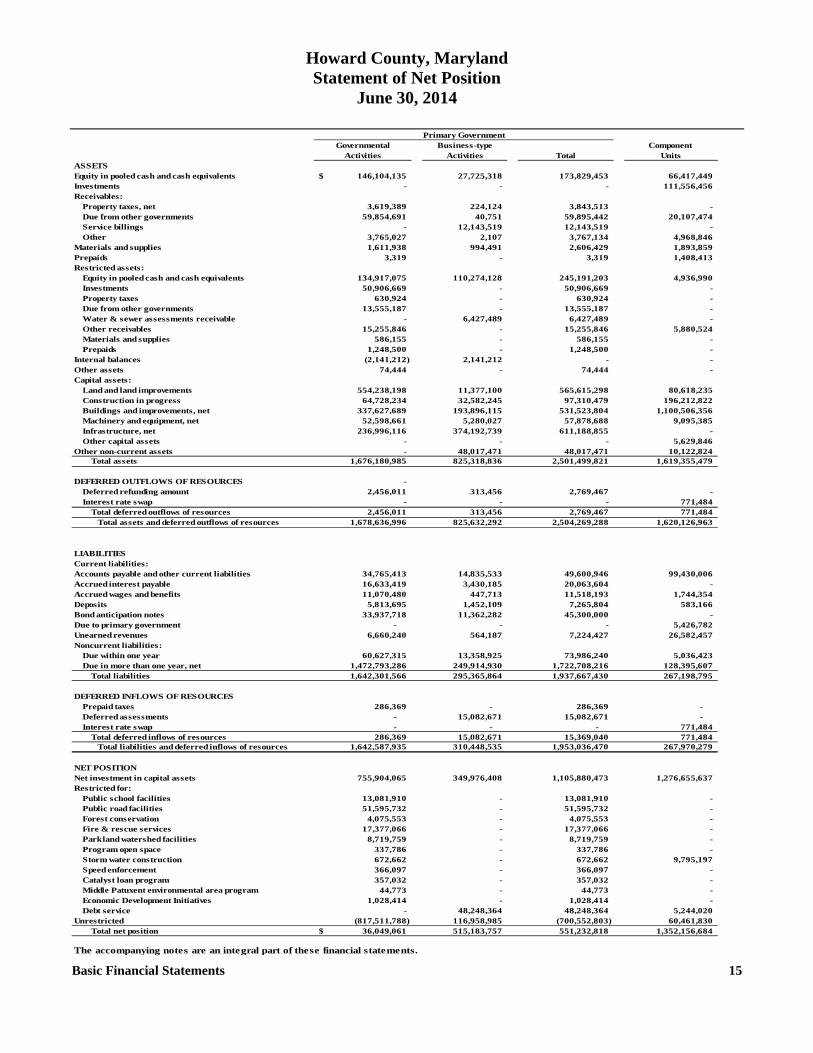
Howard County, Maryland Statement of Net Position
June 30, 2014
Basic Financial Statements 15
Governmental Business-type Component Activities Activities Total Units
ASSETSEquity in pooled cash and cash equivalents 146,104,135$ 27,725,318 173,829,453 66,417,449 Investments - - - 111,556,456 Receivables:
Property taxes, net 3,619,389 224,124 3,843,513 - Due from other governments 59,854,691 40,751 59,895,442 20,107,474 Service billings - 12,143,519 12,143,519 - Other 3,765,027 2,107 3,767,134 4,968,846
Materials and supplies 1,611,938 994,491 2,606,429 1,893,859 Prepaids 3,319 - 3,319 1,408,413 Restricted assets:
Equity in pooled cash and cash equivalents 134,917,075 110,274,128 245,191,203 4,936,990 Investments 50,906,669 - 50,906,669 - Property taxes 630,924 - 630,924 - Due from other governments 13,555,187 - 13,555,187 - Water & sewer assessments receivable - 6,427,489 6,427,489 - Other receivables 15,255,846 - 15,255,846 5,880,524 Materials and supplies 586,155 - 586,155 - Prepaids 1,248,500 - 1,248,500 -
Internal balances (2,141,212) 2,141,212 - - Other assets 74,444 - 74,444 - Capital assets:
Land and land improvements 554,238,198 11,377,100 565,615,298 80,618,235 Construction in progress 64,728,234 32,582,245 97,310,479 196,212,822 Buildings and improvements, net 337,627,689 193,896,115 531,523,804 1,100,506,356 Machinery and equipment, net 52,598,661 5,280,027 57,878,688 9,095,385 Infrastructure, net 236,996,116 374,192,739 611,188,855 - Other capital assets - - - 5,629,846
Other non-current assets - 48,017,471 48,017,471 10,122,824 Total assets 1,676,180,985 825,318,836 2,501,499,821 1,619,355,479
DEFERRED OUTFLOWS OF RESOURCES - Deferred refunding amount 2,456,011 313,456 2,769,467 -
Interest rate swap - - - 771,484 Total deferred outflows of resources 2,456,011 313,456 2,769,467 771,484 Total assets and deferred outflows of resources 1,678,636,996 825,632,292 2,504,269,288 1,620,126,963
LIABILITIESCurrent liabilities:Accounts payable and other current liabilities 34,765,413 14,835,533 49,600,946 99,430,006 Accrued interest payable 16,633,419 3,430,185 20,063,604 - Accrued wages and benefits 11,070,480 447,713 11,518,193 1,744,354 Deposits 5,813,695 1,452,109 7,265,804 583,166 Bond anticipation notes 33,937,718 11,362,282 45,300,000 - Due to primary government - - - 5,426,782 Unearned revenues 6,660,240 564,187 7,224,427 26,582,457 Noncurrent liabilities:
Due within one year 60,627,315 13,358,925 73,986,240 5,036,423 Due in more than one year, net 1,472,793,286 249,914,930 1,722,708,216 128,395,607
Total liabilities 1,642,301,566 295,365,864 1,937,667,430 267,198,795
DEFERRED INFLOWS OF RESOURCESPrepaid taxes 286,369 - 286,369 - Deferred assessments - 15,082,671 15,082,671 - Interest rate swap - - - 771,484
Total deferred inflows of resources 286,369 15,082,671 15,369,040 771,484 Total liabilities and deferred inflows of resources 1,642,587,935 310,448,535 1,953,036,470 267,970,279
NET POSITIONNet investment in capital assets 755,904,065 349,976,408 1,105,880,473 1,276,655,637 Restricted for:
Public school facilities 13,081,910 - 13,081,910 - Public road facilities 51,595,732 - 51,595,732 - Forest conservation 4,075,553 - 4,075,553 - Fire & rescue services 17,377,066 - 17,377,066 - Parkland watershed facilities 8,719,759 - 8,719,759 - Program open space 337,786 - 337,786 - Storm water construction 672,662 - 672,662 9,795,197 Speed enforcement 366,097 - 366,097 - Catalyst loan program 357,032 - 357,032 - Middle Patuxent environmental area program 44,773 - 44,773 - Economic Development Initiatives 1,028,414 - 1,028,414 - Debt service - 48,248,364 48,248,364 5,244,020
Unrestricted (817,511,788) 116,958,985 (700,552,803) 60,461,830 Total net position 36,049,061$ 515,183,757 551,232,818 1,352,156,684
The accompanying notes are an integral part of these financial statements.
Primary Government
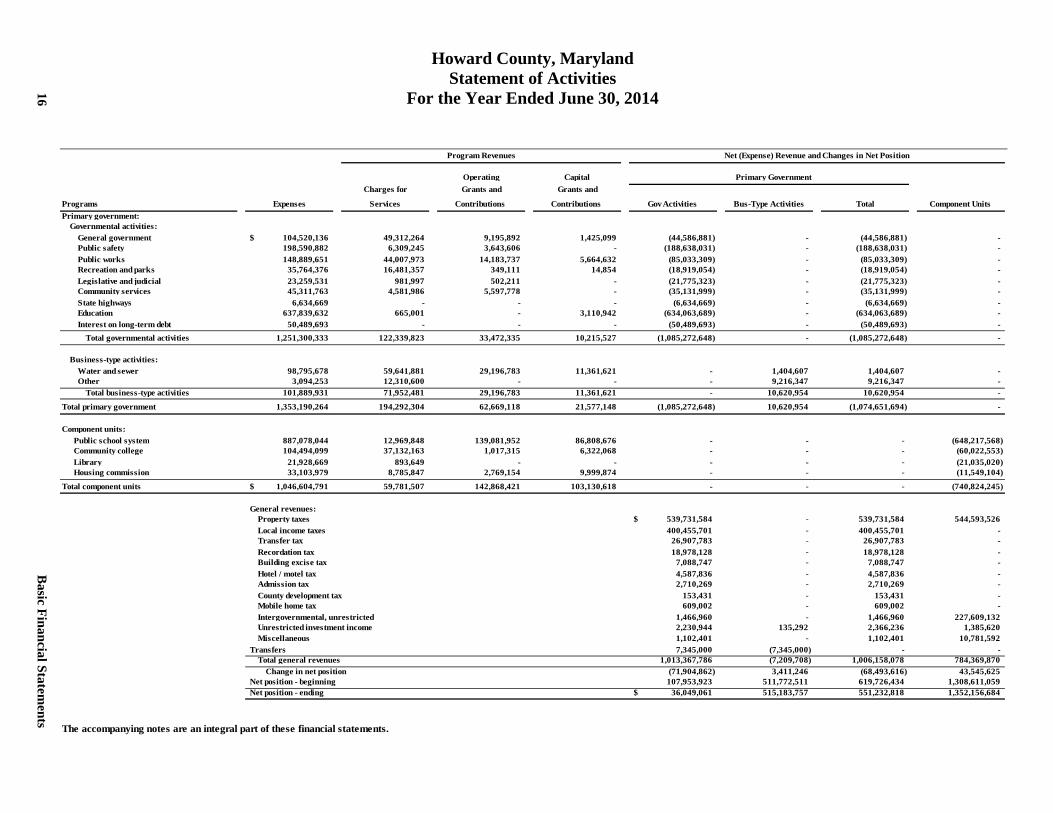
Howard County, Maryland Statement of Activities
For the Year Ended June 30, 2014
Program Revenues Net (Expense) Revenue and Changes in Net Position
Operating Capital Primary GovernmentCharges for Grants and Grants and
Programs Expenses Services Contributions Contributions Gov Activities Bus-Type Activities Total Component Units Primary government:
Governmental activities:General government 104,520,136$ 49,312,264 9,195,892 1,425,099 (44,586,881) - (44,586,881) - Public safety 198,590,882 6,309,245 3,643,606 - (188,638,031) - (188,638,031) - Public works 148,889,651 44,007,973 14,183,737 5,664,632 (85,033,309) - (85,033,309) - Recreation and parks 35,764,376 16,481,357 349,111 14,854 (18,919,054) - (18,919,054) - Legislative and judicial 23,259,531 981,997 502,211 - (21,775,323) - (21,775,323) - Community services 45,311,763 4,581,986 5,597,778 - (35,131,999) - (35,131,999) - State highways 6,634,669 - - - (6,634,669) - (6,634,669) - Education 637,839,632 665,001 - 3,110,942 (634,063,689) - (634,063,689) - Interest on long-term debt 50,489,693 - - - (50,489,693) - (50,489,693) -
Total governmental activities 1,251,300,333 122,339,823 33,472,335 10,215,527 (1,085,272,648) - (1,085,272,648) -
Business-type activities:Water and sewer 98,795,678 59,641,881 29,196,783 11,361,621 - 1,404,607 1,404,607 - Other 3,094,253 12,310,600 - - - 9,216,347 9,216,347 -
Total business-type activities 101,889,931 71,952,481 29,196,783 11,361,621 - 10,620,954 10,620,954 -
Total primary government 1,353,190,264 194,292,304 62,669,118 21,577,148 (1,085,272,648) 10,620,954 (1,074,651,694) -
Component units: Public school system 887,078,044 12,969,848 139,081,952 86,808,676 - - - (648,217,568) Community college 104,494,099 37,132,163 1,017,315 6,322,068 - - - (60,022,553) Library 21,928,669 893,649 - - - - - (21,035,020) Housing commission 33,103,979 8,785,847 2,769,154 9,999,874 - - - (11,549,104)
Total component units 1,046,604,791$ 59,781,507 142,868,421 103,130,618 - - - (740,824,245)
General revenues:Property taxes 539,731,584$ - 539,731,584 544,593,526 Local income taxes 400,455,701 - 400,455,701 - Transfer tax 26,907,783 - 26,907,783 - Recordation tax 18,978,128 - 18,978,128 - Building excise tax 7,088,747 - 7,088,747 - Hotel / motel tax 4,587,836 - 4,587,836 - Admission tax 2,710,269 - 2,710,269 - County development tax 153,431 - 153,431 - Mobile home tax 609,002 - 609,002 - Intergovernmental, unrestricted 1,466,960 - 1,466,960 227,609,132 Unrestricted investment income 2,230,944 135,292 2,366,236 1,385,620 Miscellaneous 1,102,401 - 1,102,401 10,781,592
Transfers 7,345,000 (7,345,000) - - Total general revenues 1,013,367,786 (7,209,708) 1,006,158,078 784,369,870
Change in net position (71,904,862) 3,411,246 (68,493,616) 43,545,625 Net position - beginning 107,953,923 511,772,511 619,726,434 1,308,611,059 Net position - ending 36,049,061$ 515,183,757 551,232,818 1,352,156,684
- - The accompanying notes are an integral part of these financial statements. - -
16
Basic Financial Statem
ents
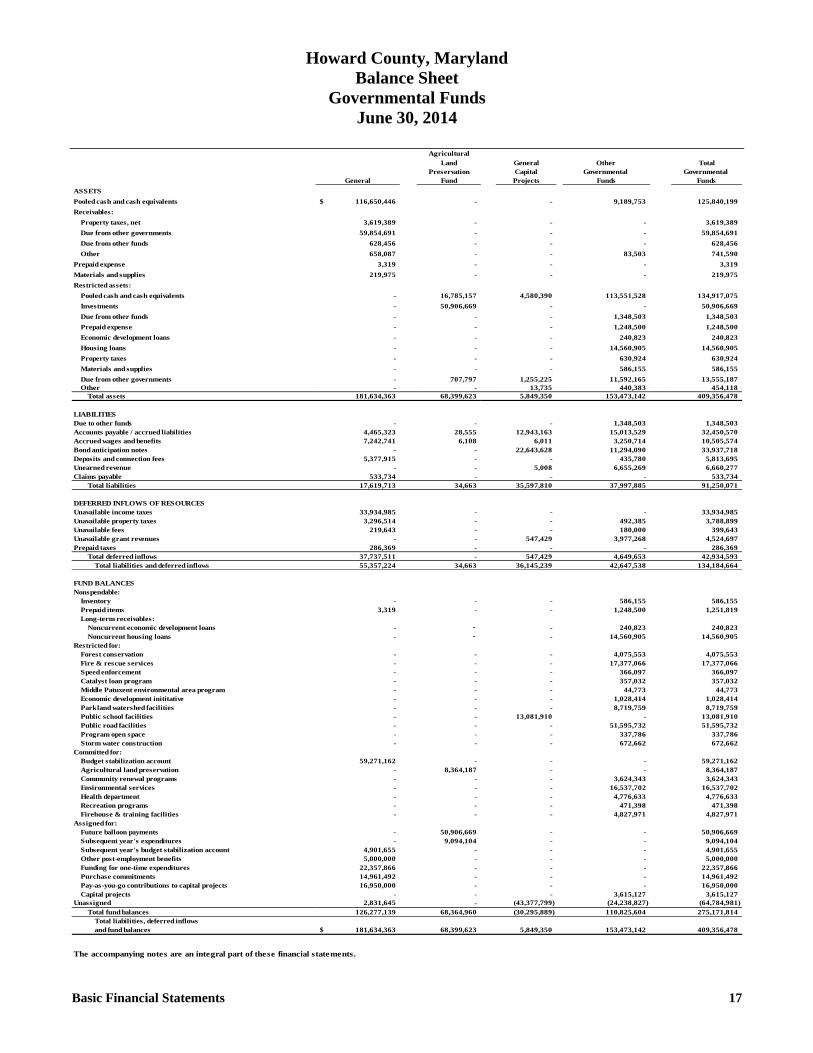
Howard County, Maryland Balance Sheet
Governmental Funds June 30, 2014
Basic Financial Statements 17
AgriculturalLand General Other Total
Preservation Capital Governmental Governmental General Fund Projects Funds Funds
ASSETSPooled cash and cash equivalents 116,650,446$ - - 9,189,753 125,840,199 Receivables:
Property taxes, net 3,619,389 - - - 3,619,389 Due from other governments 59,854,691 - - - 59,854,691 Due from other funds 628,456 - - - 628,456 Other 658,087 - - 83,503 741,590
Prepaid expense 3,319 - - - 3,319 Materials and supplies 219,975 - - - 219,975 Restricted assets:
Pooled cash and cash equivalents - 16,785,157 4,580,390 113,551,528 134,917,075 Investments - 50,906,669 - - 50,906,669 Due from other funds - - - 1,348,503 1,348,503 Prepaid expense - - - 1,248,500 1,248,500 Economic development loans - - - 240,823 240,823 Housing loans - - - 14,560,905 14,560,905 Property taxes - - - 630,924 630,924 Materials and supplies - - - 586,155 586,155 Due from other governments - 707,797 1,255,225 11,592,165 13,555,187 Other - - 13,735 440,383 454,118
Total assets 181,634,363 68,399,623 5,849,350 153,473,142 409,356,478
LIABILITIESDue to other funds - - - 1,348,503 1,348,503 Accounts payable / accrued liabilities 4,465,323 28,555 12,943,163 15,013,529 32,450,570 Accrued wages and benefits 7,242,741 6,108 6,011 3,250,714 10,505,574 Bond anticipation notes - - 22,643,628 11,294,090 33,937,718 Deposits and connection fees 5,377,915 - - 435,780 5,813,695 Unearned revenue - - 5,008 6,655,269 6,660,277 Claims payable 533,734 - - - 533,734
Total liabilities 17,619,713 34,663 35,597,810 37,997,885 91,250,071
DEFERRED INFLOWS OF RESOURCESUnavailable income taxes 33,934,985 - - - 33,934,985 Unavailable property taxes 3,296,514 - - 492,385 3,788,899 Unavailable fees 219,643 - - 180,000 399,643 Unavailable grant revenues - - 547,429 3,977,268 4,524,697 Prepaid taxes 286,369 - - - 286,369
Total deferred inflows 37,737,511 - 547,429 4,649,653 42,934,593 Total liabilities and deferred inflows 55,357,224 34,663 36,145,239 42,647,538 134,184,664
FUND BALANCESNonspendable:
Inventory - - - 586,155 586,155 Prepaid items 3,319 - - 1,248,500 1,251,819 Long-term receivables:
Noncurrent economic development loans - - - 240,823 240,823 Noncurrent housing loans - - - 14,560,905 14,560,905
Restricted for:Forest conservation - - - 4,075,553 4,075,553 Fire & rescue services - - - 17,377,066 17,377,066 Speed enforcement - - - 366,097 366,097 Catalyst loan program - - - 357,032 357,032 Middle Patuxent environmental area program - - - 44,773 44,773 Economic development inititative - - - 1,028,414 1,028,414 Parkland watershed facilities - - - 8,719,759 8,719,759 Public school facilities - - 13,081,910 - 13,081,910 Public road facilities - - - 51,595,732 51,595,732 Program open space - - - 337,786 337,786 Storm water construction - - - 672,662 672,662
Committed for:Budget stabilization account 59,271,162 - - - 59,271,162 Agricultural land preservation - 8,364,187 - - 8,364,187 Community renewal programs - - - 3,624,343 3,624,343 Environmental services - - - 16,537,702 16,537,702 Health department - - - 4,776,633 4,776,633 Recreation programs - - - 471,398 471,398 Firehouse & training facilities - - - 4,827,971 4,827,971
Assigned for:Future balloon payments - 50,906,669 - - 50,906,669 Subsequent year's expenditures - 9,094,104 - - 9,094,104 Subsequent year's budget stabilization account 4,901,655 - - - 4,901,655 Other post-employment benefits 5,000,000 - - - 5,000,000 Funding for one-time expenditures 22,357,866 - - - 22,357,866 Purchase commitments 14,961,492 - - - 14,961,492 Pay-as-you-go contributions to capital projects 16,950,000 - - - 16,950,000 Capital projects - - - 3,615,127 3,615,127
Unassigned 2,831,645 - (43,377,799) (24,238,827) (64,784,981) Total fund balances 126,277,139 68,364,960 (30,295,889) 110,825,604 275,171,814
Total liabilities, deferred inflows and fund balances 181,634,363$ 68,399,623 5,849,350 153,473,142 409,356,478
The accompanying notes are an integral part of these financial statements.
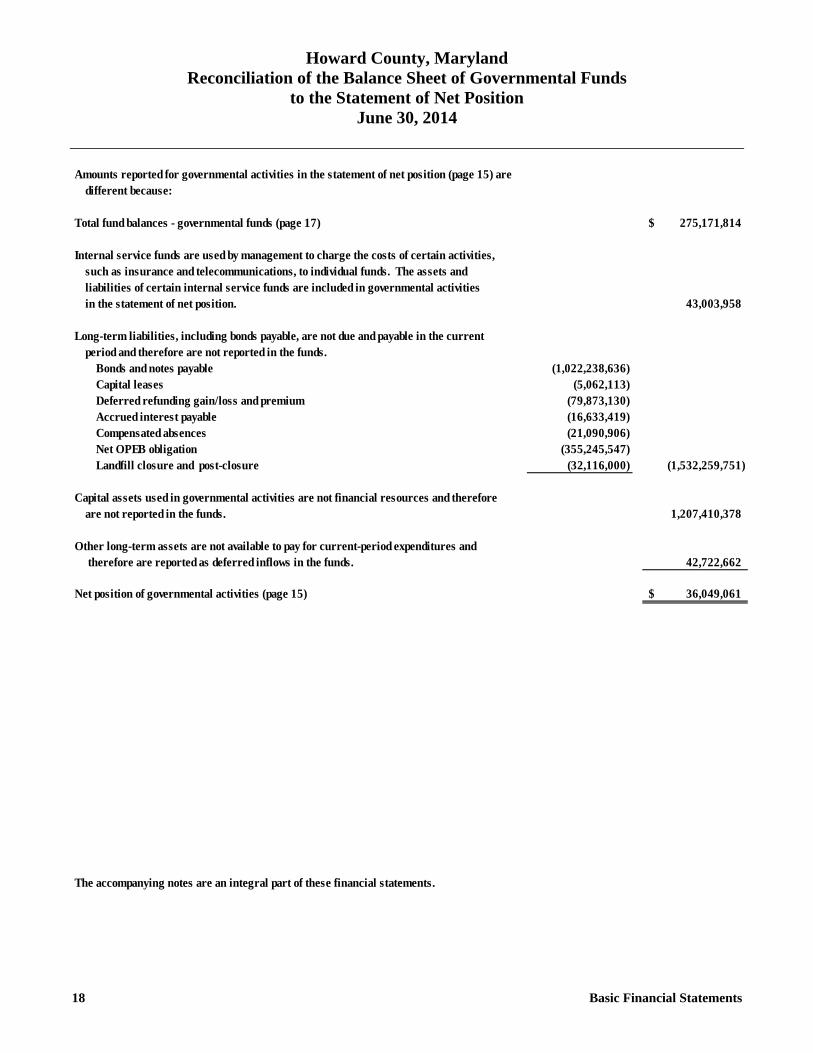
Howard County, Maryland Reconciliation of the Balance Sheet of Governmental Funds
to the Statement of Net Position June 30, 2014
18 Basic Financial Statements
Amounts reported for governmental activities in the statement of net position (page 15) are different because:
Total fund balances - governmental funds (page 17) 275,171,814$
Internal service funds are used by management to charge the costs of certain activities,such as insurance and telecommunications, to individual funds. The assets and liabilities of certain internal service funds are included in governmental activitiesin the statement of net position. 43,003,958
Long-term liabilities, including bonds payable, are not due and payable in the current period and therefore are not reported in the funds.
Bonds and notes payable (1,022,238,636) Capital leases (5,062,113) Deferred refunding gain/loss and premium (79,873,130) Accrued interest payable (16,633,419) Compensated absences (21,090,906) Net OPEB obligation (355,245,547) Landfill closure and post-closure (32,116,000) (1,532,259,751)
Capital assets used in governmental activities are not financial resources and therefore are not reported in the funds. 1,207,410,378
Other long-term assets are not available to pay for current-period expenditures and therefore are reported as deferred inflows in the funds. 42,722,662
Net position of governmental activities (page 15) 36,049,061$
T:\SHARED\CAFR\CAFR\CAFR 14\PDF\Statements\[Rec of BS of Govermental Funds.xlsx]1411/25/2014 16:25
The accompanying notes are an integral part of these financial statements.
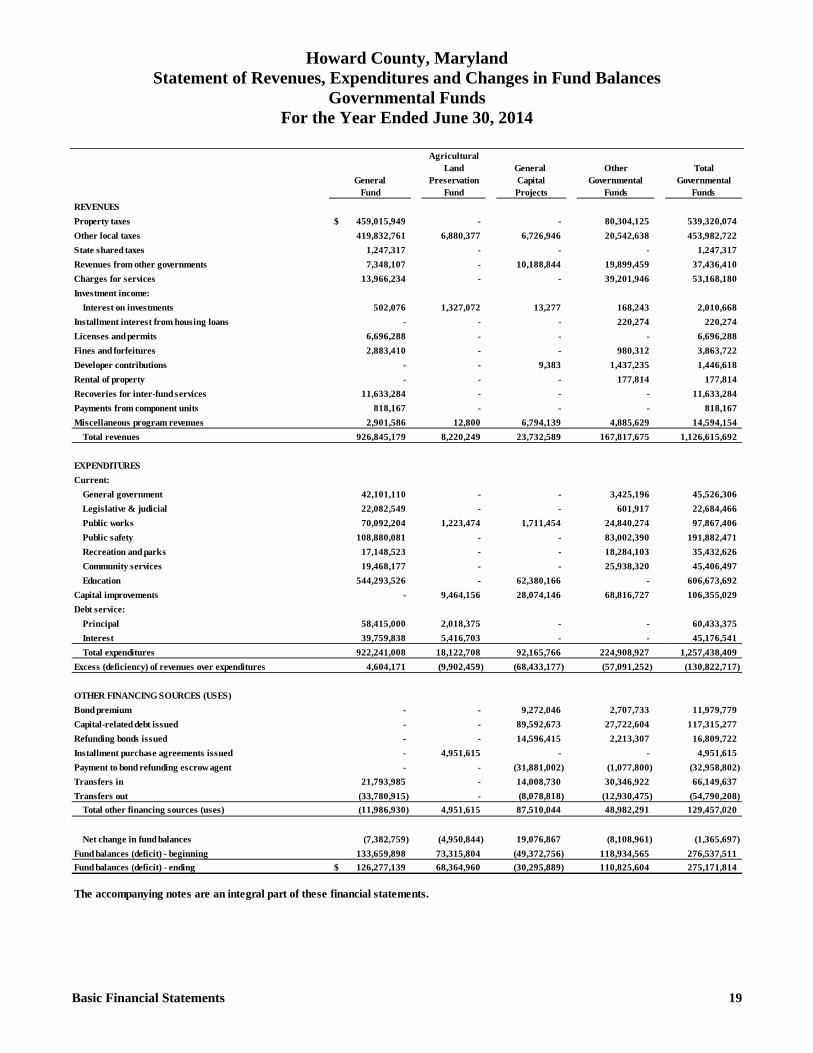
Howard County, Maryland Statement of Revenues, Expenditures and Changes in Fund Balances
Governmental Funds For the Year Ended June 30, 2014
Basic Financial Statements 19
AgriculturalLand General Other Total
General Preservation Capital Governmental GovernmentalFund Fund Projects Funds Funds
REVENUESProperty taxes 459,015,949$ - - 80,304,125 539,320,074 Other local taxes 419,832,761 6,880,377 6,726,946 20,542,638 453,982,722 State shared taxes 1,247,317 - - - 1,247,317 Revenues from other governments 7,348,107 - 10,188,844 19,899,459 37,436,410 Charges for services 13,966,234 - - 39,201,946 53,168,180 Investment income:
Interest on investments 502,076 1,327,072 13,277 168,243 2,010,668 Installment interest from housing loans - - - 220,274 220,274 Licenses and permits 6,696,288 - - - 6,696,288 Fines and forfeitures 2,883,410 - - 980,312 3,863,722 Developer contributions - - 9,383 1,437,235 1,446,618 Rental of property - - - 177,814 177,814 Recoveries for inter-fund services 11,633,284 - - - 11,633,284 Payments from component units 818,167 - - - 818,167 Miscellaneous program revenues 2,901,586 12,800 6,794,139 4,885,629 14,594,154
Total revenues 926,845,179 8,220,249 23,732,589 167,817,675 1,126,615,692
EXPENDITURESCurrent:
General government 42,101,110 - - 3,425,196 45,526,306 Legislative & judicial 22,082,549 - - 601,917 22,684,466 Public works 70,092,204 1,223,474 1,711,454 24,840,274 97,867,406 Public safety 108,880,081 - - 83,002,390 191,882,471 Recreation and parks 17,148,523 - - 18,284,103 35,432,626 Community services 19,468,177 - - 25,938,320 45,406,497 Education 544,293,526 - 62,380,166 - 606,673,692
Capital improvements - 9,464,156 28,074,146 68,816,727 106,355,029 Debt service:
Principal 58,415,000 2,018,375 - - 60,433,375 Interest 39,759,838 5,416,703 - - 45,176,541 Total expenditures 922,241,008 18,122,708 92,165,766 224,908,927 1,257,438,409
Excess (deficiency) of revenues over expenditures 4,604,171 (9,902,459) (68,433,177) (57,091,252) (130,822,717)
OTHER FINANCING SOURCES (USES)Bond premium - - 9,272,046 2,707,733 11,979,779 Capital-related debt issued - - 89,592,673 27,722,604 117,315,277 Refunding bonds issued - - 14,596,415 2,213,307 16,809,722 Installment purchase agreements issued - 4,951,615 - - 4,951,615 Payment to bond refunding escrow agent - - (31,881,002) (1,077,800) (32,958,802) Transfers in 21,793,985 - 14,008,730 30,346,922 66,149,637 Transfers out (33,780,915) - (8,078,818) (12,930,475) (54,790,208)
Total other financing sources (uses) (11,986,930) 4,951,615 87,510,044 48,982,291 129,457,020
Net change in fund balances (7,382,759) (4,950,844) 19,076,867 (8,108,961) (1,365,697) Fund balances (deficit) - beginning 133,659,898 73,315,804 (49,372,756) 118,934,565 276,537,511 Fund balances (deficit) - ending 126,277,139$ 68,364,960 (30,295,889) 110,825,604 275,171,814
The accompanying notes are an integral part of these financial statements.
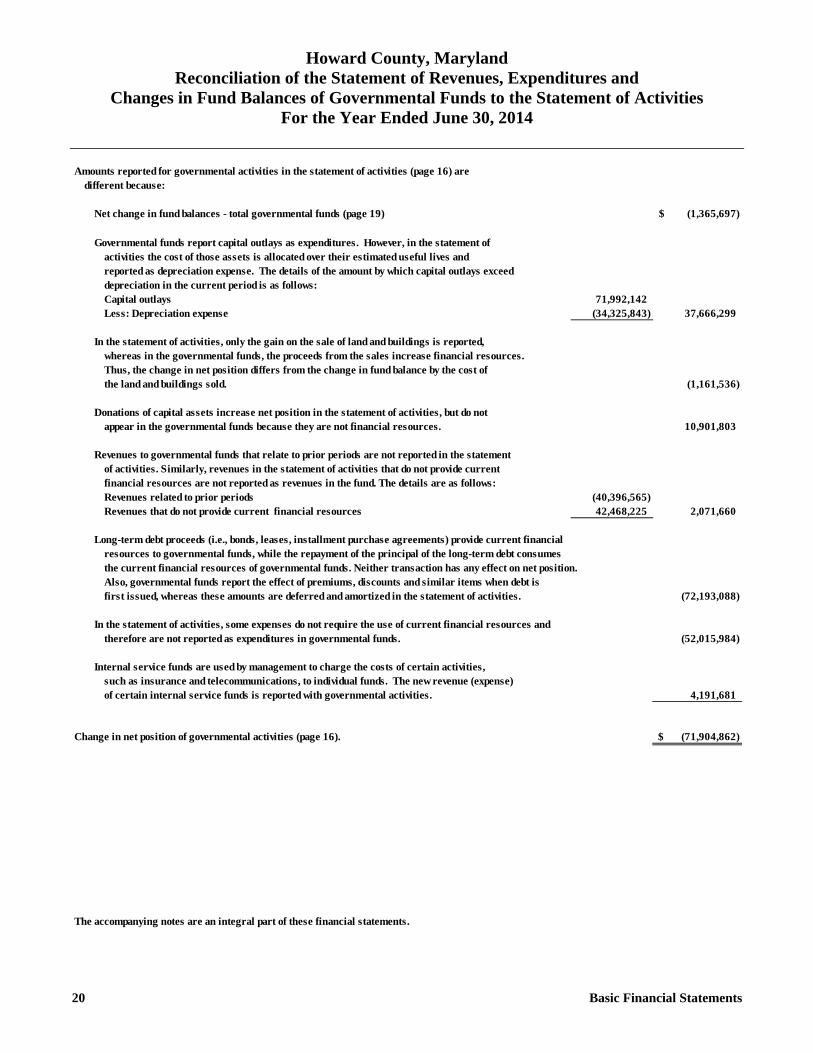
Howard County, Maryland Reconciliation of the Statement of Revenues, Expenditures and
Changes in Fund Balances of Governmental Funds to the Statement of Activities For the Year Ended June 30, 2014
20 Basic Financial Statements
Amounts reported for governmental activities in the statement of activities (page 16) aredifferent because:
Net change in fund balances - total governmental funds (page 19) (1,365,697)$
Governmental funds report capital outlays as expenditures. However, in the statement ofactivities the cost of those assets is allocated over their estimated useful lives andreported as depreciation expense. The details of the amount by which capital outlays exceeddepreciation in the current period is as follows:Capital outlays 71,992,142 Less: Depreciation expense (34,325,843) 37,666,299
In the statement of activities, only the gain on the sale of land and buildings is reported,whereas in the governmental funds, the proceeds from the sales increase financial resources.Thus, the change in net position differs from the change in fund balance by the cost ofthe land and buildings sold. (1,161,536)
Donations of capital assets increase net position in the statement of activities, but do notappear in the governmental funds because they are not financial resources. 10,901,803
Revenues to governmental funds that relate to prior periods are not reported in the statement of activities. Similarly, revenues in the statement of activities that do not provide current
financial resources are not reported as revenues in the fund. The details are as follows:Revenues related to prior periods (40,396,565) Revenues that do not provide current financial resources 42,468,225 2,071,660
Long-term debt proceeds (i.e., bonds, leases, installment purchase agreements) provide current financial resources to governmental funds, while the repayment of the principal of the long-term debt consumesthe current financial resources of governmental funds. Neither transaction has any effect on net position.Also, governmental funds report the effect of premiums, discounts and similar items when debt isfirst issued, whereas these amounts are deferred and amortized in the statement of activities. (72,193,088)
In the statement of activities, some expenses do not require the use of current financial resources and therefore are not reported as expenditures in governmental funds. (52,015,984)
Internal service funds are used by management to charge the costs of certain activities, such as insurance and telecommunications, to individual funds. The new revenue (expense)of certain internal service funds is reported with governmental activities. 4,191,681
Change in net position of governmental activities (page 16). (71,904,862)$
T:\SHARED\CAFR\CAFR\CAFR 14\PDF\Statements\[Rec of RevExp.xlsx]1411/21/2014 14:20
The accompanying notes are an integral part of these financial statements.
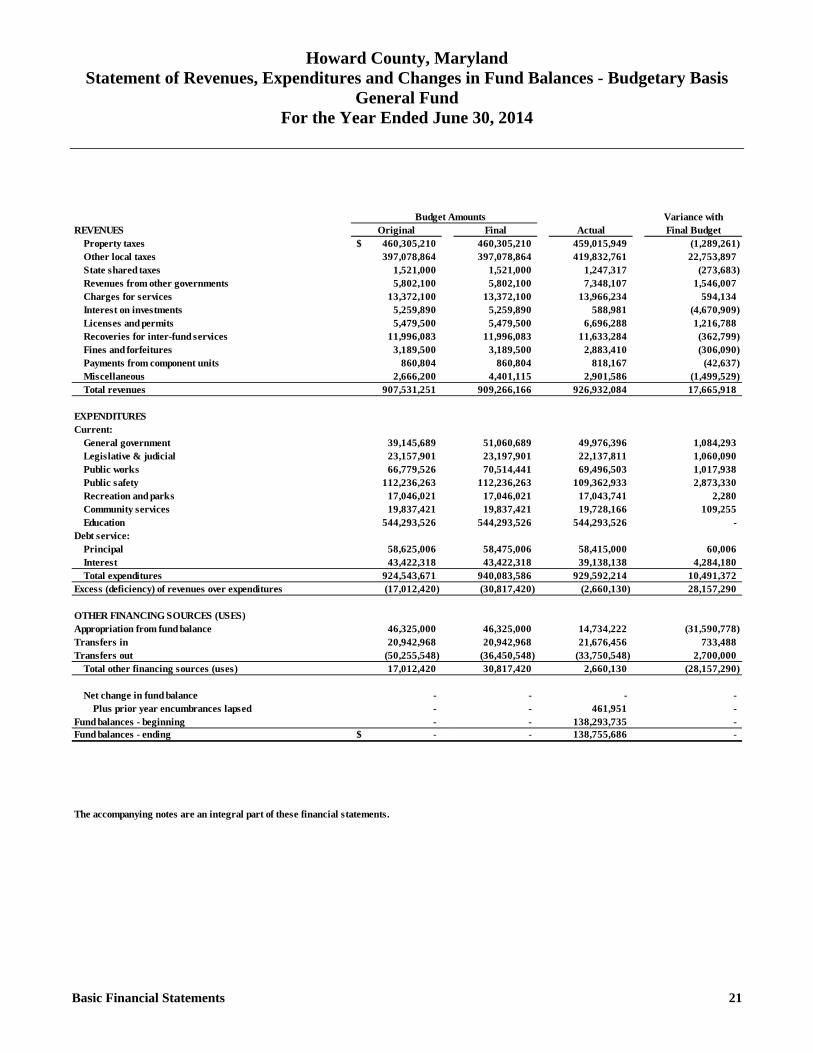
Howard County, Maryland Statement of Revenues, Expenditures and Changes in Fund Balances - Budgetary Basis
General Fund For the Year Ended June 30, 2014
Basic Financial Statements 21
Budget Amounts Variance withREVENUES Original Final Actual Final Budget
Property taxes 460,305,210$ 460,305,210 459,015,949 (1,289,261) Other local taxes 397,078,864 397,078,864 419,832,761 22,753,897 State shared taxes 1,521,000 1,521,000 1,247,317 (273,683) Revenues from other governments 5,802,100 5,802,100 7,348,107 1,546,007 Charges for services 13,372,100 13,372,100 13,966,234 594,134 Interest on investments 5,259,890 5,259,890 588,981 (4,670,909) Licenses and permits 5,479,500 5,479,500 6,696,288 1,216,788 Recoveries for inter-fund services 11,996,083 11,996,083 11,633,284 (362,799) Fines and forfeitures 3,189,500 3,189,500 2,883,410 (306,090) Payments from component units 860,804 860,804 818,167 (42,637) Miscellaneous 2,666,200 4,401,115 2,901,586 (1,499,529) Total revenues 907,531,251 909,266,166 926,932,084 17,665,918
EXPENDITURESCurrent:
General government 39,145,689 51,060,689 49,976,396 1,084,293 Legislative & judicial 23,157,901 23,197,901 22,137,811 1,060,090 Public works 66,779,526 70,514,441 69,496,503 1,017,938 Public safety 112,236,263 112,236,263 109,362,933 2,873,330 Recreation and parks 17,046,021 17,046,021 17,043,741 2,280 Community services 19,837,421 19,837,421 19,728,166 109,255 Education 544,293,526 544,293,526 544,293,526 -
Debt service:Principal 58,625,006 58,475,006 58,415,000 60,006 Interest 43,422,318 43,422,318 39,138,138 4,284,180 Total expenditures 924,543,671 940,083,586 929,592,214 10,491,372
Excess (deficiency) of revenues over expenditures (17,012,420) (30,817,420) (2,660,130) 28,157,290
OTHER FINANCING SOURCES (USES)Appropriation from fund balance 46,325,000 46,325,000 14,734,222 (31,590,778) Transfers in 20,942,968 20,942,968 21,676,456 733,488 Transfers out (50,255,548) (36,450,548) (33,750,548) 2,700,000
Total other financing sources (uses) 17,012,420 30,817,420 2,660,130 (28,157,290)
Net change in fund balance - - - - Plus prior year encumbrances lapsed - - 461,951 -
Fund balances - beginning - - 138,293,735 - Fund balances - ending -$ - 138,755,686 -
The accompanying notes are an integral part of these financial statements.
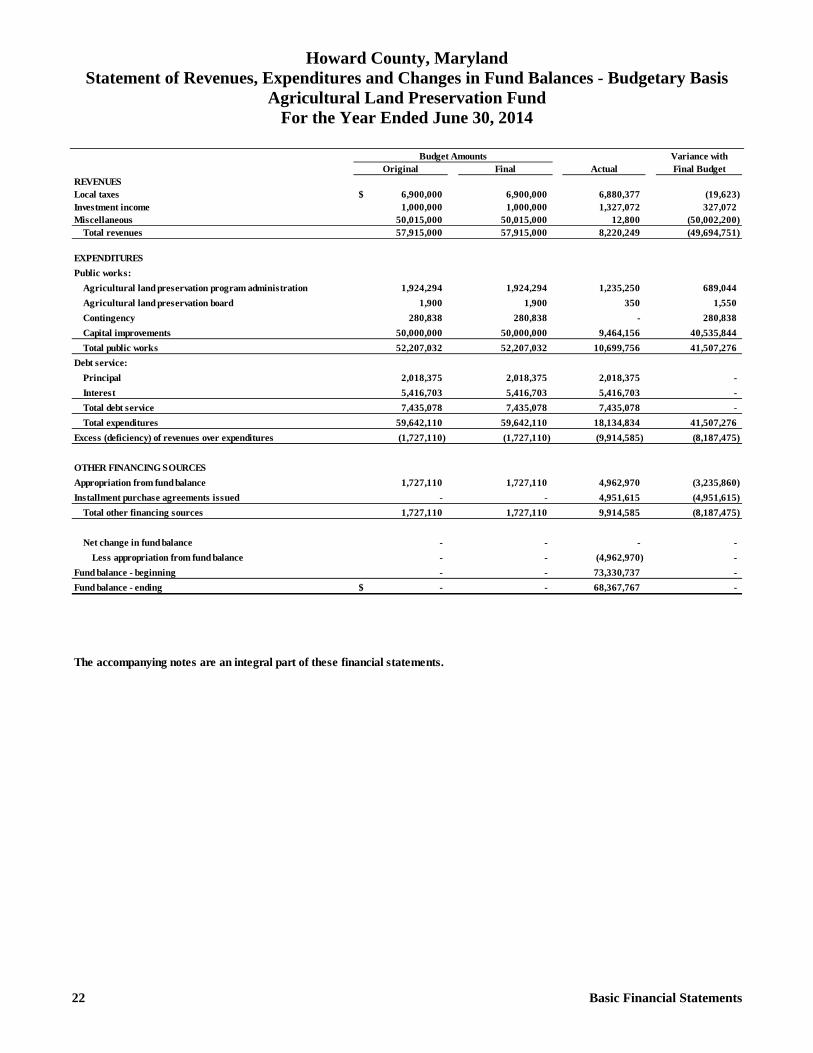
Howard County, Maryland Statement of Revenues, Expenditures and Changes in Fund Balances - Budgetary Basis
Agricultural Land Preservation Fund For the Year Ended June 30, 2014
22 Basic Financial Statements
Budget Amounts Variance withOriginal Final Actual Final Budget
REVENUESLocal taxes 6,900,000$ 6,900,000 6,880,377 (19,623) Investment income 1,000,000 1,000,000 1,327,072 327,072 Miscellaneous 50,015,000 50,015,000 12,800 (50,002,200)
Total revenues 57,915,000 57,915,000 8,220,249 (49,694,751)
EXPENDITURESPublic works:
Agricultural land preservation program administration 1,924,294 1,924,294 1,235,250 689,044 Agricultural land preservation board 1,900 1,900 350 1,550 Contingency 280,838 280,838 - 280,838 Capital improvements 50,000,000 50,000,000 9,464,156 40,535,844 Total public works 52,207,032 52,207,032 10,699,756 41,507,276
Debt service:Principal 2,018,375 2,018,375 2,018,375 - Interest 5,416,703 5,416,703 5,416,703 - Total debt service 7,435,078 7,435,078 7,435,078 - Total expenditures 59,642,110 59,642,110 18,134,834 41,507,276
Excess (deficiency) of revenues over expenditures (1,727,110) (1,727,110) (9,914,585) (8,187,475)
OTHER FINANCING SOURCESAppropriation from fund balance 1,727,110 1,727,110 4,962,970 (3,235,860) Installment purchase agreements issued - - 4,951,615 (4,951,615)
Total other financing sources 1,727,110 1,727,110 9,914,585 (8,187,475)
Net change in fund balance - - - - Less appropriation from fund balance - - (4,962,970) -
Fund balance - beginning - - 73,330,737 - Fund balance - ending -$ - 68,367,767 -
The accompanying notes are an integral part of these financial statements.
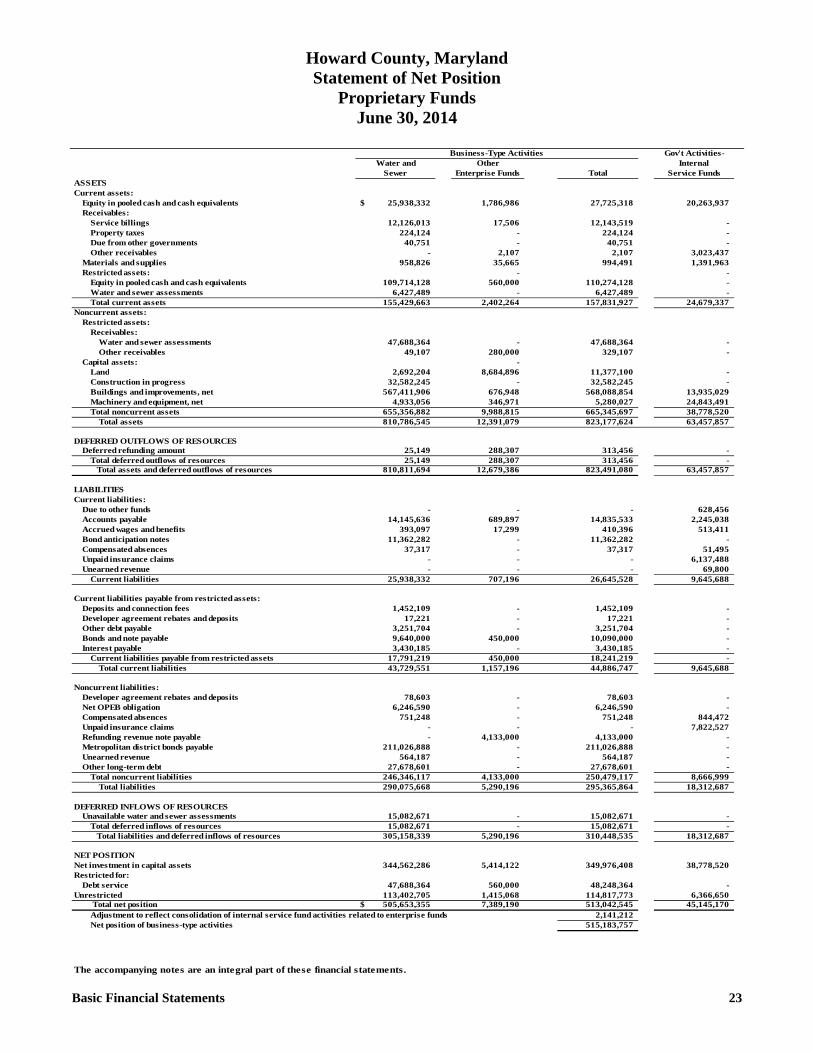
Howard County, Maryland Statement of Net Position
Proprietary Funds June 30, 2014
Basic Financial Statements 23
Business-Type Activities Gov't Activities-Water and Other Internal
Sewer Enterprise Funds Total Service FundsASSETSCurrent assets:
Equity in pooled cash and cash equivalents 25,938,332$ 1,786,986 27,725,318 20,263,937 Receivables:
Service billings 12,126,013 17,506 12,143,519 - Property taxes 224,124 - 224,124 - Due from other governments 40,751 - 40,751 - Other receivables - 2,107 2,107 3,023,437
Materials and supplies 958,826 35,665 994,491 1,391,963 Restricted assets: - -
Equity in pooled cash and cash equivalents 109,714,128 560,000 110,274,128 - Water and sewer assessments 6,427,489 - 6,427,489 - Total current assets 155,429,663 2,402,264 157,831,927 24,679,337
Noncurrent assets:Restricted assets:
Receivables:Water and sewer assessments 47,688,364 - 47,688,364 - Other receivables 49,107 280,000 329,107 -
Capital assets: - Land 2,692,204 8,684,896 11,377,100 - Construction in progress 32,582,245 - 32,582,245 - Buildings and improvements, net 567,411,906 676,948 568,088,854 13,935,029 Machinery and equipment, net 4,933,056 346,971 5,280,027 24,843,491 Total noncurrent assets 655,356,882 9,988,815 665,345,697 38,778,520
Total assets 810,786,545 12,391,079 823,177,624 63,457,857
DEFERRED OUTFLOWS OF RESOURCES Deferred refunding amount 25,149 288,307 313,456 -
Total deferred outflows of resources 25,149 288,307 313,456 - Total assets and deferred outflows of resources 810,811,694 12,679,386 823,491,080 63,457,857
LIABILITIESCurrent liabilities:
Due to other funds - - - 628,456 Accounts payable 14,145,636 689,897 14,835,533 2,245,038 Accrued wages and benefits 393,097 17,299 410,396 513,411 Bond anticipation notes 11,362,282 - 11,362,282 - Compensated absences 37,317 - 37,317 51,495 Unpaid insurance claims - - - 6,137,488 Unearned revenue - - - 69,800
Current liabilities 25,938,332 707,196 26,645,528 9,645,688
Current liabilities payable from restricted assets:Deposits and connection fees 1,452,109 - 1,452,109 - Developer agreement rebates and deposits 17,221 - 17,221 - Other debt payable 3,251,704 - 3,251,704 - Bonds and note payable 9,640,000 450,000 10,090,000 - Interest payable 3,430,185 - 3,430,185 -
Current liabilities payable from restricted assets 17,791,219 450,000 18,241,219 - Total current liabilities 43,729,551 1,157,196 44,886,747 9,645,688
Noncurrent liabilities:Developer agreement rebates and deposits 78,603 - 78,603 - Net OPEB obligation 6,246,590 - 6,246,590 - Compensated absences 751,248 - 751,248 844,472 Unpaid insurance claims - - - 7,822,527 Refunding revenue note payable - 4,133,000 4,133,000 - Metropolitan district bonds payable 211,026,888 - 211,026,888 - Unearned revenue 564,187 - 564,187 - Other long-term debt 27,678,601 - 27,678,601 -
Total noncurrent liabilities 246,346,117 4,133,000 250,479,117 8,666,999 Total liabilities 290,075,668 5,290,196 295,365,864 18,312,687
DEFERRED INFLOWS OF RESOURCES Unavailable water and sewer assessments 15,082,671 - 15,082,671 -
Total deferred inflows of resources 15,082,671 - 15,082,671 - Total liabilities and deferred inflows of resources 305,158,339 5,290,196 310,448,535 18,312,687
NET POSITIONNet investment in capital assets 344,562,286 5,414,122 349,976,408 38,778,520 Restricted for:
Debt service 47,688,364 560,000 48,248,364 - Unrestricted 113,402,705 1,415,068 114,817,773 6,366,650 Total net position 505,653,355$ 7,389,190 513,042,545 45,145,170
Adjustment to reflect consolidation of internal service fund activities related to enterprise funds 2,141,212 Net position of business-type activities 515,183,757
The accompanying notes are an integral part of these financial statements.
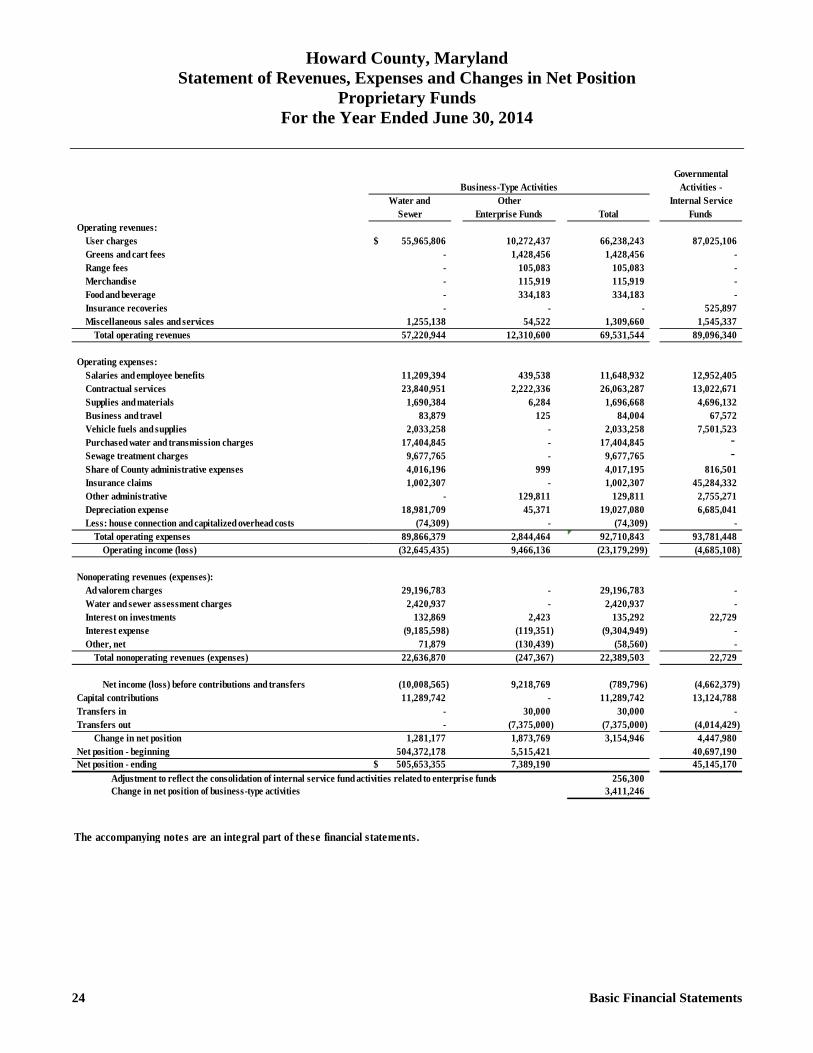
Howard County, Maryland Statement of Revenues, Expenses and Changes in Net Position
Proprietary Funds For the Year Ended June 30, 2014
24 Basic Financial Statements
Governmental
Activities -Water and Other Internal Service
Sewer Enterprise Funds Total FundsOperating revenues:
User charges 55,965,806$ 10,272,437 66,238,243 87,025,106 Greens and cart fees - 1,428,456 1,428,456 - Range fees - 105,083 105,083 - Merchandise - 115,919 115,919 - Food and beverage - 334,183 334,183 - Insurance recoveries - - - 525,897 Miscellaneous sales and services 1,255,138 54,522 1,309,660 1,545,337
Total operating revenues 57,220,944 12,310,600 69,531,544 89,096,340
Operating expenses:Salaries and employee benefits 11,209,394 439,538 11,648,932 12,952,405 Contractual services 23,840,951 2,222,336 26,063,287 13,022,671 Supplies and materials 1,690,384 6,284 1,696,668 4,696,132 Business and travel 83,879 125 84,004 67,572 Vehicle fuels and supplies 2,033,258 - 2,033,258 7,501,523 Purchased water and transmission charges 17,404,845 - 17,404,845 - Sewage treatment charges 9,677,765 - 9,677,765 - Share of County administrative expenses 4,016,196 999 4,017,195 816,501 Insurance claims 1,002,307 - 1,002,307 45,284,332 Other administrative - 129,811 129,811 2,755,271 Depreciation expense 18,981,709 45,371 19,027,080 6,685,041 Less: house connection and capitalized overhead costs (74,309) - (74,309) -
Total operating expenses 89,866,379 2,844,464 92,710,843 93,781,448 Operating income (loss) (32,645,435) 9,466,136 (23,179,299) (4,685,108)
Nonoperating revenues (expenses):Ad valorem charges 29,196,783 - 29,196,783 - Water and sewer assessment charges 2,420,937 - 2,420,937 - Interest on investments 132,869 2,423 135,292 22,729 Interest expense (9,185,598) (119,351) (9,304,949) - Other, net 71,879 (130,439) (58,560) -
Total nonoperating revenues (expenses) 22,636,870 (247,367) 22,389,503 22,729
Net income (loss) before contributions and transfers (10,008,565) 9,218,769 (789,796) (4,662,379) Capital contributions 11,289,742 - 11,289,742 13,124,788 Transfers in - 30,000 30,000 - Transfers out - (7,375,000) (7,375,000) (4,014,429)
Change in net position 1,281,177 1,873,769 3,154,946 4,447,980 Net position - beginning 504,372,178 5,515,421 40,697,190 Net position - ending 505,653,355$ 7,389,190 45,145,170
Adjustment to reflect the consolidation of internal service fund activities related to enterprise funds 256,300 Change in net position of business-type activities 3,411,246
The accompanying notes are an integral part of these financial statements.
Business-Type Activities
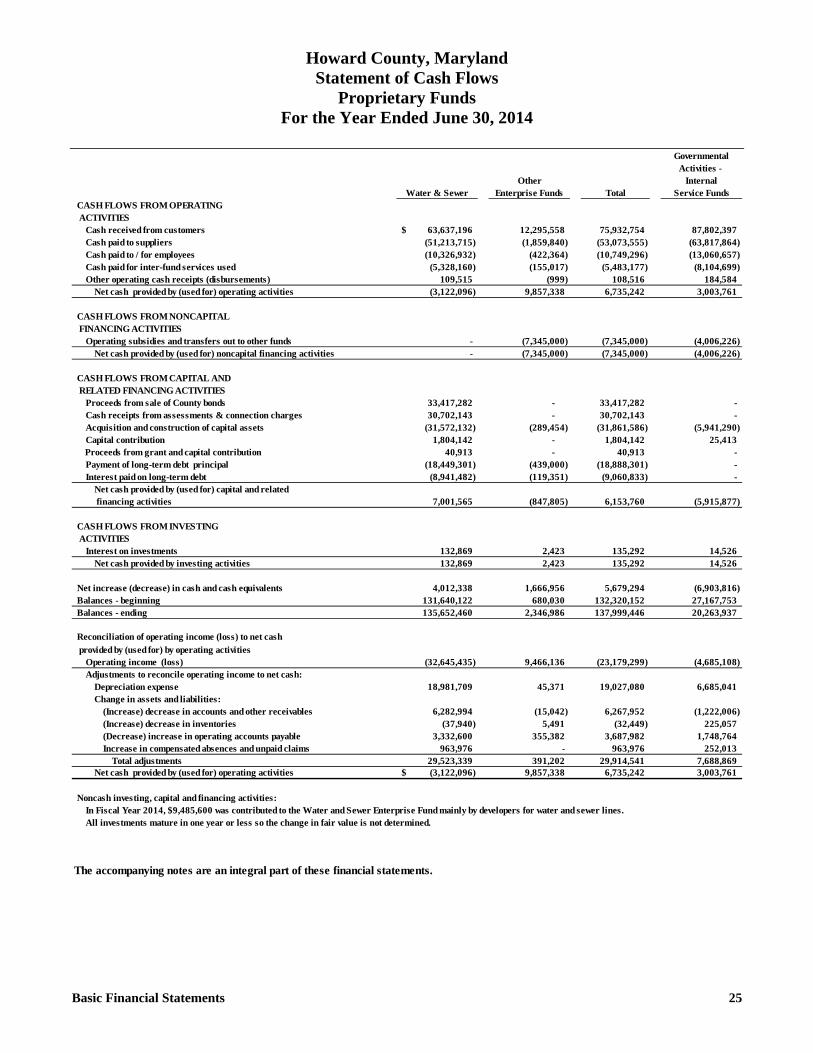
Howard County, Maryland Statement of Cash Flows
Proprietary Funds For the Year Ended June 30, 2014
Basic Financial Statements 25
GovernmentalActivities -
Other InternalWater & Sewer Enterprise Funds Total Service Funds
CASH FLOWS FROM OPERATING ACTIVITIES
Cash received from customers 63,637,196$ 12,295,558 75,932,754 87,802,397 Cash paid to suppliers (51,213,715) (1,859,840) (53,073,555) (63,817,864) Cash paid to / for employees (10,326,932) (422,364) (10,749,296) (13,060,657) Cash paid for inter-fund services used (5,328,160) (155,017) (5,483,177) (8,104,699) Other operating cash receipts (disbursements) 109,515 (999) 108,516 184,584
Net cash provided by (used for) operating activities (3,122,096) 9,857,338 6,735,242 3,003,761
CASH FLOWS FROM NONCAPITAL FINANCING ACTIVITIES
Operating subsidies and transfers out to other funds - (7,345,000) (7,345,000) (4,006,226) Net cash provided by (used for) noncapital financing activities - (7,345,000) (7,345,000) (4,006,226)
CASH FLOWS FROM CAPITAL AND RELATED FINANCING ACTIVITIES
Proceeds from sale of County bonds 33,417,282 - 33,417,282 - Cash receipts from assessments & connection charges 30,702,143 - 30,702,143 - Acquisition and construction of capital assets (31,572,132) (289,454) (31,861,586) (5,941,290) Capital contribution 1,804,142 - 1,804,142 25,413
Proceeds from grant and capital contribution 40,913 - 40,913 - Payment of long-term debt principal (18,449,301) (439,000) (18,888,301) - Interest paid on long-term debt (8,941,482) (119,351) (9,060,833) -
Net cash provided by (used for) capital and related financing activities 7,001,565 (847,805) 6,153,760 (5,915,877)
CASH FLOWS FROM INVESTING ACTIVITIES
Interest on investments 132,869 2,423 135,292 14,526 Net cash provided by investing activities 132,869 2,423 135,292 14,526
Net increase (decrease) in cash and cash equivalents 4,012,338 1,666,956 5,679,294 (6,903,816) Balances - beginning 131,640,122 680,030 132,320,152 27,167,753 Balances - ending 135,652,460 2,346,986 137,999,446 20,263,937
Reconciliation of operating income (loss) to net cash provided by (used for) by operating activities
Operating income (loss) (32,645,435) 9,466,136 (23,179,299) (4,685,108) Adjustments to reconcile operating income to net cash:
Depreciation expense 18,981,709 45,371 19,027,080 6,685,041 Change in assets and liabilities:
(Increase) decrease in accounts and other receivables 6,282,994 (15,042) 6,267,952 (1,222,006) (Increase) decrease in inventories (37,940) 5,491 (32,449) 225,057 (Decrease) increase in operating accounts payable 3,332,600 355,382 3,687,982 1,748,764 Increase in compensated absences and unpaid claims 963,976 - 963,976 252,013
Total adjustments 29,523,339 391,202 29,914,541 7,688,869 Net cash provided by (used for) operating activities (3,122,096)$ 9,857,338 6,735,242 3,003,761
Noncash investing, capital and financing activities:In Fiscal Year 2014, $9,485,600 was contributed to the Water and Sewer Enterprise Fund mainly by developers for water and sewer lines.All investments mature in one year or less so the change in fair value is not determined.
The accompanying notes are an integral part of these financial statements.
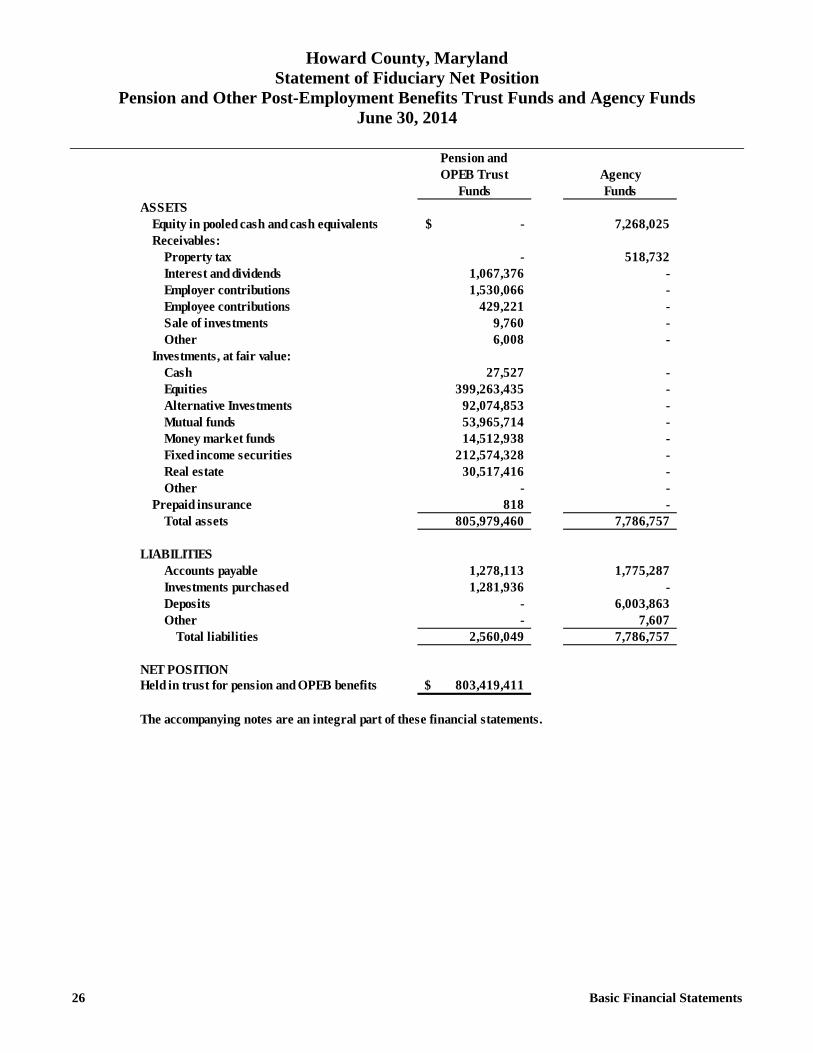
Howard County, Maryland Statement of Fiduciary Net Position
Pension and Other Post-Employment Benefits Trust Funds and Agency Funds June 30, 2014
26 Basic Financial Statements
Pension and OPEB Trust Agency
Funds FundsASSETS
Equity in pooled cash and cash equivalents -$ 7,268,025 Receivables:
Property tax - 518,732 Interest and dividends 1,067,376 - Employer contributions 1,530,066 - Employee contributions 429,221 - Sale of investments 9,760 - Other 6,008 -
Investments, at fair value:Cash 27,527 - Equities 399,263,435 - Alternative Investments 92,074,853 - Mutual funds 53,965,714 - Money market funds 14,512,938 - Fixed income securities 212,574,328 - Real estate 30,517,416 - Other - -
Prepaid insurance 818 - Total assets 805,979,460 7,786,757
LIABILITIESAccounts payable 1,278,113 1,775,287 Investments purchased 1,281,936 - Deposits - 6,003,863 Other - 7,607
Total liabilities 2,560,049 7,786,757
NET POSITIONHeld in trust for pension and OPEB benefits 803,419,411$
The accompanying notes are an integral part of these financial statements.
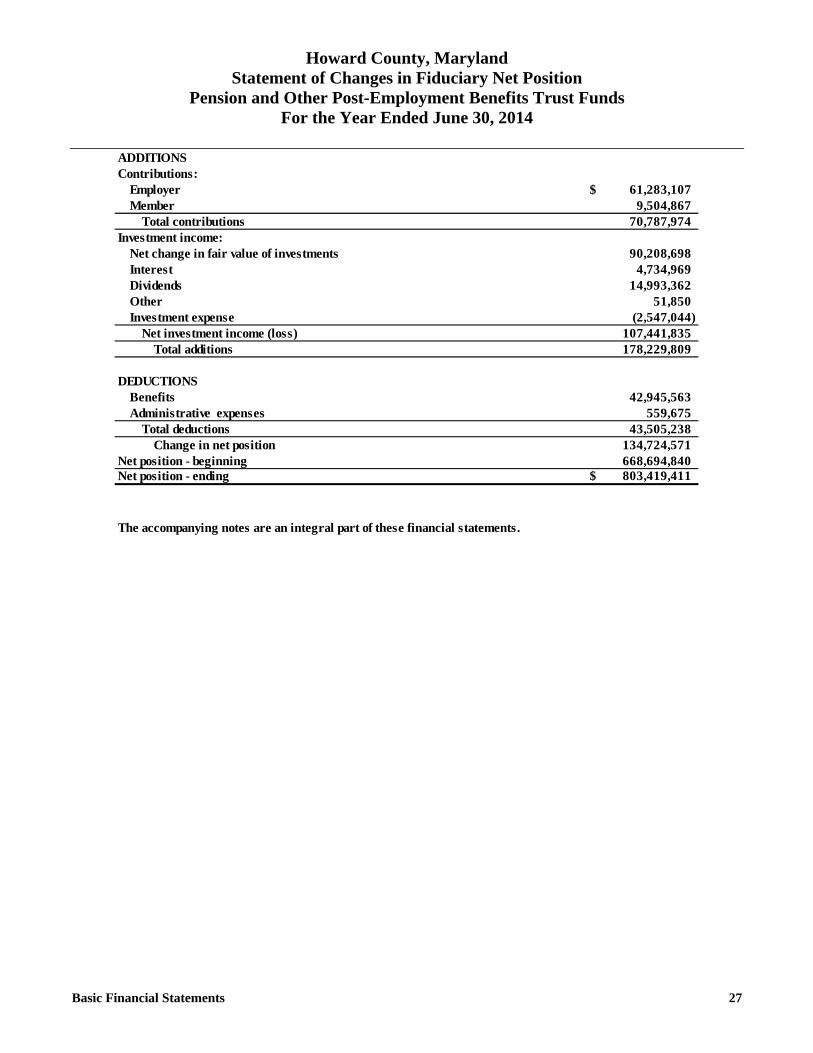
Howard County, Maryland Statement of Changes in Fiduciary Net Position
Pension and Other Post-Employment Benefits Trust Funds For the Year Ended June 30, 2014
Basic Financial Statements 27
ADDITIONSContributions:
Employer 61,283,107$ Member 9,504,867
Total contributions 70,787,974 Investment income:
Net change in fair value of investments 90,208,698 Interest 4,734,969 Dividends 14,993,362 Other 51,850 Investment expense (2,547,044)
Net investment income (loss) 107,441,835 Total additions 178,229,809
DEDUCTIONSBenefits 42,945,563 Administrative expenses 559,675
Total deductions 43,505,238 Change in net position 134,724,571
Net position - beginning 668,694,840 Net position - ending 803,419,411$
The accompanying notes are an integral part of these financial statements.
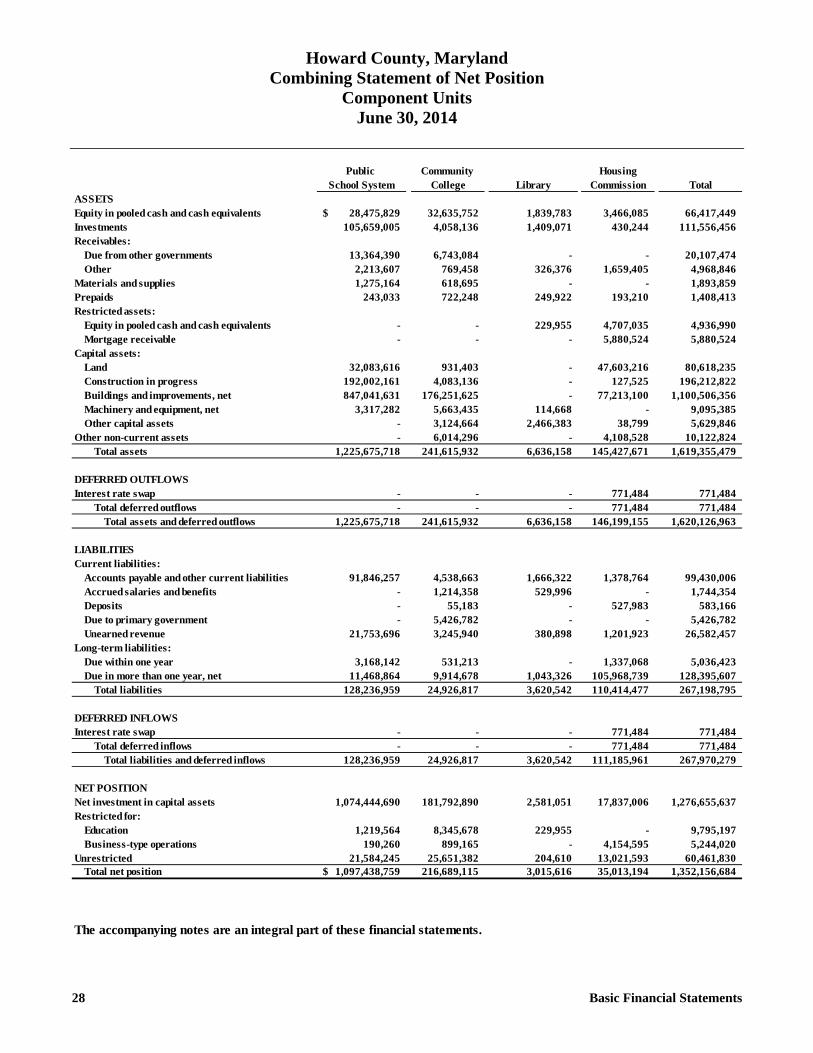
Howard County, Maryland Combining Statement of Net Position
Component Units June 30, 2014
28 Basic Financial Statements
Public Community HousingSchool System College Library Commission Total
ASSETSEquity in pooled cash and cash equivalents 28,475,829$ 32,635,752 1,839,783 3,466,085 66,417,449 Investments 105,659,005 4,058,136 1,409,071 430,244 111,556,456 Receivables:
Due from other governments 13,364,390 6,743,084 - - 20,107,474 Other 2,213,607 769,458 326,376 1,659,405 4,968,846
Materials and supplies 1,275,164 618,695 - - 1,893,859 Prepaids 243,033 722,248 249,922 193,210 1,408,413 Restricted assets:
Equity in pooled cash and cash equivalents - - 229,955 4,707,035 4,936,990 Mortgage receivable - - - 5,880,524 5,880,524
Capital assets:Land 32,083,616 931,403 - 47,603,216 80,618,235 Construction in progress 192,002,161 4,083,136 - 127,525 196,212,822 Buildings and improvements, net 847,041,631 176,251,625 - 77,213,100 1,100,506,356 Machinery and equipment, net 3,317,282 5,663,435 114,668 - 9,095,385 Other capital assets - 3,124,664 2,466,383 38,799 5,629,846
Other non-current assets - 6,014,296 - 4,108,528 10,122,824 Total assets 1,225,675,718 241,615,932 6,636,158 145,427,671 1,619,355,479
DEFERRED OUTFLOWSInterest rate swap - - - 771,484 771,484
Total deferred outflows - - - 771,484 771,484 Total assets and deferred outflows 1,225,675,718 241,615,932 6,636,158 146,199,155 1,620,126,963
LIABILITIESCurrent liabilities:
Accounts payable and other current liabilities 91,846,257 4,538,663 1,666,322 1,378,764 99,430,006 Accrued salaries and benefits - 1,214,358 529,996 - 1,744,354 Deposits - 55,183 - 527,983 583,166 Due to primary government - 5,426,782 - - 5,426,782 Unearned revenue 21,753,696 3,245,940 380,898 1,201,923 26,582,457
Long-term liabilities:Due within one year 3,168,142 531,213 - 1,337,068 5,036,423 Due in more than one year, net 11,468,864 9,914,678 1,043,326 105,968,739 128,395,607
Total liabilities 128,236,959 24,926,817 3,620,542 110,414,477 267,198,795
DEFERRED INFLOWSInterest rate swap - - - 771,484 771,484
Total deferred inflows - - - 771,484 771,484 Total liabilities and deferred inflows 128,236,959 24,926,817 3,620,542 111,185,961 267,970,279
NET POSITIONNet investment in capital assets 1,074,444,690 181,792,890 2,581,051 17,837,006 1,276,655,637 Restricted for:
Education 1,219,564 8,345,678 229,955 - 9,795,197 Business-type operations 190,260 899,165 - 4,154,595 5,244,020
Unrestricted 21,584,245 25,651,382 204,610 13,021,593 60,461,830 Total net position 1,097,438,759$ 216,689,115 3,015,616 35,013,194 1,352,156,684
The accompanying notes are an integral part of these financial statements.
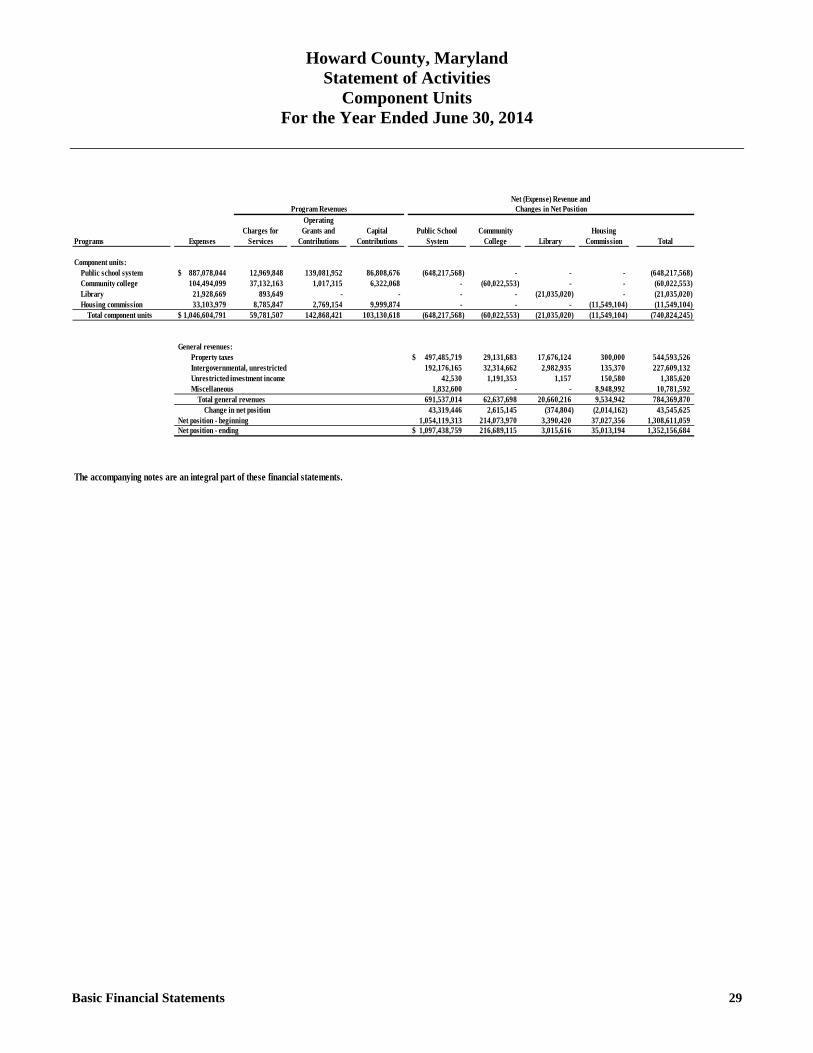
Howard County, Maryland Statement of Activities
Component Units For the Year Ended June 30, 2014
Basic Financial Statements 29
Net (Expense) Revenue and Program Revenues Changes in Net Position
OperatingCharges for Grants and Capital Public School Community Housing
Programs Expenses Services Contributions Contributions System College Library Commission Total
Component units:Public school system 887,078,044$ 12,969,848 139,081,952 86,808,676 (648,217,568) - - - (648,217,568) Community college 104,494,099 37,132,163 1,017,315 6,322,068 - (60,022,553) - - (60,022,553) Library 21,928,669 893,649 - - - - (21,035,020) - (21,035,020) Housing commission 33,103,979 8,785,847 2,769,154 9,999,874 - - - (11,549,104) (11,549,104)
Total component units 1,046,604,791$ 59,781,507 142,868,421 103,130,618 (648,217,568) (60,022,553) (21,035,020) (11,549,104) (740,824,245) 1 2 3 4
General revenues:Property taxes 497,485,719$ 29,131,683 17,676,124 300,000 544,593,526 5Intergovernmental, unrestricted 192,176,165 32,314,662 2,982,935 135,370 227,609,132 6Unrestricted investment income 42,530 1,191,353 1,157 150,580 1,385,620 7Miscellaneous 1,832,600 - - 8,948,992 10,781,592 8
Total general revenues 691,537,014 62,637,698 20,660,216 9,534,942 784,369,870 Change in net position 43,319,446 2,615,145 (374,804) (2,014,162) 43,545,625
Net position - beginning 1,054,119,313 214,073,970 3,390,420 37,027,356 1,308,611,059 Net position - ending 1,097,438,759$ 216,689,115 3,015,616 35,013,194 1,352,156,684
The accompanying notes are an integral part of these financial statements.

Promoting Partnerships with Local Businesses In 2013, Howard County Executive Ken Ulman joined Johns Hopkins University Applied Physics Laboratory (APL) Director Ralph Semmel and Howard County Economic Development Authority (HCEDA) CEO Larry Twele to unveil a new Accelerator of Commercial Technology partnership between APL and HCEDA. Through the partnership, HCEDA and APL will work together to accelerate the transfer of newly developed technologies from the laboratory to the commercial marketplace. The unveiling featured displays and demonstrations of several technologies identified for possible commercialization, including RoboSally, a robotic system developed by a team at APL that leverages two Modular Prosthetic Limbs, designed to replicate human capabilities to safely remove humans from life-threatening operations.
Notes to Basic Financial Statements
The Notes are an integral part of the financial statements.

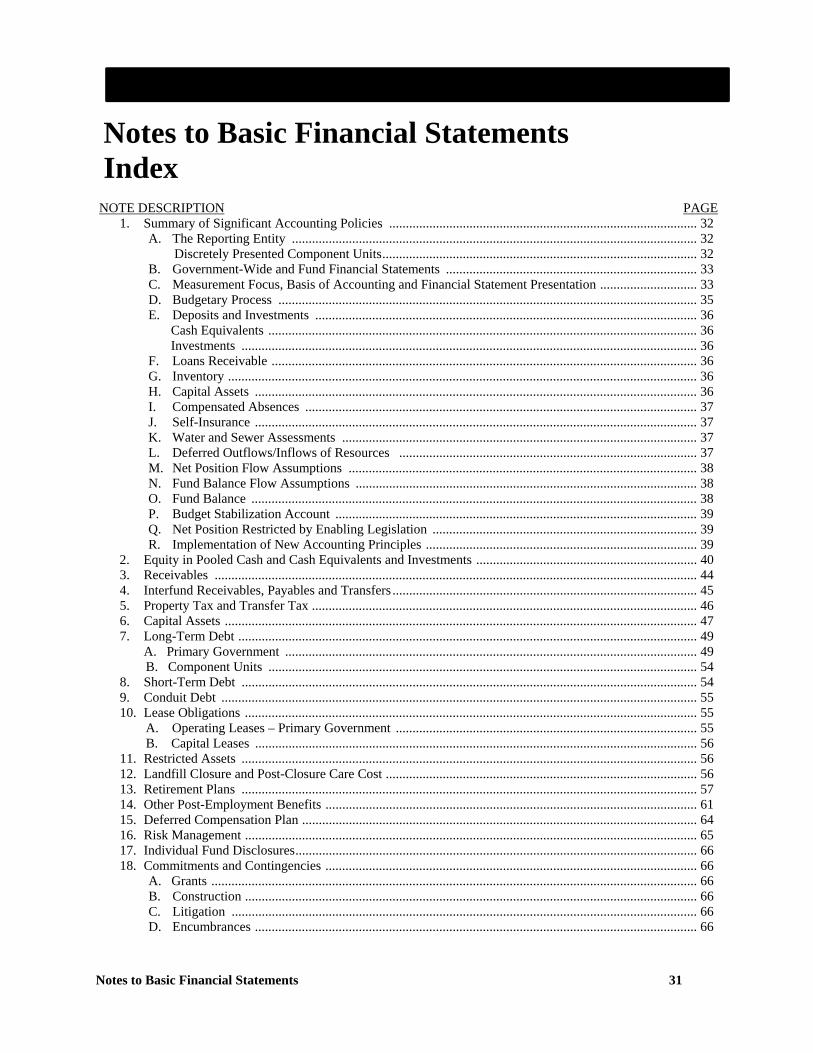
Notes to Basic Financial Statements 31
Notes to Basic Financial Statements Index NOTE DESCRIPTION PAGE
1. Summary of Significant Accounting Policies ............................................................................................ 32 A. The Reporting Entity ......................................................................................................................... 32
Discretely Presented Component Units .............................................................................................. 32 B. Government-Wide and Fund Financial Statements ........................................................................... 33 C. Measurement Focus, Basis of Accounting and Financial Statement Presentation ............................. 33 D. Budgetary Process ............................................................................................................................. 35 E. Deposits and Investments .................................................................................................................. 36
Cash Equivalents ................................................................................................................................ 36 Investments ........................................................................................................................................ 36
F. Loans Receivable ............................................................................................................................... 36 G. Inventory ............................................................................................................................................ 36 H. Capital Assets .................................................................................................................................... 36 I. Compensated Absences ..................................................................................................................... 37 J. Self-Insurance .................................................................................................................................... 37 K. Water and Sewer Assessments .......................................................................................................... 37 L. Deferred Outflows/Inflows of Resources ......................................................................................... 37 M. Net Position Flow Assumptions ........................................................................................................ 38 N. Fund Balance Flow Assumptions ...................................................................................................... 38 O. Fund Balance ..................................................................................................................................... 38 P. Budget Stabilization Account ............................................................................................................ 39 Q. Net Position Restricted by Enabling Legislation ............................................................................... 39 R. Implementation of New Accounting Principles ................................................................................. 39
2. Equity in Pooled Cash and Cash Equivalents and Investments .................................................................. 40 3. Receivables ................................................................................................................................................ 44 4. Interfund Receivables, Payables and Transfers ........................................................................................... 45 5. Property Tax and Transfer Tax ................................................................................................................... 46 6. Capital Assets ............................................................................................................................................. 47 7. Long-Term Debt ......................................................................................................................................... 49
A. Primary Government ........................................................................................................................... 49 B. Component Units ................................................................................................................................ 54
8. Short-Term Debt ........................................................................................................................................ 54 9. Conduit Debt .............................................................................................................................................. 55 10. Lease Obligations ....................................................................................................................................... 55
A. Operating Leases – Primary Government .......................................................................................... 55 B. Capital Leases .................................................................................................................................... 56
11. Restricted Assets ........................................................................................................................................ 56 12. Landfill Closure and Post-Closure Care Cost ............................................................................................. 56 13. Retirement Plans ........................................................................................................................................ 57 14. Other Post-Employment Benefits ............................................................................................................... 61 15. Deferred Compensation Plan ...................................................................................................................... 64 16. Risk Management ....................................................................................................................................... 65 17. Individual Fund Disclosures ........................................................................................................................ 66 18. Commitments and Contingencies ............................................................................................................... 66
A. Grants ................................................................................................................................................. 66 B. Construction ....................................................................................................................................... 66 C. Litigation ........................................................................................................................................... 66 D. Encumbrances .................................................................................................................................... 66
32 Notes to Basic Financial Statements
Notes to Basic Financial Statements
1. Summary of Significant Accounting Policies
A. The Reporting Entity
Howard County, Maryland (the County), was formed in 1851 under a commission form of government. Under home rule charter since 1968, the County is governed by an elected County Executive and a 5- member County Council serving separate executive and legislative functions.
The basic financial statements include Howard County, Maryland as the primary government and its significant component units, entities for which the County is considered to be financially accountable. The component units include the activities of the Howard County Public School System, the Library, the Community College, and the Housing Commission. The Volunteer Fire Districts have not met the established criteria for inclusion in the reporting entity and, accordingly, are excluded from this report. The component units are included in the County’s reporting entity because of the significance of their operational or financial relationship with the County in that the County approves budgetary requests and provides a significant amount of funding. Discretely Presented Component Units
The financial data of the County’s component units are discretely presented in a column separate from the financial data of the primary government. They are reported in a separate column to emphasize that they are legally separate from the County. The following are the County’s component units that are included in the reporting:
The Howard County Public School System is responsible for the operation of special education, elementary, middle and high schools. The Board of Education is comprised of five members elected by County voters. The County is responsible for levying taxes and has budgetary control over the Board. The Howard County Library operates various library branches throughout the County. The Library is governed by a seven-member board nominated by the County Executive and approved by the County Council. The County approves the Library’s annual budget and provides substantial funding to the Library. The Howard Community College provides educational services to County citizens by offering two- year associate degrees and a continuing education program. The Community College is governed by a seven-member board appointed by the governor of Maryland. The County approves the College’s annual budget and provides substantial funding to the College. The Howard County Housing Commission is a public corporation established by Maryland and Howard County law to act as builder, developer, owner, and manager of housing for eligible participants. The Commission is comprised of seven commissioners appointed by the County Executive and confirmed by the County Council. The County provides substantial funding to the Commission and approves its annual budget.
Financial information regarding the component units is included in the component units combining statements. Annual financial reports for individual component units can be obtained from their respective administrative offices: Howard County Public School System Howard County Library 10910 Route 108 10375 Little Patuxent Parkway Ellicott City, Maryland 21042 Columbia, Maryland 21044
Notes to Basic Financial Statements 33
Howard Community College Howard County Housing Commission 10901 Little Patuxent Parkway 6751 Columbia Gateway Drive, 3rd Floor Columbia, Maryland 21044 Columbia, Maryland 21046
B. Government-Wide and Fund Financial Statements
The Statement of Net Position and Statement of Activities present financial information on all the non-fiduciary activities of the primary government and its component units. Generally, the effect of interfund activity has been removed from these statements with the exception of interfund services provided and used. Government activities, which primarily are supported by taxes and intergovernmental revenues, are reported separately from business-type activities, which rely to a significant extent on fees and charges for support. Likewise, the primary government is reported separately from certain legally separate component units for which the primary government is financially accountable. The Statement of Activities displays the extent to which direct expenses are offset by program revenues for each function of governmental activities and for each segment of business-type activities. Direct expenses are those that can be attributed to a specific function or segment. Program revenues include 1) charges to customers or applicants who purchase, use, or directly benefit from goods, services, or privileges provided by a given function or segment, and 2) grants and contributions that are restricted to meeting the operational or capital requirements of a particular function or segment. Taxes and other items not properly included among program revenues are reported instead as general revenues. Separate financial statements are provided for governmental funds, proprietary funds, and fiduciary funds even though the latter are excluded from the government-wide financial statements. Major individual governmental funds and major individual enterprise funds are reported as separate columns in the fund financial statements.
C. Measurement Focus, Basis of Accounting, and Financial Statement Presentation The government-wide financial statements are reported using the economic resources measurement focus and the accrual basis of accounting, as are the proprietary fund and pension trust fund financial statements. Agency funds do not have a measurement focus and are reported using the accrual basis of accounting. Revenues are recognized when earned and expenses are recorded when liabilities are incurred, regardless of the timing of related cash flows. Property taxes are recognized as revenues in the year for which they are levied. Grants and similar items are recognized as revenue as soon as all eligibility requirements have been met. Governmental fund financial statements are reported using the current financial resources measurement focus and the modified accrual basis of accounting. Revenues are recognized when they become both measureable and available. Revenues are considered to be available when they are collectible within the current period, or soon enough thereafter to pay liabilities of the current period. The County considers all revenues, with the exception of income tax revenue, to be available if they are collected within sixty days after the end of the current fiscal period. Income tax revenue is considered to be available if it is collected within thirty days after the end of the current fiscal period. Expenditures generally are recorded when a liability is incurred, as under accrual accounting. However, principal and interest on long-term debt, as well as expenditures related to vacation, sick leave, claims, and judgments, are recorded only when payment is due. Property taxes, other local taxes, state shared taxes, fines and forfeitures, and interest associated with the current fiscal period are all considered to be susceptible to accrual and so have been recognized as revenues of the current fiscal period. Only the portion of special assessments receivable due within the current fiscal period is considered to be susceptible to accrual as revenue of the current period. All other revenue items are considered to be measureable and available only when cash is received by the County.
34 Notes to Basic Financial Statements
The County reports the following major governmental funds:
The General Fund is the County’s primary operating fund. It accounts for all financial resources of the general government, except those required to be accounted for in another fund. The Agricultural Land Preservation Fund accounts for 25% of the local transfer tax and the County development tax which are dedicated to preserving the agricultural use of land through the purchase of development rights of property owners. The General Capital Projects Fund is used to account for the construction of general capital projects such as senior centers, community centers, and administrative buildings, in addition to public schools and buildings for the Community College.
The County reports the following major proprietary funds:
The Water and Sewer Fund accounts for the County’s water and sewer operations, construction or acquisition of capital assets, and related debt service costs. All assets, except those available to fund current liabilities, are considered restricted because a change in the charter is required to allow these assets to be used for other purposes.
The County reports the following fund types:
Special Revenues Funds are used to account for and report the proceeds of special revenue sources that are restricted or committed to expenditures for specified purposes other than debt service or capital projects. This definition establishes that at least one restricted or committed revenue source must be the foundation of the special revenue fund. The following revenue sources are included in special revenue funds: local transfer tax, fire and rescue tax, forest conservation developer fees, residential trash collection and disposal fees, grants, registration fees for recreational programs, fines for speed enforcement, and fees for health services. Capital Projects Funds are used to account for and report financial resources that are restricted, committed, or assigned to expenditure for capital outlays, including the acquisition or construction of capital facilities and other capital assets, except those accounted for in the General Capital Projects Fund and proprietary fund types. Enterprise Funds are used to account for the activities of the Special Recreation Facility Fund and Watershed Protection and Restoration Fund. The Special Recreation Facility Fund accounts for the operations and related debt service costs of a public golf course and the Watershed Protection and Restoration Fund accounts for the maintenance, operations, and improvement of the local stormwater management system. All assets, except those available to fund current liabilities, are considered restricted because a change in the charter is required to allow these assets to be used for other purposes. Internal Service Funds are funds used to account for goods and services furnished by one County department to another County department on a cost reimbursement basis. Internal Service Funds account for centralized vehicle fleet and mailing services; technology and communication operation; risk management activities for workers’ compensation, general liability, environmental, vehicle and property insurance; and County employee health benefit costs. Agency Funds are used to account for resources held in a custodial capacity on behalf of parties outside the government, including money paid by residents for State property tax, bay restoration fees, surety bonds held on construction work, and multifarious funds donated to be used by the Law Library, the Revenue Authority and the Domestic Violence Center. Pension Trust Funds are used to account for the activities of the County’s single-employer public employee retirement plans. These include the Police and Fire Employees’ Retirement Plan and the General Employees’ Plan. The plans account for employee contributions, County contributions and
Notes to Basic Financial Statements 35
the earnings and profits from investments. They also account for the disbursements made for employee retirements, withdrawals, disability, and death benefits as well as administrative expenses. Annual Financial Reports for both pension trust funds can be obtained from their administrative office at Howard County, Maryland, Director of Finance, 3430 Court House Drive, Ellicott City, Maryland, 21043 or from the website at www.howardcountymd.gov. Other Post-Employment Benefits (OPEB) Trust Fund was established to account for the other post-employment benefits of the County and its component units. The trust fund acts as a funding mechanism for employers’ cost of retiree benefits.
Generally, the effect of interfund activity has been eliminated from the government-wide financial statements. An exception to this general rule is charges between water and sewer operations and other County departments because the elimination of those charges would distort the direct costs and program revenues reported for the various functions concerned. Amounts reported as program revenues include 1) charges to customers or applicants for goods, services, or privileges provided, 2) operating grants and contributions, and 3) capital grants and contributions, including special assessments. Internally dedicated resources are reported as general revenues rather than as program revenues. Likewise, general revenues include all taxes. Proprietary funds distinguish operating revenues and expenses from non-operating items. Operating revenues and expenses generally result from providing services and producing and delivering goods in connection with a proprietary fund’s principal ongoing operations. The principal operating revenues of the Enterprise Funds and Internal Service Funds are charges to customers for sales and services. Operating expenses for Enterprise Funds and Internal Service Funds include the cost of services, administrative expenses, and depreciation on capital assets. All revenues and expenses not meeting this definition are reported as non-operating revenues and expenses. When both restricted and unrestricted resources are available for use, it is the County’s policy to use restricted resources first and then unrestricted resources as they are needed.
D. Budgetary Process
Pursuant to County Charter, the County Executive’s capital and operating portions of the budget for all County funds are submitted to the County Council by April 1 and 21, respectively. The County Council holds public hearings before passing the annual budget appropriation ordinance. If the County Council does not pass the budget ordinance, the Executive’s proposed budget ordinance stands adopted. The adopted budget becomes effective July 1, and provides the spending authority at the individual department level for the operations of the County government with the unexpanded or unencumbered appropriation authority of the operating budget expiring the following June 30. Capital unencumbered appropriations continue until the capital project is closed. During the fiscal year, the County Council, upon the request of the County Executive, may approve transfers between projects in the capital budget but it may not increase the total size of the capital budget. The County Council, at any time during the fiscal year, may approve supplemental operating budget requests from the County Executive. The budgeted contingency reserve, which may not exceed 4 percent of the appropriated budget, is the funding source for supplemental request. After April 1 of each year, the Council may also, at the request of the Executive, approve transfers between departments in the operating budgets. The Council may approve supplemental budgets from un-appropriated funds only in emergencies affecting “life, health, and property.” Additionally, the County Executive has the authority to make transfers within a department at any time during the year without approval of the County Council. During fiscal year 2014, the Council approved three capital budget transfers and three operating budget supplements. Budgetary data, as revised, is presented in the Basic Financial Statements for the General and Agricultural Land Preservation Funds. Outstanding encumbrances are included in the final budget as actual expenditure amounts in those statements because they remain in force and do not lapse until the end of the subsequent
36 Notes to Basic Financial Statements
fiscal year. Lapsed appropriations are reported as additions to fund balance on a budgetary basis.
E. Deposits and Investments Cash Equivalents The County considers all demand deposits and investments with a maturity of three months or less when purchased to be cash and cash equivalents. Investments The County follows Governmental Accounting Standards Board (GASB) Statement 31, Accounting and Financial Reporting for Certain Investments and for External Investment Pools, which requires marketable securities to be carried at fair value. The County currently limits its purchases to maturities of one year or less (except those items described in the next paragraph). The County has an internal investment pool that is available for use by all funds. The investments of the Pension Trust Funds are reported at fair value. The securities of the Pension Trust Funds traded on a national or international exchange are valued at the last reported sales price at current exchange rates. Investments in the Governmental Funds represent stripped-coupon U.S. Treasury securities stated at fair value in the Agricultural Land Preservation Fund. They are also reported in aggregate as part of U.S. Government Securities in the Equity in Pooled Cash and Cash Equivalents and Investments note. Also, in accordance with investment policy, the Pension Trust Funds may invest in collateralized mortgage obligations (CMO) and putable bonds. These investments are reported as part of U.S. Government Agency notes in the Equity in Pooled Cash and Cash Equivalents and Investments note disclosure.
F. Loans Receivable For purposes of the fund financial statements, housing loans in the Community Renewal Fund are charged to the budget upon funding, and the loans are recorded with an offset to a non-spendable fund balance account. For purposes of the government-wide financial statements, housing loans are not offset by restricted Net Position accounts.
G. Inventory Materials and supplies are valued at cost, using the weighted average method. Materials and supplies are recorded as assets when purchased, and charged to expenditures/expenses when consumed. This is referred to as the consumption method of inventory accounting. The County also has some materials and supplies that are expensed off directly when purchased.
H. Capital Assets Capital assets include property, plant, equipment, and infrastructure assets (e.g., roads, bridges, sidewalks, and similar items). They are recorded at historical or at estimated historical cost if actual historical cost is not available. Donated capital assets are valued at their estimated fair market value at the date donated. Capital assets are defined by Howard County as assets with an initial, individual cost of $5,000 or greater and an estimated useful life in excess of one year.
Notes to Basic Financial Statements 37
Capital assets are depreciated using the straight-line method over the estimated useful lives (in years) as follows: Buildings 50 Computer Software 5 Infrastructure 15-40 Vehicles 5-10 Water and sewer lines 50 Furniture and equipment 5-20 The costs of normal maintenance and repairs that do not add to the value of the asset or materially extend asset lives are not capitalized; they are charged to operations when incurred. Betterments and major improvements that significantly increases values, change capacities or extend useful lives are capitalized.
I. Compensated Absences County employees are granted vacation, personal, and sick leave in varying amounts. In the event of termination, an employee is reimbursed for accumulated vacation days. Classified employees are limited to an accrual of forty days and executive exempt employees have no leave accrual limit. Employees who terminate employment are not reimbursed for accumulated sick leave. Payments made to terminated employees for accumulated vacation leave are charged as expenditures/expenses, primarily in the General Fund, Special Revenue Funds, and Proprietary Funds, when paid. Accumulated vacation benefits at year-end are recorded as obligations in the Statement of Net Position and Proprietary Fund Statements.
J. Self-Insurance The County establishes its funding of claims liabilities as they occur. This funding level includes provisions for indemnity, medical losses, and allocated loss adjustment expenses which are all classified as incremental claim adjustment expenses. Unpaid claims in the self-insurance funds include liabilities for unpaid claims based upon individual case estimates for claims reported and claims incurred but not reported (IBNR) as of fiscal year-end.
K. Water and Sewer Assessments Water and sewer assessments are charged to property owners on a 30-year basis to recover the debt service on bonds used to construct main and lateral water and sewer lines which benefit such properties. A water and sewer assessments receivable (restricted assets) is established for the entire uncollected assessed amount. The portion of the receivable relating to bond principal is credited to Net Position and the portion representing interest is initially recorded as a deferred inflow and then recognized as revenue when billed. From 1980 to 2004 the deferred inflow increased as the water and sewer system was being built. The deferred inflow is now declining and will continue to do so as debt is retired and there are minimal new assessments. The Water and Sewer ad valorem charge (billed annually to all property within the Metropolitan District) is sufficient to fund the debt service related to the cost of infrastructure.
L. Deferred Outflows/Inflows of Resources In addition to assets, the statement of financial position will sometimes report a separate section for deferred outflows of resources. This separate financial statement element, deferred outflows of resources, represents a consumption of net position that applies to a future period(s) and so will not be recognized as an outflow of resources (expense/expenditure) until then. The government only has one item that qualifies for reporting in this category. It is the deferred refunding amount reported in the government-wide statement of net position. A deferred charge on refunding results from the difference in the carrying value of refunded debt and its reacquisition price. This amount is deferred and amortized over the shorter of the life of the refunded or refunding debt.
38 Notes to Basic Financial Statements
In addition to liabilities, the statement of financial position will sometimes report a separate section for deferred inflows of resources. This separate financial statement element, deferred inflows of resources, represents an acquisition of net position that applies to a future period(s) and so will not be recognized as an inflow of resources (revenue) until that time. The government has several deferred inflows of resources that qualify for reporting in this category on the government-wide statement of net position. For governmental activities, this includes prepaid taxes. For business-type activities, the government reports unavailable revenues from water and sewer assessments. These amounts are deferred and recognized as an inflow of resources in the period that the amounts become available. Under the modified accrual basis of accounting, several deferred inflows of resources are reported as unavailable revenue in the governmental fund balance sheet. The governmental funds report unavailable revenues from: prepaid taxes, and unavailable property and income taxes, fees, and grant revenues. These amounts are deferred and recognized as an inflow of resources in the period that the amounts become available.
M. Net Position Flow Assumptions
Sometimes the County will fund outlays for a particular purpose from both restricted (e.g., restricted bond or grant proceeds) and unrestricted resources. In order to calculate the amounts to report as restricted – net position and unrestricted – net position in the government-wide and proprietary fund financial statements, a flow assumption must be made about the order in which the resources are considered to be applied.
It is the County’s policy to consider restricted – net position to have been depleted before unrestricted – net position is applied.
N. Fund Balance Flow Assumptions
Sometimes the County will fund outlays for a particular purpose from both restricted and unrestricted resources (the total of committed, assigned, and unassigned fund balance). In order to calculate the amounts to report as restricted, committed, assigned, and unassigned fund balance in the governmental fund financial statements, a flow assumption must be made about the order in which the resources are considered to be applied. It is the County’s policy to consider restricted fund balance to have been depleted before using any of the components of unrestricted fund balance. Further, when the components of unrestricted fund balance can be used for the same purpose, committed fund balance is depleted first, followed by assigned fund balance. Unassigned fund balance is applied last.
O. Fund Balance
In the fund financial statements, fund balance is classified based on the extent to which the County is bound to observe constraints on the specific purposes for which the amounts can be spent. Fund balance is reported within one of the five fund balance categories listed below:
Nonspendable – Includes fund balance amounts that cannot be spent because they are either (1) not in spendable form or (2) legally or contractually required to be maintained intact such as a permanent fund. Not in spendable form includes items that are not expected to be converted to cash, such as inventories and prepaid items. Restricted – Includes fund balance amounts that are restricted to specific purposes when constraints are placed on the use of resources by external parties, constitution provisions or enabling legislation. Enabling legislation authorizes the County to assess, levy, charge or otherwise mandate payment of resources and includes a legally enforceable requirement that those resources be used only for the specific purpose stipulated in the legislation. Committed – Includes fund balance amounts for which constraints have been imposed by the government itself, using the highest level of decision-making authority via County ordinances. In addition, these constraints can only be removed or changed through formal action by the Council.
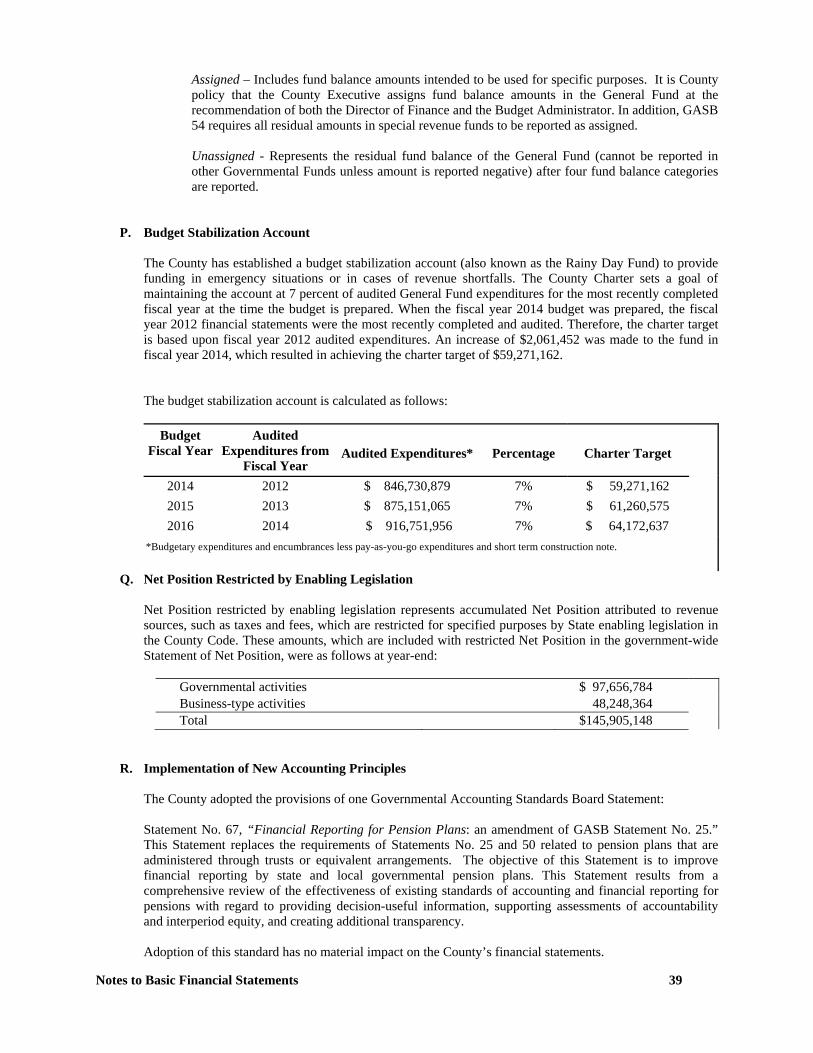
Notes to Basic Financial Statements 39
Assigned – Includes fund balance amounts intended to be used for specific purposes. It is County policy that the County Executive assigns fund balance amounts in the General Fund at the recommendation of both the Director of Finance and the Budget Administrator. In addition, GASB 54 requires all residual amounts in special revenue funds to be reported as assigned. Unassigned - Represents the residual fund balance of the General Fund (cannot be reported in other Governmental Funds unless amount is reported negative) after four fund balance categories are reported.
P. Budget Stabilization Account The County has established a budget stabilization account (also known as the Rainy Day Fund) to provide funding in emergency situations or in cases of revenue shortfalls. The County Charter sets a goal of maintaining the account at 7 percent of audited General Fund expenditures for the most recently completed fiscal year at the time the budget is prepared. When the fiscal year 2014 budget was prepared, the fiscal year 2012 financial statements were the most recently completed and audited. Therefore, the charter target is based upon fiscal year 2012 audited expenditures. An increase of $2,061,452 was made to the fund in fiscal year 2014, which resulted in achieving the charter target of $59,271,162. The budget stabilization account is calculated as follows:
Budget Fiscal Year
Audited Expenditures from
Fiscal Year
Audited Expenditures*
Percentage
Charter Target
2014 2012 $ 846,730,879 7% $ 59,271,162 2015 2013 $ 875,151,065 7% $ 61,260,575 2016 2014 $ 916,751,956 7% $ 64,172,637
*Budgetary expenditures and encumbrances less pay-as-you-go expenditures and short term construction note.
Q. Net Position Restricted by Enabling Legislation Net Position restricted by enabling legislation represents accumulated Net Position attributed to revenue sources, such as taxes and fees, which are restricted for specified purposes by State enabling legislation in the County Code. These amounts, which are included with restricted Net Position in the government-wide Statement of Net Position, were as follows at year-end:
Governmental activities $ 97,656,784 Business-type activities 48,248,364 Total $145,905,148
R. Implementation of New Accounting Principles The County adopted the provisions of one Governmental Accounting Standards Board Statement: Statement No. 67, “Financial Reporting for Pension Plans: an amendment of GASB Statement No. 25.” This Statement replaces the requirements of Statements No. 25 and 50 related to pension plans that are administered through trusts or equivalent arrangements. The objective of this Statement is to improve financial reporting by state and local governmental pension plans. This Statement results from a comprehensive review of the effectiveness of existing standards of accounting and financial reporting for pensions with regard to providing decision-useful information, supporting assessments of accountability and interperiod equity, and creating additional transparency. Adoption of this standard has no material impact on the County’s financial statements.
40 Notes to Basic Financial Statements
2. Equity in Pooled Cash and Cash Equivalents and Investments The County’s cash and cash equivalents and investments are managed separately from the Pension and Other Post-Employment Benefits Trust funds and each are discussed separately below. County’s Cash and Cash Equivalents and Investments The County maintains a cash, cash equivalents, and investment pool that is available for use by all funds except the Pension and Other Post-Employment Benefits Trust funds. Each County fund is allocated interest income based on its share of the investment pool. Except as otherwise legislated, interest income earned by Governmental and Internal Service Funds is transferred to the General Fund. Custodial Credit Risk – Deposits: In the case of deposits, this is the risk that in the event of a bank failure, the government’s deposits may not be returned to it. The County’s investment policy requires at least 102% collateralization of deposits. None of the component units have a policy covering deposits. The carrying amount of total deposits, including certificates of deposit, for the County was $54,977,730 and the bank balance was $57,688,252 at fiscal year-end. The bank balance was covered by federal depositary insurance or by collateral held by the County’s agent in the County’s name. The component units had a combined bank balance of $53,092,865. Of that amount, $1,621,634 was covered by federal depositary insurance or by collateral held in the component unit’s name and the remaining $51,471,231 was covered by collateral held in the pledging bank’s trust department or by the pledging bank’s agent in the component unit’s name. Investments: The County has adopted an investment policy that is designed to provide maximum safety and liquidity of funds while providing a reasonable rate of return. Permissible investments include U.S. Treasury Obligations, U.S. Government Agency and U.S. Government-Sponsored Enterprises, repurchase agreements, collateralized certificates of deposit, bankers’ acceptances, commercial paper, the Maryland Local Government Investment Pool, and mutual funds dealing in government securities. The County’s policy and State law require that the underlying collateral for repurchase agreements and certificates of deposit must have a market value of at least 102% of the investment’s cost plus accrued interest. The County’s policy is more restrictive than State law, limiting the percentage of total portfolio that can be invested in certain investment types. These investment types, and the maximum percentage of the portfolio that can be invested in each are: U.S. Treasury Obligations – 100%, U.S. Government Agency and U.S. Government-Sponsored Enterprises – 90%, repurchase agreements – 90%, collateralized certificates of deposit - 5% bankers’ acceptances – 30%, commercial paper – 5%, and mutual funds – 60%. State law places no limits on these types of investments. Another restriction the County has is to limit the maximum amount invested through any broker, dealer or other financial institution to 40% of the portfolio. In addition, all component units have investment policies. The table below reconciles the County’s deposits ($54,977,729) and the investments ($1,225,136,572) to the government-wide Statement of Net Position and the Statement of Fiduciary Net Position – Pension and Other Post-Employment Benefits Trust Funds and Agency Funds:
Equity in pooled cash and cash equivalents 169,717,936$ Restricted equity in pooled cash and cash equivalents 256,553,485 Investments - fair value 853,842,880 Total 1,280,114,301$
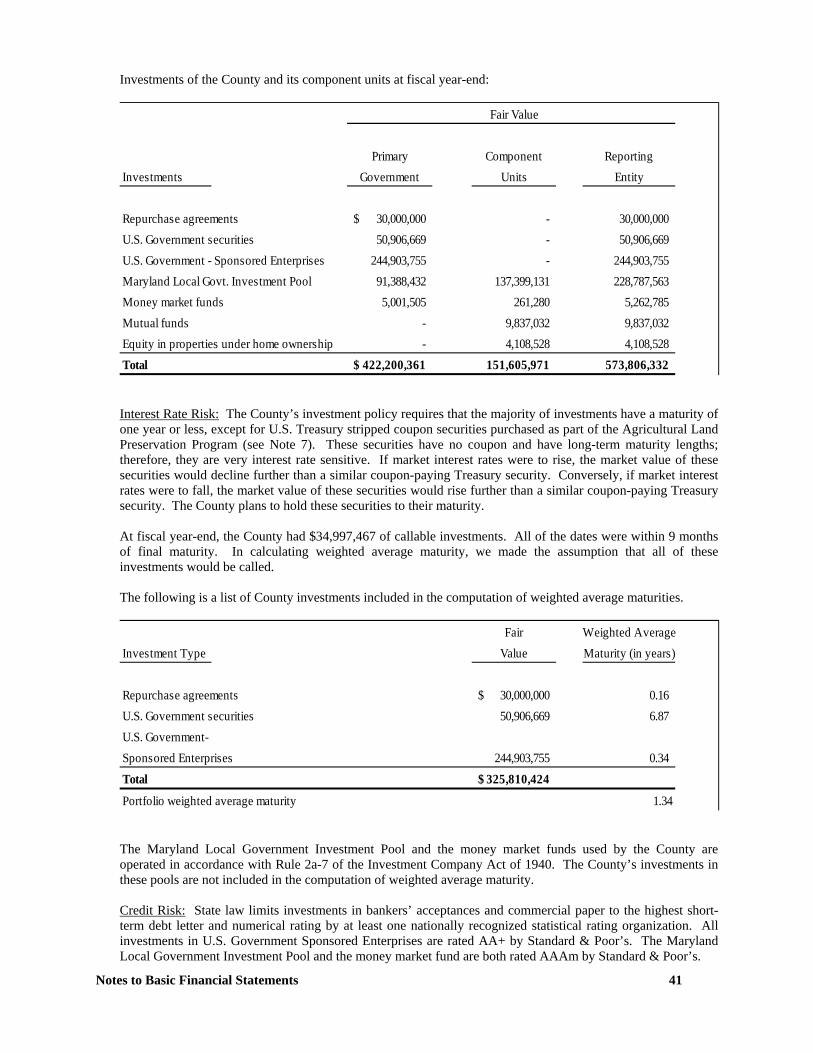
Notes to Basic Financial Statements 41
Investments of the County and its component units at fiscal year-end:
Fair Value
Primary Component ReportingInvestments Government Units Entity
Repurchase agreements 30,000,000$ - 30,000,000 U.S. Government securities 50,906,669 - 50,906,669 U.S. Government - Sponsored Enterprises 244,903,755 - 244,903,755 Maryland Local Govt. Investment Pool 91,388,432 137,399,131 228,787,563 Money market funds 5,001,505 261,280 5,262,785 Mutual funds - 9,837,032 9,837,032 Equity in properties under home ownership - 4,108,528 4,108,528 Total 422,200,361$ 151,605,971 573,806,332
Interest Rate Risk: The County’s investment policy requires that the majority of investments have a maturity of one year or less, except for U.S. Treasury stripped coupon securities purchased as part of the Agricultural Land Preservation Program (see Note 7). These securities have no coupon and have long-term maturity lengths; therefore, they are very interest rate sensitive. If market interest rates were to rise, the market value of these securities would decline further than a similar coupon-paying Treasury security. Conversely, if market interest rates were to fall, the market value of these securities would rise further than a similar coupon-paying Treasury security. The County plans to hold these securities to their maturity. At fiscal year-end, the County had $34,997,467 of callable investments. All of the dates were within 9 months of final maturity. In calculating weighted average maturity, we made the assumption that all of these investments would be called. The following is a list of County investments included in the computation of weighted average maturities.
Fair Weighted AverageInvestment Type Value Maturity (in years)
Repurchase agreements 30,000,000$ 0.16 U.S. Government securities 50,906,669 6.87 U.S. Government-Sponsored Enterprises 244,903,755 0.34 Total 325,810,424$
Portfolio weighted average maturity 1.34 The Maryland Local Government Investment Pool and the money market funds used by the County are operated in accordance with Rule 2a-7 of the Investment Company Act of 1940. The County’s investments in these pools are not included in the computation of weighted average maturity. Credit Risk: State law limits investments in bankers’ acceptances and commercial paper to the highest short-term debt letter and numerical rating by at least one nationally recognized statistical rating organization. All investments in U.S. Government Sponsored Enterprises are rated AA+ by Standard & Poor’s. The Maryland Local Government Investment Pool and the money market fund are both rated AAAm by Standard & Poor’s.
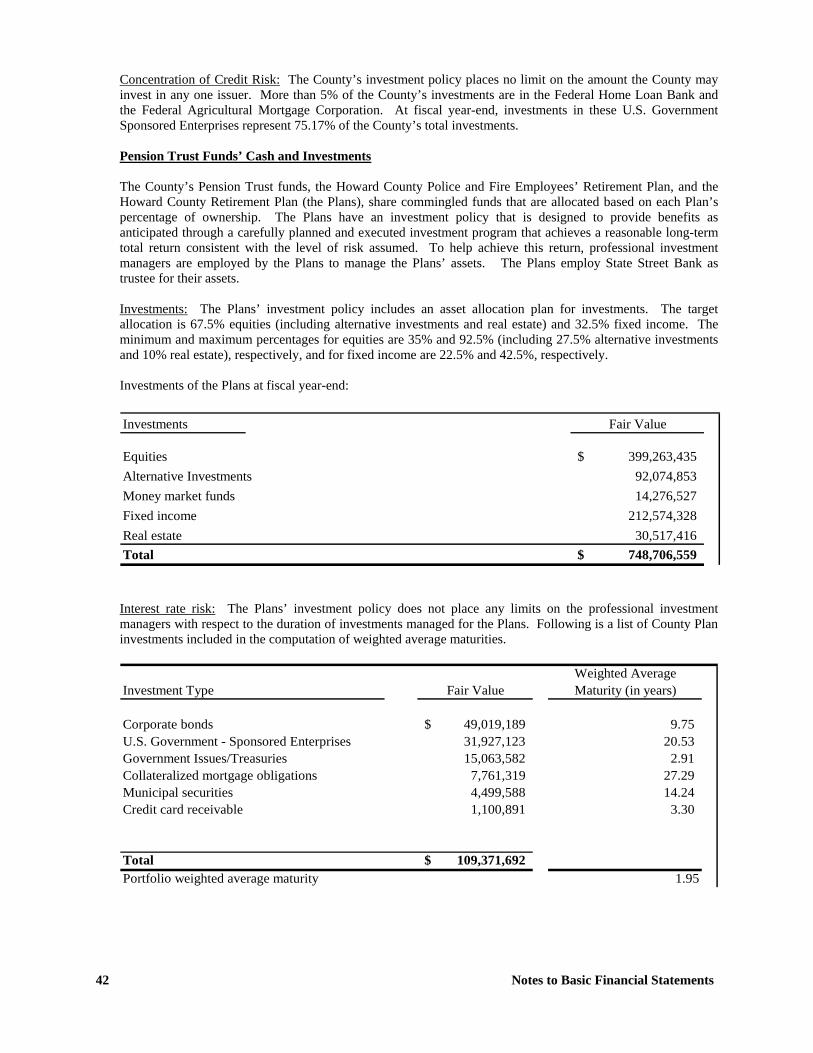
42 Notes to Basic Financial Statements
Concentration of Credit Risk: The County’s investment policy places no limit on the amount the County may invest in any one issuer. More than 5% of the County’s investments are in the Federal Home Loan Bank and the Federal Agricultural Mortgage Corporation. At fiscal year-end, investments in these U.S. Government Sponsored Enterprises represent 75.17% of the County’s total investments. Pension Trust Funds’ Cash and Investments The County’s Pension Trust funds, the Howard County Police and Fire Employees’ Retirement Plan, and the Howard County Retirement Plan (the Plans), share commingled funds that are allocated based on each Plan’s percentage of ownership. The Plans have an investment policy that is designed to provide benefits as anticipated through a carefully planned and executed investment program that achieves a reasonable long-term total return consistent with the level of risk assumed. To help achieve this return, professional investment managers are employed by the Plans to manage the Plans’ assets. The Plans employ State Street Bank as trustee for their assets. Investments: The Plans’ investment policy includes an asset allocation plan for investments. The target allocation is 67.5% equities (including alternative investments and real estate) and 32.5% fixed income. The minimum and maximum percentages for equities are 35% and 92.5% (including 27.5% alternative investments and 10% real estate), respectively, and for fixed income are 22.5% and 42.5%, respectively. Investments of the Plans at fiscal year-end:
Investments Fair Value
Equities 399,263,435$ Alternative Investments 92,074,853 Money market funds 14,276,527 Fixed income 212,574,328 Real estate 30,517,416 Total 748,706,559$
Interest rate risk: The Plans’ investment policy does not place any limits on the professional investment managers with respect to the duration of investments managed for the Plans. Following is a list of County Plan investments included in the computation of weighted average maturities.
Weighted AverageInvestment Type Fair Value Maturity (in years)
Corporate bonds 49,019,189$ 9.75 U.S. Government - Sponsored Enterprises 31,927,123 20.53 Government Issues/Treasuries 15,063,582 2.91 Collateralized mortgage obligations 7,761,319 27.29 Municipal securities 4,499,588 14.24 Credit card receivable 1,100,891 3.30
Total 109,371,692$ Portfolio weighted average maturity 1.95
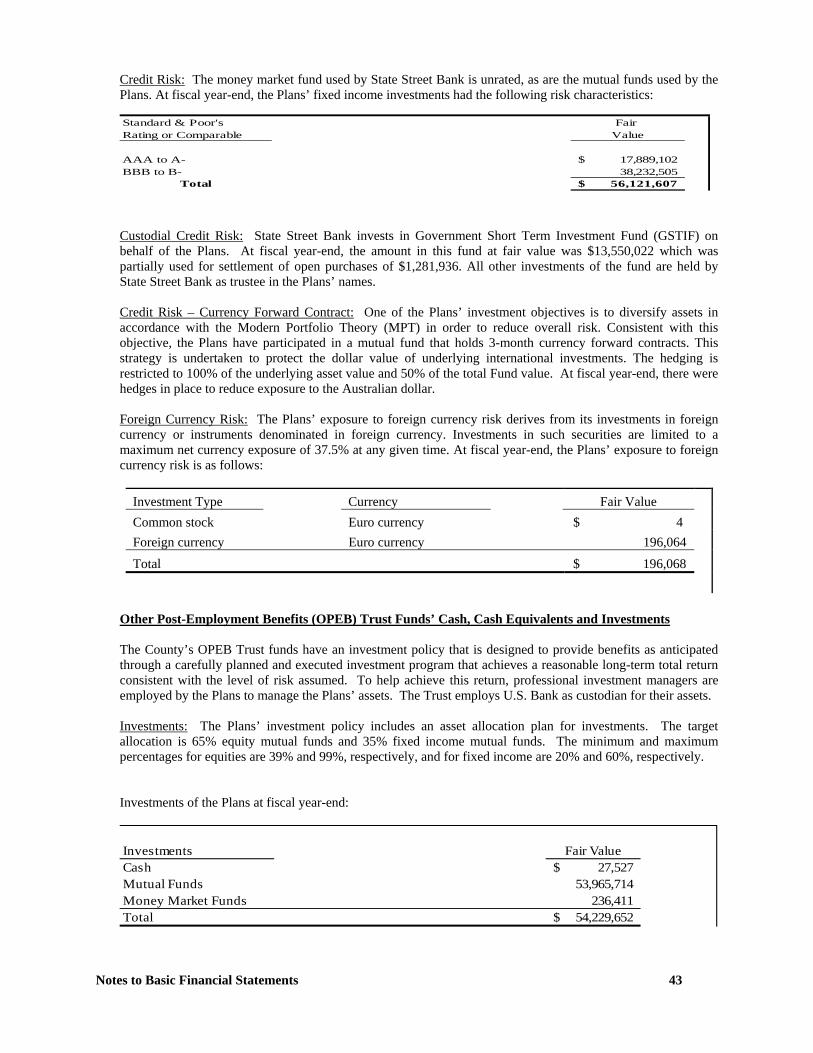
Notes to Basic Financial Statements 43
Credit Risk: The money market fund used by State Street Bank is unrated, as are the mutual funds used by the Plans. At fiscal year-end, the Plans’ fixed income investments had the following risk characteristics:
Standard & Poor's Fair Rating or Comparable Value
AAA to A- 17,889,102$ BBB to B- 38,232,505
Total 56,121,607$
Custodial Credit Risk: State Street Bank invests in Government Short Term Investment Fund (GSTIF) on behalf of the Plans. At fiscal year-end, the amount in this fund at fair value was $13,550,022 which was partially used for settlement of open purchases of $1,281,936. All other investments of the fund are held by State Street Bank as trustee in the Plans’ names. Credit Risk – Currency Forward Contract: One of the Plans’ investment objectives is to diversify assets in accordance with the Modern Portfolio Theory (MPT) in order to reduce overall risk. Consistent with this objective, the Plans have participated in a mutual fund that holds 3-month currency forward contracts. This strategy is undertaken to protect the dollar value of underlying international investments. The hedging is restricted to 100% of the underlying asset value and 50% of the total Fund value. At fiscal year-end, there were hedges in place to reduce exposure to the Australian dollar. Foreign Currency Risk: The Plans’ exposure to foreign currency risk derives from its investments in foreign currency or instruments denominated in foreign currency. Investments in such securities are limited to a maximum net currency exposure of 37.5% at any given time. At fiscal year-end, the Plans’ exposure to foreign currency risk is as follows:
Investment Type Currency Fair Value Common stock Euro currency $ 4 Foreign currency Euro currency 196,064 Total $ 196,068
Other Post-Employment Benefits (OPEB) Trust Funds’ Cash, Cash Equivalents and Investments The County’s OPEB Trust funds have an investment policy that is designed to provide benefits as anticipated through a carefully planned and executed investment program that achieves a reasonable long-term total return consistent with the level of risk assumed. To help achieve this return, professional investment managers are employed by the Plans to manage the Plans’ assets. The Trust employs U.S. Bank as custodian for their assets. Investments: The Plans’ investment policy includes an asset allocation plan for investments. The target allocation is 65% equity mutual funds and 35% fixed income mutual funds. The minimum and maximum percentages for equities are 39% and 99%, respectively, and for fixed income are 20% and 60%, respectively. Investments of the Plans at fiscal year-end:
Investments Fair ValueCash 27,527$ Mutual Funds 53,965,714 Money Market Funds 236,411 Total 54,229,652$
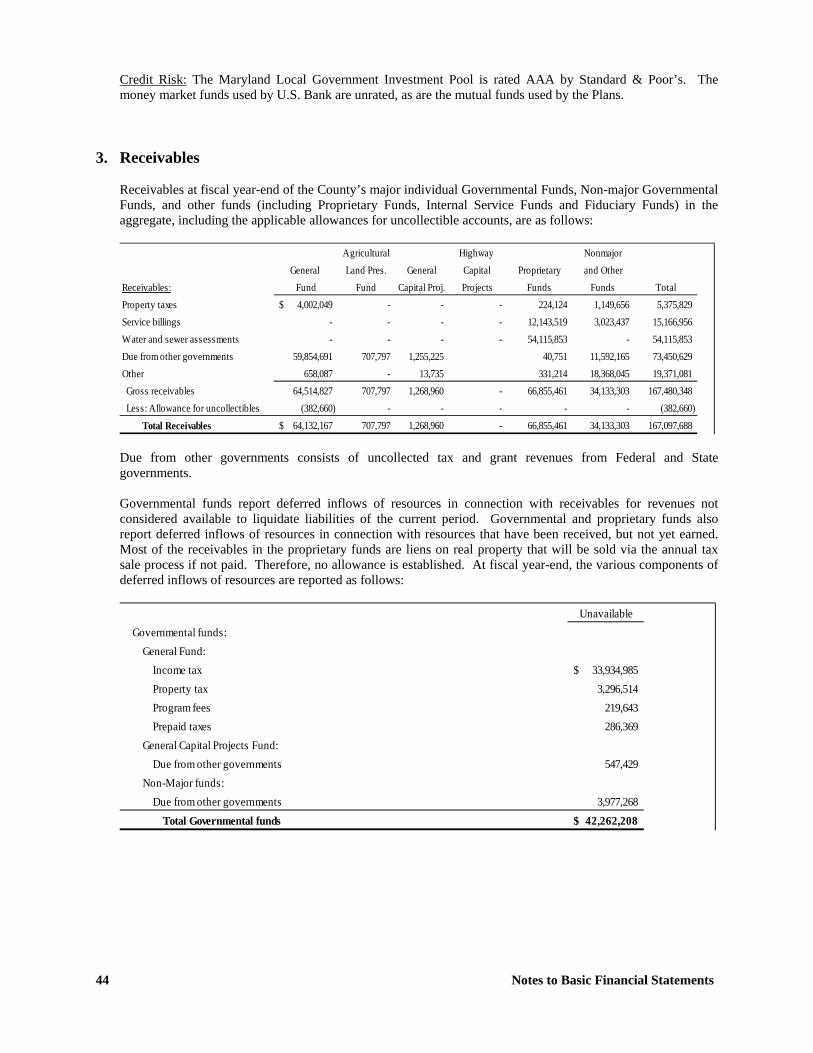
44 Notes to Basic Financial Statements
Credit Risk: The Maryland Local Government Investment Pool is rated AAA by Standard & Poor’s. The money market funds used by U.S. Bank are unrated, as are the mutual funds used by the Plans.
3. Receivables Receivables at fiscal year-end of the County’s major individual Governmental Funds, Non-major Governmental Funds, and other funds (including Proprietary Funds, Internal Service Funds and Fiduciary Funds) in the aggregate, including the applicable allowances for uncollectible accounts, are as follows:
Agricultural Highway NonmajorGeneral Land Pres. General Capital Proprietary and Other
Receivables: Fund Fund Capital Proj. Projects Funds Funds TotalProperty taxes 4,002,049$ - - - 224,124 1,149,656 5,375,829 Service billings - - - - 12,143,519 3,023,437 15,166,956 Water and sewer assessments - - - - 54,115,853 - 54,115,853 Due from other governments 59,854,691 707,797 1,255,225 40,751 11,592,165 73,450,629 Other 658,087 - 13,735 331,214 18,368,045 19,371,081 Gross receivables 64,514,827 707,797 1,268,960 - 66,855,461 34,133,303 167,480,348 Less: Allowance for uncollectibles (382,660) - - - - - (382,660)
Total Receivables 64,132,167$ 707,797 1,268,960 - 66,855,461 34,133,303 167,097,688 Due from other governments consists of uncollected tax and grant revenues from Federal and State governments. Governmental funds report deferred inflows of resources in connection with receivables for revenues not considered available to liquidate liabilities of the current period. Governmental and proprietary funds also report deferred inflows of resources in connection with resources that have been received, but not yet earned. Most of the receivables in the proprietary funds are liens on real property that will be sold via the annual tax sale process if not paid. Therefore, no allowance is established. At fiscal year-end, the various components of deferred inflows of resources are reported as follows:
UnavailableGovernmental funds:
General Fund:Income tax 33,934,985$ Property tax 3,296,514 Program fees 219,643 Prepaid taxes 286,369
General Capital Projects Fund:Due from other governments 547,429
Non-Major funds:Due from other governments 3,977,268
Total Governmental funds 42,262,208$
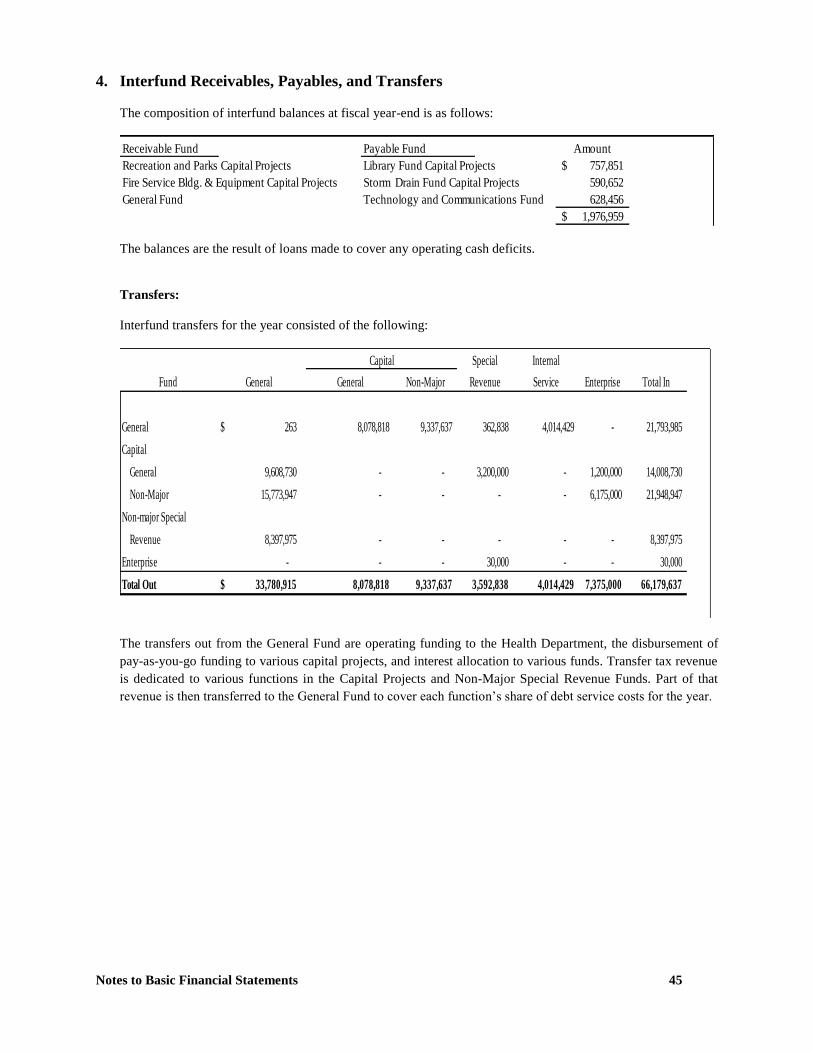
Notes to Basic Financial Statements 45
4. Interfund Receivables, Payables, and Transfers
The composition of interfund balances at fiscal year-end is as follows:
Receivable Fund Payable Fund Amount
Recreation and Parks Capital Projects Library Fund Capital Projects 757,851$
Fire Service Bldg. & Equipment Capital Projects Storm Drain Fund Capital Projects 590,652
General Fund Technology and Communications Fund 628,456
1,976,959$
The balances are the result of loans made to cover any operating cash deficits.
Transfers:
Interfund transfers for the year consisted of the following:
Capital Special Internal
General General Non-Major Revenue Service Enterprise Total In
General 263$ 8,078,818 9,337,637 362,838 4,014,429 - 21,793,985
Capital
General 9,608,730 - - 3,200,000 - 1,200,000 14,008,730
Non-Major 15,773,947 - - - - 6,175,000 21,948,947
Non-major Special
Revenue 8,397,975 - - - - - 8,397,975
Enterprise - - - 30,000 - - 30,000
Total Out 33,780,915$ 8,078,818 9,337,637 3,592,838 4,014,429 7,375,000 66,179,637
Fund
The transfers out from the General Fund are operating funding to the Health Department, the disbursement of
pay-as-you-go funding to various capital projects, and interest allocation to various funds. Transfer tax revenue
is dedicated to various functions in the Capital Projects and Non-Major Special Revenue Funds. Part of that
revenue is then transferred to the General Fund to cover each function’s share of debt service costs for the year.
46 Notes to Basic Financial Statements
5. Property Tax and Transfer Tax The County’s real property tax is levied each July 1 on the assessed value certified as of that date for all taxable real property located in the County. Assessed values are established by the Maryland State Department of Assessments and Taxation at 100 percent of estimated market value. The State uses January 1 as the date of finality and processes additions, deletions and corrections throughout the year. A revaluation of all property is required to be completed every three years. County taxes are due and payable, and become a lien on the property, on July 1 of each fiscal year. A discount of ½ percent is allowed if payment is made in July. Property taxes are billed and payable semi-annually on properties designated as “principal residence” unless a taxpayer makes an election to pay annually. The first installment is due by September 30 while the second installment is due December 31. If delinquent, taxes are charged a penalty and interest (1.5 percent) each month that they remain unpaid. If the annual payment election is made, taxes become delinquent October 1 and are charged a penalty and interest (1.5 percent) each month that taxes remain unpaid. Tax lien certificates are sold at a public auction in May or June for properties with delinquent taxes. Property taxes levied during the current year are recorded as receivables and revenue, net of estimated uncollectible amounts of personal property tax. The net receivables uncollected 60 days after year-end are recorded as deferred inflows of resources as described in Note 3. The Howard County Code imposes a transfer tax upon every instrument of writing conveying title to real or leasehold property offered for sale or lease and recorded in Howard County. The Code specifies that the proceeds shall be distributed to the School Construction Fund (25 percent), the Recreation and Parks Fund (25 percent), the Agricultural Land Preservation Fund (25 percent), the Community Renewal Fund (12-1/2 percent), and the Fire Service Building and Equipment Fund (12-1/2 percent).
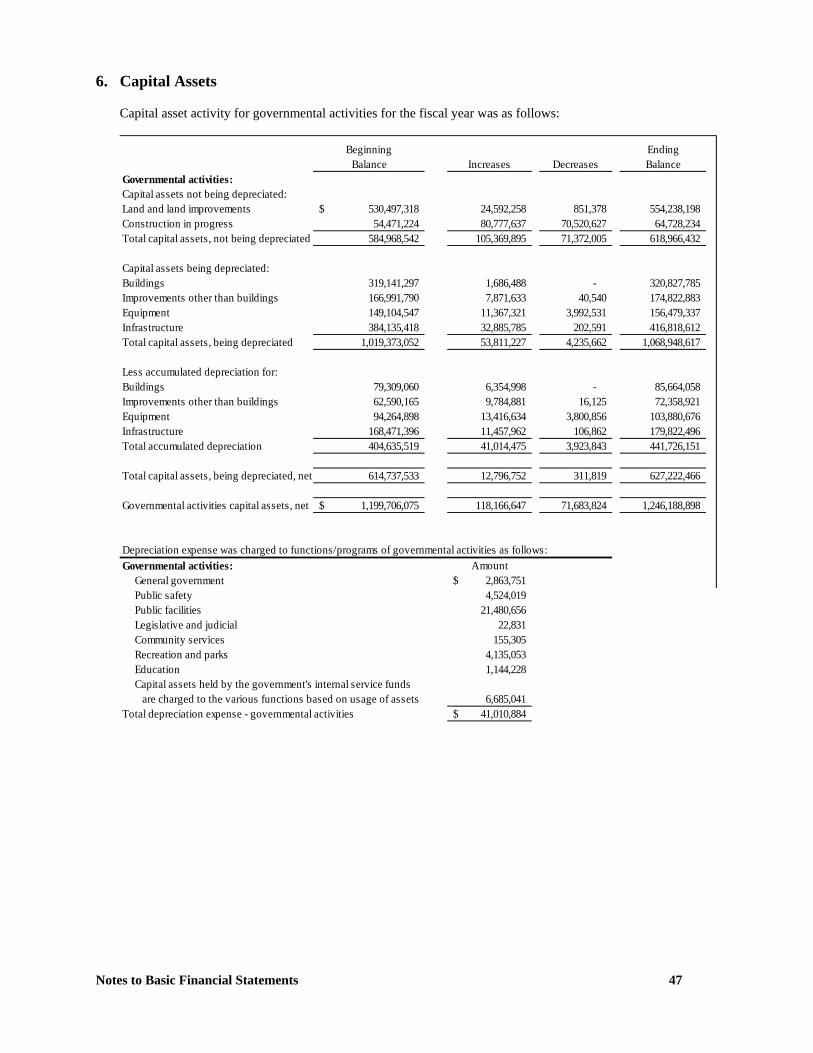
Notes to Basic Financial Statements 47
6. Capital Assets Capital asset activity for governmental activities for the fiscal year was as follows:
Beginning EndingBalance Increases Decreases Balance
Governmental activities:Capital assets not being depreciated:Land and land improvements 530,497,318$ 24,592,258 851,378 554,238,198 Construction in progress 54,471,224 80,777,637 70,520,627 64,728,234 Total capital assets, not being depreciated 584,968,542 105,369,895 71,372,005 618,966,432
Capital assets being depreciated:Buildings 319,141,297 1,686,488 - 320,827,785 Improvements other than buildings 166,991,790 7,871,633 40,540 174,822,883 Equipment 149,104,547 11,367,321 3,992,531 156,479,337 Infrastructure 384,135,418 32,885,785 202,591 416,818,612 Total capital assets, being depreciated 1,019,373,052 53,811,227 4,235,662 1,068,948,617
Less accumulated depreciation for:Buildings 79,309,060 6,354,998 - 85,664,058 Improvements other than buildings 62,590,165 9,784,881 16,125 72,358,921 Equipment 94,264,898 13,416,634 3,800,856 103,880,676 Infrastructure 168,471,396 11,457,962 106,862 179,822,496 Total accumulated depreciation 404,635,519 41,014,475 3,923,843 441,726,151
Total capital assets, being depreciated, net 614,737,533 12,796,752 311,819 627,222,466
Governmental activities capital assets, net 1,199,706,075$ 118,166,647 71,683,824 1,246,188,898
Depreciation expense was charged to functions/programs of governmental activities as follows:Governmental activities: Amount General government 2,863,751$ Public safety 4,524,019 Public facilities 21,480,656 Legislative and judicial 22,831 Community services 155,305 Recreation and parks 4,135,053 Education 1,144,228 Capital assets held by the government's internal service funds are charged to the various functions based on usage of assets 6,685,041 Total depreciation expense - governmental activities 41,010,884$
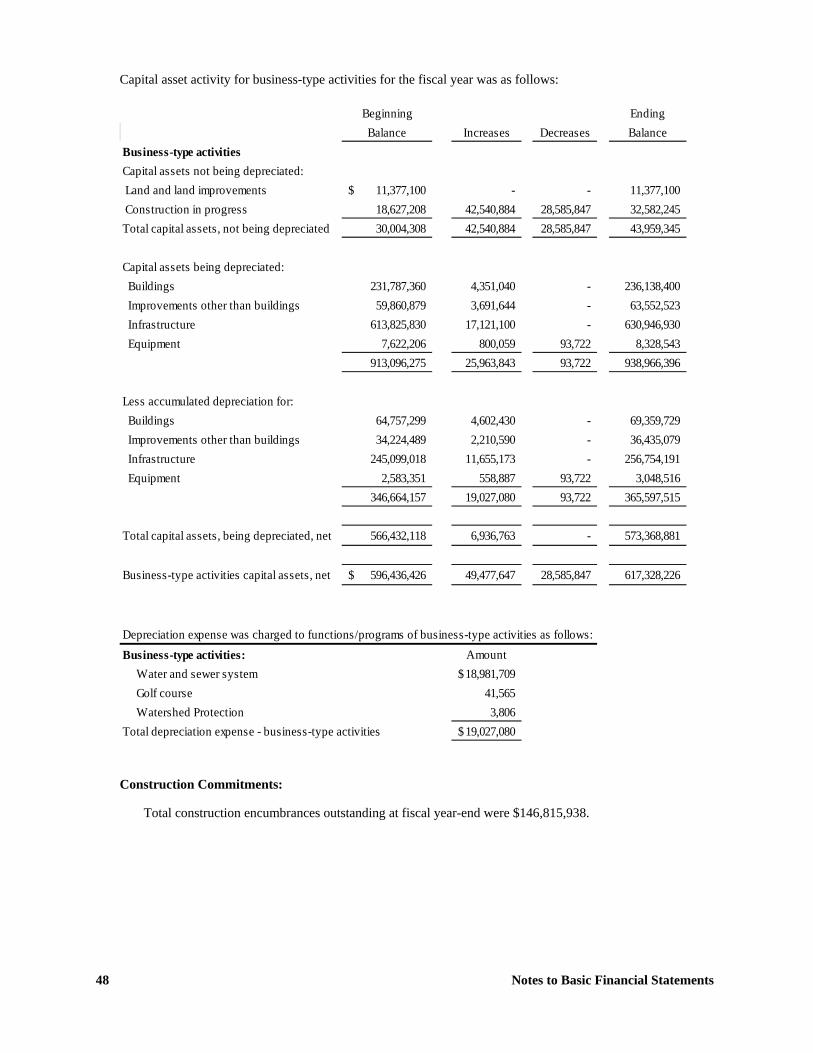
48 Notes to Basic Financial Statements
Capital asset activity for business-type activities for the fiscal year was as follows:
Construction Commitments:
Total construction encumbrances outstanding at fiscal year-end were $146,815,938.
Beginning EndingBalance Increases Decreases Balance
Business-type activitiesCapital assets not being depreciated: Land and land improvements 11,377,100$ - - 11,377,100 Construction in progress 18,627,208 42,540,884 28,585,847 32,582,245 Total capital assets, not being depreciated 30,004,308 42,540,884 28,585,847 43,959,345
Capital assets being depreciated: Buildings 231,787,360 4,351,040 - 236,138,400 Improvements other than buildings 59,860,879 3,691,644 - 63,552,523 Infrastructure 613,825,830 17,121,100 - 630,946,930 Equipment 7,622,206 800,059 93,722 8,328,543
913,096,275 25,963,843 93,722 938,966,396
Less accumulated depreciation for: Buildings 64,757,299 4,602,430 - 69,359,729 Improvements other than buildings 34,224,489 2,210,590 - 36,435,079 Infrastructure 245,099,018 11,655,173 - 256,754,191 Equipment 2,583,351 558,887 93,722 3,048,516
346,664,157 19,027,080 93,722 365,597,515
Total capital assets, being depreciated, net 566,432,118 6,936,763 - 573,368,881
Business-type activities capital assets, net 596,436,426$ 49,477,647 28,585,847 617,328,226
Depreciation expense was charged to functions/programs of business-type activities as follows:Business-type activities: Amount Water and sewer system 18,981,709$ Golf course 41,565 Watershed Protection 3,806Total depreciation expense - business-type activities 19,027,080$
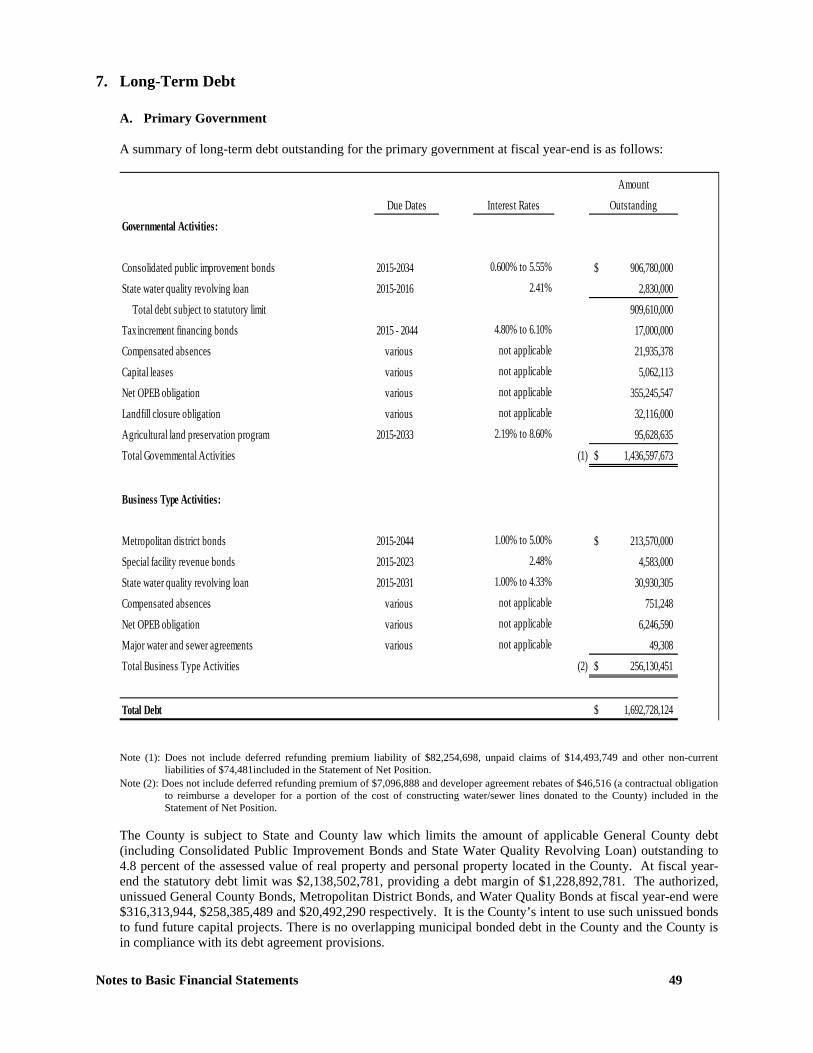
Notes to Basic Financial Statements 49
7. Long-Term Debt A. Primary Government
A summary of long-term debt outstanding for the primary government at fiscal year-end is as follows:
AmountDue Dates Interest Rates Outstanding
Governmental Activities:
Consolidated public improvement bonds 2015-2034 0.600% to 5.55% 906,780,000$ State water quality revolving loan 2015-2016 2.41% 2,830,000 Total debt subject to statutory limit 909,610,000 Tax increment financing bonds 2015 - 2044 4.80% to 6.10% 17,000,000 Compensated absences various not applicable 21,935,378 Capital leases various not applicable 5,062,113 Net OPEB obligation various not applicable 355,245,547 Landfill closure obligation various not applicable 32,116,000 Agricultural land preservation program 2015-2033 2.19% to 8.60% 95,628,635 Total Governmental Activities (1) 1,436,597,673$
Business Type Activities:
Metropolitan district bonds 2015-2044 1.00% to 5.00% 213,570,000$ Special facility revenue bonds 2015-2023 2.48% 4,583,000 State water quality revolving loan 2015-2031 1.00% to 4.33% 30,930,305 Compensated absences various not applicable 751,248 Net OPEB obligation various not applicable 6,246,590 Major water and sewer agreements various not applicable 49,308 Total Business Type Activities (2) 256,130,451$
Total Debt 1,692,728,124$
Note (1): Does not include deferred refunding premium liability of $82,254,698, unpaid claims of $14,493,749 and other non-current liabilities of $74,481included in the Statement of Net Position.
Note (2): Does not include deferred refunding premium of $7,096,888 and developer agreement rebates of $46,516 (a contractual obligation to reimburse a developer for a portion of the cost of constructing water/sewer lines donated to the County) included in the Statement of Net Position.
The County is subject to State and County law which limits the amount of applicable General County debt (including Consolidated Public Improvement Bonds and State Water Quality Revolving Loan) outstanding to 4.8 percent of the assessed value of real property and personal property located in the County. At fiscal year-end the statutory debt limit was $2,138,502,781, providing a debt margin of $1,228,892,781. The authorized, unissued General County Bonds, Metropolitan District Bonds, and Water Quality Bonds at fiscal year-end were $316,313,944, $258,385,489 and $20,492,290 respectively. It is the County’s intent to use such unissued bonds to fund future capital projects. There is no overlapping municipal bonded debt in the County and the County is in compliance with its debt agreement provisions.
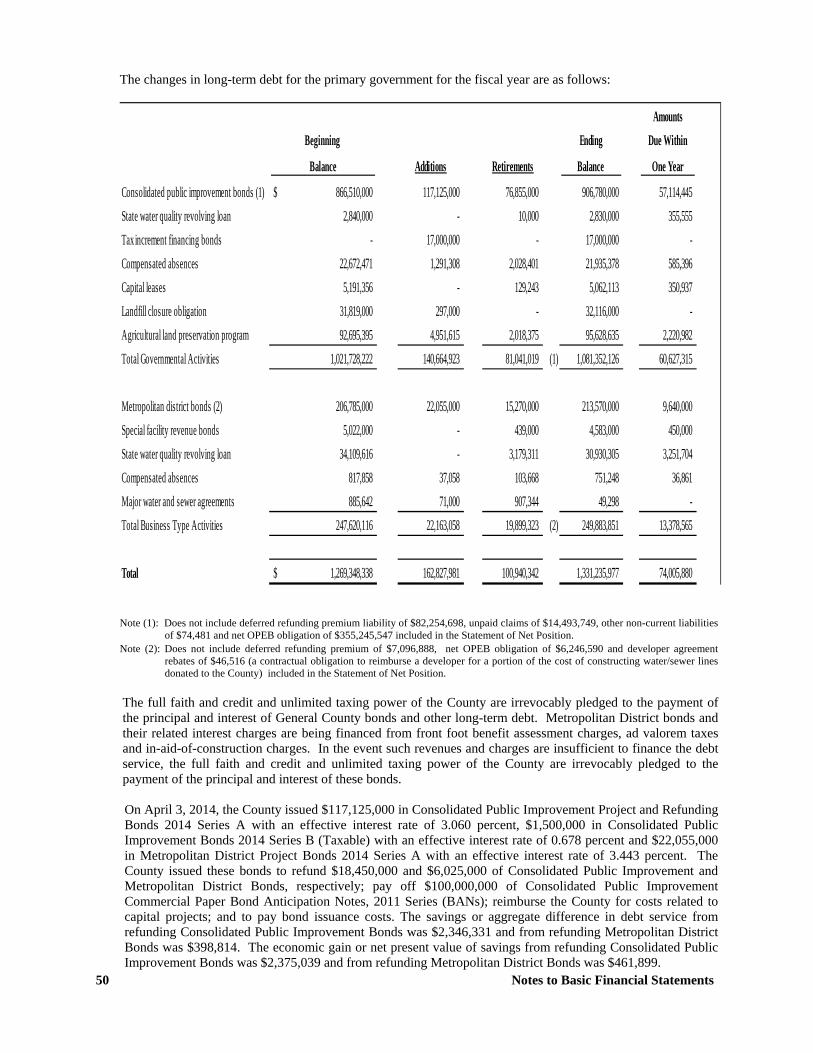
50 Notes to Basic Financial Statements
The changes in long-term debt for the primary government for the fiscal year are as follows:
AmountsBeginning Ending Due Within
Balance Additions Retirements Balance One Year
Consolidated public improvement bonds (1) 866,510,000$ 117,125,000 76,855,000 906,780,000 57,114,445 State water quality revolving loan 2,840,000 - 10,000 2,830,000 355,555 Tax increment financing bonds - 17,000,000 - 17,000,000 - Compensated absences 22,672,471 1,291,308 2,028,401 21,935,378 585,396 Capital leases 5,191,356 - 129,243 5,062,113 350,937 Landfill closure obligation 31,819,000 297,000 - 32,116,000 - Agricultural land preservation program 92,695,395 4,951,615 2,018,375 95,628,635 2,220,982 Total Governmental Activities 1,021,728,222 140,664,923 81,041,019 (1) 1,081,352,126 60,627,315
Metropolitan district bonds (2) 206,785,000 22,055,000 15,270,000 213,570,000 9,640,000 Special facility revenue bonds 5,022,000 - 439,000 4,583,000 450,000 State water quality revolving loan 34,109,616 - 3,179,311 30,930,305 3,251,704 Compensated absences 817,858 37,058 103,668 751,248 36,861 Major water and sewer agreements 885,642 71,000 907,344 49,298 - Total Business Type Activities 247,620,116 22,163,058 19,899,323 (2) 249,883,851 13,378,565
Total 1,269,348,338$ 162,827,981 100,940,342 1,331,235,977 74,005,880
Note (1): Does not include deferred refunding premium liability of $82,254,698, unpaid claims of $14,493,749, other non-current liabilities
of $74,481 and net OPEB obligation of $355,245,547 included in the Statement of Net Position. Note (2): Does not include deferred refunding premium of $7,096,888, net OPEB obligation of $6,246,590 and developer agreement
rebates of $46,516 (a contractual obligation to reimburse a developer for a portion of the cost of constructing water/sewer lines donated to the County) included in the Statement of Net Position.
The full faith and credit and unlimited taxing power of the County are irrevocably pledged to the payment of the principal and interest of General County bonds and other long-term debt. Metropolitan District bonds and their related interest charges are being financed from front foot benefit assessment charges, ad valorem taxes and in-aid-of-construction charges. In the event such revenues and charges are insufficient to finance the debt service, the full faith and credit and unlimited taxing power of the County are irrevocably pledged to the payment of the principal and interest of these bonds. On April 3, 2014, the County issued $117,125,000 in Consolidated Public Improvement Project and Refunding Bonds 2014 Series A with an effective interest rate of 3.060 percent, $1,500,000 in Consolidated Public Improvement Bonds 2014 Series B (Taxable) with an effective interest rate of 0.678 percent and $22,055,000 in Metropolitan District Project Bonds 2014 Series A with an effective interest rate of 3.443 percent. The County issued these bonds to refund $18,450,000 and $6,025,000 of Consolidated Public Improvement and Metropolitan District Bonds, respectively; pay off $100,000,000 of Consolidated Public Improvement Commercial Paper Bond Anticipation Notes, 2011 Series (BANs); reimburse the County for costs related to capital projects; and to pay bond issuance costs. The savings or aggregate difference in debt service from refunding Consolidated Public Improvement Bonds was $2,346,331 and from refunding Metropolitan District Bonds was $398,814. The economic gain or net present value of savings from refunding Consolidated Public Improvement Bonds was $2,375,039 and from refunding Metropolitan District Bonds was $461,899.
Notes to Basic Financial Statements 51
The County issues debt to finance the construction of certain capital facilities of its component units and to finance major water and sewer projects done in conjunction with the City of Baltimore (the “City”) and Baltimore County, which affects the “unrestricted” net position component in the statement of net position. The following summarizes these situations in which the County is reporting the debt in its financial statements, while the corresponding assets are reported by the other reporting entity.
The Board of Education (Public School System) and the Community College have no authority to issue bonded debt. The authority rests with the County subject to approval the Council. The County had $542.4 million of its net Consolidated Public Improvement general obligation bonds outstanding that is related to capital facilities of the component units at fiscal year-end.
The Metropolitan District Act requires the City to provide water to the County’s Metropolitan
District. The City also treats sewage from the Metropolitan District at cost. The County has agreed to pay the City on a pro rata basis for construction of certain City-owned water and sewer capital projects that serve the Metropolitan District. The County has contributed approximately $60.1 million toward these City-owned facilities that are funded primarily with bond proceeds. The County estimates 7.05% of its net Metropolitan District general obligation bonds outstanding of $15.0 million is related to these facilities at fiscal year-end.
Since 1993, the County has participated in the State Water Quality Revolving Loan Program. Under this program, the State makes loans to local governments with interest rates that are below the market rate for tax-exempt financing. As of fiscal year-end the County has borrowed $91,255,779, of which $77,045,779 was borrowed by the Water and Sewer Enterprise Fund to expand the County’s water reclamation plant and $14,210,000 was used to refund Consolidated Public Improvement Bonds. The outstanding balances of these loans are $30,930,315 and $2,830,000, respectively. Industrial revenue bonds issued by the County for the benefit of private businesses in the County are neither debt of nor charges against the general credit or taxing power of the County. These amounts are not included in general long-term debt (see Note 9). During fiscal year 1995, the County issued Special Facility Revenue Bonds in the amount of $10,675,000. On June 1, 2003, the County refunded the balance of the Special Facility Revenue Bonds, which was $9,220,000 and issued Golf Course Refunding Bonds in the amount of $9,880,000. On May 30, 2012, the County refunded the balance of the Golf Course Refunding Bonds, which was $5,775,000, and issued a Taxable Golf Course Refunding Note in the amount of $5,400,000. The original bonds were issued for the purpose of constructing a public golf course with related facilities. Income derived from the golf course facility is pledged to pay debt service on these bonds and to establish a debt service reserve fund equal to the greatest amount of debt service payable in a fiscal year. The balance in the debt service reserve fund at fiscal year-end is $560,000. If a deficiency exists in the debt service reserve fund securing the note, the County is obligated to restore the amount in the debt service reserve fund to $560,000 not later than 30 days after the beginning of the first fiscal year beginning after such deficiency is determined, until the note has been paid in full. This note does not constitute a pledge of the County’s full faith and credit or taxing power, but the County’s covenant to restore the amount in the debt service reserve fund is a general contractual obligation of the County. In prior years, the County defeased certain Consolidated Public Improvement and Metropolitan District bonds by placing the proceeds of new bonds in an irrevocable trust to provide for all future debt service payments on the old bonds. Accordingly, the trust account assets and the liability for the defeased bonds are not included as long-term obligations of the County. At fiscal year-end, $59,490,000 of Consolidated Public Improvement Bonds and $1,295,000 of Metropolitan District Bonds were considered defeased. Under its Agricultural Land Preservation Program, the County acquires development rights on a parcel of agricultural property by entering into an installment purchase agreement with the property owner. The County acquires the development rights to the land in perpetuity. Historically, under the terms of the agreement, the County paid the property owner semiannual interest payments for 30 years and minimal portions of the installment purchase price until maturity. The remaining amount of the purchase price was paid at the end of 30 years with a balloon payment. Upon execution of an agreement, the County purchased stripped-coupon U.S. Treasury obligations in amounts sufficient to equal the balloon payment in 30 years (see Note 2). Under
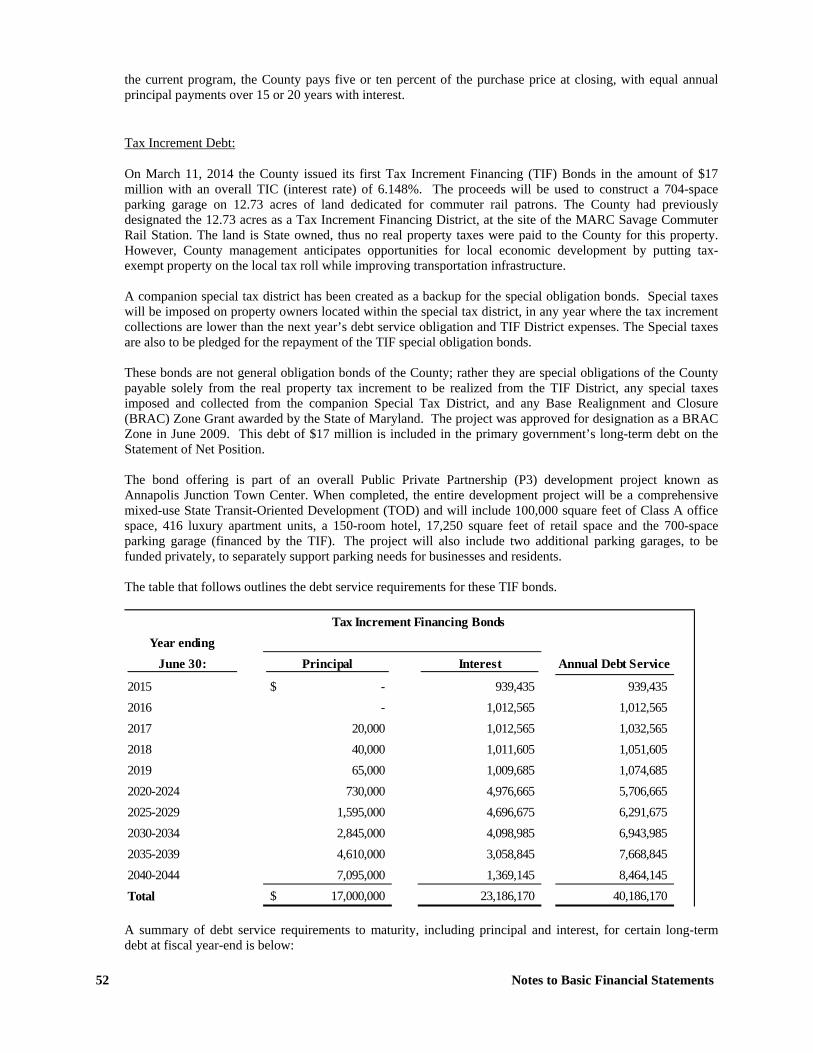
52 Notes to Basic Financial Statements
the current program, the County pays five or ten percent of the purchase price at closing, with equal annual principal payments over 15 or 20 years with interest. Tax Increment Debt:
On March 11, 2014 the County issued its first Tax Increment Financing (TIF) Bonds in the amount of $17 million with an overall TIC (interest rate) of 6.148%. The proceeds will be used to construct a 704-space parking garage on 12.73 acres of land dedicated for commuter rail patrons. The County had previously designated the 12.73 acres as a Tax Increment Financing District, at the site of the MARC Savage Commuter Rail Station. The land is State owned, thus no real property taxes were paid to the County for this property. However, County management anticipates opportunities for local economic development by putting tax-exempt property on the local tax roll while improving transportation infrastructure. A companion special tax district has been created as a backup for the special obligation bonds. Special taxes will be imposed on property owners located within the special tax district, in any year where the tax increment collections are lower than the next year’s debt service obligation and TIF District expenses. The Special taxes are also to be pledged for the repayment of the TIF special obligation bonds. These bonds are not general obligation bonds of the County; rather they are special obligations of the County payable solely from the real property tax increment to be realized from the TIF District, any special taxes imposed and collected from the companion Special Tax District, and any Base Realignment and Closure (BRAC) Zone Grant awarded by the State of Maryland. The project was approved for designation as a BRAC Zone in June 2009. This debt of $17 million is included in the primary government’s long-term debt on the Statement of Net Position. The bond offering is part of an overall Public Private Partnership (P3) development project known as Annapolis Junction Town Center. When completed, the entire development project will be a comprehensive mixed-use State Transit-Oriented Development (TOD) and will include 100,000 square feet of Class A office space, 416 luxury apartment units, a 150-room hotel, 17,250 square feet of retail space and the 700-space parking garage (financed by the TIF). The project will also include two additional parking garages, to be funded privately, to separately support parking needs for businesses and residents. The table that follows outlines the debt service requirements for these TIF bonds.
Tax Increment Financing BondsYear ending
June 30: Principal Interest Annual Debt Service
2015 -$ 939,435 939,435 2016 - 1,012,565 1,012,565 2017 20,000 1,012,565 1,032,565 2018 40,000 1,011,605 1,051,605 2019 65,000 1,009,685 1,074,685 2020-2024 730,000 4,976,665 5,706,665 2025-2029 1,595,000 4,696,675 6,291,675 2030-2034 2,845,000 4,098,985 6,943,985 2035-2039 4,610,000 3,058,845 7,668,845 2040-2044 7,095,000 1,369,145 8,464,145 Total 17,000,000$ 23,186,170 40,186,170 A summary of debt service requirements to maturity, including principal and interest, for certain long-term debt at fiscal year-end is below:
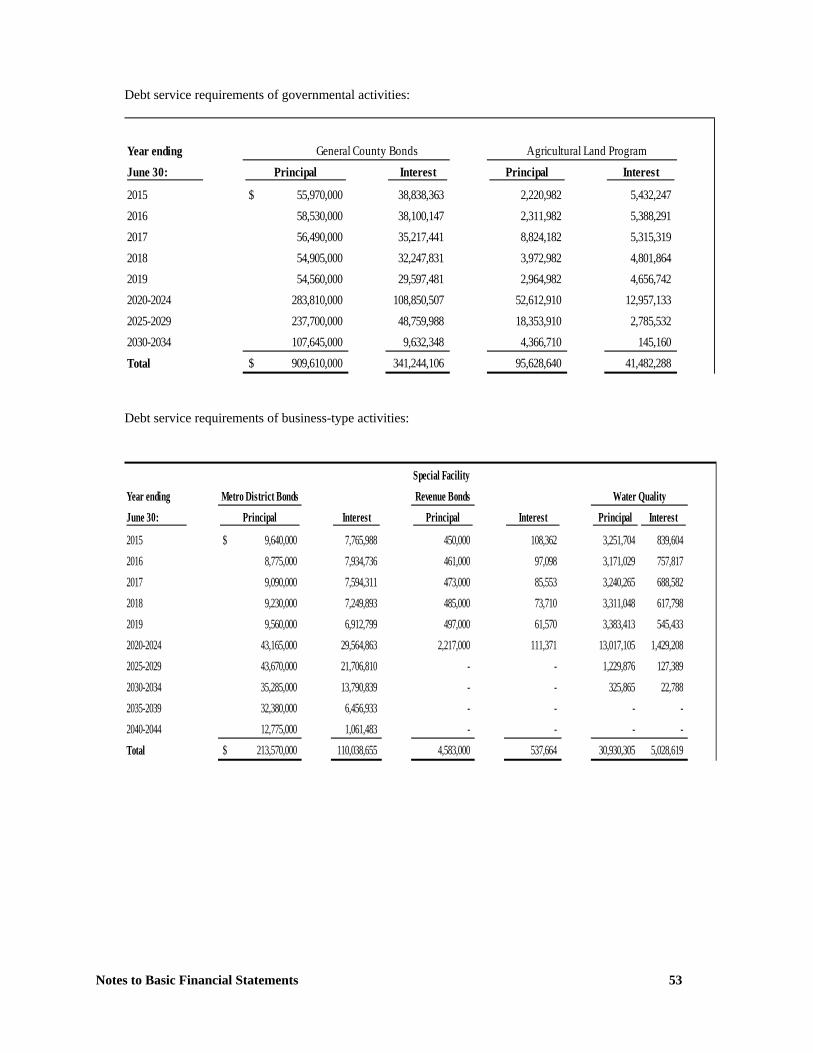
Notes to Basic Financial Statements 53
Debt service requirements of governmental activities:
Year ending General County Bonds Agricultural Land ProgramJune 30: Principal Interest Principal Interest
2015 55,970,000$ 38,838,363 2,220,982 5,432,247 2016 58,530,000 38,100,147 2,311,982 5,388,291 2017 56,490,000 35,217,441 8,824,182 5,315,319 2018 54,905,000 32,247,831 3,972,982 4,801,864 2019 54,560,000 29,597,481 2,964,982 4,656,742 2020-2024 283,810,000 108,850,507 52,612,910 12,957,133 2025-2029 237,700,000 48,759,988 18,353,910 2,785,532 2030-2034 107,645,000 9,632,348 4,366,710 145,160 Total 909,610,000$ 341,244,106 95,628,640 41,482,288
Debt service requirements of business-type activities:
Special Facility Year ending Metro District Bonds Revenue Bonds Water QualityJune 30: Principal Interest Principal Interest Principal Interest
2015 9,640,000$ 7,765,988 450,000 108,362 3,251,704 839,604 2016 8,775,000 7,934,736 461,000 97,098 3,171,029 757,817 2017 9,090,000 7,594,311 473,000 85,553 3,240,265 688,582 2018 9,230,000 7,249,893 485,000 73,710 3,311,048 617,798 2019 9,560,000 6,912,799 497,000 61,570 3,383,413 545,433 2020-2024 43,165,000 29,564,863 2,217,000 111,371 13,017,105 1,429,208 2025-2029 43,670,000 21,706,810 - - 1,229,876 127,389 2030-2034 35,285,000 13,790,839 - - 325,865 22,788 2035-2039 32,380,000 6,456,933 - - - - 2040-2044 12,775,000 1,061,483 - - - - Total 213,570,000$ 110,038,655 4,583,000 537,664 30,930,305 5,028,619
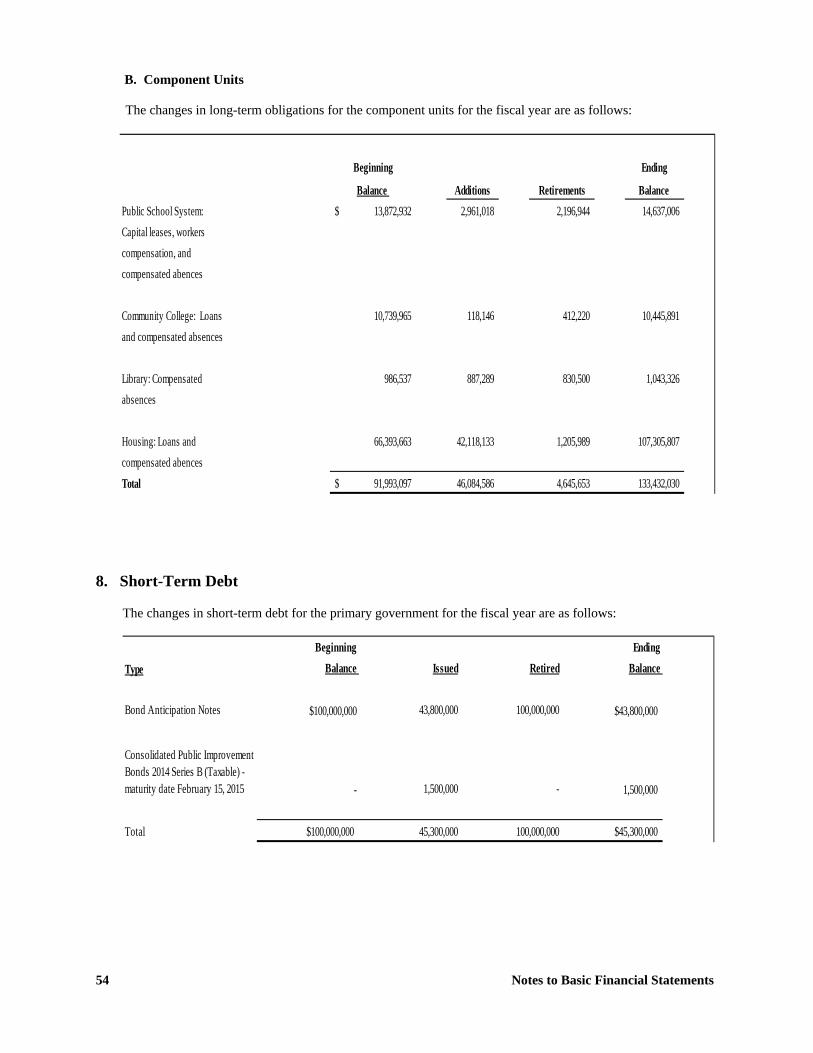
54 Notes to Basic Financial Statements
B. Component Units The changes in long-term obligations for the component units for the fiscal year are as follows:
Beginning Ending
Balance Additions Retirements Balance Public School System: 13,872,932$ 2,961,018 2,196,944 14,637,006 Capital leases, workerscompensation, andcompensated abences
Community College: Loans 10,739,965 118,146 412,220 10,445,891 and compensated absences
Library: Compensated 986,537 887,289 830,500 1,043,326 absences
Housing: Loans and 66,393,663 42,118,133 1,205,989 107,305,807 compensated abencesTotal 91,993,097$ 46,084,586 4,645,653 133,432,030
8. Short-Term Debt The changes in short-term debt for the primary government for the fiscal year are as follows:
Beginning Ending Balance Issued Retired Balance
Bond Anticipation Notes 43,800,000 100,000,000 $43,800,000
Consolidated Public Improvement Bonds 2014 Series B (Taxable) - maturity date February 15, 2015 1,500,000 - 1,500,000
Total $100,000,000 45,300,000 100,000,000 $45,300,000
Type
$100,000,000
-
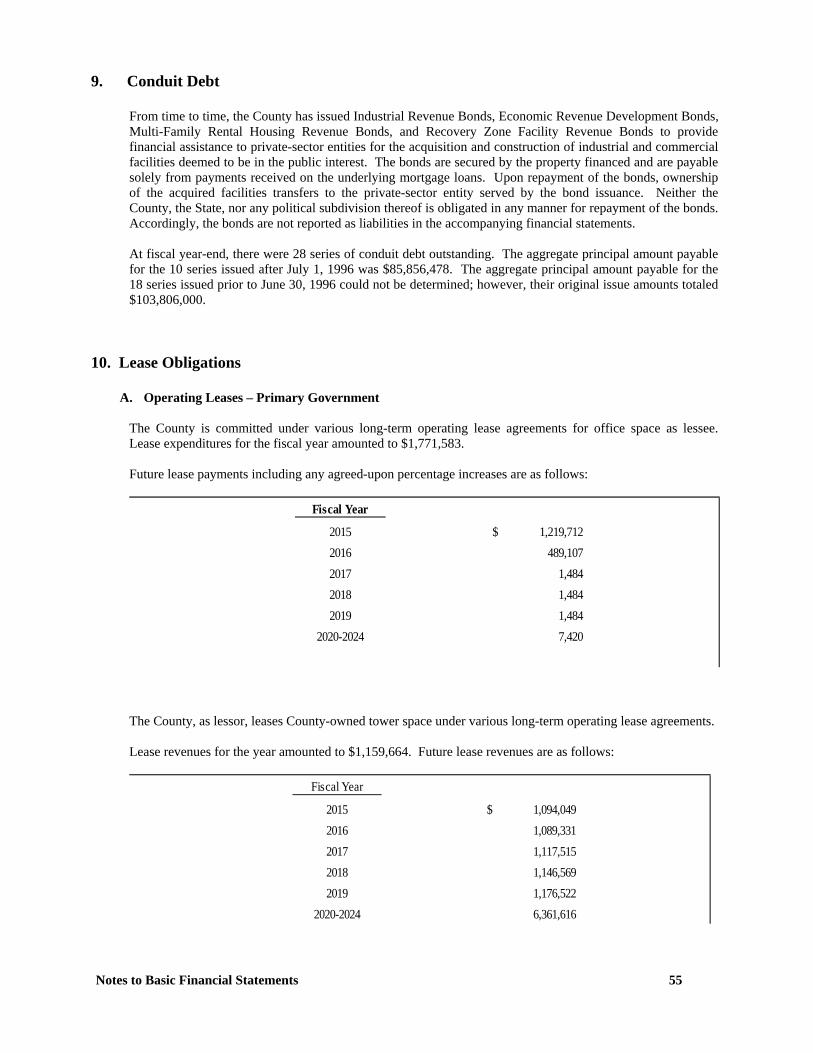
Notes to Basic Financial Statements 55
9. Conduit Debt
From time to time, the County has issued Industrial Revenue Bonds, Economic Revenue Development Bonds, Multi-Family Rental Housing Revenue Bonds, and Recovery Zone Facility Revenue Bonds to provide financial assistance to private-sector entities for the acquisition and construction of industrial and commercial facilities deemed to be in the public interest. The bonds are secured by the property financed and are payable solely from payments received on the underlying mortgage loans. Upon repayment of the bonds, ownership of the acquired facilities transfers to the private-sector entity served by the bond issuance. Neither the County, the State, nor any political subdivision thereof is obligated in any manner for repayment of the bonds. Accordingly, the bonds are not reported as liabilities in the accompanying financial statements. At fiscal year-end, there were 28 series of conduit debt outstanding. The aggregate principal amount payable for the 10 series issued after July 1, 1996 was $85,856,478. The aggregate principal amount payable for the 18 series issued prior to June 30, 1996 could not be determined; however, their original issue amounts totaled $103,806,000.
10. Lease Obligations A. Operating Leases – Primary Government
The County is committed under various long-term operating lease agreements for office space as lessee. Lease expenditures for the fiscal year amounted to $1,771,583. Future lease payments including any agreed-upon percentage increases are as follows:
Fiscal Year
2015 1,219,712$ 2016 489,107 2017 1,484 2018 1,484 2019 1,484
2020-2024 7,420
The County, as lessor, leases County-owned tower space under various long-term operating lease agreements. Lease revenues for the year amounted to $1,159,664. Future lease revenues are as follows:
Fiscal Year
2015 1,094,049$ 2016 1,089,331 2017 1,117,515 2018 1,146,569 2019 1,176,522
2020-2024 6,361,616
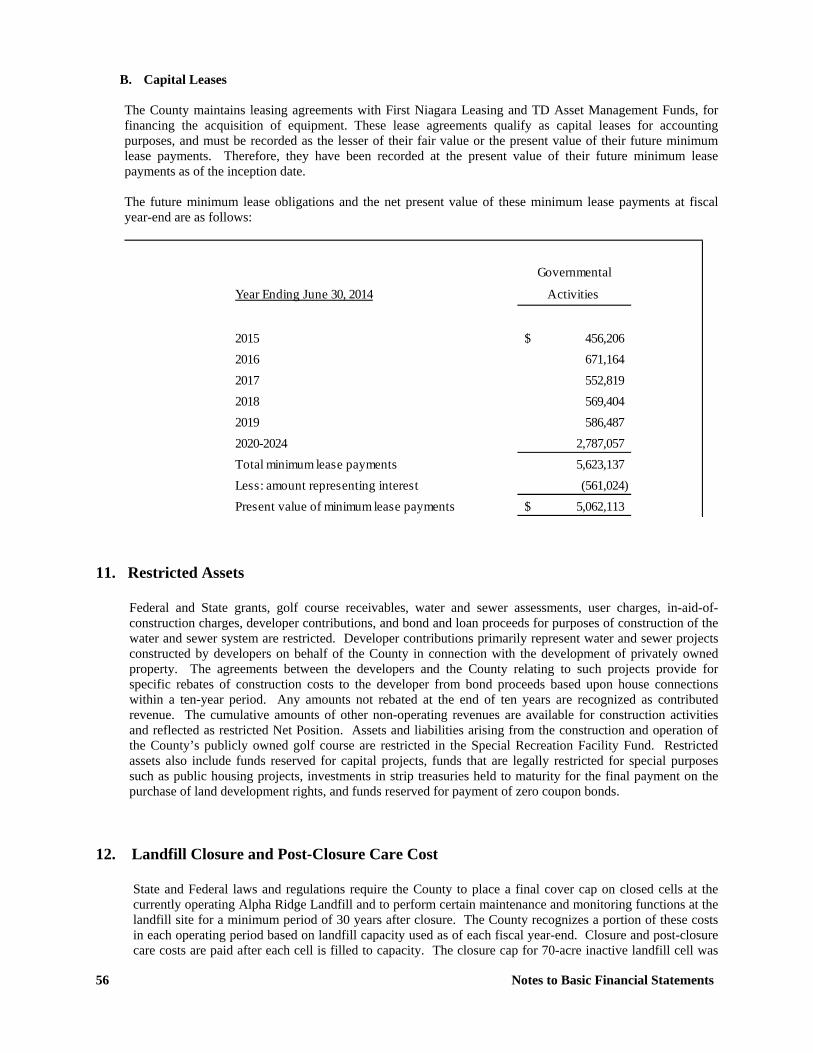
56 Notes to Basic Financial Statements
B. Capital Leases
The County maintains leasing agreements with First Niagara Leasing and TD Asset Management Funds, for financing the acquisition of equipment. These lease agreements qualify as capital leases for accounting purposes, and must be recorded as the lesser of their fair value or the present value of their future minimum lease payments. Therefore, they have been recorded at the present value of their future minimum lease payments as of the inception date. The future minimum lease obligations and the net present value of these minimum lease payments at fiscal year-end are as follows:
Governmental
Year Ending June 30, 2014 Activities
2015 456,206$ 2016 671,164 2017 552,819 2018 569,404 2019 586,487 2020-2024 2,787,057 Total minimum lease payments 5,623,137 Less: amount representing interest (561,024) Present value of minimum lease payments 5,062,113$
11. Restricted Assets
Federal and State grants, golf course receivables, water and sewer assessments, user charges, in-aid-of-construction charges, developer contributions, and bond and loan proceeds for purposes of construction of the water and sewer system are restricted. Developer contributions primarily represent water and sewer projects constructed by developers on behalf of the County in connection with the development of privately owned property. The agreements between the developers and the County relating to such projects provide for specific rebates of construction costs to the developer from bond proceeds based upon house connections within a ten-year period. Any amounts not rebated at the end of ten years are recognized as contributed revenue. The cumulative amounts of other non-operating revenues are available for construction activities and reflected as restricted Net Position. Assets and liabilities arising from the construction and operation of the County’s publicly owned golf course are restricted in the Special Recreation Facility Fund. Restricted assets also include funds reserved for capital projects, funds that are legally restricted for special purposes such as public housing projects, investments in strip treasuries held to maturity for the final payment on the purchase of land development rights, and funds reserved for payment of zero coupon bonds.
12. Landfill Closure and Post-Closure Care Cost
State and Federal laws and regulations require the County to place a final cover cap on closed cells at the currently operating Alpha Ridge Landfill and to perform certain maintenance and monitoring functions at the landfill site for a minimum period of 30 years after closure. The County recognizes a portion of these costs in each operating period based on landfill capacity used as of each fiscal year-end. Closure and post-closure care costs are paid after each cell is filled to capacity. The closure cap for 70-acre inactive landfill cell was
Notes to Basic Financial Statements 57
completed in fiscal year 2000. A separate active lined landfill cell is projected to close no earlier than 2050 if current operating conditions continue and will be capped at that time. In addition, the County has constructed closure caps and groundwater treatment systems at two older closed landfills, and the post-closure operating costs are included in the Environmental Services Fund budget. The long-term liability for these older landfills has been removed from long-term debt. Future total closure and post-closure care costs for the Alpha Ridge Landfill as determined through engineering studies will approximate $39,849,982. Actual costs may differ due to inflation or future design changes. The County ceased using the Alpha Ridge Landfill as its primary disposal site as of March 1997 and, thus, it is not expected to use the landfill to its full capacity in the foreseeable future. The County is exporting waste to a regional landfill in Virginia. The remaining capacity at the landfill will be held for backup or future use. At fiscal year-end, the County has recognized $32,116,000 of these costs. This cumulative amount reported to date is based on the use of 70.45 percent of the existing cell and 100 percent of the closed cell. The total current cost of closure and post-closure care to be recognized in future years is $7,733,982. The County intends to finance these costs through the proceeds of bonds and through its annual operating budget. The General Fund has been used in prior years to liquidate the liability.
13. Retirement Plans
The Retirement Plan and the Police and Fire Plan are single-employer defined benefit public employee retirement plans administered by Howard County, Maryland, which provide retirement benefits as well as death and disability benefits and cost-of-living adjustments. The Plans were established and operate under the provisions of the Howard County Code, Sections 1.400, 1.401 to 1.478, and 1.401A to 1.478A. Essentially all the County full-time benefited and part-time benefited employees are eligible to participate in one of the Retirement Plans, except for certain exceptions provided for in Howard County Code Section 1.406. Responsibilities for administration and operation of the Retirement Plan and Police and Fire Plan vest in Retirement Committees with seven members each (“Committees”). The Committees and the Trustees have authority to establish and amend the respective benefit and contribution provisions. Generally, the majority of employees of the primary government, except certain police and fire officers, participate in the Howard County Retirement Plan (“Retirement Plan”), which was established July 1, 1995. As of that date, approximately 73 percent of the County employees participating in the Maryland State Retirement Systems, described below, transferred to the Retirement Plan. Certain police and fire personnel participate in the Howard County Police and Fire Employees’ Retirement Plan (“Police and Fire Plan”), which was established July 1, 1990. The remaining employees of the primary government participate in the State Employees Retirement System (“Retirement System”) established October 1, 1941, and the State Employees’ Pension System (“Pension System”) established January 1, 1980. These cost-sharing multiple-employer defined benefit systems administered by the Maryland State Retirement Systems were established under the provisions of Article 73B of the Annotated Code of Maryland. Responsibility for administration and operation of the systems vests in a 14-member Board of Trustees (“Trustees”). The payroll for employees covered by the Retirement Plan for the fiscal year was $94,732,951. The payroll for police and fire employees covered by the Police and Fire Plan for the fiscal year was $65,863,197. The payroll for employees covered by the State Retirement System and State Pension System for the fiscal year was $2,009,961 and $4,563,095, respectively. The County's total payroll was approximately $202,967,102. Both the Retirement Plan and the Police and Fire Plan issue separate audited financial reports which may be obtained by writing to: Howard County, Maryland, Director of Finance, 3430 Court House Drive, Ellicott City, Maryland 21043, or by accessing the reports online at www.howardcountymd.gov.
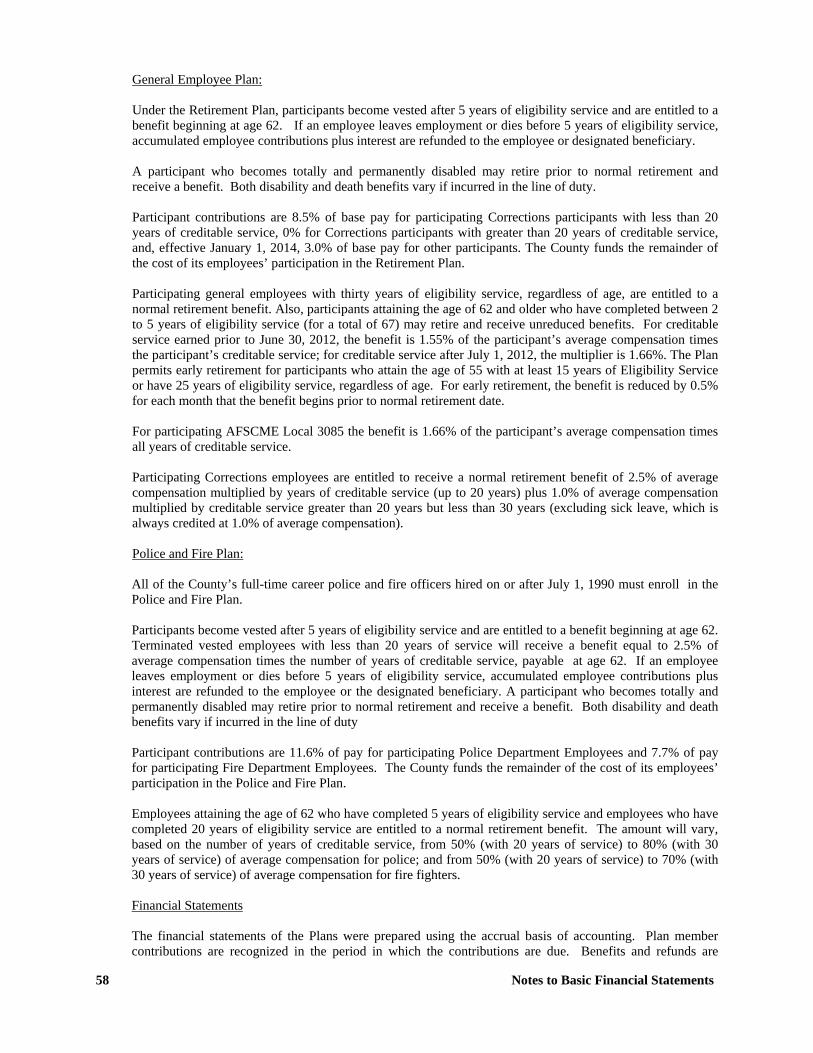
58 Notes to Basic Financial Statements
General Employee Plan: Under the Retirement Plan, participants become vested after 5 years of eligibility service and are entitled to a benefit beginning at age 62. If an employee leaves employment or dies before 5 years of eligibility service, accumulated employee contributions plus interest are refunded to the employee or designated beneficiary. A participant who becomes totally and permanently disabled may retire prior to normal retirement and receive a benefit. Both disability and death benefits vary if incurred in the line of duty. Participant contributions are 8.5% of base pay for participating Corrections participants with less than 20 years of creditable service, 0% for Corrections participants with greater than 20 years of creditable service, and, effective January 1, 2014, 3.0% of base pay for other participants. The County funds the remainder of the cost of its employees’ participation in the Retirement Plan. Participating general employees with thirty years of eligibility service, regardless of age, are entitled to a normal retirement benefit. Also, participants attaining the age of 62 and older who have completed between 2 to 5 years of eligibility service (for a total of 67) may retire and receive unreduced benefits. For creditable service earned prior to June 30, 2012, the benefit is 1.55% of the participant’s average compensation times the participant’s creditable service; for creditable service after July 1, 2012, the multiplier is 1.66%. The Plan permits early retirement for participants who attain the age of 55 with at least 15 years of Eligibility Service or have 25 years of eligibility service, regardless of age. For early retirement, the benefit is reduced by 0.5% for each month that the benefit begins prior to normal retirement date. For participating AFSCME Local 3085 the benefit is 1.66% of the participant’s average compensation times all years of creditable service. Participating Corrections employees are entitled to receive a normal retirement benefit of 2.5% of average compensation multiplied by years of creditable service (up to 20 years) plus 1.0% of average compensation multiplied by creditable service greater than 20 years but less than 30 years (excluding sick leave, which is always credited at 1.0% of average compensation). Police and Fire Plan: All of the County’s full-time career police and fire officers hired on or after July 1, 1990 must enroll in the Police and Fire Plan. Participants become vested after 5 years of eligibility service and are entitled to a benefit beginning at age 62. Terminated vested employees with less than 20 years of service will receive a benefit equal to 2.5% of average compensation times the number of years of creditable service, payable at age 62. If an employee leaves employment or dies before 5 years of eligibility service, accumulated employee contributions plus interest are refunded to the employee or the designated beneficiary. A participant who becomes totally and permanently disabled may retire prior to normal retirement and receive a benefit. Both disability and death benefits vary if incurred in the line of duty Participant contributions are 11.6% of pay for participating Police Department Employees and 7.7% of pay for participating Fire Department Employees. The County funds the remainder of the cost of its employees’ participation in the Police and Fire Plan. Employees attaining the age of 62 who have completed 5 years of eligibility service and employees who have completed 20 years of eligibility service are entitled to a normal retirement benefit. The amount will vary, based on the number of years of creditable service, from 50% (with 20 years of service) to 80% (with 30 years of service) of average compensation for police; and from 50% (with 20 years of service) to 70% (with 30 years of service) of average compensation for fire fighters. Financial Statements The financial statements of the Plans were prepared using the accrual basis of accounting. Plan member contributions are recognized in the period in which the contributions are due. Benefits and refunds are
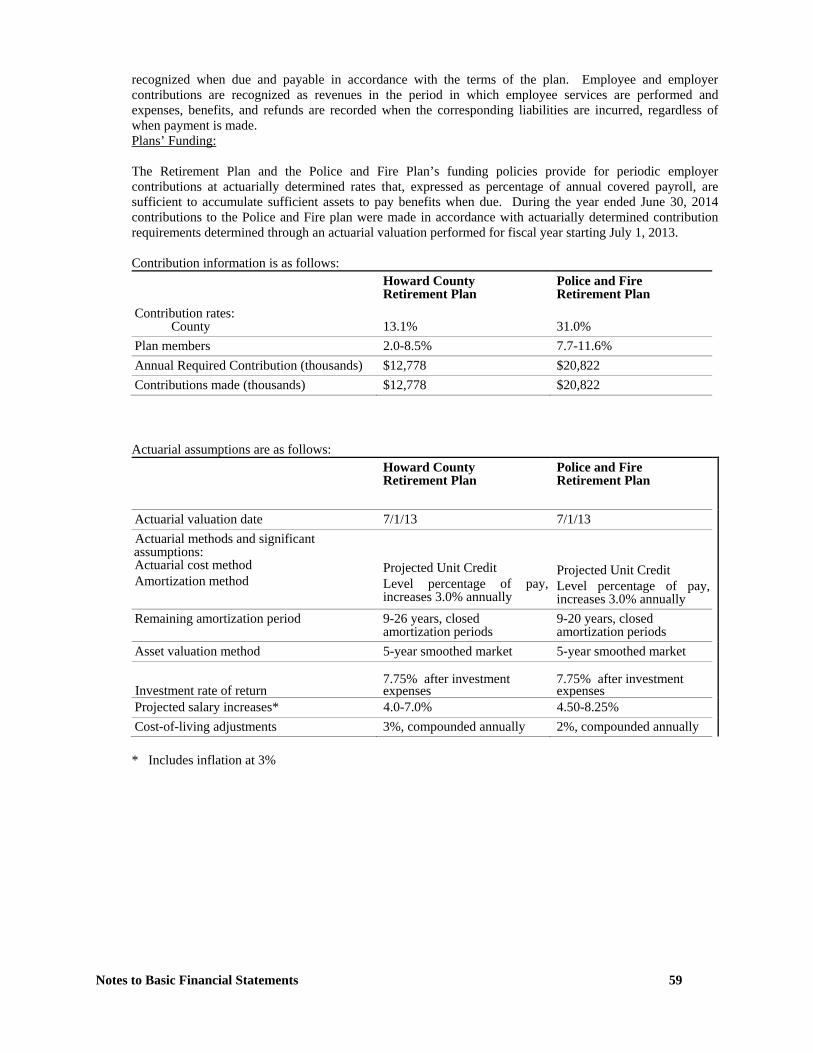
Notes to Basic Financial Statements 59
recognized when due and payable in accordance with the terms of the plan. Employee and employer contributions are recognized as revenues in the period in which employee services are performed and expenses, benefits, and refunds are recorded when the corresponding liabilities are incurred, regardless of when payment is made. Plans’ Funding: The Retirement Plan and the Police and Fire Plan’s funding policies provide for periodic employer contributions at actuarially determined rates that, expressed as percentage of annual covered payroll, are sufficient to accumulate sufficient assets to pay benefits when due. During the year ended June 30, 2014 contributions to the Police and Fire plan were made in accordance with actuarially determined contribution requirements determined through an actuarial valuation performed for fiscal year starting July 1, 2013. Contribution information is as follows:
Howard County Retirement Plan
Police and Fire Retirement Plan
Contribution rates: County
13.1%
31.0%
Plan members 2.0-8.5% 7.7-11.6% Annual Required Contribution (thousands) $12,778 $20,822 Contributions made (thousands) $12,778 $20,822
Actuarial assumptions are as follows: Howard County Retirement Plan
Police and Fire Retirement Plan
Actuarial valuation date 7/1/13 7/1/13 Actuarial methods and significant assumptions: Actuarial cost method Amortization method
Projected Unit Credit Level percentage of pay, increases 3.0% annually
Projected Unit Credit Level percentage of pay, increases 3.0% annually
Remaining amortization period 9-26 years, closed amortization periods
9-20 years, closed amortization periods
Asset valuation method 5-year smoothed market 5-year smoothed market
Investment rate of return 7.75% after investment expenses
7.75% after investment expenses
Projected salary increases* 4.0-7.0% 4.50-8.25% Cost-of-living adjustments 3%, compounded annually 2%, compounded annually
* Includes inflation at 3%
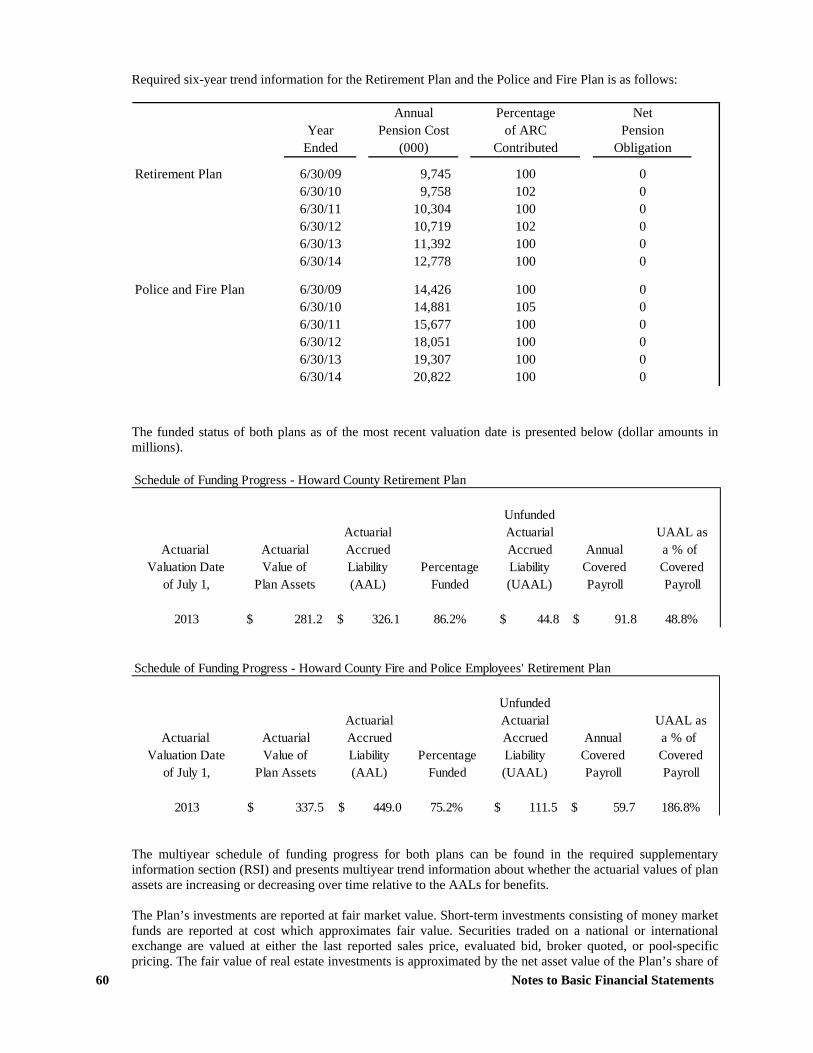
60 Notes to Basic Financial Statements
Required six-year trend information for the Retirement Plan and the Police and Fire Plan is as follows:
Annual Percentage NetYear Pension Cost of ARC Pension
Ended (000) Contributed Obligation
Retirement Plan 6/30/09 9,745 100 06/30/10 9,758 102 06/30/11 10,304 100 06/30/12 10,719 102 06/30/13 11,392 100 06/30/14 12,778 100 0
Police and Fire Plan 6/30/09 14,426 100 06/30/10 14,881 105 06/30/11 15,677 100 06/30/12 18,051 100 06/30/13 19,307 100 06/30/14 20,822 100 0
The funded status of both plans as of the most recent valuation date is presented below (dollar amounts in millions). Schedule of Funding Progress - Howard County Retirement Plan
UnfundedActuarial Actuarial UAAL as
Actuarial Actuarial Accrued Accrued Annual a % of Valuation Date Value of Liability Percentage Liability Covered Covered
of July 1, Plan Assets (AAL) Funded (UAAL) Payroll Payroll
2013 281.2$ 326.1$ 86.2% 44.8$ 91.8$ 48.8% Schedule of Funding Progress - Howard County Fire and Police Employees' Retirement Plan
UnfundedActuarial Actuarial UAAL as
Actuarial Actuarial Accrued Accrued Annual a % of Valuation Date Value of Liability Percentage Liability Covered Covered
of July 1, Plan Assets (AAL) Funded (UAAL) Payroll Payroll
2013 337.5$ 449.0$ 75.2% 111.5$ 59.7$ 186.8% The multiyear schedule of funding progress for both plans can be found in the required supplementary information section (RSI) and presents multiyear trend information about whether the actuarial values of plan assets are increasing or decreasing over time relative to the AALs for benefits. The Plan’s investments are reported at fair market value. Short-term investments consisting of money market funds are reported at cost which approximates fair value. Securities traded on a national or international exchange are valued at either the last reported sales price, evaluated bid, broker quoted, or pool-specific pricing. The fair value of real estate investments is approximated by the net asset value of the Plan’s share of
Notes to Basic Financial Statements 61
ownership of the co-mingled real estate investment funds. Fair value of other securities is determined by the mean of the most recent bid and asked prices as obtained from dealers that make markets in such securities. Component Units: Generally, all employees of the component units participate in The State of Maryland Employees’ Retirement and Pension Systems (“Employees’ Retirement and Pension Systems”) and the Teachers’ Retirement and Pension Systems (“Teachers’ Retirement and Pension Systems”). The component units’ employer contributions to the Employees’ Retirement and Pension Systems were $13,052,618, $10,326,154, and $5,374,180 for fiscal years 2014, 2013 and 2012, respectively. Contributions to the Teachers’ Retirement and Pension Systems are made directly by the State of Maryland according to State statute on behalf of the component units and amounted to $59,906,364, $51,179,051 and $64,256,904 in fiscal years 2014, 2013 and 2012, respectively.
The State Retirement Agency issues a publicly available Comprehensive Annual Financial Report that includes the Systems’ financial statements and required supplementary information. That report may be obtained by writing to the State Retirement and Pension System of Maryland, State Retirement Agency, 120 East Baltimore Street, 14th Floor, Baltimore, Maryland 21202-6700 or by calling (800) 492-5909.
14. Other Post-Employment Benefits (OPEB)
Plan Description The County’s OPEB plan is a Cost-Sharing Multiple Employer Defined Benefit Healthcare Plan. Per Section 1.406B of Howard County Bill No. 14-2008, the County established an irrevocable trust for administering the plan assets and paying healthcare costs on behalf of the participants. The Plan includes the County (consisting of the County government, Howard County Library, Mental Health Authority, and Economic Development Authority), and its component units, Howard County Community College and Howard County Public School System. The County provides a post-employment health insurance program in addition to the pension benefits described in Note 13. These post-employment benefits are subject to change at any time. All employees who retire from the County may participate in the program. In order to be eligible, the retiree must have a minimum of fifteen years of County service and, immediately preceding retirement, have been enrolled in a medical, vision or prescription drug insurance plan offered to active employees of the County. The County will pay a percentage of the retiree’s health insurance premium based upon these criteria. This percentage varies with the number of years of service attained by the employee. Other retirees who do not meet the eligibility criteria are permitted to participate in the retirees' health insurance program by paying the full premium at the group rate. The component units provide medical benefits to eligible employees who retire from employment with the entity. The eligibility requirements vary among different entities. Each entity pays a percentage of the health insurance premium based on certain criteria. In addition to medical benefits, the school system offers life insurance benefits to eligible retirees who have provided ten years of service with the school system and have retired from the Howard County Public School System. Plan membership at fiscal year-end per the most recent actuarial valuation consisted of the following: Retirees and beneficiaries receiving benefits 2,450 Active plan members 9,310 Deferred vested terminations 44 Total 11,804 There are no separate financial statements for the Plan.
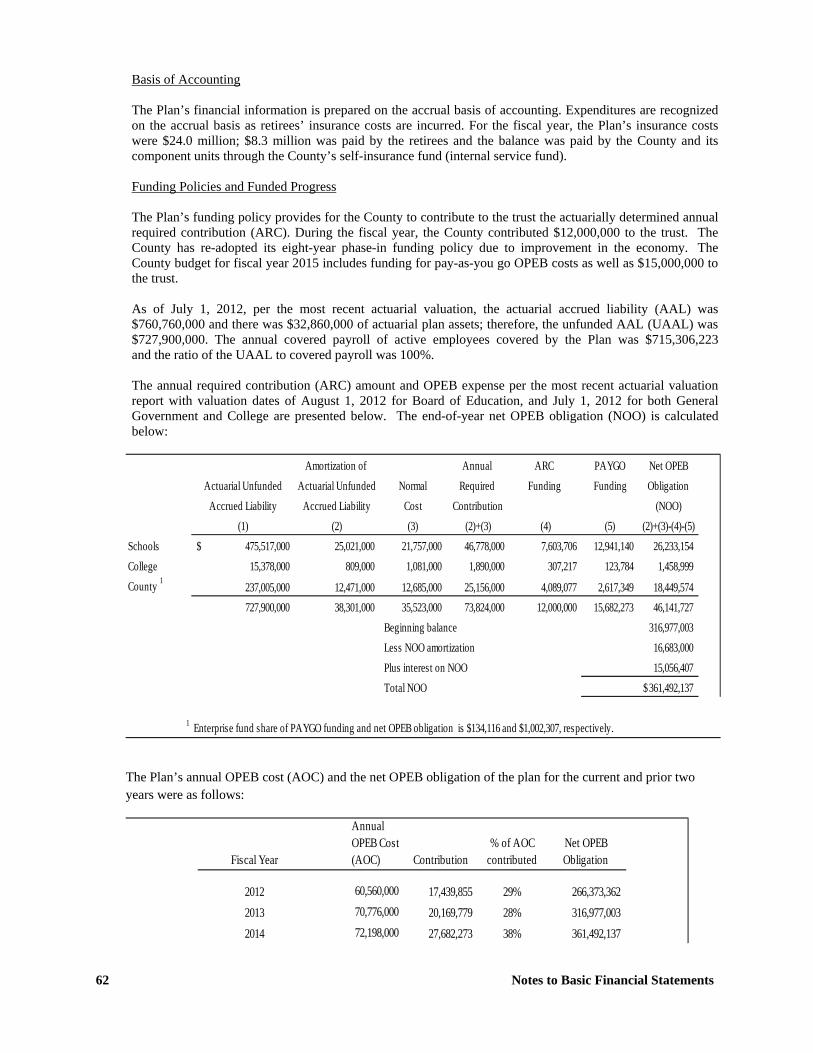
62 Notes to Basic Financial Statements
Basis of Accounting The Plan’s financial information is prepared on the accrual basis of accounting. Expenditures are recognized on the accrual basis as retirees’ insurance costs are incurred. For the fiscal year, the Plan’s insurance costs were $24.0 million; $8.3 million was paid by the retirees and the balance was paid by the County and its component units through the County’s self-insurance fund (internal service fund). Funding Policies and Funded Progress The Plan’s funding policy provides for the County to contribute to the trust the actuarially determined annual required contribution (ARC). During the fiscal year, the County contributed $12,000,000 to the trust. The County has re-adopted its eight-year phase-in funding policy due to improvement in the economy. The County budget for fiscal year 2015 includes funding for pay-as-you go OPEB costs as well as $15,000,000 to the trust. As of July 1, 2012, per the most recent actuarial valuation, the actuarial accrued liability (AAL) was $760,760,000 and there was $32,860,000 of actuarial plan assets; therefore, the unfunded AAL (UAAL) was $727,900,000. The annual covered payroll of active employees covered by the Plan was $715,306,223 and the ratio of the UAAL to covered payroll was 100%. The annual required contribution (ARC) amount and OPEB expense per the most recent actuarial valuation report with valuation dates of August 1, 2012 for Board of Education, and July 1, 2012 for both General Government and College are presented below. The end-of-year net OPEB obligation (NOO) is calculated below:
Amortization of Annual ARC PAYGO Net OPEBActuarial Unfunded Actuarial Unfunded Normal Required Funding Funding Obligation
Accrued Liability Accrued Liability Cost Contribution (NOO)(1) (2) (3) (2)+(3) (4) (5) (2)+(3)-(4)-(5)
Schools 475,517,000$ 25,021,000 21,757,000 46,778,000 7,603,706 12,941,140 26,233,154 College 15,378,000 809,000 1,081,000 1,890,000 307,217 123,784 1,458,999 County 1
237,005,000 12,471,000 12,685,000 25,156,000 4,089,077 2,617,349 18,449,574 727,900,000 38,301,000 35,523,000 73,824,000 12,000,000 15,682,273 46,141,727
Beginning balance 316,977,003 Less NOO amortization 16,683,000 Plus interest on NOO 15,056,407 Total NOO 361,492,137$
1 Enterprise fund share of PAYGO funding and net OPEB obligation is $134,116 and $1,002,307, respectively.
The Plan’s annual OPEB cost (AOC) and the net OPEB obligation of the plan for the current and prior two years were as follows:
Fiscal Year
Annual OPEB Cost (AOC) Contribution
% of AOC contributed
Net OPEB Obligation
2012 60,560,000 17,439,855 29% 266,373,362 2013 70,776,000 20,169,779 28% 316,977,003 2014 72,198,000 27,682,273 38% 361,492,137
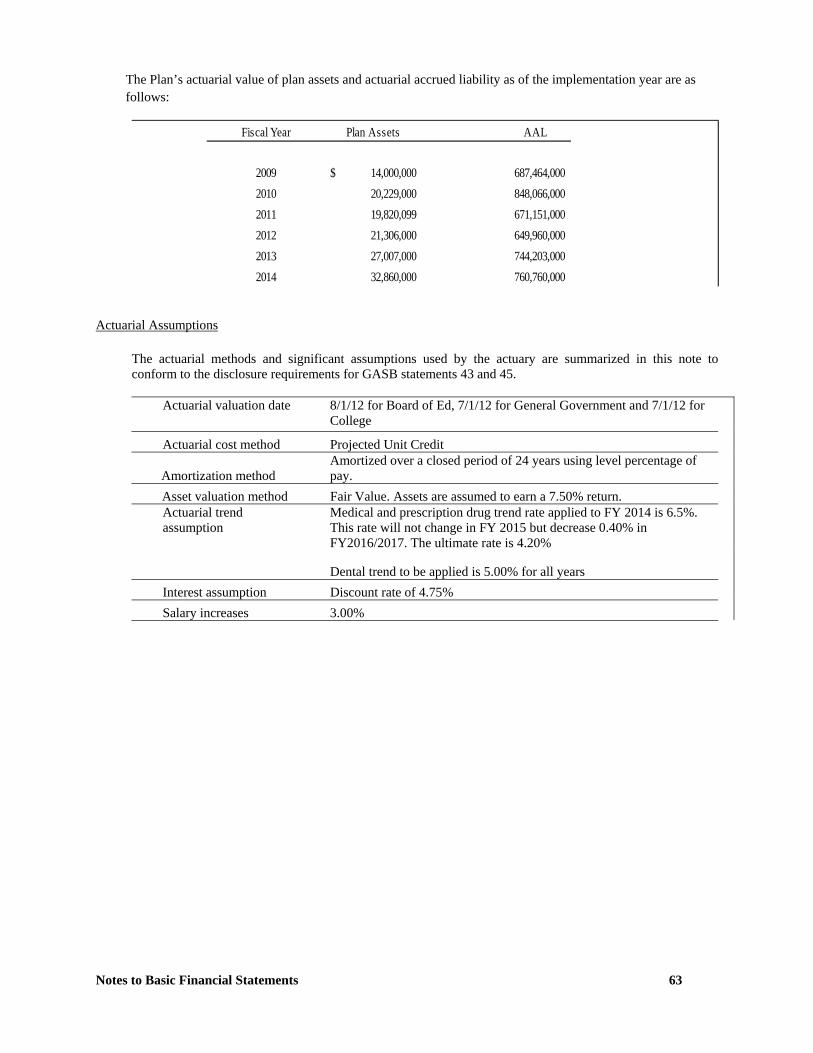
Notes to Basic Financial Statements 63
The Plan’s actuarial value of plan assets and actuarial accrued liability as of the implementation year are as follows:
Fiscal Year Plan Assets AAL
2009 14,000,000$ 687,464,000 2010 20,229,000 848,066,000 2011 19,820,099 671,151,000 2012 21,306,000 649,960,000 2013 27,007,000 744,203,000 2014 32,860,000 760,760,000
Actuarial Assumptions
The actuarial methods and significant assumptions used by the actuary are summarized in this note to conform to the disclosure requirements for GASB statements 43 and 45.
Actuarial valuation date
8/1/12 for Board of Ed, 7/1/12 for General Government and 7/1/12 for College
Actuarial cost method Projected Unit Credit
Amortization method Amortized over a closed period of 24 years using level percentage of pay.
Asset valuation method Fair Value. Assets are assumed to earn a 7.50% return. Actuarial trend assumption
Medical and prescription drug trend rate applied to FY 2014 is 6.5%. This rate will not change in FY 2015 but decrease 0.40% in FY2016/2017. The ultimate rate is 4.20%
Dental trend to be applied is 5.00% for all years Interest assumption Discount rate of 4.75% Salary increases 3.00%
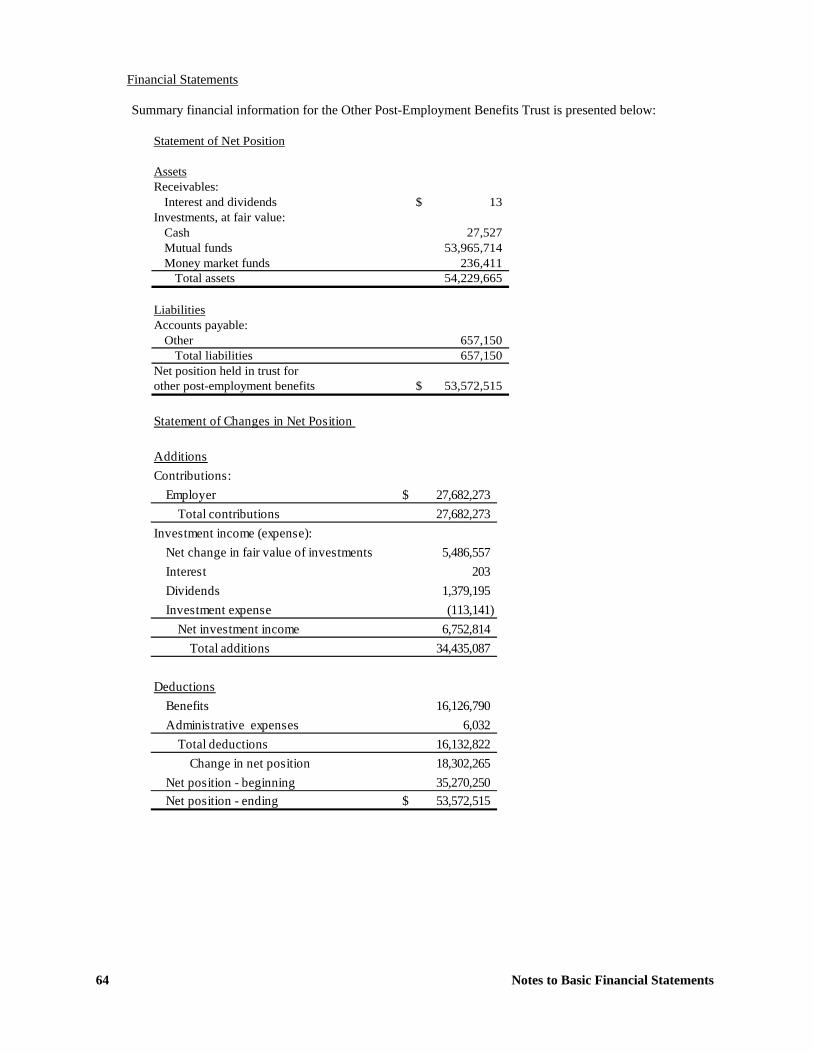
64 Notes to Basic Financial Statements
Financial Statements Summary financial information for the Other Post-Employment Benefits Trust is presented below:
Statement of Net Position
AssetsReceivables:
Interest and dividends 13$ Investments, at fair value:
Cash 27,527 Mutual funds 53,965,714 Money market funds 236,411
Total assets 54,229,665
LiabilitiesAccounts payable:
Other 657,150 Total liabilities 657,150
Net position held in trust for other post-employment benefits 53,572,515$
Statement of Changes in Net Position
AdditionsContributions:
Employer 27,682,273$ Total contributions 27,682,273
Investment income (expense):Net change in fair value of investments 5,486,557 Interest 203 Dividends 1,379,195 Investment expense (113,141)
Net investment income 6,752,814 Total additions 34,435,087
DeductionsBenefits 16,126,790 Administrative expenses 6,032
Total deductions 16,132,822 Change in net position 18,302,265
Net position - beginning 35,270,250 Net position - ending 53,572,515$
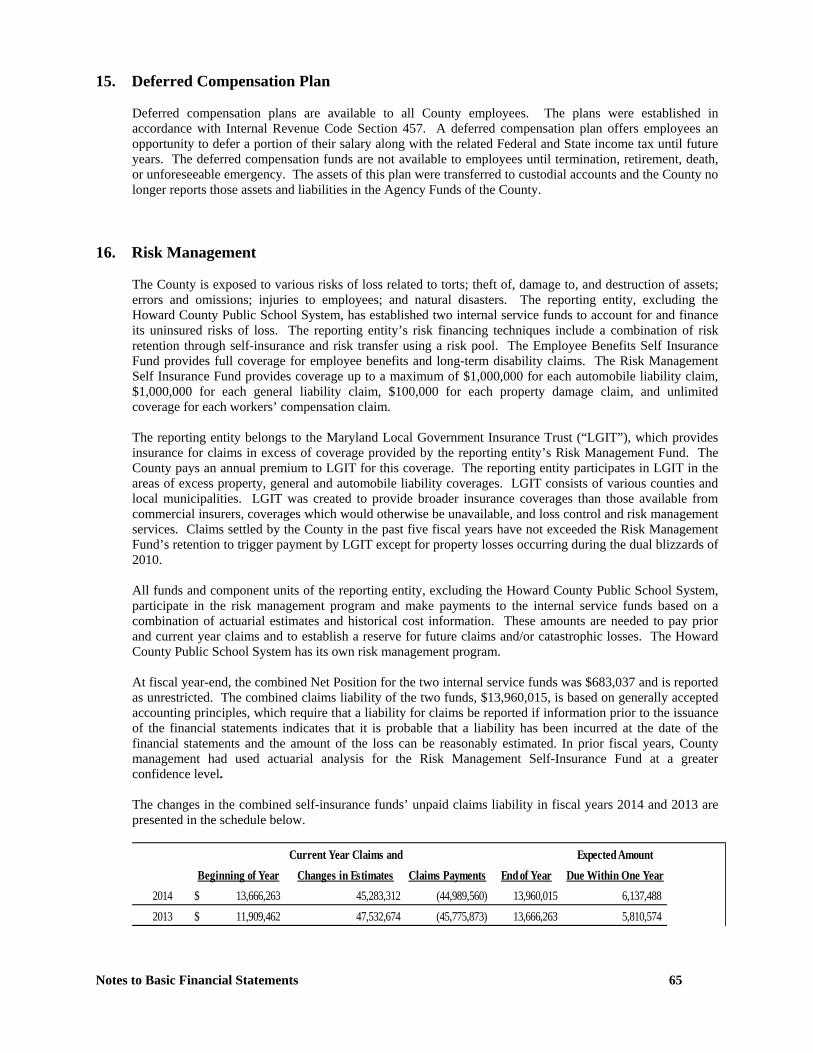
Notes to Basic Financial Statements 65
15. Deferred Compensation Plan
Deferred compensation plans are available to all County employees. The plans were established in accordance with Internal Revenue Code Section 457. A deferred compensation plan offers employees an opportunity to defer a portion of their salary along with the related Federal and State income tax until future years. The deferred compensation funds are not available to employees until termination, retirement, death, or unforeseeable emergency. The assets of this plan were transferred to custodial accounts and the County no longer reports those assets and liabilities in the Agency Funds of the County.
16. Risk Management
The County is exposed to various risks of loss related to torts; theft of, damage to, and destruction of assets; errors and omissions; injuries to employees; and natural disasters. The reporting entity, excluding the Howard County Public School System, has established two internal service funds to account for and finance its uninsured risks of loss. The reporting entity’s risk financing techniques include a combination of risk retention through self-insurance and risk transfer using a risk pool. The Employee Benefits Self Insurance Fund provides full coverage for employee benefits and long-term disability claims. The Risk Management Self Insurance Fund provides coverage up to a maximum of $1,000,000 for each automobile liability claim, $1,000,000 for each general liability claim, $100,000 for each property damage claim, and unlimited coverage for each workers’ compensation claim. The reporting entity belongs to the Maryland Local Government Insurance Trust (“LGIT”), which provides insurance for claims in excess of coverage provided by the reporting entity’s Risk Management Fund. The County pays an annual premium to LGIT for this coverage. The reporting entity participates in LGIT in the areas of excess property, general and automobile liability coverages. LGIT consists of various counties and local municipalities. LGIT was created to provide broader insurance coverages than those available from commercial insurers, coverages which would otherwise be unavailable, and loss control and risk management services. Claims settled by the County in the past five fiscal years have not exceeded the Risk Management Fund’s retention to trigger payment by LGIT except for property losses occurring during the dual blizzards of 2010. All funds and component units of the reporting entity, excluding the Howard County Public School System, participate in the risk management program and make payments to the internal service funds based on a combination of actuarial estimates and historical cost information. These amounts are needed to pay prior and current year claims and to establish a reserve for future claims and/or catastrophic losses. The Howard County Public School System has its own risk management program. At fiscal year-end, the combined Net Position for the two internal service funds was $683,037 and is reported as unrestricted. The combined claims liability of the two funds, $13,960,015, is based on generally accepted accounting principles, which require that a liability for claims be reported if information prior to the issuance of the financial statements indicates that it is probable that a liability has been incurred at the date of the financial statements and the amount of the loss can be reasonably estimated. In prior fiscal years, County management had used actuarial analysis for the Risk Management Self-Insurance Fund at a greater confidence level. The changes in the combined self-insurance funds’ unpaid claims liability in fiscal years 2014 and 2013 are presented in the schedule below.
Current Year Claims and Expected AmountBeginning of Year Changes in Estimates Claims Payments End of Year Due Within One Year
2014 $ 13,666,263 45,283,312 (44,989,560) 13,960,015 6,137,488 2013 $ 11,909,462 47,532,674 (45,775,873) 13,666,263 5,810,574
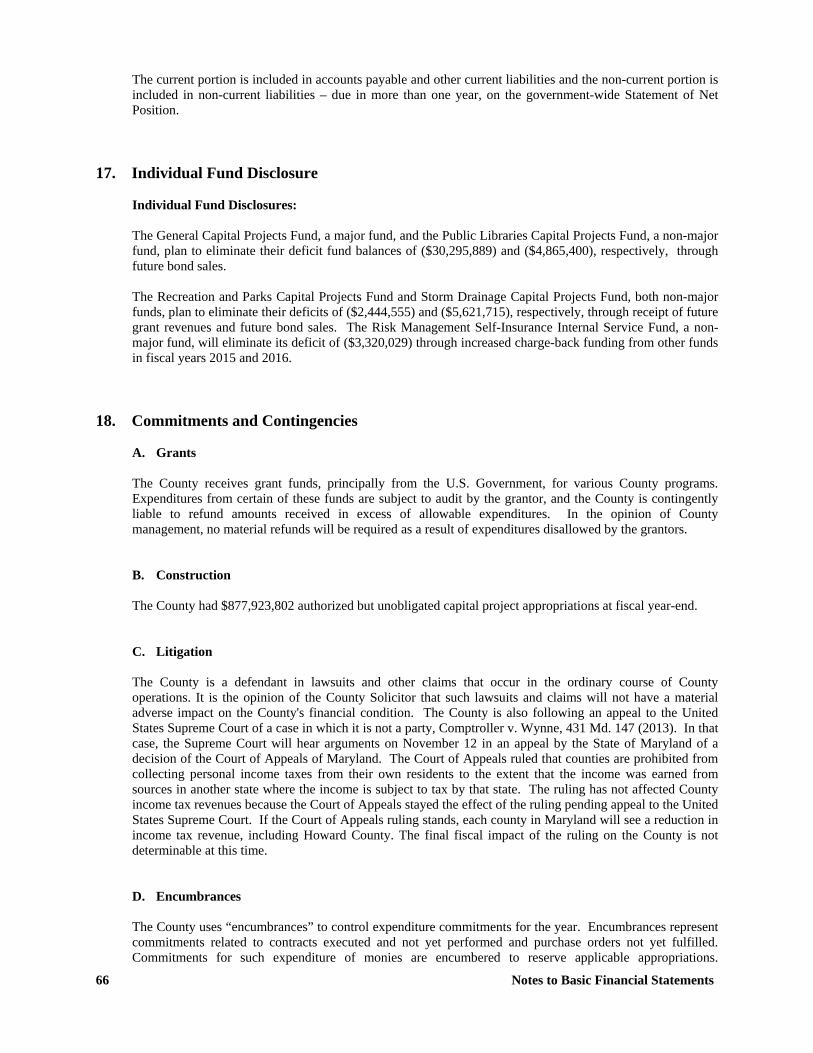
66 Notes to Basic Financial Statements
The current portion is included in accounts payable and other current liabilities and the non-current portion is included in non-current liabilities – due in more than one year, on the government-wide Statement of Net Position.
17. Individual Fund Disclosure
Individual Fund Disclosures: The General Capital Projects Fund, a major fund, and the Public Libraries Capital Projects Fund, a non-major fund, plan to eliminate their deficit fund balances of ($30,295,889) and ($4,865,400), respectively, through future bond sales. The Recreation and Parks Capital Projects Fund and Storm Drainage Capital Projects Fund, both non-major funds, plan to eliminate their deficits of ($2,444,555) and ($5,621,715), respectively, through receipt of future grant revenues and future bond sales. The Risk Management Self-Insurance Internal Service Fund, a non-major fund, will eliminate its deficit of ($3,320,029) through increased charge-back funding from other funds in fiscal years 2015 and 2016.
18. Commitments and Contingencies
A. Grants
The County receives grant funds, principally from the U.S. Government, for various County programs. Expenditures from certain of these funds are subject to audit by the grantor, and the County is contingently liable to refund amounts received in excess of allowable expenditures. In the opinion of County management, no material refunds will be required as a result of expenditures disallowed by the grantors. B. Construction The County had $877,923,802 authorized but unobligated capital project appropriations at fiscal year-end. C. Litigation
The County is a defendant in lawsuits and other claims that occur in the ordinary course of County operations. It is the opinion of the County Solicitor that such lawsuits and claims will not have a material adverse impact on the County's financial condition. The County is also following an appeal to the United States Supreme Court of a case in which it is not a party, Comptroller v. Wynne, 431 Md. 147 (2013). In that case, the Supreme Court will hear arguments on November 12 in an appeal by the State of Maryland of a decision of the Court of Appeals of Maryland. The Court of Appeals ruled that counties are prohibited from collecting personal income taxes from their own residents to the extent that the income was earned from sources in another state where the income is subject to tax by that state. The ruling has not affected County income tax revenues because the Court of Appeals stayed the effect of the ruling pending appeal to the United States Supreme Court. If the Court of Appeals ruling stands, each county in Maryland will see a reduction in income tax revenue, including Howard County. The final fiscal impact of the ruling on the County is not determinable at this time. D. Encumbrances
The County uses “encumbrances” to control expenditure commitments for the year. Encumbrances represent commitments related to contracts executed and not yet performed and purchase orders not yet fulfilled. Commitments for such expenditure of monies are encumbered to reserve applicable appropriations.
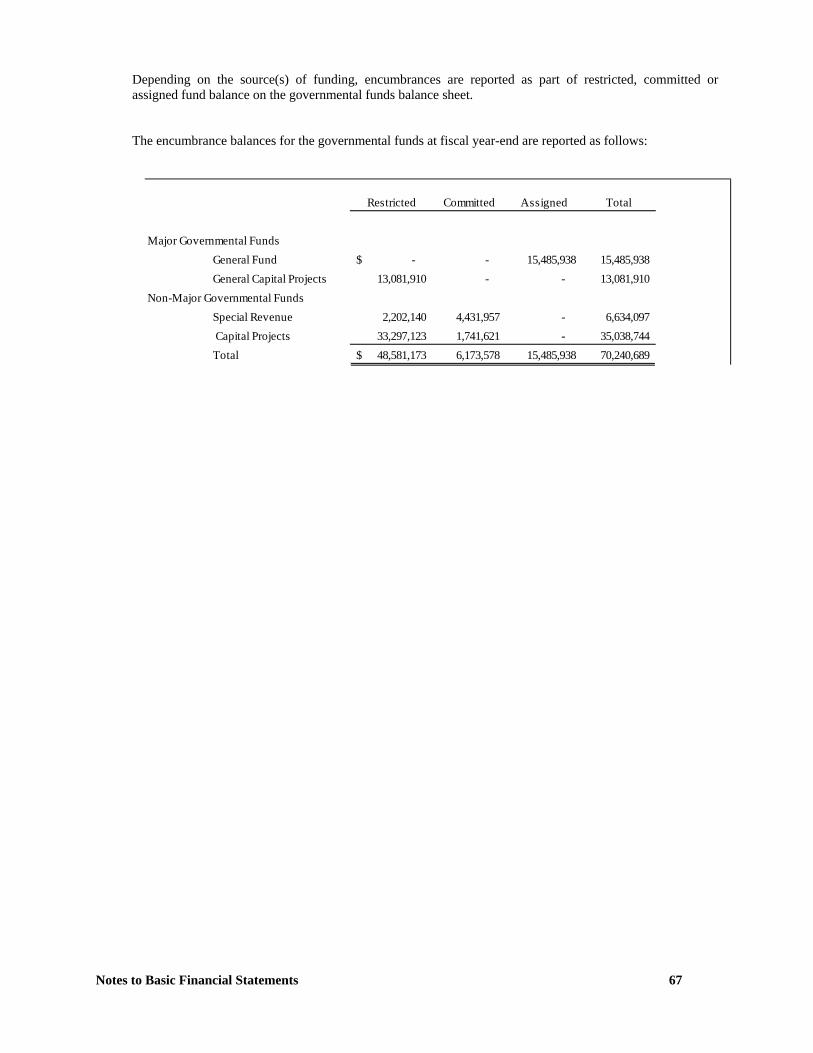
Notes to Basic Financial Statements 67
Depending on the source(s) of funding, encumbrances are reported as part of restricted, committed or assigned fund balance on the governmental funds balance sheet. The encumbrance balances for the governmental funds at fiscal year-end are reported as follows:
Restricted Committed Assigned Total
Major Governmental FundsGeneral Fund -$ - 15,485,938 15,485,938 General Capital Projects 13,081,910 - - 13,081,910
Non-Major Governmental FundsSpecial Revenue 2,202,140 4,431,957 - 6,634,097 Capital Projects 33,297,123 1,741,621 - 35,038,744 Total 48,581,173$ 6,173,578 15,485,938 70,240,689

3D Maryland: Driving Business Growth through Innovative Products and Processes 3D Maryland is an initiative of the Howard County Economic Development Authority and the Maryland Center for Entrepreneurship (MCE) geared toward strengthening Maryland’s economy by increasing awareness of 3D printing and the competitive advantages these technologies offer. Howard County Government has devoted funding to the 3D Maryland effort and committed 2,000 square feet of space inside MCE to bring 3D manufacturers together and to nurture the ecosystem. Using a state-of-the-art print lab, 3D Maryland will be able to offer entrepreneurs the ability to rapidly manufacture prototypes and projects.
Required Supplementary Information

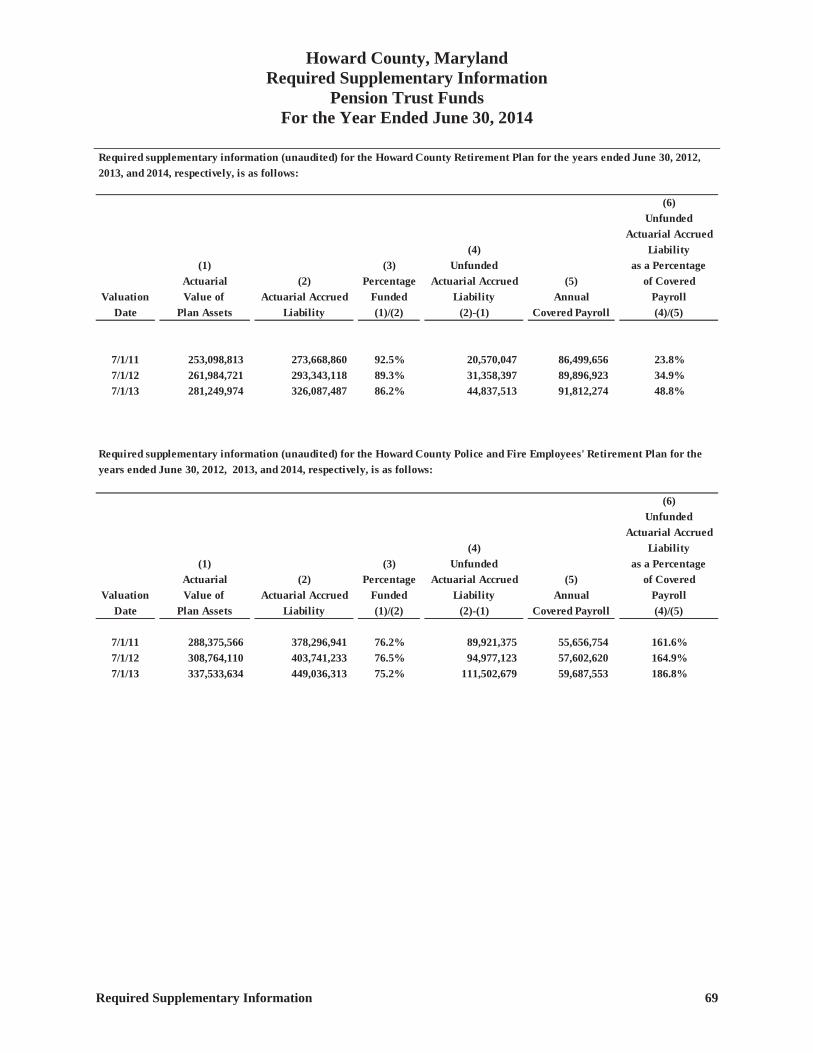
Howard County, Maryland Required Supplementary Information
Pension Trust Funds For the Year Ended June 30, 2014
Required Supplementary Information 69
Required supplementary information (unaudited) for the Howard County Retirement Plan for the years ended June 30, 2012,2013, and 2014, respectively, is as follows:
(6)Unfunded
Actuarial Accrued(4) Liability
(1) (3) Unfunded as a PercentageActuarial (2) Percentage Actuarial Accrued (5) of Covered
Valuation Value of Actuarial Accrued Funded Liability Annual PayrollDate Plan Assets Liability (1)/(2) (2)-(1) Covered Payroll (4)/(5)
7/1/11 253,098,813 273,668,860 92.5% 20,570,047 86,499,656 23.8%7/1/12 261,984,721 293,343,118 89.3% 31,358,397 89,896,923 34.9%7/1/13 281,249,974 326,087,487 86.2% 44,837,513 91,812,274 48.8%
Required supplementary information (unaudited) for the Howard County Police and Fire Employees' Retirement Plan for theyears ended June 30, 2012, 2013, and 2014, respectively, is as follows:
(6)Unfunded
Actuarial Accrued(4) Liability
(1) (3) Unfunded as a PercentageActuarial (2) Percentage Actuarial Accrued (5) of Covered
Valuation Value of Actuarial Accrued Funded Liability Annual PayrollDate Plan Assets Liability (1)/(2) (2)-(1) Covered Payroll (4)/(5)
7/1/11 288,375,566 378,296,941 76.2% 89,921,375 55,656,754 161.6%7/1/12 308,764,110 403,741,233 76.5% 94,977,123 57,602,620 164.9%7/1/13 337,533,634 449,036,313 75.2% 111,502,679 59,687,553 186.8%
T:\SHARED\CAFR\CAFR\CAFR 14\PDF\[rsi - Pension.xlsx]14
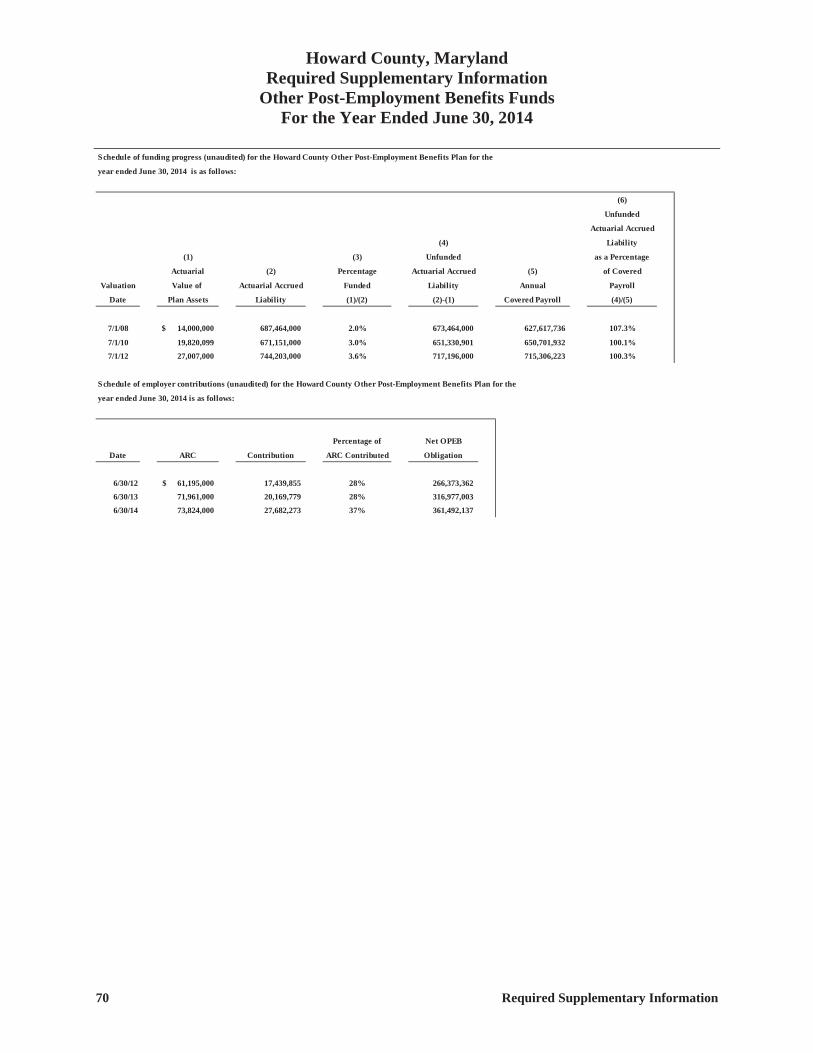
Howard County, Maryland Required Supplementary Information
Other Post-Employment Benefits Funds For the Year Ended June 30, 2014
70 Required Supplementary Information
Schedule of funding progress (unaudited) for the Howard County Other Post-Employment Benefits Plan for the
year ended June 30, 2014 is as follows:
(6)
Unfunded
Actuarial Accrued
(4) Liability
(1) (3) Unfunded as a Percentage
Actuarial (2) Percentage Actuarial Accrued (5) of Covered
Valuation Value of Actuarial Accrued Funded Liability Annual Payroll
Date Plan Assets Liability (1)/(2) (2)-(1) Covered Payroll (4)/(5)
7/1/08 14,000,000$ 687,464,000 2.0% 673,464,000 627,617,736 107.3%
7/1/10 19,820,099 671,151,000 3.0% 651,330,901 650,701,932 100.1%
7/1/12 27,007,000 744,203,000 3.6% 717,196,000 715,306,223 100.3%
Schedule of employer contributions (unaudited) for the Howard County Other Post-Employment Benefits Plan for the
year ended June 30, 2014 is as follows:
Percentage of Net OPEB
Date ARC Contribution ARC Contributed Obligation
6/30/12 61,195,000$ 17,439,855 28% 266,373,362
6/30/13 71,961,000 20,169,779 28% 316,977,003
6/30/14 73,824,000 27,682,273 37% 361,492,137
Combining and Individual Fund
Statements and Schedules
The Combining and Individual fund statements and schedules provide
detailed information concerning financial position and results of
operations.
General Fund
Non-Major Governmental Funds
Enterprise Funds-Other
Internal Service Funds
Fiduciary Funds
Capital Assets Used in the Operation of
Governmental Funds
Capital Assets Used in the Operation of
Enterprise Funds
Long-Term Debt

General Fund
The General fund is the general operating fund of the County. This fund is used to account for all financial resources except those required to be accounted for in another fund.

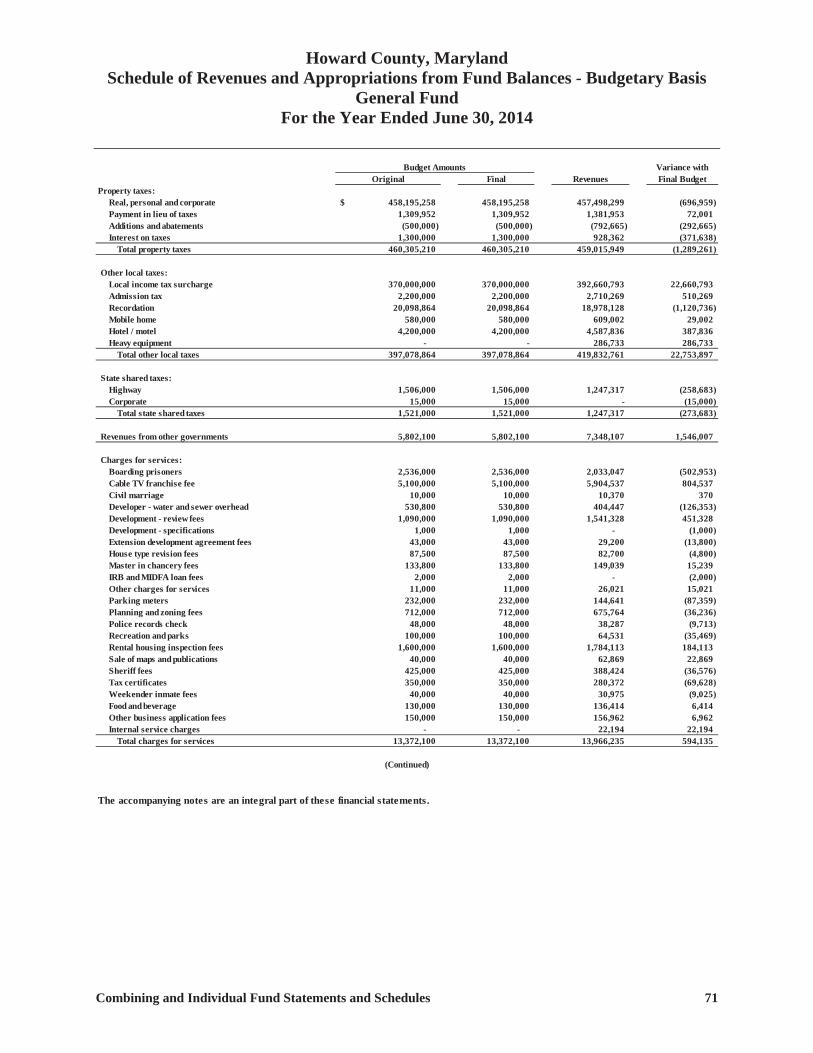
Howard County, Maryland Schedule of Revenues and Appropriations from Fund Balances - Budgetary Basis
General Fund For the Year Ended June 30, 2014
Combining and Individual Fund Statements and Schedules 71
Budget Amounts Variance withOriginal Final Revenues Final Budget
Property taxes:Real, personal and corporate 458,195,258$ 458,195,258 457,498,299 (696,959) Payment in lieu of taxes 1,309,952 1,309,952 1,381,953 72,001 Additions and abatements (500,000) (500,000) (792,665) (292,665) Interest on taxes 1,300,000 1,300,000 928,362 (371,638)
Total property taxes 460,305,210 460,305,210 459,015,949 (1,289,261)
Other local taxes:Local income tax surcharge 370,000,000 370,000,000 392,660,793 22,660,793 Admission tax 2,200,000 2,200,000 2,710,269 510,269 Recordation 20,098,864 20,098,864 18,978,128 (1,120,736) Mobile home 580,000 580,000 609,002 29,002 Hotel / motel 4,200,000 4,200,000 4,587,836 387,836 Heavy equipment - - 286,733 286,733
Total other local taxes 397,078,864 397,078,864 419,832,761 22,753,897
State shared taxes:Highway 1,506,000 1,506,000 1,247,317 (258,683) Corporate 15,000 15,000 - (15,000)
Total state shared taxes 1,521,000 1,521,000 1,247,317 (273,683)
Revenues from other governments 5,802,100 5,802,100 7,348,107 1,546,007
Charges for services:Boarding prisoners 2,536,000 2,536,000 2,033,047 (502,953) Cable TV franchise fee 5,100,000 5,100,000 5,904,537 804,537 Civil marriage 10,000 10,000 10,370 370 Developer - water and sewer overhead 530,800 530,800 404,447 (126,353) Development - review fees 1,090,000 1,090,000 1,541,328 451,328 Development - specifications 1,000 1,000 - (1,000) Extension development agreement fees 43,000 43,000 29,200 (13,800) House type revision fees 87,500 87,500 82,700 (4,800) Master in chancery fees 133,800 133,800 149,039 15,239 IRB and MIDFA loan fees 2,000 2,000 - (2,000) Other charges for services 11,000 11,000 26,021 15,021 Parking meters 232,000 232,000 144,641 (87,359) Planning and zoning fees 712,000 712,000 675,764 (36,236) Police records check 48,000 48,000 38,287 (9,713) Recreation and parks 100,000 100,000 64,531 (35,469) Rental housing inspection fees 1,600,000 1,600,000 1,784,113 184,113 Sale of maps and publications 40,000 40,000 62,869 22,869 Sheriff fees 425,000 425,000 388,424 (36,576) Tax certificates 350,000 350,000 280,372 (69,628) Weekender inmate fees 40,000 40,000 30,975 (9,025) Food and beverage 130,000 130,000 136,414 6,414 Other business application fees 150,000 150,000 156,962 6,962 Internal service charges - - 22,194 22,194
Total charges for services 13,372,100 13,372,100 13,966,235 594,135
The accompanying notes are an integral part of these financial statements.
(Continued)
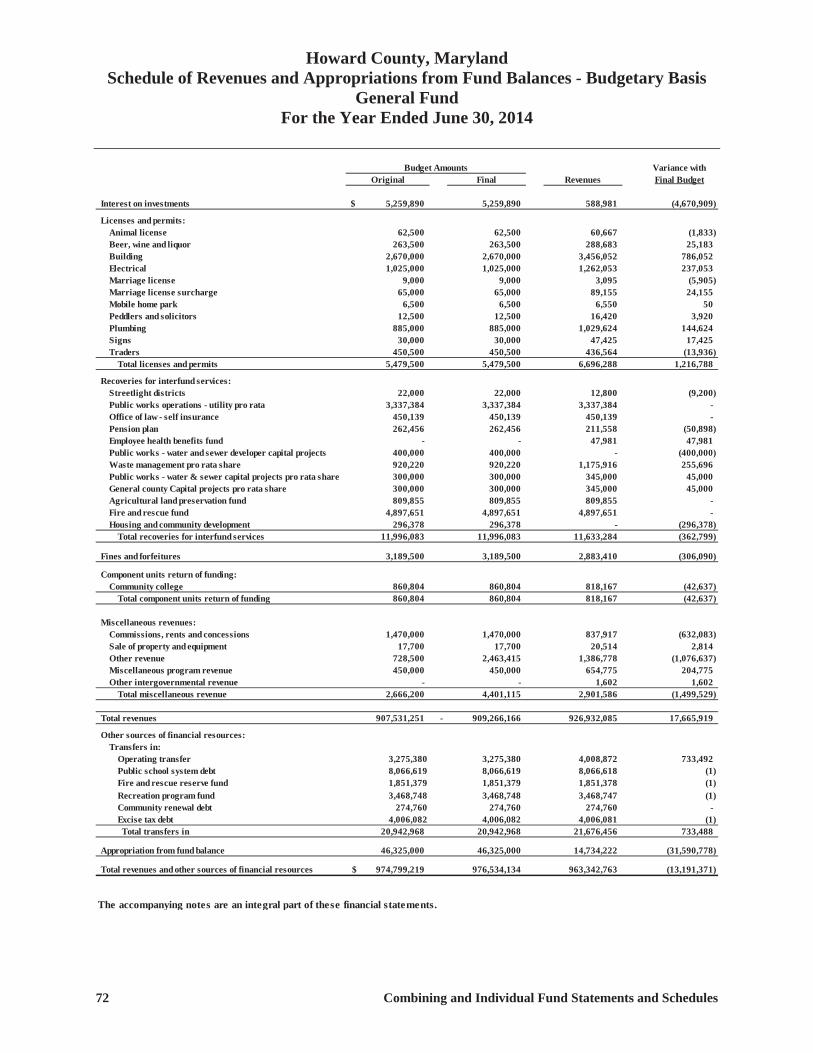
Howard County, Maryland Schedule of Revenues and Appropriations from Fund Balances - Budgetary Basis
General Fund For the Year Ended June 30, 2014
72 Combining and Individual Fund Statements and Schedules
Budget Amounts Variance withOriginal Final Revenues Final Budget
Interest on investments 5,259,890$ 5,259,890 588,981 (4,670,909)
Licenses and permits:Animal license 62,500 62,500 60,667 (1,833) Beer, wine and liquor 263,500 263,500 288,683 25,183 Building 2,670,000 2,670,000 3,456,052 786,052 Electrical 1,025,000 1,025,000 1,262,053 237,053 Marriage license 9,000 9,000 3,095 (5,905) Marriage license surcharge 65,000 65,000 89,155 24,155 Mobile home park 6,500 6,500 6,550 50 Peddlers and solicitors 12,500 12,500 16,420 3,920 Plumbing 885,000 885,000 1,029,624 144,624 Signs 30,000 30,000 47,425 17,425 Traders 450,500 450,500 436,564 (13,936)
Total licenses and permits 5,479,500 5,479,500 6,696,288 1,216,788
Recoveries for interfund services:Streetlight districts 22,000 22,000 12,800 (9,200) Public works operations - utility pro rata 3,337,384 3,337,384 3,337,384 - Office of law - self insurance 450,139 450,139 450,139 - Pension plan 262,456 262,456 211,558 (50,898) Employee health benefits fund - - 47,981 47,981 Public works - water and sewer developer capital projects 400,000 400,000 - (400,000) Waste management pro rata share 920,220 920,220 1,175,916 255,696 Public works - water & sewer capital projects pro rata share 300,000 300,000 345,000 45,000 General county Capital projects pro rata share 300,000 300,000 345,000 45,000 Agricultural land preservation fund 809,855 809,855 809,855 - Fire and rescue fund 4,897,651 4,897,651 4,897,651 - Housing and community development 296,378 296,378 - (296,378)
Total recoveries for interfund services 11,996,083 11,996,083 11,633,284 (362,799)
Fines and forfeitures 3,189,500 3,189,500 2,883,410 (306,090)
Component units return of funding:Community college 860,804 860,804 818,167 (42,637)
Total component units return of funding 860,804 860,804 818,167 (42,637)
Miscellaneous revenues:Commissions, rents and concessions 1,470,000 1,470,000 837,917 (632,083) Sale of property and equipment 17,700 17,700 20,514 2,814 Other revenue 728,500 2,463,415 1,386,778 (1,076,637) Miscellaneous program revenue 450,000 450,000 654,775 204,775 Other intergovernmental revenue - - 1,602 1,602
Total miscellaneous revenue 2,666,200 4,401,115 2,901,586 (1,499,529)
Total revenues 907,531,251 - 909,266,166 926,932,085 17,665,919
Other sources of financial resources:Transfers in:
Operating transfer 3,275,380 3,275,380 4,008,872 733,492 Public school system debt 8,066,619 8,066,619 8,066,618 (1) Fire and rescue reserve fund 1,851,379 1,851,379 1,851,378 (1) Recreation program fund 3,468,748 3,468,748 3,468,747 (1) Community renewal debt 274,760 274,760 274,760 - Excise tax debt 4,006,082 4,006,082 4,006,081 (1) Total transfers in 20,942,968 20,942,968 21,676,456 733,488
Appropriation from fund balance 46,325,000 46,325,000 14,734,222 (31,590,778)
Total revenues and other sources of financial resources 974,799,219$ 976,534,134 963,342,763 (13,191,371)
The accompanying notes are an integral part of these financial statements.
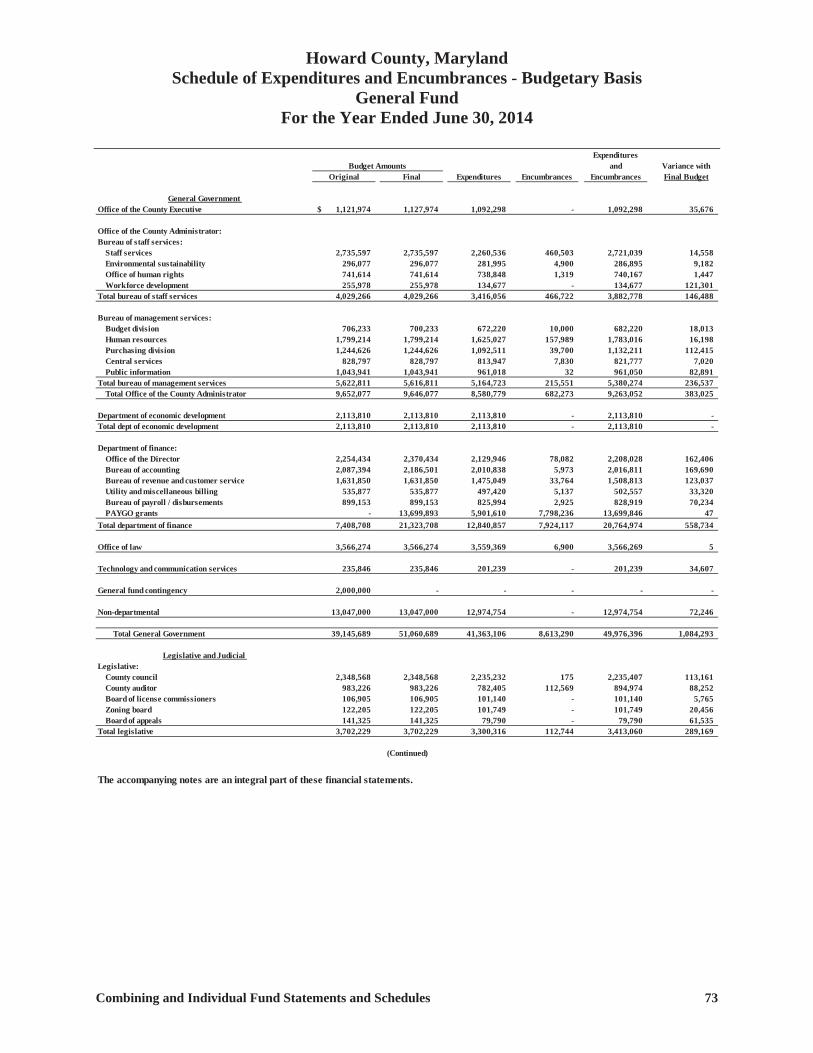
Howard County, Maryland Schedule of Expenditures and Encumbrances - Budgetary Basis
General Fund For the Year Ended June 30, 2014
Combining and Individual Fund Statements and Schedules 73
ExpendituresBudget Amounts and Variance with
Original Final Expenditures Encumbrances Encumbrances Final Budget
General Government Office of the County Executive 1,121,974$ 1,127,974 1,092,298 - 1,092,298 35,676
Office of the County Administrator:Bureau of staff services:
Staff services 2,735,597 2,735,597 2,260,536 460,503 2,721,039 14,558Environmental sustainability 296,077 296,077 281,995 4,900 286,895 9,182Office of human rights 741,614 741,614 738,848 1,319 740,167 1,447Workforce development 255,978 255,978 134,677 - 134,677 121,301
Total bureau of staff services 4,029,266 4,029,266 3,416,056 466,722 3,882,778 146,488
Bureau of management services: Budget division 706,233 700,233 672,220 10,000 682,220 18,013Human resources 1,799,214 1,799,214 1,625,027 157,989 1,783,016 16,198Purchasing division 1,244,626 1,244,626 1,092,511 39,700 1,132,211 112,415Central services 828,797 828,797 813,947 7,830 821,777 7,020Public information 1,043,941 1,043,941 961,018 32 961,050 82,891
Total bureau of management services 5,622,811 5,616,811 5,164,723 215,551 5,380,274 236,537Total Office of the County Administrator 9,652,077 9,646,077 8,580,779 682,273 9,263,052 383,025
Department of economic development 2,113,810 2,113,810 2,113,810 - 2,113,810 -Total dept of economic development 2,113,810 2,113,810 2,113,810 - 2,113,810 -
Department of finance: Office of the Director 2,254,434 2,370,434 2,129,946 78,082 2,208,028 162,406Bureau of accounting 2,087,394 2,186,501 2,010,838 5,973 2,016,811 169,690Bureau of revenue and customer service 1,631,850 1,631,850 1,475,049 33,764 1,508,813 123,037Utility and miscellaneous billing 535,877 535,877 497,420 5,137 502,557 33,320Bureau of payroll / disbursements 899,153 899,153 825,994 2,925 828,919 70,234PAYGO grants - 13,699,893 5,901,610 7,798,236 13,699,846 47
Total department of finance 7,408,708 21,323,708 12,840,857 7,924,117 20,764,974 558,734
Office of law 3,566,274 3,566,274 3,559,369 6,900 3,566,269 5
Technology and communication services 235,846 235,846 201,239 - 201,239 34,607
General fund contingency 2,000,000 - - - - -
Non-departmental 13,047,000 13,047,000 12,974,754 - 12,974,754 72,246
Total General Government 39,145,689 51,060,689 41,363,106 8,613,290 49,976,396 1,084,29392,000,106 92,000,106 84,758,683 84,784,709 7,215,397
Legislative and Judicial 131,145,795 143,060,795 126,121,789 8,613,290 134,761,105 8,299,690Legislative:
County council 2,348,568 2,348,568 2,235,232 175 2,235,407 113,161County auditor 983,226 983,226 782,405 112,569 894,974 88,252Board of license commissioners 106,905 106,905 101,140 - 101,140 5,765Zoning board 122,205 122,205 101,749 - 101,749 20,456Board of appeals 141,325 141,325 79,790 - 79,790 61,535
Total legislative 3,702,229 3,702,229 3,300,316 112,744 3,413,060 289,169
(Continued)
The accompanying notes are an integral part of these financial statements.
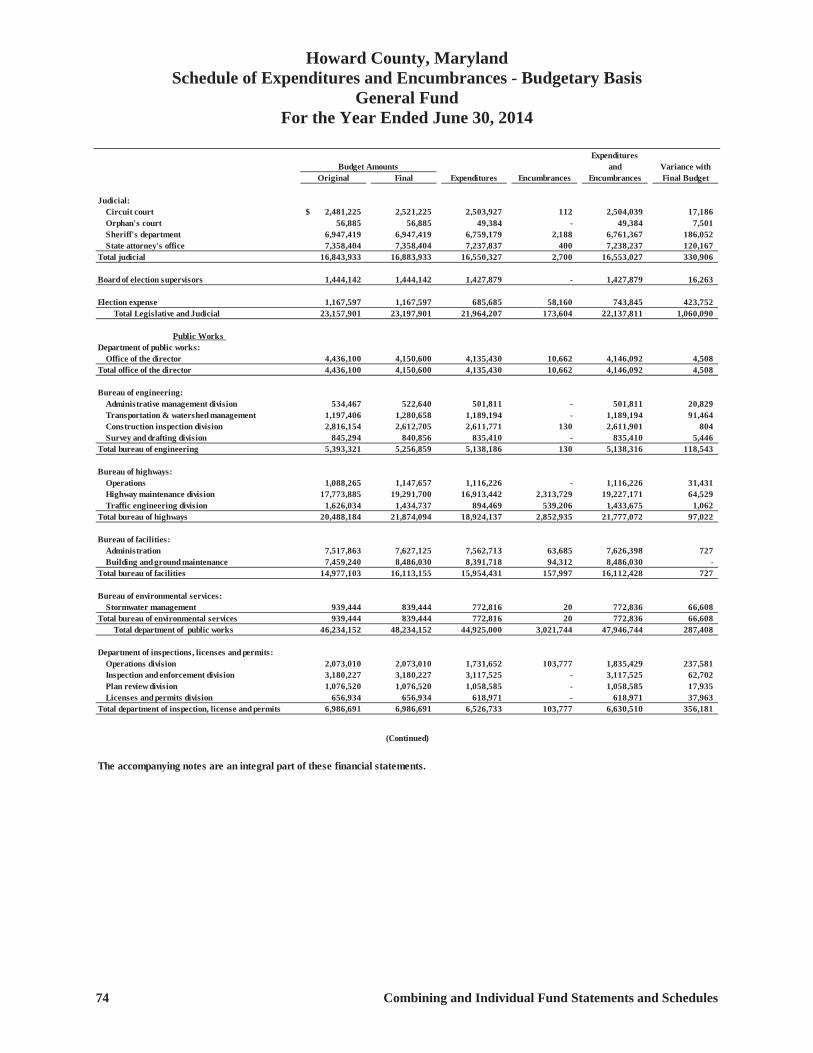
Howard County, Maryland Schedule of Expenditures and Encumbrances - Budgetary Basis
General Fund For the Year Ended June 30, 2014
74 Combining and Individual Fund Statements and Schedules
ExpendituresBudget Amounts and Variance with
Original Final Expenditures Encumbrances Encumbrances Final Budget
Judicial:Circuit court 2,481,225$ 2,521,225 2,503,927 112 2,504,039 17,186Orphan's court 56,885 56,885 49,384 - 49,384 7,501Sheriff's department 6,947,419 6,947,419 6,759,179 2,188 6,761,367 186,052State attorney's office 7,358,404 7,358,404 7,237,837 400 7,238,237 120,167
Total judicial 16,843,933 16,883,933 16,550,327 2,700 16,553,027 330,906
Board of election supervisors 1,444,142 1,444,142 1,427,879 - 1,427,879 16,263
Election expense 1,167,597 1,167,597 685,685 58,160 743,845 423,752Total Legislative and Judicial 23,157,901 23,197,901 21,964,207 173,604 22,137,811 1,060,090
Public Works Department of public works:
Office of the director 4,436,100 4,150,600 4,135,430 10,662 4,146,092 4,508Total office of the director 4,436,100 4,150,600 4,135,430 10,662 4,146,092 4,508
Bureau of engineering: Administrative management division 534,467 522,640 501,811 - 501,811 20,829Transportation & watershed management 1,197,406 1,280,658 1,189,194 - 1,189,194 91,464Construction inspection division 2,816,154 2,612,705 2,611,771 130 2,611,901 804Survey and drafting division 845,294 840,856 835,410 - 835,410 5,446
Total bureau of engineering 5,393,321 5,256,859 5,138,186 130 5,138,316 118,543
Bureau of highways: Operations 1,088,265 1,147,657 1,116,226 - 1,116,226 31,431Highway maintenance division 17,773,885 19,291,700 16,913,442 2,313,729 19,227,171 64,529Traffic engineering division 1,626,034 1,434,737 894,469 539,206 1,433,675 1,062
Total bureau of highways 20,488,184 21,874,094 18,924,137 2,852,935 21,777,072 97,022
Bureau of facilities: Administration 7,517,863 7,627,125 7,562,713 63,685 7,626,398 727Building and ground maintenance 7,459,240 8,486,030 8,391,718 94,312 8,486,030 -
Total bureau of facilities 14,977,103 16,113,155 15,954,431 157,997 16,112,428 727
Bureau of environmental services: Stormwater management 939,444 839,444 772,816 20 772,836 66,608
Total bureau of environmental services 939,444 839,444 772,816 20 772,836 66,608Total department of public works 46,234,152 48,234,152 44,925,000 3,021,744 47,946,744 287,408
Department of inspections, licenses and permits: Operations division 2,073,010 2,073,010 1,731,652 103,777 1,835,429 237,581Inspection and enforcement division 3,180,227 3,180,227 3,117,525 - 3,117,525 62,702Plan review division 1,076,520 1,076,520 1,058,585 - 1,058,585 17,935Licenses and permits division 656,934 656,934 618,971 - 618,971 37,963
Total department of inspection, license and permits 6,986,691 6,986,691 6,526,733 103,777 6,630,510 356,181
(Continued)
The accompanying notes are an integral part of these financial statements.
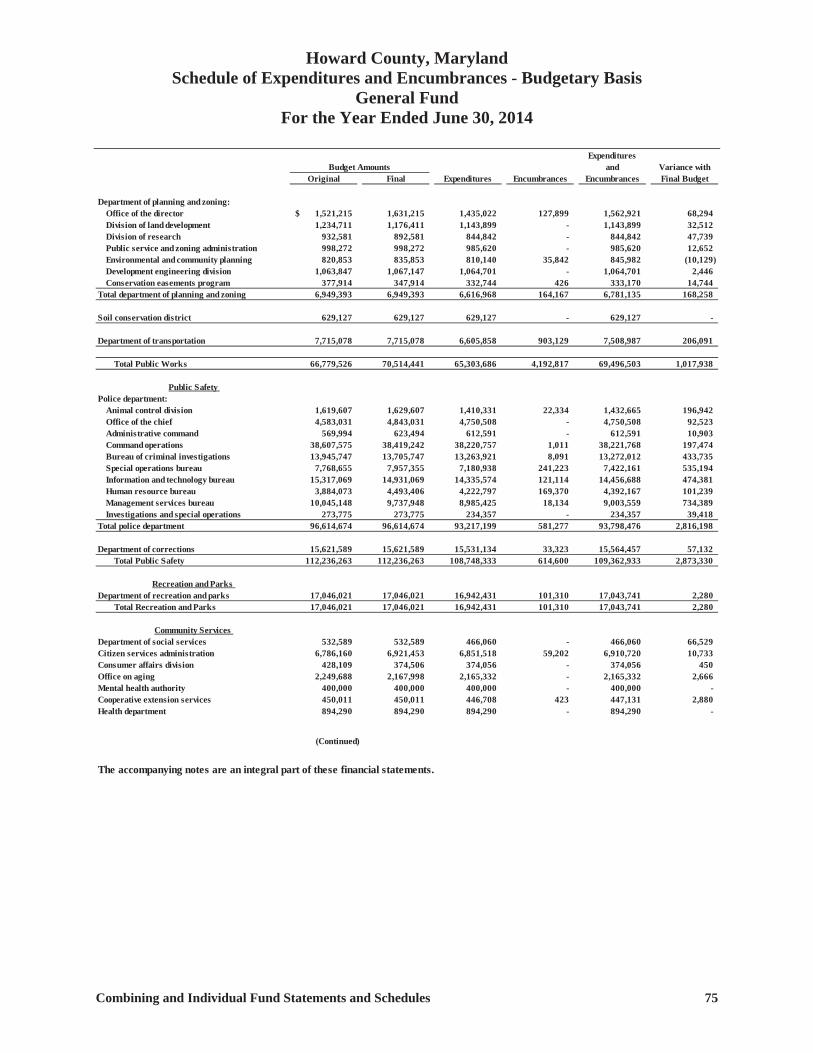
Howard County, Maryland Schedule of Expenditures and Encumbrances - Budgetary Basis
General Fund For the Year Ended June 30, 2014
Combining and Individual Fund Statements and Schedules 75
ExpendituresBudget Amounts and Variance with
Original Final Expenditures Encumbrances Encumbrances Final Budget
Department of planning and zoning: Office of the director 1,521,215$ 1,631,215 1,435,022 127,899 1,562,921 68,294 Division of land development 1,234,711 1,176,411 1,143,899 - 1,143,899 32,512 Division of research 932,581 892,581 844,842 - 844,842 47,739 Public service and zoning administration 998,272 998,272 985,620 - 985,620 12,652 Environmental and community planning 820,853 835,853 810,140 35,842 845,982 (10,129) Development engineering division 1,063,847 1,067,147 1,064,701 - 1,064,701 2,446 Conservation easements program 377,914 347,914 332,744 426 333,170 14,744
Total department of planning and zoning 6,949,393 6,949,393 6,616,968 164,167 6,781,135 168,258
Soil conservation district 629,127 629,127 629,127 - 629,127 -
Department of transportation 7,715,078 7,715,078 6,605,858 903,129 7,508,987 206,091
Total Public Works 66,779,526 70,514,441 65,303,686 4,192,817 69,496,503 1,017,938
Public Safety Police department:
Animal control division 1,619,607 1,629,607 1,410,331 22,334 1,432,665 196,942 Office of the chief 4,583,031 4,843,031 4,750,508 - 4,750,508 92,523 Administrative command 569,994 623,494 612,591 - 612,591 10,903 Command operations 38,607,575 38,419,242 38,220,757 1,011 38,221,768 197,474 Bureau of criminal investigations 13,945,747 13,705,747 13,263,921 8,091 13,272,012 433,735 Special operations bureau 7,768,655 7,957,355 7,180,938 241,223 7,422,161 535,194 Information and technology bureau 15,317,069 14,931,069 14,335,574 121,114 14,456,688 474,381 Human resource bureau 3,884,073 4,493,406 4,222,797 169,370 4,392,167 101,239 Management services bureau 10,045,148 9,737,948 8,985,425 18,134 9,003,559 734,389 Investigations and special operations 273,775 273,775 234,357 - 234,357 39,418
Total police department 96,614,674 96,614,674 93,217,199 581,277 93,798,476 2,816,198
Department of corrections 15,621,589 15,621,589 15,531,134 33,323 15,564,457 57,132 Total Public Safety 112,236,263 112,236,263 108,748,333 614,600 109,362,933 2,873,330
Recreation and Parks Department of recreation and parks 17,046,021 17,046,021 16,942,431 101,310 17,043,741 2,280
Total Recreation and Parks 17,046,021 17,046,021 16,942,431 101,310 17,043,741 2,280
Community Services Department of social services 532,589 532,589 466,060 - 466,060 66,529 Citizen services administration 6,786,160 6,921,453 6,851,518 59,202 6,910,720 10,733 Consumer affairs division 428,109 374,506 374,056 - 374,056 450 Office on aging 2,249,688 2,167,998 2,165,332 - 2,165,332 2,666 Mental health authority 400,000 400,000 400,000 - 400,000 - Cooperative extension services 450,011 450,011 446,708 423 447,131 2,880 Health department 894,290 894,290 894,290 - 894,290 -
(Continued)
The accompanying notes are an integral part of these financial statements.
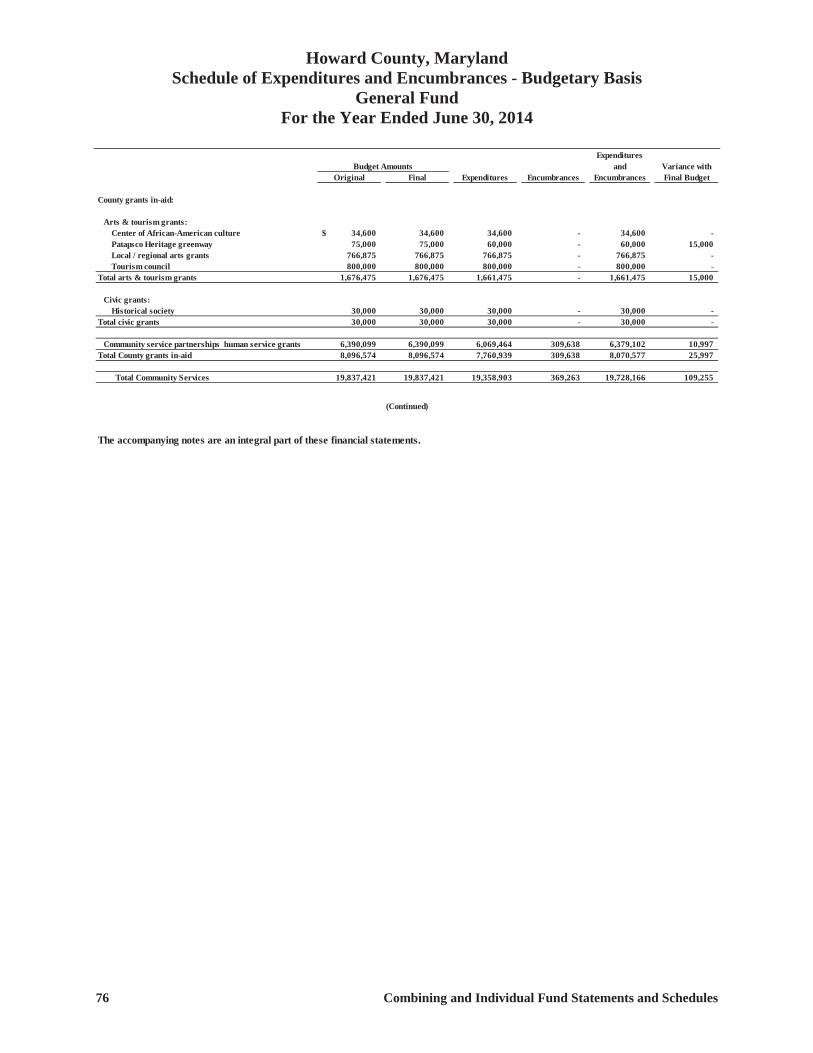
Howard County, Maryland Schedule of Expenditures and Encumbrances - Budgetary Basis
General Fund For the Year Ended June 30, 2014
76 Combining and Individual Fund Statements and Schedules
ExpendituresBudget Amounts and Variance with
Original Final Expenditures Encumbrances Encumbrances Final Budget
County grants in-aid:
Arts & tourism grants: Center of African-American culture 34,600$ 34,600 34,600 - 34,600 - Patapsco Heritage greenway 75,000 75,000 60,000 - 60,000 15,000 Local / regional arts grants 766,875 766,875 766,875 - 766,875 - Tourism council 800,000 800,000 800,000 - 800,000 -
Total arts & tourism grants 1,676,475 1,676,475 1,661,475 - 1,661,475 15,000
Civic grants: Historical society 30,000 30,000 30,000 - 30,000 -
Total civic grants 30,000 30,000 30,000 - 30,000 -
Community service partnerships human service grants 6,390,099 6,390,099 6,069,464 309,638 6,379,102 10,997 Total County grants in-aid 8,096,574 8,096,574 7,760,939 309,638 8,070,577 25,997
Total Community Services 19,837,421 19,837,421 19,358,903 369,263 19,728,166 109,255
(Continued)
The accompanying notes are an integral part of these financial statements.
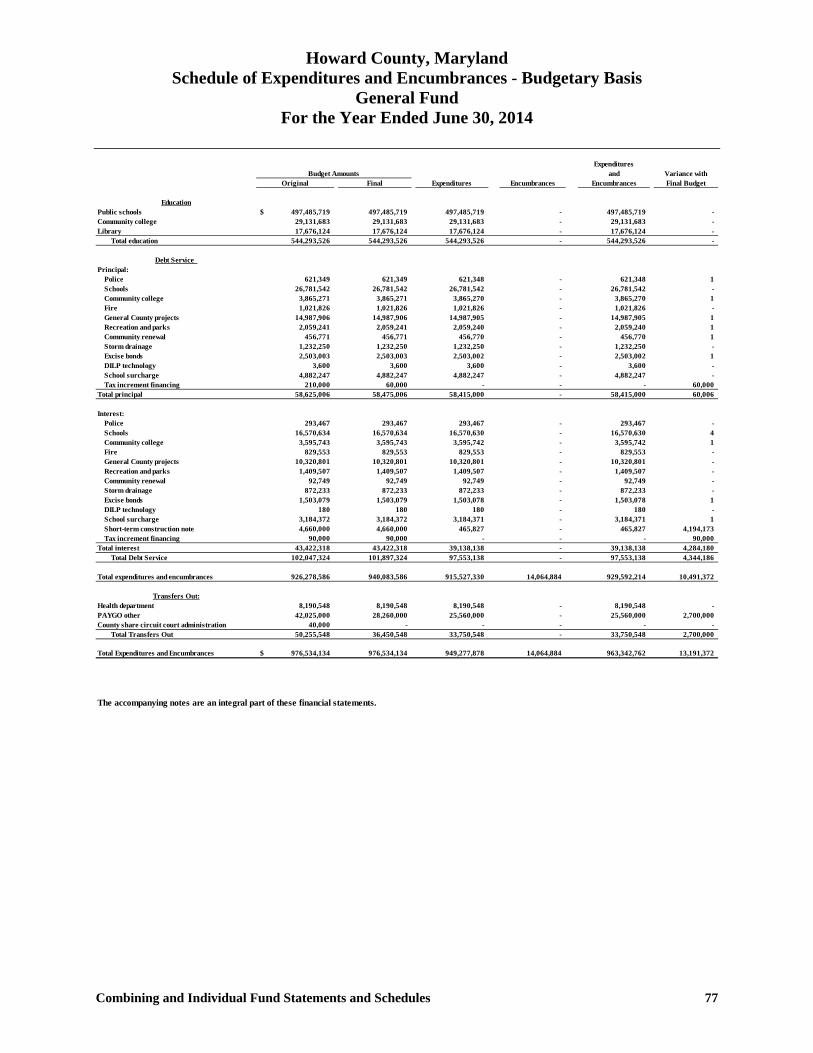
Howard County, Maryland Schedule of Expenditures and Encumbrances - Budgetary Basis
General Fund For the Year Ended June 30, 2014
Combining and Individual Fund Statements and Schedules 77
ExpendituresBudget Amounts and Variance with
Original Final Expenditures Encumbrances Encumbrances Final Budget
EducationPublic schools 497,485,719$ 497,485,719 497,485,719 - 497,485,719 - Community college 29,131,683 29,131,683 29,131,683 - 29,131,683 - Library 17,676,124 17,676,124 17,676,124 - 17,676,124 -
Total education 544,293,526 544,293,526 544,293,526 - 544,293,526 -
Debt Service Principal:
Police 621,349 621,349 621,348 - 621,348 1 Schools 26,781,542 26,781,542 26,781,542 - 26,781,542 - Community college 3,865,271 3,865,271 3,865,270 - 3,865,270 1 Fire 1,021,826 1,021,826 1,021,826 - 1,021,826 - General County projects 14,987,906 14,987,906 14,987,905 - 14,987,905 1 Recreation and parks 2,059,241 2,059,241 2,059,240 - 2,059,240 1 Community renewal 456,771 456,771 456,770 - 456,770 1 Storm drainage 1,232,250 1,232,250 1,232,250 - 1,232,250 - Excise bonds 2,503,003 2,503,003 2,503,002 - 2,503,002 1 DILP technology 3,600 3,600 3,600 - 3,600 - School surcharge 4,882,247 4,882,247 4,882,247 - 4,882,247 - Tax increment financing 210,000 60,000 - - - 60,000
Total principal 58,625,006 58,475,006 58,415,000 - 58,415,000 60,006
Interest:Police 293,467 293,467 293,467 - 293,467 - Schools 16,570,634 16,570,634 16,570,630 - 16,570,630 4 Community college 3,595,743 3,595,743 3,595,742 - 3,595,742 1 Fire 829,553 829,553 829,553 - 829,553 - General County projects 10,320,801 10,320,801 10,320,801 - 10,320,801 - Recreation and parks 1,409,507 1,409,507 1,409,507 - 1,409,507 - Community renewal 92,749 92,749 92,749 - 92,749 - Storm drainage 872,233 872,233 872,233 - 872,233 - Excise bonds 1,503,079 1,503,079 1,503,078 - 1,503,078 1 DILP technology 180 180 180 - 180 - School surcharge 3,184,372 3,184,372 3,184,371 - 3,184,371 1 Short-term construction note 4,660,000 4,660,000 465,827 - 465,827 4,194,173 Tax increment financing 90,000 90,000 - - - 90,000
Total interest 43,422,318 43,422,318 39,138,138 - 39,138,138 4,284,180 Total Debt Service 102,047,324 101,897,324 97,553,138 - 97,553,138 4,344,186
Total expenditures and encumbrances 926,278,586 940,083,586 915,527,330 14,064,884 929,592,214 10,491,372
Transfers Out:Health department 8,190,548 8,190,548 8,190,548 - 8,190,548 - PAYGO other 42,025,000 28,260,000 25,560,000 - 25,560,000 2,700,000 County share circuit court administration 40,000 - - - - -
Total Transfers Out 50,255,548 36,450,548 33,750,548 - 33,750,548 2,700,000
Total Expenditures and Encumbrances 976,534,134$ 976,534,134 949,277,878 14,064,884 963,342,762 13,191,372 976,534,134 976,534,134 949,277,878 14,064,884 963,342,762 13,191,372
- - - - - -
The accompanying notes are an integral part of these financial statements.
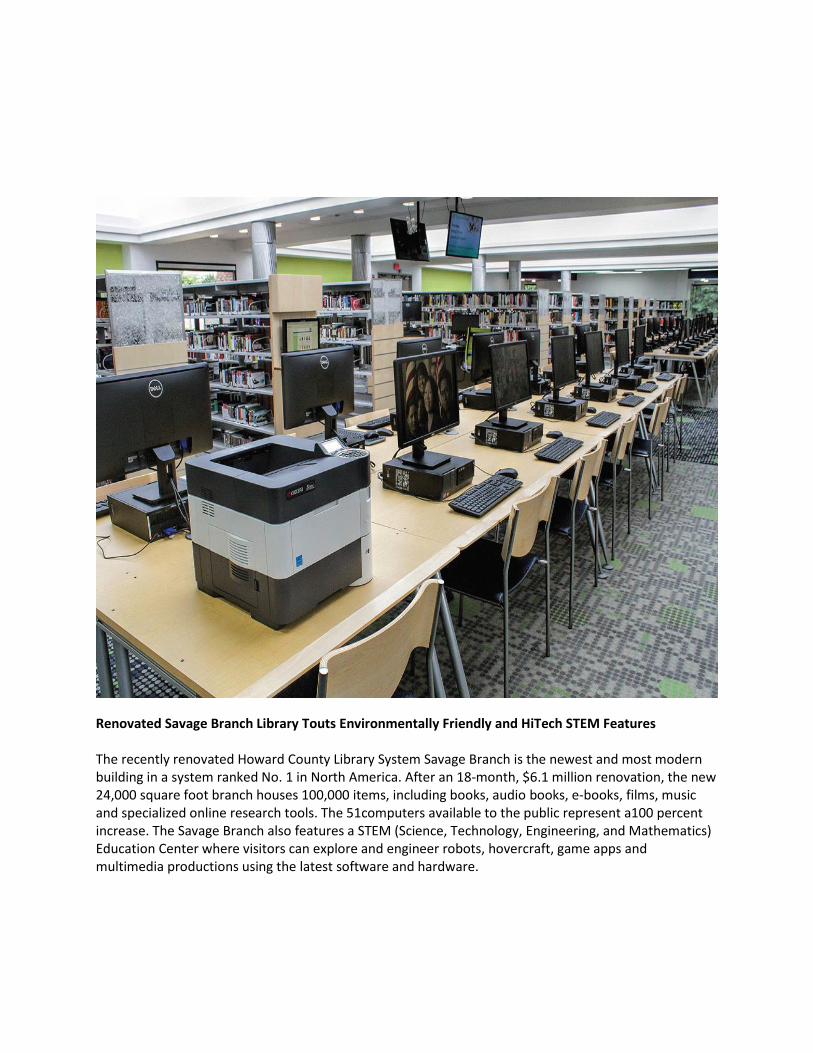
Renovated Savage Branch Library Touts Environmentally Friendly and HiTech STEM Features The recently renovated Howard County Library System Savage Branch is the newest and most modern building in a system ranked No. 1 in North America. After an 18-month, $6.1 million renovation, the new 24,000 square foot branch houses 100,000 items, including books, audio books, e-books, films, music and specialized online research tools. The 51computers available to the public represent a100 percent increase. The Savage Branch also features a STEM (Science, Technology, Engineering, and Mathematics) Education Center where visitors can explore and engineer robots, hovercraft, game apps and multimedia productions using the latest software and hardware.
Non-Major Governmental Funds
Special revenue funds are used to account for specific revenues that are
legally restricted to expenditure for particular purposes.
Capital project funds are used to account for the construction of major capital
facilities. These funds are generally financed by bond issues,
intergovernmental revenue, and contributions.

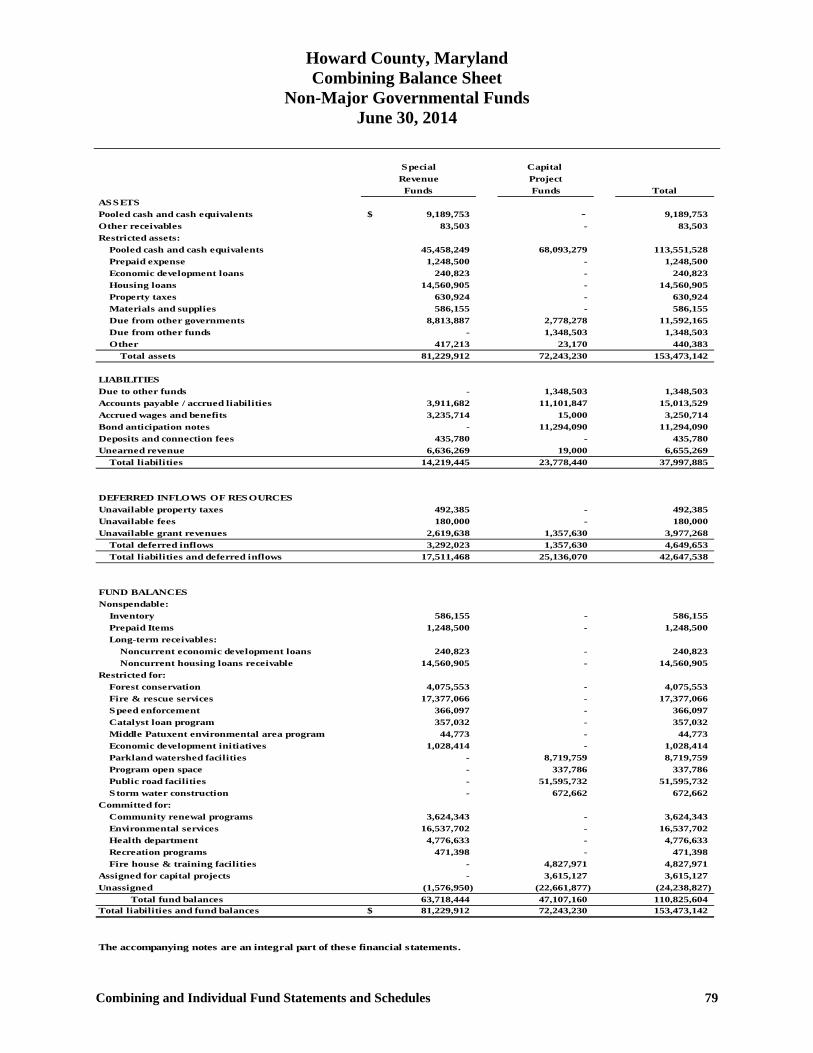
Howard County, Maryland Combining Balance Sheet
Non-Major Governmental Funds June 30, 2014
Combining and Individual Fund Statements and Schedules 79
Special Capital Revenue ProjectFunds Funds Total
ASSETSPooled cash and cash equivalents 9,189,753$ - 9,189,753 Other receivables 83,503 - 83,503 Restricted assets:
Pooled cash and cash equivalents 45,458,249 68,093,279 113,551,528 Prepaid expense 1,248,500 - 1,248,500 Economic development loans 240,823 - 240,823 Housing loans 14,560,905 - 14,560,905 Property taxes 630,924 - 630,924 Materials and supplies 586,155 - 586,155 Due from other governments 8,813,887 2,778,278 11,592,165 Due from other funds - 1,348,503 1,348,503 Other 417,213 23,170 440,383
Total assets 81,229,912 72,243,230 153,473,142
LIABILITIESDue to other funds - 1,348,503 1,348,503 Accounts payable / accrued liabilities 3,911,682 11,101,847 15,013,529 Accrued wages and benefits 3,235,714 15,000 3,250,714 Bond anticipation notes - 11,294,090 11,294,090 Deposits and connection fees 435,780 - 435,780 Unearned revenue 6,636,269 19,000 6,655,269
Total liabilities 14,219,445 23,778,440 37,997,885
DEFERRED INFLOWS OF RESOURCESUnavailable property taxes 492,385 - 492,385 Unavailable fees 180,000 - 180,000 Unavailable grant revenues 2,619,638 1,357,630 3,977,268
Total deferred inflows 3,292,023 1,357,630 4,649,653 Total liabilities and deferred inflows 17,511,468 25,136,070 42,647,538
FUND BALANCESNonspendable:
Inventory 586,155 - 586,155 Prepaid Items 1,248,500 - 1,248,500 Long-term receivables:
Noncurrent economic development loans 240,823 - 240,823 Noncurrent housing loans receivable 14,560,905 - 14,560,905
Restricted for:Forest conservation 4,075,553 - 4,075,553 Fire & rescue services 17,377,066 - 17,377,066 Speed enforcement 366,097 - 366,097 Catalyst loan program 357,032 - 357,032 Middle Patuxent environmental area program 44,773 - 44,773 Economic development initiatives 1,028,414 - 1,028,414 Parkland watershed facilities - 8,719,759 8,719,759 Program open space - 337,786 337,786 Public road facilities - 51,595,732 51,595,732 Storm water construction - 672,662 672,662
Committed for:Community renewal programs 3,624,343 - 3,624,343 Environmental services 16,537,702 - 16,537,702 Health department 4,776,633 - 4,776,633 Recreation programs 471,398 - 471,398 Fire house & training facilities - 4,827,971 4,827,971
Assigned for capital projects - 3,615,127 3,615,127 Unassigned (1,576,950) (22,661,877) (24,238,827)
Total fund balances 63,718,444 47,107,160 110,825,604 Total liabilities and fund balances 81,229,912$ 72,243,230 153,473,142
- - (0) - (0) - - (0) - (0)
The accompanying notes are an integral part of these financial statements.
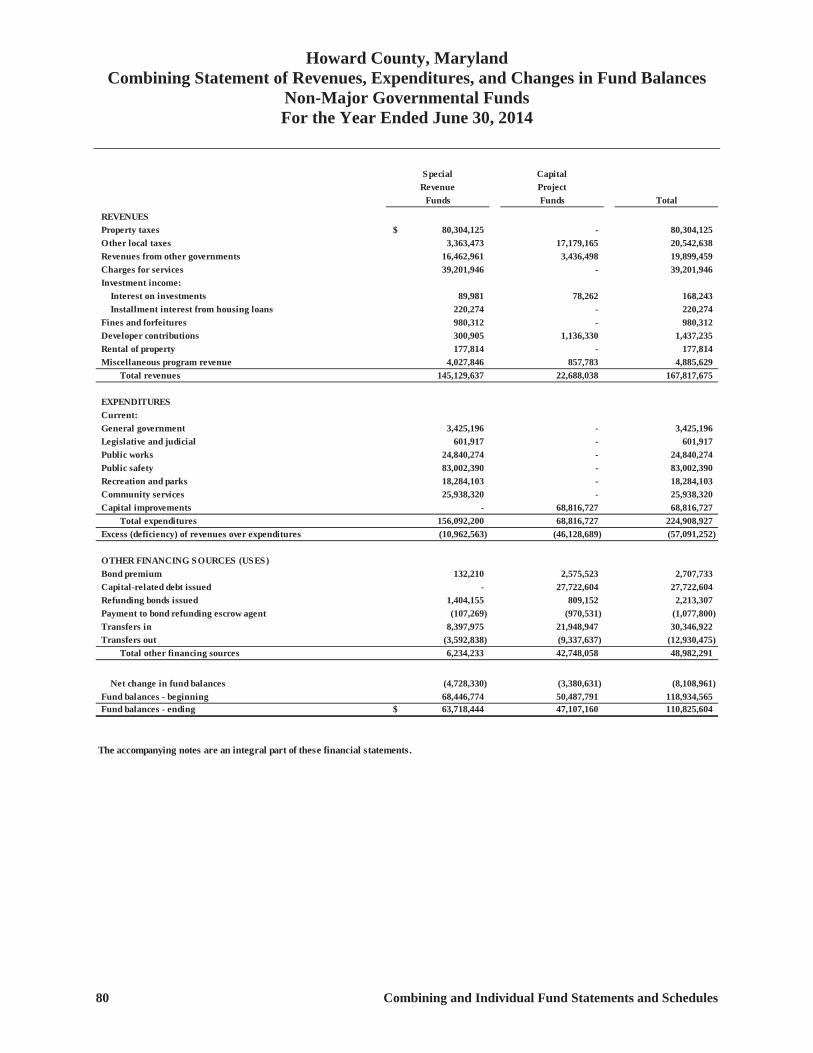
Howard County, Maryland Combining Statement of Revenues, Expenditures, and Changes in Fund Balances
Non-Major Governmental Funds For the Year Ended June 30, 2014
80 Combining and Individual Fund Statements and Schedules
Special CapitalRevenue Project
Funds Funds Total
REVENUESProperty taxes 80,304,125$ - 80,304,125 Other local taxes 3,363,473 17,179,165 20,542,638 Revenues from other governments 16,462,961 3,436,498 19,899,459 Charges for services 39,201,946 - 39,201,946 Investment income:
Interest on investments 89,981 78,262 168,243 Installment interest from housing loans 220,274 - 220,274
Fines and forfeitures 980,312 - 980,312 Developer contributions 300,905 1,136,330 1,437,235 Rental of property 177,814 - 177,814 Miscellaneous program revenue 4,027,846 857,783 4,885,629
Total revenues 145,129,637 22,688,038 167,817,675
EXPENDITURESCurrent:General government 3,425,196 - 3,425,196 Legislative and judicial 601,917 - 601,917 Public works 24,840,274 - 24,840,274 Public safety 83,002,390 - 83,002,390 Recreation and parks 18,284,103 - 18,284,103 Community services 25,938,320 - 25,938,320 Capital improvements - 68,816,727 68,816,727
Total expenditures 156,092,200 68,816,727 224,908,927 Excess (deficiency) of revenues over expenditures (10,962,563) (46,128,689) (57,091,252)
OTHER FINANCING SOURCES (USES)Bond premium 132,210 2,575,523 2,707,733 Capital-related debt issued - 27,722,604 27,722,604 Refunding bonds issued 1,404,155 809,152 2,213,307 Payment to bond refunding escrow agent (107,269) (970,531) (1,077,800) Transfers in 8,397,975 21,948,947 30,346,922 Transfers out (3,592,838) (9,337,637) (12,930,475)
Total other financing sources 6,234,233 42,748,058 48,982,291
Net change in fund balances (4,728,330) (3,380,631) (8,108,961) Fund balances - beginning 68,446,774 50,487,791 118,934,565 Fund balances - ending 63,718,444$ 47,107,160 110,825,604
T:\SHARED\CAFR\CAFR\CAFR 14\PDF\Statements\[Entreprise Rev.xlsx]14The accompanying notes are an integral part of these financial statements.
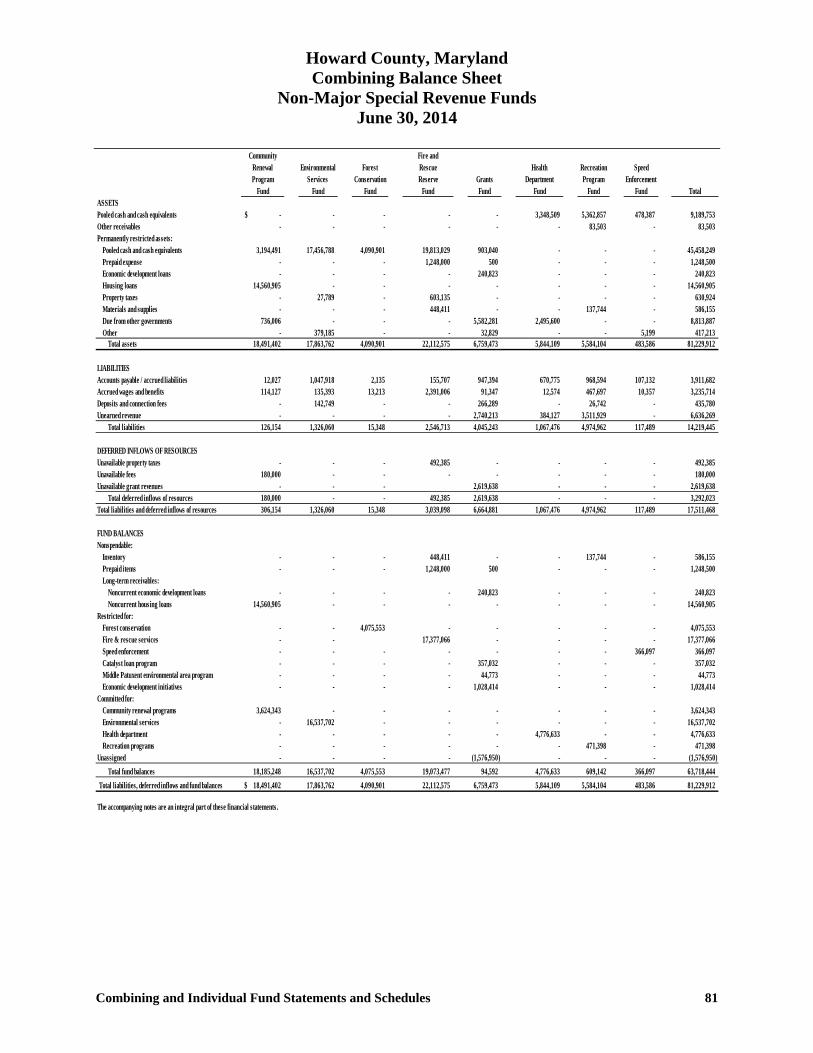
Howard County, Maryland Combining Balance Sheet
Non-Major Special Revenue Funds June 30, 2014
Combining and Individual Fund Statements and Schedules 81
Community Fire andRenewal Environmental Forest Rescue Health Recreation SpeedProgram Services Conservation Reserve Grants Department Program Enforcement
Fund Fund Fund Fund Fund Fund Fund Fund TotalASSETSPooled cash and cash equivalents -$ - - - - 3,348,509 5,362,857 478,387 9,189,753 Other receivables - - - - - - 83,503 - 83,503 Permanently restricted assets:
Pooled cash and cash equivalents 3,194,491 17,456,788 4,090,901 19,813,029 903,040 - - - 45,458,249 Prepaid expense - - - 1,248,000 500 - - - 1,248,500 Economic development loans - - - - 240,823 - - - 240,823 Housing loans 14,560,905 - - - - - - - 14,560,905 Property taxes - 27,789 - 603,135 - - - - 630,924 Materials and supplies - - - 448,411 - - 137,744 - 586,155 Due from other governments 736,006 - - - 5,582,281 2,495,600 - - 8,813,887 Other - 379,185 - - 32,829 - - 5,199 417,213
Total assets 18,491,402 17,863,762 4,090,901 22,112,575 6,759,473 5,844,109 5,584,104 483,586 81,229,912
LIABILITIESAccounts payable / accrued liabilities 12,027 1,047,918 2,135 155,707 947,394 670,775 968,594 107,132 3,911,682 Accrued wages and benefits 114,127 135,393 13,213 2,391,006 91,347 12,574 467,697 10,357 3,235,714 Deposits and connection fees - 142,749 - - 266,289 - 26,742 - 435,780 Unearned revenue - - - - 2,740,213 384,127 3,511,929 - 6,636,269
Total liabilities 126,154 1,326,060 15,348 2,546,713 4,045,243 1,067,476 4,974,962 117,489 14,219,445
DEFERRED INFLOWS OF RESOURCESUnavailable property taxes - - - 492,385 - - - - 492,385 Unavailable fees 180,000 - - - - - - - 180,000 Unavailable grant revenues - - - 0 2,619,638 - - - 2,619,638
Total deferred inflows of resources 180,000 - - 492,385 2,619,638 - - - 3,292,023 Total liabilities and deferred inflows of resources 306,154 1,326,060 15,348 3,039,098 6,664,881 1,067,476 4,974,962 117,489 17,511,468
FUND BALANCESNonspendable:
Inventory - - - 448,411 - - 137,744 - 586,155 Prepaid items - - - 1,248,000 500 - - - 1,248,500 Long-term receivables:
Noncurrent economic development loans - - - - 240,823 - - - 240,823 Noncurrent housing loans 14,560,905 - - - - - - - 14,560,905
Restricted for:Forest conservation - - 4,075,553 - - - - - 4,075,553 Fire & rescue services - - 17,377,066 - - - - 17,377,066 Speed enforcement - - - - - - - 366,097 366,097 Catalyst loan program - - - - 357,032 - - - 357,032 Middle Patuxent environmental area program - - - - 44,773 - - - 44,773 Economic development initiatives - - - - 1,028,414 - - - 1,028,414
Committed for:Community renewal programs 3,624,343 - - - - - - - 3,624,343 Environmental services - 16,537,702 - - - - - - 16,537,702 Health department - - - - - 4,776,633 - - 4,776,633 Recreation programs - - - - - - 471,398 - 471,398
Unassigned - - - - (1,576,950) - - - (1,576,950) Total fund balances 18,185,248 16,537,702 4,075,553 19,073,477 94,592 4,776,633 609,142 366,097 63,718,444
Total liabilities, deferred inflows and fund balances 18,491,402$ 17,863,762 4,090,901 22,112,575 6,759,473 5,844,109 5,584,104 483,586 81,229,912
The accompanying notes are an integral part of these financial statements.
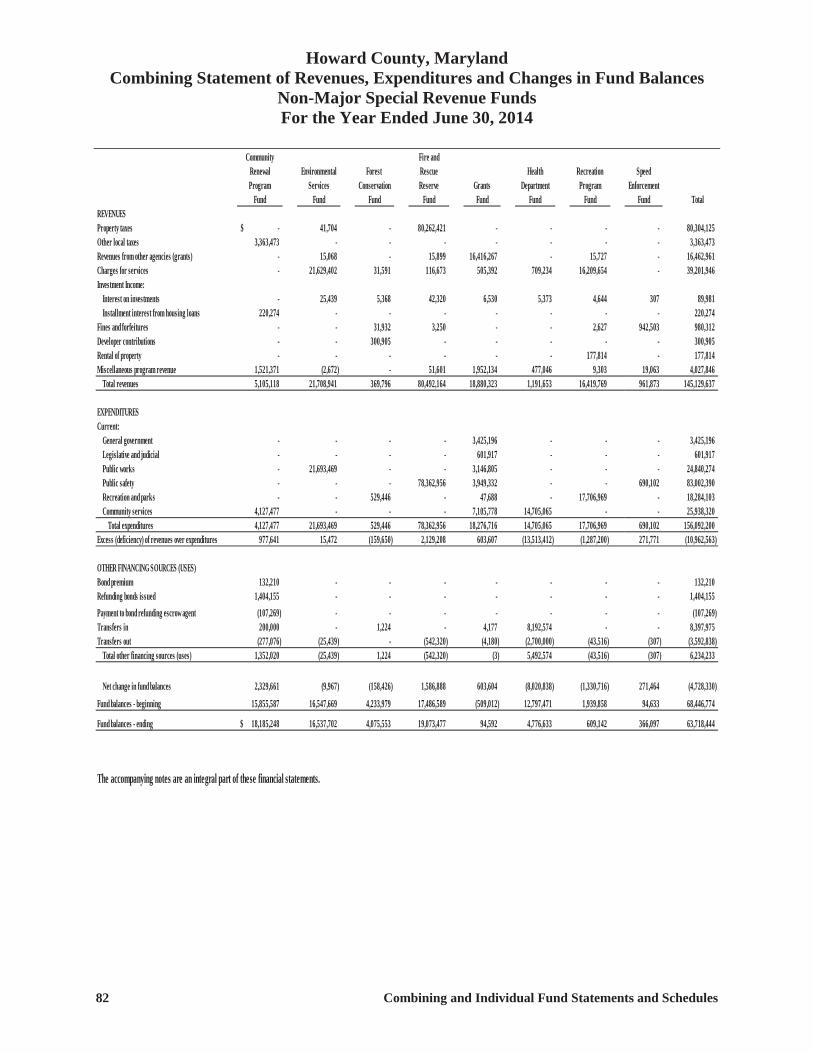
Howard County, Maryland Combining Statement of Revenues, Expenditures and Changes in Fund Balances
Non-Major Special Revenue Funds For the Year Ended June 30, 2014
82 Combining and Individual Fund Statements and Schedules
Community Fire andRenewal Environmental Forest Rescue Health Recreation SpeedProgram Services Conservation Reserve Grants Department Program Enforcement
Fund Fund Fund Fund Fund Fund Fund Fund TotalREVENUESProperty taxes -$ 41,704 - 80,262,421 - - - - 80,304,125Other local taxes 3,363,473 - - - - - - - 3,363,473Revenues from other agencies (grants) - 15,068 - 15,899 16,416,267 - 15,727 - 16,462,961Charges for services - 21,629,402 31,591 116,673 505,392 709,234 16,209,654 - 39,201,946Investment Income:
Interest on investments - 25,439 5,368 42,320 6,530 5,373 4,644 307 89,981Installment interest from housing loans 220,274 - - - - - - - 220,274
Fines and forfeitures - - 31,932 3,250 - - 2,627 942,503 980,312Developer contributions - - 300,905 - - - - - 300,905Rental of property - - - - - - 177,814 - 177,814Miscellaneous program revenue 1,521,371 (2,672) - 51,601 1,952,134 477,046 9,303 19,063 4,027,846
Total revenues 5,105,118 21,708,941 369,796 80,492,164 18,880,323 1,191,653 16,419,769 961,873 145,129,637
EXPENDITURESCurrent:
General government - - - - 3,425,196 - - - 3,425,196Legislative and judicial - - - - 601,917 - - - 601,917Public works - 21,693,469 - - 3,146,805 - - - 24,840,274Public safety - - - 78,362,956 3,949,332 - - 690,102 83,002,390Recreation and parks - - 529,446 - 47,688 - 17,706,969 - 18,284,103Community services 4,127,477 - - - 7,105,778 14,705,065 - - 25,938,320
Total expenditures 4,127,477 21,693,469 529,446 78,362,956 18,276,716 14,705,065 17,706,969 690,102 156,092,200Excess (deficiency) of revenues over expenditures 977,641 15,472 (159,650) 2,129,208 603,607 (13,513,412) (1,287,200) 271,771 (10,962,563)
OTHER FINANCING SOURCES (USES)Bond premium 132,210 - - - - - - - 132,210Refunding bonds issued 1,404,155 - - - - - - - 1,404,155Payment to bond refunding escrow agent (107,269) - - - - - - - (107,269)Transfers in 200,000 - 1,224 - 4,177 8,192,574 - - 8,397,975Transfers out (277,076) (25,439) - (542,320) (4,180) (2,700,000) (43,516) (307) (3,592,838)
Total other financing sources (uses) 1,352,020 (25,439) 1,224 (542,320) (3) 5,492,574 (43,516) (307) 6,234,233
Net change in fund balances 2,329,661 (9,967) (158,426) 1,586,888 603,604 (8,020,838) (1,330,716) 271,464 (4,728,330)Fund balances - beginning 15,855,587 16,547,669 4,233,979 17,486,589 (509,012) 12,797,471 1,939,858 94,633 68,446,774
Fund balances - ending 18,185,248$ 16,537,702 4,075,553 19,073,477 94,592 4,776,633 609,142 366,097 63,718,444
The accompanying notes are an integral part of these financial statements.
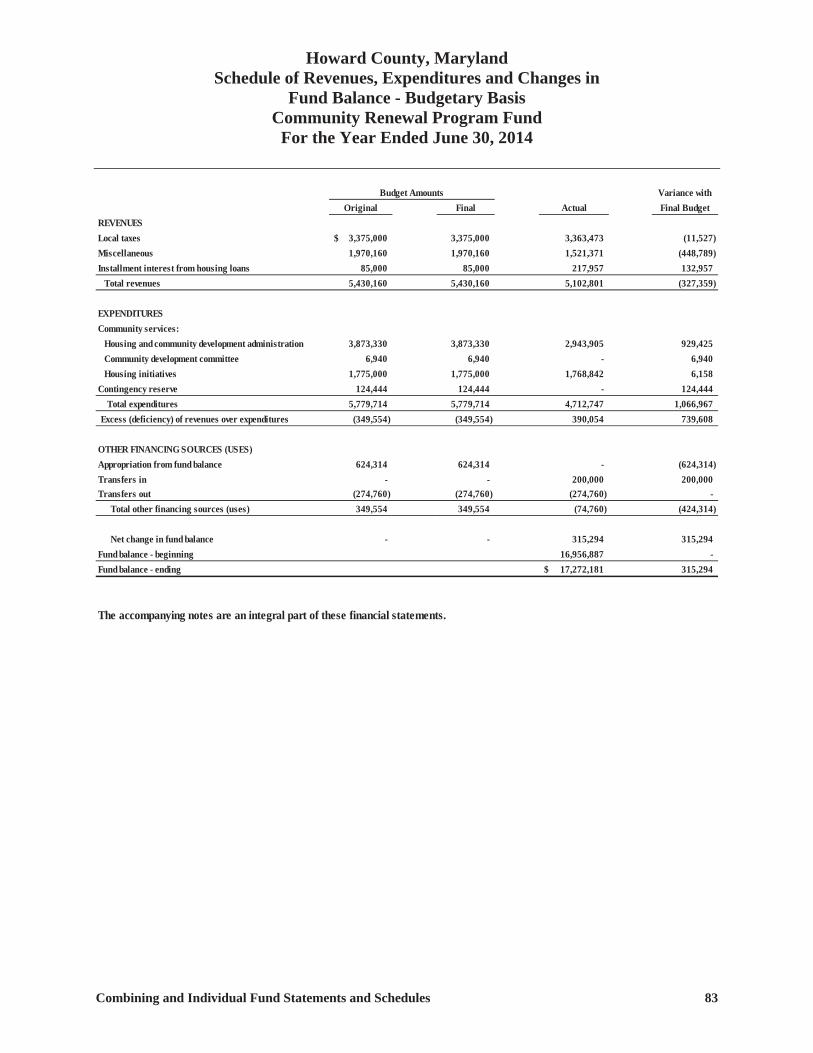
Howard County, Maryland Schedule of Revenues, Expenditures and Changes in
Fund Balance - Budgetary Basis Community Renewal Program Fund
For the Year Ended June 30, 2014
Combining and Individual Fund Statements and Schedules 83
Variance withOriginal Final Actual Final Budget
REVENUESLocal taxes 3,375,000$ 3,375,000 3,363,473 (11,527) Miscellaneous 1,970,160 1,970,160 1,521,371 (448,789) Installment interest from housing loans 85,000 85,000 217,957 132,957
Total revenues 5,430,160 5,430,160 5,102,801 (327,359)
EXPENDITURESCommunity services:
Housing and community development administration 3,873,330 3,873,330 2,943,905 929,425 Community development committee 6,940 6,940 - 6,940 Housing initiatives 1,775,000 1,775,000 1,768,842 6,158
Contingency reserve 124,444 124,444 - 124,444 Total expenditures 5,779,714 5,779,714 4,712,747 1,066,967
Excess (deficiency) of revenues over expenditures (349,554) (349,554) 390,054 739,608
OTHER FINANCING SOURCES (USES)Appropriation from fund balance 624,314 624,314 - (624,314) Transfers in - - 200,000 200,000 Transfers out (274,760) (274,760) (274,760) -
Total other financing sources (uses) 349,554 349,554 (74,760) (424,314)
Net change in fund balance - - 315,294 315,294 Fund balance - beginning 16,956,887 - Fund balance - ending 17,272,181$ 315,294
The accompanying notes are an integral part of these financial statements.
Budget Amounts
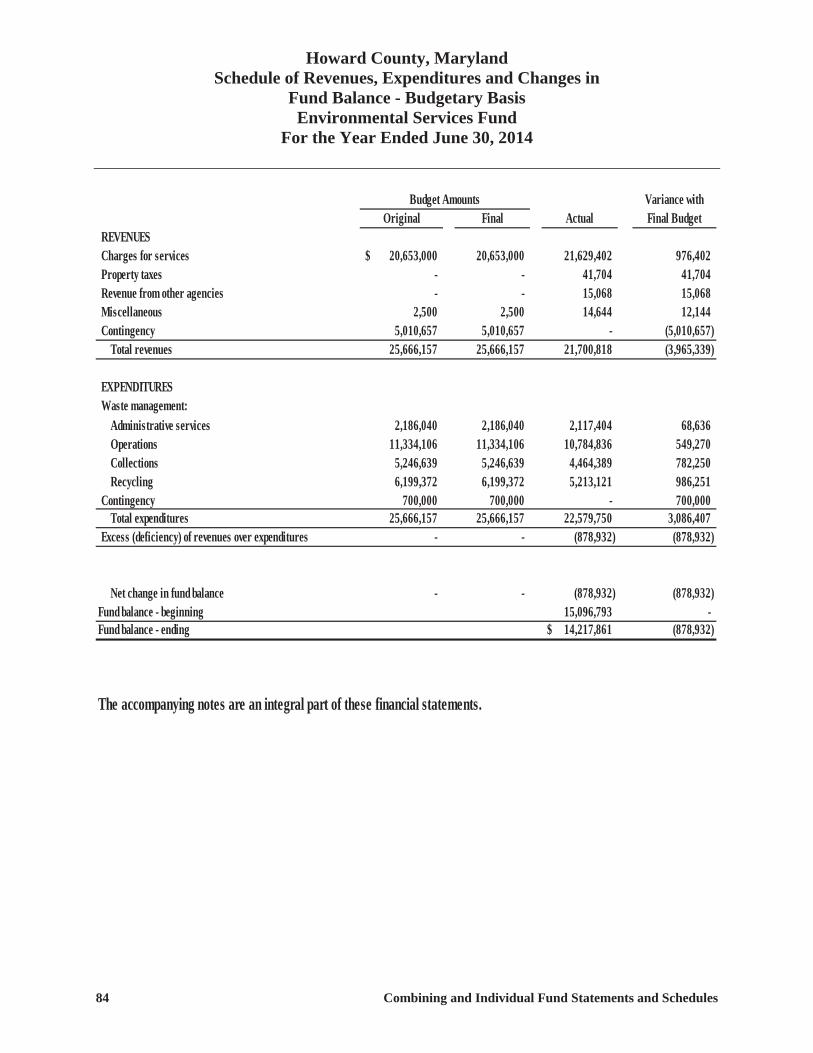
Howard County, Maryland Schedule of Revenues, Expenditures and Changes in
Fund Balance - Budgetary Basis Environmental Services Fund
For the Year Ended June 30, 2014
84 Combining and Individual Fund Statements and Schedules
Variance withOriginal Final Actual Final Budget
REVENUESCharges for services 20,653,000$ 20,653,000 21,629,402 976,402 Property taxes - - 41,704 41,704 Revenue from other agencies - - 15,068 15,068 Miscellaneous 2,500 2,500 14,644 12,144 Contingency 5,010,657 5,010,657 - (5,010,657)
Total revenues 25,666,157 25,666,157 21,700,818 (3,965,339)
EXPENDITURESWaste management:
Administrative services 2,186,040 2,186,040 2,117,404 68,636 Operations 11,334,106 11,334,106 10,784,836 549,270 Collections 5,246,639 5,246,639 4,464,389 782,250 Recycling 6,199,372 6,199,372 5,213,121 986,251
Contingency 700,000 700,000 - 700,000 Total expenditures 25,666,157 25,666,157 22,579,750 3,086,407
Excess (deficiency) of revenues over expenditures - - (878,932) (878,932)
Net change in fund balance - - (878,932) (878,932) Fund balance - beginning 15,096,793 - Fund balance - ending 14,217,861$ (878,932)
The accompanying notes are an integral part of these financial statements.
Budget Amounts
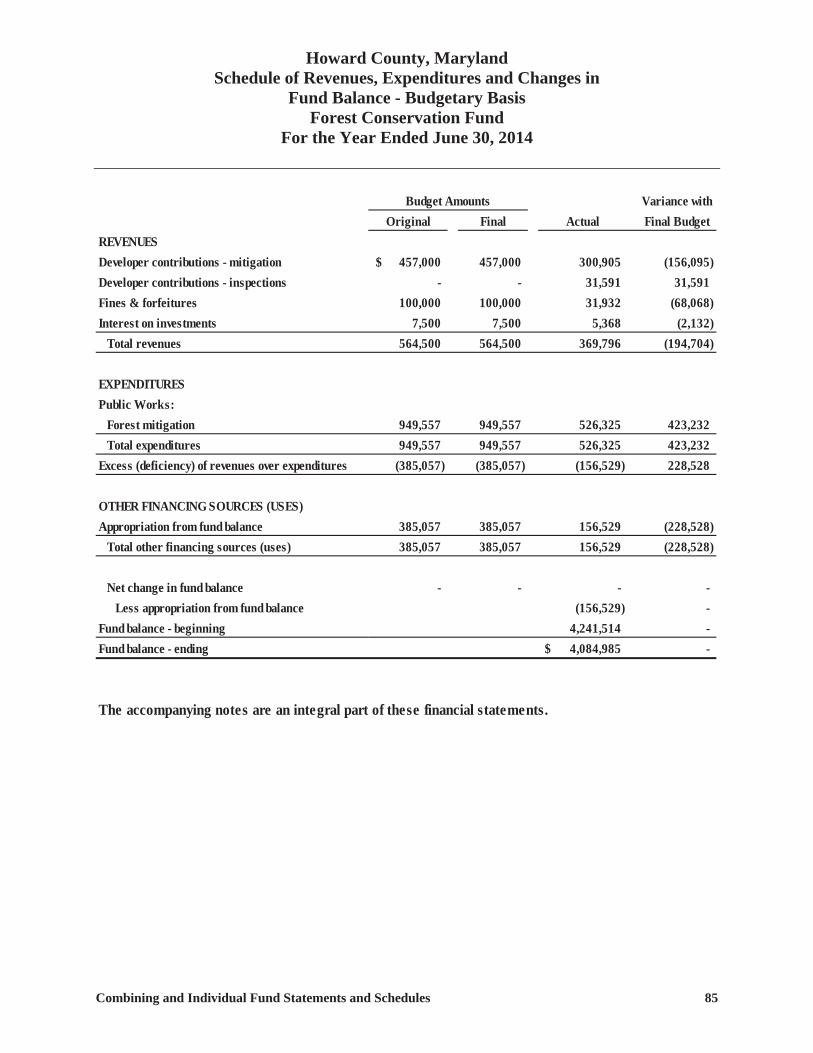
Howard County, Maryland Schedule of Revenues, Expenditures and Changes in
Fund Balance - Budgetary Basis Forest Conservation Fund
For the Year Ended June 30, 2014
Combining and Individual Fund Statements and Schedules 85
Budget Amounts Variance withOriginal Final Actual Final Budget
REVENUESDeveloper contributions - mitigation 457,000$ 457,000 300,905 (156,095) Developer contributions - inspections - - 31,591 31,591 Fines & forfeitures 100,000 100,000 31,932 (68,068) Interest on investments 7,500 7,500 5,368 (2,132)
Total revenues 564,500 564,500 369,796 (194,704)
EXPENDITURESPublic Works:
Forest mitigation 949,557 949,557 526,325 423,232 Total expenditures 949,557 949,557 526,325 423,232
Excess (deficiency) of revenues over expenditures (385,057) (385,057) (156,529) 228,528
OTHER FINANCING SOURCES (USES)Appropriation from fund balance 385,057 385,057 156,529 (228,528)
Total other financing sources (uses) 385,057 385,057 156,529 (228,528)
Net change in fund balance - - - - Less appropriation from fund balance (156,529) -
Fund balance - beginning 4,241,514 - Fund balance - ending 4,084,985$ -
The accompanying notes are an integral part of these financial statements.
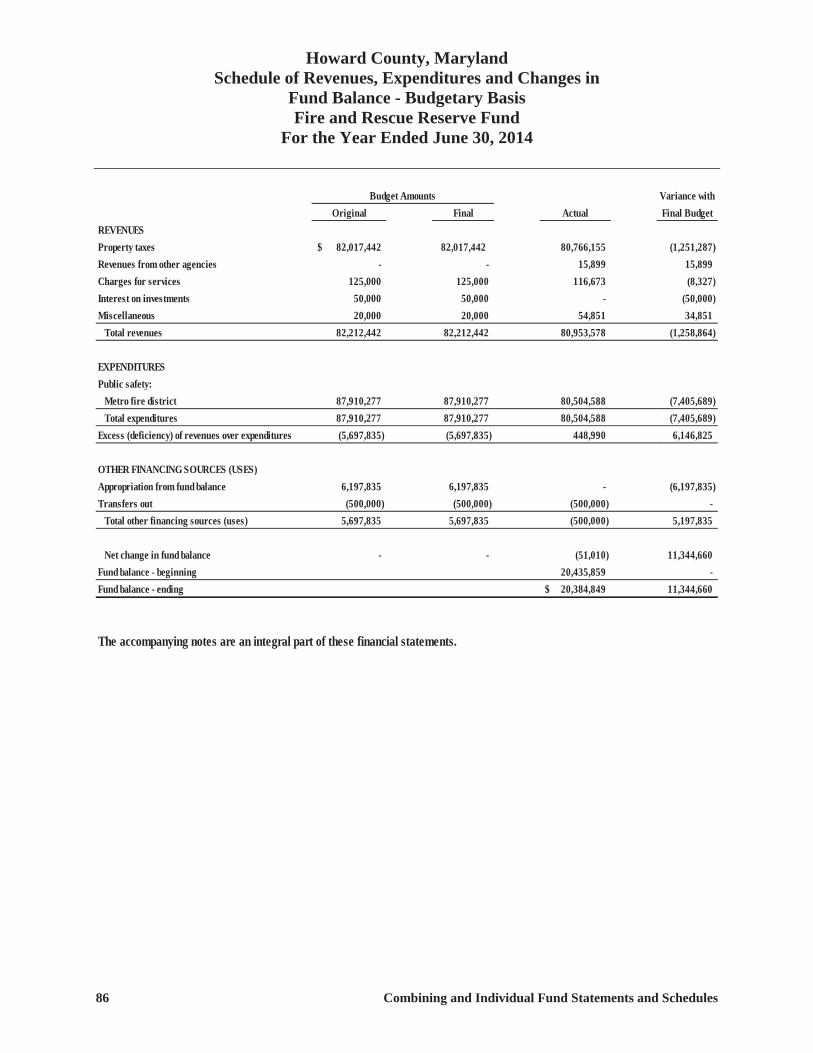
Howard County, Maryland Schedule of Revenues, Expenditures and Changes in
Fund Balance - Budgetary Basis Fire and Rescue Reserve Fund
For the Year Ended June 30, 2014
86 Combining and Individual Fund Statements and Schedules
Budget Amounts Variance withOriginal Final Actual Final Budget
REVENUESProperty taxes 82,017,442$ 82,017,442 80,766,155 (1,251,287) Revenues from other agencies - - 15,899 15,899 Charges for services 125,000 125,000 116,673 (8,327) Interest on investments 50,000 50,000 - (50,000) Miscellaneous 20,000 20,000 54,851 34,851
Total revenues 82,212,442 82,212,442 80,953,578 (1,258,864)
EXPENDITURESPublic safety:
Metro fire district 87,910,277 87,910,277 80,504,588 (7,405,689) Total expenditures 87,910,277 87,910,277 80,504,588 (7,405,689)
Excess (deficiency) of revenues over expenditures (5,697,835) (5,697,835) 448,990 6,146,825
OTHER FINANCING SOURCES (USES)Appropriation from fund balance 6,197,835 6,197,835 - (6,197,835) Transfers out (500,000) (500,000) (500,000) -
Total other financing sources (uses) 5,697,835 5,697,835 (500,000) 5,197,835
Net change in fund balance - - (51,010) 11,344,660Fund balance - beginning 20,435,859 - Fund balance - ending 20,384,849$ 11,344,660
The accompanying notes are an integral part of these financial statements.
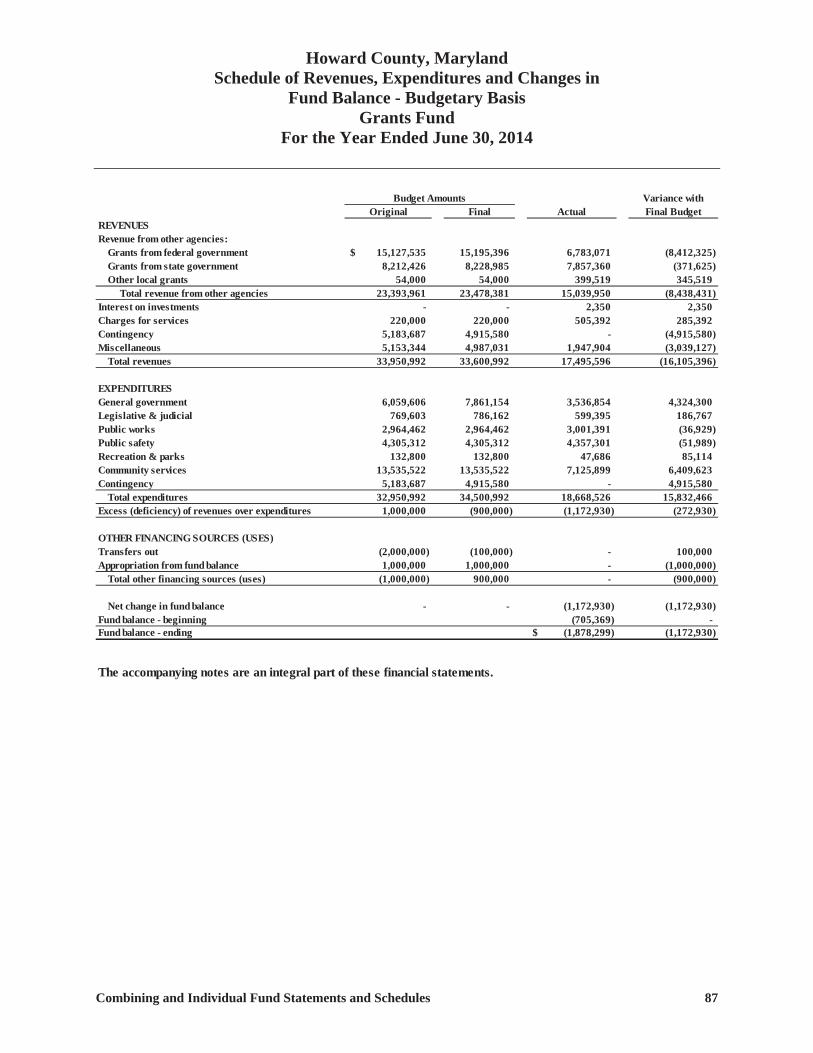
Howard County, Maryland Schedule of Revenues, Expenditures and Changes in
Fund Balance - Budgetary Basis Grants Fund
For the Year Ended June 30, 2014
Combining and Individual Fund Statements and Schedules 87
Budget Amounts Variance withOriginal Final Actual Final Budget
REVENUESRevenue from other agencies:
Grants from federal government 15,127,535$ 15,195,396 6,783,071 (8,412,325) Grants from state government 8,212,426 8,228,985 7,857,360 (371,625) Other local grants 54,000 54,000 399,519 345,519
Total revenue from other agencies 23,393,961 23,478,381 15,039,950 (8,438,431) Interest on investments - - 2,350 2,350 Charges for services 220,000 220,000 505,392 285,392 Contingency 5,183,687 4,915,580 - (4,915,580) Miscellaneous 5,153,344 4,987,031 1,947,904 (3,039,127)
Total revenues 33,950,992 33,600,992 17,495,596 (16,105,396)
EXPENDITURESGeneral government 6,059,606 7,861,154 3,536,854 4,324,300 Legislative & judicial 769,603 786,162 599,395 186,767 Public works 2,964,462 2,964,462 3,001,391 (36,929) Public safety 4,305,312 4,305,312 4,357,301 (51,989) Recreation & parks 132,800 132,800 47,686 85,114 Community services 13,535,522 13,535,522 7,125,899 6,409,623 Contingency 5,183,687 4,915,580 - 4,915,580
Total expenditures 32,950,992 34,500,992 18,668,526 15,832,466 Excess (deficiency) of revenues over expenditures 1,000,000 (900,000) (1,172,930) (272,930)
OTHER FINANCING SOURCES (USES)Transfers out (2,000,000) (100,000) - 100,000 Appropriation from fund balance 1,000,000 1,000,000 - (1,000,000)
Total other financing sources (uses) (1,000,000) 900,000 - (900,000)
Net change in fund balance - - (1,172,930) (1,172,930) Fund balance - beginning (705,369) - Fund balance - ending (1,878,299)$ (1,172,930)
The accompanying notes are an integral part of these financial statements.
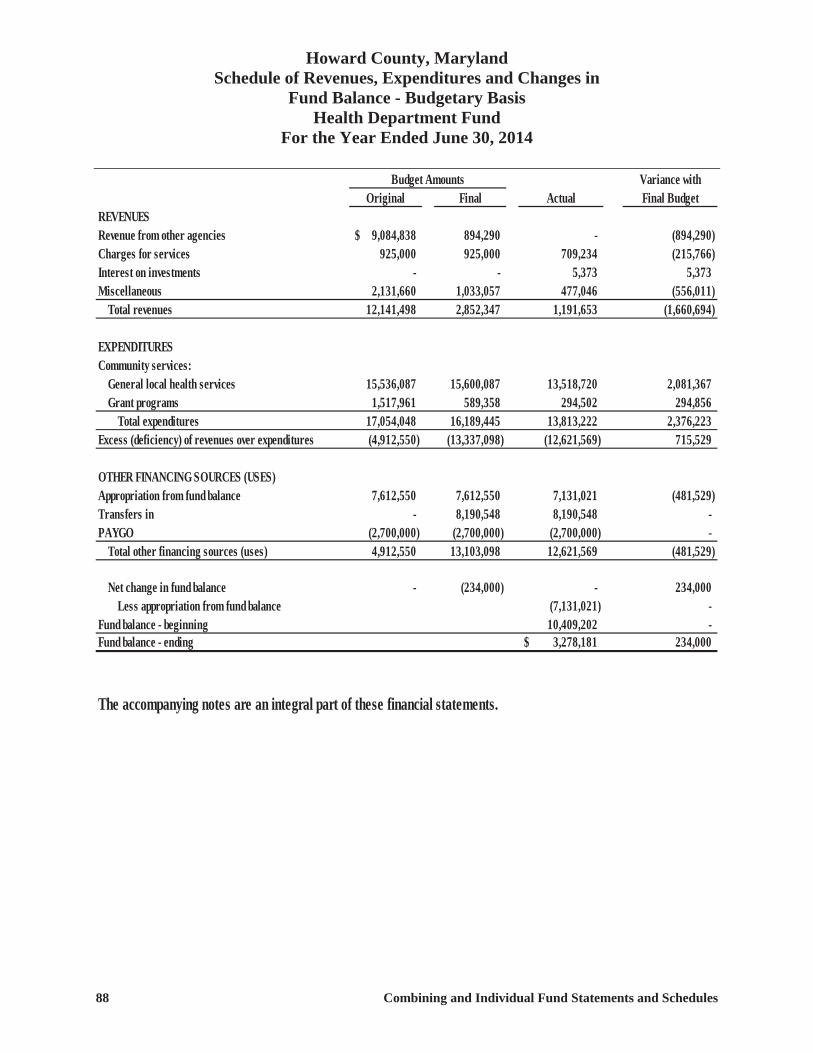
Howard County, Maryland Schedule of Revenues, Expenditures and Changes in
Fund Balance - Budgetary Basis Health Department Fund
For the Year Ended June 30, 2014
88 Combining and Individual Fund Statements and Schedules
Budget Amounts Variance withOriginal Final Actual Final Budget
REVENUESRevenue from other agencies 9,084,838$ 894,290 - (894,290) Charges for services 925,000 925,000 709,234 (215,766) Interest on investments - - 5,373 5,373 Miscellaneous 2,131,660 1,033,057 477,046 (556,011)
Total revenues 12,141,498 2,852,347 1,191,653 (1,660,694)
EXPENDITURESCommunity services:
General local health services 15,536,087 15,600,087 13,518,720 2,081,367 Grant programs 1,517,961 589,358 294,502 294,856
Total expenditures 17,054,048 16,189,445 13,813,222 2,376,223 Excess (deficiency) of revenues over expenditures (4,912,550) (13,337,098) (12,621,569) 715,529
OTHER FINANCING SOURCES (USES)Appropriation from fund balance 7,612,550 7,612,550 7,131,021 (481,529) Transfers in - 8,190,548 8,190,548 - PAYGO (2,700,000) (2,700,000) (2,700,000) -
Total other financing sources (uses) 4,912,550 13,103,098 12,621,569 (481,529)
Net change in fund balance - (234,000) - 234,000 Less appropriation from fund balance (7,131,021) -
Fund balance - beginning 10,409,202 - Fund balance - ending 3,278,181$ 234,000
GAAP Revenues (A614) 13,004,640 2,282,678 The accompanying notes are an integral part of these financial statements.
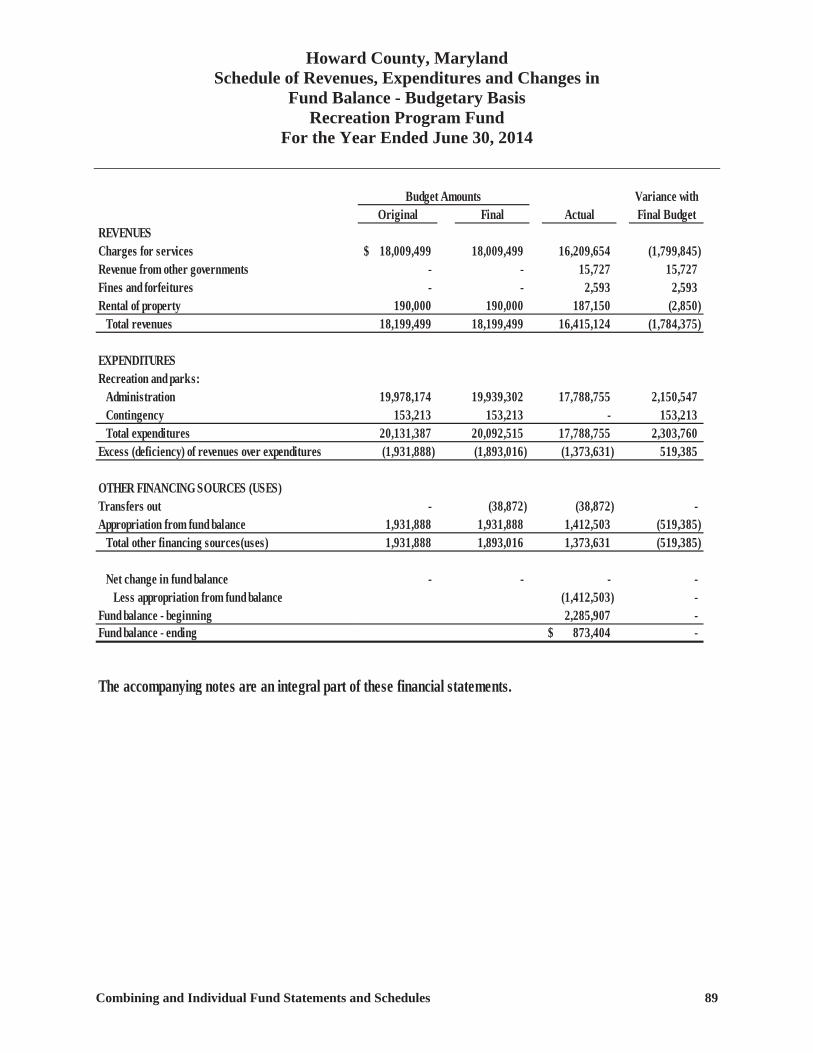
Howard County, Maryland Schedule of Revenues, Expenditures and Changes in
Fund Balance - Budgetary Basis Recreation Program Fund
For the Year Ended June 30, 2014
Combining and Individual Fund Statements and Schedules 89
Budget Amounts Variance withOriginal Final Actual Final Budget
REVENUESCharges for services 18,009,499$ 18,009,499 16,209,654 (1,799,845) Revenue from other governments - - 15,727 15,727 Fines and forfeitures - - 2,593 2,593 Rental of property 190,000 190,000 187,150 (2,850)
Total revenues 18,199,499 18,199,499 16,415,124 (1,784,375)
EXPENDITURESRecreation and parks:
Administration 19,978,174 19,939,302 17,788,755 2,150,547 Contingency 153,213 153,213 - 153,213 Total expenditures 20,131,387 20,092,515 17,788,755 2,303,760
Excess (deficiency) of revenues over expenditures (1,931,888) (1,893,016) (1,373,631) 519,385
OTHER FINANCING SOURCES (USES)Transfers out - (38,872) (38,872) - Appropriation from fund balance 1,931,888 1,931,888 1,412,503 (519,385)
Total other financing sources(uses) 1,931,888 1,893,016 1,373,631 (519,385)
Net change in fund balance - - - - Less appropriation from fund balance (1,412,503) -
Fund balance - beginning 2,285,907 - Fund balance - ending 873,404$ -
The accompanying notes are an integral part of these financial statements.
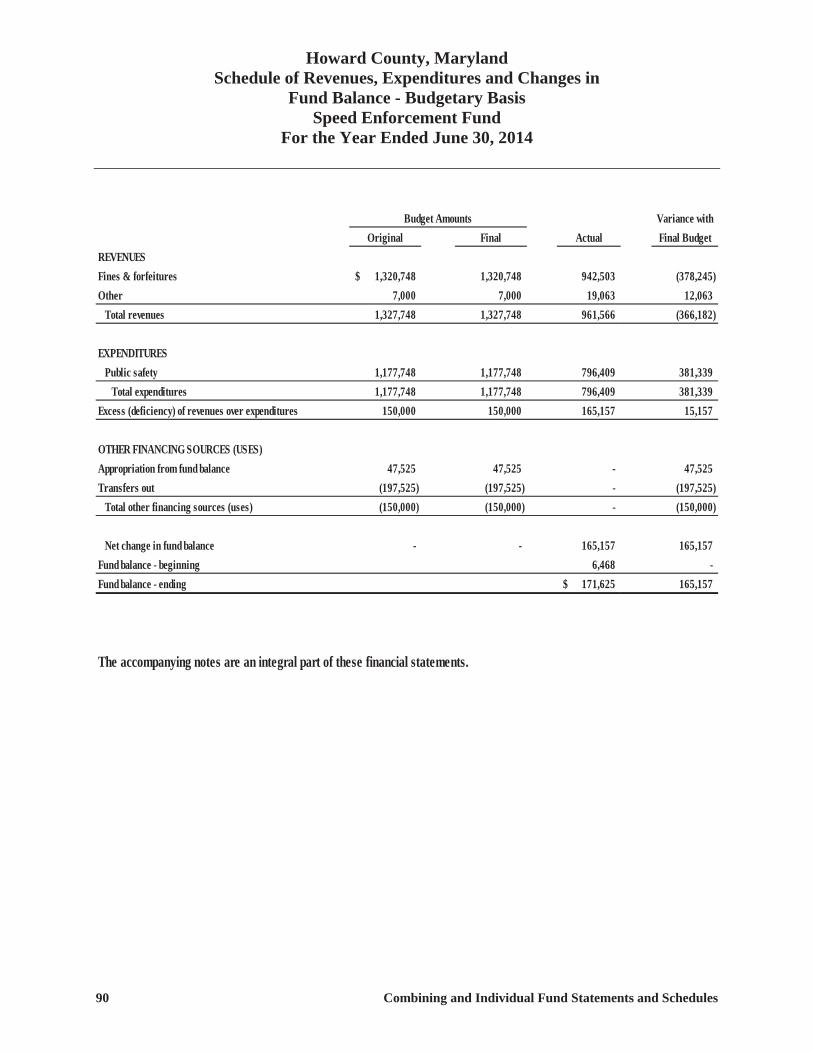
Howard County, Maryland Schedule of Revenues, Expenditures and Changes in
Fund Balance - Budgetary Basis Speed Enforcement Fund
For the Year Ended June 30, 2014
90 Combining and Individual Fund Statements and Schedules
Budget Amounts Variance withOriginal Final Actual Final Budget
REVENUESFines & forfeitures 1,320,748$ 1,320,748 942,503 (378,245) Other 7,000 7,000 19,063 12,063
Total revenues 1,327,748 1,327,748 961,566 (366,182)
EXPENDITURESPublic safety 1,177,748 1,177,748 796,409 381,339
Total expenditures 1,177,748 1,177,748 796,409 381,339 Excess (deficiency) of revenues over expenditures 150,000 150,000 165,157 15,157
OTHER FINANCING SOURCES (USES)Appropriation from fund balance 47,525 47,525 - 47,525 Transfers out (197,525) (197,525) - (197,525)
Total other financing sources (uses) (150,000) (150,000) - (150,000)
Net change in fund balance - - 165,157 165,157 Fund balance - beginning 6,468 - Fund balance - ending 171,625$ 165,157
The accompanying notes are an integral part of these financial statements.
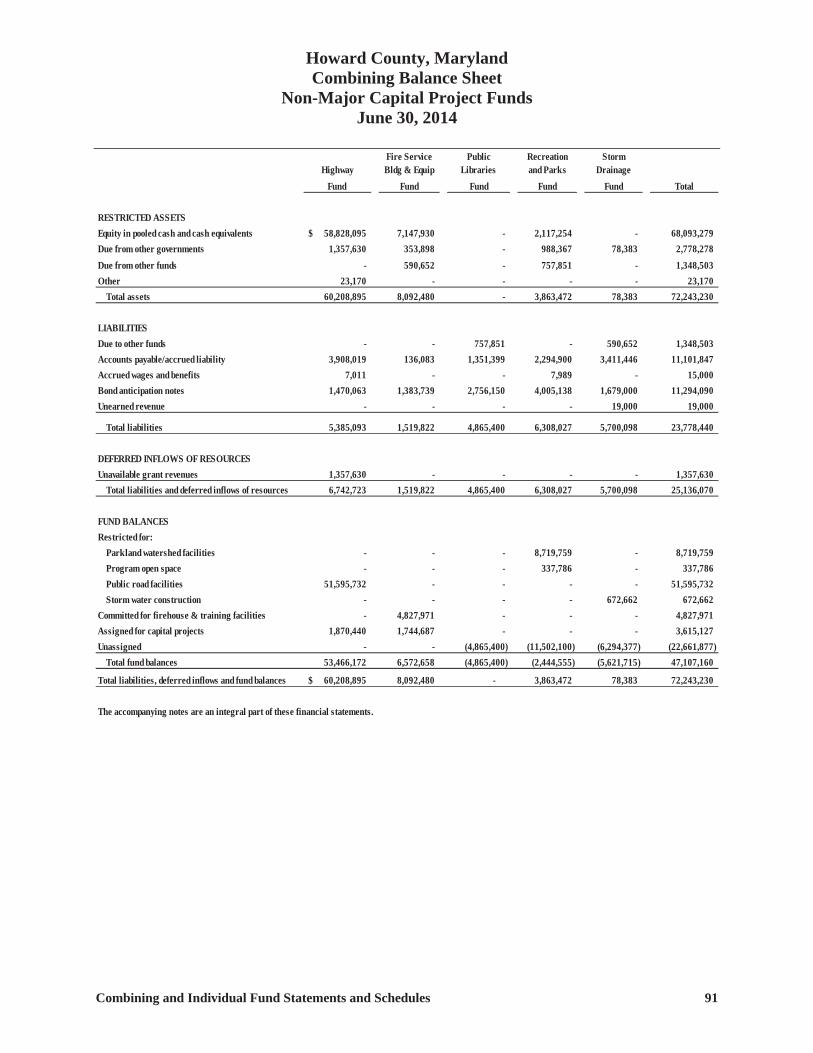
Howard County, Maryland Combining Balance Sheet
Non-Major Capital Project Funds June 30, 2014
Combining and Individual Fund Statements and Schedules 91
Fire Service Public Recreation StormHighway Bldg & Equip Libraries and Parks Drainage
Fund Fund Fund Fund Fund Total
RESTRICTED ASSETSEquity in pooled cash and cash equivalents 58,828,095$ 7,147,930 - 2,117,254 - 68,093,279 Due from other governments 1,357,630 353,898 - 988,367 78,383 2,778,278 Due from other funds - 590,652 - 757,851 - 1,348,503 Other 23,170 - - - - 23,170
Total assets 60,208,895 8,092,480 - 3,863,472 78,383 72,243,230
LIABILITIESDue to other funds - - 757,851 - 590,652 1,348,503 Accounts payable/accrued liability 3,908,019 136,083 1,351,399 2,294,900 3,411,446 11,101,847 Accrued wages and benefits 7,011 - - 7,989 - 15,000 Bond anticipation notes 1,470,063 1,383,739 2,756,150 4,005,138 1,679,000 11,294,090 Unearned revenue - - - - 19,000 19,000
Total liabilities 5,385,093 1,519,822 4,865,400 6,308,027 5,700,098 23,778,440
DEFERRED INFLOWS OF RESOURCESUnavailable grant revenues 1,357,630 - - - - 1,357,630
Total liabilities and deferred inflows of resources 6,742,723 1,519,822 4,865,400 6,308,027 5,700,098 25,136,070
FUND BALANCESRestricted for:
Parkland watershed facilities - - - 8,719,759 - 8,719,759 Program open space - - - 337,786 - 337,786 Public road facilities 51,595,732 - - - - 51,595,732 Storm water construction - - - - 672,662 672,662
Committed for firehouse & training facilities - 4,827,971 - - - 4,827,971 Assigned for capital projects 1,870,440 1,744,687 - - - 3,615,127 Unassigned - - (4,865,400) (11,502,100) (6,294,377) (22,661,877)
Total fund balances 53,466,172 6,572,658 (4,865,400) (2,444,555) (5,621,715) 47,107,160
Total liabilities, deferred inflows and fund balances 60,208,895$ 8,092,480 - 3,863,472 78,383 72,243,230 - - - - (0) (0)
The accompanying notes are an integral part of these financial statements.
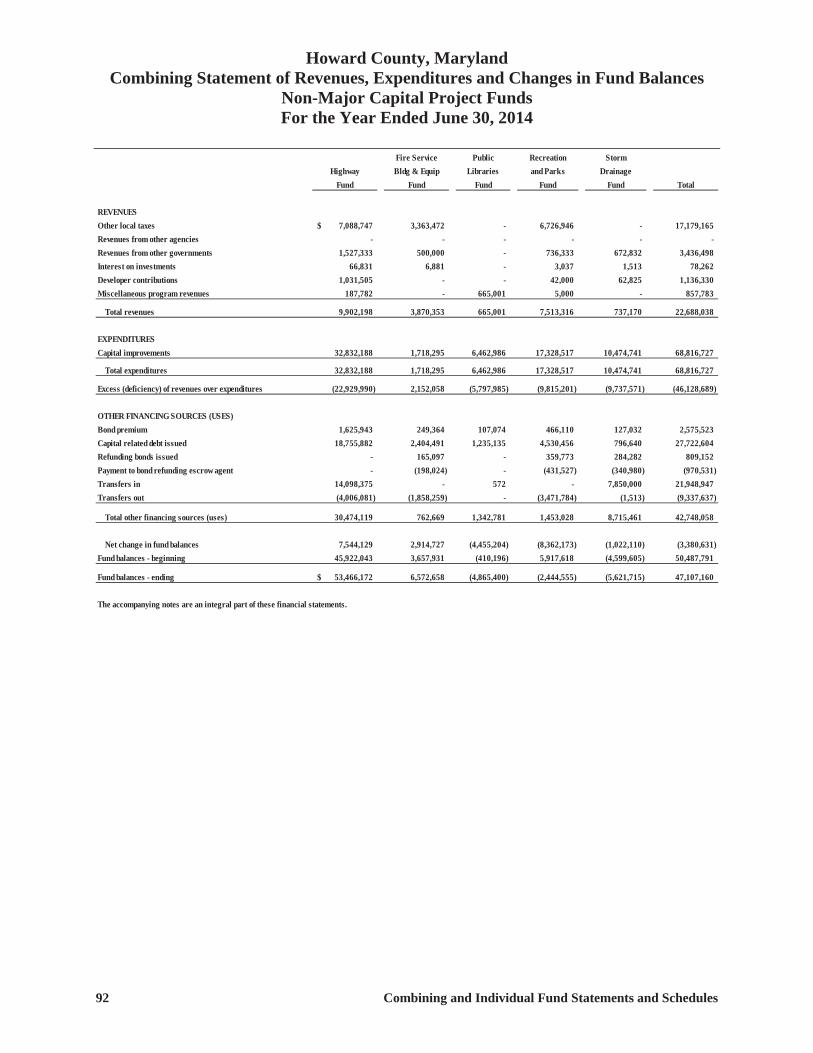
Howard County, Maryland Combining Statement of Revenues, Expenditures and Changes in Fund Balances
Non-Major Capital Project Funds For the Year Ended June 30, 2014
92 Combining and Individual Fund Statements and Schedules
Fire Service Public Recreation StormHighway Bldg & Equip Libraries and Parks Drainage
Fund Fund Fund Fund Fund Total
REVENUESOther local taxes 7,088,747$ 3,363,472 - 6,726,946 - 17,179,165 Revenues from other agencies - - - - - - Revenues from other governments 1,527,333 500,000 - 736,333 672,832 3,436,498 Interest on investments 66,831 6,881 - 3,037 1,513 78,262 Developer contributions 1,031,505 - - 42,000 62,825 1,136,330 Miscellaneous program revenues 187,782 - 665,001 5,000 - 857,783
Total revenues 9,902,198 3,870,353 665,001 7,513,316 737,170 22,688,038
EXPENDITURESCapital improvements 32,832,188 1,718,295 6,462,986 17,328,517 10,474,741 68,816,727
Total expenditures 32,832,188 1,718,295 6,462,986 17,328,517 10,474,741 68,816,727
Excess (deficiency) of revenues over expenditures (22,929,990) 2,152,058 (5,797,985) (9,815,201) (9,737,571) (46,128,689)
OTHER FINANCING SOURCES (USES)Bond premium 1,625,943 249,364 107,074 466,110 127,032 2,575,523 Capital related debt issued 18,755,882 2,404,491 1,235,135 4,530,456 796,640 27,722,604 Refunding bonds issued - 165,097 - 359,773 284,282 809,152 Payment to bond refunding escrow agent - (198,024) - (431,527) (340,980) (970,531) Transfers in 14,098,375 - 572 - 7,850,000 21,948,947 Transfers out (4,006,081) (1,858,259) - (3,471,784) (1,513) (9,337,637)
Total other financing sources (uses) 30,474,119 762,669 1,342,781 1,453,028 8,715,461 42,748,058
Net change in fund balances 7,544,129 2,914,727 (4,455,204) (8,362,173) (1,022,110) (3,380,631) Fund balances - beginning 45,922,043 3,657,931 (410,196) 5,917,618 (4,599,605) 50,487,791
Fund balances - ending 53,466,172$ 6,572,658 (4,865,400) (2,444,555) (5,621,715) 47,107,160
The accompanying notes are an integral part of these financial statements.
Non-major Enterprise Funds
Enterprise funds are used to account for services for which
customers are charged a fee.

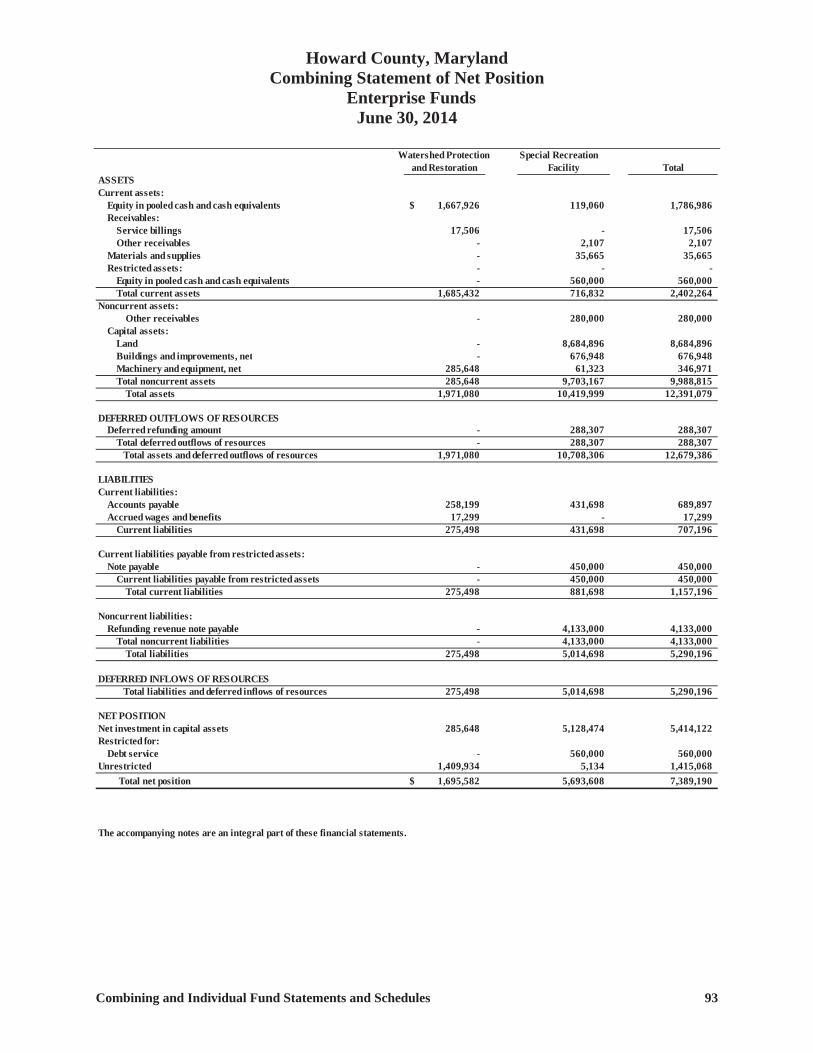
Howard County, Maryland Combining Statement of Net Position
Enterprise Funds June 30, 2014
Combining and Individual Fund Statements and Schedules 93
Watershed Protection Special Recreationand Restoration Facility Total
ASSETSCurrent assets:
Equity in pooled cash and cash equivalents 1,667,926$ 119,060 1,786,986 Receivables:
Service billings 17,506 - 17,506 Other receivables - 2,107 2,107
Materials and supplies - 35,665 35,665 Restricted assets: - - -
Equity in pooled cash and cash equivalents - 560,000 560,000 Total current assets 1,685,432 716,832 2,402,264
Noncurrent assets:Other receivables - 280,000 280,000
Capital assets:Land - 8,684,896 8,684,896 Buildings and improvements, net - 676,948 676,948 Machinery and equipment, net 285,648 61,323 346,971 Total noncurrent assets 285,648 9,703,167 9,988,815
Total assets 1,971,080 10,419,999 12,391,079
DEFERRED OUTFLOWS OF RESOURCES Deferred refunding amount - 288,307 288,307
Total deferred outflows of resources - 288,307 288,307 Total assets and deferred outflows of resources 1,971,080 10,708,306 12,679,386
LIABILITIESCurrent liabilities:
Accounts payable 258,199 431,698 689,897 Accrued wages and benefits 17,299 - 17,299
Current liabilities 275,498 431,698 707,196
Current liabilities payable from restricted assets:Note payable - 450,000 450,000
Current liabilities payable from restricted assets - 450,000 450,000 Total current liabilities 275,498 881,698 1,157,196
Noncurrent liabilities:Refunding revenue note payable - 4,133,000 4,133,000
Total noncurrent liabilities - 4,133,000 4,133,000 Total liabilities 275,498 5,014,698 5,290,196
DEFERRED INFLOWS OF RESOURCES Total liabilities and deferred inflows of resources 275,498 5,014,698 5,290,196
NET POSITIONNet investment in capital assets 285,648 5,128,474 5,414,122 Restricted for:
Debt service - 560,000 560,000 Unrestricted 1,409,934 5,134 1,415,068 Total net position 1,695,582$ 5,693,608 7,389,190
Adjustment to reflect consolidation of internal service fund activities related to enterprise funds 1,884,912 Net position of business-type activities 9,274,102
The accompanying notes are an integral part of these financial statements.
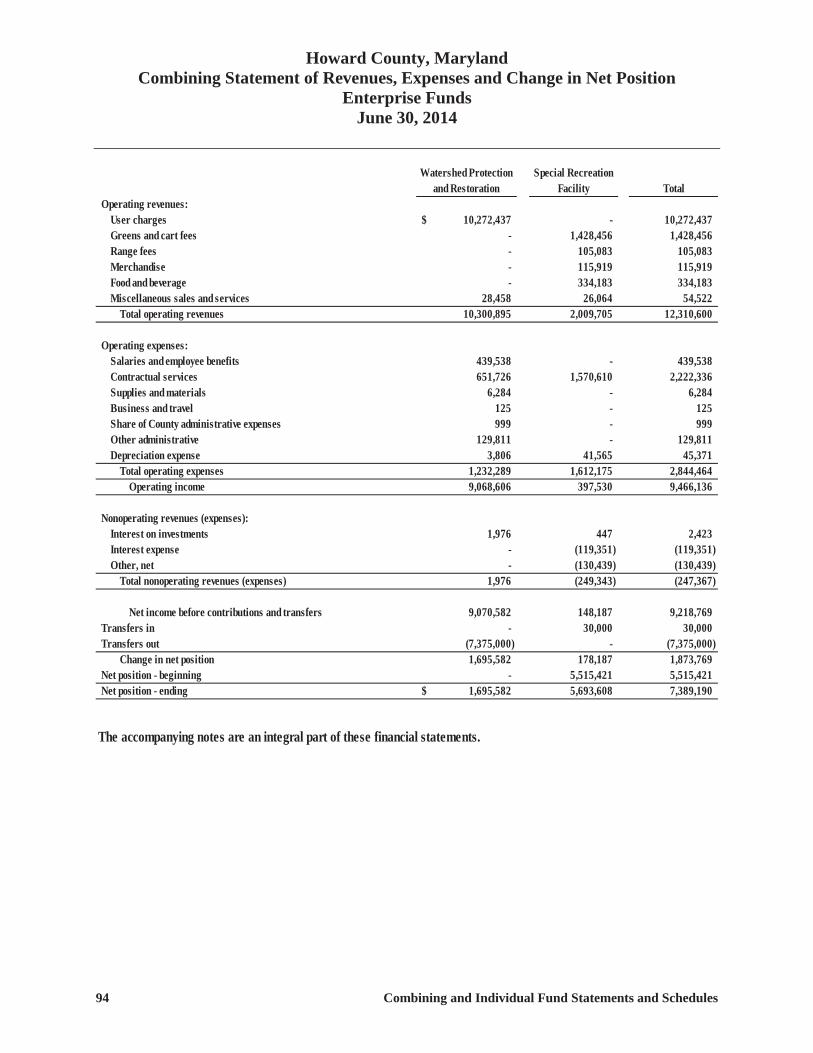
Howard County, Maryland Combining Statement of Revenues, Expenses and Change in Net Position
Enterprise Funds June 30, 2014
94 Combining and Individual Fund Statements and Schedules
Watershed Protection Special Recreationand Restoration Facility Total
Operating revenues:User charges 10,272,437$ - 10,272,437 Greens and cart fees - 1,428,456 1,428,456 Range fees - 105,083 105,083 Merchandise - 115,919 115,919 Food and beverage - 334,183 334,183 Miscellaneous sales and services 28,458 26,064 54,522
Total operating revenues 10,300,895 2,009,705 12,310,600
Operating expenses:Salaries and employee benefits 439,538 - 439,538 Contractual services 651,726 1,570,610 2,222,336 Supplies and materials 6,284 - 6,284 Business and travel 125 - 125 Share of County administrative expenses 999 - 999 Other administrative 129,811 - 129,811 Depreciation expense 3,806 41,565 45,371
Total operating expenses 1,232,289 1,612,175 2,844,464 Operating income 9,068,606 397,530 9,466,136
Nonoperating revenues (expenses):Interest on investments 1,976 447 2,423 Interest expense - (119,351) (119,351) Other, net - (130,439) (130,439)
Total nonoperating revenues (expenses) 1,976 (249,343) (247,367)
Net income before contributions and transfers 9,070,582 148,187 9,218,769 Transfers in - 30,000 30,000 Transfers out (7,375,000) - (7,375,000)
Change in net position 1,695,582 178,187 1,873,769 Net position - beginning - 5,515,421 5,515,421 Net position - ending 1,695,582$ 5,693,608 7,389,190
Adjustment to reflect the consolidation of internal service fund activities related to enterprise fundsChange in net position of business - type activities
The accompanying notes are an integral part of these financial statements.
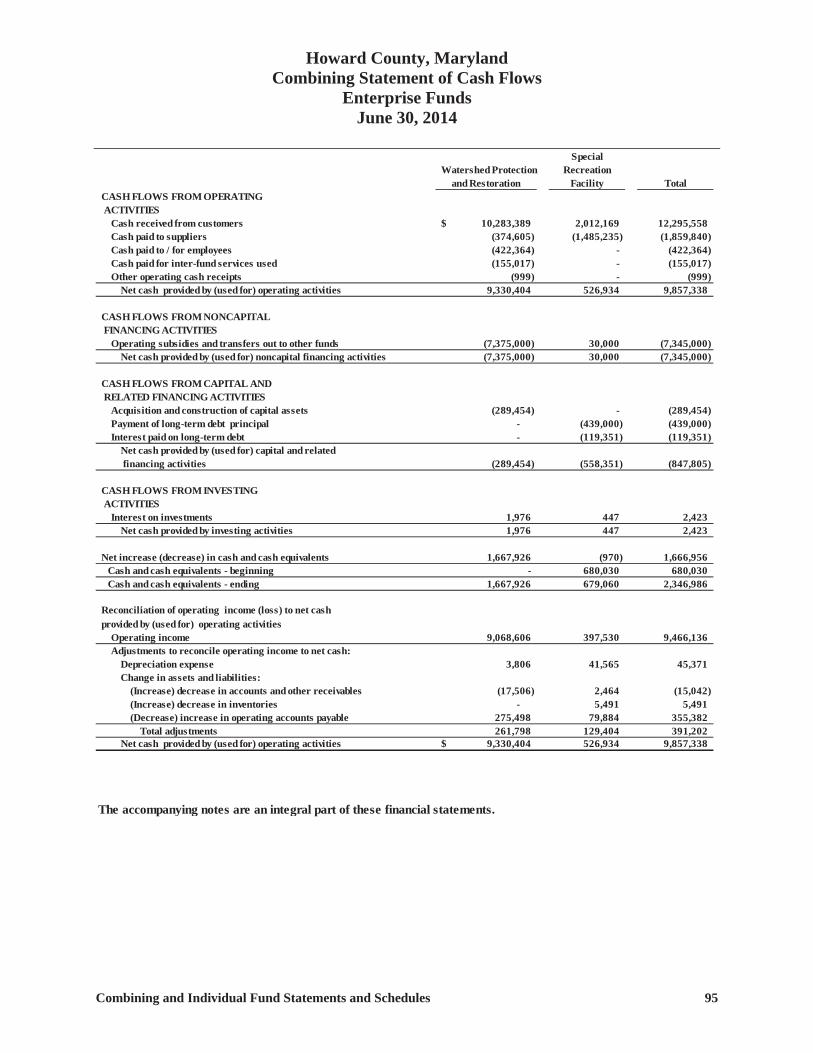
Howard County, Maryland Combining Statement of Cash Flows
Enterprise Funds June 30, 2014
Combining and Individual Fund Statements and Schedules 95
SpecialWatershed Protection Recreation
and Restoration Facility TotalCASH FLOWS FROM OPERATING ACTIVITIES
Cash received from customers 10,283,389$ 2,012,169 12,295,558 Cash paid to suppliers (374,605) (1,485,235) (1,859,840) Cash paid to / for employees (422,364) - (422,364) Cash paid for inter-fund services used (155,017) - (155,017) Other operating cash receipts (999) - (999)
Net cash provided by (used for) operating activities 9,330,404 526,934 9,857,338
CASH FLOWS FROM NONCAPITAL FINANCING ACTIVITIES
Operating subsidies and transfers out to other funds (7,375,000) 30,000 (7,345,000) Net cash provided by (used for) noncapital financing activities (7,375,000) 30,000 (7,345,000)
CASH FLOWS FROM CAPITAL AND RELATED FINANCING ACTIVITIES
Acquisition and construction of capital assets (289,454) - (289,454) Payment of long-term debt principal - (439,000) (439,000) Interest paid on long-term debt - (119,351) (119,351)
Net cash provided by (used for) capital and related financing activities (289,454) (558,351) (847,805)
CASH FLOWS FROM INVESTING ACTIVITIES
Interest on investments 1,976 447 2,423 Net cash provided by investing activities 1,976 447 2,423
Net increase (decrease) in cash and cash equivalents 1,667,926 (970) 1,666,956 Cash and cash equivalents - beginning - 680,030 680,030 Cash and cash equivalents - ending 1,667,926 679,060 2,346,986
Reconciliation of operating income (loss) to net cashprovided by (used for) operating activities
Operating income 9,068,606 397,530 9,466,136 Adjustments to reconcile operating income to net cash:
Depreciation expense 3,806 41,565 45,371 Change in assets and liabilities:
(Increase) decrease in accounts and other receivables (17,506) 2,464 (15,042) (Increase) decrease in inventories - 5,491 5,491 (Decrease) increase in operating accounts payable 275,498 79,884 355,382
Total adjustments 261,798 129,404 391,202 Net cash provided by (used for) operating activities 9,330,404$ 526,934 9,857,338
Noncash investing, capital and financing activities:In Fiscal Year 2014, $9,522,754 was contributed to the water and sewer enterprise fund mainly by developers for water and sewer lines.All investments mature in one year or less so the change in fair value is not determined.
The accompanying notes are an integral part of these financial statements.

Internal Service Funds
Internal service funds are used to account for the financing, on a cost-reimbursement basis, of goods and services provided by one department to other departments within the County.

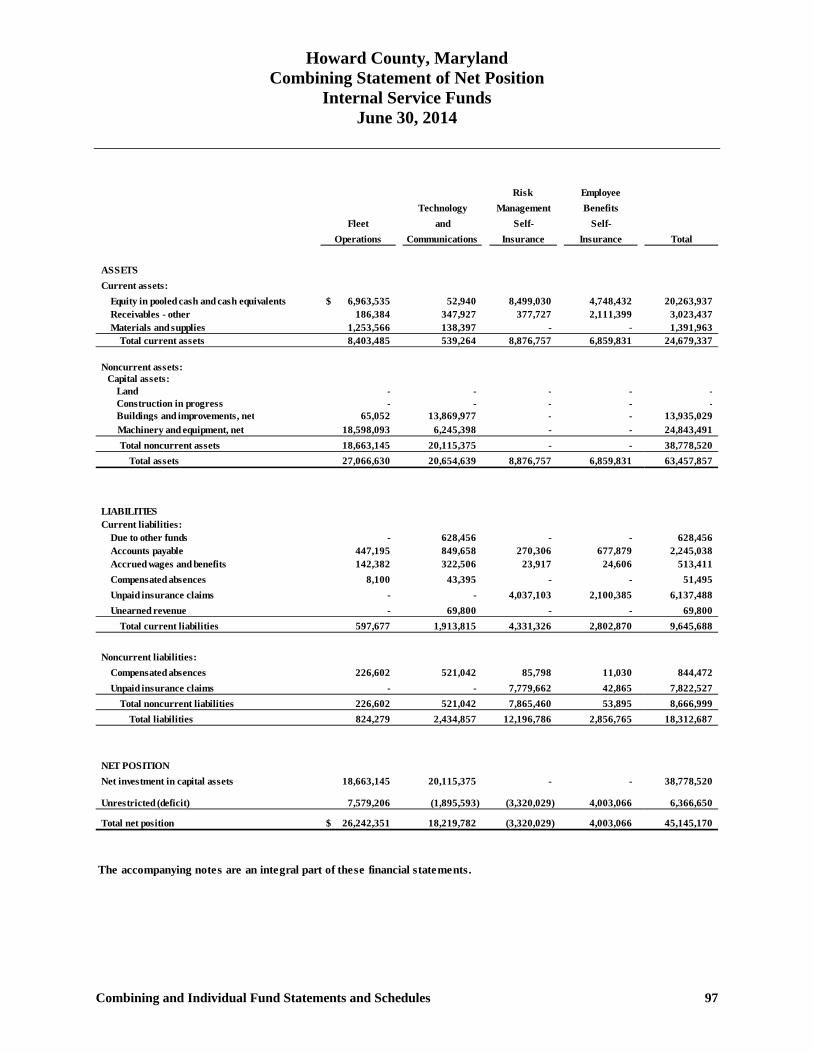
Howard County, Maryland Combining Statement of Net Position
Internal Service Funds June 30, 2014
Combining and Individual Fund Statements and Schedules 97
Risk EmployeeTechnology Management Benefits
Fleet and Self- Self-Operations Communications Insurance Insurance Total
ASSETSCurrent assets:
Equity in pooled cash and cash equivalents 6,963,535$ 52,940 8,499,030 4,748,432 20,263,937 Receivables - other 186,384 347,927 377,727 2,111,399 3,023,437 Materials and supplies 1,253,566 138,397 - - 1,391,963
Total current assets 8,403,485 539,264 8,876,757 6,859,831 24,679,337
Noncurrent assets:Capital assets:
Land - - - - - Construction in progress - - - - - Buildings and improvements, net 65,052 13,869,977 - - 13,935,029
Machinery and equipment, net 18,598,093 6,245,398 - - 24,843,491 Total noncurrent assets 18,663,145 20,115,375 - - 38,778,520
Total assets 27,066,630 20,654,639 8,876,757 6,859,831 63,457,857
LIABILITIESCurrent liabilities:
Due to other funds - 628,456 - - 628,456 Accounts payable 447,195 849,658 270,306 677,879 2,245,038 Accrued wages and benefits 142,382 322,506 23,917 24,606 513,411 Compensated absences 8,100 43,395 - - 51,495 Unpaid insurance claims - - 4,037,103 2,100,385 6,137,488 Unearned revenue - 69,800 - - 69,800
Total current liabilities 597,677 1,913,815 4,331,326 2,802,870 9,645,688
Noncurrent liabilities:Compensated absences 226,602 521,042 85,798 11,030 844,472 Unpaid insurance claims - - 7,779,662 42,865 7,822,527
Total noncurrent liabilities 226,602 521,042 7,865,460 53,895 8,666,999 Total liabilities 824,279 2,434,857 12,196,786 2,856,765 18,312,687
NET POSITIONNet investment in capital assets 18,663,145 20,115,375 - - 38,778,520
Unrestricted (deficit) 7,579,206 (1,895,593) (3,320,029) 4,003,066 6,366,650
Total net position 26,242,351$ 18,219,782 (3,320,029) 4,003,066 45,145,170 - - - - -
The accompanying notes are an integral part of these financial statements.
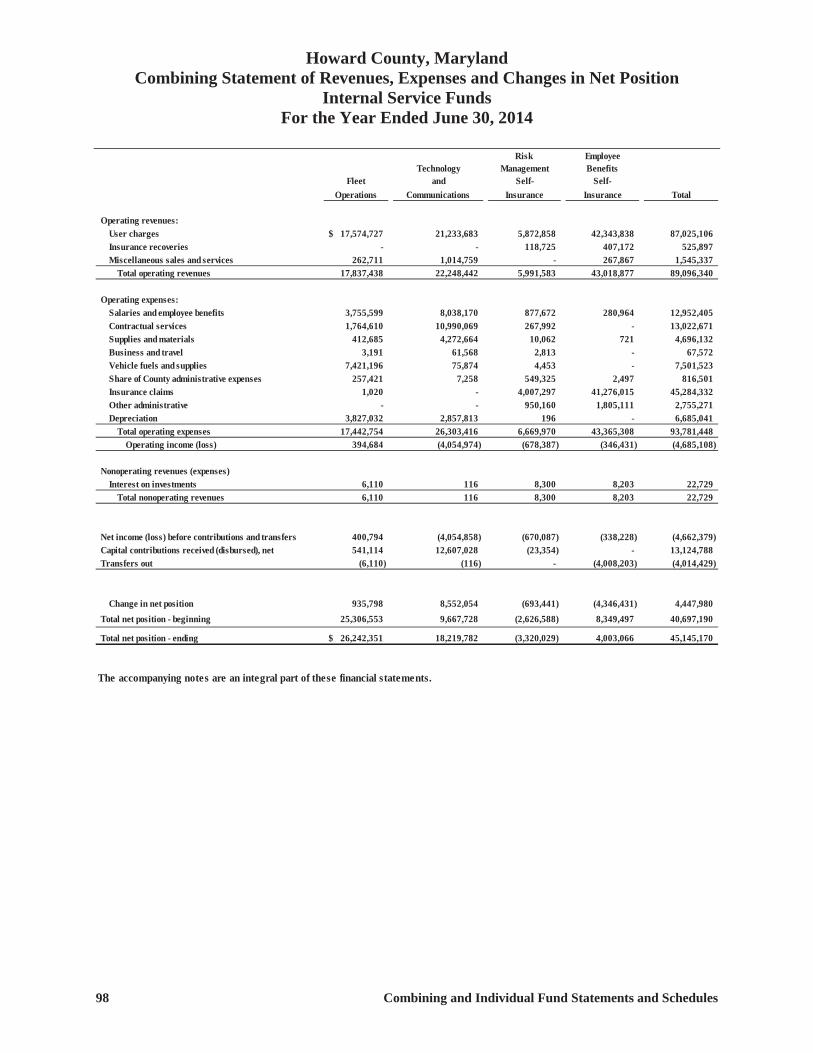
Howard County, Maryland Combining Statement of Revenues, Expenses and Changes in Net Position
Internal Service Funds For the Year Ended June 30, 2014
98 Combining and Individual Fund Statements and Schedules
Risk EmployeeTechnology Management Benefits
Fleet and Self- Self-Operations Communications Insurance Insurance Total
Operating revenues:User charges 17,574,727$ 21,233,683 5,872,858 42,343,838 87,025,106 Insurance recoveries - - 118,725 407,172 525,897 Miscellaneous sales and services 262,711 1,014,759 - 267,867 1,545,337
Total operating revenues 17,837,438 22,248,442 5,991,583 43,018,877 89,096,340
Operating expenses:Salaries and employee benefits 3,755,599 8,038,170 877,672 280,964 12,952,405 Contractual services 1,764,610 10,990,069 267,992 - 13,022,671 Supplies and materials 412,685 4,272,664 10,062 721 4,696,132 Business and travel 3,191 61,568 2,813 - 67,572 Vehicle fuels and supplies 7,421,196 75,874 4,453 - 7,501,523 Share of County administrative expenses 257,421 7,258 549,325 2,497 816,501 Insurance claims 1,020 - 4,007,297 41,276,015 45,284,332 Other administrative - - 950,160 1,805,111 2,755,271 Depreciation 3,827,032 2,857,813 196 - 6,685,041
Total operating expenses 17,442,754 26,303,416 6,669,970 43,365,308 93,781,448 Operating income (loss) 394,684 (4,054,974) (678,387) (346,431) (4,685,108)
Nonoperating revenues (expenses)Interest on investments 6,110 116 8,300 8,203 22,729
Total nonoperating revenues 6,110 116 8,300 8,203 22,729
Net income (loss) before contributions and transfers 400,794 (4,054,858) (670,087) (338,228) (4,662,379) Capital contributions received (disbursed), net 541,114 12,607,028 (23,354) - 13,124,788 Transfers out (6,110) (116) - (4,008,203) (4,014,429)
Change in net position 935,798 8,552,054 (693,441) (4,346,431) 4,447,980 Total net position - beginning 25,306,553 9,667,728 (2,626,588) 8,349,497 40,697,190
Total net position - ending 26,242,351$ 18,219,782 (3,320,029) 4,003,066 45,145,170
The accompanying notes are an integral part of these financial statements.
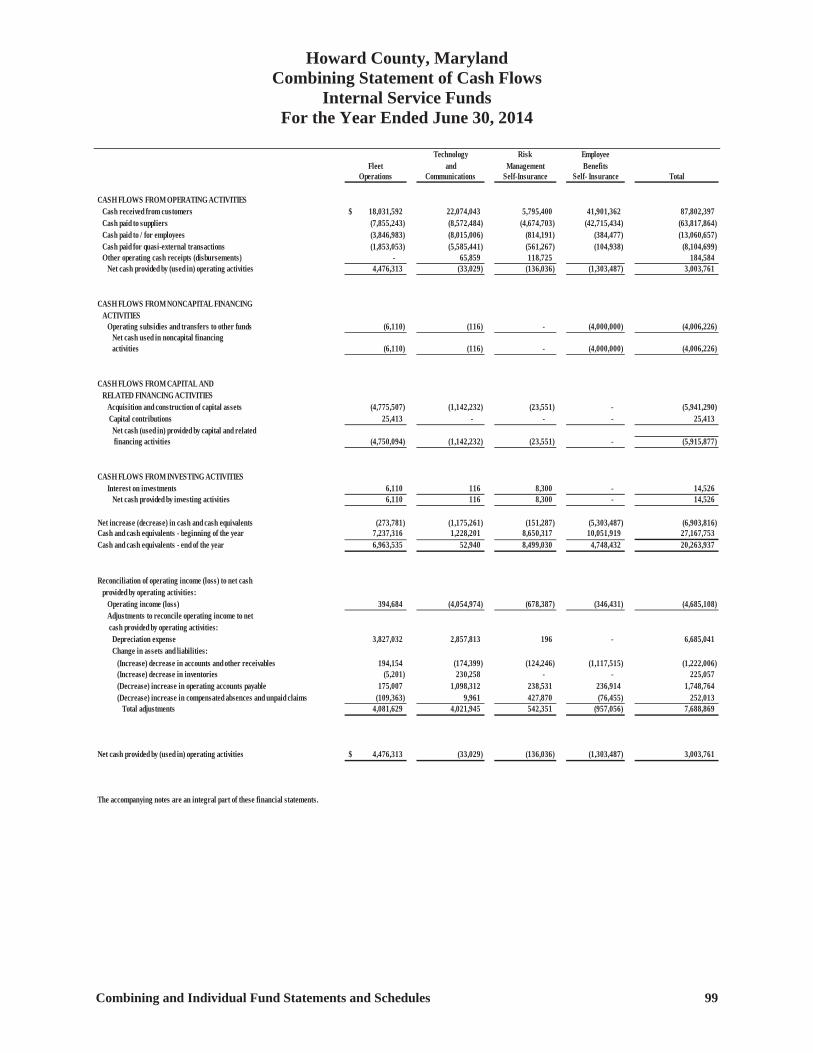
Howard County, Maryland Combining Statement of Cash Flows
Internal Service Funds For the Year Ended June 30, 2014
Combining and Individual Fund Statements and Schedules 99
Technology Risk EmployeeFleet and Management Benefits
Operations Communications Self-Insurance Self- Insurance Total
CASH FLOWS FROM OPERATING ACTIVITIES Cash received from customers 18,031,592$ 22,074,043 5,795,400 41,901,362 87,802,397 Cash paid to suppliers (7,855,243) (8,572,484) (4,674,703) (42,715,434) (63,817,864) Cash paid to / for employees (3,846,983) (8,015,006) (814,191) (384,477) (13,060,657) Cash paid for quasi-external transactions (1,853,053) (5,585,441) (561,267) (104,938) (8,104,699) Other operating cash receipts (disbursements) - 65,859 118,725 184,584
Net cash provided by (used in) operating activities 4,476,313 (33,029) (136,036) (1,303,487) 3,003,761
CASH FLOWS FROM NONCAPITAL FINANCING ACTIVITIES
Operating subsidies and transfers to other funds (6,110) (116) - (4,000,000) (4,006,226) Net cash used in noncapital financingactivities (6,110) (116) - (4,000,000) (4,006,226)
CASH FLOWS FROM CAPITAL ANDRELATED FINANCING ACTIVITIES
Acquisition and construction of capital assets (4,775,507) (1,142,232) (23,551) - (5,941,290) Capital contributions 25,413 - - - 25,413
Net cash (used in) provided by capital and related financing activities (4,750,094) (1,142,232) (23,551) - (5,915,877)
CASH FLOWS FROM INVESTING ACTIVITIES Interest on investments 6,110 116 8,300 - 14,526
Net cash provided by investing activities 6,110 116 8,300 - 14,526
Net increase (decrease) in cash and cash equivalents (273,781) (1,175,261) (151,287) (5,303,487) (6,903,816) Cash and cash equivalents - beginning of the year 7,237,316 1,228,201 8,650,317 10,051,919 27,167,753 Cash and cash equivalents - end of the year 6,963,535 52,940 8,499,030 4,748,432 20,263,937
Reconciliation of operating income (loss) to net cash provided by operating activities:
Operating income (loss) 394,684 (4,054,974) (678,387) (346,431) (4,685,108) Adjustments to reconcile operating income to net cash provided by operating activities:
Depreciation expense 3,827,032 2,857,813 196 - 6,685,041 Change in assets and liabilities:
(Increase) decrease in accounts and other receivables 194,154 (174,399) (124,246) (1,117,515) (1,222,006) (Increase) decrease in inventories (5,201) 230,258 - - 225,057 (Decrease) increase in operating accounts payable 175,007 1,098,312 238,531 236,914 1,748,764 (Decrease) increase in compensated absences and unpaid claims (109,363) 9,961 427,870 (76,455) 252,013
Total adjustments 4,081,629 4,021,945 542,351 (957,056) 7,688,869
Net cash provided by (used in) operating activities 4,476,313$ (33,029) (136,036) (1,303,487) 3,003,761
The accompanying notes are an integral part of these financial statements.

Howard County’s Emergency Services Command Unit Purchased in 2006 with Homeland Security Grant funding, the County’s Emergency Service Command Unit serves as our Emergency Operations Center (EOC) on wheels. This mobile EOC provides County agencies with a highly technical platform for incident command on-scene versus the stationary EOC confines of the County Government complex, as was the case with the January 2014 active shooter event at The Mall in Columbia. The unit responds to significant emergency incidents, exercises and planned events throughout Howard County and the Baltimore region.
Fiduciary Funds
Fiduciary funds are used to report assets held in a trustee or agency capacity for others and which cannot be used to support the government’s own programs.

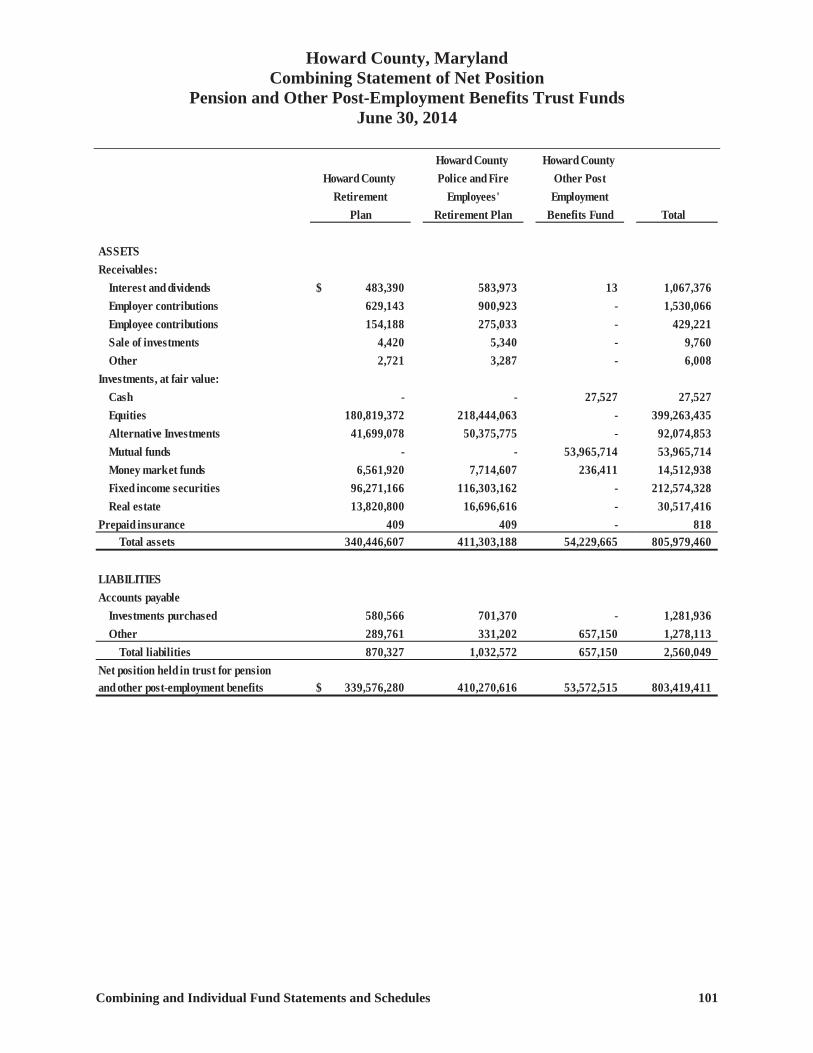
Howard County, Maryland Combining Statement of Net Position
Pension and Other Post-Employment Benefits Trust Funds June 30, 2014
Combining and Individual Fund Statements and Schedules 101
Howard County Howard County Howard County Police and Fire Other Post
Retirement Employees' EmploymentPlan Retirement Plan Benefits Fund Total
ASSETSReceivables:
Interest and dividends 483,390$ 583,973 13 1,067,376 Employer contributions 629,143 900,923 - 1,530,066 Employee contributions 154,188 275,033 - 429,221 Sale of investments 4,420 5,340 - 9,760 Other 2,721 3,287 - 6,008
Investments, at fair value:Cash - - 27,527 27,527 Equities 180,819,372 218,444,063 - 399,263,435 Alternative Investments 41,699,078 50,375,775 - 92,074,853 Mutual funds - - 53,965,714 53,965,714 Money market funds 6,561,920 7,714,607 236,411 14,512,938 Fixed income securities 96,271,166 116,303,162 - 212,574,328 Real estate 13,820,800 16,696,616 - 30,517,416
Prepaid insurance 409 409 - 818 Total assets 340,446,607 411,303,188 54,229,665 805,979,460
LIABILITIESAccounts payable
Investments purchased 580,566 701,370 - 1,281,936 Other 289,761 331,202 657,150 1,278,113
Total liabilities 870,327 1,032,572 657,150 2,560,049 Net position held in trust for pension and other post-employment benefits 339,576,280$ 410,270,616 53,572,515 803,419,411
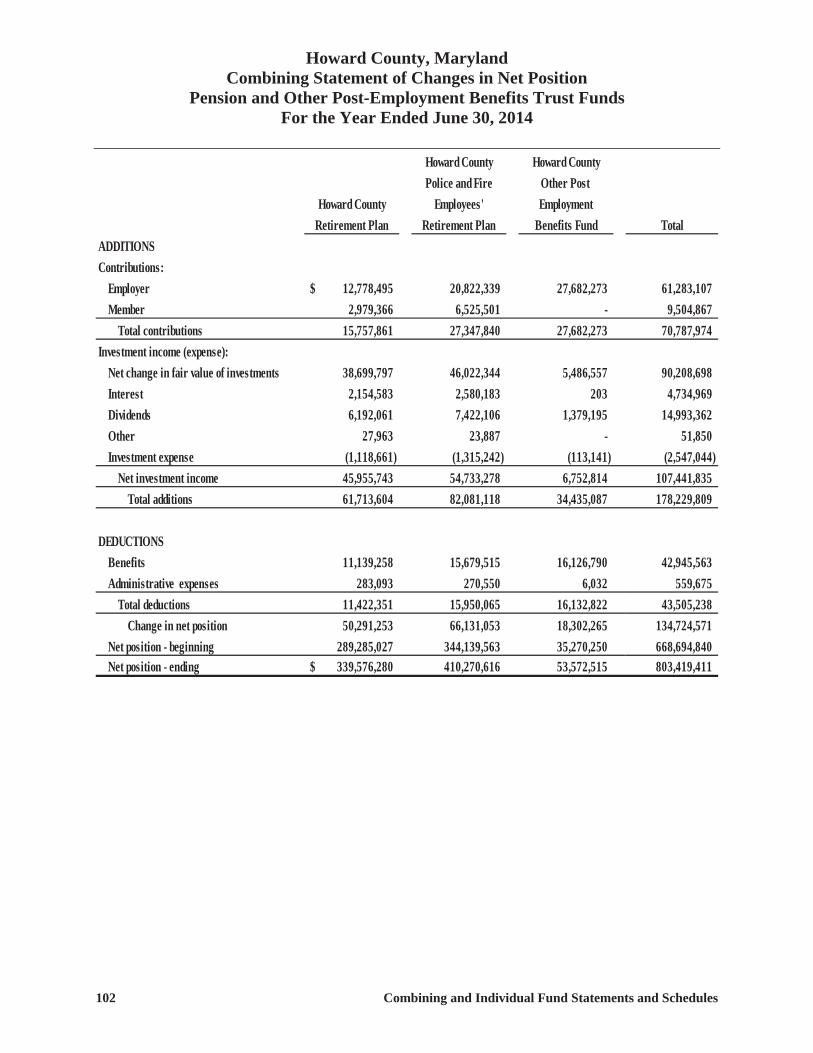
Howard County, Maryland Combining Statement of Changes in Net Position
Pension and Other Post-Employment Benefits Trust Funds For the Year Ended June 30, 2014
102 Combining and Individual Fund Statements and Schedules
Howard County Howard CountyPolice and Fire Other Post
Howard County Employees' EmploymentRetirement Plan Retirement Plan Benefits Fund Total
ADDITIONSContributions:
Employer 12,778,495$ 20,822,339 27,682,273 61,283,107 Member 2,979,366 6,525,501 - 9,504,867
Total contributions 15,757,861 27,347,840 27,682,273 70,787,974 Investment income (expense):
Net change in fair value of investments 38,699,797 46,022,344 5,486,557 90,208,698 Interest 2,154,583 2,580,183 203 4,734,969 Dividends 6,192,061 7,422,106 1,379,195 14,993,362 Other 27,963 23,887 - 51,850 Investment expense (1,118,661) (1,315,242) (113,141) (2,547,044)
Net investment income 45,955,743 54,733,278 6,752,814 107,441,835 Total additions 61,713,604 82,081,118 34,435,087 178,229,809
DEDUCTIONSBenefits 11,139,258 15,679,515 16,126,790 42,945,563 Administrative expenses 283,093 270,550 6,032 559,675
Total deductions 11,422,351 15,950,065 16,132,822 43,505,238 Change in net position 50,291,253 66,131,053 18,302,265 134,724,571
Net position - beginning 289,285,027 344,139,563 35,270,250 668,694,840 Net position - ending 339,576,280$ 410,270,616 53,572,515 803,419,411
161,731,617
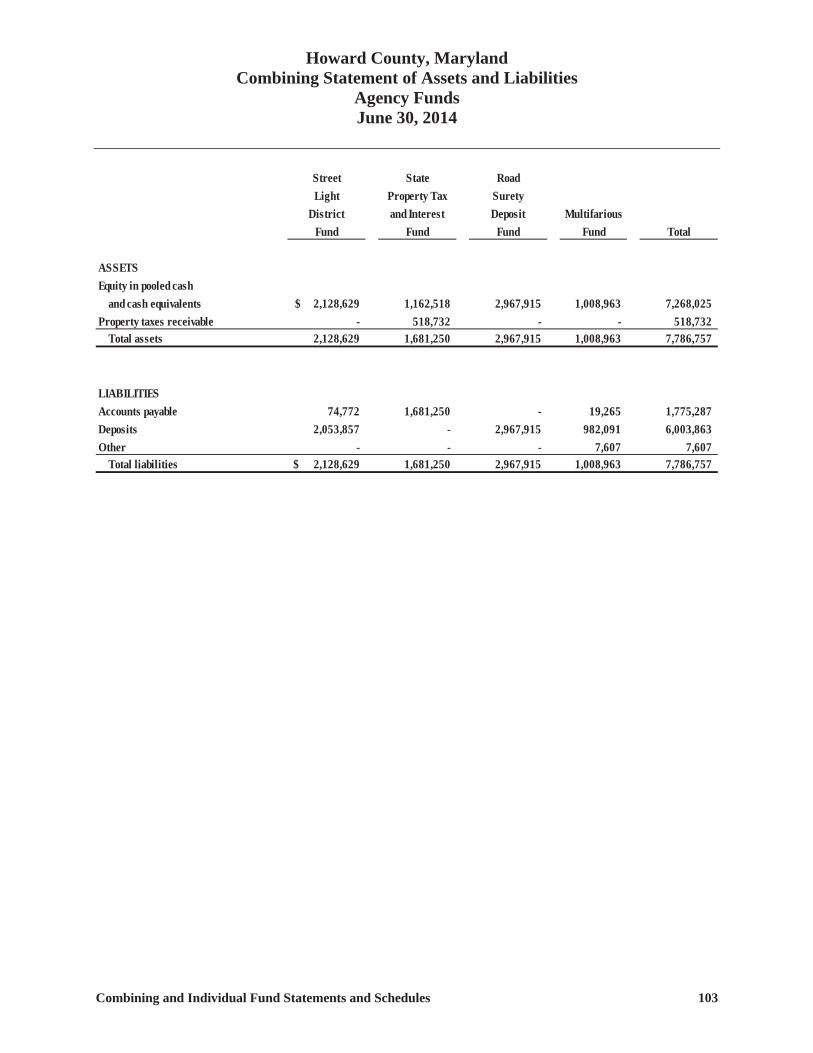
Howard County, Maryland Combining Statement of Assets and Liabilities
Agency Funds June 30, 2014
Combining and Individual Fund Statements and Schedules 103
Street State RoadLight Property Tax Surety
District and Interest Deposit MultifariousFund Fund Fund Fund Total
ASSETSEquity in pooled cash
and cash equivalents 2,128,629$ 1,162,518 2,967,915 1,008,963 7,268,025 Property taxes receivable - 518,732 - - 518,732
Total assets 2,128,629 1,681,250 2,967,915 1,008,963 7,786,757
LIABILITIESAccounts payable 74,772 1,681,250 - 19,265 1,775,287 Deposits 2,053,857 - 2,967,915 982,091 6,003,863 Other - - - 7,607 7,607
Total liabilities 2,128,629$ 1,681,250 2,967,915 1,008,963 7,786,757
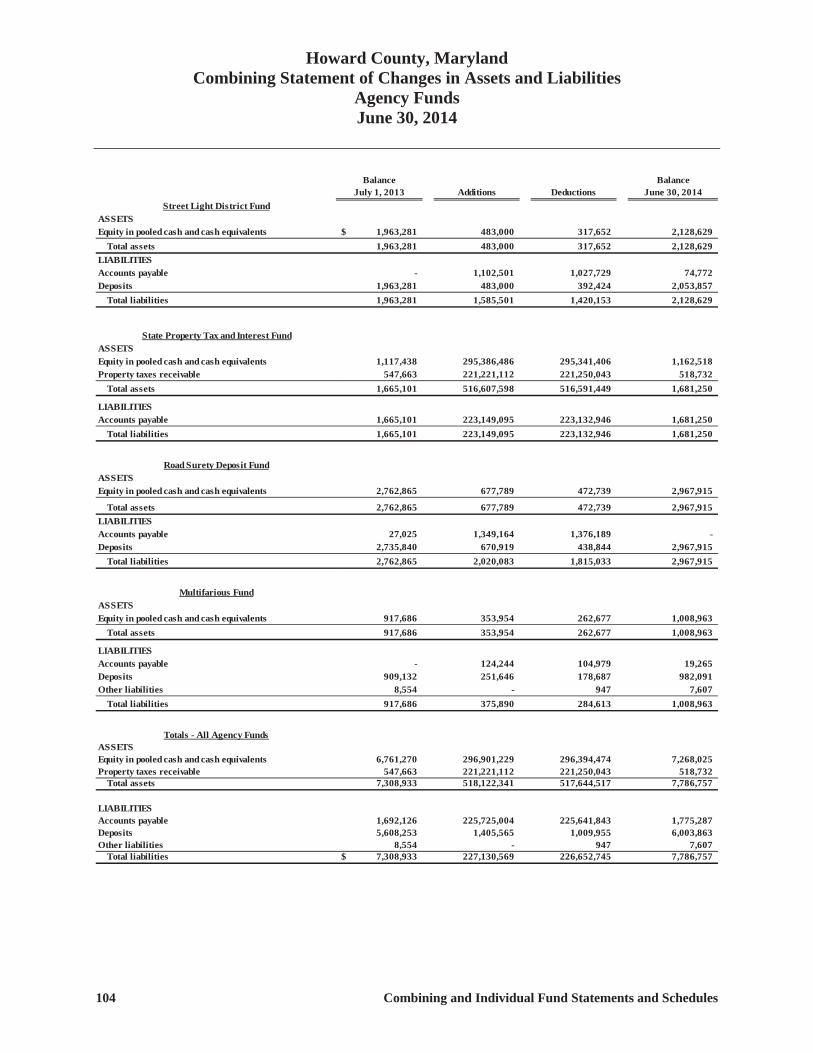
Howard County, Maryland Combining Statement of Changes in Assets and Liabilities
Agency Funds June 30, 2014
104 Combining and Individual Fund Statements and Schedules
Balance BalanceJuly 1, 2013 Additions Deductions June 30, 2014
Street Light District FundASSETSEquity in pooled cash and cash equivalents 1,963,281$ 483,000 317,652 2,128,629
Total assets 1,963,281 483,000 317,652 2,128,629 LIABILITIESAccounts payable - 1,102,501 1,027,729 74,772 Deposits 1,963,281 483,000 392,424 2,053,857
Total liabilities 1,963,281 1,585,501 1,420,153 2,128,629
State Property Tax and Interest FundASSETSEquity in pooled cash and cash equivalents 1,117,438 295,386,486 295,341,406 1,162,518 Property taxes receivable 547,663 221,221,112 221,250,043 518,732
Total assets 1,665,101 516,607,598 516,591,449 1,681,250
LIABILITIESAccounts payable 1,665,101 223,149,095 223,132,946 1,681,250
Total liabilities 1,665,101 223,149,095 223,132,946 1,681,250
Road Surety Deposit FundASSETSEquity in pooled cash and cash equivalents 2,762,865 677,789 472,739 2,967,915
Total assets 2,762,865 677,789 472,739 2,967,915 LIABILITIESAccounts payable 27,025 1,349,164 1,376,189 - Deposits 2,735,840 670,919 438,844 2,967,915
Total liabilities 2,762,865 2,020,083 1,815,033 2,967,915
Multifarious FundASSETSEquity in pooled cash and cash equivalents 917,686 353,954 262,677 1,008,963
Total assets 917,686 353,954 262,677 1,008,963
LIABILITIESAccounts payable - 124,244 104,979 19,265 Deposits 909,132 251,646 178,687 982,091 Other liabilities 8,554 - 947 7,607
Total liabilities 917,686 375,890 284,613 1,008,963
Totals - All Agency FundsASSETSEquity in pooled cash and cash equivalents 6,761,270 296,901,229 296,394,474 7,268,025 Property taxes receivable 547,663 221,221,112 221,250,043 518,732
Total assets 7,308,933 518,122,341 517,644,517 7,786,757
LIABILITIESAccounts payable 1,692,126 225,725,004 225,641,843 1,775,287 Deposits 5,608,253 1,405,565 1,009,955 6,003,863 Other liabilities 8,554 - 947 7,607
Total liabilities 7,308,933$ 227,130,569 226,652,745 7,786,757
Capital Assets Used in the Operation of Governmental Funds

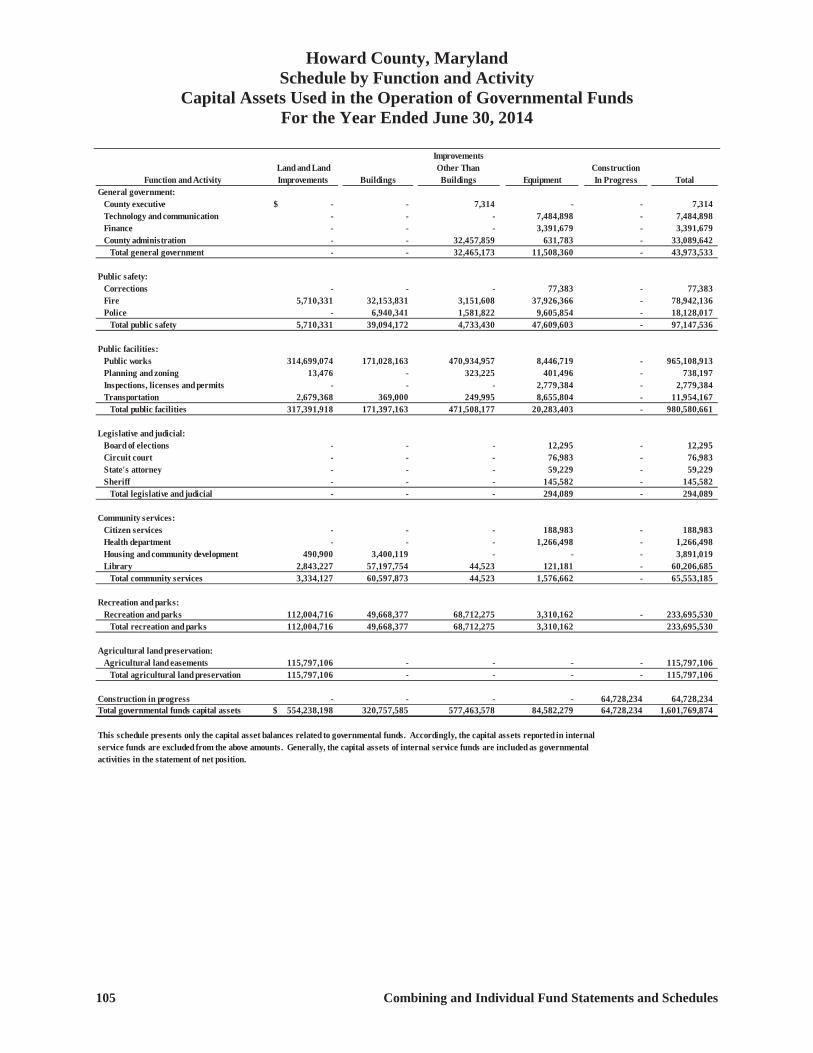
Howard County, Maryland Schedule by Function and Activity
Capital Assets Used in the Operation of Governmental Funds For the Year Ended June 30, 2014
105 Combining and Individual Fund Statements and Schedules
ImprovementsLand and Land Other Than Construction
Function and Activity Improvements Buildings Buildings Equipment In Progress TotalGeneral government:
County executive -$ - 7,314 - - 7,314 Technology and communication - - - 7,484,898 - 7,484,898 Finance - - - 3,391,679 - 3,391,679 County administration - - 32,457,859 631,783 - 33,089,642
Total general government - - 32,465,173 11,508,360 - 43,973,533
Public safety:Corrections - - - 77,383 - 77,383 Fire 5,710,331 32,153,831 3,151,608 37,926,366 - 78,942,136 Police - 6,940,341 1,581,822 9,605,854 - 18,128,017
Total public safety 5,710,331 39,094,172 4,733,430 47,609,603 - 97,147,536
Public facilities:Public works 314,699,074 171,028,163 470,934,957 8,446,719 - 965,108,913 Planning and zoning 13,476 - 323,225 401,496 - 738,197 Inspections, licenses and permits - - - 2,779,384 - 2,779,384 Transportation 2,679,368 369,000 249,995 8,655,804 - 11,954,167
Total public facilities 317,391,918 171,397,163 471,508,177 20,283,403 - 980,580,661
Legislative and judicial:Board of elections - - - 12,295 - 12,295 Circuit court - - - 76,983 - 76,983 State's attorney - - - 59,229 - 59,229 Sheriff - - - 145,582 - 145,582
Total legislative and judicial - - - 294,089 - 294,089
Community services:Citizen services - - - 188,983 - 188,983 Health department - - - 1,266,498 - 1,266,498 Housing and community development 490,900 3,400,119 - - - 3,891,019 Library 2,843,227 57,197,754 44,523 121,181 - 60,206,685
Total community services 3,334,127 60,597,873 44,523 1,576,662 - 65,553,185
Recreation and parks:Recreation and parks 112,004,716 49,668,377 68,712,275 3,310,162 - 233,695,530
Total recreation and parks 112,004,716 49,668,377 68,712,275 3,310,162 233,695,530
Agricultural land preservation:Agricultural land easements 115,797,106 - - - - 115,797,106
Total agricultural land preservation 115,797,106 - - - - 115,797,106
Construction in progress - - - - 64,728,234 64,728,234 Total governmental funds capital assets 554,238,198$ 320,757,585 577,463,578 84,582,279 64,728,234 1,601,769,874
This schedule presents only the capital asset balances related to governmental funds. Accordingly, the capital assets reported in internalservice funds are excluded from the above amounts. Generally, the capital assets of internal service funds are included as governmentalactivities in the statement of net position.
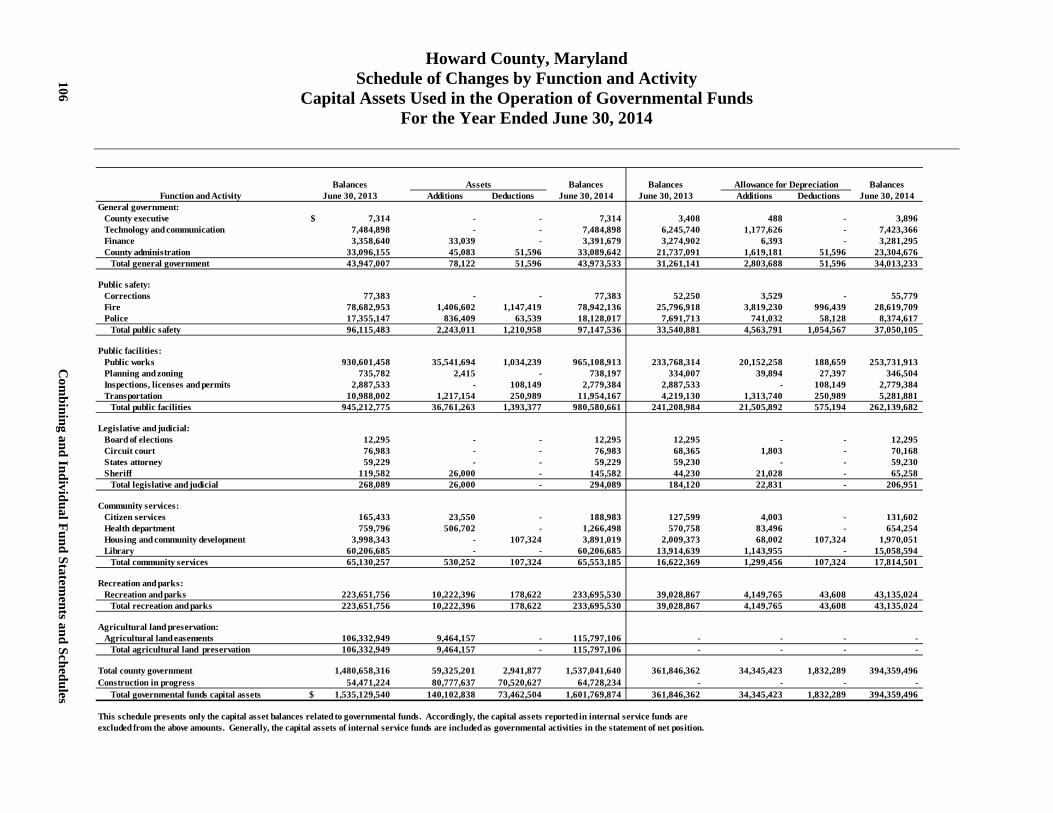
Howard County, Maryland Schedule of Changes by Function and Activity
Capital Assets Used in the Operation of Governmental Funds For the Year Ended June 30, 2014
Balances Assets Balances Balances Allowance for Depreciation BalancesFunction and Activity June 30, 2013 Additions Deductions June 30, 2014 June 30, 2013 Additions Deductions June 30, 2014
General government:County executive 7,314$ - - 7,314 3,408 488 - 3,896 Technology and communication 7,484,898 - - 7,484,898 6,245,740 1,177,626 - 7,423,366 Finance 3,358,640 33,039 - 3,391,679 3,274,902 6,393 - 3,281,295 County administration 33,096,155 45,083 51,596 33,089,642 21,737,091 1,619,181 51,596 23,304,676
Total general government 43,947,007 78,122 51,596 43,973,533 31,261,141 2,803,688 51,596 34,013,233
Public safety:Corrections 77,383 - - 77,383 52,250 3,529 - 55,779 Fire 78,682,953 1,406,602 1,147,419 78,942,136 25,796,918 3,819,230 996,439 28,619,709 Police 17,355,147 836,409 63,539 18,128,017 7,691,713 741,032 58,128 8,374,617
Total public safety 96,115,483 2,243,011 1,210,958 97,147,536 33,540,881 4,563,791 1,054,567 37,050,105
Public facilities:Public works 930,601,458 35,541,694 1,034,239 965,108,913 233,768,314 20,152,258 188,659 253,731,913 Planning and zoning 735,782 2,415 - 738,197 334,007 39,894 27,397 346,504 Inspections, licenses and permits 2,887,533 - 108,149 2,779,384 2,887,533 - 108,149 2,779,384 Transportation 10,988,002 1,217,154 250,989 11,954,167 4,219,130 1,313,740 250,989 5,281,881
Total public facilities 945,212,775 36,761,263 1,393,377 980,580,661 241,208,984 21,505,892 575,194 262,139,682
Legislative and judicial:Board of elections 12,295 - - 12,295 12,295 - - 12,295 Circuit court 76,983 - - 76,983 68,365 1,803 - 70,168 States attorney 59,229 - - 59,229 59,230 - - 59,230 Sheriff 119,582 26,000 - 145,582 44,230 21,028 - 65,258
Total legislative and judicial 268,089 26,000 - 294,089 184,120 22,831 - 206,951
Community services:Citizen services 165,433 23,550 - 188,983 127,599 4,003 - 131,602 Health department 759,796 506,702 - 1,266,498 570,758 83,496 - 654,254 Housing and community development 3,998,343 - 107,324 3,891,019 2,009,373 68,002 107,324 1,970,051 Library 60,206,685 - - 60,206,685 13,914,639 1,143,955 - 15,058,594
Total community services 65,130,257 530,252 107,324 65,553,185 16,622,369 1,299,456 107,324 17,814,501
Recreation and parks:Recreation and parks 223,651,756 10,222,396 178,622 233,695,530 39,028,867 4,149,765 43,608 43,135,024
Total recreation and parks 223,651,756 10,222,396 178,622 233,695,530 39,028,867 4,149,765 43,608 43,135,024
Agricultural land preservation:Agricultural land easements 106,332,949 9,464,157 - 115,797,106 - - - -
Total agricultural land preservation 106,332,949 9,464,157 - 115,797,106 - - - -
Total county government 1,480,658,316 59,325,201 2,941,877 1,537,041,640 361,846,362 34,345,423 1,832,289 394,359,496 Construction in progress 54,471,224 80,777,637 70,520,627 64,728,234 - - - -
Total governmental funds capital assets 1,535,129,540$ 140,102,838 73,462,504 1,601,769,874 361,846,362 34,345,423 1,832,289 394,359,496
This schedule presents only the capital asset balances related to governmental funds. Accordingly, the capital assets reported in internal service funds are excluded from the above amounts. Generally, the capital assets of internal service funds are included as governmental activities in the statement of net position.
106
Com
bining and Individual Fund Statements and Schedules
Capital Assets Used in the Operation of Enterprise Funds

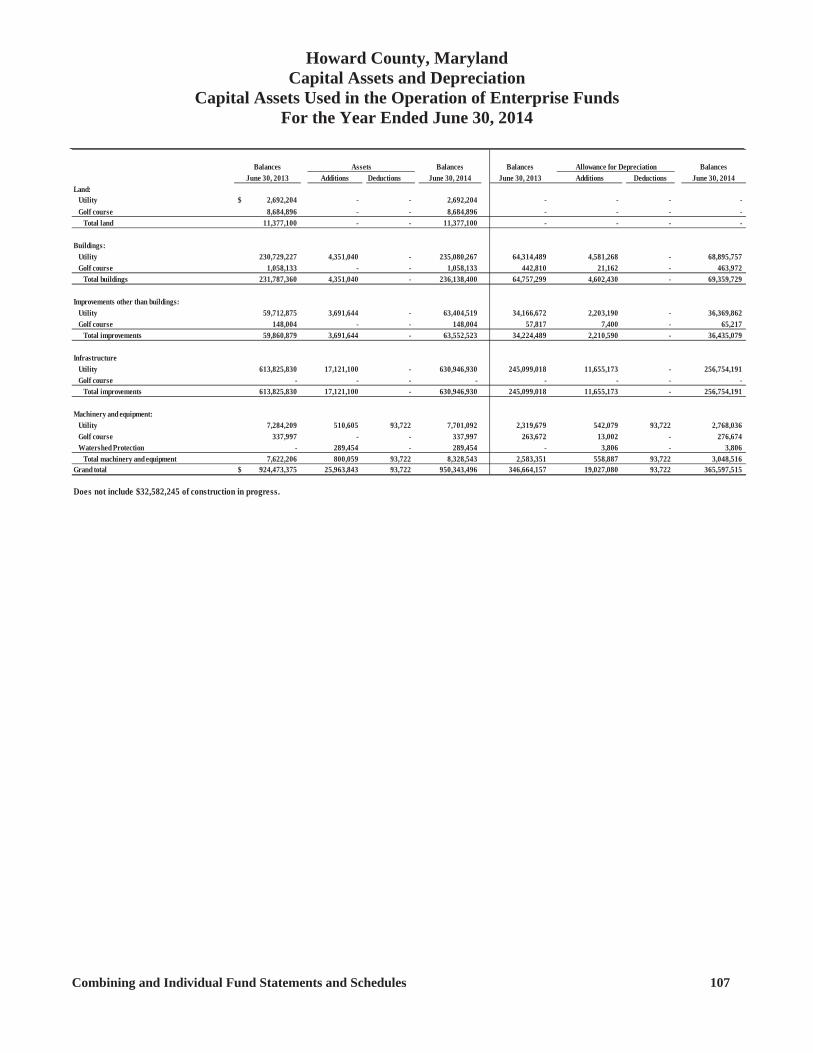
Howard County, Maryland Capital Assets and Depreciation
Capital Assets Used in the Operation of Enterprise Funds For the Year Ended June 30, 2014
Combining and Individual Fund Statements and Schedules 107
Balances Assets Balances Balances Allowance for Depreciation BalancesJune 30, 2013 Additions Deductions June 30, 2014 June 30, 2013 Additions Deductions June 30, 2014
Land: Utility 2,692,204$ - - 2,692,204 - - - - Golf course 8,684,896 - - 8,684,896 - - - -
Total land 11,377,100 - - 11,377,100 - - - -
Buildings: Utility 230,729,227 4,351,040 - 235,080,267 64,314,489 4,581,268 - 68,895,757 Golf course 1,058,133 - - 1,058,133 442,810 21,162 - 463,972
Total buildings 231,787,360 4,351,040 - 236,138,400 64,757,299 4,602,430 - 69,359,729
Improvements other than buildings: Utility 59,712,875 3,691,644 - 63,404,519 34,166,672 2,203,190 - 36,369,862 Golf course 148,004 - - 148,004 57,817 7,400 - 65,217
Total improvements 59,860,879 3,691,644 - 63,552,523 34,224,489 2,210,590 - 36,435,079
InfrastructureUtility 613,825,830 17,121,100 - 630,946,930 245,099,018 11,655,173 - 256,754,191 Golf course - - - - - - - -
Total improvements 613,825,830 17,121,100 - 630,946,930 245,099,018 11,655,173 - 256,754,191
Machinery and equipment: Utility 7,284,209 510,605 93,722 7,701,092 2,319,679 542,079 93,722 2,768,036 Golf course 337,997 - - 337,997 263,672 13,002 - 276,674 Watershed Protection - 289,454 - 289,454 - 3,806 - 3,806
Total machinery and equipment 7,622,206 800,059 93,722 8,328,543 2,583,351 558,887 93,722 3,048,516 Grand total 924,473,375$ 25,963,843 93,722 950,343,496 346,664,157 19,027,080 93,722 365,597,515
Does not include $32,582,245 of construction in progress.
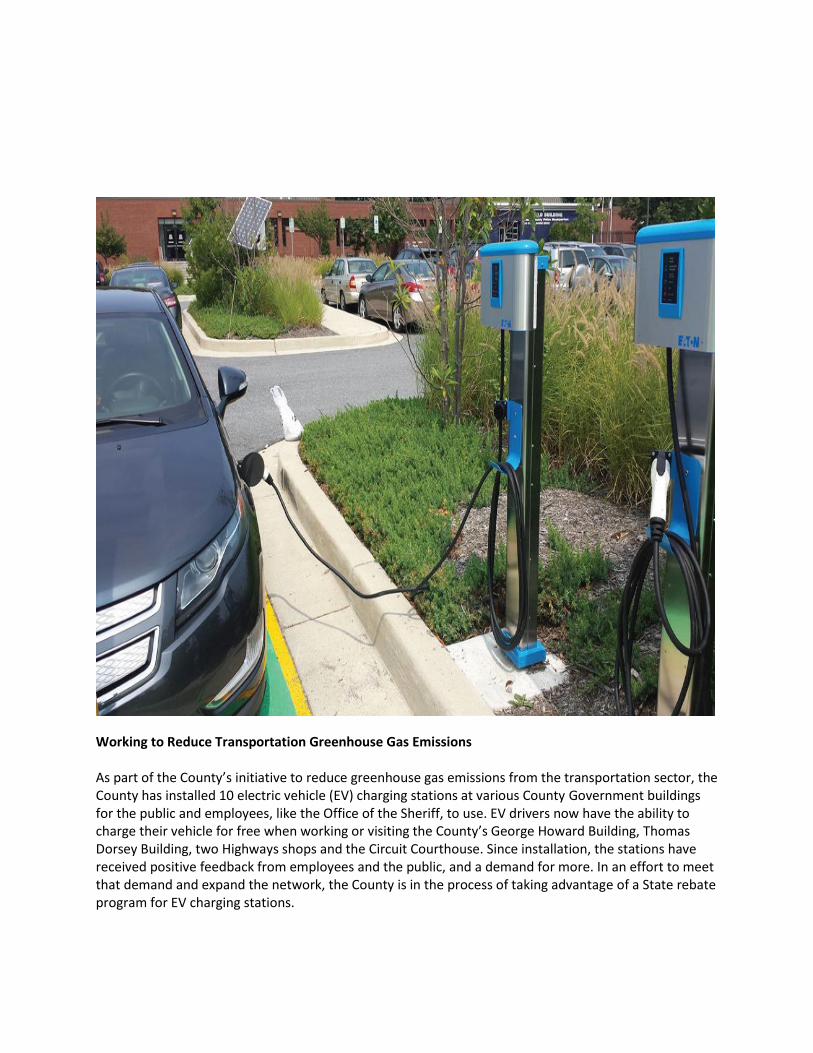
Working to Reduce Transportation Greenhouse Gas Emissions As part of the County’s initiative to reduce greenhouse gas emissions from the transportation sector, the County has installed 10 electric vehicle (EV) charging stations at various County Government buildings for the public and employees, like the Office of the Sheriff, to use. EV drivers now have the ability to charge their vehicle for free when working or visiting the County’s George Howard Building, Thomas Dorsey Building, two Highways shops and the Circuit Courthouse. Since installation, the stations have received positive feedback from employees and the public, and a demand for more. In an effort to meet that demand and expand the network, the County is in the process of taking advantage of a State rebate program for EV charging stations.
Long-Term Debt
Liabilities of the County represented by outstanding general obligation bonds and other long-term debt.

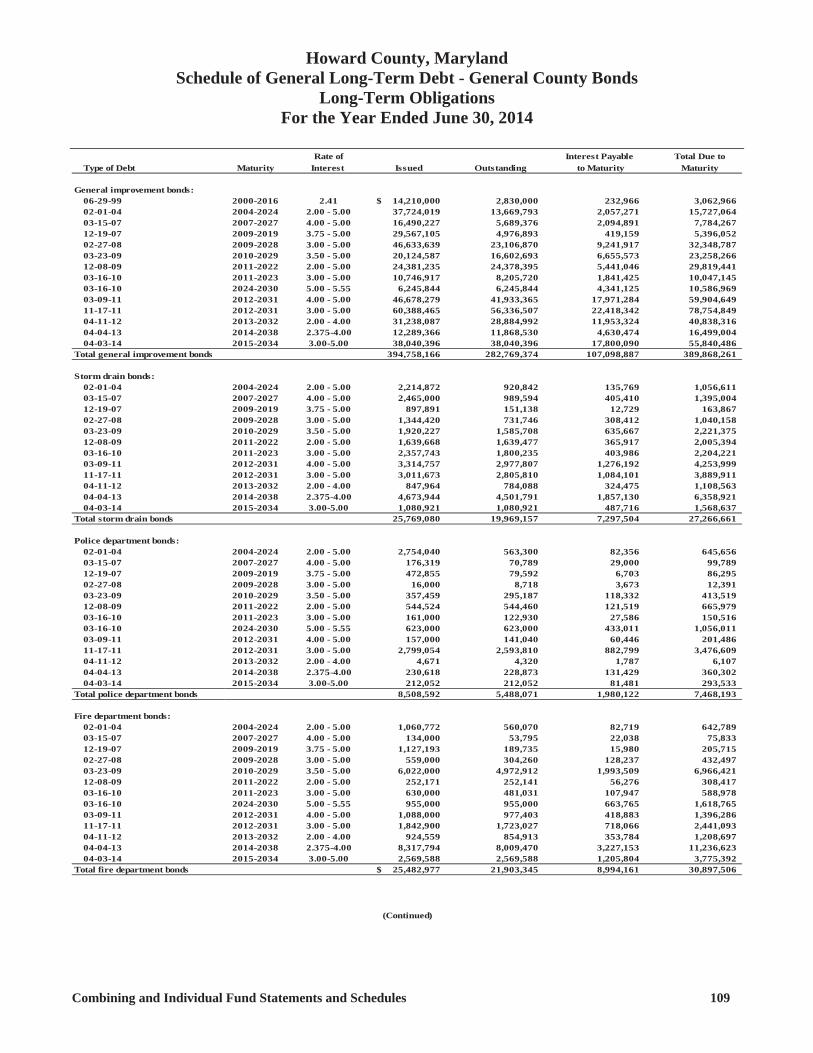
Howard County, Maryland Schedule of General Long-Term Debt - General County Bonds
Long-Term Obligations For the Year Ended June 30, 2014
Combining and Individual Fund Statements and Schedules 109
Rate of Interest Payable Total Due toType of Debt Maturity Interest Issued Outstanding to Maturity Maturity
General improvement bonds:06-29-99 2000-2016 2.41 14,210,000$ 2,830,000 232,966 3,062,96602-01-04 2004-2024 2.00 - 5.00 37,724,019 13,669,793 2,057,271 15,727,06403-15-07 2007-2027 4.00 - 5.00 16,490,227 5,689,376 2,094,891 7,784,26712-19-07 2009-2019 3.75 - 5.00 29,567,105 4,976,893 419,159 5,396,05202-27-08 2009-2028 3.00 - 5.00 46,633,639 23,106,870 9,241,917 32,348,78703-23-09 2010-2029 3.50 - 5.00 20,124,587 16,602,693 6,655,573 23,258,26612-08-09 2011-2022 2.00 - 5.00 24,381,235 24,378,395 5,441,046 29,819,44103-16-10 2011-2023 3.00 - 5.00 10,746,917 8,205,720 1,841,425 10,047,14503-16-10 2024-2030 5.00 - 5.55 6,245,844 6,245,844 4,341,125 10,586,96903-09-11 2012-2031 4.00 - 5.00 46,678,279 41,933,365 17,971,284 59,904,64911-17-11 2012-2031 3.00 - 5.00 60,388,465 56,336,507 22,418,342 78,754,84904-11-12 2013-2032 2.00 - 4.00 31,238,087 28,884,992 11,953,324 40,838,31604-04-13 2014-2038 2.375-4.00 12,289,366 11,868,530 4,630,474 16,499,00404-03-14 2015-2034 3.00-5.00 38,040,396 38,040,396 17,800,090 55,840,486
Total general improvement bonds 394,758,166 282,769,374 107,098,887 389,868,261
Storm drain bonds:02-01-04 2004-2024 2.00 - 5.00 2,214,872 920,842 135,769 1,056,61103-15-07 2007-2027 4.00 - 5.00 2,465,000 989,594 405,410 1,395,00412-19-07 2009-2019 3.75 - 5.00 897,891 151,138 12,729 163,86702-27-08 2009-2028 3.00 - 5.00 1,344,420 731,746 308,412 1,040,15803-23-09 2010-2029 3.50 - 5.00 1,920,227 1,585,708 635,667 2,221,37512-08-09 2011-2022 2.00 - 5.00 1,639,668 1,639,477 365,917 2,005,39403-16-10 2011-2023 3.00 - 5.00 2,357,743 1,800,235 403,986 2,204,22103-09-11 2012-2031 4.00 - 5.00 3,314,757 2,977,807 1,276,192 4,253,99911-17-11 2012-2031 3.00 - 5.00 3,011,673 2,805,810 1,084,101 3,889,91104-11-12 2013-2032 2.00 - 4.00 847,964 784,088 324,475 1,108,56304-04-13 2014-2038 2.375-4.00 4,673,944 4,501,791 1,857,130 6,358,92104-03-14 2015-2034 3.00-5.00 1,080,921 1,080,921 487,716 1,568,637
Total storm drain bonds 25,769,080 19,969,157 7,297,504 27,266,661
Police department bonds:02-01-04 2004-2024 2.00 - 5.00 2,754,040 563,300 82,356 645,65603-15-07 2007-2027 4.00 - 5.00 176,319 70,789 29,000 99,78912-19-07 2009-2019 3.75 - 5.00 472,855 79,592 6,703 86,29502-27-08 2009-2028 3.00 - 5.00 16,000 8,718 3,673 12,39103-23-09 2010-2029 3.50 - 5.00 357,459 295,187 118,332 413,51912-08-09 2011-2022 2.00 - 5.00 544,524 544,460 121,519 665,97903-16-10 2011-2023 3.00 - 5.00 161,000 122,930 27,586 150,51603-16-10 2024-2030 5.00 - 5.55 623,000 623,000 433,011 1,056,01103-09-11 2012-2031 4.00 - 5.00 157,000 141,040 60,446 201,48611-17-11 2012-2031 3.00 - 5.00 2,799,054 2,593,810 882,799 3,476,60904-11-12 2013-2032 2.00 - 4.00 4,671 4,320 1,787 6,10704-04-13 2014-2038 2.375-4.00 230,618 228,873 131,429 360,30204-03-14 2015-2034 3.00-5.00 212,052 212,052 81,481 293,533
Total police department bonds 8,508,592 5,488,071 1,980,122 7,468,193
Fire department bonds:02-01-04 2004-2024 2.00 - 5.00 1,060,772 560,070 82,719 642,78903-15-07 2007-2027 4.00 - 5.00 134,000 53,795 22,038 75,83312-19-07 2009-2019 3.75 - 5.00 1,127,193 189,735 15,980 205,71502-27-08 2009-2028 3.00 - 5.00 559,000 304,260 128,237 432,49703-23-09 2010-2029 3.50 - 5.00 6,022,000 4,972,912 1,993,509 6,966,42112-08-09 2011-2022 2.00 - 5.00 252,171 252,141 56,276 308,41703-16-10 2011-2023 3.00 - 5.00 630,000 481,031 107,947 588,97803-16-10 2024-2030 5.00 - 5.55 955,000 955,000 663,765 1,618,76503-09-11 2012-2031 4.00 - 5.00 1,088,000 977,403 418,883 1,396,28611-17-11 2012-2031 3.00 - 5.00 1,842,900 1,723,027 718,066 2,441,09304-11-12 2013-2032 2.00 - 4.00 924,559 854,913 353,784 1,208,69704-04-13 2014-2038 2.375-4.00 8,317,794 8,009,470 3,227,153 11,236,62304-03-14 2015-2034 3.00-5.00 2,569,588 2,569,588 1,205,804 3,775,392
Total fire department bonds 25,482,977$ 21,903,345 8,994,161 30,897,506
(Continued)
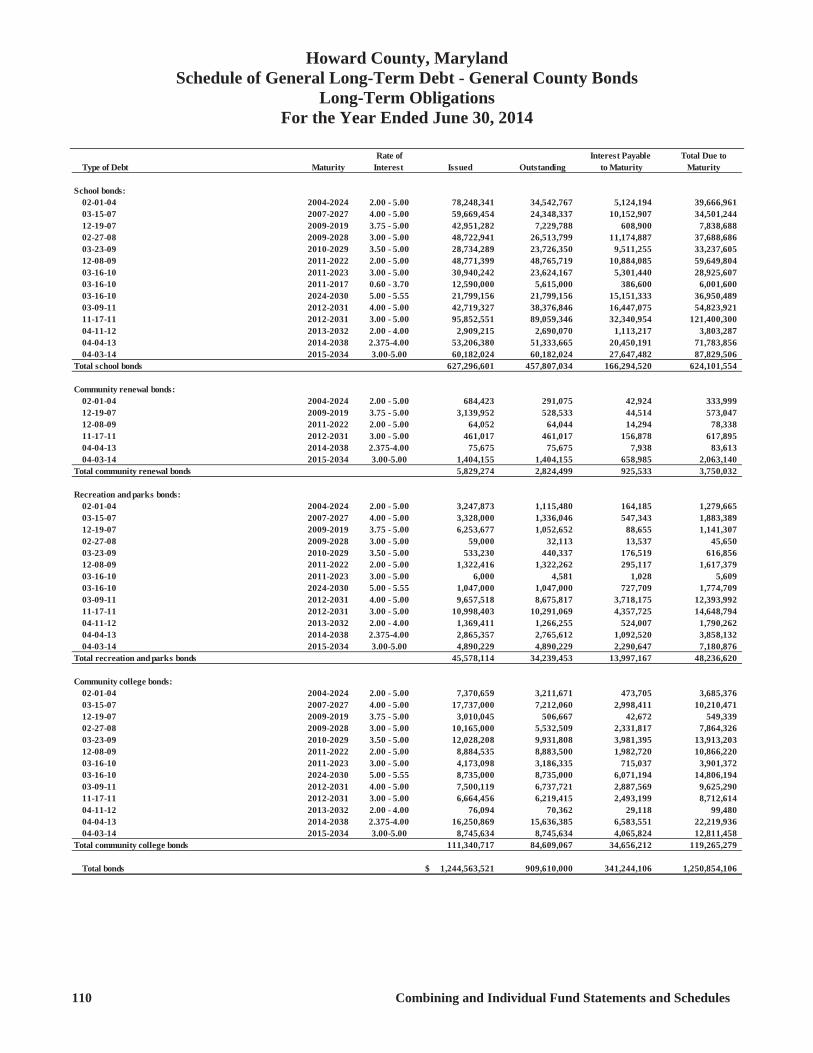
Howard County, Maryland Schedule of General Long-Term Debt - General County Bonds
Long-Term Obligations For the Year Ended June 30, 2014
110 Combining and Individual Fund Statements and Schedules
Rate of Interest Payable Total Due toType of Debt Maturity Interest Issued Outstanding to Maturity Maturity
School bonds:02-01-04 2004-2024 2.00 - 5.00 78,248,341 34,542,767 5,124,194 39,666,961 03-15-07 2007-2027 4.00 - 5.00 59,669,454 24,348,337 10,152,907 34,501,244 12-19-07 2009-2019 3.75 - 5.00 42,951,282 7,229,788 608,900 7,838,688 02-27-08 2009-2028 3.00 - 5.00 48,722,941 26,513,799 11,174,887 37,688,686 03-23-09 2010-2029 3.50 - 5.00 28,734,289 23,726,350 9,511,255 33,237,605 12-08-09 2011-2022 2.00 - 5.00 48,771,399 48,765,719 10,884,085 59,649,804 03-16-10 2011-2023 3.00 - 5.00 30,940,242 23,624,167 5,301,440 28,925,607 03-16-10 2011-2017 0.60 - 3.70 12,590,000 5,615,000 386,600 6,001,600 03-16-10 2024-2030 5.00 - 5.55 21,799,156 21,799,156 15,151,333 36,950,489 03-09-11 2012-2031 4.00 - 5.00 42,719,327 38,376,846 16,447,075 54,823,921 11-17-11 2012-2031 3.00 - 5.00 95,852,551 89,059,346 32,340,954 121,400,300 04-11-12 2013-2032 2.00 - 4.00 2,909,215 2,690,070 1,113,217 3,803,287 04-04-13 2014-2038 2.375-4.00 53,206,380 51,333,665 20,450,191 71,783,856 04-03-14 2015-2034 3.00-5.00 60,182,024 60,182,024 27,647,482 87,829,506
Total school bonds 627,296,601 457,807,034 166,294,520 624,101,554
Community renewal bonds:02-01-04 2004-2024 2.00 - 5.00 684,423 291,075 42,924 333,999 12-19-07 2009-2019 3.75 - 5.00 3,139,952 528,533 44,514 573,047 12-08-09 2011-2022 2.00 - 5.00 64,052 64,044 14,294 78,338 11-17-11 2012-2031 3.00 - 5.00 461,017 461,017 156,878 617,895 04-04-13 2014-2038 2.375-4.00 75,675 75,675 7,938 83,613 04-03-14 2015-2034 3.00-5.00 1,404,155 1,404,155 658,985 2,063,140
Total community renewal bonds 5,829,274 2,824,499 925,533 3,750,032
Recreation and parks bonds:02-01-04 2004-2024 2.00 - 5.00 3,247,873 1,115,480 164,185 1,279,665 03-15-07 2007-2027 4.00 - 5.00 3,328,000 1,336,046 547,343 1,883,389 12-19-07 2009-2019 3.75 - 5.00 6,253,677 1,052,652 88,655 1,141,307 02-27-08 2009-2028 3.00 - 5.00 59,000 32,113 13,537 45,650 03-23-09 2010-2029 3.50 - 5.00 533,230 440,337 176,519 616,856 12-08-09 2011-2022 2.00 - 5.00 1,322,416 1,322,262 295,117 1,617,379 03-16-10 2011-2023 3.00 - 5.00 6,000 4,581 1,028 5,609 03-16-10 2024-2030 5.00 - 5.55 1,047,000 1,047,000 727,709 1,774,709 03-09-11 2012-2031 4.00 - 5.00 9,657,518 8,675,817 3,718,175 12,393,992 11-17-11 2012-2031 3.00 - 5.00 10,998,403 10,291,069 4,357,725 14,648,794 04-11-12 2013-2032 2.00 - 4.00 1,369,411 1,266,255 524,007 1,790,262 04-04-13 2014-2038 2.375-4.00 2,865,357 2,765,612 1,092,520 3,858,132 04-03-14 2015-2034 3.00-5.00 4,890,229 4,890,229 2,290,647 7,180,876
Total recreation and parks bonds 45,578,114 34,239,453 13,997,167 48,236,620
Community college bonds: 02-01-04 2004-2024 2.00 - 5.00 7,370,659 3,211,671 473,705 3,685,376 03-15-07 2007-2027 4.00 - 5.00 17,737,000 7,212,060 2,998,411 10,210,471 12-19-07 2009-2019 3.75 - 5.00 3,010,045 506,667 42,672 549,339 02-27-08 2009-2028 3.00 - 5.00 10,165,000 5,532,509 2,331,817 7,864,326 03-23-09 2010-2029 3.50 - 5.00 12,028,208 9,931,808 3,981,395 13,913,203 12-08-09 2011-2022 2.00 - 5.00 8,884,535 8,883,500 1,982,720 10,866,220 03-16-10 2011-2023 3.00 - 5.00 4,173,098 3,186,335 715,037 3,901,372 03-16-10 2024-2030 5.00 - 5.55 8,735,000 8,735,000 6,071,194 14,806,194 03-09-11 2012-2031 4.00 - 5.00 7,500,119 6,737,721 2,887,569 9,625,290 11-17-11 2012-2031 3.00 - 5.00 6,664,456 6,219,415 2,493,199 8,712,614 04-11-12 2013-2032 2.00 - 4.00 76,094 70,362 29,118 99,480 04-04-13 2014-2038 2.375-4.00 16,250,869 15,636,385 6,583,551 22,219,936 04-03-14 2015-2034 3.00-5.00 8,745,634 8,745,634 4,065,824 12,811,458
Total community college bonds 111,340,717 84,609,067 34,656,212 119,265,279
Total bonds 1,244,563,521$ 909,610,000 341,244,106 1,250,854,106
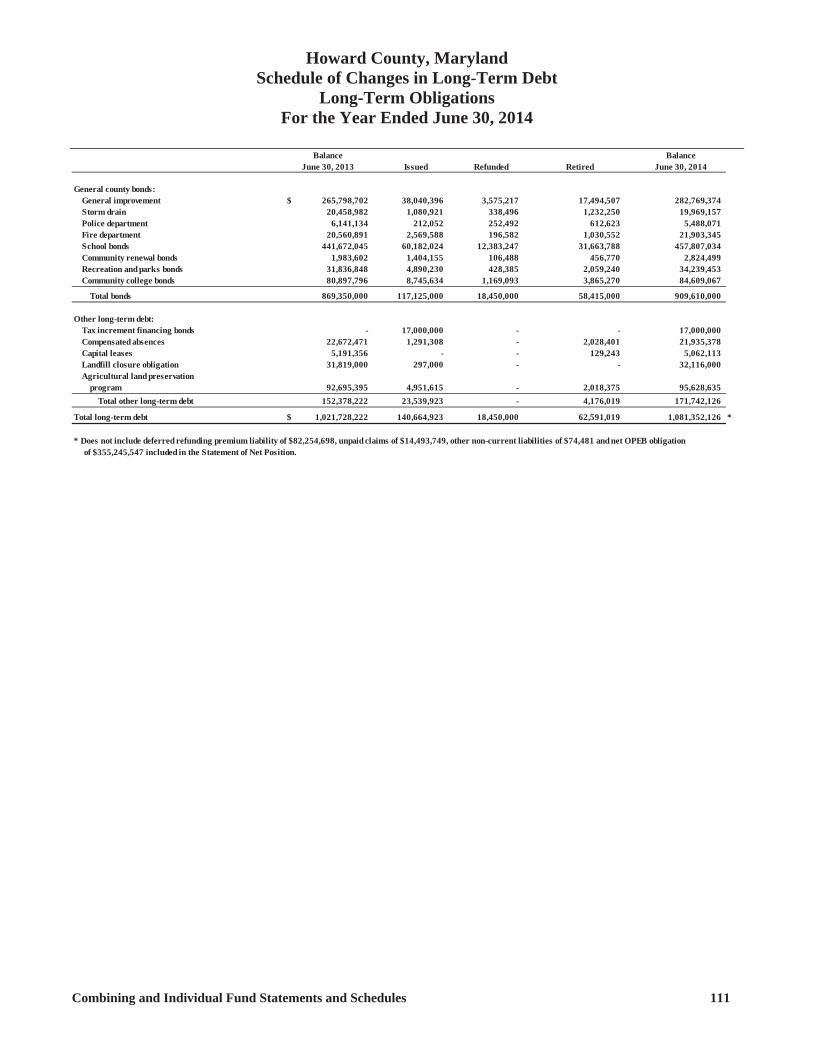
Howard County, Maryland Schedule of Changes in Long-Term Debt
Long-Term Obligations For the Year Ended June 30, 2014
Combining and Individual Fund Statements and Schedules 111
Balance BalanceJune 30, 2013 Issued Refunded Retired June 30, 2014
General county bonds:General improvement 265,798,702$ 38,040,396 3,575,217 17,494,507 282,769,374 Storm drain 20,458,982 1,080,921 338,496 1,232,250 19,969,157 Police department 6,141,134 212,052 252,492 612,623 5,488,071 Fire department 20,560,891 2,569,588 196,582 1,030,552 21,903,345 School bonds 441,672,045 60,182,024 12,383,247 31,663,788 457,807,034 Community renewal bonds 1,983,602 1,404,155 106,488 456,770 2,824,499 Recreation and parks bonds 31,836,848 4,890,230 428,385 2,059,240 34,239,453 Community college bonds 80,897,796 8,745,634 1,169,093 3,865,270 84,609,067
Total bonds 869,350,000 117,125,000 18,450,000 58,415,000 909,610,000
Other long-term debt:Tax increment financing bonds - 17,000,000 - - 17,000,000 Compensated absences 22,672,471 1,291,308 - 2,028,401 21,935,378 Capital leases 5,191,356 - - 129,243 5,062,113 Landfill closure obligation 31,819,000 297,000 - - 32,116,000 Agricultural land preservation
program 92,695,395 4,951,615 - 2,018,375 95,628,635 Total other long-term debt 152,378,222 23,539,923 - 4,176,019 171,742,126
Total long-term debt 1,021,728,222$ 140,664,923 18,450,000 62,591,019 1,081,352,126 *
* Does not include deferred refunding premium liability of $82,254,698, unpaid claims of $14,493,749, other non-current liabilities of $74,481 and net OPEB obligation of $355,245,547 included in the Statement of Net Position.
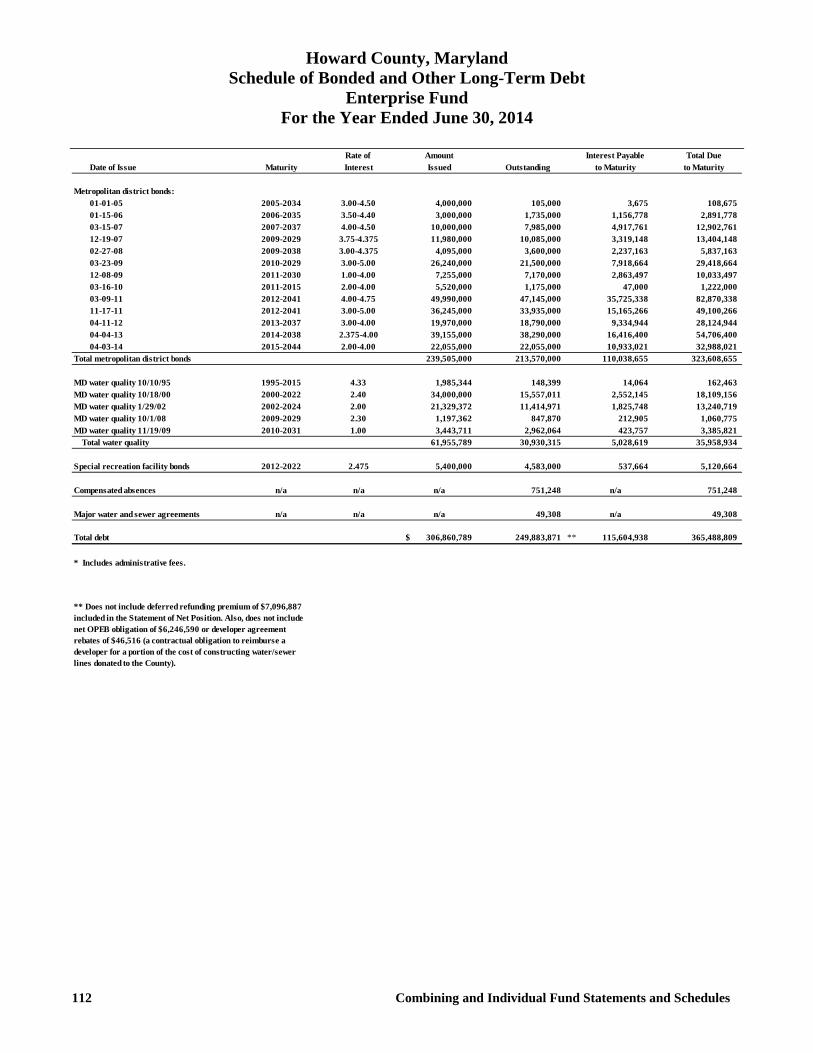
Howard County, Maryland Schedule of Bonded and Other Long-Term Debt
Enterprise Fund For the Year Ended June 30, 2014
112 Combining and Individual Fund Statements and Schedules
Rate of Amount Interest Payable Total DueDate of Issue Maturity Interest Issued Outstanding to Maturity to Maturity
Metropolitan district bonds:01-01-05 2005-2034 3.00-4.50 4,000,000 105,000 3,675 108,675 01-15-06 2006-2035 3.50-4.40 3,000,000 1,735,000 1,156,778 2,891,778 03-15-07 2007-2037 4.00-4.50 10,000,000 7,985,000 4,917,761 12,902,761 12-19-07 2009-2029 3.75-4.375 11,980,000 10,085,000 3,319,148 13,404,148 02-27-08 2009-2038 3.00-4.375 4,095,000 3,600,000 2,237,163 5,837,163 03-23-09 2010-2029 3.00-5.00 26,240,000 21,500,000 7,918,664 29,418,664 12-08-09 2011-2030 1.00-4.00 7,255,000 7,170,000 2,863,497 10,033,497 03-16-10 2011-2015 2.00-4.00 5,520,000 1,175,000 47,000 1,222,000 03-09-11 2012-2041 4.00-4.75 49,990,000 47,145,000 35,725,338 82,870,338 11-17-11 2012-2041 3.00-5.00 36,245,000 33,935,000 15,165,266 49,100,266 04-11-12 2013-2037 3.00-4.00 19,970,000 18,790,000 9,334,944 28,124,944 04-04-13 2014-2038 2.375-4.00 39,155,000 38,290,000 16,416,400 54,706,400 04-03-14 2015-2044 2.00-4.00 22,055,000 22,055,000 10,933,021 32,988,021
Total metropolitan district bonds 239,505,000 213,570,000 110,038,655 323,608,655
MD water quality 10/10/95 1995-2015 4.33 1,985,344 148,399 14,064 * 162,463 MD water quality 10/18/00 2000-2022 2.40 34,000,000 15,557,011 2,552,145 * 18,109,156 MD water quality 1/29/02 2002-2024 2.00 21,329,372 11,414,971 1,825,748 * 13,240,719 MD water quality 10/1/08 2009-2029 2.30 1,197,362 847,870 212,905 * 1,060,775 MD water quality 11/19/09 2010-2031 1.00 3,443,711 2,962,064 423,757 * 3,385,821
Total water quality 61,955,789 30,930,315 5,028,619 35,958,934
Special recreation facility bonds 2012-2022 2.475 5,400,000 4,583,000 537,664 5,120,664
Compensated absences n/a n/a n/a 751,248 n/a 751,248
Major water and sewer agreements n/a n/a n/a 49,308 n/a 49,308
Total debt 306,860,789$ 249,883,871 ** 115,604,938 365,488,809
* Includes administrative fees.
** Does not include deferred refunding premium of $7,096,887 included in the Statement of Net Position. Also, does not include net OPEB obligation of $6,246,590 or developer agreement rebates of $46,516 (a contractual obligation to reimburse a developer for a portion of the cost of constructing water/sewer lines donated to the County).
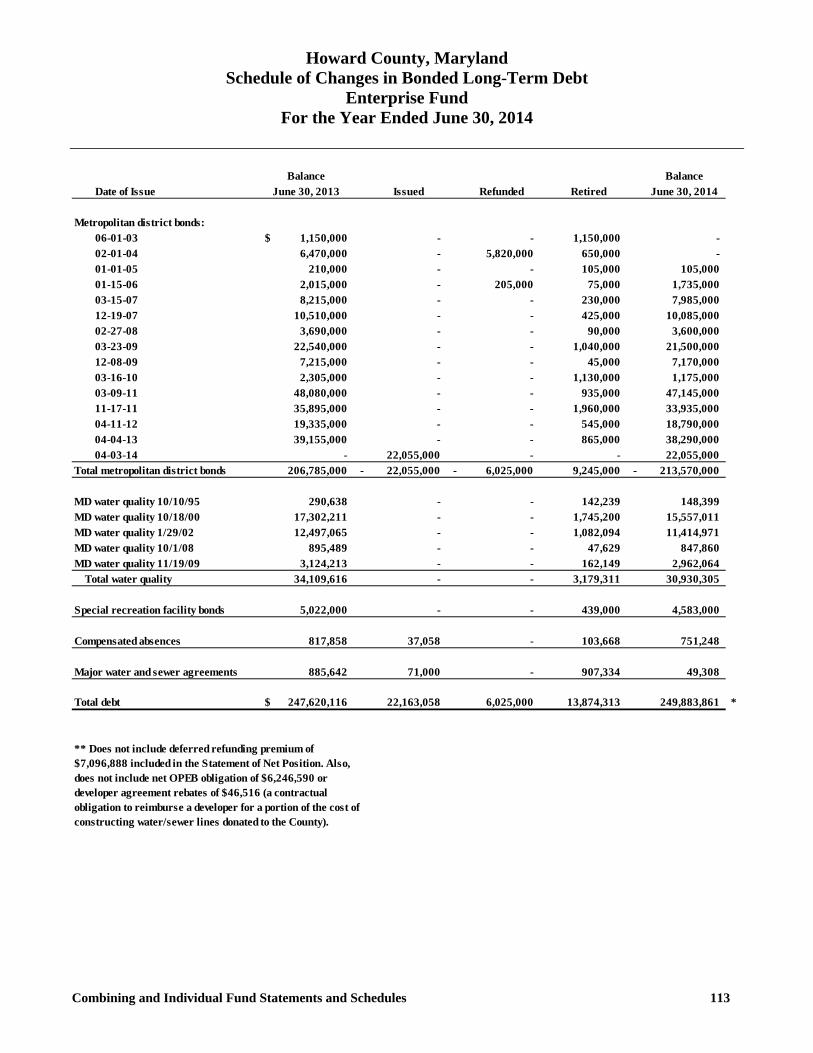
Howard County, Maryland Schedule of Changes in Bonded Long-Term Debt
Enterprise Fund For the Year Ended June 30, 2014
Combining and Individual Fund Statements and Schedules 113
Balance BalanceDate of Issue June 30, 2013 Issued Refunded Retired June 30, 2014
Metropolitan district bonds:06-01-03 1,150,000$ - - 1,150,000 - 02-01-04 6,470,000 - 5,820,000 650,000 - 01-01-05 210,000 - - 105,000 105,000 01-15-06 2,015,000 - 205,000 75,000 1,735,000 03-15-07 8,215,000 - - 230,000 7,985,000 12-19-07 10,510,000 - - 425,000 10,085,000 02-27-08 3,690,000 - - 90,000 3,600,000 03-23-09 22,540,000 - - 1,040,000 21,500,000 12-08-09 7,215,000 - - 45,000 7,170,000 03-16-10 2,305,000 - - 1,130,000 1,175,000 03-09-11 48,080,000 - - 935,000 47,145,000 11-17-11 35,895,000 - - 1,960,000 33,935,000 04-11-12 19,335,000 - - 545,000 18,790,000 04-04-13 39,155,000 - - 865,000 38,290,000 04-03-14 - 22,055,000 - - 22,055,000
Total metropolitan district bonds 206,785,000 - 22,055,000 - 6,025,000 9,245,000 - 213,570,000
MD water quality 10/10/95 290,638 - - 142,239 148,399 MD water quality 10/18/00 17,302,211 - - 1,745,200 15,557,011 MD water quality 1/29/02 12,497,065 - - 1,082,094 11,414,971 MD water quality 10/1/08 895,489 - - 47,629 847,860 MD water quality 11/19/09 3,124,213 - - 162,149 2,962,064
Total water quality 34,109,616 - - 3,179,311 30,930,305
Special recreation facility bonds 5,022,000 - - 439,000 4,583,000
Compensated absences 817,858 37,058 - 103,668 751,248
Major water and sewer agreements 885,642 71,000 - 907,334 49,308
Total debt 247,620,116$ 22,163,058 6,025,000 13,874,313 249,883,861 *
** Does not include deferred refunding premium of $7,096,888 included in the Statement of Net Position. Also, does not include net OPEB obligation of $6,246,590 or developer agreement rebates of $46,516 (a contractual obligation to reimburse a developer for a portion of the cost of constructing water/sewer lines donated to the County).

Howard County’s Mobile Market: The Roving Radish Part of a broad food initiative to develop a comprehensive approach to nutrition and sustainability unveiled by County Executive Ken Ulman in 2013, The Roving Radish is a new effort to bring fresh, affordable and healthy meals to more people. The Roving Radish mobile market delivers reasonably priced, ready-to-prepare meals to participants at five drop-off sites throughout Howard County. Each kit provides all of the ingredients and instructions for two flavorful and fresh meals for a family of four. Food is provided by regional farmers and prepared for distribution at the Howard County Detention Center, where inmates receive job skill training.
Independent Auditor’s Report on
Internal Control Over Financial Reporting and on
Compliance and Other Matters Based on an Audit of
Financial Statements Performed in
Accordance with Government Auditing Standards

Report on Internal Control 115
Report on Internal Control over Financial Reporting and
on Compliance and Other Matters Based on an Audit of
Financial Statements Performed in Accordance with
Government Auditing Standards
To the Honorable Members of the County Council
Howard County, Maryland
We have audited the financial statements of the governmental activities, the business-type activities, the
aggregate discretely presented component units, each major fund, and the aggregate remaining fund
information of Howard County, Maryland (the County), as of and for the year ended June 30, 2014,
which collectively comprise the County’s basic financial statements and have issued our report thereon
dated November 24, 2014. We conducted our audit in accordance with auditing standards generally
accepted in the United States of America and the standards applicable to financial audits contained in
Government Auditing Standards, issued by the Comptroller General of the United States.
Internal Control over Financial Reporting
Management of Howard County, Maryland, is responsible for establishing and maintaining effective
internal control over financial reporting. In planning and performing our audit, we considered the
County’s internal control over financial reporting as a basis for designing our auditing procedures that
are appropriate in the circumstances for the purpose of expressing our opinions on the financial
statements, but not for the purpose of expressing an opinion on the effectiveness of Howard County,
Maryland’s internal control over financial reporting. Accordingly, we do not express an opinion on the
effectiveness of the County’s internal control over financial reporting.
Our consideration of internal control over financial reporting was for the limited purpose described in
the preceding paragraph and was not designed to identify all deficiencies in internal control over
financial reporting that might be significant deficiencies or material weaknesses and therefore, there can
be no assurance that all deficiencies, significant deficiencies, or material weaknesses have been
identified. However, as described below, we identified a certain deficiency in internal control over
financial reporting that we consider to be a material weakness.
A deficiency in internal control exists when the design or operation of a control does not allow
management or employees, in the normal course of performing their assigned functions, to prevent, or
detect and correct misstatements on a timely basis. A material weakness is a deficiency, or a
combination of deficiencies, in internal control such that there is a reasonable possibility that a material
misstatement of the entity’s financial statements will not be prevented, or detected and corrected on a
timely basis. We consider the deficiency described below to be a material weakness.
116 Report on Internal Control
Capital Assets
During the audit we noted material journal entries that were required to be posted in the current fiscal
year to Capital Assets. We noted the County is in the process of implementing a procedure to track the
status of capital projects, including identifying Finance Department personnel to meet with Project
Managers on a quarterly basis to discuss project status, identify costs to be expensed, placed in service
or remain in construction in progress, prepare reconciliations for every project and identify a Finance
Department supervisor to review all quarterly reconciliations.
We recommend the County continue to improve upon the process and effectively implement the
procedures as outlined above.
Compliance and Other Matters
As part of obtaining reasonable assurance about whether the County’s financial statements are free of
material misstatement, we performed tests of its compliance with certain provisions of laws, regulations,
contracts, and grant agreements, noncompliance with which could have a direct and material effect on
the determination of financial statement amounts. However, providing an opinion on compliance with
those provisions was not an objective of our audit, and accordingly, we do not express such an opinion.
The results of our tests disclosed no instances of noncompliance or other matters that are required to be
reported under Government Auditing Standards.
Management Response
Management agrees with the recommendation. We have created a Division of Capital Projects/Fixed
Assets and hired a supervisor for the division to assist in managing the periodic reviews and
reconciliations.
We noted certain matters that we reported to management of Howard County, Maryland, in a separate
letter dated November 24, 2014.
The County’s response to the findings identified in our audit is described above. We did not audit the
County’s response and, accordingly, we express no opinion on it.
This report is intended solely for the information and use of management, County Council, others within
the entity, and federal awarding agencies and pass-through entities and is not intended to be and should
not be used by anyone other than these specified parties.
Baltimore, Maryland
November 24, 2014
Statistical Section
The Statistical Section provides detailed information for the primary government as a context for understanding what the information in the financial statements, note disclosures, and required supplementary information says about the County’s overall financial health. The tables in this section are unaudited because they often present data from outside accounting records.

Statistical Section 117
Statistical Section (Unaudited)
Index
Financial Trends - These schedules contain trend information to help the reader understand how the County’s financial performance and well-being have changed over time.
Revenue Capacity - These schedules contain information to help the reader assess the County’s most significant local revenue source, the property tax.
Debt Capacity - These schedules present information to help the reader assess the affordability of the County’s current levels of outstanding debt and the County’s ability to issue additional debt in the future.
Demographic and Economic Information - These schedules offer demographic and economic indicators to help the reader understand the environment within which the County’s financial activities take place.
Operating Information - These schedules contain service and infrastructure data to help the reader understand how the information in the County’s financial report relates to the services the County provides and the activities it performs.

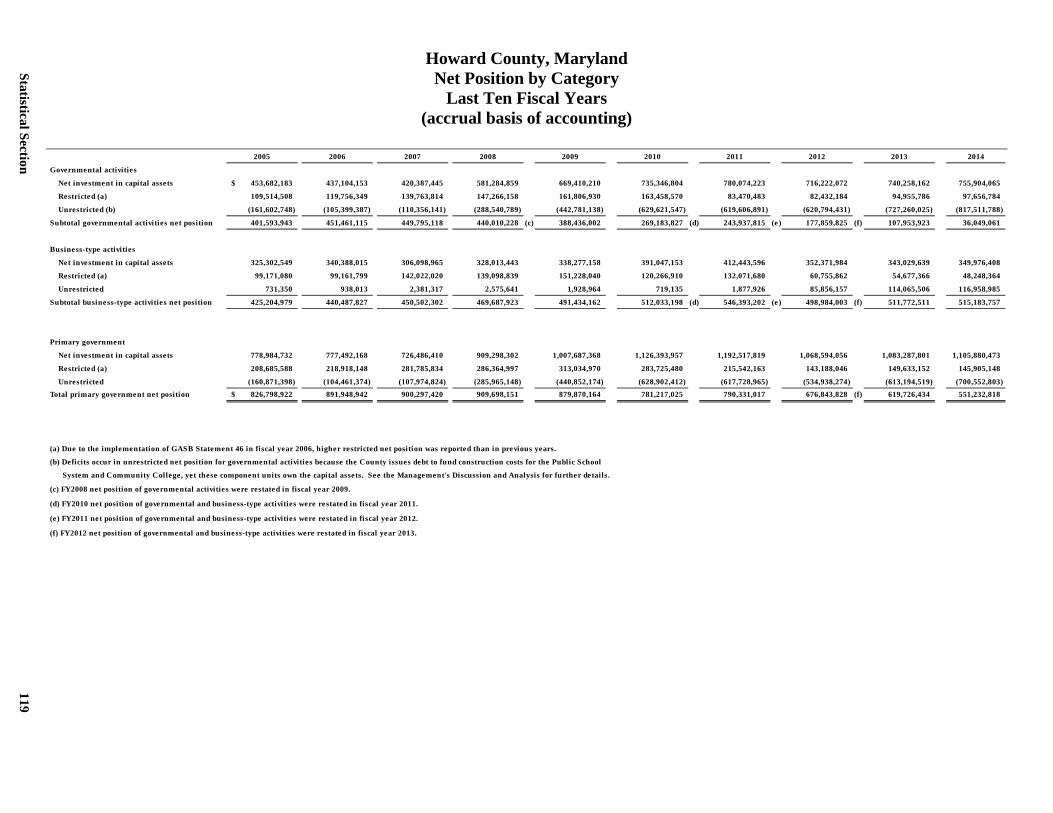
Howard County, Maryland Net Position by Category
Last Ten Fiscal Years (accrual basis of accounting)
2005 2006 2007 2008 2009 2010 2011 2012 2013 2014
Governmental activities
Net investment in capital assets 453,682,183$ 437,104,153 420,387,445 581,284,859 669,410,210 735,346,804 780,074,223 716,222,072 740,258,162 755,904,065
Restricted (a) 109,514,508 119,756,349 139,763,814 147,266,158 161,806,930 163,458,570 83,470,483 82,432,184 94,955,786 97,656,784
Unrestricted (b) (161,602,748) (105,399,387) (110,356,141) (288,540,789) (442,781,138) (629,621,547) (619,606,891) (620,794,431) (727,260,025) (817,511,788)
Subtotal governmental activities net position 401,593,943 451,461,115 449,795,118 440,010,228 (c) 388,436,002 269,183,827 (d) 243,937,815 (e ) 177,859,825 (f) 107,953,923 36,049,061
Business-type activities
Net investment in capital assets 325,302,549 340,388,015 306,098,965 328,013,443 338,277,158 391,047,153 412,443,596 352,371,984 343,029,639 349,976,408
Restricted (a) 99,171,080 99,161,799 142,022,020 139,098,839 151,228,040 120,266,910 132,071,680 60,755,862 54,677,366 48,248,364
Unrestricted 731,350 938,013 2,381,317 2,575,641 1,928,964 719,135 1,877,926 85,856,157 114,065,506 116,958,985
Subtotal business-type activities net position 425,204,979 440,487,827 450,502,302 469,687,923 491,434,162 512,033,198 (d) 546,393,202 (e ) 498,984,003 (f) 511,772,511 515,183,757
Primary government
Net investment in capital assets 778,984,732 777,492,168 726,486,410 909,298,302 1,007,687,368 1,126,393,957 1,192,517,819 1,068,594,056 1,083,287,801 1,105,880,473
Restricted (a) 208,685,588 218,918,148 281,785,834 286,364,997 313,034,970 283,725,480 215,542,163 143,188,046 149,633,152 145,905,148
Unrestricted (160,871,398) (104,461,374) (107,974,824) (285,965,148) (440,852,174) (628,902,412) (617,728,965) (534,938,274) (613,194,519) (700,552,803) Total primary government net position 826,798,922$ 891,948,942 900,297,420 909,698,151 879,870,164 781,217,025 790,331,017 676,843,828 (f) 619,726,434 551,232,818
(a) Due to the implementation of GASB Statement 46 in fiscal year 2006, higher restricted net position was reported than in previous years.
(b) Deficits occur in unrestricted net position for governmental activities because the County issues debt to fund construction costs for the Public School
System and Community College, yet these component units own the capital assets. See the Management's Discussion and Analysis for further details.
(c) FY2008 net position of governmental activities were restated in fiscal year 2009.
(d) FY2010 net position of governmental and business-type activities were restated in fiscal year 2011.
(e) FY2011 net position of governmental and business-type activities were restated in fiscal year 2012.
(f) FY2012 net position of governmental and business-type activities were restated in fiscal year 2013.
Statistical Section 119
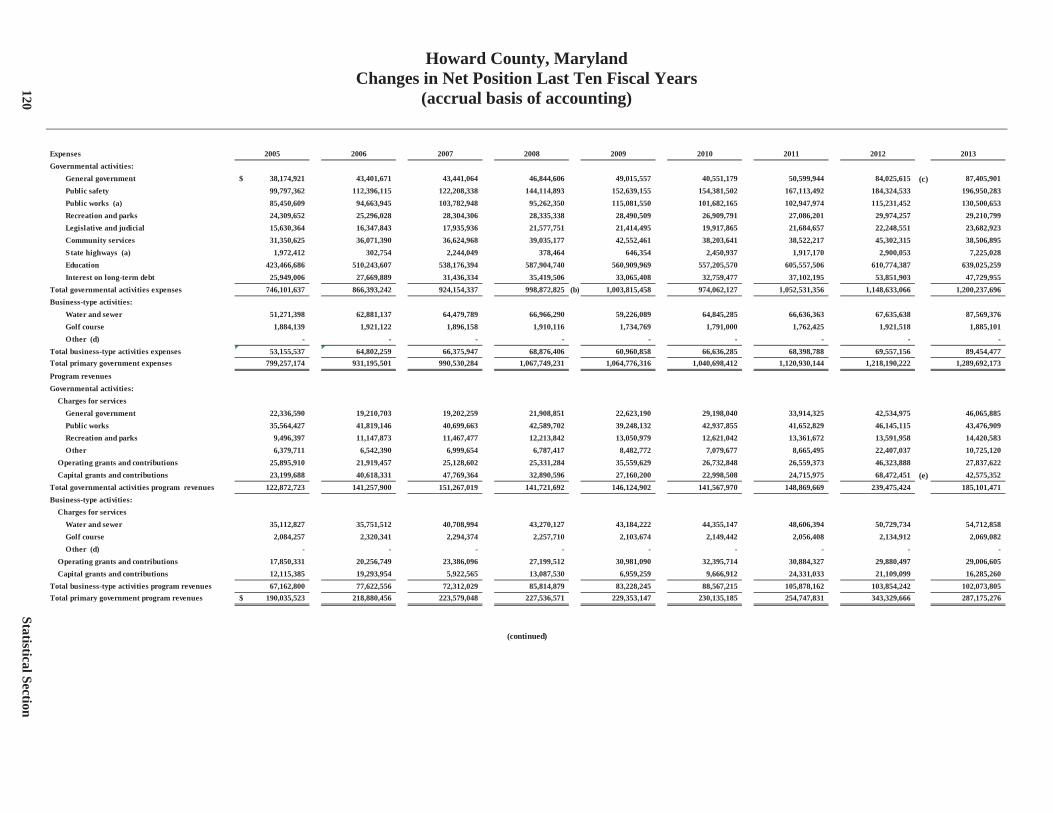
Howard County, Maryland Changes in Net Position Last Ten Fiscal Years
(accrual basis of accounting)
Expenses 2005 2006 2007 2008 2009 2010 2011 2012 2013Governmental activities:
General government 38,174,921$ 43,401,671 43,441,064 46,844,606 49,015,557 40,551,179 50,599,944 84,025,615 (c) 87,405,901 Public safety 99,797,362 112,396,115 122,208,338 144,114,893 152,639,155 154,381,502 167,113,492 184,324,533 196,950,283 Public works (a) 85,450,609 94,663,945 103,782,948 95,262,350 115,081,550 101,682,165 102,947,974 115,231,452 130,500,653 Recreation and parks 24,309,652 25,296,028 28,304,306 28,335,338 28,490,509 26,909,791 27,086,201 29,974,257 29,210,799 Legislative and judicial 15,630,364 16,347,843 17,935,936 21,577,751 21,414,495 19,917,865 21,684,657 22,248,551 23,682,923 Community services 31,350,625 36,071,390 36,624,968 39,035,177 42,552,461 38,203,641 38,522,217 45,302,315 38,506,895 State highways (a) 1,972,412 302,754 2,244,049 378,464 646,354 2,450,937 1,917,170 2,900,053 7,225,028 Education 423,466,686 510,243,607 538,176,394 587,904,740 560,909,969 557,205,570 605,557,506 610,774,387 639,025,259 Interest on long-term debt 25,949,006 27,669,889 31,436,334 35,419,506 33,065,408 32,759,477 37,102,195 53,851,903 47,729,955
Total governmental activities expenses 746,101,637 866,393,242 924,154,337 998,872,825 (b) 1,003,815,458 974,062,127 1,052,531,356 1,148,633,066 1,200,237,696 Business-type activities:
Water and sewer 51,271,398 62,881,137 64,479,789 66,966,290 59,226,089 64,845,285 66,636,363 67,635,638 87,569,376 Golf course 1,884,139 1,921,122 1,896,158 1,910,116 1,734,769 1,791,000 1,762,425 1,921,518 1,885,101 Other (d) - - - - - - - - -
Total business-type activities expenses 53,155,537 64,802,259 66,375,947 68,876,406 60,960,858 66,636,285 68,398,788 69,557,156 89,454,477 Total primary government expenses 799,257,174 931,195,501 990,530,284 1,067,749,231 1,064,776,316 1,040,698,412 1,120,930,144 1,218,190,222 1,289,692,173
Program revenuesGovernmental activities:
Charges for servicesGeneral government 22,336,590 19,210,703 19,202,259 21,908,851 22,623,190 29,198,040 33,914,325 42,534,975 46,065,885 Public works 35,564,427 41,819,146 40,699,663 42,589,702 39,248,132 42,937,855 41,652,829 46,145,115 43,476,909 Recreation and parks 9,496,397 11,147,873 11,467,477 12,213,842 13,050,979 12,621,042 13,361,672 13,591,958 14,420,583 Other 6,379,711 6,542,390 6,999,654 6,787,417 8,482,772 7,079,677 8,665,495 22,407,037 10,725,120
Operating grants and contributions 25,895,910 21,919,457 25,128,602 25,331,284 35,559,629 26,732,848 26,559,373 46,323,888 27,837,622 Capital grants and contributions 23,199,688 40,618,331 47,769,364 32,890,596 27,160,200 22,998,508 24,715,975 68,472,451 (e) 42,575,352
Total governmental activities program revenues 122,872,723 141,257,900 151,267,019 141,721,692 146,124,902 141,567,970 148,869,669 239,475,424 185,101,471 Business-type activities:
Charges for servicesWater and sewer 35,112,827 35,751,512 40,708,994 43,270,127 43,184,222 44,355,147 48,606,394 50,729,734 54,712,858 Golf course 2,084,257 2,320,341 2,294,374 2,257,710 2,103,674 2,149,442 2,056,408 2,134,912 2,069,082 Other (d) - - - - - - - - -
Operating grants and contributions 17,850,331 20,256,749 23,386,096 27,199,512 30,981,090 32,395,714 30,884,327 29,880,497 29,006,605 Capital grants and contributions 12,115,385 19,293,954 5,922,565 13,087,530 6,959,259 9,666,912 24,331,033 21,109,099 16,285,260
Total business-type activities program revenues 67,162,800 77,622,556 72,312,029 85,814,879 83,228,245 88,567,215 105,878,162 103,854,242 102,073,805 Total primary government program revenues 190,035,523$ 218,880,456 223,579,048 227,536,571 229,353,147 230,135,185 254,747,831 343,329,666 287,175,276
(continued)
120
Statistical Section
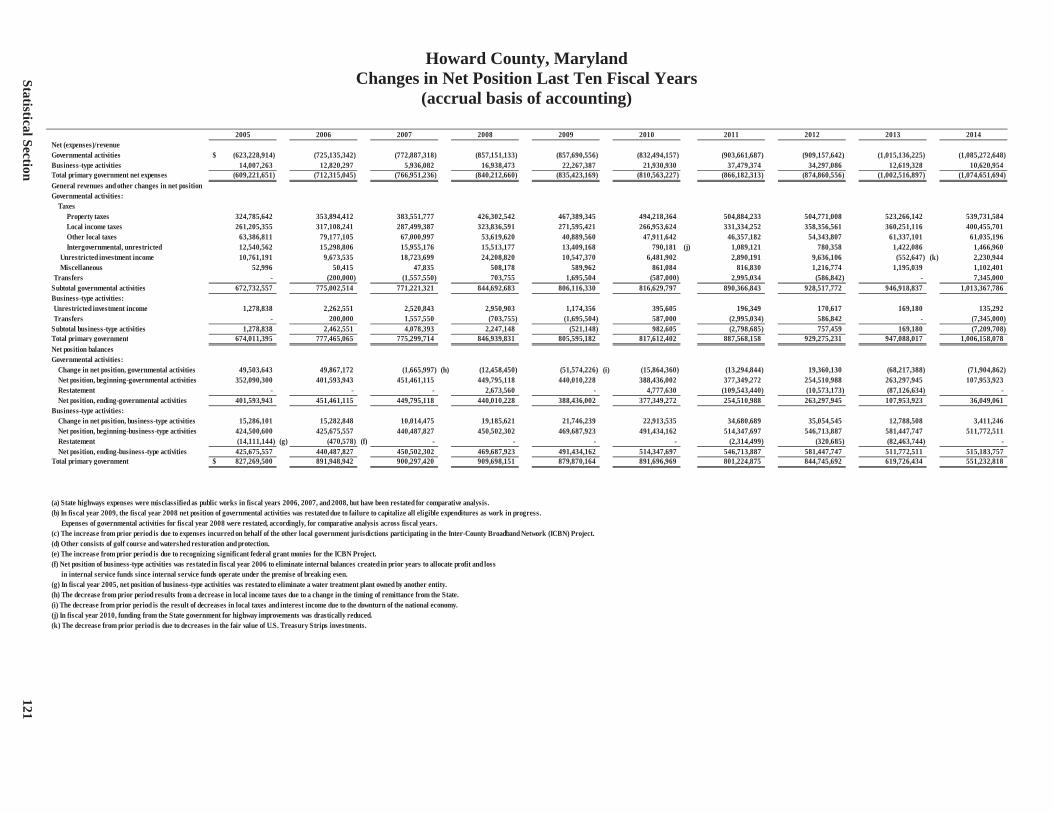
Howard County, Maryland Changes in Net Position Last Ten Fiscal Years
(accrual basis of accounting)
2005 2006 2007 2008 2009 2010 2011 2012 2013 2014Net (expenses)/revenueGovernmental activities (623,228,914)$ (725,135,342) (772,887,318) (857,151,133) (857,690,556) (832,494,157) (903,661,687) (909,157,642) (1,015,136,225) (1,085,272,648) Business-type activities 14,007,263 12,820,297 5,936,082 16,938,473 22,267,387 21,930,930 37,479,374 34,297,086 12,619,328 10,620,954 Total primary government net expenses (609,221,651) (712,315,045) (766,951,236) (840,212,660) (835,423,169) (810,563,227) (866,182,313) (874,860,556) (1,002,516,897) (1,074,651,694) General revenues and other changes in net positionGovernmental activities:
TaxesProperty taxes 324,785,642 353,894,412 383,551,777 426,302,542 467,389,345 494,218,364 504,884,233 504,771,008 523,266,142 539,731,584 Local income taxes 261,205,355 317,108,241 287,499,387 323,836,591 271,595,421 266,953,624 331,334,252 358,356,561 360,251,116 400,455,701 Other local taxes 63,386,811 79,177,105 67,000,997 53,619,620 40,889,560 47,911,642 46,357,182 54,343,807 61,337,101 61,035,196 Intergovernmental, unrestricted 12,540,562 15,298,806 15,955,176 15,513,177 13,409,168 790,181 (j) 1,089,121 780,358 1,422,086 1,466,960
Unrestricted investment income 10,761,191 9,673,535 18,723,699 24,208,820 10,547,370 6,481,902 2,890,191 9,636,106 (552,647) (k) 2,230,944 Miscellaneous 52,996 50,415 47,835 508,178 589,962 861,084 816,830 1,216,774 1,195,039 1,102,401
Transfers - (200,000) (1,557,550) 703,755 1,695,504 (587,000) 2,995,034 (586,842) - 7,345,000 Subtotal governmental activities 672,732,557 775,002,514 771,221,321 844,692,683 806,116,330 816,629,797 890,366,843 928,517,772 946,918,837 1,013,367,786 Business-type activities:Unrestricted investment income 1,278,838 2,262,551 2,520,843 2,950,903 1,174,356 395,605 196,349 170,617 169,180 135,292 Transfers - 200,000 1,557,550 (703,755) (1,695,504) 587,000 (2,995,034) 586,842 - (7,345,000)
Subtotal business-type activities 1,278,838 2,462,551 4,078,393 2,247,148 (521,148) 982,605 (2,798,685) 757,459 169,180 (7,209,708) Total primary government 674,011,395 777,465,065 775,299,714 846,939,831 805,595,182 817,612,402 887,568,158 929,275,231 947,088,017 1,006,158,078 Net position balancesGovernmental activities:
Change in net position, governmental activities 49,503,643 49,867,172 (1,665,997) (h) (12,458,450) (51,574,226) (i) (15,864,360) (13,294,844) 19,360,130 (68,217,388) (71,904,862) Net position, beginning-governmental activities 352,090,300 401,593,943 451,461,115 449,795,118 440,010,228 388,436,002 377,349,272 254,510,988 263,297,945 107,953,923 Restatement - - - 2,673,560 - 4,777,630 (109,543,440) (10,573,173) (87,126,634) - Net position, ending-governmental activities 401,593,943 451,461,115 449,795,118 440,010,228 388,436,002 377,349,272 254,510,988 263,297,945 107,953,923 36,049,061
Business-type activities:Change in net position, business-type activities 15,286,101 15,282,848 10,014,475 19,185,621 21,746,239 22,913,535 34,680,689 35,054,545 12,788,508 3,411,246 Net position, beginning-business-type activities 424,500,600 425,675,557 440,487,827 450,502,302 469,687,923 491,434,162 514,347,697 546,713,887 581,447,747 511,772,511 Restatement (14,111,144) (g) (470,578) (f) - - - - (2,314,499) (320,685) (82,463,744) - Net position, ending-business-type activities 425,675,557 440,487,827 450,502,302 469,687,923 491,434,162 514,347,697 546,713,887 581,447,747 511,772,511 515,183,757
Total primary government 827,269,500$ 891,948,942 900,297,420 909,698,151 879,870,164 891,696,969 801,224,875 844,745,692 619,726,434 551,232,818
(a) State highways expenses were misclassified as public works in fiscal years 2006, 2007, and 2008, but have been restated for comparative analysis.(b) In fiscal year 2009, the fiscal year 2008 net position of governmental activities was restated due to failure to capitalize all eligible expenditures as work in progress. Expenses of governmental activities for fiscal year 2008 were restated, accordingly, for comparative analysis across fiscal years.(c) The increase from prior period is due to expenses incurred on behalf of the other local government jurisdictions participating in the Inter-County Broadband Network (ICBN) Project.(d) Other consists of golf course and watershed restoration and protection.(e) The increase from prior period is due to recognizing significant federal grant monies for the ICBN Project.(f) Net position of business-type activities was restated in fiscal year 2006 to eliminate internal balances created in prior years to allocate profit and loss in internal service funds since internal service funds operate under the premise of breaking even. (g) In fiscal year 2005, net position of business-type activities was restated to eliminate a water treatment plant owned by another entity. (h) The decrease from prior period results from a decrease in local income taxes due to a change in the timing of remittance from the State.(i) The decrease from prior period is the result of decreases in local taxes and interest income due to the downturn of the national economy. (j) In fiscal year 2010, funding from the State government for highway improvements was drastically reduced.(k) The decrease from prior period is due to decreases in the fair value of U.S. Treasury Strips investments.
Statistical Section 121
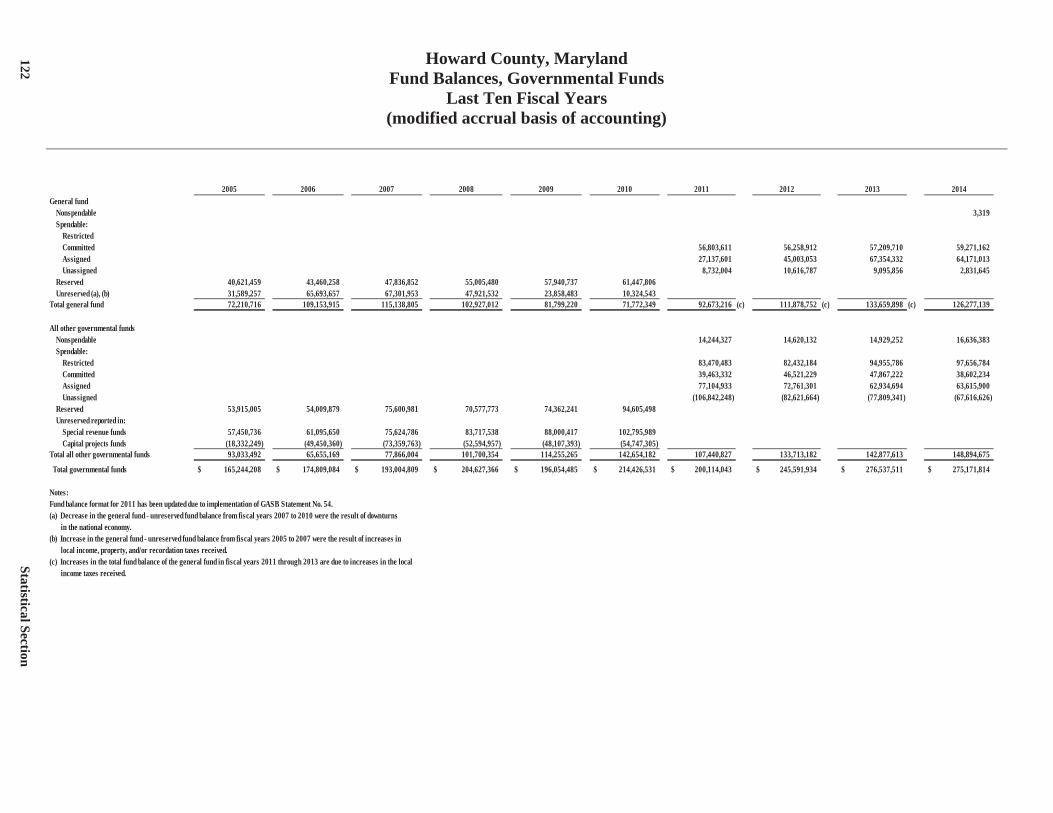
Howard County, Maryland Fund Balances, Governmental Funds
Last Ten Fiscal Years (modified accrual basis of accounting)
2005 2006 2007 2008 2009 2010 2011 2012 2013 2014General fund
Nonspendable 3,319 Spendable:
RestrictedCommitted 56,803,611 56,258,912 57,209,710 59,271,162 Assigned 27,137,601 45,003,053 67,354,332 64,171,013 Unassigned 8,732,004 10,616,787 9,095,856 2,831,645
Reserved 40,621,459 43,460,258 47,836,852 55,005,480 57,940,737 61,447,806 Unreserved (a), (b) 31,589,257 65,693,657 67,301,953 47,921,532 23,858,483 10,324,543
Total general fund 72,210,716 109,153,915 115,138,805 102,927,012 81,799,220 71,772,349 92,673,216 (c) 111,878,752 (c) 133,659,898 (c) 126,277,139
All other governmental fundsNonspendable 14,244,327 14,620,132 14,929,252 16,636,383 Spendable:
Restricted 83,470,483 82,432,184 94,955,786 97,656,784 Committed 39,463,332 46,521,229 47,867,222 38,602,234 Assigned 77,104,933 72,761,301 62,934,694 63,615,900 Unassigned (106,842,248) (82,621,664) (77,809,341) (67,616,626)
Reserved 53,915,005 54,009,879 75,600,981 70,577,773 74,362,241 94,605,498 Unreserved reported in:
Special revenue funds 57,450,736 61,095,650 75,624,786 83,717,538 88,000,417 102,795,989 Capital projects funds (18,332,249) (49,450,360) (73,359,763) (52,594,957) (48,107,393) (54,747,305)
Total all other governmental funds 93,033,492 65,655,169 77,866,004 101,700,354 114,255,265 142,654,182 107,440,827 133,713,182 142,877,613 148,894,675
Total governmental funds 165,244,208$ 174,809,084$ 193,004,809$ 204,627,366$ 196,054,485$ 214,426,531$ 200,114,043$ 245,591,934$ 276,537,511$ 275,171,814$
Notes:Fund balance format for 2011 has been updated due to implementation of GASB Statement No. 54.(a) Decrease in the general fund - unreserved fund balance from fiscal years 2007 to 2010 were the result of downturns in the national economy.(b) Increase in the general fund - unreserved fund balance from fiscal years 2005 to 2007 were the result of increases in local income, property, and/or recordation taxes received.(c) Increases in the total fund balance of the general fund in fiscal years 2011 through 2013 are due to increases in the local income taxes received.
122
Statistical Section
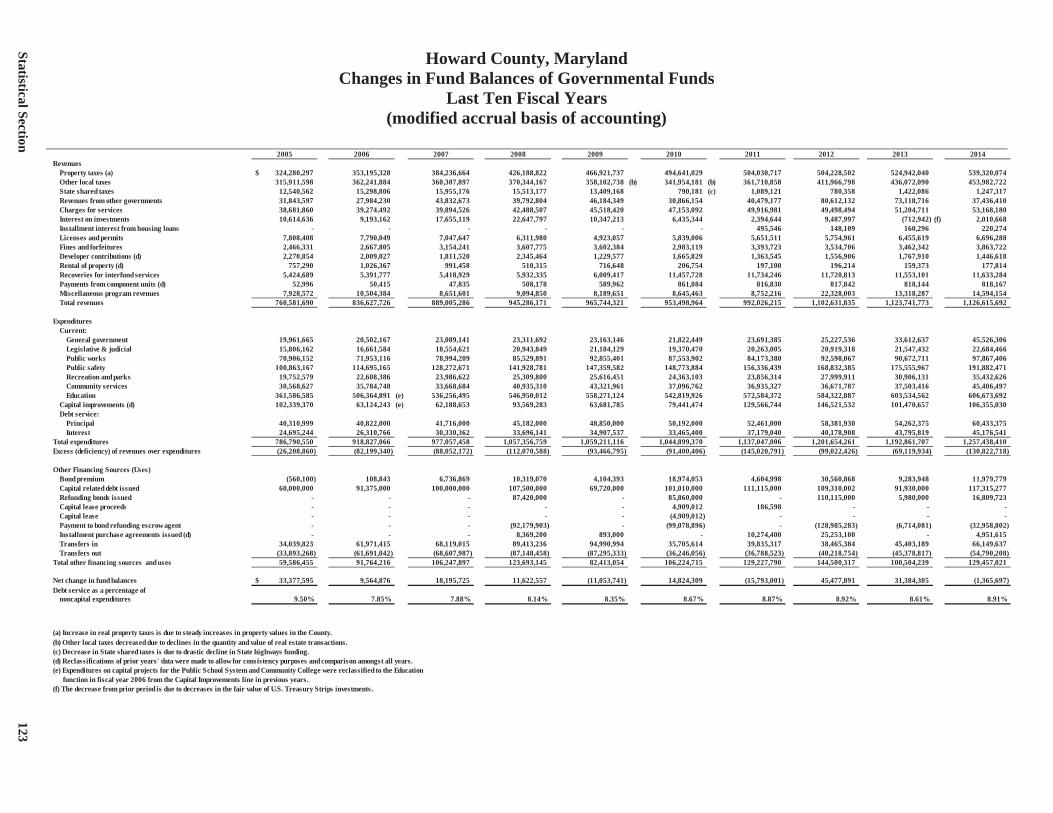
Howard County, Maryland Changes in Fund Balances of Governmental Funds
Last Ten Fiscal Years (modified accrual basis of accounting)
2005 2006 2007 2008 2009 2010 2011 2012 2013 2014Revenues
Property taxes (a) 324,280,297$ 353,195,328 384,236,664 426,188,822 466,921,737 494,641,029 504,030,717 504,228,502 524,942,040 539,320,074 Other local taxes 315,911,598 362,241,884 360,307,897 370,344,167 358,102,738 (b) 341,954,181 (b) 361,710,858 411,966,798 436,072,090 453,982,722 State shared taxes 12,540,562 15,298,806 15,955,176 15,513,177 13,409,168 790,181 (c) 1,089,121 780,358 1,422,086 1,247,317 Revenues from other governments 31,843,597 27,984,230 43,832,673 39,792,804 46,184,349 30,866,154 40,479,177 80,612,132 73,118,716 37,436,410 Charges for services 38,681,860 39,274,492 39,894,526 42,488,507 45,518,420 47,153,092 49,916,981 49,498,494 51,204,711 53,168,180 Interest on investments 10,614,636 9,193,162 17,655,119 22,647,797 10,347,213 6,435,344 2,394,644 9,487,997 (712,942) (f) 2,010,668 Installment interest from housing loans - - - - - - 495,546 148,109 160,296 220,274 Licenses and permits 7,808,408 7,790,049 7,047,647 6,311,980 4,923,057 5,839,006 5,651,511 5,754,961 6,455,619 6,696,288 Fines and forfeitures 2,466,331 2,667,805 3,154,241 3,607,775 3,602,384 2,983,119 3,393,723 3,534,706 3,462,342 3,863,722 Developer contributions (d) 2,270,854 2,009,027 1,811,520 2,345,464 1,229,577 1,665,829 1,363,545 1,556,906 1,767,910 1,446,618 Rental of property (d) 757,290 1,026,367 991,458 510,315 716,648 206,754 197,100 196,214 159,373 177,814 Recoveries for interfund services 5,424,689 5,391,777 5,418,929 5,932,335 6,009,417 11,457,728 11,734,246 11,720,813 11,553,101 11,633,284 Payments from component units (d) 52,996 50,415 47,835 508,178 589,962 861,084 816,830 817,842 818,144 818,167 Miscellaneous program revenues 7,928,572 10,504,384 8,651,601 9,094,850 8,189,651 8,645,463 8,752,216 22,328,003 13,318,287 14,594,154 Total revenues 760,581,690 836,627,726 889,005,286 945,286,171 965,744,321 953,498,964 992,026,215 1,102,631,835 1,123,741,773 1,126,615,692
ExpendituresCurrent:
General government 19,961,665 20,502,167 23,089,141 23,311,692 23,163,146 21,822,449 23,691,385 25,227,536 33,612,637 45,526,306 Legislative & judicial 15,806,162 16,661,584 18,554,621 20,943,849 21,184,129 19,370,470 20,263,005 20,919,318 21,547,432 22,684,466 Public works 70,906,152 71,953,116 78,994,209 85,529,891 92,855,401 87,553,902 84,173,380 92,598,067 90,672,711 97,867,406 Public safety 100,863,167 114,695,165 128,272,671 141,928,781 147,359,582 148,773,884 156,336,439 168,832,385 175,555,967 191,882,471 Recreation and parks 19,752,579 22,608,386 23,986,622 25,309,800 25,616,451 24,363,103 23,856,314 27,999,911 30,906,131 35,432,626 Community services 30,568,627 35,784,748 33,668,684 40,935,310 43,321,961 37,096,762 36,935,327 36,671,787 37,503,416 45,406,497 Education 361,586,585 506,364,891 (e) 536,256,495 546,950,012 558,271,124 542,819,926 572,584,372 584,322,887 603,534,562 606,673,692
Capital improvements (d) 102,339,370 63,124,243 (e) 62,188,653 93,569,283 63,681,785 79,441,474 129,566,744 146,521,532 101,470,657 106,355,030 Debt service:
Principal 40,310,999 40,822,000 41,716,000 45,182,000 48,850,000 50,192,000 52,461,000 58,381,930 54,262,375 60,433,375 Interest 24,695,244 26,310,766 30,330,362 33,696,141 34,907,537 33,465,400 37,179,040 40,178,908 43,795,819 45,176,541
Total expenditures 786,790,550 918,827,066 977,057,458 1,057,356,759 1,059,211,116 1,044,899,370 1,137,047,006 1,201,654,261 1,192,861,707 1,257,438,410 Excess (deficiency) of revenues over expenditures (26,208,860) (82,199,340) (88,052,172) (112,070,588) (93,466,795) (91,400,406) (145,020,791) (99,022,426) (69,119,934) (130,822,718)
Other Financing Sources (Uses)Bond premium (560,100) 108,843 6,736,869 10,319,070 4,104,393 18,974,053 4,604,998 30,560,868 9,283,948 11,979,779 Capital related debt issued 60,000,000 91,375,000 100,000,000 107,500,000 69,720,000 101,010,000 111,115,000 109,310,002 91,930,000 117,315,277 Refunding bonds issued - - - 87,420,000 - 85,860,000 - 110,115,000 5,980,000 16,809,723 Capital lease proceeds - - - - - 4,909,012 186,598 - - - Capital lease - - - - - (4,909,012) - - - - Payment to bond refunding escrow agent - - - (92,179,903) - (99,078,896) - (128,985,283) (6,714,081) (32,958,802) Installment purchase agreements issued (d) - - - 8,369,200 893,000 - 10,274,400 25,253,100 - 4,951,615 Transfers in 34,039,823 61,971,415 68,119,015 89,413,236 94,990,994 35,705,614 39,835,317 38,465,384 45,403,189 66,149,637 Transfers out (33,893,268) (61,691,042) (68,607,987) (87,148,458) (87,295,333) (36,246,056) (36,788,523) (40,218,754) (45,378,817) (54,790,208)
Total other financing sources and uses 59,586,455 91,764,216 106,247,897 123,693,145 82,413,054 106,224,715 129,227,790 144,500,317 100,504,239 129,457,021
Net change in fund balances 33,377,595$ 9,564,876 18,195,725 11,622,557 (11,053,741) 14,824,309 (15,793,001) 45,477,891 31,384,305 (1,365,697) Debt service as a percentage of
noncapital expenditures 9.50% 7.85% 7.88% 8.14% 8.35% 8.67% 8.87% 8.92% 8.61% 8.91%
(a) Increase in real property taxes is due to steady increases in property values in the County.(b) Other local taxes decreased due to declines in the quantity and value of real estate transactions.(c) Decrease in State shared taxes is due to drastic decline in State highways funding.(d) Reclassifications of prior years' data were made to allow for consistency purposes and comparison amongst all years. (e) Expenditures on capital projects for the Public School System and Community College were reclassified to the Education function in fiscal year 2006 from the Capital Improvements line in previous years. (f) The decrease from prior period is due to decreases in the fair value of U.S. Treasury Strips investments.
Statistical Section
123
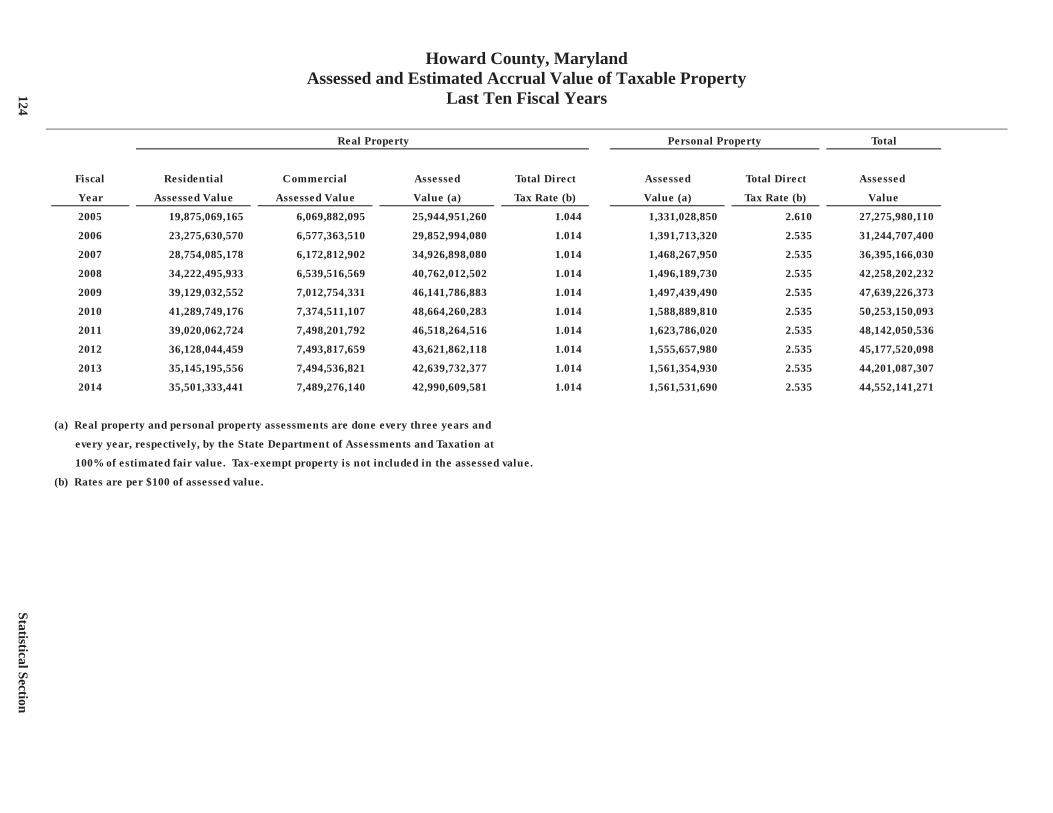
Howard County, Maryland Assessed and Estimated Accrual Value of Taxable Property
Last Ten Fiscal Years
Real Property Personal Property Total
Fiscal Residential Commercial Assessed Total Direct Assessed Total Direct Assessed
Year Assessed Value Assessed Value Value (a) Tax Rate (b) Value (a) Tax Rate (b) Value
2005 19,875,069,165 6,069,882,095 25,944,951,260 1.044 1,331,028,850 2.610 27,275,980,110
2006 23,275,630,570 6,577,363,510 29,852,994,080 1.014 1,391,713,320 2.535 31,244,707,400
2007 28,754,085,178 6,172,812,902 34,926,898,080 1.014 1,468,267,950 2.535 36,395,166,030
2008 34,222,495,933 6,539,516,569 40,762,012,502 1.014 1,496,189,730 2.535 42,258,202,232
2009 39,129,032,552 7,012,754,331 46,141,786,883 1.014 1,497,439,490 2.535 47,639,226,373
2010 41,289,749,176 7,374,511,107 48,664,260,283 1.014 1,588,889,810 2.535 50,253,150,093
2011 39,020,062,724 7,498,201,792 46,518,264,516 1.014 1,623,786,020 2.535 48,142,050,536
2012 36,128,044,459 7,493,817,659 43,621,862,118 1.014 1,555,657,980 2.535 45,177,520,098
2013 35,145,195,556 7,494,536,821 42,639,732,377 1.014 1,561,354,930 2.535 44,201,087,307
2014 35,501,333,441 7,489,276,140 42,990,609,581 1.014 1,561,531,690 2.535 44,552,141,271
(a) Real property and personal property assessments are done every three years and
every year, respectively, by the State Department of Assessments and Taxation at
100% of estimated fair value. Tax-exempt property is not included in the assessed value.
(b) Rates are per $100 of assessed value.
Statistical Section 124
Statistical Section
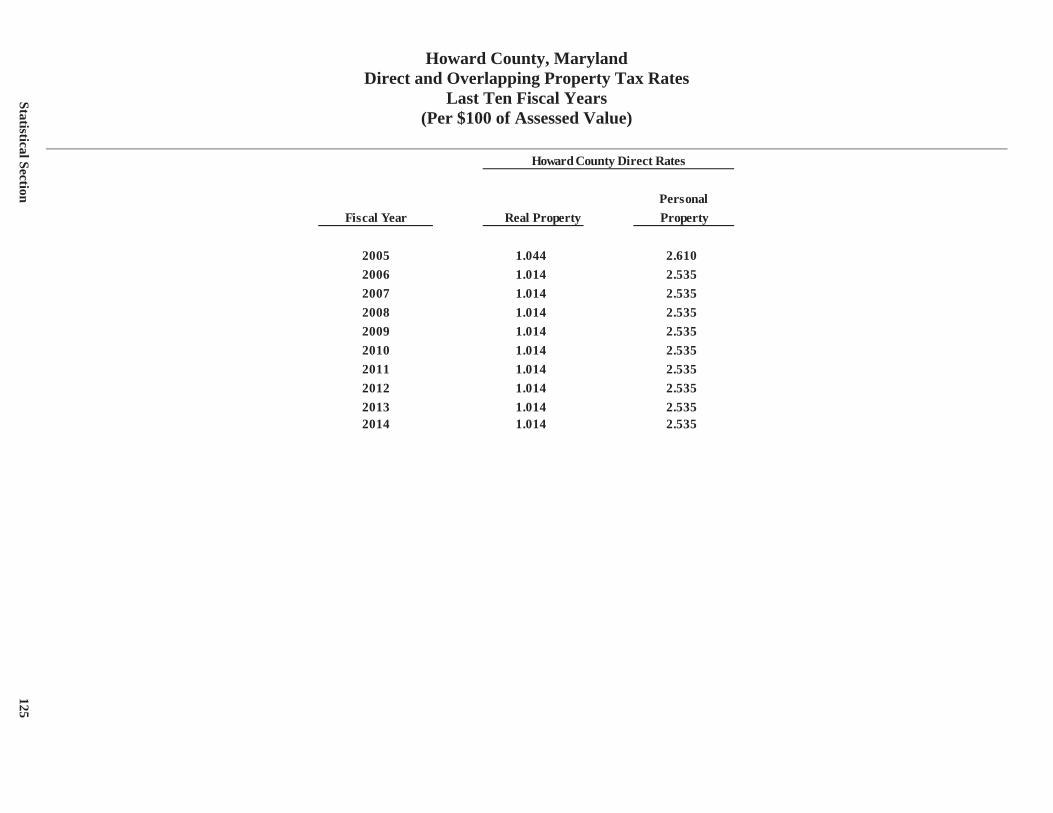
Howard County, Maryland Direct and Overlapping Property Tax Rates
Last Ten Fiscal Years (Per $100 of Assessed Value)
PersonalFiscal Year Real Property Property
2005 1.044 2.6102006 1.014 2.5352007 1.014 2.5352008 1.014 2.5352009 1.014 2.5352010 1.014 2.5352011 1.014 2.5352012 1.014 2.5352013 1.014 2.5352014 1.014 2.535
Howard County Direct Rates
Statistical Section 125
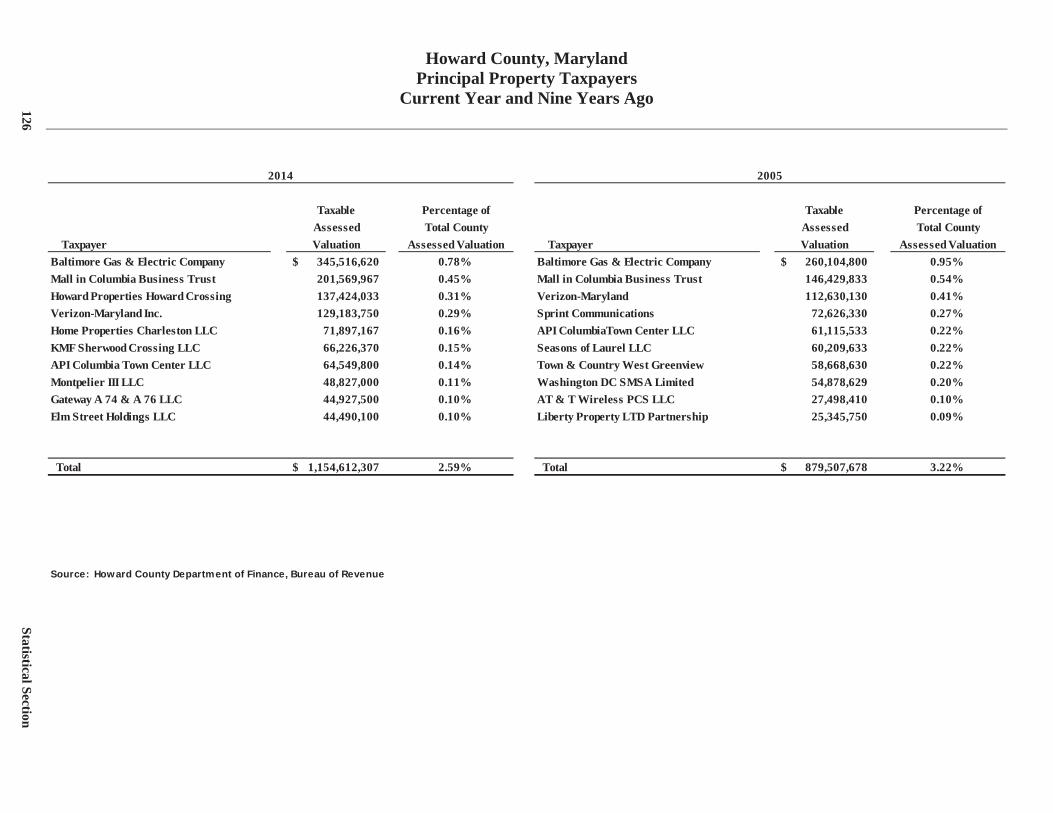
Howard County, Maryland Principal Property Taxpayers
Current Year and Nine Years Ago
2014 2005
Taxable Percentage of Taxable Percentage ofAssessed Total County Assessed Total County
Taxpayer Valuation Assessed Valuation Taxpayer Valuation Assessed ValuationBaltimore Gas & Electric Company 345,516,620$ 0.78% Baltimore Gas & Electric Company 260,104,800$ 0.95%Mall in Columbia Business Trust 201,569,967 0.45% Mall in Columbia Business Trust 146,429,833 0.54%Howard Properties Howard Crossing 137,424,033 0.31% Verizon-Maryland 112,630,130 0.41%Verizon-Maryland Inc. 129,183,750 0.29% Sprint Communications 72,626,330 0.27%Home Properties Charleston LLC 71,897,167 0.16% API ColumbiaTown Center LLC 61,115,533 0.22%KMF Sherwood Crossing LLC 66,226,370 0.15% Seasons of Laurel LLC 60,209,633 0.22%API Columbia Town Center LLC 64,549,800 0.14% Town & Country West Greenview 58,668,630 0.22%Montpelier III LLC 48,827,000 0.11% Washington DC SMSA Limited 54,878,629 0.20%Gateway A 74 & A 76 LLC 44,927,500 0.10% AT & T Wireless PCS LLC 27,498,410 0.10%Elm Street Holdings LLC 44,490,100 0.10% Liberty Property LTD Partnership 25,345,750 0.09%
Total 1,154,612,307$ 2.59% Total 879,507,678$ 3.22%
Source: Howard County Department of Finance, Bureau of Revenue
126
Statistical Section
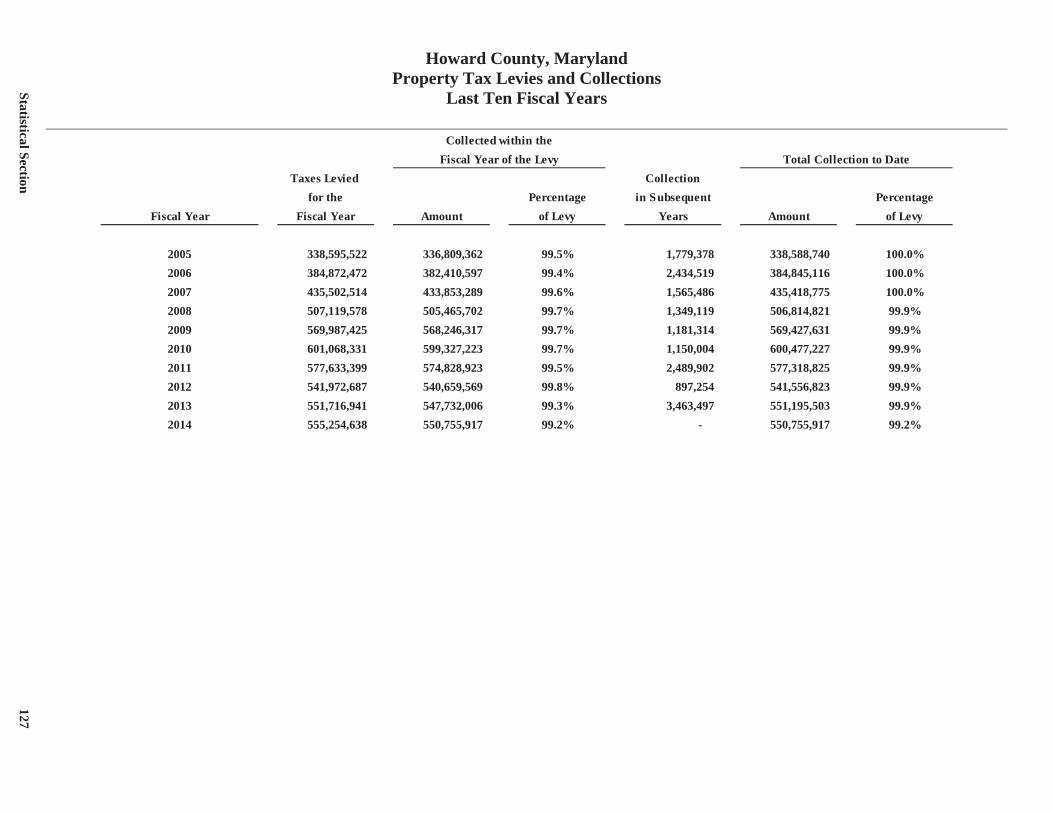
Howard County, Maryland Property Tax Levies and Collections
Last Ten Fiscal Years
Collected within theFiscal Year of the Levy Total Collection to Date
Taxes Levied Collectionfor the Percentage in Subsequent Percentage
Fiscal Year Fiscal Year Amount of Levy Years Amount of Levy
2005 338,595,522 336,809,362 99.5% 1,779,378 338,588,740 100.0%2006 384,872,472 382,410,597 99.4% 2,434,519 384,845,116 100.0%2007 435,502,514 433,853,289 99.6% 1,565,486 435,418,775 100.0%2008 507,119,578 505,465,702 99.7% 1,349,119 506,814,821 99.9%2009 569,987,425 568,246,317 99.7% 1,181,314 569,427,631 99.9%2010 601,068,331 599,327,223 99.7% 1,150,004 600,477,227 99.9%2011 577,633,399 574,828,923 99.5% 2,489,902 577,318,825 99.9%2012 541,972,687 540,659,569 99.8% 897,254 541,556,823 99.9%2013 551,716,941 547,732,006 99.3% 3,463,497 551,195,503 99.9%2014 555,254,638 550,755,917 99.2% - 550,755,917 99.2%
Statistical Section 127
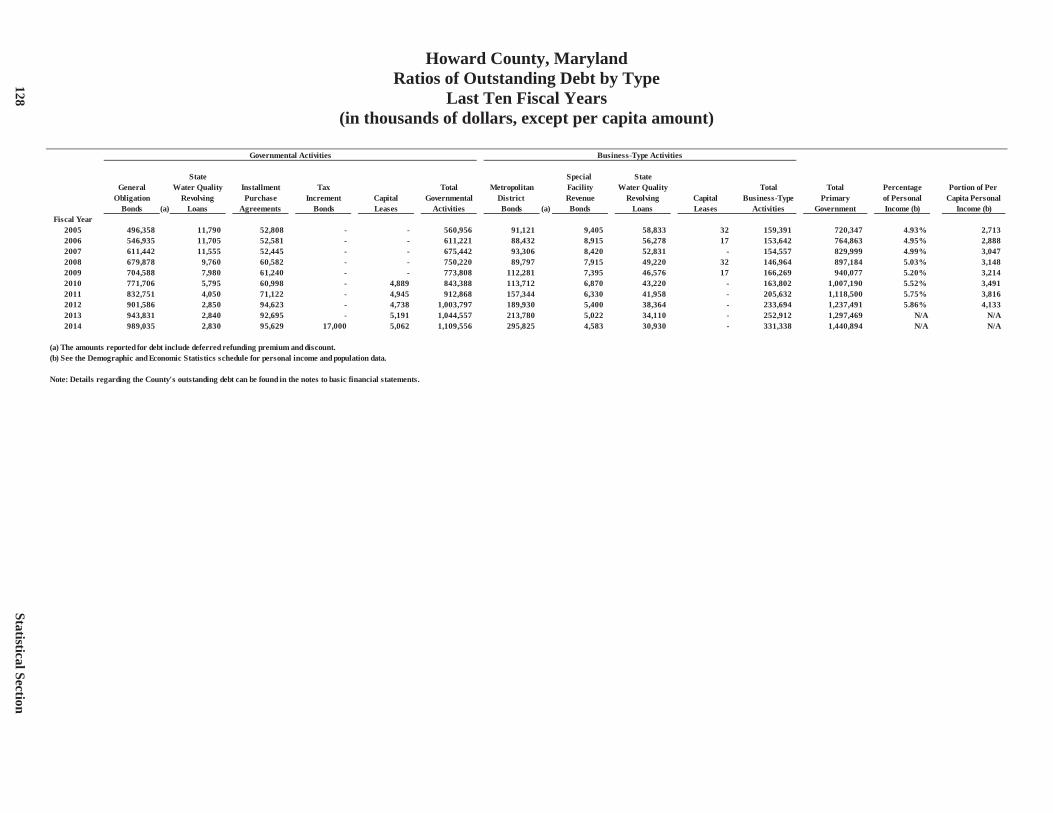
Howard County, Maryland Ratios of Outstanding Debt by Type
Last Ten Fiscal Years (in thousands of dollars, except per capita amount)
Business-Type Activities
State Special StateGeneral Water Quality Installment Tax Total Metropolitan Facility Water Quality Total Total Percentage Portion of Per
Obligation Revolving Purchase Increment Capital Governmental District Revenue Revolving Capital Business-Type Primary of Personal Capita PersonalBonds (a) Loans Agreements Bonds Leases Activities Bonds (a) Bonds Loans Leases Activities Government Income (b) Income (b)
Fiscal Year2005 496,358 11,790 52,808 - - 560,956 91,121 9,405 58,833 32 159,391 720,347 4.93% 2,713 2006 546,935 11,705 52,581 - - 611,221 88,432 8,915 56,278 17 153,642 764,863 4.95% 2,888 2007 611,442 11,555 52,445 - - 675,442 93,306 8,420 52,831 - 154,557 829,999 4.99% 3,047 2008 679,878 9,760 60,582 - - 750,220 89,797 7,915 49,220 32 146,964 897,184 5.03% 3,148 2009 704,588 7,980 61,240 - - 773,808 112,281 7,395 46,576 17 166,269 940,077 5.20% 3,214 2010 771,706 5,795 60,998 - 4,889 843,388 113,712 6,870 43,220 - 163,802 1,007,190 5.52% 3,491 2011 832,751 4,050 71,122 - 4,945 912,868 157,344 6,330 41,958 - 205,632 1,118,500 5.75% 3,816 2012 901,586 2,850 94,623 - 4,738 1,003,797 189,930 5,400 38,364 - 233,694 1,237,491 5.86% 4,133 2013 943,831 2,840 92,695 - 5,191 1,044,557 213,780 5,022 34,110 - 252,912 1,297,469 N/A N/A2014 989,035 2,830 95,629 17,000 5,062 1,109,556 295,825 4,583 30,930 - 331,338 1,440,894 N/A N/A
(a) The amounts reported for debt include deferred refunding premium and discount. (b) See the Demographic and Economic Statistics schedule for personal income and population data.
Note: Details regarding the County's outstanding debt can be found in the notes to basic financial statements.
Governmental Activities
128
Statistical Section
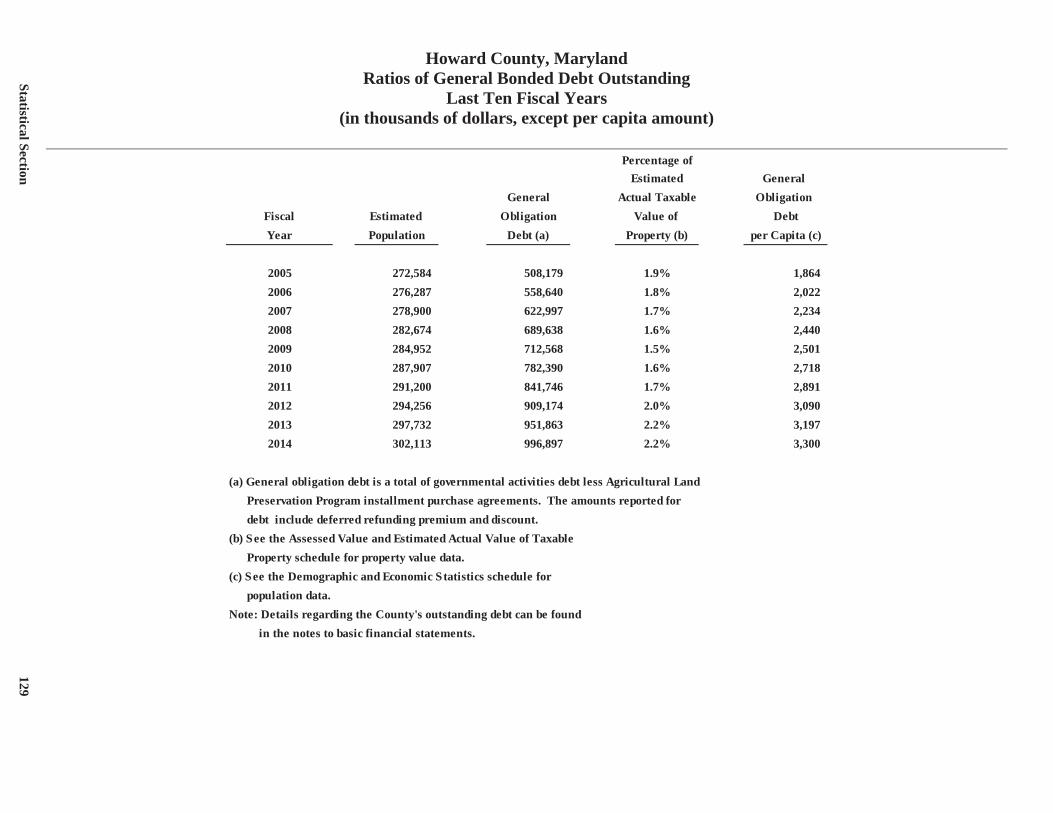
Howard County, Maryland Ratios of General Bonded Debt Outstanding
Last Ten Fiscal Years (in thousands of dollars, except per capita amount)
Percentage ofEstimated General
General Actual Taxable Obligation Fiscal Estimated Obligation Value of DebtYear Population Debt (a) Property (b) per Capita (c)
2005 272,584 508,179 1.9% 1,864 2006 276,287 558,640 1.8% 2,022 2007 278,900 622,997 1.7% 2,234 2008 282,674 689,638 1.6% 2,440 2009 284,952 712,568 1.5% 2,501 2010 287,907 782,390 1.6% 2,718 2011 291,200 841,746 1.7% 2,891 2012 294,256 909,174 2.0% 3,090 2013 297,732 951,863 2.2% 3,197 2014 302,113 996,897 2.2% 3,300
(a) General obligation debt is a total of governmental activities debt less Agricultural Land Preservation Program installment purchase agreements. The amounts reported for debt include deferred refunding premium and discount. (b) See the Assessed Value and Estimated Actual Value of Taxable Property schedule for property value data.(c) See the Demographic and Economic Statistics schedule for population data.Note: Details regarding the County's outstanding debt can be found
in the notes to basic financial statements.
Statistical Section 129
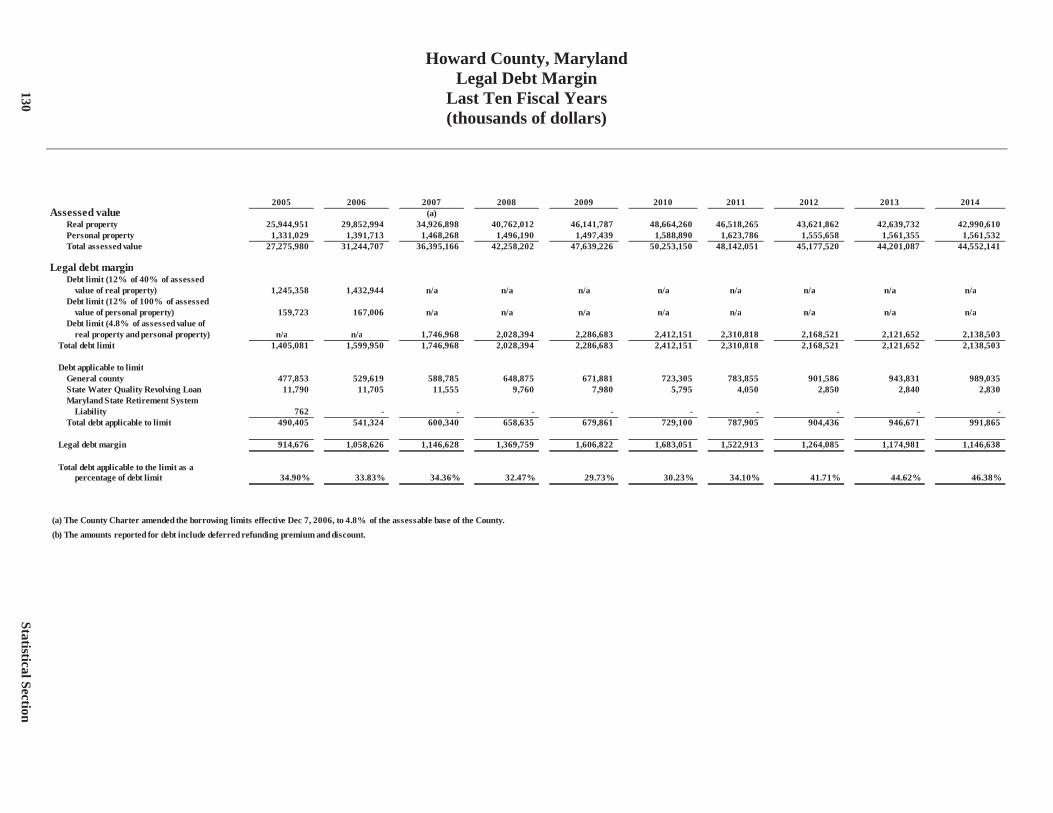
Howard County, Maryland Legal Debt Margin
Last Ten Fiscal Years (thousands of dollars)
2005 2006 2007 2008 2009 2010 2011 2012 2013 2014Assessed value (a)
Real property 25,944,951 29,852,994 34,926,898 40,762,012 46,141,787 48,664,260 46,518,265 43,621,862 42,639,732 42,990,610 Personal property 1,331,029 1,391,713 1,468,268 1,496,190 1,497,439 1,588,890 1,623,786 1,555,658 1,561,355 1,561,532 Total assessed value 27,275,980 31,244,707 36,395,166 42,258,202 47,639,226 50,253,150 48,142,051 45,177,520 44,201,087 44,552,141
Legal debt marginDebt limit (12% of 40% of assessed
value of real property) 1,245,358 1,432,944 n/a n/a n/a n/a n/a n/a n/a n/aDebt limit (12% of 100% of assessed
value of personal property) 159,723 167,006 n/a n/a n/a n/a n/a n/a n/a n/aDebt limit (4.8% of assessed value of
real property and personal property) n/a n/a 1,746,968 2,028,394 2,286,683 2,412,151 2,310,818 2,168,521 2,121,652 2,138,503 Total debt limit 1,405,081 1,599,950 1,746,968 2,028,394 2,286,683 2,412,151 2,310,818 2,168,521 2,121,652 2,138,503
Debt applicable to limitGeneral county 477,853 529,619 588,785 648,875 671,881 723,305 783,855 901,586 943,831 989,035 State Water Quality Revolving Loan 11,790 11,705 11,555 9,760 7,980 5,795 4,050 2,850 2,840 2,830 Maryland State Retirement System
Liability 762 - - - - - - - - - Total debt applicable to limit 490,405 541,324 600,340 658,635 679,861 729,100 787,905 904,436 946,671 991,865
Legal debt margin 914,676 1,058,626 1,146,628 1,369,759 1,606,822 1,683,051 1,522,913 1,264,085 1,174,981 1,146,638
Total debt applicable to the limit as a percentage of debt limit 34.90% 33.83% 34.36% 32.47% 29.73% 30.23% 34.10% 41.71% 44.62% 46.38%
(a) The County Charter amended the borrowing limits effective Dec 7, 2006, to 4.8% of the assessable base of the County. (b) The amounts reported for debt include deferred refunding premium and discount.
130
Statistical Section
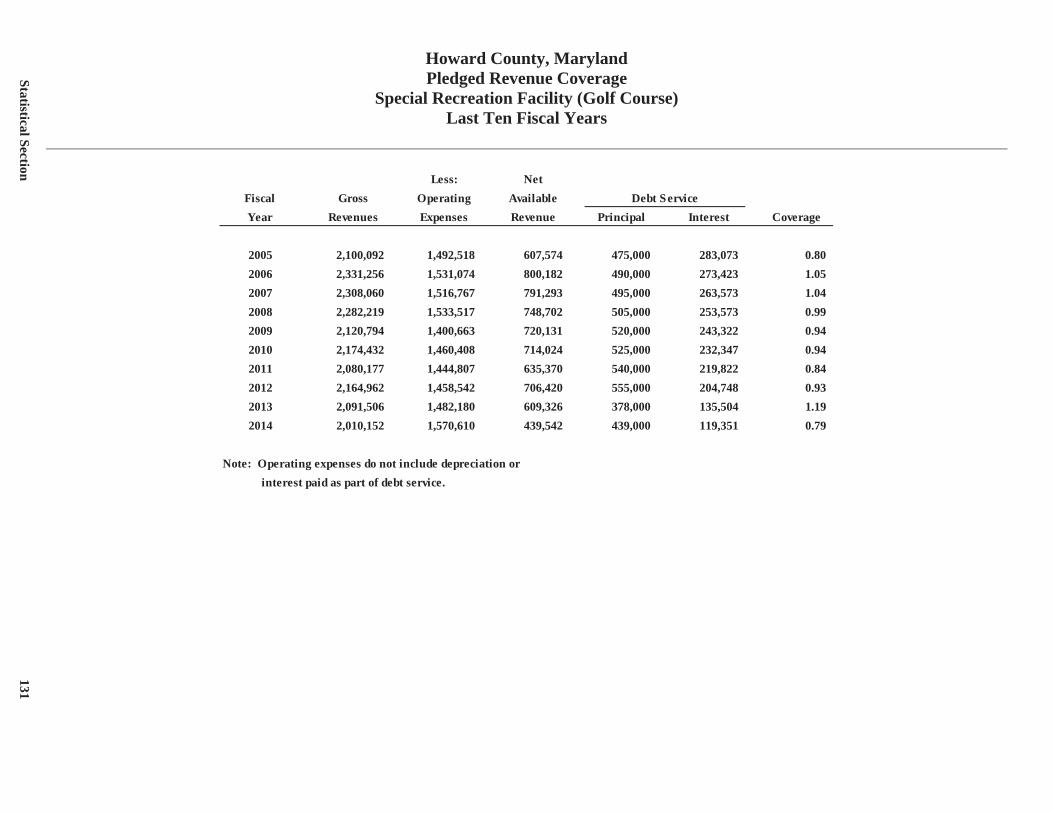
Howard County, Maryland Pledged Revenue Coverage
Special Recreation Facility (Golf Course) Last Ten Fiscal Years
Less: NetFiscal Gross Operating Available Debt ServiceYear Revenues Expenses Revenue Principal Interest Coverage
2005 2,100,092 1,492,518 607,574 475,000 283,073 0.80 2006 2,331,256 1,531,074 800,182 490,000 273,423 1.05 2007 2,308,060 1,516,767 791,293 495,000 263,573 1.04 2008 2,282,219 1,533,517 748,702 505,000 253,573 0.99 2009 2,120,794 1,400,663 720,131 520,000 243,322 0.94 2010 2,174,432 1,460,408 714,024 525,000 232,347 0.94 2011 2,080,177 1,444,807 635,370 540,000 219,822 0.84 2012 2,164,962 1,458,542 706,420 555,000 204,748 0.93 2013 2,091,506 1,482,180 609,326 378,000 135,504 1.19 2014 2,010,152 1,570,610 439,542 439,000 119,351 0.79
Note: Operating expenses do not include depreciation or interest paid as part of debt service.
Statistical Section 131
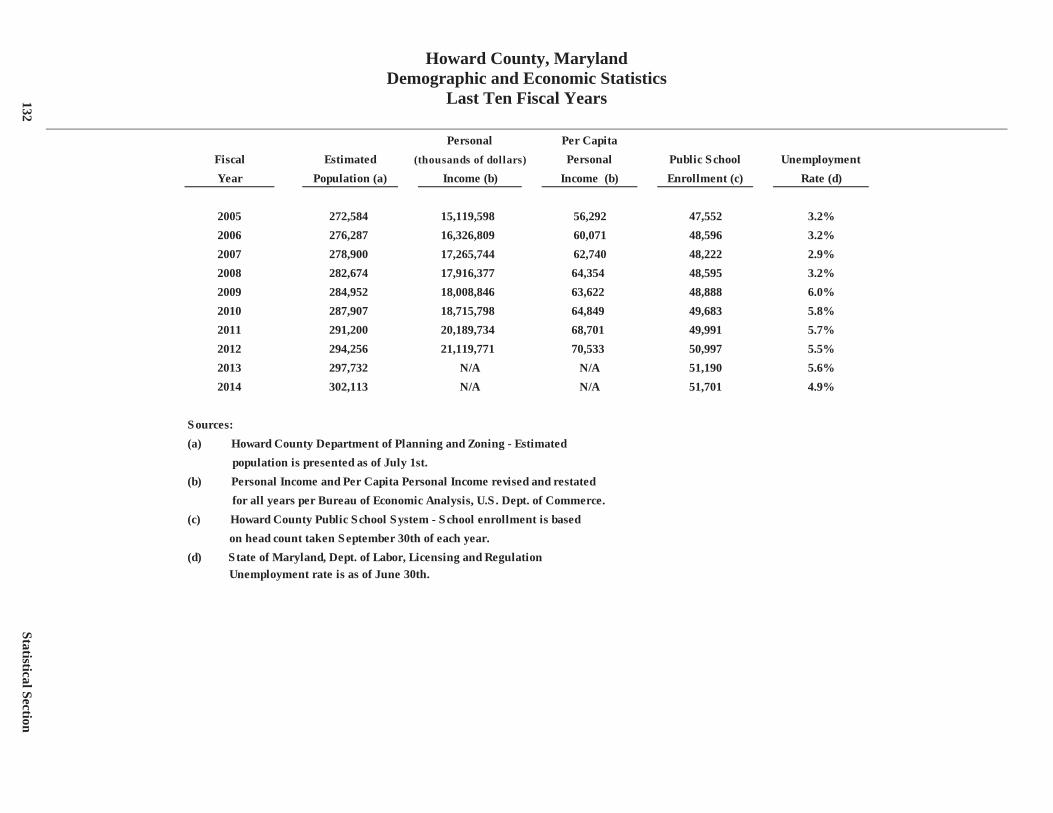
Howard County, Maryland Demographic and Economic Statistics
Last Ten Fiscal Years
Personal Per CapitaFiscal Estimated (thousands of dollars) Personal Public School UnemploymentYear Population (a) Income (b) Income (b) Enrollment (c) Rate (d)
2005 272,584 15,119,598 56,292 47,552 3.2%2006 276,287 16,326,809 60,071 48,596 3.2%2007 278,900 17,265,744 62,740 48,222 2.9%2008 282,674 17,916,377 64,354 48,595 3.2%2009 284,952 18,008,846 63,622 48,888 6.0%2010 287,907 18,715,798 64,849 49,683 5.8%2011 291,200 20,189,734 68,701 49,991 5.7%2012 294,256 21,119,771 70,533 50,997 5.5%2013 297,732 N/A N/A 51,190 5.6%2014 302,113 N/A N/A 51,701 4.9%
Sources:(a) Howard County Department of Planning and Zoning - Estimated population is presented as of July 1st.(b) Personal Income and Per Capita Personal Income revised and restated for all years per Bureau of Economic Analysis, U.S . Dept. of Commerce.(c) Howard County Public School System - School enrollment is based on head count taken September 30th of each year.(d) S tate of Maryland, Dept. of Labor, Licensing and Regulation Unemployment rate is as of June 30th.
132
Statistical Section
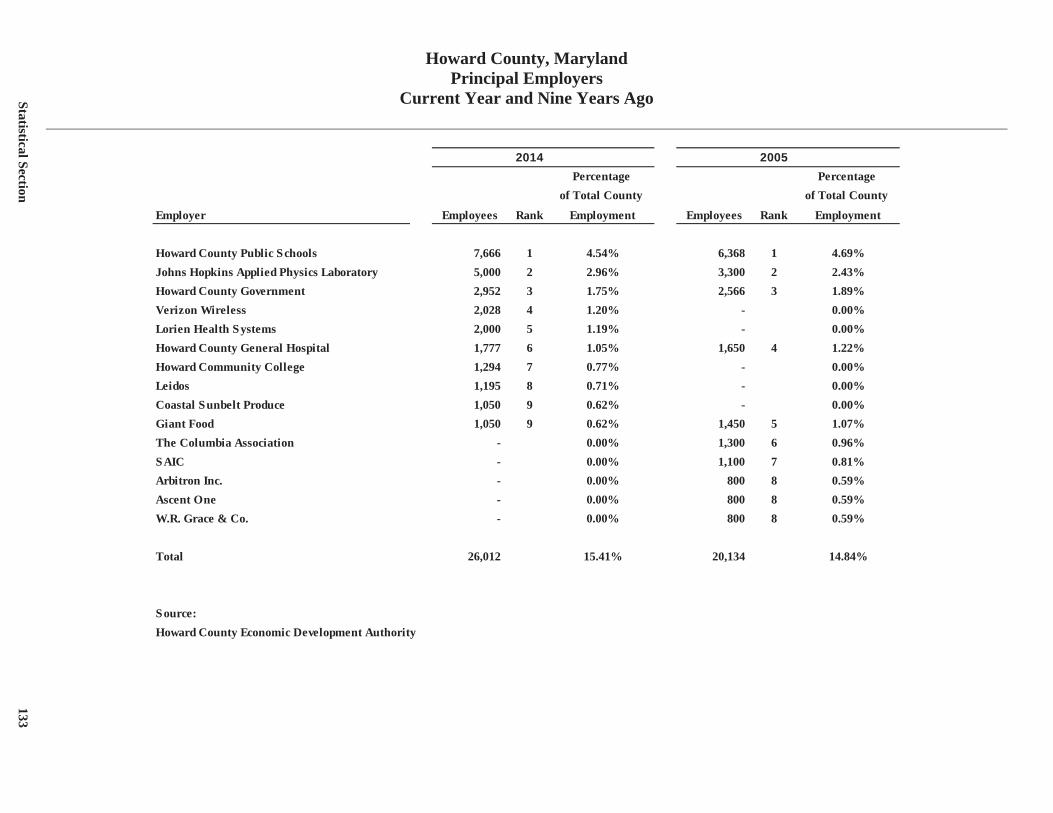
Howard County, Maryland Principal Employers
Current Year and Nine Years Ago
2014 2005
Percentage Percentage of Total County of Total County
Employer Employees Rank Employment Employees Rank Employment
Howard County Public Schools 7,666 1 4.54% 6,368 1 4.69%Johns Hopkins Applied Physics Laboratory 5,000 2 2.96% 3,300 2 2.43%Howard County Government 2,952 3 1.75% 2,566 3 1.89%Verizon Wireless 2,028 4 1.20% - 0.00%Lorien Health Systems 2,000 5 1.19% - 0.00%Howard County General Hospital 1,777 6 1.05% 1,650 4 1.22%Howard Community College 1,294 7 0.77% - 0.00%Leidos 1,195 8 0.71% - 0.00%Coastal Sunbelt Produce 1,050 9 0.62% - 0.00%Giant Food 1,050 9 0.62% 1,450 5 1.07%The Columbia Association - 0.00% 1,300 6 0.96%SAIC - 0.00% 1,100 7 0.81%Arbitron Inc. - 0.00% 800 8 0.59%Ascent One - 0.00% 800 8 0.59%W.R. Grace & Co. - 0.00% 800 8 0.59%
Total 26,012 15.41% 20,134 14.84%
Source:Howard County Economic Development Authority
Statistical Section 133
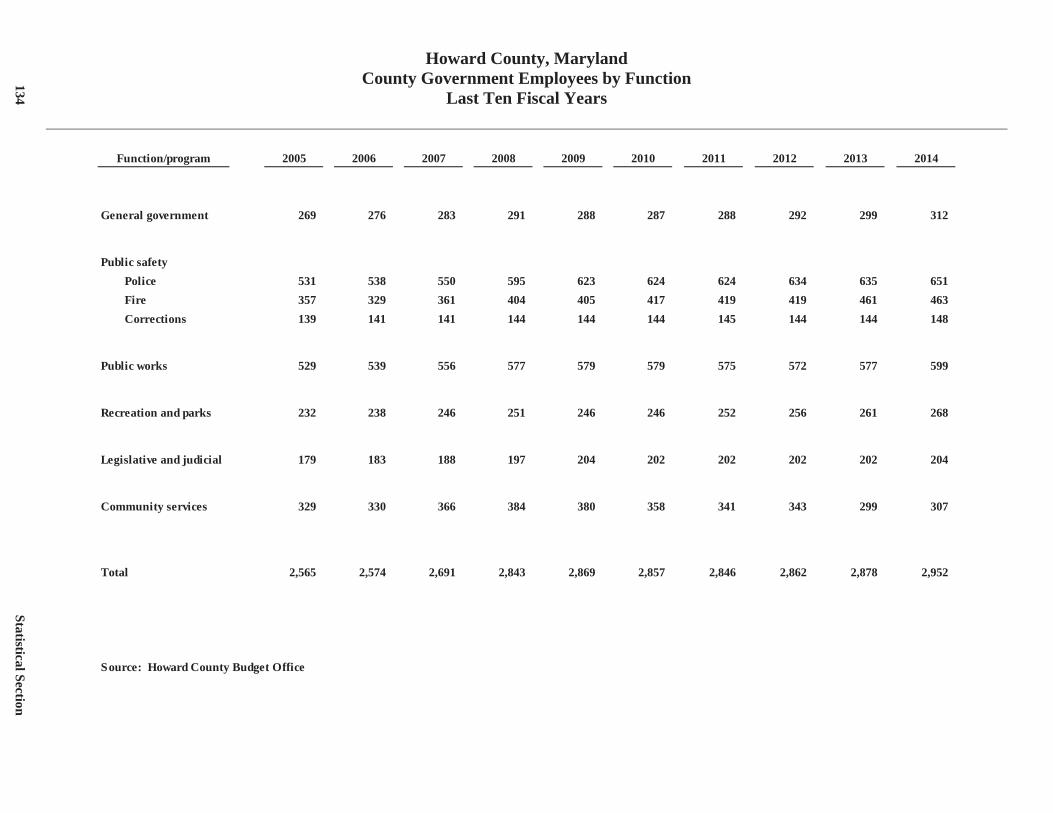
Howard County, Maryland County Government Employees by Function
Last Ten Fiscal Years
Function/program 2005 2006 2007 2008 2009 2010 2011 2012 2013 2014
General government 269 276 283 291 288 287 288 292 299 312
Public safety Police 531 538 550 595 623 624 624 634 635 651 Fire 357 329 361 404 405 417 419 419 461 463 Corrections 139 141 141 144 144 144 145 144 144 148
Public works 529 539 556 577 579 579 575 572 577 599
Recreation and parks 232 238 246 251 246 246 252 256 261 268
Legislative and judicial 179 183 188 197 204 202 202 202 202 204
Community services 329 330 366 384 380 358 341 343 299 307
Total 2,565 2,574 2,691 2,843 2,869 2,857 2,846 2,862 2,878 2,952
Source: Howard County Budget Office
134
Statistical Section
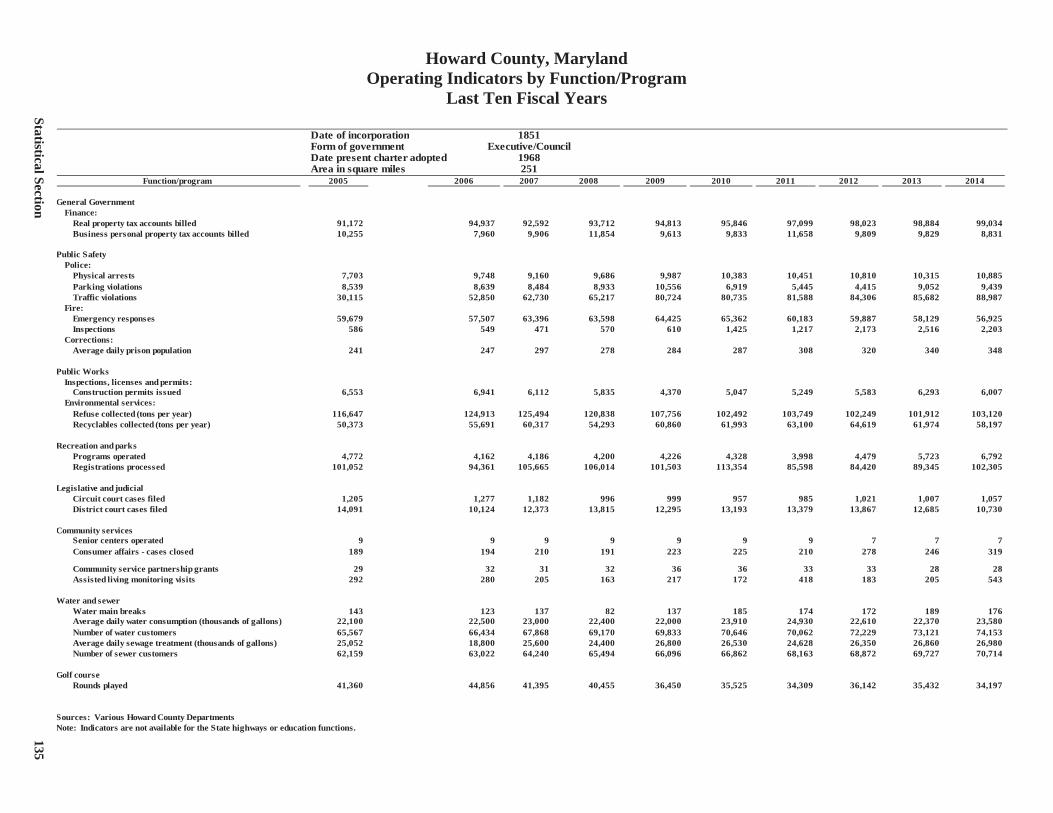
Howard County, Maryland Operating Indicators by Function/Program
Last Ten Fiscal Years
Date of incorporation 1851Form of government Executive/CouncilDate present charter adopted 1968Area in square miles 251
Function/program 2005 2006 2007 2008 2009 2010 2011 2012 2013 2014
General GovernmentFinance:
Real property tax accounts billed 91,172 94,937 92,592 93,712 94,813 95,846 97,099 98,023 98,884 99,034Business personal property tax accounts billed 10,255 7,960 9,906 11,854 9,613 9,833 11,658 9,809 9,829 8,831
Public SafetyPolice:
Physical arrests 7,703 9,748 9,160 9,686 9,987 10,383 10,451 10,810 10,315 10,885Parking violations 8,539 8,639 8,484 8,933 10,556 6,919 5,445 4,415 9,052 9,439Traffic violations 30,115 52,850 62,730 65,217 80,724 80,735 81,588 84,306 85,682 88,987
Fire:Emergency responses 59,679 57,507 63,396 63,598 64,425 65,362 60,183 59,887 58,129 56,925Inspections 586 549 471 570 610 1,425 1,217 2,173 2,516 2,203
Corrections:Average daily prison population 241 247 297 278 284 287 308 320 340 348
Public WorksInspections, licenses and permits:
Construction permits issued 6,553 6,941 6,112 5,835 4,370 5,047 5,249 5,583 6,293 6,007Environmental services:
Refuse collected (tons per year) 116,647 124,913 125,494 120,838 107,756 102,492 103,749 102,249 101,912 103,120Recyclables collected (tons per year) 50,373 55,691 60,317 54,293 60,860 61,993 63,100 64,619 61,974 58,197
Recreation and parksPrograms operated 4,772 4,162 4,186 4,200 4,226 4,328 3,998 4,479 5,723 6,792Registrations processed 101,052 94,361 105,665 106,014 101,503 113,354 85,598 84,420 89,345 102,305
Legislative and judicialCircuit court cases filed 1,205 1,277 1,182 996 999 957 985 1,021 1,007 1,057District court cases filed 14,091 10,124 12,373 13,815 12,295 13,193 13,379 13,867 12,685 10,730
Community servicesSenior centers operated 9 9 9 9 9 9 9 7 7 7Consumer affairs - cases closed 189 194 210 191 223 225 210 278 246 319
Community service partnership grants 29 32 31 32 36 36 33 33 28 28Assisted living monitoring visits 292 280 205 163 217 172 418 183 205 543
Water and sewerWater main breaks 143 123 137 82 137 185 174 172 189 176Average daily water consumption (thousands of gallons) 22,100 22,500 23,000 22,400 22,000 23,910 24,930 22,610 22,370 23,580Number of water customers 65,567 66,434 67,868 69,170 69,833 70,646 70,062 72,229 73,121 74,153Average daily sewage treatment (thousands of gallons) 25,052 18,800 25,600 24,400 26,800 26,530 24,628 26,350 26,860 26,980Number of sewer customers 62,159 63,022 64,240 65,494 66,096 66,862 68,163 68,872 69,727 70,714
Golf courseRounds played 41,360 44,856 41,395 40,455 36,450 35,525 34,309 36,142 35,432 34,197
Sources: Various Howard County DepartmentsNote: Indicators are not available for the State highways or education functions.
Statistical Section
135
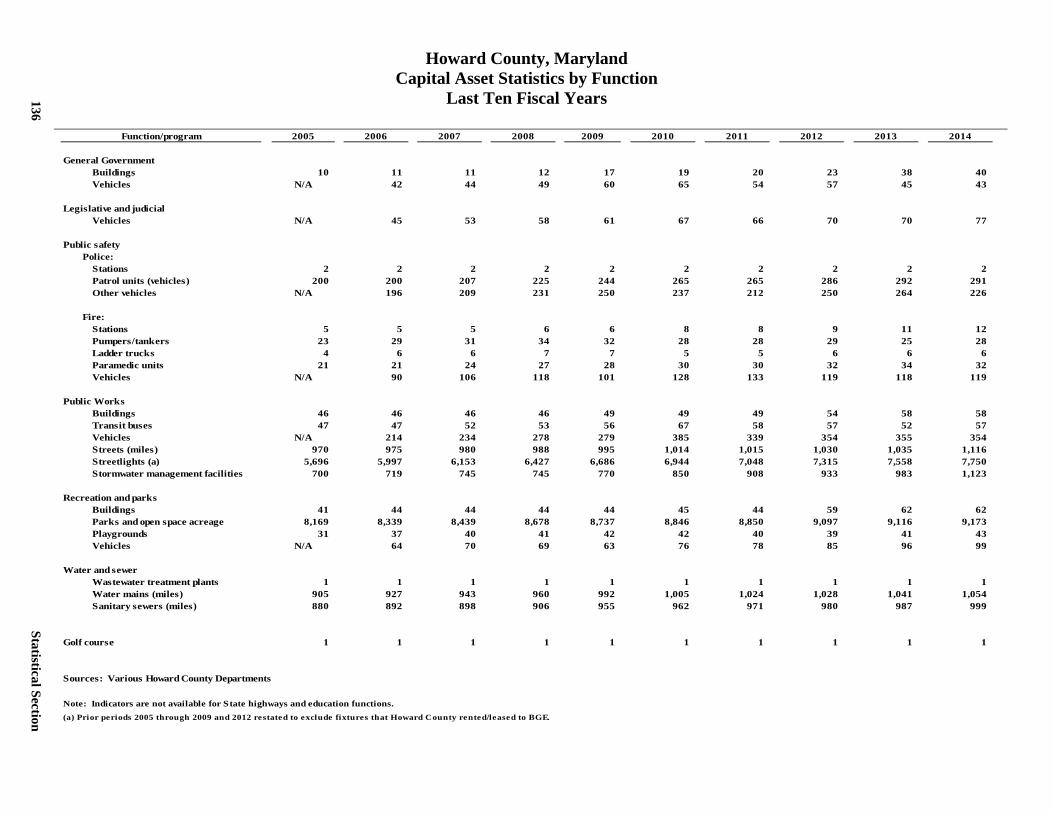
Howard County, Maryland Capital Asset Statistics by Function
Last Ten Fiscal Years
Function/program 2005 2006 2007 2008 2009 2010 2011 2012 2013 2014
General GovernmentBuildings 10 11 11 12 17 19 20 23 38 40 Vehicles N/A 42 44 49 60 65 54 57 45 43
Legislative and judicialVehicles N/A 45 53 58 61 67 66 70 70 77
Public safetyPolice:
Stations 2 2 2 2 2 2 2 2 2 2 Patrol units (vehicles) 200 200 207 225 244 265 265 286 292 291 Other vehicles N/A 196 209 231 250 237 212 250 264 226
Fire:Stations 5 5 5 6 6 8 8 9 11 12 Pumpers/tankers 23 29 31 34 32 28 28 29 25 28 Ladder trucks 4 6 6 7 7 5 5 6 6 6 Paramedic units 21 21 24 27 28 30 30 32 34 32 Vehicles N/A 90 106 118 101 128 133 119 118 119
Public WorksBuildings 46 46 46 46 49 49 49 54 58 58 Transit buses 47 47 52 53 56 67 58 57 52 57 Vehicles N/A 214 234 278 279 385 339 354 355 354 Streets (miles) 970 975 980 988 995 1,014 1,015 1,030 1,035 1,116 Streetlights (a) 5,696 5,997 6,153 6,427 6,686 6,944 7,048 7,315 7,558 7,750 Stormwater management facilities 700 719 745 745 770 850 908 933 983 1,123
Recreation and parksBuildings 41 44 44 44 44 45 44 59 62 62 Parks and open space acreage 8,169 8,339 8,439 8,678 8,737 8,846 8,850 9,097 9,116 9,173 Playgrounds 31 37 40 41 42 42 40 39 41 43 Vehicles N/A 64 70 69 63 76 78 85 96 99
Water and sewerWastewater treatment plants 1 1 1 1 1 1 1 1 1 1 Water mains (miles) 905 927 943 960 992 1,005 1,024 1,028 1,041 1,054 Sanitary sewers (miles) 880 892 898 906 955 962 971 980 987 999
Golf course 1 1 1 1 1 1 1 1 1 1
Sources: Various Howard County Departments
Note: Indicators are not available for State highways and education functions.(a) Prior periods 2005 through 2009 and 2012 restated to exclude fixtures that Howard County rented/leased to BGE.
136
Statistical Section
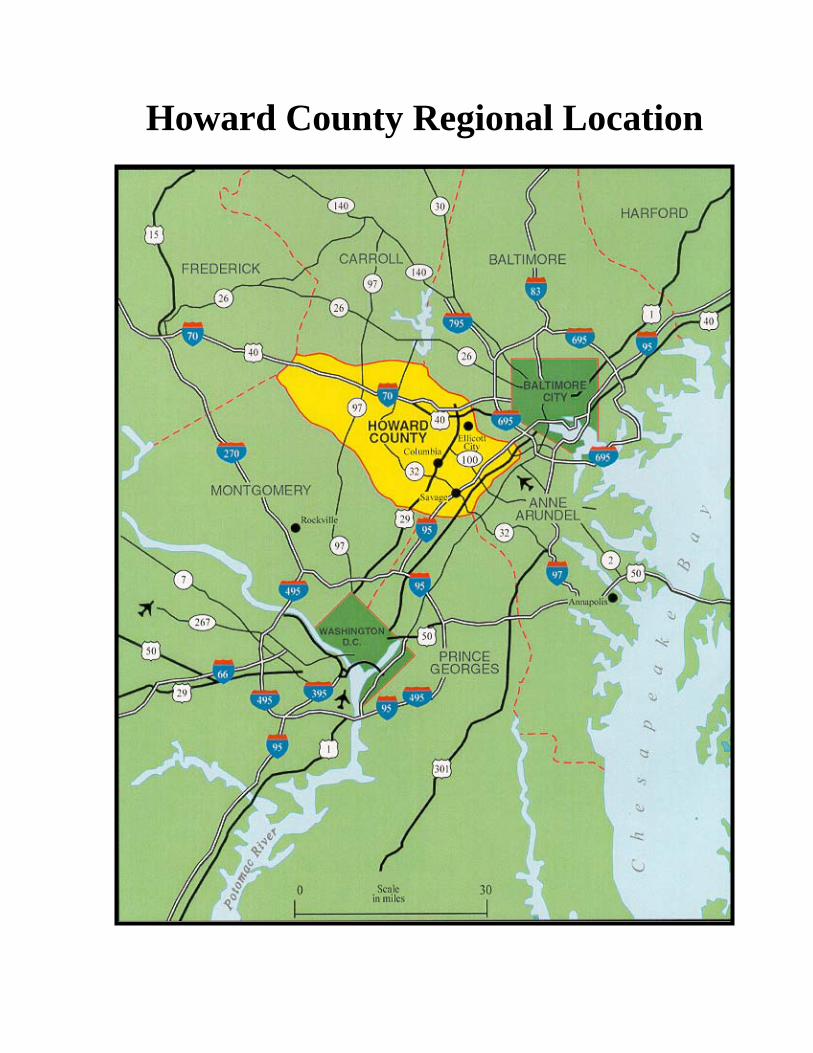
Howard County Regional Location

Department of Finance, 3430 Court House Drive, Ellicott City, Maryland 21043 (410) 313-2195 TDD 313-2323