Embed Size (px)
Citation preview
Hydration of alkali-activated slag: comparison
with ordinary Portland cement
A. Gruskovnjak,* B. Lothenbach,* L. Holzer,* R. Figi* and F. Winnefeld*
EMPA, Materials Science and Technology, Dubendorf, Switzerland
A multi-method approach was used for the investigation and comparison of alkali-activated slag binders (AAS),
pure slag and ordinary Portland cement (OPC). X-ray fluorescence, X-ray powder diffraction, granulometry,
calorimetry, thermo-gravimetric analysis and environmental scanning electron microscope investigations of the
microstructure with energy dispersive X-ray analyses were used to characterise the cements and their hydrate
phases. In addition, the chemical composition of the pore solution, including the different sulphur-containing ions,
was analysed. The precipitation mechanisms during binder hydration in the AAS and OPC systems exhibit
significant differences: in AAS the formation of the ‘outer product’ C–S–H is much faster than in OPC. The high
Si concentrations in the pore solution during the early hydration of AAS are related to the fast dissolution of
Na-metasilicate. The fast reaction of Na is an important factor for the voluminous precipitation of C–S–H within
the interstitial space already during the first 24 h. In addition to the Na-metasilicate component, the high fineness
of the slag represents a further important factor for the fast hydration of AAS. The small slag particles (, 2 �m)are completely dissolved or hydrated within the first 24 h, whereas hydration of the larger particles is much
slower. The fast formation of a gel-like matrix in AAS is the product of a fast ‘through solution’ precipitation,
which contrasts with the slower dissolution–precipitation mechanism of a ‘topotactic’ growth of C–S–H in OPC.
The chemical and mineralogical characterisation of solid and liquid phases and their changes with time are the
basis for thermodynamic modelling of the corresponding hydration process, which is presented in a second paper.
Introduction
Ground granulated blast-furnace slag can be acti-
vated with alkalis to obtain a clinker-free binder. The
production of alkali-activated slag (AAS) utilises in-
dustrial by-products, requires less energy than ordinary
Portland cement (OPC) and is associated with low CO2
emission.
The reactivity and strength development of slag
depend on various factors such as composition, glass
content, particle size distribution, type of activator and
alkali content.1,2 Different activators such as alkali
hydroxides, Na-metasilicate (waterglass) and others
have been used.3–6 Na-metasilicate was found to be the
most efficient2,7 activator which results in rapid hard-
ening and high compressive strength in comparison with
OPC.8 Slag cements activated with Na-metasilicate
[Na2O(n)SiO2] with moduli n between 0.6 and 1.5
showed higher ultimate strengths than Portland cement.9
The main hydration products of AAS are calcium
silicate hydrate (C–S–H) with a low Ca/Si ratio,
hydrotalcite and Aluminate-Ferrite-mono(sulphate) hy-
drate phase (AFm).10,11 AFm phases have the general
formula [Ca2(Al,Fe)(OH)6].X.xH2O, where X denotes
one formula unit of a single charged anion, or half a
formula unit of a doubly charged anion. The C–S–H
phases in OPC and alkali-activated slags show differ-
ences in morphology, crystallinity and chemical com-
position.10,12,13
In the OPC, topotactic growth of C–S–H is pre-
dominant, whereas in the AAS C–S–H is formed in
the pore space.10,11,13 Different silicate concentrations
in the pore solution are at least partially responsible for
these differences.14 Slag activated by Na-metasilicate
exhibits a relatively high concentration of Si in solution
and forms a foil-like C–S–H phase (as observed with
transmission electron microscopy12), whereas OPC has
a lower Si concentration and has a needle-like C–S–H
phase. C–S–H with a low Ca/Si ratio, as in AAS, is
also characterised by a higher Al/Ca ratio than C–S–H
in the OPC system.15,16
In this study the hydration process and the develop-
Advances in Cement Research, 2006, 18, No. 3, July, 119–128
119
0951-7197 # 2006 Thomas Telford Ltd
* EMPA, Materials Science and Technology, Uberlandstrasse 129,
8600 Dubendorf, Switzerland.
(ACR 5526) Paper received 31 May 2005; accepted 12 April 2006
ment of the microstructure in an alkali-activated slag
system is investigated using a wide range of analytical
techniques and compared with the well known OPC
system.
Experiment
Materials
Experiments were carried out with a slag without
activator, an alkali-activated slag (AAS) and an ordin-
ary Portland cement (CEM I 42.5 N). The AAS
consists of slag which was mixed with solid Na-
metasilicate pentahydrate (Na2SiO3.5H2O) at a ratio of
91 : 9 wt %.
The chemical composition of the slag without acti-
vator and the OPC is given in Table 1. The negative
loss on ignition of the slag was due to the oxidation of
sulphide. X-ray diffraction (XRD) analyses showed that
the slag contained approximately 10 wt % merwinite,
some minor amounts of calcite and anhydrite (due to
limited oxidation and carbonation of the slag). The
specific surface area (blaine) of the slag is 6730 cm2/g;
of the AAS 5640 cm2/g (slag + activator), and of the
OPC 2960 cm2/g. Slag had a relatively high fraction of
fine particles (, 20 �m) whereas OPC had somewhat
coarser particles.
Methods
Samples for X-ray fluorescence (XRF) were analysed
by Philips PW 2400. Mineralogical composition was
determined by XRD using a Siemens D500 powder
diffractometer. Particle size distribution was determined
with a laser granulometer, Malvern Mastersizer X.
Slag cement pastes were prepared with a water/
cement ratio (w/c) of 0.3 (OPC with a w/c of 0.5) and
mixed twice for 90 s according to EN 196-3. Calori-
metric measurements (conduction calorimeter TAM
Air) were carried out with 5 g of the fresh paste; the
remaining paste was cast in 0.5 l polyethylene bottles,
sealed and stored under controlled conditions at 208C.
Pore fluids of the hardened samples were extracted
using the steel die method17 with pressures up to
530 N/mm2, the solutions were filtered immediately
(0.45 �m nylon filter). The pH was analysed with a
combined pH-electrode which was calibrated against
KOH solutions; the total concentrations of Al, Ca, Fe,
K, Mg, Na, Si and S were determined by inductively
coupled plasma optical emission spectrometry (ICP-
OES) in samples diluted by a factor 10 with HNO3
(6.5%) to prevent the precipitation of solids. The
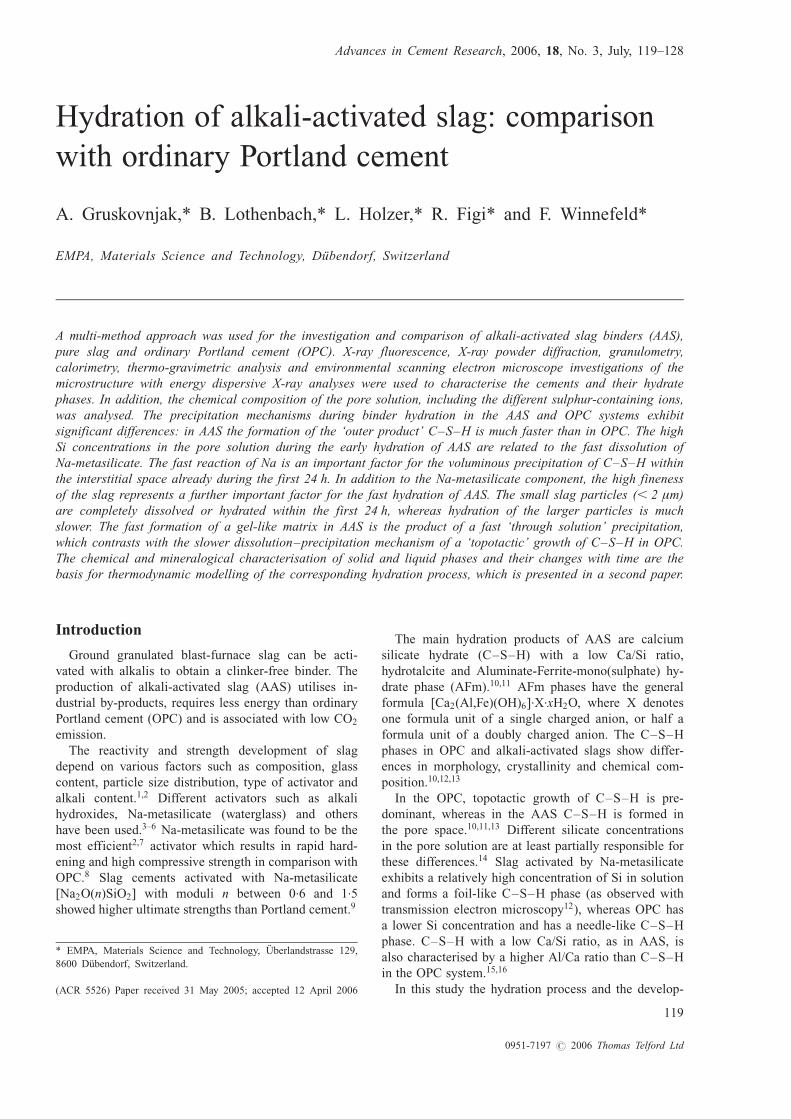
concentrations of SO42–, SO3
2– and HS– were also
determined by colorimetry, iodometry and ion chroma-
tography (cf. Fig. 1). In addition, Si was also measured
in more diluted (factor 100) samples (in HCl) to verify
that no Si had precipitated in the acidified samples.
A fraction of the solid paste was removed before
pore fluid extraction, crushed and submersed in acetone
to remove the pore solution, dried at 408C in an oven
and then used for thermogravimetric analysis (TGA)
and XRD analyses. TGA measurements were carried
out under N2 with powdered samples at a heating rate
of 20 K/min up to 9808C.
Samples were also examined by scanning electron
microscopy (Philips ESEM FEG XL 30) using back-
scattered, secondary electron images and energy dis-
persive X-ray (EDX) analysis of polished surfaces.
Sample preparation included pressure impregnation
with epoxy resin, cutting, polishing and then coating
with carbon.
Results and discussion
Strength development and heat evolution
Both the investigated OPC and AAS showed similar
28 day strength, however the early strength evolution of
the two systems showed significant differences. The
AAS was characterised by a higher early strength (Table
2), but after 1 day, the strength development and hydra-
tion rates decreased in the AAS system. The strength
development of slag without activator was much slower.
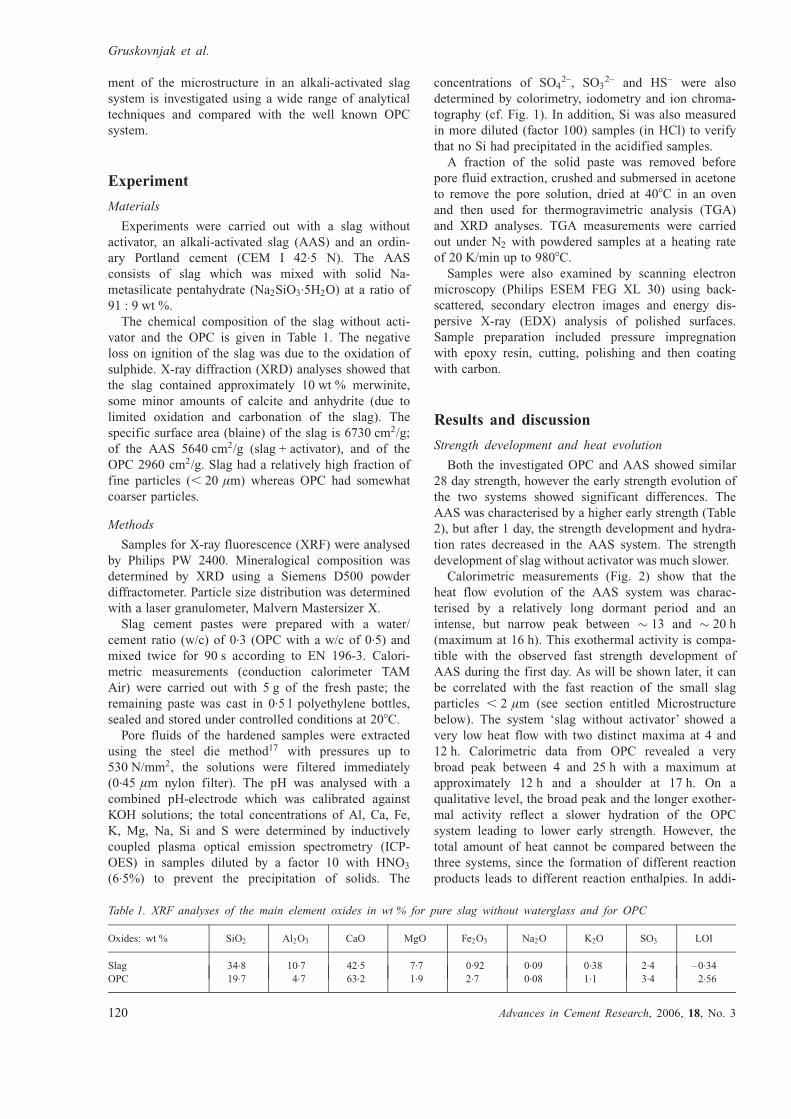
Calorimetric measurements (Fig. 2) show that the
heat flow evolution of the AAS system was charac-
terised by a relatively long dormant period and an
intense, but narrow peak between � 13 and � 20 h
(maximum at 16 h). This exothermal activity is compa-
tible with the observed fast strength development of
AAS during the first day. As will be shown later, it can
be correlated with the fast reaction of the small slag
particles , 2 �m (see section entitled Microstructure
below). The system ‘slag without activator’ showed a
very low heat flow with two distinct maxima at 4 and
12 h. Calorimetric data from OPC revealed a very
broad peak between 4 and 25 h with a maximum at
approximately 12 h and a shoulder at 17 h. On a
qualitative level, the broad peak and the longer exother-
mal activity reflect a slower hydration of the OPC
system leading to lower early strength. However, the
total amount of heat cannot be compared between the
three systems, since the formation of different reaction
products leads to different reaction enthalpies. In addi-
Table 1. XRF analyses of the main element oxides in wt % for pure slag without waterglass and for OPC
Oxides: wt % SiO2 Al2O3 CaO MgO Fe2O3 Na2O K2O SO3 LOI
Slag 34.8 10.7 42.5 7.7 0.92 0.09 0.38 2.4 –0.34
OPC 19.7 4.7 63.2 1.9 2.7 0.08 1.1 3.4 2.56
Gruskovnjak et al.
120 Advances in Cement Research, 2006, 18, No. 3
tion, the absolute height of the peaks should not be
compared with each other, but rather their relative
shapes should be compared.
Strength development strongly depends on the inter-
actions between solid and liquid components; that is
dissolution rates, saturation/chemical equilibrium of the
pore solution, precipitation or hydration rates and micro-
structural evolution. The following sections are thus
focused on these various aspects of cement hydration, in
order to explore the mechanisms behind the observed
strength and heat flow developments in AAS and OPC.
Hydration products
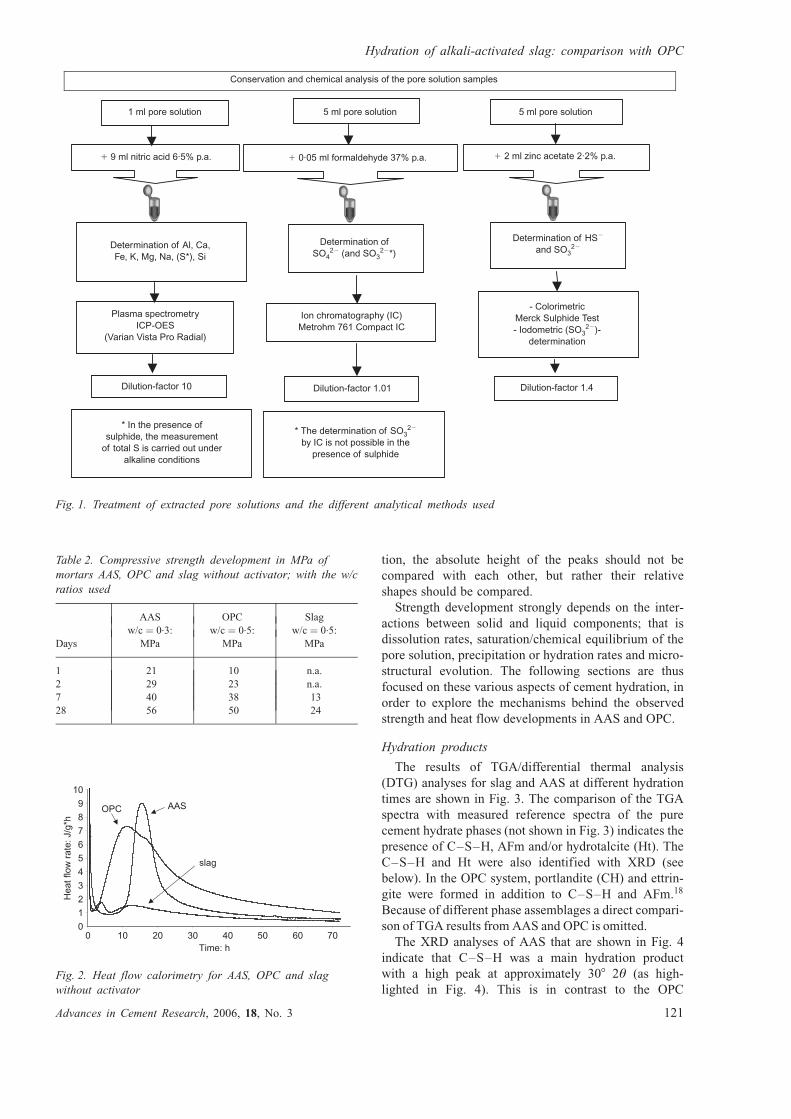
The results of TGA/differential thermal analysis
(DTG) analyses for slag and AAS at different hydration
times are shown in Fig. 3. The comparison of the TGA
spectra with measured reference spectra of the pure
cement hydrate phases (not shown in Fig. 3) indicates the
presence of C–S–H, AFm and/or hydrotalcite (Ht). The
C–S–H and Ht were also identified with XRD (see
below). In the OPC system, portlandite (CH) and ettrin-
gite were formed in addition to C–S–H and AFm.18
Because of different phase assemblages a direct compari-
son of TGA results from AAS and OPC is omitted.
The XRD analyses of AAS that are shown in Fig. 4
indicate that C–S–H was a main hydration product
with a high peak at approximately 308 2Ł (as high-
lighted in Fig. 4). This is in contrast to the OPC
��������������� ��� ������������������������������������
�������������������������������� ����������������
��������� �� ����������� ������������������������������� ������� � �� �������������
!������������"�#���#$�#�%#�&'#�(�#�)*+,#�*
!�����������*-.
���)����*-���+,
!������������/*�
����*-���
0��������� &�� 1�*�������2��0�3������ �)*-�
��,0���������
!����0�� �����.
3��� ������'������)3�,&��������������� �3�
!����0�� �������
+�2����������������*-���
4��3�����������4������������� ������������
+�3����������� �����������#���������������������*��� ��������������
��1����� ������
!����0�� �����
5��������� ������3�50-6*
)7�����7���5���8����,
Fig. 1. Treatment of extracted pore solutions and the different analytical methods used
Table 2. Compressive strength development in MPa of
mortars AAS, OPC and slag without activator; with the w/c
ratios used
AAS OPC Slag
w/c ¼ 0.3: w/c ¼ 0.5: w/c ¼ 0.5:
Days MPa MPa MPa
1 21 10 n.a.
2 29 23 n.a.
7 40 38 13
28 56 50 24
����.���9�
��
/��
����:����;�<='+�
���'
� �� �� ��2��;��
.� �� �� ��
-5� ""*
Fig. 2. Heat flow calorimetry for AAS, OPC and slag
without activator
Hydration of alkali-activated slag: comparison with OPC
Advances in Cement Research, 2006, 18, No. 3 121
system, in which usually no such distinct peak is
observed, for C–S–H, as discussed by Taylor.19 The
high peak in the AAS spectra indicates a higher
crystallinity of C–S–H in the AAS system. For AAS, a
C–S–H peak was already visible after 1 day, whereas
the pure slag reacted more slowly.
After the first day the C–S–H peak height of AAS
increased only slightly. Again, this demonstrates the
slow hydration rate after the first day. The C–S–H
formation after 1 day is either very slow or the products
are X-ray amorphous. In addition to C–S–H, peaks
from quartz and the main crystalline slag phase
(merwinite) can be identified in all samples. Merwinite
is hardly dissolved during the first 180 days. Hydro-
talcite can be identified after 28 and 180 days (128 2Ł).
Characteristics of C–S–H. EDX analyses of C–S–
H after 28 and 3–7 days of hydration for AAS and
OPC, respectively, shows a linear trend in the graph of
Ca/Si plotted against Ca/Al (Fig. 5), which indicates a
constant substitution of Si by Al.16 A similar linear
trend is observed for both AAS and OPC; however, the
slope is steeper (m ¼ 11.2) for OPC than for AAS
(m ¼ 3.4). This reflects a lower Al concentration of C–
S–H in the OPC system.
Hydrotalcite is closely mixed with C–S–H; the
uptake of Al in the C–S–H phase may be estimated
from the intercept in an Al/Ca to Mg/Ca ratio plot.20
Extrapolating the line to Mg/Ca ¼ 0 indicates that the
C–S–H contains a significant amount of Al (Al/
Ca � 0.1).
C–S–H in slag systems is characterised by elevated
crystallinity and therefore longer Si–O–Si dreierketten
chains, as documented with NMR.21 Consequently
more bridging tetrahedra are available within the C–S–
H structure. Bridging tetrahedra are the main potential
sites for Si substitution by Al.22 Thus, the higher Al
content in C–S–H from AAS in Fig. 5 may be
��
��
��
��
9�
9�
��
��
���
2���������;�>�
?�'�
;��
�����
����9
�����
����.
�����
����
����
���.
����
���9
����
!������
����
��:�'�
;��
""*#������
""*#�������
""*#��9�����""*#��9������
���'#��9�����""*#����������
/="$�
�0*0/
:���0'����
�� ��� ��� �.� ��� �9� .�� ��� ��� ��� ��� 9�� 9�� �.�
Fig. 3. Thermo-gravimetric analysis (TGA) of AAS (unhydrated, 1, 7, 28 and 180 days) and slag without activator (28 days).
Upper part shows the total loss of weight in %, the lower part shows the differential of weight %. Peaks from waterglass,
C–S–H phase, hydrotalcite (Ht) and AFm phase can be observed
�
���
����
����
����
5����;��2���
���
��
/@�*/
&&
&&
&&
&& &
�*/
�
� �� �� �� �� �� �� .� .� �� ��
/
""*��9������
""*��9�����
""*�������
""*������
""*����������
���'��9��������'����������
""
""
Fig. 4. XRD analyses of slag without activator (unhydrated,
28 days) and AAS (unhydrated, 1, 7, 28 and 180 days) allow
a qualitative identification of the different mineral and
glassy phases. Ht, hydrotalcite; Q, quartz; M, merwinite;
C, calcite; and C–S–H phase
������.�������
������������.�9
�
�
��
��
��
��
��
����""*����-5��)35,
��=*�����9
��=*������
��� ��� ��� ��� ��� �����=*;���� ����
��="�;����
����
Fig. 5. Ca/Si against Ca/Al atomic ratio plot of EDX
analyses of C–S–H phase in AAS and OPC (just from the
inner product IP) after a few days of hydration. The mean
Ca/Si ratios and the slopes of the two systems are indicated
Gruskovnjak et al.
122 Advances in Cement Research, 2006, 18, No. 3

correlated with a higher crystallinity of C–S–H. The
mean Ca/Si ratio of the C–S–H was very different in
the two systems: 0.8 in AAS and 1.3 in OPC. The low
Ca/Si ratios in AAS reflect the relatively high concen-
tration of Si and low Ca concentration in the pore
solution (see below). The mean Ca/(Si+Al) ratios of
0.55 for AAS and 1.18 for OPC, respectively, indicate
a higher Al substitution in AAS.
In Table 3 different atomic ratios are given from
EDX analyses of C–S–H in the three systems: AAS,
OPC and slag without activator. Whereas the AAS
shows a high Na uptake, the OPC and the pure slag
system without activator exhibit much lower Na/Ca
ratios. The Ca/Si ratio of slag without activator is
closer to that of OPC, but there is still a higher Al
incorporation observed than in the OPC system.
Pore solution chemistry
In the OPC system, the composition of the pore
solution is dominated during the first hours by K,
S(VI) and a high pH, whereas lower concentrations of
Na, Ca, Si, Al are observed.18,23 After 12–24 h,
sulphate concentrations decrease rapidly as anhydrite
and gypsum are consumed by the precipitation of
ettringite and at the same time the pH increases
accordingly. As hydration proceeds, K, Na concentra-
tions and the pH in the OPC system increase slowly as
the amount of pore solution decreases due to the
precipitation of hydrates and as more and more alkalis
(originally trapped in the clinkers) are released into the
pore solution (Table 4).18
The composition of the pore solution in the AAS
system is different (Table 4); Ca concentrations are 10
times lower than in the OPC system, whereas Si
concentrations are 50 to 100 times higher. The AAS
system is dominated by a high pH and a high Na, S
content and somewhat lower K, Al, and Si concentra-
tions. The presence of sulphide in the slag leads to
sulphide (HS–) in the pore solution. The HS– present
partially oxidises to sulphite (SO32–) and sulphate
(SO42–). Sulphate also stems from the dissolution of
anhydrite in the slag (Table 4). Sulphide oxidation is
complex as various products and intermediates are
produced. The main intermediates and products ob-
served in alkaline solutions are thiosulphate (S2O32–),
sulphite and sulphate.24–26 In the pore solutions investi-
gated, sulphide, sulphite and sulphate were determined.
Table 3. Different atomic ratios of C–S–H in AAS, OPC and
slag without activator (with EDX analysis)
Atomic ratio AAS OPC Slag
Ca/Si 0.8 1.3 1.2
Al/Ca 0.5 0.1 0.4
Na/Ca 0.5 , 0.1 , 0.1
K/Ca , 0.1 , 0.1 , 0.1
Table4.Chem
icalanalysesofthepore
solutionsextracted
from
AASlandOPC
(mmol/l)
Na:
K:
Li:
Ca:
Al:
Si:
P:
S(V
I):
S(IV):
S(–II):*
Stotaly:
pH
Sam
ple
mmol/l
mmol/l
mmol/l
mmol/l
mmol/l
mmol/l
mmol/l
mmol/l
mmol/l
mmol/l
mmol/l
AAS-1
day
153
102
29
1. 4
0. 25
7. 0
11
0. 06
47{
16
87
410
13. 7
AAS-7
days
133
102
38
2. 2
0. 35
4. 8
8. 5
0. 03
36{
17
350
n.a.
13. 6
AAS-28days
143
102
45
1. 2
0. 36
4. 3
9. 6
0. 03
39{
20
260
550
13. 7
AAS-180days
133
102
48
1. 2
0. 47
3. 2
5. 9
0. 03
46{
24
350
n.a.
13. 7
OPC-1
day
44
430
0. 75
4. 2
0. 17
0. 07
––
––
83}
13. 4
OPC-7
days
55
520
0. 81
2. 1
0. 24
0. 09
––
––
10}
13. 6
OPC-28days
63
560
0. 92
1. 2
0. 27
0. 12
––
––
11}
13. 6
OPC-105days
57
650
0. 86
1. 5
0. 21
0. 04
––
––
17}
13. 8
MeasuredBa,
Cr,Fe,
Mg,MoandSrconcentrationsin
theAASsystem
werebelow
therespectivedetectionlimitsBa,
Mo,Sr,
0. 01;Cr,Fe,
0. 02andMg,
0. 04mmol/l.n.a.,notanalysed.AAS:K,Ca,
Si,
AlandpH
meanoftwoindependentdeterminations.
*Relativeerrorofsulphidemeasurements
�20%;
y MeasuredbyICP-O
ESin
alkalinesolutions;
thesum
ofanalysedS(V
I),S(IV)andS(–II)is
lower
then
Stotalas
differentinorganic
andorganic
S-species
mightbepresent,whichhavenotbeenquantified,{MeasuredbyIC;
} MeasuredbyICP-O
ES
inacidifiedsolutions,
StotalcorrespondsforOPC
toS
(VI).
Hydration of alkali-activated slag: comparison with OPC
Advances in Cement Research, 2006, 18, No. 3 123
Comparison with the measured total sulphur concentra-
tions (Table 4) indicates the presence of additional
sulphur species, most probably thiosulphate. The pre-
sence of relatively high concentrations of thiosulphate
was established by Glasser et al.27 in the pore solution
of a blended slag–OPC system.
During the first hours and days, the chemical
composition of the pore solution is dominated by the
dissolution of fast-reacting components such as Na-
metasilicate and the small fraction of anhydrite and
calcite present in the slag. In addition, small slag
particles (, 2 �m) dissolve – as observed by environ-
mental scanning electron microscope (ESEM) (cf sec-
tion Microstructure) – within 7 days, which is
consistent with the presence of Al, K and sulphide in
the pore solutions (Table 4).
The dissolution of the Na-metasilicate activator leads
initially to relatively high Na and Si concentrations in
the pore solution of the AAS system (Table 4), which
decrease with time as C–S–H precipitates. Puertas et
al.28 reported for slag activated with Na-metasilicate
around 2 mol/l Na and Si in the pore solution after 3 h,
which was drastically reduced after 24 h as precipitat-
ing C–S–H also included, in addition to Ca and Si,
significant amounts of alkalis and Al (cf section
entitled Characteristic of C–S–H above, and
Refs 29–31).
In contrast to the decreasing Na concentrations, K
concentrations slowly increase with time, as K stems
from the slow dissolution of the slag particles whereas
Na originates mainly from the Na-metasilicate activa-
tor. Similarly to Na, K also fractionates between pore
solution and C–S–H. Al and Ca concentrations in the
pore solution remain more or less constant with time as
they are in equilibrium with the precipitation of solid
phases such as C–S–H, hydrotalcite or AFm.
In contrast to OPC, which is characterised by a high
Ca/Si+Al ratio in the pore solution and the presence of
portlandite, in the AAS system a low Ca/Si ratio in the
pore solution is observed, which corresponds to the
lower Ca/Si ratio in the precipitated C–S–H. The pore
solution of AAS has an approximately 10 times lower
Ca concentration than the pore solution of OPC, but a
comparable pH value. This indicates that in the AAS
system the pore solution is undersaturated with respect
to portlandite, which agrees with the absence of portlan-
dite from the solid phases in AAS. Similarly, the high
Al concentrations in the solution correspond to the
observed high Al/Si ratio in the C–S–H phase. These
findings agree with NMR studies,15,16 which have
shown that increasing amounts of Al in solution result
in a C–S–H phase with an increased quantity of Al
incorporated in the chain structure and corresponding
with an increased chain length and a higher crystallinity.
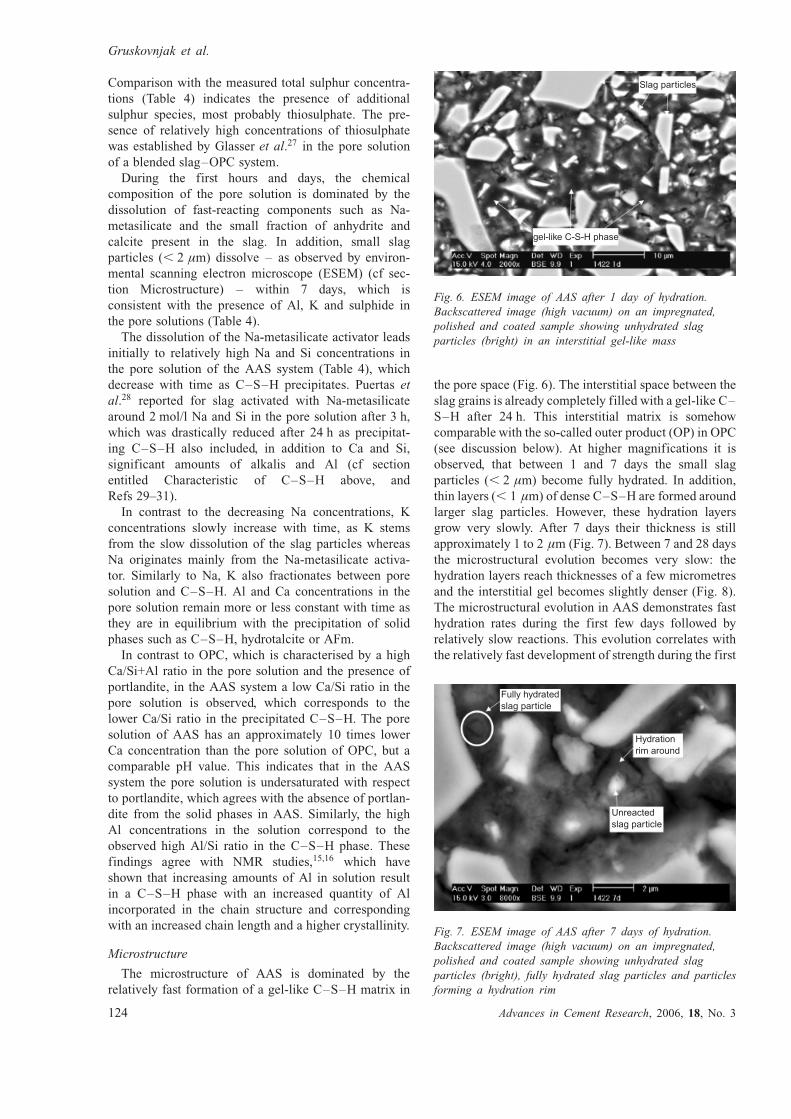
Microstructure
The microstructure of AAS is dominated by the
relatively fast formation of a gel-like C–S–H matrix in
the pore space (Fig. 6). The interstitial space between the
slag grains is already completely filled with a gel-like C–
S–H after 24 h. This interstitial matrix is somehow
comparable with the so-called outer product (OP) in OPC
(see discussion below). At higher magnifications it is
observed, that between 1 and 7 days the small slag
particles (, 2 �m) become fully hydrated. In addition,
thin layers (, 1 �m) of dense C–S–H are formed around
larger slag particles. However, these hydration layers
grow very slowly. After 7 days their thickness is still
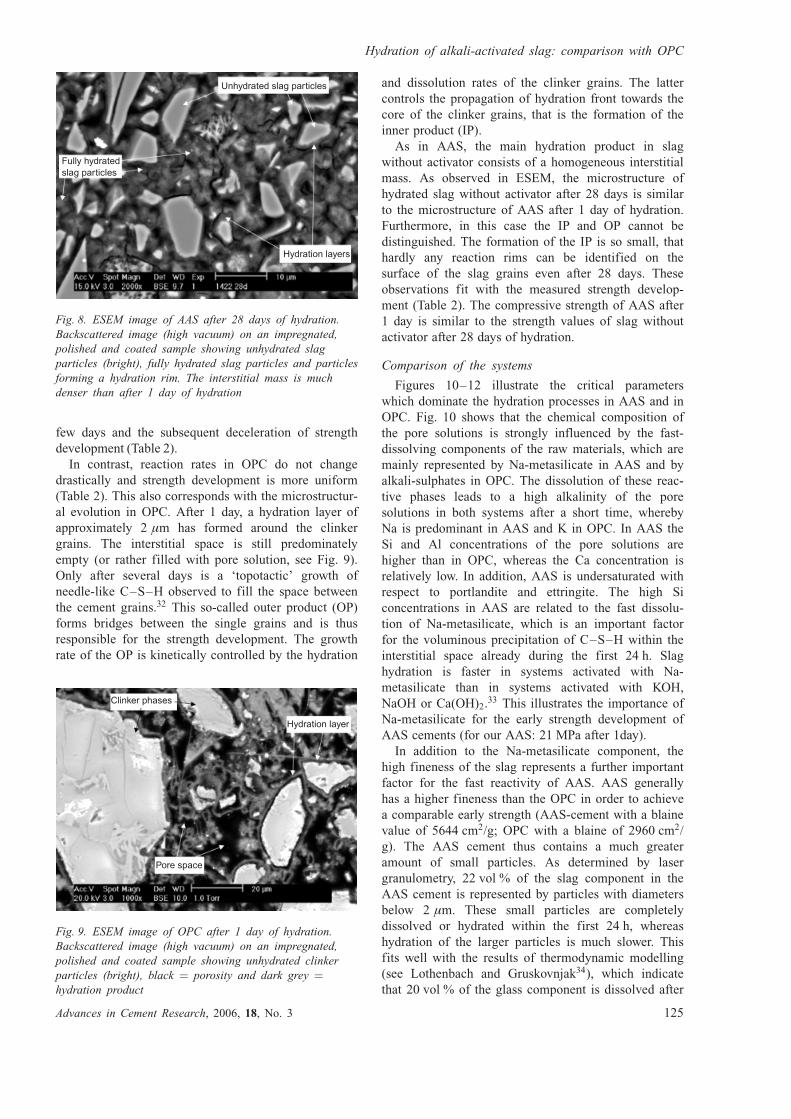
approximately 1 to 2 �m (Fig. 7). Between 7 and 28 days
the microstructural evolution becomes very slow: the
hydration layers reach thicknesses of a few micrometres
and the interstitial gel becomes slightly denser (Fig. 8).
The microstructural evolution in AAS demonstrates fast
hydration rates during the first few days followed by
relatively slow reactions. This evolution correlates with
the relatively fast development of strength during the first
*��'���� ���
'��0�1���0*0/������
Fig. 6. ESEM image of AAS after 1 day of hydration.
Backscattered image (high vacuum) on an impregnated,
polished and coated sample showing unhydrated slag
particles (bright) in an interstitial gel-like mass
$���������������'���� ��
/���������������
A���� �����'���� ��
Fig. 7. ESEM image of AAS after 7 days of hydration.
Backscattered image (high vacuum) on an impregnated,
polished and coated sample showing unhydrated slag
particles (bright), fully hydrated slag particles and particles
forming a hydration rim
Gruskovnjak et al.
124 Advances in Cement Research, 2006, 18, No. 3
few days and the subsequent deceleration of strength
development (Table 2).
In contrast, reaction rates in OPC do not change
drastically and strength development is more uniform
(Table 2). This also corresponds with the microstructur-
al evolution in OPC. After 1 day, a hydration layer of
approximately 2 �m has formed around the clinker
grains. The interstitial space is still predominately
empty (or rather filled with pore solution, see Fig. 9).
Only after several days is a ‘topotactic’ growth of
needle-like C–S–H observed to fill the space between
the cement grains.32 This so-called outer product (OP)
forms bridges between the single grains and is thus
responsible for the strength development. The growth
rate of the OP is kinetically controlled by the hydration
and dissolution rates of the clinker grains. The latter
controls the propagation of hydration front towards the
core of the clinker grains, that is the formation of the
inner product (IP).
As in AAS, the main hydration product in slag
without activator consists of a homogeneous interstitial
mass. As observed in ESEM, the microstructure of
hydrated slag without activator after 28 days is similar
to the microstructure of AAS after 1 day of hydration.
Furthermore, in this case the IP and OP cannot be
distinguished. The formation of the IP is so small, that
hardly any reaction rims can be identified on the
surface of the slag grains even after 28 days. These
observations fit with the measured strength develop-
ment (Table 2). The compressive strength of AAS after
1 day is similar to the strength values of slag without
activator after 28 days of hydration.
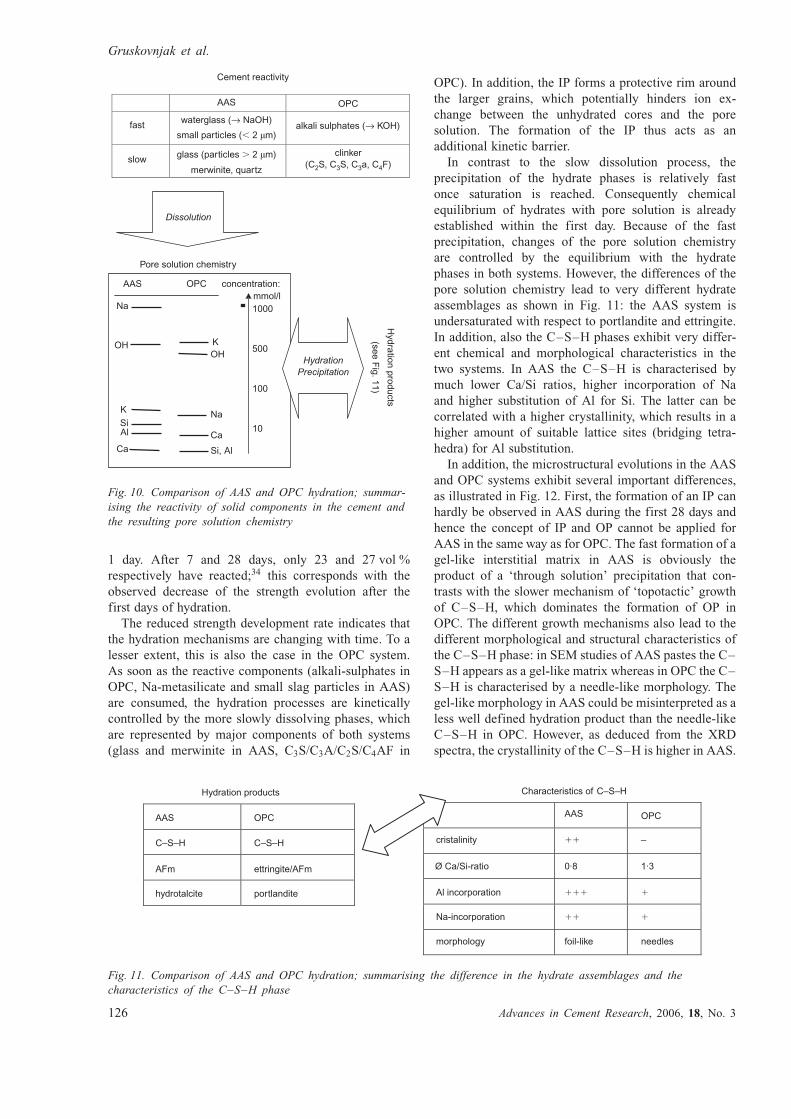
Comparison of the systems
Figures 10–12 illustrate the critical parameters
which dominate the hydration processes in AAS and in
OPC. Fig. 10 shows that the chemical composition of
the pore solutions is strongly influenced by the fast-
dissolving components of the raw materials, which are
mainly represented by Na-metasilicate in AAS and by
alkali-sulphates in OPC. The dissolution of these reac-
tive phases leads to a high alkalinity of the pore
solutions in both systems after a short time, whereby
Na is predominant in AAS and K in OPC. In AAS the
Si and Al concentrations of the pore solutions are
higher than in OPC, whereas the Ca concentration is
relatively low. In addition, AAS is undersaturated with
respect to portlandite and ettringite. The high Si
concentrations in AAS are related to the fast dissolu-
tion of Na-metasilicate, which is an important factor
for the voluminous precipitation of C–S–H within the
interstitial space already during the first 24 h. Slag
hydration is faster in systems activated with Na-
metasilicate than in systems activated with KOH,
NaOH or Ca(OH)2.33 This illustrates the importance of
Na-metasilicate for the early strength development of
AAS cements (for our AAS: 21 MPa after 1day).
In addition to the Na-metasilicate component, the
high fineness of the slag represents a further important
factor for the fast reactivity of AAS. AAS generally
has a higher fineness than the OPC in order to achieve
a comparable early strength (AAS-cement with a blaine
value of 5644 cm2/g; OPC with a blaine of 2960 cm2/
g). The AAS cement thus contains a much greater
amount of small particles. As determined by laser
granulometry, 22 vol % of the slag component in the
AAS cement is represented by particles with diameters
below 2 �m. These small particles are completely
dissolved or hydrated within the first 24 h, whereas
hydration of the larger particles is much slower. This
fits well with the results of thermodynamic modelling
(see Lothenbach and Gruskovnjak34), which indicate
that 20 vol % of the glass component is dissolved after
$���������������'���� ���
A������������'���� ���
/�������������
Fig. 8. ESEM image of AAS after 28 days of hydration.
Backscattered image (high vacuum) on an impregnated,
polished and coated sample showing unhydrated slag
particles (bright), fully hydrated slag particles and particles
forming a hydration rim. The interstitial mass is much
denser than after 1 day of hydration
���1���������
/������������
5������� �
Fig. 9. ESEM image of OPC after 1 day of hydration.
Backscattered image (high vacuum) on an impregnated,
polished and coated sample showing unhydrated clinker
particles (bright), black ¼ porosity and dark grey ¼hydration product
Hydration of alkali-activated slag: comparison with OPC
Advances in Cement Research, 2006, 18, No. 3 125
1 day. After 7 and 28 days, only 23 and 27 vol %
respectively have reacted;34 this corresponds with the
observed decrease of the strength evolution after the
first days of hydration.
The reduced strength development rate indicates that
the hydration mechanisms are changing with time. To a
lesser extent, this is also the case in the OPC system.
As soon as the reactive components (alkali-sulphates in
OPC, Na-metasilicate and small slag particles in AAS)
are consumed, the hydration processes are kinetically
controlled by the more slowly dissolving phases, which
are represented by major components of both systems
(glass and merwinite in AAS, C3S/C3A/C2S/C4AF in
OPC). In addition, the IP forms a protective rim around
the larger grains, which potentially hinders ion ex-
change between the unhydrated cores and the pore
solution. The formation of the IP thus acts as an
additional kinetic barrier.
In contrast to the slow dissolution process, the
precipitation of the hydrate phases is relatively fast
once saturation is reached. Consequently chemical
equilibrium of hydrates with pore solution is already
established within the first day. Because of the fast
precipitation, changes of the pore solution chemistry
are controlled by the equilibrium with the hydrate
phases in both systems. However, the differences of the
pore solution chemistry lead to very different hydrate
assemblages as shown in Fig. 11: the AAS system is
undersaturated with respect to portlandite and ettringite.
In addition, also the C–S–H phases exhibit very differ-
ent chemical and morphological characteristics in the
two systems. In AAS the C–S–H is characterised by
much lower Ca/Si ratios, higher incorporation of Na
and higher substitution of Al for Si. The latter can be
correlated with a higher crystallinity, which results in a
higher amount of suitable lattice sites (bridging tetra-
hedra) for Al substitution.
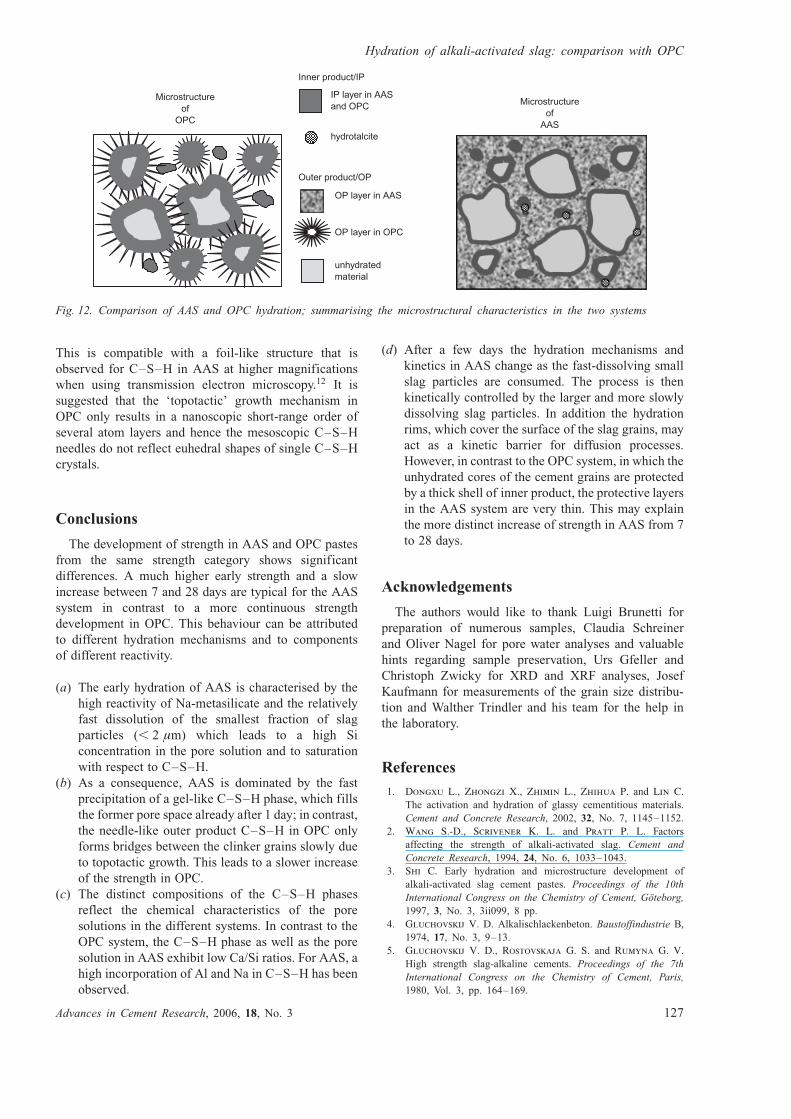
In addition, the microstructural evolutions in the AAS
and OPC systems exhibit several important differences,
as illustrated in Fig. 12. First, the formation of an IP can
hardly be observed in AAS during the first 28 days and
hence the concept of IP and OP cannot be applied for
AAS in the same way as for OPC. The fast formation of a
gel-like interstitial matrix in AAS is obviously the
product of a ‘through solution’ precipitation that con-
trasts with the slower mechanism of ‘topotactic’ growth
of C–S–H, which dominates the formation of OP in
OPC. The different growth mechanisms also lead to the
different morphological and structural characteristics of
the C–S–H phase: in SEM studies of AAS pastes the C–
S–H appears as a gel-like matrix whereas in OPC the C–
S–H is characterised by a needle-like morphology. The
gel-like morphology in AAS could be misinterpreted as a
less well defined hydration product than the needle-like
C–S–H in OPC. However, as deduced from the XRD
spectra, the crystallinity of the C–S–H is higher in AAS.
��� ��1������������)��%-/,
���:
���
����
���
��
�� ������;
5����������� ������
-/
%*
��
(�
%-/
(�
*#�"�
��
�����������
/������������ �
)����$'����,
""* -5�
��������� ����)������,
'�����)��� ����������,
���:��#�B���
��1��)��*#���*#����#��.$,
""* -5�����=�
"�
�� ����������������
:���'�����)��(�-/,
��������� ��
Fig. 10. Comparison of AAS and OPC hydration; summar-
ising the reactivity of solid components in the cement and
the resulting pore solution chemistry
/������������ �
""* -5�
�C*C/ �C*C/
"$�
������� �
���'�="$�
��������
����� ��� ������C*C/
""* -5�
������
D���=*0���
"��� ��������
(�0� ��������
��������'�
��
��9
���
��
���0�1�
C
���
�
�
�������
Fig. 11. Comparison of AAS and OPC hydration; summarising the difference in the hydrate assemblages and the
characteristics of the C–S–H phase
Gruskovnjak et al.
126 Advances in Cement Research, 2006, 18, No. 3
This is compatible with a foil-like structure that is
observed for C–S–H in AAS at higher magnifications
when using transmission electron microscopy.12 It is
suggested that the ‘topotactic’ growth mechanism in
OPC only results in a nanoscopic short-range order of
several atom layers and hence the mesoscopic C–S–H
needles do not reflect euhedral shapes of single C–S–H
crystals.
Conclusions
The development of strength in AAS and OPC pastes
from the same strength category shows significant
differences. A much higher early strength and a slow
increase between 7 and 28 days are typical for the AAS
system in contrast to a more continuous strength
development in OPC. This behaviour can be attributed
to different hydration mechanisms and to components
of different reactivity.
(a) The early hydration of AAS is characterised by the
high reactivity of Na-metasilicate and the relatively
fast dissolution of the smallest fraction of slag
particles (, 2 �m) which leads to a high Si
concentration in the pore solution and to saturation
with respect to C–S–H.
(b) As a consequence, AAS is dominated by the fast
precipitation of a gel-like C–S–H phase, which fills
the former pore space already after 1 day; in contrast,
the needle-like outer product C–S–H in OPC only
forms bridges between the clinker grains slowly due
to topotactic growth. This leads to a slower increase
of the strength in OPC.
(c) The distinct compositions of the C–S–H phases
reflect the chemical characteristics of the pore
solutions in the different systems. In contrast to the
OPC system, the C–S–H phase as well as the pore
solution in AAS exhibit low Ca/Si ratios. For AAS, a
high incorporation of Al and Na in C–S–H has been
observed.
(d) After a few days the hydration mechanisms and
kinetics in AAS change as the fast-dissolving small
slag particles are consumed. The process is then
kinetically controlled by the larger and more slowly
dissolving slag particles. In addition the hydration
rims, which cover the surface of the slag grains, may
act as a kinetic barrier for diffusion processes.
However, in contrast to the OPC system, in which the
unhydrated cores of the cement grains are protected
by a thick shell of inner product, the protective layers
in the AAS system are very thin. This may explain
the more distinct increase of strength in AAS from 7
to 28 days.
Acknowledgements
The authors would like to thank Luigi Brunetti for
preparation of numerous samples, Claudia Schreiner
and Oliver Nagel for pore water analyses and valuable
hints regarding sample preservation, Urs Gfeller and
Christoph Zwicky for XRD and XRF analyses, Josef
Kaufmann for measurements of the grain size distribu-
tion and Walther Trindler and his team for the help in
the laboratory.
References
1. Dongxu L., Zhongzi X., Zhimin L., Zhihua P. and Lin C.
The activation and hydration of glassy cementitious materials.
Cement and Concrete Research, 2002, 32, No. 7, 1145–1152.
2. Wang S.-D., Scrivener K. L. and Pratt P. L. Factors
affecting the strength of alkali-activated slag. Cement and
Concrete Research, 1994, 24, No. 6, 1033–1043.
3. Shi C. Early hydration and microstructure development of
alkali-activated slag cement pastes. Proceedings of the 10th
International Congress on the Chemistry of Cement, Goteborg,
1997, 3, No. 3, 3ii099, 8 pp.
4. Gluchovskij V. D. Alkalischlackenbeton. Baustoffindustrie B,
1974, 17, No. 3, 9–13.
5. Gluchovskij V. D., Rostovskaja G. S. and Rumyna G. V.
High strength slag-alkaline cements. Proceedings of the 7th
International Congress on the Chemistry of Cement, Paris,
1980, Vol. 3, pp. 164–169.
& ����� �����
-5�
3���������� =35
35���������""*����-5�
������� �
-��������� =-5
-5���������""*
-5���������-5�
���������������
& ����� �����
""*
Fig. 12. Comparison of AAS and OPC hydration; summarising the microstructural characteristics in the two systems
Hydration of alkali-activated slag: comparison with OPC
Advances in Cement Research, 2006, 18, No. 3 127
6. Yuan C. Z. and Xin L. The selection of stimulation agents for
alkali-slag cement. Proceedings of the 9th International
Congress on the Chemistry of Cement, New Delhi, India,
1992, Vol. 3, pp. 305–311.
7. Bakharev T., Sanjayan J. G. and Cheng Y.-B. Effect
of admixtures on properties of alkali-activated slag
concrete. Cement and Concrete Research, 2000, 30, No. 9,
1367–1374.
8. Shi C., Day R. L., Wu X. and Tang M. Comparison of the
microstructure and performance of alkali-slag and Portland
cement pastes. Proceedings of the 9th International Congress
on the Chemistry of Cement, New Dehli, India, 1992, Vol. 3,
pp. 298–304.
9. Krizan D. and Zivanovic B. Effects of dosage and modulus
of water glass on early hydration of alkali-slag cements.
Cement and Concrete Research, 2002, 32, No. 8, 1181–1188.
10. Wang S.-D. and Scrivener K. L. Hydration products of alkali
activated slag cement. Cement and Concrete Research, 1995,
25, No. 3, 561–571.
11. Jiang W., Silsbee M. R. and Roy D. M. Alkali activation
reaction mechanism and its influences on microstructure of
slag cement. Proceedings of the 10th International Congress
on the Chemistry of Cement, Goteborg, 1997, Vol. 3, 3ii100,
9 pp.
12. Richardson I. G., Brough A. R., Groves G. W. and Dobson
C. M. The characterization of hardened alkali-activated blast-
furnace slag pastes and the nature of the calcium silicate
hydrate (C–S–H) phase. Cement and Concrete Research, 1994,
24, No. 5, 813–829.
13. Richardson I. G. The nature of C–S–H in hardened cements.
Cement and Concrete Research, 1999, 29, No. 8, 1131–1147.
14. Jennings H. M. The developing microstructure in Portland
cement. In: Advances in Cement Technology (Ghosh S. N.
(ed.)). Pergamon Press, New York, 1983, pp. 349–396.
15. Richardson I. G. and Groves G. W. The incorporation of
minor and trace elements into calcium silicate hydrate (C–S–
H) gel in hardened cement pastes. Cement and Concrete
Research, 1993, 23, No. 1, 131–138.
16. Faucon P., Delagrave A., Petit J. C., Richet C.,
Marchand J. M. and Zanni H. Aluminum incorporation in
calcium silicate hydrate (C–S–H) depending on their Ca/Si
ratio. Journal of Physical Chemistry, 1999, 103, No. 37, 7796–
7802.
17. Barneyback R. F. J. and Diamond S. Expression and analysis
of pore fluids from hardened cement pastes and mortars.
Cement and Concrete Research, 1981, 11, No. 2, 279–285.
18. Lothenbach B. and Winnefeld F. Thermodynamic model-
ling of the hydration of Portland cement. Cement and Concrete
Research, 2006, 36, No. 2, 209–366.
19. Taylor H. F. W. Cement Chemistry, 2nd edn. Thomas Telford
Services Ltd, London, 1997.
20. Wang S.-D. Alkali-activated slag: hydration process and
development of microstructure. Advances in Cement Research,
2000, 12, No. 4, 163–172.
21. Wang S.-D. and Scrivener K. L.29Si and 27Al NMR study
of alkali-activated slag. Cement and Concrete Research, 2003,
33, No. 5, 769–774.
22. Richardson I. G., Brough A. R., Brydson R., Groves G.
W. and Dobson C. M. Location of aluminum in substituted
calcium silicate hydrate (C–S–H) gels as determined by 29Si
and 27Al NMR and EELS. Journal of the American Ceramic
Society, 1993, 76, No. 9, 2285–2288.
23. Rothstein D., Thomas J. J., Christensen B. J. and
Jennings H. M. Solubility behavior of Ca-, S-, Al-, and Si-
bearing solid phases in Portland cement pore solutions as a
function of hydration time. Cement and Concrete Research,
2002, 32, No. 10, 1663–1671.
24. Chen K. Y. and Morris J. C. Kinetics of oxidation of
aqueous sulfide by O2. Environmental Science & Technology,
1972, 6, No. 6, 529–536.
25. O’Brien D. J. and Birkner F. B. Kinetics of oxygenation of
reduced sulfur species in aqueous solution. Environmental
Science & Technology, 1977, 11, No. 12, 1114–1120.
26. Fischer H., Schulz-Ekloff G. and Wohrle D. Oxidation of
aqeous sulfide solutions by dioxygen. Part I: autooxidation
reaction. Chemical Engineering & Technology, 1997, 20, No.
7, 462–468.
27. Glasser F. P. Luke K. and Angus M. J. Modification of
cement pore fluid compositions by pozzolanic additives.
Cement and Concrete Research, 1988, 18, 165–178.
28. Puertas F., Fernandez-Jimenez A. and Blanco-Varela
M. T. Pore solution in alkali activated slag cement pastes;
relation to the composition and structure of calcium silicate
hydrate. Cement and Concrete Research, 2004, 34, 139–148.
29. Hong S.-Y. and Glasser F. P. Alkali binding in cement
pastes; Part I: The C–S–H phase. Cement and Concrete
Research, 1999, 29, 1893–1903.
30. Hong S.-Y and Glasser F. P. Alkali sorption by C–S–H and
C–A–S–H gels; Part II: Role of alumina.Cement and Concrete
Research, 2002, 32, 1101–1111.
31. Andersen M. D., Jakobsen H. J. and Skibsted J. Incorpora-
tion of aluminum in the calcium silicate hydrate (C–S–H) of
hydrated Portland cements: a high field 27Al and 29Si MAS
NMR investigation. Inorganic Chemistry, 2003, 42, No. 7,
2280–2287.
32. Holzer, L., Winnefeld, F., Lothenbach, B. and Zampini,
D. The early cement hydration: a multi-method approach.
Proceedings of the 11th International Congress on the
Chemistry of Cement ICCC, Durban, 2003, pp. 236–248.
33. Brough A. R. and Atkinson A. Sodium silicate-based, alkali-
activated slag mortars; Part I: Strength, hydration and
microstructure. Cement and Concrete Research, 2002, 32,
No. 6, 865–879.
34. Lothenbach B. and Gruskovnjak A. Hydration of alkali-
activated slag; Part II: Thermodynamic modelling. Advances in
Cement Research, submitted.
Discussion contributions on this paper should reach the editor by
1 January 2007
Gruskovnjak et al.
128 Advances in Cement Research, 2006, 18, No. 3


![Impact analysis of Mg slag[1]](https://img.pdfslide.net/doc/110x75/631df2590ff042c6110c1bf6/impact-analysis-of-mg-slag1.jpg)


