Embed Size (px)
Citation preview
International Research Journal of Engineering and Technology (IRJET) e-ISSN: 2395-0056
Volume: 02 Issue: 06 | Sep-2015 www.irjet.net p-ISSN: 2395-0072
© 2015, IRJET ISO 9001:2008 Certified Journal Page 1125
IMAGE DE-NOISING USING DUAL-TREE COMPLEX WAVELET TRANSFORM FOR SATELLITE APPLICATIONS
Dinesh kumar1 , DVS Nagendra kumar2,
1 Student, Digital electronics and communication engineering ,MGIT ,Telangana , India 2 Senior assistant professor, Electronics and communication , MGIT,Telangana, India
---------------------------------------------------------------------***---------------------------------------------------------------------ABSTRACT
This paper presents a unique thanks to cut back noise introduced or exacerbated by image sweetening strategies; especially algorithms supported the random spray sampling technique, however not solely. Multi scale decomposition based on dual-tree complex wavelet transform and edge preservation is presented for SRE of the satellite images. Resolution enhancement schemes (which are not based on wavelets) suffer from the drawback of losing high frequency contents (which results in blurring). A wavelet-domain approach based on dual-tree complex wavelet transform (DT-CWT) and nonlocal means is used for RE of the satellite images. A satellite input image is decomposed by DT-CWT (which is nearly shift invariant) to obtain high-frequency sub bands. The high-frequency sub band and the low-resolution (LR) input image are interpolated using the bi-cubic interpolator. The result's a map of the directional structures gift within the non-enhanced image. Same map is then wont to shrink the coefficients of the improved image. The contracted coefficients and also the coefficients from the non-enhanced image area unit then mixed in keeping with information radial asymmetry. The simulated results will show that technique used in this process provides better accuracy rather than prior methods.
Keywords:-Satellite Resolution Enhancement DTCWT,
low-Resolution, Interpolator, Accuracy.
INTRODUCTION:-
Multi-spectral satellite imagery is an economical, precise
and appropriate method of obtaining information on land
use and land cover since they provide data at regular
intervals and is economical when compared to the other
traditional methods of ground survey and aerial
photography. Classification of multispectral remotely
sensed data is investigated with a special focus on
uncertainty analysis in the produced land-cover maps. To
humans, an image is not just a random collection of pixels;
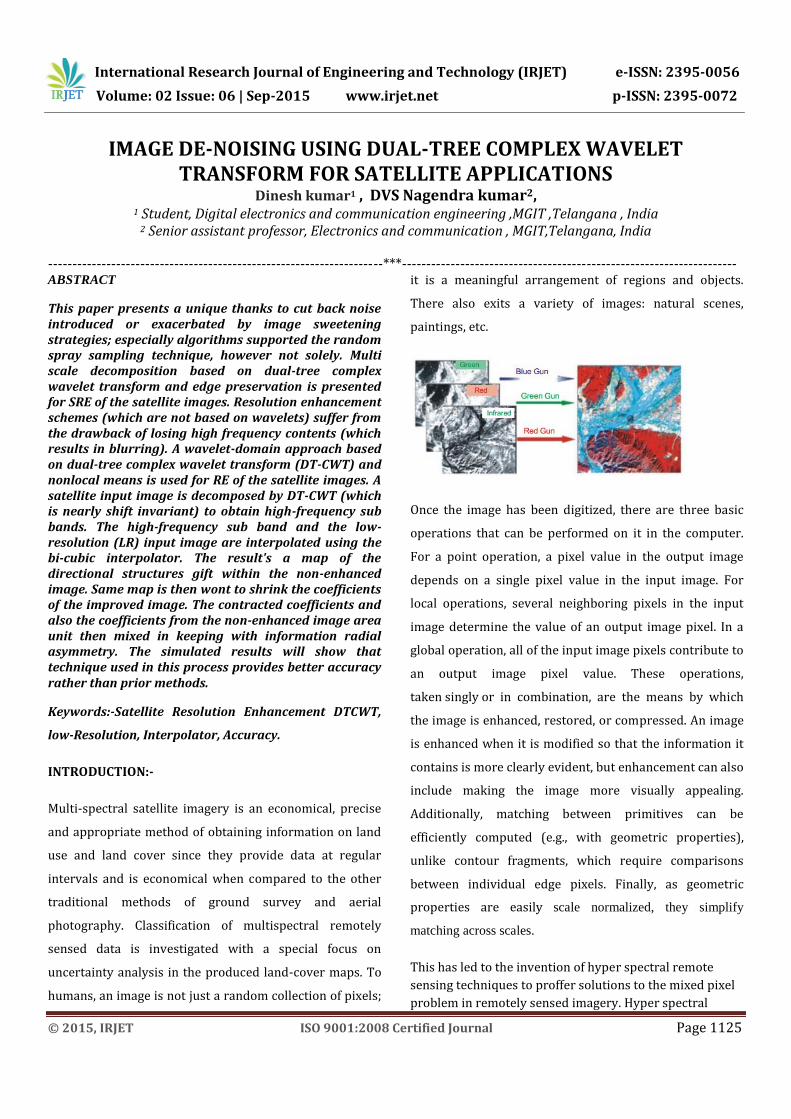
it is a meaningful arrangement of regions and objects.
There also exits a variety of images: natural scenes,
paintings, etc.
Once the image has been digitized, there are three basic
operations that can be performed on it in the computer.
For a point operation, a pixel value in the output image
depends on a single pixel value in the input image. For
local operations, several neighboring pixels in the input
image determine the value of an output image pixel. In a
global operation, all of the input image pixels contribute to
an output image pixel value. These operations,
taken singly or in combination, are the means by which
the image is enhanced, restored, or compressed. An image
is enhanced when it is modified so that the information it
contains is more clearly evident, but enhancement can also
include making the image more visually appealing.
Additionally, matching between primitives can be
efficiently computed (e.g., with geometric properties),
unlike contour fragments, which require comparisons
between individual edge pixels. Finally, as geometric
properties are easily scale normalized, they simplify
matching across scales.
This has led to the invention of hyper spectral remote
sensing techniques to proffer solutions to the mixed pixel
problem in remotely sensed imagery. Hyper spectral

International Research Journal of Engineering and Technology (IRJET) e-ISSN: 2395-0056
Volume: 02 Issue: 06 | Sep-2015 www.irjet.net p-ISSN: 2395-0072
© 2015, IRJET ISO 9001:2008 Certified Journal Page 1126
images have been used in many real applications because
of their rich sources of information. Examples of the useful
applications of hyper spectral imaging include mineral
exploration, urban processes, agriculture, risk prevention,
land cover mapping, surveillance system, resource
management, tracking wildfires, detecting biological
threats and chemical contamination (Hall et al. 1991; Ellis
2001; Lacar et al. 2001; Zhang et al. 2011). These images
provide abundant spectral information to identify and
differentiate between spectrally similar, but unique
materials. They provide potential, detailed and accurate
information extraction as compared to other remotely
sensed data (Karaka et al. 2004). In addition, hyper
spectral images provide a high-resolution reflectance
spectrum for each pixel in the image (Boardman et al.
1995). As a result, large scale land cover maps constructed
from remotely sensed data have become important
information sources (Boardman et al. 1995).
Image enhancement techniques are the algorithms which
improve the quality of images by removing blurring and
noise, increasing contrast and sharpness of digital medical
images. There are many image enhancement approaches
(theories) like Contrast stretching, Range compression,
Histogram equalization and noise smoothing. A certain
amount of trial and error usually is required before a
particular image enhancement approach is selected. There
is no general theory of image enhancement. When an
image is processed for visual interpretation, the viewer is
the ultimate judge of how well a particular method works.
Visual evaluation of image quality is a highly subjective
process.
LITERATURE SURVEY
Image denoising in steerable pyramid domain based
on a local Laplace prior
This paper presents a new image denoising algorithm
based on the modeling of coefficients in each subband of
steerable pyramid employing a Laplacian probability
density function (pdf) with local variance. This pdf is able
to model the heavy-tailed nature of steerable pyramid
coefficients and the empirically observed correlation
between the coefficient amplitudes. Within this
framework, we describe a novel method for image
denoising based on designing both maximum a posteriori
(MAP) and minimum mean squared error (MMSE)
estimators, which relies on the zero-mean Laplacian
random variables with high local correlation. Despite the
simplicity of our spatially adaptive denoising method, both
in its concern and implementation, our denoising results
achieves better performance than several published
methods such as Bayes least squared Gaussian scale
mixture (BLS-GSM) technique that is a state-of-the-art
denoising technique.
Spectral Clustering Ensemble Applied to SAR Image
Segmentation
Spectral clustering (SC) has been used with success in the
field of computer vision for data clustering. In this paper, a
new algorithm named SC ensemble (SCE) is proposed for
the segmentation of synthetic aperture radar (SAR)
images. The gray-level cooccurrence matrix-based statistic
features and the energy features from the undecimated
wavelet decomposition extracted for each pixel being the
input, our algorithm performs segmentation by combining
multiple SC results as opposed to using outcomes of a
single clustering process in the existing literature. The
random subspace, random scaling parameter, and
Nyström approximation for component SC are applied to
construct the SCE. This technique provides necessary
diversity as well as high quality of component learners for
an efficient ensemble. It also overcomes the shortcomings
faced by the SC, such as the selection of scaling parameter,
and the instability resulted from the Nyström
approximation method in image segmentation.
Experimental results show that the proposed method is
effective for SAR image segmentation and insensitive to
the scaling parameter.
EXISTING METHOD ANALYSIS
The overall assumption in multi-resolution shrinkage is
that image information provides rise to thin coefficients
within the remodel house. Thus, American state noising is
achieved by compression (shrinking) those coefficients
that compromise information inadequacy. Such method is

International Research Journal of Engineering and Technology (IRJET) e-ISSN: 2395-0056
Volume: 02 Issue: 06 | Sep-2015 www.irjet.net p-ISSN: 2395-0072
© 2015, IRJET ISO 9001:2008 Certified Journal Page 1127
sometimes improved by associate degree elaborate applied
mathematics analysis of the dependencies between
coefficients at totally different scales. Yet, whereas
effective, ancient multi-resolution strategies area unit
designed to solely take away one explicit style of noise
(e.g. mathematician noise).
Discrete Wavelet Transform
Discrete Wavelet transform (DWT) is a mathematical tool
for hierarchically decomposing an image. The DWT
decomposes an input image into four components labeled
as LL, HL, LH and HH [9]. The first letter corresponds to
applying either a low pass frequency operation or high
pass frequency operation to the rows, and the second
letter refers to the filter applied to the columns. The
lowest resolution level LL consists of the approximation
part of the original image. The remaining three resolution
levels consist of the detail parts and give the vertical high
(LH), horizontal high (HL) and high (HH) frequencies.
Figure 3 shows three-level wavelet decomposition
of an image.
Figure7: Three-level Discrete Wavelet Transform.
The black and white mask from the segmentation
step was used to determine which coefficient to select
from the transformed image. Typically, discrete multi
dimensional wavelet transforms produce a wavelet matrix
half the size of the original image using a technique called
down-sampling where only half the coefficients are
preserved.
In order to maintain the original image size, a discrete
wavelet transformation was used which suppresses down-
sampling, producing a wavelet matrix the same size as the
input matrix. For both levels, the mean and variance of
wavelet coefficients for approximations and details were
calculated, resulting in a total of 8 features. Features were
then normalized to range between 0 and 1.
PROPOSED METHOD ANALYSIS
Image enhancement techniques improve the quality of an
image as perceived by a human. These techniques are
most useful because many satellite images when examined
on a colour display give inadequate information for image
interpretation. There is no conscious effort to improve the
fidelity of the image with regard to some ideal form of the
image. There exists a wide variety of techniques for
improving image quality. Image enhancement methods are
applied separately to each band of a multispectral image.
Contrast ratio has a strong bearing on the resolving power

International Research Journal of Engineering and Technology (IRJET) e-ISSN: 2395-0056
Volume: 02 Issue: 06 | Sep-2015 www.irjet.net p-ISSN: 2395-0072
© 2015, IRJET ISO 9001:2008 Certified Journal Page 1128
and delectability of an image. Larger this ratio, more easy
it is to interpret the image. Satellite images lack adequate
contrast and require contrast improvement.
Image Preparation
Digital images of melanoma and benign nevi were
collected in JPEG format from different sources totaling
72, half melanoma and half benign. MATLAB’s Wavelet
Toolbox only supports indexed images with linear
monotonic color maps
so the RGB images were converted to grayscale
images. The next step in the process was to segment the
lesion from the surrounding skin. Since a clear color
distinction existed between lesion and skin, thresholding
was very suitable for this task. A black and white image
was produced and its size increased by six pixels all
around in order to include the entire border region in the
segmented image.
Pre-Processing:-
The L* axis represents Lightness. This is vertical; from 0,
which has no lightness (i.e. absolute black), at the bottom;
through 50 in the middle, to 100 which is maximum
lightness (i.e. absolute white) at the top. The c* axis
represents Chrome or 'saturation'. This ranges from 0 at
the centre of the circle, which is completely unsaturated
(i.e. a neutral grey, black or white) to 100 or more at the
edge of the circle for very high Chrome (saturation) or
'colour purity'. The h* axis represents Hue. If we take a
horizontal slice through the centre, cutting the 'sphere'
('apple') in half, we see a coloured circle. Around the edge
of the circle we see every possible saturated colour,
or Hue. This circular axis is known as h° for Hue. The units
are in the form of degrees° (or angles), ranging from 0°
(red) through 190° (yellow), 80° (green), 270° (blue) and
back to 0°.
Dual-Tree Complex Wavelet Transforms (DT-CWT)
The dual-tree complex wavelet transform (CWT) is a
relatively recent enhancement to the discrete wavelet
transform (DWT), with important additional properties: It
is nearly shift invariant and directionally selective in two
and higher dimensions. It achieves this with a redundancy
factor of only 2d for d-dimensional signals, which is
substantially lower than the un decimated DWT.
The multidimensional (M-D) dual-tree CWT is non
separable but is based on a computationally efficient,
separable filter bank (FB).

International Research Journal of Engineering and Technology (IRJET) e-ISSN: 2395-0056
Volume: 02 Issue: 06 | Sep-2015 www.irjet.net p-ISSN: 2395-0072
© 2015, IRJET ISO 9001:2008 Certified Journal Page 1129
DTCWT Decomposition: Low frequency Co-Efficient
In the neighborhood of an edge, the real DWT produces
both large and small wavelet coefficients In contrast, the
(approximately) analytic CWT produces coefficients
whose magnitudes are more directly related to their
proximity to the edge. The theory behind the dual-tree
transforms shows how complex wavelets with good
properties can be designed, and illustrates a range of
applications in signal and image processing.
DTCWT Decomposition: High frequency Co-Efficient
INTERPOLATION
Interpolation is way through which images are enlarged.
There are many different types of interpolation methods,
each resulting in a different to the final picture. Thus, it is
best if the quality, or visible distinction for each pixel, is
retained throughout the enlargement process. Thus, one
cannot simply have a number of pixels directly represent a
single original pixel; this is not sufficient for commercial
use. Conspicuous blocks of single color will be visible, and
depending on size of enlargement, the original image will
be unrecognizable. Cubic Convolution Interpolation
determines the grey level value from the weighted average
of the 16 closest pixels to the specified input coordinates,
and assigns that value to the output coordinates. The
image is slightly sharper than that produced by Bilinear
Interpolation, and it does not have the disjointed
appearance produced by Nearest Neighbor Interpolation.
Expectation Maximization (EM) algorithm was used to
train the Markov tree model. The algorithm essentially
works by finding the set of parameters which would most
likely result in the set of observed wavelet coefficients.
Analysis using Filter Banks
Filters are one of the most widely used signal processing
functions. Wavelets can be realized by iteration of filters
with rescaling. The resolution of the signal, which is a
measure of the amount of detail information in the signal,
is determined by the filtering operations, and the scale is
determined by up sampling and down sampling (sub
sampling) operations.
Noise reduction we can do in two steps.
For plain image we have to add some noise and applying
filtering concept we have to remove noise. In second step
we can remove the noise for existing noisy image.

International Research Journal of Engineering and Technology (IRJET) e-ISSN: 2395-0056
Volume: 02 Issue: 06 | Sep-2015 www.irjet.net p-ISSN: 2395-0072
© 2015, IRJET ISO 9001:2008 Certified Journal Page 1130
ADVANTAGES:
Very economical
Shrunk with the coefficients provides reduced noise
firmly.
Produces sensible quality output.
Removing noise while not sterilization the underlying
directional structures in the image. Also, verified
effective on compression and latent noise delivered to
the surface by bar graph exploit.
Quality Measurement:-
The Quality of the reconstructed image is measured in-
terms of mean sq. error (MSE) and peak signal to noise
magnitude relation (PSNR) magnitude relation. The MSE is
commonly known as reconstruction error variance q2.
The MSE between the initial image f and therefore the
reconstructed image g at decoder is outlined as:
MSE = MXN
1
kj
kjgkjf,
]),[],[(
Where the total over j, k denotes the total over all pixels
within the image and N is that the variety of pixels in every
image.
From that the height {signal-to-noise magnitude
relation|signal-to-noise|signal/noise
ratio|signal/noise|S/N|ratio} is outlined because the ratio
between signal variance and reconstruction error
variance. The PSNR between 2 pictures having eight bits
per pel in terms of decibels (dB) is given by:
PSNR = 10 log10
MSE
2255
Generally once PSNR is twenty decibel or larger, then the
initial and therefore the reconstructed pictures ar just
about in-distinguishable by human eyes.

International Research Journal of Engineering and Technology (IRJET) e-ISSN: 2395-0056
Volume: 02 Issue: 06 | Sep-2015 www.irjet.net p-ISSN: 2395-0072
© 2015, IRJET ISO 9001:2008 Certified Journal Page 1131
Conclusion
In Our Project the shape detected guided wrapping and
smoothing filters succeeded in enhancing low contrast
satellite images. The noise reduction technique supported
twin Tree advanced riffle remodel coefficients shrinkage.
the most purpose of novelty is delineate by its application
in post-processing on the output of a picture sweetening
technique (both the non increased image and also the
increased one area unit required) and also the lack of
assumptions on the distribution of noise. It is presented
that dual tree complex wavelet transform better
compatible to provide texture and edges of an image from
different orientation . It was proved that an low resolution
remote sensing image is enhanced to better visual
perception by interpolating at high frequency sub bands
and it reduces the problem of blocking and ringing
artifacts because of its shift invariant property. Here, Edge
preservation filtering named as non local means filter also
used for This module involves Difference image
generation using Image fusion and neural network based
segmentation technology.On the opposite hand, the non-
enhanced image is meant to be noise-free or laid low with
non perceivable noise.
Future Scope:-
This resolution enhancement can further improve with
Lenclos based up-sampling and Gabor filtering for texture
characterization. Up-sampling reduces the distortion of
detailed information and Gabor provides detail, structure
components at different orientations using Satellite
Images.
REFERENCES
[1] H. Demirel and G. Anbarjafari, “Discrete wavelet
transform-based satellite image resolution enhancement,”
IEEE Trans Geosci. Remote Sens., vol. 49, no. 6, pp. 1997–
2004, Jun. 2011.
[2] H. Demirel and G. Anbarjafari, “Image resolution
enhancement by using discrete and stationary wavelet
decomposition,” IEEE Trans. Image Process.,
vol. 20, no. 5, pp. 1458–1460, May 2011.
[3] H. Demirel and G. Anbarjafari, “Satellite image
resolution enhancement using complex wavelet
transform,” IEEE Geosci. Remote Sens. Lett., vol. 7, no. 1, pp.
123–126, Jan. 2010.
[4] H. Demirel and G. Anbarjafari, “Image super resolution
based on interpolation of wavelet domain high frequency

International Research Journal of Engineering and Technology (IRJET) e-ISSN: 2395-0056
Volume: 02 Issue: 06 | Sep-2015 www.irjet.net p-ISSN: 2395-0072
© 2015, IRJET ISO 9001:2008 Certified Journal Page 1132
subbands and the spatial domain input image,” ETRI J., vol.
32, no. 3, pp. 390–394, Jan. 2010.
[5] X. Chen, C. Deng, and S. Wang, “Shearlet-based
adaptive shrinkage threshold for image denoising,” in
Proc. Int. Conf. E-Bus. E-Government, Nanchang, China,
May 2010, pp. 1616–1619.
[6] J. Zhao, L. Lu, and H. Sun, “Multi-threshold image
denoising based on shearlet transform,” Appl. Mech.
Mater., vols. 29–32, pp. 2251–2255, Aug. 2010. technique
for shift invariance and directional filters,” in Proc. 8th
IEEE Digit. Signal Process. Workshop, Aug. 1998, no. 86,
pp. 1–4.
[7] Y. Piao, I. Shin, and H. W. Park, “Image resolution
enhancement using inter-subband correlation in wavelet
domain,” in Proc. Int. Conf. Image Process., San Antonio, TX,
2007, pp. I-445–I-448.
[8] C. B. Atkins, C. A. Bouman, and J. P. Allebach, “Optimal
image scaling using pixel classification,” in Proc. Int. Conf.
Image Process., Oct. 7–10, 2001, pp. 864–867.
[9] A. S. Glassner, K. Turkowski, and S. Gabriel, “Filters for
common resampling tasks,” in Graphics Gems. New York:
Academic, 1990, pp. 147–165.
[10] D. Tschumperle and R. Deriche, “Vector-valued image
regularization with PDE’s: A common framework for
different applications,” IEEE Trans. Pattern Anal. Mach.
Intell., vol. 27, no. 4, pp. 506–517, Apr. 2005.
[11] A. Gambardella andM.Migliaccio, “On the super
resolution of microwave scanning radiometer
measurements,” IEEE Geosci. Remote Sens. Lett., vol. 5, no.
4, pp. 796–800, Oct. 2008.
[12] A. Buades, B. Coll, and J. M. Morel, “A review of image
denoising algorithms,
with a new one,” Multisc. Model. Simul., vol. 4, no. 2, pp.
490– 530, 2005.
[13] I. W. Selesnick, R. G. Baraniuk, and N. G. Kingsbur,
“The dual-tree complex wavelet transform,” IEEE Signal
Prcess. Mag., vol. 22, no. 6, pp. 123–151, Nov. 2005.


