Embed Size (px)
Citation preview

A r t i c l e
The Rockefeller University Press $30.00J. Gen. Physiol. Vol. 140 No. 3 249–266www.jgp.org/cgi/doi/10.1085/jgp.201210818 249
I N T R O D U C T I O N
Cellular signaling cascades are generally housed in specialized subcellular microcompartments, including cilia, microvilli, pre- and postsynaptic compartments, and lamellar membrane systems such as the ER and the Golgi apparatus, that are highly spatially and volume constrained (Dix and Verkman, 2008; Zhou et al., 2008; Najafi et al., 2012). Yet, much of what we know about cell signaling comes from in vitro studies where the original compartments have been disrupted mechani-cally by detergent dissolution or by other harsh treat-ments that reduce signaling cascades to systems that are tractable for study using dilute solution assumptions, which are far from physiological reality. It has thus been a long-standing goal in cell biology and biophysics to approach the study of cell signaling within live cells
Correspondence to Peter D. Calvert: c a l v e r t p @ u p s t a t e . e d u Abbreviations used in this paper: EGFP, enhanced GFP; EM, electron
microscopy; GPCR, G protein–coupled receptor; mFRAP, multiphoton fluorescence relaxation after photoconversion; psf, point spread function; Rho, rhodopsin; XOP, Xenopus opsin promoter.
using optical methods, where the concentrations of cascade components and the geometries of the signal-ing microcompartments are physiologically relevant. This goal has been hampered, however, by the fact that most of these signaling microcompartments are smaller than can be resolved with current live cell– imaging modalities.
A case in point is G protein–coupled receptor (GPCR) signaling. GPCRs are ubiquitous sensors found in the membranes of cell microcompartments and are respon-sible for transducing hundreds of different biological signals, including hormone, peptide, chemical, and light, into electrical and chemical responses that convey infor-mation about the cell’s physical environment (Rosenbaum et al., 2009). Once activated, lateral diffusion in the membranes is thought to allow serial activation of
Impact of signaling microcompartment geometry on GPCR dynamics in live retinal photoreceptors
Mehdi Najafi,1,2 Mohammad Haeri,1,4 Barry E. Knox,3,4 William E. Schiesser,5 and Peter D. Calvert1,2,3,4
1Department of Ophthalmology, 2Department of Biochemistry and Molecular Biology, 3Department of Neuroscience and Physiology, and 4SUNY Eye Institute, State University of New York Upstate Medical University, Syracuse, NY 13210
5Department of Chemical Engineering, Lehigh University, Bethlehem, PA 18015
G protein–coupled receptor (GPCR) cascades rely on membrane protein diffusion for signaling and are generally found in spatially constrained subcellular microcompartments. How the geometry of these microcompartments impacts cascade activities, however, is not understood, primarily because of the inability of current live cell–imag-ing technologies to resolve these small structures. Here, we examine the dynamics of the GPCR rhodopsin within discrete signaling microcompartments of live photoreceptors using a novel high resolution approach. Rhodopsin fused to green fluorescent protein variants, either enhanced green fluorescent protein (EGFP) or the photoacti-vatable PAGFP (Rho-E/PAGFP), was expressed transgenically in Xenopus laevis rod photoreceptors, and the geom-etries of light signaling microcompartments formed by lamellar disc membranes and their incisure clefts were resolved by confocal imaging. Multiphoton fluorescence relaxation after photoconversion experiments were then performed with a Ti–sapphire laser focused to the diffraction limit, which produced small sub–cubic micrometer volumes of photoconverted molecules within the discrete microcompartments. A model of molecular diffusion was developed that allows the geometry of the particular compartment being examined to be specified. This was used to interpret the experimental results. Using this unique approach, we showed that rhodopsin mobility across the disc surface was highly heterogeneous. The overall relaxation of Rho-PAGFP fluorescence photoactivated within a microcompartment was biphasic, with a fast phase lasting several seconds and a slow phase of variable duration that required up to several minutes to reach equilibrium. Local Rho-EGFP diffusion within defined compartments was monotonic, however, with an effective lateral diffusion coefficient Dlat = 0.130 ± 0.012 µm2s1. Comparison of rho-dopsin-PAGFP relaxation time courses with model predictions revealed that microcompartment geometry alone may explain both fast local rhodopsin diffusion and its slow equilibration across the greater disc membrane. Our approach has for the first time allowed direct examination of GPCR dynamics within a live cell signaling microcom-partment and a quantitative assessment of the impact of compartment geometry on GPCR activity.
© 2012 Najafi et al. This article is distributed under the terms of an Attribution– Noncommercial–Share Alike–No Mirror Sites license for the first six months after the publi-cation date (see http://www.rupress.org/terms). After six months it is available under a Creative Commons License (Attribution–Noncommercial–Share Alike 3.0 Unported license, as described at http://creativecommons.org/licenses/by-nc-sa/3.0/).
The
Jour
nal o
f G
ener
al P
hysi
olo
gy

250 Rhodopsin dynamics in live rod microcompartments
were identified by examining fluorescence intensities in retinas of anesthetized tadpoles via epifluorescent fundus imaging and allowed to develop into late-stage tadpoles and adult frogs. It should be noted that, strictly speaking, rhodopsin is formed from an opsin apoprotein with bound 11-cis retinal (vitamin A1 alde-hyde). Xenopus rods, however, predominantly contain porphyropsin, which consists of the opsin apoprotein with 11-cis-3-dehdroretinal (vitamin A2 aldehyde) bound. Because we do not expect substan-tial differences between the diffusion of opsin with bound A1 versus A2 chromophore, we here use the generic and more widely recognized term “rhodopsin” to describe the visual pigment in Xenopus rods.
Animal rearingTransgenic Xenopus tadpoles were housed in tanks containing de-ionized water supplemented with 20 mM of artificial sea salt (Instant Ocean; United Pet Group, Inc.). Tank water was changed three times per week with a water–Instant Ocean mixture that was allowed to stand in the tadpole room for at least 24 h before use to equilibrate to ambient temperature. Tadpoles were fed nettle powder suspended in the water–Instant Ocean mixture three times per week, several hours before changing the tank water. Postmetamorphic froglets were fed sinking frog pellets (Xenopus express) three times per week. The tadpole room was maintained at 18–20°C and on a 12-h light–12-h dark cycle.
Tissue preparation for imagingXenopus tadpoles stage 42–60, or froglets, were dark-adapted for at least 2 h before experiment. All subsequent procedures were per-formed under infrared illumination to minimize activation of rhodopsin. Animals were anesthetized by bathing in 0.05% tri-caine (ethyl 3-aminobenzoate methanesulfonate; Sigma-Aldrich) and decapitated. Eyes were removed, and retinas were dissected into frog Ringer’s solution (in mM: 120 NaCl, 2 KCl, 10 HEPES, 1.6 MgCl2, 10 glucose, 0.03 EDTA, and 1.0 CaCl2). Retinas were oriented ganglion cell side down in a 50-µl bubble of Ringer’s solution on a polypropylene sheet and sliced into strips 50–100-µm wide and 100–200-µm long. Slices were transferred to an imaging chamber as described previously (Peet et al., 2004; Calvert et al., 2007, 2010).
Imaging of live Xenopus rodsImaging and protein diffusion measurements were performed with a custom-built multiphoton/confocal scanning laser micro-scope (MPCLSM) described previously (Peet et al., 2004; Calvert et al., 2007, 2010). Transgenic expression of proteins under the XOP results in heterogeneous protein levels across rods in a given animal’s retina (Peet et al., 2004; Calvert et al., 2010; Haeri and Knox, 2012). Thus, 3-D scans of the retinal slices were performed before experiment to identify rods with sufficient Rho-E/PAGFP expression and that were well oriented with their long axis as close to parallel to the x–y image plane as possible (side-on imaging) or with their outer segments near to perpendicular to the x–y imaging plane such that incisure patterns were detected (end-on imaging). The initial 3-D scans were performed with visible confocal scanning using the 488-nm line of an argon ion laser (model 163C; Spectra Physics) focused to the diffraction limit, with a 60×, 1.2-NA, water-immersion objective (Nikon).
Multiphoton FRAPa and FRAPb of Rho-E/PAGFPRho-E/PAGFP dynamics were examined by mFRAP. All mFRAP experiments were performed on our custom MPCLSM, which is housed in a tightly temperature-controlled room at 20 ± 1°C. PAGFP or EGFP was photoconverted at specified coordinates within cells by multiphoton excitation from the Ti–sapphire laser (Mai Tai HP; Spectra Physics) tuned to 820 nm (PAGFP mFRAPa, photoactivation) or 920 nm (EGFP mFRAPb, photobleaching)
many heterotrimeric GTP-binding proteins (G proteins) that carry and amplify the signal between the re cep-tor and the downstream effectors of various transduc-tion cascades. This amplification step is particularly important for sensory signaling. For instance, retinal photoreceptors are able to signal the activation of a single GPCR, a rhodopsin molecule, because it sequen-tially activates 100 G proteins presumably via diffu-sional encounter (Pugh and Lamb, 2000). Although early macroscopic studies of translational rhodopsin diffusion in lamellar disc membranes of photoreceptors established its ability to move across the discs (Liebman and Entine, 1974; Poo and Cone, 1974), the mobility of rhodopsin within the disc membrane microcompart-ments formed by incisure clefts could only be indirectly inferred (Poo and Cone, 1974) because of limitations in the spatial resolution of the imaging approach used.
Here, we have overcome the limitations on spatial resolution and report the first measurement of the translational dynamics of rhodopsin within defined sig-naling membrane microcompartments of live photo-receptor cells. To accomplish this, we developed an approach that draws upon our recently reported ability to directly visualize membrane microcompartments, formed by lamellar discs and their incisures, in live Xen-opus laevis rod outer segments (Najafi et al., 2012). Fusions of rhodopsin with GFP variants were expressed transgenically, and rhodopsin diffusional dynamics within the identified membrane microcompart ments was examined using high spatial resolution multi-photon fluorescence relaxation after photoconversion (mFRAP) (Calvert et al., 2007, 2010). We find that the relaxation of Rho-PAGFP photoconverted within a disc lobule is dramatically inhomogeneous over long time periods where interlobular equilibration occurs. Relax-ation within a lobule, however, is rapid and complete, and appears monotonic. Analysis of the results with a novel membrane protein diffusion model, which accounts for the no-flux boundaries imposed by disc incisures in a pattern specific to the particular cell being examined, reveals that these observations are best described by diffusion of a mono-dispersed popula-tion of rhodopsins with uniform diffusivities, and that the lobule connections to the greater disc surface impose significant, variable deterrents to interlobule rhodopsin transport.
M A T E R I A L S A N D M E T H O D S
Generation of transgenic XenopusTransgenic Xenopus-expressing EGFP or Xenopus opsin fused to enhanced GFP (EGFP) or the photoactivatable variant of GFP, PAGFP (Rho-EGFP or Rho-PAGFP) (Patterson and Lippincott-Schwartz, 2002), in rods under the Xenopus opsin promoter (XOP; Mani et al., 2001), was generated using the REMI method (Kroll and Amaya, 1996; Knox et al., 1998). Transgenic animals

Najafi et al. 251
and passed through 10-nm band-pass interference filters (Omega Optical, Inc.) to obtain desired wavelength, and a series of neutral density filters (Thorlabs) to obtain the desired power. The beam was reflected into the back aperture of the long working-distance, 0.52-NA condenser on the inverted microscope (TE2000; Nikon) into which our multiphoton/confocal imaging systems are cou-pled. The effective numerical aperture of the condenser was reduced to <0.3 by under filling the back aperture and closing down the field stop. In so doing, the rays incident to the sample were nearly parallel. A linear polarizer on an optical mount with adjustable axis was inserted into the illumination path immediately before the condenser. Images of samples illumi-nated as described above were obtained using a 60×, 1.2-NA, water-immersion objective (Nikon) and a high sensitivity EMCCD camera (Andor Technology).
Rod outer segment preparation and density recording. Outer segments from transgenic frogs expressing Rho-EGFP, reared on a 12-h/12-h light/dark cycle, and dark-adapted for at least 12 h, were isolated from retinas by fluid sheering in frog Ringer’s solu-tion. Retinas were removed to Ringer’s solution, mixed by gentle vortexing, and allowed to stand for several minutes to allow larger pieces of retina to settle. A 10-µl aliquot was removed and added to 40 µl of Ringer’s solution in the imaging chamber that con-tained a final concentration of 50–100 mM NH2OH, included to rapidly cleave the retinal Schiff base upon bleaching (Wald, 1968). Once outer segments settled to the coverslip floor of the chamber, images were acquired using polarized illumination at wavelengths specified by appropriate band-pass filters.
TheoryHere, we describe our approach to the solution of the diffusion equations used to model the dynamics of membrane proteins in photoreceptor discs. Intrinsic and tightly bound peripheral mem-brane proteins are assumed to freely diffuse in two spatial dimensions
and focused to the diffraction limit. The use of multiphoton excitation was essential to our approach, as it allowed the produc-tion of spatially well-defined fields of photoconverted molecules (Zipfel et al., 2003). The photoconversion laser exposures ranged from 0.1 to 100 ms in duration and 10- to 20-mW average power. The equilibration of the activated or bleached molecules was then monitored with serial x–y scans with 488-nm confocal excita-tion that intersected the photoconversion site (mFRAPa of Rho-PAGFP), or by fluorescence recording from the stationary Ti–sapphire laser point spread function (psf) at lower power and positioned at the location of the bleach site (mFRAPb of Rho-EGFP). In the case of mFRAPa, rapid focus corrections were made before and after the photoconversion pulse to account for the measured focus difference between 820- and 488-nm illu-mination caused by objective chromatic aberration (Calvert et al., 2007). Raw images were processed as described previously using custom MATLAB (The MathWorks) routines (Calvert et al., 2007, 2010).
In end-on mode, retina slices were placed in the imaging cham-ber such that outer segment tips were in close apposition to the cover glass that formed the chamber bottom, and such that the outer segments were parallel with the direction of light propaga-tion. The best aligned outer segments in the end-on mode were selected, as judged by minimal lateral image shift upon z scan-ning. Rods where the incisure patterns were clearly visible were then selected for mFRAP studies.
Lateral diffusion coefficients, Dlat, were obtained from mFRAPb data using a 3-D model of diffusion in cylindrical coordinates described previously (Calvert et al., 2010). The initial fast recov-ery phase was attributed to the well-characterized photophysical effect of triplet-state relaxation (Partikian et al., 1998; Verkman, 1999) and was not included in fittings.
The psf intensity profiles in 3-D were estimated from spatial fluo-rescence distribution patterns obtained from 3-D scans of 0.1-µm fluorescent microspheres (Polysciences, Inc.) as described previ-ously (Calvert et al., 2007). The fluorescence profiles in x,y and x,z were approximated by peak normalized Gaussian functions with x,y = 0.19 and x,z = 0.68 for the focused Ti–sapphire laser tuned to 820 nm (multiphoton excitation), and x,y = 0.16 and x,z = 0.61 for the 488-nm line of the argon ion laser.
An important consideration in mFRAP experiments is the potential of local heating of the specimen by the Ti–sapphire laser focused to the diffraction limit within the sample, caused mainly by water absorption in the near infrared. The heating of biological samples by diffraction-limited near infrared laser beams has been thoroughly studied in the field of optical laser trapping (Liu et al., 1995; Neuman et al., 1999; Peterman et al., 2003). Liu et al. (1995) directly measured the local heating within Chinese hamster ovary cells caused by near infrared trapping lasers focused to the diffraction limit and found that tempera-tures within the trapping beam rose linearly with laser power with a slope of 1.5°C/100 mW, and that the rise and fall times of the temperature changes upon onset and cessation of illumination were 10 ms. Based on this analysis, we estimate the local heating within the mpsf volume during the brightest and longest photo-conversion pulses in our experiments to be on the order of 0.15–0.3°C. Given the linear dependence of D on temperature in the Stokes–Einstein relation, this temperature change is not expected to appreciably impact our estimations of Rho-E/PAGFP Dlat in either mFRAPa or mFRAPb protocols.
Microdensitometry of rhodopsin in Xenopus rod outer segmentsApparatus development. To determine if rhodopsin density varied along the long axis of rod outer segments, we assembled a microdensitometer with submicrometer spatial resolution. A 75-W xenon arc lamp source (Oriel Instruments) was collimated
Figure 1. 2-D membrane diffusion model grid. White ellipse rep-resents the disc perimeter, and red lines indicate incisure posi-tions traced onto the grid from the image of a rod outer segment on which an mFRAP experiment was performed. The Gaussian intensity profile represents the initial distribution of photocon-verted molecules, and the flux at the disc perimeter and incisure grid points are set to zero. Diffusivities at all other grid points within the ellipse may be set arbitrarily; for this study, they were assumed to be uniform and equal to the empirically derived Dlat of Rho-EGFP (see Fig. 6).

252 Rhodopsin dynamics in live rod microcompartments
the diffraction-limited Gaussian intensity profile of the Ti–sapphire laser beam, lo cated on the model grid at a position appropriate for a specific experiment.
The diffusion equations. The general partial differential equation governing diffusion of substance c in 2-D in Cartesian coordinates is
∂∂
=∂∂
+∂∂
ct
Dc
xD
cyx y
2
2
2
2 , (1)
where t is time and Dx and Dy are the diffusion coefficients of c in the specified direction.
The initial condition is defined as
c x y t c( , , ) ,= =0 0 (2)
where c0 is the distribution of photoconverted molecules pro-duced by exposure to the Ti–sapphire laser. The no-flux bound-ary conditions at the ellipse and incisure coordinates (indicated by subscript zero) are written as
∂∂
=∂∂
=c x y
xc x y
y( , ) ( , )
.0 0 0 (3)
Solution of the diffusion equations. Solution of system Eqs. 1–3 was accomplished using the numerical method of lines (MOL) (Schiesser and Griffiths, 2009). Thus, a 2-D spatial grid was de-fined as described above, consisting of nx and ny positions with
within or along the surface of membranous discs in the outer segment of ciliary photoreceptors. The discs essentially consist of flattened bilayer membrane vesicles into which clefts known as incisures extend approximately radially from the periphery toward the disc center, thus segmenting the discs into discrete lobules (Rosenkranz, 1977; see Fig. 4). The geometry of the incisures and disc lobules varies significantly within a given disc membrane. We thus reasoned that to fully understand the dynam-ics of proteins intrinsic to the disc membranes, it was necessary to model diffusion using an approach that allowed no-flux bound-aries (Neumann) to be imposed at the positions of incisures and the radial limit of the disc in a pattern that is specific to the particular cell under investigation. To this end, we used numeri-cal approaches to solve the diffusion equations in two spatial dimensions where the initial and boundary conditions may be arbitrarily defined.
Coordinate system and initial and boundary conditions. The Cartesian coordinate system was used, as it appears to be the most convenient for the asymmetrical initial and boundary con-ditions in our study. We began with a 2-D x,y grid of length and grid point frequency appropriate for a Xenopus rod photorecep-tor disc. This required a grid that accommodated up to 8-µm di-ameter rods at a spatial resolution of 0.1 µm; thus, a typical grid measured 80 grid points to a side (Fig. 1). Onto this grid was layered an ellipse depicting the radial limit of the disc membrane and lines depicting the incisure patterns, both of which were traced directly from end-on photoreceptor images using a custom Matlab interface. Grid points that were intersected by the ellipse and incisure lines were treated as no-flux boundaries. Finally, an initial distribution of diffusing species was defined according to
Figure 2. Transgenic expression of Rho-EGFP. (A) Constructs used to generate transgenic frogs. The color-coded regions above correspond to the colors of the amino acids below (PAGFP is shown). E/PAGFP was placed on the C terminus of Xenopus rod opsin with a single amino acid linker (H). The eight C-terminal amino acids of bovine rhodopsin were added to the C terminus of the GFP sequences. (B) Images of dissociated rod outer segments show-ing variable expression patterns of Rho-GFP. (Left) Trans-illumination images acquired with 700-nm wavelength illumination. (Right) Epifluorescence images acquired with 488-nm excitation. (C) Fluo-rescence of the outer segments shown in B averaged radially and plotted against axial distance. The top panel in C shows the fluorescence distribution of the dimmer cell in the top panels of B.

Najafi et al. 253
mode appeared asynchronous between rods. The overall expression levels also varied significantly between rods, with fluorescence of some rods being undetectable while being very bright in others, and everything in between.
Lateral diffusion of Rho-PAGFP in disc membranes is directionally heterogeneousInitially, we examined Rho-PAGFP diffusion using the mFRAPa approach in the “side-on” imaging orientation (Calvert et al., 2007, 2010) (Fig. 3). We chose to use mFRAPa with a Rho-PAGFP fusion protein because the signal after photoactivation is 100-fold higher than on the nonphotoconverted background, which allows tracking of activated molecules over longer distances and times than can be achieved with traditional fluores-cence recovery after photobleach (FRAPb) of EGFP (Calvert et al., 2007). Rho-PAGFP in rod outer segments of live retinal slices was photoactivated with a brief ex-posure from the Ti–sapphire laser applied at the radial center of outer segments. We had shown previously that after photoactivation, unfused PAGFP diffused both ra-dially and axially, resulting in the relaxation of fluores-cence at the activation site to preactivation levels within a few seconds (Calvert et al., 2010), indicating that un-fused PAGFP was not retained on or between the disc membranes. In contrast, activated Rho-PAGFP diffused radially but did not diffuse axially, with the photocon-verted molecules being retained for tens of minutes at the axial position where the activation took place (Fig. 3). This demonstrated that virtually the entire fluo-rescence signal in Rho-E/PAGFP-expressing rods origi-nated from the fusion protein. Free GFP, if present, did not produce appreciable fluorescence signal.
Interestingly, the radial equilibration of Rho-PAGFP was inhomogeneous in the majority of the side-on ex-periments (Fig. 3, B and C). After photoactivation, the pattern of dispersing Rho-PAGFP mass tended to favor one radial direction over the other. In the example in Fig. 3 (B and C), the mass moved toward the upper boundary of the outer segment more quickly than to-ward the lower, as seen in the time course traces from regions 2 and 3 (Fig. 3 C). This suggested directional variability in rhodopsin’s diffusion across disc mem-brane surfaces and demonstrates the power of our high resolution mFRAP approach. The inhomogeneity in ra-dial rhodopsin diffusion was revealed because the small sub–cubic micrometer volume of our multiphoton pho-toconversion psf produced highly localized regions of photoactivated Rho-PAGFPs, which we could then track as they were moving out of the photoconversion zone. Such inhomogeneity would have been impossible to de-tect using classical densitometry and FRAPb approaches that required much larger bleach areas.
A likely explanation for the directional heterogeneity in rhodopsin diffusion is diffusion path tortuosity im-posed by disc membrane incisures, clefts in the disc
indices i and j, respectively. The derivatives in x and y were approximated with finite differences, which converts them into algebraic expressions and leaves only derivatives in t and thus ordinary differential equations (ODEs).
Derivatives in x. The MOL approximation of the spatial derivative of Eq. 1 at general grid point (i,j) is
∂∂
≈+ − + −2
2 2
1 2 1cx
Dc i j c i j c i j
xx( , ) ( , ) ( , )
,∆
(4a)
where x is the spatial increment in x. Similarly, the MOL approxi-mation in y is
∂∂
≈+ − + −2
2 2
1 2 1cy
Dc i j c i j c i j
yy( , ) ( , ) ( , )
,∆
(4b)
where y is the spatial increment in y.The approximation at the grid point neighboring the no-flux
boundaries in the positive x direction is
∂∂
≈ ⋅+ −
2
2 221c
xc i j c i j
x( , ) ( , )
,∆
(5)
where the flux between (i 1,j), a fictitious point outside of the boundary, and (i,j) is taken to be zero. Similarly, the approxima-tion at the grid point neighboring the no-flux boundaries in the negative x direction is
∂∂
≈ ⋅− −
2
2 221c
xc i j c i j
x( , ) ( , )
,∆
(6)
where the flux between (i + 1,j), a fictitious point outside of the boundary, and (i,j) is taken to be zero.Derivatives in y are similarly found.
Integration. The ODEs were integrated in time using the Matlab integrator ode45. Selection of Eqs. 4–6 (as well as those for the y dimension), which are used to calculate the flux between grid points, was determined through a series of conditional statements that referenced a matrix identifying the type and coordinates of the boundaries.
R E S U L T S
Rho-EGFP expression in rods is heterogeneousTo examine rhodopsin diffusion in live retinal slice preparations, fusion constructs encoding EGFP or PAGFP attached to the C terminus of Xenopus rod opsin were expressed in Xenopus rods under the control of the opsin promoter (Fig. 2 A). As noted previously (Moritz et al., 2001; Haeri and Knox, 2012), the fluorescence distribution along the axial dimension of the outer segments varied significantly within and between rods (Fig. 2 B). The fluorescence within a given outer seg-ment varied in two basic modes. A high frequency, low amplitude mode orbited a low frequency mode in which the expression varied from undetectable to bright peaks, thus indicating extensive variation in transgene expres-sion levels. The high frequency mode appeared to be synchronized between rods, whereas the low frequency

254 Rhodopsin dynamics in live rod microcompartments
patterns (Fig. 4). The likely explanation for this dim-ming is that the membrane geometry and/or structure of the incisures reduce access to, or exclude molecules from, the incisure region. Membranes associated with the hairpin terminal loops at disc incisures and rims ap-pear to largely exclude rhodopsin molecules (Roof and Heuser, 1982; Molday et al., 1987). Moreover, the de-creased local volume of the aqueous cytoplasm caused by the geometry of stacked terminal loops will reduce the numbers of soluble GFPs in the incisure regions, which may be enhanced by the steric volume exclusion effect (Najafi et al., 2012). Further evidence that the dim line patterns represent incisures comes from good agreement between the average number of dim lines detected in end-on fluorescence images per disc diam-eter (compare the average lobule arc length; Table 1) and the average lobule arc length found in electron microscopy (EM) images from frog rods, 1 µm (Corless et al., 1987; Tsukamoto, 1987).
The above physical features as well as the fact that in-cisures are well aligned over many micrometers along the axial extent of the outer segment (Fig. 4 C) are respon-sible for our ability to distinguish incisures and lobules in end-on confocal scans. Disc lobules formed by the
membranes that extend radially from the disc rim toward its center (Rosenkranz, 1977; Mariani, 1986; Corless et al., 1987; Tsukamoto, 1987). We next sought to examine the heterogeneity of rhodopsin diffusion in more detail and to identify the underlying mechanisms. However, the side-on imaging configuration did not allow a detailed examination of the radial diffusion along the disc surface, nor did it allow detailed examination of diffusion within or between disc membrane lobules formed by incisures. We thus turned to the high spatial resolution “end-on” imaging configuration to examine this possibility in more detail.
High resolution “end-on” imaging of rod outer segments expressing GFP reveals structural details of disc membranesWe have demonstrated previously that end-on imaging of live rod outer segments expressing EGFP or PAGFP in our confocal system showed linear patterns of fluo-rescence dimming projecting radially from the periph-ery of the outer segment toward the center that were reminiscent of disc incisures (Najafi et al., 2012). Here, we show that imaging of Rho-EGFP and Rho-PAGFP in live rods in the end-on configuration reveals similar
Figure 3. Rho-PAGFP diffusion in outer segments of intact rods is inhomogeneous in the radial direction and absent on the axial direction. (A; left) Confocal image of a Rho-PAGFP–express-ing rod taken at a single z plane before photoactivation. (Right) Confocal image of the same rod after several multiphoton photo-activation exposures at differ-ent positions along the outer segment. Each fluorescent line across the outer segment rep-resents a single multiphoton photo activation pulse of 0.1-ms duration and 20-mW average power from the Ti–sappire laser tuned to 820 nm. The times indi-cate the total time after activation for the indicated fluorescence line. Variation in fluorescence intensity was caused by the vari-able expression of Rho-PAGFP as shown in Fig. 2. (B) Time course of Rho-PAGFP relaxation after multiphoton photoactivation at the radial center of the outer segment. Note the asymmetrical radial diffusion. (C; right) Time course of fluorescence changes monitored by averaging the fluo-rescence signals in the indicated regions of interest (left), normal-ized to the preactivation fluores-cence in that region.

Najafi et al. 255
apparent cross section of its opening onto the greater disc surface. In all cases, the time courses of relax-ation exhibited multiple phases, with a fast relaxation phase followed by at least one slow phase (Fig. 5 B). To quantify the relaxation of Rho-PAGFP across the larger disc surface, we fitted the fluorescence relaxation time courses with a two-exponential decay function (Table 2). Approximately 80% of the fluorescence relaxation occurred quickly, within several seconds after the pho-toactivation exposure. The recovery kinetics of the slow phases varied significantly, with an average time constant of 140 s. Interestingly, the amplitude of the fast recovery phase correlated with the peripheral arc length of the lobule, and the time constant of the slow phase declined as a function of increasing width of the lobule–disc conduit, as determined from end-on images (Fig. 5, C and D).
Despite the overall time to equilibration of photoacti-vated Rho-PAGFP across the disc surface being generally very slow and variable, in all experiments Rho-PAGFP eventually equilibrated and thus did not indicate an im-mobile fraction of rhodopsins, as had been proposed pre-viously (Liebman and Entine, 1974; Poo and Cone, 1974; Wey et al., 1981; Drzymala et al., 1984; Govardovskii et al., 2009). Several basic mechanisms may explain these re-sults. It is possible that the population of rhodopsin is heterogeneous, with dramatically different diffusivities, as might be seen if rhodopsins formed the recently proposed large crystalline arrays on the disc surface (Fotiadis et al., 2003, 2004; Liang et al., 2003; Govardovskii et al., 2009). The effective viscosity of the disc membranes may be vari-able, as might be the case in regions of the disc where inci-sures converge and disc rim proteins act to organize the lipids (Molday et al., 1987), or caused by lipid raft domains
incisures are generally large enough to accommodate the first and second sigmas of the Gaussian beam pro-files of the single- and multiphoton photoconversion psfs in x–y, particularly at positions nearing the radial boundary of the cell where the incisure separa-tions are largest. Thus, in addition to allowing the inci-sures and disc lobules to be distinguished, the end-on imaging configuration allowed discrete multiphoton photoconversion of PAGFP and EGFP within lobule regions and, thus, examination of the diffusion of mol-ecules directly within cell signaling microcompartments of known geometries.
End-on mFRAPa of Rho-PAGFP in disc membrane lobules reveals temporal heterogeneity in rhodopsin diffusion across the disc surfaceTo examine the dynamics of rhodopsin diffusion across the full extent of the surface of disc membranes, we performed mFRAPa experiments with Rho-PAGFP–ex-pressing rods in the end-on imaging orientation (Fig. 5). Fluorescence relaxation of lobule-activated Rho-PAGFP indeed appeared to have significantly different time courses depending on the size of the lobule and the
Figure 4. End-on imaging of GFP-expressing rod outer segments allows incisure patterns to be visualized. (A) Images of retinal slices arranged with outer segments perpendicular to the cham-ber floor. (B) Averages of 10–20 488-nm confocal scans at single z planes 10–20 µm from the outer segment tip showing the incisure patterns in EGFP and Rho-EGFP– or Rho-PAGFP–express-ing rods. (C) EM images showing the incisure patterns in frog rods (dark lines in the enface transmission electron micrograph and parallel lines indicated by the yellow arrows in the freeze fracture image). The size of the psf at the first sigma of its Gaussian intensity profile is shown approximately to scale (red ellipse). Enface EM reprinted with permission from Experimental Eye Research (Tsukamoto, 1987). Bar, 5 µm. Freeze fracture image reprinted with permission from Journal of Comparative Neurology (Corless et al., 1987).
TA B L E 1
Mean incisure counts and disc diameters
Genotype Outer segment diameter
Number of incisures
Lobule arc length at disc periphery
n
µm µm
XOP-EGFP 6.92 ± 0.16 21.2 ± 0.42 1.03 ± 0.02 10
XOP-Rho-EGFP 6.48 ± 0.06 17.17 ± 0.31 1.19 ± 0.03 6
XOP-Rho-PAGFP 7.26 ± 0.33 18.29 ± 0.40 1.25 ± 0.04 7

256 Rhodopsin dynamics in live rod microcompartments
rhodopsins, the local relaxation of photoconverted molecules within an individual lobule would reflect the observed multiphasic recovery across the larger disc surface. We thus set out to examine the local dynamics of Rho-GFP within discrete disc lobule microcompart-ments. However, because of limitations in the acquisi-tion rate of the mFRAPa approach, which in our system is currently limited to 10 Hz, it was clear that up to 60% of the initial activated Rho-PAGFP fluorescence relaxation was not recorded (Fig. 5 B). It was thus neces-sary to examine intralobular rhodopsin diffusion using an alternative higher temporal resolution approach.
To achieve higher temporal resolution, we examined the mobility of Rho-EGFP at fixed positions within live
that have been suggested to impede the diffusion of trans-ducin (Wang et al., 2008). Finally, the variation in the slow phase could simply be caused by the length and narrow-ness of the diffusion path for rhodopsin imposed by the incisures, which would produce variable resistance to dif-fusion in much the same way that wires of diminishing diameters and increasing lengths produce increasing elec-trical resistance. We investigated these possibilities in the following experiments.
Rho-EGFP recovery in disc lobules after mFRAPb is rapid, monotonic, and completeWe reasoned that if the biphasic recovery of Rho-PAGFP were caused by a heterogeneous population of
Figure 5. Rho-PAGFP equili-bration across disc faces after photoactivation within discrete lobules is biphasic. (A) mFRAPa of Rho-PAGFP in two cells with different lobule geometries; cell 1 with wide and cell 2 with nar-row connections to the larger disc. (Top left) Averaged fluores-cence images before photoactiva-tion showing incisure patterns. (Top right) Images showing el-lipses and traced incisures used for modeling in Fig. 9. (Bottom) Time course images after photo-activation. (B) Time courses of fluorescence relaxation from the photoactivation sites, normalized to the projected fluorescence immediately after photoactiva-tion, F0. Red circles indicate F/F0 recorded from the images in A. (C) The amplitudes of the fast ex-ponential decay phases obtained from fitting data from 11 experi-ments (Table 2) plotted against lobule arc length show positive correlation, indicating that the transition between fast and slow phases occurs when diffusing Rho-PAGFP contacts the incisure boundary. (D) Plot of the time constants of the slow exponential decays from 11 experiments ver-sus the width of the conduit con-necting the lobule to the larger disc. The time constants fall with increasing conduit width, up to 0.75 µm, after which other fac-tors appear to limit the equilibra-tion rate.

Najafi et al. 257
These results indicate that local mFRAPb of Rho-EGFP largely recovers from a local pool of unbleached molecules within the lobule that received the bleach, and that rhodopsin densities did not significantly vary in the disc lobules despite large variation in the Rho-EGFP expression levels. Nevertheless, the discrepancy in Dlat between our results and those obtained previ-ously lead to the question of whether or not transgene expression of Rho-GFP has changed its mobility. It has been suggested that the degree of crowding of rho-dopsins in photoreceptor disc membranes significantly impacts its lateral mobility (Saxton, 1987; Saxton and Owicki, 1989; Calvert et al., 2001). Thus, it was impor-tant to examine whether or not the variation in Rho-GFP expression leads to variation in total rhodopsin density in the disc membranes.
Total rhodopsin levels in rod disc membranes vary little despite large variation in transgenic Rho-EGFP expressionTransgenic expression of Rho-EGFP, or any transgene expressed under the control of the XOP fragment used in this study, generally did not exceed 20% of the mil-limolar expression levels of endogenous rhodopsin (Fig. 6 C) (compare Moritz et al., 2001; Peet et al., 2004; Haeri and Knox, 2012). It thus seemed unlikely that transgene-expressed Rho-E/PAGFP would have a sig-nificant impact on disc membrane crowding. However, the high frequency component of Rho-EGFP fluores-cence variation had a peak to trough ratio of 1.3:3. Thus, there appeared to be a significant cyclical varia-tion in transgene Rho-EGFP expression, or in its deliv-ery to outer segment discs, that differed mechanistically from the variation in expression proposed previously to
rod disc lobules using multiphoton mFRAPb (Calvert et al., 2007), which on our system allowed up to 1-MHz data acquisition rates (Fig. 6). Rods expressing Rho-EGFP were scanned in the end-on orientation, lobules were visualized, and a lobule region was selected for bleaching (Fig. 6 A). Fluorescence was then recorded using multi-photon excitation with the Ti–sapphire laser tuned to 920 nm. Bleaching of Rho-EGFP was effected by rapid, 0.2–1-ms, increases of the Ti–sapphire beam power, after which recovery was recorded for up to 1 s. This cycle was repeated 20–30 times. The individual traces were normal-ized to the prebleach level and averaged (Fig. 6 B).
In all cases, recovery from bleach was rapid, with half-times of 100 ms. Importantly, the recoveries were gen-erally nearly complete, with a small reduction in the postbleach fluorescence that was consistent with the fraction of Rho-EGFP bleached within the lobule. This result shows that within a disc membrane lobule, all rhodopsins are mobile. Rho-EGFP diffusivities within the lobule were estimated using the 3-D cylinder diffu-sion model described previously (Calvert et al., 2010), where diffusion in the axial direction was zero and the cross-sectional area was matched to the lobule cross-sectional areas (Fig. 6 B). On average, the effective lat-eral diffusion coefficient, Dlat, for Rho-EGFP in lobule membranes was 0.130 ± 0.012 µm2s1, somewhat below previous estimates of 0.3–0.5 µm2s1 that were based on indirect low spatial resolution rhodopsin bleach–recovery experiments (Liebman and Entine, 1974; Poo and Cone, 1974; Wey et al., 1981; Govardovskii et al., 2009) (See Discussion).
Values of Dlat did not appear to correlate with the lob-ule area or the expression level of Rho-EGFP (Fig. 6 C).
TA B L E 2
Lobule geometries and exponential fitting parameters from Rho-PAGFP mFRAPa experiments1
Cell Lobule area Lobule width Conduit width Outer segment diameter
a b c tau 1 tau 2
µm2 µm µm µm
1 4.702 1.72 1.00 7.66 0.87 0.19 0.035 0.247 21.01
2 5.493 1.93 0.14 8.69 0.82 0.21 0.003 2.703 526.32
3 3.671 1.55 1.07 6.51 0.72 0.19 0.035 0.953 57.14
4 3.923 1.19 2.10 6.62 0.71 0.14 0.029 0.641 40.00
5 2.829 1.48 0.90 4.98 0.78 0.16 0.052 0.292 28.57
6 4.403 1.37 0.88 7.51 0.85 0.12 0.020 0.358 70.62
7 2.101 1.75 0.80 6.89 0.79 0.20 0.027 1.064 80.65
8 3.654 1.54 0.33 7.18 0.75 0.12 0.070 0.785 209.64
9 4.212 1.47 1.54 6.63 0.76 0.20 0.066 1.188 52.08
10 4.783 0.98 0.14 7.09 0.64 0.29 0.030 2.392 354.74
11 1.463 1.58 0.54 6.50 0.85 0.13 0.055 0.368 78.74
mean 3.75 1.505 0.858 6.93 0.776 0.178 0.038 1.00 138.14
SEM 0.36 0.079 0.178 0.28 0.022 0.015 0.006 0.25 48.94
mFRAPa recoveries were fitted with the following equation: F t
Fa
ttau
bt
tauc
( )= ⋅ −
+ ⋅ −
+
0 1 2exp exp ,
where F is the fluorescence at the photoactivation site, and F0 is the fluorescence at that site immediately after photoactivation.

258 Rhodopsin dynamics in live rod microcompartments
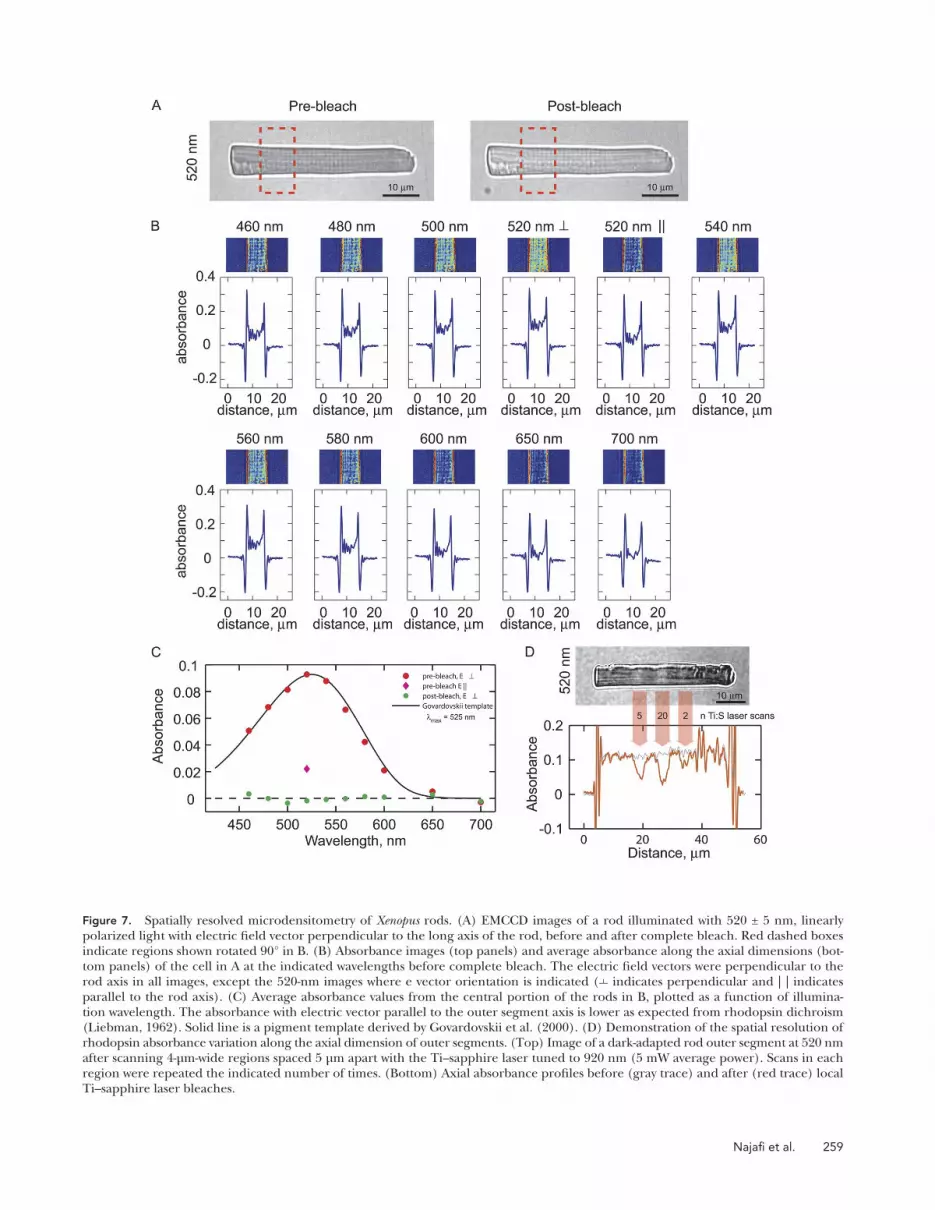
methods). We tested the system by obtaining images of rod outer segments isolated from dark-adapted animals using various illumination wavelengths before and after complete bleaching of the chromophore (Fig. 7 A). The optical density of dark-adapted outer segments var-ied as a function of the illumination wavelength and the orientation of the electric field vector relative to the outer segment axial dimension (Fig. 7, B and C). On average, the maximum density was recorded at 520 nm, with the electric field vector perpendicular to the outer segment axis. This density corresponded to a specific absorbance (absorbance/outer segment diameter) at 520 nm of 11.9 ± 0.6 × 103 µm1 (n = 15), in good agreement with previously reported values for wild-type Xenopus rods (Solessio et al., 2009), thus demonstrating that the Rho-E/PAGFP transgene did not impact total rhodopsin expression. Rotating the polarization angle 90° reduced the density 3.53 ± 0.07–fold (n = 5; Fig. 7 C).
be caused by the XOP promoter (Moritz et al., 2001) to explain the low frequency component. A major ques-tion for the present work was whether or not this appar-ently intrinsic variation in Rho-EGFP levels in the outer segment was indicative of variation in total rhodopsin surface density in disc membranes that might impact Rho-E/PAGFP lateral mobility.
To determine if the high frequency Rho-EGFP fluo-rescence pattern traced variation in endogenous rho-dopsin levels in disc membranes, we examined the optical density of outer segments along their axial dimensions by spatially resolved microdensitometry (Figs. 7 and 8). This was accomplished by assembling an optical system on our confocal/multiphoton microscope that con-sisted of a monochromatic polarized illuminator di-rected into the sample chamber on our microscope stage via a low numerical aperture condenser, and a high sensitivity EMCCD camera (see Materials and
Figure 6. Recovery of Rho-EGFP within discrete disc lobules after multiphoton photobleaching is monotonic and rapid. (A) Aver-aged end-on fluorescence im-ages (top panels) are shown, and the traced disc periphery and incisure patterns with mFRAPb site are indicated by a red dot (bottom panels). (B) mFRAPb recovery curves. The recovery curves were fitted with a cylinder diffusion model (red line) de-scribed previously (Calvert et al., 2010). Green line is the data model difference. (C) Dlat plot-ted as a function of expression level and lobule area. The Pear-son correlation coefficients (R) indicated poor correlation for both comparisons.
Najafi et al. 259
Figure 7. Spatially resolved microdensitometry of Xenopus rods. (A) EMCCD images of a rod illuminated with 520 ± 5 nm, linearly polarized light with electric field vector perpendicular to the long axis of the rod, before and after complete bleach. Red dashed boxes indicate regions shown rotated 90° in B. (B) Absorbance images (top panels) and average absorbance along the axial dimensions (bot-tom panels) of the cell in A at the indicated wavelengths before complete bleach. The electric field vectors were perpendicular to the rod axis in all images, except the 520-nm images where e vector orientation is indicated ( indicates perpendicular and | | indicates parallel to the rod axis). (C) Average absorbance values from the central portion of the rods in B, plotted as a function of illumina-tion wavelength. The absorbance with electric vector parallel to the outer segment axis is lower as expected from rhodopsin dichroism (Liebman, 1962). Solid line is a pigment template derived by Govardovskii et al. (2000). (D) Demonstration of the spatial resolution of rhodopsin absorbance variation along the axial dimension of outer segments. (Top) Image of a dark-adapted rod outer segment at 520 nm after scanning 4-µm-wide regions spaced 5 µm apart with the Ti–sapphire laser tuned to 920 nm (5 mW average power). Scans in each region were repeated the indicated number of times. (Bottom) Axial absorbance profiles before (gray trace) and after (red trace) local Ti–sapphire laser bleaches.

260 Rhodopsin dynamics in live rod microcompartments
biochemistry, and physiology, amphibian photorecep-tors are ideal for exploring the effects of cell structure—protein interactions on cell activities at high spatial resolution using optical approaches (Calvert et al., 2010; Najafi et al., 2012). Here we show, using a combi-nation of transgenically expressed high signal to noise photo-switchable fluorescent protein probes, live cell confocal and multiphoton imaging, and quantitative analyses, that we are able to examine the dynamics of the GPCR rhodopsin within discrete membrane lobule signaling microcompartments of known geometry in live photoreceptors. Thus, this approach has allowed, for the first time, direct examination of the impact of signaling compartment geometry on GPCR mobility.
High resolution mFRAPa of Rho-PAGFP reveals rhodopsin diffusion across outer segment disc membranes to be dramatically heterogeneousOur high resolution approach to measuring rhodopsin mobility revealed heterogeneity in its diffusivity that was
The average optical density as a function of illumination wavelength was well fitted with a pigment nomogram (Govardovskii et al., 2000), with average maximum ab-sorbance at a wavelength of 522 nm (Fig. 7 C), thus demonstrating the predominance of opsin with the vita-min A2 chromophore bound and, strictly speaking, the predominance of porphyropsin in the Xenopus rods ex-amined in this study.
To determine the spatial resolving power of our mi-crodensitometer, we took advantage of rhodopsin’s ability to photobleach upon multiphoton absorption of near infrared light to bleach lines across the diameter of outer segments using the Ti–sapphire laser tuned to 920 nm (Fig. 7 D). Rectangular scans 4 µm wide, spaced 5 µm along the outer segment length, were applied to bleach rhodopsins in local outer segment regions. Sequential scans in a given region led to progressive local bleaching of rhodopsin, the amplitude of which scaled linearly with the logarithm of the number of scans at a particular laser power, as would be expected for progressive linear bleaching. Yet rhodopsin density in regions of the outer segment between the bleached regions did not change. This result clearly demon-strates, first, that we are able to detect variations of 5–10% or more in optical density at a spatial frequency of 10 µm along the outer segment, and second, that multiphoton scans of the outer segment confine bleach-ing to the scan region, leaving neighboring regions virtually unbleached.
Despite the up to threefold variation in fluorescence levels along the length of outer segments, axial varia-tion in optical density to 520-nm illumination was not detectable (Fig. 8). Thus, the variation in Rho-EGFP fluorescence in outer segments did not appear to re-flect variation in endogenous rhodopsin densities in disc membranes of greater than 5–10%. The lack of correlation between rho-EGFP expression levels and estimated lateral diffusivities (Fig. 6), together with the results in Fig. 8, shows that either total rhodopsin is not varying in parallel with Rho-EGFP, or that the variations are small and had little impact on rhodopsin mobility.
D I S C U S S I O N
Quantifying the dynamics of protein transport within spatially constrained subcellular microcompartments of live functioning cells is essential for a complete under-standing of cell signaling mechanisms and their regula-tion. Particularly important to understand is how cell and protein structures influence protein dynamics, dis-tributions, and signaling. This goal has been hampered by the fact that most cell signaling compartments are smaller than can be resolved using extant live cell–imaging approaches. We have recently demonstrated that, owing to their large size and well-characterized ultrastructure,
Figure 8. Axial rhodopsin absorbance is invariant despite large variation in Rho-EGFP levels. (A) A 520-nm transmission image (top) and a 488-nm epifluorescence image (bottom) of an outer segment from a Rho-EGFP–expressing rod. (B) A 520-nm axial absorbance profile. (C) Axial fluorescence profile.

Najafi et al. 261
Disc membrane microcompartment architecture is the origin of heterogeneous rhodopsin diffusionThe heterogeneous diffusion of rhodopsin across disc membranes may be explained by three basic mecha-nisms. The first possibility that has recently gained sig-nificant recognition is GPCR “corralling” (Kusumi et al., 2005, 2011). Early studies of rhodopsin diffusion sug-gested that recoveries after photobleaching were up to 40% lower than expected (Wey et al., 1981; Drzymala et al., 1984; Govardovskii et al., 2009), and the unrecov-ered components were generally treated as immobile fractions. Drzymala et al. (1984) and Govardovskii et al. (2009) suggested that the incomplete recoveries were caused by disc lobules that were physically separated from the larger disc membranes. Alternatively, it was re-cently proposed from atomic force microscopy studies that large oligomers of what appear to be hundreds to thousands of rhodopsins form in disc membranes (Fotiadis et al., 2003, 2004; Liang et al., 2003) that were later proposed as a possible origin of the immobile phase (Govardovskii et al., 2009). A second possibility is that heterogeneity is simply caused by tortuosity in rho-dopsin diffusion paths imposed by the disc incisures. Finally, the heterogeneity may be caused by variable resistance to diffusion into or out of lobules caused by the variable width of the lobule connections to the larger disc. Our high resolution mFRAP approach allowed us to differentiate between these possibilities.
Two lines of evidence argue against corralling of rho-dopsins. First, we showed that mFRAPa of Rho-PAGFP within a defined lobule always resulted in its equilibra-tion across the larger disc surface, albeit with variable rates. Second, we showed that mFRAPb of Rho-EGFP within individual lobules yielded fast monotonic re-coveries that were complete to within 95–99% of the fluorescence level before bleaching. The small 1–5% reduction in fluorescence after bleaching was account-able as the fraction of Rho-EGFP depleted by the psf bleaching profile and thus did not represent an immobile population of rhodopsins. These results show that within disc lobules of Xenopus rods rho-dopsins appear to be monodispersed with diffusion coefficients of 0.13 µm2s1 and rule out rhodopsin confinement to lobules by physical separation from the discs or by the existence of large arrays of rela-tively immobile rhodopsin as explanations for the heterogeneity of rhodopsin diffusion.
The elimination of rhodopsin corralling within disc lobules leaves tortuosity of diffusion paths and frictional resistance of the lobule–disc conduit as the most prob-able mechanisms for heterogeneity of rhodopsin diffu-sion. It is well known from EM studies of amphibian rod outer segments that their discs contain multiple inci-sures that segment them into lobules of 1 µm arc length at the periphery (Corless et al., 1987; Tsukamoto, 1987). These studies also show that the depth into the
not previously detected using lower resolution ap-proaches and thus demonstrates the importance of examining protein behavior within identified subcellu-lar signaling microcompartments of live cells. We were able to achieve high resolution imaging by taking advan-tage of the multiphoton FRAPa method we described previously (Calvert et al., 2007) and well-characterized geometrical features of the of amphibian rod outer seg-ments. The volume of PAGFP-tagged molecules that were converted to the 488-nm excitable form in our mul-tiphoton psf was 1 attoliter (1e-18 liter) and typically produced an 100-fold increase in local fluorescence (see Calvert et al., 2007). This volume spanned 15 to 20 discs along the axial dimension of the outer segments in the end-on imaging orientation and was easily accommo-dated by single incisure-bounded disc membrane lobules in the radial dimension. Because the incisures are well aligned axially over many micrometers (Roof and Heuser, 1982; Corless and Schneider, 1987; Corless et al., 1987; Tsukamoto, 1987), our approach effectively averaged the diffusion across several discs with essentially identical in-cisures and lobule geometries.
In contrast, previous studies used two low spatial resolution approaches to probe rhodopsin diffusion in isolated rod outer segments. The first method relied on measuring the intrinsic optical density of rhodop-sin using microdensitometry (Liebman and Entine, 1974; Poo and Cone, 1974; Gupta and Williams, 1990; Govardovskii et al., 2009). Typically, rhodopsins in roughly half of a dark-adapted cylindrical rod outer segment were fully bleached, and the exchange of bleached and unbleached molecules between the two halves was monitored side-on over time. This geometry represents a five orders of magnitude larger perturba-tion volume than in our approach and encompassed many disc lobules of unknown geometry. The second method used fluorescent tags, either of all the outer segment proteins (Wey et al., 1981) or transgenically expressed Rho-EGFP (Wang et al., 2008), that were bleached using single-photon excitation from weakly focused lasers applied to the outer segments in the side-on imaging orientation. The bleaching volume in these studies was smaller than in the densitometry approaches; however, because of the side-on imaging orientation and the geometry of the bleaching beam, they also represent recoveries from bleaches that spanned many lobules of undefined geometry. Therefore, these low resolution approaches invariably represented the interlobule diffusion of rhodopsins averaged over many lobules of heterogeneous shape. Moreover, the recovery signals in both of these approaches were in the best case twofold changes in absorbance or fluorescence. Collectively, these limitations would not have permit-ted the detection of the heterogeneity of rhodopsin diffusion revealed by our high resolution/high signal to noise approach.

262 Rhodopsin dynamics in live rod microcompartments
width increases (Fig. 5, C and D, and Table 2), supports the notion that the biphasic behavior of rhodopsin diffu-sion directly stems from its interaction with the incisure boundaries and the resistance of the conduit. Qualita-tively, the simplest explanation for the variable biphasic relaxation of Rho-PAGFP in our study is, therefore, a combination of diffusion path tortuosity and slowed flux between the disc lobule and the larger disc caused by lobule–disc conduits of variable geometry.
Modeling molecular diffusion in disc membranes quantitatively demonstrates that microcompartment geometry alone is sufficient to explain heterogeneity in rhodopsin dynamicsTo quantitatively determine if diffusion path tortuos-ity and lobule-to-disc conduit resistance can explain the observed rhodopsin equilibration rates in mFRAPa
disc that the incisures extend and the degree to which they converge vary greatly, as do the widths of the lob-ule connections to the larger disc. The lobule–disc con-duit width may be as narrow as 100 nm and as wide as 1.3 µm or more. Moreover, these EMs show that in some cases incisures that converge to within 90–100 nm may remain at this close distance for more than a mi-crometer (Corless and Schneider, 1987). Thus, the inci-sures produce lobule conduits of various lengths and widths that, based on Fick’s first law, are predicted to act as variable resisters to rhodopsin flux.
Indeed, the correlation of the amplitude of the first exponential decay found from the two-exponential fit-ting of the mFRAPa relaxation curves with the arc length of the lobule in which the experiment was performed, as well as the observation that the time constant of the sec-ond exponential in the fitting falls as the lobule conduit
Figure 9. A disc membrane diffusion model shows that microcompartment geometries are sufficient to explain heterogeneous Rho-PAGFP relaxation. (A) Model time course images based on the disc geometries of cells 1 and 2 of Fig. 5, with and without incisures. (B) Comparison of model prediction of the Rho-PAGFP relaxation time course with the observed relaxation replotted from Fig. 5.

Najafi et al. 263
began with the pioneering studies in amphibian photo-receptors of Poo and Cone (1974) and Liebman and Entine (1974). These studies, as well as later studies (Wey et al., 1981; Drzymala et al., 1984; Williams, 1984; Gupta and Williams, 1990; Wang et al., 2008; Govardovskii et al., 2009), produced a range of estimates for the lateral diffusion coefficient of rhodopsin of 0.1–0.6 µm2s1. Our estimate of Dlat = 0.130 ± 0.012 µm2s1 is in reason-able agreement, although on the lower end of the range. There are several explanations that may account for the slightly lower estimate for Dlat in our study. Previous stud-ies have suggested that the changes in the packing den-sity of rhodopsin in disc membranes may lead to changes in the effective Dlat (Saxton, 1987; Calvert et al., 2001). Thus, introduction of a transgene that expresses Rho-E/PAGFP in addition to endogenous rhodopsin might have led to increased crowding of the disc membranes. However, our demonstration that changes in fluores-cence of expressed Rho-EGFP did not correlate with changes in outer segment optical density at 520 nm, cou-pled with the lack of correlation between Dlat and Rho-EGFP expression levels, argues against this possibility.
A caveat to our approach is that the transgenically ex-pressed Rho-E/PAGFP may not behave identically to endogenous rhodopsins. The E/PAGFP label on the C terminus of rhodopsin in our study projected into the interdiscal space. It is thus possible that the GFP tag ex-erted an increased viscous drag on the rhodopsins or interacted with peripheral membrane proteins in the interdiscal space, and thus decreased its mobility and apparent diffusion coefficient. To our knowledge, there is no satisfactory theory for the diffusion of molecules that span the interface between two media with differ-ent viscosities. The only treatment of this case found in the literature deals with probes, such as gold particles, that are much larger than the molecule of interest dif-fusing in the membrane (Broday, 2002), which is not relevant to the case of GFP-labeled rhodopsins, a probe and protein of approximately the same size. However, an estimation of the impact of the GFP label on the mo-bility of rhodopsin may be made. Borrowing from the approach of Lee et al. (1993), the frictional coefficient of Rho-E/PAGFP in the Einstein relation f D= k TB Rho-GFP/ is the total of the frictional coefficient of GFP in the cytosolic milieu, fc, and that of rhodopsin in the disc membrane, fm, i.e., f f ftot c m= + . Thus, invoking Stokes’ law, the ratio of the apparent diffusion coefficients of native rhodopsin and the Rho-E/PAGFP fusion protein may be approximated as
DD
aa
Rho
Rho-EGFP
c EGFP
m Rho
≈ +1ηη
,
where c and m are the cytosolic and membrane vis-cosities, and aEGFP and aRho are the approximate radii of GFP and rhodopsin, respectively. Needless to say, this is
experiments, we generated a disc membrane diffusion model that includes the specific geometries of the inci-sures and the lobules they form (Fig. 9 and Theory). The model allows arbitrary definition of disc, incisure, and lobule geometry relevant to specific experimental cases (Fig. 9 A). The average diffusion coefficient of Rho-EGFP measured in mFRAPb experiments (Fig. 6) was used in the model calculations and was assumed to be uniform across the disc surface. Flux at the incisure and disc rim boundaries was set to zero, i.e., ∂ ∂ =c t/ 0 . With these constraints, the model reasonably predicted the mFRAPa results from the two cells with vastly differ-ing lobule geometries displayed in Fig. 5 (Fig. 9 B).
A caveat to this analysis is that the width of the lobule–disc conduits was uncertain in lobules where incisures were highly convergent because they were smaller than could be reliably resolved by our imaging system (com-pare Fig. 5, cell 2). Thus, in the case of the model of cell 2 (Fig. 9, model of cell 2), we simply adjusted the geom-etry of the lobule–disc connection to see if we could find a reasonable set of parameters that fitted the data. A lobule–disc connection of 100-nm width and 0.5-µm long produced a satisfactory fitting of the en-tire relaxation time course. These results show that the diffusion of rhodopsin between disc lobules can be rea-sonably accounted for by the geometry of the lobules and incisures alone.
However, factors other than path narrowing may be involved in the slowing of rhodopsin diffusion, includ-ing the possibility that the viscosity of the disc membrane within and immediately adjacent to the incisures is higher than that of membranes more distant from these structures. The disc membranes make hairpin turns at the incisures and the disc rims as they fold back upon themselves, forming structures known as terminal loops (Corless et al., 1987). These loops contain the proteins rom-1 and peripherin, which apparently stabilize the end loop structure (Papermaster et al., 1978; Molday et al., 1987; Arikawa et al., 1992; Bascom et al., 1992; Moritz and Molday, 1996). Importantly, the terminal loops ap-pear to exclude rhodopsin (Molday et al., 1987) and reduce access of other peripheral membrane proteins (Roof and Heuser, 1982). Collectively, these results sug-gest that the membranes at the incisures have different characteristics from the bulk disc membranes, including the possibility that the lipids are less mobile. Thus, the mobility of rhodopsins found near incisures could be lower than in the bulk membrane and, in cases where the lobule–disc conduits are very narrow, the flux be-tween a lobule and the bulk disc may be reduced beyond that expected for narrowing of the diffusion path alone.
Rhodopsin Dlat quantified within defined disc lobules agrees with previous macroscopic estimationsEstimations of rhodopsin lateral diffusion coefficients in photoreceptor disc membranes have a long history that

264 Rhodopsin dynamics in live rod microcompartments
a threefold reduction in Dlat, the radius of the rhodop-sin oligomer would have to be 50-fold larger than the radius of monomer rhodopsin. Thus, the number of rhodopsins in an average oligomer would be 2,500, and the resulting raft of rhodopsins would have a radius of 175 nm. Although it seems unlikely, we do not know with certainty that these large oligomers of rho-dopsin do not form. Additionally, light adaptation may have led to the movement of arrestin into the outer seg-ment compartment and to its binding with bleach rho-dopsin. This may have increased the abovementioned collisional encounter rate of the GFP tag with transduc-tion proteins potentially leading to slower diffusion. Thus, it will be important to examine the diffusion of rhodopsins in the dark state in live photoreceptors, for which we are currently developing a strategy.
Finally, other factors that may have influenced esti-mations of rhodopsin Dlat include the temperature at which experiments were performed, accuracy in esti-mating the bleaching beam geometry, differences in signal to noise ratios in the recording setups, species variations in rhodopsin diffusivities, and uncertainties in the contribution of rhodopsin metaproduct decay in densitometry experiments (Govardovskii et al., 2009). Collectively, it would not be unexpected that these un-certainties would lead to variations in the estimates of Dlat between laboratories of an order of magnitude.
Concluding remarksWe have, for the first time, examined the dynamics of a GPCR within the spatially constrained cell signaling microcompartments in which it normally resides. The high spatial resolution and high signal to noise approaches we developed allowed us to resolve long-standing questions about the diffusion of rhodopsin in photoreceptor disc membranes and revealed pre-viously unknown heterogeneity in the diffusivity of rhodopsin in different disc regions. Finally, we have developed a quantitative model for molecular diffu-sion within identified subcellular microcompartments of arbitrary geom etry that allows quantitative assess-ment of protein dynamics within and between micro-compartments. These novel tools will allow the direct examination of the dynamics, interactions, and regu-lation of signaling cascade components within identi-fied subcellular microcompartments.
We thank Dr. Edward N. Pugh Jr. for many insightful discussions and Nycole Maza, Tina Gill, Maria Goralski, and Julia Bedy for technical assistance.
This work was supported by the National Institutes of Health (grant R01EY018421 to P.D. Calvert and grant R01EY012975 to B.E. Knox). P.D. Calvert is the recipient of a Career Develop-ment Award from Research to Prevent Blindness and a grant from the Karl Kirchgessner Foundation. SUNY Upstate Depart-ment of Ophthalmology is the recipient of an unrestricted grant from Research to Prevent Blindness and is supported by Lions district 20-Y1.
an approximation because the Navier–Stokes equations are unsolvable for a cylinder in a 2-D medium, the so-called Stokes’ paradox (Saffman and Delbrück, 1975). Based on m of 3 P (Poo and Cone, 1974) and c of 0.05 P based on our previous measurements of the diffusion of GFP in the interlobule microcompartment (Najafi et al., 2012), the DRho/DRho-EGFP ratio is expected to be 1.02, a value insufficient to explain the approxi-mately threefold difference between our estimate and previous estimates of Dlat. This analysis does not rule out the possibility that the GFP tag slows diffusion by intro-ducing collisional encounters with other transduction proteins such as transducin.
Another possibility is that the low spatial resolution of previous methods led to overestimation of rhodopsin dif-fusivities. For example, to account for the low resolution of their method, Poo and Cone (1974) empirically found correction factors for the impact of incisures on their es-timate of Dlat using an ingenious, albeit limited, method of comparing heat conduction in metal discs with and without incisure-like clefts cut into them. For frog rods, the resulting correction factor was 2.7, which was used to adjust their estimate of Dlat from a value of 0.13 µm2s1 to a value of 0.35 µm2s1. This correction factor was used again in later reports that used fluorescent labeling of outer segment membrane proteins (Wey et al., 1981) or Rho-GFP fusions (Wang et al., 2008) to arrive at similar corrected estimates of Dlat of 0.3 µm2s1 and 0.4 µm2s1, respectively. Govardovskii et al. (2009) independently found a correction factor of 2.8 using a numerical model of disc membrane diffusion to arrive at Dlat of 0.33 µm2s1 for frog rods. These analyses, however, relied on estimates of half-times of recovery and thus are highly dependent on how the experimenters chose the time at which complete equilibration was attained, which was difficult to judge from the low resolution methods. In-deed, in the experiments shown in Wey et al. (1981), it does not appear that complete equilibration of bleached and unbleached molecules was attained over the time frame of their recordings. These limitations may have led to underestimates of the recovery t1/2s and thus overesti-mates of rhodopsin Dlat.
It is important to note that our experiments, as well as all previous experiments on rhodopsin diffusion, were necessarily performed on bleached rhodopsins in light-adapted photorecpetors. It has been shown previously that fully bleached rhodopsins may form aggregates in membranes (Chen and Hubbell, 1973), although per-haps smaller than the large crystalline arrays proposed by Fotiadis et al. (2003). Particle diffusion in mem-branes, however, is highly insensitive to changes in molecular size. According to the membrane diffusion model of Saffman and Delbrück (1975), and consider-ing the approximate viscosity of rod disc membranes at 20°C of 3 Poise (Cone, 1972) and that of the aqueous cytoplasm of 5 cPoise (Najafi et al., 2012), to achieve

Najafi et al. 265
Govardovskii, V.I., D.A. Korenyak, S.A. Shukolyukov, and L.V. Zueva. 2009. Lateral diffusion of rhodopsin in photoreceptor membrane: a reappraisal. Mol. Vis. 15:1717–1729.
Gupta, B.D., and T.P. Williams. 1990. Lateral diffusion of visual pig-ments in toad (Bufo marinus) rods and in catfish (Ictalurus punc-tatus) cones. J. Physiol. 430:483–496.
Haeri, M., and B.E. Knox. 2012. Rhodopsin mutant P23H destabi-lizes rod photoreceptor disk membranes. PLoS ONE. 7:e30101. http://dx.doi.org/10.1371/journal.pone.0030101
Knox, B.E., C. Schlueter, B.M. Sanger, C.B. Green, and J.C. Besharse. 1998. Transgene expression in Xenopus rods. FEBS Lett. 423:117–121. http://dx.doi.org/10.1016/S0014-5793(98)00018-0
Kroll, K.L., and E. Amaya. 1996. Transgenic Xenopus embryos from sperm nuclear transplantations reveal FGF signaling requirements during gastrulation. Development. 122:3173–3183.
Kusumi, A., C. Nakada, K. Ritchie, K. Murase, K. Suzuki, H. Murakoshi, R.S. Kasai, J. Kondo, and T. Fujiwara. 2005. Paradigm shift of the plasma membrane concept from the two-dimensional continuum fluid to the partitioned fluid: high-speed single-molecule tracking of membrane molecules. Annu. Rev. Biophys. Biomol. Struct. 34:351–378. http://dx.doi.org/10.1146/annurev.biophys.34.040204.144637
Kusumi, A., K.G. Suzuki, R.S. Kasai, K. Ritchie, and T.K. Fujiwara. 2011. Hierarchical mesoscale domain organization of the plasma membrane. Trends Biochem. Sci. 36:604–615. http://dx.doi.org/10.1016/j.tibs.2011.08.001
Lee, G.M., F. Zhang, A. Ishihara, C.L. McNeil, and K.A. Jacobson. 1993. Unconfined lateral diffusion and an estimate of pericellular matrix viscosity revealed by measuring the mobility of gold-tagged lipids. J. Cell Biol. 120:25–35. http://dx.doi.org/10.1083/jcb.120.1.25
Liang, Y., D. Fotiadis, S. Filipek, D.A. Saperstein, K. Palczewski, and A. Engel. 2003. Organization of the G protein-coupled re-ceptors rhodopsin and opsin in native membranes. J. Biol. Chem. 278:21655–21662. http://dx.doi.org/10.1074/jbc.M302536200
Liebman, P.A. 1962. In situ microspectrophotometric studies on the pigments of single retinal rods. Biophys. J. 2:161–178. http://dx.doi.org/10.1016/S0006-3495(62)86847-7
Liebman, P.A., and G. Entine. 1974. Lateral diffusion of visual pig-ment in photorecptor disk membranes. Science. 185:457–459. http://dx.doi.org/10.1126/science.185.4149.457
Liu, Y., D.K. Cheng, G.J. Sonek, M.W. Berns, C.F. Chapman, and B.J. Tromberg. 1995. Evidence for localized cell heating induced by infrared optical tweezers. Biophys. J. 68:2137–2144. http://dx.doi.org/10.1016/S0006-3495(95)80396-6
Mani, S.S., S. Batni, L. Whitaker, S. Chen, G. Engbretson, and B.E. Knox. 2001. Xenopus rhodopsin promoter. Identification of im-mediate upstream sequences necessary for high level, rod-specific transcription. J. Biol. Chem. 276:36557–36565. http://dx.doi.org/10.1074/jbc.M101685200
Mariani, A.P. 1986. Photoreceptors of the larval tiger salamander ret-ina. Proc. R. Soc. Lond. B Biol. Sci. 227:483–492. http://dx.doi.org/10.1098/rspb.1986.0035
Molday, R.S., D. Hicks, and L. Molday. 1987. Peripherin. A rim-specific membrane protein of rod outer segment discs. Invest. Ophthalmol. Vis. Sci. 28:50–61.
Moritz, O.L., and R.S. Molday. 1996. Molecular cloning, membrane topology, and localization of bovine rom-1 in rod and cone photo-receptor cells. Invest. Ophthalmol. Vis. Sci. 37:352–362.
Moritz, O.L., B.M. Tam, D.S. Papermaster, and T. Nakayama. 2001. A functional rhodopsin-green fluorescent protein fusion protein localizes correctly in transgenic Xenopus laevis retinal rods and is expressed in a time-dependent pattern. J. Biol. Chem. 276:28242–28251. http://dx.doi.org/10.1074/jbc.M101476200
Najafi, M., N.A. Maza, and P.D. Calvert. 2012. Steric volume ex-clusion sets soluble protein concentrations in photoreceptor
Angus C. Nairn served as editor.
Submitted: 13 April 2012Accepted: 26 July 2012
R E F E R E N C E SArikawa, K., L.L. Molday, R.S. Molday, and D.S. Williams. 1992.
Localization of peripherin/rds in the disk membranes of cone and rod photoreceptors: relationship to disk membrane mor-phogenesis and retinal degeneration. J. Cell Biol. 116:659–667. http://dx.doi.org/10.1083/jcb.116.3.659
Bascom, R.A., S. Manara, L. Collins, R.S. Molday, V.I. Kalnins, and R.R. McInnes. 1992. Cloning of the cDNA for a novel photore-ceptor membrane protein (rom-1) identifies a disk rim protein family implicated in human retinopathies. Neuron. 8:1171–1184. http://dx.doi.org/10.1016/0896-6273(92)90137-3
Broday, D.M. 2002. Motion of nanobeads proximate to plasma membranes during single particle tracking. Bull. Math. Biol. 64:531–563. http://dx.doi.org/10.1006/bulm.2002.0289
Calvert, P.D., V.I. Govardovskii, N. Krasnoperova, R.E. Anderson, J. Lem, and C.L. Makino. 2001. Membrane protein diffusion sets the speed of rod phototransduction. Nature. 411:90–94. http://dx.doi.org/10.1038/35075083
Calvert, P.D., J.A. Peet, A. Bragin, W.E. Schiesser, and E.N. Pugh Jr. 2007. Fluorescence relaxation in 3D from diffraction-limited sources of PAGFP or sinks of EGFP created by multiphoton pho-toconversion. J. Microsc. 225:49–71. http://dx.doi.org/10.1111/j.1365-2818.2007.01715.x
Calvert, P.D., W.E. Schiesser, and E.N. Pugh Jr. 2010. Diffusion of a soluble protein, photoactivatable GFP, through a sensory cilium. J. Gen. Physiol. 135:173–196. http://dx.doi.org/10.1085/jgp.200910322
Chen, Y.S., and W.L. Hubbell. 1973. Temperature- and light-depen-dent structural changes in rhodopsin-lipid membranes. Exp. Eye Res. 17:517–532. http://dx.doi.org/10.1016/0014-4835(73)90082-1
Cone, R.A. 1972. Rotational diffusion of rhodopsin in the visual receptor membrane. Nat. New Biol. 236:39–43.
Corless, J.M., and T.G. Schneider. 1987. Patterns of interdisk con-nections within the lamellar domains of retinal rod outer seg-ment disks: observations relevant to the axial propagation of incisures. Exp. Eye Res. 45:883–905. http://dx.doi.org/10.1016/S0014-4835(87)80104-5
Corless, J.M., R.D. Fetter, O.B. Zampighi, M.J. Costello, and D.L. Wall-Buford. 1987. Structural features of the terminal loop re-gion of frog retinal rod outer segment disk membranes: II. Organization of the terminal loop complex. J. Comp. Neurol. 257:9–23. http://dx.doi.org/10.1002/cne.902570103
Dix, J.A., and A.S. Verkman. 2008. Crowding effects on diffusion in solutions and cells. Annu Rev Biophys. 37:247–263. http://dx.doi.org/10.1146/annurev.biophys.37.032807.125824
Drzymala, R.E., H.L. Weiner, C.A. Dearry, and P.A. Liebman. 1984. A barrier to lateral diffusion of porphyropsin in Necturus rod outer segment disks. Biophys. J. 45:683–692. http://dx.doi.org/10.1016/S0006-3495(84)84210-1
Fotiadis, D., Y. Liang, S. Filipek, D.A. Saperstein, A. Engel, and K. Palczewski. 2003. Atomic-force microscopy: Rhodopsin dimers in native disc membranes. Nature. 421:127–128. http://dx.doi.org/10.1038/421127a
Fotiadis, D., Y. Liang, S. Filipek, D.A. Saperstein, A. Engel, and K. Palczewski. 2004. The G protein-coupled receptor rhodopsin in the native membrane. FEBS Lett. 564:281–288. http://dx.doi.org/10.1016/S0014-5793(04)00194-2
Govardovskii, V.I., N. Fyhrquist, T. Reuter, D.G. Kuzmin, and K. Donner. 2000. In search of the visual pigment template. Vis. Neurosci. 17:509–528. http://dx.doi.org/10.1017/S0952523800174036

266 Rhodopsin dynamics in live rod microcompartments
Saffman, P.G., and M. Delbrück. 1975. Brownian motion in biological membranes. Proc. Natl. Acad. Sci. USA. 72:3111–3113. http://dx.doi.org/10.1073/pnas.72.8.3111
Saxton, M.J. 1987. Lateral diffusion in an archipelago. The effect of mobile obstacles. Biophys. J. 52:989–997. http://dx.doi.org/10.1016/S0006-3495(87)83291-5
Saxton, M.J., and J.C. Owicki. 1989. Concentration effects on reactions in membranes: rhodopsin and transducin. Biochim. Biophys. Acta. 979:27–34. http://dx.doi.org/10.1016/0005-2736(89)90519-1
Schiesser, W.E., and G.W. Griffiths. 2009. A Compendium of Partial Differential Equation Models: Method of Lines Analysis with MATLAB. Cambridge University Press, New York. 476 pp.
Solessio, E., Y. Umino, D.A. Cameron, E. Loew, G.A. Engbretson, B.E. Knox, and R.B. Barlow. 2009. Light responses in rods of vita-min A-deprived Xenopus. Invest. Ophthalmol. Vis. Sci. 50:4477–4486. http://dx.doi.org/10.1167/iovs.08-3186
Tsukamoto, Y. 1987. The number, depth and elongation of disc incisures in the retinal rod of Rana catesbeiana. Exp. Eye Res. 45:105–116. http://dx.doi.org/10.1016/S0014-4835(87)80082-9
Verkman, A.S. 1999. Green fluorescent protein as a probe to study intracellular solute diffusion. Methods Enzymol. 302:250–264. http://dx.doi.org/10.1016/S0076-6879(99)02024-8
Wald, G. 1968. Molecular basis of visual excitation. Science. 162:230–239. http://dx.doi.org/10.1126/science.162.3850.230
Wang, Q., X. Zhang, L. Zhang, F. He, G. Zhang, M. Jamrich, and T.G. Wensel. 2008. Activation-dependent hindrance of photore-ceptor G protein diffusion by lipid microdomains. J. Biol. Chem. 283:30015–30024. http://dx.doi.org/10.1074/jbc.M803953200
Wey, C.L., R.A. Cone, and M.A. Edidin. 1981. Lateral diffusion of rhodopsin in photoreceptor cells measured by fluorescence pho-tobleaching and recovery. Biophys. J. 33:225–232. http://dx.doi.org/10.1016/S0006-3495(81)84883-7
Williams, T.P. 1984. Some properties of old and new rhodopsin in single Bufo rods. J. Gen. Physiol. 83:841–852. http://dx.doi.org/10.1085/jgp.83.6.841
Zhou, H.X., G. Rivas, and A.P. Minton. 2008. Macromolecular crowding and confinement: biochemical, biophysical, and po-tential physiological consequences. Annu Rev Biophys. 37:375–397. http://dx.doi.org/10.1146/annurev.biophys.37.032807 .125817
Zipfel, W.R., R.M. Williams, and W.W. Webb. 2003. Nonlinear magic: multiphoton microscopy in the biosciences. Nat. Biotechnol. 21:1369–1377. http://dx.doi.org/10.1038/nbt899
sensory cilia. Proc. Natl. Acad. Sci. USA. 109:203–208. http://dx.doi.org/10.1073/pnas.1115109109
Neuman, K.C., E.H. Chadd, G.F. Liou, K. Bergman, and S.M. Block. 1999. Characterization of photodamage to Escherichia coli in op-tical traps. Biophys. J. 77:2856–2863. http://dx.doi.org/10.1016/S0006-3495(99)77117-1
Papermaster, D.S., B.G. Schneider, M.A. Zorn, and J.P. Kraehenbuhl. 1978. Immunocytochemical localization of a large intrinsic mem-brane protein to the incisures and margins of frog rod outer seg-ment disks. J. Cell Biol. 78:415–425. http://dx.doi.org/10.1083/jcb.78.2.415
Partikian, A., B. Olveczky, R. Swaminathan, Y. Li, and A.S. Verkman. 1998. Rapid diffusion of green fluorescent protein in the mi-tochondrial matrix. J. Cell Biol. 140:821–829. http://dx.doi.org/10.1083/jcb.140.4.821
Patterson, G.H., and J. Lippincott-Schwartz. 2002. A photoactivat-able GFP for selective photolabeling of proteins and cells. Science. 297:1873–1877. http://dx.doi.org/10.1126/science.1074952
Peet, J.A., A. Bragin, P.D. Calvert, S.S. Nikonov, S. Mani, X. Zhao, J.C. Besharse, E.A. Pierce, B.E. Knox, and E.N. Pugh Jr. 2004. Quantification of the cytoplasmic spaces of living cells with EGFP reveals arrestin-EGFP to be in disequilibrium in dark adapted rod photoreceptors. J. Cell Sci. 117:3049–3059. http://dx.doi.org/10.1242/jcs.01167
Peterman, E.J., F. Gittes, and C.F. Schmidt. 2003. Laser-induced heat-ing in optical traps. Biophys. J. 84:1308–1316. http://dx.doi.org/10.1016/S0006-3495(03)74946-7
Poo, M., and R.A. Cone. 1974. Lateral diffusion of rhodopsin in the photoreceptor membrane. Nature. 247:438–441. http://dx.doi.org/10.1038/247438a0
Pugh, E.N., Jr., and T.D. Lamb. 2000. Phototransduction in verte-brate rods and cones: molecular mechanisms of amplification, recovery and light adaptation. In Hanbook of Biological Physics. Volume 3. D.G. Stavenga, W.J. de Grip, and E.N. Pugh Jr., editors. Elsevier Science, Amsterdam. 183–255.
Roof, D.J., and J.E. Heuser. 1982. Surfaces of rod photoreceptor disk membranes: integral membrane components. J. Cell Biol. 95:487–500. http://dx.doi.org/10.1083/jcb.95.2.487
Rosenbaum, D.M., S.G.F. Rasmussen, and B.K. Kobilka. 2009. The structure and function of G-protein-coupled receptors. Nature. 459:356–363. http://dx.doi.org/10.1038/nature08144
Rosenkranz, J. 1977. New aspects of the ultrastructure of frog rod outer segments. Int. Rev. Cytol. 50:25–158. http://dx.doi.org/10.1016/S0074-7696(08)60098-4


