Embed Size (px)
Citation preview

Improving IMRT-plan quality with MLC leaf position refinementpost plan optimization
Ying NiuDepartment of Physics, The George Washington University, Washington, DC 20052 andDepartment of Radiation Oncology, University of Maryland School of Medicine, Baltimore, Maryland 21201
Guowei ZhangRadiation Medicine, Georgetown University Hospital, Washington, DC 20007
Barry L. Berman and William C. ParkeDepartment of Physics, The George Washington University, Washington, DC 20052
Byongyong Yi and Cedric X. Yua)
Department of Radiation Oncology, University of Maryland School of Medicine, Baltimore, Maryland 21201
(Received 29 February 2012; revised 29 June 2012; accepted for publication 2 July 2012;published 27 July 2012)
Purpose: In intensity-modulated radiation therapy (IMRT) planning, reducing the pencil-beam sizemay lead to a significant improvement in dose conformity, but also increase the time needed forthe dose calculation and plan optimization. The authors develop and evaluate a postoptimizationrefinement (POpR) method, which makes fine adjustments to the multileaf collimator (MLC) leafpositions after plan optimization, enhancing the spatial precision and improving the plan qualitywithout a significant impact on the computational burden.Methods: The authors’ POpR method is implemented using a commercial treatment planning sys-tem based on direct aperture optimization. After an IMRT plan is optimized using pencil beams withregular pencil-beam step size, a greedy search is conducted by looping through all of the involvedMLC leaves to see if moving the MLC leaf in or out by half of a pencil-beam step size will improvethe objective function value. The half-sized pencil beams, which are used for updating dose distri-bution in the greedy search, are derived from the existing full-sized pencil beams without need forfurther pencil-beam dose calculations. A benchmark phantom case and a head-and-neck (HN) caseare studied for testing the authors’ POpR method.Results: Using a benchmark phantom and a HN case, the authors have verified that their POpRmethod can be an efficient technique in the IMRT planning process. Effectiveness of POpR is con-firmed by noting significant improvements in objective function values. Dosimetric benefits of POpRare comparable to those of using a finer pencil-beam size from the optimization start, but with far lesscomputation and time.Conclusions: The POpR is a feasible and practical method to significantly improve IMRT-plan qual-ity without compromising the planning efficiency. © 2012 American Association of Physicists inMedicine. [http://dx.doi.org/10.1118/1.4737518]
Key words: IMRT, plan-quality refinement
I. INTRODUCTIONIntensity-modulated radiation therapy (IMRT) has been rou-tinely used to shape the high dose volume to a tumor whileminimizing exposure to surrounding critical structures.1 Inthe past decade, many researchers have devoted themselvesto improve the IMRT planning to achieve better treatmentquality. Evidently, any room for improving an IMRT plan de-pends strongly on the degrees of freedom provided by the ma-chines and the related facilities.2 Multileaf collimator (MLC)is a critical piece of the equipment which makes an effectivedelivery of intensity modulated beams possible. During thelast two decades, MLCs have been continually refined by lin-ear accelerator vendors to accommodate the development ofIMRT. Newer MLCs are designed with narrower leaf widthsand fewer movement restrictions to allow more accurate andversatile field shaping.3, 4
In IMRT treatment planning, a virtual grid is applied todivide the beam’s eye view (BEV) of the planning target vol-ume (PTV) into a series of small rectangular “bixels,” eachtraversed by an imaginary pencil beam of radiation. For planoptimization and dose calculation, the doses deposited in thepatient by each of the small “pencil” beams defined by thebixels are precalculated and stored. With precalculated pencilbeams, the composite dose distribution from all the involvedbixels, as well as for any modifications such as changing theweight of a bixel or adding/removing a bixel, can be quicklycomputed. For IMRT planning by either optimizing the bixelweights or directly optimizing aperture shapes and weights,the pencil-beam calculation is normally the first step. As such,the grid that defines the bixels determines the resolution ofthe final intensity map and the boundary roughness of theapertures.
5118 Med. Phys. 39 (8), August 2012 © 2012 Am. Assoc. Phys. Med. 51180094-2405/2012/39(8)/5118/9/$30.00
5119 Niu et al.: Improving IMRT-plan quality with MLC leaf position refinement 5119
The bixel size sets an artificial constraint in plan optimiza-tion by forcing MLC leaves, which can move continuously,to move in discrete steps. Using a high-performance dose-calculation engine to calculate pencil beams, a finer bixel sizeduring optimization might allow the treatment planning sys-tem to achieve a better plan quality.5 The effect on plan qual-ity caused by the pencil-beam step size, defined as the bixeldimension in the direction of MLC-leaf travel, was studiedby Zhang et al.6 They found that the final objective functionvalue could be decreased significantly when smaller pencil-beam step size was used, leading to significant improve-ments in dose conformity. These improvements are more pro-nounced when the structures to be spared are close to the tar-get and a high dose gradient is desired.
Reducing the pencil-beam step size increases the pencil-beam number. Consequently, the pencil-beam calculationtime, as well as the required disk space and computer mem-ory, correspondingly increases. Also, the optimization timeincreases because the search space is enlarged. Even withthe latest computers, the added computational burden can bepractically prohibitive.
An effective method of improving plan quality and plan-ning efficiency was the coarse-to-fine scheme for the plan-ning of intensity-modulated arc therapy (IMAT).7, 8 This strat-egy starts from a suboptimal IMAT plan which is achieved bystratifying the fluence profiles. The MLC leaf positions aresubsequently refined using an efficient downhill search.
Here, we introduce a method to refine the MLC leafpositions after an initial plan optimization with a coarsepencil-beam step size. After the optimization, the artificialconstraint on the pencil-beam step size is released, and MLCleaves are allowed to move to positions between adjacentgridlines to reduce effectively the step size. We find that,by a special refinement technique to determine new MLCpositions after the plan optimization, a significantly betterplan quality is achieved with little impact on the overallcomputational burden.
II. METHODS AND MATERIALS
II.A. Direct aperture optimization (DAO) andsimulation environment
Our refinement method, described in Sec. II.B, is tested un-der the scheme of direct aperture optimization (DAO) (Ref. 9)although it can be applied to other plan optimization schemes.In DAO, the weight of apertures and the positions of MLCleaves are variables in the optimization process. Other treat-ment parameters are predetermined, such as the orientationof beams, the number of apertures per beam, etc. Comparedwith the scheme of fluence-map optimization, DAO does notneed a leaf-sequencer to convert the optimized intensity mapto deliverable MLC apertures. The positions of MLC leavesas well as the aperture weightings are directly optimized byan iterative search algorithm.
Prowess PantherTM (Prowess Inc., Concord, CA), a com-mercial DAO-based inverse planning system employing thesimulated annealing (SA) search algorithm, is used in this
study. During the optimization process, a tentative change isaccepted when the objective value decreases. If the objec-tive value increases, the change is accepted with a probabilitydetermined by a SA cooling schedule, thereby allowing theoptimization to escape from being trapped in a local but notglobal minimum. To terminate the SA process, a user can setthe maximal tolerated number of the consecutive unacceptedchanges. Alternatively, the user can set the maximal numberof accepted iterations, or manually cease the search when theintended objectives are met.
For a change of MLC-leaf position during iteration, a ran-dom travel distance is sampled from a Gaussian distribution.The sampled travel distance is always rounded to be an inte-gral multiple of pencil-beam step size so that the leaf end is ata bixel grid line. As the accepted SA iterations increasing, thevariance of sampling decreases and tends toward unity.7 Thus,at a late stage of SA process, the tentative travel distances ofMLC leaves are often less than one pencil-beam step size,causing no leaf position changes. However, if the use of pen-cil beams with a finer step size is allowed at this juncture, afurther refining search is enabled, and better aperture shapescan be formed.
In this study, the Prowess PantherTM system is performedon a 2.21 GHz PC with dual core AMD CPU. Dose dis-tributions are calculated using the convolution/superpositionmethod with voxels of size 3 × 3 × 3 mm3. The pencil-beam dose distributions are individually calculated for eachposition in the fluence map, accounting for inhomogeneousmedia. The Elekta MLC (with 1 cm wide leaves) is commis-sioned to the planning system.
II.B. Postoptimization refinement (POpR)of leaf positions
The goal of this study is to see if it is possible to refine theleaf positions of all the beam apertures with minimal increaseof computational burden after the SA process. The scheme wedevised is to take a plan optimized with a coarse pencil-beamstep size, and add a postoptimization refinement (POpR) pro-cess by relocating MLC leaves. We aim to see if allowing theleaves to move either forward or backward by half a step sizewould improve the plan quality, and if it would, how the re-sultant plan of POpR compares with the plan optimized usinga smaller pencil-beam step size from the start of SA process.In this study, the objective function and penalties used in thePOpR are kept the same as those used in the SA process.
The key for this scheme to work is being able to judgequickly the plan quality based on the resulting dose distri-butions. To evaluate the dose distribution after a MLC leafmakes a move of half step size, we implemented a method toapproximiate the dose distriubtions of a half pencil beam. Theapproximation method is described in Sec. II.C.
II.C. Computing the dose distributionsof half pencil beams
The refinement by using half pencil beams happens at theaperture’s boundary [Fig. 1]. Therefore, the number of needed
Medical Physics, Vol. 39, No. 8, August 2012

5120 Niu et al.: Improving IMRT-plan quality with MLC leaf position refinement 5120
FIG. 1. The illustration of BEV and the grid for the division of pecil beams.An OAR overlaps with the PTV. If the pencil beams with half step size areprovided, a better aperture shape (i.e., the dashed boundary) can be formedbased on the optimized configuration of SA (i.e., the solid boudary). Onlyhalf pecil beams at the boundary of the aperture need to be calculated forrefinement.
half pencil beams for POpR is much less than the number ofpencil beams would be required for the SA optimization usingthe half step size from the start.
To calculate these POpR-involved half pencil beams, it isnot unreasonable to assume that the half pencil beam traversesthe same anatomy as the whole pencil beam. As shown inFig. 2(a), if we further ignore the slight difference in diver-gence between the two abutting half pencil beams that makesthe full pencil beam, the dose distributions of them will havethe same functional form but just have a lateral shift from eachother.
With these assumptions, we can quickly derive the dosedistribution of the half pencil beam from the full-sized pencilwith a shift-and-subtract operation. As shown in Fig. 2, wesum two abutting full-sized pencil beams [Fig. 2(b)], whichare prepared before optimization. Then, we shift the summeddose distribution to the right with a distance of the half pencil
FIG. 2. (a) The single pencil beam with a step size of | �S| can be split into twoabutting half pencil beams which can be approximately transformed by shift-ing | �S/2| reciprocally. (b)–(d) The dose distribution of the half pencil beamwith a step size of | �S/2| can be obtained by a shift-and-subtract operation.
FIG. 3. The dose profiles of pencil beams on the beam-axis plane at differentdepth d: 5 mm step size (squares) vs 2.5 mm step size (asterisks). The halfpencil beams are calculated by using the prepared full-sized pencil beamswith the dose distribution in a homogeneous water phantom. The voxels forstoring dose are 3 × 3 × 3 mm3 in size, and the maximum value of all voxelsis normalized to 1.
beam step size [Fig. 2(c)]. The dose distribution of the halfpencil beam can be easily obtained as the difference betweenthese two broad fields [i.e., the positive part in Fig. 2(d)]. Thisshift-and-subtract operation can be performed with negligiblecomputer time. In principle, the pencil beam of an arbitrarystep size can be generated by shifting with the distance ofcorresponding step size.
Figure 3 gives the dose distribution resulting from a shift-and-subtraction operation for two half pencil beams with 2.5mm step size versus the dose distribution of a full-sized pencilbeam of 5 mm step size. The generated half pencil-beam dose
Medical Physics, Vol. 39, No. 8, August 2012

5121 Niu et al.: Improving IMRT-plan quality with MLC leaf position refinement 5121
profiles not only represent accurately the central line of pri-mary fluences and the depth-dose variation, but also predictthe penumbra region correctly. The correct penumbra is veryimportant for the refinement process at the aperture boundary,where the alignment of dose gradient is highly critical to thetreatment plan.
II.D. Greedy search
A greedy search is implemented for the POpR. One by one,each MLC leaf is moved forward or backward by half of theoriginal step size. The corresponding dose and the objectivefunction value are evaluated after each move. For each move,if the objective value decreases, the new position will be ac-cepted, whereas the move in the opposite direction will not betested. If the objective value increases (i.e., the plan worsens),the movement of half a pencil-beam step size in the oppositedirection will be tested. If moving the leaf either forward orbackward does not improve the plan quality, the leaf positionis not changed. After one greedy search is completed for allinvolved MLC leaves, a new aperture is obtained. The leavesthat are not moved will be tested again in the next iteration.No moveable MLC leaf exists after a few iterations. Duringthis greedy-search process, the mechanical constraints are al-ways checked to ensure deliverability.
II.E. Method of testing the POpR
A benchmark phantom case is studied for testing the ef-fectiveness and efficiency of the POpR method. In addition, ahead-and-neck (HN) case is studied to verify benefits of thePOpR method in clinical planning practice. Multiple planningtrials with different pencil-beam step sizes are conducted forboth phantom and patient studies. Here, we use an abbrevi-ation POpR-x to denote a trial of SA-optimization processusing x mm step size from the start, which is followed by agreedy-search process with tentative moves by half of originalpencil-beam step size (i.e., x/2 mm). An abbreviation Op-xdenotes a trial of SA optimization using x mm step size fromthe start without an extra greedy-search refinement.
II.E.1. Benchmark phantom study
An IMRT benchmark phantom is used for the simulationstudy. A cross section of the phantom is shown in Fig. 4, inwhich a C-shaped PTV partially wraps around a circular or-gan of risk (OAR). The planning goal is to deliver 100% ofprescription dose to 95% of the PTV. No more than 15% of theOAR should receive more than 60% of the prescribed dose. Tocontrol hot spots, the maximum dose within the PTV shouldbe no more than 120%, and no more than 10% of healthytissue volume (HTV) should receive more than 100% of theprescribed dose.
Various pencil-beam step sizes are initialized for the plan-ning trials. Two trials (i.e., POpR-10 and POpR-5) for testingthe method are conducted. The trials (i.e., Op-10, Op-5, andOp-2) with only SA-optimization processes are conductedfor performance comparison. Because fractional-millimeterpencil-beam step size is not allowed in Prowess PantherTM
FIG. 4. The C-shaped benchmark phantom. The phantom is a cylinder, 10cm in diameter and 10 cm in length. The OAR is a central cylinder, 1.6 cm indiameter and 8 cm in length. The PTV, which has the same length with OAR,is a 2.5 cm wide half-annulus that surrounds the OAR over 180◦. The rest ofvolume, which does not belong to PTV and OAR, is defined as HTV.
system, 2 mm of pencil-beam step size is selected instead of2.5 mm. For each planning trial of Op-x or POpR-x, the sameset of constraints and objectives is used. For each trial, seven6 MV photon beams equally spaced in gantry angle are ini-tialized for DAO with seven apertures per beam direction.
II.E.2. HN case study
An oropharyngeal cancer case is used to test our POpRmethod in clinical practice. As shown in Fig. 5, the PTV in-cluding a primary target is of a concave shape, which partiallywraps around the spinal cord, the brain stem, and bilateralneck nodes. The PTV is 545.9 cm3, and the length is 20.7cm in the superior-inferior (SI) direction extending from thecochleae to the clavicles. Besides the brainstem and the cer-vical spine, the OARs also include the parotid glands on bothsides, which overlap with PTV by 7.4% on the right side and5.6% on the left.
FIG. 5. The PTV and OARs delineations on a set of planning CT for the firstcourse of IMRT treatment. (a) A transverse plane presents PTV, parotids, andspinal cord. A 0.3 cm margin is added to the cord. (b) A 3D view of all ofinvolved volumes and organs. A skin volume is defined to have 0.3 cm depthfrom the patient surface, which is not shown here.
Medical Physics, Vol. 39, No. 8, August 2012

5122 Niu et al.: Improving IMRT-plan quality with MLC leaf position refinement 5122
TABLE I. Dose specifications at University of Maryland Medical Center forthe HN case.
Target coverage Acceptance criteria
PTV = 59.4 Gy V95 � 95% PTV volumeV105 � 5% PTV volume
Normal tissue constraintSpinal cord Dmax < 42 GyBrain stem Dmax < 45 GyCochlea Dmax < 42 GyParotid glands Dmean � 25 Gy
aNote: V95 = the volume receives at least 95% of the PTV prescription dose; Dmax
= the maximal dose; Dmean = the mean dose.
Plans are optimized to meet the dose specification shownin Table I. The planning goal is to deliver 59.4 Gy in 33 frac-tions to the entire PTV. The doses to the spinal cord and brainstem are limited to 42 Gy–45 Gy, respectively, so as to leav-ing room for subsequent boost to the primary target. The closeproximity of the PTV to the skin and the overlaps betweenthe PTV and the parotid glands create a challenging case withconflicting objectives.
Initial pencil-beam step sizes of 10 mm and 5 mm areused, as these are common choices in clinical settings. TwoSA-optimization trials (i.e., Op-10 and Op-5) and two refine-ment trials (i.e., POpR-10 and POpR-5) are conducted usingthe same set of constraints and objectives based on the dosespecification. Seven 6 MV photon beams are used for eachtrial. The beam angles are 0o, 51o, 103o, 160o, 200o, 255o,305o, which are chosen to best target the PTV volume. Due tothe MLC limitation on the maximal travel distance across thecenterline, the fields are split when BEVs are large. The totalnumber of initialized apertures is 154 (i.e., 22 for each beam).
III. RESULTS
III.A. The benchmark phantom study results
III.A.1. Efficiency and effectiveness of POpR
Table II shows the comparisons of the pencil-beam prepar-ing time, the SA search time, the successful SA iterations, andthe objective values. We easily find better plan qualities re-sulting from finer pencil-beam step sizes, which accords with
the conclusions of Zhang et al.6 To ensure valid comparisonof efficiency and effectiveness, multiple runs were conductedto ensure that the cooling schedule is adequate and all trialsconverge to the minimum.
As shown in Table II, about twice the optimization timeis spent (e.g., 5–6 h for Op-5 vs 2–3 h for Op-10) to obtainan improvement in objective value using finer pencil-beamstep size rather than a coarse one. However, the time neededfor our refinement (POpR), including the time to generate thehalf-sized pencil beams, is only 1–3 min, which is negligi-ble compared with the time consumed in the SA-optimizationprocesses. The refinement, for which 1200–1500 leaves areinvolved, results in around 35% of the leaves being relocatedduring the fine adjustment. The entire time of refinement isdominated by the time needed for generating half-sized pen-cil beams.
Compared with the Op-10 trial, the refinement process ofthe POpR-10 trial significantly lowers the average objectivevalues by 57% of the unit objective value. In the POpR-5 trial, the average objective values decrease by 21% com-pared to the Op-5 trial. Comparing the POpR trials usingthe coarse step sizes with the Op-x trials using finer pencil-beam step sizes (i.e., POpR-10 vs Op-5 and POpR-5 vs Op-2), we only find 10%–15% differences in average objectivevalues.
III.A.2. Dosimetric benefits from POpR
For each Op-x trial, the best plan from one of the ten runsis selected to show dosimetric results. The selected Op-x planis used to generate a refined POpR-x plan. Figure 6 shows iso-dose curves for the Op-10 plan and the corresponding POpR-10 plan. The comparisons of dose volume histograms (DVHs)are presented in Fig. 7. Detailed dose analysis of all Op-x andPOpR-x plans is shown in Table III. All the dose distribu-tions for comparison are scaled to ensure that 95% of PTVreceives 100% prescription dose. (For geometrically challeng-ing cases in planning, the PTV coverage will be insufficientif the prescription dose is set to D50 of PTV as recommendedby ICRU.10 In this paper, the prescribing is contingent on thespecific clinical requirement.)
The POpR makes better homogeneity of PTV dose, whichis found in Table III based on the decrease of near-maximum(D2) dose and the increase of the near-minimum (D98)
TABLE II. The performances of planning trials with or without a greed-search refinement.
Pencil-beam Optimization Successful SA Objective valuesTrial calculating time time (h) iterations (10 runs)
Op-10a 15 min 2–3 ∼30 000 1.87 ± 0.06POpR-10b 15 min 2–3 ∼30 000 1.30 ± 0.06Op-5 30 min 5–6 ∼50 000 1.20 ± 0.06c
POpR-5 30 min 5–6 ∼50 000 0.99 ± 0.05Op-2 1 h 15 min 8–10 ∼100 000 0.84 ± 0.05
aOp-10 denotes the SA-optimization trial without a refinement process using 10 mm pencil-beam step size.bPOpR-10 denotes the post-optimization refinement trial with 10 mm initial pencil-beam step size.cAmong all the runs of Op-5, the run with minimal objective value is chosen to be the unit objective value to normalizethe objective values of all the runs of the different trials of POpR-x and Op-x.
Medical Physics, Vol. 39, No. 8, August 2012

5123 Niu et al.: Improving IMRT-plan quality with MLC leaf position refinement 5123
FIG. 6. Isodose lines of the central transverse slices for the plans of Op-10 and POpR-10. The isodose lines from inner to outer positions represent 116%,100%, 80%, 60%, 40%, and 30% of the prescription dose.
dose after refinement. (To avoid the reporting inaccuracydue to a single computation point, the near-maximum andnear-minimum doses, which are recommended by ICRU,10
are used as indicators instead of the maximal and minimaldose.) The homogeneity index (HI), which is defined as(D2-D98)/D50, is also presented in Table III, indicating theimprovement of PTV coverage after refinement. Comparedwith the Op-x plans, the POpR-x plans perform better incontrolling hot spots of PTV, which is observed through theshrinking area of 116% isodose curve, as well as the valuesof V116 and V120. The improvements in OAR sparing due tothe refinement is indicated by the changes of dose gradient,which can be found when comparing the isodose lines ofplans in Fig. 6. The refining benefits for OAR sparing are alsoshown as the decreases of Dmean, Dnear-max, and V60. Afterrefining, the hot area of HTV becomes smaller accordingto the move of 100% isodose curve and the decrease ofV100. The dosimetric performances of POpR-10 and POpR-5even reach or approach the performances of Op-5 and Op-2,respectively, which are demonstrated by the HI of PTV, themean dose to the OAR, etc.
III.B. The HN case study
III.B.1. Efficiency of POpR in the HN case
The planning times and objective values of the SA-optimization trials and the greedy-search refinement trials areshown in Table IV. The objective values decrease on aver-age by 17% when we refine the pencil-beam step size from10 mm to 5 mm, resulting in nearly equal objective values asobtained using 5 mm step size from the start. Refining plansfrom 5 mm step size to 2.5 mm step size yields 4% averagedecrease in the objective values. Only 5 min are needed forthe greedy-search process of each POpR-x trials. Comparedwith the performances of the Op-x trials at the late stage ofSA processes (i.e., <1% decrease in objective value during15 min), the performances of POpR-x trials show an advan-tage in saving planning time.
III.B.2. Dosimetric benefits from POpR in the HN case
Table V shows the dosimetric performances of the Op-xplans and the corresponding POpR-x plans with various plan-
FIG. 7. The DVH comparison of the resulted plans of Op-10 (dotted-dashed lines), POpR-10 (solid lines), and Op-5 (dashed lines). The plan of POpR-10 is arefined result based on the optimized segments of Op-10.
Medical Physics, Vol. 39, No. 8, August 2012

5124 Niu et al.: Improving IMRT-plan quality with MLC leaf position refinement 5124
TABLE III. Dosimetric data analysis of the optimized plans of Op-10, Op-5,Op-2 and the refined plans of POpR-10, POpR-5 for the phantom study.
Op-10 POpR-10 Op-5 POpR-5 Op-2
PTV Dnear-max (%) 125.9 119.7 120.1 119.5 118.3Dnear-min (%) 90.3 97.0 92.8 94.4 96.0
HI 0.314 0.204 0.243 0.225 0.200V116 (%) 26.0 11.2 17.8 16.1 10.7V120 (%) 9.8 2.3 1.5 2.3 0.2
OAR Dmean (%) 45.7 43.6 42.9 41.3 41.1Dnear-max (%) 75.4 74.2 74.3 69.3 68.4
V60 (%) 19.9 17.0 16.0 12.8 10.4HTV V100 (%) 12.1 7.6 7.3 6.5 6.3
aNote: Dmean = the mean dose; Dnear-max = D2, the minimal dose received by 2%of most irradiated volume; Dnear-min = D98, the minimal dose received by 98%of most irradiated volume; HI = (D2–D98)/D50. All of doses are presented as thepercentage of PTV prescription dose.
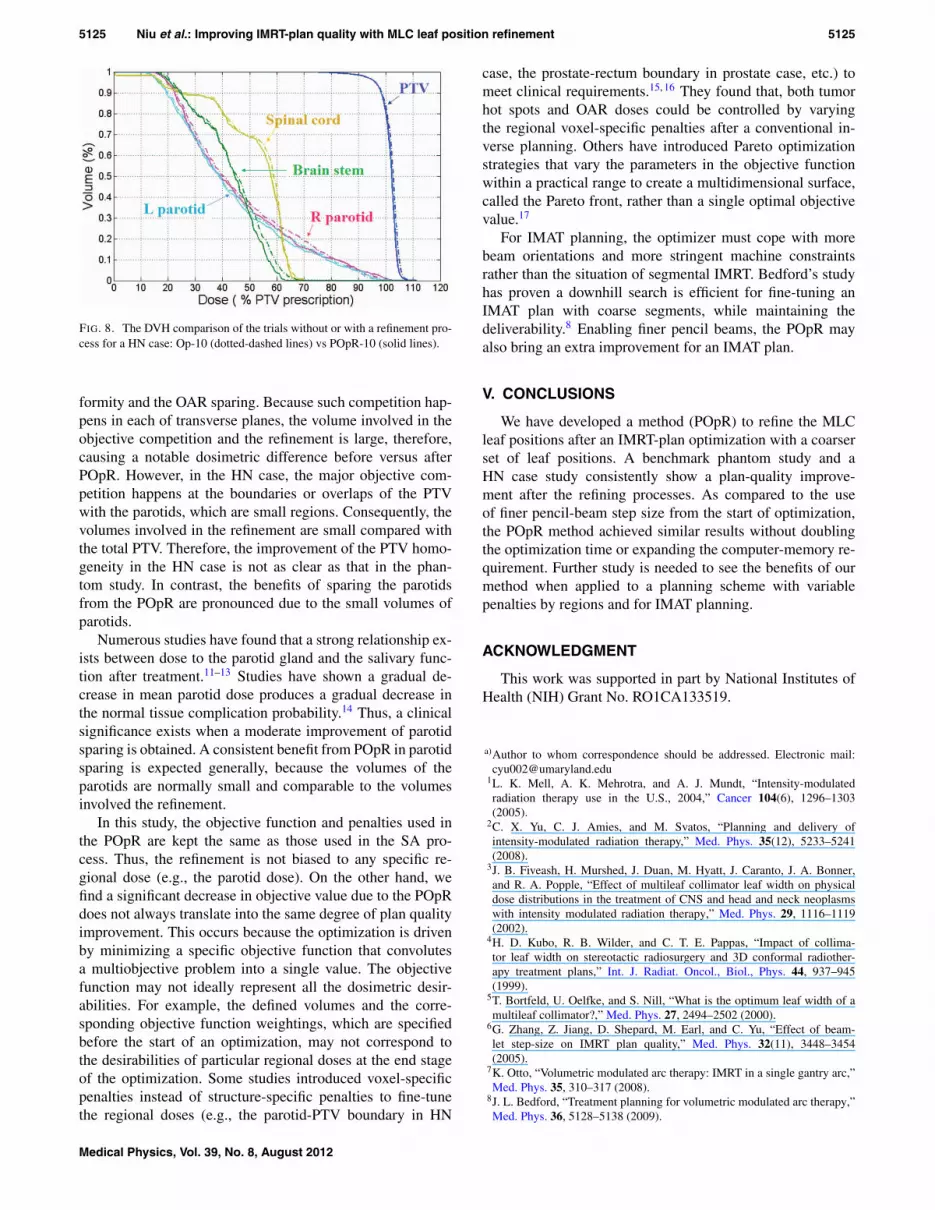
quality indicators. The plans of Op-10 and POpR-10 are alsocompared in DVHs as shown in Fig. 8. We normalize doses ofplans to make 96% of PTV receive at least 95% prescriptiondose (i.e., V95 = 96%).
Comparing the plans of POpR-10 and Op-10, a better PTVcoverage is obtained after refinement, which is indicated bythe decrease of HI. The hot spots of PTV also are reduced ac-cording to the decreases of V103 and V105. The mean doses tothe spinal cord and brain stem decrease by 0.7 Gy and 0.6 Gy,respectively. The near-maximum dose received by the brainstem decreases by 1.7 Gy, and the near-maximum dose to thespinal cord decreases by 0.4 Gy. The near-maximum cochleadoses are not improved in general, because the acceptance cri-terion concerning the cochlea has been well met before refine-ment. The V95 of skin decreases by 0.4%. Satisfactory meandoses to the parotids (i.e., <25 Gy) are not achieved in bothplans of POpR-10 and Op-10. However, the refinement de-creases the mean doses to the two parotids by 0.6 Gy and 0.5Gy, respectively.
Comparing the plans of POpR-5 and Op-5, small improve-ments of refinement are found in the hot-spot area (e.g., V103)and mean dose to parotids as presented in Table V, whilethe values of other quality indicators are left unchanged ingeneral.
IV. DISCUSSION
The POpR method helps the optimizer efficiently approachthe optimum which was previously unreachable without using
TABLE V. Dose-data comparison of the SA-optimization trails (Op-x) andthe postoptimization refinement trials (POpR-x) for the HN case.
Op-10/POpR-10 Op-5/POpR-5
PTV Dnear-min (Gy) 54.4/54.2 54.0/54.0Dnear-max (Gy) 63.3/62.4 62.1/62.1
HI 0.146/0.135 0.134/0.134V105 (%) 6.7/2.6 2.4/2.0V103 (%) 37.2/24.2 27.4/25.6
Spinal cord Dnear-max (Gy) 39.3/38.9 39.7/39.6Dmean (Gy) 30.7/30.0 31.3/31.2
Brain stem Dnear-max (Gy) 37.6/35.9 37.8/37.9Dmean (Gy) 25.8/25.2 26.8/26.7
Right parotid Dmean (Gy) 27.4/26.8 28.9/28.8Left parotid Dmean (Gy) 26.2/25.7 26.3/26.0Right cochlea Dnear-max (Gy) 22.8/24.2 25.5/25.8Left cochlea Dnear-max (Gy) 26.1/25.1 25.5/25.2Skin Dmean (Gy) 20.4/20.3 20.7/20.7
Dnear-max (Gy) 57.0/56.1 56.8/56.8V95 (%) 2.3/1.9 2.1/2.1
finer pencil-beam step sizes from the start of the SA process.In both the phantom and HN studies, the refined plans showimprovements in both PTV homogeneity and OAR sparingcompared to the plans generated with coarse pencil-beam stepsizes, and the qualities of the refined plans approach those op-timized with finer step sizes from the start. As compared withthe use of finer pencil beams, POpR achieves similar improve-ments with negligible time relative to the time needed for theinitial plan optimization rather than doubling the computationtime.
The dosimetric studies for both the phantom and HN casesclearly demonstrate that the POpR decreases in the objectivevalues, producing real improvements in plan qualities. It isverified that the approximations used applied to half pencilbeams provides enough accuracy to ensure the proper dosepredictions in the greedy-search process, while saving muchtime for refinement.
Many factors may affect the performance of POpR in spe-cific cases. Notable benefits of POpR are expected after weoptimize a challenging case with competing objectives. Forexample, the benefits of POpR in improving the PTV ho-mogeneity are not so evident in the HN case compared withthose in the phantom case, which accords with the differenceof the two cases in how much the objective-value decreases.In the phantom case, the PTV surrounding the OAR with avery small gap causes a competition between the PTV con-
TABLE IV. The performance of SA-optimization trials (Op-10 and Op-5) and greedy-search refinement trials(POpR-10 and POpR-5) for the HN patient.
Pencil-beam Optimization Successful SA Objective valuesTrial calculating time time (h) iterations (10 runs)
Op-10 ∼40 min 1–1.5 h ∼10 000 1.80 ± 0.02POpR-10 ∼40 min 1–1.5 h ∼10 000 1.50 ± 0.03Op-5 ∼1 h 20 min 2.5–3 h ∼16 000 1.48 ± 0.02POpR-5 ∼1 h 20 min 2.5–3 h ∼16 000 1.42 ± 0.02
Medical Physics, Vol. 39, No. 8, August 2012
5125 Niu et al.: Improving IMRT-plan quality with MLC leaf position refinement 5125
FIG. 8. The DVH comparison of the trials without or with a refinement pro-cess for a HN case: Op-10 (dotted-dashed lines) vs POpR-10 (solid lines).
formity and the OAR sparing. Because such competition hap-pens in each of transverse planes, the volume involved in theobjective competition and the refinement is large, therefore,causing a notable dosimetric difference before versus afterPOpR. However, in the HN case, the major objective com-petition happens at the boundaries or overlaps of the PTVwith the parotids, which are small regions. Consequently, thevolumes involved in the refinement are small compared withthe total PTV. Therefore, the improvement of the PTV homo-geneity in the HN case is not as clear as that in the phan-tom study. In contrast, the benefits of sparing the parotidsfrom the POpR are pronounced due to the small volumes ofparotids.
Numerous studies have found that a strong relationship ex-ists between dose to the parotid gland and the salivary func-tion after treatment.11–13 Studies have shown a gradual de-crease in mean parotid dose produces a gradual decrease inthe normal tissue complication probability.14 Thus, a clinicalsignificance exists when a moderate improvement of parotidsparing is obtained. A consistent benefit from POpR in parotidsparing is expected generally, because the volumes of theparotids are normally small and comparable to the volumesinvolved the refinement.
In this study, the objective function and penalties used inthe POpR are kept the same as those used in the SA pro-cess. Thus, the refinement is not biased to any specific re-gional dose (e.g., the parotid dose). On the other hand, wefind a significant decrease in objective value due to the POpRdoes not always translate into the same degree of plan qualityimprovement. This occurs because the optimization is drivenby minimizing a specific objective function that convolutesa multiobjective problem into a single value. The objectivefunction may not ideally represent all the dosimetric desir-abilities. For example, the defined volumes and the corre-sponding objective function weightings, which are specifiedbefore the start of an optimization, may not correspond tothe desirabilities of particular regional doses at the end stageof the optimization. Some studies introduced voxel-specificpenalties instead of structure-specific penalties to fine-tunethe regional doses (e.g., the parotid-PTV boundary in HN
case, the prostate-rectum boundary in prostate case, etc.) tomeet clinical requirements.15, 16 They found that, both tumorhot spots and OAR doses could be controlled by varyingthe regional voxel-specific penalties after a conventional in-verse planning. Others have introduced Pareto optimizationstrategies that vary the parameters in the objective functionwithin a practical range to create a multidimensional surface,called the Pareto front, rather than a single optimal objectivevalue.17
For IMAT planning, the optimizer must cope with morebeam orientations and more stringent machine constraintsrather than the situation of segmental IMRT. Bedford’s studyhas proven a downhill search is efficient for fine-tuning anIMAT plan with coarse segments, while maintaining thedeliverability.8 Enabling finer pencil beams, the POpR mayalso bring an extra improvement for an IMAT plan.
V. CONCLUSIONS
We have developed a method (POpR) to refine the MLCleaf positions after an IMRT-plan optimization with a coarserset of leaf positions. A benchmark phantom study and aHN case study consistently show a plan-quality improve-ment after the refining processes. As compared to the useof finer pencil-beam step size from the start of optimization,the POpR method achieved similar results without doublingthe optimization time or expanding the computer-memory re-quirement. Further study is needed to see the benefits of ourmethod when applied to a planning scheme with variablepenalties by regions and for IMAT planning.
ACKNOWLEDGMENT
This work was supported in part by National Institutes ofHealth (NIH) Grant No. RO1CA133519.
a)Author to whom correspondence should be addressed. Electronic mail:[email protected]
1L. K. Mell, A. K. Mehrotra, and A. J. Mundt, “Intensity-modulatedradiation therapy use in the U.S., 2004,” Cancer 104(6), 1296–1303(2005).
2C. X. Yu, C. J. Amies, and M. Svatos, “Planning and delivery ofintensity-modulated radiation therapy,” Med. Phys. 35(12), 5233–5241(2008).
3J. B. Fiveash, H. Murshed, J. Duan, M. Hyatt, J. Caranto, J. A. Bonner,and R. A. Popple, “Effect of multileaf collimator leaf width on physicaldose distributions in the treatment of CNS and head and neck neoplasmswith intensity modulated radiation therapy,” Med. Phys. 29, 1116–1119(2002).
4H. D. Kubo, R. B. Wilder, and C. T. E. Pappas, “Impact of collima-tor leaf width on stereotactic radiosurgery and 3D conformal radiother-apy treatment plans,” Int. J. Radiat. Oncol., Biol., Phys. 44, 937–945(1999).
5T. Bortfeld, U. Oelfke, and S. Nill, “What is the optimum leaf width of amultileaf collimator?,” Med. Phys. 27, 2494–2502 (2000).
6G. Zhang, Z. Jiang, D. Shepard, M. Earl, and C. Yu, “Effect of beam-let step-size on IMRT plan quality,” Med. Phys. 32(11), 3448–3454(2005).
7K. Otto, “Volumetric modulated arc therapy: IMRT in a single gantry arc,”Med. Phys. 35, 310–317 (2008).
8J. L. Bedford, “Treatment planning for volumetric modulated arc therapy,”Med. Phys. 36, 5128–5138 (2009).
Medical Physics, Vol. 39, No. 8, August 2012

5126 Niu et al.: Improving IMRT-plan quality with MLC leaf position refinement 5126
9D. M. Shepard, M. A. Earl, X. A. Li, S. Naqvi, and C. Yu, “Direct apertureoptimization: A turnkey solution for step-and-shoot IMRT,” Med. Phys. 29,1007–1018 (2002).
10ICRU Report 83, “Prescribing, recording, and reporting intensity-modulated radiation therapy,” Journal of the International Commission onRadiation Units and Measurements (Oxford University Press, Oxford, UK,2010), Vol. 10(1).
11A. Eisbruch, H. M. Kim, J. E. Terrell, L. H. Marsh, L. A. Dawson, andJ. A. Ship, “Xerostomia and its predictors following parotid-sparing irra-diation of head-and-neck cancer,” Int. J. Radiat. Oncol., Biol., Phys. 50,695–704 (2001).
12M. W. Münter, C. P. Karger, S. G. Hoffner, H. Hof, C. Thilmann, V. Rudat,S. Nill, M. Wannenmacher, and J. Debus, “Evaluation of salivary glandfunction after treatment of head-and-neck tumors with intensity-modulatedradiotherapy by quantitative pertechnetate scintigraphy,” Int. J. Radiat. On-col., Biol., Phys. 58, 175–184 (2004).
13A. I. Blanco, K. S. Chao, I. El Naga, G. E. Franklin, K. Zakarian, M. Vicic,and J. O. Deasy, “Dose-volume modeling of salivary function in patientswith head-and-neck cancer receiving radiotherapy,” Int. J. Radiat. Oncol.,Biol., Phys. 62, 1055–1069 (2005).
14T. Dijkema, C. P. J. Raaijmakers, R. K. Ten Haken, J. M. Roesink,P. M. Braam, A. C. Houweling, M. A. Moerland, A. Eisbruch, and C. H.J. Terhaard, “Parotid gland function after radiotherapy: The combinedMichigan and Utrecht experience,” Int. J. Radiat. Oncol., Biol., Phys. 78,449–453 (2010).
15C. Cotrutz and L. Xing, “IMRT dose shaping with regionally variablepenalty scheme,” Med. Phys. 30, 544–541 (2003).
16C. Holdsworth, M. Kim, J. Liao, and M. Phillips, “The use of a multiob-jective evolutionary algorithm to increase flexibility in the search for betterIMRT plans,” Med. Phys. 39, 2261–2274 (2012).
17D. Craft, T. Halabi, and T. Bortfeld, “Exploration of tradeoffs in intensity-modulated radiotherapy,” Phys. Med. Biol. 50, 5857–5868 (2005).
Medical Physics, Vol. 39, No. 8, August 2012


