Embed Size (px)
Citation preview

The vibrational and NMR spectra, conformations and ab initiocalculations of 1-aminoethylidene propanedinitrile and its
N-methyl derivativesq
A. Gatiala,* , S. Sklenaka, V. Milatab, S. Biskupica, R. Salzerc, D. Schellerc, G. Woelkic
aDepartment of Physical Chemistry, Slovak Technical University, SK-81237 Bratislava, Slovak RepublicbDepartment of Organic Chemistry, Slovak Technical University, SK-81237 Bratislava, Slovak Republic
cInstitute of Analytical Chemistry, Technical University Dresden, D-01062 Dresden, Germany
Received 26 February 1999; accepted 22 March 1999
Abstract
The IR and Raman spectra of 1-aminoethylidene propanedinitrile (AE) [H2N–C(CH3)yC(CN)2], 1-(methylamino)ethylidenepropanedinitrile (MAE) [CH3NH–C(CH3)yC(CN)2] and 1-(dimethylamino)ethylidene propanedinitrile (DMAE) [(CH3)2N–C(CH3)yC(CN)2] were recorded as solids and solutes in various solvents in the region 4000–50 cm21. AE and DMAE can existonly as single conformers. From the vibrational and NMR spectra of MAE in solutions, the existence of two conformers withthe methyl group orientedanti andsyntowards the double CyC bond were confirmed. The enthalpy differenceDH0 between theconformers was measured to be 1.9^ 1.3 kJ mol21 from the NMR spectra in DMSO solution.
Semi-empirical (AM1, PM3, MNDO, MINDO3) and ab initio SCF calculations using a DZP basis set were carried out for allthe three compounds. The calculations support the existence of two conformersanti and syn for MAE with anti being9.4 kJ mol21 more stable thansyn from ab initio and 7.4, 12.0, 7.8 and 9.2 kJ mol21 from AM1, PM3, MNDO andMINDO3 calculations, respectively.
Finally, complete assignments of the vibrational spectra for all the three compounds were made with the aid of normalcoordinate calculations employing scaled ab initio force constants. The scale factors from the similar aminomethylene propa-nedinitrile and itsN-methyl derivatives were used and a very good agreement between calculated and experimental frequencieswas achieved.q 1999 Elsevier Science B.V. All rights reserved.
Keywords:Vibrational and NMR spectra; Conformational analysis; Enamines; Semi-empirical and ab initio calculations
1. Introduction
Enamines are highly reactive compounds which arevery important in a number of synthetic processes
[1,2]. An aminoethylene derivatives of the generalformula R1R2N–CR3yCXY, where R1, R2 and R3
are H, alkyl or (hetero)aryl and X and Y are electronwithdrawing groups, which are useful as materials forpharmaceutical, dye and polymer synthesis. Amino-methylene- (R3 � H) and 1-aminoethylidene- (R3 �CH3) propanedinitrile and their homologues with thegeneral formula R1R2N–CR3yC(CN)2 represent agroup of compounds which also have a wide use inorganic synthesis [3] and they are often used as
Journal of Molecular Structure 509 (1999) 67–92
0022-2860/99/$ - see front matterq 1999 Elsevier Science B.V. All rights reserved.PII: S0022-2860(99)00212-4
q In honour of Professor Peter Klæboe on the occasion of his70th birthday.
* Corresponding author. Tel.:1 421-7-59325661; fax:1 421-7-393198.
E-mail address:[email protected] (A. Gatial)
www.elsevier.nl/locate/molstruc

starting reactants or intermediates for the preparationof many compounds.
Despite the wide use in organic synthesis, theirphysico-chemical properties have not been studiedin detail until now. Aminomethylene propanedinitrileand itsN-methyl derivatives (R3 � H and R1 and R2
are H or CH3) have been subjected to our formerspectroscopic (IR, Raman, NMR) and ab initioconformational study [4]. This work represents anextension of these studies on 1-aminoethylidenepropanedinitrile and itsN-methyl derivatives (R3 �CH3 and R1 and R2 are H or CH3).
According to our knowledge 1-aminoethylidenepropanedinitrile (AE) [H2N–C(CH3)yC(CN)2], 1-(methylamino)ethylidene propanedinitrile (MAE)[CH3NH–C(CH3)yC(CN)2] and 1-(dimethylami-no)ethylidene propanedinitrile (DMAE) [(CH3)2N–C(CH3)yC(CN)2] have not been yet investigated byvibrational or NMR spectroscopy.
To extend the information about the structure ofthese molecules we have also carried out an ab initiostudy with fully optimized geometries, a determina-tion of the force fields and a calculation of frequenciesfor the normal modes of vibrations.
2. Experimental
2.1. Preparative
The compounds were prepared according to thefollowing reaction scheme:
R1R2NH 1 RO–C�CH3�yC�CN�2! R1R2N–C�CH3�yC�CN�2 1 ROH
Details of the synthesis have been described in aprevious article [4]. The purity and melting pointswere determined by differential scanning calorimetryusing a Perkin–Elmer DSC-7 calorimeter. The purityof all three compounds was better than 98% and themelting points are 2258C for AE, 1508C for MAE and598C for DMAE. Identity and purity of the sampleswere also confirmed by mass and by NMR spectro-scopy.
2.2. Spectra
Mid-IR spectra in the region 4000–200 cm21 were
A. Gatial et al. / Journal of Molecular Structure 509 (1999) 67–9268
Fig. 1. IR spectrum of AE in KBr pellet at room temperature.

A. Gatial et al. / Journal of Molecular Structure 509 (1999) 67–92 69
Fig. 2. Raman spectrum of solid AE at room temperature.
Table 1Infrared and Raman spectral data (weak bands in the regions 4000–3500 and 2800–2300 cm21 have been omitted) for 1-aminoethylidenepropanedinitrile (AE)
Infrared Raman Interpretation
Liquid (CH3CN)a Solid Liquid (CH3CN)a Solid
KBr pellet Nujol
3420b m 3465 w 3466 w3357 s 3353 s 3352 s 3356 w n1
3253 s 3206 s 3205 s 3253 vw 3205 m n2
3201 m,sh 3096 w,sh 3096 w,sh3028 vw n3
2924 vw 2933 m n4, n23
2834 w 2834 vw2216 vs 2221 vs 2222 vs 2216 vs 2219 vvs n5
2196 s,sh 2199 vs 2199 vs 2196 s,sh 2200 vvs n6
2157 vw 2159 m,sh 2159 m,sh 2159 w2125 w,sh 2125 w,sh1833 vw 1832 vw
1658 vs 1673 vs 1672 vs 1653 w 1671 m n7
1623 vvw 1629 vvw 1629 vvw1572 w,sh 1573 w,sh 1570 vw
1558 vs 1550 vs 1548 vs 1554 w 1542 w n8
1500 vw 1508 vw1468 vw 1460 w,sh n24
1439 m n9, n10

recorded on Bruker model IFS 88 and on Philipsmodel PU9800 FT-IR spectrometers. The mid-IRspectra at room temperature of all the threecompounds were measured as KBr pellets and asNujol suspensions. Because the samples are notsoluble in CCl4 or CS2, we used CH3CN, CH2Cl2and CHCl3 as solvents. The solubility increased inthe order AE, MAE, DMAE. The IR spectra of the
solutions were measured in a cell equipped with KBrwindows and a variable path length.
Raman recordings using an argon ion laser wasimpossible for each of the three samples due to extre-mely high fluorescence. Therefore, a Bruker RFS 100instrument equipped with Nd31:YAG laser was used.Raman spectra at room temperature of powderedsolids were obtained for all three samples in the region
A. Gatial et al. / Journal of Molecular Structure 509 (1999) 67–9270
Table 1 (continued)
Infrared Raman Interpretation
Liquid (CH3CN)a Solid Liquid (CH3CN)a Solid
KBr pellet Nujol
1374 m 1373 w n11
1340 w,sh 1341 w,sh1310 vw,sh 1309 vw, sh
1238 w 1248 w 1248 w 1240 m 1250 s n12
1218 vw 1217 vw 1220 vvw1158 w 1168 mw 1168 mw 1160 vw 1169 w n13
1149 w 1149 w 1150 vw1085 vw 1085 vw 1085 vvw1053 vw 1054 vw n25
1025 w 1026 w 1029 w n14
988 vw962 w 964 w 987 vw 963 w n15
946 w 963 w 946 vw895? 893 vvw802 vw,sh 803 vw,sh
625 s 714 s, brd 709 s,sh n26
658 m.sh 671 m 671 m 658 s 670 vs n16
662 m,sh 665 m,sh616 w
606 w 609 m 609 m 605 w 609 w n17
548 mw 548 mw 548 w n27
536 vw 543 w,sh 542 w,sh 533 w 544 w n18
511 m 516 s 517 s 516 vw n28
467 w 473 w 473 w 476 vw n29
440 m 448 s 448 s 438 w 449 m n19
390 w 389 w 394 m n20
348 vvw,brdt 250? t 250? n30
193 s n31
175 vs n21
151 w n22
124 vs n32
112 w,sh93 w n33
86 s6 5 s
a Solvent used.b Abbreviations used are s: strong; m: medium; w: weak; v: very, sh: shoulder; brd: broad.

A. Gatial et al. / Journal of Molecular Structure 509 (1999) 67–92 71
Fig. 3. IR spectrum of MAE in KBr pellet at room temperature.
Fig. 4. Raman spectrum of solid MAE at room temperature.

4000–50 cm21. Owing to the low solubility, morethan a 1000 scans were recorded to obtain theRaman spectra in acetonitrile solution.
The 1H and 13C NMR spectra were run at roomtemperature on a Bruker MSL 300 spectrometer. Toobtain a frequency resolution of 0.23 Hz/point, zerofilling up to 64k was used for gated decoupled spectrabefore transformation.
3. Results
A mid-IR survey spectrum of AE as a KBr pellet isshown in Fig. 1 while a Raman spectrum as a solidpowder is given in Fig. 2. The wave numbers of theobserved IR and Raman bands are listed in Table 1.
The corresponding spectra of MAE are shown inFigs. 3 and 4, respectively. The IR and Raman spectraof the solid are compared in Fig. 5 with those of theacetonitrile solution in the region 750–450 cm21.Some weak Raman bands in acetonitrile solutionvanishing in the solid spectra are demonstrated in
Fig. 6. The experimental wave numbers for MAEare collected in Table 2.
A mid-IR spectrum of DMAE as a KBr pelletappears in Fig. 7 whereas a Raman spectrum of asolid powder is given in Fig. 8. The wave numbersof the observed IR and Raman bands are listed inTable 3.
A comparison of the13C NMR spectra of all thethree samples in DMSO solution appears in Fig. 9,while the chemical shifts and vicinal couplingconstants are listed in Table 4.
3.1. Conformational analysis
Similarly as for aminomethylene propanedinitrileand its N-methyl derivatives studied earlier [4] theconformational possibility for all the three samplesis determined by the rotation around the C–N bond.We can again suppose that the stable configuration ofthe amino group is the one where the lone electronpair at the amino nitrogen atom is included in a highlyconjugated system of the CyC double bond and thetriple bonds of both cyano groups. Then it is obvious
A. Gatial et al. / Journal of Molecular Structure 509 (1999) 67–9272
Fig. 5. IR spectra (top) of MAE as a solution in acetonitrile (curve a) and in KBr pellet (curve b); Raman spectra (bottom) of MAE as a solute inacetonitrile (curve a) and as a powdered solid (curve b) at room temperature. Dashed lines are the corresponding spectra of pure solvent.

that AE and DMAE can exist only as a singleconformer independent of the structure of the aminogroup (pyramidal or planar). It means that only MAEcan exist in two conformations with the methyl grouporiented out from the CyC double bond—anticonformer and towards the CyC double bond—synconformer:
In the case of (methylamino)methylene propane-dinitrile [(NC)2CyCH–NHCH3] studied earlier, theanti conformer was found to be more stable by 3.7^
1.4 kJ mol21 from the IR spectra in acetonitrile solu-tion and by 3.4 1.1 kJ mol21 from the NMR spectrain DMSO solution [4]. For MAE, we can alsointuitively assume from steric reasons that again the
anti conformer will be the more stable one, but due tothe repulsion of the olefinic methyl group, a lowerenergy difference between conformers can beexpected.
All the three samples have a very small vapourpressure and low solubility in most solvents. AE issoluble only in small amounts in more polar solvents
(CH3CN) and only the strongest bands could beobserved in the IR solution spectra. The best solublecompound is DMAE and for this sample also the IRspectra in less polar solvent (CH2Cl2 and CHCl3)could be obtained. No bands were missing in the solu-tion spectra of these two compounds compared to thesolid phase spectra.
A. Gatial et al. / Journal of Molecular Structure 509 (1999) 67–92 73
Fig. 6. Raman spectra of MAE in acetonitrile solution (curve a) and as a powdered solid (curve b) at room temperature. Dashed lines are theRaman spectra of acetonitrile.

A. Gatial et al. / Journal of Molecular Structure 509 (1999) 67–9274
Fig. 7. IR spectrum of DMAE in KBr pellet at room temperature.
Fig. 8. Raman spectrum of a solid DMAE at room temperature.

A. Gatial et al. / Journal of Molecular Structure 509 (1999) 67–92 75
Table 2Infrared and Raman spectral data (weak bands in the regions 4000–3400 and 2800–2300 cm21 have been omitted) for 1-(methylamino)ethy-lidene propanedinitrile (MAE)
Infrared Raman Interpretation
Liquid (CH3CN)a Solid Liquid (CH3CN)a Solid anti syn
KBr pellet Nujol
3332 sb 3361 m,sh 3360 w,sh 3325 vw3281 s 3278 s 3283 vw n1
3210 m,sh3173 m,sh 3170 m,sh3040 vw 3038 vw n2
3011 vw 3012 w n3
2978 vw 2975 w n28, n29
2948 w 2948 m n4
2937 m n5
2886 vw,sh 2883 w2849 vw,sh 2846 vw2827 w
2210 vs 2216 vs 2215 vs 2210 vvs 2216 vvs n6
2200 vs 2194 vs 2193 vs 2201 vs,sh 2195 vs n7
2172 w,sh 2169 m,sh 2168 s,sh 2173 m,sh 2171 m2157 w,sh 2156 w,sh 2157 w2141 vw,sh 2142 w,sh 2143 vw1939 vw 1938 vw1860 vw 1859 vw
1602 vs 1611 vs 1608 vs 1601 m n8
1590 vs 1584 vs 1590 m1577 w,sh p n8
1535 w,sh 1536 w,sh 1538?1480 vw 1480 s 1472 s n9, n10, n11
1460 w 1452 m n30, n31
1417 w,sh 1412 w,sh 1411 vw,sh 1416 s 1411 m n12
1409 s 1399 m 1398 w 1401 w,sh n13
1370? 1362 m 1365 m 1367 w n14
1350 vvw,sh p 1350 w p n14
1328 vw 1326 w,sh 1327 vvw1246 m 1247 m 1246 m 1246 s 1247 s n15
1234 w,sh 1235 w,sh1228 w,sh p n15
1215 vw 1217 vw1194 vw 1199 vw 1199 vw1175 vw 1166 w 1166 w 1173 vw 1167 vw n16
1127 vvw 1132 vw 1133 vw 1120 vvw 1133 vvw n32
1097 vw 1097 w,sh 1098 w,sh1083 w,sh 1082 w,sh 1083 vw n17
1071 w 1069 m,sh 1068 m,sh 1070 vw 1070 w n33
1063 m 1062 m n18
1028 w 1028 w 1033 vvw 1028 vw986 vw 986 vw951 vw 951 vvw
949 vw 924 w 924 w 925 w n19
823 w,sh 820 w,sh800 w 800 w
754 w,sh 751 vw

Relatively good IR spectra could be obtained forMAE in acetonitrile solution, but only weak spectrawere measured for solution in less polar solvents(CH2Cl2) due to the very low solubility. Also severalRaman spectra of MAE in acetonitrile solution wererecorded. Unfortunately, even in the case of an almostsaturated solution, the Raman bands are weak and riseonly slightly above the noise level after averaging upto 4000 scans. Despite this, the Raman spectra of thesolid sample and of the acetonitrile solution may becompared, as can be seen in Figs. 5 and 6. From thecomparison of the IR and Raman spectra in solutionand in the solid phase, we have found some bands
which disappear in the latter spectra. These bandsare located in acetonitrile solution at 1577, 1350,1228, 636, 621, 585 and 261 cm21. These factssupport the conclusion that MAE exists in two confor-mational forms in acetonitrile solution.
These results were also confirmed by NMR spectro-scopy. The13C and1H NMR spectra of AE, MAE andDMAE in DMSO were measured at room temperature(Fig. 9). In these spectra each main band has a weakercounterpart only in the spectrum of MAE, meaningthat the room temperature is below the coalescencetemperature and confirming the existence of twoconformers for this sample.
A. Gatial et al. / Journal of Molecular Structure 509 (1999) 67–9276
Table 2 (continued)
Infrared Raman Interpretation
Liquid (CH3CN)a Solid Liquid (CH3CN)a Solid anti syn
KBr pellet Nujol
707 m 730 s,brd 729? 711 vvw? 724 vw n34
695 m,sh 693 m,sh 690 s 696 s n20
679 m p n34
636 mw p n20
621 w p n21
613 w,sh610 vw 610 m 610 m 611 m 609 m n21
586 vw p 585 vw,sh p n22
566 vw 564 vw522 w 527 m 527 m 521 w 528 w n35
521 vvw 521 vvw 521 w n22
510 m 510 s 510 s 504 vw,sh 514 w n36
476 m,sh464 mw 471 m 471 m 465 s 470 s n37
467 m,sh 464 w,sh442 w,sh 444 w 449 w n23
423 vw,sh 420 vw 420 vw401 vw 402 vw 400 w n24
383 vw328 w 323 vw 331 w n25
261 w p n25
217? 211 w 222 w n38
168 s,sh n39
155 vs 154 vs n26
143 s 142 s,sh n27
111 s n40
89 s n41, n42
78 m,sh56 m
a Solvent used.b Abbreviations used are s: strong; m: medium; w: weak; v: very; sh: shoulder; brd: broad;p denotes bands vanishing in the solid phase.

A. Gatial et al. / Journal of Molecular Structure 509 (1999) 67–92 77
Table 3Infrared and Raman spectral data (weak bands in the regions 4000–3100 and 2800–2300 cm21 were omitted) for 1-(dimethylamino)ethylidenepropanedinitrile (DMAE)
Infrared Raman Interpretation
Liquid Solid Liquid (CH3CN)a Solid
CH2Cl2a CH3CNa KBr pellet Nujol
3020 vwb 3018 vw 3021 mw 3018 m n1
2989 w 2991 w 2985 m 2988 w,sh n2, n3
2975 m n4, n5
2951 w,sh 2960 w,sh 2958 w,sh n6
2941 m 2940? 2941 mw 2940 s n7, n8
2922 w,sh 2923 w,sh n9
2890 w 2889 w 2887 vw 2886 vw,sh 2888 w n14 1 n19� 28942850 vvw 2848 vvw 2848 w 2n19� 2848
2824 w 2823 vw 2825 vw n19 1 n20� 28332815 w 2811 vw,sh 2817 mw 2812 w 2n20� 28182254 w
2226 w,sh 2230 vw2209 vs 2206 vs 2202 vs 2203 vs 2205 vs 2201 vs n10
2191 vs 2188 vs 2181 vs 2178 vs 2186 vs 2182 vs n11
2149 w 2146 w 2142 w,sh 2143 w,sh 2144 w 2142 w2136 w,sh 2136 w,sh 2136 vw
1857 vw 1857 vw 1860 vw 1859 vvw1640 w,sh 1637 w,sh 1643 vw 1646 vw
1579 vs 1585 vs 1585 vs 1584 vs 1585 mw 1590 w n12
1575 s,sh 1576 w1551 s,sh 1553 s,sh n13
1471 m,sh 1470 m,sh 1468 m,sh 1468 m,sh 1467 m,sh n14, n15
1453 m 1457 m 1456 m 1454 m 1451 m n16, n17
1430 m,sh 1428 w,sh n18
1424 s 1425 s 1423 s 1427? 1419 s,sh n19
1415 s 1414 s 1409 s 1407? 1415 s 1411 s n20
1383 m 1383 m n21
1378 ms 1376 m,sh 1376 mw n22
1270 w,sh1264 m 1261 mw 1260 mw 1264 m 1263 mw n23
1218 vw,sh 1219 vw 1216 vw 1216 vw 1220 m 1216 m n24
1171 vw,sh 1169 vw,sh 1170 w,sh1158 m 1161 m 1156 w 1155 w 1161 m 1158 m n25, n26
1099 vw 1098 vw 1099 vw n27
1086 vw n28
1074 w 1076 w 1072 w 1072 w 1077 vw1064 vw,sh 1063 vw,sh 1064 vw n29
1050 m 1052 m,sh 1046 w 1045 w 1050 vw 1046 vw n30
1027 vw,sh1019 s 1020 s 1018 s 1018 s 1022 w 1020 w n31
934 vw 941 vw 940 vw 939 vw 940 vw839 w 840 w 837 vw 836 vw 840 vw 838 w n32
821 vw,sh 819 w,sh802 w,sh? 803 vw? 803 w 802 w
647? 647? 642 s 648 m n33
621 m,sh 621 m,sh 621 s n34
617 s 617 s 617 s 617 s 618 s 618 s,sh n35

A. Gatial et al. / Journal of Molecular Structure 509 (1999) 67–9278
Table 3 (continued)
Infrared Raman Interpretation
Liquid Solid Liquid (CH3CN)a Solid
CH2Cl2a CH3CNa KBr pellet Nujol
569 vvw?545 w,sh 544 w,sh 544 vw 544 vw 547 w 545 vw n36
525 m 528 m 532 m 532 m 529 w 532 w n37
490 vvw468 w 471 w 470 w 470 w 470 mw 470 m n38
447 vw 446 vw 448 w 448 w 449 m 452 m n39
430 m 430 m 428 mw 428 mw 432 ms 430 m n40, n41
375?311 m 306 m n42
278 mw 278 w n43
? n44, n45
163 vs 175 vs n46, n47, n48
? n49
85 vs,sh n50
73 vs n51
a Solvents used.b Abbreviations used are s: strong; m: medium; w: weak; v: very; sh: shoulder.
Fig. 9. 13C NMR spectra of AE, MAE and DMAE in DMSO solution at room temperature.

A. Gatial et al. / Journal of Molecular Structure 509 (1999) 67–92 79
Table 413C and1H NMR data of the compounds R1R2N–C(CH3)y(CN)2
Compound AE R1 � R2 � H MAE: anti R1 � CH3, R2 � H MAE: synR1 � H, R2 � CH3 DMAE R1 � R2 � CH3
13C chemical shiftsa in ppmC1 48.0 47.0 45.9 47.6C2 172.6 172.2 168.2 168.9C10 117.0 117.4 118.0 118.7C12 115.3 115.6 117.0 117.5C5 19.8 16.8 21.7 20.4C4 31.0 42.8C6 31.3 42.81H chemical shiftsa in ppmH4 8.66 8.86H14,15,16 2.90 3.24H6 8.37 8.60H17,18,19 3.08 3.24Vicinal coupling constantsa in HzH4–C1 (trans) 9.2 7.9H6–C1 (cis) 4.6 3.7H4–C5 (cis) 4.2 2.8H6–C5 (trans) 7.5 5.6
a Numbering of the atoms according to Figs. 10 and 11.
Fig. 10. Internal coordinates for AE (X4yX6yH), anti MAE (X4yC, X6yH) andsynMAE (X4yH, X6yC).

3.2. Conformational energy difference
The enthalpy difference between the two confor-mers of the MAE in solution can be determinedfrom the temperature studies of the appropriate partof the IR or Raman spectra. The best band pairsshould be conformationally pure belonging to theanti andsynconformers with sufficient intensity andseparation. Unfortunately, from all the MAE bands inacetonitrile solution mentioned earlier, we did not findsuch a band pair.
In contrast, well separated bands are found inthe 1H NMR spectra corresponding to the methylgroup protons for both conformers. Therefore,we measured the 1H NMR spectra in thetemperature range 298–338 K. The band areaswere used for determining the equilibriumconstantK at different temperatures. By applyingthe van’t Hoff equation we have determinedDH0
by plotting lnK versus 1/T, where DH0/R is theslope of the line obtained by a least squaresprocedure. It is assumed thatDH0 does not dependon the temperature in such a short interval. A value
DH0(syn–anti) � 1.9 ^ 1.3 kJ mol21 was obtained,but due to short interval, uncertainty is relativelyhigh.
3.3. Semi-empirical and ab initio calculations
As for aminomethylene propanedinitrile and itsN-methyl derivatives [4] studied previously, we alsocarried out semi-empirical and ab initio calculationsto support the interpretation of the obtained experi-mental data. The semi-empirical AM1, PM3, MNDOand MINDO3 methods were employed using theMOPAC program [5]. For the ab initio Hartree–Fock SCF calculations the TURBOMOL program[6] and the standard Huzinaga DZP basis set [7,8]were employed. To improve the accuracy of the abinitio energies, MP2 corrections were carried out, butgeometries of the molecules were not reoptimized atMP2 level.
A decreasing character of the pyramidal structureof the amino group due to conjugation of the nitrogenlone electron pair from CH3NH2 to CH2yCHNH2 hasbeen measured [9,10]. In substituted aniline a planar
A. Gatial et al. / Journal of Molecular Structure 509 (1999) 67–9280
Table 5Torsional angles (in degrees) of the amino group for the AE, MAE and DMAE calculated by ab initio and semi-empirical methods
Compound Method t(C1yC2–N3–X4)a t(C1yC2–N3–X6) t(C5–C2–N3–X4)
AE Ab initio 180.14 20.05 0.15AM1 179.98 20.01 0.00PM3 156.40 23.12 228.02MNDO 153.87 23.36 231.14MINDO3 179.99 0.01 20.02
anti MAE Ab initio 177.33 1.25 23.01AM1 180.00 0.00 0.00PM3 158.87 20.89 225.50MNDO 157.50 5.16 225.29MINDO3 179.99 20.02 20.03
synMAE Ab initio 179.96 0.13 0.14AM1 180.02 0.22 0.00PM3 165.37 28.96 226.87MNDO 178.87 223.60 22.03MINDO3 179.61 20.44 20.07
DMAE Ab initio 163.22 221.44 216.52AM1 169.52 215.83 28.73PM3 160.63 264.28 215.06MNDO 106.64 2106.43 273.35MINDO3 97.21 297.21 282.79
a Numbering of the atoms according to Figs. 10 and 11.

A. Gatial et al. / Journal of Molecular Structure 509 (1999) 67–92 81
Table 6Ab initio structural parameters (bond lengths in angstroms, bond and torsion angles in degrees) for AE, MAE and DMAE
Namea Internal coordinateb AE MAE DMAE
anti syn
R1 r(C1yC2) 1.3672 1.3739 1.3714 1.3780R2 r(C2–N3) 1.3344 1.3339 1.3351 1.3409R3 r(N3–H4) 0.9954 0.9960R3 r(N3–C4) 1.4476 1.4540R4 r(N3–H6) 0.9986 0.9993R4 r(N3–C6) 1.4521 1.4567R5 r(C2–C5) 1.5002 1.5004 1.5074 1.5087R6 r(C1–C10) 1.4299 1.4286 1.4345 1.4339R7 r(C10xN11) 1.1348 1.1352 1.1348 1.1351R8 r(C1–C12) 1.4319 1.4306 1.4343 1.4330R9 r(C12xN13) 1.1352 1.1357 1.1345 1.1348R10 r(C5–H7) 1.0828 1.0826 1.0818 1.0824R11 r(C5–H8) 1.0896 1.0890 1.0896 1.0866R12 r(C5–H9) 1.0896 1.0886 1.0896 1.0896R13 r(C4–H14) 1.0852 1.0826R14 r(C4–H15) 1.0878 1.0873R15 r(C4–H16) 1.0899 1.0919R16 r(C6–H17) 1.0859 1.0834R17 r(C6–H18) 1.0863 1.0878R18 r(C6–H19) 1.0862 1.0879d /(C1yC2–N3) 121.95 121.17 126.45 124.36f /(C1yC2–C5) 122.56 121.43 120.52 118.72w /(C2–N3–H4) 120.68 114.97w k(C2–N3–C4) 126.41 122.24m /(C2–N3–H6) 121.49 116.94m /(C2–N3–C6) 129.49 123.62b /(C2yC1–C10) 122.13 122.25 120.34 120.79g /(C2yC1–C12) 119.55 119.63 125.12 124.48l /(C1–C10xN11) 179.67 179.73 179.67 179.48k /(C1–C12xN13) 176.50 176.40 178.04 177.82t /(C2–C5–H7) 112.03 111.40 112.60 110.96y1 /(C2–C5–H8) 109.24 109.70 109.15 110.81y2 /(C2–C5–H9) 109.23 109.96 109.13 109.86p /(N3–C4–H14) 107.75 111.74u1 /(N3–C4–H15) 111.77 108.43u2 /(N3–C4–H16) 112.20 111.77j /(N3–C6–H17) 107.18 110.52c1 /(N3–C6–H18) 111.72 107.71c2 /(N3–C6–H19) 111.71 112.56t1 t(C1yC2–N3–H4) 180.14 179.96t1 t(C1yC2–N3–C4) 177.33 163.22t2 t(C1yC2–N3–H6) 20.05 1.25t2 t(C1yC2–N3–C6) 0.13 221.44t3 t(C5–C2–N3–H4) 0.15 0.14t3 t(C5–C2–N3–C4) 23.01 216.52t4 t(N3–C2yC1–C10) 180.02 179.41 180.03 172.20t5 t(N3–C2yC1–C12) 0.02 20.34 0.02 214.17t6 t(C1yC2–C5–H7) 0.06 22.51 0.67 18.16t7 t(C1yC2–C5–H8) 120.90 117.93 121.57 139.24t8 t(C1yC2–C5–H9) 239.21 236.64 239.82 259.28

A. Gatial et al. / Journal of Molecular Structure 509 (1999) 67–9282
Table 6 (continued)
Namea Internal coordinateb AE MAE DMAE
anti syn
t9 t(C2–N3–C4–H14) 174.12 225.61t10 t(C2–N3–C4–H15) 55.76 216.26t11 t(C2–N3–C4–H16) 266.95 96.93t12 t(C2–N3–C6–H17) 180.03 227.28t13 t(C2–N3–C6–H18) 61.17 214.89t14 t(C2–N3–C6–H19) 261.12 94.8011c lc(C2C10C1N11) 0.33 0.27 20.33 20.4512c lc(C2C12C1N13) 3.50 3.60 21.96 21.1513c lp(C2C10C1N11) 0.00 20.04 0.00 0.2614c lp(C2C12C1N13) 0.00 0.04 20.01 1.85
a Internal coordinate symbol.b Numbering of the atoms according to Figs. 10 and 11.c Coordinate describing linear part of molecule in degrees.
Fig. 11. Internal coordinates for DMAE.

structure was calculated [11] due to electron-with-drawing groups in the benzene ring. Similarly, anearly planar structure of the amino group is expectedin the present molecules due to the strongly electron-withdrawing cyano groups. This is important forinterpreting the vibrational spectra of the presentmolecules. If the amino group is planar and if theplane of the amino group is oriented in the plane of
the rest of the molecule, the molecule may have Cs
symmetry. Otherwise, the molecule lacks a planeof symmetry and has C1 symmetry. In all thesemi-empirical and ab initio calculations the full setof structural parameters were optimized with noassumptions regarding symmetry. The results of thetorsional angles for the CyC(CH3)–NR1R2 moiety (R1
and R2 is H or C) are summarized in Table 5.
A. Gatial et al. / Journal of Molecular Structure 509 (1999) 67–92 83
Table 7Comparison of the observed and calculated vibrational frequencies for AE
No. Fundamentala Observedb Ab initio Scaledc PEDd
A 0
n1 NH2 asym stretch 3357 3939 3420 97 NH2 asn2 NH2 sym stretch 3253 3802 3301 97 NH2 ssn3 CH3 asym stretch 3028 3338 3054 92 CH3 asn4 CH3 sym stretch 2933 3196 2924 93 CH3 ssn5 CxN stretch 2216 2587 2214 84 CxN sn6 CxN stretch 2196 2578 2207 84 CxN sn7 NH2 deformation 1653 1802 1643 78 NH2 d , 19 C–N sn8 CyC stretch 1554 1723 1581 63 CyC s, 13 NH2 dn9 yC–N stretch 1439 1579 1438 24 C–N s, 26 CH3 ad , 29 CH3 adn10 CH3 asym bend 1439 1570 1436 56 CH3 ad , 12 C–N sn11 CH3 sym bend 1373 1507 1373 71 CH3 sd , 12 C–N sn12 CC2 asym stretch 1240 1344 1227 48 CC2 as, 11 C–N sn13 NH2 rock 1160 1266 1154 38 NH2 ro, 19 CC2 as, 10 CC2 ssn14 CH3 sym rock 1025 1112 1013 69 CH3 ro, 11 NH2, ro, 10 C–N sn15 yC–CH3 stretch 962 1036 949 47 C–CH3 s, 24 NH2 ro, 10 CC2 ssn16 CC2 sym stretch 658 700 639 26 CC2 ss, 15 CyC s, 15 C–CH3 sn17 CC2 deformation 605 668 603 26 CC2 d , 26 CCxN sd , 26 CC2 ssn18 C–CxN asym bend 533 591 533 26 CCxN ad , 30 CC2 ro, 10 CyCN dn19 CyC–N bend 438 471 426 55 CyCN d , 17 CCxN adn20 yC–CH3 rock 394 427 386 67 CH3 ro, 19 CCxN adn21 CC2 rock 175 181 163 48 CC2 ro, 33 CCxN adn22 C–CxN sym bend 151 156 139 61 CCxN sd , 54 CC2 d
A 00
n23 CH3 asym stretch 2933 3267 2989 100 CH3 asn24 CH3 asym bend 1460 1592 1447 92 CH3 adn25 CH3 asym rock 1053 1157 1057 70 CH3 ron26 C–CxN sym bend 625 752 689 23 CCxN sd , 27 CC2 wa, 38 CH3 wan27 NH2 torsion 548 613 560 40 NH2 t , 27 CCxN sd , 6 CC2 wan28 yC–CH3 wag 511 555 512 38 CH3 wa, 36 NH2 t , 15 CCxN sdn29 C–CxN asym bend 467 532 471 84 CCxN ad , 6 CyC tn30 NH2 wag 286 248 135 NH2 wan31 CC2 wag 193 207 190 62 CC2 wa, 32 CCxN sdn32 CyC torsion 124 122 114 108 CyC tn33 CH3 torsion 93 87 82 144 CH3 t
a Approximate assignment taking into account also the comparison of the spectra of all three samples.b Observed frequencies are from liquid if available.c Calculated using scaling factors mentioned in the text.d Potential energy distribution for scaled frequencies.

From these results it is obvious that ab initio, AM1and MINDO3 methods give planar structures of theamino group for AE and for both conformers of MAE.Very small non-planarity (2–38) for the anticonformer of MAE in the ab initio method is probablydue to the steric repulsion of the olefinic methylgroup. In all these cases the orientation of themethyl group follows the plane of the symmetryof the heavy atoms (again with small exceptionfor the anti conformer of MAE in ab intiomethod) and we can accept in these methods formolecules the Cs symmetry. PM3 and MNDO giveonly non-planar pyramidal structures of the aminogroup for these molecules. When the plane of thesymmetry was fixed, the obtained energies weresignificantly higher and the vibrational analysisgave one negative vibrational mode meaning thatthe planar structure can be a saddle point for inversionprocesses.
Unlike (dimethylamino)methylene propanedinitrile[4] studied earlier, for DMAE the ab initio as well asall semi-empirical methods suggest only significantlynon-planar structures of the molecule probably due tosteric interactions of the olefinic and amino methylgroups; the differences are only in the geometry ofthe amino group, while the ab initio and AM1methods suggest practically planar structure of theC–NC2 moiety, but turned 15–208 from the plane ofthe rest of molecule, the PM3, MNDO and MINDO3methods give significantly pyramidal structure of theamino group orientated toward the olefinic methylgroup. The last two methods give even the aminogroup turned symmetricaly perpendicular to theplane of rest of molecule.
As the most acceptable results, we consider the abinitio calculations which were calculated with a rela-tively large basis set. Refinement of the ab initiogeometry was carried out until the norm of gradientwas lower than 1024 a.u. (most of them in the range1025) and the vibrational analysis gave only non-negative vibrational modes to ensure that it is an equi-librium structure and no saddle point. The obtainedinternal coordinates with their names and labellingaccording to Figs. 10 and 11 are listed in the Table6. Since experimental structural data are not availablefor any of these molecules, the reliability of the abinitio structures is difficult to ascertain. Nevertheless,for interpreting the vibrational spectra, we have
accepted planar structures with Cs symmetry for AEand MAE and a non-planar structure with C1
symmetry for DMAE. The same conclusion regardingto the planarity of the amino group has been done in arecent theoretical study of the formamide,N-methyl-formamide,N,N-dimethylformamide, acetamide andN-methylacetamide [12]. The molecular structure ofthe mentioned compounds were investigated by abinitio Hartree–Fock, MP2 and density functionaltheory BLYP and B3LYP methods in con-junction with basis sets ranging from 6-31Gp to 6-3111G(2d,p) and at all levels of theory the heavyatom skeleton was found to be planar.
All the five mentioned computational methodssuggest theanti conformer of MAE as more stable.From the ab initio calculations in a DZP basis setat HF/DZP SCF level theanti conformer is morestable by 12.3 kJ mol21. After including the MP2corrections (calculated for SCF geometry) andzero point vibrational energy (ZPE), theanticonformer is at the MP2/HF/DZP level by9.6 kJ mol21 and at the ZPE/MP2/HF/DZP level by9.4 kJ mol21 more stable. For AM1, PM3, MNDOand MINDO3, the values 7.4, 12.0, 7.8 and9.2 kJ mol21 were calculated.
3.4. Normal coordinate analysis
The calculated ab initio HF vibrational frequenciesin a DZP basis set for all the three samples are given inTables 7–10. In order to obtain a more completedescription of the molecular motions involved in thenormal vibration, we have carried out a normal coor-dinate analysis. It is well known that raw ab initio HFfrequencies in different basis sets are systematically10–15% higher that the observed fundamental vibra-tional frequencies [13], but after a suitable correctionby one or several few scale factors they give anaccurate prediction of the vibrational fundamentals[14]. Therefore, the ab initio force fields for allthe three samples in the Cartesian coordinatescalculated in a DZP basis set at the HF levelwere transformed to suitable internal coordinatesand then subsequently scaled according to the typeof internal coordinates, using the scheme [15]:Fij �scaled� � Fij �ab initio�·�xixj�1=2; where xi andxj are the scaling factors for the diagonalconstants. The eight scaling factors: 0.851 for
A. Gatial et al. / Journal of Molecular Structure 509 (1999) 67–9284

A. Gatial et al. / Journal of Molecular Structure 509 (1999) 67–92 85
Table 8Comparison of the observed and calculated vibration frequencies foranti MAE
No. Fundamentala Observedb Ab initio Scaledc PEDd
A 0
n1 N–H stretch 3283 3826 3322 99 NH sn2 CH3 asym stretch 3040 3340 3055 93 (N)CH3 asn3 CH3 asym stretch 3011 3307 3025 93 (C)CH3 asn4 CH3 sym stretch 2948 3204 2931 90 (N)CH3 ssn5 CH3 sym stretch 2937 3191 2919 89 (C)CH3 ssn6 CxN stretch 2210 2582 2210 82 CxN sn7 CxN stretcj 2200 2571 2202 82 CxN sn8 N–H rock 1602 1773 1622 42 NH ro, 31 CyC s, 22 C–N sn9 CyC stretch 1480 1636 1497 23 CyC s, 15 C–N s, 17 (N)CH3 adn10 yC–N stretch 1480 1617 1473 12 C–N s, 50 (N)CH3 sd , 14 (N)CH3 ad ,n11 CH3 asym bend 1480 1612 1467 52 (N)CH3 ad , 16 (C)CH3 ad , 13 NH ron12 CH3 asym bend 1417 1569 1429 61 (C)CH3 ad , 11 CyC sn13 CH3 sym bend 1409 1549 1412 30 (N)CH3 sd , 35 (C)CH3 sd , 11 NH ron14 CH3 sym bend 1362 1505 1371 54 (C)CH3 sd , 13 C–N s, 11 (N)CH3 sdn15 CC2 asym stretch 1246 1360 1243 41 CC2 as, 17 N–CH3 sn16 CH3 sym rock 1175 1289 1175 44 (N)CH3 ro, 18 CC2 asn17 N–CH3 stretch 1083 1177 1078 34 N–CH3 s, 18 (C)CH3 ro, 13 (N)CH3 ron18 CH3 sym rock 1063 1156 1050 26 (C)CH3 ron19 C–CH3 stretch 949 1007 923 17 C–CH3 s, 22 N–CH3 s, 16 C–N sn20 CC2 sym stretch 690 736 673 15 CC2 ss, 26 C–CH3 s, 15 CNCdn21 CC2 deformation 610 671 605 27 CC2 d , 27 CCxN sd , 24 CC2 ssn22 C–CxN asym bend 521 583 523 34 CCxN ad , 32 CC2 ron23 CyC–N bend 449 500 456 11 CyCN d , 28 CNCd , 16 C–CH3 ron24 C–CH3 rock 400 429 387 46 C–CH3 ro, 23 CyCN d , 24 CCxN adn25 C–N–C bend 323 326 296 38 CNCd , 18 CyCN d , 13 C–CH3 ron26 C–CxN sym bend 155 165 147 33 CCxN sd , 31 CC2 dn27 CC2 rock 143 145 131 26 CC2 ro, 17 CCxN ad
A 00
n28 CH3 asym stretch 2975 3276 2996 94 (N)CH3 asn29 CH3 asym stretch 2975 3266 2987 90 (C)CH3 asn30 CH3 asym bend 1460 1605 1459 60 (N)CH3 ad , 28 (C)CH3 adn31 CH3 asym bend 1460 1589 1445 60 (C)CH3 ad , 31 (N)CH3 adn32 CH3 asym rock 1127 1240 1128 88 (N)CH3 ron33 CH3 asym rock 1071 1151 1054 46 (C)CH3 ron34 C–CxN sym bend 707 749 684 23 CCxN sd , 25 CC2 wa, 41 C–CH3 wan35 N–H wag 522 619 556 24 NH wa, 10 C–Nt , 35 CCxN sdn36 C–CH3 wag 510 551 501 31 C–CH3 wa, 16 NH wa, 26 C–Ntn37 C–CxN asym bend 464 537 474 85 CCxN ad , 5 CyC tn38 CC2 wag 211 219 201 53 CC2 wa, 26 CCxN sdn39 C–CH3 torsion 168 200 186 37 C–CH3 t , 20 N–CH3 t , 10 C–Ntn40 yC–N torsion 111 128 119 14 C–Nt , 74 C–CH3 t , 41 CyC tn41 CyC torsion 89 104 96 61 CyC tn42 N–CH3 torsion 89 65 60 45e N–CH3 t , 33 NH wa, 10 C–Nt
a Approximate assignment taking into account also the comparison of the spectra of all three samples.b Observed frequencies are from liquid if available.c Calculated using scaling factors mentioned in the text.d Potential energy distribution for scaled frequencies.e Relative values.
A. Gatial et al. / Journal of Molecular Structure 509 (1999) 67–9286
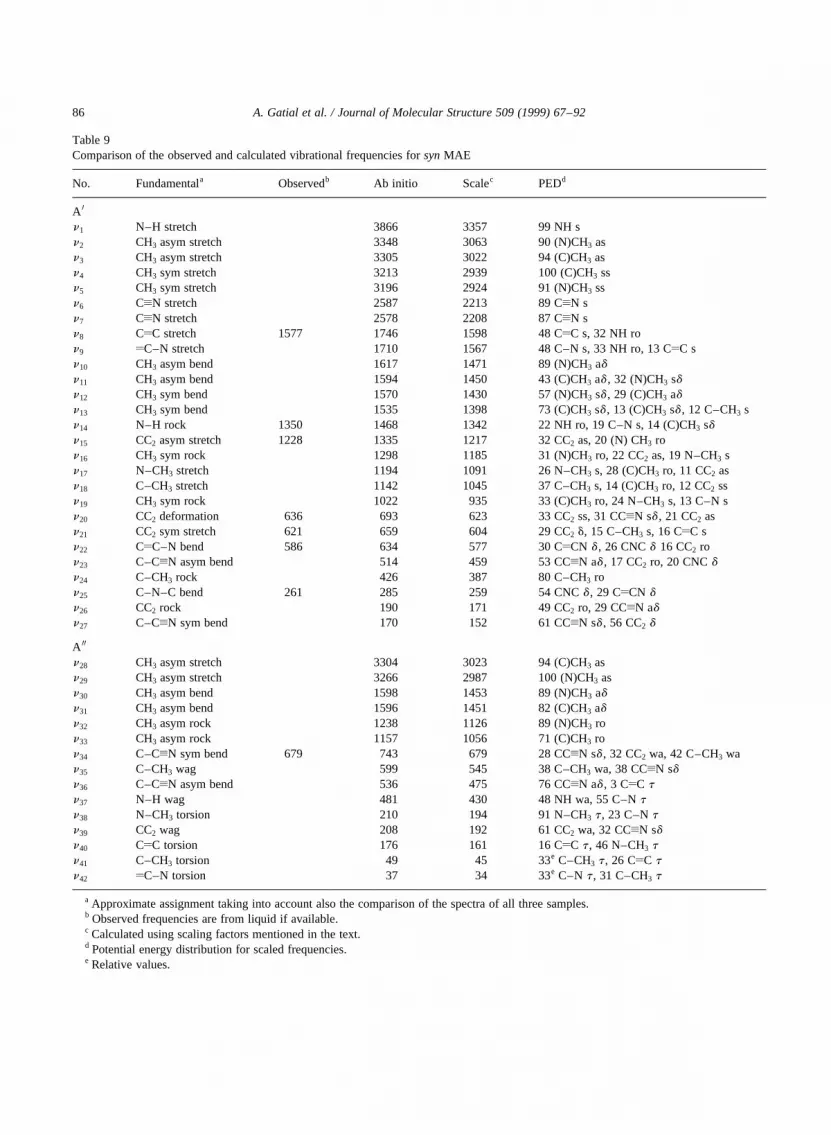
Table 9Comparison of the observed and calculated vibrational frequencies forsynMAE
No. Fundamentala Observedb Ab initio Scalec PEDd
A 0
n1 N–H stretch 3866 3357 99 NH sn2 CH3 asym stretch 3348 3063 90 (N)CH3 asn3 CH3 asym stretch 3305 3022 94 (C)CH3 asn4 CH3 sym stretch 3213 2939 100 (C)CH3 ssn5 CH3 sym stretch 3196 2924 91 (N)CH3 ssn6 CxN stretch 2587 2213 89 CxN sn7 CxN stretch 2578 2208 87 CxN sn8 CyC stretch 1577 1746 1598 48 CyC s, 32 NH ron9 yC–N stretch 1710 1567 48 C–N s, 33 NH ro, 13 CyC sn10 CH3 asym bend 1617 1471 89 (N)CH3 adn11 CH3 asym bend 1594 1450 43 (C)CH3 ad , 32 (N)CH3 sdn12 CH3 sym bend 1570 1430 57 (N)CH3 sd , 29 (C)CH3 adn13 CH3 sym bend 1535 1398 73 (C)CH3 sd , 13 (C)CH3 sd , 12 C–CH3 sn14 N–H rock 1350 1468 1342 22 NH ro, 19 C–N s, 14 (C)CH3 sdn15 CC2 asym stretch 1228 1335 1217 32 CC2 as, 20 (N) CH3 ron16 CH3 sym rock 1298 1185 31 (N)CH3 ro, 22 CC2 as, 19 N–CH3 sn17 N–CH3 stretch 1194 1091 26 N–CH3 s, 28 (C)CH3 ro, 11 CC2 asn18 C–CH3 stretch 1142 1045 37 C–CH3 s, 14 (C)CH3 ro, 12 CC2 ssn19 CH3 sym rock 1022 935 33 (C)CH3 ro, 24 N–CH3 s, 13 C–N sn20 CC2 deformation 636 693 623 33 CC2 ss, 31 CCxN sd , 21 CC2 asn21 CC2 sym stretch 621 659 604 29 CC2 d, 15 C–CH3 s, 16 CyC sn22 CyC–N bend 586 634 577 30 CyCN d , 26 CNCd 16 CC2 ron23 C–CxN asym bend 514 459 53 CCxN ad , 17 CC2 ro, 20 CNCdn24 C–CH3 rock 426 387 80 C–CH3 ron25 C–N–C bend 261 285 259 54 CNCd , 29 CyCN dn26 CC2 rock 190 171 49 CC2 ro, 29 CCxN adn27 C–CxN sym bend 170 152 61 CCxN sd , 56 CC2 d
A 00
n28 CH3 asym stretch 3304 3023 94 (C)CH3 asn29 CH3 asym stretch 3266 2987 100 (N)CH3 asn30 CH3 asym bend 1598 1453 89 (N)CH3 adn31 CH3 asym bend 1596 1451 82 (C)CH3 adn32 CH3 asym rock 1238 1126 89 (N)CH3 ron33 CH3 asym rock 1157 1056 71 (C)CH3 ron34 C–CxN sym bend 679 743 679 28 CCxN sd , 32 CC2 wa, 42 C–CH3 wan35 C–CH3 wag 599 545 38 C–CH3 wa, 38 CCxN sdn36 C–CxN asym bend 536 475 76 CCxN ad , 3 CyC tn37 N–H wag 481 430 48 NH wa, 55 C–Ntn38 N–CH3 torsion 210 194 91 N–CH3 t , 23 C–Ntn39 CC2 wag 208 192 61 CC2 wa, 32 CCxN sdn40 CyC torsion 176 161 16 CyC t , 46 N–CH3 tn41 C–CH3 torsion 49 45 33e C–CH3 t , 26 CyC tn42 yC–N torsion 37 34 33e C–N t , 31 C–CH3 t
a Approximate assignment taking into account also the comparison of the spectra of all three samples.b Observed frequencies are from liquid if available.c Calculated using scaling factors mentioned in the text.d Potential energy distribution for scaled frequencies.e Relative values.

stretching, 0.827 for bending, 0.874 for torsion andout of plane, 0.754 for N–H stretching, 0.837 forC–H stretching, 0.720 for CxN stretching, 0.750 forhydrogen wagging and 0.770 for C–CxN linearbending coordinates obtained in the earlier vibrationalstudy for similar molecules of aminomethylenepropanedinitrile and itsN-methyl derivatives [4]have been used. In the mentioned study, introducingthe separate scaling factors for a well localized vibra-tional modes of the N–H, C–H and CxN stretchingcoordinates, for the hydrogen wagging coordinates(yC–H, –NH2 and –N–H wagging coordinates) andfor the C–CxN linear bending coordinates improvedvery much the agreement of the calculated andobserved frequencies. These scale factors wereoptimized on the 85 experimental frequencies.Frequencies calculated with the mentioned scalingfactors and the corresponding potential energydistributions (PED) for AE,anti and syn MAEand DMAE are given in Tables 7–10. Agreementwith the experimental frequencies is up to 5%outside the low frequency region below 250 cm21
where data from the fluid phases are missing and theassignment is also rather uncertain due to the latticemodes.
4. Discussion
4.1. Geometry
As for aminomethylene propanedinitrile and itsN-methyl derivatives [4], experimental structuredata are also not available for the moleculesstudied. The reliability of the calculated geome-trical values can be tested only in comparisonwith similar compounds. This was donepreviously, where a decreasing of the multiplecharacter of the carbon–carbon double bond andincreasing the carbon–nitrogen bond order due tointeraction of the nitrogen lone electron pair withthe p-electron system were confirmed [4].
The calculated CyC and C–N bond lengths for ourenamines indicate a highly conjugated system andboth are slightly longer than for the correspondingaminomethylene propanedinitrile and itsN-methylderivatives [4] studied earlier. It means that thesubstitution of an olefinic hydrogen by the
electron-donating methyl group increases theCyC bond length which is in agreement withthe view of enhancing of the conjugation effect,but simultaneous increasing of C–N bond lengthis against this view. Similar trends were calculatedby ab initio HF/6-31Gp and DFT B3LYP/6-31Gp
calculations [12] and measured by electron diffrac-tion [18,20] for CyO and C–N bonds intrans N-methylformamide andtrans N-methylacetamide.This might be due to steric effect as the methylgroup is bulkier that hydrogen. However, substitu-tion of an amino hydrogen by the electron-donating methyl group enhance the conjugationeffect and a slight increase in the CyC bondlengths is accompanied by a slight decrease inthe yC–N bond lengths. The same conclusionwas made for aminomethylene propanedinitrileand its N-methyl derivatives [4] studied earlier,and was also calculated for structurally similarformamide andtrans N-methylformamide and foracetamide andtrans N-methylacetamide from abinitio HF/6-31Gp and DFT B3LYP/6-31Gp calcula-tions [12]. These results are in agreementwith thebond lengths from electron diffraction for forma-mide [16,17],trans N-methylformamide [18], acet-amide [19] andtrans N-methylacetamide [20]. Thesubstitution of the second amino hydrogen bymethyl group inN,N-dimethylformamide leads tofurther increase of the CyC bond length and alsoto the increasing of theyC–N bond length prob-ably is due to steric effects of the bulky methylgroup [12,21]. Then, the same result is notsurprising for DMAE, where the steric effectsdue to olefinic methyl group are much higher.The tendency of forming a planar structure ofthe amino group with a higher degree of conjuga-tion has also been discussed [4]. The repulsionsteric effects of the methyl groups affect thistendency and therefore the calculated non-planarstructure of DMAE with the three methyl groupsis comprehensible.
4.2. Conformational energy
The conformational energies of MAE calculated bythe all methods are at least three times higher than theexperimental value determined from NMR spectra.Such high difference may be attributed to possible
A. Gatial et al. / Journal of Molecular Structure 509 (1999) 67–92 87

A. Gatial et al. / Journal of Molecular Structure 509 (1999) 67–9288
Table 10Comparison of observed and calculated vibrational frequencies for DMAE
No. Fundamentala Observedb Ab initio Scaledc PEDd
n1 CH3 asym stretch 3020 3340 3056 88 (C)CH3 asn2 CH3 asym stretch 2989 3331 3047 87 (N)CH3 asn3 CH3 asym stretch 2989 3329 3045 94 (N)CH3 asn4 CH3 asym stretch 2975 3284 3004 95 (C)CH3 asn5 CH3 asym stretch 2975 3280 3000 94 (N)CH3 asn6 CH3 asym stretch 2951 3265 2986 83 (N)CH3 asn7 CH3 sym stretch 2941 3206 2933 78 (N)CH3 ssn8 CH3 sym stretch 2941 3205 2932 82 (N)CH3 ssn9 CH3 sym stretch 2922 3181 2910 79 (N)CH3 ssn10 CxN stretch 2209 2584 2210 89 CxN sn11 CxN stretch 2191 2575 2205 88 Cx N sn12 CyC stretch 1585 1716 1573 41 CyC s, 34 C–N sn13 C–N stretch 1551 1645 1504 13 C–N s, 20 CyC s, 12 C–CH3 sn14 CH3 asym bend 1471 1621 1475 56 (N)CH3 ad , 14 (C)CH3 adn15 CH3 asym bend 1471 1618 1472 74 (N)CH3 adn16 CH3 asym bend 1453 1610 1464 50 (N)CH3 ad , 23 (C)CH3 adn17 CH3 asym bend 1453 1608 1462 74 (N)CH3 adn18 CH3 asym bend 1430 1592 1448 32 (C)CH3 ad , 17 (N)CH3 adn19 CH3 asym bend 1424 1580 1437 51 (C)CH3 ad , 21 (N)CH3 sdn20 CH3 sym bend 1415 1569 1428 64 (N)CH3 sdn21 CH3 sym bend 1383 1563 1424 62 (N)CH3 sdn22 CH3 sym bend 1378 1527 1389 84 (C)CH3 sdn23 NC2 asym stretch 1264 1409 1289 40 NC2 as 17 CyCNd , 14 NC2 ron24 CC2 asym stretch 1220 1350 1233 26 CC2 as, 16 NC2 as, 19
(N)CH3 ron25 CH3 rock 1158 1263 1153 28 (N)CH3 ro, 34 CC2 asn26 CH3 rock 1158 1251 1138 100 (N)CH3 ron27 CH3 rock 1099 1218 1108 89 (N)CH3 ron28 CH3 rock 1086 1181 1076 50 (N)CH3 ron29 CH3 rock 1064 1161 1060 33 (C)CH3 ro, 20 NC2 asn30 CH3 rock 1050 1142 1043 63 (C)CH3 ron31 C–CH3 stretch 1019 1108 1015 22 C–CH3 s, 21 NC2 ss, 14
(C)CH3 ron32 NC2 sym stretch 839 916 840 48 NC2 ss, 13 CC2 ss, 14
(C)CH3 ron33 C–CxN sym bend 642 734 670 29 CCxN sd , 35 CC2 wa, 41 C–
CH3 wan34 CC2 deformation 621 694 625 34 CC2 d , 30 CCxN sd , 17
CC2 ssn35 CC2 sym stretch 617 670 615 19 CC2 ss, 24 C–CH3 sn36 yC–CH3 wag 545 608 553 34 C–CH3 wa, 30 CCxN sdn37 C–CxN asym bend 525 586 531 15 CCxN ad , 17 CC2 ro, 13
NC2 dn38 C–CxN asym bend 470 537 475 84 CCxN ad ,6CyC tn39 CyC – N bend 449 493 442 20 CyCNd , 26 NC2 d , 10 NC2 ron40 NC2 deformation 432 467 426 19 NC2 d , 24 NC2 ro, 26 C–
CH3 ron41 yC – CH3 rock 432 441 402 52yC–CH3 ron42 NC2 rock 311 341 311 24 NC2 ro, 28 CyCN dn43 NC2 wag 273 255 88 NC2 wan44 N–CH3 torsion 241 224 97 N–CH3 tn45 C–CH3 torsion 227 211 82 C–CH3 t

interactions of the highly polar MAE molecule withthe polar solvents (DMSO) used for the experimentalenergy determination compared with the isolatedmolecule in the calculations. In difference with theprevious calculations for aminomethylene propanedi-nitrile and itsN-methyl derivatives [4], slightly betterresults are given in the semi-empirical methods. Ashas been already mentioned theanti conformer ofMAE is destabilized by the olefinic methyl groupand the less energy difference between conformerscan be expected. Measured energy difference reallydecrease from the value 3.4 1.1 kJ mol21 for(methylamino)methylene propanedinitrile [4] to thevalue 1.9^ 1.3 kJ mol21 for MAE. This trend isreflected by all the semi-empirical methods, but notby the ab initio method at HF level and probablycalculations at MP2 level are necessary.
4.3. NMR spectra
The general behaviour is comparable to the non-methylated at C2 compounds reported in Ref. [4].The chemical shifts of C2 are changed downfield byapproximately 10 ppm as expected by the methylgroup substitution. For theN-monomethylatedcompound MAE two conformersanti and syn exist,as well. The assignment of NMR spectra to theconformers results from the vicinal coupling constantsvalues (Table 4):trans couplings are about twice aslarge as thecis couplings in all cases. From theconcentration ratioanti:syn 70:30 at room tempera-ture the value of ca. 2.1 kJ mol21 for the Gibbs free
enthalpy can be calculated. This value is by1.4 kJ mol21 lower than for the similar molecules of(methylamino)methylene propanedinitrile [4]. Intro-ducing the methyl group at C2 atom decreases theanti:synratio, theanti conformer population becomesless preferred. In contrast to (dimethylamino)methy-lene propanedinitrile [4], at the same temperature, weobserved only one (collapsed) signal for C4 and C6 ofthe DMAE. The chemical shift of 42.8 ppm nearlyequals the mean value of the different signals at37.8 and 46.8 ppm of (dimethylamino)methylenepropanedinitrile. From this fact a decrease of the rota-tional barrier around the C2–N3 axis or, in otherwords, decrease of the double bond character of thisbond by methylation at C2 is to be concluded.Observed free rotation of the DMAE dimethylaminogroup in comparison with the hindered rotation of thesame group in (dimethylamino)methylene propanedi-nitrile confirm the calculated non-planar structure ofthe CyC–NC2 moiety. Non-planar structure meansdecreasing of the conjugation and lowering of therotation barrier.
The proton NMR spectra obtained at 300 MHz alsoreflect the hindrance of rotational motion around theC2–N3 axis. AE has two broadened signals of H4 andH6. The temperature dependence of the MAEconformer mixture spectra results in an activationenergy of 75.8 kJ mol21 for the syn–anti exchangecalculated by the coalescence temperature (350 K)of the N-methyl proton signals. In DMAE theN-methyl signals collapse at room temperature inanalogy to the13C NMR spectra. Additionally, the
A. Gatial et al. / Journal of Molecular Structure 509 (1999) 67–92 89
Table 10 (continued)
No. Fundamentala Observedb Ab initio Scaledc PEDd
n46 CC2 wag 163 197 181 33 CC2 wa, 12 CCxN sd , 33 C–N t
n47 CC2 rock 163 182 166 26 CC2 ro, 16 CCxN ad , 22 C–CH3 t
n48 C–CxN sym bend 163 171 153 48 CCxN sd , 40 CC2 dn49 N–CH3 torsion 145 135 121 N–CH3 tn50 yC – N torsion 85 100 93 103 C–Ntn51 CyC torsion 73 67 62 90 CyC t
a Approximate description taking into account also the comparison of the spectra of all three samples.b Observed frequencies are from liquid if available.c Calculated using scaling factors mentioned in the text.d Potential energy distribution for scaled frequencies.

temperature dependence of DMAE in deuteratedacetone solution was measured. Spectra revealedthat coalescence temperature is 283 K and loweringthe temperature leads to splitting ofN-methyl signals.The proton chemical shifts in acetone at 273 K are3.430 and 3.305 ppm forN-dimethyl and 2.320 ppmfor olefinic protons. From the chemical shiftdifference and coalescence temperature the freestandard enthalpy of activation 58.7 kJ mol21 wascalculated.
4.4. Vibrational spectra
The N–H stretching modes are those with thehighest wave numbers and, therefore, their assign-ment in the vibrational spectra for AE and MAE isstraightforward. A doublet band structure of thesevibrational modes in the solid and solution spectrahas been discussed [4]. The bands in the C–Hfrequency region belong only to the CH3 stretchingmodes. Their assignment is not clear without addi-tional isotopic studies and is based only on the normalcoordinate calculations.
The CxN stretching modes were found at about 5–10 cm21 lower than for the aminomethylene propane-dinitrile and itsN-methyl derivatives studied earlier[4]. The wave number downshifts correspond with thevery slight decrease of the multiple character of thesebonds due to increasing of the conjugation aftersubstitution of the olefinic hydrogen by the electron-donating methyl group.
The CyC stretching mode frequency 1662 cm21 forthe previously studied aminomethylene propane-dinitrile, 1648 and 1630 cm21 for anti and syn con-formers of (methylamino)methylene propanedinitrileand 1644 cm21 for (dimethylamino)methylenepropanedinitrile were found [4]. Highest frequenciesin this region above 1500 cm21 are 1653 and1554 cm21 for AE, 1602 and 1577 cm21 for MAEand 1585 and 1551 cm21 for DMAE. According tothe normal coordinate calculations the CyC stretchingmode is mixed with the NH2 scissoring mode for AE,with the N–H rocking mode for MAE and with theC–N stretching mode for DMAE. Therefore, theassignment of the CyC stretching mode to the bandwith the highest frequency is not straightforward.Nevertheless, the highest mentioned frequencies arelower than for the earlier studied compounds [4] and
confirm the calculated slight decrease of the doublebond character of the CyC bond in studied moleculesafter substitution of the olefinic hydrogen by theelectron-donating methyl group. The C–N stretchingmode frequencies for the earlier studied amino-methylene propanedinitrile, (methylamino)methylenepropanedinitrile and (dimethylamino)methylenepropanedinitrile were assigned at 1329, 1337 and1408 cm21, respectively [4]. For compounds studiedin this article, increasing of the C–N stretching modefrequency from 1439 cm21 for AE to 1551 cm21 forDMAE can be concluded. Similar frequency upshiftof the C–N stretching mode (amide III mode) wasobserved after substitution of the carbonyl hydrogenby the methyl group for formamide and acetamide,and trans N-methylformamide andtrans N-methyl-acetamide [22].
In-plane vibrational modes (scissoring androcking) of the amino groups –NH2 and –NHare in the expected regions [22]. According tothe calculated PED, the bands at 548 cm21 forAE and 522 cm21 for MAE were assigned as thenon-planar wagging modes of the –NH2 and –NHgroups, respectively. However, common featuresof both the 625 cm21 for AE and 707 (or679) cm21 for MAE bands—strong and broadbands in IR spectra and absence in Raman spectra,frequency downshift in the solution spectra—andthe fact that a band of such character is notpresent in this region in the vibrational spectraof DMAE indicate the assignment of these bandsto amino groups. Also, a calculated higherfrequency for the NH2 torsional mode comparedwith the NH2 wagging mode is characteristic forplanar amides rather than for non-planar aliphatic oraromatic amines where the NH2 wagging mode is in theregion 700–850 cm21 [22]. This means that themeasured lower frequency of 625 cm21 for the NH2
out-of-plane mode support the planar structure of theamino group.
As for the aminomethylne propanedinitrile and itsN-methyl derivatives [4] studied earlier, the normalcoordinate calculations indicate again that each ofthe four C–CxN linear bending modes is mixedwith one of the four deformation modes of theyCC2 group. The CC2 scissor is mixed with the in-plane symmetric linear bending mode of both CCxNgroups, and the CC2 rock is mixed with the in-plane
A. Gatial et al. / Journal of Molecular Structure 509 (1999) 67–9290

CCxN asymmetric linear bending mode. The CC2
wag is mixed with the out-of-plane symmetric linearbending mode of both CCxN groups. The CC2 twistfor a non-planarlCC2 structure or the CyC torsionalmode for a planaryCC2 structure is mixed with theout-of-plane asymmetric CCxN linear bending mode.In each mentioned pairs one mode should occurbetween 400 and 600 cm21 and the other between100 and 300 cm21.
The out-of-plane asymmetric CCxN linearbending appears as the most localized modeaccording to the PED, and therefore its assignmentis the most straightforward among the bands in thevery narrow region 464–470 cm21 for all the threesamples. The corresponding CyC torsional mode isdue to substitution of the olefinic hydrogen shift downto 100 cm21.
The CC2 scissoring and the in-plane symmetricCCxN linear bending modes are both highlymixed as previously reported for 1,1-dicyanocyclo-propane [23], 1,1-dicyanocyclobutane [24] andcarbonyl cyanide [25]. Based on these results,we assigned the CC2 scissoring mode in the highfrequency region 605–621 cm21 and the corre-sponding CCxN linear bend in the low frequencyrange.
The two remaining CC2 modes (rocking andwagging), although mixed with the mentionedCCxN modes, should occur in the low frequencyregion. The CCxN bending modes were assigned inthe regions 521–533 cm21 (the in-plane asymmetriclinear bend) and 642–707 cm21 (the out-of-planesymmetric linear bend), respectively. It is necessaryto note that the last bending mode mixed with the CC2
wagging mode was calculated at about 100 cm21
higher than for the related compounds mentioned[4,23–25]; therefore, its interchanging with the–NH2 and –NH wagging mode for AE and MAE,respectively, is plausible.
The CyC–N bending mode was assigned for all thethree samples to a band with very similar character inthe narrow frequency interval 438–449 cm21.
The assignment of the deformation modes andespecially of the torsional modes below 250 cm21 isvery tentative because spectral data from the fluidphases are missing in this region and many latticemodes for AE and MAE are present in the solidphase spectra.
Acknowledgements
A.G. and R.S. are very grateful for the stay atPeter Klaeboe’s laboratory and the introductioninto the field of conformational analysis. A.G.gratefully acknowledges “die Konferenz derdeutschen Akademien der Wissenschaften” for ascholarship. The work reported in this paper hasbeen funded also by the Slovak Grant Agency, projectno. 1/4205/97.
References
[1] A.G. Cook (Ed.), Enamines: Synthesis, Structure and Reac-tions, Marcel Dekker, New York, 1969.
[2] S.F. Dyke, The Chemistry of Enamines, Cambridge Univer-sity Press, London, 1973.
[3] F. Freeman, LONZA Reaction of Malononitrile Derivatives,Georg Thieme Verlag, Stuttgart, 1981 Synthesis 1981, p.925.
[4] A. Gatial, S Sklenak, V. Milata, P. Klaeboe, S. Biskupicˇ,J. Jurasˇkova, Struct. Chem. 7 (1996) 17.
[5] J.J.P. Stewart, QCPE Bull. 3 (1983) 101.[6] R. Ahlrichs, M. Bar, M. Ehring, M. Haser, H. Horn, Ch.
Kolmel, A. Schafer, TURBOMOL Version 3.0, 1992.[7] S. Huzinaga, J. Chem. Phys. 42 (1965) 1293.[8] T.H. Dunning, J. Chem. Phys. 53 (1970) 2823.[9] K. Takagi, T. Kojima, J. Phys. Soc. Jpn 30 (1971) 1145.
[10] F.J. Lovas, F.O. Clark, E. Tiemann, J. Chem. Phys. 62 (1975)1925.
[11] D.B. Adams, J. Chem. Soc., Perkin Trans. 2 (1993) 567.[12] X. Zhou, J.A. Krauser, D.R. Tate, A.S. VanBuren, J.A.
Clark, P.R. Moody, R. Liu, J. Phys. Chem. 100 (1996)16822.
[13] J.A. Pople, H.B. Schlegel, R. Krishnan, D.J. Defrees, J.S.Binkley, M.J. Frisch, R.A. Whiteside, R.F. Hout, W.J.Hehre, Int. J. Quant. Chem. Symp. 15 (1981) 269.
[14] J.R. Durig, in: W. Kiefer, M. Cardona, G. Schaach, F.W.Schneider, H.W. Schro¨tter (Eds.), 13th Int. Conf. RamanSpectroscopy, Wiley, Chichester, 1992, pp. 44.
[15] P. Pulay, G. Fogarasi, G. Pongor, J.E. Boggs, A. Vargha,J. Am. Chem. Soc. 105 (1983) 7037.
[16] M. Kitano, K. Kuchitsu, Bull. Chem. Soc. Jpn 47 (1974)67.
[17] E. Hirota, R. Sugisaki, C.J. Nielsen, G.O. Sorensen, J. Mol.Spectrosc. 49 (1974) 251.
[18] M. Kitano, K. Kuchitsu, Bull. Chem. Soc. Jpn 47 (1974)631.
[19] M. Kitano, K. Kuchitsu, Bull. Chem. Soc. Jpn 46 (1973)3048.
[20] M. Kitano, T. Fukuyama, K. Kuchitsu, Bull. Chem. Soc. Jpn46 (1973) 384.
[21] G. Schultz, I. Hargittai, J. Phys. Chem. 97 (1993) 4966.[22] N.P.G. Roeges, A Guide to the Complete Interpretation of
A. Gatial et al. / Journal of Molecular Structure 509 (1999) 67–92 91

Infrared Spectra of Organic Structures, Wiley, Chichester,1994.
[23] T.S. Little, W. Zhao, J.R. Durig, J. Raman Spectrosc. 19(1988) 479.
[24] J.R. Durig, W. Zhao, T.S. Little, M. Dakkouri, Chem. Phys.128 (1988) 335.
[25] F.A. Miller, B.M. Harney, Spectrochim. Acta 27A (1971)1003.
A. Gatial et al. / Journal of Molecular Structure 509 (1999) 67–9292


![Vibrational energies for NH[sub 3] based on high level ab initio potential energy surfaces](https://img.pdfslide.net/doc/110x75/6324cd8a584e51a9ab0b3efe/vibrational-energies-for-nhsub-3-based-on-high-level-ab-initio-potential-energy.jpg)


