Embed Size (px)
Citation preview
Electronic copy available at: http://ssrn.com/abstract=1395565
First Draft: April 2008 This Draft: 27 April 2009
Comments welcome
Interest Rate Risk Estimation:
A New Duration-Based Approach
EMANUELE BAJO, MASSIMILIANO BARBI, AND DAVID HILLIER
Abstract
Duration is widely used by fixed income managers to proxy the interest rate risk of their assets and liabilities. However, it is well known that the convexity of the price-yield relationship introduces approximation errors that grow with changes in yield. In this paper we suggest a new approach, discrete duration, which significantly improves upon the accuracy of traditional duration methods and achieves a level of accuracy close to the more complex duration plus convexity. In particular, discrete duration performs particularly well for long dated and low coupon rate bonds, where the estimation error is impressively close to zero.
JEL classification: G10
Keywords: Duration; Interest Rate Risk; Hedging; Fixed Income.
The authors are from the University of Bologna (Bajo), Catholic University of Milan (Barbi), and University of Leeds (Hillier) respectively. Corresponding Author: Massimiliano Barbi, Catholic University of Milan, Italy; e-mail address: [email protected]. We would like to thank Marco Bigelli Charlie Cai, Allan Hodgson, and Qi Zhang for their helpful comments. All errors are our responsibility.
Electronic copy available at: http://ssrn.com/abstract=1395565
1
1. Introduction
This paper contributes to the fixed income literature by proposing a new
method of interest rate sensitivity, which we call discrete duration. Discrete
duration significantly improves upon the accuracy of the traditional
duration measure and matches or betters the more complex duration plus
convexity extension.
Duration hedging is a major building block of interest rate risk
management. A number of fixed income sensitivity indicators, including
the “price value of a basis point” (PV01) and the “yield value of a price
change” are situated within the duration framework [see Fabozzi, 2005].
Furthermore, the simplicity and intuitive interpretation of duration has
made it a popular interest rate risk management tool for treasury managers.
In particular, duration can be used to complement earnings at risk (EaR)
and gap analysis, since it summarizes, in a single number, the relevant
characteristics of future cash flows (size and timing). Finally, duration can
be used to measure the impact of an interest rate change on net shareholder
wealth [see Crouhy, Galai, and Mark, 2001].
Unfortunately, given the number of restrictive assumptions in
calculating duration, duration-based forecast errors of bond price
movements can be substantial. In response, two separate approaches have
been developed to minimize approximation errors arising from using
duration alone.
The first approach, which assumes perfect correlation between
prevailing rates at different maturities, introduces higher order terms into
the basic duration formula [for example, the duration plus convexity method of
2
Redington, 1952]. Alternatively, the efficiency of the original duration
formula may be improved [see for example, exponential duration (Livingston
and Zhou, 2005)].
The second approach removes the assumption of a parallel shift in the
yield curve and introduces a multifactor structure to represent the discount
rate function [see Litterman and Scheinkman, 1991; Nelson and Siegel,
1987; and Svensson, 1994], or adds additional risk factors to the standard
duration approach [Ho, 1992].
Generally, the second approach offers more realistic models.
However, the effort required to estimate a large number of parameters
makes it less convenient in most cases. It is therefore not surprising that
methodologies based on the first approach are still used in spite of their
lower accuracy.
This paper builds on existing duration-based techniques by introducing
a simple but highly effective transformation that significantly improves
upon the base measure and matches more complex methods. We carry
out a number of simulations to assess the robustness of the new measure
and stress test it for different types of bonds.
For example, when basic duration is used to predict bond price
changes, a 1 percent drop in bond yields produces a 0.39 percent
approximation error for a ten year coupon bond trading at par and a 4.68
percent error for a thirty year zero-coupon bond. Our method slashes the
respective estimation errors to 0.04 percent and 0.01 percent. In contrast,
duration plus convexity produces comparable results for the ten year
coupon bond (0.01 percent error), but undoubtedly a worse performance
3
than discrete duration in the case of the thirty year zero-coupon bond (0.46
percent).
In the next section, we review existing duration-based approaches and
introduce that discrete duration measure. Section 3 presents our main
simulation results, and Section 4 concludes.
2. Duration-Based Measures
In this section, we review the traditional and exponential measures of
duration. The new discrete duration measure is then introduced.
2.1 Traditional and exponential Duration
The price of a bond is a function of its yield-to-maturity, y, defined as the
internal rate of return that discounts the bond’s cash flows back to the
current price. Hence, the bond price, P0, can be expressed as
( ) ( )0
1 0 0
coupon face value
1 1
Tt T
t Tt
Py y=
= ++ +
∑ [1]
By Taylor series expansion we can evaluate the impact of a parallel shift
in the yield curve, from y0 to y0 + ∆y, on the bond value. The exact new
price is given by
( )011 0 !
0 0
d 1
d
n
n
n nn
P yP P y
y P
∞
=
= ∆∑ [2]
Truncating this series at a given order yields an approximate bond price
and, limited to the first or second order, is represented by equations [3] and
[4], respectively.
4
[ ]1 0 1DP P D y≈ − ⋅∆ [3]
& 211 0 21D CP P D y C y ≈ − ⋅∆ + ⋅∆ [4]
where D and C define Macaulay’s (1938) modified duration, equation [5],
and Redington’s (1952) modified convexity, equation [6].
( )
( ) ( )0
1 110 0 0 0
d coupon1 1 face value
d 1 1
Tt T
t Tt
P y t TD
y P P y y+ +
=
⋅ ⋅≡ − = +
+ + ∑ [5]
( ) ( )
( )
( )
( )
2
0
2 2210 0 0 0
d 1 coupon 1 face value1 1
d 1 1
Tt T
t Tt
P y t t T TC
y P P y y+ +
=
⋅ + ⋅ ⋅ + ⋅≡ = +
+ + ∑ [6]
Clearly, the approximation error is progressively reduced by adding
further terms to the Taylor series expansion in equation [2]. In other
words, the difference between the true bond price (equation [2]) and the
approximated bond price obtained through the basic duration
approximation (equation [3]) is always greater than the difference between
the true bond price and the duration-plus-convexity estimated price
(equation [4]).1
Recently, Livingston and Zhou (2005) have proposed a new measure,
called exponential duration, which improves upon the accuracy of the first-
order price approximation formula. With exponential duration, the bond
price in response to a change in its yield-to-maturity is approximated by
equation [7].
1 0 eED D yP P − ⋅∆≈ [7]
1 Note that the latter difference requires the absolute value since duration-plus-convexity overestimates (underestimates) the true bond price for positive (negative) interest rate changes. This is different from the basic duration approximation error which is always negative (Fabozzi, 2005).
5
The authors prove that this solution is more accurate than basic
duration (equation [3]). In fact, their exponential bond price function lies,
for any condition (time-to-maturity, coupon rate and yield-to-maturity
change), between the basic duration estimate and the true price function,
thus reducing the net approximation error. In some circumstances,
exponential duration also produces estimates close to duration plus
convexity.
2.2 Discrete duration
Although exponential duration produces smaller approximation errors
relative to the basic duration approach, in the event of significant interest
rate changes or when applied to low-coupon bonds, it generates
unsatisfactory forecasts.
For example, a ten year 5 percent coupon bond trading at par generates
forecast errors of -8 basis points, -36 basis points, and -88 basis points for a
1 percent, 2 percent and 3 percent fall in bond yields when using
exponential duration. Similarly, for a 1, 2, and 3 percent increase in bond
yields, exponential duration produces forecast errors of −6 basis points, −26
basis points, and −52 basis points.
For a 30 year zero-coupon bond, errors are even larger. A fall in the
bond yield of 1, 2, and 3 percent leads to forecast errors of -18 basis points,
-98 basis points, and -296 basis points, respectively. Bond yield increases
incur less of an error, but are significant nonetheless. For the same bond,
a 1, 2, and 3 percent jump in bond yields results in forecast errors of -10
basis points, -30 basis points, and -51 basis points, respectively.
6
As these examples show, the exponential approximation always
produces an underestimation of the actual bond price. In fact, much of the
error in exponential duration is caused by a mismatch between the discrete
compounding used to construct duration and the continuous
transformation used in equation [7]. A more appropriate transformation is
give by equation [8], which uses discrete compounding, hence the name
discrete duration.
( )1 0 1DDDP P y
−≈ + ∆ [8]
It can be shown (the proof is presented in the Appendix) that the
absolute value of the approximation error stemming from equation [8] is
always smaller than that of exponential duration. In the next section, we use
simulation methods to demonstrate the dominance of discrete duration
over other first-order solutions for a variety of bond types.
3. Simulations
3.1 Base analysis
To assess the accuracy of our method we first take into consideration a ten
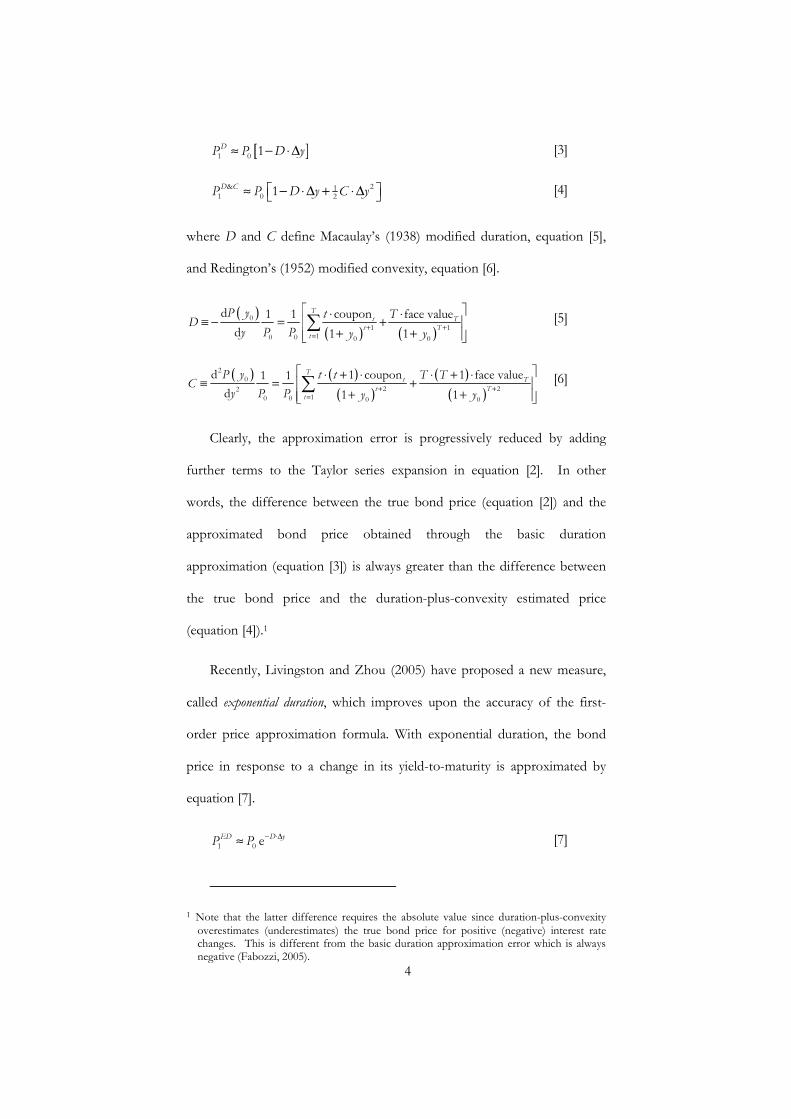
year, five percent, coupon bond, trading at par. Figure 1 presents the
approximation error (in basis points) of the different duration-based
approaches.
Ignoring basic duration, which always leads to large forecast errors for
significant jumps in bond yield, discrete duration always performs better
than exponential duration and frequently betters duration plus convexity.
7
For the simulation domain, the error obtained through exponential
approximation is roughly twice as large as discrete duration.
For a 1, 2, and 3 percent drop in yield-to-maturity, discrete duration
underestimates the true bond price by 4, 18, and 43 basis points compared
to exponential duration, which underestimates the true bond price by 8, 36,
and 88 basis points, respectively.
Discrete duration has comparable performance to that of duration plus
convexity. Duration plus convexity produces better forecasts for drops
in yield to maturity of less than 3 percent. However, for large drops
(greater than 3 percent) and most increases in yield to maturity, discrete
duration performs markedly better. Moreover, the dominance of discrete
duration over all other approximation methods becomes greater as the
jumps in yield get higher. Finally, while duration plus convexity
overestimates bond values for any growth in bond yield, discrete duration
always remains below zero. This is a particularly important characteristic
for prudent fixed income managers.
3.2 The effect of term to maturity
In this, and the next, subsection, we extend the core analysis to consider the
impact of yield to maturity and coupon rate on the performance of discrete
duration.
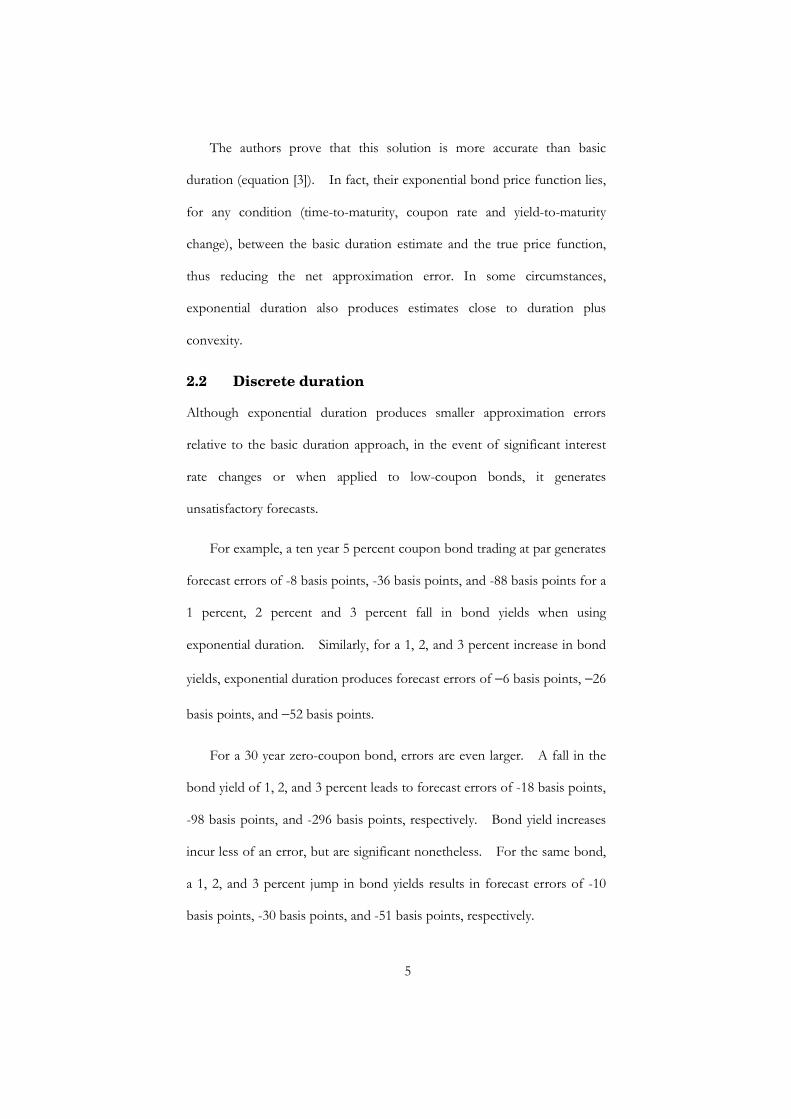
Figure 2 shows the difference between the discrete duration and
exponential duration approximation errors for a 5 percent coupon par bond
with different terms to maturity. For any yield change and term to
8
maturity combination, discrete duration always performs better than
exponential duration. For small changes in the bond yield, both
approaches are comparable, but this is not the case for large yield jumps.
For example, with a 30 year, 5 percent, par bond, discrete duration
guarantees an increase in accuracy equal to 10 basis points for a 1 percent
yield drop, but four and ten times as much for 2 percent and 3 percent falls
in yield to maturity. Figure 2 markedly shows the improvement in
performance of discrete duration for drops in the bond yield. However,
the most important insight is that, regardless of the change in yields or term
to maturity, discrete duration always provides a more efficient
approximation of the bond price function compared to exponential
duration for any term to maturity and yield change.
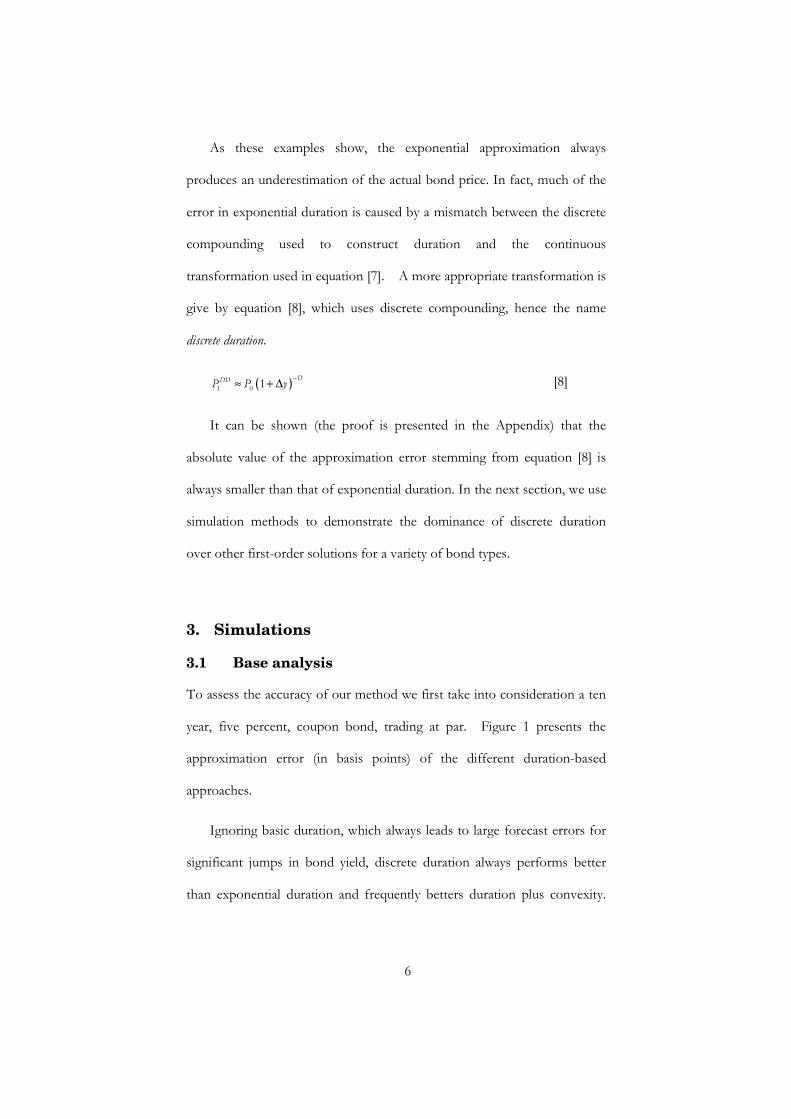
Figure 3 presents a comparison of the performance of discrete duration
against duration plus convexity for bonds of different terms to maturity.
For small yield changes, the difference is virtually zero. For larger jumps,
the behavior of the two methods is widely divergent and strengthens as
term to maturity gets bigger.
In general, discrete duration leads to higher accuracy for upward
interest rate movements, whilst it underperforms duration plus convexity
when the bond yield falls. Similar to Figure 2, the difference gets more
pronounced as term to maturity grows. However, this difference tends to
remain steady and only peaks up (for about 400 basis points) or down (for
about 200 basis points) as a response to a jump of yield to maturity above
or below 3 percent.
3.3 Premium and discount bonds
9
Another important bond characteristic that affects the curvature of the
bond price function is the coupon rate relative to the yield to maturity.
We now compare the precision of discrete duration, exponential duration,
and duration plus convexity for a premium bond (10 percent coupon rate)
and a discount (zero coupon) bond. The yield to maturity is still assumed
to be 5 percent.
A 10 percent coupon rate may appear unrealistic if compared to the
yield to maturity of 5 percent. However, our objective is to show the
performance of duration-based approximation on a bond that is far from
parity, and once we establish the error pattern for this and a par bond, the
approximation error of any other bond can be inferred.
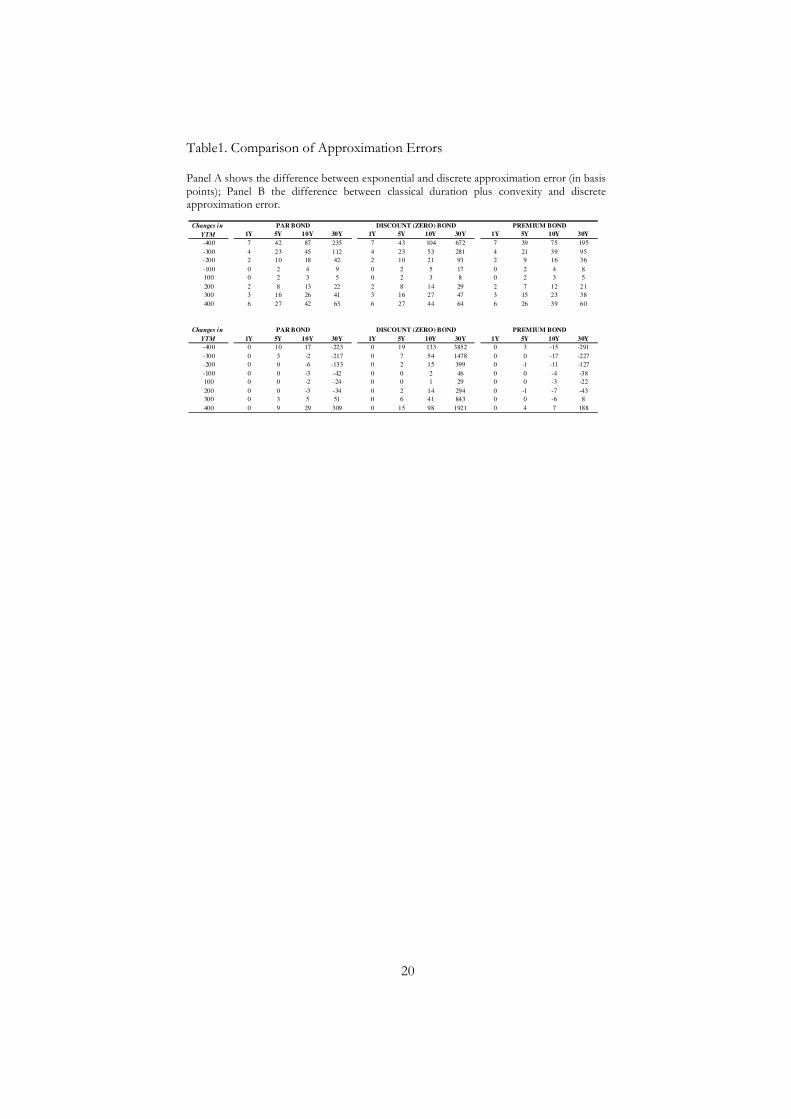
Table 1 reports the error difference (in basis points) between
exponential duration, discrete duration, and duration plus convexity, for a
par, zero-coupon, and premium bond for different levels of time-to-
maturity. Starting with the latter, our simulation results clearly indicate the
higher accuracy of discrete duration relative to exponential duration.
For example, in the event of a 1 percent drop in yield to maturity, the
error difference between the two methods2 for the premium bond is 2
basis points with five years to maturity, 4 basis points with ten years to
maturity and 8 basis points with thirty years to maturity. The par bond
leads to a similar relative performance of 2, 4, and 9 basis points.
Larger changes bring relatively greater differences. For example,
assuming a 3 percent drop in yield to maturity, the same errors for a
2 Measured as the exponential duration forecast error minus discrete duration forecast error.
10
premium (par) bond becomes 21 (23), 39 (45) and 95 (112) basis points for
maturities of 5, 10 and 30 years, respectively.
More interesting is the scenario for zero-coupon bonds. For positive
changes in interest rates, discrete duration is slightly more accurate than
exponential duration, particularly for long-dated bonds. The performance
of discrete duration improves by 3 basis points (from 5 basis points to 8
basis points) when there is a 1 percent increase in yield to maturity for a
thirty year zero-coupon bond. A 2 percent increase in yield to maturity
improves the relative performance between discrete duration and
exponential duration by 7 basis points (from 22 to 29 basis points).
With a drop in yield to maturity, the precision of discrete duration is
notably better, especially for long dated zero-coupon bonds where the
forecast error of discrete duration is half that of exponential duration.
3.3.1 A closer look at zero-coupon bonds
The basic duration model is unable to precisely estimate the interest-rate
risk for low coupon bonds with high term to maturity. A simple numeric
example, based on a 30 year zero-coupon bond will help to illustrate the
magnitude of the potential problem. A 1 percent drop in yield to maturity
causes a duration approximation error equal to -468 basis points. Even with
duration plus convexity, the approximation error is -46 basis points.
Hence, even the use of a two-factor approximation does not fully
mitigate the approximation error, potentially leading to a misspecification
and underperformance of hedging strategies based on the duration method.
11
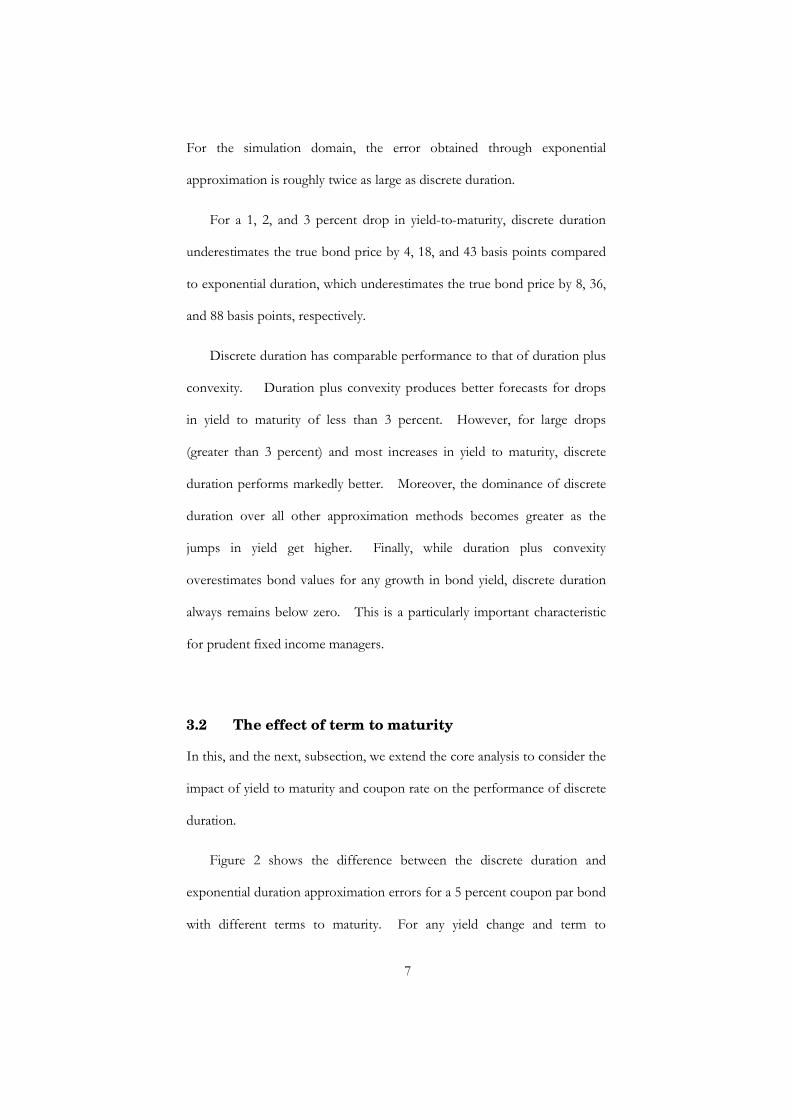
For such reason, we now focus on a long-dated zero-coupon bond to
illustrate the advantage of discrete duration.
Figure 4 presents the approximation error produced by different
duration-based approximation methods for a 30 year zero coupon bond
around a narrower yield change window of (-100, +100) basis points. It is
immediately visible that, with the exception of discrete duration, all the
duration-based methods are unsuccessful in measuring the price change in
response to a fluctuation of interest rates.
The performance of discrete duration is fairly impressive since the
continuous error line in Figure 4 lies just slightly above the x-axis. The data
reported below the graph also indicate that, for any yield change within the
considered interval, the discrete duration approximation error is contained
between 0 and 1 bps.
Recalling the previous example, a 1 percent yield drop would lead
to a 46 basis point error if duration-plus-convexity is used, 18 basis points
with exponential duration and only 1 basis point with discrete duration
method. Furthermore, the higher accuracy of discrete duration is not
constrained to only negative yield changes.
4. Conclusions
Money and bond market managers use duration to implement trading and
hedging strategies. However, duration provides only an approximate
measure of interest-rate risk and generates significant estimation bias for
large yield shifts, particularly with long-dated and low-coupon bonds.
12
The use of second-order Taylor series approximation (convexity)
leads to a substantial reduction in estimation error, but requires the
computation of an additional risk factor. Moreover, duration plus
convexity can lead to significant errors for particular yield change-bond
characteristic combinations. For instance, in the event of a 1 percent fall
in bond yields, the price estimation via duration plus convexity for a 30 year
zero-coupon bond is about fifty basis points, which cannot be considered a
negligible error.
Recently, Livingston and Zhou (2005) have proposed a new
duration-based approach for the estimation of bond price. The authors
show how an exponential transformation of classical duration produces a
more accurate price forecast. However, as the authors point out, the
exponential approximation always underestimates the actual bond price and
frequently, duration plus convexity, leads to lower forecast errors.
We introduce and test a new duration measure, which we call
discrete duration, and show that it outperforms all other methods for a
large set of different bond characteristic and yield change scenarios.
Discrete duration dominates exponential duration in all simulations, and
performs exceptionally well against duration plus convexity. Generally,
discrete duration is more accurate than duration plus convexity for upward
yield curve shifts and, with low coupon bonds, for any interest rate
movement.
13
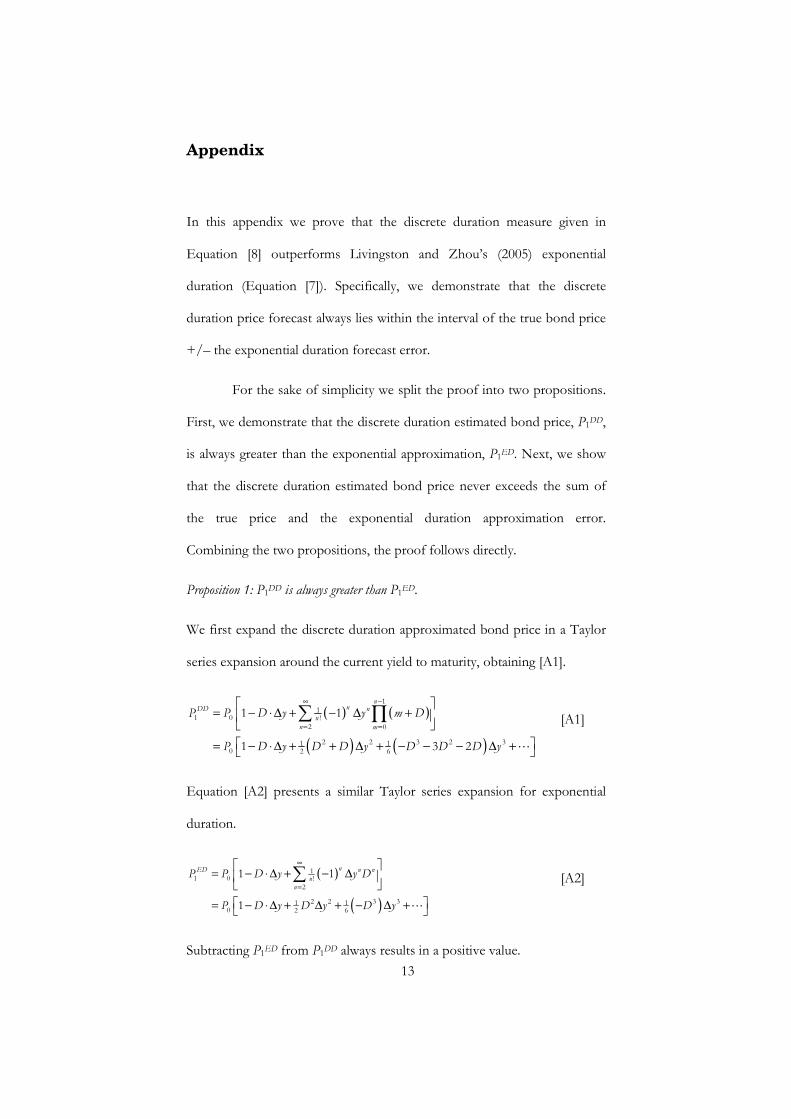
Appendix
In this appendix we prove that the discrete duration measure given in
Equation [8] outperforms Livingston and Zhou’s (2005) exponential
duration (Equation [7]). Specifically, we demonstrate that the discrete
duration price forecast always lies within the interval of the true bond price
+/– the exponential duration forecast error.
For the sake of simplicity we split the proof into two propositions.
First, we demonstrate that the discrete duration estimated bond price, P1DD,
is always greater than the exponential approximation, P1ED. Next, we show
that the discrete duration estimated bond price never exceeds the sum of
the true price and the exponential duration approximation error.
Combining the two propositions, the proof follows directly.
Proposition 1: P1DD is always greater than P1ED.
We first expand the discrete duration approximated bond price in a Taylor
series expansion around the current yield to maturity, obtaining [A1].
( ) ( )
( ) ( )
11
1 0 !2 0
2 2 3 2 31 10 2 6
1 1
1 3 2
nnDD n
n
n m
P P D y y m D
P D y D D y D D D y
−∞
= =
= − ⋅∆ + − ∆ +
= − ⋅∆ + + ∆ + − − − ∆ +
∑ ∏
�
[A1]
Equation [A2] presents a similar Taylor series expansion for exponential
duration.
( )
( )
11 0 !
2
2 2 3 31 10 2 6
1 1
1
nED n n
n
n
P P D y y D
P D y D y D y
∞
=
= − ⋅ ∆ + − ∆
= − ⋅ ∆ + ∆ + − ∆ +
∑
�
[A2]
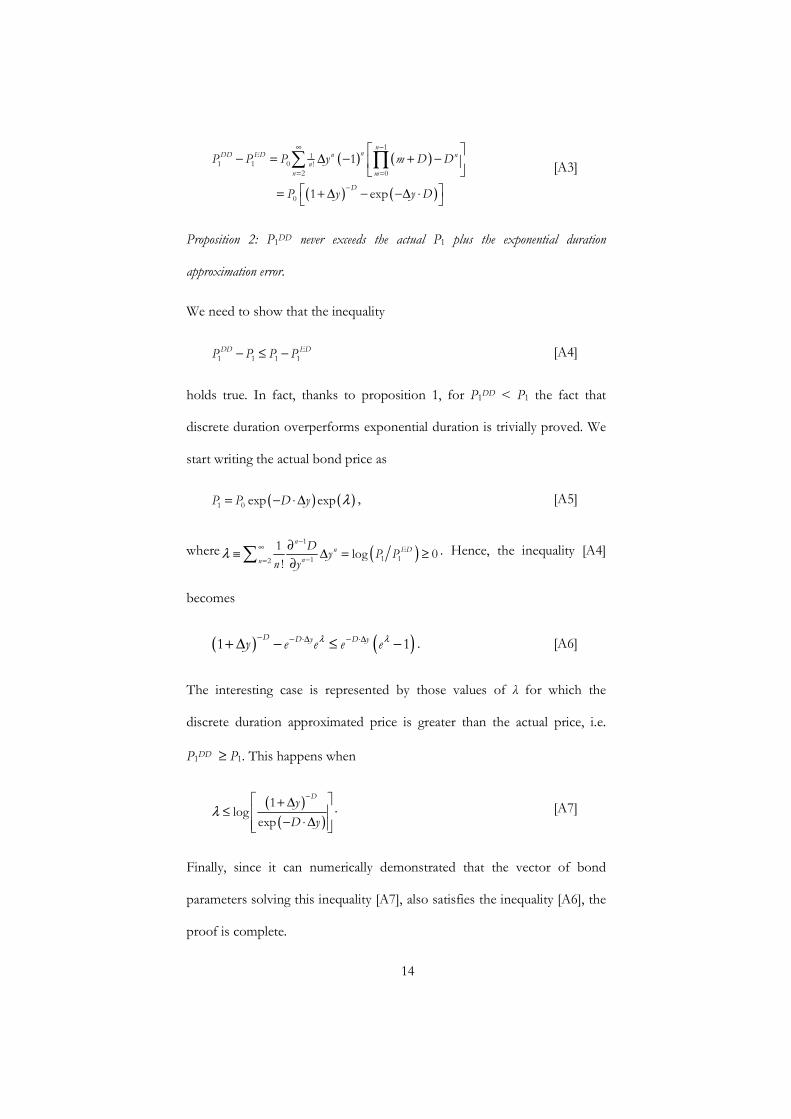
Subtracting P1ED from P1DD always results in a positive value.
14
( ) ( )
( ) ( )
11
1 1 0 !2 0
0
1
1 exp
nnDD ED n n
n
n m
D
P P P y m D D
P y y D
−∞
= =
−
− = ∆ − + −
= + ∆ − −∆ ⋅
∑ ∏ [A3]
Proposition 2: P1DD never exceeds the actual P1 plus the exponential duration
approximation error.
We need to show that the inequality
1 1 1 1DD EDP P P P− ≤ − [A4]
holds true. In fact, thanks to proposition 1, for P1DD < P1 the fact that
discrete duration overperforms exponential duration is trivially proved. We
start writing the actual bond price as
( ) ( )λ= − ⋅∆1 0 exp expP P D y , [A5]
where ( )λ−
∞
−=
∂≡ ∆ = ≥
∂∑
1
1 112
1log 0
!
nn ED
nn
Dy P P
n y. Hence, the inequality [A4]
becomes
( ) ( )λ λ− − ⋅∆ − ⋅∆+ ∆ − ≤ −1 1D D y D yy e e e e . [A6]
The interesting case is represented by those values of λ for which the
discrete duration approximated price is greater than the actual price, i.e.
P1DD ≥ P1. This happens when
( )
( )λ
− + ∆≤
− ⋅∆
1log
exp
Dy
D y. [A7]
Finally, since it can numerically demonstrated that the vector of bond
parameters solving this inequality [A7], also satisfies the inequality [A6], the
proof is complete.
15
References
Crouhy, M., Galai, D. and R. Mark, 2001, Risk Management, McGraw-Hill Professional.
Fabozzi, F.J., 2005, The Handbook of Fixed Income Securities, 7th Ed., McGraw-Hill.
Ho, T.S.Y., 1992, Key Rate Durations: Measures of Interest Rate Risks, Journal of Fixed Income 12, 41-50.
Litterman, R. and J. Scheinkman, 1991, Common Factors Affecting Bond Returns, Journal of Fixed Income 1, 54-61.
Livingston, M. and L. Zhou, 2005, Exponential Duration: A More Accurate Estimation of Interest Rate Risk, Journal of Financial Research 28, 343-361.
Macaulay, F., 1938, Some Theoretical Problems Suggested by the Movement of Interest Rates, Bonds, Yields, and Stock Prices in the United States Since 1856, Columbia University Press.
Nelson, C.R. and A.F. Siegel, 1987, Parsimonious Modeling of Yield Curves, Journal of Business 60, 473-489.
Redington, F.M., 1952, Review of the Principles of Life Office Valuations, Journal of the Institute of Actuaries 78, 286-315.
Svensson, L., 1994, Estimating and Interpreting Forward Interest Rates: Sweden 1992-94, CEPR Discussion Paper 1051.
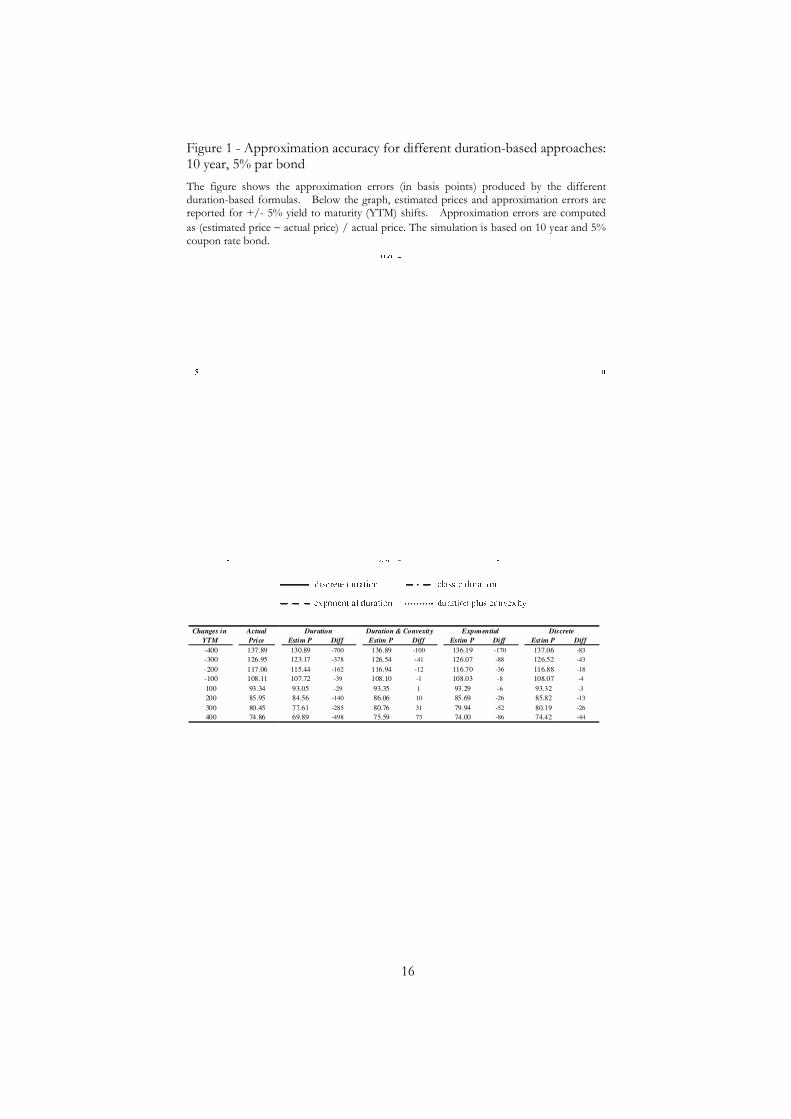
Figure 1 - Approximation accuracy for differen10 year, 5% par bond
The figure shows the approximation errors (in basis points) produced by duration-based formulasreported for +/- 5% yield to maturity (YTM) shifts. Approximation errors are com
as (estimated price −coupon rate bond.
Changes in Actual
YTM Price
-400 137.89
-300 126.95
-200 117.06
-100 108.11
100 93.34
200 85.95
300 80.45
400 74.86
16
Approximation accuracy for different duration-based approaches: par bond
The figure shows the approximation errors (in basis points) produced by the different based formulas. Below the graph, estimated prices and approximation errors are
% yield to maturity (YTM) shifts. Approximation errors are com
− actual price) / actual price. The simulation is based on 10 year and 5%
Estim P Diff Estim P Diff Estim P Diff Estim P
130.89 -700 136.89 -100 136.19 -170 137.06
123.17 -378 126.54 -41 126.07 -88 126.52
115.44 -162 116.94 -12 116.70 -36 116.88
107.72 -39 108.10 -1 108.03 -8 108.07
93.05 -29 93.35 1 93.29 -6 93.32
84.56 -140 86.06 10 85.69 -26 85.82
77.61 -285 80.76 31 79.94 -52 80.19
69.89 -498 75.59 73 74.00 -86 74.42
Duration Duration & Convexity DiscreteExponential
based approaches:
the different Below the graph, estimated prices and approximation errors are
% yield to maturity (YTM) shifts. Approximation errors are computed
actual price) / actual price. The simulation is based on 10 year and 5%
Diff
-83
-43
-18
-4
-3
-13
-26
-44
Discrete
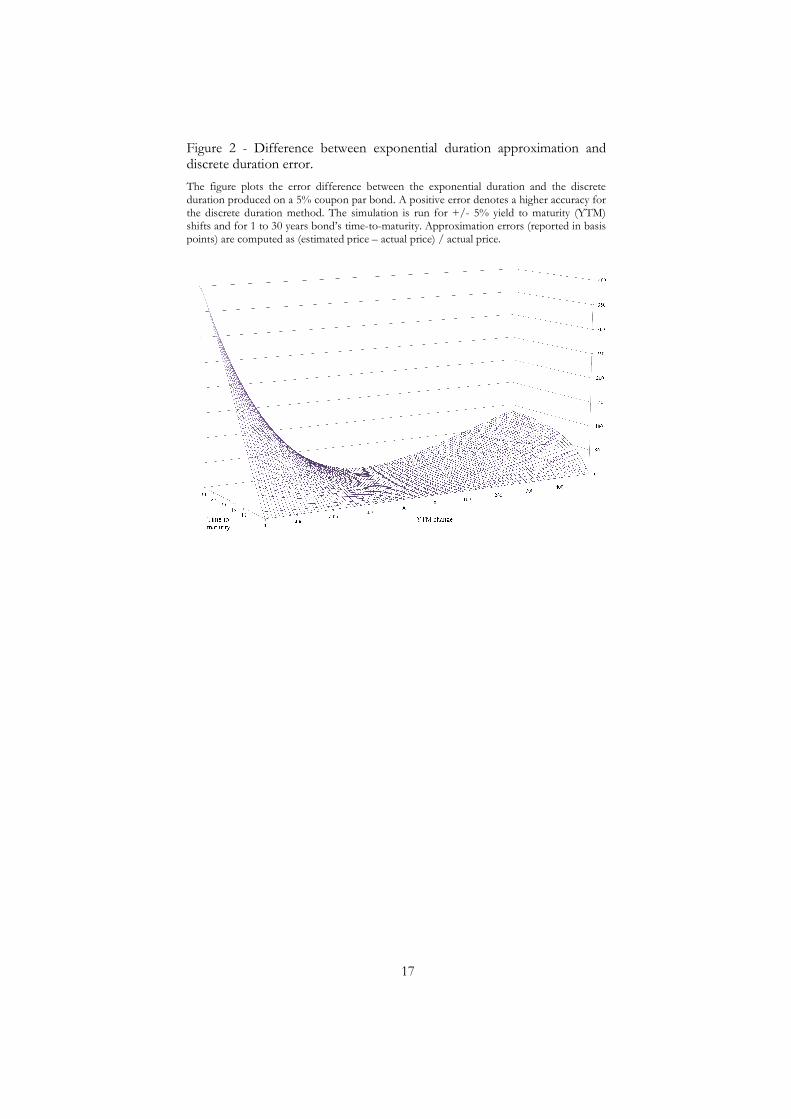
Figure 2 - Difference between exponential duration approximation and discrete duration error.
The figure plots the error difference between the exponential duration and the discrete duration produced on a 5% coupon par bond. A positive error denotes a higher accuracy for the discrete duration method. The simulation is run for shifts and for 1 to 30 years bond’s timepoints) are computed as (estimated price
17
Difference between exponential duration approximation and discrete duration error.
The figure plots the error difference between the exponential duration and the discrete duration produced on a 5% coupon par bond. A positive error denotes a higher accuracy for the discrete duration method. The simulation is run for +/- 5% yield to maturishifts and for 1 to 30 years bond’s time-to-maturity. Approximation errors (reported in basis points) are computed as (estimated price – actual price) / actual price.
Difference between exponential duration approximation and
The figure plots the error difference between the exponential duration and the discrete duration produced on a 5% coupon par bond. A positive error denotes a higher accuracy for
% yield to maturity (YTM) maturity. Approximation errors (reported in basis
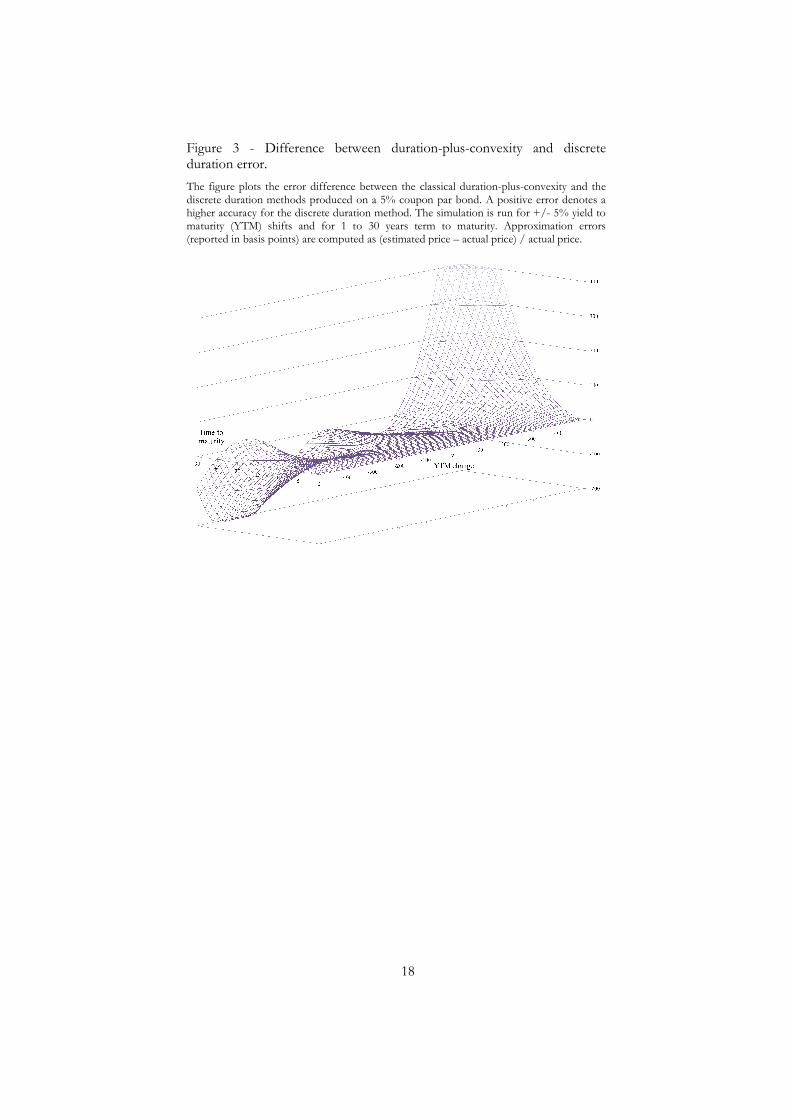
Figure 3 - Difference between durationduration error.
The figure plots the error difference between the classical durationdiscrete duration methods produced on a 5% coupon par bond. A positive error denotes a higher accuracy for the discrete duration method. The simulation is run for maturity (YTM) shifts and for 1 to 30 years (reported in basis points) are computed as (estimated price
18
Difference between duration-plus-convexity and discrete
The figure plots the error difference between the classical duration-plus-convexity and the discrete duration methods produced on a 5% coupon par bond. A positive error denotes a
her accuracy for the discrete duration method. The simulation is run for +/- 5maturity (YTM) shifts and for 1 to 30 years term to maturity. Approximation errors (reported in basis points) are computed as (estimated price – actual price) / actual
convexity and discrete
convexity and the discrete duration methods produced on a 5% coupon par bond. A positive error denotes a
5% yield to maturity. Approximation errors
price.
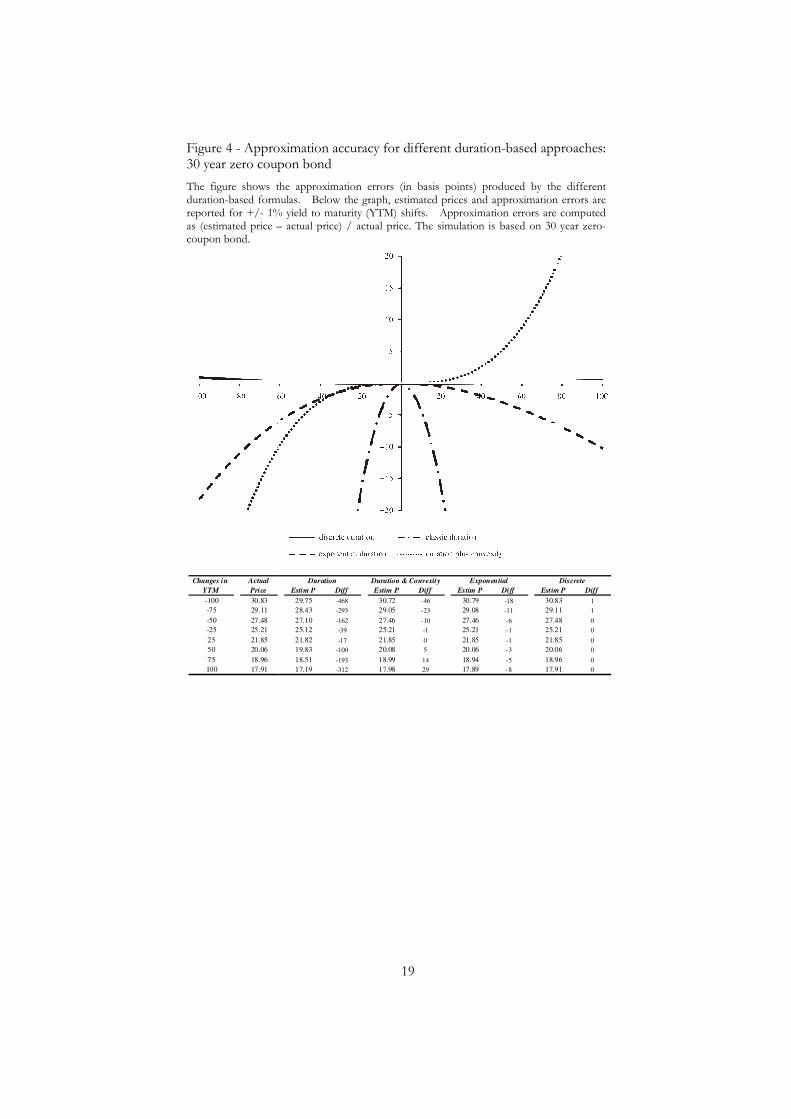
Figure 4 - Approximation accuracy for different duration30 year zero coupon
The figure shows the approximation errors (in basis points) produced by the duration-based formulas. reported for +/- 1% yield to maturity (YTM) shifts. Approximation errors are computed as (estimated price –coupon bond.
Changes in Actual
YTM Price
-100 30.83
-75 29.11
-50 27.48
-25 25.21
25 21.85
50 20.06
75 18.96
100 17.91
19
Approximation accuracy for different duration-based approaches: 0 year zero coupon bond
The figure shows the approximation errors (in basis points) produced by the based formulas. Below the graph, estimated prices and approximation errors are
1% yield to maturity (YTM) shifts. Approximation errors are computed – actual price) / actual price. The simulation is based on 30 year zero
Estim P Diff Estim P Diff Estim P Diff Estim P
29.75 -468 30.72 -46 30.79 -18 30.83
28.43 -293 29.05 -23 29.08 -11 29.11
27.10 -162 27.46 -10 27.46 -6 27.48
25.12 -39 25.21 -1 25.21 -1 25.21
21.82 -17 21.85 0 21.85 -1 21.85
19.83 -100 20.08 5 20.06 -3 20.06
18.51 -193 18.99 14 18.94 -5 18.96
17.19 -312 17.98 29 17.89 -8 17.91
Duration Duration & Convexity Exponential
based approaches:
The figure shows the approximation errors (in basis points) produced by the different Below the graph, estimated prices and approximation errors are
1% yield to maturity (YTM) shifts. Approximation errors are computed actual price) / actual price. The simulation is based on 30 year zero-
Estim P Diff
30.83 1
29.11 1
27.48 0
25.21 0
21.85 0
20.06 0
18.96 0
17.91 0
Discrete
20
Table1. Comparison of Approximation Errors
Panel A shows the difference between exponential and discrete approximation error (in basis points); Panel B the difference between classical duration plus convexity and discrete approximation error.
Changes in
YTM 1Y 5Y 10Y 30Y 1Y 5Y 10Y 30Y 1Y 5Y 10Y 30Y
-400 7 42 87 235 7 43 104 672 7 39 75 195
-300 4 23 45 112 4 23 53 281 4 21 39 95
-200 2 10 18 42 2 10 21 93 2 9 16 36
-100 0 2 4 9 0 2 5 17 0 2 4 8
100 0 2 3 5 0 2 3 8 0 2 3 5
200 2 8 13 22 2 8 14 29 2 7 12 21
300 3 16 26 41 3 16 27 47 3 15 23 38
400 6 27 42 63 6 27 44 64 6 26 39 60
Changes in
YTM 1Y 5Y 10Y 30Y 1Y 5Y 10Y 30Y 1Y 5Y 10Y 30Y
-400 0 10 17 -223 0 19 133 3852 0 3 -15 -291
-300 0 3 -2 -217 0 7 54 1478 0 0 -17 -227
-200 0 0 -6 -133 0 2 15 399 0 -1 -11 -127
-100 0 0 -3 -42 0 0 2 46 0 0 -4 -38
100 0 0 -2 -24 0 0 1 29 0 0 -3 -22
200 0 0 -3 -34 0 2 14 294 0 -1 -7 -43
300 0 3 5 51 0 6 41 843 0 0 -6 8
400 0 9 29 309 0 15 98 1921 0 4 7 188
PAR BOND DISCOUNT (ZERO) BOND PREMIUM BOND
PAR BOND DISCOUNT (ZERO) BOND PREMIUM BOND


