Embed Size (px)
Citation preview
Inventories and Output VolatilityPaula R. Worthington
Working Papers SeriesResearch Department(WP-99-21)
Federal Reserve Bank of Chicago
Working Paper Series
Inventories and output volatility
Paula R. WorthingtonEconomic Research DepartmentFederal Reserve Bank of Chicago
230 South LaSalleChicago, Illinois 60604
(312) [email protected]
This draft: December 1998
Abstract: Analyzing disaggregate data on inventories and sales from the U.S. manufacturing andtrade sector between 1960 and 1997 yields four main findings. First, I find that IS ratios aresomewhat lower after 1984:1 among durable goods manufacturers and durable goods retailersoutside the motor vehicle industry. Second, I find that industries which have lowered their ISratios tend to be those in which the variance of output relative to sales has declined. Third, bydecomposing the variance of output into its components, I find that the variance of sales is lessimportant, and the variance of inventory investment is more important, after 1984:1 than in earlieryears for the overall manufacturing and trade sector. Finally, the evidence suggests that industrieswhere IS ratios fell are those where inventory investment volatility played a smaller role in outputvolatility in the later period.
The author would like to thank Thomas Klier, Helen Koshy, David Marshall, Dan Sullivan, and seminar participants atthe Federal Reserve Bank of Chicago and the October 1998 meetings of the Illinois Economic Association for valuablediscussions and comments and Kenneth Housinger for excellent research assistance. The views expressed in this paperare strictly those of the author, and they do not necessarily represent the position of the Federal Reserve Bank of Chicagoor the Federal Reserve System.
Introduction
Are business cycles less pronounced now than in earlier years? Several studies offer
evidence of decreased aggregate volatility in recent years, and business analysts, too, often claim
that future business cycles are likely to feature shorter, less pronounced contractions than earlier
cycles displayed. For example, McConnell and Quiros (1997) present informal evidence that
post-war GDP volatility declined in the early 1980s, and they specifically find evidence of a one-
time decline in the volatility of post-war GDP in 1984:1. Suggested reasons for such changes in
output volatility or cyclicality are many and varied, but one item on nearly every "short list" of
factors is the widespread embrace of just-in-time inventory management techniques by U.S. firms.
For example, the Economist (1998) writes:
What is clear, however, is that the economic cycle has become less bumpy than it used tobe...There are several possible explanations for the taming of the businesscycle....[including] better inventory control through just-in-time techniques and the use ofcomputers.
Similarly, McConnell and Quiros (1997) point to a decline in the share of inventory investment in
GDP fluctuations as a possible source of the output volatility decline.
In this paper, I investigate the relationship between inventory holdings and output
volatility at the industry level. I use detailed data from the U.S. manufacturing and trade (M&T)
sector from 1960 to 1997, and I relate inventory-sales ratios to several measures of output and
inventory volatility. I focus on output volatility because swings in business inventory
accumulation have historically accounted for large fractions of GDP volatility. In particular, I
take as given the breakpoint identified by McConnell and Quiros (1997) and compare inventory
behavior before and after 1983:4. In brief, I find that IS ratios are somewhat lower in the later
period among durable goods manufacturers and durable goods retailers outside the motor vehicle
2
industry. I also find that in the manufacturing and retail sectors, the industries which have
lowered their IS ratios tend to be the ones whose output variance (relative to the variance of
sales) has declined. Third, by decomposing the variance of output into its components, I find that
the variance of sales is less important, and the variance of inventory investment is more important,
in the later period than in the earlier period for the overall manufacturing and trade sector. One
prominent exception in the manufacturing sector is the motor vehicles industry, where inventory
investment variance declined. In retailing, the contribution of inventory investment variance
nearly trebled, rising from 20.7% to 59.3% between the earlier and later periods, suggesting an
increased role for inventory investment fluctuations in that sector. Overall, the evidence suggests
that industries where IS ratios fell are those where inventory investment volatility played a smaller
role in output volatility in the later period.
Facts and theories about inventories
Economists care about inventory behavior because, historically, swings in inventory
investment have played a prominent role in cyclical fluctuations. In brief, inventory investment is
highly volatile and contributes significantly to recessionary declines in GDP, and inventory-sales
(IS) ratios are strongly countercyclical, rising during recessions and falling in expansions. In fact,
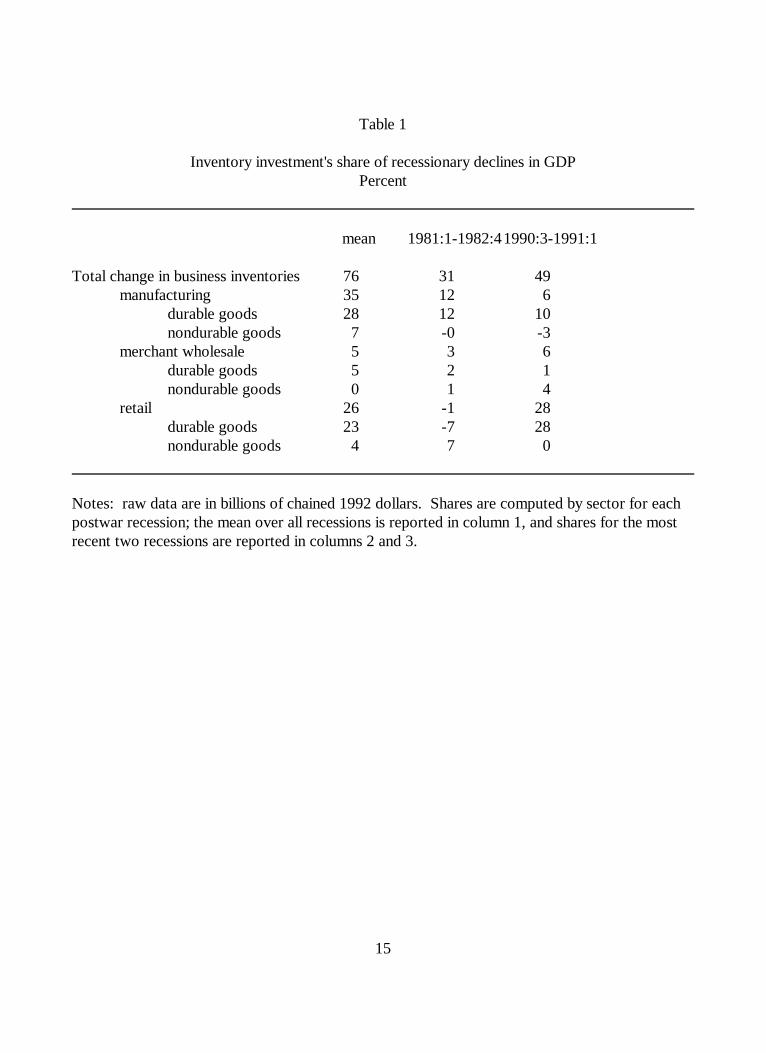
inventory disinvestment is a central part of cyclical contractions. Table 1 reports the average
post-war contribution of changes in inventory accumulation ("inventory disinvestment") to the
peak-to-trough decline in GDP during contractions. The table shows that the decline in inventory
investment accounted for 76 percent of GDP's decline in the average post-war recession. The
table reveals three features of the data. First, the manufacturing and retail sectors dominate the
wholesale trade sector, accounting for most of the inventory effect, with retailers accounting for
3
about one- third (.26/.76) of the total contribution.1 Second, firms in the durable goods sectors
account for most of the impact. Third, during the two most recent recessions, the role of durable
goods manufacturers was quite muted, as their inventory disinvestment during those episodes
accounted for a below-average 11% of the total contraction in GDP. In contrast, the retail sector
was of little consequence in the 1981-1982 recession, but key in the 1990-1991 recession. On
balance, table 1's evidence suggests that durables goods inventories held by manufacturers and
retailers are key to any analysis of the cyclical behavior of inventories.
1Although not shown in the table, the shares for the three categories of inventories held by
manufacturers, namely materials, goods in process, and finished goods, confirm Blinder andMaccini's (1991) finding that finished goods inventories account for little of the total contribution(6% post-war average) despite being the focus of much economic research. In contrast, goods inprogress and, to a lesser extent, materials and supplies held by manufacturers are more important.
4
The two major competing models of inventory behavior, production smoothing models
and S,s threshold-type models, offer competing predictions about two key aspects of inventories,
namely the variance of output relative to sales and the correlation between sales and inventory
investment; see Fitzgerald (1997) or Hornstein (1998) for useful discussions.2 In production
smoothing models, output is predicted to be less (more) variable than sales, when shocks are
solely on the demand (cost) side. Such models also typically predict a negative covariance
between sales and inventory investment. In contrast, generalized S,s models do not offer
predictions on these points (Hornstein (1998)), though with specific assumptions about
aggregation and other model features, such models do offer specific predictions. For example,
McCarthy and Zakrajsek (1997) develop an S,s model in which output is predicted to be more
variable than sales and in which sales and inventory investment should be uncorrelated.
Data
The data used in this paper are quarterly inventories and sales (shipments) data, in chained
1992 billions of dollars, from the U.S. Department of Commerce, for the manufacturing and trade
sectors. Manufacturing includes 21 separate industries (essentially 2-digit SIC industries), the
merchant wholesale sector includes 19 industries, and the retail trade sector includes 13 sectors.3
I construct output as the sum of shipments and inventory investment, and the inventory-sales ratio
2For retailers and wholesalers, the terms "production" and "output" are taken to mean
deliveries of goods from their suppliers. In this paper, I will use these terms interchangeably todenote output in the manufacturing sector and deliveries in the trade sector.
3Data on the detailed sectors is available in manufacturing and retail from 1959 onwards;detailed wholesale sectors have data only from 1967 forward. Unless otherwise noted, the paper'scalculations will use the 1960-1997 period, thus will include wholesale trade only at the level ofdurable and nondurable goods.
5
is denominated in months. Because it is the business cycle aspects of inventory investment which
are of most interest, the data are detrended using the Hodrick-Prescott filter.4
Have inventory-sales ratios fallen?
4See Hodrick and Prescott (1997), and also see Hornstein (1998) for a more general
discussion of detrending, extracting the appropriate frequencies from the data, and so on.
6
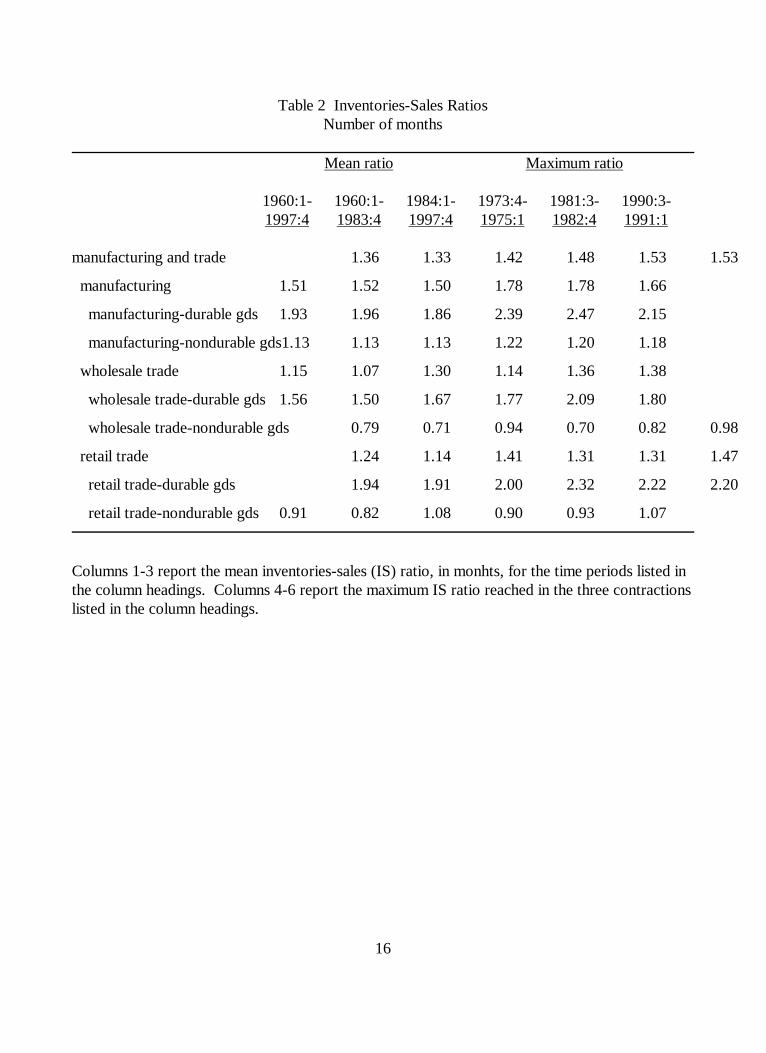
Table 2 reports inventory-sales (IS) ratios by sector over several alternative time periods,
with period means reported in columns 1 through 3 and cyclical highs reported in columns 4
through 6.5 Turning first to the means, we find that IS ratios are higher in durable goods
industries than in nondurable goods industries and that ratios are highest among durable goods
manufacturers. Further, comparing the early period (1960:1-1983:4) to the later period (1984:1-
1997:4), we see that IS ratios have not fallen overall; in fact, they have risen. Only among durable
goods manufacturers, on average, did IS ratios fall, with the greatest declines occurring in SIC
industries 35 (industrial and commercial machinery and computer equipment), 371 (motor
vehicles and equipment), and 38 (instruments). In the retail sector, motor vehicle IS ratios rose
from 1.55 to 1.85 months, while all other durable goods retailers saw IS ratios fall.
Columns 4 through 6 offer another perspective on whether IS ratios have dropped in
recent years. The table shows that the overall M&T IS ratio peaked at about the same point in
each of the three recessions reported in the table: 1.48 in the 1973-1975 recession, and 1.53 in
the 1981-1982 and 1990-1991 recessions. From that perspective, little has changed. However,
durable goods firms saw the cyclical highs fall in the last recession relative to the preceding one,
especially in the manufacturing sector. Furthermore, the three broadest sectors exhibit different
patterns: in manufacturing, the cyclical maximum fell; in wholesale, it was basically unchanged;
and in retail, it rose. Again, one interesting aspect is how motor vehicle-related inventories
behaved: in manufacturing (SIC 371), the cyclical high fell from 1.06 to 0.86, comparing the
1981-1982 and 1990-1991 recessions, while in the retail trade sector, motor vehicle inventories
reached cyclical highs of 1.92 in 1981-82 and 2.08 in 1990-1991.
5The ratios are constructed from the data prior to detrending.
7
On balance, then, the evidence points to declining IS ratios among durable goods
manufacturers and durable goods retailers excluding motor vehicles. Outside of these groups, IS
ratios were at best flat, at worst up somewhat. This compares to earlier work by Ben Salem and
Jacques (1996) and Hirsch (1996), who find that inventory-sales (IS) ratios have declined in the
manufacturing sector, but that ratios have risen in the wholesale and retail trade sectors.
The variance of output relative to sales
In this section of the paper, I examine the variance of output relative to the variance of
sales, and I relate this relative output variance to IS ratios. In brief, I find some evidence that
industries with high IS ratios are those whose output variance is relatively high. I also find that in
the manufacturing and retail sectors, the industries which have lowered their IS ratios tend to be
the ones whose relative output variance has declined; the opposite seems to be true in the
wholesale sector. This establishes, in an unstructured way, a connection between lower IS ratios
and decreased output volatility, at least in the manufacturing and retail sectors.
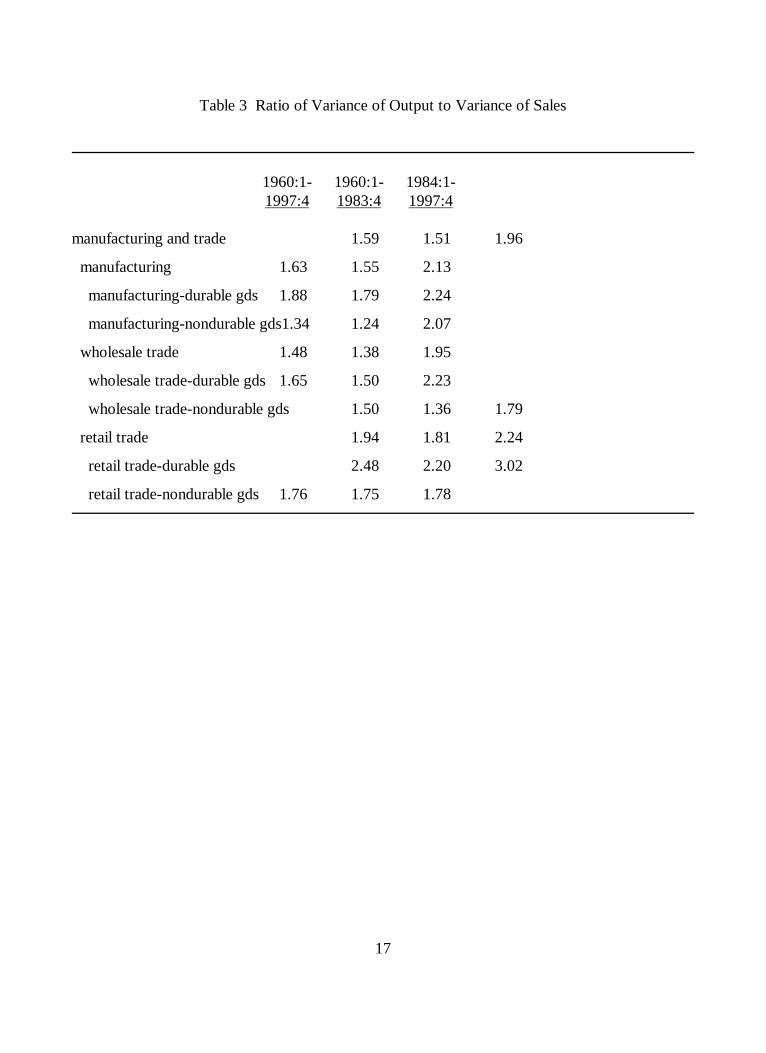
Table 3 reports the ratio of the variance of output to the variance of sales for the broad
sectors studied here. The ratio exceeds 1 in all cases, as output is more volatile than sales. This is
especially true in the durable goods sectors. Comparing the early and later periods, I find that
output volatility relative to sales has risen in all cases.6 However, the disaggregate data indicate
that eight of the 21 manufacturing industries experienced declines, most notably several durable
goods industries, including SICs 32 (stone, clay and glass), 35 (industrial machinery and computer
equipment), 36 (electronic equipment), 371 (motor vehicles), and 37-excluding 371 (all other
6As we shall see in table 5 below, the variance of output has declined in absolute terms;
table 3's relative variance measure has risen because the variance of sales has declined even
8
transportation equipment). In the retail sector, although only one disaggregate industry (other
durable goods retailers) showed a decline in relative output variability, the overall retail sector
excluding motor vehicles experienced a decline from 3.12 to 2.05. This highlights the importance
of retail motor vehicles, in which output variability rose from 2.74 to 4.16. Note the overlap
between the sectors where IS ratios have declined and sectors where output volatility has
declined: for example, SIC 35 (industrial machinery) had its mean IS ratios fall from 3.32 to 2.14,
while SIC 371 (motor vehicles) had its IS ratio fall from 0.98 to 0.63; both industries experienced
declines in output volatility. In the retail sector, motor vehicle IS ratios rose from 1.55 to 1.85 as
output volatility rose considerably. For motor vehicles, it appears that IS ratios and output
volatility relative to sales volatility have fallen in the manufacturing sector but risen in the retail
trade sector.
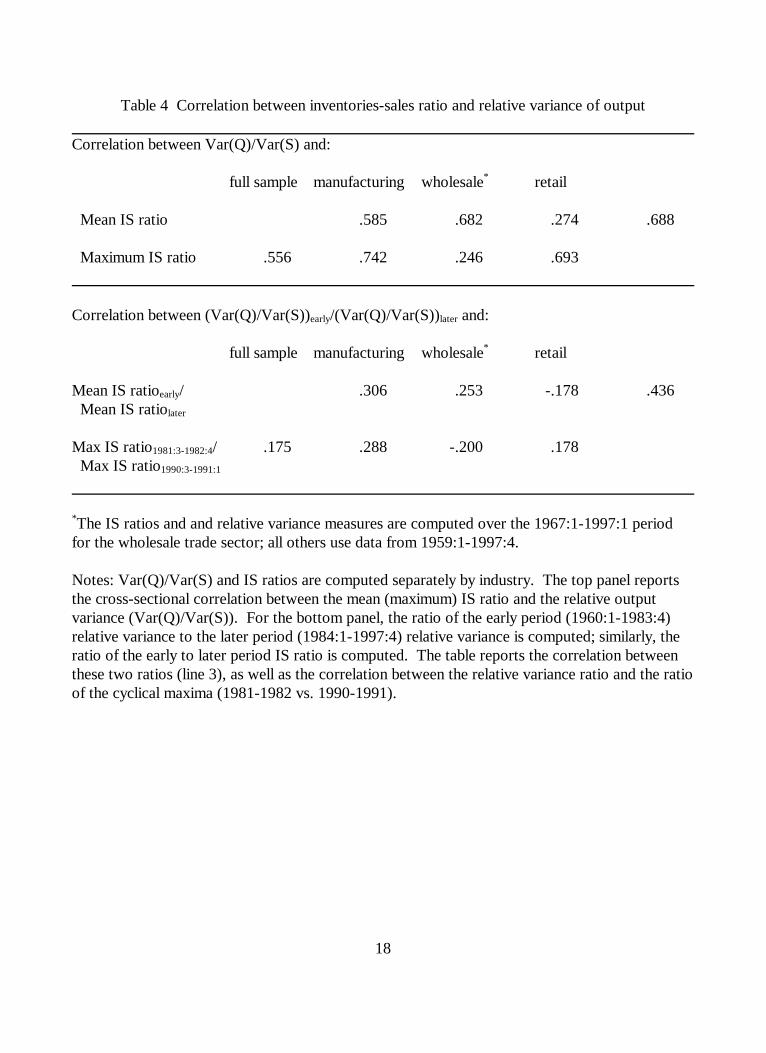
Table 4 relates the relative variance of output to IS ratios in a more formal way. For each
detailed sector, I compute the relative variance of output, first over the full sample period and
then separately for the early and later periods. I also compute the mean and maximum IS ratio for
those time periods. Table 4's top panel reports the cross-sectional correlation coefficients
between the IS ratio and the relative variance measure, for all industries together as well as
separately for the three broad sectors. In manufacturing and retail, the correlation is large and
positive, suggesting that high IS ratios are associated with high output volatility; the correlation is
weaker in the wholesale sector. The bottom panel addresses the issue of whether those sectors
that lowered their IS ratios are those whose output volatility declined. For each industry, I
calculate the ratio of the early to later period output volatility, the ratio of the early to later mean
further.
9
IS ratios, and the ratio of the 1981-1982 cyclical high to the 1990-1991 cyclical high IS ratio.
The table's bottom panel reports the cross-sectional correlation between the early to later output
volatility ratio and the early to later period IS ratio. Again, manufacturing and retail show
positive correlations, suggesting that industries whose IS ratios fell are indeed those industries
whose output volatility (relative to sales) declined. The wholesale sector is somewhat different,
showing a negative correlation.
Covariance of sales and inventory investment
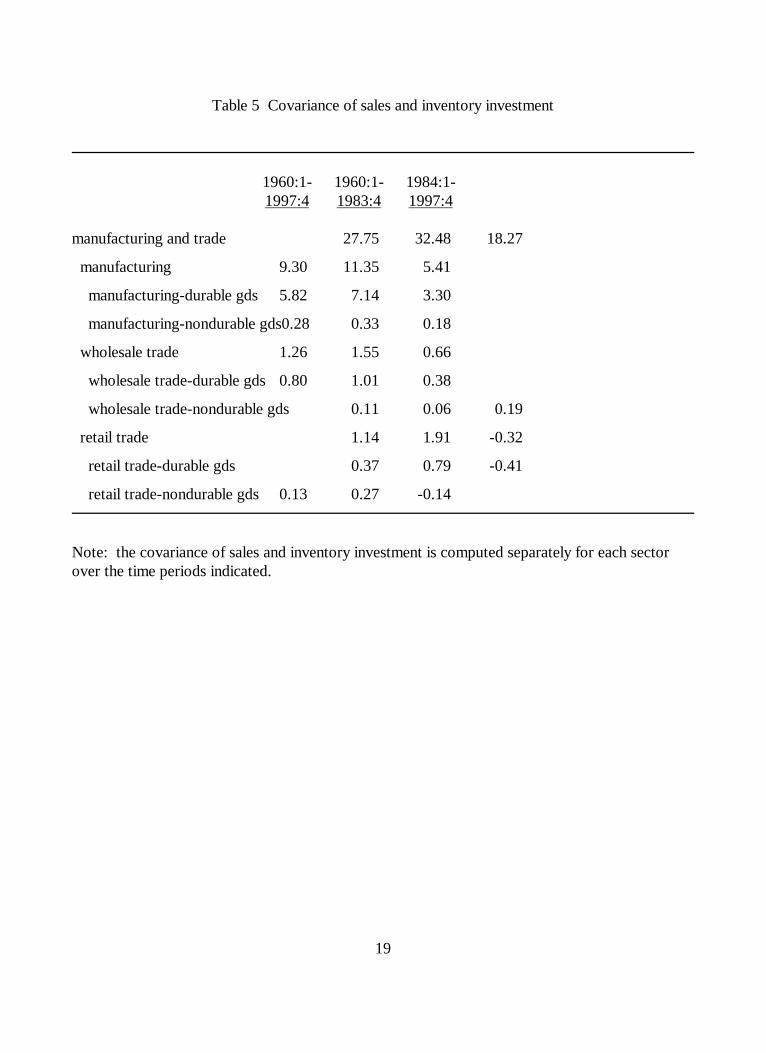
Table 5 contains the covariances between sales (S) and inventory investment (CBI) for the
broad sectors studied here, again for the full period as well as for the early and later periods. In
all cases, the covariance is positive over the full sample period, and the covariance declines
between the early and later periods. In retail, the covariance actually becomes slightly negative in
the later period, implying that inventory investment declines when sales are rising.
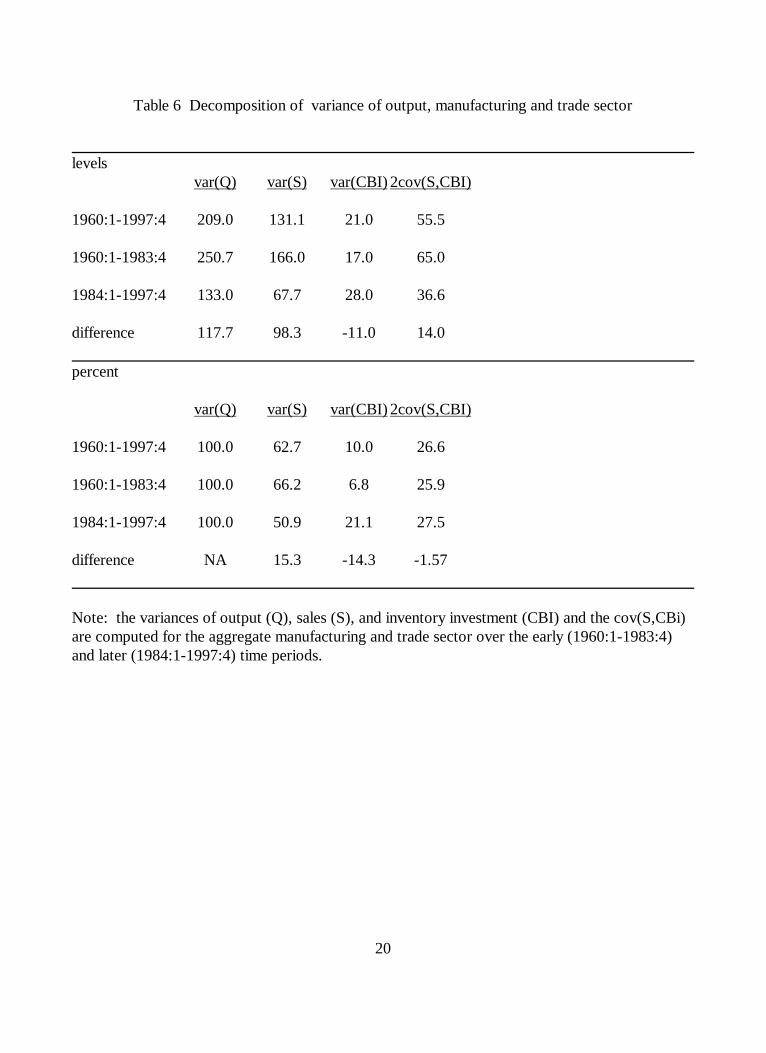
Because we are ultimately interested in output volatility, decomposing the variance of
output into its components is useful. Since output is the sum of sales and inventory investment,
the variance of output equals the sum of the variance of sales, the variance of inventory
investment, and twice the covariance between sales and inventory investment. Table 6 reports, in
levels and in percent terms, the components for the overall manufacturing and trade sector for the
different time periods studied.
Several patterns emerge from the table. First, the variance of output has declined; this is
true for the disaggregate industries in the manufacturing and wholesale trade sectors, as well as
for the retail sector excluding motor vehicles. Much of the decline is due to a decline in the
variance of sales, which occurred in all but eight of the 34 manufacturing and retail industries. In
10
percentage terms, the variance of sales is less important in the later period, accounting for 50.9%
of total output variance, compared to 66.2% of the total during the earlier period. Second, the
variance of inventory investment has risen for the M&T sector overall, as well as for the
manufacturing, wholesale trade, and retail trade sectors independently. However, nine of 21
manufacturing industries show a decline in the variance of inventory investment, though as a share
of total output variance, inventory investment variance has risen in nearly all industries. The one
prominent exception is, again, SIC 371, the motor vehicles industry, where the share of total
output variance accounted for by inventory investment variance fell from 7.8% to 3.5% between
the earlier and later periods. In retailing, the variance of inventory investment rose in all industries
but one (lumber stores), and as a percentage of total output variance, the contribution of
inventory investment variance rose from 20.7% to a whopping 59.3% between the earlier and
later periods. In that sense, we can say that inventory investment volatility has become a more
pronounced factor in the retail sector. Furthermore, this increase is not solely due to motor
vehicles; it is prominent throughout the sector.
In fact, computing correlations between IS ratios and the shares of inventory investment
variance in total output variance, similar to the exercise in table 4, shows that in the
manufacturing and retail sectors, the industries where IS ratios fell the most are those in which
inventory investment variance accounted for smaller shares of total output variance; the
correlation is especially strong in the retail sector. In the wholesale trade sector, the correlation is
negative.
Discussion and conclusions
In this paper, I use detailed manufacturing and trade sector data to examine several
11
measures of inventory behavior before and after 1984:1, a point identified by previous researchers
as the time of a one-time decline in GDP volatility. Because movements in wholesale trade
inventory investment are, on average, less important in business cycle fluctuations than are
movements in manufacturing and retail inventory accumulation, I emphasize the key results from
the latter two sectors.
First, I find some evidence that IS ratios were lower after 1984:1 than in the earlier period
among durable goods manufacturers and durable goods retailers excluding motor vehicles; outside
of these groups, IS ratios were at best flat, at worst up somewhat. Second, output is more
variable than sales in all industries over each time period examined, by and large consistent with
previous research. Comparing the early and later periods, I find that output volatility relative to
sales has risen overall, but that several durable goods manufacturing industries show declines,
noticeably several whose IS ratios have declined over time. In fact, simple correlations show that
in the manufacturing and retail sectors, the industries which have lowered their IS ratios tend to
be the ones whose relative output variance has declined; the opposite seems to be true in the
wholesale sector.
Third, I decompose the variance of output into its components and find that much of the
decline in output variability after 1984:1 is due to declines in sales variability, which, in percentage
terms, is less important in the later period. The share of total output variance accounted for by
inventory investment variance has risen for the M&T sector overall. One prominent exception in
the manufacturing sector is the motor vehicles industry, where inventory investment variance
became less important in the later period. In retailing, the contribution of inventory investment
variance nearly trebled, rising from 20.7% to 59.3% between the earlier and later periods,
12
suggesting an increased role for inventory investment fluctuations in that sector. More formally,
correlations between IS ratios and the shares accounted for by inventory investment variance are
positive in the manufacturing and retail sector, suggesting that industries where IS ratios fell are
those where inventory investment volatility played a smaller role in output volatility in the later
period.
Finally, the motor vehicle industry stands out as sector worth further study. In the
manufacturing sector, motor vehicle IS ratios fell, output volatility fell, and inventory investment
volatility became less important a factor in overall output volatility. In the retail motor vehicle
sector, the opposite was true on all counts. If inventories and volatility have just been pushed
"downstream", then it is hard to argue that, for the economy as a whole, changes in inventory
management in one sector of the economy imply smoother aggregate output paths in the years
ahead.
In conclusion, this paper has established a cross-sectional correlation between IS ratios,
output volatility, and inventory volatility. This is a useful first step in addressing the extent to
which recent changes in inventory management techniques may have "tamed" the business cycle.
Of course, as Hornstein (1998) notes, attributing overall inventory investment volatility to
individual sectors is difficult because of the covariance across sectors, and I cannot conclude that
changes in inventory management techniques, as revealed through lower IS ratios, are responsible
for declines in output volatility. However, the cross-sectional evidence does point to a connection
between lower inventory holdings and decreased output volatility. Future research must address
the covariance issue to make more progress in understanding the implications of new inventory
management techniques for the business cycle.

13
14
References
Ben Salem, Melika, and Jean-Francois Jacques, "About the stability of the inventory-sales ratio: an empirical study with U.S. sectoral data." Applied Economics Letters 3 (1996): 467-469.
Blinder, Alan S., and Louis J. Maccini, "Taking Stock: A Critical Assessment of Recent Researchon Inventories." Journal of Economic Perspectives 5, 1 (Winter 1991): 73-96.
The Economist. "The business cycle: puncture ahead." December 5, 1998, p. 90.
Fitzgerald, Terry J., "Inventories and the Business Cycle: An Overview." Economic Review,Federal Reserve Bank of Cleveland, 33, 3 (1997): 11-22.
Hirsch, Albert A., "Has inventory management in the U.S. become more efficient and flexible" Amacroeconomic perspective." International Journal of Production Economics 45 (1996): 37-46.
Hodrick, Robert J., and Edward C. Prescott. "Postwar U.S. Business Cycles: An EmpiricalInvestigation." Journal of Money, Credit, and Banking 29, 1 (February 1997): 1-16.
Hornstein, Andreas. "Inventory investment and the business cycle." Federal Reserve Bank ofRichmond Economic Quarterly 84, 2 (Spring 1998): 49-71.
McCarthy, Jonathan, and Egon Zakrajsek, "Microeconomic Inventory Adjustment and AggregateDynamics." Working paper, Federal Reserve Bank of New York, November 1998.
McCarthy, Jonathan, and Egon Zakrajsek, "Trade Inventories." Working paper, Federal ReserveBank of New York, December 1997.
McConnell, Margaret M., and Gabriel Perez Quiros, "Output Fluctuations in the United States: What Has Changed Since the Early 1980s?" Working paper 9735, Federal Reserve Bankof New York, November 1997.
15
Table 1
Inventory investment's share of recessionary declines in GDPPercent
mean 1981:1-1982:41990:3-1991:1
Total change in business inventories 76 31 49manufacturing 35 12 6
durable goods 28 12 10nondurable goods 7 -0 -3
merchant wholesale 5 3 6durable goods 5 2 1nondurable goods 0 1 4
retail 26 -1 28durable goods 23 -7 28nondurable goods 4 7 0
Notes: raw data are in billions of chained 1992 dollars. Shares are computed by sector for eachpostwar recession; the mean over all recessions is reported in column 1, and shares for the mostrecent two recessions are reported in columns 2 and 3.
16
Table 2 Inventories-Sales RatiosNumber of months
Mean ratio Maximum ratio
1960:1- 1960:1- 1984:1- 1973:4- 1981:3- 1990:3-1997:4 1983:4 1997:4 1975:1 1982:4 1991:1
manufacturing and trade 1.36 1.33 1.42 1.48 1.53 1.53
manufacturing 1.51 1.52 1.50 1.78 1.78 1.66
manufacturing-durable gds 1.93 1.96 1.86 2.39 2.47 2.15
manufacturing-nondurable gds1.13 1.13 1.13 1.22 1.20 1.18
wholesale trade 1.15 1.07 1.30 1.14 1.36 1.38
wholesale trade-durable gds 1.56 1.50 1.67 1.77 2.09 1.80
wholesale trade-nondurable gds 0.79 0.71 0.94 0.70 0.82 0.98
retail trade 1.24 1.14 1.41 1.31 1.31 1.47
retail trade-durable gds 1.94 1.91 2.00 2.32 2.22 2.20
retail trade-nondurable gds 0.91 0.82 1.08 0.90 0.93 1.07
Columns 1-3 report the mean inventories-sales (IS) ratio, in monhts, for the time periods listed inthe column headings. Columns 4-6 report the maximum IS ratio reached in the three contractionslisted in the column headings.
17
Table 3 Ratio of Variance of Output to Variance of Sales
1960:1- 1960:1- 1984:1-1997:4 1983:4 1997:4
manufacturing and trade 1.59 1.51 1.96
manufacturing 1.63 1.55 2.13
manufacturing-durable gds 1.88 1.79 2.24
manufacturing-nondurable gds1.34 1.24 2.07
wholesale trade 1.48 1.38 1.95
wholesale trade-durable gds 1.65 1.50 2.23
wholesale trade-nondurable gds 1.50 1.36 1.79
retail trade 1.94 1.81 2.24
retail trade-durable gds 2.48 2.20 3.02
retail trade-nondurable gds 1.76 1.75 1.78
18
Table 4 Correlation between inventories-sales ratio and relative variance of output
Correlation between Var(Q)/Var(S) and:
full sample manufacturing wholesale* retail
Mean IS ratio .585 .682 .274 .688
Maximum IS ratio .556 .742 .246 .693
Correlation between (Var(Q)/Var(S))early/(Var(Q)/Var(S))later and:
full sample manufacturing wholesale* retail
Mean IS ratioearly/ .306 .253 -.178 .436 Mean IS ratiolater
Max IS ratio1981:3-1982:4/ .175 .288 -.200 .178 Max IS ratio1990:3-1991:1
*The IS ratios and and relative variance measures are computed over the 1967:1-1997:1 periodfor the wholesale trade sector; all others use data from 1959:1-1997:4.
Notes: Var(Q)/Var(S) and IS ratios are computed separately by industry. The top panel reportsthe cross-sectional correlation between the mean (maximum) IS ratio and the relative outputvariance (Var(Q)/Var(S)). For the bottom panel, the ratio of the early period (1960:1-1983:4)relative variance to the later period (1984:1-1997:4) relative variance is computed; similarly, theratio of the early to later period IS ratio is computed. The table reports the correlation betweenthese two ratios (line 3), as well as the correlation between the relative variance ratio and the ratioof the cyclical maxima (1981-1982 vs. 1990-1991).
19
Table 5 Covariance of sales and inventory investment
1960:1- 1960:1- 1984:1-1997:4 1983:4 1997:4
manufacturing and trade 27.75 32.48 18.27
manufacturing 9.30 11.35 5.41
manufacturing-durable gds 5.82 7.14 3.30
manufacturing-nondurable gds0.28 0.33 0.18
wholesale trade 1.26 1.55 0.66
wholesale trade-durable gds 0.80 1.01 0.38
wholesale trade-nondurable gds 0.11 0.06 0.19
retail trade 1.14 1.91 -0.32
retail trade-durable gds 0.37 0.79 -0.41
retail trade-nondurable gds 0.13 0.27 -0.14
Note: the covariance of sales and inventory investment is computed separately for each sectorover the time periods indicated.
20
Table 6 Decomposition of variance of output, manufacturing and trade sector
levelsvar(Q) var(S) var(CBI) 2cov(S,CBI)
1960:1-1997:4 209.0 131.1 21.0 55.5
1960:1-1983:4 250.7 166.0 17.0 65.0
1984:1-1997:4 133.0 67.7 28.0 36.6
difference 117.7 98.3 -11.0 14.0
percent
var(Q) var(S) var(CBI) 2cov(S,CBI)
1960:1-1997:4 100.0 62.7 10.0 26.6
1960:1-1983:4 100.0 66.2 6.8 25.9
1984:1-1997:4 100.0 50.9 21.1 27.5
difference NA 15.3 -14.3 -1.57
Note: the variances of output (Q), sales (S), and inventory investment (CBI) and the cov(S,CBi)are computed for the aggregate manufacturing and trade sector over the early (1960:1-1983:4)and later (1984:1-1997:4) time periods.