Embed Size (px)
Citation preview
Organisation for Economic Co-operation and Development
ECO/WKP(2021)21
Unclassified English - Or. English
18 May 2021
ECONOMICS DEPARTMENT
INVESTING IN COMPETENCES AND SKILLS AND REFORMING THE LABOUR MARKET TO CREATE BETTER JOBS IN INDONESIA
ECONOMICS DEPARTMENT WORKING PAPERS No. 1670 By Patrice Ollivaud
OECD Working Papers should not be reported as representing the official views of the OECD or of its member countries. The opinions expressed and arguments employed are those of the author(s). Authorised for publication by Alvaro Pereira, Director, Country Studies Branch, Economics Department.
All Economics Department Working Papers are available at www.oecd.org/eco/workingpapers.
JT03476582 OFDE
This document, as well as any data and map included herein, are without prejudice to the status of or sovereignty over any territory, to the
delimitation of international frontiers and boundaries and to the name of any territory, city or area.
2 ECO/WKP(2021)21
Unclassified
OECD Working Papers should not be reported as representing the official views of the OECD or of its
member countries. The opinions expressed and arguments employed are those of the author(s).
Working Papers describe preliminary results or research in progress by the author(s) and are
published to stimulate discussion on a broad range of issues on which the OECD works.
Comments on Working Papers are welcomed, and may be sent to the Economics Department, OECD,
2 rue André-Pascal, 75775 Paris Cedex 16, France, or by e-mail to [email protected].
All Economics Department Working Papers are available at www.oecd.org/eco/workingpapers.
This document and any map included herein are without prejudice to the status of or sovereignty over any territory, to the delimitation of international frontiers and boundaries and to the name of any territory, city or area. The statistical data for Israel are supplied by and under the responsibility of the relevant Israeli authorities. The use of such data by the OECD is without prejudice to the status of the Golan Heights, East Jerusalem and Israeli settlements in the West Bank under the terms of international law. © OECD (2021)
You can copy, download or print OECD content for your own use, and you can include excerpts from
OECD publications, databases and multimedia products in your own documents, presentations, blogs,
websites and teaching materials, provided that suitable acknowledgment of OECD as source and
copyright owner is given. All requests for commercial use and translation rights should be submitted to
ECO/WKP(2021)21 3
Unclassified
ABSTRACT/RÉSUMÉ
Investing in competences and skills and reforming the labour market to create better jobs in
Indonesia
Favourable demographics has boosted Indonesia’s economic growth in recent decades, but its contribution
will wane over time. Skills and competences will therefore become increasingly important to raise living
standards. Educational attainment has improved considerably, but the quality of education remains
disappointing. At the same time, technological changes, new organisational business models and evolving
worker preferences make upskilling and reskilling increasingly important. This warrants continuous
investment in improving education and lifelong training, in terms of both quality and quantity, with an
enhanced role for social partners. Tackling existing and rising skill shortages requires more participation
from women, older adults, internal migrants, disadvantaged groups, and foreign workers. Expanding
access to early childhood education would provide all children with better opportunities and bring significant
benefits. Reducing informality is key to encouraging investment in skills. The COVID-19 crisis has
highlighted workers’ insufficient protection against shocks, underlining the need for unemployment
insurance. It is also an opportunity to boost digitalisation and innovate with smart practices. School closures
are already penalising learning outcomes and will reduce future earnings.
This Working Paper relates to the 2021 OECD Economic Survey of Indonesia
(http://www.oecd.org/economy/indonesia-economic-snapshot/)
JEL Classification: I25, J21, J24, J30, J46
Keywords: Indonesia, education, labour market, informal jobs, skills
*************
Investir dans les compétences et les qualifications et réformer le marché du travail pour créer de
meilleurs emplois en Indonésie
Des conditions démographiques favorables ont favorisé la croissance économique de l’Indonésie ces
dernières décennies, mais leur contribution va disparaitre progressivement. Les qualifications et
compétences vont par conséquent devenir de plus en plus importantes pour assurer l’augmentation des
niveaux de vie. Le niveau de scolarité s’est considérablement amélioré, mais la qualité de l’éducation reste
décevante. Parallèlement, les évolutions technologiques, de nouveaux modèles d’organisation au sein des
entreprises ainsi que les changements de préférences des travailleurs font que les reconversions et le
renforcement des compétences deviennent encore plus cruciaux. Cela justifie un investissement continu
dans l’éducation et la formation permanente, à la fois en termes quantitatifs et qualitatifs, en prenant soin
de faire participer davantage les partenaires sociaux. S’attaquer aux pénuries de compétences existantes
et celles à venir, nécessite de faire davantage appel aux femmes, aux adultes plus âgés, aux migrants,
aux groupes défavorisés et aux travailleurs étrangers. Élargir l’accès à l’éducation préscolaire pourrait
donner de meilleures opportunités aux enfants et serait source de nombreux avantages. Abaisser le niveau
du travail informel est un élément clé pour encourager l’investissement dans les compétences. La crise du
COVID-19 a mis en lumière la protection insuffisante des travailleurs face aux chocs, soulignant ainsi le
besoin d’une assurance chômage. C’est également une opportunité pour accélérer la transformation
numérique et susciter des pratiques innovatrices et intelligentes. La fermeture des écoles engendre déjà
une baisse des acquis d’apprentissage, ce qui pèsera sur les revenus futurs.
Ce Document de travail a trait à l’Étude économique de l’OCDE de l’Indonésie, 2020
(http://www.oecd.org/fr/economie/indonesie-en-un-coup-d-oeil/).
JEL Classification : I25, J21, J24, J30, J46
Mots clés : Indonésie, éducation, marché du travail, emplois informels, qualifications
4 ECO/WKP(2021)21
Unclassified
Table of contents
Investing in competences and skills and reforming the labour market to create better jobs in Indonesia 5
Demographic transitions and skills 6
Improving education quality is crucial to boosting human capital 8
Labour market rigidities are holding back the potential of the economy 25
Policy recommendations 42
References 43
FIGURES
Figure 1. The OECD measure of human capital puts Indonesia in the middle of peer countries 6 Figure 2. Indonesia is enjoying a demographic dividend 7 Figure 3. The dependency ratio is currently low but set to increase significantly 7 Figure 4. More than 20% of Indonesian youth are inactive 8 Figure 5. There is ample room to improve the quality of schooling 9 Figure 6. Indicators of government spending on education 9 Figure 7. Public funds are tilted towards primary education 10 Figure 8. Spending per student is lower than in peer countries 11 Figure 9. Only half of the population has completed secondary education 12 Figure 10. Indonesia is close to the average of peer countries in participation in upper secondary education 12 Figure 11. Indonesians’ performance in reading, mathematics and science is lagging 14 Figure 12. Indicators of spending per pupil vary substantially across provinces 16 Figure 13. Lower secondary education enrolment varies considerably across provinces 18 Figure 14. A quarter of Indonesian primary school pupils have had no early childhood education 19 Figure 15. Enrolment in tertiary education is close to the average for middle-income countries 21 Figure 16. Few Indonesians study abroad 23 Figure 17. A third of upper-secondary Indonesian schools lack access to computers 24 Figure 18. Informality is pervasive in Indonesia 27 Figure 19. The importance of informality varies across provinces but is high everywhere 29 Figure 20. The correlation between the minimum wage and provincial GDP per capita is weak 32 Figure 21. Access to internet is increasing rapidly but remains elusive for more than half of Indonesia’s
population 34 Figure 22. Labour regulations are restrictive 38 Figure 23. At similar educational attainment, women’s employment rate is lower 39 Figure 24. Female labour force participation is picking up after decades of stagnation 40 Figure 25. Indonesian women have received less education than men 41
TABLES
Table 1. Labour market performance in G20 countries 28 Table 2. The share of workers paid below the minimum wage differs across provinces 33
ECO/WKP(2021)21 5
Unclassified
By Patrice Ollivaud1
Indonesia is struggling to recover from the COVID-19 pandemic and its high human cost, especially for
disadvantaged groups. Unemployment and poverty are set to increase dramatically, putting at risk two
decades of improvements. The ongoing recession limits government and household resources for
investment in human capital. For Indonesia to prosper over the longer run, it is key to uphold funding for
education and life-long learning, so that skills match the future needs of the economy and society at large.
Indeed, human capital, defined as capabilities developed through formal and informal education and
through training, experience, and mobility in the labour market (Mincer, 1981) is key for productivity, GDP
growth, well-being and inclusiveness. This is a longstanding top policy priority.
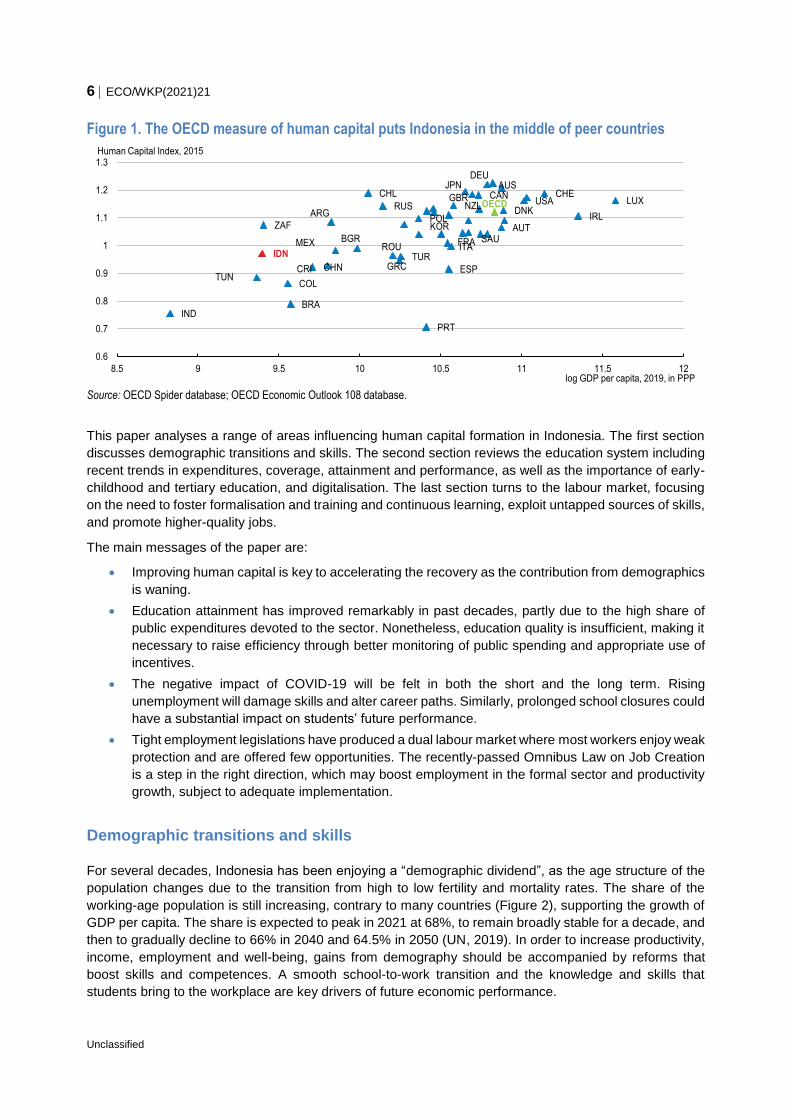
Indonesia’s human capital compares favourably with other emerging market economies (Figure 1) but
needs to improve further to avoid the middle-income trap and prepare for the future. The index summarises
the performance in terms of years of schooling and returns to education, the latter being U-shaped and
varying across time and countries. The OECD estimates show substantially higher average returns to
education in large emerging market economies than in OECD countries, with a generalised increase over
time (Botev et al., 2019). On this metric, Indonesia has recorded impressive and continuous progress since
1950 but slower improvements in recent years.
1 Patrice Ollivaud is Economist in the OECD Economics Department (ECO). The author would like to thank Oliver
Denk, Andrea Goldstein, Vincent Koen, Mauro Pisu and Alvaro Pereira (ECO), Sebastien Martin and Alexander Hijzen
(Directorate for Employment, Labour and Social Affairs), and Beatriz Pont (Directorate for Education and Skills), for
useful comments and suggestions. The paper has also benefitted from comments by Indonesian officials and by
members of the OECD Economic and Development Review Committee. Special thanks go to Natia Mosiashvili for
statistical assistance and to Sisse Nielsen and Michelle Ortiz (ECO) for editorial assistance.
Investing in competences and skills and
reforming the labour market to create
better jobs in Indonesia
6 ECO/WKP(2021)21
Unclassified
Figure 1. The OECD measure of human capital puts Indonesia in the middle of peer countries
Source: OECD Spider database; OECD Economic Outlook 108 database.
This paper analyses a range of areas influencing human capital formation in Indonesia. The first section
discusses demographic transitions and skills. The second section reviews the education system including
recent trends in expenditures, coverage, attainment and performance, as well as the importance of early-
childhood and tertiary education, and digitalisation. The last section turns to the labour market, focusing
on the need to foster formalisation and training and continuous learning, exploit untapped sources of skills,
and promote higher-quality jobs.
The main messages of the paper are:
Improving human capital is key to accelerating the recovery as the contribution from demographics
is waning.
Education attainment has improved remarkably in past decades, partly due to the high share of
public expenditures devoted to the sector. Nonetheless, education quality is insufficient, making it
necessary to raise efficiency through better monitoring of public spending and appropriate use of
incentives.
The negative impact of COVID-19 will be felt in both the short and the long term. Rising
unemployment will damage skills and alter career paths. Similarly, prolonged school closures could
have a substantial impact on students’ future performance.
Tight employment legislations have produced a dual labour market where most workers enjoy weak
protection and are offered few opportunities. The recently-passed Omnibus Law on Job Creation
is a step in the right direction, which may boost employment in the formal sector and productivity
growth, subject to adequate implementation.
Demographic transitions and skills
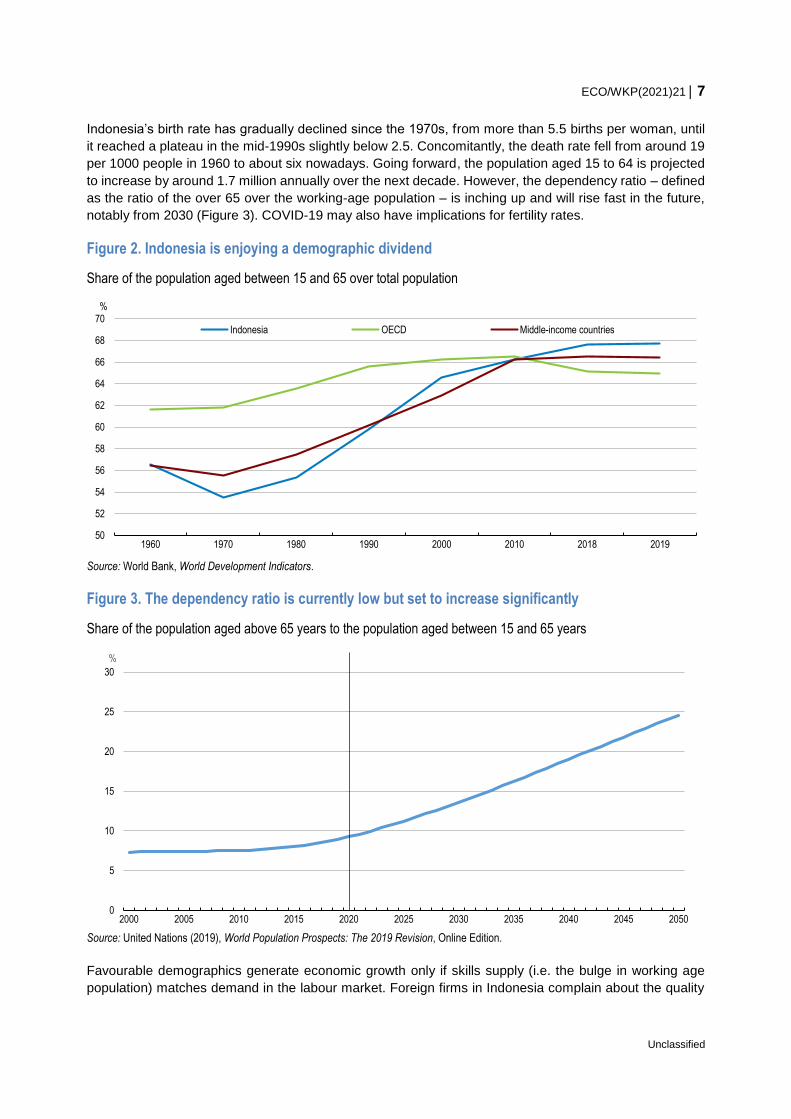
For several decades, Indonesia has been enjoying a “demographic dividend”, as the age structure of the
population changes due to the transition from high to low fertility and mortality rates. The share of the
working-age population is still increasing, contrary to many countries (Figure 2), supporting the growth of
GDP per capita. The share is expected to peak in 2021 at 68%, to remain broadly stable for a decade, and
then to gradually decline to 66% in 2040 and 64.5% in 2050 (UN, 2019). In order to increase productivity,
income, employment and well-being, gains from demography should be accompanied by reforms that
boost skills and competences. A smooth school-to-work transition and the knowledge and skills that
students bring to the workplace are key drivers of future economic performance.
ARG
AUS
AUTBGR
BRA
CAN CHECHL
CHN
COL
CRI
DEU
DNK
ESP
FRA
GBR
GRC
IDN
IND
IRL
ITA
JPN
KOR
LUX
MEX
NZLOECD
POL
PRT
ROU
RUS
SAU
TUN
TUR
USA
ZAF
0.6
0.7
0.8
0.9
1
1.1
1.2
1.3
8.5 9 9.5 10 10.5 11 11.5 12
Human Capital Index, 2015
log GDP per capita, 2019, in PPP
ECO/WKP(2021)21 7
Unclassified
Indonesia’s birth rate has gradually declined since the 1970s, from more than 5.5 births per woman, until
it reached a plateau in the mid-1990s slightly below 2.5. Concomitantly, the death rate fell from around 19
per 1000 people in 1960 to about six nowadays. Going forward, the population aged 15 to 64 is projected
to increase by around 1.7 million annually over the next decade. However, the dependency ratio – defined
as the ratio of the over 65 over the working-age population – is inching up and will rise fast in the future,
notably from 2030 (Figure 3). COVID-19 may also have implications for fertility rates.
Figure 2. Indonesia is enjoying a demographic dividend
Share of the population aged between 15 and 65 over total population
Source: World Bank, World Development Indicators.
Figure 3. The dependency ratio is currently low but set to increase significantly
Share of the population aged above 65 years to the population aged between 15 and 65 years
Source: United Nations (2019), World Population Prospects: The 2019 Revision, Online Edition.
Favourable demographics generate economic growth only if skills supply (i.e. the bulge in working age
population) matches demand in the labour market. Foreign firms in Indonesia complain about the quality
50
52
54
56
58
60
62
64
66
68
70
1960 1970 1980 1990 2000 2010 2018 2019
%
Indonesia OECD Middle-income countries
0
5
10
15
20
25
30
2000 2005 2010 2015 2020 2025 2030 2035 2040 2045 2050
%
8 ECO/WKP(2021)21
Unclassified
of employees, even though it is not the main obstacle they face, compared to other countries in the region
(JETRO, 2020; World Bank Enterprise Surveys). There is an excess of unskilled workers and a shortage
of skilled ones, with the mismatch affecting up to around 25% of the labour force and expected to endure
(OECD, 2019a). Shortages are particularly acute for engineers (Petriella, 2017) and in the ICT sector
(World Bank, 2018a). Before COVID-19, the lack of qualified staff was also penalising tourism (OECD,
2018a). This may happen again in the medium term and hinder the strategy to reposition Indonesia as a
high-end tourism destination. More broadly, there could be a deficit of 1.3 million high-skilled workers in
2020, increasing to 3.8 million in 2030 (representing about a third of the highly-skilled labour force by then)
(Korn Ferry, 2018). In addition to shortages, there is occupational mismatch: Allen (2016) estimates that
51.5% and 8.5% of workers are underqualified and overqualified, respectively.
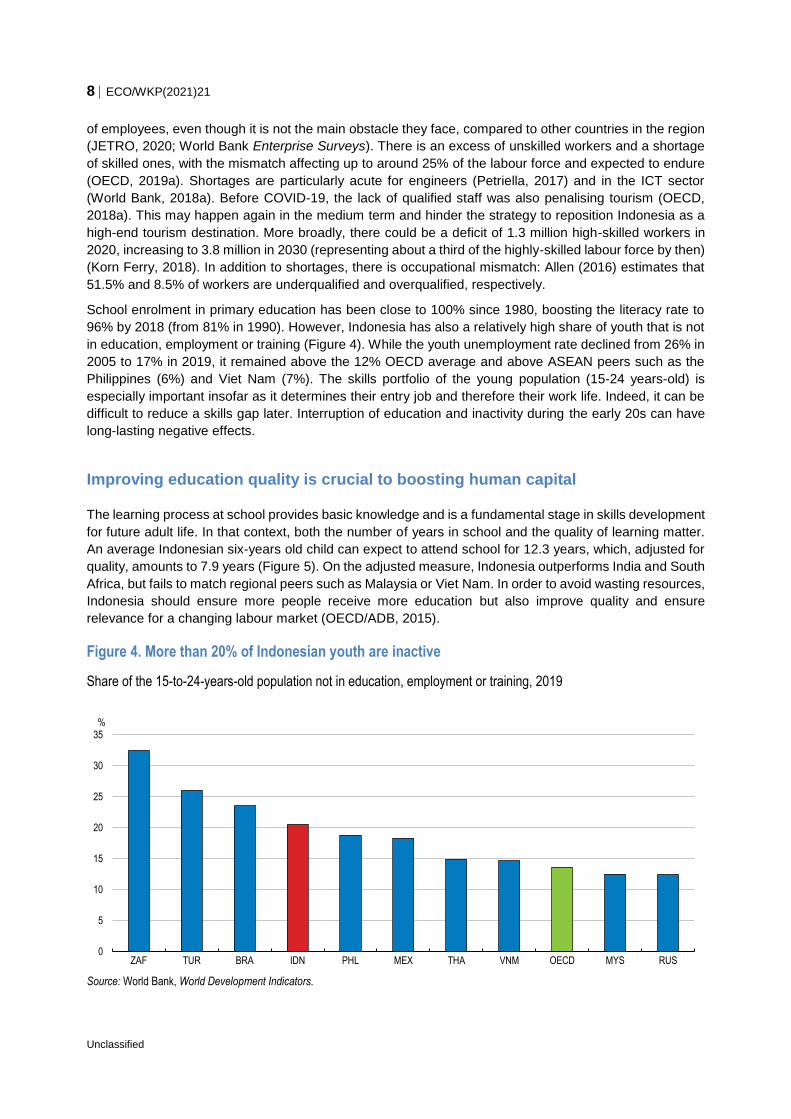
School enrolment in primary education has been close to 100% since 1980, boosting the literacy rate to
96% by 2018 (from 81% in 1990). However, Indonesia has also a relatively high share of youth that is not
in education, employment or training (Figure 4). While the youth unemployment rate declined from 26% in
2005 to 17% in 2019, it remained above the 12% OECD average and above ASEAN peers such as the
Philippines (6%) and Viet Nam (7%). The skills portfolio of the young population (15-24 years-old) is
especially important insofar as it determines their entry job and therefore their work life. Indeed, it can be
difficult to reduce a skills gap later. Interruption of education and inactivity during the early 20s can have
long-lasting negative effects.
Improving education quality is crucial to boosting human capital
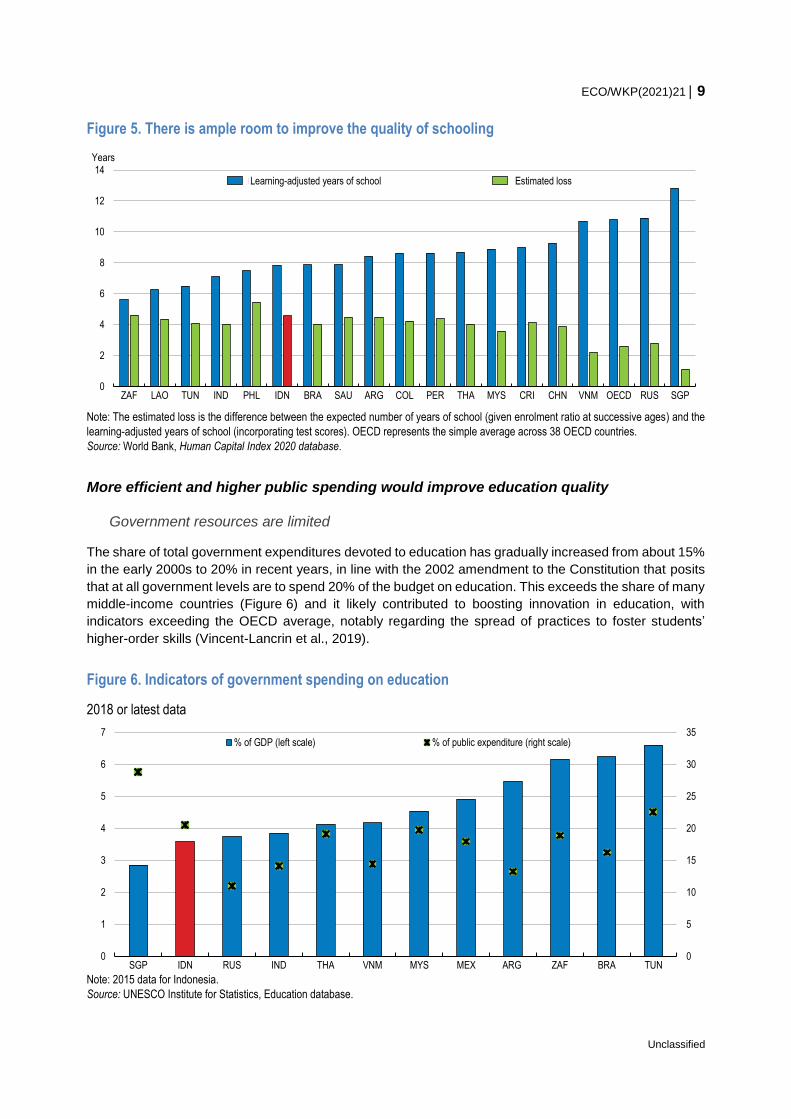
The learning process at school provides basic knowledge and is a fundamental stage in skills development
for future adult life. In that context, both the number of years in school and the quality of learning matter.
An average Indonesian six-years old child can expect to attend school for 12.3 years, which, adjusted for
quality, amounts to 7.9 years (Figure 5). On the adjusted measure, Indonesia outperforms India and South
Africa, but fails to match regional peers such as Malaysia or Viet Nam. In order to avoid wasting resources,
Indonesia should ensure more people receive more education but also improve quality and ensure
relevance for a changing labour market (OECD/ADB, 2015).
Figure 4. More than 20% of Indonesian youth are inactive
Share of the 15-to-24-years-old population not in education, employment or training, 2019
Source: World Bank, World Development Indicators.
0
5
10
15
20
25
30
35
ZAF TUR BRA IDN PHL MEX THA VNM OECD MYS RUS
%
ECO/WKP(2021)21 9
Unclassified
Figure 5. There is ample room to improve the quality of schooling
Note: The estimated loss is the difference between the expected number of years of school (given enrolment ratio at successive ages) and the
learning-adjusted years of school (incorporating test scores). OECD represents the simple average across 38 OECD countries.
Source: World Bank, Human Capital Index 2020 database.
More efficient and higher public spending would improve education quality
Government resources are limited
The share of total government expenditures devoted to education has gradually increased from about 15%
in the early 2000s to 20% in recent years, in line with the 2002 amendment to the Constitution that posits
that at all government levels are to spend 20% of the budget on education. This exceeds the share of many
middle-income countries (Figure 6) and it likely contributed to boosting innovation in education, with
indicators exceeding the OECD average, notably regarding the spread of practices to foster students’
higher-order skills (Vincent-Lancrin et al., 2019).
Figure 6. Indicators of government spending on education
2018 or latest data
Note: 2015 data for Indonesia.
Source: UNESCO Institute for Statistics, Education database.
0
2
4
6
8
10
12
14
ZAF LAO TUN IND PHL IDN BRA SAU ARG COL PER THA MYS CRI CHN VNM OECD RUS SGP
Years
Learning-adjusted years of school Estimated loss
0
5
10
15
20
25
30
35
0
1
2
3
4
5
6
7
SGP IDN RUS IND THA VNM MYS MEX ARG ZAF BRA TUN
% of GDP (left scale) % of public expenditure (right scale)
10 ECO/WKP(2021)21
Unclassified
However, because the government raises little revenue (OECD, 2018a), education spending as a share of
GDP is comparatively modest. In Southeast Asia, despite a similar share in government expenditures,
Malaysia’s spending on education is 1% of GDP higher, and Thailand’s 0.5% of GDP higher. One
consequence is that educational inputs in Indonesia, such as the quality of buildings, air-conditioning or
lighting, fall short (the fourth-worst score across 68 countries), to the detriment of student performance
(OECD, 2016a).
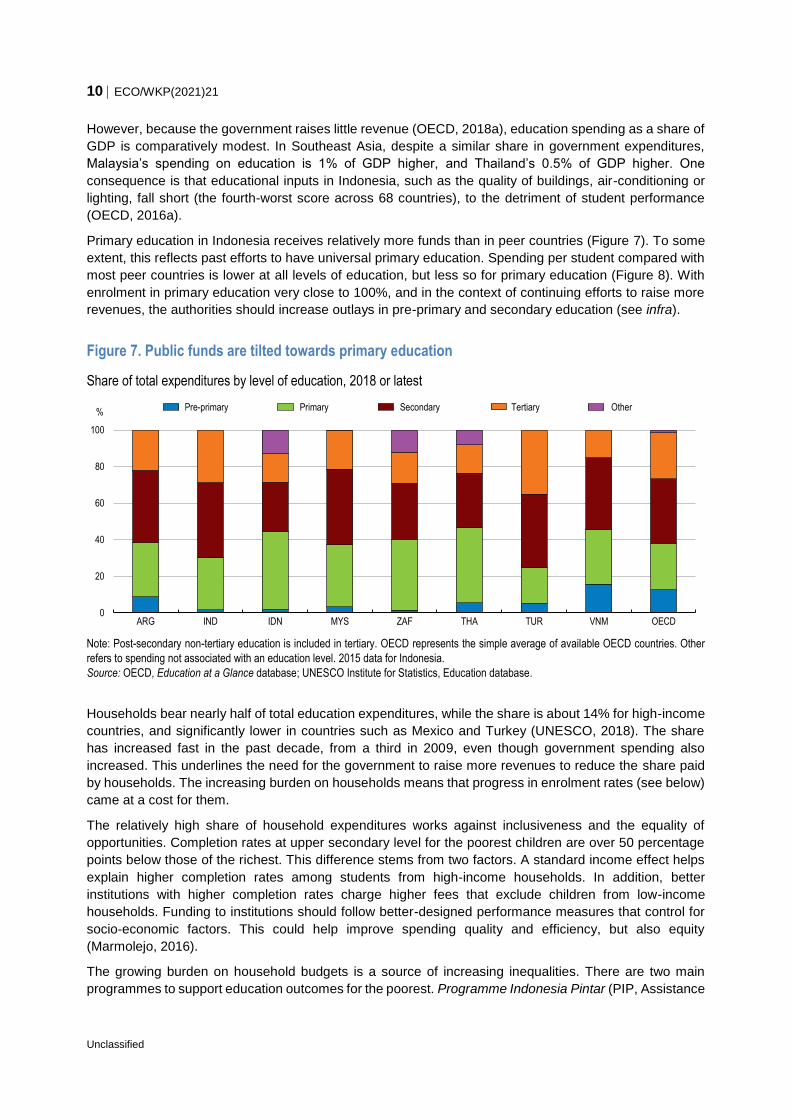
Primary education in Indonesia receives relatively more funds than in peer countries (Figure 7). To some
extent, this reflects past efforts to have universal primary education. Spending per student compared with
most peer countries is lower at all levels of education, but less so for primary education (Figure 8). With
enrolment in primary education very close to 100%, and in the context of continuing efforts to raise more
revenues, the authorities should increase outlays in pre-primary and secondary education (see infra).
Figure 7. Public funds are tilted towards primary education
Share of total expenditures by level of education, 2018 or latest
Note: Post-secondary non-tertiary education is included in tertiary. OECD represents the simple average of available OECD countries. Other
refers to spending not associated with an education level. 2015 data for Indonesia.
Source: OECD, Education at a Glance database; UNESCO Institute for Statistics, Education database.
Households bear nearly half of total education expenditures, while the share is about 14% for high-income
countries, and significantly lower in countries such as Mexico and Turkey (UNESCO, 2018). The share
has increased fast in the past decade, from a third in 2009, even though government spending also
increased. This underlines the need for the government to raise more revenues to reduce the share paid
by households. The increasing burden on households means that progress in enrolment rates (see below)
came at a cost for them.
The relatively high share of household expenditures works against inclusiveness and the equality of
opportunities. Completion rates at upper secondary level for the poorest children are over 50 percentage
points below those of the richest. This difference stems from two factors. A standard income effect helps
explain higher completion rates among students from high-income households. In addition, better
institutions with higher completion rates charge higher fees that exclude children from low-income
households. Funding to institutions should follow better-designed performance measures that control for
socio-economic factors. This could help improve spending quality and efficiency, but also equity
(Marmolejo, 2016).
The growing burden on household budgets is a source of increasing inequalities. There are two main
programmes to support education outcomes for the poorest. Programme Indonesia Pintar (PIP, Assistance
0
20
40
60
80
100
ARG IND IDN MYS ZAF THA TUR VNM OECD
% Pre-primary Primary Secondary Tertiary Other
ECO/WKP(2021)21 11
Unclassified
for Poor Students) has expanded to cover about 20 million beneficiaries by 2018, but suffers from leakages
to the non-poor (OECD, 2019b). Programme Keluarga Harapan (PKH − conditional cash transfers) is the
most effective tool to reduce poverty thanks to its long-term impacts on human capital development (ibid.).
It has also expanded, reaching 10 million households. A database is used to manage PKH recipients,
among which there are 23 million children. The government is also accelerating digitalisation of social
assistance to improve targeting, swiftness and transparency of distribution, notably through electronic
cards. Integrating PIP with PKH to expand social assistance coverage would reduce administrative costs
and leakages.
It is also important to improve co-operation with all stakeholders, including subnational governments. One
example in this area is Thailand’s Equitable Education Fund, launched in 2018, which supports youth at
all education levels and underpins a comprehensive strategy to meet provincial education and employment
needs (OECD, 2020a). The Fund develops flexible learning strategies and provides conditional cash
transfers, collaborating with the provinces, to reach out-of-school children.
Low spending leads to poor outcomes
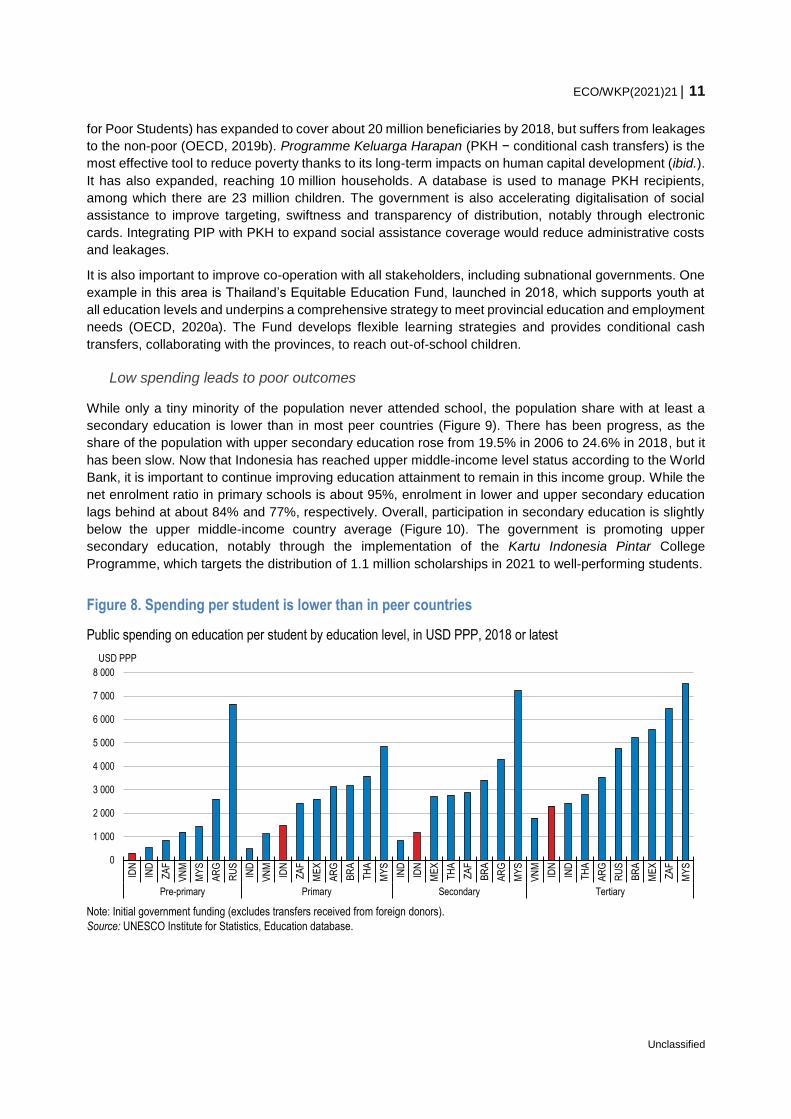
While only a tiny minority of the population never attended school, the population share with at least a
secondary education is lower than in most peer countries (Figure 9). There has been progress, as the
share of the population with upper secondary education rose from 19.5% in 2006 to 24.6% in 2018, but it
has been slow. Now that Indonesia has reached upper middle-income level status according to the World
Bank, it is important to continue improving education attainment to remain in this income group. While the
net enrolment ratio in primary schools is about 95%, enrolment in lower and upper secondary education
lags behind at about 84% and 77%, respectively. Overall, participation in secondary education is slightly
below the upper middle-income country average (Figure 10). The government is promoting upper
secondary education, notably through the implementation of the Kartu Indonesia Pintar College
Programme, which targets the distribution of 1.1 million scholarships in 2021 to well-performing students.
Figure 8. Spending per student is lower than in peer countries
Public spending on education per student by education level, in USD PPP, 2018 or latest
Note: Initial government funding (excludes transfers received from foreign donors).
Source: UNESCO Institute for Statistics, Education database.
0
1 000
2 000
3 000
4 000
5 000
6 000
7 000
8 000
IDN
IND
ZA
F
VN
M
MY
S
AR
G
RU
S
IND
VN
M
IDN
ZA
F
ME
X
AR
G
BR
A
TH
A
MY
S
IND
IDN
ME
X
TH
A
ZA
F
BR
A
AR
G
MY
S
VN
M
IDN
IND
TH
A
AR
G
RU
S
BR
A
ME
X
ZA
F
MY
S
Pre-primary Primary Secondary Tertiary
USD PPP
12 ECO/WKP(2021)21
Unclassified
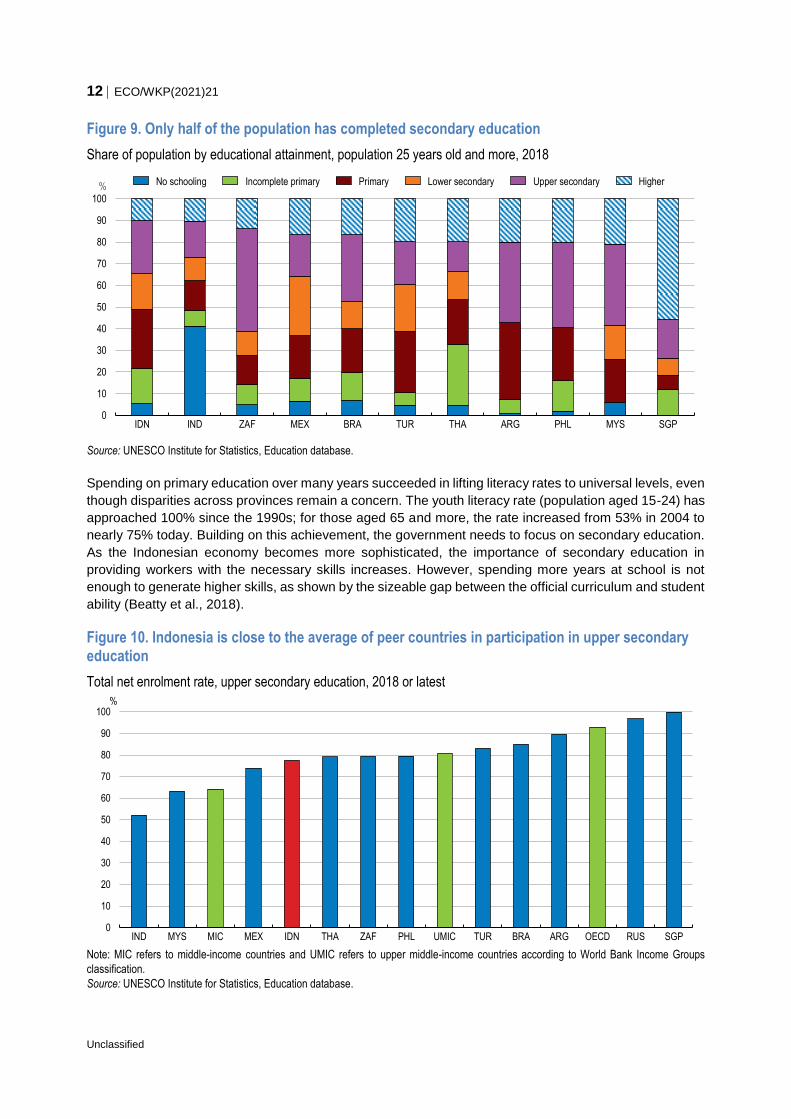
Figure 9. Only half of the population has completed secondary education
Share of population by educational attainment, population 25 years old and more, 2018
Source: UNESCO Institute for Statistics, Education database.
Spending on primary education over many years succeeded in lifting literacy rates to universal levels, even
though disparities across provinces remain a concern. The youth literacy rate (population aged 15-24) has
approached 100% since the 1990s; for those aged 65 and more, the rate increased from 53% in 2004 to
nearly 75% today. Building on this achievement, the government needs to focus on secondary education.
As the Indonesian economy becomes more sophisticated, the importance of secondary education in
providing workers with the necessary skills increases. However, spending more years at school is not
enough to generate higher skills, as shown by the sizeable gap between the official curriculum and student
ability (Beatty et al., 2018).
Figure 10. Indonesia is close to the average of peer countries in participation in upper secondary education
Total net enrolment rate, upper secondary education, 2018 or latest
Note: MIC refers to middle-income countries and UMIC refers to upper middle-income countries according to World Bank Income Groups
classification.
Source: UNESCO Institute for Statistics, Education database.
0
10
20
30
40
50
60
70
80
90
100
IDN IND ZAF MEX BRA TUR THA ARG PHL MYS SGP
% No schooling Incomplete primary Primary Lower secondary Upper secondary Higher
0
10
20
30
40
50
60
70
80
90
100
IND MYS MIC MEX IDN THA ZAF PHL UMIC TUR BRA ARG OECD RUS SGP
%
ECO/WKP(2021)21 13
Unclassified
The National Exam (Ujian Nasional, commonly abbreviated as UNAS or UN) is a standard evaluation
performed at the end of primary, and lower and upper secondary schools. UNAS scores are low overall
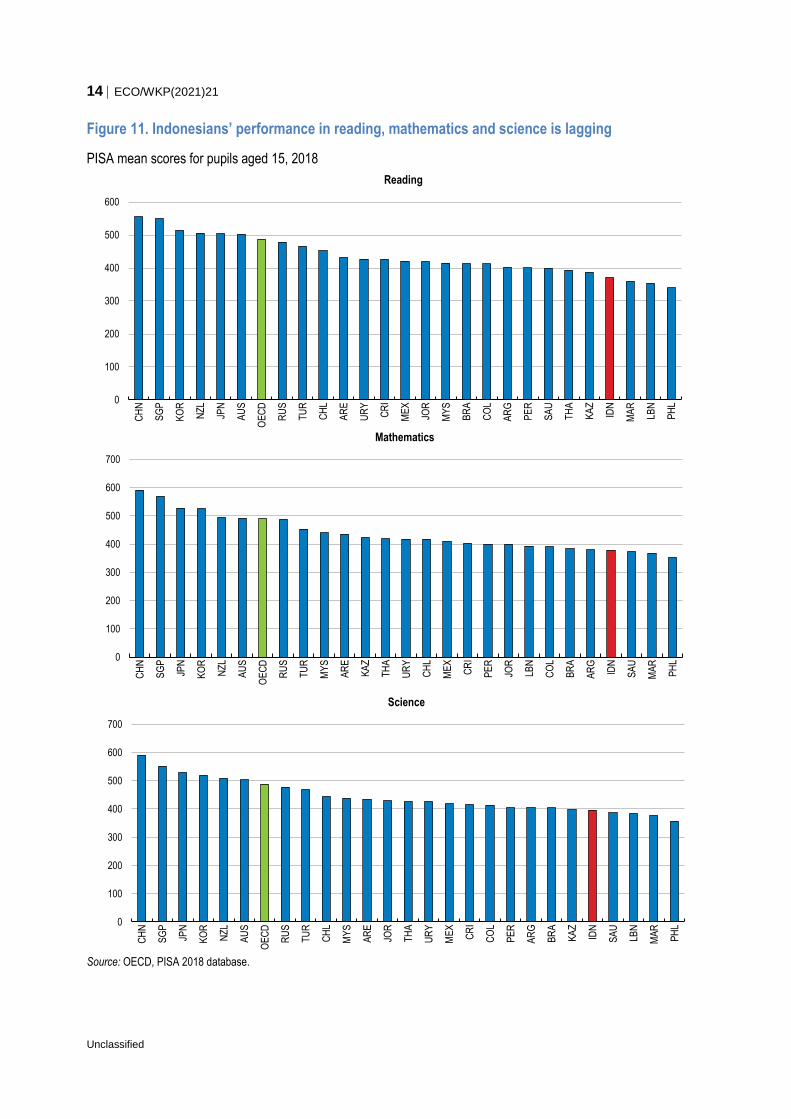
(World Bank, 2020a). In international comparison, the scores for 15-year-old Indonesian students in the
OECD Programme for International Student Assessment (PISA) tests trail well behind their peers in other
emerging-market economies, such as Brazil, Malaysia, Mexico, Thailand, or Turkey (Figure 11). A further
cause for concern is the stability of the PISA score since the early 2000s and their recent decrease. A
likely explanation for this relatively poor performance over time is the broadening of the population sampled
by PISA from 46% of the 15-year-olds in 2001 to 85% in 2018, which has resulted in the inclusion of low-
achieving students (OECD, 2019c). In 2020, the government abolished the National Exam and replaced it
with the National Assessment (starting from September 2021), which focuses on minimum competencies
acquisition instead of subject mastery.
Teachers lack adequate preparation
The education outcome gap vis-à-vis best international performers is notably due to weak teacher
competencies and pedagogical skills (Rosser, 2018). One essential lever to raise learning outcomes is to
strengthen the quality of teachers (OECD, 2019d). That requires making the profession more attractive,
reviewing teacher selection, promoting professional learning, and rewarding performance. Qualified
teachers account for 90% and 96% of the staff in primary and secondary education, respectively, as
compared with 100% in Thailand and the Philippines (according to UNESCO). A useful step would be to
reduce the number of honorary teachers and increase tenured positions (Huang, 2019) – honorary
teachers have temporary contracts and receive no salary, but honoraria which are usually below minimum
wages, often forcing them to have another job. The share of non-permanent teachers (about 42% in
secondary) is much higher than in India, Lao PDR and Malaysia, for example (UNESCO, 2018). Permanent
contracts should become the norm and local governments – responsible for contract teachers’ recruitment
– should make greater efforts to ensure that teachers without permanent contracts have the necessary
qualifications and competencies. The government’s project to convert the status of one million honorary
teachers in 2021 by making their contracts permanent is welcome.
Teacher professional development can fill possible gaps at recruitment. However, in Indonesia, teachers’
continuous training has suffered from lack of incentives, poor adaptation to teachers’ experience and
absence of follow-up (Revina et al., 2020). Therefore, training does not improve teaching quality and the
latest government’s initiative (Pengembangan Keprofesian Berkelanjutan) has failed to produce significant
advances (ibid.). The situation is unlikely to change until the education system rewards highly-skilled
teachers and investment is stepped up in training low-skilled teachers who do not meet minimum
standards.
An earlier reform, the teacher certification programme, aimed at raising teacher competence (OECD,
2016b; World Bank, 2018b). It raised the share of certified teachers and their pay. Unfortunately, despite
important fiscal outlays, it failed to significantly lift student achievements (de Ree et al., 2018). The
programme was meant to provide financial incentives to teachers seeking quality certification. It ended up
rewarding teachers’ degrees or seniority instead of demonstrated competences and a large share of
teachers became certified (World Bank, 2016). Renewed efforts to improve the pool of teachers are called
for via more rigorous entry standards to the profession, enhanced supervision, more relevant pre-service
teacher education and enhanced teacher professional development (OECD, 2019d). One recent example
along these lines is Malaysia’s plan to improve teachers’ situation through raising entry requirements,
enhancing working conditions, emphasising continuous professional development and revamping career
progression (OECD, 2019e). In Indonesia, one step in this direction is the new teacher certification scheme
(Pendidikan Profesi Guru), introduced in 2020 to improve the linkages between teacher allowance and
student results. It requires one year of training (six months) for new (current) teachers. As with the previous
system, it is important to evaluate and adapt the model to make sure the best-performing teachers are duly
rewarded (rather than almost all teachers).
14 ECO/WKP(2021)21
Unclassified
Figure 11. Indonesians’ performance in reading, mathematics and science is lagging
PISA mean scores for pupils aged 15, 2018
Source: OECD, PISA 2018 database.
0
100
200
300
400
500
600
CH
N
SG
P
KO
R
NZ
L
JPN
AU
S
OE
CD
RU
S
TU
R
CH
L
AR
E
UR
Y
CR
I
ME
X
JOR
MY
S
BR
A
CO
L
AR
G
PE
R
SA
U
TH
A
KA
Z
IDN
MA
R
LBN
PH
L
Reading
0
100
200
300
400
500
600
700
CH
N
SG
P
JPN
KO
R
NZ
L
AU
S
OE
CD
RU
S
TU
R
MY
S
AR
E
KA
Z
TH
A
UR
Y
CH
L
ME
X
CR
I
PE
R
JOR
LBN
CO
L
BR
A
AR
G
IDN
SA
U
MA
R
PH
L
Mathematics
0
100
200
300
400
500
600
700
CH
N
SG
P
JPN
KO
R
NZ
L
AU
S
OE
CD
RU
S
TU
R
CH
L
MY
S
AR
E
JOR
TH
A
UR
Y
ME
X
CR
I
CO
L
PE
R
AR
G
BR
A
KA
Z
IDN
SA
U
LBN
MA
R
PH
L
Science
ECO/WKP(2021)21 15
Unclassified
Allocation and efficiency of spending should improve
More efficient and effective spending would mitigate the difficulty to raise more revenues (OECD, 2016b).
There seems to be a gap between the current level of spending and outcomes (Kurniawati et al., 2018).
Therefore spending better is important and will help Indonesia achieve its development goals (World Bank,
2020a). Conditioning expenditures to learning outcomes would encourage efficiency. As mentioned in
previous Surveys, intergovernmental transfers also tend to incentivise personnel spending (including
teachers) and therefore reduce capacity to invest in other areas (OECD, 2016b). Improving the quality of
learning is now one of the main focus areas of the government, including through a projected redesign of
intergovernmental transfers.
One Indonesian idiosyncrasy is the large number of schools and teachers. Schools are relatively small and
the ratio of pupils per teacher is comparatively low. The national average ratio is below Thailand’s and
Viet Nam’s, both having better learning outcomes (OECD, 2016b). To some extent, this is related to poor
transport infrastructure. In addition, many schools lack basic infrastructure: only 93% of primary schools
have access to electricity, 72% to basic handwashing facilities and 84% to drinking water (according to the
Ministry of Education). As a term of comparison, nation-wide access to drinking water was 89% in 2019.
More broadly, only 25% and 40% of primary and upper secondary schools, respectively, are in good
condition (World Bank, 2020a). To reduce staff and infrastructure costs per school and better focus
spending, previous OECD Economic Surveys recommended closing selected small schools, developing
multi-grade teaching and using massive open online courses, such as The Ministry of Education’s Rumah
Belajar, when appropriate. When closing schools is not possible, improving existing infrastructure is crucial.
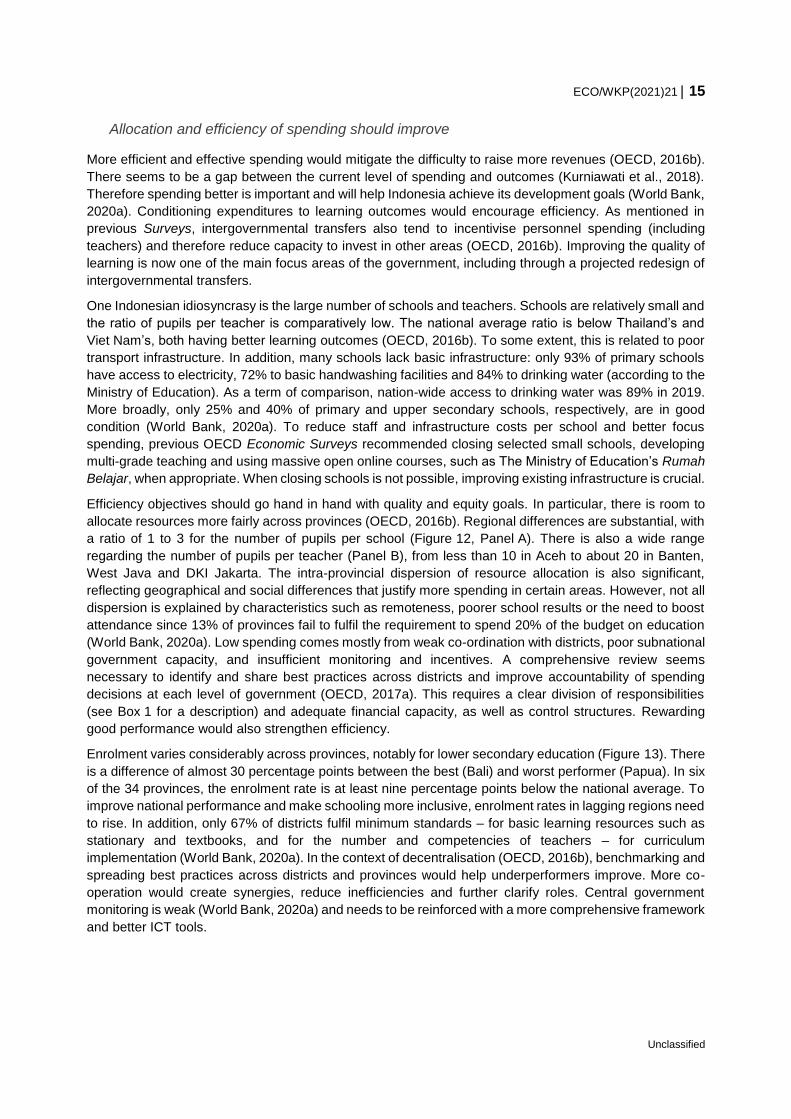
Efficiency objectives should go hand in hand with quality and equity goals. In particular, there is room to
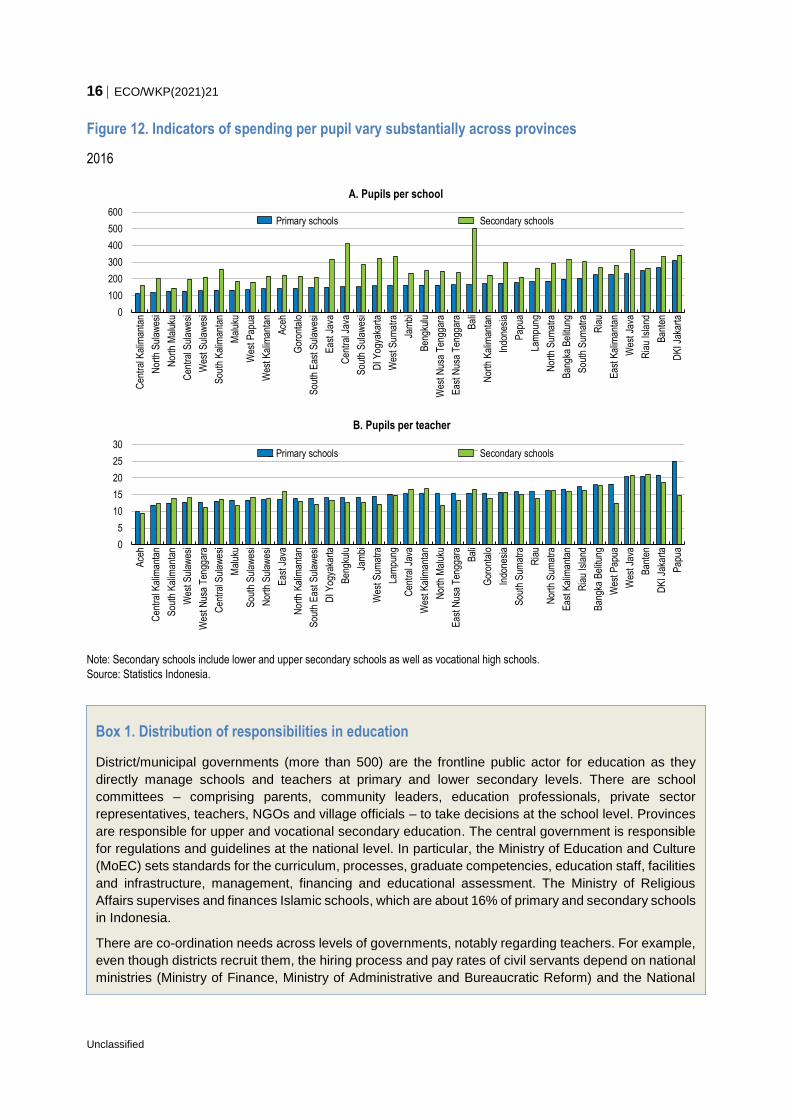
allocate resources more fairly across provinces (OECD, 2016b). Regional differences are substantial, with
a ratio of 1 to 3 for the number of pupils per school (Figure 12, Panel A). There is also a wide range
regarding the number of pupils per teacher (Panel B), from less than 10 in Aceh to about 20 in Banten,
West Java and DKI Jakarta. The intra-provincial dispersion of resource allocation is also significant,
reflecting geographical and social differences that justify more spending in certain areas. However, not all
dispersion is explained by characteristics such as remoteness, poorer school results or the need to boost
attendance since 13% of provinces fail to fulfil the requirement to spend 20% of the budget on education
(World Bank, 2020a). Low spending comes mostly from weak co-ordination with districts, poor subnational
government capacity, and insufficient monitoring and incentives. A comprehensive review seems
necessary to identify and share best practices across districts and improve accountability of spending
decisions at each level of government (OECD, 2017a). This requires a clear division of responsibilities
(see Box 1 for a description) and adequate financial capacity, as well as control structures. Rewarding
good performance would also strengthen efficiency.
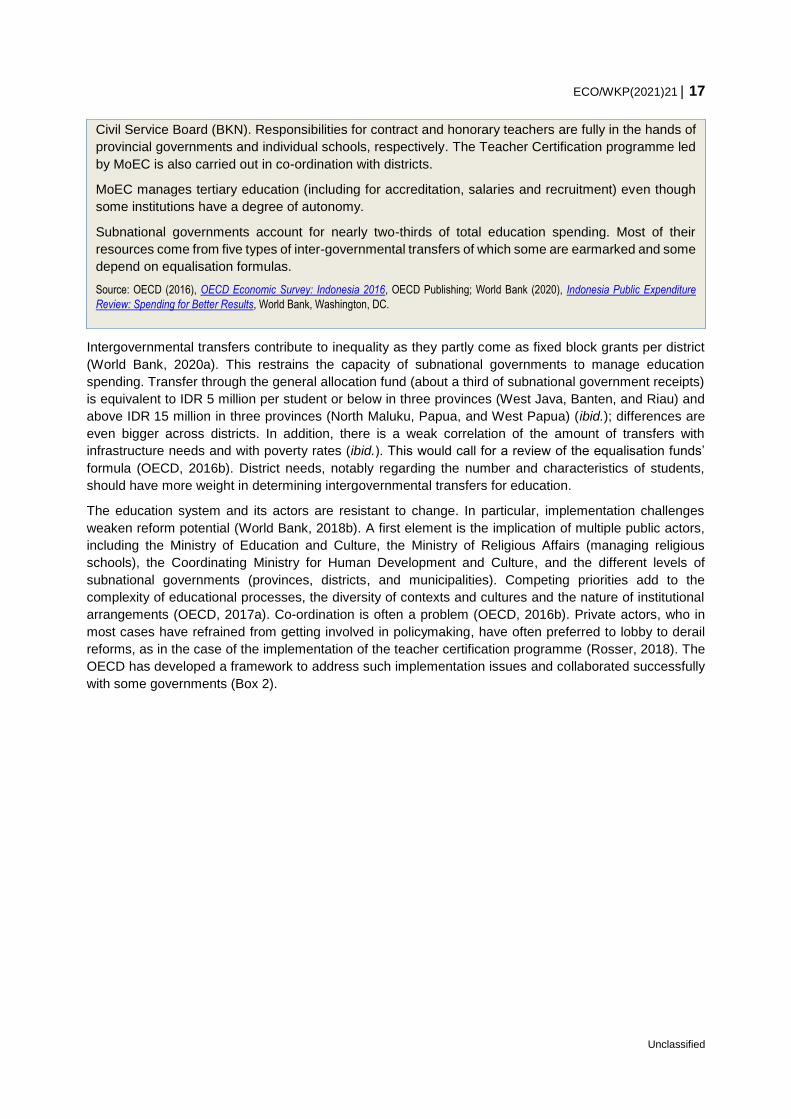
Enrolment varies considerably across provinces, notably for lower secondary education (Figure 13). There
is a difference of almost 30 percentage points between the best (Bali) and worst performer (Papua). In six
of the 34 provinces, the enrolment rate is at least nine percentage points below the national average. To
improve national performance and make schooling more inclusive, enrolment rates in lagging regions need
to rise. In addition, only 67% of districts fulfil minimum standards – for basic learning resources such as
stationary and textbooks, and for the number and competencies of teachers – for curriculum
implementation (World Bank, 2020a). In the context of decentralisation (OECD, 2016b), benchmarking and
spreading best practices across districts and provinces would help underperformers improve. More co-
operation would create synergies, reduce inefficiencies and further clarify roles. Central government
monitoring is weak (World Bank, 2020a) and needs to be reinforced with a more comprehensive framework
and better ICT tools.
16 ECO/WKP(2021)21
Unclassified
Figure 12. Indicators of spending per pupil vary substantially across provinces
2016
Note: Secondary schools include lower and upper secondary schools as well as vocational high schools.
Source: Statistics Indonesia.
0
100
200
300
400
500
600
Cen
tral
Kal
iman
tan
Nor
th S
ulaw
esi
Nor
th M
aluk
u
Cen
tral
Sul
awes
i
Wes
t Sul
awes
i
Sou
th K
alim
anta
n
Mal
uku
Wes
t Pap
ua
Wes
t Kal
iman
tan
Ace
h
Gor
onta
lo
Sou
th E
ast S
ulaw
esi
Eas
t Jav
a
Cen
tral
Jav
a
Sou
th S
ulaw
esi
DI Y
ogya
kart
a
Wes
t Sum
atra
Jam
bi
Ben
gkul
u
Wes
t Nus
a T
engg
ara
Eas
t Nus
a T
engg
ara
Bal
i
Nor
th K
alim
anta
n
Indo
nesi
a
Pap
ua
Lam
pung
Nor
th S
umat
ra
Ban
gka
Bel
itung
Sou
th S
umat
ra
Ria
u
Eas
t Kal
iman
tan
Wes
t Jav
a
Ria
u Is
land
Ban
ten
DK
I Jak
arta
A. Pupils per school
Primary schools Secondary schools
0
5
10
15
20
25
30
Ace
h
Cen
tral
Kal
iman
tan
Sou
th K
alim
anta
n
Wes
t Sul
awes
i
Wes
t Nus
a T
engg
ara
Cen
tral
Sul
awes
i
Mal
uku
Sou
th S
ulaw
esi
Nor
th S
ulaw
esi
Eas
t Jav
a
Nor
th K
alim
anta
n
Sou
th E
ast S
ulaw
esi
DI Y
ogya
kart
a
Ben
gkul
u
Jam
bi
Wes
t Sum
atra
Lam
pung
Cen
tral
Jav
a
Wes
t Kal
iman
tan
Nor
th M
aluk
u
Eas
t Nus
a T
engg
ara
Bal
i
Gor
onta
lo
Indo
nesi
a
Sou
th S
umat
ra
Ria
u
Nor
th S
umat
ra
Eas
t Kal
iman
tan
Ria
u Is
land
Ban
gka
Bel
itung
Wes
t Pap
ua
Wes
t Jav
a
Ban
ten
DK
I Jak
arta
Pap
ua
B. Pupils per teacher
Primary schools Secondary schools
Box 1. Distribution of responsibilities in education
District/municipal governments (more than 500) are the frontline public actor for education as they
directly manage schools and teachers at primary and lower secondary levels. There are school
committees – comprising parents, community leaders, education professionals, private sector
representatives, teachers, NGOs and village officials – to take decisions at the school level. Provinces
are responsible for upper and vocational secondary education. The central government is responsible
for regulations and guidelines at the national level. In particular, the Ministry of Education and Culture
(MoEC) sets standards for the curriculum, processes, graduate competencies, education staff, facilities
and infrastructure, management, financing and educational assessment. The Ministry of Religious
Affairs supervises and finances Islamic schools, which are about 16% of primary and secondary schools
in Indonesia.
There are co-ordination needs across levels of governments, notably regarding teachers. For example,
even though districts recruit them, the hiring process and pay rates of civil servants depend on national
ministries (Ministry of Finance, Ministry of Administrative and Bureaucratic Reform) and the National
ECO/WKP(2021)21 17
Unclassified
Intergovernmental transfers contribute to inequality as they partly come as fixed block grants per district
(World Bank, 2020a). This restrains the capacity of subnational governments to manage education
spending. Transfer through the general allocation fund (about a third of subnational government receipts)
is equivalent to IDR 5 million per student or below in three provinces (West Java, Banten, and Riau) and
above IDR 15 million in three provinces (North Maluku, Papua, and West Papua) (ibid.); differences are
even bigger across districts. In addition, there is a weak correlation of the amount of transfers with
infrastructure needs and with poverty rates (ibid.). This would call for a review of the equalisation funds’
formula (OECD, 2016b). District needs, notably regarding the number and characteristics of students,
should have more weight in determining intergovernmental transfers for education.
The education system and its actors are resistant to change. In particular, implementation challenges
weaken reform potential (World Bank, 2018b). A first element is the implication of multiple public actors,
including the Ministry of Education and Culture, the Ministry of Religious Affairs (managing religious
schools), the Coordinating Ministry for Human Development and Culture, and the different levels of
subnational governments (provinces, districts, and municipalities). Competing priorities add to the
complexity of educational processes, the diversity of contexts and cultures and the nature of institutional
arrangements (OECD, 2017a). Co-ordination is often a problem (OECD, 2016b). Private actors, who in
most cases have refrained from getting involved in policymaking, have often preferred to lobby to derail
reforms, as in the case of the implementation of the teacher certification programme (Rosser, 2018). The
OECD has developed a framework to address such implementation issues and collaborated successfully
with some governments (Box 2).
Civil Service Board (BKN). Responsibilities for contract and honorary teachers are fully in the hands of
provincial governments and individual schools, respectively. The Teacher Certification programme led
by MoEC is also carried out in co-ordination with districts.
MoEC manages tertiary education (including for accreditation, salaries and recruitment) even though
some institutions have a degree of autonomy.
Subnational governments account for nearly two-thirds of total education spending. Most of their
resources come from five types of inter-governmental transfers of which some are earmarked and some
depend on equalisation formulas.
Source: OECD (2016), OECD Economic Survey: Indonesia 2016, OECD Publishing; World Bank (2020), Indonesia Public Expenditure
Review: Spending for Better Results, World Bank, Washington, DC.
18 ECO/WKP(2021)21
Unclassified
Figure 13. Lower secondary education enrolment varies considerably across provinces
Gross enrolment ratio in lower secondary education: difference with the national average, in percentage points, 2020
Source: Statistics Indonesia.
Early childhood education should be promoted
Experiences across the world show the importance of early childhood education for future education
outcomes. On average across OECD countries, a 15-year-old student with no pre-primary education is
around twice as likely to suffer from a low performance in mathematics than a student with at least one
year of pre-primary education, after controlling for student characteristics (OECD, 2016c). In emerging
market economies, the size of the effect depends notably on the quality of programmes (Engle et al., 2011).
Early childhood education may also be the most effective way to reduce the strong role of family
background and the intergenerational persistence of educational inequality (Smidova, 2019). Pre-primary
education is particularly effective for the most vulnerable children, and therefore particularly important to
reduce inequality of opportunities. Expanding early childhood education could then contribute to reducing
inequalities and break the link between being poor as a child and earning little as an adult (Rizky et al.,
2019).
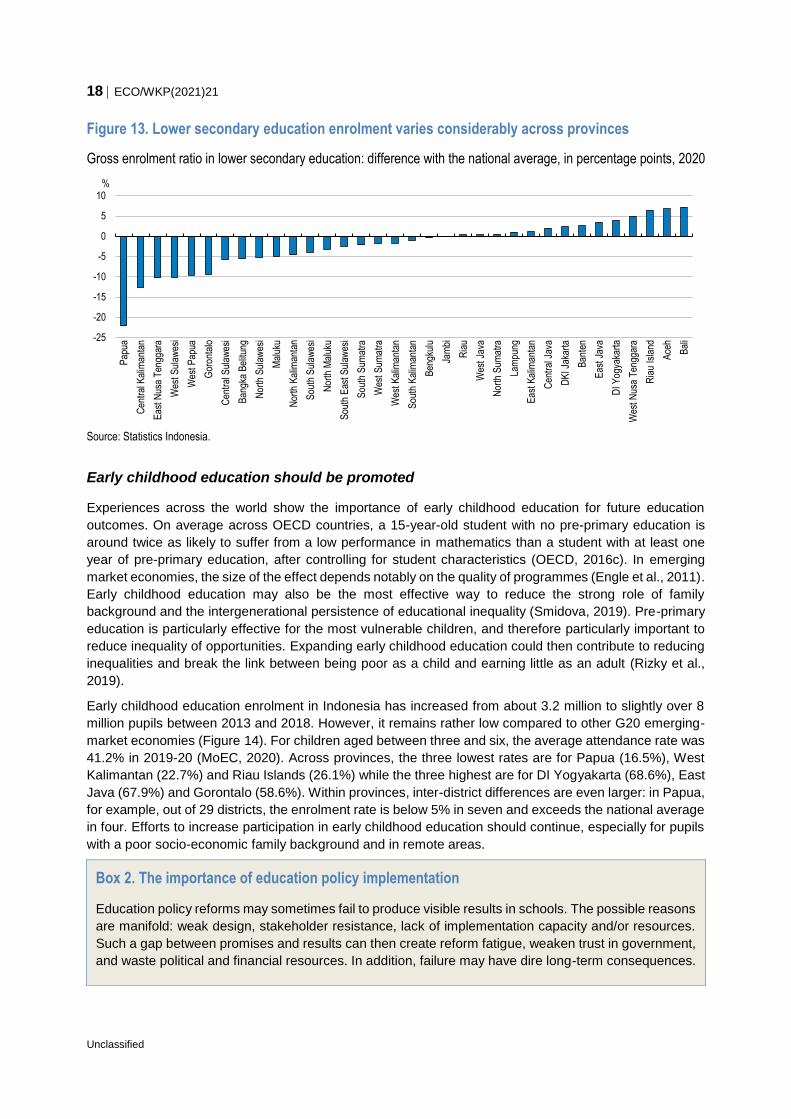
Early childhood education enrolment in Indonesia has increased from about 3.2 million to slightly over 8
million pupils between 2013 and 2018. However, it remains rather low compared to other G20 emerging-
market economies (Figure 14). For children aged between three and six, the average attendance rate was
41.2% in 2019-20 (MoEC, 2020). Across provinces, the three lowest rates are for Papua (16.5%), West
Kalimantan (22.7%) and Riau Islands (26.1%) while the three highest are for DI Yogyakarta (68.6%), East
Java (67.9%) and Gorontalo (58.6%). Within provinces, inter-district differences are even larger: in Papua,
for example, out of 29 districts, the enrolment rate is below 5% in seven and exceeds the national average
in four. Efforts to increase participation in early childhood education should continue, especially for pupils
with a poor socio-economic family background and in remote areas.
-25
-20
-15
-10
-5
0
5
10
Pap
ua
Cen
tral
Kal
iman
tan
Eas
t Nus
a T
engg
ara
Wes
t Sul
awes
i
Wes
t Pap
ua
Gor
onta
lo
Cen
tral
Sul
awes
i
Ban
gka
Bel
itung
Nor
th S
ulaw
esi
Mal
uku
Nor
th K
alim
anta
n
Sou
th S
ulaw
esi
Nor
th M
aluk
u
Sou
th E
ast S
ulaw
esi
Sou
th S
umat
ra
Wes
t Sum
atra
Wes
t Kal
iman
tan
Sou
th K
alim
anta
n
Ben
gkul
u
Jam
bi
Ria
u
Wes
t Jav
a
Nor
th S
umat
ra
Lam
pung
Eas
t Kal
iman
tan
Cen
tral
Jav
a
DK
I Jak
arta
Ban
ten
Eas
t Jav
a
DI Y
ogya
kart
a
Wes
t Nus
a T
engg
ara
Ria
u Is
land
Ace
h
Bal
i
%
Box 2. The importance of education policy implementation
Education policy reforms may sometimes fail to produce visible results in schools. The possible reasons
are manifold: weak design, stakeholder resistance, lack of implementation capacity and/or resources.
Such a gap between promises and results can then create reform fatigue, weaken trust in government,
and waste political and financial resources. In addition, failure may have dire long-term consequences.
ECO/WKP(2021)21 19
Unclassified
Earlier entry in the education system improves performance during primary school, notably in rural
Indonesia (Hasan et al., 2019). As primary education is now universal, it is time to develop early childhood
education and make parents aware of its importance. A first step could be to make one-year pre-primary
education compulsory, notably to attract pupils from poorer families. This is the case in Brazil since 2009.
It requires a transition to ensure the right teachers are available. Introducing some degree of conditionality,
such as the risk of losing welfare benefits in case of non-attendance, could contribute to increase
enrolment.
Figure 14. A quarter of Indonesian primary school pupils have had no early childhood education
Percentage of new entrants to grade 1 of primary education with early childhood education experience, 2018 or
latest
Source: UNESCO Institute for Statistics, Education database.
Health is crucial for young children to build their future. In particular, stunting has a sizeable negative
impact on physical and mental development and is correlated with poor education performance in some
areas. The stunting prevalence in children under five years decreased from 37.2% in 2013 to 27.7% in
2019 but remains elevated compared to the global average (21.3% according to World Bank Development
Indicators). The government ambitiously targets a reduction of stunting prevalence to 14% by mid-2020s
and 18 public institutions devoted IDR 30 trillion (about USD 2 billion) in 2019 to fight child stunting. As
mentioned in the previous Survey, improving targeting of support, promoting breastfeeding and informing
about the dangers of child malnutrition are crucial. Early childhood education could play a substantial role
by providing food and nutrients to children and improving detection and prevention.
0
10
20
30
40
50
60
70
80
90
100
IND ZAF IDN MYS TUN MEX CHN THA PHL
%
Successful implementation requires first of all to acknowledge that this phase of the policy cycle is as
important as the policy elaboration, and then to engage with key stakeholders, and be ready to adapt
the strategy throughout the process. The OECD developed a framework to analyse education policy
implementation and help enhance processes. It proposes to weave together policy design, stakeholder
engagement and contextual elements into a coherent implementation strategy.
The OECD Implementing Education Policies project aims to promote education reforms, offering peer-
learning opportunities and tailored support. The project has for instance supported the implementation
of Norway’s new competence development model for schools and Wales’ large-scale improvement
reform.
Source: OECD (2019),Improving School Quality in Norway: The New Competence Development Model, Implementing Education Policies,
OECD Publishing, Paris; OECD (2018), Developing Schools as Learning Organisations in Wales, Implementing Education Policies, OECD
Publishing, Paris.
20 ECO/WKP(2021)21
Unclassified
Technical and vocational education and training need to be enhanced
In international comparisons, Indonesia stands out for the very high proportion of students in technical and
vocational education and training (TVET) (OECD, 2018a). In 2011, the Ministry of Education’s masterplan
(MP3EI) envisaged to reach a secondary gross enrolment rate of 97% by 2020, of which 60% in vocational
schools. The share of upper-secondary students in the vocational stream did increase from 33% in 2007
to nearly 44% in 2018, and there were nearly 40% more classrooms and 70% more teachers (including
headmasters) in vocational schools in 2019-20 than in 2012-13. Nonetheless, academic education remains
the first choice – 87% of students consider that society values vocational education less than academic
education (Das et al., 2018). In addition, the rapid expansion of vocational education entails risks for the
quality of education, with the recruitment of many unqualified teachers in poorly-supervised schools (which
are mostly private). Indonesia could follow the example of the Philippines, which in 2017 launched the
National TVET Trainers Academy to oversee trainers’ development. Indonesia could also improve data
collection, monitoring and evaluation of TVET programmes (OECD/ADB, 2020).
The government is also strengthening vocational training. This is important notably to reach those who left
schools early in order to improve their skills. Vocational training is carried out in public and private
vocational training centres (VTC) and directly in companies. There are more than 400 public VTCs, 5 000
private VTCs and about 1 800 VTCs in companies.
The authorities also put in place the IQF (Indonesian Qualifications Framework) in 2012. It aims to provide
a unified reference for qualifications from year 9 of schooling to TVET and higher education and includes
formal, non-formal and informal education as well as work experience (MoEC, 2012). The intention was to
address the fragmentation of education and training provision, so that the system provides a clear path to
upgrade an individual’s qualifications. Across countries, national qualifications frameworks appear to be
beneficial for labour market outcomes, especially in the long term (Allais, 2017). However, implementation
is challenging, notably regarding quality assurance in Indonesia where information over competencies as
required by employers is still limited (ACDP, 2016). While the IQF can boost long-term outcomes, it is
crucial that the authorities also continue improving schools, curricula and the quality of teachers.
Another issue is to guarantee the curriculum includes skills aligned with market needs and opens good
employment opportunities. The involvement of local government is crucial to integrate medium-term local
planning parameters into education and training content. For example, in the tourism industry, the
authorities opened vocational institutions in Lombok, Medan and Palembang to meet the demand of the
sector in line with a masterplan to boost tourism (OECD, 2018a). Donors can also help develop TVET
through co-operation such as Switzerland’s support in tourism (ibid.). In 2019, Switzerland extended its
support in Lombok through training of 21 professionals (SwissContact, 2019). The creation of a special
directorate within the Ministry of Education and Culture in charge of the relationship with the business
sector aims to favour the involvement of industries (Antaranews, 2020). The link with the private sector is
essential but needs to be regulated to ensure the education system serves student needs.
Despite the rapid expansion of TVET, employers report that many graduates lack relevant skills (Kadir et
al., 2016). Employers and students alike express concerns about the lack of employers’ input in the
curriculum, limited hands-on training and low teacher quality (Das et al., 2018). Greater flexibility and
transparency, as well as stronger consultation mechanisms with employers, would improve the quality of
TVET. For example, Malaysia has taken steps to improve the connection between businesses and the
education system with the former having a role in TVET programmes accreditation (OECD, 2019e). In
addition, the 2u2i programme of the Ministry of Education in collaboration with firms aims to provide
students with real work experiences before graduation. Promoting local networks of employers could also
facilitate their involvement in skills training (OECD/ADB, 2020).
ECO/WKP(2021)21 21
Unclassified
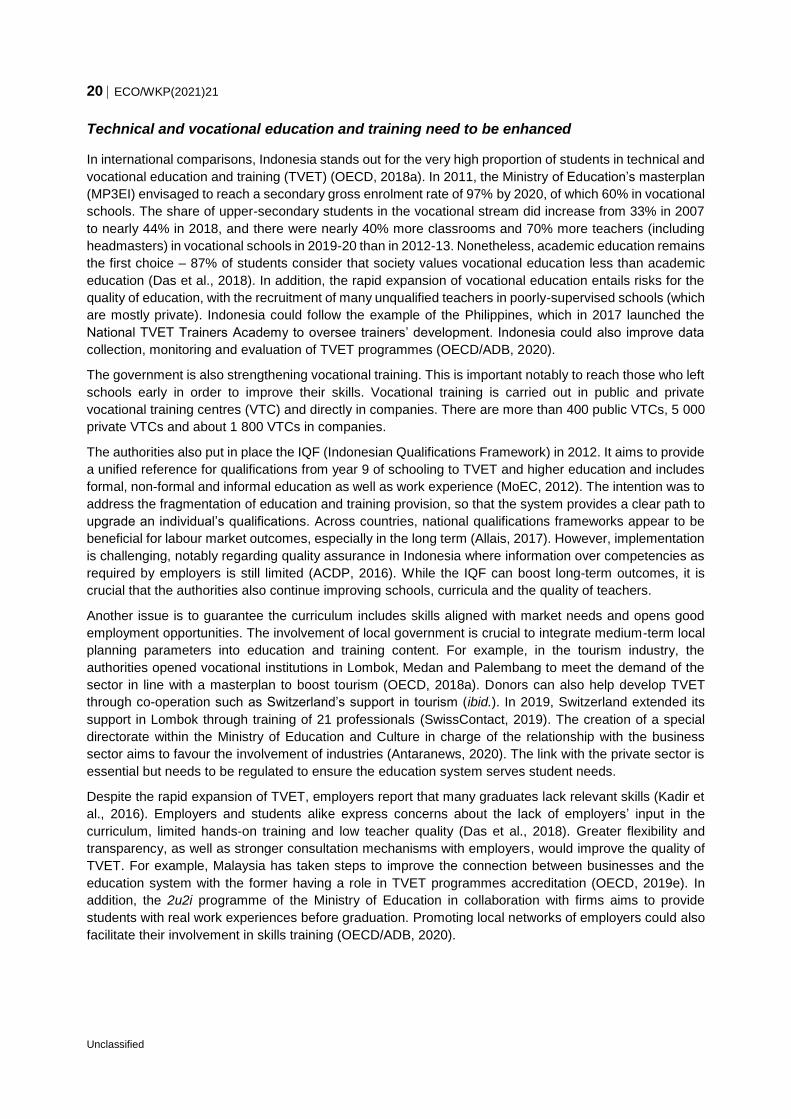
Access to tertiary education has expanded but the quality of universities is uneven
At other levels of education, the enrolment rate in tertiary education has progressively risen, from 8.4% in
1990 to 36.3% in 2018. It is now close to the average level in middle-income countries (Figure 15). The
premium to university attainment is considerable: 3.5 years of additional schooling are associated with a
26.6% increase in hourly wages, larger than what is observed on average across OECD countries (OECD,
2016d).
Figure 15. Enrolment in tertiary education is close to the average for middle-income countries
Gross enrolment ratio, tertiary education, in percentage of the official school-age population, 2018 or latest
Note: MIC stands for the average of middle-income countries according to World Bank Income Groups classification.
Source: UNESCO Institute for Statistics, Education database.
In the absence of an equivalent of PISA to gauge the quality of tertiary education, an alternative is to
examine the lists of the world’s top 500 universities. Three Indonesian universities are included in the QS
World University Rankings 2021 (QS, 2020), up from two in 2015. Their position improved slightly in the
past five years, but the first one (Gadjah Mada University) is only 254th, notably because of the low number
of citations of the research output. As a term of comparison, in other emerging countries the best local
universities are ranked 15th in China, 59th in Malaysia, 74th in the Russian Federation, 115th in Brazil, 172nd
in India, 208th in Thailand, and 220th in South Africa. The government seeks to increase the number of
Indonesian global universities and their ranking, something that will require substantial improvements in
the quality of teachers, infrastructure and governance. Most university lecturers only hold a master degree,
and in some cases, it is possible to teach with a bachelor (Srivastava, 2020). The number of high-education
institutions (HEI) is high – twice as many as in China, which has a population five times as large (ibid.) –,
but many of them, mainly private, suffer from low quality. The rapid growth in students outpaced capacity
and many HEIs are underfunded (Logli, 2016). Quality assurance should raise, notably by enforcing
minimum standards in the private sector and improving accreditation mechanisms (see OECD, 2019f for
Mexico’s approach). The government is promoting the merger of private HEIs to create synergies and
economies of scale, but with little success.
The structure of HEI fees tends to be regressive and so is government support for tertiary education, which
disproportionately benefits students from higher socio-economic backgrounds. Students and their families
have been paying an increasing share of the overall HEI budget as the result of low government funding
(Logli, 2016). The burden is equivalent to a third of annual expenditure for an average household
(OECD/ADB, 2015). Since the early 2010s, the government has expanded the number of scholarships
(Bidik Misi) and financial assistance with the target of reaching 20% of students. Inequality, however,
0
10
20
30
40
50
60
70
80
90
100
ZAF IND VNM TUN PHL IDN MIC MEX MYS THA CHN BRA RUS SGP ARG
%
22 ECO/WKP(2021)21
Unclassified
remains high with an overrepresentation of students from Java (including Jakarta), urban areas and
wealthier families (31% of students from top quintile households). Lack of information and the difficulty and
costs of relocating also explain low access for disadvantaged groups. Recent reforms, namely the revision
to the entry system in public universities (to better target support of socio-economically disadvantaged
groups), the Akademi Komunitas programme (one to two years of high vocational education at district
level), as well as the opening of universities in underserved areas, could improve the situation. Continued
monitoring of the situation of students from disadvantaged socio-economic backgrounds is crucial to fight
dropping out. Subsidised loans could also benefit students and have broader medium-term benefits (Elmira
and Suryadarma, 2018).
The experience of other Asian countries shows the positive contribution that foreign investment in HEI
could play in boosting domestic competition and education outcomes. For example, in Viet Nam, FDI has
complemented the domestic offer of education services (Box 3). Foreign HEIs can operate in Indonesia
since 2012, under the condition of partnering with local universities through student exchanges, grants and
scholarships, dual degree programmes, joint research and publications. However, there was resistance
from Indonesian HEIs to allowing a foreign university to open a full-fledged campus (Rosser, 2018). The
Comprehensive Economic Partnership Agreement (CEPA) with Australia (ratified in mid-2020) allows an
Australian investor to own the majority of a university in Indonesia (and vice versa). Melbourne’s Monash
University, which already operates a campus in Malaysia, has announced its intention of investing in
Indonesia.
Box 3. FDI in Viet Nam’s education sector
Viet Nam has experienced rapid economic development with GDP growth averaging 6.4% over the past
15 years. Concomitantly, net FDI inflows have surged, from under USD 2 billion per year over 1995-
2005 to USD 15.5 billion in 2018 (about 6.3% of GDP).
Human capital is the major factor limiting the development of Viet Nam (OECD, 2020; WEF, 2019).
Despite important public expenditures in education (above 4% of GDP), the surge in demand led to the
opening of many low-quality private universities (Trines, 2017). Student net outflows, according to
UNESCO, went from 17 000 in 2005 to about 90 000 in 2017, in the face of access limitations and
quality problems in Viet Nam. Five international universities opened branches while there are 13
international high schools (Vietnam Economic Times, 2018). With the demand for foreign-language
schooling booming, domestic investors launched three more international schools.
A 2018 decree eased regulations so that foreign-owned schools and universities can enrol more
students. A subsequent decree, in 2019, allows foreign investors to own 100% of education institutions,
subject to minimum capital requirements depending on the education level: for example
USD 21.5 million for universities. This new regulation also grants more autonomy to higher education
institutions regarding academic activities, staff, training and education structure (Vietnam Briefing,
2020).
Source: OECD (2020), Multi-dimensional Review of Viet Nam, OECD Publishing; WEF (2019), The Global Competitiveness Report, World
Economic Forum; Trines, S. (2017), Education in Vietnam, WENR; Vietnam Briefing (2020), Education in Vietnam: Opportunities and
Challenges, Dezan Shira & Associates.
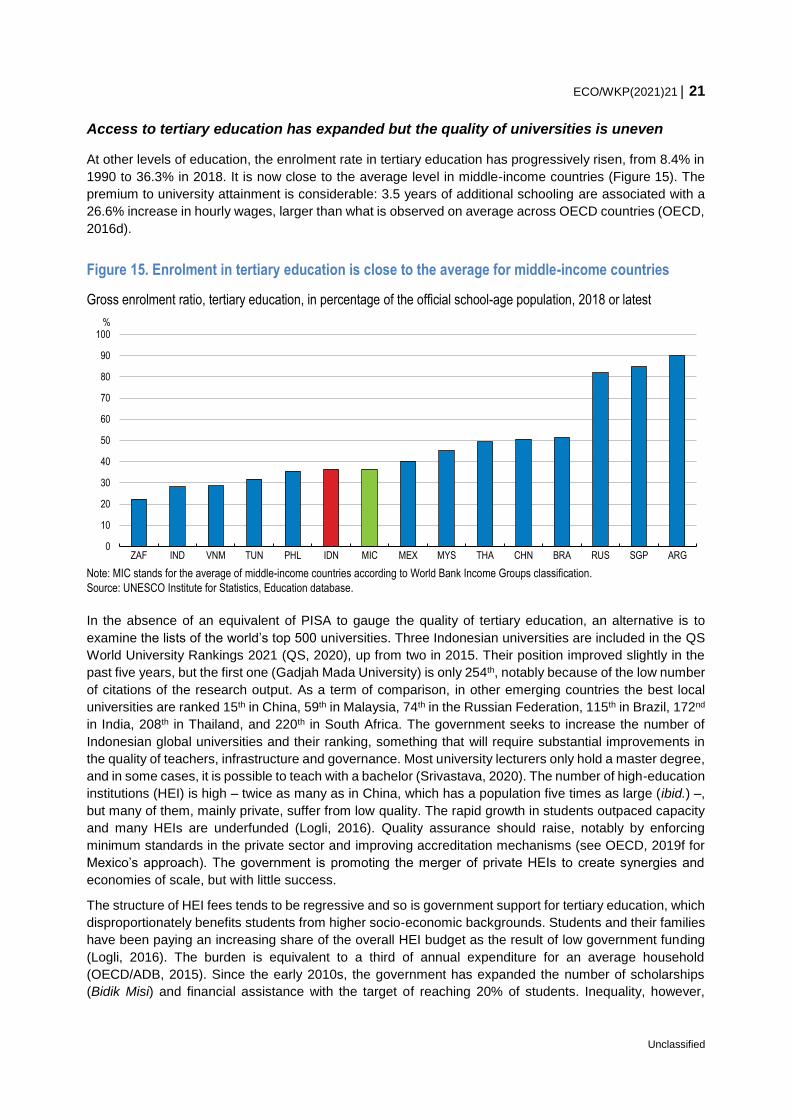
Some skills shortages may result from the absence or low supply of certain types of training in Indonesia
and can therefore be tackled through studies abroad. Fewer Indonesians study abroad than in most
comparable countries (Figure 16) and the rate has trended downwards – it was above 1% in the early
2000s. This contrasts with the large number of Indonesians between age 13 and 18 considering studying
abroad (81%, according to Banov et al., 2017). Affordability is the main barrier, as nearly half of the
surveyed population would need a full scholarship. The Indonesia Endowment Fund for Education –
ECO/WKP(2021)21 23
Unclassified
providing scholarships for studying both domestically and abroad – has increased in recent years but
remains insufficient: in 2018, there were only 825 additional awardees for overseas scholarships (LPDP,
2019). Other sources of funding, including domestic philanthropy, and international co-operation could
support more scholarships for students in need, as advocated by President Joko Widodo (UWN, 2017). In
this regard, the ASEAN International Mobility for Students (AIMS), akin to Erasmus+ in Europe, is welcome
as it supports one-semester study at participating institutions.
Figure 16. Few Indonesians study abroad
Number of students studying abroad, as a share of total tertiary enrolment, 2018
Note: MIC stands for middle-income countries according to World Bank Income Groups classification.
Source: UNESCO Institute for Statistics, Education database.
Digitalisation is playing an increasing role in the education system
COVID-19 has tested the ability of education systems worldwide to adapt and reinforced the incentive for
faster digitalisation, while also magnifying inequalities across and within countries. Making the most of
digitalisation in education requires sufficient ICT infrastructure in schools, providing specific training to
teachers, and incorporating ICT in curricula (OECD, 2019a). In general, administrations, teachers, parents
and students were ill-prepared for the anti-pandemic measures, notably school closures and physical
distancing, and education delivery proved difficult for many pupils (Gouëdard et al., 2020). Remote learning
also proved challenging, especially for students from poor or otherwise disadvantaged backgrounds. In
addition to the direct costs in terms of failure to acquire competencies, there are losses in marginal future
earnings that, cumulated over time, can be substantial. However, the efforts spent to find ways to learn
and teach remotely have the potential to improve pedagogical efficacy in the future (Reimers and
Schleicher, 2020).
Schools in Indonesia started to close in mid-March and have remained shut until end-December in most
cases. Soon after the first school closures, the Ministry of Education set up a website to provide
information, guidelines and news to students facing COVID-19 (see
https://bersamahadapikorona.kemdikbud.go.id). The difficulties for the education system in such a
situation are numerous: reaching all students, who may lack the necessary infrastructure (internet access,
computer, printer, even electricity); poor self-learning capacities; a breakdown in communication between
parents and teachers; nutrition, health and housing challenges for many low-income families; and
technological challenges for teachers (Gouëdard et al., 2020). Some 90 000 additional children may drop
0
1
2
3
4
5
6
7
8
9
ARG PHL IDN TUR MEX BRA ZAF RUS IND THA MIC CHN VNM SAU MYS TUN
%
24 ECO/WKP(2021)21
Unclassified
out of school due to COVID-19 – especially in remote areas – and the first four months of schools’ closure
may have reduced Indonesia’s PISA score by 11 points (Yarrow et al., 2020).
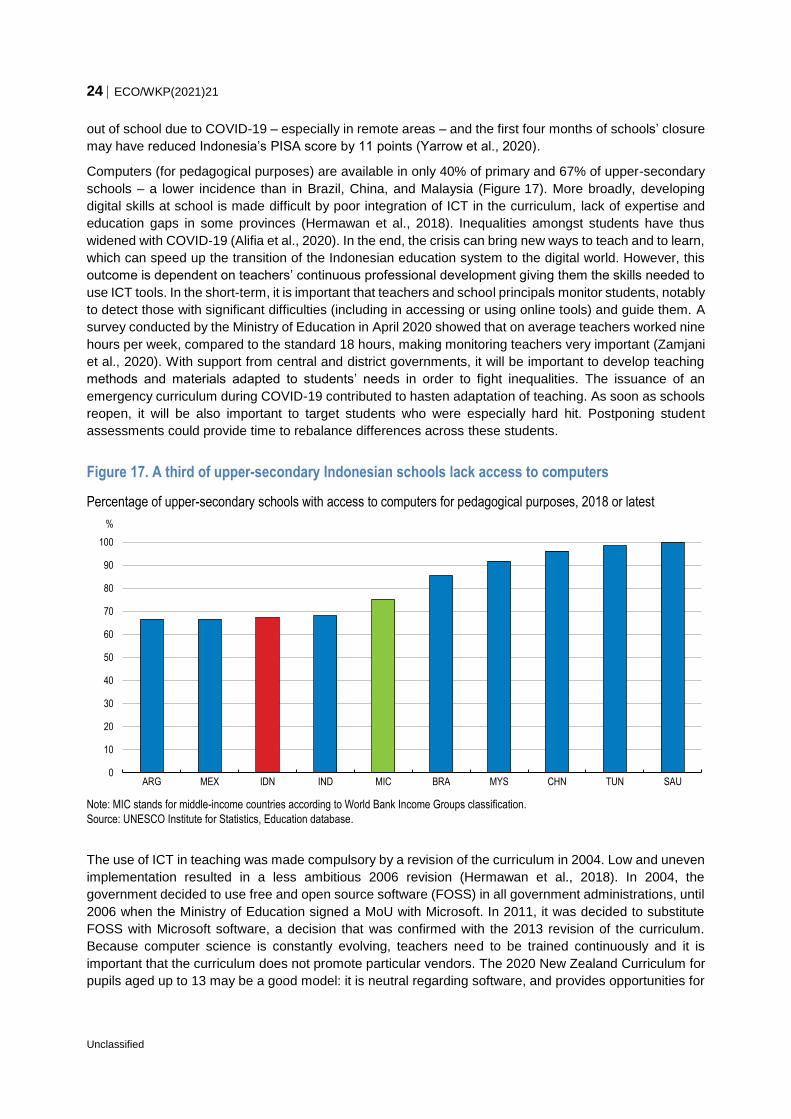
Computers (for pedagogical purposes) are available in only 40% of primary and 67% of upper-secondary
schools – a lower incidence than in Brazil, China, and Malaysia (Figure 17). More broadly, developing
digital skills at school is made difficult by poor integration of ICT in the curriculum, lack of expertise and
education gaps in some provinces (Hermawan et al., 2018). Inequalities amongst students have thus
widened with COVID-19 (Alifia et al., 2020). In the end, the crisis can bring new ways to teach and to learn,
which can speed up the transition of the Indonesian education system to the digital world. However, this
outcome is dependent on teachers’ continuous professional development giving them the skills needed to
use ICT tools. In the short-term, it is important that teachers and school principals monitor students, notably
to detect those with significant difficulties (including in accessing or using online tools) and guide them. A
survey conducted by the Ministry of Education in April 2020 showed that on average teachers worked nine
hours per week, compared to the standard 18 hours, making monitoring teachers very important (Zamjani
et al., 2020). With support from central and district governments, it will be important to develop teaching
methods and materials adapted to students’ needs in order to fight inequalities. The issuance of an
emergency curriculum during COVID-19 contributed to hasten adaptation of teaching. As soon as schools
reopen, it will be also important to target students who were especially hard hit. Postponing student
assessments could provide time to rebalance differences across these students.
Figure 17. A third of upper-secondary Indonesian schools lack access to computers
Percentage of upper-secondary schools with access to computers for pedagogical purposes, 2018 or latest
Note: MIC stands for middle-income countries according to World Bank Income Groups classification.
Source: UNESCO Institute for Statistics, Education database.
The use of ICT in teaching was made compulsory by a revision of the curriculum in 2004. Low and uneven
implementation resulted in a less ambitious 2006 revision (Hermawan et al., 2018). In 2004, the
government decided to use free and open source software (FOSS) in all government administrations, until
2006 when the Ministry of Education signed a MoU with Microsoft. In 2011, it was decided to substitute
FOSS with Microsoft software, a decision that was confirmed with the 2013 revision of the curriculum.
Because computer science is constantly evolving, teachers need to be trained continuously and it is
important that the curriculum does not promote particular vendors. The 2020 New Zealand Curriculum for
pupils aged up to 13 may be a good model: it is neutral regarding software, and provides opportunities for
0
10
20
30
40
50
60
70
80
90
100
ARG MEX IDN IND MIC BRA MYS CHN TUN SAU
%
ECO/WKP(2021)21 25
Unclassified
all learners to become digitally capable, with content designed to be flexible to respond to new
developments and technologies as they emerge (NZMoE, 2020).
Digitalisation eases distance learning and teachers’ training, which can support the education system,
especially in countries like Indonesia where reaching remote areas is a distinct challenge. It also facilitates
collaboration with foreign institutions. However, with distance learning, students tend to lose teacher
contact time, and online systems thus rely much more on parents, resulting in poorer average learning
outcomes in the case of US online charter schools (CREDO, 2015). Additionally, possessing a computer
is still rather uncommon in Indonesia: only 34% of 15-years-old students have access to a computer for
schoolwork (according to the latest PISA survey). This is particularly difficult for students living in remote
areas: about half of them do not have an internet connection (according to the Ministry of Education). Since
the outbreak of the COVID-19 crisis, several initiatives – for example BisaBelajar in Yogyakarta – have
sought to collect older smartphones and donations for mobile data plans, in order to distribute them to
students from low-income families. The government has also launched a mobile data subsidy programme
worth IDR 7.2 trillion (about USD 550 million) for September-December 2020 to support online learning.
Start-ups have begun to propose new tools to ease learners’ and teachers’ work, building on the increasing
number of mobile users (nearly a third of the population). For example, the CoLearn platform has been
used by 200 000 students after its launch in September; ruangkelas, launched in July, has already reached
17 000 teachers. Funding of the education technology sector (USD 200 million in 2019, according to
Redseer) remains low and below India for example (USD 2.5 billion) but is picking up, notably thanks to
the development of services to other businesses (Riaz et al., 2020). The government has promoted free
access to several online learning platforms during COVID-19. It will be important to guarantee a conducive
business environment for new forms of e-services and preserve the level playing field with incumbent
business.
Labour market rigidities are holding back the potential of the economy
Indonesia’s labour market is characterised by strong dualism. Jobs in the formal economy are relatively
well protected, whereas informal workers (about 80% of the workforce) face poor working conditions. Some
regulations are particularly strict and prevent workers and employers from adapting quickly to labour
market needs. Annually over 2015-19, the labour force and employment grew by over 2 million and nearly
2.5 million people respectively (according to Statistics Indonesia) but labour productivity is low (about 73%
below the OECD average). In addition, Indonesia’s labour market performs relatively poorly with regard to
job quality and inclusiveness, even compared to other emerging market economies (Table 1). The COVID-
19 crisis is magnifying some of the weaknesses of the current system. The momentum for ambitious labour
market reform, as envisaged before COVID-19, should not vanish, and the OECD Jobs Strategy offers a
template (OECD, 2018b). The recently-passed Omnibus Bill could be a milestone in that regard (see
below).
Higher educational attainment tends to increase the likelihood of being employed (OECD, 2020b). In
Indonesia, while completing upper secondary education does not materially improve the employment rate
for 25-34 year-olds, having a tertiary education degree does increase the employment rate by more than
10 percentage points. This highlights the aforementioned quality shortcomings of secondary education.
The consequences of COVID-19 are dramatic
As result of the COVID-19 pandemic and the associated economic contraction, the government estimates
that 1.8 to 4.8 million people may fall into poverty in 2020, while 3 to 5.2 million may lose their job. Other
estimates are higher: one study concludes that the poverty rate may increase from 9.2% pre-crisis to 16.6%
(nearly 20 million more poor people), back to the level observed in 2004, in the most severe recessionary
26 ECO/WKP(2021)21
Unclassified
scenario (Suryahadi et al., 2020). By August, the unemployment rate stood at 7.1% of the labour force, 1.8
percentage points above the August 2019 reading, while the share of informal (national definition) and
part-time workers increased by 4.6 and 3.4 percentage points, respectively. In total, nearly 30 million
workers were directly affected by the crisis (either losing their job, leaving the labour force or involuntarily
working fewer hours). At the peak of the crisis, in April, the impact on employment was particularly large
for six sectors: accommodation, food and beverages; trading; transportation and warehousing;
construction; processing industry; and other services (Rahman et al., 2020).
In June 2020, Statistics Indonesia released a survey of nearly 90 000 workers, reporting that over a third
of those still working said that their income decreased. The impact was particularly strong for informal and
low-income workers (Rahman et al., 2020). Many did not have enough savings and government support
to cope with an activity stop. Some turned to illegal mining or to a previous activity, for example seaweed
harvesting. The long-term consequences of lower income will be disastrous too and may inter alia reduce
life expectancy by up to 1.7 year (Gibson and Olivia, 2020). The crisis had also a larger impact on women
given their role in the most affected sectors (ibid.). Taking care of children during school closure affected
also them disproportionately (UNESCO, 2020).
Notwithstanding the authorities’ numerous economic policy measures, the crisis revealed shortcomings in
Indonesian public administration. Bureaucratic processes delayed counter-cyclical fiscal spending,
including for social safety nets for which only a third of budgeted expenditures were spent by end-June
(Bloomberg, 2020). In addition, the list of recipients in need was not up-to-date. Difficulties in social
assistance distribution were one of the main causes of dissatisfaction in public opinion polls (Indo
Barometer, survey between 12 and 18 May). The Indonesian Ombudsman received numerous complaints
about the distribution of social aid, suggesting corruption cases. For example, in Papua and Jambi, data
manipulation altered the number and names of recipients. It is important that the Supreme Audit Institution
(BPK) quickly reviews government interventions related to COVID-19 and intervenes when needed to
ensure accountability (IDI, 2020).
Before the crisis, the government initiated an ambitious reform to promote training for adults: the “pre-
employment card” programme (see also below). It ingeniously adapted it to COVID-19, accelerating and
widening implementation to provide cash aid as well as a training subsidy to the growing ranks of job-
seekers. Each recipient is to get IDR 600 000 per month for four months, IDR 150 000 if they fill in three
surveys plus IDR 1 million to pay for optional training. Partnership with online training platforms allowed
beneficiaries to respect distancing rules. In June, almost 11 million people had registered, 5.6 million had
passed the first validation process and slightly more than 680 000 actually received a pre-employment
card. Despite registration issues and design weakness – for example, control of trainee attendance was
irregular or there was no open tender for procurement of the education platform and courses (KPK, 2020)
– it was a rapid way to support the unemployed during the crisis. However, the number of beneficiaries
has remained relatively small. In the medium term, a comprehensive unemployment insurance system
(see below) would be preferable.
The duration of the crisis and the capacity of the economy to rebound will be crucial for future labour market
outcomes. Skills erode without practice and many temporary lay-offs may become permanent and produce
scarring effects. Evidence from earlier crises in the United States suggests that the detrimental effects of
losing and/or not finding a job can last (Kahn, 2010; Rothstein, 2019). The costs are particularly high for
first-time jobseekers, who may be compelled to accept positions for which they are overqualified and then
find their successive career path compromised. Youth who have recently or will soon graduate are more
at risk, as they face a depressed labour market (ILO, 2020a). A potential solution is to help them continue
studying or to propose vocational and soft-skills training, including through online services.
Conversely, there could be opportunities in the longer term. The crisis could help formalise the informal
sector if welfare recipients enjoy automatic registration to social security (without penalties for informal
activities) and be an opportunity for Indonesia to create a database of informal workers consolidating
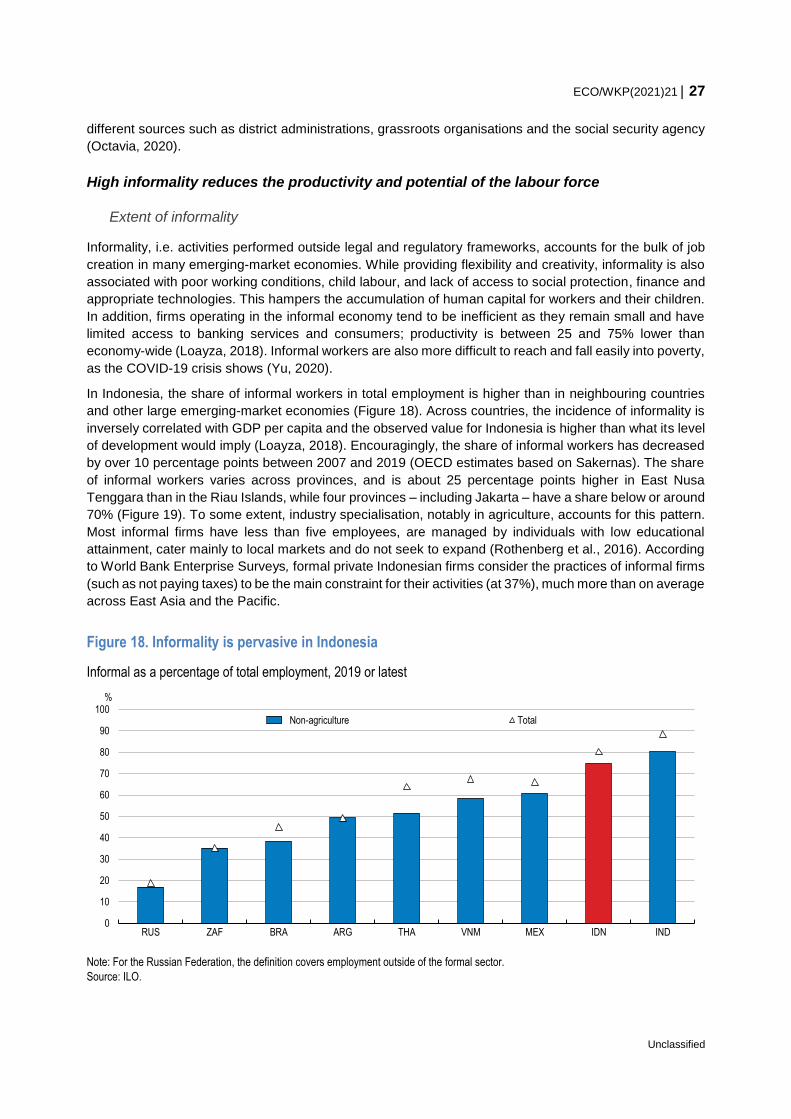
ECO/WKP(2021)21 27
Unclassified
different sources such as district administrations, grassroots organisations and the social security agency
(Octavia, 2020).
High informality reduces the productivity and potential of the labour force
Extent of informality
Informality, i.e. activities performed outside legal and regulatory frameworks, accounts for the bulk of job
creation in many emerging-market economies. While providing flexibility and creativity, informality is also
associated with poor working conditions, child labour, and lack of access to social protection, finance and
appropriate technologies. This hampers the accumulation of human capital for workers and their children.
In addition, firms operating in the informal economy tend to be inefficient as they remain small and have
limited access to banking services and consumers; productivity is between 25 and 75% lower than
economy-wide (Loayza, 2018). Informal workers are also more difficult to reach and fall easily into poverty,
as the COVID-19 crisis shows (Yu, 2020).
In Indonesia, the share of informal workers in total employment is higher than in neighbouring countries
and other large emerging-market economies (Figure 18). Across countries, the incidence of informality is
inversely correlated with GDP per capita and the observed value for Indonesia is higher than what its level
of development would imply (Loayza, 2018). Encouragingly, the share of informal workers has decreased
by over 10 percentage points between 2007 and 2019 (OECD estimates based on Sakernas). The share
of informal workers varies across provinces, and is about 25 percentage points higher in East Nusa
Tenggara than in the Riau Islands, while four provinces – including Jakarta – have a share below or around
70% (Figure 19). To some extent, industry specialisation, notably in agriculture, accounts for this pattern.
Most informal firms have less than five employees, are managed by individuals with low educational
attainment, cater mainly to local markets and do not seek to expand (Rothenberg et al., 2016). According
to World Bank Enterprise Surveys, formal private Indonesian firms consider the practices of informal firms
(such as not paying taxes) to be the main constraint for their activities (at 37%), much more than on average
across East Asia and the Pacific.
Figure 18. Informality is pervasive in Indonesia
Informal as a percentage of total employment, 2019 or latest
Note: For the Russian Federation, the definition covers employment outside of the formal sector.
Source: ILO.
0
10
20
30
40
50
60
70
80
90
100
RUS ZAF BRA ARG THA VNM MEX IDN IND
%
Non-agriculture Total
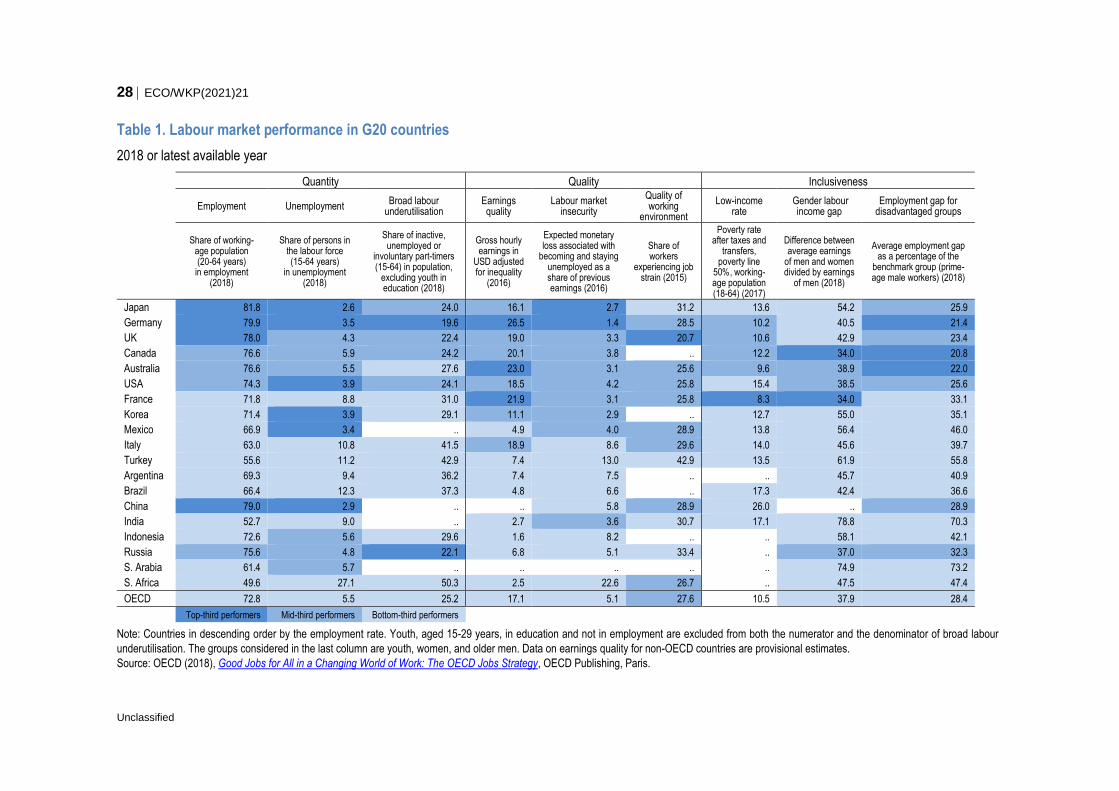
28 ECO/WKP(2021)21
Unclassified
Table 1. Labour market performance in G20 countries
2018 or latest available year
Quantity Quality Inclusiveness
Employment Unemployment Broad labour
underutilisation Earnings quality
Labour market insecurity
Quality of working
environment
Low-income rate
Gender labour income gap
Employment gap for disadvantaged groups
Share of working-
age population (20-64 years) in employment
(2018)
Share of persons in the labour force (15-64 years)
in unemployment (2018)
Share of inactive, unemployed or
involuntary part-timers (15-64) in population,
excluding youth in education (2018)
Gross hourly earnings in
USD adjusted for inequality
(2016)
Expected monetary loss associated with
becoming and staying unemployed as a share of previous earnings (2016)
Share of workers
experiencing job strain (2015)
Poverty rate after taxes and
transfers, poverty line
50%, working-age population (18-64) (2017)
Difference between average earnings
of men and women divided by earnings
of men (2018)
Average employment gap as a percentage of the
benchmark group (prime-age male workers) (2018)
Japan 81.8 2.6 24.0 16.1 2.7 31.2 13.6 54.2 25.9
Germany 79.9 3.5 19.6 26.5 1.4 28.5 10.2 40.5 21.4
UK 78.0 4.3 22.4 19.0 3.3 20.7 10.6 42.9 23.4
Canada 76.6 5.9 24.2 20.1 3.8 .. 12.2 34.0 20.8
Australia 76.6 5.5 27.6 23.0 3.1 25.6 9.6 38.9 22.0
USA 74.3 3.9 24.1 18.5 4.2 25.8 15.4 38.5 25.6
France 71.8 8.8 31.0 21.9 3.1 25.8 8.3 34.0 33.1
Korea 71.4 3.9 29.1 11.1 2.9 .. 12.7 55.0 35.1
Mexico 66.9 3.4 .. 4.9 4.0 28.9 13.8 56.4 46.0
Italy 63.0 10.8 41.5 18.9 8.6 29.6 14.0 45.6 39.7
Turkey 55.6 11.2 42.9 7.4 13.0 42.9 13.5 61.9 55.8
Argentina 69.3 9.4 36.2 7.4 7.5 .. .. 45.7 40.9
Brazil 66.4 12.3 37.3 4.8 6.6 .. 17.3 42.4 36.6
China 79.0 2.9 .. .. 5.8 28.9 26.0 .. 28.9
India 52.7 9.0 .. 2.7 3.6 30.7 17.1 78.8 70.3
Indonesia 72.6 5.6 29.6 1.6 8.2 .. .. 58.1 42.1
Russia 75.6 4.8 22.1 6.8 5.1 33.4 .. 37.0 32.3
S. Arabia 61.4 5.7 .. .. .. .. .. 74.9 73.2
S. Africa 49.6 27.1 50.3 2.5 22.6 26.7 .. 47.5 47.4
OECD 72.8 5.5 25.2 17.1 5.1 27.6 10.5 37.9 28.4
Top-third performers Mid-third performers Bottom-third performers
Note: Countries in descending order by the employment rate. Youth, aged 15-29 years, in education and not in employment are excluded from both the numerator and the denominator of broad labour
underutilisation. The groups considered in the last column are youth, women, and older men. Data on earnings quality for non-OECD countries are provisional estimates.
Source: OECD (2018), Good Jobs for All in a Changing World of Work: The OECD Jobs Strategy, OECD Publishing, Paris.
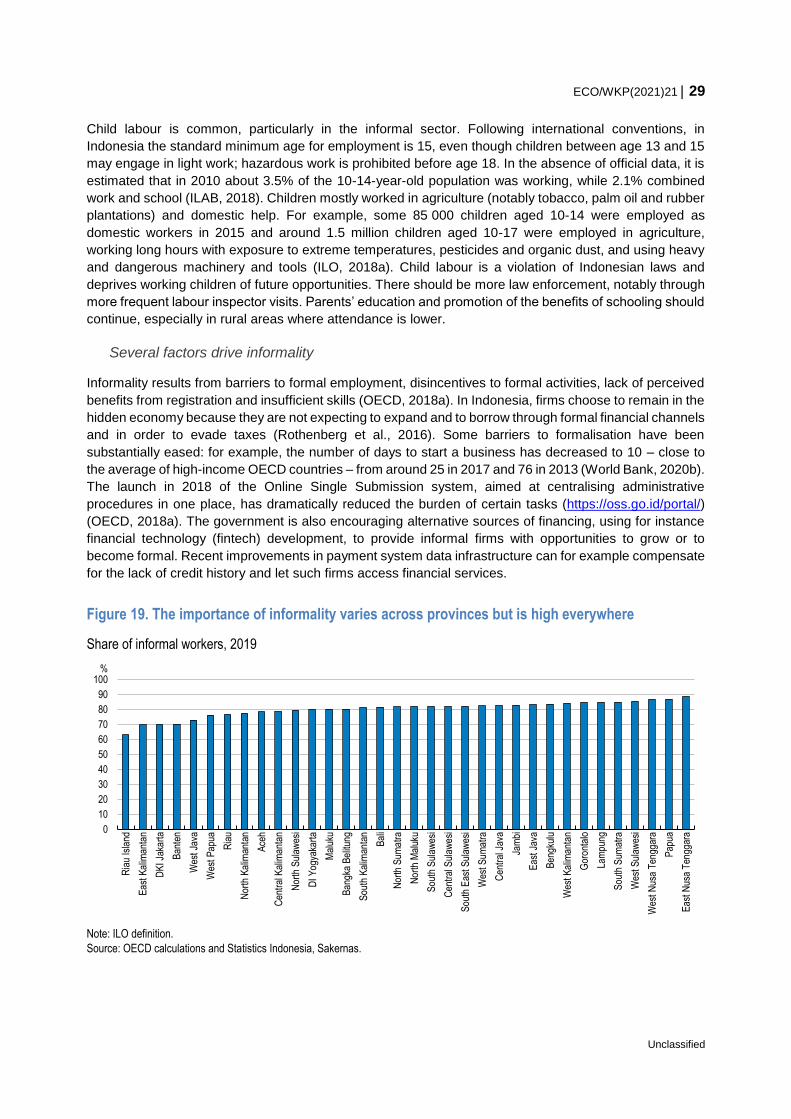
ECO/WKP(2021)21 29
Unclassified
Child labour is common, particularly in the informal sector. Following international conventions, in
Indonesia the standard minimum age for employment is 15, even though children between age 13 and 15
may engage in light work; hazardous work is prohibited before age 18. In the absence of official data, it is
estimated that in 2010 about 3.5% of the 10-14-year-old population was working, while 2.1% combined
work and school (ILAB, 2018). Children mostly worked in agriculture (notably tobacco, palm oil and rubber
plantations) and domestic help. For example, some 85 000 children aged 10-14 were employed as
domestic workers in 2015 and around 1.5 million children aged 10-17 were employed in agriculture,
working long hours with exposure to extreme temperatures, pesticides and organic dust, and using heavy
and dangerous machinery and tools (ILO, 2018a). Child labour is a violation of Indonesian laws and
deprives working children of future opportunities. There should be more law enforcement, notably through
more frequent labour inspector visits. Parents’ education and promotion of the benefits of schooling should
continue, especially in rural areas where attendance is lower.
Several factors drive informality
Informality results from barriers to formal employment, disincentives to formal activities, lack of perceived
benefits from registration and insufficient skills (OECD, 2018a). In Indonesia, firms choose to remain in the
hidden economy because they are not expecting to expand and to borrow through formal financial channels
and in order to evade taxes (Rothenberg et al., 2016). Some barriers to formalisation have been
substantially eased: for example, the number of days to start a business has decreased to 10 – close to
the average of high-income OECD countries – from around 25 in 2017 and 76 in 2013 (World Bank, 2020b).
The launch in 2018 of the Online Single Submission system, aimed at centralising administrative
procedures in one place, has dramatically reduced the burden of certain tasks (https://oss.go.id/portal/)
(OECD, 2018a). The government is also encouraging alternative sources of financing, using for instance
financial technology (fintech) development, to provide informal firms with opportunities to grow or to
become formal. Recent improvements in payment system data infrastructure can for example compensate
for the lack of credit history and let such firms access financial services.
Figure 19. The importance of informality varies across provinces but is high everywhere
Share of informal workers, 2019
Note: ILO definition.
Source: OECD calculations and Statistics Indonesia, Sakernas.
0
10
20
30
40
50
60
70
80
90
100
Ria
u Is
land
Eas
t Kal
iman
tan
DK
I Jak
arta
Ban
ten
Wes
t Jav
a
Wes
t Pap
ua
Ria
u
Nor
th K
alim
anta
n
Ace
h
Cen
tral
Kal
iman
tan
Nor
th S
ulaw
esi
DI Y
ogya
kart
a
Mal
uku
Ban
gka
Bel
itung
Sou
th K
alim
anta
n
Bal
i
Nor
th S
umat
ra
Nor
th M
aluk
u
Sou
th S
ulaw
esi
Cen
tral
Sul
awes
i
Sou
th E
ast S
ulaw
esi
Wes
t Sum
atra
Cen
tral
Jav
a
Jam
bi
Eas
t Jav
a
Ben
gkul
u
Wes
t Kal
iman
tan
Gor
onta
lo
Lam
pung
Sou
th S
umat
ra
Wes
t Sul
awes
i
Wes
t Nus
a T
engg
ara
Pap
ua
Eas
t Nus
a T
engg
ara
%
30 ECO/WKP(2021)21
Unclassified
Nonetheless, administrative complexity endures. In particular, there are co-ordination issues between
central and local governments, either because of overlapping responsibilities and colliding regulations, or
because of subnational government capacity limitations. In addition, corruption and bribery continue to
affect relations between private and public actors, notably at the local level (OECD, 2018a). In 2016, the
President announced that the government would revoke over 3 000 local regulations. In 2017, the
constitutional court prohibited the central government from revoking local bylaws, on the grounds that only
the Supreme Court could do it. Therefore, as mentioned in the previous Survey, improving co-ordination
and building capacity are key.
Product market regulation and employment protection legislation are quite restrictive in Indonesia
compared with other emerging G20 economies, which weighs on formal sector activity (OECD, 2021a). At
the beginning of 2020, the government launched an ambitious reform agenda – the Omnibus Bill on Job
Creation – to improve the business environment. The bill, passed by Parliament in October, replaces 79
existing laws in order to harmonise and simplify the legal framework, attract more investment and boost
job creation in the formal sector (Box 4; OECD, 2021a). Decrees are not yet published and will provide
much-needed details with regard to funding of the unemployment fund and conditions for beneficiaries.
Surveys show that public opinion has reacted rather unfavourably to the reform, notably in relation to
employment protection. The participation of labour unions is crucial, notably to ensure the new
unemployment fund is an effective mechanism to protect dismissed workers. More generally, wide-ranging
and meaningful stakeholder consultations and communications campaigns should be ensured (OECD,
2020c).
Box 4. Labour reforms in the Omnibus Law on Job Creation
On October 5, the Parliament passed a wide-ranging law, intended to boost investment and job creation.
Regarding the labour market, the main points are:
Reduction of maximum severance payments to 19 months of salary (from 32 months);
Establishment of an unemployment fund to provide six months of salary and pay for training;
Exemption from the minimum wage for labour-intensive sectors;
Revision of minimum wage adjustments to follow either inflation or GDP growth, but not both as
currently;
Abolition of mandatory paid leave for family weddings, childbirth and bereavement, and
replacement with contract agreements between employers and employees;
Removal of the three-year limit for fixed contracts;
Relaxation of obstacles to outsourcing;
Opening of all positions to foreign workers and easing of immigration procedures.
Internal migration eases job or education access, thereby reducing poverty (Wajdi et al., 2017), but it has
also contributed to boosting informality in the services sector. Most migrants find employment as urban
informal workers, who in turn are mostly migrants (Octavia, 2020). The share of workers paid below the
minimum wage is higher in other services (ISIC sectors R, S, T and U), and accommodation and food
service activities (J), even compared with agriculture, forestry and fishing (A), traditionally a source of
informality (OECD calculation based on Sakernas data). The development of manufacturing would help
reduce the prevalence of informality. The so-called Industry 4.0 roadmap launched by the government in
2018 (Agarwal et al., 2018) targets a contribution of 21-26% to GDP from manufacturing industry by 2030,
up from around 18%, which would boost the share of formal activities. The manufacturing share has
actually declined by around ½ percentage point since 2016. Investing in skills, as suggested in this paper,
would help achieving a manufacturing recovery, as would other actions recommended in previous Surveys,
such as trade liberalisation (OECD, 2018a).
ECO/WKP(2021)21 31
Unclassified
New forms of business tend to boost the incidence of informality, but employment could still be formalised.
This is the case in particular for the emerging “sharing economy” – peer-to-peer activities that rely on
community-based internet platforms to match supply and demand. A well-known example are online
transportation services, which rely on self-employed drivers who must comply with company rules
governing registration, fares, safety, insurance (for passengers and drivers) and quality checks.
Nonetheless, in terms of working conditions, social security coverage and bargaining power, drivers can
be assimilated with informal workers (Schwellnus et al., 2019). Thus, there may be scope to encourage
self-employed in this sector to register formally. For example, a first step would be to require self-employed
workers to officially register with the social security agency, at least for health insurance.
The role of minimum wages
While informality can be a way out of poverty, it may also condemn many to in-work poverty, holding back
human capital development. About 36% of the employed population lives with less than USD PPP 1.9 per
day (according to the ILO). Regional statutory minimum wages are in place to reduce the risk of in-work
poverty and have helped reduce wage inequalities in the past two decades (Chun and Khor, 2020).
However, they have had no impact on informal workers’ wages (ibid.).
In fact, when set too high, minimum wages may contribute to informality (see for instance Mora and Muro,
2017 in the case of Colombia). This seems to be the case in Indonesia. About 38% of workers are paid
less than the minimum (Table 2), while foreign firms consider the sharp increases in wages (in the formal
sector) the main impediment to investment in Indonesia. Labour costs increases, which are driven to some
extent by minimum wage hikes over 2013-20, were among the highest in ASEAN (JETRO, 2020). Past
reforms limited minimum wage revisions to nominal GDP growth, reducing the imbalance with productivity
(OECD, 2016b). However, the ratio of minimum to median wages remains high by international standards:
at 85%, it is well above the level in Turkey (73.5%), Brazil (73%), Mexico (40%) and China (28%) (OECD,
2018a). Adjustments should follow productivity developments more closely. The recently-legislated
Omnibus Law sets a new adjustment formula that uses either inflation or GDP growth. For example, in
2020, the minimum wage increased by 8.5% in DKI Jakarta. It will grow by 3.3% in 2021 (firms can ask for
an exemption) using the new formula, despite a central government circular calling for freezing minimum
wages to help keep businesses afloat. Because minimum settings are seldom applied in labour-intensive
industries, the recent reform that exempts them from applying minimum wages is welcome given that
sufficient protections exist for those workers (OECD, 2020c).
Minimum wages vary widely across provinces, with a ratio of 1 to 2.5 between the province with the lowest
(DI Yogyakarta) and the highest level (DKI Jakarta), which is not explained by different levels of income
(Figure 20). The difference between minimum and median wages varies significantly across provinces
(Table 2). In nearly a third of the provinces, more workers are paid below the minimum wage than above.
In addition, inside provinces, some districts/municipalities impose higher minimum wages: for instance in
North Sumatra, statutory minimum wages in Medan are 30% higher than for the province – already the
third highest in Indonesia. A thorough review of minimum wage levels would contribute to align regional
minimum wages with local needs to avoid incentivising informality. This should be accompanied by clear
communication on the consequences of overly high minima.
Supporting young workers in finding jobs in the formal sector is important to reduce informality over the
medium term. An informal first job increases the probability of an informal career, not least because the
individual loses opportunities to acquire better skills (ILO, 2020b). There is evidence of such a “low-skill
trap” in OECD countries (OECD, 2017b). In addition, minimum wages in Indonesia may be too high for the
younger population given their productivity level, keeping them out of formal jobs. In Chile, Subsidio al
Empleo Joven gives a subsidy to firms hiring 18-24-years-old workers from the 40% most vulnerable
households, provided they are formalised (OECD, 2021b). Alternatively, as envisaged in the previous
Survey, a lower minimum wage for young workers could be tried out in special economic zones, to
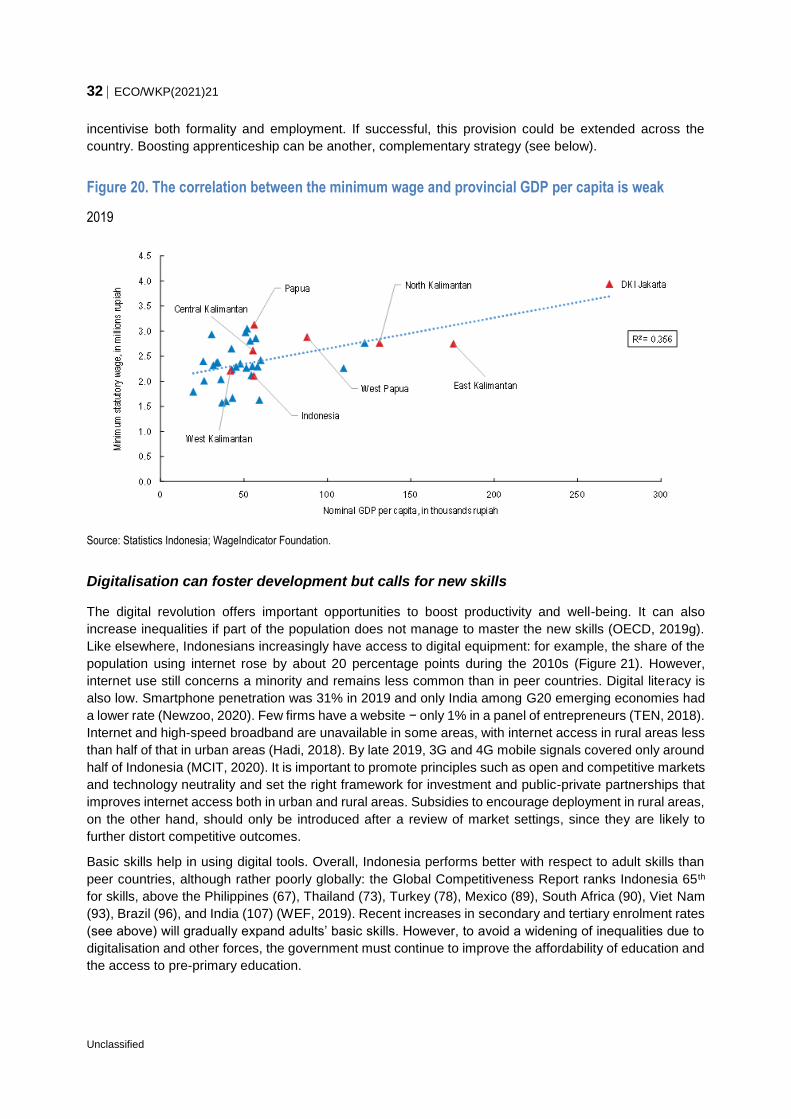
32 ECO/WKP(2021)21
Unclassified
incentivise both formality and employment. If successful, this provision could be extended across the
country. Boosting apprenticeship can be another, complementary strategy (see below).
Figure 20. The correlation between the minimum wage and provincial GDP per capita is weak
2019
Source: Statistics Indonesia; WageIndicator Foundation.
Digitalisation can foster development but calls for new skills
The digital revolution offers important opportunities to boost productivity and well-being. It can also
increase inequalities if part of the population does not manage to master the new skills (OECD, 2019g).
Like elsewhere, Indonesians increasingly have access to digital equipment: for example, the share of the
population using internet rose by about 20 percentage points during the 2010s (Figure 21). However,
internet use still concerns a minority and remains less common than in peer countries. Digital literacy is
also low. Smartphone penetration was 31% in 2019 and only India among G20 emerging economies had
a lower rate (Newzoo, 2020). Few firms have a website − only 1% in a panel of entrepreneurs (TEN, 2018).
Internet and high-speed broadband are unavailable in some areas, with internet access in rural areas less
than half of that in urban areas (Hadi, 2018). By late 2019, 3G and 4G mobile signals covered only around
half of Indonesia (MCIT, 2020). It is important to promote principles such as open and competitive markets
and technology neutrality and set the right framework for investment and public-private partnerships that
improves internet access both in urban and rural areas. Subsidies to encourage deployment in rural areas,
on the other hand, should only be introduced after a review of market settings, since they are likely to
further distort competitive outcomes.
Basic skills help in using digital tools. Overall, Indonesia performs better with respect to adult skills than
peer countries, although rather poorly globally: the Global Competitiveness Report ranks Indonesia 65th
for skills, above the Philippines (67), Thailand (73), Turkey (78), Mexico (89), South Africa (90), Viet Nam
(93), Brazil (96), and India (107) (WEF, 2019). Recent increases in secondary and tertiary enrolment rates
(see above) will gradually expand adults’ basic skills. However, to avoid a widening of inequalities due to
digitalisation and other forces, the government must continue to improve the affordability of education and
the access to pre-primary education.
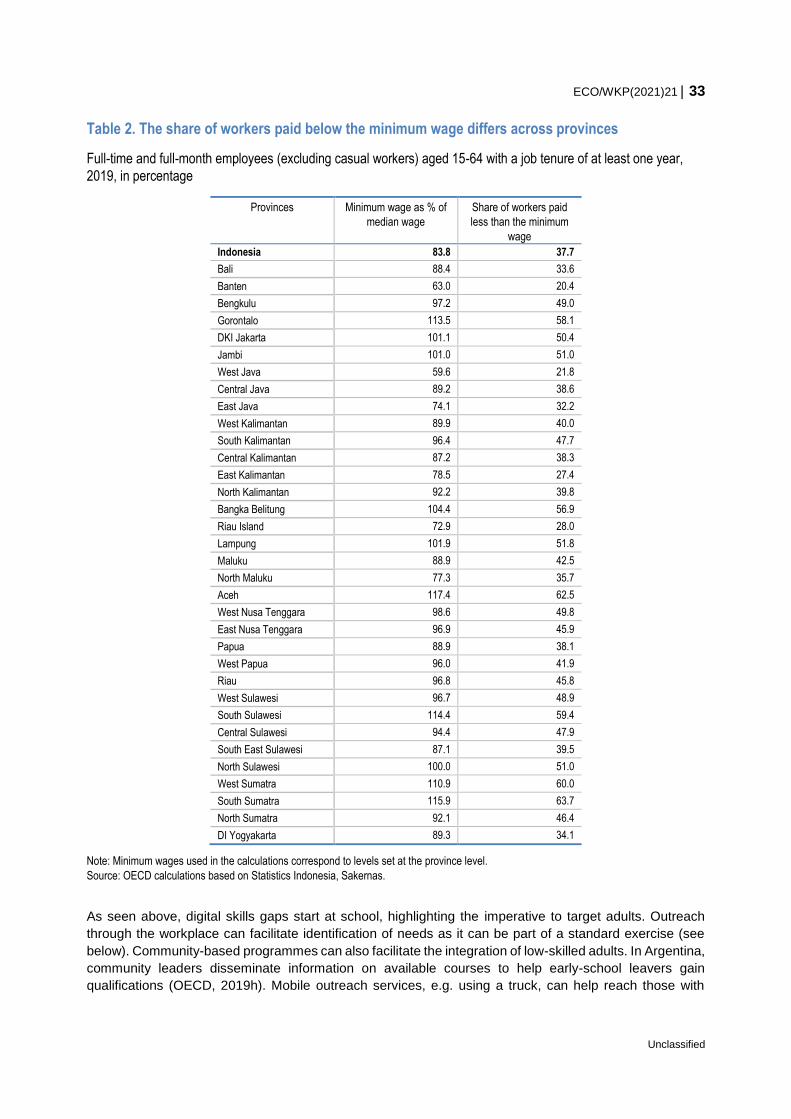
ECO/WKP(2021)21 33
Unclassified
Table 2. The share of workers paid below the minimum wage differs across provinces
Full-time and full-month employees (excluding casual workers) aged 15-64 with a job tenure of at least one year,
2019, in percentage
Provinces Minimum wage as % of
median wage
Share of workers paid
less than the minimum
wage
Indonesia 83.8 37.7
Bali 88.4 33.6
Banten 63.0 20.4
Bengkulu 97.2 49.0
Gorontalo 113.5 58.1
DKI Jakarta 101.1 50.4
Jambi 101.0 51.0
West Java 59.6 21.8
Central Java 89.2 38.6
East Java 74.1 32.2
West Kalimantan 89.9 40.0
South Kalimantan 96.4 47.7
Central Kalimantan 87.2 38.3
East Kalimantan 78.5 27.4
North Kalimantan 92.2 39.8
Bangka Belitung 104.4 56.9
Riau Island 72.9 28.0
Lampung 101.9 51.8
Maluku 88.9 42.5
North Maluku 77.3 35.7
Aceh 117.4 62.5
West Nusa Tenggara 98.6 49.8
East Nusa Tenggara 96.9 45.9
Papua 88.9 38.1
West Papua 96.0 41.9
Riau 96.8 45.8
West Sulawesi 96.7 48.9
South Sulawesi 114.4 59.4
Central Sulawesi 94.4 47.9
South East Sulawesi 87.1 39.5
North Sulawesi 100.0 51.0
West Sumatra 110.9 60.0
South Sumatra 115.9 63.7
North Sumatra 92.1 46.4
DI Yogyakarta 89.3 34.1
Note: Minimum wages used in the calculations correspond to levels set at the province level.
Source: OECD calculations based on Statistics Indonesia, Sakernas.
As seen above, digital skills gaps start at school, highlighting the imperative to target adults. Outreach
through the workplace can facilitate identification of needs as it can be part of a standard exercise (see
below). Community-based programmes can also facilitate the integration of low-skilled adults. In Argentina,
community leaders disseminate information on available courses to help early-school leavers gain
qualifications (OECD, 2019h). Mobile outreach services, e.g. using a truck, can help reach those with
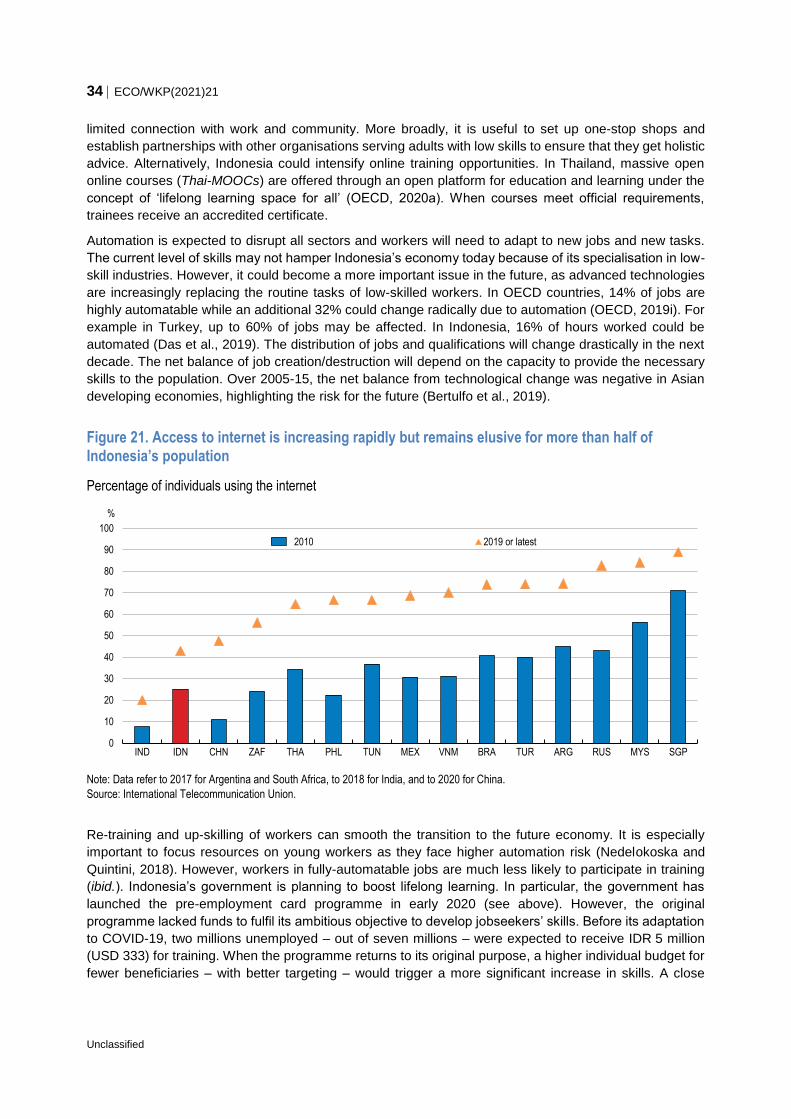
34 ECO/WKP(2021)21
Unclassified
limited connection with work and community. More broadly, it is useful to set up one-stop shops and
establish partnerships with other organisations serving adults with low skills to ensure that they get holistic
advice. Alternatively, Indonesia could intensify online training opportunities. In Thailand, massive open
online courses (Thai-MOOCs) are offered through an open platform for education and learning under the
concept of ‘lifelong learning space for all’ (OECD, 2020a). When courses meet official requirements,
trainees receive an accredited certificate.
Automation is expected to disrupt all sectors and workers will need to adapt to new jobs and new tasks.
The current level of skills may not hamper Indonesia’s economy today because of its specialisation in low-
skill industries. However, it could become a more important issue in the future, as advanced technologies
are increasingly replacing the routine tasks of low-skilled workers. In OECD countries, 14% of jobs are
highly automatable while an additional 32% could change radically due to automation (OECD, 2019i). For
example in Turkey, up to 60% of jobs may be affected. In Indonesia, 16% of hours worked could be
automated (Das et al., 2019). The distribution of jobs and qualifications will change drastically in the next
decade. The net balance of job creation/destruction will depend on the capacity to provide the necessary
skills to the population. Over 2005-15, the net balance from technological change was negative in Asian
developing economies, highlighting the risk for the future (Bertulfo et al., 2019).
Figure 21. Access to internet is increasing rapidly but remains elusive for more than half of Indonesia’s population
Percentage of individuals using the internet
Note: Data refer to 2017 for Argentina and South Africa, to 2018 for India, and to 2020 for China.
Source: International Telecommunication Union.
Re-training and up-skilling of workers can smooth the transition to the future economy. It is especially
important to focus resources on young workers as they face higher automation risk (Nedelokoska and
Quintini, 2018). However, workers in fully-automatable jobs are much less likely to participate in training
(ibid.). Indonesia’s government is planning to boost lifelong learning. In particular, the government has
launched the pre-employment card programme in early 2020 (see above). However, the original
programme lacked funds to fulfil its ambitious objective to develop jobseekers’ skills. Before its adaptation
to COVID-19, two millions unemployed – out of seven millions – were expected to receive IDR 5 million
(USD 333) for training. When the programme returns to its original purpose, a higher individual budget for
fewer beneficiaries – with better targeting – would trigger a more significant increase in skills. A close
0
10
20
30
40
50
60
70
80
90
100
IND IDN CHN ZAF THA PHL TUN MEX VNM BRA TUR ARG RUS MYS SGP
%
2010 2019 or latest
ECO/WKP(2021)21 35
Unclassified
monitoring of recipients is also necessary, crosschecking with other sources of information. This would
help evaluate and improve the programme on the fly.
Skills anticipation exercises help policymakers identify skills in need but demand considerable efforts to
coordinate a variety of stakeholders. To reduce this burden, information collection can focus on priority
sectors, as in Finland (CEDEFOP, 2019). Training participants and employers can help identify areas
where updates of regulations, frameworks and standards are most needed. Setting up a coordinating body
can also help assemble information and streamline the process. The involvement of social partners is
essential (OECD, 2019h).
Digitalisation also opens opportunities to reduce search costs in the labour market. In the absence of
comprehensive government services, the private sector has launched several websites dedicated to job
advertisements. Recently, the Ministry of Manpower launched a new website (www.kemnaker.go.id) that
facilitates matching and monitoring of the labour market, provides information on training and career
opportunities, and expedites work permits for foreigners. The website should be further promoted and be
responsive to user needs and requests. In particular, it should contain a list of occupations with acute skills
shortages to guide young people in their education and training choices. Malaysia publishes one such list
of occupations that are skilled, in high demand and of strategic importance to economic development
(OECD, 2019e).
Competencies, skills and talents are also fundamental for an innovation-driven economy. The incidence of
innovation in early-stage entrepreneurial activity is relatively low in Indonesia (GEM, 2018). The start-up
rate is also particularly low at 0.6 per million people, versus 6.2 in Malaysia, 1.5 in India and 0.9 in Thailand
(Das et al., 2018). This is partly due to the dearth of highly skilled personnel as well as weak ICT
infrastructure (TEN, 2018). Investment in R&D is also particularly low, at 0.2% of GDP in Indonesia (of
which 90% is public spending) compared with 0.5% in Viet Nam, 0.6% in India, 1% in Thailand and 1.3%
in Brazil. Overall, Indonesia ranks 85th in the Global Innovation Index, the last amongst its peers, driven
notably by weak outcomes in human capital and research (Cornell University, INSEAD and WIPO, 2019).
Promoting innovation is essential to boost GDP growth and overcome the middle-income trap, as shown
in the past by the experience of successful developing countries (OECD, 2012). More public spending on
R&D (direct funding or through tax incentives) would develop high-end skills and can spill over to business
R&D (Guellec and van Pottelsberghe de la Potterie, 2000).
The early-stage total entrepreneurial activity rate is above the Asian regional average in 2018, thanks to
high perceived opportunities and capabilities (GEM, 2018). However, entrepreneurs do not anticipate
creating many jobs, suggesting that they expect to remain small. In addition, many youth use self-
employment to compensate for the lack of opportunities in the formal economy; SMEs account for 97% of
total employment (OECD, 2018c). There is an opportunity to encourage the development of
entrepreneurial skills at school to equip future entrepreneurs (and existing micro-firm owners) with the skills
needed to succeed and scale up (TEN, 2018). Devoting more and specific resources to improve teaching
of entrepreneurship, for example classroom lectures, case studies, business games and on-site visits,
would improve entrepreneurial activity (OECD, 2018c).
Firms are key to boost apprenticeship
As seen above, availability of skills is not the main concern of firms overall, but it is in some sectors or
firms, notably the export-oriented ones (di Gropello et al., 2011). The gap with non-exporters is especially
large for critical thinking, and computer and English-language skills. Exporting firms seek a higher
educational profile that is difficult to find, dragging down productivity in key sectors. With a high share of
youth neither employed, in education or training (see above), the government set up the National
Apprenticeship Programme in 2016 to smooth school-to-work transition and address skills shortages.
Some sectors are prioritised including tourism and hospitality, manufacturing, agribusiness, healthcare and
the digital economy. Apprenticeships are essential to bridge the gap between prospective employees’
36 ECO/WKP(2021)21
Unclassified
abilities and firms’ needs, to the benefit of both parties. Cooperation between employers, government and
training institutions is key. For example, thanks to cooperation with a public training centre, Toyota’s
apprenticeship programme trained 700 apprentices in 2020, who will be certified after six months if they
pass company tests; Schindler had its first graduated apprentices in 2019.
However, outcomes from the government project to boost apprenticeships are disappointing (ILO, 2018b).
Several challenges remain: Indonesian society does not yet properly value the contribution of
apprenticeships to employability; competency standards are lacking in some sectors, and so are follow-up
and monitoring (ILO, 2020c). Giving business associations and trade unions a greater role could reinforce
the quality and quantity of apprenticeships, in the same vein as the cooperation underlying the 2015-18
InSIGHT Project (The Global Deal, 2020). Even though trade unions membership has decreased to around
7% of the labour force, they are still essential to make sure workers’ voice is heard. In Germany, the social
partners participate in discussions regarding VET at all government levels (Apprenticeship Toolbox, 2019).
Pre-employment training institutions are also insufficient in quantity and quality (Lindsay et al., 2016). The
situation forces firms to invest in internal and external on-the-job training, collaborating with either
government institutions or the private sector. Those programmes tend to be more responsive to needs,
but also to focus on the short-term rather than longer-term development of the person (di Gropello et al.,
2011). In addition, firms generally do not train enough. Financial incentives can help increase demand for
training, and focus more on long-term competencies. A 2019 regulation offers firms a gross income
deduction of 100% for internships and training activities. An additional 100% deduction is available in case
the skilling activities concern validated competencies and are offered in co-operation with a government
institution. While this measure is welcome, a proper evaluation would help ensure value for money.
Most adult learning takes place at work. However, the population that engages in life-long learning hardly
coincides with the most in need. Among OECD countries, there is an inverse relationship between skills
and participation in learning, even though low-skilled workers need more up- and re-skilling (OECD, 2019i).
Workers in high unemployment sectors also tend to participate less. Recognition of prior learning is also
difficult to get while it would help workers change job and is particularly important for low-skilled workers.
In Indonesia, as in OECD countries, social partners have an important role to play to adapt the learning
system as they hold vital information on training needs, priorities and best practices (ibid.). This can be
facilitated if, following the United Kingdom, specific training is offered to union representatives who then
help workers identify training needs and arrange training opportunities (OECD, 2019h).
Enhancing well-being and protecting workers is crucial
Creating jobs is necessary for well-being, but far from sufficient. Countries that have policies and
institutions that promote job quality and inclusiveness perform better than countries that solely focus on
market flexibility (Box 5). A core principle of the OECD Jobs Strategy to be more inclusive is to follow a
preventive rather than remedial approach, which means seeking equality of opportunities, adopting a life-
course perspective, making work pay, protecting workers rather than jobs, and providing sufficient social
protection (OECD, 2018b). In Indonesia, social safety nets are important to help the poor and provide them
with a vital minimum, notably with regard to health and education, thus limiting long-term consequences
on children. There are fewer issues with targeting thanks to the use of an updated database of beneficiaries
and of electronic cards in programmes such as PKH (Box 6). A further improvement would be to introduce
benefit schedules, which could gradually decline with additional income. This could contribute to limiting
benefit dependency and poverty traps. However, those programmes do not adequately smooth the
transition into work. They do not prevent people from not falling into poverty in case of individual shocks
or systemic crises, leaving Indonesia without a proper counter-cyclical social protection mechanism
(OECD, 2019b).
The government needs to continue addressing poverty through social assistance while renewing efforts to
support displaced workers. The current system of severance pay is insufficient. Its generosity (30 months
ECO/WKP(2021)21 37
Unclassified
of salary for 20 years of service) exceeds the level observed in peer countries, but the compliance rate
could be as low as 10% (OECD, 2019b; OECD, 2018a). On paper, employees enjoy protection in Indonesia
– with minimum wages too (see above) – but only formal workers, a small share of the workforce, are
actually protected. Regulations make Indonesia’s labour market one of the least flexible among
neighbouring or large emerging-market economies, except for Brazil (Figure 22). Excessive and inefficient
employment protection affects productivity (notably because it encourages informality) and formal
employment (Chun and Khor, 2020). It would be much more efficient and inclusive to protect workers,
rather than jobs (OECD, 2018b).
Expanding the recently-introduced unemployment insurance scheme (Box 4) would increase flexibility and
protection. With the current approach, a lump sum of at most six months of wages is provided at the time
of dismissal as compensation for the reduction in severance payments. The system should gradually be
improved via negotiations between social partners. It should be designed so as to minimise the unintended
effects of benefit receipt on incentives to work, while maximising support to job losers in their search for
quality work. One avenue would be to give individuals more responsibility for the cost of unemployment
benefits through individual saving accounts, collective schemes with limited generosity, or a combination
of the two (ibid.). Promoting the reallocation of workers between firms, industries and regions would
enhance economic development. As the nature of work evolves, notably because of digitalisation, workers
will likely change job or need re- or up-skilling more often.
Box 5. Good jobs for all in a changing world of work: The OECD Jobs Strategy
Low productivity growth, high levels of income inequality in many countries, as well as rapid economic
change related to technological progress, globalisation and demographic changes raise new policy
challenges for good labour market performance. The aim of the new OECD Jobs Strategy is to help
countries address these challenges.
The OECD Jobs Strategy goes beyond job quantity and considers job quality and inclusiveness as
central policy priorities, while emphasising the importance of resilience and adaptability for good
economic and labour market performance in a changing world of work. It recognises that flexibility-
enhancing policies in product and labour markets are necessary but not sufficient. Policies and
institutions that protect workers, foster inclusiveness and allow workers and firms to make the most of
ongoing challenges are also needed to promote good outcomes.
The OECD actively supports countries with the implementation of the OECD Jobs Strategy through the
identification of country-specific policy priorities and recommendations. This is done through the
preparation of chapters in the OECD Economic Surveys as well as more analytical background papers
on the implementation of the OECD Jobs Strategy in specific countries. The process will be concluded
with a synthesis report that will draw lessons from the country reviews and highlight good practices
across the full range of policy tools identified by the OECD Jobs Strategy.
Since the outbreak of the COVID-19 crisis, the implementation of the Jobs Strategy has become a key
activity through which the OECD can provide tailored support to countries for the development of
policies and institutions that promote resilient labour markets (OECD, forthcoming).
For further details, see http://www.oecd.org/employment/jobs-strategy/.
Source: OECD (forthcoming), Implementing the OECD Jobs Strategy: An Update.
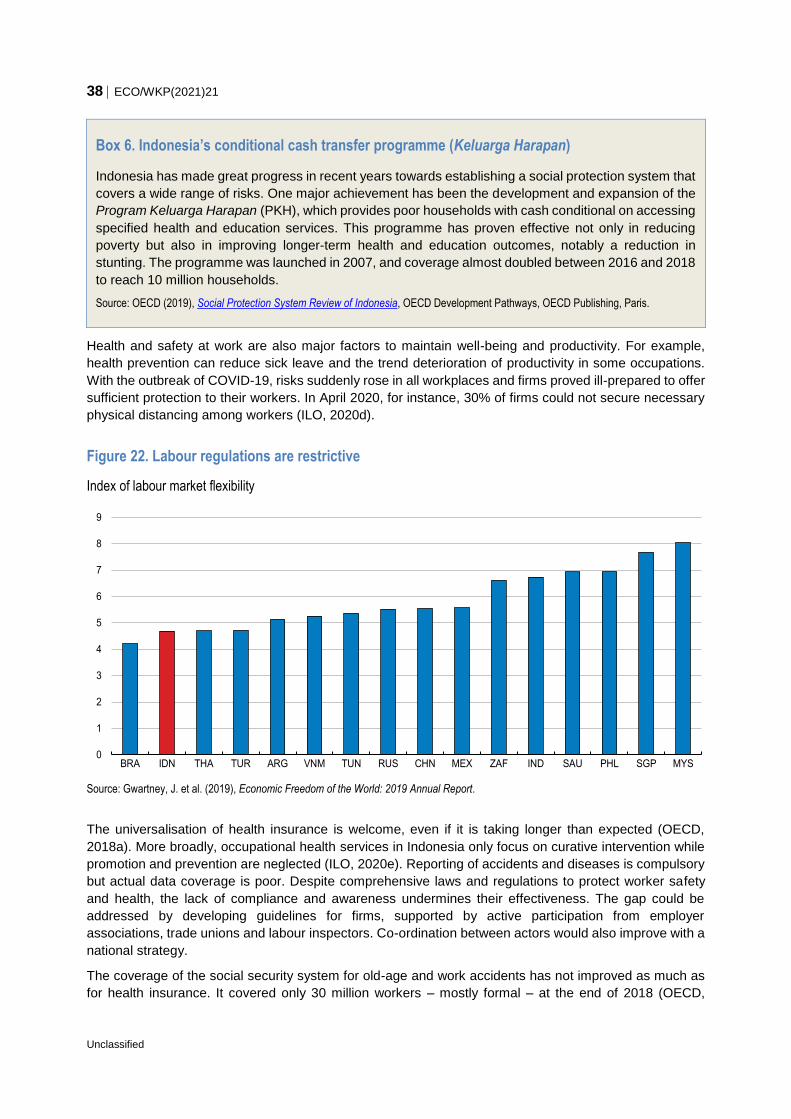
38 ECO/WKP(2021)21
Unclassified
Box 6. Indonesia’s conditional cash transfer programme (Keluarga Harapan)
Indonesia has made great progress in recent years towards establishing a social protection system that
covers a wide range of risks. One major achievement has been the development and expansion of the
Program Keluarga Harapan (PKH), which provides poor households with cash conditional on accessing
specified health and education services. This programme has proven effective not only in reducing
poverty but also in improving longer-term health and education outcomes, notably a reduction in
stunting. The programme was launched in 2007, and coverage almost doubled between 2016 and 2018
to reach 10 million households.
Source: OECD (2019), Social Protection System Review of Indonesia, OECD Development Pathways, OECD Publishing, Paris.
Health and safety at work are also major factors to maintain well-being and productivity. For example,
health prevention can reduce sick leave and the trend deterioration of productivity in some occupations.
With the outbreak of COVID-19, risks suddenly rose in all workplaces and firms proved ill-prepared to offer
sufficient protection to their workers. In April 2020, for instance, 30% of firms could not secure necessary
physical distancing among workers (ILO, 2020d).
Figure 22. Labour regulations are restrictive
Index of labour market flexibility
Source: Gwartney, J. et al. (2019), Economic Freedom of the World: 2019 Annual Report.
The universalisation of health insurance is welcome, even if it is taking longer than expected (OECD,
2018a). More broadly, occupational health services in Indonesia only focus on curative intervention while
promotion and prevention are neglected (ILO, 2020e). Reporting of accidents and diseases is compulsory
but actual data coverage is poor. Despite comprehensive laws and regulations to protect worker safety
and health, the lack of compliance and awareness undermines their effectiveness. The gap could be
addressed by developing guidelines for firms, supported by active participation from employer
associations, trade unions and labour inspectors. Co-ordination between actors would also improve with a
national strategy.
The coverage of the social security system for old-age and work accidents has not improved as much as
for health insurance. It covered only 30 million workers – mostly formal – at the end of 2018 (OECD,
0
1
2
3
4
5
6
7
8
9
BRA IDN THA TUR ARG VNM TUN RUS CHN MEX ZAF IND SAU PHL SGP MYS
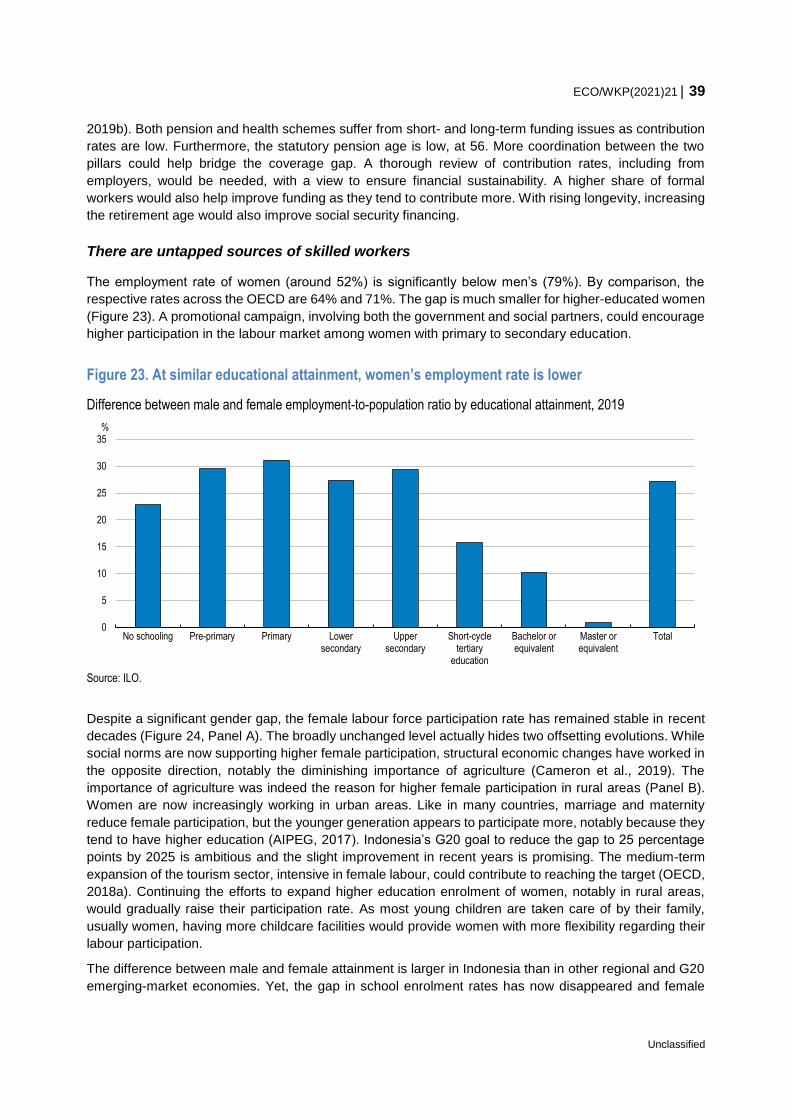
ECO/WKP(2021)21 39
Unclassified
2019b). Both pension and health schemes suffer from short- and long-term funding issues as contribution
rates are low. Furthermore, the statutory pension age is low, at 56. More coordination between the two
pillars could help bridge the coverage gap. A thorough review of contribution rates, including from
employers, would be needed, with a view to ensure financial sustainability. A higher share of formal
workers would also help improve funding as they tend to contribute more. With rising longevity, increasing
the retirement age would also improve social security financing.
There are untapped sources of skilled workers
The employment rate of women (around 52%) is significantly below men’s (79%). By comparison, the
respective rates across the OECD are 64% and 71%. The gap is much smaller for higher-educated women
(Figure 23). A promotional campaign, involving both the government and social partners, could encourage
higher participation in the labour market among women with primary to secondary education.
Figure 23. At similar educational attainment, women’s employment rate is lower
Difference between male and female employment-to-population ratio by educational attainment, 2019
Source: ILO.
Despite a significant gender gap, the female labour force participation rate has remained stable in recent
decades (Figure 24, Panel A). The broadly unchanged level actually hides two offsetting evolutions. While
social norms are now supporting higher female participation, structural economic changes have worked in
the opposite direction, notably the diminishing importance of agriculture (Cameron et al., 2019). The
importance of agriculture was indeed the reason for higher female participation in rural areas (Panel B).
Women are now increasingly working in urban areas. Like in many countries, marriage and maternity
reduce female participation, but the younger generation appears to participate more, notably because they
tend to have higher education (AIPEG, 2017). Indonesia’s G20 goal to reduce the gap to 25 percentage
points by 2025 is ambitious and the slight improvement in recent years is promising. The medium-term
expansion of the tourism sector, intensive in female labour, could contribute to reaching the target (OECD,
2018a). Continuing the efforts to expand higher education enrolment of women, notably in rural areas,
would gradually raise their participation rate. As most young children are taken care of by their family,
usually women, having more childcare facilities would provide women with more flexibility regarding their
labour participation.
The difference between male and female attainment is larger in Indonesia than in other regional and G20
emerging-market economies. Yet, the gap in school enrolment rates has now disappeared and female
0
5
10
15
20
25
30
35
No schooling Pre-primary Primary Lowersecondary
Uppersecondary
Short-cycletertiary
education
Bachelor orequivalent
Master orequivalent
Total
%
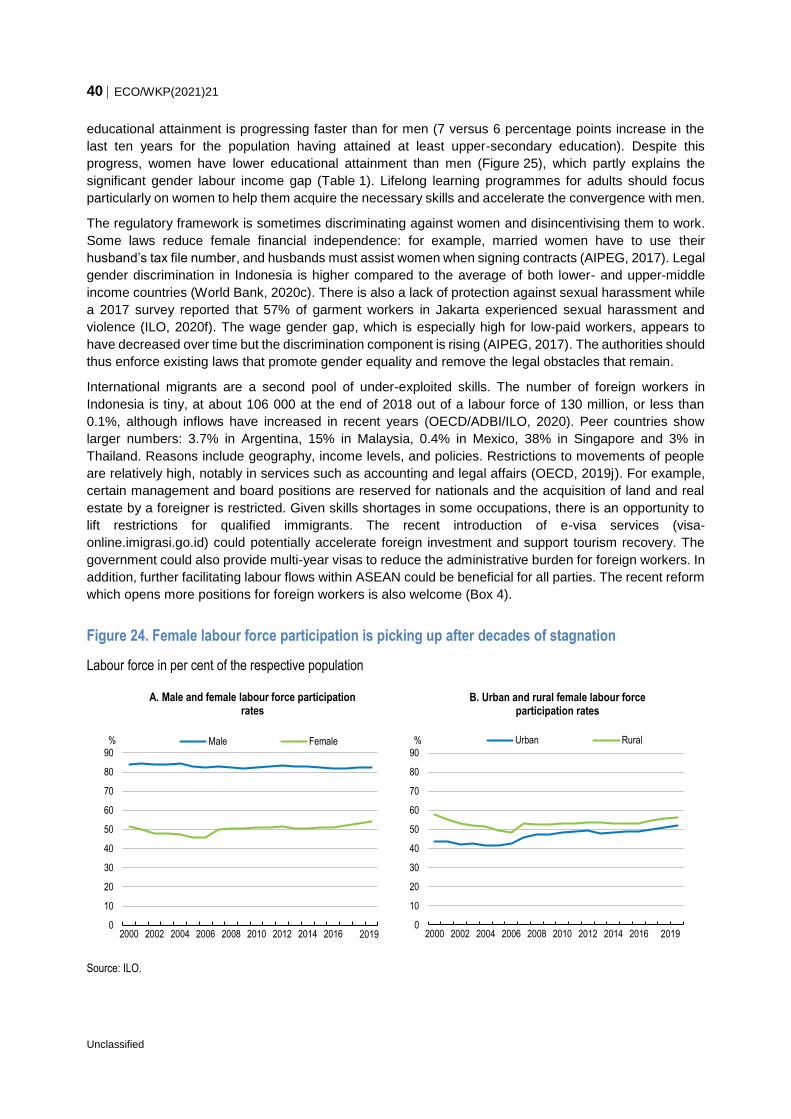
40 ECO/WKP(2021)21
Unclassified
educational attainment is progressing faster than for men (7 versus 6 percentage points increase in the
last ten years for the population having attained at least upper-secondary education). Despite this
progress, women have lower educational attainment than men (Figure 25), which partly explains the
significant gender labour income gap (Table 1). Lifelong learning programmes for adults should focus
particularly on women to help them acquire the necessary skills and accelerate the convergence with men.
The regulatory framework is sometimes discriminating against women and disincentivising them to work.
Some laws reduce female financial independence: for example, married women have to use their
husband’s tax file number, and husbands must assist women when signing contracts (AIPEG, 2017). Legal
gender discrimination in Indonesia is higher compared to the average of both lower- and upper-middle
income countries (World Bank, 2020c). There is also a lack of protection against sexual harassment while
a 2017 survey reported that 57% of garment workers in Jakarta experienced sexual harassment and
violence (ILO, 2020f). The wage gender gap, which is especially high for low-paid workers, appears to
have decreased over time but the discrimination component is rising (AIPEG, 2017). The authorities should
thus enforce existing laws that promote gender equality and remove the legal obstacles that remain.
International migrants are a second pool of under-exploited skills. The number of foreign workers in
Indonesia is tiny, at about 106 000 at the end of 2018 out of a labour force of 130 million, or less than
0.1%, although inflows have increased in recent years (OECD/ADBI/ILO, 2020). Peer countries show
larger numbers: 3.7% in Argentina, 15% in Malaysia, 0.4% in Mexico, 38% in Singapore and 3% in
Thailand. Reasons include geography, income levels, and policies. Restrictions to movements of people
are relatively high, notably in services such as accounting and legal affairs (OECD, 2019j). For example,
certain management and board positions are reserved for nationals and the acquisition of land and real
estate by a foreigner is restricted. Given skills shortages in some occupations, there is an opportunity to
lift restrictions for qualified immigrants. The recent introduction of e-visa services (visa-
online.imigrasi.go.id) could potentially accelerate foreign investment and support tourism recovery. The
government could also provide multi-year visas to reduce the administrative burden for foreign workers. In
addition, further facilitating labour flows within ASEAN could be beneficial for all parties. The recent reform
which opens more positions for foreign workers is also welcome (Box 4).
Figure 24. Female labour force participation is picking up after decades of stagnation
Labour force in per cent of the respective population
Source: ILO.
0
10
20
30
40
50
60
70
80
90
2000 2002 2004 2006 2008 2010 2012 2014 2016 2018
%
A. Male and female labour force participation rates
Male Female
20190
10
20
30
40
50
60
70
80
90
2000 2002 2004 2006 2008 2010 2012 2014 2016 2018
%
B. Urban and rural female labour force participation rates
Urban Rural
2019
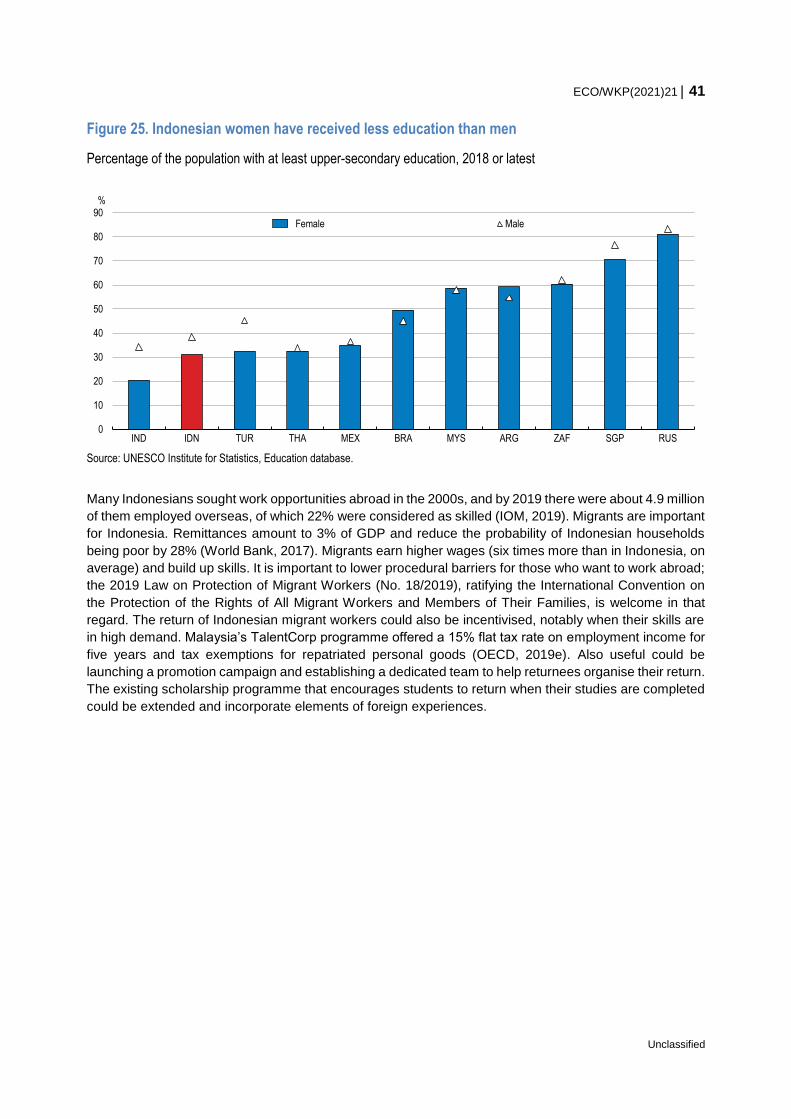
ECO/WKP(2021)21 41
Unclassified
Figure 25. Indonesian women have received less education than men
Percentage of the population with at least upper-secondary education, 2018 or latest
Source: UNESCO Institute for Statistics, Education database.
Many Indonesians sought work opportunities abroad in the 2000s, and by 2019 there were about 4.9 million
of them employed overseas, of which 22% were considered as skilled (IOM, 2019). Migrants are important
for Indonesia. Remittances amount to 3% of GDP and reduce the probability of Indonesian households
being poor by 28% (World Bank, 2017). Migrants earn higher wages (six times more than in Indonesia, on
average) and build up skills. It is important to lower procedural barriers for those who want to work abroad;
the 2019 Law on Protection of Migrant Workers (No. 18/2019), ratifying the International Convention on
the Protection of the Rights of All Migrant Workers and Members of Their Families, is welcome in that
regard. The return of Indonesian migrant workers could also be incentivised, notably when their skills are
in high demand. Malaysia’s TalentCorp programme offered a 15% flat tax rate on employment income for
five years and tax exemptions for repatriated personal goods (OECD, 2019e). Also useful could be
launching a promotion campaign and establishing a dedicated team to help returnees organise their return.
The existing scholarship programme that encourages students to return when their studies are completed
could be extended and incorporate elements of foreign experiences.
0
10
20
30
40
50
60
70
80
90
IND IDN TUR THA MEX BRA MYS ARG ZAF SGP RUS
%
Female Male
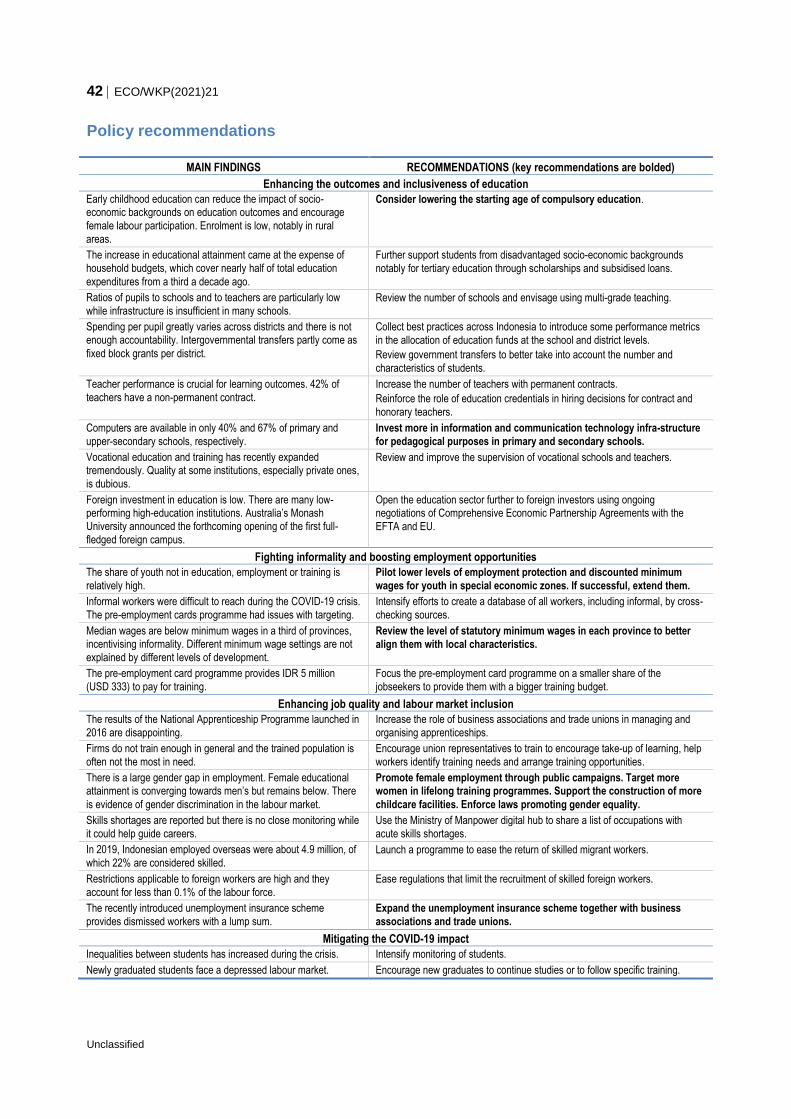
42 ECO/WKP(2021)21
Unclassified
Policy recommendations
MAIN FINDINGS RECOMMENDATIONS (key recommendations are bolded)
Enhancing the outcomes and inclusiveness of education
Early childhood education can reduce the impact of socio-economic backgrounds on education outcomes and encourage
female labour participation. Enrolment is low, notably in rural
areas.
Consider lowering the starting age of compulsory education.
The increase in educational attainment came at the expense of household budgets, which cover nearly half of total education
expenditures from a third a decade ago.
Further support students from disadvantaged socio-economic backgrounds
notably for tertiary education through scholarships and subsidised loans.
Ratios of pupils to schools and to teachers are particularly low
while infrastructure is insufficient in many schools. Review the number of schools and envisage using multi-grade teaching.
Spending per pupil greatly varies across districts and there is not enough accountability. Intergovernmental transfers partly come as
fixed block grants per district.
Collect best practices across Indonesia to introduce some performance metrics
in the allocation of education funds at the school and district levels.
Review government transfers to better take into account the number and
characteristics of students.
Teacher performance is crucial for learning outcomes. 42% of
teachers have a non-permanent contract.
Increase the number of teachers with permanent contracts.
Reinforce the role of education credentials in hiring decisions for contract and
honorary teachers.
Computers are available in only 40% and 67% of primary and
upper-secondary schools, respectively.
Invest more in information and communication technology infra-structure
for pedagogical purposes in primary and secondary schools.
Vocational education and training has recently expanded tremendously. Quality at some institutions, especially private ones,
is dubious.
Review and improve the supervision of vocational schools and teachers.
Foreign investment in education is low. There are many low-performing high-education institutions. Australia’s Monash University announced the forthcoming opening of the first full-
fledged foreign campus.
Open the education sector further to foreign investors using ongoing negotiations of Comprehensive Economic Partnership Agreements with the
EFTA and EU.
Fighting informality and boosting employment opportunities
The share of youth not in education, employment or training is
relatively high.
Pilot lower levels of employment protection and discounted minimum
wages for youth in special economic zones. If successful, extend them.
Informal workers were difficult to reach during the COVID-19 crisis.
The pre-employment cards programme had issues with targeting.
Intensify efforts to create a database of all workers, including informal, by cross-
checking sources.
Median wages are below minimum wages in a third of provinces, incentivising informality. Different minimum wage settings are not
explained by different levels of development.
Review the level of statutory minimum wages in each province to better
align them with local characteristics.
The pre-employment card programme provides IDR 5 million
(USD 333) to pay for training.
Focus the pre-employment card programme on a smaller share of the
jobseekers to provide them with a bigger training budget.
Enhancing job quality and labour market inclusion
The results of the National Apprenticeship Programme launched in
2016 are disappointing.
Increase the role of business associations and trade unions in managing and
organising apprenticeships.
Firms do not train enough in general and the trained population is
often not the most in need.
Encourage union representatives to train to encourage take-up of learning, help
workers identify training needs and arrange training opportunities.
There is a large gender gap in employment. Female educational attainment is converging towards men’s but remains below. There
is evidence of gender discrimination in the labour market.
Promote female employment through public campaigns. Target more women in lifelong training programmes. Support the construction of more
childcare facilities. Enforce laws promoting gender equality.
Skills shortages are reported but there is no close monitoring while
it could help guide careers.
Use the Ministry of Manpower digital hub to share a list of occupations with
acute skills shortages.
In 2019, Indonesian employed overseas were about 4.9 million, of
which 22% are considered skilled. Launch a programme to ease the return of skilled migrant workers.
Restrictions applicable to foreign workers are high and they
account for less than 0.1% of the labour force.
Ease regulations that limit the recruitment of skilled foreign workers.
The recently introduced unemployment insurance scheme
provides dismissed workers with a lump sum.
Expand the unemployment insurance scheme together with business
associations and trade unions.
Mitigating the COVID-19 impact
Inequalities between students has increased during the crisis. Intensify monitoring of students.
Newly graduated students face a depressed labour market. Encourage new graduates to continue studies or to follow specific training.
ECO/WKP(2021)21 43
Unclassified
References
ACDP (2016), Support to the Development of the Indonesian Qualification Framework, Education Sector
Analytical and Capacity Development Partnership.
Alifia, U., A. Barasa, L. Bima, R. Pramana, S. Revina and F. Tresnatri (2020), “Learning from Home: A
Portrait of Teaching and Learning Inequalities in Time of the COVID-19 Pandemic”, SMERU Briefs.
Agarwal, V., K. Eloot and A. Patel (2018), Moving Past the ‘Pilot Trap’ to Unleash Industry 4.0 in
Indonesia, McKinsey & Company.
AIPEG (2017), Women’s Economic Participation in Indonesia, Australia Indonesia Partnership for
Economic Governance.
Allais, S. (2017), Labour Market Impact of National Qualification Frameworks in six Countries, ILO.
Allen, E. (2016), Analysis of Trends and Challenges in the Indonesian Labour Market, ADB papers on
Indonesia.
Antaranews (2020), Industry’s Involvement to Usher in Improvement in Educational Quality, Antara
news, 3rd February.
Apprenticeship Toolbox (2019), Involvement of Social Partners in Germany, web page.
Banov, H., A. Kammerer and I. Salciute (2017), Mapping Generation Z in Indonesia, AFS Intercultural
Programs report.
Beatty, A. et al. (2018), “Indonesia Got Schooled: 15 Years of Rising Enrolment and Flat Learning
Profiles”, RISE Working Paper, No. 18/026.
Bertulfo, D., E. Gentile and G. de Vries (2019), “The Employment Effects of Technological, Innovation,
Consumption, and Participation in Global Value Chains: Evidence from Developing Asia”, ADB
Economics Working Paper Series, No. 572.
Bloomberg (2020), Red Tape Holds Up $50 Billion Needed to End Indonesia Slump, 8 July.
Botev, J. et al. (2019), “A New Macroeconomic Measure of Human Capital with Strong Empirical Links to
Productivity“,OECD Economics Department Working Papers, No. 1575, OECD Publishing, Paris.
Cameron, L., D. Contreras Suarez and W. Rowell (2019), “Female Labour Force Participation in
Indonesia: Why Has It Stalled?”, Bulletin of Indonesian Economic Studies, Vol. 55/2.
CEDEFOP (2019), Vocational Education and Training in Europe: Finland, European Centre for the
Development of Vocational Training reports.
Chun, N. and N. Khor (2020), “Minimum Wages and Changing Wage Inequality in Indonesia”, ADB
Economics Working Paper Series, Vol. 196.
Cornell University, INSEAD and WIPO (2019), The Global Innovation Index 2019: Creating Healthy Lives
- The Future of Medical Innovation.
CREDO (2015), Online Charter School Study, Centre for Research on Education Outcomes, Stanford
University.
Das, K. et al. (2019), Automation and the Future of Work in Indonesia: Jobs Lost, Jobs Gained, Jobs
Changed, McKinsey & Company.
Das, K. et al. (2018), The Digital Archipelago: How Online Commerce is Driving Indonesia’s Economic
Development, McKinsey & Company.
de Ree, J. et al. (2018), “Double for Nothing? Experimental Evidence on an Unconditional Teacher
Salary Increase in Indonesia”, The Quarterly Journal of Economics, Vol. 133/2.
Elmira, E. and D. Suryadarma (2018), “Financing Higher Education in Indonesia: Assessing the
Feasibility of an Income-Contingent Loan System”, SMERU Working Paper, SMERU.
44 ECO/WKP(2021)21
Unclassified
Engle, P. et al. (2011), “Strategies for Reducing Inequalities and Improving Developmental Outcomes for
Young Children in Low-income and Middle-income Countries”, The Lancet, Vol. 378/9799.
GEM (2018), Entrepreneurial Behaviour and Attitudes,Global Entrepreneurhip Monitor.
Gibson, J. and S. Olivia (2020), “Direct and Indirect Effects of COVID-19 on Life Expectancy and Poverty
in Indonesia”, Bulletin of Indonesian Economic Studies, Vol. 56/3.
Gouëdard, P. et al. (2020), “Education responses to COVID-19: Implementing a way forward”, OECD
Education Working Papers, No. 224, OECD Publishing, Paris.
Guellec, D. and B. van Pottelsberghe de la Potterie (2000), “The Impact of Public R&D Expenditure on
Business R&D“, OECD Science, Technology and Industry Working Papers, No. 2000/4, OECD
Publishing, Paris.
Gwartney, J. et al. (2019), Economic Freedom of the World: 2019 Annual Report, Fraser Institute.
Hadi, A. (2018), “Bridging Indonesia’s Digital Divide: Rural-Urban Linkages?”, Jurnal Ilmu Sosial dan Ilmu
Politik, Vol. 22/1.
Hasan, A. et al. (2019), “Understanding the Longer-Term Impact of Improving Access to Preschool
Education in Rural Indonesia”, World Bank Policy Research Working Paper No. 9060.
Hayes, A. and D. Setyonaluri (2015), Taking Advantage of The Demographic Dividend in Indonesia: A
Brief Introduction to Theory and Practice, United Nations Population Fund.
Hermawan, H., D. Yunita and N. Deswila (2018), Implementation of ICT in Education in Indonesia during
2004-2017, 2018 International Symposium on Educational Technology, Osaka.
Huang, A. (2019), Indonesia’s Teachers Need a Smarter Education System, East Asia Forum, web page.
IDI (2020), Accountability in a Time of Crisis, Intosai Development Initiative.
ILAB (2018), 2018 Findings on the Worst Forms of Child Labour: Indonesia, Bureau of International
Labor Affairs.
ILO (2020a), Youth & COVID-19: Impacts on Jobs, Education, Rights and Mental Well-being,
International Labour Organisation.
ILO (2020b), Global Employment Trends for Youth 2020, International Labour Organisation.
ILO (2020c), Learning and Good Practices of Apprenticeship Program in Indonesia, International Labour
Organisation.
ILO (2020d), The Clock is Ticking for Survival of Indonesian Enterprises, Jobs at risk, International
Labour Organisation.
ILO (2020e), Safety and Health in Micro-, Small and Medium-sized enterprises: A collection of Five Case
Studies, International Labour Organisation.
ILO (2020f), “Leading to Success: The Business Case for Women in Business and Management in
Indonesia”, Research Brief, June.
ILO (2018a), Eliminating Child Labour in Indonesia: 25 years of Support, International Labour
Organisation.
ILO (2018b), Project Brief: Piloting National Apprenticeship Programme in Indonesia, International
Labour Organisation.
IOM (2019), IOM Indonesia Mission Strategy 2019-2020, International Organisation for Migration.
JETRO (2020), 2019 JETRO Survey on Business Conditions of Japanese Companies in Asia and
Oceania, Japan External Trade Organisation.
Kadir, S., Nirvansyah and B. Bachrul (2016), Vocational Education and Technical Training in Indonesia,
Case Study, Lee Kuan Yew School of Public Policy.
Kahn, L. (2010), “The Long-Term Labor Market Consequences of Graduating from College in a Bad
Economy“, Labour Economics, Vol. 17/2.
ECO/WKP(2021)21 45
Unclassified
Korn Ferry (2018), The Global Talent Crunch: Indonesia, Country Perspectives.
KPK (2020), KPK Minta Pemerintah Tunda Program Kartu Prakerja (KPK Asks Government to Postpone
the Employment Card Program), Corruption Eradication Commission, web page.
Kurniawati, S. et al. (2018), “Education in Indonesia: a White Elephant?”, Journal of Southeast Asian
Economies, Vol. 35/2.
Lindsay, J. et al. (2016), Analysis of Skills Demand in Indonesia, FHI360 report.
Loayza, N. (2018), “Informality: Why Is It So Widespread and How Can It Be Reduced?”, World Bank
Research & Policy Briefs No. 20.
LPDP (2019), Annual Report 2018, Indonesia Endowment Fund for Education.
Marmolejo, F. (2016), “What Matter Most for Tertiary Education: A Framework Paper”, SABER Working
Paper Series, No. 11, World Bank.
Mincer, J. (1981), “Human Capital and Economic Growth”, NBER Working Paper No. 803.
MCIT (2020), 2019 Annual Report, Ministry of Communications and Information Technology.
MoEC (2020), Angka Partisipasi Kasar Pendidikan Anak Usia Dini (Gross Participation Rates for Early
Childhood Education), Ministry of Education and Culture.
MoEC (2012), Indonesian Qualification Framework, Ministry of Education and Culture.
Mora, J. and J. Muro (2017), “Dynamic Effects of the Minimum Wage on Informality in Colombia”,
Labour, Vol. 31/1.
MRTHE (2019), Rencana Srategis Tahun 2015-2019 - Revisi (Strategic Plan for 2015-19 - revised
version), Ministry of Research, Technology and Higher Education.
Nedelkoska, L. and G. Quintini (2018), “Automation, Skills Use and Training“,OECD Social, Employment
and Migration Working Papers, No. 202, OECD Publishing, Paris.
NZMoE (2020), Digital Technologies and the National Curriculum, New Zealand Ministry of Education.
Newzoo (2020), Newzoo Global Mobile Market Report 2019.
Octavia, J. (2020), Towards a National Database of Workers in the Informal Sector: COVID-19 Pandemic
Response and Future Recommendations, CSIS, web page.
OECD (2021a), OECD Economic Surveys: Indonesia 2021, OECD Publishing, Paris.
OECD (2021b), OECD Economic Surveys: Chile 2021, OECD Publishing, Paris.
OECD (2020a), OECD Economic Surveys: Thailand 2020, OECD Publishing, Paris.
OECD (2020b), Education at a Glance 2020, OECD Publishing, Paris.
OECD (2020b), OECD Investment Policy Reviews: Indonesia 2020, OECD Publishing, Paris.
OECD (2019a), Economic Outlook for Southeast Asia, China and India 2020: Rethinking Education for
the Digital Era, OECD Publishing, Paris.
OECD (2019b), Social Protection System Review of Indonesia, OECD Development Pathways, OECD
Publishing, Paris.
OECD (2019c), PISA 2018 Results (Volume I): What Students Know and Can Do, PISA, OECD
Publishing, Paris.
OECD (2019d), Working and Learning Together: Rethinking Human Resource Policies for Schools,
OECD Reviews of School Resources, OECD Publishing, Paris.
OECD (2019e), OECD Economic Surveys: Malaysia 2019, OECD Publishing, Paris.
OECD (2019f), The Future of Mexican Higher Education: Promoting Quality and Equity, Reviews of
National Policies for Education, OECD Publishing, Paris.
OECD (2019g), OECD Skills Outlook 2019 : Thriving in a Digital World, OECD Publishing, Paris.
46 ECO/WKP(2021)21
Unclassified
OECD (2019h), Getting Skills Right: Future-Ready Adult Learning Systems, Getting Skills Right, OECD
Publishing, Paris.
OECD (2019i), OECD Employment Outlook 2019: The Future of Work, OECD Publishing, Paris.
OECD (2019j), OECD Services Trade Restrictiveness Index (STRI): Indonesia 2019.
OECD (2018a), OECD Economic Surveys: Indonesia 2018, OECD Publishing, Paris.
OECD (2018b), Good Jobs for All in a Changing World of Work: The OECD Jobs Strategy, OECD
Publishing, Paris.
OECD (2018c), SME and Entrepreneurship Policy in Indonesia 2018, OECD Studies on SMEs and
Entrepreneurship, OECD Publishing, Paris.
OECD (2017a), The Funding of School Education: Connecting Resources and Learning, OECD Reviews
of School Resources, OECD Publishing, Paris.
OECD (2017b), Educational Opportunity for All: Overcoming Inequality throughout the Life Course,
Educational Research and Innovation, OECD Publishing, Paris.
OECD (2016a), PISA 2015 Results (Volume II): Policies and Practices for Successful Schools, PISA,
OECD Publishing, Paris.
OECD (2016b), OECD Economic Surveys: Indonesia 2016, OECD Publishing, Paris.
OECD (2016c), “What are the Benefits from Early Childhood Education?“, Education Indicators in Focus,
No. 42, OECD Publishing, Paris.
OECD (2012), OECD Science, Technology and Industry Outlook 2012, OECD Publishing, Paris.
OECD/ADBI/ILO (2020), Innovative Approaches for the Management of Labor Migration in Asia, OECD
Publishing, Paris/ADBI, Tokyo.
OECD/ADB (2020), Employment and Skills Strategies in Indonesia, OECD Reviews on Local Job
Creation, OECD Publishing, Paris.
OECD/ADB (2015), Education in Indonesia: Rising to the Challenge, Reviews of National Policies for
Education, OECD Publishing, Paris.
Petriella, Y. (2017), Skilled Workforce: Indonesia has Shortage of Engineers.
QS (2020), QS World University Rankings 2021, Quacquarelli Symonds.
Rahman, M., A. Kusuma and H. Arfyanto (2020), Situasi Ketenagakerjaan di Lapangan Usaha yang
Terdampak Pandemi COVID-19 (The Situation of Employment in Business Fields Affected by the
Pandemic COVID-19), SMERU, web page.
Reimers, F. and A. Schleicher (2020), Schooling Disrupted, Schooling Rethought: How the Covid-19
Pandemic is Changing Education, OECD report.
Revina, S., R. Pramana, R. Fillaili and D. Suryadarma (2020), “Systemic Constraints Facing Teacher
Professional Development in a Middle-Income Country: Indonesia’s Experience Over Four Decades”,
RISE Working Paper, No. 20/054.
Riaz, B., N. Yarrow and M. Cali (2020), EdTech in Indonesia : Ready for Take-off?, World Bank,
Washington DC.
Rizky, M., D. Suryadarma and A. Suryahadi (2019), “Effect of Growing up Poor on Labour Market
Outcomes: Evidence from Indonesia”, ADBI Working Paper Series, No. 1002.
Rosser, A. (2018), Beyond Access: Making Indonesia’s Education System Work, Lowy Institute.
Rothenberg, A. et al. (2016), “Rethinking Indonesia’s Informal Sector”, World Development, Vol. 80/4.
Rothstein, J. (2019), The Lost Generation? Scarring after the Great Recession, mimeo, University of
California, Berkeley.
Schwellnus, C. et al. (2019), “Gig Economy Platforms: Boon or Bane?”, OECD Economics Department
Working Papers, No. 1550, OECD Publishing, Paris.
ECO/WKP(2021)21 47
Unclassified
Smidova, Z. (2019), “Educational outcomes: A Literature Review of Policy Drivers from a Macroeconomic
Perspective“, OECD Economics Department Working Papers, No. 1577, OECD Publishing, Paris.
Srivastava, A. (2020), “Education 4.0: Is Indonesia ready?“,The Asean Post, web page.
Suryahadi, A., R. Al Izzati and D. Suryadarma (2020), “Estimating the Impact of COVID-19 Outbreak on
Poverty”, Bulletin of Indonesian Economic Studies, Vol. 56/2.
Swisscontact (2019), ToT for Vocational Trainers in Lombok Indonesia.
TEN (2018), The 2018 Survey of Entrepreneurs and MSMEs in Indonesia, APF Canada.
The Global Deal (2020), Social Dialogue and the Future of Work.
UN (2019), World Population Prospects, The 2019 Revision - Volume I: Comprehensive Tables, United
Nations.
UNESCO (2020), Inequitable Impact of COVID-19 in Indonesia: Evidence and Policy Response, Policy
Report, Jakarta.
UNESCO (2018), Global Education Report, 2019: Migration, displacement and education: building
bridges, not walls, UNESCO Paris.
UWN (2017), Funding Hike for Scholarships including Study abroad, University World News.
Vincent-Lancrin, S. et al. (2019), Measuring Innovation in Education 2019: What Has Changed in the
Classroom?, Educational Research and Innovation, OECD Publishing, Paris.
Wajdi, N., C. Mulder and S. Adioetomo (2017), “Inter-Regional Migration in Indonesia: A Micro
Approach”, Journal of Population Research, Vol. 34.
WEF (2019), The Global Competitiveness Report 2019, World Economic Forum, Geneva.
World Bank (2020a), Indonesia Public Expenditure Review: Spending for Better Results, Washington
DC.
World Bank (2020b), Doing Business 2020, Washington DC.
World Bank (2020c), Women, Business and the Law 2020, Washington DC.
World Bank (2018a), Preparing ICT Skills for Digital Economy: Indonesia within the ASEAN context, blog.
World Bank (2018b), “Learning more, Growing faster”, Indonesia Economic Quarterly, Jakarta.
World Bank (2017), Indonesia’s Global Workers: Juggling Opportunities and Risks.
World Bank (2016), Indonesia Teacher Certification and Beyond, Jakarta.
World Bank (2015), Indonesia: A Video Study of Teaching Practices in TIMSS Eighth Grade
Mathematics Classrooms, Jakarta.
Yarrow, N., E. Masood and R. Afkar (2020), Estimates of COVID-19 Impacts on Learning and Earning in
Indonesia: How to Turn the Tide, World Bank, Jakarta.
Yu, S. (2020), “How Does Informality Aggravate the Impact of COVID-19?“, in Global Economic
Prospects June 2020, World Bank, Washington DC.
Zamjani, I., S. Azizah, I. Pratiwi, D. Rakhmah, I. Hijriani and S. Hidayati (2020), “Adaptasi Ekosistem
Sekolah Selama Belajar dari Rumah (School Adaptation to the Distance Learning)”, Policy Brief,
Centre for Policy Research, Ministry of Education.