Embed Size (px)
Citation preview
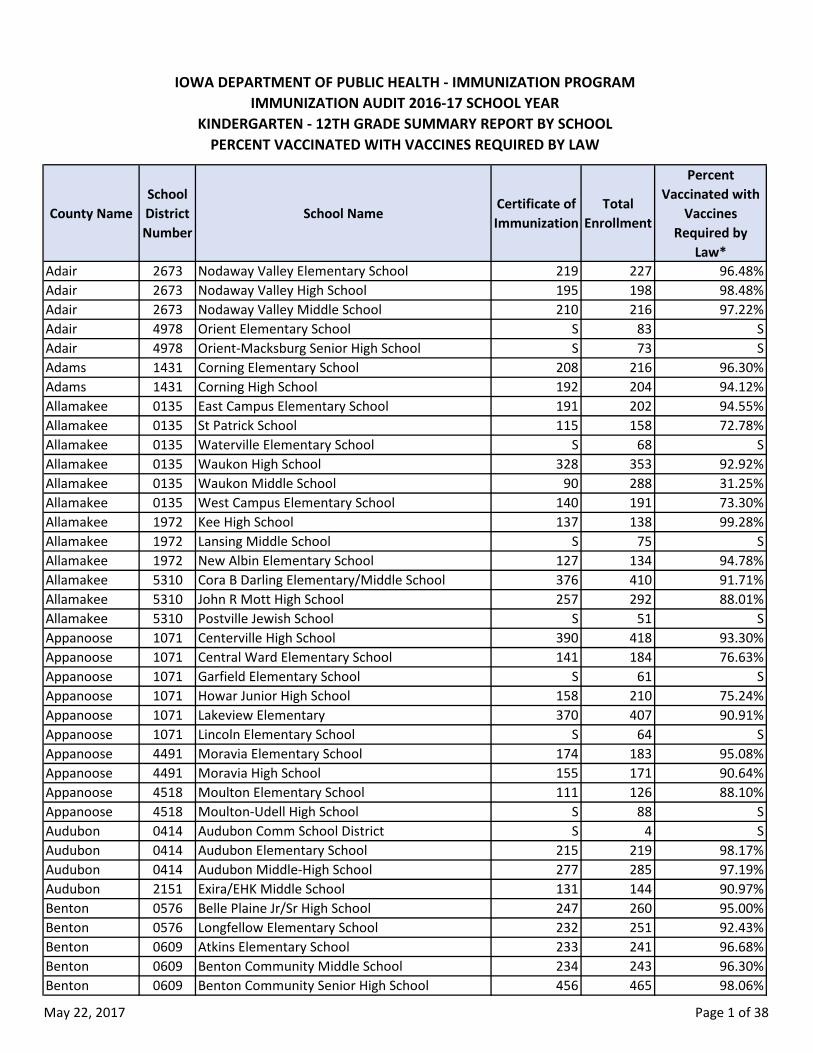
May 22, 2017 Page 1 of 38
County NameSchool District Number
School NameCertificate of Immunization
Total Enrollment
Percent Vaccinated with
Vaccines Required by
Law*Adair 2673 Nodaway Valley Elementary School 219 227 96.48%Adair 2673 Nodaway Valley High School 195 198 98.48%Adair 2673 Nodaway Valley Middle School 210 216 97.22%Adair 4978 Orient Elementary School S 83 SAdair 4978 Orient-Macksburg Senior High School S 73 SAdams 1431 Corning Elementary School 208 216 96.30%Adams 1431 Corning High School 192 204 94.12%Allamakee 0135 East Campus Elementary School 191 202 94.55%Allamakee 0135 St Patrick School 115 158 72.78%Allamakee 0135 Waterville Elementary School S 68 SAllamakee 0135 Waukon High School 328 353 92.92%Allamakee 0135 Waukon Middle School 90 288 31.25%Allamakee 0135 West Campus Elementary School 140 191 73.30%Allamakee 1972 Kee High School 137 138 99.28%Allamakee 1972 Lansing Middle School S 75 SAllamakee 1972 New Albin Elementary School 127 134 94.78%Allamakee 5310 Cora B Darling Elementary/Middle School 376 410 91.71%Allamakee 5310 John R Mott High School 257 292 88.01%Allamakee 5310 Postville Jewish School S 51 SAppanoose 1071 Centerville High School 390 418 93.30%Appanoose 1071 Central Ward Elementary School 141 184 76.63%Appanoose 1071 Garfield Elementary School S 61 SAppanoose 1071 Howar Junior High School 158 210 75.24%Appanoose 1071 Lakeview Elementary 370 407 90.91%Appanoose 1071 Lincoln Elementary School S 64 SAppanoose 4491 Moravia Elementary School 174 183 95.08%Appanoose 4491 Moravia High School 155 171 90.64%Appanoose 4518 Moulton Elementary School 111 126 88.10%Appanoose 4518 Moulton-Udell High School S 88 SAudubon 0414 Audubon Comm School District S 4 SAudubon 0414 Audubon Elementary School 215 219 98.17%Audubon 0414 Audubon Middle-High School 277 285 97.19%Audubon 2151 Exira/EHK Middle School 131 144 90.97%Benton 0576 Belle Plaine Jr/Sr High School 247 260 95.00%Benton 0576 Longfellow Elementary School 232 251 92.43%Benton 0609 Atkins Elementary School 233 241 96.68%Benton 0609 Benton Community Middle School 234 243 96.30%Benton 0609 Benton Community Senior High School 456 465 98.06%
IOWA DEPARTMENT OF PUBLIC HEALTH - IMMUNIZATION PROGRAM IMMUNIZATION AUDIT 2016-17 SCHOOL YEAR
KINDERGARTEN - 12TH GRADE SUMMARY REPORT BY SCHOOLPERCENT VACCINATED WITH VACCINES REQUIRED BY LAW
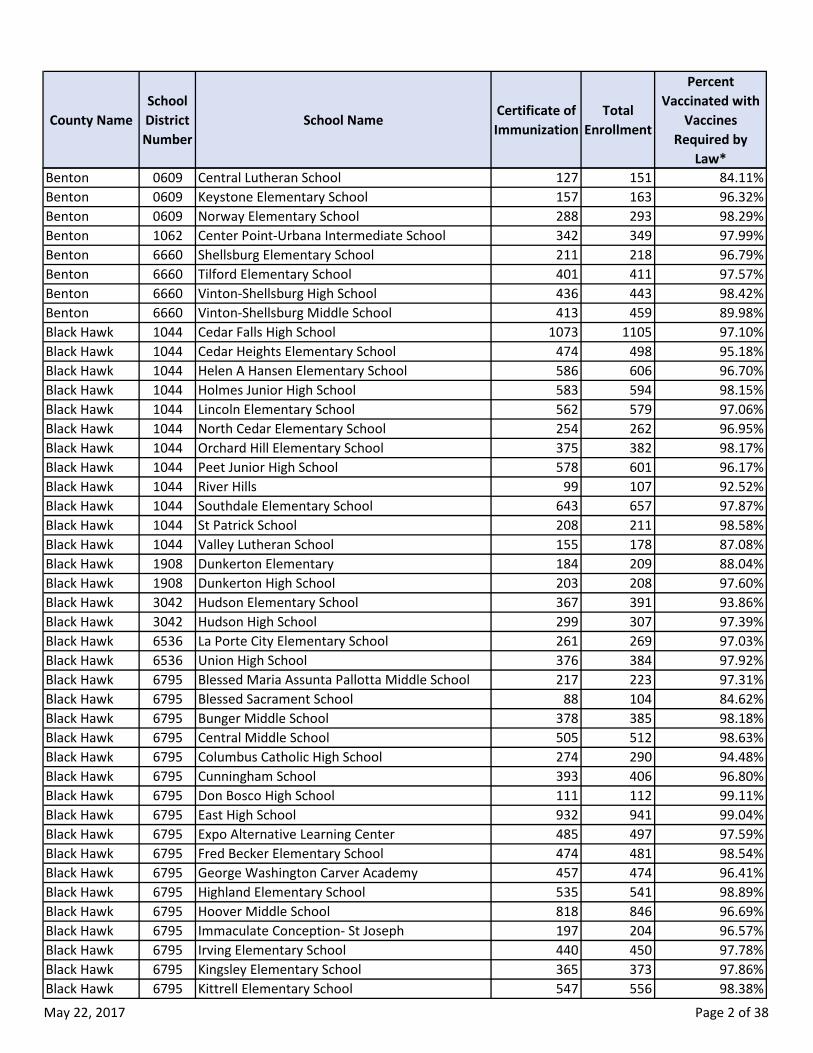
May 22, 2017 Page 2 of 38
County NameSchool District Number
School NameCertificate of Immunization
Total Enrollment
Percent Vaccinated with
Vaccines Required by
Law*Benton 0609 Central Lutheran School 127 151 84.11%Benton 0609 Keystone Elementary School 157 163 96.32%Benton 0609 Norway Elementary School 288 293 98.29%Benton 1062 Center Point-Urbana Intermediate School 342 349 97.99%Benton 6660 Shellsburg Elementary School 211 218 96.79%Benton 6660 Tilford Elementary School 401 411 97.57%Benton 6660 Vinton-Shellsburg High School 436 443 98.42%Benton 6660 Vinton-Shellsburg Middle School 413 459 89.98%Black Hawk 1044 Cedar Falls High School 1073 1105 97.10%Black Hawk 1044 Cedar Heights Elementary School 474 498 95.18%Black Hawk 1044 Helen A Hansen Elementary School 586 606 96.70%Black Hawk 1044 Holmes Junior High School 583 594 98.15%Black Hawk 1044 Lincoln Elementary School 562 579 97.06%Black Hawk 1044 North Cedar Elementary School 254 262 96.95%Black Hawk 1044 Orchard Hill Elementary School 375 382 98.17%Black Hawk 1044 Peet Junior High School 578 601 96.17%Black Hawk 1044 River Hills 99 107 92.52%Black Hawk 1044 Southdale Elementary School 643 657 97.87%Black Hawk 1044 St Patrick School 208 211 98.58%Black Hawk 1044 Valley Lutheran School 155 178 87.08%Black Hawk 1908 Dunkerton Elementary 184 209 88.04%Black Hawk 1908 Dunkerton High School 203 208 97.60%Black Hawk 3042 Hudson Elementary School 367 391 93.86%Black Hawk 3042 Hudson High School 299 307 97.39%Black Hawk 6536 La Porte City Elementary School 261 269 97.03%Black Hawk 6536 Union High School 376 384 97.92%Black Hawk 6795 Blessed Maria Assunta Pallotta Middle School 217 223 97.31%Black Hawk 6795 Blessed Sacrament School 88 104 84.62%Black Hawk 6795 Bunger Middle School 378 385 98.18%Black Hawk 6795 Central Middle School 505 512 98.63%Black Hawk 6795 Columbus Catholic High School 274 290 94.48%Black Hawk 6795 Cunningham School 393 406 96.80%Black Hawk 6795 Don Bosco High School 111 112 99.11%Black Hawk 6795 East High School 932 941 99.04%Black Hawk 6795 Expo Alternative Learning Center 485 497 97.59%Black Hawk 6795 Fred Becker Elementary School 474 481 98.54%Black Hawk 6795 George Washington Carver Academy 457 474 96.41%Black Hawk 6795 Highland Elementary School 535 541 98.89%Black Hawk 6795 Hoover Middle School 818 846 96.69%Black Hawk 6795 Immaculate Conception- St Joseph 197 204 96.57%Black Hawk 6795 Irving Elementary School 440 450 97.78%Black Hawk 6795 Kingsley Elementary School 365 373 97.86%Black Hawk 6795 Kittrell Elementary School 547 556 98.38%
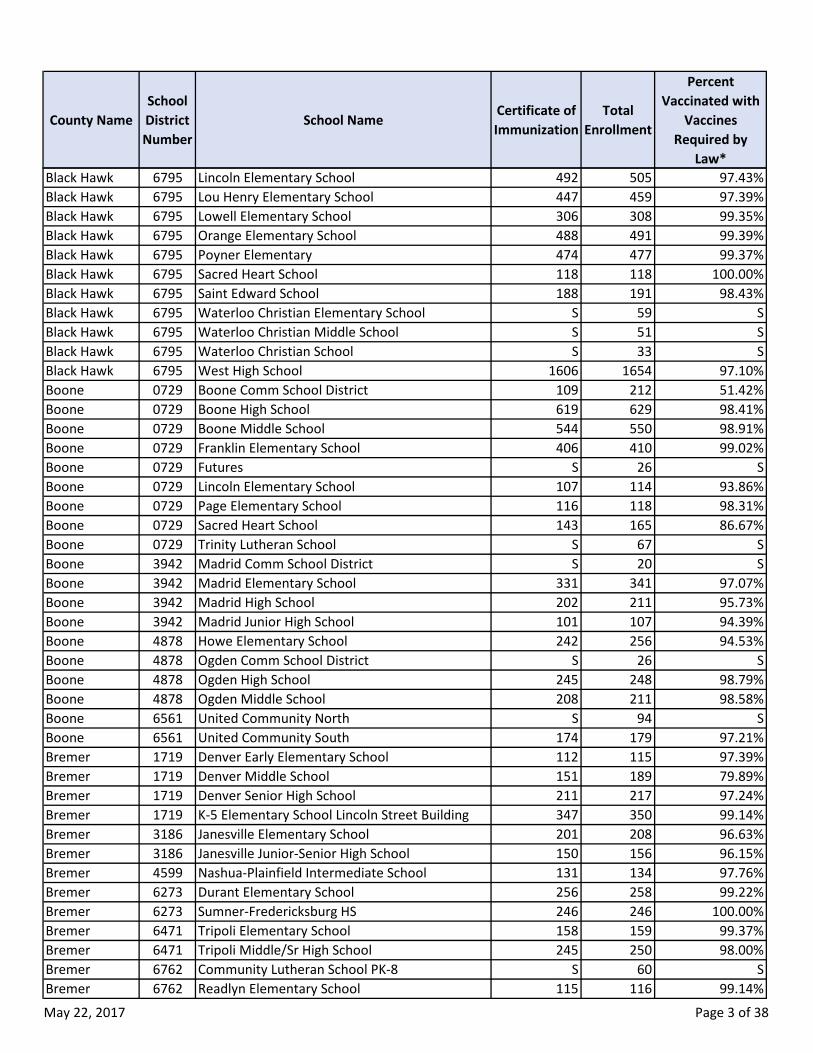
May 22, 2017 Page 3 of 38
County NameSchool District Number
School NameCertificate of Immunization
Total Enrollment
Percent Vaccinated with
Vaccines Required by
Law*Black Hawk 6795 Lincoln Elementary School 492 505 97.43%Black Hawk 6795 Lou Henry Elementary School 447 459 97.39%Black Hawk 6795 Lowell Elementary School 306 308 99.35%Black Hawk 6795 Orange Elementary School 488 491 99.39%Black Hawk 6795 Poyner Elementary 474 477 99.37%Black Hawk 6795 Sacred Heart School 118 118 100.00%Black Hawk 6795 Saint Edward School 188 191 98.43%Black Hawk 6795 Waterloo Christian Elementary School S 59 SBlack Hawk 6795 Waterloo Christian Middle School S 51 SBlack Hawk 6795 Waterloo Christian School S 33 SBlack Hawk 6795 West High School 1606 1654 97.10%Boone 0729 Boone Comm School District 109 212 51.42%Boone 0729 Boone High School 619 629 98.41%Boone 0729 Boone Middle School 544 550 98.91%Boone 0729 Franklin Elementary School 406 410 99.02%Boone 0729 Futures S 26 SBoone 0729 Lincoln Elementary School 107 114 93.86%Boone 0729 Page Elementary School 116 118 98.31%Boone 0729 Sacred Heart School 143 165 86.67%Boone 0729 Trinity Lutheran School S 67 SBoone 3942 Madrid Comm School District S 20 SBoone 3942 Madrid Elementary School 331 341 97.07%Boone 3942 Madrid High School 202 211 95.73%Boone 3942 Madrid Junior High School 101 107 94.39%Boone 4878 Howe Elementary School 242 256 94.53%Boone 4878 Ogden Comm School District S 26 SBoone 4878 Ogden High School 245 248 98.79%Boone 4878 Ogden Middle School 208 211 98.58%Boone 6561 United Community North S 94 SBoone 6561 United Community South 174 179 97.21%Bremer 1719 Denver Early Elementary School 112 115 97.39%Bremer 1719 Denver Middle School 151 189 79.89%Bremer 1719 Denver Senior High School 211 217 97.24%Bremer 1719 K-5 Elementary School Lincoln Street Building 347 350 99.14%Bremer 3186 Janesville Elementary School 201 208 96.63%Bremer 3186 Janesville Junior-Senior High School 150 156 96.15%Bremer 4599 Nashua-Plainfield Intermediate School 131 134 97.76%Bremer 6273 Durant Elementary School 256 258 99.22%Bremer 6273 Sumner-Fredericksburg HS 246 246 100.00%Bremer 6471 Tripoli Elementary School 158 159 99.37%Bremer 6471 Tripoli Middle/Sr High School 245 250 98.00%Bremer 6762 Community Lutheran School PK-8 S 60 SBremer 6762 Readlyn Elementary School 115 116 99.14%
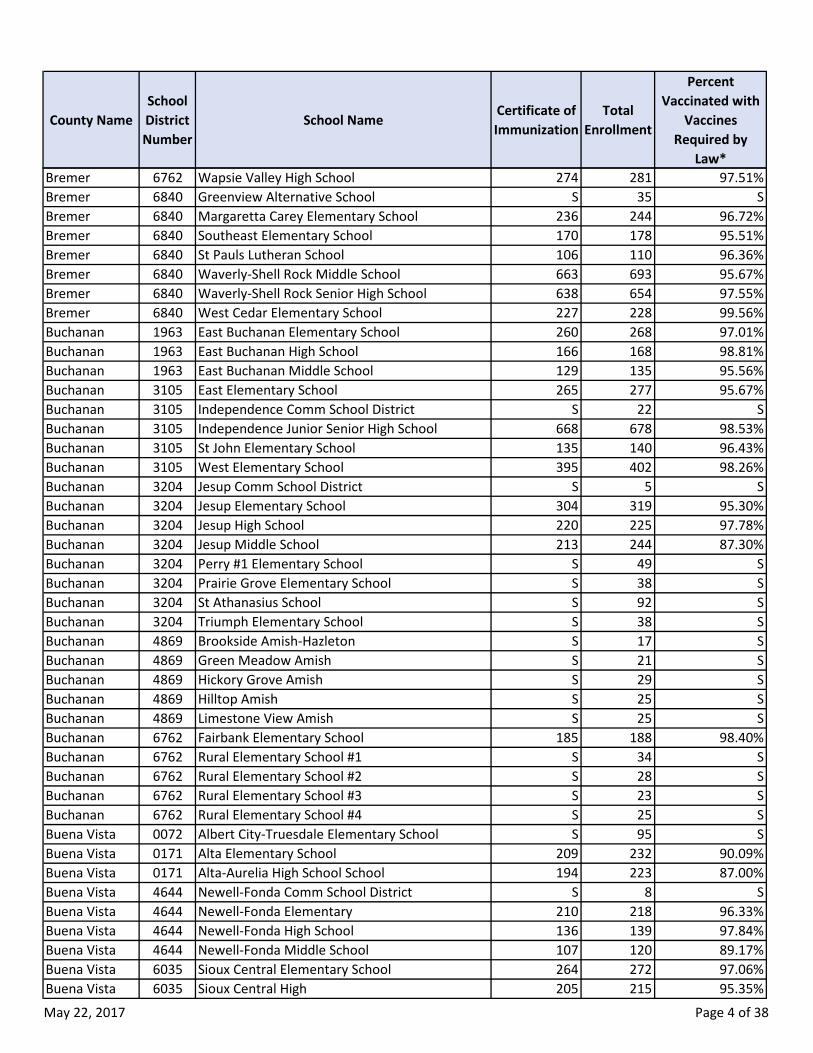
May 22, 2017 Page 4 of 38
County NameSchool District Number
School NameCertificate of Immunization
Total Enrollment
Percent Vaccinated with
Vaccines Required by
Law*Bremer 6762 Wapsie Valley High School 274 281 97.51%Bremer 6840 Greenview Alternative School S 35 SBremer 6840 Margaretta Carey Elementary School 236 244 96.72%Bremer 6840 Southeast Elementary School 170 178 95.51%Bremer 6840 St Pauls Lutheran School 106 110 96.36%Bremer 6840 Waverly-Shell Rock Middle School 663 693 95.67%Bremer 6840 Waverly-Shell Rock Senior High School 638 654 97.55%Bremer 6840 West Cedar Elementary School 227 228 99.56%Buchanan 1963 East Buchanan Elementary School 260 268 97.01%Buchanan 1963 East Buchanan High School 166 168 98.81%Buchanan 1963 East Buchanan Middle School 129 135 95.56%Buchanan 3105 East Elementary School 265 277 95.67%Buchanan 3105 Independence Comm School District S 22 SBuchanan 3105 Independence Junior Senior High School 668 678 98.53%Buchanan 3105 St John Elementary School 135 140 96.43%Buchanan 3105 West Elementary School 395 402 98.26%Buchanan 3204 Jesup Comm School District S 5 SBuchanan 3204 Jesup Elementary School 304 319 95.30%Buchanan 3204 Jesup High School 220 225 97.78%Buchanan 3204 Jesup Middle School 213 244 87.30%Buchanan 3204 Perry #1 Elementary School S 49 SBuchanan 3204 Prairie Grove Elementary School S 38 SBuchanan 3204 St Athanasius School S 92 SBuchanan 3204 Triumph Elementary School S 38 SBuchanan 4869 Brookside Amish-Hazleton S 17 SBuchanan 4869 Green Meadow Amish S 21 SBuchanan 4869 Hickory Grove Amish S 29 SBuchanan 4869 Hilltop Amish S 25 SBuchanan 4869 Limestone View Amish S 25 SBuchanan 6762 Fairbank Elementary School 185 188 98.40%Buchanan 6762 Rural Elementary School #1 S 34 SBuchanan 6762 Rural Elementary School #2 S 28 SBuchanan 6762 Rural Elementary School #3 S 23 SBuchanan 6762 Rural Elementary School #4 S 25 SBuena Vista 0072 Albert City-Truesdale Elementary School S 95 SBuena Vista 0171 Alta Elementary School 209 232 90.09%Buena Vista 0171 Alta-Aurelia High School School 194 223 87.00%Buena Vista 4644 Newell-Fonda Comm School District S 8 SBuena Vista 4644 Newell-Fonda Elementary 210 218 96.33%Buena Vista 4644 Newell-Fonda High School 136 139 97.84%Buena Vista 4644 Newell-Fonda Middle School 107 120 89.17%Buena Vista 6035 Sioux Central Elementary School 264 272 97.06%Buena Vista 6035 Sioux Central High 205 215 95.35%
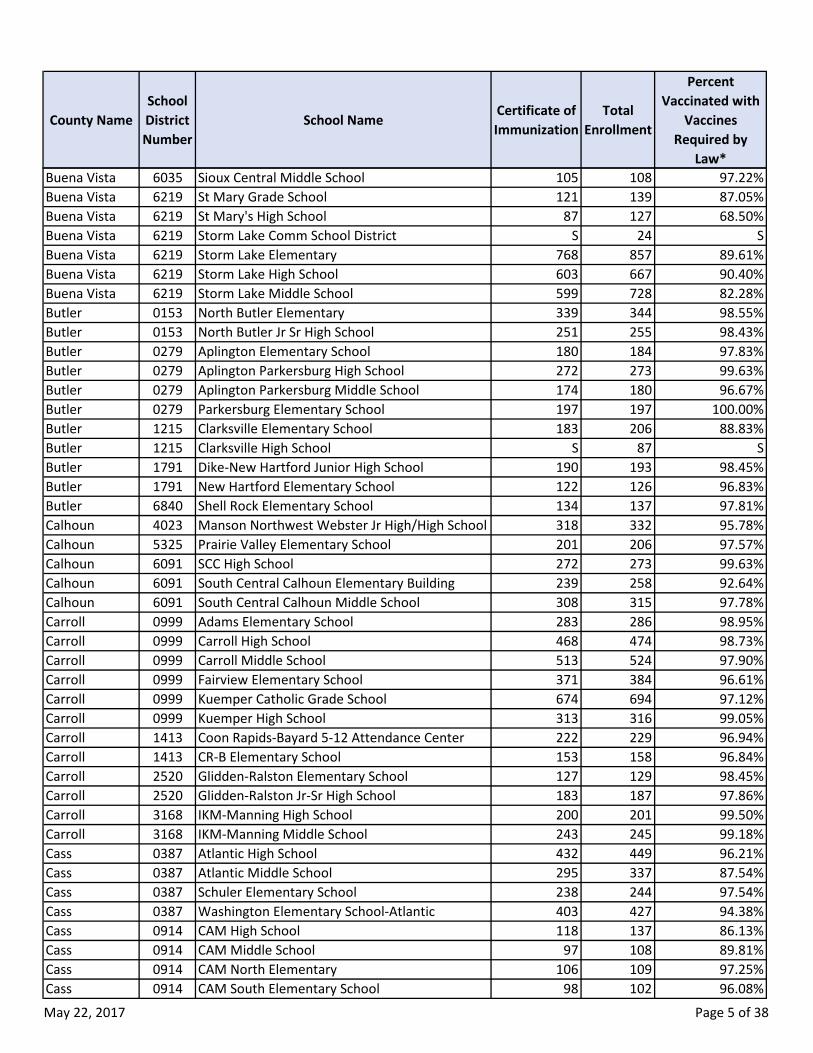
May 22, 2017 Page 5 of 38
County NameSchool District Number
School NameCertificate of Immunization
Total Enrollment
Percent Vaccinated with
Vaccines Required by
Law*Buena Vista 6035 Sioux Central Middle School 105 108 97.22%Buena Vista 6219 St Mary Grade School 121 139 87.05%Buena Vista 6219 St Mary's High School 87 127 68.50%Buena Vista 6219 Storm Lake Comm School District S 24 SBuena Vista 6219 Storm Lake Elementary 768 857 89.61%Buena Vista 6219 Storm Lake High School 603 667 90.40%Buena Vista 6219 Storm Lake Middle School 599 728 82.28%Butler 0153 North Butler Elementary 339 344 98.55%Butler 0153 North Butler Jr Sr High School 251 255 98.43%Butler 0279 Aplington Elementary School 180 184 97.83%Butler 0279 Aplington Parkersburg High School 272 273 99.63%Butler 0279 Aplington Parkersburg Middle School 174 180 96.67%Butler 0279 Parkersburg Elementary School 197 197 100.00%Butler 1215 Clarksville Elementary School 183 206 88.83%Butler 1215 Clarksville High School S 87 SButler 1791 Dike-New Hartford Junior High School 190 193 98.45%Butler 1791 New Hartford Elementary School 122 126 96.83%Butler 6840 Shell Rock Elementary School 134 137 97.81%Calhoun 4023 Manson Northwest Webster Jr High/High School 318 332 95.78%Calhoun 5325 Prairie Valley Elementary School 201 206 97.57%Calhoun 6091 SCC High School 272 273 99.63%Calhoun 6091 South Central Calhoun Elementary Building 239 258 92.64%Calhoun 6091 South Central Calhoun Middle School 308 315 97.78%Carroll 0999 Adams Elementary School 283 286 98.95%Carroll 0999 Carroll High School 468 474 98.73%Carroll 0999 Carroll Middle School 513 524 97.90%Carroll 0999 Fairview Elementary School 371 384 96.61%Carroll 0999 Kuemper Catholic Grade School 674 694 97.12%Carroll 0999 Kuemper High School 313 316 99.05%Carroll 1413 Coon Rapids-Bayard 5-12 Attendance Center 222 229 96.94%Carroll 1413 CR-B Elementary School 153 158 96.84%Carroll 2520 Glidden-Ralston Elementary School 127 129 98.45%Carroll 2520 Glidden-Ralston Jr-Sr High School 183 187 97.86%Carroll 3168 IKM-Manning High School 200 201 99.50%Carroll 3168 IKM-Manning Middle School 243 245 99.18%Cass 0387 Atlantic High School 432 449 96.21%Cass 0387 Atlantic Middle School 295 337 87.54%Cass 0387 Schuler Elementary School 238 244 97.54%Cass 0387 Washington Elementary School-Atlantic 403 427 94.38%Cass 0914 CAM High School 118 137 86.13%Cass 0914 CAM Middle School 97 108 89.81%Cass 0914 CAM North Elementary 106 109 97.25%Cass 0914 CAM South Elementary School 98 102 96.08%
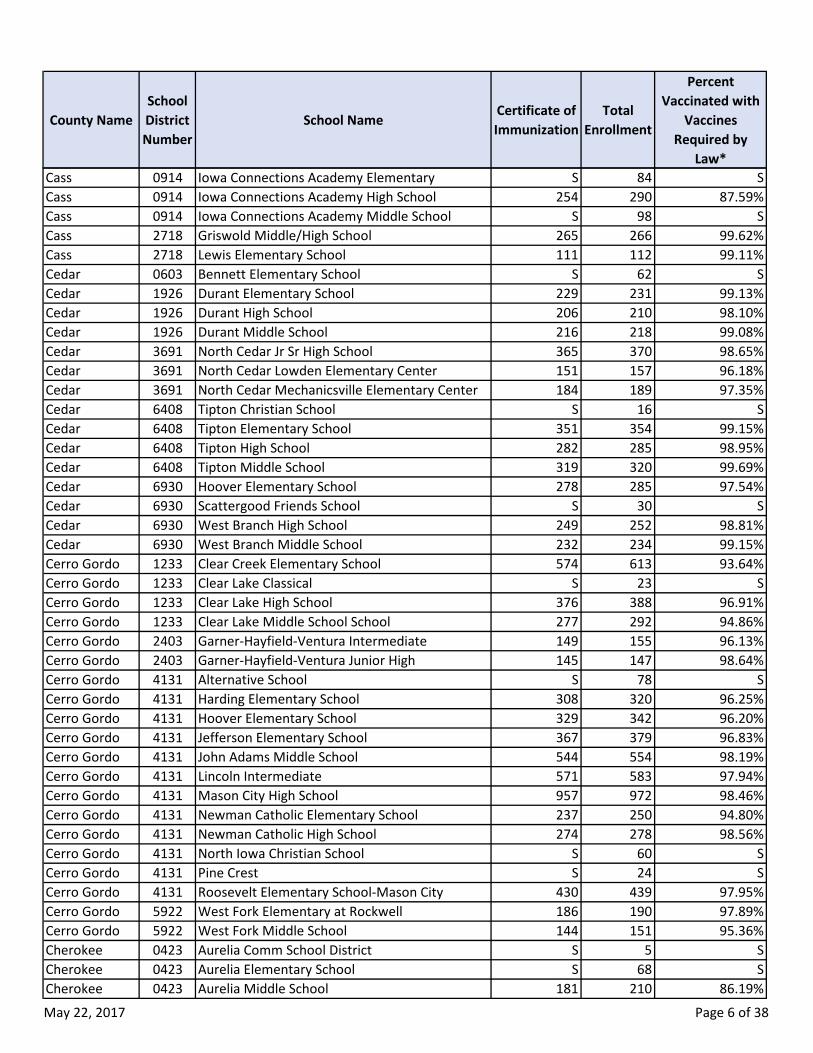
May 22, 2017 Page 6 of 38
County NameSchool District Number
School NameCertificate of Immunization
Total Enrollment
Percent Vaccinated with
Vaccines Required by
Law*Cass 0914 Iowa Connections Academy Elementary S 84 SCass 0914 Iowa Connections Academy High School 254 290 87.59%Cass 0914 Iowa Connections Academy Middle School S 98 SCass 2718 Griswold Middle/High School 265 266 99.62%Cass 2718 Lewis Elementary School 111 112 99.11%Cedar 0603 Bennett Elementary School S 62 SCedar 1926 Durant Elementary School 229 231 99.13%Cedar 1926 Durant High School 206 210 98.10%Cedar 1926 Durant Middle School 216 218 99.08%Cedar 3691 North Cedar Jr Sr High School 365 370 98.65%Cedar 3691 North Cedar Lowden Elementary Center 151 157 96.18%Cedar 3691 North Cedar Mechanicsville Elementary Center 184 189 97.35%Cedar 6408 Tipton Christian School S 16 SCedar 6408 Tipton Elementary School 351 354 99.15%Cedar 6408 Tipton High School 282 285 98.95%Cedar 6408 Tipton Middle School 319 320 99.69%Cedar 6930 Hoover Elementary School 278 285 97.54%Cedar 6930 Scattergood Friends School S 30 SCedar 6930 West Branch High School 249 252 98.81%Cedar 6930 West Branch Middle School 232 234 99.15%Cerro Gordo 1233 Clear Creek Elementary School 574 613 93.64%Cerro Gordo 1233 Clear Lake Classical S 23 SCerro Gordo 1233 Clear Lake High School 376 388 96.91%Cerro Gordo 1233 Clear Lake Middle School School 277 292 94.86%Cerro Gordo 2403 Garner-Hayfield-Ventura Intermediate 149 155 96.13%Cerro Gordo 2403 Garner-Hayfield-Ventura Junior High 145 147 98.64%Cerro Gordo 4131 Alternative School S 78 SCerro Gordo 4131 Harding Elementary School 308 320 96.25%Cerro Gordo 4131 Hoover Elementary School 329 342 96.20%Cerro Gordo 4131 Jefferson Elementary School 367 379 96.83%Cerro Gordo 4131 John Adams Middle School 544 554 98.19%Cerro Gordo 4131 Lincoln Intermediate 571 583 97.94%Cerro Gordo 4131 Mason City High School 957 972 98.46%Cerro Gordo 4131 Newman Catholic Elementary School 237 250 94.80%Cerro Gordo 4131 Newman Catholic High School 274 278 98.56%Cerro Gordo 4131 North Iowa Christian School S 60 SCerro Gordo 4131 Pine Crest S 24 SCerro Gordo 4131 Roosevelt Elementary School-Mason City 430 439 97.95%Cerro Gordo 5922 West Fork Elementary at Rockwell 186 190 97.89%Cerro Gordo 5922 West Fork Middle School 144 151 95.36%Cherokee 0423 Aurelia Comm School District S 5 SCherokee 0423 Aurelia Elementary School S 68 SCherokee 0423 Aurelia Middle School 181 210 86.19%
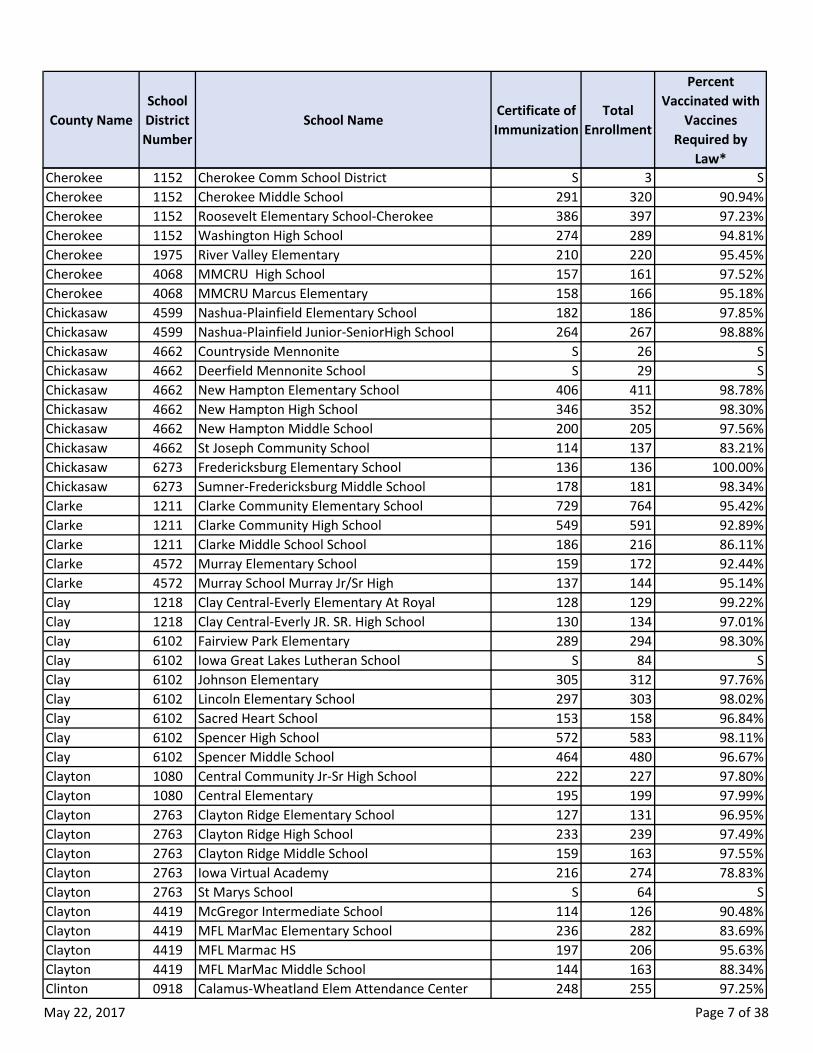
May 22, 2017 Page 7 of 38
County NameSchool District Number
School NameCertificate of Immunization
Total Enrollment
Percent Vaccinated with
Vaccines Required by
Law*Cherokee 1152 Cherokee Comm School District S 3 SCherokee 1152 Cherokee Middle School 291 320 90.94%Cherokee 1152 Roosevelt Elementary School-Cherokee 386 397 97.23%Cherokee 1152 Washington High School 274 289 94.81%Cherokee 1975 River Valley Elementary 210 220 95.45%Cherokee 4068 MMCRU High School 157 161 97.52%Cherokee 4068 MMCRU Marcus Elementary 158 166 95.18%Chickasaw 4599 Nashua-Plainfield Elementary School 182 186 97.85%Chickasaw 4599 Nashua-Plainfield Junior-SeniorHigh School 264 267 98.88%Chickasaw 4662 Countryside Mennonite S 26 SChickasaw 4662 Deerfield Mennonite School S 29 SChickasaw 4662 New Hampton Elementary School 406 411 98.78%Chickasaw 4662 New Hampton High School 346 352 98.30%Chickasaw 4662 New Hampton Middle School 200 205 97.56%Chickasaw 4662 St Joseph Community School 114 137 83.21%Chickasaw 6273 Fredericksburg Elementary School 136 136 100.00%Chickasaw 6273 Sumner-Fredericksburg Middle School 178 181 98.34%Clarke 1211 Clarke Community Elementary School 729 764 95.42%Clarke 1211 Clarke Community High School 549 591 92.89%Clarke 1211 Clarke Middle School School 186 216 86.11%Clarke 4572 Murray Elementary School 159 172 92.44%Clarke 4572 Murray School Murray Jr/Sr High 137 144 95.14%Clay 1218 Clay Central-Everly Elementary At Royal 128 129 99.22%Clay 1218 Clay Central-Everly JR. SR. High School 130 134 97.01%Clay 6102 Fairview Park Elementary 289 294 98.30%Clay 6102 Iowa Great Lakes Lutheran School S 84 SClay 6102 Johnson Elementary 305 312 97.76%Clay 6102 Lincoln Elementary School 297 303 98.02%Clay 6102 Sacred Heart School 153 158 96.84%Clay 6102 Spencer High School 572 583 98.11%Clay 6102 Spencer Middle School 464 480 96.67%Clayton 1080 Central Community Jr-Sr High School 222 227 97.80%Clayton 1080 Central Elementary 195 199 97.99%Clayton 2763 Clayton Ridge Elementary School 127 131 96.95%Clayton 2763 Clayton Ridge High School 233 239 97.49%Clayton 2763 Clayton Ridge Middle School 159 163 97.55%Clayton 2763 Iowa Virtual Academy 216 274 78.83%Clayton 2763 St Marys School S 64 SClayton 4419 McGregor Intermediate School 114 126 90.48%Clayton 4419 MFL MarMac Elementary School 236 282 83.69%Clayton 4419 MFL Marmac HS 197 206 95.63%Clayton 4419 MFL MarMac Middle School 144 163 88.34%Clinton 0918 Calamus-Wheatland Elem Attendance Center 248 255 97.25%
May 22, 2017 Page 8 of 38
County NameSchool District Number
School NameCertificate of Immunization
Total Enrollment
Percent Vaccinated with
Vaccines Required by
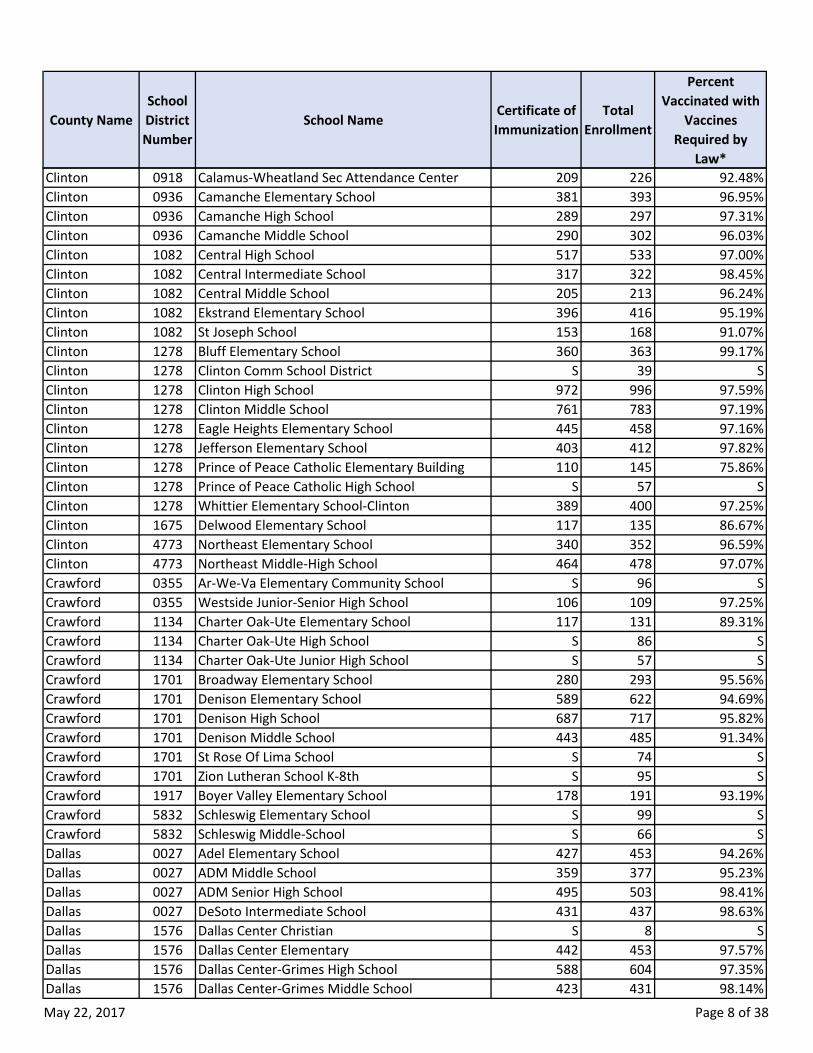
Law*Clinton 0918 Calamus-Wheatland Sec Attendance Center 209 226 92.48%Clinton 0936 Camanche Elementary School 381 393 96.95%Clinton 0936 Camanche High School 289 297 97.31%Clinton 0936 Camanche Middle School 290 302 96.03%Clinton 1082 Central High School 517 533 97.00%Clinton 1082 Central Intermediate School 317 322 98.45%Clinton 1082 Central Middle School 205 213 96.24%Clinton 1082 Ekstrand Elementary School 396 416 95.19%Clinton 1082 St Joseph School 153 168 91.07%Clinton 1278 Bluff Elementary School 360 363 99.17%Clinton 1278 Clinton Comm School District S 39 SClinton 1278 Clinton High School 972 996 97.59%Clinton 1278 Clinton Middle School 761 783 97.19%Clinton 1278 Eagle Heights Elementary School 445 458 97.16%Clinton 1278 Jefferson Elementary School 403 412 97.82%Clinton 1278 Prince of Peace Catholic Elementary Building 110 145 75.86%Clinton 1278 Prince of Peace Catholic High School S 57 SClinton 1278 Whittier Elementary School-Clinton 389 400 97.25%Clinton 1675 Delwood Elementary School 117 135 86.67%Clinton 4773 Northeast Elementary School 340 352 96.59%Clinton 4773 Northeast Middle-High School 464 478 97.07%Crawford 0355 Ar-We-Va Elementary Community School S 96 SCrawford 0355 Westside Junior-Senior High School 106 109 97.25%Crawford 1134 Charter Oak-Ute Elementary School 117 131 89.31%Crawford 1134 Charter Oak-Ute High School S 86 SCrawford 1134 Charter Oak-Ute Junior High School S 57 SCrawford 1701 Broadway Elementary School 280 293 95.56%Crawford 1701 Denison Elementary School 589 622 94.69%Crawford 1701 Denison High School 687 717 95.82%Crawford 1701 Denison Middle School 443 485 91.34%Crawford 1701 St Rose Of Lima School S 74 SCrawford 1701 Zion Lutheran School K-8th S 95 SCrawford 1917 Boyer Valley Elementary School 178 191 93.19%Crawford 5832 Schleswig Elementary School S 99 SCrawford 5832 Schleswig Middle-School S 66 SDallas 0027 Adel Elementary School 427 453 94.26%Dallas 0027 ADM Middle School 359 377 95.23%Dallas 0027 ADM Senior High School 495 503 98.41%Dallas 0027 DeSoto Intermediate School 431 437 98.63%Dallas 1576 Dallas Center Christian S 8 SDallas 1576 Dallas Center Elementary 442 453 97.57%Dallas 1576 Dallas Center-Grimes High School 588 604 97.35%Dallas 1576 Dallas Center-Grimes Middle School 423 431 98.14%
May 22, 2017 Page 9 of 38
County NameSchool District Number
School NameCertificate of Immunization
Total Enrollment
Percent Vaccinated with
Vaccines Required by
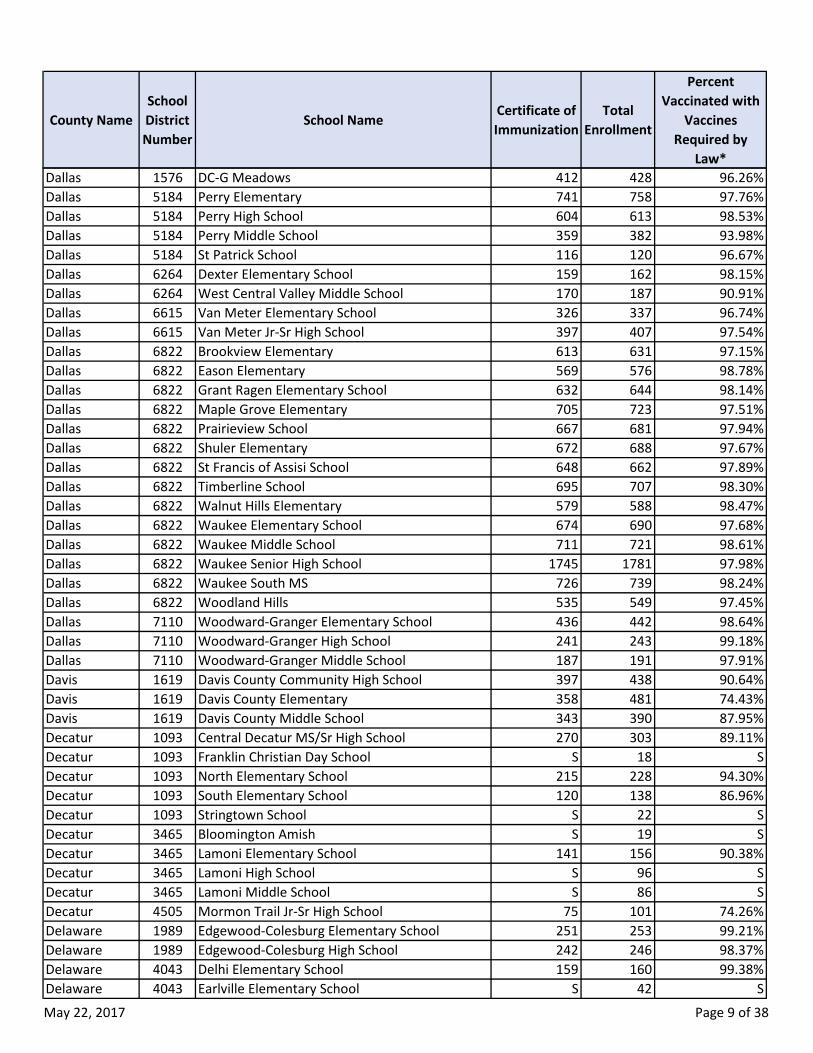
Law*Dallas 1576 DC-G Meadows 412 428 96.26%Dallas 5184 Perry Elementary 741 758 97.76%Dallas 5184 Perry High School 604 613 98.53%Dallas 5184 Perry Middle School 359 382 93.98%Dallas 5184 St Patrick School 116 120 96.67%Dallas 6264 Dexter Elementary School 159 162 98.15%Dallas 6264 West Central Valley Middle School 170 187 90.91%Dallas 6615 Van Meter Elementary School 326 337 96.74%Dallas 6615 Van Meter Jr-Sr High School 397 407 97.54%Dallas 6822 Brookview Elementary 613 631 97.15%Dallas 6822 Eason Elementary 569 576 98.78%Dallas 6822 Grant Ragen Elementary School 632 644 98.14%Dallas 6822 Maple Grove Elementary 705 723 97.51%Dallas 6822 Prairieview School 667 681 97.94%Dallas 6822 Shuler Elementary 672 688 97.67%Dallas 6822 St Francis of Assisi School 648 662 97.89%Dallas 6822 Timberline School 695 707 98.30%Dallas 6822 Walnut Hills Elementary 579 588 98.47%Dallas 6822 Waukee Elementary School 674 690 97.68%Dallas 6822 Waukee Middle School 711 721 98.61%Dallas 6822 Waukee Senior High School 1745 1781 97.98%Dallas 6822 Waukee South MS 726 739 98.24%Dallas 6822 Woodland Hills 535 549 97.45%Dallas 7110 Woodward-Granger Elementary School 436 442 98.64%Dallas 7110 Woodward-Granger High School 241 243 99.18%Dallas 7110 Woodward-Granger Middle School 187 191 97.91%Davis 1619 Davis County Community High School 397 438 90.64%Davis 1619 Davis County Elementary 358 481 74.43%Davis 1619 Davis County Middle School 343 390 87.95%Decatur 1093 Central Decatur MS/Sr High School 270 303 89.11%Decatur 1093 Franklin Christian Day School S 18 SDecatur 1093 North Elementary School 215 228 94.30%Decatur 1093 South Elementary School 120 138 86.96%Decatur 1093 Stringtown School S 22 SDecatur 3465 Bloomington Amish S 19 SDecatur 3465 Lamoni Elementary School 141 156 90.38%Decatur 3465 Lamoni High School S 96 SDecatur 3465 Lamoni Middle School S 86 SDecatur 4505 Mormon Trail Jr-Sr High School 75 101 74.26%Delaware 1989 Edgewood-Colesburg Elementary School 251 253 99.21%Delaware 1989 Edgewood-Colesburg High School 242 246 98.37%Delaware 4043 Delhi Elementary School 159 160 99.38%Delaware 4043 Earlville Elementary School S 42 S
May 22, 2017 Page 10 of 38
County NameSchool District Number
School NameCertificate of Immunization
Total Enrollment
Percent Vaccinated with
Vaccines Required by
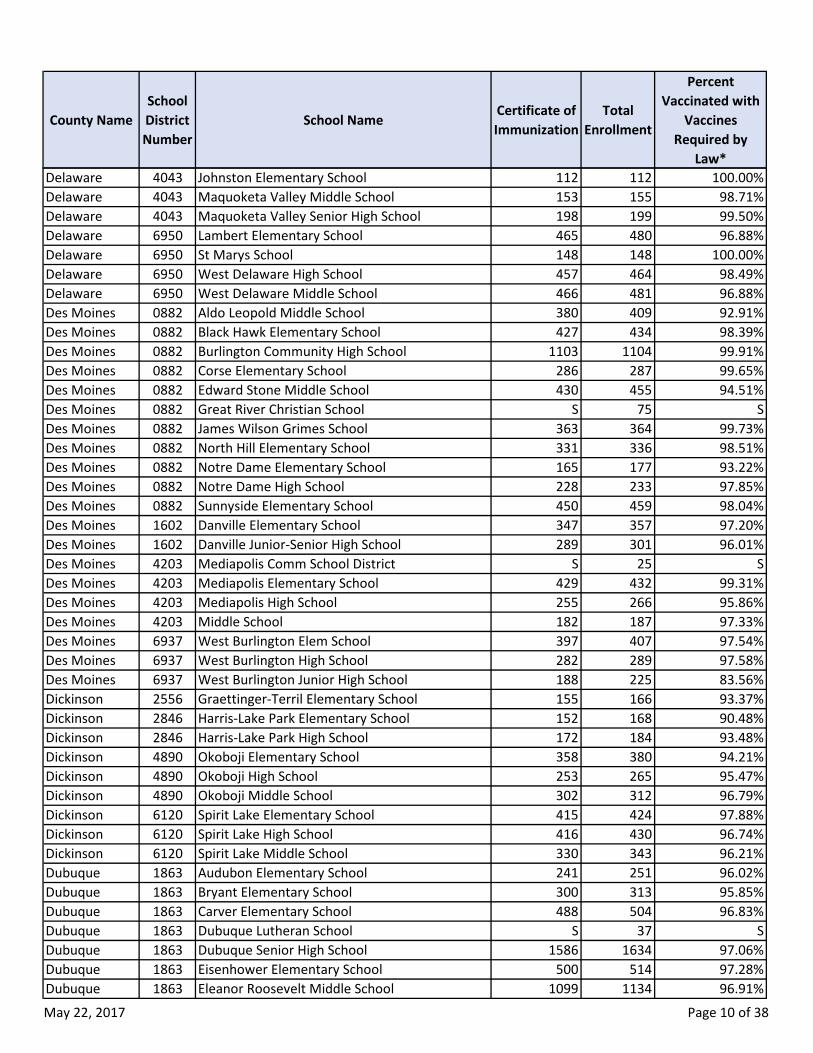
Law*Delaware 4043 Johnston Elementary School 112 112 100.00%Delaware 4043 Maquoketa Valley Middle School 153 155 98.71%Delaware 4043 Maquoketa Valley Senior High School 198 199 99.50%Delaware 6950 Lambert Elementary School 465 480 96.88%Delaware 6950 St Marys School 148 148 100.00%Delaware 6950 West Delaware High School 457 464 98.49%Delaware 6950 West Delaware Middle School 466 481 96.88%Des Moines 0882 Aldo Leopold Middle School 380 409 92.91%Des Moines 0882 Black Hawk Elementary School 427 434 98.39%Des Moines 0882 Burlington Community High School 1103 1104 99.91%Des Moines 0882 Corse Elementary School 286 287 99.65%Des Moines 0882 Edward Stone Middle School 430 455 94.51%Des Moines 0882 Great River Christian School S 75 SDes Moines 0882 James Wilson Grimes School 363 364 99.73%Des Moines 0882 North Hill Elementary School 331 336 98.51%Des Moines 0882 Notre Dame Elementary School 165 177 93.22%Des Moines 0882 Notre Dame High School 228 233 97.85%Des Moines 0882 Sunnyside Elementary School 450 459 98.04%Des Moines 1602 Danville Elementary School 347 357 97.20%Des Moines 1602 Danville Junior-Senior High School 289 301 96.01%Des Moines 4203 Mediapolis Comm School District S 25 SDes Moines 4203 Mediapolis Elementary School 429 432 99.31%Des Moines 4203 Mediapolis High School 255 266 95.86%Des Moines 4203 Middle School 182 187 97.33%Des Moines 6937 West Burlington Elem School 397 407 97.54%Des Moines 6937 West Burlington High School 282 289 97.58%Des Moines 6937 West Burlington Junior High School 188 225 83.56%Dickinson 2556 Graettinger-Terril Elementary School 155 166 93.37%Dickinson 2846 Harris-Lake Park Elementary School 152 168 90.48%Dickinson 2846 Harris-Lake Park High School 172 184 93.48%Dickinson 4890 Okoboji Elementary School 358 380 94.21%Dickinson 4890 Okoboji High School 253 265 95.47%Dickinson 4890 Okoboji Middle School 302 312 96.79%Dickinson 6120 Spirit Lake Elementary School 415 424 97.88%Dickinson 6120 Spirit Lake High School 416 430 96.74%Dickinson 6120 Spirit Lake Middle School 330 343 96.21%Dubuque 1863 Audubon Elementary School 241 251 96.02%Dubuque 1863 Bryant Elementary School 300 313 95.85%Dubuque 1863 Carver Elementary School 488 504 96.83%Dubuque 1863 Dubuque Lutheran School S 37 SDubuque 1863 Dubuque Senior High School 1586 1634 97.06%Dubuque 1863 Eisenhower Elementary School 500 514 97.28%Dubuque 1863 Eleanor Roosevelt Middle School 1099 1134 96.91%
May 22, 2017 Page 11 of 38
County NameSchool District Number
School NameCertificate of Immunization
Total Enrollment
Percent Vaccinated with
Vaccines Required by
Law*Dubuque 1863 Fulton Elementary School 299 320 93.44%Dubuque 1863 George Washington Middle School 642 691 92.91%Dubuque 1863 Hempstead High School 1602 1643 97.50%Dubuque 1863 Holy Ghost School S 78 SDubuque 1863 Hoover Elementary School 309 323 95.67%Dubuque 1863 Irving Elementary School 409 420 97.38%Dubuque 1863 John Kennedy Elementary School 560 580 96.55%Dubuque 1863 Lincoln Elementary School 232 248 93.55%Dubuque 1863 Marshall Elementary School 290 302 96.03%Dubuque 1863 Mazzuchelli Catholic Middle School 379 400 94.75%Dubuque 1863 Prescott Elementary School 237 247 95.95%Dubuque 1863 Resurrection School 204 209 97.61%Dubuque 1863 Sageville Elementary School 266 272 97.79%Dubuque 1863 St Anthony School 255 272 93.75%Dubuque 1863 St Columbkille School 235 248 94.76%Dubuque 1863 Table Mound Elementary School 368 377 97.61%Dubuque 1863 Thomas Jefferson Middle School 525 563 93.25%Dubuque 1863 Wahlert Catholic High School 468 482 97.10%Dubuque 6961 Aquin Elementary School 224 231 96.97%Dubuque 6961 Beckman High School Beckman Catholic HS 400 410 97.56%Dubuque 6961 Bernard Elementary School S 21 SDubuque 6961 Cascade Elementary School 253 258 98.06%Dubuque 6961 Cascade Junior-Senior High School 347 365 95.07%Dubuque 6961 Drexler Middle- Intermediate School 545 564 96.63%Dubuque 6961 Dyersville Elementary School 242 259 93.44%Dubuque 6961 Epworth Elementary School 202 206 98.06%Dubuque 6961 Farley Elementary School 396 406 97.54%Dubuque 6961 LaSalle Catholic School S 51 SDubuque 6961 Peosta Elementary School 235 238 98.74%Dubuque 6961 Seton Catholic Elem Sch Farley Center 94 100 94.00%Dubuque 6961 Seton Catholic Elem Sch Peosta Center 222 232 95.69%Dubuque 6961 St Francis Xavier School 306 310 98.71%Dubuque 6961 Western Dubuque High School 934 951 98.21%Emmet 0333 North Union High School 185 190 97.37%Emmet 2124 Demoney Elementary School 468 478 97.91%Emmet 2124 Estherville Lincoln Central High School 369 372 99.19%Emmet 2124 Estherville Lincoln Central Middle School 397 407 97.54%Fayette 4774 North Fayette Elementary Fayette Center 111 112 99.11%Fayette 4774 North Fayette High School 324 331 97.89%Fayette 4774 Scenic View Christian School S 23 SFayette 4774 West Union Elementary School 257 263 97.72%Fayette 4869 Little Husky Learning Center S 93 SFayette 4869 Oelwein High School 369 390 94.62%
May 22, 2017 Page 12 of 38
County NameSchool District Number
School NameCertificate of Immunization
Total Enrollment
Percent Vaccinated with
Vaccines Required by
Law*Fayette 4869 Oelwein Middle School 237 279 84.95%Fayette 4869 Parkside Elementary School S 88 SFayette 4869 Sacred Heart Elementary School S 71 SFayette 4869 Wings Park Elementary School 365 376 97.07%Fayette 6175 Starmont Elementary School 263 267 98.50%Fayette 6175 Starmont High School 177 180 98.33%Fayette 6175 Starmont Middle School 131 133 98.50%Fayette 6591 North Fayette-Valley Middle School 143 163 87.73%Fayette 6591 Rolling Hills Amish S 18 SFayette 6591 Valley Elementary 175 190 92.11%Fayette 6943 West Central Charter High School S 80 SFayette 6943 West Central K - 8 School 168 176 95.45%Floyd 1116 Calvary Baptist Christian Academy S 3 SFloyd 1116 Carrie Lane High School S 25 SFloyd 1116 Charles City High School 498 539 92.39%Floyd 1116 Charles City Middle School 393 481 81.70%Floyd 1116 Gospel Lighthouse Academy S 48 SFloyd 1116 Immaculate Conception School 173 193 89.64%Floyd 1116 Lincoln Elementary School 221 235 94.04%Floyd 1116 Washington Elementary School-Charles City 244 259 94.21%Floyd 5697 Rockford Junior-Senior Rockford Senior High 220 239 92.05%Floyd 5697 RRMR Elementary School 176 197 89.34%Franklin 0916 CAL Community High School 119 123 96.75%Franklin 0916 CAL Elementary School 94 101 93.07%Franklin 0916 St Pauls Lutheran School S 34 SFranklin 2781 Hampton-Dumont High School 353 360 98.06%Franklin 2781 Hampton-Dumont Middle School 454 470 96.60%Franklin 2781 North Side Elementary School S 87 SFranklin 2781 South Side Elementary School 264 274 96.35%Franklin 5922 West Fork Elementary Sheffield 102 107 95.33%Franklin 5922 West Fork High School 187 197 94.92%Fremont 2369 Fremont-Mills Elementary School 232 249 93.17%Fremont 2369 Fremont-Mills Middle And Senior High School 189 210 90.00%Fremont 2772 Marnie Simons Elementary School 139 154 90.26%Fremont 6003 Sidney Elementary School 200 215 93.02%Fremont 6003 Sidney High School 245 274 89.42%Greene 3195 Greene County Elementary 348 352 98.86%Greene 3195 Greene County High School 391 399 97.99%Greene 3195 Greene County Intermediate Sch-Grand Junction 269 273 98.53%Greene 3195 Greene County Middle School 192 196 97.96%Greene 5139 Paton-Churdan Elementary S 99 SGreene 5139 Paton-Churdan Jr-Sr High School 101 104 97.12%Grundy 0009 AGWSR Elementary at Wellsburg S 61 S
May 22, 2017 Page 13 of 38
County NameSchool District Number
School NameCertificate of Immunization
Total Enrollment
Percent Vaccinated with
Vaccines Required by
Law*Grundy 0009 AGWSR Middle School 118 125 94.40%Grundy 0009 Timothy Christian School S 41 SGrundy 0540 BCLUW Elementary School 207 209 99.04%Grundy 0540 BCLUW High School 195 197 98.98%Grundy 1791 Dike Elementary School 556 558 99.64%Grundy 1791 Dike-New Hartford High School 271 273 99.27%Grundy 2502 Gladbrook-Reinbeck High School 152 153 99.35%Grundy 2502 Reinbeck Elementary School 271 280 96.79%Grundy 2727 Grundy Center Elementary School 260 263 98.86%Grundy 2727 Grundy Center High School 198 199 99.50%Grundy 2727 Grundy Center Middle School 209 218 95.87%Guthrie 0018 Adair-Casey Elementary School 134 136 98.53%Guthrie 0018 Adair-Casey Jr High 123 126 97.62%Guthrie 2754 Guthrie Center Elementary School 255 262 97.33%Guthrie 2754 Guthrie Center High School 236 244 96.72%Guthrie 5121 Panorama Comm School District S 29 SGuthrie 5121 Panorama Elementary 324 332 97.59%Guthrie 5121 Panorama High School 221 224 98.66%Guthrie 5121 Panorama Middle School 137 143 95.80%Guthrie 6264 Stuart Elementary School 190 201 94.53%Guthrie 6264 West Central Valley High School 246 263 93.54%Hamilton 4775 Northeast Hamilton Elementary School S 87 SHamilton 6095 South Hamilton Elementary 318 331 96.07%Hamilton 6095 South Hamilton Middle And High School 355 369 96.21%Hamilton 6246 Stratford Elementary S 69 SHamilton 6867 Pleasant View Elementary School 195 201 97.01%Hamilton 6867 St Thomas Aquinas School S 67 SHamilton 6867 Sunset Heights Elementary School 337 340 99.12%Hamilton 6867 Webster City High School 540 551 98.00%Hamilton 6867 Webster City Middle School 545 553 98.55%Hancock 0819 Kanawha Christian School S 21 SHancock 0819 West Hancock Elementary School 219 221 99.10%Hancock 0819 West Hancock High School 173 175 98.86%Hancock 0819 West Hancock Middle School 179 180 99.44%Hancock 2403 Garner-Hayfield-Ventura Elementary School 337 347 97.12%Hancock 2403 Garner-Hayfield-Ventura High School 321 323 99.38%Hardin 0009 AGWSR Elementary School 219 223 98.21%Hardin 0009 AGWSR High School 150 155 96.77%Hardin 0108 Alden Elementary School 240 240 100.00%Hardin 0540 BCLUW Middle School 176 181 97.24%Hardin 2007 Eldora-New Providence Elementary School 584 598 97.66%Hardin 2007 South Hardin High School 317 325 97.54%Hardin 3033 Hubbard-Radcliffe Elementary School 156 161 96.89%
May 22, 2017 Page 14 of 38
County NameSchool District Number
School NameCertificate of Immunization
Total Enrollment
Percent Vaccinated with
Vaccines Required by
Law*Hardin 3033 South Hardin Middle School 211 213 99.06%Hardin 3150 Iowa Falls - Alden High School 439 457 96.06%Hardin 3150 Pineview Elementary 243 281 86.48%Hardin 3150 Riverbend Middle School 289 310 93.23%Hardin 3150 Rock Run Elementary 240 249 96.39%Harrison 1917 Boyer Valley Middle/High School 239 246 97.15%Harrison 3798 Logan-Magnolia Elementary School 310 338 91.72%Harrison 3798 Logan-Magnolia Jr-Sr High School 273 305 89.51%Harrison 4356 Missouri Valley Elementary 318 327 97.25%Harrison 4356 Missouri Valley High School 246 252 97.62%Harrison 4356 Missouri Valley Middle School 177 185 95.68%Harrison 6969 West Harrison Elementary 182 187 97.33%Harrison 6969 West Harrison High School 109 110 99.09%Harrison 7092 Woodbine Elementary School 326 338 96.45%Harrison 7092 Woodbine High School S 99 SHenry 4536 Harlan Elementary School 236 240 98.33%Henry 4536 Lincoln Elementary School 276 283 97.53%Henry 4536 Mount Pleasant Comm School District S 83 SHenry 4536 Mount Pleasant High School 620 635 97.64%Henry 4536 Mount Pleasant Middle School 423 434 97.47%Henry 4536 Mt Pleasant Christian School S 75 SHenry 4536 Salem Elementary School 102 103 99.03%Henry 4536 Van Allen Elementary School 226 232 97.41%Henry 4536 WisdomQuest Education Center S 27 SHenry 4689 Clark Elementary School 223 236 94.49%Henry 4689 New London Jr-Sr High School 263 285 92.28%Henry 6700 Waco Comm School District S 42 SHenry 6700 WACO High School 190 201 94.53%Henry 7047 Winfield Elementary School 163 165 98.79%Henry 7047 Winfield-Mt Union Jr-Sr High School 250 254 98.43%Howard 3029 Crestwood Elementary School 481 487 98.77%Howard 3029 Crestwood High School 587 595 98.66%Howard 3029 Little Wapsi Mennonite S 31 SHoward 3029 Notre Dame Elementary School 190 198 95.96%Howard 3029 Pine Grove Mennonite School S 36 SHoward 3029 Scenic Ridge Mennonite School S 27 SHoward 3029 Timber View Amish S 13 SHoward 3029 Timber View Mennonite School S 19 SHoward 5508 Oak Grove Amish S 18 SHoward 5508 Riceville Elementary School 213 217 98.16%Howard 5508 Riceville High School S 92 SHoward 6509 Trinity Catholic School S 40 SHumboldt 2493 Gilmore City Elementary School S 56 S
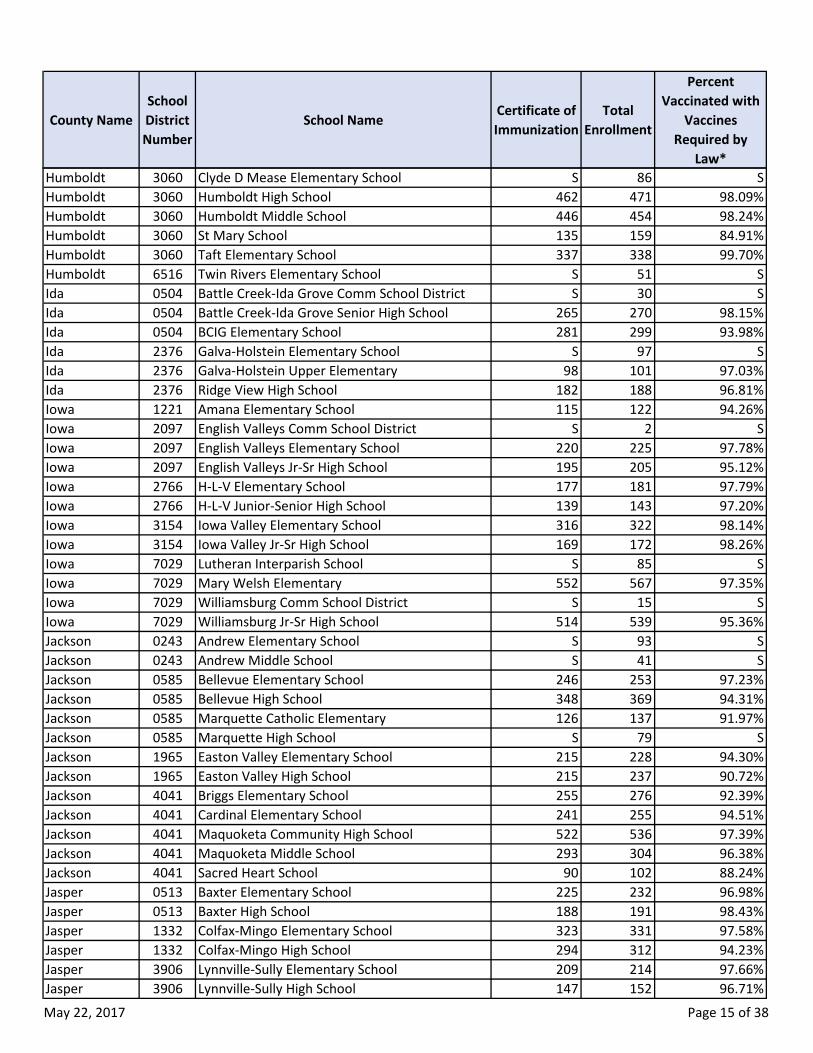
May 22, 2017 Page 15 of 38
County NameSchool District Number
School NameCertificate of Immunization
Total Enrollment
Percent Vaccinated with
Vaccines Required by
Law*Humboldt 3060 Clyde D Mease Elementary School S 86 SHumboldt 3060 Humboldt High School 462 471 98.09%Humboldt 3060 Humboldt Middle School 446 454 98.24%Humboldt 3060 St Mary School 135 159 84.91%Humboldt 3060 Taft Elementary School 337 338 99.70%Humboldt 6516 Twin Rivers Elementary School S 51 SIda 0504 Battle Creek-Ida Grove Comm School District S 30 SIda 0504 Battle Creek-Ida Grove Senior High School 265 270 98.15%Ida 0504 BCIG Elementary School 281 299 93.98%Ida 2376 Galva-Holstein Elementary School S 97 SIda 2376 Galva-Holstein Upper Elementary 98 101 97.03%Ida 2376 Ridge View High School 182 188 96.81%Iowa 1221 Amana Elementary School 115 122 94.26%Iowa 2097 English Valleys Comm School District S 2 SIowa 2097 English Valleys Elementary School 220 225 97.78%Iowa 2097 English Valleys Jr-Sr High School 195 205 95.12%Iowa 2766 H-L-V Elementary School 177 181 97.79%Iowa 2766 H-L-V Junior-Senior High School 139 143 97.20%Iowa 3154 Iowa Valley Elementary School 316 322 98.14%Iowa 3154 Iowa Valley Jr-Sr High School 169 172 98.26%Iowa 7029 Lutheran Interparish School S 85 SIowa 7029 Mary Welsh Elementary 552 567 97.35%Iowa 7029 Williamsburg Comm School District S 15 SIowa 7029 Williamsburg Jr-Sr High School 514 539 95.36%Jackson 0243 Andrew Elementary School S 93 SJackson 0243 Andrew Middle School S 41 SJackson 0585 Bellevue Elementary School 246 253 97.23%Jackson 0585 Bellevue High School 348 369 94.31%Jackson 0585 Marquette Catholic Elementary 126 137 91.97%Jackson 0585 Marquette High School S 79 SJackson 1965 Easton Valley Elementary School 215 228 94.30%Jackson 1965 Easton Valley High School 215 237 90.72%Jackson 4041 Briggs Elementary School 255 276 92.39%Jackson 4041 Cardinal Elementary School 241 255 94.51%Jackson 4041 Maquoketa Community High School 522 536 97.39%Jackson 4041 Maquoketa Middle School 293 304 96.38%Jackson 4041 Sacred Heart School 90 102 88.24%Jasper 0513 Baxter Elementary School 225 232 96.98%Jasper 0513 Baxter High School 188 191 98.43%Jasper 1332 Colfax-Mingo Elementary School 323 331 97.58%Jasper 1332 Colfax-Mingo High School 294 312 94.23%Jasper 3906 Lynnville-Sully Elementary School 209 214 97.66%Jasper 3906 Lynnville-Sully High School 147 152 96.71%
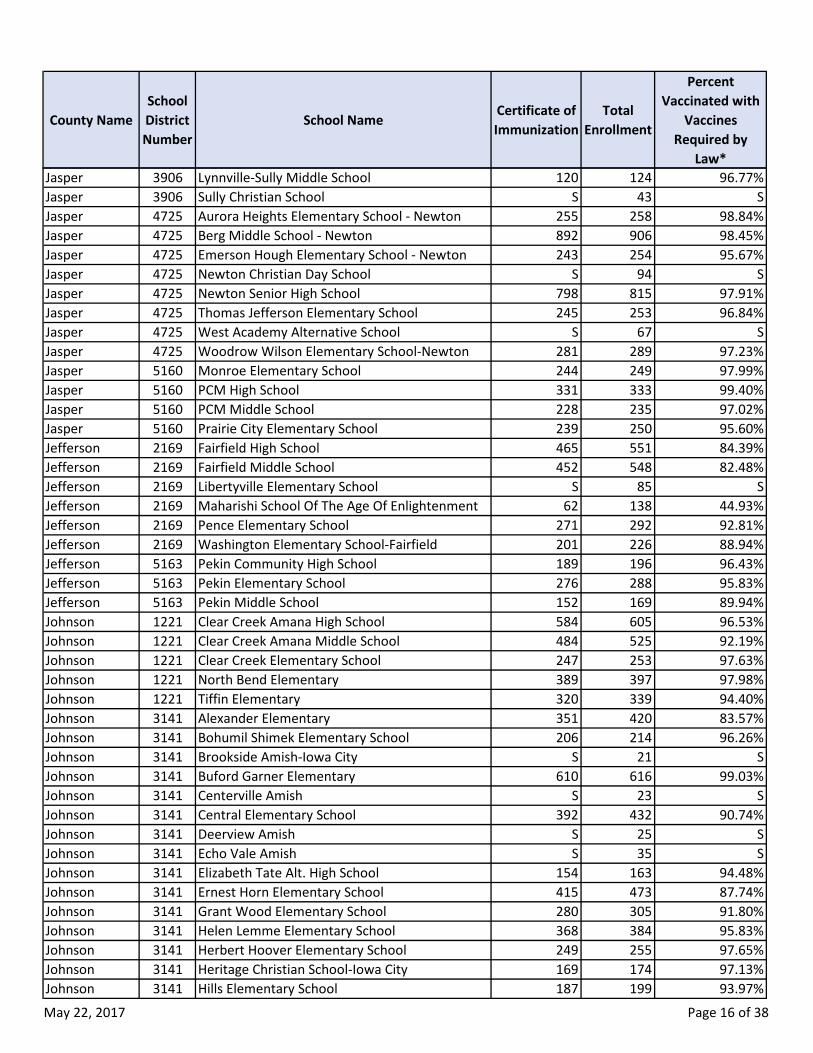
May 22, 2017 Page 16 of 38
County NameSchool District Number
School NameCertificate of Immunization
Total Enrollment
Percent Vaccinated with
Vaccines Required by
Law*Jasper 3906 Lynnville-Sully Middle School 120 124 96.77%Jasper 3906 Sully Christian School S 43 SJasper 4725 Aurora Heights Elementary School - Newton 255 258 98.84%Jasper 4725 Berg Middle School - Newton 892 906 98.45%Jasper 4725 Emerson Hough Elementary School - Newton 243 254 95.67%Jasper 4725 Newton Christian Day School S 94 SJasper 4725 Newton Senior High School 798 815 97.91%Jasper 4725 Thomas Jefferson Elementary School 245 253 96.84%Jasper 4725 West Academy Alternative School S 67 SJasper 4725 Woodrow Wilson Elementary School-Newton 281 289 97.23%Jasper 5160 Monroe Elementary School 244 249 97.99%Jasper 5160 PCM High School 331 333 99.40%Jasper 5160 PCM Middle School 228 235 97.02%Jasper 5160 Prairie City Elementary School 239 250 95.60%Jefferson 2169 Fairfield High School 465 551 84.39%Jefferson 2169 Fairfield Middle School 452 548 82.48%Jefferson 2169 Libertyville Elementary School S 85 SJefferson 2169 Maharishi School Of The Age Of Enlightenment 62 138 44.93%Jefferson 2169 Pence Elementary School 271 292 92.81%Jefferson 2169 Washington Elementary School-Fairfield 201 226 88.94%Jefferson 5163 Pekin Community High School 189 196 96.43%Jefferson 5163 Pekin Elementary School 276 288 95.83%Jefferson 5163 Pekin Middle School 152 169 89.94%Johnson 1221 Clear Creek Amana High School 584 605 96.53%Johnson 1221 Clear Creek Amana Middle School 484 525 92.19%Johnson 1221 Clear Creek Elementary School 247 253 97.63%Johnson 1221 North Bend Elementary 389 397 97.98%Johnson 1221 Tiffin Elementary 320 339 94.40%Johnson 3141 Alexander Elementary 351 420 83.57%Johnson 3141 Bohumil Shimek Elementary School 206 214 96.26%Johnson 3141 Brookside Amish-Iowa City S 21 SJohnson 3141 Buford Garner Elementary 610 616 99.03%Johnson 3141 Centerville Amish S 23 SJohnson 3141 Central Elementary School 392 432 90.74%Johnson 3141 Deerview Amish S 25 SJohnson 3141 Echo Vale Amish S 35 SJohnson 3141 Elizabeth Tate Alt. High School 154 163 94.48%Johnson 3141 Ernest Horn Elementary School 415 473 87.74%Johnson 3141 Grant Wood Elementary School 280 305 91.80%Johnson 3141 Helen Lemme Elementary School 368 384 95.83%Johnson 3141 Herbert Hoover Elementary School 249 255 97.65%Johnson 3141 Heritage Christian School-Iowa City 169 174 97.13%Johnson 3141 Hills Elementary School 187 199 93.97%
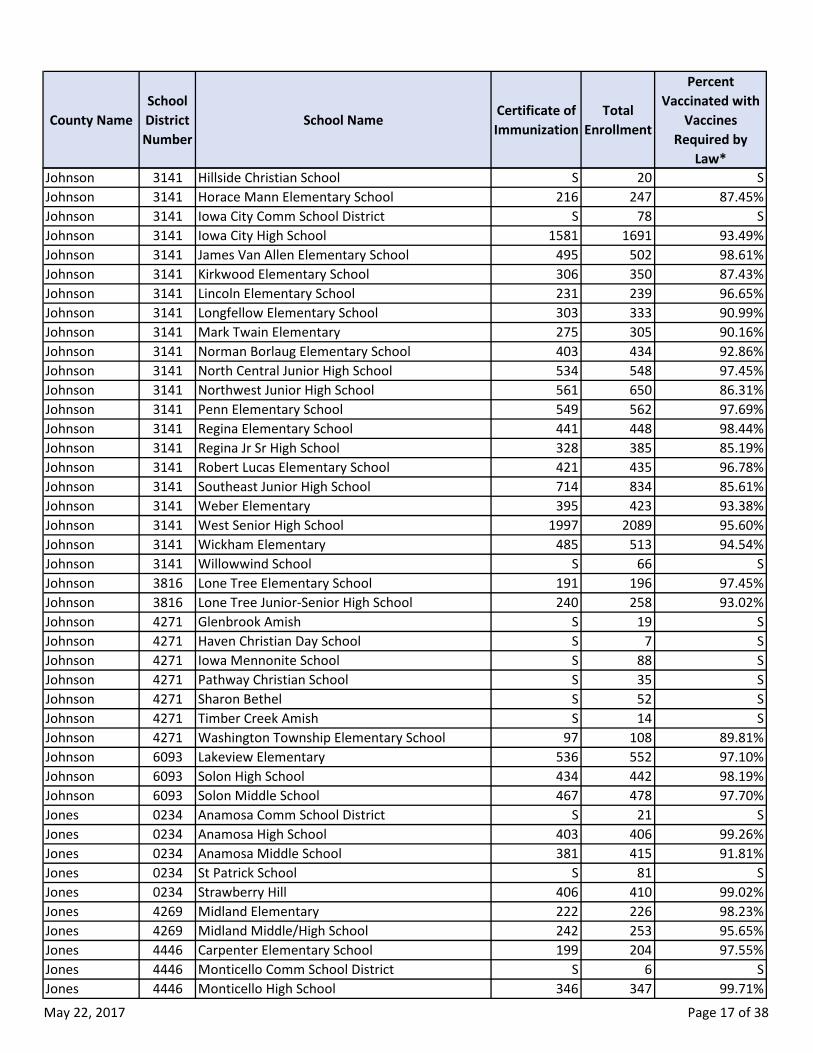
May 22, 2017 Page 17 of 38
County NameSchool District Number
School NameCertificate of Immunization
Total Enrollment
Percent Vaccinated with
Vaccines Required by
Law*Johnson 3141 Hillside Christian School S 20 SJohnson 3141 Horace Mann Elementary School 216 247 87.45%Johnson 3141 Iowa City Comm School District S 78 SJohnson 3141 Iowa City High School 1581 1691 93.49%Johnson 3141 James Van Allen Elementary School 495 502 98.61%Johnson 3141 Kirkwood Elementary School 306 350 87.43%Johnson 3141 Lincoln Elementary School 231 239 96.65%Johnson 3141 Longfellow Elementary School 303 333 90.99%Johnson 3141 Mark Twain Elementary 275 305 90.16%Johnson 3141 Norman Borlaug Elementary School 403 434 92.86%Johnson 3141 North Central Junior High School 534 548 97.45%Johnson 3141 Northwest Junior High School 561 650 86.31%Johnson 3141 Penn Elementary School 549 562 97.69%Johnson 3141 Regina Elementary School 441 448 98.44%Johnson 3141 Regina Jr Sr High School 328 385 85.19%Johnson 3141 Robert Lucas Elementary School 421 435 96.78%Johnson 3141 Southeast Junior High School 714 834 85.61%Johnson 3141 Weber Elementary 395 423 93.38%Johnson 3141 West Senior High School 1997 2089 95.60%Johnson 3141 Wickham Elementary 485 513 94.54%Johnson 3141 Willowwind School S 66 SJohnson 3816 Lone Tree Elementary School 191 196 97.45%Johnson 3816 Lone Tree Junior-Senior High School 240 258 93.02%Johnson 4271 Glenbrook Amish S 19 SJohnson 4271 Haven Christian Day School S 7 SJohnson 4271 Iowa Mennonite School S 88 SJohnson 4271 Pathway Christian School S 35 SJohnson 4271 Sharon Bethel S 52 SJohnson 4271 Timber Creek Amish S 14 SJohnson 4271 Washington Township Elementary School 97 108 89.81%Johnson 6093 Lakeview Elementary 536 552 97.10%Johnson 6093 Solon High School 434 442 98.19%Johnson 6093 Solon Middle School 467 478 97.70%Jones 0234 Anamosa Comm School District S 21 SJones 0234 Anamosa High School 403 406 99.26%Jones 0234 Anamosa Middle School 381 415 91.81%Jones 0234 St Patrick School S 81 SJones 0234 Strawberry Hill 406 410 99.02%Jones 4269 Midland Elementary 222 226 98.23%Jones 4269 Midland Middle/High School 242 253 95.65%Jones 4446 Carpenter Elementary School 199 204 97.55%Jones 4446 Monticello Comm School District S 6 SJones 4446 Monticello High School 346 347 99.71%
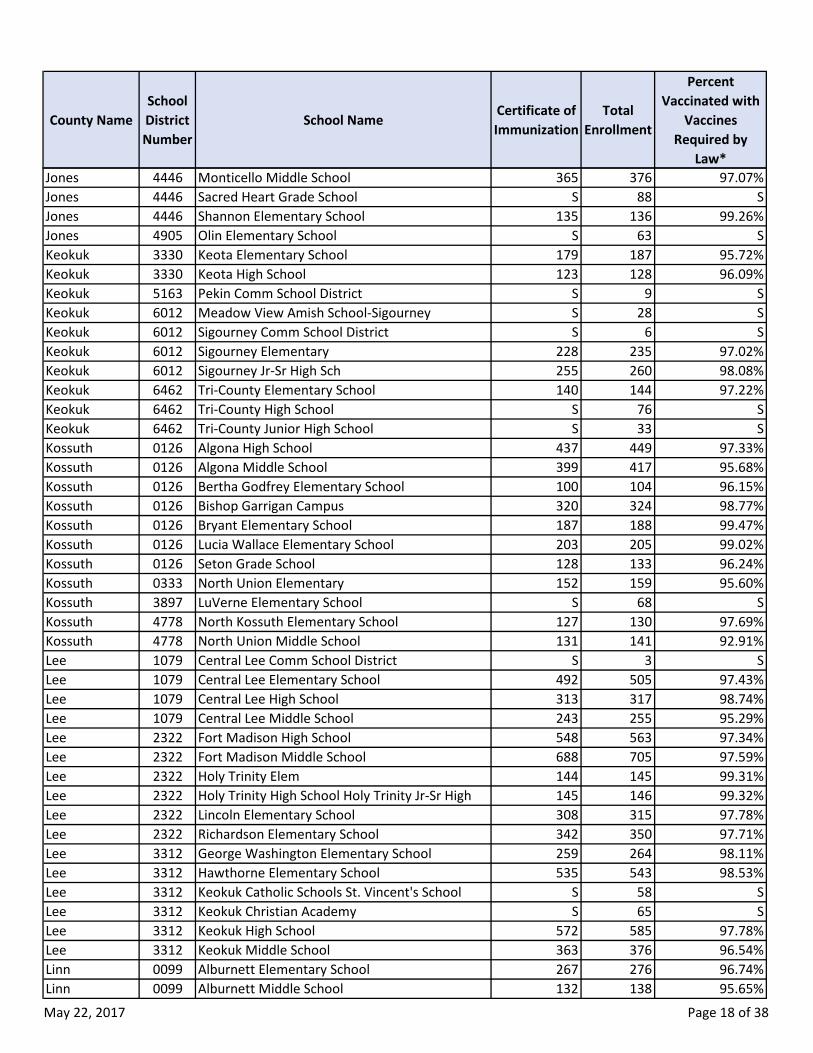
May 22, 2017 Page 18 of 38
County NameSchool District Number
School NameCertificate of Immunization
Total Enrollment
Percent Vaccinated with
Vaccines Required by
Law*Jones 4446 Monticello Middle School 365 376 97.07%Jones 4446 Sacred Heart Grade School S 88 SJones 4446 Shannon Elementary School 135 136 99.26%Jones 4905 Olin Elementary School S 63 SKeokuk 3330 Keota Elementary School 179 187 95.72%Keokuk 3330 Keota High School 123 128 96.09%Keokuk 5163 Pekin Comm School District S 9 SKeokuk 6012 Meadow View Amish School-Sigourney S 28 SKeokuk 6012 Sigourney Comm School District S 6 SKeokuk 6012 Sigourney Elementary 228 235 97.02%Keokuk 6012 Sigourney Jr-Sr High Sch 255 260 98.08%Keokuk 6462 Tri-County Elementary School 140 144 97.22%Keokuk 6462 Tri-County High School S 76 SKeokuk 6462 Tri-County Junior High School S 33 SKossuth 0126 Algona High School 437 449 97.33%Kossuth 0126 Algona Middle School 399 417 95.68%Kossuth 0126 Bertha Godfrey Elementary School 100 104 96.15%Kossuth 0126 Bishop Garrigan Campus 320 324 98.77%Kossuth 0126 Bryant Elementary School 187 188 99.47%Kossuth 0126 Lucia Wallace Elementary School 203 205 99.02%Kossuth 0126 Seton Grade School 128 133 96.24%Kossuth 0333 North Union Elementary 152 159 95.60%Kossuth 3897 LuVerne Elementary School S 68 SKossuth 4778 North Kossuth Elementary School 127 130 97.69%Kossuth 4778 North Union Middle School 131 141 92.91%Lee 1079 Central Lee Comm School District S 3 SLee 1079 Central Lee Elementary School 492 505 97.43%Lee 1079 Central Lee High School 313 317 98.74%Lee 1079 Central Lee Middle School 243 255 95.29%Lee 2322 Fort Madison High School 548 563 97.34%Lee 2322 Fort Madison Middle School 688 705 97.59%Lee 2322 Holy Trinity Elem 144 145 99.31%Lee 2322 Holy Trinity High School Holy Trinity Jr-Sr High 145 146 99.32%Lee 2322 Lincoln Elementary School 308 315 97.78%Lee 2322 Richardson Elementary School 342 350 97.71%Lee 3312 George Washington Elementary School 259 264 98.11%Lee 3312 Hawthorne Elementary School 535 543 98.53%Lee 3312 Keokuk Catholic Schools St. Vincent's School S 58 SLee 3312 Keokuk Christian Academy S 65 SLee 3312 Keokuk High School 572 585 97.78%Lee 3312 Keokuk Middle School 363 376 96.54%Linn 0099 Alburnett Elementary School 267 276 96.74%Linn 0099 Alburnett Middle School 132 138 95.65%
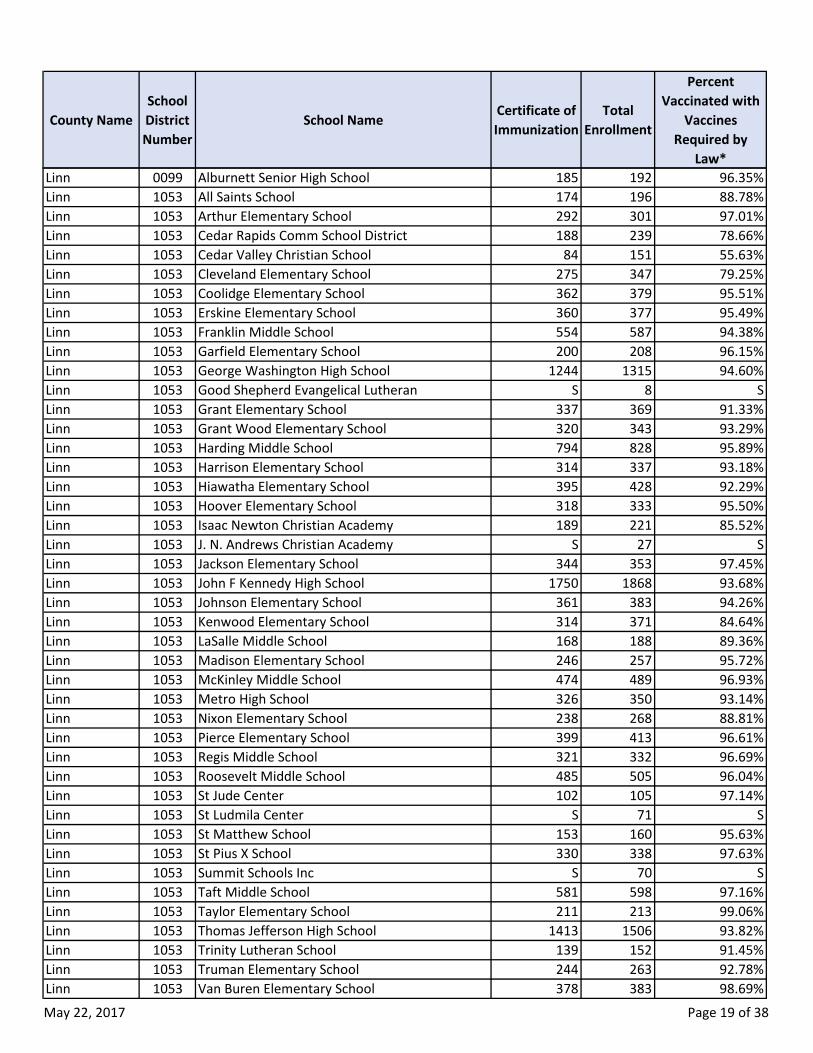
May 22, 2017 Page 19 of 38
County NameSchool District Number
School NameCertificate of Immunization
Total Enrollment
Percent Vaccinated with
Vaccines Required by
Law*Linn 0099 Alburnett Senior High School 185 192 96.35%Linn 1053 All Saints School 174 196 88.78%Linn 1053 Arthur Elementary School 292 301 97.01%Linn 1053 Cedar Rapids Comm School District 188 239 78.66%Linn 1053 Cedar Valley Christian School 84 151 55.63%Linn 1053 Cleveland Elementary School 275 347 79.25%Linn 1053 Coolidge Elementary School 362 379 95.51%Linn 1053 Erskine Elementary School 360 377 95.49%Linn 1053 Franklin Middle School 554 587 94.38%Linn 1053 Garfield Elementary School 200 208 96.15%Linn 1053 George Washington High School 1244 1315 94.60%Linn 1053 Good Shepherd Evangelical Lutheran S 8 SLinn 1053 Grant Elementary School 337 369 91.33%Linn 1053 Grant Wood Elementary School 320 343 93.29%Linn 1053 Harding Middle School 794 828 95.89%Linn 1053 Harrison Elementary School 314 337 93.18%Linn 1053 Hiawatha Elementary School 395 428 92.29%Linn 1053 Hoover Elementary School 318 333 95.50%Linn 1053 Isaac Newton Christian Academy 189 221 85.52%Linn 1053 J. N. Andrews Christian Academy S 27 SLinn 1053 Jackson Elementary School 344 353 97.45%Linn 1053 John F Kennedy High School 1750 1868 93.68%Linn 1053 Johnson Elementary School 361 383 94.26%Linn 1053 Kenwood Elementary School 314 371 84.64%Linn 1053 LaSalle Middle School 168 188 89.36%Linn 1053 Madison Elementary School 246 257 95.72%Linn 1053 McKinley Middle School 474 489 96.93%Linn 1053 Metro High School 326 350 93.14%Linn 1053 Nixon Elementary School 238 268 88.81%Linn 1053 Pierce Elementary School 399 413 96.61%Linn 1053 Regis Middle School 321 332 96.69%Linn 1053 Roosevelt Middle School 485 505 96.04%Linn 1053 St Jude Center 102 105 97.14%Linn 1053 St Ludmila Center S 71 SLinn 1053 St Matthew School 153 160 95.63%Linn 1053 St Pius X School 330 338 97.63%Linn 1053 Summit Schools Inc S 70 SLinn 1053 Taft Middle School 581 598 97.16%Linn 1053 Taylor Elementary School 211 213 99.06%Linn 1053 Thomas Jefferson High School 1413 1506 93.82%Linn 1053 Trinity Lutheran School 139 152 91.45%Linn 1053 Truman Elementary School 244 263 92.78%Linn 1053 Van Buren Elementary School 378 383 98.69%
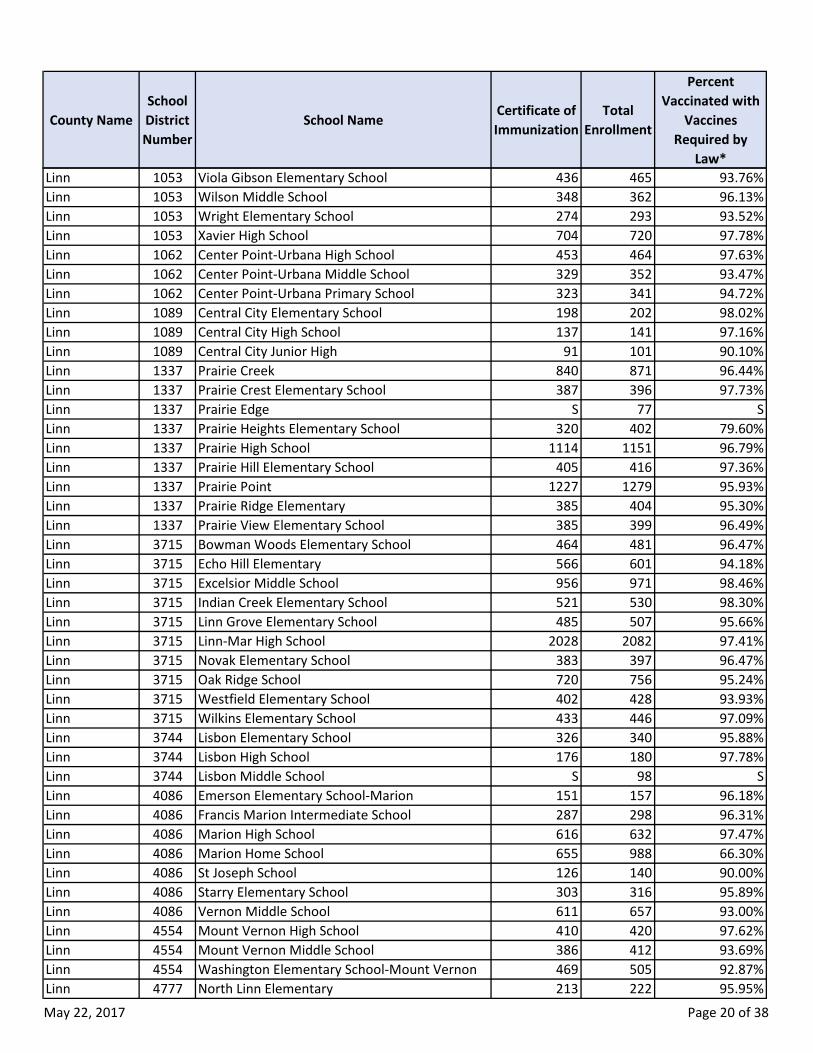
May 22, 2017 Page 20 of 38
County NameSchool District Number
School NameCertificate of Immunization
Total Enrollment
Percent Vaccinated with
Vaccines Required by
Law*Linn 1053 Viola Gibson Elementary School 436 465 93.76%Linn 1053 Wilson Middle School 348 362 96.13%Linn 1053 Wright Elementary School 274 293 93.52%Linn 1053 Xavier High School 704 720 97.78%Linn 1062 Center Point-Urbana High School 453 464 97.63%Linn 1062 Center Point-Urbana Middle School 329 352 93.47%Linn 1062 Center Point-Urbana Primary School 323 341 94.72%Linn 1089 Central City Elementary School 198 202 98.02%Linn 1089 Central City High School 137 141 97.16%Linn 1089 Central City Junior High 91 101 90.10%Linn 1337 Prairie Creek 840 871 96.44%Linn 1337 Prairie Crest Elementary School 387 396 97.73%Linn 1337 Prairie Edge S 77 SLinn 1337 Prairie Heights Elementary School 320 402 79.60%Linn 1337 Prairie High School 1114 1151 96.79%Linn 1337 Prairie Hill Elementary School 405 416 97.36%Linn 1337 Prairie Point 1227 1279 95.93%Linn 1337 Prairie Ridge Elementary 385 404 95.30%Linn 1337 Prairie View Elementary School 385 399 96.49%Linn 3715 Bowman Woods Elementary School 464 481 96.47%Linn 3715 Echo Hill Elementary 566 601 94.18%Linn 3715 Excelsior Middle School 956 971 98.46%Linn 3715 Indian Creek Elementary School 521 530 98.30%Linn 3715 Linn Grove Elementary School 485 507 95.66%Linn 3715 Linn-Mar High School 2028 2082 97.41%Linn 3715 Novak Elementary School 383 397 96.47%Linn 3715 Oak Ridge School 720 756 95.24%Linn 3715 Westfield Elementary School 402 428 93.93%Linn 3715 Wilkins Elementary School 433 446 97.09%Linn 3744 Lisbon Elementary School 326 340 95.88%Linn 3744 Lisbon High School 176 180 97.78%Linn 3744 Lisbon Middle School S 98 SLinn 4086 Emerson Elementary School-Marion 151 157 96.18%Linn 4086 Francis Marion Intermediate School 287 298 96.31%Linn 4086 Marion High School 616 632 97.47%Linn 4086 Marion Home School 655 988 66.30%Linn 4086 St Joseph School 126 140 90.00%Linn 4086 Starry Elementary School 303 316 95.89%Linn 4086 Vernon Middle School 611 657 93.00%Linn 4554 Mount Vernon High School 410 420 97.62%Linn 4554 Mount Vernon Middle School 386 412 93.69%Linn 4554 Washington Elementary School-Mount Vernon 469 505 92.87%Linn 4777 North Linn Elementary 213 222 95.95%
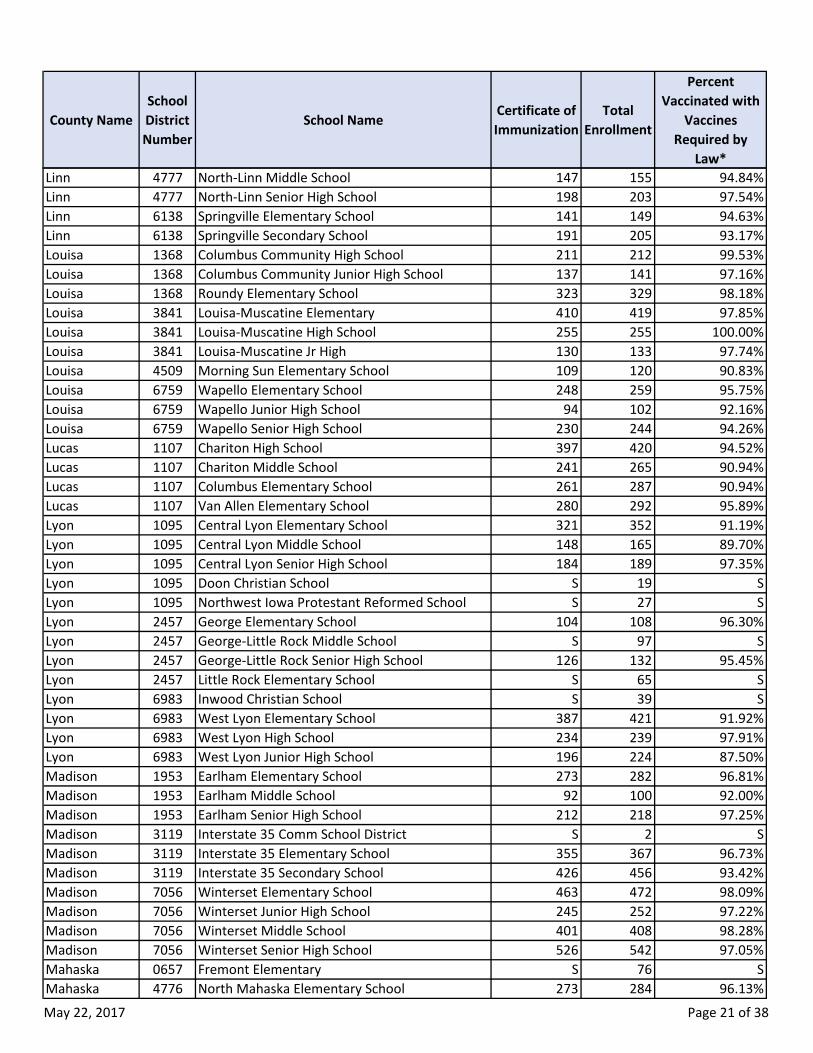
May 22, 2017 Page 21 of 38
County NameSchool District Number
School NameCertificate of Immunization
Total Enrollment
Percent Vaccinated with
Vaccines Required by
Law*Linn 4777 North-Linn Middle School 147 155 94.84%Linn 4777 North-Linn Senior High School 198 203 97.54%Linn 6138 Springville Elementary School 141 149 94.63%Linn 6138 Springville Secondary School 191 205 93.17%Louisa 1368 Columbus Community High School 211 212 99.53%Louisa 1368 Columbus Community Junior High School 137 141 97.16%Louisa 1368 Roundy Elementary School 323 329 98.18%Louisa 3841 Louisa-Muscatine Elementary 410 419 97.85%Louisa 3841 Louisa-Muscatine High School 255 255 100.00%Louisa 3841 Louisa-Muscatine Jr High 130 133 97.74%Louisa 4509 Morning Sun Elementary School 109 120 90.83%Louisa 6759 Wapello Elementary School 248 259 95.75%Louisa 6759 Wapello Junior High School 94 102 92.16%Louisa 6759 Wapello Senior High School 230 244 94.26%Lucas 1107 Chariton High School 397 420 94.52%Lucas 1107 Chariton Middle School 241 265 90.94%Lucas 1107 Columbus Elementary School 261 287 90.94%Lucas 1107 Van Allen Elementary School 280 292 95.89%Lyon 1095 Central Lyon Elementary School 321 352 91.19%Lyon 1095 Central Lyon Middle School 148 165 89.70%Lyon 1095 Central Lyon Senior High School 184 189 97.35%Lyon 1095 Doon Christian School S 19 SLyon 1095 Northwest Iowa Protestant Reformed School S 27 SLyon 2457 George Elementary School 104 108 96.30%Lyon 2457 George-Little Rock Middle School S 97 SLyon 2457 George-Little Rock Senior High School 126 132 95.45%Lyon 2457 Little Rock Elementary School S 65 SLyon 6983 Inwood Christian School S 39 SLyon 6983 West Lyon Elementary School 387 421 91.92%Lyon 6983 West Lyon High School 234 239 97.91%Lyon 6983 West Lyon Junior High School 196 224 87.50%Madison 1953 Earlham Elementary School 273 282 96.81%Madison 1953 Earlham Middle School 92 100 92.00%Madison 1953 Earlham Senior High School 212 218 97.25%Madison 3119 Interstate 35 Comm School District S 2 SMadison 3119 Interstate 35 Elementary School 355 367 96.73%Madison 3119 Interstate 35 Secondary School 426 456 93.42%Madison 7056 Winterset Elementary School 463 472 98.09%Madison 7056 Winterset Junior High School 245 252 97.22%Madison 7056 Winterset Middle School 401 408 98.28%Madison 7056 Winterset Senior High School 526 542 97.05%Mahaska 0657 Fremont Elementary S 76 SMahaska 4776 North Mahaska Elementary School 273 284 96.13%
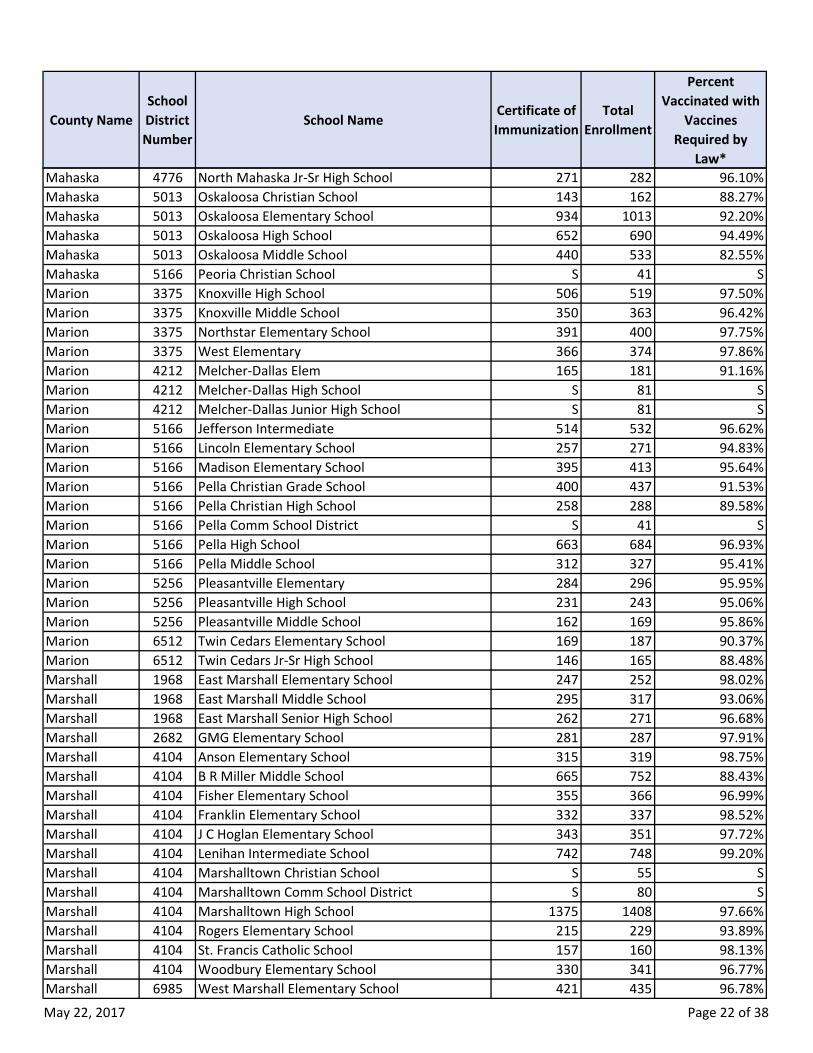
May 22, 2017 Page 22 of 38
County NameSchool District Number
School NameCertificate of Immunization
Total Enrollment
Percent Vaccinated with
Vaccines Required by
Law*Mahaska 4776 North Mahaska Jr-Sr High School 271 282 96.10%Mahaska 5013 Oskaloosa Christian School 143 162 88.27%Mahaska 5013 Oskaloosa Elementary School 934 1013 92.20%Mahaska 5013 Oskaloosa High School 652 690 94.49%Mahaska 5013 Oskaloosa Middle School 440 533 82.55%Mahaska 5166 Peoria Christian School S 41 SMarion 3375 Knoxville High School 506 519 97.50%Marion 3375 Knoxville Middle School 350 363 96.42%Marion 3375 Northstar Elementary School 391 400 97.75%Marion 3375 West Elementary 366 374 97.86%Marion 4212 Melcher-Dallas Elem 165 181 91.16%Marion 4212 Melcher-Dallas High School S 81 SMarion 4212 Melcher-Dallas Junior High School S 81 SMarion 5166 Jefferson Intermediate 514 532 96.62%Marion 5166 Lincoln Elementary School 257 271 94.83%Marion 5166 Madison Elementary School 395 413 95.64%Marion 5166 Pella Christian Grade School 400 437 91.53%Marion 5166 Pella Christian High School 258 288 89.58%Marion 5166 Pella Comm School District S 41 SMarion 5166 Pella High School 663 684 96.93%Marion 5166 Pella Middle School 312 327 95.41%Marion 5256 Pleasantville Elementary 284 296 95.95%Marion 5256 Pleasantville High School 231 243 95.06%Marion 5256 Pleasantville Middle School 162 169 95.86%Marion 6512 Twin Cedars Elementary School 169 187 90.37%Marion 6512 Twin Cedars Jr-Sr High School 146 165 88.48%Marshall 1968 East Marshall Elementary School 247 252 98.02%Marshall 1968 East Marshall Middle School 295 317 93.06%Marshall 1968 East Marshall Senior High School 262 271 96.68%Marshall 2682 GMG Elementary School 281 287 97.91%Marshall 4104 Anson Elementary School 315 319 98.75%Marshall 4104 B R Miller Middle School 665 752 88.43%Marshall 4104 Fisher Elementary School 355 366 96.99%Marshall 4104 Franklin Elementary School 332 337 98.52%Marshall 4104 J C Hoglan Elementary School 343 351 97.72%Marshall 4104 Lenihan Intermediate School 742 748 99.20%Marshall 4104 Marshalltown Christian School S 55 SMarshall 4104 Marshalltown Comm School District S 80 SMarshall 4104 Marshalltown High School 1375 1408 97.66%Marshall 4104 Rogers Elementary School 215 229 93.89%Marshall 4104 St. Francis Catholic School 157 160 98.13%Marshall 4104 Woodbury Elementary School 330 341 96.77%Marshall 6985 West Marshall Elementary School 421 435 96.78%

May 22, 2017 Page 23 of 38
County NameSchool District Number
School NameCertificate of Immunization
Total Enrollment
Percent Vaccinated with
Vaccines Required by
Law*Marshall 6985 West Marshall High School 282 284 99.30%Marshall 6985 West Marshall Middle School 232 237 97.89%Mills 2511 Glenwood Comm School District S 38 SMills 2511 Glenwood Middle School 458 465 98.49%Mills 2511 Glenwood Senior High School 593 601 98.67%Mills 2511 Northeast Elementary School 433 442 97.96%Mills 2511 West Elementary School 438 449 97.55%Mills 3978 East Mills Elementary 226 232 97.41%Mills 3978 East Mills Jr/Sr High School 196 206 95.15%Mitchell 3029 Sunny Meadow S 19 SMitchell 4995 East Lincoln Mennonite School S 25 SMitchell 4995 Lincoln Elementary School 316 332 95.18%Mitchell 4995 Osage High School 302 307 98.37%Mitchell 4995 Osage Middle School 256 262 97.71%Mitchell 4995 Walnut Grove Mennonite S 16 SMitchell 5508 Little Cedar Mennonite School S 18 SMitchell 5508 Plainview Amish Schools-McIntire S 15 SMitchell 5508 Valley View Amish School S 9 SMitchell 5508 Wapsie Valley Amish School S 14 SMitchell 5508 Wild Rose Christian School S 13 SMitchell 5751 St Ansgar Elementary School 602 604 99.67%Mitchell 5751 St Ansgar High School 197 197 100.00%Mitchell 5751 St. Ansgar Middle School 186 186 100.00%Monona 4033 Maple Valley-Anthon Oto High School 188 194 96.91%Monona 4033 Mapleton Elementary School 181 189 95.77%Monona 6987 West Monona Elementary 264 266 99.25%Monona 6987 West Monona High School 172 172 100.00%Monona 6987 West Monona Middle School 161 163 98.77%Monona 7002 Whiting Elementary School S 85 SMonona 7002 Whiting Senior High School 121 121 100.00%Monroe 0081 Albia High School 330 350 94.29%Monroe 0081 Albia Middle School 168 196 85.71%Monroe 0081 Grant Center 338 362 93.37%Monroe 0081 Lincoln Center 259 279 92.83%Montgomery 2718 Elliott Elementary School 101 104 97.12%Montgomery 5463 Inman Primary School 306 314 97.45%Montgomery 5463 Red Oak High School 350 351 99.72%Montgomery 5463 Red Oak Middle School 246 248 99.19%Montgomery 5463 Washington Intermediate School 174 177 98.31%Montgomery 6165 Stanton Elementary School 106 108 98.15%Montgomery 6165 Stanton High School 128 129 99.22%Montgomery 6651 Southwest Valley Middle School 150 154 97.40%Montgomery 6651 Sylvia Enarson Elementary School 125 125 100.00%
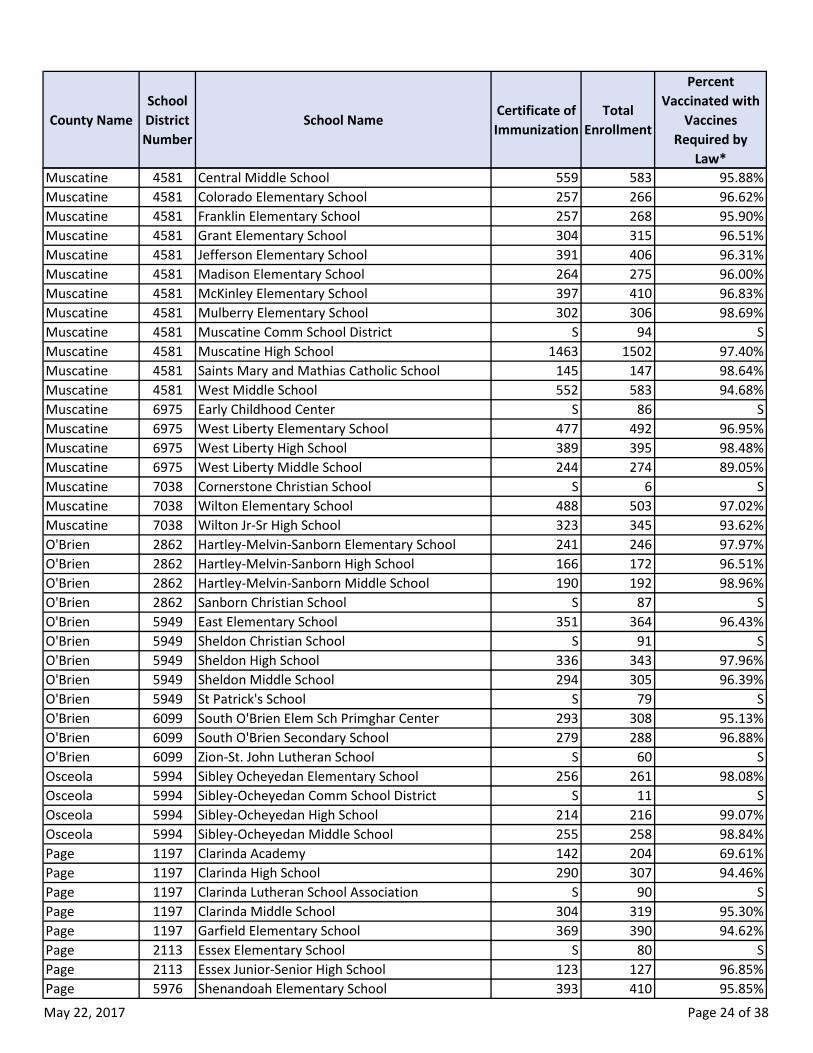
May 22, 2017 Page 24 of 38
County NameSchool District Number
School NameCertificate of Immunization
Total Enrollment
Percent Vaccinated with
Vaccines Required by
Law*Muscatine 4581 Central Middle School 559 583 95.88%Muscatine 4581 Colorado Elementary School 257 266 96.62%Muscatine 4581 Franklin Elementary School 257 268 95.90%Muscatine 4581 Grant Elementary School 304 315 96.51%Muscatine 4581 Jefferson Elementary School 391 406 96.31%Muscatine 4581 Madison Elementary School 264 275 96.00%Muscatine 4581 McKinley Elementary School 397 410 96.83%Muscatine 4581 Mulberry Elementary School 302 306 98.69%Muscatine 4581 Muscatine Comm School District S 94 SMuscatine 4581 Muscatine High School 1463 1502 97.40%Muscatine 4581 Saints Mary and Mathias Catholic School 145 147 98.64%Muscatine 4581 West Middle School 552 583 94.68%Muscatine 6975 Early Childhood Center S 86 SMuscatine 6975 West Liberty Elementary School 477 492 96.95%Muscatine 6975 West Liberty High School 389 395 98.48%Muscatine 6975 West Liberty Middle School 244 274 89.05%Muscatine 7038 Cornerstone Christian School S 6 SMuscatine 7038 Wilton Elementary School 488 503 97.02%Muscatine 7038 Wilton Jr-Sr High School 323 345 93.62%O'Brien 2862 Hartley-Melvin-Sanborn Elementary School 241 246 97.97%O'Brien 2862 Hartley-Melvin-Sanborn High School 166 172 96.51%O'Brien 2862 Hartley-Melvin-Sanborn Middle School 190 192 98.96%O'Brien 2862 Sanborn Christian School S 87 SO'Brien 5949 East Elementary School 351 364 96.43%O'Brien 5949 Sheldon Christian School S 91 SO'Brien 5949 Sheldon High School 336 343 97.96%O'Brien 5949 Sheldon Middle School 294 305 96.39%O'Brien 5949 St Patrick's School S 79 SO'Brien 6099 South O'Brien Elem Sch Primghar Center 293 308 95.13%O'Brien 6099 South O'Brien Secondary School 279 288 96.88%O'Brien 6099 Zion-St. John Lutheran School S 60 SOsceola 5994 Sibley Ocheyedan Elementary School 256 261 98.08%Osceola 5994 Sibley-Ocheyedan Comm School District S 11 SOsceola 5994 Sibley-Ocheyedan High School 214 216 99.07%Osceola 5994 Sibley-Ocheyedan Middle School 255 258 98.84%Page 1197 Clarinda Academy 142 204 69.61%Page 1197 Clarinda High School 290 307 94.46%Page 1197 Clarinda Lutheran School Association S 90 SPage 1197 Clarinda Middle School 304 319 95.30%Page 1197 Garfield Elementary School 369 390 94.62%Page 2113 Essex Elementary School S 80 SPage 2113 Essex Junior-Senior High School 123 127 96.85%Page 5976 Shenandoah Elementary School 393 410 95.85%
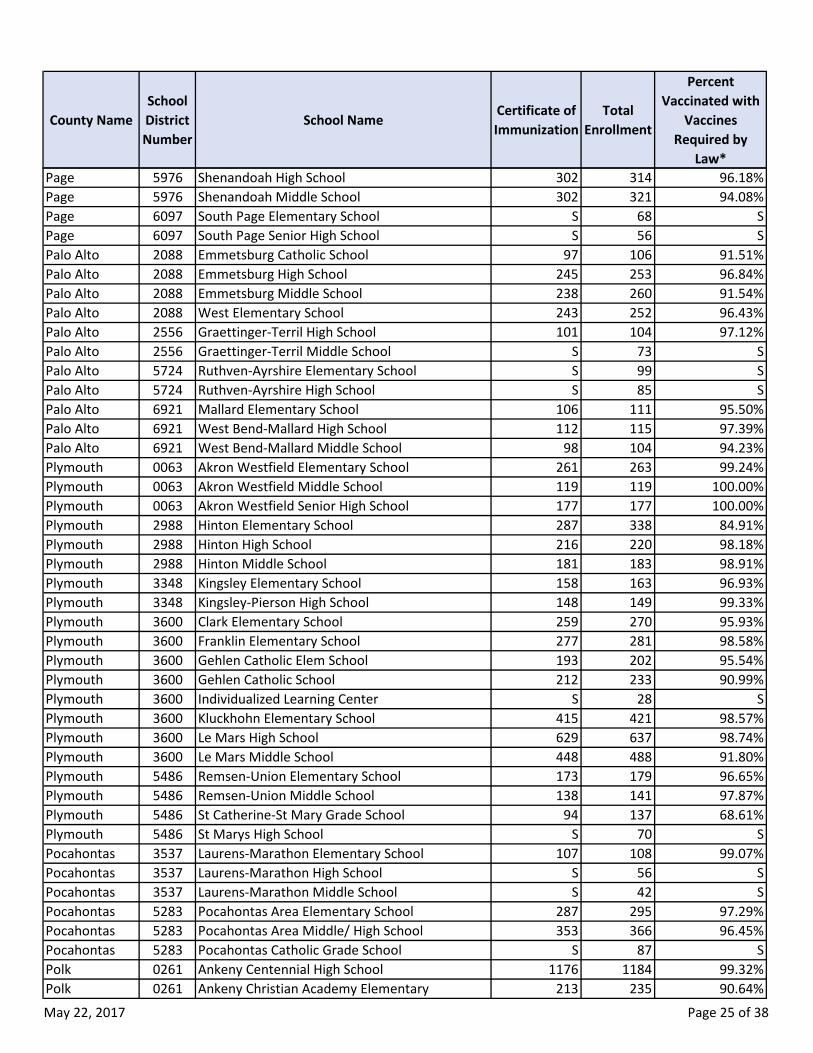
May 22, 2017 Page 25 of 38
County NameSchool District Number
School NameCertificate of Immunization
Total Enrollment
Percent Vaccinated with
Vaccines Required by
Law*Page 5976 Shenandoah High School 302 314 96.18%Page 5976 Shenandoah Middle School 302 321 94.08%Page 6097 South Page Elementary School S 68 SPage 6097 South Page Senior High School S 56 SPalo Alto 2088 Emmetsburg Catholic School 97 106 91.51%Palo Alto 2088 Emmetsburg High School 245 253 96.84%Palo Alto 2088 Emmetsburg Middle School 238 260 91.54%Palo Alto 2088 West Elementary School 243 252 96.43%Palo Alto 2556 Graettinger-Terril High School 101 104 97.12%Palo Alto 2556 Graettinger-Terril Middle School S 73 SPalo Alto 5724 Ruthven-Ayrshire Elementary School S 99 SPalo Alto 5724 Ruthven-Ayrshire High School S 85 SPalo Alto 6921 Mallard Elementary School 106 111 95.50%Palo Alto 6921 West Bend-Mallard High School 112 115 97.39%Palo Alto 6921 West Bend-Mallard Middle School 98 104 94.23%Plymouth 0063 Akron Westfield Elementary School 261 263 99.24%Plymouth 0063 Akron Westfield Middle School 119 119 100.00%Plymouth 0063 Akron Westfield Senior High School 177 177 100.00%Plymouth 2988 Hinton Elementary School 287 338 84.91%Plymouth 2988 Hinton High School 216 220 98.18%Plymouth 2988 Hinton Middle School 181 183 98.91%Plymouth 3348 Kingsley Elementary School 158 163 96.93%Plymouth 3348 Kingsley-Pierson High School 148 149 99.33%Plymouth 3600 Clark Elementary School 259 270 95.93%Plymouth 3600 Franklin Elementary School 277 281 98.58%Plymouth 3600 Gehlen Catholic Elem School 193 202 95.54%Plymouth 3600 Gehlen Catholic School 212 233 90.99%Plymouth 3600 Individualized Learning Center S 28 SPlymouth 3600 Kluckhohn Elementary School 415 421 98.57%Plymouth 3600 Le Mars High School 629 637 98.74%Plymouth 3600 Le Mars Middle School 448 488 91.80%Plymouth 5486 Remsen-Union Elementary School 173 179 96.65%Plymouth 5486 Remsen-Union Middle School 138 141 97.87%Plymouth 5486 St Catherine-St Mary Grade School 94 137 68.61%Plymouth 5486 St Marys High School S 70 SPocahontas 3537 Laurens-Marathon Elementary School 107 108 99.07%Pocahontas 3537 Laurens-Marathon High School S 56 SPocahontas 3537 Laurens-Marathon Middle School S 42 SPocahontas 5283 Pocahontas Area Elementary School 287 295 97.29%Pocahontas 5283 Pocahontas Area Middle/ High School 353 366 96.45%Pocahontas 5283 Pocahontas Catholic Grade School S 87 SPolk 0261 Ankeny Centennial High School 1176 1184 99.32%Polk 0261 Ankeny Christian Academy Elementary 213 235 90.64%
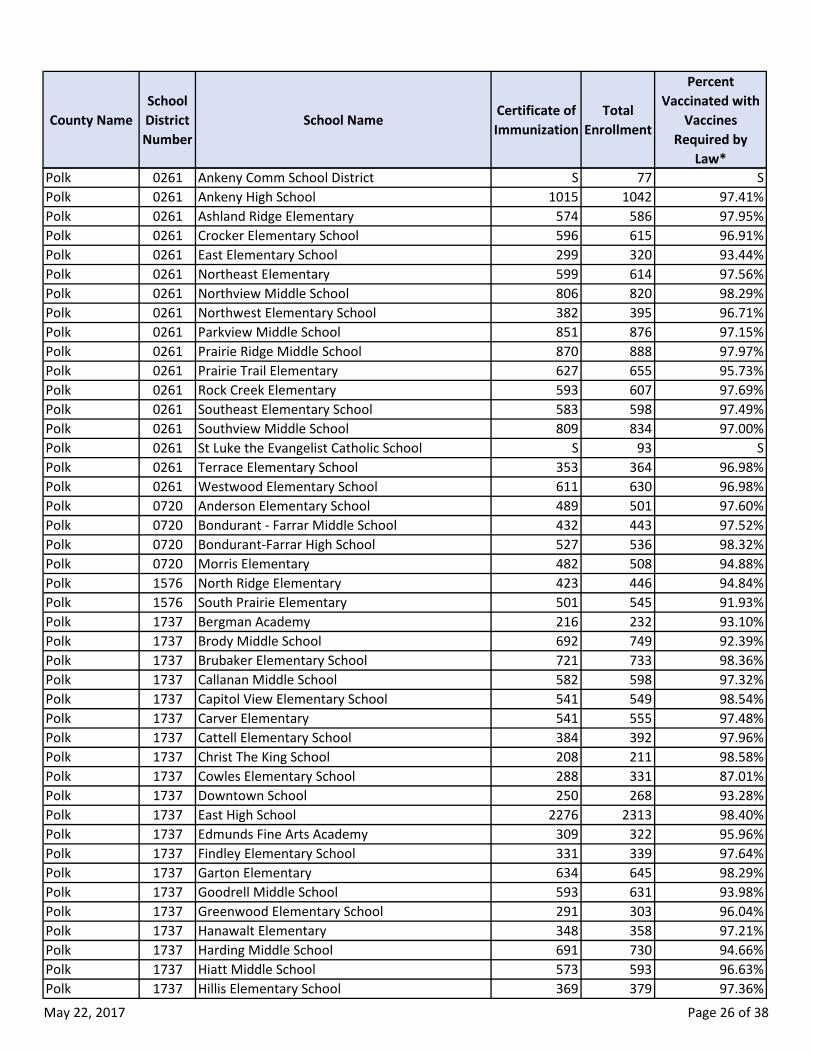
May 22, 2017 Page 26 of 38
County NameSchool District Number
School NameCertificate of Immunization
Total Enrollment
Percent Vaccinated with
Vaccines Required by
Law*Polk 0261 Ankeny Comm School District S 77 SPolk 0261 Ankeny High School 1015 1042 97.41%Polk 0261 Ashland Ridge Elementary 574 586 97.95%Polk 0261 Crocker Elementary School 596 615 96.91%Polk 0261 East Elementary School 299 320 93.44%Polk 0261 Northeast Elementary 599 614 97.56%Polk 0261 Northview Middle School 806 820 98.29%Polk 0261 Northwest Elementary School 382 395 96.71%Polk 0261 Parkview Middle School 851 876 97.15%Polk 0261 Prairie Ridge Middle School 870 888 97.97%Polk 0261 Prairie Trail Elementary 627 655 95.73%Polk 0261 Rock Creek Elementary 593 607 97.69%Polk 0261 Southeast Elementary School 583 598 97.49%Polk 0261 Southview Middle School 809 834 97.00%Polk 0261 St Luke the Evangelist Catholic School S 93 SPolk 0261 Terrace Elementary School 353 364 96.98%Polk 0261 Westwood Elementary School 611 630 96.98%Polk 0720 Anderson Elementary School 489 501 97.60%Polk 0720 Bondurant - Farrar Middle School 432 443 97.52%Polk 0720 Bondurant-Farrar High School 527 536 98.32%Polk 0720 Morris Elementary 482 508 94.88%Polk 1576 North Ridge Elementary 423 446 94.84%Polk 1576 South Prairie Elementary 501 545 91.93%Polk 1737 Bergman Academy 216 232 93.10%Polk 1737 Brody Middle School 692 749 92.39%Polk 1737 Brubaker Elementary School 721 733 98.36%Polk 1737 Callanan Middle School 582 598 97.32%Polk 1737 Capitol View Elementary School 541 549 98.54%Polk 1737 Carver Elementary 541 555 97.48%Polk 1737 Cattell Elementary School 384 392 97.96%Polk 1737 Christ The King School 208 211 98.58%Polk 1737 Cowles Elementary School 288 331 87.01%Polk 1737 Downtown School 250 268 93.28%Polk 1737 East High School 2276 2313 98.40%Polk 1737 Edmunds Fine Arts Academy 309 322 95.96%Polk 1737 Findley Elementary School 331 339 97.64%Polk 1737 Garton Elementary 634 645 98.29%Polk 1737 Goodrell Middle School 593 631 93.98%Polk 1737 Greenwood Elementary School 291 303 96.04%Polk 1737 Hanawalt Elementary 348 358 97.21%Polk 1737 Harding Middle School 691 730 94.66%Polk 1737 Hiatt Middle School 573 593 96.63%Polk 1737 Hillis Elementary School 369 379 97.36%
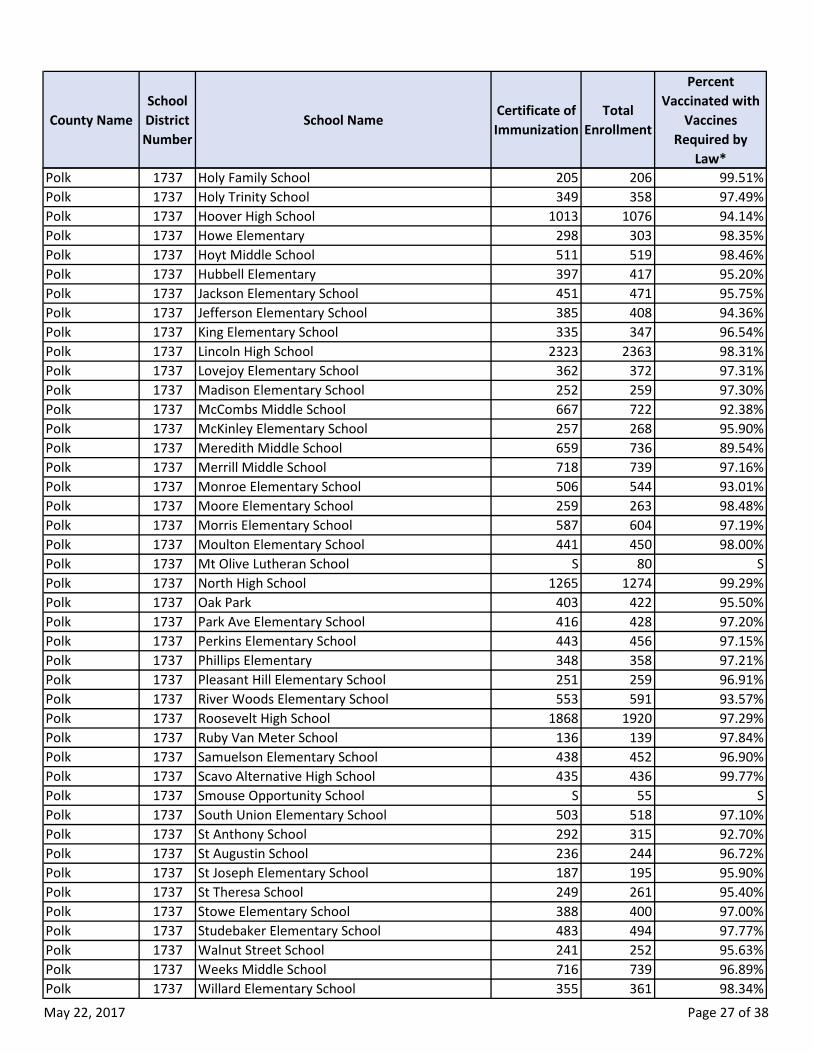
May 22, 2017 Page 27 of 38
County NameSchool District Number
School NameCertificate of Immunization
Total Enrollment
Percent Vaccinated with
Vaccines Required by
Law*Polk 1737 Holy Family School 205 206 99.51%Polk 1737 Holy Trinity School 349 358 97.49%Polk 1737 Hoover High School 1013 1076 94.14%Polk 1737 Howe Elementary 298 303 98.35%Polk 1737 Hoyt Middle School 511 519 98.46%Polk 1737 Hubbell Elementary 397 417 95.20%Polk 1737 Jackson Elementary School 451 471 95.75%Polk 1737 Jefferson Elementary School 385 408 94.36%Polk 1737 King Elementary School 335 347 96.54%Polk 1737 Lincoln High School 2323 2363 98.31%Polk 1737 Lovejoy Elementary School 362 372 97.31%Polk 1737 Madison Elementary School 252 259 97.30%Polk 1737 McCombs Middle School 667 722 92.38%Polk 1737 McKinley Elementary School 257 268 95.90%Polk 1737 Meredith Middle School 659 736 89.54%Polk 1737 Merrill Middle School 718 739 97.16%Polk 1737 Monroe Elementary School 506 544 93.01%Polk 1737 Moore Elementary School 259 263 98.48%Polk 1737 Morris Elementary School 587 604 97.19%Polk 1737 Moulton Elementary School 441 450 98.00%Polk 1737 Mt Olive Lutheran School S 80 SPolk 1737 North High School 1265 1274 99.29%Polk 1737 Oak Park 403 422 95.50%Polk 1737 Park Ave Elementary School 416 428 97.20%Polk 1737 Perkins Elementary School 443 456 97.15%Polk 1737 Phillips Elementary 348 358 97.21%Polk 1737 Pleasant Hill Elementary School 251 259 96.91%Polk 1737 River Woods Elementary School 553 591 93.57%Polk 1737 Roosevelt High School 1868 1920 97.29%Polk 1737 Ruby Van Meter School 136 139 97.84%Polk 1737 Samuelson Elementary School 438 452 96.90%Polk 1737 Scavo Alternative High School 435 436 99.77%Polk 1737 Smouse Opportunity School S 55 SPolk 1737 South Union Elementary School 503 518 97.10%Polk 1737 St Anthony School 292 315 92.70%Polk 1737 St Augustin School 236 244 96.72%Polk 1737 St Joseph Elementary School 187 195 95.90%Polk 1737 St Theresa School 249 261 95.40%Polk 1737 Stowe Elementary School 388 400 97.00%Polk 1737 Studebaker Elementary School 483 494 97.77%Polk 1737 Walnut Street School 241 252 95.63%Polk 1737 Weeks Middle School 716 739 96.89%Polk 1737 Willard Elementary School 355 361 98.34%
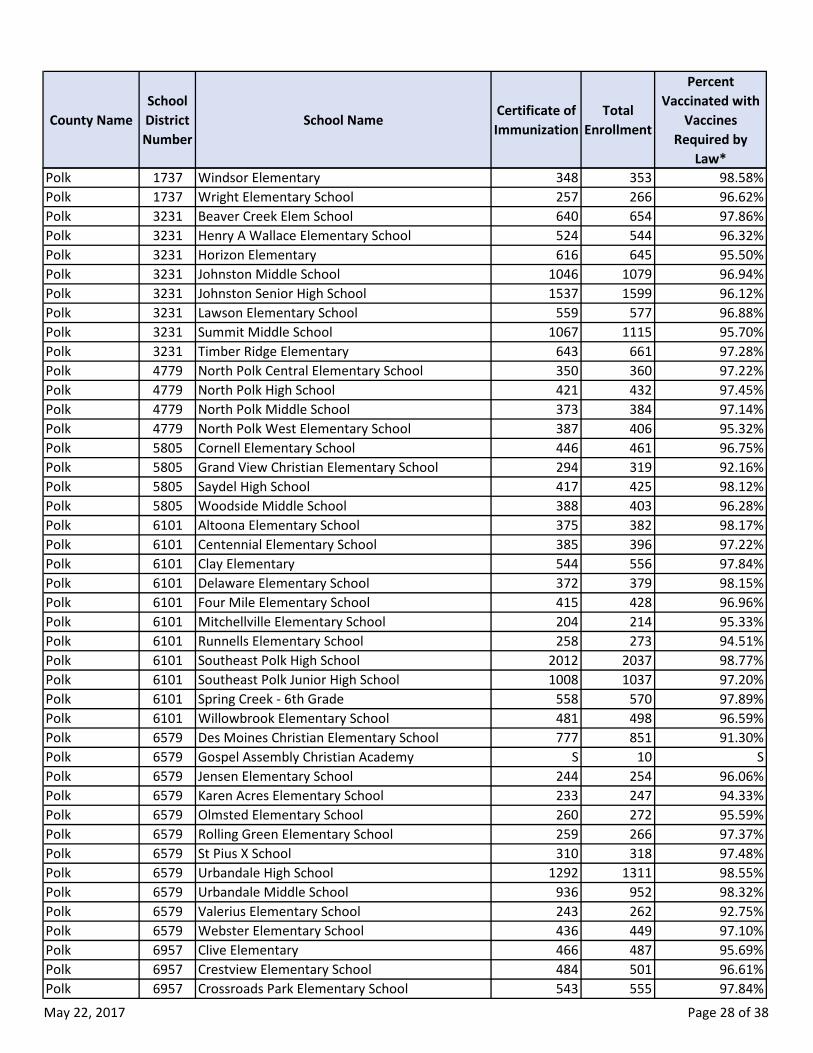
May 22, 2017 Page 28 of 38
County NameSchool District Number
School NameCertificate of Immunization
Total Enrollment
Percent Vaccinated with
Vaccines Required by
Law*Polk 1737 Windsor Elementary 348 353 98.58%Polk 1737 Wright Elementary School 257 266 96.62%Polk 3231 Beaver Creek Elem School 640 654 97.86%Polk 3231 Henry A Wallace Elementary School 524 544 96.32%Polk 3231 Horizon Elementary 616 645 95.50%Polk 3231 Johnston Middle School 1046 1079 96.94%Polk 3231 Johnston Senior High School 1537 1599 96.12%Polk 3231 Lawson Elementary School 559 577 96.88%Polk 3231 Summit Middle School 1067 1115 95.70%Polk 3231 Timber Ridge Elementary 643 661 97.28%Polk 4779 North Polk Central Elementary School 350 360 97.22%Polk 4779 North Polk High School 421 432 97.45%Polk 4779 North Polk Middle School 373 384 97.14%Polk 4779 North Polk West Elementary School 387 406 95.32%Polk 5805 Cornell Elementary School 446 461 96.75%Polk 5805 Grand View Christian Elementary School 294 319 92.16%Polk 5805 Saydel High School 417 425 98.12%Polk 5805 Woodside Middle School 388 403 96.28%Polk 6101 Altoona Elementary School 375 382 98.17%Polk 6101 Centennial Elementary School 385 396 97.22%Polk 6101 Clay Elementary 544 556 97.84%Polk 6101 Delaware Elementary School 372 379 98.15%Polk 6101 Four Mile Elementary School 415 428 96.96%Polk 6101 Mitchellville Elementary School 204 214 95.33%Polk 6101 Runnells Elementary School 258 273 94.51%Polk 6101 Southeast Polk High School 2012 2037 98.77%Polk 6101 Southeast Polk Junior High School 1008 1037 97.20%Polk 6101 Spring Creek - 6th Grade 558 570 97.89%Polk 6101 Willowbrook Elementary School 481 498 96.59%Polk 6579 Des Moines Christian Elementary School 777 851 91.30%Polk 6579 Gospel Assembly Christian Academy S 10 SPolk 6579 Jensen Elementary School 244 254 96.06%Polk 6579 Karen Acres Elementary School 233 247 94.33%Polk 6579 Olmsted Elementary School 260 272 95.59%Polk 6579 Rolling Green Elementary School 259 266 97.37%Polk 6579 St Pius X School 310 318 97.48%Polk 6579 Urbandale High School 1292 1311 98.55%Polk 6579 Urbandale Middle School 936 952 98.32%Polk 6579 Valerius Elementary School 243 262 92.75%Polk 6579 Webster Elementary School 436 449 97.10%Polk 6957 Clive Elementary 466 487 95.69%Polk 6957 Crestview Elementary School 484 501 96.61%Polk 6957 Crossroads Park Elementary School 543 555 97.84%
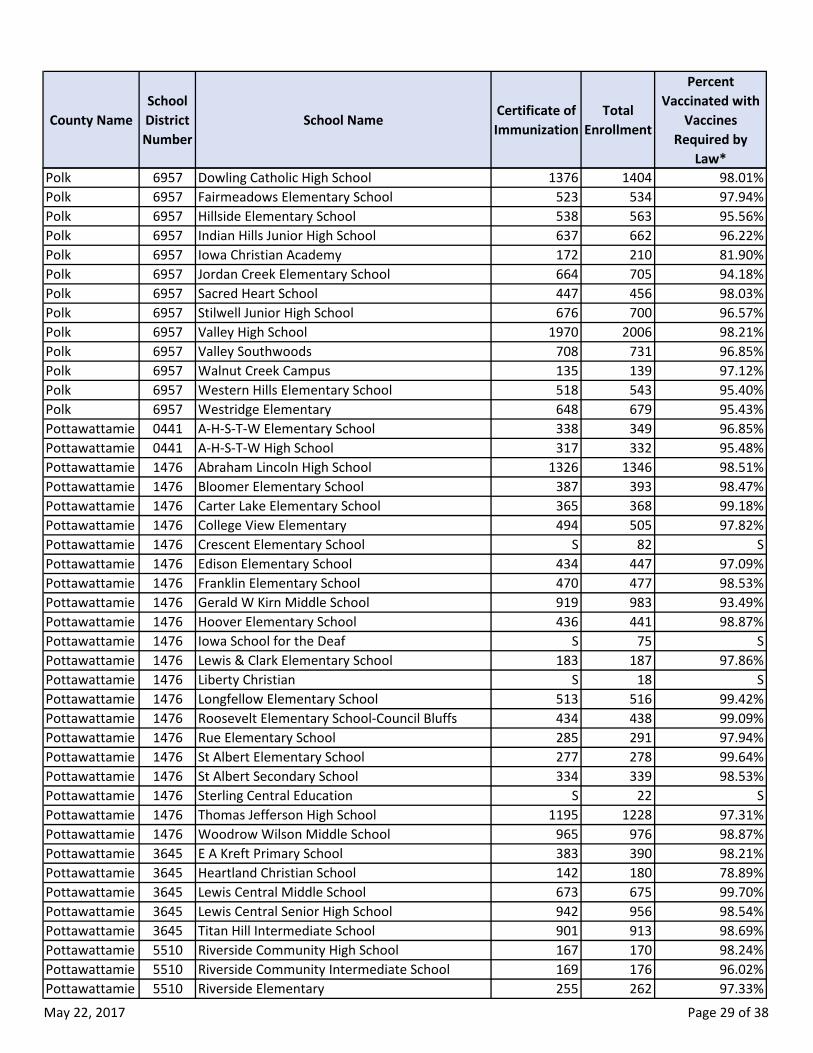
May 22, 2017 Page 29 of 38
County NameSchool District Number
School NameCertificate of Immunization
Total Enrollment
Percent Vaccinated with
Vaccines Required by
Law*Polk 6957 Dowling Catholic High School 1376 1404 98.01%Polk 6957 Fairmeadows Elementary School 523 534 97.94%Polk 6957 Hillside Elementary School 538 563 95.56%Polk 6957 Indian Hills Junior High School 637 662 96.22%Polk 6957 Iowa Christian Academy 172 210 81.90%Polk 6957 Jordan Creek Elementary School 664 705 94.18%Polk 6957 Sacred Heart School 447 456 98.03%Polk 6957 Stilwell Junior High School 676 700 96.57%Polk 6957 Valley High School 1970 2006 98.21%Polk 6957 Valley Southwoods 708 731 96.85%Polk 6957 Walnut Creek Campus 135 139 97.12%Polk 6957 Western Hills Elementary School 518 543 95.40%Polk 6957 Westridge Elementary 648 679 95.43%Pottawattamie 0441 A-H-S-T-W Elementary School 338 349 96.85%Pottawattamie 0441 A-H-S-T-W High School 317 332 95.48%Pottawattamie 1476 Abraham Lincoln High School 1326 1346 98.51%Pottawattamie 1476 Bloomer Elementary School 387 393 98.47%Pottawattamie 1476 Carter Lake Elementary School 365 368 99.18%Pottawattamie 1476 College View Elementary 494 505 97.82%Pottawattamie 1476 Crescent Elementary School S 82 SPottawattamie 1476 Edison Elementary School 434 447 97.09%Pottawattamie 1476 Franklin Elementary School 470 477 98.53%Pottawattamie 1476 Gerald W Kirn Middle School 919 983 93.49%Pottawattamie 1476 Hoover Elementary School 436 441 98.87%Pottawattamie 1476 Iowa School for the Deaf S 75 SPottawattamie 1476 Lewis & Clark Elementary School 183 187 97.86%Pottawattamie 1476 Liberty Christian S 18 SPottawattamie 1476 Longfellow Elementary School 513 516 99.42%Pottawattamie 1476 Roosevelt Elementary School-Council Bluffs 434 438 99.09%Pottawattamie 1476 Rue Elementary School 285 291 97.94%Pottawattamie 1476 St Albert Elementary School 277 278 99.64%Pottawattamie 1476 St Albert Secondary School 334 339 98.53%Pottawattamie 1476 Sterling Central Education S 22 SPottawattamie 1476 Thomas Jefferson High School 1195 1228 97.31%Pottawattamie 1476 Woodrow Wilson Middle School 965 976 98.87%Pottawattamie 3645 E A Kreft Primary School 383 390 98.21%Pottawattamie 3645 Heartland Christian School 142 180 78.89%Pottawattamie 3645 Lewis Central Middle School 673 675 99.70%Pottawattamie 3645 Lewis Central Senior High School 942 956 98.54%Pottawattamie 3645 Titan Hill Intermediate School 901 913 98.69%Pottawattamie 5510 Riverside Community High School 167 170 98.24%Pottawattamie 5510 Riverside Community Intermediate School 169 176 96.02%Pottawattamie 5510 Riverside Elementary 255 262 97.33%
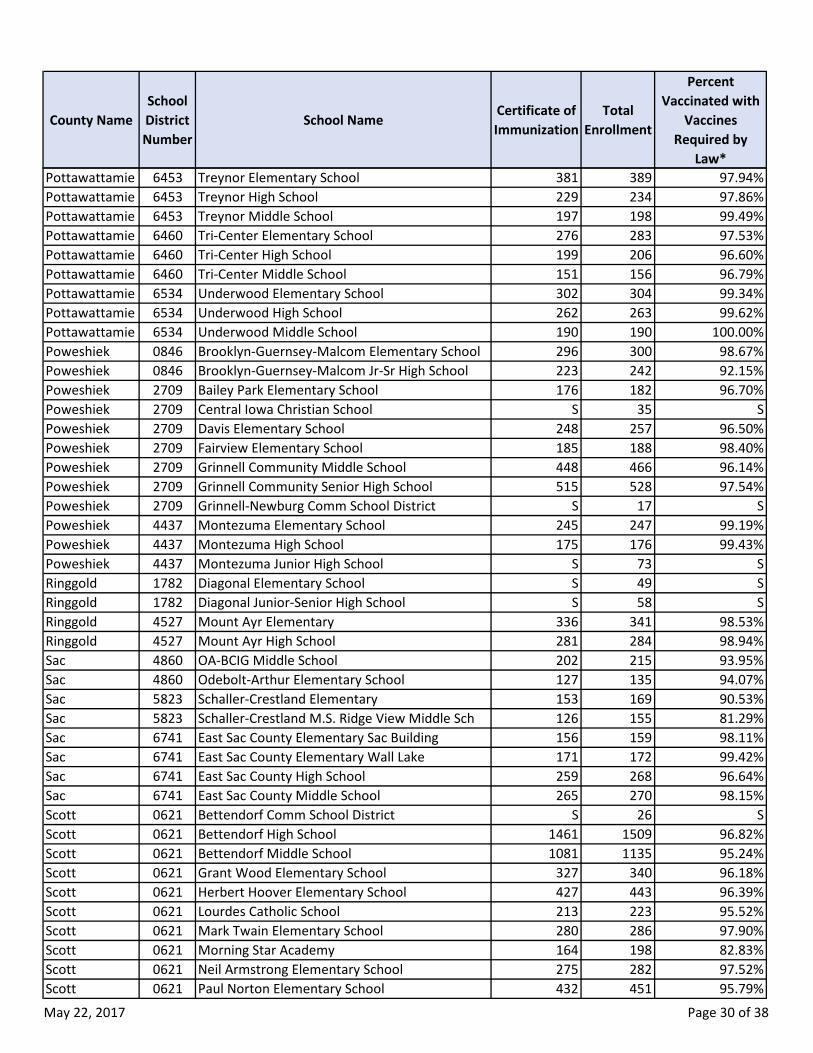
May 22, 2017 Page 30 of 38
County NameSchool District Number
School NameCertificate of Immunization
Total Enrollment
Percent Vaccinated with
Vaccines Required by
Law*Pottawattamie 6453 Treynor Elementary School 381 389 97.94%Pottawattamie 6453 Treynor High School 229 234 97.86%Pottawattamie 6453 Treynor Middle School 197 198 99.49%Pottawattamie 6460 Tri-Center Elementary School 276 283 97.53%Pottawattamie 6460 Tri-Center High School 199 206 96.60%Pottawattamie 6460 Tri-Center Middle School 151 156 96.79%Pottawattamie 6534 Underwood Elementary School 302 304 99.34%Pottawattamie 6534 Underwood High School 262 263 99.62%Pottawattamie 6534 Underwood Middle School 190 190 100.00%Poweshiek 0846 Brooklyn-Guernsey-Malcom Elementary School 296 300 98.67%Poweshiek 0846 Brooklyn-Guernsey-Malcom Jr-Sr High School 223 242 92.15%Poweshiek 2709 Bailey Park Elementary School 176 182 96.70%Poweshiek 2709 Central Iowa Christian School S 35 SPoweshiek 2709 Davis Elementary School 248 257 96.50%Poweshiek 2709 Fairview Elementary School 185 188 98.40%Poweshiek 2709 Grinnell Community Middle School 448 466 96.14%Poweshiek 2709 Grinnell Community Senior High School 515 528 97.54%Poweshiek 2709 Grinnell-Newburg Comm School District S 17 SPoweshiek 4437 Montezuma Elementary School 245 247 99.19%Poweshiek 4437 Montezuma High School 175 176 99.43%Poweshiek 4437 Montezuma Junior High School S 73 SRinggold 1782 Diagonal Elementary School S 49 SRinggold 1782 Diagonal Junior-Senior High School S 58 SRinggold 4527 Mount Ayr Elementary 336 341 98.53%Ringgold 4527 Mount Ayr High School 281 284 98.94%Sac 4860 OA-BCIG Middle School 202 215 93.95%Sac 4860 Odebolt-Arthur Elementary School 127 135 94.07%Sac 5823 Schaller-Crestland Elementary 153 169 90.53%Sac 5823 Schaller-Crestland M.S. Ridge View Middle Sch 126 155 81.29%Sac 6741 East Sac County Elementary Sac Building 156 159 98.11%Sac 6741 East Sac County Elementary Wall Lake 171 172 99.42%Sac 6741 East Sac County High School 259 268 96.64%Sac 6741 East Sac County Middle School 265 270 98.15%Scott 0621 Bettendorf Comm School District S 26 SScott 0621 Bettendorf High School 1461 1509 96.82%Scott 0621 Bettendorf Middle School 1081 1135 95.24%Scott 0621 Grant Wood Elementary School 327 340 96.18%Scott 0621 Herbert Hoover Elementary School 427 443 96.39%Scott 0621 Lourdes Catholic School 213 223 95.52%Scott 0621 Mark Twain Elementary School 280 286 97.90%Scott 0621 Morning Star Academy 164 198 82.83%Scott 0621 Neil Armstrong Elementary School 275 282 97.52%Scott 0621 Paul Norton Elementary School 432 451 95.79%
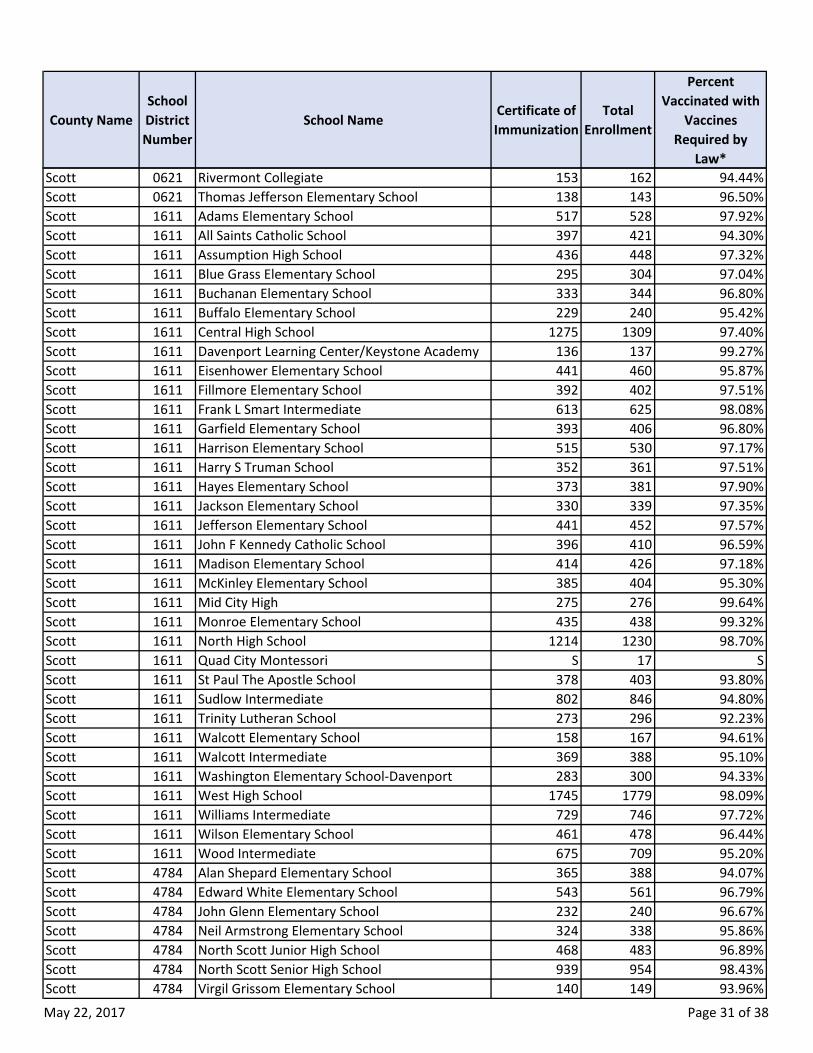
May 22, 2017 Page 31 of 38
County NameSchool District Number
School NameCertificate of Immunization
Total Enrollment
Percent Vaccinated with
Vaccines Required by
Law*Scott 0621 Rivermont Collegiate 153 162 94.44%Scott 0621 Thomas Jefferson Elementary School 138 143 96.50%Scott 1611 Adams Elementary School 517 528 97.92%Scott 1611 All Saints Catholic School 397 421 94.30%Scott 1611 Assumption High School 436 448 97.32%Scott 1611 Blue Grass Elementary School 295 304 97.04%Scott 1611 Buchanan Elementary School 333 344 96.80%Scott 1611 Buffalo Elementary School 229 240 95.42%Scott 1611 Central High School 1275 1309 97.40%Scott 1611 Davenport Learning Center/Keystone Academy 136 137 99.27%Scott 1611 Eisenhower Elementary School 441 460 95.87%Scott 1611 Fillmore Elementary School 392 402 97.51%Scott 1611 Frank L Smart Intermediate 613 625 98.08%Scott 1611 Garfield Elementary School 393 406 96.80%Scott 1611 Harrison Elementary School 515 530 97.17%Scott 1611 Harry S Truman School 352 361 97.51%Scott 1611 Hayes Elementary School 373 381 97.90%Scott 1611 Jackson Elementary School 330 339 97.35%Scott 1611 Jefferson Elementary School 441 452 97.57%Scott 1611 John F Kennedy Catholic School 396 410 96.59%Scott 1611 Madison Elementary School 414 426 97.18%Scott 1611 McKinley Elementary School 385 404 95.30%Scott 1611 Mid City High 275 276 99.64%Scott 1611 Monroe Elementary School 435 438 99.32%Scott 1611 North High School 1214 1230 98.70%Scott 1611 Quad City Montessori S 17 SScott 1611 St Paul The Apostle School 378 403 93.80%Scott 1611 Sudlow Intermediate 802 846 94.80%Scott 1611 Trinity Lutheran School 273 296 92.23%Scott 1611 Walcott Elementary School 158 167 94.61%Scott 1611 Walcott Intermediate 369 388 95.10%Scott 1611 Washington Elementary School-Davenport 283 300 94.33%Scott 1611 West High School 1745 1779 98.09%Scott 1611 Williams Intermediate 729 746 97.72%Scott 1611 Wilson Elementary School 461 478 96.44%Scott 1611 Wood Intermediate 675 709 95.20%Scott 4784 Alan Shepard Elementary School 365 388 94.07%Scott 4784 Edward White Elementary School 543 561 96.79%Scott 4784 John Glenn Elementary School 232 240 96.67%Scott 4784 Neil Armstrong Elementary School 324 338 95.86%Scott 4784 North Scott Junior High School 468 483 96.89%Scott 4784 North Scott Senior High School 939 954 98.43%Scott 4784 Virgil Grissom Elementary School 140 149 93.96%
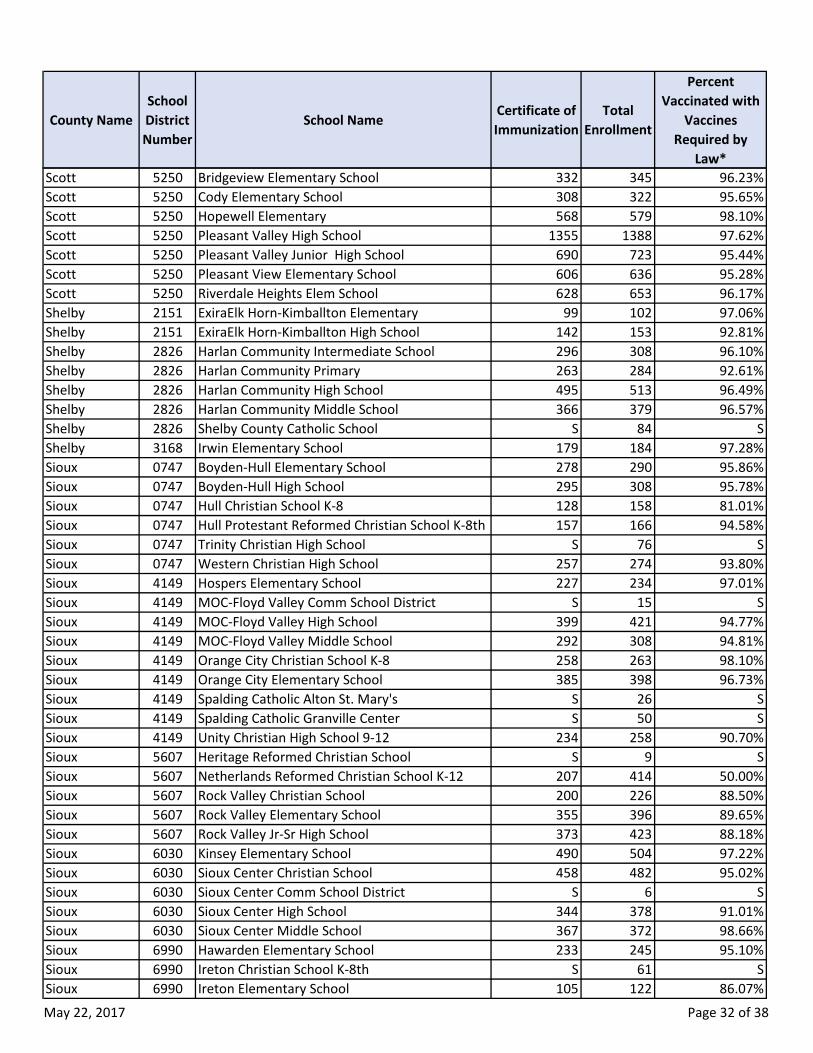
May 22, 2017 Page 32 of 38
County NameSchool District Number
School NameCertificate of Immunization
Total Enrollment
Percent Vaccinated with
Vaccines Required by
Law*Scott 5250 Bridgeview Elementary School 332 345 96.23%Scott 5250 Cody Elementary School 308 322 95.65%Scott 5250 Hopewell Elementary 568 579 98.10%Scott 5250 Pleasant Valley High School 1355 1388 97.62%Scott 5250 Pleasant Valley Junior High School 690 723 95.44%Scott 5250 Pleasant View Elementary School 606 636 95.28%Scott 5250 Riverdale Heights Elem School 628 653 96.17%Shelby 2151 ExiraElk Horn-Kimballton Elementary 99 102 97.06%Shelby 2151 ExiraElk Horn-Kimballton High School 142 153 92.81%Shelby 2826 Harlan Community Intermediate School 296 308 96.10%Shelby 2826 Harlan Community Primary 263 284 92.61%Shelby 2826 Harlan Community High School 495 513 96.49%Shelby 2826 Harlan Community Middle School 366 379 96.57%Shelby 2826 Shelby County Catholic School S 84 SShelby 3168 Irwin Elementary School 179 184 97.28%Sioux 0747 Boyden-Hull Elementary School 278 290 95.86%Sioux 0747 Boyden-Hull High School 295 308 95.78%Sioux 0747 Hull Christian School K-8 128 158 81.01%Sioux 0747 Hull Protestant Reformed Christian School K-8th 157 166 94.58%Sioux 0747 Trinity Christian High School S 76 SSioux 0747 Western Christian High School 257 274 93.80%Sioux 4149 Hospers Elementary School 227 234 97.01%Sioux 4149 MOC-Floyd Valley Comm School District S 15 SSioux 4149 MOC-Floyd Valley High School 399 421 94.77%Sioux 4149 MOC-Floyd Valley Middle School 292 308 94.81%Sioux 4149 Orange City Christian School K-8 258 263 98.10%Sioux 4149 Orange City Elementary School 385 398 96.73%Sioux 4149 Spalding Catholic Alton St. Mary's S 26 SSioux 4149 Spalding Catholic Granville Center S 50 SSioux 4149 Unity Christian High School 9-12 234 258 90.70%Sioux 5607 Heritage Reformed Christian School S 9 SSioux 5607 Netherlands Reformed Christian School K-12 207 414 50.00%Sioux 5607 Rock Valley Christian School 200 226 88.50%Sioux 5607 Rock Valley Elementary School 355 396 89.65%Sioux 5607 Rock Valley Jr-Sr High School 373 423 88.18%Sioux 6030 Kinsey Elementary School 490 504 97.22%Sioux 6030 Sioux Center Christian School 458 482 95.02%Sioux 6030 Sioux Center Comm School District S 6 SSioux 6030 Sioux Center High School 344 378 91.01%Sioux 6030 Sioux Center Middle School 367 372 98.66%Sioux 6990 Hawarden Elementary School 233 245 95.10%Sioux 6990 Ireton Christian School K-8th S 61 SSioux 6990 Ireton Elementary School 105 122 86.07%
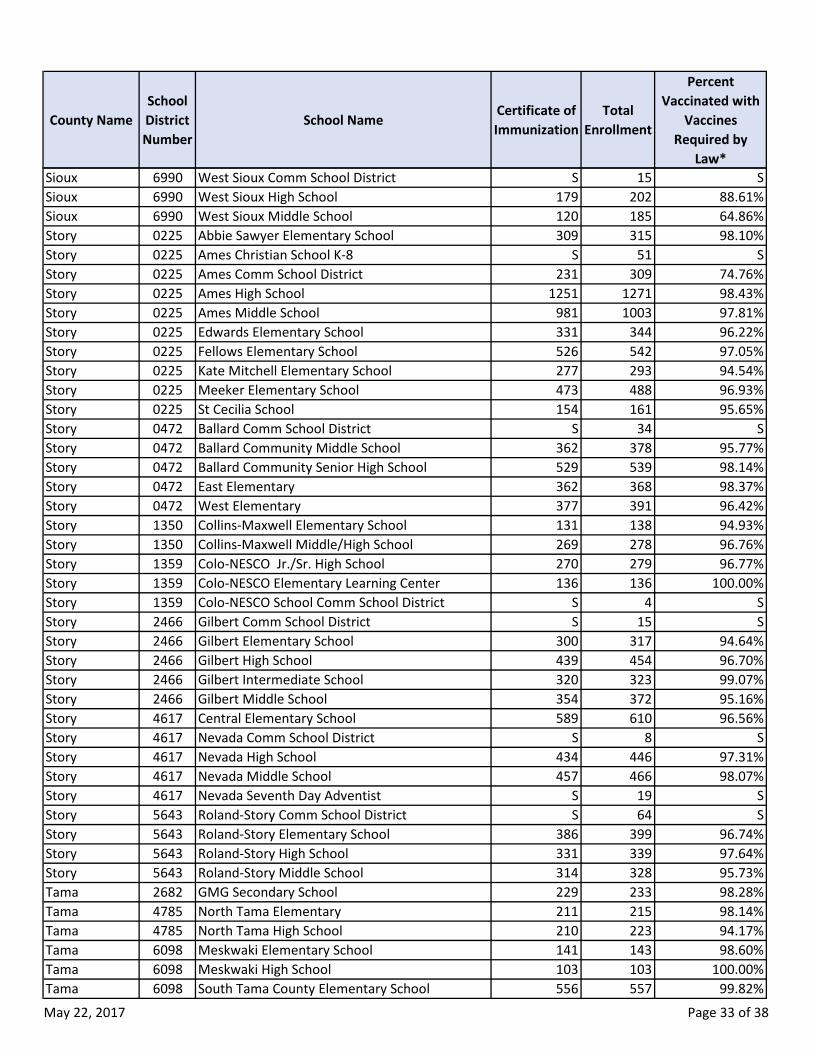
May 22, 2017 Page 33 of 38
County NameSchool District Number
School NameCertificate of Immunization
Total Enrollment
Percent Vaccinated with
Vaccines Required by
Law*Sioux 6990 West Sioux Comm School District S 15 SSioux 6990 West Sioux High School 179 202 88.61%Sioux 6990 West Sioux Middle School 120 185 64.86%Story 0225 Abbie Sawyer Elementary School 309 315 98.10%Story 0225 Ames Christian School K-8 S 51 SStory 0225 Ames Comm School District 231 309 74.76%Story 0225 Ames High School 1251 1271 98.43%Story 0225 Ames Middle School 981 1003 97.81%Story 0225 Edwards Elementary School 331 344 96.22%Story 0225 Fellows Elementary School 526 542 97.05%Story 0225 Kate Mitchell Elementary School 277 293 94.54%Story 0225 Meeker Elementary School 473 488 96.93%Story 0225 St Cecilia School 154 161 95.65%Story 0472 Ballard Comm School District S 34 SStory 0472 Ballard Community Middle School 362 378 95.77%Story 0472 Ballard Community Senior High School 529 539 98.14%Story 0472 East Elementary 362 368 98.37%Story 0472 West Elementary 377 391 96.42%Story 1350 Collins-Maxwell Elementary School 131 138 94.93%Story 1350 Collins-Maxwell Middle/High School 269 278 96.76%Story 1359 Colo-NESCO Jr./Sr. High School 270 279 96.77%Story 1359 Colo-NESCO Elementary Learning Center 136 136 100.00%Story 1359 Colo-NESCO School Comm School District S 4 SStory 2466 Gilbert Comm School District S 15 SStory 2466 Gilbert Elementary School 300 317 94.64%Story 2466 Gilbert High School 439 454 96.70%Story 2466 Gilbert Intermediate School 320 323 99.07%Story 2466 Gilbert Middle School 354 372 95.16%Story 4617 Central Elementary School 589 610 96.56%Story 4617 Nevada Comm School District S 8 SStory 4617 Nevada High School 434 446 97.31%Story 4617 Nevada Middle School 457 466 98.07%Story 4617 Nevada Seventh Day Adventist S 19 SStory 5643 Roland-Story Comm School District S 64 SStory 5643 Roland-Story Elementary School 386 399 96.74%Story 5643 Roland-Story High School 331 339 97.64%Story 5643 Roland-Story Middle School 314 328 95.73%Tama 2682 GMG Secondary School 229 233 98.28%Tama 4785 North Tama Elementary 211 215 98.14%Tama 4785 North Tama High School 210 223 94.17%Tama 6098 Meskwaki Elementary School 141 143 98.60%Tama 6098 Meskwaki High School 103 103 100.00%Tama 6098 South Tama County Elementary School 556 557 99.82%
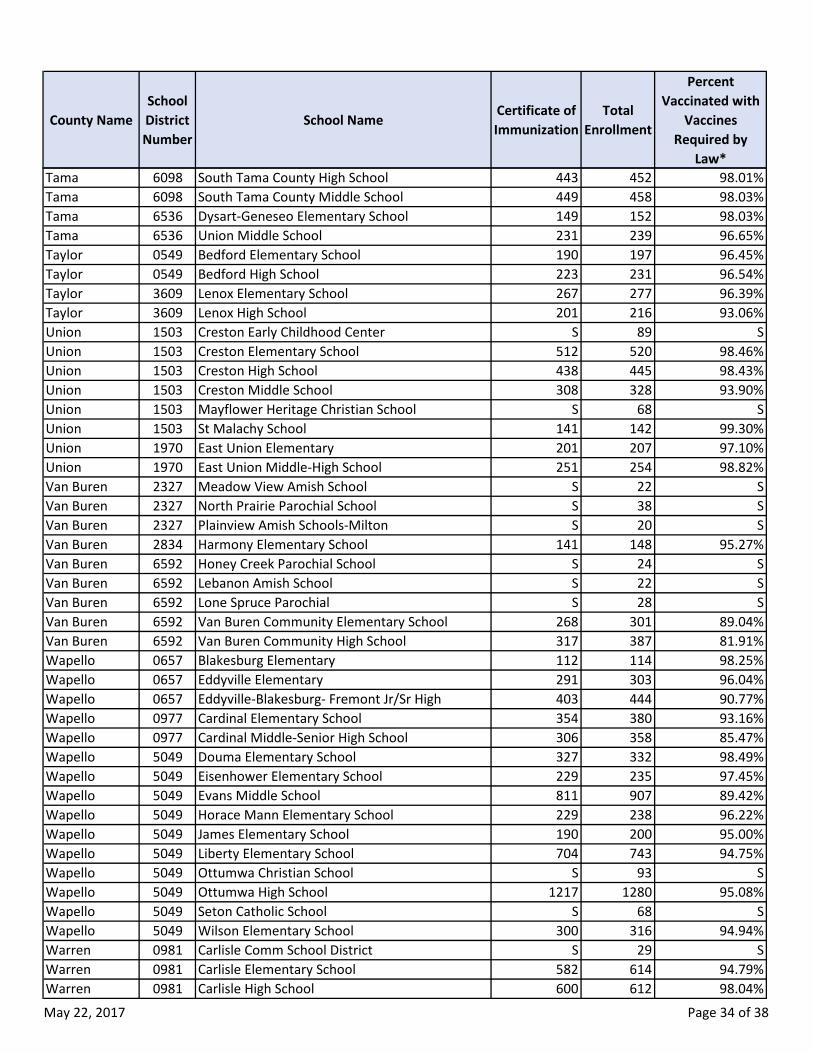
May 22, 2017 Page 34 of 38
County NameSchool District Number
School NameCertificate of Immunization
Total Enrollment
Percent Vaccinated with
Vaccines Required by
Law*Tama 6098 South Tama County High School 443 452 98.01%Tama 6098 South Tama County Middle School 449 458 98.03%Tama 6536 Dysart-Geneseo Elementary School 149 152 98.03%Tama 6536 Union Middle School 231 239 96.65%Taylor 0549 Bedford Elementary School 190 197 96.45%Taylor 0549 Bedford High School 223 231 96.54%Taylor 3609 Lenox Elementary School 267 277 96.39%Taylor 3609 Lenox High School 201 216 93.06%Union 1503 Creston Early Childhood Center S 89 SUnion 1503 Creston Elementary School 512 520 98.46%Union 1503 Creston High School 438 445 98.43%Union 1503 Creston Middle School 308 328 93.90%Union 1503 Mayflower Heritage Christian School S 68 SUnion 1503 St Malachy School 141 142 99.30%Union 1970 East Union Elementary 201 207 97.10%Union 1970 East Union Middle-High School 251 254 98.82%Van Buren 2327 Meadow View Amish School S 22 SVan Buren 2327 North Prairie Parochial School S 38 SVan Buren 2327 Plainview Amish Schools-Milton S 20 SVan Buren 2834 Harmony Elementary School 141 148 95.27%Van Buren 6592 Honey Creek Parochial School S 24 SVan Buren 6592 Lebanon Amish School S 22 SVan Buren 6592 Lone Spruce Parochial S 28 SVan Buren 6592 Van Buren Community Elementary School 268 301 89.04%Van Buren 6592 Van Buren Community High School 317 387 81.91%Wapello 0657 Blakesburg Elementary 112 114 98.25%Wapello 0657 Eddyville Elementary 291 303 96.04%Wapello 0657 Eddyville-Blakesburg- Fremont Jr/Sr High 403 444 90.77%Wapello 0977 Cardinal Elementary School 354 380 93.16%Wapello 0977 Cardinal Middle-Senior High School 306 358 85.47%Wapello 5049 Douma Elementary School 327 332 98.49%Wapello 5049 Eisenhower Elementary School 229 235 97.45%Wapello 5049 Evans Middle School 811 907 89.42%Wapello 5049 Horace Mann Elementary School 229 238 96.22%Wapello 5049 James Elementary School 190 200 95.00%Wapello 5049 Liberty Elementary School 704 743 94.75%Wapello 5049 Ottumwa Christian School S 93 SWapello 5049 Ottumwa High School 1217 1280 95.08%Wapello 5049 Seton Catholic School S 68 SWapello 5049 Wilson Elementary School 300 316 94.94%Warren 0981 Carlisle Comm School District S 29 SWarren 0981 Carlisle Elementary School 582 614 94.79%Warren 0981 Carlisle High School 600 612 98.04%
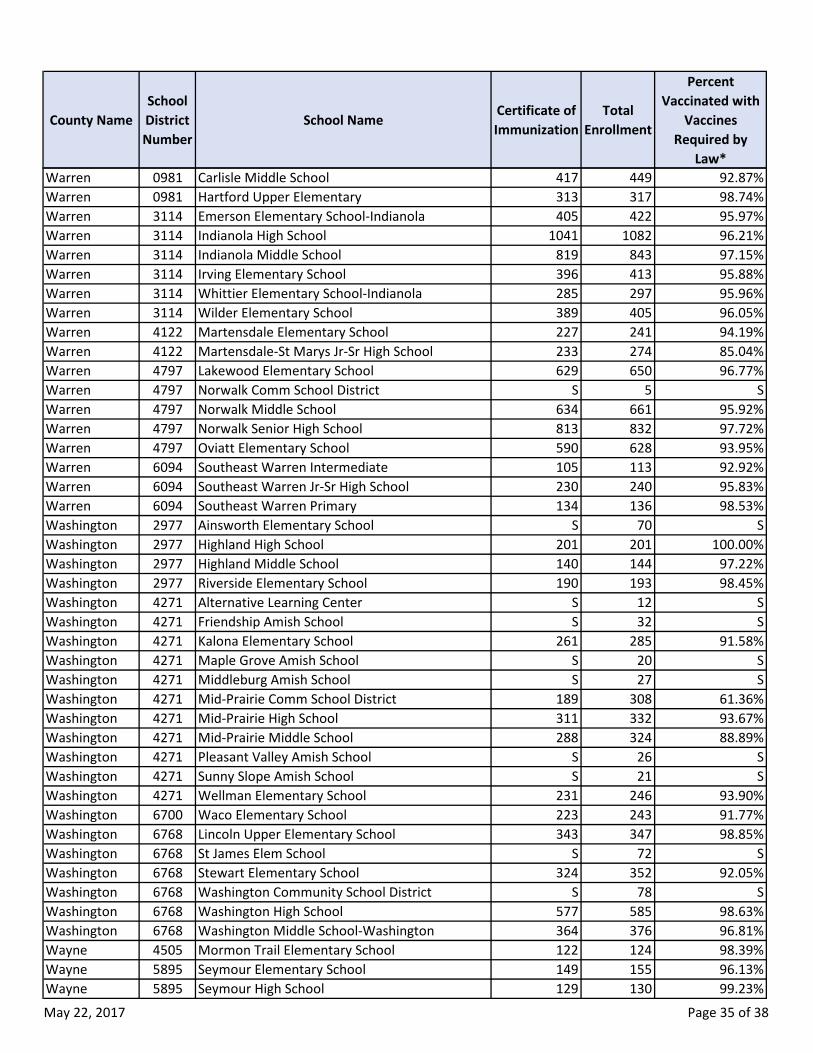
May 22, 2017 Page 35 of 38
County NameSchool District Number
School NameCertificate of Immunization
Total Enrollment
Percent Vaccinated with
Vaccines Required by
Law*Warren 0981 Carlisle Middle School 417 449 92.87%Warren 0981 Hartford Upper Elementary 313 317 98.74%Warren 3114 Emerson Elementary School-Indianola 405 422 95.97%Warren 3114 Indianola High School 1041 1082 96.21%Warren 3114 Indianola Middle School 819 843 97.15%Warren 3114 Irving Elementary School 396 413 95.88%Warren 3114 Whittier Elementary School-Indianola 285 297 95.96%Warren 3114 Wilder Elementary School 389 405 96.05%Warren 4122 Martensdale Elementary School 227 241 94.19%Warren 4122 Martensdale-St Marys Jr-Sr High School 233 274 85.04%Warren 4797 Lakewood Elementary School 629 650 96.77%Warren 4797 Norwalk Comm School District S 5 SWarren 4797 Norwalk Middle School 634 661 95.92%Warren 4797 Norwalk Senior High School 813 832 97.72%Warren 4797 Oviatt Elementary School 590 628 93.95%Warren 6094 Southeast Warren Intermediate 105 113 92.92%Warren 6094 Southeast Warren Jr-Sr High School 230 240 95.83%Warren 6094 Southeast Warren Primary 134 136 98.53%Washington 2977 Ainsworth Elementary School S 70 SWashington 2977 Highland High School 201 201 100.00%Washington 2977 Highland Middle School 140 144 97.22%Washington 2977 Riverside Elementary School 190 193 98.45%Washington 4271 Alternative Learning Center S 12 SWashington 4271 Friendship Amish School S 32 SWashington 4271 Kalona Elementary School 261 285 91.58%Washington 4271 Maple Grove Amish School S 20 SWashington 4271 Middleburg Amish School S 27 SWashington 4271 Mid-Prairie Comm School District 189 308 61.36%Washington 4271 Mid-Prairie High School 311 332 93.67%Washington 4271 Mid-Prairie Middle School 288 324 88.89%Washington 4271 Pleasant Valley Amish School S 26 SWashington 4271 Sunny Slope Amish School S 21 SWashington 4271 Wellman Elementary School 231 246 93.90%Washington 6700 Waco Elementary School 223 243 91.77%Washington 6768 Lincoln Upper Elementary School 343 347 98.85%Washington 6768 St James Elem School S 72 SWashington 6768 Stewart Elementary School 324 352 92.05%Washington 6768 Washington Community School District S 78 SWashington 6768 Washington High School 577 585 98.63%Washington 6768 Washington Middle School-Washington 364 376 96.81%Wayne 4505 Mormon Trail Elementary School 122 124 98.39%Wayne 5895 Seymour Elementary School 149 155 96.13%Wayne 5895 Seymour High School 129 130 99.23%
May 22, 2017 Page 36 of 38
County NameSchool District Number
School NameCertificate of Immunization
Total Enrollment
Percent Vaccinated with
Vaccines Required by
Law*Wayne 6854 Wayne Comm School District S 32 SWayne 6854 Wayne Community Jr-Sr High School 246 252 97.62%Wayne 6854 Wayne Elementary School 280 288 97.22%Webster 2313 Butler Elementary School 472 483 97.72%Webster 2313 Community Christian School S 67 SWebster 2313 Cooper Elementary School 284 287 98.95%Webster 2313 Duncombe Elementary School 345 357 96.64%Webster 2313 Feelhaver Elementary School 216 225 96.00%Webster 2313 Fort Dodge High School 1107 1143 96.85%Webster 2313 Fort Dodge Middle School 1021 1070 95.42%Webster 2313 Harvest Baptist School S 56 SWebster 2313 Riverside ELC S 46 SWebster 2313 St Paul Lutheran School S 85 SWebster 2313 St. Edmond Catholic 618 630 98.10%Webster 4023 Manson Northwest Webster Elem Sch-Barnum 370 391 94.63%Webster 4023 Rabiner Treatment Center S 53 SWebster 5325 Southeast Valley High School 342 349 97.99%Webster 6096 Dayton Center 194 203 95.57%Webster 6096 Southeast Webster-Grand Southeast Valley Mid 284 314 90.45%Winnebago 0873 North Iowa Elem Buffalo Center 197 205 96.10%Winnebago 0873 North Iowa High School 194 201 96.52%Winnebago 0873 North Iowa Middle School S 61 SWinnebago 2295 Forest City Christian School S 16 SWinnebago 2295 Forest City Elementary School 465 477 97.48%Winnebago 2295 Forest City High School 386 390 98.97%Winnebago 2295 Forest City Middle School 233 245 95.10%Winnebago 3420 Lake Mills Elementary School 309 315 98.10%Winnebago 3420 Lake Mills Middle School 151 152 99.34%Winnebago 3420 Lake Mills Senior High School 215 221 97.29%Winnebago 3420 Scarville Lutheran School S 14 SWinneshiek 1638 Carrie Lee Elementary 219 229 95.63%Winneshiek 1638 Decorah High School 555 588 94.39%Winneshiek 1638 Decorah Middle School 501 516 97.09%Winneshiek 1638 John Cline Elementary School 284 297 95.62%Winneshiek 1638 St Benedict School 110 122 90.16%Winneshiek 4787 North Winneshiek Elementary School S 67 SWinneshiek 4787 North Winneshiek Middle School S 37 SWinneshiek 6100 Calmar Festina Spillville Catholic School 128 132 96.97%Winneshiek 6100 De Sales Grade School S 92 SWinneshiek 6100 South Winneshiek Elementary School 170 176 96.59%Winneshiek 6100 South Winneshiek High School 198 209 94.74%Winneshiek 6100 South Winneshiek Middle School S 89 SWinneshiek 6509 Turkey Valley Elementary School 159 161 98.76%
May 22, 2017 Page 37 of 38
County NameSchool District Number
School NameCertificate of Immunization
Total Enrollment
Percent Vaccinated with
Vaccines Required by
Law*Winneshiek 6509 Turkey Valley Jr-Sr High School 177 181 97.79%Woodbury 1975 River Valley Junior- Senior High School 178 196 90.82%Woodbury 3348 Pierson Elementary School S 32 SWoodbury 3348 Pierson Middle School 108 113 95.58%Woodbury 3555 Bronson Elementary School 308 316 97.47%Woodbury 3555 Lawton Junior-Senior High School 267 270 98.89%Woodbury 4033 Anthon Elementary 99 102 97.06%Woodbury 4033 Danbury Catholic School S 60 SWoodbury 4033 MVAO Middle School 123 134 91.79%Woodbury 5877 Sergeant Bluff-Luton Elementary School 381 381 100.00%Woodbury 5877 Sergeant Bluff-Luton Middle School 375 386 97.15%Woodbury 5877 Sergeant Bluff-Luton Primary School 330 335 98.51%Woodbury 5877 Sergeant Bluff-Luton Senior High School 466 477 97.69%Woodbury 6039 Bishop Heelan Catholic High School 504 523 96.37%Woodbury 6039 Bryant Elementary School-Sioux City 303 314 96.50%Woodbury 6039 Clark Elementary School 102 111 91.89%Woodbury 6039 East High School 1380 1398 98.71%Woodbury 6039 East Middle School 1050 1060 99.06%Woodbury 6039 Holy Cross Blessed Sacrament School 230 240 95.83%Woodbury 6039 Holy Cross St Michael School S 88 SWoodbury 6039 Hunt Elementary School 311 332 93.67%Woodbury 6039 Irving Elementary School 738 757 97.49%Woodbury 6039 Leeds Elementary School 688 693 99.28%Woodbury 6039 Liberty Elementary School 743 764 97.25%Woodbury 6039 Loess Hills Elementary 617 626 98.56%Woodbury 6039 Mater Dei Sch Immaculate Conception Center 188 193 97.41%Woodbury 6039 Mater Dei School Nativity Center 123 126 97.62%Woodbury 6039 Morningside Elementary 658 666 98.80%Woodbury 6039 Nodland Elementary School 214 216 99.07%Woodbury 6039 North High School 1447 1495 96.79%Woodbury 6039 North Middle School 1090 1113 97.93%Woodbury 6039 Perry Creek Elementary School 631 636 99.21%Woodbury 6039 Riverside Elementary School 256 269 95.17%Woodbury 6039 Sacred Heart School 311 316 98.42%Woodbury 6039 Seventh Day Adventist-Sioux City S 11 SWoodbury 6039 Sioux City Comm School District S 89 SWoodbury 6039 Siouxland Community Christian 180 201 89.55%Woodbury 6039 Spalding Park Elementary 583 587 99.32%Woodbury 6039 St Pauls Lutheran School S 29 SWoodbury 6039 Sunnyside Elementary School 219 222 98.65%Woodbury 6039 Unity Elementary School 497 513 96.88%Woodbury 6039 West High School 1141 1185 96.29%Woodbury 6039 West Middle School 806 943 85.47%
May 22, 2017 Page 38 of 38
County NameSchool District Number
School NameCertificate of Immunization
Total Enrollment
Percent Vaccinated with
Vaccines Required by
Law*Woodbury 6992 Westwood Elementary School 347 388 89.43%Woodbury 6992 Westwood High School 169 176 96.02%Woodbury 7098 Moville Elementary School 242 254 95.28%Woodbury 7098 Woodbury Central High School 186 193 96.37%Woodbury 7098 Woodbury Central Middle School 132 137 96.35%Worth 4772 Central Springs Elementary Manly Campus 123 127 96.85%Worth 4772 Central Springs Elem. School - Nora Springs 107 114 93.86%Worth 4772 Central Springs High School 225 229 98.25%Worth 4772 Central Springs Middle School 247 273 90.48%Worth 4788 Northwood-Kensett Elementary 270 273 98.90%Worth 4788 Northwood-Kensett Jr-Sr High School 234 242 96.69%Wright 0594 Belmond-Klemme Community Jr-Sr High School 205 213 96.24%Wright 0594 Richard O. Jacobson Elementary School 482 500 96.40%Wright 1206 Clarion-Goldfield-Dows Elementary School 404 412 98.06%Wright 1206 Clarion-Goldfield-Dows HS 293 305 96.07%Wright 1206 Clarion-Goldfield-Dows MS 199 206 96.60%Wright 1944 Eagle Grove Comm School District S 8 SWright 1944 Eagle Grove Elementary 323 327 98.78%Wright 1944 Eagle Grove High School 241 247 97.57%Wright 1944 Robert Blue School 237 239 99.16%
Percent Vaccinated with Vaccines Required by Law is calculated by dividing the number of Valid Certificates of Immunization by Total Enrollment.
*Schools with a Total Enrollment of less than 100 are suppressed and marked with an S.