Embed Size (px)
Citation preview
The inventory chapter of existing conditions is the initial step in the preparation of the Chandler Munic‐ipal Airport (CHD) Master Plan. The inventory will serve as an overview of the airport’s physical and operational features, including facilities, users, and activity levels, as well as specific information related to the airspace, air traffic activity, and role of the airport. Finally, a summary of socioeconomic charac‐teristics and review of existing environmental conditions on and adjacent to the airport are thoroughly detailed, which will provide further input into the study process.
Information provided in Chapter One serves as the baseline for the remainder of the master plan, which is compiled using a wide variety of resources, including: applicable planning documents; on‐site visits; interviews with airport staff, tenants, and users; aerial and ground photography; federal, state, and local publications; and project record drawings. Specific sources are those listed below; environmental re‐sources are detailed at the end of this chapter.
Inventory | DRAFT FINAL 1-1
Inventory Source Documents: Chandler Municipal Airport 2007 Airport Master Plan Update City of Chandler’s airport website1 Chandler Municipal Airport FAA Form 5010, Airport Master Record FAA Operations & Performance Data, Operations Network (OPSNET) Chandler General Plan 2016, passed and adopted by the Mayor and City Council on April 14, 2016 Maricopa Association of Governments 2040 Regional Transportation Plan Update, December 19,
2019 (Draft)
AIRPORT SETTING LOCALE The Chandler Municipal Airport is located within the City of Chandler, Arizona. With a current population of 263,1652 as of January 1, 2020, Chandler is the third largest city (after Phoenix and Mesa) among the communities that make up the Phoenix metropolitan area, also known as the “Valley of the Sun.” Lo‐cated in Maricopa County, the City of Chandler is represented in the Maricopa Association of Govern‐ments (MAG), which serves as the regional planning agency for the Phoenix metropolitan area. Chan‐dler’s Community Vision, as outlined in its Chandler General Plan 2016 is as follows:
“The City of Chandler is a major urban center reaching build‐out over the next few dec‐ades, which requires a shift from outward growth to quality community building. Chan‐dler is connected by an efficient regional system and local multimodal transportation net‐work. The city is the recognized leader for its strong economic foundation, desirable neighborhoods, and outstanding public services and its leaders remain focused on quality, sustained planning that ensures a future better than today. Chandler is a regional em‐ployment center and important Arizona economic driver; its world‐class corporations, emerging technology businesses, and next‐generation entrepreneurs call Chandler home because of its well‐educated workforce, exceptional educational achievement and oppor‐tunities, and superior quality of life.”
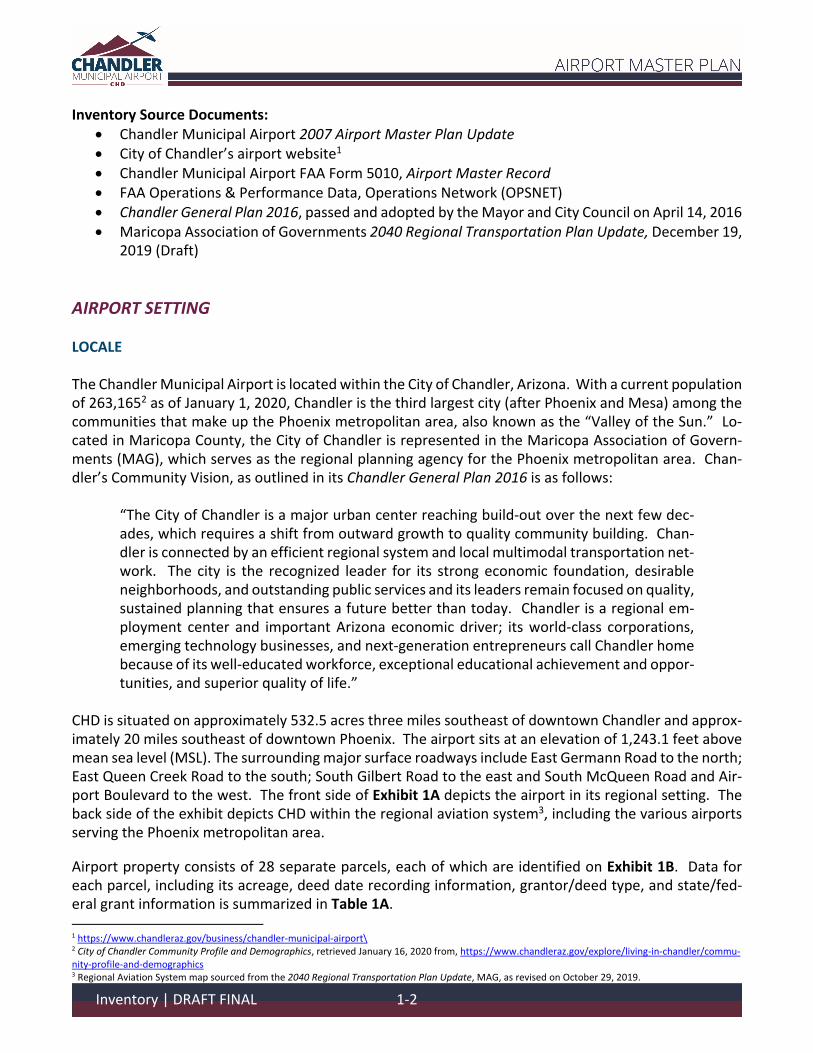
CHD is situated on approximately 532.5 acres three miles southeast of downtown Chandler and approx‐imately 20 miles southeast of downtown Phoenix. The airport sits at an elevation of 1,243.1 feet above mean sea level (MSL). The surrounding major surface roadways include East Germann Road to the north; East Queen Creek Road to the south; South Gilbert Road to the east and South McQueen Road and Air‐port Boulevard to the west. The front side of Exhibit 1A depicts the airport in its regional setting. The back side of the exhibit depicts CHD within the regional aviation system3, including the various airports serving the Phoenix metropolitan area.
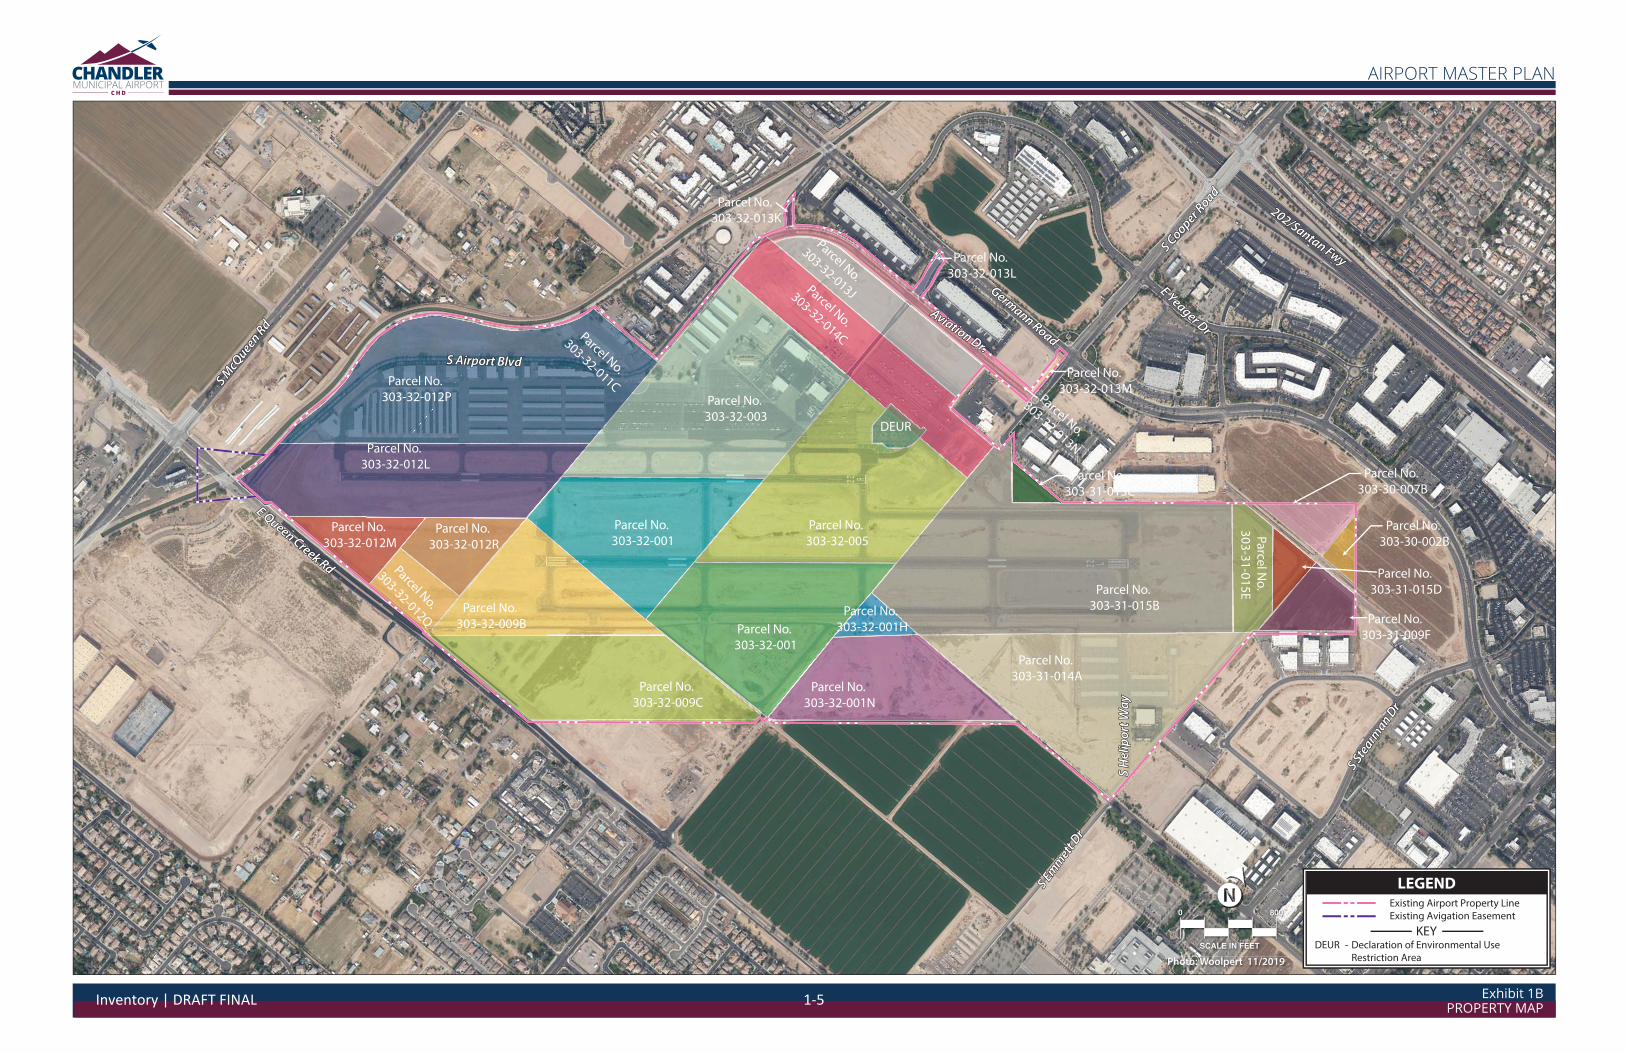
Airport property consists of 28 separate parcels, each of which are identified on Exhibit 1B. Data for each parcel, including its acreage, deed date recording information, grantor/deed type, and state/fed‐eral grant information is summarized in Table 1A.
1 https://www.chandleraz.gov/business/chandler‐municipal‐airport\ 2 City of Chandler Community Profile and Demographics, retrieved January 16, 2020 from, https://www.chandleraz.gov/explore/living‐in‐chandler/commu‐nity‐profile‐and‐demographics 3 Regional Aviation System map sourced from the 2040 Regional Transportation Plan Update, MAG, as revised on October 29, 2019.
Inventory | DRAFT FINAL 1-2
W German Rd German Rd
W Pecos Rd
W Queen Creek RdW Queen Creek Rd E Queen Creek RdE Queen Creek Rd
S Arizona AveS Arizona Ave
S McQeen RdS McQeen Rd
S Cooper RdS Cooper Rd
S Gilbert RdS Gilbert Rd
202
87
W German RdW German Rd GGeGeGeGeGeGeGeGeGeGermrmrmrmrmrmrmrmrmrmanananananananananan RRRRRRRRRRddddddddddGGeGeGeGeGeGeGeGeGeGermrmrmrmrmrmrmrmrmrmanananananananananan RRRRRRRRRRdddddddddd
W Pecos RdW Pecos Rd
202
60
60
60
70
95
93
93
89
89
ALT89
180
180
180
163160
160
191
191
191
191
40
40
15
17
10
10
10
19
8
PolaccaPolacca
Saint MichaelsSaint Michaels
WelltonWellton Swift Trail JunctionSwift Trail Junction
BylasBylas
EhrenbergEhrenberg
GanadoGanado
FredoniaFredonia
TombstoneTombstone
Gila BendGila BendMorenciMorenci
MammothMammothPimaPima
ClaypoolClaypool
SpringervilleSpringerville
WilliamsWilliams
SellsSells
San CarlosSan Carlos
AjoAjo
TaylorTaylor
OracleOracle
Cave CreekCave Creek
Colorado CityColorado City
SuperiorSuperior
WillcoxWillcox
San ManuelSan Manuel
BensonBenson
Kayenta
ThatcherThatcher
SnowflakeSnowflake
EagarEagar
ChinleChinle
BuckeyeBuckeye
WickenburgWickenburg
MaranaMaranaSomertonSomerton
Show LowShow Low
Chino ValleyChino ValleyCottonwoodCottonwood
CoolidgeCoolidge
Tuba CityTuba City
Camp VerdeCamp Verde
EloyEloy
PagePage
SedonaSedona
San LuisSan Luis
WinslowWinslow
PaysonPayson
Green ValleyGreen Valley
DouglasDouglas
Casa GrandeCasa Grande
Bullhead CityBullhead City
AvondaleAvondale
Sierra VistaSierra Vista
Lake Havasu CityLake Havasu City
ChandlerChandlerScottsdaleScottsdale
GlendaleGlendale
PhoenixPhoenix
ParkerParker
CliftonClifton
Saint JohnsSaint Johns
HolbrookHolbrook
BisbeeBisbee
FlorenceFlorence
KingmanKingman
NogalesNogales
PrescottPrescott
FlagstaffFlagstaff
TucsonTucson
YumaYuma
Kaaayeyeyeyeyyyyyyyyyyyyyy ntntntntataaa ntnn aKaaaayeyyyyyyyyyyyyyyyyy ntntnttaaaaA R I Z O N AA R I Z O N A
CHANDLER MUNICIPAL
AIRPORT
CHANDLER MUNICIPAL
AIRPORT
Exhibit 1AAIRPORT VICINITY/LOCATION MAP
AIRPORT MASTER PLAN
Inventory | DRAFT FINAL 1-3
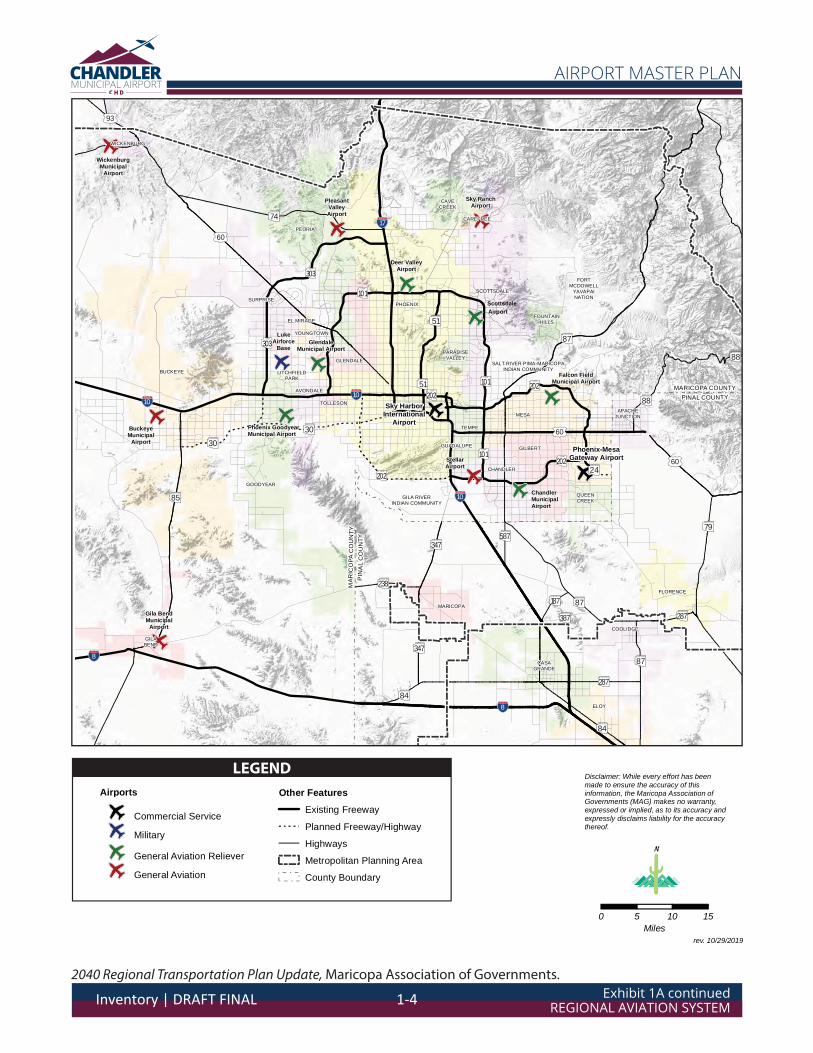
Exhibit 1A continuedREGIONAL AVIATION SYSTEM
AIRPORT MASTER PLAN
o
o
o
o
o
o
o
o
o
o
oo
o
o
o
85ARI ZONA
74ARI ZONA
202LOOP
10 202LOOP
51ARI ZONA
10
87ARI ZONA
303LOOP
303LOOP
101LOOP
60
8
17
51ARI ZONA
10
101LOOP
202LOOP
202LOOP
101LOOP
6030ARI ZONA
24ARI ZONA
238ARI ZONA
587ARI ZONA
187ARI ZONA
387ARI ZONA
87ARI ZONA
347ARI ZONA
8
84ARI ZONA
287ARI ZONA
87ARI ZONA
79ARI ZONA
60
88ARI ZONA
88ARI ZONA
30ARI ZONA
93
287ARI ZONA
347ARI ZONA
84ARI ZONA
MESA
WICKENBURG
CASAGRANDE
GILABEND
TEMPE
COOLIDGE
CAVECREEK
CAREFREE
FOUNTAINHILLSEL MIRAGE
YOUNGTOWN
FLORENCE
SURPRISE
PARADISEVALLEY
LITCHFIELDPARK
AVONDALE
TOLLESONAPACHE
JUNCTION
GUADALUPE GILBERT
GLENDALE
MARICOPA
PEORIA
PHOENIX
CHANDLER
GOODYEAR
BUCKEYE
ELOY
QUEENCREEK
GILA RIVERINDIAN COMMUNITY
SALT RIVER PIMA-MARICOPAINDIAN COMMUNITY
FORTMCDOWELL
YAVAPAINATION
MARICOPA COUNTYPINAL COUNTY
MAR
I CO
PAC
OU
NTY
PIN
AL
CO
UN
TY
Sky HarborInternational
Airport
Phoenix-MesaGateway Airport
LukeAirforce
Base
ChandlerMunicipalAirport
Deer ValleyAirport
Scott
SDALE
Airport
GlendaleMunicipal Airport
Phoenix GoodyearMunicipal Airport
Falcon FieldMunicipal Airport
WickenburgMunicipal
Airport
Sky RanchAirport
Gila BendMunicipal
Airport
BuckeyeMunicipal
Airport
StellarAirport
PleasantValleyAirport
Other Features
Existing Freeway
Planned Freeway/Highway
Highways
Metropolitan Planning Area
County Boundary
rev. 10/29/2019
Disclaimer: While every effort has beenmade to ensure the accuracy of thisinformation, the Maricopa Association ofGovernments (MAG) makes no warranty,expressed or implied, as to its accuracy andexpressly disclaims liability for the accuracythereof.
0 5 10 15Miles
Airports
oMilitary
oCommercial Service
oGeneral Aviation RelieveroGeneral Aviation
2040 Regional Transportation Plan Update, Maricopa Association of Governments.
LEGEND
Inventory | DRAFT FINAL 1-4
Parcel No. 303-32-009C
Parcel No. 303-32-009B
Parcel No. 303-32-012R
Parcel No. 303-32-012M
Parcel No. 303-32-012L
Parcel No. 303-32-012P
Parcel No.
303-32-011CParcel No. 303-32-003
DEUR
Parcel No. 303-32-013K
Parcel No. 303-32-013L
Parcel No. 303-32-013M
Parcel No.
303-32-014C
Parcel No.
303-32-013J
Parcel No.
303-32-013N
Parcel No. 303-32-001
Parcel No. 303-32-001
Parcel No. 303-32-005
Parcel No. 303-32-001N
Parcel No. 303-32-001H
Parcel No. 303-31-014A
Parcel No. 303-31-015B
Parcel No.
303-32-012Q Parcel No. 303-31-009F
Parcel No.
303-31-015E
Parcel No. 303-31-015D
Parcel No. 303-31-013C
Parcel No. 303-30-007B
Parcel No. 303-30-002B
0 800
SCALE IN FEET
Photo: Woolpert 11/2019
LEGENDExisting Airport Property LineExisting Avigation Easement
KEY DEUR - Declaration of Environmental Use Restriction Area
Germann Road
Germann Road
S Cooper Road
S Cooper Road
202/Santan Fwy
202/Santan Fwy
E Queen Creek Rd
E Queen Creek Rd
S Emm
ett Dr
S Emm
ett Dr
S Stearm
an Dr
S Stearm
an Dr
S H
elip
ort W
ayS
Hel
ipor
t Way
S McQ
ueen Rd
S McQ
ueen Rd
E Yeager Dr
E Yeager Dr
S Airport BlvdS Airport Blvd
Aviation Dr.
Aviation Dr.
Exhibit 1BPROPERTY MAP
AIRPORT MASTER PLAN
Inventory | DRAFT FINAL 1-5

This page intentionally left blank
Inventory | DRAFT FINAL 1-6
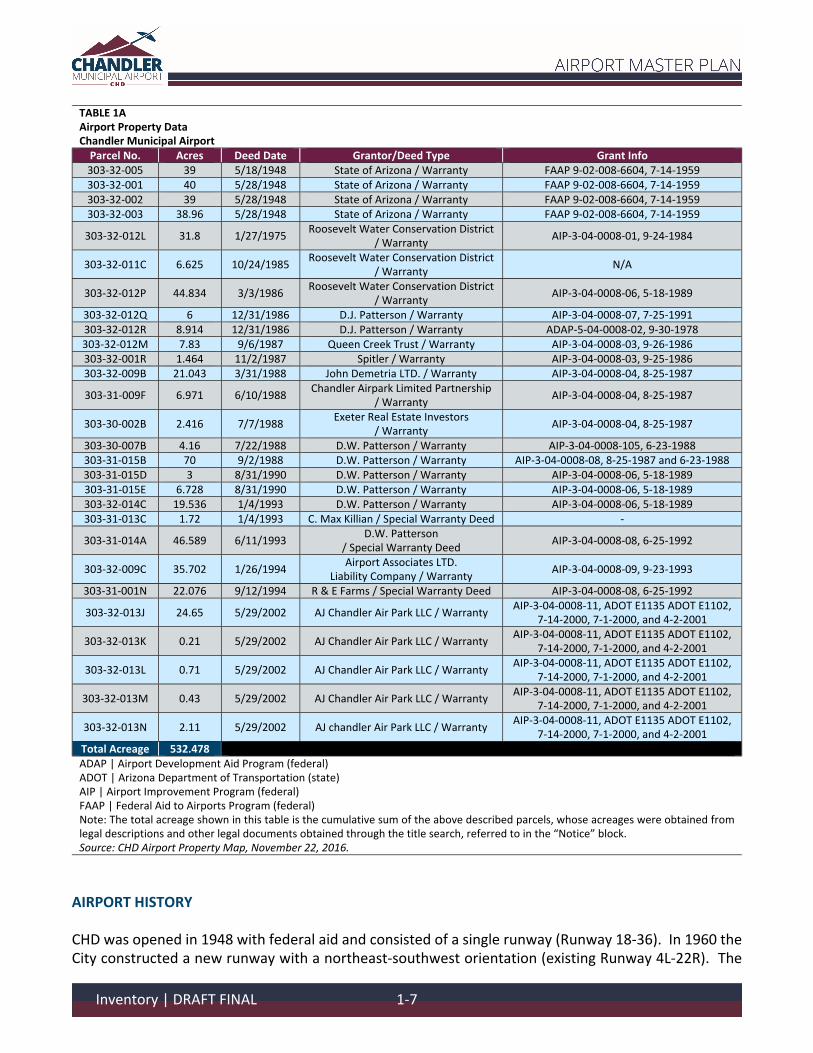
TABLE 1A Airport Property Data Chandler Municipal Airport Parcel No. Acres Deed Date Grantor/Deed Type Grant Info 303‐32‐005 39 5/18/1948 State of Arizona / Warranty FAAP 9‐02‐008‐6604, 7‐14‐1959 303‐32‐001 40 5/28/1948 State of Arizona / Warranty FAAP 9‐02‐008‐6604, 7‐14‐1959 303‐32‐002 39 5/28/1948 State of Arizona / Warranty FAAP 9‐02‐008‐6604, 7‐14‐1959 303‐32‐003 38.96 5/28/1948 State of Arizona / Warranty FAAP 9‐02‐008‐6604, 7‐14‐1959
303‐32‐012L 31.8 1/27/1975 Roosevelt Water Conservation District
/ Warranty AIP‐3‐04‐0008‐01, 9‐24‐1984
303‐32‐011C 6.625 10/24/1985 Roosevelt Water Conservation District
/ Warranty N/A
303‐32‐012P 44.834 3/3/1986 Roosevelt Water Conservation District
/ Warranty AIP‐3‐04‐0008‐06, 5‐18‐1989
303‐32‐012Q 6 12/31/1986 D.J. Patterson / Warranty AIP‐3‐04‐0008‐07, 7‐25‐1991 303‐32‐012R 8.914 12/31/1986 D.J. Patterson / Warranty ADAP‐5‐04‐0008‐02, 9‐30‐1978 303‐32‐012M 7.83 9/6/1987 Queen Creek Trust / Warranty AIP‐3‐04‐0008‐03, 9‐26‐1986 303‐32‐001R 1.464 11/2/1987 Spitler / Warranty AIP‐3‐04‐0008‐03, 9‐25‐1986 303‐32‐009B 21.043 3/31/1988 John Demetria LTD. / Warranty AIP‐3‐04‐0008‐04, 8‐25‐1987
303‐31‐009F 6.971 6/10/1988 Chandler Airpark Limited Partnership
/ Warranty AIP‐3‐04‐0008‐04, 8‐25‐1987
303‐30‐002B 2.416 7/7/1988 Exeter Real Estate Investors
/ Warranty AIP‐3‐04‐0008‐04, 8‐25‐1987
303‐30‐007B 4.16 7/22/1988 D.W. Patterson / Warranty AIP‐3‐04‐0008‐105, 6‐23‐1988 303‐31‐015B 70 9/2/1988 D.W. Patterson / Warranty AIP‐3‐04‐0008‐08, 8‐25‐1987 and 6‐23‐1988 303‐31‐015D 3 8/31/1990 D.W. Patterson / Warranty AIP‐3‐04‐0008‐06, 5‐18‐1989 303‐31‐015E 6.728 8/31/1990 D.W. Patterson / Warranty AIP‐3‐04‐0008‐06, 5‐18‐1989 303‐32‐014C 19.536 1/4/1993 D.W. Patterson / Warranty AIP‐3‐04‐0008‐06, 5‐18‐1989 303‐31‐013C 1.72 1/4/1993 C. Max Killian / Special Warranty Deed ‐
303‐31‐014A 46.589 6/11/1993 D.W. Patterson
/ Special Warranty Deed AIP‐3‐04‐0008‐08, 6‐25‐1992
303‐32‐009C 35.702 1/26/1994 Airport Associates LTD.
Liability Company / Warranty AIP‐3‐04‐0008‐09, 9‐23‐1993
303‐31‐001N 22.076 9/12/1994 R & E Farms / Special Warranty Deed AIP‐3‐04‐0008‐08, 6‐25‐1992
303‐32‐013J 24.65 5/29/2002 AJ Chandler Air Park LLC / Warranty AIP‐3‐04‐0008‐11, ADOT E1135 ADOT E1102,
7‐14‐2000, 7‐1‐2000, and 4‐2‐2001
303‐32‐013K 0.21 5/29/2002 AJ Chandler Air Park LLC / Warranty AIP‐3‐04‐0008‐11, ADOT E1135 ADOT E1102,
7‐14‐2000, 7‐1‐2000, and 4‐2‐2001
303‐32‐013L 0.71 5/29/2002 AJ Chandler Air Park LLC / Warranty AIP‐3‐04‐0008‐11, ADOT E1135 ADOT E1102,
7‐14‐2000, 7‐1‐2000, and 4‐2‐2001
303‐32‐013M 0.43 5/29/2002 AJ Chandler Air Park LLC / Warranty AIP‐3‐04‐0008‐11, ADOT E1135 ADOT E1102,
7‐14‐2000, 7‐1‐2000, and 4‐2‐2001
303‐32‐013N 2.11 5/29/2002 AJ chandler Air Park LLC / Warranty AIP‐3‐04‐0008‐11, ADOT E1135 ADOT E1102,
7‐14‐2000, 7‐1‐2000, and 4‐2‐2001 Total Acreage 532.478 ADAP | Airport Development Aid Program (federal) ADOT | Arizona Department of Transportation (state) AIP | Airport Improvement Program (federal) FAAP | Federal Aid to Airports Program (federal) Note: The total acreage shown in this table is the cumulative sum of the above described parcels, whose acreages were obtained from legal descriptions and other legal documents obtained through the title search, referred to in the “Notice” block. Source: CHD Airport Property Map, November 22, 2016.
AIRPORT HISTORY CHD was opened in 1948 with federal aid and consisted of a single runway (Runway 18‐36). In 1960 the City constructed a new runway with a northeast‐southwest orientation (existing Runway 4L‐22R). The
Inventory | DRAFT FINAL 1-7
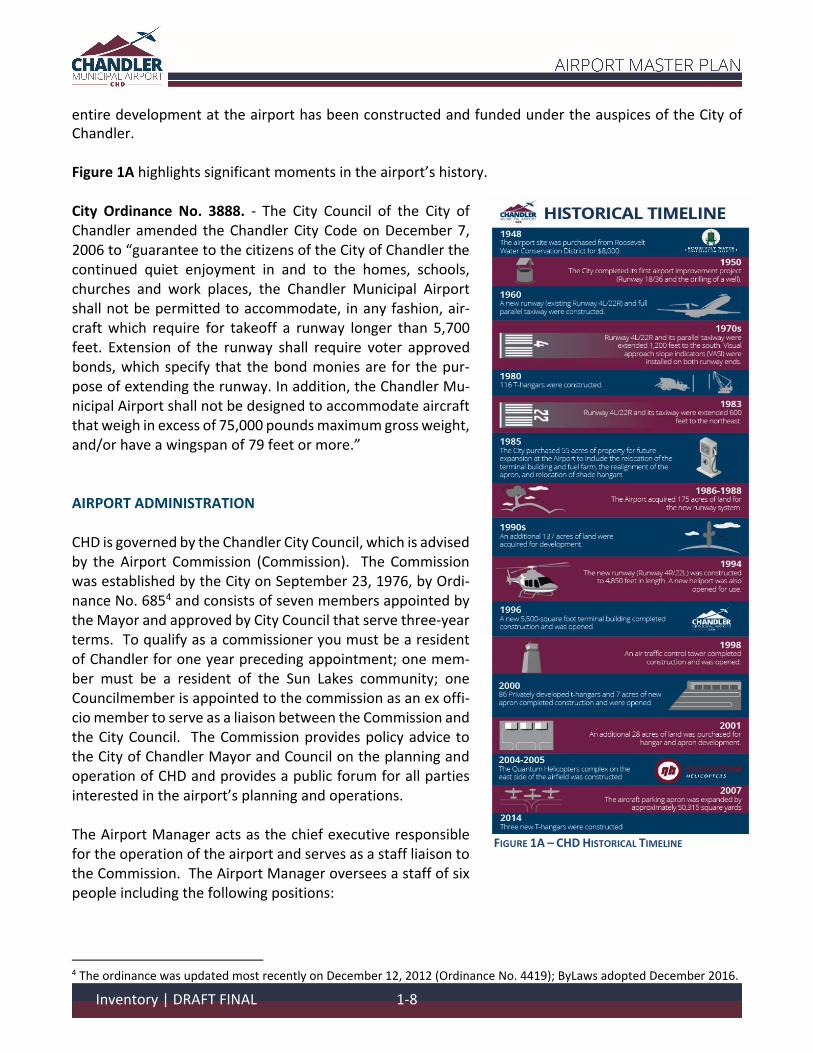
entire development at the airport has been constructed and funded under the auspices of the City of Chandler. Figure 1A highlights significant moments in the airport’s history. City Ordinance No. 3888. ‐ The City Council of the City of Chandler amended the Chandler City Code on December 7, 2006 to “guarantee to the citizens of the City of Chandler the continued quiet enjoyment in and to the homes, schools, churches and work places, the Chandler Municipal Airport shall not be permitted to accommodate, in any fashion, air‐craft which require for takeoff a runway longer than 5,700 feet. Extension of the runway shall require voter approved bonds, which specify that the bond monies are for the pur‐pose of extending the runway. In addition, the Chandler Mu‐nicipal Airport shall not be designed to accommodate aircraft that weigh in excess of 75,000 pounds maximum gross weight, and/or have a wingspan of 79 feet or more.” AIRPORT ADMINISTRATION CHD is governed by the Chandler City Council, which is advised by the Airport Commission (Commission). The Commission was established by the City on September 23, 1976, by Ordi‐nance No. 6854 and consists of seven members appointed by the Mayor and approved by City Council that serve three‐year terms. To qualify as a commissioner you must be a resident of Chandler for one year preceding appointment; one mem‐ber must be a resident of the Sun Lakes community; one Councilmember is appointed to the commission as an ex offi‐cio member to serve as a liaison between the Commission and the City Council. The Commission provides policy advice to the City of Chandler Mayor and Council on the planning and operation of CHD and provides a public forum for all parties interested in the airport’s planning and operations. The Airport Manager acts as the chief executive responsible for the operation of the airport and serves as a staff liaison to the Commission. The Airport Manager oversees a staff of six people including the following positions:
4 The ordinance was updated most recently on December 12, 2012 (Ordinance No. 4419); ByLaws adopted December 2016.
FIGURE 1A – CHD HISTORICAL TIMELINE
Inventory | DRAFT FINAL 1-8
(1) Airport Planning Administrator
(1) Airport Business Coordinator
(1) Airport Operations and Maintenance Supervisor
(2) Airport Operation and Maintenance Technicians
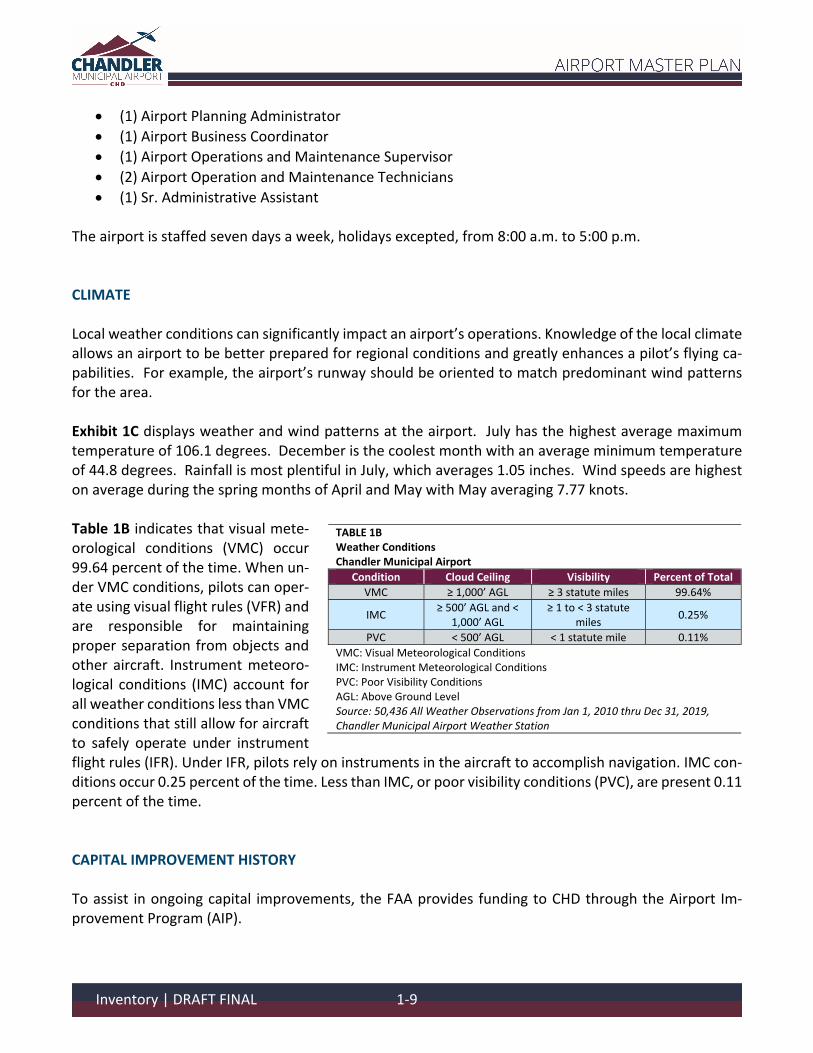
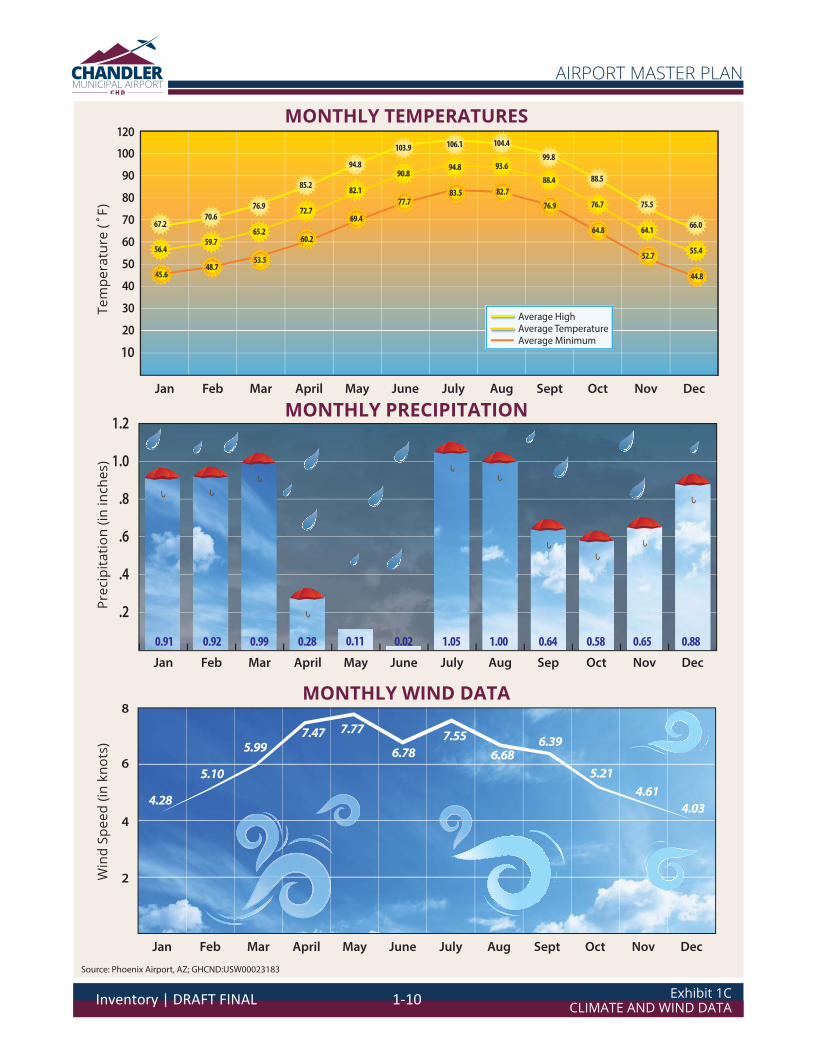
(1) Sr. Administrative Assistant The airport is staffed seven days a week, holidays excepted, from 8:00 a.m. to 5:00 p.m. CLIMATE Local weather conditions can significantly impact an airport’s operations. Knowledge of the local climate allows an airport to be better prepared for regional conditions and greatly enhances a pilot’s flying ca‐pabilities. For example, the airport’s runway should be oriented to match predominant wind patterns for the area. Exhibit 1C displays weather and wind patterns at the airport. July has the highest average maximum temperature of 106.1 degrees. December is the coolest month with an average minimum temperature of 44.8 degrees. Rainfall is most plentiful in July, which averages 1.05 inches. Wind speeds are highest on average during the spring months of April and May with May averaging 7.77 knots. Table 1B indicates that visual mete‐orological conditions (VMC) occur 99.64 percent of the time. When un‐der VMC conditions, pilots can oper‐ate using visual flight rules (VFR) and are responsible for maintaining proper separation from objects and other aircraft. Instrument meteoro‐logical conditions (IMC) account for all weather conditions less than VMC conditions that still allow for aircraft to safely operate under instrument flight rules (IFR). Under IFR, pilots rely on instruments in the aircraft to accomplish navigation. IMC con‐ditions occur 0.25 percent of the time. Less than IMC, or poor visibility conditions (PVC), are present 0.11 percent of the time. CAPITAL IMPROVEMENT HISTORY To assist in ongoing capital improvements, the FAA provides funding to CHD through the Airport Im‐provement Program (AIP).
TABLE 1B Weather Conditions Chandler Municipal Airport
Condition Cloud Ceiling Visibility Percent of Total
VMC ≥ 1,000’ AGL ≥ 3 statute miles 99.64%
IMC ≥ 500’ AGL and < 1,000’ AGL
≥ 1 to < 3 statute miles
0.25%
PVC < 500’ AGL < 1 statute mile 0.11%
VMC: Visual Meteorological Conditions IMC: Instrument Meteorological Conditions PVC: Poor Visibility Conditions AGL: Above Ground Level Source: 50,436 All Weather Observations from Jan 1, 2010 thru Dec 31, 2019, Chandler Municipal Airport Weather Station
Inventory | DRAFT FINAL 1-9
2
4
6
8
DecNovOctSeptAugJulyJuneMayAprilMarFebJan
4.28
5.10
5.997.47 7.77
6.787.55
6.686.39
5.21
4.034.61
Prec
ipita
tion
(in in
ches
)W
ind
Spee
d (in
kno
ts)
Tem
pera
ture
(˚F)
.2
.4
.6
.8
1.0
1.2
DecNovOctSepAugJulyJuneMayAprilMarFebJan
MONTHLY TEMPERATURES
MONTHLY PRECIPITATION
MONTHLY WIND DATA
Source: Phoenix Airport, AZ; GHCND:USW00023183
10
20
30
40
50
60
70
80
90
DecNovOctSeptAugJulyJuneMayAprilMarFebJan
0.91 0.92 0.99 0.28 0.11 0.02 1.05 1.00 0.64 0.58 0.65 0.88
100
120
Average HighAverage TemperatureAverage Minimum
94.8
83.5
106.1
93.6
82.7
104.4
88.4
76.9
99.8
76.7
64.8
88.5
64.1
52.7
75.5
55.4
44.8
66.0
90.8
77.7
103.9
82.1
69.4
94.8
72.7
60.2
85.2
65.2
53.5
76.9
59.7
48.7
70.6
56.4
45.6
67.2
Exhibit 1CCLIMATE AND WIND DATA
AIRPORT MASTER PLAN
Inventory | DRAFT FINAL 1-10
Table 1C summarizes CHD capital improvement projects undertaken since 2005 that received funding through the FAA’s AIP. During this period, the airport received $11.1 million in AIP grants. Airports that apply for and accept AIP grants must adhere to various grant assurances. These assurances include maintaining the airport facility safely and efficiently in accordance with specific conditions. The duration of the assurances depends on the type of airport, the useful life of the facility being developed, and other factors. Typically, the useful life for an airport development project is a minimum of 20 years. Thus, when an airport accepts AIP grants, they are obligated to maintain that facility in accordance with FAA standards for at least that long. TABLE 1C AIP Grant History: 2005 ‐ 2019 Chandler Municipal Airport
Fiscal Year Grant Number Work Description AIP Funds
2005 16 Construct Heliport/Helipad, Install Airfield Guidance Signs $1,521,960
2006 17 Conduct Noise Compatibility Plan Study $272,650
2006 18 Construct Access Road $150,000
2007 19 Construct Apron $2,709,244
2009 20 Construct Service Road $323,693
2011 21 Install Weather Reporting Equipment $75,000
2012 22 Install Weather Reporting Equipment $200,393
2013 23 Rehabilitate Apron, Rehabilitate Taxiway Lighting $393,380
2015 24 Improve Airport Drainage $1,262,432
2018 26 Rehabilitate Apron $3,671,699
2019 27 Update Airport Master Plan Study $546,360
AIP Total (2005‐2019) $11,126,811
Source: FAA AIP Grant History; https://www.faa.gov/airports/aip/grant_histories/lookup/
THE AIRPORT’S SYSTEM ROLE Airport planning takes place at the local, state, and national levels, each of which has a different empha‐sis and purpose.
Local | CHD has an Airport Master Plan, which was last updated in 2007. State | CHD is included within the 2006 Arizona State Airport System Plan (ASASP). As of 2018,
the ASASP is in the process of being updated. ASASP information used in this Master Plan will be updated as new information comes available.
National | CHD is included in the National Plan of Integrated Airport Systems (NPIAS), which cat‐egorizes overall airport roles and responsibilities based on input from local and state planning efforts (i.e., master plans and state system plans).
LOCAL AIRPORT PLANNING 2007 Airport Master Plan Update | The 2007 Airport Master Plan Update is the primary local planning document that provides a 20‐year airport development vision based on aviation demand forecasts. The 2007 Airport Master Plan Update used 2005 data for its aviation forecasts baseline. The primary recom‐mendations from the 2007 Airport Master Plan Update included extending Runway 4R‐22L by 850 feet,
Inventory | DRAFT FINAL 1-11
extension of Taxiway B to the end of Runway 4L, and expansion of landside facilities (aprons/tax‐ilanes/hangars) on the north and southeast sides of the airfield. Since the completion of the previous master plan, the airport has not extended its runway; however, new apron space has been added, new T‐hangars have been constructed, and taxiway improvements have been made to meet FAA design standards. STATE AIRPORT PLANNING The primary planning document for the State of Arizona is the SASP, which was last updated in October 2018. The SASP focuses on keeping Arizona’s airports highly advanced, safe, and responsive to the pub‐lic’s needs today and throughout the 20‐year planning horizon. CHD is classified as a reliever airport within the SASP. The SASP definition for a reliever airport is identical to the NPIAS definition, which is an airport that relieves congestion at a commercial service airport. In CHD’s case, its purpose is to relieve congestion from Phoenix Sky Harbor International Airport (PHX). FEDERAL AIRPORT PLANNING Many of the nation’s existing airports were either initially constructed by the federal government or their development and maintenance was partially funded through various federal grant‐in‐aid programs to local communities. The system of airports existing today is, therefore, due, in large part, to federal policy that promotes the development of civil aviation. As part of a continuing effort to develop a national airport system, the U.S. Congress has maintained a national plan for the development and maintenance of airports. The FAA maintains a database of airports that are eligible for AIP funding and are for public use called the National Plan of Integrated Airport Systems (NPIAS). The NPIAS is published and used by the FAA in admin‐istering the AIP, which is the source of federal funds for airport improvement projects across the country. The AIP is funded exclusively by user fees and user taxes, such as those on fuel and airline tickets. An airport must be included in the NPIAS to be eligible for federal funding assistance through the AIP. The most current plan is the NPIAS 2019‐2023, which identified 3,328 public‐use airports (3,321 existing and 7 proposed) that are important to national air transportation. The plan estimates that approximately $35.1 billion in AIP‐eligible airport projects will require financial assistance between 2019 and 2023. The NPIAS categorizes airports by the type of activities that take place, including commercial service, cargo service, reliever operations, and general aviation. CHD is currently classified as a reliever airport in the FAA’s NPIAS. Due to different operating requirements between small general aviation aircraft and large commercial aircraft, general aviation pilots often find it difficult to use a congested commercial service airport. In recognition of this, the FAA has encouraged the development of high‐capacity general aviation airports in major metropolitan areas. These specialized airports, called relievers, provide pilots with attractive alternatives to using congested hub airports. They also provide general aviation access to the surrounding area. To be eligible for reliever designation, these airports must be open to the public, have 100 or more based aircraft, or have 25,000 annual itinerant operations. There are 261 reliever airports within the NPIAS with an average of 177 based aircraft, which in total represents 23 percent of the nation’s general aviation fleet.
Inventory | DRAFT FINAL 1-12
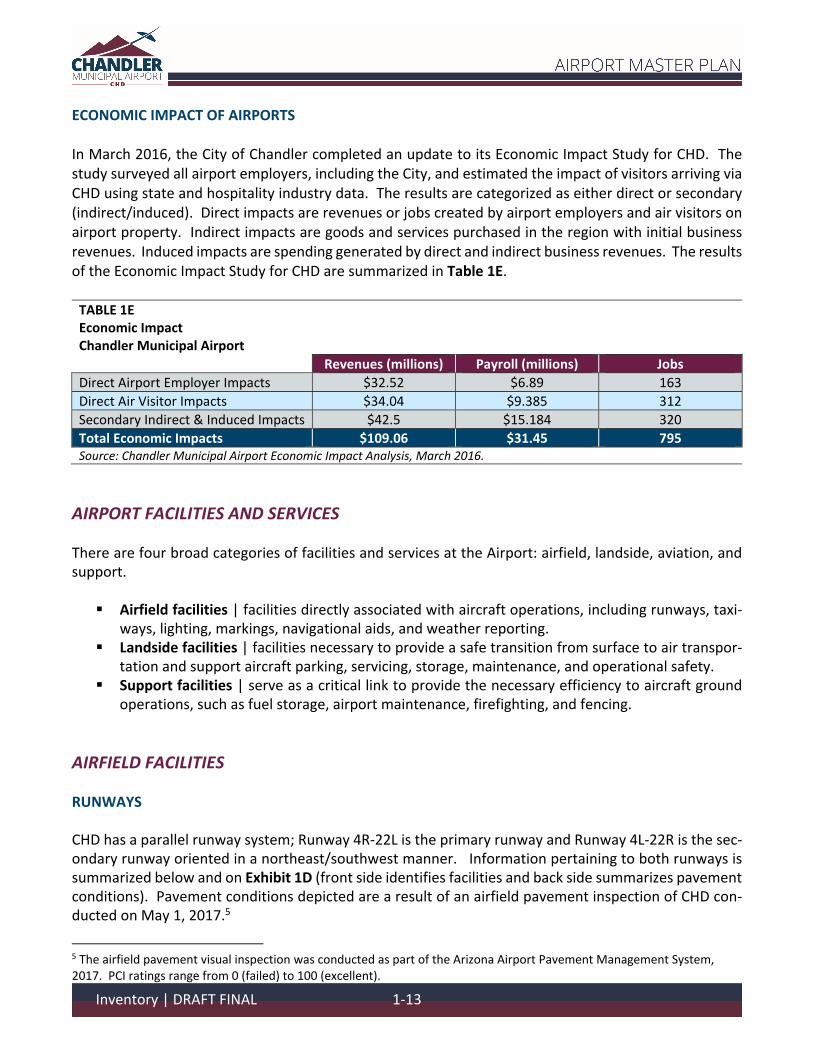
ECONOMIC IMPACT OF AIRPORTS In March 2016, the City of Chandler completed an update to its Economic Impact Study for CHD. The study surveyed all airport employers, including the City, and estimated the impact of visitors arriving via CHD using state and hospitality industry data. The results are categorized as either direct or secondary (indirect/induced). Direct impacts are revenues or jobs created by airport employers and air visitors on airport property. Indirect impacts are goods and services purchased in the region with initial business revenues. Induced impacts are spending generated by direct and indirect business revenues. The results of the Economic Impact Study for CHD are summarized in Table 1E. TABLE 1E Economic Impact Chandler Municipal Airport
Revenues (millions) Payroll (millions) Jobs
Direct Airport Employer Impacts $32.52 $6.89 163
Direct Air Visitor Impacts $34.04 $9.385 312
Secondary Indirect & Induced Impacts $42.5 $15.184 320
Total Economic Impacts $109.06 $31.45 795 Source: Chandler Municipal Airport Economic Impact Analysis, March 2016.
AIRPORT FACILITIES AND SERVICES There are four broad categories of facilities and services at the Airport: airfield, landside, aviation, and support. Airfield facilities | facilities directly associated with aircraft operations, including runways, taxi‐
ways, lighting, markings, navigational aids, and weather reporting. Landside facilities | facilities necessary to provide a safe transition from surface to air transpor‐
tation and support aircraft parking, servicing, storage, maintenance, and operational safety. Support facilities | serve as a critical link to provide the necessary efficiency to aircraft ground
operations, such as fuel storage, airport maintenance, firefighting, and fencing.
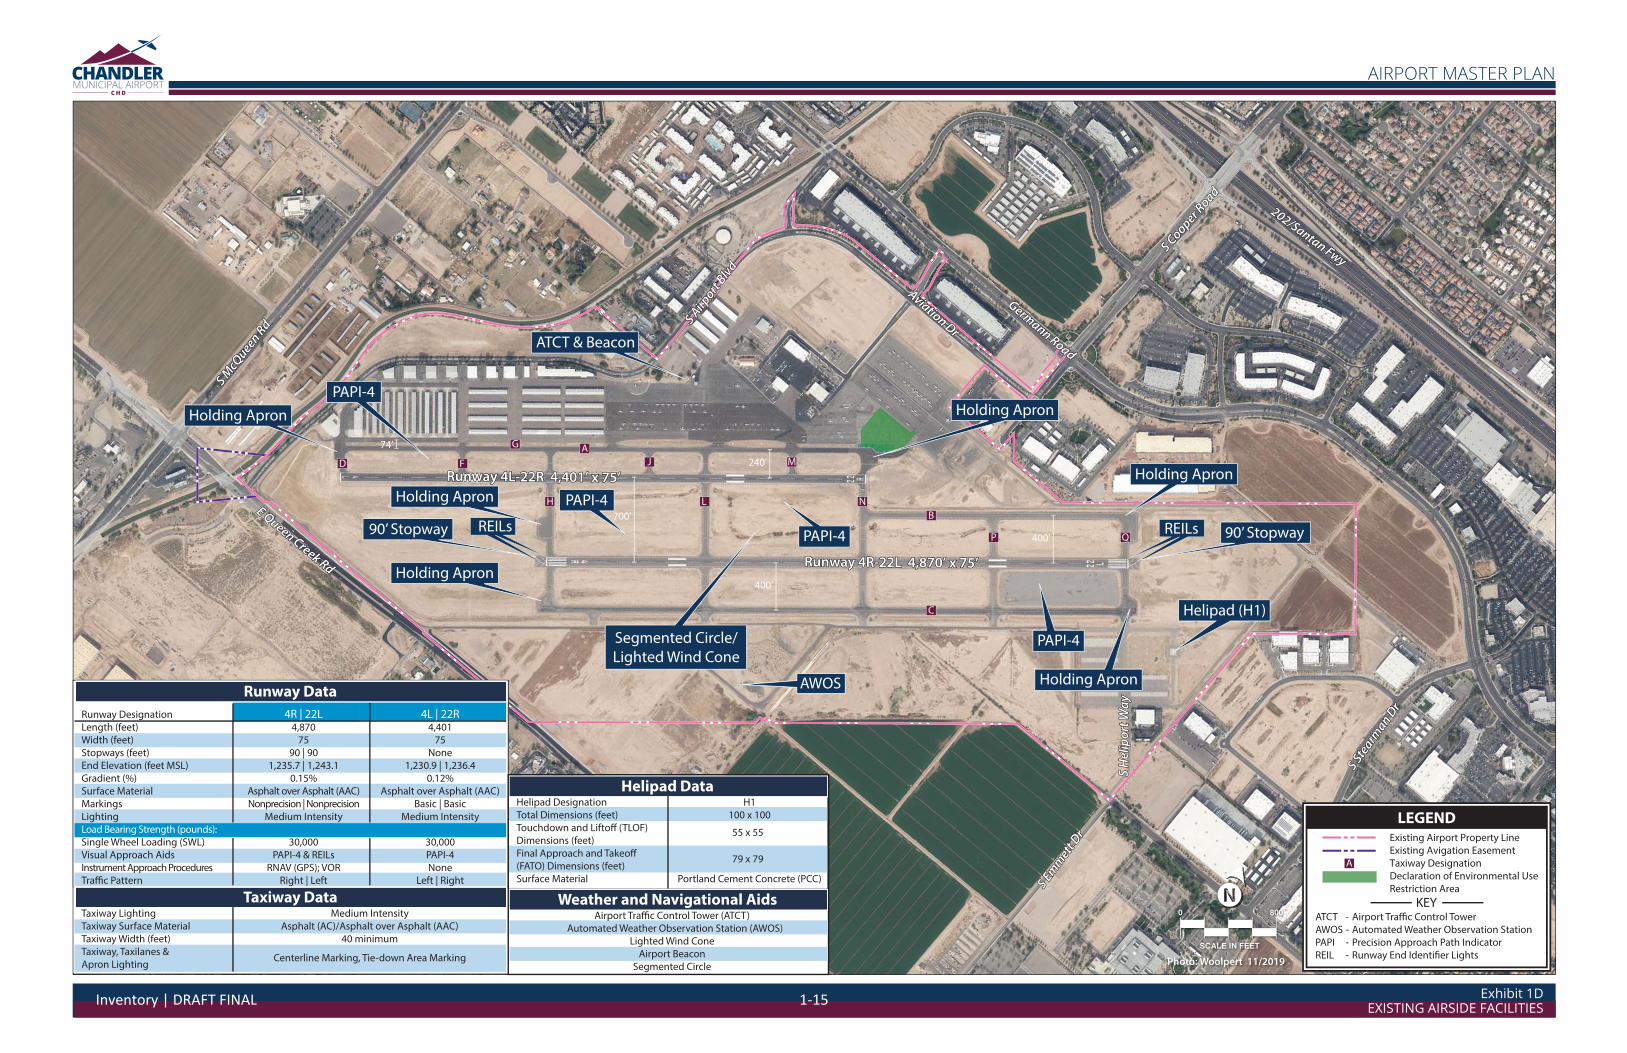
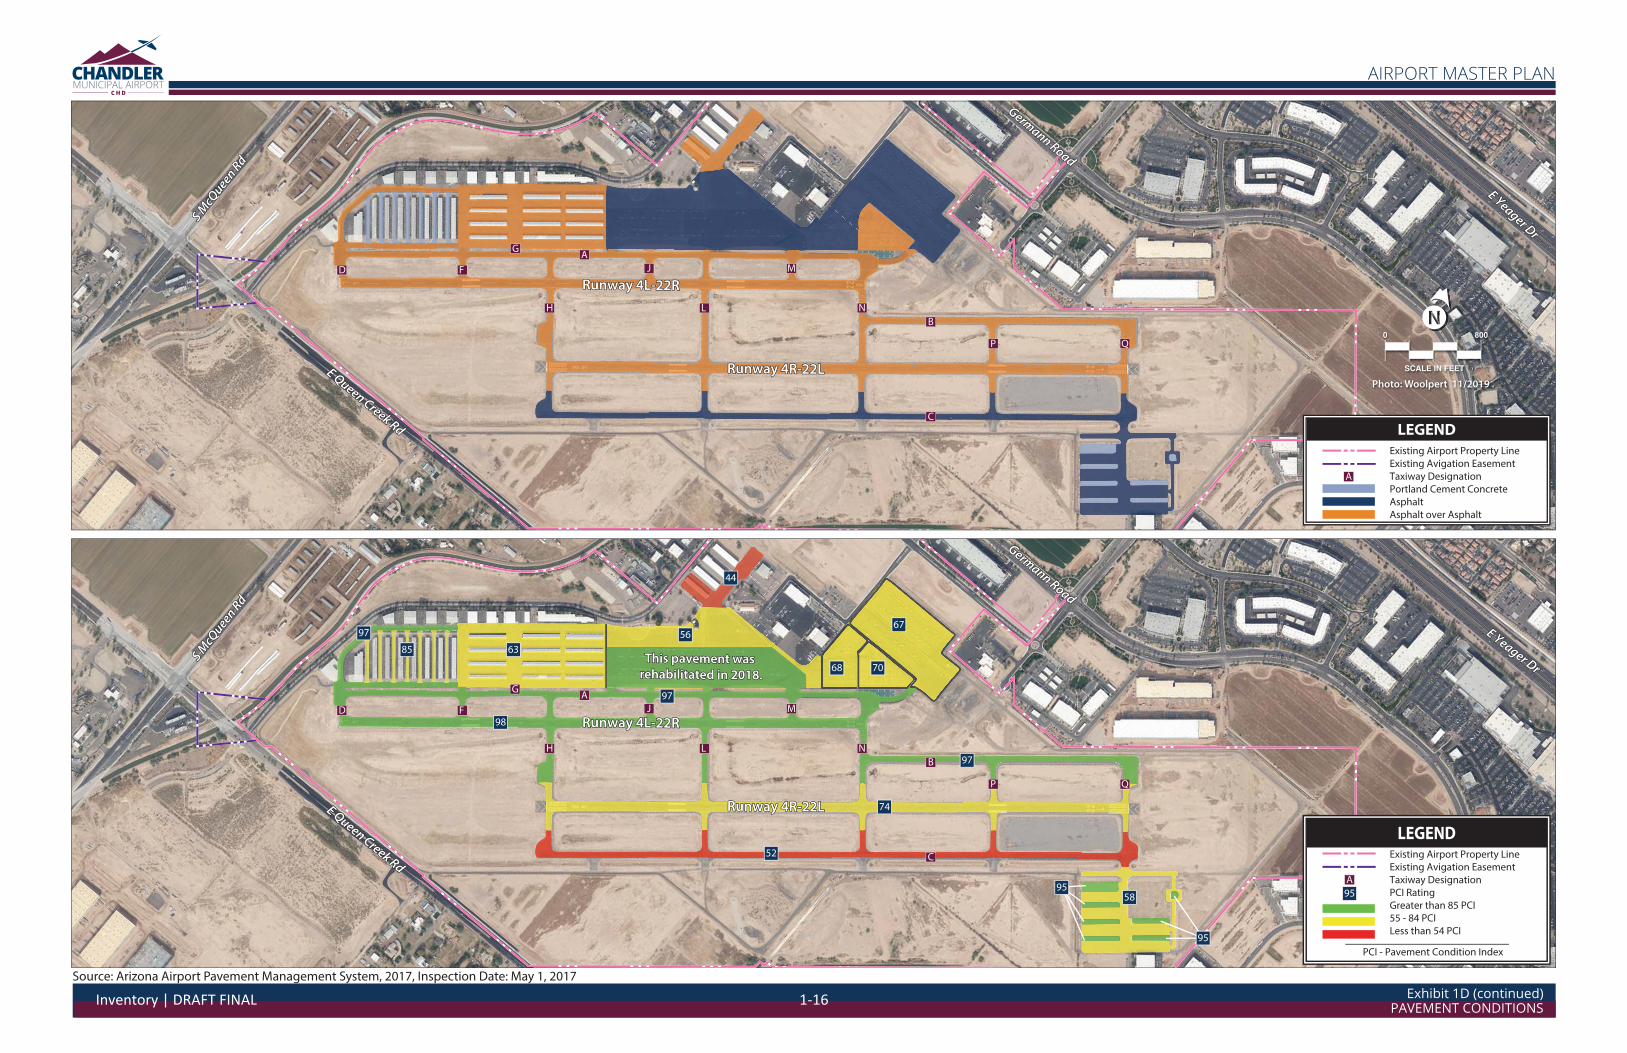
AIRFIELD FACILITIES RUNWAYS CHD has a parallel runway system; Runway 4R‐22L is the primary runway and Runway 4L‐22R is the sec‐ondary runway oriented in a northeast/southwest manner. Information pertaining to both runways is summarized below and on Exhibit 1D (front side identifies facilities and back side summarizes pavement conditions). Pavement conditions depicted are a result of an airfield pavement inspection of CHD con‐ducted on May 1, 2017.5
5 The airfield pavement visual inspection was conducted as part of the Arizona Airport Pavement Management System, 2017. PCI ratings range from 0 (failed) to 100 (excellent).
Inventory | DRAFT FINAL 1-13
Primary Runway 4R‐22L | Runway 4R‐22L is paved with asphalt and measures 4,870 feet long and 75 feet wide and has a single wheel (SWL) strength of 30,000 pounds (Pavement Classification Number [PCN] data was not available). The runway has non‐precision pavement markings that include a runway end designation, threshold markings, centerline, edge markings, and aiming points. Runway lighting/ap‐proach aid systems available include medium intensity runway lighting (MIRL), runway end identifier lights (REILs), and precision approach path indicator (PAPI‐4) systems at both ends. The runway slopes down from the 22R end at a gradient of 0.15 percent. Both ends of the runway have 90‐foot stopways.6 The primary runway underwent its most recent maintenance/repair project in January 2020, which was a crack seal and overlay. As of the 2017 pavement inspection, the primary runway was found to have a Pavement Condition Index (PCI) rating of 74 with low and medium severity longitudinal and transverse cracking. Runway 4R‐22L has a total pavement area of 440,565 square feet. Secondary Runway 4L‐22R | Runway 4L‐22R is constructed of asphalt and measures 4,401 feet long and 75 feet wide and has a SWL strength of 30,000 pounds (PCN data was not available). The runway has basic runway pavement markings including the runway end designation, centerline, edge markings, and aiming points. Runway lighting/approach aid systems available include MIRL and PAPI‐4s. The runway slopes down from the 22L end at a gradient of 0.12 percent. This runway is not equipped with stopways and was last rehabilitated on November 3, 2015 when a 1‐inch asphalt overlay was applied. As of the 2017 pavement inspection, the secondary runway was found to have a PCI rating of 98 with low severity longitudinal and transverse cracking. Runway 4L‐22R has a total pavement area of 328,490 sf.
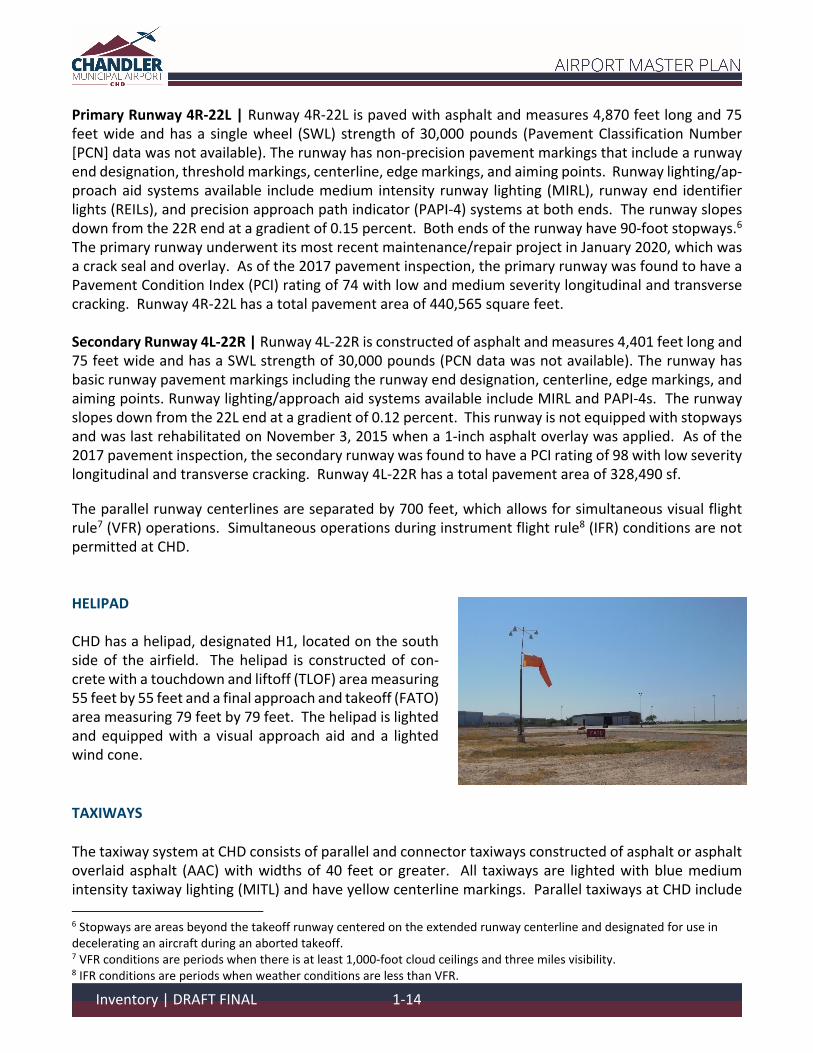
The parallel runway centerlines are separated by 700 feet, which allows for simultaneous visual flight rule7 (VFR) operations. Simultaneous operations during instrument flight rule8 (IFR) conditions are not permitted at CHD. HELIPAD CHD has a helipad, designated H1, located on the south side of the airfield. The helipad is constructed of con‐crete with a touchdown and liftoff (TLOF) area measuring 55 feet by 55 feet and a final approach and takeoff (FATO) area measuring 79 feet by 79 feet. The helipad is lighted and equipped with a visual approach aid and a lighted wind cone. TAXIWAYS The taxiway system at CHD consists of parallel and connector taxiways constructed of asphalt or asphalt overlaid asphalt (AAC) with widths of 40 feet or greater. All taxiways are lighted with blue medium intensity taxiway lighting (MITL) and have yellow centerline markings. Parallel taxiways at CHD include
6 Stopways are areas beyond the takeoff runway centered on the extended runway centerline and designated for use in decelerating an aircraft during an aborted takeoff. 7 VFR conditions are periods when there is at least 1,000‐foot cloud ceilings and three miles visibility. 8 IFR conditions are periods when weather conditions are less than VFR.
Inventory | DRAFT FINAL 1-14
Holding Apron
Holding Apron
Holding Apron
90’ Stopway
Holding Apron
Helipad (H1)
Holding ApronAWOS
Segmented Circle/
Lighted Wind ConePAPI-4
PAPI-4
Holding Apron
ATCT & Beacon
PAPI-4
PAPI-4
D F
G
H L
A
J M
N
B
C
P QREILs
240’
400’
400’
700’
74’
REILs 90’ Stopway
Germann Road
Germann Road
S Airp
ort Blvd
S Airp
ort Blvd
Aviation Dr
Aviation Dr
S Cooper Road
S Cooper Road
202/Santan Fwy
202/Santan Fwy
E Queen Creek Rd
E Queen Creek Rd
S Emm
ett Dr
S Emm
ett Dr
S Stearm
an Dr
S Stearm
an Dr
S H
elip
ort W
ayS
Hel
ipor
t Way
S McQ
ueen Rd
S McQ
ueen Rd
0 800
SCALE IN FEET
Photo: Woolpert 11/2019
LEGEND
KEY
Existing Airport Property Line
Existing Avigation Easement
Taxiway Designation
Declaration of Environmental Use
Restriction Area
A
ATCT - Airport Traffic Control Tower
AWOS - Automated Weather Observation Station
PAPI - Precision Approach Path Indicator
REIL - Runway End Identifier Lights
Runway 4R-22L 4,870’ x 75’Runway 4R-22L 4,870’ x 75’
Runway 4L-22R 4,401’ x 75’Runway 4L-22R 4,401’ x 75’
Runway DataRunway Designation 4R | 22L 4L | 22RLength (feet) 4,870 4,401
Width (feet) 75 75
Stopways (feet) 90 | 90 None
End Elevation (feet MSL) 1,235.7 | 1,243.1 1,230.9 | 1,236.4
Gradient (%) 0.15% 0.12%
Surface Material Asphalt over Asphalt (AAC) Asphalt over Asphalt (AAC)
Markings Nonprecision | Nonprecision Basic | Basic
Lighting Medium Intensity Medium Intensity
Load Bearing Strength (pounds):
Single Wheel Loading (SWL) 30,000 30,000
Visual Approach Aids PAPI-4 & REILs PAPI-4
Instrument Approach Procedures RNAV (GPS); VOR None
Traffic Pattern Right | Left Left | Right
Taxiway Data Taxiway Lighting Medium Intensity
Taxiway Surface Material Asphalt (AC)/Asphalt over Asphalt (AAC)
Taxiway Width (feet) 40 minimum
Taxiway, Taxilanes &
Apron Lighting
Helipad DataHelipad Designation H1
Total Dimensions (feet) 100 x 100
Touchdown and Liftoff (TLOF)
Dimensions (feet)
Final Approach and Takeoff
(FATO) Dimensions (feet)
Surface Material Portland Cement Concrete (PCC)
Weather and Navigational AidsAirport Traffic Control Tower (ATCT)
Automated Weather Observation Station (AWOS)
Lighted Wind Cone
Airport Beacon
Segmented Circle
79 x 79
55 x 55
Centerline Marking, Tie-down Area Marking
Exhibit 1DEXISTING AIRSIDE FACILITIES
AIRPORT MASTER PLAN
Inventory | DRAFT FINAL 1-15
Gilb
ert R
oad
Gilb
ert R
oad
67
7068
44
56
6385
97
97
97
74
9558
95
52
98
Germann Road
Germann Road
Germann Road
Germann Road
D F
H L
AG
J M
N
B
C
P Q
D F
H L
A
J M
N
B
C
P Q
G
0 800
SCALE IN FEET
Photo: Woolpert 11/2019
LEGENDExisting Airport Property Line
Existing Avigation Easement
Taxiway Designation
Portland Cement Concrete
Asphalt
Asphalt over Asphalt
A
Runway 4R-22LRunway 4R-22L
Runway 4L-22R Runway 4L-22R
Runway 4R-22LRunway 4R-22L
Runway 4L-22R Runway 4L-22R
This pavement was rehabilitated in 2018.This pavement was
rehabilitated in 2018.
LEGENDExisting Airport Property Line
Existing Avigation Easement
Taxiway Designation
PCI Rating
Greater than 85 PCI
55 - 84 PCI
Less than 54 PCI
PCI - Pavement Condition Index
A
95
Exhibit 1D (continued)PAVEMENT CONDITIONS
AIRPORT MASTER PLAN
E Yeager Dr
E Yeager Dr
E Queen Creek Rd
E Queen Creek Rd
S McQ
ueen Rd
S McQ
ueen Rd
S McQ
ueen Rd
S McQ
ueen Rd
E Queen Creek Rd
E Queen Creek Rd
E Yeager Dr
E Yeager Dr
Source: Arizona Airport Pavement Management System, 2017, Inspection Date: May 1, 2017
Inventory | DRAFT FINAL 1-16
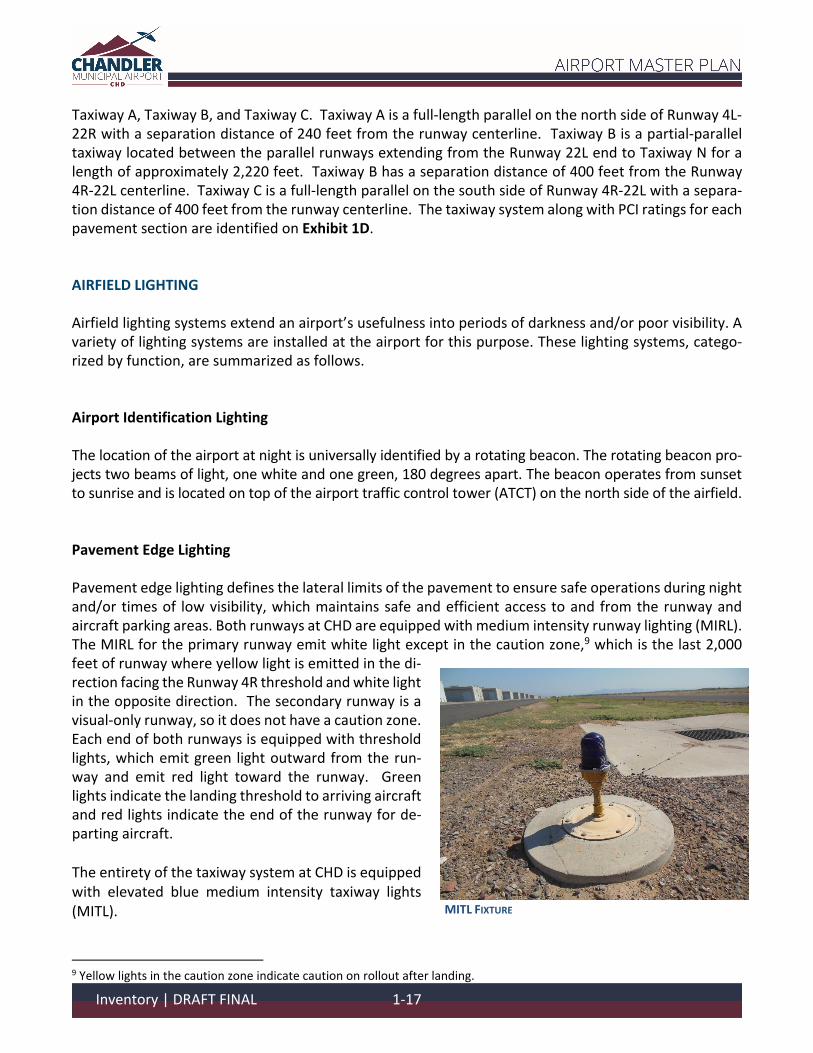
Taxiway A, Taxiway B, and Taxiway C. Taxiway A is a full‐length parallel on the north side of Runway 4L‐22R with a separation distance of 240 feet from the runway centerline. Taxiway B is a partial‐parallel taxiway located between the parallel runways extending from the Runway 22L end to Taxiway N for a length of approximately 2,220 feet. Taxiway B has a separation distance of 400 feet from the Runway 4R‐22L centerline. Taxiway C is a full‐length parallel on the south side of Runway 4R‐22L with a separa‐tion distance of 400 feet from the runway centerline. The taxiway system along with PCI ratings for each pavement section are identified on Exhibit 1D. AIRFIELD LIGHTING Airfield lighting systems extend an airport’s usefulness into periods of darkness and/or poor visibility. A variety of lighting systems are installed at the airport for this purpose. These lighting systems, catego‐rized by function, are summarized as follows. Airport Identification Lighting The location of the airport at night is universally identified by a rotating beacon. The rotating beacon pro‐jects two beams of light, one white and one green, 180 degrees apart. The beacon operates from sunset to sunrise and is located on top of the airport traffic control tower (ATCT) on the north side of the airfield. Pavement Edge Lighting Pavement edge lighting defines the lateral limits of the pavement to ensure safe operations during night and/or times of low visibility, which maintains safe and efficient access to and from the runway and aircraft parking areas. Both runways at CHD are equipped with medium intensity runway lighting (MIRL). The MIRL for the primary runway emit white light except in the caution zone,9 which is the last 2,000 feet of runway where yellow light is emitted in the di‐rection facing the Runway 4R threshold and white light in the opposite direction. The secondary runway is a visual‐only runway, so it does not have a caution zone. Each end of both runways is equipped with threshold lights, which emit green light outward from the run‐way and emit red light toward the runway. Green lights indicate the landing threshold to arriving aircraft and red lights indicate the end of the runway for de‐parting aircraft. The entirety of the taxiway system at CHD is equipped with elevated blue medium intensity taxiway lights (MITL).
9 Yellow lights in the caution zone indicate caution on rollout after landing.
MITL FIXTURE
Inventory | DRAFT FINAL 1-17
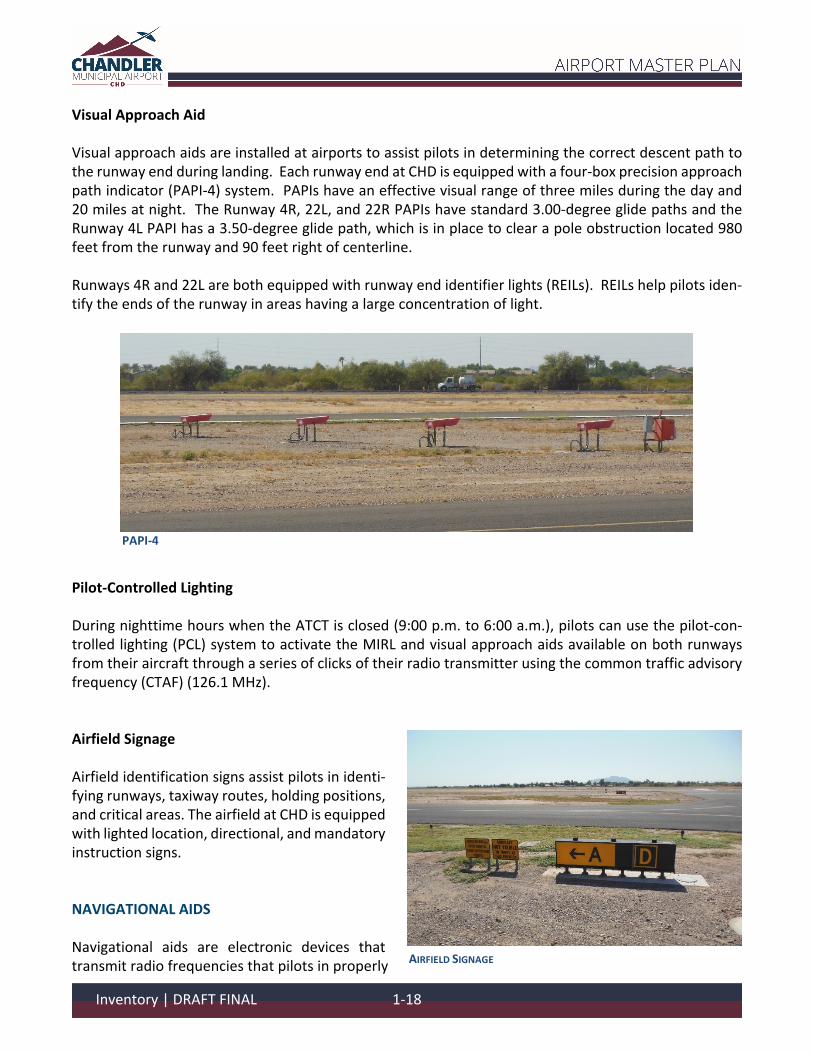
Visual Approach Aid Visual approach aids are installed at airports to assist pilots in determining the correct descent path to the runway end during landing. Each runway end at CHD is equipped with a four‐box precision approach path indicator (PAPI‐4) system. PAPIs have an effective visual range of three miles during the day and 20 miles at night. The Runway 4R, 22L, and 22R PAPIs have standard 3.00‐degree glide paths and the Runway 4L PAPI has a 3.50‐degree glide path, which is in place to clear a pole obstruction located 980 feet from the runway and 90 feet right of centerline. Runways 4R and 22L are both equipped with runway end identifier lights (REILs). REILs help pilots iden‐tify the ends of the runway in areas having a large concentration of light.
PAPI‐4
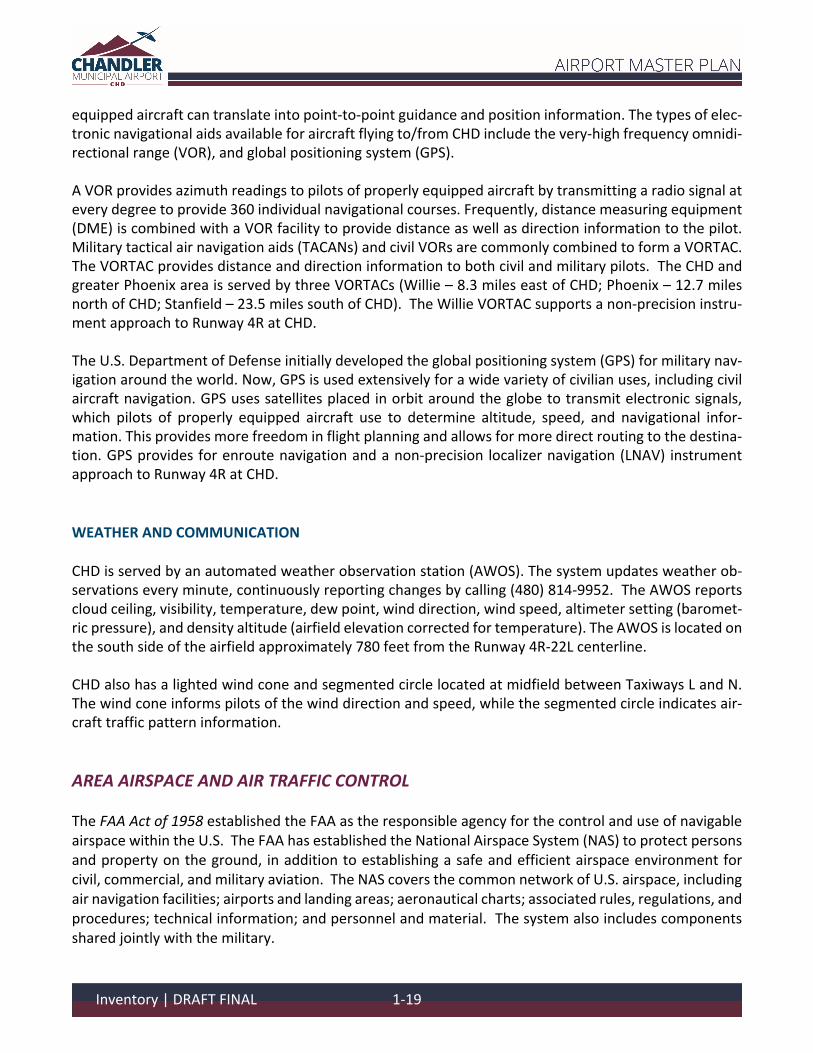
Pilot‐Controlled Lighting During nighttime hours when the ATCT is closed (9:00 p.m. to 6:00 a.m.), pilots can use the pilot‐con‐trolled lighting (PCL) system to activate the MIRL and visual approach aids available on both runways from their aircraft through a series of clicks of their radio transmitter using the common traffic advisory frequency (CTAF) (126.1 MHz). Airfield Signage Airfield identification signs assist pilots in identi‐fying runways, taxiway routes, holding positions, and critical areas. The airfield at CHD is equipped with lighted location, directional, and mandatory instruction signs. NAVIGATIONAL AIDS Navigational aids are electronic devices that transmit radio frequencies that pilots in properly AIRFIELD SIGNAGE
Inventory | DRAFT FINAL 1-18
equipped aircraft can translate into point‐to‐point guidance and position information. The types of elec‐tronic navigational aids available for aircraft flying to/from CHD include the very‐high frequency omnidi‐rectional range (VOR), and global positioning system (GPS). A VOR provides azimuth readings to pilots of properly equipped aircraft by transmitting a radio signal at every degree to provide 360 individual navigational courses. Frequently, distance measuring equipment (DME) is combined with a VOR facility to provide distance as well as direction information to the pilot. Military tactical air navigation aids (TACANs) and civil VORs are commonly combined to form a VORTAC. The VORTAC provides distance and direction information to both civil and military pilots. The CHD and greater Phoenix area is served by three VORTACs (Willie – 8.3 miles east of CHD; Phoenix – 12.7 miles north of CHD; Stanfield – 23.5 miles south of CHD). The Willie VORTAC supports a non‐precision instru‐ment approach to Runway 4R at CHD. The U.S. Department of Defense initially developed the global positioning system (GPS) for military nav‐igation around the world. Now, GPS is used extensively for a wide variety of civilian uses, including civil aircraft navigation. GPS uses satellites placed in orbit around the globe to transmit electronic signals, which pilots of properly equipped aircraft use to determine altitude, speed, and navigational infor‐mation. This provides more freedom in flight planning and allows for more direct routing to the destina‐tion. GPS provides for enroute navigation and a non‐precision localizer navigation (LNAV) instrument approach to Runway 4R at CHD. WEATHER AND COMMUNICATION CHD is served by an automated weather observation station (AWOS). The system updates weather ob‐servations every minute, continuously reporting changes by calling (480) 814‐9952. The AWOS reports cloud ceiling, visibility, temperature, dew point, wind direction, wind speed, altimeter setting (baromet‐ric pressure), and density altitude (airfield elevation corrected for temperature). The AWOS is located on the south side of the airfield approximately 780 feet from the Runway 4R‐22L centerline. CHD also has a lighted wind cone and segmented circle located at midfield between Taxiways L and N. The wind cone informs pilots of the wind direction and speed, while the segmented circle indicates air‐craft traffic pattern information.
AREA AIRSPACE AND AIR TRAFFIC CONTROL The FAA Act of 1958 established the FAA as the responsible agency for the control and use of navigable airspace within the U.S. The FAA has established the National Airspace System (NAS) to protect persons and property on the ground, in addition to establishing a safe and efficient airspace environment for civil, commercial, and military aviation. The NAS covers the common network of U.S. airspace, including air navigation facilities; airports and landing areas; aeronautical charts; associated rules, regulations, and procedures; technical information; and personnel and material. The system also includes components shared jointly with the military.
Inventory | DRAFT FINAL 1-19
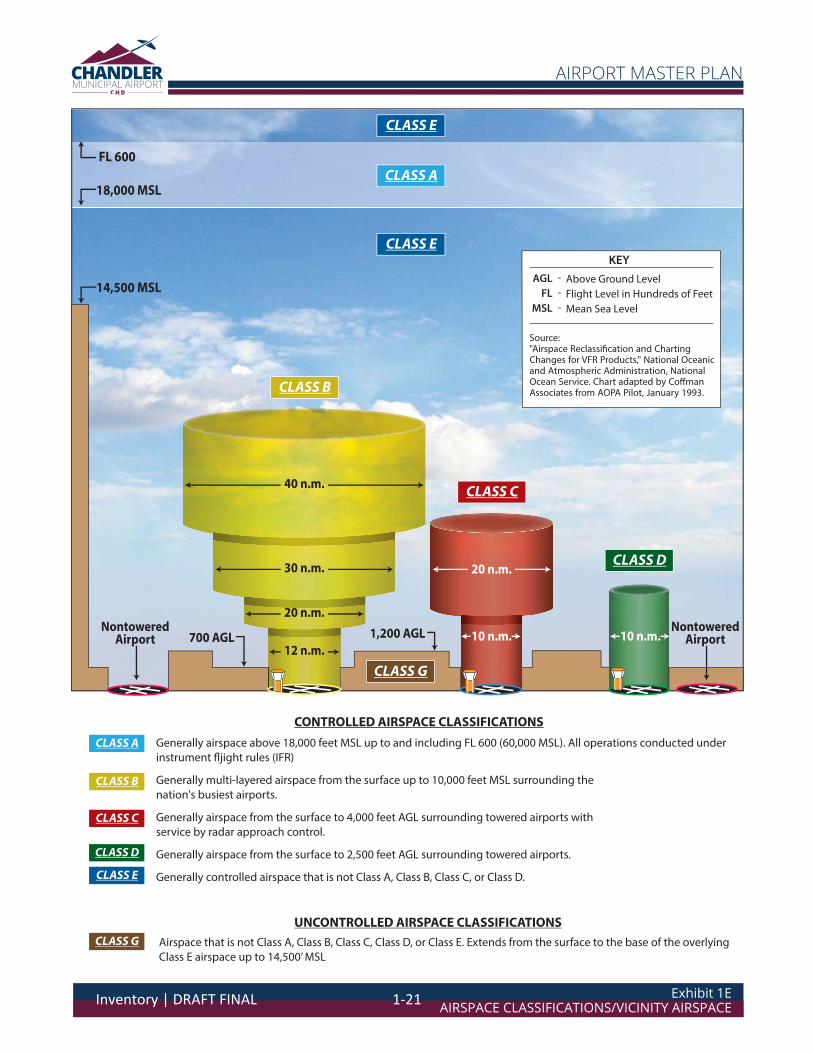
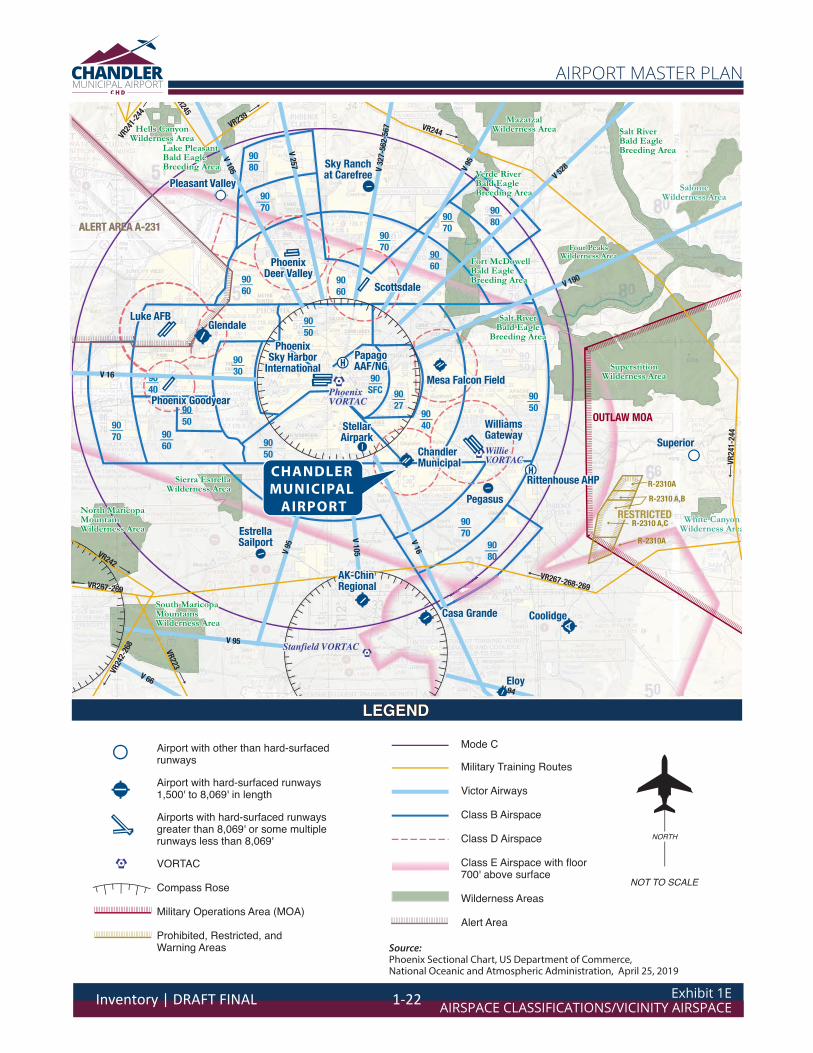
AIRSPACE STRUCTURE Airspace within the U.S. is broadly classified as either “controlled” or “uncontrolled.” The difference be‐tween controlled and uncontrolled airspace relates primarily to requirements for pilot qualifications, ground‐to‐air communications, navigation and air traffic services, and weather conditions. Six classes of airspace have been designated in the U.S., as shown on Exhibit 1E. Airspace designated as Class A, B, C, D, or E is considered controlled airspace. Aircraft operating within controlled airspace are subject to varying requirements for positive air traffic control. Airspace near CHD is depicted on the back side of Exhibit 1E. Class A Airspace | Class A airspace includes all airspace from 18,000 feet MSL to flight level (FL) 600 (approximately 60,000 feet MSL) over the contiguous 48 states and Alaska. This airspace is designated in Federal Aviation Regulation (F.A.R.) Part 71.33 for positive control of aircraft. All aircraft must be on an IFR clearance to operate within Class A airspace. Class B Airspace | Class B airspace has been designated around some of the country’s major airports, such as Phoenix Sky Harbor International Airport (PHX) to separate all aircraft within a specified radius of the primary airport. Each Class B airspace is specifically tailored for its primary airport. All aircraft operating within Class B airspace must have air traffic control clearance. Certain minimum aircraft equip‐ment and pilot certification requirements must also be met. This airspace is the most restrictive con‐trolled airspace routinely encountered by pilots operating under VFR in an uncontrolled environment. CHD is located within PHX’s Class B airspace at the convergence of three different sections. Each of the sections in the immediate vicinity of CHD have ceilings of 9,000 feet. Class B airspace floors immediately surrounding CHD are 4,000 feet to the north/east; 5,000 feet to the west; and 6,000 feet to the south. Class C Airspace | The FAA has established Class C airspace at approximately 120 airports around the country that have significant levels of IFR traffic. Class C airspace is designed to regulate the flow of uncontrolled traffic above, around, and below the arrival and departure airspace required for high‐per‐formance, passenger‐carrying aircraft at major airports. To fly inside Class C airspace, an aircraft must have a two‐way radio, an encoding transponder, and have established communication with the ATC fa‐cility. Aircraft may fly below the floor of the Class C airspace or above the Class C airspace ceiling without establishing communication with ATC. The nearest Class C airspace to CHD surrounds Tucson Interna‐tional Airport (TUS) and Davis Monthan Air Force Base (DMA). Class D Airspace | Class D airspace is controlled airspace surrounding airports with an ATCT. The Class D airspace typically constitutes a cylinder with a horizontal radius of four or five nautical miles (NM) from the airport, extending from the surface up to a designated vertical limit, typically set at approximately 2,500 feet above the airport elevation. As shown on Exhibit 1E, CHD operates within Class D airspace beginning at the surface and extending to 3,000 feet MSL during the operational hours of the ATCT. Aircraft operators planning to operate within Class D airspace are required to contact the CHD air traffic control prior to entering or departing CHD airspace and must maintain in contact while within the con‐trolled airspace to land at CHD or to transverse the area. When the ATCT is inactive, CHD airspace reverts to Class E airspace.
Inventory | DRAFT FINAL 1-20
Generally airspace above 18,000 feet MSL up to and including FL 600 (60,000 MSL). All operations conducted under
instrument fljight rules (IFR)
Generally multi-layered airspace from the surface up to 10,000 feet MSL surrounding the
nation's busiest airports.
Generally airspace from the surface to 4,000 feet AGL surrounding towered airports with
service by radar approach control.
Generally airspace from the surface to 2,500 feet AGL surrounding towered airports.
Generally controlled airspace that is not Class A, Class B, Class C, or Class D.
NontoweredAirport
14,500 MSL
NontoweredAirport700 AGL 1,200 AGL
18,000 MSL
FL 600
10 n.m.
40 n.m.
30 n.m.
20 n.m.
12 n.m.
20 n.m.
10 n.m.
- Above Ground Level
- Flight Level in Hundreds of Feet
- Mean Sea Level
AGLFL
MSL
KEY
CLASS A
CLASS A
CLASS B
CLASS C
CLASS D
CLASS E
CLASS G
CLASS E
CLASS E
CLASS B
CLASS G
CLASS C
CLASS D
Source: "Airspace Reclassification and Charting Changes for VFR Products," National Oceanic and Atmospheric Administration, National Ocean Service. Chart adapted by Coffman Associates from AOPA Pilot, January 1993.
CONTROLLED AIRSPACE CLASSIFICATIONS
UNCONTROLLED AIRSPACE CLASSIFICATIONSAirspace that is not Class A, Class B, Class C, Class D, or Class E. Extends from the surface to the base of the overlying
Class E airspace up to 14,500’ MSL
Exhibit 1EAIRSPACE CLASSIFICATIONS/VICINITY AIRSPACE
AIRPORT MASTER PLAN
Inventory | DRAFT FINAL 1-21
9070
9060
9080
9050
9050
9060
9070
9060
9070
9080
9050
9080
9060
9060
9070
9070
9030 90
SFC 9027
9040
9050
9040
OUTLAW MOA
ALERT AREA A-231ALERT AREA A-231
R-2310A
R-2310AR-2310 A,B
R-2310 A,CRESTRICTEDRESTRICTED
Stanfield VORTACStanfield VORTAC
WillieVORTACWillieVORTAC
PhoenixVORTACPhoenixVORTAC
Hells CanyonWilderness Area
Hells CanyonWilderness Area
Lake PleasantBald EagleBreeding Area
Lake PleasantBald EagleBreeding Area
Salt RiverBald EagleBreeding Area
Salt RiverBald EagleBreeding Area
MazatzalWilderness Area
MazatzalWilderness Area
Four PeaksWilderness Area
Four PeaksWilderness Area
SuperstitionWilderness Area
SuperstitionWilderness Area
Verde RiverBald EagleBreeding Area
Verde RiverBald EagleBreeding Area
Fort McDowellBald EagleBreeding Area
Fort McDowellBald EagleBreeding Area
Salt RiverBald Eagle
Breeding Area
Salt RiverBald Eagle
Breeding Area
Sierra EstrellaWilderness Area
Sierra EstrellaWilderness Area
North MaricopaMountainWilderness Area
North MaricopaMountainWilderness Area
White CanyonWilderness AreaWhite Canyon
Wilderness Area
South MaricopaMountainsWilderness Area
South MaricopaMountainsWilderness Area
SalomeWilderness Area
SalomeWilderness Area
V 95
V 105
V 16
V 190
V 528V 9
5
V 16
VR267-268-269
VR24
1-24
4
VR239VR244VR
241-2
44
VR245
VR223
VR242
VR267-269
V 95
V 32
7-56
2-56
7
V 105
V 257
V 66V 94
EstrellaSailportEstrellaSailport
Sky Ranchat CarefreeSky Ranchat Carefree
WilliamsGatewayWilliamsGateway
Mesa Falcon FieldMesa Falcon Field
ScottsdaleScottsdale
Luke AFBLuke AFBGlendaleGlendale
Phoenix GoodyearPhoenix Goodyear
PhoenixDeer Valley
PhoenixDeer Valley
ChandlerMunicipalChandlerMunicipal
StellarAirparkStellarAirpark
PhoenixSky Harbor
International
PhoenixSky Harbor
InternationalPapagoAAF/NGPapagoAAF/NG
Pleasant ValleyPleasant Valley
CoolidgeCoolidgeCasa GrandeCasa Grande
EloyEloy
AK-ChinRegionalAK-ChinRegional
PegasusPegasus
SuperiorSuperior
H
H
Rittenhouse AHPRittenhouse AHP
VR24
2-26
8
CHANDLER MUNICIPAL
AIRPORT
Airport with other than hard-surfacedrunways
Airport with hard-surfaced runways1,500' to 8,069' in length
Airports with hard-surfaced runwaysgreater than 8,069' or some multiplerunways less than 8,069'
VORTAC
Compass Rose
Military Operations Area (MOA)
Prohibited, Restricted, and Warning Areas
Mode C
Military Training Routes
Victor Airways
Class B Airspace
Class D Airspace
Class E Airspace with floor700' above surface
Wilderness Areas
Alert Area
Source:Phoenix Sectional Chart, US Department of Commerce, National Oceanic and Atmospheric Administration, April 25, 2019
NOT TO SCALE
NORTH
LEGENDLEGENDLEGEND
Exhibit 1EAIRSPACE CLASSIFICATIONS/VICINITY AIRSPACE
AIRPORT MASTER PLAN
Inventory | DRAFT FINAL 1-22
Class E Airspace | Class E airspace consists of controlled airspace designed to contain IFR operations near an airport and while aircraft are transitioning between the airport and enroute environments. Un‐less otherwise specified, Class E airspace terminates at the base of the overlying airspace. Only aircraft operating under IFR are required to be in contact with ATC when operating in Class E airspace. While aircraft conducting visual flights in Class E airspace are not required to be in radio communications with ATC facilities, visual flight can only be conducted if minimum visibility and cloud ceilings exist. Class G Airspace | Airspace not designated as Class A, B, C, D, or E is considered uncontrolled, or Class G, airspace. Air traffic control does not have the authority or responsibility to exercise control over air traffic within this airspace. Class G airspace lies between the surface and the overlaying Class E airspace (700 to 1,200 feet above ground level). While aircraft may technically operate within this Class G airspace without any contact with ATC, it is unlikely that many aircraft will operate this low to the ground. Furthermore, federal regulations specify minimum altitudes for flight. F.A.R. Part 91.119, Minimum Safe Altitudes, generally states that except when necessary for takeoff or landing, pilots must not operate an aircraft over any congested area of a city, town, or settlement, or over any open‐air assembly of persons, at an altitude of 1,000 feet above the highest obstacle within a horizontal radius of 2,000 feet of the aircraft. Over less congested areas, pilots must maintain an altitude of 500 feet above the surface, except over open water or sparsely populated areas. In those cases, the aircraft may not be operated closer than 500 feet to any person, vessel, vehicle, or structure. Helicopters may be operated at less than the mini‐mums prescribed above if the operation is conducted without hazard to persons or property on the surface. In addition, each person operating a helicopter shall comply with any routes or altitudes spe‐cifically prescribed for helicopters by the FAA. Victor Airways | For aircraft arriving or departing the regional area using VOR facilities, a system of Fed‐eral Airways, referred to as Victor Airways, has been established. Victor Airways are corridors of airspace eight miles wide that extend upward from 1,200 feet above ground level (AGL) to 18,000 feet MSL and extend between VOR navigational facilities. Victor Airways near CHD are identified on Exhibit 1E. Alert Areas / Military Operations Area (MOA) & Military Training Routes (MTRs) / Restricted Areas | Alert areas, MOAs, MTRs, and restricted areas are depicted on aeronautical charts to inform nonpartic‐ipating pilots of areas that may contain a high volume of pilot training, military operations/activities, or an unusual type of aerial activity. Pilots should exercise caution near and within these areas. All activity within these areas, if granted by the controlling agency, should be conducted in accordance with regu‐lations, without waiver, and pilots of participating aircraft, as well as pilots transitioning the area, are equally responsible for collision avoidance. The Outlaw MOA, beginning approximately 21.4 nautical miles (NM) east of CHD. Restricted areas (R‐2310A, B, and C) are located approximately 23.7 NM south‐east of CHD. These restricted areas are used for live fire munitions training and unmanned aerial vehicle (UAV) training.
Inventory | DRAFT FINAL 1-23
AIRSPACE CONTROL Albuquerque Air Route Traffic Control Center (ARTCC) | The FAA has established 21 ARTCCs throughout the continental U.S. to control aircraft operating under IFR within controlled airspace and while enroute. An ARTCC assigns specific routes and altitudes along Federal Airways to maintain separation and orderly traffic flow. The Albuquerque Center ARTCC controls IFR airspace enroute to and from the Phoenix met‐ropolitan area, including CHD, at altitudes greater than 10,000 feet above ground level (AGL). Phoenix Terminal Radar Approach Control (TRACON) | The Phoenix TRACON is responsible for maintaining sep‐aration between aircraft operating under 10,000 feet AGL during their approach and departures from airports in the Phoenix metropolitan area. Once aircraft enter CHD airspace (typically within five miles of the airport and below 2,500 feet), the TRACON “hands‐off” respon‐sibility for the aircraft to the CHD ATCT. This process is reversed for aircraft departing CHD. Chandler Airport Traffic Control Tower (ATCT) | Ap‐proaching, departing, and taxiing aircraft at CHD are managed by the Chandler ATCT controllers. The CHD ATCT was commissioned on July 13, 1998 and is located on the north side of the airfield. The tower operates from 6:00 a.m. to 9:00 p.m. seven days per week. The CHD ATCT is part of the FAA’s contract tower program, which utilizes non‐federal controllers. Serco Manage‐ment Services, Inc. is the current ATCT operator. Flight service stations (FSS) | FSS’s are air traffic facilities which provide pilot briefings, flight plan pro‐cessing, inflight radio communications, search and rescue (SAR) services, and assistance to lost aircraft and aircraft in emergency situations. FSSs also relay air traffic control clearances, process Notice to Air‐men (NOTAMs), and broadcast aviation meteorological and aeronautical information. FLIGHT PROCEDURES Flight procedures are a set of predetermined maneuvers established by the FAA, using electronic or vis‐ual navigational aids that assist pilots in locating and landing or departing from an airport. Instrument Approach Procedures: Instrument approach procedures are a series of predetermined ma‐neuvers established by the FAA, using electronic navigational aids that assist pilots in locating and land‐ing at an airport, especially during instrument flight conditions. Precision instrument approaches, which provide vertical descent information and course guidance information to the pilot. Non‐precision ap‐proaches only provide course guidance to the pilot; however, the relatively new GPS localizer perfor‐mance with vertical guidance (LPV) approaches are currently categorized by the FAA as an approach with vertical guidance (APV), which is not considered a precision approach.
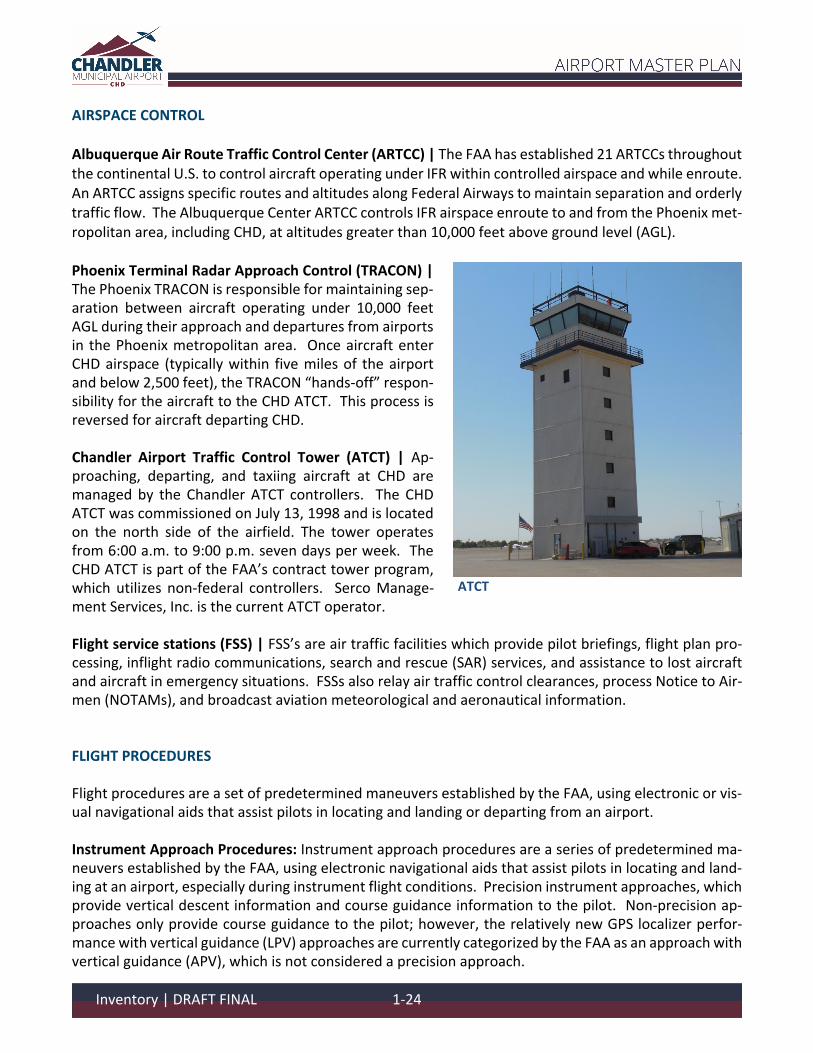
ATCT
Inventory | DRAFT FINAL 1-24
There are currently two published non‐precision instrument approach procedures at CHD, both to Run‐way 4R. The visibility and cloud height minimums associated with the approach define the capability of an instrument approach procedure. Visibility minimums define the horizontal distance the pilot must be able to see to complete the approach. Cloud height defines the lowest level a cloud layer (defined in feet above the ground) can be situated for the pilot to complete the approach. If the observed visibility or cloud ceilings are below the minimums prescribed for the approach, the pilot cannot complete the instrument approach. Table 1F summarizes FAA‐approved and published instrument approach proce‐dures, including associated weather minimums for CHD.
TABLE 1F Instrument Approach Procedures Chandler Municipal Airport
WEATHER MINIMUMS BY AIRCRAFT TYPE Category A Category B Category C Category D
RNAV (GPS) Runway 4R LNAV MDA 1680’/1‐mile 1680’/1‐mile 1680’/1.25‐mile NA Circling 1720’/1‐mile 1720’/1‐mile 1720’/1.5‐mile NA VOR Runway 4R S‐4R 1680’/1‐mile 1680’/1‐mile 1680’/1.25‐mile NA Circling 1720’/1‐mile 1720’/1‐mile 1720’/1.5‐mile NA Aircraft categories are based on the approach speed of aircraft, which is determined as 1.3 times the stall speed in landing configuration as follows: Category A: 0‐90 knots (e.g., Cessna 172) Category B: 91‐120 knots (e.g., Beechcraft King Air) Category C: 121‐140 knots (e.g., Learjet) Category D: 141‐166 knots (e.g., Gulfstream G450)
Abbreviations: GPS ‐ Global Positioning System LNAV/RNAV ‐ A technical variant of GPS (Lateral, Area Navigation) MDA ‐ Minimum Decision Altitude VOR – Very High Frequency Omnidirectional Range
Note: (xxx'/ x‐mile) = Cloud ceiling height/Visibility minimum Source: U.S. Terminal Procedures (Effective January 2020)
Local Operating Procedures: The traffic pattern at the airport is maintained to provide the safest and most efficient use of the airspace. At CHD, Runways 4L and 22L use left‐hand traffic patterns, which means aircraft conduct left‐hand turns within the traffic pattern when operating on either of the two runways. Runways 4R and 22R use right‐hand traffic patterns. As a result, aircraft operating within Runway 4L‐22R’s pattern remain north of the airport and aircraft operating within Runway 4R‐22L’s pat‐tern stay south of the airport. The typical traffic pattern altitude for rotorcraft is 500 feet AGL; piston aircraft is between 800 and 1,000 feet AGL; and 1,500 feet AGL for turbine aircraft. CHD traffic patterns and generalized flight tracks are depicted in Figure 1B.
Prevailing wind conditions dictate runway usage (i.e. easterly winds generally favor the use of Runways 4R/4L; westerly winds generally favor Runway 22L/22R). During calm wind conditions, Runways 4R/4L are the preferred runways.
Inventory | DRAFT FINAL 1-25
CHD does not have aircraft restrictions, curfews, or a mandatory noise abatement program, as these programs would violate the Federal Airport Noise and Capacity Act (ANCA) of 1990. Federal law requires the airport to remain open 24 hours a day, 7 days a week, and to accept all civilian and military aircraft that can be safely accommodated.
FIGURE 1B – CHD TRAFFIC PATTERN AND GENERALIZED FLIGHT TRACKS
REGIONAL AIRPORTS
A review of other public‐use airports with at least one paved runway within a 30‐nm radius of CHD was conducted to identify and distinguish the types of air service provided in the region. It is important to consider the capabilities and limitations of these airports when planning for future changes or improve‐ments at CHD. Table 1G provides basic level information on 12 public‐use airports within the vicinity of CHD. All regional airports, including CHD, combine for over 2.2 million annual operations and over 3,200 based aircraft. A more detailed discussion of regional airports and their impact on CHD’s service area is provided in Chapter Two of this report.
Inventory | DRAFT FINAL 1-26
TABLE 1G Airports Within 30 NM from CHD
Airport Nautical Miles/
Direction from CHD¹ FAA Service
Level² Based Aircraft¹
Annual Operations¹
Longest Runway (ft.)¹
Lowest Visibility Minimum¹
Chandler Municipal ‐‐ Reliever 441 220,662 4,870’ 1‐mile Stellar Airpark 5.5nm/WNW N/A 176 40,150 4,416’ 1‐mile Phoenix‐Mesa Gateway 8.1nm/ENE Primary 126 288,715 10,401’ ¾‐mile Falcon Field 12.2nm/NNE Reliever 644 300,030 5,100 1‐mile Phoenix Sky Harbor 14.1nm/NW Primary 70 434,715 11,489’ ½‐mile Ak‐Chin Regional 17.6nm/SSW GA 13 31,755 4,751’ None Casa Grande Municipal 19.0nm/S GA 82 119,720 5,200’ ½‐mile Scottsdale 21.8nm/NNW Reliever 353 183,595 8,249’ 1‐mile Coolidge Municipal 27.8nm/SE GA 38 4,212 5,564’ 1‐mile Phoenix Deer Valley 28.6nm/NNW Reliever 973 378,505 8,196’ 1‐mile Glendale Municipal 28.8nm/WNW Reliever 113 74,825 7,150’ 1‐mile Phoenix Goodyear 29.8nm/WNW Reliever 217 127,750 8,500’ 1‐mile Eloy Municipal 30.0nm/SSE GA 20 29,930 3,901’ None Sources: ¹www.airnav.com / basedaircraft.com / CHD ATCT operations counts for 2019; ²NPIAS;
LANDSIDE FACILITIES TERMINAL BUILDING Constructed in 1996, the gen‐eral aviation terminal building at CHD has a total area of ap‐proximately 5,500 sf. The ter‐minal is located on the north side of the airfield where it pro‐vides space for administration offices, pilot and passenger ar‐eas, restrooms, pilot’s lounge, flight planning area, lobby, and conference room. AIRPORT BUSINESSES Businesses on the airport are concentrated primarily in the area immediately east/north‐east of the terminal building. The following is a description of the various business operations based at CHD:
TERMINAL BUILDING
CHANDLER AIR SERVICE
Inventory | DRAFT FINAL 1-27
Chandler Air Service, Inc. | a full‐service FBO that provides a variety of services including fueling, FAR Part 141 flight training, aircraft rental, pilot supplies, and aircraft maintenance/parts sales.
Chandler Aviation | a specialty avi‐ation service operator (SASO) that provides a complete line of mainte‐nance‐related services, annual in‐spections, sheet metal repairs, fab‐ric repairs and engine overhauls.
Chandler Avionics | a SASO provid‐ing avionics installation and certifi‐cation.
The Hangar Café | a restaurant lo‐cated within the Chandler Air Ser‐vice FBO facility.
Quantum Helicopters | a SASO providing helicopter flight training and charter service. Located on the south side of the airfield. Quantum has provided FAR Part 61 and 141 flight training at CHD since 1993.
Southwest Aircraft Charter | Air‐craft charter operations and man‐agement. Aircraft fleet includes four Beechcraft Barons, two Beechcraft King Air 200s, and two Learjet 45s.
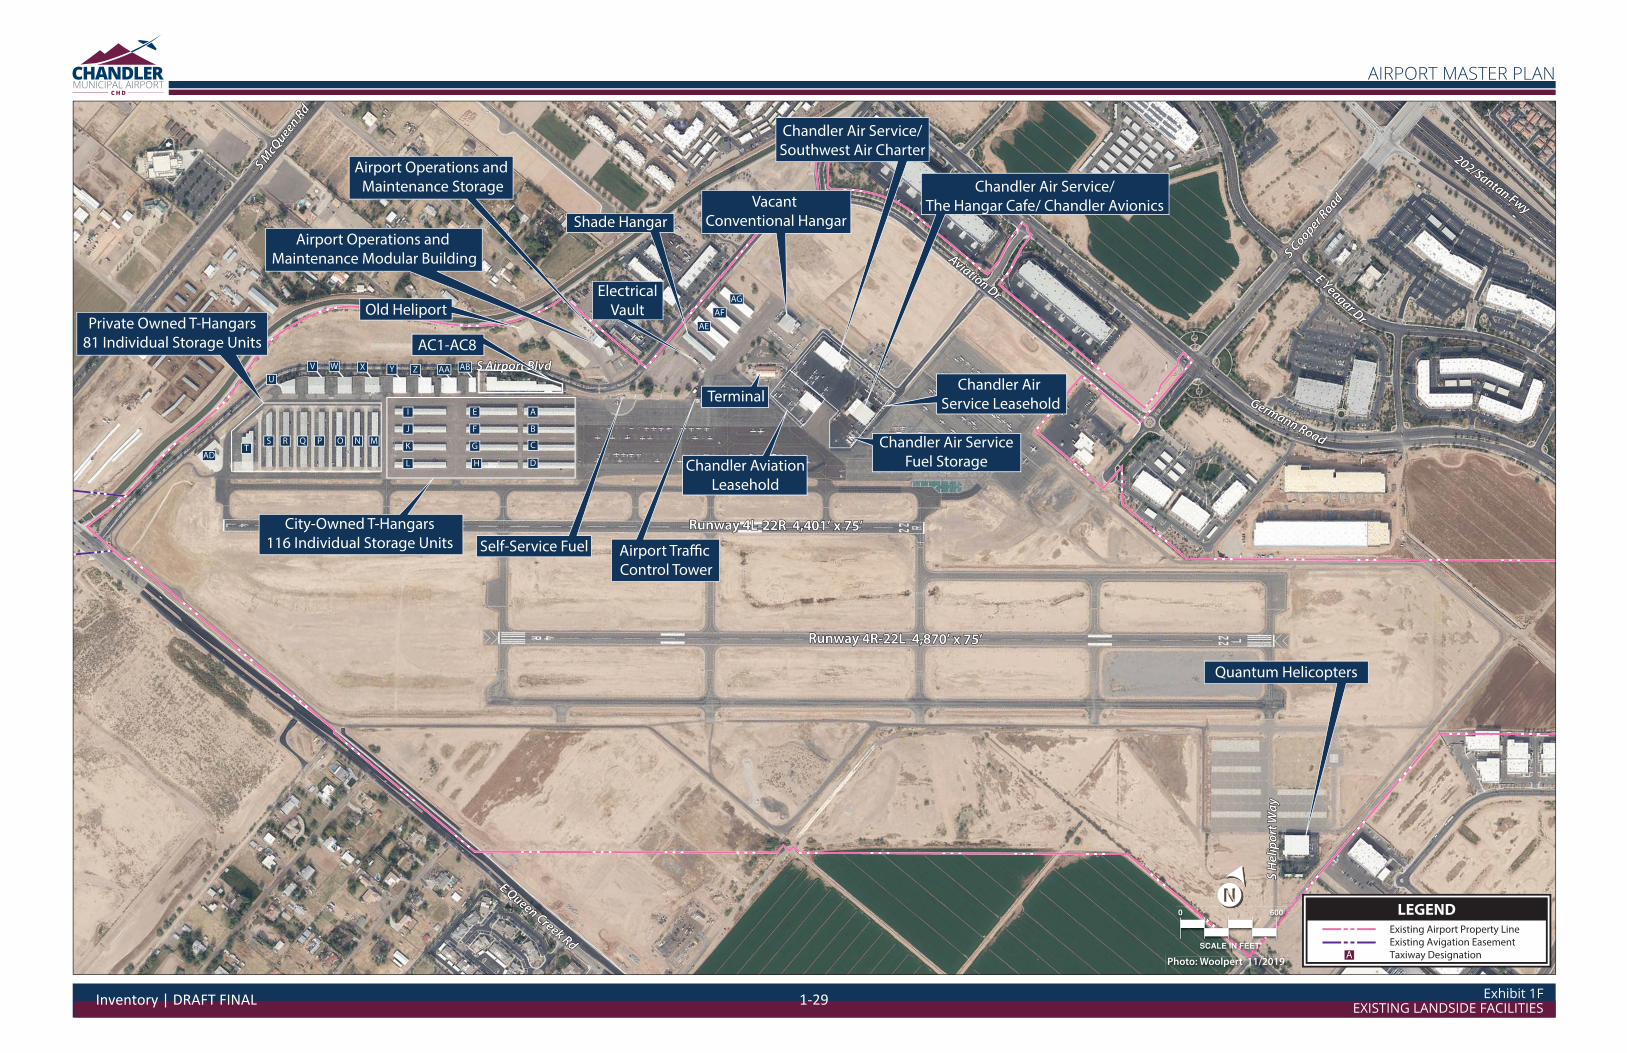
AIRCRAFT HANGAR FACILITIES Existing hangar facilities at CHD consist of large conventional‐style hangars utilized by the various FBO/SASOs on the airport, T‐hangars and shade hangars used by small aircraft, and executive‐style and box hangars, which are mid‐sized hangars. Hangar facilities are described in Table 1H and identified on Exhibit 1F. In total, CHD has 438,517 sf of hangar storage capacity.
THE HANGAR CAFÉ
QUANTUM HELICOPTERS
CHANDLER AVIATION
Inventory | DRAFT FINAL 1-28
Germann Road
Germann Road
E Yeagar Dr
E Yeagar Dr
S Cooper Road
S Cooper Road
202/Santan Fwy
202/Santan Fwy
E Queen Creek Rd
E Queen Creek Rd
S H
elip
ort W
ayS
Hel
ipor
t Way
S McQ
ueen Rd
S McQ
ueen Rd
S Airport BlvdS Airport Blvd
Aviation Dr
Aviation Dr
0 600
SCALE IN FEET
Photo: Woolpert 11/2019
LEGENDExisting Airport Property Line
Existing Avigation Easement
Taxiway DesignationA
Runway 4R-22L 4,870’ x 75’Runway 4R-22L 4,870’ x 75’
Runway 4L-22R 4,401’ x 75’Runway 4L-22R 4,401’ x 75’
Shade Hangar
Chandler Air Service/
Southwest Air Charter
Quantum Helicopters
Chandler Air Service/
The Hangar Cafe/ Chandler AvionicsVacant
Conventional Hangar
Airport Operations and
Maintenance Storage
Airport Operations and
Maintenance Modular Building
Private Owned T-Hangars
81 Individual Storage Units
Old Heliport
AC1-AC8
Terminal
Chandler Air Service
Fuel Storage
Chandler Air
Service Leasehold
Chandler Aviation
Leasehold
Electrical
Vault
Airport Traffic
Control Tower
Self-Service Fuel
City-Owned T-Hangars
116 Individual Storage Units
TS R Q P O N M
I
J
K
L
E
F
G
H
A
B
C
D
U
V W X Y Z AA
AE
AF
AG
AB
AD
Exhibit 1FEXISTING LANDSIDE FACILITIES
AIRPORT MASTER PLAN
Inventory | DRAFT FINAL 1-29

This page intentionally left blank
Inventory | DRAFT FINAL 1-30
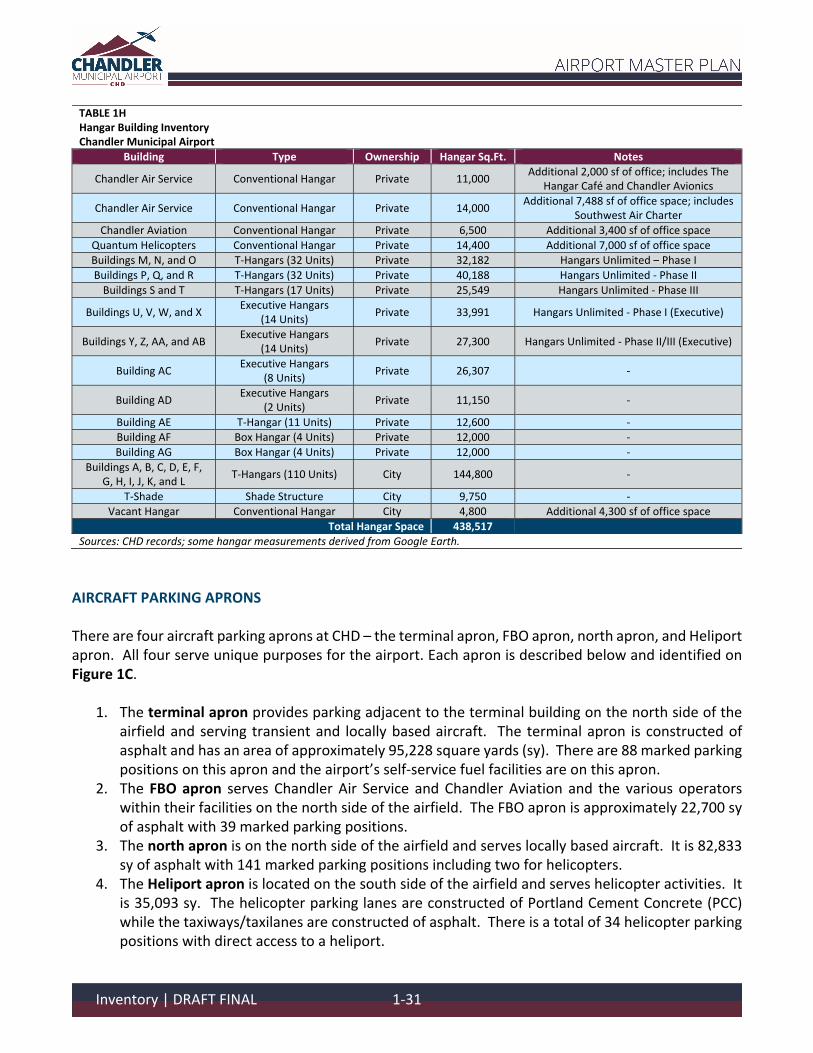
TABLE 1H Hangar Building Inventory Chandler Municipal Airport
Building Type Ownership Hangar Sq.Ft. Notes
Chandler Air Service Conventional Hangar Private 11,000 Additional 2,000 sf of office; includes The
Hangar Café and Chandler Avionics
Chandler Air Service Conventional Hangar Private 14,000 Additional 7,488 sf of office space; includes
Southwest Air Charter
Chandler Aviation Conventional Hangar Private 6,500 Additional 3,400 sf of office space
Quantum Helicopters Conventional Hangar Private 14,400 Additional 7,000 sf of office space Buildings M, N, and O T‐Hangars (32 Units) Private 32,182 Hangars Unlimited – Phase I
Buildings P, Q, and R T‐Hangars (32 Units) Private 40,188 Hangars Unlimited ‐ Phase II
Buildings S and T T‐Hangars (17 Units) Private 25,549 Hangars Unlimited ‐ Phase III
Buildings U, V, W, and X Executive Hangars
(14 Units) Private 33,991 Hangars Unlimited ‐ Phase I (Executive)
Buildings Y, Z, AA, and AB Executive Hangars
(14 Units) Private 27,300 Hangars Unlimited ‐ Phase II/III (Executive)
Building AC Executive Hangars
(8 Units) Private 26,307 ‐
Building AD Executive Hangars
(2 Units) Private 11,150 ‐
Building AE T‐Hangar (11 Units) Private 12,600 ‐ Building AF Box Hangar (4 Units) Private 12,000 ‐
Building AG Box Hangar (4 Units) Private 12,000 ‐
Buildings A, B, C, D, E, F, G, H, I, J, K, and L
T‐Hangars (110 Units) City 144,800 ‐
T‐Shade Shade Structure City 9,750 ‐ Vacant Hangar Conventional Hangar City 4,800 Additional 4,300 sf of office space
Total Hangar Space 438,517 Sources: CHD records; some hangar measurements derived from Google Earth.
AIRCRAFT PARKING APRONS There are four aircraft parking aprons at CHD – the terminal apron, FBO apron, north apron, and Heliport apron. All four serve unique purposes for the airport. Each apron is described below and identified on Figure 1C.
1. The terminal apron provides parking adjacent to the terminal building on the north side of the airfield and serving transient and locally based aircraft. The terminal apron is constructed of asphalt and has an area of approximately 95,228 square yards (sy). There are 88 marked parking positions on this apron and the airport’s self‐service fuel facilities are on this apron.
2. The FBO apron serves Chandler Air Service and Chandler Aviation and the various operators within their facilities on the north side of the airfield. The FBO apron is approximately 22,700 sy of asphalt with 39 marked parking positions.
3. The north apron is on the north side of the airfield and serves locally based aircraft. It is 82,833 sy of asphalt with 141 marked parking positions including two for helicopters.
4. The Heliport apron is located on the south side of the airfield and serves helicopter activities. It is 35,093 sy. The helicopter parking lanes are constructed of Portland Cement Concrete (PCC) while the taxiways/taxilanes are constructed of asphalt. There is a total of 34 helicopter parking positions with direct access to a heliport.
Inventory | DRAFT FINAL 1-31
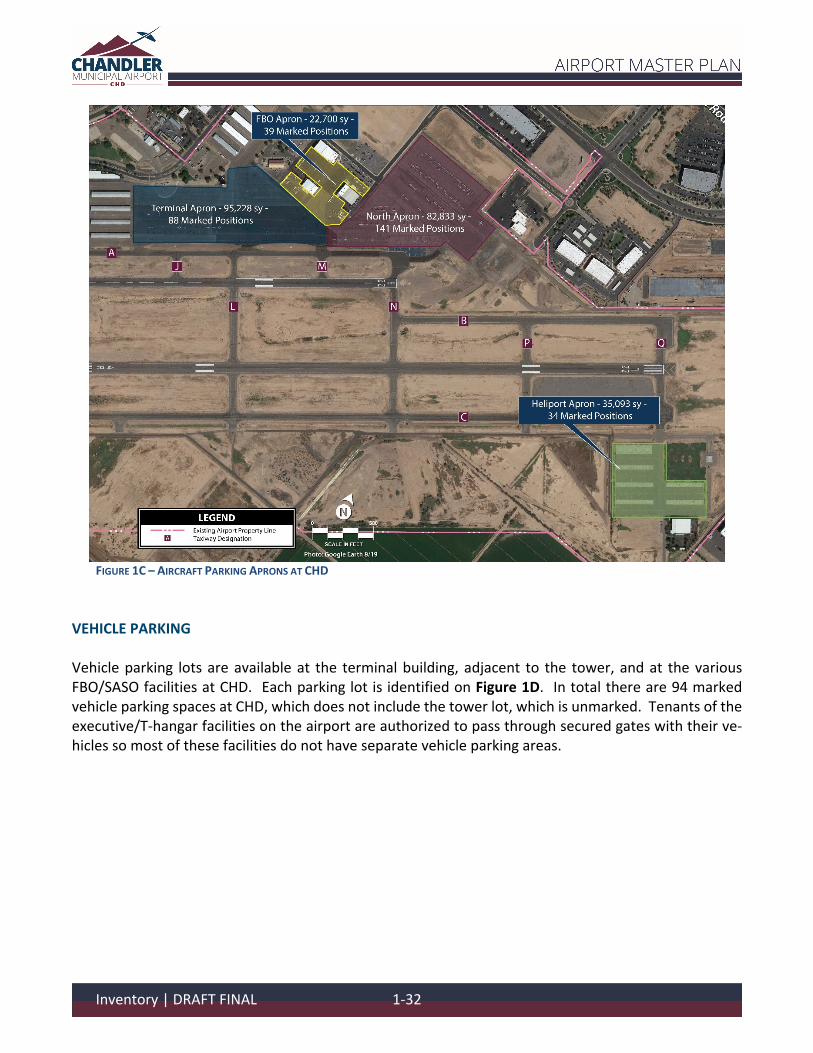
FIGURE 1C – AIRCRAFT PARKING APRONS AT CHD
VEHICLE PARKING Vehicle parking lots are available at the terminal building, adjacent to the tower, and at the various FBO/SASO facilities at CHD. Each parking lot is identified on Figure 1D. In total there are 94 marked vehicle parking spaces at CHD, which does not include the tower lot, which is unmarked. Tenants of the executive/T‐hangar facilities on the airport are authorized to pass through secured gates with their ve‐hicles so most of these facilities do not have separate vehicle parking areas.
Inventory | DRAFT FINAL 1-32
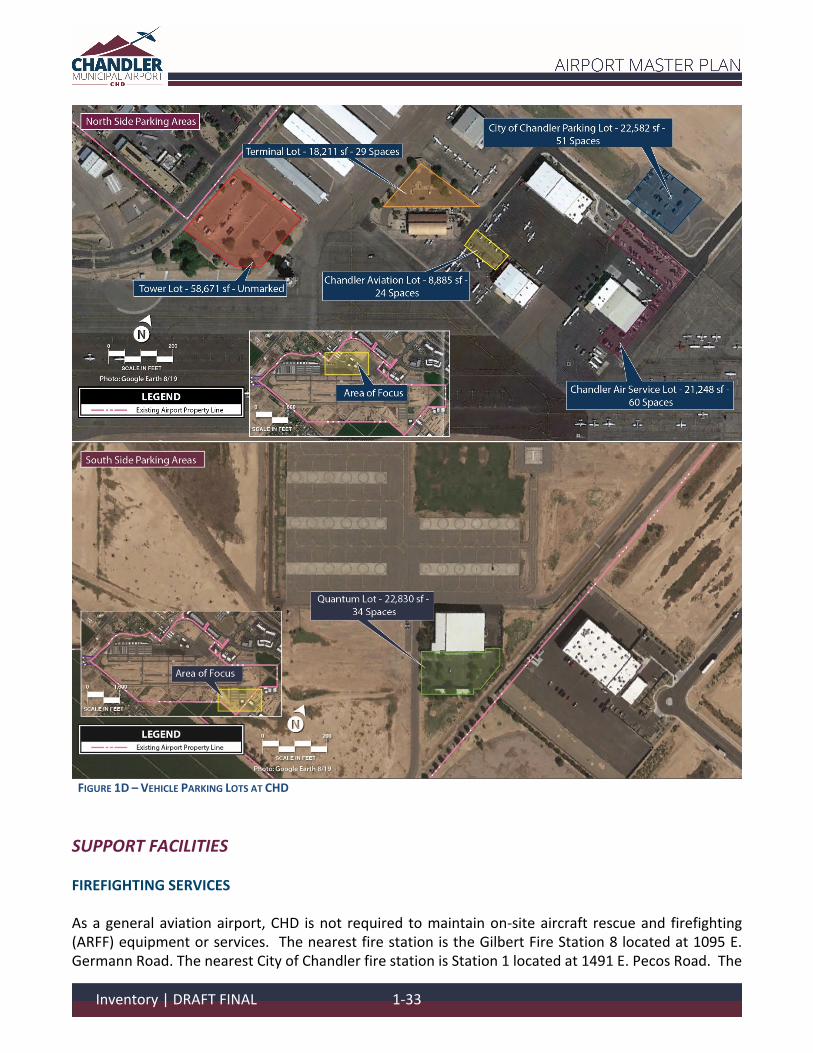
FIGURE 1D – VEHICLE PARKING LOTS AT CHD
SUPPORT FACILITIES FIREFIGHTING SERVICES As a general aviation airport, CHD is not required to maintain on‐site aircraft rescue and firefighting (ARFF) equipment or services. The nearest fire station is the Gilbert Fire Station 8 located at 1095 E. Germann Road. The nearest City of Chandler fire station is Station 1 located at 1491 E. Pecos Road. The
Inventory | DRAFT FINAL 1-33
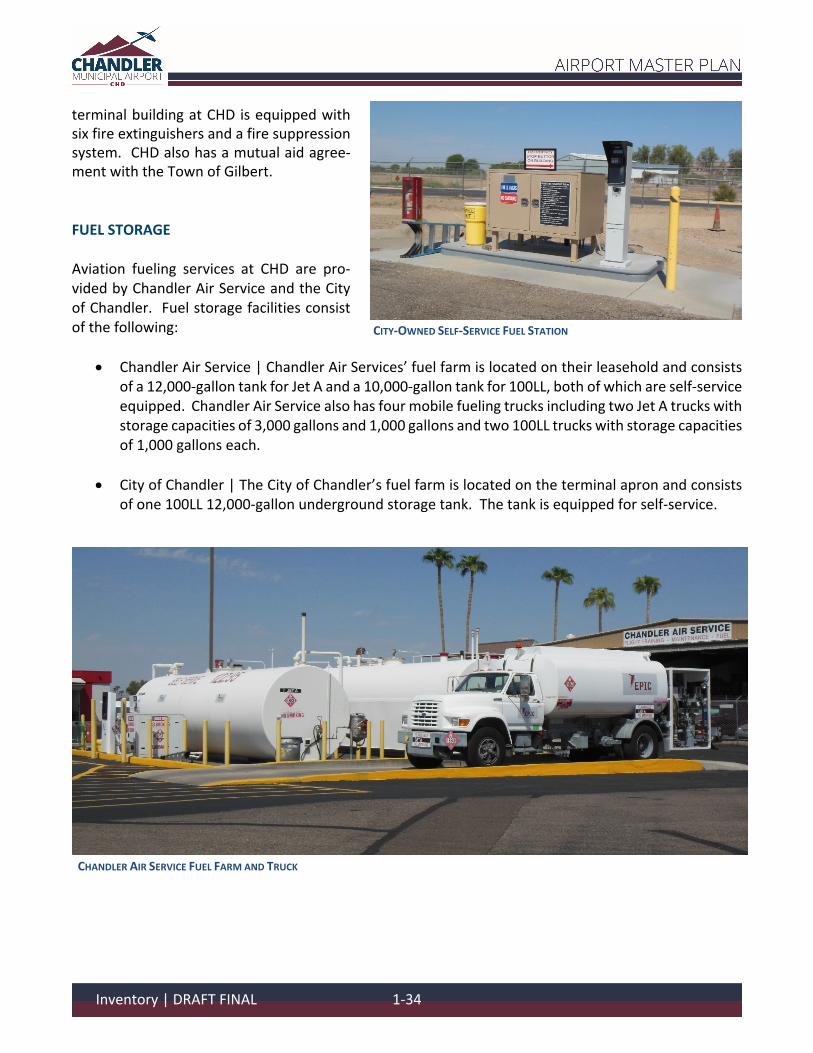
terminal building at CHD is equipped with six fire extinguishers and a fire suppression system. CHD also has a mutual aid agree‐ment with the Town of Gilbert. FUEL STORAGE Aviation fueling services at CHD are pro‐vided by Chandler Air Service and the City of Chandler. Fuel storage facilities consist of the following:
Chandler Air Service | Chandler Air Services’ fuel farm is located on their leasehold and consists of a 12,000‐gallon tank for Jet A and a 10,000‐gallon tank for 100LL, both of which are self‐service equipped. Chandler Air Service also has four mobile fueling trucks including two Jet A trucks with storage capacities of 3,000 gallons and 1,000 gallons and two 100LL trucks with storage capacities of 1,000 gallons each.
City of Chandler | The City of Chandler’s fuel farm is located on the terminal apron and consists of one 100LL 12,000‐gallon underground storage tank. The tank is equipped for self‐service.
CHANDLER AIR SERVICE FUEL FARM AND TRUCK
CITY‐OWNED SELF‐SERVICE FUEL STATION
Inventory | DRAFT FINAL 1-34
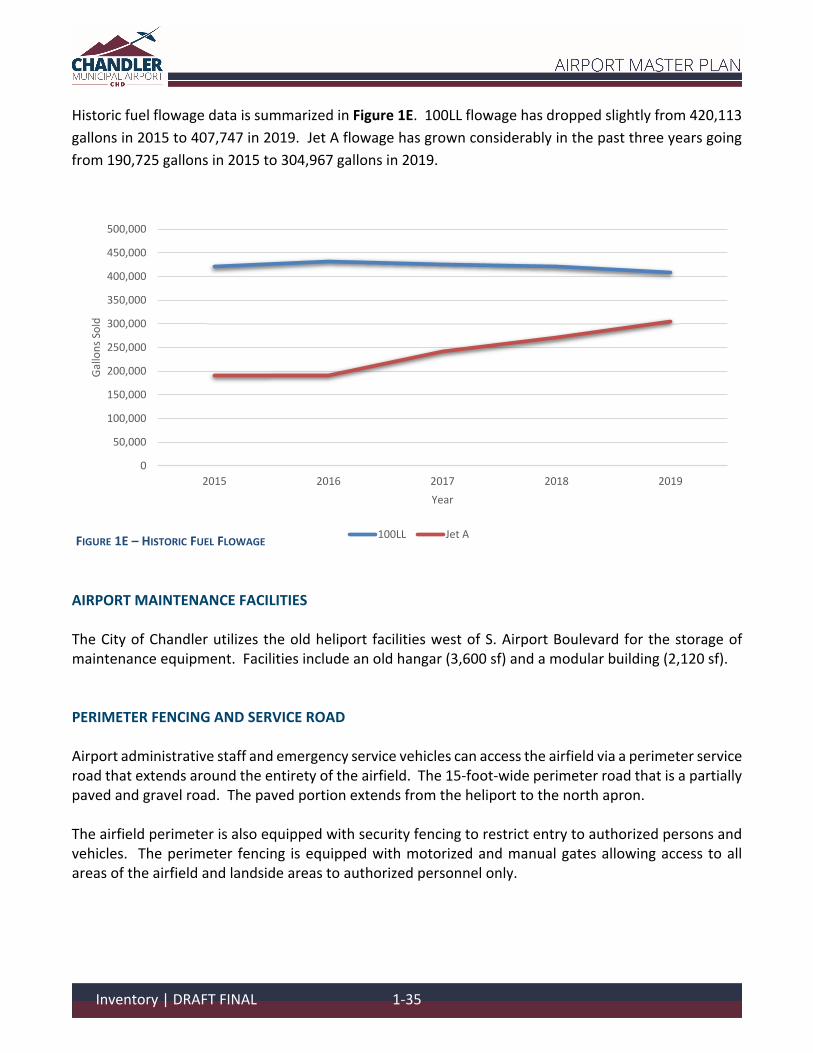
Historic fuel flowage data is summarized in Figure 1E. 100LL flowage has dropped slightly from 420,113
gallons in 2015 to 407,747 in 2019. Jet A flowage has grown considerably in the past three years going
from 190,725 gallons in 2015 to 304,967 gallons in 2019.
AIRPORT MAINTENANCE FACILITIES The City of Chandler utilizes the old heliport facilities west of S. Airport Boulevard for the storage of maintenance equipment. Facilities include an old hangar (3,600 sf) and a modular building (2,120 sf). PERIMETER FENCING AND SERVICE ROAD Airport administrative staff and emergency service vehicles can access the airfield via a perimeter service road that extends around the entirety of the airfield. The 15‐foot‐wide perimeter road that is a partially paved and gravel road. The paved portion extends from the heliport to the north apron. The airfield perimeter is also equipped with security fencing to restrict entry to authorized persons and vehicles. The perimeter fencing is equipped with motorized and manual gates allowing access to all areas of the airfield and landside areas to authorized personnel only.
0
50,000
100,000
150,000
200,000
250,000
300,000
350,000
400,000
450,000
500,000
2015 2016 2017 2018 2019
Gal
lon
s So
ld
Year
FIGURE 1E – HISTORIC FUEL FLOWAGE100LL Jet A
Inventory | DRAFT FINAL 1-35
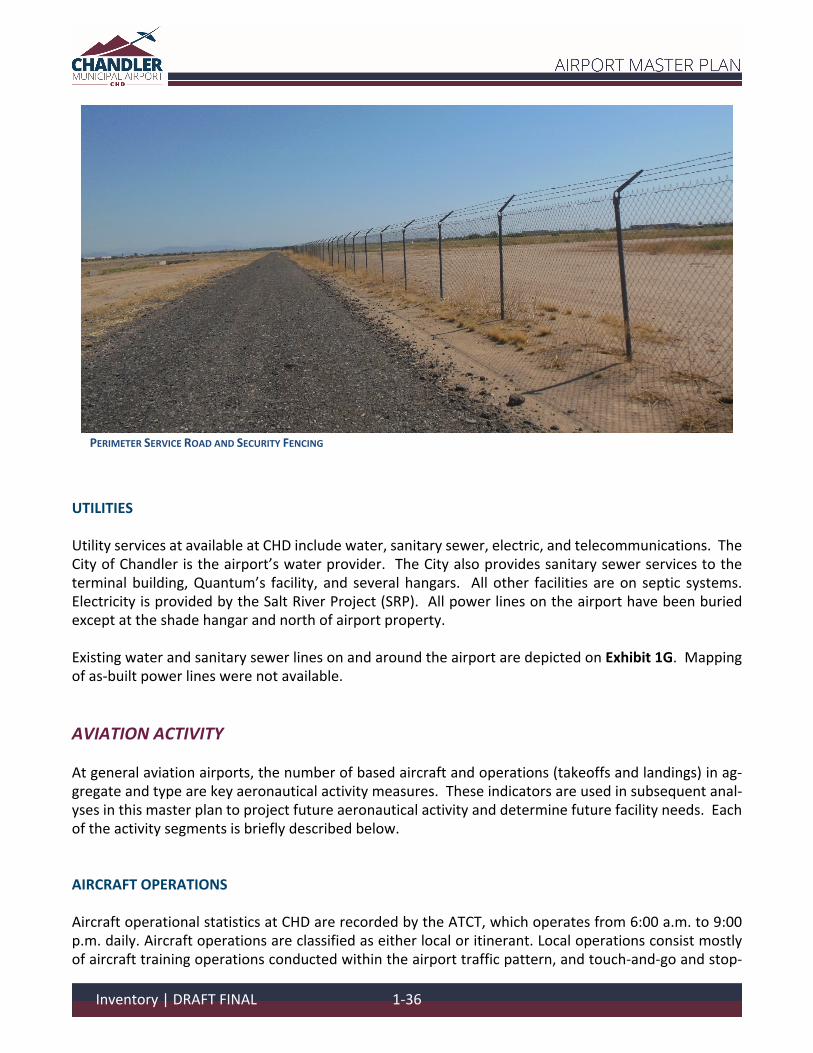
PERIMETER SERVICE ROAD AND SECURITY FENCING
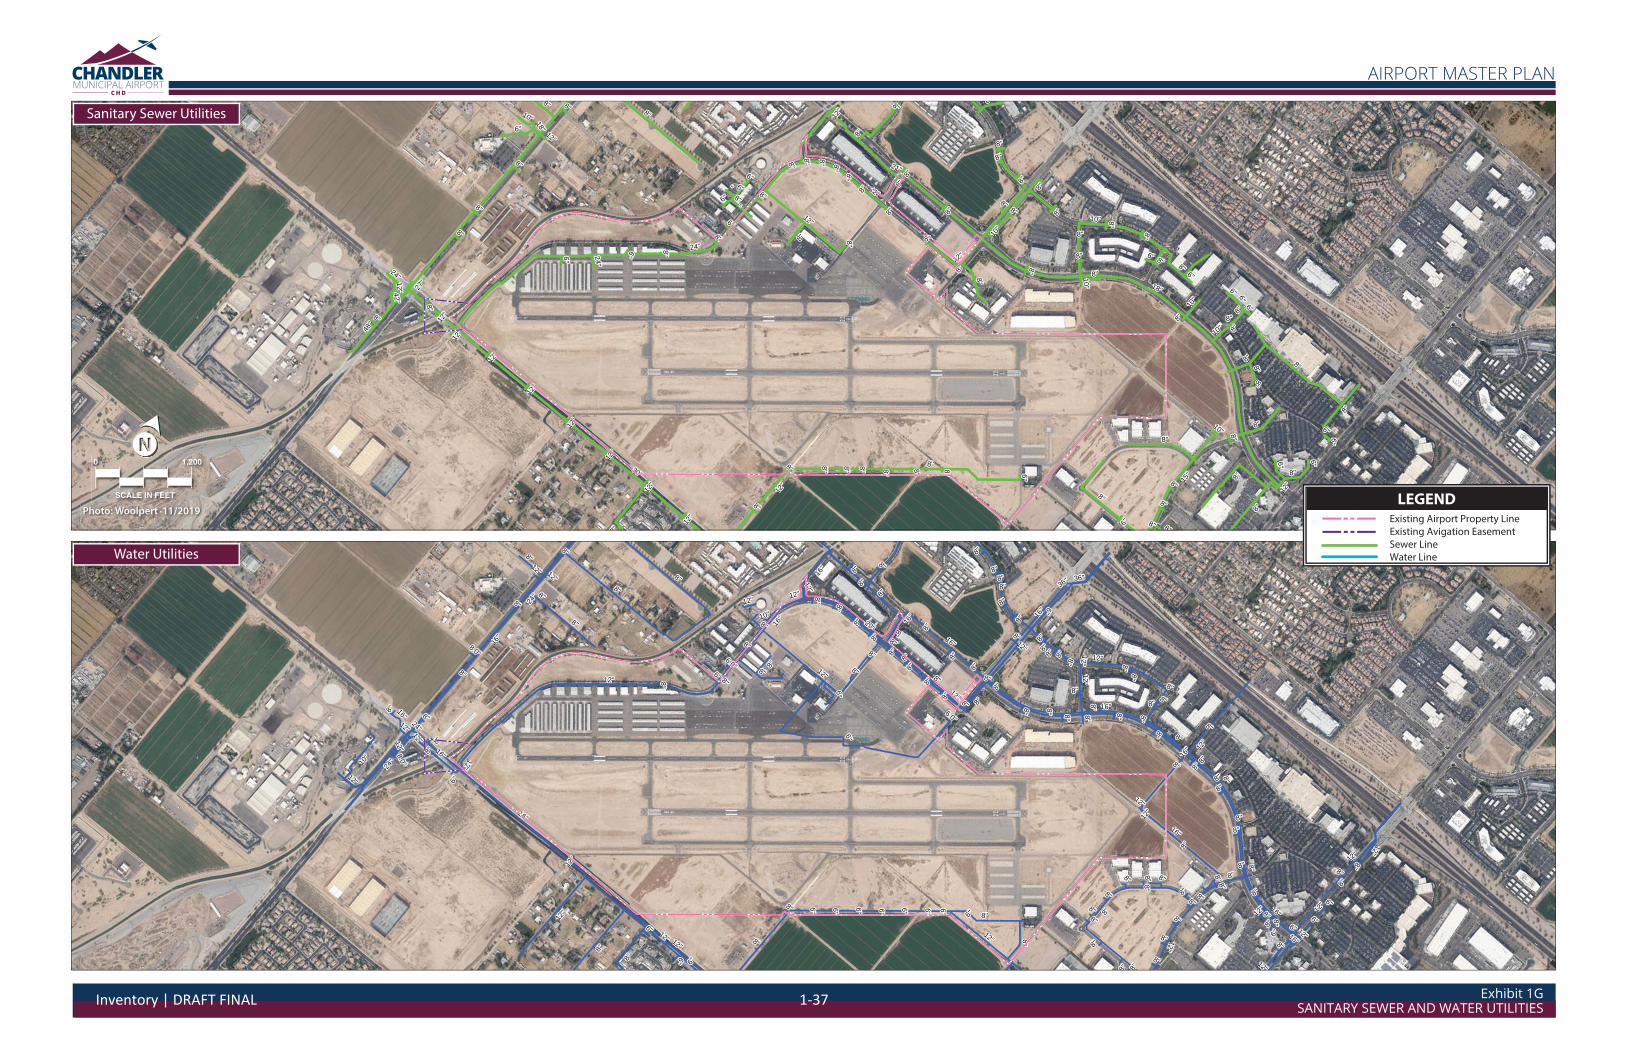
UTILITIES Utility services at available at CHD include water, sanitary sewer, electric, and telecommunications. The City of Chandler is the airport’s water provider. The City also provides sanitary sewer services to the terminal building, Quantum’s facility, and several hangars. All other facilities are on septic systems. Electricity is provided by the Salt River Project (SRP). All power lines on the airport have been buried except at the shade hangar and north of airport property. Existing water and sanitary sewer lines on and around the airport are depicted on Exhibit 1G. Mapping of as‐built power lines were not available.
AVIATION ACTIVITY At general aviation airports, the number of based aircraft and operations (takeoffs and landings) in ag‐gregate and type are key aeronautical activity measures. These indicators are used in subsequent anal‐yses in this master plan to project future aeronautical activity and determine future facility needs. Each of the activity segments is briefly described below. AIRCRAFT OPERATIONS Aircraft operational statistics at CHD are recorded by the ATCT, which operates from 6:00 a.m. to 9:00 p.m. daily. Aircraft operations are classified as either local or itinerant. Local operations consist mostly of aircraft training operations conducted within the airport traffic pattern, and touch‐and‐go and stop‐
Inventory | DRAFT FINAL 1-36
8''
6''6''
''
8''
6''
6''
6''
6''
''
8''
8''
10''
8''
8''
8''
8''
10''
12'' 8''
8''
8''
8''
8''
8''
8''
8''8''
8''
8''
12''
24''
8''
6''
8''
8''
12''
8''
8''
6''
12''
8''
12''
12''
12''
12''
8''
8''
8''
8''
8''
8''
6''
12''
10''
8''
8''
8''
8''
8''
8''
8''
8''
8''
8''
8''
8''
8''
8''
8''
8''
8''
8''
8''
8''
8
6''
8''
6''
8''
8''
8''
8''
48''
6''
8''
6''
8''
18''
8''
8''
12''
6''
6'' 6''
6''
8''
12''
12''
12''
10''
8''
8''
8''
12''
6''
8''
15''
8''
8''
8''
42''
24''
10''
12''
24''
8''
8''
12''
18''
8''
8''
10''
27''
8''
8''
10''
21''
30''
0 1,200
SCALE IN FEET
Photo: Woolpert 11/2019
8''
8''
8''
8''
6''
6''
8''
12''
8''
6.0''
8''
8''
8''
8''
8''
8.0''
8''
8''
8''
6''
8'' 8''
8''
8''
8''
8''
8''
8''8''
8''
12'' 16''
8''
8''
8''
8''
8''
8''
6''
8''
6''
8''
16''
8''
8''
8''
12''
8''
8''
12''
6''
8''
12''12''
8''
8''
8''
16''
8''
8''
16''
8''
12''
8''
8''
8''
8''
8''
8''
12''
8''
8''
8'' 8''
16''
16''
8''
8''
12''
8''
8''
24''
12''
8.0''
8''
8''
8''
8''
8''
12''8''
8''
8''
8''
8''
8''
24''
8''
8'' 8''
8''
8''
12''
8''
8''
12''
8''
12''
8''
8''
8''
8''
12''
8''
12''
12''
8''
8''
20''
8''
10''
8''
8''
16''
6''
24''
16''
8''
8''
6''
8''
16''
6''
12''
8''
8''
8''
6''
8''
16''
6''
6''
8''
8''
8''
8''
8''
12''
6''
8''
6''
8''
12''
8''
8''
6''
8''
8''
6''
8''
6''
12''
8''
12''
8''
8''
6''16''
'
12''
12''
10''
12''
8''
8''
12''
8''
8''
12''
6''
6.0''
8''
8''
12''
16''
16''
12''
12''
12''
36''36''
12''
16''
8''
6''
LEGENDExisting Airport Property LineExisting Avigation EasementSewer LineWater Line
Exhibit 1GSANITARY SEWER AND WATER UTILITIES
AIRPORT MASTER PLAN
Sanitary Sewer Utilities
Water Utilities
Inventory | DRAFT FINAL 1-37

This page intentionally left blank
Inventory | DRAFT FINAL 1-38
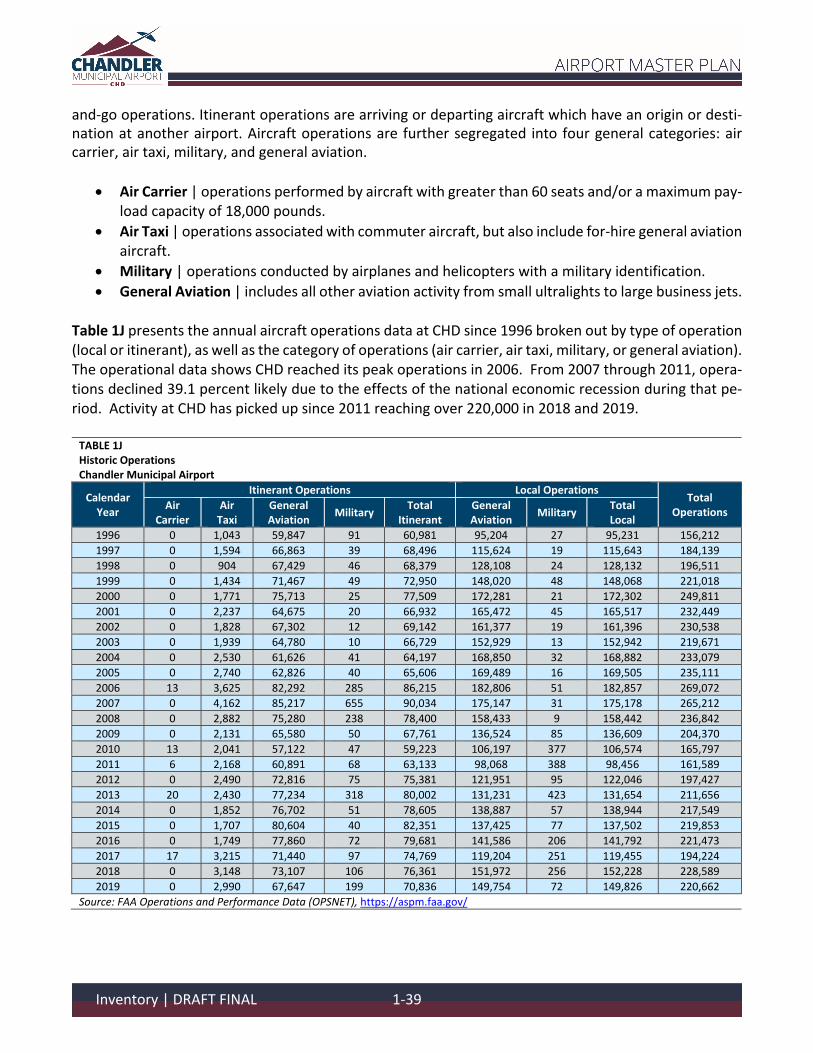
and‐go operations. Itinerant operations are arriving or departing aircraft which have an origin or desti‐nation at another airport. Aircraft operations are further segregated into four general categories: air carrier, air taxi, military, and general aviation.
Air Carrier | operations performed by aircraft with greater than 60 seats and/or a maximum pay‐load capacity of 18,000 pounds.
Air Taxi | operations associated with commuter aircraft, but also include for‐hire general aviation aircraft.
Military | operations conducted by airplanes and helicopters with a military identification.
General Aviation | includes all other aviation activity from small ultralights to large business jets. Table 1J presents the annual aircraft operations data at CHD since 1996 broken out by type of operation (local or itinerant), as well as the category of operations (air carrier, air taxi, military, or general aviation). The operational data shows CHD reached its peak operations in 2006. From 2007 through 2011, opera‐tions declined 39.1 percent likely due to the effects of the national economic recession during that pe‐riod. Activity at CHD has picked up since 2011 reaching over 220,000 in 2018 and 2019. TABLE 1J Historic Operations Chandler Municipal Airport
Calendar Year
Itinerant Operations Local Operations Total
Operations Air
Carrier Air Taxi
General Aviation
Military Total
Itinerant General Aviation
Military Total Local
1996 0 1,043 59,847 91 60,981 95,204 27 95,231 156,212
1997 0 1,594 66,863 39 68,496 115,624 19 115,643 184,139
1998 0 904 67,429 46 68,379 128,108 24 128,132 196,511
1999 0 1,434 71,467 49 72,950 148,020 48 148,068 221,018
2000 0 1,771 75,713 25 77,509 172,281 21 172,302 249,811
2001 0 2,237 64,675 20 66,932 165,472 45 165,517 232,449
2002 0 1,828 67,302 12 69,142 161,377 19 161,396 230,538
2003 0 1,939 64,780 10 66,729 152,929 13 152,942 219,671
2004 0 2,530 61,626 41 64,197 168,850 32 168,882 233,079
2005 0 2,740 62,826 40 65,606 169,489 16 169,505 235,111
2006 13 3,625 82,292 285 86,215 182,806 51 182,857 269,072
2007 0 4,162 85,217 655 90,034 175,147 31 175,178 265,212
2008 0 2,882 75,280 238 78,400 158,433 9 158,442 236,842
2009 0 2,131 65,580 50 67,761 136,524 85 136,609 204,370
2010 13 2,041 57,122 47 59,223 106,197 377 106,574 165,797
2011 6 2,168 60,891 68 63,133 98,068 388 98,456 161,589
2012 0 2,490 72,816 75 75,381 121,951 95 122,046 197,427
2013 20 2,430 77,234 318 80,002 131,231 423 131,654 211,656
2014 0 1,852 76,702 51 78,605 138,887 57 138,944 217,549
2015 0 1,707 80,604 40 82,351 137,425 77 137,502 219,853
2016 0 1,749 77,860 72 79,681 141,586 206 141,792 221,473
2017 17 3,215 71,440 97 74,769 119,204 251 119,455 194,224
2018 0 3,148 73,107 106 76,361 151,972 256 152,228 228,589
2019 0 2,990 67,647 199 70,836 149,754 72 149,826 220,662
Source: FAA Operations and Performance Data (OPSNET), https://aspm.faa.gov/
Inventory | DRAFT FINAL 1-39
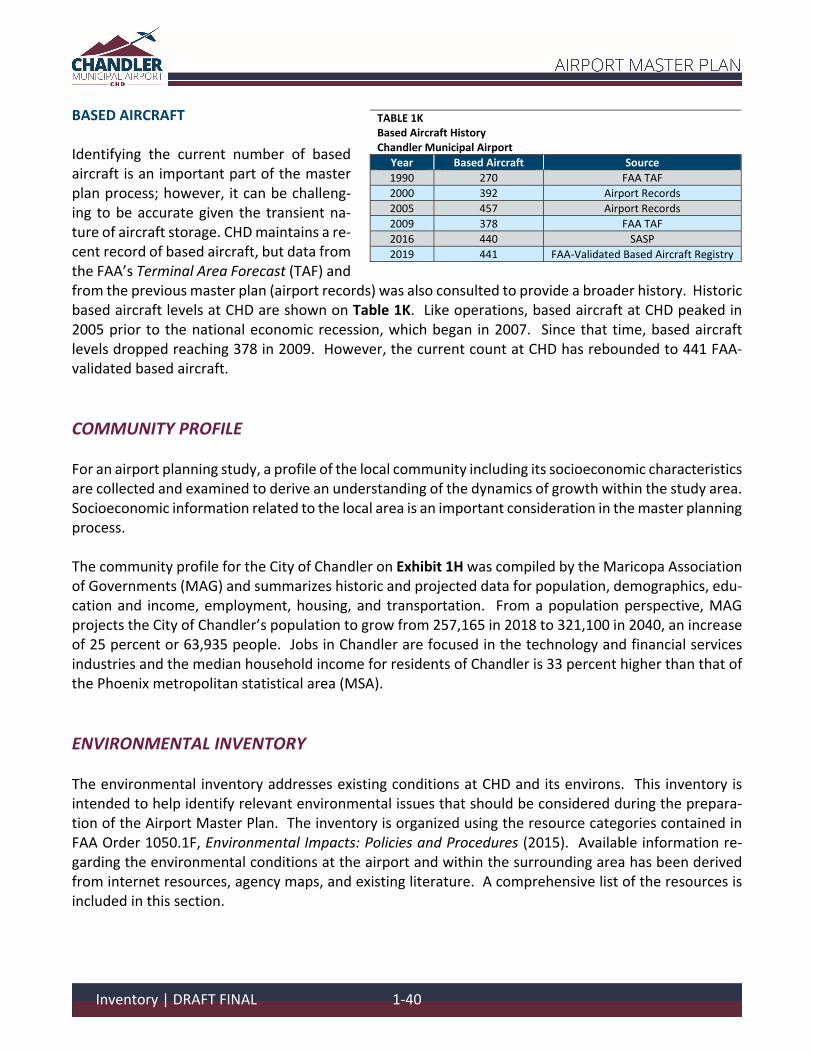
BASED AIRCRAFT Identifying the current number of based aircraft is an important part of the master plan process; however, it can be challeng‐ing to be accurate given the transient na‐ture of aircraft storage. CHD maintains a re‐cent record of based aircraft, but data from the FAA’s Terminal Area Forecast (TAF) and from the previous master plan (airport records) was also consulted to provide a broader history. Historic based aircraft levels at CHD are shown on Table 1K. Like operations, based aircraft at CHD peaked in 2005 prior to the national economic recession, which began in 2007. Since that time, based aircraft levels dropped reaching 378 in 2009. However, the current count at CHD has rebounded to 441 FAA‐validated based aircraft.
COMMUNITY PROFILE For an airport planning study, a profile of the local community including its socioeconomic characteristics are collected and examined to derive an understanding of the dynamics of growth within the study area. Socioeconomic information related to the local area is an important consideration in the master planning process. The community profile for the City of Chandler on Exhibit 1H was compiled by the Maricopa Association of Governments (MAG) and summarizes historic and projected data for population, demographics, edu‐cation and income, employment, housing, and transportation. From a population perspective, MAG projects the City of Chandler’s population to grow from 257,165 in 2018 to 321,100 in 2040, an increase of 25 percent or 63,935 people. Jobs in Chandler are focused in the technology and financial services industries and the median household income for residents of Chandler is 33 percent higher than that of the Phoenix metropolitan statistical area (MSA).
ENVIRONMENTAL INVENTORY The environmental inventory addresses existing conditions at CHD and its environs. This inventory is intended to help identify relevant environmental issues that should be considered during the prepara‐tion of the Airport Master Plan. The inventory is organized using the resource categories contained in FAA Order 1050.1F, Environmental Impacts: Policies and Procedures (2015). Available information re‐garding the environmental conditions at the airport and within the surrounding area has been derived from internet resources, agency maps, and existing literature. A comprehensive list of the resources is included in this section.
TABLE 1K Based Aircraft History Chandler Municipal Airport
Year Based Aircraft Source
1990 270 FAA TAF
2000 392 Airport Records
2005 457 Airport Records
2009 378 FAA TAF
2016 440 SASP
2019 441 FAA‐Validated Based Aircraft Registry
Inventory | DRAFT FINAL 1-40
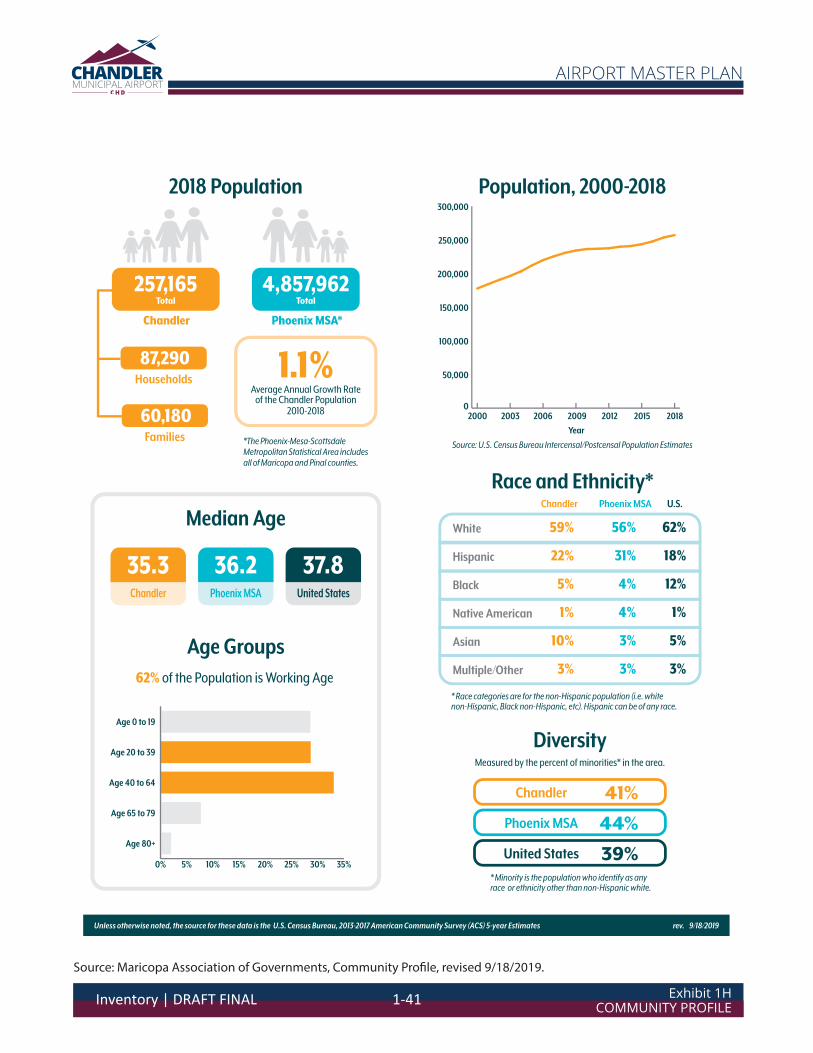
Exhibit 1HCOMMUNITY PROFILE
AIRPORT MASTER PLAN
rev.
*The Phoenix-Mesa-Scottsdale Metropolitan Statistical Area includes all of Maricopa and Pinal counties.
Unless otherwise noted, the source for these data is the U.S. Census Bureau, 2013-2017 American Community Survey (ACS) 5-year Estimates
2016 Population2018
9/18/2019
Age Groups
of the Population is Working Age62%
35.3Chandler
36.2Phoenix MSA
37.8United States
Median Age
Households
87,290
Families
60,180
41%Chandler
44%Phoenix MSA
39%United States
DiversityMeasured by the percent of minorities* in the area.
* Minority is the population who identify as any race or ethnicity other than non-Hispanic white.
4,857,962
Phoenix MSA*
Total257,165
Chandler
Total
1.1%of the Chandler Population
Average Annual Growth Rate
2010-2018
0% 5% 10% 15% 20% 25% 30% 35%
Age 80+
Age 65 to 79
Age 40 to 64
Age 20 to 39
Age 0 to 19
Population, 2000-2018
Source: U.S. Census Bureau Intercensal/Postcensal Population Estimates
Race and Ethnicity*
* Race categories are for the non-Hispanic population (i.e. white non-Hispanic, Black non-Hispanic, etc). Hispanic can be of any race.
White
Hispanic
Black
Asian
Native American
Multiple/Other
59%
22%
5%
1%
10%
3%
56%
31%
4%
4%
3%
3%
62%
18%
12%
1%
5%
3%
Chandler Phoenix MSA U.S.
0,000
50,000
100,000
150,000
200,000
250,000
300,000
2000 20062003 2009
Year
2012 2015 2018
Source: Maricopa Association of Governments, Community Profile, revised 9/18/2019.
Inventory | DRAFT FINAL 1-41

Exhibit 1H continuedCOMMUNITY PROFILE
AIRPORT MASTER PLAN
Poverty status is determined for all persons except institutionalized people, military personnel in group quarters, people in college dormitories, and
unrelated individuals under 15 years old. Poverty levels are determined based on the official Federal Poverty Level thresholds.
Chandler9%
United States15%
Phoenix MSA16%
Poverty Rate
31%
29%
27%
13%
UnitedStates
42%
33%
18%
8%
30%
33%
23%
13%
PhoenixMSA
Bachelor Degreeor Higher
Some College orAssociate Degree
High School Grador Equivalent
No High SchoolDiploma
for the population age 25 years and older
Highest Level of Education
Median Household Income
United States
$57,652
$57,935$77,278Phoenix MSAChandler
United StatesPhoenix MSAChandler
Household Income
0% 10% 20% 30% 40% 50% 60% 70%
Less than $50,000
$50,000 to $99,999
$100,000 to $199,999
$200,000 or more
Percent of Households
Chandler
Unless otherwise noted, the source for these data is the U.S. Census Bureau, 2013-2017 American Community Survey (ACS) 5-year Estimates rev. 9/18/2019
Source: Maricopa Association of Governments, Community Profile, revised 9/18/2019.
Inventory | DRAFT FINAL 1-42
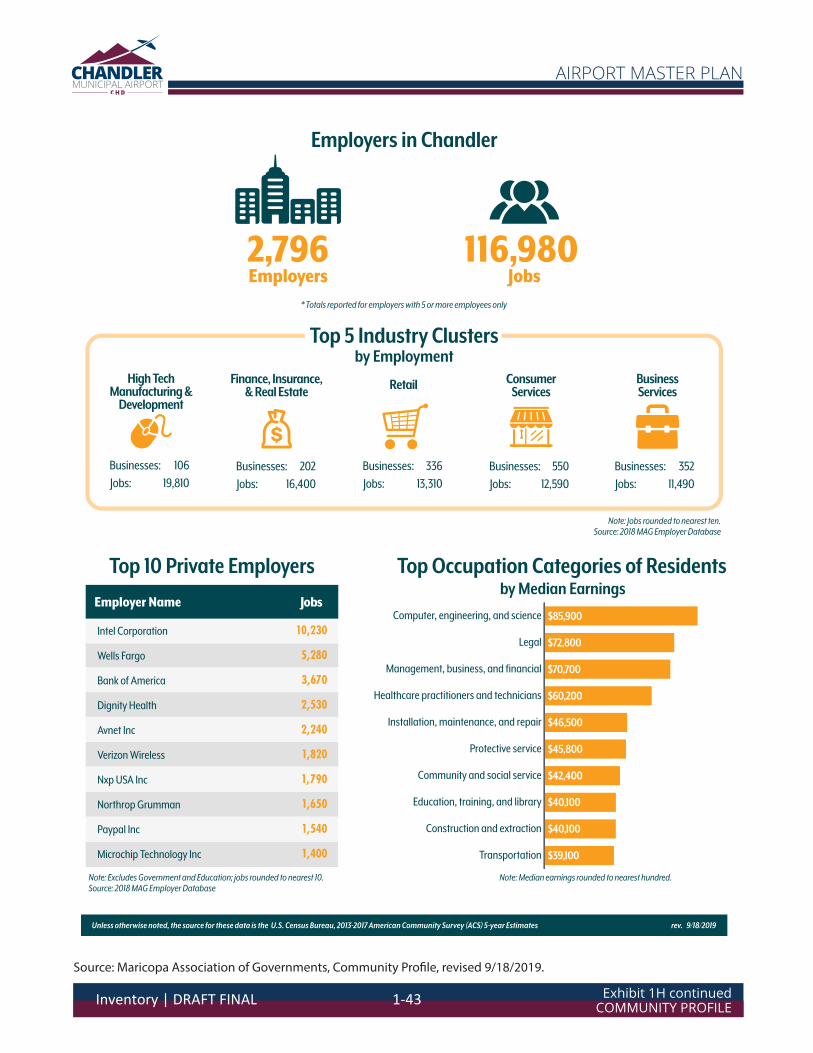
Exhibit 1H continuedCOMMUNITY PROFILE
AIRPORT MASTER PLAN
Transportation
Construction and extraction
Education, training, and library
Community and social service
Protective service
Installation, maintenance, and repair
Healthcare practitioners and technicians
Management, business, and financial
Legal
Computer, engineering, and science
Unless otherwise noted, the source for these data is the U.S. Census Bureau, 2013-2017 American Community Survey (ACS) 5-year Estimates
Note: Excludes Government and Education; jobs rounded to nearest 10.Source: 2018 MAG Employer Database
JobsEmployer Name
Intel Corporation
Wells Fargo
Bank of America
Dignity Health
Avnet Inc
Verizon Wireless
Nxp USA Inc
Northrop Grumman
Paypal Inc
Microchip Technology Inc
10,230
5,280
3,670
2,530
2,240
1,820
1,790
1,650
1,540
1,400
Employers in Chandler
* Totals reported for employers with 5 or more employees only
Top 5 Industry Clusters
Jobs:
Businesses: 336
13,310Jobs:
Businesses: 202
16,400Jobs:
Businesses: 106
19,810 Jobs:
Businesses: 550
12,590 Jobs:
Businesses: 352
11,490
Note: Jobs rounded to nearest ten.Source: 2018 MAG Employer Database
$85,900
$72,800
$70,700
$60,200
$46,500
$45,800
$42,400
$40,100
$40,100
$39,100
Top Occupation Categories of Residentsby Median Earnings
rev. 9/18/2019
116,980Jobs
2,796Employers
Top 10 Private Employers
Note: Median earnings rounded to nearest hundred.
by Employment
High Tech Manufacturing &
Development
Finance, Insurance, & Real Estate
Retail Consumer Services
BusinessServices
Source: Maricopa Association of Governments, Community Profile, revised 9/18/2019.
Inventory | DRAFT FINAL 1-43
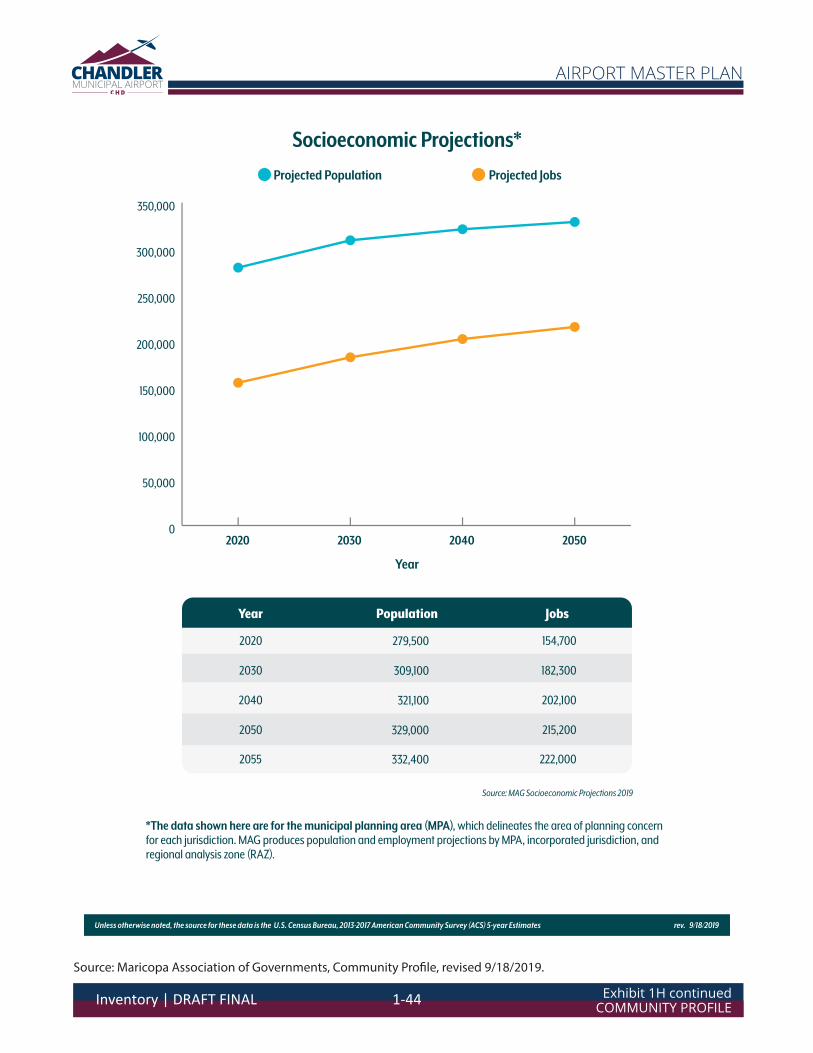
Exhibit 1H continuedCOMMUNITY PROFILE
AIRPORT MASTER PLAN
Unless otherwise noted, the source for these data is the U.S. Census Bureau, 2013-2017 American Community Survey (ACS) 5-year Estimates
2020
2030
2040
2050
2055
Year Population
279,500
309,100
321,100
329,000
332,400
Jobs
154,700
182,300
202,100
215,200
222,000
Source: MAG Socioeconomic Projections 2019
*The data shown here are for the municipal planning area (MPA), which delineates the area of planning concern for each jurisdiction. MAG produces population and employment projections by MPA, incorporated jurisdiction, and regional analysis zone (RAZ).
rev. 9/18/2019
Socioeconomic Projections*
Projected Population Projected Jobs
0,000
50,000
100,000
150,000
200,000
250,000
300,000
350,000
2020 20502040
Year
2030
Source: Maricopa Association of Governments, Community Profile, revised 9/18/2019.
Inventory | DRAFT FINAL 1-44
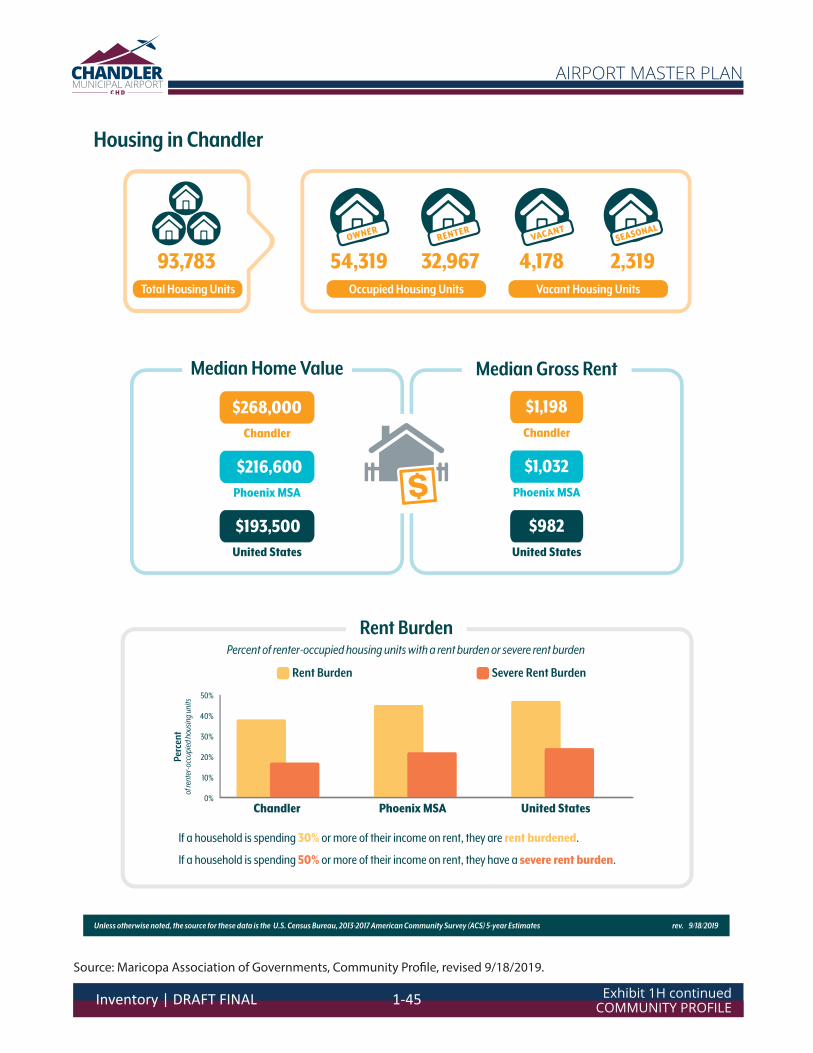
Exhibit 1H continuedCOMMUNITY PROFILE
AIRPORT MASTER PLAN
Total Housing Units
93,783OWNER
54,319RENTER
32,967VACANT
4,178Occupied Housing Units Vacant Housing Units
SEASONAL
2,319
United States
$193,500
$216,600Phoenix MSA
$268,000Chandler
United States
$982
$1,032Phoenix MSA
$1,198Chandler
Median Home Value Median Gross Rent
Housing in Chandler
Percent of renter-occupied housing units with a rent burden or severe rent burden
Unless otherwise noted, the source for these data is the U.S. Census Bureau, 2013-2017 American Community Survey (ACS) 5-year Estimates
Chandler Phoenix MSA United States0%
10%
20%
30%
40%
50%
Per
cen
tof
rent
er-o
ccup
ied
hous
ing
units
rev. 9/18/2019
Rent Burden
Rent Burden Severe Rent Burden
If a household is spending 30% or more of their income on rent, they are rent burdened.
If a household is spending 50% or more of their income on rent, they have a severe rent burden.
Source: Maricopa Association of Governments, Community Profile, revised 9/18/2019.
Inventory | DRAFT FINAL 1-45
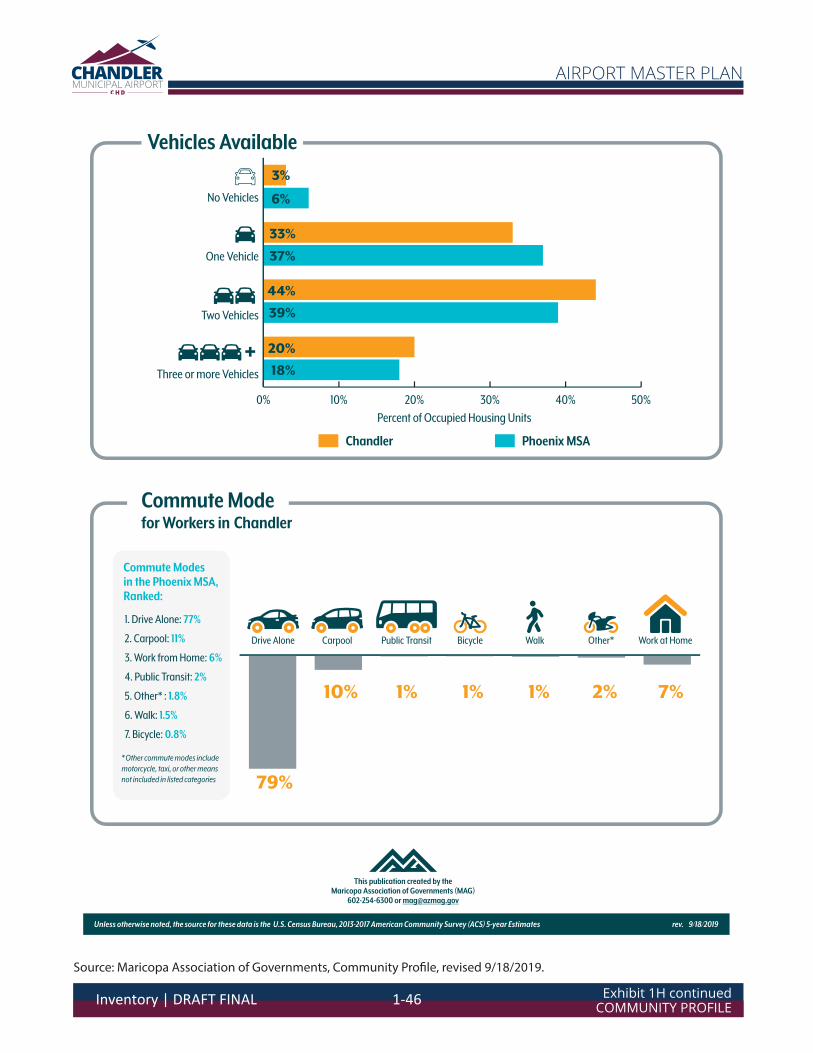
Exhibit 1H continuedCOMMUNITY PROFILE
AIRPORT MASTER PLAN
0% 10% 20% 30% 40% 50%
No Vehicles
One Vehicle
Two Vehicles
Three or more Vehicles
3%
6%
37%
33%
44%
39%
20%
18%
Vehicles Available
Work at HomeOther*WalkBicyclePublic TransitCarpoolDrive Alone
79%
10% 1% 1% 1% 2% 7%
* Other commute modes include
motorcycle, taxi, or other means
not included in listed categories
Commute Modes in the Phoenix MSA, Ranked:
1. Drive Alone: 77%
2. Carpool: 11%
3. Work from Home: 6%
4. Public Transit: 2%
5. Other* : 1.8%
6. Walk: 1.5%
7. Bicycle: 0.8%
Commute Modefor Workers in Chandler
Unless otherwise noted, the source for these data is the U.S. Census Bureau, 2013-2017 American Community Survey (ACS) 5-year Estimates
This publication created by theMaricopa Association of Governments (MAG)
602-254-6300 or [email protected]
rev. 9/18/2019
Percent of Occupied Housing Units
Phoenix MSAChandler
Source: Maricopa Association of Governments, Community Profile, revised 9/18/2019.
Inventory | DRAFT FINAL 1-46
AIR QUALITY The concentration of various pollutants in the atmosphere describes the local air quality. The signifi‐cance of a pollution concentration is determined by comparing it to the state and federal air quality standards. In 1971, the U.S. Environmental Protection Agency (EPA) established standards that specify the maximum permissible short‐ and long‐term concentrations of various air contaminants. The Na‐tional Ambient Air Quality Standards (NAAQS) consist of primary and secondary standards for criteria pollutants: ozone (O3), carbon monoxide (CO), sulfur dioxide (SO2), nitrogen dioxide (NO2), coarse par‐ticulate matter (PM10), fine particulate matter (PM2.5), and lead (Pb). Based on federal air quality standards, a specific geographic area can be classified as either an “attain‐ment,” “maintenance,” or “nonattainment” area for each pollutant. The threshold for nonattainment designation varies by pollutant. Maricopa County is designated as a nonattainment area for 8‐hour O3 (2008 Moderate), 8‐hour O3 (2015 Marginal), and PM10 (Serious). The county was previously a nonat‐tainment area for CO and was designated as a maintenance area in 2005.10 The county is in attainment for all other criteria pollutants. BIOLOGICAL RESOURCES Biotic resources include the various types of plants and animals that are present in an area. The term also applies to rivers, lakes, wetlands, forests, and other habitat types that support plants and animals. The U.S. Fish and Wildlife Service (USFWS) is charged with overseeing the requirements contained within Section 7 of the Endangered Species Act (ESA). The ESA was put into place to protect animal or plant species whose populations are threatened by human activities. Along with the FAA, the USFWS reviews projects to determine if a significant impact to protected species will result in the implementation of a proposed project. Significant impacts occur when a proposed action could jeopardize the continued existence of a protected species or would result in the destruction or adverse modification of federally designated critical habitat in the area. On November 5 and 7, 2019, SWCA Environmental Consultants (SWCA) performed a biological survey of the airport and adjacent area to determine the presence of endangered and/or threatened species and habitat.11 Seventeen species protected under the ESA were identified in Maricopa County, and it was determined that none of these species was observed in or near the project area, nor was critical habitat or proposed critical habitat present near the airport. The biological survey noted that while critical habitat or proposed critical habitat for five species was present within Maricopa County – acuña cactus (Echinomastus erectocentrus var. acunensis), Mexican
10 U.S. Environmental Protection Agency Green Book (https://www3.epa.gov/airquality/greenbook/anayo_az.html); Sep‐tember 2019. 11 SWCA Environmental Consultants Biological Overview for the Chandler Municipal Airport Master Plan Update Project, Maricopa County, Arizona (November 2019).
Inventory | DRAFT FINAL 1-47
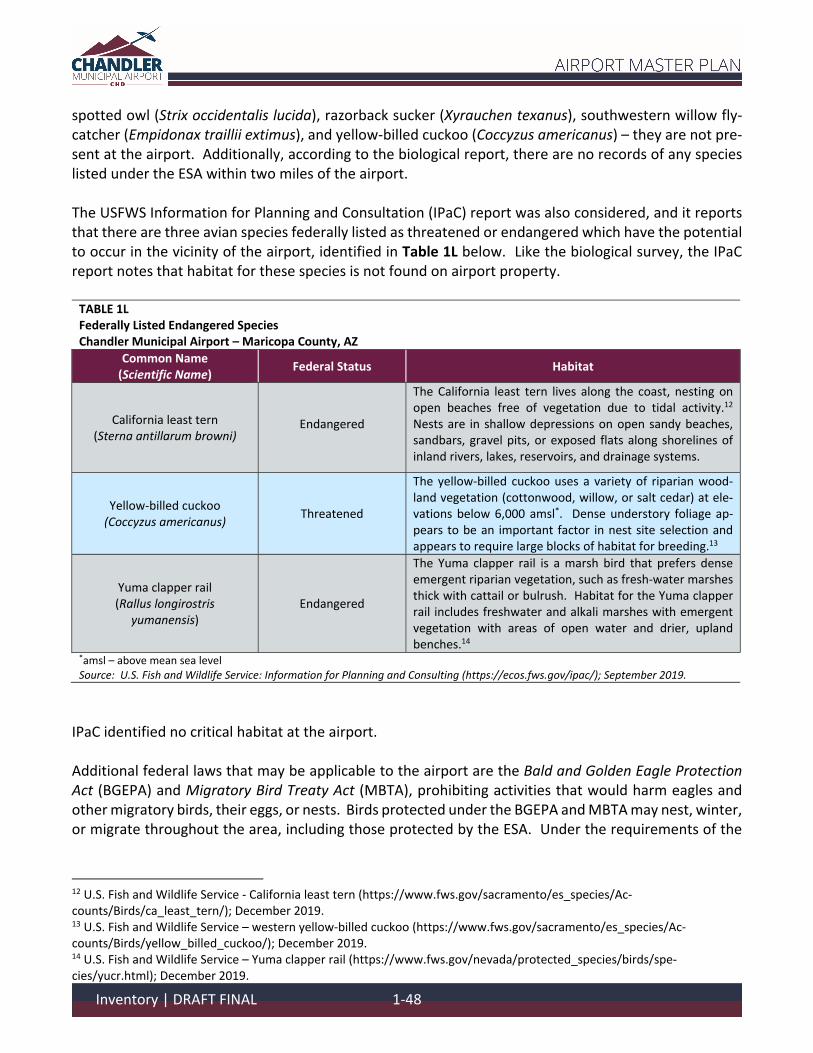
spotted owl (Strix occidentalis lucida), razorback sucker (Xyrauchen texanus), southwestern willow fly‐catcher (Empidonax traillii extimus), and yellow‐billed cuckoo (Coccyzus americanus) – they are not pre‐sent at the airport. Additionally, according to the biological report, there are no records of any species listed under the ESA within two miles of the airport. The USFWS Information for Planning and Consultation (IPaC) report was also considered, and it reports that there are three avian species federally listed as threatened or endangered which have the potential to occur in the vicinity of the airport, identified in Table 1L below. Like the biological survey, the IPaC report notes that habitat for these species is not found on airport property. TABLE 1L Federally Listed Endangered Species Chandler Municipal Airport – Maricopa County, AZ
Common Name (Scientific Name)
Federal Status Habitat
California least tern (Sterna antillarum browni)
Endangered
The California least tern lives along the coast, nesting on open beaches free of vegetation due to tidal activity.12 Nests are in shallow depressions on open sandy beaches, sandbars, gravel pits, or exposed flats along shorelines of inland rivers, lakes, reservoirs, and drainage systems.
Yellow‐billed cuckoo (Coccyzus americanus)
Threatened
The yellow‐billed cuckoo uses a variety of riparian wood‐land vegetation (cottonwood, willow, or salt cedar) at ele‐vations below 6,000 amsl*. Dense understory foliage ap‐pears to be an important factor in nest site selection and appears to require large blocks of habitat for breeding.13
Yuma clapper rail (Rallus longirostris
yumanensis) Endangered
The Yuma clapper rail is a marsh bird that prefers dense emergent riparian vegetation, such as fresh‐water marshes thick with cattail or bulrush. Habitat for the Yuma clapper rail includes freshwater and alkali marshes with emergent vegetation with areas of open water and drier, upland benches.14
*amsl – above mean sea level Source: U.S. Fish and Wildlife Service: Information for Planning and Consulting (https://ecos.fws.gov/ipac/); September 2019.
IPaC identified no critical habitat at the airport. Additional federal laws that may be applicable to the airport are the Bald and Golden Eagle Protection Act (BGEPA) and Migratory Bird Treaty Act (MBTA), prohibiting activities that would harm eagles and other migratory birds, their eggs, or nests. Birds protected under the BGEPA and MBTA may nest, winter, or migrate throughout the area, including those protected by the ESA. Under the requirements of the
12 U.S. Fish and Wildlife Service ‐ California least tern (https://www.fws.gov/sacramento/es_species/Ac‐counts/Birds/ca_least_tern/); December 2019. 13 U.S. Fish and Wildlife Service – western yellow‐billed cuckoo (https://www.fws.gov/sacramento/es_species/Ac‐counts/Birds/yellow_billed_cuckoo/); December 2019. 14 U.S. Fish and Wildlife Service – Yuma clapper rail (https://www.fws.gov/nevada/protected_species/birds/spe‐cies/yucr.html); December 2019.
Inventory | DRAFT FINAL 1-48
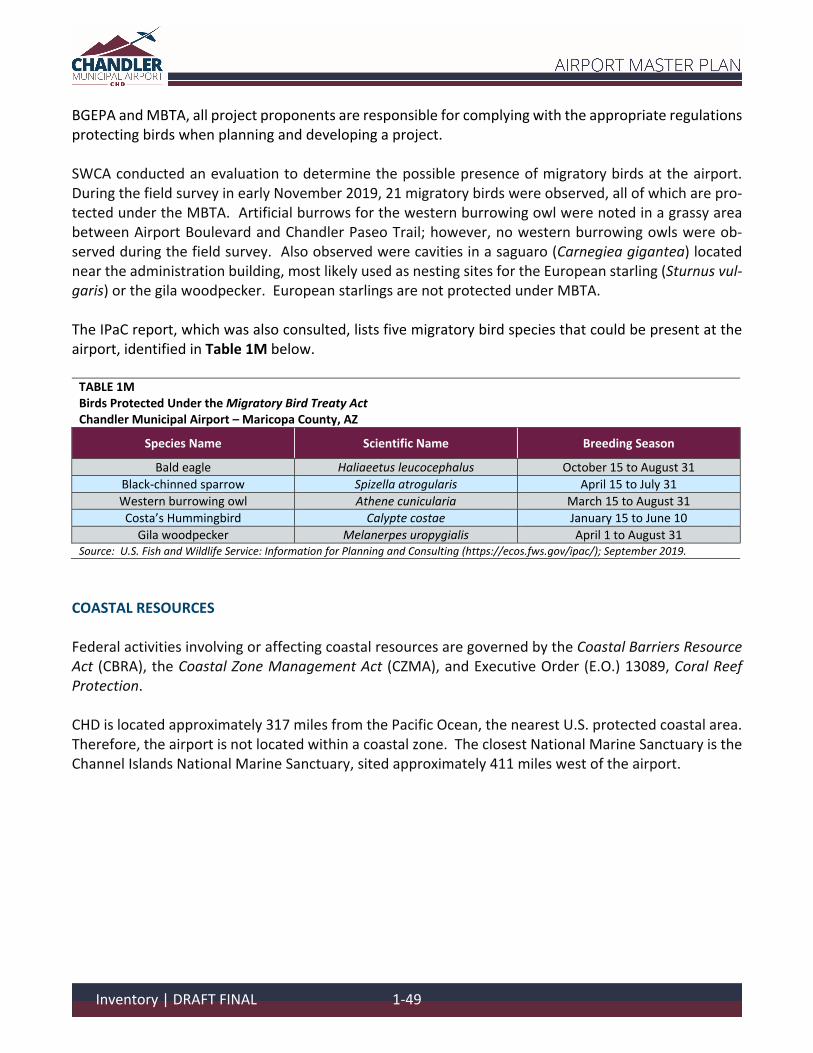
BGEPA and MBTA, all project proponents are responsible for complying with the appropriate regulations protecting birds when planning and developing a project. SWCA conducted an evaluation to determine the possible presence of migratory birds at the airport. During the field survey in early November 2019, 21 migratory birds were observed, all of which are pro‐tected under the MBTA. Artificial burrows for the western burrowing owl were noted in a grassy area between Airport Boulevard and Chandler Paseo Trail; however, no western burrowing owls were ob‐served during the field survey. Also observed were cavities in a saguaro (Carnegiea gigantea) located near the administration building, most likely used as nesting sites for the European starling (Sturnus vul‐garis) or the gila woodpecker. European starlings are not protected under MBTA. The IPaC report, which was also consulted, lists five migratory bird species that could be present at the airport, identified in Table 1M below. TABLE 1M Birds Protected Under the Migratory Bird Treaty Act Chandler Municipal Airport – Maricopa County, AZ
Species Name Scientific Name Breeding Season
Bald eagle Haliaeetus leucocephalus October 15 to August 31
Black‐chinned sparrow Spizella atrogularis April 15 to July 31
Western burrowing owl Athene cunicularia March 15 to August 31
Costa’s Hummingbird Calypte costae January 15 to June 10
Gila woodpecker Melanerpes uropygialis April 1 to August 31 Source: U.S. Fish and Wildlife Service: Information for Planning and Consulting (https://ecos.fws.gov/ipac/); September 2019.
COASTAL RESOURCES Federal activities involving or affecting coastal resources are governed by the Coastal Barriers Resource Act (CBRA), the Coastal Zone Management Act (CZMA), and Executive Order (E.O.) 13089, Coral Reef Protection. CHD is located approximately 317 miles from the Pacific Ocean, the nearest U.S. protected coastal area. Therefore, the airport is not located within a coastal zone. The closest National Marine Sanctuary is the Channel Islands National Marine Sanctuary, sited approximately 411 miles west of the airport.
Inventory | DRAFT FINAL 1-49
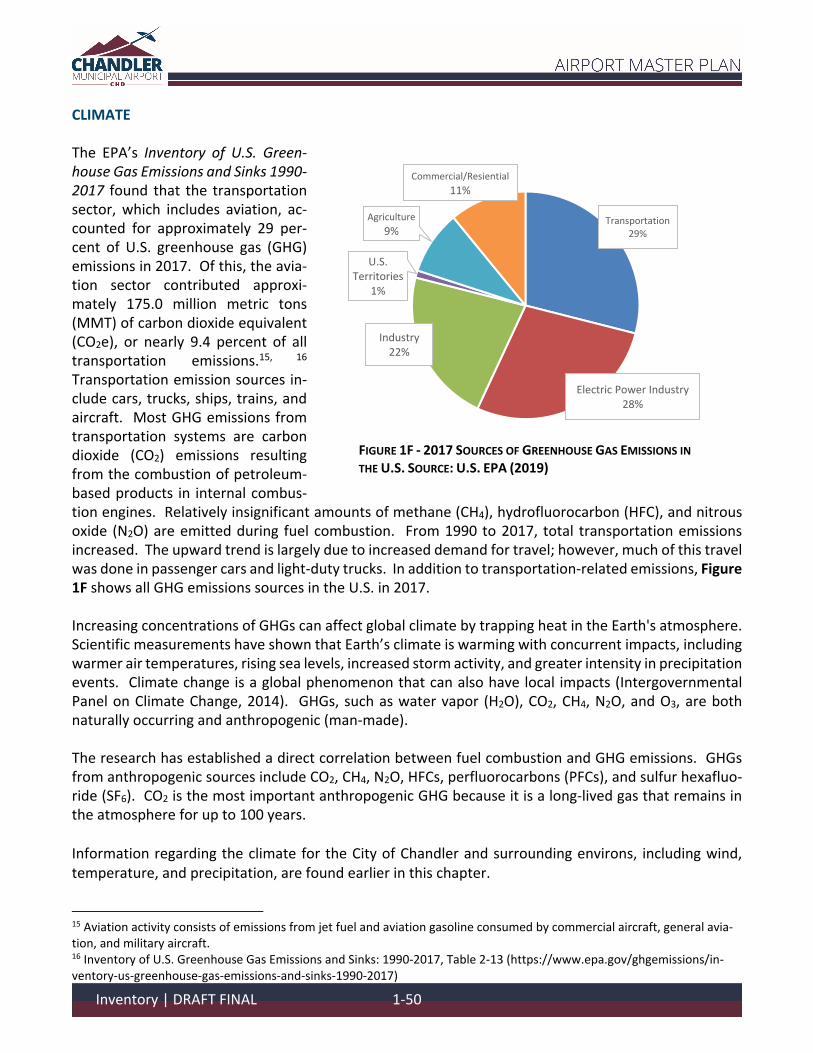
CLIMATE The EPA’s Inventory of U.S. Green‐house Gas Emissions and Sinks 1990‐2017 found that the transportation sector, which includes aviation, ac‐counted for approximately 29 per‐cent of U.S. greenhouse gas (GHG) emissions in 2017. Of this, the avia‐tion sector contributed approxi‐mately 175.0 million metric tons (MMT) of carbon dioxide equivalent (CO2e), or nearly 9.4 percent of all transportation emissions.15, 16 Transportation emission sources in‐clude cars, trucks, ships, trains, and aircraft. Most GHG emissions from transportation systems are carbon dioxide (CO2) emissions resulting from the combustion of petroleum‐based products in internal combus‐tion engines. Relatively insignificant amounts of methane (CH4), hydrofluorocarbon (HFC), and nitrous oxide (N2O) are emitted during fuel combustion. From 1990 to 2017, total transportation emissions increased. The upward trend is largely due to increased demand for travel; however, much of this travel was done in passenger cars and light‐duty trucks. In addition to transportation‐related emissions, Figure 1F shows all GHG emissions sources in the U.S. in 2017. Increasing concentrations of GHGs can affect global climate by trapping heat in the Earth's atmosphere. Scientific measurements have shown that Earth’s climate is warming with concurrent impacts, including warmer air temperatures, rising sea levels, increased storm activity, and greater intensity in precipitation events. Climate change is a global phenomenon that can also have local impacts (Intergovernmental Panel on Climate Change, 2014). GHGs, such as water vapor (H2O), CO2, CH4, N2O, and O3, are both
naturally occurring and anthropogenic (man‐made). The research has established a direct correlation between fuel combustion and GHG emissions. GHGs from anthropogenic sources include CO2, CH4, N2O, HFCs, perfluorocarbons (PFCs), and sulfur hexafluo‐ride (SF6). CO2 is the most important anthropogenic GHG because it is a long‐lived gas that remains in the atmosphere for up to 100 years. Information regarding the climate for the City of Chandler and surrounding environs, including wind, temperature, and precipitation, are found earlier in this chapter.
15 Aviation activity consists of emissions from jet fuel and aviation gasoline consumed by commercial aircraft, general avia‐tion, and military aircraft. 16 Inventory of U.S. Greenhouse Gas Emissions and Sinks: 1990‐2017, Table 2‐13 (https://www.epa.gov/ghgemissions/in‐ventory‐us‐greenhouse‐gas‐emissions‐and‐sinks‐1990‐2017)
Transportation29%
Electric Power Industry28%
Industry22%
U.S. Territories
1%
Agriculture
9%
Commercial/Resiential
11%
FIGURE 1F ‐ 2017 SOURCES OF GREENHOUSE GAS EMISSIONS IN
THE U.S. SOURCE: U.S. EPA (2019)
Inventory | DRAFT FINAL 1-50
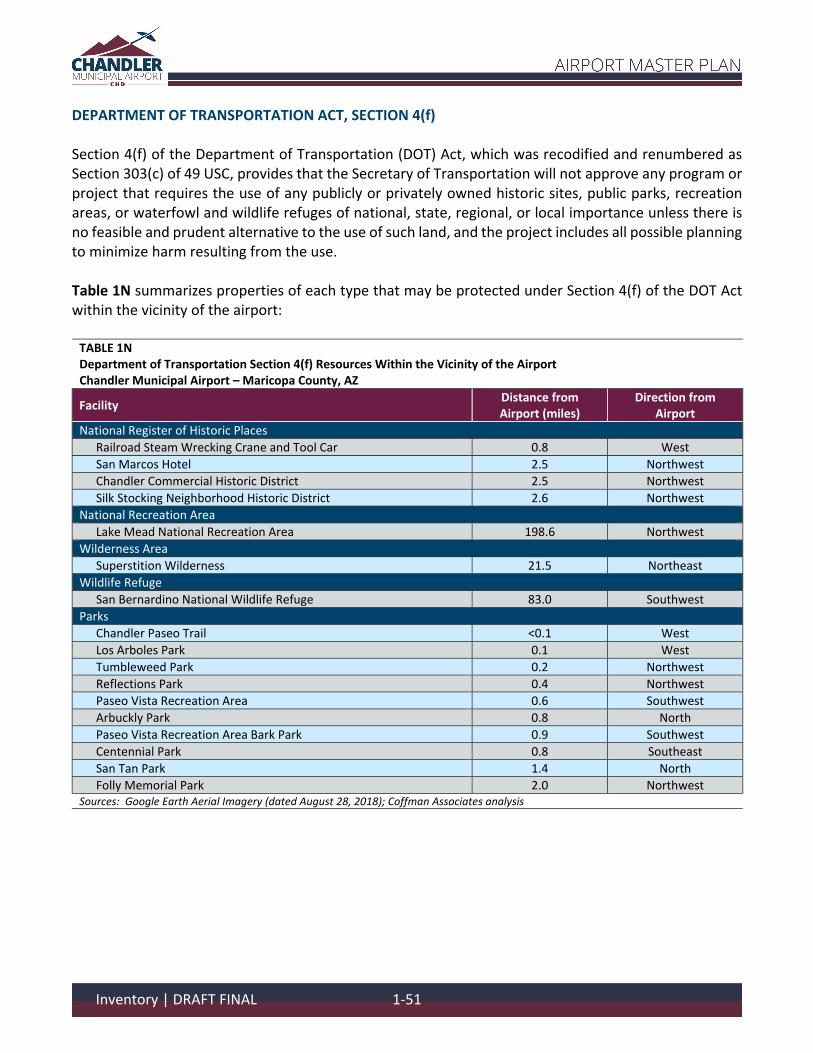
DEPARTMENT OF TRANSPORTATION ACT, SECTION 4(f) Section 4(f) of the Department of Transportation (DOT) Act, which was recodified and renumbered as Section 303(c) of 49 USC, provides that the Secretary of Transportation will not approve any program or project that requires the use of any publicly or privately owned historic sites, public parks, recreation areas, or waterfowl and wildlife refuges of national, state, regional, or local importance unless there is no feasible and prudent alternative to the use of such land, and the project includes all possible planning to minimize harm resulting from the use. Table 1N summarizes properties of each type that may be protected under Section 4(f) of the DOT Act within the vicinity of the airport: TABLE 1N Department of Transportation Section 4(f) Resources Within the Vicinity of the Airport Chandler Municipal Airport – Maricopa County, AZ
Facility Distance from Airport (miles)
Direction from Airport
National Register of Historic Places
Railroad Steam Wrecking Crane and Tool Car 0.8 West
San Marcos Hotel 2.5 Northwest
Chandler Commercial Historic District 2.5 Northwest
Silk Stocking Neighborhood Historic District 2.6 Northwest
National Recreation Area
Lake Mead National Recreation Area 198.6 Northwest
Wilderness Area
Superstition Wilderness 21.5 Northeast
Wildlife Refuge
San Bernardino National Wildlife Refuge 83.0 Southwest
Parks
Chandler Paseo Trail <0.1 West
Los Arboles Park 0.1 West
Tumbleweed Park 0.2 Northwest
Reflections Park 0.4 Northwest
Paseo Vista Recreation Area 0.6 Southwest
Arbuckly Park 0.8 North
Paseo Vista Recreation Area Bark Park 0.9 Southwest
Centennial Park 0.8 Southeast
San Tan Park 1.4 North
Folly Memorial Park 2.0 Northwest Sources: Google Earth Aerial Imagery (dated August 28, 2018); Coffman Associates analysis
Inventory | DRAFT FINAL 1-51
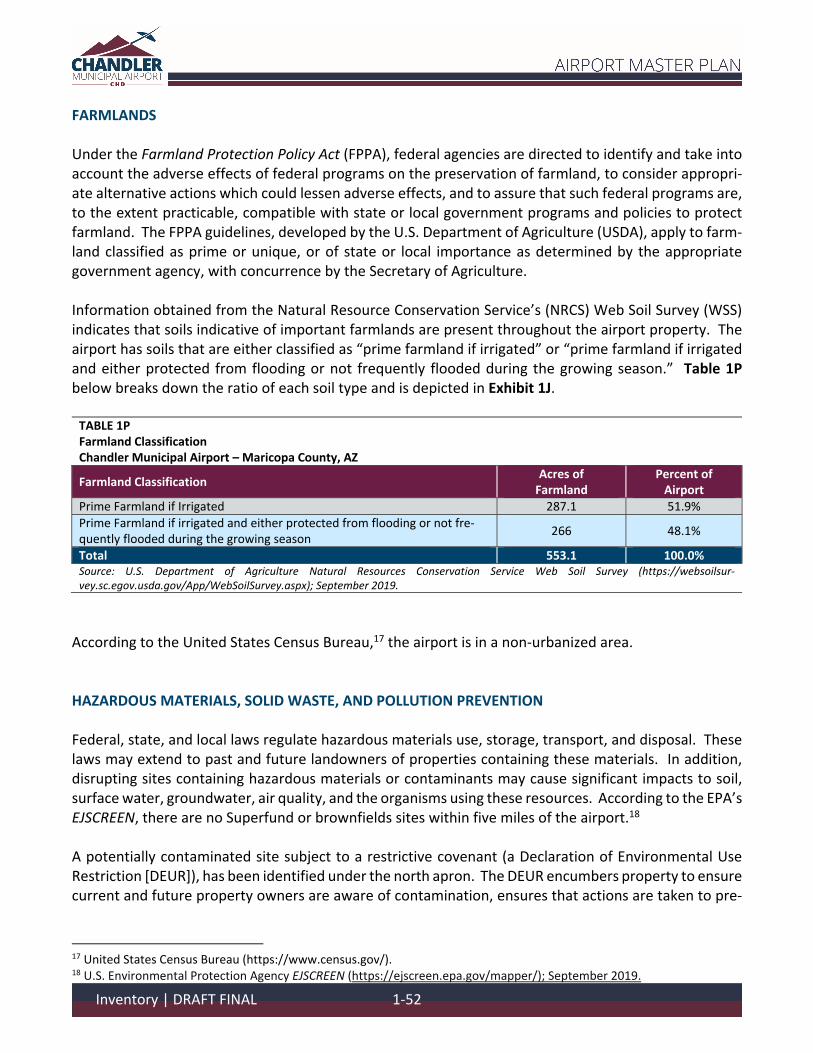
FARMLANDS Under the Farmland Protection Policy Act (FPPA), federal agencies are directed to identify and take into account the adverse effects of federal programs on the preservation of farmland, to consider appropri‐ate alternative actions which could lessen adverse effects, and to assure that such federal programs are, to the extent practicable, compatible with state or local government programs and policies to protect farmland. The FPPA guidelines, developed by the U.S. Department of Agriculture (USDA), apply to farm‐land classified as prime or unique, or of state or local importance as determined by the appropriate government agency, with concurrence by the Secretary of Agriculture. Information obtained from the Natural Resource Conservation Service’s (NRCS) Web Soil Survey (WSS) indicates that soils indicative of important farmlands are present throughout the airport property. The airport has soils that are either classified as “prime farmland if irrigated” or “prime farmland if irrigated and either protected from flooding or not frequently flooded during the growing season.” Table 1P below breaks down the ratio of each soil type and is depicted in Exhibit 1J. TABLE 1P Farmland Classification Chandler Municipal Airport – Maricopa County, AZ
Farmland Classification Acres of Farmland
Percent of Airport
Prime Farmland if Irrigated 287.1 51.9% Prime Farmland if irrigated and either protected from flooding or not fre‐quently flooded during the growing season
266 48.1%
Total 553.1 100.0% Source: U.S. Department of Agriculture Natural Resources Conservation Service Web Soil Survey (https://websoilsur‐vey.sc.egov.usda.gov/App/WebSoilSurvey.aspx); September 2019.
According to the United States Census Bureau,17 the airport is in a non‐urbanized area. HAZARDOUS MATERIALS, SOLID WASTE, AND POLLUTION PREVENTION Federal, state, and local laws regulate hazardous materials use, storage, transport, and disposal. These laws may extend to past and future landowners of properties containing these materials. In addition, disrupting sites containing hazardous materials or contaminants may cause significant impacts to soil, surface water, groundwater, air quality, and the organisms using these resources. According to the EPA’s EJSCREEN, there are no Superfund or brownfields sites within five miles of the airport.18 A potentially contaminated site subject to a restrictive covenant (a Declaration of Environmental Use Restriction [DEUR]), has been identified under the north apron. The DEUR encumbers property to ensure current and future property owners are aware of contamination, ensures that actions are taken to pre‐
17 United States Census Bureau (https://www.census.gov/). 18 U.S. Environmental Protection Agency EJSCREEN (https://ejscreen.epa.gov/mapper/); September 2019.
Inventory | DRAFT FINAL 1-52
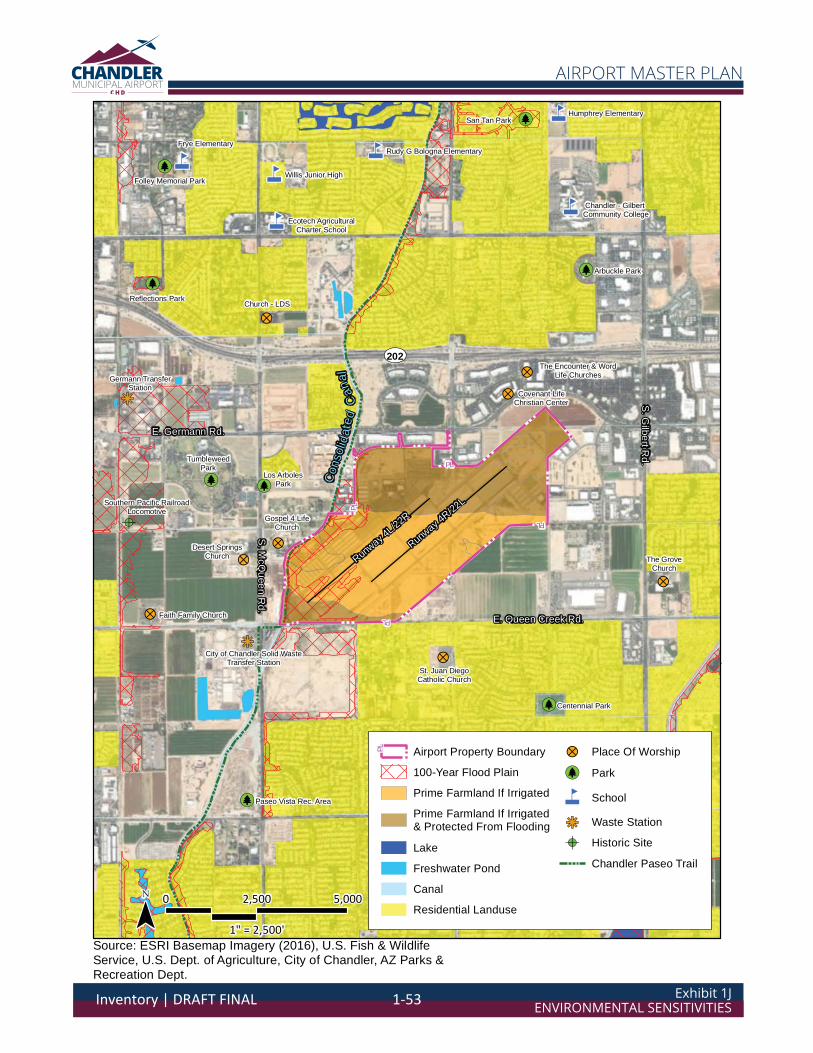
Exhibit 1JENVIRONMENTAL SENSITIVITIES
AIRPORT MASTER PLAN
PL
PL
PL
PL
[j[j
[j[j
[j
[j
[j
[j
[j
444
4
44
!?
!?
!?
!?
!?
!?
!?
!?
!?
kj
kj
!A
City of Chandler Solid WasteTransfer Station
Germann TransferStation
Southern Pacific RailroadLocomotive
Church - LDS
Church - LDS
San Tan Park
Arbuckle Park
Frye Elementary
Centennial Park
TumbleweedPark
Reflections Park
Willis Junior High
Faith Family Church
Gospel 4 LifeChurch
Desert SpringsChurch
Paseo Vista Rec. Area
Rudy G Bologna Elementary
St. Juan DiegoCatholic Church
Covenant LifeChristian Center
The Encounter & WordLife Churches
Ecotech AgriculturalCharter School
Chandler - Gilbert Community College
The GroveChurch
Los ArbolesPark
Humphrey Elementary
Folley Memorial Park
Runway 4
L/22R
S. McQ
ueen Rd.
Source: ESRI Basemap Imagery (2016), U.S. Fish & WildlifeService, U.S. Dept. of Agriculture, City of Chandler, AZ Parks &Recreation Dept.
Runway 4
R/22L
UV202
S. Gilbert R
d.
E. Germann Rd.
E. Queen Creek Rd.
PL Airport Property Boundary
100-Year Flood Plain
Prime Farmland If Irrigated
Prime Farmland If Irrigated& Protected From Flooding
Lake
Freshwater Pond
Canal
Residential Landuse
!? Place Of Worship
[j Park
4 School
kj Waste Station
!A Historic Site
Chandler Paseo Trail
0 2,500 5,000
1" = 2,500'¯
Con
solid
ated
Can
al
Inventory | DRAFT FINAL 1-53
vent or mitigate additional contamination, and is monitored by the Arizona Department of Environmen‐tal Quality (ADEQ). A triangular‐shaped contaminated site has been indicated at the termination of South Cooper Road, south of Runway 4R‐22L. The following municipal solid waste stations are within the vicinity of the airport:
the City of Chandler Solid Waste Transfer Station is located approximately 0.24 miles southwest; and
the Germann Transfer Station is approximately 1.2 miles west. HISTORICAL, ARCHITECTURAL, ARCHAEOLOGICAL, AND CULTURAL RESOURCES Determination of a project’s environmental impact to historic and cultural resources is made under guid‐ance in the National Historic Preservation Act (NHPA) of 1966, as amended, the Archaeological and His‐toric Preservation Act (AHPA) of 1974, the Archaeological Resources Protection Act (ARPA), and the Na‐tive American Graves Protection and Repatriation Act (NAGPRA) of 1990. In addition, the Antiquities Act of 1906, the Historic Sites Act of 1935, and the American Indian Religious Freedom Act of 1978 also pro‐tect historical, architectural, archaeological, and cultural resources. Impacts may occur when a proposed project causes an adverse effect on a resource which has been identified (or is unearthed during con‐struction) as having historical, architectural, archaeological, or cultural significance. In November 2019, SWCA conducted an archaeological field survey of the entire airport to determine if historically significant artifacts are present.19 During the field survey, six isolated occurrences (IOs) were identified consisting of fragmented sun‐colored amethyst glass, whiteware ceramic, colorless glass, milk glass, and a horseshoe; and it was determined these IOs are ineligible for the NRHP. No historic‐era buildings or structures were identified during the field survey area. Prior to the November 2019 archaeological survey performed by SWCA, two previous archaeological surveys have been conducted in the project area. SWCA included the conclusions of these surveys in the November 2019 report, and are summarized as follows:
In 1998, a linear archaeological survey was conducted on 181 acres for a proposed widening of South McQueen Road, and no cultural resources were identified.
In 2004, SWCA performed a block survey on approximately 50 acres for a proposed drainage improvement project. Only 15 acres of the survey area was on airport property. One IO was identified during the course of the survey and it was not located on airport property.
Four sites listed on the National Register of Historic Places (NRHP) are within five miles of the airport. These include:
19 SWCA Environmental Consultants Cultural Resources Survey for the Chandler Municipal Airport Master Plan Update Pro‐ject, Maricopa County, Arizona (November 2019).
Inventory | DRAFT FINAL 1-54
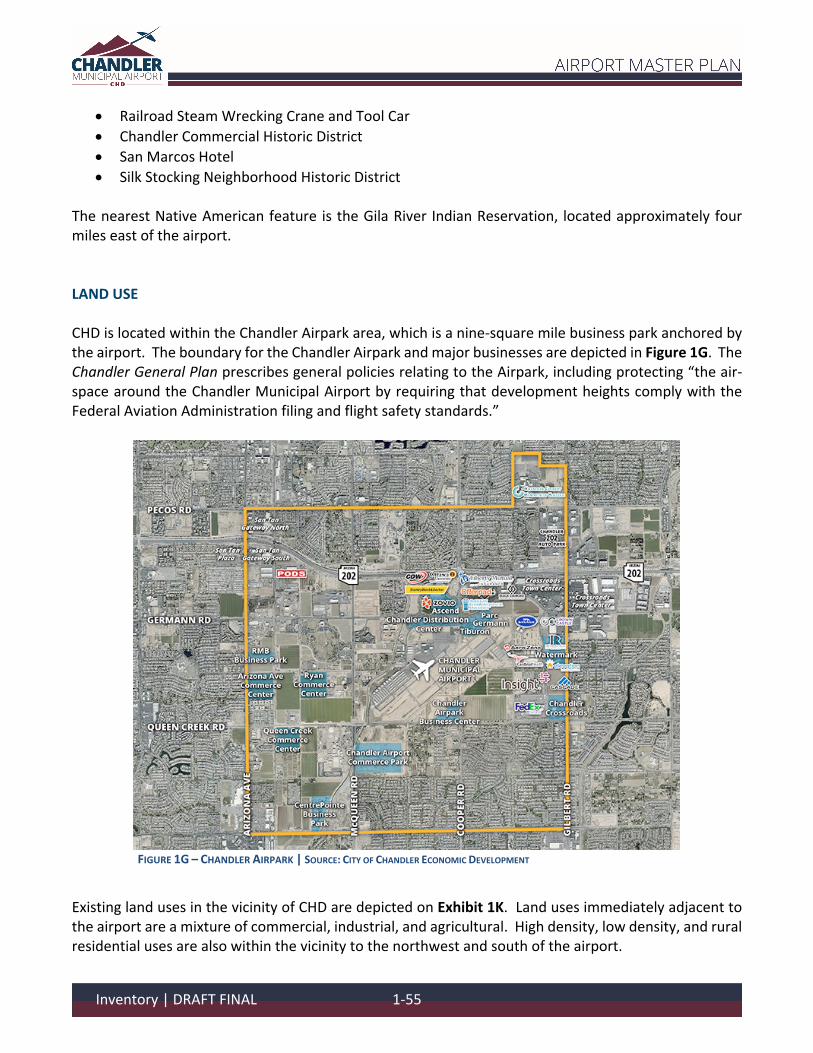
Railroad Steam Wrecking Crane and Tool Car
Chandler Commercial Historic District
San Marcos Hotel
Silk Stocking Neighborhood Historic District The nearest Native American feature is the Gila River Indian Reservation, located approximately four miles east of the airport. LAND USE CHD is located within the Chandler Airpark area, which is a nine‐square mile business park anchored by the airport. The boundary for the Chandler Airpark and major businesses are depicted in Figure 1G. The Chandler General Plan prescribes general policies relating to the Airpark, including protecting “the air‐space around the Chandler Municipal Airport by requiring that development heights comply with the Federal Aviation Administration filing and flight safety standards.”
FIGURE 1G – CHANDLER AIRPARK | SOURCE: CITY OF CHANDLER ECONOMIC DEVELOPMENT
Existing land uses in the vicinity of CHD are depicted on Exhibit 1K. Land uses immediately adjacent to the airport are a mixture of commercial, industrial, and agricultural. High density, low density, and rural residential uses are also within the vicinity to the northwest and south of the airport.
Inventory | DRAFT FINAL 1-55
The City of Chandler General Plan 2016 designates the airport and airpark area as one of six targeted growth areas in the city. The Future Land Use Plan, depicted on Exhibit 1L, shows the airport and sur‐rounding area planned for future employment development. An Airport Impact Overlay District (AIO) has been codified in Chapter 35, Land Use and Zoning, of the General Ordinances of the City of Chandler.20 The purpose and intent of the AIO is to ensure public health around the airport by minimizing exposure to high noise level and accidental hazards associated with airport operations and to encourage surrounding development compatible with the airport. The AIO boundary is codified in Section 35‐3001(A) and described as “Sections 1, 2, 3, 10, 11, 12, 13, 14, and 15 of Township 2 South, Range 5 of the Gila and Salt River Meridians.” Three Airport Noise Overlays (ANO) and one Clear Zone Overlay (CZO) areas are established to provide clear and defining boundaries for compatible development around the airport. The ANOs are defined by 2005 noise contours published in the 2010 Chandler Municipal Airport Master Plan,21 with each ANO zone defined by the 55 day‐night average sound level (Ldn) – 60 Ldn, 60 Ldn – 70 Ldn, and greater than 70 Ldn contours. The CZO is defined as the “area on either side of an extension of the centerline of a runway beginning at a line two hundred (200) feet from the end of a runway and, for Runway 4L‐22R of the Chandler Municipal Airport: two hundred fifty (250) feet wide and flaring outward to a width of four hundred fifty (450) feet at a distance of one thousand (1,000) feet; for Runway 4R‐22L of the Chandler Municipal Airport: five hundred (500) feet wide and flaring outward to a width of one thousand ten (1,010) feet at a distance of one thousand seven hundred (1,700) feet…” Permitted uses within the ANO and CZO are permitted with the underlying zoning district; however, uses are subject to additional height and safety regulations set forth in Section 35‐3005 of the municipal code. The Airport District (AP‐1) is intended to provide for aircraft operations, air services, and related com‐mercial uses for the airport owned or leased by the City of Chandler. The AP‐1 zoning district establishes strict bulk development standards (such as height limitations and setbacks) to ensure the safety and compatibility with airport operations. The boundaries of the AP‐1 zoning district are intended to coin‐cide with the airport property line and not be considered for a rezoning classification. Principle uses under this district include those necessary for airport operations, such as aircraft hangars, ATCT, or avi‐ation fuel farms. Additional uses allowed in the AP‐1 district are FBOs, heliports, and office space as an accessory to an approved principal use. NATURAL RESOURCES AND ENERGY SUPPLY E.O. 13423, Strengthening Federal Environmental, Energy, and Transportation Management instructs federal agencies to advance the nation’s energy security and environmental performance by achieving specified goals. Natural resources and energy supply provide an evaluation of a project’s consumption of natural resources. It is the policy of FAA Order 1053.1, Energy and Water Management Program for
20 City of Chandler, AZ General Ordinances of the City of Chandler (https://www.chandleraz.gov/government/depart‐ments/city‐clerks‐office/city‐code‐and‐charter); accessed September 2019. 21 Wilbur Smith Associates Chandler Municipal Airport 2010 Airport Master Plan Update (April 2010).
Inventory | DRAFT FINAL 1-56
Germann RoadGermann Road
E Yeager DrE Yeager Dr
S Co
oper
Roa
dS
Coop
er R
oad
202/Santan Fwy202/Santan Fwy
E Queen Creek RdE Queen Creek Rd
S Airport Blvd
S Airport Blvd
Aviation DrAviation Dr
S Em
met
t Dr
S Em
met
t Dr
S St
earm
an D
rS
Stea
rman
Dr
S Helip
ort W
ay
S Helip
ort W
ay
S M
cQue
en R
dS
McQ
ueen
Rd
Exhibit 1KEXISTING LAND USE
AIRPORT MASTER PLAN
D
F
G
H
L
A
J
MN
B
C
P
Q
Runway 4R-22L 4,870’ x 75’
Runway 4R-22L 4,870’ x 75’
Runway 4L-22R 4,401’ x 75’
Runway 4L-22R 4,401’ x 75’
0 1,000
SCALE IN FEET
Photo: Google Earth 8/19
LEGENDExisting Airport Property LineExisting Avigation EasementTaxiway DesignationAgricultureCommercialNoise SensitiveHigh Density ResidentialIndustrialLow Density ResidentialOpen SpacePublic Buildings/FacilitiesRural ResidentialVacant
A
Inventory | DRAFT FINAL 1-57
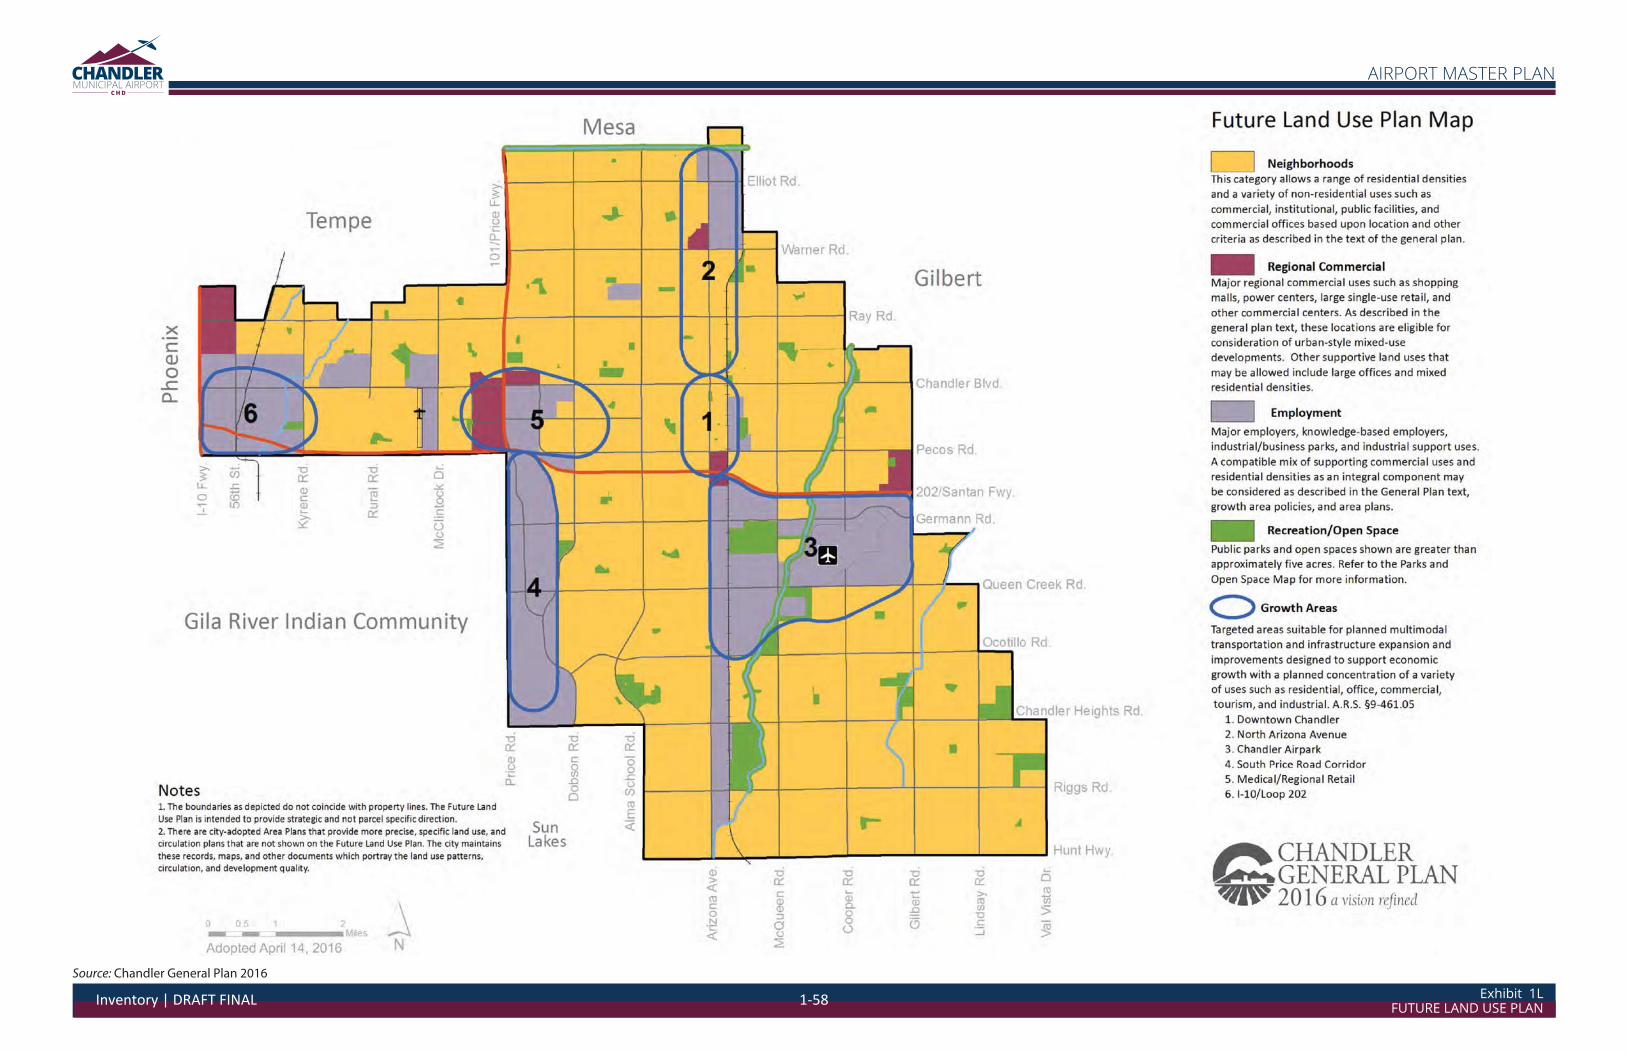
Exhibit 1LFUTURE LAND USE PLAN
AIRPORT MASTER PLAN
Source: Chandler General Plan 2016
Inventory | DRAFT FINAL 1-58
FAA Buildings and Facilities, to encourage the development of facilities that exemplify the highest stand‐ards of design, including principles of sustainability. Natural resources and energy supply are discussed earlier in this chapter under “Fuel Facilities and Equip‐ment” and “Utilities.” NOISE AND NOISE‐COMPATIBLE LAND USE Federal land use compatibility guidelines are established under 14 Code of Federal Regulations (CFR) Part 150, Airport Noise Compatibility Planning. According to 14 CFR Part 150, residential land uses and schools are noise‐sensitive land uses that are not considered compatible with a 65 decibel (dB) Day‐Night Average Sound Level (Ldn). Other noise‐sensitive land uses (such as religious facilities, hospitals, or nurs‐ing homes), if located within a 65 dB LDN contour, are generally compatible when an interior noise level reduction of 25 dB is incorporated into the design and construction of the structure. Special considera‐tion should also be given to noise‐sensitive areas within Section 4(f) properties where the land use com‐patibility guidelines in 14 CFR Part 150 do not account for the value, significance, and enjoyment of the area in question. A 14 CFR Part 150 Study was conducted for the airport in the late 1990s, with the FAA issuing a Record of Approval on July 11, 2000.22 A Noise Exposure Map update was performed in February 2010.
Currently, the AIO incorporated noise overlays established by noise contours generated in 2005. The noise overlay was discussed in detail in the “Land Use” section of this chapter.
Noise‐sensitive land uses near the airport consist primarily of residential uses to the west, south, and east. Additional noise‐sensitive land uses within approximately one mile of the airport are outlined in Table 1Q below.
While there are additional noise‐sensitive land uses in the City of Chandler, they are beyond one mile of the airport boundary.
22 Federal Aviation Administration Planning Data and Noise Compatibility Program Status – Arizona (https://www.faa.gov/airports/environmental/airport_noise/part_150/states/az/); December 2019.
Inventory | DRAFT FINAL 1-59
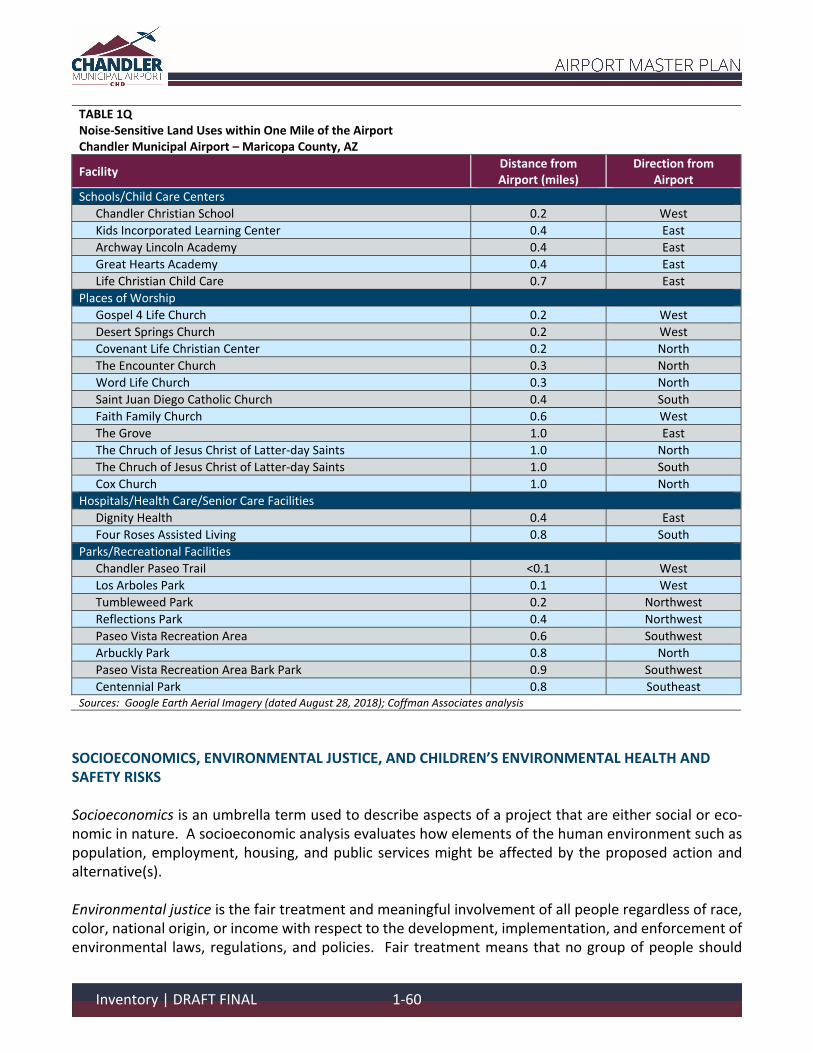
TABLE 1Q Noise‐Sensitive Land Uses within One Mile of the Airport Chandler Municipal Airport – Maricopa County, AZ
Facility Distance from Airport (miles)
Direction from Airport
Schools/Child Care Centers
Chandler Christian School 0.2 West
Kids Incorporated Learning Center 0.4 East
Archway Lincoln Academy 0.4 East
Great Hearts Academy 0.4 East
Life Christian Child Care 0.7 East
Places of Worship
Gospel 4 Life Church 0.2 West
Desert Springs Church 0.2 West
Covenant Life Christian Center 0.2 North
The Encounter Church 0.3 North
Word Life Church 0.3 North
Saint Juan Diego Catholic Church 0.4 South
Faith Family Church 0.6 West
The Grove 1.0 East
The Chruch of Jesus Christ of Latter‐day Saints 1.0 North
The Chruch of Jesus Christ of Latter‐day Saints 1.0 South
Cox Church 1.0 North
Hospitals/Health Care/Senior Care Facilities
Dignity Health 0.4 East
Four Roses Assisted Living 0.8 South
Parks/Recreational Facilities
Chandler Paseo Trail <0.1 West
Los Arboles Park 0.1 West
Tumbleweed Park 0.2 Northwest
Reflections Park 0.4 Northwest
Paseo Vista Recreation Area 0.6 Southwest
Arbuckly Park 0.8 North
Paseo Vista Recreation Area Bark Park 0.9 Southwest
Centennial Park 0.8 Southeast Sources: Google Earth Aerial Imagery (dated August 28, 2018); Coffman Associates analysis
SOCIOECONOMICS, ENVIRONMENTAL JUSTICE, AND CHILDREN’S ENVIRONMENTAL HEALTH AND SAFETY RISKS Socioeconomics is an umbrella term used to describe aspects of a project that are either social or eco‐nomic in nature. A socioeconomic analysis evaluates how elements of the human environment such as population, employment, housing, and public services might be affected by the proposed action and alternative(s). Environmental justice is the fair treatment and meaningful involvement of all people regardless of race, color, national origin, or income with respect to the development, implementation, and enforcement of environmental laws, regulations, and policies. Fair treatment means that no group of people should
Inventory | DRAFT FINAL 1-60
bear a disproportionate share of the negative environmental consequences resulting from industrial, governmental, and commercial operations or policies. Meaningful Involvement23 ensures that:
people have an opportunity to participate in decisions about activities that may affect their en‐vironment and/or health;
the public’s contribution can influence the regulatory agency’s decision; their concerns will be considered in the decision‐making process; and the decision‐makers seek out and facilitate the involvement of those potentially affected.
FAA Order 1050.1F, Environmental Impacts: Policies and Procedures specifically requires that a federal action causing disproportionate impacts to an environmental justice population (i.e., a low‐income or minority population), be considered, as well as an evaluation of environmental health and safety risks to children. The EPA’s EJSCREEN online tool identifies the presence of environmental justice areas within the airport environs. The population within five miles of the airport is approximately 237,000, of which 20 percent of the population is considered low‐income and 38 percent are considered a minority popu‐lation. Likewise, according to EJSCREEN, seven percent of the population is under the age of five within a five‐mile radius of the airport. VISUAL EFFECTS Visual effects deal broadly with the extent to which a proposed action or alternative(s) would either (1) produce light emissions that create an annoyance or interfere with activities; or (2) contrast with, or detract from, the visual resources and/or the visual character of the existing environment. Each juris‐diction will typically address outdoor lighting, scenic vistas, and scenic corridors in zoning ordinances and their general plan. Light emissions include any light that originates from a light source into the surrounding environment, such as airfield and apron floodlighting, navigational aids, parking lot illumination, and roadway lighting. Glare is a type of light emission that occurs when light is reflected off a surface, including solar panels or window glass. Visual character refers to the overall visual makeup of the existing environment where a proposed action or its alternative(s) would be located. For example, areas near densely populated areas generally have a visual character that could be defined as urban, whereas less developed areas could have a visual character defined by the surrounding landscape features, such as open grass fields, forests, mountains, or deserts, etc. Visual resources include buildings, sites, traditional cultural properties, and other natural or manmade landscape features that are visually important or have unique characteristics. Visual resources may in‐clude structures or objects that obscure or block other landscape features. In addition, visual resources can include the cohesive collection of various individual visual resources that can be viewed at once or in concert from the area surrounding the site of the proposed action or alternative(s).
23 Requirements for meaningful public involvement by minority and low‐income populations are addressed in Paragraph 2‐5.2.b of FAA Order 1050.1F, Environmental Impacts: Policies and Procedures.
Inventory | DRAFT FINAL 1-61
Light Emissions. Light emission impacts typically relate to the extent to which any light or glare results from a source that could create an annoyance for people or would interfere with normal activities. Gen‐erally, local jurisdictions will include ordinances in the local code addressing outdoor illumination to re‐duce the impact of light on surrounding properties. According to the City of Chandler’s Land Use and Zoning Code, “all external lighting shall be located and designed to prevent lighting rays from being directed off the property upon which the lighting is located.” The City of Chandler and its surrounding environs are not designated as dark sky places. However, Tonto National Monument, located approximately 47 miles northeast, is designated as an International Dark Sky Park.24 Visual Resources and Visual Character. Impact on visual resources and visual character typically relates to a reduction in the aesthetic quality of the surrounding environs from development, construction, or demolition. When making a determination of visual impacts, consideration should be made whether a proposed project or alternative(s) would have an effect on any visual resources or alter local character. The City of Chandler’s Land Use and Zoning Code25 does not address scenic vistas or corridors. The Chan‐dler General Plan26 states the importance of incorporating open space areas that replicate the natural desert habitat as the city comes to full build‐out. According to the Federal Highway Administration, no scenic byways are located within the vicinity of the airport.27 WATER RESOURCES Wetlands. The U.S. Army Corps of Engineers regulates the discharge of dredged and/or fill material into waters of the United States, including adjacent wetlands, under Section 404 of the Clean Water Act (CWA). Wetlands are defined in E.O. 11990, Protection of Wetlands, as “those areas that are inundated by surface or groundwater with a frequency sufficient to support and under normal circumstances does or would support a prevalence of vegetative or aquatic life that requires saturated or seasonally satu‐rated soil conditions for growth and reproduction.” Wetlands can include swamps, marshes, bogs, sloughs, potholes, wet meadows, river overflows, mudflats, natural ponds, estuarine areas, tidal over‐flows, and shallow lakes and ponds with emergent vegetation. Wetlands exhibit three characteristics: the soil is inundated or saturated to the surface at some time during the growing season (hydrology), has a population of plants able to tolerate various degrees of flooding or frequent saturation (hydro‐phytes), and soils that are saturated enough to develop anaerobic (absent of air or oxygen) conditions during the growing season (hydric).28
24 International Dark Sky Association (https://www.darksky.org/); December 2019. 25 City of Chandler Planning and Zoning, Chapter 35 Land Use and Zoning Code (https://www.chandleraz.gov/govern‐ment/departments/development‐services/planning‐and‐zoning); December 2019. 26 City of Chandler Planning and Zoning Chandler General Plan (April 2016) (https://www.chandleraz.gov/government/de‐partments/development‐services/planning‐and‐zoning); December 2019. 27 Federal Highway Administration (https://www.fhwa.dot.gov/byways/states/AZ); December 2019. 28 National Resources Conservation Service – U.S. Department of Agriculture (https://www.nrcs.usda.gov/wps/por‐tal/nrcs/detail/soils/use/hydric/?cid=nrcs142p2_053961); September 2019.
Inventory | DRAFT FINAL 1-62
According to USFWS, which manages the National Wetlands Inventory on behalf of all federal agencies, the Consolidated Canal west of the airport and stormwater drainage along East Germann Road north of the airport has been identified as wetlands; although it is important to note that these areas were iden‐tified as wetlands based on a review of undated aerial photography. Upon review of a Google Earth aerial image (image dated August 28, 2018), the canal and drainage ways are still present. No wetlands are identified on airport property. Based on information from the NRCS‐WSS, no hydric soils are present on airport property. Floodplains. E.O. 11988, Floodplain Management, directs federal agencies to take action to reduce the risk of flood loss, minimize the impact of floods on human safety, health, and welfare, and restore and preserve the natural and beneficial values served by the floodplains. A review of the Federal Emergency Management Agency (FEMA) Flood Insurance Rate Map (FIRM) panels 04013C2739M and 04013C2743M (dated November 4, 2015) indicates the presence of a Special Flood Area, identified as Zone AH, associated with the Consolidated Canal within the southwest area of the airport, impacting taxiways and Runway 4L‐22R. The AH Zone is subject to a 100‐year flood event with a one‐ to three‐foot flood depth, with a base elevation of 1,230 feet above sea level. Surface Waters. The CWA establishes water quality standards, control discharges, develop waste treat‐ment management plans and practices, prevent or minimize the loss of wetlands, and regulate other issues concerning water quality. Water quality concerns related to airport development most often re‐late to the potential for surface runoff and soil erosion, as well as the storage and handling of fuel, pe‐troleum products, solvents, etc. Additionally, Congress has mandated (under the CWA) the National Pollutant Discharge Elimination System (NPDES). The Arizona Department of Environmental Quality has the authority to administer the NPDES program in the state, tribal lands excluded. The Arizona Pollutant Discharge Elimination System (AZPDES) permit mandates certain procedures required to prevent con‐tamination of water bodies from stormwater runoff.
Examples of direct impacts to surface waters include any in‐water work resulting from the expansion of an existing FAA facility adjacent to surface waters, or withdrawal of water from surface water for con‐struction or operations. No impaired waters under Section 303(d) of the CWA are located within the vicinity of the airport.
A review of the National Hydrography Dataset, published by the United States Geological Survey, indi‐cates there is an engineered drainage channel crossing through the north end of the airport along an airport service road north of Runway 4R‐22L. A second drainage channel is the Consolidated Canal along the western boundary of the airport.
On November 5, 2019, SWCA performed a field investigation to determine whether the ephemeral drain‐ages on airport property qualify as Waters of the United States (WOTUS).29 It is concluded that all drain‐age features on the airport are ephemeral in nature, and only flow during localized precipitation events. These drainages do not show a developed bed or bank and do not have an ordinary high‐water mark (OHWM) typical of a WOTUS. Most of these drainages can be described as small erosional features, swales, and/or engineered ditches.
29 SWCA Environmental Consultants, Inc. Wetlands and Other Waters of the U.S. Review for Chandler Municipal Airport Master Plan Update Project in Chandler, Maricopa County, Arizona (November 25, 2019).
Inventory | DRAFT FINAL 1-63
Other small, local canals on and around the airport benefiting individual fields do not receive water from natural surface flow and do not connect downstream to a WOTUS.
Wild and Scenic Rivers. The National Wild and Scenic Rivers Act was established to preserve certain rivers with outstanding natural, cultural, and recreational values in a free‐flowing condition for the en‐joyment of present and future generations. The closest designated Wild and Scenic River is a segment of the Verde River, located approximately 60 miles north of the airport.30
The Nationwide River Inventory (NRI) is a list of over 3,400 rivers or river segments that appear to meet the minimum Wild and Scenic Rivers Act eligibility requirements based on their free‐flowing status and resource values. The development of the NRI resulted from Section 5(d)(1) in the Wild and Scenic Rivers Act, directing Federal agencies to consider potential wild and scenic rivers in the comprehensive planning process.31 The river closest to the airport which appears on the NRI is a segment of the Arnett/Telegraph Creeks, located approximately 36 miles east of the airport.
Groundwater. Groundwater is subsurface water that occupies the space between sand, clay, and rock formations. The term aquifer is used to describe the geologic layers that store or transmit groundwater, such as wells, springs, and other water sources. Examples of direct impacts to groundwater could include withdrawal of groundwater for operational purposes or reduction of infiltration or recharge area due to new impervious surfaces. The geological make‐up of the area includes fine‐grained deposits of silt and clay, which tends to become more compact and less permeable with depth. Surrounding aquifers are considered basin‐fill aquifers, which is typically bounded by low‐permeability rock. Some basin‐fill aqui‐fers, like those found in parts of California and Arizona, have supplied water for irrigation and other uses.32
The Upper Santa Cruz and Avra Basin sole source aquifer is located approximately 40 miles southeast of the airport.33 ENVIRONMENTAL INVENTORY SOURCES A variety of resources were used during the inventory process. The following listing reflects a compila‐tion of these sources.
Federal Emergency Management Agency Flood Map Service Center: https://msc.fema.gov/portal/search?AddressQuery=Chandler%2C%20AZ#searchresultsanchor
Intergovernmental Panel on Climate Change:
https://www.ipcc.ch/
30 National Wild and Scenic Rivers System (https://rivers.gov/wsr‐act.php); December 2019. 31 National Park Service – Nationwide Rivers Inventory (https://www.nps.gov/subjects/rivers/nationwide‐rivers‐inven‐tory.htm); December 2019. 32 U.S. Geologive Survey – Aquifers and Groundwater (https://water.usgs.gov/ogw/aquifer/101514‐wall‐map.pdf); Decem‐ber, 2019. 33 U.S. Environmental Protection Agency Sole Source Aquifer for Drinking Water (https://www.epa.gov/dwssa); September 2019.
Inventory | DRAFT FINAL 1-64
National Wild and Scenic Rivers System: https://rivers.gov/wsr‐act.php
Natural Resources Conservation Service, Web Soil Survey:
https://websoilsurvey.sc.egov.usda.gov/App/WebSoilSurvey.aspx
U.S. Environmental Protection Agency, EJSCREEN: http://www.epa.gov/ejscreen
U.S. Environmental Protection Agency, Green Book National Area and County‐Level Multi‐Pollutant Information:
https://www3.epa.gov/airquality/greenbook/anayo_az.html
U.S. Fish and Wildlife Service Information, Information for Planning and Consultation: https://ecos.fws.gov/ipac/
U.S. Fish and Wildlife Service National Wetlands Inventory:
http://www.fws.gov/wetlands/Data/Mapper.html
U.S. Geological Survey National Map: http://nationalmap.gov/
U.S. National Park Service – National Register of Historic Places:
https://www.nps.gov/subjects/nationalregister/index.htm
Inventory | DRAFT FINAL 1-65