Embed Size (px)
Citation preview

www.elsevier.com/locate/foreco
Forest Ecology and Management 236 (2006) 177–192
Land use context and natural soil controls on plant community
composition and soil nitrogen and carbon dynamics
in urban and rural forests
Peter M. Groffman a,*, Richard V. Pouyat b, Mary L. Cadenasso c,Wayne C. Zipperer b, Katalin Szlavecz d, Ian D. Yesilonis b,
Lawrence E. Band e, Grace S. Brush f
a Institute of Ecosystem Studies, Box AB, Millbrook, NY 12545, USAb USDA Forest Service, Northeastern Research Station, c/o Baltimore Ecosystem Study,
5200 Westland Blvd., Baltimore, MD 21227, USAc Department of Plant Sciences, University of California, Davis, CA 95615, USA
d Johns Hopkins University, Department of Earth and Planetary Sciences, Baltimore, MD 21218, USAe Department of Geography, University of North Carolina, Chapel Hill, NC 27599, USA
f Johns Hopkins University, Department of Geography and Environmental Engineering, Baltimore, MD 21218, USA
Received 9 May 2006; received in revised form 4 September 2006; accepted 5 September 2006
Abstract
Forests embedded in an urban matrix are a useful venue for investigating the effects of multiple factors such as climate change, altered
disturbance regimes and species invasions on forest ecosystems. Urban forests also represent a significant land area, with potentially important
effects on landscape and regional scale nitrogen (N) and carbon (C) storage and flux. We measured forest community composition, litterfall, leaf
area index, soil chemical properties, in situ net N mineralization and nitrification, soil and soil solution inorganic N pools, and soil:atmosphere
fluxes of nitrous oxide (N2O), carbon dioxide (CO2) and methane (CH4) in eight forest stands that differed in their exposure to urban atmospheric
conditions and natural soil conditions (high versus low fertility). Our objectives were (1) to compare the influence of urban land use context and
natural soil controls on forest composition and C and N cycling processes and (2) to evaluate the importance of ‘‘natural’’ N cycle processes relative
to anthropogenic N fluxes in the urban landscape. Forest productivity and N cycling varied more with soil type than with proximity to urban land
use, while forest composition and soil:atmosphere fluxes of CO2 and CH4 were more strongly influenced by exposure to an urban land use matrix
and atmosphere. The magnitude of natural processes was important in the context of urban and suburban landscapes, i.e. production of, and annual
variation in, inorganic N in forest patches was large relative to watershed-scale atmospheric deposition, fertilizer use and food/sewage fluxes that
have been measured in other studies in these study landscapes.
# 2006 Elsevier B.V. All rights reserved.
Keywords: Carbon; Forests; Greenhouse gases; Mineralization; Nitrate; Nitrification; Nitrogen; Urban
1. Introduction
One of the challenges facing ecosystem ecologists is
unraveling the effects of multiple factors on the structure and
function of ecosystems (Vitousek, 1994; Aber and Driscoll,
1997; Groffman et al., 2004a). Forests in many areas of the
world are simultaneously affected by climate change, atmo-
spheric pollution, altered disturbance regimes and species
* Corresponding author. Tel.: +1 845 677 7600x128; fax: +1 845 677 5976.
E-mail address: [email protected] (P.M. Groffman).
0378-1127/$ – see front matter # 2006 Elsevier B.V. All rights reserved.
doi:10.1016/j.foreco.2006.09.002
invasions. Understanding these factors, and how they interact
with natural controls such as soil type and ecosystem
development to influence nutrient cycling processes requires
multiple research approaches, including long-term monitoring,
manipulation studies, comparative analyses and simulation
modeling (Carpenter, 1998).
Urban land use change produces multiple environmental
effects on forests that remain embedded within urban and
suburban landscapes (Foley et al., 2005; Pouyat et al., in press).
Impervious surfaces now cover over 110,000 km2 in the U.S.
(Elvidge et al., 2004), and urban land use change affects a much

P.M. Groffman et al. / Forest Ecology and Management 236 (2006) 177–192178
larger area through alteration of climate, atmospheric chemistry
and water quantity, quality and flow (Oke, 1990; Imhoff et al.,
1997; Shepherd and Burian, 2003; Gregg et al., 2003; Ziska
et al., 2004; Kaye et al., 2006). Forests embedded in an urban
matrix are thus a useful venue for investigating the effects of
multiple environmental factors on forest ecosystems (Pouyat
et al., 1995; Carreiro and Tripler, 2005). They are particularly
useful if comparisons can be made along urban to rural
gradients and if variation in natural controls, e.g. soil type, can
be compared with variation in exposure to multiple urban
effects (McDonnell and Pickett, 1990; McDonnell et al., 1997).
In addition to investigating multi-factor influences on
nutrient cycling processes, study of urban forests is important
in its own right. On average, urban land in the northeast U.S. has
33% tree canopy cover (Nowak and Crane, 2002) with values
up to 80% in older residential areas (Freedman et al., 1996) and
significant areas of remnant forest. Urban forests thus represent
a significant forest area, with important effects on landscape
and regional N and C storage and flux (McPherson, 1998;
Jenkins et al., 2001; Jenkins and Riemann, 2003; Pouyat et al.,
2006). Urban watersheds have been reported to have
surprisingly high capacity for nitrogen retention (Baker
et al., 2001; Groffman et al., 2004b; Wollheim et al., 2005),
and forests likely play an important role in this important
ecosystem service. Urban forests also have socio-cultural
significance, influencing human perceptions of environmental
quality and well being (Grove et al., 2006). Given that the vast
majority of the human population lives in urban areas, there is
great interest in the factors regulating urban forest processes
that underlie their productivity and dynamics, such as nutrient
cycling.
In the Baltimore Ecosystem Study (BES, http://beslter.org),
one of two urban components of the U.S. National Science
Foundation’s Long-term Ecological Research (LTER) network,
we have established a series of long-term study plots to evaluate
the control by urban environment and natural soil type on forest
processes. Four plots are located close to the urban core of
Baltimore City, and four are located approximately 30 km into
the rural/suburban fringe of Baltimore County. In addition to
evaluating effects of an urban land use matrix on forest
ecosystems, these plots also allow us to compare the major
natural soil/vegetation controls in this region as three of the
plots are located on relatively fine-textured, fertile soils while
five are located on less fertile, more coarse-textured soils.
In this paper we present data from the BES long-term forest
study plots on several ecosystem N cycle variables including
forest community composition, basic soil properties, in situ net
N mineralization and nitrification, soil and soil solution
inorganic N pools, and soil:atmosphere fluxes of nitrous oxide
(N2O). We also measured a series of parameters related to C
cycling, and its influence on N dynamics, including leaf area
index, litterfall and soil:atmosphere fluxes of carbon dioxide
(CO2) and methane (CH4). Our objectives were (1) to compare
the influence of urban land use context and natural soil controls
on forest composition and C and N cycling processes and (2) to
evaluate the importance of ‘‘natural’’ N cycle processes
(mineralization, nitrification) relative to anthropogenic N
fluxes (atmospheric deposition, fertilizer, food imports,
sewage exports) that have been measured in the BES study
watersheds.
2. Methods
2.1. Study area
BES research is centered on the Gwynns Falls watershed
(768300, 398150 and approximately 17,150 ha) in Baltimore
City and Baltimore County, MD. Watershed population in the
year 2000 was approximately 356,000 people, with sub-
watershed densities ranging from 2.2 to 19.4 persons ha�1.
Land use varies, with the lower sub-watersheds containing
predominantly residential/commercial/industrial and the upper
sub-watersheds a mixture of lower density residential areas
along with agricultural and forested land use.
The watershed lies in two physiographic provinces, the
Piedmont to the northwest and the Atlantic Coastal Plain to the
southeast. All BES research is focused on the Piedmont
portions of the watershed. The Piedmont Plateau is underlain by
old igneous and metamorphic rocks. Differences in these rocks
underlie variation in inherent soil fertility, i.e. base saturation,
pH and water holding capacity (Froelich et al., 1980). Low
fertility soils are found over acid crystalline rocks such as
gneiss and micaceous schist, while high fertility soils are found
over mixed mafic rocks and material weathered from
amphibolite, diabase, or other basic igneous rocks (NRCS,
1998). These soils thus have higher pH and base saturation, as
well as better water holding capacity.
The natural forest vegetation of the area (currently
approximately 20% of the watershed) consists mostly of tulip
poplar (Liriodendron tulipifera) and oaks, primarily chestnut
(Quercus prinus), scarlet (Quercus coccinea) and white
(Quercus alba) in the uplands and red maple (Acer rubrum),
green ash (Fraxinus pennsylvanica), American elm (Ulmus
americana), river birch (Betula nigra) and sycamore (Platanus
occidentalis) in the lowlands (Brush et al., 1980).
Average annual precipitation is approximately 1060 mm
year�1 and stream discharge is approximately 380 mm year�1
(Doheny, 1999). The greatest rainfall intensities occur in the
summer and early fall during convective events and occasional
tropical depressions.
2.2. Long-term study plot establishment
Due to the complex pattern of land development, long-term
study plots could not be located to provide a comprehensive test
of the effects of natural soil controls and land use context within
the Baltimore metropolitan area. Rather in 1998, eight plots
were surveyed into three remnant forests in public parks in the
study region. Four ‘‘rural’’ plots were established in Oregon
Ridge Park and four ‘‘urban’’ plots were established in
Hillsdale and Leakin Parks, two per park. The urban plots were
located approximately 5 km from the urban core of Baltimore
City and the rural plots were approximately 30 km from the
core, in Baltimore County. Data from these plots thus provide

P.M. Groffman et al. / Forest Ecology and Management 236 (2006) 177–192 179
inference on the population of forest remnants within the
Baltimore metropolitan area study region.
Specific sites were selected within the parks to (1) avoid
obvious habitat boundaries or edges, (2) have consistent
drainage lines within the plot, and (3) maintain at least 80%
continuous tree canopy. Plots were surveyed in to correct for
slope and to achieve an accuracy of plot side length to within
0.5 cm. Plots were 1600 m2 with the exception of the Hillsdale
plots which were 900 m2.
2.3. Soil characterization
At each plot, a 1.5 m2 soil pit was excavated with a back-hoe
or by hand to a depth of 1.8 m. Soil horizons were identified and
described using NRCS guidelines for describing and sampling
soils (NRCS, 2004). A representative sample from each horizon
was collected and analyzed for total organic C and N (dry
combustion), exchangeable Ca, Mg, K and Na (NH4OAc
extractable), extractable P (resin extraction), extractable heavy
metal concentrations (nitric acid), percentage clay, silt and sand
(pipet method), and pH (CaCl2 and H2O) at the NRCS Lincoln,
NE Laboratory (NRCS, 2004). In the field, the 20–75 mm
fraction was sieved, weighed, and discarded. Samples taken to
the laboratory were sieved and weighed to determine the
<2 mm fraction. Weight percentages of the >2 mm fractions
were estimated from volume estimates of the >2 mm fractions
and weight determinations of the <2 mm fractions. Three
undisturbed clods were taken from each horizon for bulk
density analysis from the same pit faces as the mixed,
representative samples (Blake and Hartge, 1986). Two of the
clods were used in the primary analysis, while the third clod
was reserved for a rerun, if needed. Amoozemeters were used to
measure in situ saturated hydraulic conductivity (Amoozegar,
1989).
2.4. Vegetation characterization
For vegetation characterization, each plot was subdivided
into four 10 m � 10 m subplots. All vegetation layers were
sampled in order to characterize the structure and composition
of the plant community. All trees in the plot were identified and
their diameter at breast height (dbh) measured. Trees were
defined as greater than 8 cm dbh. In each 10 m � 10 m subplot,
the height of the tallest tree was measured and the percent open
canopy assessed. All other vegetation layers were characterized
within a random sampling of 5 m � 5 m subplots stratified by
the 10 m � 10 m subplots. There were 16, 5 m � 5 m subplots
at each site (except Hillsdale plots which had 9). Within the
5 m � 5 m subplots, all saplings were identified and their
diameter measured. Saplings were defined as less than 8 cm dbh
and taller than 1 m. The cover of shrubs and vines was
quantified along two sides of each 5 m � 5 m subplot for a total
of 160 m of transect at each site (90 m at Hillsdale sites).
Shrubs and vines were identified, the percent cover for each 1 m
segment of the transects determined, and the maximum height
measured. Seedling composition, cover, and density and
herbaceous species identity and cover were quantified in two
1 m2 plots established at a right angle to each other within each
5 m � 5 m subplot.
Litter was collected from each permanent plot during 1999
and 2000. Eight litter baskets were randomly placed in each of
the Oregon Ridge and Leakin Park plots. Because Hillsdale
plots were smaller, four baskets were randomly placed at each
site. Litter was collected each month during leaf-off and leaf-on
periods. During the leaf-fall period, litter was collected weekly.
Samples were placed in brown paper bags and returned to the
lab where they were dried at 65 8C to a constant weight to
obtain total dry-weight of litter per plot.
Litter samples were also collected during leaf-fall to obtain
leaf-area measurements. Prior to a forecast of dry weather for at
least 24 h, baskets were emptied of all litter. After a 24 h period,
baskets were again emptied. This sample was placed in brown
bags. Upon returning to the lab, samples were pooled by plot
and separated by species. A sample of 20 randomly chosen
leaves per species was photocopied to obtain leaf areas. Leaf
areas were measured using a CI-251 Leaf Area Meter (CID
Inc., Vancouver, WA).
2.5. In situ net N mineralization and nitrification
Net N mineralization and nitrification were measured using
an in situ intact core method (Robertson et al., 1999). At each
sampling day, ten, 2 cm diameter � 25 cm depth intact cores
were removed from each plot. Five of the cores were returned
to the laboratory for extraction (2N KCl) of inorganic N
(ammonium (NH4+) and nitrate (NO3
�)) and five were
returned to the plot for in situ incubation. During the growing
season, cores were incubated for approximately 4 weeks
before harvesting and extraction. Cores overwintered from
December to March. Inorganic N was quantified color-
ometrically using a PerstorpTM 3000 flow injection analyzer.
Net N mineralization rates were calculated as the accumula-
tion of total inorganic N over the course of the incubation. Net
nitrification rates were calculated as the accumulation of
NO3� over the course of the incubation. Values were converted
to an areal basis (g N m�2) using bulk density values from the
soil characterization described above. Mineralization and
nitrification were only measured for 2 years (fall 1998–fall
2000) due to concerns that repeated soil coring would damage
our long-term study plots.
2.6. Soil solution chemistry
Zero tension lysimeters (two or three replicates) of the
design described by Johnson et al. (2000) were installed at
50 cm depth in two or three subplots at each site in fall 1998.
The objective of placing lysimeters at this depth was to be
below the root zone to sample water and nutrients exported
from the surface ecosystem. Porous cup tension lysimeters
(four replicates) were installed at 10 and 50 cm depth in each
plot.
Lysimeter samples were collected monthly and stored at
4 8C prior to analysis. To sample tension lysimeters, suction
(30 cbar) was applied to each lysimeter on 1 day and samples

P.M. Groffman et al. / Forest Ecology and Management 236 (2006) 177–192180
were taken the next day. Ammonium and NO3� were analyzed
as described above.
Estimates of annual leaching losses were produced by
multiplying annual runoff measured at the BES forested
referenced watershed by the annual volume-weighted mean
NO3� concentration in tension lysimeters at 50 cm. Runoff
from this watershed, which contains the four rural sites,
represents water that has passed through the plant canopy and
soil profile and is thus a good estimate of soil solution volume,
assuming that surface runoff is negligible (Chang, 2006).
2.7. Soil:atmosphere trace gas fluxes
Trace gas fluxes were measured using an in situ chamber
design identical to that used by Bowden et al. (1990, 1991).
Chambers (three per plot) consisted of 287 mm diameter (i.d.)
by 40 mm high polyvinyl chloride (PVC) cylinders which were
placed on permanently installed PVC base rings immediately
prior to measurement. At 0, 10, 20 and 30 min following
placement of the chamber on the base, 9 mL gas samples were
collected from gas sampling ports in the center of the chamber
top using fine-needle polypropylene syringes. Samples were
transferred to evacuated glass vials which were stored at room
temperature prior to analysis by gas chromatography with
electron capture (N2O), thermal conductivity (CO2) or flame
ionization (CH4) detection. Fluxes were calculated from the
linear rate of change in gas concentration, the chamber internal
volume and soil surface area.
2.8. Statistical analysis
Differences among plots and years were evaluated using
two-way analysis of variance (with interactions). Plot and
annual means were compared using Fisher’s protected least
significant difference test. The Statistical Analysis System
(SAS, 1989) was used for all analyses.
3. Results
3.1. Soils
Soils in the urban plots varied widely in their characteristics
and classification. The Legore soil (plots Leakin 1 and Hillsdale
2) was very deep and well drained. This soil was underlain by
semibasic and mixed basic and acidic rocks at a depth of 1.5–
3 m. The Legore is classified as a fine-loamy, mixed, mesic
Ultic Hapludalf. This soil had the highest pH and base
saturation of all the soils in this study (Table 1). The Occaquon
soil, associated with plot Leakin 2, was an inclusion in a large
Legore map unit in the Baltimore City soil survey (NRCS,
1998). Occaquon soil is classified as a loamy-skeletal, mixed
subactive, Typic Dystrudept. This soil had the highest
percentage of sand and coarse fragments, and in the deeper
horizons ranked lowest of all soils in base cation concentrations
(Table 1). The Jackland soil associated with Hillsdale 1, was
classified as a fine, smectitic, mesic, Typic Hapludalf. This soil
had the lowest percentage of sand of all the sites and was
somewhat poorly to moderately well drained. While having
relatively high base saturation in the surface horizon, this soil
was strongly acidic (pH 5.1–5.5).
Three of the four rural plots had soils of the Glenelg series.
These soils developed on mica schist and were classified as
fine-loamy, paramicaceous, mesic, Typic Hapludults. The two
upper plots consisted of deep, well drained, gently sloping (1–
8%) soils, while the lower plots were more strongly sloping (4–
16%). These soils were the most acidic of all the soils and were
intermediate in base saturation (Table 1). Of all the pedons
described, the Glenelg soils had the most well-defined O layer
(Oe and Oi horizons, respectively). The highest concentrations
of total N were found in the O horizons across all soils;
therefore, the Glenelg soils with well-defined O horizons had
relatively high total N (Table 1). The fourth rural plot (Oregon
mid 2) had Manor soil; a deep, well drained to somewhat
excessively drained coarse-loamy, paramicaceous, semiactive,
mesic, Typic Hapludult.
A comparison of what we qualitatively defined as ‘‘low
fertility’’ soils, i.e. the Glenelg, Manor and Occoquan soils in
the four rural and one urban (Leakin 2) plots, with what we
qualitatively defined as ‘‘high fertility’’ soils, i.e. the Legore
and Jackland soils in the urban Hillsdale and Leakin 1 sites
showed that the low fertility soils had significantly higher %
sand and C:N ratio, and lower pH and base saturation than the
high fertility soils (Table 2).
3.2. Vegetation
Ninety-seven species were found across all plots: 31 species
of trees, 17 shrubs, 11 vines, and 38 herbs. Sites ranged in
species richness from 35 to 54 (Table 3). The most species rich
site was Leakin 2, an urban site on low fertility soil. This high
richness relative to other sites was primarily due to high shrub
and herbaceous species richness as tree richness in this site was
low compared to other sites. All four of the rural plots had
similar species richness in the tree, sapling, shrub, and vine
layers. Species richness of the herbaceous layer in these plots
ranged from 3 to 11 species. The plots in the two urban forests,
however, had a greater range of species richness in all
vegetation layers. Two of the urban sites had low tree species
richness and one of the urban sites had high tree species
richness relative to all plots. The vegetation layers in Hillsdale 2
had low species richness except for a species rich vine layer.
Leakin 2, had fewer species than average in the tree canopy but
more species rich seedling, shrub and herb layers. In contrast,
Leakin 1 had high species richness in tree, sapling, and
herbaceous layers, but low richness in the shrub and vine layers
(Table 3). Only 9 species were non-natives and none were
widespread. Six of the non-native species were shrubs
(Ligustrum vulgare, Rosa multiflora and Rubus phoenicolasius)
and vines (Celastrus orbiculatus, Hedera helix, Lonicera
japonica). The non-native tree species were Acer platanoides
and Prunus avium, and A. platanoides occurred as a single tree
in only one plot, Hillsdale 2. The single non-native herbaceous
species (Amphicapraea bracteata) was found only in the two
Leakin Park plots.

P.M. Groffman et al. / Forest Ecology and Management 236 (2006) 177–192 181
Table 1
Soil series, family taxonomic units, characteristics and pedon descriptions to approximately 50 cm
Plot Horizon Depth
(cm)
Sand
(%)
Clay
(%)
Total N
(g kg�1)
Total C
(g kg�1)
pHa Sum of all basesb
(mequiv. 100 g�1)
Base
saturationc (%)
Bulk density
(g cm�3)
Glenelg (fine-loamy, paramicaceous, mesic Typic Hapludult)
Oregon upper 1
(rural, low
fertility)
Duff 2–0 na na 17.7 382.7 na na na na
Oe 0–3 na na 1.14 207.6 4.5 39.7 49 na
A 3–10 46.3 17.8 0.315 59.5 4.4 1.9 10 0.74
AE 10–20 43.4 20.2 0.112 18.2 4.3 0.7 6 1.16
BE 20–41 41.3 20.9 0.038 3.7 5.4 0.5 6 1.47
Bt1 41–59 44.5 23.7 0.023 2.2 5.1 0.7 9 1.7
Glenelg (fine-loamy, paramicaceous, mesic Typic Hapludult)
Oregon mid 1
(rural, low
fertility)
Duff 2–0 na na 1.972 467.6 na na na na
Oi 0–3 na na 1.206 301.8 na na na na
A 3–8 78.5 9.6 na na 4.9 1.2 20 0.9
A 8–18 43.3 22.2 0.168 15.9 4.7 1.4 10 1.07
BE 18–31 42.8 25.3 0.078 5.6 4.3 0.8 9 1.57
Bt1 31–58 43.3 32.7 0.044 2.3 4.8 2.4 25 1.54
Glenelg (fine-loamy, paramicaceous, mesic Typic Hapludult)
Oregon upper 2
(rural, low
fertility)
Duff 2–0 na na 16.3 385.8 na na na na
A1 0–8 39.7 18.3 3.1 46.9 4.4 3.2 15 0.97
A2 8–20 37.8 19 1.2 16.8 4.6 0.9 8 1.21
BE 20–31 33.8 23.2 0.7 5.5 4.5 0.5 6 1.52
Bt1 31–58 36.5 27.3 0.3 3 4.7 0.9 10 1.62
Manor (coarse-loamy, paramicaceous, semiactive, mesic Typic Dystrochrept)
Oregon mid 2
(rural, low
fertility)
Duff 2–0 na na 23.2 418.7 na na na na
Ap 0–13 38.3 20.1 2.9 38.1 5 4.1 23 1.09
EA 13–20 35.7 24.6 0.5 3.7 4.8 1.1 12 1.31
Bt1 20–38 39.4 20 1 13 4.3 1.1 11 1.45
Bt2 38–56 51.5 23.1 0.5 1.6 4.8 1.9 21 1.52
Legore (fine-loamy, mixed, mesic, Ultic Hapludalf)
Leakin 1
(urban, high
fertility)
Duff 2–0 33.3 na 10.3 301.4 5.3 na na na
A 0–12 35.3 14.8 2 27.4 5.1 8.4 49 1.12
EA 12–21 33.1 13.2 0.8 10.4 5 5.3 46 1.52
BE 21–33 35.8 16.2 0.5 4.4 5.2 5.4 51 1.64
Bt1 33–53 57.4 24.2 0.4 2.9 5.1 14.8 62 1.54
Occaquon (loamy-skeletal, mixed, subactive Typic Dystrudept)
Leakin 2
(urban, low
fertility)
Duff 2–0 na na na na na na na na
A 0–8 53.3 10.1 7.5 na 4.9 6.6 32 1.2
EA 8–24 57.2 7.9 2.5 na 4.9 0.8 9 na
Bw1 24–36 60.2 8.1 0.9 na 4.4 0.4 9 1.67
Bw2 36–51 66.7 8.8 0.2 na 4.5 0.5 9 1.81
Jackland (Fine, smecitic, mesic Typic Hapludalf)
Hillsdale
(urban, high
fertility)
Duff 3–0 na na 16.4 445.1 na na na na
A 0–8 9.8 14.2 3.6 59.3 5.7 6.4 27 0.89
A/E 8–14 10.9 14.1 1.7 29.7 4.4 1.8 13 1.1
BE 14–25 10.9 14.4 0.8 7.3 4.2 0.7 8 1.49
Bt1 25–46 6.8 22.2 0.5 4.4 4.5 2.0 15 1.54
Bt2 46–69 5.1 37.5 0.4 2.7 4.7 18.7 68 1.15
a Measured at soil/water 1:1 H2O.b NH4OAc extractable Ca, Mg, Na, and K.c Base saturation equals sum of bases divided by sum of cations.
The structure of the forests was well developed with canopy
and subcanopy tree layers, shrub and vine layers, and
herbaceous cover. The sites differed in the percent openness
of their canopies. In general, the urban plots had higher canopy
openness than the rural plots (Table 2). Hillsdale 2 had lost
approximately 57% of its canopy and standing dead trees were
the largest component of the total basal area of the stand. The
average height of the tree layer ranged from 24 to 34 m with the
rural plots maintaining a taller canopy. The range of average
sapling heights from 5.6 to 7.5 m was much smaller than the
range of tree heights. The average height range of shrubs was 1–
1.5 m across the sites with the exception of Hillsdale 2, which
had a taller shrub layer (3.7 m), and one rural plot with a shorter
shrub layer (0.75 m) (Table 3).
Tree density was greatest in the Hillsdale forest while total
basal area per hectare was smallest. The plots in Leakin Park
and those in the rural forest were similar in both tree density and
basal area (Table 3).

P.M. Groffman et al. / Forest Ecology and Management 236 (2006) 177–192182
Table 2
Soil parameters in low vs. high fertility plots
Parameter Low fertility High fertility
% sand 47 (3)* 24 (6)*
% clay 19 (2) 19 (3)
Total C (g kg�1) 114 (36) 81 (45)
Total N (g kg�1) 3.3 (1.2) 3.4 (1.6)
C:N 75 (18)** 14 (2.3)**
pH 4.7 (0.1)*** 4.9 (0.2)****
Sum of bases (mequiv. 100 g�1) 3.4 (1.8) 7.1 (2.0)
% base saturation 15 (2.3)* 38 (7.4)*
Bulk density (g cm�3) 1.3 (0.1) 1.3 (0.1)
Values are means (with standard error) of all horizons sampled from soil pits in
the five low fertility and two high fertility sites described in Table 1. *, **, ***
indicate statistically significant differences at p < 0.01, 0.05 and 0.10, respec-
tively.
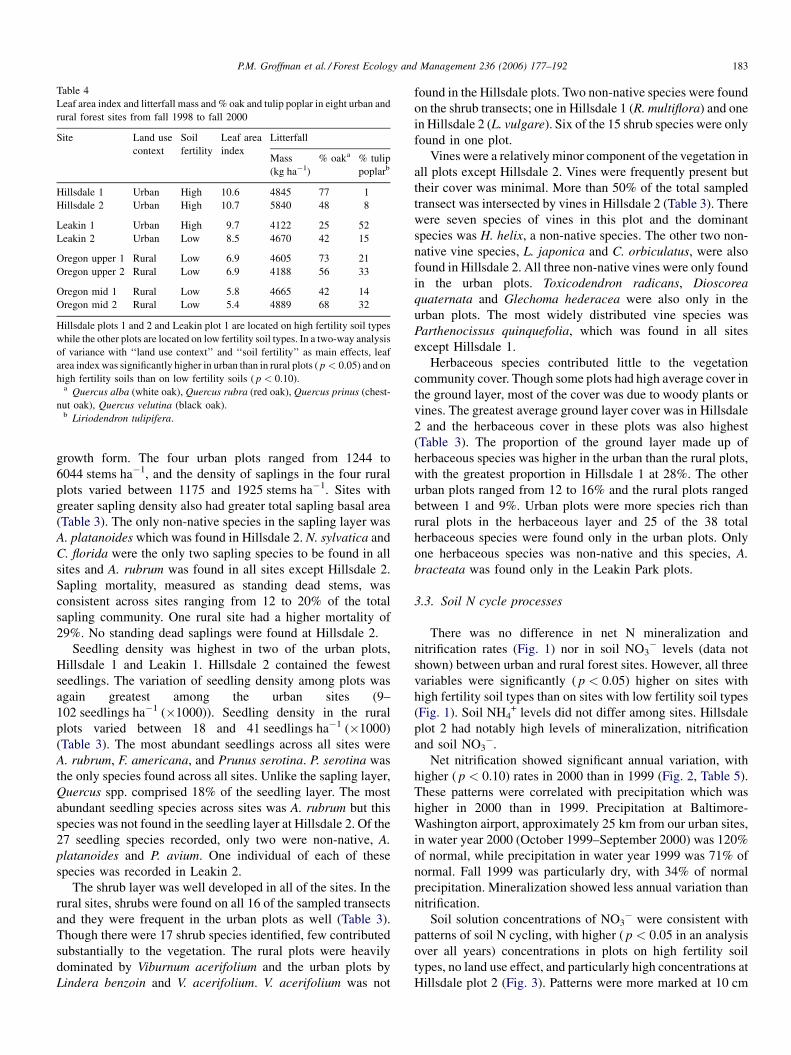
The urban plots had higher ( p < 0.05) leaf area index (LAI)
than the rural plots and the plots on high fertility soils had
higher ( p < 0.10) LAI than the plots on low fertility soils
(Table 4). Leakin plot 2, the urban plot located on a low fertility
soil type had the lowest LAI of the urban plots.
able 3
egetation composition and structure in eight forest plots arrayed along an urban rural gradient and a soil fertility gradient
and use context Urban Rural
Hillsdale 1a Hillsdale 2a Leakin 1a Leakin 2b Oregon Ridge
upper 1b
Oregon Ridge
upper 2a
Oregon Ridge
mid 1a
Oregon Ridge
mid 2a
rea (m2) 900 900 1600 1600 1600 1600 1600 1600
o. of tree species 12 7 16 8 12 10 11 10
o. of sapling species 14 8 17 12 13 13 12 7
o. of seedling species 10 6 10 17 13 14 15 14
o. of shrub species 10 4 4 12 8 10 8 8
o. of vine species 9 10 6 8 6 7 6 3
o. of herbaecous species 12 8 14 16 3 8 4 11
otal vascular plantsc 49 35 45 54 37 42 35 39
o. of non-native species 5 5 3 7 0 3 0 0
canopy gap 19 57 1 14 1 3 6 1
verage maximum
tree height (m)
25.16 24.22 29.48 30.40 28.91 33.95 33.17 32.68
verage maximum
sapling height (m)
7.53 5.67 5.95 6.27 6.00 6.03 7.36 6.85
verage maximum
shrub height (m)
1.04 3.69 0.95 1.12 0.96 1.46 0.76 0.95
rees ha�1 84 63 37 39 38 38 46 43
.A. ha (cm2 � 1000) 156.16 199.24 331.38 338.55 224.79 376.82 349.79 352.98
aplings ha�1 6044 1244 3100 5575 1425 1175 1925 1400
.A. ha (cm2 � 1000) 32.93 13.30 16.31 36.80 16.40 13.94 26.34 19.71
eedling ha�1 (�1000) 77.78 8.89 102.81 36.25 41.25 18.44 34.38 38.75
seedling frequency 94.44 27.78 100.00 90.63 100.00 71.88 9.38 6.25
hrub cover (cm m�1) 9.24 81.67 16.83 16.39 50.29 61.64 30.88 38.85
shrub frequency 78 100 62.5 93.75 100 100 100 100
ine cover (cm m�1) 5.26 57.10 4.98 5.01 2.74 2.31 1.11 0.39
vine frequency 78.00 100.00 87.50 75.00 56.25 62.50 68.75 37.50
nderstory plant cover (%) 39.28 92.03 47.56 42.83 47.66 62.78 32.72 30.89
erbaceous cover (%) 11.06 15.11 6.64 4.97 0.84 1.91 0.34 2.91
a High fertility soil.b Low fertility soil.c Total vascular plants is not additive because a single species can exist in more than one lifeform, e.g. tree and sapling.
T
V
L
A
N
N
N
N
N
N
T
N
%
A
A
A
T
B
S
B
S
%
S
%
V
%
U
H
Twenty-one of the tree species occurred as canopy trees and
all sites were dominated by L. tulipifera, and several species of
Quercus (Q. velutina, Q. alba, Q. rubra, and Q. prinus). Q. alba
was the only species to occur across all sites. A. rubrum, Carya
tomentosa, L. tulipifera, Q. rubra and Q. velutina were found in
all sites except Hillsdale 2. Six other species each occurred in
only one site. Litterfall was dominated by oak species, followed
by tulip poplar, except at the Hillsdale sites, which had very
little tulip poplar (Table 4).
Twenty-nine species of saplings were found across all sites.
The dominant species in the sapling layer were not the same
species that dominated the canopy layer and, in fact, Quercus
spp. and L. tulipifera saplings were rarely found in the sapling
layer. The sapling layers of the rural sites were all dominated by
Nyssa sylvatica, A. rubrum, and Cornus florida. The sapling
layers in the Leakin Park sites were dominated by C. florida,
Sassafras albidum, and A. rubrum. The two plots in Hillsdale
Park represented the two extremes of the sapling density
gradient. Hillsdale 1, with 6044 stems ha�1, was dominated by
F. americana and C. florida and Hillsdale 2, with
1244 stems ha�1, by Viburnum prunifolium. V. prunifolium
was sampled as a sapling because of its single stem and tall
P.M. Groffman et al. / Forest Ecology and Management 236 (2006) 177–192 183
Table 4
Leaf area index and litterfall mass and % oak and tulip poplar in eight urban and
rural forest sites from fall 1998 to fall 2000
Site Land use
context
Soil
fertility
Leaf area
index
Litterfall
Mass
(kg ha�1)
% oaka % tulip
poplarb
Hillsdale 1 Urban High 10.6 4845 77 1
Hillsdale 2 Urban High 10.7 5840 48 8
Leakin 1 Urban High 9.7 4122 25 52
Leakin 2 Urban Low 8.5 4670 42 15
Oregon upper 1 Rural Low 6.9 4605 73 21
Oregon upper 2 Rural Low 6.9 4188 56 33
Oregon mid 1 Rural Low 5.8 4665 42 14
Oregon mid 2 Rural Low 5.4 4889 68 32
Hillsdale plots 1 and 2 and Leakin plot 1 are located on high fertility soil types
while the other plots are located on low fertility soil types. In a two-way analysis
of variance with ‘‘land use context’’ and ‘‘soil fertility’’ as main effects, leaf
area index was significantly higher in urban than in rural plots ( p < 0.05) and on
high fertility soils than on low fertility soils ( p < 0.10).a Quercus alba (white oak), Quercus rubra (red oak), Quercus prinus (chest-
nut oak), Quercus velutina (black oak).b Liriodendron tulipifera.
growth form. The four urban plots ranged from 1244 to
6044 stems ha�1, and the density of saplings in the four rural
plots varied between 1175 and 1925 stems ha�1. Sites with
greater sapling density also had greater total sapling basal area
(Table 3). The only non-native species in the sapling layer was
A. platanoides which was found in Hillsdale 2. N. sylvatica and
C. florida were the only two sapling species to be found in all
sites and A. rubrum was found in all sites except Hillsdale 2.
Sapling mortality, measured as standing dead stems, was
consistent across sites ranging from 12 to 20% of the total
sapling community. One rural site had a higher mortality of
29%. No standing dead saplings were found at Hillsdale 2.
Seedling density was highest in two of the urban plots,
Hillsdale 1 and Leakin 1. Hillsdale 2 contained the fewest
seedlings. The variation of seedling density among plots was
again greatest among the urban sites (9–
102 seedlings ha�1 (�1000)). Seedling density in the rural
plots varied between 18 and 41 seedlings ha�1 (�1000)
(Table 3). The most abundant seedlings across all sites were
A. rubrum, F. americana, and Prunus serotina. P. serotina was
the only species found across all sites. Unlike the sapling layer,
Quercus spp. comprised 18% of the seedling layer. The most
abundant seedling species across sites was A. rubrum but this
species was not found in the seedling layer at Hillsdale 2. Of the
27 seedling species recorded, only two were non-native, A.
platanoides and P. avium. One individual of each of these
species was recorded in Leakin 2.
The shrub layer was well developed in all of the sites. In the
rural sites, shrubs were found on all 16 of the sampled transects
and they were frequent in the urban plots as well (Table 3).
Though there were 17 shrub species identified, few contributed
substantially to the vegetation. The rural plots were heavily
dominated by Viburnum acerifolium and the urban plots by
Lindera benzoin and V. acerifolium. V. acerifolium was not
found in the Hillsdale plots. Two non-native species were found
on the shrub transects; one in Hillsdale 1 (R. multiflora) and one
in Hillsdale 2 (L. vulgare). Six of the 15 shrub species were only
found in one plot.
Vines were a relatively minor component of the vegetation in
all plots except Hillsdale 2. Vines were frequently present but
their cover was minimal. More than 50% of the total sampled
transect was intersected by vines in Hillsdale 2 (Table 3). There
were seven species of vines in this plot and the dominant
species was H. helix, a non-native species. The other two non-
native vine species, L. japonica and C. orbiculatus, were also
found in Hillsdale 2. All three non-native vines were only found
in the urban plots. Toxicodendron radicans, Dioscorea
quaternata and Glechoma hederacea were also only in the
urban plots. The most widely distributed vine species was
Parthenocissus quinquefolia, which was found in all sites
except Hillsdale 1.
Herbaceous species contributed little to the vegetation
community cover. Though some plots had high average cover in
the ground layer, most of the cover was due to woody plants or
vines. The greatest average ground layer cover was in Hillsdale
2 and the herbaceous cover in these plots was also highest
(Table 3). The proportion of the ground layer made up of
herbaceous species was higher in the urban than the rural plots,
with the greatest proportion in Hillsdale 1 at 28%. The other
urban plots ranged from 12 to 16% and the rural plots ranged
between 1 and 9%. Urban plots were more species rich than
rural plots in the herbaceous layer and 25 of the 38 total
herbaceous species were found only in the urban plots. Only
one herbaceous species was non-native and this species, A.
bracteata was found only in the Leakin Park plots.
3.3. Soil N cycle processes
There was no difference in net N mineralization and
nitrification rates (Fig. 1) nor in soil NO3� levels (data not
shown) between urban and rural forest sites. However, all three
variables were significantly ( p < 0.05) higher on sites with
high fertility soil types than on sites with low fertility soil types
(Fig. 1). Soil NH4+ levels did not differ among sites. Hillsdale
plot 2 had notably high levels of mineralization, nitrification
and soil NO3�.
Net nitrification showed significant annual variation, with
higher ( p < 0.10) rates in 2000 than in 1999 (Fig. 2, Table 5).
These patterns were correlated with precipitation which was
higher in 2000 than in 1999. Precipitation at Baltimore-
Washington airport, approximately 25 km from our urban sites,
in water year 2000 (October 1999–September 2000) was 120%
of normal, while precipitation in water year 1999 was 71% of
normal. Fall 1999 was particularly dry, with 34% of normal
precipitation. Mineralization showed less annual variation than
nitrification.
Soil solution concentrations of NO3� were consistent with
patterns of soil N cycling, with higher ( p < 0.05 in an analysis
over all years) concentrations in plots on high fertility soil
types, no land use effect, and particularly high concentrations at
Hillsdale plot 2 (Fig. 3). Patterns were more marked at 10 cm

P.M. Groffman et al. / Forest Ecology and Management 236 (2006) 177–192184
Fig. 2. Mean in situ net mineralization (top) and nitrification (bottom) in seven
urban and rural forest stands from November 1998 to November 2000. Values
are mean (standard error). A one-way analysis of variance with ‘‘year’’ as the
main effect found that nitrification was significantly ( p < 0.10) higher in 2000
than in 1999.
Table 5
Annual (g N m�2 year�1) net N mineralization, nitrification, nitrate leaching
and nitrous oxide flux, 1999–2002
1999 2000 2001 2002
Net N mineralizationa 6.1 (0.6) 7.1 (0.9) ND ND
Net nitrificationa 0.6 (0.1) 1.6 (0.5) ND ND
Nitrate leachingb ND 0.06 (0.01) 0.05 (0.01) 0.03 (0.01)
Nitrous oxide flux 0.14 (0.02) 0.07 (0.02) 0.10 (0.02) 0.03 (0.02)
Values are the mean (standard error) of seven forest plots for mineralization,
nitrification and leaching, and eight plots for nitrous oxide flux. ND = not
determined.a Hillsdale plot 2 was not included in these calculations because mineraliza-
tion and nitrification were only measured in 2000 on this plot.b Hillsdale plot 2 was not included in these calculations because values were
so much higher for this plot than all other plots (see Fig. 4).
Fig. 1. Mean in situ net N mineralization (top) and nitrification (bottom) rates in
urban and rural forest sites measured at 15 dates from fall 1998 to summer 2000.
Values are mean (standard error). Hillsdale plots 1 and 2 and Leakin plot 1 are
located on high fertility soil types while the other plots are located on low
fertility soil types. Bars with different superscripts are significantly different at
p < 0.05 in a one-way analysis of variance with ‘‘plot’’ as the main effect. A
two-way analysis of variance with ‘‘land use’’ and ‘‘soil fertility’’ as main
effects found no significant land use effect, but soil fertility was significant for
both variables.
than at 50 cm depth, and concentrations were much lower at
50 cm. Only data from tension lysimeters are reported as the
zero tension lysimeters did not collect solutions efficiently at
the four rural sites, likely due to differences in soil texture and
structure, especially the presence of a highly permeable layer
above the 50 cm depth collectors at the rural plots. This layer
was indicated by high saturated hydraulic conductivity values
measuring during soil pit characterizations. Solution volumes
collected by the tension lysimeters were very similar at the
different sites. Annual leaching losses of NO3� were low
relative to mineralization and nitrification (<0.1 g N m�2
year�1, Table 5).
3.4. Soil:atmosphere trace gas fluxes
Soil:atmosphere fluxes of CO2 showed marked seasonal
patterns, with higher rates during the warmer seasons than the
colder seasons, but fluxes of N2O and CH4 did not (Fig. 4). We
also observed a strong influence of soil moisture on CO2 flux,
with low fluxes during the dry summer of 2000 and very low
fluxes during very dry conditions in summer 2002. Production
of CO2 was higher ( p < 0.05), and consumption of CH4 was
lower ( p < 0.05) in the urban than the rural plots (Fig. 5).
Consistent with other N cycle process data, Hillsdale plot 2 had
high N2O flux relative to the other sites. Annual fluxes of N2O
ranged from 0.03 to 0.14 g N m�2 year�1.

P.M. Groffman et al. / Forest Ecology and Management 236 (2006) 177–192 185
Fig. 3. Volume-weighted nitrate concentrations in tension lysimeters at 10 cm (top) and 50 cm (bottom) depth in eight urban and rural forest stands from fall 1999 to
fall 2002). Note the separate y-axis that applies only to the Urban (HD) 2 site. Values are the mean of four replicate lysimeters at each depth that produced samples
from 1 to 10 times each year. Hillsdale (HD) plots 1 and 2 and Leakin (LEA) plot 1 are located on high fertility soil types while the other plots are located on low
fertility soil types. A two-way analysis of variance with ‘‘land use’’ and ‘‘soil fertility’’ as main effects found no significant land use effect, but soil fertility was
significant at 10 cm depth.
4. Discussion
The importance of geology and soil parent material as a
controller of forest vegetation and N cycling processes has been
studied in many locations (Pastor et al., 1982, 1984; Schimel
et al., 1985; Groffman and Tiedje, 1989; Zak et al., 1989; Scott
and Binkley, 1997; Amundson and Jenny, 1997; Finzi et al.,
1998). Our objective here was to determine if these controls are
still important in human-dominated landscapes where remnant
forests are surrounded by urban and suburban land use. This
objective is hard to achieve, as land development patterns do
not vary systematically with patterns of geology and soil parent
material. Our approach was to quantify natural soil patterns
with soil profile descriptions and sampling, and then to analyze
how plant community composition and soil C and N cycling
processes vary in response to those patterns in both urban and
rural land use contexts.
Our results show that fundamental, ‘‘natural controls’’ are
still important in forests affected by the complex environmental
changes induced by urban land use change. Forest productivity
and N cycling varied more with soil type than with proximity to
urban land use. On the other hand, forest community
composition and soil:atmosphere fluxes of CO2 and CH4
appeared to be more strongly influenced by exposure to altered

P.M. Groffman et al. / Forest Ecology and Management 236 (2006) 177–192186
Fig. 4. Soil:atmosphere fluxes of CO2, CH4 and N2O from fall 1998 to fall
2002. Values are the means of four in situ flux chambers in eight forest plots.
Fig. 5. Mean soil:atmosphere CO2 (top), CH4 (middle) and N2O (bottom) flux
in urban and rural forest sites measured at 38 dates from fall 1998 to fall 2002.
Values are mean (standard error). Hillsdale plots 1 and 2 and Leakin plot 1 are
located on high fertility soil types while the other plots are located on low
fertility soil types. Bars with different superscripts are significantly different at
p < 0.05 in a one-way analysis of variance with ‘‘plot’’ as the main effect. A
two-way analysis of variance with ‘‘land use’’ and ‘‘soil fertility’’ as main
effects found that land use was significant for CH4 and CO2 and soil fertility was
not significant for any variable.
disturbance regimes and atmospheric chemistry associated with
urbanization. These measures varied strongly between urban
and rural sites, independent of soil type. Our results also show
that the magnitude of natural processes is important in the
context of urban landscapes, i.e. production of (and annual
variation in) inorganic N in forest patches was large relative to
atmospheric deposition, fertilizer use and food/sewage fluxes
that have been measured in BES urban and suburban
watersheds.
4.1. Soils
In the Baltimore metropolitan area, urban land use change
has taken place on top of significant natural variation in geology
and soil parent material that creates natural variation in soil

P.M. Groffman et al. / Forest Ecology and Management 236 (2006) 177–192 187
fertility. Low fertility soils in the region, e.g. the Manor,
Glenelg and Occoquan soils on our plots, formed in acid
crystalline rocks such as gneiss and micaceous schist and thus
were strongly acid. The relatively high fertility soils in the
region, e.g. the Legore and Jackland soils in our plots, formed in
mixed mafic rocks and material weathered from amphibolite,
diabase, or other basic igneous rocks.
Unfortunately, soil properties vary in a confounded way with
land use patterns in the Baltimore region. Older, denser urban
areas tend to be underlain by high fertility soils, while low
fertility soils dominate at the rural fringe. This pattern
confounds our ability to evaluate the relative importance of
natural soil versus land use matrix effects on forest processes. In
Leakin Park, we have a direct comparison of high versus low
fertility soil types in an urban context, i.e. Leakin plot 1 is on the
high fertility soil that dominates the urban core and Leakin 2 is
on an inclusion of low fertility material in Leakin Park. But this
comparison is unreplicated, and is not matched by a soil fertility
comparison in a rural context.
Although our experimental design is imperfect, our results
show coherent linkages between soil properties and N cycle
processes. In a combined analysis of all low versus high fertility
horizons (Table 2), we observed significant differences in soil
C:N ratio, percent sand, soil pH and percent base saturation
between the low fertility and high fertility soil types. And these
differences appear to cut across the urban–rural gradient. For
example, Leakin plot 2 was similar in soil chemistry and
nitrogen cycling to the rural Oregon Ridge plots, while Leakin
plot 1 was similar in most properties to the other high soil
fertility urban plots. Moreover, these changes in basic soil
properties are consistent with the significant differences that we
observed in N mineralization, nitrification and soil and soil
solution NO3� levels between plots, and with previous studies
that have examined links between soil properties and N cycling
(Pastor et al., 1984; Lovett et al., 2002; Ross et al., 2004). These
results suggest, albeit imperfectly, that natural soil controls are
still expressed, and are still important regulators of N dynamics
in urban forests.
4.2. Vegetation
Variation in geology and soils has been found to be a strong
controller of variation in forest community composition and
dynamics at ecosystem, landscape and regional scales (Pastor
et al., 1982; Zak et al., 1989; van Breemen et al., 1997; Finzi
et al., 1998). In these studies, variation in soil water and nutrient
holding capacity leads to variation in forest composition,
productivity and C and N dynamics. At finer scales, site history
and disturbance regime also become important in determining
forest community structure (Pickett et al., 1989). At the scale of
our comparison, natural controls on forest composition are
modified by human factors, especially in the forests situated in
an urban context, with the effects on C and N dynamics
dependent on the nature and extent of the modification.
The most marked human effects on forest composition were
observed in the plots in Hillsdale Park. This park is a relatively
small patch of forest between a residential neighborhood and a
golf course, while the other urban park (Leakin) and the rural
park (Oregon Ridge) are much larger tracts of relatively intact
forest. As a result, the Hillsdale forest is more exposed to
external sources of disturbance and loss of canopy trees. Less
than 50% of the Hillsdale 2 plot had a tree canopy. This loss of
canopy may allow greater vegetation density in lower canopy
layers. Increased density was not seen in the sapling and
seedling layers, which may not have had sufficient time since
canopy loss to establish. However, the shrub, vine, and ground
layers were very dense, maintaining covers much higher than
any other urban or rural plot. Alternatively, the loss of canopy
trees, especially in a small isolated forest, may result in the loss
of source trees for seeds and consequently less establishment of
seedlings and saplings. In addition, the shrub layer in Hillsdale
2 was more than twice the height of shrub layers in any other
plot. The loss of canopy may be recent in Hillsdale 2 as standing
dead stems were the largest component of the basal area in the
plot and there was no mortality recorded among the few
regenerating saplings. Hillsdale 1, on the other hand, had
greater than 80% canopy cover. The sapling and seedling layers
in this plot were very dense and the shrub, vine and ground
layers were much less dense than in Hillsdale 2. In fact, the
shrub layer in Hillsdale 1 was surprisingly sparse, most likely
due to the very thick sapling layer. The relatively high number
of trees per hectare and low total basal area in the Hillsdale
plots indicate that this forest may be younger than the forests in
Leakin and Oregon Ridge Parks.
Leakin Park, the other urban forest, was similar in tree
canopy structure to the rural Oregon Ridge Park plots and
similar to Hillsdale Park in the structure of the understory
layers. This may indicate a difference in response times to
altered environments by the different canopy layers. Many of
the canopy trees in Leakin Park were present as the city grew
around the Park’s perimeters. This canopy layer may be slower
to respond to altered environmental conditions ushered in by
the change in adjacent land cover. The canopy layer heights,
tree density and basal areas in Leakin Park were similar to those
in the Oregon Ridge plots. The lower canopy layers, however,
may respond faster to altered conditions and the structure of
these layers varied between the Parks (Cadenasso et al., in
press). The sapling layer in Leakin Park was denser and the
saplings smaller than in Oregon Ridge. In addition shrub cover
was lower and vine and herbaceous cover was higher in Leakin
Park.
The four plots in Oregon Ridge Park were very similar in
structure and were characterized by closed canopies, large tall
trees and a well-developed sapling layer. The understory
maintained an even cover of shrubs. The consistency in
vegetation structure indicates a similar age and conditions
among the four plots in this forest.
To compare the structure of the urban and rural plots,
Hillsdale 2 and Leakin 2 were removed because of the loss of
tree canopy and a different soil type, respectively. Comparing
Hillsdale 1 and Leakin 1 to the Oregon Ridge plots reveals that
the urban plots had a less continuous tree canopy as the taller
older trees are beginning to senesce or were otherwise
damaged. The greater density of saplings in the urban plots

P.M. Groffman et al. / Forest Ecology and Management 236 (2006) 177–192188
relative to the rural forest may reflect the more open canopy in
these plots. The urban and rural forests tend to vary in the
density of alternate canopy layers which may be a response to
competition among canopy layers. For example, in the urban
plots, the tree canopy had more gaps, the sapling layer was
denser, the shrub layer was sparser, and seedlings were denser
and herbaceous cover greater. Alternatively, in the rural plots,
the canopy was closed, the sapling layer was sparser, the shrub
layer was denser and seedling density and herbaceous cover
were lower. Canopy openness may drive resource availability in
the system and consequent vegetation layer structure. Lower
seedling and sapling density in the rural forest may, however,
indicate greater herbivore pressure.
Vegetation composition also varied among the plots along
the urban–rural gradient. Composition is a product of both
dispersal and plant performance. Both of these mechanisms
may be altered by the urban environment. The tree and sapling
layers contained similar species along the gradient but the
shrub, vine, and herbaceous layers differed greatly. This may
result from the tree species responding more slowly to altered
conditions and adjacent land uses relative to the lower canopy
layers. The dominant shrub species were the same among plots
within the same location (urban versus rural) but species did not
overlap among plots across gradient locations. Though the
urban plots were similar to the rural plots in that one species of
shrub dominated, albeit a different species from the rural plots,
there were also many more species of shrubs in the urban plots.
Vines played a much larger role in the urban plots than the rural
plots which may be due to the greater gapiness of the urban
forest allowing light to reach the forest floor and facilitate vine
growth. The vine community in the urban plots was much more
species rich and six species occurred only in the urban plots.
Herbaceous species richness was also higher in the urban plots
than the rural plots. This may be due to a greater seed source in
the urban matrix and higher soil fertility.
One of the surprising results from this sampling is that exotic
species played a minor role in these communities. The few
exotic species that we observed occurred primarily in the urban
plots but not in large numbers or percent cover. One exception
was the vine layer in Hillsdale 2. This may be a product of
canopy loss through senescence or damage by insects and
storms, releasing resources for the lower canopy layers or as the
forests are exposed to more seed influx from the surrounding
landscape. Exotic species presence in the forest may also be
higher along edges and pathways (Bertin et al., 2005), two
features purposely avoided in the site selection.
Vegetation structure varied among the forest plots but the
cause of that variation is unclear. Stand age and the amount of
disturbance to the forest canopy distinguish the plots
structurally. Whether the amount of canopy disturbance and
urban landscape context are correlated is a question open for
further research. Some differences such as higher sapling
density in the urban plots may be a factor of both landscape
context and soil type. The urban landscape context may result in
canopy openness and this greater openness and more fertile soil
may both lead to denser understory vegetation. However, the
variation among plots in species composition was most likely
due to the landscape context. The canopy trees in all plots were
the same suite of species—L. tulipifera and Quercus spp. In
contrast, the plots maintained different species in the sapling,
shrub, vine, and herbaceous layers. These differences were
consistent across the urban to rural contrast, but not across soil
types. The urban landscape and related alterations of
biophysical conditions have been dynamic on the temporal
scale of the understory populations; less so on the temporal
scale of the tree canopy. It is likely that as the tree canopy is
disturbed, the urban forest structure and composition will
continue to diverge from the rural forest. The relatively small
size of the Hillsdale forest patch may contribute to the canopy
of this forest experiencing more disturbance than Leakin Park
and the Hillsdale forest may, consequently, be diverging faster.
4.3. Carbon dynamics
Given that all of our stands are roughly the same age (80–
100 years), leaf area index (LAI) provides a rough index of
productivity, or site quality for our sites. As such, it is not
surprising that LAI was higher on the high fertility sites than the
low fertility sites. LAI values for our plots are high relative to
(but within the range of) other temperate forests, consistent
with their mature status (Asner et al., 2003). It is interesting to
note that Leakin 2, the low fertility site in an urban land use
context, had higher LAI than the rural sites, suggesting a
possible stimulation of productivity in the urban core. Such a
result would be consistent with other studies that have found
high productivity in cities due to higher atmospheric CO2 and/
or lower ozone levels relative to suburban or rural areas (Gregg
et al., 2003; Ziska et al., 2004). Higher levels of atmospheric
CO2 would be particularly important at relieving water stress,
which is more likely on the coarse-textured low fertility soils
(Norby and Luo, 2004).
In addition to stimulating productivity, an urban atmosphere
effect on carbon dynamics is also apparent in the soil:atmo-
sphere fluxes of CO2 and CH4. Soil:atmosphere CO2 flux is a
measure of total soil respiration (roots plus microorganisms)
and was consistently higher in the urban stands than the rural
stands. Total soil respiration is influenced by several factors
including litter quality, which influences decomposition rate,
soil moisture, which controls microbial and root activity, soil
texture, which influences microbial access to substrates and soil
moisture, and the flow of labile C from aboveground production
(Fahey et al., 2005). The flow of labile C is highly responsive to
increased atmospheric CO2 levels (Zak et al., 2003), therefore,
the consistent increase that we observed in the urban stands,
over a range of litter quality and soil conditions, suggests an
atmospheric effect.
Our estimates of respiration (approximately 700 g C m�2
year�1) are high relative to rates measured in the northern
hardwood forests at the Hubbard Brook Experimental Forest
(HBEF) in New Hampshire using the same methods used here
(Groffman et al., 2006) which is logical given the higher
temperatures and longer growing season in Baltimore. Our
estimates are similar to other measurements at the HBEF and at
other forest sites in the northeastern U.S. made using fast

P.M. Groffman et al. / Forest Ecology and Management 236 (2006) 177–192 189
response detectors (infrared gas analyzers) and short-term
incubations. Fahey et al. (2005) report total soil respiration
ranging from 540 to 800 g C m�2 year�1 in eight stands at the
HBEF sampled from 1998 to 2000, while Savage and Davidson
(2001) reported soil respiration rates of greater than
500 g C m�2 year�1 from upland sites at the Harvard Forest
in Massachusetts, and greater than 800 g C m�2 year�1 from
upland sites at the Howland Forest in Maine. In addition to
using fast response detectors, these other studies were based on
more high resolution sampling than we did, which captures
episodes of high flux that are missed with our less frequent
sampling (Parkin and Kaspar, 2004).
There were significant differences in CH4 uptake between
the urban and rural stands. This uptake is strongly influenced by
soil texture and moisture, with coarse-textured, dry soils,
having higher rates of uptake due to enhanced diffusion of
atmospheric CH4 into the soil (Castro et al., 1995; Smith et al.,
2000). Uptake is also influenced by N status, with N additions
having an inhibitory effect in many, but not all, studies
(Steudler et al., 1989; Goldman et al., 1995; Reay and Nedwell,
2004). Thus, the low rates of uptake in our urban sites are likely
due to both natural soil factors as well as the high rates of N
deposition that are common in urban areas (Lovett et al., 2000).
The low rates of uptake at Leakin 2, the urban site with coarse
soil texture, suggest that the N deposition effect is more
important than the soil texture effect. Goldman et al. (1995)
also found reduced CH4 uptake in urban forests.
The CH4 uptake rates observed in our rural sites
(approximately 665 g CH4 m�2 year�1) were similar to those
measured at forested sites in the northeastern U.S. but the rates
at our urban sites (approximately 350 g CH4 m�2 year�1) are
lower than most previous studies in this region (Castro et al.,
1995). Forests in the northeastern U.S. tend to have high CH4
uptake relative to forests in other parts of the world (Smith
et al., 2000).
4.4. Nitrogen dynamics
While several parameters related to C dynamics were clearly
influenced by the urban land use context, N dynamics appeared
to be more strongly influenced by natural soil factors. Rates of
N mineralization and nitrification and soil and soil solution
NO3� levels were all higher in the high fertility sites than the
low fertility sites. The consistent grouping of Leakin plot 2, the
urban site on the low fertility soil, with the rural sites, which are
all on the low fertility soil, amplifies the idea that natural soil
factors dominate over land use context in controlling soil N
dynamics among our sites.
As expected, mineralization and nitrification were large
internal fluxes in the nitrogen cycle. The Hillsdale 2 site, which
showed evidence of extensive disturbance to the plant
community and extensive invasion by exotic species, had the
highest mineralization rates, and particularly high rates of
nitrification.
The rates of mineralization and nitrification that we
observed in our urban forests were somewhat higher than
those measured in mixed oak forests at the Coweeta Hydrologic
Laboratory in North Carolina (Knoepp and Swank, 1998) and
lower than those measured in oak–maple forests at the Fernow
Experimental Forest in West Virginia (Peterjohn et al., 1999),
using similar methods. Summer in situ N mineralization rates at
Coweeta averaged 0.06 mg N kg�1 day�1, while summer rates at
our sites were generally greater than 0.2 mg N kg�1 day�1. Our
nitrification rates were also higher than those observed at
Coweeta where summer rates averaged 0.007 mg N kg�1 day�1
compared to rates of approximately 0.05 at our sites. At Fernow,
annual N mineralization ranged from approximately 8 to 16 and
nitrification ranged from 0.7 to 12 g N m�2 year�1 compared to
mineralization rates of 6.6 and nitrification rates of
1.1 g N m�2 year�1 at our sites.
Nitrate leaching losses were quite low (<0.1 g N m�2
year�1, Table 5) from most of our sites (except for Hillsdale 2,
which had leaching losses greater than 2.5 g N m�2 year�1,
data not shown), supporting the idea that forests have high
retention of N, even when atmospheric inputs (approximately
0.9 g N m�2 year�1) and internal cycling through mineraliza-
tion and nitrification are high. Similar to mineralization and
nitrification, the soil solution NO3� levels that we observed
(approximately 0.05 mg N L�1) were higher than those
observed at Coweeta (0.008 mg N L�1, Montagnini et al.,
1991) and lower than those observed at Fernow (0.07–
2.3 mg N L�1, Peterjohn et al., 1999).
Our leaching losses may be somewhat of an underestimate
because we used concentration data derived from tension
lysimeters, which sample water that is also accessible to plants
(Lajtha et al., 1999). Zero tension lysimeters, which sample
more freely draining water may provide better estimates of
NO3� losses, but these did not work at our rural forest sites. We
were able to directly compare volume-weighted NO3�
concentrations in tension and zero tension lysimeters at the
Leakin and Hillsdale sites, where both types of lysimeters
routinely produced large sample volumes. This comparison
showed that tension lysimeters produced lower NO3�
concentrations than zero tension lysimeters (as expected) at
Leakin Park (0.48 mg N L�1 in zero tension, 0.09 mg N L�1 in
tension) while we observed the opposite pattern at Hillsdale
Park (2.2 mg N L�1 in zero tension and 4.3 mg N L�1 in
tension). It is therefore, impossible for us to determine if we
have systematically underestimated leaching losses.
The high leaching losses at the Hillsdale 2 site are consistent
with the high rates of mineralization, nitrification and soil
NO3� levels at this site, and confirm the idea that this is a highly
disturbed site. In contrast to all of the other sites, NO3�
concentrations in soil solution were much higher at 50 cm than
at 10 cm, suggesting that there may be a history of soil
disturbance at this site, in addition to the evident disturbance of
the plant community.
Mean summer nitrous oxide fluxes at our sites
(1.5 ng N cm�2 h�1) were similar to those measured at Fernow
(0.5–0.7 ng N cm�2 h�1, Peterjohn et al., 1998). Our estimates
of annual N2O flux (0.08 g N m�2 year�1) are at the high end of
rates reported for deciduous forests (Groffman et al., 2000;
Bowden et al., 2000). Rates were highest at the disturbed
Hillsdale 2 site, but were also relatively high at the Hillsdale 1

P.M. Groffman et al. / Forest Ecology and Management 236 (2006) 177–192190
site. These sites had the finest textured soils among our sites,
which often leads to higher N2O fluxes.
Our results confirm the idea, developed in previous studies,
that urban land use change has complex effects on forest N
dynamics that are difficult to predict. Studies along an urban to
rural gradient in the New York City metropolitan area found
significant increases in N mineralization, and especially
nitrification, in urban and suburban oak stands relative to rural
stands with closely matched soil and land use history conditions
(Pouyat et al., 1995; Steinberg et al., 1997; Zhu and Carreiro,
1999, 2004). However, this effect was largely driven by the
presence of large numbers of earthworms that stimulated
decomposition and N cycling despite lower litter quality in the
urban sites (Carreiro et al., 1999; Pouyat and Carreiro, 2003).
Goldman et al. (1995) found no difference in N mineralization
between urban and rural stands along the New York City urban
to rural gradient when comparisons were made by soil horizon,
which controls for the earthworm effect. Baxter et al. (1999,
2002) also found no difference in mineralization between urban
and rural stands on the New York City gradient, but found that
N and P availability to plants and ectomycorhizal colonization
were lower in the urban stands due to earthworm activity and
lower litter quality. Carreiro et al. (in press) found that N
mineralization was higher in urban stands than rural stands
along an urban to rural gradient centered on Louisville, KY, but
that nitrification was negligible in all stands. Pavao-Zuckerman
and Coleman (2005) found that N mineralization was higher in
urban soils along an urban to rural gradient centered on
Asheville, NC, likely due to higher temperatures in the urban
sites, i.e. the ‘‘urban heat island’’ effect. The variable results
along urban to rural gradients support the idea that natural soil
factors (discussed above) and species change (discussed below)
are stronger controllers of soil N dynamics than exposure to
urban atmospheric change (elevated temperature, ozone,
nitrogen).
One pattern that emerges from our results and from previous
studies is that species change, whether in the plant community
such as we observed at Hillsdale plot 2 or in the soil community,
as was observed in the New York City sites, is a powerful driver
of N cycling along urban to rural gradients (Ehrenfeld et al.,
2001; Ashton et al., 2005). Hillsdale plot 2, which showed
evidence of significant vegetation disturbance, with a high
percent of exotic and pioneer species, had markedly higher
rates of mineralization, nitrification, soil and soil solution
NO3� levels and N2O flux than any of the other plots. Results
from our other plots confirm the idea that in the absence of
species change, the complex atmospheric changes caused by
urban land use conversion do not overwhelm natural soil
controls on N cycling.
5. Conclusions
Our results suggest that natural N cycling processes are
important relative to watershed-scale atmospheric deposition,
fertilizer use and food/sewage fluxes that have been measured
in other studies in these study landscapes. Within the Gwynns
Falls watershed as a whole, which is 20% forested, natural
production of inorganic N by mineralization in forests
(6.6 g N m�2 year�1) is greater than atmospheric N deposition
(1.1 g N m�2 year�1, Groffman et al., 2004b), even if we
assume that no mineralization occurs in the non-forested
portions of the watershed, which is clearly not the case. If we
consider the 80 ha headwater catchment of the Gwynns Falls
(Glyndon, Groffman et al., 2004b), which has approximately
20% impervious surface, and we assume that all the pervious
surface has our average mineralization rate, then natural soil N
production (4224 kg) exceeds atmospheric deposition (896 kg)
by almost a factor of 5. Natural N production also exceeds
fertilizer input to home lawns (1152 kg N, Groffman et al.,
2004b; Law et al., 2004) and food imports (2800 kg N,
Groffman et al., 2004b) by a large margin, although it is
important to note that the intensity of fertilizer input (input per
unit area) is quite high. It is also difficult to compare internal
fluxes such as mineralization, with inputs such as fertilizer and
deposition. However, our analysis shows that the N cycle in
suburban watershed ecosystems is still dominated by natural
processes. The variance in natural processes also appears to be
significant, especially for nitrification, which varied by nearly a
factor of 3 in the 2 years of our study. These results suggest that
natural soil N cycle processes must be considered in the
assessment and management of urban watersheds in water
quality, air quality and carbon sequestration contexts.
Acknowledgements
This research was supported by the National Science
Foundation LTER program (Grant no. DEB-9714835) and the
EPA-NSF joint program in Water and Watersheds (Project no.
GAD-R825792). The City of Baltimore Department of Parks
and Recreation and Department of Public Works, the Baltimore
County Department of Parks and the Maryland Department of
Natural Resources all kindly provided access or management of
land for our studies. The authors thank Jessica Hopkins, Alex
Kalejs, Emilie Stander, Nathan Forand, Alan Lorefice, Evan
Grant, Amanda Thimmayya, Jonah Smith and Helen Thomp-
son for help with field sampling and laboratory and data
analysis. Special thanks to C. Robinette and J. Brewer and
Lincoln, NE Laboratories, NRCS for soil pit descriptions and
analysis.
References
Aber, J.D., Driscoll, C.T., 1997. Effects of land use, climate variation and N
deposition on N cycling and C storage in northern hardwood forests. Global
Biogeochem. Cy. 11, 639–648.
Amoozegar, A., 1989. A compact constant head permeameter for measuring
saturated hydraulic conductivity of the vadose zone. Soil Sci. Soc. Am. J.
53, 1356–1361.
Amundson, R., Jenny, H., 1997. On a state factor model of ecosystems.
Bioscience 47, 536–543.
Ashton, I.W., Hyatt, L.A., Howe, K.M., Gurevitch, J., Lerdau, M.T., 2005.
Invasive species accelerate decomposition and litter nitrogen loss in a mixed
deciduous forest. Ecol. Appl. 15, 1263–1272.
Asner, G.P., Scurlock, J.M.O., Hicke, J.A., 2003. Global synthesis of leaf area
index observations: implications for ecological and remote sensing studies.
Global Ecol. Biogeogr. 12, 191–205.

P.M. Groffman et al. / Forest Ecology and Management 236 (2006) 177–192 191
Baker, L.A., Hope, D., Xu, Y., Edmonds, J., Lauver, L., 2001. Nitrogen balance
for the central Arizona-Phoenix (CAP) ecosystem. Ecosystems 4, 582–602.
Baxter, J., Pickett, S.T.A., Carreiro, M.M., Dighton, J., 1999. Ectomycorrhizal
diversity and community structure in oak forest stands exposed to con-
trasting anthropogenic impacts. Can. J. Bot. 77, 771–782.
Baxter, J., Pickett, S.T.A., Dighton, J., Carreiro, M.M., 2002. Nitrogen and
phosphorus availability in oak forest stands exposed to contrasting anthro-
pogenic impacts. Soil Biol. Biochem. 34, 623–633.
Bertin, R.I., Manner, M.E., Larrow, B.F., Cantwell, T.W., Berstene, E.M., 2005.
Norway maple (Acer platanoides) and oher non-native trees in urban
woodlands of central Massachusetts. J. Torrey Bot. Soc. 132, 225–235.
Blake, G.R., Hartge, K.H., 1986. Bulk density. In: Klute, A. (Ed.), Methods of
Soil Analysis. Part 1. Physical and Mineralogical Methods. Soil Science
Society of America Inc., Madison, pp. 363–376.
Bowden, R., Steudler, P., Melillo, J., Aber, J., 1990. Annual nitrous oxide fluxes
from temperate forest soils in the northeastern United States. J. Geophys.
Res. Atmos. 95, 13997–14005.
Bowden, R., Melillo, J., Steudler, P., Aber, J., 1991. Effects of nitrogen additions
on annual nitrous oxide fluxes from temperate forest soils in the north-
eastern United States. J. Geophys. Res. Atmos. 96, 9321–9328.
Bowden, R.D., Rullo, G., Stevens, G.R., Steudler, P.A., 2000. Soil fluxes of
carbon dioxide, nitrous oxide, and methane at a productive temperate
deciduous forest. J. Environ. Qual. 29, 268–276.
Brush, G.S., Lenk, C., Smith, J., 1980. The natural forests of Maryland: an
explanation of the vegetation map of Maryland (with 1:250,000 map). Ecol.
Monogr. 50, 77–92.
Cadenasso, M.L., Pickett, S.T.A., McDonnell, M.J., Pouyat, R.V., in press.
Forest vegetation along an urban–rural gradient in the New York City
metropolitan area: patterns and relationships to ecosystem processes. Trans.
Linn. Soc. NY.
Carpenter, S.R., 1998. The need for large-scale experiments to assess and
predict the response of ecosystems to perturbation. In: Pace, M.L., Groff-
man, P.M. (Eds.), Successes, Limitations and Frontiers in Ecosystem
Science. Springer-Verlag, New York, pp. 287–312.
Carreiro, M.M., Tripler, C.E., 2005. Forest remnants along urban–rural gra-
dients: examining their potential for global change research. Ecosystems 8,
568–582.
Carreiro, M.M., Howe, K., Parkhurst, D.F., Pouyat, R.V., 1999. Variation in
quality and decomposability of red oak leaf litter along an urban–rural
gradient. Biol. Fertil. Soils 30, 258–268.
Carreiro, M.M., Pouyat, R.V., Tripler, C.E., Zhu, W., in press. Carbon and
nitrogen cycling in soils of remnant forests along urban–rural gradients:
case studies in New York City and Louisville, Kentucky. In: McDonnell,
M.J., Hahs, A., Breuste, J. (Eds.), Comparative Ecology of Cities and
Towns. Cambridge University Press, New York.
Castro, M.S., Steudler, P.A., Melillo, J.M., Aber, J.D., Bowden, R.D., 1995.
Factors controlling atmospheric methane consumption by temperate forest
soils. Global Biogeochem. Cy. 9, 1–10.
Chang, M., 2006. Forest Hydrology: An Introduction to Water and Forests, 2nd
ed. CRC Press, Bacon Raton, FL.
Doheny, E., 1999. Index of Hydrologic Characteristics and Data Resources for
the Gwynns Falls Watershed, Baltimore County and Baltimore City, Mary-
land. U.S.G.S., Open-File Report 99-213, Baltimore, MD.
Ehrenfeld, J.G., Kourtev, P., Huang, W.Z., 2001. Changes in soil functions
following invasions of exotic understory plants in deciduous forests. Ecol.
Appl. 11, 1287–1300.
Elvidge, C.D., Milesi, C., Dietz, J.B., Tuttle, B.T., Sutton, P.C., Nemani, R.,
Vogelmann, J.E., 2004. U.S. constructed area approaches the size of Ohio.
EOS 85, 233–234.
Fahey, T.J., Tierney, G.L., Fitzhugh, R.D., Wilson, G.F., Siccama, T.G., 2005.
Soil respiration and soil carbon balance in a northern hardwood forest
ecosystem. Can. J. For. Res. 35, 244–253.
Finzi, A.C., van Breemen, N., Canham, C.C., 1998. Canopy tree–soil interac-
tions within temperate forests: species effects on soil carbon and nitrogen.
Ecol. Appl. 8, 440–446.
Foley, J.A., DeFries, R., Asner, G.P., Barford, C., Bonan, G., Carpenter, S.R.,
Chapin, F.S., Coe, M.T., Daily, G.C., Gibbs, H.K., Helkowski, J.H., Hollo-
way, T., Howard, E.A., Kucharik, C.J., Monfreda, C., Patz, J.A., Prentice,
I.C., Ramankutty, N., Snyder, P.K., 2005. Global consequences of land use.
Science 309, 570–574.
Freedman, B., Love, S., O’Neil, B., 1996. Tree species composition, structure,
and carbon storage in stands of urban forest of varying character in Halifax,
Nova Scotia. Can. Field Nat. 110, 675–682.
Froelich, A.J., Hack, J.T., Otton, E.G., 1980. Geologic and hydrologic map
reports for land-use planning in the Baltimore-Washington urban area. US
Geological Survey circular 806. US Geological Survey, Reston, VA.
Goldman, M.B., Groffman, P.M., Pouyat, R.V., McDonnell, M.J., Pickett,
S.T.A., 1995. Methane uptake and nitrogen availability in forest soils along
an urban to rural gradient. Soil Biol. Biochem. 27, 281–286.
Gregg, J.W., Jones, C.G., Dawson, T.E., 2003. Urbanization effects on tree
growth in the vicinity of New York City. Nature 424, 183–187.
Groffman, P.M., Tiedje, J.M., 1989. Denitrification in north temperate forest
soils: spatial and temporal patterns at the landscape and seasonal scales. Soil
Biol. Biochem. 21, 613–620.
Groffman, P.M., Brumme, R., Butterbach-Bahl, K., Dobbie, K.E., Mosier, A.R.,
Ojima, D., Papen, H., Parton, W.J., Smith, K.A., Wagner-Riddle, C., 2000.
Evaluating annual nitrous oxide fluxes at the ecosystem scale. Global
Biogeochem. Cy. 14, 1061–1070.
Groffman, P.M., Driscoll, C.T., Likens, G.E., Fahey, T.J., Holmes, R.T., Eagar,
C., Aber, J.D., 2004a. Nor gloom of night: a new conceptual model for the
Hubbard Brook ecosystem study. Bioscience 54, 139–148.
Groffman, P.M., Law, N.L., Belt, K.T., Band, L.E., Fisher, G.T., 2004b.
Nitrogen fluxes and retention in urban watershed ecosystems. Ecosystems
7, 393–403.
Groffman, P.M., Hardy, J.P., Driscoll, C.T., Fahey, T.J., 2006. Snow depth, soil
freezing and trace gas fluxes in a northern hardwood forest. Global Change
Biol. 12, 1748–1760.
Grove, J.M., Troy, A.R., O’Neil-Dunne, J.P.M., Burch Jr., W.R., Cadenasso,
M.L., Pickett, S.T.A., 2006. Characterization of households and its
implications for the vegetation of urban ecosystems. Ecosystems 9,
578–597.
Imhoff, M.L., Lawrence, W.T., Elvidge, C.D., Paul, T., Levine, E., Privalsky,
M.V., Brown, V., 1997. Using nighttime DMSP/OLS images of city lights to
estimate the impact of urban land use on soil resources in the United States.
Remote Sens. Environ. 59, 105–117.
Jenkins, J., Birdsey, R., Pan, Y., 2001. Biomass and NPP estimation for the mid-
Atlantic region (USA) using forest inventory data. Ecol. Appl. 11, 1174–
1193.
Jenkins, J., Riemann, R., 2003. What does nonforest land contribute to the
global C balance? In: McRoberts, R., Reams, G.A., Van Deusen, P.A.,
Moser, J.W. (Eds.), Third Annual FIA Science Symposium, St. Paul, MN,
October 14–16, 2001. USDA Forest Service North Central Research Station
General Technical Report NC-230, Traverse City, pp. 173–179.
Johnson, C.E., Driscoll, C.T., Siccama, T.G., Likens, G.E., 2000. Element fluxes
and landscape position in a northern hardwood forest watershed-ecosystem.
Ecosystems 3, 159–184.
Kaye, J.P., Groffman, P.M., Grimm, N.B., Baker, L.A., Pouyat, R.V., 2006. A
distinct urban biogeochemistry? Trends Ecol. Evol. 21, 192–199.
Knoepp, J.D., Swank, W.T., 1998. Rates of nitrogen mineralization across an
elevation and vegetation gradient in the southern Appalachians. Plant Soil
204, 235–241.
Lajtha, K., Jarrell, W.M., Johnson, D.W., Sollins, P., 1999. Collection of soil
solution. In: Robertson, G.P., Bledsoe, C.S., Coleman, D.C., Sollins, P.
(Eds.), Standard Soil Methods for Long-term Ecological Research. Oxford
University Press, New York, pp. 166–184.
Law, N.L., Band, L.E., Grove, J.M., 2004. Nitrogen inputs to urban watersheds
from fertilizer usage. J. Environ. Plann. Manage. 47, 737–755.
Lovett, G.M., Traynor, M.M., Pouyat, R.V., Carreiro, M.M., Zhu, W., Baxter,
J.W., 2000. Atmospheric deposition to oak forests along an urban–rural
gradient. Environ. Sci. Technol. 34, 4294–4300.
Lovett, G.M., Weathers, K.C., Arthur, M.A., 2002. Control of nitrogen loss from
forested watersheds by soil carbon:nitrogen ratio and tree species composi-
tion. Ecosystems 5, 712–718.
McDonnell, M.J., Pickett, S.T.A., 1990. Ecosystem structure and function along
urban–rural gradients: an unexploited opportunity for ecology. Ecology 71,
1232–1237.

P.M. Groffman et al. / Forest Ecology and Management 236 (2006) 177–192192
McDonnell, M.J., Pickett, S.T.A., Pouyat, R.V., Carreiro, M.M., Groffman, P.,
Bohlen, P., Parmelee, R., Zipperer, W.C., Medley, K., 1997. Ecosystem
processes along urban-to-rural gradients. Urban Ecosyst. 1, 21–36.
McPherson, E., 1998. Atmospheric carbon dioxide reduction by Sacramento’s
urban forest. J. Arboric. 24, 215–223.
Montagnini, F., Haines, B., Swank, W.T., 1991. Soil-solution chemistry in black
locust, pine/mixed hardwoods and oak/hickory forest stands in the southern
Appalachians, USA. For. Ecol. Manage. 40, 199–208.
Norby, R.J., Luo, Y.Q., 2004. Evaluating ecosystem responses to rising atmo-
spheric CO2 and global warming in a multi-factor world. New Phytol. 162,
281–293.
Nowak, D., Crane, D., 2002. Carbon storage and sequestration by urban trees in
the United States. Environ. Pollut. 116, 381–389.
NRCS, 1998. Soil Survey of City of Baltimore, Maryland. Natural Resource
Conservation Service, Washington, DC.
NRCS 2004. Soil Survey Laboratoy Methods Manual. Soil Survey Investiga-
tions Report no. 42, Version 4.0. Natural Resource Conservation Service,
Lincoln, NE.
Oke, T.R., 1990. The micrometeorology of the urban forest. Quart. J. Roy.
Meteorol. Soc. 324, 335–349.
Parkin, T.B., Kaspar, T.C., 2004. Temporal variability of soil carbon dioxide
flux: effect of sampling frequency on cumulative carbon loss estimation.
Soil Sci. Soc. Am. J. 58, 1234–1241.
Pastor, J., Aber, J.D., McClaughertry, C.A., Melillo, J.M., 1982. Geology, soils
and vegetation of Blackhawk Island, Wisconsin. Am. Midl. Nat. 108, 266–
277.
Pastor, J., Aber, J.D., McClaugherty, C.A., Melillo, J.M., 1984. Aboveground
production and N and P cycling along a nitrogen mineralization gradient on
Blackhawk Island, Wisconsin. Ecology 65, 256–268.
Pavao-Zuckerman, M.A., Coleman, D.C., 2005. Decomposition of chestnut oak
(Quercus prinus) leaves and nitrogen mineralization in an urban environ-
ment. Biol. Fertil. Soils 41, 343–349.
Peterjohn, W.T., McGervey, R.J., Sexstone, A.J., Christ, M.J., Foster, C.J.,
Adams, M.B., 1998. Nitrous oxide production in two forested watersheds
exhibiting symptoms of nitrogen saturation. Can. J. For. Res. 28, 1723–
1732.
Peterjohn, W., Foster, C.J., Christ, M.J., Adams, M.B., 1999. Patterns of
nitrogen availability within a forested watershed exhibiting symptoms of
nitrogen saturation. For. Ecol. Manage. 199, 247–257.
Pickett, S.T.A., Kolasa, J., Armesto, J.J., Collins, S.L., 1989. The ecological
concept of disturbance and its expression at different hierarchical levels.
Oikos 54, 129–156.
Pouyat, R.V., Carreiro, M.M., 2003. Controls on mass loss and nitrogen
dynamics of oak leaf litter along an urban–rural land-use gradient. Oeco-
logia 135, 288–298.
Pouyat, R.V., McDonnell, M.J., Pickett, S.T.A., Groffman, P.M., Carreiro,
M.M., Parmelee, R.W., Medley, K.E., Zipperer, W.C., 1995. Carbon and
nitrogen dynamics in oak stands along an urban–rural gradient. In: Kelly,
J.M., McFee, W.W. (Eds.), Carbon Forms and Functions in Forest Soils.
Soil Science Society of America, Madison, pp. 569–587.
Pouyat, R.V., Belt, K.T., Pataki, D.E., Groffman, P.M., Hom, J., Band, L.E., in
press. Urban land-use change effects on biogeochemical cycles. In: Cana-
dell, P., Pataki, D., Pitelka, L. (Eds.), Terrestrial Ecosystems in a Changing
World. Springer-Verlag, New York.
Pouyat, R.V., Yesilonis, I.D., Nowak, D.J., 2006. Carbon storage by urban soils
in the United States. J. Environ. Qual. 35, 1566–1575.
Reay, D.S., Nedwell, D.B., 2004. Methane oxidation in temperate soils: effects
of inorganic N. Soil Biol. Biochem. 36, 2059–2065.
Robertson, G.P., Wedin, D., Groffman, P.M., Blair, J.M., Holland, E.A.,
Nadelhoffer, K.J., Harris, D., 1999. Soil carbon and nitrogen availability:
nitrogen mineralization, nitrification and carbon turnover. In: Robertson,
G.P., Bledsoe, C.S., Coleman, D.C., Sollins, P. (Eds.), Standard Soil
Methods for Long-term Ecological Research. Oxford University Press,
New York, pp. 258–271.
Ross, D.S., Lawrence, G.B., Fredriksen, G., 2004. Mineralization and nitrifica-
tion patterns at eight northeastern forested research sites. For. Ecol. Manage.
188, 317–335.
SAS, 1989. SAS/STAT User’s Guide, Release 6. 03. SAS Institute Incorporated,
Cary.
Savage, K.E., Davidson, E.A., 2001. Interannual variation of soil respiration in
two New England forests. Global Biogeochem. Cy. 15, 337–350.
Schimel, D.S., Stillwell, M.A., Woodmansee, R.G., 1985. Biogeochemistry of
C, N, and P in a soil catena of the shortgrass steppe. Ecology 66, 276–282.
Scott, N.A., Binkley, D., 1997. Foliage litter quality and annual net N miner-
alization: comparison across North American forested sites. Oecologia 11,
151–159.
Shepherd, J.M., Burian, S.J., 2003. Detection of urban-induced rainfall anoma-
lies in a major coastal city. Earth Interact. 7, 1–14.
Smith, K.A., Dobbie, K.E., Ball, B.C., Bakken, L.R., Sitaula, B.K., Hansen, S.,
Brumme, R., Borken, W., Christensen, S., Prieme, A., Fowler, D., Macdo-
nald, J.A., Skiba, U., Klemedtsson, L., Kasimir-Klemedtsson, A., Degorska,
A., Orlanski, P., 2000. Oxidation of atmospheric methane in northern
European soils, comparison with other ecosystems, and uncertainties in
the global terrestrial sink. Global Change Biol. 6, 791–803.
Steinberg, D.A., Pouyat, R.V., Parmelee, R.W., Groffman, P.M., 1997. Earth-
worm activity and nitrogen mineralization rates along an urban–rural land
use gradient. Soil Biol. Biochem. 29, 427–430.
Steudler, P.A., Bowden, R.D., Melillo, J.M., Aber, J.D., 1989. Influence of
nitrogen fertilization on methane uptake in temperate forest soils. Nature
341, 314–316.
van Breemen, N., Finzi, A.C., Canham, C.D., 1997. Canopy tree-soil interac-
tions within temperate forests: effects of soil elemental composition and
texture on species distributions. Can. J. For. Res. 27, 1110–1116.
Vitousek, P.M., 1994. Beyond global warming: ecology and global change.
Ecology 75, 1861–1876.
Wollheim, W.M., Pellerin, B.A., Vorosmarty, C.J., Hopkinson, C.S., 2005. N
retention in urbanizing headwater catchments. Ecosystems 8, 871–884.
Zak, D.R., Host, G.E., Pregitzer, K.S., 1989. Regional variability in nitrogen
mineralization, nitrification and overstory biomass in northern Lower
Michigan. Can. J. For. Res. 19, 1521–1526.
Zak, D.R., Holmes, W.E., Finzi, A.C., Norby, R.J., Schlesinger, W.H., 2003.
Soil nitrogen cycling under elevated CO2: a synthesis of forest FACE
experiments. Ecol. Appl. 13, 1508–1514.
Zhu, W.X., Carreiro, M.M., 1999. Chemoautotrophic nitrification in acidic
forest soils along an urban–rural gradient. Soil Biol. Biochem. 31, 1091–
1100.
Zhu, W.X., Carreiro, M.M., 2004. Temporal and spatial variations in nitrogen
transformations in deciduous forest ecosystems along an urban–rural gra-
dient. Soil Biol. Biochem. 36, 267–278.
Ziska, L.H., Bunce, J.A., Goins, E.W., 2004. Characterization of an urban–rural
CO2/temperature gradient and associated changes in initial plant produc-
tivity during secondary succession. Oecologia 139, 454–458.


