Embed Size (px)
Citation preview
LIBRARY MOSS LANDING
p 0. 450 Moss landing, California
BLUE WHALES FEEDING ON IllGH CONCENTRATIONS OF EUPHAUSIIDS AROUND MONTEREY SUBMARINE CANYON
A Thesis
· Presented to
The Faculty of the Department of Moss Landing Marine Laboratories
San Jose State University
In Partial Fulfillment
of the Requirements for the Degree
Master of Science
By
Jill R. Schoenherr
June 1988
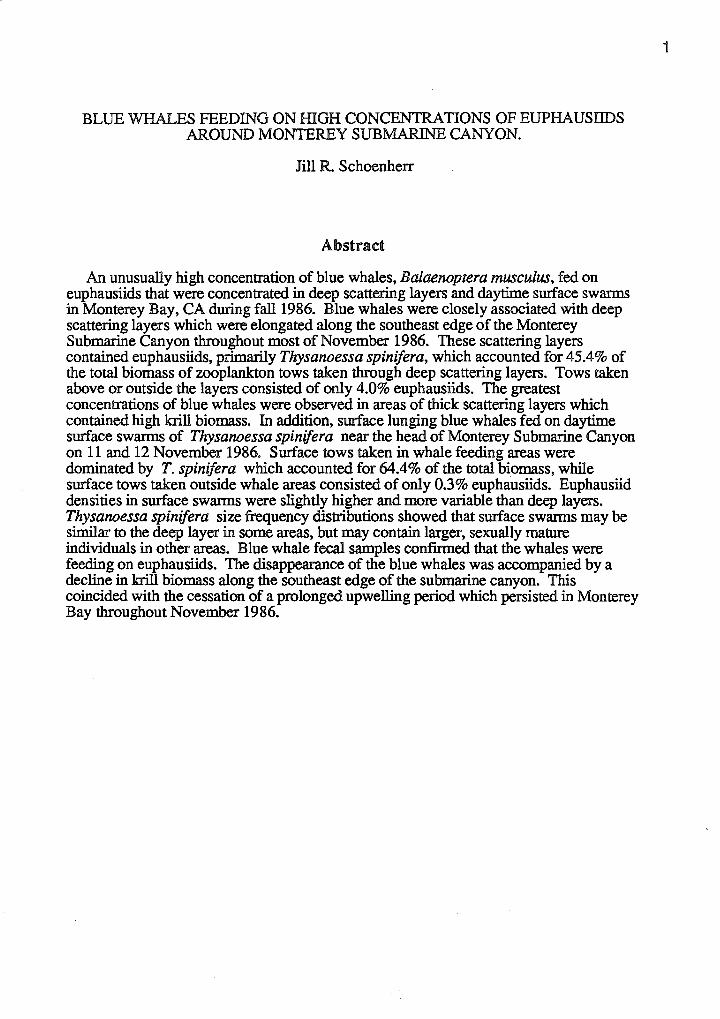
BLUE WHALES FEEDING ON HIGH CONCENTRATIONS OF EUPHAUSIIDS AROUND MONTEREY SUBMARINE CANYON.
Jill R. Schoenherr
Abstract
An unusually high concentration of blue whales, Balaenoptera musculus, fed on euphausiids that were concentrated in deep scattering layers and daytime surface swarms in Monterey Bay, CA during fall1986. Blue whales were closely associated with deep scattering layers which were elongated along the southeast edge of the Monterey Submarine Canyon throughout most of November 1986. These scattering layers contained euphausiids, primarily Thysanoessa spinifera, which accounted for 45.4% of the total biomass of zooplankton tows taken through deep scattering layers. Tows taken above or outside the layers consisted of only 4.0% euphausiids. The greatest concentrations of blue whales were observed in areas of thick scattering layers which contained high krill biomass. In addition, surface lunging blue whales fed on daytime surface swarms of Thysanoessa spinifera near the head of Monterey Submarine Canyon on 11 and 12 November 1986. Surface tows taken in whale feeding areas were dominated by T. spinifera which accounted for 64.4% of the total biomass, while surface tows taken outside whale areas consisted of only 0.3% euphausiids. Euphausiid densities in surface swarms were slightly higher and more variable than deep layers. Thysanoessa spinifera size frequency distributions showed that surface swarms may be similar to the deep layer in some areas, but may contain larger, sexually mature individuals in other areas. Blue whale fecal samples confirmed that the whales were feeding on euphausiids. The disappearance of the blue whales was accompanied by a decline in krill biomass along the southeast edge of the submarine canyon. This coincided with the cessation of a prolonged upwelling period which persisted in Monterey Bay throughout November 1986.
t: tl
~ ... .
Introduction
Most baleen whales undergo seasonal feeding migrations in search of heavy
concentrations of food organisms. Although this relationship has been established for
many geographic areas, it is not well quantified. The whale/plankton link was initially
supported by agreements between whale catch records and general euphausiid
distributions in the Antarctic (Hardy and Gunther, 1935; Mackintosh, 1934). Stronger
evidence of the whale/prey relationship was revealed when stomach contents and catch
statistics of baleen whales in the North Pacific were compared to published plankton data
(Nemoto, 1957; 1959; 1963).
More localized studies revealed that baleen whale distributions were closely
associated with that of their prey. The distribution and movements of humpback whales
off New England and Newfoundland were related to the distribution and movements of
schooling fish (Payne, et al., 1985; Whitehead and Glass, 1985). Humpback whales in
southeastern Alaska were concentrated only in areas of extensive prey concentrations,
primarily deep layers of euphausiids (Krieger and Wing, 1986). Sonar scans and
underwater camera footage revealed that humpback whales fed on dense patches of
euphausiids in Frederick Sound, Alaska (Dolphin, 1987a). These studies give stronger
evidence of the relationship between whales and their prey; however, they lack
quantitative data on prey availability outside whale feeding areas.
A few recent studies have convincing prey data from both inside and outside
whale feeding areas. Surface feeding right whales occurred in areas of extraordinarily
dense Calanus concentrations in the Great South Channel off New England (Wishner, et
al., in press). Bowhead whales fed in areas of thick copepod layers in the Eastern
Alaskan Beaufort Sea (Richardson, 1987). In both studies, data from the feeding whale
2
areas were limited to only a few days and lack quantified correlations between the number
of whales and the quantity of available prey.
This study was intended to explore the relationship between blue whales which
fed on euphauslids in deep scattering layers and surface swarms around Monterey
Submarine Canyon. Euphausiids were found in large densities within whale feeding
areas, orders of magnitude larger than densities observed outside the whale areas. The
number of feeding blue whales was positively correlated with the density of euphauslids.
The densest patches of both euphauslids and blue whales were associated with steep
topographical features of the Monterey Submarine Canyon.
Study Area
Monterey Bay is located along the central California coast and contains one of the
largest submarine canyons along the west coast of North America. This canyon, which
extends very close to the shore, has a profound effect on the circulation in Monterey Bay.
Submarine canyon topography acts like a funnel, channeling seasonal upwelling events
onshore. Coastal upwelling occurs north and south of Monterey Bay between March and
October, and upwelled waters from these areas may be advected into the Bay. This
upwelling relaxes during late summer and fall and the Davidson Current has usually
become established by early November (Breaker and Broenkow, in press). Changes in
abundance and composition of phytoplankton (Bolin and Abbott, 1963; Garrison, 1979)
and zooplankton (Barham, 1956) have been shown to be associated with these
hydrographic periods.
The upwelling conditions in Monterey Bay may affect the distribution patterns of
euphausiids. Dense accumulations of euphausiids are most likely to be found where
3
:=;: r;:;i: ,.., '
~ > -l , '
c: a ~ !:l! ~:
turbulence or upwelling occurs (Eddie, 1977). Monterey Submarine Canyon provides
channels for onshore, upward advection of deep nutrient-rich waters. It is during such
upwelling periods that tremendous surface swarms of Euphausia pacifica (Barham,
1956) and Thysanoessa spinifera (Harvey, 1979) have been observed around Monterey
Submarine Canyon.
In autumn, blue whales have been frequently observed in the outer portions of
Monterey Bay and over the Monterey Submarine Canyon (Dohl, et al., 1983). The blue
whales are presumably migrating south from their Alaskan feeding grounds during this
time (Rice, 1974). Sears (1987) suggested that the blue whales sighted off California
could be the same as those he observed in the Gulf of California. He recently matched
photographs of two blue whales observed in the Gulf in a previous year with individuals
seen in Monterey Bay during fal11986 (pers. comm.).
Unusually large numbers of blue whales were present in Monterey Bay from
August through most of November 1986. From the beginning of August, groups of up
to 7-9 animals were reported by local charter boats (Shearwater Journeys) and research
vessels (University of California, Santa Cruz and Monterey Bay Aquarium). In early
October, while conducting a survey of marine birds and mammals, researchers from
Moss Landing Marine Laboratories observed 14 blue whales in Monterey Bay. Large
aggregations (of perhaps over 20 animals) were frequently concentrated along the
southeast edge of the Monterey Submarine Canyon during October and November. On
several occasions the whales were seen lunge feeding on surface swarms of euphausiids
near the head of the Monterey Submarine Canyon.
4
Methods
From October 1986 through March 1987, field data were collected from cruises
aboard the Moss Landing Marine Laboratories' 35-foot research vessel Ed Ricketts. The
boat was equipped with a Gearmatic Model-5 utility winch, North Star 8000 LORAN,
Lowrance X-15B recording depth sounder (operating at 192kHz), Ross 800-B depth
sounder (50 kHz operating frequency) and a 3-meter high observation platform.
Distribution and abundance of krill were assessed by acoustical techniques and net tows.
Since echo sounders operating at high acoustic frequencies (50-200 kHz) successfully
record layers and patches of euphausiids (Eddie, 1977; Nemoto, 1983), the distribution
of euphausiid biomass was estimated from echo records. Zooplankton biomass was
further quantified using a 1-meter diameter, 505-micron mesh plankton net. While sitting
on the platform. observers using binoculars independently recorded whale sightings.
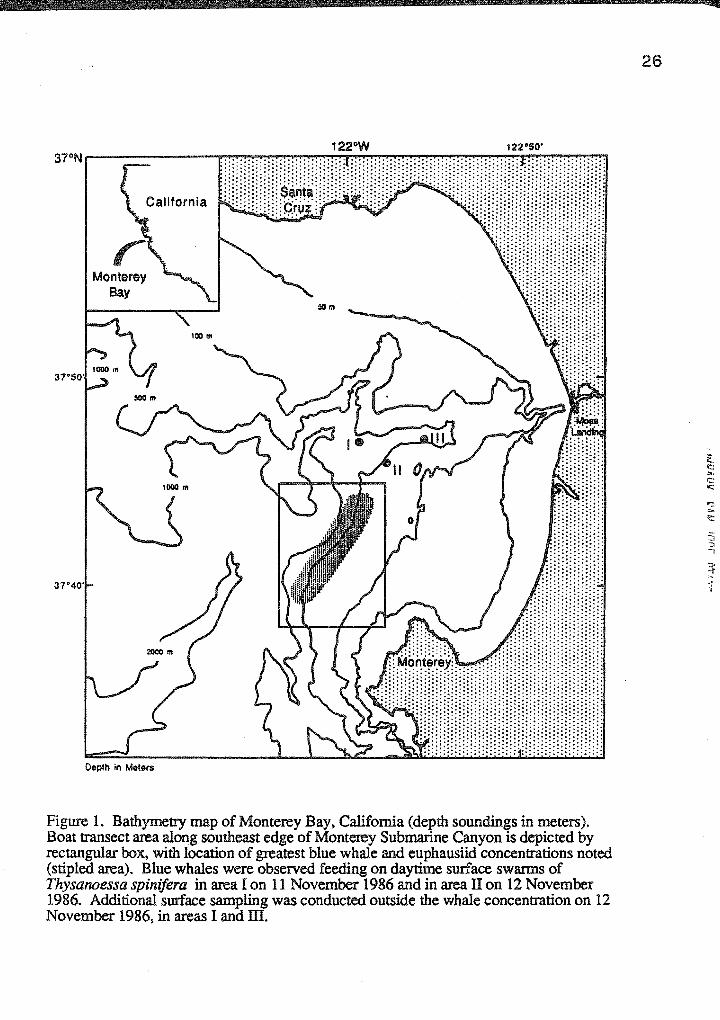
Sampling efforts were primarily focused on the areas of greatest whale
concentrations, most frequently along the southeast edge of the Monterey Submarine
Canyon (Figure 1, rectangular box). Upon departing Moss Landing harbor, the vessel
would generally follow the canyon edge south to this area until whales were sighted. The
blows of blue whales were often visible for over 2 kilometers, which allowed an area
well beyond the boat's actual course to be surveyed for the presence of whales. Whale
observers on the platform recorded the number of whales, their distribution and behavior
while the Lowrance depth sounder recorded prey concentrations (fable 1). In addition,
researchers in the wheelhouse recorded the LORAN position, bottom depth and sea
surface temperature.
On 16 and 18 November 1986, a series of transects, two kilometers apart, were
run perpendicular to the southeast edge of the Monterey Submarine Canyon at a speed of
2 meters/second (4 knots). The length of each transect varied somewhat, from 2.3 to 4.6
5
km. However, all transects consistently extended from a 110 meter bottom depth
nearshore to a bottom depth of greater than 37 5 meters (over the submarine canyon drop
off). The Lowrance depth sounder continuously recorded bottom depth and presence of
scattering layers. Meanwhile, whale observers on the platform surveyed the area ahead
of the boat and 90 degrees to either side. All whales observed within one kilometer of the
boat were recorded; sightings were considered accurate in sea conditions up to a Beaufort
scale 3.
Whales were identified as feeding or not feeding based primarily on surface
behavior. Non-feeding whales followed a relatively straight-line path through the survey
area, as indicated by body orientation during successive surfacings. In contrast, whales
feeding below the smface dove and surfaced repeatedly within a localized area.
Occasionally, whale feces (later found to contain krill. remains) were observed in this
area. Localized dive activity and presence of feces have been used as evidence of feeding
at depth in other baleen whale studies (Dolphin, 1987b; Wiirsig et al., 1985). Whales
which were surface feeding lunged rapidly through aggregations of euphausiids; often the
distended throat pleats of the whales were observed during the lunge.
Deep scattering layers were quantified by echo records and plankton net tows.
The depth to the scattering layer and thickness of the layer were measured from the echo
traces. Plankton net tows were used to identify and quantify the abundance of krill and
other zooplankton. While the boat was stationary, the net was lowered to a depth below
the layer, allowed to settle for one minute and then raised vertically through the water
column at an average rate of 0.6 meters/second (s.d.= 0.02 m/sec, n=26). If no layer
was present, the net was towed vertically from 200 meters below the surface, the
maximum depth from which the Lowrance sounder could detect a layer. On 9, 14 and 25
November, plankton tows were taken both within and outside of whale feeding areas.
6
On 16 and 28 November, tows were taken above the scattering layer in addition to tows
taken through the scattering layer. The tow rate was similar for these shallower tows
(linear relationship between ascent time and tow depth).
Within the upper 10 meters of the water column, surface swarms of krill were
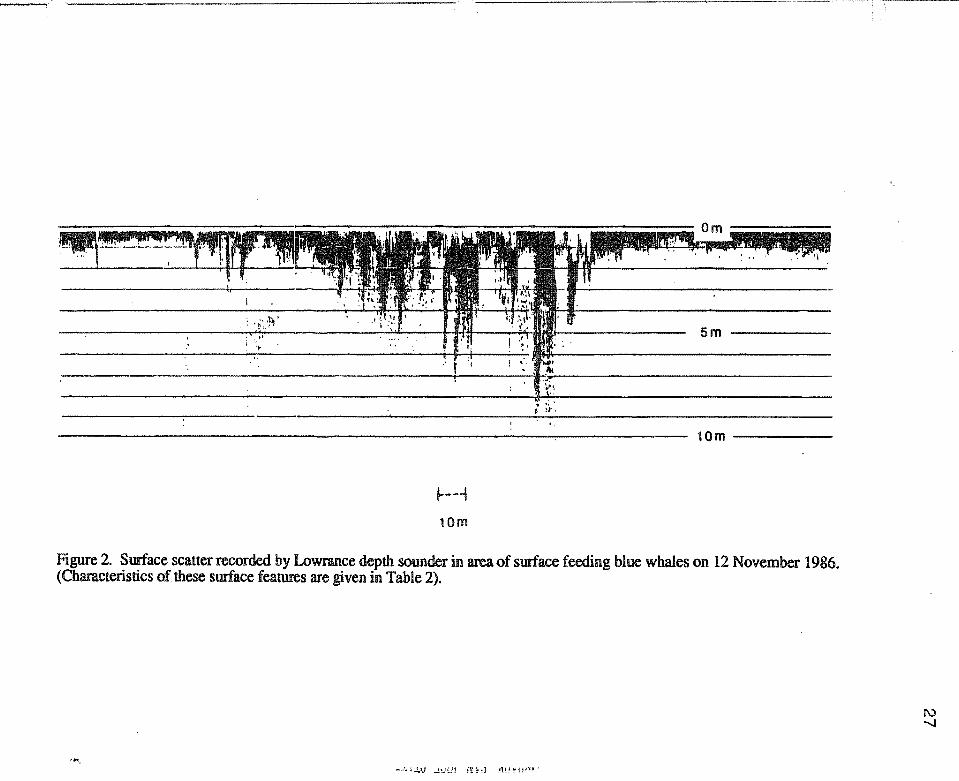
recorded as distinctive "features" on the Lowrance depth sounder (Figure 2). Though
incidental surface reverberations were continuously recorded in the upper 1 to 2 meters of
the water column, scattering areas which extended to a depth of at least 3 meters were
defined as distinctive features. Adjacent features were difficult to differentiate, but were
conservatively recorded only if they were at least 10 meters apart. Surface scattering was
continuously recorded in conjunction with LORAN positions, during transects run
through whale feeding areas at a speed of 1 meter/sec (2 knots). On 12 November,
similar transects were also run in two areas outside of whale feeding areas. The surface
scattering records were later used to determine average width and maximum depth of the
features for each area. These swarm characteristics from the two whale feeding areas
were statistically compared to each other using the student's t-test (Zar, 1984). The
plankton net was horizontally towed just below the surface for 1.5 minutes at an average
speed of 0.6 meters/sec (1.2 knots}, both inside and outside the whale feeding areas.
Plankton samples were brought to the laboratory where they were fixed in 10%
formalin, then transferred to 40% isopropyl alcohol. They were split to an approximate
25-milliliter volume with a Folsum plankton splitter. Using a Bausch & Lomb dissecting
microscope (lOx to 40x), krill were sorted, identified to species using Boden et al. (1955)
identification key and enumerated. Wet weights were determined using a Scientech
Model300 top loading balance. Larval krill, as defined by Brinton and Wyllie (1976),
were sorted, counted and weighed but not identified to species. The remaining non
euphausiid zooplankton was also weighed.
7
Total krill biomass and other plankton biomass were statistically analyzed. Two
factor analyses of variance were used to compare deep tows taken inside and outside
whale feeding areas on 9, 14 and 25 November and those taken through and above the
deep scattering layer on 16 and 28 November (Zar, 1984). Due to lack of homogeneity
of variances, surface tows taken inside and outside whale feeding areas were compared
using a non-parametric Mann Whitney U-test, comparing pooled data from the two areas
of feeding whales to the areas outside of feeding whales.
Total krill biomass and number of non-larval krill were standardized per cubic
meter of water filtered. Areas outside surface swarms and outside or above deep layers
were standardized assuming that the small amount of krill encountered were integrated
throughout the water column. The krill biomass and numbers per tow were standardized
by dividing by the total volume of water filtered (area of net mouth x tow distance). For a
given day, the average biomass and number of krill per tow outside surface swarms or
outside or above deep layers were subtracted from the tows done through surface swarms
or deep layers on the same day. These numbers were then standardized to grams or
numbers per cubic meter by dividing by area of net mouth x distance of tow (for surface
tows) or by area of net mouth x thickness of scattering layer (for deep tows).
Total length (tip of rostrum to tip of telson) was measured to the nearest millimeter
for all Thysanoessa spinifera sorted in the plankton splits from 15 and 16 November
deep tows and 11 and 12 November surface tows. Fertilized females were distinguished
by the presence of their distinctive brownish, barbell-shaped spermatophores. Size
frequency distributions were generated from pooled data for each area and statistically
compared using Kolmolgorov-Smirnov test for differences in relative cumulative
frequency distributions.
8
~ ~. m c ?! fJ ~-
Five blue whale fecal samples were retrieved by using a fme mesh net or a bucket.
A 0.5 m1 aliquot was taken from homogeneous mixtures and approximate volumetric
percentages of prey items were estimated visually. The number of Thysanoessa spinifera
molars and spermatophores were then enumerated from this aliquot
Oceanographic data were indirectly assessed from daily satellite images, monthly
coastal upwelling index anomalies and sea surface temperature anomalies for August
1986 through January 1987, in order to better understand what processes may have
caused aggregations of whale prey in Monterey Submarine Canyon. Archived satellite
images of the eastern North Pacific were studied at the National Weather Service in
Redwood City, CA and images, that clearly depicted the oceanographic conditions in
Monterey Bay, were processed by Scripps Institute of Oceanography Satellite Services.
The coastal upwelling indices calculated for 36° N, 122°W were compared to the 20-year
average reported by Bakun (1973). Sea surface temperatures measured at Granite
Canyon were compared to a 12-year record for that area, calculated by Breaker (1983).
Results
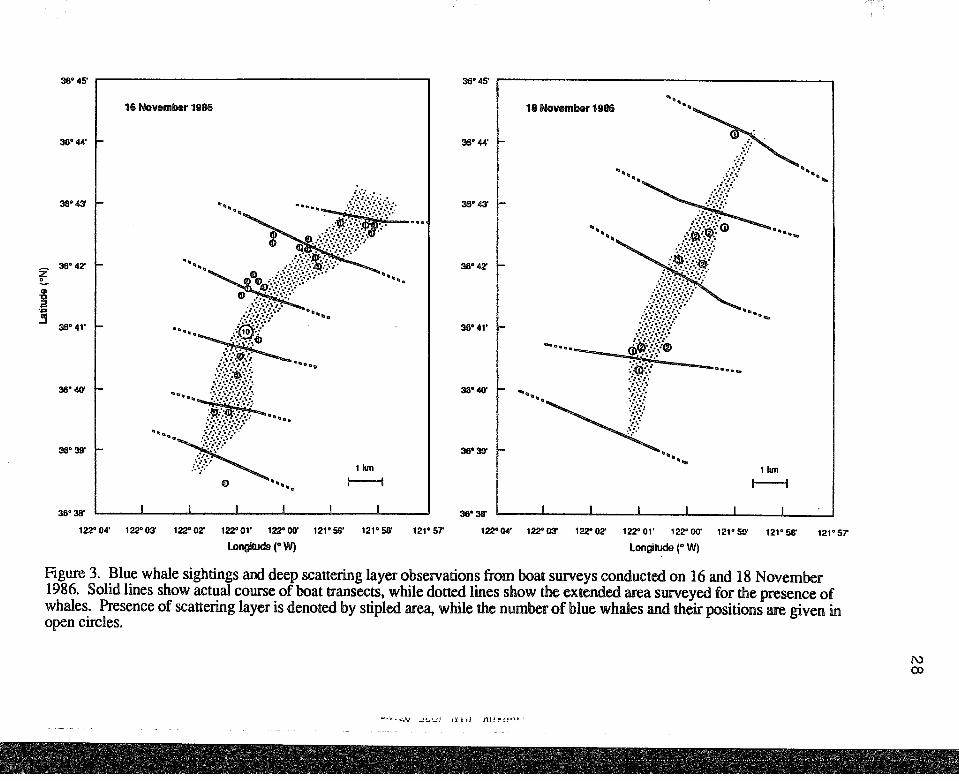
Blue whales were closely associated with the deep scattering layer observed along
the southeast edge of the Monterey Submarine Canyon (Figure 3). On both 16 and 18
November, over 75% of the whales observed were sighted directly over the scattering
layer. The location of the scattering layer changed between days; it occurred slightly
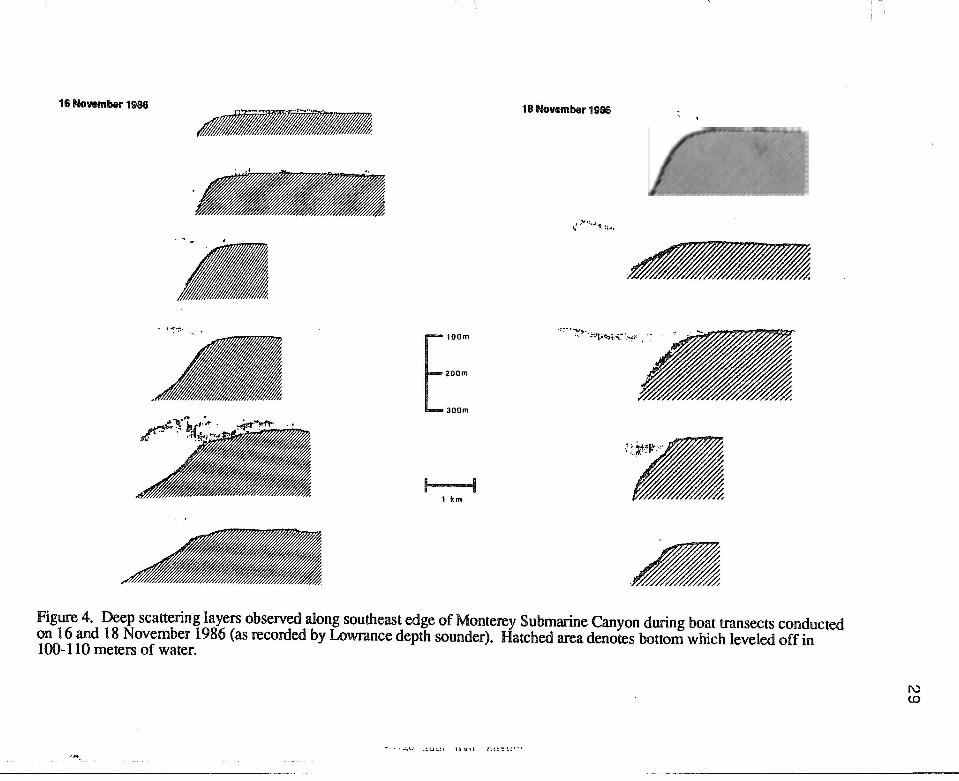
further offshore and in deeper water on 18 November. The thickness and depth of the
layer varied, both between days and between transect lines on a given day (Figure 4). In
general, the scattering layer was 1-2 km wide and elongated along the canyon edge with
the thickest patches concentrated along the canyon drop-off at depths of 130-140 meters.
9
Later in the afternoon, the scattering layer often appeared in shallower water, concentrated
just above the sea floor, at depths of 100-110 meters.
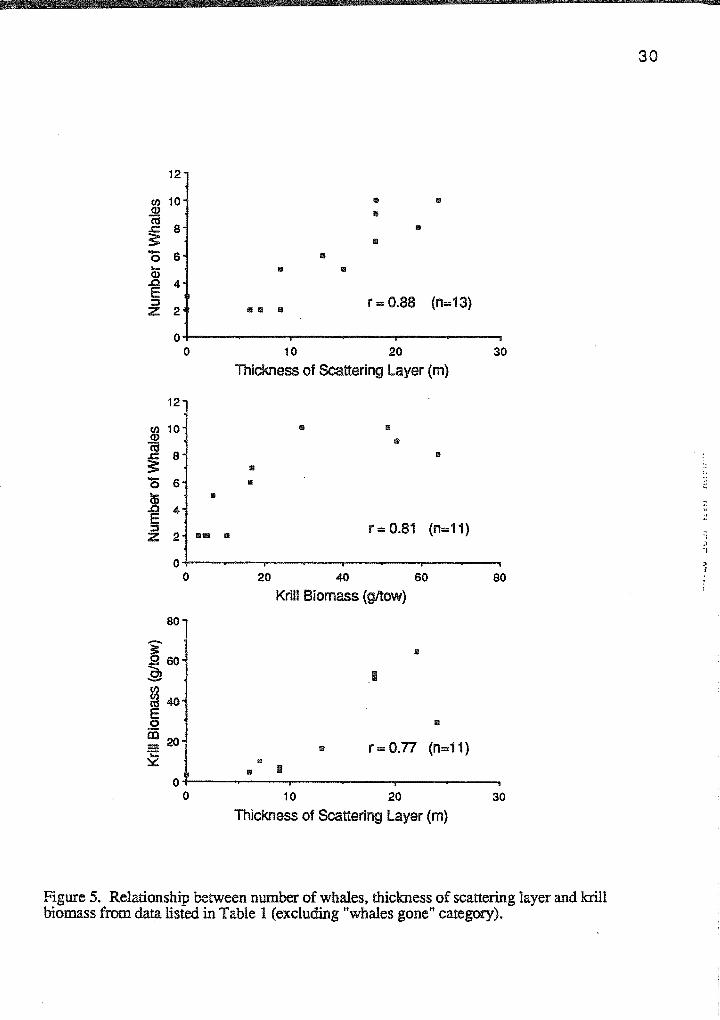
The greatest concentrations of blue whales were observed in areas of thick
scattering layers and high krill biomass (Table 2). The number of whales observed
within the 1-kilometer survey area was strongly associated with both thickness of
scattering layer (r=0.88, p<0.001) and with krill biomass (r=0.81, 0.002<p<0.005).
Similarly, krill biomass was highly correlated with the thickness of the scattering layer
(r=0.77, 0.005<p<0.01), (Figure 5). Although the tow depth varied between days, there
was no correlation between krill biomass and tow depth (r=0.16, p>0.05). Thus, krill
biomass was more closely associated with the location of the scattering layer than with the
tow depth.
Lunge-feeding blue whales were observed on 11 and 12 November over the
Monterey Submarine Canyon mouth (Figure 1). Surface swarms of krill occurred within
the surface-feeding areas, but not outside these areas. Krill swarms were characterized
by an overall mean width of 39.4 meters (s.d.= 55.4 m, n=36) and maximum depth of
4.6 meters (s.d.= 1.6 m, n=36). There was no significant difference in feature width
(t=0.14, p>0.05) or maximum depth (t=0.22, p>0.05) between the two whale areas
(Table 3). The swarms appeared to be more concentrated in Area II (4.5 features/kin)
compared to Area I (2.7 features/kin); however, the transects in Area II were more
localized in the whale feeding area
Euphausiids, primarily Thysanoessa spinifera, accounted for 31.5%
(s.d.=15.3%, n=10) of the zooplankton biomass of the deep tows taken inside whale
feeding areas, but contributed only 3.9% (s.d.=4.4%, n=10) to the total biomass outside
the whale feeding areas (Table 4). Overall, T. spinifera accounted for 23.3%
(s.d.=16.3%, n=10) of the total biomass in whale feeding areas on 9, 14 and 25
10
;f.··
November; Euphausia pacifica accounted for an additional16.1% (s.d.=2.2%, n=3) of
the total biomass on 14 November, while Nyctiphanes simplex contributed another 4.9%
(s.d.=5.5%, n=5) of the biomass on 25 November. Larval krill accounted for only 0.8%
(s.d.=0.5%, n=lO) of the biomass in whale feeding areas and a similar 0.9%
(s.d.=0.5%, n=lO) outside whale areas. Total krill biomass and other plankton biomass
was significantly higher inside whale areas than outside whale areas (krill biomass;
F=22.09, p<0.001; other plankton biomass; F=7.03, p<0.05) but not significantly
different between days (krill biomass; F=2.52, p>0.05; other plankton biomass; F=3.06,
p>0.05). There was no significant interaction between these two factors (krill biomass:
F=2.88, p>0.05; other plankton biomass: F=3.39, p>0.05).
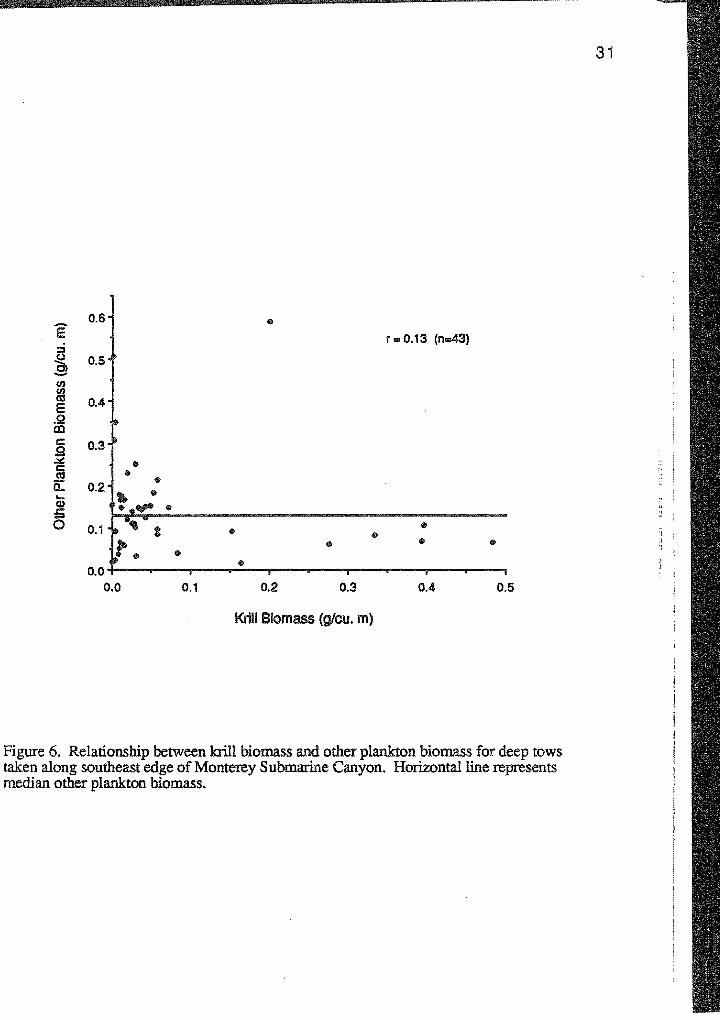
Krill biomass was not significantly associated with other plankton biomass
(r=0.13, p>0.05). Nevertheless, of the 8 tows containing highest krill biomass, 7 of
these had other plankton biomass lower than the median other plankton biomass (Figure
6).
Euphausiids accounted for 65.2% (s.d.=25.8%, n=7) of the total biomass from
deep tows taken through the scattering layer, while tows taken above the layer consisted
of only 5.4% (s.d.=3.4%, n=7) euphausiids (Table 5). On 16 November, T. spinifera
dominated the catch, accounting for 77.6% (s.d.=3.2%, n=4) of the total biomass; while
on 28 November, E. pacifica was the predominant krill species, contributing 40.1%
(s.d.=20.1 %, n=3) of the total biomass. Larval krill averaged only 1.1% (s.d.=0.9%,
n=7) of the total biomass in tows through the scattering layer and 4.1% (s.d.=3.8%,
n=7) for tows above the layer.
Total krill biomass was significantly higher in tows taken through the scattering
layer, rather than above the layer (F=151.16, p<0.001). There was also a significant
difference in krill biomass between the two days (F=72.38, p<0.001), as well as a
; ;
significant interaction between these two factors (F=72.93, p<0.001). Other plankton
biomass did not differ in tows taken through versus above the layer (F=1.08, p>0.05),
but was significantly different between days (F=9.00, p<0.05). There was no significant
interaction between these factors affecting other plankton biomass (F=l.24, p>0.05).
Surface tows taken in whale feeding areas were dominated by T. spinifera , which
accounted for 64.4% (s.d.=38.9%, n=10) of the total biomass while surface tows taken
outside whale areas consisted of only 0.3% (s.d.=0.3%, n=10) euphausiids (Table 6).
Only trace amounts of other krill species were encountered in these surface tows. Larval
krill accounted for only 0.1% of the total biomass in the whale areas (s.d.=0.2%, n=lO),
and 0.3% outside whale areas (s.d.=0.3%, n=10). Whale feeding areas had significantly
higher krill biomass (U=100, p<0.001) than areas without feeding whales. However,
biomass of plankton other than krill did not differ significantly inside and outside whale
feeding areas (U=52, p>0.05).
Euphausiid densities were orders of magnitude greater within surface swarms and
deep layers, compared to areas outside these patches. Surface swarms showed higher
and more variable standardized krill biomass estimates (overall mean=3.3 g/cu. m,
s.d.=5.6, n=lO) compared to within the deep layer (overall mean=1.7 g/cu. m, s.d.=1.3,
n=17). Conversely, the average number of krill were lower within surface swarms
(overall mean=60.7/cu. m, s.d.=105.6, n=10) compared to numbers found within the
deep layer (overall mean=70.6/cu. m, s.d.=45.0, n=17) (Table 7). Outside these dense
areas, krill biomass averaged 0.001 g/cu. m (s.d.=0.001, n=10) in the surface waters and
0.005 g/cu. m (s.d.=0.004, n=17) throughout the upper 200 meters of the water column.
Similarly, low numbers of krill were encountered outside the patches, with surface waters
averaging 0.02 individual krilVcu. m (s.d.=0.03, n=lO) and the water column averaging
0.5 individuals/cu. m (s.d.=0.9, n=17).
12
c: ~
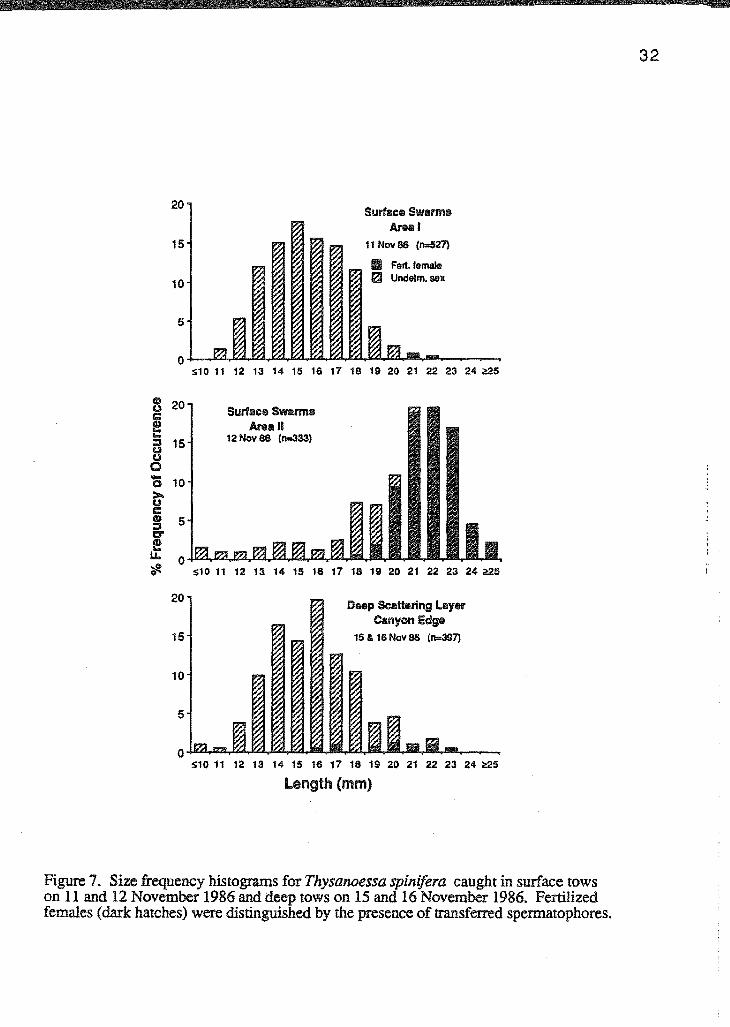
Size frequency distributions of T. spinifera showed that surface swarms may be
similar to the deep layer in some areas but may contain larger, sexually mature individuals
in other areas (Figure 7). Deep layer tows consisted mostly of unfertilized females and/or
males with an average total length of 15 to 16 mm. Area I surface swarms exhibited a
similar distribution (D=O.OS, p>O.OS); however, Area II surface swarms consisted
mainly of larger, fertilized females. This size frequency distribution was significantly
different from both the deep layer (D=0.69, p<0.001) and the Area I surface swarms
(D=0.73, p<O.OOl).
Blue whale fecal samples confirmed that the whales were feeding exclusively on
euphausiids (Table 8). The fecal samples retrieved from surface-feeding whales were
less digested than those from deep-feeding whales, which allowed a greater percentage of
the euphausiid remains to be identified from the samples. In both deep and surface
samples, all identifiable euphausiid remains were of T. spinifera.
The cessation of an extended upwelling period that persisted throughout
November 1986 coincided with a decline in krill biomass and the disappearance of the
blue whales in Monterey Bay. Satellite images from Monterey Bay showed that
upwelling persisted through November and the warm-water Davidson Current did not
appear until December (Figure 8). Monthly coastal upwelling index anomalies and sea
surface temperature anomalies confirmed higher than normal upwelling during
November, followed by higher sea surface temperatures in December (Table 9). By the
beginning of December, aggregations of blue whales and their prey had also disappeared
in Monterey Bay (Table 1).
13
Discussion
Dense aggregations of prey around Monterey Submarine Canyon supported
abnormally large concentrations of blue whales during fal11986. The distribution of the
euphausiids directly influenced the distribution of as many as 20 blue whales in Monterey
Bay, as evidenced by strong associations between the whales and their abundant prey.
Blue whales fed in areas of highest krill biomass, characterized by euphausiid densities
that were orders of magnitude larger than densities found outside these whale feeding
areas. The euphausiid patches were always in close association with the canyon, either
concentrated in dense scattering layers along the canyon edge or in large surface swarms
near the head of the canyon.
Upwelling may be a potentially important mechanism providing increased prey
aggregations around Monterey Submarine Canyon. Submarine canyon topography
promotes circulation that enhances mixing and may lead to increased productivity
(Church, et al., 1984). Abundance and concentration of deep water forage items in
shallower water areas adjacent to submarine canyons may also be increased. Periods of
highly intense advective processes, especially in conjunction with abundance peaks of
dominant canyon organisms, could account for the occurrence of dense concentrations of
fishes, birds and marine mammals in the vicinity of submarine canyons and along the
edges of banks (Kenney and Winn, 1987; Morejohn, et al., 1978; Payne et al., 1986).
Anomalous upwelling that persisted in Monterey Bay throughout November most
likely increased productivity and plankton biomass in the area. Zooplankton, especially
krill, are known to accumulate in areas of increased turbulence or upwelling (Eddie,
1977; Everson, 1977; Witek, et al., 1982). High densities of Thysanoessa spinifera are
associated with upwelling centers in the North Pacific (Brinton, 1962). Beklemishev
(1960) found that krill was more abundant and more blue and humpback whales prevailed
14
in regions of the Antarctic where cyclones were more frequent. Fin whales near Iceland
concentrated in a semipermanent area of upwelling, where zooplankton biomass was
higher than in surrounding areas (Foerster and Thompson, 1985).
The anomolous upwelling may have been responsible for high concentrations of
the euphausiids that in tum provided food for blue whales around Monterey Submarine
Canyon. This parallels a similar anomaly reported by Latyshkevich, et al. (summarized
in McWhinnie, et al., 1981) in which increased advection resulted in higher krill
concentrations in the Scotia Sea region of the Antarctic. Greater aggregations of fin and
sei whales resulted in a particularly good year for Scotia Sea whaling.
Deep scattering layers were often variable in terms of thickness, depth in the water
column and general patchiness but were always most dense along the canyon edge. The
euphausiid patches were elongated along the canyon edge and were usually dispersed at
the head of the canyon, perhaps as a result of increased vertical mixing. Simard et al.
(1986a) found similar aggregations of euphausiids, distributed in a long, narrow patch
along the edge of the Laurentian Channel, St. Lawrence estuary. Pieper (1979) also
showed significant horizontal patchiness in the distribution of euphausiids as well as
variable depths in the water column. Physical processes such as upwelling, circulation,
semidiumal internal tides. turbulence and tidal influences (Breaker and Broenkow, in
press; Sameoto, 1983; Shea and Broenkow, 1982), and biological processes such as
euphausiid behavior (Hamner, et al., 1983; Simard, et al .• 1986a) could be acting as
concentrating mechanisms.
Acoustical prey data provide indirect evidence for the depth of blue whale dives.
Since blue whales were found over prey which was sometimes as deep as 165 meters, it
can be inferred that these whales fed at this range. The maximum feeding depth of blue
whales is not known; however, it is assumed that the normal range of baleen whales does
15
not exceed 300 meters in depth (Nemoto, 1963). In the North Atlantic, Whitehead
(1983) obtained depth sounder traces representing humpback whales in depths down to
195 meters, while Dolphin (1987a) found that humpbacks restricted their foraging to the
upper 120 meters of the water column in nearshore feeding areas of south Alaska. More
direct evidence, such as time-depth records or sonar traces, is needed to confirm the
actual feeding range of blue whales.
Baleen whales must feed selectively in areas of concentrated prey. Euphausiids
were consistently concentrated in the scattering layer and not integrated throughout the
water column. Biomass measurements of euphausiids have been made in widely diverse
areas; they usually constitute 5-10% of the total biomass of plankton (Mauchline, 1980).
Vertical tows taken where there was no evidence of scattering layers or taken above
scattering layers had similarly low euphausiid percentages (3.9% and 5.4%,
respectively); however, those tows taken through scattering layers had significantly
higher percentages of euphausiids (accounting for up to 88% of the total biomass). In
general, zooplankton concentrations are orders of magnitude higher within the scattering
layer than outside (Simard, et al, 1986b). Sameoto (1976; 1980) found that samples
taken in the scattering layer always contained large numbers of euphausiids, while few or
no euphausiids were found in samples taken above or in areas where there was no
scattering layer.
The swarming behavior of euphausiids makes them an important prey item for
many species of whales. The extensive surface swarms of Thysanoessa spinifera that
attracted many blue whales to the head of the Monterey Submarine Canyon were an
unusual occurrence this late in the year. Surface swarms have been reported in Monterey
Bay (Barham, 1956; Harvey, 1979) and the Gulf of the Farallones (Smith and Adams,
1988) but only during spring and summer months, the time when upwelling events are
16
most frequent and intense along the central California coast (Bakun, 197 5). Efforts have
been made to discover the environmental and biological conditions which govern these
sporadic events; however, no single satisfactory explanation has been found (Komaki,
1967).
Size frequency distributions gave no evidence that swarms were only related to
some reproductive phenomenon. Individuals taken on 12 November 1986 were mostly
fertilized females, suggesting that swarming might be related to reproduction. Many
euphausiid swarms have been characterized by distinctive sex ratios and reproductive
states (Brinton and Wyllie, 1976; Endo, 1984; Nicol, 1984; O'Brien et al., 1986; Smith
and Adams, 1988). However, the 11 November 1986 surface swarms suggest that some
other process brought the euphausiids to the surface. There have also been reports of
cases in which swarming was not apparently related to reproduction (Brinton and Wyllie,
1976; Brown, et al., 1979; Marr, 1962; Nicol, et al., 1987). Brinton and Wyllie (1976)
suggested that principal reproductive areas tend to occur where differential transport is
relatively efficient; Monterey Submarine Canyon may provide such a favorable
environment for euphausiid reproduction.
Small patches of surface swarms utilized by blue whales had larger maximum
euphausiid biomass than deep layers (15 g/cu. m compared to 4.5 g/cu. m). The high
variability obtained in surface tows suggests that the swarms were more patchy than the
deep layers. Nemoto (1983) suggested that euphausiid densities are generally higher in
swarms than layers. Marr (1962) commented that "one is struck by the frequency with
which the surface nets produce enormously larger samples than are produced by oblique
nets fished at subsurface levels." Conversely, Sameoto (1983) proposed that high
densities and biomasses reported at the surface may occur deeper in the water column as
well.
17
The high euphausiid concentrations found in whale feeding areas were similar to
deep scattering layer densities reported in other studies (Table 10). Compared to reports
for other species, surface swarms of Thysanoessa spinifera in Monterey Bay were lower
in density; however, they served as a concentrated food source for over 15 blue whales.
Euphausiid abundance is difficult to assess with ordinary plankton nets. Net catches are
comprised of an undetermined number of patches; therefore. they provide estimates of
average densities, not the maximum concentration within the swarm (Nemoto, 1983;
Watkins, et al., 1986). Additional variables such as net avoidance (Brinton and Wyllie,
1976; Moore, 1950; Wiebe, et al., 1982), euphausiid population density and size
(Brinton, et al., 1987) and swarming behavior (Hamner, et al., 1983) also affect
euphausiid abundance measurements.
The fact that large numbers of blue whales occurred over euphausiid-rich areas for
over a month strongly implies that the density of euphausiids was sufficient to support
feeding blue whales. Brodie et al. (1978) estimated that a fin whale must feed on
euphausiid concentrations of at least 17.5 g/cu. m to obtain its daily food requirements.
Average euphausiid densities in areas of feeding blue whales were much lower than this
estimate, perhaps due to sampling biases. It is likely that this discrepancy will be
resolved by comparisons of in situ krill densities to densities determined from tow
samples. For example, Dolphin (1987a) estimated densities of euphausiid layers to be
910/cu. m from underwater photographs, compared to maximum densities of 23.5/cu. m
obtained from net tows. He determined the minimum euphausiid patch density upon
which humpback whales fed was 50 krill/cu. m (but gave no estimate in terms of
biomass).
Blue whales utilized highly concentrated, dense patches of prey in large, extensive
deep scattering layers or localized surface swarms. Baleen whales feed preferentially in
iS
areas of higher than average zooplankton biomass and whenever they encounter areas
where large but local food stocks are available, they undoubtedly prey upon them
(Kawamura, 1980). There have been reports of blue whales feeding on large
· concentrations of krill (Sears, 1987) and possibly on shoals of pelagic red crabs (Rice,
197 4) outside their summer feeding grounds. These sporadic feeding sessions may make
a small contribution to the annual energy requirement of the whales.
High numbers of blue whales observed in the fall 1986 were exploiting locally
abundant euphausiids in Monterey Bay. Important biological and hydrographic processes
occurring in the Monterey Submarine Canyon may have increased the supply of these
oceanic plankton. A better knowledge of these processes is necessary to determine the
causes of euphausiid aggregations dense enough to support feeding blue whales.
Acknowledgements
This study was made possible thanks to the help of many people. The research
was supported by Moss Landing Marine Laboratories, through the encouragement of the
director, Dr. John Martin. Tracy Thomas and Mike Prince equipped and maintained the
research vessel Ed Ricketts. Jo Guerrero gave me the initial inspiration to undertake the
investigation and provided never ending encouragement. Drs. John Oliver, Bernd
Wlirsig, Gregor Cailliet and Larry Breaker guided me throughout the study. Numerous
people assisted in the field, and I am especially grateful to Bernd Wtirsig, Keiko
Sekiguchi, Bernie Tershy, Craig Strong and Vince Dollarhide for countless hours of data
collection.
Many people and organizations assisted in the final analysis. The euphausiids
were identified with help from Susan Smith (NMFS-Tiburon Laboratory) and Peter
19

Slattery (Moss Landing Marine Laboratories). Oceanographic data was provided by
Pacific Environmental Group and Granite Canyon Marine Culture Laboratory, Monterey,
CA. Satellite images were made available by National Weather Service, Redwood City,
CA and processed by Scripps Institute of Oceanography Satellite Services.
Numerous friends at Moss Landing Marine Laboratories and in the Moss Landing
community helped me to complete this project. Shiela and Alan Baldridge always pulled
through with those hard-to-find references. Gail Johnston and Sandy Yarbrough took
care of countless details. Lynn McMasters prepared many of the figures. Tom
Kieckhefer assisted in the graphics. Jo Guerrero, John Oliver and Sunny Schoenherr
improved the manuscript with suggestions in their reviews. My neighbors supported me
with enthusiasm and encouragement Janet Stein provided friendship and laughter when
I needed it the most Eric Nigg and Carolyn Green furnished moral support. I thank
everyone at Moss Landing for an endless supply of fond memories and special
friendships that I will never forget.
20
Literature Cited
Ba.k:un, A. 1973. Coastal upwelling indices, West Coast of North America, 1946-1971. US Dep. Commer., NOAA Technical Report, NMFS SSRF-671.
Bakun, A. 1975. Daily and weekly upwelling indices, West Coast of North America, 1967-73. US Dep. Commer., NOAA Technical Report, NMFS SSRF-693.
Barham, E. G. 1956. The ecology of sonic scattering layers in the Monterey Bay area, California. Ph.D. Dissertation, Stanford University. 182 pp.
Bary, B. McK. 1966. Back scattering at 12 kc/s in relation to biomass and numbers of zooplankton organisms in Saanich Inlet, British Columbia. Deep-Sea Res. 13:655-666.
Beklemishev, K. V. 1960. Southern atmospheric cyclones and the whale feeding grounds in the Antarctic. Nature, 187(4736):530-531.
Boden, B. P., M. W. Johnson and E. Brinton. 1955. The Euphausiacea (Crustacea) of the North Pacific. Calif. Univ. Scripps Inst Oceanogr. Bull. 6(8):287-397.
Bolin, R. L. and D.P. Abbott. 1963. Studies on the marine climate and phytoplankton of the central coastal area of California, 1954-1960. Calif. Coop. Oceanic Fish. Invest. Rep. 9:23-45.
Breaker, L. C. 1983. The space-time scales of variability in oceanic thermal structure off the central California coast Ph.D. Dissertation, Naval Postgraduate School, Monterey, CA. 483 pp.
Breaker, L. C. and W. W. Broenkow. In press. The circulation of Monterey Bay and related processes. Prog. Oceanogr.
Brinton, E. 1962. Variable factors affecting the apparent range and estimated concentration of euphausiids in the North Pacific. Pac. Sci. 16:374-408.
Brinton, and J. G. Wyllie. 1976. Distributional Atlas of Euphausiid Growth Stages off Southern California. 1953-1956. Calif. Coop. Oceanic Fish. Invest. Rep. Atlas #24. .
Brinton, E., V. J. Loeb, M. C. Macaulay and E. Shulenberger. 1987. Variability of Euphausia superba populations near Elephant Island and the South Shetlands: 1981 vs. 1984. Polar Bioi. 7:345-362.
Brodie, P. F., D. D. Sameoto and R. W. Sheldon. 1978. Population densities of euphausiids off Nova Scotia as indicated by net samples, whale stomach contents and sonar. Liminol. Oceanogr. 23:1264-1267.
21
Brown, R. G. B., S. P. Barker and D. E. Gaskin. 1979. Daytime smface swarming by Meganyctiphanes norvegica (M. Sars) (Crustacea, Euphausiacea) off Brier Island, Bay of Fundy. Can. J. Zool. 57(12):2285-2291.
Church, T. M., C. N. K. Mooers and A. D. Voorhis. 1984. Exchange processes over a Middle Atlantic bight shelfbreak canyon. Estuarine Coast. Shelf Sci. 19:393-411.
Cushing, D. H. and I. D. Richardson. 1956. A record of plankton on the echosounder. J. Mar. Bioi. Assoc. U.K. 35:231-240.
Dohl, T. P., R. C. Guess, M. L. Duman and R. C. Helm. 1983. Cetaceans of Central and Northern Calfornia, 1980-1983: Status, Abundance and Distribution. US Dep. Inter., Minerals Management Serv. Contract #14-12-0001-29090.
Dolphin, W. F. 1987a. Prey densities and foraging of humpback whales, Megaptera novaeangliae. Experientia, 43(4): 468-471. -
Dolphin, W. F. 1987b. Ventilation and dive patterns of humpback whales, Megaptera novaeangliae, on their Alaskan USA feeding grounds. Can. J. Zool. 65(1) 83-90.
Eddie, G. 0. 1977. The harvesting of krill. Food and Agriculture Organization of the United Nations, GLO/S0fl7/1. 76 pp.
Endo, Y. 1984. Daytime surface swarming of Euphausia pacifica, (Crustacea: Euphausiacea) in the Sanriku coastal waters off Northeastern Japan. Mar. Bioi. 79:269-276.
Everson, I. 1977. The living resources of the Southern Ocean. Food and Agriculture Organization of the United Nations, GLO/S0fl7/1. 156 pp.
Foerster, J. W. and P.M. Thompson. 1985. Plankton and whaling ground dynamics in the Denmark Strait. Bull. Mar. Sci. 37(2):504-517.
Garrison, D. L. 1979. Monterey Bay phytoplankton. I. Seasonal cycles of phytoplankton assemblages. J. Plankton Res. 1(3):241-265.
Hamner, W. M., P. P. Hamner, S. W. Strand and R. W. Gilmer. 1983. Behavior of Antarctic krill, Euphausia superba: chemoreception, feeding, schooling and molting. Science, 220(4595):433-435.
Hardy~ A. C. and E. R. Gunther. 1935. The plankton of the South Georgia whaling grounds and adjacent water: 1926-1927. Discovery Rep. 11:1-456.
Harvey, J. T. 1979. Aspects of the life history of the blue shark, Prionace glauca 1., in Monterey Bay, California. Masters Thesis, San Jose State University. 86 pp.
Kawamura; A. 1980. A review of food of Balaenopterid whales. Sci. Rep. Whales Res. Inst. Tokyo, (32):155-198.
22
I
Kenney, R. D. and H. E. Winn. 1987. Cetacean biomass densities near submarine canyons compared to adjacent shelf/slope areas. Continental Shelf Res. 7(2): 107-114.
Komaki, Y. 1967. On the surface swarming of Euphausiid crustaceans. Pac. Sci. 21:433-448.
Krieger, K. J. and B. L. Wing. 1986. Hydroacoustic monitoring of prey to determine humpback whale movements. U S Dep. Commer. NOAA Technical Memorandum NMFSF/NWC-98.
Latyshkevich, A. 1., A. S. Pervushin and B. A. Iarogov. 1973. (Effect of hydrological conditions in the Scotia Sea on aggregations of baleen whales.) Vliianie Gidrologicheskikh Uslovii Moria Skosha na Formirovanie Kontsentratsii Usatykh Kitov. Trudy Atlanticheskogo Nauchno-Issledovatel'skogo Instituta Rybnogo Khozyaistva i Okeanografii, (51): 172-178. (Russian)
Macaulay, M. C., T. S. English and 0. A. Mathisen. 1984. Acoustic characterization of swarms of Antarctic krill (Euphausia superba) from Elephant Island and Bransfield Strait. J. Crust. Bio. 4(Spec. No. 1): 16-44.
Mackintosh, N. A. 1934. Distribution of the macroplankton in the Atlantic sector of the Antarctic. Discovery Rep. 9:65-160.
Marr, J. 1962. The natural history and geography of the Antarctic krill (Euphausia superba Dana). Discovery Rep. 32:33-464.
Mauchline, J. 1980. Biology ofEuphausiids. Adv. Mar. Bioi. 18:373-623.
McWhinnie, M. A., C. J. Denys and P. v: Angione. 1981. Euphausiacea BibliographyA world literature survey. Pergamon Press, New York. 731 pp.
Morejohn, G. V., J. T. Harvey and L. D. Krasnow. 1978. The importance of Loligo opalescens in the food web of marine vertebrates in Monterey Bay, California. Calif. Dep. Fish Game Fish Bull. 169:67-98.
Moore, H. B. 1950. The relation between the scattering layer and the Euphausiacea. Biol. Bull. 99(2):181-212.
Nemoto, T. 1957. Foods of baleen whales in the Northern Pacific. Sci. Rep. Whales Res. Inst. Tokyo, (12):33-89.
Nemoto, T. 1959. Food of baleen whales with reference to whale movements. Sci. Rep. Whales Res. Inst. Tokyo, (14):149-290.
Nemoto, T. 1963. Some aspects of the distribution of Calanus cristatus and C. Plwnchrus in the Bering and its neighbouring waters, with reference to the feeding of baleen whales. Sci. Rep. Whales Res. Inst. Tokyo, (17):157-170.
23
Nemoto, T. 1983. Net sampling and abundance assessment of euphausiids. Bioi. Oceanogr. 2:211-226.
Nicol, S. 1984. Population structure of daytime surface swanns of the euphausiid Megarryctiphanes norvegica in the Bay of Fundy. Mar. Ecol. Prog. Ser. 18:241-251.
Nicol, S., A. James and G. Pitcher. 1987. A first record of daytime surface swarming by Euphausia lucens in the Southern Benguela region. Mar. Bioi. 94:7-10.
O'Brien, D.P., D. A. Ritz and R. J. Kirkwood. 1986. Stranding and mating in krill. Mar. Bioi. 93(3):465-473.
Payne, P.M., J. R. Nicolas, L. O'Brien and K. D. Powers. 1986. The distribution of the humpback whale, Megaptera novaeagliae, on Georges Bank and in the Gulf of Maine, USA in relation to densities of the sand eel, Ammodytes americanus. Nat. Mar. Fish. Serv. Fish. Bull. 84(2):271-278.
Pieper, R. E. 1979. Euphausiid distribution and biomass determined acoustically at 102 kHz. Deep Sea Res. 26:687-702.
Richardson, W. J. (ed.). 1987. Importance of the eastern Alaskan Beaufort Sea to feeding bowhead whales: 1985-86. US Dep. Inter., Minerals Management Serv. Contract# 14-12-0001-30233. 547 pp.
Rice, D. W. 1974. Whales and whale research in the eastern North Pacific. In The Whale Problem. Edited by W. F. Schevill. Harvard Univ. Press. Cambridge, Ma. pp. 170-195.
Sameoto, D. D. 1976. Distribution of sound scattering layers caused by euphausiids and their relationship to chlorophyll a concentrations in the Gulf of St Lawrence Estuary. J. Fish. Res. Board Can. 33:681-687.
Sameoto, D. D. 1980. Quantitative measurements of euphausiids using a 120-kHz sounder and their in situ orientation. J. Fish. Res. Board Can. 37:693-702.
Sameoto, D. D. 1983. Euphausiid distribution in acoustic scattering layers and its significance to surface swanns. J. Plankton Res. 5(2):129-143.
Sears, R. 1987. The photographic identification of individual blue whales (Balaenoptera musculus) in the Sea of Cortez. Cetus, 7(1):14-17.
Shea, R. E. and W. W. Broenkow. 1982. The role of internal tides in the nutrient enrichment of Monterey Bay, California. Estuarine Coast. Shelf Sci. 15:57-66.
Simard, Y., R. deLadurantaye and J. Therriault. 1986a. Aggregation of euphausiids along a coastal shelf in an upwelling environment Mar. Ecol. 32:203-215.
24
Simard, Y., G. Lacroix and L. Legendre. 1986b. Diel vertical migrations and nocturnal feeding of a dense coastal krill scattering layer (Thysanoessa raschi and Meganyctiphanes norvegica) in stratifed sutface waters. Mar. Bioi. 91:93-105.
Smith, S. E. and P. B. Adams. 1988. Daytime sutface swarms ofThysanoessa spinifera (Euphausiacea) in the Gulf of Farallones, California. Bull. Mar. Sci. 42(1):76-84.
Terazaki, M. 1980. Sutface swarms of a euphausiid Euphausia pacifica in Otsuchi Bay, North Japan. Bull. Plankton Soc. Jap. 27:19-25.
Watkins, J. L., D. J. Morris, C. Ricketts and J. Priddle. 1986. Differences between swanns of Antarctic krill and some implications for sampling krill populations. Mar. Bioi. 93:137-146.
Whitehead, H. 1983. Structure and stability of humpback whale groups off Newfoundland. Can J. Zool. 61(6):1391-1397.
Whitehead, H. and C. Glass. 1985. The significance of the Southeast Shoal of the Grand Bank to humpback whales and other cetacean species. Can. J. Zool. 63(11):2617-2625.
Wiebe, P. H., S. H. Boyd, B. M. Davis and J. L. Cox. 1982. Avoidance of towed nets by the euphausiidNematoscelis megalops. Fish. Bull. 80(1):75-91.
Wishner, K., E. Durbin, A. Durbin, M. Macaulay, H. Winn and R. Kenney. In press. . Copepod patches and right whales in the Great South Channel off New England
Bull. Mar. Sci.
Witek, Z., A. Grelowski and J. Kalinowski. 1982. Formation of Antarctic krill concentrations in relation to hydrodynamic processes and social behavior. ICES Biological Oceanography Committee C. M. 1982/L:59. 22 pp.
Wtirsig, B., E. M. Dorsey, M. A. Fraker, R. S. Payne and W. J. Richardson. 1985. Behavior of bowhead whales Balaena mysticetus summering in the Beaufort Sea: a description. US Nat. Mar. Fish. Serv. Bull. 83(3):357-378.
Zar, J. H. 1984. Biostatistical Analysis. Prentice-Hall, Inc., Englewood Cliffs, NJ. 718 pp.
25
Depth in Meters
Figure 1. Bathymetry map of Monterey Bay, California (depth soundings in meters). Boat transect area along southeast edge of Monterey Submarine Canyon is depicted by rectangular box, with location of greatest blue whale and euphausiid concentrations noted (stipled area). Blue whales were observed feeding on daytime surface swarms of Thysanoessa spinifera in area I on 11 November 1986 and in area II on 12 November 1986. Additional surface sampling was conducted outside the whale concentration on 12 November 1986, in areas I and ill.
26
'·
10m-----
~--1
10m
Figure 2. Surface scatter recorded by Lowrance depth sounder in area of surface feeding blue whales on 12 November 1986. (Characteristics of these surface features are given in Table 2) .
....
z e...
~ "Q
~
36"45' .-----------------------,
36° 44'
36" 43'
36" 42'
36° 41'
36" 40'
36" 39'
36" 38'
16 November 1986
.... __ _
·-~~~. ."·~®::
G) •••••
.. ...
1 km
t---1
122"04' 122"03' 122"02' 122"01' 122"00' 121"59' 121°58' 121°57'
L.ongilude (0 W)
36"45' ,..-------------------....,
36" 38'
... ···~
·····~,(t ····-... :~ . .. ,, ·~:~· -·-
................
·····'---- ' --Jl ...... ___
.................
1 km
t---1
122"04' 122"03' 122"02' 122"01' 122"00' 121"59' 121"58' 121"57'
longitude (0 W)
Figure 3. Blue whale sightings and deep scattering layer observations from boat surveys conducted on 16 and 18 November 1986. Solid lines show actual course of boat transects, while dotted lines show the extended area surveyed for the presence of whales. Presence of scattering layer is denoted by stipled area, while the number of blue whales and their positions are given in open circles.
1& November 1986
- '-:~·
tiOOm
200m
300m
1 km
18 November 1986
Figure 4. Deep scattering layers observed along southeast edge of Monterey Submarine Canyon during boat transects conducted on 16 and 18 November 1986 (as recorded by Lowrance depth sounder). Hatched area denotes bottom which leveled off in 100-110 meters of water.
1\)
<.0
12
(I) 10 lit llll
Q) Ill Cti
..c::: s • s: Ill - 6 Ill 0 .... ill ill Q) .c 4 E
r = 0.88 (n=13} ::I z 2 Ill II Ill
0 0 10 20 30
Thickness of Scattering Layer (m)
12
(I) 10 ill Ill Q)
1111 Cti ..c::: s Ill
s: Ill - 6 Ill 0 ..... Ill Q) .c 4 E
r= 0.81 (n=11} ::I z 2 IIIII Iii
0 0 20 40 60 so
Krill Biomass (g/tow)
so
-~ Ill
~ 60 II -
~40 E 0 II
0520 Ill r=o.n (n=11) ·c
::::.::: .. II I
0 0 10 20 30
Thickness of Scattering Layer (m)
Figure 5. Relationship between number of whales, thickness of scattering layer and krill biomass from data listed in Table 1 (excluding "whales gone" category).
30
:l ~ .I
- 0.6 E r ... 0.13 (n-43)
~ - 0.5
0
~ 0.4 E .2 CD c: 0.3 .9
.:Jt(.
i • a: 0.2 .... (I) • s 0 0.1 a • • • • • • 0.0
0.0 0.1 0.2 0.3 0.4 0.5
Krill Biomass (gtcu. m)
Figure 6. Relationship between krill biomass and other plankton biomass for deep tows taken along southeast edge of Monterey Submarine Canyon. Horizontal line represents median other plankton biomass.
31
20
15
10
5
8 20 c: e ... a 15 u 0
20
15
10
5
Surface Swarma Areal
11 Novas (11=527)
Ill Fert. female IZI Undetm. sex
S10 11 12 13 14 15 16 17 18 19 20 21 22 23 24 ~5
Surface Swarms Area II
12 Nov 86 (n..333)
S10 11 12 13 14 15 18 17 18 19 20 21 22 23 24 ~5
Deep Scattering Layer Canyon Edge
15 & 16 Nov 86 (11=397)
S10 11 12 13 14 15 16 17 18 19 20 21 22 23 24 ~5
Length {mm)
Figure 7. Size frequency histograms for Thysanoessa spinifera caught in surface tows on 11 and 12 November 1986 and deep tows on 15 and 16 November 1986. Fertilized females (dark hatches) were distinguished by the presence of transferred spermatophores.
32
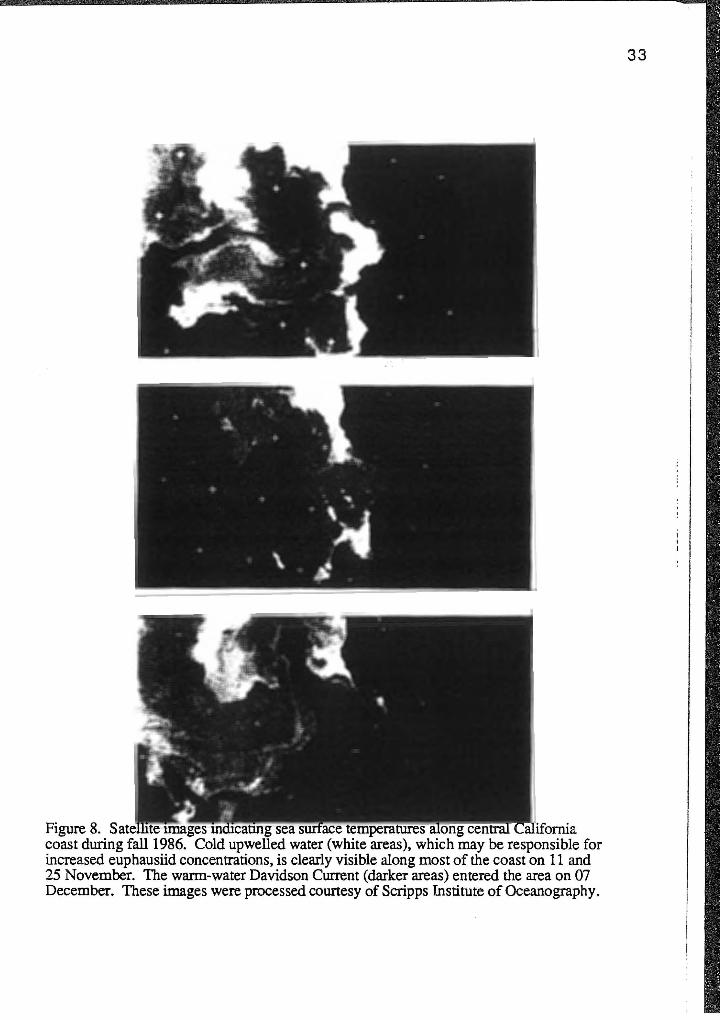
Figure 8. u ... -...u.a..-.. .o.u""5'~" m101can.n1g coast during fall1986. Cold water (white areas), which may be responsible for increased euphausiid concentrations, is clearly visible along most of the coast on 11 and 25 November. The warm-water Davidson Current (darker areas) entered the area on 07 December. These images were processed courtesy of Scripps Institute of Oceanography.
33
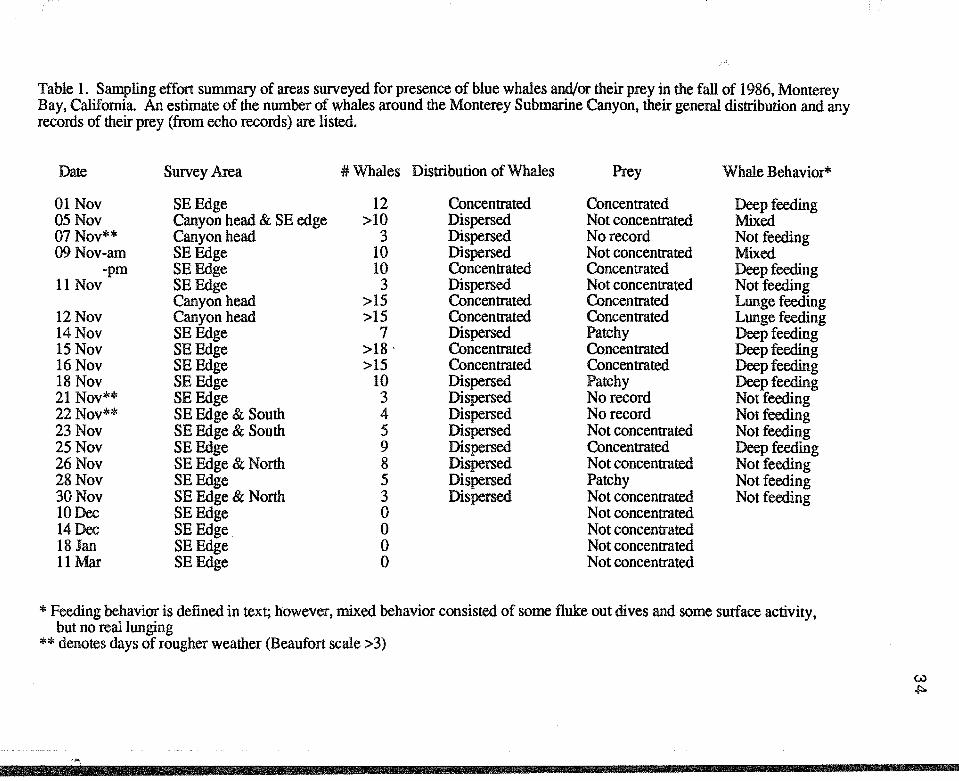
Table 1. Sampling effort summary of areas swveyed for presence of blue whales and/or their prey in the fall of 1986, Monterey Bay, California. An estimate of the number of whales around the Monterey Submarine Canyon, their general distribution and any records of their prey (from echo records) are listed.
Date Survey Area #Whales Distribution of Whales Prey Whale Behavior*
01 Nov SEEdge 12 Concentrated Concentrated Deep feeding 05Nov Canyon head & SE edge >10 Dispersed Not concentrated Mixed 07 Nov** Canyon head 3 Dispersed No record Not feeding 09Nov-am SEEdge 10 Dispersed Not concentrated Mixed
-pm SEEdge 10 Concentrated Concentrated Deep feeding 11 Nov SEEdge 3 Dispersed Not concentrated Not feeding
Canyon head >15 Concentrated Concentrated Lunge feeding 12Nov Canyon head >15 Concentrated Concentrated Lunge feeding 14Nov SEEdge 7 Dispersed Patchy Deep feeding 15Nov SEEdge >18. Concentrated Concentrated Deep feeding 16Nov SEEdge >15 Concentrated Concentrated Deep feeding 18 Nov SEEdge 10 Dispersed Patchy Deep feeding 21 Nov** SEEdge 3 Dispersed No record Not feeding 22Nov** SE Edge & South 4 Dispersed No record Not feeding 23Nov SE Edge & South 5 Dispersed Not concentrated Not feeding 25Nov SEEdge 9 Dispersed Concentrated Deep feeding 26Nov SE Edge & North 8 Dispersed Not concentrated Not feeding 28Nov SEEdge 5 Dispersed Patchy Not feeding 30Nov SE Edge & North 3 Dispersed Not concentrated Not feeding 10Dec SEEdge 0 Not concentrated 14Dec SEEdge 0 Not concentrated 18 Jan SEEdge 0 Not concentrated llMar SEEdge 0 Not concentrated
*Feeding behavior is defined in text; however, mixed behavior consisted of some fluke out dives and some smface activity, but no real lunging
**denotes days of rougher weather (Beaufort scale >3)
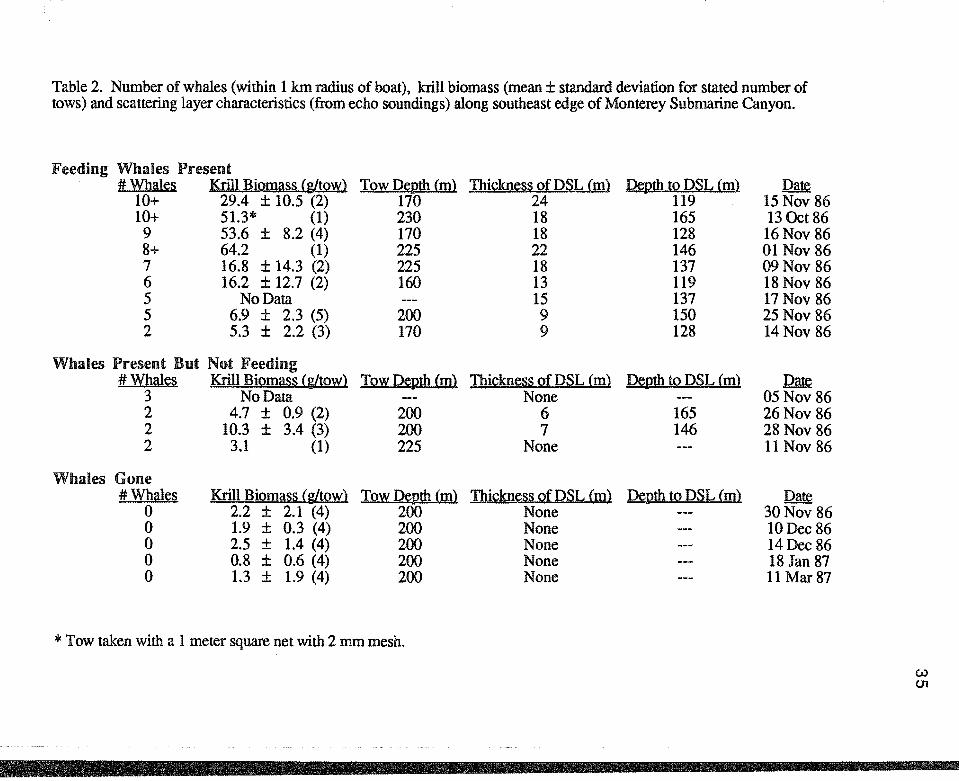
Table 2. Number of whales (within 1 km radius of boat), krill biomass (mean± standard deviation for stated number of tows) and scattering layer characteristics (from echo soundings) along southeast edge of Monterey Submarine Canyon.
Feeding Whales Present #Whales Krill BiQllli!§§ (g[!QW) TQ~ Denth (m) Thi£kn~§S Qf DSL (m) Denth to DSL (m) Date
10+ 29.4 ± 10.5 (2) 170 24 119 15 Nov 86 10+ 51.3* (1) 230 18 165 13 Oct 86
9 53.6 ± 8.2 (4) 170 18 128 16Nov 86 8+ 64.2 (1) 225 22 146 01 Nov 86 7 16.8 ± 14.3 (2) 225 18 137 09Nov 86 6 16.2 ± 12.7 (2) 160 13 119 18Nov 86 5 No Data 15 137 17 Nov 86 5 6.9 ± 2.3 (5) 200 9 150 25Nov 86 2 5.3 ± 2.2 (3) 170 9 128 14 Nov 86
Whales Present .But Not Feeding #Whales Krill BiQmi!§~ (glt~) TowD~th(m) Thi£kn~s~ Qf DSL (m) Denth 12 DSL (m} ~
3 No Data None 05Nov 86 2 4.7 ± 0.9 (2) 200 6 165 26Nov 86 2 10.3 ± 3.4 (3) 200 7 146 28 Nov 86 2 3.1 (1) 225 None 11 Nov 86
Whales Gone #Whales Krill Biomi!~~ (gltQw} TQwD~th(m} Thi£kn~~§ Qf DSL (m) Denth to DSL (m} Date
0 2.2 ± 2.1 (4) 200 None 30Nov 86 0 1.9 ± 0.3 (4) 200 None lODec 86 0 2.5 ± 1.4 (4) 200 None 14Dec 86 0 0.8 ± 0.6 (4) 200 None 18 Jan 87 0 1.3 ± 1.9 (4) 200 None 11 Mar 87
* Tow taken with a 1 meter square net with 2 mm mesh.
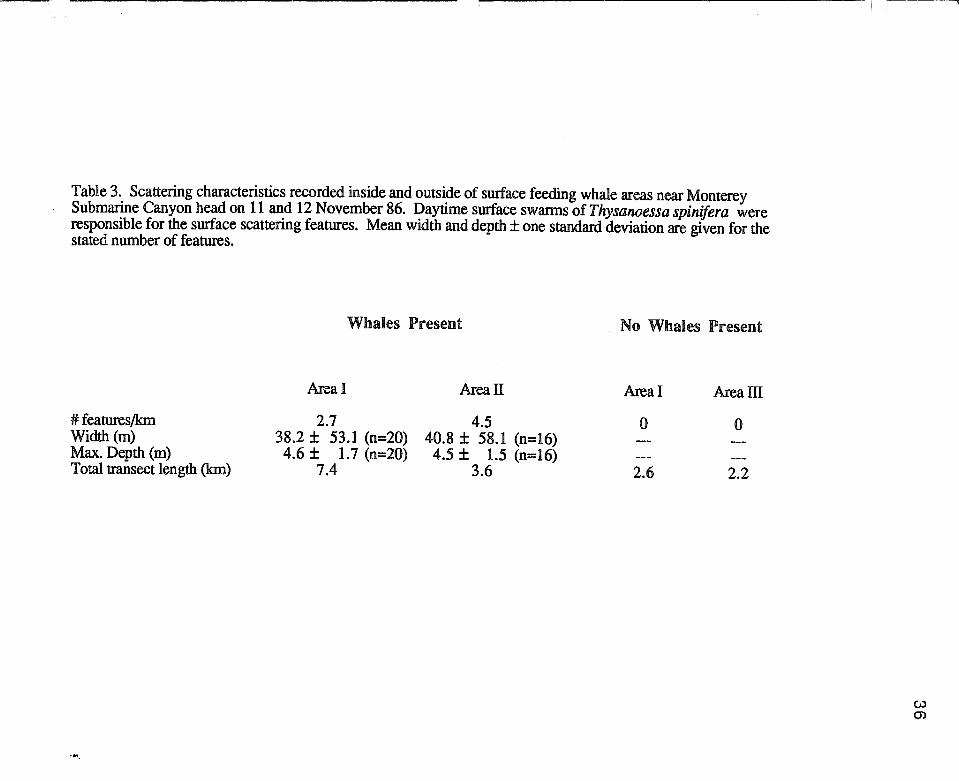
Table 3. Scattering characteristics recorded inside and outside of surface feeding whale areas near Monterey Submarine Canyon head on 11 and 12 November 86. Daytime surface swarms of Thysanoessa spinifera were responsible for the surface scattering features. Mean width and depth ± one standard deviation are given for the stated number of features.
Whales Present No Whales Present
Areal Areall Areal Area ill
# features/km 2.7 4.5 0 0 Width (m) 38.2 ± 53.1 (n=20) 40.8 ± 58.1 (n=16) Max. Depth (m) 4.6 ± 1.7 (n=20) 4.5 ± 1.5 (n=16) Total transect length (km) 7.4 3.6 2.6 2.2
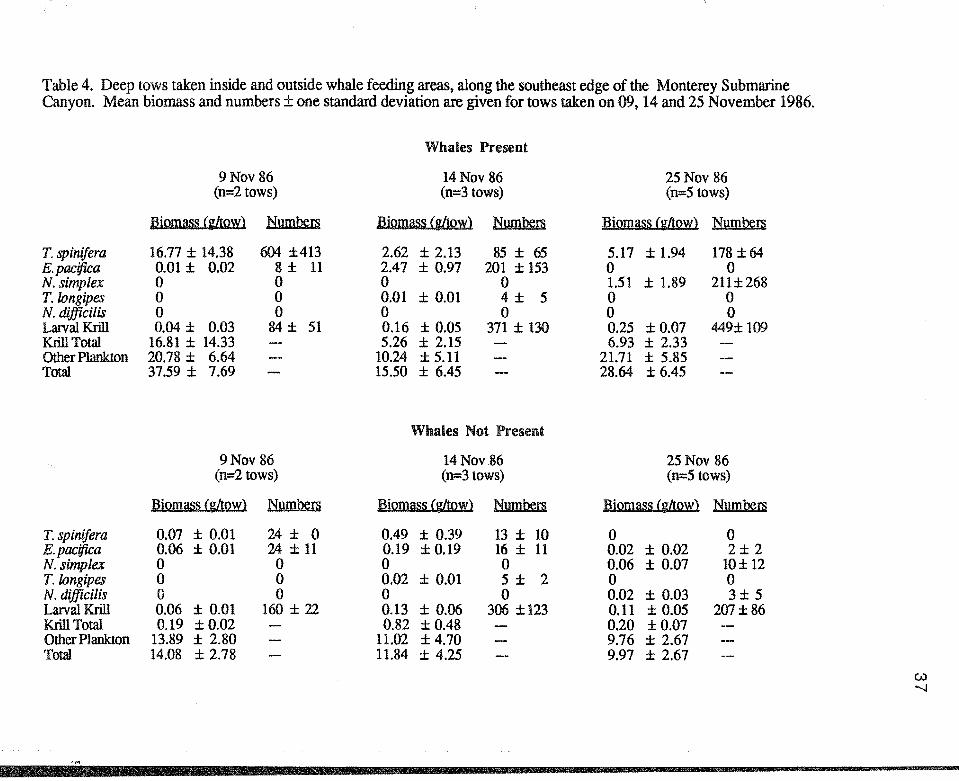
Table 4. Deep tows taken inside and outside whale feeding areas. along the southeast edge of the Monterey Submarine Canyon. Mean biomass and numbers± one standard deviation are given for tows taken on 09, 14 and 25 November 1986.
Whales Present
9Nov 86 14Nov 86 25 Nov 86 (n=2 tows) (n=3 tows) (n=5 tows)
Biomass (g/towl Numbers Biomass Cgltow) Numbers Biomass (g/towl Numbers
T. spinifera 16.77 ± 14.38 604 ±413 2.62 ± 2.13 85±65 5.17 ± 1.94 178 ±64 E. pacifica 0.01 ± 0.02 8± 11 2.47 ± 0.97 201 ± 153 0 0 N. simplex 0 0 0 0 1.51 ± 1.89 211±268 T.longipes 0 0 0.01 ± 0.01 4± 5 0 0 N. difficilis 0 0 0 0 0 0 Lanral Krill 0.04 ± 0.03 84± 51 0.16 ± 0.05 371 ± 130 0.25 ± 0.07 449± 109 Krill Total 16.81 ± 14.33 5.26 ± 2.15 6.93 ± 2.33 Other Plankton 20.78 ± 6.64 10.24 ± 5.11 21.71 ± 5.85 Total 37.59 ± 7.69 15.50 ± 6.45 28.64 ± 6.45
Whales Not Present
9Nov 86 14Nov 86 25 Nov 86 (n=2 tows) (n=3tows) (n=5 tows)
Biomass (g/tow) Numbers Biomass (g/towl Numbers Biomass Cg/towl Numbers
T. spinifera 0.07 ± 0.01 24 ± 0 0.49 ± 0.39 13± 10 0 0 E. pacifica 0.06 ± 0.01 24±11 0.19 ± 0.19 16 ± 11 0.02 ± 0.02 2± 2 N. simplex 0 0 0 0 0.06 ± 0.07 10± 12 T.longipes 0 0 0.02 ± 0.01 5 ± 2 0 0 N. difficilis 0 0 0 0 0.02 ± 0.03 3± 5 Lanral Krill 0.06 ± 0.01 160 ± 22 0.13 ± 0.06 306 ±123 0.11 ± 0.05 207±86 Krill Total 0.19 ±0.02 0.82 ± 0.48 0.20 ±0.07 Other Plankton 13.89 ± 2.80 11.02 ±4.70 9.76 ± 2.67 Total 14.08 ± 2.78 11.84 ± 4.25 9.97 ± 2.67
(A)
"""-.!
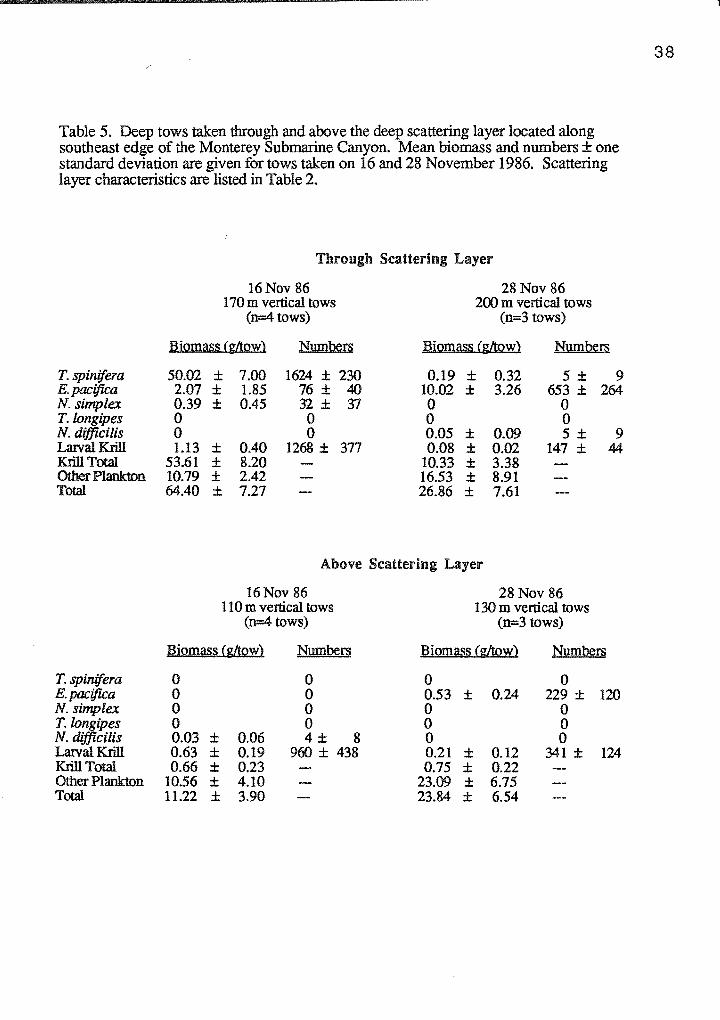
Table 5. Deep tows taken through and above the deep scattering layer located along southeast edge of the Monterey Submarine Canyon. Mean biomass and numbers ± one standard deviation are given for tows taken on 16 and 28 November 1986. Scattering layer characteristics are listed in Table 2.
Through Scattering Layer
16Nov 86 28 Nov 86 170m vertical tows 200 m vertical tows
(n=4 tows) (n=3 tows)
Biomass Cg/tow) Numbers Biomass Cg/tow) Numbers
T. spinifera 50.02 ± 7.00 1624 ± 230 0.19 ± 0.32 5 ± 9 E. pacifica 2.07 ± 1.85 76 ± 40 10.02 ± 3.26 653 ± 264 N. simplex 0.39 ± 0.45 32± 'rl 0 0 T.longipes 0 0 0 0 N. difftcilis 0 0 0.05 ± 0.09 5 ± 9 Lalval Krill 1.13 ± 0.40 1268 ± 377 0.08 ± 0.02 147 ± 44 Krill Total 53.61 ± 8.20 10.33 ± 3.38 Other Plankton 10.79 ± 2.42 16.53 ± 8.91 Total 64.40 ± 7.27 26.86 ± 7.61
Above Scattering Layer
16Nov 86 28 Nov 86 110m vertical tows 130m vertical tows
(n=4 tows) (n=3 tows)
BiQmas:i (gltow} Numbers Biomas:i (gltow) N:nmbers
T. spinifera 0 0 0 0 E. pacifica 0 0 0.53 ± 0.24 229 ± 120 N. simplex 0 0 0 0 T.longipes 0 0 0 0 N. difftcilis 0.03 ± 0.06 4± 8 0 0 Lalval Krill 0.63 ± 0.19 960 ± 438 0.21 ± 0.12 341 ± 124 Krill Total 0.66 ± 0.23 0.75 ± 0.22 Other Plankton 10.56 ± 4.10 23.09 ± 6.75 Total 11.22 ± 3.90 23.84 ± 6.54
38
it
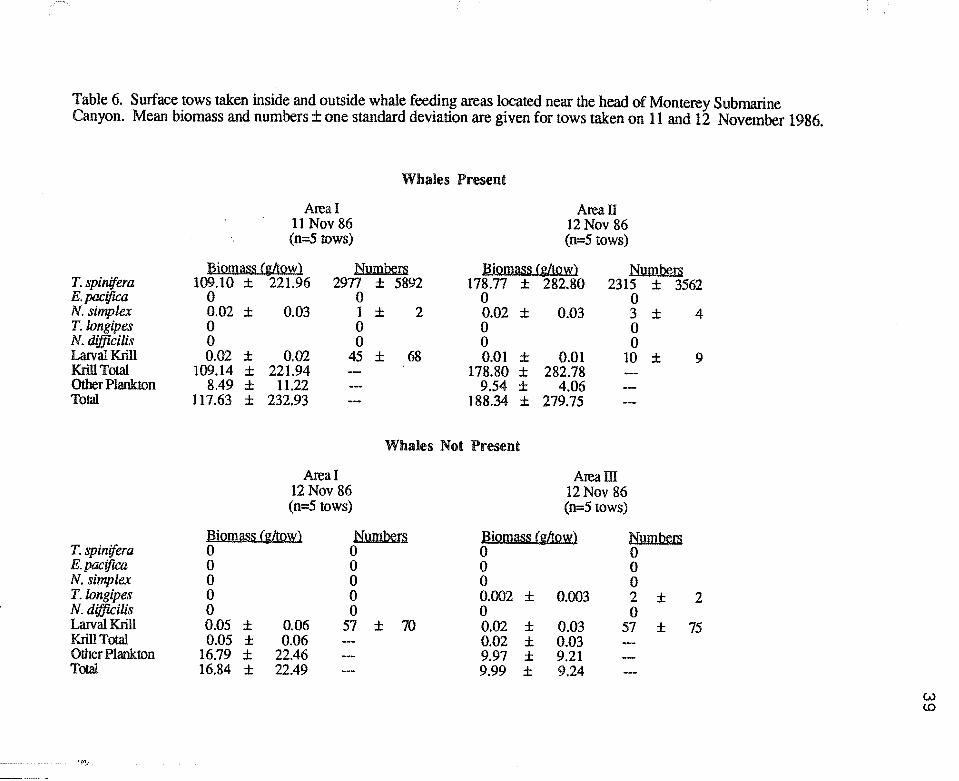
Table 6. Surface tows taken inside and outside whale feeding areas located near the head of Monterey Submarine Canyon. Mean biomass and numbers± one standard deviation are given for tows taken on 11 and 12 November 1986.
T. spinijera E. pacifica N. simplex T.longipes N. difficilis Larval Krill Krill Total Other Plankton Total
T. spinifera E. pacifica N. simplex T.longipes N. difficilis Larval Krill Krill Total Other Plankton Total
Areal 11 Nov 86 (n=5 tows)
Biomass (g[tmY)
Whales Present
Area II 12Nov 86 (n=5 tows)
Numbers Biomass (g[tow) Numbers 109.10 ± 221.96 2971 ± 5892 178.77 ± 282.80 2315 ± 3562
0 0 0 0 0.02 ± 0.03 1 ± 2 0.02 ± 0.03 3 ± 0 0 0 0 0 0 0 0 0.02 ± 0.02 45 ± 68 0.01 ± 0.01 10 ±
109.14 ± 221.94 178.80 ± 282.78 8.49 ± 11.22 9.54 ± 4.06
117.63 ± 232.93 188.34 ± 279.75
Whales Not Present
Areal 12 Nov 86 (n=5 tows)
Bioma&s (gltmY} Numbers 0 0 0 0 0 0 0 0 0 0 0.05 ± 0.06 57 ± 70 0.05 ± 0.06
16.79 ± 22.46 16.84 ± 22.49
Aream 12Nov 86 (n=5 tows)
Biomass (g[tgw) Numbem 0 0 0 0 0 0 0.002 ± 0.003 2 ± 0 0 0.02 ± 0.03 57 ± 0.02 ± 0.03 9.97 ± 9.21 9.99 ± 9.24
4
9
2
75
w <D
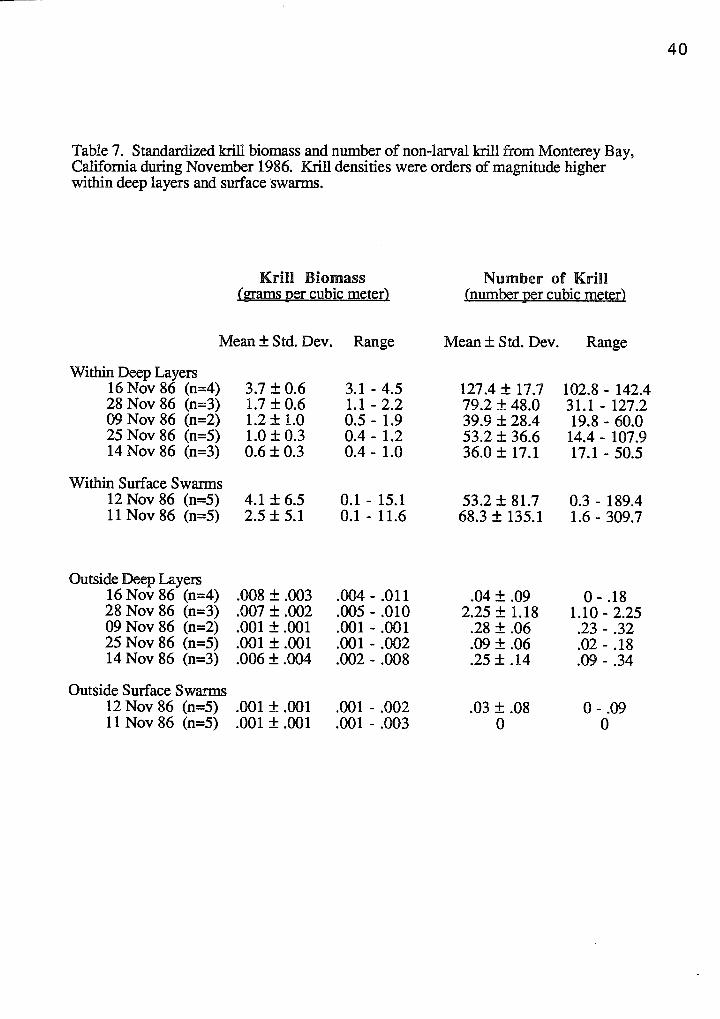
Table 7. Standardized krill biomass and number of non-larval krill from Monterey Bay, California during November 1986. Krill densities were orders of magnitude higher within deep layers and surface ·swarms.
Krill Biomass Number of Krill (grams per cubic meter) (number per cubic meter)
Mean ± Std. Dev. Range Mean± Std. Dev. Range
Within Deep Layers 16 Nov 86 (n=4) 3.7 ± 0.6 3.1 - 4.5 127.4 ± 17.7 102.8 - 142.4 28 Nov 86 (n=3) 1.7 ± 0.6 1.1 - 2.2 79.2 ± 48.0 31.1 - 127.2 09 Nov 86 (n=2) 1.2 ± 1.0 0.5- 1.9 39.9 ± 28.4 19.8 - 60.0 25 Nov 86 (n=5) 1.0 ± 0.3 0.4- 1.2 53.2 ± 36.6 14.4- 107.9 14 Nov 86 (n=3) 0.6 ± 0.3 0.4- 1.0 36.0 ± 17.1 17.1- 50.5
Within Surface Swarms 12 Nov 86 (n=5) 4.1 ± 6.5 0.1 - 15.1 53.2 ± 81.7 0.3 - 189.4 11 Nov 86 (n=5) 2.5 ± 5.1 0.1-11.6 68.3 ± 135.1 1.6- 309.7
Outside Deep Layers 16 Nov 86 (n=4) .008 ± .003 .004- .011 .04 ± .09 0- .18 28 Nov 86 (n=3) .007 ± .002 .005- .010 2.25 ± 1.18 1.10- 2.25 09 Nov 86 (n=2) .001 ± .001 .001 - .001 .28 ± .06 .23- .32 25 Nov 86 (n=5) .001 ± .001 .001- .002 .09 ± .06 .02- .18 14 Nov 86 (n=3) .006 ± .004 .002- .008 .25 ± .14 .09- .34
Outside Surface Swarms 12 Nov 86 (n=5) .001 ± .001 .001- .002 .03 ± .08 0-.09 11 Nov 86 (n=5) .001 ± .001 .001- .003 0 0
40
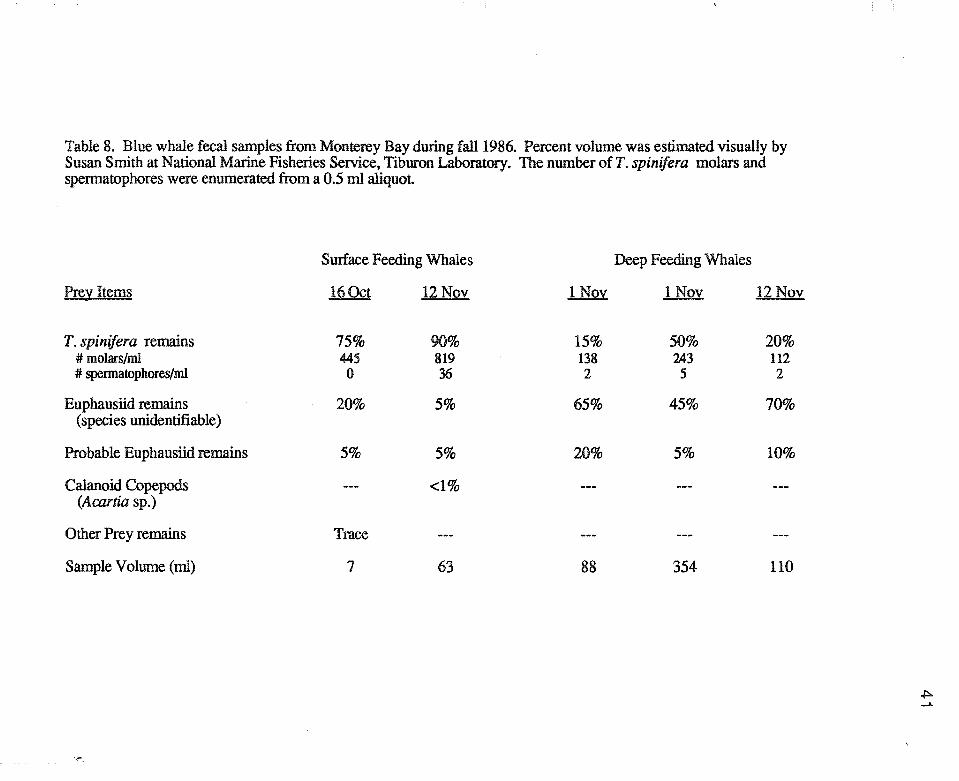
Table 8. Blue whale fecal samples from Monterey Bay during fall1986. Percent volume was estimated visually by Susan Smith at National Marine Fisheries Service, Tiburon Laboratory. The number ofT. spinifera molars and spermatophores were enumerated from a 0.5 m1 aliquot
Surface Feeding Whales Deep Feeding Whales
Prey Items 160ct 12Nov 1 Nov 1 Nov 12Nov
T. spinifera remains 75% 90% 15% 50% 20% # molars/ml 445 819 138 243 112 # spennatophores/ml 0 36 2 5 2
Euphausiid remains 20% 5% 65% 45% 70% (species unidentifiable)
Probable Euphausiid remains 5% 5% 20% 5% 10%
Calanoid Copepods <1% (Acartia sp.)
Other Prey remains Trace
Sample Volume (ml) 7 63 88 354 110
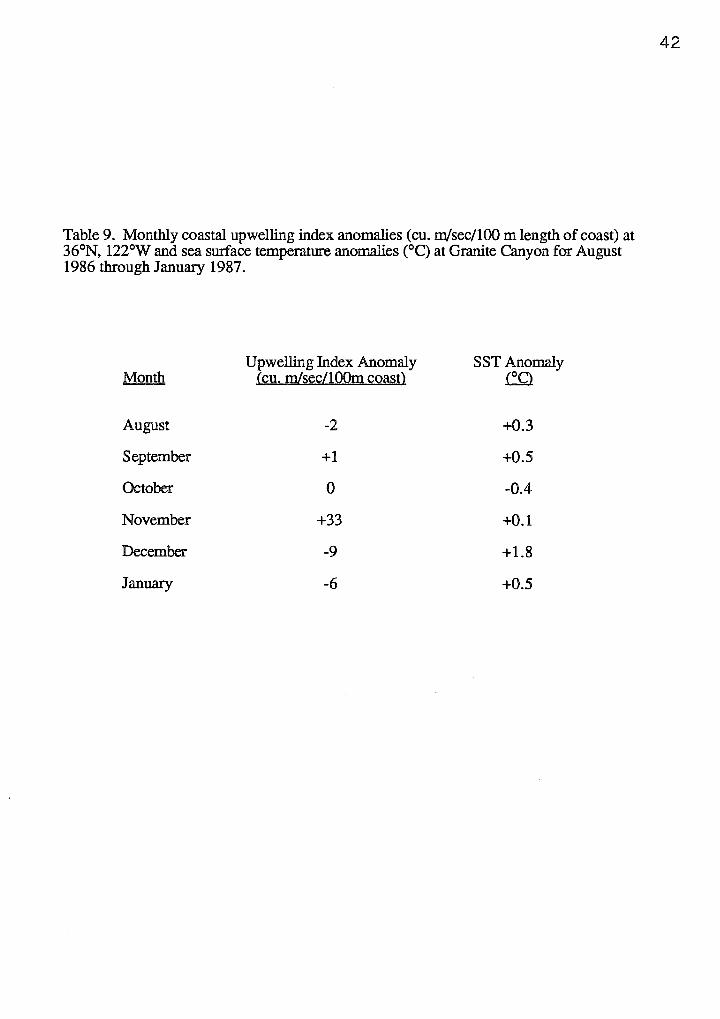
Table 9. Monthly coastal upwelling index anomalies (cu. m/sec/100 m length of coast) at 36°N, 122°W and sea swface temperature anomalies (°C) at Granite Canyon for August 1986 through January 1987.
Upwelling Index Anomaly SST Anomaly Month (cu. m/sec/100m coast) ro
August -2 +0.3
September +1 +0.5
October 0 -0.4
November +33 +0.1
December -9 +1.8
January -6 +0.5
42
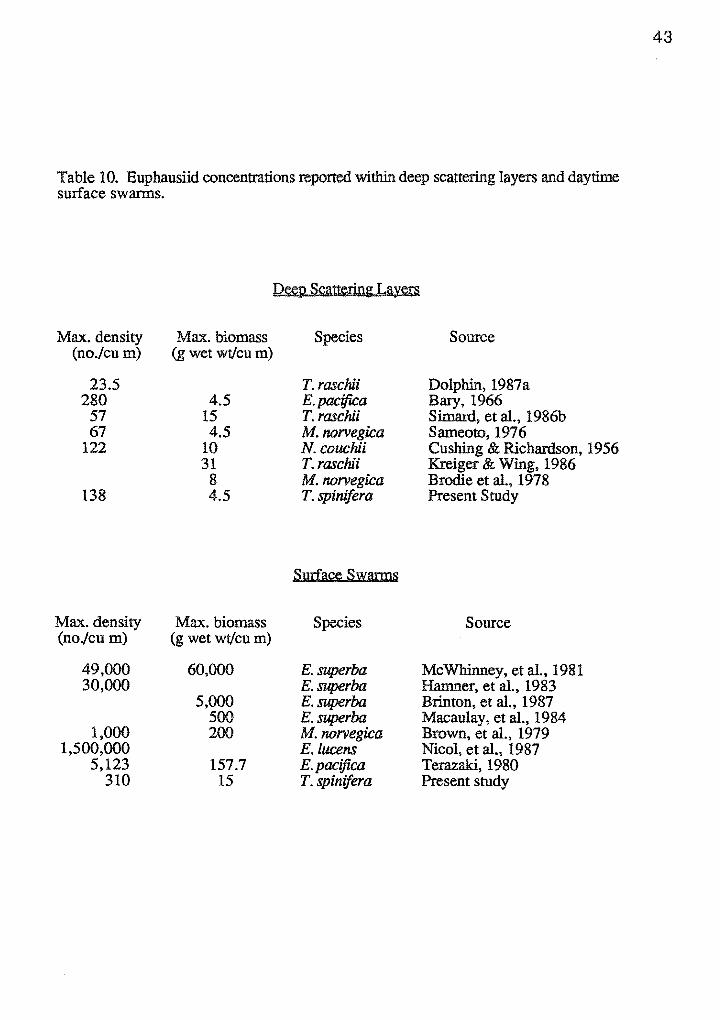
Table 10. Euphausiid concentrations reported within deep scattering layers and daytime surface swarms.
Max. density (no./cu m)
23.5 280
57 67
122
138
Max. density (nojcu m)
49,000 30,000
1,000 1,500,000
5,123 310
Deep Scattering Layers
Max. biomass Species (g wet wt/cu m)
T. raschii 4.5 E.pacijica
15 T. raschii 4.5 M. norvegica
10 N. couchii 31 T. raschii
8 M. norvegica 4.5 T. spinifera
Surface Swarms
Max. biomass Species (g wet wt/cu m)
60,000 E.superba E.superba
5,000 E.superba 500 E.superba 200 M. norvegica
E.lucens 157.7 E. pacifica
15 T. spinifera
Source
Dolphin, 1987a Bary, 1966 Simard, et al., 1986b Sameoto, 1976 Cushing & Richardson, 1956 Kreiger & Wing, 1986 Brodie et al., 1978 Present Study
Source
McWhinney, et al., 1981 Hamner, et al., 1983 Brinton, et al., 1987 Macaulay, et al., 1984 Brown, et al., 1979 Nicol, et al., 1987 Terazaki, 1980 Present study
43