Embed Size (px)
Citation preview
Georgia State University Georgia State University
ScholarWorks @ Georgia State University ScholarWorks @ Georgia State University
Public Management and Policy Dissertations
9-1-2006
The Effect of Linkages on Science and Technology at Historically The Effect of Linkages on Science and Technology at Historically
Black Colleges and Universities Black Colleges and Universities
Kathryn T. Brice
Follow this and additional works at: https://scholarworks.gsu.edu/pmap_diss
Part of the Public Affairs, Public Policy and Public Administration Commons
Recommended Citation Recommended Citation Brice, Kathryn T., "The Effect of Linkages on Science and Technology at Historically Black Colleges and Universities." Dissertation, Georgia State University, 2006. https://scholarworks.gsu.edu/pmap_diss/9
This Dissertation is brought to you for free and open access by ScholarWorks @ Georgia State University. It has been accepted for inclusion in Public Management and Policy Dissertations by an authorized administrator of ScholarWorks @ Georgia State University. For more information, please contact [email protected].
THE EFFECT OF LINKAGES ON SCIENCE AND TECHNOLOGY AT HISTORICALLY BLACK COLLEGES AND UNIVERSITIES
A Dissertation Presented to
The Academic Faculty
By
Kathryn T. Brice
In Partial Fulfillment of the Requirements for the Degree
Doctor of Philosophy in Public Policy
Georgia Institute of Technology/Georgia State University
December, 2005
Copyright © Kathryn T. Brice 2005
THE EFFECTS OF LINKAGES ON SCIENCE AND TECHNOLOGY AT HISTORICALLY BLACK COLLEGES AND UNIVERSITIES
Approved by:
Dr. Philip Shapira, Advisor Dr. Amy Helling School of Public Policy Andrew Young School of Policy Studies Georgia Institute of Technology Georgia State University Dr. Willie Pearson, Jr. Dr. Juan Rogers School of History, Technology, and Society School of Public Policy Georgia Institute of Technology Georgia Institute of Technology Dr. Bhaven Sampat Date Approved: November 7, 2005 School of Public Policy Georgia Institute of Technology
This dissertation is dedicated to my husband, David, who shared the risks and sacrifices
required to complete it while supporting me through this entire adventure. I cannot
possibly thank him enough for supporting me over and over again, enduring my trials and
tribulations and encouraging me to stick with it. I thank also my parents, John and
Phyllis Rice for their endless encouragement and for inspiring me to succeed in life.
ii iii
ACKNOWLEDGEMENTS
There are several people that must be acknowledged for the time, effort and love they provided during the time it has taken me to complete my dissertation. My husband, David Brice, deserves acknowledgement not only for his patience and continuous support but also for his good advice, his persistence in helping me see other sides of the picture and the assistance he provided during crucial moments of the process. Thank you . I wish to express my deep and sincere appreciation to one of my best friends, Dr. Michelle Greene. Without her encouragement, input, and unfailingly good advice, I would still not be done. Thank you. To members of MTFO II, and you know who you are, Thank you. I’ll leave our name undisclosed for the moment but it is so apropos for the moment. I’ve learned so much from you about the dissertation process and life. Thank you. Last but not least, to my committee composed of Dr. Phil Shapira, Dr. Amy Helling, Dr. Willie Pearson, Dr. Juan Rogers and Dr. Bhaven Sampat, thank you. It’s been a long haul and I appreciate the fact that you’ve hung in there with me.
iii iv
TABLE OF CONTENTS DEDICATION……………………………………………………………. iii ACKNOWLEDGEMENTS……………………………………………….. iv LIST OF TABLES………………………………………………………… x LIST OF FIGURES……………………………………………………….. xi LIST OF SYMBOLS AND ABBREVIATIONS…………………………. xii SUMMARY……………………………………………………………….. xiii CHAPTER 1: INTRODUCTION…………………………………………. 1 1.1 The Theoretical Bases……………………………………….. 4 1.2 Why HBCUs………………………………………………… 7 1.3 Research Design Methods…………………………………… 10 1.4 Contributions to Literature…………………………………… 11 1.5 Policy Implications…………………………………………… 12 1.6 Overview of Chapters………………………………………… 13 CHAPTER 2: HBCUS AND UNIQUE HISTORICAL FORCES…..…… 17 2.1 What are HBCUs……………………………………………. 17 2.2 Historical Context……………………………………………. 21 2.3 Policy and Funding…………………………………………… 26 2.4 Collaboration, Cooperation and Clusters…………………….. 29 2.5 Effectiveness at Graduating Students………………………… 31 2.6 Summary……………………………………………………… 37 CHAPTER 3: LITERATURE RELATING TO THE DEVELOPMENT OF SCIENCE AND TECHNOLOGY AT UNIVERSITIES.. 40 3.1 Theoretical Bases……………………………………………… 41 3.1.1 Literature on Higher Education…………………………. 41 3.1.2 Universities in the Present……………………………… 43 3.1.3 The Future – the Entrepreneurial University…………… 45 3.2 Literature on National Systems of Innovation………………… 47 3.3 Competitive Advantage Literature……………………………. 50 3.3.1 Application to Industry…………………………………. 52 3.3.2 Application to Universities……………………………... 54 3.4 Summary of the Literature…………………………………….. 56 3.5 Gaps and Issues in the Literature……………………………… 57 3.6 Contributions to the Literature………………………………… 59
iv v
CHAPTER 4: LINKAGES AND RIVAL STRATEGIES…………..……… 61 4.1 Linkages as a Concept…………………………………………. 61 4.2 Initial Stage…………………………………………………….. 63 4.3 Expanding Stage……………………………………………….. 65 4.4 Mature Stage…………………………………………………… 66 4.5 Networking and Clustering as they apply to Universities……… 69 4.6 Rival Theories to Explain University S&T Productivity………. 70 4.6.1 Policy……………………………………………………… 71 4.6.2 Leadership……………………………………………….… 72 4.6.3 Proximity…………………………………………………. 72 4.6.4 Demand for Research and Skilled Personnel……………… 73 4.7 Summary……………………………………………………….. 75 CHAPTER 5: RESEARCH DESIGN………………………………...……… 76 5.1 Unit of Analysis………………………………………………… 76 5.2 Dependent Variables……………………………………………. 76 5.3 Independent Variables………………………………………….. 80 5.4 Phase I…………………………………………………………… 81 5.4.1 Phase I: Methodology…………………………………….. 82 5.5 Phase II………………………………………………………….. 83 5.5.1 Phase II: Methodology……………………………………. 83 5.6 Design…………………………………………………………… 84 5.7 Selection of Universities………………………………………… 86 5.8 Process………………………………………………………….. 87 5.9 Data Sources…………………………………………………….. 89 5.10 Data Analysis Plan……………………………………………… 91 CHAPTER 6: QUANTITATIVE ANALYSIS……………………………….. 94 6.1 HBCU S&T Index……………………………………………….. 94 6.2 Results of the S&T Index……………………………………….... 97 6.3 Results and Findings……………………………………………... 100 6.4 Results …………………………………………………………… 100 6.5 Selection of Three HBCUs……………..……………………….. 105 6.6 Summary………………………………………………………… 108
v vi
CHAPTER 7: FORT VALLEY STATE UNIVERSITY…….………………. 109
7.1 Fort Valley State University……………………………………. 109 7.1.1 Characteristics…………………………………………... 109 7.1.2 History………………………………………………….. 109 7.1.3 Structure………………………………………………… 111 7.1.4 S&T Statistics…………………………………………… 111 7.1.5 Unique Achievements…………………………………… 112 7.1.6 Analysis…………………………………………………. 113
7.2 Interviews……………………………………………………….. 115 7.2.1 A Science Program……………………………………… 116 7.2.2 CDEP…………………………………………………… 117 7.2.3 Middle Georgia Regional Council……………………… 120 7.2.4 A Bio-Technology Program……………………………. 120 7.2.5 Administrator…………………………………………… 121
7.3 Summary……………………………………………………….. 122 CHAPTER 8: HAMPTON UNIVERSITY…………………………………… 124 8.1 Hampton University…………………………………………….. 124
8.1.1 Characteristics…………………………………………... 124 8.1.2 History………………………………………………….. 124 8.1.3 Structure………………………………………………… 127 8.1.4 S&T Statistics…………………………………………… 127 8.1.5 Unique Achievements…………………………………… 128 8.1.6 Analysis…………………………………………………. 128
8.2 Interviews……………………………………………………….. 130 8.2.1 The Military Industrial Complex……………………….. 131 8.2.2 A Breast Cancer Program………………………………. 134 8.2.3 COSM and the CERN project………………………….. 135 8.2.4 The School of Engineering……………………………... 137
8.3 Summary………………………………………………………... 139
vi vii
CHAPTER 9: FLORIDA AGRICULTURAL AND MECHANICAL UNIVERSITY………………………………………………… 140 9.1 Hampton University……………………………………………. 140
9.1.1 Characteristics…………………………………………... 140 9.1.2 History………………………………………………….. 140 9.1.3 Structure………………………………………………… 144 9.1.4 S&T Statistics…………………………………………… 144 9.1.5 Unique Achievements…………………………………… 144 9.1.6 Analysis…………………………………………………. 145
9.2 Interviews……………………………………………………….. 146 9.2.1 The Viticulture Center………………………………….. 147 9.2.2 A Research Program……………………………………. 150 9.2.3 A Joint College of Engineering………………………… 152 9.2.4 Industry Cluster………………………………………… 154 9.2.5 Environmental Sciences Institute……………………… 154 9.2.6 Administrator………………………………………….. 157
9.3 Summary……………………………………………………… 158 CHAPTER 10: ANALYSIS OF LINKAGES AND RIVAL THEORIES….... 160 10.1 Analysis…………………………………………………………. 161
10.2 Linkages…………………………………………………………. 164 10.2.1 Results and Findings……..……………………………. 164
10.3 Policy……………………………………………………..……. 166 10.3.1 Results and Findings…..………………………………. 167
10.4 Leadership……………………………………………………..… 167 10.4.1 Results and Findings…..………………………………. 168
10.5 Proximity………………………………………………………… 170 10.5.1 Results and Findings…..………………………………. 171
10.6 Demand for Skilled Personnel…………………………………… 172 10.6.1 Results and Findings…..………………………………. 173
10.7 Factors Contributing to Expansion of Program…………………. 174 10.8 External Agency Responses……………………………………. 176 10.9 Conclusion………………………………………………………. 177
CHAPTER 11: CONCLUSION………………………………………………. 179
11.1 Phase I – Results and Findings………………………………….. 180 11.2 Phase II – Results and Findings…………………………………. 181 11.3 Strategy Selection……………………………………………….. 182 11.4 Rival Explanations………………………………………………. 185 11.5 Limitations………………………………………………………. 187 11.6 Policy Implications and Recommendations…………………….. 190
11.6.1 Recommendations for Policy Personnel………………. 191 11.6.2 Recommendations for HBCU Administrators………… 196
11.6.2.1 Internal Policy Initiatives…………………… 196 11.6.2.2 External Policy Initiatives…………………….. 199
vii viii
APPENDIX A: List of HBCUs………………………………………………. 201 APPENDIX B: Definitions of Independent Variables………………………… 203 APPENDIX C: Statistical Summary of FAMU, Hampton, FVSU…………… 205 APPENDIX D: HBCU Case Study Protocol………………………………… 208 APPENDIX E: Pattern Matching – Predictions……………………………… 218 REFERENCES………………………………………………………………… 221
viii ix
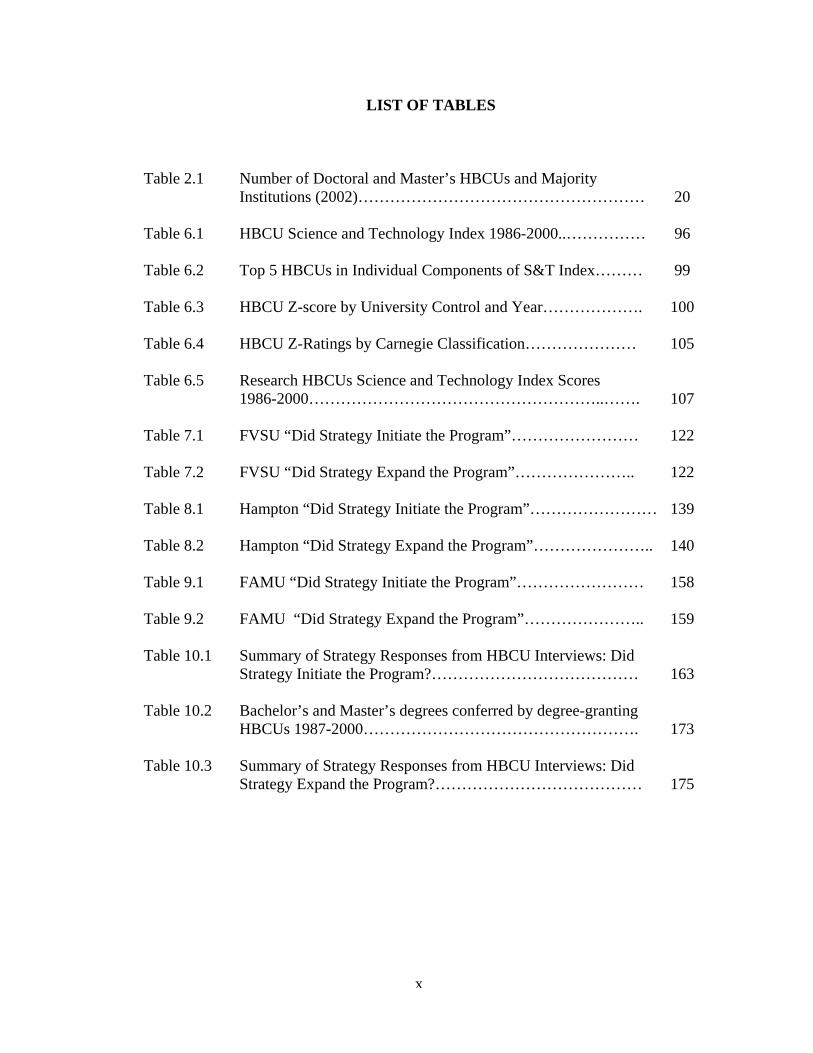
LIST OF TABLES Table 2.1 Number of Doctoral and Master’s HBCUs and Majority
Institutions (2002)……………………………………………… 20 Table 6.1 HBCU Science and Technology Index 1986-2000..…………… 96 Table 6.2 Top 5 HBCUs in Individual Components of S&T Index……… 99 Table 6.3 HBCU Z-score by University Control and Year………………. 100 Table 6.4 HBCU Z-Ratings by Carnegie Classification………………… 105 Table 6.5 Research HBCUs Science and Technology Index Scores 1986-2000………………………………………………..……. 107 Table 7.1 FVSU “Did Strategy Initiate the Program”…………………… 122 Table 7.2 FVSU “Did Strategy Expand the Program”………………….. 122 Table 8.1 Hampton “Did Strategy Initiate the Program”…………………… 139 Table 8.2 Hampton “Did Strategy Expand the Program”………………….. 140 Table 9.1 FAMU “Did Strategy Initiate the Program”…………………… 158 Table 9.2 FAMU “Did Strategy Expand the Program”………………….. 159 Table 10.1 Summary of Strategy Responses from HBCU Interviews: Did Strategy Initiate the Program?………………………………… 163 Table 10.2 Bachelor’s and Master’s degrees conferred by degree-granting HBCUs 1987-2000……………………………………………. 173 Table 10.3 Summary of Strategy Responses from HBCU Interviews: Did Strategy Expand the Program?………………………………… 175
ix x
LIST OF FIGURES
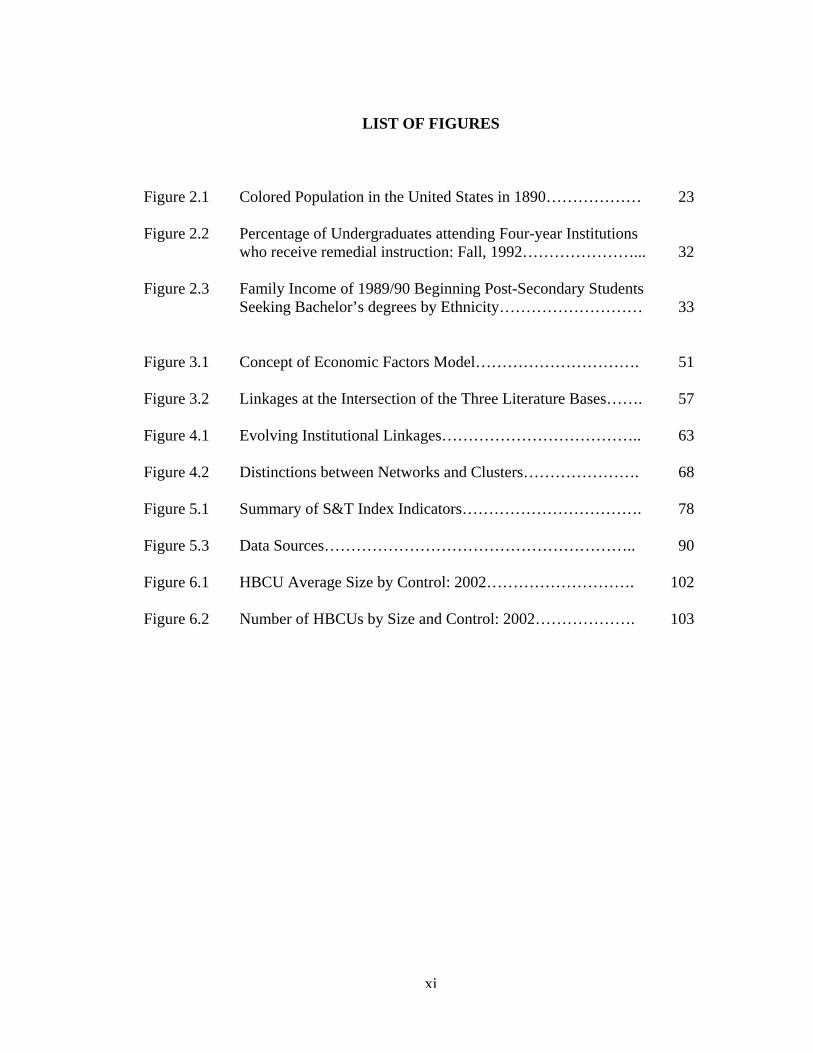
Figure 2.1 Colored Population in the United States in 1890……………… 23 Figure 2.2 Percentage of Undergraduates attending Four-year Institutions who receive remedial instruction: Fall, 1992…………………... 32 Figure 2.3 Family Income of 1989/90 Beginning Post-Secondary Students Seeking Bachelor’s degrees by Ethnicity……………………… 33 Figure 3.1 Concept of Economic Factors Model…………………………. 51 Figure 3.2 Linkages at the Intersection of the Three Literature Bases……. 57 Figure 4.1 Evolving Institutional Linkages……………………………….. 63 Figure 4.2 Distinctions between Networks and Clusters…………………. 68 Figure 5.1 Summary of S&T Index Indicators……………………………. 78 Figure 5.3 Data Sources………………………………………………….. 90 Figure 6.1 HBCU Average Size by Control: 2002………………………. 102 Figure 6.2 Number of HBCUs by Size and Control: 2002………………. 103
x xi
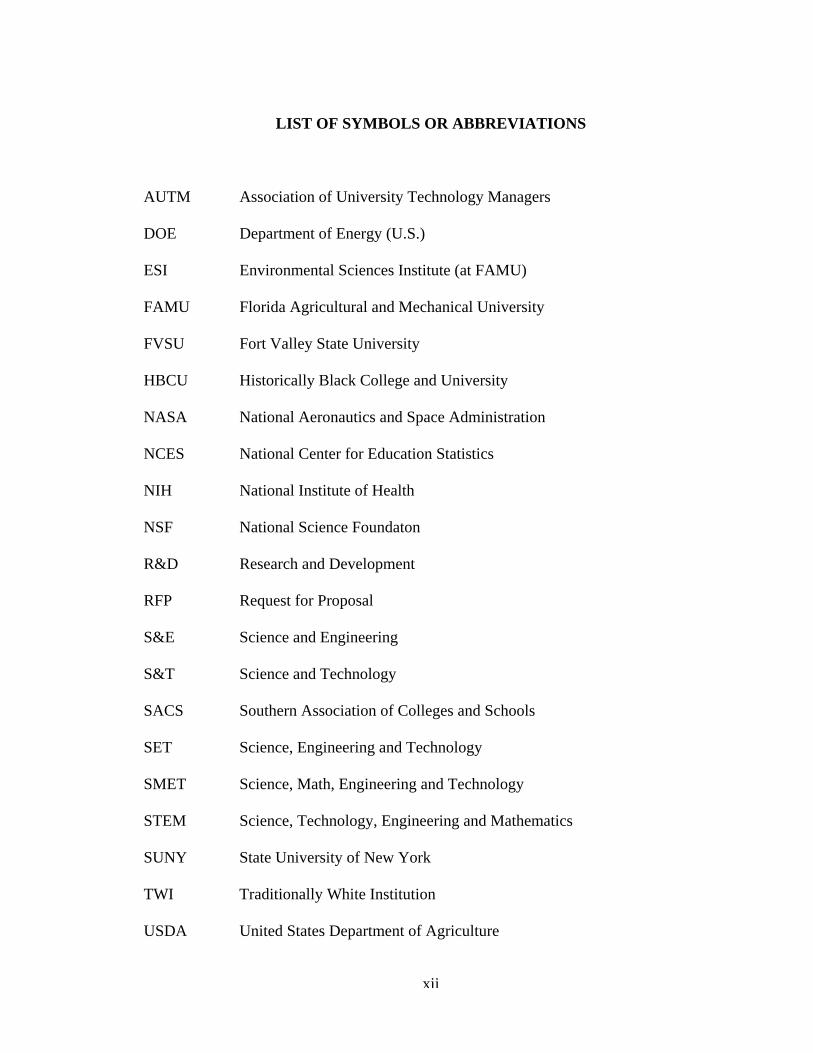
LIST OF SYMBOLS OR ABBREVIATIONS
AUTM Association of University Technology Managers
DOE Department of Energy (U.S.)
ESI Environmental Sciences Institute (at FAMU)
FAMU Florida Agricultural and Mechanical University
FVSU Fort Valley State University
HBCU Historically Black College and University
NASA National Aeronautics and Space Administration
NCES National Center for Education Statistics
NIH National Institute of Health
NSF National Science Foundaton
R&D Research and Development
RFP Request for Proposal
S&E Science and Engineering
S&T Science and Technology
SACS Southern Association of Colleges and Schools
SET Science, Engineering and Technology
SMET Science, Math, Engineering and Technology
STEM Science, Technology, Engineering and Mathematics
SUNY State University of New York
TWI Traditionally White Institution
USDA United States Department of Agriculture
xi xii
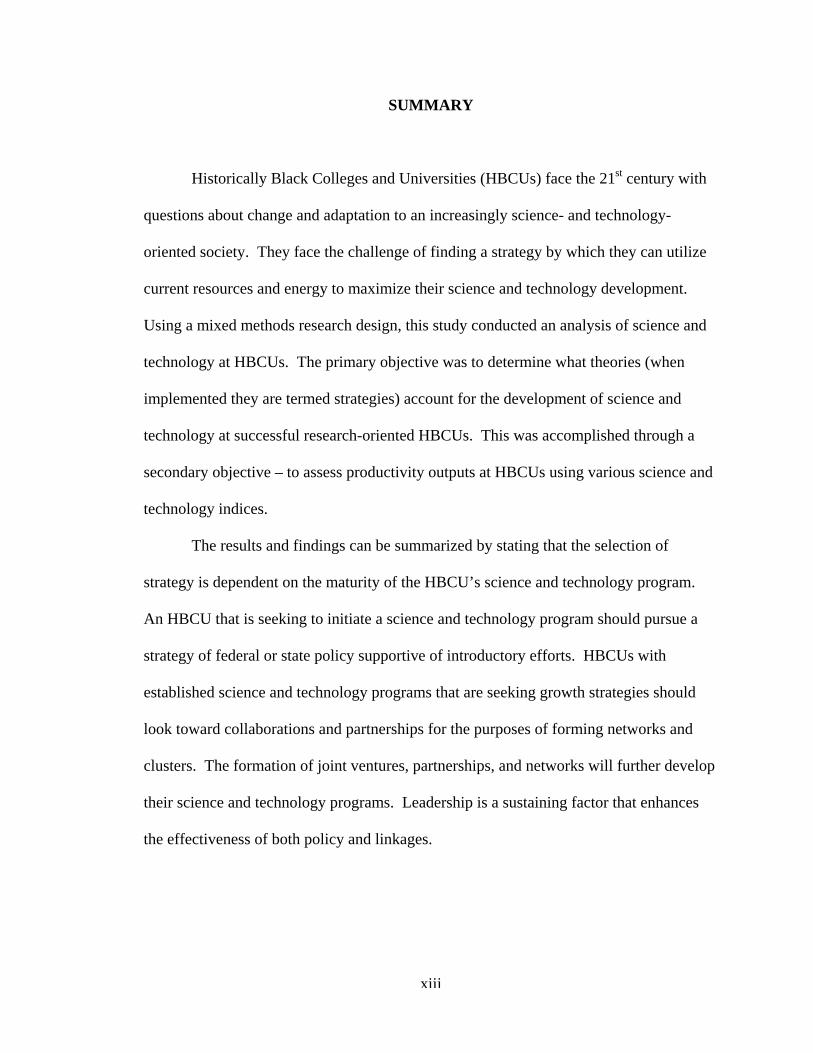
SUMMARY
Historically Black Colleges and Universities (HBCUs) face the 21st century with
questions about change and adaptation to an increasingly science- and technology-
oriented society. They face the challenge of finding a strategy by which they can utilize
current resources and energy to maximize their science and technology development.
Using a mixed methods research design, this study conducted an analysis of science and
technology at HBCUs. The primary objective was to determine what theories (when
implemented they are termed strategies) account for the development of science and
technology at successful research-oriented HBCUs. This was accomplished through a
secondary objective – to assess productivity outputs at HBCUs using various science and
technology indices.
The results and findings can be summarized by stating that the selection of
strategy is dependent on the maturity of the HBCU’s science and technology program.
An HBCU that is seeking to initiate a science and technology program should pursue a
strategy of federal or state policy supportive of introductory efforts. HBCUs with
established science and technology programs that are seeking growth strategies should
look toward collaborations and partnerships for the purposes of forming networks and
clusters. The formation of joint ventures, partnerships, and networks will further develop
their science and technology programs. Leadership is a sustaining factor that enhances
the effectiveness of both policy and linkages.
xii xiii
CHAPTER 1 INTRODUCTION
Historically Black Colleges and Universities (HBCUs) face the 21st century with
questions about change and adaptation to an increasingly science- and technology-
oriented society. They face the challenge of finding a strategy by which they can utilize
current resources and energy to maximize their science and technology development.
Using a mixed methods research design, this study conducts an analytical study of
science and technology at HBCUs. The results of this study will assist HBCUs and those
interested in supporting HBCU research institutions in determining productivity levels,
characteristics of competitive universities, and effective strategies for science and
technology productivity. The primary objective is to determine what theories (when
implemented they are termed strategies) account for the development of science and
technology at the most successful research-oriented HBCUs. (This is not meant to imply
“best strategies” but strategies that appear to be useful and working well.) This will be
accomplished through a secondary objective – to assess productivity outputs at HBCUs in
various science and technology indices.
Universities have become increasingly important to society. They are the
repository of human intellectual property; the physical focal point of much research and
development; and the crossroads between businesses, resources, and the government.
They are engaging in contractual arrangements and agreements with other universities,
industry, and government, particularly in the science and technology arena, to the point
where they are developing a network that impacts society and their role and mission in
1
society. HBCUs, universities that historically serviced a predominantly Black student
body are a subset within the population of universities that have a unique historical
background. While they participate in and contribute in all the aforementioned ways,
there have been few, if any, studies that contribute to an understanding of what strategies
or methods have evolved in this unique subset of universities to develop their science and
technology productivity.
The theories introduced in this dissertation are drawn from three literature bases.
One concept is highlighted throughout the reviewed literature – the concept of linkages.
While the term linkages is more fully defined further in this report, this study
operationalizes linkages as networks. The literature bases suggest that linkages offer an
explanation as to how universities can best develop their science and technology
capability.
However, the applicability of the linkages concept to HBCUs is questionable.
The history of HBCUs is based on that of a separate identity, both because of historically
racist policies by Whites and because of a continuing choice by Black universities to
retain a separate identity despite the advent of integrated university systems. These two
elements, racism and separation, run counter to the concept of linkages. Yet the linkages
concept remains the dominant explanation for science and technology development.
Since HBCUs are a subset of universities and there are few published studies to indicate
what differences exist between HBCUs and traditionally White universities in relation to
science and technology, this study maintains the hypothesis that linkages are the most
effective strategy for HBCUs to adopt to develop science and technology capacity.
2
Using a qualitative exploratory approach, this study also examines several other
theories to determine whether they have more validity for explaining the development of
science and technology at HBCUs. These rival theories or strategies have emerged from
literature bases on higher education, labor, and innovation. The quantum increase in
funding for basic research and development as well as support for training of science
personnel at universities has been attributed to government policy. A theory of
leadership at universities by key scientists or administrators has been held to be
responsible for important innovations and the systems that have arisen around them.
Spatial proximity studies indicate that information transmission and spillovers occur in
regions between universities and firms, which lead to enhanced development of science
and technology. The demand for skilled science and technology personnel has resulted in
support for an increase in the number of university students graduating in science and
technology related. Finally, the theory of linkages uses the concept of networks/clusters
to explain the science and technology benefits that accrue to universities that engage in
partnerships and collaborations with other parties. Of the theories advanced to account
for science and technology development, the concept of linkages has received the most
attention. This is due to its ability to encompass a wide range of actions as well as its
prominence in explaining the interaction that occurs in systems, particularly systems of
innovation.
By reviewing these theories, this dissertation will explore how HBCUs have
developed their science and technology productivity. The major question addressed by
this dissertation is, “What strategies have been utilized by HBCUs that exhibit the most
3
success in developing their science and technology capacity?” The following
subquestions will be addressed. Which HBCUs are the most productive in certain
science and technology indicators? What are the characteristics of those HBCUs that are
considered the most productive? Are linkages the most effective strategy HBCUs should
adopt to be more productive in science and technology? Are there other effective
strategies utilized by HBCUs to develop their science and technology capacity?
1.1 The Theoretical Bases
The theoretical basis of this dissertation study is taken from the intersection of three
bodies of literature – competitive advantage literature, higher education literature, and
systems of innovation literature. The strategies that account for the development of
science and technology emerge from these various literature bases. The concept of
linkages is an integral component that is present in all three literature bases.
The literature on higher education institutions, as it relates to science and technology,
covers the evolution of these institutions from having a mission of preserving culture and
transmitting knowledge to a mission of creating knowledge and interacting with industry,
government and other universities to transfer that knowledge and potentially capitalize on
it.
The concept of linkages in the literature on institutions of higher education can be
traced back to WWII. Historical reviews on universities and science and technology
explore the significance of a significant infusion of federal funds after WWII to
universities for research. The dramatic increases in funding for research, personnel,
equipment and libraries enabled a minor function at universities (research) to grow into a
4
significant component. Scientists and basic research became important leading to
legislation that supported the growth of sponsored research offices at many universities.
Another body of literature grew out of the passage of the Bayh-Doyle Act of 1980
exploring the significance and impact of universities retaining the rights and profits of
their research. Patent production grew and the interaction between industry and
universities increased. The interaction between universities and industry intensified
leading academicians to study and write on the linkages or networks between
government, universities and industry. The literature on higher education now maintains
that the mission at many universities is to teach, research, and exchange knowledge. This
is done through linkages or networks universities are building with other entities.
The role of universities in this network system is a key component of the literature on
innovation. The system of innovation theory contends that the three major actors within
the system are firms, government, and universities. Universities conduct the research that
is often a foundation of new products. Universities train scientists and engineers and they
interact with firms to transfer knowledge. While firms produce most of the innovation
that occurs, they could not do so without the personnel and knowledge from the
university and the funding and policies provided by government. A system of linkages or
networks evolves, consciously or unconsciously, formal or informal that supports
interaction leading to innovation. Knowledge spillovers occur in this network of
information that benefits universities and firms in close proximity to the centers of
information. Many academicians have striven to understand how this system evolves and
what types of linkages are important to making innovation occur.
5
Some of these answers are provided by the extensive literature on competitive
advantage. The theory of competitive advantage grew out of studies explaining the
dynamics of industry growth and success or decline. Competitive or successful industries
are often geographically close and they build upon technological innovation. This
closeness and interaction leads to linkages or networks which the theory expands upon
and terms “clusters.” This grouping of companies within an industry that operate
vertically and horizontally with suppliers and distributors creates a force whose
productivity is greater than the sum of its parts. Although the theory of competitive
advantage is focused on firms and some of the implicit assumptions held in economics,
the theory has been applied to universities due to their ability to claim property rights of
new products and their close relationship with industry and government causing them to
behave more like a firm.
The theory of competitive advantage gives this dissertation a dynamic explanation for
how an industry like the university system can increase, improve, change or identify how
to change their position. Using the competitive advantage model, this study analyzes
strategies in light of their impact on growth and development.
It is clear that there is a great deal of overlap between the three literature bases. The
literatures on higher education and innovation display universities as a major actor with
research as a key contribution to new products. The intersection between higher
education and competitive advantage comes from universities acting more like industries
due to the tremendous increases in funding and their ability to own rights and profits
from their inventions. Universities’ behavior of increasing their research functions,
6
establishing sponsored research offices, and partnering more frequently and intensively
with industry enables the use of competitive advantage theory to be applied to
universities. It becomes almost necessary to look at all three literature bases
simultaneously to understand the dynamics of what is occurring in science and
technology at universities.
1.2 Why HBCUs?
The 104 Historically Black Colleges and Universities (HBCUs) are a unique
subset of the higher education system in the United States. Black colleges and
universities were created, funded and supported by both Blacks and Whites as a result of
legal segregation. This forced a separation between Blacks and Whites in almost all
aspects of life in the southern part of the United States (where most Blacks resided).
Most of the colleges and universities that were created to teach higher education to
Blacks during the segregation era started with elementary and high school level
education. Over time, they gained accreditation and became competitors with other
majority colleges and universities who opened their doors to Black students. The
majority of HBCUs that survive still serve a predominantly Black population. However,
most HBCUs are small, serve a population that has been identified as more academically
challenged, and are generally underfunded. Thus, the question is legitimately raised as to
what HBCUs have to offer and why they should be selected as targets of study.
There are several reasons why HBCUs should be explored and why science and
technology at HBCUs should be explored. HBCUs have demonstrated success at their
mission of educating and graduating students. While the majority of Blacks attend
7
traditionally White institutions (defined as educational institutions with predominantly
White student populations), HBCUs account for the majority of Black students that
graduate in many fields (Allen, Epps, & Haniff, 1991; Hoffman, Snyder, & Sonnenberg,
1992). On the average, HBCUs have been proportionately more successful (compared to
majority institutions) in graduating students in science and math fields (Thomas, 1991;
Trent & Hill, 1994).
Perhaps more important is the need for America to maintain its economic edge
and competitiveness. National demographics are changing. In the last decade, the
minority population increased by 35%. As Shirley Jackson pointed out,
While the non-Hispanic White population grew only 3.4%, the Hispanic population grew by 58%, Asian Americans by 50% and African-Americans by 16%. Since our traditional science, mathematics, engineering, and technology (SMET) workforce is nearly 82% White and more than 75% male, it appears unlikely that we can replace it with a similar population (Jackson, 2004).
As the Deputy Director of the National Science Foundation, Joseph Bordogna, stated,
It [the s&t workforce issue] is NOT about the total number of scientists and engineers the nation may or may not need….It IS about including a larger proportion of women, underrepresented minorities and persons with disabilities in the scientific workforce, no matter the size of that workforce….we need a robust and varied mix, and that means broadening participation (Committee on Equal Opportunities in Science and Engineering, 2004).
Data on HBCUs reveal a growth trend amongst African American students
graduating from science and engineering fields in post secondary schools (National
Science Foundation, 2004c). Statistics show a growing percentage of foreign born
students at the graduate level in the United States, while the number of White American
students at the graduate level has remained consistent. There has been little growth in
native born supply of labor over the last decade; much of the increase has come from
8
minorities (National Science Board, 2004b). This means that without an increase in
domestic students, the estimated shortage of science and technology workers will not be
filled by Americans. The United States had been turning to a foreign labor supply to
meet their excess needs in science and technology (National Research Council, 2001).
However, since September 11, 2001, the number of foreigners applying for visas and the
number of foreigners applying for graduate education in the United States has declined
considerably. Some universities have reported a decline of as much as 40% (Jackson,
2004). Thus, given the changing demographics, the increase in science and engineering
as fields of study by African American students and other minorities, makes them an
interesting phenomenon to study.
The National Science Foundation, the National Science Board, the Council on
Competitiveness, and the Congressional Commission on the Advancement of Women in
Science, Engineering and Technology amongst other organizations seek to “widen”
(expand the circle of institutions seeking to increase output) and “deepen” (develop more
talent within existing institutions), the institutional capacity of higher education to
increase its science and engineering students, particularly students of color (BEST, 2004;
Committee on Equal Opportunities in Science and Engineering, 2004). In this effort,
strategies adopted by HBCUs are worthy of examination.
It is also interesting to look at HBCUs in the perspective of the Carnegie
classification typology. There is a greater percentage of HBCUs that are research-
oriented universities and colleges than in the greater population of universities (see
Chapter 2). This and the factors mentioned above are why this dissertation study focuses
9
on HBCUs. It remains to be seen whether linkages or networks are a factor in HBCUs’
achievements.
1.3 Research Design Methods
This dissertation study utilizes a mixed methods approach in its research design. A
quantitative approach is nested within the overall qualitative approach. Each is addressed
separately as each approach has different requirements. In both approaches the unit of
analysis is the university. The variables in this research study were drawn from
theoretical models in previous research on science and technology at universities.
A quantitative approach is used to determine the productivity level in science and
technology at each HBCU. The dependent variable is science and technology
productivity. Bibliometric techniques are combined with data from federal public
databases to calculate a composite science and technology (S&T) index for each HBCU.
Characteristics of the different levels of universities are explored. The goal of this part of
this research is to a) determine which HBCUs are the most productive in science and
technology and b) use the HBCU science and technology index ranking to select three
research HBCUs.
Results from the composite science and technology index are used to inform the
direction of the qualitative approach. Based on the index ratings, three HBCUs are
selected as case studies for further in-depth exploration to determine what strategies they
utilized to develop their science and technology productivity. Interviews and archival
analysis are used to provide further information on the development of linkages and the
validity of rival explanations. Techniques identified for use with qualitative data will be
10
used – a) pattern matching using independent variables, b) rival explanations and c) time
sequencing. Triangulation will be achieved by interviewing liaisons – individuals that
work with but are external to HBCUs. The goal in the qualitative part of the research is
to assess which strategies are utilized and which provide the most explanation for
affecting science and technology development. This strategy is similar to the one utilized
by Michael Porter in his nation-assessment of productivity (M. Porter, 1990).
1.4 Contributions to Literature
This study contributes to the literature on higher education by exploring in greater
depth the subset of HBCUs. While HBCUs should be classified as a part of the
university population, they also have sufficiently different and interesting characteristics
that they can be classified in a unique category within the university typology.
In the intersection between higher education and national systems of innovation,
studies on colleges and universities use generally accepted variables such as patents,
funding and publications to assess the potential for innovation. While human capital is
acknowledged as an important component, the number of graduates is not commonly
operationalized. Rather, the actual number of scientists and engineers is often used as a
direct measure of “knowledge labor” or “human capital.” However, graduates in science
and technology related fields have been identified by many studies as part of the network
that produces innovation. Graduates attract companies that need a literate and skilled
base of employees and graduates help produce the linkages that transmit/transfer
knowledge through liaisons, associations, and jobs in different companies. Therefore,
there is validity in using graduates as a variable to assess innovation or potential for
11
science and technology. This study contributes to the literature by including the student
body (graduates) as part of its assessment of universities.
In the intersection between competitive advantage and national systems of
innovation literatures, this dissertation study contributes to the exploration of non-profit
entities, such as universities, behaving in a manner similar to for profit organizations.
Theories have emerged such as Triple Helix (Etzkowitz, Webster, & Healey, 1998) and
Mode 2 (Gibbons et al., 1994) that suggest that universities are interacting more with
industry and government. These theories use terms such as ‘entrepreneurial university’
and ‘capitalization of knowledge’. OECD (the Organization for Economic Cooperation
and Development) has taken the theory of competitive advantage and applied it in a
limited manner to universities but there are few academic studies that have explored the
concept of competitive advantage and clusters at universities (OECD, 1999). Thus, this
study seeks to contribute to that body of literature by exploring how a particular set of
universities, HBCUs, seeks to enhance their competitive advantage in the fields of
science and technology.
1.5 Policy Implications
The target audiences to which the findings are directed are HBCU leaders involved
in policy, HBCU science and technology departments, and federal and state government
agencies that are interested in identifying potential niches for support of science and
technology development. Policy implications of this study are relevant, as the findings
will help federal agencies better understand strategies for science and technology
development and HBCUs will have models of strategy that are effective and productive.
12
Another target audience to which this dissertation is not directed but to whom the
findings may contribute is those who review colleges and university classifications. The
Carnegie Foundation classification has become the standard typology (Carnegie
Foundation for the Advancement of Teaching, 2001). That organization (along with
others) has been exploring whether to classify HBCUs and other ethnic colleges and
universities as a unique classification. By determining whether HBCUs present a
difference from majority universities, this study may contribute to that policy decision.
1.6 Overview of Chapters
This Introduction - Chapter 1 identifies the goal of this dissertation study – to
determine effective strategies for HBCUs to adopt regarding their approach and
adaptation to a technological society. It sets forth the questions, literature base,
theoretical approach, and methodology by which the study will achieve its goal. It also
describes the audience to whom this study is directed, the contributions to the field of
academics, and the potential policy implications.
The next chapter, Chapter 2, takes a historical look at HBCUs and identifies the
factors that contribute to defining and understanding HBCUs, particularly factors that
affect their development of science and technology. From this chapter, one should be
able to understand the context in which HBCUs exist. The chapter explores their
historical legacy which impacts the choice of strategies that are utilized. It also examines
current issues facing HBCUs and by implication, the nation.
Chapter 3 presents the theoretical propositions and the literature bases. It delves
further into the three literature bases of higher education, national systems of innovation,
13
and competitive advantage. Out of the intersection of these three bodies of literature
emerge the various theories/strategies that explain the development of science and
technology at universities. The goal is to understand how these strategies can be applied
to enhance the production and productivity levels of HBCUs.
It is hypothesized that linkages are the strategy that HBCUs should adopt to
develop science and technology productivity. Chapter 4 discusses the various uses and
meanings of linkages by different authors and organizations. The concept of linkages, as
used in its various forms, is grouped into three categories. The third category, the most
defined and mature form of linkages, networks and collaborations, is the definition
adopted by this study. Rival theories are also presented as a contrast to the primary
concept of linkages.
Chapter 5 presents the research design and the methodology. The unit of analysis,
dependent and independent variables are identified for the quantitative approach. The
research design utilizes a two phase approach. Phase I is a quantitative approach with
one set of hypotheses and methods. The goal is to develop a science and technology
index. The results of the index are used to select three research HBCUs for further in-
depth study. Hence, the results of the quantitative phase are used to guide and direct the
qualitative section. In Phase II, the primary question and a hypothesis are presented
regarding what strategy should be adopted by HBCUs to develop science and technology
capacity. The chapter provides information on data sources and data analysis.
Chapter 6 presents results from Phase I – the construction of the HBCU science
and technology index. The results enable identification of HBCUs with high productivity
14
levels in science and technology indicators. Chapter 6 presents the 35 research
universities and categorizes them into high, medium and low productivity. The
categorization facilitates selection of three research HBCUs - Fort Valley State
University (FVSU), Hampton University, and Florida Agricultural & Mechanical
University (FAMU).
Chapters 7, 8 and 9 highlight the three case studies presenting FVSU, Hampton
and FAMU respectively. Each chapter begins with an in-depth review of the university.
This includes their characteristics, history, structure, science and technology
achievements, and strengths and weaknesses. Information obtained from the website,
books, archival, and policy documents is included in this background analysis.
Following the review, the results of the interviews are presented. The analytic tools of
pattern matching, rival explanation and chronology of events methodologies combine to
uncover a unique history that unfolds behind the origin of various programs at HBCUs.
The theories/strategies are compared within each case study for the purpose of
determining which has the most validity.
Chapter 10 summarizes the results from Chapters 7, 8 and 9. It summarizes the
results and findings from the study. What was learned? How do the results impact
actions taken by HBCUs? What theories were most prevalent and why? Was the data
obtained from interviews supported by data obtained from external liaisons? The
findings from the interviews enables responses to the questions posed.
Chapter 11, the Concluding chapter, ties together the entire study. It summarizes
the outcomes of both Phase I and II and seeks to determine how the findings from both
15
approaches impacts the direction taken by HBCUs as they seek to develop science and
technology productivity. Chapter 11 discusses the limitations and vulnerabilities found
in the design and implementation of the research. It explores impact on existing theory.
Most importantly, it discusses the importance of the findings for policy and its relevance
to policy personnel and administrators at HBCUs. Finally, the chapter examines what
future questions emerge for further research study.
16
CHAPTER 2 HBCUS AND UNIQUE HISTORICAL FORCES
Despite evolving within a similar physical environment (the United States),
HBCUs have had singular forces impacting their development as institutions of higher
education. HBCUs and Traditionally White Institutions/Universities (TWIs) both started
with weak educational infrastructures and a significant number of students needing
remedial or pre-college courses (Jones & Weathersby, 1978). Both worked on improving
the quality of their curriculum. The parallel pathways veered off track after WWII;
however, when huge infusions of federal funds transformed many Traditionally White
Universities into institutions with science and research capability. HBCUs did not share
in that distribution of funds, which left them at a disadvantage in terms of facilities,
buildings, faculty, and equipment. In order to remain competitive, HBCUs developed a
niche by capitalizing on a tradition of teaching and matriculating African-American
students. They utilized strategies adopted by other colleges and universities while
developing strategies unique to their characteristics and their environment.
This chapter focuses on HBCUs. It defines the colleges and universities that are
included within the designation, discusses historical and internal factors that affect the
development of science and technology at HBCUs, and explores the concept of linkages
and other strategies as they relate to HBCUs.
2.1 What are HBCUs?
Within the literature on universities, there is one subset of universities that has
gone relatively unexamined – Historically Black Colleges and Universities (HBCUs: see
17
Appendix A for list of HBCUs). HBCUs represent 2.7% of the total colleges and
universities’ population (Carnegie Foundation for the Advancement of Teaching, 2001).
Designated in 1980 by the United States White House Initiative on Historically Black
Colleges and Universities, the term Historically Black Colleges and Universities can be
found and defined in the Higher Education Act of 1965. HBCUs are defined as "any
historically black college or university that was established prior to 1964, whose principal
mission was and is the education of black Americans, and that is accredited by a
nationally recognized accrediting agency or association determined by the Secretary (of
Education) to be a reliable authority as to the quality of training offered or is, according
to such an agency or association, making reasonable progress toward accreditation" (20
USC 1061 (2), Title III of the Higher Education Act of 1965).
Initially, 105 Black colleges and universities were designated by the White House
Initiative on HBCUs in 1980; however, since then, other colleges and universities have
been categorized as HBCUs while some have discontinued operation. This dissertation
study utilizes the initial definition - being predominantly Black (upon inception) and
created prior to 1964. This resulted in 103 current HBCUs as of 2003.
HBCUs were attended by a predominantly African-American/Black population1
at their inception because during that time period they were legally restricted from
attending predominantly White universities in the South and were not accepted by most
universities in the North. Black colleges and universities were not racially restricted;
1 African-American, Negro and Black are used interchangeably throughout this document despite having slightly different meanings. Different terms are associated with certain time periods. Additionally, all three terms are capitalized when used because they refer to a race rather than being used as an adjective.
18
however, despite the efforts of Blacks and some Northerners, the prevailing social
customs held and the student bodies became overwhelmingly Black. Today, some of that
has changed. While the vast majority of HBCUs have overwhelmingly Black
populations, there are a few with significant White populations (sometimes a majority).2
Many faculty at HBCUs are White and/or foreign born. In addition, there are colleges
that have a predominantly Black population (such as some CUNY institutions in New
York), that are not designated as HBCUs; these are usually referred to as Minority
Serving Institutions (MSI). MSIs generally do not share the cultural and historical
heritage that characterizes many of the HBCUs. For the purposes of this research,
HBCUs shall be defined as the 103 institutions operating in 2003 that were designated in
the initial White House legislation in 1980.
HBCUs are as varied as the total population of colleges and universities; however
there are characteristics that are common to many of them. The “typical” HBCU is
located in the Southeast (69.2%) and was created prior to 1900 (72%). The typical
HBCU is a four-year college (85.4%), private (54.8%), rated as a Baccalaureate-General
(38%) or a Master’s I institution (24.3%), and has less than 2,000 students (51.9%). The
rest of the HBCUs are located in the Northeast, the District of Columbia, Missouri, Ohio,
Oklahoma, Texas, and the Virgin Islands. They include a mix of public four-year, public
two-year, private four-year, and private two-year institutions. Many are more than 100
years old, with Cheyney University of Pennsylvania, being the oldest of these institutions
founded in 1837.
2 HBCUs with majority White populations include West Virginia State College, Bluefield State College, Saint Phillips College, Shelton State Community College, and Lincoln University in Missouri.
19
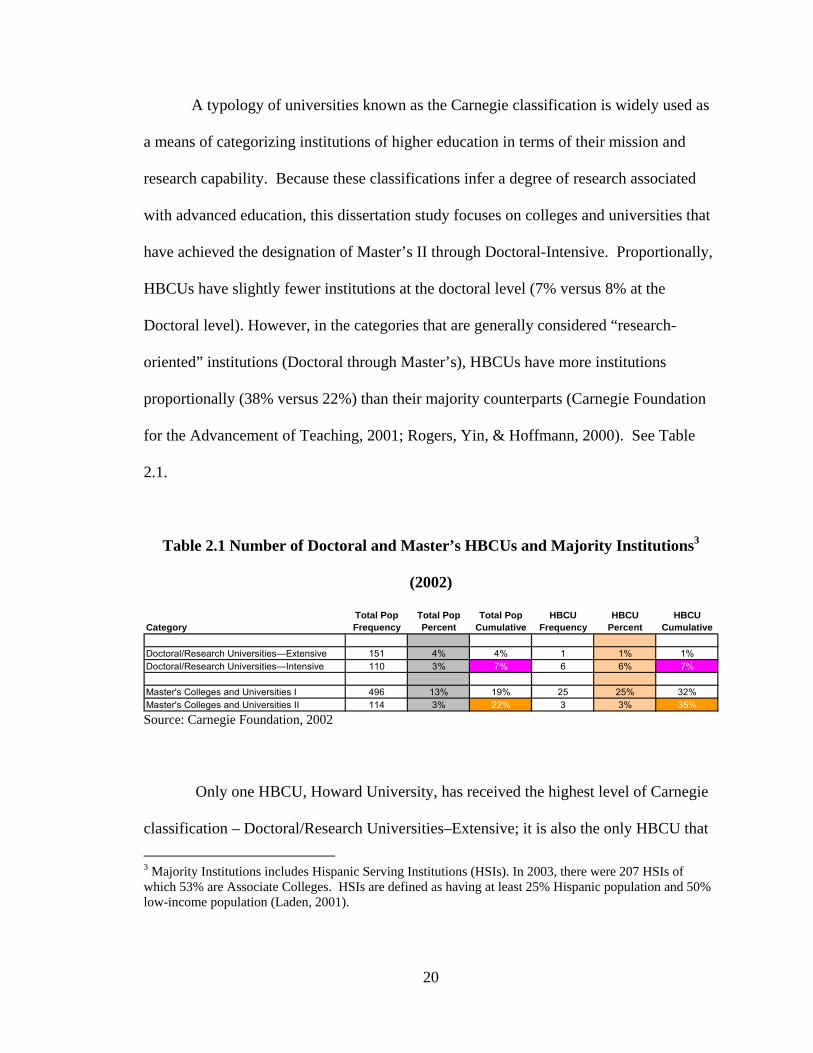
A typology of universities known as the Carnegie classification is widely used as
a means of categorizing institutions of higher education in terms of their mission and
research capability. Because these classifications infer a degree of research associated
with advanced education, this dissertation study focuses on colleges and universities that
have achieved the designation of Master’s II through Doctoral-Intensive. Proportionally,
HBCUs have slightly fewer institutions at the doctoral level (7% versus 8% at the
Doctoral level). However, in the categories that are generally considered “research-
oriented” institutions (Doctoral through Master’s), HBCUs have more institutions
proportionally (38% versus 22%) than their majority counterparts (Carnegie Foundation
for the Advancement of Teaching, 2001; Rogers, Yin, & Hoffmann, 2000). See Table
2.1.
Table 2.1 Number of Doctoral and Master’s HBCUs and Majority Institutions3
(2002)
CategoryTotal Pop Frequency
Total Pop Percent
Total Pop Cumulative
HBCU Frequency
HBCU Percent
HBCU Cumulative
Doctoral/Research Universities—Extensive 151 4% 4% 1 1% 1%Doctoral/Research Universities—Intensive 110 3% 7% 6 6% 7%
Master's Colleges and Universities I 496 13% 19% 25 25% 32%Master's Colleges and Universities II 114 3% 22% 3 3% 35% Source: Carnegie Foundation, 2002
Only one HBCU, Howard University, has received the highest level of Carnegie
classification – Doctoral/Research Universities–Extensive; it is also the only HBCU that
3 Majority Institutions includes Hispanic Serving Institutions (HSIs). In 2003, there were 207 HSIs of which 53% are Associate Colleges. HSIs are defined as having at least 25% Hispanic population and 50% low-income population (Laden, 2001).
20
has a medical school as part of its structure.4 The impact of the lack of medical schools is
significant economically. A report by RAND on federal R&D funds indicates that the
majority of federal funds for 2002 are directed towards universities and colleges, and
within that group, medical schools are the prime beneficiaries. Forty-five percent of total
federal R&D funding to universities and colleges goes to medical schools (Fossum,
Painter, Eiseman, Ettedgui, & Adamson, 2004).
While the 35 HBCUs at the Doctoral and Master’s level have disproportionately
fewer medical schools (compared to the larger university population), they have
disproportionately more land-grant universities (17% of HBCUs versus 1% of TWIs).
This is important to note because education and research at land-grant universities, due to
their mission, is usually more applied; therefore, they may not fare as well in securing
research and development dollars or in authoring publications (Graham & Diamond,
1997). Finally, the location of most HBCUs in the South, which on the average has
lower academic high school ratings than other regions in the United States, may affect
their development of science and technology (Holmes, 1934). Segregation resulted in an
inequitable and inefficient distribution of funds. The appropriation of scarce resources to
a larger number of schools than necessary caused the entire system to suffer
educationally.
2.2 Historical Context
In 1866, the first year after emancipation of the slaves in the United States, about
90 to 95% of the Black adult population was functionally illiterate (Thompson, 1978).
4 There are two other HBCUs that are medical schools (Morehouse School of Medicine and Meharry); however, they are not part of a larger institution. They are categorized as separate institutions.
21
To address their needs, the institutions they created focused primarily on training
teachers. The majority of HBCUs were created in the South because that was where the
majority of Black people resided. Institutionalized racism prevented Blacks from
enrolling or participating in White educational institutions. Thus, in order to obtain an
education they created their own educational institutions.
The Negro or Black population constituted over one-third of the population in the
South and formed a majority in several states – South Carolina, Mississippi and
Louisiana. In Alabama, Florida, Georgia and Virginia, the Black population ranged from
42 to 49% of the total population, while North Carolina, Tennessee and Texas reported
their Black population as 37%, 26%, and 31%, respectively. With the Black population
freed by the Civil War in 1865, a large, potentially political and social body that had
heretofore been invisible and impotent became a presence to be dealt with in the South
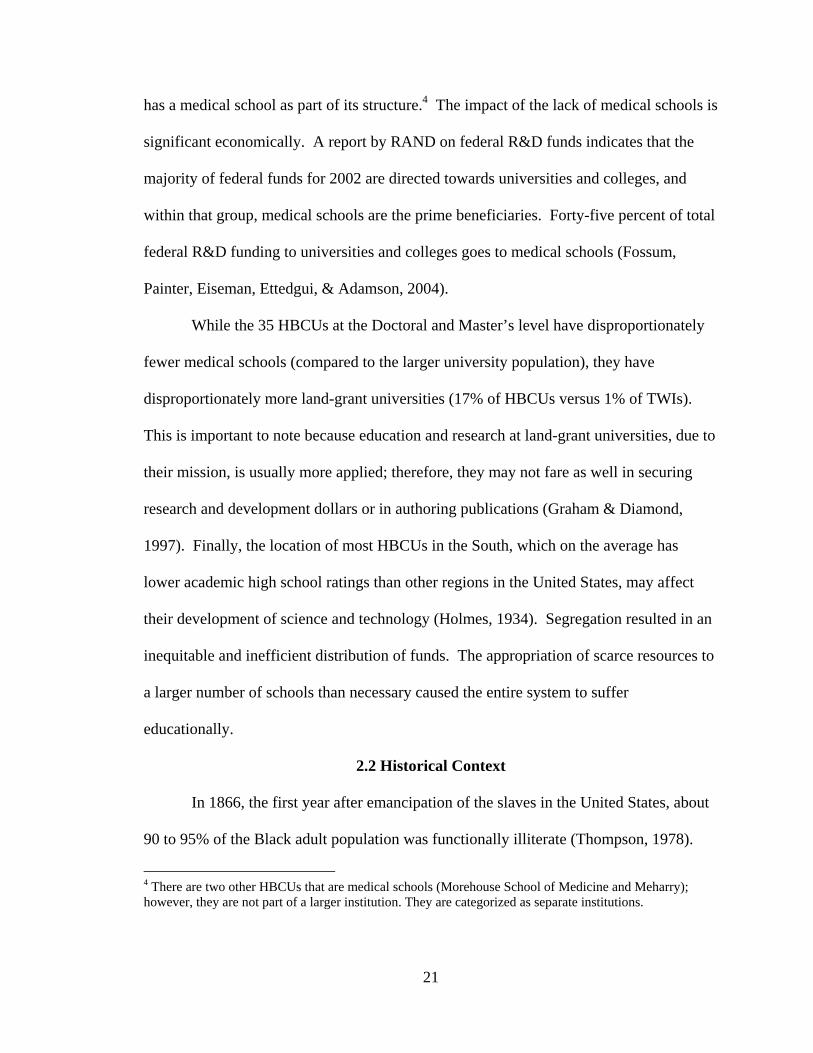
(Anderson, 1988). See Figure 2.1.
22
http://www.ushistoricalarchive.com/cds/1890.html
Figure 2.1 Colored Population in the United States in 18905
Black churches and Northern White missionaries were primarily responsible for
the creation of many Black schools. While many of the early higher education
institutions used the title of “college”, most of them were teaching the majority of their
classes at the elementary and secondary school level. The great need for teachers who
could provide this education led to many of the schools adopting teacher training as all or
part of their mission. And in this they were successful. Illiteracy rates for the Black
population declined considerably (70% in 1880 to 16.3% in 1930) (Davis, 1933).)
5 The darker the color the more concentrated the colored population. The term colored is used because the map includes Indians and Asians (who are more concentrated in the Midwest and the West.)
23
Conditions at White schools during this period were not much different. In 1865,
the General Superintendent of Education conducted an inspection that included Negro
colleges and observed that “in the District of Columbia, 75% of the Negro children
attended school as against only 41% of the white children; that in Memphis, Tennessee
72% of the Negro children attended school, in Alabama 79% and in Virginia 82%”
(Jones & Weathersby, 1978). He compared these figures with an attendance of 43%
White students in the public schools of New York State and 93% in Boston, which
probably ranked first in this respect among the cities of the entire country. Even as late
as 1895, all of the White colleges in Alabama except the University of Alabama reported
students at the elementary and high school levels. The University of Massachusetts,
Boston College and Tufts reported pre-college enrollments in 1895 (Jones & Weathersby,
1978). For Black colleges, however, the presence of secondary education at the college
level extended well into the 1930s while such practices faded at TWIs prior to 1910.
The American educational system is known for its plethora of institutions of
higher education in contrast to the European system from which it emanated (Lucas,
1994). In this respect, Black colleges followed the American model by creating many
institutions of higher learning. White colleges continued their path toward higher
education, challenged by the obstacles of finding funds but undeterred by philanthropic
interests seeking to derail their pursuits. Linkages are built on trust and relationships.
The trust was undermined by industrial philanthropists’ support and funding of industrial
education, which most Negores opposed. They belived it to be another action preventing
them from acquiring the education needed to move ahead.
24
Black higher education was derailed by one of the three philanthropic groups that
formed the power structure in black higher education. From 1865 to 1950, missionary
philanthropy (northern white benevolent societies and denominational bodies), Black
philanthropy (black religious organizations), and industrial philanthropy (large corporate
foundations and wealthy individuals)6 exerted great influence on the development of
higher education for Blacks. The ideologies and philosophies of the different
philanthropic groups were in sharp disagreement over the value and purpose of Black
higher education. Each group imposed its educational policy and practices on their vision
of the role Blacks should play in the New South.
Both missionaries and Black philanthropists believed Blacks could be
contributing equal partners in the new society. They promoted and pursued classic liberal
arts education for Blacks – languages, math, science, English and culture. The industrial
philanthropists, the most influential, powerful and well financed group of the three
favored industrial education. They were opposed to the potential political and social
power which the Negro represented and thus supported the premise of teaching the Negro
the “dignity of manual labor.” Industrial education focused on applied training in
agriculture, mechanical engineering, and military arts. It provided no instruction above
the secondary level (high school), and no teaching of subjects that constituted a liberal
arts education (Anderson, 1988; Holmes, 1934; LeMelle & LeMelle, 1969).
6 Prominent individual industrial philanthropists included Ulysses S. Grant, Rutherford B. Hayes, James A. Garfield, Theodore Roosevelt, Jr., Julius Rosenwald, and others. The most well known industrial foundations included the John E. Slater Fund, the General Education Board, Ana T. Jeanes Foundation, the Phelps-Stoke fund, Carnegie Foundation, Laura Spelman Rockefeller Memorial Fund, and the Julius Rosenwald Fund.
25
It is noteworthy that the industrial philanthropists opposed higher education
because industry and its ancillary organizations is responsible for most of the research
funding today. Thus, for the hypothesis that linkages are responsible for the development
of science and technology at universities to hold true for HBCUs, some of the racism
industry had towards HBCUs and the distrust HBCUs had for industry must have been
overcome.
HBCUs faced a choice. They could remain distinct entities that employed unique
strategies or become more like TWIs and utilize strategies identified earlier in this study
such as linkages. HBCUs took both paths. They remained distinct institutions that
initiated new strategies; however, they also adopted strategies utilized by TWIs.
2.3 Policy and Funding
Prior to WWII, federal funding was not a significant source of revenue for most
universities. The massive amounts of funding that White colleges received from the
federal government after WWII was not received in equitable measure by Black colleges.
Sixteen TWIs were considered preeminent in academic research; eleven of these were
private institutions7 (Graham & Diamond, 1997). The scientific advancements made
during the war were instrumental in turning the course of the war and the subsequent
balance of power to the United States. This prompted the federal government to support
universities and academic research. From 1958 to 1968, the nation’s universities
experienced the Golden Era – quantum leaps (increases from seven fold to a thousand
7 The sixteen private and flagship universities were Berkeley, Chicago, Caltech, Columbia, Cornell, Harvard, Illinois, Johns Hopkins, MIT, Michigan, Minnesota, Pennsylvania, Princeton, Stanford, University of California, Wisconsin, and Yale.
26
fold) in federal funding for science, research, equipment, personnel and facilities
(Graham & Diamond, 1997). (See Chapter 3 – Literature Review for more detailed
information.)
Yet very little of this trickled down to HBCUs. Until 1967, no federal formula
funds (dedicated funding allotted to land-grants by the federal government) were received
by HBCUs (Payton, 1992). The historically black land-grant universities that by law
were supposed to receive funds from the federal government (Morrill Act of 1890) didn’t
begin to receive federal support until 1967, nearly 70 years later. Funding began in 1965
due to Congress approving Public Law 89-106 to provide the U.S. Secretary of
Agriculture with a discretionary appropriation of $2 million. Beginning in 1967, a total of
$283,000 was taken from this fund and divided among the sixteen 1890 institutions (as
they are commonly referred to)8 on the basis of a newly established formula for
historically black land-grant institutions (Bonnen, 1992; Mayes, 1992). Over time,
funding from the Department of Agriculture increased. In 2002, the Department of
Agriculture was the largest provider of federal R&D funds to HBCUs.
In response to Civil Rights agitation and demonstration, policy became a major
vehicle by which change occurred. With the passage of the Higher Education Act of
1965, Black colleges and universities were able to obtain direct institutional subsidy and
federal student aid. The Civil Rights era also brought challenges to HBCUs. As
8 The sixteen land-grant HBCUs are Alabama A&M, Alcorn State, Florida A&M, Fort Valley State, Kentucky State, Langston, Lincoln University (Missouri), North Carolina A&T State University, Prairie View A&M, South Carolina State University, Southern University A&M College, Tuskegee University, Universit of Arkansas at Pine Bluff, University of Maryland Eastern Shore, University of the Virgin Islands, Virginia State, and West Virginia State University
27
integration progressed, Black colleges and universities found themselves in direct
competition with TWIs for the best students and faculty (Drewry & Doermann, 2001).
In 1980, efforts were made to redress past wrongs through a significant legislative
policy that marked a shift in federal relations towards HBCUs - the White House
Initiative on HBCUs. This initiative recognized Black colleges formed prior to 1965 as a
historical group of institutions deserving of specific federal policy to “overcome the
effects of discriminatory treatment and to strengthen and expand the capacity of HBCUs
to provide quality education” (White House, 1998). From President Reagan to Clinton,
the policy has been renewed and strengthened. Just as the federal government created
EPSCOR (Experimental Program to Stimulate Competitive Research) to assist states that
have historically received less federal funding, it also introduced policies to encourage
science and technology research and development capacity at HBCUs. The White House
initiative on HBCUs is a significant federal policy affecting Black institutions of higher
education. It appears that since the policy was created, HBCUs have strengthened their
science and technology capacity by establishing partnerships with federal agencies,
procuring government contracts and funds, and conducting research. The White House
Initiative on HBCUs supports and encourages HBCUs to a) develop linkages with federal
agencies and b) develop their science and technology potential. In the1998 White House
Initiative on HBCUs renewed by President Clinton, two stated goals support this:
“To strengthen the communication linkages between HBCUs and federal agencies
to increase the number of contractual relationships;
28
To encourage collaborations and partnerships among HBCUs and other
organizations to produce the greatest leverage of federal and private dollars”
(White House, 1998).
In addition, the 1998 White House policy on HBCUs advised the private sector to
“increase the number of graduates with degrees in science and technology by enhancing
their career prospects.” The President’s Board of Advisors on HBCUs also
recommended support of HBCUs’ long-term development plans for “sources of
alternative faculty talent in the science and technology disciplines” (White House, 1998).
The policy demonstrates the targeting of HBCUs in the federal arena as potential sources
for graduates, networking, and science and technology production. Under President
George W. Bush, the policy still exists but has been transferred from the White House to
the Office of the Secretary in the Department of Education effectively downgrading the
importance of the initiative (U.S. Department of Education, 2005).
2.4 Collaboration, Cooperation and Clusters
Public HBCUs, able to rely on public funds from state and local sources, have
been more fiscally stable over time than other HBCUs (Hoffman et al., 1992; Jones &
Weathersby, 1978). Several attempts at collaboration and cooperation were made by
public and private HBCUs including the ACNY (Association of Colleges for Negro
Youth), the SACS (Southern Association of Colleges and Secondary Schools), the
ALGCU (Association of LandGrant Colleges and Universities), and the CCCP (Council
on Cooperative College Projects). However, private HBCUs, mostly small and
underfunded still found themselves vulnerable.
29
In 1944, Frederick Patterson, President of Tuskegee Institute introduced the idea
of a membership association having as its primary purpose the raising of unrestricted
operating funds for its members. This was a unique idea that had not been attempted by a
group of universities. Twenty-seven private Black colleges and universities established
the United Negro College Fund believing that the sum might be greater than its parts.
They believed a united, nationwide appeal for funds would have more success than any
individual campaigns. Foundations were becoming increasingly unwilling to grant
unrestricted funds. Presidents realized they were spending inordinate amounts of time on
fundraising (Drewry & Doermann, 2001). In this sense, the United Negro College Fund
(UNCF) might represent the first formal network of universities (a small group of
universities that have a formal agreement (implicit or explicit) for mutually beneficial
goals).
Despite raising only half of their campaign goal in the first year ($750,000), the
total amount was several times the total amount collected individually in previous years.
The UNCF was considered a success and the Presidents of the private Black member
colleges made a commitment to continue the effort. It provided funds to private HBCUs
at a time when federal aid and industrial philanthropy was not available. Today, the
UNCF is probably the most influential organization among private Black colleges. Part
of its mission is to assist its members in maintaining fiscal stability (Drewry &
Doermann, 2001).
The success of UNCF led to the founding of another national organization, the
National Association for Equal Opportunity in Higher Education (NAFEO). Founded in
30
1969 by a group of HBCU presidents, NAFEO was a professional association created to
champion their interests with executive, legislative, regulatory and judicial branches of
federal and state governments as well as with corporations, foundations, associations and
non-governmental organizations. The mission of NAFEO is to build the capacity of
HBCUs, to engage in policy and advocacy on behalf of HBCUs, and to seek and secure
federal and private dollars for its members.
2.5 Effectiveness at Graduating Students
The period from 1860-1920 set the stage for forces that shaped funding strategies
developed at Black higher education institutions. It established a culture dedicated to
teaching which remains one of the foundations of HBCUs. According to several authors,
this culture’s tradition emphasizes individualized student attention (Mays, 1978),
graduating students (Thompson, 1978), and faculty attentiveness to teaching
(Wenglinsky, 1997 ). Indeed, many academicians attribute the success of HBCUs’
ability to graduate at-risk students to the teachers who serve them.
The emphasis on teaching continues today, in part to support students who need
greater academic preparation. The following tables depict two factors that relate to
African-American student educational preparedness. The first table (Table 2.2) indicates
that, on average, a higher percentage of African-American undergraduate students need
preparatory or remedial courses.
31
8.0
4.4
2.4 2.0 2.2
19.8
11.4
8.8
4.0
7.4
14.6
8.3
4.7
2.3
6.4
8.7
4.0 4.0
1.2
4.7
0.0
5.0
10.0
15.0
20.0
25.0
Any Remedial Course Math Reading Study Skills Writing
WhiteAfrican AmericanHispanicOther
African-American Data Book (Nettles Ph.D. & Perna, 1997)
Figure 2.2 Percentage of Undergraduates attending Four-year Institutions who receive remedial instruction: Fall, 1992
The second table (Table 2.3) indicates a higher percentage of African-American students
with lower family incomes. On the average, lower socio-economic status is correlated
with lower educational performance (Wenglinsky, 1997).
32
0.0
5.0
10.0
15.0
20.0
25.0
30.0
35.0
40.0
45.0
Less than $19,999 $20,000 to $39,999 $40,000 to $59,999 $60,000 to $79,999 $80,000 or More
WhiteA-A Non HBCUHispanicOtherA-A HBCU
African-American Data Book (Nettles Ph.D. & Perna, 1997)
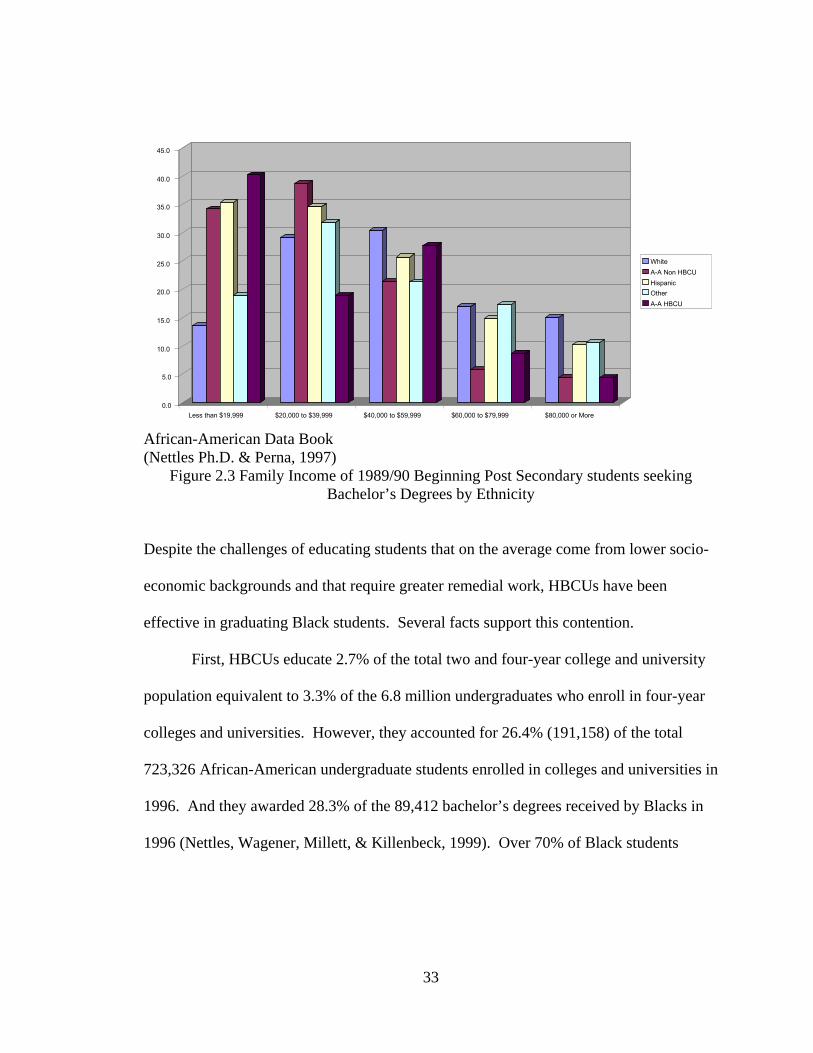
Figure 2.3 Family Income of 1989/90 Beginning Post Secondary students seeking Bachelor’s Degrees by Ethnicity
Despite the challenges of educating students that on the average come from lower socio-
economic backgrounds and that require greater remedial work, HBCUs have been
effective in graduating Black students. Several facts support this contention.
First, HBCUs educate 2.7% of the total two and four-year college and university
population equivalent to 3.3% of the 6.8 million undergraduates who enroll in four-year
colleges and universities. However, they accounted for 26.4% (191,158) of the total
723,326 African-American undergraduate students enrolled in colleges and universities in
1996. And they awarded 28.3% of the 89,412 bachelor’s degrees received by Blacks in
1996 (Nettles, Wagener, Millett, & Killenbeck, 1999). Over 70% of Black students
33
attend TWIs; however, 70% do not matriculate (compared to 50% at HBCUs) (Trent &
Hill, 1994).
Second, several studies indicate that students at HBCUs are more likely than
students at majority schools to major in science and technology fields. Data indicates
that African-Americans are underrepresented in science and technical fields (math,
engineering, physical and biological sciences) in proportion to their population in the
U.S. (McBay, 1978; Pearson Jr. & Bechtel, 1989; Thomas, 1989). Due to higher
retention rates, HBCUs are disproportionately responsible for science and engineering
degrees among African-Americans. Engineering and engineering technology programs
have grown considerably at HBCUs. Students at HBCUs are more likely than Black
students in general to major in business, engineering or the sciences (Thomas, 1989;
Trent & Hill, 1994). In 1990, when 28% of Blacks attended HBCUs, these institutions
awarded over 44% of Blacks’ bachelors degrees in physical sciences, 41% in
mathematics, 38% in computer sciences and life sciences, 37% in education, and 25% in
engineering (Hoffman et al., 1992). The National Science Foundation (NSF) found that
between 1989 and 1996, the proportion of graduates from HBCUs majoring in computer
science has been about twice the comparable rate of TWIs (National Research Council,
2001).
Third, Nettles found that Black students from HBCUs have higher progression
rates than Black students at TWIs. Progression is defined as the number of credits taken
each semester toward completion of the degree (Nettles et al., 1999). These findings are
supported by a study authored by Astin who found that controlling for prior student
34
achievement (e.g.; high school grades and SAT scores), institutional size, and
institutional selectivity, Blacks from HBCUs are more likely to complete their degree
than Blacks at TWIs (Astin, Tsui, & Avalos, 1996). Wenglinsky found in a study that
compared students at HBCUs to Black students at TWIs that students at HBCUs were
more likely to plan on entering a program in the sciences, engineering or business; to
have higher retention rates (82% vs. 66%), obtain their Ph.D. (21% vs. 18%) and receive
it quicker (5.57 years versus 6.14 years) (Wenglinsky, 1997).
To summarize, HBCUs afford an educational opportunity to students from lower
socio-economic backgrounds that might not otherwise go to college. On the average, as
noted above, Black students at HBCUs when compared to Black counterparts at majority
schools are more likely to major in science and engineering, complete their degree, attend
graduate school in science and engineering fields, pursue Ph.D.s, and obtain their degree
of choice faster (Astin et al., 1996; Thomas, 1991; Wenglinsky, 1997). Thus, one can
conclude that HBCUs are more successful than TWIs in preparing Black students for
careers in engineering, science or business, graduate school and various professions.
Recent data by NSF indicates that TWIs may be eroding this traditional
stronghold of HBCUs. The number of Black graduates (U.S. citizen and permanent
resident Blacks who received Bachelor’s degrees) has increased in science and
engineering fields by 26.6% from 1994-2001 (26,289 in 1994 to 33,290 in 2001). The
number of students served by HBCUs has increased; however, their percentage of the
total number of graduates with bachelors degrees in science and engineering has declined
35
from 29.7% to 26.1% (National Science Foundation, 2004c). It remains to be seen
whether this trend will continue.
Within HBCUs’ strength in graduating at-risk students may lay a weakness. As
will be explained further in Chapter 3, many universities have taken on another mission –
producing knowledge through research. To be competitive and move into the 21st
century, universities have set up research offices and are encouraging their faculty to
engage in more research. Scott has written about the lack of faculty production at
HBCUs due to the heavy teaching workloads and the individualized student attention
(Scott, 1981). Thus, the factors that make HBCUs effective at graduating students may
be an impediment when it comes to pursuing a research agenda. Agesa’s study on
economics research at HBCUs confirms that a substantial portion of the economics
departments at HBCUs are not engaged in scholarly activity in terms of published
research. However, she also notes that this is not an attribute unique to HBCUs. In a
study of liberal arts colleges, Agesa cites McCaughey’s finding that 38% of the faculty
never published in a professional journal, 69% had never published a book, and 49%
were not engaged in research that would lead to a publication (Agesa, Granger, & Price,
1998). The importance of these findings is that firms seek interaction with universities
primarily for research purposes and to find skilled personnel in science and technology.
The demand for skilled personnel is a theory that explains development of science and
technology at universities. The effectiveness of HBCUs in fulfilling this role may be a
strategy which HBCUs can exploit to further develop their science and technology
capacity.
36
2.6 Summary
A review of critical components in HBCU history that relate to science and
technology reveal a niche that HBCUs have capitalized on – graduating students in
science, engineering and business fields. The niche evolved over time due to
circumstances unique to African-Americans. A tradition of emphasis on teaching was
created from the large number of African-Americans that desired an education after being
freed by the Civil War. Given the demand, a large number of Black colleges focused on
producing teachers. A culture developed that emphasized faculty attention to student
achievement. This culture enables HBCUs to graduate African-American students in
greater numbers than TWIs. The ability to graduate students in greater proportions
extended itself to the science, math, engineering and business fields.
What strategies have been used or have been proven useful in developing this
niche and other elements of science and technology? Until the late 1960s, HBCUs were
opposed in principle (by industrial philanthropists who opposed higher education for
Blacks), segregated (by legal and de facto racism in the South), and underfunded
(disregarded in the Golden Era of funding for science and research). All three factors run
counter to the establishment of linkages. Yet events have transpired that have overcome
some of these factors.
Policy has been critical. The Higher Education Act of 1965 became the basis for
a number of policies that attempted to redress the inequities that resulted from
segregationist policies. Examples include the initiation of funding to land-grant colleges
and universities, federal aid to students that attended HBCUs, and the White House
37
Initiative on HBCUs. A multitude of policies, both formal and informal emerged from the
Civil Rights era in support of HBCUs.
The need for collaboration and partnerships also played a critical and unique part.
The development of the United Negro College Fund in 1944 was a unique and creative
response to the vulnerability experienced by many Black private colleges and
universities. However, this response reflected an internal collaboration. Linkages with
external entities such as corporations, other universities and the federal government, even
on the basic level of communication and interaction did not begin until the 1960s-1970s.
Demand for sciences and engineering graduates also appears to be a factor. Data
of graduates as early as 1987 indicate an already large increase in the number of students
at HBCUs selecting a science or engineering related major. A body of literature has
emerged on the selection of career choices by Black students. Although many
conjectures have been made, there are no empirical studies found by this author to
indicate whether students selected science and technology fields by personal
encouragement, advertising or marketing from various sources or whether they perceived
a lucrative job market available and, therefore, chose the field (Llewellyn & Usselman,
2001; Thomas, 1984).
Leadership always plays an important role in change. It is difficult to separate the
influence of leadership from other factors. This historical review has purposefully
focused on trends, shifts, and factors that have been experienced or exhibited by groups.
Thus, the factor of leadership has been downplayed. The creation of the UNCF, an
innovative response to a serious problem by Patterson is a notable exception.
38
The strategy of proximity does not appear to be a notable strategy thus far in
HBCU development of science and technology.
HBCUs have overcome some of the challenges stemming from a legacy of a large
illiterate population and the opposition of industrial philanthropists to higher education
for Blacks. As strengths, they have developed an emphasis on teaching, demonstrated the
ability to collaborate with other HBCUs, and exploited a niche in graduating students in
science and technology fields. While they have overcome much, there is still change and
improvement that needs to occur. HBCUs must move from a teaching agenda to
university missions that includes research. And while they have begun to develop
linkages they still face obstacles and challenges that constrain their competitiveness.
HBCUs need to continuously adapt, improve and be flexible in order to be or remain
competitive with their peers and counterparts. This study is being conducted to
determine whether linkages has become an integral part of HBCUs’ development of
science and technology.
39
CHAPTER 3 LITERATURE RELATING TO THE DEVELOPMENT OF SCIENCE AND
TECHNOLOGY AT UNIVERSITIES
Chapter 3 identifies the key theoretical propositions and literature reviews related
to the development of science and technology at universities. Several bodies of literature
– higher education, the national systems of innovation, and competitive advantage –
converge to offer a hypothesis for this study. Each offers a critical piece to understanding
how science and technology develops at universities.
An overlap of agreement on the concept of linkages (defined fully in Chapter 4)
exists among the three bodies of literature. According to the literature on higher
education, the evolution of universities from storehouses of knowledge to producers of
knowledge and innovation is occurring as a result of the intimate links between
universities and firms. Innovation systems literature takes a different perspective on the
same subject. It takes a systems perspective and looks at the process. Linkages between
the university and a number of other participants create an environment in which
innovation emerges and hopefully flourishes. The competitive advantage literature is
concerned neither with universities nor innovation per se. It provides a dynamic
interpretation by which industries (and in this study we include universities as an
industry) can change or adapt to achieve certain ends. The concept of clusters or linkages
between firms/universities and the entities with which they conduct business is critical to
the way in which firms/universities learn, modify and adapt new strategies and
innovations to become better and more competitive.
40
Several theories emerge from the literature that explains the development of
science and technology at universities. They include the influence of government policy,
the impact of internal university leadership, the effects of spatial proximity, and the
demand for skilled science and technology personnel. The literature provides evidence
for each; this study attempts to discern whether one theory operates more strongly than
the others at HBCUs.
Finally, the chapter looks at gaps and issues within the literature bases as an
indication of what may not have been considered. They also represent areas where future
studies may be conducted. The Chapter concludes with contributions that a study of this
nature can make to the literature.
3.1 Theoretical Bases
There are several literature bases (higher education, innovation, and competitive
advantage) that blend together to shed insight into universities and their role in
developing and maintaining science and technology programs. Certain points seem to
emerge in all three literature bases – the increasing entrepreneurial nature of universities,
the significance of research and innovation to economic growth and therefore the greater
significance of the institutions that produce it, and the importance of competitiveness to
institutional or industry growth.
3.1.1 Literature on Higher Education
Universities are dynamic institutions. Originally, universities were conceived to
preserve culture and transmit it to the next generation. In that context, the focus was
primarily on storing knowledge and graduating students; trained students were considered
41
the primary “product” of universities. In Europe, universities were considered ‘elitist’;
they were institutions that defined and educated either the professionals or the rich and
upper class. In contrast, the different approach taken by the relatively new country, the
United States, sowed the seeds for changes that would take place in higher education. In
the United States, the federal government rejected the European system of elite
universities and elected to leave education and its funding to the states. This led to a
multitude of secondary schools (high schools), colleges, and universities in the 1800s,
most of which were weak (Lucas, 1994). Their educational offerings included
elementary level courses; they were not considered as operating with the same
educational rigor as European universities.
The divergence in educational structures is key to understanding how the
American system evolved into a world renowned educational system. The European
universities protected their role as the guardians and storehouses of knowledge by
upholding high standards and rigorous entry into the system. Enrollment rates reveal the
result of different approaches. In 1910, France had 16 universities enrolling 14,000
students while America had 1,000 colleges and universities enrolling 333,000 students
(Graham & Diamond, 1997). In Germany, distinguished professors or Chairs dominated
the educational environment and its research and personnel while administrative
decisions were made by ministry officials. The European system that proved too rigid to
accommodate the upcoming pace of scientific change. In contrast, openness-to-change in
the competitive educational system of the United States enabled American universities to
exploit and take advantage of the changes in science in the 1940s and 1950s while the
42
European system fell far behind. Some claim the European-like resistance to change can
be attributed to many HBCUs. An emphasis on traditional education at the expense of
pursuing scientific and engineering or technological opportunities has impeded progress
at HBCUs while some TWIs have moved ahead (see Chapter 2).
3.1.2 Universities in the Present
The 1950s to the present constitutes the second phase of changes within the
higher education system. World War II led to dramatic changes in almost all aspects of
society. As universities evolved, they took on a new mission – creating new knowledge.
A new product emerged – research. Research for the purposes of war produced many
new products including nuclear technology, radar, and cryptography that secured for the
United States not only their victory in WWII but also the subsequent control of the arms
race in the world. Vannevar Bush underscored the preeminence of science with his
famous report that eventually triggered federal support for research, “Science – the
Endless Frontier”. It was a highly influential policy paper that made a forceful Polanyi
argument (i.e., developments in science are independent of economic influence). It called
for the independence of scientific research conducted by peer review removing it from
the control of industry or government (Laursen & Salter, 2002).
At the same time, America was ripe for the concept that every student should be
entitled to a college education regardless of ability to pay. Higher education became a
highly competitive industry with huge infusions of federal dollars, greater numbers of
students, and strong market demand for research and innovations (Martin & Etzkowitz,
43
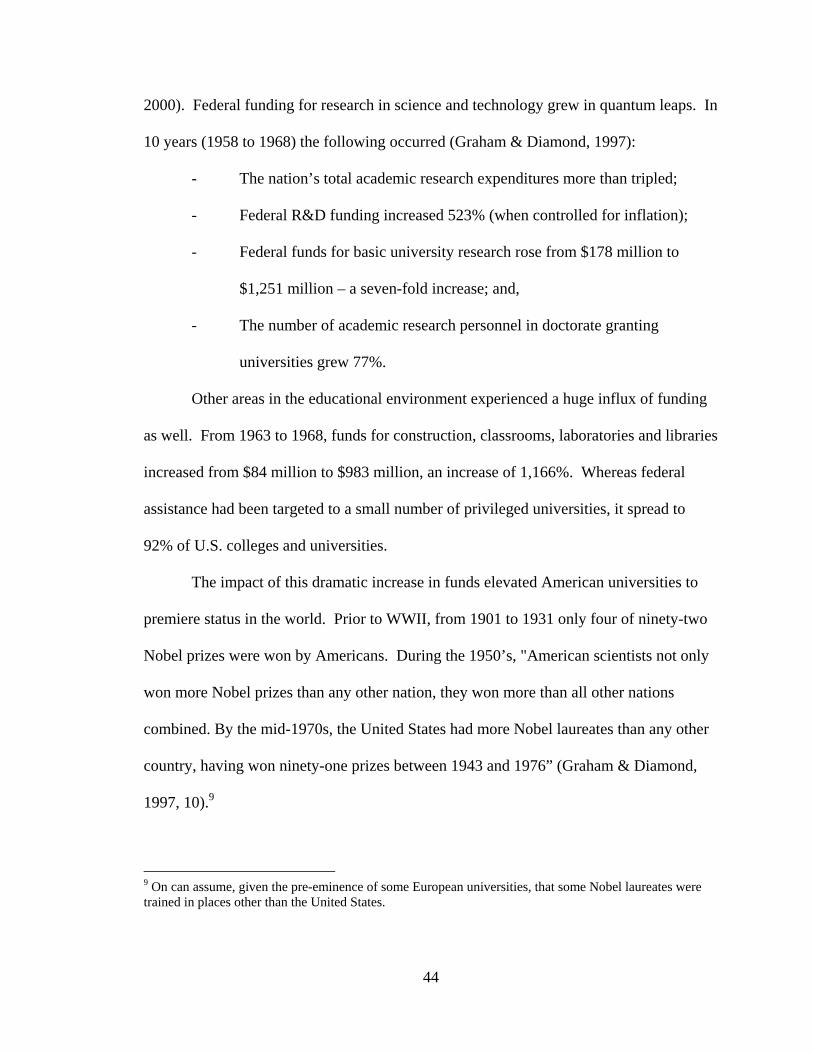
2000). Federal funding for research in science and technology grew in quantum leaps. In
10 years (1958 to 1968) the following occurred (Graham & Diamond, 1997):
- The nation’s total academic research expenditures more than tripled;
- Federal R&D funding increased 523% (when controlled for inflation);
- Federal funds for basic university research rose from $178 million to
$1,251 million – a seven-fold increase; and,
- The number of academic research personnel in doctorate granting
universities grew 77%.
Other areas in the educational environment experienced a huge influx of funding
as well. From 1963 to 1968, funds for construction, classrooms, laboratories and libraries
increased from $84 million to $983 million, an increase of 1,166%. Whereas federal
assistance had been targeted to a small number of privileged universities, it spread to
92% of U.S. colleges and universities.
The impact of this dramatic increase in funds elevated American universities to
premiere status in the world. Prior to WWII, from 1901 to 1931 only four of ninety-two
Nobel prizes were won by Americans. During the 1950’s, "American scientists not only
won more Nobel prizes than any other nation, they won more than all other nations
combined. By the mid-1970s, the United States had more Nobel laureates than any other
country, having won ninety-one prizes between 1943 and 1976” (Graham & Diamond,
1997, 10).9
9 On can assume, given the pre-eminence of some European universities, that some Nobel laureates were trained in places other than the United States.
44
An enormous economic payoff for the national economy resulted from the
innovations in science and technology. Science and technology continue to be the
forward troops in the quest for economic growth. It pulled the US out of its doldrums in
the 1970s into the forefront of tremendous technical advances and economic growth
through innovations in medicine, computers, biotechnology, television in the 1990s
(Malecki, 1997). The effect of huge infusions of federal funding has transformed
American colleges and universities causing them to emphasize research, innovation and
collaboration with industry and government (Adams, 2001).10
3.1.3 The Future - the Entrepreneurial University
The emphasis on research with the reward of substantial federal funding made
many universities invest in changes to their infrastructure in order to increase their
science and technology productivity (Graham & Diamond, 1997; Pavitt, 2001). Policy
also responded to market demand. In 1980, Congress approved the Bayh-Dole Act which
permitted universities to “own” and profit from their inventions. Prior to this point, there
had been little motivation for universities to engage in research leading to commercial
innovation. A literature base on patents, leasing and university commercialization has
been built that explores the significance and results of this policy (Hu & Jaffe, 2001;
Kash & Kingston, 2001; Mowery, Nelson, Sampat, & Ziedonis, 2001). The number of
patents from universities has increased dramatically since the Bayh-Dole Act (Laursen &
Salter, 2002; Pavitt, 1998). Offices of sponsored research (or similar positions) now exist
at most universities in the United States. While only a small number of colleges and
10 As is true of many professions, a small proportion of U.S. colleges and universities are responsible for the bulk of the research conducted in the United States.
45
universities experience a significant revenue base from their patents or inventions,
research is still seen as a positive benefit for the university due to its value to industry,
associated lucrative partnerships that form, attractiveness for students, and so forth.
As a result of such influences, universities have begun to act more and more in
their own best interest. Their behavior simulates industry/firm behavior (Crow & Tucker,
2001; Hall, 2000; Laursen & Salter, 2002; Martin & Etzkowitz, 2000). The rise of the
“knowledge driven economy” is causing science to become more dependent on the
economy and vice versa. A central point within the theory behind a knowledge economy
is that the way new ideas are generated, diffused and used in the economic system can
have important implications for national competitiveness. New ideas found to be
economically useful are often generated through investments in the science system.
Many countries have made efforts to link their science system to the economic needs of
industry (OECD, 1999). Distinctions among the roles of the actors involved (government
agencies, industry, and scientists and researchers) are become more blurred as
consultants, contractors and projects interact. Theories such as Mode 2 (Gibbons et al.,
1994), triple helix (Etzkowitz et al., 1998), and the entrepreneurial university (Martin &
Etzkowitz, 2000) have arisen to describe this evolution. The linkages between these
actors are becoming more complex leading some to assert that universities are becoming
more entrepreneurial (Etzkowitz et al., 1998; Jacob, 2001; Kjolhede, Husted, Monsted, &
Wenneberg, 2001).
46
3.2 Literature on National Systems of Innovation
The literature on national systems of innovation complements the literature base
on the evolving entrepreneurial nature of universities. It attempts to understand the
systemic conditions necessary for the development of innovation. Developed almost
simultaneously by three academicians who worked together on various projects, the
national systems of innovation literature describes universities as one of the three major
institutions necessary for innovation to occur (industry and government are the other two
(Freeman, 1988; Lundvall, 1992; Nelson, 1993). This literature base emphasizes the
triangular dynamics among university, government and industry in creating conditions
for innovation. The dynamic is also called linkages. The literature on linkages examines
the nature of interaction between the three aforementioned major actors, the environment,
and the culture. It brings more of an anthropological and sociological perspective on
research, universities and innovation than the other literatures mentioned.
Key to this model is the idea of linkages, relationships, and networks.
Repeatedly, studies indicate that the difference in socio-economic performance between
systems or economies is often related to the network of relationships or linkages that
evolve in that particular region to support the process of innovation. This historical
development of relationships is variously described as associations/network (Cooke &
Morgan, 1998), as culture (Saxenian, 1994), as trust (Malecki, 1997), as systems (Nelson,
1993), as linkages (de la Mothe & Paquet, 2000), and
relationships/interdependencies/collective action (Storper, 1997). Although institutions
are often thought of as the primary vehicles of innovation, this literature argues
47
otherwise. It contends that the nature of relationships/linkages between various
institutions ignites the innovative forces which Schumpeter insisted was a key element in
economic growth (Schumpeter, 1934).
Richard Nelson’s work in 15 countries, considered one of the premiere studies on
innovation, not only identified the three major institutions involved but also differentiated
the units of study (countries) across different criteria (size, income, geographical
location) to enable comparison on different aspects. Nelson and subsequent studies
determined that certain factors were important in shaping the system of innovation that
evolved in each country. These factors included natural resources, national security
concerns (including but not limited to military), aggressive industrial development,
competitive firms, an educational base that provided knowledge and skills to support
industry needs, and a package of fiscal, monetary, and trade policies that supported
competition, education and innovation (Malecki, 1997; Nelson, 2000).
Linkages, particularly between university and industry, are crucial to the
development of an innovative system. In order to be competitive, firms must continue to
either develop new products or improve on existing processes and products. This
requires research. While firms conduct the bulk of research and development, they are
also dependent on basic research conducted at universities. Thus, each country/regional
system becomes defined based on what institutions are responsible for its research, the
funding required to support it, the level of funding provided, and the linkages that
develop between institutions to diffuse/transmit knowledge and information (Markusen,
Hall, & Glasmeier, 1986; Storper, 1997). Thus, on one hand you have a system like
48
Italy’s where research is conducted amongst small firms interacting with little influence
or resources from government. The innovative flexible products and process that results
are very different from those in Japan’s. There, research is a highly supported
government priority resulting in, as an example, a high technology, automated assembly
lines.
What Nelson and other studies indicate is that the existence of various factors
such as a highly literate work force or natural resources or a progressive government
policy is not enough to stimulate innovation. There must be linkages between institutions
that facilitate collaboration to support industry. Industries within different countries that
accomplish this become competitive.
Other studies have taken the theory a step further by examining the spatial aspects
of innovation. Researchers such as Varga, Saxenian, and Feldman study the effects of
spatial concentration of high technology regions (Feldman, 2002; Saxenian, 1994; Varga,
2000). A few studies look at spinoffs and entrepreneurial startups (Malecki, 1997), some
focus on technology or knowledge transfer spillovers (Acs, FitzRoy, & Smith, 1996), and
others measure the spatial distribution of innovation and the influence of being in a high
technology area (Varga, 2000).
By identifying important factors, as Nelson did in his worldwide study in 1993, he
hoped potentially innovative regions could be identified and supported. Others have
contributed to Nelson’s work with their own studies leading to a large body of work on
innovation. While the strengths of this literature base is its identification of important
49
factors, its weakness lies in not clearly defining the interrelationships between actors that
are necessary for the development of innovation.
3.3 Competitive Advantage Literature
In order to describe and explain the changes occurring in science and technology at
universities, a concept was needed that was both dynamic in nature and explanatory in
practice. The economics literature on competitive advantage plays an important part by
providing an understanding of the dynamic nature of change and how strategies, niches,
and trends develop (M. Porter, 1990; Tsipouri, 2001). A team led by Michael Porter
conducted a study of 111 narrowly defined industries within ten nations. Looking for
underlying themes across widely varying countries and environments, the theory of
competitive advantage evolved based on the critical concept of “clusters.” Porter defines
clusters as
industries related by links of various kinds…That is, successful industries or
companies are often geographically close, they build upon technological
innovation, and they operate in a system of vertical activities that includes
relationships with upstream suppliers and downstream distributors… They also
provide a framework for understanding why national industries wither and die.
(M. Porter, 1990, p 131).
This dissertation takes the theory of competitive advantage and applies it to the
university (depicted in the higher education literature) and the system in which it
operates (depicted in the system of innovation literature) to understand the current
context of universities and their ability/capacity to change; i.e., to develop a strategy.
50
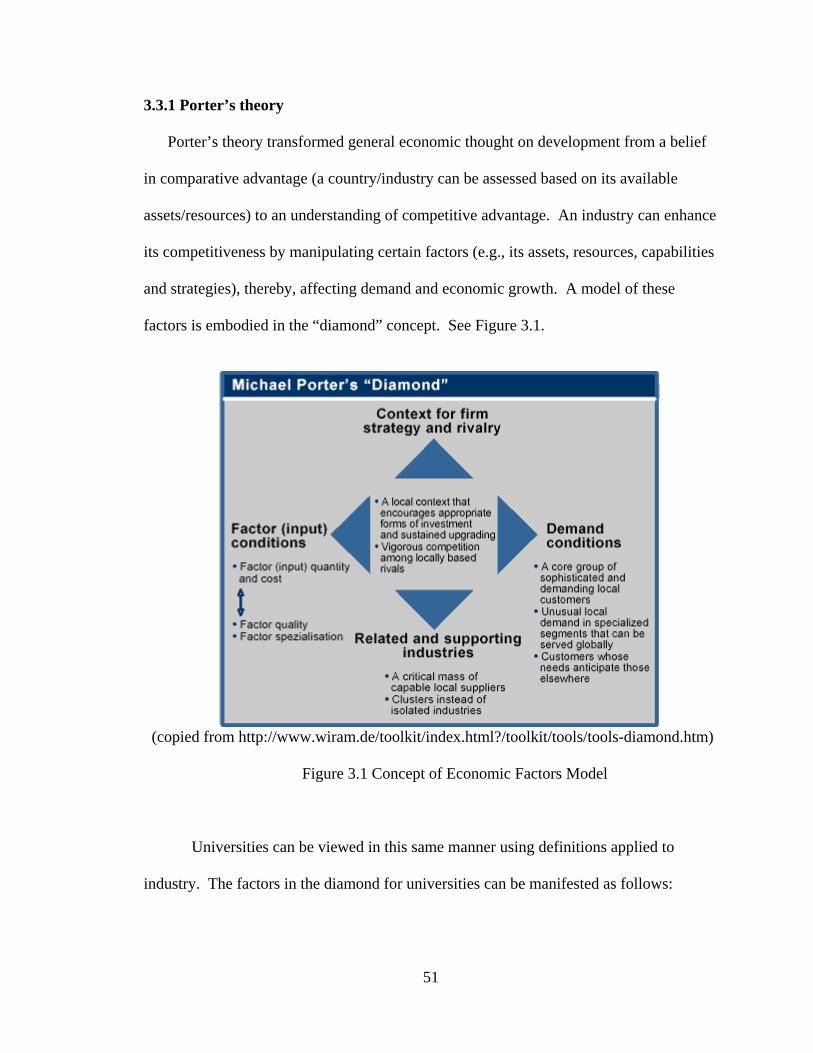
3.3.1 Porter’s theory
Porter’s theory transformed general economic thought on development from a belief
in comparative advantage (a country/industry can be assessed based on its available
assets/resources) to an understanding of competitive advantage. An industry can enhance
its competitiveness by manipulating certain factors (e.g., its assets, resources, capabilities
and strategies), thereby, affecting demand and economic growth. A model of these
factors is embodied in the “diamond” concept. See Figure 3.1.
(copied from http://www.wiram.de/toolkit/index.html?/toolkit/tools/tools-diamond.htm)
Figure 3.1 Concept of Economic Factors Model
Universities can be viewed in this same manner using definitions applied to
industry. The factors in the diamond for universities can be manifested as follows:
51
Factor Conditions for universities would include the state/regional/city economic
environment, general education environment, funding, and other factors that are part of
the local spatial and social environment.
Related and Supporting Institutions would be not only those institutions that provide
input to universities (government agencies and secondary schools), but also institutions to
which universities provide their output (industry and government).
Strategy, Structure and Rivalry would behave as does industry. Universities exhibit an
array of structures (private, public, landgrant) and levels (doctoral granting universities,
associate colleges, professional degree granting, and so forth) that result in a competitive
rivalry for students, faculty, resources, funding, publications, research and so forth.
Strategies used to compete would include the theories presented – leadership, policy,
proximity and linkages.
Demand Conditions refers to the nature, composition, growth, size and quality of the
domestic market’s needs and pressures for research and trained personnel.
3.3.1 Application to Industry
In order to understand how competitive advantage theory applies to universities, it is
appropriate to very briefly explain how the theory works with firms. Porter takes several
case studies to explain the chain of events that causes the rise of an industry. One of the
strongest empirical findings to emerge from the research was an “association between
vigorous domestic rivalry and the creation and persistence of competitive advantage in an
industry” [Porter, 1990 #107]. Using case studies of the printing industry in Germany,
the ceramic tile industry in Italy, the robotic industry in Japan and several others, Porter
52
reveals that the linkage between a number of actors (suppliers, distributors, consumers,
and competing firms) is crucial to obtaining competitive advantage. The process of
growth generally starts with one firm or individual that innovates or significantly
improves upon a product. The improvement or innovation enables the company or
individual to obtain an “edge” over its competitors. As the product is diffused into the
market, other companies desiring to maintain their share of the market adopt or adapt to
the new technology. Suppliers are important actors in this diffusion of information and
the adoption of new technology or innovation. They interact with various companies in
the same product line and become a frontline force for knowing what is new and the
source of innovation. Companies often choose to locate closer to the “first mover” in
order to better understand the new technology and how it works. As additional
companies adapt to the new technology, they are able to offer similar products or
services. Feedback from consumers is provided by distributors who are liaisons between
firms and users. They relate information on the level of demand and the comments,
problems and suggestions from end users. This information is used to modify and
improve the product which in turn, is used by the company to maintain or obtain a
competitive edge. A vigorous rivalry emerges between the various companies aided by
the exchange of information that occurs in close settings as a result of the linkages
between suppliers, distributors, retail outlets, consumers, and manufacturers. In order to
retain market share corporations stimulate demand, work with suppliers and distributors,
and manipulate strategies to become more efficient. The rivalry contributes to an
53
increasingly more efficient and improved performance, which ultimately results in a
competitive advantage.
3.3.2 Application to Universities
Universities are not profit-oriented institutions yet they mimic firms in using
strategy to improve their status. Universities compete with one another for better faculty
and students, more grants and contracts, more production of research, and higher
rankings. The transformation of inputs such as students, faculty, facilities, equipment,
and applications of funding into outputs such as graduates, research, publications, and
government and industry funding occurs through networks and clustering (linkages)
between universities, government and industry.
It is in the area of strategy that the competitive advantage theory can be applied to
universities because they are dynamic institutions. Although it is unclear how much
entrepreneurship can be attributed to the Bayh-Dole Act of 1980, it is clear that
entrepreneurial activity at universities has increased. “Among the 84 universities that
have responded consistently to AUTM’s surveys over the period 1991-200, disclosures of
new inventions by academic investigators shot up an impressive 84%, new patent
applications rose 238%, license agreements 161%, and royalties more than 520%”
(Washburn, 2005).
As one of many examples, Rosenberg describes how Stanford introduced
computer science as a curriculum in the 1960s by bringing in private-sector electrical
engineers to teach integrated circuitry (Rosenberg, 2003). Other American universities
followed Stanford’s lead and began to introduce computer science curriculum at a time
54
when no other foreign universities were considering it. American universities obtained a
similar advantage with their support of bio-medical research. Support for bio-medical
research has catapulted the life sciences (biology, medicine, agriculture) over the physical
sciences (physics, chemistry, astronomy) as the dominant research concern. In 2000, “the
latter received less than 10% of total academic R&D spending in the U.S. (total was
$30.2 billion in 2000), while engineering disciplines (including computer science)
received less than 20%, and the life sciences received well over half of the total”
(Rosenberg, 2003). American universities have responded to the commercial
opportunities available in both computer science and bio-medical research quicker than
their European or foreign university counterparts (Rosenberg, 2003).
As stated above, American universities are not profit-oriented and, therefore, do
not mimic firms in every component of the diamond. However, American universities
are flexible. They enact strategies to improve their standing. Linkages, a central
component of clusters, play a part in universities’ ability to make those changes. The
collaborations/linkages between universities, industry, and government provided the
means to introduce new curriculum, obtain support to shift to new fields like life
sciences, and so forth.
This study addresses the question of what strategies HBCUs should adopt to adapt
to an increasingly science and technology oriented society. Linkages are highlighted in
the competitive advantage literature particularly through the concept of clusters.
Proximity and economic benefit work together leading to localization economies. Social
capital gets built through the networks and relationships that evolve from proximity. The
55
value added benefits accrue to firms causing them to experience benefits greater than
what would result from its own efforts. How does this work for universities?
Linkages in the form of Networking or Clustering are defined as at least three
institutions working together formally or informally to gain some form of benefits. Thus,
an input like students can be transformed into graduates by the networking or clustering
of an HBCU. The efforts of an HBCU, a government agency and another university may
result in a dual-degree program which results in highly trained graduates. Or the
collaboration between industry, government and an HBCU that results in support of a
research program or an Institute may turn the inputs of faculty, laboratories, and funding
applications into outputs such as research, publications, and additional funding.
Other strategies universities can adopt are presented later in this paper. Based
upon the advantages presented by Porter and the benefits presented in other literature
bases, linkages appear to be a successful strategy for universities and HBCUs to adopt to
enhance science and technology development.
3.4 Summary of the Literature
The intersection of the three literature bases depict universities as dynamic
institutions that are becoming more like industry with research as their “product” and
linkages as their means to change/grow.
Each body of literature emphasized the importance of “linkages” to the success of
innovation, economic growth, and productivity. By taking this intersection of the three
literature bases, one can analyze the position of HBCUs, understand what factors
56
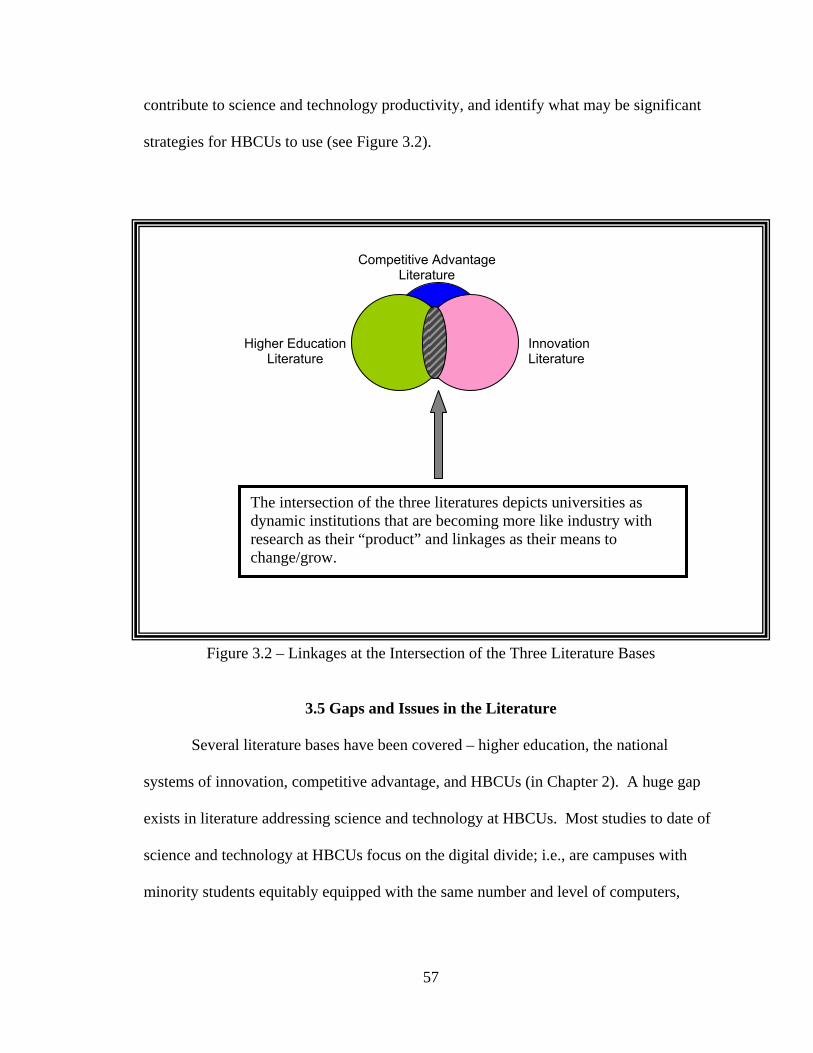
contribute to science and technology productivity, and identify what may be significant
strategies for HBCUs to use (see Figure 3.2).
Higher Education Literature
Innovation Literature
Competitive Advantage Literature
The intersection of the three literatures depicts universities as dynamic institutions that are becoming more like industry with research as their “product” and linkages as their means to change/grow.
Figure 3.2 – Linkages at the Intersection of the Three Literature Bases
3.5 Gaps and Issues in the Literature
Several literature bases have been covered – higher education, the national
systems of innovation, competitive advantage, and HBCUs (in Chapter 2). A huge gap
exists in literature addressing science and technology at HBCUs. Most studies to date of
science and technology at HBCUs focus on the digital divide; i.e., are campuses with
minority students equitably equipped with the same number and level of computers,
57
Internet access, optic fiber and cable connections, and so forth compared to TWIs. The
larger question of what this equipment is used for (research, innovation, and economic
growth) has not yet been addressed.
Another issue/gap exists in the application of an economic concept (competitive
advantage) to a nonprofit institution. This is an interesting and controversial issue since
it is not yet generally accepted that universities are behaving in an entrepreneurial
manner. A limited number of studies applying the concept of competitive advantage to
universities are coming to light. Researchers at OECD (Organization for Economic
Cooperation and Development) paved researcher’s way by crossing two disciplines –
economics and science and technology. This encouraged academicians and practitioners
to put into practice the concepts of clusters enabling the development of science,
technology and innovation.
A weakness of the literatures is the vagueness of linkages as a concept. Everyone
seems to understand and acknowledge the necessity of linkages. Few seem to understand
or be able to explain how they work, what precisely they are, or to establish a causal
nature between linkages and economic growth or impact. Thus, gaps exist on several
levels – defining linkages, categorizing them, explaining how they are causal agents, and
understanding how they work on an intimate level.
The subject of HBCUs also suggest issues on several levels. In addition to the
challenges faced by all universities, HBCUs present questions caused by their unique
nature. Have they uncovered potentially new and different ways of conducting research
due to the constraints caused by a lack of funding, resources and equipment? Do the
58
tools and techniques developed by the larger population of universities work the same or
differently in the HBCU environment? Has the land-grant nature of HBCUs enabled
them to develop relationships with industry more easily? Do they exhibit more of an
entrepreneurial nature than other universities? Do or should HBCUs seek to mirror
majority universities in their approach to science, technology and research? These are just
some of the questions that come to mind when examining science and technology at
HBCUs. As information accumulates, it will become easier to see where HBCUs diverge
from the general population of universities and where they are similar. HBCUs represent
an interesting arena of study for future scholars.
3.6 Contributions to the Literature
This dissertation contributes to the literature by addressing a few of the
aforementioned gaps and issues. This study specifically addresses an important gap in
the literature – the development of science and technology at a set of universities with a
historical orientation and culture that differs from most universities. This is important
from an internal and external perspective. The data presented will determine how
HBCUs are faring in generally accepted science and technology indicators. Also, the
information gathered will show how HBCUs, with underfunding, disparities in resources
and equipment, and with a unique student body, approach developing science and
technology. Internally, HBCUs will be able to use this information as a means of
understanding what tools and strategies they can currently (and potentially) utilize.
Externally, other agencies can use the data to better understand what strengths and
weaknesses are exhibited by HBCUs and what needs can/should be targeted.
59
This study takes the competitive advantage concept and applies it to a unique
subset of universities - HBCUs. While the contribution is not novel, it will provide
further insight about how the competitive advantage concept works when applied to
universities.
Furthermore, this study utilizes a new variable of measurement that is not
generally used when measuring science and technology productivity, research or
innovation at universities: number of graduates in science and technology related fields.
All studies on innovation and research acknowledge the importance of literacy and a
skilled workforce. However, universities’ primary output, graduation of students, should
be considered a factor when evaluating their production and productivity. In addition,
graduate students in science and technology fields are an important ingredient in the
development of innovation, research, and science and technology. They have the
potential to attract businesses, share information, contribute to increasing industrial
competitiveness and foster a culture of science and technology growth.
60
CHAPTER 4 LINKAGES AND RIVAL STRATEGIES
This chapter clarifies and categorizes the concept of linkages. The term “linkages” is
frequently used but rarely defined. The number of ways in which the term is used can be
dazzlingly confusing and quite often the term is used without efforts to constrain and
categorize its meanings. In order to clarify the definition of linkages and to utilize the
concept as a meaningful variable, this paper takes the concept of linkages as used in its
various forms and groups them into three categories – Initial
(Communication/Interaction), Expanding (Relationships/Contracts) and Mature
(Networking/Clustering). Each phase builds on the other; that is, the Expanding phase
includes elements of the Initial phase while the Mature phase finds the factors present in
the other two, albeit with greater depth and impact. This study assumes that linkages
affect science and technology productivity and that it is a strategy HBCUs should adopt.
Although linkages are recognized at several different levels, this study
operationalizes linkages as Networking and Clustering (the Mature level). At the two
lower levels – Communication/Interaction and Relationships/Contracts, the ability to
separate linkages from other strategies becomes too difficult because communication and
relationships are embedded in many strategies. Thus, Linkages in this dissertation study
focuses on Networking and Clustering.
4.1 Linkages as a Concept
Linkages are particularly useful to those interested in the development of science
and technology. Several sources offer basic definitions. Webster’s Dictionary defines it
61
62
as “the act of linking; a system of links; the fact or state of having something in
common.” The Council of Science and Technology Advisors in Canada offers the
following definition, “The concept of s&t linkages is about fostering relationships across
the national science and innovation system in the pursuit of s&t for mutual interest and
benefit….Linkages can cover the full spectrum of relationships, from the simple sharing
of information, to broader, more integrated networks, to more formal, sophisticated
collaborative arrangements” (Sussex Circle Inc./Le Cercle Sussex Inc., 2003). The
sharing of information, depending on the milieu, is also referred to as technology transfer,
spillovers, learning capital, knowledge economy and so forth. Linkages are needed for
the diffusion of innovation. When a first-mover (the company that first introduces a new
product) innovates, the individual company benefits. As the technology transfers to other
companies, economic benefits spread, industry leaders develop and the region or a
society benefits. Hence, linkages are a basic, influential, pervasive and critical concept.
The following diagram (Figure 4.1) categorizes linkages based on the different uses and
meanings presented in various studies and books. A fuller description of each category
follows.
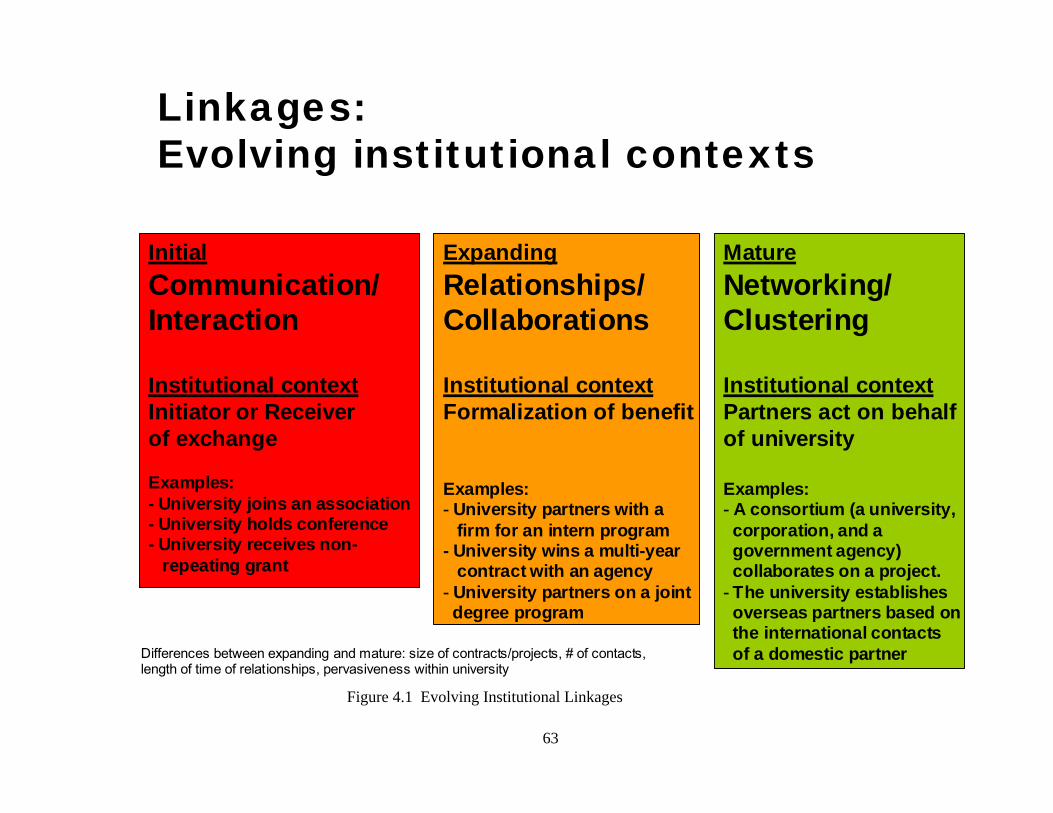
63
Linkages:Evolving institutional contexts
InitialCommunication/Interaction
Institutional contextInitiator or Receiver of exchange
Examples:- University joins an association- University holds conference- University receives non-
repeating grant
ExpandingRelationships/Collaborations
Institutional contextFormalization of benefit
Examples:- University partners with a
firm for an intern program- University wins a multi-year
contract with an agency- University partners on a jointdegree program
MatureNetworking/Clustering
Institutional contextPartners act on behalfof university
Examples:- A consortium (a university,corporation, and a government agency)collaborates on a project.
- The university establishesoverseas partners based onthe international contactsof a domestic partnerifferences between expanding and mature: size of contracts/projects, # of contacts,
length of time of relationships, pervasiveness within university
Figure 4.1 Evolving Institutional Linkages
D
4.2 Initial Stage
In the Initial stage, linkages stem from Communication/Interaction. They can be
thought of as “flows” between parties. These flows can take the form of information,
communication, knowledge, products and so forth. Linkages in the initial stage generally
do not have significant impact on producing outputs or outcomes. They represent the
early stages of communication or interaction that over time becomes more important.
Malecki uses the term linkages in a number of different ways – from flows of
information, resources, transport and data resulting in multiplier effects; to flows of
capital and labor for interregional growth; to flows of services from one firm to another
(Malecki, 1997). Malecki’s terminology can be summed up to be a flow of goods or
services between parties to accomplish a purpose.
The national system of innovation theory emphasizes the use of linkages as
interaction (formal and informal) between institutions…and the flows of intellectual
resources between institutions (de la Mothe & Paquet, 2000). Markusen used linkages to
describe the flow of information that resulted in Silicon Valley from employees sharing
their knowledge base as they moved from one company to another or shared meals or
other personal interactions (Markusen et al., 1986). OECD describes the “science link”
as the interface or flow between the science system and the enterprise sector (OECD,
1999).
Examples of universities using linkages in the initial stage would include holding
or attending a conference, joining an association, participating on a panel, or obtaining a
non-repeating grant. Scientific knowledge can be accessed and used in a variety of ways
– published in journals, embedded in new instruments and methodologies, transmitted via
64
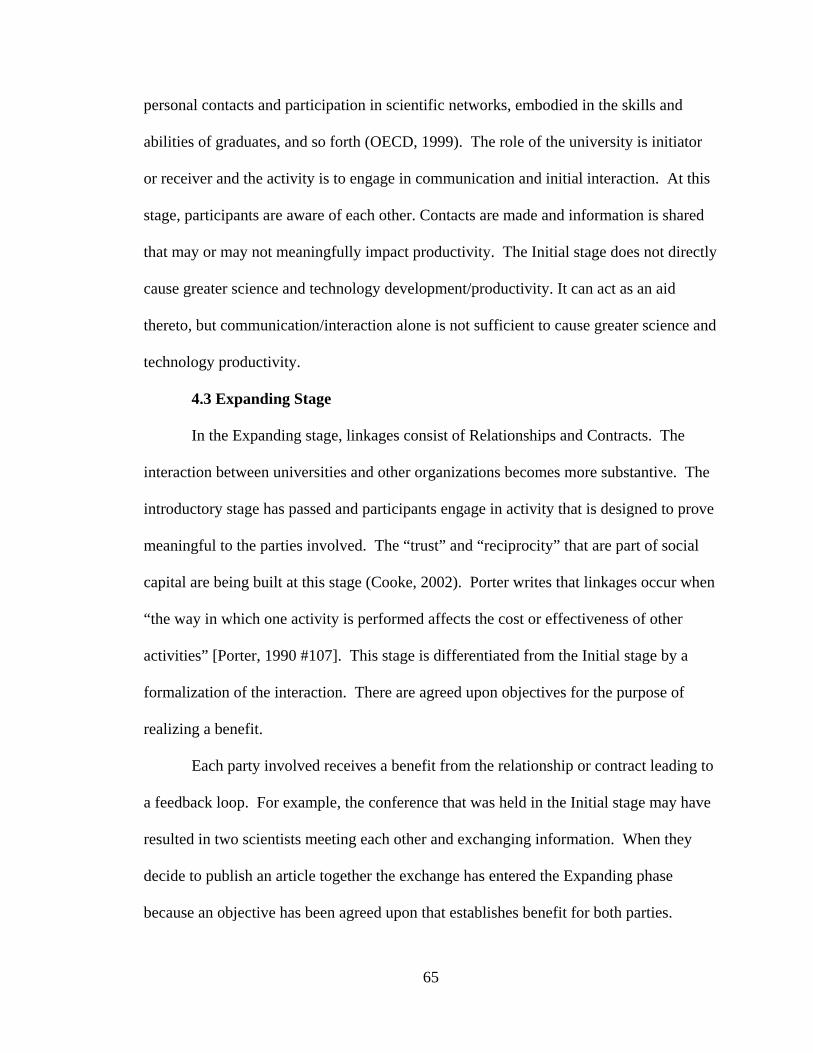
personal contacts and participation in scientific networks, embodied in the skills and
abilities of graduates, and so forth (OECD, 1999). The role of the university is initiator
or receiver and the activity is to engage in communication and initial interaction. At this
stage, participants are aware of each other. Contacts are made and information is shared
that may or may not meaningfully impact productivity. The Initial stage does not directly
cause greater science and technology development/productivity. It can act as an aid
thereto, but communication/interaction alone is not sufficient to cause greater science and
technology productivity.
4.3 Expanding Stage
In the Expanding stage, linkages consist of Relationships and Contracts. The
interaction between universities and other organizations becomes more substantive. The
introductory stage has passed and participants engage in activity that is designed to prove
meaningful to the parties involved. The “trust” and “reciprocity” that are part of social
capital are being built at this stage (Cooke, 2002). Porter writes that linkages occur when
“the way in which one activity is performed affects the cost or effectiveness of other
activities” [Porter, 1990 #107]. This stage is differentiated from the Initial stage by a
formalization of the interaction. There are agreed upon objectives for the purpose of
realizing a benefit.
Each party involved receives a benefit from the relationship or contract leading to
a feedback loop. For example, the conference that was held in the Initial stage may have
resulted in two scientists meeting each other and exchanging information. When they
decide to publish an article together the exchange has entered the Expanding phase
because an objective has been agreed upon that establishes benefit for both parties.
65
Another example could be a conversation that starts between two individuals resulting in
a corporation agreeing to a summer intern program composed of students from the
university. Agreement is reached on the activities and boundaries of the relationships
whether it be formal or informal.
Examples of linkages at the Expanding stage include the university partnering
with a firm for an intern program, two scientists at different universities agreeing to co-
publish an article, a federal agency granting a multi-year award to a university, or two
universities agreeing to offer a joint degree program. Linkages at the Expanding stage
(Relationships/Contracts) can lead to greater science and technology development and
productivity.
4.4 Mature Stage
In the Mature stage, linkages are defined as Networking and Clustering.
Collaborations become institutionalized. Therefore, this dissertation study defines
linkages as the act of networking and clustering. This should not be confused with the
physical network or cluster. Defining and understand what the physical network and
clusters are aids in understanding the sophisticated level at which the linkages are
operating.
The concept of networks and clusters evolved from the theory of the ‘industrial
district’ (a large number of firms that are geographically proximate and who contribute in
some form or fashion to the production of a product). The firms are separate from each
other but through social capital (trust, cooperation and collaboration) they form
relationships which evolve into networks or clusters (Bergman & Feser, 1999).
66
With the help of previous work by Stuart Rosenfeld, Cooke provides a clear
definition of networks and distinguishes them from clusters (Cooke, 2002). Networks
rely on active civic cooperation. Based upon the trust they establish with each other,
firms seek to enhance their own welfare by working with other firms or organizations
toward agreed upon objectives. Cooke cites five characteristics of networks.
1) Relatively few firms are involved.
2) Membership is restricted and often takes the form of horizontal relationships
between firms of comparable size.
3) Networks rely on links derived from trust, reputation or reciprocity. The
cooperation between firms is used to compete more effectively against other
firms.
4) Networks are formalized, implicitly or explicitly.
5) The existence of the network implies a high degree of agreement about the
pursuit of common objective (otherwise commitment may be low or a lack of
consensus may occur).
Clusters, on the other hand, do not actively seek to work cooperatively with a
small number of firms. The agglomeration effects of proximity help them realize the
advantages of sharing information, spillover effects and developing learning capital.
Because of this they seek to establish relations within the cluster. Porter put forth the first
generally accepted definition of clusters as “a geographically proximate group of
interconnected companies and associated institutions in a particular field, linked by
commonalities and complementarities” (M. Porter, 1990). However, the definition does
not distinguish clusters from networks and it does not make clear whether companies are
67
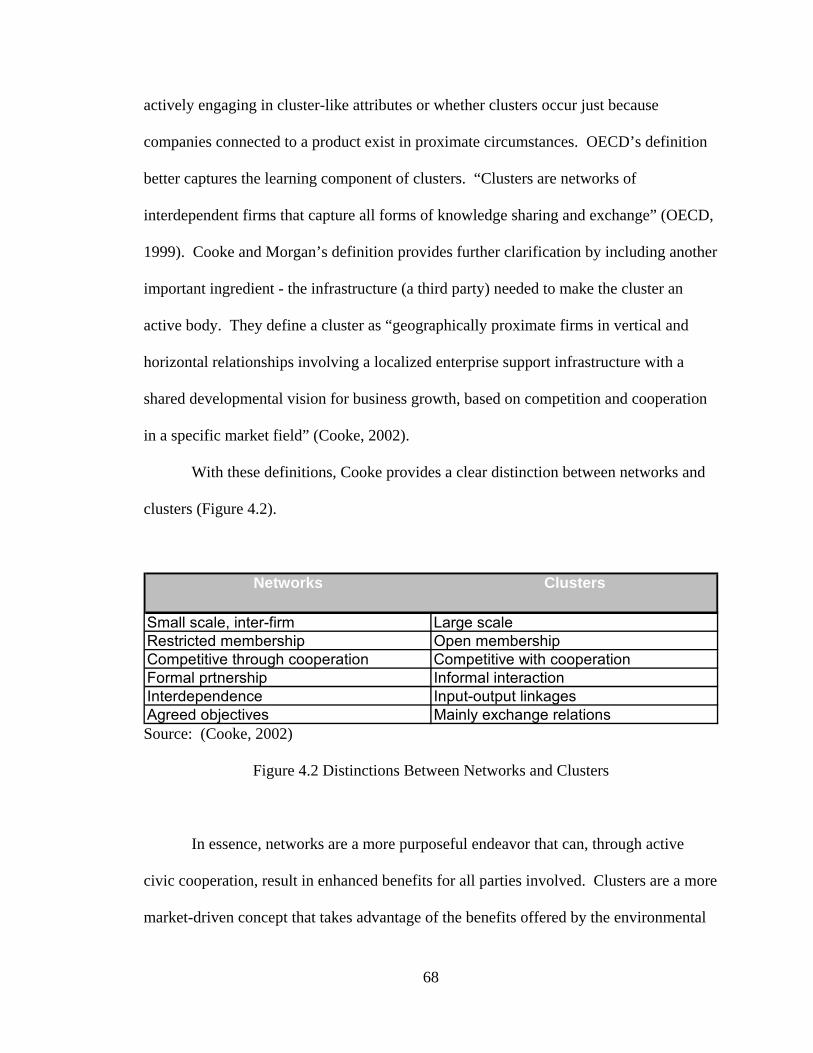
actively engaging in cluster-like attributes or whether clusters occur just because
companies connected to a product exist in proximate circumstances. OECD’s definition
better captures the learning component of clusters. “Clusters are networks of
interdependent firms that capture all forms of knowledge sharing and exchange” (OECD,
1999). Cooke and Morgan’s definition provides further clarification by including another
important ingredient - the infrastructure (a third party) needed to make the cluster an
active body. They define a cluster as “geographically proximate firms in vertical and
horizontal relationships involving a localized enterprise support infrastructure with a
shared developmental vision for business growth, based on competition and cooperation
in a specific market field” (Cooke, 2002).
With these definitions, Cooke provides a clear distinction between networks and
clusters (Figure 4.2).
Networks Clusters
Small scale, inter-firm Large scaleRestricted membership Open membershipCompetitive through cooperation Competitive with cooperationFormal prtnership Informal interactionInterdependence Input-output linkagesAgreed objectives Mainly exchange relations Source: (Cooke, 2002)
Figure 4.2 Distinctions Between Networks and Clusters
In essence, networks are a more purposeful endeavor that can, through active
civic cooperation, result in enhanced benefits for all parties involved. Clusters are a more
market-driven concept that takes advantage of the benefits offered by the environmental
68
proximity. In clusters, the natural competitive nature exhibited by companies is
transformed into cooperation if the companies can be shown that by working
collaboratively they can achieve greater results than when working individually. The
support infrastructure that convinces other firms of the benefits of working cooperatively
consists of intervening parties such as an association, an economic development
authority, a government agency, a third party, or even another firm (Cooke, 2002).
Networking and clustering are linkages that can create added value to the system.
As Porter writes, “Linkages are more than the aggregate sum of the firm’s [university’s]
activities, they cause synergies to arise from the interactions and dynamics between
economic actors” (M. Porter, 1990). Examples include California’s Silicon Valley and
Route 128 in Massachusetts where the commercial and economic growth generated in
those regions led to and influenced significant growth in not only that region but also the
American economy.
4.5 Networking and Clustering as they Apply to Universities
As discussed in the Literature Review, this study categorizes universities as an
industry. Generally, colleges and universities are considered part of the supporting
infrastructure. They assist in identifying networks and clusters, help negotiate collective
learning, and moderate the cooperation that develops between competitive firms.
Examples of networking by universities should reflect civic cooperative activities
that result in agreements (formal or informal) on specific objectives. That would include
consortiums in which universities work with other universities, government agencies and
firms; and, international collaborations that often involve at least two universities and a
foreign agency. Science and technology centers and departments at universities can be
69
the results of networking if they emerged due to a process that involved other
organizations. Any project that has multiple partners may be a result of networking.
Examples of clustering by universities should reflect collaborations that evolve
out of geographical proximity assisted by market-driven opportunities. This would
include university spin-offs, joint ventures with firms and other universities for research
or commercial products (i.e., IUCRCs – Industry-University Cooperative Research
Centers), large projects with federal agencies in which multiple partners are involved, and
generally any project in which spillover effects occur.
Universities deviate somewhat from the traditional definition of clusters in that
they may collaborate with institutions that are not geographically proximate. Yet,
Perroux in his theory of growth poles wrote that economic space may be closer than
geographical space (Malizia & Feser, 1999, cited in). And universities collaborate with
institutions to obtain the same results as industry – to benefit from agglomeration effects
stemming from collaborating with institutions engaged in the same service or product.
In this study, the proposition is that of all the theoretical propositions advanced in
the various literature bases, linkages represented by Networking or Clustering appear to
be one of the most powerful factors influencing science and technology development at
universities. Therefore, this study tests whether linkages is a strategy for HBCUs to
adopt to develop their science and technology productivity.
4.6 Rival Theories to Explain University Science and Technology
Productivity
This research focuses on linkages as the key force behind science and technology
productivity but at least four other theories have been offered as explanations for
70
universities’ ability to develop their science and technology productivity. Explanations
such as policy; leadership or the influence wielded by key individuals; proximity or
location that enhances the development of clusters; and demand for research, scientists
and innovation have also been advanced. The following text introduces and reviews each
rival theory
4.6.1 Policy
Graham and Diamond developed a methodology to determine new entrants into
the list of research universities. When the authors examined the reasons for entry into the
list of leading research universities, in each case, there was an agreement at the regional
or state level to select one or a few entrants as the focal repositories for research
development. Funds were generated to these institutions and, over time, they developed
their infrastructure and capacity resulting in the institution entering the list of key
research universities (Graham & Diamond, 1997). The policy, or the agreement by
government agencies to develop certain universities was the identifying factor present in
each case to explain how these universities increased their productivity and enhanced
their competitiveness. Cooke describes policy as an effective strategy for economic
restructuring that led to innovation in many European regions (Cooke & Morgan, 1998).
Policy has been credited with promoting science and technology at HBCUs. Shirley
McBay, a mathematics professor at Spelman, cited policy at the national level as the
primary impetus for change in the doubling of science majors at Spelman and other
HBCUs (McBay, 1978; Scriven, 2006). In the summer of 1972 (the same year that
federal funding was extended to include land-grant HBCUs), special programs were
established at the national level to support the improvement of science education at
71
minority institutions. It is McBay’s belief that, “the primary factor responsible for more
than doubling the number of science majors at Spelman is believed to be the summer
program that began in 1972” (McBay, 1978).
4.6.2 Leadership
The influence of key individuals has been offered as another explanation for the
ability to create science and technology capacity at a university. De la Mothe describes
the importance of leadership as enabling inter-institutional and inter-sectoral partnerships
to develop and become operational (de la Mothe & Paquet, 2000). The ‘star’ theory has
evolved as an explanation of how key scientists can influence the direction of a science
department or be a key component of the commercialization of a particular product
(Darby & Zucker, 1996). New administrators can be instrumental in causing departments
to adopt new policies or strive for greater science and technology efficiency. Bozeman
and Papadakis found that 87% of projects (federal laboratory-industry partnerships) were
initiated by either the companies’ top management or their research managers (Bozeman
& Wittmer, 2001). The importance of leadership at HBCUs has been voiced by many
authors as the difference between institutions that survive and those that do not
(Anderson, 1988; Drewry & Doermann, 2001).
4.6.3 Proximity
A growing body of literature devotes itself to the spatial proximity factors of
universities, industry and innovation. Based on county innovation factors in the United
States, evidence indicates that innovation activity is concentrated in geographical clusters
as is industrial research and development (Niosi, Saviotti, Bellon, & Crow, 1993; Oinas
& Malecki, 2002). While university research is more evenly distributed spatially than
72
innovation, it also is found in clusters. In the U.S., the top ten counties carry out one-
third of the total university R&D ($1,600 million out of $4,800 million) (Varga, 2000).
There is an overlap of the largest university research clusters (measured in university
R&D funds) with clusters of innovation activities, causing the term ‘local innovation
system’ to arise. The characteristics of a ‘typical city’ in which a critical mass of
innovation occurs and where university research translates into a feedback loop of
commercialization, technology transfer and employment, are a size of about 3 million
with employment in high-technology production facilities and business service firms
numbering around 160,000 and 4,000, respectively (Varga, 2000). The implications
from this research are that a university can increase its science and productivity by
locating in an ‘innovative region’.
Proximity may be more relevant to HBCUs since they are predominantly located
in the Southeast portion of the United States. Despite the South’s lack of innovative
activity compared to the rest of the United States, the proximity of many HBCUs
provides potential for the development of a cluster. Cooperation between HBCUs has
been a theme in the literature on Black higher education (Branson, 1942; Clement, 1942;
MacLean, 1942; Roach, 1998).
4.6.4 Demand for Research and Skilled Personnel
The demand for personnel skilled in the fields of science and technology is not
new. During WWII, it was noted that there was a great need for physicists, engineers,
chemists, and mathematicians to do work and research for the war effort. For example,
the American Institute of Physics reported that, "estimates indicate that the need (for
physicists) is now growing at the rate of 1,500 to 2,000 per year, and that the current
73
annual supply from schools is no more than 500” (Branson, 1942). Bulletin No. 26,
Higher Education and National Defense, issued by the American Council on Education,
April 30, 1942, showed that of 103 professional occupations, shortages existed in 62 of
them in January 1942. Of the 62, thirty were listed under engineering and physical
sciences. The author suggests that since Negroes were 10% of the population, they
should contribute 10% of the personnel (Branson, 1942).
In 1997, the National Academy of Sciences sponsored a report on the labor
shortages in information technology. A 1997 study by the Information Technology
Association of America (ITAA) estimated a shortage of 340,000 information technology
(IT) personnel. In September of 1997, the Department of Commerce released a report
concluding that there was a shortage of IT workers; and the Bureau of Labor Statistics
projected that the U.S. would require more than 1 million additional IT workers between
1994 and 2005, compared to the U.S. bachelor’s degrees awarded in computer and
information sciences annually (24,553 in 1994) (National Research Council, 2001). The
shortage of skilled personnel in information technology and other science, engineering,
and technical fields; the large number of immigrants that have been hired by domestic
companies in the U.S.; and the large number of foreigners at higher levels of education in
science and technical fields have led the U.S. to pour resources into identifying promising
science and math students; encouraging minorities to enter science, engineering and
mathematics fields; and strengthening science and technology infrastructure at colleges
and universities [National Research Council, 2001 #393.
74
4.7 Summary
Linkages are highlighted in the literature as a key component of the development
of science and technology in the New Economy. This chapter categorized the various
ways in which Linkages have been used and defined. This dissertation study utilizes the
most developed form of Linkages - Networking and Clustering. The depiction of
networks and clusters is used to enhance understanding of the level at which linkages are
operating. Often used interchangeably, networks and clusters are defined as two different
concepts. The end goal of both concepts is to maximize the utility of the participating
members; however networks are more a result of civic cooperative action; clusters are
more reflective of market driven actions. Despite the barriers and challenges faced by
HBCUs to develop linkages, the nature of collaboration is such that it may be essential
for the development of science and technology according to many studies.
In order to strengthen the test of the primary hypothesis, rival theories are also
posed and tested. Rival theories include the influence of government policy, the impact
of leadership, the effects of proximity, and the demand for skilled personnel.
Despite the challenges and barriers, HBCUs must still build trust and form
partnerships and collaborations in order to develop their science and technology
productivity. This study tests that proposition by examining the influences of the various
strategies on the development of science and technology at selected HBCUs.
75
CHAPTER 5 RESEARCH DESIGN
This chapter presents the research design for determining what theories account
for the development of science and technology at HBCUs. The research design utilizes a
mixed methods approach which consists of a quantitative methodology nested within a
qualitative design. The methods are conducted sequentially for several reasons – to
respond to different questions within the study, to accommodate the different
methodological requirements of each approach, and to use the results from the
quantitative approach to inform and guide the direction of the qualitative approach. The
two approaches combine to provide greater insight into the findings.
5.1 Unit of Analysis
The unit of analysis is the university. Porter’s methodology utilizes the industry
as the unit of analysis; however, the findings upon which he bases his ‘diamond’ are case
studies of superlative companies that shifted the direction of the industry. Since this
study focuses on a subset within the industry of universities (HBCUs), the appropriate
unit of analysis is the university.
5.2 Dependent Variable
The variables in this research study are drawn from models in previous science
and technology research (Barre, 2001; Kleinknecht & Bain, 1993). The most commonly
used traditional measures are included in the Innovative Capacity Index by Porter and
Stern (M. E. Porter & Stern, 2001), the Composite Indicator of Science and Technology
by NISTEP in Japan (Science and Technology Agency, 1995), the Technology
Achievement Index composed by the United Nations Development Programme (United
76
77
Nations Development Programme, 2001), the State Technology and Science Index at the
Milken Institute (Devol, Koepp, & Ki, 2004), and so forth (see Figure 5.1 of variables in
the above cited indexes). Each composite index utilizes different indicators; however,
certain categories appear to be common. All the composite indicators utilized a
workforce indicator (scientists, researchers and engineers). Four of the five indices
included a knowledge component (publications, patents, leasing, etc.). Three of the five
included a financial indicator (research and development expenditures or inputs, and
innovation financing).
The dependent variable for this study is science and technology productivity
operationalized as a science and technology index consisting of six variables:
1) federal R&D expenditures at colleges and universities from 1985-2001;
2) industry R&D expenditures at colleges and universities from 1985-2001;
3) institutional R&D expenditures at colleges and universities from 1985-2001;
4) state and local R&D expenditures at colleges and universities from 1985-2001;
(the first four represent an R&D indicator);
5) bachelors and master’s degrees awarded in science and technology fields from
1987-2000 (the workforce indicator); and,
6) publications, notes and abstracts from 1986-2002 (the knowledge component).
R&D expenditures represent funds spent on research; students conduct research; and
publications reflect the diffusion of research. A productivity measure was obtained
by dividing the scores of the above variables by full-time faculty. (See Appendix B
for definition of science and technology fields for graduates.)
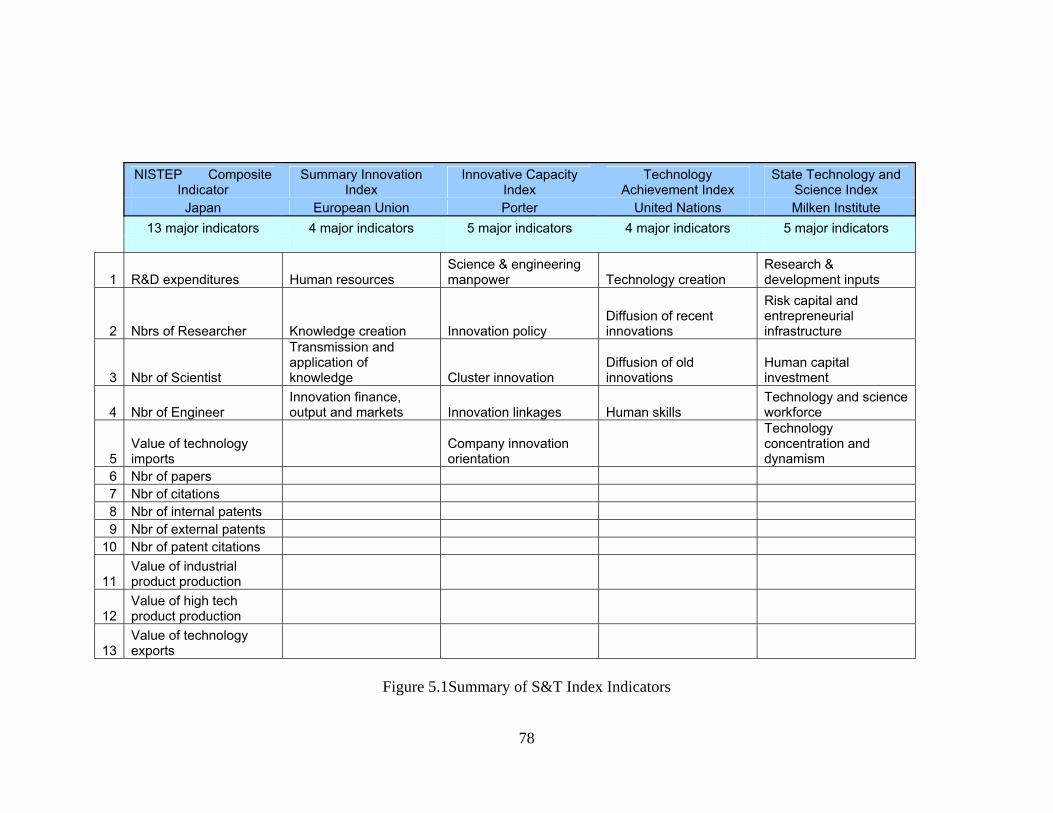
78
NISTEP Composite
Indicator Summary Innovation
Index Innovative Capacity
Index Technology
Achievement Index State Technology and
Science Index Japan European Union Porter United Nations Milken Institute 13 major indicators 4 major indicators 5 major indicators 4 major indicators 5 major indicators
1 R&D expenditures Human resources Science & engineering manpower Technology creation
Research & development inputs
2 Nbrs of Researcher Knowledge creation Innovation policy Diffusion of recent innovations
Risk capital and entrepreneurial infrastructure
3 Nbr of Scientist
Transmission and application of knowledge Cluster innovation
Diffusion of old innovations
Human capital investment
4 Nbr of Engineer Innovation finance, output and markets Innovation linkages Human skills
Technology and science workforce
5 Value of technology imports
Company innovation orientation
Technology concentration and dynamism
6 Nbr of papers 7 Nbr of citations 8 Nbr of internal patents 9 Nbr of external patents
10 Nbr of patent citations
11 Value of industrial product production
12 Value of high tech product production
13 Value of technology exports
Figure 5.1Summary of S&T Index Indicators
This study uses the same method employed by Rogers, Yin and Hoffmann in their
study to develop a technology transfer effectiveness index (Rogers et al., 2000).
Developing standardized scores was preferable to a simple ranking of the universities
because it permits a more accurate comparison of results. A standardized score can tell
us that University 1’s score is twice greater than University 2 and so forth. It provides
greater accuracy in the ranking.
The six variables are measured in different units – dollars, number of students and
number of publications. Each variable was summed across the years. A productivity
measure was obtained by using full time faculty as an input measure.11 In order to
compare different units, each variable was converted to standardized scores (z-scores).12
Each variable was given equal weight as none has been proven to be of more importance
than the others. The composite index is obtained by averaging each HBCU’s z-scores for
the six variables and then putting them in rank order on the basis of their score. A rank
score of 1 to 103 is assigned with 1 being the highest score.13 The index allows
identification of the top performing institutions in science and technology productivity.
The index does not determine the “best” HBCUs, so much as it identifies the institutions
that have manifested certain levels of comparable success in achieving science and
technology productivity.
The first indicator, research and development expenditures may be seen as an
input in contrast to graduates and publications which are outputs. The funds received are 11 Full time faculty was used in Graham and Diamond’s study on productivity of research universities. 12 A z-score measures each observation in terms of standard deviation units from the mean, hence it’s usually referred to as a standard score. 13 The lowest score should be 103; however, the last 14 institutions have equal scores. The fourteen institutions do not receive any research and development funding, do not produce any science or technology related publications and do not have graduate students in science and engineering fields (or data is not provided).
79
used for programs and research which can result in publications and graduates. In the
case of HBCUs, the application for research dollars is often preceded by an internal
decision to purposefully increase science and technology capacity. Since the data for the
number of applications is not available, the award of research and development dollars is
used as a proxy to indicate university efforts at increasing science and technology output.
5.3 Independent Variables
The independent variables for Phase I, the quantitative section, are university
characteristics that impact science and technology indicators. Region (South, Mid-
Atlantic, Southwest, Mid-west), size (Very Small, Small, Medium, and Large), control
(private, public and landgrant) and Carnegie classification (Research, Baccalaureate, and
Associates and Others) have been identified as such factors (see Appendix __ for further
clarification on definitions).
The independent variables for Phase II, the qualitative section, are linkages and
the four rival theories – policy, leadership, proximity, and demand for personnel. In
Phase II, linkages are defined as Networks/Clusters and constructed as a dummy variable
(yes- this is networking/clustering, no- this is not networking/clustering). Linkages as
Networks/Clusters are operationalized by participation in a joint venture, contract,
agreement, Center, or Department in which three or more universities or agencies agree
to work together toward a common objective(s).
The rival theories are also set up as dummy variables (yes/no). Policy initiatives
are operationalized as external governmental policy - federal legislation or policy,
regional policy, state legislation or policies. Leadership is defined as internal action by
the HBCU President, Dean or Key Scientist (faculty). The variable representing
80
proximity is location and participation near a science park or a noted
science/engineering/technology facility or center. Demand is understood as internal
university action to increase number of students enrolled in science, math or engineering
programs. This variable assumes knowledge exists of societal demand for science and
technology personnel.
5.4 Phase I
Based upon theoretical claims, this research proposes the following expectations in
response to the associated questions. The expectations are geared more toward an
understanding of relationships than proof of causality.
Q1: What are the characteristics of HBCUs that explain higher productivity levels in
science and technology indicators?
Based upon research conducted by Graham and Diamond measuring productivity by
federal R&D dollars and journal publications in science, sociology and arts and
humanities, four year private institutions were found to be initially more productive than
public for-profit and non-profit colleges and universities. Despite a significant narrowing
of the gap between public and private universities, the latter still enjoys a higher ranking
than public universities in science and technology criteria (Graham & Diamond, 1997).
Inferences from these findings are used in support of the following expectations.14
E1: Four year private HBCUs will average a higher rating on science and technology
productivity indicators than four year public HBCUs
E2: Four year private HBCUs will average a higher rating on science and technology
productivity indicators than four year landgrant HBCUs
14 E1, E2, and E3 stand for Expectations 1, 2, and 3.
81
E3: Four year private HBCUs will average a higher rating on science and technology
productivity indicators than 2 year HBCU associate colleges.
Doctoral level and master’s level universities are categorized according to the number of
students that graduate at a post secondary level. These students are expected to
contribute to the knowledge base through theses, dissertations, research, and teaching
(Carnegie Foundation for the Advancement of Teaching, 2001). Thus, it’s expected that
research output will be higher at institutions that produce a greater output of post-
secondary students.
E4: Research HBCUs categorized as Doctoral Extensive and Intensive and Master’s I and
II according to the Carnegie classification will average a higher rating on science and
technology productivity indicators than all other HBCUs (except HBCU medical
schools).
5.4.1 Phase I: Methodology
The research will proceed in two phases. To determine which universities are more
productive, a composite science and technology index is constructed with a rating
assigned for each university. Each phase uses different techniques in examining different
subject populations.
Phase 1: Ranking of all HBCUs in science and technology related fields
Goal: To assess the characteristics of higher performing HBCUs
Population: 103 HBCUs
Methods: Development of a science and technology index through the use of
standardized scores, regression analysis on the resultant index
82
For the science and technology indicators, the population is all 103 HBCUs.
Regression analysis is used to understand what characteristics account for universities
with higher science and technology scores. The science and technology index is the
independent variable and the characteristics are the independent variables.
5.5 Phase II
The primary question addressed by this phase (and of the dissertation overall) is what
theory(ies) (termed strategies when implemented) account for the development of science
and technology at research-oriented HBCUs. Phase II, the qualitative approach of the
research design, hypothesizes that linkages are the primary factor influencing the
development of science and technology at HBCUs. This will be explored by assessing
which strategies are utilized by the most productive research universities.
5.5.1 Phase II: Methodology
The 35 research-oriented HBCUs (Doctoral and Master’s universities according to the
Carnegie classification) are ranked and classified into high, middle and low ratings
according to their composite science and technology index. One HBCU is selected from
each category for more in-depth study.
Phase II: Assessing the effects of linkages and other rival theories
Goal: To determine a) whether linkages are the primary factor in influencing
science and technology productivity and b) if linkages are not the primary
factor, then what is/are the most influential theory(ies)?
Sample Population: 3 HBCUs
Methods: Interviews, archival analysis, pattern matching, rival explanations,
triangulation, and chronology of events
83
The central hypothesis of this dissertation study asserts that linkages are the
primary factor influencing science and technology development at HBCUs. This
hypothesis will be proven false if a) no evidence of linkages exists or b) evidence of
linkages is found to exist but there is no evidence linking it to the development of science
and technology; or c) evidence of linkages is found to exist but a rival explanation is
found to have more influence on the development of science and technology at the
university (i.e., the rival explanation occurs more frequently or the rival explanation
precedes linkages in a time chronology). This dissertation’s earlier chapters established
the logical consistency of each theory. Deductions were made based upon the logic
presented in each theory. Replicability and generalizability resulted from comparing the
same theory in different environments. These case studies, therefore, achieve the
standards set by science and qualitative research practice through its design. It
establishes rigor by having several case studies, introducing several rival theories, and
establishing predictions for each theory.
5.6 Design
A qualitative approach design was chosen for two reasons. First, there are a small
number of HBCUs relative to the population of colleges and universities and their
characteristics are skewed. Statistical analyses could be completed but the results might
be biased. Second, questions that seek to uncover explanations that may be complex in
nature or have more than one factor involved lend themselves more to a qualitative than
quantitative approach.
The selection of the three research HBCUs is explained further in Section 5.7.
Once the HBCU was selected, its website was reviewed for university characteristics,
84
Mission Statement, Strategic Plan, structure, goals and objectives, departments, key
personnel, Fact Book, President’s report, annual report, report of External Funding,
partner organizations, and any other relevant information. Science and technology
departments, schools, and notable (featured as successful on the website) programs were
identified.
Original interview plans included administrators, faculty and students. A pilot
interview was conducted with a student to determine whether he/she had sufficient
knowledge to respond to interview questions. The student was unable to provide any
information regarding the development or conduct of a program; therefore, they were
removed from the list of people to interview.
Letters requesting approval to interview faculty were sent to the President
requesting interviews with the Vice President of Sponsored Research (or similar position)
and the number of faculty that represented the number of Colleges/Departments
associated with science and technology. A limited number of interviews were requested
in order to secure approval. When appointments were arranged with the department, a
request was sometimes made to interview faculty within significant programs if such
were found on the website. Attempts were not made to speak with staff because it was
believed that interviewees might be inhibited in their responses if they were aware that
their boss was responding to similar questions.
Chairs of the department were sought when possible because they often had
longer tenures, more information about the history of the department, more understanding
of the goals and objectives, and insights as to what direction the department was taking.
85
Questions were constructed based upon a) understanding how science and
technology programs are created and expand, b) understanding how linkages affect s&t
development, and c) uncovering which of the rival theories deserves credit for creation
and expansion of s&t programs. Assistance with question formation and placement was
sought from questionnaires on the Internet, previous surveys by Georgia Institute of
Technology and Georgia State University, and qualitative research manuals.
Ethical considerations were considered minimal. The primary dissertation
question is not of a personal nature so potential harm to humans is low. HBCUs have
been maligned in the past and labeled as inferior and sub-standard. The image portrayed
could have hurt the university by inhibiting students from attending the institutions. The
major concern was in maintaining an appropriate balance of objective yet critical inquiry
into the subject matter. By developing a standardized method of ranking the HBCUs,
ranking in only one subject area, and not making any judgements about the HBCU, the
researcher believes objectivity was maintained. Further explanation of the process is
explained in section 5.8 - Process and Appendix D – Case Study protocol.
5.7 Selection of Universities
Methods for selection of HBCUs were taken from the United States Accounting
Office on Case Study evaluations. Using a purposive representative sample scheme,
three research-oriented HBCUs are selected as case studies. A representative scheme is
defined as a sample that has approximately the same distribution of characteristics as the
population from which it is drawn. The universities that are selected are typical or
representative of important variations in HBCUs (U.S. General Accounting Office,
1990). The 35 research HBCUs were ranked and divided into three equally proportioned
86
sections representing high, medium and low science and technology productivity based
upon the ratings obtained from the science and technology index produced in Phase I. An
HBCU was selected from each section. In selecting the three universities, an attempt was
made to include a cross section of factors such as location, Carnegie classification, size
and control. Selecting more than one case study, choosing congruent universities while
including variation in the samples chosen strengthens the rigorousness of the case,
methods, and results (Lee, 1989).
5.8 Process
The first step after selection of the three research HBCUs was to obtain
descriptive, background information. In addition to contextual information obtained on
each institution, data was collected on factors relating to science and technology
development. The second step was to seek official university documentation presenting
the university’s position regarding science and technology. Documents such as the
Mission Statement, the Strategic Plan, the President’s message/report, goals/mission
statements of science and technology related departments, department annual reports,
lists of companies that contracted with those departments, and descriptions of projects on
which the departments were working, were obtained from the universities and their
websites (or as much of the above as could be obtained). The purpose of obtaining these
documents was to determine whether the University had a policy towards science and
technology, whether the University was interested in increasing its production or
productivity, and whether any progress had been made towards those goals (if they
87
existed)15 The results of the first and second step can be found in Chapter 7 – The Three
Research Universities.
The third step was to formulate a set of standard questions for each of the three
universities regarding their development in science and technology. These questions
were to be presented to the Deans or Chairs of the primary departments associated with
science and technology. Prior to the questions being addressed to the HBCUs, a pilot test
was conducted with Spelman University16 (an HBCU that was ineligible since it was not
a research university). The pilot test facilitated validation of the survey tool. The
amended survey tool was sent to the Vice President of Research at the Georgia Tech
Research Center, Dr. Jilda Garton, to obtain the perspective of a research university not
part of the study. Comments from both sources were incorporated into the final survey
tool.
Once the basic questions were finalized, the information obtained from the
databases and the websites were incorporated into the standard set of questions so the
department/university could respond according to its unique development. Approval to
conduct the research according to university procedures was obtained from the Georgia
Institute of Technology Institutional Review Board. The Dean, Chair or Director of the
largest colleges/departments/institutes or programs were interviewed. Eighteen HBCU
administrators were interviewed (two of the interviews had the present and past Chair
present). In addition, interviews were conducted with 6 administrators at external
agencies that partnered or worked with HBCUs including non-profit organizations,
15 As stated in Chapter 7, Hampton University would not provide any strategic documents. 16 Spelman University is a single-sex (females only) HBCU which presents a potential bias in the pilot. However, sex has not been identified as a source of potential bias in the development of science and technology at universities. Thus, the use of Spelman as a pilot is not expected to have adverse effects. Additionally, Spelman was not the only test subject.
88
government, and corporations. They were given an amended version of the survey for
the purpose of corroborating or countering responses or providing additional insights
about HBCUs. As an individual organization, each could provide insight and additional
explanation to information provided by the HBCU. However, an external agency is not
in a position to explain what initiates programs at HBCUs. Thus, their answers were
used to support or constrain responses provided by the HBCU respondents. Their
responses were coded in the section addressing the expansion of science and technology.
5.9 Data Sources
Research and development expenditures data is publicly available information
obtained from the National Science Foundation. Limited information on graduates in
selected fields is available from the National Center for Education Statistics (NCES).
Associates at NCES supplied additional information for graduates from HBCUs. Data on
the number of publications, notes and abstracts was obtained through bibliometric
software17 that tabulated and summed results from the Web of Science, a service that
provides Internet access to research literature through various access points.
17 The bibliometric software was obtained by using Vantage software, a trademark technology produced at Georgia Institute of Technology. Vantage is innovative software that enables researchers to capture citation data across a wide spectrum of data. It is limited only by the constraints of the databases themselves (e.g., whether foreign publications are included, whether English only publications are included, etc.).
89
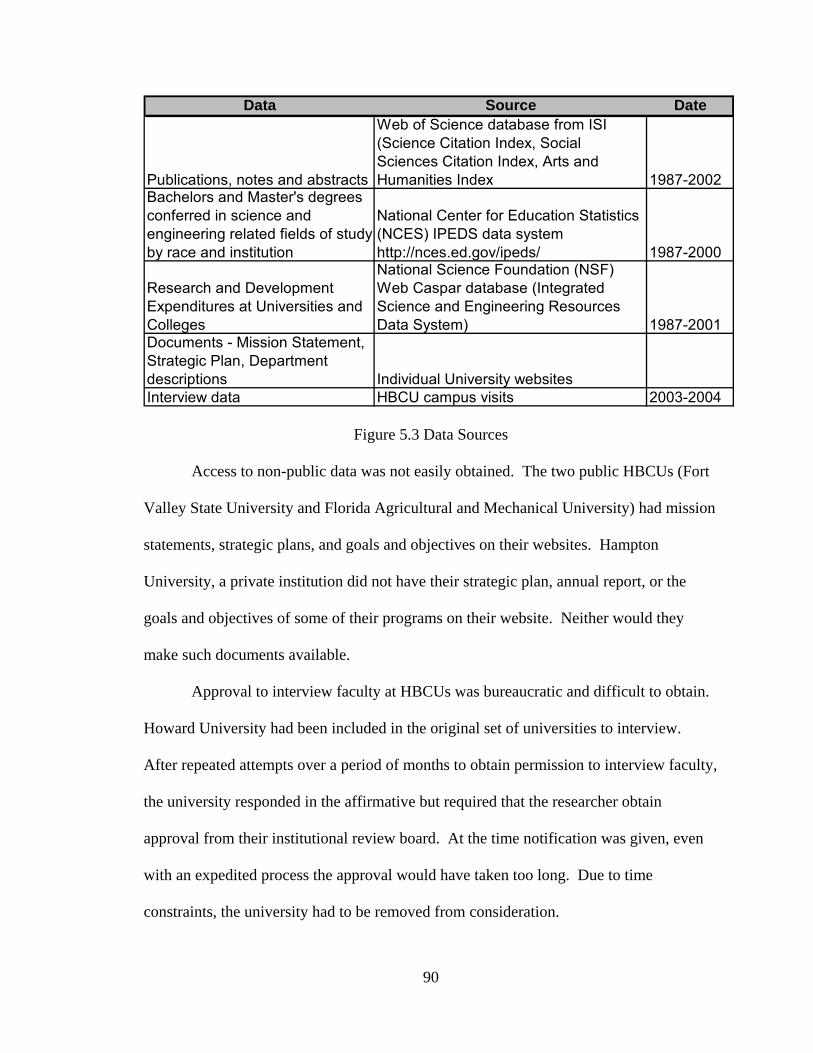
Data Source Date
Publications, notes and abstracts
Web of Science database from ISI (Science Citation Index, Social Sciences Citation Index, Arts and Humanities Index 1987-2002
Bachelors and Master's degrees conferred in science and engineering related fields of study by race and institution
National Center for Education Statistics (NCES) IPEDS data system http://nces.ed.gov/ipeds/ 1987-2000
Research and Development Expenditures at Universities and Colleges
National Science Foundation (NSF) Web Caspar database (Integrated Science and Engineering Resources Data System) 1987-2001
Documents - Mission Statement, Strategic Plan, Department descriptions Individual University websitesInterview data HBCU campus visits 2003-2004
Figure 5.3 Data Sources Access to non-public data was not easily obtained. The two public HBCUs (Fort
Valley State University and Florida Agricultural and Mechanical University) had mission
statements, strategic plans, and goals and objectives on their websites. Hampton
University, a private institution did not have their strategic plan, annual report, or the
goals and objectives of some of their programs on their website. Neither would they
make such documents available.
Approval to interview faculty at HBCUs was bureaucratic and difficult to obtain.
Howard University had been included in the original set of universities to interview.
After repeated attempts over a period of months to obtain permission to interview faculty,
the university responded in the affirmative but required that the researcher obtain
approval from their institutional review board. At the time notification was given, even
with an expedited process the approval would have taken too long. Due to time
constraints, the university had to be removed from consideration.
90
Attempts to obtain information apart from the interviews were often unsuccessful
due to bureaucracy and the time required to obtain permission. For example, when it was
discovered a science park existed on FAMU’s campus, attempts were made to approach
businesses and/or administrators of the science park. Information on businesses, related
personnel from FAMU or University of Florida, and science park staff associated with
the park was not obtainable during the visit. Attempts to interview faculty not on the
itinerary were unsuccessful.
5.10 Data Analysis Plan
For the qualitative data, four techniques have been chosen to analyze the data.
Four techniques – pattern matching (did the theories match their prediction), validity
against rival explanations (did one explanation offer more explanatory value than
another), chronology of events (did one theory precede another and therefore become
more causal than another theory), and investigator triangulation (was more than one
process used) strengthened the internal validity and reliability of the research (Garson,
2001; Yin, 1989).
Pattern matching compares the prediction derived from the theory to the evidence
collected. Thus, under the proximity theory, the prediction that proximity to a science
center leads to the development of science and technology would have to be supported
from evidence or documentation.
Rival explanations/theories, another form of pattern matching searches for
variations in the independent variables (rival theories) given the same dependent variable
(science and technology productivity). Again, the concern is with the pattern of results.
91
Internal validity is strengthened when rival hypotheses can be ruled out and the leading
hypothesis confirmed by a preponderance of the evidence.
Chronology of events over time attempts to create a temporal sequence of events.
Observations assist in the determination of causality from different variables. One event
must precede another to establish causality. For example, using a chronology of events
analysis, actions taken at a university after the introduction of a new Chair may be
causally linked to leadership, whereas, actions in support of science and technology
before the Chair came aboard cannot be causally attributed to leadership18.
Of the four basic types of triangulation (data, method, investigator and theory),
this dissertation study uses three – data (time, space and persons), theory (using more
than one theory in analyzing the phenomenon) and methodological (using more than one
method). Data triangulation is achieved by gathering and comparing data from three
sources – statistical data from NSF, NCES and ISI Web of Knowledge;
archival/historical documents; and interviews with internal representatives and external
liaisons. Theory triangulation is achieved through rival explanations. Using both
quantitative and qualitative methods represents the methodological triangulation.
There are vulnerabilities to this design. In Phase I, the descriptive characteristics
used are mostly demographic variables. While important and insightful, other
characteristics addressing capability such as infrastructure, library resources, lab
equipment, and other contextual/cultural features would have added further insight into
what characteristics describe “successful” HBCUs. In addition, the design would be
improved by comparing HBCUs to majority universities. The assumption is that HBCUs
18 Causality cannot be established because results followed the leader but causality can be eliminated if action occurs prior to the leader.
92
are a unique subset of universities. Without comparing HBCUs to other colleges and
universities in science and technology related criteria, HBCUs’ uniqueness remains an
assumption rather than an observed fact.
In Phase II, the selection of three universities is a small sample from which to
draw conclusions that may relate to the HBCU population. However, this is an issue that
confronts all case studies. There is a trade off between the time and resources required to
do in-depth research and the generalizability of the findings to the entire population.
The methodology outlined in this research design should enable the analysis of
Linkages as the strategy most adopted by HBCUs for developing science and technology
productivity. Due to constraints of resources and funding, vulnerabilities will remain to
some degree. However, the rigorousness of the design should strengthen the validity of
the findings.
93
CHAPTER 6 Quantitative Analysis
This Chapter presents the findings from Phase I, the configuration of the science
and technology index. Several questions are answered in this section. Which HBCUs
exhibit high levels of production and productivity in science and technology indicators?
What are the characteristics of productive HBCUs? Do the findings support the
expectations?
Based on the methods described in Chapter 5, results of the Science and
Technology (S&T) Index are presented for the 103 HBCUs. The index is analyzed to
determine whether there is support for the expectations; it is then regressed on descriptive
characteristics to identify which characteristics, if any, show a relationship to successful
HBCUs. Finally, the index is used to select three research HBCUs for further in-depth
study of strategies utilized for the development of science and technology.
Findings from this section of the dissertation study support the expectation that
research universities have higher levels of productivity. Further analysis indicates that
the higher the Carnegie classification, the higher the level of productivity. It does not
support the expectations that four-year private HBCUs exhibit higher levels of science
and technology productivity than four-year public or land-grant HBCUs.
6.1 HBCU S&T Index
The methodology for construction of the science and technology index follows
the method used by Rogers & Yin in their development of a technology transfer
effectiveness index. The methodology is explained in Chapter 5. In brief, the
independent variables are university characteristics (Carnegie classification, control,
94
region, size and years). The dependent variable is composed of six normalized variables
representing a knowledge component, a human capital component and a research and
development investment component (normalized by full-time faculty).19 The six
variables, with various units of measurement, are converted to standardized Z scores.
The variables are considered equally important components of science and technology
development at universities.20 The composite index measure is obtained by averaging
each university’s z-scores for the six variables, rank-ordering the universities based on
their resultant average z-scores for science and technology development, and assigning
rank scores from 1 (highest science and technology index score) to 90. (Although there
are 103 HBCUs, the lowest rank is 90 because the 14 lowest ranked HBCUs have
identical scores). The scores represent a productivity measure normalized by full-time
faculty. Table 6.1 displays the results of the HBCU science and technology index.
19 The six variables are federal R&D expenditures, industry R&D expenditures, state and local R&D expenditures, institutional R&D expenditures 1985-2001 at colleges and universities (the research and development indicator); b) bachelors and master’s degrees awarded in science and technology fields from 1987-2000 (the workforce indicator); and, c) publications, notes and abstracts from 1986-2002 (the knowledge component). 20 Although each variable is equally weighted, the use of four variables representing expenditures at colleges and universities versus one each of publications and graduates represents a weight. It is the opinion of this author that the importance of funding justifies the use of four variables. This is true also in the other science and technology indexes.
95
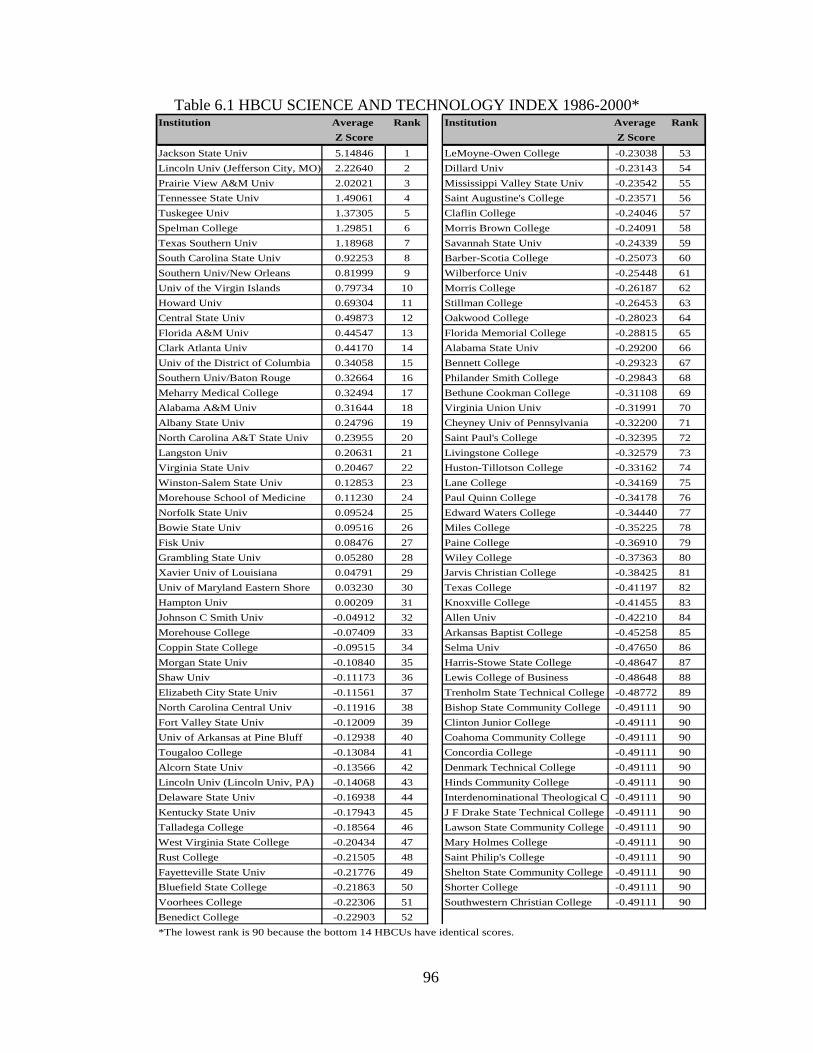
Table 6.1 HBCU SCIENCE AND TECHNOLOGY INDEX 1986-2000* Institution Average Rank Institution Average Rank
Z Score Z ScoreJackson State Univ 5.14846 1 LeMoyne-Owen College -0.23038 53Lincoln Univ (Jefferson City, MO) 2.22640 2 Dillard Univ -0.23143 54Prairie View A&M Univ 2.02021 3 Mississippi Valley State Univ -0.23542 55Tennessee State Univ 1.49061 4 Saint Augustine's College -0.23571 56Tuskegee Univ 1.37305 5 Claflin College -0.24046 57Spelman College 1.29851 6 Morris Brown College -0.24091 58Texas Southern Univ 1.18968 7 Savannah State Univ -0.24339 59South Carolina State Univ 0.92253 8 Barber-Scotia College -0.25073 60Southern Univ/New Orleans 0.81999 9 Wilberforce Univ -0.25448 61Univ of the Virgin Islands 0.79734 10 Morris College -0.26187 62Howard Univ 0.69304 11 Stillman College -0.26453 63Central State Univ 0.49873 12 Oakwood College -0.28023 64Florida A&M Univ 0.44547 13 Florida Memorial College -0.28815 65Clark Atlanta Univ 0.44170 14 Alabama State Univ -0.29200 66Univ of the District of Columbia 0.34058 15 Bennett College -0.29323 67Southern Univ/Baton Rouge 0.32664 16 Philander Smith College -0.29843 68Meharry Medical College 0.32494 17 Bethune Cookman College -0.31108 69Alabama A&M Univ 0.31644 18 Virginia Union Univ -0.31991 70Albany State Univ 0.24796 19 Cheyney Univ of Pennsylvania -0.32200 71North Carolina A&T State Univ 0.23955 20 Saint Paul's College -0.32395 72Langston Univ 0.20631 21 Livingstone College -0.32579 73Virginia State Univ 0.20467 22 Huston-Tillotson College -0.33162 74Winston-Salem State Univ 0.12853 23 Lane College -0.34169 75Morehouse School of Medicine 0.11230 24 Paul Quinn College -0.34178 76Norfolk State Univ 0.09524 25 Edward Waters College -0.34440 77Bowie State Univ 0.09516 26 Miles College -0.35225 78Fisk Univ 0.08476 27 Paine College -0.36910 79Grambling State Univ 0.05280 28 Wiley College -0.37363 80Xavier Univ of Louisiana 0.04791 29 Jarvis Christian College -0.38425 81Univ of Maryland Eastern Shore 0.03230 30 Texas College -0.41197 82Hampton Univ 0.00209 31 Knoxville College -0.41455 83Johnson C Smith Univ -0.04912 32 Allen Univ -0.42210 84Morehouse College -0.07409 33 Arkansas Baptist College -0.45258 85Coppin State College -0.09515 34 Selma Univ -0.47650 86Morgan State Univ -0.10840 35 Harris-Stowe State College -0.48647 87Shaw Univ -0.11173 36 Lewis College of Business -0.48648 88Elizabeth City State Univ -0.11561 37 Trenholm State Technical College -0.48772 89North Carolina Central Univ -0.11916 38 Bishop State Community College -0.49111 90Fort Valley State Univ -0.12009 39 Clinton Junior College -0.49111 90Univ of Arkansas at Pine Bluff -0.12938 40 Coahoma Community College -0.49111 90Tougaloo College -0.13084 41 Concordia College -0.49111 90Alcorn State Univ -0.13566 42 Denmark Technical College -0.49111 90Lincoln Univ (Lincoln Univ, PA) -0.14068 43 Hinds Community College -0.49111 90Delaware State Univ -0.16938 44 Interdenominational Theological C -0.49111 90Kentucky State Univ -0.17943 45 J F Drake State Technical College -0.49111 90Talladega College -0.18564 46 Lawson State Community College -0.49111 90West Virginia State College -0.20434 47 Mary Holmes College -0.49111 90Rust College -0.21505 48 Saint Philip's College -0.49111 90Fayetteville State Univ -0.21776 49 Shelton State Community College -0.49111 90Bluefield State College -0.21863 50 Shorter College -0.49111 90Voorhees College -0.22306 51 Southwestern Christian College -0.49111 90Benedict College -0.22903 52*The lowest rank is 90 because the bottom 14 HBCUs have identical scores.
96
6.2 Results of the S&T Index
Jackson State University, a public Doctoral-Intensive university with a large
student population (6,360) in Mississippi had the highest average science and technology
z-score rating of all the HBCUs. Its average z-score (5.15) is more than 3 standard
deviations from the norm and more than twice the second highest-ranking HBCU.
Therefore, it is considered an outlier. It had the highest score in four of the six categories
– Federal R&D expenditures, Industry R&D expenditures, Institutional R&D
expenditures and Publications. That Jackson State University achieved this despite its
large size is notable. Larger organizations encounter more of a challenge achieving
productivity since the law of diminishing returns often starts to take effect. Increasing the
number of faculty or some other independent measure given the same level of
governmental, industry or societal resources usually means the output (number of grants,
publications, graduates and so forth) drops. This result can be mitigated if growth occurs
in other areas as well.
It is interesting to view the results of the universities that have the highest
production versus the universities that have the highest productivity (see Table 6.2). The
big three in terms of overall output are Howard University, Clark Atlanta, and Florida
Agricultural and Mechanical University (FAMU). Each is within the top five in output
for five of the six variables. In productivity, five different universities stand out. Jackson
State University is within the top 5 in five of the six variables, Lincoln University
(Missouri) in four of the variables, and Tennessee State, Spelman and Texas Southern are
within the top five in three of the variables. Further research would be necessary to
97
98
understand what combination of variables permits Jackson State University to overcome
the productivity challenges inherent in its size.
The difference between HBCUs with the highest production versus the highest
productivity is not unusual because diminishing returns start to take effect. However,
effectiveness ratings (high productivity) often point to up and coming (or solidly
performing) “stars.” In corporations, it is usually a sign of good management; in
universities, it may indicate the same. Thus, those universities that have high
productivity today may be the ones that will have the highest production a number of
years from now.
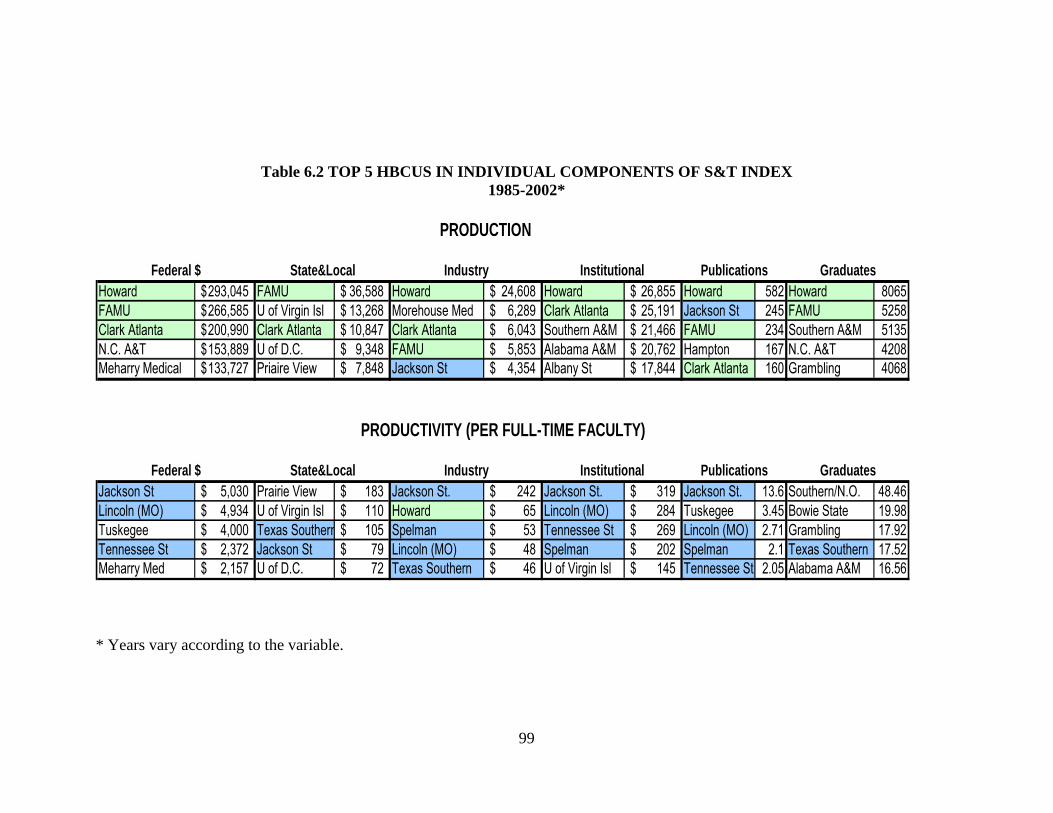
99
Table 6.2 TOP 5 HBCUS IN INDIVIDUAL COMPONENTS OF S&T INDEX
1985-2002*
Howard 293,045$ FAMU 36,588$ Howard 24,608$ Howard 26,855$ Howard 582 Howard 8065FAMU 266,585$ U of Virgin Isl 13,268$ Morehouse Med 6,289$ Clark Atlanta 25,191$ Jackson St 245 FAMU 5258Clark Atlanta 200,990$ Clark Atlanta 10,847$ Clark Atlanta 6,043$ Southern A&M 21,466$ FAMU 234 Southern A&M 5135N.C. A&T 153,889$ U of D.C. 9,348$ FAMU 5,853$ Alabama A&M 20,762$ Hampton 167 N.C. A&T 4208Meharry Medical 133,727$ Priaire View 7,848$ Jackson St 4,354$ Albany St 17,844$ Clark Atlanta 160 Grambling 4068
Jackson St 5,030$ Prairie View 183$ Jackson St. 242$ Jackson St. 319$ Jackson St. 13.6 Southern/N.O. 48.46Lincoln (MO) 4,934$ U of Virgin Isl 110$ Howard 65$ Lincoln (MO) 284$ Tuskegee 3.45 Bowie State 19.98Tuskegee 4,000$ Texas Southern 105$ Spelman 53$ Tennessee St 269$ Lincoln (MO) 2.71 Grambling 17.92Tennessee St 2,372$ Jackson St 79$ Lincoln (MO) 48$ Spelman 202$ Spelman 2.1 Texas Southern 17.52Meharry Med 2,157$ U of D.C. 72$ Texas Southern 46$ U of Virgin Isl 145$ Tennessee St 2.05 Alabama A&M 16.56
Publications Graduates
Federal $ State&Local
Federal $ State&Local Industry Institutional
Industry Institutional Publications Graduates
PRODUCTIVITY (PER FULL-TIME FACULTY)
PRODUCTION
* Years vary according to the variable.
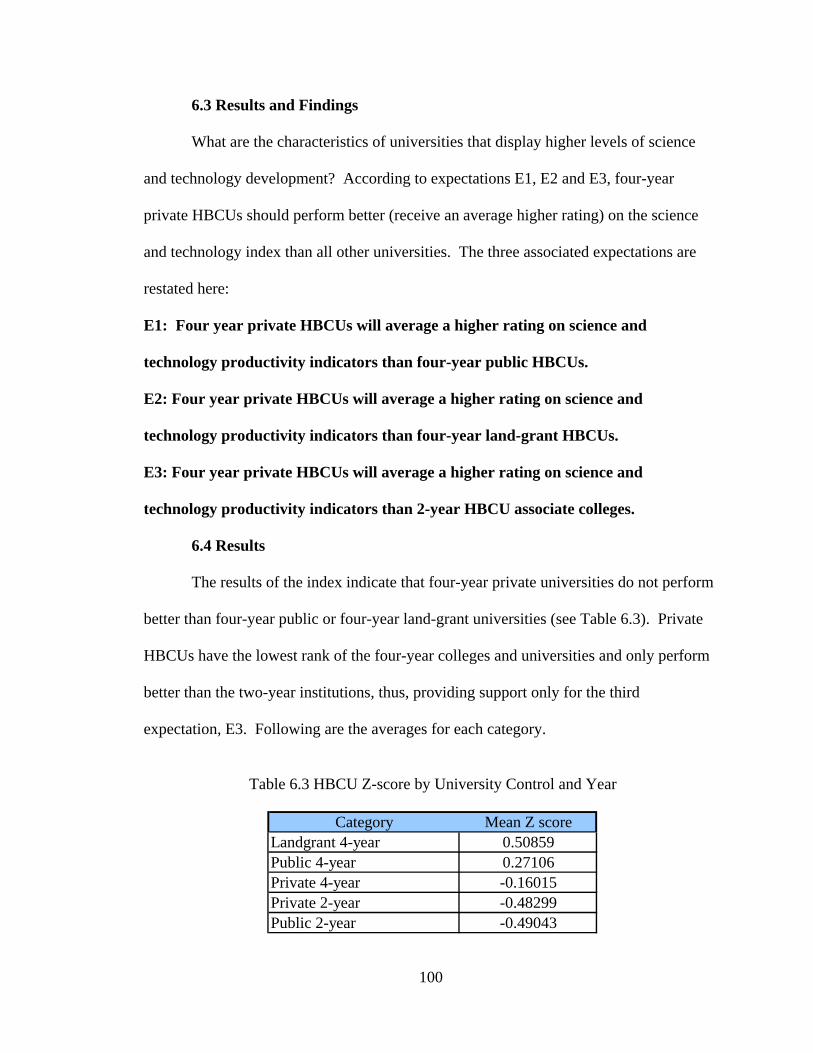
6.3 Results and Findings
What are the characteristics of universities that display higher levels of science
and technology development? According to expectations E1, E2 and E3, four-year
private HBCUs should perform better (receive an average higher rating) on the science
and technology index than all other universities. The three associated expectations are
restated here:
E1: Four year private HBCUs will average a higher rating on science and
technology productivity indicators than four-year public HBCUs.
E2: Four year private HBCUs will average a higher rating on science and
technology productivity indicators than four-year land-grant HBCUs.
E3: Four year private HBCUs will average a higher rating on science and
technology productivity indicators than 2-year HBCU associate colleges.
6.4 Results
The results of the index indicate that four-year private universities do not perform
better than four-year public or four-year land-grant universities (see Table 6.3). Private
HBCUs have the lowest rank of the four-year colleges and universities and only perform
better than the two-year institutions, thus, providing support only for the third
expectation, E3. Following are the averages for each category.
Table 6.3 HBCU Z-score by University Control and Year
Category Mean Z scoreLandgrant 4-year 0.50859Public 4-year 0.27106Private 4-year -0.16015Private 2-year -0.48299Public 2-year -0.49043
100
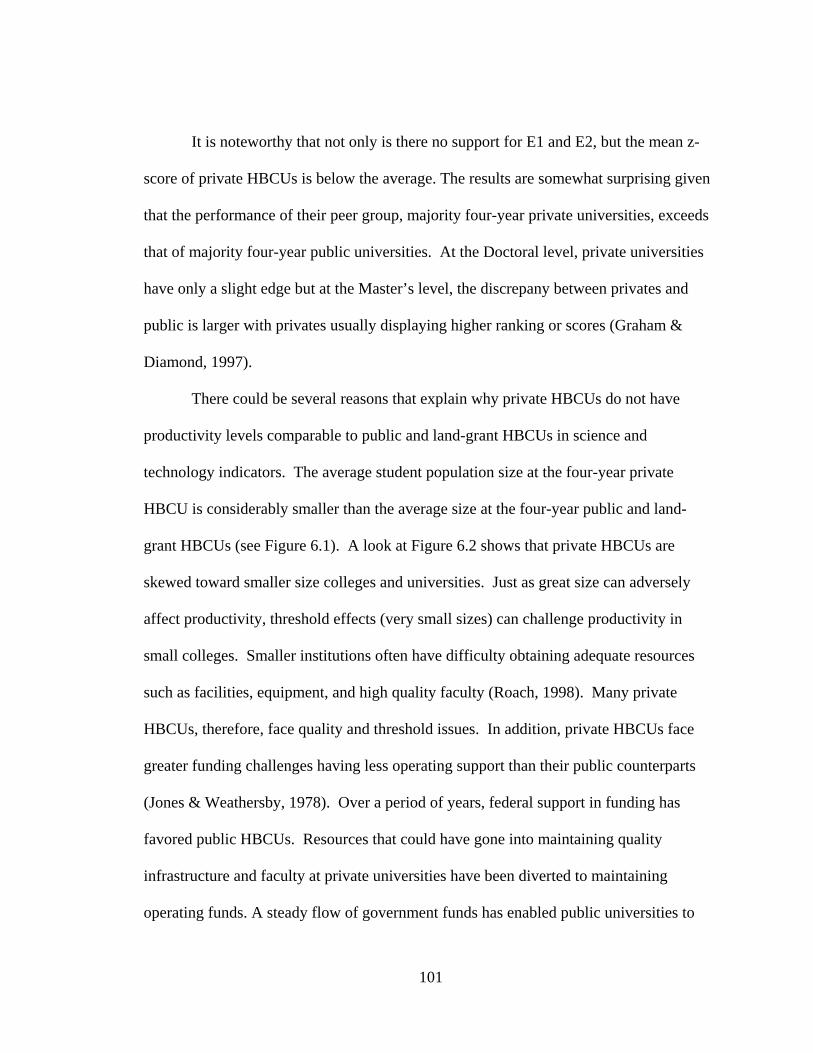
It is noteworthy that not only is there no support for E1 and E2, but the mean z-
score of private HBCUs is below the average. The results are somewhat surprising given
that the performance of their peer group, majority four-year private universities, exceeds
that of majority four-year public universities. At the Doctoral level, private universities
have only a slight edge but at the Master’s level, the discrepany between privates and
public is larger with privates usually displaying higher ranking or scores (Graham &
Diamond, 1997).
There could be several reasons that explain why private HBCUs do not have
productivity levels comparable to public and land-grant HBCUs in science and
technology indicators. The average student population size at the four-year private
HBCU is considerably smaller than the average size at the four-year public and land-
grant HBCUs (see Figure 6.1). A look at Figure 6.2 shows that private HBCUs are
skewed toward smaller size colleges and universities. Just as great size can adversely
affect productivity, threshold effects (very small sizes) can challenge productivity in
small colleges. Smaller institutions often have difficulty obtaining adequate resources
such as facilities, equipment, and high quality faculty (Roach, 1998). Many private
HBCUs, therefore, face quality and threshold issues. In addition, private HBCUs face
greater funding challenges having less operating support than their public counterparts
(Jones & Weathersby, 1978). Over a period of years, federal support in funding has
favored public HBCUs. Resources that could have gone into maintaining quality
infrastructure and faculty at private universities have been diverted to maintaining
operating funds. A steady flow of government funds has enabled public universities to
101
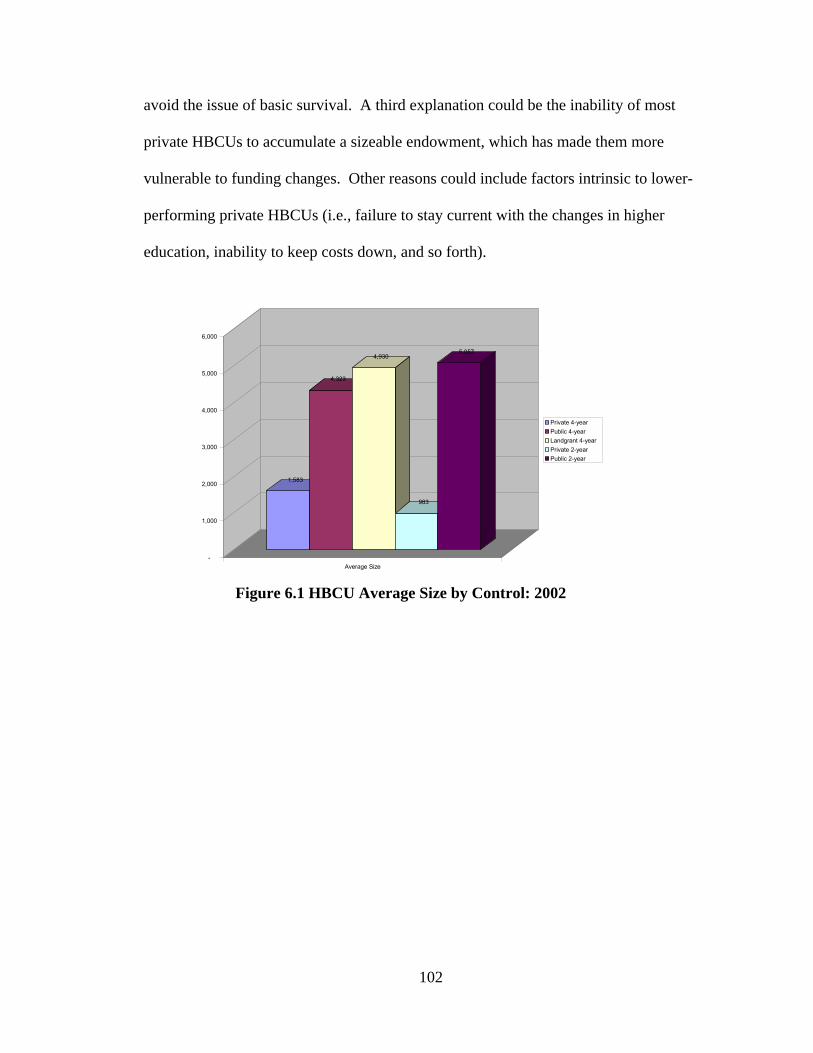
avoid the issue of basic survival. A third explanation could be the inability of most
private HBCUs to accumulate a sizeable endowment, which has made them more
vulnerable to funding changes. Other reasons could include factors intrinsic to lower-
performing private HBCUs (i.e., failure to stay current with the changes in higher
education, inability to keep costs down, and so forth).
1,583
4,323
4,930
983
5,057
-
1,000
2,000
3,000
4,000
5,000
6,000
Average Size
Private 4-year Public 4-year Landgrant 4-year Private 2-year Public 2-year
Figure 6.1 HBCU Average Size by Control: 2002
102
0
5
10
15
20
25
30
35
Number of HBCUs
HBCU Size
PrivatePublic Land-grant
Private 2 12 11 34
Public 11 7 6 1
Land-grant 6 12 1 0
Large (≥ 5,000) Medium (2,000-4,999)
Small (1,000 - 1,999)
Very Small (< 1,000)
Figure 6.2 NUMBER OF HBCUS BY SIZE AND CONTROL - 2002 Why do land-grants achieve a higher average science and technology index rating
than public universities? Land-grant universities are public universities with one major
difference. They are imbued by an act of Congress with a special mission – to teach
agriculture, military tactics, and mechanical arts so that each state can be assured of at
least one educational institution that provides practical training via training and service
extensions. Congress provides funding in support of this mission via a federal formula.
Due to their mission, land-grant universities are more applied in their educational
endeavors than public universities. They provide services through field extension offices
and continuing education classes. Therefore, they do not conduct as much basic research.
Their lower levels of research should disadvantage land-grant universities on the
science and technology index. Instead, land-grant universities are the highest performing
103
HBCUs. Stable, predictable and significant funding appear to be the most prominent
explanation. The struggle of HBCUs to survive has been heavily reliant on funding. As
explained in Chapter 3-Literature Review, funding has been an important factor in the
growth of universities, particularly in their ability to conduct research, hire faculty, and
improve their infrastructure. Thus, the additional funding received by land-grant HBCUs
as part of the federal government formula funding may be the edge that enables land-
grant universities to achieve more in science and technology indicators than public
universities. It could also be that government requirements have forced land-grant
HBCUs to be more accountable operationally in response to grants or contracts earned.
Another hypothesis is that applied universities are more in synchrony with related
industry interested in research that has an application (as per the Mode 2, entrepreneurial
university explanation in Chapter 3). At this point, it is not clear why land-grant
universities on the average have a higher productivity level in science and technology
indicators. The answer to that question lies in further research.
The next expectation, E4, is restated as follows:
E4: Research HBCUs categorized as Doctoral Extensive and Intensive and Master’s I and
II according to the Carnegie classification will average a higher rating on science and
technology productivity indicators than all other HBCUs (except HBCU medical
schools).
A research university is “a university whose primary mission emphasizes 1) the
conduct of research, and 2) the training of graduate students in how to conduct research”
(Rogers et al., 2000, 49). Based on the definition used by the Carnegie Foundation
typology of universities, Doctoral (at least 10 doctoral degrees across 3 or more
104
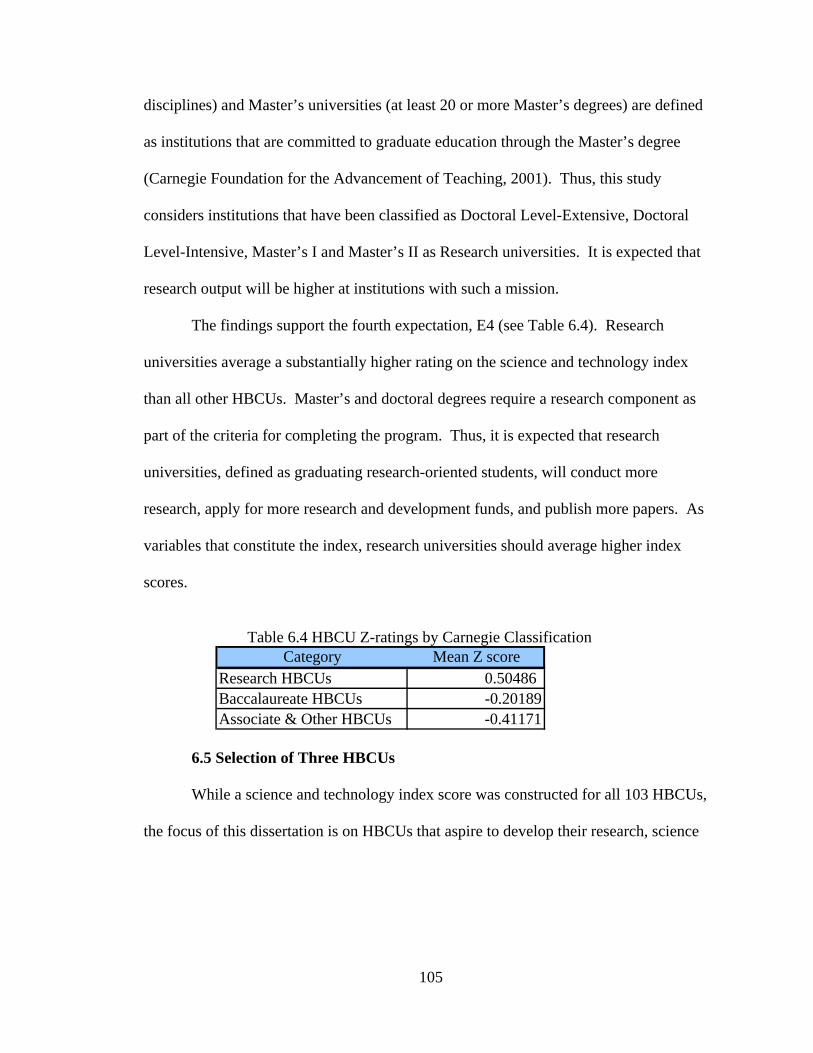
disciplines) and Master’s universities (at least 20 or more Master’s degrees) are defined
as institutions that are committed to graduate education through the Master’s degree
(Carnegie Foundation for the Advancement of Teaching, 2001). Thus, this study
considers institutions that have been classified as Doctoral Level-Extensive, Doctoral
Level-Intensive, Master’s I and Master’s II as Research universities. It is expected that
research output will be higher at institutions with such a mission.
The findings support the fourth expectation, E4 (see Table 6.4). Research
universities average a substantially higher rating on the science and technology index
than all other HBCUs. Master’s and doctoral degrees require a research component as
part of the criteria for completing the program. Thus, it is expected that research
universities, defined as graduating research-oriented students, will conduct more
research, apply for more research and development funds, and publish more papers. As
variables that constitute the index, research universities should average higher index
scores.
Table 6.4 HBCU Z-ratings by Carnegie Classification
Category Mean Z scoreResearch HBCUs 0.50486 Baccalaureate HBCUs -0.20189Associate & Other HBCUs -0.41171
6.5 Selection of Three HBCUs
While a science and technology index score was constructed for all 103 HBCUs,
the focus of this dissertation is on HBCUs that aspire to develop their research, science
105
and technology capability. These universities are categorized as research universities.
Within the 103 HBCUs, there are 35 research universities.21
The 35 research HBCUs were put into rank order based on their average z-scores
for science and technology development. A rank score was assigned from 1 (highest
score) to 35 (see Table 6.8). The universities were then partitioned into three equal
groups. The top third percentile was classified as high science and technology
productivity HBCUs, the second percentile as middle productivity, and the third
percentile as lower productivity HBCUs.
In order to fulfill the requirements for a purposive representative sample scheme,
one university was selected from each group. Using this method enables the sample to
represent the distribution of characteristics in the population from which it came. The
selection of one particular HBCU from within each of the groups was based on the desire
to retain variation in the characteristics, to have access and availability to the faculty and
administration, and to stay within the researcher’s financial resources.
In selecting the three universities, an attempt was made to include a cross section
of characteristics such as location, Carnegie classification, size and control. FAMU was
selected from the High Productivity group, Hampton from the Middle Productivity and
FVSU from the Lower Productivity group. These universities were studied further using
qualitative methods. Selecting more than one case study and choosing congruent
universities while including variation in the sample, strengthens the rigorousness of the
case, methods, and results (Lee, 1989).
21 Research universities do not include medical or professional schools.
106
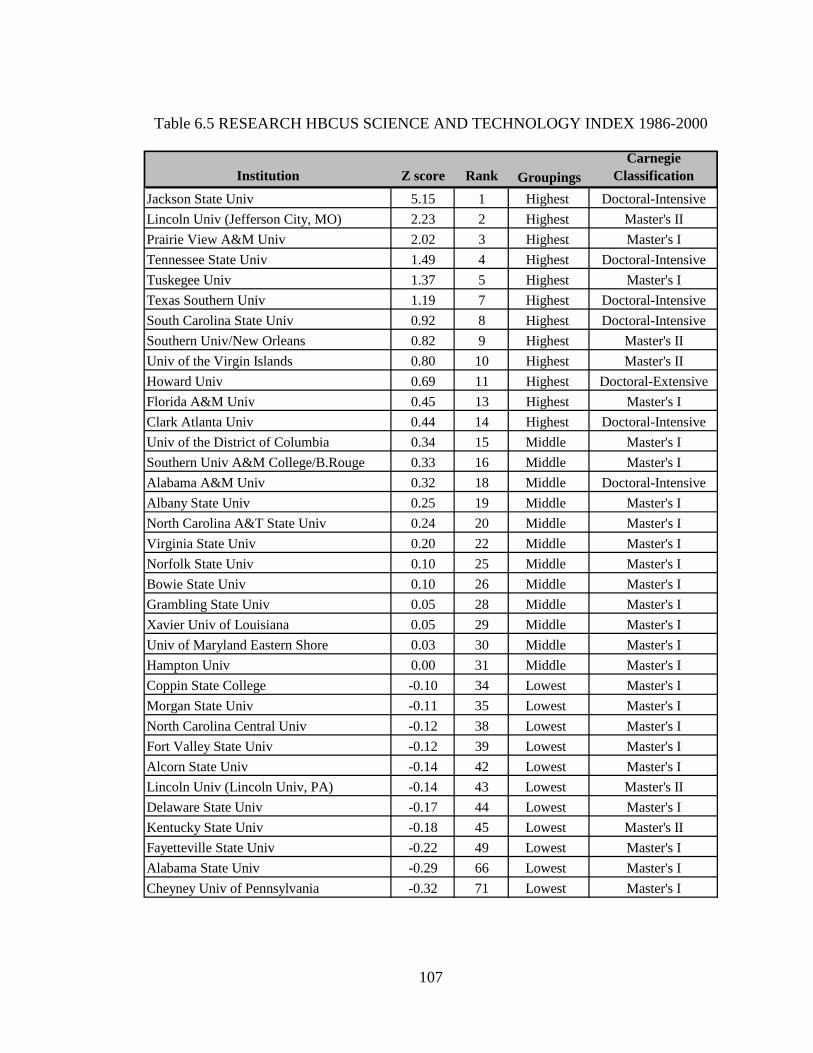
Table 6.5 RESEARCH HBCUS SCIENCE AND TECHNOLOGY INDEX 1986-2000
Institution Z score Rank GroupingsCarnegie
Classification
Jackson State Univ 5.15 1 Highest Doctoral-IntensiveLincoln Univ (Jefferson City, MO) 2.23 2 Highest Master's IIPrairie View A&M Univ 2.02 3 Highest Master's ITennessee State Univ 1.49 4 Highest Doctoral-IntensiveTuskegee Univ 1.37 5 Highest Master's ITexas Southern Univ 1.19 7 Highest Doctoral-IntensiveSouth Carolina State Univ 0.92 8 Highest Doctoral-IntensiveSouthern Univ/New Orleans 0.82 9 Highest Master's IIUniv of the Virgin Islands 0.80 10 Highest Master's IIHoward Univ 0.69 11 Highest Doctoral-ExtensiveFlorida A&M Univ 0.45 13 Highest Master's IClark Atlanta Univ 0.44 14 Highest Doctoral-IntensiveUniv of the District of Columbia 0.34 15 Middle Master's ISouthern Univ A&M College/B.Rouge 0.33 16 Middle Master's IAlabama A&M Univ 0.32 18 Middle Doctoral-IntensiveAlbany State Univ 0.25 19 Middle Master's INorth Carolina A&T State Univ 0.24 20 Middle Master's IVirginia State Univ 0.20 22 Middle Master's INorfolk State Univ 0.10 25 Middle Master's IBowie State Univ 0.10 26 Middle Master's IGrambling State Univ 0.05 28 Middle Master's IXavier Univ of Louisiana 0.05 29 Middle Master's IUniv of Maryland Eastern Shore 0.03 30 Middle Master's IHampton Univ 0.00 31 Middle Master's ICoppin State College -0.10 34 Lowest Master's IMorgan State Univ -0.11 35 Lowest Master's INorth Carolina Central Univ -0.12 38 Lowest Master's IFort Valley State Univ -0.12 39 Lowest Master's IAlcorn State Univ -0.14 42 Lowest Master's ILincoln Univ (Lincoln Univ, PA) -0.14 43 Lowest Master's IIDelaware State Univ -0.17 44 Lowest Master's IKentucky State Univ -0.18 45 Lowest Master's IIFayetteville State Univ -0.22 49 Lowest Master's IAlabama State Univ -0.29 66 Lowest Master's ICheyney Univ of Pennsylvania -0.32 71 Lowest Master's I
107
6.6 Summary
In summary, the findings from the science and technology index produced
Jackson State University in Mississippi as the HBCU with the highest science and
technology productivity rating. As a large, Doctoral-Intensive university, Jackson State
University continues to have high growth in several areas. Jackson State University has
both high production as well as high productivity. The university is a model for
developing and maintaining science and technology capability.
The findings do not support expectations 1 or 2 which state that private 4-year
HBCUs will outperform public and land-grant HBCUs. This stands in contrast to TWIs
where private universities have a slight edge. Federal, state and local funding received by
public universities could be an explanation as to why private HBCUs do not perform at
the same level as public HBCUs. Private, four-year HBCUs receive a higher average
science and technology rating than 2-year private and 2-year public HBCUs thus
supporting the third expectation, E3. The latter are not eligible for certain funding which
could be one explanation for their lower ratings.
Based upon these findings, three research-oriented HBCUs were selected from
each category of high, medium and lower level of science and technology rankings.
These universities were chosen to include a cross section of characteristics present in the
population. Results from in-depth research conducted at these universities will be used to
determine what strategies HBCUs should adopt to develop their science and technology
productivity.
108
CHAPTER 7 FORT VALLEY STATE UNIVERSITY
7.1 Fort Valley State University (Low productivity)
7.1.1. Characteristics
Fort Valley State University (FVSU) is located in the state of Georgia, the
southern region of the United States. It is a public, land-grant, 4-year university.
Opening its doors in the late 1800’s, Fort Valley State University is now classified as a
Master’s I Research University. It is a medium-sized university (2,660 students in 2002)
serving a population that is 92% Black. On the science and technology index developed
in this dissertation study, this university was ranked in the bottom third percentile of the
35 research universities. It is relatively recent (1996) that FVSU received its Master’s I
designation in the Carnegie classification typology and its designation as a Level IV
university by the Southern Association of Colleges and Schools (SACS) (1995). FVSU’s
science and technology program can be categorized as “emerging.”
7.1.2 History
Fort Valley State has come a long way from its industrial origins as a junior
college. Originally named Fort Valley High and Industrial School in 1895, it emerged
out of a joint venture between several small towns that attempted to establish a school
system in rural Georgia but failed because of farming demands. In 1901, the Board of
Trustees, overseen by the Episcopal Church, hired the second president, Henry Hunt,
under whose leadership the university would become an accredited 4-year college. Hunt
inherited a run-down, disorganized school of 145 students running on a budget of $840 a
year (Neyland, 1990; Range, 1951). The grounds were described as “water standing
109
around the house…the old laundry shack right alongside the principal’s home…and so
forth” (Range, 1951). By the mid-1920s, the grounds and buildings of the university
grew in value to nearly half a million dollars while the $840 budget rose to $80,000 per
year.
The school philosophy was the Hampton-Tuskegee ideal – industrial education as
opposed to a classic liberal arts education. But progress led to change and by 1939 a
merger occurred with the State Teachers and Agricultural College of Forsyth to form the
4-year Fort Valley State College (FVSC). In 1945, the Board of Regents authorized
FVSC to initiate a 4-year program to train, place and follow-up with all students
interested in training in Agriculture.
Fort Valley State was not the original designee of the Negro land-grant institution
for the state of Georgia. Clark Atlanta, a more wealthy and stable institution which
seemed the automatic choice, was considered too progressive. Georgia State Industrial
College for Colored Youths (known today as Savannah State) won the bid to receive the
award. (Range, 1951). The Strayer Committee, named by the University of Georgia,
recommended the establishment of a four year school of agriculture in Fort Valley.
Feeling that FVSC was “in a position to develop a sound program in the field of general
agriculture as a basis for the preparation of teachers of Vocational Agriculture,” the
committee recommended that “FVSC be developed distinctly as the State College for
Negroes in the fields of agriculture and home economics.” The state agreed and in 1949,
the land-grant award status was transferred to FVSC. Through the 1940s and 1950s
FVSC continued to train teachers in agriculture. This emphasis was largely due to the
110
scarcity of employment opportunities except for those in vocational agriculture. It was
also consistent with the mission of the college.
The Southern Association of Colleges and Schools admitted FVSC entry in 1957.
According to Fort Valley State’s website, FVSC achieved university status in 1996. It
also achieved Master’s I Carnegie classification in the mid-1990’s (Fort Valley State
University, 2005). So it is relatively recent that FVSU has emerged as a research
university.
7.1.3 Structure
FVSU is located in a rural environment, one hour away from Atlanta, Georgia. It
currently has two colleges affiliated with science or technology - the College of Arts,
Science and Education and the College of Agriculture, Home Economics and Allied
Programs. In addition, it has the Cooperative Developmental Energy Program (CDEP),
an innovative energy education program that focuses on increasing the number of
minorities and women working in the private and government sectors of the energy
industry (Fort Valley State University, 2005).
7.1.4 S&T Statistics
One of Fort Valley’s strengths (and one of HBCUs’ strengths in general) is the
graduation of students in science, engineering and technology fields. From 1987-1996,
Fort Valley State more than doubled its number of students in science and technology
related fields (from 99 to 201). It averaged an increase of 20% per year during those
years. Since 1996, the numbers have begun to decline (National Center for Education
Statistics, 2001).
111
The funding picture provides some insight into the college’s growth. Fort Valley
State received no federal funds for research and development until 1989 according to the
National Science Foundation’s data on Research and Development Expenditures
(National Science Foundation, 2004a)]. Despite being a land-grant university with a
mandated mission to do basic and applied research in agriculture by and for the state, Fort
Valley State received no state and local funds for research and development until 1996.
Around the same time, Fort Valley began to receive a small amount of industry funds for
research and development. Thus, it is not until the last fifteen years that Fort Valley
obtained research funding.
The university receives the bulk of its federal funding from the U.S. Department
of Agriculture (USDA). Of the $6,019,000 Fort Valley received in federal funds for
science and engineering in 2002, $5,227,000 (86%) came from the USDA. Most if not
all of this went to the College of Agriculture, Home Economics and Allied Programs
(National Science Foundation, 2000b).
No data could be gathered on publications indicating either no research has been
published or they could not be found.22
7.1.5 Unique Achievements
The CDEP program at Fort Valley claims to be the only “program of its kind” in
that it is an industry-university-government partnership providing students with
internships leading to careers in the field of science, energy and ecology. The program
solicits talented individuals and provides them with internships at selected energy
companies. CDEP prepares students for technology-oriented employment and facilitates
22 The VantagePoint bibliometric software using the database Web of Science by ISI Web of Knowledge uncovered no articles from Fort Valley State University despite using several variations of the name (i.e., Fort Valley, FVSU, Fort Valley State University).
112
this through its dual degree program (one degree from FVSU and one from the other
institution). Dual degree programs have been established with the Georgia Institute of
Technology, the University of Nevada, the University of Oklahoma and the University of
Texas-Austin. The federal government assists this effort through matching funds for the
student interns.
FVSU also distinguishes itself in other ways. The Biology program produces a
higher number of minority students enrolling in medical or dental schools than any other
state university in Georgia.23 The Georgia Goat Research and Extension Center is the
largest facility of its kind east of the Mississippi.
7.1.6 Analysis
Fort Valley State presents a picture of a university that has evolved considerably
from its educational roots of applied industrial education. Sixty years ago (1945) Fort
Valley State University became a 4-year institution. Less than ten years ago (in 1996) it
achieved university and Master’s I Institution (Carnegie Classification) status. Fort
Valley’s strategic plan commits to a research agenda. Its mission statement includes
“research and public and extension services…a commitment to a basic and applied
research program and a full range of degree programs in the food and agricultural
sciences…consistent with its land-grant….tradition.” Its strategic initiatives include
fostering collaborations, developing international links, and accelerating the full
development of its basic and applied research program. Consistent with that plan, it has
increased its level of federal, state and local funding as well as its production of graduates
in science and engineering fields from 1987 to 2001.
23 This fact is stated on their website. It could not be verified otherwise.
113
But there are some areas of weakness as well. Its funding base is not diversified.
As a land-grant institution, the university receives the bulk of its research (86%) and
development funds from the U.S. Department of Agriculture. This compares to an
average of 12.4% in funding received from the U.S. Department of Agriculture by the
total population of land-grants (National Science Foundation, 2000a).24 The USDA
funds benefit predominantly one college at FVSU – the College of Agriculture. This
could mean that other departments receive insufficient attention from university
administration. Alternatively, other departments may not display sufficient initiative to
obtain grants from other sources. In addition, the increase of funding since 1987 is not
accompanied by evidence of research. The inability to obtain publication data does not
indicate there is no research, but it does indicate that if research is being done, the results
are not as readily available as they should be.
Overall, Fort Valley State University continues to make progress as can be seen
by its recent elevation to Level IV status by the Southern Association of Colleges and
Schools (SACS) in 1995. The strategic initiative represents a plan that commits the
university towards a goal of research, scholarship and collaboration. The next few years
will indicate whether the implementation process matches the written commitment.
FVSU’s president from 2001-2005 (the time period during which the strategic initiatives
were developed), Dr. Kofi Lomotey, is no longer with the university. It remains to be
seen whether his departure will disrupt implementation plans. His departure is also an
24 A list of 75 land-grant universities was extrapolated from Table B-17 from the NSF Survey of Federal obligations for science and engineering research and development (R&D) to universities and colleges, by State, institution, and agency: fiscal year 2000. A calculation was made of the average percent received by all land-grant universities (including HBCUs) from each agency.
114
interesting litmus test for the importance of leadership in science and technology
productivity.
7.2 Interviews
The material that follows presents summaries of interviews conducted at FVSU.
Each summary begins with a description of the current status of the program. Following
that is data obtained in response to the first data analysis tool – chronology of events.
Each interviewee was asked to explain the origins of a typical program. In the
concluding paragraph, the response is analyzed for pattern matching – evidence matching
the predictions for linkages and rival theories (predictions can be found in the case study
protocol – Appendix E).
Based upon chronology of events, two questions emerged regarding development
of science and technology programs. The first question was, “Did this theory lead to
initiation of the program?” The second question was, “Did this theory cause the program
to expand?” For a theory to be credited, it must be critical to initiation or expansion of
the program (depending on the question that is being asked) and must meet the
requirements of the prediction.
The chapter concludes with the findings - a table summarizing the interviews and
coding for each question. Each theory is coded affirmatively if there is a match between
the prediction of the theory and the evidence presented in the interview. More than one
theory may be supported by the evidence.
7.2.1 A Science program
FVSU-1 is Chair of a science department at FVSU. Currently, the department
joint ventures on summer programs (medical, dental, pharmaceutical and chiropractic)
115

with several nearby universities that provide graduate education. The programs often act
as entryways to those universities for FVSU students interested in pursuing further
education in those fields. The programs benefit FVSU and the graduate institutions.
FVSU is able to advertise graduate opportunities to potential applicants and the graduate
institutions have a minority pool of talent from which to draw that are already interested
in their fields. FVSU-1 has been at the University since 1963 and has headed this
program since its inception.
When asked how the program began, FVSU-1 recounted that in 1965, laws came
into effect that mandated integration. Until that point, the surrounding colleges and
universities had refused to admit Black students despite applications from FVSU. In
1965, in order to comply with integration laws, the Medical College of Georgia accepted
its first Black student from FVSU. No relationships existed when the Medical College
reached out to FVSU. The University of Georgia School of Pharmacy initiated a similar
program. Over time, the graduate institutions saw the advantages of having an additional
pool of qualified students. They now eagerly support the program. Summer programs
were set up with nearby institutions (within and eventually outside the state of Georgia)
so students could be exposed to work in the field. In addition, the graduate schools offer
additional course preparation if needed.
Based on the integration policy, the information obtained by the chronology of
events analysis indicated Policy was the strategy that initiated this program. FVSU was
aware of the policy. It worked with surrounding institutions within the year to enact
programs that would facilitate the policy and expand science and technology
116
development. Based on the institutions that reached out to FVSU for student applications
and summer programs, the theory of Proximity was also found to be a critical factor.
The summer programs have not changed in a significant manner since their
inception. Growth has been in the form of more institutions and more students
participating. Thus, Proximity and Demand were strategies that expanded the program.
7.2.2 CDEP (Cooperative Developmental Energy Program)
FVSU-2 is the Director of the CDEP program. The CDEP program is a thriving
program for students interested in energy careers. It is a collaborative effort between
FVSU, energy-oriented corporations, the federal Department of Energy, and various
other universities. Dual degree programs exist in engineering with Georgia Institute of
Technology, in engineering and health physics with University of Nevada-Las Vegas,
and in geo-sciences and petroleum engineering with the University of Oklahoma.
How did the program begin? FVSU-2 had conducted a previous project with the
U.S. Department of Energy (DOE) prior to employment at FVSU. In November 1982,
the Office of Minority Impact at DOE contacted him regarding a Request for Proposal
(RFP) for initiatives that would increase the number of minorities in energy. A less
important goal within the RFP was to expose students to careers in energy. FVSU-2
recognized early on that focusing on minority businesses would create a temporary
program. The real money in the industry was in heavy equipment. Minority energy-
related businesses were too small – they could do only 2-3% of energy company
operations. FVSU-2 decided to infiltrate the industry with students. Three other
universities were awarded the grant in 1983; by 1986 only FVSU had a viable program
still in operation. In the response to the RFP, FVSU-2 asked DOE for 50% of minimum
117
wage for each student in the internship program; corporations would pay the rest. He
selected only science students. He referred to them as his “Special Forces” – military
terminology for the highly trained special forces units that penetrate the target area
(corporations) and prepare it for subsequent troops. Cold calls were made to all the
utilities and energy-related companies in the area. Georgia Power, Atlanta Gas & Light,
Oglethorpe Power, MEAG and Flint responded. FVSU-2’s effort was assisted by a key
figure at Georgia Power who promoted the program and influenced the other energy
companies to support the program. Employees from each company, usually a minority,
would make presentations to the students and encourage them to consider careers in the
field. The program was a success. FVSU-2 could have stopped there but he was
interested in expanding the program.
The next phase was to expand beyond the state of Georgia and get other energy
companies to hire FVSU students. Additional cold calls were made to energy companies.
Contacts were made at the Hoover Dam, Portland (Oregon), San Francisco, and the
Nevada Test Site. The need for personnel skilled in these areas led national companies to
support summer internships. FVSU did not have the faculty, infrastructure or skills to
offer training in these areas. FVSU-2 recognized that relationships had to be formed with
other universities so students could receive the needed training. Plant Vogel in Georgia,
an internship site for FVSU students, needed plant physicists. Georgia Institute of
Technology eventually agreed to a dual-degree engineering program.
The Department of Energy in Las Vegas contacted FVSU-2. FVSU students were
interning at the Nevada Test Site. DOE in Las Vegas and FVSU reached an agreement to
fund an initial program at the University of Las Vegas-Nevada provided FVSU recruit
118
students from Las Vegas. A dual-degree program in engineering began that later
expanded to include Health Physics. A third dual-degree program was initiated based on
a friendship that started from a cold call. Mr. Hofstedler, President of Cities Service Oil
and Gas, had accepted several students from the CDEP program. At the time, there was
no geo-science program that existed to measure seismic movements. He proposed a dual-
degree program. An alumni of the University of Oklahoma and a geo-scientist, he
facilitated discussions between University of Oklahoma and FVSU. The dual degree
program in geo-sciences and later, petroleum engineering, was initiated.
As noted earlier, three of the programs that received funding at the same time as
the CDEP program were no longer in existence after three years. Three strategies
combined to make FVSU successful. The RFP, a Policy from the Department of Energy
led to the creation and support of the program. The initiative and Leadership of FVSU-2
brought on other companies that supported the program. And, the Demand for students
who could become qualified personnel was necessary for initial support of the program.
Linkages did not exist initially but the cold calls resulted in friendships and
relationships. As a result of the urging, participation and facilitation of one of these
friends, a dual-degree program emerged in a different state. The Network of companies
built by FVSU-2’s initiative produced benefits that were not the result of direct efforts by
FVSU. This was also one of the few instances where Policy remained important. The
DOE in Las Vegas contacted FVSU to increase the number of minorities in energy.
Leadership and initiative by FVSU-2 continued to be critical to the growth of the
program as did demand for skilled personnel in energy. The CDEP program is the only
instance at FVSU where Linkages operated on the level of Networks/Clusters. There
119
were a number of relationships that existed, various types of participants (government,
corporations and other universities), and actions being taken on behalf of the university
by members in the Network. The actions resulted in formal agreements that are
characteristic of Networks.
7.2.3 Middle Georgia Regional Council
In 1995, FVSU was asked by Governor Zel Miller to act as fiscal agent for the
Middle Georgia P16 Regional Council. The goal of the Commission is to improve
educational standards and opportunities in that area. The Commission does not
concentrate solely on science and technology; however, it is a part of their overall
educational focus. FVSU-3 was the Director of the initiative. FVSU-3 spoke about the
goal to reach out to K-12 regarding educational quality and science programs but no
specific projects for science and technology were in effect. FVSU-3 described the
Council as sustaining itself but not growing. This program supported the theory of
Policy as it would not have been created without a request by Governor Zel Miller. The
program has not expanded beyond its original creation.
7.2.4 Bio-Technology Program
FVSU-4, a member of the faculty, has been at FVSU for the shortest period of the
FVSU interviewees – seven years. Of foreign born descent, FVSU-4 came to the
university with a research interest in agricultural biotechnology. He currently has two
grants totaling $600,000 from the USDA to expose students to agricultural
biotechnology. FVSU-4 is responsible for FVSU’s first grant from the National Science
Foundation (NSF). The grant, $2.5 million, was awarded from the NSF bio-technology
program to strengthen undergraduate preparation in SMET (science, math, engineering
120
and technology). FVSU is the only HBCU and the only land-grant institution to be
funded under this grant.
When asked about the origins of the program, FVSU-4 stated that when he came
to the university there was no program in bio-technology at all. However, that was his
research interest. He searched on the NSF website for potential funding opportunities.
He found an RFP and made a cold call to NSF to ask for information. NSF made a site
visit and provided technical assistance. He is now pursuing a second grant from NSF.
The first grant from NSF has produced a collaborative effort between 20 universities that
provides internships for FVSU and other universities’ students. Several activities are
coalescing around FVSU-4’s efforts. Another researcher, who has similar academic
interests, recently received a patent for producing a transgenic strawberry. FVSU-4 has
plans to start a bio-technology major at FVSU within a couple of years.
There appears to be only one strategy critical to the initiation of a bio-technology
initiative at FVSU that also meets the requirements of the prediction – Leadership.
FVSU-4 appears dedicated to his research interests and the students at FVSU. Without
his efforts, no program would exist. He used previous contacts (at his graduate institution
and his post-doctoral organization) to establish collaborations for the internships but they
are not responsible for initiating or expanding the program. FVSU-4’s efforts created the
program and they sustain the program. Further follow-up is required to determine
whether continued growth can be attributed to other factors or strategies.
7.2.5 Administrator
FVSU-5 is a member of the Administration. He cited the efforts of the new
President, Dr. Kofi Lomotey, as significant in the support for a research agenda at FVSU.
121
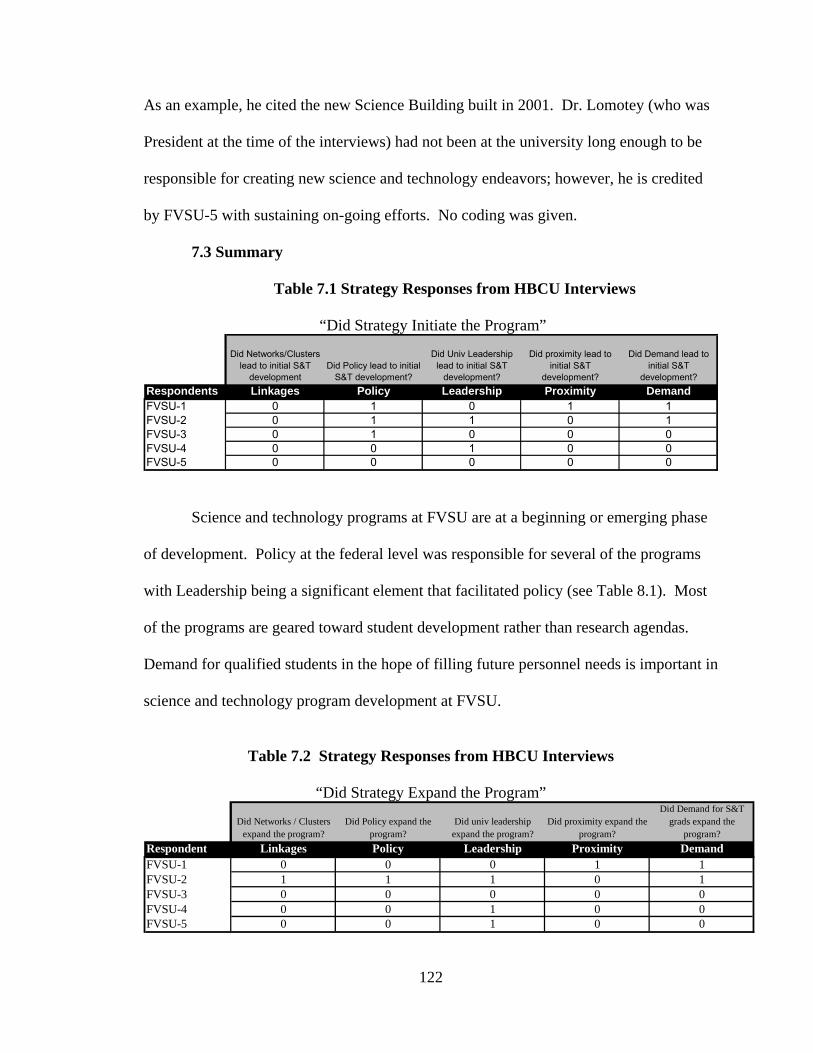
As an example, he cited the new Science Building built in 2001. Dr. Lomotey (who was
President at the time of the interviews) had not been at the university long enough to be
responsible for creating new science and technology endeavors; however, he is credited
by FVSU-5 with sustaining on-going efforts. No coding was given.
7.3 Summary
Table 7.1 Strategy Responses from HBCU Interviews
“Did Strategy Initiate the Program”
Did Networks/Clusters lead to initial S&T
developmentDid Policy lead to initial
S&T development?
Did Univ Leadership lead to initial S&T
development?
Did proximity lead to initial S&T
development?
Did Demand lead to initial S&T
development?Respondents Linkages Policy Leadership Proximity DemandFVSU-1 0 1 0 1 1FVSU-2 0 1 1 0 1FVSU-3 0 1 0 0 0FVSU-4 0 0 1 0 0FVSU-5 0 0 0 0 0 Science and technology programs at FVSU are at a beginning or emerging phase
of development. Policy at the federal level was responsible for several of the programs
with Leadership being a significant element that facilitated policy (see Table 8.1). Most
of the programs are geared toward student development rather than research agendas.
Demand for qualified students in the hope of filling future personnel needs is important in
science and technology program development at FVSU.
Table 7.2 Strategy Responses from HBCU Interviews
“Did Strategy Expand the Program”
Did Networks / Clusters expand the program?
Did Policy expand the program?
Did univ leadership expand the program?
Did proximity expand the program?
Did Demand for S&T grads expand the
program?Respondent Linkages Policy Leadership Proximity DemandFVSU-1 0 0 0 1 1FVSU-2 1 1 1 0 1FVSU-3 0 0 0 0 0FVSU-4 0 0 1 0 0FVSU-5 0 0 1 0 0
122
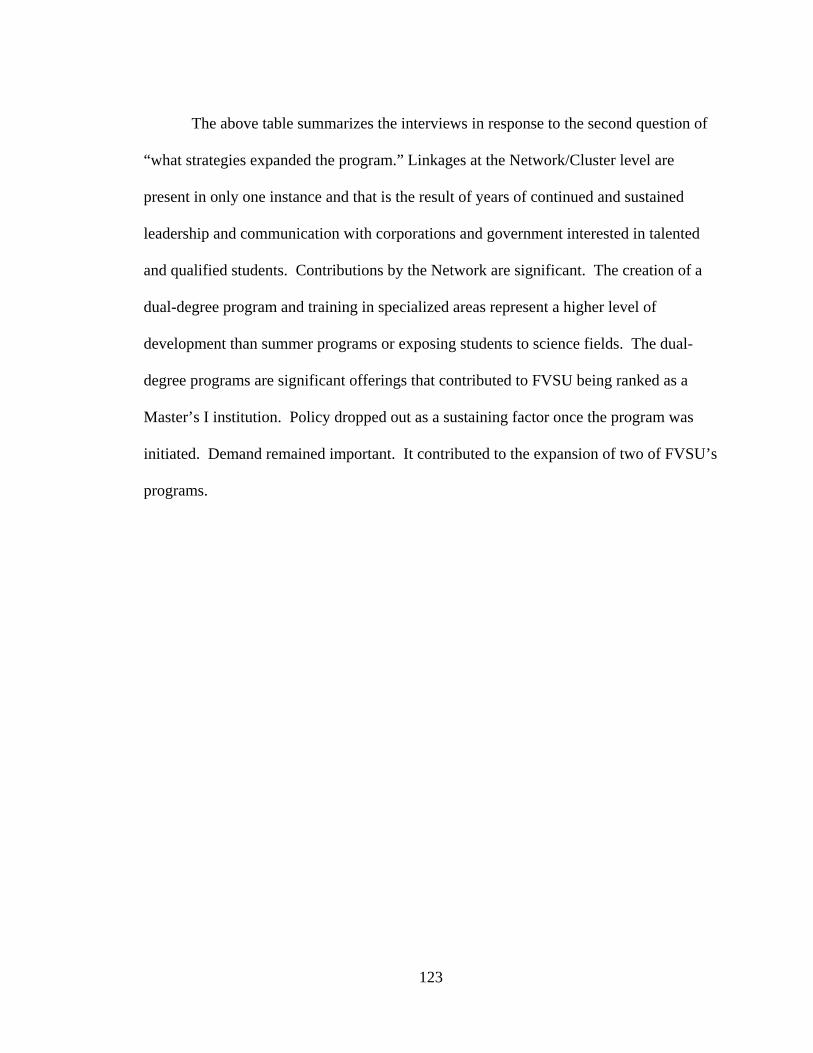
The above table summarizes the interviews in response to the second question of
“what strategies expanded the program.” Linkages at the Network/Cluster level are
present in only one instance and that is the result of years of continued and sustained
leadership and communication with corporations and government interested in talented
and qualified students. Contributions by the Network are significant. The creation of a
dual-degree program and training in specialized areas represent a higher level of
development than summer programs or exposing students to science fields. The dual-
degree programs are significant offerings that contributed to FVSU being ranked as a
Master’s I institution. Policy dropped out as a sustaining factor once the program was
initiated. Demand remained important. It contributed to the expansion of two of FVSU’s
programs.
123
CHAPTER 8 HAMPTON UNIVERSITY
8.1 Hampton University (Mid-level productivity)
8.1.1 Introduction and Characteristics
Hampton University, commonly referred to as Hampton, is located in the state of
Virginia, in the Mid-Atlantic region of the United States. It is a private, 4-year, Master’s
I research university. Hampton is considered large with over 5,000 students and a 96%
Black population. It was ranked in the middle third on the science and technology index.
As a private university, it is not subject to the same reporting requirements as public
universities. Hence, documents like the strategic plan and funding from industry and
other sources are not publicly available. Hampton exhibits a sophisticated and mature
level of linkages operating on the Networking and Clustering level.
8.1.2 History
Brigadier General Samuel Chapman Armstrong founded the Hampton Normal
and Agricultural Institute in 1868 with a mission to train common school teachers to lead
and teach newly-freed Negroes. His philosophy became known as the “Hampton Idea” –
the education of Negroes to do the honest work of menial labor without aspiring to a
liberal arts/classical education. The philosophy of industrial education was to have
enormous influence on almost all public Negro colleges, as funding typically depended
on its adoption (Anderson, 1988; Drewry & Doermann, 2001).
Hampton and its philosophical peer, Tuskegee, exemplified the white southern
and northern industrialist philosophical beliefs. This caused them to be the recipients of
the lion’s share of the philanthropic funding for Negro colleges making them the two
124
most well endowed and well-known Negro colleges of that time. In 1891 Hampton was
designated the Negro land-grant college by the state of Virginia. By 1916, only 2 Negro
colleges had substantial endowments - Hampton ($2,700,000) and Tuskegee
($1,900,000). In the 1920s, Hampton and Tuskegee accounted for 75% of endowment
funds held by HBCUs (Anderson, 1988).
Despite its relative financial security, the weaknesses and failures in Hampton
became evident by 1915 when Hampton admitted it could not find one of its own
graduates sufficiently qualified to fill a teaching position at the Whittier Elementary Lab
School located on Hampton's campus because they were insufficiently trained to provide
any further knowledge to the children. The routine labor in unskilled and semi-skilled
agricultural and industrial training, the discouraging of college or even high-quality
secondary work, and the heavy emphasis on moral development and ideological training
made it difficult for the graduates to meet state and local academic requirements for
teacher certification. One example of this is that students worked 60 hours per week for
the first three years in simple mechanical arts earning .07 cents an hour. As a further
example, one prominent graduate testified that he took gymnastics, nothing else, for two
or three summers. As a result, in 1920, the land-grant designation was transferred to
Virginia State University at Petersburg. Hampton retained its status as a private
institution and shifted to emphasizing a liberal arts curriculum and teacher training
(Holmes, 1934; Neyland, 1990).
By 1932, Hampton enrolled 889 students and had caught up to its institutional
peers. The Black private colleges maintained a reputation for more demanding academic
125

programs but by the 1950’s they had lost their dominance in enrollment. Public HBCUs
had enhanced the quality of their programs while offering lower tuition costs.
Hampton was now in the higher education market without any particular
advantage. It had to compete against other black private schools with better academic
reputations such as Fisk and Howard. In addition, black public institutions by the 1960s
were able to offer better faculty salaries as did private and public white colleges and
universities that had more resources (Drewry & Doermann, 2001).
In the 1960s and 1970s Hampton strengthened its financial position placing it first
in endowment among Black colleges. By the 1970s, however, the level of financial
remuneration had dropped and was not a major attraction in drawing and retaining
faculty. Drewry notes one change that occurred in the 1960s and 1970s.
The stronger private black colleges came to more closely resemble one another and to separate themselves from the more slowly developing private black colleges…They were by and large, urban schools at a moment when the city was becoming a powerful draw for prospective students. Their growth generally outpaced that of other schools. Their endowments tended to be healthier and their facilities remained more intact. Naturally, then, they were best able to give serious consideration to and plan coherently for a future unlike any that private black colleges had faced in their previous hundred years. Thus, they were in a position to strengthen their situation in the years to come (Drewry & Doermann, 2001, 126).
In 1978, Dr. William Harvey was named President of Hampton University, a
position he still holds. A businessman with 100% ownership of a Pepsi Cola franchise,
Dr. Harvey brought his business and entrepreneurial philosophy and applied them to
Hampton. During his 27-year tenure as President, the student enrollment at Hampton
University increased from approximately 2,700 students to over 6,000, and the SAT
scores of entering freshmen increased approximately 300 points (Hampton University,
126
2005). Among his many achievements, Dr. Harvey initiated a University-owned
commercial development named Hampton Harbor consisting of a shopping center and
246 two-bedroom apartments. Profits from the Hampton Harbor Project are primarily
utilized for student scholarships.
8.1.3 Structure
Hampton has 7 schools at the undergraduate level of which the School of
Engineering and Technology, the School of Science, and the School of Liberal Arts and
Education offer courses related to science and technology. There are three divisions
within the School of Science – the Division of Biological, Chemical and Environmental
Sciences, the Division of Health Sciences, and the Division of Mathematical and Physical
Sciences. Master’s degrees programs are offered in Applied Mathematics, Biology,
Chemistry, Communicative Sciences and Disorders, Computer Science, Mathematics,
Physics and Environmental Science. The doctor of philosophy (Ph. D.) degree is offered
in physics. Under the School of Liberal Arts and Education resides the Division of Social
and Behavioral Sciences.
Since 1978, President Harvey has been responsible for 64 new academic
programs, 17 new buildings and $50 million spent on the renovation of existing facilities
(Hampton University, 2005).
8.1.4 S&T Statistics
Hampton has significantly increased its output of publications from 1987-2002
and the number of students graduating in science and technology fields (from 369
students in 1987 to 602 students in 2001, a 63% increase) (Appendix C).
127
One strength Hampton displays is in the level of funds it receives from the federal
government. Federal research and development funding went from $2,168,000 in 1989
to $8,337,000 in 2001 (287% increase) greatly outpacing the 113% growth rate of all
U.S. universities (National Science Foundation, 2004b). President Harvey has also
increased the university endowment from $20 million in 1987 to $140 million in 2004.
However, this strength is offset by the weakness of not raising any state or local funding
since its loss of land-grant status in 1920. Likewise, Hampton appears to have little
success with receiving research and development funds from industry. Hampton’s
numbers may be misleading. As a private university, it is not required to divulge as much
financial or other information as public universities. With its reputation as a physics
center, there may be more partnerships with industry and government than what is known
or reported.
8.1.5 Unique Achievements
Hampton has the 4th highest endowment of all HBCUs - $140 million (Cooke,
2002). Hampton’s physics department has an international reputation. The Center for
the study of the Origin and Structure of Matter (COSM) is one of four Physics Frontier
Centers established in 2001 by the National Science Foundation and the only one to be
located at a historically black university [Hampton, 2004 #540].
8.1.6 Analysis
As a private institution, Hampton University would not yield any documents such
as the Strategic Plan, Mission Statement or Report of External Funding. The university’s
website did not contain any of these documents. In the absence of such documents,
128
information was obtained from interviews or gleaned from external sources such as
books, magazines, or journals.
From the time it was created in 1868, Hampton has had a long distinguished
history as one of the top Negro colleges in the United States. However, its early
reputation was based on industrial education even as it eschewed a classic, liberal arts
education. Its educational stagnancy and lack of competitiveness forced the university to
enhance the quality of its curriculum around 1930.
Hampton was like many HBCUs in size and wealth until the 1970’s when Dr.
William Harvey took over as President. As a businessman, Dr. Harvey brought an
entrepreneurial attitude to the university. He created and implemented a financial and
marketing plan. Not only did he forge relationships with government and business, he
started profit-making institutions which will enable Hampton to be self-sustaining. His
efforts have paid off with Hampton having the fourth largest endowment of all HBCUs
(Ebony, 1997).
While Dr. Harvey and Hampton University have been impressive in receiving
federal funds and establishing relationships and collaborations with government and
business, there are some areas for improvement. Hampton receives no research and
development dollars from state and local sources (see Appendix C).25 According to NSF
data, they received no industry dollars until 2001. Given their achievements and
prominence in physics (a Ph.D. program in Physics, scientists with international repute, a
Physics Frontier Center designation by the National Science Foundation, and so forth),
Hampton should receive more research dollars from industry.
25 Information obtained from the interview indicates they have applied but state legislators believe public funds should not be directed toward private institutions.
129
Despite the lack of support from state and local sources, Hampton has built a solid
financial foundation, established a science department of international repute, and
displayed entrepreneurial creativity in setting a direction for the future that includes a
niche in physics and science.
8.2 Interviews
The material that follows presents summaries of interviews conducted at
Hampton. Each summary begins with a description of the current status of the program.
Following that is data obtained in response to the first data analysis tool – chronology of
events. Each interviewee was asked to explain the origins of a typical program. In the
concluding paragraph, the response is analyzed for pattern matching – evidence matching
the predictions for linkages and rival theories (predictions can be found in the case study
protocol – Appendix E).
Based upon chronology of events, two questions emerged regarding development
of science and technology programs. The first question was, “Did this theory lead to
initiation of the program?” The second question was, “Did this theory cause the program
to expand?” For a theory to be credited, it must be critical to initiation or expansion of
the program (depending on the question that is being asked) and must meet the
requirements of the prediction.
The chapter concludes with the findings - a table summarizing the interviews and
coding for each question. Each theory is coded affirmatively if there is a match between
the prediction of the theory and the evidence presented in the interview. More than one
theory may be supported by the evidence.
130
8.2.1 The Military Industrial Complex
Hampton-1 is an Administrator whose responsibilities include obtaining money
and raising funds for Hampton. He opened his comments by stating,
Hampton is a private university which means Hampton sees itself as an economic enterprise. Hampton is not supported by public funds, thus, whatever we need we must raise. We get our money through the private sector and research. The strategic plan is designed to increase research – $100 million in 10 years. Hampton currently receives 80% of its money from government but Hampton-1
believes that government is getting out of sponsored research. He went on to say that
Hampton does not label itself as a “Black” university; its goals are to compete against the
top universities in the United States. It will compete by building institutions in areas that
represent market niches for African Americans. For example, health care disparities have
a disproportionate effect on African Americans. “Health and health care is a trillion
dollar business. Yet, HBCUs who do research on Blacks and health get only a miniscule
amount of that money, perhaps ¼ of 1%. Thus, it’s a potential area for Hampton to
target.”
Hampton-1 was asked how Hampton developed its niche in science and physics in
particular. The President, Dr. Harvey, sponsored a market analysis of the region and
discovered it was home to the largest military cluster in the United States. The decision
was made to target the military complex and focus on developing an excellent, high
quality science department that catered to the military’s needs. He targeted NASA
because it was proximate and represented financial opportunity and stability. Hampton
needed to develop the infrastructure to support NASA’s needs. Two NASA officers were
brought on board at Hampton. In addition, Dr. Harvey raised funds to support endowed
professorships so he could bring on the level of talent needed by NASA and its projects.
131
Dr. Harvey developed a Vision and a Plan to meet that vision. He targeted a major
research sponsor that was within Hampton’s reach and then put into place the
infrastructure needed to meet that sponsor’s needs. The process utilized by Dr. Harvey
was as follows:
1) Identify an area of opportunity.
2) Develop a Plan and Vision.
3) Create track records. Get your foot in the door by getting a small project and
performing it with excellence. Communicate with the agency. Compare the
quality Hampton provides to the requirements of the project and the money
received. Prove that Hampton can do the job and do it well.
4) Invest in human capital. Raise money for endowed Chairs and get nationally
renowned faculty. Attract high quality students.
5) Repeat with other programs and other subject areas.
Rather than create brick and mortar infrastructure, Hampton strategically decided
to build collaborations. An example is the University of Virginia. A partnership has
been established between Hampton and the University of Virginia (UVA) for Hampton to
utilize UVA’s infrastructure and personnel for commercialization, patents, licenses and
so forth. Hampton has access to UVA’s patent attorneys, license attorneys, patent base,
and so forth. In this way, Hampton can leverage UVA’s mature structure to get Hampton
products in the marketplace. For example, Dr. Keppel, a faculty member at Hampton has
14 patent disclosures. Hampton cannot afford $10,000 per disclosure nor does it have
access to the marketplace. So Hampton is making a strategic effort to collaborate with
132
universities or other entities that can enhance Hampton’s growth and commercial
prospects.
Dr. Harvey’s goals were focused on improving the financial and educational
status of Hampton University by exploiting market opportunities. Circumstances were
such that science and technology areas represented the best opportunity by which
Hampton could achieve its goals. Thus, attention and effort were focused on developing
the School of Science. The two strategies critical to initiation of the program was the
President’s Vision and Leadership as well as the Proximity of the military complex.
As Hampton completed several initial projects and gained the military’s
confidence in its abilities and capabilities, it began to develop relationships with other
components of the military complex such as Langley Air Force Base, Jefferson Labs, the
Naval base, and other agencies. The relationships (social capital) Hampton developed
with NASA was used as a means to gain projects from the other organizations. As the
School of Science continued to grow, the collaborations between Hampton and the
various components of the military complex can be described as Clustering. There was
no formal agreement to use Hampton, but its Proximity, the skills in which it specialized,
its established reputation, and its quality work made it easy for the various agencies to
choose to work with the institution. Agglomeration effects clearly aided Hampton in
growing its School of Science and other departments. In addition, the growth of the
program can be attributed to the Leadership, continued vision, direction, and support of
the President. Thus, Networking/Clustering, Leadership, and Proximity were
strategies that expanded the program.
133
8.2.2 A Breast Cancer program
The School of Science has several established divisions. It currently offers
Master’s degrees in several programs and a doctor of philosophy in Physics (with a
doctor of philosophy in Physical Therapy to be added next year). The physics
department cites several accomplishments. One includes their Center for the study of the
Origin and Structure of Matter (COSM), one of four Physics Frontier Centers established
in 2001 by the National Science Foundation.
When asked about the origins of a relationship between Hampton and another
organization that was typical of how relationships began, Hampton-2&3 chose the
National Institute of Health (NIH) and the development of the cancer research program.
The relationship between Hampton and NIH started 20 years ago but it was only within
the last 5-6 years that significant results have been realized.
Twenty years ago, few Hampton faculty were persistent at applying for grants. A
previous Chair attempted to initiate interaction by encouraging faculty to serve at NIH by
participating on panels to review proposals. While there, Hampton learned that NIH was
concerned about the number of biomedical research dollars going to HBCUs. There were
no minorities on decision making boards yet there were certain health disparities that
affected Blacks disproportionately such as breast cancer.26 NIH created an initiative to
include HBCUs in biomedical research. Hampton became aware of the policy and its
intent but had no biomedical research program and inadequate facilities so they had to
“get creative.”
26 It was not stated at the interview but while White women develop breast cancer at higher rates than African American women, African American women have a higher likelihood of dying from the disease (Gibbs, 2004).
134
Interested faculty at Hampton applied for and received a three year grant to train
faculty. They partnered with the University of Pittsburgh medical department whose
staff agreed to provide training to Hampton faculty and students interested in breast
cancer research. The University of Pittsburgh already had research capabilities in this
area. The training occurs partly through distance learning. Research is done in the
summer at the University of Pittsburgh. According to Hampton-2, it is a win-win
situation for both schools. “Hampton gets faculty training in breast cancer research, a
portion of the funding, and a pipeline to a doctor of philosophy program in research at the
University of Pittsburgh. The University of Pittsburgh gets funding, recognition for a
breast cancer research program, and facility enhancement.” Now there is a core of
faculty at Hampton that are interested and trained in breast cancer research.
Based on the above information, it became clear that Policy by NIH and
Linkages was the strategy that initiated the program. A health disparity that
disproportionately affected the Black population motivated NIH to set policy that would
provide research on the causes of the disparity. However, Hampton, in realizing it did
not have the facilities, was forced to establish a relationship with another institution. The
formal collaboration between the two universities and the government proved to be more
beneficial than each initially realized. Hampton gained access to a Ph.D. program which
in turn led to a larger applicant pool for the University of Pittsburgh.
Linkages/Networking were critical elements that enabled the program to expand.
8.2.3 COSM and the CERN project
Hampton-4 had been working at Jefferson Labs and another university when he
was hired by Hampton. He made it clear that he joined Hampton’s faculty because of the
135
presence of such high quality scientists as Dr. Keith Baker, a graduate of Massachusetts
Institute of Technology and Stanford University in experimental nuclear physics. They
both hold concurrent positions at both Hampton and Jefferson Labs. Hampton-4 is a
faculty member and an Administrator in the COSM Center.
When asked about a significant relationship, Hampton-4 chose to focus on
relations with CERN in Switzerland. CERN is a joint venture between 20 European
countries conducting high-energy physics research. CERN is the world’s largest particle
physics laboratory and credits itself with creating the World Wide-Web browser. The
United States made a policy decision to join the European collaboration. They
implemented this decision by putting together U.S. teams composed of scientists from
various universities that would make a contribution. Dr. Keith Baker, a faculty member,
was identified because of his work in particle physics. He is considered a star scientist.
The flagship project at CERN is the building of the Large Hadron Collider (LHC),
an undertaking in which Hampton is participating. Through the COSM center, Hampton
is working in the ATLAS experiment using the Large Hadron Collider at the CERN
laboratory to explore the basic forces that shape the universe. COSM is constructing the
Barrel Transition Radiation Tracker which will measure the momentum of each charged
particle during the experiment.
The policy decision by the United States to get involved in a European effort and
the selection of Dr. Keith Baker resulted in coding of Policy and Leadership as
strategies that initiated the program. The institutional decision to get involved led to
growth in the program. Hampton-4 agreed to join the faculty; he also worked on the
CERN project. Hampton’s involvement was a likely contributor to the university being
136
awarded the COSM Center. By joining the network of organizations collaborating in the
project, Hampton exhibited linkages at the level of Networks/Clusters. The U.S. policy
decision played no part in Hampton’s decision to continue its participation in the
collaboration. Thus, networking and the continued role of star scientists resulted in
coding of Linkages and Leadership as necessary for expansion of the program.
8.2.4 The School of Engineering
The School of Engineering and Technology (SET) emerged from the School of
Science about 15 years ago. Ten years ago it became a department (the terms School and
department were used interchangeably). The School is small in numbers and considers
itself in its early stages. It has plans to introduce a new program within the department –
Mechanical Engineering. The School specializes in a few areas. It focuses on aerospace
propulsion as a result of proximity to Langley Air Force Base, the work being conducted
by Langley on wind tunnels, and the opportunity for research. For this reason, Hampton-
5, who received his Doctor of Science degree from Massachusetts Institute of
Technology, was recently hired as an Administrator. The School also targets the
development of sensors and nanotechnology because they can partner with the Physics
department which is already working in these areas and enjoys a national reputation. A
top priority of the School is to build partnerships both internally and externally.
Hampton 5&6 chose Lockheed Martin as a company that typified how relationships
began at the Department. They both explained that the School of Engineering had
emerged because there were additional needs expressed by elements of the military
complex that had grown beyond the domain of the School of Science. (Hampton-5 had
been hired a few months prior to the interview.) Lockheed Martin has a history of being
137
friendly to HBCUs. They provide support to a laboratory on Hampton’s campus and they
hire students from Hampton to work in their company. Hampton-6, a former
Administrator, focused on developing a “marriage” with Lockheed. Lockheed had
significant money in defense contracts and a desire to diversify. The Department of
Science at Hampton always had a relationship with Lockheed. Hampton-6 fostered and
developed a relationship with Lockheed to obtain support for the SET program.
Hampton-6 maintained an open door philosophy; he welcomed industry and purposefully
cultivated a relationship with the company by inviting them over to the premises and
sending them promising students. Hampton-6’s philosophy was “If you want it, you
better get it yourself.” (All the Department Deans seem to understand that whatever you
want, you’ve got to find the funds to get it.) Over time, he built a relationship with
Lockheed and now they support SET.
In the example of Lockheed Martin, Hampton-6 relied on several factors. He tapped
in to and exploited the network built by the School of Science. For this, the strategy of
Linkages was coded. Hampton-6 identified an existing client that had expanding
interests. He courted and cultivated their support by supplying one of their most
important needs – promising students. The strategy of Demand was coded. Without
these two strategies, the School of Engineering may not have emerged from the School of
Science.
Hampton-5 worked at NSF prior to coming to Hampton. He explained that NSF total
funding increases every year, however, with the large amounts of funding that go to
multi-year contacts and the rate of inflation, there is little real increase in funds. Funding
from corporations is low for Hampton because the region is not highly industrialized. It
138
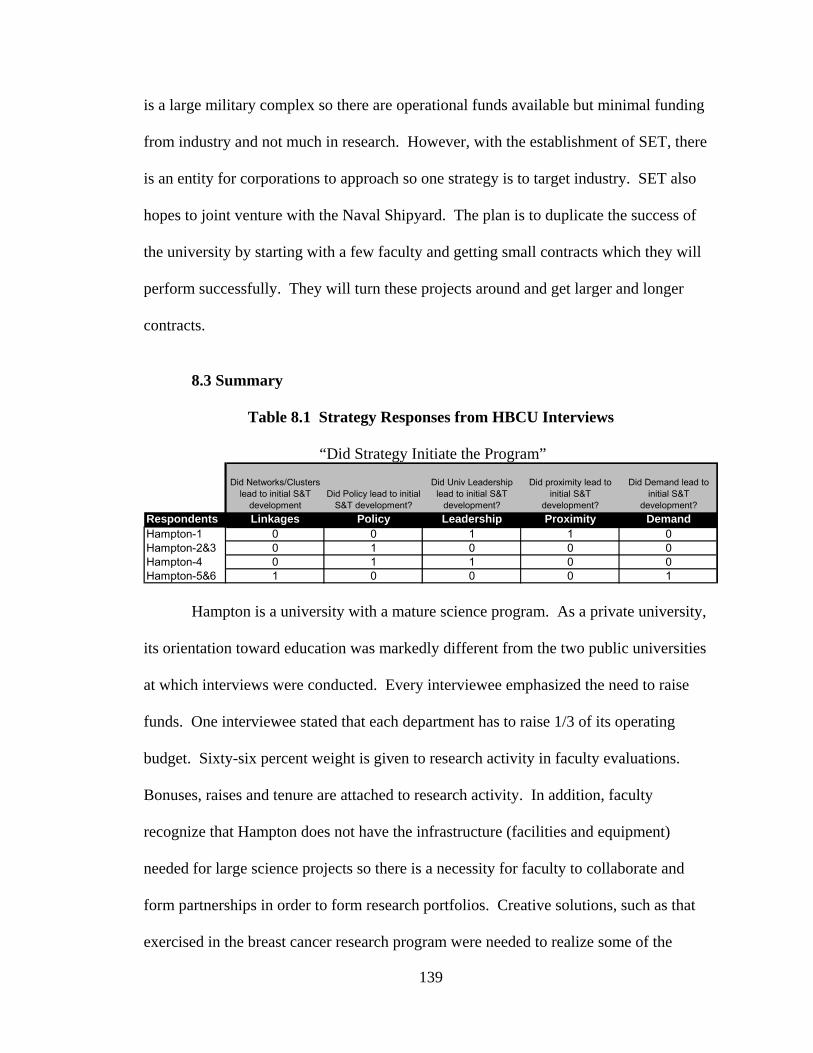
is a large military complex so there are operational funds available but minimal funding
from industry and not much in research. However, with the establishment of SET, there
is an entity for corporations to approach so one strategy is to target industry. SET also
hopes to joint venture with the Naval Shipyard. The plan is to duplicate the success of
the university by starting with a few faculty and getting small contracts which they will
perform successfully. They will turn these projects around and get larger and longer
contracts.
8.3 Summary
Table 8.1 Strategy Responses from HBCU Interviews
“Did Strategy Initiate the Program”
Did Networks/Clusters lead to initial S&T
developmentDid Policy lead to initial
S&T development?
Did Univ Leadership lead to initial S&T
development?
Did proximity lead to initial S&T
development?
Did Demand lead to initial S&T
development?Respondents Linkages Policy Leadership Proximity DemandHampton-1 0 0 1 1 0Hampton-2&3 0 1 0 0 0Hampton-4 0 1 1 0 0Hampton-5&6 1 0 0 0 1 Hampton is a university with a mature science program. As a private university,
its orientation toward education was markedly different from the two public universities
at which interviews were conducted. Every interviewee emphasized the need to raise
funds. One interviewee stated that each department has to raise 1/3 of its operating
budget. Sixty-six percent weight is given to research activity in faculty evaluations.
Bonuses, raises and tenure are attached to research activity. In addition, faculty
recognize that Hampton does not have the infrastructure (facilities and equipment)
needed for large science projects so there is a necessity for faculty to collaborate and
form partnerships in order to form research portfolios. Creative solutions, such as that
exercised in the breast cancer research program were needed to realize some of the
139
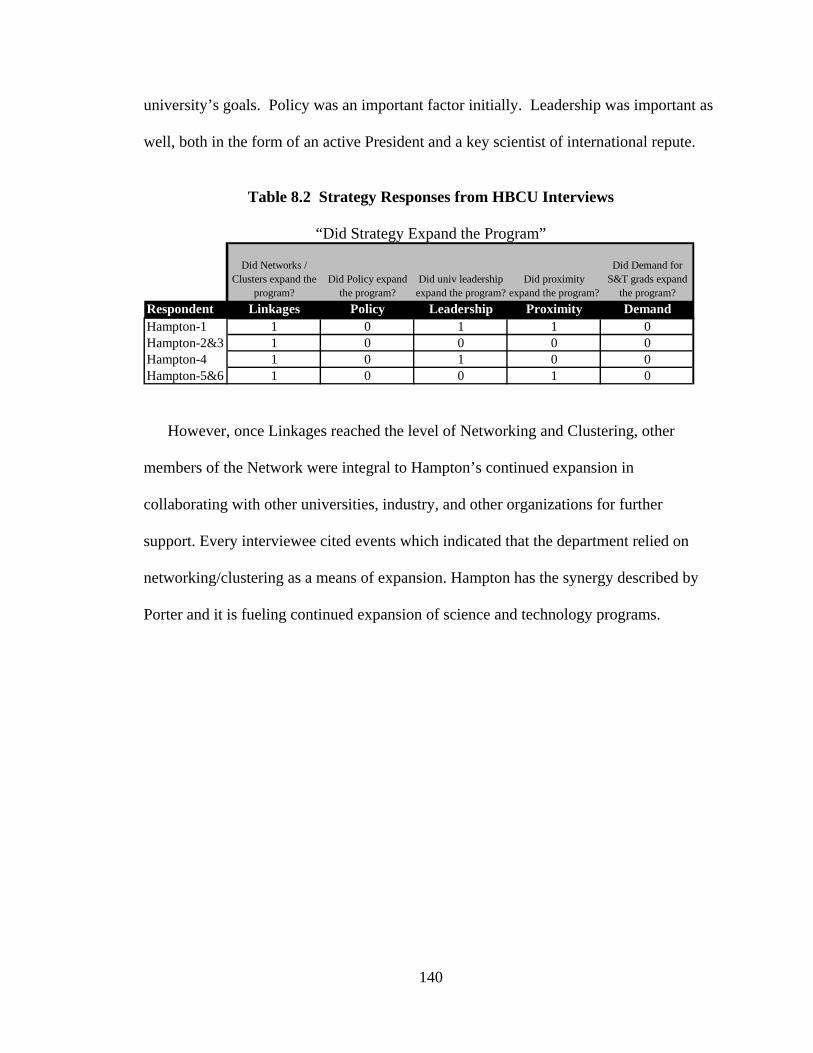
university’s goals. Policy was an important factor initially. Leadership was important as
well, both in the form of an active President and a key scientist of international repute.
Table 8.2 Strategy Responses from HBCU Interviews
“Did Strategy Expand the Program”
Did Networks / Clusters expand the
program?Did Policy expand
the program?Did univ leadership
expand the program?Did proximity
expand the program?
Did Demand for S&T grads expand
the program?Respondent Linkages Policy Leadership Proximity DemandHampton-1 1 0 1 1 0Hampton-2&3 1 0 0 0 0Hampton-4 1 0 1 0 0Hampton-5&6 1 0 0 1 0
However, once Linkages reached the level of Networking and Clustering, other
members of the Network were integral to Hampton’s continued expansion in
collaborating with other universities, industry, and other organizations for further
support. Every interviewee cited events which indicated that the department relied on
networking/clustering as a means of expansion. Hampton has the synergy described by
Porter and it is fueling continued expansion of science and technology programs.
140
CHAPTER 9 FLORIDA AGRICULTURAL AND MECHANICAL (FAMU)
9.1 Florida Agricultural and Mechanical University (High Productivity)
9.1.1 Characteristics
Florida A&M University (FAMU) is located in Tallahassee, Florida, in the
southern region of the United States. It is a public, land-grant, 4-year university in an
urban environment. Currently classified as a Master’s I Research university, it is in the
‘very large’ size category, catering to more than 12,000 students of whom over 90% are
Black. FAMU is in the top third of all research HBCUs on the science and technology
index and consistently ranks in the top 10% of all HBCUs on most other indicators.
9.1.2 History
The origins of FAMU are not atypical of other Negro land-grant colleges. In
April 1887, the state legislature of Florida approved two schools – one white and one
black - to teach illiterate or poorly educated students in the state. The school for Negro
students was called the State Normal College for Colored Students. Florida appropriated
$4,000 for each school for the next two years. Upon passage of the Morrill Act of 1890
which gave scrip (land) to each of the 17 southern states so it could establish revenue to
pay for the establishment of Negro land-grant colleges, the State Normal College for
Colored Students was designated the Negro land-grant college for Florida. By 1909, the
legislature changed the name to Florida Agricultural and Mechanical College (FAMC)
for Negroes and recognized it as a 4-year college level institution.
The land-grant designation required that FAMC establish an industrial education
curriculum (applied agricultural, mechanical and military sciences) which, at that time,
141
was looked upon by southern blacks as an inferior education. Despite this emphasis, the
first two presidents, Thomas Tucker and Nathan Young, advocated a liberal arts
education to accompany the industrial arts education. Each President was fired from his
position for advocating that Negroes should receive an elevated education (Neyland,
1990). However, their labor and commitment yielded some results. In 1910, FAMC
awarded its first post-secondary degree, a Bachelor of Science. By 1916, according to
the survey by the U.S. Department of Education, FAMC had 16 students studying at the
collegiate level, the only Negro land-grant institution to be offering college level courses
(Anderson, 1988; Hill, 1985).
Appropriations from the state decreased as Morrill fund appropriations increased.
However, student enrollment increased due to the growth in the number of public
schools, thereby increasing revenue from tuition. With the new “college” status firmly
established, FAMC received an “A” rating by Southern Association of Colleges and
Schools (SACS) in 1935 (Holmes, 1934). In 1953, the college’s name was changed by
legislative action from FAMC to FAMU. When SACS finally opened its membership to
include black schools in 1957, FAMU was the first to be admitted (Drewry & Doermann,
2001; Neyland, 2001).
As with most colleges, FAMU benefited from the return of the veterans of WWII
through an increase in enrollment and associated military benefits subsidizing education.
Student enrollment grew from 812 in 1944 to 2000 by 1949. In 1971, the state of Florida
recognized FAMU by installing the institution as a full partner in the 9 university state,
public higher education system. And, in 1984, the University granted its first Doctor of
Philosophy degree - in Pharmacology. In less than 100 years, FAMU had gone from
142
teaching illiterate students at the elementary and secondary level to offering both a liberal
arts and engineering, industrial and technical curricula as a recognized, accredited
institution.
In 1985, Frederick Humphries, a chemist by training, became the 10th president of
FAMU. His 16-year stint represented a phase of remarkable leadership.
When Humphries took over, enrollment, morale and facilities were declining. He is
credited with the academic equivalent of a corporate turnaround. Under his motto of
“Excellence with Caring,” Humphries doubled enrollment from 1985 to 2000; surpassed
or tied the Ivy League schools in attracting the highest number of National Achievement
scholars in 1992, 1995, 1997 and 2000; increased the number of science and engineering
students tenfold over the same period of time; increased contracts and grants by the
Division of Sponsored Research from $8.5 million in 1985 to $46 million in 2000
(441%); and increased funds from the private sector through the FAMU Industry Cluster
from $6.2 million in 1986 to $62.5 million in 2000 (908%) (Neyland, 2001). Under
Humphries leadership, the state went from appropriating $0 research and development
dollars to an average of $2.3 million dollars annually. Humphries was able to accomplish
much of this by raising the level of corporate dollars and establishing a University
Industry Cluster.27 He fought to have a law school approved but the Florida legislature
denied the request despite a nationwide controversy.28
27 The University Industry Cluster is a group of companies that donated funds, joint ventured in summer intern programs, provided strategic advice on university planning and otherwise supported the university. 28 The controversy ensued because the State of Florida had designated FAMU to be only a comprehensive level university. Approval of a law program would potentially elevate FAMU’s status. The application was denied.
143
9.1.3 Structure
Today, FAMU has 131 buildings situated on 416 acres. Its student population
consists primarily of undergraduates. The University has 13 schools and colleges that
offer 62 bachelor’s degrees in 103 majors/tracks, 36 master’s degrees with 56 majors,
two professional degrees and eleven Ph.D. programs.
In 1982, FAMU/Florida State initiated their joint College of Engineering. The
legislature initially debated the request for an engineering school and almost refused it,
but after intense lobbying decided instead to approve a joint College of Engineering
between FAMU and Florida State University. From a standing start in 1982, it grew to
more than 2,000 students by 2002. The college now offers doctoral programs in all its
engineering disciplines. The college graduates six of every 10 Black engineering
students in Florida. It is one of the top five universities in the nation in the number of
minorities graduating in engineering.
A science park, geographically designed to take advantage of the university
setting, is located adjacent to the FAMU and Florida State University campuses.
9.1.4 S&T Statistics
From 1987-2002, FAMU had an average growth of 10% in publications. Its
strengths include its growth not only in the number of science and technology graduates
(an average of 26% from 1989-1996) but also in federal research and development
funding (yearly increases averaging 20% from 1989-1992). FAMU receives more state
dollars than any other HBCU, sometimes accounting for more than 50% of state funds
allotted to HBCUs in a single year (see Appendix D).
144
The latest data showing federal obligations for science and engineering for 2000
by agency shows FAMU with a well-diversified portfolio. Health and Human Services
(HHS), USDA and NASA are the largest contributors with relatively comparable
amounts near $5 million each year. The Department of Commerce and Defense also
provide significant sources of over $1 million each year.
9.1.5 Unique Achievements
The institution’s tremendous growth and accomplishments during President
Frederick Humphries tenure is one of the reasons that Time magazine chose FAMU as its
College of the Year in 1998. The awarding of 129 bachelor's degrees in 1998-99 made
FAMU America's second-highest producer of Black engineers (Neyland, 2001).
The development of the University’s Industry Cluster was a creative means of
garnering industry dollars and support for FAMU initiatives. Only 48% of HBCUs
receive funds from industry for R&D. Of those, FAMU is the second highest receiving
9.17 million dollars (National Science Foundation, 2005).
9.1.6 Analysis
Florida Agricultural and Mechanical (FAMU) benefited from the philosophical
beliefs of its first two presidents. They believed in higher education’s inherent value and
set a curriculum based on a classical education. FAMU began its education of Negro
students in 1887, the post-Reconstruction era. It offered higher quality courses earlier
than any other public HBCU becoming a 4-year institution by 1909. Despite this strong
beginning, in 1968 FAMU was still a medium-sized institution facing many of the same
obstacles and challenges other HBCUs face today.
145
In 1985, the Board of Trustees hired an exceptional leader in President Frederick
Humphries. As a chemist, he recognized the importance of science and technology. As
part of a strategic planning process he made a research agenda, collaboration and
partnership integral priorities of a strategic plan for the University. Humphries devised a
creative tool – the Industry Cluster - to partner with industry to fund his plans for
educational excellence.
There are few weaknesses to point to for FAMU except that it remains to be seen
whether Humphries’ plans for excellence were institutionalized or whether the research
agenda and partnerships with Industry instituted during his tenure were a result of great
leadership. Since Humphries departure in 2001, there have been 3 Presidents. Dr.
Castell Bryant is the current Interim President. Cluster corporate participation and funds
declined in 2003 but that has been attributed to a downturn in the economy.29
9.2 Interviews
The material that follows presents summaries of interviews conducted at FAMU.
Each summary begins with a description of the current status of the program. Following
that is data obtained in response to the first data analysis tool – chronology of events.
Each interviewee was asked to explain the origins of a typical program. In the
concluding paragraph, the response is analyzed for pattern matching – evidence matching
the predictions for linkages and rival theories (predictions can be found in the case study
protocol – Appendix E).
Based upon chronology of events, two questions emerged regarding development
of science and technology programs. The first question was, “Did this theory lead to
initiation of the program?” The second question was, “Did this theory cause the program 29 This information was provided by FAMU-4.
146
to expand?” For a theory to be credited, it must be critical to initiation or expansion of
the program (depending on the question that is being asked) and must meet the
requirements of the prediction.
The chapter concludes with the findings - a table summarizing the interviews and
coding for each question. Each theory is coded affirmatively if there is a match between
the prediction of the theory and the evidence presented in the interview. More than one
theory may be supported by the evidence.
9.2.1 The Viticultural Center
The Center for Viticulture and Small Fruit Research (Viticulture Center) was
chosen because the Center presented itself (on its website) as a partnership between
FAMU and grape growers. It emphasizes technical transfer of knowledge. The Center
for Viticulture and Small Fruit Research is part of the College of Engineering Sciences,
Technology and Agriculture (CESTA) at FAMU. It is located several miles away from
the main campus. It has its own building that has a tropical feel to it with a courtyard in
the front and acres of vines with some other small fruit in the back. The Center expects
to have several patents on grapes and seedless muscadines within the next few years.
They have already developed new strains but several years ago the University of Florida
announced new strains of grapes. The new grapes were so vulnerable to disease that they
were not considered quality grapes. The Center wants to avoid that problem so it is doing
extensive testing and re-testing of the grapes to ensure quality. FAMU-1 believes the
Viticulture Center is one of the flagships of the University because the quality of the
work and research has given FAMU nationwide exposure.
147
Grape growing is a new and emerging industry in Florida where climatic
conditions favor the industry. The industry is new and small compared to the wine
industry in California, Oregon, and New York. For example, there are 1 million acres
dedicated to grapes in California; Florida has 1,200 acres of grapes. Ten years ago
(1994), 50,000 gallons of wine was made from 4-5 wineries in Florida; today, over
250,000 gallons of wine are made every year from about 50 wineries. The Viticulture
Center is the only one in the Southeast dedicated exclusively to the grape industry.
FAMU-1 described the growth of the relationship between FAMU and the grape
growers association. The grape and wine industry represent a cluster in the mid to north-
Florida area. The state passed the Florida Viticulture Policy Act in 1978 to support the
fledgling industry by providing funds to farmers ($1,000 per acre if they devoted at least
5 acres to growing grapes) and to the universities (University of Florida and FAMU) for
research. FAMU’s Center for Viticulture and Small Fruit Research was established in
1978 to a) help grape growers become better and more efficient growers through transfer
of technical knowledge, b) promote interest and consumption of Florida grapes and
wines, c) strengthen and promote understanding between grape growers, processors and
the scientific community, and d) contribute to the development and growth of Florida’s
grape and wine industry (these goals are listed in their brochure). Later, the State
established a Florida Viticultural Advisory Council composed of FAMU, the University
of Florida, the Department of Agriculture, the Grape Growers’ Association, and several
wineries, nurseries, process product companies and fresh fruit companies. They have
annual meetings and regular workshops. They talk about 25-30 times a year. The
council not only keeps the participants informed of new developments, it makes them
148
participants in policy affecting the grape industry. Every two years the Advisory Council
develops a new plan that details the needs of the industry, goals, and so forth. FAMU’s
Viticulture Center formulates its strategies, program areas, and objectives around the
Council’s plan.
About 13 years ago, the University of Florida decided to terminate its
involvement in research on grapes. FAMU maintained its involvement. The progress
made by the industry and FAMU made University of Florida reconsider its position and
re-enter the field. University of Florida suffered a temporary setback when its newly
patented grapes did not perform well. FAMU-1 considers its work to be cutting edge and
nationally competitive despite the lack of facilities, staff and equipment. The consortium
of organizations represented in the Council interacts to further the industry’s growth. The
State continues to be a significant supporter of the Viticulture Center by contributing to
the payment of salaries.
There are several necessary ingredients that contributed to the growth and success
of FAMU’s Viticulture Center. Policy decisions were made at the state and local level to
nurture a fledging industry with considerable economic development potential. State
policy continues to be important as it provides salaries for continued research. Proximity
to grape growers and other components of the cluster is critical for knowledge transfer
which occurs on a daily basis with either grape growers or various members of the
Council. The formation of the Council led to Linkages at the Clustering/Networking
level. The networking that resulted from the Council was critical to maintaining a level
of knowledge that enabled FAMU to conduct meaningful research and expand the
program.
149
9.2.2 Research programs
FAMU-2 is an Administrator in the College for Engineering Sciences,
Technology and Agriculture (CESTA). He has been at the university for 27 years.
CESTA is an established college at the university.
Prior to describing the evolution of a program at CESTA, FAMU-2 recounted that
in his early years at FAMU, few faculty submitted applications for research funding.
During Dr. Humphries tenure, the President insisted that each faculty develop a plan of
work. Faculty would be held accountable by evaluation on publications, grants, and
student advisements. (No specific targets were mentioned by the interviewee.) As a
means of support, FAMU-2 sends RFPs and communicates regularly with faculty. In
response to a question on policies that affect the department, FAMU-2 informed the
interviewer that two policies had great impact on FAMU.
A piece of legislation called the Evans-Allen Funds authorized funding for 1890
colleges (Black land-grant colleges). There was also an Executive Order from the White House mandating agencies to work with 1890s. Without these pieces of legislation, FAMU wouldn’t be on federal agencies’ radar. Reagan started federal support in 1980. The State never matched federal funding until the past 5 years. (The interview was conducted in 2004.) Currently, the University of Florida gets $120 million for research and extension from the State. FAMU used to get $0, now it gets $1 million from the State.
When asked about the evolution of a particular program, FAMU-2 chose two
examples. The first example concerned the U.S. Department of Agriculture Cooperative
State Research Extension and Education Services (CSREES). FAMU-2 communicates
with CSREES almost every day. The relationship began as a result of a Congressional
mandate that began in 1972 to provide funding to FAMU. The funds appropriated by
Congress are apportioned to 18-20 agencies within the U.S. Department of Agriculture.
150
FAMU obtains funding from CSREES, one of the Department’s agencies. Funding is
disbursed according to the percentage of the rural population in the State.
Another example is the ARS (Agricultural Research Services) which has
laboratories across the U.S. on anything related to agriculture (food, fiber, corn, weeds,
strawberries, food, fiber, etc.). FAMU is currently conducting research on biological
control in vegetable crops. FAMU was interested in expanding the program. ARS was
interested in a program that didn’t use chemicals to control crops. There was a mutual
interest in developing a program for crop research so ARS told FAMU to develop a
concept paper/proposal. FAMU sent it in and ARS sent site visitors to FAMU. The
proposal was strengthened and sent to Congress for appropriation. Congress approved
the program in their budget.
FAMU-2 attributed the growth in his College to internal Leadership provided by
former President Humphries and key faculty within the department. The President of the
university was important because he emphasized research as a priority. He implemented
the priority by holding the faculty accountable via the evaluation process. Other faculty
were also considered important because they supported the President and shifted from a
teaching agenda to include the work of establishing a research agenda. Yet his
explanation of the origination of the programs reveals federal Policy as an integral
component in the initiation of various projects. The programs that start as a result of
policy may not be sustained by policy; however, the department sustains continued
growth by continuous application to bids. Thus, Policy is seen as causing the program to
sustain and expand.
151
9.2.3 A Joint College of Engineering
FAMU and the University of Florida joint ventured to form a Joint College of
Engineering. The College is an impressive building located at the edge of both campuses
and within easy walking distance of a science park. The school has one dean, one staff
and one faculty (taken from both schools); however, the school answers to two boards of
trustees. As the budget entity, funds are directed to FAMU. Each school can give
additional funding. The School is considered a success. According to FAMU-3, the
University is the third largest producer of minority engineers in the United States. She
claimed that if graduates of the Computer Science program were included (they’re in
CESTA), they would be the largest producer in the United States.
FAMU-3 explained how the Joint College of Engineering was created. Both
universities applied for a College of Engineering at the same time 22 years ago (1982).
FAMU’s application for a law school prior to the application for the College of
Engineering had been denied because the university had been designated by the State as a
comprehensive university. This meant FAMU was limited to offering Master’s level
courses not doctoral level coursework. The rationale was that funding could be most
efficiently allocated by allowing only a select few institutions at the highest level.
FAMU and others saw this as a discriminatory policy because there were no Black
institutions approved at the highest level statewide, FAMU and others had no input in this
policy decision, and FAMU had demonstrated the capability to offer doctoral programs
but had been denied (these insights were provided by another interviewee – FAMU-6).
Thus, they were being penalized for a condition which had been denied by those who
were judging. A college of engineering was needed; there were five or six in the state but
152
none in the Panhandle area. Therefore, the legislature, in trying to figure out how to
make a politically correct decision, decided to grant a joint college to both schools.
FAMU-3 did not believe there was a “typical” organization that represented how
science and technology programs/projects evolve at the School of Engineering. For
example, one relationship with the ICURC in the Southeast came about because of the
strength of the contacts of the Department Chair who had many contacts in industry and
government. Another example of how relationships developed can be seen in the Florida
Highway Safety Patrol program. The College of Engineering received a request from
Highway Safety for research assistance from faculty to analyze crash data. They were so
happy with the results that the school now gets $3 million per year. Another example is a
printing company that wanted a work flow analysis. That opportunity was great for
faculty but it also gave students a real life problem to solve. Programs come many
different ways. Many times faculty will initiate a partnership as well.
Several factors were responsible for growth at the Joint College of Engineering.
A Policy decision by the legislature to create the joint College was critical to the
initiation of the School. Without Proximity of the two universities the College could not
have been created. Additionally, Leadership was critical because the President of
FAMU had to wage a national campaign to overcome an existing policy and garner
sufficient support to force the state of Florida to allow FAMU to offer doctoral degrees.
Once established, the Demand for students became another key factor. A tool used by
President Humphries to attract corporations was the base of quality students at the
College of Engineering.
153
9.2.4 Industry Cluster
The Industry Cluster was initiated by former President Humphries as a creative
and innovative means of paying for the upgrade of FAMU. He solicited corporations and
then gave them a meaningful role in improving FAMU’s infrastructure. Corporations
invested in FAMU by offering internships, engaging in strategic planning, and providing
funds to the university. It is not a cluster in the traditional economic definition of the
term. It is instead an example of networking at the university level. In this case, it is a
collaboration and informal agreement between FAMU and a number of different
corporations. Some of the corporations participate only by offering internship programs;
others operate on an Advisory level offering strategic planning advice. The latter also
usually provide significant funding to the university. It is a win-win situation for all who
participate. FAMU benefits from internship programs, corporate sponsorship and
investment, and corporate strategic planning. Corporations benefit by having access to a
pool of quality students.
Leadership via personal salesmanship by the President of the university was
responsible for the initiation and expansion of the Industry Cluster.
9.2.5 Environmental Sciences Institute
The Environmental Sciences Institute (ESI) is relatively young. Established in
1995, the Institute has been in existence for 10 years. In that short time, it has become
the largest producer of Black doctorates in the environmental sciences in the United
States. The Institute has a strong emphasis on research. All undergraduates are required
to produce and present a senior thesis based on a research project. FAMU-5, a former
Director of ESI, served (and still continues to serve) on many organizations enabling
154
FAMU to interact with state, federal and international agencies. Some of these
organizations include the Center for Environmental Studies, Florida Sea Grant, Florida
Institute of Oceanography, statewide committees, the Board of Regents (which he chaired
at one point). One of his roles on the Board of Regents was to determine which courses
(in environmental science) based on their content should be assigned to which category.
He has also staffed the former Florida governor’s commission on environment science.
FAMU-5’s tenure at FAMU began as an Instructor for the first classes taught by
the Institute in 1996. FAMU-5 had worked at the Oak Ridge National Laboratory in
Knoxville, Tennessee as a Radiation Safety Officer. He was highly respected at Oak
Ridge such so that he could be categorized as a “key scientist.” The DOE (Department of
Energy) provided funds to Lockheed to run Oak Ridge. Various federal agencies were
interested in supporting programs where there was a critical need for personnel.
FAMU-5 was interested in promoting minorities in science. A mutual interest was held
by FAMU. The university was aware of the high correlation between environmental
hazardous areas (toxic waste sites, brownfields, etc.) in poor and minority neighborhoods
and the low number of African American professionals in the environmental sciences
field. DOE was also aware of this underrepresentation and sought African American
expertise. The participation of FAMU-5 gave all members of the collaboration a sense of
assurance that the program would be taught in a quality manner. When FAMU applied
for the degree to the Board of Regents, it stressed the collaborative efforts between
FAMU, DOE and Oak Ridge.
The first class of the Institute began in Fall, 1996. FAMU-5 worked at the
Institute as a Professor and commuted from Tennessee to teach at FAMU. Oak Ridge
155
provided FAMU-5 “flex” time to teach the classes. He also had wide experience in
supervising Ph.D. candidates as well as an excellent record in securing grants from the
federal government and other agencies. Eventually he agreed to leave Oak Ridge and
was selected as the Director of the Environmental Science Institute.
Under FAMU-5’s leadership, the program grew. Faculty were required to have a
research portfolio. ESI fostered a culture to support a high quality educational program.
This included 1) a right mix of academic programs, 2) offering a Ph.D. research level
program, 3) supporting an environment for applying for funds. When FAMU-5 first
came to ESI, there were a total of 3-4 applications for funding. When he left the
department as a result of being promoted to Vice-President at FAMU, there was an
average of 3-4 applications per professor.
In summary, it was federal Policy, motivated by a desire to increase diversity that
led to the initiation of the Environmental Sciences Institute at FAMU. DOE’s goal of
increasing the number of minorities in the field was supported by a network of agencies
with similar objectives albeit different motives. In addition to federal policy, the creation
of the Institute could not have occurred without the Linkages that existed at the
Networking level between the Department of Energy, Oakridge Laboratories, and
FAMU. A formal agreement rose between the three entities that was used to encourage
the Florida legislature to support the program and enact Policy. Finally, the stature of the
key scientist, FAMU-5 encouraged the three entities to agree to the program. This falls
under the theory or strategy of Leadership.
156
9.2.6 Administrator
FAMU-6 is a high level Administrator at FAMU who is phasing out of active
duty. He spoke of development at the university overall as well as the development of
the Environmental Sciences Institute. FAMU-6 stated that you need to have a fairly
specific relationship over a period of years. He is concerned about a lack of long term
commitment that prevents true development of a college program and expertise in the
field. The College of Pharmacy program at FAMU is an example of a program that was
nurtured and is now very productive with several Ph.D. specialties. Over time, the
College of Pharmacy was able to recruit outstanding faculty which led to a high quality
program.
As an example of how a relationship typically forms, FAMU-6 used the NOAA
(National Oceanic and Atmospheric Administration). In December 1997, the former
Administrator for NOAA invited HBCUs to Washington DC to help build their capacity
so that NOAA could, in turn, diversify its agency. An African-American Under
Secretary of Commerce and a graduate of an HBCU, supported this policy. The NOAA
Consortium comprised of HBCUs was formed. In 1998, a request was put in the federal
budget for $5 million to fund environmental centers. It was not approved. In 1999 the
request was submitted again with the same outcome. An administrator at the Education
Partnership program suggested a dramatic increase in the request for funding with the
understanding that HBCUs would compete for the funds. In 2000, the federal legislature
approved $50 million for environmental centers with a competitive request for bid open
to all universities. Four centers were approved and three of the four had HBCUs
involved. The four centers covered Remote Sensing, Atmospheric, Marine Science and
157
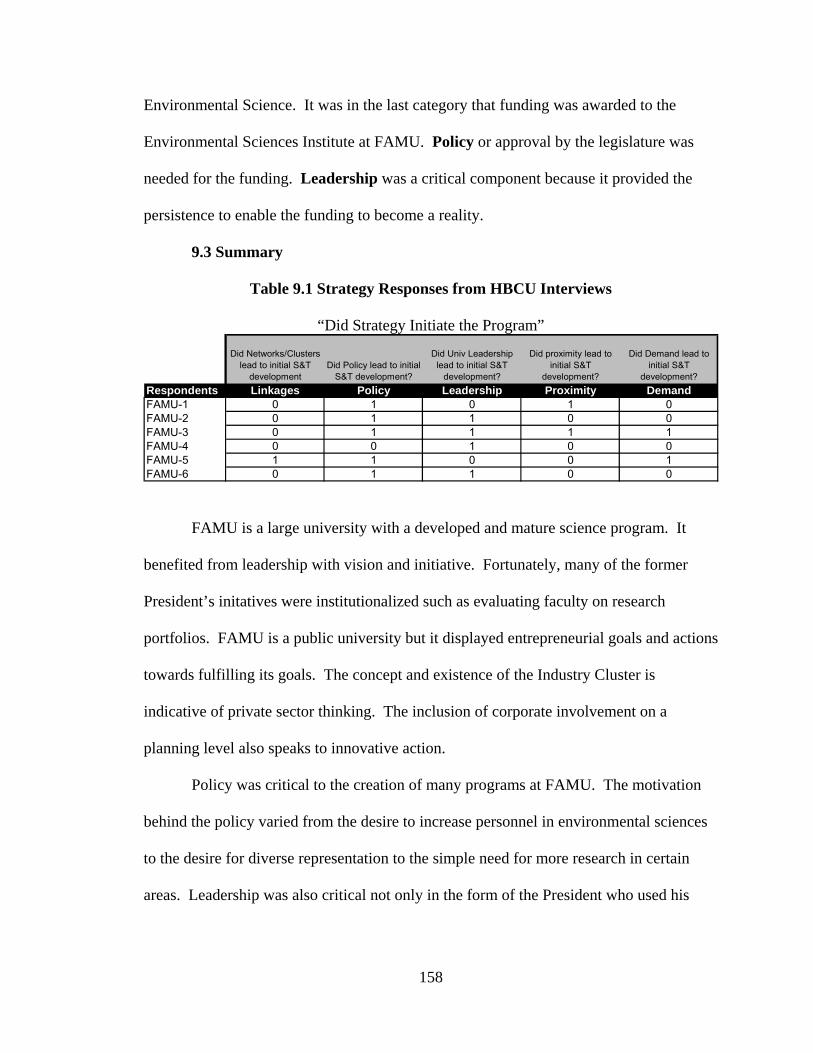
Environmental Science. It was in the last category that funding was awarded to the
Environmental Sciences Institute at FAMU. Policy or approval by the legislature was
needed for the funding. Leadership was a critical component because it provided the
persistence to enable the funding to become a reality.
9.3 Summary
Table 9.1 Strategy Responses from HBCU Interviews
“Did Strategy Initiate the Program”
Did Networks/Clusters lead to initial S&T
developmentDid Policy lead to initial
S&T development?
Did Univ Leadership lead to initial S&T
development?
Did proximity lead to initial S&T
development?
Did Demand lead to initial S&T
development?Respondents Linkages Policy Leadership Proximity DemandFAMU-1 0 1 0 1 0FAMU-2 0 1 1 0 0FAMU-3 0 1 1 1 1FAMU-4 0 0 1 0 0FAMU-5 1 1 0 0 1FAMU-6 0 1 1 0 0 FAMU is a large university with a developed and mature science program. It
benefited from leadership with vision and initiative. Fortunately, many of the former
President’s initatives were institutionalized such as evaluating faculty on research
portfolios. FAMU is a public university but it displayed entrepreneurial goals and actions
towards fulfilling its goals. The concept and existence of the Industry Cluster is
indicative of private sector thinking. The inclusion of corporate involvement on a
planning level also speaks to innovative action.
Policy was critical to the creation of many programs at FAMU. The motivation
behind the policy varied from the desire to increase personnel in environmental sciences
to the desire for diverse representation to the simple need for more research in certain
areas. Leadership was also critical not only in the form of the President who used his
158
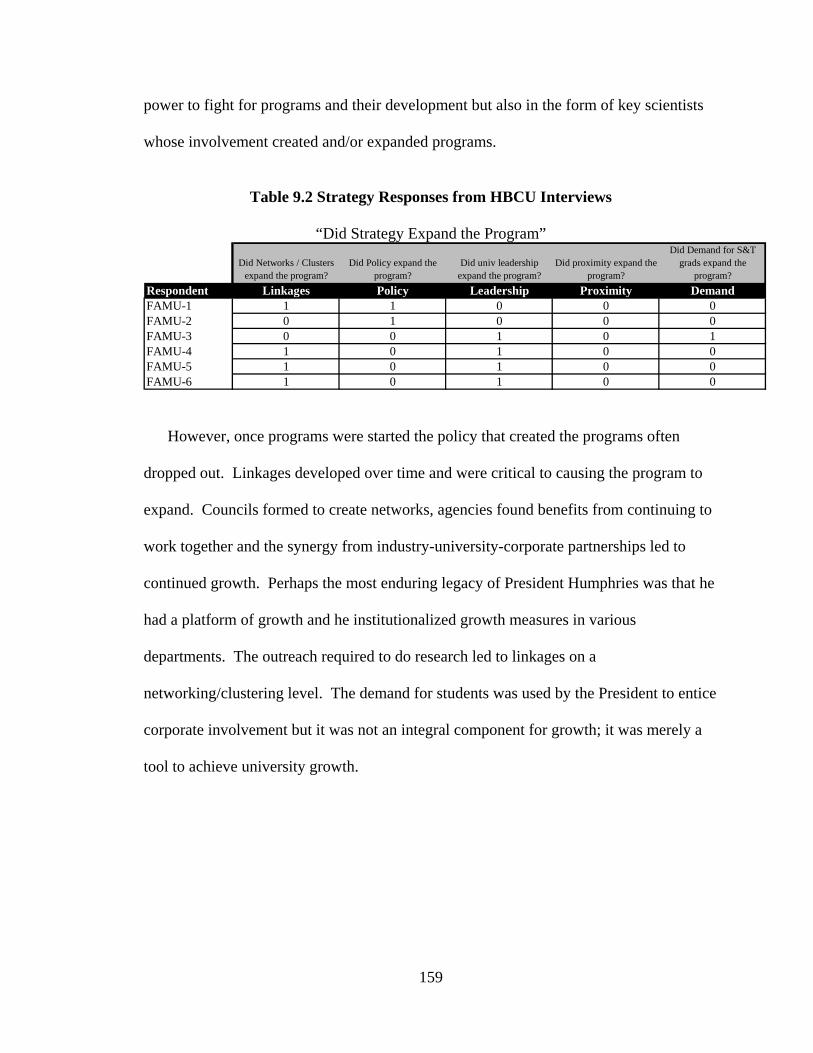
power to fight for programs and their development but also in the form of key scientists
whose involvement created and/or expanded programs.
Table 9.2 Strategy Responses from HBCU Interviews
“Did Strategy Expand the Program”
Did Networks / Clusters expand the program?
Did Policy expand the program?
Did univ leadership expand the program?
Did proximity expand the program?
Did Demand for S&T grads expand the
program?Respondent Linkages Policy Leadership Proximity DemandFAMU-1 1 1 0 0 0FAMU-2 0 1 0 0 0FAMU-3 0 0 1 0 1FAMU-4 1 0 1 0 0FAMU-5 1 0 1 0 0FAMU-6 1 0 1 0 0
However, once programs were started the policy that created the programs often
dropped out. Linkages developed over time and were critical to causing the program to
expand. Councils formed to create networks, agencies found benefits from continuing to
work together and the synergy from industry-university-corporate partnerships led to
continued growth. Perhaps the most enduring legacy of President Humphries was that he
had a platform of growth and he institutionalized growth measures in various
departments. The outreach required to do research led to linkages on a
networking/clustering level. The demand for students was used by the President to entice
corporate involvement but it was not an integral component for growth; it was merely a
tool to achieve university growth.
159
CHAPTER 10 ANALYSIS OF LINKAGES AND RIVAL THEORIES AT HBCUS
This chapter presents the findings from the interviews. The primary question
asked in this dissertation is what theories (when implemented they are termed strategies)
account for the development of science and technology at HBCUs. Relying on the
theories of higher education in universities, national systems of innovation, and
competitive advantage, this study posits the hypothesis that linkages in the form of
networks and clusters are the strategy that HBCUs should adopt to enhance their
development of science and technology. Several theories were offered as rivals including
the effects of policy, leadership, and proximity to centers of science and technology, and
demand for skilled personnel. Qualitative research methods were conducted including
interviews with key participants and liaisons, review of university policy documents, and
analysis of public data on HBCUs. Data analysis tools included pattern matching, rival
explanations and chronology of events. This chapter reviews the evidence and judges the
effectiveness of linkages as a strategy for science and technology development.
The findings from this research do not support the use of linkages as the best
strategy for HBCUs to initiate the development of science and technology. Rather,
policy emerges as the strategy that seems most responsible for the initiation of science
and technology at HBCUs. However, linkages and leadership emerge as the most
important factors once the initial stages of development have passed and greater
productivity is the goal.
The following presents information collected through interviews and documents.
It summarizes the findings from the analysis of the primary hypothesis and rival theories.
160
10.1 Analysis
Results were analyzed for reliability through pattern matching (did the theories
match their prediction), for validity against rival explanations (did one explanation offer
more explanatory value than another), and for chronology of events (did one theory
precede another and therefore become more causal than another theory). It is possible for
more than one theory to be causal for a particular respondent. For example, if a program
is located near a science park and a prominent faculty member initiates a research project
with a corporation at the science park, then two theories could potentially be coded –
proximity and leadership. If the project would not or could not have occurred without the
geographical location and that particular scientist then the two theories would be credited.
Each theory offers a different perspective.
Three qualitative methods - pattern matching, rival theories, and chronology of
events were used. The format for pattern matching can be found in Appendix E. It
contains several sections: 1) a brief explanation of the theory, 2) a description of the
questions on the survey instrument from which evidence is derived, 3) the prediction, and
4) the evidence necessary to fulfill the prediction. Each of the rival theories follows the
same format, thus, fulfilling the requirements of exploring rival explanations.
Finally, the third methodology, chronology of events is fulfilled by answering the
question, “Does this theory lead to initial science and technology development?” This
question seeks the root causes of development; i.e., what factors came first in causing the
development of science and technology. A summary concludes each theory tying
together the evidence found (results), offering support for (or against) the theory, and
suggesting its implications (findings).
161
162
Each of the rival explanations had supporting evidence. This is not unusual for
theories derived from logic and/or evidentiary studies. It is possible for more than one
theory to be responsible for the development of science and technology at each
College/program/department.30 However, the validity of the theory is gained by
examining which theory is supported by a preponderance of the evidence, and whether
the theory is contravened by existing evidence. The theory must have been a necessary
and critical factor for it to be credited for being causal (i.e., did the theory lead to the
program). The theory that occurs with the most frequency should logically be deemed
the theory with the most validity. See Table 10.1 for a complete analysis of each theory
at the three universities. In the table, each theory is coded either 0 as not leading to
program development or 1 for being necessary and integral for the program to occur at
the university.
Respondents from the HBCUs included Vice-Presidents, Deans, Chairs and
Directors. The average employment term for the respondents was 13 years. Universities
that exhibited higher levels of science and technology development (as per the index)
typically had more complex structures that included more colleges, institutes,
departments and programs. It was impossible to cover all the science and technology
related programs or departments at each of the three HBCUs; therefore, in general, larger
or more successful programs at each HBCU were selected for interviews. The following
table summarizes the results discussed on the following pages (see Table 10.1).
30 Questions were not asked about the creation of the department as many of them existed since the school began or by the mid-1900s. Rather, the questions addressed the cause behind the development of a typical program or partner at the university. The lone exception is the engineering department at Hampton University created within the past 15 years.
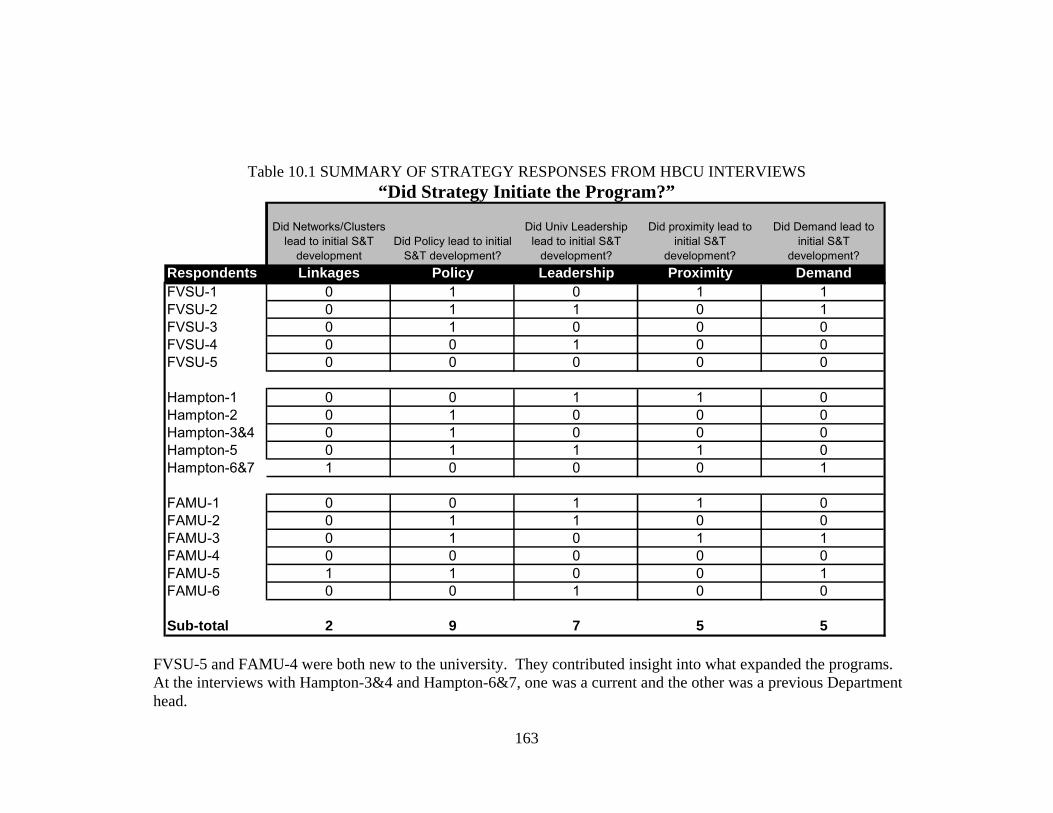
163
Table 10.1 SUMMARY OF STRATEGY RESPONSES FROM HBCU INTERVIEWS
“Did Strategy Initiate the Program?”
Did Networks/Clusters lead to initial S&T
developmentDid Policy lead to initial
S&T development?
Did Univ Leadership lead to initial S&T
development?
Did proximity lead to initial S&T
development?
Did Demand lead to initial S&T
development?Respondents Linkages Policy Leadership Proximity DemandFVSU-1 0 1 0 1 1FVSU-2 0 1 1 0 1FVSU-3 0 1 0 0 0FVSU-4 0 0 1 0 0FVSU-5 0 0 0 0 0
Hampton-1 0 0 1 1 0Hampton-2 0 1 0 0 0Hampton-3&4 0 1 0 0 0Hampton-5 0 1 1 1 0Hampton-6&7 1 0 0 0 1
FAMU-1 0 0 1 1 0FAMU-2 0 1 1 0 0FAMU-3 0 1 0 1 1FAMU-4 0 0 0 0 0FAMU-5 1 1 0 0 1FAMU-6 0 0 1 0 0
Sub-total 2 9 7 5 5
FVSU-5 and FAMU-4 were both new to the university. They contributed insight into what expanded the programs. At the interviews with Hampton-3&4 and Hampton-6&7, one was a current and the other was a previous Department head.
10.2 Linkages
Theories on Linkages as Networks and Clusters state that formal partnerships
(implicit or explicit) between HBCUs and external organizations in which there are
mutually exchanged benefits positively affect science and technology productivity at
HBCUs.
Evidence supporting Linkages was gathered from three questions on the survey
instrument. The first question asked the Respondent to select an organization with whom
the University interacts a great deal that might be typical of how relationships are
developed at the department and to explain how a relationship began and developed. The
second question asks the Respondent whether there were policies to collaborate with
other institutions. The third question asks what benefits were received from university
partners. Evidence was also pulled from relevant responses to other questions.
Predictions: 1. Networks or Clusters exist (as defined earlier in this study).
2. The network/cluster formed in order to stimulate the HBCU’s
development of science and technology.
3. The network/cluster was the reason for the initiation of the s&t
program/department/college
Linkages received a “Yes” in response to the question, “Did linkages lead to initial s&t
development?” if evidence was found to support all three criteria.
10.2.1 Results and Findings
Some form of linkages exists at all the universities, although only two of the three
HBCUs had linkages at the level of Networks/Clusters that initiated development.
Networks and clusters, by definition, evolve out of social capital, which takes time to
164
develop. Twenty years ago, when the seeds of many of these programs were being
planted or just starting to grow, social capital was just beginning to emerge. A lack of
trust was the norm and issues of equity were dominant in the discourse between HBCUs,
the federal government and other universities.
Currently, there are more plentiful examples of Linkages. The strategic plans of
FAMU and FVSU both state a priority to develop partnerships, including global ones.
However, there is little to indicate that Linkages were the cause of science and
technology development at these universities. The example of the engineering
department at Hampton is a recent and novel development.
Other factors appear responsible for stimulating initial science and technology
development. For example, FAMU fostered the creation of a University-Industry cluster
– a group of corporations brought together to be a source of revenue, strategic planning,
internship opportunities, executive assistance and so forth – for the College of
Engineering Sciences, Technology and Agriculture. However, while this Cluster was and
is instrumental in facilitating the growth of science and technology at the university, it
was Leadership that conceived the idea of the cluster and put emphasis on its growth.
Responses from external agencies corroborate other factors as critical to initiation
of programs and projects. All the respondents stated that partnerships were important,
however, they pointed to other factors as initiators. One example is AMIE
(Advancement of Minorities in Engineering), a non-profit organization that acts as a
catalyst to forge Government-Industry-HBCU partnerships. AMIE points to demand of
science personnel as a motivating factor. As the AMIE respondent stated, “HBCUs’
biggest draw is their students.”
165
In summation, networks and clusters represent a sophisticated level of
collaboration and interaction that support science and technology capacity building.
Networks and clusters do not appear to be the strategy that typically initiates science and
technology at HBCUs. However, they appear to be an effective and necessary strategy
for sustainability and growth of science and technology programs.
10.3 Policy
The Policy theory states that external formal or informal policies (laws,
guidelines, and initiatives) developed by federal, state and local governments and their
related agencies have assisted and enabled the growth of science and technology
productivity at HBCUs. Evidence supporting the theory of Policy was gathered primarily
from the question on the survey instrument that asked, “What policies external to the
University at the government level (federal, state or local) are you aware of that have had
an impact on your university’s involvement in science and technology?” Evidence was
also pulled from relevant responses to other questions.
Predictions: 1. A policy exists which enables HBCUs to develop science and
technology.
2. HBCUs become aware of these policies and initiate action to take
advantage of the policy within a year.
3. HBCU policy regarding science and technology is initiated for the
purpose of increasing the university’s role in science and technology.
Policy received a “Yes” in response to the question, “Did government policy lead to
initial science and technology development?” if evidence was found to support all three
criteria.
166
10.3.1 Results and Findings
It is important to note that none of the respondents mentioned policy as the
initiating factor for the program. Many of them attributed the development of the
program to leadership from the President, a Dean or a faculty-scientist. However, their
description of how the program evolved and what served as the catalyst for action to
begin was the point of importance for this author. Policy was a causal factor in many of
the science and technology programs at the selected three HBCUs.
The motivation behind instituting the policy varies; however, a few things stand
out. Respondents most frequently cited the influence of federal policy on HBCUs. The
Civil Rights Act, Title IX, the White House initiative and subsequent policies afforded
HBCU’s economic and social capital. Second, a frequent motivation has been the desire
to increase minority participation in agency decision making. Such diversity is seen as a
valued element. Third, this desire often stems from the impact of issues, illnesses or
problems that disproportionately affect minority areas. These policies strengthen HBCUs
by providing them with not only more resources, programs, and opportunities, but also
better equipment in science and technology areas. The government benefits from having
educated minority participants that provide a voice for affected parties. HBCUs benefit
from federal support for a university program.
10.4 Leadership
Theories emphasizing the role of Leadership in science and technology
development state that key individuals, whether they be administrators (President, Dean,
S&T Department Chair) or “star” scientists, are responsible for the growth of science and
technology productivity at HBCUs. Whereas Policy represents external influences on the
167
university, Leadership represents internal actions initiated within the HBCU to effect
change. Evidence supporting Leadership was gathered primarily from the question on
the survey instrument that asked the respondent whether there were any administrators
(faculty, Deans or Chairs) or key scientists responsible for promoting science and
technology at the university. Evidence was also pulled from relevant responses to other
questions.
Predictions: 1. A new or newly promoted leader/star scientist joins the program.
2. Advocacy or influence in the form of promoting S&T or increasing
S&T productivity rates are visible within 1 year after the introduction of
the new or newly promoted leader/star (within 1 year).
Leadership received a “Yes” in response to the question, “Did Leadership lead to initial
science and technology development?” if evidence was found to support both criteria.
10.4.1 Results and Findings
Leadership has been a critical element in increasing science and technology
programs at the three universities. Two of the universities have been beneficiaries of
exceptional leadership at the Presidential level. The benefit of leadership at the
Presidential level is that it creates a systemic approach to growth which over time often
results in a network or cluster effect. This occurs in several ways. First, university
policies such as expecting a specific number of grant applications and evaluating faculty
on the effort results in institutionalization of production. University personnel gain
training in grant preparation, education on becoming aware of what is available, release
time to write and submit applications, and experience in receiving and responding to
feedback. Second, such policies require consistent contact with agencies that provide
168
funding, which cultivates and nurtures relationships. Third, the systemic approach
created by policy at the university level fosters the interactive relationship described in
Mode 2 theory where universities become more entrepreneurial. The agency, the
university and other contractors work so closely together that it is hard to tell where
boundaries end and who works for what organization. For example, at Hampton, a key
scientist works at the University and is also a staff member at a government lab. Strong
presidential leadership at places like FAMU and Hampton creates a systemic approach to
growth that results in networks.
While leadership is important, there is a logical inconsistency in stating that it
leads to science and technology development. There is a history of strong presidential
leadership at HBCUs both individually and as an organization. As an example, Black
land-grant colleges formed an organization known as the Association of Negro Land-
Grant Colleges on January 15-16, 1923. For 32 years, the organization, composed of
Presidents of the Black land-grant colleges, fought to improve the quality of their
institution and gain equity in funding, mostly without success. The university presidents
met with President Truman in 1946, produced reports revealing the inequities, and tried
unsuccessfully to meet and work with the comparable majority organization, Association
of Land-Grant Colleges and Universities [ALGCU] (Neyland, 1990). The United Negro
College Fund in its early days also had difficulty meeting with success. Despite these
efforts, the disparities and inequities in funding to HBCUs continue until today.
Assuming an equal and consistent level of leadership over time, yet with different
outcomes, one must conclude that intervening factors are also responsible.
169
External respondents also cite HBCU leadership as one of the hurdles to the
development of science and technology. One of the federal government respondents, one
non-profit respondent, and a couple of university respondents cited the ‘traditional’
thinking of HBCU leadership as an obstacle. Some HBCU leaders do not place an
emphasis or priority on science and technology. Others continue to emphasize a teaching
mission. And others do not know how to develop a science or engineering program.
In analyzing which of the theories is most valid, Leadership is clearly important;
but it appears to need the effects of other factors such as Policy. The circumstances or
chronology, which maximizes these strategies, should be addressed in another study.
10.5 Proximity
The Spatial Proximity theory states that locating near centers of innovation (high
science and technology activity) creates a feedback loop. It enhances the participants
near or within the system. They, in turn, increase science and technology output, which
feeds back into the system. (Oinas & Malecki, 2002; Varga, 2000). Evidence supporting
Proximity was gathered primarily from the question on the survey instrument that asked,
“Has there been any S&T development at your university due to its spatial proximity to a
business, another university or science park? If so, how, why and when did development
occur?” Evidence was also pulled from relevant responses to other questions.
Predictions: 1. The HBCU must be located near a science park, a technology center or
a business/university known for research or technology development.
2. Science and technology activities at the HBCU are attributed to the
proximity of the technology center.
170
3. An increase in science and technology development is seen at the
HBCU within one year of being located near the technology center.
Proximity received a “Yes” in response to the question, “Did Proximity lead to
initial science and technology development?” if evidence was found to support all the
criteria
10.5.1 Results and Findings
Support was found for the theory that proximity to centers of science, engineering
and technology instigates a feedback loop that enhances participants near the system.
Hampton is a prime example. After exploring potential growth opportunities, the
university conceived a strategy to promote contact with one of the most concentrated
military complexes in the United States. They did so because of the opportunity
presented by being in close quarters.
FAMU represents a good example of the benefits of being in close proximity to
industry and research centers. One institute owes its existence to the proximity of the
grape growing industry. However, FAMU also reveals that proximity is not sufficient for
development of partnerships to occur. A prime opportunity with a technology park
resulted in no collaboration occurring after 5 years. Such contradictory evidence
undermines the theory. Does one occurrence nullify a theory? Not necessarily. But
when one examines several competing theories and evidence emerges to contradict the
logic, the argument is weakened. By implication, competing theories are strengthened.
171
10.6 Demand for Skilled Personnel
The Demand theory, in application to universities, relies on traditional economic
theory of supply and demand to explain science and technology development. The
science and technological explosion since the 1950s in the United States has caused a
significant need and demand for research, innovation, and skilled personnel. There is a
limited supply of skilled personnel to conduct research and innovation. The market
therefore, adjusts to produce factors at universities (resources, programs, policies,
investments) that will increase the supply of scientists and research. Evidence supporting
the theory of demand for skilled personnel was gathered primarily from the survey
question that asked, “Has your university changed its policies toward student graduation
as a result of the demand for skilled personnel?” Evidence was also pulled from relevant
responses to other questions.
Predictions: 1. The University is aware of the personnel shortage and research needs.
2. The University creates programs for students to major in S&T or to
encourage faculty to get more S&T contracts.
3. The University graduates more students in S&T fields.
Demand for skilled personnel received a “Yes” in response to the question, “Did
Demand lead to initial science and technology development?” if evidence was found to
support all three criteria.
172
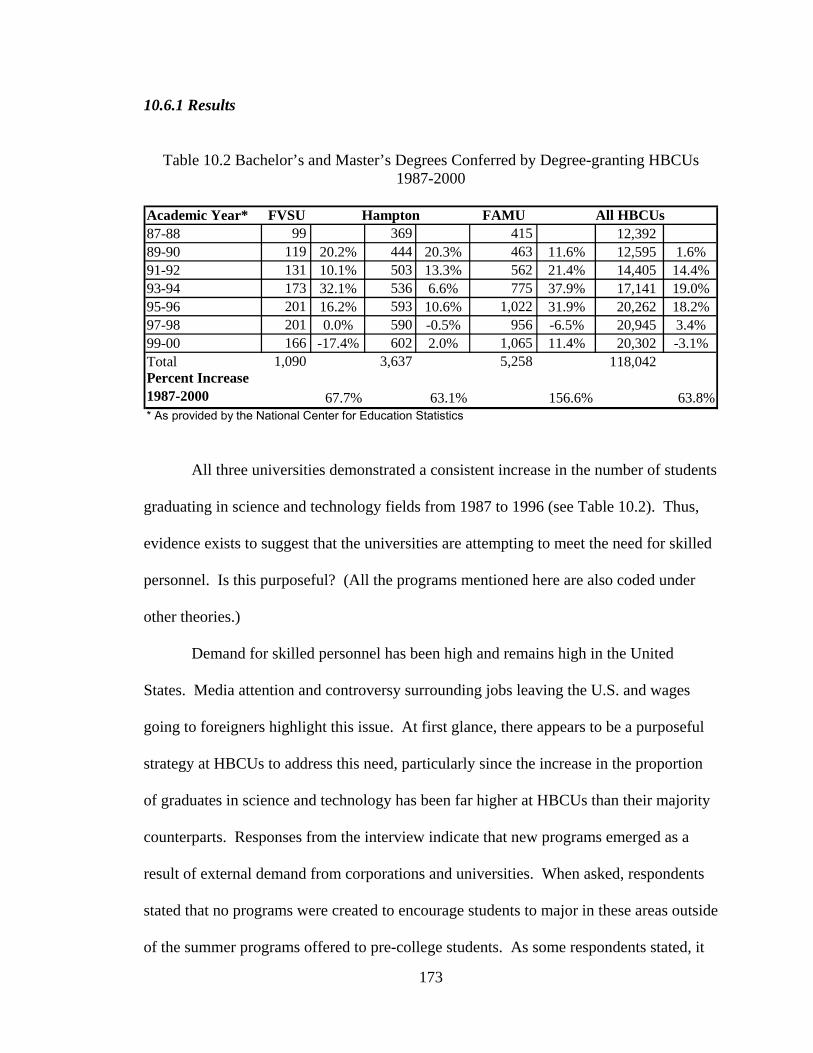
10.6.1 Results
Table 10.2 Bachelor’s and Master’s Degrees Conferred by Degree-granting HBCUs
1987-2000 Academic Year* FVSU Hampton FAMU All HBCUs87-88 99 369 415 12,392 89-90 119 20.2% 444 20.3% 463 11.6% 12,595 1.6%91-92 131 10.1% 503 13.3% 562 21.4% 14,405 14.4%93-94 173 32.1% 536 6.6% 775 37.9% 17,141 19.0%95-96 201 16.2% 593 10.6% 1,022 31.9% 20,262 18.2%97-98 201 0.0% 590 -0.5% 956 -6.5% 20,945 3.4%99-00 166 -17.4% 602 2.0% 1,065 11.4% 20,302 -3.1%Total 1,090 3,637 5,258 118,042 Percent Increase 1987-2000 67.7% 63.1% 156.6% 63.8%* As provided by the National Center for Education Statistics All three universities demonstrated a consistent increase in the number of students
graduating in science and technology fields from 1987 to 1996 (see Table 10.2). Thus,
evidence exists to suggest that the universities are attempting to meet the need for skilled
personnel. Is this purposeful? (All the programs mentioned here are also coded under
other theories.)
Demand for skilled personnel has been high and remains high in the United
States. Media attention and controversy surrounding jobs leaving the U.S. and wages
going to foreigners highlight this issue. At first glance, there appears to be a purposeful
strategy at HBCUs to address this need, particularly since the increase in the proportion
of graduates in science and technology has been far higher at HBCUs than their majority
counterparts. Responses from the interview indicate that new programs emerged as a
result of external demand from corporations and universities. When asked, respondents
stated that no programs were created to encourage students to major in these areas outside
of the summer programs offered to pre-college students. As some respondents stated, it
173
appears that students themselves, aware of increased opportunities, decided to major in
these fields.
HBCUs responded to external interest in skilled personnel; however, it appears
that the agencies needing personnel have been more active in encouraging greater number
of students to major in the field. Federal agencies have provided incentives, through
policies and subsequent funding, for universities to create programs to attract students.
Corporations have done likewise, providing incentives such as jobs and internship
programs. HBCUs, more so than majority universities, represent growth opportunities
for increased supply of skilled science and technology personnel. However, as the
numbers indicate, the number of Black students deciding to major in these fields has
declined within the last years in which data were available. HBCU respondents did not
appear to have a strategy to counteract the decline. The lack of strategy to counteract the
decline is an interesting observation as student graduation, and particularly student
graduation in the sciences and engineering fields appear to be a competitive niche for
HBCUs. The active interest from corporations and government is understandable; it
seems that HBCUs should consider creating programs to encourage students to maintain
interest in these fields.
10.7 Factors Contributing to Expansion of Program
The preceding analysis sought to determine the factors that initiated science and
technology development at the three selected HBCUs. What factors have contributed to
expanding the programs once initiated? Expansion would be defined as more students,
more revenue, or elevation of a program from major to Institute to college and so forth.
174
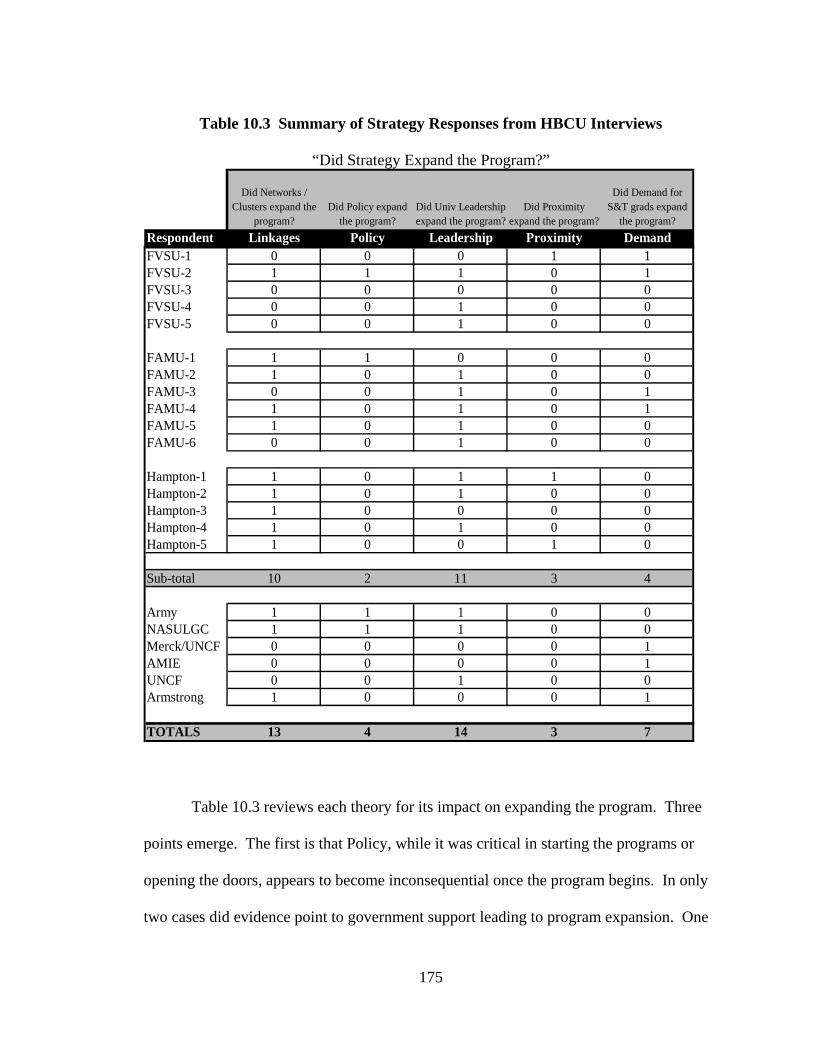
Table 10.3 Summary of Strategy Responses from HBCU Interviews
“Did Strategy Expand the Program?”
Did Networks / Clusters expand the
program?Did Policy expand
the program?Did Univ Leadership expand the program?
Did Proximity expand the program?
Did Demand for S&T grads expand
the program?Respondent Linkages Policy Leadership Proximity DemandFVSU-1 0 0 0 1 1FVSU-2 1 1 1 0 1FVSU-3 0 0 0 0 0FVSU-4 0 0 1 0 0FVSU-5 0 0 1 0 0
FAMU-1 1 1 0 0 0FAMU-2 1 0 1 0 0FAMU-3 0 0 1 0 1FAMU-4 1 0 1 0 1FAMU-5 1 0 1 0 0FAMU-6 0 0 1 0 0
Hampton-1 1 0 1 1 0Hampton-2 1 0 1 0 0Hampton-3 1 0 0 0 0Hampton-4 1 0 1 0 0Hampton-5 1 0 0 1 0
Sub-total 10 2 11 3 4
Army 1 1 1 0 0NASULGC 1 1 1 0 0Merck/UNCF 0 0 0 0 1AMIE 0 0 0 0 1UNCF 0 0 1 0 0Armstrong 1 0 0 0 1
TOTALS 13 4 14 3 7 Table 10.3 reviews each theory for its impact on expanding the program. Three
points emerge. The first is that Policy, while it was critical in starting the programs or
opening the doors, appears to become inconsequential once the program begins. In only
two cases did evidence point to government support leading to program expansion. One
175
of these instances was state supported policy. Federal policy stops being a factor after
initiation. Other factors become responsible for sustaining the program.
The second point is that Leadership emerges as a sustaining factor. Leadership
was an important factor in initiating the programs; it remains an important factor in
helping the program sustain growth. The third point is that Linkages emerge as being
critical for growth. Networks and Clusters, represented by collaborations and
partnerships, become vital for growth or sustainability. According to Hampton-1, their
growth strategy is based on sustainable collaborations and partnerships. The evidence
supports this strategic priority.
10.8 External Agency Responses
The external agencies interviewed – non-profits, corporations and federal
government agencies – offered differing viewpoints. There was no unanimity in support
of one theory over another whether it was in regards to what initiated the development of
the program/partnership or what sustained it. As a matter of fact, each theory found
support depending on the agency. But all the external agency respondents agreed that
lack of funding was an issue faced by most that prevented them from developing their
science and technology capability. Lab equipment, libraries, faculty, research time and
so forth are adversely affected by a lack of funding. As one agency said, “It’s not
feasible for HBCUs to go after a $200 million contract. That’s one of the reasons they’re
starting to collaborate.”
Human capital was the motivation for many of these agencies to work with
HBCUs. Whether it was students or faculty needed for research, the desire for sharp,
176
quality, and skilled personnel leads government, corporations and non-profits to seek out
collaborations and liaisons with HBCUs.
There was no agreement on what theory/strategy HBCUs should adopt. The
respondent from Merck answered that all the strategies were needed.
It’s like splitting hairs. They’re all synergistic. It’s imperative that you’re close to a center because most HBCUs don’t have the resources by themselves. NIH won’t give a grant because they [the HBCU] has no track record so they need partnerships. But there must be a person to participate and be able to conduct the research. And the partnership won’t happen unless university has upper level buy-in to support. And if there’s no national support or effort it won’t occur either. The reality is that you need all of them. But if I had to choose one, it would be the research individuals at the department level.
10.9 Conclusion
The feature hypothesis of this dissertation is that linkages, represented by
Networks and Clusters, are the primary factor influencing science and technology
development at HBCUs. Four rival hypotheses were offered as factors for influencing
science and technology development. Three HBUs were selected to obtain facts
supporting one or more of the theoretical explanations. Three methodologies for
qualitative data analysis were used to determine the validity of each explanation. One of
the methodologies, the method of chronology of events, asks, “which theory initiated the
project/program?”
Upon initiation of this dissertation study, it was assumed that the factors that
initiated the program were the same factors that would sustain it and cause it to expand.
When evidence was collected to determine which of the theoretical explanations came
first and was therefore, causal, it was discovered that linkages were not the primary factor
influencing the initiation of science and technology at the three selected HBCUs. Rather,
177
government policy which sought to include Blacks in areas where they had been a)
excluded or b) where Blacks were disenfranchised from government decision making or
c) resident in an area disproportionately affecting Blacks was the primary factor
influencing the initiation of science and technology at the three selected HBCUs.
Further analysis of the data indicated that policy was not the primary factor for
growth or sustainability. As Hampton-5 stated, “HBCUs are going from one operating
mode to another – from a teaching mission to a research mission. That means we must
collaborate with other HBCUs, universities and partners.” When linkages begin to result
in the development of relationships that lead to contracts, joint ventures, and internship
programs, a system evolves that lays the groundwork for continued growth. If leadership
maintains its efforts to stimulate growth, then the system keeps evolving until networks
or clusters form. Collaborations and multiple partnerships form. Knowledge gets shared.
External agencies begin to work on behalf of the university and benefits accrue that are
greater than the efforts of the individual university.
This is the essence of the cluster effect of which Michael Porter writes. Linkages
and their resulting synergy, enable “the whole to be greater than the sum of its parts.”
Respondents at each University mentioned the desire and need to partner and collaborate
with other universities, industry and government in order to grow. From the data
collected, it appears that policy, leadership and linkages are critical to creation and
expansion of science and technology at HBCUs. The choice of strategy is dependent on
the stage of science and technology development.
178
CHAPTER 11 CONCLUSION
As HBCUs enter the 21st century, how should they respond to an increasingly
science- and technology-oriented society? What strategies should they adopt to
maximize science and technology development? What is the productivity of HBCUs in
science and technology indices? These are the questions addressed in this dissertation.
This chapter assesses what has been learned.
Various literature bases covering HBCUs, higher education, systems of
innovation and competitive advantage were examined to uncover theories and strategies
on science and technology development. Five theories emerged – linkages, policy,
leadership, proximity, and demand for personnel. Of these theories, previous studies
pointed to linkages as the most prominent explanation for achieving science and
technology productivity. This study adopted the theory that linkages was the strategy
HBCUs should adopt for development of science and technology.
To test this theory, a two-phase research design was implemented. The first
phase, the construction of a science and technology index, revealed the HBCUs that had
the highest productivity. The measure also enabled testing of hypotheses regarding the
characteristics of “successful” or high performing HBCUs. The second phase assessed
the effects of linkages and the four rival theories at research HBCUs. The results and
findings from these two phases are summarized below. Following the summary of the
results and findings, the limitations to this dissertation will be discussed.
Recommendations to the findings will also be presented.
179
11.1 Phase I – Results and Findings
This study used a mixed-methods approach composed of two phases. Phase I was
a nested approach to acquire and analyze information for Phase II. A science and
technology index was constructed using standardized scores of various s&t indices. Four
expectations were tested using the index to compare s&t productivity across different
types of university ownership and classification. Three of the hypotheses predicted that
four-year private HBCUs would average a higher s&t index rating than a) four-year
public HBCUs, b) four-year land-grant HBCUs and c) two-year HBCUs. This would be
in accordance with performance by TWIs where four-year private universities generally
hold a slight edge in performance over peer public and land-grant universities.
The results of the index revealed that four-year private HBCUs not only averaged
significantly lower s&t scores than four-year public and four-year land-grant HBCUs, but
their average s&t score was below the mean. This represents a significant difference
from their peer group of TWIs. Land-grant HBCUs dominated the top 20 HBCUs index.
Based on the literature on HBCUs, it is understandable that public HBCUs fare better.
Cost is an important factor since a larger percentage of the HBCU student population is
low-income than at TWIs. However, that does not explain why land-grant HBCUs (a
sub-set of public HBCUs) received a higher average index score than public HBCUs.
Further research is required to better understand the dynamics behind the performance of
the three control structures. However, the results indicate that land-grant HBCUs, on the
average, have acquired a greater level of s&t efficiency than their HBCU peers.
The data on four-year private HBCUs shows that 77% have student populations
under 2,000. Given their small size, their below average performance is not surprising.
180
Size does not dictate performance but the very small size of many HBCUs (58% have
population under 1,000) causes threshold issues to arise. Very small colleges and
universities find it difficult to garner enough resources to compete for faculty, funding,
students and so forth. Hence, organizations like the United Negro College Fund, whose
efforts provide small private HBCUs with additional funding, are crucial support
mechanisms. Land-grant institutions sustain an advantage based on the financial security
afforded by consistent federal and state funding. Having long benefited from being able
to offer a lower cost education, land-grants and public universities average larger student
bodies than private HBCUs. Among other benefits, this results in more tuition, a
significant source of operating funds for HBCUs. Previous studies show that funding
plays a critical role in the operational capability of many HBCUs.
11.2 Phase II - Results and Findings
Phase II addressed the primary question of the dissertation – What strategy should
HBCUs adopt to maximize science and technology development? Using the science and
technology index from Phase I, 3 of the 35 research HBCUs were selected representing
high, medium and low performance on the s&t index score (FAMU, Hampton and FVSU
respectively). The selection of methodology was critical. Pattern matching, rival
explanations, and chronology of events combined to bring out results that would not have
been obtained with a survey process. Based on responses to the chronology of events
methods (i.e., did one theory precede another and therefore, become more causal than
another theory), two questions had to be asked – “what led to the initiation of this s&t
program?” and “what caused the program to expand?” University respondents would
often attribute the achievements of the program to a “leader”; however, when pressed
181
about the origins of the program, another answer would emerge that pointed to a rival
explanation. Without rival theories, the author would not have picked up on the
significance of other explanations for s&t program initiation (which is why the
respondents mistakenly attributed its cause to leadership).
Based on results obtained from interviews and archival data, policy had the
highest number of occurrences (9 of 16) in response to the question of initiation of the
program. Leadership was a close second with 7 occurrences. When seeking to answer
the question of what led to expansion of the program, the results were markedly different.
Policy almost completely dropped out of consideration (2 out of the 16 HBCU
respondents). Linkages emerged as a very close second to Leadership (13 occurrences
versus 14 for Leadership). Several findings can be extrapolated from the results based on
evidence from the interviews, archival data, published statistics, and so forth.
11.3 Strategy Selection
The first and most significant finding to emerge is that strategy selection varies
according to the context of the university environment. Why was policy so significant as
an initiator? Most of the programs discussed had their seeds planted in the 1970s and
1980s, during the civil rights era. Policy was shifting from being exclusive to inclusive
for minorities. Funds were set-aside in a number of areas to counter the effects of
previous discrimination. Federal government, reacting to policy and the change in
societal attitudes, began to see a greater need for minority representation on decision-
making boards and for minority input in areas that were disproportionately affecting
minorities. As technology became more important, they sought more skilled personnel,
regardless of color. Doors began to open. Funding that had been previously closed to
182
HBCUs was now offered, and HBCUs responded with new programs. Land-grant
universities received the beginning of federal funding for land-grant services in 1972.
A policy opportunity existed during the 1970s and 1980s for HBCUs to develop
science and technology related programs. This is analogous to the policy opportunity that
existed for TWIs during the Golden Era of the 1960s, when the federal government
dramatically increased science and research funding to TWIs. Federal involvement with
HBCUs occurred later. Many of the programs that were discussed during the HBCU
interviews evolved during the 1970s and 1980s. However, government funding does not
generally continue for one program over a number of years. Thus, while policy could be
credited with initiating the program, it was rarely responsible for maintaining or
sustaining the program. Policy’s influence in the equation waned.
For programs to be sustainable, HBCUs had to engage in development activities.
As an example, FVSU-2 received initial funding from DOE to provide training to
minority businesses and, as an aside, a small portion went to students. FVSU-2 used the
funds for students to start a student program. In order to maintain the program, however,
he made cold calls to local corporations for financial assistance and job opportunities. In
reaching out to these companies, he developed contacts and relationships. In the process,
he built social capital. After a period of time, the program was able to offer scholarship
money and a summer internship. Both the program and the scholarships attracted quality
students. The corporations with whom he developed relationships, spoke on behalf of
FVSU to other companies. Further contacts developed, and from those, a dual degree
program emerged in another state on the other side of the country at the University of
Nevada at Las Vegas. Thus, three levels of program achievement occurred from the
183
initial program. The first level was the incidental money from DOE for students
(initiation based on policy). The second level was the scholarship and summer intern
program (impetus provided from leadership). The third level was the dual degree
program (higher level benefits resulting from linkages and networks).
This ‘science and technology development’ occurred in many different ways at
the various universities. Social capital grew from the networking and clustering that
enabled HBCUs to sustain their programs. Linkages through social capital caused further
programs not only to evolve but also to eventually build an infrastructure that became
sustainable. This is how linkages emerged as a vital and critical strategy for science and
technology development.
Linkages was not just significant when looking at expansion. The evidence for
linkages came primarily from two universities – the medium productivity HBCU
(Hampton) and the high productivity HBCU (FAMU). We infer from this that linkages
are more likely to exist at HBCUs that have already achieved a level of development.
This inference is supported by the science and technology index’s analysis. This author,
from the results of this study, finds that, at HBCUs, there is likely not only a correlation
between policy and early science and technology development, but also a correlation
between linkages and more sophisticated science and technology development.
These findings can be summarized by stating that the selection of strategy must
consider the maturity of the HBCU’s science and technology endeavors. An HBCU that
is seeking to initiate a science and technology strategy should look to federal or state
policy supportive of programs at HBCUs or they can find issues that disproportionately
affect minorities and seek government support or offerings in those areas. An HBCU that
184
has a foundation (meaning they’ve already exploited some policy opportunities and have
some programs and infrastructure in place), and is seeking growth strategies in science
and technology areas, should look toward collaborations and partnerships for the
purposes of forming networks and clusters.
Why wouldn’t the HBCUs starting a program seek to form partnerships and
collaborations as well as relying on policy? Lower-performing HBCUs have not yet
developed the social capital to make collaborations and partnerships possible or fruitful.
Trust, a critical component of social capital, takes time to develop. It is trust that leads an
individual or organization to work on behalf of a university. Synergy among individuals
or organizations that use their contacts to bring benefits to the HBCU explains how “the
sum is greater than its individual parts.” For HBCUs initiating a science and technology
program, greater productivity will result from energy expended toward exploiting policy
initiatives rather than expending time and energy toward forming collaborations and
partnerships.
11.4 Rival Explanations
A second finding concerns the role leadership plays in the development of science
and technology. Leadership scored high in explaining both the initiation of science and
technology development and its expansion. Leadership is usually an important variable;
however, archival and historical data was important in showing that leadership was an
insufficient explanation by itself. Although FAMU and Hampton had impressive,
outstanding leaders, past history indicates outstanding individuals at the helms of HBCUs
in the past. Yet, past leaders and key scientists at HBCUs did not achieve equitable
funding for their programs, they were prevented from participating in peer associations,
185
and they did not establish the linkages and networks that exist today between HBCUs and
other universities, federal agencies, and corporations. Past leaders of HBCUs did not
achieve the same advances that HBCUs have made in recent years (Neyland, 1990).
Given the same input (leadership), but a different output (greater s&t development) logic
dictates that other variables must be involved. One of those variables is policy, which
opened the door and mitigated the racial barriers and the distrust that abounded. A
second variable is Linkages. Leadership is dynamic and can foment change, but it cannot
operate by itself. Funding from the government requires acquiescence by government
officials. Internship programs require cooperation by the corporate sponsor. Dual degree
programs require partnerships with another university. Thus, leadership is a vital
ingredient as the results show, but it is an intervening variable. Leadership is necessary
for policy and linkages to work but it cannot operate by itself. Thus, this author suggests
the following mix of context and strategy:
Introductory science and technology development – Policy
Mid-level science and technology development – Leadership
Upper-level science and technology development - Linkages
What can be said about the two other competing theories in this study – proximity
and demand? The theory of spatial proximity was undermined by one situation where no
signs of science and technology development occurred despite the proximity of a science
park and the intent to exploit the advantages of proximity. The weakness lies in the
implementation of the theory. Proximity can promote development, but geographical
proximity alone does not necessarily lead to development unless other facilitating factors
like leadership or linkages exist.
186
The theory of demand for skilled personnel yielded interesting results.
Information gleaned from external liaisons was influential in highlighting the importance
of HBCU graduates. It was clear from them, the literature, and the HBCU respondents,
that there was strong demand from government, corporations and other universities for
HBCU graduates in science and technology areas. HBCUs responded to the demand by
creating new programs, Institutes and departments. However, while HBCUs responded
to demand, they were not as active in cultivating supply. HBCUs experienced large
increases of students majoring in science, engineering and technology fields over the past
15 years without university intervention. As a result, they may have believed there was
no need to encourage students. However, while the numbers of Black graduates in S&E
fields has increased from 1994-2001, HBCU’s percentage has decreased. TWIs are
graduating more Black students (National Science Foundation, 2004c). HBCU
respondents seemed to have no strategy to counteract their declining percentages.
Demand for students led to some development of science and technology at HBCUs but it
was not a dominant strategy.
In conclusion, HBCUs have a choice of several strategies to pursue to develop
their science and technology capacity. This study has highlighted which ones may be
more productive and efficient for them to pursue and why that is so. To maximize
productivity, the choice of strategy should be predicated upon the maturity of their
science and technology endeavors.
11.5 Limitations
Various methodologies were used in this study to eliminate weaknesses in the
design. Triangulation was achieved through multiple methods (utilizing both quantitative
187
and qualitative methodologies); multiple data sources (using data from public, archival,
interview, and website sources), and multiple theories (introducing and testing rival
theories). However, certain vulnerabilities still exist.
Due to the type of information that was needed, only a small number of people at
HBCUs could be interviewed. The interviewees were all administrators, and most had
been at their individual university for a long period of time. While their length of service
provided them with critical information, it may also have produced a bias in their
response. For example, respondents at FAMU were reluctant to discuss the technology
park located nearby. Although they had no ownership in the park, they were supposed to
be participants. Their lack of productivity from the park revealed a weakness (from their
perspective). It was difficult to obtain information as to why the park had not worked the
way it was intended. Attempts were made to speak to officials external to FAMU –
administrators at the park, Florida State personnel, or businesses at the park. However,
the attempts were unsuccessful and did not yield any further revealing information.
Thus, the limited number of interviewees and the homogeneity of their position may have
biased the results. Interviewing a larger number of government and corporate partners
familiar with the university would strengthen potential counterpoints and offset subject’s
potential bias.
Another vulnerability (inherent in many case studies) is a potential bias in the
sample selection. In this case, for example, two of the three universities had presidents
that had long tenures and were outstanding leaders. It is not known whether this is
typical of research HBCUs but good leadership is not common. Therefore, a possibility
exists that although the cases were not purposefully selected, a bias may exist in the
188
chosen sample. This always exists as a possibility in the absence of the best known
process to obtain a representative sample, random selection. A limited solution to this
issue for future research would be to expand the number of HBCUs where interviews are
conducted.
An additional issue came from lack of access to critical documents and
information. Hampton University, as a private institution is not forced to make public
financial reports, annual reports, budgets, strategic plans and so forth. Despite persistent
requests, they refused to produce documentation that could be used to corroborate
information gleaned from interviews or public data.
Although not considered a vulnerability, the author would have liked to include
TWIs in the sample of case studies. Available resources and time prevented that option.
The inclusion of TWIs in the study would have enabled further understanding into the
differences between HBCUs and TWIs. Is policy as important in the initiation of science
and technology programs at TWIs or do they initiate programs through
networking/clustering, internal fundraising efforts or industry funds? Do TWIs have a
broader base of financial support? In terms of expansion, is industry a significant
component (after you get past the top universities)? Are there differences between the
two populations that would act as insight or best practices for the other? Further research
would have enabled comparisons between a selected sample (HBCUs) and the general
population (all universities). HBCUs are only 3% of a larger population. Are they
typical? How different are they? Including TWIs in a similar study would answer these
questions. Such a study presents a potential future research topic.
189
The results uncovered areas where further research was required. In Phase I, it
was learned that four-year private HBCUs ran counter to expectations by averaging lower
s&t scores than their four-year public and land-grant counterparts. Although part of the
answer can be found in the threshold issues they face, there is also a question of why they
haven’t developed more strategies to address the problems and weaknesses that come
with being very small. For example, why are there not more examples of collaboration?
Do they share resources such as libraries, equipment, faculty, and so forth? Are more
organizations like the United Negro College Fund needed? Conversely, the superior
performance of land-grant HBCUs invites further research. While consistent government
funding appears to be a significant factor in their achieving the highest average science
and technology index rating, more research is required to determine whether funding,
size, collaboration, efficiency, accountability, etc. are sufficient explanations.
Although vulnerabilities to this design exist and further research would provide
explanations for some of the results that emerged, the design and methodologies used
proved sufficient to produce results and findings that contribute to the literature.
11.6 Policy Implications and Recommendations
This study was designed to provide guidance to HBCU leadership, HBCU science
and technology departments, and federal and state agencies that are interested in
identifying potential niches for support of science and technology development. These
recommendations are made with them in mind. Many of the comments made by the
external liaisons are relevant to this section.
190
11.6.1 Recommendations for Policy Personnel
One of the key points emerging from this dissertation is that policy supporting
science and technology is critical, not just for HBCUs, but for America as well. The
significance of policy supporting science and technology endeavors goes back to the
1960s when significant sums of federal funds led to fundamental scientific discoveries
that changed the balance of power in the world. The Bayh-Dole policy has led to an
increase in university commercialization. Graham and Diamond’s research revealed the
impact of state policy decisions in elevating University of California’s eight campuses,
SUNY (State University of New York) at Albany and Buffalo, and the University of
Alabama at Birmingham to research prominence. This dissertation adds to these studies
by pointing out the importance of policy in assisting HBCUs in starting their science and
technology programs. The performance by HBCUs contributes to American
performance; conversely, the lack of performance by HBCUs detracts from America’s
ability to compete (Jackson, 2004). How does this translate into policy
recommendations?
(a) Policy personnel at all government levels should support a two-pronged approach
– a policy driven approach at an introductory level to initiate s&t programs and a
linkages approach for more sophisticated programs to support collaborations,
partnerships and networks among HBCUs and other universities government and
industry. Policy personnel should understand that policy opens doors and
overcomes previous distrust and racial attitudes. As the NASULGC
representative stated, “Public policy provides the framework by which
opportunity develops.” Linkages are the meat and flesh on the policy framework.
191
(b) The federal government should be more aggressive in promoting student
participation in science and technology endeavors. The Newsweek article of May
5, 2005 discussed participation in Intel’s worldwide science competition. The
U.S. had 65,000 students participate in the competition versus China’s 6,000,000
potential scientists (Fareed et al., 2005). These numbers can be put into context
by examining the population of the two countries. The ratio of China’s youth to
America’s youth (15 and under) in mid-2005 was 4.6 to 1; however, the
participation in the science fair was 92.3 to 1 respectively (Population Reference
Bureau, 2005). At the pace in which China is investing, the U.S. will be left
behind. It is important to be pro-active in encouraging students at a young age to
engage in science or technology fields. The companion piece to the National
Science Board’s Science and Engineering Indicators 2004 report states, “students
entering the science and engineering workforce in 2004 with advanced degrees
decided to take the necessary math courses to enable this career path when they
were in middle school, up to 14 years ago” (National Science Board, 2004a).
Policy personnel, administrators in higher education institutions, and corporations
that need the workforce must invest in strategies that will encourage young people
to engage in science, engineering and technology fields at a young age.
(c) The U.S. should focus on capacity-building of minority workforce. The
competitive advantage the United States has enjoyed in science and technology is
being threatened by advances and investment in other countries and by the lack of
preparation to maintain its own workforce within its borders. The U.S. scientific
and engineering workforce is aging. Over 50% of the science and engineering
192
workforce is age 40 or over; the number reaching retirement within the next
decade may triple (National Science Board, 2004b). Yet there are fewer
American students choosing to study science. The number of foreign nationals
that were once relied upon to fill the workforce gap is decreasing. Since
September 11, 2001, the number of visa applications has declined dramatically
and the number of foreign students attending American universities has declined.
Some American universities have reported a drop of as much as 40% in foreign
graduate student applications (Jackson, 2004).
The demographic changes in the national population point to the need for
minorities to make up some of the shortfall in the science and engineering
workforce. The non-Hispanic White population grew only 3.4% in the last
decade while the Hispanic population grew by 58%, the Asian American
population by 50%, and the African American population by 16%. Therefore, as
per the recommendation of the organization, Building Engineering and Science
Talent (BEST), an initiative of the Council on Competitiveness formed at the
recommendation of the Congressional Commission on the Advancement of
Women in Science, Engineering and Technology, federal policy has to reframe
the issue of diversity (BEST, 2004). Instead of denying minorities and women
admittance to science fields on the grounds of securing competitive advantage,
administrators of higher education should recognize the importance of building a
quality workforce. The focus should be on capacity-building.
(d) There should be equitable treatment for HBCUs. The NASULGC representative
pointed out, “HBCU land-grants just started getting state money 5 years ago
193
(2000). TWI’s get $7 state dollars for every $1 federal dollar. HBCUs are lucky
if they get $1 for every federal $1. We cannot afford to have regressive attitudes.
We need to invest in our students and be progressive.” The aforementioned
statistics support the need to treat minority institutions in an equitable manner.
Even if there was no need to rely on minority workforce in science and
engineering fields, all universities of the same status (accreditation and control)
should receive equitable treatment for America to be more competitive. A free,
competitive educational arena will most likely heighten the standard and quality
of the education. Given that the supply of foreign labor the economy has
traditionally relied on is decreasing and minority replacement is the most likely
and viable alternative, then policy personnel should support the institutions that
are disproportionately successful in supplying potential minority workforce.
Federal agencies should also take diversity into account when awarding education
and research grants to institutions of higher education.
(e) Federal agencies and other universities should study and understand the factors
that make HBCUs successful in graduating at-risk students. HBCUs have higher
proportions of at-risk students yet higher rates of matriculation of African
American students than TWIs. A National Assessment of Educational Progress
study shows underperformance by most minorities. A study of high school
seniors found that 74% of white students and 80% of Asian/ Pacific Islander
students scored at or above a level deemed basic by a national panel of experts.
Only 31% of black, 44% of Hispanic, and 57% of American Indian/Alaskan
Native students attained that level (National Science Board, 2004a). A number of
194
factors have been advanced to explain minorities’ substandard performance (e.g.,
low teacher expectations, lack of interest in schooling, lack of role models,
insufficient institutional support, isolation, insufficient parental support,
outmoded curricula, peer pressure, and even claims of genetic inferiority),but no
explanation has received widespread acceptance (Armstrong & Thompson, 2003;
Lewis, 2003). Further research would provide insights in to the causes for
disparity and the solutions to address it.
(f) This dissertation study, the BEST report, the Standing our Ground report, and
other publications seek to research best methods and practices for producing
quality science and engineering programs and workforce (Committee on Equal
Opportunities in Science and Engineering, 2004; Malcom, Chubin, & Jesse,
2004). However, much more needs to be done. It is not only quantity of
personnel that are needed but quality of personnel that are skilled in state-of-the-
art equipment, techniques and practices. Policy personnel should, therefore,
continue the study of successful research programs and best practices and use the
insights gained to improve research and development programs overall.
11.6.2 Recommendations for HBCU Administrators
Administrators at HBCUs who are interested in either establishing a science and
technology program or who are interested in growth strategies for their existing program
should be interested in the results and findings of this study. The finding that strategy
should be tied to context is significant. The study and the index should give them more
insight into important variables, strengths and weaknesses in their program, and how to
view their particular environment. As this is a relatively new and unexplored area they
195
will find several of the findings and recommendations to be relevant. Some of the
following policy recommendations are directed toward establishing internal initiatives;
others are directed toward exploiting external opportunities. Many HBCUs are not fully
aware of the opportunities inherent in pursuing a science, engineering and technology
program. Or they may be aware of the opportunities but believe that such a program is
not within their budget or educational pursuit. The following are recommendations for
HBCUs at various stages in their science and technology programs.
11.6.2.1 Internal University Policy
(a) In the 1940s, as U.S. prepared for the war, Black academicians like W.E.B.
DuBois, Rufus Clement, Malcolm McLean and Herman Branson encouraged
HBCUs to train personnel for the sciences, and other technical fields (Anderson,
1988; Branson, 1942; Clement, 1942; MacLean, 1942). As Branson put it. “If
Blacks are 10% of the population they should be producing 10% of America’s
needs for physics science and technical personnel” (Branson, 1942, 299). HBCUs
should adopt this belief today, particularly at this time. America is in need of
skilled and trained scientists and technicians for security, defense, medical, and
economic reasons. Many HBCUs understand that workforce needs exist in
science and engineering. However, they have not aggressively addressed an
increase in the supply. Apart from the programs they offer exposing science and
engineering to high school students, there are few programs at the college level
that encourage students to select s&t fields. The Science and Engineering
Indicators 2004 report indicates that “the number of jobs in the U.S. economy that
require science and engineering training will grow” while “the number of U.S.
196
citizens prepared for those jobs will, at best, be level” (National Science Board,
2004a). Responses from the liaisons support the numbers. Demand for students
acts as a catalyst for development of linkages, partnerships and joint ventures (or
vice-versa). Regardless of the direction of causality, the result is development of
science and technology programs. Corporations want access to a talented labor
pool. HBCUs enter a win-win proposition if they encourage students to not only
major in STEM fields but pursue their education in those fields until they gain a
specialized skill.
(b) The same academicians as early as the 1940s suggested that larger HBCUs should
act as “mentors” and team up with smaller HBCUs to create a win-win situation
or that smaller HBCUs should discontinue operation and merge with larger
HBCUs (Branson, 1942; MacLean, 1942). In other words, HBCUs should engage
in clustering. Larger HBCUs could win science and technology related contracts
based on their infrastructure while utilizing personnel from other schools; smaller
HBCUs could get their faculty trained and experienced at participating in
contracts. This experience could lead into opportunities for the smaller HBCUs.
Both groups share students, history, and culture. In modern culture, this idea can
be accommodated through innovative education – virtual education and/or long
distance education. As one Dean stated, discussions have already begun around
the idea of creating a “virtual center.” As he explained, HBCUs lack the
infrastructure and resources to compete. But by collaborating and pooling
resources, we can create a virtual center in which students can have access to a
197
larger library, different faculty, and different equipment. The idea of mentoring
and collaboration is still viable and a solid recommendation for smaller HBCUs.
(c) HBCUs should consider expanding their mission and looking beyond the
traditional boundaries of being teacher colleges or universities. They should
consider learning how to start a science program. How do you start such a
program? The Army representative said it always starts with a researcher.
Someone has an idea. Maybe they think they can grease a wheel on a jeep better. They study military requirements and align their interests. The HBCU will contact an Army representative at Research Park and White Papers will exchange. The Army will decide to fund the idea. That idea grows into some students deciding to work on it. Annual solicitations come. The relationship with the Army causes other topics to be offered. The research may have $300,000 assigned to it. A center may evolve. Tuskegee now has $2 million for a 5-year period. In 5 years, Tuskegee will no longer be eligible for the Center but the Army may fund a follow-up in Material Sciences. Then a doctorate program evolves.
(d) HBCUs should invest in research and either develop or hire faculty that have
those skills. Perhaps HBCU faculty can be given more release time. FAMU and
Hampton have exhibited substantial progress in this area. They have produced
research agendas in their department by establishing goals and holding faculty
accountable through the evaluation process. A policy recommendation by BEST
for all institutions of higher education is especially applicable for HBCUs.
“Expanding the base of effective programs will require more rigorous evaluation
of outcomes, support of cutting-edge research on the issues that surround
teaching and learning, and increased participation of underrepresented groups in
national research and evaluation efforts” (BEST, 2004). HBCUs should commit
to shift from a “teaching” mission to a “teaching and research” mission.
198
(e) At the other end of the spectrum of encouraging students to choose s&t fields,
HBCUs should encourage students to pursue Ph.D.s in science, engineering and
technology fields. Since few HBCUs have doctoral programs, there may appear
to be little incentive to provide encouragement in this direction. However, if the
graduate student earns his/her degree at an HBCU, their presence helps bring in
corporate dollars. If the student graduates from an HBCU and earns their Ph.D. at
another school that student then represents a potential network contact for the
HBCU. One of the liaisons was such an example. He felt some loyalty to his
alma mater and thus encouraged and participated in the program his company had
with an HBCU. Thus, students should be cultivated on all levels in science and
technology fields.
11.6.2.2. External Policy Initiatives
(a) While internal initiatives focus on clustering with other HBCUs and universities,
external policy focuses on networking. Just as Hampton found a market niche in
the military complex and FAMU found a niche with the grape growers there are
industry clusters all around the country. HBCUs should seek opportunities nearby
and exploit them.
(b) Land-grants already have a link to industry based on their historical mission.
They should determine the needs of industries with whom they are already
affiliated so they know what to supply. They are in a natural position to do
research on those needs.
(c) HBCUs should apply for all potential funding not just funds set-aside for
minorities. As Hampton-1 stated “Those [set-aside] funds are a drop in the
199
bucket.” The competition will make HBCUs improve. Even the failure to receive
funding provides lessons for persistent applicants to learn the process and the
requirements. This is a lesson learned from the competitive advantage literature.
(d) HBCUs should pool resources to work with and support organizations like
NASULGC to lobby on their behalf and keep them informed. Support of
organizations like this could result in a greater return to the HBCU. NASULGC
sends information on funding opportunities to HBCUs. It is not clear how much
interaction occurs regarding policy which affects HBCUs and policy which
HBCUs could be initiating.
As the United States enters the 21st century, there is a need for America to remain
scientifically competitive for economic, social, and political reasons. The U.S. must take
advantage of every opportunity there is to develop science and technological capacity and
that includes supporting HBCUs in their science and technology endeavors. As the
NASULGC liaison stated, “Public policy provides the framework by which opportunity
develops.” This dissertation proves that policy does indeed open the doors and provide
opportunity. But this dissertation also shows that policy gives way to relationships.
Linkages are the key. Getting to the networking and clustering stages will give HBCUs
the tools and strategies to forge a new path.
200
APPENDIX A: LIST OF HBCUS
HBCU State CarnegieCode Control Region Size1 Alabama A&M Univ Alabama Doctoral II Land-grant South Large2 Alabama State Univ Alabama Master's I Public South Large3 Albany State Univ Georgia Master's I Public South Medium4 Alcorn State Univ Mississippi Master's I Land-grant South Medium5 Allen Univ South Carolina Baccalaureate Private South Very Small6 Arkansas Baptist College Arkansas Baccalaureate Private South Very Small7 Barber-Scotia College North Carolina Baccalaureate Private South Very Small8 Benedict College South Carolina Baccalaureate Private South Medium9 Bennett College North Carolina Baccalaureate Private South Very Small
10 Bethune Cookman College Florida Baccalaureate Private South Medium11 Bishop State Community College Alabama Associates Private South Medium12 Bluefield State College West Virginia Baccalaureate Private Mid-Atlantic Medium13 Bowie State Univ Maryland Master's I Public Mid-Atlantic Large14 Central State Univ Ohio Baccalaureate Public Midwest Small15 Cheyney Univ of Pennsylvania Pennsylvania Master's I Public Mid-Atlantic Small16 Claflin College South Carolina Baccalaureate Private South Small17 Clark Atlanta Univ Georgia Doctoral II Private South Medium18 Clinton Junior College South Carolina Associates Private South Very Small19 Coahoma Community College Mississippi Associates Private South Small20 Concordia College Alabama Baccalaureate Private South Very Small21 Coppin State College Maryland Master's I Public Mid-Atlantic Medium22 Delaware State Univ Delaware Master's I Public Mid-Atlantic Medium23 Denmark Technical College South Carolina Associates Public South Small24 Dillard Univ Louisiana Baccalaureate Private South Medium25 Edward Waters College Florida Baccalaureate Private South Very Small26 Elizabeth City State Univ North Carolina Baccalaureate Public South Small27 Fayetteville State Univ North Carolina Master's I Public South Medium28 Fisk Univ Tennessee Baccalaureate Private South Very Small29 Florida A&M Univ Florida Master's I Land-grant South Large30 Florida Memorial College Florida Baccalaureate Private South Small31 Fort Valley State Univ Georgia Master's I Land-grant South Medium32 Grambling State Univ Louisiana Master's I Public South Medium33 Hampton Univ Virginia Master's I Private Mid-Atlantic Large34 Harris-Stowe State College Missouri Other Public Midwest Small35 Hinds Community College Mississippi Associates Public South Large36 Howard Univ D.C. Doctoral I Private Mid-Atlantic Large37 Huston-Tillotson College Texas Baccalaureate Private Southwest Very Small38 Interdenominational Theological CentGeorgia Other Private South Very Small39 J F Drake State Technical College Alabama Associates Private South Very Small40 Jackson State Univ Mississippi Master's I Public South Large41 Jarvis Christian College Texas Baccalaureate Private Southwest Very Small42 Johnson C Smith Univ North Carolina Baccalaureate Private South Small43 Kentucky State Univ Kentucky Master's II Land-grant South Medium44 Knoxville College Tennessee Associates Private South Very Small45 Lane College Tennessee Baccalaureate Private South Very Small46 Langston Univ Oklahoma Baccalaureate Land-grant Midwest Medium47 Lawson State Community College Alabama Associates Private South Small48 LeMoyne-Owen College Tennessee Baccalaureate Private South Very Small49 Lewis College of Business Michigan Associates Private Midwest Very Small50 Lincoln Univ (Jefferson City, MO) Missouri Master's II Land-grant Midwest Medium51 Lincoln Univ (Lincoln Univ, PA) Pennsylvania Master's II Public Mid-Atlantic Small52 Livingstone College North Carolina Baccalaureate Private South Very Small
201
HBCU State CarnegieCode Control Region Size53 Mary Holmes College Mississippi Associates Private South Very Small54 Meharry Medical College Tennessee Other Private South Very Small55 Miles College Alabama Baccalaureate Private South Small56 Mississippi Valley State Univ Mississippi Baccalaureate Public South Medium57 Morehouse College Georgia Baccalaureate Private South Medium58 Morehouse School of Medicine Georgia Other Private South Very Small59 Morgan State Univ Maryland Master's I Public Mid-Atlantic Large60 Morris Brown College Georgia Baccalaureate Private South Medium61 Morris College South Carolina Baccalaureate Private South Very Small62 Norfolk State Univ Virginia Master's I Public Mid-Atlantic Large63 North Carolina A&T State Univ North Carolina Master's I Land-grant South Large64 North Carolina Central Univ North Carolina Master's I Public South Large65 Oakwood College Alabama Baccalaureate Private South Small66 Paine College Georgia Baccalaureate Private South Very Small67 Paul Quinn College Texas Baccalaureate Private Southwest Very Small68 Philander Smith College Arkansas Baccalaureate Private South Small69 Prairie View A&M Univ Texas Master's I Land-grant Southwest Large70 Rust College Mississippi Baccalaureate Private South Very Small71 Saint Augustine's College North Carolina Baccalaureate Private South Small72 Saint Paul's College Virginia Baccalaureate Private Mid-Atlantic Very Small73 Saint Philip's College Texas Associates Public Southwest Large74 Savannah State Univ Georgia Baccalaureate Public South Medium75 Selma Univ Alabama Baccalaureate Private South Very Small76 Shaw Univ North Carolina Baccalaureate Private South Medium77 Shelton State Community College Alabama Associates Public South Large78 Shorter College Arkansas Associates Private South Very Small79 South Carolina State Univ South Carolina Master's I Land-grant South Medium80 Southern Univ A&M College/Baton RoLouisiana Master's I Land-grant South Large81 Southern Univ/New Orleans Louisiana Master's II Private South Medium82 Southwestern Christian College Texas Other Private Southwest Very Small83 Spelman College Georgia Baccalaureate Private South Medium84 Stillman College Alabama Baccalaureate Private South Small85 Talladega College Alabama Baccalaureate Private South Very Small86 Tennessee State Univ Tennessee Doctoral II Private South Large87 Texas College Texas Baccalaureate Private Southwest Very Small88 Texas Southern Univ Texas Doctoral II Public Southwest Large89 Tougaloo College Mississippi Baccalaureate Private South Very Small90 Trenholm State Technical College Alabama Associates Public South Very Small91 Tuskegee Univ Alabama Master's I Land-grant South Medium92 Univ of Arkansas at Pine Bluff Arkansas Baccalaureate Land-grant South Medium93 Univ of Maryland Eastern Shore Maryland Master's I Land-grant Mid-Atlantic Medium94 Univ of the District of Columbia District of Columb Master's I Land-grant Mid-Atlantic Large95 Univ of the Virgin Islands U.S. Virgin IslandsMaster's II Land-grant Virgin IslandsSmall96 Virginia State Univ Virginia Master's I Land-grant Mid-Atlantic Medium97 Virginia Union Univ Virginia Baccalaureate Private Mid-Atlantic Small98 Voorhees College South Carolina Baccalaureate Private South Very Small99 West Virginia State College West Virginia Baccalaureate Land-grant Mid-Atlantic Medium
100 Wilberforce Univ Ohio Baccalaureate Private Midwest Very Small101 Wiley College Texas Baccalaureate Private Southwest Very Small102 Winston-Salem State Univ North Carolina Baccalaureate Public South Medium103 Xavier Univ of Louisiana Louisiana Master's I Private South Medium
202
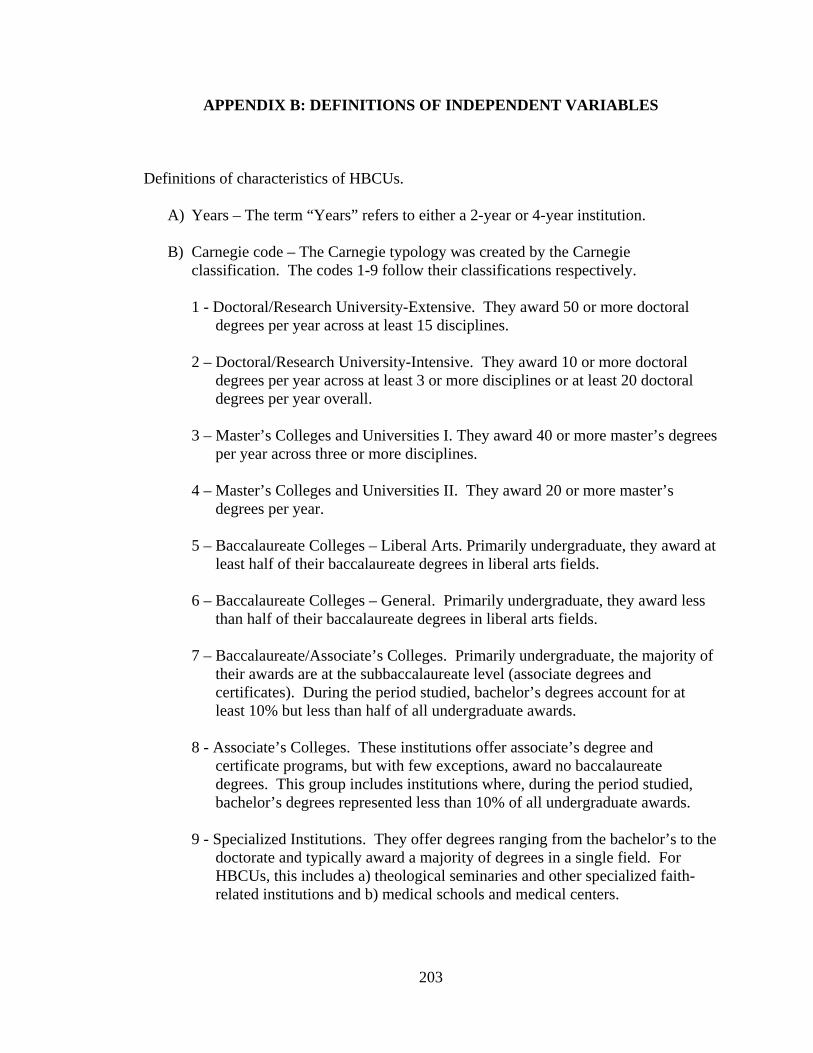
APPENDIX B: DEFINITIONS OF INDEPENDENT VARIABLES
Definitions of characteristics of HBCUs.
A) Years – The term “Years” refers to either a 2-year or 4-year institution.
B) Carnegie code – The Carnegie typology was created by the Carnegie classification. The codes 1-9 follow their classifications respectively.
1 - Doctoral/Research University-Extensive. They award 50 or more doctoral
degrees per year across at least 15 disciplines. 2 – Doctoral/Research University-Intensive. They award 10 or more doctoral
degrees per year across at least 3 or more disciplines or at least 20 doctoral degrees per year overall.
3 – Master’s Colleges and Universities I. They award 40 or more master’s degrees
per year across three or more disciplines. 4 – Master’s Colleges and Universities II. They award 20 or more master’s
degrees per year. 5 – Baccalaureate Colleges – Liberal Arts. Primarily undergraduate, they award at
least half of their baccalaureate degrees in liberal arts fields. 6 – Baccalaureate Colleges – General. Primarily undergraduate, they award less
than half of their baccalaureate degrees in liberal arts fields. 7 – Baccalaureate/Associate’s Colleges. Primarily undergraduate, the majority of
their awards are at the subbaccalaureate level (associate degrees and certificates). During the period studied, bachelor’s degrees account for at least 10% but less than half of all undergraduate awards.
8 - Associate’s Colleges. These institutions offer associate’s degree and
certificate programs, but with few exceptions, award no baccalaureate degrees. This group includes institutions where, during the period studied, bachelor’s degrees represented less than 10% of all undergraduate awards.
9 - Specialized Institutions. They offer degrees ranging from the bachelor’s to the
doctorate and typically award a majority of degrees in a single field. For HBCUs, this includes a) theological seminaries and other specialized faith-related institutions and b) medical schools and medical centers.
203
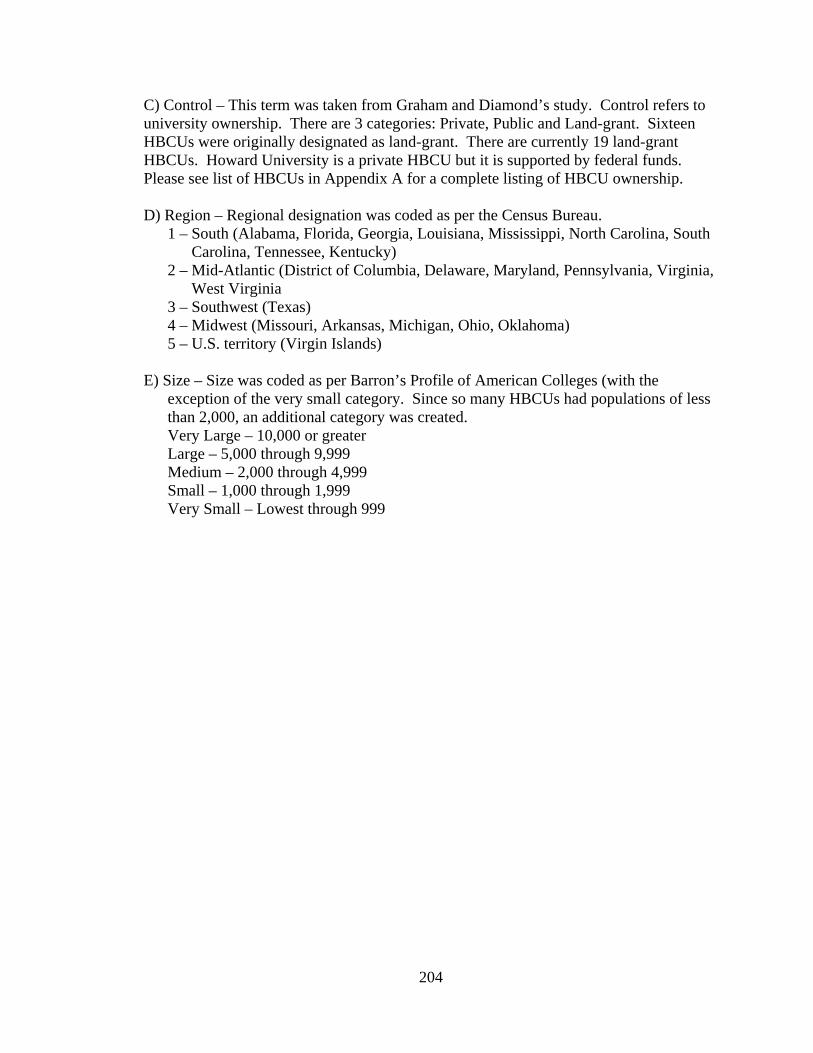
C) Control – This term was taken from Graham and Diamond’s study. Control refers to university ownership. There are 3 categories: Private, Public and Land-grant. Sixteen HBCUs were originally designated as land-grant. There are currently 19 land-grant HBCUs. Howard University is a private HBCU but it is supported by federal funds. Please see list of HBCUs in Appendix A for a complete listing of HBCU ownership. D) Region – Regional designation was coded as per the Census Bureau.
1 – South (Alabama, Florida, Georgia, Louisiana, Mississippi, North Carolina, South Carolina, Tennessee, Kentucky)
2 – Mid-Atlantic (District of Columbia, Delaware, Maryland, Pennsylvania, Virginia, West Virginia
3 – Southwest (Texas) 4 – Midwest (Missouri, Arkansas, Michigan, Ohio, Oklahoma) 5 – U.S. territory (Virgin Islands)
E) Size – Size was coded as per Barron’s Profile of American Colleges (with the
exception of the very small category. Since so many HBCUs had populations of less than 2,000, an additional category was created. Very Large – 10,000 or greater Large – 5,000 through 9,999 Medium – 2,000 through 4,999 Small – 1,000 through 1,999 Very Small – Lowest through 999
204
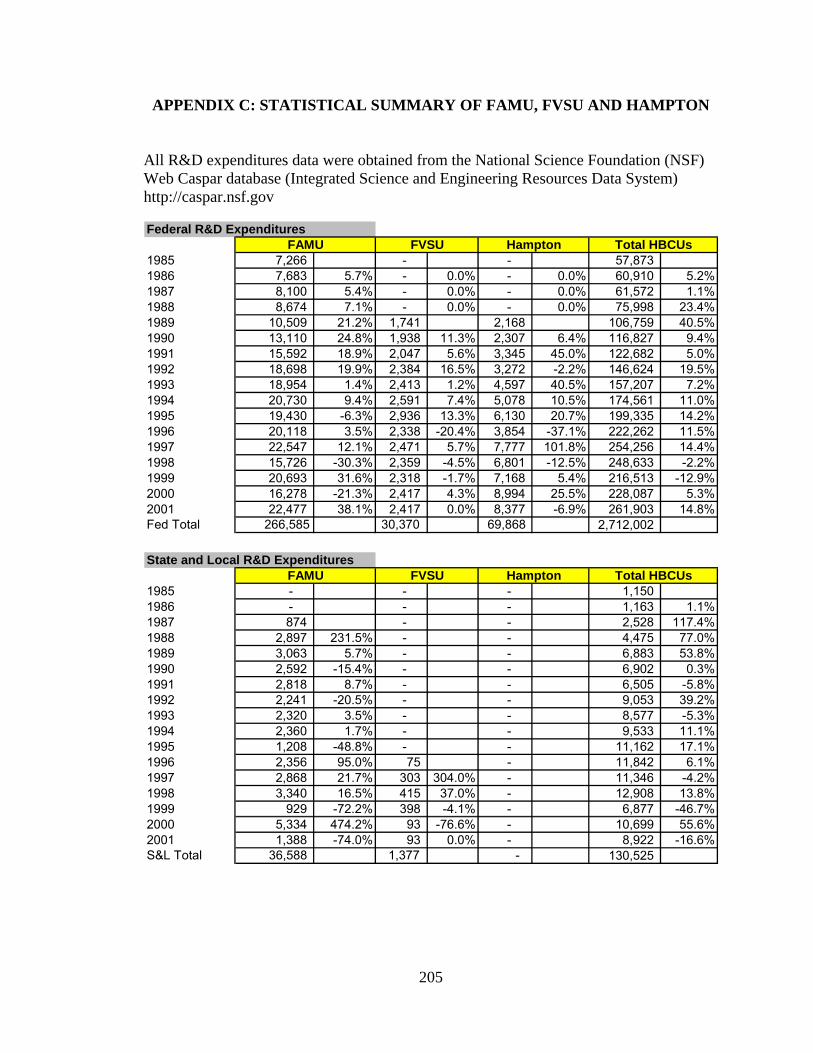
APPENDIX C: STATISTICAL SUMMARY OF FAMU, FVSU AND HAMPTON
All R&D expenditures data were obtained from the National Science Foundation (NSF) Web Caspar database (Integrated Science and Engineering Resources Data System) http://caspar.nsf.gov Federal R&D Expenditures 1985 7,266 - - 57,873 1986 7,683 5.7% - 0.0% - 0.0% 60,910 5.2%1987 8,100 5.4% - 0.0% - 0.0% 61,572 1.1%1988 8,674 7.1% - 0.0% - 0.0% 75,998 23.4%1989 10,509 21.2% 1,741 2,168 106,759 40.5%1990 13,110 24.8% 1,938 11.3% 2,307 6.4% 116,827 9.4%1991 15,592 18.9% 2,047 5.6% 3,345 45.0% 122,682 5.0%1992 18,698 19.9% 2,384 16.5% 3,272 -2.2% 146,624 19.5%1993 18,954 1.4% 2,413 1.2% 4,597 40.5% 157,207 7.2%1994 20,730 9.4% 2,591 7.4% 5,078 10.5% 174,561 11.0%1995 19,430 -6.3% 2,936 13.3% 6,130 20.7% 199,335 14.2%1996 20,118 3.5% 2,338 -20.4% 3,854 -37.1% 222,262 11.5%1997 22,547 12.1% 2,471 5.7% 7,777 101.8% 254,256 14.4%1998 15,726 -30.3% 2,359 -4.5% 6,801 -12.5% 248,633 -2.2%1999 20,693 31.6% 2,318 -1.7% 7,168 5.4% 216,513 -12.9%2000 16,278 -21.3% 2,417 4.3% 8,994 25.5% 228,087 5.3%2001 22,477 38.1% 2,417 0.0% 8,377 -6.9% 261,903 14.8%Fed Total 266,585 30,370 69,868 2,712,002
FAMU FVSU Hampton Total HBCUs
State and Local R&D Expenditures 1985 - - - 1,150 1986 - - - 1,163 1.1%1987 874 - - 2,528 117.4%1988 2,897 231.5% - - 4,475 77.0%1989 3,063 5.7% - - 6,883 53.8%1990 2,592 -15.4% - - 6,902 0.3%1991 2,818 8.7% - - 6,505 -5.8%1992 2,241 -20.5% - - 9,053 39.2%1993 2,320 3.5% - - 8,577 -5.3%1994 2,360 1.7% - - 9,533 11.1%1995 1,208 -48.8% - - 11,162 17.1%1996 2,356 95.0% 75 - 11,842 6.1%1997 2,868 21.7% 303 304.0% - 11,346 -4.2%1998 3,340 16.5% 415 37.0% - 12,908 13.8%1999 929 -72.2% 398 -4.1% - 6,877 -46.7%2000 5,334 474.2% 93 -76.6% - 10,699 55.6%2001 1,388 -74.0% 93 0.0% - 8,922 -16.6%S&L Total 36,588 1,377 - 130,525
FAMU FVSU Hampton Total HBCUs
205
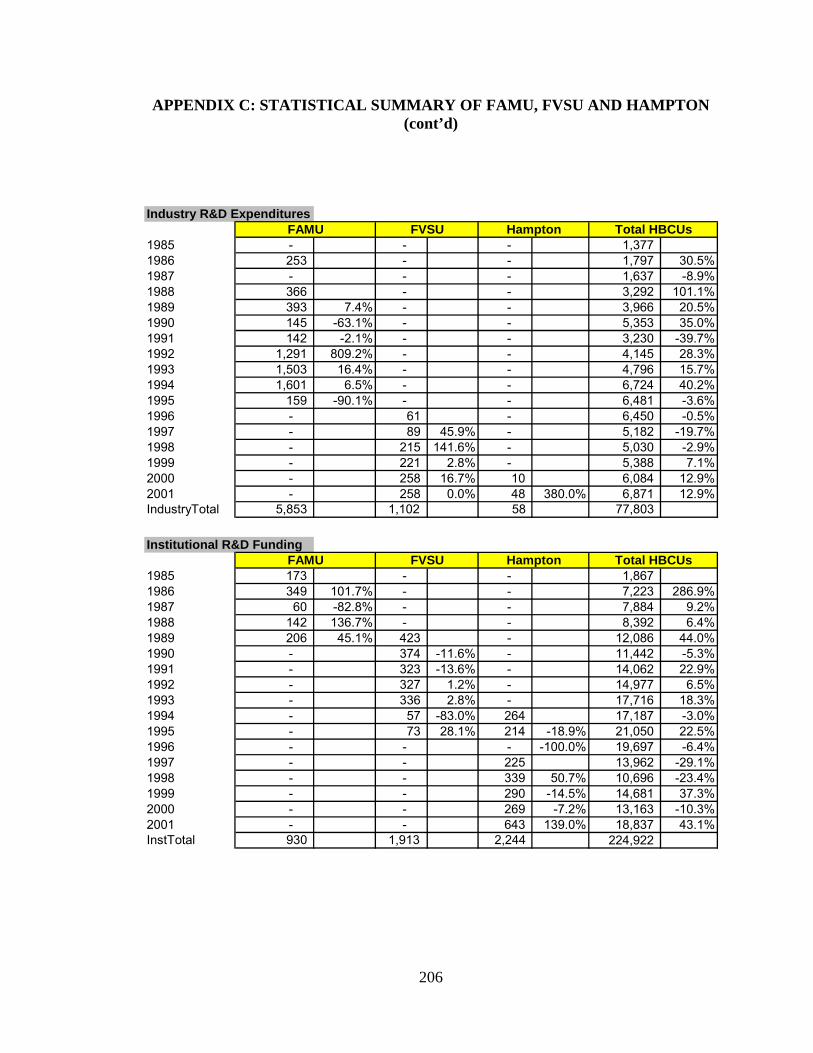
APPENDIX C: STATISTICAL SUMMARY OF FAMU, FVSU AND HAMPTON (cont’d)
Industry R&D Expenditures 1985 - - - 1,377 1986 253 - - 1,797 30.5%1987 - - - 1,637 -8.9%1988 366 - - 3,292 101.1%1989 393 7.4% - - 3,966 20.5%1990 145 -63.1% - - 5,353 35.0%1991 142 -2.1% - - 3,230 -39.7%1992 1,291 809.2% - - 4,145 28.3%1993 1,503 16.4% - - 4,796 15.7%1994 1,601 6.5% - - 6,724 40.2%1995 159 -90.1% - - 6,481 -3.6%1996 - 61 - 6,450 -0.5%1997 - 89 45.9% - 5,182 -19.7%1998 - 215 141.6% - 5,030 -2.9%1999 - 221 2.8% - 5,388 7.1%2000 - 258 16.7% 10 6,084 12.9%2001 - 258 0.0% 48 380.0% 6,871 12.9%IndustryTotal 5,853 1,102 58 77,803
FAMU FVSU Hampton Total HBCUs
Institutional R&D Funding 1985 173 - - 1,867 1986 349 101.7% - - 7,223 286.9%1987 60 -82.8% - - 7,884 9.2%1988 142 136.7% - - 8,392 6.4%1989 206 45.1% 423 - 12,086 44.0%1990 - 374 -11.6% - 11,442 -5.3%1991 - 323 -13.6% - 14,062 22.9%1992 - 327 1.2% - 14,977 6.5%1993 - 336 2.8% - 17,716 18.3%1994 - 57 -83.0% 264 17,187 -3.0%1995 - 73 28.1% 214 -18.9% 21,050 22.5%1996 - - - -100.0% 19,697 -6.4%1997 - - 225 13,962 -29.1%1998 - - 339 50.7% 10,696 -23.4%1999 - - 290 -14.5% 14,681 37.3%2000 - - 269 -7.2% 13,163 -10.3%2001 - - 643 139.0% 18,837 43.1%InstTotal 930 1,913 2,244 224,922
FAMU FVSU Hampton Total HBCUs
206
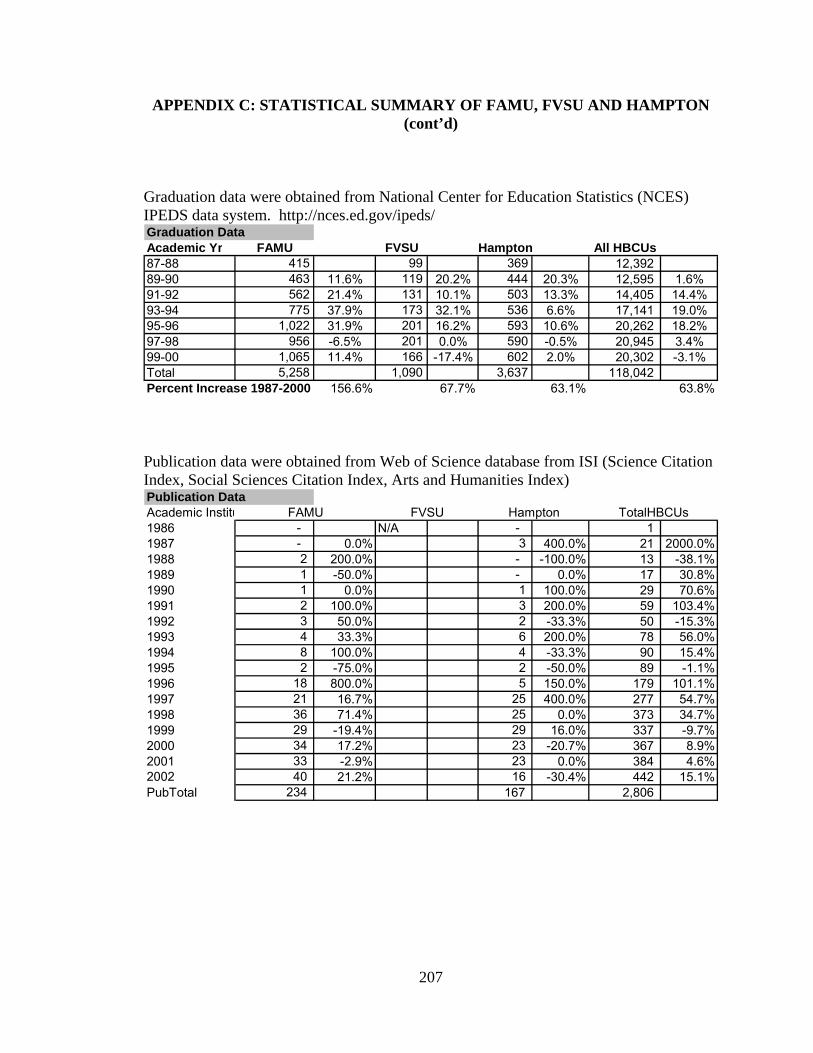
APPENDIX C: STATISTICAL SUMMARY OF FAMU, FVSU AND HAMPTON (cont’d)
Graduation data were obtained from National Center for Education Statistics (NCES) IPEDS data system. http://nces.ed.gov/ipeds/ Graduation DataAcademic Yr FAMU FVSU Hampton All HBCUs87-88 415 99 369 12,392 89-90 463 11.6% 119 20.2% 444 20.3% 12,595 1.6%91-92 562 21.4% 131 10.1% 503 13.3% 14,405 14.4%93-94 775 37.9% 173 32.1% 536 6.6% 17,141 19.0%95-96 1,022 31.9% 201 16.2% 593 10.6% 20,262 18.2%97-98 956 -6.5% 201 0.0% 590 -0.5% 20,945 3.4%99-00 1,065 11.4% 166 -17.4% 602 2.0% 20,302 -3.1%Total 5,258 1,090 3,637 118,042 Percent Increase 1987-2000 156.6% 67.7% 63.1% 63.8%
Publication data were obtained from Web of Science database from ISI (Science Citation Index, Social Sciences Citation Index, Arts and Humanities Index) Publication DataAcademic Institu1986 - N/A - 1 1987 - 0.0% 3 400.0% 21 2000.0%1988 2 200.0% - -100.0% 13 -38.1%1989 1 -50.0% - 0.0% 17 30.8%1990 1 0.0% 1 100.0% 29 70.6%1991 2 100.0% 3 200.0% 59 103.4%1992 3 50.0% 2 -33.3% 50 -15.3%1993 4 33.3% 6 200.0% 78 56.0%1994 8 100.0% 4 -33.3% 90 15.4%1995 2 -75.0% 2 -50.0% 89 -1.1%1996 18 800.0% 5 150.0% 179 101.1%1997 21 16.7% 25 400.0% 277 54.7%1998 36 71.4% 25 0.0% 373 34.7%1999 29 -19.4% 29 16.0% 337 -9.7%2000 34 17.2% 23 -20.7% 367 8.9%2001 33 -2.9% 23 0.0% 384 4.6%2002 40 21.2% 16 -30.4% 442 15.1%PubTotal 234 167 2,806
TotalHBCUsFAMU FVSU Hampton
207
APPENDIX D HBCU CASE STUDY PROTOCOL
I. OVERVIEW A. Project Description and Objectives
Historically Black Colleges and Universities (HBCUs) face the 21st century with questions about change and adaptation to an increasingly science and technology oriented society. They face the challenge of determining a strategy by which they can utilize current resources and energy to find their science and technology niche. This study conducts a comparative and analytical study of science and technology at HBCUs for the purpose of assisting HBCUs and those interested in supporting potentially capable science and technology institutions in determining productivity levels, characteristics of competitive universities, and effective strategies for science and technology productivity. The primary objective is to determine what theories (when implemented they are termed strategies) account for the development of science and technology at the most successful research-oriented HBCUs. (This is not meant to imply “best strategies” but strategies that appear to be useful and working well.) This will be accomplished through a secondary objective – to assess productivity outputs at HBCUs in various science and technology indices.
This dissertation study posits the theory that development of linkages in the form of networking or clustering between the university and external bodies is a strategy that can be adopted to improve science and technology productivity at HBCUs. Using a qualitative exploratory approach, this study also examines several other theories to determine whether they have more validity for explaining the development of science and technology at HBCUs. These rival theories or strategies have emerged from literature bases on higher education, labor, and innovation. The target audience to which the findings are directed are HBCU leadership involved in policy, HBCU science and technology departments, and federal and state government agencies that are interested in identifying potential niches for support of science and technology development. B. Case Study Issues Several substantive issues arise in relation to this research topic.
- The first issue to be addressed is whether HBCUs should be a topic of study in
regards to science and technology. They are a small segment of the university population, they cater to a select targeted audience, their student population size is generally small, and few studies have explored the general state of science and technology development at HBCUs outside of issues regarding the digital divide (what computer hardware do students at HBCUs have relative to the general population).
208
Appendix D - Case Study Protocol (cont’d)
- What criteria and methods should be used to measure science and technology productivity at HBCUs? As a generally disadvantaged population, should traditional measures such as patents, citations, leasing revenue, and so forth be used? Researchers have given considerable discussion to exploring the development of valid, adequate, and useful measures for science and technology and have found many current criteria as wanting in some aspect. Criteria such as patents and licenses often lead to weighting in favor of medical schools, life science departments, and large departments. Small and poor student populations as well as historically discriminatory funding patterns put HBCUs at a financial disadvantage. The selection of appropriate but under-utilized indices is important for entities such as HBCUs that are unique institutions.
- This study puts forward the hypothesis that linkages in the form of networking
and clustering is the predominant explanation accounting for science and technology growth at HBCUs. However, several rival hypotheses have also been advanced. At issue is the determination of which theory can gather the preponderance of the evidence to support its claim that it explains science and technology growth at HBCUs. Also, what constitutes “preponderance of evidence.”
- How should “linkages” be defined? The term is used in a myriad number of
ways. Rarely is the term defined since it encompasses many levels of communication and interaction. Clearly there are differing levels of linkages. How should the more elementary levels of linkages such as attending association or sharing information during meals which are forms of technology diffusion be compared to collaborations and networks that result in dual-degree programs? Should this study use all forms of definitions or should the study select one aspect of linkages? Finally, there is the question of some levels of linkages being embedded in rival explanations. Is communication or linkages involved in universities becoming aware of federal policy? Another example lies in the communication that occurs as a result of proximity. These questions and issues must be addressed in the study.
- Another issue is access to and availability of data. In past articles and studies,
HBCUs have been portrayed as poor, inferior institutions that offer substandard education. As a result, they are sensitive to research studies that may make “judgments.” Some of the documentation required to support and substantiate the theoretical claims will have to come from the university. A challenge for this research study is whether the data for support of the theory(ies) exists and whether it will be made available for this study.
209
Appendix D - Case Study Protocol (cont’d) - Finally, there arise issues associated with case study methodology. Are the results
and findings generalizable and applicable to other situations? This study has been structured to meet the same scientific standards required by general scientific experiments. By adopting these standards, this study enables the theory, which leads to the findings to be generalizable and applicable to other similar universities.
C. Relevant Readings 1) Literature on Higher Education - [Graham, 1997 #405] - [National Science Board, 2004 #556] - [Anderson, 1988 #518] - [BEST, 2004 #553] - [Lucas, 1994 #532] 2) Literature on National Systems of Innovation - [Nelson, 1993 #383] - [de la Mothe, 2000 #349] - [Acs, 2000 #333] - [Storper, 1997 #390] 3) Literature on Competitive Advantage - [Porter, 1990 #107] - [Doeringer, 1995 #106] - [Bergman, 1999 #304] - [Cooke, 2002 #536] Further readings on these topics can be found in the References section.
210

Appendix D - Case Study Protocol (cont’d) II. FIELD PROCEDURES A. Presentation of Credentials and Access to the Case study “sites”
Letters requesting access to interview faculty and students were sent to the Presidents of the three targeted HBCUs. A sample of the letter follows: Dear President X, I am writing to seek your assistance in conducting a sample of research interviews at your institution as part of my doctoral dissertation. I am a Ph.D. candidate in the Joint Doctoral program in Public Policy at Georgia Institute of Technology and Georgia State University. My doctoral dissertation, “the Effect of Linkages on Science and Technology at HBCUs” seeks to understand the factors contributing to the growth of science and technology at predominantly Black research universities. My dissertation advisor is Professor Philip Shapira of the Georgia Tech School of Public Policy. Other advisors include a member of my dissertation committee, Dr. Willie Pearson, author of Blacks in Science, and Dr. Shirley Malcom who has agreed to assist me as well. I would like to interview several people at your university – the Vice President of Sponsored Research (or the equivalent position) and two faculty members. The interview will cover topics such as science and technology specialties at your school, partners with whom the university works, and how partners were developed. Each interview should last about 20-30 minutes. Participation is voluntary. All interviews will be conducted in accordance with procedures for research with human subjects established by the Georgia Tech Institutional Review Board. Your approval will be greatly appreciated. I look forward to hearing from you. If you have any questions please feel free to contact me by mail at the above address or by email at [email protected] or by phone at (770) 490-9657.
Sincerely, Kathryn T. Brice
211
Appendix D - Case Study Protocol (cont’d) B. General Sources of Information - Vice President of Sponsored Research - Deans/Chairs/Directors of science, engineering and technology programs - Websites - Mission Statements - Department goals and objectives - Budgets - Annual Reports - External liaisons to the HBCU (corporations, government, and other universities) - Journal articles - Reports - Magazine and newspaper articles - Books - Personal observation - Public databases (CASPAR, IPEDS, ISI Web of Science) C. Procedural Reminders
1) Get IRB from Georgia Tech. 2) Collect as much research as possible from external sources (associations,
federal government policies, state government policies, Black S&T journals, Black S&T magazines, local newspaper articles on S&T at HBCU or majority university) and university internal sources (website, annual report, 5 year plan)
3) Send letter requesting approval to interview subjects to HBCU President 4) Go to website and determine what departments Chairs should be
interviewed 5) Make note of the mission statements and goals and objectives for the
targeted department 6) Develop itinerary of interviews with contact numbers 7) Prior to the interview, review the NSF Federal obligations for science and
engineering by agency for the university 8) Incorporate the NSF data into the questions 9) Incorporate the department’s/interviewee’s goals and objectives into the
questions 10) Print a copy of the tailored questionnaire for each interview prior to site
visit 11) Start the interview by getting the Consent Form signed. 12) Conduct the interview 13) While at the university site, go to other departments that may contain
relevant information – e.g. obtain budget, strategic plan, university park 14) Type the results of the interview
212
Appendix D - Case Study Protocol (cont’d) III. CASE STUDY QUESTIONS
The questions were obtained by checking two sources. The first source was questionnaires for science and technology productivity on the Internet. The second source was a review of the questionnaires used for two survey studies conducted at affiliated institutions – Georgia Institute of Technology and Georgia State University. Questions were drawn and rephrased for the purpose of this study. The first draft of questions was presented to an HBCU that was ineligible for the study (it was not a research HBCU). The questionnaire was revised. The questionnaire was then sent to a research university and further revised. The following represents the final questionnaire. University _____________________ Interview Date ___________ Person _________________________ Start Date at Univ ________ Position ________________________ Hello, my name is Kathryn Brice and I am a doctoral student in pubic policy at Georgia Tech and Georgia State University. My dissertation is on science and technology at HBCUs and I’m interviewing you to get your perspective on partnerships and other factors that may contribute to the development of science and technology at your university. FYI, for the purpose of these questions I am defining partners, entities and collaborators as the same thing - organizations (whether they be federal, state, or local agencies, private companies, universities or non profits) with whom you have received a contract, developed a program, supplied students, joint ventured on a program, and so forth.
1. What are the priorities or goals of your department as it relates to S&T. ____________________________________________________________________________________________________________________________________________________________________________________________________________________________________
2. What type of organizations that provide benefits/resources to Hampton do you
interact with the most – government, industry, other universities, or other organizations? Why – most or best resources or services? What type of resources/services do they provide? Who are the top organizations within the type you chose? ________________________________________________________________________________________________________________________________________________________________________________________________________________________________________________________________________________________________________________
213
Appendix D - Case Study Protocol (cont’d) 3. Can you take one of the organizations above that you interact with a great deal
that might be typical of how you develop relationships and explain how a relationship began between this organization and your university?
a. Who is the organization? b. When communication was initiated with this organization c. the individual/position with whom you communicate, d. for what time period, e. with what frequency, f. and for what purpose? g. Is the development of this relationship typical of how relationships with
other organizations developed? ________________________________________________________________________________________________________________________________________________________________________________________________________________________________________________________________________________________________________________________________________________________________________________________________________________________________________________________________________________________________________________________
4. Have any of the organizations that you work with or obtain benefits from initiated
actions to benefit the university (e.g., found another partner for the university, provided contacts elsewhere or overseas, helped establish a program with another partner, raised funds, and so forth)? Would you say most of the organizations you work with do this, a good number of them, one or two, or none of the organizations you work with. What do the organizations that assist you do? ________________________________________________________________________________________________________________________________________________________________________________________________________________________________________________________________________________________________________________
5. Does your university have a policy to collaborate with other institutions (federal,
state and local agencies as well as firms)? If so, how? Is there any extra effort to collaborate with other universities or HBCUs? ________________________________________________________________________________________________________________________________________________________________________________________________________________________________________________________________________________________________________________
214
Appendix D - Case Study Protocol (cont’d) 6. What policies are you aware of that have had an impact on this university’s
involvement in science and technology (federal, state or local)? the White House initiative on HBCUs? Has the White House policy influenced other policies to be created that foster science and technology at HBCUs? When did they occur at the national level? State level?
7. Have there been any administrators at the overall university level, or any Deans or
Chairs of S&T departments, or any key faculty/scientists/contractors that have promoted the development of S&T at this university? If so, who are they, when did they join the University, and what impact have they had? Have any actions been taken as a result of their support of S&T?
8. Has there been any S&T development at the university due to its spatial proximity
to a highly productive S&T center (i.e., another university known for S&T, a science or technology park, a business known for S&T, etc? If so, how and why did development occur at the university based on its spatial proximity?
9. Has S&T development at the university changed due to societal demand for
skilled personnel in S&T but scarce national supply? If so, what was the time period in which decisions to respond to the demand were made? Have students demanded the development of S&T (i.e., S&T courses)? How has supply and demand impacted the university?
10. Identify the barriers that impede your institution’s advancement of research,
training of students in S&T fields, obtaining of contracts, or commercialization of any products or research you conduct.
215
Appendix D - Case Study Protocol (cont’d) 11. Which do you believe best accounts for the development of S&T at your
university – a) the development of linkages or relationships, b) public policy that has been enacted, c) leadership from within the university, d) spatial proximity to an entity already productive in S&T, or e) supply and demand conditions for skilled S&T personnel? Why do you believe the one you chose had the most impact?
12. How do HBCUs differ from majority institutions in their S&T development, if at
all? Are there other criteria, other than the standard ones of publications, patents, federal R&D dollars, and number of student grads in S&T, that should be used to measure science and technology productivity at HBCUs?
13. Is there anything I haven't asked that you think is important to the development
of S&T at HBCUs?
216
Appendix D - Case Study Protocol (cont’d) IV. GUIDE FOR THE CASE STUDY REPORT A. Outline for each Case Study
I. Overview of the University - Introduction and Characteristics - History - Structure - S&T Statistics - Unique Achievements - Analysis
II. Interviews – the evidence (partnerships, policies, location, current leadership in S&T) obtained from the interviews
III. Summary of Interviews– analysis of the evidence to determine support for the theory(ies)
IV. Coding – matrix that depicts results and coding of interviews B. Format for the Data - Coding Matrix C. Use and presentation of Other Document – Put information on Liaisons and other
corroborating or conflicting information in Chapter following the Case studies
D. Bibliographical Information – see References section
217
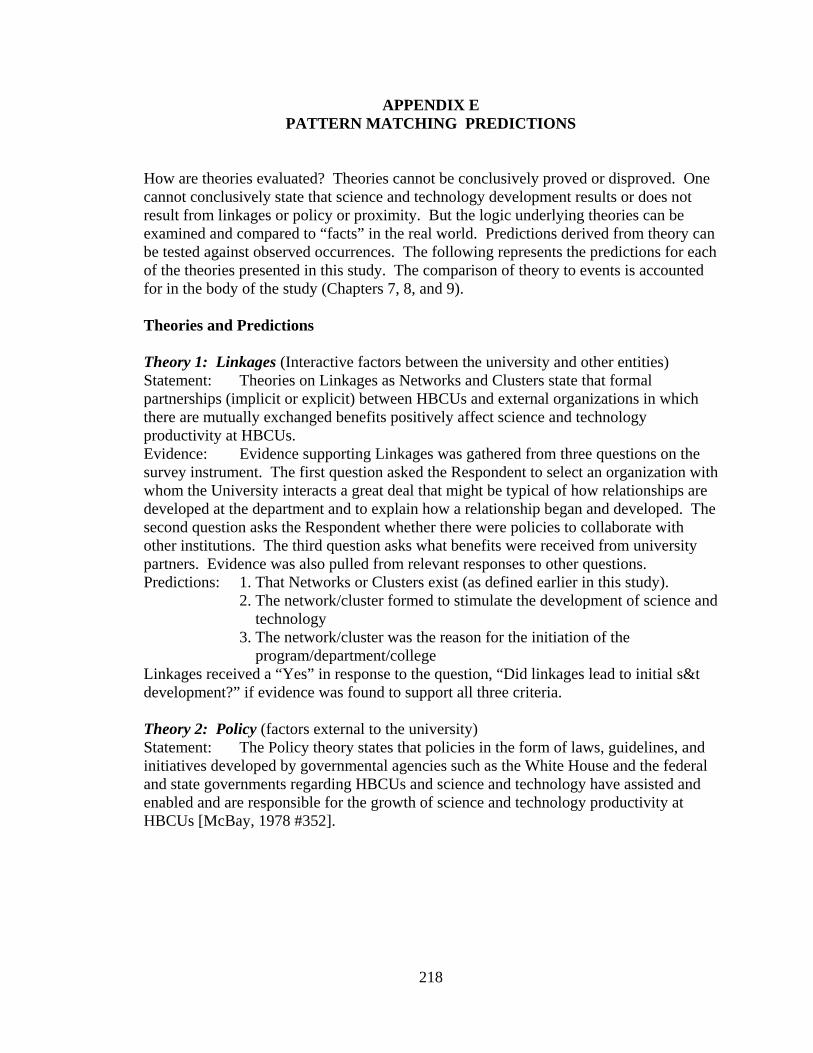
APPENDIX E PATTERN MATCHING PREDICTIONS
How are theories evaluated? Theories cannot be conclusively proved or disproved. One cannot conclusively state that science and technology development results or does not result from linkages or policy or proximity. But the logic underlying theories can be examined and compared to “facts” in the real world. Predictions derived from theory can be tested against observed occurrences. The following represents the predictions for each of the theories presented in this study. The comparison of theory to events is accounted for in the body of the study (Chapters 7, 8, and 9). Theories and Predictions Theory 1: Linkages (Interactive factors between the university and other entities) Statement: Theories on Linkages as Networks and Clusters state that formal partnerships (implicit or explicit) between HBCUs and external organizations in which there are mutually exchanged benefits positively affect science and technology productivity at HBCUs. Evidence: Evidence supporting Linkages was gathered from three questions on the survey instrument. The first question asked the Respondent to select an organization with whom the University interacts a great deal that might be typical of how relationships are developed at the department and to explain how a relationship began and developed. The second question asks the Respondent whether there were policies to collaborate with other institutions. The third question asks what benefits were received from university partners. Evidence was also pulled from relevant responses to other questions. Predictions: 1. That Networks or Clusters exist (as defined earlier in this study). 2. The network/cluster formed to stimulate the development of science and
technology 3. The network/cluster was the reason for the initiation of the
program/department/college Linkages received a “Yes” in response to the question, “Did linkages lead to initial s&t development?” if evidence was found to support all three criteria. Theory 2: Policy (factors external to the university) Statement: The Policy theory states that policies in the form of laws, guidelines, and initiatives developed by governmental agencies such as the White House and the federal and state governments regarding HBCUs and science and technology have assisted and enabled and are responsible for the growth of science and technology productivity at HBCUs [McBay, 1978 #352].
218
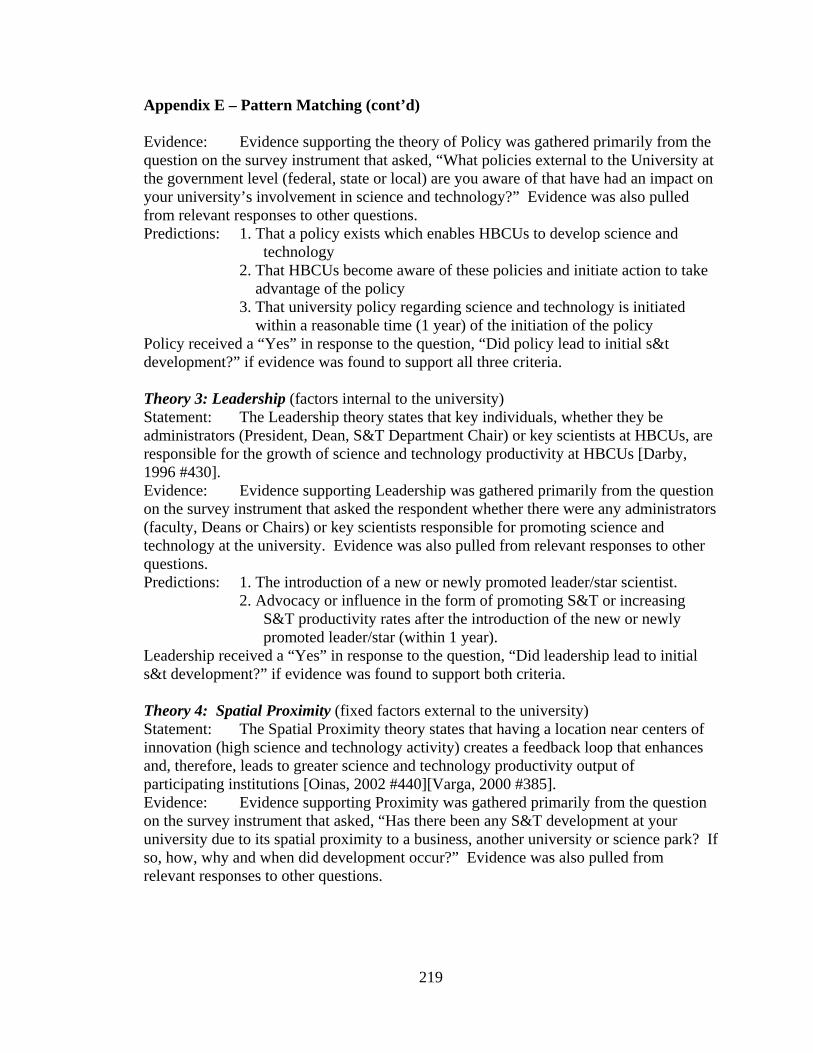
Appendix E – Pattern Matching (cont’d) Evidence: Evidence supporting the theory of Policy was gathered primarily from the question on the survey instrument that asked, “What policies external to the University at the government level (federal, state or local) are you aware of that have had an impact on your university’s involvement in science and technology?” Evidence was also pulled from relevant responses to other questions. Predictions: 1. That a policy exists which enables HBCUs to develop science and
technology 2. That HBCUs become aware of these policies and initiate action to take
advantage of the policy 3. That university policy regarding science and technology is initiated
within a reasonable time (1 year) of the initiation of the policy Policy received a “Yes” in response to the question, “Did policy lead to initial s&t development?” if evidence was found to support all three criteria. Theory 3: Leadership (factors internal to the university) Statement: The Leadership theory states that key individuals, whether they be administrators (President, Dean, S&T Department Chair) or key scientists at HBCUs, are responsible for the growth of science and technology productivity at HBCUs [Darby, 1996 #430]. Evidence: Evidence supporting Leadership was gathered primarily from the question on the survey instrument that asked the respondent whether there were any administrators (faculty, Deans or Chairs) or key scientists responsible for promoting science and technology at the university. Evidence was also pulled from relevant responses to other questions. Predictions: 1. The introduction of a new or newly promoted leader/star scientist.
2. Advocacy or influence in the form of promoting S&T or increasing S&T productivity rates after the introduction of the new or newly promoted leader/star (within 1 year).
Leadership received a “Yes” in response to the question, “Did leadership lead to initial s&t development?” if evidence was found to support both criteria. Theory 4: Spatial Proximity (fixed factors external to the university) Statement: The Spatial Proximity theory states that having a location near centers of innovation (high science and technology activity) creates a feedback loop that enhances and, therefore, leads to greater science and technology productivity output of participating institutions [Oinas, 2002 #440][Varga, 2000 #385]. Evidence: Evidence supporting Proximity was gathered primarily from the question on the survey instrument that asked, “Has there been any S&T development at your university due to its spatial proximity to a business, another university or science park? If so, how, why and when did development occur?” Evidence was also pulled from relevant responses to other questions.
219
Appendix E – Pattern Matching (cont’d) Predictions: 1. Higher S&T productivity rates for HBCUs located near a center of innovation or
2. Creation or expansion of an s&t program Proximity received a “Yes” in response to the question, “Did proximity lead to initial s&t development?” if evidence was found to support either criteria. Theory 5: Demand for Research and Skilled Personnel (factors external to the
university) Statement: The Demand theory relies on traditional economic theory of supply and
demand to explain that the science and technological explosion since the 1950s in the United States has caused a significant need and demand for research, innovation, and skilled personnel. There is a limited supply of skilled personnel to do research and innovation. The market therefore, is adjusting to produce factors (resources, programs, policies, investments) at universities that will increase the supply of scientists and research.
Evidence: Evidence supporting the theory of demand for skilled personnel was gathered primarily from the survey question that asked, “Has your university changed its policies toward student graduation as a result of the demand for skilled personnel?” Evidence was also pulled from relevant responses to other questions. Predictions: 1. The University is aware of the personnel shortage and research needs 2. The University creates programs to encourage students to major in S&T
or to encourage faculty to get more S&T contracts. 3. The University graduates more students in S&T fields.
Demand received a “Yes” in response to the question, “Did demand for skilled personnel lead to initial s&t development?” if evidence was found to support all three criteria.
220
REFERENCES
Acs, Z., FitzRoy, F. R., & Smith, I. (1996). High Technology Employment, Wages and University R&D Spillovers: Evidence from U.S. Cities: Babson College.
Adams, J. (2001). Comparative Localization of Academic and Industrial Spillovers (No.
NBER Working Paper No. 8292): National Bureau of Economics. Agesa, J., Granger, M., & Price, G. N. (1998). Economics Research at Historically Black
Colleges and Universities: Rankings and Effects on the Supply of Black Economists. Review of Black Political Economy, 25(4), 41-53.
Allen, W. R., Epps, E. G., & Haniff, N. Z. (Eds.). (1991). College in Black and White:
African American Students in Predominantly White and in Historically Black Public Universities. Albany, New York: State University of New York Press.
Anderson, J. D. (1988). The education of Blacks in the South, 1860-1935. Chapel Hill:
The University of North Carolina Press. Armstrong, E., & Thompson, K. (2003). Strategies for Increasing Minorities in the
Sciences: A University of Maryland, College Park, Model. Journal of Women and Minorities in Science and Engineering, 9, 159-167.
Astin, A. W., Tsui, L., & Avalos, J. (1996). Degree Attainment Rates at American
Colleges and Universities: Effects of Race, Gender, and Institution Type. Los Angeles: Higher Education Research Institute.
Barre, R. (2001). Sense and nonsense of S&T productivity indicators. Science and Public
Policy, 28(4), 259-266. Bergman, E. M., & Feser, E. J. (1999). Industrial and Regional Clusters: Concepts and
Comparative Applications. Retrieved October 31, 2001, 2001, from http://www.rri.wvu.edu/WebBook/Bergman-Feser/contents.htm
BEST, B. E. a. S. T. (2004). A Bridge for All: Higher Education Design Principles to
Broaden Participation in Science, Technology, Engineering and Mathematics. San Diego, CA: Council on Competitiveness.
Bonnen, J. T. (1992). Keeping the Land-Grant Tradition. In R. D. Christy & L.
Williamson (Eds.), A Century of Service: Land-Grant Colleges and Universities 1890-1990. New Brunswick: Transaction Publishers.
Bozeman, B., & Wittmer, D. (2001). Technical roles and success of U.S. federal
laboratory-industry partnerships. Science and Public Policy, 28(4), 169-178.
221
Branson, H. (1942). The Role of the Negro College in the Preparation of Technical Personnel for the War Effort. Journal of Negro Education, 11(3), 297-303.
Carnegie Foundation for the Advancement of Teaching. (2001). Carnegie Classification:
the Carnegie Classification of Institutions of Higher Education. Retrieved July 14, 2002, 2002, from http://www.carnegiefoundation.org/Classification/CIHE2000/background.htm
Clement, R. E. (1942). The Impact of the War Upon Negro Graduate and Professional
Schools. Journal of Negro Education, 11(3), 365-374. Committee on Equal Opportunities in Science and Engineering, C. (2004). Broadening
Participation in America's Science and Engineering Workforce: The 1994-2003 Decennial & 2004 Biennial Reports to Congress. Arlington, VA: National Science Foundation.
Cooke, P. (2002). Knowledge economies: clusters, learning and cooperative advantage.
London: Routledge. Cooke, P., & Morgan, K. (1998). The Associational Economy: firms, regions, and
innovation. Oxford: Oxford University Press. Crow, M. M., & Tucker, C. (2001). The American research university system as
America's de facto technology policy. Science and Public Policy, 28(1, February), 2-10.
Darby, M. R., & Zucker, L. G. (1996). Star Scientists, Institutions and the Entry of
Japanese (NBER Working Paper Series No. Working Paper 5795). Cambridge, MA: National Bureau of Economic Research.
Davis, J. W. (1933). The Negro Land-Grant College. Journal of Negro Education, 2(3),
312-328. de la Mothe, J., & Paquet, G. (2000). National Innovation Systems and Instituted
Processes. In Z. J. Acs (Ed.), Regional Innovation, Knowledge and Global Change (pp. 27-36). London: The Cromwell Press.
Devol, R., Koepp, R., & Ki, J. (2004). State Technology and Science Index: Enduring
lessons for the intangible economy: Milken Institute. Drewry, H. N., & Doermann, H. (2001). Stand and Prosper: private Black colleges and
their students. Princeton, NJ: Princeton University Press. Ebony. (1997, November, 1997). The richest Black college$. Ebony, 53, 116-120.
222
Etzkowitz, H., Webster, A., & Healey, P. (Eds.). (1998). Capitalizing knowledge: new intersections of industry and academia. Albany, NY: State University of New York Press.
Fareed, Z., Lius, M., Caryl, C., Miller, k. L., Punoose, R., & Barry, J. (2005, May 9,
2005). Does the Future Belong to China? Newsweek, 145, 25-40. Feldman, M. P. (2002). Government R&D Subsidies, Economic Incentives and
Knowledge Spill-overs (Report). Baltimore, MD: Johns Hopkins University. Fort Valley State University. (2005). Fort Valley State University. Retrieved 2005 Fossum, D., Painter, L. S., Eiseman, E., Ettedgui, E., & Adamson, D. M. (2004). Vital
Assets: Federal investment in research and development at the nation's universities and colleges (No. Contract # ENG-9812731). Arlington, VA: National Science Foundation.
Freeman, C. (1988). Japan: a new national system of innovation. In G. Dosi, C. Freeman,
R. Nelson, G. Silverberg & L. Soete (Eds.), Technical Change and Economic Theory. London: Pinter.
Garson, D. G. (2001). Case Studies. Raleigh, NC: North Carolina State University. Gibbons, M., Limoges, C., Nowotny, H., Schswartzman, S., Scott, P., & Trow, M.
(1994). The New Production of Knowledge: The Dynamics of Science and Research in Contemporary Societies (1st ed.). London: Sage Publications, Inc.
Gibbs, I. M. D. (2004). Breast Cancer. Retrieved October 12, 2005, 2005, from
http://www.blackwomenshealth.com/breast_cancer.htm Graham, H. D., & Diamond, N. (1997). The Rise of American Research Universities:
Elites and Challengers in the Postwar Area. Baltimore, MD: The Johns Hopkins Press.
Hall, B. H. (2000, January 22-23, 2000). University-Industry Research Partnerships and
Intellectual Property. Paper presented at the EC/DG-Research Workshop on the "IPR Aspects of Integrated Internet Collaborations", Brussels.
Hampton University. (2005). Hampton University. Retrieved July 20, 2005, 2005 Hill, S. T. (1985). The Traditionally Black Institutions of Higher Education 1860 to 1982:
National Center for Education Statistics.
223
Hoffman, C. M., Snyder, T. D., & Sonnenberg, B. (1992). Historically Black Colleges and Universities 1976-90 (No. NCES 92-640). Washington, D.C.: U.S. Department of Education Office of Educational Research and Improvement, National Center for Education Statistics.
Holmes, D. O. W. (1934). The Evolution of the Negro College. College Park, Maryland:
McGrath Publishing Company. Hu, A., & Jaffe, A. B. (2001). Patent Citations and International Knowledge Flow: The
cases of Korea and Taiwan: National University of Singapore and Brandeis University.
Jackson, S. A., Ph.D. (2004). The Perfect Storm: A Weather Forecast. Seattle,
Washington: American Association for the Advancement of Science Annual Meeting.
Jacob, M. (2001). Managing the Institutionalisation of Mode 2 Knowledge Production.
Science Studies, 14(2), 83-100. Jones, S. J., & Weathersby, G. B. (1978). Financing the Black College. In C. Willie (Ed.),
Black Colleges in America (pp. 100-131). New York: Teachers College, Columbia University.
Kash, D. E., & Kingston, W. (2001). Patents in a world of complex technologies. Science
and Public Policy, 28(1, February), 11-22. Kjolhede, E. E., Husted, K., Monsted, M., & Wenneberg, S. B. (2001). Managing
university research in the triple helix. Science and Public Policy, 28(1), 49-55. Kleinknecht, A., & Bain, D. (Eds.). (1993). New Concepts in Innovation Output
Measurement. New York, NY: St. Martin's Press, Inc. Laden, B. V. (2001). Hispanic-Serving Institutions: Myths and Realities. Peabody
Journal of Education, 76(1), 73-92. Laursen, K., & Salter, A. (2002). The Fruits of Intellectual Production: Economic and
Scientific Specialization among OECD countries (No. Paper No. 78). Brighton, U.K.: Science and Technology Policy Research.
Lee, A. S. (1989). A Scientific Methodology for MIS Case Studies. MIS Quarterly, 13(1),
32-50. LeMelle, T. J., & LeMelle, W. J. (1969). The Black College: A strategy for achieving
relevancy. New York: Frederick A. Praeger.
224
Lewis, B. (2003). A Critique of Literature on the Underrepresentation of African Americans in Science: Directions for Future Research. Journal of Women and Minorities in Science and Engineering, 9, 361-373.
Llewellyn, D., & Usselman, M. (2001, April, 2001). Ethnic Differences in Female
Applicants to Engineering and Information Technology Majors. Paper presented at the AERA Conference, Seattle, Washington.
Lucas, C. (1994). American Higher Education: A history. New York, NY: St. Martin's
Press, Inc. Lundvall, B.-A. (Ed.). (1992). National Systems of Innovation: Towards a Theory of
Innovation and Interactive Learning. London: Pinter. MacLean, M. S. (1942). The Impact of World War II Upon Institutions for the Higher
Education of the Negro. Journal of Negro Education, 11(3), 338-345. Malcom, S., Chubin, D., & Jesse, J. (2004). Standing Our Ground: A Guidebook for
STEM Educators in the Post-Michigan Era. Washington, D.C.: American Association for the Advancement of Science, National Action Council for Minorities in Engineering.
Malecki, E. (1997). Technology and Economic Development: the dynamics of local,
regional and national competitiveness (2nd ed.). Essex, England: Addison Wesley Longman Limited.
Malizia, E. E., & Feser, E. J. (1999). Understanding Local Economic Development. New
Brunswick: Center for Urban Policy Research, Rutgers University. Markusen, A., Hall, P., & Glasmeier, A. (1986). High tech America: the what, how,
where, and why of the sunrise industries. Boston: Allen & Unwin. Martin, B. R., & Etzkowitz, H. (2000). The Origin and Evolution of the University
Species. Journal for Science and Technology Studies, 13(3-4), 9-34. Mayes, M. (1992). Status of Agricultural Research Programs at 1890 Land-Grant
Institutions and Tuskegee University. In R. D. Christy & L. Williamson (Eds.), A Century of Service: Land-Grant Colleges and Universities 1890-1990. New Brunswick: Transaction Publishers.
Mays, B. E. (1978). The Black College in Higher Education. In C. V. W. a. R. R.
Edmonds (Ed.), Black Colleges in America (pp. 19-28). New York, New York: Teachers College, Columbia University.
225
McBay, S. M. (1978). Black Students in the Sciences: A Look at Spelman College. In C. V. W. a. R. R. Edmonds (Ed.), Black Colleges in America (pp. 292). New York, New York: Teachers College, Columbia College.
Mowery, D., Nelson, R., Sampat, B., & Ziedonis, A. (2001). The Growth of Patenting
and Licensing by U.S. Universities: An Assessment of the Effects of the Bayh-Dole Act of 1980. Research Policy, 30, 99-119.
National Center for Education Statistics, O. o. E. R. a. I. (2001). Postsecondary
Institutions in the United States: Fall 2000 and Degrees and Other Awards Conferred: 1999-2000 (No. NCES 2002-156). Washington, D.C.: U.S. Department of Education.
National Research Council, C. o. W. N. i. I. T. (2001). Building a Workforce for the
Information Economy. Washington D.C.: National Academy of Sciences. National Science Board. (2004a). An Emerging and Critical Problem of the Science and
Engineering Labor Force: A companion to Science and Engineering Indicators 2004 (No. NSB 04-07). Arlington, VA: The National Science Foundation.
National Science Board. (2004b). Science and Engineering Indicators 2004. Arlington,
VA: National Science Foundation. National Science Foundation, D. o. S. R. S. (2000a). Federal obligations for science and
engineering research and development (R&D) to universities and colleges, by State, institution, and agency: fiscal year 2000, (NSF 03-326). Table B-17: National Science Foundation.
National Science Foundation, D. o. S. R. S. (2000b). Federal obligations for science and
engineering to historically black colleges and universities ranked by total amount received, by agency: Fiscal year 2000 (NSF 02-310). Table B-21: National Science Foundation.
National Science Foundation, D. o. S. R. S. (2004a). Federal Funds for Research and
Development: Fiscal Years 1970-2003; Federal obligations for research by agency and detailed field of science and engineering, (NSF 04-332). Arlington, VA: National Science Foundation.
National Science Foundation, D. o. S. R. S. (2004b). R&D Expenditures at Universities
and Colleges, from http://caspar.nsf.gov National Science Foundation, D. o. S. R. S. (2004c). Women, Minorities, and Persons
with Disabilities in Science and Engineering: 2004 (NSF 04-317). Arlington, VA: National Science Foundation.
226
National Science Foundation, D. o. S. R. S. (2005). Federal Science and Engineering Support to Universities, Colleges, and Nonprofit Institutions: FY 2002. (NSF 05-309). Arlington, VA.
Nelson, R. R. (1993). National Innovation Systems: A Comparative Analysis. New York:
Oxford University Press. Nelson, R. R. (2000). National Innovation Systems. In Z. J. Acs (Ed.), Regional
innovation, knowledge, and global change (pp. 11-26). Trowbridge, Wiltshire: The Cromwell Press.
Nettles, M. T., Wagener, U., Millett, C. M., & Killenbeck, A. M. (1999). Student
Retention and Progression: A Special Challenge for Private Historically Black Colleges and Universities. In G. H. Gaither (Ed.), Promising Practices in Recruitment, Remediation and Retention (Vol. XXVII, Number 4, pp. 136). San Francisco, CA: Jossey-Bass Inc. Publishers.
Nettles Ph.D., M. T., & Perna, L. W. (1997). The African American Education Data
Book: Volume I: Higher and Adult Education (Vol. Volume I: Higher and Adult Education). Fairfax, Virginia: Frederick D. Patterson Research Institute of The College Fund/UNCF.
Neyland, L. W. (1990). Historically Black Land-Grant Institutions and the development
of Agriculture and Home Economics 1890-1990. Tallahassee: Florida A&M University Foundation, Inc.
Neyland, L. W. (2001). Florida Agricultural and Mechanical University: Sixteen years of
excellence with caring (1985-2001). Tallahassee, FL: Florida Agricultural and Mechanical University Foundation, Inc.
Niosi, J., Saviotti, P., Bellon, B., & Crow, M. (1993). National systems of innovation: in
search of a workable concept. Technology in Society, 15(2), 207-227. OECD, O. f. E. C.-o. a. D. (1999). Managing National Innovation Systems. Paris, France:
OECD Publications. Oinas, P., & Malecki, E. (2002). The Evolution of Technologies in Time and Space:
National and Regional to Spatial Innovation Systems. International Regional Science Review, 25(1), 102-131.
Pavitt, K. (1998). Do Patents Reflect the Useful Research Output of Universities.
Research Evaluation, 7(2), 105-112. Pavitt, K. (2001). Public Policies to Support Basic Research: What can the rest of the
world learn from U.S. theory and practice? (And what they should not learn). Industrial and Corporate Change, 10(3), 761-779.
227
Payton, B. F. (1992). Future Roles of 1890 Land-Grant Institutions: Instruments of Opportunity and Excellence. In R. D. Christy & L. Williamson (Eds.), A Century of Service: Land-Grant Colleges and Universities 1890-1990. New Brunswick: Transaction Publishers.
Pearson Jr., W., & Bechtel, H. K. (Eds.). (1989). Blacks, Science and American
Education. New Brunswick, NJ: Rutgers University Press. Population Reference Bureau. (2005). 2005 World Population Data Sheet. Washington,
D.C.: Population Reference Bureau. Porter, M. (1990). The Competitive Advantage of Nations. New York: Free Press. Porter, M. E., & Stern, S. (2001). National Innovative Capacity. In The Global
Competitiveness Report 2001-2002. New York: Oxford Press. Range, W. (1951). The Rise and Progress of Negro Colleges in Georgia 1865-1949.
Athens, Georgia: The McGregor Company. Roach, R. (1998). NAFEO signs new technology partner. Black Issues in Higher
Education, 15(6), 10. Rogers, E., Yin, J., & Hoffmann, J. (2000). Assessing the Effectiveness of Technology
Transfer Offices at U.S. Research Universities: University of New Mexico. Rosenberg, N. (2003). America's Entrepreneurial Universities. In D. Hart (Ed.), The
Emergence of Entrepreneurship Policy: governance, start-ups, and growth in the U.S. knowledge economy (pp. 113-140). Cambridge, UK: Cambridge University Press.
Saxenian, A. (1994). Regional Advantage: culture and competition in Silicon Valley and
Route 128. Cambridge, Massachusetts: Harvard University Press. Schumpeter, J. A. (1934). The Theory of Economic Development: An Inquiry into Profits,
Capital, Credit, Interest and the Business Cycle. (R. O. t. f. t. German, Trans.). Cambridge: Harvard University Press.
Science and Technology Agency, J. (1995). Science and Technology Indicators 1994: A
systematic analysis of science and technology activities in Japan (No. 37). Japan: National Institute of Science and Technology Policy (NISTEP).
Scott, R. R. (1981). Black Faculty Productivity and Interpersonal Academic Contacts.
Journal of Negro Education, 50(3), 224-236.
228
Scriven, O. (2006). The Politics of Particularism: HBCUs, Spelman College, and the Struggle to Educate African Americans in Science, 1950 - 1997. Georgia Institute of Technology, Atlanta.
Storper, M. (1997). The Regional World: territorial development in a global economy.
London: The Guilford Press. Sussex Circle Inc./Le Cercle Sussex Inc. (2003). Case Studies in Science and Technology
Linkages: Canada. Canada: Council of Science and Technology Advisors (CSTA).
Thomas, G. E. (1984). Black College Students and Factors Influencing their Major Field
Choice. Baltimore: Center for Social Organization of Schools, John Hopkins University.
Thomas, G. E. (1989). Black Science Majors in Colleges and Universities. In W. Pearson
& H. K. Bechtel (Eds.), Blacks, Science, and American Education (pp. 59 - 78). New Brunswick, NJ: Rutgers University Press.
Thomas, G. E. (1991). Assessing the College Major Selection Process for Black Students.
In W. R. Allen, E. G. Epps & N. Z. Haniff (Eds.), College in black and white: African American students in predominantly white and in historically Black public universities (pp. 322). Albany, New York: State University of New York Press.
Thompson, D. C. (1978). Black College Faculty and Students: The Nature of their
Interaction. In C. V. W. a. R. R. Edmonds (Ed.), Black colleges in America (pp. 292). New York, New York: Teachers College, Columbia University.
Trent, W., & Hill, J. (1994). The Contributions of Historically Black Colleges and
Universities to the Production of African American Scientists and Engineers. In W. Pearson & A. Fechter (Eds.), Who will do Science? Educating the Next Generation (pp. 169). Baltimore: The Johns Hopkins University Press.
Tsipouri, L. (2001). Can we benchmark the contribution of research and development
investment to growth and competitiveness? Science and Public Policy, 28(4, August), 295-302.
U.S. Department of Education. (2005). White House Initiative on Historically Black
Colleges and Universities. Retrieved July 20, 2005, 2005, from http://www.ed.gov/about/inits/list/whhbcu/edlite-index.html
U.S. General Accounting Office. (1990). Case Study Evaluations. Washington, D.C.:
United States General Accounting Office.
229
United Nations Development Programme. (2001). Human Development Report 2001: Making new technologies work for human development. New York, New York: Oxford University Press.
Varga, A. (2000). Universities in Local Innovation Systems. In Z. J. Acs (Ed.), Regional
Innovation, Knowledge and Global Change (pp. 139-152). London: The Cromwell Press.
Washburn, J. (2005). University Inc.: the corporate corruption of American higher
education. New York, NY: Basic Books. Wenglinsky, H. (1997). Students at Historically Black Colleges and Universities: Their
Aspirations and Accomplishments. Princeton, NJ: Educational Testing Service. White House, I. o. H. B. C. a. U. (1998). White House Initiative on Historically Black
Colleges and Universities (Government document No. Executive Order 12876). Washington, D.C.: U.S. Department of Education.
Yin, R. K. (1989). Case Study Research: design and methods (2nd ed. Vol. 5). Newbury
Park: Sage Publications.
230