Embed Size (px)
Citation preview
LIQUEFACTION AND UNDRAINED RESPONSE EVALUATION OF
SANDS FROM DRAINED FORMULATION
By Mohamed Ashour1 and Gary Norris,2 Members, ASCE
ABSTRACT: A general approach has been established to assess the undrained stress-strain curve and effectivestress path under monotonic loading from drained triaxial tests. An appropriate formulation of a drained anddrained rebounded (i.e., overconsolidated) triaxial test response is developed that, in turn, allows the assessmentof developing liquefaction and the undrained behavior of saturated sands. The formulation presented is basedupon reported experimental drained test results that were obtained from different investigators using differenttesting techniques. This formulation is a function of the confining pressure and basic properties of the sand,such as relative density, uniformity coefficient, and particle shape (roundness), which can be obtained fromvisual inspection. The approach is verified by comparing predicted and reported (observed) undrained behavior.The developed formulas allow one to predict the potential of sand to liquefy, the type of liquefaction, the peakand residual strength values, as well as the whole undrained stress-strain curve and effective stress path. Thesimplicity of this approach makes it an attractive general method to characterize the undrained behavior of sandsin a preliminary analysis with no need to run sophisticated experimental tests.
INTRODUCTION
Several studies have been conducted to provide a better un-derstanding of the undrained behavior of saturated sand underdifferent types of loading. Some of the pioneering work in thisfield has been performed by Seed and Lee (1967), Castro(1969), Ishihara et al. (1975), Casagrande (1976), Castro andPoulos (1977), Poulos (1981), and Castro et al. (1982). Inaddition, several recent studies (Mohamad and Dobry 1986;Guzman et al. 1988; Vaid et al. 1989; Ishihara 1993) havemade significant contributions to the understanding of the un-drained behavior of saturated sands. The main interest in thesestudies is to relate the undrained strength of sand to its initialstate in order to allow the designer to predict the potential fora saturated sand to liquefy. In other words, most of the inves-tigations focused on the influence of the consolidation pressureand the associated void ratio of the sand on the undrainedbehavior of the saturated sand under monotonic and cyclicloading.
The undrained behavior of isotropically consolidated satu-rated sand under monotonic loading is accompanied by achange in the excess pore-water pressure, which, in turn, leadsto different forms of undrained behavior. Unfortunately, noprior study provides a clear picture of mobilized undrainedbehavior and the associated effective stress path under un-drained monotonic loading. The available studies indicate thepotential for sand to liquefy, and characterize it as liquefiableor nonliquefiable material. The only way to assess the mobi-lized undrained behavior of a saturated sand (its stress-strainand stress path) under monotonic loading is via laboratory test-ing. By consolidating the saturated sand to different values ofconfining pressure or void ratio, a series of isotopically con-solidated undrained (ICU) tests allow one to assess the vari-ation in the peak undrained resistance, the residual stress ofthe saturated sand, and the associated levels of strain.
Recently, it has been shown that the undrained response ofsand can be assessed from its drained laboratory response
1Asst. Prof., Civ. Engrg. Dept., El-Mansoura Univ., Egypt; Postdoc-toral Res. Fellow, Civ. Engrg. Dept., Univ. of Nevada, Reno, NV 89557.E-mail: [email protected]
2Prof., Civ. Engrg. Dept., Univ. of Nevada, Reno, NV.Note. Discussion open until January 1, 2000. To extend the closing
date one month, a written request must be filed with the ASCE Managerof Journals. The manuscript for this paper was submitted for review andpossible publication on March 3, 1998. This paper is part of the Journalof Geotechnical and Geoenvironmental Engineering, Vol. 125, No. 8,August, 1999. qASCE, ISSN 1090-0241/99/0008-0649–0658/$8.00 1$.50 per page. Paper No. 17828.
JOURNAL OF GEOTECHN
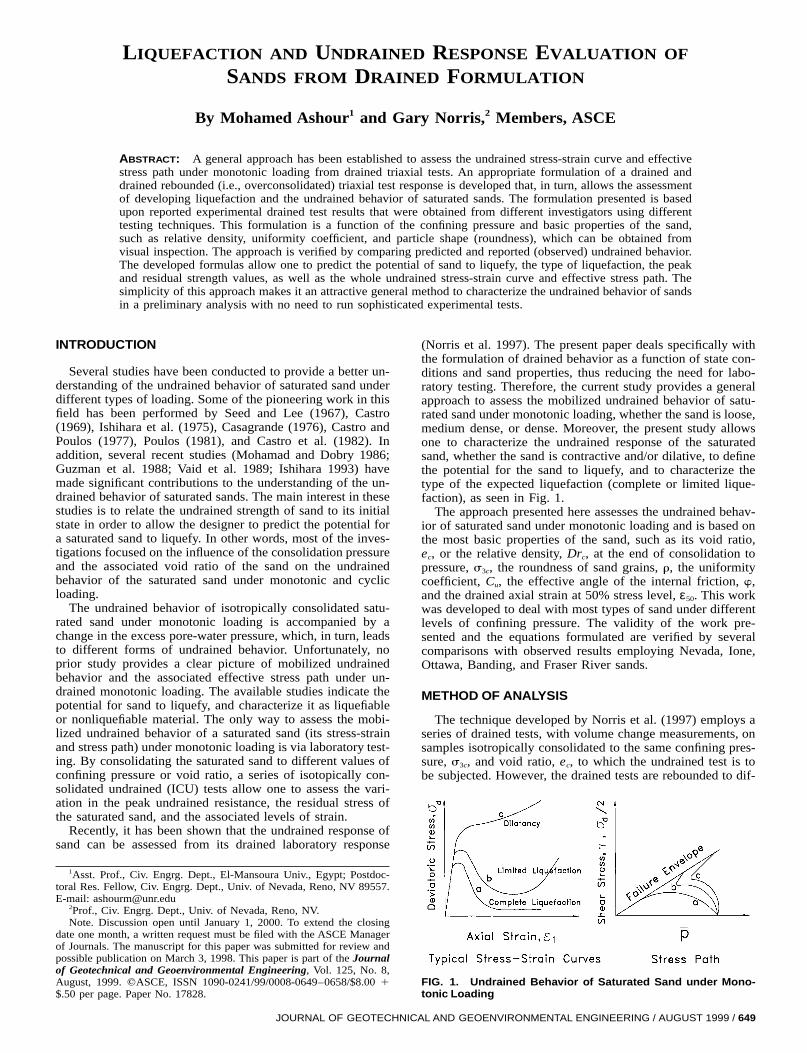
FIG. 1. Undrained Behavior of Saturated Sand under Mono-tonic Loading
(Norris et al. 1997). The present paper deals specifically withthe formulation of drained behavior as a function of state con-ditions and sand properties, thus reducing the need for labo-ratory testing. Therefore, the current study provides a generalapproach to assess the mobilized undrained behavior of satu-rated sand under monotonic loading, whether the sand is loose,medium dense, or dense. Moreover, the present study allowsone to characterize the undrained response of the saturatedsand, whether the sand is contractive and/or dilative, to definethe potential for the sand to liquefy, and to characterize thetype of the expected liquefaction (complete or limited lique-faction), as seen in Fig. 1.
The approach presented here assesses the undrained behav-ior of saturated sand under monotonic loading and is based onthe most basic properties of the sand, such as its void ratio,ec, or the relative density, Drc, at the end of consolidation topressure, s3c, the roundness of sand grains, r, the uniformitycoefficient, Cu, the effective angle of the internal friction, w,and the drained axial strain at 50% stress level, ε50. This workwas developed to deal with most types of sand under differentlevels of confining pressure. The validity of the work pre-sented and the equations formulated are verified by severalcomparisons with observed results employing Nevada, Ione,Ottawa, Banding, and Fraser River sands.
METHOD OF ANALYSIS
The technique developed by Norris et al. (1997) employs aseries of drained tests, with volume change measurements, onsamples isotropically consolidated to the same confining pres-sure, s3c, and void ratio, ec, to which the undrained test is tobe subjected. However, the drained tests are rebounded to dif-
ICAL AND GEOENVIRONMENTAL ENGINEERING / AUGUST 1999 / 649
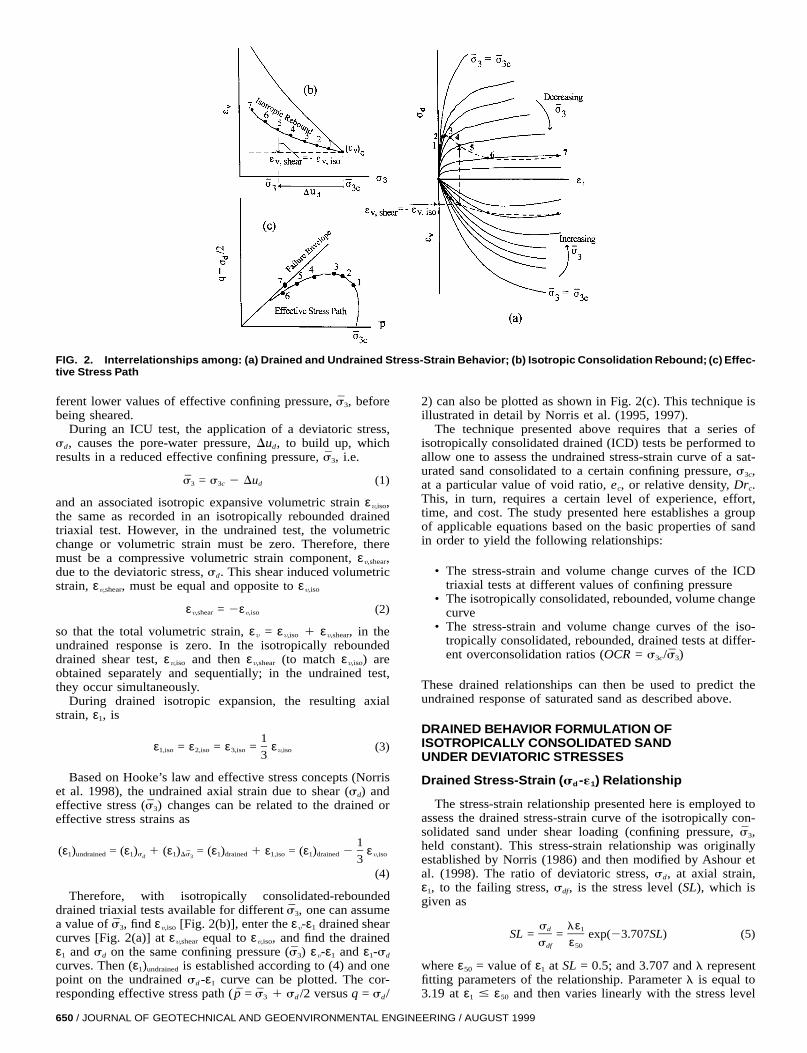
FIG. 2. Interrelationships among: (a) Drained and Undrained Stress-Strain Behavior; (b) Isotropic Consolidation Rebound; (c) Effec-tive Stress Path
ferent lower values of effective confining pressure, befores ,3
being sheared.During an ICU test, the application of a deviatoric stress,
sd, causes the pore-water pressure, Dud, to build up, whichresults in a reduced effective confining pressure, i.e.s ,3
s = s 2 Du (1)3 3c d
and an associated isotropic expansive volumetric strain ε ,v,iso
the same as recorded in an isotropically rebounded drainedtriaxial test. However, in the undrained test, the volumetricchange or volumetric strain must be zero. Therefore, theremust be a compressive volumetric strain component, ε ,v,shear
due to the deviatoric stress, sd. This shear induced volumetricstrain, must be equal and opposite toε , εv,shear v,iso
ε = 2ε (2)v,shear v,iso
so that the total volumetric strain, εv = 1 in theε ε ,v,iso v,shear
undrained response is zero. In the isotropically reboundeddrained shear test, and then (to match areε ε ε )v,iso v,shear v,iso
obtained separately and sequentially; in the undrained test,they occur simultaneously.
During drained isotropic expansion, the resulting axialstrain, ε1, is
1ε = ε = ε = ε (3)1,iso 2,iso 3,iso v,iso3
Based on Hooke’s law and effective stress concepts (Norriset al. 1998), the undrained axial strain due to shear (sd) andeffective stress changes can be related to the drained or(s )3
effective stress strains as
1(ε ) = (ε ) 1 (ε ) = (ε ) 1 ε = (ε ) 2 ε¯1 undrained 1 s 1 Ds 1 drained 1,iso 1 drained v,isod 3 3
(4)
Therefore, with isotropically consolidated-reboundeddrained triaxial tests available for different one can assumes ,3
a value of find [Fig. 2(b)], enter the εv-ε1 drained shears , ε3 v,iso
curves [Fig. 2(a)] at equal to and find the drainedε ε ,v,shear v,iso
ε1 and sd on the same confining pressure εv-ε1 and ε1-sd(s )3
curves. Then is established according to (4) and one(ε )1 undrained
point on the undrained sd -ε1 curve can be plotted. The cor-responding effective stress path ( p = 1 sd /2 versus q = sd/s3
650 / JOURNAL OF GEOTECHNICAL AND GEOENVIRONMENTAL ENG
2) can also be plotted as shown in Fig. 2(c). This technique isillustrated in detail by Norris et al. (1995, 1997).
The technique presented above requires that a series ofisotropically consolidated drained (ICD) tests be performed toallow one to assess the undrained stress-strain curve of a sat-urated sand consolidated to a certain confining pressure, s3c,at a particular value of void ratio, ec, or relative density, Drc.This, in turn, requires a certain level of experience, effort,time, and cost. The study presented here establishes a groupof applicable equations based on the basic properties of sandin order to yield the following relationships:
• The stress-strain and volume change curves of the ICDtriaxial tests at different values of confining pressure
• The isotropically consolidated, rebounded, volume changecurve
• The stress-strain and volume change curves of the iso-tropically consolidated, rebounded, drained tests at differ-ent overconsolidation ratios (OCR = s /s )3c 3
These drained relationships can then be used to predict theundrained response of saturated sand as described above.
DRAINED BEHAVIOR FORMULATION OFISOTROPICALLY CONSOLIDATED SANDUNDER DEVIATORIC STRESSES
Drained Stress-Strain (sd-«1) Relationship
The stress-strain relationship presented here is employed toassess the drained stress-strain curve of the isotropically con-solidated sand under shear loading (confining pressure, s ,3
held constant). This stress-strain relationship was originallyestablished by Norris (1986) and then modified by Ashour etal. (1998). The ratio of deviatoric stress, sd, at axial strain,ε1, to the failing stress, sdf, is the stress level (SL), which isgiven as
s lεd 1SL = = exp(23.707SL) (5)
s εdf 50
where ε50 = value of ε1 at SL = 0.5; and 3.707 and l representfitting parameters of the relationship. Parameter l is equal to3.19 at ε1 # ε50 and then varies linearly with the stress level
INEERING / AUGUST 1999
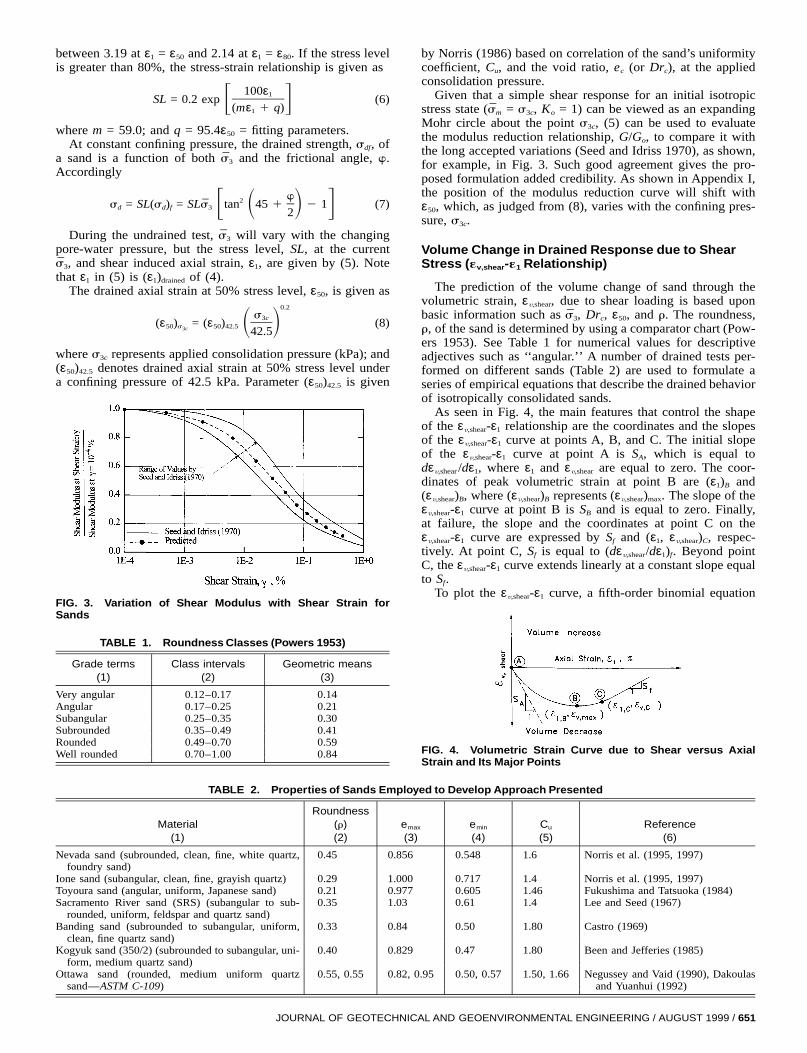
TABLE 1. Roundness Classes (Powers 1953)
Grade terms(1)
Class intervals(2)
Geometric means(3)
Very angular 0.12–0.17 0.14Angular 0.17–0.25 0.21Subangular 0.25–0.35 0.30Subrounded 0.35–0.49 0.41Rounded 0.49–0.70 0.59Well rounded 0.70–1.00 0.84
FIG. 3. Variation of Shear Modulus with Shear Strain forSands
between 3.19 at ε1 = ε50 and 2.14 at ε1 = ε80. If the stress levelis greater than 80%, the stress-strain relationship is given as
100ε1SL = 0.2 exp (6)F G(mε 1 q)1
where m = 59.0; and q = 95.4ε50 = fitting parameters.At constant confining pressure, the drained strength, sdf, of
a sand is a function of both and the frictional angle, w.s3
Accordingly
w2s = SL(s ) = SLs tan 45 1 2 1 (7)d d f 3 F S D G2
During the undrained test, will vary with the changings3
pore-water pressure, but the stress level, SL, at the currentand shear induced axial strain, ε1, are given by (5). Notes ,3
that ε1 in (5) is of (4).(ε )1 drained
The drained axial strain at 50% stress level, ε50, is given as0.2
s3c(ε ) = (ε ) (8)50 s 50 42.5 S D3c 42.5
where s3c represents applied consolidation pressure (kPa); and(ε50)42.5 denotes drained axial strain at 50% stress level undera confining pressure of 42.5 kPa. Parameter (ε50)42.5 is given
JOURNAL OF GEOTECHN
FIG. 4. Volumetric Strain Curve due to Shear versus AxialStrain and Its Major Points
by Norris (1986) based on correlation of the sand’s uniformitycoefficient, Cu, and the void ratio, ec (or Drc), at the appliedconsolidation pressure.
Given that a simple shear response for an initial isotropicstress state = s3c, Ko = 1) can be viewed as an expanding(sm
Mohr circle about the point s3c, (5) can be used to evaluatethe modulus reduction relationship, G/Go, to compare it withthe long accepted variations (Seed and Idriss 1970), as shown,for example, in Fig. 3. Such good agreement gives the pro-posed formulation added credibility. As shown in Appendix I,the position of the modulus reduction curve will shift withε50, which, as judged from (8), varies with the confining pres-sure, s3c.
Volume Change in Drained Response due to ShearStress («v,shear-«1 Relationship)
The prediction of the volume change of sand through thevolumetric strain, due to shear loading is based uponε ,v,shear
basic information such as Drc, ε50, and r. The roundness,s ,3
r, of the sand is determined by using a comparator chart (Pow-ers 1953). See Table 1 for numerical values for descriptiveadjectives such as ‘‘angular.’’ A number of drained tests per-formed on different sands (Table 2) are used to formulate aseries of empirical equations that describe the drained behaviorof isotropically consolidated sands.
As seen in Fig. 4, the main features that control the shapeof the -ε1 relationship are the coordinates and the slopesεv,shear
of the -ε1 curve at points A, B, and C. The initial slopeεv,shear
of the -ε1 curve at point A is SA, which is equal toεv,shear
where ε1 and are equal to zero. The coor-dε /dε , εv,shear 1 v,shear
dinates of peak volumetric strain at point B are (ε1)B andwhere represents The slope of the(ε ) , (ε ) (ε ) .v,shear B v,shear B v,shear max
-ε1 curve at point B is SB and is equal to zero. Finally,εv,shear
at failure, the slope and the coordinates at point C on the-ε1 curve are expressed by Sf and (ε1, respec-ε ε ) ,v,shear v,shear C
tively. At point C, Sf is equal to Beyond point(dε /dε ) .v,shear 1 f
C, the -ε1 curve extends linearly at a constant slope equalεv,shear
to Sf.To plot the -ε1 curve, a fifth-order binomial equationεv,shear
TABLE 2. Properties of Sands Employed to Develop Approach Presented
Material(1)
Roundness(r)(2)
emax
(3)emin
(4)Cu
(5)Reference
(6)
Nevada sand (subrounded, clean, fine, white quartz,foundry sand)
0.45 0.856 0.548 1.6 Norris et al. (1995, 1997)
Ione sand (subangular, clean, fine, grayish quartz) 0.29 1.000 0.717 1.4 Norris et al. (1995, 1997)Toyoura sand (angular, uniform, Japanese sand) 0.21 0.977 0.605 1.46 Fukushima and Tatsuoka (1984)Sacramento River sand (SRS) (subangular to sub-
rounded, uniform, feldspar and quartz sand)0.35 1.03 0.61 1.4 Lee and Seed (1967)
Banding sand (subrounded to subangular, uniform,clean, fine quartz sand)
0.33 0.84 0.50 1.80 Castro (1969)
Kogyuk sand (350/2) (subrounded to subangular, uni-form, medium quartz sand)
0.40 0.829 0.47 1.80 Been and Jefferies (1985)
Ottawa sand (rounded, medium uniform quartzsand—ASTM C-109)
0.55, 0.55 0.82, 0.95 0.50, 0.57 1.50, 1.66 Negussey and Vaid (1990), Dakoulasand Yuanhui (1992)
ICAL AND GEOENVIRONMENTAL ENGINEERING / AUGUST 1999 / 651
is established based on the slopes and the coordinates at thethree major points on the -ε1 curve (A, B, and C). Theεv,shear
slopes and coordinates at the points A, B, and C represent theboundary conditions of (9)
2 3 4 5ε = a 1 bε 1 cε 1 dε 1 eε 1 fε (9)v,shear 1 1 1 1 1
Terms a– f = constants needed to satisfy these boundaryconditions; and ε1 and symbolize axial strain and theεv,shear
associated volumetric strain due to deviatoric stress of anypoint on the -ε1 curve, respectively. The derivation of (9)εv,shear
is presented in Appendix I.The slopes and coordinates at points A, B, and C on the
-ε1 curve at s3c are obtained using (10)–(15). Theseεv,shear
equations are empirically developed based on data of isotrop-ically consolidated drained tests on seven different sands fromdifferent environments and obtained by different investigators(Table 2). It should be mentioned here that the volume changebehavior of any sand is influenced by the method of samplepreparation (Been and Jefferies 1985; Ishihara 1993). Thedrained tests were performed on loose, medium, and densesands prepared by different methods. Therefore, the followingformulation represents an average for different sample prepa-ration techniques. The sands were isotropically consolidatedto different confining pressures (s3c).
652 / JOURNAL OF GEOTECHNICAL AND GEOENVIRONMENTAL ENG
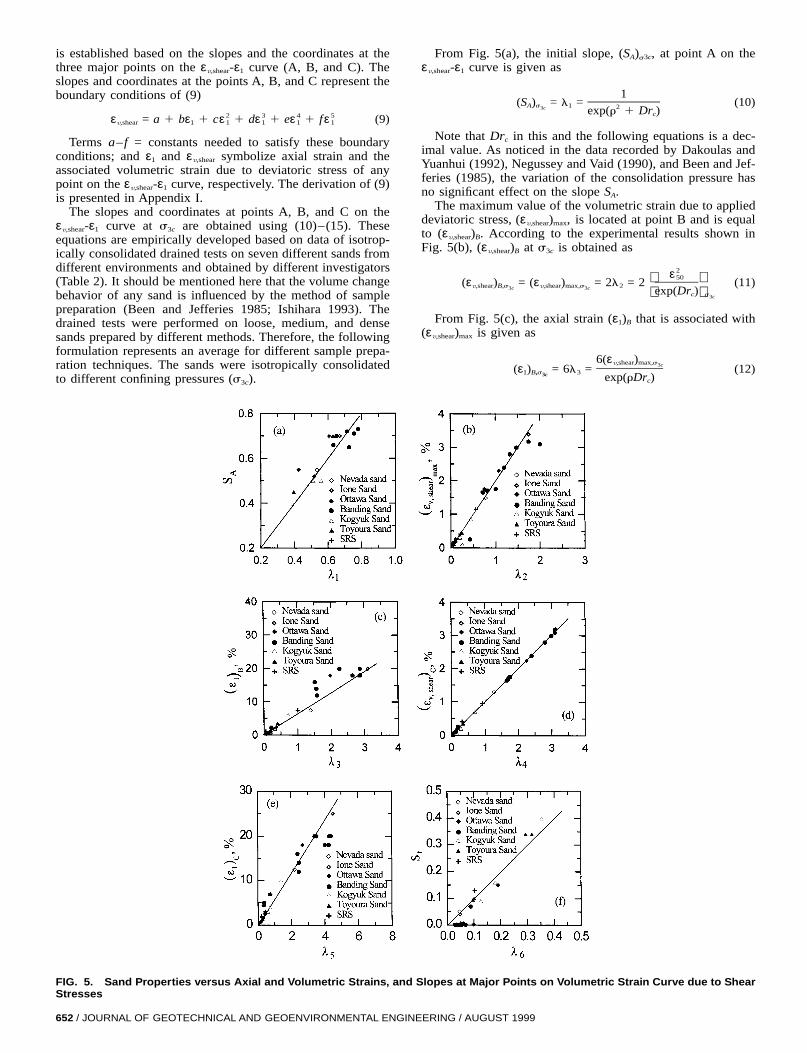
From Fig. 5(a), the initial slope, (SA)s3c, at point A on the-ε1 curve is given asεv,shear
1(S ) = l = (10)A s 1 23c exp(r 1 Dr )c
Note that Drc in this and the following equations is a dec-imal value. As noticed in the data recorded by Dakoulas andYuanhui (1992), Negussey and Vaid (1990), and Been and Jef-feries (1985), the variation of the consolidation pressure hasno significant effect on the slope SA.
The maximum value of the volumetric strain due to applieddeviatoric stress, is located at point B and is equal(ε ) ,v,shear max
to According to the experimental results shown in(ε ) .v,shear B
Fig. 5(b), at s3c is obtained as(ε )v,shear B
2ε 50 (ε ) = (ε ) = 2l = 2 (11)v,shear B,s v,shear max,s 23c 3c exp(Dr )c s 3c
From Fig. 5(c), the axial strain (ε1)B that is associated withis given as(ε )v,shear max
6(ε )v,shear max,s3c(ε ) = 6l = (12)1 B,s 33c exp(rDr )c
FIG. 5. Sand Properties versus Axial and Volumetric Strains, and Slopes at Major Points on Volumetric Strain Curve due to ShearStresses
INEERING / AUGUST 1999
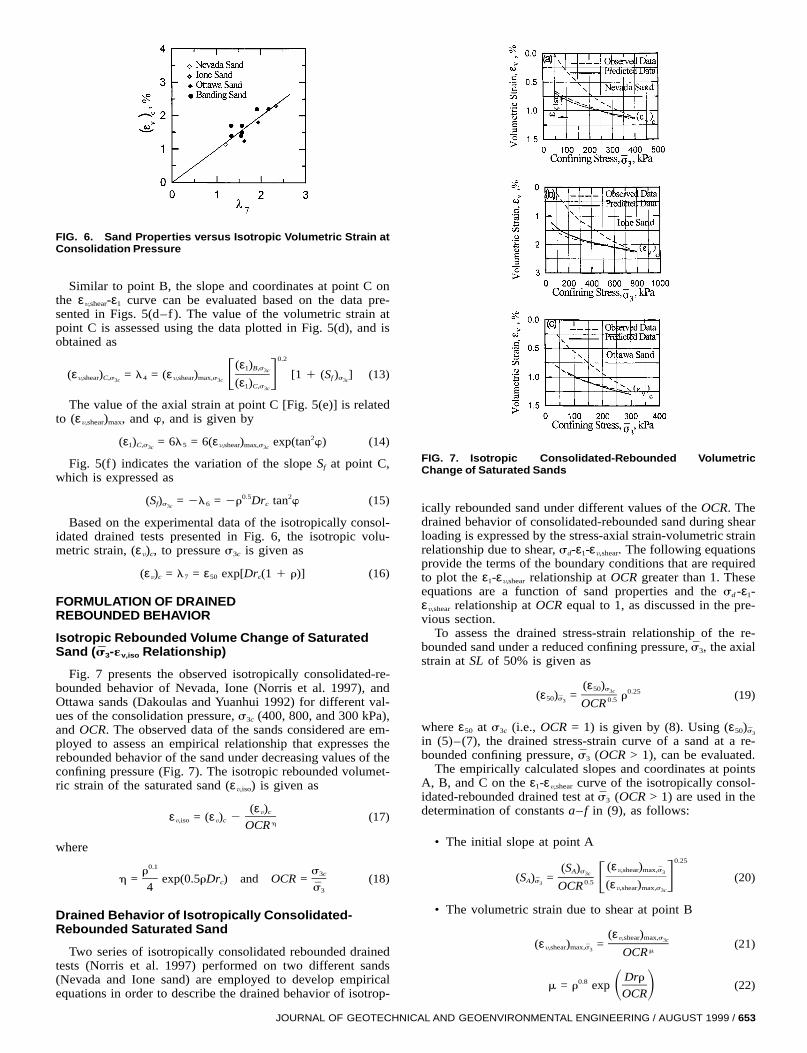
FIG. 6. Sand Properties versus Isotropic Volumetric Strain atConsolidation Pressure
Similar to point B, the slope and coordinates at point C onthe -ε1 curve can be evaluated based on the data pre-εv,shear
sented in Figs. 5(d–f). The value of the volumetric strain atpoint C is assessed using the data plotted in Fig. 5(d), and isobtained as
0.2(ε )1 B,s3c(ε ) = l = (ε ) [1 1 (S ) ] (13)v,shear C,s 4 v,shear max,s f sF G3c 3c 3c(ε )1 C,s3c
The value of the axial strain at point C [Fig. 5(e)] is relatedto and w, and is given by(ε ) ,v,shear max
2(ε ) = 6l = 6(ε ) exp(tan w) (14)1 C,s 5 v,shear max,s3c 3c
Fig. 5(f) indicates the variation of the slope Sf at point C,which is expressed as
0.5 2(S ) = 2l = 2r Dr tan w (15)f s 6 c3c
Based on the experimental data of the isotropically consol-idated drained tests presented in Fig. 6, the isotropic volu-metric strain, to pressure s3c is given as(ε ) ,v c
(ε ) = l = ε exp[Dr (1 1 r)] (16)v c 7 50 c
FORMULATION OF DRAINEDREBOUNDED BEHAVIOR
Isotropic Rebounded Volume Change of SaturatedSand Relationship)(s -«3 v,iso
Fig. 7 presents the observed isotropically consolidated-re-bounded behavior of Nevada, Ione (Norris et al. 1997), andOttawa sands (Dakoulas and Yuanhui 1992) for different val-ues of the consolidation pressure, s3c (400, 800, and 300 kPa),and OCR. The observed data of the sands considered are em-ployed to assess an empirical relationship that expresses therebounded behavior of the sand under decreasing values of theconfining pressure (Fig. 7). The isotropic rebounded volumet-ric strain of the saturated sand is given as(ε )v,iso
(ε )v cε = (ε ) 2 (17)v,iso v c hOCR
where
0.1r s3ch = exp(0.5rDr ) and OCR = (18)c4 s3
Drained Behavior of Isotropically Consolidated-Rebounded Saturated Sand
Two series of isotropically consolidated rebounded drainedtests (Norris et al. 1997) performed on two different sands(Nevada and Ione sand) are employed to develop empiricalequations in order to describe the drained behavior of isotrop-
JOURNAL OF GEOTECHN
FIG. 7. Isotropic Consolidated-Rebounded VolumetricChange of Saturated Sands
ically rebounded sand under different values of the OCR. Thedrained behavior of consolidated-rebounded sand during shearloading is expressed by the stress-axial strain-volumetric strainrelationship due to shear, sd-ε1- The following equationsε .v,shear
provide the terms of the boundary conditions that are requiredto plot the ε1- relationship at OCR greater than 1. Theseεv,shear
equations are a function of sand properties and the sd -ε1-relationship at OCR equal to 1, as discussed in the pre-εv,shear
vious section.To assess the drained stress-strain relationship of the re-
bounded sand under a reduced confining pressure, the axials ,3
strain at SL of 50% is given as
(ε )50 s3c 0.25(ε ) = r (19)¯50 s 0.53 OCR
where ε50 at s3c (i.e., OCR = 1) is given by (8). Using (ε ) ¯50 s3
in (5)–(7), the drained stress-strain curve of a sand at a re-bounded confining pressure, (OCR > 1), can be evaluated.s3
The empirically calculated slopes and coordinates at pointsA, B, and C on the ε1- curve of the isotropically consol-εv,shear
idated-rebounded drained test at (OCR > 1) are used in thes3
determination of constants a– f in (9), as follows:
• The initial slope at point A0.25
(ε ) ¯(S ) v,shear max,sA s 33c(S ) = (20)¯ GA s F0.53 (ε )OCR v,shear max,s3c
• The volumetric strain due to shear at point B
(ε )v,shear max,s3c(ε ) = (21)¯v,shear max,s3 mOCR
Drr0.8m = r exp (22)S DOCR
ICAL AND GEOENVIRONMENTAL ENGINEERING / AUGUST 1999 / 653
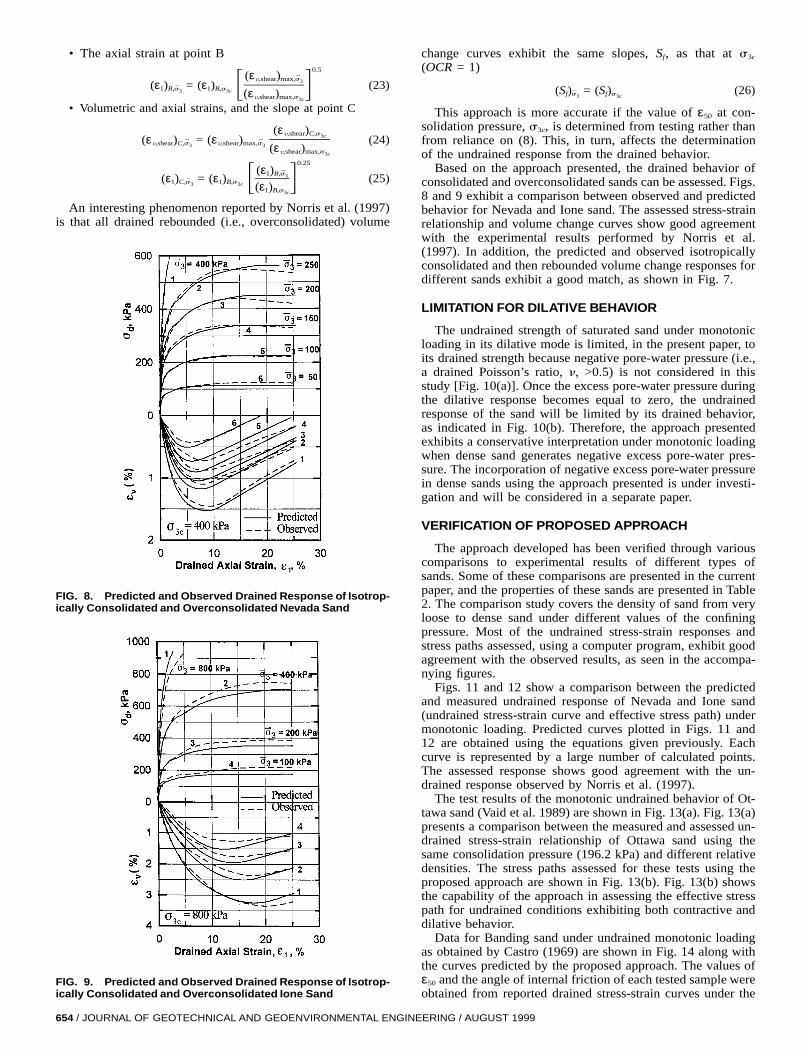
FIG. 9. Predicted and Observed Drained Response of Isotrop-ically Consolidated and Overconsolidated Ione Sand
FIG. 8. Predicted and Observed Drained Response of Isotrop-ically Consolidated and Overconsolidated Nevada Sand
• The axial strain at point B0.5
(ε ) ¯v,shear max,s3(ε ) = (ε ) (23)¯1 B,s 1 B,s F G3 3c (ε )v,shear max,s3c
• Volumetric and axial strains, and the slope at point C
(ε )v,shear C,s3c(ε ) = (ε ) (24)¯ ¯v,shear C,s v,shear max,s3 3 (ε )v,shear max,s3c
0.25(ε ) ¯1 B,s3(ε ) = (ε ) (25)¯1 C,s 1 B,s F G3 3c (ε )1 B,s3c
An interesting phenomenon reported by Norris et al. (1997)is that all drained rebounded (i.e., overconsolidated) volume
654 / JOURNAL OF GEOTECHNICAL AND GEOENVIRONMENTAL ENGIN
change curves exhibit the same slopes, Sf, as that at s3c
(OCR = 1)
(S ) = (S ) (26)¯f s f s3 3c
This approach is more accurate if the value of ε50 at con-solidation pressure, s3c, is determined from testing rather thanfrom reliance on (8). This, in turn, affects the determinationof the undrained response from the drained behavior.
Based on the approach presented, the drained behavior ofconsolidated and overconsolidated sands can be assessed. Figs.8 and 9 exhibit a comparison between observed and predictedbehavior for Nevada and Ione sand. The assessed stress-strainrelationship and volume change curves show good agreementwith the experimental results performed by Norris et al.(1997). In addition, the predicted and observed isotropicallyconsolidated and then rebounded volume change responses fordifferent sands exhibit a good match, as shown in Fig. 7.
LIMITATION FOR DILATIVE BEHAVIOR
The undrained strength of saturated sand under monotonicloading in its dilative mode is limited, in the present paper, toits drained strength because negative pore-water pressure (i.e.,a drained Poisson’s ratio, n, >0.5) is not considered in thisstudy [Fig. 10(a)]. Once the excess pore-water pressure duringthe dilative response becomes equal to zero, the undrainedresponse of the sand will be limited by its drained behavior,as indicated in Fig. 10(b). Therefore, the approach presentedexhibits a conservative interpretation under monotonic loadingwhen dense sand generates negative excess pore-water pres-sure. The incorporation of negative excess pore-water pressurein dense sands using the approach presented is under investi-gation and will be considered in a separate paper.
VERIFICATION OF PROPOSED APPROACH
The approach developed has been verified through variouscomparisons to experimental results of different types ofsands. Some of these comparisons are presented in the currentpaper, and the properties of these sands are presented in Table2. The comparison study covers the density of sand from veryloose to dense sand under different values of the confiningpressure. Most of the undrained stress-strain responses andstress paths assessed, using a computer program, exhibit goodagreement with the observed results, as seen in the accompa-nying figures.
Figs. 11 and 12 show a comparison between the predictedand measured undrained response of Nevada and Ione sand(undrained stress-strain curve and effective stress path) undermonotonic loading. Predicted curves plotted in Figs. 11 and12 are obtained using the equations given previously. Eachcurve is represented by a large number of calculated points.The assessed response shows good agreement with the un-drained response observed by Norris et al. (1997).
The test results of the monotonic undrained behavior of Ot-tawa sand (Vaid et al. 1989) are shown in Fig. 13(a). Fig. 13(a)presents a comparison between the measured and assessed un-drained stress-strain relationship of Ottawa sand using thesame consolidation pressure (196.2 kPa) and different relativedensities. The stress paths assessed for these tests using theproposed approach are shown in Fig. 13(b). Fig. 13(b) showsthe capability of the approach in assessing the effective stresspath for undrained conditions exhibiting both contractive anddilative behavior.
Data for Banding sand under undrained monotonic loadingas obtained by Castro (1969) are shown in Fig. 14 along withthe curves predicted by the proposed approach. The values ofε50 and the angle of internal friction of each tested sample wereobtained from reported drained stress-strain curves under the
EERING / AUGUST 1999
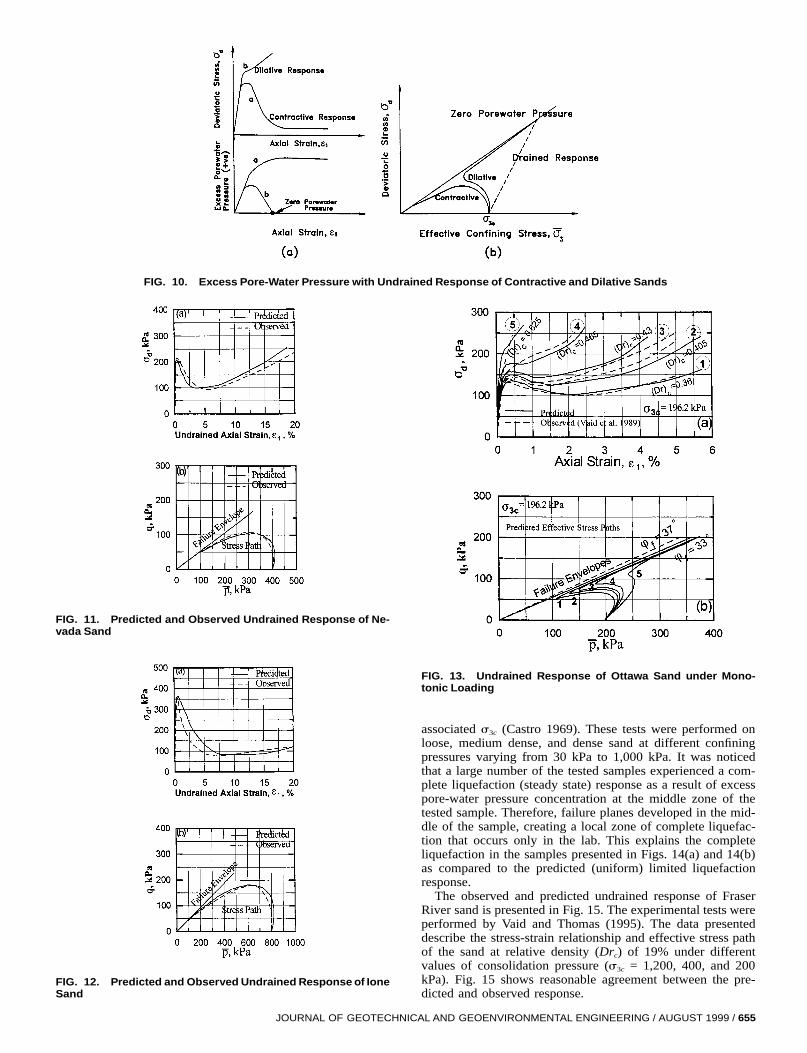
FIG. 10. Excess Pore-Water Pressure with Undrained Response of Contractive and Dilative Sands
FIG. 11. Predicted and Observed Undrained Response of Ne-vada Sand
FIG. 12. Predicted and Observed Undrained Response of IoneSand
JOURNAL OF GEOTECHN
FIG. 13. Undrained Response of Ottawa Sand under Mono-tonic Loading
associated s3c (Castro 1969). These tests were performed onloose, medium dense, and dense sand at different confiningpressures varying from 30 kPa to 1,000 kPa. It was noticedthat a large number of the tested samples experienced a com-plete liquefaction (steady state) response as a result of excesspore-water pressure concentration at the middle zone of thetested sample. Therefore, failure planes developed in the mid-dle of the sample, creating a local zone of complete liquefac-tion that occurs only in the lab. This explains the completeliquefaction in the samples presented in Figs. 14(a) and 14(b)as compared to the predicted (uniform) limited liquefactionresponse.
The observed and predicted undrained response of FraserRiver sand is presented in Fig. 15. The experimental tests wereperformed by Vaid and Thomas (1995). The data presenteddescribe the stress-strain relationship and effective stress pathof the sand at relative density (Drc) of 19% under differentvalues of consolidation pressure (s3c = 1,200, 400, and 200kPa). Fig. 15 shows reasonable agreement between the pre-dicted and observed response.
ICAL AND GEOENVIRONMENTAL ENGINEERING / AUGUST 1999 / 655
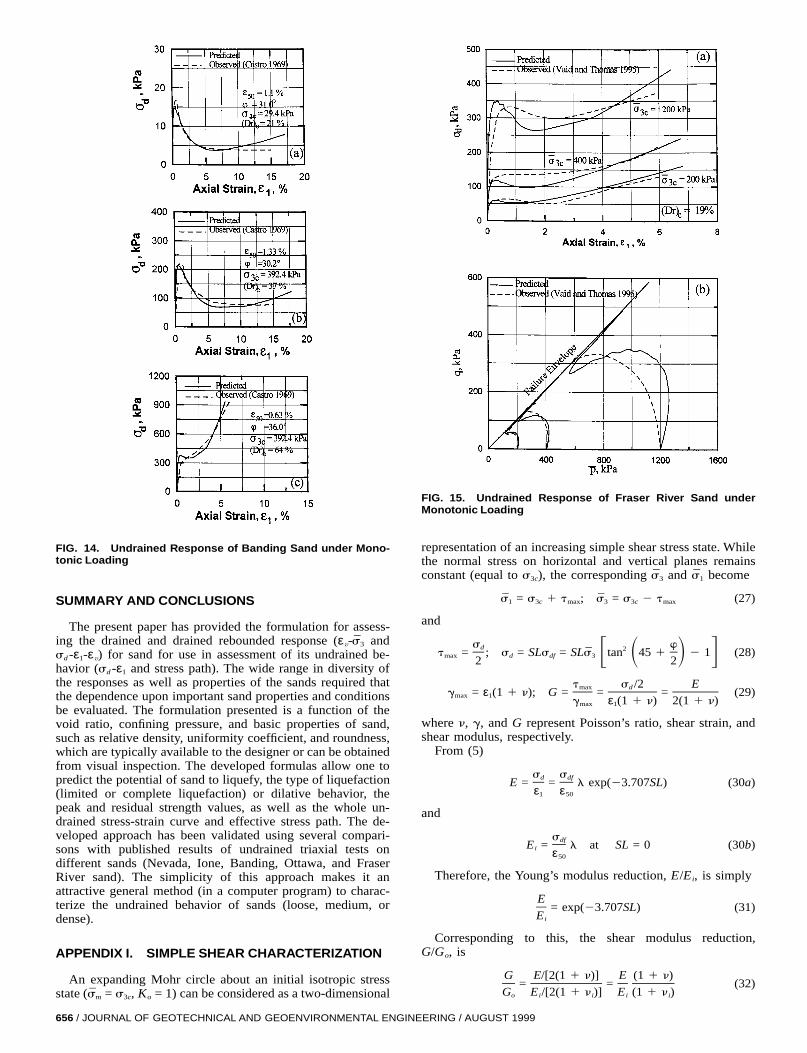
FIG. 14. Undrained Response of Banding Sand under Mono-tonic Loading
SUMMARY AND CONCLUSIONS
The present paper has provided the formulation for assess-ing the drained and drained rebounded response (εv- ands3
sd -ε1-εv) for sand for use in assessment of its undrained be-havior (sd -ε1 and stress path). The wide range in diversity ofthe responses as well as properties of the sands required thatthe dependence upon important sand properties and conditionsbe evaluated. The formulation presented is a function of thevoid ratio, confining pressure, and basic properties of sand,such as relative density, uniformity coefficient, and roundness,which are typically available to the designer or can be obtainedfrom visual inspection. The developed formulas allow one topredict the potential of sand to liquefy, the type of liquefaction(limited or complete liquefaction) or dilative behavior, thepeak and residual strength values, as well as the whole un-drained stress-strain curve and effective stress path. The de-veloped approach has been validated using several compari-sons with published results of undrained triaxial tests ondifferent sands (Nevada, Ione, Banding, Ottawa, and FraserRiver sand). The simplicity of this approach makes it anattractive general method (in a computer program) to charac-terize the undrained behavior of sands (loose, medium, ordense).
APPENDIX I. SIMPLE SHEAR CHARACTERIZATION
An expanding Mohr circle about an initial isotropic stressstate = s3c, Ko = 1) can be considered as a two-dimensional(sm
656 / JOURNAL OF GEOTECHNICAL AND GEOENVIRONMENTAL ENGIN
FIG. 15. Undrained Response of Fraser River Sand underMonotonic Loading
representation of an increasing simple shear stress state. Whilethe normal stress on horizontal and vertical planes remainsconstant (equal to s3c), the corresponding and becomes s3 1
s = s 1 t ; s = s 2 t (27)1 3c max 3 3c max
and
s wd 2t = ; s = SLs = SLs tan 45 1 2 1 (28)max d df 3 F S D G2 2
t s /2 Emax dg = ε (1 1 n); G = = = (29)max 1
g ε (1 1 n) 2(1 1 n)max 1
where n, g, and G represent Poisson’s ratio, shear strain, andshear modulus, respectively.
From (5)
s sd dfE = = l exp(23.707SL) (30a)
ε ε1 50
and
sdfE = l at SL = 0 (30b)i ε50
Therefore, the Young’s modulus reduction, E/Ei, is simply
E= exp(23.707SL) (31)
Ei
Corresponding to this, the shear modulus reduction,G/Go, is
G E/[2(1 1 n)] E (1 1 n)= = (32)
G E /[2(1 1 n )] E (1 1 n )o i i i i
EERING / AUGUST 1999
where E/Ei is given by (31). If one takes n to vary linearlywith SL from n i = 0.1 at SL = 0 to, say, n = 1/2 at SL = 1/2,then G/Go versus g can be obtained in the following fashion:
1. Choose SL.2. Assess ε1, n, and gmax.3. Assess E/Ei and G/Go.4. Plott G/Go versus gmax.5. Repeat steps 1–4.
Fig. 3 was constructed in this fashion for a value of ε50 =0.003 at s3c = 100 kPa, and n = 0.1 1 0.8SL, for SL from0.0 to 0.5.
APPENDIX II
The ε1- relationship (Fig. 4) is expressed by a fifth-εv,shear
order binomial equation as follows:
2 3 4 5y = a 1 bx 1 cx 1 dx 1 ex 1 fx (33)
The slope of any point on the ε1- relationship is givenεv,shear
as
2 3 4y = b 1 2cx 1 3dx 1 4ex 1 5fx (34)
where x represents axial strain ε1; y symbolizes volumetricstrain due to shear and y indicates slope of a point onε ;v,shear
the curve of the ε1- relationshipε (dε /dε ).v,shear 1 v,shear
Boundary Conditions at Point A
x = 0; y = 0; y = S (35)A
By substituting the above conditions in (33) and (34)
a = 0; b = S (36)A
Therefore, (33) and (34) can be rewritten as
2 3 4 5y = S x 1 cx 1 dx 1 ex 1 fx (37)A
2 3 4y = S 1 2cx 1 3dx 1 4ex 1 5fx (38)A
Boundary Conditions at Point B
x = x ; y = y ; y = 0 (39)B B
Therefore
2 3 4 5y = S x 1 cx 1 dx 1 ex 1 fx (40)B A B B B B B
y SB A 2 3c = 2 2 dx 2 ex 2 fx (41)B B B2x xB B
and
2 3 4y = S 1 2cx 1 3dx 1 4ex 1 5fx = 0 (42)B A B B B B
2yB 2 3 4 2S 1 22S 2 2dx 2 2ex 2 2 fx 1 3dxA A B B B BxB
3 41 4ex 1 5fx = 0B B (43)
2yB 2 3 42S 1 1 dx 1 2ex 1 3 fx = 0 (44)A B B BxB
S 2yA B 2d = 2 2 2ex 2 3 fx (45)B B2 3x xB B
By substituting for constant d [(45)] in (41), constant c canbe written as
3y 2SB A 2 3c = 2 1 ex 1 2 fx (46)B B2x xB B
JOURNAL OF GEOTECHNI
Boundary Conditions at Point C
x = x ; y = y ; y = S = S (47)C C C f
Therefore2 3 4 5y = S x 1 cx 1 dx 1 ex 1 fx (48)C A C C C C C
By substituting for constants c and d [(45) and (46)] in (48)
3y 2SB A 2 3 2y = S x 1 2 1 ex 1 2 fx xC A C B B CS D2x xB B
S 2yA B 2 3 4 51 2 2 2ex 2 3 fx x 1 ex 1 fxB B C C CS D2 3x xB B (49)
2 2 3 33y x 2S x S x 2y xB C A C A C B Cy = S x 1 2 1 2C A CS D2 2 3x x x xB B B B
2 2 3 4 3 2 2 3 51 e(x x 2 2x x 1 x ) 1 f (2x x 2 3x x 1 x )B C B C C B C B C C (50)
Eq. (50) can be expressed in shorthand as
y = M 1 eN 1 fO (51)C
where M, N, and O symbolize parenthetic terms in (50).Consequently, constant e is given as
(y 2 M 2 fO)Ce = (52)
N
Using (52), constants c and d [(45) and (46)] can be ex-pressed as
3y 2S (y 2 M 2 fO)B A C2 3c = 2 1 x 1 2 fx (53)B B2x x NB B
and
S 2y (y 2 M 2 fO)A B C 2d = 2 2 2x 2 3 fx (54)B B2 3x x NB B
The slope at point C is defined as Sf and represents the sixthboundary condition [(47)]. By substituting into (38)
2 3 4S = S 1 2cx 1 3dx 1 4ex 1 5fx (55)f A C C C C
By substituting for constants c, d, and e [(52)–(54)] in (55)
6y x 4S x (y 2 M 2 fO)B C A C C2 3S = S 1 2 1 2x x 1 4fx xf A C B B CF G2x x NB B
2 23S x 6y x (y 2 M 2 fO)A C B C C2 2 21 2 2 6x x 2 9fx xB C B CF G2 3x x NB B
(y 2 M 2 fO)C3 41 4x 1 5fxC CF GN (56)
2 26y x 4S x 3S x 6y xB C A C A C B CS = S 1 2 1 2f AS D2 2 3x x x xB B B C
(y 2 M 2 fO) (y 2 M 2 fO)C C2 21 2x x 2 6x xC B B CN N
(y 2 M 2 fO)C3 3 2 2 41 4x 1 f (4x x 2 9x x 1 5x )C B C B C CN (57)
(y 2 M )C 2 2 3S = Q 1 (2x x 2 6x x 1 4x )f B C B C CN
O2 2 31 f (6x x 2 2x x 2 4x ) 1 fPB C B C CN (58)
where Q and P denote first and last parenthetic terms in (57).Therefore
CAL AND GEOENVIRONMENTAL ENGINEERING / AUGUST 1999 / 657
(y 2 M )C 2 2 3S 2 Q 2 (2x x 2 6x x 1 4x )f B C B C CN
f = (59)O2 2 3P 1 (6x x 2 2x x 2 4x )B C B C CN
According to (59), constant f can be evaluated as a functionof the slopes and coordinates of points A, B, and C on theε1- relationship (Fig. 4). Having constant f, all other con-εv,shear
stants (c, d, and e) of (37) can be determined using (52)–(54).
ACKNOWLEDGMENTS
The work described herein was supported by the U.S. Army Corps ofEngineers (USACE) and the California Department of Transportation(Caltrans). The writers would like to acknowledge Richard Ledbetter, thecontract manager of the project (USACE), for his encouragement. Also,the writers would like to thank the Caltrans group (Dr. Abbas Abghari,Ken Jackura, Tim Leahy, Chris Campbell, Angel Perez-Cobo, and Tho-mas Shantz) for their interest and encouragement.
APPENDIX III. REFERENCES
Ashour, M., Norris, G., and Pilling, P. (1998). ‘‘Lateral loading of a pilein layered soil using the strain wedge model.’’ J. Geotech. and Geoen-vir. Engrg., ASCE, 124(4), 303–315.
Been, K., and Jefferies, M. G. (1985). ‘‘A state of parameter for sands.’’Geotechnique, London, 35(2), 99–112.
Casagrande, A. (1976). ‘‘Liquefaction and cyclic deformation of sands:A critical review.’’ 5th Panamerican Conf. on Soil Mech. and Found.Engrg.
Castro, G. (1969). ‘‘Liquefaction of sands,’’ PhD thesis, Division of En-gineering and Applied Physics, Harvard University, Cambridge, Mass.
Castro, G., and Poulos, S. (1977). ‘‘Factors affecting liquefaction andcyclic mobility.’’ J. Geotech. Engrg. Div., ASCE, 103(6), 501–516.
Castro, G., Poulos, S., France, J., and Enos, J. (1982). ‘‘Liquefactioninduced by cyclic loading.’’ Rep. NSF/SEE-82018 Prepared for Nat.Sci. Found.
Dakoulas, P., and Yuanhui, S. (1992). ‘‘Fine Ottawa sand: Experimentalbehavior and theoretical predictions.’’ J. Geotech. Engrg., ASCE,118(12), 1906–1923.
658 / JOURNAL OF GEOTECHNICAL AND GEOENVIRONMENTAL ENG
Fukushima, S., and Tatsuoka, F. (1984). ‘‘Strength and deformation char-acteristics of saturated sand at extremely low pressures.’’ J. Soils andFound., 24(4), 30–48.
Ishihara, K. (1993). ‘‘Liquefaction and flow failure during earthquakes.’’Geotechnique, London, 43(3), 351–415.
Ishihara, K., Tatasuoka, F., and Yasuda, S. (1975). ‘‘Undrained defor-mation and liquefaction of sand under cyclic stresses.’’ J. Soils andFound., (1), 29–44.
Lee, K. L., and Seed, H. B. (1967). ‘‘Drained strength characteristics ofsands.’’ J. Soil Mech. and Found. Div., ASCE, 93(6), 117–141.
Mohamad, R., and Dobry, M. (1986). ‘‘Undrained monotonic and cyclictriaxial strength of sand.’’ J. Geotech. Engrg., ASCE, 112(10), 941–958.
Negussey, D., and Vaid, Y. P. (1990). ‘‘Stress dilatancy of sand at stressratio states.’’ J. Soils and Found., 30(1), 155–166.
Norris, G., Madhu, R., Valceschini, R., and Ashour, M. (1995). ‘‘Lique-faction and residual strength of loose sands from drained triaxial tests.’’Rep. No. CCEER-95-2 Prepared for U.S. Army Corps of Engrs., CivilEngineering Department, University of Nevada at Reno.
Norris, G., Siddharthan, R., Zafir, Z., and Madhu, R. (1997). ‘‘Liquefac-tion and residual strength of sands from drained triaxial tests.’’ J. Geo-tech. Engrg., ASCE, 123(3), 220–228.
Norris, G., Zafir, Z., and Siddharthan, R. (1998). ‘‘An effective stressunderstanding of liquefaction behavior.’’ J. Envir. & Engrg. Geosci.,4(1), 93–101.
Norris, G. M. (1986). ‘‘Theoretically based BEF laterally loaded pileanalysis.’’ Proc., 3rd Int. Conf. on Numer. Methods in Offshore Piling,361–386.
Powers, M. C. (1953). ‘‘A new roundness scale for sedimentary parti-cles.’’ J. Sedimentary Petrology, 23(2), 117–119.
Seed, H. B., and Idriss, I. M. (1970). ‘‘Soil moduli and damping factorsfor dynamic response analyses.’’ Rep. No. EERC 70-10, College ofEngineering, University of California, Berkeley, Calif.
Seed, H. B., and Lee, K. L. (1967). ‘‘Undrained strength characteristicsof cohesionless soil.’’ J. Soil Mech. and Found. Div., ASCE, 93(6),333–360.
Vaid, Y. P., Chung, E. K. F., and Kuerbis, R. H. (1989). ‘‘Preshearing andundrained response of sand.’’ J. Soils and Found., 29(4), 49–61.
Vaid, Y. P., and Thomas, J. (1995). ‘‘Liquefaction and postliquefactionbehavior of sand.’’ J. Geotech. Engrg., ASCE, 121(2), 163–173.
INEERING / AUGUST 1999


