Embed Size (px)
Citation preview

Accepted Manuscript
Liquid Phase Optimisation in a Horizontal Flow Biofilm Reactor (HFBR) Tech-nology for the Removal of Methane at Low Temperatures
C. Kennelly, S. Gerrity, G. Collins, E. Clifford
PII: S1385-8947(13)01652-5DOI: http://dx.doi.org/10.1016/j.cej.2013.12.071Reference: CEJ 11609
To appear in: Chemical Engineering Journal
Received Date: 12 September 2013Revised Date: 18 December 2013Accepted Date: 22 December 2013
Please cite this article as: C. Kennelly, S. Gerrity, G. Collins, E. Clifford, Liquid Phase Optimisation in a HorizontalFlow Biofilm Reactor (HFBR) Technology for the Removal of Methane at Low Temperatures, ChemicalEngineering Journal (2014), doi: http://dx.doi.org/10.1016/j.cej.2013.12.071
This is a PDF file of an unedited manuscript that has been accepted for publication. As a service to our customerswe are providing this early version of the manuscript. The manuscript will undergo copyediting, typesetting, andreview of the resulting proof before it is published in its final form. Please note that during the production processerrors may be discovered which could affect the content, and all legal disclaimers that apply to the journal pertain.
Liquid Phase Optimisation in a Horizontal Flow Biofilm Reactor (HFBR) Technology for the
Removal of Methane at Low Temperatures
C. Kennelly1*
, S. Gerrity2, G. Collins
2,3, E. Clifford
1,3.
1. Civil Engineering, National University of Ireland, Galway
2. Department of Microbiology, National University of Ireland, Galway
3. Ryan Institute, National University of Ireland, Galway
*Corresponding Author
Email: [email protected]
Tel: +353 (0) 91 49 2219
Abstract
Methane (CH4) is a potent greenhouse gas often emitted in low concentrations from waste sector
activities. Biological oxidation techniques have the potential to offer effective methods for the
remediation of such emissions. In this paper, methods of improving the CH4 oxidation performance of
a horizontal flow biofilm reactor (HFBR) technology, operated at low temperatures, are investigated.
Three pilot scale HFBRs were operated over three studies (Study 1, 2 & 3) lasting 310 days in total.
The reactors were loaded with 13.2 g CH4/m3/hr during each study and operated at an average
temperature of 10oC.
In Study 1, nutrients were added to the biofilm via a liquid nutrient feed (LNF) comprising water and
nutrient mineral salts. Average removals were 4.2, 3.1 and 2.3 g CH4/m3/hr for HFBRs 1, 2 and 3
respectively.
In Study 2 silicone oil was added to the LNF of all three HFBRs. Average removals increased, when
compared to Study 1, by 31%, 79% and 78% for HFBRs 1, 2 and 3 respectively.

In Study 3 a non ionic surfactant (Brij 35) was added to the LNF and silicone oil liquid phase of
HFBRs 1 and 2. The operating conditions of HFBR 3 were not changed and it was used as a control. A
concentration of 1.0 g Brij 35/L proved most effective in improving reactor performance; with
removal rates increasing by 105% and 171% for HFBRs 1 and 2 respectively when compared to Study
1.
These results indicate the potential of liquid phase optimisation for improving mass transfer rates and
removal performances in biological reactors treating CH4.
Keywords
Biological oxidation, biofilm reactor, methane, non ionic surfactant, secondary liquid phase, silicone
oil
1. Introduction

Methane is a prominent greenhouse gas with a global warming potential 25 times that of carbon
dioxide (CO2) and comprises almost a quarter of worldwide greenhouse emissions (Haubrichs and
Widmann, 2006; Rocha Rios et al., 2009). 55% of anthropogenic methane (CH4) emissions are below
the lower explosive limit (LEL) for CH4 and cannot be thermally oxidised (Avalos Ramirez et al.,
2012a). In such cases, biological waste treatment technologies can be an effective mitigation measure
against these emissions (Chiemchaisri et al., 2013; Kraakman and Witherspoon, 2013). Biofilm
reactors are a practical alternative for the control and mitigation of these emissions (Kraakman and
Witherspoon, 2013; Veillette et al., 2012; Kennelly et al., 2012). Biofilm reactors are low cost, energy
efficient and are simple to construct and operate (Veillette et al., 2012). Biofilm reactors treating CH4
have been previously shown to be capable of achieving high removals of up to 100 g CH4/m3/hr
(Rocha Rios et al., 2009; Nikiema and Heitz, 2009) and have successfully been deployed at site scale
(Melse and Van der Werf, 2005).
There are, however, a number of challenges when designing CH4 biofilm reactor, foremost of which is
the low solubility of CH4 in water. This presents a barrier to mass transfer and necessitates long
hydraulic retention times, especially at low temperatures (Rocha Rios et al., 2009). Biofilm reactors
treating CH4 have typically required retention times 100 times greater than biofilm reactors treating
odorous compounds such as hydrogen sulphide or ammonia (Streese and Stegmann, 2003), with
required empty bed retention times (EBRT) of over 1 hour previously reported (Gerbert and
Grongroft, 2006; Melse and Van der Werf, 2005; du Plessis et al., 2003).
Recent studies have shown, however, that the limiting effect of low solubility can be alleviated in a
number of different ways. Optimising the nutrients in the liquid phase to maximise methanotrophic
activity in the biofilm can significantly improve performance (Clifford et al., 2012; Nikiema et al.,
2009a). The use of a secondary organic liquid phase with a higher affinity for methane than water such
as polydimethylsiloxane (silicon oil) or hexadecane have been shown to result in greater rates of mass
transfer in both a packed bed biotrickling filter and in a stirred tank reactor and lead to improved
oxidation rates (Gulfam et al., 2011; Bordel et al., 2010; Munoz et al., 2007). Addition of silicone oil
leads to improved methane solubility as the partition coefficient of methane in silicone oil is

approximately 10 times lower than in water; thus at equilibrium, the ratio of concentrations of
methane dissolved the oil and water phases will be 10:1 (Rocha Rios et al., 2009).
In other studies, non-ionic surfactants such as Brij 35 and Tween 20 have been used to improve reactor
performance (Avalos Ramirez et al., 2012a). Non ionic surfactant molecules contain both hydrophilic
and hydrophobic elements and when added to the aqueous phase of a biofilm reactor, can increase the
solubility of low water soluble compounds such as methane (Avalos Ramirez et al., 2012a; King,
2001). Non ionic surfactants have successfully improved performances of packed bed biofilters
(Avalos Ramirez et al., 2012a; Jurado et al., 2007) and are largely biodegradable and non toxic in low
concentrations (< 0.5 % w/w), (Avalos Ramirez et al., 2012b). Brij 35 can also be used as an oil water
emulsifier (its hydrophobic-lipophilic balance (HLB) number is 16.9 - within the range for
solubilising oils into water).
To date limited work has focused on the combined use of transfer vectors such as silicone oil and non-
ionic surfactants (e.g. Brij 35) to aid mass transfer of CH4 into the liquid phase. Rocha Rios and Revah
(2013) found that the effectiveness of silicone oil as a transfer vector is dependent on the degree of oil
dispersion in the liquid phase. While a number of studies use mechanical turbulence to create
dispersion (Arriga et al., 2006; Rocha Rios et al., 2009; Quijano et al., 2010a) previous studies have
not examined the possibility of combining transfer vectors to both enhance mass transfer and improve
oil dispersion in the water phase.
Furthermore, most studies are carried out at temperatures of 20oC or more. In many scenarios (due to
the facility in question or the climate) temperatures can be significantly lower.
The horizontal flow biofilm reactor (HFBR) has been previously applied successfully to both
wastewater and waste gas treatment (Kennelly et. al, 2012; Clifford et al., 2010). The unique flow
regime in the HFBR ensures good contact with the biofilm in the reactor and alleviates problems that
can be associated with conventional biofilm reactors such as clogging, channelling, compaction and
pressure drop. In this study, the effect of adding silicone oil, both with and without Brij 35, to the
liquid phase of HFBRs treating methane gas, was investigated.

2. Materials and methods
2.1. Horizontal Flow Biofilm Reactor (HFBR)

Three HFBR units (HFBR 1, HFBR 2 and HFBR 3) were commissioned during these trials. Each
HFBR comprised 55 horizontal plastic sheets with integrated frustums stacked vertically - one above
the other. The sheet stack was placed in a sealed enclosure that could be opened for visual assessment
and biofilm sampling. The working volume of each reactor was 18 L and the top plan surface area
(TPSA) of the plastic media was 0.04 m2, giving a total media plan area of 2.4 m
2. 6 intermediate
sample ports were located along the vertical profile of each reactor allowing for intermediate samples
of air and water to be taken.
The HFBR units were housed in a temperature-controlled laboratory, maintained at 10oC. The influent
gas mixture stream comprised a mixture of atmospheric air with a CH4 gas supply. Mass flow
controllers (Bronkhorst High Tech BV, Ruurlo, Netherlands), flowmeters (Key Instruments, Trevose,
USA) and pressure regulators (GCE DruVa, Cheshire, United Kingdom) were used to control gas flow
rates and gas mix proportions as required (Figure 1).
The gas mixture, containing approximately 1.6% v/v CH4, was introduced at the top of the reactor
(Sheet 1) and flowed horizontally across each sheet before moving to the sheet below. Similarly a
liquid phase, introduced onto Sheets 1 and 30 of the reactor, flowed over each sheet before dropping to
the sheet below (i.e. the unit does not operate as a submerged reactor). The gas and liquid exited the
reactor below Sheet 55 (the bottom sheet in the reactor). Operating parameters are summarised in
Table 1
Nutrients were added to each of the reactors in the form of a Liquid Nutrient Feed (LNF) mixture,
similar to that used by Nikiema et al., (2009a) (Table 2). The LNF was delivered intermittently (10
mins/hr) via a peristaltic pump. The LNF was delivered in a step feed manner, i.e. 75% of the LNF (3
L/day) was dosed onto Sheet 1 and 25% of the LNF (1 L/day) onto Sheet 30.
Table 1
Flow and loading parameters during each study
Parameter Study 1 Study 2 Study 3
Air Mixture Flow Rate (m3/m3/hr) 1.3 1.0 1.1
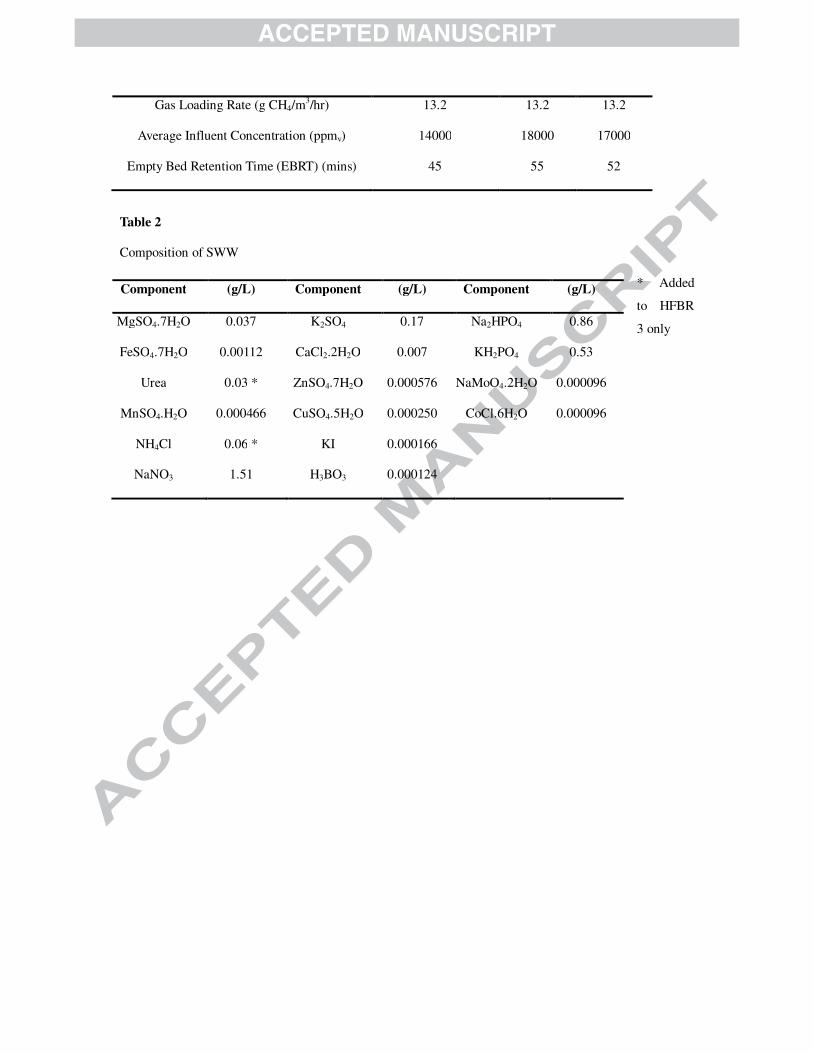
Gas Loading Rate (g CH4/m3/hr) 13.2 13.2 13.2
Average Influent Concentration (ppmv) 14000 18000 17000
Empty Bed Retention Time (EBRT) (mins) 45 55 52
Table 2
Composition of SWW
* Added
to HFBR
3 only
Component (g/L) Component (g/L) Component (g/L)
MgSO4.7H2O 0.037 K2SO4 0.17 Na2HPO4 0.86
FeSO4.7H2O 0.00112 CaCl2.2H2O 0.007 KH2PO4 0.53
Urea 0.03 * ZnSO4.7H2O 0.000576 NaMoO4.2H2O 0.000096
MnSO4.H2O 0.000466 CuSO4.5H2O 0.000250 CoCl.6H2O 0.000096
NH4Cl 0.06 * KI 0.000166
NaNO3 1.51 H3BO3 0.000124

Figure 1. Schematic of the HFBR system
2.2. Biofilm growth and inoculation
An enrichment strategy was employed to cultivate a methanotroph-rich biomass capable of methane
oxidation which could be used to seed the HFBRs. A biomass mix comprising landfill cover soil,
landfill leachate, composted organic fraction municipal solid waste (OFMSW) and compost leachate
Gas
Cylinder
Air Compressor
Regulator
Regulator
Regulator
Flowmeter
Flowmeter
Venturi
VacuumCombiner
Manifold
Flowmeter
Flowmeter
Flowmeter
HFBR 1
LNF Reservoir
Peristaltic Pump
LNF Inlet
(1 perreactor)
LNF StepFeed (1 per
reactor)
Intermediate
SamplingPorts
HFBR 2
HFBR 3
Flowmeter Flow
meter
Flowmeter
Gas and LNF Outlets
Direction of Gas
and LNF flow
Direction of Gas and
Liquid (LNF) flow
200 200
Airtight
housing
Mass Flow Controller
in a 1:1:1:1 ratio was used for the enrichment culture. Briefly, 2 ml of the biomass mix were placed in
each of several 40-ml crimp-top, glass vials with 8 ml Adapted Whittenbury Medium (AWM;
Whittenbury et al., 1970). The vials were sealed and the headspace was adjusted to a methane
concentration of 10% at atmospheric pressure. Vials were incubated in the dark at 10°C shaking at 80
rpm. The headspace methane concentration was monitored by gas chromatography (GC; Varian CP-
3800 Gas Chromatograph) analysis of twice-weekly headspace samples. Once the headspace methane
concentration was <0.5%, the headspace was flushed with air and a 10% methane headspace was re-
instated. Over the course of 4 months, the cultures were subcultured (c. 10% inoculum) to fresh
medium and eventually were scaled to 2-l enrichment cultures to cultivate sufficient biomass for
HFBR inoculation. The enriched culture was added to the HFBRs at the beginning of the trial and then
re-circulated around the systems for several days to encourage biofilm formation.
2.3. Experimental plan and data analysis

The trial was divided into 3 studies (Study 1, 2 and 3 lasting 150, 90 and 70 days respectively). The 3
studies ran consecutively with the end of one study marking with the beginning of the next study.
During Study 1 the LNF (Table 2) was the sole component of the liquid phase. All reactors were
operated identically however, HFBRs 1 and 2 used nitrate-nitrogen (NO3-N) as the main nitrogen
source in the LNF whereas HFBR 3 used both ammonium-nitrogen (NH4-N) and NO3-N.
In Study 2, silicone oil (10% v/v, Mistral, Northern Ireland) was added each of the three reactors as a
second liquid phase. The silicone oil was added to the LNF and continuously agitated with a magnetic
stirrer in a feed container, before being pumped into each of the reactors with the LNF.
During Study 3, Brij 35 (Acros Organics, NJ, USA) was added in concentrations of 0.5 g/L (Study
3a), 1.0 g/L (Study 3b), 2.0 g/L (Study 3c), 1.0 g/L (Study 3d) and 0.75 g/L (Study 3e) to HFBRs 1
and 2. The Brij-35 was added to the LNF and silicone oil in the LNF reservoir tank. Brij 35 was not
added to HFBR 3, which was used as a control during Study 3.
Each study was carried out at 10oC, which can be typical of onsite temperature in Ireland, Northern
Europe and other temperate climates.
Throughout each study, influent, effluent and profile samples of the gas mixtures were taken from
each reactor and analysed. The removal efficiency (RE) of each reactor was measured by comparing
influent and effluent samples of the gas air mixture. Intermediate samples were taken from the 6
sampling ports located along the vertical profile of each reactor, to allow detailed profiling of CH4
oxidation and CO2 production to be carried out. Gas samples were taken with a syringe and analysed
for CH4 and CO2 concentrations using an Agilent 7890A GC (Agilent Technologies Ireland Ltd, Cork,
Ireland). In order to give further insight into microbial activity in the biofilm, LNF samples from
influent, effluent and intermediate sampling ports were taken regularly and analysed in accordance
with standard methods (APHA-AWWA-WEF, 2005). Total Nitrogen (TN) and Total Phosphorous (TP)
were analysed using a Biotector TOC TN TP Analyser (Biotector, Cork, Ireland). NH4-N, nitrite-
nitrogen (NO2-N), NO3-N and phosphate-phosphorous (PO4-P) concentrations were determined using
a Thermo Clinical Labsystems, Konelab 20 Nutrient Analyser (Fisher Scientific, Waltham,

Massachusetts, USA). All analytical equipment was checked, maintained and calibrated as per
manufacturer’s guidelines.
Experimental results were statistically compared to check for significant improvements (between
experiments) or differences (between replications). One-way analysis of variance (ANOVA) carried
out using GraphPad InStat software (Version 3.10). The analysis was carried out at a confidence
interval of 95% (a significance level of 0.05).
3. Results and discussion
3.1. CH4 Removal – Study 1
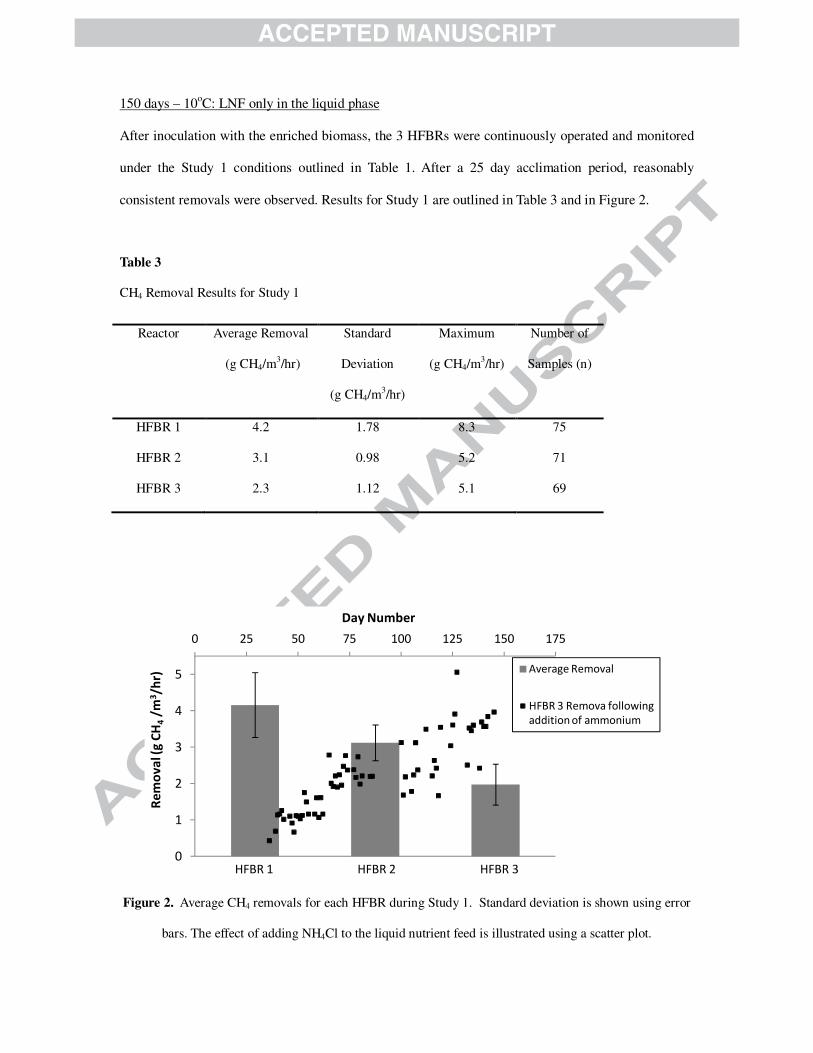
150 days – 10oC: LNF only in the liquid phase
After inoculation with the enriched biomass, the 3 HFBRs were continuously operated and monitored
under the Study 1 conditions outlined in Table 1. After a 25 day acclimation period, reasonably
consistent removals were observed. Results for Study 1 are outlined in Table 3 and in Figure 2.
Table 3
CH4 Removal Results for Study 1
Reactor
Average Removal
(g CH4/m3/hr)
Standard
Deviation
(g CH4/m3/hr)
Maximum
(g CH4/m3/hr)
Number of
Samples (n)
HFBR 1 4.2 1.78 8.3 75
HFBR 2 3.1 0.98 5.2 71
HFBR 3 2.3 1.12 5.1 69
Figure 2. Average CH4 removals for each HFBR during Study 1. Standard deviation is shown using error
bars. The effect of adding NH4Cl to the liquid nutrient feed is illustrated using a scatter plot.
0 25 50 75 100 125 150 175
0
1
2
3
4
5
Day Number
Re
mo
va
l (g
CH
4/m
3/h
r)
HFBR 1 HFBR 2 HFBR 3
Average Removal
HFBR 3 Remova following
addition of ammonium

Average removals for the reactors were 4.2, 3.1 and 2.3 g CH4/m3/hr for HFBRs 1, 2 and 3
respectively. These results compare reasonably well with results from previous trials by Kennelly et al.
(2012), who reported average removals of 5.19 g CH4/m3/hr for a HFBR unit operated under similar
conditions and using the LNF outlined in Table 2.
HFBR 3, although identical in operation and influent loading, initially underperformed in comparison
to HFBRs 1 and 2. In previous HFBR trials the best performing units were those which used feed
containing ammonium salts in the LNF and had organic carbon removed (Clifford et al., 2012;
Kennelly et al., 2012). Thus NH4Cl was added to the LNF of HFBR 3. Following the addition of
NH4Cl (on Day 30) average removals steadily increased, from 1.0 g CH4/m3/hr to 3.0 g CH4/m
3/hr for
the latter 2 months of the trial - a performance more in line with HFBR 2. This is illustrated in Figure
2 with the scatter plot representing performance in HFBR 3 following addition of NH4Cl to the LNF.
It can be observed from Figure 2 that a time lag of about 20 days was observed between the addition
of NH4-N and subsequent improvement in reactor performance. This was most likely due to the
specialised microbial consortia requiring time to adapt to the feed modification i.e. methanotrophic
species which are less tolerant to NH4+ would be replaced by species which are more tolerant to NH4+
(Veillette et al., 2012). This observed improvement in performance following the addition of NH4 salts
indicates low levels of NH4-N may improve reactor performance. It should be noted that previous
studies by Nikiema et al. (2009a), who noted that in the presence of high quantities of ammonium in
the liquid phase (12 – 28%), some methanotrophic activity, is diverted towards the nitrification.
However in this case, the proportions of NH4Cl are significantly lower (0.0025% or 25 mg N/L).
Hernandez and Omil, (2013) observed a severe decrease in removal efficiency when NH4-N
concentrations reached 1000 mg NH4-N/L but noticed a significant increase in removal efficiency by
increasing the ammonium nitrogen concentration (as NH4Cl) from 260 mg NH4-N/L to 520 mg NH4-
N/L. This suggests that ammonia only inhibits methanotrophic activity beyond a threshold
concentration. A similar view was presented by Veillette et al. (2011), who suggested that

methanotrophic activity in a packed bed biofilter, is only inhibited by NH4+
beyond a tolerance limit of
methanotrophic microbes in the biofilm of between 0.1 and 0.2 g N/L.
Previous studies differ as to the most appropriate species and concentrations of nitrogen for use in CH4
biofilm reactors (Bodelier et al., 2000; Nikiema et al., 2009a; Clifford et al., 2012; Hernandez and
Omil, 2013). The difference between these studies may be due to environmental factors such as
temperature and reactor design though further studies are necessary to examine and adequately
describe nitrogen dynamics in a CH4 oxidising bioreactors.
One-way ANOVA, carried out between replications for steady state removals during Study 1, revealed
that variations in the performances of the triplicate reactors were significant. This was previously
observed in similar trials with the HFBR (Clifford et al., 2012; Kennelly et al., 2012). As the reactors
were operated and sampled identically (except for the 25 mg/L of NH4Cl that was added to the LNF to
HFBR 3 after Day 30), the variations in each reactor performance may be due to in-situ (i.e. within
each individual reactor) differences in microbial immobilisation rates following inoculation,
dissimilarities in microbial growth rates and in-situ variations environmental conditions.
3.2. CH4 Removal – Study 2

90 days – 10oC: Liquid Phase comprises LNF and Silicone Oil
Rocha Rios et al. (2009) observed that methane biodegradation in a packed bed biofilter is limited by
mass transfer and not by biological reaction. Therefore, during Study 2 silicone oil was added to the
LNF to investigate its potential to enhance mass transfer rates and potentially increase reactor
performance. Silicone oil was selected as a suitable transfer vector as methane is more readily
dissolved into silicone oil when compared to water (Rocha Rios et al., 2010). Moreover, it has
previously been demonstrated that silicone oil is not biodegraded by the methanotrophic consortia in a
biofilm reactor (Munoz et al., 2007; Rocha Rios et al., 2009) and so does not result in the introduction
of excessive concentrations of biodegradable carbon into the LNF. The results for Study 2 are
summarised in Table 4 and Figure 3.
Table 4
CH4 Removal Results for Study 2
Reactor Average
Removal
(g CH4/m3/hr)
Standard
Deviation
(g CH4/m3/hr)
Maximum
Removal
(g CH4/m3/hr)
Performance
Improvement
(compared to
Study 1)
Number of
Samples (n)
HFBR 1 5.5 0.99 7.1 31 % 42
HFBR 2 5.5 1.15 7.9 79 % 43
HFBR 3 4.0 1.05 6.1 78 % 42

Figure 3. CH4 Removals for Study 1 and Study 2. Standard deviation shown using error bars
Significant improvements in reactor performance were observed in each of the three reactors. Average
removal rates increased to 5.6, 5.5 and 4.0 g CH4/m3/hr for HFBRs 1, 2 and 3 respectively,
representing improvements, when compared to Study 1, of 31% for HFBR 1, 79% for HFBR 2 and
78% for HFBR 3.
As can be seen from Figure 3, similar removals were recorded in HFBRs 1 and 2 and removal rates in
HFBR 3 were lower. This is supported by one way statistical analysis (ANOVA testing), which shows
removals in HFBRs 1 and 2 were similar and that the difference in removal rates between them and
HFBR 3 were significant. As the reactors were operated and sampled in triplicate during Study 2, in-
situ variations in microbial ecology and environmental conditions were most likely the reason for the
disparity between HFBR 3 and the other reactors.
Similarly, by performing a comparison of variance between steady state removals during Study 1 and
Study 2, the impact of adding the silicone oil to the LNF during Study 2 was found to be statistically
significant.
0
1
2
3
4
5
6
7
Re
mo
va
l (g
CH
4/m
3/h
r)
Average Removal (Study 2)
Average Removal (Study 1)
HFBR 1 HFBR 2 HFBR 3

The principal mechanism for this enhancement is most likely increased mass transfer of methane into
the LNF. The partition coefficient between a gas and liquid phase is closely related to the Henry’s law
constant and can be defined as:
(Equation 1)
Where Cg and Cl are the concentrations of the gas in the gas phase and the liquid phase at equilibrium,
respectively (Lomond and Tong, 2011).
Rocha Rios et al. (2009) previously determined that partition coefficients of methane in water and
silicone oil at 30oC (303.15 K) were 33.5 and 3.2 respectively. Using the following Van’t Hoff
extrapolation;
(Equation 2)
where;
(Equation 3)
and KT1
g,l is the partition coefficient at temperature T1 (K), KT2
g,l is the partition coefficient at
temperature T2 (K), DsolnH is enthalpy of solution and R is a gas constant. The partition coefficients for
methane in water and oil at 10oC (283.15 K) can be calculated as 22.5 + 0.2 and 2.15 + 0.2.
Therefore, despite the lower operating temperatures and consequently lower partition coefficients used
during this study, the effect of silicone oil addition was in line with that observed by Rocha Rios et al.
(2009). This is reflected in the fact that performance improvements following the addition of the
silicon oil during Study 2 of this trial (31%, 78% and 79%) were similar to those observed by Rocha

Rios et. al (2009), (41% and 131%). The remaining disparity between the two studies may be partly
due to differences in the degree of dispersion of the oil within the respective reactor systems.
Given that the average concentration of CH4 during Study 2 was 12.4 g CH4/m3 gas air mixture (i.e.
1.8 % v/v), the increase in CH4 solubility can be calculated as follows;
(Equation 4)
Where CCH4,w and CCH4,o are the concentrations of CH4 in the water and silicone oil phases
respectively and X and Y are the volumetric fractions of water and silicone oil respectively (Rocha
Rios et al., 2010). In this case the volumetric fractions are 0.9 for water and 0.1 for silicone oil. Given
the partition coefficients for water and oil at 10oC are 22.5 and 2.15 + 0.2, the values of CCH4,w and
CCH4,o in Study 2 can be calculated as 0.55 g CH4/m3 and 5.79 g CH4/m
3 respectively. Thus given an
average liquid phase flow rate of 4 L/day, 2.21 x 10⁻³
g CH4 is dissolved in the water phase and 2.31 x
10-2
g CH4 is dissolved in the silicone oil phase. Hence the concentration of CH4 in the silicone oil is
about 10 times that of the concentration in water.
As mass transfer is the limiting step in biological methane oxidation, particularly at such low
temperatures, this increased mass transfer significantly enhanced reactor performance during Study 2.
There was a visually observed improvement in biofilm growth and consistency compared to Study 1.
Biofilm on the sheets was slightly thicker and more evenly distributed throughout each of the sheets in
the reactors. This, along with a consistent distribution of silicone oil on each sheet in each reactor,
suggests a reasonable level of oil dispersion within the system.
In previous experiments examining two-phase biofilm reactors, a suitable degree of silicone oil
dispersion could be generated within the reactor mechanically (Rocha Rios et al., 2009; Bordel et al.,
2010; Gulfam et al., 2011) The flow regime employed by the HFBR precludes the generation of
mechanical dispersion in this manner, with magnetic agitation at the LNF reservoir rather than within
the reactor. As the effectiveness of silicone oil on mass transfer is dependent on the degree of oil

dispersion (Rocha Rios and Revah, 2013), increasing the degree of dispersion within the HFBR could
lead to additional performance improvements.
3.3. CH4 Study 3
(70 days – 10oC): Liquid phase of HFBR 1 and 2 comprises LNF, silicone oil and Brij 35.
Non-ionic surfactants such as Brij 35 have previously been shown to act as transfer vectors in a
methane oxidising biofilm (Avalos Ramirez et al., 2012a). Brij 35 has a hydrophilic-lipophilic balance
(HLB) number of 16.9 - within the range for solubilising oils into water. Thus the efficacy of
including a suitable concentration of a non-ionic surfactant could also lead to a greater degree of
silicone oil dispersion within the HFBR. Furthermore, low concentrations of Brij 35 (< 0.5% w/w or 5
g/L) have previously been shown to be both biodegradable and non-toxic to methanotrophic biomass
(Avalos Ramirez et al., 2012b).
Study 3 was divided into 5 sub-studies, namely Study 3a, Study 3b, Study 3a, Study 3c, Study 3d and
Study 3e lasting for 16, 17, 11, 14 and 12 days respectively.
Average removal rates, in Study 3a, increased by 28% (to 7.0 g CH4/m3/hr) and 23% (to 6.9 g
CH4/m3/hr) for HFBRs 1 and 2 respectively when compared to Study 2. In Study 3b average removals
further increased by 19% to 8.6 g CH4/m3/hr and 23% to 8.4 g CH4/m
3/hr for HFBRs 1 and 2
respectively.
During Study 3c, where concentrations of Brij-35 was increased to 2 g/L in the liquid phase, average
removals decreased by 41% (to 4.9 g CH4/m3/hr) and 33% (to 5.6 g CH4/m
3/hr) for HFBRs 1 and 2
respectively.
Following this decrease in performance the concentration of non-ionic surfactant was reduced to 1.0 g
CH4/m3/hr (Study 3d) for 14 days. Average removal rates recovered to 5.6 and 6.0 g CH4/m
3/hr,
representing an improvement of 15% and 7% for HFBRs 1 and 2 respectively when compared to
Study 3c. The concentration was further reduced to 0.75 g/L during Study 3e and average removal
rates further increased by 39% and 27% to 7.8 g CH4/m3/hr and 7.6 g CH4/m
3/hr for HFBRs 1 and 2

respectively. Throughout Study 3, the performance of HFBR 3 – which did not have Brij 35 – added
remained steady.
The performance of each reactor during Study 3 is illustrated in Table 5 and in Figure 4.
Table 5
CH4 Removal Results for Study 3 – Standard deviation shown in parentheses.
All removals in g CH4/m3/hr.
Study 3 a Study 3 b Study 3 c Study 3 d Study 3 e
Average
Removal
Maximum
Removal
Average
Removal
Maximum
Removal
Average
Removal
Maximum
Removal
Average
Removal
Maximum
Removal
Average
Removal
Maximum
Removal
HFBR
1
7.0
(0.36)
7.8
8.6
(0.81)
10.1
4.9
(1.09)
7.5
5.8
(0.64)
7.0
7.8
(0.81)
8.7
HFBR
2
6.9
(0.75)
8.1
8.5
(1.14)
10.4
5.6
(1.27)
8.3
6.0
(0.56)
6.9
7.6
(0.54)
8.21
HFBR
3
4.4
(0.56)
5.2
4.9
(0.84)
6.5
4.3
(0.62)
5.6
4.4
(0.68)
5.5
4.5
(0.30)
5.1

Figure 4. Average CH4 Removal for Study 3
As can be seen in Figure 4, the performances of HFBRs 1 and 2 initially improved significantly
following the addition of Brij 35. Comparison of variance (ANOVA) between steady state removals
during Study 2 and Study 3 revealed the increase in the removal performances of HFBRs 1 and 2 were
significant, whereas the average removal for HFBR 3, which did not have Brij 35 added, remained
similar during both Study 2 and Study 3.
The most probable reasons for this are the increase in CH4 availability in the liquid phase with the
non-ionic surfactant (Brij 35) acting as a direct transfer vector, in addition to the emulsifying effect of
the Brij 35 on the oil-water phase. Thus the addition of Brij may provide an alternative to mechanical
agitation used in previous studies to improve oil dispersion (Rocha Rios et al., 2009; Bordel et al.,
2010; Gulfam et al., 2011).
There was a notable improvement in the consistency of results (as measured by the standard deviation
of the average removals) during Study 3 (and indeed Study 2) when compared to Study 1 (during
pseudo steady state). This indicates that the improved (and possibly more consistent) mass transfer
resulted in a more stable reactor performance.
0
1
2
3
4
5
6
7
8
9
10
Re
mo
va
l (g
CH
4/m
3/h
r)
HFBR 1 Average HFBR 2 Average HFBR 3 Average
Study 3a, Study 3b, Study 3c, Study 3d, Study 3e

It can be observed from Figure 4 that a disimprovement occurred during Study 3c when the
concentration of Brij was increased from 1.0 g/L to 2.0 g/L (0.1% up to 0.2% w/w). The most
probable reason for this was excessive stripping of useful biomass brought about by the detergent
effect of the non-ionic surfactant. It is also possible that the bacterial population utilised the Brij 35 as
carbon source, leading to a decrease CH4 oxidation and corresponding increase in CO2 production
(discussed in more detail in Section 3.5). Excessive concentrations of biodegradable carbon have
previously been shown to be detrimental to the CH4 oxidation performance of a HFBR (Clifford et al.,
2012). The reactors quickly recovered when Brij 35 concentrations were returned to previous levels
(Study 3d and 3e). This observation contrasts with studies by Avalos Ramirez et al. (2012a), who
observed that although biomass production was reduced as the concentration of non-ionic surfactant
increased from 0.1 to 1.0% w/w due to biomass stripping, overall oxidation performance was not
diminished in this range. This contrast may be due to the design of the HFBR when compared to a
packed bed reactor such as was used in the study by Avalos Ramirez (2012a). The HFBR is designed
to maximise hydraulic retention time and promote good axial dispersion and mixing in the liquid
phase (Rodgers and Clifford, 2009). This may accentuate the detergent effect of the Brij-35 on the
biomass as the liquid phase moves through the reactor. Avalos Ramirez et al., (2012a) also observed
that the method of delivery of a non-ionic surfactant to a biotrickling filter had a significant effect on
performance. Therefore further optimisation of the method of delivery of the Brij 35 to the HFBR
could reduce susceptibility to higher concentrations and maximise its effect on mass transfer and
reducing surface tensions in the liquid phase.
3.4. Profile Removal Analysis
Profile analysis indicated removals were reasonably consistent down through the reactor during each
phase, with no particular zone producing consistently higher or lower removal rates. Profile results for
each of the three reactors during Study 1 are illustrated in Figure 5. Study 2 results are presented in
Figure 6 and Study 3 results are presented in Figure 7. During Study 1 of this study, influent organic

carbon concentration remained low (< 20 mg TOC/L) and the performance of uppermost sheets was
consistent with the rest of the reactor in each case. A similar case was observed during Study 2, where
organic carbon concentrations were slightly higher throughout the reactor, in the range 20 – 70 mg
TOC/L. This additional carbon, due to the addition of silicone oil, and has been shown previously to
be non-biodegradable (Rocha Rios et al., 2009; Munoz et al., 2007; Arriaga et al., 2006).
0
10
20
30
40
50
60
0 1 2 3 4
Sh
ee
t N
um
be
r
CH4 Removal (g CH4/m3/hr)
HFBR 1
HFBR 2
HFBR 3
Figure 5. CH4 profile removal results for Study 1
0
10
20
30
40
50
60
0 2 4 6 8
Sh
ee
t N
um
be
r
CH4 Removal (g CH4/m3/hr)
HFBR 1
HFBR 2
HFBR 3
Figure 6. CH4 profile removal results for Study 2
Organic carbon concentrations during Study 3 were higher in HFBRs 1 and 2 (250 – 350 mg TOC/L)
than in HFBR 3 (30 – 80 mg TOC/L). This additional organic was due to the presence of Brij 35 and
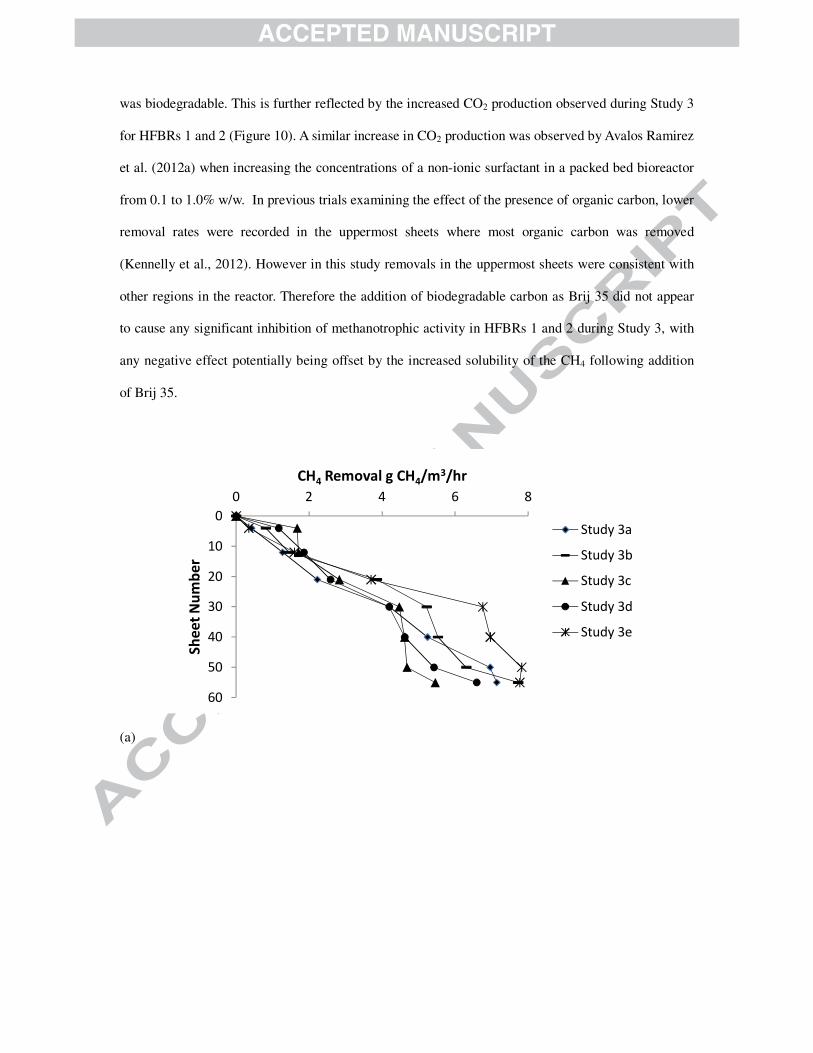
was biodegradable. This is further reflected by the increased CO2 production observed during Study 3
for HFBRs 1 and 2 (Figure 10). A similar increase in CO2 production was observed by Avalos Ramirez
et al. (2012a) when increasing the concentrations of a non-ionic surfactant in a packed bed bioreactor
from 0.1 to 1.0% w/w. In previous trials examining the effect of the presence of organic carbon, lower
removal rates were recorded in the uppermost sheets where most organic carbon was removed
(Kennelly et al., 2012). However in this study removals in the uppermost sheets were consistent with
other regions in the reactor. Therefore the addition of biodegradable carbon as Brij 35 did not appear
to cause any significant inhibition of methanotrophic activity in HFBRs 1 and 2 during Study 3, with
any negative effect potentially being offset by the increased solubility of the CH4 following addition
of Brij 35.
(a)
0
10
20
30
40
50
60
0 2 4 6 8
Sh
ee
t N
um
be
r
CH4 Removal g CH4/m3/hr
Study 3a
Study 3b
Study 3c
Study 3d
Study 3e

(b)
(c)
Figure 7. Study 3 CH4 profile removal results for (a) HFBR 1, (b) HFBR 2 and (c) HFBR 3
Profiles of the specific methane elimination capacities (i.e. g CH4 oxidised/g VSS/hr, where VSS
refers to volatile suspended solids) for each reactor at the end of Study 3 are shown in Table 6. The
values are in the range of 10-4
– 10-2
g CH4 oxidised/g VSS/hr. Although the average values for
specific methane elimination are lower than those presented by Rocha Rios et al. (2009), they are in
0
10
20
30
40
50
60
0 2 4 6 8
Sh
ee
t N
um
be
r
CH4 Removal g CH4/m3/hr
Study 3a
Study 3b
Study 3c
Study 3d
Study 3e
0
10
20
30
40
50
60
0 1 2 3 4 5 6
Sh
ee
t N
um
be
r
CH4 Removal g CH4/m3/hr
Study 3a
Study 3b
Study 3c
Study 3d
Study 3e

line with values from other studies in the literature, which were found to range between 10-6
– 10-2
g
CH4 oxidised/g VSS/hr (Xin, et al., 2003; Watanabe et al., 1997). The most likely reason for the values
presented in Table 6 being lower than those presented by Rocha Rios et al. (2009) is the lower
temperatures and lower loading rates used during this study. It was also observed that following the
addition of Brij 35, the biofilm appeared to become thicker and more consistent. While this may be
mostly a consequence of improved mass transfer and CH4 oxidation (a similar observation of
increased biofilm thickness and consistency was made at the end of Study 2), it is possible also that
the presence of biodegradable carbon as Brij 35 in the LNF resulted in the growth of some
carbonaceous heterotrophs, leading to increased biomass yield (Clifford et al., 2012) and reduced
specific methane elimination capacities.
Table 6
Specific CH4 Elimination Capacities
g CH4 oxidised/gVSS/hr
HFBR 1 HFBR 2 HFBR 3
Sheets 1-4 9.90 x 10⁻³ 1.77 x 10⁻² 3.78 x 10⁻³
Sheets 5-12 9.74 x 10⁻⁴ 1.35 x 10⁻³ 9.67 x 10⁻⁴
Sheets 13-21 2.46 x 10⁻³ 1.08 x 10⁻³ 1.36 x 10⁻³
Sheets 22-30 1.88 x 10⁻³ 1.58 x 10⁻³ 5.69 x 10⁻⁴
Sheets 31-40 5.98 x 10⁻⁴ 4.77 x 10⁻⁴ 1.36 x 10⁻³
Sheets 41-50 1.11 x 10⁻³ 6.95 x 10⁻⁴ 2.02 x 10⁻⁴
Sheets 51-55 1.24 x 10⁻³ 2.41 x 10⁻³ 5.11 x 10⁻⁴
As CH4 moves down through the reactor, diffusion profiles through biofilm on each sheet will vary.
Diffusion of methane through a methanotrophic biofilm can be given as follows (Nikiema et.al.
2009b):
��� ������� (Equation 5)
where:

Def = effective diffusion coefficient of CH4 in the biofilm (m2/s), SCH4 = concentration of CH4 within
the biofilm (g CH4/m3), x = depth coordinate in the biofilm (m).
The boundary conditions of this equation can be given follows:
At x = 0 and for 0 < z < H: �� �0, �� = ������ ����� (Equation 6)
where:
CCH4 = concentration of CH4 in the gas phase (g CH4/m3), HCH4 = Henry’s coefficient of CH4
z = biofilm reactor height coordinate (m), H = biofilm reactor height (m) and T = operating
temperature (oC)
At x = d and for 0 < z < H: ������,��
� = 0 (Equation 7)
where:
d = biofilm thickness (m) and SCH4 (d,z) = concentration of CH4 at depth d in the biofilm and height z
in the reactor (g CH4/m3).
i.e. no biodegradation takes place before mass transfer from the gas phase and biodegradation reaches
zero at a given depth through the biofilm (i.e. at a critical biofilm depth, below which no further
oxidation of the substrate occurs). This critical biofilm depth depends on the coefficient of diffusion of
the gas into the biofilm and the thickness of the biofilm (as well as the available concentration of
substrate).
This critical depth was modelled by Stewart (2003) who, having regard to biofilm phenomena such as
nutrient gradients, diverse microbial ecologies and solute reactivity described the following equation
to estimate the penetration depth of a reacting solute in a “flat-slab” shaped biofilm community:
� = ���������� � (Equation 8)
where:
Def = Effective diffusion coefficient of CH4 in the biofilm (m2/s), CCH4 = concentration of CH4 at the
gas-biofilm interface (g CH4/m3) and k0 = volumetric reaction rate = ! "
#$%
where:
µ = specific growth rate of microorganisms within the biofilm (s-1
), X = cell density in the biofilm
(g/m3) and Yxs = biomass yield coefficient (g biomass/g CH4)
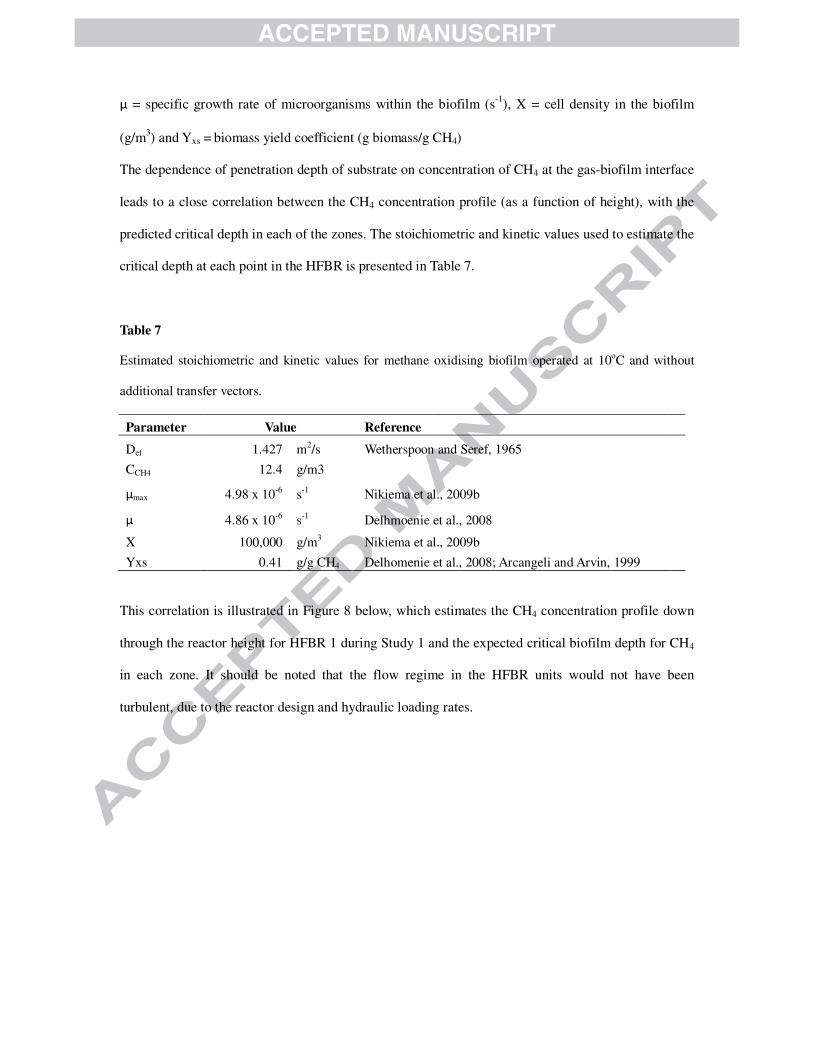
The dependence of penetration depth of substrate on concentration of CH4 at the gas-biofilm interface
leads to a close correlation between the CH4 concentration profile (as a function of height), with the
predicted critical depth in each of the zones. The stoichiometric and kinetic values used to estimate the
critical depth at each point in the HFBR is presented in Table 7.
Table 7
Estimated stoichiometric and kinetic values for methane oxidising biofilm operated at 10oC and without
additional transfer vectors.
Parameter Value Reference
Def 1.427 m2/s Wetherspoon and Seref, 1965
CCH4 12.4 g/m3
µmax 4.98 x 10-6 s-1 Nikiema et al., 2009b
µ 4.86 x 10⁻⁶ s-1 Delhmoenie et al., 2008
X 100,000 g/m3 Nikiema et al., 2009b
Yxs 0.41 g/g CH4 Delhomenie et al., 2008; Arcangeli and Arvin, 1999
This correlation is illustrated in Figure 8 below, which estimates the CH4 concentration profile down
through the reactor height for HFBR 1 during Study 1 and the expected critical biofilm depth for CH4
in each zone. It should be noted that the flow regime in the HFBR units would not have been
turbulent, due to the reactor design and hydraulic loading rates.
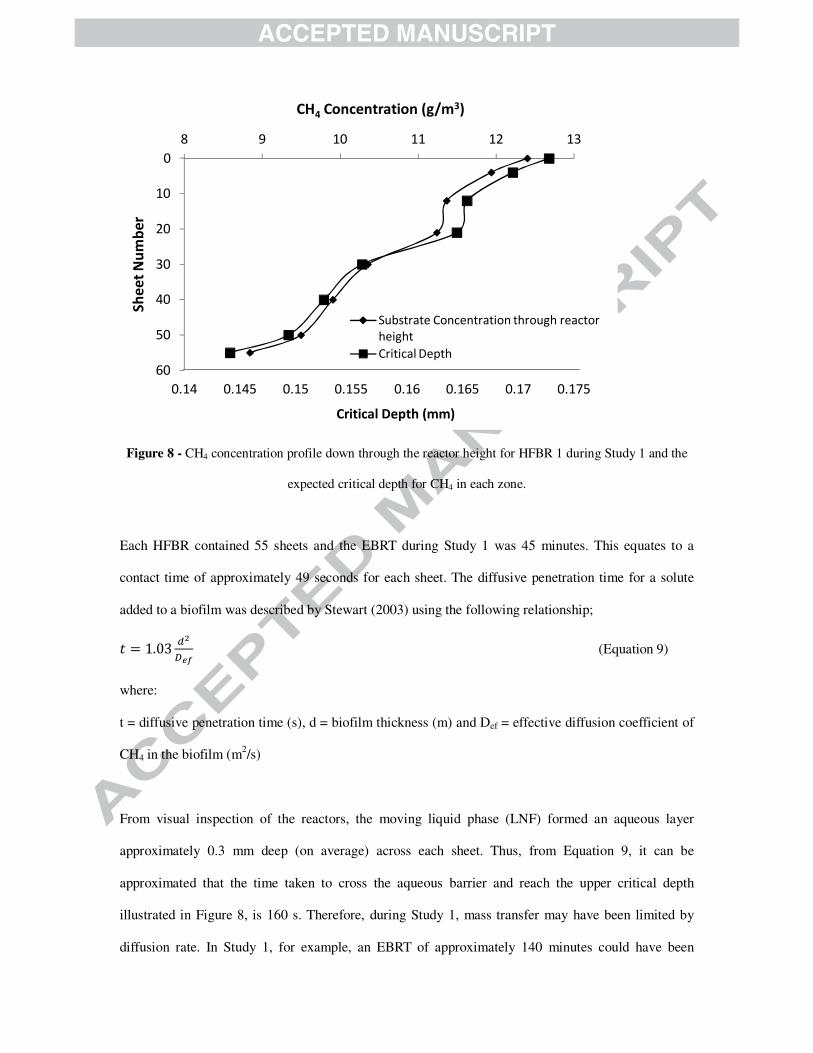
Figure 8 - CH4 concentration profile down through the reactor height for HFBR 1 during Study 1 and the
expected critical depth for CH4 in each zone.
Each HFBR contained 55 sheets and the EBRT during Study 1 was 45 minutes. This equates to a
contact time of approximately 49 seconds for each sheet. The diffusive penetration time for a solute
added to a biofilm was described by Stewart (2003) using the following relationship;
& = 1.03 ����� (Equation 9)
where:
t = diffusive penetration time (s), d = biofilm thickness (m) and Def = effective diffusion coefficient of
CH4 in the biofilm (m2/s)
From visual inspection of the reactors, the moving liquid phase (LNF) formed an aqueous layer
approximately 0.3 mm deep (on average) across each sheet. Thus, from Equation 9, it can be
approximated that the time taken to cross the aqueous barrier and reach the upper critical depth
illustrated in Figure 8, is 160 s. Therefore, during Study 1, mass transfer may have been limited by
diffusion rate. In Study 1, for example, an EBRT of approximately 140 minutes could have been
0.14 0.145 0.15 0.155 0.16 0.165 0.17 0.175
0
10
20
30
40
50
60
8 9 10 11 12 13
Critical Depth (mm)
Sh
ee
t N
um
be
r
CH4 Concentration (g/m3)
Substrate Concentration through reactor
height
Critical Depth

required to allow for complete mass transfer. As mentioned before, the concentration of methane
dissolved into the oil phase can be 10 times greater than that dissolved into the water phase. Thus, the
time taken to cross the liquid barrier and reach the upper critical depth (illustrated in Figure 8) would
likely reduce. It is expected that the addition of Brij 35 had a similar effect on the diffusion limitation;
however, detailed analysis of diffusion of methane into a liquid phase with multiple transfer vectors
would require a separate study. As EBRT should be minimised for practical design purposes, transfer
vectors such as silicone oil can be used to improve mass transfer into the liquid phase.
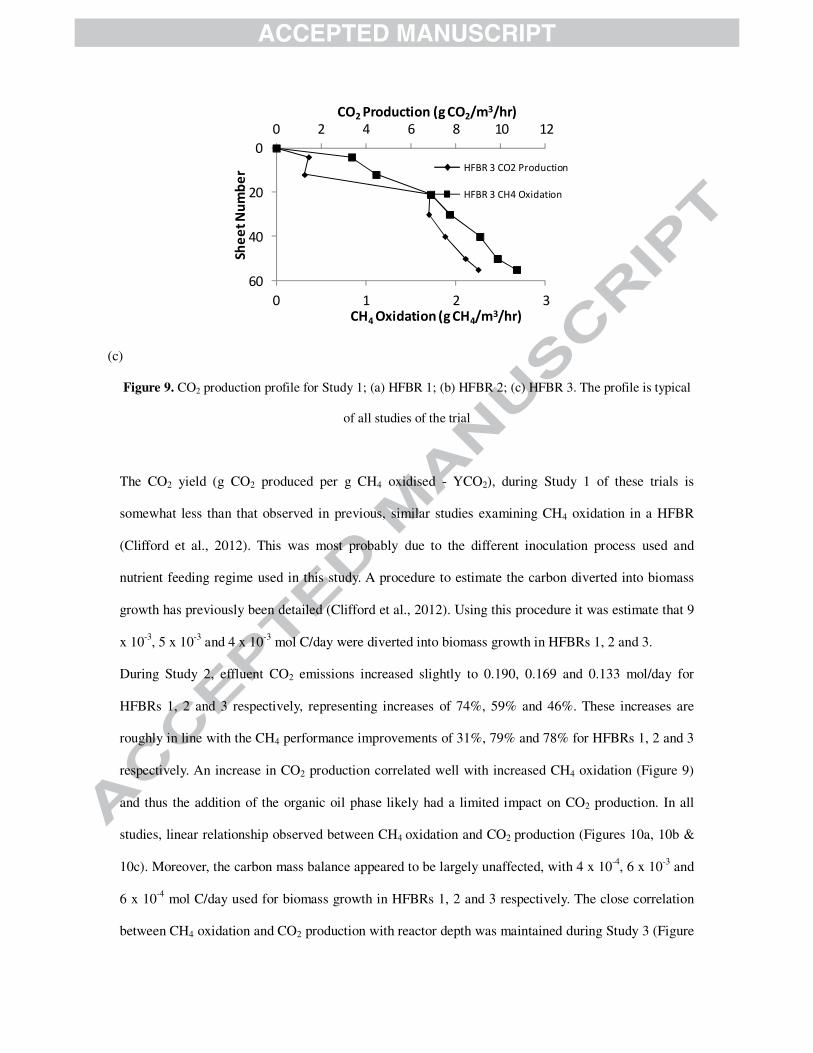
3.5. CO2 Production

CO2 production throughout HFBRs 1, 2 and 3 was monitored over each study to give additional
insight into methanotrophic activity in the biofilm. During each of the 3 studies the CO2 production
followed a similar profile to CH4 oxidation (Figure 9 shows the pattern during Study 1, similar
patterns were observed for all reactors during Study 2 and Study 3).
0 2 4
0
20
40
60
0 2 4 6 8 10 12
CH4 Oxidation (g CH4/m3/hr)
Sh
ee
t N
um
be
r
CO2 Production (g CO2/m3/hr)
HFBR 1 CO2 Production
HFBR 1 CH4 Oxidation
(a)
0 1 2 3 4
0
20
40
60
0 2 4 6 8 10 12
CH4 Oxidation (g CH4/m3/hr)
Sh
ee
t N
um
be
r
CO2 Production (g CO2/m3/hr)
HFBR 2 CO2 Production
HFBR 2 CH4 Oxidation
(b)
0 1 2 3
0
20
40
60
0 2 4 6 8 10 12
CH4 Oxidation (g CH4/m3/hr)
She
et
Nu
mb
er
CO2 Production (g CO2/m3/hr)
HFBR 3 CO2 Production
HFBR 3 CH4 Oxidation
(c)
Figure 9. CO2 production profile for Study 1; (a) HFBR 1; (b) HFBR 2; (c) HFBR 3. The profile is typical
of all studies of the trial
The CO2 yield (g CO2 produced per g CH4 oxidised - YCO2), during Study 1 of these trials is
somewhat less than that observed in previous, similar studies examining CH4 oxidation in a HFBR
(Clifford et al., 2012). This was most probably due to the different inoculation process used and
nutrient feeding regime used in this study. A procedure to estimate the carbon diverted into biomass
growth has previously been detailed (Clifford et al., 2012). Using this procedure it was estimate that 9
x 10-3
, 5 x 10⁻³
and 4 x 10⁻³
mol C/day were diverted into biomass growth in HFBRs 1, 2 and 3.
During Study 2, effluent CO2 emissions increased slightly to 0.190, 0.169 and 0.133 mol/day for
HFBRs 1, 2 and 3 respectively, representing increases of 74%, 59% and 46%. These increases are
roughly in line with the CH4 performance improvements of 31%, 79% and 78% for HFBRs 1, 2 and 3
respectively. An increase in CO2 production correlated well with increased CH4 oxidation (Figure 9)
and thus the addition of the organic oil phase likely had a limited impact on CO2 production. In all
studies, linear relationship observed between CH4 oxidation and CO2 production (Figures 10a, 10b &
10c). Moreover, the carbon mass balance appeared to be largely unaffected, with 4 x 10⁻⁴
, 6 x 10⁻³
and
6 x 10⁻⁴
mol C/day used for biomass growth in HFBRs 1, 2 and 3 respectively. The close correlation
between CH4 oxidation and CO2 production with reactor depth was maintained during Study 3 (Figure

10c) indicating the CO2 emitted in the effluent was due mainly to CH4 oxidation, which is in line with
other studies (Avalos Ramirez et al., 2012b).
However, as can be seen from Figure 11, YCO2 increased in HFBRs 1 and 2 during Study 3c and 3d.
This indicates additional organic carbon oxidation and subsequent CO2 production, probably due to
the presence of the Brij 35 in the LNF. This has been observed other studies (Avalos Ramirez et al.,
2012b), which also recorded an increase in YCO2 following addition of non-ionic surfactant.
The presence of biodegradable organic carbon has previously been shown to inhibit performance of a
CH4 oxidising HFBR (Clifford et al., 2012) and therefore may have been a factor in the reduced
oxidation performance that was observed at higher concentrations of Brij 35 (Study 3c).
(a)
(b)
0
55
0
2
4
6
8
10
0 1 2 3 4 5
Sh
ee
t N
um
be
r
CO
2P
rod
uct
ion
(g C
O2/m
3/h
r)
CH4 Oxidation (g CH4/m3/hr)
HFBR 1
HFBR 2
HFBR 3
0
55
0
5
10
15
20
0 2 4 6
Sh
ee
t N
um
be
r
CO
2P
rod
uct
ion
(g C
O2/m
3/h
r)
CH4 Oxidation (g CH4/m3/hr)
HFBR 1
HFBR 2
HFBR 3

(c)
Figure 10. Relationship between CO2 production and CH4 oxidation at different depths of each reactor for;
(a) Study 1; (b) Study 2 and (c) Study 3 (all sub-studies). R2 for each linear equation varied between 0.92 and
0.98 for all studies. Slopes are within 1 standard deviation of overall effluent YCO2 for each study.
Figure 11. YCO2 for HFBRs 1, 2 and 3
3.6. Liquid Phase Analysis
3.6.1. Total Organic Carbon
0
55
0
5
10
15
20
25
0 2 4 6 8
Sh
ee
t N
um
be
r
CO
2P
rod
uct
ion
(g C
O2/m
3/h
r)
CH4 Oxidation (g CH4/m3/hr)
HFBR 1
HFBR 2
HFBR 3
0
1
2
3
4
5
6
7
0 1 2 3 4 5 6
YC
O2
(g C
O2/g
CH
4)
HFBR 1 HFBR 2 HFBR 3
Study 1 Study 2 Study 3a Study 3b Study 3c Study 3d Study 3e

The absence of external biodegradable carbon in the nutrient feed leads to improved methanotrophic
activity in a methane oxidising HFBR (Clifford et al., 2012; Kennelly et al., 2012). Therefore during
Study 1 of these trials, influent organic carbon was minimal (< 18 mg TOC/L) and removal of liquid
phase organic carbon was consistently below 15%.
Organic carbon was slightly higher in each of the reactors during Study 2. This additional carbon was
due to the addition of silicone oil (non-biodegradable), and therefore of liquid phase organic carbon
remained consistently below 10%.
As can be seen from Figure 12, influent TOC removal increased in HFBRs 1 and 2 during Study 3.
This additional organic carbon removal was due to the addition of Brij 35, which was biodegradable.
Liquid phase TOC removal increased to 27% for HFBR 1 and 29% for HFBR 2. No increases in
liquid phase TOC removal was observed for HFBR 3 (which had no Brij 35 added during Study 3).
Figure 12. Total Organic Carbon (TOC). Average removals are shown as columns.
3.6.2. Nitrogen
Previous studies (Nikiema et al., 2009a) established that the optimum nitrogen concentration for a
packed bed biofilter treating similar loads of CH4 to this study is 0.75 g N/L as nitrate (NO3-N). The
0
5
10
15
20
25
30
35
40
% T
OC
Re
mo
va
l
Study 1 Removal Study 2 Removal Study 3 Removal
HFBR 1 HFBR 2 HFBR 3

results of that study also found that concentrations of 0.25 g N/L were generally as effective as
concentrations of 0.75 up to a loading rate of 20 g CH4/m3/hr, therefore 0.25 g N/L as nitrate were
included in the LNF for this study.
However during these trials, NO3-N uptake was variable (4 – 34 %) and no clear pattern of uptake
could be established from the LNF profile analysis (Figure 13). This contrasts with the uptake pattern
of NH4 added to HFBR 3 during Study 1, which steadily reduced in concentration as it passed through
HFBR 3 (Figure 14). The performance of HFBR 3 improved following the addition of 25 mg NH4-
N/L suggesting that ammonia may be the preferred nitrogen species in a CH4 oxidising HFBR, in line
with previous studies (Clifford et al., 2012; Kennelly et al., 2012).
However given the complex nature of nitrogen dynamics in such a system, further studies are
necessary to describe how nitrogen addition can be optimised and reconciled with other operating and
environmental parameters such as CH4 loading rate, optimised LNF flow regime, temperature, pH,
inoculation techniques etc.
Figure 13. Nitrate Nitrogen (NO3-N) average removals during Study 1. The profile is typical of all studies of
the trial
0
10
20
30
40
50
60
100.0 150.0 200.0 250.0 300.0
Sh
ee
t N
um
be
r
NO3-N (mg/L)
HFBR 1
HFBR 2
HFBR 3
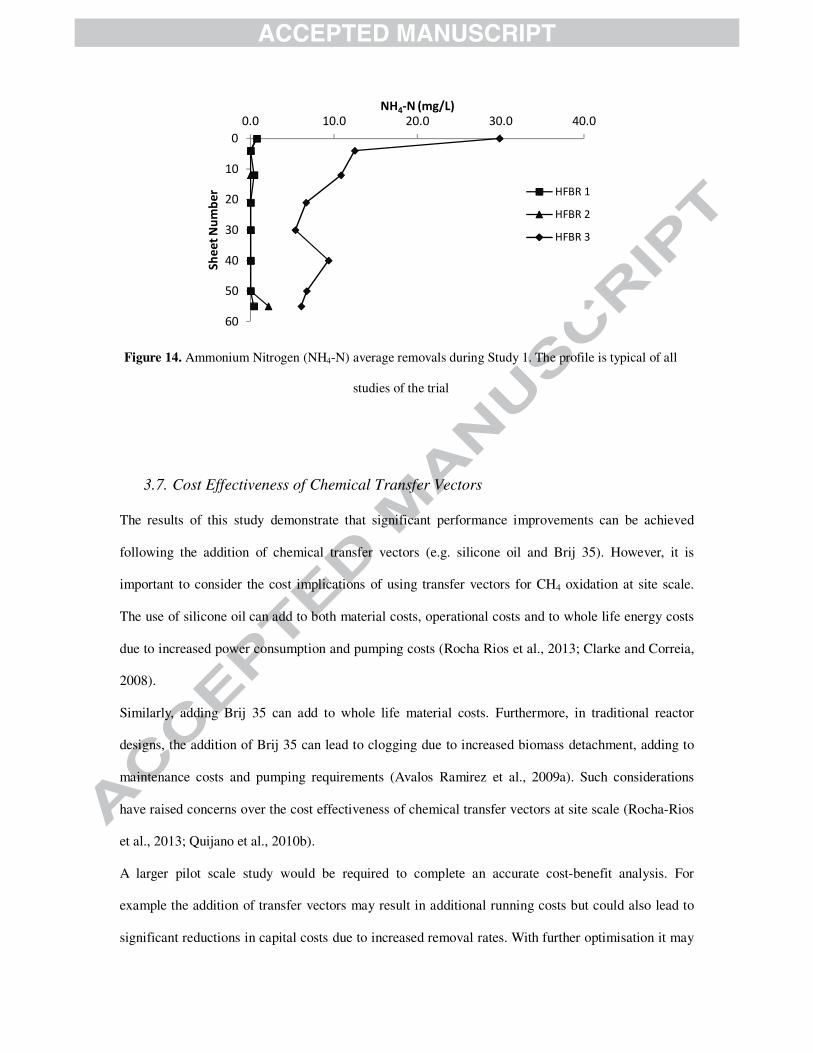
Figure 14. Ammonium Nitrogen (NH4-N) average removals during Study 1. The profile is typical of all
studies of the trial
3.7. Cost Effectiveness of Chemical Transfer Vectors
The results of this study demonstrate that significant performance improvements can be achieved
following the addition of chemical transfer vectors (e.g. silicone oil and Brij 35). However, it is
important to consider the cost implications of using transfer vectors for CH4 oxidation at site scale.
The use of silicone oil can add to both material costs, operational costs and to whole life energy costs
due to increased power consumption and pumping costs (Rocha Rios et al., 2013; Clarke and Correia,
2008).
Similarly, adding Brij 35 can add to whole life material costs. Furthermore, in traditional reactor
designs, the addition of Brij 35 can lead to clogging due to increased biomass detachment, adding to
maintenance costs and pumping requirements (Avalos Ramirez et al., 2009a). Such considerations
have raised concerns over the cost effectiveness of chemical transfer vectors at site scale (Rocha-Rios
et al., 2013; Quijano et al., 2010b).
A larger pilot scale study would be required to complete an accurate cost-benefit analysis. For
example the addition of transfer vectors may result in additional running costs but could also lead to
significant reductions in capital costs due to increased removal rates. With further optimisation it may
0
10
20
30
40
50
60
0.0 10.0 20.0 30.0 40.0
Sh
ee
t N
um
be
r
NH4-N (mg/L)
HFBR 1
HFBR 2
HFBR 3

be possible to circumvent many of the additional costs incurred by using chemical transfer vectors.
For example, an effective liquid phase recirculation strategy could significantly reduce material costs,
although further research would be necessary to determine the degradation rates of nutrients and Brij
35 in the liquid phase. In addition, the HFBR has previously been shown to be a low cost and energy
efficient reactor technology, both at laboratory and site scale (Clifford et al., 2010; Rodgers and
Clifford, 2009).
4. Conclusions
In this paper, methods of improving the performance of a CH4 oxidising Horizontal Flow Biofilm
Reactor (HFBR) operating at low temperatures were investigated. The study shows how liquid phase
improvement using secondary organic liquid phases and non-ionic surfactants can significantly reduce
mass transfer limitations in a CH4 biofilm reactor. Furthermore, despite the low operating
temperatures employed in this study, the HFBR technology has excellent potential to treat emissions
of low concentrations of CH4. The key conclusions are as follows:
• Given the low operating temperature (10oC) during this trial, the results compare
favourably with previous studies, even without the addition of chemical transfer
vectors. Maximum average removals of 8.6 g CH4/m3/hr were observed. The
maximum observed removal was 10.5 g CH4/m3/hr.
• The results suggest that the addition of ammonium salts in low concentrations can
have a positive influence on the performance a methanotrophic biofilm. It should be
noted that reports in literature vary as to the optimum species and concentrations of
nitrogen that should be added to the liquid phase of a CH4 oxidising biofilm reactor.
This is an area that may require further research.

• The addition of silicone oil to the liquid nutrient feed (LNF) led to performance
improvements of 31%, 79% and 78% for HFBRs 1, HFBR 2 and HFBR 3
respectively. The most probable reason for this improvement was increased mass
transfer of CH4 into the liquid phase following the addition of the silicone oil.
• Subsequent addition of a non-ionic surfactant (Brij 35) to HFBRs 1 and 2 led to
further significant improvements in reactor performance of up to 110% and 174%
respectively when compared to the addition of silicone oil alone. This was most likely
due to the increase in CH4 availability in the liquid phase. The non-ionic surfactant
(Brij 35) acted as a direct transfer vector, in addition to its emulsifying effect of the
oil-water phase.
• Profile analysis indicated consistent CH4 oxidation throughout each zone of each
HFBR throughout the study. Although microbial communities will vary with depth
due to changes in substrate and nutrient availabilities, the consistent removal profile is
in keeping with the structured, modular nature of the HFBR that limits bypass and
maximises contact time.
Further work could focus on the costs and cost benefits of using transfer vectors at a larger scale.
Detailed microbial analysis currently underway will help characterise the microbial communities
dominant in the HFBR during these trials and may illustrate provide additional information on
processes within in the HFBR system.
5. Acknowledgements

The authors would like to gratefully acknowledge financial support from Science Foundation Ireland
(SFI) and Enterprise Ireland.
6. References:
1. APHA-AWWA-WEF. 2005. Standard Methods for Examination of Water and
Wastewater 21st ed. American Public Health Association, Washington.
2. Arcangeli, J.P & Arvin, E. (1999). Modelling the growth of a methanotrophic biofilm:
Estimation of parameters and variability. Biodegradation 10: 177-191.
3. Arriaga, S., Munoz, R., Hernandez, S., Guieysse, B. and Revah, S. (2006). Gaseous
hexane biodegradation by Fusarium solani in two liquid phase packed-bed and stirred
tank bioreactors, Environ. Sci. Technol. 40: 2390–2395.
4. Avalos Ramirez, A., Jones, P.J., Heitz, M. (2012a). Improvement of methane biofiltration
by addition of non-ionic surfactants to biofilters packed with inert materials. Process
Biochem. 47: 76-82.
5. Avalos Ramirez, A., Jones, P.J., Heitz, M. (2012b). Methane treatment in biotrickling
filters packed with inert materials in presence of a non-ionic surfactant. J. Chem. Technol.
Biotechnol. 87: 848-853.
6. Bodelier, P.L., Roslev, P., Henckel, T., Frenzel1, P. (2000). Stimulation by ammonium-
based fertilizers of methane oxidation in soil around rice roots. Nature 403: 421-424.
7. Bordel S., Hernández M., Villaverde S., Muñoz R. (2010). Modelling gas-liquid VOCs
transport in two-liquid phase partitioning bioreactors. Int J Heat Mass Transfer 53:1139-
1145.
8. Clifford, E., Kennelly, C., Walsh, R., Gerrity, S., O. Reilly, E., Collins, G. (2012).
Optimisation of a horizontal flow biofilm reactor for the removal of methane at low

temperatures. Journal of the Air and Waste Management Association. 62 (10):1154–1161,
2012.
9. Clifford, E., Nielsen, M., Sørensen, K., Rodgers, M. 2010. Nitrogen dynamics and
removal in a horizontal flow biofilm reactor for wastewater treatment. Water Research.
44 (13): 3819- 3828.
10. Chiemchaisri, W., Chiemchaisri, C. and Boonchaiyuttasak J. (2013). Utilization of
stabilized wastes for reducing methane emission from municipal solid waste disposal.
Bioresource. Technology. 141: 199 - 204.
11. Clarke, K. and Correia, L. 2008. Oxygen transfer in hydrocarbon–aqueous dispersions
and its applicability to alkane bioprocesses: a review, Biochem. Eng. J. 39: 405-429.
12. Delhomenie, M.C., Nikiema, J., Bibeau, L. & Heitz, M. (2008). A new method to
determine the microbial kinetic parameters in biological air filters. Chemical Engineering
Science, 63: 4126-4134.
13. du Plessis, C.A., Strauss, J.M., Sebapalo, E.M.T. and Reidel, K.H.J. (2003). Empirical
Model for Methane Oxidation using a Composted Pine Bark Biofilter. Fuel 82: 1359 -
1365.
14. Gerbert, J. and Grongroft, A. (2006). Performance of a Passively Vented Field Scale
Biofilter for the Microbial Oxidation of Landfill Methane. Waste Management 26: 399 –
407.
15. Gulfam, M., Lee, J.M. and Chung, B.G. (2011). Two-phase bioreactor system for cell-
laden hydrogel assembly. Biotechnol Prog. 27(2):466-472.
16. Haubrichs R., Widmann R. 2006. Evaluation of Aerated Biofilter Systems for Microbial
Methane Oxidation of Poor Landfill Gas. Waste Management, 26: 408-416.
17. Hernández, J and Omil, F. (2013). Long-term biofiltration of methane diffuse emissions:
optimization of conventional parameters and the role of SMP and EPS. Proceedings of

the 5th IWA Specialized Conference on Odors and Air Emissions. 4-7 March 2013 San
Francisco, California, USA.
18. Kennelly, C., Clifford, E., Gerrity, S., Walsh, R., Rodgers, M., Collins, G. (2012). A
Horizontal Flow Biofilm Reactor (HFBR) Technology for the Removal of Methane and
Hydrogen Sulphide at Low Temperatures. Water Science and Technology. 66 (9): 1997-
2006.
19. King, A.D. (2001). Solubilization of gases by poly(ethylene oxide) – poly(propylene
oxide) triblock copolymers. Journal of Colloid and Interface Science 244:123 - 127.
20. Kraakman, B. and Witherspoon, J. (2013). Review of Innovative and Developmental
Methane Mitigation Technologies. Proceedings of the 5th IWA Specialized Conference
on Odors and Air Emissions. 4-7 March 2013 San Francisco, California, USA.
21. Jurado, E., Fernandez-Serrano, M., Nunez-Olea, J. and Lechuga, M. (2007) Primary
biodegradation of commercial fatty-alcohol ethoxylate surfactants: characteristic
parameters. Journal of Surfactants and Detergents 10:145 - 153.
22. Lomond, J.S. and Tong, A.Z. (2011). Rapid Analysis of Dissolved Methane, Ethylene,
Acetylene and Ethane using Partition Coefficients and Headspace-Gas Chromatography.
Journal of Chromatographic Science. 49: 469-475.
23. Melse, R.W. and Van Der Werf, A. W. (2005). Biofiltration for Mitigation of Methane
Emission from Animal Husbandry. Environ. Sci Technol, 39: 5460-5468
24. Munoz, R., Villaverde, S., Guieysse, B. and Revah, S. (2007) Two-phase partitioning
bioreactors for treatment of volatile organic compounds. Biotech. Adv. 25: 410–422.
25. Nikiema, J., Girard, M., Brzezinski, R., Heitz, M. (2009a). Biofiltration of methane using
an inorganic filter bed: Influence of Inlet load and nitrogen concentration. Can. J. Civ.
Eng. 36: 1903-1910.

26. Nikiema, J., Payre, G., Heitz, M. (2009b). A mathematical steady state model for
methane bioelimination in a closed biofilter. Chemical Engineering Journal. 150: 418-
425.
27. Nikiema, J. and Heitz, M. (2009). The Influence of the Gas Flow Rate during Methane
Biofiltration on an Inorganic Packing Material. The Canadian Journal of Civil
Engineering, 87: 136 - 142.
28. Quijano, G., Chavez-Avila, R., Muñoz, R., Thalasso, F. and Ordaz, A. (2010a). KLa
measurement in two-phase partitioning bioreactors: new insights on potential errors at
low power input. Journal of Chemical Technology and Biotechnology. 85:1407-1412.
29. Quijano, G., Hernandez, M., Villaverde, S., Thalasso, F., Muñoz, R. 2010b. A step-
forward in the characterization and potential applications of solid and liquid oxygen
transfer vectors, Appl. Microbiol. Biotechnol. 85: 543–551.
30. Rocha Rios, J. and Revah, S. (2013). Oxygen transfer rate determination during steady
methane biodegradation in a two-phase partition stirred tank reactor. Proceedings of the
5th IWA Specialized Conference on Odors and Air Emissions. 4-7 March 2013 San
Francisco, California, USA.
31. Rocha-Rios, J., Kraakman N.J.R., Kleerebezem, R., Revah, S., Kreutzer, M.T., van
Loosdrecht, M.C.M. (2013). A capillary bioreactor to increase methane transfer and
oxidation through Taylor flow formation and transfer vector addition. Chemical
Engineering Journal 217: 91-98.
32. Rocha Rios, J., Munoz, R. and Revah, S. (2010). Effect of silicone oil fraction and
stirring rate on methane degradation in a stirred tank reactor. J. Chem. Technol.
Biotechnol. 85: 314-319.
33. Rocha Rios, J., Bordel, S., Hernandez, S. (2009). Methane degradation in two-phase
partition bioreactors. Chem. Eng. J. 152: 289-292.

34. Rodgers, M and Clifford, E. (2009). Horizontal-Flow Biofilm Reactors for the Removal
of Carbon and Nitrogen from Domestic-Strength Wastewaters. Water Environ. Res. 81
(4): 339-347.
35. Stewart, P.S. (2003). Diffusion in Biofilms. Journal of Bacteriology, 185 (5): 1485-1491.
36. Streese, J., Stegmann, R. (2003). Microbial Oxidation of Methane from old Landfills in
Biofilters. Waste Management. 23: 573-580.
37. Veillette, M., Viens, P., Avalos Ramirez, A., Brzezinski, R. and Heitz, M. (2011) Effect
of ammonium concentration on microbial population and performance of a biofilter
treating air polluted with methane. Chemical engineering journal. 171, 114-1123.
38. Veillette, M., Girard, M., Viens, P., Brzezinski, R. and Heitz, M. (2012). Function and
limits of biofilters for the removal of methane in exhaust gases from the pig industry.
Applied Microbiology and Biotechnology. 94: 601–611.
39. Watanabe, I., Hashimoto T. and A. Shimoyama. (1997). Methane-oxidizing activities and
methanotrophic populations associated with wetland rice plants. Biol Fertil Soils 24:
261–265
40. Whittenbury, R., Phillips, K.C. and Wilkinson, J.F. (1970). Enrichment, isolation and
some properties of methane-utilizing bacteria. Journal of General Microbiology. 61: 205-
218.
41. Witherspoon, P. A. & Saraf, D.N. (1965). Diffusion of Methane, Ethane, Propane, and n-
Butane in Water from 25 to 43oC. The Journal of Physical Chemistry, 69 (11): 3752-
3755.
42. Xin, J., Cui, J., Chen, J., Li, S., Xia, C., and Zhu, L. (2003). Continuous biocatalytic
synthesis of epoxypropane using a biofilm reactor, Proc. Biochem. 38 1739–1746.

HIGHLIGHTS
• Methods for the optimisation of a horizontal flow biofilm reactor for the removal
of methane gas are investigated.
• Ammonium salts appeared to have a positive influence on the performance of
HFBR 3.
• Addition of silicone oil to the liquid phase led to significant performance
improvements.
• Addition of a non ionic surfactant led to further significant improvements.
• CO2 analysis revealed good correlation between CO2 production and CH4
oxidation.


