Embed Size (px)
Citation preview
Recommendations and Supporting Analysis of Conservation Opportunities
for the Marbled Murrelet Long-Term Conservation Strategy
Prepared for:Washington State Department of Natural Resources
Olympia, Washington
September 2008

Suggested Citation
Raphael, M. G., S. K. Nelson, P. Swedeen, M. Ostwald, K. Flotlin, S. Desimone, S. Horton,
P. Harrison, D. Prenzlow Escene, and W. Jaross. 2008. Recommendations and
Supporting Analysis of Conservation Opportunities for the Marbled Murrelet Long-Term
Conservation Strategy. Washington State Department of Natural Resources, Olympia,
WA.

Recommendations and Supporting Analysis
of Conservation Opportunities for the
Marbled Murrelet Long-Term Conservation Strategy
Prepared for: Washington State Department of Natural Resources
Olympia, Washington
Prepared by: The Marbled Murrelet Science Team
M. G. Raphael, S. K. Nelson, P. Swedeen, M. Ostwald, K. Flotlin, S. Desimone, S. Horton, P. Harrison, D. Prenzlow Escene, and W. Jaross
In Association With: Hamer Environmental, L.P.
Mt. Vernon, Washington and
EDAW, Inc. Seattle, Washington
September 2008


1111 WASHINGTON ST SE i PO BOX 47041 i OLYMPIA, WA 98504-7041 TEL: (360) 902-1250 i FAX: (360) 902-1780i TTY: (360) 902-1125
Equal Opportunity / Affirmative Action Employer
DOUG SUTHERLAND Commissioner of Public Lands
September 9, 2008 Dear Reader: The Washington State Department of Natural Resources (DNR) is proud to present a technical report prepared by the Marbled Murrelet Science Team for the management of marbled murrelet habitat on DNR-managed forests in Southwest Washington and on the Olympic Peninsula titled, Recommendations and Supporting Analysis of Conservation Opportunities for the Marbled Murrelet Long-Term Conservation Strategy. The report was released on the internet in February 2008 while waiting for two chapters to be completed. The completed report is now final and updated online. When DNR completed its Habitat Conservation Plan in 1997, it was not able to include a Long-Term Conservation Strategy for the marbled murrelet due to the lack of sufficient scientific knowledge regarding habitat and nesting criteria. Instead, an interim strategy was created to guide the collection of data to inform the subsequent development of a Long-Term Conservation Strategy. In 2004, DNR convened a team of professionals to compile expert opinion, data, and research on marbled murrelet habitat conservation. These specialists, known within this report as the Science Team, were asked to develop a set of recommendations for DNR to consider when developing a Long-Term Conservation Strategy for the marbled murrelet on DNR-managed forestlands. The attached report, which embodies the Science Team’s recommendations and their supporting analysis, is a thoughtful and innovative piece of scientific work unlike that done by any other landowner for the conservation of this federally threatened species. The Science Team members, all marbled murrelet experts with varied backgrounds in research, monitoring and management, worked for almost four years to fulfill their mandate. I believe you will be impressed with the quality of their work. This report supplies a landscape-level examination of conservation opportunities for DNR to consider in their crafting of a Long-Term Conservation Strategy. It includes the definition of appropriate biological goals for habitat conservation, an evaluation and rationale for important landscapes for support of those biological goals, and some preliminary forest modeling to demonstrate tools for DNR to use in evaluating alternative approaches to a Long-Term Conservation Strategy. This report details recommendations developed by the Science Team for DNR’s consideration; it is not a draft strategy. The development of a proposed Long-Term Conservation Strategy will be done by DNR with input from the U.S. Fish and Wildlife Service, and will be informed by additional analysis and public input. Opportunities for public input will be provided

Recommendations and Supporting Analysis of Conservation Opportunities for the Marbled Murrelet Long-Term Conservation Strategy September 9, 2008 Page 2 of 2 through the environmental review process under the National Environmental Policy Act and State Environmental Policy Act. I greatly appreciate the time and work that DNR’s team members devoted to this important effort, and the tireless and rigorous scientific contributions that the Science Team provided. Their work gives DNR the scientific foundation for a conservation strategy that will make a contribution to the conservation of marbled murrelet habitat in western Washington. Sincerely,
Bruce Mackey DNR Land Steward
September 2008 A
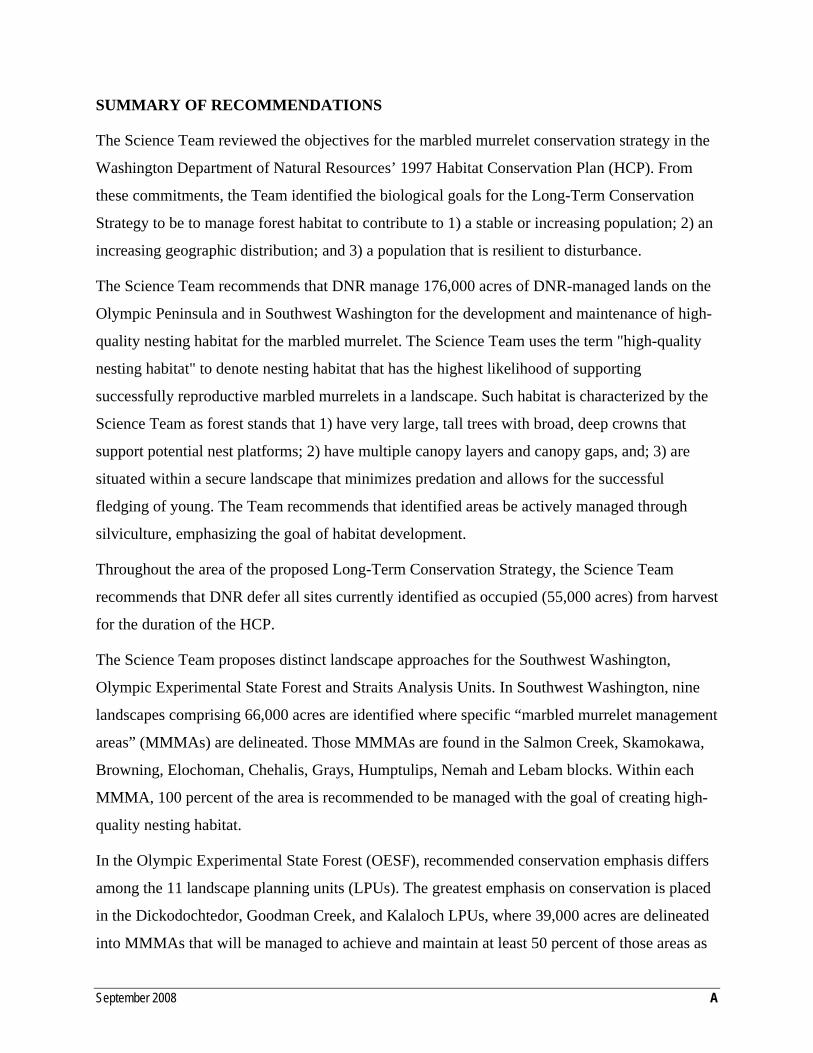
SUMMARY OF RECOMMENDATIONS
The Science Team reviewed the objectives for the marbled murrelet conservation strategy in the
Washington Department of Natural Resources’ 1997 Habitat Conservation Plan (HCP). From
these commitments, the Team identified the biological goals for the Long-Term Conservation
Strategy to be to manage forest habitat to contribute to 1) a stable or increasing population; 2) an
increasing geographic distribution; and 3) a population that is resilient to disturbance.
The Science Team recommends that DNR manage 176,000 acres of DNR-managed lands on the
Olympic Peninsula and in Southwest Washington for the development and maintenance of high-
quality nesting habitat for the marbled murrelet. The Science Team uses the term "high-quality
nesting habitat" to denote nesting habitat that has the highest likelihood of supporting
successfully reproductive marbled murrelets in a landscape. Such habitat is characterized by the
Science Team as forest stands that 1) have very large, tall trees with broad, deep crowns that
support potential nest platforms; 2) have multiple canopy layers and canopy gaps, and; 3) are
situated within a secure landscape that minimizes predation and allows for the successful
fledging of young. The Team recommends that identified areas be actively managed through
silviculture, emphasizing the goal of habitat development.
Throughout the area of the proposed Long-Term Conservation Strategy, the Science Team
recommends that DNR defer all sites currently identified as occupied (55,000 acres) from harvest
for the duration of the HCP.
The Science Team proposes distinct landscape approaches for the Southwest Washington,
Olympic Experimental State Forest and Straits Analysis Units. In Southwest Washington, nine
landscapes comprising 66,000 acres are identified where specific “marbled murrelet management
areas” (MMMAs) are delineated. Those MMMAs are found in the Salmon Creek, Skamokawa,
Browning, Elochoman, Chehalis, Grays, Humptulips, Nemah and Lebam blocks. Within each
MMMA, 100 percent of the area is recommended to be managed with the goal of creating high-
quality nesting habitat.
In the Olympic Experimental State Forest (OESF), recommended conservation emphasis differs
among the 11 landscape planning units (LPUs). The greatest emphasis on conservation is placed
in the Dickodochtedor, Goodman Creek, and Kalaloch LPUs, where 39,000 acres are delineated
into MMMAs that will be managed to achieve and maintain at least 50 percent of those areas as

Summary of Recommendations
September 2008 B
high-quality nesting habitat. In the other eight LPUs, varying conservation emphases are
recommended based on specific landscape configuration, forest conditions, and other
management considerations in those individual landscapes. The Science Team also recommends
that all designated “old forest” in the OESF, about 44,000 acres, be deferred from harvest for the
duration of the HCP in support of nesting habitat for the marbled murrelet.
In the Straits Analysis Unit, due to the presence of high-quality nesting habitat on federal lands,
it is proposed that DNR maintain and buffer all occupied sites as the only conservation measure
employed.
Across all three analysis units, in areas without specific recommended conservation emphasis,
management will increase marbled murrelet nesting habitat through the implementation of other
conservation objectives.
Using quantitative methods, the Science Team evaluated two simplified forest land management
scenarios for their ability to maximize over the life of the HCP the quality and quantity of
marbled murrelet habitat on DNR-managed land on the Olympic Peninsula and in southwest
Washington. These two scenarios, “No Management” and “Habitat Management”, simulated
forest growth and consequent development of marbled murrelet habitat. Analysis suggests that
DNR’s policies, in concert with the specific approach to marbled murrelet conservation, will
result in improved inland habitat conditions in the Southwest Washington and Olympic
Experimental State Forest Analysis Units. Projected habitat conditions improve under both
scenarios, with DNR-managed lands doubling their potential capability to provide habitat for
marbled murrelets in both analysis units. The Habitat Management scenario creates more
potential habitat capability in Southwest Washington than the No Management scenario over the
life of the HCP, while both scenarios perform equally well in the Olympic Experimental State
Forest. Additional analysis is required in order to fine tune habitat development modeling, which
will be undertaken during the development of alternatives to be considered by the Department of
Natural Resources and the U.S. Fish and Wildlife Service during the development of the Long-
Term Conservation Strategy.

September 2008 i
ACKNOWLEDGEMENTS
AUTHORS AND PRINCIPAL CONTRIBUTORS Principal Authors
Dr. Martin G. Raphael U.S. Forest Service Pacific Northwest Research Station
Kim Nelson Oregon State University
Dr. Paula Swedeen Consultant
Mark Ostwald U.S. Fish and Wildlife Service
Kimberly Flotlin U.S. Fish and Wildlife Service
Steve Desimone Washington Department of Fish and Wildlife
Dr. Scott Horton Washington Department of Natural Resources
Peter Harrison Washington Department of Natural Resources
Danielle Prenzlow Escene Washington Department of Natural Resources
Weikko Jaross Washington Department of Natural Resources
Project Managers
Peter Harrison Science Team Lead
Washington Department of Natural Resources
Corina Logan Project Coordinator
Washington Department of Natural Resources
Andrew Hayes Project Manager
Washington Department of Natural Resources GIS Support
Christina Kellum Washington Department of Natural Resources
Rebecca Niggemann Washington Department of Natural Resources
Chris Snyder Washington Department of Natural Resources
Ned Wright Washington Department of Natural Resources

Acknowledgements
September 2008 ii
DOCUMENT PREPARATION
Tom Hamer Hamer Environmental, L.P.
Nathalie Denis Hamer Environmental, L.P.
Thomas Mohagen Hamer Environmental, L.P.
Erin Colclazier Hamer Environmental, L.P.
Jake Verschuyl Hamer Environmental, L.P.
Jim Keany EDAW, Inc.
Amber Martin EDAW, Inc.
Julie Nichols EDAW, Inc.
Christy Seifert EDAW, Inc.
Angela Cahill Washington Department of Natural Resources
Cassandra Koerner Washington Department of Natural Resources
ACKNOWLEDGEMENTS We thank Zach Peery, Alan Burger, and Daniel Rosenberg for their invaluable reviews.
COVER PHOTO CREDITS
Tree: Steve Curry 2005
Marbled murrelet at-sea: Rich MacIntosh
Marbled murrelet nesting: Tom Hamer

September 2008 iii
TABLE OF CONTENTS
EXECUTIVE SUMMARY……………………………………………………………………………ES-1 1.0 INTRODUCTION .................................................................................................................... 1-1
1.1 Interim Conservation Strategy ................................................................................... 1-4 1.2 Developing a Long-Term Conservation Strategy....................................................... 1-6
2.0 MARBLED MURRELET ECOLOGY AND LIFE HISTORY ..................................................... 2-1
2.1 Species Description and Taxonomy .......................................................................... 2-1 2.2 Geographic Distribution ............................................................................................. 2-5 2.3 Movement, Dispersal, Site Fidelity, and Philopatry.................................................... 2-7 2.4 Flight Distance and Behavior....................................................................................2-10 2.5 Food Habits and Foraging Behaviors .......................................................................2-11 2.6 Population Ecology...................................................................................................2-13 2.7 Habitat Loss and Fragmentation...............................................................................2-31 2.8 Conclusion................................................................................................................2-39
3.0 RECOMMENDED LANDSCAPE CONSERVATION APPROACH.......................................... 3-1
I INTRODUCTION....................................................................................................... 3-1 II DNR MANAGEMENT GUIDANCE ............................................................................ 3-1 III CONSERVATION OBJECTIVES............................................................................... 3-2 IV POPULATION-BASED CONSERVATION APPROACH FOR DNR-MANAGED
FORESTLANDS........................................................................................................ 3-3 3.1 Land Designations for Habitat Conservation ............................................................. 3-9 3.2 Conservation Approach for a Marbled Murrelet Long-Term Conservation
Strategy in Southwest Washington...........................................................................3-12 3.3 Conservation Approach for a Marbled Murrelet Long-Term Conservation
Strategy in the Olympic Experimental State Forest ..................................................3-32 3.4 Conservation Approach for a Marbled Murrelet Long-Term Conservation
Strategy in the Straits ...............................................................................................3-58

Table of Contents
September 2008 iv
4.0 HABITAT ASSESSMENT METHODS .................................................................................... 4-1 I ESTIMATING POTENTIAL MARBLED MURRELET POPULATION
RESPONSES TO CURRENT AND PROJECTED FOREST HABITAT ..................... 4-1 4.1 Population Responses to Habitat .............................................................................. 4-1 4.2 An Index of the Potential Influence of Habitat Quality and Quantity on Marbled
Murrelet Populations in Washington .......................................................................... 4-2 4.3 The Relationship of Habitat Area with Marbled Murrelet Abundance ........................ 4-3 4.4 The Relationship of the Structure and Composition of Forest Stands with Their
Potential Contribution to Carrying Capacity for Marbled Murrelets ............................ 4-4 4.5 Estimating Current and Future Marbled Murrelet Habitat .......................................... 4-9 4.6 Projecting Marbled Murrelet Habitat Development on DNR-Managed Lands...........4-10 4.7 Summary of the Projected Current and Future Contribution of Forest Stands to
Marbled Murrelet Carrying Capacity .........................................................................4-15 4.8 Edge Effects on Quality of Marbled Murrelet Habitat and Its Potential Influence
on Carrying Capacity ................................................................................................4-17 4.9 The Habitat Capability (K’) Equation.........................................................................4-18 4.10 The Influence of Distance from Marine Habitat on the Quality of Inland
Marbled Murrelet Habitat and its Effects on Carrying Capacity ................................4-19 II METHODS FOR PROJECTING THE DEVELOPMENT OF MARBLED
MURRELET HABITAT UNDER THE SCIENCE TEAM’S RECOMMENDED CONSERVATION APPROACH................................................................................4-19
4.11 Goals and Objective Criteria.....................................................................................4-20 4.12 Model Structure ........................................................................................................4-20 4.13 Model Development..................................................................................................4-21 4.14 Management Scenarios: Silvicultural Activities and Projected Forest
Responses................................................................................................................4-22 4.15 Model Limitations......................................................................................................4-25 4.16 Management Scenario Analysis Results ..................................................................4-26
5.0 HABITAT ASSESSMENT RESULTS: PROJECTIONS OF MARBLED MURRELET HABITAT AND POTENTIAL POPULATION RESPONSE RESULTING FROM THE SCIENCE TEAM’S CONSERVATION RECOMMENDATIONS.............................................. 5-1

Table of Contents
September 2008 v
5.1 Comparison of Current and Projected Future Marbled Murrelet Habitat and Its Potential for Population Support among Analysis Units and of DNR’s Relative Role within Analysis Units.......................................................................................... 5-2
5.2 Projected Rate of Habitat Development on DNR-Managed Lands ............................ 5-8 5.3 A Comparison of the No Management and Habitat Management Scenarios............5-11 5.4 A Comparison of Marbled Murrelet Habitat on DNR-Managed Lands within
and outside Marbled Murrelet Management Areas...................................................5-12 5.5 Summary and Discussion .......................................................................................5-15
6.0 CONCEPTS IN ADAPTIVE MANAGEMENT.......................................................................... 6-1 6.1 Introduction................................................................................................................ 6-1 6.2 Characteristics of DNR’s Marbled Murrelet Long-Term Conservation Strategy......... 6-3 6.3 Management Approaches.......................................................................................... 6-7 6.4 Adaptive Management for the Long-Term Conservation Strategy............................. 6-9 6.5 Potential Topics for Adaptive Management ..............................................................6-14
7.0 LITERATURE CITED.............................................................................................................. 7-1 APPENDICES
APPENDIX A: DNR Marbled Murrelet Summit Meeting Attendees APPENDIX B: Forest Stand Classification Crosswalk APPENDIX C: Management Scenario Analysis Assumptions and Methods APPENDIX D: Science Team Recommendations: Roads, Yarding and Salvage in
Occupied Sites APPENDIX E: Science Team Recommendations: Performance Criteria for Buffers
Around Occupied Sites APPENDIX F: Evaluation of Survey Efforts for DNR Surveys APPENDIX G: Comprehensive Summary of Results from the Management Scenario
Analysis APPENDIX H: Marbled Murrelet Potential Habitat Capability (K’) Model Sensitivity
Analysis

Table of Contents: Figures
September 2008 vi
FIGURES
Figure 1-1. DNR-Managed Lands Covered by the Habitat Conservation Plan ................................................1-2 Figure 1-2. DNR Marbled Murrelet Long-Term Conservation Strategy Process Flow Chart.............................1-3 Figure 2-1. Marbled Murrelet Adult in Breeding Plumage .................................................................................2-2 Figure 2-2. Marbled Murrelet After-Hatch-Year Bird in Winter Plumage ...........................................................2-3 Figure 2-3. Juvenile (Hatch-Year) Marbled Murrelet Just Before Fledging from the Nest.................................2-3 Figure 2-4. Distribution of Breeding and Non-Breeding (At-Sea) Marbled Murrelets in North America ............2-6 Figure 2-5. Three-State Marbled Murrelet Range, U.S. Fish and Wildlife Service Conservation Zones
Boundaries, and Land Ownership ................................................................................................2-17 Figure 2-6. Marbled Murrelet Conservation Zone One and the Three Primary Sampling Units Used to
Estimate Population Size for the Northwest Forest Plan Effectiveness Monitoring Program .......2-28 Figure 2-7. Marbled Murrelet Conservation Zone Two and the Two Primary Sampling Units Used to
Estimate Population Size for the Northwest Forest Plan Effectiveness Monitoring Program .......2-29 Figure 2-8. Relationship of Estimated Mean At-Sea Marbled Murrelet Population Size with Adjacent
Potential Marbled Murrelet Nesting Habitat within the Conservation Zones, with Segment Numbers Denoting Conservation Zones and Segments within Zones. ........................................2-32
Figure 2-9. Recent Trends in Washington Timber Harvests on Public and Private Lands..............................2-33 Figure 2-10. Recent Trends in Washington Timber Harvests on Public Lands.................................................2-34 Figure 3-1. Planning Area Considered by the Science Team, Including Marbled Murrelet Analysis
Units and DNR HCP Planning Units. ..............................................................................................3-6 Figure 3-2. Major Public Lands in Each Analysis Unit within the Planning Area Considered by the
Science Team.................................................................................................................................3-7 Figure 3-3. Geographic Planning Blocks for the Southwest Washington Analysis Unit ..................................3-18 Figure 3-4. Overall Scorecard Results by Geographic Planning Block for the Southwest Washington
Analysis Unit .................................................................................................................................3-19 Figure 3-5. Proposed Science Team Land Allocations for Marbled Murrelet Management Areas in the
Nemah Planning Block .................................................................................................................3-21 Figure 3-6. Proposed Science Team Land Allocations for Marbled Murrelet Management Areas in the
Browning Planning Block ..............................................................................................................3-22 Figure 3-7. Proposed Science Team Land Allocations for Marbled Murrelet Management Areas in the
Salmon Creek Planning Block ......................................................................................................3-24 Figure 3-8. Proposed Science Team Land Allocations for Marbled Murrelet Management Areas in the
Elochoman Planning Block ...........................................................................................................3-25 Figure 3-9. Proposed Science Team Land Allocations for Marbled Murrelet Management Areas in the
Skamokawa Planning Block .........................................................................................................3-27

Table of Contents: Figures
September 2008 vii
FIGURES (CONTINUED)
Figure 3-10. Proposed Science Team Land Allocations for Marbled Murrelet Management Areas in the Humptulips Planning Block ...........................................................................................................3-28
Figure 3-11. Proposed Science Team Land Allocations for Marbled Murrelet Management Areas in the Grays Planning Block ...................................................................................................................3-29
Figure 3-12. Proposed Science Team Land Allocations for Marbled Murrelet Management Areas in the Chehalis Planning Block ...............................................................................................................3-30
Figure 3-13. Proposed Science Team Land Allocations for Marbled Murrelet Management Area in the Lebam Planning Block..................................................................................................................3-31
Figure 3-14. Olympic Experimental State Forest Landscape Planning Units within the OESF Analysis Unit ...............................................................................................................................................3-33
Figure 3-15. Proposed Science Team Land Allocations for Upper Clearwater LPU.........................................3-40 Figure 3-16. Proposed Science Team Land Allocations for Willy-Huel LPU.....................................................3-41 Figure 3-17. Proposed Science Team Land Allocations for Reade Hill LPU ....................................................3-43 Figure 3-18. Proposed Science Team Land Allocations for Queets LPU .........................................................3-45 Figure 3-19. Proposed Science Team Land Allocations for Copper Mine LPU ................................................3-47 Figure 3-20. Proposed Science Team Land Allocations for Upper Sol Duc LPU..............................................3-49 Figure 3-21. Proposed Science Team Land Allocations for Clallam LPU.........................................................3-51 Figure 3-22. Proposed Science Team Land Allocations for Sekiu LPU............................................................3-52 Figure 3-23. Proposed Science Team Land Allocations for Dickodochtedor LPU ............................................3-54 Figure 3-24. Proposed Science Team Land Allocations for Goodman Creek LPU...........................................3-55 Figure 3-25. Proposed Science Team Land Allocations for Kalaloch LPU .......................................................3-56 Figure 3-26. Overview of the Proposed Science Team Land Allocations for the North Portion of the
Straits Analysis Unit......................................................................................................................3-60 Figure 3-27. Overview of the Proposed Science Team Land Allocations for the East Portion of the
Straits Analysis Unit......................................................................................................................3-61 Figure 4-1. Model-Averaged Predicted Probability of Marbled Murrelet Occupancy Compared with the
Interaction of Platforms per Acre and Canopy Layers. ...................................................................4-6 Figure 4-2. Development Stages for a Stand of Naturally Regenerated Mixed-Species/Western
Hemlock with a Western Hemlock 50-Year Site Index of 110 ......................................................4-13 Figure 4-3. Science Team Assumptions Regarding the Rate at which Transitions Occur among
Categories of Pstage Values for Marbled Murrelet Habitat Quality in Western Hemlock and Douglas-Fir Dominated Stands ....................................................................................................4-15
Figure 4-4. Stand Density Management Diagram. ..........................................................................................4-25

Table of Contents: Figures
September 2008 viii
FIGURES (CONTINUED)
Figure 5-1. The Estimated Current and Projected Future Area of Forest Cover That Has Potential to Provide Marbled Murrelet Nesting Habitat (Figure 5-1A) and the Estimated Capability of That Habitat to Support Marbled Murrelet Populations Based on Its Quality and Abundance (Figure 5-1B) Across all Ownerships within Each Analysis Unit (under the Habitat Management Scenario). .....................................................................................................5-3
Figure 5-2. The Current and Projected Future Capability of Forests Managed by DNR, Federal Agencies, and Other Landowners to Support Marbled Murrelet Populations (K’) and Pattern of Land Ownership (Expressed as a Percentage of Total Landscape) in the SWWA, Straits, and OESF Analysis Units (under the Habitat Management Scenario). .................5-4
Figure 5-3. The Relative Current and Projected Future Capability of Forests Managed by DNR, Federal Agencies, and Other Landowners to Support Marbled Murrelet Populations (Averaged over the Area of that Ownership or K’/1000 Acres [405 Hectares]) in the SWWA, Straits, and OESF Analysis Units (under the Habitat Management Scenario). .................5-5
Figure 5-4. The Current and Projected Future Capability of DNR-Managed Forests, Classified by Stand Development Stage (Brodie et al. 2004), to Support Marbled Murrelet Populations (K’) in the SWWA, Straits, and OESF Analysis Units (under the Habitat Management Scenario). .......................................................................................................................................5-9
Figure 5-5. The Current and Projected Future Capability of DNR-Managed Interior Forest Habitat (More than 164 Feet [50 Meters] from Edges) to Support Marbled Murrelet Populations (K’) in the SWWA, Straits, and OESF Analysis Units (under the Habitat Management Scenario) (Figure 5-5A). The Proportion of Total K’ Provided by DNR-Managed Interior Forest Habitat in the SWWA , Straits, and OESF Analysis Units (under the Habitat Management Scenario) (Figure 5-5B).. ........................................................................................5-10
Figure 5-6. The Current and Projected Future Capability of DNR-Managed Forests to Support Marbled Murrelet Populations (K’) in the SWWA and OESF Analysis Units for the No Management and Habitat Management Scenario. .......................................................................5-11
Figure 5-7. The Current and Projected Future Capability of DNR-Managed Forests to Support Marbled Murrelet Populations (K’) within and outside MMMAs in the SWWA and OESF Analysis Units (under the Habitat Management Scenario) ...........................................................5-13
Figure 5-8. The Current and Projected Future Capability of DNR-Managed Forests, Classified by Stand Development Stage (Brodie et al. 2004, Appendix B) to Support Marbled Murrelet Populations (K’) within and outside MMMAs in the SWWA and OESF Analysis Units (under the Habitat Management Scenario).................................................................................. 5-14

Table of Contents: Tables
September 2008 ix
TABLES
Table 1-1. Marbled Murrelet Science Team Members.....................................................................................1-7 Table 2-1. Chronology of Breeding for the Marbled Murrelet Showing Approximate Dates of Each
Phase of Breeding for Each State or Province. ............................................................................2-14 Table 3-1. Abundance of Federally Managed and DNR-Managed Lands and Marbled Murrelet Forest
Habitat in the Marbled Murrelet Analysis Units ...............................................................................3-8 Table 3-2. Definitions for Habitat Terms Used in this Document ...................................................................3-10 Table 3-3. Definitions for Terms Used Throughout This Document to Delineate the Landscape..................3-13 Table 3-4. Scorecard Category Definitions, Formulas, and Weights .............................................................3-16 Table 3-5. Properties of Landscape Planning Units (LPUs) in the Olympic Experimental State Forest
Analysis Unit .................................................................................................................................3-36 Table 3-6. Conservation Approaches and Recommendations—Upper Clearwater and Willy-Huel LPUs. ....3-39 Table 3-7. Conservation Approaches and Recommendations—Reade Hill LPU ..........................................3-42 Table 3-8. Conservation Approaches and Recommendations—Queets LPU ...............................................3-44 Table 3-9. Conservation Approaches and Recommendations—Copper Mine LPU ......................................3-46 Table 3-10. Conservation Approaches and Recommendations—Upper Sol Duc LPU....................................3-48 Table 3-11. Conservation Approaches and Recommendations—Clallam and Sekiu LPUs ............................3-50 Table 3-12. Conservation Approaches and Recommendations—Dickodochtedor, Goodman Creek,
and Kalaloch LPUs .......................................................................................................................3-53 Table 3-13. Olympic Experimental State Forest Landscape Planning Unit Habitat Calculations.....................3-58 Table 4-1. All Possible Logistic Models Fit to the Marbled Murrelet Survey Results, their ∆AIC
Values, and a Normalized Measure of the Weight of Evidence that Model i was the Best among the Set (w) ..........................................................................................................................4-5
Table 4-2. Projections of Forest Succession among Seral Stages for Previously Harvested Areas on Non-DNR-Managed Lands ...........................................................................................................4-10
Table 4-3. Structural Indicators and Estimated Proportions of Marbled Murrelet Carrying Capacity based on Stand Development Stages ..........................................................................................4-11
Table 4-4. Summary Assumptions Regarding Marbled Murrelet Habitat Potential (Pstage) for Two Classifications of Forest Successional Stages .............................................................................4-16
Table 5-1. Current and Projected Future Acreage of Forests Managed by DNR, Federal Agencies, and Other Landowners That Could Provide Habitat to Support Marbled Murrelet Populations in the SWWA, Straits, and OESF Analysis Units (under the Habitat Management Scenario). .................................................................................................................5-6

Table of Contents: Tables
September 2008 x
TABLES (CONTINUED)
Table 5-2. The Current (2004) and Projected Future (2013, 2031, and 2067) Capability of Forests Managed by DNR, Federal Agencies, and Other Landowners to Support Marbled Murrelet Populations (K’) in the SWWA, Straits, and OESF Analysis Units (under the Habitat Management Scenario) ..................................................................................................................5-7
Table 5-3. Summary of the Current and Projected Future Condition of Marbled Murrelet Habitat in the SWWA, OESF, and Straits Analysis Units Relative to the Science Team’s Biological Goals for Marbled Murrelet Conservation. ....................................................................................5-18
Table 6-1. Hypothesized Demographic and Ecological Mechanisms that Influence Risk and Demographic Performance, and Subsequent Models. ...................................................................6-5

Acronyms and Abbreviations
September 2008 xi
ACRONYMS AND ABBREVIATIONS
ASOS Automated Surface Airways System a-v Audio-visual BA Biological assessment BNR Board of Natural Resources CD Climatological data CI Confidence interval CWD Coarse woody debris dbh Diameter at breast height DEM Digital Elevation Model DFFC Desired Future Forest Conditions DNR Washington State Department of Natural Resources EIS Environmental impact statement ESA Endangered Species Act FEIS Final environmental impact statement FRIS Forest Resource Inventory System GIS Geographic Information System HCP Habitat conservation plan IVMP Interagency Vegetation Mapping Project LCD Local climatological data LIDAR Light Detection and Ranging LPU Landscape Planning Unit LTS Large Tree Exclusion LTCS Long-Term Conservation Strategy MMMA Marbled Murrelet Management Area mph Miles per hour NEPA National Environmental Policy Act NMFS National Marine Fisheries Service NOAA National Oceanic and Atmospheric Administration NSO Northern spotted owl NWS National Weather Service OESF Olympic Experimental State Forest PNWRS Pacific Northwest Research Station QMD Quadratic mean diameter RD Relative density

Acronyms and Abbreviations
September 2008 xii
ACRONYMS AND ABBREVIATIONS (CONTINUED)
RIU Resource Inventory Units SDMD Stand density management diagram SE Standard error SEPA State Environmental Policy Act SDS Stand Development Stage SHC Sustainable Harvest Calculation SWWA Southwest Washington TPA Trees per acre USC United States Code USFWS U.S. Fish and Wildlife Service WAC Washington Administrative Code WAU Watershed Administrative Unit WDFW Washington Department of Fish and Wildlife WRIA Water Resource Inventory Area

September 2008 Page ES-1
EXECUTIVE SUMMARY
ES.1 PURPOSE
The purpose of this executive summary is to provide a complete guide to the contents of this
document, including an overview of the background, methodology, analyses, and results. Unlike
many executive summaries, it is technically detailed and written to provide an average interested
reader with enough information to gain an understanding of its substantive content without
reviewing the entire report.
ES.2 INTRODUCTION
Contributing to the conservation of endangered and threatened species and their habitat is a
priority for the Washington State Department of Natural Resources (DNR) in its habitat
conservation plan (HCP). The marbled murrelet (Brachyramphus marmoratus) was listed as a
threatened species by the federal government in 1992, primarily because of the loss of older
forest habitat. The greatest threat identified to marbled murrelets in Washington, Oregon,
California, British Columbia, and Alaska is the loss of habitat-containing quality nesting sites,
primarily older forests, as well as an increase in forest fragmentation which is thought to increase
predation and decrease nesting success.
The HCP (DNR 1997a) required the development of a conservation strategy for the marbled
murrelet; however, because of a lack of information on this species, DNR implemented an
Interim Conservation Strategy (DNR 1997a) until a Long-Term Conservation Strategy (LTCS)
could be created. This document was produced by a team of marbled murrelet scientists that was
convened to bring together the current data, research, and expert opinion on habitat conservation
and population biology of the marbled murrelet. The result is a set of recommendations for DNR
to consider while it develops an LTCS for the marbled murrelet on DNR-managed forestlands.
The purpose of this report is to provide the Science Team’s research to DNR and present
recommendations for marbled murrelet conservation on DNR-managed lands in southwest
Washington and the Olympic Peninsula.

ES.3 Background
September 2008 Page ES-2
ES.3 BACKGROUND
A habitat conservation plan is a long-term management tool, authorized under the federal
Endangered Species Act (ESA) (Title 16, Section 1531 et seq. of the United States Code [16
USC 1531 et seq.]). For DNR, an HCP allows timber harvesting and other land management
activities to continue on forested state trust lands, while providing for species conservation as
described in the ESA.
In 1997, DNR completed a final multi-species HCP for DNR-managed lands in order to be
compliant with the ESA (DNR 1997a). The HCP covers approximately 1.8 million acres of
DNR-managed lands, and provides mitigation for the incidental take of ESA-listed species,
including the marbled murrelet, northern spotted owl (Strix occidentalis caurina), and several
other species. DNR committed in its HCP “to develop a long-term conservation strategy for the
habitat of the marbled murrelet that will provide minimization and mitigation for any incidental
take of this species” (DNR 1997a, p. IV. 39) in the Olympic Experimental State Forest (OESF)
and five westside planning units. The HCP states that DNR will:
“…[H]elp meet the recovery objectives of the U.S. Fish and Wildlife Service, contribute
to the conservation efforts of the President’s Northwest Forest Plan, and make a
significant contribution to maintaining and protecting marbled murrelet populations in
western Washington over the life of the HCP”(DNR 1997a, p. IV.44).
However, the HCP did not contain an LTCS for marbled murrelets because of a lack of
knowledge of the species’ habitat use on DNR-managed lands, locations of nesting areas, and
factors affecting the population, as well as the lack of a completed federal recovery plan.
Without this knowledge, development of a credible LTCS to adequately aid in the conservation
of marbled murrelet populations was not considered possible. Therefore, an Interim
Conservation Strategy (DNR 1997a, pp. IV.39-45) was designed to protect marbled murrelet
habitat on DNR-managed lands while DNR conducted studies and collected information on the
biology and ecology of the species in each of the HCP planning units. After satisfactory
completion of the Interim Conservation Strategy, DNR would develop and transition to the
implementation of an LTCS. At the request of DNR management, this document provides recent
research and expert opinion on the conservation biology of the marbled murrelet and develops a

ES.4 Interim Conservation Strategy – SWWA, OESF, and Straits
September 2008 Page ES-3
set of recommendations that provide the foundation for a credible, science-based LTCS that
meets the requirements of DNR’s HCP.
This document will provide DNR and the U.S. Fish and Wildlife Service (USFWS) the scientific
information necessary to develop alternative approaches to the LTCS to be examined through the
State Environmental Policy Act and National Environmental Policy Act processes. Those
processes will provide decision makers with information about the potential environmental
impacts of a proposal and the public with an opportunity to provide input on potential
alternatives and the types of potential impacts that should be analyzed. The environmental
impact statement (EIS) arising from this analysis will be used with other relevant information by
DNR to propose an LTCS to USFWS.
The Board of Natural Resources will review the LTCS and final EIS, conduct an assessment of
the impacts to the trusts, and identify a proposed LTCS for USFWS. Once identified, the LTCS
for the marbled murrelet will be submitted to USFWS as part of the application for an amended
incidental take permit for the marbled murrelet. USFWS will analyze the LTCS per the
requirements specified in the ESA and HCP, and will write a biological opinion to analyze
impacts on the species’ population. If the amended permit is granted for the LTCS, it will allow
implementation of this strategy on DNR-managed lands for the term of the HCP.
ES.4 INTERIM CONSERVATION STRATEGY
DNR’s Interim Conservation Strategy for the marbled murrelet is described in the HCP (DNR
1997a) and involves several basic steps.
1. Identify and defer from harvest any part of a block of suitable habitat for the marbled
murrelet.
2. Complete habitat relationship studies to determine the relative importance, based on
occupancy by marbled murrelets, of the various habitats.
3. After the habitat relationship studies are completed, make available for timber harvest the
lowest quality habitats, which are expected to contain a maximum of 5% of the occupied
sites. All known occupied sites were protected.

ES.5 Developing a Long-Term Conservation Strategy – SWWA, OESF, and Straits
September 2008 Page ES-4
4. Survey for occupancy by marbled murrelets in the higher quality habitat areas identified from
the habitat relationships study; certain unoccupied habitats would then become available for
timber harvest. Occupied habitat and some unoccupied habitat would be protected.
5. Develop an LTCS for the marbled murrelet on DNR-managed lands.
While these steps were being implemented, DNR participated in cooperative regional research
efforts to understand more about the biology and ecology of the marbled murrelet.
DNR substantively completed these steps for four of the six westside HCP planning units—
Columbia, South Coast, Straits, and OESF—which are the subject of these recommendations.
ES.5 DEVELOPING A LONG-TERM CONSERVATION STRATEGY
In January 2004, a Science Team (Table ES-1) was created to review current literature about the
marbled murrelet, examine survey and research data collected by DNR and other researchers,
and draft recommendations for conservation opportunities for an LTCS on DNR-managed lands
in the Columbia, South Coast, Straits, and OESF Planning Units. The Science Team consisted of
biologists with marbled murrelet expertise from research and academic institutions, USFWS, the
Washington Department of Fish and Wildlife (WDFW), and DNR.
The Science Team held regular meetings beginning in January 2004. Data gathered during the
Interim Conservation Strategy phases were reviewed and organized for further analysis, and the
Table ES-1. DNR Marbled Murrelet Science Team Members.
Name Agency
Martin G. Raphael, Ph.D. U.S. Forest Service, Pacific Northwest Research Station
S. Kim Nelson, M.S. Oregon State University
Paula Swedeen, Ph.D. Consultant
Mark Ostwald, B.S. U.S. Fish and Wildlife Service
Kim Flotlin, B.S. U.S. Fish and Wildlife Service
Steve Desimone, M.S. Washington Department of Fish and Wildlife
Scott Horton, Ph.D. Washington Department of Natural Resources
Peter Harrison, B.S. Washington Department of Natural Resources
Danielle Prenzlow Escene, M.S. Washington Department of Natural Resources
Weikko Jaross, M.S. Washington Department of Natural Resources

ES.6 Life History and Population Status of the Marbled Murrelet – SWWA, OESF, and Straits
September 2008 Page ES-5
team began to develop conservation opportunities for the LTCS. The Science Team’s
recommendations for conservation opportunities for an LTCS do not involve the North Puget
and South Puget Planning Units because the interim strategy in those planning units is still
underway.
This document describes conservation opportunities for marbled murrelet habitat on DNR-
managed forested lands developed by the Science Team for the Columbia, South Coast, Straits,
and OESF HCP Planning Units.
ES.6 LIFE HISTORY AND POPULATION STATUS OF THE MARBLED MURRELET
The marbled murrelet is a small, dove-sized seabird that nests in old-growth conifer forests along
the Pacific coast of North America. These extremely secretive birds spend most of their lives in
small groups or pairs, on protected coastal waters just beyond the breakers. They forage in
nearshore waters using wing propulsion to “fly” underwater, chasing prey to depths of 164 feet.
Until 1974, little was known about the birds’ nesting habits. Today, it is known that they nest as
far as 50 miles inland in mature coniferous forests, usually 120 to 150 feet above ground.
Because the nest itself is just a shallow depression in lichens or moss on a tree limb, they rely on
tall, old trees with large limbs and a complex canopy to access and conceal their nests.
Marbled murrelet populations range along the Pacific coast from the Aleutian Islands in Alaska
to the Baja Peninsula in Mexico. Historically, they inhabited the entire Washington coast and the
Puget Sound region. From at-sea surveys, population estimates currently place the number of
murrelets in Washington at around 9,800 birds. Major gaps in the at-sea distribution of murrelets
in Washington occur in the southern Puget Sound and along the southwestern coast (north of the
Columbia River, off the coast of Grays Harbor and Willapa Bay).
The marbled murrelet populations of Washington, Oregon, and California were federally listed
as threatened in 1992. The listing decision was based on threats to the marbled murrelet that
included loss of nesting habitat from timber harvest and mortality from gill-net fishing and oil
spills at sea. Estimates indicate that the number of marbled murrelet individuals is declining at a
rate of about 4 to 8% per year (Beissinger and Nur 1997).

ES.7 Recommended Landscape Conservation Approach – SWWA, OESF, and Straits
September 2008 Page ES-6
ES.7 RECOMMENDED LANDSCAPE CONSERVATION APPROACH
DNR Management Guidance
DNR management tasked the Science Team with developing recommendations that would
provide the foundation for a credible, science-based LTCS that would meet DNR’s obligations
under the HCP. The Science Team developed the conservation recommendations without
consideration for DNR’s fiduciary responsibility to the trusts, with the exception of special
considerations for Wahkiakum and Pacific Counties. The Science Team received special
guidance from DNR management for Wahkiakum and Pacific Counties, as they rely primarily on
revenue generated from DNR-managed trust lands for their operations budget (Daniels 2004). A
special effort was made to recommend marbled murrelet conservation measures that reflect
DNR’s responsibility to consider potential revenue impacts to those two smaller trust
beneficiaries. The financial analyses and impacts will be addressed for all DNR-managed lands
during DNR’s EIS development, primarily through the alternatives in the draft and final EISs.
Conservation Objectives
The Science Team’s objectives were based on two recovery principles: “to stabilize and then
increase the population size, changing the current downward trend to an upward (improving)
trend throughout the listing range” and “to provide conditions in the future that allow for a
reasonable likelihood of continued existence of viable populations” (USFWS 1997, p. 112).
DNR defined its goal to contribute to the above USFWS recovery objectives and “…make a
significant contribution to maintaining and protecting marbled murrelet populations in western
Washington over the life of the HCP” (DNR 1997a, p. IV.44). The team adopted biological goals
that reflect those principles at appropriate scales for the abundance and distribution of DNR-
managed forestlands in Washington. The Science Team recommends that DNR manage forest
habitat to contribute to the following three biological goals: a stable or increasing population, an
increasing geographic distribution, and thus a population that is resilient to disturbances. Because
DNR manages forestland and not wildlife, DNR is able to contribute to the USFWS recovery
plan and population goals for the marbled murrelet through the maintenance and creation of the
birds’ nesting habitat.

ES.8 Population-Based Conservation Approach for DNR-Managed Forestlands – SWWA, OESF, and Straits
September 2008 Page ES-7
The Science Team’s conservation objectives set the foundation for the following
recommendations and analyses developed by the Science Team. The objectives of the analyses
applied to the Science Team’s recommendations are to:
1. Present objective, repeatable, quantitative comparisons of current and projected forest habitat
for marbled murrelets on DNR-managed and other lands.
2. Illustrate potential marbled murrelet population responses to current and projected habitat
using an index of carrying capacity.
This information will prove valuable for DNR and USFWS managers as they evaluate the overall
effects of different management alternatives and their contributions to HCP conservation
objectives for the marbled murrelet.
ES.8 POPULATION-BASED CONSERVATION APPROACH FOR DNR-MANAGED FORESTLANDS
The abundance and distribution of marbled murrelets and their potential inland habitat vary
regionally within Washington, as do the distribution and relative abundance of DNR-managed
lands. To determine the association between marbled murrelets and their habitat distribution on
state forestlands, DNR agreed to consider and develop marbled murrelet conservation plans
unique to each of six ecologically-based HCP planning units (DNR 1997a), four of which are
considered in this document (Figure ES-1):
1. Columbia
2. South Coast
3. Olympic Experimental State Forest (OESF)
4. Straits
Based on similar distribution and quantity of DNR-managed lands, and the abundance of inland
habitat and marbled murrelets, the Columbia and South Coast Planning Units (west of Interstate
5, south of Olympic National Forest, and south of Quinault Indian Reservation) were combined
into one, and are referred to as the Southwest Washington (SWWA) Analysis Unit (see Figure
ES-1). SWWA is the term used in the following conservation approach and model analyses
sections of this report. Within SWWA the Science Team focused conservation efforts on DNR-
managed lands within approximately 40 miles of the Pacific coast (see Figure ES-1). The OESF

ES.8 Population-Based Conservation Approach for DNR-Managed Forestlands – SWWA, OESF, and Straits
September 2008 Page ES-8
and Straits Planning Units (hereafter also referred to as analysis units) have distinctive
characteristics and retain separate identities.
In the OESF and Straits Analysis Units, the fairly abundant existing marbled murrelet habitat is
concentrated largely on federal lands, with habitat on DNR-managed lands occurring
approximately in proportion to its abundance (Table ES-2). This contrasts sharply with SWWA,
where there is little federal land or federally managed habitat. Although DNR-managed lands are
relatively scarce, making up only 13% of the total area, they contain 28% of the habitat in the
analysis unit (Table ES-2).
Table ES-2. Abundance of Federally Managed and DNR-Managed Lands, and Marbled Murrelet Forest Habitat by Analysis Unit.
Total Federally Managed1 DNR-Managed Geographic
Area Area2 Habitat2,3 % of total Area2 % of
Total Habitat2,3% of Total
HabitatArea2 % of
Total Habitat2,3 % of Total
Habitat
SWWA 2,530 268 11 1.5 0 0.7 0 324 13 74 28
OESF 1,299 421 32 523 40 266 63 271 21 83 20
Straits 1,178 377 32 704 60 284 75 118 10 46 12
Olympic Peninsula4 2,932 948 32 1,530 52 675 71 389 13 129 14
1 Includes lands managed by National Park Service and U.S. Forest Service. Lands managed by other federal agencies are not included. 2 Thousands of acres. 3 Habitat estimates are Biomapper estimates from Raphael et al. (2006) who used this program to build an Ecological Niche Factor Analysis Model (ENFA) of marbled murrelet habitat suitability. Model inputs were GIS-based rasters of ecogeographical variables (forest cover derived from satellite imagery, as well as topography, solar radiation, and distance to coastline) and species presence data. Habitat estimates are based on an ENFA habitat suitability index greater than 60. 4 Entire Olympic Peninsula: OESF, Straits, plus Other Olympic Peninsula (see Figure ES-1). Note: analysis unit and ownership areas are from DNR’s GIS data (July 20, 2005). Percentages do not sum to 100 because tribal lands, privately managed lands, and some federally managed lands are not included.
The breeding-season marine distribution and abundance of marbled murrelets on the Olympic
Peninsula and in SWWA generally corresponds with the inland distribution of habitat. The
majority of the marbled murrelet numbers from survey counts (Hull et al. 2001 [at-sea and inland
surveys], Miller et al. 2006 [at-sea surveys]: approximately 90%) occur within 40 miles of the
Olympic Peninsula, a reasonable commuting distance for nesting birds, while less than 10% of
the offshore birds counted occur adjacent to SWWA (Miller et al. 2006). Additionally, more
general range-wide assessments (USFWS 1997, McShane et al. 2004) identified SWWA as an

ES.8 Population-Based Conservation Approach for DNR-Managed Forestlands – SWWA, OESF, and Straits
September 2008 Page ES-9
Figure ES-1. Planning Area Considered by the Science Team, Including Marbled Murrelet Analysis Units and DNR HCP Planning Units (Murrelet-Dense Marine Waters are Defined in Section 3.2b).

ES.8 Population-Based Conservation Approach for DNR-Managed Forestlands – SWWA, OESF, and Straits
September 2008 Page ES-10
area of low density in the distribution of marbled murrelets and their inland habitat. Thus,
SWWA is an important area in which to address the conservation goal of increasing the
geographic distribution by increasing inland nesting habitat.
The differences in current habitat and federal land distribution led to three specific strategic
approaches to marbled murrelet conservation that acknowledged how conservation efforts in
each analysis unit could help achieve objectives for population stability.
• In SWWA, DNR-managed lands contain 28% of the existing inland habitat base for a
depressed marbled murrelet population (Table ES-2). Substantial habitat restoration across
much of the DNR-managed land base is central to achieving conservation objectives
(USFWS 1997, McShane et al. 2004).
• In the OESF, where DNR-managed lands in the low-elevation Sitka spruce zone have the
potential to increase the number of forest types occupied by marbled murrelets, explicit
efforts at habitat restoration through active silviculture in distinct DNR-managed areas are a
key component of the recommended conservation approach.
• In the Straits, where DNR-managed lands contribute less to the land and habitat base, a
relatively minimal approach is appropriate—occupied sites identified during comprehensive
inland surveys were mapped and designated for conservation management.
The landscape-level conservation approach, methodology, and rationale are presented in the
above sequence.
Land Designations for Habitat Conservation
The Science Team recommends the employment of three basic management approaches to
creating and maintaining habitat in the three analysis units (SWWA, OESF and Straits).
In areas where potential and known marbled murrelet nesting habitat is well developed and needs
to simply be retained on the landscape in support of the stated biological goals, the Science Team
proposes deferral of those lands from harvest for the life of the conservation strategy. These
include all currently known occupied sites and old forest stands in the OESF. The Science Team
is not recommending that DNR continue identifying additional occupied sites once the LTCS is
completed.

ES.8 Population-Based Conservation Approach for DNR-Managed Forestlands – SWWA, OESF, and Straits
September 2008 Page ES-11
Areas of the landscape that have the ability to provide future potential nesting habitat have been
identified and proposed to be actively managed as Marbled Murrelet Management Areas
(MMMAs). Some proportion or all of DNR-managed lands within their boundaries (depending
on the analysis unit) would have as their management goal high-quality nesting habitat.
Marbled murrelet nesting habitat is defined as large trees with sizeable nesting platforms
supporting high levels of moss, and generally occurring in old-growth forests with low amounts
of edge (Nelson et al. 2006). Based on current data and knowledge, there is no explicit way of
identifying these features on DNR-managed land. For the purposes of this report, forest stand
development stages (Brodie et al. 2004, see also Appendix B) are used as a surrogate measure for
nesting habitat. Under this classification system, the more complex, older stages—Large Tree
Exclusion, Understory Development, Botanically Diverse, Niche Diversification, and Fully
Functional—are classified as “potential marbled murrelet habitat.”
It is envisioned that active management techniques will be applied to accelerate the development
of non-habitat to stimulate the development of suitable marbled murrelet habitat where
silviculturally appropriate. This aspect of the Science Team’s conservation approach was
developed to emphasize marbled murrelet conservation in a geographic area where it could be
most effective in meeting the biological goals and gaining the largest benefit for marbled
murrelet habitat conservation. The Science Team recommends deferral of all known occupied
marbled murrelet sites located inside proposed MMMAs.
In some cases, the Science Team has recommended moderated forest management to
complement deferred areas and habitat areas within MMMAs. In these areas, retention of forest
structure around areas being recommended specifically for habitat creation and maintenance is
proposed. These include areas not required for meeting habitat thresholds in MMMAs and
buffers around occupied sites and old forest.
Finally, the Science Team anticipates that other conservation strategies being implemented in
fulfillment of the HCP on DNR-managed lands will complement the recommended marbled
murrelet conservation measures. Conservation measures including the northern spotted owl
strategy, riparian forest restoration strategy, and efforts to protect unstable landforms, to name a
few, are expected to develop a matrix of complex forest structure on the landscape and support
marbled murrelet biological goals.

ES.8 Population-Based Conservation Approach for DNR-Managed Forestlands – SWWA, OESF, and Straits
September 2008 Page ES-12
Conservation Approach for a Marbled Murrelet Long-Term Conservation Strategy in Southwest Washington
SWWA serves an important distributional role in the listed range of the marbled murrelet
(USFWS 1997, McShane et al. 2004). This area, close to coastal waters, has very little forested
federal ownership (Table ES-2); thus, non-federal forests are critical to marbled murrelet
conservation. DNR-managed forestlands in this landscape provide a significant and vital
opportunity for maintenance of local breeding populations and are crucial to meeting the
biological goals stated above.
Within SWWA, ownership blocks were examined for their potential to contribute to the
objectives of the LTCS (population stability, distribution, and resilience). A scorecard ranking
exercise was used to achieve an objective, replicable means of identifying high-priority areas in
which to invest DNR’s efforts at marbled murrelet conservation.
The Scorecard
The Science Team used a scorecard to rank the potential conservation value of geographic land
blocks and to inform their proposals regarding the size and locations of MMMAs. The Science
Team defined 20 metrics, including marbled murrelet detections, habitat data, and other
ecological and topographic data deemed important to marbled murrelet conservation (see below).
Values for the metrics were calculated relative to the maximum value for all blocks and rescaled
to range from 0 to 10. Each metric was assigned a weight by the Science Team to reflect its
overall importance in estimating potential conservation value. The sum of the 20 weighted
category scores resulted in an overall score for each block.
Marbled Murrelet Management Areas in SWWA
Seventeen ownership blocks of DNR-managed lands were delineated by the Science Team and
subsequently reviewed and edited by the local biologists (Figure ES-2). These ownership blocks
(referred to as planning blocks) were delineated as logical groupings of DNR-managed lands.
The overall scores ranged from 8.41 for the Nemah block to 0.88 for the Lake Creek block
(Figure ES-3). The top five blocks down to Skamokawa were considered the highest priority.
The second six blocks, including Humptulips through Pe Ell, were considered a secondary
priority, except Capitol which contained no occupied sites and is not proposed for conservation

ES.8 Population-Based Conservation Approach for DNR-Managed Forestlands – SWWA, OESF, and Straits
September 2008 Page ES-13
Figure ES-2. Geographic Planning Blocks for the Southwest Washington Analysis Unit.

ES.8 Population-Based Conservation Approach for DNR-Managed Forestlands – SWWA, OESF, and Straits
September 2008 Page ES-14
Scorecard Results
0
2
4
6
8
10N
emah
Bro
wni
ng
Sal
mon
Cre
ek
Elo
chom
an
Ska
mok
awa
Hum
ptul
ips
Cap
itol
Gra
ys
Che
halis
Leba
m
Pe
Ell
Linc
oln
Pum
phre
y
Eas
t I-5
Dee
p C
reek
Sko
okum
chuc
k
Lake
Cre
ek
Blocks
Scor
e
High Medium Low
Figure ES-3. Overall Scorecard Results by Geographic Planning Block for the Southwest Washington Analysis Unit.
emphasis. The bottom six blocks from Lincoln to Lake Creek were considered the lowest
priority, do not contain occupied sites, and therefore are not recommended for conservation
emphasis in this report.
Delineation of Marbled Murrelet Management Areas
The Science Team delineated MMMAs in SWWA in an iterative process that:
• Used the scorecard exercise to help consider the relative importance of each planning block
to the goals of the LTCS.
• Examined amounts and locations of past and current marbled murrelet activity.
• Reviewed amounts and locations of mature forest conditions.
• Considered the size and configuration of each block within the matrix of privately managed
forests.

ES.8 Population-Based Conservation Approach for DNR-Managed Forestlands – SWWA, OESF, and Straits
September 2008 Page ES-15
• Considered the financial impacts on beneficiaries of Pacific County and Wahkiakum County
forest board lands.
Figure ES-2 provides an overview map of the location of the proposed MMMAs. Chapter 3.0
describes the MMMAs in detail and includes maps of their locations.
Conservation Approach for a Marbled Murrelet Long-Term Conservation Strategy in the Olympic Experimental State Forest
The OESF Analysis Unit has unique conservation strategies as part of its mandate to learn how
to achieve integration of old forest ecosystem functions with commercial forestry on state trust
lands (DNR 1997a). The management strategy of the OESF is that of an “unzoned forest” (i.e.,
land management decisions are guided by earth, biological, and other sciences) to achieve
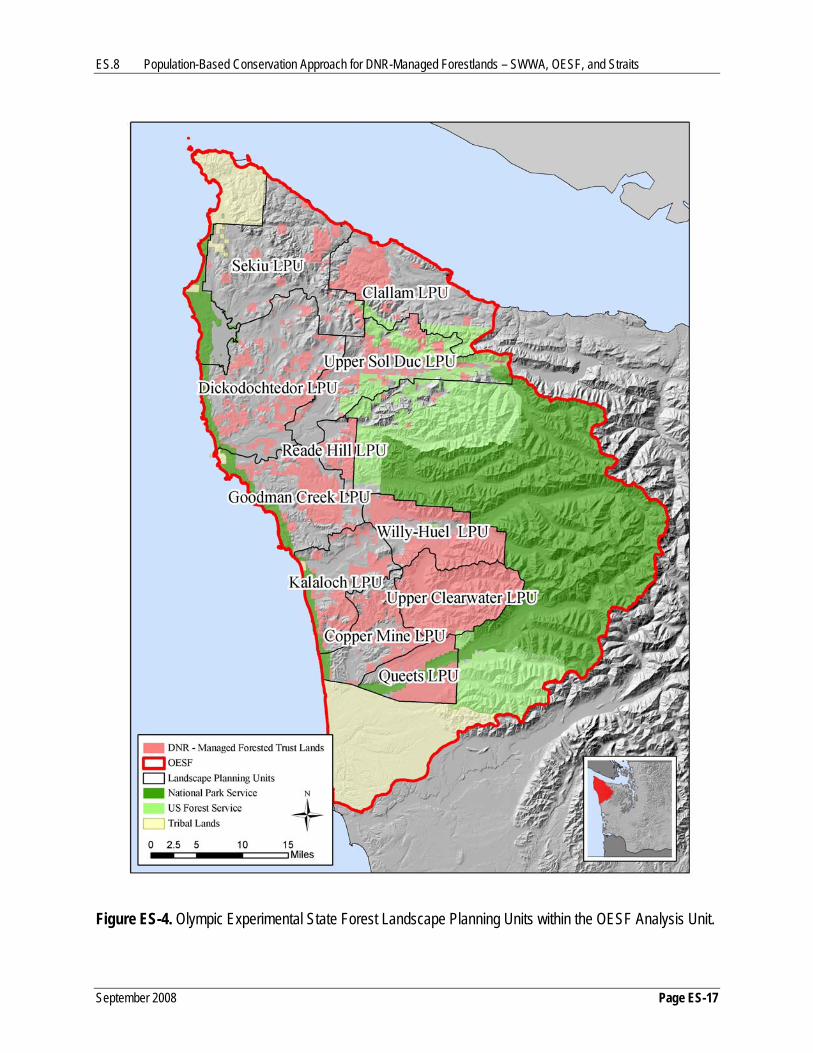
multiple objectives across 11 intermediate-scale landscape planning units (LPUs) (Figure ES-4).
Biological Goals for Marbled Murrelet Conservation in the Context of the OESF
Marbled murrelets have been observed moving throughout the waters off the Olympic Peninsula,
not just off the areas of adjacent habitat (Bloxton and Raphael 2007). These long-distance
movements suggest that habitat abundance in the Straits and OESF Analysis Units should be
considered in the context of the entire Olympic Peninsula. Table ES-2 shows that DNR-managed
lands comprise 13% of the Olympic Peninsula (389,000 of 2.9 million acres), which is
dominated by federal lands, most with congressional or administrative designations that
emphasize conservation of old forests. In this context, DNR habitat conservation in the OESF
can provide only a relatively minor contribution to regional carrying capacity base for marbled
murrelets (Table ES-5 and discussion in Chapter 5.0). DNR has already committed to increase
the amount of old forest and to improve its function across the OESF through other DNR policies
and objectives, most notably northern spotted owl and riparian management commitments in the
HCP, adding incrementally to the carrying capacity of the Olympic Peninsula for marbled
murrelets. The Science Team assumes that the areas under protection by the other conservation
strategies will remain protected throughout the life of the HCP. The Science Team recommends
that, if other conservation strategies change such that they discontinue benefits to the marbled
murrelet, policy be examined to maintain protection of areas important to the marbled murrelet.

ES.8 Population-Based Conservation Approach for DNR-Managed Forestlands – SWWA, OESF, and Straits
September 2008 Page ES-16
DNR-managed lands exist in a variety of settings, with a variety of land uses (e.g., timber
management, surface mines, transportation network, leased communication sites, recreation and
natural areas) that likely result in a wide range of fragmentation effects on the quality of nesting
habitat. Thus, it is likely that habitat in the OESF will be variable in its success at contributing to
the goal of population stability. Areas that will be managed for contiguous blocks of old forest
will provide a higher contribution than areas where ownership patterns or management policies
result in smaller patches of habitat.
From the conservation biology principle of “spreading the risk” (Den Boer 1981), perhaps the
most important role the OESF can play, in addition to the maintenance of high-quality habitat
(including occupied sites) is to broaden the ecological distribution of marbled murrelets on the
Olympic Peninsula. Federal lands are scarce in the low-elevation Sitka spruce zone (Franklin and
Dyrness 1988), and private land managers are unlikely to restore substantial marbled murrelet
habitat capability within the OESF Analysis Unit; thus, DNR’s OESF conservation efforts in this
low-elevation Sitka spruce zone will be disproportionately important. The Sitka spruce element
of the OESF has the greatest potential to contribute to a resilient marbled murrelet population.
Approaches to Marbled Murrelet Conservation in the OESF
The 11 LPUs in the OESF (Figure ES-4) vary in their overall size, area of DNR-managed lands,
and context; and in the amount, distribution, and condition of existing forest cover.
The strategic approach of Everett and Lehmkuhl (1999) suggests using two basic approaches to
achieve the biological goals for marbled murrelet conservation in an unzoned OESF. While
marbled murrelet conservation will occur in all LPUs, the two approaches represent opposite
ends of a gradient. At one end, marbled murrelet conservation would occur through existing
policy and procedures (e.g., riparian and northern spotted owl conservation strategies); at the
other end, LPUs exist where marbled murrelet conservation would be emphasized as a guiding
element in landscape design and management.
Guiding Elements for Landscape Design within the 11 Landscape Planning Units for Marbled Murrelet Conservation in an Unzoned OESF
The following four marbled murrelet conservation objectives are recommended for use in
landscape design and management in an unzoned OESF.
ES.8 Population-Based Conservation Approach for DNR-Managed Forestlands – SWWA, OESF, and Straits
September 2008 Page ES-17
Figure ES-4. Olympic Experimental State Forest Landscape Planning Units within the OESF Analysis Unit.

ES.8 Population-Based Conservation Approach for DNR-Managed Forestlands – SWWA, OESF, and Straits
September 2008 Page ES-18
1. Conservation through existing policy and procedure model (Upper Clearwater and Willy-
Huel LPUs): The conservation through existing policy and procedure model is proposed for
large contiguous blocks of DNR-managed lands adjacent to large federal reserves, such as
the Upper Clearwater and Willy-Huel LPUs. These LPUs are at middle to upper elevations,
with high densities of dissected, unstable landforms, and contain high densities of existing
marbled murrelet habitat. Maturation and generally more conservative management of
adjacent stands will result in diminishing negative edge effects during the lengthy period of
habitat restoration in riparian and unstable areas. Retention of current nesting habitat, habitat
restoration, and overall maturation of early-seral forests in these landscapes which will
diminish fragmentation effects are, in combination, predicted to help achieve the goals of
population stability and increasing size.
2. Intermediate approach for smaller landscapes (Reade Hill, Copper Mine, and Queets
LPUs): One type of intermediate approach is proposed for smaller landscapes at generally
lower elevations and lesser, but still significant, amounts of old forests. Active management
to limit fragmentation around existing stands of suitable structure in Reade Hill and Copper
Mine, and broader areas of the Queets LPU, is hypothesized to improve the goal of
population stability.
3. Intermediate approach for the northern landscapes (Upper Sol Duc, Clallam, and Sekiu
LPUs): Another intermediate approach is in the northern LPUs with very little older forest
remaining: Upper Sol Duc, Clallam, and Sekiu. These LPUs are largely in lower to middle
elevations and vary in the size of DNR-managed blocks and their adjacency to federal
reserves. Additionally, riparian and unstable areas adjacent to current habitat will buffer
suitable habitat as they mature. Current nesting habitat will incur diminishing fragmentation
effects over time. Similar to the first conservation objective (conservation through existing
policy and procedure model), marbled murrelet conservation will largely be a product of
existing management policy and procedures for other objectives in these LPUs, but the nature
of these landscapes (fragmented ownership, and amount, distribution, and condition of
existing habitat) is such that they will likely contribute less to the biological goals than the
Upper Clearwater and Willy-Huel LPUs.

ES.8 Population-Based Conservation Approach for DNR-Managed Forestlands – SWWA, OESF, and Straits
September 2008 Page ES-19
4. Emphasis on marbled murrelet conservation model (Dickodochtedor, Goodman Creek,
and Kalaloch LPUs): The emphasis on marbled murrelet conservation model will apply in
the Sitka spruce zone of three coastal plain LPUs with some existing older forest:
Dickodochtedor, Goodman Creek, and Kalaloch. To limit potential negative fragmentation
effects, MMMAs were located adjacent to federal lands or in areas with a high density of
DNR-managed lands, and avoided areas of higher human impact with enriched corvid
populations. Active management in the emphasis areas is hypothesized to improve their
contribution to achieving the goal of population stability, while their location in the Sitka
spruce zone is intended to contribute to distribution and resilience goals.
The specific elements of these approaches are detailed and mapped for each of the 11 LPUs in
chapter 3.0.
Conservation Approach for a Marbled Murrelet Long-Term Conservation Strategy in the Straits Analysis Unit
Non-federal lands in the Straits Analysis Unit occur in a narrow peripheral band, approximately
four to nine miles wide, on the northern and eastern Olympic Peninsula. DNR-managed lands
(118,000 acres) comprise approximately one-fourth of the non-federal land base in the analysis
unit (Figures ES-5A and ES-5B).
Marbled murrelets have been observed moving throughout the waters surrounding the Olympic
Peninsula and engaging in very long commuting flights (over 50 miles one-way) between nesting
and foraging areas (Bloxton and Raphael 2006, 2007). These long-distance movements suggest
that marbled murrelet nesting habitat in the Straits Analysis Unit should be considered in the
context of the entire Olympic Peninsula. The nature and abundance of existing potential marbled
murrelet habitat on federal and DNR-managed forests, as well as results of comprehensive inland
surveys for marbled murrelets on DNR-managed lands (Harrison et al. 2003), suggest that state
forests currently provide only a relatively minor contribution to the carrying capacity for marbled
murrelets in the Straits Analysis Unit. The habitat known to be occupied on DNR-managed lands
in the Straits Analysis Unit occurs predominantly in smaller, isolated stands compared to the
adjacent, extensive old-growth forests found on federal lands. Additionally, the quality of these
occupied stands is almost exclusively second growth Douglas-fir forest. Consequently, the
Science Team recommended that all currently known occupied marbled murrelet sites be

ES.8 Population-Based Conservation Approach for DNR-Managed Forestlands – SWWA, OESF, and Straits
September 2008 Page ES-20
Figure ES-5A. Overview of the Proposed Science Team Land Allocations for the North Portion of the Straits Analysis Unit.

ES.8 Population-Based Conservation Approach for DNR-Managed Forestlands – SWWA, OESF, and Straits
September 2008 Page ES-21
Figure ES-5B. Overview of the Proposed Science Team Land Allocations for the East Portion of the Straits Analysis Unit.
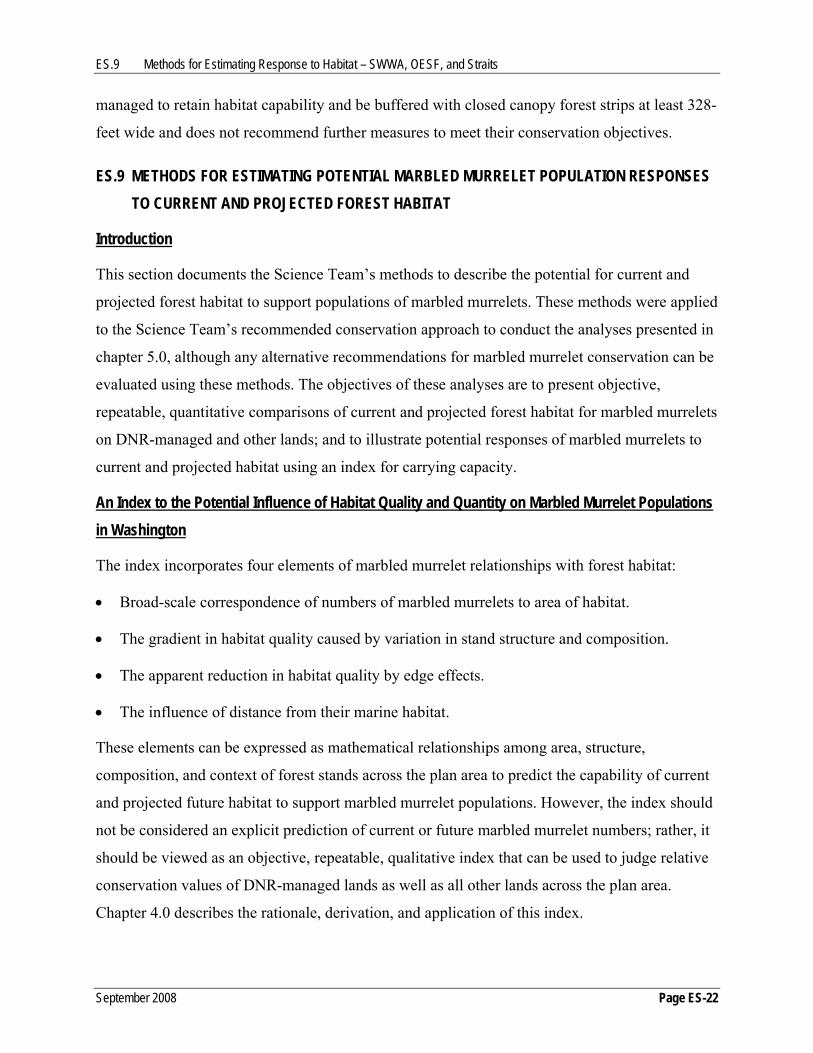
ES.9 Methods for Estimating Response to Habitat – SWWA, OESF, and Straits
September 2008 Page ES-22
managed to retain habitat capability and be buffered with closed canopy forest strips at least 328-
feet wide and does not recommend further measures to meet their conservation objectives.
ES.9 METHODS FOR ESTIMATING POTENTIAL MARBLED MURRELET POPULATION RESPONSES TO CURRENT AND PROJECTED FOREST HABITAT
Introduction
This section documents the Science Team’s methods to describe the potential for current and
projected forest habitat to support populations of marbled murrelets. These methods were applied
to the Science Team’s recommended conservation approach to conduct the analyses presented in
chapter 5.0, although any alternative recommendations for marbled murrelet conservation can be
evaluated using these methods. The objectives of these analyses are to present objective,
repeatable, quantitative comparisons of current and projected forest habitat for marbled murrelets
on DNR-managed and other lands; and to illustrate potential responses of marbled murrelets to
current and projected habitat using an index for carrying capacity.
An Index to the Potential Influence of Habitat Quality and Quantity on Marbled Murrelet Populations in Washington
The index incorporates four elements of marbled murrelet relationships with forest habitat:
• Broad-scale correspondence of numbers of marbled murrelets to area of habitat.
• The gradient in habitat quality caused by variation in stand structure and composition.
• The apparent reduction in habitat quality by edge effects.
• The influence of distance from their marine habitat.
These elements can be expressed as mathematical relationships among area, structure,
composition, and context of forest stands across the plan area to predict the capability of current
and projected future habitat to support marbled murrelet populations. However, the index should
not be considered an explicit prediction of current or future marbled murrelet numbers; rather, it
should be viewed as an objective, repeatable, qualitative index that can be used to judge relative
conservation values of DNR-managed lands as well as all other lands across the plan area.
Chapter 4.0 describes the rationale, derivation, and application of this index.

ES.9 Methods for Estimating Response to Habitat – SWWA, OESF, and Straits
September 2008 Page ES-23
The Relationship of Habitat Area with Marbled Murrelet Abundance
Raphael et al. (2006) estimated that, on average, 396 acres of nesting habitat were available per
marbled murrelet detected by radar during their 2002 study. Using radiotelemetry studies of
inland flight behavior by marbled murrelets by Peery et al. (2004b) suggests that approximately
43% of the population is likely to be detected with radar; thus, K (carrying capacity) is
approximately 170 acres (i.e., 396 acres * 0.43) of potential nesting habitat per marbled murrelet.
Estimating Current and Future Marbled Murrelet Habitat Current conditions were estimated using 2004 forest inventory data for DNR-managed lands and
Interagency Vegetation Mapping Project (IVMP) data (collected from 1992 to 1996), classified
as described in chapter 4.0 and projected to 2004 for other ownerships. Future conditions were
evaluated in the years 2013, 2031, and 2067 using growth and harvest projections from DNR’s
2004 sustainable harvest calculation preferred alternative (DNR 2004b).
Land cover estimates for many non-DNR-managed lands were largely held static through these
projections, assuming that these areas reflected a natural disturbance regime, so that the 1992–
1996 satellite images broadly represented future conditions as well.
Forest succession was projected for several portions of the analysis landscape according to a
series of assumptions detailed in chapter 4.0. Areas where clearcut, early- and mid-seral conifer
stands existed would advance to late-seral development (Green et al. 1993) according to growth
projections of model stands in the analysis area.
Summary of the Projected Current and Future Contribution of Forest Stands to Marbled Murrelet Carrying Capacity
The series of relationships and assumptions described lead to a set of explicit assumptions
regarding the predicted values of marbled murrelet habitat quality, or “Pstage” values, which vary
according to three dimensions: land ownership, existing versus projected land cover, and the
application of a variety of projected management regimes for DNR-managed lands. The Pstage
values that are assumed to result from the relationship with these dimensions are summarized in
Table ES-3.

ES.9 Methods for Estimating Response to Habitat – SWWA, OESF, and Straits
September 2008 Page ES-24
Table ES-3. Summary Assumptions Regarding Marbled Murrelet Habitat Potential (Pstage) for Two Classifications of Forest Successional Stages.
Relative Marbled Murrelet Habitat Potential (Pstage)
Stand Development Stages (Brodie et al.
2004)
Seral Stages (Green et al.
1993)
Existing and Projected Future Conifer Stands
on DNR-Managed Land
Existing Conifer Forest in
Olympic National Park and
Olympic National Forest
Other1 Existing Conifer Forests
Projected Future Conifer Forests in
Previously Harvested Areas of Olympic National
Forest
Projected Future Riparian Conifer Forests in
Previously Harvested Riparian Areas Outside of Olympic National Forest
Ecosystem Initiation Nonconifer (in part) 0 0 0 0 0
Sapling Exclusion Early-seral 0 0 0 0 0
Pole Exclusion Mid-seral 0 0 0 0 0
Large Tree Exclusion Late-seral 0.25 0.682 0.312 0.203 0.133
Understory Development Late-seral 0.36 0.68 0.31 0.20 0.13
Botanically Diverse Late-seral 0.47 0.68 0.31 0.20 0.13
Niche Diversification Late-seral 0.62 0.68 0.31 0.20 0.13
Fully Functional Late-seral 0.89 0.68 0.31 0.20 0.13 1 Predominantly private and tribal land. 2 See discussion for these calculations in section 4.4. 3 See discussion for these calculations in section 4.5. Note: assumptions on the influence of land ownership, existing versus projected land cover on non-DNR ownerships, and several potential forest management regimes for DNR-managed lands on Pstage are discussed in the preceding section.

ES.9 Methods for Estimating Response to Habitat – SWWA, OESF, and Straits
September 2008 Page ES-25
Edge Effects on Quality of Marbled Murrelet Habitat and Its Potential Influence on Carrying Capacity
Based on the observed relationship of diminished nest success with stand edges (Manley and
Nelson 1999), the Science Team determined to discount the predicted contribution of edge-
influenced potential marbled murrelet habitat to carrying capacity (K). A 164-foot distance
reflecting edge effects (Manley and Nelson 1999) and the values for low and high nest success
hypothesized by McShane et al. (2004) (0.38 and 0.54, respectively) were used together to
determine a discount factor, or Pedge, of 0.70 (0.38 / 0.54 = 0.70; i.e., success at edges is assumed
to be 70% of forest interior values). This discount factor (0.70) was used to modify the predicted
contribution to K of current or potential future edge-influenced habitat as Kedge = Kstage * Pedge.
Predictions of K across edge and interior (Kinterior=Kstage) habitat are summarized as K ’= Kedge +
Kinterior. Thus for example, applying this concept to a 100-acre stand in the Botanically Diverse
(Appendix B) stage (P=0.47) with 50 acres of interior and 50 acres of edge influence, K’ = (170
acres / marbled murrelet) * [(0.47 * 50 acres) + (0.47 * 0.70 * 50 acres)] = 0.251 “marbled
murrelet units.”
Areas of potential marbled murrelet habitat subject to edge effects were identified and
summarized using the 82-foot resolution GIS grids that represented current and projected land
cover. The land cover categories of Green et al. (1993) were the basis for determining edge-
influenced areas of potential marbled murrelet habitat that occurred only in the late-seral
category. Non-forest, non-conifer, and early-seral conifer were considered “edge-creating”
categories. Among DNR’s stand development stage (SDS) categories, Ecosystem Initiation and
Sapling Exclusion were considered edge-creating when adjacent to categories that provided
some K.
The Influence of Distance from Marine Habitat on the Quality of Inland Marbled Murrelet Habitat and Its Effects on Carrying Capacity
Radiotelemetry studies in southwestern British Columbia (Hull et al. 2001) suggest that 40 miles
is a reasonable one-way commuting distance for nesting marbled murrelets. The at-sea
distribution of marbled murrelets during the breeding season (Miller et al. 2006) and results of
DNR’s inland marbled murrelet surveys in the South Coast and Columbia HCP Planning Units
(see Prenzlow Escene 1999 and Harrison et al. 2003 for survey reports) confirm that the value of
inland habitat declines dramatically beyond 40 miles from marine foraging areas.
ES.10 Methods for Projecting the Development of Marbled Murrelet Habitat – SWWA, OESF, and Straits
September 2008 Page ES-26
The Science Team applied an arbitrary discount factor of 0.25 to reflect the diminished potential
contribution to K’ of stands more than 40 miles from marine waters with an observed high
density of marbled murrelets during the breeding season (Miller et al. 2006). Within the analysis
areas, locations distant from marine foraging areas were exclusively in the far eastern portion of
the SWWA Analysis Unit (Figure ES-1).
ES.10 METHODS FOR PROJECTING THE DEVELOPMENT OF MARBLED MURRELET HABITAT UNDER THE SCIENCE TEAM’S RECOMMENDED CONSERVATION APPROACH
As described previously, the Science Team designated MMMAs in the SWWA Analysis Unit. In
the OESF, the Science Team designated the proposed areas in the Queets, Dickodochtedor,
Goodman Creek, and Kalaloch LPUs as MMMAs for the purposes of examining current and
projected forest habitat. The total area of all MMMAs is approximately 117,000 acres of forested
state trust lands. These MMMAs were designated so that management within them would have
the explicit objective of enhancing existing lower-quality habitat and developing new habitat in
areas that have not been found to be occupied. This section summarizes the methods and
assumptions used to project forest growth and response to silviculture in those MMMAs. The
principal objective of this modeling exercise was to provide an objective, repeatable, quantitative
assessment of the results of proactive silviculture intended to maximize the quality and quantity
of marbled murrelet habitat, according to the unique conditions desired for each MMMA, within
the 70 year term of the HCP. Since recommendations for the development of marbled murrelet
habitat in the Straits Analysis Unit are to provide solely passive management, these exercises
were not conducted there.
Goals and Objective Criteria
The goal of this exercise was to create as much potential nesting habitat for marbled murrelets as
possible within the proposed area on DNR-managed land, as rapidly as possible within the
seven-decade HCP agreement. Habitat was identified using the SDS criteria summarized in the
previous section; thus, the solution led to the maximum K summed over all stands in the
MMMAs in decade seven. For the purpose of demonstrating the process of applying these tools
and interpreting the results, habitat was summed across all scales so that it was maximized within
units of forest, blocks, or LPUs, and ultimately within and across analysis units.

ES.10 Methods for Projecting the Development of Marbled Murrelet Habitat – SWWA, OESF, and Straits
September 2008 Page ES-27
Model Development
To frame what the Science Team recommended as “biologically appropriate silviculture,” a
series of preliminary modeling exercises examined several simplistic silvicultural approaches for
achieving and improving nesting habitat. These exercises inspected outcomes of five
hypothetical management approaches (scenarios) for achieving as much habitat as rapidly as
possible: “No Management,” “Light Thinning Only,” “Heavy Thinning Only,” “Conversion
Only,” and “Combination.” The Combination approach found a solution that freely selected
among the other approaches to maximize habitat. The silvicultural characteristics of each of
these approaches are described in chapter 4.0.
Results of all five trial approaches demonstrated a steady increase in the abundance and quality
of marbled murrelet habitat, but the scenarios could be lumped into two groups based on their
performance. One group, consisting of No Management, Light Thinning Only, and Conversion
Only, showed initial rapid gains in habitat, seen mainly in the first decade. Heavy Thinning and
Combination comprised the other group, predicted to produce more high-quality habitat by
decade seven.
Results of these initial trials were evaluated and integrated, acknowledging biophysical
limitations on the effectiveness of silviculture, to form the Habitat Management scenario.
Biophysical limitations refer to the capacity of the site’s soil, light, and other nutrients to support
a particular forest stand structure growing at a particular rate, as well as taking into consideration
species composition, competition, and windthrow risk. All the listed silvicultural approaches
were combined in the Habitat Management scenario to include considerations of how the
interaction of stand density and the structural properties of trees could influence outcomes of
silvicultural manipulations designed to create and/or improve marbled murrelet habitat. The No
Management scenario was merely a simulation of forest development without active silvicultural
intervention and was developed to provide a point of reference reflecting a preservation approach
to habitat management.

ES.11 Projections of Habitat and Population Response to the Conservation Recommendations – SWWA, OESF, and Straits
September 2008 Page ES-28
ES.11 PROJECTS OF MARBLED MURRELET HABITAT AND POTENTIAL POPULATION RESPONSE TO THE SCIENCE TEAM’S CONSERVATION RECOMMENDATIONS
This section presents and discusses results from analyses of the current and projected future
quantity and quality of marbled murrelet habitat and the potential for this habitat to contribute to
the biological objectives for marbled murrelet conservation in the SWWA, OESF, and Straits
Analysis Units. The analyses were intended 1) to provide objective, repeatable, quantitative
comparisons of current and projected future forest habitat for marbled murrelets on DNR-
managed and other lands; and 2) to estimate potential marbled murrelet population responses to
current and projected future habitat under the Science Team’s proposed approach using an index
of the capability of forest habitat to support marbled murrelets (K’). K’ is scaled to approximate
DNR’s current understanding of marbled murrelet population responses to forest habitat. Results
from the K’ analyses are presented in “marbled murrelet units.” However, those values should
not be viewed as explicit predictions of current or future marbled murrelet numbers. Rather, K’
provides an objective, repeatable index that can be used to judge relative conservation values of
future projected marbled murrelet habitat on DNR-managed lands and other lands across the area
of analysis. This exercise may be used by DNR in the future to evaluate revisions to this
approach or any alternative recommendations for the Marbled Murrelet LTCS.
Comparison of Current and Projected Marbled Murrelet Habitat and its Potential for Population Support Among Analysis Units and of DNR’s Relative Role within Analysis Units
SUMMARY: DNR’s current local-habitat contributions to populations of marbled
murrelets depend on patterns of land ownership and land use within each analysis
unit. In contrast, habitat quality depends on stand structure and edge effects.
Currently, the OESF and Straits Analysis Units contribute more to the marbled
murrelet population than the SWWA Analysis Unit; however, under the Science
Team’s conservation approach, the ability to support the population is likely to
increase in all analysis units. This is especially true in SWWA because it has the
greatest proportion of DNR ownership to overall land base and because it has high
amounts of current edge habitat that can eventually be converted to high-quality
habitat.

ES.11 Projections of Habitat and Population Response to the Conservation Recommendations – SWWA, OESF, and Straits
September 2008 Page ES-29
The quality and quantity of current and projected future marbled murrelet habitat differed
markedly among the analysis units. Currently, habitat is most abundant in the OESF, followed by
the Straits and then the SWWA Analysis Unit (Figure ES-6A; see section 4.4 for projected
habitat calculation). However, since habitat is of higher quality in the largely native forests on
federal lands on the Olympic Peninsula (see section ES-8), the OESF and Straits provide
substantially greater support to the broader marbled murrelet population than do the managed
forests in SWWA (Figure ES-6B). However, habitat capability (K’) is projected to increase at a
slower rate than habitat area (Figures ES-6B and ES-6A, respectively) because projected
increases in habitat area will largely occur in the lower-quality stages within the analysis period
(Table ES-4). Thus projections for K’ suggest that OESF, then Straits, will have much greater
capability to support murrelets than SWWA over the life of the HCP (Figure ES-6B).
Forests managed by DNR comprise a minority of the land base in all analysis units, ranging from
10% in Straits to 21% in the OESF (Table ES-2). The relative contribution of DNR-managed
forests to support local marbled murrelet populations depends on patterns of land ownership and
land use within each analysis unit (Figure ES-7). In SWWA, where nearly all public forestlands
occur on the 13% of the land base managed by DNR (Table ES-2), almost 40% of the current
Figure ES-6APotential Murrelet Habitat
(1000s of Acres)
0
100
200
300
400
500
600
700
800
2000 2010 2020 2030 2040 2050 2060 2070Year
Thou
sand
s of
Acr
es
SWWAOESFStraits
Figure ES-6BPotential Habitat Capability (K')
0
400
800
1200
1600
2000
2000 2010 2020 2030 2040 2050 2060 2070
Year
K'
SWWAOESFStraits
Figure ES-6. The Estimated Current and Projected Future Area of Forest Cover That Has Potential to Provide Marbled Murrelet Nesting Habitat (Figure ES-6A) and the Estimated Capability of That Habitat to Support Marbled Murrelet Populations Based on Its Quality and Abundance (Figure ES-6B) across All Ownerships within Each Analysis Unit (Under the Habitat Management Scenario).

ES.11 Projections of Habitat and Population Response to the Conservation Recommendations – SWWA, OESF, and Straits
September 2008 Page ES-30
habitat capability is on those DNR-managed lands (Figure ES-7). DNR-managed forests make
such a significant contribution to K’ because the abundance and quality of habitat on DNR-
managed lands is relatively greater, particularly than that of other landowners (Table ES-4). This
trend also holds for projected future forests. This abundance and quality of potential habitat can
be seen when viewed as averaged over area by ownership. When averaged on a per-1000 acre
basis, DNR-managed forests provide substantially more potential habitat capability than other
landowners, with federal lands providing the most projected benefit on a per-area basis,
particularly in the OESF Analysis Unit. The Olympic Peninsula is dominated by public
forestlands, with the federally managed Olympic National Park and Olympic National Forest
comprising half the land base (Table ES-2). Those federal lands provide the majority of support
for marbled murrelet populations in the Straits and the OESF (Figure ES-7, Table ES-4).
Under the Science Team’s recommended conservation approach, marbled murrelet habitat and
its estimated capability to support marbled murrelet populations is projected to increase in all
analysis units, assuming that marbled murrelets move into and successfully nest in newly created
habitat. Those projections, illustrated in Figures ES-6 and ES-7, are based on the Habitat
Management scenario for MMMAs on DNR-managed land; at the scale of these analyses,
differences between No Management and Habitat Management are not discernable and therefore
were not shown graphically. The relative difference in these increases is greatest in SWWA,
where K’ is projected to nearly double by 2067 (Table ES-5) because of the combined effects of
new management practices on private forestlands (i.e., Forest and Fish Rules [Washington State
Forest Practices Board 2002], which mandate managing streamside forests for future conditions
that could potentially provide some capability as marbled murrelet habitat), management of state
forests under current DNR policies, and the Science Team’s recommended approach for marbled
murrelet conservation.

ES.11 Projections of Habitat and Population Response to the Conservation Recommendations – SWWA, OESF, and Straits
September 2008 Page ES-31
Table ES-4. Current and Projected Future Acreage of Forests Managed by DNR, Federal Agencies, and Other Landowners That Could Provide Habitat to Support Marbled Murrelet Populations in the SWWA, Straits, and OESF Analysis Units (under the Habitat Management Scenario; See Appendix B for a Description of Stand Development Stages). Numbers Represent Thousands of Acres.
SWWA Straits OESF
2004 2013 2031 2067 2004 2013 2031 2067 2004 2013 2031 2067 Landowner Cover Type
Thousands of Acres
Large Tree Exclusion 51.1 38.7 28.5 25.8 8.5 7.7 5.2 5.9 8.2 8.4 7.5 37.2
Understory Development 43.7 41.4 43.0 45.5 21.3 18.2 13.5 21.0 10.2 10.0 10.2 18.7
Botanically Diverse 29.5 25.2 31.6 30.2 21.6 17.0 17.5 16.6 20.5 18.9 19.3 23.6
Niche Diversification 0.9 3.4 19.4 33.5 0.2 1.5 8.8 2.4 26.9 23.7 31.0 32.9
DNR-Managed Lands
Fully Functional 0.1 0.2 0.4 22.0 0.0 0.0 0.0 7.5 5.6 14.1 17.7 30.6
Existing Late-Seral 0.5 0.5 0.5 0.5 286.2 286.2 286.2 286.2 282.6 282.6 282.6 282.6
Federal Lands Projected Late-Seral - 0.4 0.9 1.0 - 55.3 106.1 125.9 - 43.6 83.9 98.3
Existing Late-Seral 179.5 179.5 179.5 179.5 38.0 38.0 38.0 38.0 59.5 59.5 59.5 59.5 Other
Landowners Projected Late-Seral - 121.8 270.8 400.1 - 4.0 23.2 34.6 - 23.7 69.5 88.1

ES.11 Projections of Habitat and Population Response to the Conservation Recommendations – SWWA, OESF, and Straits
September 2008 Page ES-32
0
400
800
1200
1600
2000
2004 2013 2031 2067 2004 2013 2031 2067 2004 2013 2031 2067
SWWA Straits OESF
Year and Analysis Unit
Pote
ntia
l Hab
itat C
apab
ility
( K')
DNRFederalOther
0%
13%
87%
10%
60%
30%
40%
21% 39%
Land Ownership
Land OwnershipLand Ownership
Figure ES-7. The Current and Projected Future Capability of Forests Managed by DNR, Federal Agencies, and Other Landowners to Support Marbled Murrelet Populations (K’) and Pattern of Land Ownership (Expressed as a Percentage of Total Landscape) in SWWA, Straits, and OESF Analysis Units (Under the Habitat Management Scenario).
Projected habitat quality is influenced mostly by stand structure; however, edge effects were also
assumed to be detrimental. Habitat near edges currently provides the greatest contribution to K’
in SWWA (33%) relative to Olympic Peninsula areas, where edge habitat contributes about one-
fourth the projected habitat capability, with 21% and 26% for the OESF and Straits, respectively.
Interior (non-edge) habitat is projected to increase in abundance in all areas by 73% (SWWA),
61% (OESF), and 52% (Straits) with associated increases in K’ from interior forests. In concert
with all projected changes across the landscape, a slight decrease in the proportional abundance
of edge habitat is projected on the Olympic Peninsula, so that by 2067, interior habitat will
increase to provide 80% and 77% of K’ in the OESF and Straits, respectively, and 61% in
SWWA. Edge habitat is projected to provide a greater proportion of K’ in SWWA by 2067, with
39% of the substantially greater habitat capability resulting largely from the increased abundance
of high-edge habitat projected to develop in riparian forests.

ES.11 Projections of Habitat and Population Response to the Conservation Recommendations – SWWA, OESF, and Straits
September 2008 Page ES-33
Table ES-5. The Current (2004) and Projected Future (2013, 2031, and 2067) Capability of Forests Managed by DNR, Federal Agencies, and Other Landowners to Support Marbled Murrelet Populations (K’) in the SWWA, Straits, and OESF Analysis Units (under the Habitat Management Scenario). (Note: Overall K’ is High for Other Land Ownerships Due to the Substantial Number of Acres of Land in this Category [See Table 3-1].)
Potential Habitat Capability (K’)
SWWA Straits OESF Land Ownership 2004 2013 2031 2067 2004 2013 2031 2067 2004 2013 2031 2067
DNR 151 128 195 308 111 92 107 135 207 236 282 414
Federal1 2 2 3 3 1,033 1,097 1,163 1,186 1,035 1,085 1,137 1,154
Other 233 306 385 444 56 59 70 76 92 107 135 146
Total 386 437 582 754 1,200 1,248 1,340 1,397 1,335 1,428 1,555 1,714 1 Includes lands managed by National Park Service and U.S. Forest Service. Lands managed by other federal agencies are not included.
Projected Rate of Habitat Development on DNR-Managed Lands
SUMMARY: The general trends projected through 2067 show increasing overall
habitat capability, as well as increasing habitat abundance and population support
provided by higher quality habitat. This general boost in the amount of quality
marbled murrelet habitat, particularly interior forest habitat, is in response to
management practices both within MMMAs and elsewhere.
The increase in habitat capability projected on DNR-managed lands in all three analysis units
was relative to each unit’s habitat abundance and land management objectives in concert with
those of other landowners (Figure ES-7). Section 5.3 in chapter 5.0 compares the projected
outcomes of No Management and Habitat Management. Projected effects of Habitat
Management are illustrated in Figure ES-8, showing the trend of increasing overall habitat
capability, as well as the increasing abundance (see Table ES-4) and role in population support
provided by presumed higher quality habitat.
The initial negative trends in K’ for SWWA and the Straits (Figure ES-8) are the outcomes
projected from timber harvests in areas not proposed to be designated to contribute to
conservation, and would be managed according to DNR’s broader policies under the Policy for
Sustainable Forests (DNR 2006b) and the HCP (DNR 1997a) as a result of the LTCS. Although
some projected marbled murrelet habitat is also predicted to be harvested in the OESF under this

ES.11 Projections of Habitat and Population Response to the Conservation Recommendations – SWWA, OESF, and Straits
September 2008 Page ES-34
approach, the context of DNR-managed lands and objectives specific to the OESF are such that
habitat development was projected to be the dominant process over all time steps reported from
the analyses (Figure ES-8). By 2067, K’ on DNR-managed lands is projected to double in
SWWA and the OESF, and increase by 22% in the Straits (Table ES-5). Most of those increases
are projected to occur as the amount and quality of marbled murrelet habitat improves in
response to management practices (Figure ES-8) both within MMMAs and elsewhere.
Management in MMMAs and otherwise on DNR-managed lands was projected to result in long-
term increases in the overall habitat capability of interior forest habitat, especially in SWWA and
the OESF because of the focus on marbled murrelet conservation and other conservation
objectives in these analysis units (Figure ES-9A). The proportion of habitat capability occurring
in this potentially more secure landscape context (i.e. interior forest) remained fairly constant
over time (Figure ES-9B). The temporary decreases in interior habitat due to increased edge in
0
50
100
150
200
250
300
350
400
450
2004 2013 2031 2067 2004 2013 2031 2067 2004 2013 2031 2067
SWWA Straits OESF
Year and Analysis Unit
Pote
ntia
l Hab
itat C
apab
ility
( K')
Large Tree ExclusionUnderstory DevelopmentBotanically DiverseNiche DiversificationFully Functional
Figure ES-8. The Current and Projected Future Capability of DNR-Managed Forests, Classified by Stand Development Stage (Brodie et al. 2004), to Support Marbled Murrelet Populations (K’) in the SWWA, Straits, and OESF Analysis Units (under Habitat Management Scenario).

ES.11 Projections of Habitat and Population Response to the Conservation Recommendations – SWWA, OESF, and Straits
September 2008 Page ES-35
0
50
100
150
200
250
300
350
400
2000 2010 2020 2030 2040 2050 2060 2070
Year
K'
OESFSWWA
Straits
Figure ES-9APotential Habitat Capability (K' ) of Interior Forest (> 164 ft from an edge)
0.00
0.20
0.40
0.60
0.80
1.00
2000 2010 2020 2030 2040 2050 2060 2070
Year
Prop
ortio
n
OESFSWWAStraits
Figure ES-9BProportion of Potential Habitat Capability (K' )
in Interior Forest (>164 ft from an edge)
Figure ES-9. The Current and Projected Future Capability of DNR-Managed Interior Forest Habitat (more than 164 Feet from Edges) to Support Marbled Murrelet Populations (K’) in the SWWA, Straits, and OESF Analysis Units (under the Habitat Management Scenario) (Figure ES-9A). The Proportion of Total K’ Provided by DNR-Managed Interior Forest Habitat in the SWWA, Straits, and OESF Analysis Units (under the Habitat Management Scenario) (Figure ES-9B).

ES.11 Projections of Habitat and Population Response to the Conservation Recommendations – SWWA, OESF, and Straits
September 2008 Page ES-36
the Straits and SWWA are the projected outcome of timber harvests in areas not recommended
to be designated for conservation emphasis as noted in the previous paragraph.
A Comparison of the No Management and Habitat Management Scenarios
SUMMARY: Both the No Management and Habitat Management scenarios
implement the Science Team’s goals for marbled murrelet conservation, but they
differ in their simulated management approaches, portraying passive and active
silvicultural applications, respectively. The projections show very little difference in
their projected outcomes for marbled murrelet populations, although higher quality
habitat developed at an increased rate under the Habitat Management simulation.
Both the No Management and Habitat Management scenarios reflect the habitat objectives and
geography of the Science Team’s recommended approach to long-term marbled murrelet
conservation. They differed only in their simulated management approaches, portraying a
passive and active application of silviculture within the MMMAs designated in SWWA and the
OESF. Projected management and its outcomes did not differ between those scenarios across the
remainder of DNR-managed lands in those analysis units. That is, 66,000 of 324,000 acres in
SWWA and 50,000 of 271,000 acres in the OESF were designated as MMMAs. These lands
were the basis for the comparisons reported here against the background of implementing DNR
policies and mandates over the rest of state forests in those analysis units.
Projections of the scenarios demonstrated very little difference in their projected outcomes for
marbled murrelet populations (Figure ES-10). The most pronounced difference is for SWWA in
2067, when K’ is projected to be 308 under Habitat Management compared to 275 under No
Management. Within the MMMAs, the difference between No Management and Habitat
Management were more pronounced. Projections for K’ in 2067 were 130 and 158, respectively,
or 22% greater with Habitat Management. In the OESF, the No Management scenario projected
a slightly greater K’ in 2067; 422 versus 414 for Habitat Management. This is a confounding
projected outcome, and seems unlikely in view of management applied specifically for the
purpose of accelerated habitat development under the Habitat Management scenario and habitat
gains projected in SWWA. This phenomenon requires further investigation to explore the causes
of this result in order to inform future modeling efforts. Habitat Management projected

ES.11 Projections of Habitat and Population Response to the Conservation Recommendations – SWWA, OESF, and Straits
September 2008 Page ES-37
0
50
100
150
200
250
300
350
400
450
o
2004 2013 2031 2067 2004 2013 2031 2067
SWWA OESF
Year and Analysis Unit
Pote
ntia
l Hab
itat C
apab
ility
( K')
Large Tree ExclusionUnderstory DevelopmentBotanically DiverseNiche DiversificationFully Functional
No ManagementHabitat Management
Figure ES-10. The Current and Projected Future Capability of DNR-Managed Forests to Support Marbled Murrelet Populations (K’) in SWWA and OESF Analysis Units for the No Management and Habitat Management Scenarios.
somewhat greater edge effects, with 80% versus 81% of K’ from interior habitat in SWWA, and
86% versus 90% in the OESF.
A Comparison of Marbled Murrelet Habitat on DNR-Managed Lands within and outside Marbled Murrelet Management Areas
SUMMARY: Currently, both SWWA and the OESF provide a small proportion of the
total area’s habitat capability on DNR-managed lands. The focus of retaining and/or
developing high-quality marbled murrelet habitat within MMMAs was expected by
the Science Team to increase habitat quality and increase habitat abundance as a
function of the amount and quality of habitat existing or projected to exist within
them. Active silvicultural treatments (Habitat Management) are projected to increase
these values and their capability to support marbled murrelet populations,
particularly in interior forests.
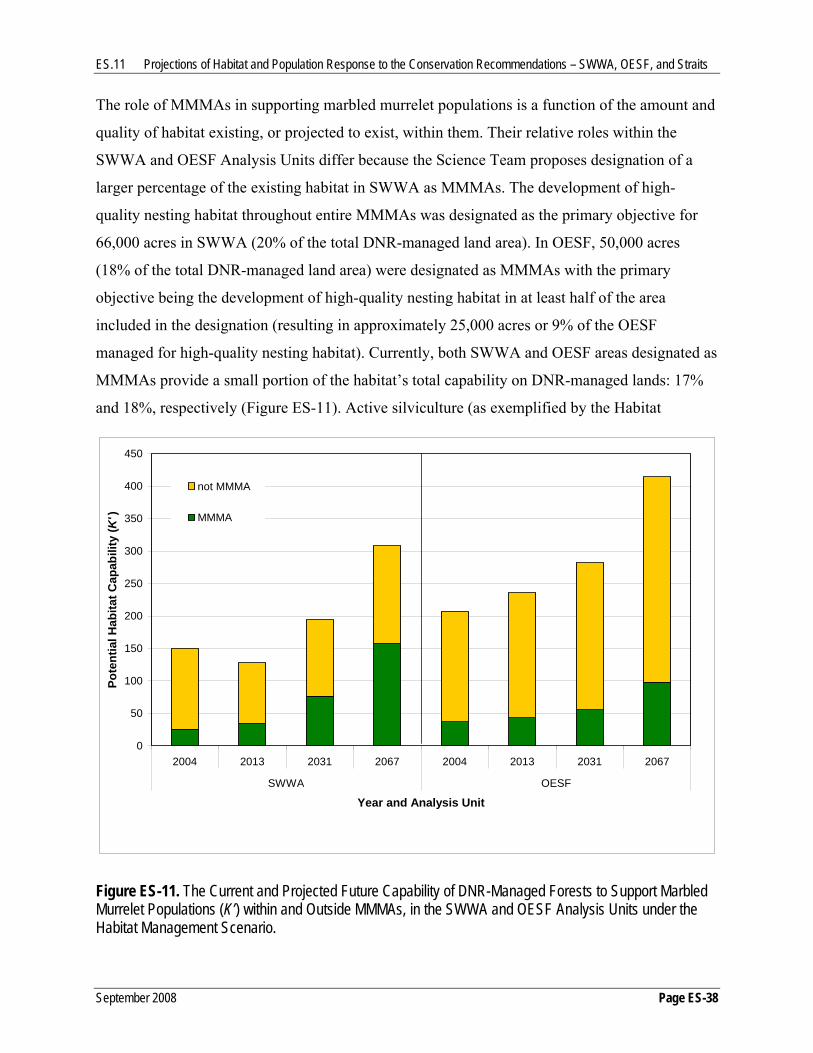
ES.11 Projections of Habitat and Population Response to the Conservation Recommendations – SWWA, OESF, and Straits
September 2008 Page ES-38
The role of MMMAs in supporting marbled murrelet populations is a function of the amount and
quality of habitat existing, or projected to exist, within them. Their relative roles within the
SWWA and OESF Analysis Units differ because the Science Team proposes designation of a
larger percentage of the existing habitat in SWWA as MMMAs. The development of high-
quality nesting habitat throughout entire MMMAs was designated as the primary objective for
66,000 acres in SWWA (20% of the total DNR-managed land area). In OESF, 50,000 acres
(18% of the total DNR-managed land area) were designated as MMMAs with the primary
objective being the development of high-quality nesting habitat in at least half of the area
included in the designation (resulting in approximately 25,000 acres or 9% of the OESF
managed for high-quality nesting habitat). Currently, both SWWA and OESF areas designated as
MMMAs provide a small portion of the habitat’s total capability on DNR-managed lands: 17%
and 18%, respectively (Figure ES-11). Active silviculture (as exemplified by the Habitat
0
50
100
150
200
250
300
350
400
450
2004 2013 2031 2067 2004 2013 2031 2067
SWWA OESF
Year and Analysis Unit
Pote
ntia
l Hab
itat C
apab
ility
( K')
not MMMA
MMMA
Figure ES-11. The Current and Projected Future Capability of DNR-Managed Forests to Support Marbled Murrelet Populations (K’) within and Outside MMMAs, in the SWWA and OESF Analysis Units under the Habitat Management Scenario.

ES.11 Projections of Habitat and Population Response to the Conservation Recommendations – SWWA, OESF, and Straits
September 2008 Page ES-39
Management scenario) to achieve the Science Team’s objectives for these areas is projected to
increase their capability to support marbled murrelet populations, such that by 2067, MMMAs in
SWWA are projected to provide 51% of K’ (which will have more than doubled since 2004) for
DNR-managed lands in SWWA (Figure ES-11). In the OESF, habitat capability in the MMMAs
is projected to increase nearly threefold by 2067 (37 to 98), comprising 24% of the overall K’ in
DNR-managed forests within the analysis unit (Figure ES-11).
The focus on retaining and/or developing high-quality marbled murrelet habitat within MMMAs
was projected to increase habitat quality and increase habitat abundance, which led to the
substantial increases in the projected values of K’ between 2004 and 2067. In SWWA, the
proportion of K’ provided by higher quality habitat, including the Botanically Diverse, Niche
Diversification and Fully Functional stand development stages (SDS), was 42% in MMMAs and
33% on other DNR-managed lands in 2004 (Figure ES-12). Projected increases in habitat quality
0
50
100
150
200
250
300
350
2004 2013 2031 2067 2004 2013 2031 2067 2004 2013 2031 2067 2004 2013 2031 2067
Not in MMMA MMMA Not in MMMA MMMA
SWWA OESF
Year and Analysis Unit
Pote
ntia
l Hab
itat C
apab
ility
( K')
Large Tree Exclusion
Understory Development
Botanically Diverse
Niche Diversification
Fully Functional
Figure ES-12. The Current and Projected Future Capability of DNR-Managed Forests, Classified by Stand Development Stage (Brodie et al. 2004, Appendix B), to Support Marbled Murrelet Populations (K’) within and Outside MMMAs in the SWWA and OESF Analysis Units (under the Habitat Management Scenario).

ES.11 Projections of Habitat and Population Response to the Conservation Recommendations – SWWA, OESF, and Straits
September 2008 Page ES-40
and abundance resulted in the majority of K’ being provided by those higher quality stages by
2067, particularly in the MMMAs where 91% of the habitat capability was projected to be found
in higher quality habitat. Overall management objectives in the OESF were more similar within
and outside MMMAs, thus the striking changes projected for SWWA were not seen there.
Habitat development was projected to increase the abundance of habitat in MMMAs, but the
higher quality SDS categories provided similar proportions of K’ in 2004 (86%) and 2067 (89%)
(Figure ES-11). Edge effects were integrated with the influence of stand structure (SDS
categories) in estimating future habitat capability; however, the effect of management on
intentionally reducing edge effects in MMMAs was evident in the projected increases in K’
provided from interior forests. In SWWA, K’ of interior forests in MMMAs increased by 618%
compared to its 2004 level, while it remained unchanged on state forests outside those areas. In
the OESF MMMAs, K’ of interior forests increased by 148% compared to an 81% increase in
other DNR-managed forests in the area.
Summary and Discussion
Chapter 4.0 provides a discussion of the hypotheses and assumptions that are the basis for the
analyses in this report. A brief review of those hypotheses and assumptions, as well as the
uncertainty around them, can help the reader interpret the results from both a quantitative and
qualitative perspective. Below is a brief summary of how knowledge and hypotheses regarding
marbled murrelet biology and forest ecology were translated into specific assumptions
concerning how forest habitat supports marbled murrelet populations and how forest succession,
with and without active silvicultural intervention, influences the development of marbled
murrelet habitat.
1. Habitat area—The assumption that 170 acres of suitable forest habitat provides sufficient
opportunities to support one nesting marbled murrelet is substantiated by inland studies using
radar to estimate marbled murrelet numbers and radiotelemetry to assess inland behavior
(Burger 2002, Raphael et al. 2002a, Peery et al. 2004, Bloxton and Raphael 2007), as well as
by estimates of marbled murrelet numbers on adjacent marine foraging areas (Miller et al.
2006). However, it is likely there is a fine-grained variability in this relationship that is
overlooked by the simple assumption used in these analyses.

ES.11 Projections of Habitat and Population Response to the Conservation Recommendations – SWWA, OESF, and Straits
September 2008 Page ES-41
2. Stand characteristics—The abundance of potential nesting platforms and the presence of
complex canopy structure are well known as essential elements of marbled murrelet nesting
habitat (Grenier and Nelson 1995, Hamer and Nelson 1995). The assumed relationship of
habitat value with stand structure and composition as within Table ES-3 was derived from
empirical studies of marbled murrelet behavior in DNR-managed stands (Prenzlow Escene
1999), but the generalization that used SDS categories as surrogates for those structural
elements has not been validated with field studies. It is likely that Table ES-3 depicts general
trends in potential habitat value (Prenzlow Escene et al. 2006), but the precise numerical
estimates should be considered as working hypotheses. Additionally, recent studies have
located marbled murrelet nests in what appear to be unsuitable land cover categories (Hamer
and Nelson 1995, Bradley and Cooke 2001, M. Raphael pers. comm.), though these nests
were generally in old forests, rather than heavily managed forest landscapes. These
discoveries probably reflect the inability of coarse-grained (i.e., stand-level) classifications to
identify the specific, rare structural elements used as nest substrates by those birds (McShane
et al. 2004).
3. Forest succession—The dynamics of succession in forest stands, with and without
silvicultural intervention, have been well studied (Shugart 2003). Forest growth models can
be sufficiently predictive (Vanclay and Skovsgaard 1997); therefore, they are widely used for
effectively developing and implementing plans to manage forest properties for multiple
objectives (Guisan and Zimmermann 2000). Projections for DNR-managed stands were
based on data from high-resolution inventories of the forests (DNR’s Forest Resource
Inventory System [FRIS]) and well-supported forest growth models (DNR 2004b). However,
as the predictions from those models become increasingly specific (i.e., for individual stands
as opposed to averages taken across multiple stands), they can become increasingly uncertain
(Heuvelink 1998).
4. Edge effects—Negative edge effects have been observed at marbled murrelet nests, and the
rates of high and low nest success used to model edge effects were developed from field
studies (Manley and Nelson 1999, Nelson and Hamer 1995b). However, research on actual
and simulated marbled murrelet nests demonstrates that edge effects are probably the result
of several complex, interacting phenomena that are not adequately represented by the simple
model employed in these analyses (Nelson and Hamer 1995b, Raphael et al. 2002b).

ES.11 Projections of Habitat and Population Response to the Conservation Recommendations – SWWA, OESF, and Straits
September 2008 Page ES-42
Projections of the amounts of edge are fairly robust because they are based on the current
landscape data on other ownerships (Interagency Vegetation Mapping Project) and
projections of growth and harvest on DNR-managed lands (DNR 2004a), but there is
substantial uncertainty as to the generality of the model that predicts their suitability as
habitat. Some of this uncertainty may be resolved by ongoing and future research (see
chapter 6.0).
5. Distance from marine foraging areas—Research on marbled murrelet behavior suggests
there is a threshold distance between nesting and foraging areas beyond which the value of
nesting habitat is markedly diminished (Hull et al. 2001). However, the assumption used in
these analyses is merely an “educated guess” that reasonably conforms to observed patterns.
It remains to be refined by ongoing research.
Thus, results of these analyses are best considered broadly. Smaller differences (e.g., on the
order of 10%) are probably more meaningful when they are based on analyses across large areas,
such as entire analysis units. Likewise, differences of that order in current or projected future
conditions are likely to be less meaningful when measured across smaller analysis areas (e.g.,
individual SDS categories within MMMAs). Although there is uncertainty in the modeling
assumptions, the fact that they were applied equally in the analyses allows the results to be
directly compared. The best use of these results may be as relative comparisons:
• What are the relative roles of the analysis units and the landowners within them in regional
marbled murrelet conservation?
• What broad trends are expected in marbled murrelet habitat within each analysis unit?
• Will DNR policies and the Science Team’s recommendations meet their goals for marbled
murrelet conservation?
• Is active silvicultural intervention an appropriate tactic for achieving marbled murrelet
conservation goals?
• Are MMMAs an appropriate strategy for achieving marbled murrelet conservation goals?
The presentations of results earlier in this chapter were made with these types of comparisons in
mind, although the text, tables, and figures allow the reader to evaluate projections at finer
scales, if so desired. Table ES-6 summarizes current and projected future conditions relative to
the Science Team’s biological goals for marbled murrelet conservation on DNR-managed lands.

ES.11 Projections of Habitat and Population Response to the Conservation Recommendations – SWWA, OESF, and Straits
September 2008 Page ES-43
In short, DNR’s broader policies, in concert with the specific approach to marbled murrelet
conservation suggested by the Science Team and current policies of federal and other
landowners, will result in improved inland habitat conditions, which are likely to support those
biological goals. However, the portion of the marbled murrelet population nesting in SWWA
will likely remain less secure than that portion using the Olympic Peninsula because of the lack
of habitat on federal lands in SWWA.
Table ES-6. Summary of the Current and Projected Future Condition of Marbled Murrelet Habitat in the SWWA, OESF, and Straits Analysis Units Relative to the Science Team’s Biological Goals for Marbled Murrelet Conservation This Summary Includes State, Federal, and Non-Federal Lands.
SWWA OESF Straits 2004 2067 2004 2067 2004 2067
Population Size (Measured by Habitat Capability)
Small (K’≈386)
Moderate (95% increase)
Large (K’≈1,335)
Large (28% increase)
Large (K’≈1,200)
Large (16% increase)
Population Stability
Much habitat in high-edge situation, potential threat to stability
73% increase in K' from interior habitat but still high proportion of edge
Much habitat in interior forests, potentially supporting more stable population
61% increase in K' from interior habitat, improved potential for stable population
Much habitat in interior forests, potentially supporting more stable population
52% increase in K' from interior habitat, improved potential for stable population
Distribution SWWA is a gap in broad distribution of habitat, few habitat concentrations within SWWA
Improved habitat distribution within SWWA and for rangewide population
Good, but ecological gap in distribution, little habitat in low elevation forest communities
Improved ecological distribution, K' increased 166% in MMMAs
Good Good
Resilience Probably low Improved but less than Olympic Peninsula areas
Probably fairly high
Further improved
Probably fairly high
Further improved
The Science Team’s conservation emphasis in SWWA is an effort to meet their translation of
biological goals for the marbled murrelet. The geography and extent of DNR-managed lands as
well as the relatively few acres of federally managed forests limit those efforts, but even with
those limitations the strategy was projected to make substantial progress toward those goals, with
DNR-managed lands providing a disproportionately large share (41%) of future habitat

ES.11 Projections of Habitat and Population Response to the Conservation Recommendations – SWWA, OESF, and Straits
September 2008 Page ES-44
capability because of increased amounts and quality of habitat on state forests. About half of the
future habitat capability on those DNR-managed lands will occur in the 20% of state forests
designated as MMMAs. Forest growth modeling suggested that appropriate active management
does not appear to affect the future development of habitat and may improve its effectiveness.
In the OESF and Straits Analysis Units, the Science Team suggested relatively lower levels of
focal management for marbled murrelet conservation because of the context of DNR-managed
lands in a landscape dominated by federal forest reserves, and because the existing OESF
northern spotted owl conservation strategy greatly supports marbled murrelet habitat.
Considering DNR-managed lands as a whole, the Straits and OESF Analysis Units contribute to
the broader trend of projected improvement in habitat capability. This is particularly true in the
OESF, where high-quality marbled murrelet habitat is a relatively larger proportion of the DNR-
managed land base and where intentional management for marbled murrelet habitat restoration is
part of the Science Team’s recommended conservation approach. MMMAs in the OESF were
likely to achieve the designated objective of increasing habitat capability in low elevation forest
communities. The total habitat capability was projected to increase by 166% (Table ES-6) from
active silviculture that included management for multiple objectives.
The management scenario analysis results indicate that there are a variety of ways to achieve
equivalent levels of marbled murrelet habitat conservation. Each scenario has its own set of
unique hypotheses and assumptions. Thoughtful evaluation of the most biologically relevant
hypotheses and a minimal set of necessary assumptions required to enact the selected
conservation strategy will ensure its success.
September 2008 Page 1-1
1.0 INTRODUCTION
A habitat conservation plan (HCP) is a long-term management tool, authorized under the federal
Endangered Species Act (ESA) (Title 16, Section 1531 et seq. of the United States Code [16
USC 1531 et seq.]). For DNR, an HCP allows timber harvesting and other land management
activities to continue on forested state trust lands, while providing for species conservation as
described in the ESA. The HCP offsets harm to a threatened or endangered species as a result of
land management activities with a plan that implements conservation on lands covered by that
HCP. DNR is issued an “incidental take permit” by the United States Fish and Wildlife Service
(USFWS) that allows limited accidental harm to a species or its habitat, known as “take”, in
exchange for the conservation provisions detailed in the HCP.
In 1997, DNR completed a multi-species HCP for state trust lands in order to be compliant with
the ESA (DNR 1997a). The HCP covers approximately 1.8 million acres (728,000 hectares) of
state trust lands (Figure 1-1), and provides mitigation for the incidental take of ESA-listed
species, including the marbled murrelet (Brachyramphus marmoratus), northern spotted owl
(Strix occidentalis caurina), and several other species. DNR committed in its HCP “to develop a
long-term conservation strategy for the habitat of the marbled murrelet that will provide
minimization and mitigation for any incidental take of this species” (DNR 1997a, p. IV.39) in the
Olympic Experimental State Forest (OESF) and five westside planning units. The HCP states
that DNR will:
“…[H]elp meet the recovery objectives of the U.S. Fish and Wildlife Service, contribute to the
conservation efforts of the President’s Northwest Forest Plan, and make a significant
contribution to maintaining and protecting marbled murrelet populations in western Washington
over the life of the HCP” (DNR 1997a, p. IV.44).
However, the HCP did not contain a Long-Term Conservation Strategy (LTCS) for marbled
murrelets because of a lack of knowledge of the species’ habitat use on DNR-managed lands,
locations of nesting areas, and factors affecting the population, as well as the lack of a completed
federal recovery plan. Without this knowledge, development of a credible LTCS to adequately
aid in the conservation of marbled murrelet populations was not considered possible. Therefore,
an Interim Conservation Strategy (DNR 1997a, pp. IV.39-45) was designed to protect marbled
murrelet habitat on DNR-managed lands while DNR conducted studies and collected

1.0 Introduction
September 2008 Page 1-2
Figure 1-1. DNR-Managed Lands Covered by the Habitat Conservation Plan.

1.0 Introduction
September 2008 Page 1-3
information on the biology and ecology of the species in each of the HCP planning units (Figure
3-1). Following satisfactory completion of the Interim Conservation Strategy, DNR would then
develop and implement the LTCS.
At the request of DNR management, this document provides an overview of recent research and
expert opinion on marbled murrelet habitat conservation and details a set of recommendations
that provide the foundation for a credible, science-based LTCS that meets DNR’s HCP
requirements.
This document will provide DNR and USFWS the scientific information necessary to develop
alternative approaches to the LTCS to be examined through the State Environmental Policy Act
and National Environmental Policy Act processes. Those processes will provide decision makers
with information about the potential environmental impacts of a proposal, and the public with an
opportunity to provide input on potential alternatives and the types of potential impacts that
should be analyzed. The environmental impact statement (EIS) arising from this analysis will be
used with other relevant information by DNR to propose an LTCS (Figure 1-2).
Figure 1-2. DNR Marbled Murrelet Long-Term Conservation Strategy Process Flow Chart.

1.1 Interim Conservation Strategy
September 2008 Page 1-4
The Board of Natural Resources will review the LTCS and final EIS, conduct an assessment of
the impacts to the trusts, and identify an LTCS to be proposed to USFWS (Figure 1-2). Once
identified, the LTCS for the marbled murrelet will be submitted to USFWS as part of the
application for an amended incidental take permit. USFWS will analyze the LTCS per the
requirements specified in the ESA and HCP, including writing a biological opinion to analyze
impacts on the species’ population. If the amended permit is granted for the LTCS, it will allow
implementation of this strategy on DNR-managed lands for the term of the HCP.
1.1 Interim Conservation Strategy 1.1a Gathering Data though a Stepwise Process
The Marbled Murrelet Interim Conservation Strategy described in the HCP (DNR 1997a, pp.
IV.39-45) directed DNR to complete research necessary to the development of the LTCS and
involved five main steps. First, DNR identified and deferred harvest of any part of a block of
suitable marbled murrelet habitat. Second, within each of the South Coast, Columbia, OESF, and
Straits Planning Units, DNR conducted a two-year habitat relationship study to determine the
relative occupancy of forest types used by marbled murrelets. Third, after the habitat relationship
studies were completed in these planning units, DNR built predictive models to identify the
marginal habitat expected to comprise a maximum of 5% of the sites occupied by marbled
murrelets on DNR-managed lands within each planning unit (Prenzlow Escene 1999). Marginal
habitat types were made available for harvest as described under the incidental take permit.
(USFWS authorized harvest of these acres in the incidental take permit.) All acreage
constituting the higher quality habitat types, as identified by predictive habitat models
(comprising 95% of the occupied sites), was included in a one-time inventory survey using
protocols approved by the Pacific Seabird Group (Ralph et al. 1994, 1995b, 1996, 1997, 1998,
Evans Mack et al. 2003) to locate occupied sites. All known occupied sites were protected.
Fourth, outside of southwest Washington (SWWA), surveyed, unoccupied habitat was made
available for timber harvest if it was not located within 0.5 miles (0.8 kilometers) of an occupied
site. (For the purposes of the Interim Conservation Strategy, SWWA was defined as that portion
of the Columbia Planning Unit west of Interstate 5 and that portion of the South Coast Planning
Unit south of State Route 8.) After harvest, 50% of the suitable habitat on DNR-managed lands
in each Watershed Administrative Unit (WAU) was designated to remain until the completion of

1.1 Interim Conservation Strategy
September 2008 Page 1-5
the LTCS. Within SWWA, no surveyed, unoccupied habitat would be released until the
completion of the LTCS. All known occupied sites in each planning unit were protected and any
additional occupied sites found during the implementation of the Interim Conservation Strategy
were protected.
Additionally, while these steps were being implemented, DNR participated in cooperative
regional research efforts to further investigate the biology and ecology of the marbled murrelet.
These research projects included:
• Marine surveys to document distribution and population size (Thompson 1999, Lance and
Pearson 2005).
• Examination of factors affecting nest success (Marzluff et al. 1999, Marzluff et al. 2000).
• Nest predation studies (Luginbuhl et al. 2001, Bradley and Marzluff 2003).
• Analyses of temporal variability and landscape-level relationships of inland activity by
marbled murrelets (Raphael et al. 2002a, 2002b, 2006).
• Development of habitat-based population models as a tool to evaluate conservation planning
(Horton 2008).
The information collected during these studies and other research efforts was used to develop
these recommendations for marbled murrelet habitat conservation on DNR lands managed under
the HCP in SWWA and the Olympic Peninsula.
1.1b Inventory Surveys on DNR-managed Lands
Reclassified habitat is the term used in step three of the Interim Conservation Strategy to
describe high-quality habitat expected to contain at least 95% of the occupied sites on DNR-
managed lands within each planning unit. Reclassified habitat was determined by applying a
predictive habitat model to each planning unit landscape (Prenzlow Escene 1999). The habitat
models for each planning unit were developed using results of the habitat relationship studies in
step two of the Interim Conservation Strategy. Per the Interim Conservation Strategy, all acres of
reclassified habitat were to be surveyed using audio-visual surveys according to Pacific Seabird
Group methodology to determine occupancy by marbled murrelets (DNR 1997a, Ralph et al.
1995b, 1996, 1997, 1998, Evans Mack et al. 2000, 2003). These surveys were termed “inventory
surveys.”

1.2 Developing a Long-Term Conservation Strategy
September 2008 Page 1-6
The marbled murrelet inventory surveys were completed for the South Coast and Columbia
Planning Units in 2002 and for the Straits Planning Unit in 2003 (Prenzlow Escene 1999). The
OESF inventory surveys were almost 75% complete in 2002 (see description below) and were
discontinued because USFWS and DNR deemed it reasonable and efficient to enter into the
LTCS process with the results available at the time. The Science Team addressed the
conservation potential and suggested appropriate management approaches for the unsurveyed
acres. Within the OESF, approximately 39,000 acres (15,800 hectares) of reclassified habitat
were surveyed, while approximately 15,000 acres (6,100 hectares) remain unsurveyed (see
chapter 3.0). Marbled murrelets were detected at 92% of the survey sites in the OESF, and
occupied behaviors were observed at 52% of the sites where they were detected.
1.2 Developing a Long-Term Conservation Strategy As a first step in the development of an LTCS, the HCP called for the assembly of a Science
Team, including biologists with expertise in the biology and ecology of marbled murrelets,
silviculturists, Geographic Information System (GIS) specialists, and DNR planning staff
familiar with components of the HCP. The Science Team would review current literature about
marbled murrelets, review survey and research data collected by DNR from each planning unit,
and assist DNR in the development of an LTCS. The Interim Conservation Strategy envisioned
that the LTCS would take into account information on the location of occupied sites, the
distribution of habitat in each planning unit, current research results, landscape-level analyses,
and site-specific management plans.
In October 2003, DNR convened a Marbled Murrelet Scientific Summit in Olympia, Washington
to generate input from experts in marbled murrelet biology and ecology for incorporation into
DNR’s LTCS. In addition, the summit discussed the most recent science on marbled murrelets
and advised DNR scientists, planners, and managers on how to incorporate these insights into the
development of an LTCS. The summit was also an opportunity to recruit marbled murrelet
Science Team members to assist DNR in identifying conservation opportunities for the LTCS
(see Appendix A for a list of summit attendees).
A Science Team was created in January 2004 (Table 1-1) to review current literature about the
marbled murrelet, examine survey and research data collected by DNR and other researchers,
and draft recommendations for conservation opportunities for an LTCS on DNR-managed lands

1.2 Developing a Long-Term Conservation Strategy
September 2008 Page 1-7
Table 1-1. Marbled Murrelet Science Team Members.
Name Agency
Martin G. Raphael, Ph.D. U.S. Forest Service, Pacific Northwest Research Station
S. Kim Nelson, M.S. Oregon State University
Paula Swedeen, Ph.D. Consultant
Mark Ostwald, B.S U.S. Fish and Wildlife Service
Kim Flotlin, B.S. U.S. Fish and Wildlife Service
Steve Desimone, M.S. Washington Department of Fish and Wildlife
Scott Horton, Ph.D. Washington Department of Natural Resources
Peter Harrison, B.S. Washington Department of Natural Resources
Danielle Prenzlow Escene, M.S. Washington Department of Natural Resources
Weikko Jaross, M.S. Washington Department of Natural Resources
in the Columbia, South Coast, Straits, and OESF Planning Units. The Science Team consisted of
biologists with marbled murrelet expertise from academic and research institutions, USFWS,
Washington Department of Fish and Wildlife (WDFW), and DNR.
The Science Team held regular meetings beginning in January 2004. Data gathered during the
Interim Conservation Strategy phases were reviewed and organized for further analysis. Next,
the team began to develop conservation recommendations for opportunities for the LTCS.
The Science Team’s recommendations for conservation opportunities for an LTCS do not
include the North Puget and South Puget Planning Units. The marbled murrelet inventory
surveys in the North Puget Planning Unit began in 2001 and are not yet complete. The surveys in
the South Puget Planning Unit are planned for spring 2008. LTCSs for these two remaining units
will be completed after surveys have been conducted or when USFWS and DNR deem it
appropriate to develop an LTCS.
The following chapters of this document describe conservation opportunities for marbled
murrelet habitat on DNR-managed forested lands developed by the Science Team for the South
Coast, Columbia, Straits, and OESF HCP Planning Units. The document is organized as follows:
• Chapter 2.0, “Marbled Murrelet Ecology and Life History,” discusses marbled
murrelet biology and ecology.

1.2 Developing a Long-Term Conservation Strategy
September 2008 Page 1-8
• Chapter 3.0, “Recommended Landscape Conservation Approach,” provides the
Science Team’s landscape recommendations for marbled murrelet conservation in the
South Coast, Columbia, Straits, and OESF Planning Units.
• Chapter 4.0, “Habitat Assessment Methods,” provides the Science Team’s methods
for analyzing habitat conservation opportunities for the marbled murrelet in the South
Coast, Columbia, Straits, and OESF Planning Units.
• Chapter 5.0, “Habitat Assessment Results: Projections of Marbled Murrelet Habitat
and Potential Population Response Resulting From the Science Team’s
Conservation Recommendations,” details the conservation opportunities that were
modeled using simplified silvicultural approaches to demonstrate two forest management
scenarios. Modeling results are presented, including the likely marbled murrelet habitat
development in response to each silvicultural approach.
• Chapter 6.0, “Concepts in Adaptive Management,” discusses how an adaptive
management approach will be an integral part of the LTCS.

September 2008 Page 2-1
2.0 MARBLED MURRELET ECOLOGY AND LIFE HISTORY
The marbled murrelet is a cryptic seabird that nests in old-growth conifer forests and forages in
nearby ocean environments. The range of the marbled murrelet extends from the Aleutian Islands
of Alaska to the northern Baja Peninsula in Mexico, with the largest population of marbled
murrelets in the three-state Northwest Forest Plan region found in Washington. Studies
throughout the range of the marbled murrelet have found low rates of nest success and all
populations appear to be in decline. The marbled murrelet is listed by the U.S. Fish and Wildlife
Service (USFWS) as an endangered species in Washington, Oregon and California, and as a
species at risk in Canada (Canadian Marbled Murrelet Recovery Team 2003). Habitat loss
through forest fragmentation is thought to be the primary cause for population declines and is
discussed in detail in section 2.7. This chapter briefly summarizes our knowledge to date of the
marbled murrelet, its taxonomy, species characteristics, habitat requirements, population ecology
and distribution. The purpose of this chapter is to inform managers of the unique ecology of the
marbled murrelet, which will lead to a better understanding of which conservation efforts may be
most effective in protecting populations in Washington State.
2.1 Species Description and Taxonomy
The marbled murrelet is a diving marine bird and member of the Alcidae family, which consists
of 23 species divided into 11 genera within the order Charadriformes (Gaston and Jones 1998).
Worldwide, three species are now recognized within the genus Brachyramphus: the marbled
murrelet (B. marmoratus), the long-billed murrelet (B. perdix), and Kittlitz’s murrelet (B.
brevirostris) (American Ornithologists’ Union 1997).
The marbled murrelet is approximately 9.5 inches (24.1 centimeters) long with a heavy compact
body and a short tail and neck (Nelson 1997). The body is relatively short compared to wing
length. Males and females have identical plumage that varies seasonally (Marshall 1988). In
breeding plumage, the bird is dark above with rust coloring at the tips of the back feathers and
heavily mottled below (National Geographic Society 1987) (Figure 2-1). This “marbled” pattern
is thought to protect breeding birds in forested habitats from detection by predators (Binford et
al. 1975, Nelson and Hamer 1995b). In winter, adults have a brown-gray upper body, a white
lower body and are distinguished from the long-billed murrelet by white scapulars (shoulder
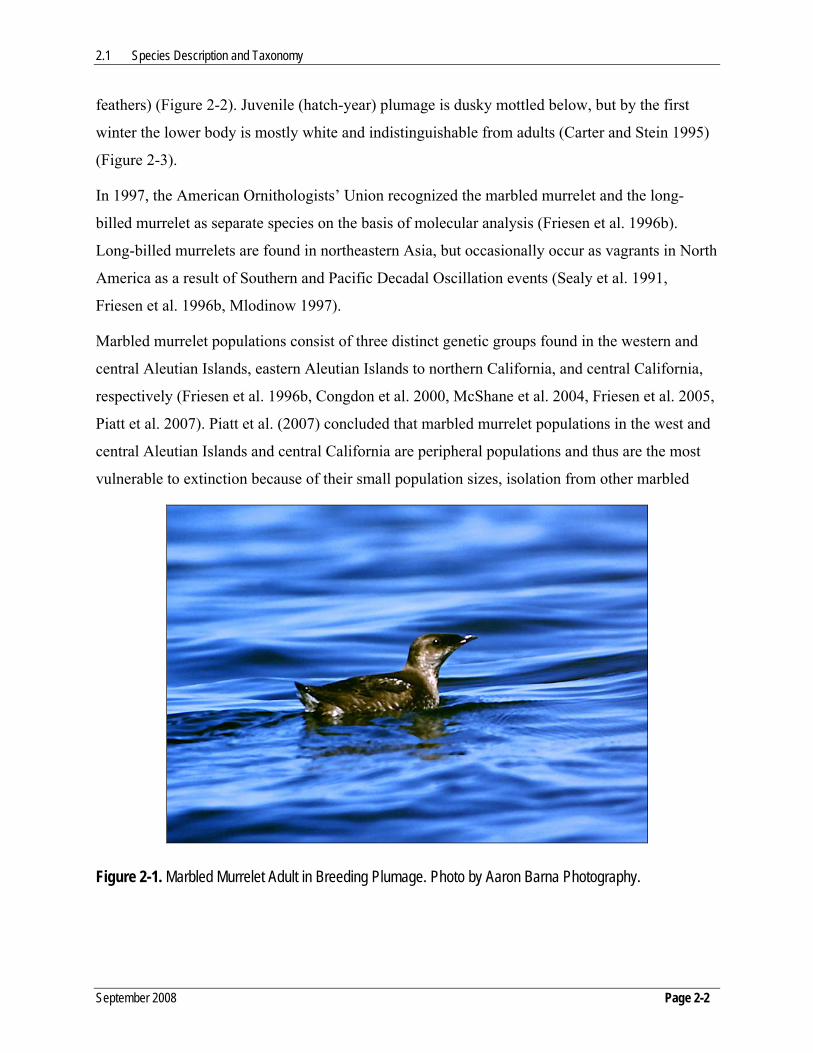
2.1 Species Description and Taxonomy
September 2008 Page 2-2
feathers) (Figure 2-2). Juvenile (hatch-year) plumage is dusky mottled below, but by the first
winter the lower body is mostly white and indistinguishable from adults (Carter and Stein 1995)
(Figure 2-3).
In 1997, the American Ornithologists’ Union recognized the marbled murrelet and the long-
billed murrelet as separate species on the basis of molecular analysis (Friesen et al. 1996b).
Long-billed murrelets are found in northeastern Asia, but occasionally occur as vagrants in North
America as a result of Southern and Pacific Decadal Oscillation events (Sealy et al. 1991,
Friesen et al. 1996b, Mlodinow 1997).
Marbled murrelet populations consist of three distinct genetic groups found in the western and
central Aleutian Islands, eastern Aleutian Islands to northern California, and central California,
respectively (Friesen et al. 1996b, Congdon et al. 2000, McShane et al. 2004, Friesen et al. 2005,
Piatt et al. 2007). Piatt et al. (2007) concluded that marbled murrelet populations in the west and
central Aleutian Islands and central California are peripheral populations and thus are the most
vulnerable to extinction because of their small population sizes, isolation from other marbled
Figure 2-1. Marbled Murrelet Adult in Breeding Plumage. Photo by Aaron Barna Photography.

2.1 Species Description and Taxonomy
September 2008 Page 2-3
Figure 2-2. Marbled Murrelet After-Hatch-Year Bird in Winter Plumage. Photo by Rich MacIntosh.
Figure 2-3. Juvenile (Hatch-Year) Marbled Murrelet Just Before Fledging from the Nest. Photo by Tom Hamer.

2.1 Species Description and Taxonomy
September 2008 Page 2-4
murrelet populations, and marginally suitable habitat. The knowledge of genetic structure within
this central population, which includes the bulk of the total current population, is limited and
requires additional study (Piatt et al. 2007).
Like other alcids, marbled murrelets are adapted for both underwater (to pursue prey) and aerial
flights. Marbled murrelets dive using their wings for propulsion (Burger 2002). Alcids have
reduced wing areas to decrease underwater drag and well-developed flight muscles; as a result,
they are relatively stocky birds with high wing loading (ratio of body mass to wing area) (Burger
2002). Birds with high wing loading require rapid flight speeds to maintain lift (Pennycuick
1987). Flight speeds of marbled murrelets range between 25 and 98 miles per hour (40 to 158
kilometers per hour). They typically fly faster when leaving the forest with a mean of 74 miles
per hour (119 kilometers per hour), than when returning from the sea (46 miles per hour [74
kilometers per hour]) or circling (50 miles per hour [80 kilometers per hour]) (Burger 1997,
Nelson 1997).
Molt timing varies from year to year and location to location, and is associated with prey
resources, stress levels, and reproductive success (Sealy 1975, Carter and Stein 1995). Adult
marbled murrelets molt into a mottled-brown breeding plumage in the spring (February–May)
and replace their alternate plumage into basic (winter) plumage in late summer through early fall
(July–November) (Carter and Stein 1995, Nelson 1997). The length of time required to complete
an entire pre-basic molt is 2 to 3 months. It takes approximately 65 days (range of 45 to 75 days)
for the molt of the primaries, secondaries, and rectrices (Pimm 1976, Carter and Stein 1995).
Because of the synchronous wing-molt during the pre-basic molting period, marbled murrelets
are flightless for up to two months during this time (Carter and Stein 1995). They must choose
areas nearshore with predictable prey resources within swimming distance (Carter and Stein
1995, Nelson 1997).
Chicks develop plumage during the first 27 to 40 days while on the nest (Nelson and Hamer
1995a). At fledging, juveniles fly from the nest and arrive at sea in their juvenile plumage;
occasionally with some down still remaining. Recently-fledged juveniles appear darker overall,
older juveniles that have been at sea longer have a “speckled” appearance, and adults develop a
whiter neck band and margins (Carter and Stein 1995). It is unknown whether this transition in
appearance results from a partial body molt or feather wear. After a period of one to two months,

2.2 Geographic Distribution
September 2008 Page 2-5
the plumage changes such that by late fall all age classes resemble the adult basic plumage
(Carter and Stein 1995).
2.2 Geographic Distribution
Marbled murrelets occur in North America along 6,500 miles (10,500 kilometers) of coastline
between the Aleutian Islands and central California during the breeding season, and as far south
as southern California and occasionally Baja California, Mexico, during the non-breeding season
(McShane et al. 2004) (Figure 2-4). Populations are thought to be fairly continuous between the
coastline just west of Kodiak Island and the southern edge of British Columbia, with the largest
concentrations occurring between Prince William Sound and southeastern Alaska (Piatt and
Naslund 1995, Ralph et al. 1995b) as well as along the west coast of Vancouver Island and
Desolation Sound in British Columbia (Piatt et al. 2007). Significant gaps may occur in the
distribution of marbled murrelets at sea: 1) in southeast Vancouver Island, 2) along the southern
Puget Sound (near Seattle to Olympia), 3) southern Washington to northern Oregon (Columbia
River to Tillamook Head), and 4) along parts of the southern Oregon and northern California
coasts (Lank et al. 2003, McShane et al. 2004). The largest gap in distribution occurs in
California between Humboldt and San Mateo Counties, and coincides with the lowest marbled
murrelet population numbers (Huff et al. 2003, Lank et al. 2003). Within the three-state area, the
largest proportion of marbled murrelets is found in Washington State, specifically in the Strait of
Juan de Fuca and Puget Sound regions. However, population densities are locally higher in some
locations on the coast of Oregon and northern California (Miller et al. 2006).
The Marbled Murrelet Effectiveness Monitoring Plan for the Northwest Forest Plan (Madsen et
al. 1999) notes that the primary marbled murrelet nesting range for Washington State
encompasses suitable habitat within 40 miles (64 kilometers) of the coast. The distance inland
for possible nesting habitat narrows to 35 miles (56 kilometers) in Oregon, 25 miles (40
kilometers) north of Fort Bragg, California, and 10 miles (16 kilometers) south of Fort Bragg.
However, the actual distance inland that marbled murrelets breed is variable from state to state
and is influenced by a number of factors including nesting habitat availability, climate suitability,
maximum foraging range, and possibly predation rates (Ralph et al. 1995b). Increased exposure

2.2 Geographic Distribution
September 2008 Page 2-6
Figure 2-4. Distribution of Breeding and Non-Breeding (At-Sea) Marbled Murrelets in North America (Figure from Piatt et al. 2007).

2.3 Movement, Dispersal, Site Fidelity, and Philopatry
September 2008 Page 2-7
to aerial predation may potentially raise rates of predation as marbled murrelets fly greater
distances inland (Ralph et al. 1995b).
The local distribution of marbled murrelets during the breeding season (April-August) is directly
related to the availability of suitable breeding resources such as old-growth and mature
coniferous forests (Nelson et al. 1992, Ralph et al. 1995b, Meyer et al. 2002, Yen et al. 2004).
During the breeding season, actively breeding marbled murrelets are limited to foraging within
commuting distance from the nest site (Carter and Sealy 1990). In Alaska and British Columbia,
marbled murrelets occur more frequently offshore; they are regularly present 25 miles (40
kilometers) offshore in the relatively shallow waters of the Gulf of Alaska (Piatt and Naslund
1995). During the non-breeding season, in some locations marbled murrelets disperse and can be
found farther from shore, as is the case with some other alcids (Strachan et al. 1995). This has
been observed in central California and southeast Alaska; however, in the winter months Carter
and Erickson (1988) maintain that many individuals remain associated with inland nesting
habitat.
2.3 Movement, Dispersal, Site Fidelity, and Philopatry
2.3a Movement and Dispersal
Evidence of movements and dispersal in alcids is typically provided by re-sightings of banded
birds, documentation of the establishment of new colonies, and/or evidence of immigration to
established colonies (Divoky and Horton 1995). Knowledge of inland activities and seasonal
movements of marbled murrelets is limited because of difficulties in marking and recapturing
marked individuals and because of their solitary nesting habitats (Divoky and Horton 1995).
However, there is evidence of small- to mid-scale seasonal movements of marbled murrelets
away from nesting areas (Burger 1995, Divoky and Horton 1995, Piatt and Naslund 1995, Strong
et al. 1995, Beauchamp et al. 1999, Peery et al. in press). Throughout the marbled murrelets’
range there is evidence that a portion of the population maintains residency near breeding sites
outside the breeding season (Nelson 1997). In a study of common murres (Uria aalge) off the
coast of Scotland, Harris and Wanless (1989) found breeding success to be higher in pairs that
visited nest sites in the winter. Carter and Erickson (1988) believe winter visits to breeding sites
may result in higher levels of breeding success by strengthening mating pair bonds, increasing
familiarity of flight routes to breeding sites, and initiating breeding ahead of non-winter nest

2.3 Movement, Dispersal, Site Fidelity, and Philopatry
September 2008 Page 2-8
visiting pairs. The degree of year-round residency for marbled murrelets in the three state area
appears to be a function of latitude. During late summer and the pre-basic molt phase, most
radio-marked marbled murrelets in central California remained near nesting areas (Burkett et al.
1999, McShane et al. 2004, Peery et al. in press).
Breeding populations in Alaska and northern British Columbia do not regularly attend nesting
habitats outside of breeding and pre-breeding seasons, although they have been detected by
Alaska Department of Fish and Game personnel at inland sites during all months of the year
except during pre-basic molt (Piatt et al. 2007). Agler et al. (1998) conducted at-sea surveys in
southeast Alaska for four summers and four winters and documented a four- to five-fold decrease
in the population from summer to winter. On the outer Washington coast and the west coast of
Vancouver Island, numbers of birds drop dramatically after the breeding season, although it is
unknown where they overwinter (Thompson 1997, Burger 2002). Certain areas of the Strait of
Georgia and Puget Sound are used for overwintering as marbled murrelet numbers have been
found to increase up to fourfold in the fall and winter (Burger 1995, 2002). Beauchamp et al.
(1999) provided some of the first direct evidence of migration between breeding and non-
breeding areas. A single adult female was banded in the summer of 1995 in Theodosia Inlet
(Desolation Sound, southwest British Columbia), and was caught in the fall of 1996 in the San
Juan Islands, Washington, approximately 137 miles (220 kilometers) south of the capture
location. The same female marbled murrelet was captured a third time during the 1997 breeding
season back in Desolation Sound. Seven other color-marked marbled murrelets from the
Theodosia Inlet population were located in the San Juan Islands after the breeding season
(Beauchamp et al. 1999).
2.3b Site Fidelity
Site fidelity is a behavior in which an animal returns repeatedly to the same area for nesting
purposes, breeding season after breeding season. As a result of the low number of observed nest
sites and the difficulty of observing bands on birds attending nest sites, few data are available on
nest site fidelity of the marbled murrelet. From the small amount of data available, it appears that
marbled murrelets display a high fidelity to nesting stands, with the same forest stands in Alaska,
Oregon, and California being occupied in each survey year for 5, 10, and 20 years, respectively
(Nelson 1997). There are more than 18 records of marbled murrelets using nest sites in the same

2.3 Movement, Dispersal, Site Fidelity, and Philopatry
September 2008 Page 2-9
or adjacent trees in successive years; however, it is unknown whether they were reused by the
same birds (Nelson and Peck 1995, Singer et al. 1995, Manley 2000, Lank et al. 2003). P.
Harrison (pers. comm.) observed a re-nesting attempt in 1998 at a previously successful nest site
on the Olympic Peninsula. However, the re-nesting attempt was abandoned. Hebert and
Golightly (2003) provided support for the hypothesis that marbled murrelets exhibit site fidelity
by the confirmation of a single nest being used for two consecutive years in Redwoods National
Park. Singer et al. (1995) found marbled murrelets at a site in California used the same nest tree
four years in a row and used the same nest at this tree three times. There have been several other
incidents of nest reuse from British Columbia: Jones (1994) found a chick in the same nest in
consecutive years; Lougheed et al. (1998) stated that three of nine nests found in their study area
in 1995 were either reused or revisited in 1996; and Manley (1999) reported that inter-annual
reuse of nest trees in her study area on the Sunshine Coast occurred for one of eight nest trees in
1996 and at three of 27 nest trees in 1997. Though a few marbled murrelets have been
documented nesting in the same trees in subsequent years, many have not, which suggests that
marbled murrelets may show site fidelity only at the forest stand level, and may still move to
different nest trees in subsequent years (Divoky and Horton 1995, Nelson 1997, Evans Mack et
al. 2003).
2.3c Philopatry
The philopatry (proportion of chicks that return to breed at or near their nesting location) of
marbled murrelets is not known (Divoky and Horton 1995); however, philopatry is common for
other alcids (Harris 1983, Hudson 1985, Harris et al. 1996a, 1996b, 2007). In a study on the Isle
of May in Scotland, Harris et al. (1996a) determined that 42% of common guillemots exhibited
philopatry to the natal colony. The actual data on marbled murrelet juvenile dispersal and native
philopatry are limited. In Desolation Sound, British Columbia, only two of 106 juvenile birds
banded from 1997 through 2000 were recaptured in subsequent years; both birds were recaptured
one year after the initial capture (Parker et al. 2003). None of the banded individuals were seen
breeding in the study area, suggesting that juveniles may be dispersing to new areas to breed.
The low numbers of juvenile recaptures could be a result of low philopatry, poor recapture
methods, high juvenile mortalities, or an artifact of the study length as marbled murrelets do not
breed until 2 to 3 years of age and may not return to breeding grounds until then (McShane et al.
2004). The issue of philopatry among marbled murrelets remains somewhat contentious, with

2.4 Flight Distance and Behavior
September 2008 Page 2-10
some believing marbled murrelet philopatry to be similar to other alcids (Swartzman et al. 1997),
and some believing it to be low due to a lack of colonial breeding and evidence of high juvenile
dispersal rates (Divoky and Horton 1995).
2.4 Flight Distance and Behavior
Although breeding adults in Washington, Oregon and California typically forage less than 1.2
miles (1.9 kilometers) from shore, they have been documented traveling distances greater than
60 miles (100 kilometers) between nesting and foraging grounds (Strachan et al. 1995,
Whitworth et al. 2000, Hull et al. 2001). Daily movements of breeding marbled murrelets
monitored by radiotelemetry have shown that birds are consistently traveling considerable
distances between potential nesting and foraging areas (McShane et al. 2004). The mean straight-
line distance traveled in Prince William Sound, Alaska, was 10 miles (16 kilometers) (13 miles
[21 kilometers] over sea), with a range of 0.6 to 19 miles (1 to 31 kilometers) (Kuletz 2005). In
Desolation Sound, southwest British Columbia, the mean distance traveled was 24 miles (39
kilometers, with a range of 7 to 63 miles (11 to 101 kilometers) (Hull et al. 2001). Even greater
nest-to-foraging distances (mean 48 miles [77 kilometers], maximum 77 miles [124 kilometers])
were documented in the inner coastal waterways of southeast Alaska (Whitworth et al. 2000).
Although the radio-tagged marbled murrelets had brood patches and were associated with at least
one other bird at the time of capture in this study, their breeding status was undetermined and
they may not have been actively breeding when the longer movements occurred (Whitworth et
al. 2000).
Marbled murrelets have distinctive flight behaviors near nest trees and in nest stands. When
approaching or exiting their nest, marbled murrelets use consistent flight paths through the forest
(Nelson and Peck 1995, Jones 1992). Flights below the canopy are commonly observed and are
believed to be a part of predator avoidance behavior, along with minimal vocalizations and
crepuscular flight patterns (Hamer and Nelson 1995, Rodway et al. 1993). Most birds appeared
to use corridors such as creeks, rivers, ridges and roads whenever available as they allow the
birds to approach and leave the nests directly. The direction of arrival and departure differed
between birds and was highly dependant on the canopy cover and gaps around the nest tree. A
study of movement around three active nests found that marbled murrelets flew under the canopy
for a distance of at least 328 feet (100 meters) before reaching the nest tree (Singer et al. 1995).

2.5 Food Habits and Foraging Behaviors
September 2008 Page 2-11
In addition, Nelson and Peck (1995) found that marbled murrelets flew as low as 16 feet (five
meters) above the ground, and then rapidly ascended to the level of the nest and landing pad. On
some occasions, marbled murrelets were observed approaching at the nest-branch level, and after
crashing through the foliage or aborting the landing, circling around for a second attempt.
Several nesting flight behaviors in nest stands and around nest trees can be categorized as
follows: sub-canopy fly-throughs, landing in trees, calling from a stationary location, and flying
straight or circling through or above the canopy. Another observed flight behavior is a low-pitch
buzzing sound created with the wings during landings, take offs and while flying through the
canopy. Landings have been observed on nest limbs but also on adjacent branches. Landing is
indicative of nesting, but is also related to other behaviors such as searching for nest sites, resting
or territoriality. When leaving the nest, outgoing birds were not observed to fly upward on
takeoff but rather drop by several meters before ascending above the canopy (Nelson and Hamer
1995a), a behavior likely due to the high wind loading of these birds.
In their flight back to the ocean, it has been reported that nesting birds are often joined by other
nesting and non-breeding birds and circle over the canopy. Non-breeders are believed to be
inspecting potential nest sites and getting familiar with breeding areas (Nelson and Hamer
1995a). Singer et al. (1995) noted that fledglings flew alone and did not use the same routes used
by adults.
2.5 Food Habits and Foraging Behaviors
Marbled murrelets feed in protected waters throughout the year. They can be found near shore
(usually within three miles [five kilometers]) in inland saltwater bays, sounds, inlets and coves.
Important differences between their winter and summer diets have been documented (Sealy
1975, Carter 1984, Ainley et al. 1995, Burkett 1995, Nelson 1997). The marbled murrelet is a
generalist feeder and has a diverse diet, but primary prey include small schooling fish and large
pelagic crustaceans (euphausiids, mysids, and amphipods) (Nelson 1997). The most common
forage fish species are Pacific sand lance (Ammodytes hexapterus), northern anchovy (Engraulis
mordax), immature Pacific herring (Clupea pallasi), capelin (Mallotus villosus), and smelt
(Hypomesus spp.) (Burkett 1995). The fish portion of the diet is most important in the summer
and corresponds to chick-rearing and the fledging period, while invertebrates (euphausiids and

2.5 Food Habits and Foraging Behaviors
September 2008 Page 2-12
mysids) become more dominant during winter and spring (Burkett 1995). During the breeding
season, marbled murrelets have also been found to feed on sockeye salmon (Oncorhynchus
nerka) and Kokanee salmon (Oncorhynchus nerka kennerlyi), both of which are found in
freshwater lakes in Russia, Alaska, British Columbia, and Washington (Carter and Sealy 1986,
Nechaev 1986, Konyukhov and Kitaysky 1995, Nelson 1997). Studies suggest that marbled
murrelets may use freshwater prey to facilitate more frequent chick feedings, particularly at nests
located far inland (Carter and Sealy 1986, Hobson 1990, Nelson 1997).
Adult marbled murrelets commonly eat large amounts of smaller prey items (0.5 to 2.5 inches
[12.7 to 63.5 millimeters] long) while larger, high-caloric and less abundant fish (2.4 to 3.9
inches [61 to 99.1 millimeters] long) are taken back to the nest to feed the young (Sealy 1975,
Carter 1984, Carter and Sealy 1987a, Carter and Sealy 1990, Vermeer et al. 1987, Burkett 1995,
Burger 2002). The selection of larger, heavier prey reduces the number of trips to the nest and
sustains high chick growth rates (Carter and Sealy 1987a, Carter and Sealy 1990). Marbled
murrelets are guided by seasonal movement and concentration of prey, and aggregate in well-
defined feeding areas in relatively shallow waters (Nelson 1997). Although there is limited
information on the underwater foraging behavior of most seabirds, foraging dive durations are
known to vary according to water depth, and are reported to be short, averaging 16 seconds
(Strachan et al. 1995). Sealy (1975) reports that marbled murrelets dive within 164 feet (50
meters) of the surface while other studies note that observations of marbled murrelet dives have
been in waters less than 98 feet (30 meters) (Jodice and Collopy 1999, Kuletz 2005). In British
Columbia, a study by Mathews and Burger (1998) found that an alcid the size of a marbled
murrelet is expected to have a have a maximum dive depth of approximately 154 feet (47
meters). Carter and Sealy (1984) observed that marbled murrelets incidentally collected in gill
nets were captured 9.8 to 16.4 feet (three to five meters) below the surface at night. Jodice and
Collopy (1999) recorded that most diving occurred in water depths of less than 33 feet (10
meters). They also suggested that the birds had to increase foraging effort in rougher seas. The
deepest incidental collection recorded in a gill net occurred at 89 feet (27 meters) off the coast of
California (Carter and Erickson 1992). In Alaska, Sanger (1987) suggested that birds may forage
in midwater depths of 59 to 148 feet (18 to 45 meters) based on prey remains found in marbled
murrelets. Kuletz reports that marbled murrelets may also feed in deep waters such as fjords

2.6 Population Ecology
September 2008 Page 2-13
when prey availability is concentrated near the surface due to upwelling, tidal rips or activity
patterns of preys (Kuletz 2005).
Patterns of foraging depend on prey resources, weather, season, and time of day (Speckman
1996). Marbled murrelets aggregate during nesting periods and forage individually or in pairs
throughout the year (Carter 1984, Nelson 1997). Paired foraging and simultaneous diving is
suggested to aid in the efficiency of foraging and prevent interference, competition and
kleptoparasitism (Carter and Sealy 1990, Strachan et al. 1995, Speckman et al. 2003). Generally,
marbled murrelets do not forage in mixed-species flocks, but have been reported to occasionally
mix with other species in the northern part of their range (Strachan et al. 1995, Nelson 1997).
Forage fish abundance has declined indirectly through the effect of climate change on macro-
zooplankton abundance and directly through fishing practices (Peery et al. 2004a, Norris et al.
2007). Therefore, it is assumed that marbled murrelets are limited by feeding conditions at sea.
This hypothesis was validated by studying stable isotopes in order to understand the effects of
trophic feeding levels on population dynamics of the marbled murrelet (Peery et al. 2004a,
Norris et al. 2007). The results indicate a need for more research to further investigate factors
influencing the quality of the marine habitat in which marbled murrelets feed.
2.6 Population Ecology
2.6a Nesting
Most of the 22 species of alcids are colonial in their nesting habits; most exhibit breeding site,
nest site, and mate fidelity; more than half lay one-egg clutches; and all share duties of
incubation and chick rearing with their mates (De Santo and Nelson 1995, Gaston and Jones
1998). Although marbled murrelets are known to exhibit some of these same characteristics, the
marbled murrelet is unique in the Alcidae as the only species to nest in trees.
Marbled murrelets do not build nests but use large limbs covered with a thick layer of moss or
duff, mistletoe brooms, or other deformities that create a sufficiently wide and flat space (Hamer
and Nelson 1995). They nest almost exclusively in coastal and inland mature and old-growth
coniferous forests (Nelson 1997). Ground nesting occurs in the Aleutian Islands and in portions
of southern Alaska, where trees are absent (DeGange 1996, Nelson 1997, Bradley and Cooke
2001, Marks and Kuletz 2001, McShane et al. 2004). Marbled murrelets also sometimes nest on

2.6 Population Ecology
September 2008 Page 2-14
the ground at or near the tree line (Piatt and Ford 1993). The first ground nests south of Alaska
were documented by Bradley and Cooke (2001) in mainland southwestern British Columbia on
mossy cliff ledges. The “structure” of these nests was similar to those of coniferous tree nests:
heavy epiphyte cover, a large platform, and vegetative cover.
Courtship behavior has been observed in early spring, throughout summer, and even into the
winter. During courtship, pairs join closely together, point their bills in the air, partially lift their
breasts out of the water, and swim rapidly forward (Nelson and Hamer 1995b). Pairs also chase
one another in flights just above the water surface throughout the spring and summer, which is
thought to be courtship behavior. Year-round breeding habitat occupancy occurs more
commonly in southern portions of the range; however, even in northern parts of their range
where most marbled murrelets undertake seasonal migrations, small numbers remain in breeding
areas during winter (Burger 1995, 2002, Agler et al. 1998, Kuletz and Kendall 1998). Migrating
birds arrive at breeding areas in late winter or early spring (Nelson 1997). The regional variation
in nesting chronology is provided in Table 2-1 (McShane et al. 2004), with birds in northerly
latitudes initiating nesting later in the season. Additional local variation in breeding chronology
may occur throughout the species’ range. McFarlane Tranquilla et al. (2005) used four methods
to compare the breeding chronologies of marbled murrelets at two sites in British Columbia that
were only 88 miles (142 kilometers) apart. They estimated the breeding chronologies using
radiotelemetry, observations of fish-holding adults, observations of juveniles on the water, and
brood patch development from captured birds. They found that birds in Desolation Sound bred
30 days later than birds at Clayoquot Sound.
Table 2-1. Chronology of Breeding for the Marbled Murrelet Showing Approximate Dates of Each Phase of Breeding for Each State or Province (from McShane et al. 2004).
Region Egg Laying & Incubation Chicks Fledglings
California Late March to mid-August Late April to mid-September Late May through early October
Oregon Late April to late August Late May to late September Late June to early October
Washington Late April to early August Late May to late August Late June to early September
British Columbia
Late April to late August, peak laying end May to early June
Late May to early September Late June to late September
Alaska Mid-May to mid-August Mid-June to mid-September Mid-July to early October

2.6 Population Ecology
September 2008 Page 2-15
Marbled murrelets have a long and asynchronous breeding season allowing ample time for
replacement laying (Nelson 1997, Lougheed et al. 2002, Hamer et al. 2003, McFarlane
Tranquilla et al. 2005). This behavior may be more common in this species than previously
thought, particularly when failure occurs early in the breeding season (McFarlane Tranquilla et
al. 2003). Marbled murrelets have been observed to lay one egg per nest attempt (Sealy 1974,
Nelson 1997). Small numbers of replacement clutches have also been documented in northern
California (Hebert et al. 2003). Although rare for alcids, laying replacement eggs has been
documented. However, there is no direct evidence documenting marbled murrelets laying a
second egg after successfully fledging the first chick.
Both the male and female share incubation duties: one broods the egg while the other forages.
Incubation shifts typically last 24 hours with exchanges generally occurring before official
sunrise, and often corresponding with the first auditory detections of marbled murrelets each
morning (Nelson and Hamer 1995b). The timing of exchanges can be significantly affected by
weather patterns and light levels; often birds arrive later during overcast or rainy conditions.
During early chick rearing, nest visitation rates by males and females were found to be similar,
but toward the end of chick rearing, female visitation declined while males maintained consistent
visitation rates. Throughout the season, males made 1.3 more inland trips than females overall
and made 1.8 times as many trips at dusk (Bradley et al. 2002). Although adult feeding visits to
nest sites can occur at any time of day, about two-thirds of the meals are delivered early in the
morning (often before sunrise) and about a third are delivered at dusk (Hamer and Nelson 1995).
Chicks on the nest remain motionless or sleep 80 to 94% of the time (Hamer and Cummins 1991,
Naslund 1993, Nelson and Peck 1995).
2.6b Breeding Success
Nest success rates have been estimated for a sample of nests in the Santa Cruz Mountains of
central California with 0% success in 2000/2001 (n=7) and 16% for 19 nests found between
1989 and 2001 (Peery et al. 2004a). In northern California, nesting success varied from 13.5% to
32.4% over a 3 year period (n=37) (R. Golightly, pers. comm., cited in McShane et al. 2004).
The nest success rate was 22% for a sample of 22 nests with known fates in California,
Washington, and Oregon (Hamer and Nelson 1995). In western Oregon, nest success was 40% in
a sample of 10 nests with known nest fates (Nelson and Wilson 2002). Higher rates of nest

2.6 Population Ecology
September 2008 Page 2-16
success up to or exceeding 46% (n=84) were found at Desolation Sound and Clayoquot Sound,
British Columbia (Bradley 2002, Manley 1999, Bradley et al. 2004, Zharikov et al. 2006). In
Alaska, where both ground and tree nests have been monitored, none of the nests monitored (n=9
for Nelson and Hamer 1995b, n=7 for Naslund et al. 1995) were successful. In a summary of
results from several studies in Alaska from 1978-1993, 2 of 11 nests (18%) were successful
(Piatt et al. 2007)
In their development of the Marbled Murrelet Conservation Zone Population Model, McShane et
al. (2004) examined a high and a low value of nesting success for each conservation zone (Figure
2-5). High values were determined from telemetry studies and low values from date-adjusted
juvenile:adult ratios calculated from at-sea surveys. The telemetry nest success data used in the
calculations were from southern British Columbia because of limited available data in the state
of Washington. Their calculations resulted in a nest success range of 38 to 54% in Conservation
Zones One and Two in Washington State (Figure 2-5).
Beissinger and Peery (2007) reconstructed the historical demography of a marbled murrelet
population in central California using age-ratio analysis of museum specimens collected 100
years ago, before large-scale population declines. They estimated rates of reproduction from the
ratio of hatch-year (HY) to after-hatch-year (AHY) birds from specimens collected from August
through October, 1892–1922. In addition, recent marbled murrelet reproduction rates were
derived from age ratios collected during at-sea surveys and capture/release studies (Peery et al.
2006b, Peery et al. 2007). Contemporary estimates of reproduction were made using age ratios of
birds surveyed at sea in July and August from 1996 to 2003 and from age ratios of birds captured
from August through October, 2002 to 2003 for demographic studies. Productivity was estimated
at the end of the breeding season both for historic specimens and for contemporary marbled
murrelets captured in dip nets. Estimates were made using the total number of individuals
observed in each age class (HY and AHY) during the sampling period and calculated as a ratio
of productivity expressed as HY:AHY.
Results indicated that reproductive rates in contemporary marbled murrelet populations were
almost an order of magnitude lower than in historical populations or the rates predicted from
comparative analysis. Productivity rates derived from museum specimens were 8.5 times greater
than the productivity estimated from contemporary at-sea captures, and 9.3 times greater than

2.6 Population Ecology
September 2008 Page 2-17
Figure 2-5. Three-State Marbled Murrelet Range, U.S. Fish and Wildlife Service Conservation Zones Boundaries, and Land Ownership (Figure from McShane et al. 2004).

2.6 Population Ecology
September 2008 Page 2-18
estimates from at-sea surveys (Beissinger and Peery 2007). Both historical ratios and
comparative analysis suggest conserving marbled murrelets will require restoring reproductive
performance to yield juvenile:post-juvenile ratios of 0.2 to 0.3, a measurable benchmark for
evaluating recovery (Beissinger and Peery 2007).
2.6c Fledging
Marbled murrelet chicks are very active for two evenings before fledging, with rapid pacing,
frequent vigorous flapping of the wings, repeated peering over the edge of the nest platform,
rapid head movements, and constant preening (Hamer and Cummins 1991, Singer et al. 1995).
Fledging occurs at 27 to 40 days of age with the chicks reaching 58 to 71% of their adult mass
(Nelson 1997). Chicks are thought to fly directly from the nest to the ocean. Hamer and
Cummins (1991) radio tagged a juvenile on a nest in Washington, and after fledging, the bird
was documented 18 hours later in the Puget Sound 1.2 miles (1.9 kilometers) north of a direct
east-west line. Fledging typically occurs at dusk and it has been surmised that low light levels
may be the catalyst for the juvenile leaving the nest (Nelson 1997, Jones 2001). After reaching
the ocean, juveniles are independent, not attended to by either parent, and are often seen solitary
on marine waters after fledging (Nelson 1997). There have been numerous documentations of
fledgling birds in North America that have become grounded during flights from the nest to the
Pacific (Hamer and Nelson 1995). This initial flight can be risky because many grounded
fledglings may be unable to take flight again or make it to the ocean by other means.
2.6d Survivorship
Survival is strongly age dependent in seabirds, with juvenile birds and subadults showing lower
survival rates compared to adults (Nur and Sydeman 1999). Without annual age-specific data on
the survivorship of individual marbled murrelets, Beissinger (1995) and Beissinger and Nur
(1997) extrapolated the survival rate based on an allometric relationship of survival rate
compared to body mass and clutch size for 10 other alcid species. This extrapolation resulted in
an estimate of annual adult (at least 3 years old) survival of 0.845 (95% CI = 0.811 to 0.880) or
84.5%. Juvenile and subadult (1 to 2 years of age) survival rates were also estimated by
Boulanger et al. (1999) using data from other alcids on the proportion of adults found in these
age classes. They estimated juvenile and subadult survivial to be 70.1% and 88.8%, respectively
(Boulanger et al. 1999).

2.6 Population Ecology
September 2008 Page 2-19
The direct estimate of adult survivorship in the three-state area comes from marbled murrelets
captured using the “nightlighting-dipnetting” technique (Whitworth et al. 1997) in central
California from 1997 to 2003 (Peery et al. 2006b). Peery et al. (2006b) estimated annual
survivorship based on 331 after-hatch-year (at least one year old) individuals captured primarily
in Año Nuevo Bay, where most of this small central California population congregates at night
following the breeding season when adults are initiating their pre-basic molt. The estimates were
0.868 (SE=0.074) and 0.896 (SE=0.670) for males and females that were not radio tagged,
respectively. For males and females that were radio tagged, estimates were 0.531 (SE=0.175) for
males and 0.572 (SE=0.181) for females. Recapture rates ranged from 0.068 to 0.166. Peery et
al. (2006b) modeled the effect of oceanographic conditions, sex and radio-tagging on local
survival rates. They concluded that survival rates were negatively affected by radio-tagging but
were positively related to the strength of the Pacific Decadal Oscillation. In warm water years,
mortality was lower, likely due to fewer birds flying inland to breed and therefore less exposure
to avian predators. Mortality was greatest during a domoic acid bloom in 1998. Domoic acid is a
neurotoxin in the marine environment. The authors concluded that mortality of after-hatch-year
marbled murrelets in central California did not appear to be of immediate concern for population
viability because survival rates were not lower than expected based on comparative analyses
(Beissinger and Nur 1997); however, they stated that factors affecting reproduction should be
ameliorated (see section 2.6b on breeding success above).
Two annual survivorship estimates from mark-recapture data on marbled murrelets gathered in
the Desolation Sound area of British Columbia are presented in Cam et al. (2003). The first
estimate of 0.9289 (95% CI=0.8493 to 0.991) was based on mist net captures of 966 after-hatch-
year birds at one site from 1991 to 2000. The second estimate was derived from a combination of
the 966 birds mist netted and an additional 533 after-hatch-year birds captured with dip nets 3.7
miles (6.0 kilometers) from the netting area, was 0.829 (95% CI=0.7162 to 0.9029). Lank et al.
(2003) suggested that despite overlapping confidence intervals, there was a real difference in
point estimates, citing confounding issues related to capture biases (mist-net captures were
biased toward birds caught later in the season and thus may have sampled older, more
experienced birds; whereas the dip-netting sample was a more heterogeneous sample of all age
groups). However, a higher proportion of dip-netted birds received radio transmitters, and in
light of recent work (Peery et al. 2004b), the difference in the point estimates may be due to the

2.6 Population Ecology
September 2008 Page 2-20
physiological stress of carrying transmitters. Transmitters have been shown to negatively impact
energy budgets, behavior, and reproductive success of seabirds (Ackerman et al 2004, Peery et
al. 2006b).
Parker et al. (2003) reported the first direct estimates of local survival rates (0.8621 [95% CI =
0.7250 to 1.001]) of juvenile marbled murrelets by estimating the survival of 34 radio-tagged
juveniles in Desolation Sound, British Columbia during the 80-day post-fledging period. From
these data, an annual survival rate of 0.51 was extrapolated, based on the assumption that
survival is constant over time. However, several biases within the study could confound the
annual survival rates, including: 1) the assumption that transmitters did not affect individual
survival; 2) the assumption of constant survival throughout the first year; 3) not accounting for
birds that died during or shortly after fledgling (juveniles were captured only after they had
successfully fledged from the nest to the water and survived on the water for an unknown period
of time); and 4) underestimating juvenile survival in radiotelemetry and capture/recapture studies
due to dispersal from the study area and the censoring of birds from the sample that cannot be
located but are actually dead (Hudson 1985). The data used were only from juveniles that
successfully flew from the nest to the water which eliminates a well documented period of
potential mortality during the first flight to the coast (Carter and Sealy 1987b, Rodway et al.
1992).
2.6e Causes of Adult Mortality
During the breeding season (April to August in Washington State) nesting adult marbled
murrelets are exposed to terrestrial predators and other hazards on their flights to and from nests
and while incubating eggs and caring for young at the nest tree itself. To provide for their young,
murrelets also spend time foraging at sea during this period, but spend the majority of their time
at sea during the remaining seven months of the year. While at sea, adults experience a
completely different host of factors that affect adult survival compared to the terrestrial
environment. Therefore, the unique ecology of the marbled murrelet exposes adults to a variety
of risks due to their reliance on both terrestrial and marine ecosystems.
Boulanger et al. (1999), using Leslie matrix population models, showed that population changes
would be driven most strongly by variation in adult survivorship. High rates of adult
survivorship are necessary to maintain population stability in species with low reproductive

2.6 Population Ecology
September 2008 Page 2-21
output and low recruitment. Marbled murrelets are particularly sensitive to adult mortality
because they produce only one egg per nesting attempt (Beissinger 1995, Ralph et al. 1995b).
Thus, human-caused mortality of adult marbled murrelets above natural levels can have
significant negative impacts on the marbled murrelet population. The primary known and
potential causes of adult mortality in both the terrestrial and marine environment are discussed
below.
2.6f Inland
In the terrestrial environment, predators documented to prey upon marbled murrelet adults at the
nest include the common raven (Corvus corax) and sharp-shinned hawk (Accipiter striatus)
(Singer et al. 1991, Marks and Naslund 1994). In addition, peregrine falcons (Falco peregrinus)
are known to capture marbled murrelets as they fly to and from their inland nest sites (Nelson
and Hamer 1995b, Nelson 1997, Suddjian 2003). Suddjian (2003) reported five predations of
marbled murrelets by peregrine falcons in central California, including finding remains of a
marbled murrelet at a peregrine nest site, three aerial kills and another observation of a peregrine
falcon feeding on a carcass.
Goshawks (Accipiter gentilis) and bald eagles (Haliaeetus leucocephalus) are also known to prey
on marbled murrelet adults as remains of marbled murrelets have been found at nest sites of both
species (Nelson 1997, Burger 2002). In some regions, goshawks may be an important predator of
marbled murrelet adults. In a study in southeast Alaska, Iverson et al. (1996) documented that
20% of goshawk nests (n=15) contained remains of alcids and most of these were marbled
murrelets. In a summary of data supplied by USFWS on prey remains in goshawk nests in
southeast Alaska, Burger (2002) reported that 10 of 361 prey items (2.8%) recorded at goshawk
nests were marbled murrelets and that 12 of 382 pellets (3.1%) contained marbled murrelet or
unidentified alcid remains. In a study of goshawk food habits on Vancouver Island by Ethier
(1999), 15% of pellets contained the remains of marbled murrelets.
Other sources of inland mortality include in-flight collisions by adults transiting between nest
sites and the ocean. In a summary by Nelson (1997), five likely instances of marbled murrelets
being killed by colliding with vehicles and three mortalities from possible collisions with
powerlines were reported. In addition, at least five adult marbled murrelets were killed or

2.6 Population Ecology
September 2008 Page 2-22
stunned after nest trees were harvested during logging operations in Alaska and British Columbia
(Nelson 1997).
2.6g At Sea
Large oil spills, chronic oil pollution, organochlorine pollution, and entanglement in gill nets are
significant sources of mortality for marbled murrelets at sea. The levels of mortality from
disease, parasites and starvation have not been studied and so effects from these factors on
populations have not been assessed. However, Nelson (1997) reported that both adult and first
year bird carcasses have been picked up on beaches in Oregon in the fall and winter and that
some of these birds may have died of starvation. In addition, predation on marbled murrelets at
sea by bald eagles, peregrine falcons, western gulls (Larus occidentalis), and northern fur seals
(Callorhinus ursinus) has been documented (Vermeer and Butler 1989, Rodway et al. 1992,
Campbell et al. 1977, Nelson 1997, Hooper 2001, Peery 2004). California sea lions (Zalophus
californianus), northern sea lions (Eumetopias jubatus), and large fish may be occasional
predators as well (Burger 2002).
The most recent review of the effects of oil spills on marbled murrelets was conducted by
McShane et al. (2004). Seabird mortality from oil pollution has been a significant conservation
issue in California, Oregon, and Washington (Ohlendorf et al. 1978, Burger and Fry 1993, Carter
and Kuletz 1995, USFWS 1997). When birds at sea come in contact with a spill, both feathers
and skin can become coated with oil. Oil destroys the ability of feathers to regulate a bird’s body
temperature and can be ingested by preening birds and the fumes inhaled, resulting in effects on
most of a bird’s physiological systems (Burger and Fry 1993). Due to their near-shore
distribution (adjacent to shipping lanes), significant time spent at sea, and foraging behavior
(pursuit diving), marbled murrelets have been ranked as one of the seabirds most vulnerable to
oil spills (Carter and Kuletz 1995).
The 1989 Exxon Valdez oil spill in Prince William Sound, Alaska, killed approximately 528
marbled murrelets and 206 unidentified murrelets (marbled, Kittlitz’s, and ancient murrelets
[Synthliboramphus antiquus]) (Carter and Kuletz 1995). These data were from counts of
carcasses actually recovered from the spill zone. Using models of estimated carcass recovery
rates by location, the total estimated mortality of marbled murrelets and unidentified murrelets
was 8,127 birds. This was the largest recorded single mortality event for marbled murrelets in

2.6 Population Ecology
September 2008 Page 2-23
North America. Indirect effects on marbled murrelets from the spill likely included sublethal
levels of oil that reduced prey populations, disturbance from increased human activity during
cleanup and monitoring after the spill, and reduced productivity of the local population in the
vicinity of the spill (Irons 1992, Oakley and Kuletz 1994, Oakley et al. 1994, Carter and Kuletz
1995, Kuletz 1996).
On the west coast, most oil spills and chronic oil pollution occur in areas of high shipping traffic.
In Washington State, these high traffic areas would include the Strait of Juan de Fuca and Puget
Sound. Lower levels also occur near smaller ports such as Grays Harbor, Washington and other
small ports along the western coast of the U.S. such as Humboldt Bay, California, and the
Columbia River in Oregon (Neel et al. 1997, USFWS 1997, Carter 2003). Most oil spills were
likely not reported before 1977 with many of the data on seabird mortalities coming from spills
reported after 1976 (Carter 2003). In Washington State, eight major spills have been reported
since 1971. These include the 1985 Arco Anchorage spill near Port Angeles, the 1988 Nestuca
spill off Grays Harbor, and the 1991 Tenyo Maru spill off Willapa Bay. Oiled carcasses of
marbled murrelets were recovered at each of these spills. In the Tenyo Maru spill, approximately
45 marbled murrelet carcasses were recovered. Estimates of total mortality ranged from 200 to
400 marbled murrelets which may have represented a large portion of the local breeding
population (Carter and Kuletz 1995). The authors state that this was likely the largest recorded
loss of marbled murrelets to an oil spill on the U.S. Pacific coast south of Alaska (Carter and
Kuletz 1995).
McShane et al. (2004) estimated oiling mortality of marbled murrelets in each conservation zone
for all spills and chronic oiling. Where estimates comparable to recent studies were not available,
they used correction factors developed by Ford et al. (2002) to determine approximate mortality.
An effort was made to account for additional mortality expected from chronic oiling of marbled
murrelets for each conservation zone by assuming conservative annual levels of mortality per
zone (Carter and Kuletz 1995). McShane et al. (2004) found that the annual mortality in Zone
One (Puget Sound, San Juan Islands and Strait of Juan de Fuca) (Figure 2-5) for the periods 1977
to 1992 and 1993 to 2003 ranged from 1.8 to 4.8 and 1.0 to 2.0 birds per year, respectively.
Based on estimates of the winter population for the San Juan Islands/northern Puget Sound area,
they concluded that annual oiling rates were well below one percent of the population. One
percent was considered a threshold, since marbled murrelet population models developed by

2.6 Population Ecology
September 2008 Page 2-24
Beissinger (1995) showed that declining population projections begin to differ greatly when
human-caused mortality exceeded one percent of the population. The annual mortality for Zone
Two (outer coast of Washington) (Figure 2-5) was estimated to be one marbled murrelet per year
from 1993-2003 but may have ranged from 13.8 to 40.4 birds per year in previous years.
Although the recent low mortality estimate of one marbled murrelet per year in Zone Two is less
than one percent of the estimated subpopulation (Huff et al. 2003), previous mortality from oil
spills may have reached one to five percent of the Zone Two population leading to steeper
population declines. Overall, McShane et al. (2004) concluded that, although still a major
concern, threats from oil spills have been reduced in most areas since the 1990s through
increased regulation.
Fry (1995) identified organochlorine compounds as a prevalent non-oil pollution threat within
the range of the marbled murrelet. Specifically, polychlorinated dibenzo-dioxins (PCDD) and
polychlorinated dibenzo-furans (PCDF), which are contained in pulp-mill discharges, cause
significant injury to fish, birds, and estuarine environments (Elliot et al. 1989, Whitehead 1989,
Colodey and Wells 1992, Fry 1995). PCDDs and PCDFs bioaccumulate in marine sediments,
fish, and fish-eating birds and can impair bird reproduction (Elliot et al. 1989, Bellward et al.
1990). There has been no record of bioaccumulated residues or breeding impairment in marbled
murrelets to date, although marbled murrelets that breed in areas of historical or current
discharge from bleached paper mills could be at risk from eating fish with bioaccumulated
organochlorine compounds (Fry 1995). In the 1990s, paper mill effluents that could affect
marbled murrelets in Washington would likely have been in areas such as Port Angeles,
Bellingham, Everett and Grays Harbor (Fry 1995). However, the author points out the impact on
marbled murrelets was likely lessened since the highest densities of marbled murrelets in
Washington are found in the Strait of Juan de Fuca and San Juan Islands with lower densities and
smaller populations in the more polluted areas of southern Puget Sound.
A detailed assessment of the potential impacts to marbled murrelets in Washington State from
gill-net and purse seine fisheries was conducted by McShane et al (2004). Although mortality
from entanglement and drowning in monofilament nests was suspected to occur from net
fisheries, little information was available before the 1990s (Carter et al. 1995). Currently
however, there is sufficient information to indicate that the number of marbled murrelets killed
in gill nets for tribal and non-treaty fisheries has declined since the 1980s as a result of increased

2.6 Population Ecology
September 2008 Page 2-25
restrictions and less fishing. In general, fishing efforts in northern and western Washington
decreased five- to tenfold between the 1980s and the late 1990s because of lower catches, fewer
fishing vessels, and greater restrictions (McShane et al. 2004). Beattie and Seiders (2003) also
noted that total gill-net effort for tribal fisheries in northern Washington waters declined by 57%
between 1993–1997 and 1998–2000. Little solid evidence is available to estimate levels of
mortality in any one year because of the complicated nature of fisheries, difficulty of obtaining
suitable observer data, clumped and variable distribution of available data and abundance of
marbled murrelets in northern Washington waters during the fall and winter. However, to
provide a general assessment of the potential significance of gill-net mortality on marbled
murrelet populations in Conservation Zone One, McShane et al. (2004) produced estimates using
a series of assumptions including: 1) residency of marbled murrelets in Zone One; 2) ratios of
populations sizes in winter versus summer and regionally; 3) marbled murrelet occurrence in
fishing areas in the fall and; 4) total estimated population size.
Using these parameters, McShane et al. (2004) estimated current gill-net mortality of about 30
birds per year from 1993-2003, although some of these birds would likely have originated from
British Columbia or Conservation Zone Two (the outer coast of Washington). By accounting for
the presence of these birds, they estimated that current gill-net mortality may remove about 19 to
25 marbled murrelets per year from the Zone One subpopulation. Although this mortality level
corresponds to less than one percent of the current estimated size of the subpopulation, the
authors considered their mortality estimates to be conservative. However, Washington
Department of Fish and Wildlife implemented a series of recommendations after 1995 to reduce
mortality from non-tribal gill-net fisheries. These efforts, along with a decreased fishing effort
due to declining salmon stocks, have likely reduced mortality levels. Marbled murrelets can also
be killed by sport fisheries (entangled in fishing lines and hooked by fishing lures) (Carter et al.
1995), but these incidences are not considered to be common and may only be an issue in
localized areas (McShane et al. 2004).
2.6h Population Size, Trend and Densities of At-Sea Populations
The size of the entire marbled murrelet population in North America is not known with certainty
because of the secretive nesting habits of the species, which make marbled murrelets difficult to
census on land. As a result, most population estimates are based on at-sea and radar surveys. In

2.6 Population Ecology
September 2008 Page 2-26
an assessment of marbled murrelets completed in 1995, Ralph et al. (1995a) estimated the North
American population to be 300,000 birds. However, Degange (1996) estimated the North
American population to be much higher (600,000 birds) and McShane et al. (2004) estimated the
population closer to 1 million. McShane et al. (2004) provided estimates of 947,500 birds in
North America, of which 90.7% (859,100) were in Alaska, 7% (66,500) in British Columbia, 1%
(9,800) in Washington, 0.8% (7,502) in Oregon, and 0.5% (4,598) in California.
However, because the majority of birds were estimated to exist in Alaska and British Columbia
(97.7%), the accuracy of population estimates from these two regions greatly influences the
overall North American population estimate. Piatt et al. (2007) conducted the most recent
comprehensive status review of marbled murrelets in Alaska and British Columbia. After
examining the abundance of available information from multiple studies, they estimated that in
the recent past, marbled murrelets in Alaska may have numbered on the order of 1 million birds.
However, using trend information from at-sea surveys that covered a wide geographic range in
Alaska, they found that marbled murrelet numbers had declined significantly at five of the eight
study sites. Annual rates of decline were estimated to range from -5.4 to -12.7% since the early
1990s. By applying these rates of decline to historical population estimates, they then estimated
the current population size of marbled murrelets in Alaska to be approximately 270,000 birds.
They stated that this represented an overall population decline of about 70% over the past 25
years (Piatt et al. 2007). In British Columbia, the trend data they reviewed indicated that marbled
murrelet populations have experienced similar declines to those reported for Alaska. Their most
recent estimate of the number of marbled murrelets in British Columbia was between 54,000 and
92,000 birds. These new estimates would put the size of the North American population between
345,900 and 383,900 birds, approximately one-third of previous assessments. Assuming previous
population assessments for the three-state area are correct, the new estimates from Alaska and
British Columbia would also more than double the estimated proportion of the North American
population inhabiting the listed range (California, Oregon, and Washington) from 2.3% to 5.7 to
6.3%.
More recent population estimates for Washington are also available from the latest 10-year
report from the Northwest Forest Plan Effectiveness Monitoring Program (Miller et al. 2006),
where at-sea surveys were carried out from 2000 to 2003. Two survey zones (Puget Sound and
Outer Coast), corresponding to established U.S. Fish and Wildlife Service recovery zones
2.6 Population Ecology
September 2008 Page 2-27
(Figure 2-5), were surveyed in Washington with two to three survey strata delineated within each
zone (Figures 2-6 and 2-7). Zone One included three strata: Puget Sound, the Strait of Juan de
Fuca, and the San Juan Islands. Zone Two included two strata along the outer coast of
Washington. Population estimates in 2003 in Zone One (Figure 2-6) for Strata One, Two, and
Three were 5,600 (95% CI=3500 to 8200), 1,700 (95% CI=900 to 2800) and 1,200 (95% CI =
200 to 1900) birds, respectively. Population estimates in 2003 in Zone Two (Figure 2-7) for
Strata One and Two were 1,900 (95% CI=1100 to 3200) and 1,500 (95% CI=500 to 2400), birds,
respectively. Therefore, the total population estimate in 2003 for Washington State was 11,900
(95% CI=7,700 to 16,700) (Miller et al. 2006). An analysis of the population trend over the four
years did not show any population declines. However, the authors completed a power analysis
showing that to detect an annual population decline of 2% (α=0.05), with the reported level of
annual survey effort, would require 15 years of data collection. Nine years would be required to
detect a five percent annual decline (Miller et al. 2006).
Bigger et al. (2006a) compared the use of radar and audio-visual surveys for determining the
trend of a marbled murrelet population in northwestern California using data collected from 2001
to 2004. Counts of marbled murrelets at inland sites using audio-visual surveys showed much
higher variation within a given survey site and overall when compared to radar data.
Additionally, twice the audiovisual survey effort would be needed to detect trends in population
size with reasonable power (80%). The advantage of using radar instead of audiovisual surveys
to detect marbled murrelet population trends include far more accurate estimates of the number
of breeding individuals from year to year (in certain situations), the ability to collect data under
poor visibility conditions, and being able to sample larger areas and detect larger proportions of
birds flying inland (Bigger et al. 2006a).
Trends in marbled murrelet populations in the three-state area and in Washington State have
been estimated using demographic models and radar count data. Using demographic analysis,
Beissinger and Nur (1997) estimated the decline in marbled murrelet populations in the Pacific
Northwest ranged from 1 to 14% per year with the most likely rate of decline around four to
eight percent per year. They estimated a four percent decline per year for Puget Sound and
northern Oregon populations. McShane et al. (2004) also developed a demographic model of
marbled murrelet populations for each conservation zone in the three-state area in an effort to

2.6 Population Ecology
September 2008 Page 2-28
Figure 2-6. Marbled Murrelet Conservation Zone One and the Three Primary Sampling Units Used to Estimate Population Size for the Northwest Forest Plan Effectiveness Monitoring Program (Figure from Miller et al. 2006).

2.6 Population Ecology
September 2008 Page 2-29
Figure 2-7. Marbled Murrelet Conservation Zone Two and the Two Primary Sampling Units Used to Estimate Population Size for the Northwest Forest Plan Effectiveness Monitoring Program (Figure from Miller et al. 2006).

2.6 Population Ecology
September 2008 Page 2-30
predict population changes. The modeling effort used a combination of adult survival data
derived from mark-recapture studies in British Columbia, estimates of productivity (nest success)
from telemetry studies, and date-adjusted ratios of juveniles to after-hatch-year birds from at-sea
surveys. Populations in all conservation zones were estimated to be in decline with annual rates
of decline per decade (40 year period) ranging from 2.1 to 6.2% (McShane et. al. 2004). Annual
percent rate of population decline (assuming a 2% annual immigration rate) for conservation
Zones One and Two in the first decade were 3.4% and 3.0% respectively. In a study on the
Olympic Peninsula using radar counts of marbled murrelets flying inland during the breeding
seasons from 1996-2004, no significant differences were detected in counts between years
(Cooper et al. 2006). However, the authors concluded that their power to detect a two to four
percent decline in the population was low and the study would have to be extended 15 and 11
years, respectively, to detect these smaller declines.
Peery et al. (2006a) found that the marbled murrelet population in central California was likely a
sink population stabilized only through immigration from northern populations. This finding was
based on a model that took into account immigration, birth rates and mortality rates within the
population. Sources and sinks must be considered in the broader landscape context. Pulliam
(1988) defines a source habitat as a location within a larger metapopulation where births are
greater than deaths and emigration is greater than immigration and a sink habitat or location as a
location where births are fewer than deaths and emigration is less than immigration. These
results reveal the need to view all demographic components of a larger metapopulation when
assessing local population parameters or habitat carrying capacity.
A number of past surveys indicate that marbled murrelets are widely distributed in Washington.
Speich and Wahl (1995) conducted surveys by small boat during the 1978 and 1979 breeding
season in northern Puget Sound (including the San Juan Islands and southern Georgia Strait) and
reported densities not greater than 1.1 birds/mile2 (0.43 birds/kilometer2) in any section.
Varoujean and Williams (1995), using aerial surveys, estimated the densities of marbled
murrelets along the Washington coast in September 1993. They found densities of marbled
murrelets to be substantially lower (0.8 to 2.3 birds/mile2 [0.3 to 0.9 birds/kilometer2]) from the
Columbia River to Destruction Island when compared to the Destruction Island to Cape Flattery
region (13.1 to 23.6 birds/mile2 [5.1 to 9.2 birds/kilometer2]). Densities along the southern border
2.7 Habitat Loss and Fragmentation
September 2008 Page 2-31
of the Strait of Juan de Fuca ranged from 2.3 to 20.8 birds/mile2 (0.9 to 8.1 birds/kilometer2)
(Varoujean and Williams 1995).
2.7 Habitat Loss and Fragmentation
USFWS recognized habitat loss as the major factor causing the decline of marbled murrelet
populations in its listing decision (Volume 57, page 45328 of the Federal Register, October 1,
1992). Threats associated with loss of nesting habitat include the following (Divoky and Horton
1995):
• A decrease in the proportion of the population that is able to reproduce due to reduced nest
site availability.
• A decrease in the population’s reproductive rate because of the inability of displaced adult
breeders to locate new nest sites after their previous sites have been destroyed.
• Fragmentation of existing habitat, which increases nest site predation, deleteriously alters
nest site microclimates and isolates portions of the population, leading to increased
vulnerability to genetic and environmental changes.
Raphael et al. (2002b) suggested that the reduced amount of nesting habitat would likely have
long-term negative impacts on nest success and short-term impacts on nest location (displaced
birds might move elsewhere, nest in marginal habitat or all move to remaining patches), both of
which would ultimately reduce population size. Marbled murrelets are thought to exhibit fidelity
to forest stands. However, the short-term consequences of habitat loss are not well known
(Nelson 1997). As a result, birds returning to newly logged areas might not breed for several
years or until they have found suitable nesting habitat elsewhere (Burger 2002). Meyer et al.
(2002) noted a time lag of a few years before marbled murrelets abandoned fragmented forests,
providing evidence for the negative response to fragmentation.
Five independent radar studies from British Columbia and one from the Olympic Peninsula,
Washington, reported significant correlations between the numbers of marbled murrelets
entering watersheds and existing areas of suitable habitat (Schroeder et al. 1999, Burger 2001,
2002, Raphael et al. 2002a, Raphael et al. 2002b, Steventon and Holmes 2002, Burger et al.
2004). Radar counts from these studies show strong positive correlations with the amount of
nesting habitat available at the drainage scale (Raphael 2006). Burger (2001) showed reduced

2.7 Habitat Loss and Fragmentation
September 2008 Page 2-32
populations in watersheds subjected to intensive logging and concluded that marbled murrelets
did not nest in higher densities within remaining old forest stands. In addition to amounts of
available nesting habitat, Burger et al. (2004) found distance to foraging grounds to be a
significant covariate for all mainland British Columbia marbled murrelet populations, but not for
west Vancouver Island marbled murrelets. These data suggest that watershed populations of
marbled murrelets are directly proportional to the areas of nesting habitat available. The strong
correlation between the total amount of habitat and the size of adjacent marbled murrelet
populations for large segments of the marbled murrelet range is shown in Figure 2-8 (Raphael
2006).
Over the three-state marbled murrelet range (Washington, Oregon and California), estimated
losses from 1994 to 2003 total 29,700 acres (12,000 hectares) of high-quality nesting habitat on
federal lands (Raphael 2006, Raphael et al. 2006). As noted by Raphael (2006), marbled murrelet
habitat losses from timber harvest totaled 2,700 acres (1,100 hectares), 74% outside of reserves,
Figure 2-8. Relationship of Estimated Mean At-Sea Marbled Murrelet Population Size with Adjacent Potential Marbled Murrelet Nesting Habitat within the Conservation Zones, with Segment Numbers Denoting Conservation Zones and Segments within Zones (Figure from Raphael 2006).

2.7 Habitat Loss and Fragmentation
September 2008 Page 2-33
while losses from fire and other stand-replacing events totaled 26,900 acres (10,900 hectares),
with 93% in reserves (most of the fire losses were from the Biscuit Fire). Total marbled murrelet
habitat losses represented 1.5% of nesting habitat on federal land over 10 years (Raphael 2006).
Raphael et al. (2006) estimated that more than 248,800 acres (100,700 hectares), about 12%, of
higher-suitability nesting habitat on non-federal lands have been lost because of timber harvest
on these lands from 1994 to 2003 in these three states.
A dramatic decline in logging of older forests in the three-state area has occurred at the federal
level since the adoption of the Northwest Forest Plan and the signing of the Record of Decision
for Amendments to Forest Service and Bureau of Land Management Planning Documents within
the Range of the Northern Spotted Owl (USDA and USDI 1994). From the peak annual
extraction rate of 1.8 billion board feet of federal timber harvested in 1968, harvest on U.S.
Forest Service lands dropped 96% to only 72 million board feet in 2002 (DNR 2004a) (Figure 2-
9). The most drastic decline in the harvest of federal timber occurred between 1988 and 1994
(Figure 2-10).
0
1,000,000
2,000,000
3,000,000
4,000,000
5,000,000
6,000,000
7,000,000
8,000,000
1965
1967
1969
1971
1973
1975
1977
1979
1981
1983
1985
1987
1989
1991
1993
1995
1997
1999
2001
Year
Volu
me
(Tho
usan
ds o
f boa
rd fe
et)
Total
Private
USFS
State
Figure 2-9. Recent Trends in Washington Timber Harvests on Public and Private Lands (DNR 2004a).

2.7 Habitat Loss and Fragmentation
September 2008 Page 2-34
0
250,000
500,000
750,000
1,000,000
1,250,000
1,500,000
1,750,000
2,000,000
1965
1967
1969
1971
1973
1975
1977
1979
1981
1983
1985
1987
1989
1991
1993
1995
1997
1999
2001
Year
Volu
me
(Tho
usan
ds o
f boa
rd fe
et)
USFS
State
Figure 2-10. Recent Trends in Washington Timber Harvests on Public Lands (DNR 2004a).
Old-growth forests in Washington, Oregon, California, and some areas of British Columbia have
been reduced by over 80% from historic levels (USFWS 1997, Burger 2002), leaving small,
isolated stands of older trees for nesting marbled murrelets (McShane et al. 2004). The
magnitude of habitat fragmentation and effects of creation of forest edges by clearcut logging on
marbled murrelets are unclear, and field data are somewhat contradictory (Burger 2002).
2.7a Microclimate Edge Effects
Forest fragmentation results in abiotic changes to forest structure which affects nest site
suitability (Malt and Lank 2007). Chen et al. (1993, 1995) found fragmented stands and forest
edge areas to have higher winds, increased solar radiation, and lower humidity than contiguous
mature and old-growth forests. Malt and Lank (2007) found that sites at timber harvest edge
(both clearcuts and regenerating forests) had lower moss abundance than interior sites and
natural edge sites (stream corridors and avalanche chutes) due to stronger winds, higher
temperature variability and lower moisture retention when compared with interior sites. Burger
(2002) found that marbled murrelets are more likely to select suitable nest trees and stands with

2.7 Habitat Loss and Fragmentation
September 2008 Page 2-35
high rates of lichen and bryophyte growth. These findings show that effects of forest
fragmentation may be more complicated and lasting than previously thought.
2.7b Nest Success
Nelson and Hamer (1995b) studied the success of nests with respect to forest edge and found that
successful nests were appreciably farther from forest edges than failed nests. Manley and Nelson
(1999) came to similar findings for 58 nests from British Columbia, Washington, Oregon, and
California. The success of nests within 164 feet (50 meters) of a forest edge was 38% (n=29) and
for those greater than 164 feet (50 meters) from an edge success was 55% (n=29), but the
difference was not statistically significant. Predation rates were higher within 164 feet (50
meters) of the forest edge and predation was responsible for the failure of 60% of all active nests.
Although not statistically significant, there was evidence to suggest that successful nests
occurred in larger stands (Manley and Nelson 1999).
Bradley (2002) conducted two analyses on the success of nests found by telemetry in Desolation
Sound, southwest British Columbia, relative to forest edges. The first analysis related nest
success at 37 nests to distances from forest edge (164 feet [50 meters] and 328 feet [100 meters])
and found no significant differences in nest success relative to forest edge. The second analysis
was conducted using 98 nests and compared nest success to nests located near natural versus
artificial edges, and interior sites. Bradley (2002) found that nests near natural edges had
significantly higher rates of nest success than interior nests, however no significant differences
between nest success at artificial edge and interior sites or artificial and natural edge sites were
determined.
Zharikov et al. (2006) analyzed landscape-level habitat associations and breeding success for two
sets of marbled murrelet nests at two climatologically similar sites in southwest British
Columbia, which differed substantially in historic levels of logging activity and forest
fragmentation. Their controversial results show that nesting marbled murrelets did not select
disproportionately large fragments of old-growth forest in a landscape, but either showed no
selection at all or preferred smaller stands of forest relative to what was available. However, as
suggested by the multivariate analyses, it is not the size of a forest fragment that is important to a
nesting marbled murrelet, but the proximity of a nesting site (tree) to an abrupt natural or
artificial edge. Edges created by streams appear to be particularly important, as they are

2.7 Habitat Loss and Fragmentation
September 2008 Page 2-36
associated with preferred nesting substrate conditions and provide flight access routes to nests
(Burger 2002). Burger and Page (2007) note many discrepancies in this research, specifically
regarding the conclusion made by Zharikov et al. (2006) that marbled murrelets prefer smaller
patch sizes 25 acres (10 hectares) versus larger habitat patches up to 494 acres (200 hectares).
Burger and Page (2007) caution that this is a misleading conclusion, and should not draw forest
managers to change their management plans in mitigating for marbled murrelet nesting habitat.
2.7c Predation Threats
Malt and Lank (2007) analyzed edge effects of forest fragmentation on predation rates at
Nimkish Valley and Desolation Sound in southwest British Columbia. Malt and Lank’s (2007)
study compared predation at interior forest stands and three types of forest edge: lands adjacent
to clearcuts, lands adjacent to regenerating forests, and lands adjacent to natural edges such as
stream corridors or avalanche chutes. Using artificial marbled murrelet nest eggs and fledglings,
Malt and Lank (2007) found that predation rates were the highest at edge sites adjacent to
clearcuts and low at all other remaining sites, suggesting that predation rates may decline at
forest edges as adjacent clearcuts regenerate over time. They found no difference in predation
rates between natural forest edges, and interior sites.
McShane et al. (2004) summarized general patterns that have emerged from research results on
predation risk relative to fragmentation and forest edges:
• Higher nest predation in areas with high predator densities.
• Increased abundance or diversity of predators with increasing habitat variety and complexity.
• Increased abundance of some corvid species (jays, crows, ravens, etc.) along edges or in
forest fragments near human activities.
• High nest predation by corvids along edges near human activities or in areas of low forest
cover.
• High predation risk by small mammals in a variety of habitats, including interior forests and
along human-created edges.
Marbled murrelets are highly vulnerable to nest site predation. By far, the greatest threat to
marbled murrelets from forest fragmentation is increased levels of nest site predation associated

2.7 Habitat Loss and Fragmentation
September 2008 Page 2-37
with forest edges (USFWS 1997). Based on a compilation of surveys by Nelson and Hamer
(1995b), 72% of nests (n=32) with known outcomes failed. Fifty-six percent of these failures
resulted from predation. In a study of marbled murrelets in central California, Peery (2004)
determined a failure rate of 84% (n=19) with predation causing nest failure at 67 to 84% of failed
nests. Most active marbled murrelet nests that have been detected and monitored have failed;
most failures appear to be the result of predation (Nelson and Hamer 1995b, Hamer and Meekins
1999, Manley and Nelson 1999, Bradley 2002, Nelson and Wilson 2002, Hebert and Golightly
2003, Manley 2003, Peery 2004). Predation has consistently been the most significant cause of
nest failure, with corvids being the primary predator (Nelson and Hamer 1995b, Raphael et al.
2002b).
Corvids were the primary predator of active marbled murrelet nests (Raphael et al. 2002b) and
corvids and squirrels were the key predators at artificial nests (Nelson and Hamer 1995b,
reviewed in Raphael et al. 2002b, Malt and Lank 2007). Forest fragmentation, as well as
urbanization and agriculture have resulted in dramatic population growth of several corvid
species in the west (Marzluff et al. 1994). Corvid populations will likely continue to increase
with increased urbanization and the creation of new clearcuts that support berry-producing plants
(Marzluff and Restani 1999).
Common ravens and Steller’s jays (Cyanocitta stelleri) are known egg and chick predators, while
sharp-shinned hawks have also been found to take chicks. Suspected predators at nest sites
include great horned owls (Bubo virginianus), barred owls (Strix varia), Cooper’s hawks
(Accipiter cooperii), northwestern crows (Corvus caurinus), American crows (Corvus
brachyrhynchos), gray jays (Perisoreus canadensis), peregrine falcons, northern goshawks,
sharp-shinned hawks and red-shouldered hawks (Buteo lineatus) (Nelson and Hamer 1995b,
Nelson 1997, Manley 1999, Raphael et al. 2002b, Vigallon and Marzluff 2005).
Multiple artificial nest studies in Oregon and Washington documented that the risk of predation
by jays increased with jay abundance (Luginbuhl et al. 2001, Vigallon and Marzluff 2005).
Luginbuhl et al. (2001) found that the rate of artificial nest predation in contiguous and complex
mature and old-growth forest landscapes was directly correlated to corvid abundance. Although
corvids in general are successful at preying on marbled murrelet chicks and eggs, only common

2.8 Conclusion
September 2008 Page 2-38
ravens are known to be capable of flushing brooding or incubating adults from nests (Nelson and
Hamer 1995b, Singer et al. 1991, Suddjian 2003).
Predation by mammals at marbled murrelet nests has only recently been documented, and is
thought to be a significant cause of nest failure (Nelson and Hamer 1995b, Nelson 1997, Manley
and Nelson 1999, Burger 2002, Malt and Lank 2007). The first documented case of predation on
a marbled murrelet nest egg by a Douglas squirrel (Tamiasciurus douglasii) was made by
Bloxton and Raphael (2006). In Pacific Northwest conifer forests, several small mammal species
are known to visit tree canopies (Bradley and Marzluff 2003). Experimental studies in
Washington and Oregon provide strong evidence for mammalian predation of marbled murrelet
eggs and nestlings (Marzluff et al. 1999, Marzluff et al. 2000, Luginbuhl et al. 2001, Raphael et
al. 2002b, Bradley and Marzluff 2003). In experimental studies involving artificial nest eggs and
pigeon nestlings, the following mammals have all made documented attacks: northern flying
squirrel (Glaucomys sabrinus), Douglas squirrel, red squirrel (Tamiasciurus hudsonicus), deer
mice (Peromyscus maniculatus and P. keeni), bushy-tailed woodrat (Neotoma cinerea), and an
unidentified mustellid (Marzluff et al. 1999, Flaherty et al. 2000, Luginbuhl et al. 2001, Bradley
and Marzluff 2003, Malt and Lank 2007).
A study by Flaherty et al. (2000) concluded that northern flying squirrels are unlikely to be able
to break into marbled murrelet eggs, suggesting that both mouth gape and egg shell thickness
could limit egg predation. In a southwestern British Columbia study using artificial eggs and
nestlings and real marbled murrelet nests, Malt and Lank (2007) found Douglas squirrel (native
to Washington State) and red squirrel (not found in the marbled murrelet’s habitat range in
Washington) predation rates to be higher at all types of forest edge (including natural edges) than
interior sites. Malt and Lank’s study (2007) found squirrels more likely to attack nest eggs than
nestlings.
With the exception of Malt and Lank’s study (2007), artificial nest studies showed corvids to be
the primary predators on eggs, whereas mammals, given their olfaction, were more adept than
corvids at depredating simulated nestlings.

2.8 Conclusion
September 2008 Page 2-39
2.8 Conclusion
Habitat loss is the primary cause for decline in marbled murrelets, with habitat fragmentation
causing increased rates of predation and changes in microhabitat quality in remaining habitat.
Marbled murrelets also face predation while at sea, and have been adversely affected by oil spills
and entanglement in gill nets. Demographic analyses indicate that marbled murrelet populations
in Washington State are likely in decline. . The unique aspects of marbled murrelet biology and
threats to population viability outlined in this chapter will be taken into consideration in the
design of the Long-Term Conservation Strategy (LTCS). Modeling exercises and population
monitoring results will be used to test the effectiveness of the LTCS in preserving habitat and
stabilizing marbled murrelet populations in Washington State.

2.8 Conclusion
September 2008 Page 2-40
This page intentionally left blank.

September 2008 Page 3-1
3.0 RECOMMENDED LANDSCAPE CONSERVATION APPROACH
I. INTRODUCTION This chapter provides the Science Team’s conservation recommendations which the Washington
State Department of Natural Resources (DNR) will use to inform the development of a Long-
Term Conservation Strategy (LTCS) for the marbled murrelet in the South Coast, Columbia,
Straits, and Olympic Experimental State Forest (OESF) Habitat Conservation Plan (HCP)
Planning Units.
II. DNR MANAGEMENT GUIDANCE DNR management tasked the Science Team with developing recommendations that would
provide the foundation for a credible, science-based LTCS that would meet DNR’s obligations
under the HCP. This task does not address DNR’s fiduciary responsibility to the trusts. The
Science Team developed the conservation recommendations without consideration for DNR’s
fiduciary responsibility to the trusts, with the exception of special considerations for Wahkiakum
and Pacific Counties. The Science Team received special guidance from DNR management for
Wahkiakum and Pacific Counties, as they rely primarily on revenue generated from DNR-
managed trust lands for their operations budget (Daniels 2004). A special effort was made to
recommend marbled murrelet conservation measures that reflect DNR’s responsibility to
consider potential revenue impacts to those two smaller trust beneficiaries. The financial
analyses and impacts will be addressed for all DNR-managed lands in part through DNR’s
analysis of alternatives in the environmental impact statement (EIS) process.
The Science Team was not asked to review DNR’s policies and procedures in the development
of their recommendations. They were provided existing HCP conservation commitments (e.g.,
OESF HCP conservation objectives, northern spotted owl conservation strategy, riparian
conservation strategy, and the conservation strategy for unstable slopes) to understand and
evaluate existing conservation as described in the HCP, as it might contribute to marbled
murrelet conservation.
III. Conservation Objectives
September 2008 Page 3-2
III. CONSERVATION OBJECTIVES The U.S. Fish and Wildlife Service’s (USFWS) Recovery Plan for the Threatened Marbled
Murrelet (Brachyramphus marmoratus) in Washington, Oregon, and California (USFWS 1997)
described two principal strategic goals for marbled murrelet recovery:
1. “to stabilize and then increase population size, changing the current downward trend to an
upward (improving) trend throughout the listing range” and
2. “to provide conditions in the future that allow for a reasonable likelihood of continued
existence of viable populations” (p. 112).
These goals are consistent with widely recognized principles of conservation biology and were
intended to provide conditions that enable the species to persist through chronic and catastrophic
events. DNR defined its goal in the HCP to contribute to the USFWS recovery objectives and
“…make a significant contribution to maintaining and protecting marbled murrelet populations
in western Washington over the life of the HCP” (DNR 1997a. p. IV.44). The Science Team
used USFWS’s (1997) two recovery principles and adopted biological goals that reflect those
principles at a scale appropriate to the abundance and distribution of DNR-managed forestlands
in Washington. The Science Team recommends that DNR manage forest habitat to contribute to
the following three biological goals: a stable or increasing population, an increasing geographic
distribution, and thus a population that is resilient to disturbances. Because DNR manages
forestland and not wildlife, DNR is able to contribute to the USFWS recovery plan and
population goals for the marbled murrelet through the maintenance and creation of nesting
habitat.
The marbled murrelet was listed because its numbers in Washington, Oregon, and California
were declining, primarily due to the loss of older forest habitat (USFWS 1997). USFWS
hypothesized the following mechanisms, which are not mutually exclusive, by which the
condition of nesting habitat threatened this population:
1. Timber harvest has reduced the amount of nesting habitat in older forests, thus decreasing the
proportion of the population that is able to find nest sites.
2. Nests in old forests fragmented by logging are subject to deleterious edge effects, especially
predation, that reduce their success rate.

IV. Population-Based Conservation Approach for DNR Managed Forestlands
September 2008 Page 3-3
3. The diminished availability of prime nesting habitat forces marbled murrelets to nest in
lower-quality habitat, which diminishes nest success.
4. Nesting marbled murrelets pack into the diminished amounts of habitat at higher densities,
thus encouraging area-restricted searching by predators, which further reduces nest success.
Subsequent research on predator behavior (e.g., Vigallon and Marzluff 2005) and marbled
murrelet nesting density (e.g., Burger 2002, Raphael et al. 2002a) suggests that packing and
consequent increased predation are less likely to be major factors contributing to diminished
fecundity. However, the first three hypotheses remain to provide significant guidance to efforts
for conservation of the marbled murrelet throughout its range.
The Science Team’s conservation objectives set the foundation for the following
recommendations and analyses developed by the Science Team. The objectives of the analyses
applied to the Science Team’s recommendations are to:
1. Present objective, repeatable, quantitative comparisons of current and projected forest habitat
for marbled murrelets on DNR-managed and other lands.
2. Illustrate potential marbled murrelet population responses to current and projected habitat
using an index of carrying capacity.
This information will prove valuable for DNR and USFWS managers as they evaluate the overall
effects of different management alternatives and their contributions to HCP conservation
objectives for the marbled murrelet.
IV. POPULATION-BASED CONSERVATION APPROACH FOR DNR-MANAGED FORESTLANDS The abundance and distribution of marbled murrelets and their potential inland habitat vary
regionally within Washington, as do the distribution and relative abundance of DNR-managed
lands. To determine the association between marbled murrelets and their habitat distribution on
state forestland, DNR agreed to consider and develop marbled murrelet conservation plans
unique to each of six ecologically-based HCP planning units (DNR 1997a), four of which are
considered in this document (Figure 3-1):
1. Columbia
2. South Coast

IV. Population-Based Conservation Approach for DNR Managed Forestlands
September 2008 Page 3-4
3. Olympic Experimental State Forest (OESF)
4. Straits
Based on similar distribution and quantity of DNR-managed lands and the abundance of inland
habitat and marbled murrelets, the Columbia and South Coast Planning Units (west of Interstate
5, south of the Olympic National Forest, and south of the Quinault Indian Reservation) were
combined, and are referred to as the Southwest Washington (SWWA) Analysis Unit (see Figure
3-1). SWWA is the term used in the following conservation approach and model analyses
sections of this report. Within SWWA, the Science Team focused conservation efforts on DNR-
managed lands within approximately 40 miles of the Pacific Coast (see Figure 3-1). The OESF
and Straits Planning Units (hereafter referred to as analysis units, see Table 3-3) have distinctive
characteristics and retain separate identities. The geographic area north of SWWA and south of
OESF is referred to as "Other Olympic Peninsula." It is approximately 450,000 acres (182,000
hectares), but contains less than 750 acres (304 hectares) of DNR-managed lands and only one
occupied site (which the Science Team recommends be deferred from harvest consistent with its
recommendations for all other known occupied sites). For this reason, it is not discussed further
in this document.
The Science Team first considered regional context in their landscape-level approach to
conservation planning for each of the HCP planning units (Figure 3-2, Table 3-1). The land and
habitat base in the Straits Analysis Unit is dominated by the federally managed Olympic
National Forest and Olympic National Park, with DNR-managed lands comprising only 10% of
the entire analysis unit. The OESF Analysis Unit is similar but with somewhat fewer federal
acres and more DNR-managed lands. In the Straits Analysis Unit, DNR-managed lands occur in
a narrow, mid-elevation band between the ocean and the federal uplands, while they are
distributed more broadly in the OESF, including the low-elevation coastal plain where federal
lands are scarce. In the OESF and Straits Analysis Units, the fairly abundant existing marbled
murrelet habitat is concentrated largely on federal lands, with habitat on DNR-managed lands
occurring approximately in proportion to its abundance (Table 3-1). This contrasts sharply with
the SWWA Analysis Unit, where there is little federal land or federally managed habitat.
Although DNR-managed lands are relatively scarce, making up only 13% of the total area, they
contain 28% of the currently existing habitat in the analysis unit (Table 3-1).

IV. Population-Based Conservation Approach for DNR Managed Forestlands
September 2008 Page 3-5
The Science Team reconciled issues regarding the implementation of the marbled murrelet
Interim Conservation Strategy. The primary issues are outlined below.
1. The habitat relationship study predictive model (Prenzlow Escene 1999) did not identify all
high-quality habitat (termed reclassified habitat) that was to be surveyed in the inventory
surveys.
2. Pacific Seabird Group’s (PSG) protocol for conducting inland surveys was revised by PSG
annually. Because these revisions added to the number of visits required to correctly classify
a site, earlier survey analyses were not as complete (see Appendix F).
The first issue was addressed by an inspection of color orthophotos (dated 2005 for OESF and
2003 for SWWA), and supplemented by limited field verification. During the orthophoto
inspection, the delineation of occupied sites was evaluated, and the condition of marbled
murrelet non-habitat, marginal habitat, and reclassified habitat was evaluated for all analysis
units. Throughout the sections of this chapter pertaining to the OESF, the term “habitat” refers to
reclassified habitat that has been adjusted with subtractions and additions based on the
orthophoto inspection. The second issue was also addressed by the Science Team and is
explained in Appendix F.
It is important to note that this report focuses solely on inland habitat and does not address
climate change issues or ocean conditions. While it is recognized that the latter two factors exert
a large influence on the life history of the marbled murrelet, DNR can only affect the terrestrial
portion of the conservation objectives.
The breeding-season marine distribution and abundance of marbled murrelets on the Olympic
Peninsula and in SWWA generally corresponds with the inland distribution of habitat. The
majority of the marbled murrelet numbers from survey counts (Hull et al. 2001 [at-sea and inland
surveys], Miller et al. 2006 [at-sea surveys]: approximately 90%) occur within 40 miles (64
kilometers, a reasonable commuting distance for nesting birds) of the Olympic Peninsula, while
less than 10% of the offshore birds counted occur adjacent to SWWA (Miller et al. 2006).
Additionally, more general range-wide assessments (USFWS 1997, McShane et al. 2004)
identified SWWA as an area of low-density in the distribution of marbled murrelets and their
inland habitat. Thus, SWWA is an important area for which to address the conservation goal of
increasing the geographic distribution by increasing their inland nesting habitat (DNR 1997a).

IV. Population-Based Conservation Approach for DNR Managed Forestlands
September 2008 Page 3-6
Figure 3-1. Planning Area Considered by the Science Team, Including Marbled Murrelet Analysis Units and DNR HCP Planning Units. Murrelet-Dense Marine Waters are Defined in Section 3.2b.

IV. Population-Based Conservation Approach for DNR Managed Forestlands
September 2008 Page 3-7
Figure 3-2. Major Public Lands in Each Analysis Unit within the Planning Area Considered by the Science Team.

IV. Population-Based Conservation Approach for DNR Managed Forestlands
September 2008 Page 3-8
Table 3-1. Abundance of Federally Managed and DNR-Managed Lands and Marbled Murrelet Forest Habitat in the Marbled Murrelet Analysis Units.
Total Federally Managed1 DNR-Managed Geographic
Area Area2 Habitat2,3 % of Total Area2 % of
Total Habitat2,3% of Total
HabitatArea2 % of
Total Habitat2,3 % of Total
Habitat
SWWA 2,530 268 11 1.5 0 0.7 0 324 13 74 28
OESF 1,299 421 32 523 40 266 63 271 21 83 20
Straits 1,178 377 32 704 60 284 75 118 10 46 12
Olympic Peninsula4 2,932 948 32 1,530 52 675 71 389 13 129 14
1 Includes lands managed by National Park Service and U.S. Forest Service. Lands managed by other federal agencies are not included. 2 Thousands of acres. 3 Habitat estimates are Biomapper estimates from Raphael et al. (2006) who used this program to build an Ecological Niche Factor Analysis Model (ENFA) of marbled murrelet habitat suitability. Model inputs were GIS-based rasters of ecogeographical variables (forest cover derived from satellite imagery, as well as topography, solar radiation, and distance to coastline) and species presence data. Habitat estimates are based on an ENFA habitat suitability index greater than 60. 4 Entire Olympic Peninsula: OESF, Straits, plus Other Olympic Peninsula (see Figure 3-2). Note: analysis unit and ownership areas are from DNR’s GIS data (July 20, 2005). Percentages do not sum to 100 because tribal lands, privately managed lands, and some federally managed lands are not included.
The differences in current habitat and federal land distribution led to three specific strategic
approaches to marbled murrelet conservation that acknowledged how conservation efforts in
each analysis unit could help achieve objectives for population stability or increasing size,
distribution, and resilience.
• In SWWA, DNR-managed lands contain 28% of the existing inland habitat base for a
depressed marbled murrelet population (Table 3-1). Substantial habitat restoration across
much of the DNR-managed land base is central to achieving conservation objectives (chapter
4.0, USFWS 1997, McShane et al. 2004).
• In the OESF, where DNR-managed lands in the low-elevation Sitka spruce zone have the
potential to increase the number of forest types occupied by marbled murrelets, explicit
efforts at habitat restoration through active silviculture in distinct DNR-managed areas are a
key component of the recommended conservation approach.
• In the Straits, where DNR-managed lands contribute less to the land and habitat base, a
relatively minimal approach is appropriate—occupied sites identified during comprehensive
inland surveys were mapped and designated for conservation management.

3.1 Land Designations for Habitat Conservation
September 2008 Page 3-9
The landscape-level conservation approach, methodology, and rationale are presented in the
above sequence in sections 3.2, 3.3 and 3.4, respectively.
3.1 Land Designations for Habitat Conservation
The Science Team recommends the employment of three basic management approaches to
creating and maintaining habitat in the three analysis units (SWWA, OESF and Straits).
In areas where potential and known marbled murrelet nesting habitat is well developed and needs
to simply be retained on the landscape in support of the stated biological goals, the Science Team
proposes deferral of those lands from harvest for the life of the conservation strategy. These
include all currently known occupied sites and old forest stands in the OESF (Table 3-2). The
Science Team is not recommending a survey and manage approach to identify additional
occupied sites once the LTCS is completed.
Areas of the landscape that have the ability to provide future potential nesting habitat have been
identified and proposed to be actively managed as marbled murrelet management areas
(MMMAs). Some proportion or all of DNR-managed lands within their boundaries (depending
on the analysis unit) would have as their management goal high-quality nesting habitat (Table 3-
2).
Marbled murrelet nesting habitat is defined as large trees with sizeable nesting platforms
supporting high levels of moss, and generally occurring in old-growth forests with low amounts
of edge (Nelson et al. 2006). Based on current data and knowledge, there is no explicit way to
identify these features on DNR-managed lands. For the purposes of this report, forest stand
development stages (Brodie et al. 2004, see also Appendix B) are used as a surrogate measure for
nesting habitat. Under this classification system, the more complex, older stages—Large Tree
Exclusion, Understory Development, Botanically Diverse, Niche Diversification, and Fully
Functional—are classified as “potential marbled murrelet habitat.”
It is envisioned that active management techniques will be applied to accelerate the development
of non-habitat to stimulate the development of suitable marbled murrelet habitat where
silviculturally appropriate. This aspect of the Science Team’s conservation approach was
developed to emphasize marbled murrelet conservation in a geographic area where it could be
most effective in meeting the biological goals and gaining the largest benefit for marbled
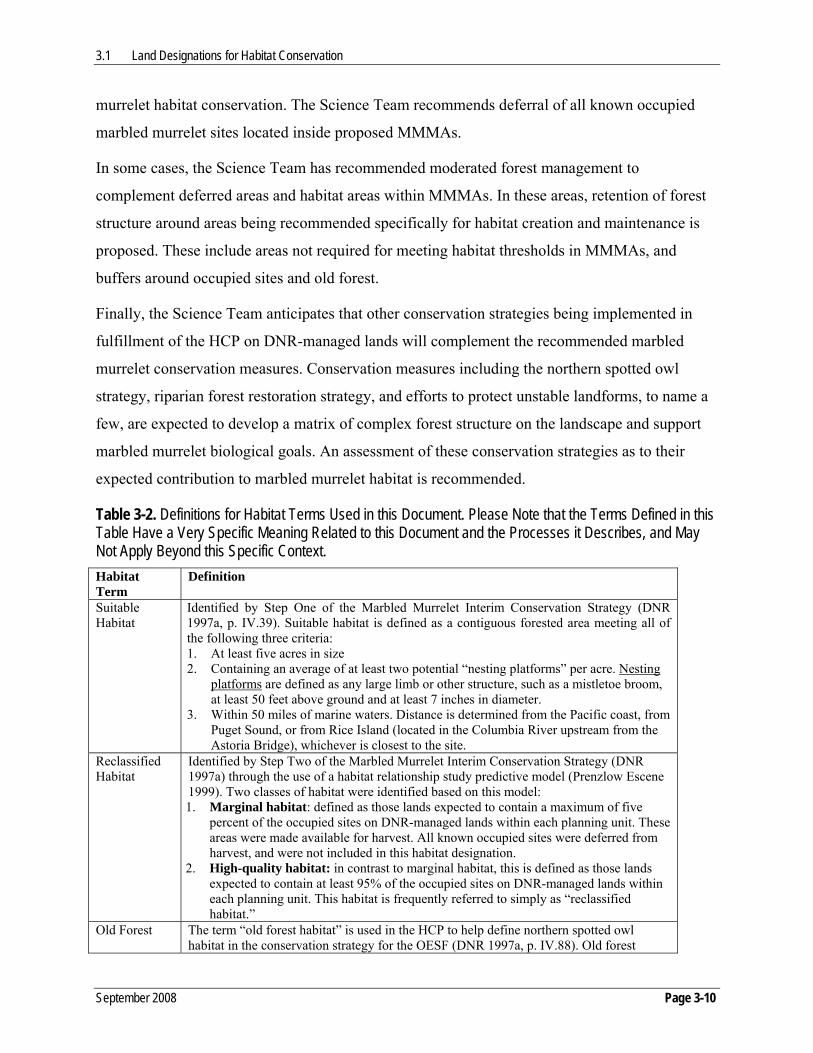
3.1 Land Designations for Habitat Conservation
September 2008 Page 3-10
murrelet habitat conservation. The Science Team recommends deferral of all known occupied
marbled murrelet sites located inside proposed MMMAs.
In some cases, the Science Team has recommended moderated forest management to
complement deferred areas and habitat areas within MMMAs. In these areas, retention of forest
structure around areas being recommended specifically for habitat creation and maintenance is
proposed. These include areas not required for meeting habitat thresholds in MMMAs, and
buffers around occupied sites and old forest.
Finally, the Science Team anticipates that other conservation strategies being implemented in
fulfillment of the HCP on DNR-managed lands will complement the recommended marbled
murrelet conservation measures. Conservation measures including the northern spotted owl
strategy, riparian forest restoration strategy, and efforts to protect unstable landforms, to name a
few, are expected to develop a matrix of complex forest structure on the landscape and support
marbled murrelet biological goals. An assessment of these conservation strategies as to their
expected contribution to marbled murrelet habitat is recommended.
Table 3-2. Definitions for Habitat Terms Used in this Document. Please Note that the Terms Defined in this Table Have a Very Specific Meaning Related to this Document and the Processes it Describes, and May Not Apply Beyond this Specific Context. Habitat Term
Definition
Suitable Habitat
Identified by Step One of the Marbled Murrelet Interim Conservation Strategy (DNR 1997a, p. IV.39). Suitable habitat is defined as a contiguous forested area meeting all of the following three criteria: 1. At least five acres in size 2. Containing an average of at least two potential “nesting platforms” per acre. Nesting
platforms are defined as any large limb or other structure, such as a mistletoe broom, at least 50 feet above ground and at least 7 inches in diameter.
3. Within 50 miles of marine waters. Distance is determined from the Pacific coast, from Puget Sound, or from Rice Island (located in the Columbia River upstream from the Astoria Bridge), whichever is closest to the site.
Reclassified Habitat
Identified by Step Two of the Marbled Murrelet Interim Conservation Strategy (DNR 1997a) through the use of a habitat relationship study predictive model (Prenzlow Escene 1999). Two classes of habitat were identified based on this model: 1. Marginal habitat: defined as those lands expected to contain a maximum of five
percent of the occupied sites on DNR-managed lands within each planning unit. These areas were made available for harvest. All known occupied sites were deferred from harvest, and were not included in this habitat designation.
2. High-quality habitat: in contrast to marginal habitat, this is defined as those lands expected to contain at least 95% of the occupied sites on DNR-managed lands within each planning unit. This habitat is frequently referred to simply as “reclassified habitat.”
Old Forest The term “old forest habitat” is used in the HCP to help define northern spotted owl habitat in the conservation strategy for the OESF (DNR 1997a, p. IV.88). Old forest

3.1 Land Designations for Habitat Conservation
September 2008 Page 3-11
Habitat Term
Definition
habitat was identified in the OESF in fulfillment of that strategy, and was then used by the Science Team to help identify areas likely to provide nesting habitat and therefore make a contribution to marbled murrelet conservation.
Desired Future Forest Condition (DFFC)
A Desired Future Forest Condition (DFFC) is a visionary but incompletely defined end state (Holmberg et al. 2005). The Science Team described an initial DFFC for stand-level marbled murrelet habitat on DNR-managed lands as having very large, tall trees with broad, deep crowns that support potential nest platforms, in a stand with multiple canopy layers and canopy gaps. A DFFC is not a rigorously defined forest development stage, but rather a benchmark against which managers can measure progress toward a structurally complex forest that will have many of the minimal habitat elements to support successful marbled murrelet nesting. The DFFC was used to describe tree and stand-level characteristics employed by the Science Team to project the development of habitat through forest modeling.
Nesting Habitat
The Science Team means “nesting habitat” to reflect the best available information based on current scientific literature. The Science Team recognizes that as our understanding of nesting requirements of the marbled murrelet improves so will the best available definition of nesting habitat. The best available definition is detailed below. Nelson et al. (2006) define marbled murrelet nesting habitat at three spatial scales: 1. Tree-level: large trees (>19 inches dbh and >98 feet tall) with sizeable platforms (≥4
inches diameter and ≥33 feet above the ground) supporting extensive amounts of substrate (e.g., moss), >70% canopy closure, and some horizontal cover.
2. Stand-level: sections of forest with extensive amounts of large trees, platforms with epiphytes, old forest, structural complexity, and gaps in the canopy for nest site access.
3. Landscape-level: old growth with low amounts of edge. High-Quality Nesting Habitat
The Science Team uses the term "high-quality nesting habitat" to denote nesting habitat that has the highest likelihood of supporting successfully reproductive marbled murrelets in a landscape. Such habitat is characterized by the Science Team as forest stands that 1) have very large, tall trees with broad, deep crowns that support potential nest platforms; 2) have multiple canopy layers and canopy gaps; and 3) are situated within a secure landscape that minimizes predation and allows for the successful fledging of young. The extent to which high-quality nesting habitat can be achieved in a given landscape over time will depend to a great extent on the potential of those forests and that land ownership pattern to achieve the above characteristics. The capability of landscapes with DNR-managed lands to create and maintain high-quality nesting habitat is not uniform. It is expected by the Science Team that high-quality nesting habitat will meet or exceed the characteristics of nesting habitat identified in Nelson et al. (2006).
Occupied Site A “contiguous area of habitat” where at least one of the following marbled murrelet behaviors occur (Evans Mack et al. 2003): 1. A nest is located; 2. Downy chicks or eggs or egg shells are found; 3. Marbled murrelets are detected flying below, through, into or out of the forest canopy; 4. Birds are calling from a stationary location within the area; or 5. Birds are circling above a stand within one tree height of the top of the canopy. A contiguous area of habitat is a minimum 5 acre block of habitat, to a maximum of 1.5 miles from the "point-of-occupancy," but confined to contiguous habitat. Once a 5 acre area whose characteristics meet the criteria of habitat is identified, all adjoining acres that also contain such criteria would be included in the suitable habitat block until there is a 300-foot or wider “break” (an area that does not meet the criteria) that completely encircles the block (DNR 1997a, p. IV.41). A point of occupancy is the point location where behavior or conditions indicating occupancy occurred.

3.2 Conservation Approach for a Marbled Murrelet Long-Term Conservation Strategy in Southwest Washington
September 2008 Page 3-12
3.2 Conservation Approach for a Marbled Murrelet Long-Term Conservation Strategy in Southwest Washington
SWWA serves an important distributional role in the listed range of the marbled murrelet
(USFWS 1997, McShane et al. 2004). This area, close to coastal waters, has very little forested
federal ownership (Table 3-1); thus, non-federal forests are critical to marbled murrelet
conservation. Among non-federal owners, habitat is disproportionately abundant on DNR-
managed lands, which contain 28% of current habitat (Table 3-1). DNR-managed lands also
account for most of the known occupied sites in SWWA (McShane et al. 2004, WDFW Wildlife
Survey Observation Database). DNR-managed forestlands in this landscape provide a significant
and vital opportunity for maintenance of local breeding populations and are crucial to meeting
the above stated biological goals (see page 3-2).
Resilience is a property of populations that enables them to recover following disturbance
(Holling 1973). Resilience results from characteristics of individuals and populations, such as
abundance, stability, and distribution (Weaver et al. 1996). Marbled murrelet conservation on
DNR-managed lands can contribute to a resilient population by increasing its size, stability, and
geographic and ecological distribution such that it is more likely to persist in the face of
disturbances such as changes in ocean conditions, oil spills, or catastrophic windthrow.
Within SWWA, ownership blocks were examined for their potential to contribute to the
biological objectives (population stability, distribution, and resilience). A scorecard ranking
exercise was used to achieve an objective, replicable means of identifying high-priority areas in
which to invest DNR’s efforts at marbled murrelet conservation.
3.2a The Scorecard
The Science Team used a scorecard to rank the potential conservation value of geographic land
blocks (planning blocks, defined in Table 3-3) and to inform their proposals regarding the size
and locations of MMMAs. The Science Team defined 20 metrics, including marbled murrelet
detections, habitat data, and other ecological and topographic data deemed important to marbled
murrelet conservation (see below). Values for the metrics were calculated relative to the
maximum value for all blocks and rescaled to range from 0 to 10. Each metric was assigned a
weight by the Science Team to reflect its overall importance in estimating potential conservation
value. The sum of the 20 weighted category scores resulted in an overall score for each block.
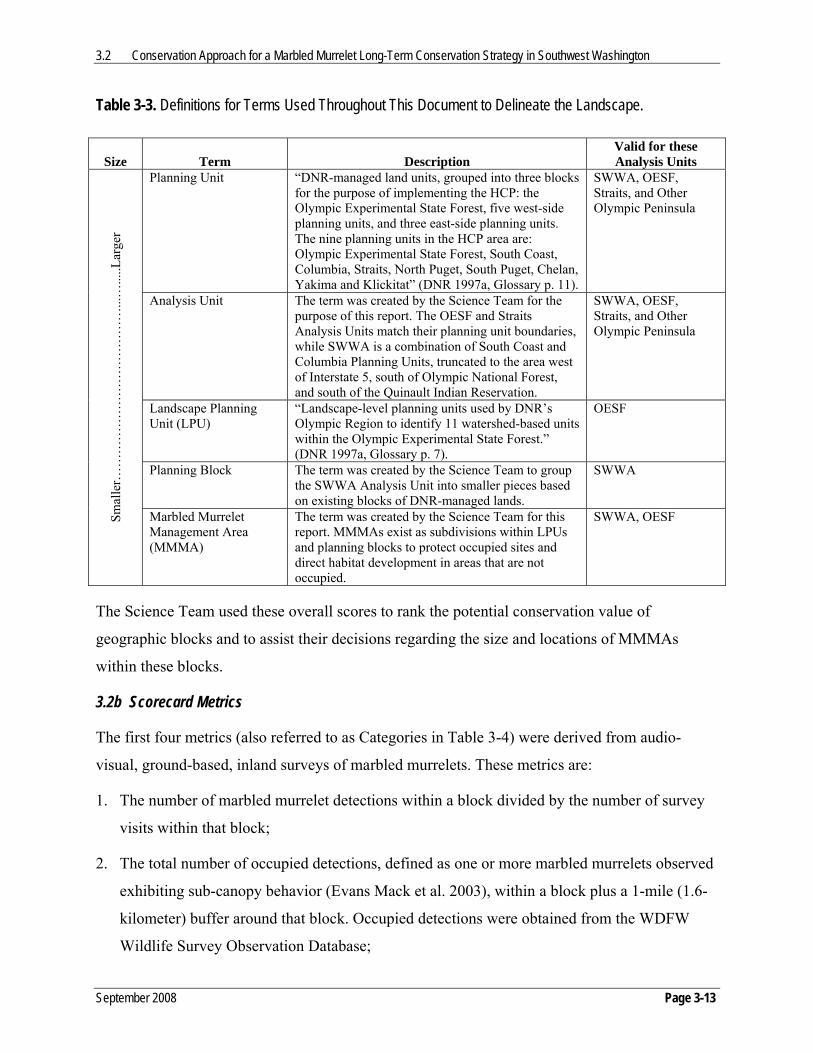
3.2 Conservation Approach for a Marbled Murrelet Long-Term Conservation Strategy in Southwest Washington
September 2008 Page 3-13
Table 3-3. Definitions for Terms Used Throughout This Document to Delineate the Landscape.
Size Term Description Valid for these Analysis Units
Planning Unit “DNR-managed land units, grouped into three blocks for the purpose of implementing the HCP: the Olympic Experimental State Forest, five west-side planning units, and three east-side planning units. The nine planning units in the HCP area are: Olympic Experimental State Forest, South Coast, Columbia, Straits, North Puget, South Puget, Chelan, Yakima and Klickitat” (DNR 1997a, Glossary p. 11).
SWWA, OESF, Straits, and Other Olympic Peninsula
Analysis Unit The term was created by the Science Team for the purpose of this report. The OESF and Straits Analysis Units match their planning unit boundaries, while SWWA is a combination of South Coast and Columbia Planning Units, truncated to the area west of Interstate 5, south of Olympic National Forest, and south of the Quinault Indian Reservation.
SWWA, OESF, Straits, and Other Olympic Peninsula
Landscape Planning Unit (LPU)
“Landscape-level planning units used by DNR’s Olympic Region to identify 11 watershed-based units within the Olympic Experimental State Forest.” (DNR 1997a, Glossary p. 7).
OESF
Planning Block The term was created by the Science Team to group the SWWA Analysis Unit into smaller pieces based on existing blocks of DNR-managed lands.
SWWA
Smal
ler…
……
……
……
……
……
……
...…
.....L
arge
r
Marbled Murrelet Management Area (MMMA)
The term was created by the Science Team for this report. MMMAs exist as subdivisions within LPUs and planning blocks to protect occupied sites and direct habitat development in areas that are not occupied.
SWWA, OESF
The Science Team used these overall scores to rank the potential conservation value of
geographic blocks and to assist their decisions regarding the size and locations of MMMAs
within these blocks.
3.2b Scorecard Metrics
The first four metrics (also referred to as Categories in Table 3-4) were derived from audio-
visual, ground-based, inland surveys of marbled murrelets. These metrics are:
1. The number of marbled murrelet detections within a block divided by the number of survey
visits within that block;
2. The total number of occupied detections, defined as one or more marbled murrelets observed
exhibiting sub-canopy behavior (Evans Mack et al. 2003), within a block plus a 1-mile (1.6-
kilometer) buffer around that block. Occupied detections were obtained from the WDFW
Wildlife Survey Observation Database;

3.2 Conservation Approach for a Marbled Murrelet Long-Term Conservation Strategy in Southwest Washington
September 2008 Page 3-14
3. The percentage of all DNR survey sites in a block that were occupied (Evans Mack et al.
2003) during the years the DNR-led surveys were conducted; and
4. The percentage of all DNR survey sites in a block that had a status of occupancy or presence
during the years the DNR-led surveys were conducted.
The next four metrics were derived from DNR’s GIS cover of stand development stages (Brodie
et al. 2004, Appendix B). The Science Team combined the eight stand development stages into
four seral classes (Appendix B). Ecosystem Initiation and Sapling Exclusion stages were
combined into an “early-seral” stage. Pole Exclusion was labeled “pole.” Large Tree Exclusion,
Understory Development, and Botanically Diverse were combined into a “mid-seral” stage.
Niche Diversification, Fully Functional, and Old Growth Natural were combined into a “late-
seral” stage. Stands labeled mid-seral were further characterized by their relative amount of
western hemlock. These metrics are:
5. Acres of late-seral stands plus the acres of mid-seral stands in which western hemlock
composes at least 30% of the total basal area;
6. The acres of core area of the stands defined by category five (Table 3-4) (core area was
delineated by producing a 328-foot (100-meter) interior buffer of the area of stands of
interest.);
7. Acres of late-seral stands plus the acres of mid-seral and pole stands in which western
hemlock composes at least 30% of the total basal area; and
8. The acres of core area of the stands defined by category seven (Table 3-4).
The remaining 12 metrics represent:
9. The area-weighted average site index for a block (The site index was retrieved from DNR’s
Forest Resource Inventory System (FRIS) and is defined as an index of productivity for the
stand determined using a sample of tree height and age.);
10. The percentage of the block biologically suited to the coastal western hemlock zone
(differentiation between western hemlock and Douglas-fir zones is based on DNR District
Management Unit and Local Management Unit boundaries [Bergvall and Sharma 1978]);
11. The acres of forest in a block that are currently deferred by DNR for marbled murrelets (The

3.2 Conservation Approach for a Marbled Murrelet Long-Term Conservation Strategy in Southwest Washington
September 2008 Page 3-15
current deferral includes reclassified habitat (see section 3.5), occupied survey sites, and
additional areas in close proximity to occupied sites.);
12. The acres of core area of the stands defined by category 11 (Table 3-4) (The core area was
delineated by producing a 328-foot (100-meter) interior buffer of the area of stands of
interest.);
13. The acres in a block of high-quality marbled murrelet habitat defined by the U.S. Forest
Service for marbled murrelet effectiveness monitoring from a model built using Interagency
Vegetation Mapping Project (IVMP) data (http://www.blm.gov/or/gis/index.php);
14. The acres of forest core area defined by category 13 (Table 3-4) (The core area was
delineated by producing a 328-foot (100-meter) interior buffer surrounding the stands of
interest.);
15. The average distance in miles from any part of a block to marbled murrelet-dense marine
waters (Miller et al. 2006) (Murrelet-dense marine waters were defined as marine waters with
the following omissions: any part of the mouth of the Columbia River, all of Willapa Bay, all
of Grays Harbor, Hood Canal south of the Duckabush River, and the rest of Puget Sound
south of the southern tip of Whidbey Island.);
16. The acres of reserved lands in a block plus a 1.5-mile (2.4-kilometer) buffer around that
block (Reserved lands managed by DNR were primarily Natural Area Preserves and Natural
Resources Conservation Areas, but also included substantial acres of forests designated as
inoperable. Many other designations, such as research plots and gene pool reserves also
contributed to the reserved lands managed by DNR. Federal, state, county, and city lands
were all designated as reserve lands unless the management type was listed as Unknown,
Other, or Non Designated Forest (DNR 2004b).);
17. The percentage of a block that is within 0.93 miles (1.5 kilometers) of a paved road (This
metric was chosen as an index to human influence and, thus, an indirect index to corvid
abundance and predation of marbled murrelet nests.);
18 & 19. The percentage of a block and acres in a block, respectively, that are riparian buffer;
areas with high-modeled probability of shallow, rapid landslides; or known landslide
locations, including shallow-rapid, debris-flow, and deep-seated categories; and

3.2 Conservation Approach for a Marbled Murrelet Long-Term Conservation Strategy in Southwest Washington
September 2008 Page 3-16
20. The local biologists’ average ranking of the blocks for their overall value to marbled murrelet
conservation, with small numbers ranking higher than larger numbers.
Formulas for scoring the blocks are listed in Table 3-4. The overall scores, by geographic block
(Figure 3-3), were sorted from highest to lowest, charted (Figure 3-4), and referred to by the
Science Team throughout the development of the conservation recommendations.
Table 3-4. Scorecard Category Definitions, Formulas, and Weights.
Category Definition Formula1 Weight
1 Total Detections / Total Visits, DNR-led surveys only 10(value/max) 0.11
2 Total Occupied Detections, from WDFW, in block plus 1 mile buffer 10(value/max) 0.12
3 % Sites Occupied, DNR-led surveys only percentage/10 0.03
4 % Sites with Occupancy or Presence, DNR-led surveys only percentage/10 0.05
5 Current Habitat: Mid-Seral with >30% basal area Hemlock, or Late-Seral (acres) 10(value/max) 0.08
6 Core Area of Category Five; 328-foot interior buffer (acres) 10(value/max) 0.07
7 Future Habitat: Mid-Seral or Pole with >30% basal area Hemlock, or Late-Seral (acres) 10(value/max) 0.05
8 Core Area of Category Seven; 328-foot interior buffer (acres) 10(value/max) 0.05
9 Site Index, area-weighted average 10(value/max) 0.01
10 Western Hemlock Zone, % of block percentage/10 0.05
11 Current Deferral by DNR for marbled murrelets (acres) 10(value/max) 0.03
12 Core Area of Category 11; 328-foot interior buffer (acres) 10(value/max) 0.02
13 IVMP High-Quality Habitat for marbled murrelets (acres) 10(value/max) 0.05
14 Core Area of Category 13; 328-foot interior buffer (acres) 10(value/max) 0.00
15 Distance to marbled murrelet-dense marine waters (miles) 10(1-(value/max)) 0.08
16 Reserved Lands, all ownerships, in block plus 1.5 mile buffer (acres) 10(value/max) 0.04
17 Index to Corvid Abundance, 0.93 mile buffer of paved roads, % of block
(100-percentage)/10 0.07
18 Riparian Buffers + Unstable Slopes, % of block percentage/10 0.05
19 Riparian Buffers + Unstable Slopes (acres) 10(value/max) 0.02
20 Local Biologists Ranking of Overall Value to Marbled Murrelet Conservation 10(1-(value/max)) 0.03
1 “Max” is the maximum value of the metric for all blocks.

3.2 Conservation Approach for a Marbled Murrelet Long-Term Conservation Strategy in Southwest Washington
September 2008 Page 3-17
3.2c Marbled Murrelet Management Areas in SWWA
Seventeen ownership blocks of DNR-managed lands were delineated by the Science Team and
subsequently reviewed and edited by the local biologists (Figure 3-3). These ownership blocks
(planning blocks) were delineated as logical groupings of DNR-managed lands.
Figure 3-4 is the chart of overall scores for SWWA. The overall scores ranged from 0.88 for the
Lake Creek block to 8.41 for the Nemah block. The top five blocks down to Skamokawa were
considered the highest priority. The second six blocks, including Humptulips through Pe Ell,
were considered a secondary priority, except Capitol which contained no occupied sites and is
not discussed in this report. The bottom six blocks from Lincoln to Lake Creek were considered
the lowest priority, do not contain occupied sites, and therefore are not discussed in this report.
3.2d Delineation of Marbled Murrelet Management Areas
MMMAs in SWWA were delineated to retain all occupied sites; retain mature forest; block up,
connect, and buffer mature forest; and reduce the negative effect of forest edge on nest success
by considering the ratio of DNR-managed lands to privately managed, commercial forests. The
purpose of retaining mature forest around occupied sites is to create core areas1 of high-quality
habitat. In addition to the large MMMAs, 13 isolated occupied sites were delineated for
protection as MMMAs. The isolated occupied sites are areas where DNR-managed lands are
small “islands” surrounded by non-DNR land (Salmon Creek, Browning, and Nemah) or are in
areas of medium priority according to the scorecard (Humptulips and Lebam). The large
MMMAs in SWWA, totaling 63,471 acres (25,686 hectares), along with 2,552 additional acres
(1,033 hectares) of MMMAs from isolated occupied sites, are recommended to be managed to
become 100% marbled murrelet high-quality nesting habitat. The Science Team delineated
MMMAs in SWWA in an iterative process that:
• Used the scorecard exercise to help consider the relative importance of each planning block
to the stated biological goals.
• Examined amounts and locations of past and current marbled murrelet activity.
• Reviewed amounts and locations of mature forest conditions.
1 Core areas are defined as high-quality nesting habitat 170 acres (69 hectares) or larger and greater than 328 feet (100 meters) from an edge.

3.2 Conservation Approach for a Marbled Murrelet Long-Term Conservation Strategy in Southwest Washington
September 2008 Page 3-18
Figure 3-3. Geographic Planning Blocks for the Southwest Washington Analysis Unit.

3.2 Conservation Approach for a Marbled Murrelet Long-Term Conservation Strategy in Southwest Washington
September 2008 Page 3-19
Scorecard Results
0
2
4
6
8
10N
emah
Bro
wni
ng
Sal
mon
Cre
ek
Elo
chom
an
Ska
mok
awa
Hum
ptul
ips
Cap
itol
Gra
ys
Che
halis
Leba
m
Pe
Ell
Linc
oln
Pum
phre
y
Eas
t I-5
Dee
p C
reek
Sko
okum
chuc
k
Lake
Cre
ek
Blocks
Scor
e
High Medium Low
Figure 3-4. Overall Scorecard Results by Geographic Planning Block for the Southwest Washington Analysis Unit.
• Considered the size and configuration of each block within the matrix of privately managed
forests.
• Considered the financial impacts on beneficiaries of Pacific County and Wahkiakum County
forest board lands (see page 3-1).
The delineations follow known occupied sites, forest inventory units, the extent of DNR-
managed lands, trust land ownership, roads, streams, orthophoto-interpreted forest stand types,
and/or areas of more contiguous DNR management. In some areas, to keep the conservation
edges simple, delineations are basic linear connections between the features just described. The
following sections detail how each of the MMMAs are delineated.
Nemah MMMAs: The large MMMA is 13,748 acres (5,564 hectares), connects occupied sites,
and blocks up disconnected areas of mature forest (Figure 3-5). All but the northeast section is
delineated by the extent of DNR-managed lands. The northeast section of DNR-managed lands is

3.2 Conservation Approach for a Marbled Murrelet Long-Term Conservation Strategy in Southwest Washington
September 2008 Page 3-20
omitted because it contains no known marbled murrelet activity and no late-successional forest,
and because it shares a border with privately managed lands. All of the omitted area has at least
20% privately managed lands in the 1.24 mile (2.00 kilometer) moving-window analysis or
neighborhood analysis (a value for each cell is established as a function of its neighboring cells
within a specified distance, or window). The delineation of the northeast section follows streams,
roads, forest inventory units, or a linear connection between them. Four isolated occupied sites,
located south and west of the large Nemah MMMA, are included in four additional MMMAs,
totaling 1,742 acres (705 hectares). These occupied sites are each buffered by a small amount of
DNR-managed land. The land outside these occupied sites is included in the MMMAs.
Browning MMMAs: All four of the large MMMAs retain and buffer occupied sites and block
up disconnected areas of mature forest (Figure 3-6). The northernmost management area of the
Browning block is 646 acres (262 hectares) and is delineated by occupied sites, DNR-managed
lands, forest inventory units, and the linear connection between forest inventory units. The next
MMMA in the Browning block, traveling south, is 2,889 acres (1,169 hectares) and is delineated
by DNR-managed lands, forest inventory units, roads, and, in some areas, the linear connection
between forest inventory units. The next MMMA is 444 acres (180 hectares) and is simply a
large buffer around an occupied site. It is delineated by roads, forest inventory units, and the
linear connection between them. The southernmost MMMA of the Browning block is 5,134
acres (2,078 hectares) and is delineated by DNR-managed lands, forest inventory units, the linear
connection between inventory units, as well as orthophoto-interpreted stand types. One isolated
occupied site located on the west side of the Browning block is 113 acres (46 hectares) and is
considered an additional MMMA. It is surrounded by a small amount of DNR-managed land that
is not included in the MMMA.

3.2 Conservation Approach for a Marbled Murrelet Long-Term Conservation Strategy in Southwest Washington
September 2008 Page 3-21
Figure 3-5 Proposed Science Team Land Allocations for Marbled Murrelet Management Areas in the Nemah Planning Block.

3.2 Conservation Approach for a Marbled Murrelet Long-Term Conservation Strategy in Southwest Washington
September 2008 Page 3-22
Figure 3-6. Proposed Science Team Land Allocations for Marbled Murrelet Management Areas in the Browning Planning Block.

3.2 Conservation Approach for a Marbled Murrelet Long-Term Conservation Strategy in Southwest Washington
September 2008 Page 3-23
Salmon Creek MMMAs: Both of the large MMMAs connect occupied sites and block up
disconnected areas of mature forest (Figure 3-7). The first MMMA on the west side of the
Salmon Creek block is 4,987 acres (2,018 hectares) and is delineated by the extent of DNR-
managed lands, except the southern tip. The southern tip of DNR-managed lands is omitted
because it contains no known marbled murrelet activity and no late-successional forest, and it
borders privately managed lands. The entire omitted southern tip contains at least 50% privately
managed lands in the 1.24 mile (2.00 kilometer) moving-window analysis. The delineation of the
southern tip follows roads and forest inventory units. The eastern border of the western
management area omits a large section of early successional forest because there is no known
marbled murrelet activity. The delineation of the eastern border follows roads and forest
inventory units. The second MMMA on the east side of the Salmon Creek block is 3,420 acres
(1,384 hectares) and is delineated by the extent of DNR-managed lands. The western border of
the MMMA encompasses areas of mature forest. The delineation of the western border follows
forest inventory units. One isolated occupied site is located southwest of the Salmon Creek
block. It is a quarter-section, 159 acres (64 hectares) that is not buffered by additional DNR-
managed land; thus the entire occupied site is the MMMA.
Elochoman MMMAs: The southern MMMA of the Elochoman block is 491 acres (199
hectares) and is simply a large buffer around an occupied site, but also blocks up some
disconnected areas of mature forest (Figure 3-8). It is delineated by DNR-managed lands, forest
inventory units, and the linear connection between them. The large, northern MMMA is 9,734
acres (3,939 hectares), captures one occupied site, and blocks up many widespread areas of late-
successional forest. The western border of the MMMA is delineated by DNR-managed lands.
The northern border is delineated by forest inventory units. The eastern and southern borders are
delineated by DNR-managed lands and by Wahkiakum County trust lands.

3.2 Conservation Approach for a Marbled Murrelet Long-Term Conservation Strategy in Southwest Washington
September 2008 Page 3-24
Figure 3-7. Proposed Science Team Land Allocations for Marbled Murrelet Management Areas in the Salmon Creek Planning Block.

3.2 Conservation Approach for a Marbled Murrelet Long-Term Conservation Strategy in Southwest Washington
September 2008 Page 3-25
Figure 3-8. Proposed Science Team Land Allocations for Marbled Murrelet Management Areas in the Elochoman Planning Block.

3.2 Conservation Approach for a Marbled Murrelet Long-Term Conservation Strategy in Southwest Washington
September 2008 Page 3-26
Skamokawa MMMA: The MMMA is 13,763 acres (5,570 hectares), connects occupied sites,
and blocks up disconnected areas of mature forest (Figure 3-9). All but the northwest, northeast,
and southeast corners of the MMMA are delineated by the extent of DNR-managed lands. The
three corners are omitted because they contain no known marbled murrelet activity and little to
no late-successional forest, and because they border privately managed lands. The omitted
northwest corner contains at least 60%, the northeast corner 40%, and the southeast corner 30%
privately managed lands in the 1.24 mile (2.00 kilometer) moving-window analysis. The
delineation of the corners follows forest inventory units and orthophoto-interpreted stand types.
The southeast corner is also partially delineated by an occupied site and a linear connection
between forest inventory units.
Humptulips MMMAs: Five isolated occupied sites located in the Humptulips block total 317
acres (128 hectares) and are considered additional MMMAs (Figure 3-10). They are surrounded
by small amounts of DNR-managed land, but DNR-managed lands outside the occupied sites are
not included in the MMMAs.
Grays MMMAs: These management areas include DNR-managed Natural Area Preserves Bone
River and Niawiakum River (Figure 3-11). They total 3,371 acres (1,364 hectares) and
encompass two occupied sites. They are delineated entirely by the extent of DNR-managed
lands. One isolated occupied site northeast of the large MMMA is 34 acres (14 hectares) and is
considered an additional MMMA. It is surrounded by a small amount of DNR-managed land that
is not included in the MMMA.
Chehalis MMMAs: The northern and southeastern MMMAs of the Chehalis block are 1,132
and 828 acres (458 and 335 hectares), respectively, and are simply large buffers around occupied
sites (Figure 3-12). They are delineated by DNR-managed lands, forest inventory units, and, in
some areas, the linear connection between them. The southwestern MMMA is 3,282 acres (1,328
hectares), buffers one occupied site adjacent to DNR-managed lands, and retains a large area of
mature forest. It is also delineated by DNR-managed lands and forest inventory units.
Lebam MMMA: One isolated occupied site located in the Lebam block is 187 acres (76
hectares) and is considered an additional MMMA (Figure 3-13). It is buffered by a large amount
of DNR-managed land that is not included in the MMMA.

3.2 Conservation Approach for a Marbled Murrelet Long-Term Conservation Strategy in Southwest Washington
September 2008 Page 3-27
Figure 3-9. Proposed Science Team Land Allocations for Marbled Murrelet Management Areas in the Skamokawa Planning Block.

3.2 Conservation Approach for a Marbled Murrelet Long-Term Conservation Strategy in Southwest Washington
September 2008 Page 3-28
Figure 3-10. Proposed Science Team Land Allocations for Marbled Murrelet Management Areas in the Humptulips Planning Block.

3.2 Conservation Approach for a Marbled Murrelet Long-Term Conservation Strategy in Southwest Washington
September 2008 Page 3-29
Figure 3-11. Proposed Science Team Land Allocations for Marbled Murrelet Management Areas in the Grays Planning Block.

3.2 Conservation Approach for a Marbled Murrelet Long-Term Conservation Strategy in Southwest Washington
September 2008 Page 3-30
Figure 3-12. Proposed Science Team Land Allocations for Marbled Murrelet Management Areas in the Chehalis Planning Block.

3.2 Conservation Approach for a Marbled Murrelet Long-Term Conservation Strategy in Southwest Washington
September 2008 Page 3-31
Figure 3-13. Proposed Science Team Land Allocations for Marbled Murrelet Management Area in the Lebam Planning Block.

3.3 Conservation Approach for a Marbled Murrelet Long-Term Conservation Strategy in the OESF
September 2008 Page 3-32
3.3 Conservation Approach for a Marbled Murrelet Long-Term Conservation Strategy in the Olympic Experimental State Forest
The OESF Analysis Unit has unique conservation strategies as part of its mandate to learn how
to achieve integration of old forest ecosystem functions with commercial forestry on state trust
lands (DNR 1997a). The management strategy of the OESF is that of an “unzoned forest” (i.e.,
land management decisions are guided by earth, biological, and other sciences) to achieve
multiple objectives across 11 intermediate-scale landscape planning units (LPUs) (Figure 3-14,
Table 3-5).
The basic working hypothesis for the OESF is that DNR can conserve or restore old forest
ecosystem functions by planning, applying, monitoring, and refining forest management
activities at multiple spatial and temporal scales rather than working around constraints of
administrative land allocations (Lindenmayer and Franklin 2002). Landscape-level analysis and
planning are intended to set the spatial and temporal patterns for achieving conservation,
revenue, and other objectives in each of the 11 LPUs. The OESF has unique conservation
strategies for northern spotted owls and riparian ecosystems, and the HCP suggested unique
marbled murrelet strategies for each planning unit (DNR 1997a). The nature and context of DNR
lands in the OESF, as well as the OESF mission, suggest an “unzoned” approach to achieving
biological goals for marbled murrelet conservation as well. The “unzoned” management
approach was used as a guiding principal while the Science Team developed the OESF
conservation objectives.
An effective unzoned approach to marbled murrelet conservation should consider the biological
goals of a stable or increasing population size, increasing geographic distribution, and increased
resilience to disturbances, in the context of other OESF objectives, and the OESF’s patterns of
land cover, ownership, and forest zones.
Everett and Lehmkuhl (1999) provide an intellectual outline for this approach, in which they
suggest three steps to achieve what they characterize as “whole-unit management.” First, they
recommend “consolidate compatible allocations,” which in this context suggests that OESF’s
objectives that direct maintenance or restoration of forests suitable for marbled murrelet habitat
(e.g., riparian and northern spotted owl conservation) be coupled with marbled murrelet

3.3 Conservation Approach for a Marbled Murrelet Long-Term Conservation Strategy in the OESF
September 2008 Page 3-33
Figure 3-14. Olympic Experimental State Forest Landscape Planning Units within the OESF Analysis Unit.

3.3 Conservation Approach for a Marbled Murrelet Long-Term Conservation Strategy in the OESF
September 2008 Page 3-34
conservation. Next, Everett and Lehmkuhl (1999) advise “integrate dissimilar allocations”
through an “emphasis-use” approach (Everett et al. 1994) that protects emphasized uses but
promotes integration of larger-scale objectives across allocations. This suggests an emphasis on
marbled murrelet conservation in strategic areas that are managed to achieve a broad set of
objectives. Finally, they suggest a “move to whole-unit management,” in which mid- to large-
scale, ecologically defined units are managed with a consistent primary objective of ecological
integrity, rather than compartmentalizing desired resource conditions among discrete land-use
allocations. This is consistent with DNR’s approach of planning and implementing management
for multiple objectives at the scale of ecologically similar, midsized LPUs based on watershed
boundaries.
3.3a Biological Goals for Marbled Murrelet Conservation in the Context of the OESF
Marbled murrelets have been observed moving throughout the waters off the Olympic Peninsula,
not just off the areas of adjacent habitat (Bloxton and Raphael 2007). These long-distance
movements suggest that habitat abundance in the Straits and OESF Analysis Units should be
considered in the context of the entire Olympic Peninsula. Table 3-1 shows that DNR-managed
lands comprise 13% of the Olympic Peninsula (389,000 of 2.9 million acres [157,000 of 1.2
million hectares]), which is dominated by federal lands, most with congressional or
administrative designations that emphasize conservation of old forests. In this context, DNR
habitat conservation in the OESF can provide only a relatively minor contribution to the regional
carrying capacity base for marbled murrelets (Table 5-2 and discussion in Chapter 5.0). DNR has
already committed to increase the amount of old forest and to improve its function across the
OESF through other DNR policies and objectives, most notably, northern spotted owl and
riparian management commitments in the HCP, adding incrementally to the carrying capacity of
the Olympic Peninsula for marbled murrelets. The Science Team assumes that the areas
protected under the other conservation strategies will remain protected throughout the life of the
HCP. The Science Team recommends that, if other conservation strategies change such that they
discontinue benefits to the marbled murrelet, policy be updated to maintain protection of areas
important to the marbled murrelet.
DNR-managed lands exist in a variety of settings, with a variety of land uses (e.g., timber
management, surface mines, transportation network, leased communication sites, recreation and

3.3 Conservation Approach for a Marbled Murrelet Long-Term Conservation Strategy in the OESF
September 2008 Page 3-35
natural areas) that likely result in a wide range of fragmentation effects on the quality of nesting
habitat. Thus, it is likely that habitat in the OESF will be variable in its success at contributing to
the goal of population stability. Areas that will be managed for contiguous blocks of old forest
will provide a higher contribution than areas where ownership patterns or management policies
result in smaller patches of habitat.
From the conservation biology principle of “spreading the risk” (Den Boer 1981), perhaps the
most important role the OESF can play, in addition to the maintenance of high-quality habitat,
including occupied sites, is to broaden the ecological distribution of marbled murrelets on the
Olympic Peninsula. Federal lands are scarce in the low-elevation Sitka spruce zone (Franklin and
Dyrness 1988), and private land managers are unlikely to restore substantial marbled murrelet
habitat capability within the OESF Analysis Unit. Thus, DNR’s OESF conservation efforts in
this low-elevation Sitka spruce zone will be disproportionately important. The Sitka spruce
element of the OESF has the greatest potential to contribute to a resilient marbled murrelet
population.
3.3b Approaches to Marbled Murrelet Conservation in the OESF
The 11 LPUs in the OESF (Table 3-5, Figure 3-14) vary in their overall size, area of DNR-
managed lands, and context, which includes ownership patterns of DNR, federal, and private
lands; landform and forest zones (Franklin and Dyrness 1988); and the amount, distribution, and
condition of existing forest cover. These basic characteristics of LPUs in the OESF can be
summarized as follows:
1. Land ownership occurs in several basic patterns:
a. Large contiguous DNR-managed blocks adjacent to federal lands (e.g., Upper Clearwater
LPU);
b. Small DNR-managed blocks adjacent to federal lands (e.g., Upper Sol Duc LPU);
c. Large DNR-managed blocks surrounded by private land (e.g., Clallam LPU);
d. Small DNR-managed blocks surrounded by private land (e.g., Sekiu LPU).
2. Landform and forest zone are related; generally the higher elevations have more dissected
topography and higher densities of unstable and/or riparian areas. The middle (~600 to 1,800
feet [183 to 549 meters]) and higher (~1,800 to 3,000 feet [549 to 914 meters]) elevations are

3.3 Conservation Approach for a Marbled Murrelet Long-Term Conservation Strategy in the OESF
September 2008 Page 3-36
in the western hemlock and Pacific silver fir zones (Franklin and Dyrness 1988),
respectively. Some of the lower elevation areas are in the Sitka spruce zone.
3. Current forest cover is the result of ecosystem properties, natural disturbance, and timber
harvest history. The areas north of Forks were predominantly harvested during the railroad-
logging era in the 1920s and 1930s; thus, little native forest remains there. These harvests
were in the Sitka spruce and western hemlock zones. Harvest on DNR-managed lands south
of Forks began in the mid-1960s and continued until the northern spotted owl was listed in
1990. Many of these harvests were in the middle and higher elevations. Thus, forests there
are old-growth, younger stands that regenerated after catastrophic windthrow (e.g., the 1921
windstorm), and modern managed stands 15 to 40 years old.
Table 3-5. Properties of Landscape Planning Units (LPUs) in the Olympic Experimental State Forest Analysis Unit. These properties help portray the differences among the LPUs with respect to ownership, landform, and forest cover.
Acres Percent of DNR-managed area Conservation
Objective Landscape
Planning Unit Total AreaDNR-
Managed Area
Riparian Old Forest1 Biomapper2
Upper Clearwater 58,233 57,357 47 27 34 Conservation through existing policy Willy-Huel 52,039 39,313 50 20 31
Reade Hill 15,809 8,809 55 17 48
Queets 34,028 22,048 27 23 28
Intermediate approach for smaller landscapes Copper Mine 44,483 20,249 55 16 25
Upper Sol Duc 83,748 19,210 37 5 32
Clallam 79,471 18,031 39 2 35
Intermediate approach for northern landscapes Sekiu 109,270 10,689 39 1 23
Dickodochtedor 111,721 29,410 39 10 28
Goodman Creek 66,260 24,860 48 19 31
Emphasis on marbled murrelet conservation
Kalaloch 54,387 19,165 52 13 23 1The term “old forest habitat” is used in the HCP to help define northern spotted owl habitat in the conservation strategy for the OESF (DNR 1997a, p. IV.88). Old forest habitat was identified in the OESF in fulfillment of that strategy, and was then used by the Science Team to help identify areas likely to provide nesting habitat and therefore make a contribution to marbled murrelet conservation. 2Biomapper estimates are from Raphael et al. (2006) who used this program to build an Ecological Niche Factor Analysis Model (ENFA) of marbled murrelet habitat suitability. Model inputs were GIS-based rasters of ecogeographical variables (forest cover derived from satellite imagery, as well as topography, solar radiation, and distance to coastline) and species presence data. Habitat estimates are based on an ENFA habitat suitability index greater than 60.

3.3 Conservation Approach for a Marbled Murrelet Long-Term Conservation Strategy in the OESF
September 2008 Page 3-37
The strategic approach of Everett and Lehmkuhl (1999) suggests using two basic approaches to
achieve the biological goals for marbled murrelet conservation in an unzoned OESF, with its
particular land ownership and biophysical patterns. While marbled murrelet conservation will
occur in all LPUs, the two approaches represent opposite ends of a gradient; at one end, marbled
murrelet conservation would occur through existing policy and procedures (e.g., riparian and
northern spotted owl conservation strategies). At the other end, LPUs exist where marbled
murrelet conservation would be emphasized as a guiding element in landscape design and
management. Due to the above three sets of LPU characteristics, there are several variations on
intermediate approaches.
3.3c Guiding Elements for Landscape Design within the 11 Landscape Planning Units for Marbled Murrelet Conservation in an Unzoned OESF
The following four marbled murrelet conservation objectives are recommended as a guiding
element for use in landscape design and management in an unzoned OESF.
1. Conservation through existing policy and procedure model: (Upper Clearwater and Willy-
Huel LPUs). The conservation through existing policy and procedure model is proposed for
large contiguous blocks of DNR-managed lands adjacent to large federal reserves. These
LPUs are at middle to upper elevations, with high densities of dissected, unstable landforms
and with high densities of existing marbled murrelet habitat on DNR-managed lands (Table
3-5). These relatively abundant old forests help achieve HCP objectives for northern spotted
owl conservation. Maturation and generally more conservative management of adjacent
stands will result in diminishing negative edge effects during the lengthy period of habitat
restoration in riparian and unstable areas. Conservation objectives for riparian ecosystems
direct DNR to grow older forests in riparian and unstable areas (DNR 1997a), which will
eventually contribute substantial amounts of potential nesting habitat. Retention of current
nesting habitat, habitat restoration, and overall maturation of early-seral forests in these
landscapes which will diminish fragmentation effects are, in combination, predicted to help
achieve the goals of population stability and increasing size.
2. Intermediate approach for smaller landscapes: (Reade Hill, Copper Mine and the Queets
LPUs). One type of intermediate approach is proposed for smaller landscapes at generally
lower elevations with less, but still significant, amounts of old forests. Objectives for
3.3 Conservation Approach for a Marbled Murrelet Long-Term Conservation Strategy in the OESF
September 2008 Page 3-38
northern spotted owl (old forest) and riparian conservation will direct substantial retention
and restoration of old forests in riparian (DNR 1997a), unstable slopes, and other areas of the
Reade Hill and Copper Mine LPUs (Table 3-5). Active management to limit fragmentation
around existing stands of suitable structure in Reade Hill and Copper Mine, and broader
areas of the Queets LPU, is hypothesized to improve their contribution to achieving the goal
of population stability.
3. Intermediate approach for the northern landscapes: (Upper Sol Duc, Clallam, and Sekiu
LPUs). Another intermediate approach is in the northern LPUs with very little old forest
remaining (Figure 3-14). These LPUs are largely in lower to middle elevations and vary in
the size of DNR-managed blocks and their adjacency to federal reserves. Northern spotted
owl and riparian conservation objectives apply in these LPUs as well; thus, substantial
restoration of old forests, especially in riparian and unstable areas (Table 3-5) will
hypothetically provide marbled murrelet habitat in the future. Additionally, riparian and
unstable areas adjacent to current habitat will buffer suitable habitat as they mature. Current
nesting habitat will thus incur diminishing fragmentation effects over time. Active
management for marbled murrelet conservation is proposed for a portion of the Upper Sol
Duc adjacent to federal lands, which is also a focal area for restoration of northern spotted
owl habitat capability. Similar to the first conservation objective (conservation through
existing policy and procedure model), marbled murrelet conservation will largely be a
product of existing management policy and procedures for other objectives in these LPUs as
well, but the nature of these landscapes (fragmented ownership, and amount, distribution, and
condition of existing habitat) is such that they will likely contribute less to the biological
goals than the Upper Clearwater and Willy-Huel LPUs.
4. Emphasis on marbled murrelet conservation model: (Dickodochtedor, Goodman Creek, and
Kalaloch LPUs). The “emphasis on marbled murrelet conservation” model will apply in the
Sitka spruce zone of three coastal plain LPUs with some existing old forest. To limit
potential negative fragmentation effects, MMMAs were located adjacent to federal lands or
in areas with a high density of DNR-managed lands and avoided areas of higher human
impact with enriched corvid populations. Northern spotted owl and riparian conservation
objectives also apply in these LPUs, so retention and restoration of old forests will occur in
the emphasis areas and throughout the LPUs, especially in the riparian and unstable areas

3.3 Conservation Approach for a Marbled Murrelet Long-Term Conservation Strategy in the OESF
September 2008 Page 3-39
(Table 3-5). Active management in the emphasis areas is hypothesized to improve their
contribution to achieving the goal of population stability, while their location in the Sitka
spruce zone is intended to contribute to distribution and resilience goals.
The specific elements of these approaches are detailed and mapped for each of the 11 LPUs in
the next section.
3.3d Marbled Murrelet Long-Term Conservation Approach by LPU in the OESF
The Science Team recommends protection of all known marbled murrelet occupied sites, most of
which are located inside the Marbled Murrelet Management Areas (MMMAs) (Table 3-2).
Tables 3-6 through 3-12 outline conservation approaches and recommendations for marbled
murrelet conservation in the respective LPUs in the OESF.
The following recommendations are shared by all LPUs:
• Defer from harvest existing old forest stands and occupied sites.
• Manage a buffer area within 328 feet (100 meters) of existing old forest stands and occupied
sites to provide conservation benefits to existing high-quality nesting habitat.
• Manage riparian and unstable slope areas according to the HCP (DNR 1997a) to provide
additional marbled murrelet nesting habitat.
Table 3-6. Conservation Approaches and Recommendations—Upper Clearwater and Willy-Huel LPUs.
Conservation Approach Recommendations
Conservation through existing policy and procedure model.
1. Remaining habitat (Table 3-13) will be managed according to broad DNR policies and procedures, including commitments for northern spotted owl and riparian conservation.
Note: see also Figures 3-15 and 3-16.

3.3 Conservation Approach for a Marbled Murrelet Long-Term Conservation Strategy in the OESF
September 2008 Page 3-40
Figure 3-15. Proposed Science Team Land Allocations for Upper Clearwater LPU.

3.3 Conservation Approach for a Marbled Murrelet Long-Term Conservation Strategy in the OESF
September 2008 Page 3-41
Figure 3-16. Proposed Science Team Land Allocations for Willy-Huel LPU.

3.3 Conservation Approach for a Marbled Murrelet Long-Term Conservation Strategy in the OESF
September 2008 Page 3-42
Table 3-7. Conservation Approaches and Recommendations—Reade Hill LPU.
Conservation Approach Recommendations
Intermediate approach for smaller landscapes model.
1. Remaining habitat adjacent to existing old forest stands will be deferred from harvest or managed to accelerate development of old forest northern spotted owl habitat, based on the assumption that this also provides good marbled murrelet habitat.
2. Remaining habitat not identified (Table 3-13) will be managed according to broad DNR policies and procedures, including commitments for northern spotted owl and riparian conservation.
Note: see also Figure 3-17.

3.3 Conservation Approach for a Marbled Murrelet Long-Term Conservation Strategy in the OESF
September 2008 Page 3-43
Figure 3-17. Proposed Science Team Land Allocations for Reade Hill LPU.

3.3 Conservation Approach for a Marbled Murrelet Long-Term Conservation Strategy in the OESF
September 2008 Page 3-44
Table 3-8. Conservation Approaches and Recommendations—Queets LPU.
Conservation Approach Recommendations
Intermediate approach for smaller landscapes model.
1. Some stands of old forest were possibly misclassified. If review of these stands finds them not to be old forest (according to DNR’s old-growth index, HCP definitions for old forest owl habitat, or other approved procedure), they will be managed according to broad DNR policies and procedures.
2. The area within one mile of Olympic National Park will be managed as an MMMA. Habitat within the MMMA will be deferred from harvest or managed to accelerate development of old forest northern spotted owl habitat, based on the assumption that this also provides good marbled murrelet habitat.
3. Two-thirds of the remaining area within the MMMA will be managed to be in stands with the tallest 40 trees per acre at least 80 feet tall.
4. Remaining habitat outside the MMMA (Table 3-13) will be managed according to broad DNR policies and procedures, including commitments for northern spotted owl and riparian conservation.
Note: see also Figure 3-18.

3.3 Conservation Approach for a Marbled Murrelet Long-Term Conservation Strategy in the OESF
September 2008 Page 3-45
Figure 3-18. Proposed Science Team Land Allocations for Queets LPU.

3.3 Conservation Approach for a Marbled Murrelet Long-Term Conservation Strategy in the OESF
September 2008 Page 3-46
Table 3-9. Conservation Approaches and Recommendations—Copper Mine LPU.
Conservation Approach Recommendations
Intermediate approach for smaller landscapes model.
1. Remaining habitat (Table 3-13) will be managed according to broad DNR policies and procedures, including commitments for northern spotted owl and riparian conservation.
Note: see also Figure 3-19.

3.3 Conservation Approach for a Marbled Murrelet Long-Term Conservation Strategy in the OESF
September 2008 Page 3-47
Figure 3-19. Proposed Science Team Land Allocations for Copper Mine LPU.

3.3 Conservation Approach for a Marbled Murrelet Long-Term Conservation Strategy in the OESF
September 2008 Page 3-48
Table 3-10. Conservation Approaches and Recommendations—Upper Sol Duc LPU.
Conservation Approach Recommendations
Intermediate approach for the northern landscapes model.
1. Designated stands of habitat (Figure 3-20) will be deferred from harvest or managed to accelerate development of old forest northern spotted owl habitat, based on the assumption that this also provides good marbled murrelet habitat.
2. Remaining habitat (Table 3-13) not designated will be managed according to broad DNR policies and procedures, including commitments for northern spotted owl and riparian conservation.
Note: see also Figure 3-20.

3.3 Conservation Approach for a Marbled Murrelet Long-Term Conservation Strategy in the OESF
September 2008 Page 3-49
Figure 3-20. Proposed Science Team Land Allocations for Upper Sol Duc LPU.

3.3 Conservation Approach for a Marbled Murrelet Long-Term Conservation Strategy in the OESF
September 2008 Page 3-50
Table 3-11. Conservation Approaches and Recommendations—Clallam and Sekiu LPUs.
Conservation Approach Recommendations
Intermediate approach for the northern landscapes model.
1. Remaining habitat (Table 3-13) will be managed according to broad DNR policies and procedures, including commitments for northern spotted owl and riparian conservation.
Note: see also Figures 3-21 and 3-22.

3.3 Conservation Approach for a Marbled Murrelet Long-Term Conservation Strategy in the OESF
September 2008 Page 3-51
Figure 3-21. Proposed Science Team Land Allocations for Clallam LPU.

3.3 Conservation Approach for a Marbled Murrelet Long-Term Conservation Strategy in the OESF
September 2008 Page 3-52
Figure 3-22. Proposed Science Team Land Allocations for Sekiu LPU.
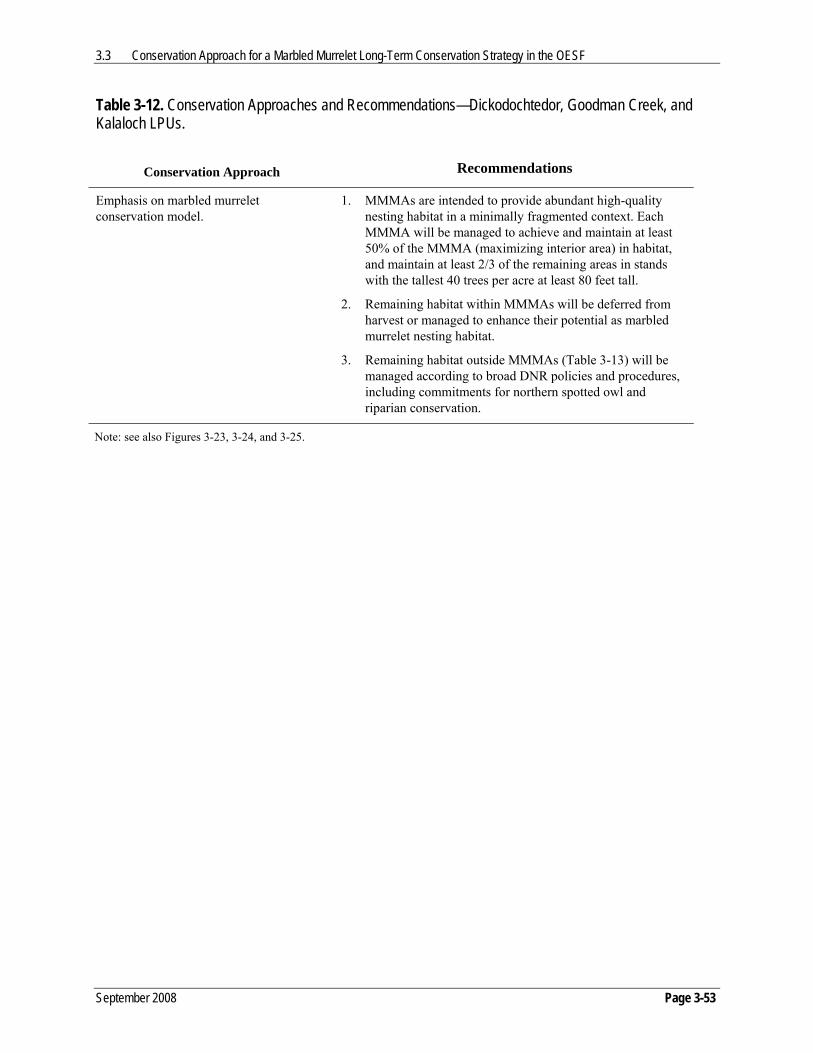
3.3 Conservation Approach for a Marbled Murrelet Long-Term Conservation Strategy in the OESF
September 2008 Page 3-53
Table 3-12. Conservation Approaches and Recommendations—Dickodochtedor, Goodman Creek, and Kalaloch LPUs.
Conservation Approach Recommendations
Emphasis on marbled murrelet conservation model.
1. MMMAs are intended to provide abundant high-quality nesting habitat in a minimally fragmented context. Each MMMA will be managed to achieve and maintain at least 50% of the MMMA (maximizing interior area) in habitat, and maintain at least 2/3 of the remaining areas in stands with the tallest 40 trees per acre at least 80 feet tall.
2. Remaining habitat within MMMAs will be deferred from harvest or managed to enhance their potential as marbled murrelet nesting habitat.
3. Remaining habitat outside MMMAs (Table 3-13) will be managed according to broad DNR policies and procedures, including commitments for northern spotted owl and riparian conservation.
Note: see also Figures 3-23, 3-24, and 3-25.

3.3 Conservation Approach for a Marbled Murrelet Long-Term Conservation Strategy in the OESF
September 2008 Page 3-54
Figure 3-23. Proposed Science Team Land Allocations for Dickodochtedor LPU.

3.3 Conservation Approach for a Marbled Murrelet Long-Term Conservation Strategy in the OESF
September 2008 Page 3-55
Figure 3-24. Proposed Science Team Land Allocations for Goodman Creek LPU.

3.3 Conservation Approach for a Marbled Murrelet Long-Term Conservation Strategy in the OESF
September 2008 Page 3-56
Figure 3-25. Proposed Science Team Land Allocations for Kalaloch LPU.

3.3 Conservation Approach for a Marbled Murrelet Long-Term Conservation Strategy in the OESF
September 2008 Page 3-57
3.3e Evaluation of Unsurveyed Habitat
As noted in chapter 1.0, not all reclassified habitat in the OESF, identified by the habitat
relationship study predictive model (Prenzlow Escene 1999), was surveyed during the inventory
phase of the Interim Conservation Strategy. Approximately 39,000 acres (15,800 hectares) of
reclassified habitat have been surveyed whereas approximately 15,000 acres (6,100 hectares)
remain unsurveyed in the OESF. Marbled murrelets were detected at 92% of the survey sites and
occupied behaviors were observed at 52% of the sites with detections (see Appendix F for a
discussion regarding DNR’s inventory survey effort). DNR and USFWS mutually agreed to
move forward with the LTCS planning without these survey results (DNR/USFWS Letter of
Concurrence, April 8, 2003). The Science Team paid additional attention to these unsurveyed
stands as conservation approaches were developed in the OESF.
Because the inventory phase of the Interim Conservation Strategy focused its survey effort in
stands of old forest, most of the surveyed area in the OESF is old forest, and conversely much of
the unsurveyed acres in the OESF are not old forest. Table 3-13 summarizes acres of habitat in
the OESF by LPU and status under these proposed conservation recommendations. Recall,
habitat refers to reclassified habitat that has been evaluated based on an orthophotograph
inspection (dated 2005 for OESF) and limited field verification and, subsequently, “adjusted”
with subtractions and additions to the original reclassified designation. The final column of Table
3-13 summarizes the acres of habitat for each LPU that are not occupied, not considered to be
old forest, not designated for marbled murrelet conservation emphasis, and not within a riparian
buffer. While, some of these remaining acres have been surveyed, the majority of them have not.
Under the Science Team recommendations, the amount of habitat that would remain in the OESF
without explicit conservation is 1,698 acres (687 hectares). These areas were not deemed critical
for achieving the biological goals established by the Science Team.

3.4 Conservation Approach for a Marbled Murrelet Long-Term Conservation Strategy in the Straits
September 2008 Page 3-58
Table 3-13. Olympic Experimental State Forest Landscape Planning Unit Habitat Calculations.
Acres of DNR-Managed Forestland Deferred Not Occupied Non-Old Forest Habitat
Managed to Enhance Habitat Potential2
Landscape Total
Habitat Occupied
Not Occupied
Old Forest1Marbled Murrelet Riparian3
Available for Management
OESF Map Legend Color Dark Blue Blue Purple Pink Yellow
Upper Clearwater 16,608 14,266 1,183 0 995 164 Willy-Huel 8,675 6,960 833 0 592 290 Reade Hill 2,558 1,470 0 954 52 82 Queets 5,220 4,752 255 137 59 17 Copper Mine 3,422 2,820 389 0 148 65 Upper Sol Duc 1,669 42 797 663 48 119 Clallam 348 319 0 0 28 1 Sekiu 85 62 23 0 0 0 Dickodochtedor 5,259 2,005 829 1,141 656 628 Goodman Creek 5,586 4,310 432 577 188 79 Kalaloch 3,391 2,255 291 198 394 253
Grand Total 52,821 39,261 5,033 3,670 3,160 1,698 1 The term “old forest habitat” is used in the HCP to help define northern spotted owl habitat in the conservation strategy for the OESF (DNR 1997a, p. IV.88). Old forest habitat was identified in the OESF in fulfillment of that strategy, and was then used by the Science Team to help identify areas likely to provide nesting habitat and therefore make a contribution to marbled murrelet conservation. 2 The acre summary columns (except Total Habitat) are mutually exclusive. 3 All riparian habitat will be managed according to the DNR riparian conservation strategy for the Olympic Experimental State Forest (DNR 1997a).
3.4 Conservation Approach for a Marbled Murrelet Long-Term Conservation Strategy in the Straits
Non-federal lands in the Straits Analysis Unit occur in a narrow peripheral band, approximately
four to nine miles (6 to 14 kilometers) wide, on the northern and eastern Olympic Peninsula
(Figures 3-26 and 3-27). DNR-managed lands (118,000 acres [47,753 hectares]) comprise
approximately one-fourth of the non-federal land base in the analysis unit (Table 3-1, Figures 3-
26 and 3-27). Similar to the other non-federal forests, they are almost exclusively second- and
third-growth forests that regenerated after commercial timber harvest, land-clearing, and
associated wildfires in the late 19th and early 20th centuries, and from subsequent commercial
harvests and reforestation. Thus, high-quality inland habitat for the marbled murrelet is scarce on

3.4 Conservation Approach for a Marbled Murrelet Long-Term Conservation Strategy in the Straits
September 2008 Page 3-59
state and private forestlands in the Straits Analysis Unit. Low-density residential is supplanting
commercial forestry as the dominant land use in the non-federal lands, with several small cities
and limited agriculture making up the remainder. Federal lands in Olympic National Park and
Olympic National Forest make up 60% of the 1.2 million acre (485,600 hectare) analysis unit
and are estimated to contain 75% of existing marbled murrelet habitat (Table 3-1). Much of this
is high-quality habitat in old-growth forests in a wilderness setting.
Marbled murrelets have been observed moving throughout the waters surrounding the Olympic
Peninsula and engaging in very long commuting flights (over 50 miles [80 kilometers] one-way)
between nesting and foraging areas (Bloxton and Raphael 2006, 2007). These long-distance
movements suggest that marbled murrelet nesting habitat in the Straits Analysis Unit should be
considered in the context of the entire Olympic Peninsula. The nature and abundance of existing
potential marbled murrelet habitat on federal and DNR-managed forests, as well as results of
comprehensive inland surveys for marbled murrelets on DNR-managed lands (Harrison et al.
2003), suggest that state forests currently provide a relatively minor contribution to the carrying
capacity for marbled murrelets in the Straits Analysis Unit. The habitat known to be occupied on
DNR-managed lands in the Straits Analysis Unit occurs predominantly in smaller, isolated
stands compared to the adjacent, extensive old-growth forests found on federal lands.
Additionally, the quality of these occupied stands is almost exclusively second growth, Douglas-
fir forest. Consequently, the Science Team recommends that all currently known occupied
marbled murrelet sites be managed to retain habitat capability and be buffered with closed
canopy forest strips at least 328 feet (100 meters) wide and does not recommend further
measures to meet their conservation objectives.

3.4 Conservation Approach for a Marbled Murrelet Long-Term Conservation Strategy in the Straits
September 2008 Page 3-60
Figure 3-26. Overview of the Proposed Science Team Land Allocations for the North Portion of the Straits Analysis Unit.

3.4 Conservation Approach for a Marbled Murrelet Long-Term Conservation Strategy in the Straits
September 2008 Page 3-61
Figure 3-27. Overview of the Proposed Science Team Land Allocations for the East Portion of the Straits Analysis Unit.

September 2008 Page 4-1
4.0 HABITAT ASSESSMENT METHODS
I. ESTIMATING POTENTIAL MARBLED MURRELET POPULATION RESPONSES TO CURRENT AND PROJECTED FOREST HABITAT
This section documents the Science Team’s methods to describe the potential for current and
projected forest habitat to support populations of marbled murrelets. These methods were applied
to the Science Team’s recommended conservation approach to conduct the analyses presented in
chapter 5.0, although any alternative recommendations for marbled murrelet conservation can be
evaluated using these methods. The objectives of the analyses applied to the Science Team’s
recommendation are to present objective, repeatable, quantitative comparisons of current and
projected forest habitat for marbled murrelets on DNR-managed lands and other ownerships; and
to illustrate potential responses of marbled murrelets to current and projected habitat using an
index for carrying capacity. Results of these analyses will be provided to DNR and USFWS
managers to assist in the evaluation of the Science Team’s recommendations and for alternatives
that are subsequently considered.
4.1 Population Responses to Habitat
Both the quality and quantity of nesting habitat are hypothesized as factors limiting the marbled
murrelet population because of their influences on nesting rates and nest success. Forest stands
differ in their functionality as potential habitat. Several elements of stand structure and
composition that often increase with successional development, particularly potential nesting
platforms and complex canopy architecture, are important for providing accessible, secure nest
sites (Nelson 1997).
At the scale of large segments of the North American coast from British Columbia, Canada south
to San Francisco, Raphael (2006) found that at-sea murrelet population size increased linearly
with increasing amounts of adjacent higher quality potential nesting habitat. Similarly, at the
scale of watersheds, the abundance of nesting marbled murrelets appears to be a function of the
abundance of potential nesting habitat because five radar studies in British Columbia (reviewed
by Burger 2002) and one on the Olympic Peninsula (Raphael et al. 2002a) consistently found
linear relationships between the amount of habitat in watersheds and the numbers of marbled
murrelets detected flying into them. At a finer scale, nesting rates (nests per acre per year) have
been hypothesized to decrease with diminishing size and contiguity of habitat patches (Meyer et

4.2 Index of Potential Influence of Habitat Quality and Quantity on Populations in Washington – SWWA and OESF
September 2008 Page 4-2
al. 2002) because, as shown with other species, reduced nest success in smaller habitat patches in
fragmented landscapes may eventually increase breeding dispersal (Haas 1998, Newton 2001,
Kokko et al. 2004) or limit nesting attempts (Ripple et al. 2003).
Nest success has been hypothesized to be greatest in interior forest, because of increased
predation at edges, and in landscapes with lower levels of fragmentation because of relatively
lower predator abundance (reviewed by McShane et al. 2004). Life-cycle modeling (Morris and
Doak 2002) can be used to predict habitat influences on overall population performance (Budy
and Schaller 2007). A model that linked performance at each stage of the marbled murrelet life
cycle with habitat conditions (Horton 2008) was developed to predict effects of the amount and
configuration of forest habitat on marbled murrelet populations. However, there is considerable
uncertainty about how the amount, stand-level characteristics, and configuration of forest habitat
influence key elements of population biology, nesting rates, nest success, and adult survival of
marbled murrelets (Raphael 2006). Thus the Science Team decided to quantify the potential
influence of current and projected nesting habitat using a conceptually simpler approach that was
not directly linked to the marbled murrelet’s life cycle—a single index that integrated habitat
abundance, stand-level quality, and negative edge effects. The development and application of
this index is described below.
4.2 An Index of the Potential Influence of Habitat Quality and Quantity on Marbled Murrelet Populations in Washington
The index incorporates four elements of marbled murrelet relationships with forest habitat:
• Broad-scale correlation of numbers of marbled murrelets to area of habitat.
• The gradient in habitat quality caused by variation in stand structure and composition.
• The apparent reduction in habitat quality by edge effects.
• The influence of distance from their marine habitat.
These elements can be expressed as mathematical relationships among area, structure,
composition, and context of forest stands across the plan area to predict the capability of current
and projected habitat to support marbled murrelet populations. However, the index should not be
considered an explicit prediction of current or future marbled murrelet numbers; rather, it should
be viewed as an objective, repeatable, qualitative index that can be used to judge relative

4.3 Relationship of Habitat Area with Marbled Murrelet Abundance – SWWA and OESF
September 2008 Page 4-3
conservation values of DNR-managed lands as well as all other lands across the planning area.
This chapter describes the rationale, derivation, and application of this index.
4.3 The Relationship of Habitat Area with Marbled Murrelet Abundance
Carrying capacity, symbolized as K, is a core concept in population ecology and describes the
relationship that occurs between population size and the abundance of environmental resources
(Odum and Barrett 2005). This concept appears to apply to marbled murrelet populations and the
abundance of their potential nesting habitat because of the consistent linear relationships between
numbers of marbled murrelets detected with radar and the amount of habitat in the watersheds
they access (Burger 2002, Raphael et al. 2002a). Although Raphael et al. (2002a) referred to this
relationship as the “ecological density” of marbled murrelets on the Olympic Peninsula, it can
also be thought of as a reflection of the carrying capacity (i.e., the numbers of marbled murrelets
that can be supported by a given area of nesting habitat).
Raphael et al. (2006) estimated that, on average, 396 acres (160 hectares) of nesting habitat were
available per marbled murrelet detected by radar during their 2002 study. However, radar only
predictably detects inland-flying marbled murrelets, so additional information is needed to relate
habitat area to the entire marbled murrelet population. Radiotelemetry studies of marbled
murrelet inland flight behavior (Peery et al. 2004b) found that in a sample of 46 tagged marbled
murrelets, breeding birds flew inland on 82% of sampling occasions while non-breeding birds
that were physiologically capable of breeding flew inland on 41% of sampled days. Non-
breeders that were not in breeding condition almost never flew inland. The 46 tagged birds were
approximately equally distributed among those three categories (28% breeders, 38% “potential
breeders”, and 34% non-breeders; Peery et al. 2004b). If one assumes that the radar studies of
Raphael et al. (2002a) examined the inland flight patterns of a marbled murrelet population that
was equally distributed among breeders, potential breeders, and non-breeders (i.e., breeders = B,
potential breeders = P, non-breeders = N, total population = T/3), and that those birds behaved
approximately (rounding conservatively 82% to 85% and 41% to 45%) as did the radio-tagged
birds studied by Peery et al. (2004b), then one can calculate that approximately 43% of the
population is likely to be detected with radar, as
(B * 0.85) + (P * 0.45) = (1/3 * 0.85) + (1/3 * 0.45) = 0.43.
Thus using these assumptions, K (carrying capacity) is approximately 170 acres (69 hectares)

4.4 Relationship of Forest Stands with Potential Contribution to Carrying Capacity – SWWA and OESF
September 2008 Page 4-4
(i.e., 396 acres * 0.43) of potential nesting habitat per marbled murrelet. Applying this
relationship to the habitat estimates from Raphael et al. (2006) predicts a Washington population
of 12,680 individuals, compared to Washington at-sea counts from the 2001 to 2005 breeding-
season surveys that estimated the population at 8,540 to 12,340 (average 10,760) (Miller et al.
2006).
4.4 The Relationship of the Structure and Composition of Forest Stands with Their Potential Contribution to Carrying Capacity for Marbled Murrelets
The estimate of K for marbled murrelets in Washington is based on a classification of marbled
murrelet habitat above and below a certain threshold (Raphael et al. 2006). Raphael et al. (2006)
used this approach to meet the objectives of their analysis that was applied to satellite imagery
and calculated a habitat index value from 0 to 100 for each 82-foot x 82-foot (25-meter x 25-
meter) pixel within the marbled murrelet’s range. That index reflected their estimate of a
gradient in habitat quality that was caused in large part by variability in stand structure and
composition. However, their methods were not directly applicable to predicting habitat
suitability from DNR’s high-resolution forest resource inventory system (FRIS) or projections of
that inventory into the future. Thus, the Science Team developed a method to estimate stand-
level habitat quality that was appropriate to DNR’s forest inventory.
Forests managed by DNR were assumed to provide carrying capacity at the spatial scale of
stands (i.e., discrete units of forest that are relatively homogenous with respect to their structure
and composition). Stands are approximated in FRIS as Resource Inventory Units (RIUs) that
average 60 acres (24 hectares) across the SWWA, OESF, and Straits Analysis Units. These RIUs
and their associated forest inventory are mapped and cataloged in DNR’s GIS. This inventory
includes robust estimates of the abundance, species composition, diameter, and height of live
trees for each RIU (DNR 2002b). These data can be used to estimate the relationship between the
current and projected structure of RIUs and their respective contributions to K, based on the
assumption that at the stand level, K is a function of habitat quality that can be inferred from the
relationship between marbled murrelet use and stand characteristics (see reviews in Burger 2002
and McShane et al. 2004).
Two stand characteristics are directly related to the abundance and availability of potential nest
sites: platforms and canopy complexity. Stands with abundant platforms and multilayered

4.4 Relationship of Forest Stands with Potential Contribution to Carrying Capacity – SWWA and OESF
September 2008 Page 4-5
canopies have been consistently found to have the greatest likelihood of marbled murrelet use
(reviewed by Burger 2002 and McShane et al. 2004). Neither of these characteristics were
directly measured during DNR’s forest inventory; instead they were inferred from inventory-
based stand tables.
The number of canopy layers was estimated with the methods of Crookston and Stage (1999),
while platform abundance was estimated with a model (Duke 1997) developed from field studies
in SWWA in support of the Washington Forest Practices protocols for identifying marbled
murrelet habitat (Washington Forest Practices Board 2005 [WAC 222-12-090]). Murrelet use
(i.e., “occupancy”) was estimated in inland surveys (Ralph et al. 1994) at 355 sites conducted
from 1994 to 2001 on DNR-managed lands in the SWWA Analysis Unit (see Prenzlow Escene
1999 and Harrison et al. 2003 for survey reports).
Logistic regression models were built from all possible subsets of three independent variables
(platforms per acre [ppa], numbers of canopy layers [lyr], and their interaction [ppa * lyr])
against the dependent variable of occupancy. Number of survey visits and number of visits with
at least one detection of occupancy were used to incorporate the uncertainty of detecting
occupancy with inland surveys (J. Baldwin, pers. comm.). The model with the lowest AIC value
(model one in Table 4-1) provided the best fit to the marbled murrelet survey results, while five
of the other models (models two through six) fit reasonably well and therefore provide some
empirical support (Burnham and Anderson 2002).
Only the model with exclusively canopy layers (model seven) failed to provide a good fit to the
survey data; models that incorporated ppa and/or the interaction of ppa and lyr were reasonably
supported by the data. Thus, model selection and averaging techniques (Burnham and Anderson
Table 4-1. All Possible Logistic Models Fit to the Marbled Murrelet Survey Results, their ∆AIC Values, and a Normalized Measure of the Weight of Evidence that Model i was the Best among the Set (w).
Model Variables ∆AIC w(i) 1 lyr ppa * layer 0.0 0.58 2 ppa lyr ppa * layer 1.3 0.30 3 ppa 4.8 0.05 4 ppa lyr 6.1 0.03 5 ppa ppa * layer 6.5 0.02 6 ppa ppa * layer 8.1 0.01 7 lyr 29.2 0.00

4.4 Relationship of Forest Stands with Potential Contribution to Carrying Capacity – SWWA and OESF
September 2008 Page 4-6
2002) were used to incorporate predictions from models one through six about the probability
that marbled murrelets occupy DNR-managed stands, based on their structure and composition
(Prenzlow Escene et al. 2006).
These models demonstrated an increasing probability of occupancy—increased habitat quality or
greater contribution of stands to K—with increasing density of platforms and numbers of canopy
layers. Figure 4-1 illustrates this relationship, plotting the multivariate, model-averaged predicted
probability of occupancy against the interaction term (ppa * lyr) for all 355 occupied and not
occupied sites in the analysis. Note that the predictions cluster along three separate curves on the
graph—illustrating predictions for stands with one, two, or three canopy layers—and that higher
probabilities of occupancy are achieved only in stands with more complex canopy structures.
These data and model-averaged predictions were used to generalize the probability of occupancy
to a description of stand development stages (SDS) (Carey et al. 1996, Brodie et al. 2004).
0
0.2
0.4
0.6
0.8
1
0 5 10 15 20 25 30
Platforms Per Acre x Layers
Pred
icte
d Pr
obab
ility
of O
ccup
ancy
Not Occupied
Occupied
Simple Canopy: LTS, UDS, BDS
Complex Canopy: NDS, FFS
0.25
0.36
0.47
0.62
0.89
Figure 4-1. Model-Averaged Predicted Probability of Marbled Murrelet Occupancy Compared with the Interaction of Platforms per Acre and Canopy Layers. LTS Refers to Large Tree Exclusion, UDS to Understory Development, BDS to Botanically Diverse, NDS to Niche Diversification, and FFS to the Fully Functional Stages of Stand Development (See Appendix B).
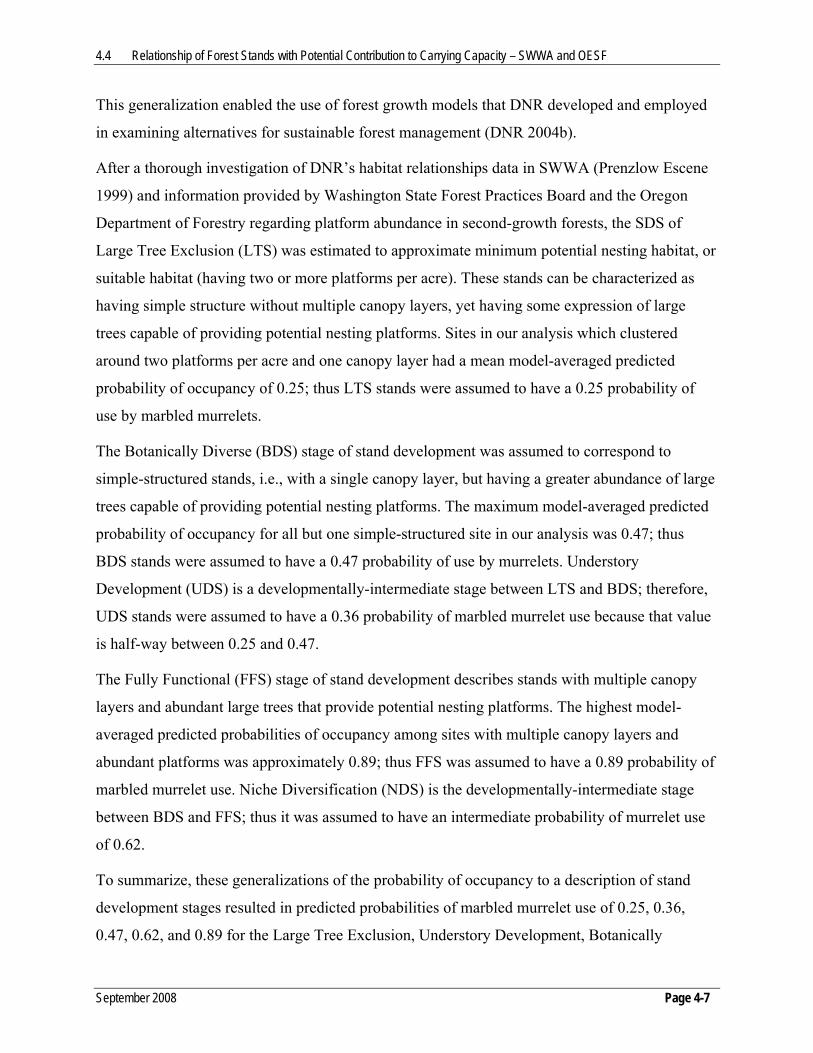
4.4 Relationship of Forest Stands with Potential Contribution to Carrying Capacity – SWWA and OESF
September 2008 Page 4-7
This generalization enabled the use of forest growth models that DNR developed and employed
in examining alternatives for sustainable forest management (DNR 2004b).
After a thorough investigation of DNR’s habitat relationships data in SWWA (Prenzlow Escene
1999) and information provided by Washington State Forest Practices Board and the Oregon
Department of Forestry regarding platform abundance in second-growth forests, the SDS of
Large Tree Exclusion (LTS) was estimated to approximate minimum potential nesting habitat, or
suitable habitat (having two or more platforms per acre). These stands can be characterized as
having simple structure without multiple canopy layers, yet having some expression of large
trees capable of providing potential nesting platforms. Sites in our analysis which clustered
around two platforms per acre and one canopy layer had a mean model-averaged predicted
probability of occupancy of 0.25; thus LTS stands were assumed to have a 0.25 probability of
use by marbled murrelets.
The Botanically Diverse (BDS) stage of stand development was assumed to correspond to
simple-structured stands, i.e., with a single canopy layer, but having a greater abundance of large
trees capable of providing potential nesting platforms. The maximum model-averaged predicted
probability of occupancy for all but one simple-structured site in our analysis was 0.47; thus
BDS stands were assumed to have a 0.47 probability of use by murrelets. Understory
Development (UDS) is a developmentally-intermediate stage between LTS and BDS; therefore,
UDS stands were assumed to have a 0.36 probability of marbled murrelet use because that value
is half-way between 0.25 and 0.47.
The Fully Functional (FFS) stage of stand development describes stands with multiple canopy
layers and abundant large trees that provide potential nesting platforms. The highest model-
averaged predicted probabilities of occupancy among sites with multiple canopy layers and
abundant platforms was approximately 0.89; thus FFS was assumed to have a 0.89 probability of
marbled murrelet use. Niche Diversification (NDS) is the developmentally-intermediate stage
between BDS and FFS; thus it was assumed to have an intermediate probability of murrelet use
of 0.62.
To summarize, these generalizations of the probability of occupancy to a description of stand
development stages resulted in predicted probabilities of marbled murrelet use of 0.25, 0.36,
0.47, 0.62, and 0.89 for the Large Tree Exclusion, Understory Development, Botanically

4.4 Relationship of Forest Stands with Potential Contribution to Carrying Capacity – SWWA and OESF
September 2008 Page 4-8
Diverse, Niche Diversification, and Fully Functional stages of stand development, respectively
(Brodie et al. 2004, Appendix B). These probabilities (Pstage) were used to modify the predicted
contribution to K of current and projected future habitat in DNR-managed stands as Kstage = K *
Pstage. For example, applying this concept to the Botanically Diverse stage (P=0.47), KBDS = (170
acres/marbled murrelet) * 0.47 = 1 acre / 0.00295597 marbled murrelets, which translates to
338.3 acres (136.9 hectares) of Botanically Diverse forest / 1 marbled murrelet. Extending this
concept to a 100-acre (40-hectare) Botanically Diverse stand, Kstand = (170 acres/marbled
murrelet) * 0.47 * 100 acres = 0.296 “marbled murrelet units.”
The same concepts were applied to forest cover across the entire planning area to assess current
and future marbled murrelet habitat on all other forestlands with methods broadly consistent with
those used for DNR-managed lands. The need to estimate edge effects and to project forest
succession across the analysis units required the use of classified satellite imagery (82-foot x 82-
foot [25-meter x 25-meter] pixels) developed by the Interagency Vegetation Mapping Project
(IVMP) (http://www.blm.gov/or/gis/index.php) from images collected between 1992 and 1996
(estimation of edge effects are discussed in section 4.8). These IVMP data were also used by
Bloxton and Raphael (2007) as input data to their marbled murrelet habitat estimates. The
methods of Green et al. (1993) were used with the IVMP data to classify land cover on non-DNR
ownerships. Land cover was assigned to six classes: late-, mid-, and early-seral conifer; a non-
conifer class that included early clearcuts, meadows, and hardwoods; non-forest; and water.
Forest land managers on the Olympic Peninsula and SWWA can be broadly classified as DNR,
federal, and other. Federally managed forests are in Olympic National Park, a wilderness area,
and Olympic National Forest, which has much congressionally-designated wilderness as well as
other areas, most of which are currently managed to maintain or restore late-successional forests
(USDA and USDI 1994). Other forest managers include forest industry, Native American tribes,
and small private landowners. Based on two separate habitat estimates reported by Raphael et al.
(2006) and the considerable local knowledge of the Science Team, existing late-seral conifer on
federally managed forests was assigned P=0.68. (The midpoint of the P applied to the more
structurally complex stages, Botanically Diverse, Niche Diversification, and Fully Functional.)
Meanwhile, existing late-seral conifer on other forests (DNR- and privately managed lands) was
assigned P=0.31. (The midpoint of the P applied to the less structurally complex stages that

4.5 Estimating Current and Future Marbled Murrelet Habitat – SWWA and OESF
September 2008 Page 4-9
could provide marbled murrelet habitat, including Large Tree Exclusion and Understory
Development.)
4.5 Estimating Current and Future Marbled Murrelet Habitat
Current conditions were estimated using 2004 forest inventory data for DNR-managed lands and
IVMP data (1992 to 1996), classified as described above and projected to 2004, for other
ownerships. Future conditions were evaluated for the years 2013, 2031, and 2067 using (a)
projections for management of the MMMAs to achieve the habitat conditions recommended by
the Science Team, and (b) growth and harvest projections from DNR’s 2004 sustainable harvest
calculation preferred alternative (DNR 2004b) for DNR-managed lands without explicit marbled
murrelet conservation roles.
Land cover estimates for many non-DNR lands were held static through these projections. This
was based on two assumptions: growth and harvest were relatively proportionally constant in
private and tribal commercial forests; and that conditions in federally managed wilderness areas
reflected a natural disturbance regime, so that the 1992 to 1996 satellite images broadly
represented future conditions as well. That is, in those portions of the 5.5-million-acre (2.2-
million-hectare) analysis landscape that encompassed 158,200 acres (64,021 hectares) of
MMMAs, landscape patterns would vary unpredictably at finer scales over the analysis period,
but landscape composition and pattern would remain relatively unchanged overall.
Forest succession was projected for several portions of the analysis landscape according to the
following assumptions. Riparian non-DNR forestlands would mature according to Washington
Forest Practices rules (Washington State Forest Practices Board 2002 [WAC 222-30-021]), as
would previously harvested areas in Late Successional Reserves and Adaptive Management
Areas of the Olympic National Forest (USDA and USDI 1994). Thus, clearcut, early-seral, and
mid-seral conifer stands advanced to late-seral (Green et al. 1993) according to growth
projections for modal stands in the analysis area. Those projections are summarized in Table 4-2
below. Late-seral forests that were projected to develop over time in those areas were
conservatively assumed to be in the Large Tree Exclusion stage (P=0.25). Late-seral forest that
was projected to develop in non-federal riparian forests was assumed to have P=0.13 (0.25 *
0.5), reflecting biophysical limitations on the development of late-seral forests in riparian areas
and disturbance-related processes (e.g., windthrow) that would also limit its development. Late

4.6 Projecting Marbled Murrelet Habitat Development on DNR-Managed Lands – SWWA and OESF
September 2008 Page 4-10
seral forest that was projected to develop in previously harvested areas in Late Successional
Reserves and Adaptive Management Areas of the Olympic National Forest (USDA and USDI
1994) was assumed to have P=0.20 (0.25 * 0.8), reflecting biophysical limitations on the
development of late-seral forests across the landscape in general.
Table 4-2. Projections of Forest Succession among Seral Stages for Previously Harvested Areas on Non-DNR-Managed Lands. (See Appendix B for an Explanation of Green et al. [1993] Forest Successional Stages.)
1992–1996 2004 2013 2031 2067
Clearcut Early-Seral Early-Seral Mid-Seral Late-Seral
Early-Seral Mid-Seral Mid-Seral Late-Seral Late-Seral
Mid-Seral Mid-Seral Late-Seral Late-Seral Late-Seral
Late-Seral Late-Seral Late-Seral Late-Seral Late-Seral
Note: This table reflects forest succession among the stages described by Green et al. (1993) for previously harvested areas in late successional reserves and adaptive management areas of the Olympic National Forest (USDA and USDI 1994) and riparian forests on private and tribal forestlands.
4.6 Projecting Marbled Murrelet Habitat Development on DNR-Managed Lands
A brief summary of the basis for projecting forest growth and a description of the stages of stand
development (Carey et al. 1996, Brodie et al. 2004) is necessary to describe how marbled
murrelet habitat development was projected for DNR-managed forests.
To expedite these analyses and to make use of the comprehensive analyses DNR had recently
conducted in support of the sustainable harvest calculation (DNR 2004b), the Science Team used
the system of stand development stages (SDS), which was developed to describe the transition
through functionally based stages of forest stand development (Brodie et al. 2004). The SDS
model was the result of several independent lines of investigation and consultations among a
diverse group of experts and stakeholders; it was not specific to the development of nesting
habitat requirements of the marbled murrelet. Brodie et al. (2004) provide a detailed description
and illustration of these stand development processes and stages. Structural indicators, Pstage
values (as described above), and predictors for transition among these stages are summarized in
Table 4-3.

4.6 Projecting Marbled Murrelet Habitat Development on DNR-Managed Lands – SWWA and OESF
September 2008 Page 4-11
Table 4-3. Structural Indicators and Estimated Proportions of Marbled Murrelet Carrying Capacity based on Stand Development Stages (Brodie et al. 2004).
Stand Development Stage Structural Indicators Relative Murrelet Habitat Potential (Pstage)
Ecosystem Initiation QMD < 2 in 0
Sapling Exclusion 2 in ≤ QMD < 5 in 0
Pole Exclusion 5 in ≤ QMD < 11 in 0
Large Tree Exclusion QMD ≥ 11 in 0.25
Understory Development Multi-layer canopy or past peak RD 0.36
Botanically Diverse Multi-layer canopy or 60 years past peak RD 0.47
Niche Diversification Snag ratio > 0.07 and CWD ≥ 2,400 ft3/acre
or 80 years past peak RD 0.62
Fully Functional and Murrelet Desired Future Forest Conditions share similar components.
Snag ratio > 0.07 and CWD ≥ 2,400 ft3/acre
or 160 years past peak RD 0.89
Note: CWD = coarse woody debris; QMD = quadratic mean diameter; RD = relative density.
Table 4-3 summarizes several elements of stand structure and composition that are important
elements of northern spotted owl habitat. The snag ratio refers to the proportion of standing dead
to live trees while coarse woody debris (CWD) refers to the volume of dead trees on the forest
floor. Although dead wood is not directly a component of marbled murrelet habitat, it is
correlated with the stand processes of differentiation and decadence, which entail increasing the
size of dominant trees and the formation of a complex canopy structure (Franklin et al. 2002).
Relative density (RD) measures present stand density in relation to a hypothetical maximum
(Woodall et al. 2006). Quadratic Mean Diameter (QMD) is the hypothetical diameter of the tree
with the average cross-sectional stem area (basal area) in the stand (Curtis and Marshall 2000).
QMD is different from the arithmetic mean diameter in that it is weighted toward the larger trees
(whose areas increase at a higher rate as their diameters increase) and accounts for diameter
variance, thus giving a more detailed idea of stand characteristics (Curtis and Marshall 2000).
However, the stand QMD does not necessarily indicate the presence of large trees (e.g., scattered
old growth) because a range of stand compositions can have the same QMD. Stand QMD may be
low due to the presence of many smaller trees; yet this does not exclude the possibility of the
presence of some large trees with platforms which provide the habitat for marbled murrelets. The

4.6 Projecting Marbled Murrelet Habitat Development on DNR-Managed Lands – SWWA and OESF
September 2008 Page 4-12
QMD, snag ratio, CWD, and canopy layers were estimated from FRIS data to classify stands with
the SDS. The higher Pstands were assumed for the latter stages with increasingly larger trees and
more complex canopies as illustrated by the models described above.
An illustration of the process of stand development is provided for an exemplary stand of
naturally regenerated mixed-species/western hemlock with a western hemlock 50-year site index
of 110 (Figure 4-2). The figure illustrates how expected QMD and relative density vary over 200
years of stand development, as well as the predicted transitions among SDS classes. Relative
density (RD) is a measure of the relationship between stand-level basal area and QMD, and
provides an index to the level of inter-tree competition. Note that the working hypothesis is that
the transition from a simple to a complex canopy occurs when the site reaches maximum RD, as
this is the point at which density-dependent mortality becomes secondary to density-independent
mortality within the stand (Franklin et al. 2002). Density-independent mortality is the process by
which canopy gaps develop in forest succession (Franklin et al. 2002). Canopy gaps are integral
to the development of marbled murrelet habitat as they increase forest accessibility (Burger 2002,
McShane et al. 2004).
Assumptions used to develop and support DNR’s 10-year timber harvest plan (DNR 2004b) lead
to a conclusion that once the threshold of maximum RD is crossed, the exemplary stand would
develop Botanically Diverse characteristics within 60 years, Niche Diversification in 80 years,
and a Fully Functional state in 160 years. To achieve greater predicted quality of marbled
murrelet habitat (i.e., Pstage), there must be a greater abundance of very large-diameter trees in
addition to complex canopy structure, because such trees provide the platforms necessary for
marbled murrelet nest sites. The development of these trees is a function of multiple factors
including inter-tree competition. In a no-harvest regime for a western hemlock stand this could
mean waiting until competition-induced mortality in the stand begins to wane (i.e., peak RD at
110 to 120 years). DNR simulated these processes for its entire forest inventory with growth
models adjusted for stand-specific site indices and existing structure and composition.
To broadly define the stand-level characteristics of high-quality marbled murrelet habitat so the
development of such habitat could be projected, the Science Team developed a Desired Future
Forest Condition (DFFC). A DFFC, by definition (Holmberg et al. 2005), is a visionary but
incompletely defined end state. The Science Team described an initial DFFC for stand-level
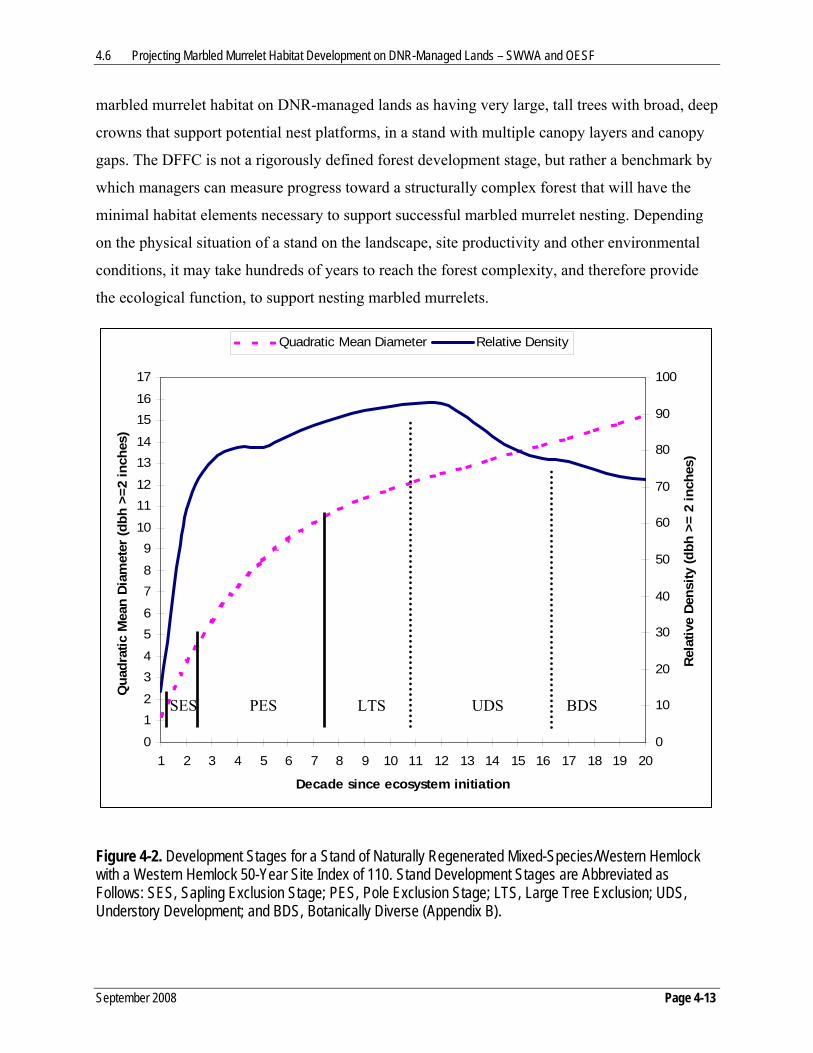
4.6 Projecting Marbled Murrelet Habitat Development on DNR-Managed Lands – SWWA and OESF
September 2008 Page 4-13
marbled murrelet habitat on DNR-managed lands as having very large, tall trees with broad, deep
crowns that support potential nest platforms, in a stand with multiple canopy layers and canopy
gaps. The DFFC is not a rigorously defined forest development stage, but rather a benchmark by
which managers can measure progress toward a structurally complex forest that will have the
minimal habitat elements necessary to support successful marbled murrelet nesting. Depending
on the physical situation of a stand on the landscape, site productivity and other environmental
conditions, it may take hundreds of years to reach the forest complexity, and therefore provide
the ecological function, to support nesting marbled murrelets.
Figure 4-2. Development Stages for a Stand of Naturally Regenerated Mixed-Species/Western Hemlock with a Western Hemlock 50-Year Site Index of 110. Stand Development Stages are Abbreviated as Follows: SES, Sapling Exclusion Stage; PES, Pole Exclusion Stage; LTS, Large Tree Exclusion; UDS, Understory Development; and BDS, Botanically Diverse (Appendix B).
0
12
34
56
78
910
1112
1314
1516
17
1 2 3 4 5 6 7 8 9 10 11 12 13 14 15 16 17 18 19 20
Decade since ecosystem initiation
Qua
drat
ic M
ean
Dia
met
er (d
bh >
=2 in
ches
)
0
10
20
30
40
50
60
70
80
90
100
Rel
ativ
e De
nsity
(dbh
>=
2 in
ches
)
Quadratic Mean Diameter Relative Density
SES PES LTS UDS BDS

4.6 Projecting Marbled Murrelet Habitat Development on DNR-Managed Lands – SWWA and OESF
September 2008 Page 4-14
Though the DFFC is a visionary goal that does not contain specific thresholds for habitat
characteristics in a stand, these characteristics can be estimated using existing DNR data. Based
on an analysis of the structural conditions of inventoried DNR-managed stands in SWWA known
to be occupied by marbled murrelets (n=220), the top 25% of this data set had four or more 7 inch
(18 centimeter) diameter platforms per acre; two or more canopy layers; and trees with diameter
at breast height (dbh) at least 36 inches (91 centimeters), height at least 140 feet (43 meters),
crown ratio (height of live crown divided by tree height) at least 50%, and crown width at least 30
feet (9 meters). Trees with these characteristics were considered a critical element of stands
achieving the DFFC.
The structural development of stands was simulated in a series of modeling exercises designed to
understand the role of active silviculture in achieving the DFFC for marbled murrelet habitat
(Reimer et al. 2004). Stands in the MMMAs that were simulated as being treated with these
proactive regimes were tracked through the SDS and consequent series of Pstage values according
to predictions of those models (see section II below). Stands outside the MMMAs were assigned
the projections and predicted Pstage values that resulted from the forest growth and harvest
modeling that described the 2004 sustainable harvest calculation preferred alternative for DNR’s
plan to implement its 10-year schedule for sustainable timber harvest (DNR 2004b). Nelson and
Wilson (2002) found that western hemlock trees used for nesting by marbled murrelets were
younger than Douglas-fir nest trees. Western hemlocks frequently develop the large limbs
necessary to provide nesting platforms at earlier ages, in part due to dwarf mistletoe infections
(Hamer and Nelson 1995). To acknowledge these differences, rates of transition among Pstage
values were adjusted according to the assumptions summarized in Figure 4-3. An important
consequence of these assumptions was that no marbled murrelet habitat capability was projected
to develop in Douglas-fir plantations because their transition to the lowest Pstage class occurred
after the end of the simulation period (2067). Conversely, the more rapid development of habitat
characteristics assumed for western hemlock led to the prediction that plantations dominated by
western hemlock could achieve a low level of habitat capability (Pstage=0.25, Table 4-4) by 2067.

4.7 Summary of Contribution of Stands to Marbled Murrelet Carrying Capacity – SWWA and OESF
September 2008 Page 4-15
0
0.1
0.2
0.3
0.4
0.5
0.6
0.7
0.8
0.9
1
0 2 4 6 8 10 12 14 16 18
Decade Past Peak Relative Density
Psta
geWestern Hemlock Douglas-fir
Figure 4-3. Science Team Assumptions Regarding the Rate at which Transitions Occur among Categories of Pstage Values for Marbled Murrelet Habitat Quality in Western Hemlock and Douglas-Fir Dominated Stands.
4.7 Summary of the Projected Current and Future Contribution of Forest Stands to Marbled Murrelet Carrying Capacity
The series of relationships and assumptions described above lead to a set of explicit assumptions
regarding the Pstage values, which vary according to three dimensions: land ownership, existing
versus projected land cover, and the application of a variety of projected management regimes
for DNR-managed lands (see section II below). The Pstage values that are assumed to result from
the relationship with these dimensions are summarized in Table 4-4. The influence of uncertainty
in the classification of habitat to a particular stand development stage on K’ is examined in a
sensitivity analysis in Appendix H.
Projections of the capability of new habitat to support additional marbled murrelets depend on
individuals immigrating to and breeding in these new habitats. The extent to which this will
occur will depend on reproductive success and the reduced influence of environmental factors
such as corvid presence, although reductions in edge effects could reduce predation.

4.7 Summary of Projected Contribution of Stands to Marbled Murrelet Carrying Capacity – SWWA and OESF
September 2008 Page 4-16
Table 4-4. Summary Assumptions Regarding Marbled Murrelet Habitat Potential (Pstage) for Two Classifications of Forest Successional Stages.
Relative Marbled Murrelet Habitat Potential (Pstage)
Stand Development Stages (Brodie et al.
2004)
Seral Stages (Green et al.
1993)
Existing and Projected Future Conifer Stands
on DNR-Managed Land
Existing Conifer Forest in
Olympic National Park and
Olympic National Forest
Other1 Existing Conifer Forests
Projected Future Conifer Forests in
Previously Harvested Areas of Olympic National
Forest
Projected Future Riparian Conifer Forests in
Previously Harvested Riparian Areas Outside of Olympic National Forest
Ecosystem Initiation Non-conifer (in part) 0 0 0 0 0
Sapling Exclusion Early-seral 0 0 0 0 0
Pole Exclusion Mid-seral 0 0 0 0 0
Large Tree Exclusion Late-seral 0.25 0.682 0.312 0.203 0.133
Understory Development Late-seral 0.36 0.68 0.31 0.20 0.13
Botanically Diverse Late-seral 0.47 0.68 0.31 0.20 0.13
Niche Diversification Late-seral 0.62 0.68 0.31 0.20 0.13
Fully Functional Late-seral 0.89 0.68 0.31 0.20 0.13 1 Predominantly private and tribal land. 2 See discussion for these calculations in section 4.4. 3 See discussion for these calculations in section 4.5. Note: Assumptions on the influence of land ownership, existing versus projected land cover on non-DNR ownerships, and several potential forest management regimes for DNR-managed lands on Pstage are discussed in the preceding section. The influence of uncertainty in the classification of habitat to a particular stand development stage on K’ is examined in a sensitivity analysis in Appendix H.

4.8 Edge Effects on Quality of Habitat and Its Potential Influence on Carrying Capacity – SWWA and OESF
September 2008 Page 4-17
4.8 Edge Effects on Quality of Marbled Murrelet Habitat and Its Potential Influence on Carrying Capacity
Edge is believed to be an important factor influencing marbled murrelet nesting success; it is also
a complex and poorly understood phenomenon. The method of addressing edge effects employed
by the Science Team was strongly influenced by studies by Nelson and Hamer (1995) and Manley
and Nelson (1999).
The Science Team reviewed and attempted to apply landscape-level predation effects as
investigated in studies on the Olympic Peninsula in Washington State (Marzluff et al.1999).
Analysis from this unpublished study suggests that edge effects influencing marbled murrelet
nesting are more complex than the simple negative relationship that forms the basis for the nest
predation analysis outlined below. While negative effects can be expected at most forest edges
bordering clearcuts or young forest, other factors such as forest structure, human influence,
elevation (Bradley [2002] found fewer predators at higher elevations), distance from edge and
type of edge (natural edges such as avalanche chutes seem to produce less severe edge impacts
[Malt and Lank 2007]) can change this relationship.
The Science Team is not aware of any peer reviewed research documenting a more complex
model for understanding influences of edge on nesting marbled murrelets. The Science Team was
therefore unable to incorporate a more sophisticated model into their analysis.
Manley and Nelson (1999) found that for a collection of well-observed marbled murrelet nests in
British Columbia, Washington, Oregon, and California, nest success within 164 feet (50 meters)
of the forest edge was 38% (n=29 nests) while nest success at greater distances was 55% (n=29
nests). Sixty percent of all nests failed because of predation. These observations, coupled with
hypotheses that edges between early and late-seral forest support increased predator abundance
and/or lead to decreased concealment of nests (Nelson and Hamer 1995b), suggested to the
Science Team that current and projected edge effects on habitat quality should be considered as a
criterion for evaluating potential outcomes of alternatives for DNR’s LTCS.
The Science Team decided to employ a simple assumption regarding edge effects while
acknowledging the considerable uncertainty that surrounds the core hypothesis of a simple
relationship between proximity to stand edge and nest success. Elements of this uncertainty
include the definition of what constitutes an “edge” and observations of the absence of a negative

4.9 The Habitat Capability (K’) Equation – SWWA and OESF
September 2008 Page 4-18
edge effect at a large sample (n=137) of marbled murrelet nests located with radiotelemetry in
southwestern British Columbia (Malt and Lank 2007, Zharikov et al. 2006, Bradley 2002).
Additional uncertainty derives from the apparently complicated relationship among the
interaction of human residential, agricultural, and recreational developments with edge effects
(Raphael et al. 2002b).
Based on the observed relationship of diminished nest success with stand edges (Manley and
Nelson 1999), the Science Team determined to discount the predicted contribution of edge-
influenced potential marbled murrelet habitat to carrying capacity. A 164-foot (50-meter)
distance reflecting edge effects (Manley and Nelson 1999) and the values for low and high nest
success hypothesized by McShane et al. (2004) (0.38 and 0.54, respectively) were used together
to determine a discount factor, or Pedge, of 0.70 (0.38 / 0.54 = 0.70; i.e. success at edges is
assumed to be 70% of forest interior values). This discount factor (0.70) was used to modify the
predicted contribution to K of current or potential future edge-influenced habitat as Kedge = Kstage
* Pedge. Predictions of K across edge and interior (Kinterior=Kstage) habitat are summarized as K’ =
Kedge + Kinterior. Thus for example, applying this concept to a 100-acre (40-hectare) stand in the
Botanically Diverse (Appendix B) stage (P=0.47) with 50 acres (20 hectares) of interior and 50
acres (20 hectares) of edge influence, K’ = (170 acres / marbled murrelet) * [(0.47 * 50 acres) +
(0.47 * 0.70 * 50 acres)] = 0.251 “marbled murrelet units.” In this example, K’ is 85% of the
estimated K of 0.296 presented in the earlier example (see section 4.4), which did not consider
the negative influence of edges.
Areas of potential marbled murrelet habitat subject to edge effects were identified and
summarized using the 82-foot (25-meter) resolution GIS grids that represented current and
projected land cover. The land cover categories of Green et al. (1993) were the basis for
determining edge-influenced areas of potential marbled murrelet habitat that occurred only in the
late-seral category. Non-forest, non-conifer, and early-seral conifer were considered “edge-
creating” categories. Among DNR’s SDS categories, Ecosystem Initiation and Sapling Exclusion
were considered edge-creating when adjacent to categories that provided some K. The influence
of uncertainty in the estimation of the edge coefficient (0.70) on K’ is examined in a sensitivity
analysis in Appendix H.
4.9 The Habitat Capability (K’) Equation

4.10 Influence of Distance from Marine Habitat on Habitat Quality and its Effects on Carrying Capacity – SWWA and OESF
September 2008 Page 4-19
The variables described above for habitat capability (K’) are summarized in equations here:
Kinterior = (Pstage * Interior Acres) / 170 acres/murrelet
Kedge = (Pstage * Pedge * Edge Acres) / 170 acres/murrelet
K’ = Kedge + Kinterior
4.10 The Influence of Distance from Marine Habitat on the Quality of Inland Marbled Murrelet Habitat and its Effects on Carrying Capacity
Radiotelemetry studies in southwestern British Columbia (Hull et al. 2001) suggest that 40 miles
(64 kilometers) is a reasonable one-way commuting distance for nesting marbled murrelets. The
at-sea distribution of marbled murrelets during the breeding season (Miller et al. 2006) and
results of DNR’s inland marbled murrelet surveys in the South Coast and Columbia HCP
Planning Units (see Prenzlow Escene 1999 and Harrison et al. 2003 for survey reports) confirm
that the value of inland habitat declines dramatically beyond 40 miles (64 kilometers) from
marine foraging areas.
The Science Team applied an arbitrary discount factor of 0.25 to reflect the diminished potential
contribution to K’ of stands more than 40 miles (64 kilometers) from marine waters with an
observed high density of marbled murrelets during the breeding season (see Figure 3-1, Miller et
al. 2006). Thus, in the previous calculation of K’, which resulted in an estimate of 0.251, if that
stand were more than 40 miles (64 kilometers) from a marine foraging area, its adjusted K’
would be 0.251 * 0.25 = 0.063 “marbled murrelet units.” Within the analysis areas, locations
distant from marine foraging areas were exclusively in the far eastern portion of the SWWA
Analysis Unit (Figure 3-1). The influence of uncertainty in the estimation of the coefficient for
distance from marine waters (0.25) on K’ is examined in a sensitivity analysis in Appendix H.
II. METHODS FOR PROJECTING THE DEVELOPMENT OF MARBLED MURRELET HABITAT UNDER THE SCIENCE TEAM’S RECOMMENDED CONSERVATION APPROACH
As described in chapter 3.0, the Science Team designated the total area of all MMMAs as
approximately 116,000 acres (47,000 hectares) of forested state trust lands. These MMMAs were
designated so that management within them would have the explicit objective of enhancing
existing lower-quality habitat and developing new habitat in areas that have not been found to be
occupied. This section summarizes the methods and assumptions used to project forest growth

4.11 Goals and Objective Criteria – SWWA and OESF
September 2008 Page 4-20
and response to silviculture in those MMMAs (see Appendix C for specific model inputs). The
principal objective of this modeling exercise was to provide an objective, repeatable, quantitative
assessment of the results of proactive silviculture intended to maximize the quality and quantity
of marbled murrelet habitat, according to the unique conditions desired for each MMMA, within
the 70-year term of the HCP. Since recommendations for the development of marbled murrelet
habitat in the Straits Analysis Unit are to provide solely passive management, these exercises
were not conducted there. Two scenarios, “No Management” and “Habitat Management,” were
modeled to provide the reference comparison reported in chapter 5.0. These scenarios
demonstrate simulated forest growth and consequent development of marbled murrelet habitat in
response to a conservative approach of no silvicultural intervention and an approach involving
silviculture intended to maximize habitat quality and quantity.
4.11 Goals and Objective Criteria
The goal of this exercise was to create as much potential nesting habitat for marbled murrelets as
possible, as rapidly as possible within the seven-decade HCP agreement. Habitat was identified
using the SDS criteria summarized in the previous section; thus, the solution led to the maximum
K summed over all stands in the MMMAs in decade seven. The Science Team’s recommended
conservation approach (see section IV in chapter 3.0) was analyzed at three scales in order to
illustrate the application of this approach in evaluating different scenarios: analysis units, defined
here as SWWA and OESF; sub-planning units (planning blocks in SWWA and landscape
planning units [LPUs] in OESF), and smaller units of forest ranging from parts of stands to
groups of adjacent stands. However, for the purpose of demonstrating the process of applying
these tools and interpreting the results, habitat was merely summed across all scales so that it
was maximized within units of forest, blocks or LPUs, and ultimately within and across the
analysis units.
4.12 Model Structure
A sophisticated, spatially explicit optimization model using Spatial Woodstock (Remsoft, Inc.
2005) was applied to illustrate the outcomes of two silvicultural pathways for carrying out the
Science Team’s recommendations for conservation in the MMMAs. The Spatial Woodstock
software uses linear programming methods to arrive at optimal solutions to forest planning
problems in which large sets of spatially explicit input data, multiple objectives, and constraints
4.13 Model Development – SWWA and OESF
September 2008 Page 4-21
present otherwise-intractable complexity. The first step in analyzing forest planning problems is
to identify goals that can be described with objective criteria that are used to judge when the
goals have been achieved (Remsoft, Inc. 2005). The analyst then defines actions and forest
responses to them, and the software generates outputs that are assessed for their contribution
toward those goals. Resource, policy, and multiple-goal constraints are entered into the problem
statement so that feasible solutions to these problems can be found (Remsoft, Inc. 2005).
4.13 Model Development
To frame what the Science Team recommended as “biologically appropriate silviculture,” a
series of preliminary modeling exercises examined several simplistic silvicultural approaches for
achieving and improving nesting habitat. These exercises inspected outcomes of five
hypothetical management approaches (scenarios) for achieving as much habitat as rapidly as
possible: “No Management,” “Light Thinning Only,” “Heavy Thinning Only,” “Conversion
Only,” and “Combination.” The Combination approach found a solution that freely selected
among the other approaches to maximize habitat. The silvicultural characteristics of each of
these approaches are described below.
Results of all five trial approaches demonstrated a steady increase in the abundance and quality
of marbled murrelet habitat, but the scenarios could be lumped into two groups based on their
performance. One group, consisting of No Management, Light Thinning Only, and Conversion
Only, showed initial, more rapid gains in habitat, seen mainly in the first decade. Heavy
Thinning and Combination comprised the other group, predicted to produce more high-quality
habitat by decade seven.
Results of these initial trials were evaluated and integrated, acknowledging biophysical
limitations on the effectiveness of silviculture, to form the “Habitat Management” scenario.
Biophysical limitations refer to the capacity of the site’s soil, light, and other nutrients to support
a particular forest stand structure growing at a particular rate, as well as taking into consideration
species composition, competition, and windthrow risk. All the listed silvicultural approaches
were combined in the Habitat Management scenario to include considerations of how the
interaction of stand density and the structural properties of trees could influence outcomes of
silvicultural manipulations designed to create and/or improve marbled murrelet habitat. The No
Management scenario was merely a simulation of forest development without active silvicultural

4.14 Management Scenarios – SWWA and OESF
September 2008 Page 4-22
intervention and was developed to provide a point of reference that reflected a preservation
approach to habitat management. Subsequent descriptions and discussion refer exclusively to the
Habitat Management scenario.
4.14 Management Scenarios: Silvicultural Activities and Projected Forest Responses
A broad range of silvicultural activities was available for modeling, from no management to
regeneration harvests that converted stands to different species and stocking densities. A range of
thinning treatments was also modeled, from lighter removals (possibly with multiple entries) to
heavier thinnings or group selection harvests. Predicted forest responses to these activities were
determined during comprehensive analyses of forest growth and yield as influenced by a broad
range of input variables including species composition, stocking levels, and a variety of tree and
site characteristics (Reimer et al. 2004).
Silviculture can be defined as the art and science of cultivating forests to deliberately attain
desired end states. A brief description of the various silvicultural treatments available within the
Habitat Management scenario follows. Note that the Habitat Management scenario is computer
optimized, meaning the computer chooses which of the following treatments to apply in specific
locations.
4.14a No Management
• No active silvicultural intervention is involved because existing marbled murrelet habitat is
assumed not to be improved by silviculture within the seven-decade analysis window.
4.14b Light Thinning Only
• Treatment is aimed at increasing habitat quality and quantity by increasing tree diameter,
improving stem form, and increasing crown length. It is expected to result in increases of
lower to mid-quality nesting habitat in the first seven decades.
• Actual and simulated removals typically emphasize the harvest of smaller-diameter
suppressed trees with shallower crowns and poor tree form, resulting in 30% to 40%
removals of basal area, in an attempt to maintain tree vigor and growing space for the
residual cohorts. Operationally, individual trees or groups of trees with unique characteristics
such as deformities, deeper crowns, and lower stocking would likely be retained to serve as
future nesting trees.

4.14 Management Scenarios – SWWA and OESF
September 2008 Page 4-23
4.14b Heavy Thinning or Partial Harvesting
• Treatment is aimed at increasing abundance of habitat by creating gaps; increasing crown
length, diversity in tree diameter, heights, and canopy structure; and improving stem form
and crown length. It is expected to result in increases of mid- to higher quality nesting habitat
in the first seven decades.
• Patterns of removals and specific management strategies may vary depending on the
proximity of riparian and upland areas. The emphasis is on harvesting smaller-diameter
suppressed trees with shallower crowns and poor tree form, resulting in 50% to 70% removal
of basal area, including meso-scale group selection (2- to 20-acre [0.8- to 8-hectare]
openings). The desired result is to maintain tree vigor and growing space for the residual
cohort in thinned areas, and aid the development of multiple tree canopies.
• Operationally, individual trees or groups of trees with unique characteristics such as
deformities, deeper crowns, and lower stocking may be retained to serve as future nesting
trees. Actual techniques applied on the ground can be more spatially sensitive (i.e., applying
both light and heavy thinning within the same stand).
4.14c Conversion
• Treatment is aimed at increasing abundance of habitat by regenerating upland portions of
stands with tree species and planting densities that perform better in terms of habitat
development (e.g., lower [70% to 80% of full] stocking with western hemlock/Sitka spruce
versus higher stocking of Douglas-fir/western hemlock).
• Increases of lower to mid-quality nesting habitat are expected to result. Higher quality habitat
is expected to develop over longer time frames than the first seven decades.
• Operationally, individual trees or groups of trees with unique characteristics such as
deformities, deeper crowns, and lower stocking may be retained to serve as future nesting
trees.
4.14d Habitat Management Scenario
The principal difference between the Habitat Management scenario (evaluated in chapter 5.0)
and the Combination scenario (evaluated as a preliminary step in the process of model

4.14 Management Scenarios – SWWA and OESF
September 2008 Page 4-24
development) was the more complex, but realistic, application of silvicultural evaluation tools in
determining how to implement thinning treatments in the face of windthrow risk in the Habitat
Management scenario. These evaluations are exemplified with the stand density management
diagram (SDMD, Figure 4-4). An SDMD is one of several tools for evaluating stand structures
and determining appropriate habitat enhancement activities. Figure 4-4 presents an SDMD
(Mitchell 2000) that illustrates stand development pathways under a range of stocking levels and
thresholds for potential windthrow risk (high, moderate, and low), which is particularly
important in determining the potential efficacy of thinning treatments. Although this figure is
presented for illustration purposes only, these concepts were used to identify stands with
structural conditions suitable for one or more of the three broadly defined treatments (light
thinning, heavier thinning with meso-scale group selection, and conversion) as part of the
modeling exercise.
In interpreting the complex information presented in an SDMD, the highly dense stands that
have poor tree form (height relative to diameter) and shallow crowns are within the “high”
windthrow susceptibility zone of the SDMD and are not suitable for thinning treatments (except
very early stocking control treatments in stands approximately 15 years old). As illustrated by
trajectory three (T3) in Figure 4-4, moderately susceptible stands may receive multiple thinning
entries of varying removal percentages and treatment timings to sustain vigor and improve tree
form, thus reducing windthrow hazard by staying in the medium hazard class for a longer period
of time. The vertical line of trajectory one (T1) demonstrates a pathway to high-quality habitat in
the shortest time possible. Cross and Comnick (2006) identified old forest habitat for northern
spotted owls in the OESF (which encompasses much high-quality marbled murrelet habitat) as
being located in the upper left-hand pinnacle of the SDMD, which coincides with a low density
of large trees. Marbled murrelet habitat of lower quality (e.g. Large Tree Exclusion and
Understory Development stand development stages [see Appendix B]) coincides with the middle
of the gray band indicating high windthrow risk.

4.15 Model Limitations – SWWA and OESF
September 2008 Page 4-25
Figure 4-4. Stand Density Management Diagram (Figure from Mitchell 2000). Trajectory Four (T4) in the Figure Represents Light Thinning in “Tall, Dense, Previously Unmanaged Stands” in order to Maintain Dominant Trees (Mitchell 2000, p. 12).
4.15 Model Limitations
Because of computing limitations, model formulation was limited to two thinning entries within
the first seven decades. Although they were not considered in this modeling exercise, more
frequent entries may be employed operationally to achieve the desired conditions with the third

4.16 Management Scenario Analysis Results – SWWA and OESF
September 2008 Page 4-26
or subsequent entries starting around the seventh decade. Likewise, the potential negative effects
of edge were not considered in discovering an optimum solution to maximizing habitat quality
and quantity (i.e., the solution maximized K rather than K’).
Additional issues not considered in this forest modeling exercise because of scope limitations
include:
• Operational-level definitions of the silviculture options available for each scenario.
• Basic operational constraints, such as realistic staffing and activity levels given current
agency resources.
• The potential for weather patterns, physiography, and the pattern of forest cover to influence
the risk for windthrow and consequent effects on development of marbled murrelet habitat.
• Legal mandates that regulate the amount of harvest over time.
• The effect of silvicultural activities designed to create and/or enhance habitat beyond the
term of the HCP.
• Any negative impacts to the marbled murrelet (these will be examined in the environmental
impact statement and implementation document).
Modeling assumptions for the SWWA, OESF, and Straits Analysis Units are presented in
Appendix C.
4.16 Management Scenario Analysis Results
Results of both the No Management simulation and the Habitat Management scenario provided
spatially explicit (i.e., mappable) predictions of forest cover in the MMMAs at three points in the
future: 2013, 2031, and 2067. The predictive maps and associated tabular data provided the basis
for the results presented in chapter 5.0, using the methods and assumptions described in section I
of this chapter. A comprehensive summary of the results from the management scenario analysis
can be found in Appendix G.

September 2008 Page 5-1
5.0 HABITAT ASSESSMENT RESULTS: PROJECTIONS OF MARBLED MURRELET HABITAT AND POTENTIAL POPULATION RESPONSE RESULTING FROM THE SCIENCE TEAM’S
CONSERVATION RECOMMENDATIONS
This chapter presents and discusses results from analyses of the current and projected future
quantity and quality of marbled murrelet habitat and the potential for this habitat to contribute to
the objective from the Washington State Department of Natural Resources (DNR) for marbled
murrelet conservation in the Southwest Washington (SWWA), Olympic Experimental State
Forest (OESF), and Straits Analysis Units. That objective, broadly stated, is “[to] make a
significant contribution to maintaining and protecting marbled murrelet populations in western
Washington over the life of the HCP [Habitat Conservation Plan]” (DNR 1997a, p. IV.44). The
Science Team translated this objective into biological goals for DNR, which are to manage forest
habitat to contribute to:
• A stable or increasing population;
• An increasing geographic distribution; and thus
• A population that is resilient to disturbances.
The analyses presented are intended 1) to provide objective, repeatable, quantitative comparisons
of current and projected future forest habitat for marbled murrelets on DNR-managed lands and
on other land ownerships; and 2) to estimate potential marbled murrelet population responses to
current and projected future habitat under the Science Team’s proposed approach using an index
of the capability of forest habitat to support marbled murrelets (K’). K’ is scaled to approximate
DNR’s current understanding of marbled murrelet population responses to forest habitat. Results
from the K’ analyses are presented in “marbled murrelet units” (see section 4.4); however, those
values should not be viewed as explicit predictions of current or future marbled murrelet
population numbers. Rather, K’ provides an objective, repeatable index that can be used to judge
relative conservation values of future projected marbled murrelet habitat on DNR-managed and
other lands across the area of analysis. This exercise may be used by DNR in the future to
evaluate revisions to this approach or any alternative recommendations for the Marbled Murrelet
Long-Term Conservation Strategy (LTCS).

5.1 Comparison of Current and Future Habitat and Potential for Population Support
September 2008 Page 5-2
Results of these analyses are presented for the three analysis units (Southwest Washington
[SWWA], the Olympic Experimental State Forest [OESF], and Straits; see Figure 3-1) and have
been organized into five sections.
1. An examination of the broader role of DNR’s conservation strategy, comparing marbled
murrelet habitat among analysis units and among major landowners within analysis units,
and of how the Science Team’s conservation approach addresses distribution and population
objectives. Result: DNR plays a large role with an especially significant impact in SWWA.
2. A description and discussion of the rate at which habitat develops (the discussion focuses
primarily on DNR-managed lands). Result: habitat develops over time with more habitat
capability in higher quality habitat.
3. A comparison of the No Management and Habitat Management scenarios applied to the
Science Team’s recommended Marbled Murrelet Management Areas (MMMAs), and the
outcome of these scenarios for all DNR-managed lands within each analysis unit. Result:
high-quality habitat develops faster through the Habitat Management scenario.
4. A comparison of marbled murrelet habitat on DNR-managed lands within and outside
MMMAs. Result: higher quality habitat develops faster inside MMMAs, especially in
SWWA.
5. A summary and brief discussion of these results with thoughts on future directions.
Appendix G provides a complete summary of the analysis outputs in acres and habitat capability
(K’) by analysis unit, year, landowner, MMMA or non-MMMA, forest stage, closer than or
farther than 40 miles (64 kilometers) from marbled murrelet-dense marine waters, and forest
edge or interior. Tables in Appendix G are the source of the summarized information in this
chapter.
5.1 Comparison of Current and Projected Future Marbled Murrelet Habitat and Its Potential for Population Support among Analysis Units and of DNR’s Relative Role within Analysis Units
The quality and quantity of current and projected future marbled murrelet habitat differs
markedly among the analysis units. Currently, habitat is most abundant in the OESF, followed by
the Straits and then the SWWA Analysis Unit (Figure 5-1A; see section 4.4 for projected habitat
calculation). However, since habitat is of higher quality in the largely native forests on federal
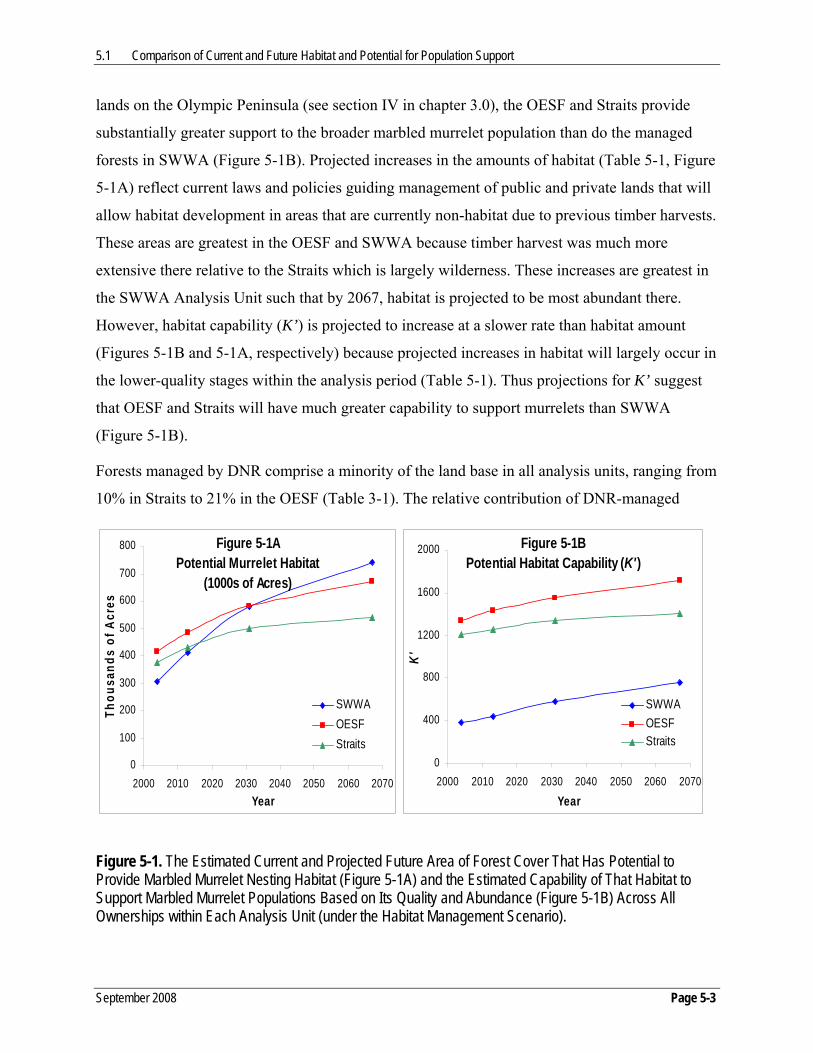
5.1 Comparison of Current and Future Habitat and Potential for Population Support
September 2008 Page 5-3
lands on the Olympic Peninsula (see section IV in chapter 3.0), the OESF and Straits provide
substantially greater support to the broader marbled murrelet population than do the managed
forests in SWWA (Figure 5-1B). Projected increases in the amounts of habitat (Table 5-1, Figure
5-1A) reflect current laws and policies guiding management of public and private lands that will
allow habitat development in areas that are currently non-habitat due to previous timber harvests.
These areas are greatest in the OESF and SWWA because timber harvest was much more
extensive there relative to the Straits which is largely wilderness. These increases are greatest in
the SWWA Analysis Unit such that by 2067, habitat is projected to be most abundant there.
However, habitat capability (K’) is projected to increase at a slower rate than habitat amount
(Figures 5-1B and 5-1A, respectively) because projected increases in habitat will largely occur in
the lower-quality stages within the analysis period (Table 5-1). Thus projections for K’ suggest
that OESF and Straits will have much greater capability to support murrelets than SWWA
(Figure 5-1B).
Forests managed by DNR comprise a minority of the land base in all analysis units, ranging from
10% in Straits to 21% in the OESF (Table 3-1). The relative contribution of DNR-managed
Figure 5-1APotential Murrelet Habitat
(1000s of Acres)
0
100
200
300
400
500
600
700
800
2000 2010 2020 2030 2040 2050 2060 2070Year
Thou
sand
s of
Acr
es
SWWAOESFStraits
Figure 5-1BPotential Habitat Capability (K')
0
400
800
1200
1600
2000
2000 2010 2020 2030 2040 2050 2060 2070
Year
K'
SWWAOESFStraits
Figure 5-1. The Estimated Current and Projected Future Area of Forest Cover That Has Potential to Provide Marbled Murrelet Nesting Habitat (Figure 5-1A) and the Estimated Capability of That Habitat to Support Marbled Murrelet Populations Based on Its Quality and Abundance (Figure 5-1B) Across All Ownerships within Each Analysis Unit (under the Habitat Management Scenario).

5.1 Comparison of Current and Future Habitat and Potential for Population Support
September 2008 Page 5-4
0
400
800
1200
1600
2000
2004 2013 2031 2067 2004 2013 2031 2067 2004 2013 2031 2067
SWWA Straits OESF
Year and Analysis Unit
Pote
ntia
l Hab
itat C
apab
ility
( K')
DNRFederalOther
0%
13%
87%
10%
60%
30%
40%
21% 39%
Land Ownership
Land OwnershipLand Ownership
Figure 5-2. The Current and Projected Future Capability of Forests Managed by DNR, Federal Agencies, and Other Landowners to Support Marbled Murrelet Populations (K’) and Pattern of Land Ownership (Expressed as a Percentage of Total Landscape) in the SWWA, Straits, and OESF Analysis Units (under the Habitat Management Scenario).
forests to support local marbled murrelet populations depends on patterns of land ownership and
land use within each analysis unit (Figure 5-2). In SWWA, where nearly all public forestlands
occur on the 13% of the land base managed by DNR (Table 3-1, Figure 5-2), almost 40% of the
current habitat capability is on DNR-managed lands (Figure 5-2). DNR-managed forests make
such a significant contribution to K’ because the abundance and quality of habitat on DNR-
managed lands is relatively greater, particularly than that of other landowners (Table 5-1). This
trend also holds for projected future forests. This abundance and quality of potential habitat can
be seen when viewed as averaged over area by ownership (Figure 5-3). When averaged on a per-
1000 acre (405 hectare) basis, DNR-managed forests provide substantially more potential habitat
capability than other landowners, with federal lands providing the most projected benefit on a
per-area basis, particularly in the OESF Analysis Unit. The Olympic Peninsula is dominated by

5.1 Comparison of Current and Future Habitat and Potential for Population Support
September 2008 Page 5-5
0.0
0.5
1.0
1.5
2.0
2.5
2004 2013 2031 2067 2004 2013 2031 2067 2004 2013 2031 2067
SWWA Straits OESFYear and Analysis Unit
Pote
ntia
l Hab
itat C
apab
ility
per
Tho
usan
d A
cres
( K'/
1000
Acr
es) Other
FederalDNR
Figure 5-3. The Relative Current and Projected Future Capability of Forests Managed by DNR, Federal Agencies, and Other Landowners to Support Marbled Murrelet Populations (Averaged over the Area of that Ownership, or K’/1000 Acres [405 Hectares]) in the SWWA, Straits, and OESF Analysis Units (under the Habitat Management Scenario).
public forestlands, with the federally managed Olympic National Park and Olympic National
Forest comprising half the land base (Table 3-1). Those federal lands provide the majority of
support for marbled murrelet populations in the Straits and the OESF (Figure 5-2, Table 5-1).
Under the Science Team’s conservation approach, marbled murrelet habitat and its estimated
capability to support marbled murrelet populations is projected to increase in all analysis units,
assuming marbled murrelets move into and successfully nest in newly created habitat. Those
projections, illustrated in Figures 5-1, 5-2 and 5-3, are based on the Habitat Management
scenario for MMMAs on DNR-managed land. At the scale of these analyses, differences
between the No Management and Habitat Management scenarios are not discernable and
therefore were not shown graphically (see Appendix G). The relative difference in these
increases is greatest in SWWA, where K’ is projected to nearly double by 2067 (Table 5-2),

5.1 Comparison of Current and Future Habitat and Potential for Population Support
September 2008 Page 5-6
Table 5-1. Current and Projected Future Acreage of Forests Managed by DNR, Federal Agencies, and Other Landowners That Could Provide Habitat to Support Marbled Murrelet Populations in the SWWA, Straits, and OESF Analysis Units (under the Habitat Management Scenario; See Appendix B for a Description of Stand Development Stages). Numbers Represent Thousands of Acres.
SWWA Straits OESF
2004 2013 2031 2067 2004 2013 2031 2067 2004 2013 2031 2067 Landowner Cover Type Thousands of Acres
Large Tree Exclusion 51.1 38.7 28.5 25.8 8.5 7.7 5.2 5.9 8.2 8.4 7.5 37.2
Understory Development 43.7 41.4 43.0 45.5 21.3 18.2 13.5 21.0 10.2 10.0 10.2 18.7
Botanically Diverse 29.5 25.2 31.6 30.2 21.6 17.0 17.5 16.6 20.5 18.9 19.3 23.6
Niche Diversification 0.9 3.4 19.4 33.5 0.2 1.5 8.8 2.4 26.9 23.7 31.0 32.9
DNR-Managed Lands
Fully Functional 0.1 0.2 0.4 22.0 0.0 0.0 0.0 7.5 5.6 14.1 17.7 30.6
Existing Late-Seral 0.5 0.5 0.5 0.5 286.2 286.2 286.2 286.2 282.6 282.6 282.6 282.6
Federal Lands Projected Late-Seral - 0.4 0.9 1.0 - 55.3 106.1 125.9 - 43.6 83.9 98.3
Existing Late-Seral 179.5 179.5 179.5 179.5 38.0 38.0 38.0 38.0 59.5 59.5 59.5 59.5 Other
Landowners Projected Late-Seral - 121.8 270.8 400.1 - 4.0 23.2 34.6 - 23.7 69.5 88.1

5.1 Comparison of Current and Future Habitat and Potential for Population Support
September 2008 Page 5-7
Table 5-2. The Current (2004) and Projected Future (2013, 2031, and 2067) Capability of Forests Managed by DNR, Federal Agencies, and Other Landowners to Support Marbled Murrelet Populations (K’) in the SWWA, Straits, and OESF Analysis Units (under the Habitat Management Scenario). (Note: Overall K’ is High for Other Land Ownerships Due to the Substantial Number of Acres of Land in this Category [See Table 3-1].)
Potential Habitat Capability (K’)
SWWA Straits OESF Land Ownership 2004 2013 2031 2067 2004 2013 2031 2067 2004 2013 2031 2067
DNR 151 128 195 308 111 92 107 135 207 236 282 414
Federal1 2 2 3 3 1,033 1,097 1,163 1,186 1,035 1,085 1,137 1,154
Other 233 306 385 444 56 59 70 76 92 107 135 146
Total 386 437 582 754 1,200 1,248 1,340 1,397 1,335 1,428 1,555 1,714 1 Includes lands managed by National Park Service or U.S. Forest Service. Lands managed by other federal agencies are not included.
of the combined effects of new management practices on private forestlands (i.e., Forest and Fish
Rules [Washington State Forest Practices Board 2002], which mandate managing streamside
forests for future conditions that could potentially provide some capability as marbled murrelet
habitat), management of state forests under current DNR policies, and the Science Team’s
recommended approach for marbled murrelet conservation. The increase and the strengthening
of habitat capability on DNR-managed forests indicate that the Science Team’s recommended
approach contributes to an increased geographic distribution of marbled murrelet habitat and
presumably of their population as well.
Projected habitat quality is influenced mostly by stand structure, however, edge effects were also
assumed to be detrimental. Habitat near edges currently provides the greatest contribution to K’
in SWWA (33%) relative to Olympic Peninsula areas, where edge habitat contributes about one-
fourth the projected habitat capability, with 21% and 26% for the OESF and Straits, respectively.
Interior habitat (non-edge) is projected to increase in abundance in all areas by 73% (SWWA),
61% (OESF), and 52% (Straits), with associated projected increases in K’ from interior forests.
In concert with all projected changes across the landscape, a slight decrease in the proportional
abundance of edge habitat is projected on the Olympic Peninsula, so that by 2067, interior
habitat will increase to provide 80% and 77% of K’ in the OESF and Straits, respectively, and

5.2 Projected Rate of Habitat Development on DNR-Managed Lands
September 2008 Page 5-8
61% in SWWA. Edge habitat is projected to provide a greater proportion of K’ in SWWA by
2067, with 39% of the substantially greater habitat capability resulting largely from the increased
abundance of high-edge habitat projected to develop in riparian forests. A complete summary of
results discussed above can be found in the G-1 tables in Appendix G.
5.2 Projected Rate of Habitat Development on DNR-Managed Lands The increase in habitat capability projected on DNR-managed lands in all three analysis units
was relative to each unit’s habitat abundance and land management objectives in concert with
those of other landowners (Figure 5-3). Section 5.3 compares the projected outcomes of No
Management and Habitat Management. Projected effects of Habitat Management are illustrated
in Figure 5-4, showing the trend of increasing overall habitat capability, as well as the increasing
abundance (see Table 5-1) and role in population support provided by presumed higher quality
habitat.
The initial negative trends in K’ for SWWA and the Straits (Figure 5-3) are the outcomes
projected from timber harvests in areas not proposed to be designated to contribute to
conservation, and would be managed according to DNR’s broader policies under the Policy for
Sustainable Forests (DNR 2006b) and the HCP (DNR 1997a). Although some potential marbled
murrelet habitat is also projected to be harvested in the OESF under this approach, the context of
DNR-managed lands and objectives specific to the OESF are such that habitat development was
projected to be the dominant process over all time steps reported from the analyses (Figure 5-4).
By 2067, K’ on DNR-managed lands is projected to double in SWWA and the OESF, and
increase by 22% in the Straits (Table 5-2). Most of those increases are projected to occur as the
amount and quality of marbled murrelet habitat improves in response to management practices
(Figure 5-4) both within MMMAs and elsewhere. A complete summary of results discussed
above can be found in the G-1 tables in Appendix G.

5.2 Projected Rate of Habitat Development on DNR-Managed Lands
September 2008 Page 5-9
0
50
100
150
200
250
300
350
400
450
2004 2013 2031 2067 2004 2013 2031 2067 2004 2013 2031 2067
SWWA Straits OESF
Year and Analysis Unit
Pote
ntia
l Hab
itat C
apab
ility
( K')
Large Tree ExclusionUnderstory DevelopmentBotanically DiverseNiche DiversificationFully Functional
Figure 5-4. The Current and Projected Future Capability of DNR-Managed Forests, Classified by Stand Development Stage (Brodie et al. 2004), to Support Marbled Murrelet Populations (K’) in the SWWA, Straits, and OESF Analysis Units (under the Habitat Management Scenario).
Management in MMMAs and otherwise on DNR-managed lands was projected to result in long-
term increases in the overall habitat capability of interior forest habitat, especially in SWWA and
the OESF, because of the focus on marbled murrelet conservation and other conservation
objectives in these analysis units (Figure 5-5A). The proportion of habitat capability occurring in
this potentially more secure landscape context (i.e., interior forest) remained fairly constant over
time (Figure 5-5B). The temporary decreases in interior habitat due to increased edge in the
Straits and SWWA are the projected outcome of timber harvests in areas not recommended to be
designated for conservation emphasis as noted in the previous paragraph.

5.2 Projected Rate of Habitat Development on DNR-Managed Lands
September 2008 Page 5-10
0
50
100
150
200
250
300
350
400
2000 2010 2020 2030 2040 2050 2060 2070
Year
K'
OESFSWWAStraits
Figure 5-5APotential Habitat Capability (K' ) of Interior Forest (> 164 ft from an edge)
0.00
0.20
0.40
0.60
0.80
1.00
2000 2010 2020 2030 2040 2050 2060 2070
Year
Prop
ortio
n
OESFSWWAStraits
Figure 5-5BProportion of Potential Habitat Capability (K' )
in Interior Forest (>164 ft from an edge)
Figure 5-5. The Current and Projected Future Capability of DNR-Managed Interior Forest Habitat (More than 164 Feet [50 Meters] from Edges) to Support Marbled Murrelet Populations (K’) in the SWWA, Straits, and OESF Analysis Units (under the Habitat Management Scenario) (Figure 5-5A). The Proportion of Total K’ Provided by DNR-Managed Interior Forest Habitat in the SWWA, Straits, and OESF Analysis Units (under the Habitat Management Scenario) (Figure 5-5B).

5.3 A Comparison of the No Management and Habitat Management Scenarios
September 2008 Page 5-11
5.3 A Comparison of the No Management and Habitat Management Scenarios Both the No Management and Habitat Management scenarios reflect the habitat objectives and
geography of the Science Team’s recommended approach to long-term marbled murrelet
conservation. They differed only in their simulated management approaches, one portraying a
passive and the other an active application of silviculture within the MMMAs designated in
SWWA and the OESF. Projected management and its outcomes did not differ between those
scenarios across the remainder of DNR-managed lands in those analysis units. That is, 66,000 of
324,000 acres (27,000 of 131,000 hectares) in SWWA and 50,000 of 271,000 acres (20,000 of
110,000 hectares) in the OESF were designated as MMMAs. These lands were the basis for the
comparisons reported here against the background of implementing DNR policies and mandates
over the rest of DNR-managed forests in those analysis units.
Projections of the scenarios demonstrated very little difference in their probable outcomes for
marbled murrelet populations (Figure 5-6). The most pronounced difference is for SWWA in
0
50
100
150
200
250
300
350
400
450
o
2004 2013 2031 2067 2004 2013 2031 2067
SWWA OESF
Year and Analysis Unit
Pote
ntia
l Hab
itat C
apab
ility
( K')
Large Tree ExclusionUnderstory DevelopmentBotanically DiverseNiche DiversificationFully Functional
No ManagementHabitat Management
Figure 5-6. The Current and Projected Future Capability of DNR-Managed Forests to Support Marbled Murrelet Populations (K’) in the SWWA and OESF Analysis Units for the No Management and Habitat Management Scenarios.

5.4 A Comparison of Habitat on DNR-Managed Lands within and outside of Marbled Murrelet Management Areas
September 2008 Page 5-12
2067, when K’ is projected to be 308 under Habitat Management compared to 275 under No
Management. Within the MMMAs, the differences between No Management and Habitat
Management were more pronounced. Projections for K’ in 2067 were 130 and 158 respectively,
or 22% greater with Habitat Management. In the OESF, the No Management scenario projected
a slightly greater K’ in 2067, 422 versus 414 for Habitat Management. This is a confounding
projected outcome, and seems unlikely in view of management applied specifically for the
purpose of accelerated habitat development under the Habitat Management scenario, and habitat
gains projected in SWWA. This phenomenon requires further investigation to explore the causes
of this result in order to inform future modeling efforts. Habitat Management projected
somewhat greater edge effects than No Management, with 80% versus 81% of K’ from interior
habitat in SWWA, and 86% versus 90% in the OESF. A complete summary of results discussed
above can be found in the G-1 and G-2 tables in Appendix G.
5.4 A Comparison of Marbled Murrelet Habitat on DNR-Managed Lands within and outside Marbled Murrelet Management Areas The role of MMMAs in supporting marbled murrelet populations is a function of the amount and
quality of habitat existing or projected to exist within them. Their relative roles within the
SWWA and OESF Analysis Units differ because the Science Team proposes designation of a
larger percentage of the existing habitat in SWWA as MMMAs. The development of high-
quality nesting habitat throughout entire MMMAs was designated as the primary objective for
66,000 acres (27,000 hectares) in SWWA (20% of the total DNR-managed land area). In OESF,
50,000 acres (20,000 hectares) (18% of the total DNR-managed land area) were designated as
MMMAs with the primary objective being the development of high-quality nesting habitat in at
least half of the area included in the designation (resulting in approximately 25,000 acres [10,000
hectares] or 9% of the OESF managed for high-quality nesting habitat). Currently, both SWWA
and OESF areas designated as MMMAs provide a small portion of the habitat’s total capability
on DNR-managed lands: 17% and 18%, respectively (Figure 5-7). Active silviculture (as
exemplified by the Habitat Management scenario) to achieve the Science Team’s objectives for
these areas is projected to increase their capability to support marbled murrelets, such that by
2067, MMMAs in SWWA are projected to provide 51% of K’ (which will have more than
doubled since 2004) for DNR-managed lands in SWWA (Figure 5-7). In the OESF, habitat

5.4 A Comparison of Habitat on DNR-Managed Lands within and outside of Marbled Murrelet Management Areas
September 2008 Page 5-13
0
50
100
150
200
250
300
350
400
450
2004 2013 2031 2067 2004 2013 2031 2067
SWWA OESF
Year and Analysis Unit
Pote
ntia
l Hab
itat C
apab
ility
( K')
not MMMA
MMMA
Figure 5-7. The Current and Projected Future Capability of DNR-Managed Forests to Support Marbled Murrelet Populations (K’) within and outside MMMAs in the SWWA and OESF Analysis Units (under the Habitat Management Scenario).
capability in the MMMAs is projected to increase nearly threefold by 2067 (37 to 98),
comprising 24% of the overall K’ on DNR-managed lands within the analysis unit (Figure 5-7).
The focus on retaining and/or developing high-quality marbled murrelet habitat within MMMAs
was projected to increase habitat quality and increase habitat abundance, which led to the
substantial increases in the projected values of K’ between 2004 and 2067. In SWWA, the
proportion of K’ provided by higher quality habitat, including Botanically Diverse, Niche
Diversification and Fully Functional stand development stages (SDS) (see Appendix B for
definitions), was 42% in MMMAs and 33% on other DNR-managed lands in 2004 (Figure 5-8).
Projected increases in habitat quality and abundance resulted in the majority of K’ being
provided by those higher quality stages by 2067, particularly in the MMMAs where 91% of the
habitat capability was projected to be found in higher quality habitat. Overall management
objectives in the OESF were more similar within and outside MMMAs, thus the striking changes

5.4 A Comparison of Habitat on DNR-Managed Lands within and outside of Marbled Murrelet Management Areas
September 2008 Page 5-14
projected for SWWA were not seen there. Habitat development was projected to increase the
abundance of habitat in MMMAs, but the higher quality habitat provided similar proportions of
K’ in 2004 (86%) and 2067 (89%) (Figure 5-8). Edge effects were integrated with the influence
of stand structure (SDS categories) in estimating future habitat capability, however the effects of
management to intentionally reduce edge effects in MMMAs was evident in the projected
increases in K’ provided from interior forests. In SWWA, K’ of interior forests in MMMAs
increased 618% compared to its 2004 level, while it remained unchanged on state forests outside
those areas. In the OESF MMMAs, K’ of interior forests increased by 148% compared to an
increase of 81% on other DNR-managed forests in the area. A complete summary of results
discussed above can be found in the G-1 tables in Appendix G.
0
50
100
150
200
250
300
350
2004 2013 2031 2067 2004 2013 2031 2067 2004 2013 2031 2067 2004 2013 2031 2067
Not in MMMA MMMA Not in MMMA MMMA
SWWA OESF
Year and Analysis Unit
Pote
ntia
l Hab
itat C
apab
ility
( K')
Large Tree Exclusion
Understory Development
Botanically Diverse
Niche Diversification
Fully Functional
Figure 5-8. The Current and Projected Future Capability of DNR-Managed Forests, Classified by Stand Development Stage (Brodie et al. 2004, Appendix B), to Support Marbled Murrelet Populations (K’) within and outside MMMAs in the SWWA and OESF Analysis Units (under the Habitat Management Scenario).

5.5 Summary and Discussion
September 2008 Page 5-15
5.5 Summary and Discussion Chapter 4.0 provides a discussion of the hypotheses and assumptions that are the basis for the
analyses reported here. A brief review of those hypotheses and assumptions, as well as the
uncertainty around them can help the reader interpret the results of those analyses from both a
quantitative and qualitative perspective. Additionally, a sensitivity analysis was conducted on the
potential habitat capability (K’) model, describing how the uncertainty in estimation or
classification of the factors listed below may contribute to habitat capability (Appendix H).
Below is a summary of how knowledge and hypotheses regarding marbled murrelet biology and
forest ecology were translated into specific assumptions concerning how forest habitat supports
marbled murrelet populations and how forest succession, with and without active silvicultural
intervention, influences the development of marbled murrelet habitat.
1. Habitat area—The assumption that 170 acres (69 hectares) of suitable forest habitat
provides sufficient opportunities to support one nesting marbled murrelet is substantiated by
inland studies using radar to estimate marbled murrelet numbers and radiotelemetry to assess
inland behavior (Burger 2002, Raphael et al. 2002a, Peery et al. 2004, Bloxton and Raphael
2007), as well as by estimates of marbled murrelet numbers on adjacent marine foraging
areas (Miller et al. 2006). However, it is likely there is a fine-grained variability in this
relationship that is overlooked by the simple assumption used in these analyses.
2. Stand characteristics—The abundance of potential nesting platforms and the presence of
complex canopy structure are well known as essential elements of marbled murrelet nesting
habitat (Grenier and Nelson 1995, Hamer and Nelson 1995). The assumed relationship of
habitat value with stand structure and composition as within Table 4-4 was derived from
empirical studies of marbled murrelet behavior in DNR-managed stands (Prenzlow Escene
1999), but the generalization that used SDS categories as surrogates for those structural
elements has not been validated with field studies. It is likely that Table 4-4 depicts general
trends in potential habitat value (Prenzlow Escene et al. 2006), but the precise numerical
estimates should be considered as working hypotheses. Additionally, recent studies have
located marbled murrelet nests in what appear to be unsuitable land cover categories (Hamer
and Nelson 1995, Bradley and Cooke 2001, M. Raphael pers. comm.), though these nests
were generally in old forests, rather than heavily managed forest landscapes. These
discoveries probably reflect the inability of coarse-grained, i.e., stand-level, classifications to

5.5 Summary and Discussion
September 2008 Page 5-16
identify the specific, rare structural elements used as nest substrates by those birds (McShane
et al. 2004).
3. Forest succession—The dynamics of succession in forest stands, with and without
silvicultural intervention, have been well studied (Shugart 2003). Forest growth models can
be sufficiently predictive (Vanclay and Skovsgaard 1997); therefore, they are widely used for
effectively developing and implementing plans to manage forest properties for multiple
objectives (Guisan and Zimmermann 2000). Projections for DNR-managed stands were
based on data from high-resolution inventories of the forests (DNR Forest Resource
Inventory System [FRIS]) and well-supported forest growth models (DNR 2004b). However,
as the predictions from those models become increasingly specific (i.e., for individual stands
as opposed to averages taken across multiple stands), they can become increasingly uncertain
(Heuvelink 1998).
4. Edge effects—Negative edge effects have been observed at marbled murrelet nests, and the
rates of high and low nest success used to model edge effects were developed from field
studies (Manley and Nelson 1999, Nelson and Hamer 1995b). However, research on actual
and simulated marbled murrelet nests demonstrates that edge effects are probably the result
of several complex, interacting phenomena that are not adequately represented by the simple
model employed in these analyses (Nelson and Hamer 1995b, Raphael et al. 2002b).
Projections of the amounts of edge are fairly robust because they are based on the current
landscape data on other ownerships (Interagency Vegetation Mapping Project) and
projections of growth and harvest on DNR-managed lands (DNR 2004a), but there is
substantial uncertainty as to the generality of the model that predicts their suitability as
habitat. Some of this uncertainty may be resolved by ongoing and future research (see
chapter 6.0).
5. Distance from marine foraging areas—Research on marbled murrelet behavior suggests
there is a threshold distance between nesting and foraging areas beyond which the value of
nesting habitat is markedly diminished (Hull et al. 2001). However, the assumption used in
these analyses is merely an “educated guess” that reasonably conforms to observed patterns.
It remains to be refined by ongoing research.

5.5 Summary and Discussion
September 2008 Page 5-17
Thus, results of these analyses are best considered broadly. Smaller differences (e.g., on the
order of 10%) are probably more meaningful when they are based on analyses across large areas,
such as entire analysis units. Likewise, differences of that order in current or projected future
conditions are likely to be less meaningful when measured across smaller analysis areas (e.g.,
individual SDS categories within MMMAs). Although there is uncertainty in the modeling
assumptions, the fact that they were applied equally in the analyses allows the results to be
directly compared. The best use of these results may be as relative comparisons:
• What are the relative roles of the analysis units and the landowners within them in regional
marbled murrelet conservation?
• What broad trends are expected in marbled murrelet habitat within each analysis unit?
• Will DNR policies and the Science Team’s recommendations meet their goals for marbled
murrelet conservation?
• Is active silvicultural intervention an appropriate tactic for achieving marbled murrelet
conservation goals?
• Are MMMAs an appropriate strategy for achieving marbled murrelet conservation goals?
The presentations of results earlier in this chapter were made with these types of comparisons in
mind, although the text, tables, and figures allow the reader to evaluate projections at finer
scales, if so desired. Table 5-3 summarizes current and projected future conditions relative to the
Science Team’s biological goals for marbled murrelet conservation on DNR-managed lands. In
short, DNR’s broader policies, in concert with the specific approach to marbled murrelet
conservation suggested by the Science Team and current policies of federal and other
landowners, will result in improved inland habitat conditions, which are likely to support those
biological goals. However, the portion of the marbled murrelet population nesting in SWWA
will likely remain less secure than that portion using the Olympic Peninsula because of the lack
of habitat on federal lands in SWWA.
The Science Team’s conservation emphasis in SWWA is an effort to meet their translation of
biological goals for the marbled murrelet (page 5-1). The geography and extent of DNR-
managed lands as well as the relatively few acres of federally managed forests limit those efforts.
Even with those limitations, the strategy was projected to make substantial progress toward those
goals, with DNR-managed lands providing a disproportionately large share (41%) of future

5.5 Summary and Discussion
September 2008 Page 5-18
Table 5-3. Summary of the Current and Projected Future Condition of Marbled Murrelet Habitat in the SWWA, OESF, and Straits Analysis Units Relative to the Science Team’s Biological Goals for Marbled Murrelet Conservation. This Summary Includes State, Federal, and Non-Federal Lands.
SWWA OESF Straits 2004 2067 2004 2067 2004 2067
Population Size (Measured by Habitat Capability)
Small (K’≈ 386)
Moderate (95% increase)
Large (K’≈ 1,335)
Large (28% increase)
Large (K’≈ 1,200)
Large (16% increase)
Population Stability
Much habitat in high-edge situation, potential threat to stability
73% increase in K' from interior habitat but still high proportion of edge
Much habitat in interior forests, potentially supporting more stable population
61% increase in K' from interior habitat, improved potential for stable population
Much habitat in interior forests, potentially supporting more stable population
52% increase in K' from interior habitat, improved potential for stable population
Distribution SWWA is a gap in broad distribution of habitat, few habitat concentrations within SWWA
Improved habitat distribution within SWWA and for rangewide population
Good, but ecological gap in distribution, little habitat in low elevation forest communities
Improved ecological distribution, K' increased 166% in MMMAs
Good Good
Resilience Probably low Improved but less than Olympic Peninsula areas
Probably fairly high
Further improved
Probably fairly high
Further improved
habitat capability because of increased amounts and quality of habitat on state forests. About half
of the future habitat capability on those DNR-managed lands will occur in the 20% of state
forests designated as MMMAs. Forest growth modeling suggested that appropriate active
management does not appear to affect the future development of habitat and may improve its
effectiveness.
In the OESF and the Straits Analysis Units, the Science Team suggests relatively lower levels of
focal management for marbled murrelet conservation because of the context of DNR-managed
lands in a landscape dominated by federal forest reserves, and because the existing OESF
northern spotted owl conservation strategy greatly supports marbled murrelet habitat.
Considering DNR-managed lands as a whole, the Straits and OESF Analysis Units contribute to
the broader trend of projected improvement in habitat capability. This is particularly true in the
5.5 Summary and Discussion
September 2008 Page 5-19
OESF, where high-quality marbled murrelet habitat is a relatively larger proportion of the DNR-
managed land base and where intentional management for marbled murrelet habitat restoration is
part of the Science Team’s recommended conservation approach. MMMAs in the OESF were
likely to achieve the designated objective of increasing habitat capability in low elevation forest
communities. The total habitat capability in MMMAs was projected to increase by 166% (Table
5-3) from active silviculture that included management for multiple objectives.
The management scenario analysis results indicate that there are a variety of ways to achieve
equivalent levels of marbled murrelet habitat conservation. Each scenario has its own set of
unique hypotheses and assumptions. Thoughtful evaluation of the most biologically relevant
hypotheses and a minimal set of necessary assumptions required to enact the selected
conservation strategy will ensure its success.

5.5 Summary and Discussion
September 2008 Page 5-20
This page intentionally left blank.
September 2008 Page 6-1
6.0 CONCEPTS IN ADAPTIVE MANAGEMENT
6.1 Introduction
This chapter presents the foundations of an adaptive management plan that could be
developed and applied once a Marbled Murrelet Long-Term Conservation Strategy
(LTCS) is adopted. Adaptive management will allow the Department of Natural
Resources (DNR) to monitor and adjust management practices in response to changing
circumstances or improved knowledge in order to better achieve marbled murrelet
conservation. This chapter frames potential topics for adaptive management, and outlines
several questions central to marbled murrelet conservation in managed forests. Future
policies, budgets, status of the species, and the composition of the adopted LTCS will
influence the eventual application of these adaptive management strategies.
The broadly accepted definition of “adaptive management” used by natural resources
sciences is “…the systematic acquisition and application of reliable information to
improve natural resources management over time” (Wilhere 2002, p. 20). This definition
is similar to that for Habitat Conservation Plans (HCP) which is described as “…a
method for examining alternative strategies for meeting measurable biological goals and
objectives, and ... adjusting future conservation management actions according to what is
learned” (USFWS and NMFS 2000, p. 35245). Although the U.S. Fish and Wildlife
Service (USFWS) and the National Marine Fisheries Service (NMFS) (together referred
to as the Services) meant to define adaptive management broadly, in order to allow a
variety of approaches to satisfy the ESA provisions, they too require a systematic
approach and reliable information to incorporate adaptive management into HCPs. Thus,
a brief review of the scientific principles of adaptive management and the Services’
standard for its application to HCPs is appropriate.
Passive and active adaptive management were originally described as two approaches to
finding solutions to ecological optimization problems (Walters and Hilborn 1978). Both
are scientifically-rigorous approaches that:
1. Predict the behavior of ecological systems in response to management actions
2. Measure selected attributes of the managed systems

6.1 Introduction
September 2008 Page 6-2
3. Evaluate performance of those attributes relative to desired outcomes, then revise
predictions and management approaches appropriately
4. Reiterate the process to approach “optimal” solutions
At step three, the two approaches differ in the degree of rigor applied to inference that
guides decision-making. Active adaptive management employs the principles of
experimental design and statistical inference, while the passive approach does not. Those
principles include replication and randomization of contrasting treatments, including
controls, to establish cause-and-effect relationships between management actions and
outcomes (Ford 2000). Thus, adaptive management programs begin with explicit
objectives for management and a scientific model (i.e., a description of how nature works
[Hilborn and Mangel 1997]) that guides management and includes explicit statements
about predicted outcomes and sources of uncertainty that affect them. In active programs,
management is implemented as designed experiments to test hypotheses about key
uncertainties, with results from those experiments used to revise future management as
well as the guiding model. Passive programs are implemented as though the model were
correct, while expecting that monitoring will help resolve uncertainties and allow revision
of the model and subsequent management. In general, implementation of active programs
requires a greater commitment of human and financial resources relative to passive
adaptive management.
The Services established a standard for adaptive management in HCP implementation
allowing both active and passive approaches (USFWS and NMFS 2000). They defined
essential characteristics of adaptive management in HCP implementation as:
1. Explicit biological goals and objectives to clarify the purpose and direction of the
HCP
2. Identification of the parameters that potentially affect that goal (i.e., models that
describe mechanistic relationships between management actions and biological
goals)
3. Identification of key uncertainties in the model
4. Experimental strategies that address those uncertainties

6.2 Characteristics of DNR’s Marbled Murrelet Long-Term Conservation Strategy
September 2008 Page 6-3
5. A monitoring design that adequately detects strategy results
6. A defined feedback process ensuring effective changes in management
Biological goals and objectives can be either species- or habitat-based. Species-based
goals are expressed in population terms while habitat-based goals express desired habitat
amount and quality. The USFWS and NMFS allow a range of adaptive management
approaches; from feedback exclusively based on HCP monitoring to integration of an
HCP with a broad range of agency and academic research and monitoring.
6.2 Characteristics of DNR’s Marbled Murrelet Long-Term Conservation Strategy
Threats to the viability of marbled murrelet populations likely result from their
interactions with both the marine and terrestrial environment. DNR’s LTCS is based on
hypothesized mechanistic links between forest management and marbled murrelet
ecology and, ultimately, demography. There are important uncertainties about many of
these mechanisms, including the strength and consistency of marbled murrelet ecological
and demographic responses, and even whether or not systems actually behave as
hypothesized. These uncertainties carry over to projected outcomes of the LTCS and
could result in the LTCS failing to perform as expected for marbled murrelet
conservation. Thus, adaptive management offers potential improvements to performance
of the strategy over time for conservation and policy objectives. Understanding the
hierarchical relationship among demographic, ecological, and management mechanisms
and the uncertainties around them can direct adaptive management of the LTCS. These
relationships are outlined and discussed below in a format where the number assigned to
each guiding hypothesis carries through the entire outline.
6.2a Hypothesized Risks about Marbled Murrelet Population Viability
1. The population is too small
2. The population is declining
3. A metapopulation structure exists in which some smaller local populations are at
risk of extirpation, thus increasing the risk to the metapopulation

6.2 Characteristics of DNR’s Marbled Murrelet Long-Term Conservation Strategy
September 2008 Page 6-4
6.2b Hypothesized Demographic Mechanisms that Influence Risk
For a description of the Hypothesized Demographic Mechanisms that Influence Risk,
please see the left column in Table 6-1.
6.2c Hypothesized Ecological Mechanisms that Influence Demographic Performance
Marbled murrelet ecology is complex and far from fully understood. Multiple hypotheses
have been proposed, or are implicit in the “conventional wisdom,” to explain
observations or assumptions of marbled murrelet breeding biology. More complete
discussions of the information and citations for these hypotheses are presented in chapter
2 and in recent reviews of marbled murrelet biology (Burger 2002, McShane et al. 2004).
Some of the hypotheses reflect competing views, while some are complementary. The
numbering and listing of hypotheses in Table 6-1 (middle column) builds on the
hypothesized demographic mechanisms that influence risk enumerated in Table 6-1 (left
column).
6.2d Models that Represent Hypotheses about Marbled Murrelet Ecology and Demography
Models are tools to evaluate hypotheses, as they enable predictions to be challenged with
data gathered through monitoring (Hilborn and Mangel 1997). The forest management
approaches of the LTCS will be based on these models, either implicitly or explicitly.
Variation in model form as well as parameter values can reflect more specific alternative
versions of a single hypothesis. Development of the general models presented below can,
and should, be further expanded in a program of adaptive management. These models are
described in more detail in chapter 4. The following general models (Table 6-1) build
upon hypotheses of ecological mechanisms that influence demographic performance. The
hypotheses that relate to each model are described in Table 6-1 and their relative
numbering identifies each throughout this summary.

6.2 Characteristics of DNR’s Marbled Murrelet Long-Term Conservation Strategy
September 2008 Page 6-5
Table 6-1. Hypothesized Demographic and Ecological Mechanisms that Influence Risk and Demographic Performance, and Subsequent Models. Hypothesized Demographic
Mechanisms that Influence Risk
Hypothesized Ecological Mechanisms that Influence Demographic Performance
Models that Represent Hypotheses about Marbled Murrelet Ecology and Demography
1. Population size is limited by the availability of nest sites.
Nest Sites: 1a. Abundance and/or availability of nest sites
increases within stands as stature and structural complexity increase.
1b. Abundance and/or availability of nest sites across landscapes is proportional to the area of stands that meet structural thresholds.
1c. Nest sites are more attractive in particular landscape contexts.
1d. Social facilitation (the presence of others encourages a particular behavior) increases the attractiveness of nest sites.
1e. Nesting is predicted by occupied behavior regardless of 1a, b, or c.
Nest Sites – stand level: 1a(1). The relationship of stand-level structural indices, tree sizes, platform
abundance/occurrence, canopy complexity, etc. to indices of marbled murrelet use (i.e., predicted probability of occupancy and nesting rates) reflects “habitat quality.”
1a(2). There is a gradient in stand-level habitat quality that can be approximated by classifying stands into groups based on the relationship of predicted marbled murrelet use to indices of forest structure.
1a(3). Managed forest stands (stands that have received silvicultural treatments to enhance nest site quality) attract marbled murrelets as predicted by models 1a (1 and 2).
Nest Sites – landscape level: 1b(1). Landscape-level population carrying capacity for marbled murrelets can
be predicted through calculating the area encompassed by suitably structured stands.
1b(2). Predictions of carrying capacity can be modified based on model 1a(2), where the contribution by lesser-quality stands is relative to their estimated quality.
1c(1). Landscape influences on attractiveness of stands of otherwise equivalent quality is a function of landscape composition and pattern.
2. The population is declining because productivity is limited by anthropogenic influences on the quality of nesting habitat.
Nest Success: 2a. Nest success is diminished by proximity to
anthropogenic, high-contrast edges due to predator abundance and/or decreased nest concealment.
2b. Nest success is a function of complex interactions of landscape pattern and composition due to landscape influences on the diversity and abundance of predators.
2c. Nesting rates (i.e., nests per unit area per year)
Nest Success – edge and landscape effects: 2a(1). The gradient of edge effects on nest success is approximated by
classifying edge distances and their predicted effects into three distance bins: <164, 164-492, and >492 feet from edge.
2b(1). A gradient of nest success is associated with landscape patchiness and compositional diversity.
Nesting Rates – influenced by nest success: 2c(1). Nesting rates, as approximated by marbled murrelet activity indices, are a
function of proximity to forest edge.

6.2 Characteristics of DNR’s Marbled Murrelet Long-Term Conservation Strategy
September 2008 Page 6-6
Hypothesized Demographic
Mechanisms that Influence Risk
Hypothesized Ecological Mechanisms that Influence Demographic Performance
Models that Represent Hypotheses about Marbled Murrelet Ecology and Demography
are correlated, following a time-lag, with nest success (see 2a and 2b) because unsuccessful nesters undertake fitness-dependent dispersal.
2d. Nesting rates and nest success are diminished by direct disturbance due to forest management activities, either additive or independent of hypotheses 2a-c.
2c(2). Nesting rates, as approximated by activity indices, are a function of landscape pattern and composition
Nest Success – disturbance effects: 2d(1). Nesting rates and nest success are a function of the frequency and
intensity of disturbances due to forest management activities.
3. Mechanisms 1 and 2 work within local populations; and small local populations face additional risk due to environmental and demographic stochasticity.
Population Structure and Dispersal: 3a. The abundance and quality of nest sites varies
within and between sub-populations, as predicted by models 1 and 2, such that source and sink areas exist.
3b. Marbled murrelets are relatively philopatric and site-faithful; thus, habitat that is unused either because of local extirpation or because it developed de novo from successional processes is infrequently colonized.
3c. Marbled murrelets may have greater natal and breeding dispersal than suggested in 3a, including fitness-dependent dispersal from poor breeding sites; thus, unused habitat may be colonized at rates proportional to its overall quality as predicted under hypotheses 1 and 2.
3d. A metapopulation with source-sink structure exists.
Population Structure - relationship to quantity and quality of nest sites: 3a(1). Population consequences of various amounts and configurations of
habitat can be predicted with demographic modeling, incorporating influences of nest site availability and nest success as predicted by models 1a-c and 2a-c.
Dispersal – relationship to site occupancy: 3b,c(1). The frequency and extent of marbled murrelet natal and breeding
dispersal, as reflected by apparent extirpation and colonization of sites, can be inferred from time-series observations of activity and nesting at sites that attract and retain marbled murrelets as a function of their overall quality as predicted by models 1a(1 and 2), 1c(1), and 2b(1 and 2), and their proximity to other sites with marbled murrelets.
Population consequences of habitat quantity/quality and dispersal 3a,b,c,d(1). Population consequences of marbled murrelet dispersal behavior
can be predicted with a metapopulation model and varying levels of dispersal among source and sink sub-populations..

6.3 Management Approaches
September 2008 Page 6-7
6.3 Management Approaches
Conservation areas were delineated to address hypothesized habitat insufficiencies to the
greatest extent possible (see chapter 3.0). Thus, this section takes a different form–brief
descriptions of classification and management criteria for each class of conservation area,
followed by a brief description of how habitat management in those areas is intended to
address the principal hypotheses about mechanistic links to marbled murrelet population
viability. The conservation areas are classified as follows: isolated occupied sites and
undesignated habitat areas (both classifications apply to all analysis units), and Marbled
Murrelet Management Areas (MMMAs) in Southwest Washington (SWWA) and the
Olympic Experimental State Forest (OESF).
6.3a Isolated Occupied Sites
Occupied behavior was observed in these small areas (<~200 acres [<~81 hectares]) that
are either in isolated DNR-managed parcels or are on DNR-managed land that lacks
explicit objectives for marbled murrelet conservation. The sites encompass a range of
structural conditions, from simple-structured second-growth to complex old-growth. The
Science Team recommends an approach of passive management (i.e., no timber harvest
and minimal disturbance) for all these areas because they may contribute to achieving the
conservation objectives. Several hypotheses are particularly relevant to the role of these
isolated occupied sites in achieving conservation: the relationship of nesting activity with
site characteristics, hypotheses 1a, 1c-e; the relationship of nest success and nest-site
fidelity with site characteristics, hypotheses 2a-d; and the role of dispersal behavior in the
use of sites, hypothesis 3a. It is recommended that these hypotheses are tested prior to
making any decisions about isolated occupied sites.
6.3b Undesignated Habitat Areas
According to HCP agreements for riparian conservation and other guiding elements of
broader DNR policy, undesignated habitat areas (i.e., marbled murrelet habitat outside
MMMAs and occupied sites) are recommended to occur throughout the analysis units.
These lands encompass some existing areas of complex-structured forest and will be
especially inclusive of extensive streamside and unstable slope areas where complex

6.3 Management Approaches
September 2008 Page 6-8
stands will be restored and maintained over time through both active and passive
management (Bigley and Deisenhofer 2006). The landscape contexts of these
undesignated habitat areas are recommended to vary according to management to meet
multiple objectives for sustainable forestry, and in some areas they will be surrounded by
stands under even-age management. These areas comprise a substantial proportion of the
landbase in each analysis unit, for example the riparian areas alone comprise 43% in the
OESF, 19% in the Straits, and more than 32% in SWWA (DNR 2004b). Although these
areas are projected to substantially increase the abundance of potential nesting habitat,
marbled murrelet productivity in these areas may be insufficient to meet objectives for
supporting stable populations. Several hypotheses are particularly relevant to the role of
these undesignated habitat areas in achieving conservation and other policy objectives:
the relationship of nesting activity with site characteristics, hypotheses 1a-e; the
relationship of nest success and nest-site fidelity with site characteristics, hypotheses 2a-
d; and the role of dispersal behavior in colonization and use of habitat, hypothesis 3a-b.
6.3c Marbled Murrelet Management Areas in Southwest Washington
MMMAs in SWWA are relatively large areas (>1,000 acres [>405 hectares]) of
contiguous DNR-managed lands. They contain occupied sites and some higher quality
reclassified habitat not found to be occupied but the majority of their area is currently
non-habitat. The Science Team recommends these MMMAs be actively managed to
restore high quality nesting habitat and passively managed to maintain habitat within an
analysis unit where contiguous blocks of high quality nesting habitat are scarce. The
relationship of nesting behavior to habitat quality (hypotheses 1a-c), and relationships
regarding landscape-level influences on nest success (hypotheses 2a-c) are central to the
LTCS. Implementation of the LTCS will be constrained by land ownership patterns. For
this component of the overall strategy to perform as desired, marbled murrelets must
colonize restored habitat (as predicted by hypothesis 3b in the 3a/3b contrast).
6.3d Marbled Murrelet Management Areas in the OESF
Conservation in the OESF relies substantially on existing HCP strategies of landscape-
level thresholds for “old-forest spotted owl habitat,” with structural properties similar to

6.4 Adaptive Management for the Long-Term Conservation Strategy
September 2008 Page 6-9
current estimates for high quality marbled murrelet nesting habitat. Existing HCP
strategies for riparian conservation through management in streamside and unstable areas
(i.e., the “undesignated habitat areas” in part described above) are additionally applied to
MMMAs in the OESF. Where it is feasible, given soil and site characteristics, marbled
murrelet habitat is recommended to be maintained or restored through active and passive
management in these areas. An additional component of the LTCS in the OESF is
management of high quality nesting habitat to enhance its security, and thus contribute to
population goals. Also, discrete MMMAs were established in portions of the Sitka Spruce
zone where restoration of high quality nesting habitat and management of its context in
the landscape are designed to increase the amount and predicted security of this habitat.
These discrete MMMAs are in an ecological type that is not well-represented on federal
lands. Several hypotheses are particularly relevant to the role of these unique OESF areas
in achieving conservation and other policy objectives: marbled murrelet responses to
landscape-level abundance and attractiveness of nesting habitat, hypotheses 1b-c; the
relationship of nest success and nest-site fidelity with site characteristics, hypotheses 2a-
c; and source-sink relationships with habitat on federal land, hypothesis 3c.
6.4 Adaptive Management for the Long-Term Conservation Strategy
A practical program of adaptive management for DNR’s marbled murrelet LTCS must be
organized around several elements: management approaches and their predicted
outcomes, uncertainties about predictions, the magnitude of consequences resulting from
incorrect predictions, and the feasibility of resolving uncertainties with adaptive
management. Examination of these elements will help identify portions of the strategy
where resolution of uncertainties can result in sufficiently improved outcomes for
biological and/or policy goals so the costs of gaining reliable knowledge can be justified.
Then, adaptive management must follow guidelines published by the Services, as
summarized in the introduction (USFWS and NMFS 2000), and comply with terms of the
HCP Implementation Agreement (DNR 1997a).
6.4a Uncertainties in the Conservation Strategy and Potential Consequences
The models (in section 6.2d) allow objective predictions of the contributions of
components of the LTCS briefly described above, as a class or as discrete geographic
6.4 Adaptive Management for the Long-Term Conservation Strategy
September 2008 Page 6-10
elements, to the size and stability of the regional marbled murrelet population. Important
uncertainties exist at many steps leading to those predictions, but the magnitude of their
consequences can be estimated by their predicted effects on marbled murrelet populations
and the amount of land committed to a particular approach. In summary, the largest
positive effects for marbled murrelet populations are predicted for habitat restoration in
the SWWA MMMAs and the undesignated habitat areas, including those noted as part of
the OESF approach (Tables G-4A through G-4L). Thus, overly optimistic predictions
about habitat development in managed forests and marbled murrelet responses to that
habitat would have the greatest consequences to a strategy failing to realize its biological
goals. The largest negative effects on other policy goals (DNR 2006b), including
generating revenue from timber harvest would derive from lands dedicated to relatively
passive management approaches that fail to achieve the marbled murrelet biological
goals. In this sense, limited nesting rates and nest success in isolated occupied sites and
incorrect predictions about marbled murrelet responses to MMMAs in SWWA would
have the greatest consequences. In either case, improving DNR’s ability to manage for
marbled murrelet conservation in a manner that achieves predictions would result in
equivalent or better marbled murrelet conservation at less cost to the trust beneficiaries.
This goal of “optimization” is explicit in academic discussions of adaptive management
and implicit in the Services’ definition.
Adaptive management to improve outcomes from these key management approaches then
depends on the feasibility of resolving uncertainties around them. Uncertainties around
the predictions of models 1a(1-3), regarding management approaches for restoring high
quality nesting habitat at the stand level; models 1b(1,2), 1c(1), 2a(1), 2b(1), 2c(1,2),
landscape influences on productivity; and model 3a,b(1), dispersal patterns, are important
to achieving both biological and other policy goals. The predictions of model 3a,b,c(1)
are important to conservation approaches in the OESF and Straits, which variously rely
on a large contribution to population size and stability afforded by federal lands. These
uncertainties are based upon the predictions of models describing relationships among
marbled murrelet biology and forest characteristics, as well as management pathways, to
achieve desired forest characteristics. A brief examination of the feasibility to resolve

6.4 Adaptive Management for the Long-Term Conservation Strategy
September 2008 Page 6-11
these uncertainties will assist in developing a program of adaptive management for
implementing the LTCS.
6.4b Marbled Murrelet Studies at Varying Spatial Scales
Types and quantities of data needed, as well as the time and effort required to collect the
data, are important to the practicability of resolving uncertainties around the LTCS. Thus,
a brief review of techniques for investigating marbled murrelet ecology and the types of
information they provide can help frame an adaptive management approach for the
strategy. In order of decreasing spatial resolution, marbled murrelet studies are conducted
at:
• Nest Sites: nest sites and their immediate vicinity, from the branch holding the
nest to the nest tree to the surrounding 1-2 acres (0.4-0.8 hectares)
• Nesting Neighborhoods: nesting neighborhoods (Raphael et al. 2002), stands
and/or the general vicinity of actual or presumed nest sites, from 10-1,000 acres
(4-405 hectares)
• Medium to Large Watersheds: watersheds from several thousand to several
hundred-thousand acres (or hectares)
• Regional Scales: similar to or larger than HCP planning units, from one to several
million acres (or hectares)
In addition, silvicultural method studies provide information relevant to the LTCS.
Silviculture studies on management techniques to restore or maintain marbled murrelet
habitat can help guide different management approaches.
6.4c Nest Site Studies
Nest site studies depend on direct observation by audio-visual (a-v) observers, with
studies of nesting behavior and outcomes often assisted by data recorders such as
cameras or other monitors. Locating nests requires intensive field work. Old nests (up to
about five years old) can be located by selective tree-climbing outside of nesting season,
enabling studies of forest characteristics without regard to nest success. Active nests can
be found through intense searches by ground-based observers, but following birds radio-
6.4 Adaptive Management for the Long-Term Conservation Strategy
September 2008 Page 6-12
tagged on the water to their nests has proven effective at providing a relatively unbiased
sample of nests from which stronger inference about marbled murrelet biology can be
made. An ongoing study of marbled murrelets on the Olympic Peninsula locates about 4
nests per year (Bloxton and Raphael 2006, 2007). If nests are apportioned in habitat
according to its relative abundance, then 10 nests might be located on DNR-managed
land (which contains 14% of the Olympic Peninsula’s habitat) in seven years of effort. If
managed-forest landscapes are less secure and/or attractive, marbled murrelets would
nest in DNR-managed lands at lower rates, and even more effort would be required to
accumulate a reasonable sample. However difficult, studies at actual nests are necessary
to resolve uncertainties around nesting in managed-forest habitat, model 1a(3), and edge
effects influences on nest success, models 2a(1) and 2b(1).
6.4d Nesting-Neighborhood or Stand-level Studies
Nesting-neighborhood studies monitor marbled murrelet responses with a-v observers
and/or radar. Decisions as to the mode of observation depend on site-specific factors that
limit radar and the nature of the study. Counts obtained with radar are less variable
(Bigger et al. 2006), but a-v observers can collect more specific behavioral information
potentially valuable for higher-resolution studies. Studies at this scale can improve the
reliability of predictions that are central to the success of the LTCS, by testing predictions
about habitat quality and restoration, models 1a(1-3); landscape-level influences on
attractiveness of stands, models 1c(1) and 2c(1,2); and patterns of extirpation and
recolonization at isolated sites, model 3a,b(1). Well-designed studies allow data collected
in nesting-neighborhood studies to be applied to watershed or landscape-level
investigations.
6.4e Watershed-Level Studies
Watershed-level studies rely on inland observations because marbled murrelets at sea
cannot be reliably assigned to a particular watershed (Bloxton and Raphael 2006). Radar
observations from strategic points in watersheds (3,500-400,000 acres [1,400-162,000
hectares]) have successfully estimated marbled murrelet numbers and their relationship
with habitat characteristics (reviewed by Burger 2002, McShane et al. 2004). Reliable
point-in-time estimates have been achieved with two to three years of monitoring. Trend

6.4 Adaptive Management for the Long-Term Conservation Strategy
September 2008 Page 6-13
studies would likely require intermittent monitoring over one to several decades. These
types of studies are appropriate for landscape-level assessments in general, not just
landscapes defined by watershed boundaries. Landform and other contingencies are very
important to enabling these types of studies, particularly at the smaller spatial scales
relevant to DNR’s LTCS. They can increase certainty around predictions of models
important to the LTCS regarding carrying capacity and attractiveness of landscapes,
1b(1,2) and 1c(1), regarding landscape-level consequences of fitness-dependent dispersal,
2c(1,2), and regarding extirpation and recolonization, 3a,b(1).
6.4f Regional-Level Studies
Regional-level studies, ongoing since 2000, are designed to estimate population size and
trends by counting marbled murrelets at sea during the breeding season. These studies are
conducted according to a sampling and analysis design allowing estimation of numbers
and uncertainty (Madsen et al. 1999, Miller et al. 2006). DNR contributes funding toward
this effort. These studies will provide reasonably certain estimates of population size and
stability within two to 20 years depending on hypothesized rates of decline (Miller et al.
2006). Certainty in these estimates is particularly important to the OESF and Straits
conservation approaches (i.e., evaluating the predictions of model 3a,b,c(1) regarding the
role of federal lands in sustaining the marbled murrelet population).
6.4g Silvicultural Methods Studies
Silvicultural methods to restore and maintain marbled murrelet habitat are currently
based on inference from studies designed to improve commodity production,
retrospective studies of unmanaged stands, and work in progress directed at broader
elements of forest biodiversity. Thus, even if models describing stand-level
characteristics of marbled murrelet habitat are correct, reliable knowledge of means to
achieve those characteristics will improve performance of the LTCS. Tree growth is a
relatively slow process, so silvicultural studies often span decades. Silvicultural research
and monitoring methods are well-established, and are explicitly acknowledged in the
broader HCP agreement as “effectiveness monitoring” (DNR 1997a) to improve
silvicultural performance at meeting habitat objectives.

6.5 Potential Topics for Adaptive Management
September 2008 Page 6-14
Reliable information to improve performance of the LTCS can be gained less directly
through inference gained in marbled murrelet studies from elsewhere in their range,
experimental studies of simulated marbled murrelet nests, and observational and/or
experimental studies of related phenomena with other bird species. Similarly, knowledge
about silviculture can be generalized from other studies. An effective program of
adaptive management will seek out and utilize multiple types of information to improve
the reliability of information that is the basis for management decisions. Furthermore, the
monitoring itself should be adaptive, changing direction and focus as information
accumulates and management needs change (Carey et al. 2003).
6.5 Potential Topics for Adaptive Management
It is appropriate to propose “potential topics” for adaptive management at this point, as
DNR, USFWS, and possibly other stakeholders must consider a broad range of factors
that may influence the range of alternatives to explore and potentially pursue, including
economics, policies, and regulations, as well as risk to marbled murrelet conservation
(USFWS and NMFS 2000). An adaptive management strategy should:
1. Identify uncertainties
2. Develop alternative (i.e., experimental) approaches, and determine which of
them to implement
3. Design a monitoring program for those approaches
4. Define how feedback from monitoring will result in effective changes in HCP
implementation (USFWS and NMFS 2000)
Alternative or experimental approaches are appropriate for active adaptive management;
passive methods are also permitted, and these would monitor outcomes from single
management approaches and adapt appropriately. Uncertainties, alternative hypotheses,
and monitoring methods are outlined and discussed as they relate to the management
approaches summarized above. Several of those that may be appropriate for adaptive
management are presented as examples in the following sections.

6.5 Potential Topics for Adaptive Management
September 2008 Page 6-15
6.5a Adaptive Management of Isolated Occupied Sites
Conservation measures at discrete occupied sites are predicted to allow those sites to
contribute to population size and stability by providing for successful nesting.
1. Uncertainties: Predictions regarding the relationship between habitat area and
marbled murrelet numbers, negative fragmentation and edge effects, and fitness-
dependent dispersal cast uncertainty on the ability of these sites to contribute
measurably to biological goals. These sites appear to contribute relatively less to
regional marbled murrelet populations in the OESF and Straits, but relatively
more in SWWA.
2. Alternatives: A passive approach is proposed for these sites, consisting of two
parts: (1) broad population monitoring for the OESF and Straits Planning Units
and the Olympic Peninsula portion of SWWA (Humptulips), and (2) focused
marbled murrelet monitoring for the SWWA Planning Unit. Individual sites
within those planning units would be assigned to one of the following three
classes based on their predicted abilities (below) to meet biological goals:
1) Least likely;
2) Moderately likely; or
3) More likely.
Classification criteria would include stand characteristics and landscape context,
and identify sites that appeared least and most likely to support biological goals
and an intermediate class.
3. Monitoring: Population size and trend estimates from at sea monitoring (Miller et
al. 2006) within Conservation Zones 1 and 2 (see chapter 2.6h) would provide the
basis for the management decisions regarding Olympic Peninsula sites.
Monitoring marbled murrelet activity and behavior according to a statistically
robust design at SWWA sites, stratified by the three classes above, would provide
the basis for management decisions in this planning unit. Radar and/or a-v
observations would be used to estimate whether sites were contributory to the
biological goals.

6.5 Potential Topics for Adaptive Management
September 2008 Page 6-16
4. Feedback: Monitoring results would initiate changes in management. If
populations in Conservation Zones 1 and/or 2 were found to be stable or
increasing, the “least likely” class could be released for timber harvest and the
“moderately likely” class could be evaluated for release. In SWWA, sufficiently
precise estimates of the annual proportion of sites in the least likely and
moderately likely classes would provide criteria for deciding whether or not to
release these sites to harvest. Such monitoring and analysis details, as well as
decision thresholds, should be determined at a future date in coordination with the
appropriate regulatory agencies.
6.5b Adaptive Management of Southwest Washington Marbled Murrelet Management
Areas and Undesignated Habitat Areas
Substantial conservation benefits are predicted to result from MMMAs and undesignated
habitat in the strategy due primarily to increased abundance of habitat from restoration
efforts and, in places, because of explicit management efforts to decrease fragmentation
effects. Three groups of hypotheses and their derivative models are important to these
predictions:
• Habitat restoration and maintenance in managed forests
• Fragmentation and edge effects on productivity
• Colonization of restored habitat
Management approaches and contextual differences among planning units are such that it
is convenient to partition this topic into these three groups.
Habitat Restoration and Maintenance
Management to restore and maintain habitat is predicted to increase nesting opportunities
and thus contribute to goals for population size and stability.
1. Uncertainties: Current habitat models likely do not provide a full description of
stand characteristics important to marbled murrelets and are based on
observations from stands that regenerated and developed without silvicultural
intervention. They may not present wholly appropriate targets for restoration

6.5 Potential Topics for Adaptive Management
September 2008 Page 6-17
silviculture. Additionally, silvicultural treatments to achieve targets in a timely
and financially efficient manner are not fully known. Finally, there is uncertainty
about the timing and magnitude of marbled murrelet responses to restored habitat.
2. Alternatives: Passive and active approaches are appropriate to resolve these
uncertainties. At present, habitat models can be refined with further analysis of
existing and new data. Designed silvicultural experiments should be conducted to
test approaches for achieving current, and possibly future, habitat targets. This
active approach should encompass a broad range of silvicultural treatments as
well as target conditions to encompass uncertainty in habitat models as well as
restoration techniques. Observing marbled murrelet responses to silviculture
would be mainly passive, but opportunities for a limited active approach to these
uncertainties exist in the OESF (i.e., designed silvicultural experiments in areas
used by marbled murrelets).
3. Monitoring: Predictions of habitat models should be tested by monitoring marbled
murrelet responses. These observational studies could be designed to explore
potential regional and/or site-level differences in habitat characteristics. A series
of silvicultural experiments in young stands without habitat capability should
monitor the rate and abundance at which characteristics of marbled murrelet
habitat develop. These experiments should be implemented in a design that is
robust to regional and site-level differences in silvics. Silvicultural experiments in
unoccupied older stands that are approaching a threshold level of habitat quality
should be conducted more cautiously. The OESF has stands of this type in a
context of relatively abundant, higher quality habitat in conservation status on
federal and DNR-managed lands. Experiments could be conducted in a sample of
these stands in an active approach that measured marbled murrelet and stand
responses. Marbled murrelet responses in these experiments, and to other
managed stands that approach threshold levels of habitat quality, can be
monitored with radar and/or a-v observers. Planned integration can allow some of
these efforts to provide information around multiple questions.
6.5 Potential Topics for Adaptive Management
September 2008 Page 6-18
4. Feedback: Habitat models can be refined in an iterative fashion through feedback
from monitoring, thus improving silvicultural targets. Likewise, conclusions from
silvicultural experiments would guide more effective, efficient management for
habitat restoration in young stands. Findings from experiments in older, lower-
quality habitat in the OESF could help direct management in all planning units
regarding enhancement techniques for lower-quality habitat and management to
maintain habitat quality while achieving other objectives. The most important
feedback will result from monitoring marbled murrelet responses to restored
habitat, which is likely to require two to four decades for sufficient restoration to
estimate responses. Management changes prompted by this feedback are likely to
depend substantially on then-current marbled murrelet population status and other
issues.
Fragmentation and Edge Effects
The pattern of state trust ownership and multiple-use objectives for trust lands requires
that all MMMAs are subject to the potentially negative effects of fragmentation and edge
on the stability of marbled murrelet populations.
1. Uncertainty: The strength and consistency of edge and broad landscape-level
influences, and their potential interaction effects on marbled murrelet nest success
and nesting rates, is uncertain. Within the three analysis units (see Figure 3-1), the
many geographically discrete designated and undesignated MMMAs exist in a
broad range of edge and landscape contexts. Thus, predicted contributions of
those areas toward the biological goals are also uncertain.
2. Alternatives: An active approach to resolving uncertainties is possible, even
without experimental modifications of the landscape context around MMMAs,
because the wide range that currently exists will allow measurement of marbled
murrelet responses to substantial contrasts. Planned habitat restoration will
provide further contrasts at some sites. Model predictions can identify sites with
contrasting edge and/or landscape effects.
3. Monitoring: Two marbled murrelet responses are important to the biological
goals: nesting rates and nest success. Due to the difficulty in locating nests nesting

6.5 Potential Topics for Adaptive Management
September 2008 Page 6-19
rates may be best inferred by monitoring marbled murrelet activity and behavior
with a-v and/or radar observations. These studies can be conducted in designed
experiments at sites sampled from across the range of landscape conditions, using
model predictions to identify contrasts. Given the existing uncertainty,
experiments might identify four groups using a 2 x 2 matrix of predicted high and
low negative edge and landscape effects, and then monitor and compare marbled
murrelet responses among them. Extensive areas of habitat restoration and/or
OESF management areas managed to minimize fragmentation could allow before
and after comparisons at the same sites. Nest success in response to these
influences must be inferred from direct observations at actual or simulated
marbled murrelet nests. Experiments with simulated marbled murrelet nests could
be conducted with a design as described above. Finding a sufficient number of
marbled murrelet nests will likely be very challenging, requiring intensive efforts,
so opportunistic observations could be compiled over time and reviewed against
model predictions in a passive approach.
4. Feedback: It is possible that conclusions from monitoring would suggest that
different habitat configurations or contexts would be more effective at meeting
biological goals. DNR should explore and implement management alternatives
and incorporate that feedback to the extent practicable. It is also possible that
conclusions may suggest that discrete geographic components of the LTCS
contribute little toward the biological goals. This potential finding is part of the
reason the Services noted the interaction of “...economics, policies and
regulations...” in identifying alternative management approaches in response to
monitoring (USFWS and NMFS 2000). Greater certainty around projected
outcomes for marbled murrelet conservation may allow DNR and USFWS to
revise the LTCS to a more effective, efficient configuration.
Colonization of Restored Habitat
Conservation benefits projected to result from implementing this component of the LTCS
depend on marbled murrelets recolonizing areas of restored habitat that are currently
remote from substantial marbled murrelet inland activity (e.g., the Elochoman MMMA in
SWWA).

6.5 Potential Topics for Adaptive Management
September 2008 Page 6-20
1. Uncertainty: It is nearly certain that marbled murrelets are capable of colonizing
newly developed habitat, given sufficient time and numbers of marbled murrelets.
However, it is possible that this may not occur as predicted within the duration of
the HCP at levels that are necessary to meet biological goals.
2. Alternatives: A substantial range of contexts relative to predicted habitat quality
and current levels of marbled murrelet inland activity exists among the basic
configuration of MMMAs. The contrasts in this range provide opportunities for a
passive approach to evaluate marbled murrelet responses to various contexts.
3. Monitoring: Model predictions can identify areas likely to have higher or lower
probabilities of recolonization. Periodic monitoring of marbled murrelet activity
at a sample of these areas could help determine whether or not predicted levels of
marbled murrelet use after habitat restoration are achieved.
4. Feedback: It is possible that conclusions may suggest that discrete geographic
components of the LTCS contribute little toward biological goals. In this case,
with feedback from other adaptive management components, it may appear that
different habitat configurations would be more effective at meeting biological
goals. DNR should explore and implement management alternatives to
incorporate that feedback. Feedback on this component of the strategy likely
awaits many decades of habitat restoration, accompanied by a well designed
marbled murrelet monitoring program. Management changes prompted by any
such feedback are likely to depend substantially on then-current marbled murrelet
population status and other issues.
September 2008 Page 7-1
7.0 LITERATURE CITED
Ackerman, J. T., J. Adams, J. Y. Takekawa, H. R. Carter, D. L. Whitworth, S. H. Newman, R. T.
Golightly, and D. L. Orthmeyer. 2004. Effects of Radiotransmitters on the Reproductive
Performance of Cassin’s Auklets. Wildlife Society Bulletin 32:1229-1241.
Agee, J.K. 1993. Fire Ecology of the Pacific Northwest Forests. Island Press. Washington, D.C.
Agler, B. A., S. J. Kendall, and D. B. Irons. 1998. Abundance and Distribution of Marbled and
Kittlitz’s Murrelets in Southcentral and Southeast Alaska. The Condor 100:254–265.
Ainley, D. G., S. G. Allen and L. B. Spear. 1995. Offshore occurrence patterns of Marbled
Murrelets in central California. Pages 361–369 in C. J. Ralph, G. L. Hunt, Jr., M. G.
Raphael, and J. F. Piatt, (Tech. eds.) Ecology and Conservation of the Marbled Murrelet.
General Technical Report PSW-GTR-152. U.S. Forest Service, Pacific Southwest
Research Station, Albany, CA.
American Ornithologists’ Union. 1957. Check-List of North American Birds. Fifth Edition.
Baltimore, MD.
American Ornithologists’ Union. 1997. Forty-first Supplement to the American Ornithologists’
Union Check-list of North American Birds. The Auk 114:542-552.
Baldwin, J. 2001 (November 21). Investigating the Possibility of Changes in Status at a Site.
Unpublished report. Available: <http://www.pacificseabirdgroup.org>.
————. 2002 (July 16). Assessing the 2-Year Protocol for Marbled Murrelets. Unpublished
report. Available: <http://www.pacificseabirdgroup.org>.
Beattie, W. and A. Seiders. 2003. Indian Gillnet and Purse Seine Fisheries Declines in
Washington State 1993-2001. Unpublished report. Northwest Indian Fisheries
Commission. Prepared for Bureau of Indian Affairs and U. S. Fish and Wildlife Service,
Olympia, WA.
Beauchamp, W. D., F. Cooke, C. Lougheed, L. W. Lougheed, C. J. Ralph, and
S. Courtney. 1999. Seasonal Movements of Marbled Murrelets: Evidence from Banded
Birds. The Condor 101:671–674.

7.0 Literature Cited
September 2008 Page 7-2
Beissinger, S. R. 1995. Population Trends of the Marbled Murrelet Projected from Demographic
Analyses. Pages 385–393 in C. J. Ralph, G. L. Hunt, M. G. Raphael, and J. F. Piatt (Tech.
eds.), Ecology and Conservation of the Marbled Murrelet. General Technical Report
PSW-GTR-152. U.S. Forest Service, Pacific Southwest Research Station, Albany, CA.
Beissinger, S. R., and N. Nur. 1997. Population Trends of the Marbled Murrelet Projected from
Demographic Analysis. Appendix B (pages B1–B35) in U.S. Fish and Wildlife Service,
Recovery Plan for the Threatened Marbled Murrelet (Brachyramphus marmoratus) in
Washington, Oregon and California. U. S. Fish and Wildlife Service, Portland, OR.
Beissinger, S. R., and M. Z. Peery. 2007. Reconstructing the Historic Demography of an
Endangered Seabird. Ecological Applications 16:1516–1528.
Bellward, G. D., R. J. Norstrom, P. E. Whitehead, J. E. Elliott, S. M. Bandiera, C. Dworschak,
T. Chang, S. Forbes, B. Cadario, L. E. Hart, and K.M. Cheng. 1990. Comparison of
Polychlorinated Dibenzodioxin Levels with Hepatic Mixed-Function Oxidase Induction
in Great Blue Herons. Journal of Toxicological Environmental Health 30:33–52.
Bergvall, J. A., and Y. D. Sharma. 1976. A Profile of Washington State Uplands. Washington
State Department of Natural Resources, Volume W. 4, Olympia, WA.
Bigger, D., M.Z. Peery, J. Baldwin, S. Chinnici, and S. P. Courtney. 2006a. Power to Detect
Trends in Marbled Murrelet Breeding Populations using Audio-Visual and Radar
Surveys. Journal of Wildlife Management 70:493–504.
Bigger, D., M. Z. Peery, S. Chinnici, and S. P. Courtney. 2006b. Efficacy of Audiovisual and
Radar Surveys for Studying Marbled Murrelets in Inland Habitats. Journal of Wildlife
Management 70:504-515.
Bigley, R. E., and F. U. Deisenhofer. 2006. Implementation Procedures for the Habitat
Conservation Plan Riparian Forest Restoration Strategy. Washington State Department
of Natural Resources, Scientific Support Section, Olympia, WA.
Binford, L. C., B. G. Elliot, and S. W. Singer. 1975. Discovery of a Nest and the Downy Young
of the Marbled Murrelet. Wilson Bulletin 87:303–319.
Bloxton, T. D., and M. G. Raphael. 2006. Breeding Ecology of the Marbled Murrelet in
Washington State. Annual Report, 2005 Field Season. Available from M. G. Raphael at

7.0 Literature Cited
September 2008 Page 7-3
U.S. Forest Service, Pacific Northwest Research Station, 3625 93rd Ave. SW, Olympia,
WA 98512-9193.
————. 2007. Breeding Ecology of the Marbled Murrelet in Washington State. Annual
Report, 2006 Field Season. Available from M. G. Raphael at U.S. Forest Service, Pacific
Northwest Research Station, 3625 93rd Ave. SW, Olympia, WA 98512-9193.
Boulanger, J. G., K. Martin, G. Kaiser, and A. E. Derocher. 1999. Evaluation Uncertainty in
Estimating Population Trends of Marbled Murrelets. Pages 55–63 in A. W. Diamond and
A. W. Nettleship (eds.), Biology and Conservation of Forest Birds. Society of Canadian
Ornithologists, Fredericton, NB, Canada.
Bradley, R.W. 2002. Breeding Ecology of Radio-Marked Marbled Murrelets (Brachyramphus
marmoratus) in Desolation Sound, British Columbia. M.S. dissertation. Simon Fraser
University, Department of Biological Sciences, Burnaby, BC, Canada.
Bradley, R. W., and F. Cooke. 2001. Cliff and Deciduous Tree Nests of Marbled Murrelets in
Southwestern British Columbia. Northwestern Naturalist 82:52–57.
Bradley, R. W., F. Cooke, L. W. Lougheed, and W. S. Boyd. 2004. Inferring Breeding Success
through Radiotelemetry in the Marbled Murrelet. Journal of Wildlife Management
68:318–331.
Bradley, R. W., and J. M. Marzluff. 2003. Rodents as Nest Predators: Influences on Predatory
Behavior and Consequences to Nesting Birds. The Auk 120:1180–1187.
Bradley, R. W., L. A. McFarlane-Tranquilla, B. A. Vanderkist, and F. Cooke. 2002. Sex
Differences in Nest Variation Rate of Chick Rearing Marbled Murrelets. The Condor
104:180–185.
Brodie, A. W., W. Jaross, B. Lu, and D. Lindley. 2004. Modeling Forest Stand Development
Stages for Strategic Modeling of Forested State Trust Lands in Western Washington.
Technical Note No. 2, Appendix B, in Washington State Department of Natural
Resources. Final Environmental Impact Statement on Alternatives for Sustainable Forest
Management of State Trust Lands in Western Washington and for Determining the
Sustainable Harvest Level. Washington State Department of Natural Resources, Olympia,
WA.

7.0 Literature Cited
September 2008 Page 7-4
Budy, P., and H. Schaller. 2007. Evaluating Tributary Restoration Potential for Pacific Salmon
Recovery. Ecological Applications 17:1068–1086.
Burger, A. E. 1995. Marine Distribution, Abundance, and Habitats of Marbled Murrelets in
British Columbia. Pages 295–312 in C. J. Ralph, G. L. Hunt, Jr., M. G. Raphael, and J. F.
Piatt (tech. eds.), Ecology and Conservation of the Marbled Murrelet. General Technical
Report PSW-GTR-152. U. S. Forest Service, Pacific Southwest Research Station.
Albany, CA.
Burger, A. E. 1997. Behavior and Numbers of Marbled Murrelets Measured with Radar. Journal
of Field Ornithology 68:208-223.
————. 2001. Using Radar to Estimate Populations and Assess Habitat Associations of
Marbled Murrelets. Journal of Wildlife Management 65:696–715.
————. 2002. Conservation Assessment of Marbled Murrelets in British Columbia: A Review
of the Biology, Populations, Habitat Associations, and Conservation. Technical Report
Series No. 387, Canadian Wildlife Service, Pacific and Yukon Region, Delta, BC.
Available: <http://www.sfu.ca/biology/wildberg/bertram/mamurt/PartA.pdf>.
Burger, A. E., and D. M. Fry. 1993. Effects of Oil Pollution on Seabirds in the Northeast Pacific.
Pages 254-263 in K. Vermeer, K.T. Briggs, K.H. Morgan, and D. Siegel-Causey, (tech.
eds.), The Status, Ecology, and Conservation of Marine Birds of the North Pacific.
Canadian Wildlife Service Special Publication, Ottawa, ON.
Burger, A. E., T. A. Chatwin, S. A. Cullen, N. P. Holmes, I. A. Manley, M. H. Mather, B. K.
Schroeder, J. D. Steventon, J. E. Duncan, P. Arcese, and E. Selak. 2004. Application of
Radar Surveys in the Management of Nesting Habitat of Marbled Murrelets
Brachyramphus marmoratus. Marine Ornithology 32:1-11.
Burger, A. E. and R. E. Page. 2007. The Need for Biological Realism in Habitat Modeling: A
Reinterpretation of Zharikov et al. (2006). Landscape Ecology (Online First)
10.1007/s10980-007-9114-6
Burkett, E. E. 1995. Marbled Murrelet Food Habits and Prey Ecology. Pages 223–246 in C. J.
Ralph, G. L. Hunt, Jr., M. G. Raphael, and J. F. Piatt (tech. eds.), Ecology and

7.0 Literature Cited
September 2008 Page 7-5
Conservation of the Marbled Murrelet. General Technical Report PSW-GTR-152. U.S.
Forest Service, Pacific Southwest Research Station, Albany, CA.
Burkett, E. E. H. R. Carter, J. Y. Takekawa, S. Newman, R. T. Golightly, and J. L. Lanser. 1999.
Marbled Murrelet Radio Telemetry in Central California in 1997 and 1998: A Reduced
Effort Noted in an El Nino Year. Pacific Seabirds 26:32.
Burnham, K. P., and D. R. Anderson. 2002. Model Selection and Multimodel Inference: A
Practical Information-Theoretic Approach. Springer-Verlag, New York.
Cam, E., L. Lougheed, R. Bradley, and F. Cooke. 2003. Demographic Assessment of a Marbled
Murrelet Population from Capture-Mark-Recapture and Radiotelemetry Data.
Conservation Biology 17:1118–1126.
Campbell, R. W., M. A. Paul, M. S. Rodway, and H. R. Carter. 1977. Tree-nesting Peregrine
Falcons in British Columbia. The Condor 79:500-501.
Canadian Marbled Murrelet Recovery Team. 2003. Marbled Murrelet Conservation Assessment
2003, Part B: Marbled Murrelet Recovery Team Advisory Document on Conservation
and Management. Canadian Marbled Murrelet Recovery Team Working Document No.
1.
Carey, A. B., S. P. Courtney, J. F. Franklin, J. M. Marzluff, M. G. Raphael, J. C. Tappanier, and
D. A. Thornburgh. 2003. Managing Second-Growth Forests in the Redwood Region to
Enhance Marbled Murrelet Habitat. Unpublished report of the Scientific Panel on
Restoration of Marbled Murrelet Habitat. Sustainable Ecosystems Institute, Portland, OR.
Carey, A. B., C. Elliot, B. R. Lippke, J. Sessions, C. J. Chambers, C. D. Oliver, J. F. Franklin,
and M. J. Raphael. 1996. A Pragmatic, Ecological Approach to Small-Landscape
Management. Washington Forest Landscape Management Project Report No. 2.
Washington State Department of Natural Resources, Olympia, WA.
Carter, H. R. 1984. At-Sea Biology of the Marbled Murrelet in Barkley Sound, British Columbia.
M.S. dissertation. University of Manitoba, Winnipeg, MB, Canada.
————. 2003. Oil and California’s Seabirds: An Overview. Marine Ornithology 31:3–9.

7.0 Literature Cited
September 2008 Page 7-6
Carter, H.R., and R.A. Erickson. 1988. Population Status and Conservation Problems of the
Marbled Murrelet in California, 1892-1987. Unpublished report, California Department
of Fish and Game, Sacramento, California.
Carter, H. R., and R.A. Erickson. 1992. Status and Conservation of the Marbled Murrelet in
California. In: H. R. Carter and M. L. Morrison (eds.), Status and Conservation of the
Marbled Murrelet in North America. Proceedings of the Western Foundation of
Vertebrate Zoology 5:92–108.
Carter, H. R., and K. J. Kuletz. 1995. Mortality of Marbled Murrelets due to Oil Pollution in
North America. Pages 161–169 in C. J. Ralph, G. L. Hunt, M. G. Raphael, and J. F. Piatt
(tech. eds.), Ecology and Conservation of the Marbled Murrelet. General Technical
Report PSW-GTR-152. U.S. Forest Service, Pacific Southwest Research Station, Albany,
CA.
Carter, H. R., and S. G. Sealy. 1984. Marbled Murrelet (Brachyramphus marmoratus) Mortality
Due to Gill-Net Fishing in Barkley Sound, British Columbia. Pages 212–220 in D. N.
Nettleship, G. A. Sanger, and P. F. Springer (eds.), Marine Birds: Their Feeding Ecology
and Commercial Fisheries Relationships. Canadian Wildlife Service Special Publication.
Ottawa, ON.
————. 1986. Year-round Use of Coastal Lakes by Marbled Murrelets. The Condor 88:473-
477.
Carter, H. R. and S. G. Sealy. 1987a. Fish-Holding Behavior of Marbled Murrelets. Wilson
Bulletin 99: 289–291.
————. 1987b. Inland Records of Downy Young and Fledgling Marbled Murrelets in North
America. The Murrelet 68:58–63.
————. 1990. Daily Foraging Behavior of Marbled Murrelets. Studies in Avian Biology
14:93–102.
Carter, H. R., and J. L. Stein. 1995. Molts and Plumages in the Annual Cycle of the Marbled
Murrelet. Pages 99–109 in C. J. Ralph, G. L. Hunt, M. G. Raphael, and
J. F. Piatt (tech. eds.), Ecology and Conservation of the Marbled Murrelet. General

7.0 Literature Cited
September 2008 Page 7-7
Technical Report PSW-GTR-152. U.S. Forest Service, Pacific Southwest Research
Station, Albany, CA.
Carter, H. R., M. L. C. McAllister, and M. E. Isleib. 1995. Mortality of Marbled Murrelets Due
to Gill-Net Fishing in North America. Pages 271–283 in C. J. Ralph, G. L. Hunt, Jr., M.
G. Raphael, and J. F. Piatt (tech. eds.), Ecology and Conservation of the Marbled
Murrelet. General Technical Report PSW-GTR-152. U.S. Forest Service, Pacific
Southwest Research Station, Albany, CA.
Chatterjee, S., and A. S. Hadi. 1988. Sensitivity Analysis in Linear Regression. John Wiley, New
York.
Chen, J., J. F. Franklin, and T. A. Spies. 1990. Microclimate Pattern and Basic Biological
Responses at the Clearcut Edge of Old-Growth Douglas-fir Stands. Northwest
Environmental Journal 6:424–425.
————. 1993. Contrasting Microclimates among Clearcut, Edge, and Interior of Old-Growth
Douglas-fir Forest. Agricultural and Forest Meteorology 63:219–237.
————. 1995. Growing-Season Microclimatic Gradients from Clearcut Edges into Old-
Growth Douglas-fir Forests. Ecological Applications 5:74–86.
Colodey, A. G., and P. G. Wells. 1992. Effects of Pulp and Paper Mill Effluents on Estuarine and
Marine Ecosystems in Canada: A Review. Journal of Aquatic Ecosystem Stress and
Recovery 1:201–226.
Congdon, B. C., J. F. Piatt, K. Martin, and V. L. Friesen. 2000. Mechanisms of Population
Differentiation in Marbled Murrelets: Historical versus Contemporary Processes.
Evolution 54:974–986.
Cooper, B. A., M. G. Raphael, and M. Z. Peery. 2006. Trends in Radar-Based Counts of Marbled
Murrelets on the Olympic Peninsula, Washington, 1996-2004. The Condor 108:936–947.
Crookston, N. L., and A. R. Stage. 1999. Percent Canopy Cover and Stand Structure Statistics
from the Forest Vegetation Simulator. General Technical Report RMRS-GTR-24. U.S.
Forest Service, Rocky Mountain Research Station, Ogden, UT.

7.0 Literature Cited
September 2008 Page 7-8
Cross, J. C., and J. M. Comnick. 2006. Identifying Northern Spotted Owl Habitat in the Olympic
Experimental State Forest: Applying Fuzzy Set Theory to Reduce Type II Errors. Final
Report to U.S. Forest Service, Pacific Northwest Research Station, Portland, OR.
Curtis, R. O., and D.D. Marshall. 2000. Why Quadratic Mean Diameter? Western Journal of
Applied Forestry 15:137–139.
Daniels, J. M. 2004. Assessing Socioeconomic Resiliency in Washington Counties. General
Technical Report PNW-GTR-607. U.S. Forest Service, Pacific Northwest Research
Station, Portland, OR.
DeGange, A. R. 1996. A Conservation Assessment for the Marbled Murrelet in Southeast Alaska.
General Technical Report PNW-GTR-388. U.S. Forest Service, Pacific Northwest
Research Station, Portland, OR.
Den Boer, P. J. 1981. On the Survival of Populations in a Heterogeneous and Variable
Environment. Oecologia 50:39–53.
De Santo, T. L, and S. K. Nelson. 1995. Comparative Reproductive Ecology of the Auks (Family
Alcidae) with Emphasis on the Marbled Murrelet. Pages 33–47 in C. J. Ralph, G. L.
Hunt, Jr., M. G. Raphael, and J. F. Piatt (tech. eds.), Ecology and Conservation of the
Marbled Murrelet. General Technical Report PSW-GTR-152. U.S. Forest Service,
Pacific Southwest Research Station, Albany, CA.
Divoky, G. J., and M. Horton. 1995. Breeding and Natal Dispersal, Nest Habitat Loss and
Implications for Marbled Murrelet Populations. Pages 83–87 in C. J. Ralph, G. L. Hunt,
Jr., M. G. Raphael, and J. F. Piatt (tech. eds.), Ecology and Conservation of the Marbled
Murrelet. General Technical Report PSW-GTR-152. U.S. Forest Service, Pacific
Southwest Research Station, Albany, CA.
DNR. See Washington State Department of Natural Resources.
Duke, S. 1997. An Inventory-Based Procedure for Estimating the Abundance of Marbled
Murrelet Platforms. Unpublished report. Weyerhaeuser, Tacoma, WA.
Eisenhawer, A. E., and T. E. Reimchen. 1990. Inland Flight Patterns of Marbled Murrelets,
Brachyramphus marmoratus, on the Queen Charlotte Islands, B.C. Canadian Field
Naturalist 104:439–444.

7.0 Literature Cited
September 2008 Page 7-9
Elliott, J. E., R. W. Butler, R. J. Nortstrom, and P. E. Whitehead. 1989. Environmental
Contaminants and Reproductive Success of Great Blue Heron (Ardea herodias) in British
Columbia, 1986–1989. Environmental Pollution 59:91–114.
Ethier, T. J. 1999. Breeding Ecology and Habitat of Northern Goshawks (Accipiter gentiles
laingi) on Vancouver Island: A Hierarchical Approach. M.S. dissertation. University of
Victoria, Victoria, BC, Canada.
Evans Mack, D., W. P. Ritchie, S. K. Nelson, E. Kuo-Harrison, P. Harrison, and T. E. Hamer.
2000. Methods for Surveying Marbled Murrelets in Forests: An Update to the Protocol
for Land Management and Research. Pacific Seabird Group Marbled Murrelet Technical
Committee, McKinleyville, CA.
Evans Mack, D., W. P. Ritchie, S. K. Nelson, E. Kuo-Harrison, P. Harrison, and T. E. Hamer.
2003. Methods for Surveying Marbled Murrelets in Forests: A Revised Protocol for Land
Management and Research. Pacific Seabird Group Marbled Murrelet Technical
Committee, McKinleyville, CA.
Everett, R. L., P. F. Hessburg, and T. R. Lillybridge. 1994. Emphasis Areas as an Alternative to
Buffer Zones and Reserved Areas in the Conservation of Biodiversity and Ecosystem
Processes. Journal of Sustainable Forestry 2:283–292.
Everett, R. L., and J. F. Lehmkuhl. 1999. Restoring Biodiversity on Public Forest Lands through
Disturbance and Patch Management Irrespective of Land-Use Allocation. Pages 87–105
in R. K. Baydack, H. Campa III, and J. B. Haufler (eds.), Practical Approaches to the
Conservation of Biological Diversity. Island Press, Washington, DC.
Flaherty, E. A., S. A. Dubay, J. Bradley, J. Marzluff, and G. D. Hayward. 2000. The Northern
Flying Squirrel (Glaucomys sabrinus) as a Potential Predator of Marbled Murrelet
(Brachyramphus marmoratus) Eggs. Northwest Science 74:335–339.
Ford, D. E. 2000. Scientific Method for Ecological Research. Cambridge University Press,
Cambridge, U.K.
Ford, R. G., G. K. Himes Boor, B. E. Sharp, and J. L. Casey. 2002. Estimates of Bird Impacts
Resulting from the M/V Kure/Humboldt Bay Oil Spill of November 5, 1997. Final report

7.0 Literature Cited
September 2008 Page 7-10
prepared for California Department of Fish and Game, Office of Spill Prevention and
Response.
Franklin, J. F., and C. T. Dyrness. 1988. Natural Vegetation of Oregon and Washington. Oregon
State University Press, Corvallis, OR.
Franklin, J. F., T. A. Spies, R. Van Pelt, A. B. Carey, D. A. Thorngurgh, D. R. Berg,
D. B. Lindenmayer, M. E. Harmon, W. S. Keeton, D. C. Shaw, K. Bible, and
J. Chen. 2002. Disturbance and Structural Development of Natural Forest Ecosystems
with Silvicultural Implications, Using Douglas-Fir Forests as an Example. Forest
Ecology and Management 155:399–423.
Friesen, V. L., A. J. Baker, and J. F. Piatt. 1996a. A Genetic Study to Aid in the Restoration of
Murres, Guillemots and Murrelets to the Gulf of Alaska. Restoration project 00169 final
report. Exxon Valdez Trustee Council, Anchorage, AK.
————. 1996b. Phylogenetic Relationships within the Alcidae (Charadriiformes: Aves)
Inferred from Total Molecular Evidence. Molecular Biology and Evolution 13:359–367.
Friesen, V. L., T. P. Birt, J. F. Piatt, R. T. Golightly, S. H. Newman, P. N. Hébert, B. C.
Congdon, and G. Gissing. 2005. Population Genetic Structure and Conservation of
Marbled Murrelets (Brachyramphus marmoratus). Conservation Genetics 6:607–614.
Friesen, V. L., B. C. Congdon, H. E. Walsh, and T. P. Birt. 1997. Intron Variation in Marbled
Murrelets Detected Using Analyses of Single-Stranded Conformational Polymorphisms.
Molecular Ecology 6:1047–1058.
Fry, D. M. 1995. Pollution and Fishing Threats to Marbled Murrelets. Pages 257–260 in C. J.
Ralph, G. L. Hunt, Jr., M. G. Raphael, and J. F. Piatt (eds.), Ecology and Conservation of
the Marbled Murrelet. General Technical Report PSW-GTR-152. U.S. Forest Service,
Pacific Southwest Research Station, Albany, CA.
Gaston, A. J., and I. L. Jones. 1998. The Auks: Alcidae. Oxford University Press, New York, NY.
Greene, S. E., P. A. Harcombe, M. E. Harmon, and G. Spycher. 1992. Patterns of Growth,
Mortality, and Biomass Change in a Coastal Picea sitchensis-Tsuga heterophylla Forest.
Journal of Vegetation Science 3:697–706.

7.0 Literature Cited
September 2008 Page 7-11
Green, K. S., S. Bernath, L. Lackey, M. Brunengo, and S. Smith. 1993. Analyzing the
Cumulative Effects of Forest Practices: Where Do We Start? Geo Info Systems 3:31–41.
Grenier, J. J., and S. K. Nelson 1995. Marbled Murrelet Habitat Associations in Oregon. Pages
191-204 in Ralph, C. J., G. L. Hunt Jr., M. G. Raphael, and J. F. Piatt (tech. eds),
Ecology and Conservation of the Marbled Murrelet. General Technical Report PSW-
GTR-152. U.S. Forest Service, Pacific Southwest Research Station, Albany, CA.
Guisan, A., and N. E. Zimmermann. 2000. Predictive Habitat Distribution Models in Ecology.
Ecological Modeling 135:147–186.
Haas, C. A. 1998. Effects of Prior Nesting Success on Site Fidelity and Breeding Dispersal: An
Experimental Approach. The Auk 115:929–936.
Hamer, T. E., and E. B. Cummins. 1991. Relationships between Forest Characteristics and the
Use of Inland Sites by Marbled Murrelets in Northern Washington. Washington
Department of Wildlife, Non-game Program, Olympia, WA.
Hamer, T. E., and D. J. Meekins. 1999. Marbled Murrelet Nest Site Selection in Relation to
Habitat Characteristics in Western Washington. Unpublished report. Hamer
Environmental, L.P., Mount Vernon, WA.
Hamer, T. E., and S. K. Nelson. 1995. Characteristics of Marbled Murrelet Nest Trees and
Nesting Stands. Pages 69–82 in C. J. Ralph, G. L. Hunt Jr., M.G. Raphael, and J. F. Piatt
(tech. eds.), Ecology and Conservation of the Marbled Murrelet. General Technical
Report PSW-GTR-152. U.S. Forest Service, Pacific Southwest Research Station, Albany,
CA.
Hamer, T. E., S. K. Nelson, and T. I. Mohagen. 2003. Nesting Chronology of the Marbled
Murrelet. Unpublished report. U. S. Fish and Wildlife Service, Portland, OR.
Harris, M. P. 1983. Biology and Survival of the Immature Puffin Fratercula arctica. Ibis
125:109–114.
Harris, M. P., and S. Wanless. 1989. Fall Colony and Attendance and Breeding Success in the
Common Murre. The Condor 91:139–146.
7.0 Literature Cited
September 2008 Page 7-12
Harris, M.P., D.J. Halley, and S. Wanless. 1996a. Philopatry in the Common Guillemot Uria
aalge. Bird Study 43:134-137.
Harris, M.P., S.Wanless, and T.R. Barton. 1996b. Site Use and Fidelity in the Common
Guillemot Uria aalge. Ibis 138:399-404.
Harris, M.P., M. Frederiksen, and S. Wanless. 2007. Within- and Between-year Variation in the
Juvenile Survival of Common Guillemots Uria aalge. Ibis 149:472–481.
Harrison, P. 2007. Natural Resources Scientist. Washington Department of Natural Resources,
Olympia, WA. March 30, 2007—e-mail to Erin Colclazier, Research Biologist, Hamer
Environmental, L.P., Mount Vernon, WA.
Harrison, P., S. Horton, D. Prenzlow Escene. 2003. Reports from DNR Inland Marbled Murrelet
Surveys. Unpublished report. Washington State Department of Natural Resources,
Olympia, WA.
Hawksworth, F. G. 1977. The 6-Class Dwarf Mistletoe Rating System. General Technical Report
RM-48. U.S. Forest Service, Rocky Mountain Forest and Range Experiment Station, Fort
Collins, CO.
Hebert, P. N., H. R. Carter, R. T. Golightly, and D. L. Orthmeyer. 2003. Radio-telemetry
Evidence of Re-nesting in the Same Season by the Marbled Murrelet. Waterbirds
26:261–265.
Hebert, P. N., and R. T. Golightly. 2003. Breeding Biology, and Human-Caused Disturbance to
Nesting of Marbled Murrelets (Brachyramphus marmoratus) in Northern California:
Progress Report 2002. Humboldt State University, Department of Wildlife, and U.S.
Geological Survey, Western Ecological Research Center, Arcata and Sacramento, CA.
Henkel, L. A., and J. T. Harvey. 2006. Potential Prey Resources for Marbled Murrelets in
Central California. California Fish and Game 92:191–206.
Heuvelink. G. B. M. 1998. Uncertainty Analysis in Environmental Modelling Under a Change of
Spatial Scale. Nutrient Cycling in Agroecosystems 50:255–264.
Hilborn, R., and M. Mangel. 1997. The Ecological Detective: Confronting Models with Data.
Princeton University Press, Princeton, NJ.

7.0 Literature Cited
September 2008 Page 7-13
Hobson, K. A. 1990. Stable Isotope Analysis of Marbled Murrelets: Evidence for Freshwater
Feeding and Determination of Trophic Level. The Condor 92:897–903.
Holling, C. S. 1973. Resilience and Stability of Ecological Systems. Annual Review of Ecology
and Systematics 4:1–23.
Holmberg, P., B. Aulds, G. McFadden, and W. Jaross. 2005. Thinning Forest Stands, Westside:
An Inter-Active Self-Study and Reference Pamphlet. Internal document. Washington State
Department of Natural Resources, Olympia, WA.
Hooper, T. D. 2001. Research and Inventory of Marbled Murrelets (Brachyramphus
marmoratus) in British Columbia: 1991–1999. Unpublished report. Canadian Wildlife
Service, Pacific and Yukon Region, Delta, BC, Canada.
Horton, S. 2008. Temporal Variability of Marbled Murrelet Activity in Old-Growth Forests.
Pages 1-35 in Ph.D. dissertation. University of Washington, College of Forest Resources,
Seattle, WA.
Hudson, P. J. 1985. Population Parameters for the Atlantic Alcidae. Pages 233–261 in
D. N. Nettleship and T. R. Birkhead (eds.), The Atlantic Alcidae. Academic Press,
London, England.
Huff, M., P. Jodice, J. Baldwin, S. Miller, R. Young, K. Ostrom, C. J. Ralph, M. Raphael, C.
Strong, and C. Thompson. 2003. Draft Marbled Murrelet Effectiveness Monitoring
Northwest Forest Plan. 2002 Annual Summary Report. Northwest Forest Plan
Interagency Regional Monitoring Program.
Hull, C. L., G. W. Kaiser, C. Lougheed, L. Lougheed, S. Boyd, and F. Cooke. 2001. Intraspecific
Variation in Commuting Distance of Marbled Murrelets (Brachyramphus marmoratus):
Ecological and Energetic Consequences of Nesting Further Inland. The Auk 118:1036–
1046.
Hunt, G.L. Jr.1995a. Monospecific and Mixed Species Foraging Associations of Marbled
Murrelets. Pages 255-256 in Ralph, C. J., G. L. Hunt Jr., M. G. Raphael, and J. F. Piatt
(tech. eds), Ecology and Conservation of the Marbled Murrelet. General Technical
Report PSW-GTR-152. U.S. Forest Service, Pacific Southwest Research Station, Albany,
CA.

7.0 Literature Cited
September 2008 Page 7-14
Hunt, G. L. Jr. 1995b. Oceanographic Processes and Marine Productivity in Waters Offshore of
Marbled Murrelet Breeding Habitat. Pages 219-222. in C. J. Ralph, J. G. L. Hunt, M. G.
Raphael, and J. F. Piatt (tech. eds.), Ecology and Conservation of the Marbled Murrelet.
General Technical Report PSW-152. U. S. Forest Service, Pacific Southwest Research
Station, Albany, CA.
Irons, D. B. 1992. Aspects of Foraging Behavior and Reproductive Biology of the Black-Legged
Kittiwake. Ph.D. dissertation. University of California, Irvine, CA.
Iverson, G. C., G. D. Hayward, K. Titus, E. DeGayner, R. E. Lowell, D. C. Crocker-Bedford, P.
F. Schempf, and J. Lindell. 1996. Conservation Assessment for the Northern Goshawk in
Southeast Alaska. General Technical Report PNW-GTR-387. U. S. Forest Service,
Pacific Northwest Research Station, Portland, OR.
Jaross, W., and W. Read. 2006. Wind Hazard Assessment in the Willapa Region of Southwestern
Washington. Unpublished document. Washington State Department of Natural
Resources, Olympia, WA.
Jodice, P. G. R., and M. W. Collopy. 1999. Diving and Foraging Patterns of Marbled Murrelets
(Brachyramphus marmoratus): Testing Predictions from Optimal-Breathing Models.
Canadian Journal of Zoology 77:1409–1418.
Jones, P.H. 1992. Marbled Murrelet Flight Behaviour at a Presumed Nesting Area in the Caren
Range, near Sechelt, British Columbia. British Columbia Birds 2:14-18.
————. 1994. Canada’s Second Marbled Murrelet Chick Sighting, Caren Range, B.C.
Discovery 23:99.
————. 2001. The Marbled Murrelets of the Caren Range and Middlepoint Bight. Western
Canada Wilderness Committee, Vancouver, BC, Canada.
Kokko, H., M. P. Harris, and S. Wanless. 2004. Competition for Breeding Sites and Site-
Dependent Population Regulation in a highly Colonial Seabird, the Common Guillemot
Uria aalge. Journal of Animal Ecology 73:367–376.
Konyukhov, N. B., and A. S. Kitaysky. 1995. The Asian Race of the Marbled Murrelet. Pages
23–29 in C. J. Ralph, G. L. Hunt, M. G. Raphael, and J. F. Piatt (tech. eds.), Ecology and

7.0 Literature Cited
September 2008 Page 7-15
Conservation of the Marbled Murrelet. General Technical Report PSW-GTR-152. U. S.
Forest Service, Pacific Southwest Research Station, Albany, CA.
Kremsater, L., and F. L. Bunnel. 1999. Edge Effects: Theory, Evidence and Implication to
Management of Western North American Forests. In J. A. Rochelle, L. Lehman, and J.
Wisniewski (eds.), Forest Fragmentation: Wildlife and Management Implications. Brill,
Leiden, The Netherlands.
Kuletz, K. J. 1996. Marbled Murrelet Abundance and Breeding Activity at Naked Island, Prince
William Sound, and Kachemak Bay, Alaska, Before and After the Exxon Valdez Oil
Spill. American Fisheries Society Symposium 18:770–784.
Kuletz, K. J. 2005. Foraging Behavior and Productivity of a Non-colonial Seabird, the Marbled
Murrelet (Brachyramphus marmoratus), Relative to Prey and Behavior. Ph.D.
dissertation. University of Victoria, Victoria, B.C., Canada.
Kuletz, K. J., and S. J. Kendall. 1998. A Productivity Index for Marbled Murrelets in Alaska
Based on Surveys at Sea. Journal of Wildlife Management 62: 446–460.
Lance, M. M., and S. F. Pearson. 2005. 2005 At-Sea Marbled Murrelet Population Monitoring.
Washington Department of Fish and Wildlife, Olympia, WA. Available:
<http://wdfw.wa.gov/wlm/research/papers/murrelet/2005_at_sea_monitoring.pdf>.
Lank, D. B., N. Parker, E. A. Krebs, and L. McFarlane-Tranquilla. 2003. Geographic
Distribution, Habitat Selection, and Population Dynamics with Respect to Nesting
Habitat Characteristics of Marbled Murrelets (Brachyramphus marmoratus). Simon
Fraser University, Center of Wildlife Ecology, Vancouver, BC, Canada.
Lindenmayer, D. B., and J. F. Franklin. 2002. Conserving Forest Biodiversity: A Comprehensive
Multiscaled Approach. Island Press, Washington, DC.
Lougheed, L. W., W. D. Beauchamp, I. A. Manley, A. E. Derocher, G. W. Kaiser, and
F. Cooke. 1998. Demography and Ecology of Marbled Murrelets in Desolation Sound,
British Columbia (1995). CWS/NSERC Wildlife Ecology Chair Technical Report No.
001. Simon Fraser University, Burnaby, BC, Canada.

7.0 Literature Cited
September 2008 Page 7-16
Lougheed, C. L., L. W. Lougheed, F. Cooke, and S. Boyd. 2002. Local Survival of Adult and
Juvenile Marbled Murrelets and Their Importance for Estimating Reproductive Success.
The Condor 104:309–318.
Luginbuhl, J. M. 2003. Patch and Landscape Factors Affecting Marbled Murrelet Nest Predation
in Coastal Oregon. Unpublished report. University of Washington, College of Forest
Resources, Seattle, WA.
Luginbuhl, J. M., J. M. Marzluff, J. E. Bradley, M. G. Raphael, and D. E. Varland. 2001. Corvid
Survey Techniques and the Relationship between Corvid Relative Abundance and Nest
Predation. Journal of Field Ornithology 72:556–572.
Madsen, S., D. Evans, T. Hamer, P. Henson, S. Miller, S. K. Nelson, D. Roby, and M. Stapanian.
1999. Marbled Murrelet Effectiveness Monitoring Plan for the Northwest Forest Plan.
General Technical Report PNW-GTR-439. U.S. Forest Service, Pacific Northwest
Research Station, Portland, OR.
Mahon T. E., G.W. Kaiser, and A. E. Burger. 1992. The Role of Marbled Murrelets in Mixed-
Species Feeding Flocks in British Columbia. The Wilson Bulletin 104:738-743.
Malt, J., and D. Lank. 2007. Temporal Dynamics of Edge Effects on Nest Predation Risk for the
Marbled Murrelet. Biological Conservation 140:160–173.
Manley, I. A. 1999. Behaviors and Habitat Selection of Marbled Murrelets Nesting on the
Sunshine Coast. Simon Fraser University, Department of Biological Sciences, Burnaby,
BC, Canada.
————. 2000. Radar Surveys of Marbled Murrelets on the Northwest Coast of Vancouver
Island, British Columbia. Unpublished report. British Columbia Ministry of
Environment, Lands and Parks, Nanaimo, BC, Canada.
————. 2003. Characteristics of Marbled Murrelet Nest Sites in Desolation Sound and
Clayoquot Sound, BC. Unpublished report. Simon Fraser University, Burnaby, BC,
Canada.
Manley, I. A., and S. Cullen. 2003. Marbled Murrelet Occurrence in the Squamish and
Chilliwack Forest Districts: Results of Reconnaissance Radar Surveys in 2002.

7.0 Literature Cited
September 2008 Page 7-17
Unpublished report. British Columbia Ministry of Water, Land and Air Protection,
Victoria, BC.
Manley, I. A., and S. K. Nelson. 1999. Habitat Characteristics Associated with Nesting Success
and Predation at Marbled Murrelet Nests. Pacific Seabirds 26:40.
Marks, D. K., and K. J. Kuletz. 2001. Use of Treeless and Forested Habitat by Marbled
Murrelets in South-Central Alaska. Waterbirds 24:161–168.
Marks, D. K., and N. L. Naslund. 1994. Sharp-Shinned Hawk Preys on a Marbled Murrelet
Nestling in Old-Growth Forest. Wilson Bulletin 106:565–567.
Marshall, D. B. 1988. Status of the Marbled Murrelet in North America: With Special Emphasis
on Populations in California, Oregon, and Washington. U.S. Fish and Wildlife Service,
Portland, OR.
Marzluff, J. M., and M. Restani. 1999. The Effects of Forest Fragmentation on Rates of Avian
Nest Predation and Parasitism. Unpublished report. University of Washington, College
of Forest Resources, Seattle, Washington.
Marzluff, J. M., J. B. Boone, and G. W. Cox. 1994. Historical Changes in Populations and
Perceptions of Native Pest Bird Species in the West. Studies in Avian Biology 15:202–
220.
Marzluff, J. M., J. M. Luginuhl, J. E. Bradley, E. Neatherlin, M. G. Raphael, D. M. Evans, D. E.
Varland, L. S. Young, S. P. Horton, and S. P. Courtney. 1999. The Influence of Stand
Structure, Proximity to Human Activity, and Forest Fragmentation on the Risk of
Predation to Nests of Marbled Murrelets on the Olympic Peninsula. Unpublished report.
Sustainable Ecosystems Institute and University of Washington College of Forest
Resources, Seattle, WA.
Marzluff, J. M., M. G. Raphael, and R. Sallabanks. 2000. Understanding the Effects of Forest
Management on Avian Species. Wildlife Society Bulletin 28:1132–1143.
Mathews, N. J. C., and A. E. Burger. 1998. Diving Depth of a Marbled Murrelet. Northwestern
Naturalist 79:70–71.

7.0 Literature Cited
September 2008 Page 7-18
McFarlane Tranquilla, L., R. Bradley, N. Parker, D. Lank, and F. Cooke. 2003. Replacement
Laying in Marbled Murrelets (Brachyramphus marmoratus). Marine Ornithology 31:75–
81.
McFarlane Tranquilla, L., N. R. Parker, R. W. Bradley, D. B. Lank, E. A. Krebs, L. Lougheed,
and C. Lougheed. 2005. Breeding Chronology of Marbled Murrelets Varies Between
Coastal and Inshore Sites in Southern British Columbia. Journal of Field Ornithology
76:357–367.
McFarlane Tranquilla, L., T. D. Williams, and F. Cooke. 2004. Using Physiology to Examine
Interannual Variation in Breeding Chronology of Marbled Murrelets in Desolation
Sound, B.C. The Auk 120:512-521.
McShane, C. T., T. Hamer, H. Carter, G. Swartzman, V. Friesen, D. Ainley, R. Tressler, K.
Nelson, A. Burger, L. Spear, T. Mohagen, R. Martin, L. Henkel, K. Prindle,
C. Strong, and J. Keany. 2004. Evaluation Report for the 5-Year Status Review of the
Marbled Murrelet in Washington, Oregon and California. Unpublished report. EDAW,
Inc. Seattle, WA. Prepared for the U.S. Fish and Wildlife Service, Region 1. Portland,
OR.
Meyer, C. B., S. L. Miller, and C. J. Ralph. 2002. Multi-scale Landscape and Seascape Patterns
Associated with Marbled Murrelet Nesting Areas on the US West Coast. Landscape
Ecology 17:95–115.
————. 2004. Logistic Regression Accuracy Across Different Spatial and Temporal Scales
for a Wide-Ranging Species, the Marbled Murrelet. Pages 94-106 in S. Huzurbazar (ed.)
Resource Selection Methods and Applications. Omnipress, Madison, Wisconsin.
Miller, S. L., C. J. Ralph, M. G. Raphael, C. Strong, C. W. Thompson, J. Baldwin, M. H. Huff,
and G. A. Falxa. 2006. At-Sea Monitoring of Marbled Murrelet Population Status and
Trend in the Northwest Forest Plan Area. Pages 31–60 in M. H. Huff, S. L. Miller, S. K.
Nelson, and J. Baldwin (tech. coords.), Northwest Forest Plan—the First 10 Years
(1994–2003): Status and Trends of Populations and Nesting Habitat for the Marbled
Murrelet. General Technical Report PNW-GTR-650. U. S. Forest Service, Pacific
Northwest Research Station, Portland, OR.

7.0 Literature Cited
September 2008 Page 7-19
Mitchell, S. J. 2000. Stand Density Management Diagram. Forest Health: Preliminary
Interpretations for Wind Damage. Forest Practices Branch Information Booklet. British
Columbia Ministry of Forests, Victoria, BC, Canada.
Mlodinow, S. G. 1997. The Long-Billed Murrelet (Brachyramphus perdix) in North America.
Birding 29:460–475.
Morris, W. F., and D. F. Doak. 2002. Quantitative Conservation Biology: Theory and Practice of
Population Viability Analysis. Sinauer Associates, Sunderland, MA.
Naslund, N. L. 1993. Breeding Biology and Seasonal Activity Patterns of Marbled Murrelets
(Brachyramphus marmoratus) Nesting in an Old-Growth Forest. M.S. dissertation.
University of California, Santa Cruz, CA.
Naslund, N. L., K. J. Kuletz, M. B. Cody, and D. K. Marks. 1995. Tree and Habitat
Characteristics and Reproductive Success at Marbled Murrelet Tree Nests in Alaska.
Northwestern Naturalist 76:12–25.
National Geographic Society. 1987. Field Guide to Birds of North America. National Geographic
Society, Washington D.C.
Nechaev, V. A. 1986. New Information on the Seabirds of Sakhalin Island. Pages 71–81 in
N. M. Lituinenko (ed.), Seabirds of the Far East. Akademiya Nauk SSSR. Vladivostok,
USSR. (In Russian; English translation by D. Siegel-Causey.)
Neel, J., C. Hart, D. Lynch, S. Chan, and J. Harris. 1997. Oil Spills in Washington State:
A Historical Analysis. Washington Department of Ecology. Olympia, WA. Available:
<http://www.ecy.wa.gov/pubs/97252.pdf>.
Nelson, S. K. 1997. Marbled Murrelet (Brachyramphus marmoratus). Pages 1–32 in A. Poole
and G. Gill, (eds.) Birds of North America, No. 276 Academy of Natural Sciences,
Philadelphia, and American Ornithologists’ Union, Washington, DC.
Nelson, S. K., M. H. Huff, S. L. Miller, M. G. Raphael. 2006. Marbled Murrelet Biology: Habitat
Relations and Populations. Pages 9–32 in M. H. Huff, M. G. Raphael, S. L. Miller, S. K.
Nelson, and J. Baldwin (tech. coords.), Northwest Forest Plan—The First 10 years
(1994-2003): Status and Trends of Populations and Nesting Habitat for the Marbled

7.0 Literature Cited
September 2008 Page 7-20
Murrelet. General Technical Report PNW-GTR-650. U. S. Forest Service, Pacific
Northwest Research Station, Portland, OR.
Nelson, S. K., and T. E. Hamer. 1995a. Nesting Biology and Behavior of the Marbled Murrelet.
Pages 57-67 in C. J. Ralph, J. G. L. Hunt, M. G. Raphael, and J. F. Piatt (tech. eds.),
Ecology and Conservation of the Marbled Murrelet. General Technical Report
PSW-152. U. S. Forest Service, Pacific Southwest Research Station, Albany, CA.
Nelson, S. K., and T. E. Hamer. 1995b. Nest Success and the Effects of Predation on Marbled
Murrelets. Pages 89–98 in C. J. Ralph, J. G. L. Hunt, M. G. Raphael, and J. F. Piatt (tech.
eds.), Ecology and Conservation of the Marbled Murrelet. General Technical Report
PSW-152, U.S. Forest Service, Pacific Southwest Research Station, Albany, CA.
Nelson, S.K., T. E. Hamer, A. K. Wilson and D. J. Meekins. 2002. Characteristics of Marbled
Murrelet Nest Trees and Nest Sites in the Pacific Northwest. Abstract. Third North
American Ornithological Conference (World Meeting Number 000 64 222), New
Orleans, LA.
Nelson, S. K., M. L. C. McAllister, M. A. Stern, D. H. Varoujean, and J. M. Scott. 1992. The
Marbled Murrelet in Oregon, 1899–1987. Pages 61–91 in H. R. Carter (editor), Status,
Distribution and Management of the Marbled Murrelet. Proceedings of the Western
Foundation Vertebrate Zoology.
Nelson, S. K., and R. W. Peck. 1995. Behavior of Marbled Murrelets at Nine Nest Sites in
Oregon. Northwestern Naturalist 76:43–53.
Nelson, S. K., and A. K. Wilson. 2002. Marbled Murrelet Habitat Characteristics on State
Lands in Western Oregon. Unpublished report to the Oregon Department of Forestry,
Salem, OR. Final report, Oregon Cooperative Fish and Wildlife Research Unit, Oregon
State University, Department of Fisheries and Wildlife, Corvallis, OR.
Newton, I. 2001. Causes and Consequences of Breeding Dispersal in the Sparrowhawk
(Accipiter nisus). Ardea 89:143–154.
Norris, D.R., P. Arcese, D. Preikshot, D.F., Bertram, and T.K. Kyser. 2007. Diet Reconstruction
and Historic Population Dynamics in a Threatened Seabird. Journal of Applied Ecology
44: 875-884.

7.0 Literature Cited
September 2008 Page 7-21
Nur, N., and W. J. Sydeman. 1999. Survival, Breeding Probability and Reproductive Success in
Relation to Population Dynamics of Brandt’s Cormorants Phalacrocorax penicillatus.
Bird Study 46:92–103.
Oakley, K. L., and K. J. Kuletz. 1994. Population, Reproduction, and Foraging of Pigeon
Guillemots at Naked Island, Alaska, Before and After the Exxon Valdez Oil Spill. Exxon
Valdez Oil Spill State/Federal Natural Resources Damage Assessment Final Reports:
Bird Study No. 9. Unpublished report. U. S. Fish and Wildlife Service, Anchorage, AK.
Oakley, K. L., T. L. Wade, and K. J. Kuletz. 1994. Aliphatic and Polycyclic Aromatic
Hydrocarbons in Livers of Marbled Murrelets in Prince William Sound, Alaska, after the
Exxon Valdez Oil Spill. Exxon Valdez Oil Spill State/Federal Natural Resources Damage
Assessment Final Reports: Bird Study 6. Unpublished manuscript supplied by authors. U.
S. Fish and Wildlife Service, Anchorage, AK.
Odum, E. P., and G. W. Barrett. 2005. Fundamentals of Ecology. Fifth edition. Thomson
Brooks/Cole, Belmont, CA.
Ohlendorf, H. M., R. W. Risebrough, and K. Vermeer. 1978. Exposure of Marine Birds to
Environmental Pollutants. Wildlife Research Report 9. U. S. Fish and Wildlife Service,
Washington, DC.
Parker, N., E. Cam, D. B. Lank, and F. Cooke. 2003. Post-Fledgling Survival of Marbled
Murrelets Brachyramphus marmoratus Estimated with Radio-Marked Juveniles in
Desolation Sound, British Columbia. Marine Ornithology 31:207–212.
Paton, P. W. C. 1995. Marbled Murrelet Inland Patterns of Activity: Defining Detections and
Behavior. Pages 113–116 in C. J. Ralph, G. L. Hunt, M. G. Raphael, and J. F. Piatt (tech.
eds.), Ecology and Conservation of the Marbled Murrelet. General Technical Report
PSW-GTR-152. U.S. Forest Service, Pacific Southwest Research Station, Albany, CA.
Peery, M. Z. 2004. Ecology and Conservation of the Marbled Murrelet (Brachyramphus
marmoratus) in Central California. Ph.D. dissertation. University of California,
Environmental Science, Policy, and Management, Berkeley, CA.

7.0 Literature Cited
September 2008 Page 7-22
Peery, M. Z., B. H. Becker, and S. R. Beissinger. 2007. Age Ratios as Estimators of
Productivity: Testing Assumptions on a Threatened Seabird, the Marbled Murrelet
(Brachyramphus marmoratus). The Auk 124:224–240.
Peery, M. Z., B. H. Becker, and S. R. Beissinger. 2006a. Combining Demographic and Count-
Based Approaches to Identify Source-Sink Dynamics: An Example Using a Threatened
Seabird. Ecological Applications 16:1516–1528.
Peery, M. Z., S. R. Beissinger, E. Burkett, and S. H. Newman. 2006b. Local Survival Rates of
Marbled Murrelets: Roles of Oceanographic Conditions, Sex, and Radio-Tagging.
Journal of Wildlife Management 70:78-88.
Peery, M. Z., S. R. Beissinger, S. H. Newman, B. H. Becker, E. Burkett, and T. D. Williams.
2004a. Applying the Declining Population Paradigm: Diagnosing Causes of Poor
Reproduction in the Marbled Murrelet. Conservation Biology 18:1088–1098.
————. 2004b. Individual and Temporal Variation in Inland Flight Behavior of Marbled
Murrelets: Implications for Population Monitoring. The Condor 106:344–353.
Peery, M. Z., L. A. Henkel, S. H. Newman, B. H. Becker, J. T. Harvey, C. Thompson, and S. R.
Beissinger. In press. Effects of Rapid Flight-Feather Molt on Post-Breeding Dispersal in
a Threatened Seabird. The Auk.
Pennycuick, C. J. 1987. Flight of Seabirds. Pages 43–62 in J. P. Croxall (ed.), Seabirds: Feeding
Ecology and Role in Marine Ecosystems. Cambridge University Press, Cambridge,
England.
Piatt, J. F., and R. G. Ford. 1993. Distribution and Abundance of Marbled Murrelets in Alaska.
The Condor 95:662–669.
Piatt, J. F., K. J. Kuletz, A. E. Burger, S. A. Hatch, T. P. Birt, M. L. Arimitsu, G. S. Drew, A. M.
A. Harding, and K. S. Bixler. 2007. Status Review of the Marbled Murrelet
(Brachyramphus marmoratus) in Alaska and British Columbia. U. S. Geological Survey
Open-File Report 2006-1387.
Piatt, J. F., and N. L. Naslund. 1995. Abundance, Distribution, and Population Status of Marbled
Murrelets in Alaska. Pages 285–294 in C. J. Ralph, G. L. Hunt, M. G. Raphael, and J. F.
Piatt (Tech. eds.), Ecology and Conservation of the Marbled Murrelet. General Technical

7.0 Literature Cited
September 2008 Page 7-23
Report PSW-GTR-152. U.S. Forest Service, Pacific Southwest Research Station. Albany,
CA.
Pimm, S. 1976. Estimation of Duration of Bird Molt. The Condor 78:550.
Prenzlow Escene, D. 1999. Marbled Murrelet Forest Habitat Relationship Studies. Unpublished
report. Washington State Department of Natural Resources. Olympia, WA.
Prenzlow Escene, D. 2002. Final Recommendations from the Steering Committee for the
Marbled Murrelet Inland Survey Protocol Statistical Analyses. Unpublished report.
Pacific Seabird Group. Available: <http://www.pacificseabirdgroup.org>.
Prenzlow Escene, D., S. Horton, W. S. Jaross, and J. Baldwin. 2006. Predicting Carrying
Capacity (K) for Marbled Murrelets in the Coastal Lowlands of Southwest Washington.
Poster presented at the Thirty-third Annual Meeting of the Pacific Seabird Group, 15-19
February 2006, Girdwood, Alaska. Available from: D. Prenzlow Escene, Washington
Department of Natural Resources, PO Box 47016, Olympia, WA, 98504-7016;
Pulliam, H.R. 1988. Sources, Sinks and Population Regulation. American Naturalist 132:652–
661.
Ralph, C. J., S. K. Nelson, M. M. Shaughnessy, and S. L. Miller. 1993. Methods for Surveying
Marbled Murrelets in Forests. Technical Paper No. 1. Pacific Seabird Group, Marbled
Murrelet Technical Committee.
Ralph, C. J., S. K. Nelson, M. M. Shaughnessy, S. L. Miller, and T. E. Hamer. 1994. Methods for
Surveying for Marbled Murrelets in Forests—A Protocol for Land Management and
Research. Technical Paper No. 1, revision. Pacific Seabird Group, Marbled Murrelet
Technical Committee. Available from U. S. Forest Service, Redwood Sciences
Laboratory, 1700 Bayview Dr., Arcata, CA.
Ralph, C. J., G. L. Hunt Jr., M. G. Raphael, and J. F. Piatt (tech. eds). 1995a. Ecology and
Conservation of the Marbled Murrelet. General Technical Report PSW-GTR-152. U. S.
Forest Service, Pacific Southwest Research Station, Albany, CA.
Ralph, C.J., G.L. Hunt Jr., M.G. Raphael, and J.F. Piatt 1995b. Ecology and Conservation of the
Marbled Murrelet in North America: an Overview. Pages 3-22 in Ralph, C. J., G. L. Hunt

7.0 Literature Cited
September 2008 Page 7-24
Jr., M. G. Raphael, and J. F. Piatt (tech. eds), Ecology and Conservation of the Marbled
Murrelet. General Technical Report PSW-GTR-152. U. S. Forest Service, Pacific
Southwest Research Station, Albany, CA.
Ralph, C. J., S. K. Nelson, S. L. Miller, and T. E. Hamer. 1995c. Pacific Seabird Group, Marbled
Murrelet Technical Committee, Inland Survey Protocol Subcommittee. March 8, 1995—
letter to marbled murrelet surveyors and managers providing additions to the 1994 inland
survey protocol. Available from U. S. Forest Service, Redwood Sciences Laboratory,
1700 Bayview Dr., Arcata, CA.
————. 1996. Pacific Seabird Group, Marbled Murrelet Technical Committee, Inland Survey
Protocol Subcommittee. April 24, 1996—letter to marbled murrelet surveyors and
managers providing clarification and updates for the 1994 protocol and 1995 protocol
letter. Available from U. S. Forest Service, Redwood Sciences Laboratory, 1700 Bayview
Dr., Arcata, CA.
————. 1997. Pacific Seabird Group, Marbled Murrelet Technical Committee, Inland Survey
Protocol Subcommittee. April 24, 1997—letter to marbled murrelet surveyors and
managers providing clarification and updates for the 1994 protocol and subsequent
protocol letters. Available from U. S. Forest Service, Redwood Sciences Laboratory,
1700 Bayview Dr., Arcata, CA.
————. 1998. Pacific Seabird Group, Marbled Murrelet Technical Committee, Inland Survey
Protocol Subcommittee. March 11, 1998—letter to marbled murrelet surveyors and
managers providing clarification and updates for the 1994 protocol and subsequent
protocol letters. Available from U. S. Forest Service, Redwood Sciences Laboratory,
1700 Bayview Dr., Arcata, CA.
Raphael, M. G. 2006. Conservation of the Marbled Murrelet under the Northwest Forest Plan.
Conservation Biology 20:297–305.
Raphael, M. G., D. Evans Mack, and B. A. Cooper. 2002a. Landscape-Scale Relationships
between Abundance of Marbled Murrelets and Distribution of Nesting Habitat. The
Condor 104:331–342.

7.0 Literature Cited
September 2008 Page 7-25
Raphael, M. G., D. Evans Mack, J. M. Marzluff, and J. M. Luginbuhl. 2002b. Effects of Forest
Fragmentation on Populations of the Marbled Murrelet. Studies in Avian Biology 25:221–
235.
Raphael, M. G., B. M. Galleher, M. H. Huff, S. L. Miller, S. K. Nelson, and R. Young. 2006.
Spatially Explicit Estimates of Potential Nesting Habitat for the Marbled Murrelet.
Chapter 5 in M. H. Huff, S. L. Miller, S. K. Nelson, and J. Baldwin (tech. coords.),
Northwest Forest Plan—The First 10 Years (1994–2003): Status and Trends of
Populations and Nesting Habitat for the Marbled Murrelet. General Technical Report
PNW-GTR-650. U. S. Forest Service, Pacific Northwest Research Station, Portland, OR.
Raphael, Martin G. Chief Research Wildlife Ecologist. U.S. Forest Service, Pacific Northwest
Research Station, Portland, OR. July 25, 2005—PowerPoint presentation in e-mail to
Scott Horton, Olympic Region Wildlife Biologist, Washington State Department of
Natural Resources, Forks, WA.
Reimer, D., W. Jaross, and M. Bowering. 2004. Growth and Yield, and Regime Analysis
Supporting DNR Sustainable Harvest Calculations. Washington State Department of
Natural Resources internal reports. Olympia, WA.
Remsoft, Inc. 2005. Woodstock 3.28 User Guide. Fredericton, NB, Canada.
Ripple, W. J., S. K. Nelson, and E. M. Glenn. 2003. Forest Landscape Patterns around Marbled
Murrelet Nest Sites in the Oregon Coast Range. Northwestern Naturalist 84:80–89.
Rodway, M. S., H. M. Regehr, and J.-P. L. Savard. 1993. Activity Patterns of Marbled
Murrelets in Old-Growth Forest in the Queen Charlotte Islands, British Columbia. The
Condor 95: 831-848.
Rodway, M. S., H. R. Carter, S. G. Sealy, and R. W. Campbell. 1992. Status of the Marbled
Murrelet in British Columbia. In: H. R. Carter and M. L. Morrison (eds.), Status and
Conservation of the Marbled Murrelet in North America. Proceedings of the Western
Foundation of Vertebrate Zoology 5:17–47.
Sanger, G. A. 1987. Winter Diets of Common Murres and Marbled Murrelets in Kachemak Bay,
Alaska. The Condor 89:426–430.

7.0 Literature Cited
September 2008 Page 7-26
Schroeder, B. K., M. H. Mather, and T. A. Chatwin. 1999. Reconnaissance Inventory of Marbled
Murrelets on the Central Coast of British Columbia 1998. Unpublished report. British
Columbia Ministry of Environment, Lands, and Parks, Nanaimo, BC.
Sealy, S. G. 1974. Breeding Phenology and Clutch Size in the Marbled Murrelet. The Auk 91:10–
23.
————. 1975. Feeding Ecology of Ancient and Marbled Murrelets near Langara Island,
British Columbia. Canadian Journal of Zoology 53:418–433.
Sealy, S. G., H. R. Carter, W. D. Shurford, K. D. Powers, and C. A. Chase III. 1991. Long-
Distance Vagrancy of the Asiatic Marbled Murrelet in North America 1979–1989.
Western Birds 22:145–155.
Shugart, H. H. 2003. A Theory of Forest Dynamics: the Ecological Implications of Forest
Succession Models. The Blackburn Press, Caldwell, New Jersey.
Singer, S. W., N. L. Naslund, S. A. Singer, and C. J. Ralph. 1991. Discovery and Observations of
Two Tree Nests of the Marbled Murrelet. The Condor 93:330–339.
Singer, S. W., D. L. Suddjian, and S. A. Singer. 1995. Fledging Behavior, Flight Patterns, and
Forest Characteristics at Marbled Murrelet Tree Nests in California. Northwestern
Naturalist 76:54–62.
Speckman, S. G. 1996. Marbled Murrelet Distribution and Abundance in Relation to the Marine
Environment. M. S. dissertation. University of Alaska, Fairbanks, AK.
Speckman, S. G., J. F. Piatt, and A. M. Springer. 2003. Deciphering the Social Structure of
Marbled Murrelets from Behavioral Observations at Sea. Waterbirds 26:266-274.
Speich, S. M., and T. R. Wahl. 1995. Marbled Murrelet Populations of Washington— Marine
Habitat Preferences and Variability of Occurrence. Pages 313–326 in C. J. Ralph, G. L.
Hunt, M. G. Raphael, and J. F. Piatt (tech. eds.), Ecology and Conservation of the
Marbled Murrelet. General Technical Report PSW-GTR-152. U. S. Forest Service,
Pacific Southwest Research Station, Albany, CA.
Steventon, J. D. and N. L. Holmes. 2002. A Radar Based Inventory of Marbled Murrelets
(Brachyramphus marmoratus): Northern Mainland Coast of British Columbia.

7.0 Literature Cited
September 2008 Page 7-27
Unpublished report. Smithers, British Columbia: Ministry of Forests, Prince Rupert
Region.
Strachan, G., M. McAllister, and C. J. Ralph. 1995. Marbled Murrelet At-Sea and Foraging
Behavior. Pages 247–254 in C. J. Ralph, G. L. Hunt, M. G. Raphael, and J. F. Piatt (eds.),
Ecology and Conservation of the Marbled Murrelet. General Technical Report PSW-
GTR-152. U. S. Forest Service, Pacific Southwest Research Station, Albany, CA.
Strong, C. S., B. S. Keitt, W. R. McIver, C. J. Palmer, and I. Gaffney. 1995. Distribution and
Population Estimates of Marbled Murrelets At-Sea in Oregon during the Summers of
1992 and 1993. Pages 339–352 in C. J. Ralph, G. L. Hunt, Jr., M. G. Raphael, and J. F.
Piatt (tech. eds.), Ecology and Conservation of the Marbled Murrelet. General Technical
Report PSW-GTR-152. U. S. Forest Service, Southwest Research Station, Albany, CA.
Suddjian, D. B. 2003. Ten Years of Monitoring Marbled Murrelets at the South Fork of Butano
Creek, San Mateo County, California, 1992-2001. Big Creek Lumber Company,
Davenport, CA.
Swartzman, G., H. Carter, S. Nelson, P. Morrison, and K. L. Sallee. 1997. LIMBS (Landscape-
Level Individual Murrelet Based Simulation): A Model for Examining the Effects of
Different Forest Management Scenarios on Marbled Murrelets in Northern California.
Unpublished report. Sierra Club and Environmental Protection Information Center,
Garberville, California.
Thompson, C. W. 1997. Distribution and Abundance of Marbled Murrelets and Common Murres
on the Outer Coast of Washington. Unpublished report to the Tenyo Maru Trustee
Council. Washington Department of Fish and Wildlife, Olympia, WA.
Thompson, C. W. 1999. Distribution and Abundance of Marbled Murrelets and Common Murres
on the Outer Coast of Washington. Washington Department of Fish and Wildlife,
Olympia, WA. Available: <http://wdfw.wa.gov/wlm/research/papers/murrelet>.
USDA and USDI. See U.S. Department of Agriculture and U.S. Department of the Interior.
U.S. Department of Agriculture and U.S. Department of the Interior. 1994. Record of Decision
for Amendments to Forest Service and Bureau of Land Management Planning
Documents within the Range of the Northern Spotted Owl; Standards and Guidelines for

7.0 Literature Cited
September 2008 Page 7-28
Management of Habitat for Late-Successional and Old-Growth Forest Related Species
within the Range of the Northern Spotted Owl. Region 10. U. S. Forest Service and
Bureau of Land Management, U.S. Government Printing Office, Washington, DC.
U.S. Fish and Wildlife Service. 1997. Recovery Plan for the Threatened Marbled Murrelet
(Brachyramphus marmoratus) in Washington, Oregon, and California. Portland, OR.
U.S. Fish and Wildlife Service and National Marine Fisheries Service. 2000. Notice of
Availability of a Final Addendum to the Handbook for Habitat Conservation Planning
and Incidental Take Permitting Process. Federal Register 65:35242–35257. Available:
<http://www.epa.gov/fedrgstr/EPA-IMPACT/2000/June/Day-01/i13553.htm>.
USFWS. See U.S. Fish and Wildlife Service.
USFWS and NMFS. See U.S. Fish and Wildlife Service and National Marine Fisheries Service.
Vanclay, J. K., and J. P. Skovsgaard. 1997. Evaluating Forest Growth Models. Ecological
Modeling 98:1–12.
Van Pelt, R. 2007. Identifying Mature and Old Forests in Western Washington. Washington
State Department of Natural Resources, Olympia, WA.
Varoujean, W. A., and D. H. Williams. 1995. Abundance and Distribution of Marbled Murrelets
in Oregon and Washington Based on Aerial Surveys. Pages 327–337 in C. J. Ralph, G. L.
Hunt, Jr., M. G. Raphael, and J. F. Piatt (tech. eds.), Ecology and Conservation of the
Marbled Murrelet. General Technical Report PSW-GTR-152. U.S. Forest Service,
Southwest Research Station. Albany, CA.
Vermeer, K., and R. W. Butler (eds.). 1989. The Ecology and Status of Marine and Shoreline
Birds in the Strait of Georgia, British Columbia. Special Publication, Canadian Wildlife
Service, Ottawa, ON, Canada.
Vermeer, K., S. G. Sealy, and G. A. Sanger. 1987. Feeding Ecology of Alcidae in the Eastern
North Pacific Ocean. Pages 189–227 in Croxall, J. P. (ed.) Seabirds: feeding biology and
role in marine ecosystems. Cambridge University Press, Cambridge, UK.
Vigallon, S. M, and J. M. Marzluff. 2005. Is Nest Predation by Steller’s Jays (Cyanocitta stelleri)
Incidental or the Result of a Specialized Search Strategy? The Auk 122:36–49.

7.0 Literature Cited
September 2008 Page 7-29
Walters, C. J., and R. Hilborn. 1978. Ecological Optimization and Adaptive Management.
Annual Reviews of Ecology and Systematics 9:157–188.
Washington State Department of Natural Resources. 1992. Forest Resource Plan. Olympia, WA.
————. 1995. Standard Methodology for Conducting Watershed Analysis. Version 3.0.
Washington Forest Practices Board, Seattle, WA.
————. 1997a. Final Habitat Conservation Plan. Olympia, WA.
————. 1997b. Permanent Marbled Murrelet Rules. Washington Forest Practices Board,
Seattle, WA.
————. 2002a. Washington Timber Harvest Summary Report 1965–2002. Olympia, WA.
Available: <http://www.dnr.wa.gov/htdocs/obe/timberharvest/timhar6501.xls>.
————. 2002b. Forest Resource Inventory System: Field Procedures. Olympia, WA.
————. 2004a. Timber Harvest Summary 2002. Office of Budget and Economics. Available:
<http://dnr.wa.gov/htdocs/obe/timberharvest/timhar6501.xls>. Accessed June 28, 2007.
————. 2004b. Final Environmental Impact Statement on Alternatives for Sustainable Forest
Management of State Trust Lands in Western Washington and for Determining the
Sustainable Harvest Level. Olympia, WA.
————. 2006a. Washington State Forest Practices Board Manual. Draft. Olympia, WA.
————. 2006b. Policy for Sustainable Forests. Olympia, WA.
Washington State Forest Practices Board. 2001. WAC 222-16-010. Forest Practices Rules
[Effective 10/27/2007] General Definitions p. 16-5.
————. 2002. WAC 222-30-021. Western Washington Riparian Management Zones
[Effective 7/1/2005] (1), (I), (ii) Harvest options pp. 30-9-11.
————. 2005. WAC 222-12-090. Forest Practices Board Manual [Effective 7/1/2005] (14 and
15).
Weaver, J. L., P. C. Paquet, and L. F. Ruggiero. 1996. Resilience and Conservation of Large
Carnivores in the Rocky Mountains. Conservation Biology 10:964–976.

7.0 Literature Cited
September 2008 Page 7-30
Whitehead, P. 1989. Toxic Chemicals in Great Blue Heron (Ardea herodius) Eggs in the Strait of
Georgia. Pages 177–183 in K. Vermeer and R. W. Butler (eds.), The Ecology and Status
of Marine and Shoreline Birds in the Strait of Georgia, British Columbia. Special
Publication. Canadian Wildlife Service, Ottawa, ON.
Whitworth, D. L., S. K. Nelson, S. H. Newman, G. B. Van Vliet, and W. P. Smith. 2000.
Foraging Distances of Radio-Marked Marbled Murrelets from Inland Areas in Southeast
Alaska. The Condor 102:452–456.
Whitworth, D. L., J. Y. Takekawa, H. R. Carter, and W. R. McIver. 1997. A Night-Lighting
Technique for At-Sea Capture of Xantus’ Murrelets. Colonial Waterbirds 20:525–531.
Wilhere, G. F. 2002. Adaptive Management in Habitat Conservation Plans. Conservation
Biology 16:20–29.
Woodall, C. W., C. H. Perry, and P. D. Miles. 2006. The Relative Density of Forests in the
United States. Forest Ecology and Management 226:368–372.
Yen, P. P. W., F. Huettmann, and F. Cooke. 2004. A Large-Scale Model for the At-Sea
Distribution and Abundance of Marbled Murrelets (Brachyramphus marmoratus) during
the Breeding Season in Coastal British Columbia, Canada. Ecological Modeling
171:395–413.
Zharikov, Y., D. B. Lank, F. Huettmann, R. W. Bradley, N. Parker, P. P-W. Yen, L. A.
McFarlane-Tranquilla, and F. Cooke. 2006. Habitat Selection and Breeding Success in a
Forest-Nesting Alcid, the Marbled Murrelet, in Two Landscapes with Different Degrees
of Forest Fragmentation. Landscape Ecology 21:107–120.

September 2008 Page A-1
APPENDIX A DNR MARBLED MURRELET SUMMIT MEETING ATTENDEES
OCTOBER 21, 2003 Janet Anthony (WDFW) Martha Bean (facilitator) Richard Bigley (DNR) Brian Cooper (ABR Inc.) Eric Cummins (WDFW) Florian Deisenhofer (DNR) Lisa Egtvedt (DNR) Kim Flotlin (USFWS) John Grettenberger (USFWS) Shelley Hall (ONP) Tom Hamer (Hamer Environmental L.P.) Peter Harrison (DNR) Scott Horton (DNR) Simon Kihia (DNR) Peter McBride (DNR) Kim Nelson (OSU) Teodora Minkova (DNR) Noelle Nordstrom (WDFW) Mark Ostwald (USFWS) Marty Raphael (PNWRS) Bill Ritchie (WDFW) Paula Swedeen (WDFW) Chris Thompson (WDFW) Todd Welker (DNR) Later arrivals: Danielle Prenzlow Escene (DNR), Craig Hansen (USFWS)
OCTOBER 22, 2003 Janet Anthony (WDFW) Martha Bean (facilitator) Richard Bigley (DNR) Andy Carey (PNWRS) Brian Cooper (ABR Inc.) Eric Cummins (WDFW) Florian Deisenhofer (DNR) Lisa Egtvedt (DNR) Kim Flotlin (USFWS) John Grettenberger (USFWS) Shelley Hall (ONP) Tom Hamer (Hamer Environmental L.P.) Craig Hansen (USFWS) Peter Harrison (DNR) Scott Horton (DNR) Simon Kihia (DNR) Dov Lank (Simon Fraser U.) Diana Linch (USFWS) Peter McBride (DNR) Kim Nelson (OSU) Teodora Minkova (DNR) Mark Ostwald (USFWS) Marty Raphael (PNWRS) Tami Riepe (DNR) Bill Ritchie (WDFW) Chris Thompson (WDFW) Todd Welker (DNR) Morning only: John Baarspul (DNR), Jodi Barnes (DNR) Later arrivals: Joe Buchanan (WDFW), Danielle Prenzlow Escene (DNR)

Appendix A Summit Meeting Attendees
September 2008 Page A-2
This page intentionally left blank.

September 2008 Page B-1
APPENDIX B FOREST STAND CLASSIFICATION CROSSWALK
Stand development stages are defined based on Brodie et al. (2004), and are crosswalked with
two seral stage classification systems used in this document (Table B-1). There were two
groupings of seral stages: one for the scorecard utilized to evaluate lands in southwest
Washington (detailed in section 3.2a of chapter 3.0) and the other for projecting potential habitat
capability predominantly on non-DNR-managed lands as part of the management scenarios
analysis (from Green et al. 1993; detailed in section 4.5 of chapter 4.0). See Van Pelt’s (2007)
chapter (pp. 27-47) and appendix (p. 103) on stand development for illustrations and further
descriptions of forest stands at different stages of development.
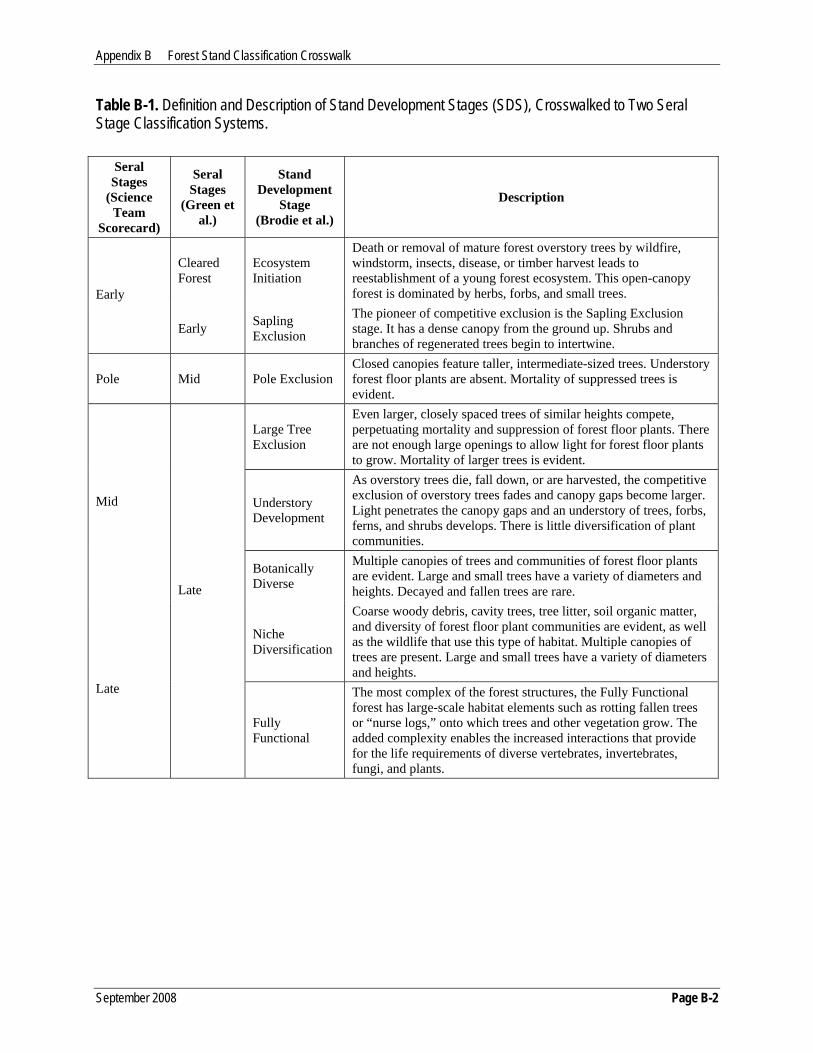
Appendix B Forest Stand Classification Crosswalk
September 2008 Page B-2
Table B-1. Definition and Description of Stand Development Stages (SDS), Crosswalked to Two Seral Stage Classification Systems.
Seral Stages
(Science Team
Scorecard)
Seral Stages
(Green et al.)
Stand Development
Stage (Brodie et al.)
Description
Cleared Forest
Ecosystem Initiation
Death or removal of mature forest overstory trees by wildfire, windstorm, insects, disease, or timber harvest leads to reestablishment of a young forest ecosystem. This open-canopy forest is dominated by herbs, forbs, and small trees. Early
Early Sapling Exclusion
The pioneer of competitive exclusion is the Sapling Exclusion stage. It has a dense canopy from the ground up. Shrubs and branches of regenerated trees begin to intertwine.
Pole Mid Pole Exclusion Closed canopies feature taller, intermediate-sized trees. Understory forest floor plants are absent. Mortality of suppressed trees is evident.
Large Tree Exclusion
Even larger, closely spaced trees of similar heights compete, perpetuating mortality and suppression of forest floor plants. There are not enough large openings to allow light for forest floor plants to grow. Mortality of larger trees is evident.
Understory Development
As overstory trees die, fall down, or are harvested, the competitive exclusion of overstory trees fades and canopy gaps become larger. Light penetrates the canopy gaps and an understory of trees, forbs, ferns, and shrubs develops. There is little diversification of plant communities.
Mid
Botanically Diverse
Multiple canopies of trees and communities of forest floor plants are evident. Large and small trees have a variety of diameters and heights. Decayed and fallen trees are rare.
Niche Diversification
Coarse woody debris, cavity trees, tree litter, soil organic matter, and diversity of forest floor plant communities are evident, as well as the wildlife that use this type of habitat. Multiple canopies of trees are present. Large and small trees have a variety of diameters and heights.
Late
Late
Fully Functional
The most complex of the forest structures, the Fully Functional forest has large-scale habitat elements such as rotting fallen trees or “nurse logs,” onto which trees and other vegetation grow. The added complexity enables the increased interactions that provide for the life requirements of diverse vertebrates, invertebrates, fungi, and plants.

September 2008 Page C-1
APPENDIX C MANAGEMENT SCENARIO ANALYSIS ASSUMPTIONS AND METHODS
C.1 Analysis Assumptions for Southwest Washington In southwest Washington (SWWA), the Science Team recommends that DNR:
1. Designate areas (Marbled Murrelet Management Areas or MMMAs) within DNR-managed
lands (see section 3.2d in chapter 3.0) within which DNR will:
a. Manage with the goal of achieving high-quality nesting habitat over the entire area
b. Not manage stands once high-quality nesting habitat is achieved
c. Defer from harvest all currently known occupied sites
d. Accelerate the development of non-functioning habitat with the goal of achieving
high-quality nesting habitat
2. Outside the designated areas (MMMAs):
a. Release all reclassified habitat from a deferral status (these areas were surveyed and
found not occupied)
Specific assumptions employed in management scenarios to analyze SWWA recommendations:
• Replace existing deferrals (pre-year 2007 modeling assumptions) with Science Team
recommended deferrals (as described above) and defer from harvest.
• Apply decadal targets across a minimum of 90% of all naturally regenerated conifer-
dominated stands in each designated area to achieve and maintain suitable habitat or better.
Apply the target to all harvest types.
• Apply a 10% maximum seven-period constraint (see below) to each designated deferral by
stand for all harvest types to account for incidental impacts and natural disturbances such as
salvage from endemic blowdown, silvicultural experiments, riparian and northern spotted
owl restoration activities, structure regeneration, landings, road access, crossings, rights-of-
way, and yarding corridors. This means that as a “modeling assumption,” no more than 10%
of the site cumulatively over the course of seven decades can be affected. This also means
that once this occurs, the site is locked out from additional harvest for the remainder of the
seven decades.

Appendix C Management Scenario Analysis Assumptions and Methods
September 2008 Page C-2
The Science Team’s recommendations are reflected in the overarching objective of this analysis,
to maximize marbled murrelet potential habitat capability subject to harvest restrictions. As this
target is being achieved over the course of the simulation, a limited range of harvest activities
may occur in non-habitat. In this context, non-habitat refers to areas within the MMMAs that do
not meet the structural requirements of suitable habitat. Simulation may also account for
regeneration within deferred areas. Yield-based definitions of stages of stand development, and
thus Pstage, are based on modeled averages for species, site class, and silvicultural treatments and
may not reflect in-field, site-specific observations. Within-year seasonal restrictions are strictly
operational considerations, and therefore do not affect annual or decadal scenario analysis.
C.2 Analysis Assumptions for Olympic Experimental State Forest In the Olympic Experimental State Forest (OESF), the Science Team recommends that DNR:
1. Designate areas (MMMAs) within DNR-managed lands (see section 3.3d in chapter 3.0)
2. Defer harvest in specific areas within the designated areas (MMMAs), including:
a. Designated stands of old forest
b. All surveyed habitat
c. All occupied habitat
3. Achieve pole-sized or better structure over two-thirds of the area of a 328-foot (100-meter)
buffer around designated occupied and older forest sites.1
4. Establish an additional restoration target within the Dickodochtedor landscape planning unit
(LPU) (Table 3-12 in chapter 3.0) for high-quality nesting habitat in 50% of each area; the
deferrals outlined under point one are included in this 50%.
5. Direct management toward restoring high-quality nesting habitat in riparian and unstable
slope areas, which comprise more than 50% of the area within the Goodman Creek and
Kalaloch LPUs (Table 3-12).
6. Achieve at least pole-sized structure over two-thirds of all (in the Queets LPU [Table 3-8]) or
the remainder of designated areas (in the Dickodochtedor, Goodman Creek, and Kalaloch
LPUs [Table 3-12]) not already designated in points one through four above.
1 Final recommendations determined by the Science Team resulted in a change from the two-thirds forested buffer area to a 100% forested buffer area around all known occupied sites in the OESF. This change will be reflected in future modeling exercises.

Appendix C Management Scenario Analysis Assumptions and Methods
September 2008 Page C-3
Specific assumptions employed in management scenarios to analyze OESF recommendations:
• Replace existing deferrals (pre-year 2007 modeling assumptions) with Science Team
recommended deferrals (as described above) and defer from harvest.
• Apply targets to achieve a 66.67% minimum of the designated area in each landscape as
described above, and a 100% target to each designated 328-foot (100-meter) buffer to
achieve and maintain a 6 inch (15 centimeter) QMD minimum for all dominant live trees
more than 2 inches (more than 5 centimeters) at all times. Apply the target to all harvest
types. Pole size structure will be assumed to be more than 5 inches (more than 13
centimeters) QMD for all dominant live trees.
• Apply targets to achieve a 50% minimum of the designated area in each landscape as
described above to achieve and maintain high-quality habitat. The target will be applied to all
harvest types. High-quality habitat is assumed to result from either natural stand development
or a series of treatments.
• Apply a 10% maximum seven-period constraint (see below for explanation) to each
designated deferral by stand for all harvest types to account for incidental impacts and natural
disturbances such as salvage from endemic blowdown, silvicultural experiments, riparian and
northern spotted owl restoration activities, structure regeneration, landings, road access,
crossings, right-of-ways, and yarding corridors. This means that as a “modeling assumption,”
no more than 10% of the site cumulatively over the course of seven decades can be affected.
This also means that once this occurs, the site is locked out from additional harvest for the
remainder of the seven decades.
As these targets are achieved over the course of the simulation, the full range of simulated
harvest activities becomes available. Simulation may also account for regeneration within
deferred areas. Yield-based definitions of stand development and potential habitat capability are
based on modeled averages for species, site class, and silvicultural treatments and may not reflect
in-field site-specific observations. Within-year seasonal restrictions are strictly operational
considerations, and therefore do not affect annual or decadal scenario analysis.

Appendix C Management Scenario Analysis Assumptions and Methods
September 2008 Page C-4
This page intentionally left blank.

September 2008 Page D-1
APPENDIX D SCIENCE TEAM RECOMMENDATIONS:
ROADS, YARDING AND SALVAGE IN OCCUPIED SITES
D.1 Road and Yarding Corridor Access Ideally, occupied sites should not be disturbed. The Science Team recognizes, within limits, the
need for DNR to access the land base for habitat restoration activities with roads and yarding
corridors. Before considering road access through an occupied site, all alternative access routes
should be thoroughly explored and impacts as to the effects of modifying occupied patch size
should also be examined. If access through an occupied site is necessary, special attention should
be given to maintain the integrity of the occupied site and to minimize the effects of human
activities. The Science Team recommends that all efforts be made to minimize:
• Loss of core areas of high-quality nesting habitat.
• Loss of platform trees with special priority given to the protection of multi-platform trees.
• Disturbance during critical nesting season (1 April through 31 August) including observing
daily peak activity periods for marbled murrelets (one hour before sunrise to two hours after;
one hour before sunset to one hour after) (Washington Forest Practices Rules 2001 [WAC
222-16-010]).
• Frequency of road use (i.e., mainline road vs. gated or temporary road).
D.2 Salvage Salvage is defined as removing downed trees, particularly in the case of catastrophic natural
events such as windthrow and fire. When salvage is being considered within Marbled Murrelet
Management Areas, the primary consideration should be the maintenance of high-quality nesting
habitat followed by the restoration of remaining habitat within the stand.
The Science Team Recommends that salvage be given the following considerations:
• Priority should be given to maintaining all standing trees.
• When removing salvage trees, consider options (legacies) for the development of a
replacement buffer.

Appendix D Roads, Yarding and Salvage in Occupied Sites
September 2008 Page D-2
• If harvest of standing trees is necessary, limit loss of platform trees with special priority
given to multi-platform trees.
• Salvage should occur outside of the critical nesting season.
• When salvaging within an occupied site, salvage should not have a negative effect on
functional habitat.
The Science Team further recommends that the above guidelines be followed for proposed
salvage within isolated occupied sites outside of MMMAs in the OESF, and for all occupied sites
within the Straits Analysis Unit. In addition, DNR should maintain the integrity (and therefore
the function) of buffers around occupied sites during salvage operations and if necessary,
develop a replacement buffer to the extent that a buffer no longer exists due to windthrow or
other factors.Once a long-term conservation strategy is adopted by DNR, it is recommended that
the implementation document provides additional details, methods, and justification for habitat
loss and salvage within occupied sites.

September 2008 Page E-1
APPENDIX E SCIENCE TEAM RECOMMENDATIONS:
PERFORMANCE CRITERIA FOR BUFFERS AROUND OCCUPIED SITES
Establishment of forest buffers is the primary management action directed at reducing edge-
related predation and environmental effects such as windthrow and microclimate changes within
a stand (Luginbuhl 2003). Current regulation requires that buffers on high-quality marbled
murrelet nesting habitat be an average of 300 feet (91 meters) wide in Washington (Washington
State Forest Practices Board 2002). There are no data on the effectiveness of these buffers.
Occupied habitat in California also receives a 300-foot (91-meter) buffer.
The Science Team recommends buffering all occupied sites with the application of a 328-foot
(100-meter) buffer area. The purpose of the buffer is to:
• Maintain the stand structure in the condition that provides high-quality nesting habitat for
marbled murrelets (McShane et al. 2004).
• Reduce potential for blowdown (Jaross and Read 2006).
• Maintain microclimates within the occupied stand (Chen et al. 1993, 1995, Kremsater and
Bunnell 1999, McShane et al. 2004).
• Reduce the impacts of hard edges, which have been linked to increased nest predation
(Nelson et al. 2002).
Ideally, buffers should be designed to absorb and mediate wind disturbance to minimize
postharvest blowdown so that adjacent marbled murrelet habitat is not compromised. The buffers
should be configured so that if some blowdown occurs within the buffer area, the integrity of the
buffer is not compromised and the buffer still provides protection to the marbled murrelet habitat
of concern.
The buffer should protect the stand from dramatic changes in sunlight, humidity, and wind
penetration within the stand after harvest. There is very little data on the tolerance of marbled
murrelet chicks to radiation and thermal stress that can result near forest edges. Kremsater and
Bunnell (1999) reported that microclimate effects can extend up to two to three tree heights (328
to 492 feet [100 to 150 meters]) into the forest.

Appendix E Performance Criteria for Buffers Around Occupied Sites
September 2008 Page E-2
This page intentionally left blank.

September 2008 Page F-1
APPENDIX F
EVALUATION OF SURVEY EFFORT FOR DNR SURVEYS
This section presents a retrospective evaluation of how variable survey efforts may have affected
the outcome of DNR surveys conducted prior to the release of the 2003 Pacific Seabird Group
(PSG) marbled murrelet inland survey protocol (Evans Mack et al. 2003). We evaluate surveys
conducted in the SWWA, OESF, and Straits Analysis Units, from 1994 through 2003. During
that time, DNR followed the guidelines of earlier PSG protocols released between 1994 and
2001 (Ralph et al. 1994, 1995c, 1996, 1997, 1998, Evans Mack et al. 2003). The Science Team
did not use the evaluation presented here to assist them in the development of the LTCS
recommendations. However, an explanation of how the guidelines from earlier PSG protocols
may have affected the classification of sites provides additional confidence that the Science
Team's recommendations are appropriate.
The most current PSG marbled murrelet inland survey protocol (Evans Mack et al. 2003)
recommends that surveys be conducted for 2 consecutive years. An analysis of the 1989 to 1998
Washington/Oregon/California marbled murrelet database showed clearly that sites could be
occupied in one year and not another (Baldwin 2001). The estimated proportion of occupied sites
that changed status between two years ranged from 18% to 65% per year, with a weighted
average of 39%.
The PSG inland survey protocol recommends a two-stage sampling technique for the number of
survey visits required to detect occupancy. In two-stage sampling over a two-year time frame,
sites are visited a set minimum number of times (s*) in each of two years. In year one, if no
detections are observed in the first s* visits, visits may be terminated for that year. If presence
behaviors are observed, a set number of additional visits are conducted for a total of s visits to
determine occupancy. In year two, for the sites with presence behaviors but no occupancy
behaviors observed in year one, a total of s year two visits are conducted for a two-year total of
2s visits to determine occupancy. For the sites with no detections in year one, a minimum of s*
visits are conducted in year two. If there are no detections observed in the first s* visits to those
sites, visits may be terminated for a two-year total of 2s* visits. If presence behaviors are first
observed during year two, additional visits are conducted for a total of s year-two visits to
Appendix F Evaluation of Survey Effort for DNR Surveys
September 2008 Page F-2
determine occupancy, and for a two-year total of s* + s visits. Of course, in all instances
described above, visits may be terminated once occupancy behaviors are observed.
To recommend a two-stage sampling effort, three detection probabilities were estimated using
the three-state database mentioned above (Baldwin 2002). Given that a site is occupied in a year,
the probability of observing no detections on a single visit during that year is 0.4244 (q0). Given
that a site is occupied in a year, the probability of observing presence-only behaviors on a single
visit during that year is 0.3416 (q1). Given that a site is occupied in a year, the probability of
observing occupied behaviors on a single visit during that year is 0.2341 (q2).
The PSG inland survey protocol (Evans Mack et al. 2003) recommends that the minimum
number of visits, or s*, be five, and the total number of visits if presence behaviors are detected,
or s, be nine. This recommendation is based on:
• The estimates of q0, q1, and q2, given above.
• The assumption of 0.40 for the proportion of sites that change status between years, of sites
that are occupied in at least one of two years.
• An overall error rate of 5% or less for misclassification of occupied sites (i.e. less than 5%
chance that a site will be classified as "not occupied" when it is actually occupied).
• The assumption that the set of sites to be surveyed is similar to the set of sites in the three-
state database.
All of DNR’s marbled murrelet inland survey efforts employed two-stage sampling for a two-
year time period, following the evolving PSG inland survey protocol valid at the time of the
surveys (Ralph et al. 1994, 1995c, 1996, 1997, 1998). Based on the recommendations from these
prior PSG inland survey protocols, DNR employed s* and s values that were often less than five
and nine, respectively. The s* and s values were often the same for year one and year two, but
some of the efforts had different s* and s values between the two years of survey. Table F-1
outlines the various survey efforts by planning unit and years, the values of s* and s for the years
of survey, and the associated error rate. The error rates listed below were calculated using the
values of q0, q1, and q2, given above, the assumption of 0.40 for the proportion of occupied sites
that change status between years, and the assumption that DNR sites are similar to the set of sites
in the three-state database. The formulas provided in the 2003 PSG inland survey protocol allow

Appendix F Evaluation of Survey Effort for DNR Surveys
September 2008 Page F-3
calculation of error rates only if s* and s are the same for both years of survey; therefore, the
error rates listed below were calculated using precursor formulas provided in Final
Recommendations from the Steering Committee for the Marbled Murrelet Inland Survey
Protocol Statistical Analysis (Prenzlow Escene 2002).
Table F-1. Evaluation of Survey Effort for DNR Surveys.
Survey Effort Years
HCP Unit(s)
Year 1 s*
Year 1 s
Year 2 s*
Year 2 s
Error Rate
Numberof
Sites
Number of Sites
Classified as
Occupied
Estimated Number
Misclassified as Not
Occupied1
Habitat Relationship Studies
1994–1996
OESF, Straits 4 6 4 10 0.072 107 41 ~3
Habitat Relationship Studies
1994–1996
S. Coast, Columbia 4 6 4 10 0.072 110 25 ~2
Inventory Surveys
1996–2001 OESF 4 5 4 5 0.152 767 306 ~55
Inventory Surveys
1998–2001
S. Coast, Columbia 4 5 4 5 0.152 305 82 ~15
Inventory Surveys
2000–2001 Straits 4 5 4 5 0.152 110 28 ~5
Inventory Surveys
2001–2002 Straits 4 5 4 8 0.102 157 30 ~3
Inventory Surveys
2001–2002
S. Coast, Columbia 4 5 4 8 0.102 122 0 0
Inventory Surveys
2002–2003 Straits 4 8 5 9 0.056 21 1 0
1 This column is defined as the number of sites that are classified as "not occupied" that, according to this retrospective evaluation, could actually be occupied. This column is calculated in two steps. First calculate the total number of occupied sites by dividing the number of sites classified as occupied by (one minus the error rate). Second, calculate the estimated number misclassified as simply the total number of occupied sites minus the number of sites classified as occupied.
What appears most alarming are the 55 inventory survey sites in the OESF predicted to be
misclassified. It is important to note that all marbled murrelet inventory surveys in the OESF
Planning Unit were conducted in old-growth forest types. The Science Team recommended that
all forests where inventory surveys were conducted (since these were almost exclusively old-
growth forest types) be deferred from harvest, regardless of their survey status. This

Appendix F Evaluation of Survey Effort for DNR Surveys
September 2008 Page F-4
recommendation completely mitigates the risk of misclassified occupied sites within the OESF
not receiving protection.
The SWWA Analysis Unit encompasses the South Coast and Columbia Planning Units. In
SWWA a total of 17 sites are predicted to be misclassified. Science Team recommendations in
the SWWA Analysis Unit prescribe substantial habitat enhancement (on the order of 60,000
acres [24,000 hectares]), which mitigates the risk of misclassified occupied sites not being
protected in SWWA.

September 2008 Page G-1
APPENDIX G
COMPREHENSIVE SUMMARY OF RESULTS FROM THE MANAGEMENT SCENARIO ANALYSIS
I. SUMMARY OF ANALYSIS RESULTS
The tables below summarize the current and projected future habitat abundance (thousands of
acres) and capability of forests to support marbled murrelet populations (K') under the Habitat
Management scenario (Tables G-1A through G-1L; see section II in chapter 4.0 for description)
and No Management scenario (Tables G-2A through G-2L; see section II in chapter 4.0 for
description) by:
• Analysis unit (SWWA, OESF, and Straits);
• Year (2004, 2013, 2031, and 2067);
• Landowner (DNR; Federal = National Park Service and U.S. Forest Service; and Other);
• DNR MMMA or DNR non-MMMA;
• Forest stage (stand development stages of LTS = Large Tree Exclusion, UDS =
Understory Development, BDS = Botanically Diverse, NDS = Niche Diversification, and
FFS = Fully Functional; and non-DNR forest stages of Existing Late-Seral and Projected
Late-Seral);
• Closer than or farther than 40 miles (64 kilometers) from marbled murrelet-dense marine
waters (see definition in section 3.2b); and
• Forest edge (less than 164 feet [less than 50 meters] from an edge) or interior (more than
164 feet [more than 50 meters] from an edge).
To simplify the presentation of projected habitat abundance under the two management
scenarios, the following G-1 and G-2 tables in this appendix as well as tables and figures in the
body of the text offer a simplified accounting by probability of occupancy (Pstage) values for each
forest stand development stage (SDS). For these tables, each projected acre of habitat fits cleanly
within one of the five reported SDS categories with an associated Pstage value. While each SDS
and associated Pstage value is predominately composed of acres in the reported SDS category,

Appendix G Summary of Results from the Management Scenario Analysis
September 2008 Page G-2
each Pstage is also composed of some acres of other SDS categories and the existing and projected
Interagency Vegetation Mapping Project (IVMP) Late-Seral forest stages. An explanation and
summary of these reporting differences for the Habitat Management scenario and the No
Management scenario is in section II of this appendix.

Appendix G Summary of Results from the Management Scenario Analysis
September 2008 Page G-3
Table G-1A. SWWA 2004—Habitat Management Scenario. Current and Projected Future Habitat Abundance (Thousands of Acres) and Capability of Forests to Support Marbled Murrelet Populations (K') (See Section II in Chapter 4.0 for Description of Habitat Management Scenario).
< 40 Miles from Marbled Murrelet-Dense Marine Waters
> 40 Miles from Marbled Murrelet-Dense Marine Waters
Interior Edge Interior Edge
Land Stage P for Stage Thousandsof Acres K P for Edge
Thousandsof Acres K
P for > 40 mi.
Thousandsof Acres K P for Edge
Thousandsof Acres K
K Int. K Edge K’
LTS 0.25 4.5 7 0.70 1.2 1 0.25 0.0 0 0.70 0.0 0 7 1 8 UDS 0.36 2.7 6 0.70 0.7 1 0.25 0.0 0 0.70 0.0 0 6 1 7 BDS 0.47 2.5 7 0.70 0.6 1 0.25 0.0 0 0.70 0.0 0 7 1 8 NDS 0.62 0.7 2 0.70 0.1 0 0.25 0.0 0 0.70 0.0 0 2 0 3 FFS 0.89 0.1 0 0.70 0.0 0 0.25 0.0 0 0.70 0.0 0 0 0 0
DNR MMMA
Total 10.4 22 2.7 4 0.0 0 0.0 0 22 4 26 LTS 0.25 15.7 23 0.70 3.2 3 0.25 21.2 8 0.70 5.3 1 31 5 36 UDS 0.36 15.3 32 0.70 3.2 5 0.25 16.8 9 0.70 5.0 2 41 7 48 BDS 0.47 10.0 28 0.70 2.3 4 0.25 10.7 7 0.70 3.5 2 35 6 41 NDS 0.62 0.0 0 0.70 0.0 0 0.25 0.0 0 0.70 0.0 0 0 0 0 FFS 0.89 0.0 0 0.70 0.0 0 0.25 0.0 0 0.70 0.0 0 0 0 0
DNR Non-MMMA
Total 41.0 83 8.7 13 48.7 24 13.8 5 107 18 125DNR Total 51.4 105 11.4 16 48.7 24 13.8 5 129 21 151Federal Existing 0.68 0.5 2 0.70 0.0 0 0.25 0.0 0 0.70 0.0 0 2 0 2 Other Existing 0.31 65.9 120 0.70 78.6 100 0.25 11.7 5 0.70 23.3 7 125 108 233Total 117.7 227 90.0 117 60.4 29 37.2 12 257 129 386Note: values for acres, K, and K' may not sum due to rounding.

Appendix G Summary of Results from the Management Scenario Analysis
September 2008 Page G-4
Table G-1B. SWWA 2013—Habitat Management Scenario. Current and Projected Future Habitat Abundance (Thousands of Acres) and Capability of Forests to Support Marbled Murrelet Populations (K') (See Section II in Chapter 4.0 for Description of Habitat Management Scenario).
< 40 Miles from Marbled Murrelet-Dense Marine Waters
> 40 Miles from Marbled Murrelet-Dense Marine Waters
Interior Edge Interior Edge
Land Stage P for Stage
Thousandsof Acres K
P for Edge
Thousandsof Acres K
P for > 40 mi.
Thousandsof Acres K
P for Edge
Thousandsof Acres K
K Int.
K Edge K’
LTS 0.25 5.6 8 0.70 1.8 2 0.25 0.0 0 0.70 0.0 0 8 2 10 UDS 0.36 1.5 3 0.70 0.5 1 0.25 0.0 0 0.70 0.0 0 3 1 4 BDS 0.47 3.9 11 0.70 0.7 1 0.25 0.0 0 0.70 0.0 0 11 1 12 NDS 0.62 1.9 7 0.70 0.3 1 0.25 0.0 0 0.70 0.0 0 7 1 8 FFS 0.89 0.2 1 0.70 0.0 0 0.25 0.0 0 0.70 0.0 0 1 0 1
DNR MMMA
Total 13.0 30 3.4 5 0.0 0 0.0 0 30 5 35 LTS 0.25 7.1 10 0.70 6.1 6 0.25 13.0 5 0.70 5.0 1 15 8 23 UDS 0.36 8.6 18 0.70 7.3 11 0.25 17.5 9 0.70 6.0 2 28 13 41 BDS 0.47 4.4 12 0.70 4.0 8 0.25 8.9 6 0.70 3.3 2 18 9 28 NDS 0.62 0.2 1 0.70 0.4 1 0.25 0.5 0 0.70 0.2 0 1 1 2 FFS 0.89 0.0 0 0.70 0.0 0 0.25 0.0 0 0.70 0.0 0 0 0 0
DNR Non-MMMA
Total 20.3 41 17.8 26 39.9 21 14.6 5 62 31 93 DNR Total 33.3 71 21.2 31 39.9 21 14.6 5 92 36 128
Existing 0.68 0.5 2 0.70 0.0 0 0.25 0.0 0 0.70 0.0 0 2 0 2 Projected 0.20 0.4 0 0.70 0.0 0 0.25 0.0 0 0.70 0.0 0 0 0 1 Federal Total 0.9 2 0.1 0 0.0 0 0.0 0 2 0 2 Existing 0.31 65.8 120 0.70 78.7 100 0.25 11.7 5 0.70 23.3 7 125 108 233Projected 0.13 51.7 40 0.70 59.6 32 0.25 2.5 0 0.70 8.0 1 40 33 73 Other Total 117.5 160 138.3 132 14.2 6 31.3 9 165 141 306
Total 151.7 233 159.5 163 54.1 26 45.9 14 260 177 437Note: values for acres, K, and K' may not sum due to rounding.

Appendix G Summary of Results from the Management Scenario Analysis
September 2008 Page G-5
Table G-1C. SWWA 2031—Habitat Management Scenario. Current and Projected Future Habitat Abundance (Thousands of Acres) and Capability of Forests to Support Marbled Murrelet Populations (K') (See Section II in Chapter 4.0 for Description of Habitat Management Scenario).
< 40 Miles from Marbled Murrelet-Dense Marine Waters
> 40 Miles from Marbled Murrelet-Dense Marine Waters
Interior Edge Interior Edge
Land Stage P for Stage
Thousandsof Acres K
P for Edge
Thousandsof Acres K
P for > 40 mi.
Thousandsof Acres K
P for Edge
ThousandsOf Acres K
K Int.
K Edge K’
LTS 0.25 7.3 11 0.70 1.0 1 0.25 0.0 0 0.70 0.0 0 11 1 12 UDS 0.36 9.2 19 0.70 1.3 2 0.25 0.0 0 0.70 0.0 0 19 2 21 BDS 0.47 6.5 18 0.70 0.9 2 0.25 0.0 0 0.70 0.0 0 18 2 20 NDS 0.62 5.7 21 0.70 0.8 2 0.25 0.0 0 0.70 0.0 0 21 2 23 FFS 0.89 0.2 1 0.70 0.0 0 0.25 0.0 0 0.70 0.0 0 1 0 1
DNR MMMA
Total 28.9 70 4.0 7 0.0 0 0.0 0 70 7 77 LTS 0.25 5.1 7 0.70 4.0 4 0.25 8.4 3 0.70 2.7 1 11 5 15 UDS 0.36 8.5 18 0.70 5.4 8 0.25 12.7 7 0.70 6.0 2 25 10 35 BDS 0.47 9.7 27 0.70 2.7 5 0.25 9.0 6 0.70 2.7 1 33 7 40 NDS 0.62 5.2 19 0.70 0.7 2 0.25 5.7 5 0.70 1.3 1 24 3 27 FFS 0.89 0.2 1 0.70 0.0 0 0.25 0.0 0 0.70 0.0 0 1 0 1
DNR Non-MMMA
Total 28.7 72 12.9 19 35.9 21 12.7 5 94 24 118DNR Total 57.6 142 16.9 26 35.9 21 12.7 5 164 31 195
Existing 0.68 0.5 2 0.70 0.0 0 0.25 0.0 0 0.70 0.0 0 2 0 2 Projected 0.20 0.8 1 0.70 0.1 0 0.25 0.0 0 0.70 0.0 0 1 0 1 Federal Total 1.3 3 0.1 0 0.0 0 0.0 0 3 0 3 Existing 0.31 69.5 127 0.70 75.0 96 0.25 12.4 6 0.70 22.6 7 132 103 235Projected 0.13 87.5 67 0.70 143.0 77 0.25 6.6 1 0.70 33.7 5 68 81 149Other Total 157.0 194 218.0 172 19.0 7 56.3 12 201 184 385
Total 215.9 339 235.0 199 54.9 28 69.1 17 367 215 582Note: values for acres, K, and K' may not sum due to rounding.

Appendix G Summary of Results from the Management Scenario Analysis
September 2008 Page G-6
Table G-1D. SWWA 2067—Habitat Management Scenario. Current and Projected Future Habitat Abundance (Thousands of Acres) and Capability of Forests to Support Marbled Murrelet Populations (K') (See Section II in Chapter 4.0 for Description of Habitat Management Scenario).
< 40 Miles from Marbled Murrelet-Dense Marine Waters
> 40 Miles from Marbled Murrelet-Dense Marine Waters
Interior Edge Interior Edge
Land Stage P for Stage Thousandsof Acres K P for Edge
Thousandsof Acres K
P for > 40 mi.
Thousandsof Acres K P for Edge
Thousandsof Acres K K Int. K Edge K’
LTS 0.25 1.6 2 0.70 0.7 1 0.25 0.0 0 0.70 0.0 0 2 1 3 UDS 0.36 3.6 8 0.70 2.3 3 0.25 0.0 0 0.70 0.0 0 8 3 11 BDS 0.47 6.8 19 0.70 2.7 5 0.25 0.0 0 0.70 0.0 0 19 5 24 NDS 0.62 16.9 62 0.70 2.8 7 0.25 0.0 0 0.70 0.0 0 62 7 69 FFS 0.89 8.7 46 0.70 1.3 5 0.25 0.0 0 0.70 0.0 0 46 5 50
DNR MMMA
Total 37.7 136 9.8 21 0.0 0 0.0 0 136 21 158LTS 0.25 6.3 9 0.70 4.1 4 0.25 9.3 3 0.70 3.8 1 13 5 18 UDS 0.36 8.8 19 0.70 6.4 9 0.25 17.3 9 0.70 7.2 3 28 12 40 BDS 0.47 5.7 16 0.70 3.7 7 0.25 8.6 6 0.70 2.7 1 22 8 30 NDS 0.62 4.1 15 0.70 2.1 5 0.25 5.5 5 0.70 2.1 1 20 7 27 FFS 0.89 3.9 21 0.70 2.1 8 0.25 5.1 7 0.70 0.9 1 27 9 36
DNR Non-MMMA
Total 28.8 79 18.4 34 45.7 30 16.7 7 109 41 150DNR Total 66.5 215 28.2 55 45.7 30 16.7 7 245 62 308
Existing 0.68 0.5 2 0.70 0.0 0 0.25 0.0 0 0.70 0.0 0 2 0 2 Projected 0.20 0.9 1 0.70 0.1 0 0.25 0.0 0 0.70 0.0 0 1 0 1 Federal Total 1.4 3 0.1 0 0.0 0 0.0 0 3 0 3 Existing 0.31 69.5 127 0.70 75.0 96 0.25 12.4 6 0.70 22.6 7 132 103 235Projected 0.13 102.4 78 0.70 223.2 119 0.25 10.2 2 0.70 64.4 9 80 128 208Other Total 171.8 205 298.2 215 22.6 8 87.0 16 213 231 444
Total 239.7 423 326.5 271 68.3 38 103.7 23 461 294 754Note: values for acres, K, and K' may not sum due to rounding.

Appendix G Summary of Results from the Management Scenario Analysis
September 2008 Page G-7
Table G-1E. OESF 2004—Habitat Management Scenario. Current and Projected Future Habitat Abundance (Thousands of Acres) and Capability of Forests to Support Marbled Murrelet Populations (K') (See Section II in Chapter 4.0 for Description of Habitat Management Scenario).
Interior Edge
Land Stage P for Stage
Thousands of Acres K
P forEdge
Thousandsof Acres K K’
LTS 0.25 0.2 0 0.70 0.1 0 0 UDS 0.36 1.3 3 0.70 0.3 0 3 BDS 0.47 2.7 7 0.70 0.5 1 8 NDS 0.62 5.4 20 0.70 1.0 3 22 FFS 0.89 0.4 2 0.70 0.1 0 2
DNR MMMA
Total 10.1 33 2.0 4 37 LTS 0.25 6.4 9 0.70 1.5 2 11 UDS 0.36 7.0 15 0.70 1.6 2 17 BDS 0.47 14.0 39 0.70 3.2 6 45 NDS 0.62 17.6 64 0.70 2.9 7 72 FFS 0.89 4.6 24 0.70 0.6 2 26
DNR Non- MMMA
Total 49.5 151 9.8 20 171 DNR Total 59.6 183 11.8 24 207 Federal Existing 0.68 203.2 813 0.70 79.3 222 1,035Other Existing 0.31 29.3 53 0.70 30.2 39 92 Total 292.1 1,050 121.3 285 1,335Note: values for acres, K, and K' may not sum due to rounding.

Appendix G Summary of Results from the Management Scenario Analysis
September 2008 Page G-8
Table G-1F. OESF 2013—Habitat Management Scenario. Current and Projected Future Habitat Abundance (Thousands of Acres) and Capability of Forests to Support Marbled Murrelet Populations (K') (See Section II in Chapter 4.0 for Description of Habitat Management Scenario).
Interior Edge
Land Stage P for Stage
Thousands of Acres K
P forEdge
Thousandsof Acres K K’
LTS 0.25 0.1 0 0.70 0.1 0 0 UDS 0.36 1.3 3 0.70 0.3 0 3 BDS 0.47 2.9 8 0.70 0.5 1 9 NDS 0.62 6.6 24 0.70 0.7 2 26 FFS 0.89 0.9 4 0.70 0.1 0 5
DNR MMMA
Total 11.8 40 1.6 4 43 LTS 0.25 6.3 9 0.70 1.9 2 11 UDS 0.36 6.1 13 0.70 2.2 3 16 BDS 0.47 12.3 34 0.70 3.2 6 40 NDS 0.62 14.7 54 0.70 1.7 4 58 FFS 0.89 12.0 63 0.70 1.2 4 67
DNR Non- MMMA
Total 51.4 173 10.2 20 193 DNR Total 63.2 212 11.8 24 236
Existing 0.68 203.3 813 0.70 79.3 222 1,035Projected 0.20 39.8 47 0.70 3.8 3 50 Federal Total 243.1 860 83.1 225 1,085Existing 0.31 29.3 53 0.70 30.2 39 92 Projected 0.13 11.4 9 0.70 12.3 7 15 Other Total 40.7 62 42.5 45 107
Total 347.0 1,134 137.5 294 1,428Note: values for acres, K, and K' may not sum due to rounding.

Appendix G Summary of Results from the Management Scenario Analysis
September 2008 Page G-9
Table G-1G. OESF 2031—Habitat Management Scenario. Current and Projected Future Habitat Abundance (Thousands of Acres) and Capability of Forests to Support Marbled Murrelet Populations (K') (See Section II in Chapter 4.0 for Description of Habitat Management Scenario).
Interior Edge
Land Stage P for Stage
Thousands of Acres K
P forEdge
Thousandsof Acres K K’
LTS 0.25 0.4 1 0.70 0.1 0 1 UDS 0.36 1.0 2 0.70 0.3 0 3 BDS 0.47 2.6 7 0.70 0.4 1 8 NDS 0.62 8.6 31 0.70 0.8 2 34 FFS 0.89 2.0 10 0.70 0.1 0 11
DNR MMMA
Total 14.6 52 1.8 4 56 LTS 0.25 5.3 8 0.70 1.7 2 9 UDS 0.36 7.0 15 0.70 1.9 3 18 BDS 0.47 13.4 37 0.70 2.9 6 43 NDS 0.62 19.6 72 0.70 1.9 5 76 FFS 0.89 14.7 77 0.70 1.0 4 80
DNR Non- MMMA
Total 60.0 208 9.3 19 226 DNR Total 74.6 260 11.1 23 282
Existing 0.68 206.8 827 0.70 75.7 212 1,039Projected 0.20 82.3 97 0.70 1.6 1 98 Federal Total 289.1 924 77.3 213 1,137Existing 0.31 30.4 56 0.70 29.1 37 93 Projected 0.13 23.1 18 0.70 46.4 25 42 Other Total 53.5 73 75.5 62 135
Total 417.2 1,257 164.0 298 1,555Note: values for acres, K, and K' may not sum due to rounding.

Appendix G Summary of Results from the Management Scenario Analysis
September 2008 Page G-10
Table G-1H. OESF 2067—Habitat Management Scenario. Current and Projected Future Habitat Abundance (Thousands of Acres) and Capability of Forests to Support Marbled Murrelet Populations (K') (See Section II in Chapter 4.0 for Description of Habitat Management Scenario).
Interior Edge
Land Stage P for Stage
Thousands of Acres K
P forEdge
Thousandsof Acres K K’
LTS 0.25 0.1 0 0.70 0.2 0 0 UDS 0.36 4.0 8 0.70 2.2 3 12 BDS 0.47 3.7 10 0.70 1.8 4 14 NDS 0.62 9.9 36 0.70 2.3 6 42 FFS 0.89 5.1 27 0.70 1.0 4 31
DNR MMMA
Total 22.8 82 7.5 16 98 LTS 0.25 27.0 40 0.70 9.8 10 50 UDS 0.36 8.9 19 0.70 3.7 6 24 BDS 0.47 13.7 38 0.70 4.3 8 46 NDS 0.62 17.6 64 0.70 3.2 8 72 FFS 0.89 21.5 113 0.70 2.9 11 123
DNR Non- MMMA
Total 88.7 273 23.9 43 316 DNR Total 111.5 355 31.4 59 414
Existing 0.68 206.7 827 0.70 75.8 212 1,039Projected 0.20 96.1 113 0.70 2.2 2 115 Federal Total 302.8 940 78.0 214 1,154Existing 0.31 30.4 55 0.70 29.1 37 93 Projected 0.13 26.0 20 0.70 62.1 33 53 Other Total 56.4 75 91.2 70 146
Total 470.74 1,370 200.7 344 1,714Note: values for acres, K, and K' may not sum due to rounding.

Appendix G Summary of Results from the Management Scenario Analysis
September 2008 Page G-11
Table G-1I. Straits 2004—Habitat Management Scenario. Current and Projected Future Habitat Abundance (Thousands of Acres) and Capability of Forests to Support Marbled Murrelet Populations (K') (See Section II in Chapter 4.0 for Description of Habitat Management Scenario).
Interior Edge
Land Stage P for Stage
Thousands of Acres K
P forEdge
Thousandsof Acres K K’
LTS 0.25 6.4 9 0.70 2.1 2 12 UDS 0.36 17.7 38 0.70 3.6 5 43 BDS 0.47 16.6 46 0.70 5.0 10 56 NDS 0.62 0.1 1 0.70 0.0 0 1 FFS 0.89 0.0 0 0.70 0.0 0 0
DNR Non- MMMA
Total 40.8 93 10.8 17 111 Federal Existing 0.68 193.2 773 0.70 93.0 260 1,033Other Existing 0.31 13.9 25 0.70 24.1 31 56 Total 248.0 892 127.9 309 1,200Note: values for acres, K, and K' may not sum due to rounding.
Table G-1J. Straits 2013—Habitat Management Scenario. Current and Projected Future Habitat Abundance (Thousands of Acres) and Capability of Forests to Support Marbled Murrelet Populations (K') (See Section II in Chapter 4.0 for Description of Habitat Management Scenario).
Interior Edge
Land Stage P for Stage
Thousands of Acres K
P forEdge
Thousandsof Acres K K’
LTS 0.25 5.0 7 0.70 2.6 3 10 UDS 0.36 13.1 28 0.70 5.1 8 35 BDS 0.47 11.5 32 0.70 5.4 10 42 NDS 0.62 0.9 3 0.70 0.6 1 5 FFS 0.89 0.0 0 0.70 0.0 0 0
DNR Non- MMMA
Total 30.5 70 13.7 22 92 Existing 0.68 193.1 772 0.70 93.1 261 1,033Projected 0.20 50.9 60 0.70 4.4 4 64 Federal Total 244.0 832 97.5 264 1,097Existing 0.31 13.8 25 0.70 24.2 31 56 Projected 0.13 1.3 1 0.70 2.7 1 2 Other Total 15.1 26 26.9 32 59
Total 289.7 929 138.1 319 1,248Note: values for acres, K, and K' may not sum due to rounding.

Appendix G Summary of Results from the Management Scenario Analysis
September 2008 Page G-12
Table G-1K. Straits 2031—Habitat Management Scenario. Current and Projected Future Habitat Abundance (Thousands of Acres) and Capability of Forests to Support Marbled Murrelet Populations (K') (See Section II in Chapter 4.0 for Description of Habitat Management Scenario).
Interior Edge K’ Land Stage
P for Stage Thousands
of Acres K P forEdge
Thousandsof Acres K
LTS 0.25 3.4 5 0.70 1.8 2 7 UDS 0.36 9.1 19 0.70 4.3 6 26 BDS 0.47 13.5 37 0.70 4.0 8 45 NDS 0.62 6.1 22 0.70 2.7 7 29 FFS 0.89 0.0 0 0.70 0.0 0 0
DNR Non- MMMA
Total 32.2 84 12.8 23 107 Existing 0.68 199.4 798 0.70 86.8 243 1,041Projected 0.20 99.5 117 0.70 6.5 5 122 Federal Total 299.0 915 93.4 248 1,163Existing 0.31 14.2 26 0.70 23.8 30 56 Projected 0.13 5.1 4 0.70 18.1 10 14 Other Total 19.3 30 41.9 40 70
Total 350.4 1,029 148.1 311 1,340Note: values for acres, K, and K' may not sum due to rounding.
Table G-1L. Straits 2067—Habitat Management Scenario. Current and Projected Future Habitat Abundance (Thousands of Acres) and Capability of Forests to Support Marbled Murrelet Populations (K') (See Section II in Chapter 4.0 for Description of Habitat Management Scenario).
Interior Edge
Land Stage P for Stage
Thousands of Acres K
P forEdge
Thousandsof Acres K K’
LTS 0.25 4.2 6 0.70 1.7 2 8 UDS 0.36 15.0 32 0.70 6.0 9 41 BDS 0.47 12.2 34 0.70 4.4 8 42 NDS 0.62 1.7 6 0.70 0.6 2 8 FFS 0.89 5.6 29 0.70 1.9 7 36
DNR Non- MMMA
Total 38.8 108 14.6 28 135 Existing 0.68 199.5 798 0.70 86.7 243 1,041Projected 0.20 117.4 138 0.70 8.4 7 145 Federal Total 316.9 936 95.2 250 1,186Existing 0.31 14.2 26 0.70 23.8 30 56 Projected 0.13 6.5 5 0.70 28.1 15 20 Other Total 20.7 31 52.0 45 76
Total 376.4 1,075 161.7 323 1,397Note: values for acres, K, and K' may not sum due to rounding.

Appendix G Summary of Results from the Management Scenario Analysis
September 2008 Page G-13
Table G-2A. SWWA 2004—No Management Scenario. Current and Projected Future Habitat Abundance (Thousands of Acres) and Capability of Forests to Support Marbled Murrelet Populations (K') (See Section II in Chapter 4.0 for Description of No Management Scenario).
< 40 Miles from Marbled Murrelet-Dense Marine Waters
> 40 Miles from Marbled Murrelet-Dense Marine Waters
Interior Edge Interior Edge
Land Stage P for Stage Thousandsof Acres K P for Edge
Thousandsof Acres K
P for > 40 mi.
Thousandsof Acres K P for Edge
Thousandsof Acres K
K Int. K Edge K’
LTS 0.25 4.5 7 0.70 1.2 1 0.25 0.0 0 0.70 0.0 0 7 1 8 UDS 0.36 2.7 6 0.70 0.7 1 0.25 0.0 0 0.70 0.0 0 6 1 7 BDS 0.47 2.5 7 0.70 0.6 1 0.25 0.0 0 0.70 0.0 0 7 1 8 NDS 0.62 0.7 2 0.70 0.1 0 0.25 0.0 0 0.70 0.0 0 2 0 3 FFS 0.89 0.1 0 0.70 0.0 0 0.25 0.0 0 0.70 0.0 0 0 0 0
DNR MMMA
Total 10.4 22 2.7 4 0.0 0 0.0 0 22 4 26 LTS 0.25 15.7 23 0.70 3.2 3 0.25 21.2 8 0.70 5.3 1 31 5 36 UDS 0.36 15.3 32 0.70 3.2 5 0.25 16.8 9 0.70 5.0 2 41 7 48 BDS 0.47 10.0 28 0.70 2.3 4 0.25 10.7 7 0.70 3.5 2 35 6 41 NDS 0.62 0.0 0 0.70 0.0 0 0.25 0.0 0 0.70 0.0 0 0 0 0 FFS 0.89 0.0 0 0.70 0.0 0 0.25 0.0 0 0.70 0.0 0 0 0 0
DNR Non-MMMA
Total 41.0 83 8.7 13 48.7 24 13.8 5 107 18 125DNR Total 51.4 105 11.4 16 48.7 24 13.8 5 129 21 151Federal Existing 0.68 0.5 2 0.70 0.0 0 0.25 0.0 0 0.70 0.0 0 2 0 2 Other Existing 0.31 65.9 120 0.70 78.6 100 0.25 11.7 5 0.70 23.3 7 125 108 233Total 117.7 227 90.0 117 60.4 29 37.2 12 257 129 386Note: values for acres, K, and K' may not sum due to rounding.

Appendix G Summary of Results from the Management Scenario Analysis
September 2008 Page G-14
Table G-2B. SWWA 2013—No Management Scenario. Current and Projected Future Habitat Abundance (Thousands of Acres) and Capability of Forests to Support Marbled Murrelet Populations (K') (See Section II in Chapter 4.0 for Description of No Management Scenario).
< 40 Miles from Marbled Murrelet-Dense Marine Waters
> 40 Miles from Marbled Murrelet-Dense Marine Waters
Interior Edge Interior Edge
Land Stage P for Stage Thousandsof Acres K P for Edge
Thousandsof Acres K
P for > 40 mi.
Thousandsof Acres K P for Edge
Thousandsof Acres K
K Int. K Edge K’
LTS 0.25 7.2 11 0.70 1.7 2 0.25 0.0 0 0.70 0.0 0 11 2 12 UDS 0.36 1.5 3 0.70 0.5 1 0.25 0.0 0 0.70 0.0 0 3 1 4 BDS 0.47 3.9 11 0.70 0.7 1 0.25 0.0 0 0.70 0.0 0 11 1 12 NDS 0.62 1.9 7 0.70 0.3 1 0.25 0.0 0 0.70 0.0 0 7 1 8 FFS 0.89 0.2 1 0.70 0.0 0 0.25 0.0 0 0.70 0.0 0 1 0 1
DNR MMMA
Total 14.6 32 3.2 5 0.0 0 0.0 0 32 5 37 LTS 0.25 7.3 11 0.70 6.1 6 0.25 13.0 5 0.70 5.0 1 16 8 23 UDS 0.36 8.6 18 0.70 7.3 11 0.25 17.5 9 0.70 6.0 2 28 13 41 BDS 0.47 4.4 12 0.70 4.0 8 0.25 8.9 6 0.70 3.3 2 18 9 28 NDS 0.62 0.2 1 0.70 0.4 1 0.25 0.5 0 0.70 0.2 0 1 1 2 FFS 0.89 0.0 0 0.70 0.0 0 0.25 0.0 0 0.70 0.0 0 0 0 0
DNR Non-MMMA
Total 20.5 42 17.8 26 39.9 21 14.6 5 63 31 94 DNR Total 35.1 74 21.0 30 39.9 21 14.6 5 95 36 131
Existing 0.68 0.5 2 0.70 0.0 0 0.25 0.0 0 0.70 0.0 0 2 0 2 Projected 0.20 0.4 0 0.70 0.0 0 0.25 0.0 0 0.70 0.0 0 0 0 1 Federal Total 0.9 2 0.1 0 0.0 0 0.0 0 2 0 2 Existing 0.31 65.8 120 0.70 78.7 100 0.25 11.7 5 0.70 23.3 7 125 108 233Projected 0.13 51.7 40 0.70 59.6 32 0.25 2.5 0 0.70 8.0 1 40 33 73 Other Total 117.5 160 138.3 132 14.2 6 31.3 9 165 141 306
Total 153.5 236 159.3 163 54.1 26 45.9 14 263 177 439Note: values for acres, K, and K' may not sum due to rounding.

Appendix G Summary of Results from the Management Scenario Analysis
September 2008 Page G-15
Table G-2C. SWWA 2031—No Management Scenario. Current and Projected Future Habitat Abundance (Thousands of Acres) and Capability of Forests to Support Marbled Murrelet Populations (K') (See Section II in Chapter 4.0 for Description of No Management Scenario).
< 40 Miles from Marbled Murrelet-Dense Marine Waters
> 40 Miles from Marbled Murrelet-Dense Marine Waters
Interior Edge Interior Edge
Land Stage P for Stage Thousandsof Acres K P for Edge
Thousandsof Acres K
P for > 40 mi.
Thousandsof Acres K P for Edge
Thousandsof Acres K K Int. K Edge K’
LTS 0.25 13.4 20 0.70 1.5 2 0.25 0.0 0 0.70 0.0 0 20 2 21 UDS 0.36 4.5 9 0.70 0.8 1 0.25 0.0 0 0.70 0.0 0 9 1 11 BDS 0.47 4.3 12 0.70 0.7 1 0.25 0.0 0 0.70 0.0 0 12 1 13 NDS 0.62 5.8 21 0.70 0.8 2 0.25 0.0 0 0.70 0.0 0 21 2 23 FFS 0.89 0.2 1 0.70 0.0 0 0.25 0.0 0 0.70 0.0 0 1 0 1
DNR MMMA
Total 28.2 63 3.7 6 0.0 0 0.0 0 63 6 69 LTS 0.25 5.8 8 0.70 4.1 4 0.25 8.5 3 0.70 2.8 1 12 5 17 UDS 0.36 7.9 17 0.70 5.3 8 0.25 12.7 7 0.70 6.0 2 24 10 34 BDS 0.47 9.5 26 0.70 2.7 5 0.25 9.0 6 0.70 2.7 1 32 7 39 NDS 0.62 5.2 19 0.70 0.7 2 0.25 5.7 5 0.70 1.3 1 24 3 27 FFS 0.89 0.2 1 0.70 0.0 0 0.25 0.0 0 0.70 0.0 0 1 0 1
DNR Non-MMMA
Total 28.6 72 12.9 19 35.9 21 12.8 5 93 24 117DNR Total 56.8 135 16.7 25 35.9 21 12.8 5 156 30 187
Existing 0.68 0.5 2 0.70 0.0 0 0.25 0.0 0 0.70 0.0 0 2 0 2 Projected 0.20 0.8 1 0.70 0.1 0 0.25 0.0 0 0.70 0.0 0 1 0 1 Federal Total 1.3 3 0.1 0 0.0 0 0.0 0 3 0 3 Existing 0.31 69.5 127 0.70 75.0 96 0.25 12.4 6 0.70 22.6 7 132 103 235Projected 0.13 87.5 67 0.70 143.0 77 0.25 6.6 1 0.70 33.7 5 68 81 149Other Total 157.0 194 218.0 172 19.0 7 56.3 12 201 184 385
Total 215.1 331 234.8 198 54.9 28 69.1 17 359 215 574Note: values for acres, K, and K' may not sum due to rounding.

Appendix G Summary of Results from the Management Scenario Analysis
September 2008 Page G-16
Table G-2D. SWWA 2067—No Management Scenario. Current and Projected Future Habitat Abundance (Thousands of Acres) and Capability of Forests to Support Marbled Murrelet Populations (K') (See Section II in Chapter 4.0 for Description of No Management Scenario).
< 40 Miles from Marbled Murrelet-Dense Marine Waters
> 40 Miles from Marbled Murrelet-Dense Marine Waters
Interior Edge Interior Edge
Land Stage P for Stage Thousandsof Acres K P for Edge
Thousandsof Acres K
P for > 40 mi.
Thousandsof Acres K P for Edge
Thousandsof Acres K K Int. K Edge K’
LTS 0.25 3.5 5 0.70 0.8 1 0.25 0.0 0 0.70 0.0 0 5 1 6 UDS 0.36 4.9 10 0.70 0.9 1 0.25 0.0 0 0.70 0.0 0 10 1 12 BDS 0.47 8.8 24 0.70 1.2 2 0.25 0.0 0 0.70 0.0 0 24 2 27 NDS 0.62 20.7 75 0.70 2.6 7 0.25 0.0 0 0.70 0.0 0 75 7 82 FFS 0.89 0.6 3 0.70 0.1 0 0.25 0.0 0 0.70 0.0 0 3 0 4
DNR MMMA
Total 38.5 119 5.6 11 0.0 0 0.0 0 119 11 130LTS 0.25 6.9 10 0.70 4.1 4 0.25 9.6 4 0.70 3.8 1 14 5 19 UDS 0.36 8.9 19 0.70 6.3 9 0.25 17.2 9 0.70 7.2 3 28 12 40 BDS 0.47 5.3 15 0.70 3.4 7 0.25 8.6 6 0.70 2.7 1 21 8 29 NDS 0.62 4.9 18 0.70 2.1 5 0.25 5.6 5 0.70 2.1 1 23 7 29 FFS 0.89 2.8 14 0.70 1.9 7 0.25 4.8 6 0.70 0.9 1 21 8 28
DNR Non-MMMA
Total 28.7 76 17.8 32 45.8 30 16.6 7 106 39 145DNR Total 67.2 194 23.4 44 45.8 30 16.6 7 224 51 275
Existing 0.68 0.5 2 0.70 0.0 0 0.25 0.0 0 0.70 0.0 0 2 0 2 Projected 0.20 0.9 1 0.70 0.1 0 0.25 0.0 0 0.70 0.0 0 1 0 1 Federal Total 1.4 3 0.1 0 0.0 0 0.0 0 3 0 3 Existing 0.31 69.5 127 0.70 75.0 96 0.25 12.4 6 0.70 22.6 7 132 103 235Projected 0.13 102.4 78 0.70 223.2 119 0.25 10.2 2 0.70 64.4 9 80 128 208Other Total 171.8 205 298.2 215 22.6 8 87.0 16 213 231 444
Total 240.4 402 321.7 259 68.4 38 103.6 23 440 282 722Note: values for acres, K, and K' may not sum due to rounding.

Appendix G Summary of Results from the Management Scenario Analysis
September 2008 Page G-17
Table G-2E. OESF 2004—No Management Scenario. Current and Projected Future Habitat Abundance (Thousands of Acres) and Capability of Forests to Support Marbled Murrelet Populations (K') (See Section II in Chapter 4.0 for Description of No Management Scenario).
Interior Edge
Land Stage P for Stage
Thousands of Acres K
P forEdge
Thousandsof Acres K K’
LTS 0.25 0.2 0 0.70 0.1 0 0 UDS 0.36 1.3 3 0.70 0.3 0 3 BDS 0.47 2.7 7 0.70 0.5 1 8 NDS 0.62 5.4 20 0.70 1.0 3 22 FFS 0.89 0.4 2 0.70 0.1 0 2
DNR MMMA
Total 10.1 33 2.0 4 37 LTS 0.25 6.4 9 0.70 1.5 2 11 UDS 0.36 7.0 15 0.70 1.6 2 17 BDS 0.47 14.0 39 0.70 3.2 6 45 NDS 0.62 17.6 64 0.70 2.9 7 72 FFS 0.89 4.6 24 0.70 0.6 2 26
DNR Non- MMMA
Total 49.5 151 9.8 20 171 DNR Total 59.6 183 11.8 24 207 Federal Existing 0.68 203.2 813 0.70 79.3 222 1,035Other Existing 0.31 29.3 53 0.70 30.2 39 92 Total 292.1 1,050 121.3 285 1,335Note: values for acres, K, and K' may not sum due to rounding.

Appendix G Summary of Results from the Management Scenario Analysis
September 2008 Page G-18
Table G-2F. OESF 2013—No Management Scenario. Current and Projected Future Habitat Abundance (Thousands of Acres) and Capability of Forests to Support Marbled Murrelet Populations (K') (See Section II in Chapter 4.0 for Description of No Management Scenario).
Interior Edge
Land Stage P for Stage
Thousands of Acres K
P forEdge
Thousandsof Acres K K’
LTS 0.25 0.2 0 0.70 0.1 0 0 UDS 0.36 1.4 3 0.70 0.3 0 3 BDS 0.47 2.9 8 0.70 0.5 1 9 NDS 0.62 6.6 24 0.70 0.7 2 26 FFS 0.89 0.9 4 0.70 0.1 0 5
DNR MMMA
Total 12.0 40 1.6 3 43 LTS 0.25 6.3 9 0.70 1.9 2 11 UDS 0.36 6.1 13 0.70 2.2 3 16 BDS 0.47 12.3 34 0.70 3.1 6 40 NDS 0.62 14.7 54 0.70 1.6 4 58 FFS 0.89 12.0 63 0.70 1.2 4 67
DNR Non- MMMA
Total 51.5 173 10.1 20 193 DNR Total 63.5 213 11.7 23 236
Existing 0.68 203.3 813 0.70 79.3 222 1,035Projected 0.20 39.8 47 0.70 3.8 3 50 Federal Total 243.1 860 83.1 225 1,085Existing 0.31 29.3 53 0.70 30.2 39 92 Projected 0.13 11.4 9 0.70 12.3 7 15 Other Total 40.7 62 42.5 45 107
Total 347.3 1,135 137.3 294 1,429Note: values for acres, K, and K' may not sum due to rounding.
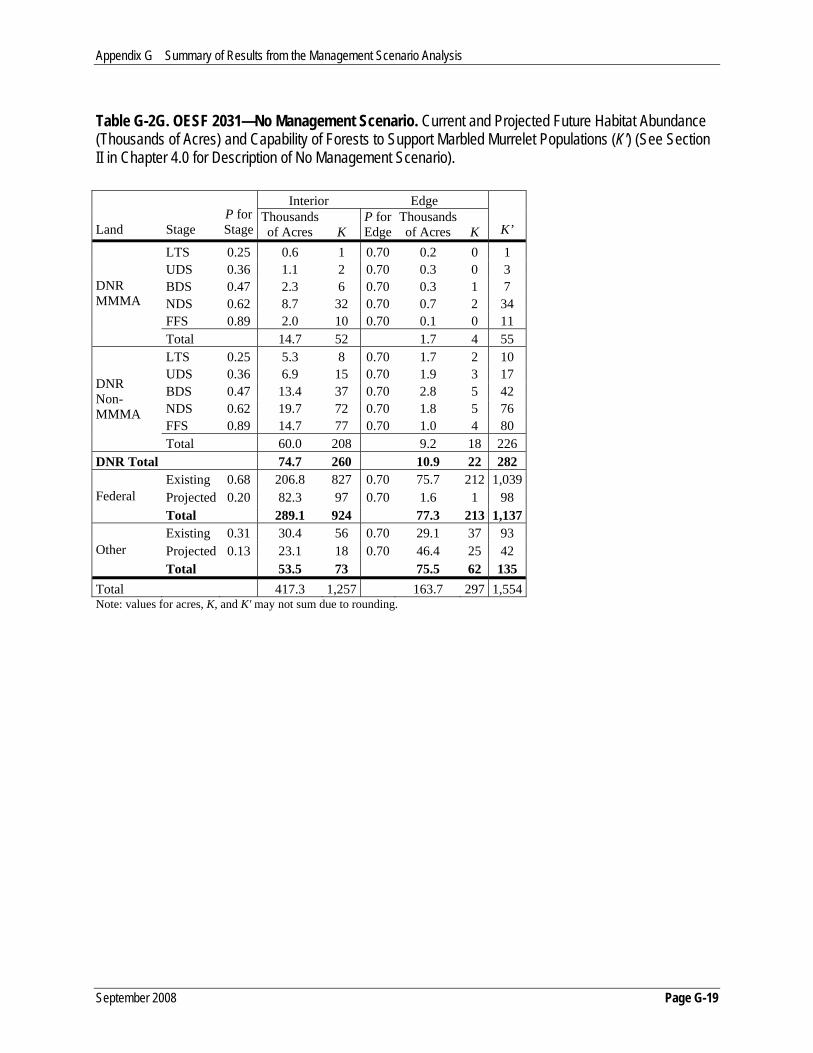
Appendix G Summary of Results from the Management Scenario Analysis
September 2008 Page G-19
Table G-2G. OESF 2031—No Management Scenario. Current and Projected Future Habitat Abundance (Thousands of Acres) and Capability of Forests to Support Marbled Murrelet Populations (K') (See Section II in Chapter 4.0 for Description of No Management Scenario).
Interior Edge
Land Stage P for Stage
Thousands of Acres K
P forEdge
Thousandsof Acres K K’
LTS 0.25 0.6 1 0.70 0.2 0 1 UDS 0.36 1.1 2 0.70 0.3 0 3 BDS 0.47 2.3 6 0.70 0.3 1 7 NDS 0.62 8.7 32 0.70 0.7 2 34 FFS 0.89 2.0 10 0.70 0.1 0 11
DNR MMMA
Total 14.7 52 1.7 4 55 LTS 0.25 5.3 8 0.70 1.7 2 10 UDS 0.36 6.9 15 0.70 1.9 3 17 BDS 0.47 13.4 37 0.70 2.8 5 42 NDS 0.62 19.7 72 0.70 1.8 5 76 FFS 0.89 14.7 77 0.70 1.0 4 80
DNR Non- MMMA
Total 60.0 208 9.2 18 226 DNR Total 74.7 260 10.9 22 282
Existing 0.68 206.8 827 0.70 75.7 212 1,039Projected 0.20 82.3 97 0.70 1.6 1 98 Federal Total 289.1 924 77.3 213 1,137Existing 0.31 30.4 56 0.70 29.1 37 93 Projected 0.13 23.1 18 0.70 46.4 25 42 Other Total 53.5 73 75.5 62 135
Total 417.3 1,257 163.7 297 1,554Note: values for acres, K, and K' may not sum due to rounding.

Appendix G Summary of Results from the Management Scenario Analysis
September 2008 Page G-20
Table G-2H. OESF 2067—No Management Scenario. Current and Projected Future Habitat Abundance (Thousands of Acres) and Capability of Forests to Support Marbled Murrelet Populations (K') (See Section II in Chapter 4.0 for Description of No Management Scenario).
Interior Edge
Land Stage P for Stage
Thousands of Acres K
P forEdge
Thousandsof Acres K K’
LTS 0.25 0.2 0 0.70 0.2 0 0 UDS 0.36 5.0 11 0.70 1.5 2 13 BDS 0.47 4.5 12 0.70 1.1 2 14 NDS 0.62 11.6 42 0.70 1.4 3 46 FFS 0.89 5.2 27 0.70 0.4 1 29
DNR MMMA
Total 26.5 93 4.5 9 102 LTS 0.25 27.8 41 0.70 9.3 10 50 UDS 0.36 9.0 19 0.70 3.6 5 24 BDS 0.47 13.7 38 0.70 4.1 8 46 NDS 0.62 18.6 68 0.70 2.5 6 74 FFS 0.89 22.7 119 0.70 1.5 6 124
DNR Non- MMMA
Total 91.9 285 20.9 35 319 DNR Total 118.4 378 25.4 44 422
Existing 0.68 206.7 827 0.70 75.8 212 1,039Projected 0.20 96.1 113 0.70 2.2 2 115 Federal Total 302.8 940 78.0 214 1,154Existing 0.31 30.4 55 0.70 29.1 37 93 Projected 0.13 26.0 20 0.70 62.1 33 53 Other Total 56.4 75 91.2 70 146
Total 477.65 1,393 194.7 329 1,722Note: values for acres, K, and K' may not sum due to rounding.

Appendix G Summary of Results from the Management Scenario Analysis
September 2008 Page G-21
Table G-2I. Straits 2004—No Management Scenario. Current and Projected Future Habitat Abundance (Thousands of Acres) and Capability of Forests to Support Marbled Murrelet Populations (K') (See Section II in Chapter 4.0 for Description of No Management Scenario).
Interior Edge
Land Stage P for Stage
Thousands of Acres K
P forEdge
Thousandsof Acres K K’
LTS 0.25 6.4 9 0.70 2.1 2 12 UDS 0.36 17.7 38 0.70 3.6 5 43 BDS 0.47 16.6 46 0.70 5.0 10 56 NDS 0.62 0.1 1 0.70 0.0 0 1 FFS 0.89 0.0 0 0.70 0.0 0 0
DNR Non- MMMA
Total 40.8 93 10.8 17 111 Federal Existing 0.68 193.2 773 0.70 93.0 260 1,033Other Existing 0.31 13.9 25 0.70 24.1 31 56 Total 248.0 892 127.9 309 1,200Note: values for acres, K, and K' may not sum due to rounding.
Table G-2J. Straits 2013—No Management Scenario. Current and Projected Future Habitat Abundance (Thousands of Acres) and Capability of Forests to Support Marbled Murrelet Populations (K') (See Section II in Chapter 4.0 for Description of No Management Scenario).
Interior Edge
Land Stage P for Stage
Thousands of Acres K
P forEdge
ThousandsOf Acres K K’
LTS 0.25 5.0 7 0.70 2.6 3 10 UDS 0.36 13.1 28 0.70 5.1 8 35 BDS 0.47 11.5 32 0.70 5.4 10 42 NDS 0.62 0.9 3 0.70 0.6 1 5 FFS 0.89 0.0 0 0.70 0.0 0 0
DNR Non- MMMA
Total 30.5 70 13.7 22 92 Existing 0.68 193.1 772 0.70 93.1 261 1,033Projected 0.20 50.9 60 0.70 4.4 4 64 Federal Total 244.0 832 97.5 264 1,097Existing 0.31 13.8 25 0.70 24.2 31 56 Projected 0.13 1.3 1 0.70 2.7 1 2 Other Total 15.1 26 26.9 32 59
Total 289.7 929 138.1 319 1,248Note: values for acres, K, and K' may not sum due to rounding.

Appendix G Summary of Results from the Management Scenario Analysis
September 2008 Page G-22
Table G-2K. Straits 2031—No Management Scenario. Current and Projected Future Habitat Abundance (thousands of acres) and Capability of Forests to Support Marbled Murrelet Populations (K') (See Section II in Chapter 4.0 for Description of No Management Scenario).
Interior Edge
Land Stage P for Stage
Thousands of Acres K
P forEdge
Thousandsof Acres K K’
LTS 0.25 3.4 5 0.70 1.8 2 7 UDS 0.36 9.1 19 0.70 4.3 6 26 BDS 0.47 13.5 37 0.70 4.0 8 45 NDS 0.62 6.1 22 0.70 2.7 7 29 FFS 0.89 0.0 0 0.70 0.0 0 0
DNR Non- MMMA
Total 32.2 84 12.8 23 107 Existing 0.68 199.4 798 0.70 86.8 243 1,041Projected 0.20 99.5 117 0.70 6.5 5 122 Federal Total 299.0 915 93.4 248 1,163Existing 0.31 14.2 26 0.70 23.8 30 56 Projected 0.13 5.1 4 0.70 18.1 10 14 Other Total 19.3 30 41.9 40 70
Total 350.4 1,029 148.1 311 1,340Note: values for acres, K, and K' may not sum due to rounding.
Table G-2L. Straits 2067—No Management Scenario. Current and Projected Future Habitat Abundance (Thousands of Acres) and Capability of Forests to Support Marbled Murrelet Populations (K') (See Section II in Chapter 4.0 for Description of No Management Scenario).
Interior Edge
Land Stage P for Stage
Thousands of Acres K
P forEdge
Thousandsof Acres K K’
LTS 0.25 4.2 6 0.70 1.7 2 8 UDS 0.36 15.0 32 0.70 6.0 9 41 BDS 0.47 12.2 34 0.70 4.4 8 42 NDS 0.62 1.7 6 0.70 0.6 2 8 FFS 0.89 5.6 29 0.70 1.9 7 36
DNR Non- MMMA
Total 38.8 108 14.6 28 135 Existing 0.68 199.5 798 0.70 86.7 243 1,041Projected 0.20 117.4 138 0.70 8.4 7 145 Federal Total 316.9 936 95.2 250 1,186Existing 0.31 14.2 26 0.70 23.8 30 56 Projected 0.13 6.5 5 0.70 28.1 15 20 Other Total 20.7 31 52.0 45 76
Total 376.4 1,075 161.7 323 1,397Note: values for acres, K, and K' may not sum due to rounding.

Appendix G Summary of Results from the Management Scenario Analysis
September 2008 Page G-23
II. REPORTING RESULTS FOR HABITAT ACREAGE AND POTENTIAL HABITAT CAPABILITY (K’) FROM MANAGEMENT SCENARIO ANALYSIS
There are three reasons for differences in how acres and potential habitat capability (K’) are
reported by SDS category and Pstage in this document and how they were projected in the
management scenario analysis:
1. Stands that had at one time been forest plantations were assigned a Pstage of 0.25 in 2067 if
they were dominated by western hemlock or western redcedar, regardless of SDS category
2. Douglas-fir dominated stands were projected to transition among Pstages at a slower rate (per
Figure 4-3 in chapter 4.0)
3. Some DNR-managed lands do not have SDS classification available; thus IVMP data were
used for these lands and classified using Green et al. (1993) in the same way as was done for
the non-DNR-managed lands (see section 4.4 in chapter 4.0)
Details of these differences are outlined below.
G.1 Western Hemlock or Western Redcedar Plantations
Stands that had at one time been forest plantations were assigned a Pstage value of 0.00,
regardless of SDS category; however, in 2067, they were assigned a Pstage value of 0.25 if they
were dominated by western hemlock or western redcedar. Thus, there are some acres of several
SDS categories included in the Pstage category of 0.25. This is discussed in section 4.6 in chapter
4.0.
G.2 Douglas-Fir Dominated Stands
Douglas-fir dominated stands were projected to transition among Pstage values at a slower rate
than stands of other species (see Figure 4-3 in chapter 4.0); thus Douglas-fir dominated stands
were assigned a lower Pstage value for each SDS category. To simplify the presentation, in Tables
G-1 and G-2 (as well as Table 5-1 in chapter 5.0), all acres of Douglas-fir dominated stands were
included with their matching Pstage value regardless of SDS category (see Table G-3). See Tables
G-6 and G-7 for a breakdown of total acres for every combination of SDS category and Pstage
value in all three analysis units and all four time periods for the Habitat Management scenario
and No Management scenario, respectively. The projection of these stands in the management
scenario analysis is discussed in section 4.6 in chapter 4.0.

Appendix G Summary of Results from the Management Scenario Analysis
September 2008 Page G-24
Table G-3. Crosswalk for Habitat Acres in Douglas-Fir Dominated Stands Projected in the Management Scenario Analysis as Compared to Reported Acres by SDS Category and Pstage Value in Tables 5-1, G-1 and G-2.
Projected in Management Scenario Analysis Reported in Tables 5-1, G-1 and G-2
Stand Development Stage Pstage value Stand Development Stage Pstage value Understory Development 0.25 Large Tree Exclusion 0.25 Botanically Diverse 0.25 Large Tree Exclusion 0.25 Botanically Diverse 0.36 Understory Development 0.36 Niche Diversification 0.25 Large Tree Exclusion 0.25 Niche Diversification 0.47 Botanically Diverse 0.47 Fully Functional 0.62 Niche Diversification 0.62
G.3 DNR-Managed Lands without SDS Classification
Some DNR-managed lands do not have SDS data available, primarily road rights-of-ways and
lands for which DNR has no forest inventory data. Thus, IVMP data were used in those areas
and classified using Green et al. (1993) in the same way as was done for the non-DNR-managed
lands (see section 4.4 in chapter 4.0). To simplify the presentation, in Table 5-1 and the G-1 and
G-2 tables, the acres of both existing and projected IVMP Late-Seral forests were reported with
the 0.25 and 0.36 Pstage values (Large Tree Exclusion and Understory Development, respectively)
(Table G-4). See Tables G-6 and G-7 for a summary of total acres for IVMP Late-Seral forest
stages on DNR-managed lands for all three analysis units and all four time periods for the
Habitat Management scenario and No Management scenario, respectively.
In order to represent the acres to which a 0.31 Pstage value was assigned to IVMP Existing Late-
Seral forests (see section 4.4 in chapter 4.0), approximately half of the acres were included with
the 0.25 Pstage value (Large Tree Exclusion) and approximately half of the acres were included
with the 0.36 Pstage value (Understory Development). In order to represent the acres to which a
0.13 Pstage value was assigned to Projected IVMP Late-Seral forests (see section 4.5 in chapter
4.0), approximately half of the acres were included with the 0.25 Pstage value (Large Tree
Exclusion).

Appendix G Summary of Results from the Management Scenario Analysis
September 2008 Page G-25
Table G-4. Crosswalk for Habitat Acres on DNR-Managed Lands without SDS Classification Projected in the Management Scenario Analysis as Compared to Reported Acres by SDS Category and Pstage Value in Tables G-1, G-2, and 5-1 (in Chapter 5.0).
Projected in Management Scenario Analysis Reported in Tables 5-1, G-1, and G-2 IVMP class Pstage value SDS (proportion attributed) Pstage value
Large Tree Exclusion (half) 0.25 Late-Seral (Existing) 0.31
Understory Development (half) 0.36
Large Tree Exclusion (half) 0.25 Late-Seral (Projected) 0.13
Not reported in table (half) 0.00
To simplify three figures in chapter 5.0 (Figures 5-4, 5-6, and 5-8) only five forest stand
development stages are indicated to contribute to K' totals. However, the IVMP Existing and
Projected Late-Seral forests also contribute to K' on DNR-managed lands, and the K' from those
Late-Seral forests is included in the Large Tree Exclusion and Understory Development
categories in the figures (Table G-5). See Tables G-8 and G-9 for a summary of K' for IVMP
Late-Seral forests on DNR-managed lands in all three analysis units and all four time periods for
the Habitat Management and No Management scenarios, respectively. Half of the total K' created
on Existing IVMP Late-Seral forests is reported with the Large Tree Exclusion category, and
half is reported with the Understory Development category. All K' created on IVMP Projected
Late-Seral forests was included with the Large Tree Exclusion category.
Table G-5. Crosswalk for K’ on DNR-Managed Lands without SDS Classification Projected in the Management Scenario Analysis Compared to that Reported by SDS Category in Figures 5-4, 5-6, and 5-8 (in Chapter 5.0).
IVMP class for which K’ is calculated for Management Scenario Analysis
SDS within which K’ is reported in Figures 5-4, 5-6, and 5-8
Large Tree Exclusion (half) Late-Seral (Existing)
Understory Development (half)
Late-Seral (Projected) Large Tree Exclusion (all)

Appendix G Summary of Results from the Management Scenario Analysis
September 2008 Page G-26
Table G-6. Acreages of Current and Projected Future Habitat on DNR-Managed Forests by Forest Stage and Pstage Value for Four Time Periods for the Three Analysis Units under the Habitat Management Scenario.
Acres of DNR-Managed Forest SWWA Straits OESF Forest
Stage Pstage 2004 2013 2031 2067 2004 2013 2031 2067 2004 2013 2031 2067 Existing Late-Seral 0.31 3,230 3,230 3,230 3,230 1,379 1,379 1,379 1,379 1,486 1,486 1,486 1,486 Projected Late-Seral 0.13 0 1,846 4,762 6,332 0 162 722 1,174 0 328 1,232 1,573 LTS 0.25 49,473 36,061 24,408 19,683 7,815 6,877 4,089 4,282 7,409 7,453 6,133 18,739
0.25 0 0 0 947 0 0 0 204 0 0 0 15,026 UDS 0.36 42,039 39,770 33,983 43,871 20,638 17,462 12,780 20,303 9,431 9,226 9,209 17,957
0.25 0 0 0 257 0 0 0 137 0 0 0 1,862 0.36 0 0 7,421 2 0 0 0 0 0 0 259 0
BDS 0.47 29,526 25,220 28,761 29,590 21,647 16,957 17,530 16,592 20,480 18,896 18,752 23,509 0.47 0 0 2,874 649 0 0 0 0 0 0 514 55
NDS 0.62 868 3,440 19,440 32,622 152 1,475 8,801 2,360 26,897 23,688 30,981 32,931 0.62 0 0 0 902 0 0 0 0 0 0 0 8
FFS 0.89 123 230 424 22,043 5 4 20 7,517 5,643 14,144 17,728 30,551
Total 125,259 109,797 125,303 160,131 51,637 44,316 45,320 53,948 71,345 75,221 86,293 143,698

Appendix G Summary of Results from the Management Scenario Analysis
September 2008 Page G-27
Table G-7. Acreages of Current and Projected Future Habitat on DNR-Managed Forests by Forest Stage and Pstage value for Four Time Periods for the Three Analysis Units under the No Management Scenario.
Acres of DNR-Managed Forest SWWA Straits OESF Forest
Stage Pstage 2004 2013 2031 2067 2004 2013 2031 2067 2004 2013 2031 2067 Existing Late-Seral 0.31 3,230 3,230 3,230 3,230 1,379 1,379 1,379 1,379 1,486 1,486 1,486 1,486 Projected Late-Seral 0.13 0 1,846 4,762 6,332 0 162 722 1,174 0 328 1,232 1,573 LTS 0.25 49,473 37,696 31,961 22,598 7,815 6,877 4,089 4,282 7,409 7,629 6,454 19,014
0.25 0 0 0 947 0 0 0 204 0 0 0 15,026 UDS 0.36 42,039 39,770 35,520 43,640 20,638 17,462 12,780 20,303 9,431 9,229 9,442 18,392
0.25 0 0 0 257 0 0 0 137 0 0 0 1,862 BDS 0.47 29,526 25,220 28,908 30,072 21,647 16,957 17,530 16,592 20,480 18,896 18,827 23,399 NDS 0.62 868 3,440 19,543 37,877 152 1,475 8,801 2,360 26,897 23,688 30,981 34,097 FFS 0.89 123 230 424 11,035 5 4 20 7,517 5,643 14,144 17,728 29,772
Total 125,259 111,432 124,348 155,989 51,637 44,316 45,320 53,948 71,345 75,400 86,149 144,622
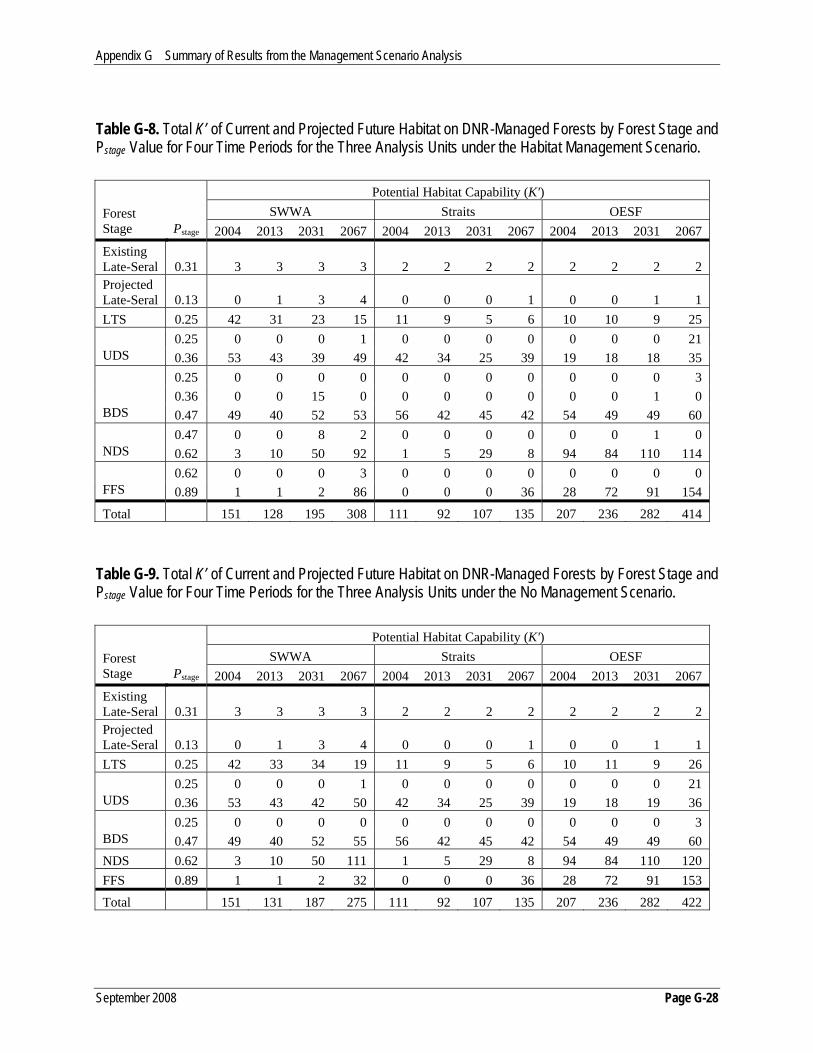
Appendix G Summary of Results from the Management Scenario Analysis
September 2008 Page G-28
Table G-8. Total K’ of Current and Projected Future Habitat on DNR-Managed Forests by Forest Stage and Pstage Value for Four Time Periods for the Three Analysis Units under the Habitat Management Scenario.
Potential Habitat Capability (K') SWWA Straits OESF Forest
Stage Pstage 2004 2013 2031 2067 2004 2013 2031 2067 2004 2013 2031 2067 Existing Late-Seral 0.31 3 3 3 3 2 2 2 2 2 2 2 2 Projected Late-Seral 0.13 0 1 3 4 0 0 0 1 0 0 1 1 LTS 0.25 42 31 23 15 11 9 5 6 10 10 9 25
0.25 0 0 0 1 0 0 0 0 0 0 0 21 UDS 0.36 53 43 39 49 42 34 25 39 19 18 18 35
0.25 0 0 0 0 0 0 0 0 0 0 0 3 0.36 0 0 15 0 0 0 0 0 0 0 1 0
BDS 0.47 49 40 52 53 56 42 45 42 54 49 49 60 0.47 0 0 8 2 0 0 0 0 0 0 1 0
NDS 0.62 3 10 50 92 1 5 29 8 94 84 110 114 0.62 0 0 0 3 0 0 0 0 0 0 0 0
FFS 0.89 1 1 2 86 0 0 0 36 28 72 91 154
Total 151 128 195 308 111 92 107 135 207 236 282 414
Table G-9. Total K’ of Current and Projected Future Habitat on DNR-Managed Forests by Forest Stage and Pstage Value for Four Time Periods for the Three Analysis Units under the No Management Scenario.
Potential Habitat Capability (K') SWWA Straits OESF Forest
Stage Pstage 2004 2013 2031 2067 2004 2013 2031 2067 2004 2013 2031 2067 Existing Late-Seral 0.31 3 3 3 3 2 2 2 2 2 2 2 2 Projected Late-Seral 0.13 0 1 3 4 0 0 0 1 0 0 1 1 LTS 0.25 42 33 34 19 11 9 5 6 10 11 9 26
0.25 0 0 0 1 0 0 0 0 0 0 0 21 UDS 0.36 53 43 42 50 42 34 25 39 19 18 19 36
0.25 0 0 0 0 0 0 0 0 0 0 0 3 BDS 0.47 49 40 52 55 56 42 45 42 54 49 49 60 NDS 0.62 3 10 50 111 1 5 29 8 94 84 110 120 FFS 0.89 1 1 2 32 0 0 0 36 28 72 91 153
Total 151 131 187 275 111 92 107 135 207 236 282 422

September 2008 Page H-1
APPENDIX H
MARBLED MURRELET POTENTIAL HABITAT CAPABILITY (K’ ) MODEL
SENSITIVITY ANALYSIS
H.1 Introduction
Sensitivity analyses are conducted to identify how variation in the output of a mathematical
model can be allocated to different sources of uncertainty in the input of the model (Chatterjee
and Hadi 1988). To address uncertainty in the definition of the marbled murrelet potential habitat
capability (K’) model component estimates and/or the validity of model assumptions, we
completed a sensitivity analysis to identify the components of the K’ model (see chapter 4.0 for
K’ model rationale and methodology) where estimation uncertainty would most greatly affect the
final calculation of potential habitat capability (K’).
The magnitude of three sources of model input uncertainty warranted further investigation
through a sensitivity analysis:
1. Estimation uncertainty regarding the influence of stand development on the capability of
habitat to support marbled murrelets for each unique stand development stage (hereafter
referred to as proportional influence values, which includes all Pstage values for DNR-
managed land, existing Late-Seral habitat on Federally managed land, and plantation
projected Late-Seral habitat for Other ownerships; see Appendix B for descriptions of stand
development stages)
2. Estimation uncertainty for proportional influence coefficients corresponding with edge
habitat and habitat greater than 40 miles from marine waters with a high density of marbled
murrelets (marbled murrelet-dense marine waters)
3. Classification accuracy of acreage determined to be marbled murrelet habitat

Appendix H Marbled Murrelet Potential Habitat Capability (K’) Model Sensitivity Analysis
September 2008 Page H-2
H.2 Methods
H.2a Uncertainty Regarding the Proportional Influence of Stand Development on Potential Habitat Capability
In the K' model, the proportional influence values and multipliers were not always the result of
mathematical calculations; therefore, the magnitude of uncertainty for their estimates was
unknown.
As a result, we chose a standard amount of variation to compare the relative sensitivity of model
components. There was no rationale for assigning different magnitudes of potential estimation
uncertainty to different stand development stages. Therefore we assumed that each proportional
influence value (associated with each unique forest development stage and ownership
combination and ranging from 0.13 to 0.89) had the same potential magnitude of estimation
uncertainty. To simulate a constant estimation uncertainty for each proportional influence value
of the K’ calculation, we added random normal variation with a standard deviation of 0.05 to
each of the unique proportional influence values for the developmental stage and ownership
combinations. We calculated a distribution of K’ for individual variation of each proportional
influence value by adding random variation to the selected proportional influence value and
running the model through 10,000 iterations while recording each output value of K’. We did not
construct confidence intervals around the K’ estimate and instead report the standard deviation of
the distribution of K’ as a sensitivity index to eliminate confusion regarding the purpose of
analysis results. The random normal variation with a standard deviation of 0.05 was consistent
across all proportional influence values, allowing the results to be reported as a relative index
that can be compared among model components and analysis units.
Sensitivity analyses for estimation uncertainty of proportional influence values (Pstage values)
were completed at all simulated time steps (decades 0, 1, 3 and 7) using acreage values (DNR
unpublished data) from the Habitat Management scenario (see section 4.14 in chapter 4.0 for
description).

Appendix H Marbled Murrelet Potential Habitat Capability (K’) Model Sensitivity Analysis
September 2008 Page H-3
H.2b Uncertainty Regarding the Proportional Influence of Edge Habitat and Habitat Greater than 40 Miles Inland
To investigate the K’ calculation’s sensitivity to uncertainty in the estimation of the proportional
influence multipliers for edge habitat (Pedge; 0.7 for acreage within 164 feet (50 meters) of an
early seral edge; see section 4.8) and distance from marine foraging areas (P>40; 0.25 for lands >
40 miles [64 kilometers] from marbled murrelet-dense marine waters; see section 4.10), the Pedge,
and P>40 multipliers were varied using the parameters of the random normal distribution with a
standard deviation of 0.05.
We report sensitivity index values for proportional influence multipliers (Pedge and P>40) as the
standard deviation of the K’ distribution resulting from the 10,000 iteration simulations. We
combined this analysis across ownerships and only report the cumulative sensitivity index values
in order to assess the sensitivity of the K’ estimate in the Pedge and P>40 estimates. We completed
sensitivity analyses for the multipliers at all simulated time steps (decades 0, 1, 3 and 7) by using
acreage values (DNR unpublished data) from the Habitat Management scenario (see section 4.14
in chapter 4.0 for description). A sensitivity analysis for the P>40 multiplier was only completed
for the SWWA Analysis Unit, which was the only analysis unit with marbled murrelet habitat
identified more than 40 miles (64 kilometers) from marbled murrelet-dense marine waters.
H.2c Uncertainty in the Classification of Habitat Acreage
Estimation uncertainty in determining the total acreage of existing habitat in each of the stand
development stages was likely proportional to the total acreage in the stage. The most probable
manifestation of acreage estimation uncertainty would be to classify acreage as a developmental
stage above or below the realized stage. Therefore, to assess the relative influence of acreage
estimation uncertainty from any of the DNR stand development stages, we transferred 10% of
the acreage within each stand development stage to the development stage above or below at
random. We repeated this process for acreage in each stand development stage on DNR-managed
land with two exceptions:
1. Ten percent of the acreage in the Large Tree stand development stage (the lowest of the five
DNR stages considered to be marbled murrelet habitat; Pstage=0.25) was allowed at random
(approximately 50% of the time) to go to the stage above (Understory Development;
Pstage=0.36) or (approximately 50% of the time) become non-habitat (Pstage=0)

Appendix H Marbled Murrelet Potential Habitat Capability (K’) Model Sensitivity Analysis
September 2008 Page H-4
2. Ten percent of the acreage in the Fully Functional stand development stage (Pstage=0.89) was
allowed at random (approximately 50% of the time) to go to the stage below or remain in the
Fully Functional habitat stage (approximately 50% of the time)
Two habitat designations suitable for marbled murrelet occupancy existed for non-DNR-
managed lands. As a result of fewer identified stand development stages, and larger differences
in the proportional influence values between stages on non-DNR–managed land, the magnitude
of classification uncertainty for Late-Seral designated habitat was assumed to be larger. As a
result, we varied classification of acreage from the existing Late-Seral designation (Federally
managed land and Other ownerships) more significantly than acreage within DNR stand
development stages. However, any habitat acreage classification error would originate from GIS
data layer discrepancies that we assumed would be consistent across all ownerships. Therefore,
the frequency of uncertainty in classifying the structural stage would likely be the same. We
shifted 10% of the acreage in existing Late-Seral habitat from Federally managed land (P=0.68)
at random to Fully Functional habitat (P=0.89) or Botanically Diverse habitat (P=0.47). The
change in proportional influence for the habitat that was shifted was ± 21% as compared with the
± 15% average within DNR-managed lands. Likewise, we multiplied 10% of existing Late-Seral
habitat in Other ownerships by proportional influence values 21% above and below (at random)
the designated Pstage value of 0.31 (i.e., 0.10 and 0.52). We report sensitivity index values as the
standard deviation of the K’ distribution resulting from 10,000 iterations of the model. We used
Habitat Management scenario (see section 4.14 in chapter 4.0 for description) acreage values
(DNR unpublished data) for all analyses. The original habitat acreage classification was
completed for current conditions. Any estimation uncertainty would only have occurred at time
step 0 and therefore the acreage classification analysis was not modeled through simulation
decades 1, 3, and 7.
H.2d Sensitivity Index Comparison between Analyses
The magnitudes of the sensitivity index values for both Pstage and habitat classification analyses
were driven by the amount each was varied. Because we set the allowable variation as equal for
each of the K’ model components within the proportional influence analyses, sensitivity index
values could be directly compared, with higher sensitivity index values reflecting greater model
component sensitivity (i.e., uncertainty in the component estimate will cause greater bias in the

Appendix H Marbled Murrelet Potential Habitat Capability (K’) Model Sensitivity Analysis
September 2008 Page H-5
final estimate of K’). Although the proportional influence values and multipliers were varied by
a fixed amount (random normal variation with SD=0.05), there was no justification for a
comparable threshold for the acreage classification analysis. As a result of this limitation, direct
comparison of the sensitivity index values between the acreage classification analysis and the
proportional influence analysis was not possible. However, because components from each
analysis unit were varied using the same criteria within each of the separate analyses, we were
able to calculate a cumulative sensitivity index value for analysis unit-ownership combinations,
allowing proportional comparison of sensitivity indices among analysis units.
H.3 Results
H.3a Relative Effects of Uncertainty Regarding the Proportional Influence on Potential Habitat Capability of Stand Development, Edge Habitat, and Habitat Greater than 40 Miles Inland
Southwest Washington (SWWA)
In the SWWA Analysis Unit, the K’ estimate was most sensitive to the estimation of proportional
influence values for the existing and projected Late-Seral habitat in Other ownerships (non-
DNR; non-Federal) (Sensitivity Index [SI]=25.84; Table H-1). The percent of the cumulative
Pstage sensitivity index corresponding to Late Seral habitat in Other ownerships ranged from
63.2-75.5% and increased for each subsequent simulation decade (Figure H-1). The percentages
were calculated by dividing the sum of the sensitivity index values for existing and projected
habitat on Other ownerships by the cumulative sensitivity index for the decade. On DNR-
managed land, the highest sensitivity index values in simulation decade zero were in the Large
Tree and Understory Development stand development stages (SI=5.70 and 5.14 respectively;
Table H-1; Figure H-2). The highest levels of sensitivity for Pstage value estimation shift to
increasingly older stand development stages through the four simulation decades (Table H-1;
Figure H-2). In simulation decade seven, the estimation of the Pstage value for the Niche
Diversification stand development stage has the highest influence on potential K’ model
variation (SI=6.01; Table H-1; Figure H-2). The Federally managed land in SWWA totals only
0.2% of the total habitat acreage, ranging from roughly 450-1450 acres (182-587 hectares)
depending on the simulation decade. As a result, the sensitivity of the K’ estimate to variation of
the proportional influence values associated with Federal habitat was comparatively low. The

Appendix H Marbled Murrelet Potential Habitat Capability (K’) Model Sensitivity Analysis
September 2008 Page H-6
Table H-1. K’ Model Component Proportional Influence Sensitivity Index Values and the Percent of Analysis Unit Total Acreage for the SWWA Analysis Unit by Decade of Simulation, Proportional Influence Value and Multiplier (see Appendix B for descriptions of stand development stages).
MULTI-PLIERS DNR FEDERAL OTHER
Edge Ocean LTS UDS BDS NDS FFS ALL Exist-ing
Project-ed
Exist-ing
Project-ed
Pstage Decade of Simulation 0.70 0.25 0.25 0.36 0.47 0.62 0.89
Sub-Total 0.68 0.20 0.31 0.13
Cumulative Sensitivity
Index (excluding multipliers)
Sensitivity Index 7.21 3.66 5.70 5.14 3.83 0.20 0.03 14.90 0.13 NA 25.84 NA 40.87
0 % of total
unit acreage 42.12 32.29 16.38 13.92 9.78 0.29 0.04 40.41 0.16 NA 59.43 NA
Sensitivity Index 7.75 3.06 3.68 3.51 2.65 0.60 0.06 10.50 0.13 0.12 16.29 12.06 39.10
1 % of total
unit acreage 49.89 24.14 8.86 9.77 6.20 0.85 0.06 25.73 0.12 0.11 44.10 29.94
Sensitivity Index 8.69 3.04 3.39 3.45 4.29 3.23 0.11 14.47 0.14 0.25 15.95 29.95 60.76
3 % of total
unit acreage 52.95 21.42 4.29 5.97 6.36 3.92 0.07 20.62 0.08 0.16 31.54 47.60
Sensitivity Index 11.14 3.83 1.81 4.10 3.73 6.01 3.71 19.36 0.14 0.26 15.49 45.03 80.28
7 % of total
unit acreage 58.36 23.19 2.69 6.13 4.08 4.55 3.14 20.58 0.07 0.13 24.53 54.69
0
10
20
30
40
50
60
70
80
0 1 3 7Decade
Perc
ent C
umul
ativ
e Pr
opor
tiona
lIn
fluen
ce
DNR
Federal
Other
Figure H-1. Percent of the Cumulative Proportional Influence Sensitivity Index Corresponding to each Ownership in the SWWA Analysis Unit (excluding Pedge and P>40).
proportional influence multiplier associated with edge habitat was more sensitive to uncertainty
throughout all four simulation decades than the proportional influence multiplier associated with

Appendix H Marbled Murrelet Potential Habitat Capability (K’) Model Sensitivity Analysis
September 2008 Page H-7
habitat greater than 40 miles (64 kilometers) from marbled murrelet-dense marine waters (Table
H-1). The sensitivity index for the proportional influence multiplier associated with edge habitat
increased through each subsequent simulation decade (Table H-1).
LTS UDS BDS NDS FFS
370
380
390
400
410
Decade 0; mean=385.75
Stand Development Stage
Pot
entia
l Hab
itat C
apab
ility
5.7 5.14 3.83 0.2 0.03
(K
')
K'
LTS UDS BDS NDS FFS
425
435
445
Decade 1; mean=436.63
Stand Development Stage
Pot
entia
l Hab
itat C
apab
ility
3.68 3.51 2.65 0.6 0.06
(K
')
K'
LTS UDS BDS NDS FFS
565
575
585
595
Decade 3; mean=582.30
Stand Development Stage
Pot
entia
l Hab
itat C
apab
ility
3.39 3.45 4.29 3.23 0.11
(K
')
K'
LTS UDS BDS NDS FFS
730
740
750
760
770
Decade 7; mean=754.45
Stand Development Stage
Pot
entia
l Hab
itat C
apab
ility
1.81 4.1 3.73 6.01 3.71
(K
')
K'
Figure H-2. K’ Variation and Resulting Sensitivity Index Values for DNR-Managed Land within the SWWA Analysis Unit by Decade of Simulation and Stand Development Stage (see Appendix B for descriptions of stand development stages).

Appendix H Marbled Murrelet Potential Habitat Capability (K’) Model Sensitivity Analysis
September 2008 Page H-8
Olympic Experimental State Forest (OESF)
In the OESF Analysis Unit, the K’ estimate was most sensitive to the estimation of proportional
influence values for the existing and projected Late-Seral habitat on Federally managed land
(Table H-2). The percent of the cumulative Pstage sensitivity index corresponding to Late Seral
habitat in Federally managed ownerships ranged from 62.5-69.2% and remained fairly consistent
throughout all simulation decades (Figure H-3). Within DNR ownership, the Pstage value for the
Niche Diversification stand development stage retained the highest sensitivity index values in all
simulation decades (Table H-2; Figure H-4). The Pstage value associated with Fully Functional
habitat also plays an increasingly significant role in total model sensitivity through each
successive simulation decade (Table H-2; Figure H-4). The sensitivity of the proportional
influence multiplier associated with edge habitat remained relatively consistent through each
subsequent simulation decade (Table H-2).
Table H-2. K’ Model Component Proportional Influence Sensitivity Index Values and the Percent of Analysis Unit Total Acreage for the OESF Analysis Unit by Decade of Simulation, Proportional Influence Value and Multiplier (see Appendix B for descriptions of stand development stages).
MULTI-PLIER DNR FEDERAL OTHER
Edge LTS UDS BDS NDS FFS All Exist-ing
Project-ed
Exist-ing
Project-ed
Pstage Decade of Simulation 0.70 0.25 0.36 0.47 0.62 0.89
Sub-Total 0.68 0.20 0.31 0.13
Cumulative Sensitivity
Index (excluding
edge multiplier)
Sensitivity Index 16.2 1.86 2.39 4.99 6.76 1.47 17.47 62.90 NA 10.55 NA 90.92
0 % of total
unit acreage 39.75 1.80 2.29 4.97 6.53 1.37 16.96 68.59 NA 14.45 NA
Sensitivity Index 16.35 1.77 2.15 4.56 6.28 3.83 18.59 62.53 11.78 10.66 4.22 107.78
1 % of total
unit acreage 28.27 1.54 1.91 3.91 4.91 2.93 15.20 58.52 9.03 12.33 4.91
Sensitivity Index 15.74 1.52 2.24 4.57 8.42 4.93 21.68 63.50 23.89 10.74 11.72 131.53
3 % of total
unit acreage 28.11 1.06 1.59 3.28 5.44 3.06 14.43 48.80 14.49 10.28 12.00
Sensitivity Index 15.69 4.13 3.88 5.19 8.14 7.88 29.22 62.63 28.88 10.78 14.96 146.47
7 % of total
unit acreage 29.80 2.80 4.93 3.79 4.93 4.57 21.02 42.23 14.69 8.90 13.16

Appendix H Marbled Murrelet Potential Habitat Capability (K’) Model Sensitivity Analysis
September 2008 Page H-9
0
10
20
30
40
50
60
70
80
0 1 3 7Decade
Perc
ent C
umul
ativ
e Pr
opor
tiona
lIn
fluen
ce
DNR
Federal
Other
Figure H-3. Percent of the Cumulative Proportional Influence Sensitivity Index Corresponding to each Ownership in the OESF Analysis Unit (excluding Pedge).

Appendix H Marbled Murrelet Potential Habitat Capability (K’) Model Sensitivity Analysis
September 2008 Page H-10
LTS UDS BDS NDS FFS
1310
1330
1350
Decade 0; mean=1334.58
Stand Development Stage
Pot
entia
l Hab
itat C
apab
ility
1.86 2.39 4.99 6.76 1.47
(K
') K'
LTS UDS BDS NDS FFS
1410
1430
1450
Decade 1; mean=1428.40
Stand Development Stage
Pot
entia
l Hab
itat C
apab
ility
1.77 2.15 4.56 6.28 3.83
(K
')
K'
LTS UDS BDS NDS FFS
1530
1550
1570
1590
Decade 3; mean=1554.75
Stand Development Stage
Pot
entia
l Hab
itat C
apab
ility
1.52 2.24 4.57 8.42 4.93
(K
')
K'
LTS UDS BDS NDS FFS
1690
1710
1730
Decade 7; mean=1714.03
Stand Development Stage
Pot
entia
l Hab
itat C
apab
ility
4.13 3.88 5.19 8.14 7.88
(K
') K'
Figure H-4. K’ Variation and Resulting Sensitivity Index Values for DNR-Managed Land within the OESF Analysis Unit by Decade of Simulation and Stand Development Stage (see Appendix B for descriptions of stand development stages).
Straits
In the Straits Analysis Unit, the K’ estimate was most sensitive to the estimation of proportional
influence values for the existing and projected Late-Seral habitat on Federally managed land
(Table H-3). The percent of the cumulative Pstage sensitivity index corresponding to Late Seral
habitat on Federally managed land ranged from 76.4-82.2% (Figure H-5). For DNR-managed

Appendix H Marbled Murrelet Potential Habitat Capability (K’) Model Sensitivity Analysis
September 2008 Page H-11
Table H-3. K’ Model Component Proportional Influence Sensitivity Index Values and the Percent of Analysis Unit Total Acreage for the Straits Analysis Unit by Decade of Simulation, Proportional Influence Value and Multiplier (see Appendix B for descriptions of stand development stages).
MULTI-PLIER DNR FEDERAL OTHER
Edge LTS UDS BDS NDS FFS ALL Exist-ing
Project-ed
Exist-ing
Project-ed
Pstage Decade of Simulation 0.70 0.25 0.36 0.47 0.62 0.89
Sub-Total 0.68 0.20 0.31 0.13
Cumulative Sensitivity
Index (excluding
edge multiplier)
Sensitivity Index 18.85 1.83 5.17 5.01 0.04 0.00 12.05 59.84 NA 6.47 NA 78.36
0 % of total
unit acreage 41.91 2.09 5.51 5.78 0.04 0.00 13.42 76.42 NA 10.16 NA
Sensitivity Index 18.52 1.43 3.82 3.58 0.29 0.00 9.12 60.15 14.99 6.47 0.67 91.40
1 % of total
unit acreage 32.19 1.61 4.10 3.98 0.35 0.00 10.03 67.13 12.97 8.92 0.94
Sensitivity Index 17.53 0.89 2.75 4.07 1.88 0.00 9.59 61.85 29.43 6.46 3.98 111.31
3 % of total
unit acreage 29.60 0.82 2.57 3.53 1.77 0.00 8.70 57.61 21.36 7.66 4.66
Sensitivity Index 17.45 0.99 4.51 3.74 0.52 1.73 11.49 61.37 34.77 6.36 6.13 120.12
7 % of total
unit acreage 29.97 0.80 3.82 3.12 0.44 1.40 9.59 53.38 23.47 7.10 6.46
land, the Pstage value for the Understory Development and Botanically Diverse stand
development stages retained the highest sensitivity index values in all simulation decades (Table
H-3; Figure H-6). The sensitivity of the proportional influence multiplier associated with edge
habitat remained relatively consistent through each of the simulation decades even though the
percent of total analysis unit habitat acreage in edge decreased (Table H-3).

Appendix H Marbled Murrelet Potential Habitat Capability (K’) Model Sensitivity Analysis
September 2008 Page H-12
0
10
20
30
40
50
60
70
80
90
0 1 3 7Decade
Perc
ent C
umul
ativ
e Pr
opor
tiona
lIn
fluen
ce
DNR
Federal
Other
Figure H-5. Percent of the Cumulative Proportional Influence Sensitivity Index Corresponding to each Ownership in the Straits Analysis Unit (excluding Pedge).

Appendix H Marbled Murrelet Potential Habitat Capability (K’) Model Sensitivity Analysis
September 2008 Page H-13
LTS UDS BDS NDS FFS
1180
1190
1200
1210
1220
Decade 0; mean=1200.18
Stand Development Stage
Pot
entia
l Hab
itat C
apab
ility
1.83 5.17 5.01 0.04 0
(K
') K'
LTS UDS BDS NDS FFS
1235
1245
1255
Decade 1; mean=1247.76
Stand Development Stage
Pot
entia
l Hab
itat C
apab
ility
1.43 3.82 3.58 0.29 0
(K
')
K'
LTS UDS BDS NDS FFS
1325
1335
1345
1355
Decade 3; mean=1339.56
Stand Development Stage
Pot
entia
l Hab
itat C
apab
ility
0.89 2.75 4.07 1.88 0
(K
')
K'
LTS UDS BDS NDS FFS
1385
1395
1405
Decade 7; mean=1397.48
Stand Development Stage
Pot
entia
l Hab
itat C
apab
ility
0.99 4.51 3.74 0.52 1.73
(K
') K'
Figure H-6. K’ Variation and Resulting Sensitivity Index Values for DNR-Managed Land within the Straits Analysis Unit by Decade of Simulation and Stand Development Stage (see Appendix B for descriptions of stand development stages).
H.3b Relative Effects of Uncertainty in the Classification of Habitat Acreage
In the SWWA Analysis Unit, the K’ estimate was most sensitive to habitat acreage classification
uncertainty in existing Late-Seral habitat designations in Other ownerships (Table H-4). In the
OESF and Straits Analysis Units the K’ estimate was most sensitive to habitat acreage
classification uncertainty in existing Late-Seral habitat on Federally managed land (Table H-4).
As expected, the OESF Analysis Unit, which had the largest total acreage of defined marbled

Appendix H Marbled Murrelet Potential Habitat Capability (K’) Model Sensitivity Analysis
September 2008 Page H-14
Table H-4. K’ Model Component Habitat Acreage Classification Sensitivity Index Values and the Percent of the Total Habitat Acreage (from all three analysis units) Associated with each Proportional Influence Value by Analysis Unit (see Appendix B for descriptions of stand development stages).
DNR FEDERAL OTHER LTS UDS BDS NDS FFS ALL Existing Existing
Pstage Analysis Unit 0.25 0.36 0.47 0.62 0.89
Sub-Total 0.68 0.31
Cumulative Sensitivity
Index
Sensitivity Index 3.03 1.61 1.36 0.10 0.01 6.11 0.06 15.8 21.97
SWWA % of total acreage 4.55 3.86 2.71 0.08 0.01 11.21 0.04 16.49 27.74
Sensitivity Index 0.75 0.58 1.48 3.18 0.43 6.42 31.96 6.24 44.62
OESF % of total acreage 0.68 0.87 1.88 2.47 0.52 6.42 25.96 5.47 37.85
Sensitivity Index 0.77 1.27 1.54 0.02 0.00 3.60 31.91 3.81 39.32
Straits % of total acreage 0.72 1.90 1.99 0.01 0.00 4.62 26.30 3.50 34.41
murrelet habitat, also had the highest cumulative sensitivity index values for habitat acreage
classification uncertainty totaled across all ownerships. On DNR-managed land, K’ had
comparatively higher sensitivity to habitat acreage classification uncertainty in the Large Tree
stand development stage in the SWWA Analysis Unit, the Niche Diversification stand
development stage in the OESF Analysis Unit, and the Botanically Diverse stand development
stage in the Straits Analysis Unit (Table H-4; Figure H-7).

Appendix H Marbled Murrelet Potential Habitat Capability (K’) Model Sensitivity Analysis
September 2008 Page H-15
LTS UDS BDS NDS FFS
380
384
388
SWWA Acreage Classification (Decade 0)
Stand Development Stage
Pot
entia
l Hab
itat C
apab
ility
3.03 1.61 1.36 0.1 0.01
(
K')
LTS UDS BDS NDS FFS
1330
1334
1338
OESF Acreage Classification (Decade 0)
Stand Development Stage
Pot
entia
l Hab
itat C
apab
ility
0.75 0.58 1.48 3.18 0.43
(
K')
LTS UDS BDS NDS FFS
1197
1199
1201
1203
Straits Acreage Classification (Decade 0)
Stand Development Stage
Pot
entia
l Hab
itat C
apab
ility
0.77 1.27 1.54 0.02 0
(
K')
Figure H-7. K’ Variation and Resulting Habitat Acreage Classification Sensitivity Index Values for DNR-Managed Land within each Analysis Unit by Stand Development Stage (see Appendix B for descriptions of stand development stages).
H.3c Cumulative Sensitivity Index Comparisons
Cumulative Model Sensitivity Indices increase with each subsequent simulation decade,
suggesting, as it might be expected, that estimation or classification uncertainty compounds

Appendix H Marbled Murrelet Potential Habitat Capability (K’) Model Sensitivity Analysis
September 2008 Page H-16
0
20
40
60
80
100
120
140
160
0 1 3 7Decade
Cum
ulat
ive
Prop
ortio
nal I
nflu
ence
Ana
lysi
s Se
nsiti
vity
Ind
ex V
alue
s
SWWAOESFStraits
Figure H-8. Cumulative K’ Model Sensitivity Index Values for Proportional Influence Analyses by Analysis Unit across Simulation Decades.
through time (Figure H-8). The acreage classification analysis cumulative sensitivity index
values remained approximately eight percent of the total sensitivity for each analysis unit
(TableH-5; Figures H-9, H-10 and H-11). In the SWWA Analysis Unit, the model components
where estimation or classification uncertainty would weigh most heavily on the resulting
estimate of K’ are the proportional influence values from Other ownerships (including
proportional influence values for existing and projected Late-Seral habitat designations) (Table
H-5; Figure H-9). In the OESF and Straits Analysis Units, the model components where
estimation or classification uncertainty would weight most heavily on the resulting estimate of
K’ are the proportional influence values from Federally managed land (including proportional
influence values for existing and projected Late-Seral habitat designations) (Table H-5; Figures
H-10 and H-11).

Appendix H Marbled Murrelet Potential Habitat Capability (K’) Model Sensitivity Analysis
September 2008 Page H-17
Table H-5. K’ Model Component Cumulative Sensitivity Index Values for all Analysis Units by Decade of Simulation and Analysis Type.
Analysis Unit Analysis Type Decade Proportional Influence
Multipliers DNR Federal Other Cumulative Sensitivity Index
0 10.87 14.90 0.13 25.84 40.87 1 10.81 10.50 0.25 28.35 39.10 3 11.73 14.47 0.39 45.90 60.76 7 14.97 19.36 0.40 60.52 80.28
Proportional Influence
All Decades 48.38 59.23 1.17 160.61 221.01
SWWA
Acreage Classification 0 6.11 0.06 15.80 21.97
0 16.20 17.47 62.90 10.55 90.92 1 16.35 18.59 74.31 14.88 107.78 3 15.74 21.68 87.39 22.46 131.53 7 15.69 29.22 91.51 25.74 146.47
Proportional Influence
All Decades 63.98 86.96 316.11 73.63 476.70
OESF
Acreage Classification 0 6.42 31.96 6.24 44.62
0 18.85 12.05 59.84 6.47 78.36 1 18.52 9.12 75.14 7.14 91.40 3 17.53 9.59 91.28 10.44 111.31 7 17.45 11.49 96.14 12.49 120.12
Proportional Influence
All Decades 72.35 42.25 322.40 36.54 401.19
Straits
Acreage Classification 0 3.60 31.91 3.81 39.32
Habitat Acreage Classification Analysis
Multipliers: Edge and Distance From Marine
Foraging AreasDNR Proportional Influence Values
Federal Proportional Influence Values
Other Proportional Influence Values
Federal AcreageDNR Acreage
Other Acreage
Figure H-9. K’ Variation and Resulting Sensitivity Index Values for All Ownerships within the SWWA Analysis Unit by Analysis Type (proportional influence, multipliers and habitat acreage classification).

Appendix H Marbled Murrelet Potential Habitat Capability (K’) Model Sensitivity Analysis
September 2008 Page H-18
Habitat Acreage Classification Analysis
Edge Multiplier
DNR Proportional Influence Values
Federal Proportional Influence Values
Other Proportional Influence Values
Federal Acreage
DNR Acreage
Other Acreage
Figure H-10. K’ Variation and Resulting Sensitivity Index Values for All Ownerships within the OESF Analysis Unit by Analysis Type (proportional influence, multipliers and habitat acreage classification).
Habitat Acreage Classification Analysis
Edge Multiplier
DNR Proportional Influence Values
Federal Proportional Influence Values Other Proportional
Influence Values Federal Acreage
DNR Acreage
Other Acreage
Figure H-11. K’ Variation and Resulting Sensitivity Index Values for All Ownerships within the Straits Analysis Unit by Analysis Type (proportional influence, multipliers and habitat acreage classification).

Appendix H Marbled Murrelet Potential Habitat Capability (K’) Model Sensitivity Analysis
September 2008 Page H-19
H.4 Discussion and Conclusion
The sensitivity analysis of the marbled murrelet potential habitat capability (K’) model does not
evaluate the model as a whole, but instead describes which components of the model weigh most
heavily in the reported outcome. The output of the sensitivity analysis is comparable relative to
other model components. The results should be used to add an additional level of transparency to
chapters 4.0 and 5.0. Therefore, the sensitivity analysis discussion and conclusion follows the
general order of the summary and discussion of K’ analysis hypotheses and assumptions as
described in chapter 5.0 (section 5.5).
1. Habitat area
Assumption: 170 acres (69 hectares) of forest habitat per marbled murrelet approximates an
ecological density or carrying capacity in Washington.
Application of Sensitivity Analysis Results: The sensitivity analysis for the K’ calculation
does not address concerns of uncertainty for the 170 acres of habitat per marbled murrelet
assumption. Any estimation uncertainty regarding this assumption would simply result in a
linear adjustment of the current, calculated K’.
2. Stand characteristics
Assumption: Forest stands that were assigned a certain growth stage have a consistent
abundance of nesting platforms and complexity of canopy structure allowing designation of
unique proportional influence values for marbled murrelets for each forest growth stage–
ownership combination.
Application of Sensitivity Analysis Results: The magnitude of K’ sensitivity resulting from
uncertainty in the estimation of each of the proportional influence values for each analysis
unit–ownership–simulation decade combination is discussed below:
» In the SWWA Analysis Unit, uncertainty in the estimation of proportional influence
values for Other ownerships (non-Federal, non-DNR-managed land) is likely to produce
the most variation in the calculated estimate of K’. However, DNR-managed land (13%
of the total acreage in the analysis unit) make up approximately 40% of the current
habitat acreage in SWWA (Table H-1).
• For DNR-managed land, uncertainty in the proportional influence values for the
Large Tree and Understory Development stages have the largest effect on the
estimation of potential habitat capability (K’) at decade 0 and simulation decade 1.
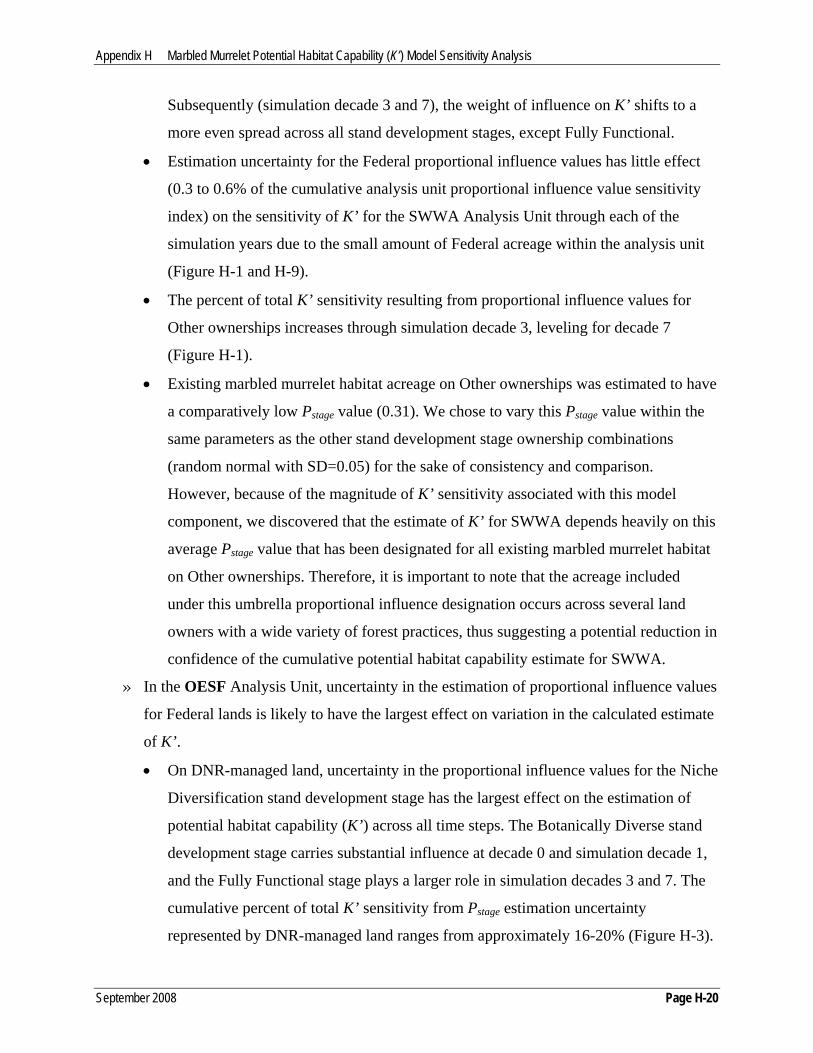
Appendix H Marbled Murrelet Potential Habitat Capability (K’) Model Sensitivity Analysis
September 2008 Page H-20
Subsequently (simulation decade 3 and 7), the weight of influence on K’ shifts to a
more even spread across all stand development stages, except Fully Functional.
• Estimation uncertainty for the Federal proportional influence values has little effect
(0.3 to 0.6% of the cumulative analysis unit proportional influence value sensitivity
index) on the sensitivity of K’ for the SWWA Analysis Unit through each of the
simulation years due to the small amount of Federal acreage within the analysis unit
(Figure H-1 and H-9).
• The percent of total K’ sensitivity resulting from proportional influence values for
Other ownerships increases through simulation decade 3, leveling for decade 7
(Figure H-1).
• Existing marbled murrelet habitat acreage on Other ownerships was estimated to have
a comparatively low Pstage value (0.31). We chose to vary this Pstage value within the
same parameters as the other stand development stage ownership combinations
(random normal with SD=0.05) for the sake of consistency and comparison.
However, because of the magnitude of K’ sensitivity associated with this model
component, we discovered that the estimate of K’ for SWWA depends heavily on this
average Pstage value that has been designated for all existing marbled murrelet habitat
on Other ownerships. Therefore, it is important to note that the acreage included
under this umbrella proportional influence designation occurs across several land
owners with a wide variety of forest practices, thus suggesting a potential reduction in
confidence of the cumulative potential habitat capability estimate for SWWA.
» In the OESF Analysis Unit, uncertainty in the estimation of proportional influence values
for Federal lands is likely to have the largest effect on variation in the calculated estimate
of K’.
• On DNR-managed land, uncertainty in the proportional influence values for the Niche
Diversification stand development stage has the largest effect on the estimation of
potential habitat capability (K’) across all time steps. The Botanically Diverse stand
development stage carries substantial influence at decade 0 and simulation decade 1,
and the Fully Functional stage plays a larger role in simulation decades 3 and 7. The
cumulative percent of total K’ sensitivity from Pstage estimation uncertainty
represented by DNR-managed land ranges from approximately 16-20% (Figure H-3).

Appendix H Marbled Murrelet Potential Habitat Capability (K’) Model Sensitivity Analysis
September 2008 Page H-21
• The percent of total K’ sensitivity resulting from proportional influence values for
Federally managed land declines slightly from 69.5% to 62.5% through the four
simulation decades (Figure H-3).
• Estimation uncertainty for Other ownership proportional influence values is similar to
the sum total of Pstage uncertainty on DNR lands on the sensitivity of K’ for the OESF
Analysis Unit and increases slightly through each of the simulation decades (Figure
H-3 and H-10).
» In the Straits Analysis Unit, uncertainty in the estimation of proportional influence
values for Federal lands is likely to have the largest effect on variation of K’.
• On DNR-managed land, uncertainty in the proportional influence values for the
Understory Development and Botanically Diverse stand development stages have the
largest effect on the estimation of potential habitat capability (K’) across all time
steps. The cumulative percent of total K’ sensitivity from Pstage estimation uncertainty
represented by DNR-managed land ranges from approximately 9-15% (Figure H-5).
• The percent of total K’ sensitivity resulting from proportional influence values for
Federally managed land in the Straits Analysis Unit increases through simulation
decade 3 and then decreases slightly in decade 7 (Figure H-5).
• The sensitivity of K’ is similarly affected by estimation uncertainty for Other
ownership proportional influence values and proportional influence values from
DNR-managed land within the Straits Analysis Unit through each of the simulation
decades (Figure H-5 and H-11).
» In summary, cumulative K’ sensitivity within each analysis unit is roughly proportional
to projected K'. The variation from direct proportionality comes from disparity in the
proportions of stand development stage acreage among analysis units, and the unique
levels of uncertainty associated with each stand development stage–ownership
combination. When total analysis unit habitat acreage is controlled for (i.e., cumulative
analysis unit sensitivity values are divided by the total acreage in each analysis unit;
viewed as an estimate of sensitivity per acre), the OESF Analysis Unit has the highest
proportional cumulative sensitivity.
3. Forest succession
Assumption: Forest growth models and ownership databases adequately project the

Appendix H Marbled Murrelet Potential Habitat Capability (K’) Model Sensitivity Analysis
September 2008 Page H-22
contribution to K' by stand development stages.
Application of Sensitivity Analysis Results: The sensitivity analysis describes the varying
implications of habitat classification uncertainty by providing the magnitude of K’
calculation sensitivity corresponding with uncertainty in the classification of habitat acreage
within each unique combination of analysis unit, ownership, and stand development stage.
» K’ sensitivity to habitat acreage classification uncertainty is roughly proportional to
habitat acreage values in each forest development stage. There is a larger effect of habitat
acreage classification uncertainty on K’ values in stand development stage-ownership
combinations where classification error would lead to designated habitat acreage
becoming non-habitat. This includes the Large Tree forest development stage on DNR-
managed land and the projected Late-Seral habitat for Other ownerships and Federally
managed land.
» In the SWWA Analysis Unit, the uncertainty of habitat acreage classification for Other
ownerships has the largest potential (71.9% of the cumulative analysis unit habitat
acreage classification sensitivity index) to produce variation in K’ (Figure H-9).
» In OESF and Straits Analysis Units, the uncertainty of habitat acreage classification for
Federally managed land has the largest potential (71.6% and 81.2% of the cumulative
analysis unit habitat acreage classification sensitivity index respectively) to produce
variation in K’ (Figures H-10 and H-11).
4. Edge effects
Assumption: Edge effects within marbled murrelet inland habitat play a predictably negative
role, such that acreage within 164 feet (50 meters) of an early seral edge has 70% of the
contribution to K' as habitat that is more interior.
Application of Sensitivity Analysis: The sensitivity analysis describes the potential variation
of K’ resulting from estimation uncertainty of the proportional influence multiplier (0.7)
resulting from designated habitat acreage being within 164 feet (50 meters) of an early seral
stand edge (Pedge). The analysis was completed for the cumulative effect of the multiplier
across all ownerships within each analysis unit–simulation decade combination. The
percentage of the total K’ sensitivity corresponding to uncertainty in the edge multiplier
peaked in decade 0 in the OESF and Straits Analysis Units (Table H-1). The percentage of
total SWWA habitat in edge settings increases with each simulation decade from 42.1% to

Appendix H Marbled Murrelet Potential Habitat Capability (K’) Model Sensitivity Analysis
September 2008 Page H-23
58.3% (Table H-1). Likewise, sensitivity to the proportional influence multiplier associated
with edge habitat increases with each simulation year in SWWA. The estimation of the edge
habitat multiplier plays a fairly significant role in the overall variation of K’. In the Straits
Analysis Unit, uncertainty in the edge multiplier will have more effect on K’ than the
cumulative uncertainty of all DNR proportional influence values combined. In the OESF and
SWWA Analysis Units, uncertainty in the edge habitat multiplier has approximately 70% as
much potential impact on the variation of K’ as the does the cumulative uncertainty of all
DNR proportional influence values.
5. Distance from marine foraging areas
Assumption: There is a threshold distance of 40 miles (64 kilometers) from marbled
murrelet-dense marine waters, beyond which the proportional influence of marbled murrelet
inland habitat decreases to 25% of what it would be within 40 miles of marbled murrelet-
dense marine waters.
Application of Sensitivity Analysis: The sensitivity analysis describes the potential variation
of K’ resulting from the estimation uncertainty of the proportional influence multiplier (0.25)
resulting from habitat being outside of 40 miles from marbled murrelet-dense marine waters
(P>40). The SWWA Analysis Unit was the only one with habitat beyond 40 miles from
marbled murrelet dense marine waters. The sensitivity of K’ to the uncertainty in the distance
from marine foraging areas multiplier (0.25) was calculated across DNR-managed land and
Other ownerships. There was no Federally managed habitat identified outside of 40 miles
from marbled murrelet-dense marine waters. The K’ sensitivity for uncertainty in the distance
from foraging areas multiplier was between 35% and 50% of the sensitivity recorded for
edge habitat for current day conditions and each of the three simulation decades.

Appendix H Marbled Murrelet Potential Habitat Capability (K’) Model Sensitivity Analysis
September 2008 Page H-24
This page intentionally left blank.