Embed Size (px)
Citation preview
African Journal of Economic and Management StudiesLong-term effects of population growth on aggregate investment dynamics:Selected country evidence for AfricaSimplice A. Asongu
Article information:To cite this document:Simplice A. Asongu , (2015),"Long-term effects of population growth on aggregate investmentdynamics", African Journal of Economic and Management Studies, Vol. 6 Iss 3 pp. 225 - 250Permanent link to this document:http://dx.doi.org/10.1108/AJEMS-12-2012-0083
Downloaded on: 08 September 2015, At: 08:43 (PT)References: this document contains references to 45 other documents.To copy this document: [email protected] fulltext of this document has been downloaded 12 times since 2015*
Users who downloaded this article also downloaded:John Kuada, (2015),"Determinants of investment and organizational performance in Africa",African Journal of Economic and Management Studies, Vol. 6 Iss 3 pp. - http://dx.doi.org/10.1108/AJEMS-07-2015-0083Edward Osei Akoto, Claire Allison Stammerjohan, (2015),"Moderating effect of perceived inflationon dual commitment to organization and professional association: A case of health professionalsin Ghana", African Journal of Economic and Management Studies, Vol. 6 Iss 3 pp. 289-307 http://dx.doi.org/10.1108/AJEMS-02-2012-0005Olufemi Bodunde Obembe, Rosemary Olufunmilayo Soetan, (2015),"Competition, corporategovernance and corporate performance: Substitutes or complements? Empirical evidence fromNigeria", African Journal of Economic and Management Studies, Vol. 6 Iss 3 pp. 251-271 http://dx.doi.org/10.1108/AJEMS-02-2012-0007
Access to this document was granted through an Emerald subscription provided byToken:JournalAuthor:7D3A5009-0468-449E-A755-6402F726C589:
For AuthorsIf you would like to write for this, or any other Emerald publication, then please use our Emeraldfor Authors service information about how to choose which publication to write for and submissionguidelines are available for all. Please visit www.emeraldinsight.com/authors for more information.
About Emerald www.emeraldinsight.comEmerald is a global publisher linking research and practice to the benefit of society. The companymanages a portfolio of more than 290 journals and over 2,350 books and book series volumes, aswell as providing an extensive range of online products and additional customer resources andservices.
Emerald is both COUNTER 4 and TRANSFER compliant. The organization is a partner of theCommittee on Publication Ethics (COPE) and also works with Portico and the LOCKSS initiative fordigital archive preservation.
Dow
nloa
ded
by M
r A
song
u Si
mpl
ice
At 0
8:43
08
Sept
embe
r 20
15 (
PT)

*Related content and download information correct at time ofdownload.
Dow
nloa
ded
by M
r A
song
u Si
mpl
ice
At 0
8:43
08
Sept
embe
r 20
15 (
PT)
Long-term effects ofpopulation growth on aggregate
investment dynamicsSelected country evidence for Africa
Simplice A. AsonguAfrican Governance and Development Institute, Yaoundé, Cameroon
AbstractPurpose – The generation is witnessing the greatest demographic transition and Africa is at the heartof it. There is mounting concern over corresponding rising unemployment and depleting per capitaincome. The purpose of this paper is to examine the issues from a long-run perspective by assessingthe relationships between population growth and a plethora of investment dynamics: public, private,foreign and domestic investments.Design/methodology/approach – Vector autoregressive models in the perspectives of vector errorcorrection and short-run Granger causality are used.Findings – In the long-run population growth will: first, decrease foreign and public investments inIvory Coast; second, increase public and private investments in Swaziland; three, deplete publicinvestment but augment domestic investment in Zambia; fourth diminish private investment andimprove domestic investment in the Congo Republic and Sudan, respectively.Practical implications –Mainstream positive linkage of population growth to investment growth inthe long-term should be treated with extreme caution. Policy orientation should not be blanket, butcontingent on country-specific trends and tailored differently across countries. The findings stress theneed for the creation of a conducive investment climate (and ease of doing business) for private andforeign investments. Family planning and birth control policies could also be considered in countrieswith little future investment avenues.Originality/value – The objective of this study is to provide policy makers with some insights onhow future investment opportunities could help manage rising population growth and correspondingunemployment.Keywords Causality, Africa, Human capital, Productivity, InvestmentPaper type Research paper
1. IntroductionThe emergence and prominence of Africa in the world as one of the continents with thehighest demographic growth rate with a population projected to double by 2036 from2009 and represent 20 percent of the world by 2050 (UN, 2009), represents an importantgeo-economic concern to policy makers, social scientists and researchers. The concernis even more crucial with soaring unemployment rate and rising economic emigration(Tom, 2006; Asongu, 2014a). These issues have reignited renewed interest in theproblem of long-run investment opportunities.
The continuous expansion of demography really raises important policy questionsabout the exhaustion of investment opportunities needed to accommodate soaringunemployment owing to population explosion. It has been substantially documentedthat, socioeconomic unrests that have marked the African geopolitical landscape in
African Journal of Economic andManagement Studies
Vol. 6 No. 3, 2015pp. 225-250
©Emerald Group Publishing Limited2040-0705
DOI 10.1108/AJEMS-12-2012-0083
Received 2 December 2012Revised 2 April 2013
15 July 201326 August 2013
Accepted 11 September 2013
The current issue and full text archive of this journal is available on Emerald Insight at:www.emeraldinsight.com/2040-0705.htm
JEL Classification — C30, J00, O10, O40The author is highly indebted to the editor and referees for their useful comments.
225
Long-termeffects of
populationgrowth
Dow
nloa
ded
by M
r A
song
u Si
mpl
ice
At 0
8:43
08
Sept
embe
r 20
15 (
PT)
recent years have been largely due to high-unemployment rates (Mohammad, 2011;Sakbani, 2011). Economists and policy makers in effect may no longer be thinkingabout the outer limits of capital accumulation and demand-side advantages ofpopulation growth. The spectacular growth of the African population, coupled with thesubstantially documented investment needs of the African continent[1] raise importantpolicy questions about the sources of future investment opportunities that wouldmanage unemployment.
By seeking to address the concern about long-run employment opportunities, thispaper has a twofold contribution to the African development literature. First, thelong-run focus of the analysis adequately calibrates the projected demographicconcerns in the distant future. Second, by examining the connections betweendemographic changes and investment dynamics, I am able to provide the investmenttrends that policy makers need to focus-on in order to tackle potential long-termunemployment[2]. The distinction among investment types in the analysis tacklesimportant questions on government (public vs private investment) and openness(foreign vs domestic investment) policies.
2. Population growth, investment and economic growth: theory andevidence2.1 The concern for population growth and need for investment in AfricaThere has been growing concerns over Africa’s population growth and correspondingrising unemployment rate (Asongu, 2013). According to Asongu, with the Africanpopulation projected to double by 2036 from 2009, many proponents have it that, ifstringent investment policies are not put in place, socio-economic issues related torising unemployment and decreasing per capita income could significantly motivatesocial unrests, brain drain and/or illegal migration.
Consistent with Asongu and Jingwa (2012, p. 146), our generation is experiencing thegreatest demographic change ever, with Africa at its center. According to the UnitedNations (2009) estimates, in the post-colonial era (in the neighborhood of the 1970s), therewere two Europeans for every African. By the time those born in the 1970s go onretirement (most probably by 2030) it is estimated that, there would be two Africans forevery European. These statistics make Africa the fastest growing continent with itspopulation projected to represent 20 percent of the world by 2050 (UN, 2009; Asongu,2013). Therefore, it is a relevant concern to investigate how this soaring population couldbe accommodated without bitter economic implications in the future. A point on whichmany analysts (directly or indirectly) agree (as a step to addressing the growing concernsraised above) is the thesis that Africa needs other forms of investments owing to thefailed privatization projects (Rolfe and Woodward, 2004; Alagidede, 2008; Bartelset al., 2009; Tuomi, 2011; Kolstad and Wiig, 2011; Darley, 2012; Asongu, 2012). DangoteGroup (2008) has reiterated that Africa needs investments not aid. It has decried therejection of commodities from African companies by multinationals and urged Africancompanies to target inter-African trade (Asongu, 2013). The position of this pressinginvestment need is supported by a recent IMF Survey (April 2009) in which manyanalysts believe foreign donors should focus more on investment avenues in Africa, thanon aid (Asongu, 2013). The basis for this recommendation is that, developmentassistance and aid would improve per capita income, but sustainable investmentcould benefit the continent more in the long-term. Though private and foreigninvestments in Africa have increased over the past years[3], rising unemploymentrates remain bleak. With structural adjustment policies imposed by the International
226
AJEMS6,3
Dow
nloa
ded
by M
r A
song
u Si
mpl
ice
At 0
8:43
08
Sept
embe
r 20
15 (
PT)
Monetary Fund and the World Bank (requiring liberalization, privatization andmeandering toward market-based economies in the 1980s), we should naturally expectforeign and private investments to have a positive incidence on population growth at theexpense of public investment.
Consistent with Asongu (2012, 2013), a strand of current issues in African businesshas focussed on the need to improve Africa’s share of foreign direct investment (FDI).Rolfe and Woodward (2004) have assessed the Zambian experience of attracting foreigninvestment through privatization. The results have shown that, despite increased foreigninvestment during the 1990s, the economy has stagnated. They conclude that, havingsold-off its state assets, Zambia like the case of other Sub-Saharan African (SSA)countries must endeavor to attract investment via other channels. Much recently, Bartelset al. (2009) have investigated the reason SSA’s share of FDI has persistently averaged1 percent of global flows and concluded that the FDI “location decision” in SSA isinfluenced strongly by policy issues[4]. As a broad extension of this analysis, usingmicrodata and firm interviews to explore the role of FDI drivers in South Africa, Tuomi(2011) has used a micro-level analysis (that enables specification of the investmentclimate constraints) and has also found the draw-backs to investment to be centeredaround wrong-policy. A position that has been recently confirmed by Kolstad and Wiig(2011) and Darley (2012) in their investigations of Chinese FDI in Africa and how toincrease SSA’s share of FDI, respectively. Three insights relevant to the context of thisstudy could be drawn from the above literature: first, the need for alternative sources ofinvestment beside FDI; second, the important role of policy making bodies in determininginvestment flows (Asongu, 2013) and; third, the soaring demography that could lead tosocial unrests in the absence of employment opportunities.
2.2 Population growth, human capital investments and investment opportunitiesIn this section, I discuss the linkages among population growth, human capital investmentand investment opportunities in three strands. The first strand examines the debate onthe relations among population growth, human capital and investment opportunities; thesecond discusses the relationship between population growth and investment opportunitieswhile the third covers the debate on linkages between population growth and economicdevelopment.
It is essential in the first strand to discuss how population explosion would beaccommodated by future investment dynamics because among the striking regularities,it is evident in aggregate cross-country data (whether investigated cross-sectionally orover-time) that, there are inverse associations between fertility rate and “per capitaincomes, schooling levels, survival rates and indicators of human capital.” As a generalrule, high-income countries have been (and are) characterized by low fertility andhigh-levels of human capital (Rosenzweig, 1990; Asongu, 2013). As a matter of fact, thosecountries that have experienced high rates of per capita income growth have alsoexperienced relatively rapid declines in fertility and increase in human capital levels[5].Therefore, it could be inferred that, declines in fertility and increases in human capitallevels move in tandem with economic development. Such aggregate relationships bythemselves do not reveal very much about the determinants of economic prosperity andhuman capital investments. It has been well documented that the decreasing rate ofpopulation growth was one of the major contributing causes for the failure of theAmerican economy to recover fully from depression in the 1930s (Rosenson, 1942). It isprobably factual that, in a boom period of rapid expansion and soaring population, asudden decrease in the rate of population growth would tend to make investors more
227
Long-termeffects of
populationgrowth
Dow
nloa
ded
by M
r A
song
u Si
mpl
ice
At 0
8:43
08
Sept
embe
r 20
15 (
PT)
cautious. Accordingly, an increasing rate of population growth might influence investorsto be pessimistically inclined to feel that, such an increase will cause more absoluteunemployment and economic hardship in a country, leading to less profitableinvestment prospects. Conversely, with an increasing rate of population, expectationsof entrepreneurs change as they tend to believe certain investments to be profitable.As investors increase their optimism, unemployment and investment decreases andincreases, respectively.
In the second strand, there are several ways in which population growth mightinfluence investment (Sweezy, 1940). First, via its effect on the propensity to consume.Second, through its effect on the composition of aggregate consumer demand. Third, bymeans of supply of labor. Fourth, as an essential part of a certain broader phenomenonwhich in turn vitally affects investment.
First, a population containing a high proportion of dependents may be estimated to havea comparatively high propensity to consume. To a considerable extent, this factor cuts bothways (from a population perspective). While a rapidly growing population has a highproportion of children, a stationary population has a high proportion of people beyondworking age. However, from sociological and political perspectives, the two situations differconsiderably. Accordingly, a high proportion of dependency from the older age grouprepresents more of a problem for the public than a high proportion of children. Moreover,during the transition period from rapid growth to complete stability, the population goesthrough a threshold in which the combined proportion of dependents is at a minimum.
Second, the incidence of population growth on the composition of total consumerdemand is important for investment opportunity. In fact, a growing population ofnecessity directs a comparatively large proportion of its expenditure toward commoditieswhich require relatively heavy capital outlays for their production (Asongu, 2013).
Third, up till now I have been considering the effect of population growth on thedemand for commodities and therefore, indirectly on the outlets for investment seekingfunds. More direct is the incidence of population growth on the labor supply. Indeed,this is the dimension in the concern that has interested classical economists and theusual treatment stems directly from their work.
Fourth, the preceding points have been attempting to know what the effects ofpopulation growth on investment and employment would be. From a broader view, thelink between population growth and investment is an essential part of a certain broaderphenomenon. Therefore, it is scarcely possible to conceive this linkage as occurring inisolation because; they are intimately bound with other factors (like technological changeand progress in health care).
The third strand which discusses linkages between population growth and economicdevelopment has been an issue of much heated debate. Whereas some proponents viewpositive demographic change as an instigator of long-term growth, others expressambivalence over this relationship. The contribution of population growth to economicdevelopment has been investigated in many studies. Azomahou and Mishra (2008) inre-examining the impact of age dynamics on economic prosperity through age-structuredpopulation for the Organization for Economic Co-Operation and Development (OECD)and non OECD countries have shown that the economies grew mostly due to the stock ofhuman capital between 1960 and 2000. In relative terms, findings reveal non OECDcountries are likely to enjoy higher economic prosperity than their OECD counterparts.Moreover, the age-dynamics dimension of the study substantiates the consensus that,age-structured population especially the work force is important in explaining disparitiesin growth between OECD and non OECD countries. Before Azomahou and Mishra,
228
AJEMS6,3
Dow
nloa
ded
by M
r A
song
u Si
mpl
ice
At 0
8:43
08
Sept
embe
r 20
15 (
PT)
Hondroyiannis and Papapetrou (2005) a study on the relationship between fertility andoutput in eight European countries (using panel cointegration analysis) had establishedsome interesting results.
3. Data and econometric methodology3.1 DataI assess a sample of 38 African countries with data fromAfrican Development Indicators ofthe World Bank (2010) for the period 1977-2007. The limitation to these 38 countries isbased on constraints in data availability. Aggregate investment dynamics include: GrossPrivate Investment ; FDI; Gross Public Investment and; Gross Domestic Investment. Factorproductivity variables are: Gross Fixed Capital Formation and Population growth rate forphysical capital and human capital, respectively. Whereas the first five variables are inratios of GDP, population growth is in annual growth rate. The definition of all variables inpercentages and ratios of GDP eases comparability. The 38 countries constituting the initialdataset are subsequently trimmed-down due to constraints in the cointegration theory[6].Therefore, in the analysis, constituent countries of the panel-base differ as I move from oneform of investment type to another. The inclusion of physical capital (or fixed capitalformation) in the analysis has a twofold justification: first, it is in line with the mainstreamaggregate production investment specification[7] and; second, it serves as a control variablefor robustness checks (in the verification of the “capital led investment” nexus).
3.2 MethodologyThe estimation strategy typically follows recent African literature on the investment-population nexus (Asongu, 2013), investment-finance nexus (Asongu, 2014b) andmainstream literature on assessing the effects of monetary policy variables on economicactivity (Starr, 2005; Nogueira, 2009). Employment of the technique requires unit root andcointegration tests that examine the stationary properties and long-term relationships(equilibriums), respectively. In these assessments, the Vector Error Correction Model(VECM) is employed for long-run effects while simple Granger causality is applied forshort-term effects. While application of the former model requires that the variables exhibitunit roots in levels and have a long-term relationship (cointegration), the latter is employedon the condition that variables do not exhibit unit roots (or are stationary).
4. VAR estimationsWith respect to the Engle-Granger (1987) methodology, short-run estimations andlong-run estimators will be derived by simple Granger causality and Vector ErrorCorrection (VEC) models, respectively.
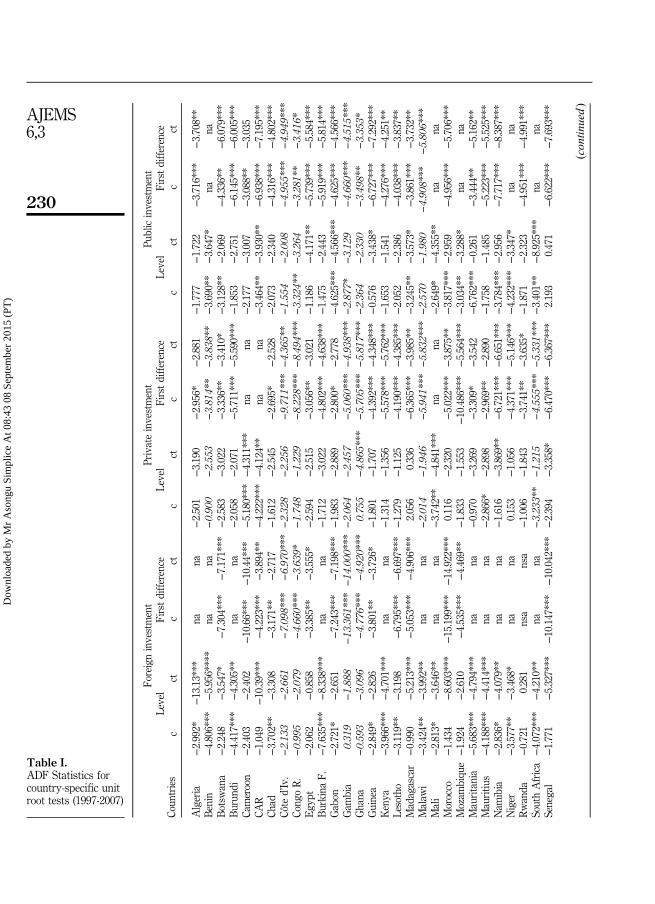
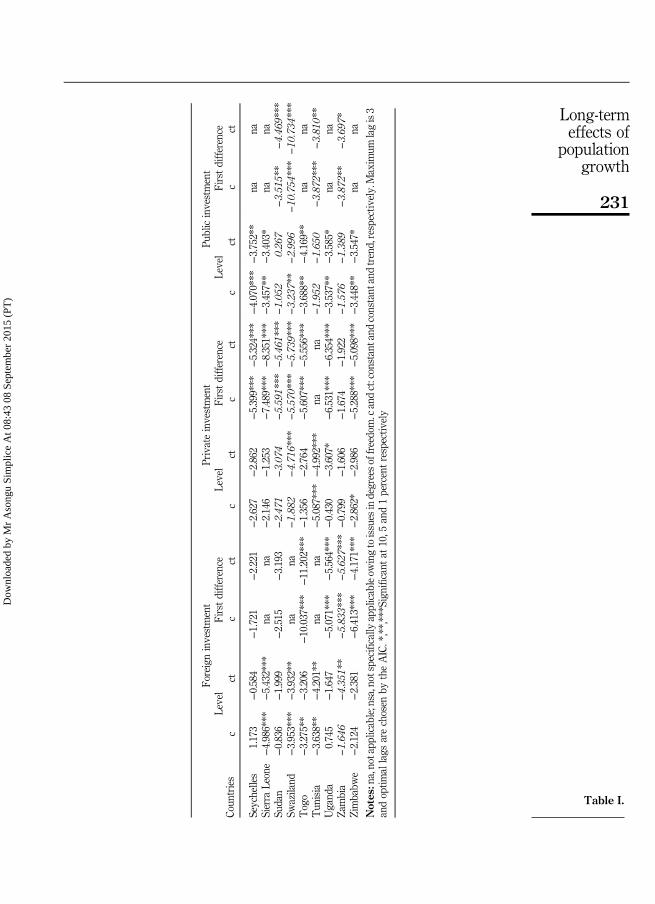
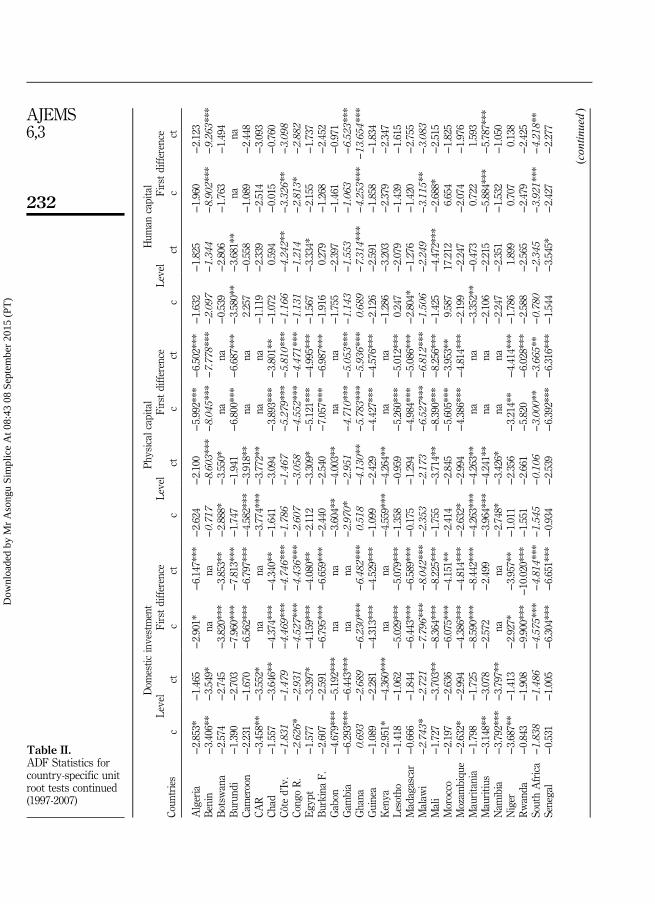
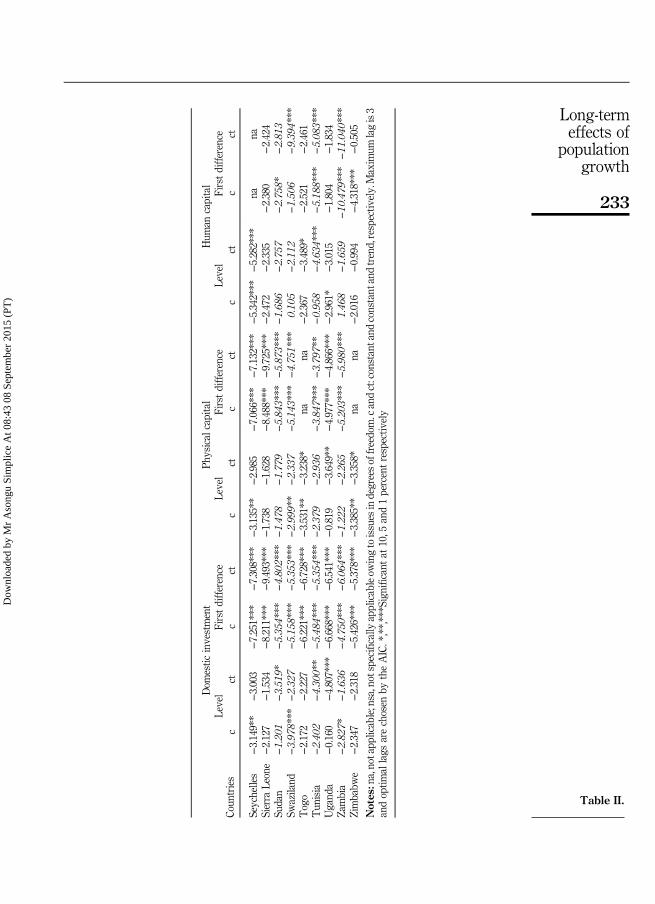
4.1 Derivation of integrated variables from country-specific unit root tests4.1.1 Country-specific unit root tests. Since the analysis is based on the cointegrationtheory, I first test for stationarity in the variables using the standard Augmented DickeyFuller [8] test. It is not worthwhile laying too much emphasis on the mechanics of the unitroot tests because it is widely applied and constitutes only an exploratory analyticaldimension of the study. Optimal lag selection for goodness of fit in model specification isin accordance with the recommendations of Liew (2004). Tables I-II above present theunit root test results. Country-specific variables with stationary properties that areconsistent with the cointegration theory are presented in bold. The choice of thesecountries depends on specific selection criteria; outlined in Section 4.1.2.
229
Long-termeffects of
populationgrowth
Dow
nloa
ded
by M
r A
song
u Si
mpl
ice
At 0
8:43
08
Sept
embe
r 20
15 (
PT)
Coun
tries
Foreigninvestment
Privateinvestment
Publicinvestment
Level
Firstdifference
Level
Firstdifference
Level
Firstdifference
cct
cct
cct
cct
cct
cct
Algeria
−2.992*
−13.13***
nana
−2.501
−3.190
−2.956*
−2.881
−1.777
−1.722
−3.716***
−3.708**
Benin
−4.806***
−5.956****
nana
−0.90
0−2.55
3−3.81
4**
−3.83
8**
−3.690**
−3.647*
nana
Botsw
ana
−2.248
−3.547*
−7.304***
−7.171***
−2.583
−3.022
−3.336**
−3.410*
−3.128**
−2.069
−4.336**
−6.079***
Burun
di−4.417***
−4.305**
nana
−2.058
−2.071
−5.711***
−5.590***
−1.853
−2.751
−6.145***
−6.005***
Cameroon
−2.403
−2.402
−10.66***
−10.44***
−5.180***
−4.311***
nana
−2.177
−3.007
−3.088**
−3.035
CAR
−1.049
−10.39***
−4.223***
−3.894**
−4.222***
−4.124**
nana
−3.464**
−3.930**
−6.938***
−7.195***
Chad
−3.702**
−3.308
−3.171**
−2.717
−1.612
−2.545
−2.695*
−2.528
−2.073
−2.340
−4.316***
−4.802***
Côte
d’Iv.
−2.13
3−2.66
1−7.09
8***
−6.97
0***
−2.32
8−2.25
6−9.71
1***
−4.36
5**
−1.55
4−2.00
8−4.95
5***
−4.94
9***
Cong
oR.
−0.99
5−2.07
9−4.66
0***
−3.63
9*−1.74
8−1.22
9−8.22
8***
−8.49
4***
−3.32
4**
−3.26
4−3.28
1**
−3.41
6*Egy
pt−2.062
−0.858
−3.385**
−3.555*
−2.594
−2.515
−3.056**
−3.021
−1.186
−4.171**
−5.739***
−5.584***
Burkina
F.−7.635***
−8.338***
nana
−1.712
−3.022
−4.802***
−4.638***
−1.475
−2.443
−5.919***
−5.814***
Gabon
−2.721*
−2.651
−7.243***
−7.198***
−1.983
−2.889
−2.800*
−2.778
−4.625***
−4.566***
−4.625***
−4.566***
Gam
bia
0.31
9−1.88
8−13
.361
***
−14
.000
***
−2.06
4−2.45
7−5.06
0***
−4.93
8***
−2.87
7*−3.12
9−4.66
0***
−4.51
5***
Ghana
−0.59
3−3.09
6−4.77
6***
−4.92
0***
0.75
5−4.86
5***
−5.70
5***
−5.81
7***
−2.36
4−2.33
0−3.49
8**
−3.35
3*Guinea
−2.849*
−2.826
−3.801**
−3.726*
−1.801
−1.707
−4.392***
−4.348***
−0.576
−3.438*
−6.727***
−7.292***
Kenya
−3.966***
−4.701***
nana
−1.314
−1.356
−5.578***
−5.762***
−1.653
−1.541
−4.276***
−4.251**
Lesotho
−3.119**
−3.198
−6.795***
−6.697***
−1.279
−1.125
−4.190***
−4.385***
−2.052
−2.386
−4.038***
−3.837**
Madagascar
−0.990
−5.213***
−5.053***
−4.906***
2.056
0.336
−6.365***
−3.985**
−3.245**
−3.573*
−3.861***
−3.732**
Malaw
i−3.424**
−3.992**
nana
−2.01
4−1.94
6−5.94
1***
−5.83
2***
−2.57
0−1.98
0−4.90
8***
−5.80
6***
Mali
−2.813*
−3.646**
nana
−3.742**
−4.841***
nana
−2.649*
−4.355**
nana
Morocco
−1.434
−8.603***
−15.199***
−14.922***
0.116
−2.320
−5.022***
−3.875**
−3.817***
−2.959
−4.956***
−5.706***
Mozam
biqu
e−1.924
−2.610
−4.535***
−4.469**
−1.833
−1.553
−10.486***
−5.564***
−3.034**
−3.288*
nana
Mauritania
−5.683***
−4.794***
nana
−0.970
−3.269
−3.309*
−3.542
−6.762***
−0.261
−3.444**
−5.162**
Mauritiu
s−4.188***
−4.414***
nana
−2.866*
−2.898
−2.969**
−2.890
−1.758
−1.485
−5.223***
−5.525***
Nam
ibia
−2.836*
−4.079**
nana
−1.616
−3.869**
−6.721***
−6.651***
−3.784***
−2.956
−7.717***
−8.387***
Niger
−3.577**
−3.468*
nana
0.153
−1.056
−4.371***
−5.146***
−4.232***
−3.347*
nana
Rwanda
−0.721
0.281
nsa
nsa
−1.006
−1.843
−3.741**
−3.635*
−1.871
−2.323
−4.951***
−4.991***
SouthAfrica
−4.072***
−4.210**
nana
−3.23
3**
−1.21
5−4.55
5***
−5.33
1***
−3.401**
−8.925***
nana
Senegal
−1.771
−5.327***
−10.147***
−10.042***
−2.394
−3.358*
−6.470***
−6.367***
2.193
0.471
−6.622***
−7.693***
(con
tinued)
Table I.ADF Statistics forcountry-specific unitroot tests (1997-2007)
230
AJEMS6,3
Dow
nloa
ded
by M
r A
song
u Si
mpl
ice
At 0
8:43
08
Sept
embe
r 20
15 (
PT)
Coun
tries
Foreigninvestment
Privateinvestment
Publicinvestment
Level
Firstdifference
Level
Firstdifference
Level
Firstdifference
cct
cct
cct
cct
cct
cct
Seychelles
1.173
−0.584
−1.721
−2.221
−2.627
−2.862
−5.399***
−5.324***
−4.070***
−3.752**
nana
Sierra
Leone
−4.986***
−5.432***
nana
−2.146
−1.253
−7.489***
−8.351***
−3.457**
−3.403*
nana
Sudan
−0.836
−1.999
−2.515
−3.193
−2.47
1−3.07
4−5.59
1***
−5.46
1***
−1.05
20.26
7−3.51
5**
−4.46
9***
Swaziland
−3.953***
−3.932**
nana
−1.88
2−4.71
6***
−5.57
0***
−5.73
9***
−3.23
7**
−2.99
6−10
.754
***
−10
.734
***
Togo
−3.275**
−3.206
−10.037***
−11.202***
−1.356
−2.764
−5.607***
−5.556***
−3.688**
−4.169**
nana
Tun
isia
−3.638**
−4.201**
nana
−5.087***
−4.992***
nana
−1.95
2−1.65
0−3.87
2***
−3.81
0**
Ugand
a0.745
−1.647
−5.071***
−5.564***
−0.430
−3.607*
−6.531***
−6.354***
−3.537**
−3.585*
nana
Zambia
−1.64
6−4.35
1**
−5.83
3***
−5.62
7***
−0.799
−1.606
−1.674
−1.922
−1.57
6−1.38
9−3.87
2**
−3.69
7*Zimbabw
e−2.124
−2.381
−6.413***
−4.171***
−2.862*
−2.986
−5.288***
−5.098***
−3.448**
−3.547*
nana
Notes
:na,notapp
licable;nsa,notspecifically
applicableow
ingtoissues
indegreesoffreedom.c
andct:constantand
constant
andtrend,respectiv
ely.Maxim
umlagis3
andoptim
allags
arechosen
bytheAIC.*,**,***Significantat
10,5
and1percentrespectiv
ely
Table I.
231
Long-termeffects of
populationgrowth
Dow
nloa
ded
by M
r A
song
u Si
mpl
ice
At 0
8:43
08
Sept
embe
r 20
15 (
PT)
Coun
tries
Dom
estic
investment
Physical
capital
Hum
ancapital
Level
Firstdifference
Level
Firstdifference
Level
Firstdifference
cct
cct
cct
cct
cct
cct
Algeria
−2.853*
−1.465
−2.901*
−6.147***
−2.624
−2.100
−5.992***
−6.502***
−1.632
−1.825
−1.960
−2.123
Benin
−3.406**
−3.549*
nana
−0.71
7−8.60
3***
−8.04
5***
−7.77
8***
−2.09
7−1.34
4−8.90
2***
−9.26
3***
Botsw
ana
−2.574
−2.745
−3.820***
−3.853**
−2.888*
−3.550*
nana
−0.539
−2.806
−1.763
−1.494
Burun
di−1.390
−2.703
−7.960***
−7.813***
−1.747
−1.941
−6.800***
−6.687***
−3.580**
−3.681**
nana
Cameroon
−2.231
−1.670
−6.562***
−6.797***
−4.582***
−3.918**
nana
2.257
−0.558
−1.089
−2.448
CAR
−3.458**
−3.552*
nana
−3.774***
−3.772**
nana
−1.119
−2.339
−2.514
−3.093
Chad
−1.557
−3.646**
−4.374***
−4.340**
−1.641
−3.094
−3.893***
−3.801**
−1.072
0.594
−0.015
−0.760
Côte
d’Iv.
−1.83
1−1.47
9−4.46
9***
−4.74
6***
−1.78
6−1.46
7−5.27
9***
−5.81
0***
−1.16
6−4.24
2**
−3.32
6**
−3.09
8Co
ngoR.
−2.62
6*−2.93
1−4.52
7***
−4.43
6***
−2.60
7−3.05
8−4.55
2***
−4.47
1***
−1.13
1−1.21
4−2.81
3*−2.88
2Egy
pt−1.577
−3.397*
−4.159***
−4.080**
−2.112
−3.309*
−5.121***
−4.995***
−1.567
−3.334*
−2.155
−1.737
Burkina
F.−2.607
−2.591
−6.795***
−6.659***
−2.440
−2.540
−7.057***
−6.987***
−1.916
0.279
−1.268
−2.452
Gabon
−4.679***
−5.192***
nana
−3.604**
−4.003**
nana
−1.755
−2.397
−1.461
−0.971
Gam
bia
−6.293***
−6.443***
nana
−2.97
0*−2.95
1−4.71
0***
−5.05
3***
−1.14
3−1.55
3−1.06
3−6.52
3***
Ghana
0.69
3−2.68
9−6.23
0***
−6.48
2***
0.51
8−4.13
0**
−5.78
3***
−5.93
6***
0.68
9−7.31
4***
−4.25
3***
−13
.654
***
Guinea
−1.089
−2.281
−4.313***
−4.529***
−1.099
−2.429
−4.427***
−4.576***
−2.126
−2.591
−1.858
−1.834
Kenya
−2.951*
−4.360***
nana
−4.559***
−4.264**
nana
−1.286
−3.203
−2.379
−2.347
Lesotho
−1.418
−1.062
−5.029***
−5.079***
−1.358
−0.959
−5.260***
−5.012***
0.247
−2.079
−1.439
−1.615
Madagascar
−0.666
−1.844
−6.443***
−6.589***
−0.175
−1.294
−4.984***
−5.086***
−2.804*
−1.276
−1.420
−2.755
Malaw
i−2.74
3*−2.72
1−7.79
6***
−8.04
2***
−2.35
3−2.17
3−6.52
7***
−6.81
2***
−1.50
6−2.24
9−3.11
5**
−3.08
3Mali
−1.727
−3.703**
−8.364***
−8.225***
−1.755
−3.714**
−8.390***
−8.256***
−1.425
−4.472***
−2.688*
−2.515
Morocco
−2.197
−2.636
−6.075***
−4.151**
−2.414
−2.845
−5.605***
−3.953**
9.587
17.212
6.654
−1.825
Mozam
biqu
e−2.632*
−2.994
−4.386***
−4.814***
−2.632*
−2.994
−4.386***
−4.814***
−2.199
−2.247
−2.074
−1.976
Mauritania
−1.798
−1.725
−8.590***
−8.442***
−4.263***
−4.263**
nana
−3.352**
−0.473
0.722
1.593
Mauritiu
s−3.148**
−3.078
−2.572
−2.499
−3.964***
−4.241**
nana
−2.106
−2.215
−5.884***
−5.787***
Nam
ibia
−3.792***
−3.797**
nana
−2.748*
−3.426*
nana
−2.247
−2.351
−1.532
−1.050
Niger
−3.687**
−1.413
−2.927*
−3.957**
−1.011
−2.356
−3.214**
−4.414***
−1.786
1.899
0.707
0.138
Rwanda
−0.843
−1.908
−9.900***
−10.020***
−1.551
−2.661
−5.820
−6.028***
−2.588
−2.565
−2.479
−2.425
SouthAfrica
−1.83
8−1.48
6−4.57
5***
−4.81
4***
−1.54
5−0.10
6−3.00
0**
−3.66
5**
−0.78
0−2.34
5−3.92
1***
−4.21
8**
Senegal
−0.531
−1.005
−6.304***
−6.651***
−0.934
−2.539
−6.392***
−6.316***
−1.544
−3.545*
−2.427
−2.277
(con
tinued)
Table II.ADF Statistics forcountry-specific unitroot tests continued(1997-2007)
232
AJEMS6,3
Dow
nloa
ded
by M
r A
song
u Si
mpl
ice
At 0
8:43
08
Sept
embe
r 20
15 (
PT)
Coun
tries
Dom
estic
investment
Physical
capital
Hum
ancapital
Level
Firstdifference
Level
Firstdifference
Level
Firstdifference
cct
cct
cct
cct
cct
cct
Seychelles
−3.149**
−3.003
−7.251***
−7.308***
−3.135**
−2.985
−7.066***
−7.132***
−5.342***
−5.282***
nana
Sierra
Leone
−2.127
−1.534
−8.211***
−9.493***
−1.738
−1.628
−8.488***
−9.725***
−2.472
−2.335
−2.380
−2.424
Sudan
−1.20
1−3.51
9*−5.35
4***
−4.80
2***
−1.47
8−1.77
9−5.84
3***
−5.87
3***
−1.68
6−2.75
7−2.75
8*−2.81
3Sw
aziland
−3.97
8***
−2.32
7−5.15
8***
−5.35
3***
−2.99
9**
−2.33
7−5.14
3***
−4.75
1***
0.10
5−2.11
2−1.50
6−9.39
4***
Togo
−2.172
−2.227
−6.221***
−6.728***
−3.531**
−3.238*
nana
−2.367
−3.489*
−2.521
−2.461
Tun
isia
−2.40
2−4.30
0**
−5.48
4***
−5.35
4***
−2.37
9−2.93
6−3.84
7***
−3.79
7**
−0.95
8−4.63
4***
−5.18
8***
−5.08
3***
Ugand
a−0.160
−4.807***
−6.668***
−6.541***
−0.819
−3.649**
−4.977***
−4.866***
−2.961*
−3.015
−1.804
−1.834
Zambia
−2.82
7*−1.63
6−4.75
0***
−6.06
4***
−1.22
2−2.26
5−5.20
3***
−5.98
0***
1.46
8−1.65
9−10
.479
***
−11
.040
***
Zimbabw
e−2.347
−2.318
−5.426***
−5.378***
−3.385**
−3.358*
nana
−2.016
−0.994
−4.318***
−0.505
Notes
:na,notapp
licable;nsa,notspecifically
applicableow
ingtoissues
indegreesoffreedom.c
andct:constantand
constant
andtrend,respectiv
ely.Maxim
umlagis3
andoptim
allags
arechosen
bytheAIC.*,**,***Significantat
10,5
and1percentrespectiv
ely
Table II.
233
Long-termeffects of
populationgrowth
Dow
nloa
ded
by M
r A
song
u Si
mpl
ice
At 0
8:43
08
Sept
embe
r 20
15 (
PT)
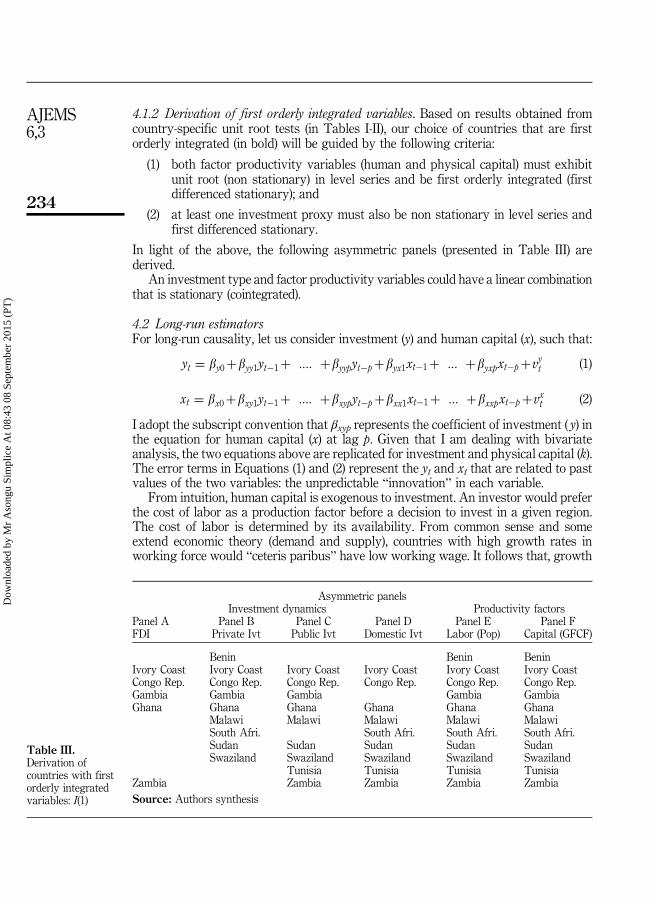
4.1.2 Derivation of first orderly integrated variables. Based on results obtained fromcountry-specific unit root tests (in Tables I-II), our choice of countries that are firstorderly integrated (in bold) will be guided by the following criteria:
(1) both factor productivity variables (human and physical capital) must exhibitunit root (non stationary) in level series and be first orderly integrated (firstdifferenced stationary); and
(2) at least one investment proxy must also be non stationary in level series andfirst differenced stationary.
In light of the above, the following asymmetric panels (presented in Table III) arederived.
An investment type and factor productivity variables could have a linear combinationthat is stationary (cointegrated).
4.2 Long-run estimatorsFor long-run causality, let us consider investment (y) and human capital (x), such that:
yt ¼ by0þbyy1yt�1þ :::: þbyypyt�pþbyx1xt�1þ ::: þbyxpxt�pþvyt (1)
xt ¼ bx0þbxy1yt�1þ :::: þbxypyt�pþbxx1xt�1þ ::: þbxxpxt�pþvxt (2)
I adopt the subscript convention that βxyp represents the coefficient of investment ( y) inthe equation for human capital (x) at lag p. Given that I am dealing with bivariateanalysis, the two equations above are replicated for investment and physical capital (k).The error terms in Equations (1) and (2) represent the yt and xt that are related to pastvalues of the two variables: the unpredictable “innovation” in each variable.
From intuition, human capital is exogenous to investment. An investor would preferthe cost of labor as a production factor before a decision to invest in a given region.The cost of labor is determined by its availability. From common sense and someextend economic theory (demand and supply), countries with high growth rates inworking force would “ceteris paribus” have low working wage. It follows that, growth
Asymmetric panelsInvestment dynamics Productivity factors
Panel A Panel B Panel C Panel D Panel E Panel FFDI Private Ivt Public Ivt Domestic Ivt Labor (Pop) Capital (GFCF)
Benin Benin BeninIvory Coast Ivory Coast Ivory Coast Ivory Coast Ivory Coast Ivory CoastCongo Rep. Congo Rep. Congo Rep. Congo Rep. Congo Rep. Congo Rep.Gambia Gambia Gambia Gambia GambiaGhana Ghana Ghana Ghana Ghana Ghana
Malawi Malawi Malawi Malawi MalawiSouth Afri. South Afri. South Afri. South Afri.Sudan Sudan Sudan Sudan SudanSwaziland Swaziland Swaziland Swaziland Swaziland
Tunisia Tunisia Tunisia TunisiaZambia Zambia Zambia Zambia ZambiaSource: Authors synthesis
Table III.Derivation ofcountries with firstorderly integratedvariables: I(1)
234
AJEMS6,3
Dow
nloa
ded
by M
r A
song
u Si
mpl
ice
At 0
8:43
08
Sept
embe
r 20
15 (
PT)
in work force should lead to cheaper labor cost, more investment and consequentlyhigher economic growth. In the same vein, physical capital naturally should increaseinvestment. When the investment variable and capital indicators of the VAR arecointegrated, I use the following VEC to estimate short-run adjustments to the long-runequilibrium:
Dyt ¼ by0þby1Dyt�1þ :::: þbypDyt�pþgy1Dxt�1þ :::
þgypDxt�p�ly yt�1�aa�a1xt�1ð Þþv ty (3)
Dxt ¼ bx0þbx1Dyt�1þ :::: þbxpDyt�pþgx1Dxt�1þ :::
þgxpDxt�p�lx yt�1�aa�a1xt�1ð Þþvxt (4)
where yt¼ α0+α1xt is the long-run co-integrating relationship between the two variablesand λy and λx are the error-correction parameters that measure how y (investment) and x(human capital) react to deviations from the long-run equilibrium. At equilibrium, thevalue of the error correction term (ECT) is zero. When this term is non-zero, it impliesinvestment and capital (human and physical) have deviated from the long-run equilibrium.Hence, the ECT helps each variable to adjust and partially restore the equation(cointegration) relation. I shall replicate the same models (1-4) for the other investmenttypes and capital in all countries under consideration. Similar deterministic trendassumptions used for cointegration tests will be applied and goodness of fit (in modelspecification) is based on the Akaike Information Criterion (AIC) (Liew, 2004).
4.3 Cointegration tests and VECMLong-run equilibrium relationships between sequences could be determined by variousmethods. Compared to cointegration tests proposed by Engle and Granger (1987) andStock and Watson (1988), I choose to use Johansen (1995a, b) because it has moredesirable properties: all tested variables are treated as endogenous. This methodconsists of testing restrictions imposed by cointegration on the VAR in the series.Between the two tests at our disposal (trace statistics and maximum Eigen value),I shall report both but based our decisions only on the trace statistics in a bid to obtainmore robust results (Cheung and Lai, 1993). Consistent with Ahking (2001), I argue thatwhen a deterministic trend[9] is included in the co-integration model, results are lessfavorable. However, robust results are obtained with the exclusion of a linear deterministictrend in the model. This is logical in the perspective that the cointegration model is basedon the difference of the series which has been de-trended in the stationary process. Beyondthis fact, Johansen (1995b) on the one hand, and Hansen and Juselius (1995) on the otherhand, have cautioned on a model based on the absence of a linear trend. They arguethat the minimum deterministic component in the model could be a constant in theco-integrating space to account for differences in measurement units. Logic and commonsense, and to some extent economic theory help us in understanding that, even if I hadnot the intention of including a constant in the co-integration equation, the presence ofany I(1) variables in the VEC require an intercept in the model. As justified above, thecointegration model will have only an intercept in the cointegration equation (CE) (level)and none in the VAR (first difference) equations. The choice of the maximum lag length is
235
Long-termeffects of
populationgrowth
Dow
nloa
ded
by M
r A
song
u Si
mpl
ice
At 0
8:43
08
Sept
embe
r 20
15 (
PT)
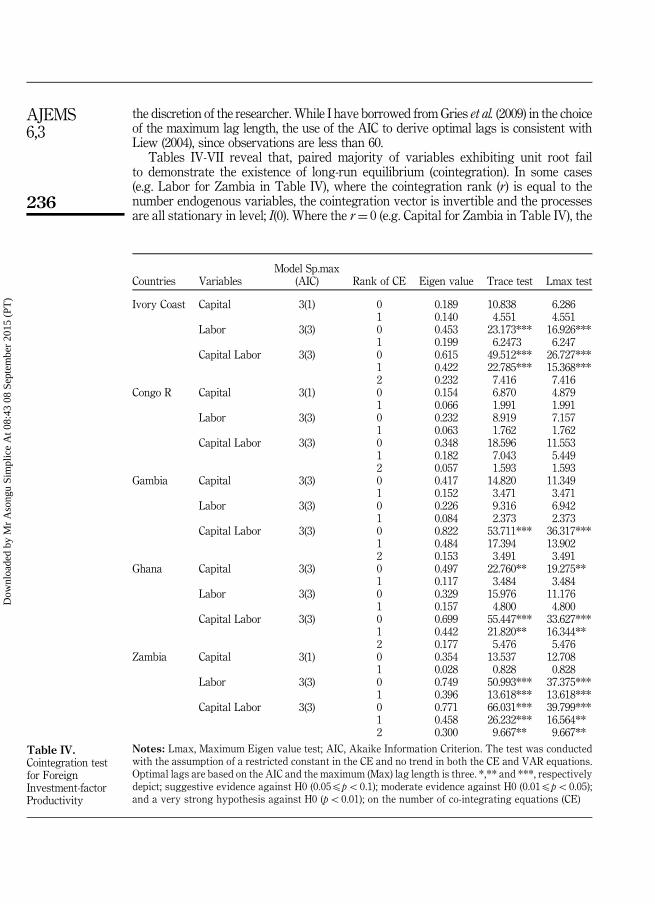
the discretion of the researcher. While I have borrowed from Gries et al. (2009) in the choiceof the maximum lag length, the use of the AIC to derive optimal lags is consistent withLiew (2004), since observations are less than 60.
Tables IV-VII reveal that, paired majority of variables exhibiting unit root failto demonstrate the existence of long-run equilibrium (cointegration). In some cases(e.g. Labor for Zambia in Table IV), where the cointegration rank (r) is equal to thenumber endogenous variables, the cointegration vector is invertible and the processesare all stationary in level; I(0). Where the r¼ 0 (e.g. Capital for Zambia in Table IV), the
Countries VariablesModel Sp.max
(AIC) Rank of CE Eigen value Trace test Lmax test
Ivory Coast Capital 3(1) 0 0.189 10.838 6.2861 0.140 4.551 4.551
Labor 3(3) 0 0.453 23.173*** 16.926***1 0.199 6.2473 6.247
Capital Labor 3(3) 0 0.615 49.512*** 26.727***1 0.422 22.785*** 15.368***2 0.232 7.416 7.416
Congo R Capital 3(1) 0 0.154 6.870 4.8791 0.066 1.991 1.991
Labor 3(3) 0 0.232 8.919 7.1571 0.063 1.762 1.762
Capital Labor 3(3) 0 0.348 18.596 11.5531 0.182 7.043 5.4492 0.057 1.593 1.593
Gambia Capital 3(3) 0 0.417 14.820 11.3491 0.152 3.471 3.471
Labor 3(3) 0 0.226 9.316 6.9421 0.084 2.373 2.373
Capital Labor 3(3) 0 0.822 53.711*** 36.317***1 0.484 17.394 13.9022 0.153 3.491 3.491
Ghana Capital 3(3) 0 0.497 22.760** 19.275**1 0.117 3.484 3.484
Labor 3(3) 0 0.329 15.976 11.1761 0.157 4.800 4.800
Capital Labor 3(3) 0 0.699 55.447*** 33.627***1 0.442 21.820** 16.344**2 0.177 5.476 5.476
Zambia Capital 3(1) 0 0.354 13.537 12.7081 0.028 0.828 0.828
Labor 3(3) 0 0.749 50.993*** 37.375***1 0.396 13.618*** 13.618***
Capital Labor 3(3) 0 0.771 66.031*** 39.799***1 0.458 26.232*** 16.564**2 0.300 9.667** 9.667**
Notes: Lmax, Maximum Eigen value test; AIC, Akaike Information Criterion. The test was conductedwith the assumption of a restricted constant in the CE and no trend in both the CE and VAR equations.Optimal lags are based on the AIC and the maximum (Max) lag length is three. *,** and ***, respectivelydepict; suggestive evidence against H0 (0.05ppo0.1); moderate evidence against H0 (0.01ppo0.05);and a very strong hypothesis against H0 (po0.01); on the number of co-integrating equations (CE)
Table IV.Cointegration testfor ForeignInvestment-factorProductivity
236
AJEMS6,3
Dow
nloa
ded
by M
r A
song
u Si
mpl
ice
At 0
8:43
08
Sept
embe
r 20
15 (
PT)
Countries VariablesModel Sp. max
(AIC) Rank of CE Eigen value Trace test Lmax test
Benin Capital 3(2) 0 0.724 25.313*** 21.930***1 0.180 3.382 3.382
Labor 3(3) 0 0.549 24.524** 12.7431 0.521 11.781** 11.781**
Capital Labor 3(3) 0 0.903 75.176*** 37.360***1 0.783 37.817*** 24.499***2 0.564 13.318*** 13.318***
Ivory Coast Capital 3(2) 0 0.444 24.089** 17.061**1 0.215 7.027 7.027
Labor 3(3) 0 0.520 33.185*** 20.580***1 0.362 12.605*** 12.605***
Capital Labor 3(3) 0 0.801 70.531*** 45.250***1 0.465 25.280*** 17.565**2 0.240 7.715* 7.715
Congo R Capital 3(1) 0 0.362 15.475 9.9091 0.223 5.565 5.565
Labor 3(3) 0 0.623 23.694** 19.547**1 0.187 4.147 4.147
Capital Labor 3(3) 0 0,662 41,378*** 21.722*1 0,492 19,656* 13.5742 0,262 6,081 6.081
Gambia Capital 3(1) 0 0.391 17.461 11.4391 0.230 6.021 6.021
Labor 3(3) 0 0.518 16.789 15.346*1 0.066 1.443 1.443
Capital Labor 3(3) 0 0.696 38.411** 25.019**1 0.361 13.392 9.4322 0.171 3.958 3.958
Ghana Capital 3(3) 0 0.340 13.419 8.7561 0.199 4.662 4.662
Labor 3(3) 0 0.697 38.904*** 25.133***1 0.480 13.771*** 13.771***
Capital Labor 3(3) 0 0.736 55.076*** 28.028***1 0.656 27.048*** 22.411***2 0.198 4.637 4.637
Malawi Capital 3(1) 0 0.258 15.603 8.9691 0.198 6.633 6.633
Labor 3(3) 0 0.328 12.977 11.1331 0.063 1.844 1.844
Capital Labor 3(3) 0 0.565 37.154** 23.317**1 0.347 13.837 11.9702 0.064 1.866 1.866
South Africa Capital 3(1) 0 0.951 92.856** 84.744***1 0.251 8.112* 8.112*
Labor 3(1) 0 0.381 17.552 14.434*1 0.098 3.117 3.117
Capital Labor 3(3) 0 0.975 119.40*** 103.42***1 0.390 15.985 13.8482 0.073 2.136 2.136
(continued )
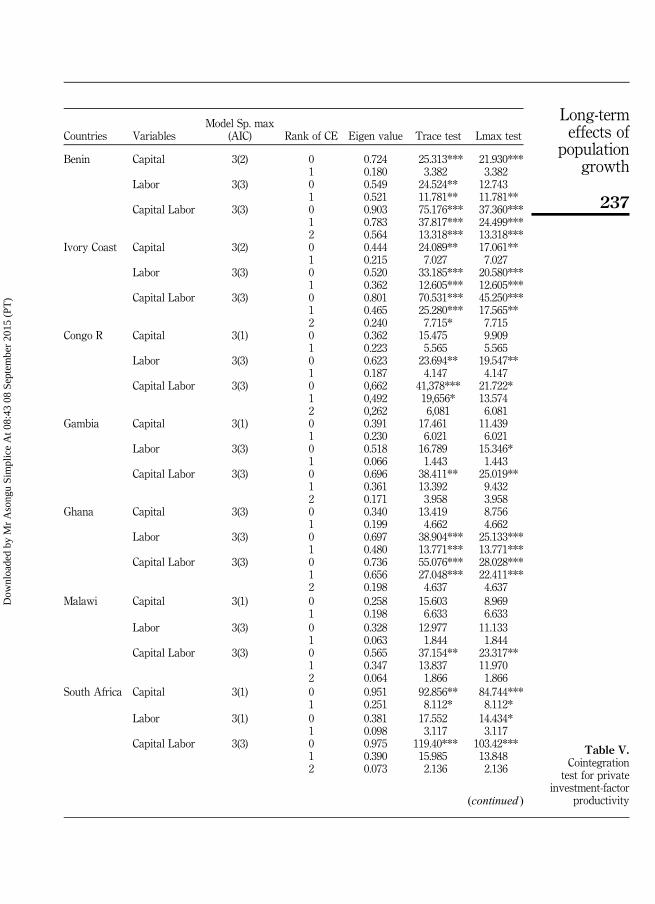
Table V.Cointegration
test for privateinvestment-factor
productivity
237
Long-termeffects of
populationgrowth
Dow
nloa
ded
by M
r A
song
u Si
mpl
ice
At 0
8:43
08
Sept
embe
r 20
15 (
PT)
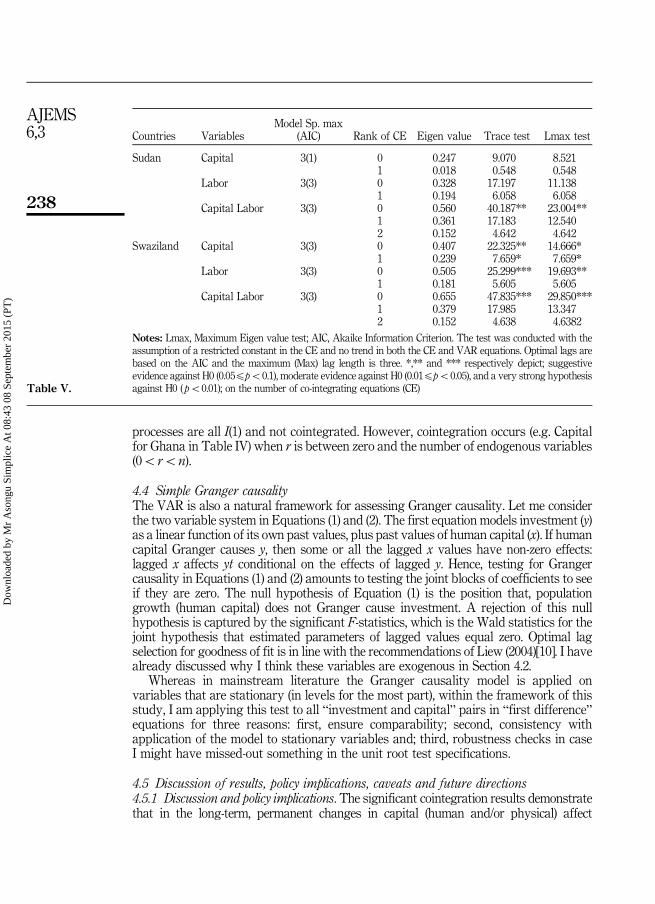
processes are all I(1) and not cointegrated. However, cointegration occurs (e.g. Capitalfor Ghana in Table IV) when r is between zero and the number of endogenous variables(0oron).
4.4 Simple Granger causalityThe VAR is also a natural framework for assessing Granger causality. Let me considerthe two variable system in Equations (1) and (2). The first equation models investment (y)as a linear function of its own past values, plus past values of human capital (x). If humancapital Granger causes y, then some or all the lagged x values have non-zero effects:lagged x affects yt conditional on the effects of lagged y. Hence, testing for Grangercausality in Equations (1) and (2) amounts to testing the joint blocks of coefficients to seeif they are zero. The null hypothesis of Equation (1) is the position that, populationgrowth (human capital) does not Granger cause investment. A rejection of this nullhypothesis is captured by the significant F-statistics, which is the Wald statistics for thejoint hypothesis that estimated parameters of lagged values equal zero. Optimal lagselection for goodness of fit is in line with the recommendations of Liew (2004)[10]. I havealready discussed why I think these variables are exogenous in Section 4.2.
Whereas in mainstream literature the Granger causality model is applied onvariables that are stationary (in levels for the most part), within the framework of thisstudy, I am applying this test to all “investment and capital” pairs in “first difference”equations for three reasons: first, ensure comparability; second, consistency withapplication of the model to stationary variables and; third, robustness checks in caseI might have missed-out something in the unit root test specifications.
4.5 Discussion of results, policy implications, caveats and future directions4.5.1 Discussion and policy implications. The significant cointegration results demonstratethat in the long-term, permanent changes in capital (human and/or physical) affect
Countries VariablesModel Sp. max
(AIC) Rank of CE Eigen value Trace test Lmax test
Sudan Capital 3(1) 0 0.247 9.070 8.5211 0.018 0.548 0.548
Labor 3(3) 0 0.328 17.197 11.1381 0.194 6.058 6.058
Capital Labor 3(3) 0 0.560 40.187** 23.004**1 0.361 17.183 12.5402 0.152 4.642 4.642
Swaziland Capital 3(3) 0 0.407 22.325** 14.666*1 0.239 7.659* 7.659*
Labor 3(3) 0 0.505 25.299*** 19.693**1 0.181 5.605 5.605
Capital Labor 3(3) 0 0.655 47.835*** 29.850***1 0.379 17.985 13.3472 0.152 4.638 4.6382
Notes: Lmax, Maximum Eigen value test; AIC, Akaike Information Criterion. The test was conducted with theassumption of a restricted constant in the CE and no trend in both the CE and VAR equations. Optimal lags arebased on the AIC and the maximum (Max) lag length is three. *,** and *** respectively depict; suggestiveevidence against H0 (0.05ppo0.1), moderate evidence against H0 (0.01ppo0.05), and a very strong hypothesisagainst H0 ( po0.01); on the number of co-integrating equations (CE)Table V.
238
AJEMS6,3
Dow
nloa
ded
by M
r A
song
u Si
mpl
ice
At 0
8:43
08
Sept
embe
r 20
15 (
PT)
Countries VariablesModel Sp.Max (AIC) Rank of CE Eigen value Trace test Lmax test
Ivory Coast Capital 3(2) 0 0.442 24.230** 16.955**1 0.221 7.275 7.275
Labor 3(3) 0 0.492 26.444*** 18.973**1 0.234 7.471 7.471
Capital Labor 3(3) 0 0.798 70.039*** 44.901***1 0.465 25.138*** 17.530**2 0.237 7.608* 7.608*
Congo R Capital 3(1) 0 0.362 15.475 9.9091 0.223 5.565 5.565
Labor 3(3) 0 0.459 21.750** 12.3081 0.376 9.441** 9.441**
Capital Labor 3(3) 0 0.662 41.378*** 21.722*1 0.492 19.656* 13.5742 0.262 6.081 6.081
Gambia Capital 3(1) 0 0.391 17.461 11.4391 0.230 6.021 6.021
Labor 3(3) 0 0.424 19.492* 13.2551 0.228 6.237 6.237
Capital Labor 3(3) 0 0.696 38.411** 25.019**1 0.361 13.392 9.4322 0.171 3.958 3.958
Ghana Capital 3(3) 0 0.340 13.419 8.7561 0.199 4.662 4.662
Labor 3(3) 0 0.646 30.674*** 21.836***1 0.343 8.837* 8.837*
Capital Labor 3(3) 0 0.736 55.076*** 28.028***1 0.656 27.048*** 22.411***2 0.198 4.637 4.637
Malawi Capital 3(1) 0 0.274 15.610 9.6061 0.181 6.003 6.003
Labor 3(3) 0 0.481 19.901* 18.402**1 0.052 1.498 1.498
Capital Labor 3(3) 0 0.623 42.004*** 27.357***1 0.364 14.647 12.6872 0.067 1.959 1.959
Sudan Capital 3(1) 0 0.268 9.894 9.3961 0.016 0.497 0.497
Labor 3(3) 0 0.289 16.487 9.5641 0.219 6.922 6.922
Capital Labor 3(1) 0 0.465 30.460 17.5511 0.271 12.909 8.8872 0.133 4.021 4.021
Swaziland Capital 3(3) 0 0.407 22.325** 14.666*1 0.239 7.659* 7.659*
Labor 3(3) 0 0.411 19.550* 14.846*1 0.154 4.704 4.704
Capital Labor 3(3) 0 0.655 47.835*** 29.850***1 0.379 17.985 13.3472 0.152 4.638 4.638
(continued )
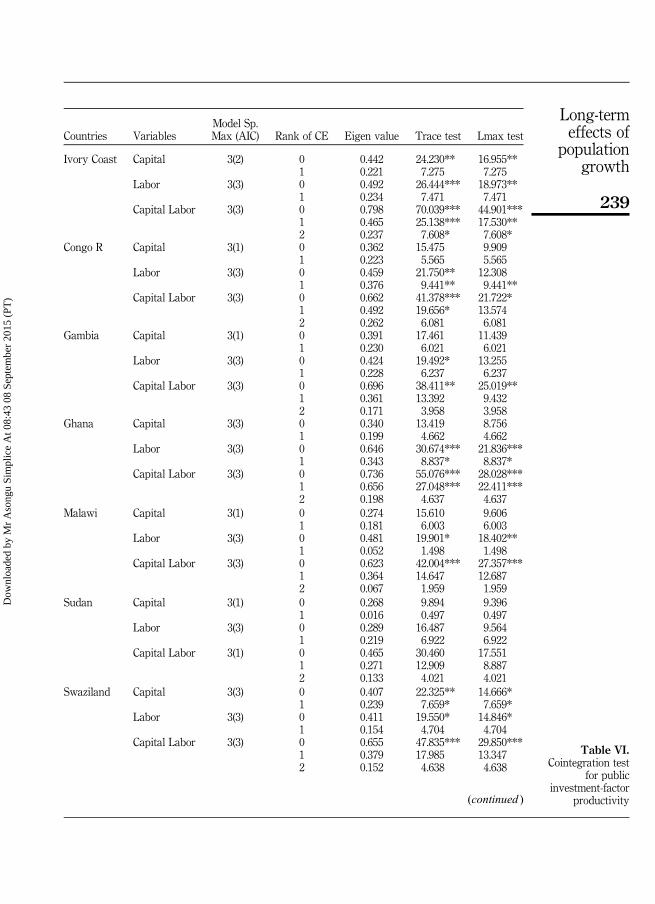
Table VI.Cointegration test
for publicinvestment-factor
productivity
239
Long-termeffects of
populationgrowth
Dow
nloa
ded
by M
r A
song
u Si
mpl
ice
At 0
8:43
08
Sept
embe
r 20
15 (
PT)
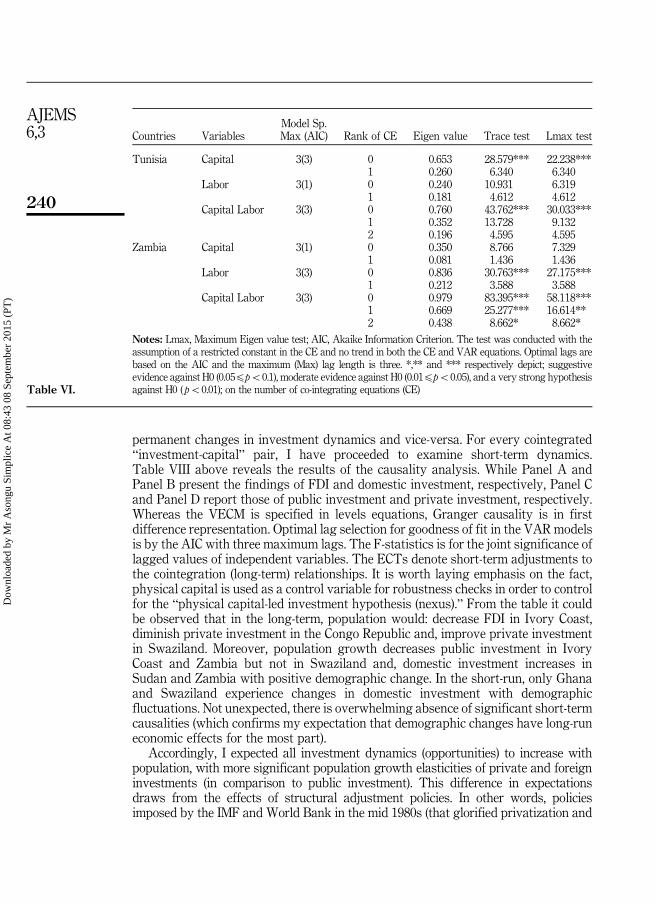
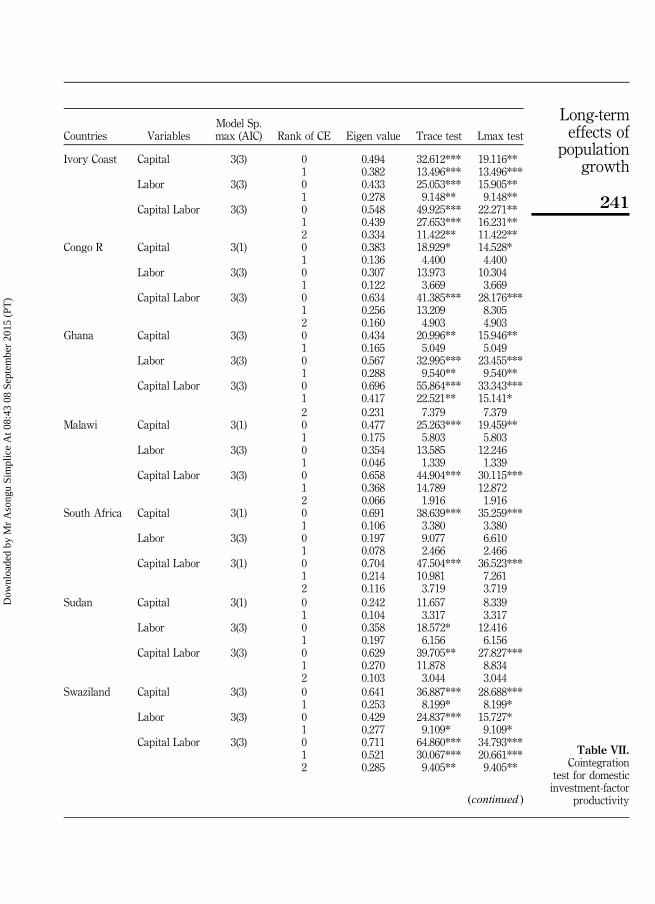
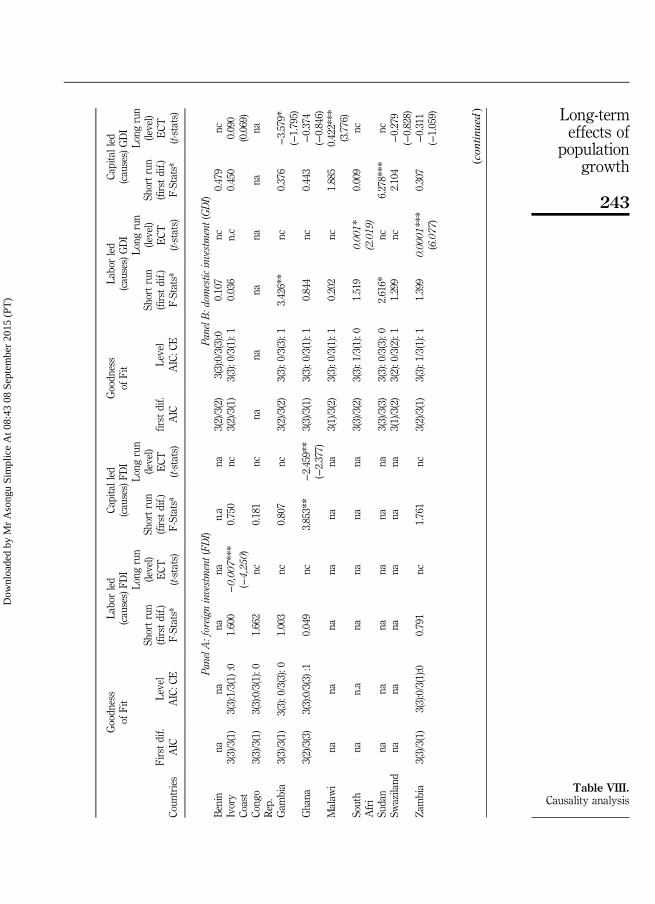
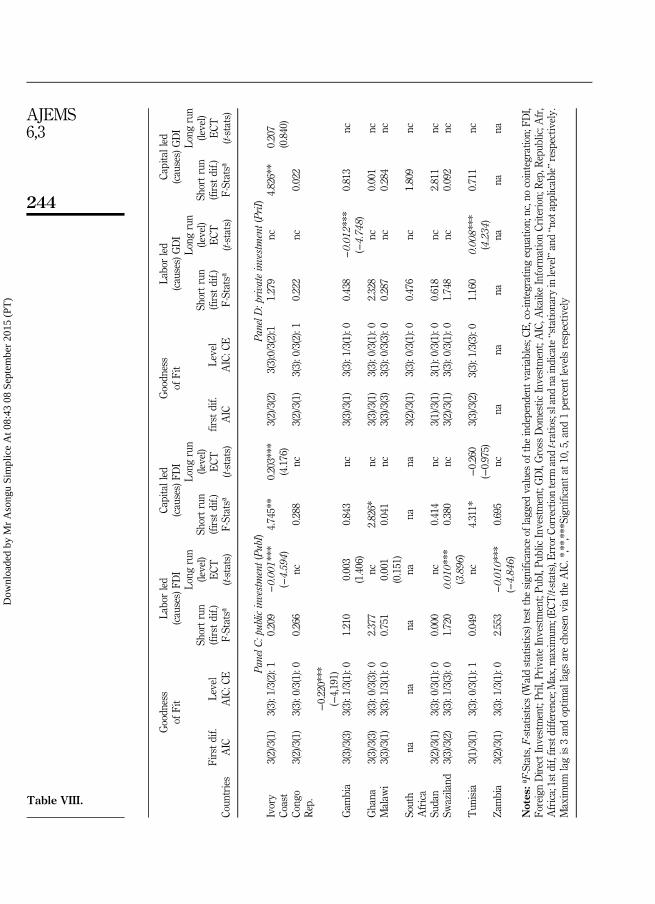
permanent changes in investment dynamics and vice-versa. For every cointegrated“investment-capital” pair, I have proceeded to examine short-term dynamics.Table VIII above reveals the results of the causality analysis. While Panel A andPanel B present the findings of FDI and domestic investment, respectively, Panel Cand Panel D report those of public investment and private investment, respectively.Whereas the VECM is specified in levels equations, Granger causality is in firstdifference representation. Optimal lag selection for goodness of fit in the VAR modelsis by the AIC with three maximum lags. The F-statistics is for the joint significance oflagged values of independent variables. The ECTs denote short-term adjustments tothe cointegration (long-term) relationships. It is worth laying emphasis on the fact,physical capital is used as a control variable for robustness checks in order to controlfor the “physical capital-led investment hypothesis (nexus).” From the table it couldbe observed that in the long-term, population would: decrease FDI in Ivory Coast,diminish private investment in the Congo Republic and, improve private investmentin Swaziland. Moreover, population growth decreases public investment in IvoryCoast and Zambia but not in Swaziland and, domestic investment increases inSudan and Zambia with positive demographic change. In the short-run, only Ghanaand Swaziland experience changes in domestic investment with demographicfluctuations. Not unexpected, there is overwhelming absence of significant short-termcausalities (which confirms my expectation that demographic changes have long-runeconomic effects for the most part).
Accordingly, I expected all investment dynamics (opportunities) to increase withpopulation, with more significant population growth elasticities of private and foreigninvestments (in comparison to public investment). This difference in expectationsdraws from the effects of structural adjustment policies. In other words, policiesimposed by the IMF and World Bank in the mid 1980s (that glorified privatization and
Countries VariablesModel Sp.Max (AIC) Rank of CE Eigen value Trace test Lmax test
Tunisia Capital 3(3) 0 0.653 28.579*** 22.238***1 0.260 6.340 6.340
Labor 3(1) 0 0.240 10.931 6.3191 0.181 4.612 4.612
Capital Labor 3(3) 0 0.760 43.762*** 30.033***1 0.352 13.728 9.1322 0.196 4.595 4.595
Zambia Capital 3(1) 0 0.350 8.766 7.3291 0.081 1.436 1.436
Labor 3(3) 0 0.836 30.763*** 27.175***1 0.212 3.588 3.588
Capital Labor 3(3) 0 0.979 83.395*** 58.118***1 0.669 25.277*** 16.614**2 0.438 8.662* 8.662*
Notes: Lmax, Maximum Eigen value test; AIC, Akaike Information Criterion. The test was conducted with theassumption of a restricted constant in the CE and no trend in both the CE and VAR equations. Optimal lags arebased on the AIC and the maximum (Max) lag length is three. *,** and *** respectively depict; suggestiveevidence against H0 (0.05ppo0.1), moderate evidence against H0 (0.01ppo0.05), and a very strong hypothesisagainst H0 ( po0.01); on the number of co-integrating equations (CE)Table VI.
240
AJEMS6,3
Dow
nloa
ded
by M
r A
song
u Si
mpl
ice
At 0
8:43
08
Sept
embe
r 20
15 (
PT)
Countries VariablesModel Sp.max (AIC) Rank of CE Eigen value Trace test Lmax test
Ivory Coast Capital 3(3) 0 0.494 32.612*** 19.116**1 0.382 13.496*** 13.496***
Labor 3(3) 0 0.433 25.053*** 15.905**1 0.278 9.148** 9.148**
Capital Labor 3(3) 0 0.548 49.925*** 22.271**1 0.439 27.653*** 16.231**2 0.334 11.422** 11.422**
Congo R Capital 3(1) 0 0.383 18.929* 14.528*1 0.136 4.400 4.400
Labor 3(3) 0 0.307 13.973 10.3041 0.122 3.669 3.669
Capital Labor 3(3) 0 0.634 41.385*** 28.176***1 0.256 13.209 8.3052 0.160 4.903 4.903
Ghana Capital 3(3) 0 0.434 20.996** 15.946**1 0.165 5.049 5.049
Labor 3(3) 0 0.567 32.995*** 23.455***1 0.288 9.540** 9.540**
Capital Labor 3(3) 0 0.696 55.864*** 33.343***1 0.417 22.521** 15.141*2 0.231 7.379 7.379
Malawi Capital 3(1) 0 0.477 25.263*** 19.459**1 0.175 5.803 5.803
Labor 3(3) 0 0.354 13.585 12.2461 0.046 1.339 1.339
Capital Labor 3(3) 0 0.658 44.904*** 30.115***1 0.368 14.789 12.8722 0.066 1.916 1.916
South Africa Capital 3(1) 0 0.691 38.639*** 35.259***1 0.106 3.380 3.380
Labor 3(3) 0 0.197 9.077 6.6101 0.078 2.466 2.466
Capital Labor 3(1) 0 0.704 47.504*** 36.523***1 0.214 10.981 7.2612 0.116 3.719 3.719
Sudan Capital 3(1) 0 0.242 11.657 8.3391 0.104 3.317 3.317
Labor 3(3) 0 0.358 18.572* 12.4161 0.197 6.156 6.156
Capital Labor 3(3) 0 0.629 39.705** 27.827***1 0.270 11.878 8.8342 0.103 3.044 3.044
Swaziland Capital 3(3) 0 0.641 36.887*** 28.688***1 0.253 8.199* 8.199*
Labor 3(3) 0 0.429 24.837*** 15.727*1 0.277 9.109* 9.109*
Capital Labor 3(3) 0 0.711 64.860*** 34.793***1 0.521 30.067*** 20.661***2 0.285 9.405** 9.405**
(continued )
Table VII.Cointegration
test for domesticinvestment-factor
productivity
241
Long-termeffects of
populationgrowth
Dow
nloa
ded
by M
r A
song
u Si
mpl
ice
At 0
8:43
08
Sept
embe
r 20
15 (
PT)
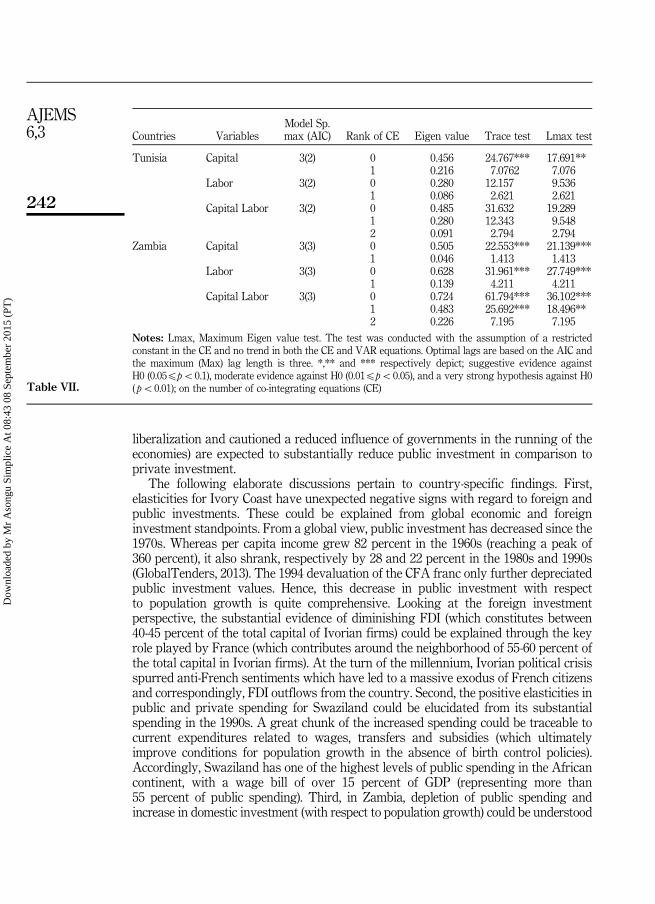
liberalization and cautioned a reduced influence of governments in the running of theeconomies) are expected to substantially reduce public investment in comparison toprivate investment.
The following elaborate discussions pertain to country-specific findings. First,elasticities for Ivory Coast have unexpected negative signs with regard to foreign andpublic investments. These could be explained from global economic and foreigninvestment standpoints. From a global view, public investment has decreased since the1970s. Whereas per capita income grew 82 percent in the 1960s (reaching a peak of360 percent), it also shrank, respectively by 28 and 22 percent in the 1980s and 1990s(GlobalTenders, 2013). The 1994 devaluation of the CFA franc only further depreciatedpublic investment values. Hence, this decrease in public investment with respectto population growth is quite comprehensive. Looking at the foreign investmentperspective, the substantial evidence of diminishing FDI (which constitutes between40-45 percent of the total capital of Ivorian firms) could be explained through the keyrole played by France (which contributes around the neighborhood of 55-60 percent ofthe total capital in Ivorian firms). At the turn of the millennium, Ivorian political crisisspurred anti-French sentiments which have led to a massive exodus of French citizensand correspondingly, FDI outflows from the country. Second, the positive elasticities inpublic and private spending for Swaziland could be elucidated from its substantialspending in the 1990s. A great chunk of the increased spending could be traceable tocurrent expenditures related to wages, transfers and subsidies (which ultimatelyimprove conditions for population growth in the absence of birth control policies).Accordingly, Swaziland has one of the highest levels of public spending in the Africancontinent, with a wage bill of over 15 percent of GDP (representing more than55 percent of public spending). Third, in Zambia, depletion of public spending andincrease in domestic investment (with respect to population growth) could be understood
Countries VariablesModel Sp.max (AIC) Rank of CE Eigen value Trace test Lmax test
Tunisia Capital 3(2) 0 0.456 24.767*** 17.691**1 0.216 7.0762 7.076
Labor 3(2) 0 0.280 12.157 9.5361 0.086 2.621 2.621
Capital Labor 3(2) 0 0.485 31.632 19.2891 0.280 12.343 9.5482 0.091 2.794 2.794
Zambia Capital 3(3) 0 0.505 22.553*** 21.139***1 0.046 1.413 1.413
Labor 3(3) 0 0.628 31.961*** 27.749***1 0.139 4.211 4.211
Capital Labor 3(3) 0 0.724 61.794*** 36.102***1 0.483 25.692*** 18.496**2 0.226 7.195 7.195
Notes: Lmax, Maximum Eigen value test. The test was conducted with the assumption of a restrictedconstant in the CE and no trend in both the CE and VAR equations. Optimal lags are based on the AIC andthe maximum (Max) lag length is three. *,** and *** respectively depict; suggestive evidence againstH0 (0.05ppo0.1), moderate evidence against H0 (0.01ppo0.05), and a very strong hypothesis against H0( po0.01); on the number of co-integrating equations (CE)Table VII.
242
AJEMS6,3
Dow
nloa
ded
by M
r A
song
u Si
mpl
ice
At 0
8:43
08
Sept
embe
r 20
15 (
PT)
Goodn
ess
ofFit
Laborled
(causes)FD
ICa
pitalled
(causes)FD
IGoodn
ess
ofFit
Laborled
(causes)GDI
Capitalled
(causes)GDI
Firstdif.
Level
Shortrun
(firstdif.)
Long
run
(level)
Shortrun
(firstdif.)
Long
run
(level)
first
dif.
Level
Shortrun
(firstdif.)
Long
run
(level)
Shortrun
(firstdif.)
Long
run
(level)
Coun
tries
AIC
AIC:C
EF-Statsª
ECT
(t-stats)
F-Statsª
ECT
(t-stats)
AIC
AIC:C
EF-Statsª
ECT
(t-stats)
F-Statsª
ECT
(t-stats)
PanelA
:foreign
investment(FDI)
PanelB
:dom
estic
investment(GDI)
Benin
nana
nana
n.a
na3(2)/3(2)
3(3):0/3(3):0
0.107
nc0.479
ncIvory
Coast
3(3)/3(1)
3(3):1/3(1):0
1.600
−0,00
7***
(−4,25
0)0.750
nc3(2)/3(1)
3(3):0/3(1):1
0.036
n.c
0.450
0.090
(0.069)
Cong
oRep.
3(3)/3(1)
3(3):0/3(1):0
1.662
nc0.181
ncna
nana
nana
na
Gam
bia
3(3)/3(1)
3(3):0/3(3):0
1.003
nc0.807
nc3(2)/3(2)
3(3):0/3(3):1
3.426**
nc0.376
−3.579*
(−1.795)
Ghana
3(2)/3(3)
3(3):0/3(3):1
0.049
nc3.853**
−2.459**
(−2.377)
3(3)/3(1)
3(3):0/3(1):1
0.844
nc0.443
−0.374
(−0.846)
Malaw
ina
nana
nana
na3(1)/3(2)
3(3):0/3(1):1
0.202
nc1.885
0.422***
(3.776)
South
Afri
nan.a
nana
nana
3(3)/3(2)
3(3):1/3(1):0
1.519
0.00
1*(2.019
)0.009
nc
Sudan
nana
nana
nana
3(3)/3(3)
3(3):0/3(3):0
2.616*
nc6.278***
ncSw
aziland
nana
nana
nana
3(1)/3(2)
3(2):0/3(2):1
1.299
nc2.104
−0.279
(−0.828)
Zambia
3(3)/3(1)
3(3):0/3(1):0
0.791
nc1.761
nc3(2)/3(1)
3(3):1/3(1):1
1.399
0.00
01***
(6.077
)0.307
−0.311
(−1.059)
(con
tinued)
Table VIII.Causality analysis
243
Long-termeffects of
populationgrowth
Dow
nloa
ded
by M
r A
song
u Si
mpl
ice
At 0
8:43
08
Sept
embe
r 20
15 (
PT)
Goodn
ess
ofFit
Laborled
(causes)FD
ICa
pitalled
(causes)FD
IGoodn
ess
ofFit
Laborled
(causes)GDI
Capitalled
(causes)GDI
Firstdif.
Level
Shortrun
(firstdif.)
Long
run
(level)
Shortrun
(firstdif.)
Long
run
(level)
first
dif.
Level
Shortrun
(firstdif.)
Long
run
(level)
Shortrun
(firstdif.)
Long
run
(level)
Coun
tries
AIC
AIC:C
EF-Statsª
ECT
(t-stats)
F-Statsª
ECT
(t-stats)
AIC
AIC:C
EF-Statsª
ECT
(t-stats)
F-Statsª
ECT
(t-stats)
PanelC
:public
investment(PubI)
PanelD
:privateinvestment(PriI)
Ivory
Coast
3(2)/3(1)
3(3):1/3(2):1
0.209
−0.00
1***
(−4.59
4)4.745**
0.203***
(4.176)
3(2)/3(2)
3(3):0/3(2):1
1.279
nc4.826**
0.207
(0.840)
Cong
oRep.
3(2)/3(1)
3(3):0/3(1):0
0.266
nc0.288
nc3(2)/3(1)
3(3):0/3(2):1
0.222
nc0.022
−0.220***
(−4,191)
Gam
bia
3(3)/3(3)
3(3):1/3(1):0
1.210
0.003
(1.406)
0.843
nc3(3)/3(1)
3(3):1/3(1):0
0.438
−0.01
2***
(−4.74
8)0.813
nc
Ghana
3(3)/3(3)
3(3):0/3(3):0
2.377
nc2.826*
nc3(3)/3(1)
3(3):0/3(1):0
2.328
nc0.001
ncMalaw
i3(3)/3(1)
3(3):1/3(1):0
0.751
0.001
(0.151)
0.041
nc3(3)/3(3)
3(3):0/3(3):0
0.287
nc0.284
nc
South
Africa
nana
nana
nana
3(2)/3(1)
3(3):0/3(1):0
0.476
nc1.809
nc
Sudan
3(2)/3(1)
3(3):0/3(1):0
0.000
nc0.414
nc3(1)/3(1)
3(1):0/3(1):0
0.618
nc2.811
ncSw
aziland
3(3)/3(2)
3(3):1/3(3):0
1.720
0.01
0***
(3.896
)0.380
nc3(2)/3(1)
3(3):0/3(1):0
1.748
nc0.092
nc
Tun
isia
3(1)/3(1)
3(3):0/3(1):1
0.049
nc4.311*
−0.260
(−0.975)
3(3)/3(2)
3(3):1/3(3):0
1.160
0.00
8***
(4.234
)0.711
nc
Zambia
3(2)/3(1)
3(3):1/3(1):0
2.553
−0.01
0***
(−4.84
6)0.695
ncna
nana
nana
na
Notes
:ªF-Stats,F-statistics(W
aldstatistics)testthesign
ificanceof
lagg
edvalues
oftheindepend
entvariables;CE
,co-integratingequatio
n;nc,nocointegration;FD
I,Fo
reignDirectInvestment;PriI,
PrivateInvestment;Pu
bI,P
ublic
Investment;GDI,Gross
Dom
estic
Investment;AIC,A
kaikeInform
ationCriterion;R
ep,R
epub
lic;A
fr,
Africa;1std
if,firstdifference;M
ax,m
axim
um;(ECT
/t-stats),E
rror
Correctio
nterm
andt-ratios;slandna
indicate“statio
nary
inlevel”and“not
applicable”r
espectively.
Maxim
umlagis3andoptim
allags
arechosen
viatheAIC.*,**,***Significantat
10,5,and
1percentlevelsrespectiv
ely
Table VIII.
244
AJEMS6,3
Dow
nloa
ded
by M
r A
song
u Si
mpl
ice
At 0
8:43
08
Sept
embe
r 20
15 (
PT)
from structural adjustment reforms undertaken by the country. By the mid 1980s,Zambia was one of the most indebted nations in the world. Austerity measuresimposed by the IMF have enabled it to decrease public spending and introduce moremarket-based economic policies. The New Economic Recovery Program of 1988introduced with the influence of the IMF was later reinforced by Chiluba’s economicreforms between 1991 and 2001.
The following could be noted as regards policy implications. first, Ivory Coastshould consider serious reforms in a bid to create a positive atmosphere for theattraction of foreign investments. Accordingly, the same recommendation applies forprivate investment. If nothing is done, based on the empirical weight of the findings, itis likely that the country would face even more political instability due to risingunemployment (as the unemployed youth cold recourse to crime and factional interests)which would seriously compromise national unity, peace and security. Second,Swaziland should adopt public spending reduction measures. As I have earlieremphasized, over 55 percent of its public spending is on wage bills. In the long-run, thegovernment cannot accommodate rising unemployment by constantly increasing itswage bill. The fact that her coffers are already running dry today should serve as awarning signal. Hence, policy measures that target the substitution of publicinvestment for private and foreign investments will substantially be beneficial to thekingdom in a distant future. Third, Zambia should continue on its path of reforms,giving priority to foreign and private investments. Broad policy recommendations forsampled countries include: the need for measures that encourage family planning andcreation of an appealing investment climate (and ease of doing business) for privateand foreign investments.
4.5.2 Caveats and future directions. As far as I know, the absence of literaturededicated to examining the bearing of demographic change on investmentdynamics makes my results less comparable. However, my findings are broadlyconsistent with the need for other forms of investments documented in the Africanbusiness (Rolfe and Woodward, 2004; Alagidede, 2008; Bartels et al., 2009; Tuomi,2011; Kolstad and Wiig, 2011; Darley, 2012; Asongu, 2012) and recent population(Asongu, 2013) literature. In this study, I have only considered demographicdeterminants of aggregate investment dynamics. However, in the real world,investment is endogenous to a complex set of variables. From a broad viewpoint,the link between population growth and investment is an essential part of a certainwider phenomenon. It is scarcely possible to conceive this linkage as occurringin isolation because; they are intimately bound with other factors (like progress inhealth care and technological change). Therefore, it would be interesting to replicatethe analysis in a multivariate VAR context.
Another future research direction could entail analyzing the human capitalfactor in productivity from an age-dynamic perspective, so that a better account ofinvestment-factor productivity with respect to age-structured work-force is broughtto light. Accordingly, my analysis is entirely limited to the quantity of labor force.However, I believe a parallel analysis based on the quality of labor force withparameters like “type of secondary education” and “health care” (among others), couldprovide more insights into this phenomenon. It could be quite challenging to measureskills, so we recommend Lall (1990) for a unique opportunity to provide first-handaccount by building a proxy using school attainments at the primary and secondarylevels (or any other proxy) in future analysis (Asongu, 2013).
245
Long-termeffects of
populationgrowth
Dow
nloa
ded
by M
r A
song
u Si
mpl
ice
At 0
8:43
08
Sept
embe
r 20
15 (
PT)
5. ConclusionThe objective of this study was to provide policy makers with some insights on howfuture investment opportunities could help manage rising population growth andcorresponding unemployment. In the assessing the population-investment nexus,I have used vector autoregressivemodels. The findings have established that, in the long-runpopulation growth will: first, decrease foreign and public investments in Ivory Coast; second,increase public and private investments in Swaziland; third, deplete public investment butaugment domestic investment in Zambia; fourth, diminish private investment and improvedomestic investment in the Congo Republic and Sudan, respectively.
The following implications have resulted from the findings: first, Ivory Coast shouldconsider serious reforms in a bid to create a positive atmosphere for the attraction of foreignand private investments; second, Swaziland should adopt public spending reductioninitiatives and policy measures designed to target the substitution of public investmentfor private and foreign investments will substantially be beneficial to the kingdom in thelong-term; third, Zambia should continue on its path of reforms, giving priority to foreignand private investments and; fourth, broad policy recommendations for sampled countriesinclude, the need for measures that encourage family planning and the creation of anappealing investment climate (and ease of doing business) for private and foreigninvestments. It would be interesting to replicate the analysis in a multivariate VAR contextbecause I have only considered demographic determinants of aggregate investmentdynamics. Another future research direction could entail analyzing the human capitalfactor in productivity from an age-dynamic perspective so that a better account ofinvestment-factor productivity with respect to age-structured work-force is brought to light.
Notes1. See recent studies in the African business literature that have focussed on factors
determining investment (Rolfe and Woodward, 2004; Alagidede, 2008; Bartels et al., 2009;Tuomi, 2011; Kolstad and Wiig, 2011; Darley, 2012; Asongu, 2012). Also see recent literatureon business strategies for achieving sustainable development in Africa (Rugimbana, 2010;Dimba, 2010; Mensah and Benedict, 2010; Oseifuah, 2010) that has been followed by aplethora of studies on entrepreneurship (Gerba, 2012; Singh et al., 2011).
2. It is an established consensus that, the three main things Africa needs are investment,investment and investment (Dangote Group, 2008; IMF Survey, 2009).
3. Foreign capital investments for example have surged from $15 billion in 2000 to $87 billionin 2007 (Asongu, 2013).
4. “Motivated by the intuition that location decision and perceptions of investors are veryinstructive in policy making, they have analyzed a survey of perceptions, operations andmotivations of 758 foreign investors in 10 SSA countries. Their results demonstrate that, theprovision of transaction cost-reducing information on industries and markets on the onehand and utility services to investors on the other hand , before and after a firm’s FDIdecision are significant factors” (Asongu, 2013).
5. It is widely believed that, as income grows, families tend to prefer the quality of children totheir quantity. Borrowing from Hasan (2010), per capita growth in China tends to lowerpopulation growth. He quotes the Becker hypothesis in supporting his findings: “[…] as percapita income increases, families turn to prefer quality over quantity of children. Theresultant increase in the cost of bearing and rearing children would induce smaller familysize and lead to decline in fertility” (p. 360). This explanation is consistent with the nexusbetween birth rate and production volatility (Pommeret and Smith, 2005).
246
AJEMS6,3
Dow
nloa
ded
by M
r A
song
u Si
mpl
ice
At 0
8:43
08
Sept
embe
r 20
15 (
PT)
6. For long-term elasticities to be estimated for a given country, factor productivity proxies mustbe integrated in the first order and cointegrated with investment dynamics.Whereas integrationrequires exhibition of unit root in level series (and thus stationarity in first differenced series),cointegration necessitates showing that, permanent variations in factor productivity variablesaffect permanent changes in investment proxies and vice-versa.
7. Starting with the aggregate investment production function:
I ¼ AKaW b (5)
where I is the investment variable, A is total factor productivity, K is capital stock, andW isthe labor composite, which is determined by the rate of population growth. I can re-writeEquation (5) in the natural log form in per capita income terms as:
log I ¼ yþalogKþblogW (6)
In the investment production function, physical capital is appreciated by gross fixed capitalformation and human capital by population growth rate.As hypothetically specified in Equation (5), there is a positive relationship between statedproductivity factors and investment types. This theoretical lay-out is similar to the positivedependence of aggregate production (GDP) on mentioned productivity factors and issupported empirically by many authors (Hondroyiannis and Papapetrou, 2005; Azomahouand Mishra, 2008). Concerning short-run effects, I do not expect the results to be significantbecause, I hypothetically assume population growth should affect investment dynamicsonly in the long-term.
8. Dickey and Fuller (1979).
9. Consistent with deterministic components in time series, but less relevant from thevisual-graphical perspective of our data set.
10. “The major findings in the current simulation study are previewed as follows. First, thesecriteria managed to pick up the correct lag length at least half of the time in small sample.Second, this performance increases substantially as sample size grows. Third, withrelatively large sample (120 or more observations), HQC is found to outdo the rest incorrectly identifying the true lag length. In contrast, AIC and FPE should be a better choicefor smaller sample. Fourth, AIC and FPE are found to produce the least probability of underestimation among all criteria under study. Finally, the problem of over estimation, however,is negligible in all cases. The findings in this simulation study, besides providing formalgroundwork supportive of the popular choice of AIC in previous empirical researches, mayas well serve as useful guiding principles for future economic researches in the determinationof autoregressive lag length” (Liew, 2004, p. 2).
References
Ahking, F.W. (2001), “Book review: measuring business cycles in economic time series”, IndianEconomic Review, Department of Economics, Delhi School of Economics, Vol. 36 No. 1,pp. 304-306.
Alagidede, P. (2008), “African stock market integration: implications for portfolio diversificationand international risk sharing”, Proceedings of the African Economic Conferences 2008,Tunis.
Asongu, S.A. (2012), “Government quality determinants of stock market performance in Africancountries”, Journal of African Business, Vol. 13 No. 2, pp. 183-199.
247
Long-termeffects of
populationgrowth
Dow
nloa
ded
by M
r A
song
u Si
mpl
ice
At 0
8:43
08
Sept
embe
r 20
15 (
PT)

Asongu, S.A. (2013), “How would population growth affect investment in the future? Asymmetricpanel causality evidence for Africa”, African Development Review, Vol. 25No. 1, pp. 14-29.
Asongu, S.A. (2014a), “The impact of health worker migration on development dynamics: evidenceof wealth-effects from Africa”, The European Journal of Health Economics, Vol. 15 No. 2,pp. 187-201, available at: http://link.springer.com/article/10.1007%2Fs10198-013-0465-4(accessed April 1, 2013).
Asongu, S.A. (2014b), “Linkages between investment flows and financial development: causalityevidence from selected African countries”, African Journal of Economic and ManagementStudies, Vol. 5 No. 3, pp. 269-299.
Asongu, S.A. and Jingwa, B.A. (2012), “Population growth and forest sustainability in Africa”,International Journal of Green Economics, Vol. 6 No. 2, pp. 145-166.
Azomahou, T. and Mishra, T. (2008), “Age dynamics and economic growth: revisiting the nexusin a nonparameric setting”, Economic Letters, Vol. 99 No. 1, pp. 67-71.
Bartels, F.L., Alladina, S.N. and Lederer, S. (2009), “Foreign direct investment in sub-saharanAfrica: motivating factors and policy issues”, Journal of African Business, Vol. 10 No. 2,pp. 141-162.
Cheung, Y.W. and Lai, K. (1993), “A fractional cointegration analysis of purchasing powerparity”, Journal of Business and Economics Statistics, Vol. 11 No. 1, pp. 103-112.
Dangote Group (2008), “18th World Economic Forum on Africa Report”, Financial NigeriaMagazine, June edition.
Darley, W.K. (2012), “Increasing Sub-Saharan Africa’s Share of foreign direct investment: publicpolicy challenges, strategies, and implications”, Journal of African Business, Vol. 13 No. 1,pp. 62-69.
Dickey, D.A. and Fuller, W.A. (1979), “Distributions of the estimators for autoregressivetime series with a unit root”, Journal of the American Statistical Association, Vol. 74No. 336a, pp. 427-31.
Dimba, B.A. (2010), “Strategic human resource managemet practices: effect on performance”,African Journal of Economic and Management Studies, Vol. 1 No. 2, pp. 128-137.
Engle, R.F. and Granger, C.W.J. (1987), “Cointegration and error-correction: representation,estimation and testing”, Econometrica, Vol. 55, No. 2, pp. 251-276.
Gerba, D.T. (2012), “Impact of entrepreneurship education on entrepreneurial intentions ofbusiness and engineering students in Ethiopia”,African Journal of Economic andManagementStudies, Vol. 3 No. 2, pp. 258-277.
GlobalTenders (2013), “Economy of Ivory Coast”, available at: www.globaltenders.com/economy-ivory-coast.htm (accessed August 26, 2013).
Gries, T., Kraft, M. and Meierrieks, D. (2009), “Linkages between financial deepening, tradeopenness, and economic development: causality evidence from Sub-Saharan Africa”, WorldDevelopment, Vol. 37 No. 12, pp. 1849-1860.
Hansen, H. and Juselius, K. (1995), Manual of CATS in RATS, Copenhagen, Estima.
Hasan, M.S. (2010), “The long-run relationship between population and per capita income growthin Chin”, Journal of Policy Modeling, Vol. 32 No. 3, pp. 355-372.
Hondroyiannis, G. and Papapetrou, E. (2005), “Fertility and output in Europe: new evidence frompanel cointegration analysis”, Journal of Policy Modeling, Vol. 27 No. 2, pp. 143-156.
IMF (2009), “Africa needs trade and investment, not more aid”, IMF Survey, April,available at: www.imf.org/external/pubs/ft/survey/so/2009/REA040109A.htm (accessedSeptember 11, 2012).
248
AJEMS6,3
Dow
nloa
ded
by M
r A
song
u Si
mpl
ice
At 0
8:43
08
Sept
embe
r 20
15 (
PT)
Johansen, S. (1995a), “Identifying restrictions in linear equations: with applications to simultaneousequations and cointegration”, Journal of Econometrics, Vol. 69 No. 1, pp. 111-132.
Johansen, S. (1995b), Likelihood Based Inference in Cointegrated Vector Autoregressive Models,Oxford University Press, Oxford.
Kolstad, I. and Wiig, A. (2011), “Better the devil you know? Chinese foreign direct investment inAfrica”, Journal of African Business, Vol. 12 No. 2, pp. 31-50.
Lall, S. (1990), “Education, skills and industrial development in the structural transformation ofAfrica”, Innocenti Occasional Papers, Economic Policy Series, 90/49, July, UNICEF,Florence.
Liew, V.K.S. (2004), “Which lag selection criteria should we employ?”, Economics Bulletin, Vol. 3No. 33, pp. 1-9.
Mensah, S.N. and Benedict, E. (2010), “Entrepeurneurship training and poverty alleviation:empowering the poor in the Eastern free state of South Africa”, African Journal ofEconomic and Management Studies, Vol. 1 No. 2, pp. 138-163.
Mohammad, A. (2011), “The Arab ‘youth quake’: implications on democratisation and stability”,Middle East Law and Governance, Vol. 3 Nos 1-2, pp. 159-170.
Nogueira, R.P. (2009), “Is monetary policy really neutral in the long-run? Evidencefor some emerging and developed economies”, Economics Bulletin, Vol. 29 No. 3,pp. 2432-2437.
Oseifuah, E.K. (2010), “Financial literacy and youth entrepreurship in South Africa”, AfricanJournal of Economic and Management Studies, Vol. 1 No. 2, pp. 164-182.
Pommeret, A. and Smith, W.T. (2005), “Fertility, volatility and growth”, Economics Letters,Vol. 87 No. 3, pp. 347-353.
Rolfe, R.J. and Woodward, D.P. (2004), “Attracting foreign investment through privatization:the Zambian experience”, Journal of African Business, Vol. 5 No. 1, pp. 5-27.
Rosenson A. (1942), “Population growth, investment and economic recovery”, The AmericanEconomic Review, Vol. 32 No. 1, pp. 122-125.
Rosenzweig, M.R. (1990), “Population growth and human capital: theory and evidence”, Journalof Political Economy, Vol. 98 No. 5, pp. 33-68.
Rugimbana, R., (2010), “Business strategies for achieving sustainable development in Africa:Introduction to the special issue”, African Journal of Economic and Manangement Studies,Vol. 1 No. 2, pp. 121-127.
Sakbani, M. (2011), “The revolutions of the Arab spring: are democracy, developmentand modernity at the gates?”, Contemporary Arab Affairs, Vol. 4 No. 2, pp. 127-147.
Singh, S., Simpson, R., Mordi, C. and Okafor, C. (2011), “Motivation to become an entrepreneur :a study of Nigerian women’s decisions”, African Journal of Economic and ManagementStudies, Vol. 2 No. 2, pp. 202-219.
Starr, M. (2005), “Does money matter in the CIS? Effects of monetary policy on output andprices”, Journal of Comparative Economics, Vol. 33 No. 3, pp. 441-461.
Stock, J.H. and Watson, M.W. (1988), “Testing for common trends”, Journal of the AmericanStatistical Association, Vol. 83 No. 404, pp. 1097-1107.
Sweezy, A.R. (1940), “Population growth and investment opportunity”, Quarterly Journal ofEconomics, Vol. 55 No. 1, pp. 64-79.
Tom, N. (2006), “High growth marred by unemployment”, African Business, No. 318,March, p. 22.
249
Long-termeffects of
populationgrowth
Dow
nloa
ded
by M
r A
song
u Si
mpl
ice
At 0
8:43
08
Sept
embe
r 20
15 (
PT)
Tuomi, K. (2011), “The role of the investment climate and tax incentives in the foreign directinvestment decision: evidence from South Africa”, Journal of African Business, Vol. 12No. 1, pp. 133-147.
United Nations (2009), Worlds Population Prospects, United Nations, New York, NY.World Bank (2010), African Development Indicators, World Bank Publications, Washington, DC.
Corresponding authorSimplice A. Asongu can be contacted at: [email protected]
For instructions on how to order reprints of this article, please visit our website:www.emeraldgrouppublishing.com/licensing/reprints.htmOr contact us for further details: [email protected]
250
AJEMS6,3
Dow
nloa
ded
by M
r A
song
u Si
mpl
ice
At 0
8:43
08
Sept
embe
r 20
15 (
PT)


