Embed Size (px)
Citation preview
Performance Management System
Quarterly ReportApril 2016
Maryland Department of Transportation
MDOT
FINAL
The Maryland Department of Transporta on and its Transporta on Business Units proudly present the offi cial mission statement.
Our Mission
i
My Fellow Marylanders,
I am pleased to present the Maryland Department of Transportation Excellerator Performance Management System. I have been a longtime proponent of performance measures as a critical ingredient which drives organizations to exceptional standards to meet the transportation demands of our customers. At the Maryland Department of Transportation, we have embarked on a dedicated journey of creating performance measures that are important to all who live in and travel throughout the State of Maryland.
The Maryland Department of Transportation, and its transportation business units, created a single focused Mission Statement, which is the guiding light for all of our transportation products and services. We are wholeheartedly committed to being driven by the needs of our customers and to exceed their expectations. Whether our customers fly out of the Baltimore/Washington International Thurgood Marshal Airport, take a cruise out of the Port of Baltimore, ride one of our buses or rail lines, register their vehicles, or travel our highways and bridges, we all stand together as the Maryland Department of Transportation.
Our Excellerator program is comprised of ten tangible results. Those results are critical components for the organization and will drive our daily business decisions. How we achieve those results will be an organization-wide process of developing measures and strategies to achieve the optimum level of performance. The public we serve is able to see the results of our performance every quarter. This program is a living, evolving performance process that is in a constant state of evaluation, analysis and action. Some quarters may be better than others, but with the appropriate measures in place, we will have a constant finger on the pulse of the products and services we deliver to the citizens of Maryland. Whether we are being a good neighbor or facilitating economic opportunities within our State, we, the Maryland Department of Transportation, are working together every day to improve our performance and strive to reach exceptional customer service.
We, thank you for this opportunity to share our initiative and are excited to embark upon a program of constant progress towards outstanding results.
Pete K. Rahn Secretary
A Message From the Secretary
ii
Maryland Department of Transportation Mission Statement ....................................................................................... i
Message from Secretary Pete K. Rahn .......................................................................................................................... ii
Table of Contents ..........................................................................................................................................................iii
Performance Measure Index ........................................................................................................................................iv
Tangible Result 1: Provide Exceptional Customer Service ............................................................................................ 1
Tangible Result 2: Use Resources Wisely .................................................................................................................... 13
Tangible Result 3: Provide a Safe and Secure Transportation Infrastructure .............................................................. 37
Tangible Result 4: Deliver Transportation Solutions and Services of Great Value ...................................................... 57
Tangible Result 5: Provide an Efficient, Well-Connected Transportation Experience ................................................. 75
Tangible Result 6: Communicate Effectively With Our Customers ............................................................................. 91
Tangible Result 7: Be Fair and Reasonable To Our Partners ..................................................................................... 103
Tangible Result 8: Be a Good Neighbor .................................................................................................................... 117
Tangible Result 9: Be a Good Steward of Our Environment ..................................................................................... 127
Tangible Result 10: Facilitate Economic Opportunity in Maryland ........................................................................... 141
Glossary .................................................................................................................................................................... 164
Table of Contents
iii
Performance Measures Index
Tangible Results Frequency DriverTangible Result # 1: Provide Exceptional Customer Service Leslie Dews, MVA
1.1 Percent of Overall Customer Satisfaction Annually Sean Adgerson, MTA
1.2 Responsiveness to MDOT Customer Correspondence Patrick Corcoran, MAA
1.2a - Average Number of Days for Correspondence Resolution
Monthly Patrick Corcoran, MAA
1.2b - Percent of First Contact Resolution Monthly Rick Powers, MPA
1.3 Customer Satisfaction with Receiving Goods and Services Darol Smith, MDTA
1.3a - Percent of Abandoned Calls at Call Centers Quarterly Darol Smith, MDTA
1.3b - Average Call Wait Times at Call Centers Quarterly Darol Smith, MDTA
1.3c - Level of Satisfaction with Resolving Call Inquiries at Call Centers
Quarterly Darol Smith, MDTA
1.3d - Level of Satisfaction with Interactions with Front Line Employees
Annually Dave Peake, SHA
1.3e - Level of Satisfaction with Website Information in Navigation of the Site
Annually Dave Peake, SHA
1.4Percent of Customers that Feel that they were Treated in a Welcoming, Supportive, Respectful and Professional Manner when Contacting MDOT
Sabrina Bass, TSO
1.4a - Percent of Customer Expectations that were Met or Exceeded Based on Employee Professionalism and Respectfulness
Annually Sabrina Bass, TSO
1.4b - Percent of Complaint Resolutions that Met or Exceeded Customer Expectations for Professional and Respectful Communication
Annually Sabrina Bass, TSO
Tangible Result # 2: Use Resources Wisely Corey Stottlemyer, TSO
2.1 Percent Capital Dollars Spent as Programmed Quarterly/ Annually Dave Fleming, TSO
2.2 Percent of Projects Leveraging Other Funding Sources Annually Dave Fleming, TSO
2.3 Employee Engagement Annually Amber Harvey, MDTA
2.4 Employee Turnover Rate Annually Amber Harvey, MDTA
2.5 Time to Fill Vacancies Quarterly Debbie Hammel, SHA
2.6Percentage of Fixed Asset Units Identified or Accounted for During the Annual Physical Inventory of Fixed Assets
Annually Bill Bertrand, SHA
2.7 Managing Capital Assets Annually Tony Moore, MPA
2.8 Percent of Procurements on Time and on Budget Quarterly Pretam Harry, MVA
2.9 Percent and Value of Change Orders on Procurements Quarterly Pretam Harry, MVA
2.10 Relationship Between Procurement Competition and Cost Quarterly Laura Getty, MTA
2.11Number of Internal Audit Findings and Number of Repeat Internal Audit Findings
Annually Patrick Bradley, MAA
2.12 Number of Legislative Repeat Audit Findings Annually Patrick Bradley, MAA
iv
Tangible Result # 3: Provide a Safe and Secure Transportation Infrastructure Aarion Franklin, MDTA
3.1Number of Crimes Against Persons and Property Committed at MDOT Facilities
Quarterly Bud Frank, TSO
3.2 Number of Traffic-Related Fatalities on All Roads Quarterly/ Annually Tom Gianni, MVA
3.3 Maryland Traffic-Related Fatality Rate Annually Tom Gianni, MVA
3.4 Number of Traffic-Related Serious Injuries on All Roads Quarterly/ Annually Tom Gianni, MVA
3.5 Maryland Traffic-Related Serious Injury Rate Annually Tom Gianni, MVA
3.6Maryland Seat Belt Usage Rate and Ranking Against Other States in Seat Belt Use
Annually Gina Watson, MPA
3.7 Disabled Motorist Assists Quarterly Cedric Ward, SHA
3.8 Number of Employee Injuries Reports Quarterly Cedric Johnson, MAA
3.9 Number of Employee Lost Work Days Due to Injuries Quarterly Cedric Johnson, MAA
3.10 MDOT Structurally Deficient Bridges Annually Bernadette Bridges, MTA
Tangible Result # 4: Deliver Transportation Solutions and Services of Great Value Jason Ridgway, SHA
4.1Percent of Estimated Project Budget as Compared to Final Project Award
Annually Terri Lins, MVA
4.2 Percent of Change for Finalized Contracts Annually Brian Miller, MPA
4.3 Meeting Needs with Value and Innovation Wayne Schuster, MAA
4.3a - Survey Satisfaction Result Annually Wayne Schuster, MAA
4.3b - Project Value by Contracting Method Annually Wayne Schuster, MAA
4.3c - Percent of Awarded Projects with Value Analysis Annually Wayne Schuster, MAA
4.4On Time Services and Solutions – Percent of Projects Completed by Original Contract Date
Annually Bill Appold, TSO
4.5 Average Cost of Common Solutions and Services Pat Keller, MTA
4.5a - Minor Road Resurfacing Annually Pat Keller, MTA
4.5b - Major Road Resurfacing Annually Pat Keller, MTA
4.5c - Interstate Resurfacing Annually Pat Keller, MTA
4.5d - Average Bridge Replacement Cost Annually Pat Keller, MTA
4.5e - Average Bridge Redeck Cost Annually Pat Keller, MTA
4.5f - Operating Cost Per Passenger Trip Annually Pat Keller, MTA
4.5g - Operating Cost Per Revenue Vehicle Mile Annually Pat Keller, MTA
4.5h - Passenger Trip Per Revenue Vehicle Mile Cost Per Transaction
Annually Pat Keller, MTA
4.5i - Farebox Recovery Ratio Annually Pat Keller, MTA
4.5j - Cost Per Transaction Annually Pat Keller, MTA
Tangible Result # 5: Provide An Efficient, Well-Connected Transportation Experience Phil Sullivan, MTA
5.1 Reliability of the Transportation Experience John O’Neill, MDTA
5.1a - Average Wait Times at our Facilities for our Services Quarterly John O’Neill, MDTA
5.1b - Percent of On-Time Performance Monthly John O’Neill, MDTA
Performance Measures Index
v
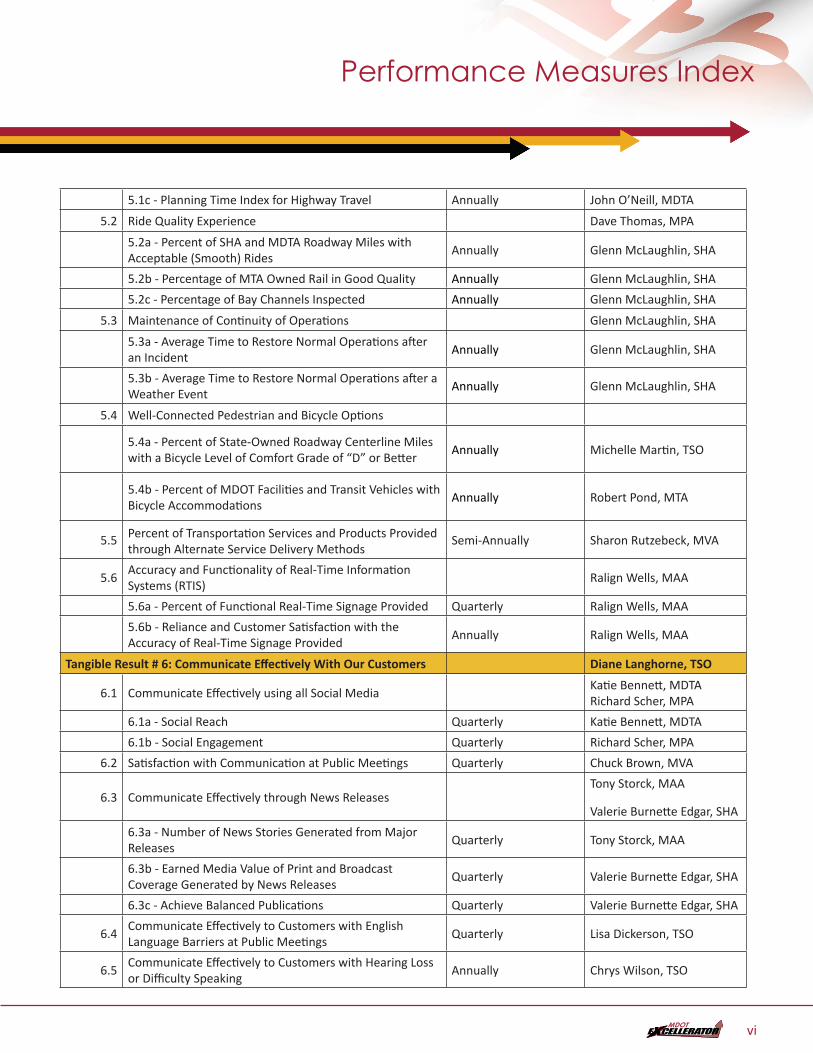
5.1c - Planning Time Index for Highway Travel Annually John O’Neill, MDTA
5.2 Ride Quality Experience Dave Thomas, MPA
5.2a - Percent of SHA and MDTA Roadway Miles with Acceptable (Smooth) Rides
Annually Glenn McLaughlin, SHA
5.2b - Percentage of MTA Owned Rail in Good Quality Annually Glenn McLaughlin, SHA
5.2c - Percentage of Bay Channels Inspected Annually Glenn McLaughlin, SHA
5.3 Maintenance of Continuity of Operations Glenn McLaughlin, SHA
5.3a - Average Time to Restore Normal Operations after an Incident
Annually Glenn McLaughlin, SHA
5.3b - Average Time to Restore Normal Operations after a Weather Event
Annually Glenn McLaughlin, SHA
5.4 Well-Connected Pedestrian and Bicycle Options
5.4a - Percent of State-Owned Roadway Centerline Miles with a Bicycle Level of Comfort Grade of “D” or Better
Annually Michelle Martin, TSO
5.4b - Percent of MDOT Facilities and Transit Vehicles with Bicycle Accommodations
Annually Robert Pond, MTA
5.5 Percent of Transportation Services and Products Provided through Alternate Service Delivery Methods
Semi-Annually Sharon Rutzebeck, MVA
5.6Accuracy and Functionality of Real-Time Information Systems (RTIS)
Ralign Wells, MAA
5.6a - Percent of Functional Real-Time Signage Provided Quarterly Ralign Wells, MAA
5.6b - Reliance and Customer Satisfaction with the Accuracy of Real-Time Signage Provided
Annually Ralign Wells, MAA
Tangible Result # 6: Communicate Effectively With Our Customers Diane Langhorne, TSO
6.1 Communicate Effectively using all Social MediaKatie Bennett, MDTA Richard Scher, MPA
6.1a - Social Reach Quarterly Katie Bennett, MDTA
6.1b - Social Engagement Quarterly Richard Scher, MPA
6.2 Satisfaction with Communication at Public Meetings Quarterly Chuck Brown, MVA
6.3 Communicate Effectively through News ReleasesTony Storck, MAA
Valerie Burnette Edgar, SHA
6.3a - Number of News Stories Generated from Major Releases
Quarterly Tony Storck, MAA
6.3b - Earned Media Value of Print and Broadcast Coverage Generated by News Releases
Quarterly Valerie Burnette Edgar, SHA
6.3c - Achieve Balanced Publications Quarterly Valerie Burnette Edgar, SHA
6.4Communicate Effectively to Customers with English Language Barriers at Public Meetings
Quarterly Lisa Dickerson, TSO
6.5Communicate Effectively to Customers with Hearing Loss or Difficulty Speaking
Annually Chrys Wilson, TSO
Performance Measures Index
Performance Measures Index
vi
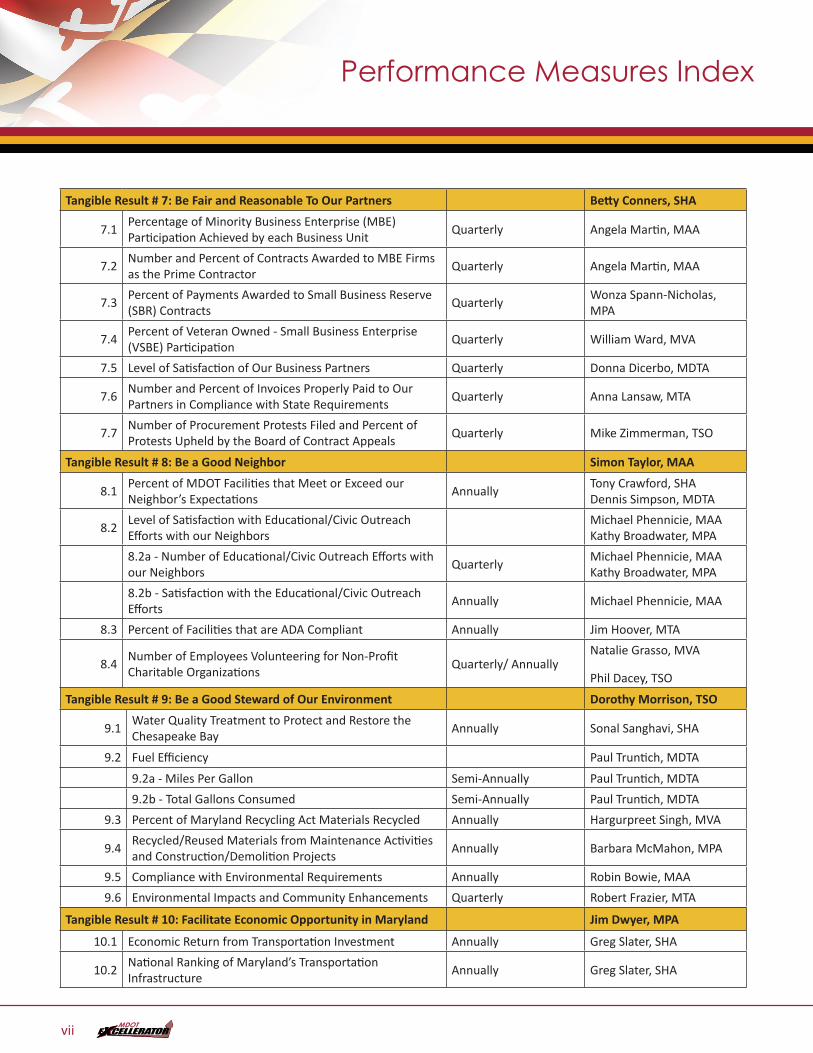
Tangible Result # 7: Be Fair and Reasonable To Our Partners Betty Conners, SHA
7.1Percentage of Minority Business Enterprise (MBE) Participation Achieved by each Business Unit
Quarterly Angela Martin, MAA
7.2Number and Percent of Contracts Awarded to MBE Firms as the Prime Contractor
Quarterly Angela Martin, MAA
7.3Percent of Payments Awarded to Small Business Reserve (SBR) Contracts
QuarterlyWonza Spann-Nicholas, MPA
7.4Percent of Veteran Owned - Small Business Enterprise (VSBE) Participation
Quarterly William Ward, MVA
7.5 Level of Satisfaction of Our Business Partners Quarterly Donna Dicerbo, MDTA
7.6Number and Percent of Invoices Properly Paid to Our Partners in Compliance with State Requirements
Quarterly Anna Lansaw, MTA
7.7Number of Procurement Protests Filed and Percent of Protests Upheld by the Board of Contract Appeals
Quarterly Mike Zimmerman, TSO
Tangible Result # 8: Be a Good Neighbor Simon Taylor, MAA
8.1Percent of MDOT Facilities that Meet or Exceed our Neighbor’s Expectations
AnnuallyTony Crawford, SHA Dennis Simpson, MDTA
8.2Level of Satisfaction with Educational/Civic Outreach Efforts with our Neighbors
Michael Phennicie, MAA Kathy Broadwater, MPA
8.2a - Number of Educational/Civic Outreach Efforts with our Neighbors
QuarterlyMichael Phennicie, MAA Kathy Broadwater, MPA
8.2b - Satisfaction with the Educational/Civic Outreach Efforts
Annually Michael Phennicie, MAA
8.3 Percent of Facilities that are ADA Compliant Annually Jim Hoover, MTA
8.4Number of Employees Volunteering for Non-Profit Charitable Organizations
Quarterly/ AnnuallyNatalie Grasso, MVA
Phil Dacey, TSO
Tangible Result # 9: Be a Good Steward of Our Environment Dorothy Morrison, TSO
9.1Water Quality Treatment to Protect and Restore the Chesapeake Bay
Annually Sonal Sanghavi, SHA
9.2 Fuel Efficiency Paul Truntich, MDTA
9.2a - Miles Per Gallon Semi-Annually Paul Truntich, MDTA
9.2b - Total Gallons Consumed Semi-Annually Paul Truntich, MDTA
9.3 Percent of Maryland Recycling Act Materials Recycled Annually Hargurpreet Singh, MVA
9.4Recycled/Reused Materials from Maintenance Activities and Construction/Demolition Projects
Annually Barbara McMahon, MPA
9.5 Compliance with Environmental Requirements Annually Robin Bowie, MAA
9.6 Environmental Impacts and Community Enhancements Quarterly Robert Frazier, MTA
Tangible Result # 10: Facilitate Economic Opportunity in Maryland Jim Dwyer, MPA
10.1 Economic Return from Transportation Investment Annually Greg Slater, SHA
10.2National Ranking of Maryland’s Transportation Infrastructure
Annually Greg Slater, SHA
Performance Measures Index
vii
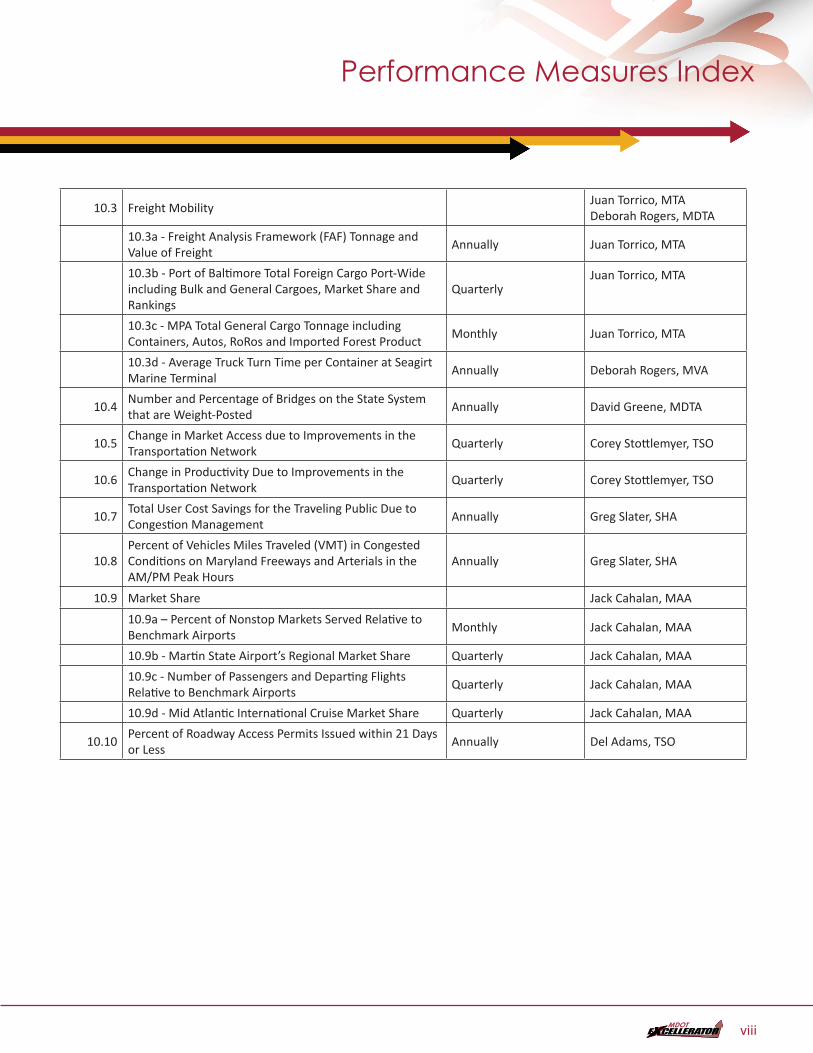
10.3 Freight MobilityJuan Torrico, MTA Deborah Rogers, MDTA
10.3a - Freight Analysis Framework (FAF) Tonnage and Value of Freight
Annually Juan Torrico, MTA
10.3b - Port of Baltimore Total Foreign Cargo Port-Wide including Bulk and General Cargoes, Market Share and Rankings
QuarterlyJuan Torrico, MTA
10.3c - MPA Total General Cargo Tonnage including Containers, Autos, RoRos and Imported Forest Product
Monthly Juan Torrico, MTA
10.3d - Average Truck Turn Time per Container at Seagirt Marine Terminal
Annually Deborah Rogers, MVA
10.4Number and Percentage of Bridges on the State System that are Weight-Posted
Annually David Greene, MDTA
10.5Change in Market Access due to Improvements in the Transportation Network
Quarterly Corey Stottlemyer, TSO
10.6Change in Productivity Due to Improvements in the Transportation Network
Quarterly Corey Stottlemyer, TSO
10.7Total User Cost Savings for the Traveling Public Due to Congestion Management
Annually Greg Slater, SHA
10.8Percent of Vehicles Miles Traveled (VMT) in Congested Conditions on Maryland Freeways and Arterials in the AM/PM Peak Hours
Annually Greg Slater, SHA
10.9 Market Share Jack Cahalan, MAA
10.9a – Percent of Nonstop Markets Served Relative to Benchmark Airports
Monthly Jack Cahalan, MAA
10.9b - Martin State Airport’s Regional Market Share Quarterly Jack Cahalan, MAA
10.9c - Number of Passengers and Departing Flights Relative to Benchmark Airports
Quarterly Jack Cahalan, MAA
10.9d - Mid Atlantic International Cruise Market Share Quarterly Jack Cahalan, MAA
10.10Percent of Roadway Access Permits Issued within 21 Days or Less
Annually Del Adams, TSO
Performance Measures Index
viii
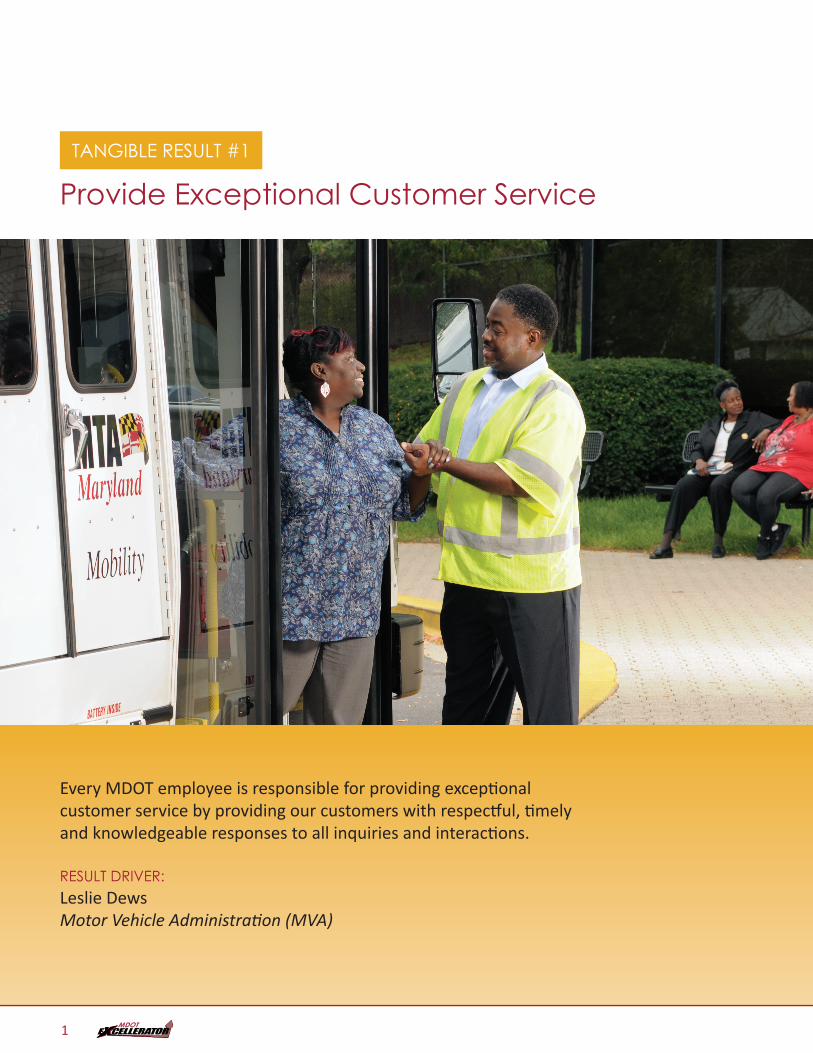
TANGIBLE RESULT #1
Provide Exceptional Customer Service
Every MDOT employee is responsible for providing exceptional customer service by providing our customers with respectful, timely and knowledgeable responses to all inquiries and interactions.
RESULT DRIVER:Leslie Dews Motor Vehicle Administration (MVA)
1
Provide Exceptional Customer Service
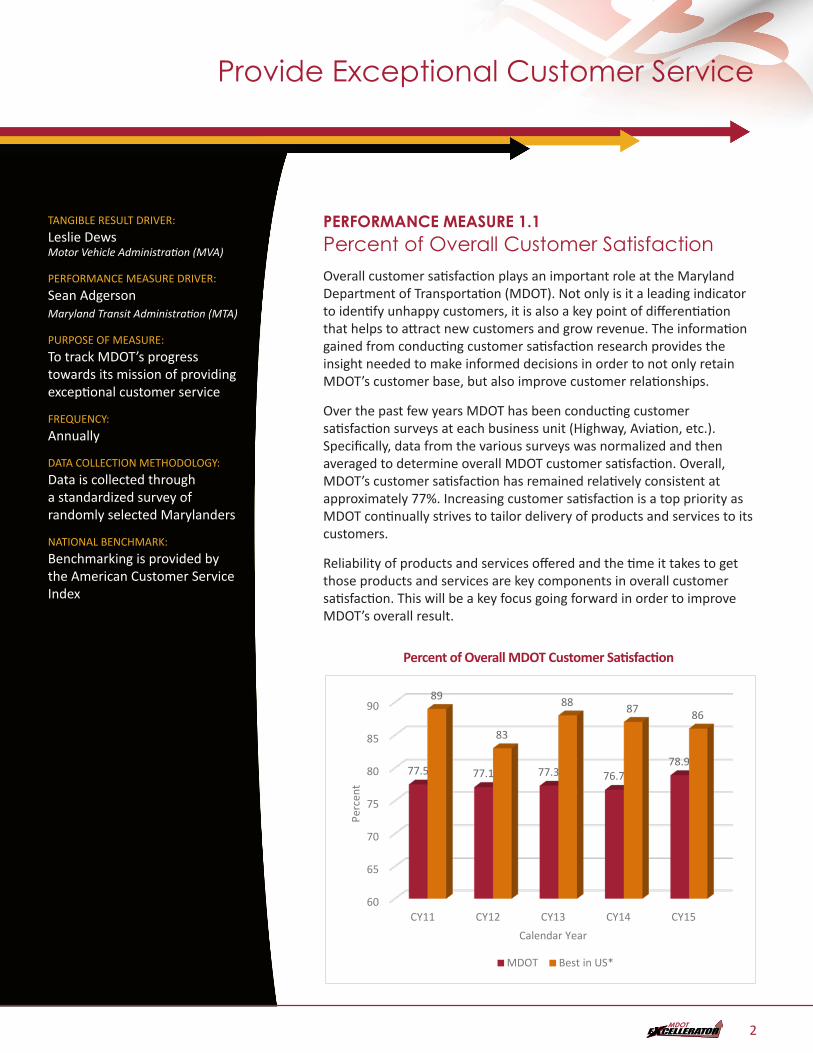
PERFORMANCE MEASURE 1.1Percent of Overall Customer SatisfactionOverall customer satisfaction plays an important role at the Maryland Department of Transportation (MDOT). Not only is it a leading indicator to identify unhappy customers, it is also a key point of differentiation that helps to attract new customers and grow revenue. The information gained from conducting customer satisfaction research provides the insight needed to make informed decisions in order to not only retain MDOT’s customer base, but also improve customer relationships.
Over the past few years MDOT has been conducting customer satisfaction surveys at each business unit (Highway, Aviation, etc.). Specifically, data from the various surveys was normalized and then averaged to determine overall MDOT customer satisfaction. Overall, MDOT’s customer satisfaction has remained relatively consistent at approximately 77%. Increasing customer satisfaction is a top priority as MDOT continually strives to tailor delivery of products and services to its customers.
Reliability of products and services offered and the time it takes to get those products and services are key components in overall customer satisfaction. This will be a key focus going forward in order to improve MDOT’s overall result.
Percent of Overall MDOT Customer Satisfaction
Set all to Excellerator color pallete, Calibri Body font 9pt Small charts are 4.5” wide, large are 7.25 (default margins)
Extract titles from charts as example below. Will be added in indesign
PM 1.1 - Percent of Overall MDOT Customer Satisfaction - DONE
done
60
65
70
75
80
85
90
CY11 CY12 CY13 CY14 CY15
77.5 77.1 77.3 76.778.9
89
83
88 87 86
Perc
ent
Calendar Year
MDOT Best in US*
TANGIBLE RESULT DRIVER:
Leslie Dews Motor Vehicle Administration (MVA)
PERFORMANCE MEASURE DRIVER:
Sean Adgerson Maryland Transit Administration (MTA)
PURPOSE OF MEASURE:
To track MDOT’s progress towards its mission of providing exceptional customer service
FREQUENCY:
Annually
DATA COLLECTION METHODOLOGY:
Data is collected through a standardized survey of randomly selected Marylanders
NATIONAL BENCHMARK:
Benchmarking is provided by the American Customer Service Index
2
TANGIBLE RESULT DRIVER:
Leslie Dews Motor Vehicle Administration (MVA)
PERFORMANCE MEASURE DRIVER:
Patrick Corcoran Maryland Aviation Administration
(MAA)
PURPOSE OF MEASURE:
To track correspondence resolution
FREQUENCY:
Monthly
DATA COLLECTION METHODOLOGY:
Statewide IQ system
NATIONAL BENCHMARK:
N/A
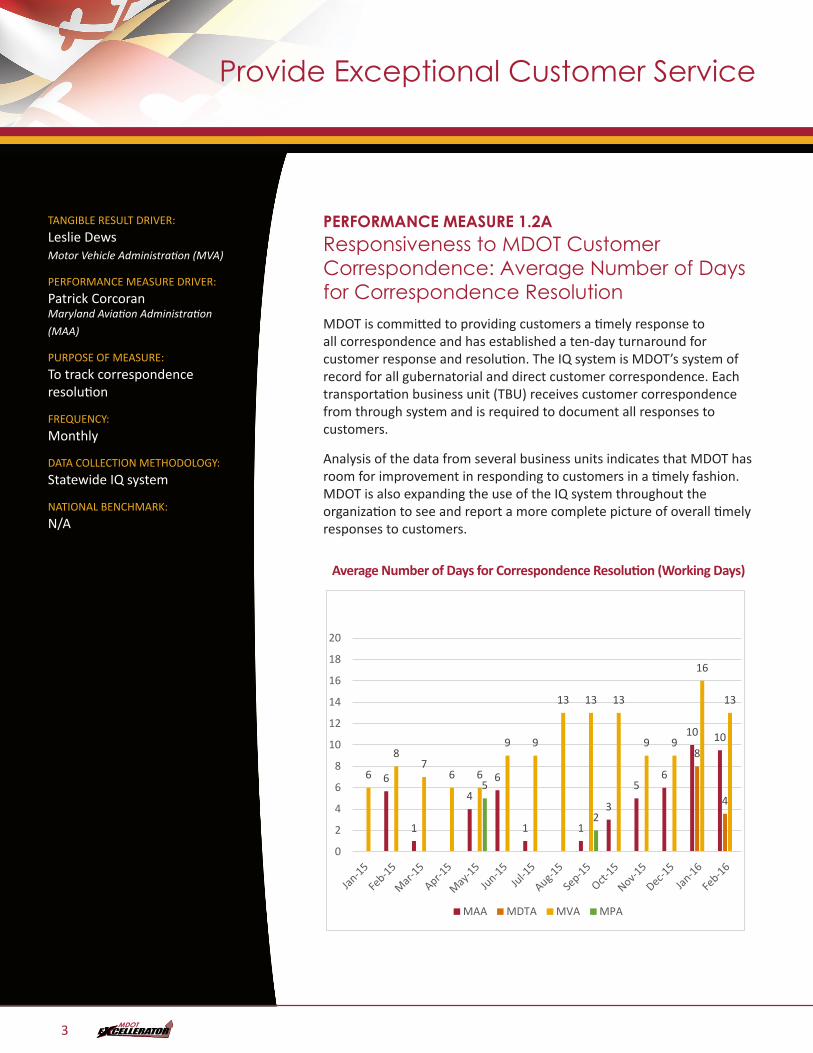
PERFORMANCE MEASURE 1.2AResponsiveness to MDOT Customer Correspondence: Average Number of Days for Correspondence ResolutionMDOT is committed to providing customers a timely response to all correspondence and has established a ten-day turnaround for customer response and resolution. The IQ system is MDOT’s system of record for all gubernatorial and direct customer correspondence. Each transportation business unit (TBU) receives customer correspondence from through system and is required to document all responses to customers.
Analysis of the data from several business units indicates that MDOT has room for improvement in responding to customers in a timely fashion. MDOT is also expanding the use of the IQ system throughout the organization to see and report a more complete picture of overall timely responses to customers.
Average Number of Days for Correspondence Resolution (Working Days)PM 1.2a - Average Number of Days for Correspondence Resolution (Working Days)
6
1
46
1 1
3
56
10 108
4
6
87
6 6
9 9
13 13 13
9 9
16
13
5
2
0
2
4
6
8
10
12
14
16
18
20
MAA MDTA MVA MPA
Provide Exceptional Customer Service
3
Provide Exceptional Customer Service
TANGIBLE RESULT DRIVER:
Leslie Dews Motor Vehicle Administration (MVA)
PERFORMANCE MEASURE DRIVER:
Richard Powers Maryland Port Administration (MPA)
PURPOSE OF MEASURE:
To track the rate of first contact resolution to MDOT customer correspondence
FREQUENCY:
Monthly
DATA COLLECTION METHODOLOGY:
Statewide IQ system
NATIONAL BENCHMARK:
N/A
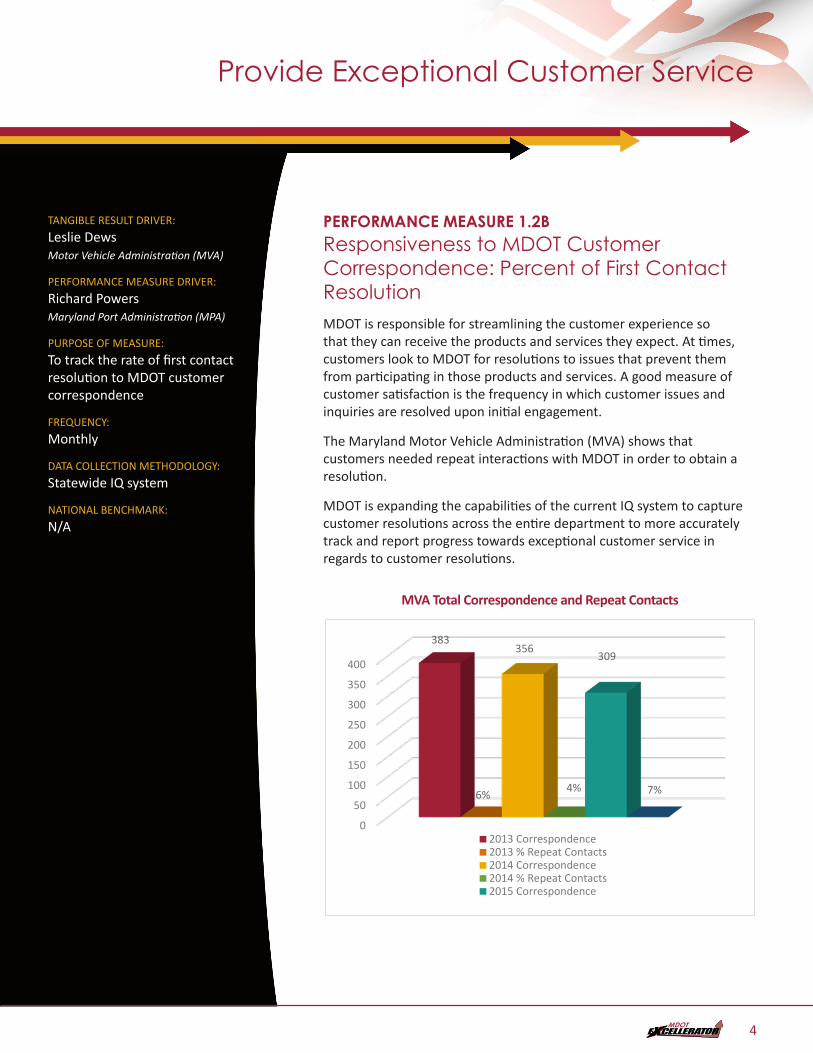
PERFORMANCE MEASURE 1.2BResponsiveness to MDOT Customer Correspondence: Percent of First Contact ResolutionMDOT is responsible for streamlining the customer experience so that they can receive the products and services they expect. At times, customers look to MDOT for resolutions to issues that prevent them from participating in those products and services. A good measure of customer satisfaction is the frequency in which customer issues and inquiries are resolved upon initial engagement.
The Maryland Motor Vehicle Administration (MVA) shows that customers needed repeat interactions with MDOT in order to obtain a resolution.
MDOT is expanding the capabilities of the current IQ system to capture customer resolutions across the entire department to more accurately track and report progress towards exceptional customer service in regards to customer resolutions.
MVA Total Correspondence and Repeat Contacts
PM 1.2b - MVA Total Correspondence and Repeat Contacts - DONE
0
50
100
150
200
250
300
350
400
383
6%
356
4%
309
7%
2013 Correspondence2013 % Repeat Contacts2014 Correspondence2014 % Repeat Contacts2015 Correspondence
4
Provide Exceptional Customer Service
TANGIBLE RESULT DRIVER:
Leslie Dews Motor Vehicle Administration (MVA)
PERFORMANCE MEASURE DRIVER:
Darol Smith Maryland Transportation Authority
(MDTA)
PURPOSE OF MEASURE:
To identify the percentage of customers not connecting or speaking with call centers resulting from not receiving goods or services from MDOT
FREQUENCY:
Quarterly
DATA COLLECTION METHODOLOGY:
Database metrics provided by TBUs. Calculated formula abandoned calls divided by total inbound calls – in percent
NATIONAL BENCHMARK:
Talkdesk Global rate 5 – 8 %, MetricNet rate 8.7%
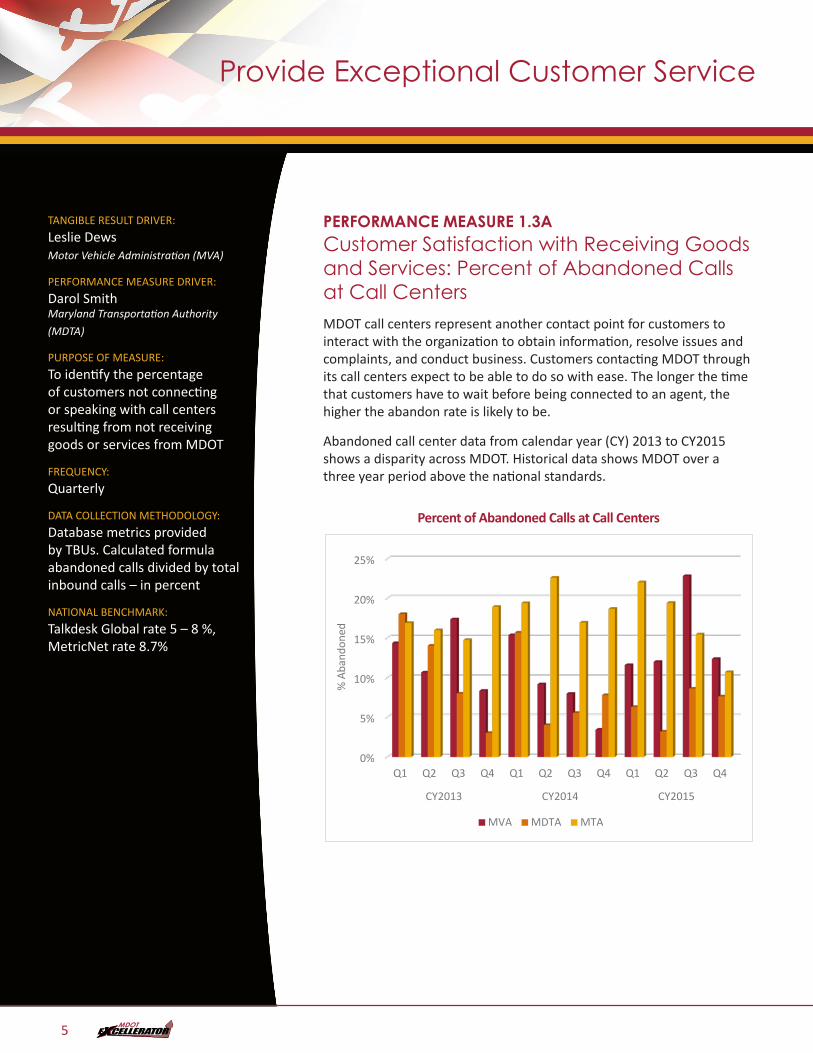
PERFORMANCE MEASURE 1.3ACustomer Satisfaction with Receiving Goods and Services: Percent of Abandoned Calls at Call CentersMDOT call centers represent another contact point for customers to interact with the organization to obtain information, resolve issues and complaints, and conduct business. Customers contacting MDOT through its call centers expect to be able to do so with ease. The longer the time that customers have to wait before being connected to an agent, the higher the abandon rate is likely to be.
Abandoned call center data from calendar year (CY) 2013 to CY2015 shows a disparity across MDOT. Historical data shows MDOT over a three year period above the national standards.
Percent of Abandoned Calls at Call CentersPM 1.3a - Percent of Abandoned Calls at Call Centers - DONE
0%
5%
10%
15%
20%
25%
Q1 Q2 Q3 Q4 Q1 Q2 Q3 Q4 Q1 Q2 Q3 Q4
CY2013 CY2014 CY2015
% A
band
oned
MVA MDTA MTA
5
Provide Exceptional Customer Service
TANGIBLE RESULT DRIVER:
Leslie Dews Motor Vehicle Administration (MVA)
PERFORMANCE MEASURE DRIVER:
Darol Smith Maryland Transportation Authority
(MDTA)
PURPOSE OF MEASURE:
To collect and evaluate the time it takes the average customer to wait before speaking with the call center to answer phone inquiries
FREQUENCY:
Quarterly
DATA COLLECTION METHODOLOGY:
Database metrics provided by TBUs. Average amount of time caller waits
NATIONAL BENCHMARK:
Reported by Talkdesk Global Metric - 60 seconds
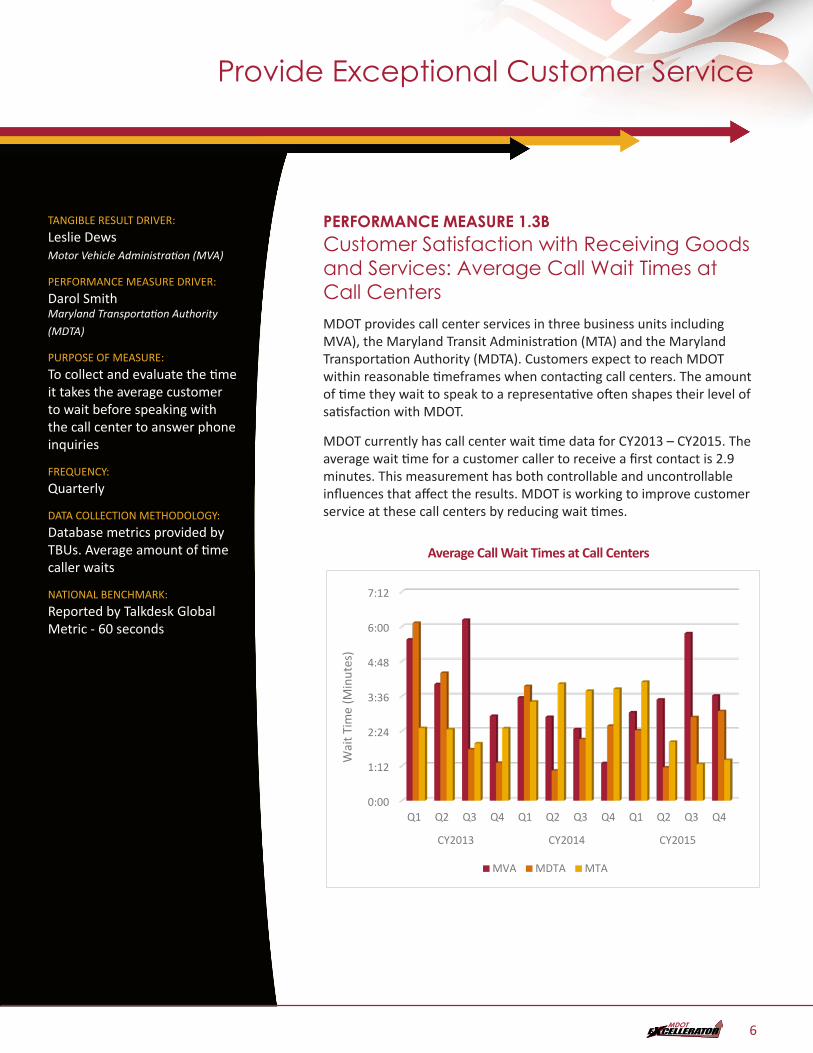
PERFORMANCE MEASURE 1.3BCustomer Satisfaction with Receiving Goods and Services: Average Call Wait Times at Call CentersMDOT provides call center services in three business units including MVA), the Maryland Transit Administration (MTA) and the Maryland Transportation Authority (MDTA). Customers expect to reach MDOT within reasonable timeframes when contacting call centers. The amount of time they wait to speak to a representative often shapes their level of satisfaction with MDOT.
MDOT currently has call center wait time data for CY2013 – CY2015. The average wait time for a customer caller to receive a first contact is 2.9 minutes. This measurement has both controllable and uncontrollable influences that affect the results. MDOT is working to improve customer service at these call centers by reducing wait times.
Average Call Wait Times at Call CentersPM 1.3b - Average Call Wait Times at Call Centers - DONE
0:00
1:12
2:24
3:36
4:48
6:00
7:12
Q1 Q2 Q3 Q4 Q1 Q2 Q3 Q4 Q1 Q2 Q3 Q4
CY2013 CY2014 CY2015
Wai
t Tim
e (M
inut
es)
MVA MDTA MTA
6
TANGIBLE RESULT DRIVER:
Leslie Dews Motor Vehicle Administration (MVA)
PERFORMANCE MEASURE DRIVER:
Darol Smith Maryland Transportation Authority
(MDTA)
PURPOSE OF MEASURE:
To assess customer satisfaction with call centers in resolving call inquiries
FREQUENCY:
Quarterly
DATA COLLECTION METHODOLOGY:
Phone survey of call center customers
NATIONAL BENCHMARK:
74% Industry Standards as reported by MetricNet
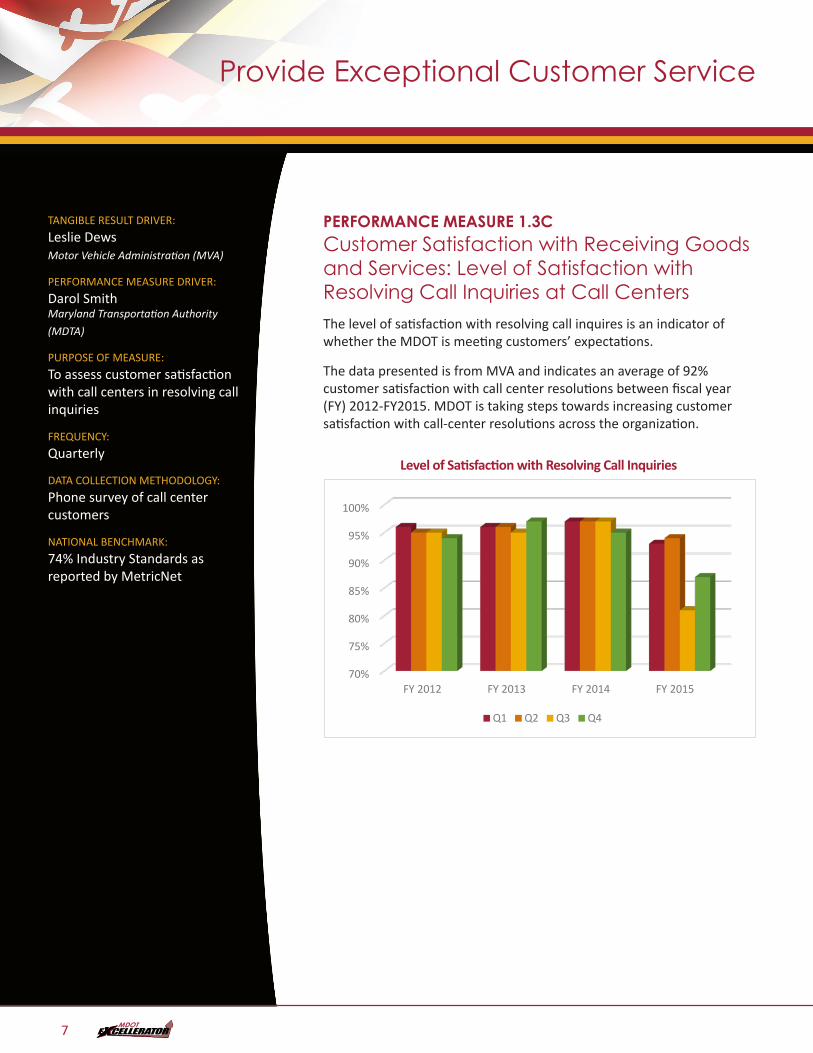
PERFORMANCE MEASURE 1.3CCustomer Satisfaction with Receiving Goods and Services: Level of Satisfaction with Resolving Call Inquiries at Call CentersThe level of satisfaction with resolving call inquires is an indicator of whether the MDOT is meeting customers’ expectations.
The data presented is from MVA and indicates an average of 92% customer satisfaction with call center resolutions between fiscal year (FY) 2012-FY2015. MDOT is taking steps towards increasing customer satisfaction with call-center resolutions across the organization.
Level of Satisfaction with Resolving Call InquiriesPM 1.3c
70%
75%
80%
85%
90%
95%
100%
FY 2012 FY 2013 FY 2014 FY 2015
Q1 Q2 Q3 Q4
Provide Exceptional Customer Service
7
Provide Exceptional Customer Service
TANGIBLE RESULT DRIVER:
Leslie Dews Motor Vehicle Administration (MVA)
PERFORMANCE MEASURE DRIVER:
Dave Peake State Highway Administration (SHA)
PURPOSE OF MEASURE:
To better determine how satisfied MDOT customers are when interacting with frontline employees
FREQUENCY:
Annually
DATA COLLECTION METHODOLOGY:
Data is collected through a survey design utilizing an on-site, in-person intercept method, complemented by online surveys
NATIONAL BENCHMARK:
Highest American Customer Satisfaction Index (ACSI) rate -86%
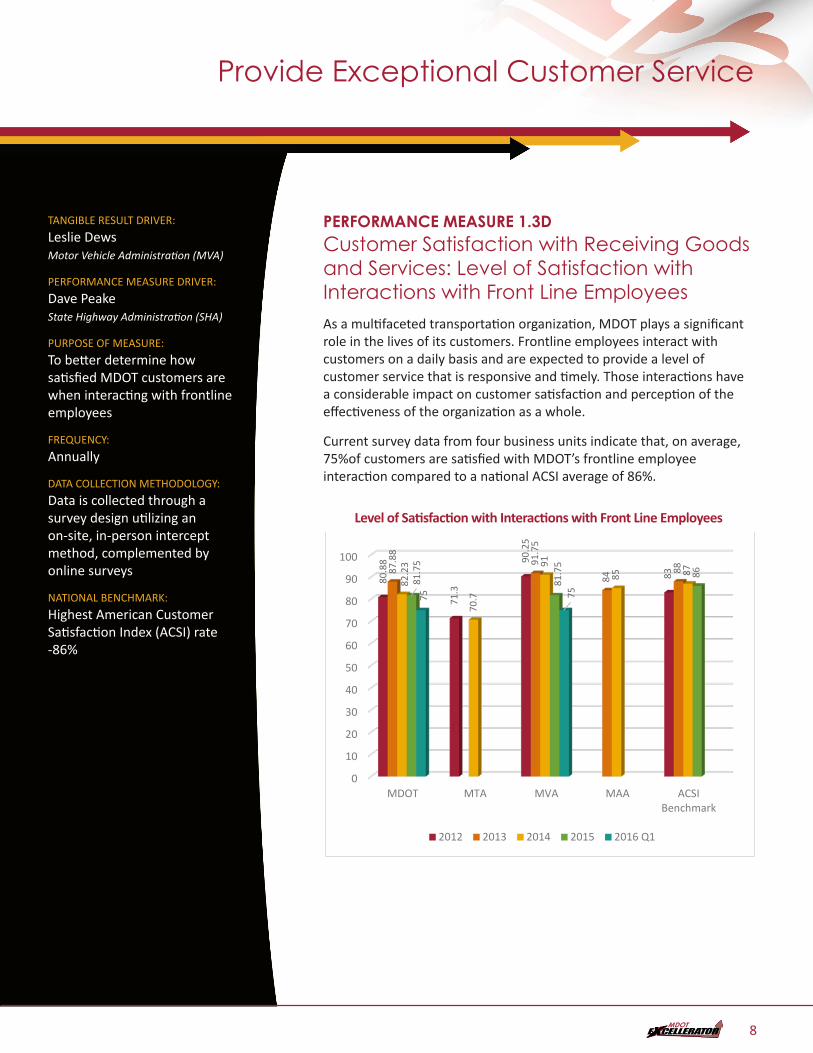
PERFORMANCE MEASURE 1.3DCustomer Satisfaction with Receiving Goods and Services: Level of Satisfaction with Interactions with Front Line Employees As a multifaceted transportation organization, MDOT plays a significant role in the lives of its customers. Frontline employees interact with customers on a daily basis and are expected to provide a level of customer service that is responsive and timely. Those interactions have a considerable impact on customer satisfaction and perception of the effectiveness of the organization as a whole.
Current survey data from four business units indicate that, on average, 75%of customers are satisfied with MDOT’s frontline employee interaction compared to a national ACSI average of 86%.
Level of Satisfaction with Interactions with Front Line EmployeesPM 1.3d - Level of Satisfaction with Interactions with Front Line Employees - DONE
0
10
20
30
40
50
60
70
80
90
100
MDOT MTA MVA MAA ACSIBenchmark
80.8
8
71.3
90.2
5
8387.8
8
91.7
5
84
88
82.2
3
70.7
91
85 87
81.7
5
81.7
5
86
75 75
2012 2013 2014 2015 2016 Q1
8
Provide Exceptional Customer Service
TANGIBLE RESULT DRIVER:
Leslie Dews Motor Vehicle Administration (MVA)
PERFORMANCE MEASURE DRIVER:
Dave Peake State Highway Administration (SHA)
PURPOSE OF MEASURE:
To show how satisfied MDOT customers are when interacting with the website and usefulness of the information
FREQUENCY:
Annually
DATA COLLECTION METHODOLOGY:
On-line Survey
NATIONAL BENCHMARK:
N/A
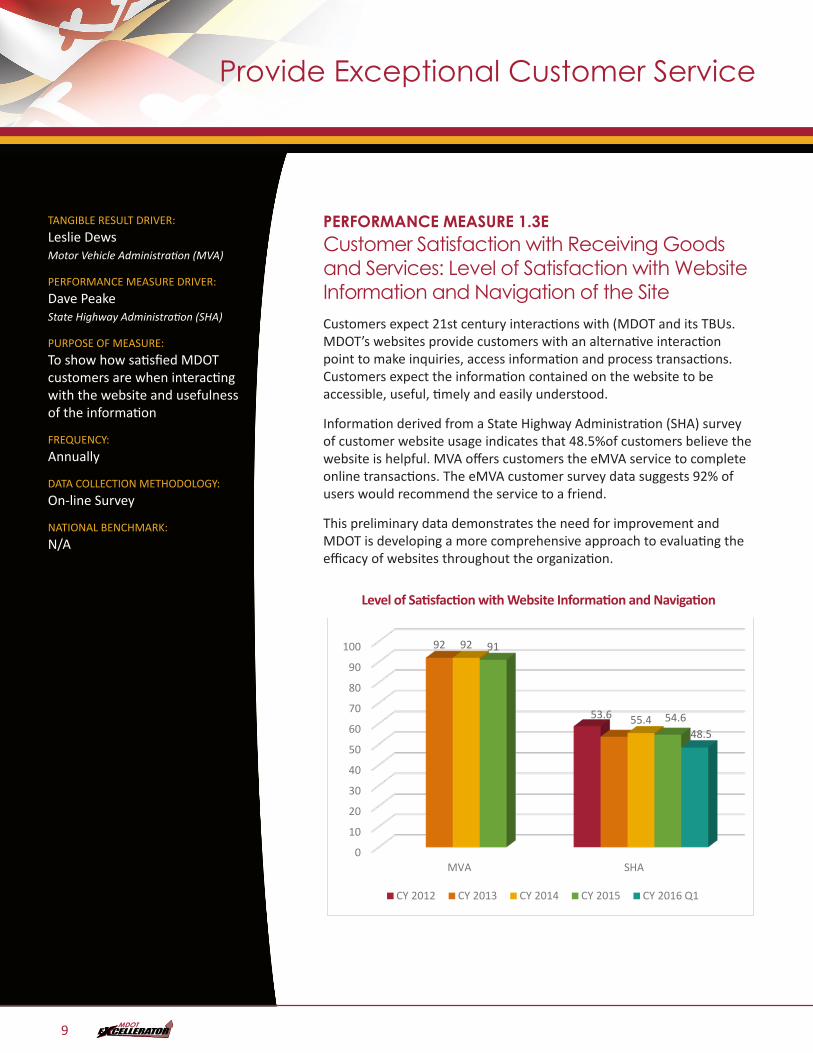
PERFORMANCE MEASURE 1.3ECustomer Satisfaction with Receiving Goods and Services: Level of Satisfaction with Website Information and Navigation of the SiteCustomers expect 21st century interactions with (MDOT and its TBUs. MDOT’s websites provide customers with an alternative interaction point to make inquiries, access information and process transactions. Customers expect the information contained on the website to be accessible, useful, timely and easily understood.
Information derived from a State Highway Administration (SHA) survey of customer website usage indicates that 48.5%of customers believe the website is helpful. MVA offers customers the eMVA service to complete online transactions. The eMVA customer survey data suggests 92% of users would recommend the service to a friend.
This preliminary data demonstrates the need for improvement and MDOT is developing a more comprehensive approach to evaluating the efficacy of websites throughout the organization.
Level of Satisfaction with Website Information and NavigationPM 1.3e - Level of Satisfaction with Website Information and Navigation of the Site - DONE
0
10
20
30
40
50
60
70
80
90
100
MVA SHA
92
53.6
92
55.4
91
54.648.5
CY 2012 CY 2013 CY 2014 CY 2015 CY 2016 Q1
9
Provide Exceptional Customer Service
TANGIBLE RESULT DRIVER:
Leslie Dews Motor Vehicle Administration (MVA)
PERFORMANCE MEASURE DRIVER:
Sabrina Bass The Secretary’s Office (TSO)
PURPOSE OF MEASURE:
To evaluate how satisfied MDOT’s customers are with the professionalism and respect in their interactions with Business Units
FREQUENCY:
Annually
DATA COLLECTION METHODOLOGY:
Data is collected through analysis of TBU customer survey responses those rating the communication as good or excellent
NATIONAL BENCHMARK:
N/A
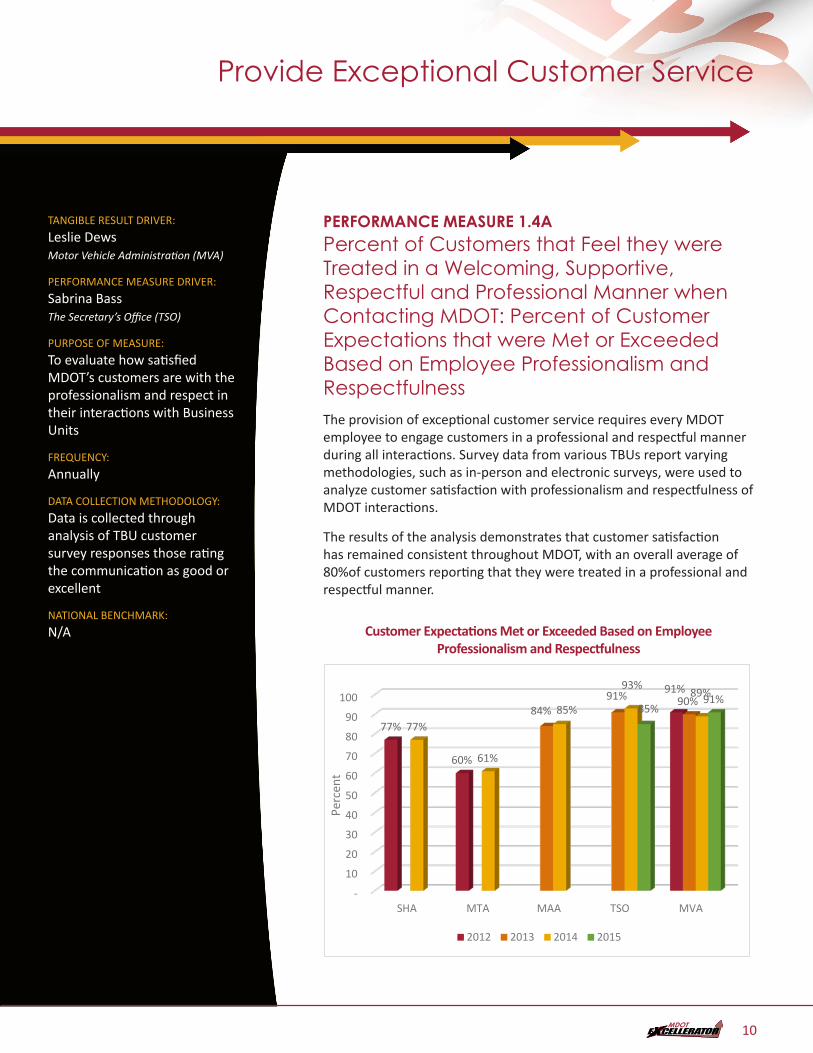
PERFORMANCE MEASURE 1.4APercent of Customers that Feel they were Treated in a Welcoming, Supportive, Respectful and Professional Manner when Contacting MDOT: Percent of Customer Expectations that were Met or Exceeded Based on Employee Professionalism and Respectfulness The provision of exceptional customer service requires every MDOT employee to engage customers in a professional and respectful manner during all interactions. Survey data from various TBUs report varying methodologies, such as in-person and electronic surveys, were used to analyze customer satisfaction with professionalism and respectfulness of MDOT interactions.
The results of the analysis demonstrates that customer satisfaction has remained consistent throughout MDOT, with an overall average of 80%of customers reporting that they were treated in a professional and respectful manner.
Customer Expectations Met or Exceeded Based on Employee Professionalism and RespectfulnessPM1.4a - Customer Expectations Met or Exceeded based on Employee Professionalism and Respectfulness - DONE
-
10
20
30
40
50
60
70
80
90
100
SHA MTA MAA TSO MVA
77%
60%
91%
84%91% 90%
77%
61%
85%
93%89%
85%91%
Perc
ent
2012 2013 2014 2015
10
Provide Exceptional Customer Service
TANGIBLE RESULT DRIVER:
Leslie Dews Motor Vehicle Administration (MVA)
PERFORMANCE MEASURE DRIVER:
Sabrina Bass The Secretary’s Office (TSO)
PURPOSE OF MEASURE:
To evaluate the level of exceptional complaint resolution delivered by employees at TBUs
FREQUENCY:
Annually
DATA COLLECTION METHODOLOGY:
Customer Survey from TBUs
NATIONAL BENCHMARK:
N/A
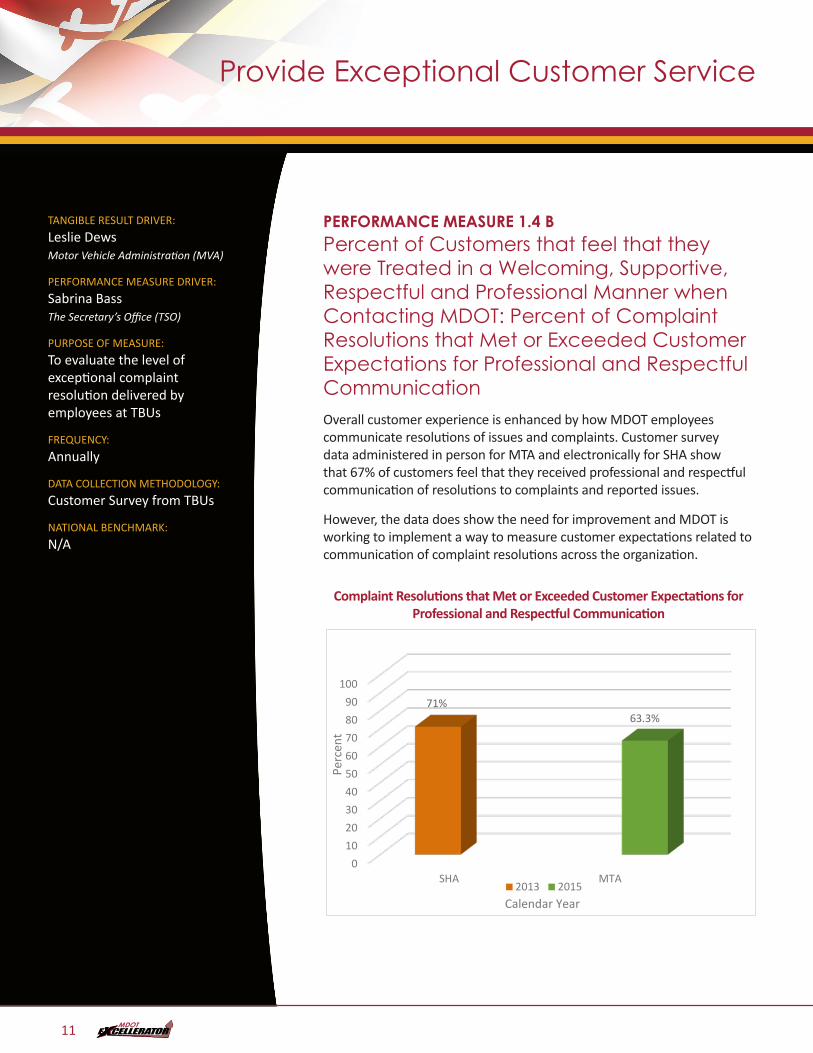
PERFORMANCE MEASURE 1.4 BPercent of Customers that feel that they were Treated in a Welcoming, Supportive, Respectful and Professional Manner when Contacting MDOT: Percent of Complaint Resolutions that Met or Exceeded Customer Expectations for Professional and Respectful CommunicationOverall customer experience is enhanced by how MDOT employees communicate resolutions of issues and complaints. Customer survey data administered in person for MTA and electronically for SHA show that 67% of customers feel that they received professional and respectful communication of resolutions to complaints and reported issues.
However, the data does show the need for improvement and MDOT is working to implement a way to measure customer expectations related to communication of complaint resolutions across the organization.
Complaint Resolutions that Met or Exceeded Customer Expectations for Professional and Respectful CommunicationPM1.4b - Complaint Resolutions that Met or Exceeded Customer Expections for Professional and Respectful Communication - DONE
0102030405060708090
100
SHA MTA
71%63.3%
Perc
ent
Calendar Year2013 2015
11
Provide Exceptional Customer Service
12
TANGIBLE RESULT #2
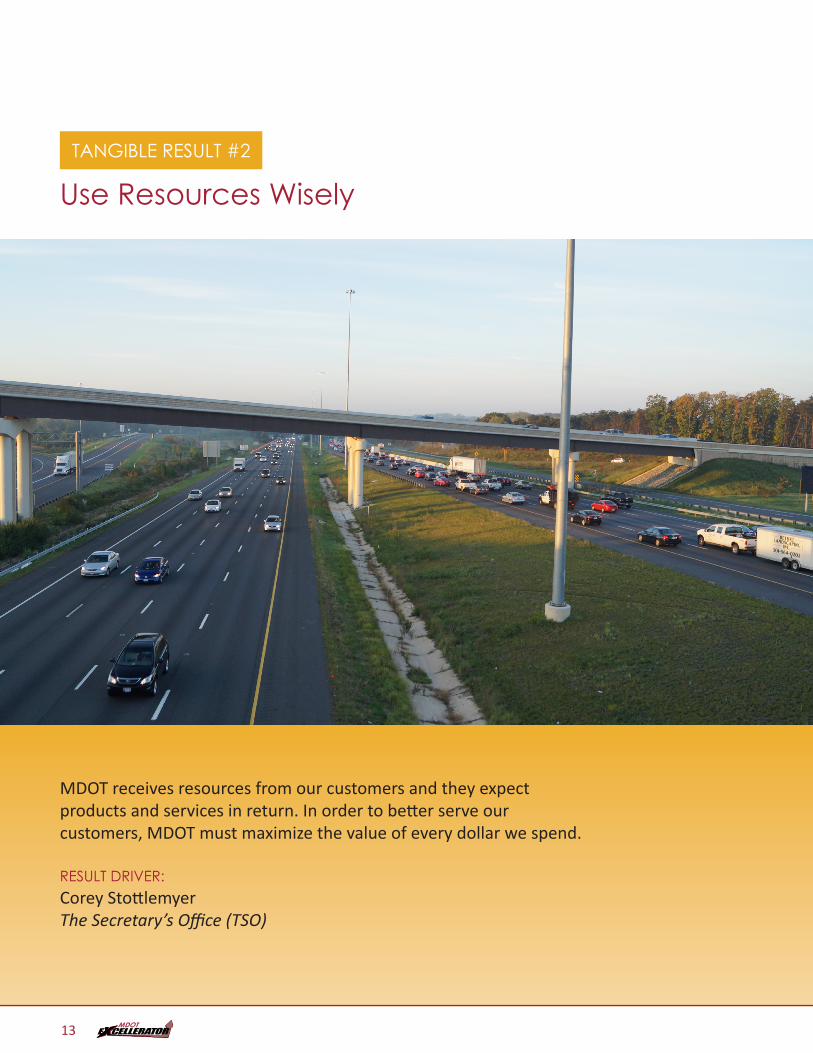
Use Resources Wisely
MDOT receives resources from our customers and they expect products and services in return. In order to better serve our customers, MDOT must maximize the value of every dollar we spend.
RESULT DRIVER:Corey Stottlemyer The Secretary’s Office (TSO)
13
Use Resources Wisely
TANGIBLE RESULT DRIVER:
Corey Stottlemyer The Secretary’s Office (TSO)
PERFORMANCE MEASURE DRIVER:
David Fleming The Secretary’s Office (TSO)
PURPOSE OF MEASURE:
To track the efficiency of capital spending
FREQUENCY:
Quarterly / Annually
DATA COLLECTION METHODOLOGY:
Tracking capital project spending versus the Consolidated Transportation Plan appropriated funds
BENCHMARK:
N/A
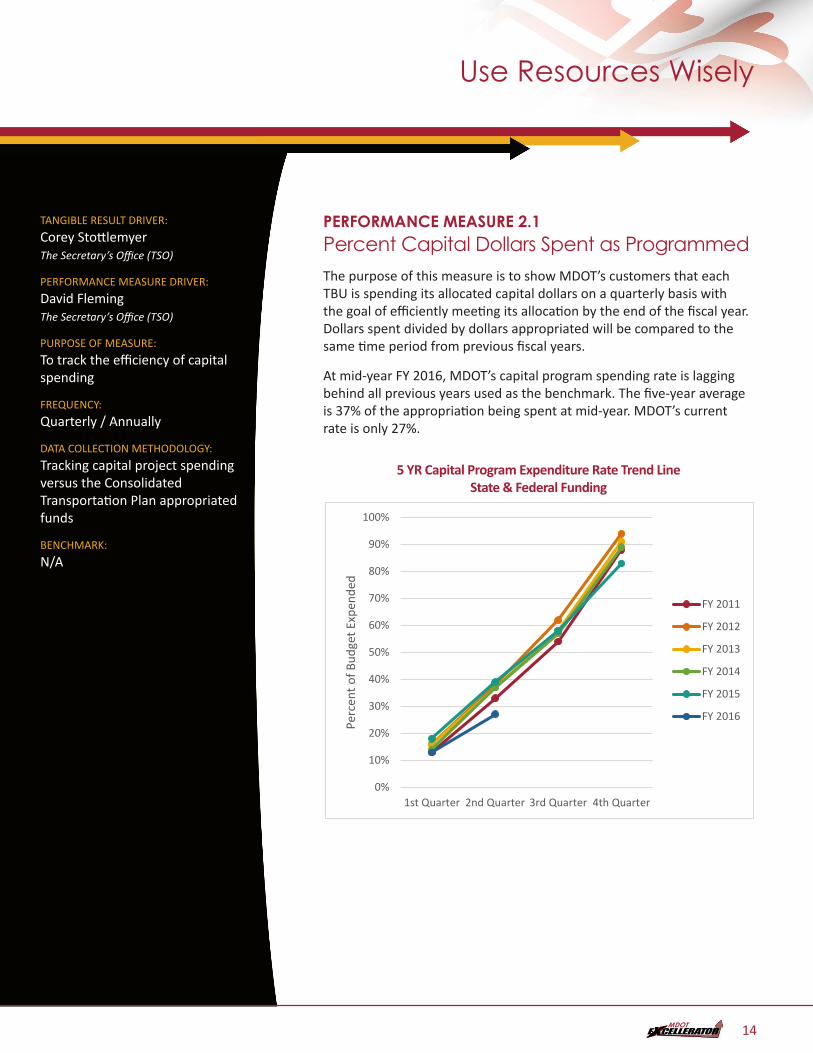
PERFORMANCE MEASURE 2.1Percent Capital Dollars Spent as ProgrammedThe purpose of this measure is to show MDOT’s customers that each TBU is spending its allocated capital dollars on a quarterly basis with the goal of efficiently meeting its allocation by the end of the fiscal year. Dollars spent divided by dollars appropriated will be compared to the same time period from previous fiscal years.
At mid-year FY 2016, MDOT’s capital program spending rate is lagging behind all previous years used as the benchmark. The five-year average is 37% of the appropriation being spent at mid-year. MDOT’s current rate is only 27%.
5 YR Capital Program Expenditure Rate Trend Line State & Federal FundingPM2.1 - 5 YR Capital Program Expenditure Rate Trend Line State & Federal Funding - DONE
0%
10%
20%
30%
40%
50%
60%
70%
80%
90%
100%
1st Quarter 2nd Quarter 3rd Quarter 4th Quarter
Perc
ent o
f Bud
get E
xpen
ded
FY 2011
FY 2012
FY 2013
FY 2014
FY 2015
FY 2016
14
PERFORMANCE MEASURE 2.1Percent Capital Dollars Spent as Programmed
3-Year Expenditure Rate By TBU at Mid-Year Mark – State & Federal FundingPM2.1b
0% 10% 20% 30% 40% 50% 60% 70% 80%
MAA
MPA
MTA
MVA
SHA
TSO
WMATA
Percent of Budget Expended
2016 2015 2014
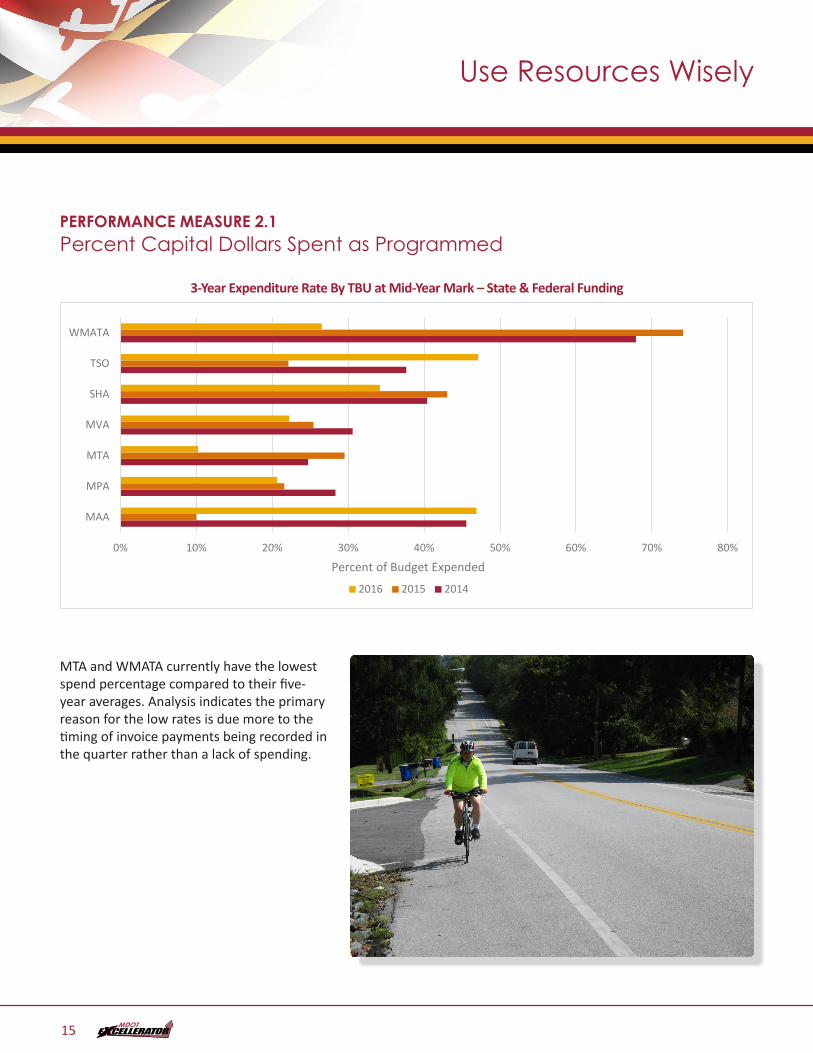
MTA and WMATA currently have the lowest spend percentage compared to their five-year averages. Analysis indicates the primary reason for the low rates is due more to the timing of invoice payments being recorded in the quarter rather than a lack of spending.
Use Resources Wisely
15
PERFORMANCE MEASURE 2.1Percent Capital Dollars Spent as Programmed
Use Resources Wisely
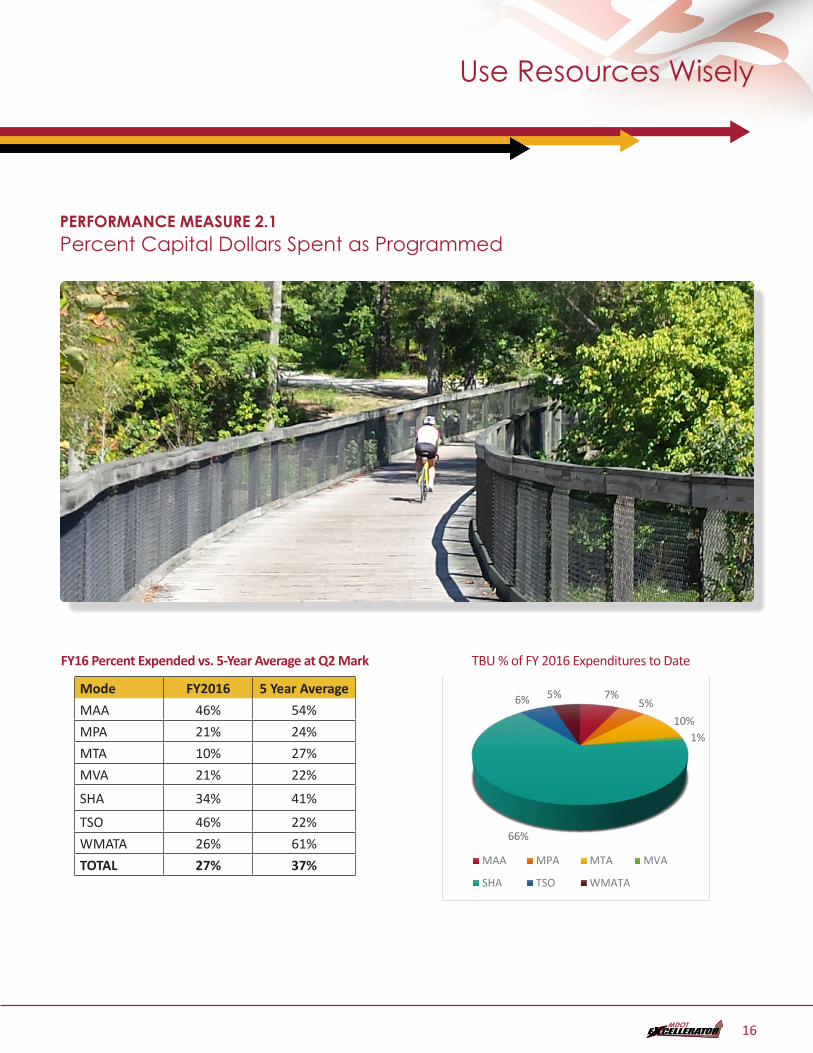
FY16 Percent Expended vs. 5-Year Average at Q2 Mark
Mode FY2016 5 Year Average
MAA 46% 54%
MPA 21% 24%
MTA 10% 27%
MVA 21% 22%
SHA 34% 41%
TSO 46% 22%
WMATA 26% 61%
TOTAL 27% 37%
TBU % of FY 2016 Expenditures to DatePM2.1d - DONE
7%5%
10%1%
66%
6% 5%
MAA MPA MTA MVA
SHA TSO WMATA
16
TANGIBLE RESULT DRIVER:
Corey Stottlemyer The Secretary’s Office (TSO)
PERFORMANCE MEASURE DRIVER:
David Fleming The Secretary’s Office (TSO)
PURPOSE OF MEASURE:
To measure the level of other sources utilized to fund capital projects
FREQUENCY:
Annually
DATA COLLECTION METHODOLOGY:
Track capital projects using 10% or more of other funds
BENCHMARK:
N/A
PERFORMANCE MEASURE 2.2Percent of Projects Leveraging Other Funding SourcesThe purpose of this measure is to track and highlight opportunities to leverage Transportation Trust Fund (TTF) dollars with local and private dollars. Projects included under this measure involve at least 10%of the cost being covered by partners. Information will be presented in two values: percent of projects and percent of additional dollars contributed from partners.
FY 2016 – FY 2021 Consolidated Transportation Program Projects using 10% or more funds from other sources
As a Percentage of Projects
Number Projects % of Projects
Total Projects 1,389 100%
Projects w/No Other Funding
1,328 96%
Projects w/Other Funding
61 4%
As a Percentage of Funding
Source Funding % of Funding
Total $15,817,983 100%
State $9,647,987 61%
Federal $4.956.488 31%
Other $1,213,508 8%
Use Resources Wisely
17
Use Resources Wisely
18
Use Resources Wisely
TANGIBLE RESULT DRIVER:
Corey Stottlemyer The Secretary’s Office (TSO)
PERFORMANCE MEASURE DRIVER:
Amber Harvey Maryland Transportation Authority
(MDTA)
PURPOSE OF MEASURE:
To track the commitment of our employees in furthering MDOT’s reputation, mission and interests by identifying key motivators and obstacles in the workplace
FREQUENCY:
Annually
DATA COLLECTION METHODOLOGY:
Develop and implement one MDOT employee engagement survey administered to all employees. Online and hard copies will be made available. Cloud-based and mobile platforms are a consideration.
NATIONAL BENCHMARK:
*GALLUP 2015 national engagement percentages:
32% Engaged employees
50.8% not engaged
17.2% actively disengaged
*International Public Management Association for Human Resources 2012 and 2014 data available
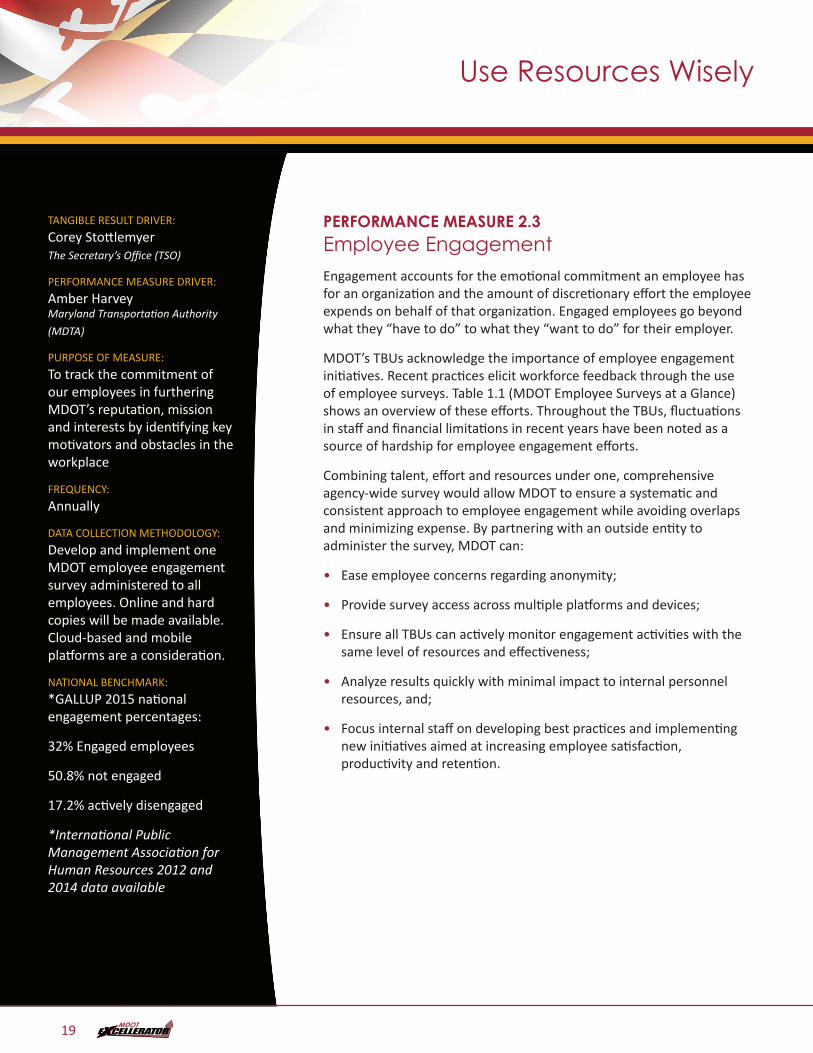
PERFORMANCE MEASURE 2.3Employee EngagementEngagement accounts for the emotional commitment an employee has for an organization and the amount of discretionary effort the employee expends on behalf of that organization. Engaged employees go beyond what they “have to do” to what they “want to do” for their employer.
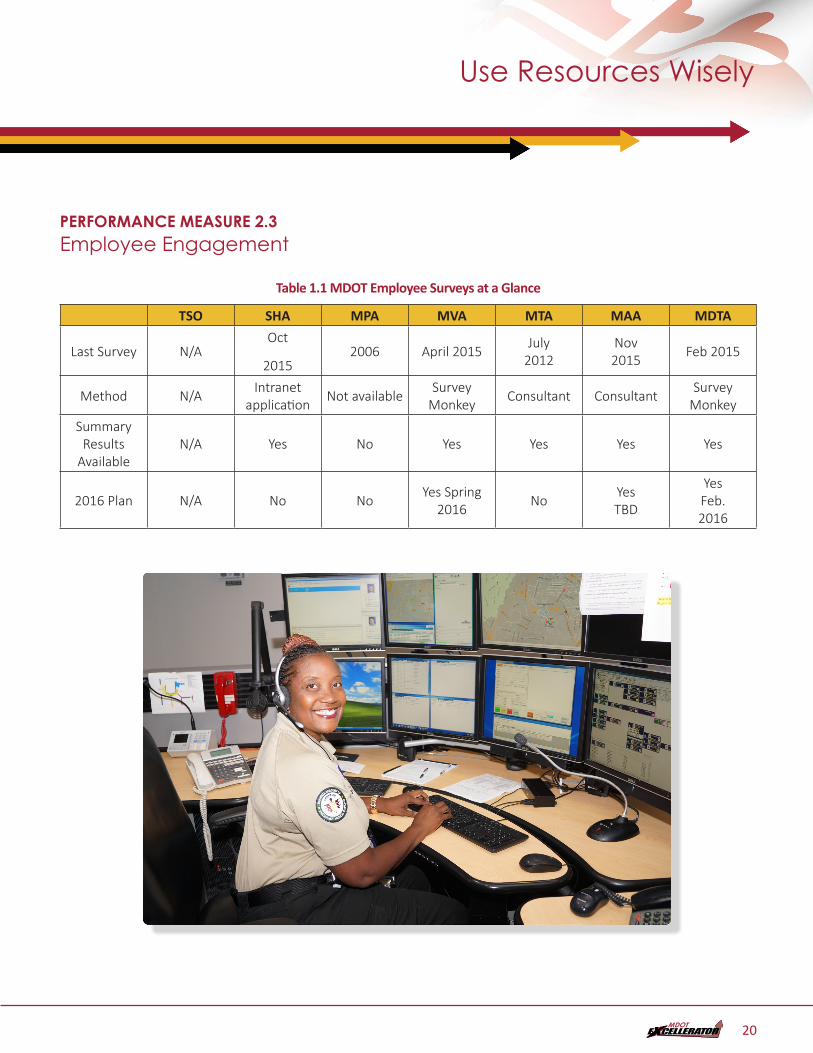
MDOT’s TBUs acknowledge the importance of employee engagement initiatives. Recent practices elicit workforce feedback through the use of employee surveys. Table 1.1 (MDOT Employee Surveys at a Glance) shows an overview of these efforts. Throughout the TBUs, fluctuations in staff and financial limitations in recent years have been noted as a source of hardship for employee engagement efforts.
Combining talent, effort and resources under one, comprehensive agency-wide survey would allow MDOT to ensure a systematic and consistent approach to employee engagement while avoiding overlaps and minimizing expense. By partnering with an outside entity to administer the survey, MDOT can:
• Ease employee concerns regarding anonymity;
• Provide survey access across multiple platforms and devices;
• Ensure all TBUs can actively monitor engagement activities with the same level of resources and effectiveness;
• Analyze results quickly with minimal impact to internal personnel resources, and;
• Focus internal staff on developing best practices and implementing new initiatives aimed at increasing employee satisfaction, productivity and retention.
19
Use Resources Wisely
PERFORMANCE MEASURE 2.3Employee Engagement
Table 1.1 MDOT Employee Surveys at a Glance
TSO SHA MPA MVA MTA MAA MDTA
Last Survey N/AOct
20152006 April 2015 July
2012Nov 2015 Feb 2015
Method N/A Intranet application Not available Survey
Monkey Consultant Consultant Survey Monkey
Summary Results
AvailableN/A Yes No Yes Yes Yes Yes
2016 Plan N/A No No Yes Spring 2016 No Yes
TBD
Yes Feb. 2016
20
TANGIBLE RESULT DRIVER:
Corey Stottlemyer The Secretary’s Office (TSO)
PERFORMANCE MEASURE DRIVER:
Amber Harvey Maryland Transportation Authority
(MDTA)
PURPOSE OF MEASURE:
To identify the percentage of employees who leave MDOT and analyze trends in voluntary and involuntary separations.
FREQUENCY:
Quarterly
DATA COLLECTION METHODOLOGY:
Quarterly reports of employee separations are provided by TSO HRIS Unit. These reports show the number of separations during a given period of time for each TBU broken down by all available separation codes (i.e. reasons).
NATIONAL BENCHMARK:
U.S. Department of Labor (DOL) Bureau of Labor Statistics for U.S. state and Local Governments
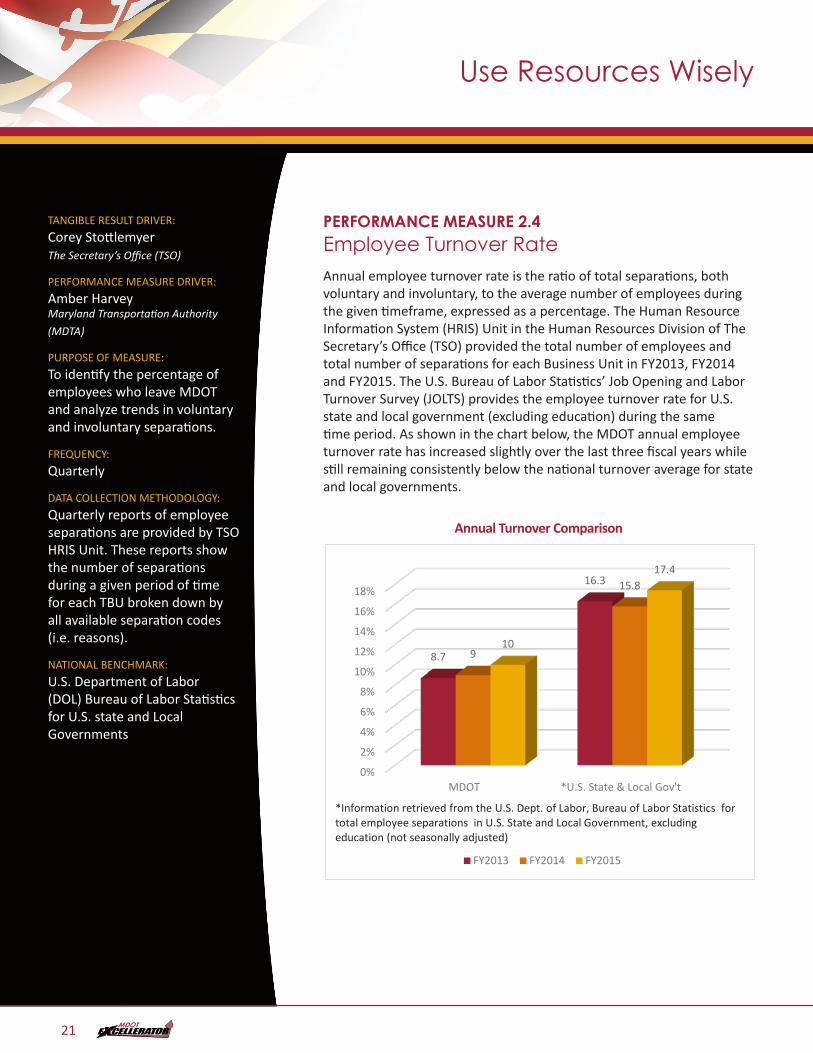
PERFORMANCE MEASURE 2.4Employee Turnover RateAnnual employee turnover rate is the ratio of total separations, both voluntary and involuntary, to the average number of employees during the given timeframe, expressed as a percentage. The Human Resource Information System (HRIS) Unit in the Human Resources Division of The Secretary’s Office (TSO) provided the total number of employees and total number of separations for each Business Unit in FY2013, FY2014 and FY2015. The U.S. Bureau of Labor Statistics’ Job Opening and Labor Turnover Survey (JOLTS) provides the employee turnover rate for U.S. state and local government (excluding education) during the same time period. As shown in the chart below, the MDOT annual employee turnover rate has increased slightly over the last three fiscal years while still remaining consistently below the national turnover average for state and local governments.
Annual Turnover ComparisonPM2.4a – Annual Turnover Comparison - DONE
0%
2%
4%
6%
8%
10%
12%
14%
16%
18%
MDOT *U.S. State & Local Gov't
8.7
16.3
9
15.8
10
17.4
FY2013 FY2014 FY2015
*Information retrieved from the U.S. Dept. of Labor, Bureau of Labor Statistics for total employee separations in U.S. State and Local Government, excluding education (not seasonally adjusted)
Use Resources Wisely
21
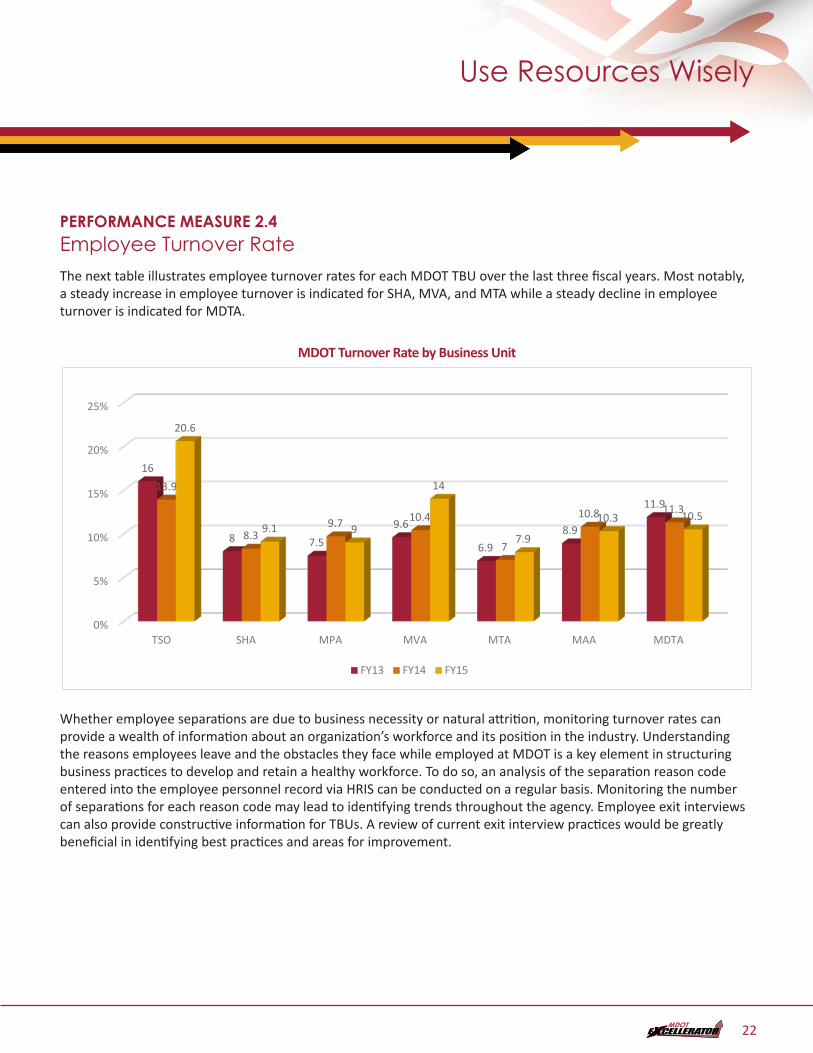
PERFORMANCE MEASURE 2.4Employee Turnover Rate The next table illustrates employee turnover rates for each MDOT TBU over the last three fiscal years. Most notably, a steady increase in employee turnover is indicated for SHA, MVA, and MTA while a steady decline in employee turnover is indicated for MDTA.
MDOT Turnover Rate by Business Unit
PM2.4b - MDOT TURNOVER RATE BY BUSINESS UNIT - DONE
0%
5%
10%
15%
20%
25%
TSO SHA MPA MVA MTA MAA MDTA
16
8 7.59.6
6.98.9
11.913.9
8.39.7 10.4
7
10.8 11.3
20.6
9.1 9
14
7.9
10.3 10.5
FY13 FY14 FY15
Whether employee separations are due to business necessity or natural attrition, monitoring turnover rates can provide a wealth of information about an organization’s workforce and its position in the industry. Understanding the reasons employees leave and the obstacles they face while employed at MDOT is a key element in structuring business practices to develop and retain a healthy workforce. To do so, an analysis of the separation reason code entered into the employee personnel record via HRIS can be conducted on a regular basis. Monitoring the number of separations for each reason code may lead to identifying trends throughout the agency. Employee exit interviews can also provide constructive information for TBUs. A review of current exit interview practices would be greatly beneficial in identifying best practices and areas for improvement.
Use Resources Wisely
22
Use Resources Wisely
TANGIBLE RESULT DRIVER
Corey Stottlemyer TSO
PERFORMANCE MEASURE DRIVER:
Deborah Hammel SHA
PURPOSE OF MEASURE:
Demonstrates efficient use of available PINs and identifies opportunities for improvement in our recruitment and selection processes.
FREQUENCY:
Quarterly
DATA COLLECTION METHODOLOGY:
Quarterly report for MDOT and each TBU from HRIS housed at TSO, with input from TBU HR Directors
NATIONAL BENCHMARK:
N/A
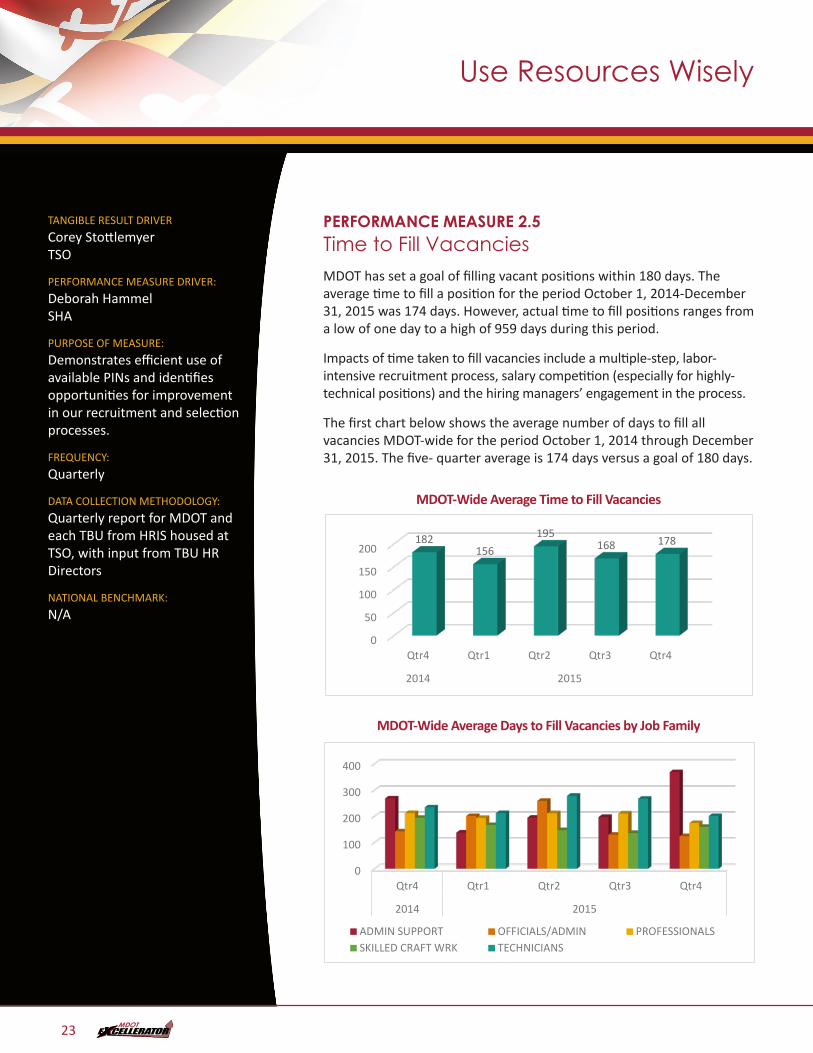
PERFORMANCE MEASURE 2.5Time to Fill VacanciesMDOT has set a goal of filling vacant positions within 180 days. The average time to fill a position for the period October 1, 2014-December 31, 2015 was 174 days. However, actual time to fill positions ranges from a low of one day to a high of 959 days during this period.
Impacts of time taken to fill vacancies include a multiple-step, labor-intensive recruitment process, salary competition (especially for highly-technical positions) and the hiring managers’ engagement in the process.
The first chart below shows the average number of days to fill all vacancies MDOT-wide for the period October 1, 2014 through December 31, 2015. The five- quarter average is 174 days versus a goal of 180 days.
MDOT-Wide Average Time to Fill VacanciesPM2.5a - MDOT-Wide Average Time to Fill Vacancies -DONE
0
50
100
150
200
Qtr4 Qtr1 Qtr2 Qtr3 Qtr4
2014 2015
182156
195168 178
MDOT-Wide Average Days to Fill Vacancies by Job Family PM2.5b - DONE
0
100
200
300
400
Qtr4 Qtr1 Qtr2 Qtr3 Qtr4
2014 2015
ADMIN SUPPORT OFFICIALS/ADMIN PROFESSIONALSSKILLED CRAFT WRK TECHNICIANS
23
Use Resources Wisely
TANGIBLE RESULT DRIVER:
Corey Stottlemyer The Secretary’s Office (TSO)
PERFORMANCE MEASURE DRIVER:
Bill Bertrand State Highway Administration (SHA)
PURPOSE OF MEASURE:
Calculate the percentage of Fixed Asset Units identified during the Annual Physical Inventory of Fixed Assets
FREQUENCY:
Annually
DATA COLLECTION METHODOLOGY:
Data will be collected when TBUs conduct Annual Fixed Asset Physical Inventories
NATIONAL BENCHMARK:
N/A
PERFORMANCE MEASURE 2.6Percentage of Fixed Asset Units Identified or Accounted for During the Annual Physical Inventory of Fixed AssetsThis performance measure is intended to emphasize the importance of stewardship and internal controls with respect to fixed assets owned by each of MDOT’s TBUs. This performance measure reports the percentage of fixed asset units identified by each TBU during its annual fixed asset physical inventories verses the number of fixed assets it owns.
Currently, five of seven TBUs conduct a full inventory of Non-Sensitive Items once every three years and a full inventory of Sensitive Items annually. The remaining TBUs, MAA and SHA, conduct a full inventory of both Sensitive and Non-Sensitive Items annually.
Results will be presented in a bar chart that displays data for the given year by TBU. Percentages will be calculated as shown below:
Number of Fixed Asset Units Identified
Number of Fixed Asset Units Recorded in the Perpetual Inventory
24
TANGIBLE RESULT DRIVER:
Corey Stottlemyer The Secretary’s Office (TSO)
PERFORMANCE MEASURE DRIVER:
Tony Moore Maryland Port Administration (MPA)
PURPOSE OF MEASURE:
Provide an overview which shows how Transportation Business Units monitor asset management activities
FREQUENCY:
Semi-Annually
DATA COLLECTION METHODOLOGY:
Asset inspection condition surveys and asset life-cycle cost analysis
NATIONAL BENCHMARK:
N/A
PERFORMANCE MEASURE 2.7Managing Capital AssetsA state of good repair results from the strategic application of transportation asset management concepts. Each Transportation Business Unit maintain its physical assets according to policies which minimize asset life-cycle cost while avoiding negative impacts on the delivery of transit services.
The Transportation Business Units manage different categories of assets in the delivery of transportation services to its customers. Selected performance measures are collected and mathematically weighted to create a TBU specific asset management index. This index makes it possible to compare the outcomes of asset management programs implemented by all TBUs.
Use Resources Wisely
25
Use Resources Wisely
PERFORMANCE MEASURE 2.7Managing Capital Assets INSPECTIONS:The TBU asset condition must be determined before the specific TBU asset management regimen can be implemented. Physical inspections are the primary technique use to assess asset conditions. Asset inspection can occur annually or over a series of years based on the asset life and use.
Below are examples of the type of inspections conducted by the TBUs:
• SHA – # of years of service life, # miles of pavement inspected, # of inspection defects
• MTA – # of buses inspected, # of safety inspection failures
• MAA – # airside and landside pavement inspections, # of landside and terminal facility inspections # of inspection improvements initiated
• MVA – # annual building inspections
• MDTA – # priority 1 defect inspections, % of priority 1 defects assigned to contractors, % of priority 1 defects assigned to task orders
• MPA – # of pile inspections per year, # of manhole inspections per year, pile inspection interval
Selected TBU inspections are included in the TBU’s Asset Management Index. The individual inspection index is calculated by dividing the actual inspection by the number of estimated asset category annual inspections. (As an example, SHA has 15 actual service life inspections ÷ 20 annual estimated inspection × 100 equals an index number of 75). All of the SHA indexes are added together and compared to similar calculated indexes for the remaining TBUs.
ASSET CONDITION:During inspection an evaluation is made to quantify the asset condition. The evaluation is used to determine which assets are good and need minimal remedies; which assets are fair and are in need of some attention; and which assets are in poor condition and either will be abandoned or require a substantial investment.
The asset condition index shows what percentage of the TBU assets are in good, fair or poor condition. This index can be used to measure the change in asset condition between annual reporting periods.
26
Use Resources Wisely
TANGIBLE RESULT DRIVER:
Corey Stottlemyer The Secretary’s Office (TSO)
PERFORMANCE MEASURE DRIVER:
Pretam Harry Motor Vehicle Administration (MVA)
PURPOSE OF MEASURE:
To track the timeliness and ability to match the budgets of the procurement process
FREQUENCY:
Quarterly
DATA COLLECTION METHODOLOGY:
Quarterly Focus reports MDOT wide showing all active BPO for the quarter
NATIONAL BENCHMARK:
N/A
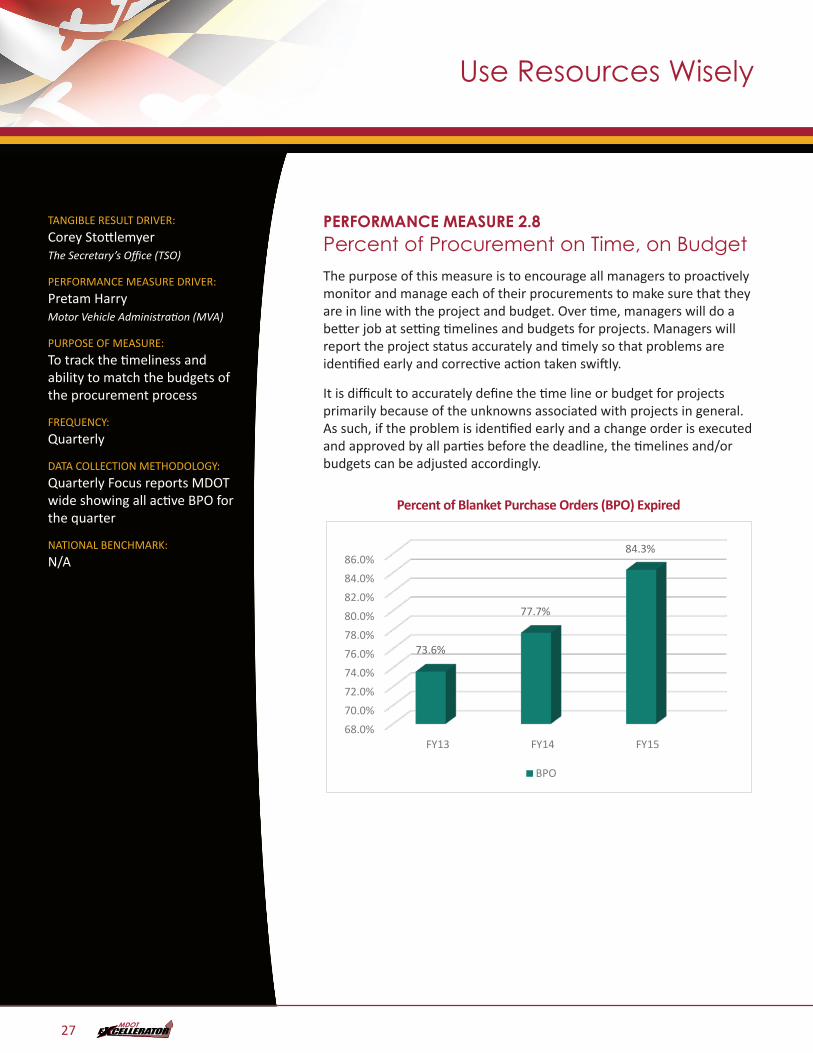
PERFORMANCE MEASURE 2.8Percent of Procurement on Time, on BudgetThe purpose of this measure is to encourage all managers to proactively monitor and manage each of their procurements to make sure that they are in line with the project and budget. Over time, managers will do a better job at setting timelines and budgets for projects. Managers will report the project status accurately and timely so that problems are identified early and corrective action taken swiftly.
It is difficult to accurately define the time line or budget for projects primarily because of the unknowns associated with projects in general. As such, if the problem is identified early and a change order is executed and approved by all parties before the deadline, the timelines and/or budgets can be adjusted accordingly.
Percent of Blanket Purchase Orders (BPO) ExpiredPM2.8 - Percent of Blanket Purchase Orders (BPO) Expired - DONE
68.0%70.0%72.0%74.0%76.0%78.0%80.0%82.0%84.0%86.0%
FY13 FY14 FY15
73.6%
77.7%
84.3%
BPO
27
Use Resources Wisely
TANGIBLE RESULT DRIVER:
Corey Stottlemyer The Secretary’s Office (TSO)
PERFORMANCE MEASURE DRIVER:
Pretam Harry Motor Vehicle Administration (MVA)
PURPOSE OF MEASURE:
To measure (a) the percent of occurrences and (b) the dollar value of unanticipated change orders on procurement contracts
FREQUENCY:
Quarterly
DATA COLLECTION METHODOLOGY:
MDOT wide showing active unanticipated change orders equal to or greater than $1 million for the quarter
NATIONAL BENCHMARK:
N/A
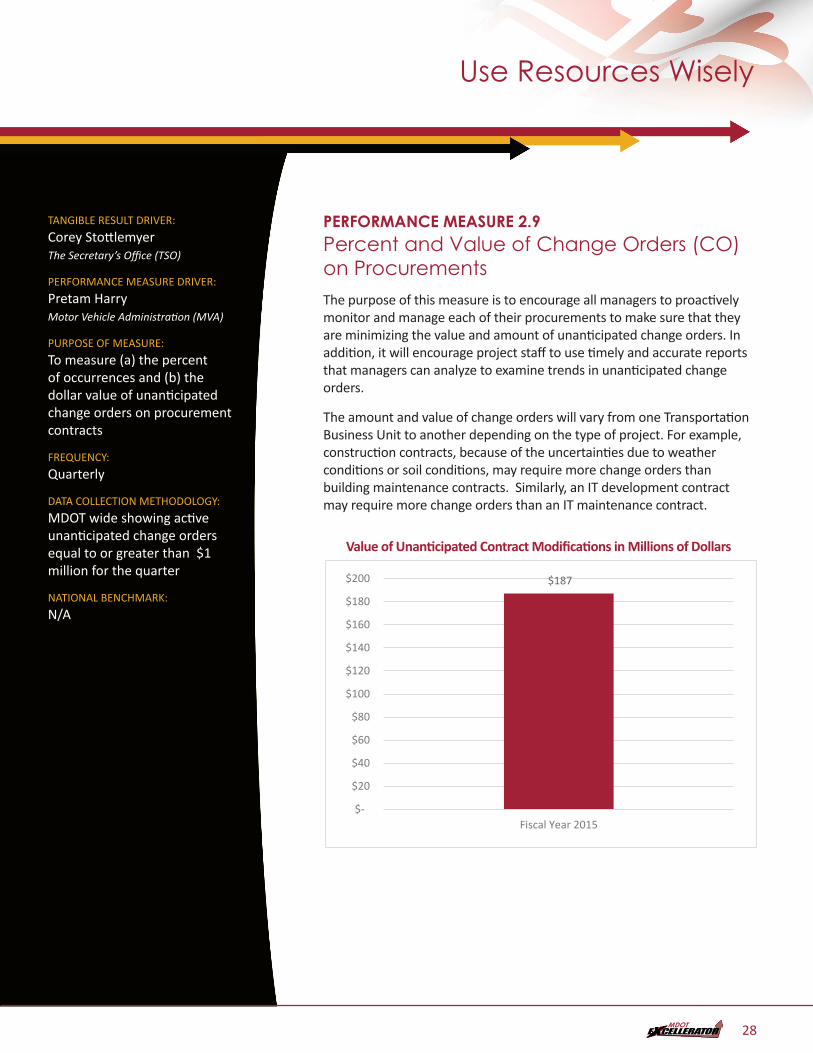
PERFORMANCE MEASURE 2.9Percent and Value of Change Orders (CO)on ProcurementsThe purpose of this measure is to encourage all managers to proactively monitor and manage each of their procurements to make sure that they are minimizing the value and amount of unanticipated change orders. In addition, it will encourage project staff to use timely and accurate reports that managers can analyze to examine trends in unanticipated change orders.
The amount and value of change orders will vary from one Transportation Business Unit to another depending on the type of project. For example, construction contracts, because of the uncertainties due to weather conditions or soil conditions, may require more change orders than building maintenance contracts. Similarly, an IT development contract may require more change orders than an IT maintenance contract.
Value of Unanticipated Contract Modifications in Millions of DollarsPM2.9a – Percent of CO - DONE
$187
$-
$20
$40
$60
$80
$100
$120
$140
$160
$180
$200
Fiscal Year 2015
28
Use Resources Wisely
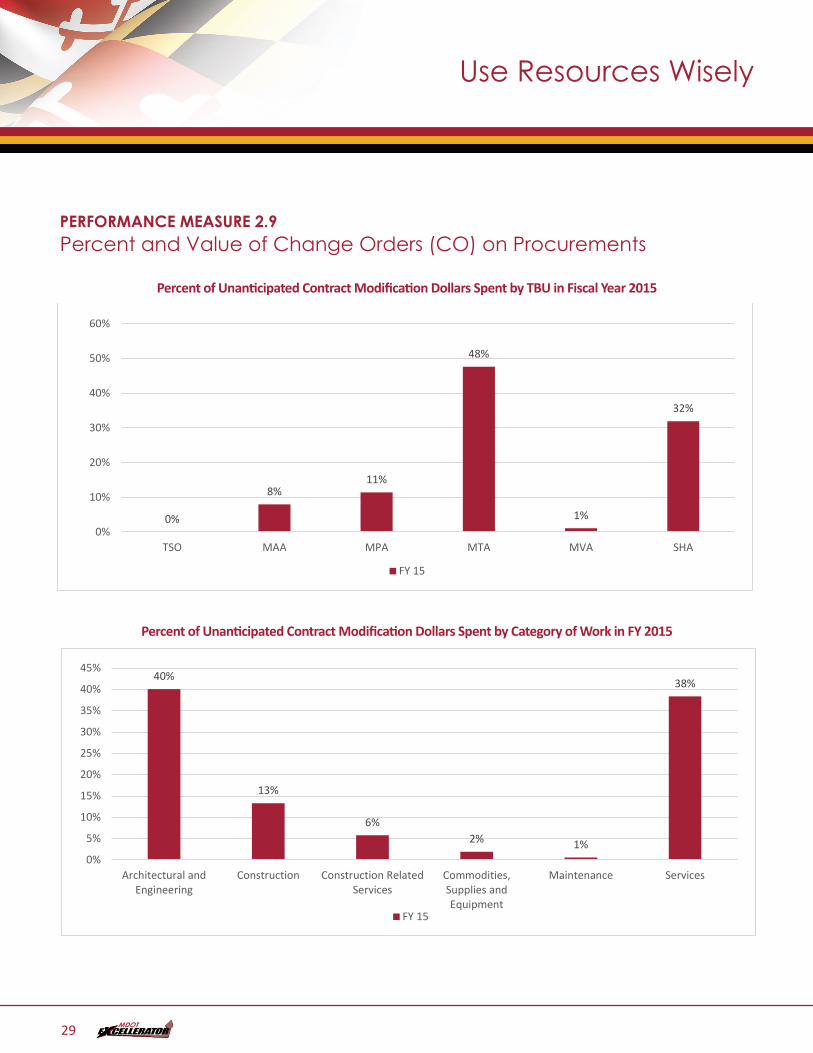
PERFORMANCE MEASURE 2.9Percent and Value of Change Orders (CO) on Procurements
Percent of Unanticipated Contract Modification Dollars Spent by TBU in Fiscal Year 2015PM2.9b – Value of Change Orders - DONE
0%
8%11%
48%
1%
32%
0%
10%
20%
30%
40%
50%
60%
TSO MAA MPA MTA MVA SHA
FY 15
Percent of Unanticipated Contract Modification Dollars Spent by Category of Work in FY 2015
PM2.9c – DONE
40%
13%
6%2% 1%
38%
0%
5%
10%
15%
20%
25%
30%
35%
40%
45%
Architectural andEngineering
Construction Construction RelatedServices
Commodities,Supplies andEquipment
Maintenance Services
FY 15
29
TANGIBLE RESULT DRIVER:
Corey Stottlemyer The Secretary’s Office (TSO)
PERFORMANCE MEASURE DRIVER:
Laura Getty Maryland Transit Administration (MTA)
PURPOSE OF MEASURE:
To understand how procurement competition impacts MDOT resources
FREQUENCY:
Quarterly
DATA COLLECTION METHODOLOGY:
Data was collected on each TBU procurement contract over $200,000 during Q2 FY 2016. Sole Source, Emergency, and Intergovernmental Cooperative Purchasing procurements were not included. Procurement contract ID, number of bids, estimated cost and final contract amount were the used data points.
NATIONAL BENCHMARK:
N/A
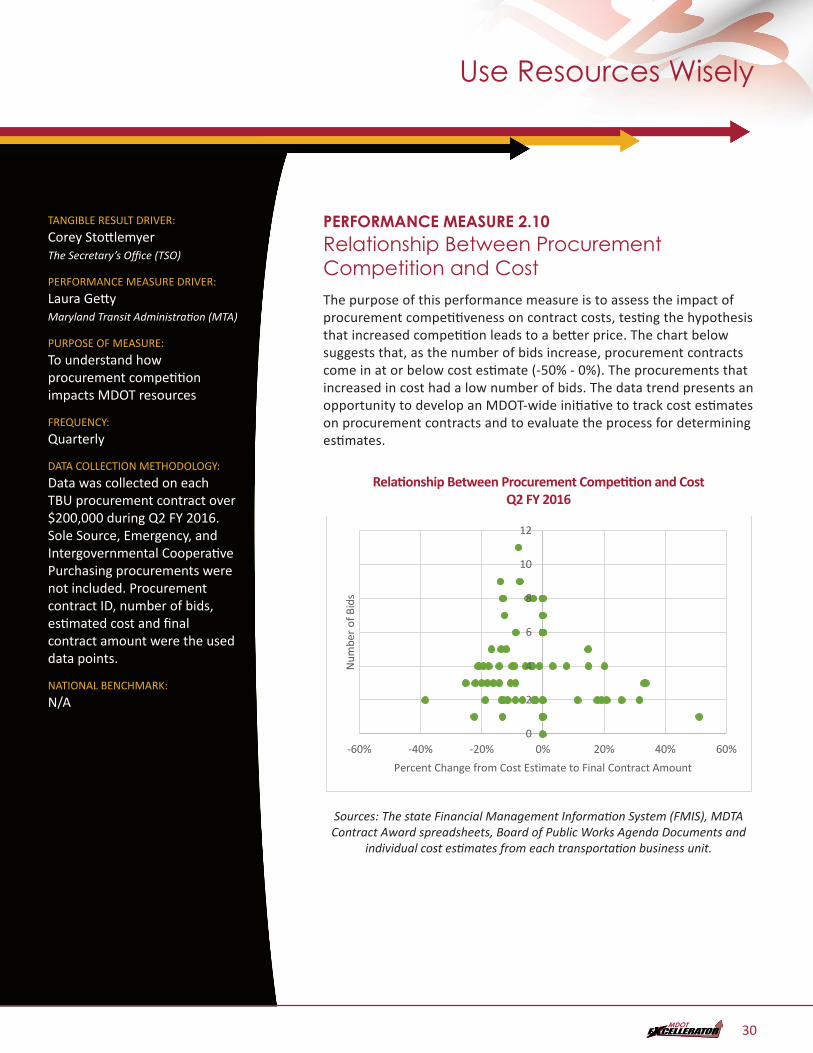
PERFORMANCE MEASURE 2.10Relationship Between Procurement Competition and CostThe purpose of this performance measure is to assess the impact of procurement competitiveness on contract costs, testing the hypothesis that increased competition leads to a better price. The chart below suggests that, as the number of bids increase, procurement contracts come in at or below cost estimate (-50% - 0%). The procurements that increased in cost had a low number of bids. The data trend presents an opportunity to develop an MDOT-wide initiative to track cost estimates on procurement contracts and to evaluate the process for determining estimates.
Relationship Between Procurement Competition and Cost Q2 FY 2016PM2.10 – Relationship between Procurement Competition and Cost Q2 FY2016
0
2
4
6
8
10
12
-60% -40% -20% 0% 20% 40% 60%
Num
ber o
f Bid
s
Percent Change from Cost Estimate to Final Contract Amount
Sources: The state Financial Management Information System (FMIS), MDTA Contract Award spreadsheets, Board of Public Works Agenda Documents and
individual cost estimates from each transportation business unit.
Use Resources Wisely
30
TANGIBLE RESULT DRIVER:
Corey Stottlemyer The Secretary’s Office (TSO)
PERFORMANCE MEASURE DRIVER:
Patrick Bradley Maryland Aviation Administration
(MAA)
PURPOSE OF MEASURE:
To track the number of Internal Audit Findings and the number of Repeat Internal Audit Findings
FREQUENCY:
Annually
DATA COLLECTION METHODOLOGY:
TBU Audit databases for FY13, FY14 and FY15
NATIONAL BENCHMARK:
N/A
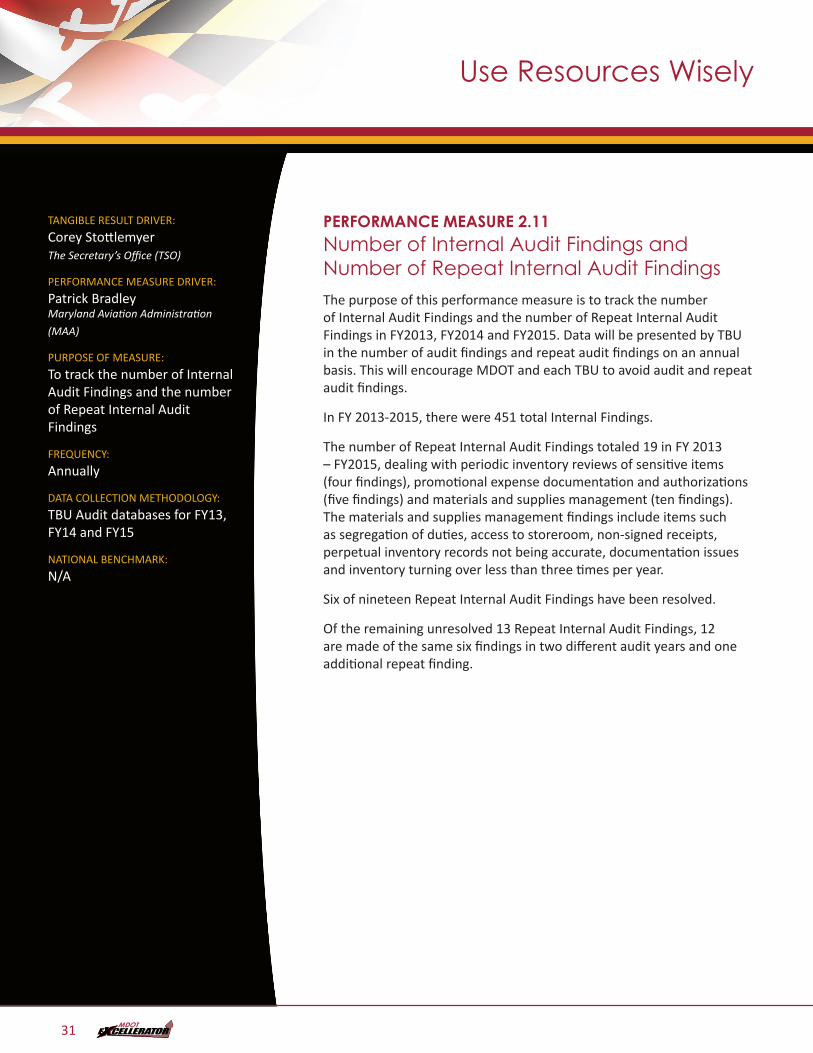
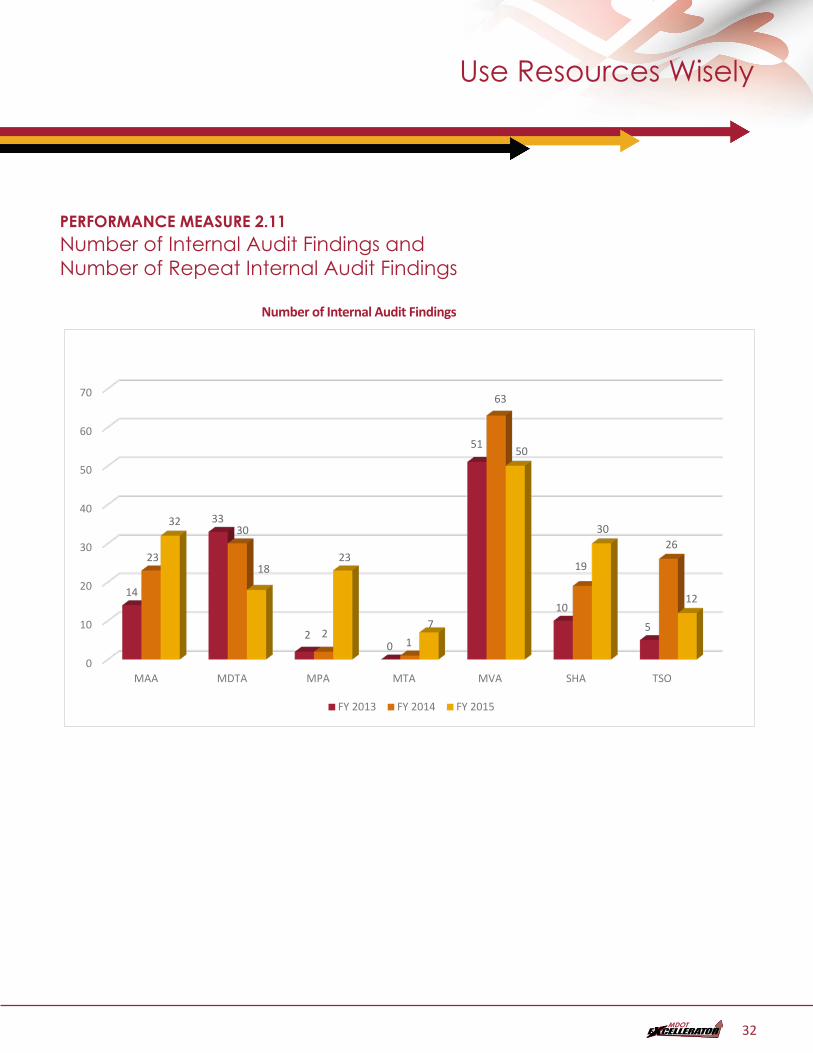
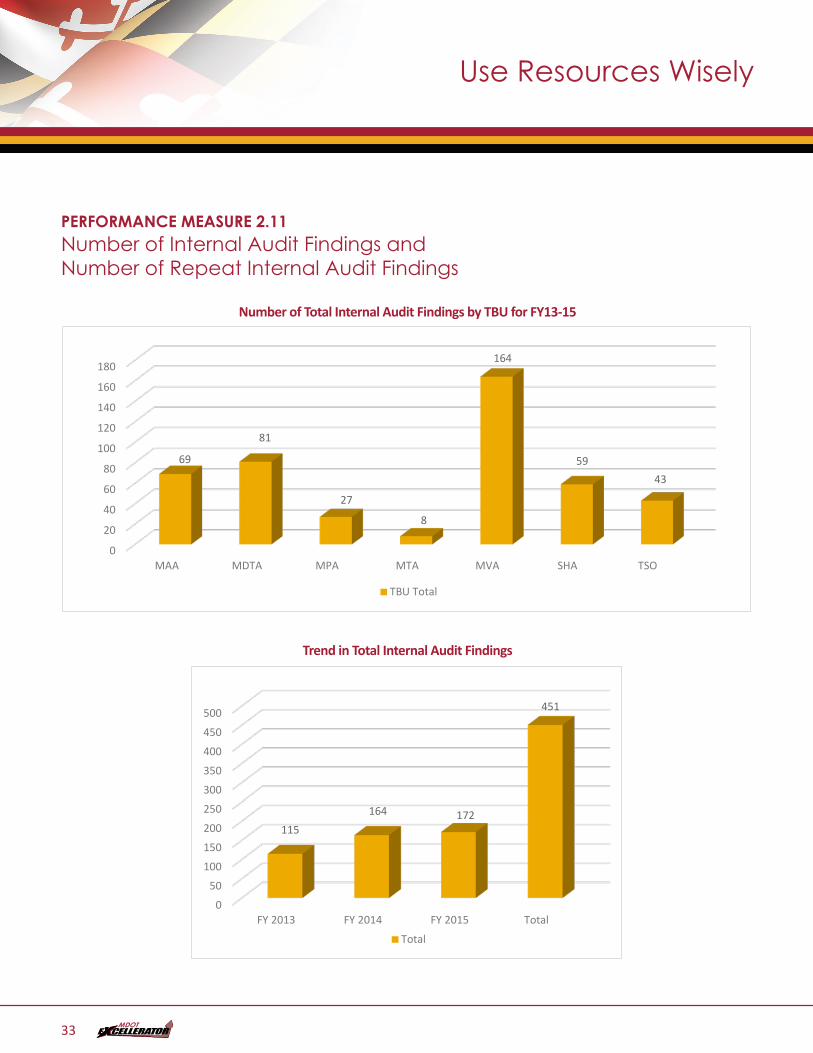
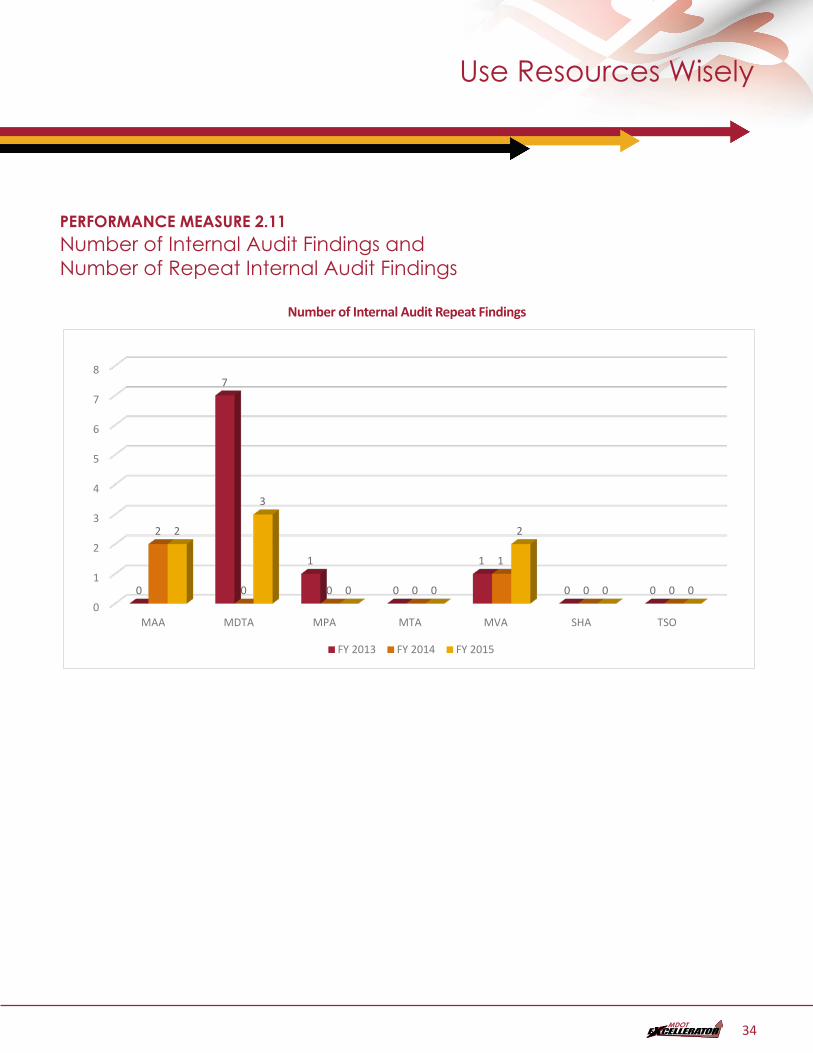
PERFORMANCE MEASURE 2.11Number of Internal Audit Findings and Number of Repeat Internal Audit FindingsThe purpose of this performance measure is to track the number of Internal Audit Findings and the number of Repeat Internal Audit Findings in FY2013, FY2014 and FY2015. Data will be presented by TBU in the number of audit findings and repeat audit findings on an annual basis. This will encourage MDOT and each TBU to avoid audit and repeat audit findings.
In FY 2013-2015, there were 451 total Internal Findings.
The number of Repeat Internal Audit Findings totaled 19 in FY 2013 – FY2015, dealing with periodic inventory reviews of sensitive items (four findings), promotional expense documentation and authorizations (five findings) and materials and supplies management (ten findings). The materials and supplies management findings include items such as segregation of duties, access to storeroom, non-signed receipts, perpetual inventory records not being accurate, documentation issues and inventory turning over less than three times per year.
Six of nineteen Repeat Internal Audit Findings have been resolved.
Of the remaining unresolved 13 Repeat Internal Audit Findings, 12 are made of the same six findings in two different audit years and one additional repeat finding.
Use Resources Wisely
31
PERFORMANCE MEASURE 2.11Number of Internal Audit Findings and Number of Repeat Internal Audit Findings
Number of Internal Audit FindingsPM2.11 - 2.11 Number of Internal Audit Findings - DONE
0
10
20
30
40
50
60
70
MAA MDTA MPA MTA MVA SHA TSO
14
33
20
51
10
5
23
30
21
63
19
26
32
1823
7
50
30
12
FY 2013 FY 2014 FY 2015
Use Resources Wisely
32
PERFORMANCE MEASURE 2.11Number of Internal Audit Findings and Number of Repeat Internal Audit Findings
Number of Total Internal Audit Findings by TBU for FY13-15PM2.11b - 2.11 Number of Total Internal Audit Findings by TBU for FY13-15 - DONE
Trend in Total Internal Audit FIndings
0
20
40
60
80
100
120
140
160
180
MAA MDTA MPA MTA MVA SHA TSO
69
81
27
8
164
5943
TBU Total
0
50
100
150
200
250
300
350
400
450
500
FY 2013 FY 2014 FY 2015 Total
115164 172
451
Total
Trend in Total Internal Audit Findings
PM2.11b - 2.11 Number of Total Internal Audit Findings by TBU for FY13-15 - DONE
Trend in Total Internal Audit FIndings
0
20
40
60
80
100
120
140
160
180
MAA MDTA MPA MTA MVA SHA TSO
69
81
27
8
164
5943
TBU Total
0
50
100
150
200
250
300
350
400
450
500
FY 2013 FY 2014 FY 2015 Total
115164 172
451
Total
Use Resources Wisely
33
Use Resources Wisely
PERFORMANCE MEASURE 2.11Number of Internal Audit Findings and Number of Repeat Internal Audit Findings
Number of Internal Audit Repeat FindingsPM2.11c - 2.11 Number of Internal Audit Repeat Findings - DONE
0
1
2
3
4
5
6
7
8
MAA MDTA MPA MTA MVA SHA TSO
0
7
1
0
1
0 0
2
0 0 0
1
0 0
2
3
0 0
2
0 0
FY 2013 FY 2014 FY 2015
34
Use Resources Wisely
TANGIBLE RESULT DRIVER:
Corey Stottlemyer Maryland Department of
Transportation (MDOT)
PERFORMANCE MEASURE DRIVER:
Patrick Bradley Maryland Aviation Administration
(MAA)
PURPOSE OF MEASURE:
To track the number of Legislative Repeat Audit Findings
FREQUENCY:
Annually
DATA COLLECTION METHODOLOGY:
TBU Audit databases for FY 13, FY14 and FY15
NATIONAL BENCHMARK:
Zero Legislative Repeat Audit Findings
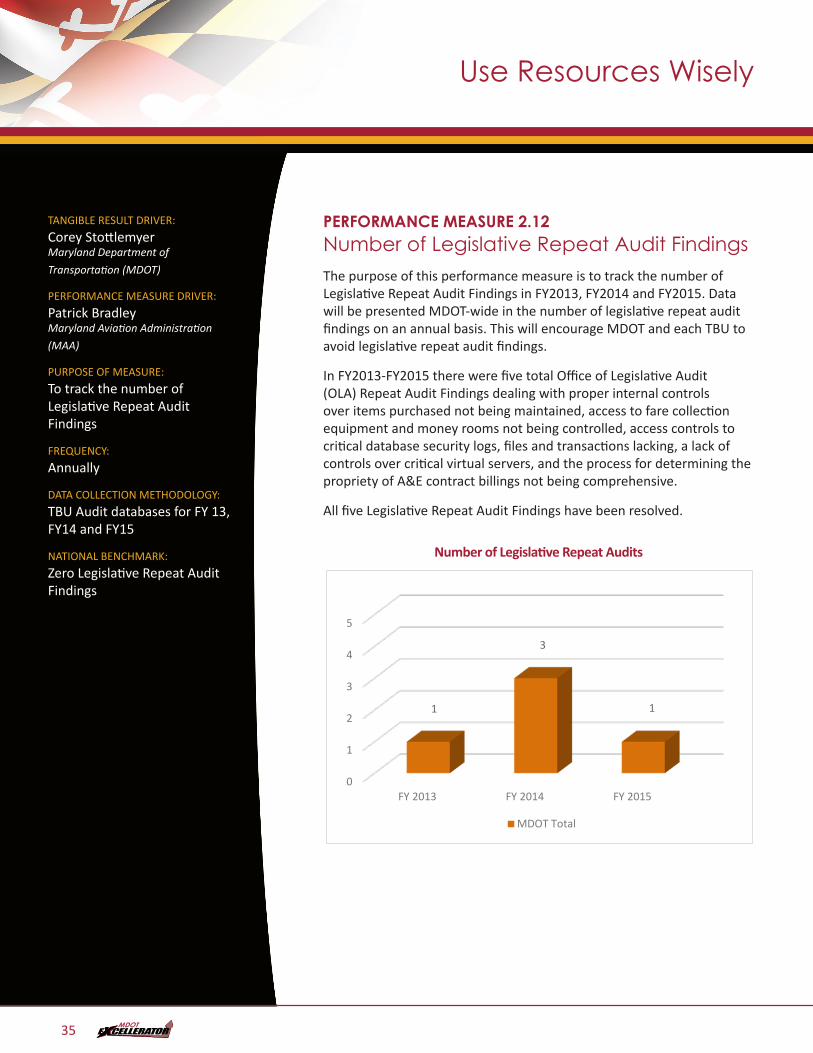
PERFORMANCE MEASURE 2.12Number of Legislative Repeat Audit FindingsThe purpose of this performance measure is to track the number of Legislative Repeat Audit Findings in FY2013, FY2014 and FY2015. Data will be presented MDOT-wide in the number of legislative repeat audit findings on an annual basis. This will encourage MDOT and each TBU to avoid legislative repeat audit findings.
In FY2013-FY2015 there were five total Office of Legislative Audit (OLA) Repeat Audit Findings dealing with proper internal controls over items purchased not being maintained, access to fare collection equipment and money rooms not being controlled, access controls to critical database security logs, files and transactions lacking, a lack of controls over critical virtual servers, and the process for determining the propriety of A&E contract billings not being comprehensive.
All five Legislative Repeat Audit Findings have been resolved.
Number of Legislative Repeat AuditsPM2.12 - 2.12 Number of Legislative Repeat Audit Findings - DONE
0
1
2
3
4
5
FY 2013 FY 2014 FY 2015
1
3
1
MDOT Total
35
Use Resources Wisely
36
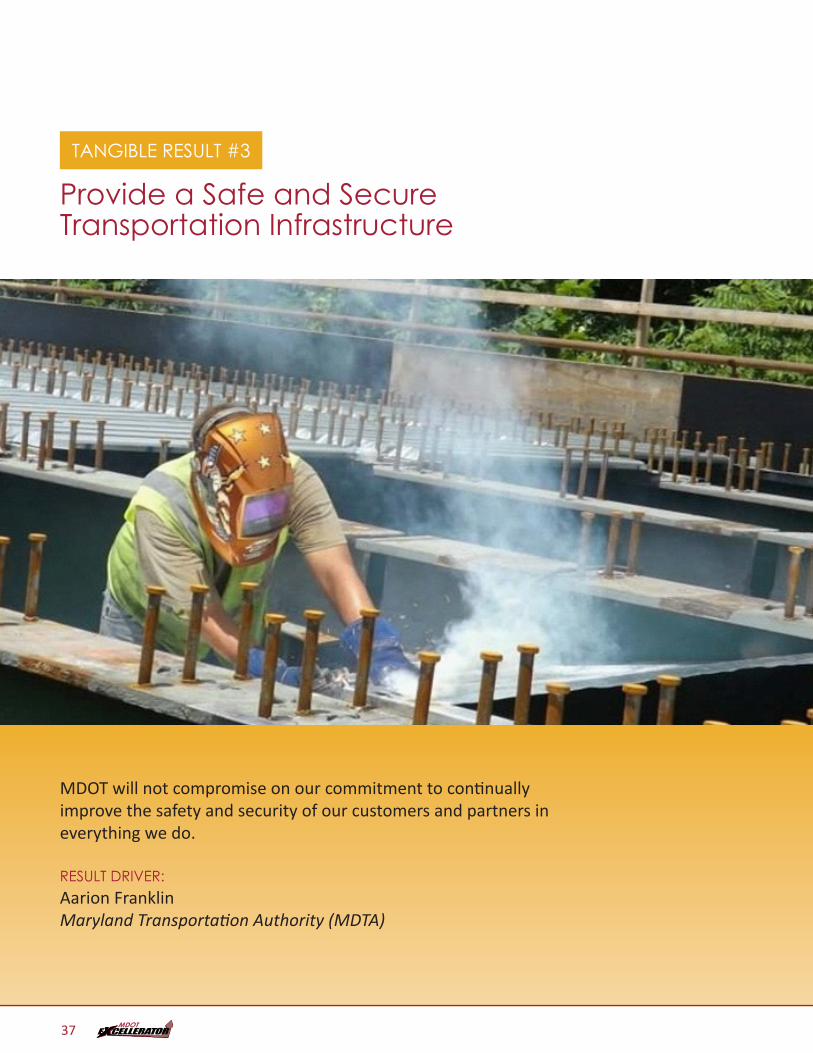
TANGIBLE RESULT #3
Provide a Safe and Secure Transportation Infrastructure
MDOT will not compromise on our commitment to continually improve the safety and security of our customers and partners in everything we do.
RESULT DRIVER:Aarion Franklin Maryland Transportation Authority (MDTA)
37
Provide a Safe and Secure Transportation Infrastructure
TANGIBLE RESULT DRIVER:
Aarion Franklin Maryland Transportation Authority
(MDTA)
PERFORMANCE MEASURE DRIVER:
Bud Frank The Secretary’s Office (TSO)
PURPOSE OF MEASURE:
To track crime trends and adjust strategies/staffing/ response to protect customers, employees, and State property
FREQUENCY:
Quarterly
DATA COLLECTION METHODOLOGY:
MTA Police and MDTA Police will report directly to Measure Driver. SHA and MVA will compile information and also report directly to Measure Driver. Measure Driver will report to Project Management Team
NATIONAL BENCHMARK:
N/A
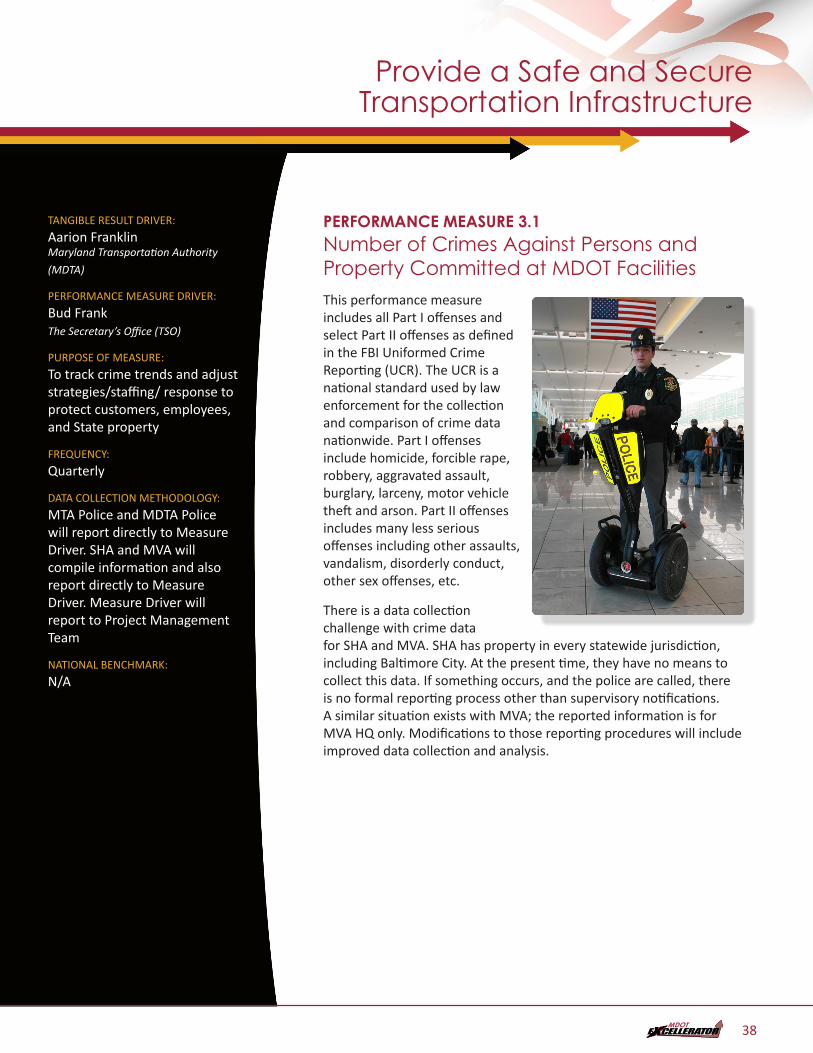
PERFORMANCE MEASURE 3.1Number of Crimes Against Persons and Property Committed at MDOT FacilitiesThis performance measure includes all Part I offenses and select Part II offenses as defined in the FBI Uniformed Crime Reporting (UCR). The UCR is a national standard used by law enforcement for the collection and comparison of crime data nationwide. Part I offenses include homicide, forcible rape, robbery, aggravated assault, burglary, larceny, motor vehicle theft and arson. Part II offenses includes many less serious offenses including other assaults, vandalism, disorderly conduct, other sex offenses, etc.
There is a data collection challenge with crime data for SHA and MVA. SHA has property in every statewide jurisdiction, including Baltimore City. At the present time, they have no means to collect this data. If something occurs, and the police are called, there is no formal reporting process other than supervisory notifications. A similar situation exists with MVA; the reported information is for MVA HQ only. Modifications to those reporting procedures will include improved data collection and analysis.
38
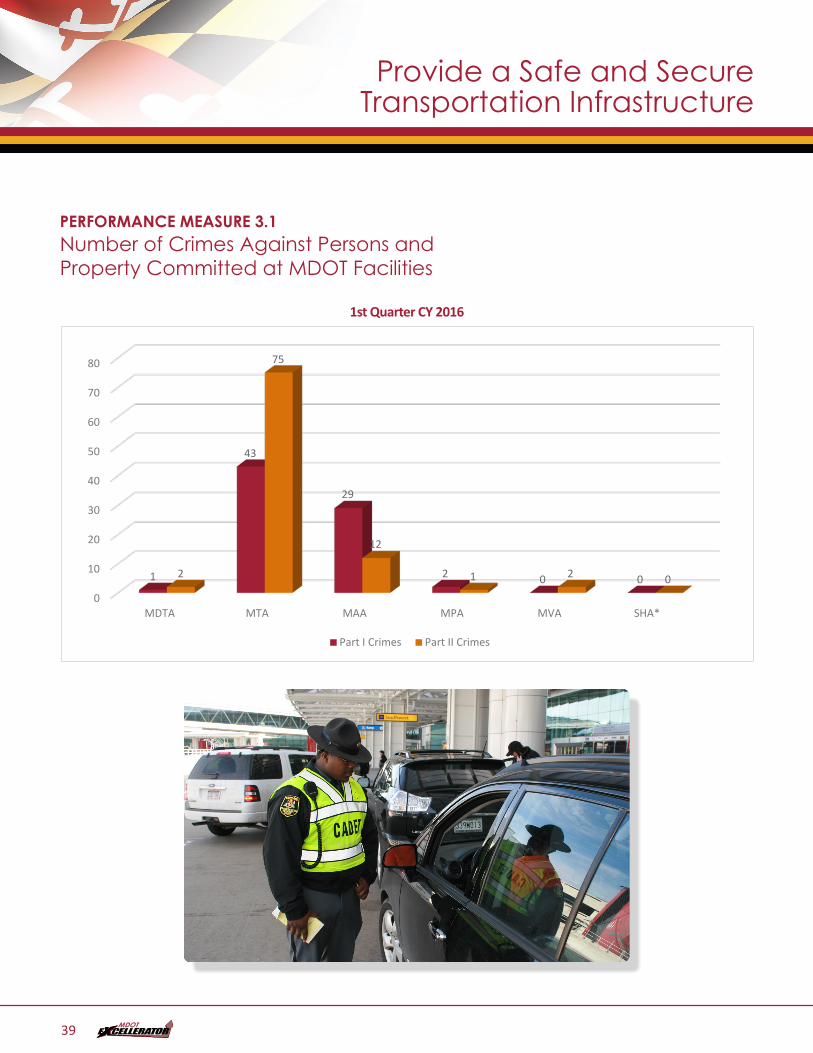
PERFORMANCE MEASURE 3.1Number of Crimes Against Persons and Property Committed at MDOT Facilities
1st Quarter CY 2016PM3.1 Q1 CY2016 - DONE
0
10
20
30
40
50
60
70
80
MDTA MTA MAA MPA MVA SHA*
1
43
29
2 0 02
75
12
1 2 0
Part I Crimes Part II Crimes
Provide a Safe and Secure Transportation Infrastructure
39

Provide a Safe and Secure Transportation Infrastructure
TANGIBLE RESULT DRIVER:
Aarion Franklin Maryland Transportation Authority
(MDTA)
PERFORMANCE MEASURE DRIVER:
Thomas Gianni Motor Vehicle Administration (MVA)
PURPOSE OF MEASURE:
To track quarterly and annual trends in the number of persons killed in motor vehicle crashes
FREQUENCY:
Quarterly
DATA COLLECTION METHODOLOGY:
Based on Collected Police Data submitted to MSP through Automated Crash Reporting System (ACRS)
NATIONAL BENCHMARK:
N/A
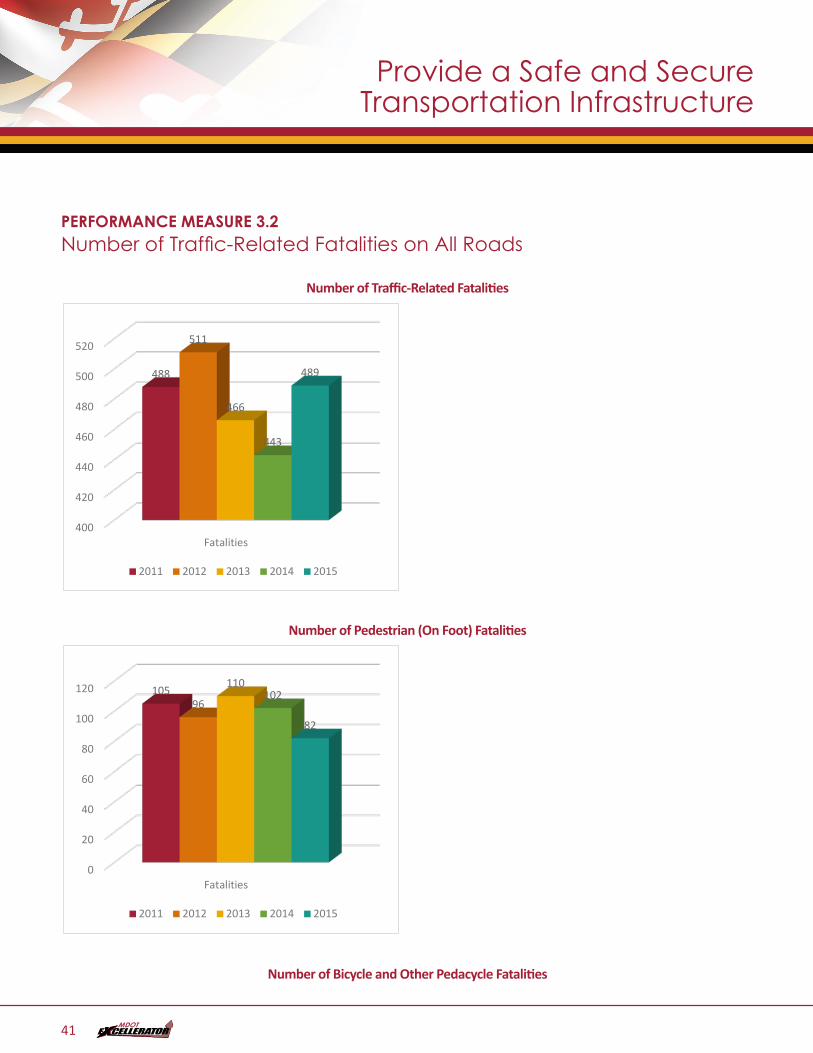
PERFORMANCE MEASURE 3.2Number of Traffic-Related Fatalities on All RoadsMDOT strives to implement programs that will increase driver safety by reducing serious traffic-related crashes. One such measure is to track the number of fatalities on all roads and analyze related trends. Maryland’s Strategic Highway Safety Plan (SHSP) is a comprehensive set of emphasis areas and strategies designed to reduce highway fatalities and serious injuries through the implementation of behavioral and engineering safety countermeasures. It is based on the Toward Zero Deaths approach to reduce fatalities by 50% by 2030 from the 2008 baseline of 592. Interim goals include 475 in 2015and 387 in 2020:.
Over the past several years there has been a significant decrease in Maryland highway fatalities. In 2014, the number of fatalities (443) was the lowest since 1948. Preliminary projections for 2015 indicate that the State witnessed a reversal in this trend with a 17% increase in highway fatalities; the largest single-year increase in over 30 years.
Pedestrian deaths typically account for approximately 20% of all traffic-related fatalities. Pedestrian fatalities consistently measure approximately 100 per year. Analysis of pedestrian fatal crashes indicates that a majority of those pedestrians were in a place where a driver would least expect them to be (e.g., not in a crosswalk).
Bicyclists typically account for approximately 1% of all fatalities annually. Bicycle fatalities hover around five to six per year. Although incomplete and preliminary, bicycle deaths in 2015 were double the annual average.
40
Provide a Safe and Secure Transportation Infrastructure
PERFORMANCE MEASURE 3.2Number of Traffic-Related Fatalities on All Roads
Number of Traffic-Related FatalitiesPM3.2 – Number of Traffic-Related Fatalities
400
420
440
460
480
500
520
Fatalities
488
511
466
443
489
2011 2012 2013 2014 2015
Number of Pedestrian (On Foot) FatalitiesPM3.2a Number of Pedestrian (On Foot) Fatalties - DONE
0
20
40
60
80
100
120
Fatalities
10596
110102
82
2011 2012 2013 2014 2015
Number of Bicycle and Other Pedacycle Fatalities
41
Provide a Safe and Secure Transportation Infrastructure
TANGIBLE RESULT DRIVER:
Aarion Franklin Maryland Transportation Authority
(MDTA)
PERFORMANCE MEASURE DRIVER:
Thomas Gianni Motor Vehicle Administration (MVA)
PURPOSE OF MEASURE:
To track quarterly and annual trends in the number of persons killed in motor vehicle crashes per vehicle miles travelled (VMT)
FREQUENCY:
Annually
DATA COLLECTION METHODOLOGY:
SHA collects Vehicle Miles Travelled (VMT) based on highway counters installed in roadways across the state. Fatality data is collected by the Maryland State Police (MSP) through its Automated Crash Reporting System (ACRS). MHSO collects the data from these two agencies
NATIONAL BENCHMARK:
National Highway Fatality Rate
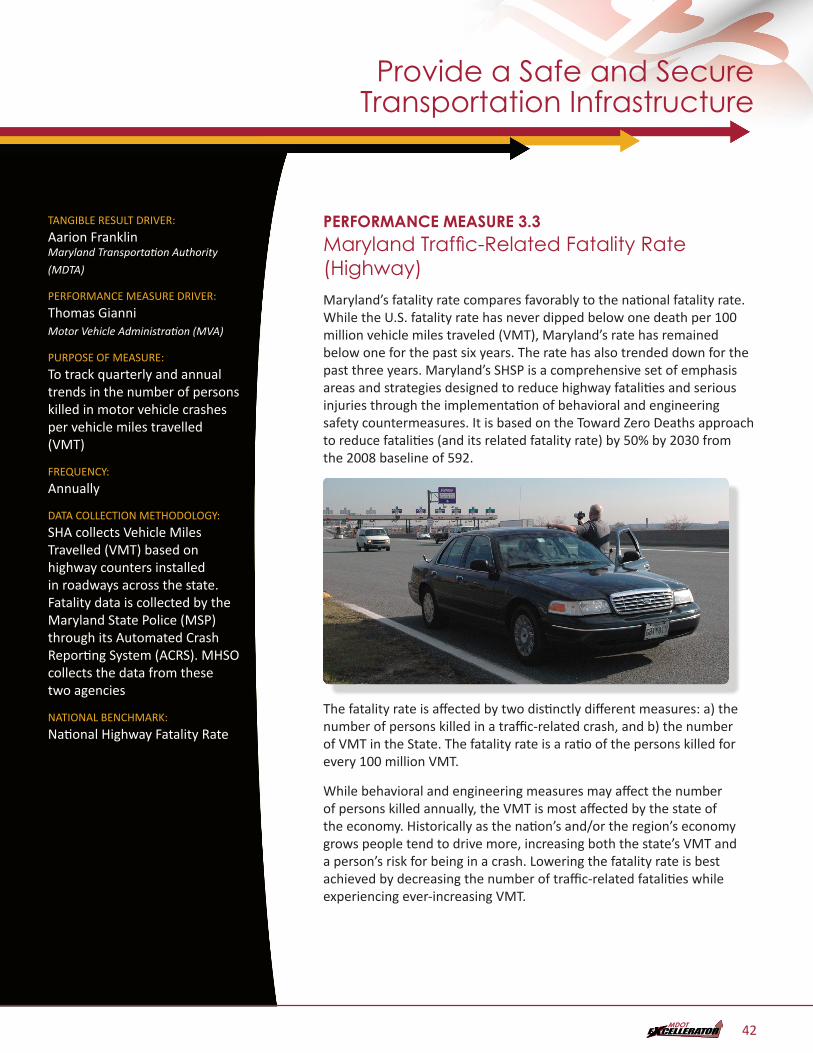
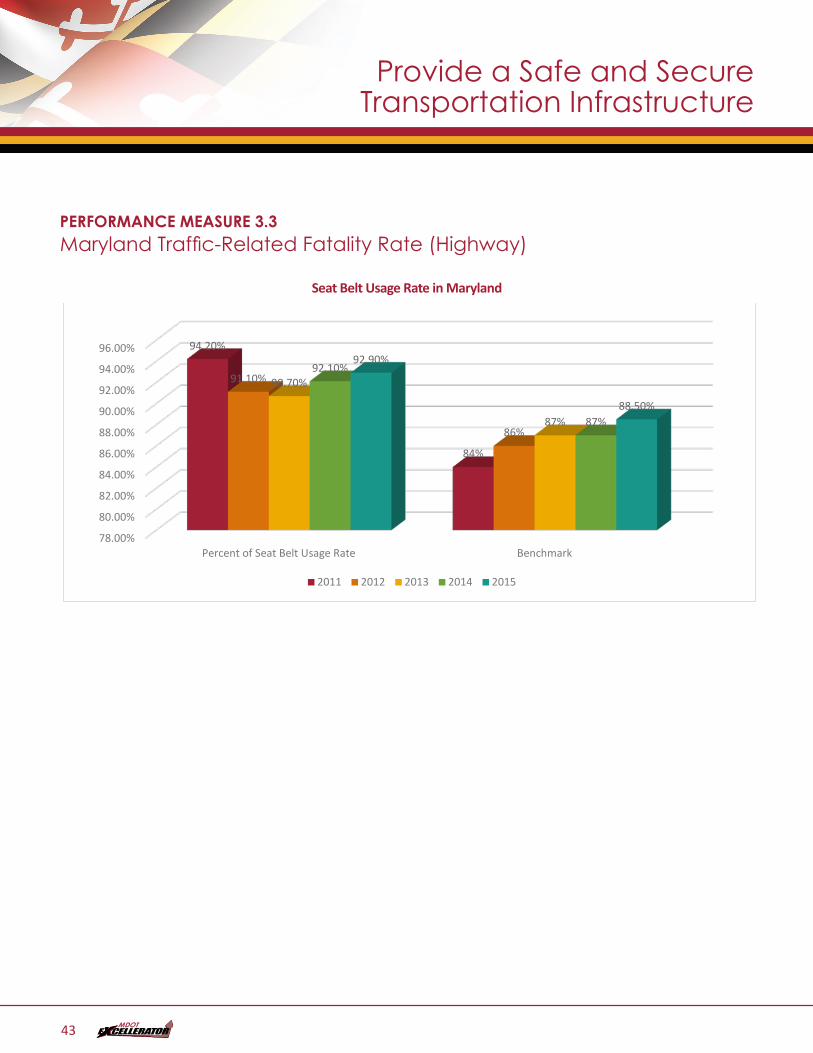
PERFORMANCE MEASURE 3.3Maryland Traffic-Related Fatality Rate (Highway)Maryland’s fatality rate compares favorably to the national fatality rate. While the U.S. fatality rate has never dipped below one death per 100 million vehicle miles traveled (VMT), Maryland’s rate has remained below one for the past six years. The rate has also trended down for the past three years. Maryland’s SHSP is a comprehensive set of emphasis areas and strategies designed to reduce highway fatalities and serious injuries through the implementation of behavioral and engineering safety countermeasures. It is based on the Toward Zero Deaths approach to reduce fatalities (and its related fatality rate) by 50% by 2030 from the 2008 baseline of 592.
The fatality rate is affected by two distinctly different measures: a) the number of persons killed in a traffic-related crash, and b) the number of VMT in the State. The fatality rate is a ratio of the persons killed for every 100 million VMT.
While behavioral and engineering measures may affect the number of persons killed annually, the VMT is most affected by the state of the economy. Historically as the nation’s and/or the region’s economy grows people tend to drive more, increasing both the state’s VMT and a person’s risk for being in a crash. Lowering the fatality rate is best achieved by decreasing the number of traffic-related fatalities while experiencing ever-increasing VMT.
42
Provide a Safe and Secure Transportation Infrastructure
PERFORMANCE MEASURE 3.3Maryland Traffic-Related Fatality Rate (Highway)
Seat Belt Usage Rate in MarylandPM3.3 Seat Belt Usage Rate in Maryland
78.00%
80.00%
82.00%
84.00%
86.00%
88.00%
90.00%
92.00%
94.00%
96.00%
Percent of Seat Belt Usage Rate Benchmark
94.20%
84%
91.10%
86%
90.70%
87%
92.10%
87%
92.90%
88.50%
2011 2012 2013 2014 2015
43
Provide a Safe and Secure Transportation Infrastructure
TANGIBLE RESULT DRIVER:
Aarion Franklin Maryland Transportation Authority
(MDTA)
PERFORMANCE MEASURE DRIVER:
Thomas Gianni Motor Vehicle Administration (MVA)
PURPOSE OF MEASURE:
To track quarterly and annual trends in the number of persons seriously injured in motor vehicle crashes.
FREQUENCY:
Quarterly
DATA COLLECTION METHODOLOGY:
To track quarterly and annual trends in the number of persons seriously injured in motor vehicle crashes.
NATIONAL BENCHMARK:
N/A
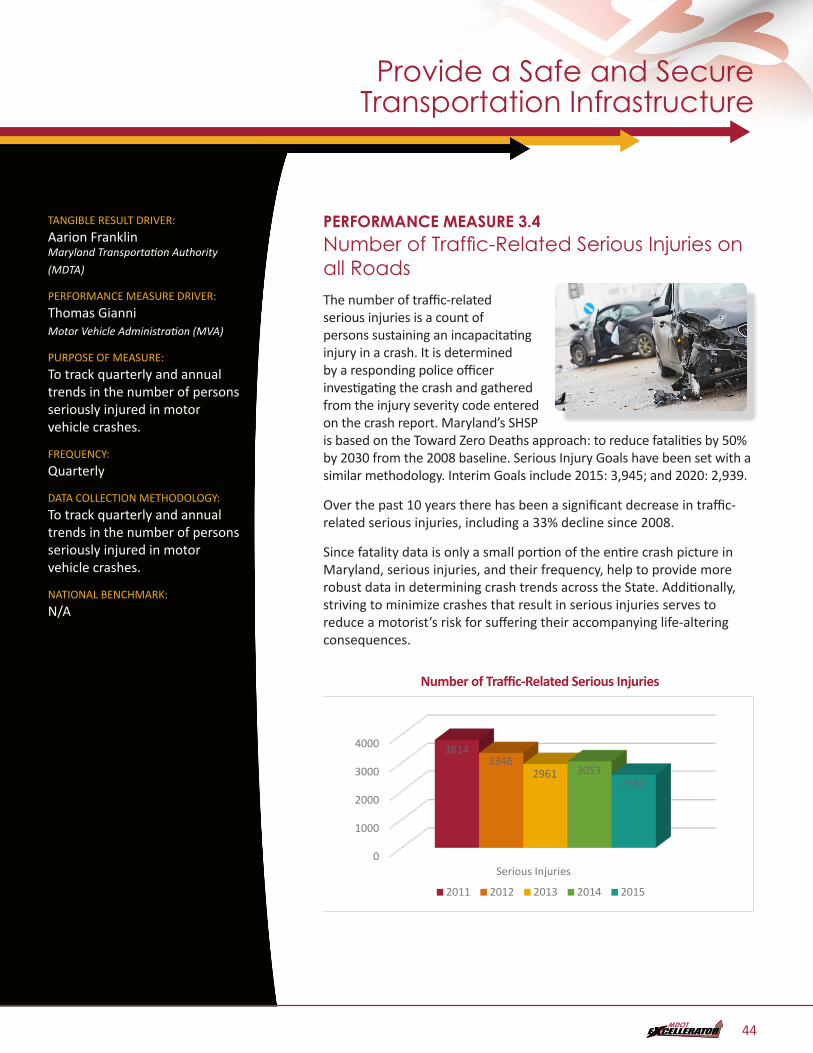
PERFORMANCE MEASURE 3.4Number of Traffic-Related Serious Injuries on all RoadsThe number of traffic-related serious injuries is a count of persons sustaining an incapacitating injury in a crash. It is determined by a responding police officer investigating the crash and gathered from the injury severity code entered on the crash report. Maryland’s SHSP is based on the Toward Zero Deaths approach: to reduce fatalities by 50% by 2030 from the 2008 baseline. Serious Injury Goals have been set with a similar methodology. Interim Goals include 2015: 3,945; and 2020: 2,939.
Over the past 10 years there has been a significant decrease in traffic-related serious injuries, including a 33% decline since 2008.
Since fatality data is only a small portion of the entire crash picture in Maryland, serious injuries, and their frequency, help to provide more robust data in determining crash trends across the State. Additionally, striving to minimize crashes that result in serious injuries serves to reduce a motorist’s risk for suffering their accompanying life-altering consequences.
Number of Traffic-Related Serious InjuriesPM3.4 Number of Traffic-Related Serious Injuries
0
1000
2000
3000
4000
Serious Injuries
38143346
2961 30532580
2011 2012 2013 2014 2015
44
Provide a Safe and Secure Transportation Infrastructure
PERFORMANCE MEASURE 3.4Number of Traffic-Related Serious Injuries on all Roads
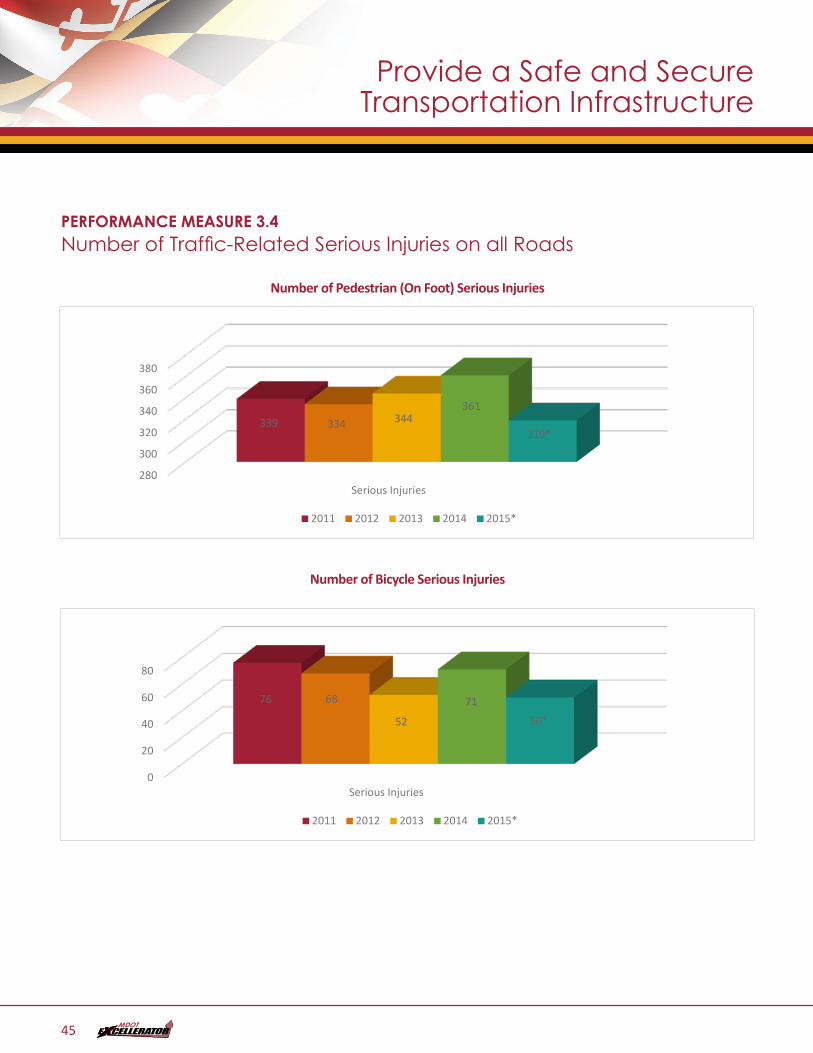
Number of Pedestrian (On Foot) Serious Injuries
PM3.4a - Number of Pedestrian (On Foot) Serious Injuries - DONE
280
300
320
340
360
380
Serious Injuries
339 334 344361
319*
2011 2012 2013 2014 2015*
Number of Bicycle Serious InjuriesPM3.4b - Number of Bicycle Serious Injuries - DONE
0
20
40
60
80
Serious Injuries
76 68
52
71
50*
2011 2012 2013 2014 2015*
45
Provide a Safe and Secure Transportation Infrastructure
TANGIBLE RESULT DRIVER:
Aarion Franklin Maryland Transportation Authority
(MDTA)
PERFORMANCE MEASURE DRIVER:
Thomas Gianni Motor Vehicle Administration (MVA)
PURPOSE OF MEASURE:
To track annual trends in the number of persons seriously injured in motor vehicle crashes per vehicle miles travelled (VMT)
FREQUENCY:
Annually
DATA COLLECTION METHODOLOGY:
Based on persons seriously injured in crashes per 100 vehicle miles traveled
NATIONAL BENCHMARK:
N/A
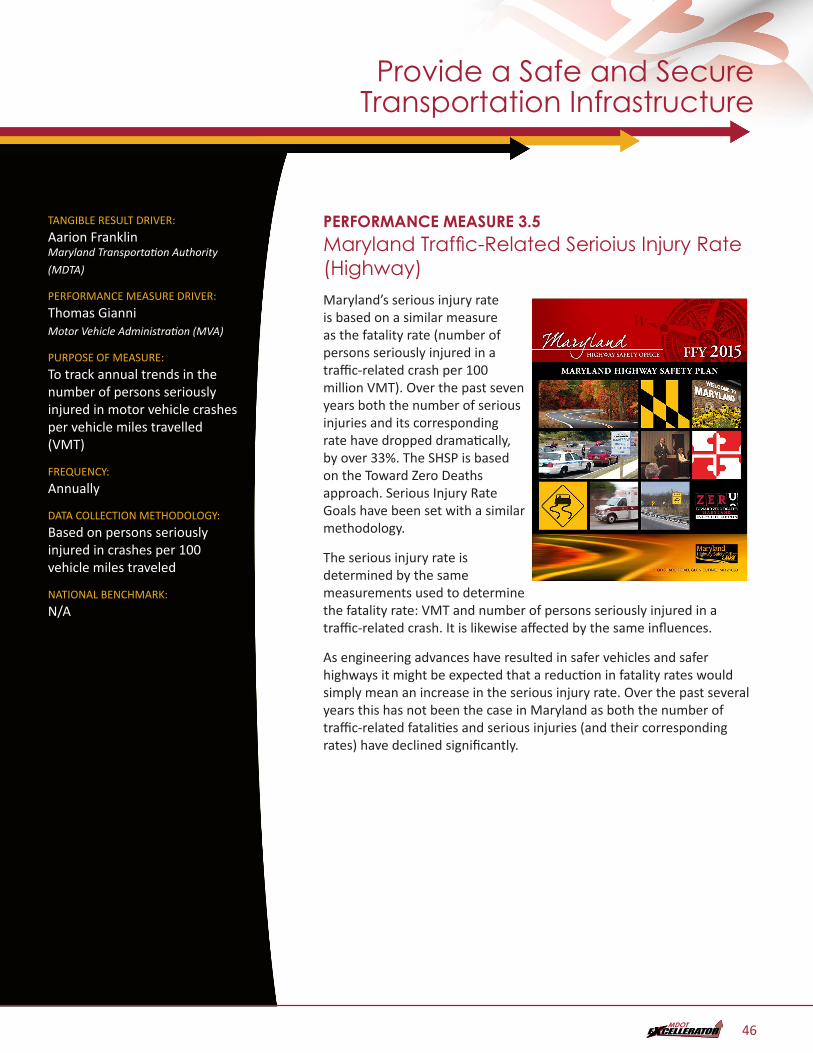
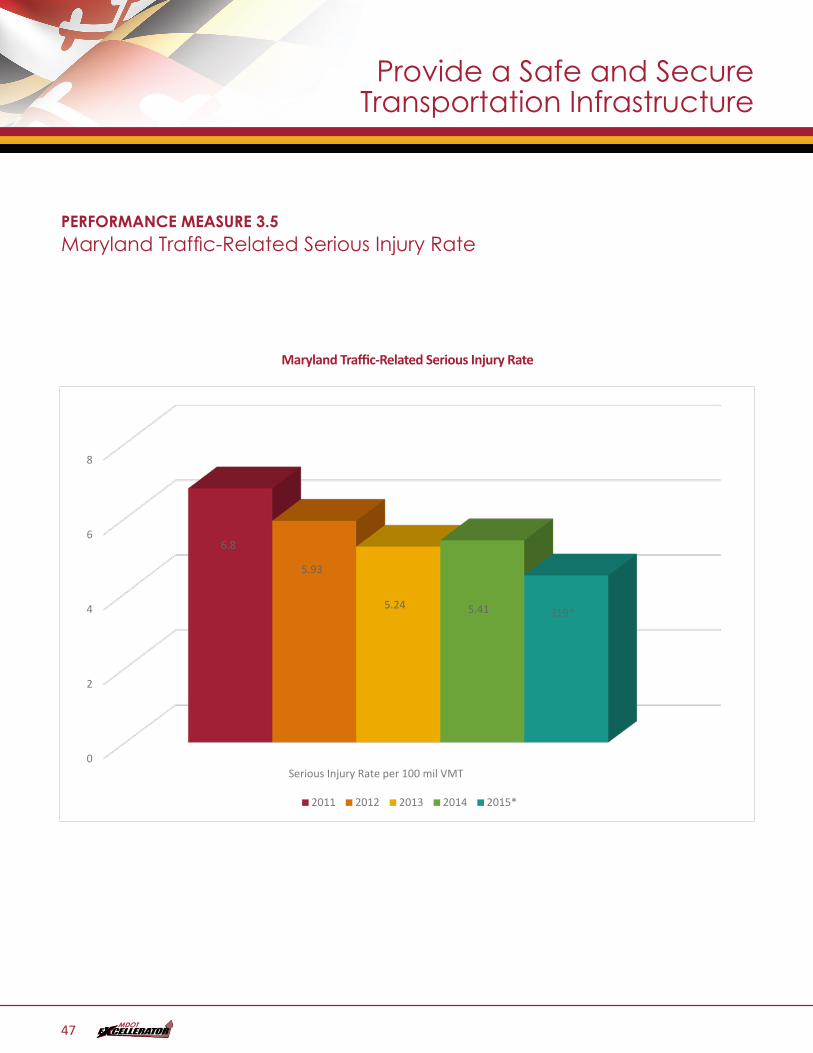
PERFORMANCE MEASURE 3.5Maryland Traffic-Related Serioius Injury Rate (Highway)Maryland’s serious injury rate is based on a similar measure as the fatality rate (number of persons seriously injured in a traffic-related crash per 100 million VMT). Over the past seven years both the number of serious injuries and its corresponding rate have dropped dramatically, by over 33%. The SHSP is based on the Toward Zero Deaths approach. Serious Injury Rate Goals have been set with a similar methodology.
The serious injury rate is determined by the same measurements used to determine the fatality rate: VMT and number of persons seriously injured in a traffic-related crash. It is likewise affected by the same influences.
As engineering advances have resulted in safer vehicles and safer highways it might be expected that a reduction in fatality rates would simply mean an increase in the serious injury rate. Over the past several years this has not been the case in Maryland as both the number of traffic-related fatalities and serious injuries (and their corresponding rates) have declined significantly.
46
Provide a Safe and Secure Transportation Infrastructure
PERFORMANCE MEASURE 3.5Maryland Traffic-Related Serious Injury Rate
Maryland Traffic-Related Serious Injury RatePM3.5 – Maryland Traffic-Related Serious Injury Rate - DONE
0
2
4
6
8
Serious Injury Rate per 100 mil VMT
6.8
5.93
5.24 5.41 319*
2011 2012 2013 2014 2015*
47
Provide a Safe and Secure Transportation Infrastructure
TANGIBLE RESULT DRIVER:
Aarion Franklin Maryland Transportation Authority
(MDTA)
PERFORMANCE MEASURE DRIVER:
Gina Watson Maryland Port Administration (MPA)
PURPOSE OF MEASURE:
To track annual trends in seat belt use in Maryland and how Maryland ranks against other states
FREQUENCY:
Annually
DATA COLLECTION METHODOLOGY:
Observational Survey
NATIONAL BENCHMARK:
Nationwide rate provided by NHTSA
PERFORMANCE MEASURE 3.6Maryland Seat Belt Usage Rate and Ranking Against Other States in Seat Belt UseStates with primary and secondary enforcement seat belt laws exhibit higher usage rates. The use of seat belts greatly reduces the severity of personal injury and occupant fatalities in Maryland.
Maryland’s seat belt usage rate is collected by an observational survey approved by the National Highway Traffic Safety Administration (NHTSA). Maryland’s 2015 seat belt usage rate was 92.9% in comparison to the national average of 88.5%.
The Maryland Highway Safety Office goal for seat belt usage for 2015 was 92.7%.
Seat belt use in Maryland has shown an increase for 2014 and 2015 following a two-year negative trend in 2012 and 2013 which was impacted by NHTSA’s newly implemented uniform survey criteria in 2013. The established new uniform criteria for surveys include more stringent survey design and administrative requirements.
48
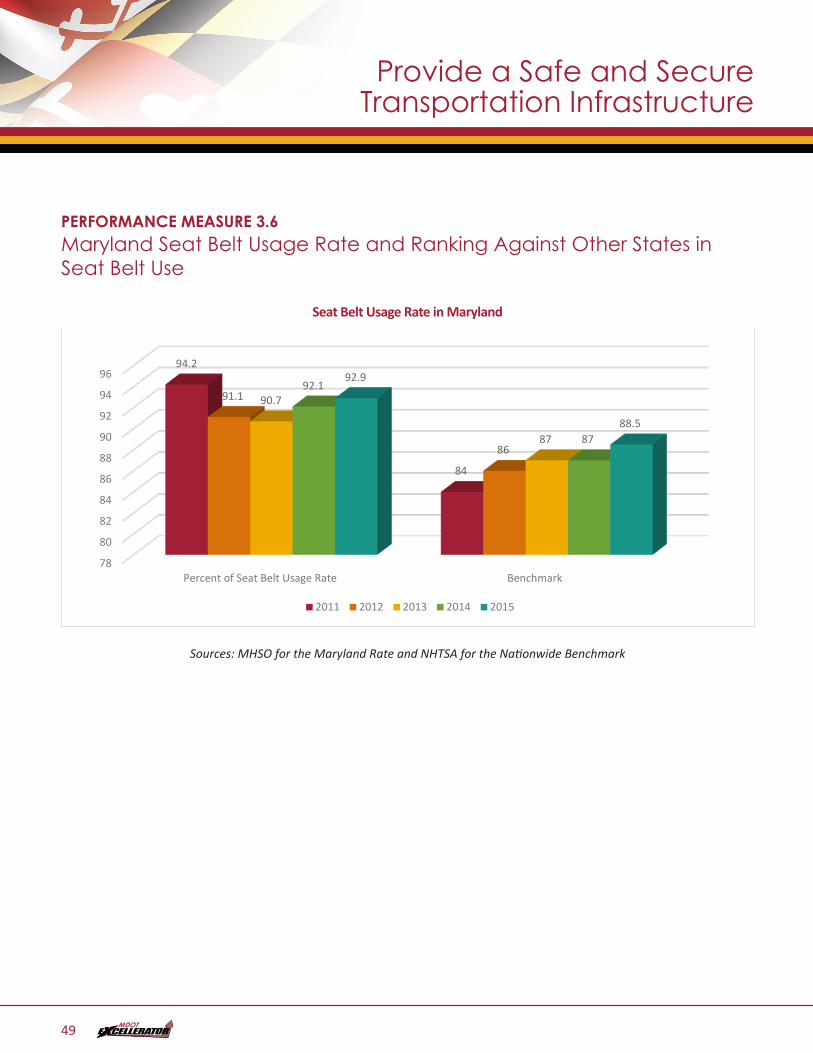
PERFORMANCE MEASURE 3.6Maryland Seat Belt Usage Rate and Ranking Against Other States in Seat Belt Use
Seat Belt Usage Rate in Maryland
PM3.6 – Seat Belt Usage Rate in Maryland - DONE
78
80
82
84
86
88
90
92
94
96
Percent of Seat Belt Usage Rate Benchmark
94.2
84
91.1
86
90.7
87
92.1
87
92.9
88.5
2011 2012 2013 2014 2015
Sources: MHSO for the Maryland Rate and NHTSA for the Nationwide Benchmark
Provide a Safe and Secure Transportation Infrastructure
49
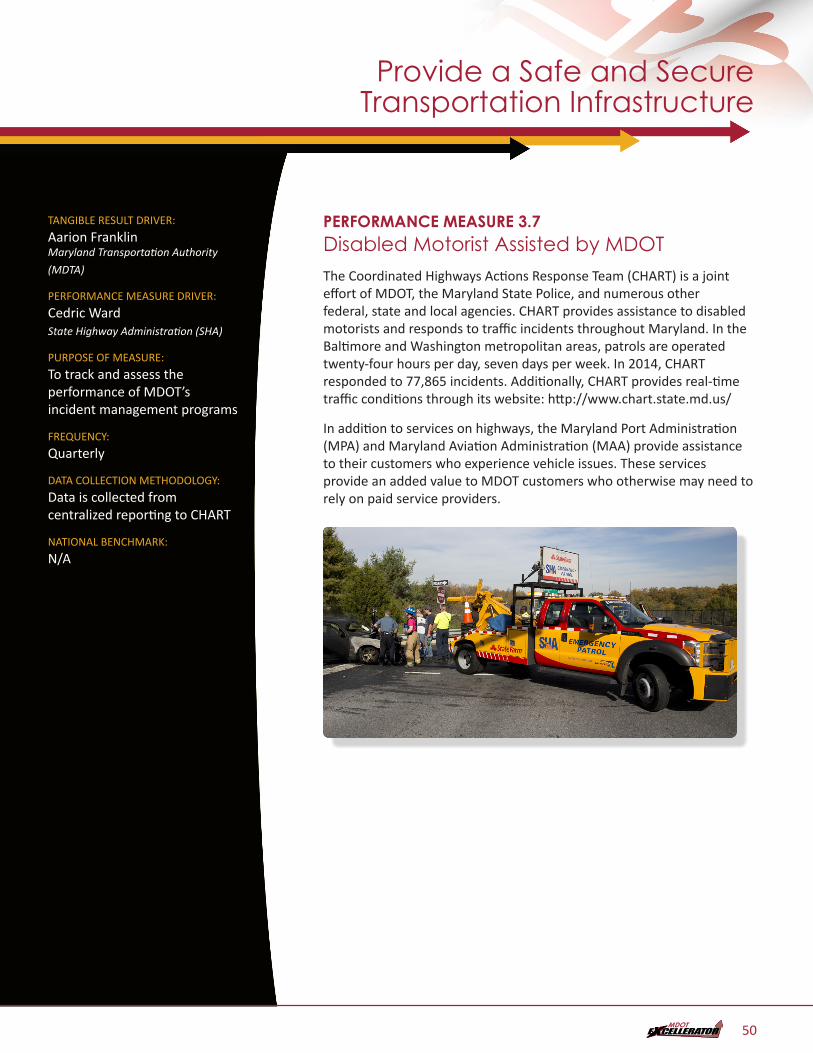
TANGIBLE RESULT DRIVER:
Aarion Franklin Maryland Transportation Authority
(MDTA)
PERFORMANCE MEASURE DRIVER:
Cedric Ward State Highway Administration (SHA)
PURPOSE OF MEASURE:
To track and assess the performance of MDOT’s incident management programs
FREQUENCY:
Quarterly
DATA COLLECTION METHODOLOGY:
Data is collected from centralized reporting to CHART
NATIONAL BENCHMARK:
N/A
PERFORMANCE MEASURE 3.7Disabled Motorist Assisted by MDOTThe Coordinated Highways Actions Response Team (CHART) is a joint effort of MDOT, the Maryland State Police, and numerous other federal, state and local agencies. CHART provides assistance to disabled motorists and responds to traffic incidents throughout Maryland. In the Baltimore and Washington metropolitan areas, patrols are operated twenty-four hours per day, seven days per week. In 2014, CHART responded to 77,865 incidents. Additionally, CHART provides real-time traffic conditions through its website: http://www.chart.state.md.us/
In addition to services on highways, the Maryland Port Administration (MPA) and Maryland Aviation Administration (MAA) provide assistance to their customers who experience vehicle issues. These services provide an added value to MDOT customers who otherwise may need to rely on paid service providers.
Provide a Safe and Secure Transportation Infrastructure
50
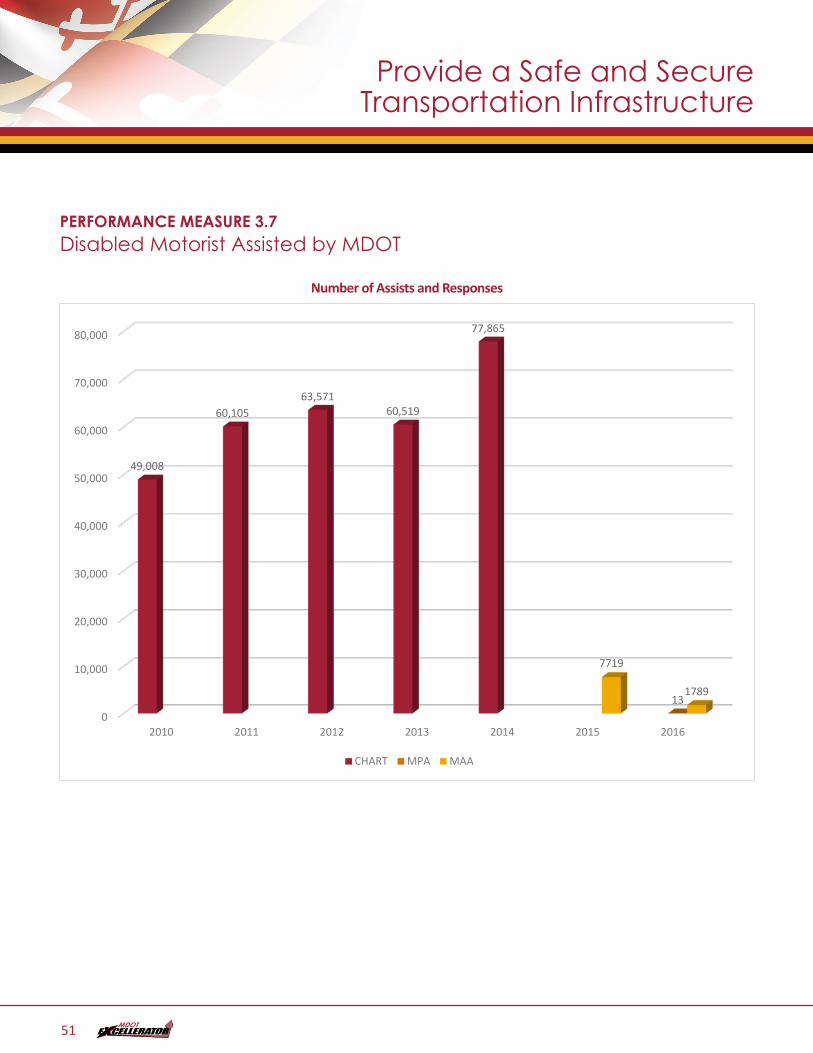
Provide a Safe and Secure Transportation Infrastructure
PERFORMANCE MEASURE 3.7Disabled Motorist Assisted by MDOT
Number of Assists and ResponsesPM3.7 - Number of Assists and Responses - DONE
0
10,000
20,000
30,000
40,000
50,000
60,000
70,000
80,000
2010 2011 2012 2013 2014 2015 2016
49,008
60,10563,571
60,519
77,865
13
7719
1789
CHART MPA MAA
51
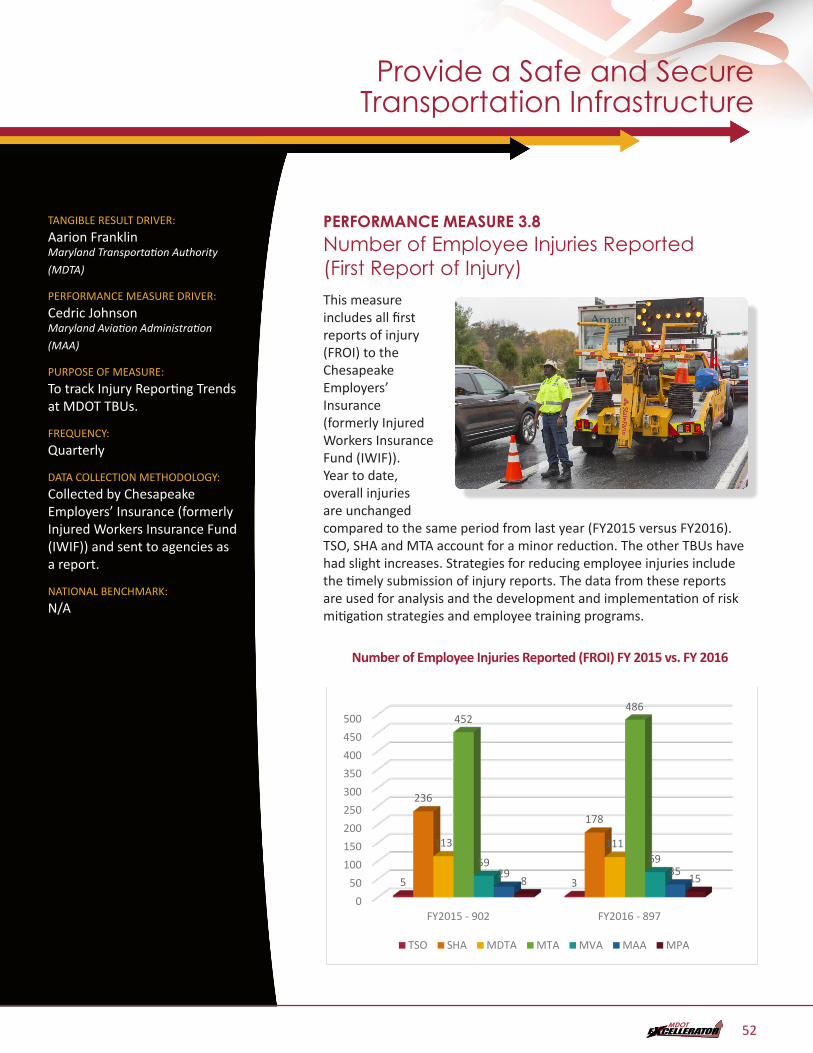
Provide a Safe and Secure Transportation Infrastructure
TANGIBLE RESULT DRIVER:
Aarion Franklin Maryland Transportation Authority
(MDTA)
PERFORMANCE MEASURE DRIVER:
Cedric Johnson Maryland Aviation Administration
(MAA)
PURPOSE OF MEASURE:
To track Injury Reporting Trends at MDOT TBUs.
FREQUENCY:
Quarterly
DATA COLLECTION METHODOLOGY:
Collected by Chesapeake Employers’ Insurance (formerly Injured Workers Insurance Fund (IWIF)) and sent to agencies as a report.
NATIONAL BENCHMARK:
N/A
PERFORMANCE MEASURE 3.8Number of Employee Injuries Reported (First Report of Injury)This measure includes all first reports of injury (FROI) to the Chesapeake Employers’ Insurance (formerly Injured Workers Insurance Fund (IWIF)). Year to date, overall injuries are unchanged compared to the same period from last year (FY2015 versus FY2016). TSO, SHA and MTA account for a minor reduction. The other TBUs have had slight increases. Strategies for reducing employee injuries include the timely submission of injury reports. The data from these reports are used for analysis and the development and implementation of risk mitigation strategies and employee training programs.
Number of Employee Injuries Reported (FROI) FY 2015 vs. FY 2016PM3.8 - DONE
050
100150200250300350400450500
FY2015 - 902 FY2016 - 897
5 3
236
178
113 111
452486
59 6929 35
8 15
TSO SHA MDTA MTA MVA MAA MPA
52
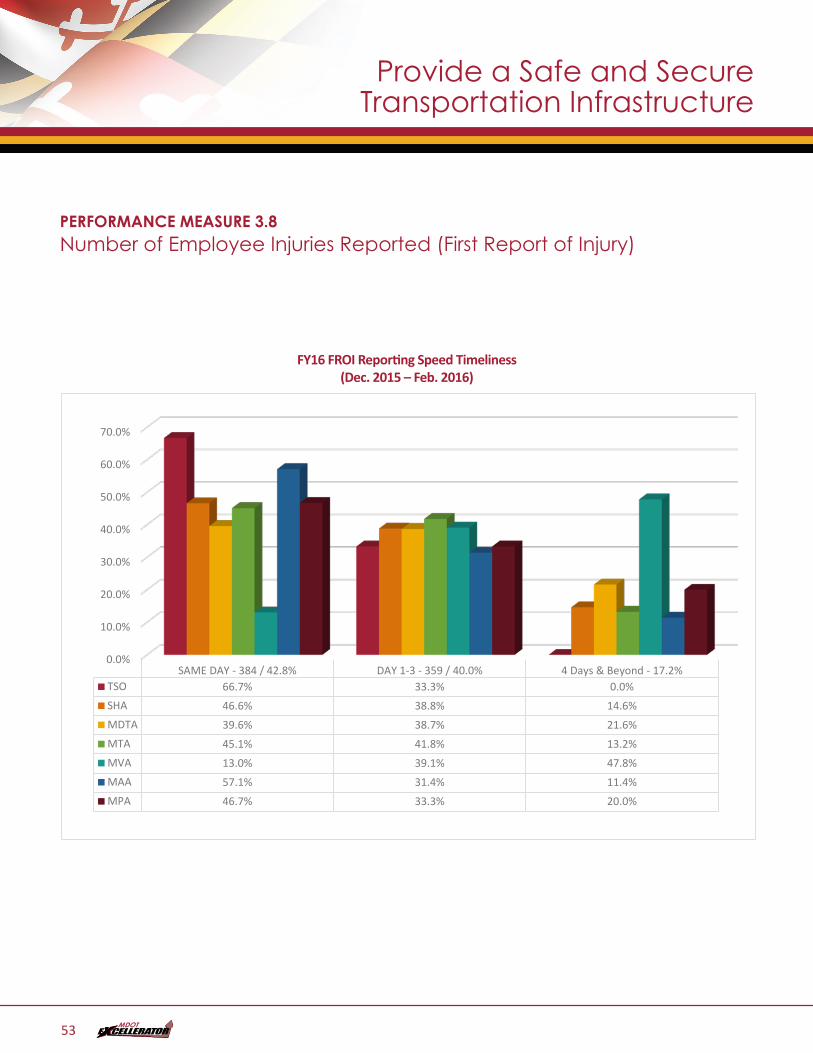
Provide a Safe and Secure Transportation Infrastructure
PERFORMANCE MEASURE 3.8Number of Employee Injuries Reported (First Report of Injury)
FY16 FROI Reporting Speed Timeliness (Dec. 2015 – Feb. 2016)PM3.8a - DONE
0.0%
10.0%
20.0%
30.0%
40.0%
50.0%
60.0%
70.0%
SAME DAY - 384 / 42.8% DAY 1-3 - 359 / 40.0% 4 Days & Beyond - 17.2%TSO 66.7% 33.3% 0.0%SHA 46.6% 38.8% 14.6%MDTA 39.6% 38.7% 21.6%MTA 45.1% 41.8% 13.2%MVA 13.0% 39.1% 47.8%MAA 57.1% 31.4% 11.4%MPA 46.7% 33.3% 20.0%
53
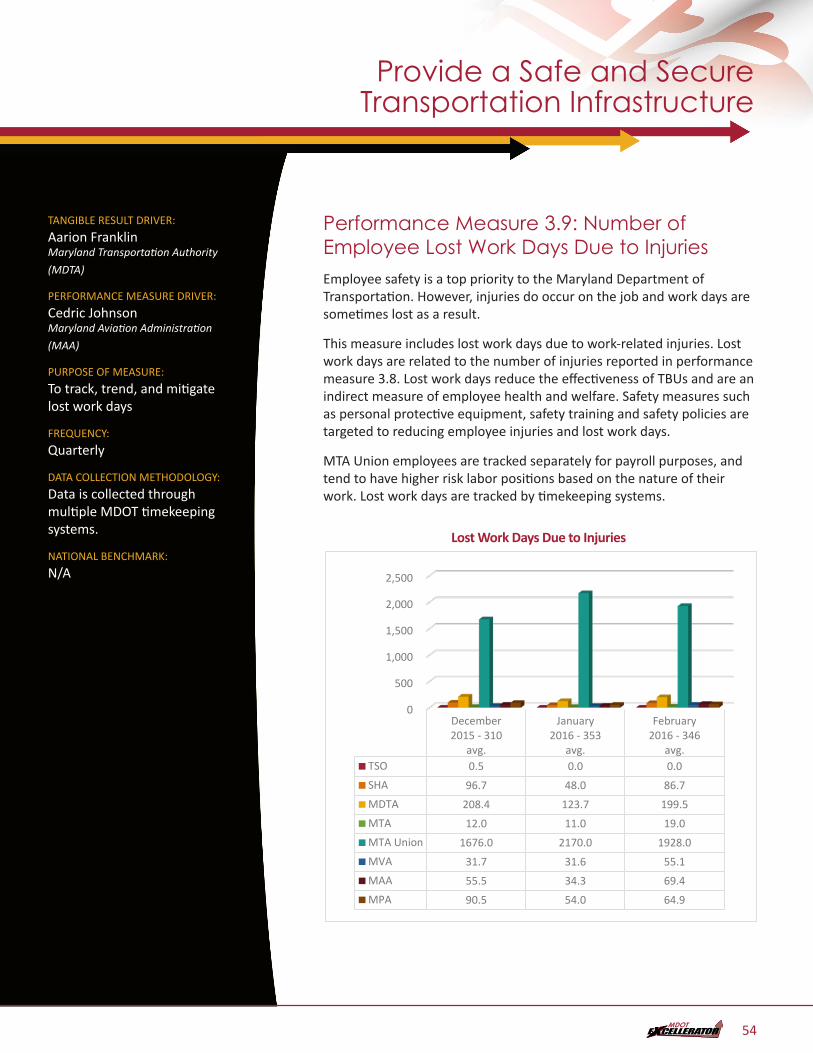
Provide a Safe and Secure Transportation Infrastructure
TANGIBLE RESULT DRIVER:
Aarion Franklin Maryland Transportation Authority
(MDTA)
PERFORMANCE MEASURE DRIVER:
Cedric Johnson Maryland Aviation Administration
(MAA)
PURPOSE OF MEASURE:
To track, trend, and mitigate lost work days
FREQUENCY:
Quarterly
DATA COLLECTION METHODOLOGY:
Data is collected through multiple MDOT timekeeping systems.
NATIONAL BENCHMARK:
N/A
Performance Measure 3.9: Number of Employee Lost Work Days Due to InjuriesEmployee safety is a top priority to the Maryland Department of Transportation. However, injuries do occur on the job and work days are sometimes lost as a result.
This measure includes lost work days due to work-related injuries. Lost work days are related to the number of injuries reported in performance measure 3.8. Lost work days reduce the effectiveness of TBUs and are an indirect measure of employee health and welfare. Safety measures such as personal protective equipment, safety training and safety policies are targeted to reducing employee injuries and lost work days.
MTA Union employees are tracked separately for payroll purposes, and tend to have higher risk labor positions based on the nature of their work. Lost work days are tracked by timekeeping systems.
Lost Work Days Due to InjuriesPM3.9 – Average Lost Work Days - DONE
0
500
1,000
1,500
2,000
2,500
December2015 - 310
avg.
January2016 - 353
avg.
February2016 - 346
avg.TSO 0.5 0.0 0.0SHA 96.7 48.0 86.7MDTA 208.4 123.7 199.5MTA 12.0 11.0 19.0MTA Union 1676.0 2170.0 1928.0MVA 31.7 31.6 55.1MAA 55.5 34.3 69.4MPA 90.5 54.0 64.9
54
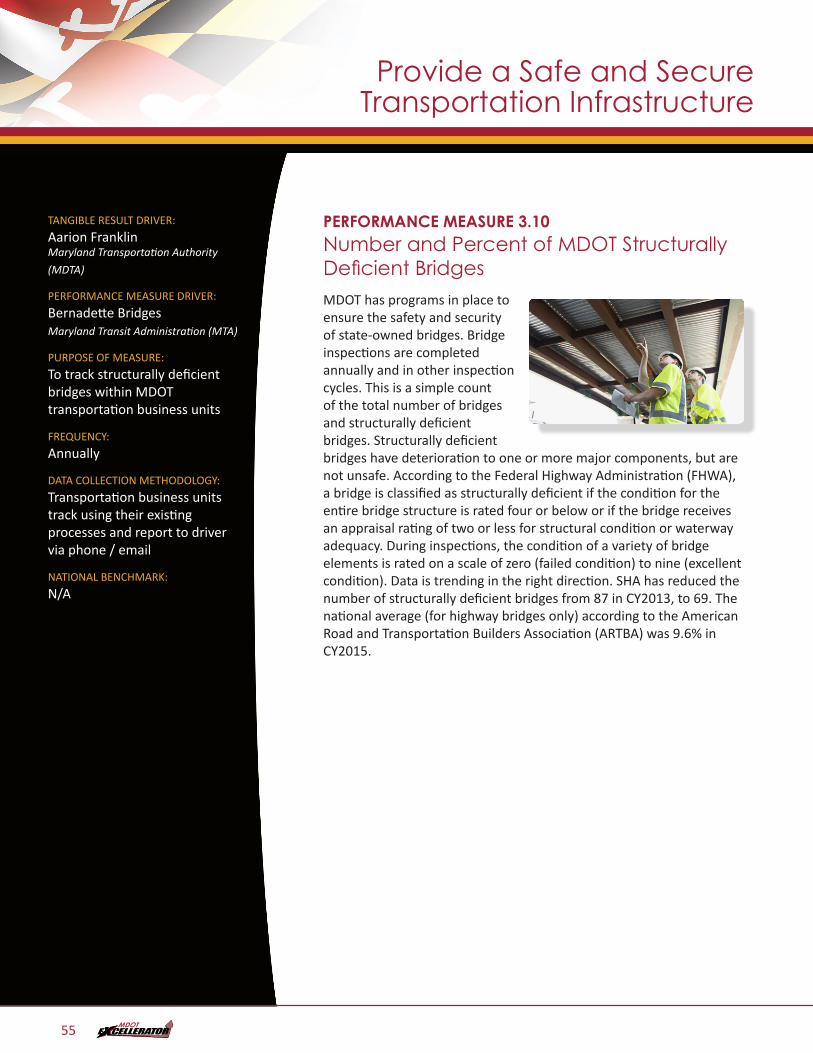
TANGIBLE RESULT DRIVER:
Aarion Franklin Maryland Transportation Authority
(MDTA)
PERFORMANCE MEASURE DRIVER:
Bernadette Bridges Maryland Transit Administration (MTA)
PURPOSE OF MEASURE:
To track structurally deficient bridges within MDOT transportation business units
FREQUENCY:
Annually
DATA COLLECTION METHODOLOGY:
Transportation business units track using their existing processes and report to driver via phone / email
NATIONAL BENCHMARK:
N/A
PERFORMANCE MEASURE 3.10Number and Percent of MDOT Structurally Deficient BridgesMDOT has programs in place to ensure the safety and security of state-owned bridges. Bridge inspections are completed annually and in other inspection cycles. This is a simple count of the total number of bridges and structurally deficient bridges. Structurally deficient bridges have deterioration to one or more major components, but are not unsafe. According to the Federal Highway Administration (FHWA), a bridge is classified as structurally deficient if the condition for the entire bridge structure is rated four or below or if the bridge receives an appraisal rating of two or less for structural condition or waterway adequacy. During inspections, the condition of a variety of bridge elements is rated on a scale of zero (failed condition) to nine (excellent condition). Data is trending in the right direction. SHA has reduced the number of structurally deficient bridges from 87 in CY2013, to 69. The national average (for highway bridges only) according to the American Road and Transportation Builders Association (ARTBA) was 9.6% in CY2015.
Provide a Safe and Secure Transportation Infrastructure
55
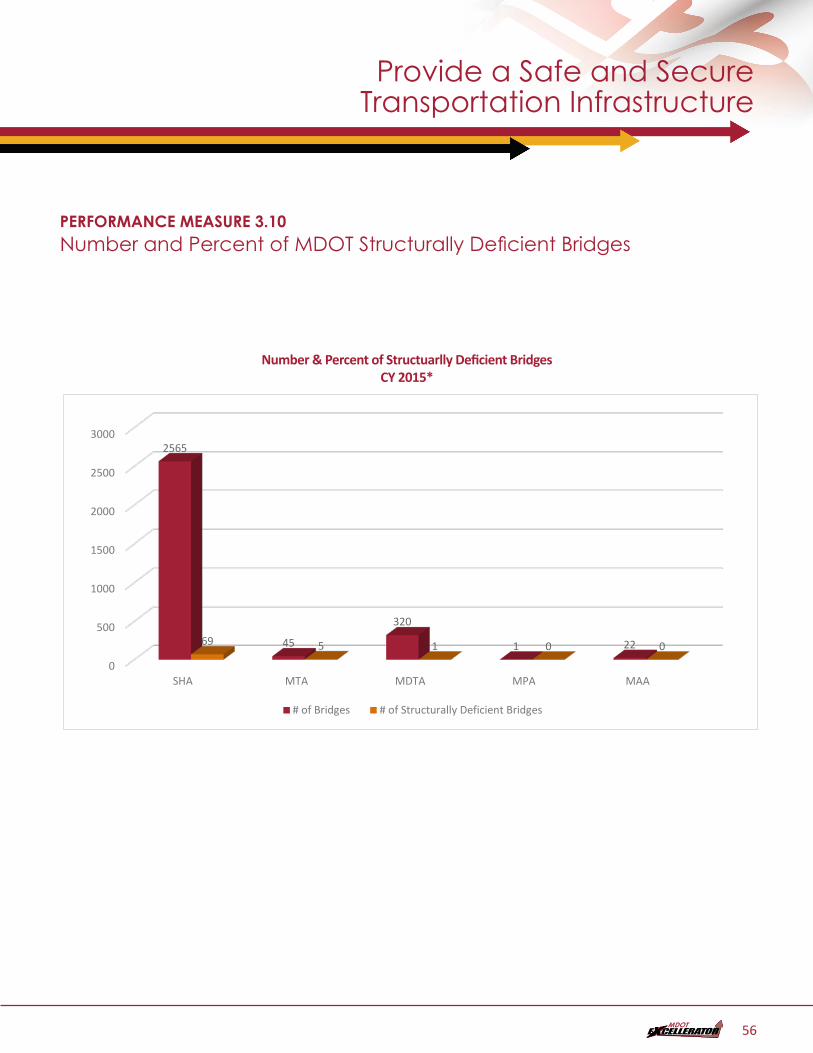
PERFORMANCE MEASURE 3.10Number and Percent of MDOT Structurally Deficient Bridges
Number & Percent of Structuarlly Deficient Bridges CY 2015*PM3.10
0
500
1000
1500
2000
2500
3000
SHA MTA MDTA MPA MAA
2565
45
320
1 2269 5 1 0 0
# of Bridges # of Structurally Deficient Bridges
Provide a Safe and Secure Transportation Infrastructure
56
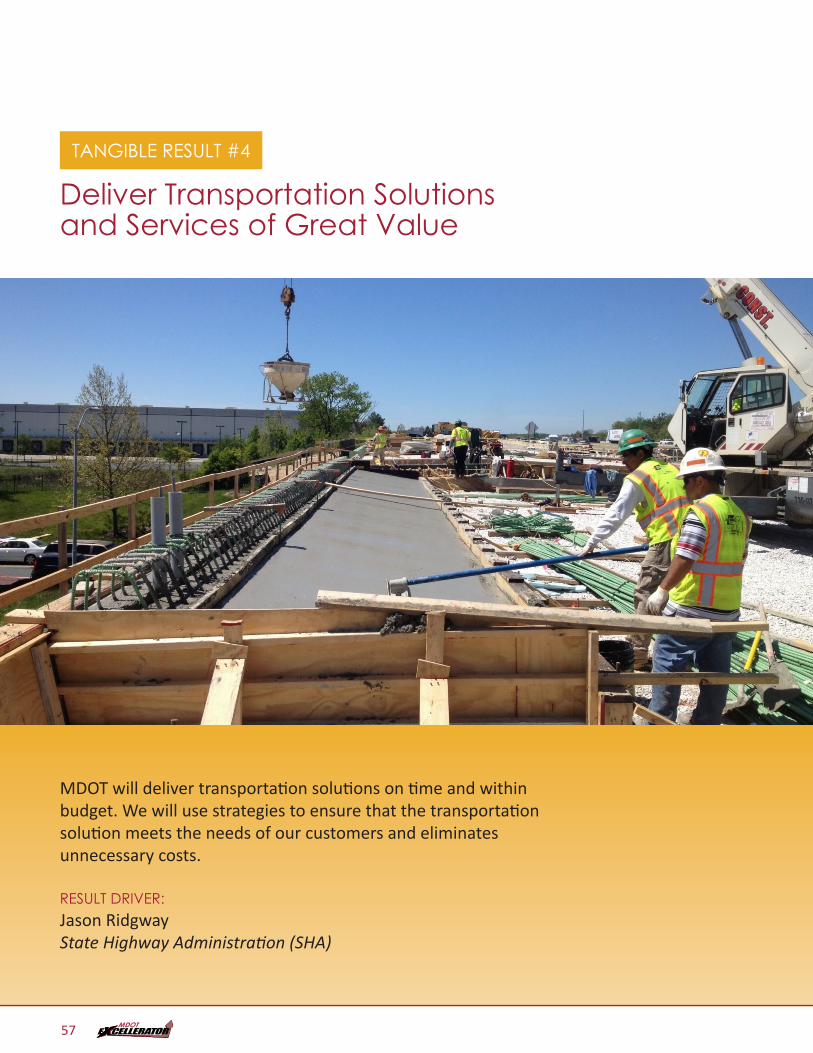
TANGIBLE RESULT #4
Deliver Transportation Solutions and Services of Great Value
MDOT will deliver transportation solutions on time and within budget. We will use strategies to ensure that the transportation solution meets the needs of our customers and eliminates unnecessary costs.
RESULT DRIVER:Jason Ridgway State Highway Administration (SHA)
57
Deliver Transportation Solutions and Services of Great Value
TANGIBLE RESULT DRIVER:
Jason Ridgway State Highway Administration (SHA)
PERFORMANCE MEASURE DRIVER:
Terri Lins Motor Vehicle Administration (MVA)
PURPOSE OF MEASURE:
To help determine how well the Department is with estimating project budgets.
FREQUENCY:
Annually
DATA COLLECTION METHODOLOGY:
Through the Capital Program Management System (CPMS) ;
The Consolidated Transportation Plan (CTP) & MDOT Procurement Offices
BENCHMARK:
N/A
PERFORMANCE MEASURE 4.1Percent of Estimated Project Budget as Compared to Final Project AwardThe Consolidated Transportation Plan (CTP) is the six- year investment plan for MDOT and its six TBUs. The CTP solidifies the Department’s planned projects and programs, both major and minor. The plan is built working with stakeholders such as Maryland citizens, local jurisdictions and the local and State delegations.
The purpose of this measure is to track the percent difference between the estimated project budgets as compared to final project award. This is a valuable measure as it fosters more accuracy and better budget management of the State’s limited transportation funding.
Accurate estimating enables MDOT to provide the services its customers want whether it is infrastructure improvements to Maryland roadways and bridges; increasing and retaining the commerce going in/out of the Port of Baltimore; attracting/retaining airlines and travelers at BWI Marshall; providing more alternative service options to Maryland citizens to conduct their MVA transaction remotely; or improving Maryland’s transit services throughout the State.
Given the diverse contract types e.g., highway construction vs information technology (IT) software development, the data has been divided into three groups by project similarity. The following graphs represent transportation business unit data for FY2013, FY2014 and FY2015 using financial thresholds for capital projects as follows:
$ All - (MDTA. SHA)
$10M - (MPA, MAA, MTA)
$400K - IT (TSO, MVA)
58
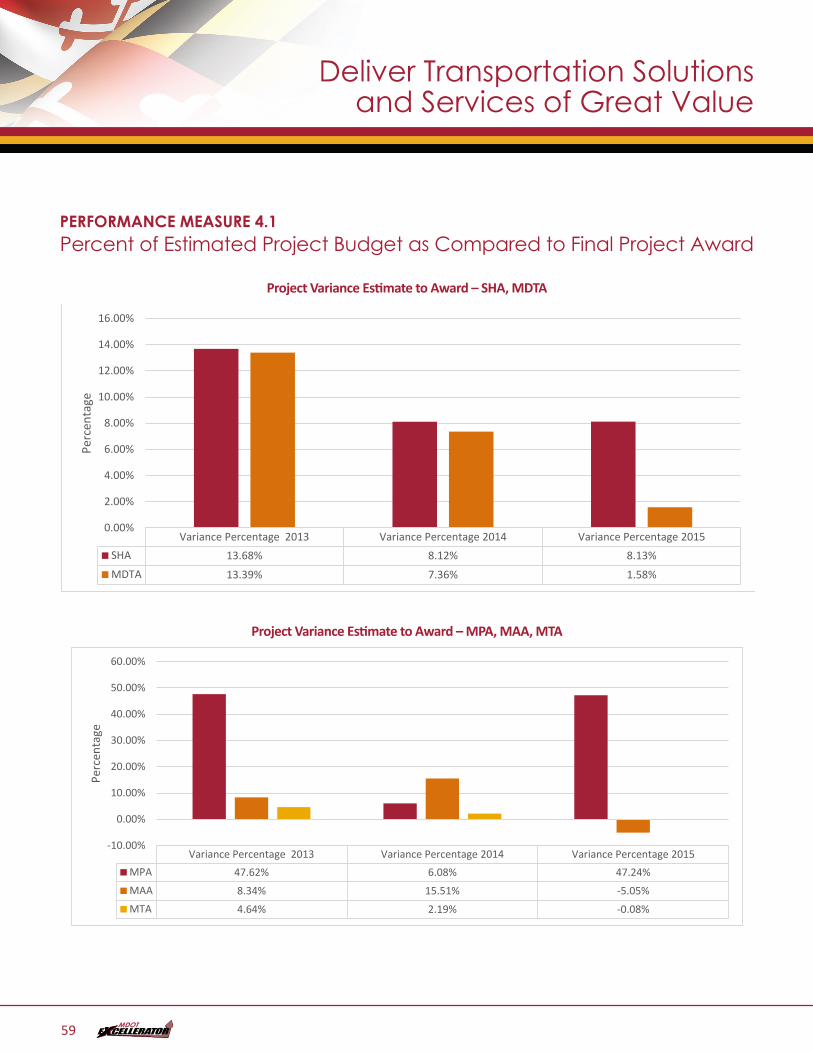
PERFORMANCE MEASURE 4.1Percent of Estimated Project Budget as Compared to Final Project Award
Project Variance Estimate to Award – SHA, MDTAPM4.1a - SHA_MDTA Project Variance Estimate to Award - DONE
Variance Percentage 2013 Variance Percentage 2014 Variance Percentage 2015SHA 13.68% 8.12% 8.13%MDTA 13.39% 7.36% 1.58%
0.00%
2.00%
4.00%
6.00%
8.00%
10.00%
12.00%
14.00%
16.00%
Perc
enta
ge
Project Variance Estimate to Award – MPA, MAA, MTAPM4.2b - MPA_MAA_MTA Project Variance Estimate to Award - DONE
Variance Percentage 2013 Variance Percentage 2014 Variance Percentage 2015MPA 47.62% 6.08% 47.24%MAA 8.34% 15.51% -5.05%MTA 4.64% 2.19% -0.08%
-10.00%
0.00%
10.00%
20.00%
30.00%
40.00%
50.00%
60.00%
Perc
enta
geDeliver Transportation Solutions
and Services of Great Value
59
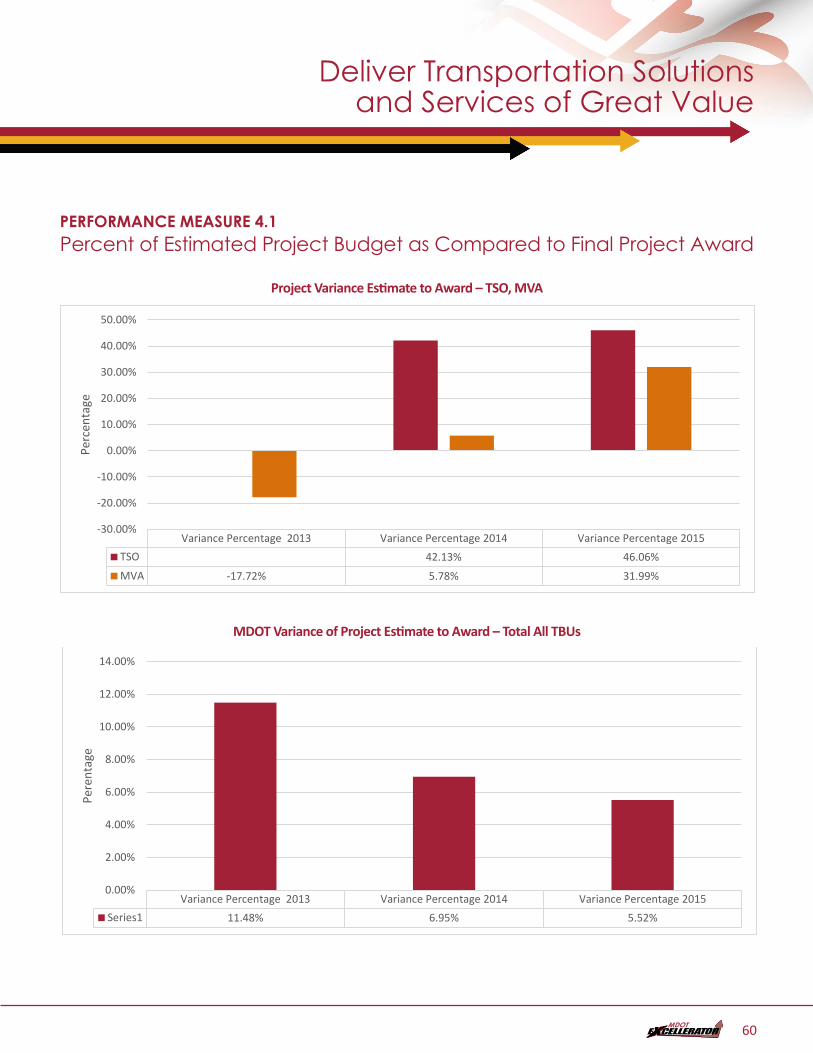
Deliver Transportation Solutions and Services of Great Value
PERFORMANCE MEASURE 4.1Percent of Estimated Project Budget as Compared to Final Project Award
Project Variance Estimate to Award – TSO, MVAPM4.2c - TSO_MVA Project Variance Estimate to Award - DONE
Variance Percentage 2013 Variance Percentage 2014 Variance Percentage 2015TSO 42.13% 46.06%MVA -17.72% 5.78% 31.99%
-30.00%
-20.00%
-10.00%
0.00%
10.00%
20.00%
30.00%
40.00%
50.00%
Perc
enta
ge
MDOT Variance of Project Estimate to Award – Total All TBUsPM4.1d - MDOT Variance of Project Estimate to Project Award Total all TBUs - DONE
Variance Percentage 2013 Variance Percentage 2014 Variance Percentage 2015Series1 11.48% 6.95% 5.52%
0.00%
2.00%
4.00%
6.00%
8.00%
10.00%
12.00%
14.00%
Pere
ntag
e
60
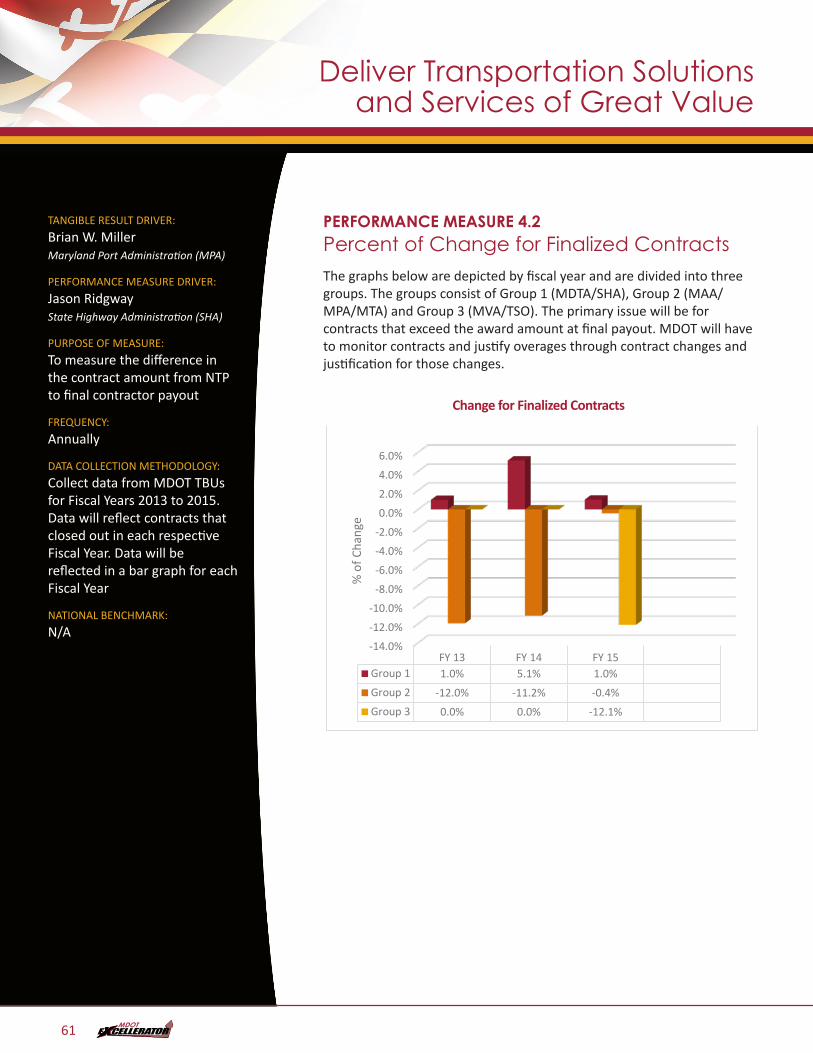
TANGIBLE RESULT DRIVER:
Brian W. Miller Maryland Port Administration (MPA)
PERFORMANCE MEASURE DRIVER:
Jason Ridgway State Highway Administration (SHA)
PURPOSE OF MEASURE:
To measure the difference in the contract amount from NTP to final contractor payout
FREQUENCY:
Annually
DATA COLLECTION METHODOLOGY:
Collect data from MDOT TBUs for Fiscal Years 2013 to 2015. Data will reflect contracts that closed out in each respective Fiscal Year. Data will be reflected in a bar graph for each Fiscal Year
NATIONAL BENCHMARK:
N/A
PERFORMANCE MEASURE 4.2Percent of Change for Finalized ContractsThe graphs below are depicted by fiscal year and are divided into three groups. The groups consist of Group 1 (MDTA/SHA), Group 2 (MAA/MPA/MTA) and Group 3 (MVA/TSO). The primary issue will be for contracts that exceed the award amount at final payout. MDOT will have to monitor contracts and justify overages through contract changes and justification for those changes.
Change for Finalized ContractsPM4.2 - Change for Finalized Contracts - DONE
-14.0%
-12.0%
-10.0%
-8.0%
-6.0%
-4.0%
-2.0%
0.0%
2.0%
4.0%
6.0%
FY 13 FY 14 FY 15Group 1 1.0% 5.1% 1.0%Group 2 -12.0% -11.2% -0.4%Group 3 0.0% 0.0% -12.1%
% o
f Cha
nge
Deliver Transportation Solutions and Services of Great Value
61
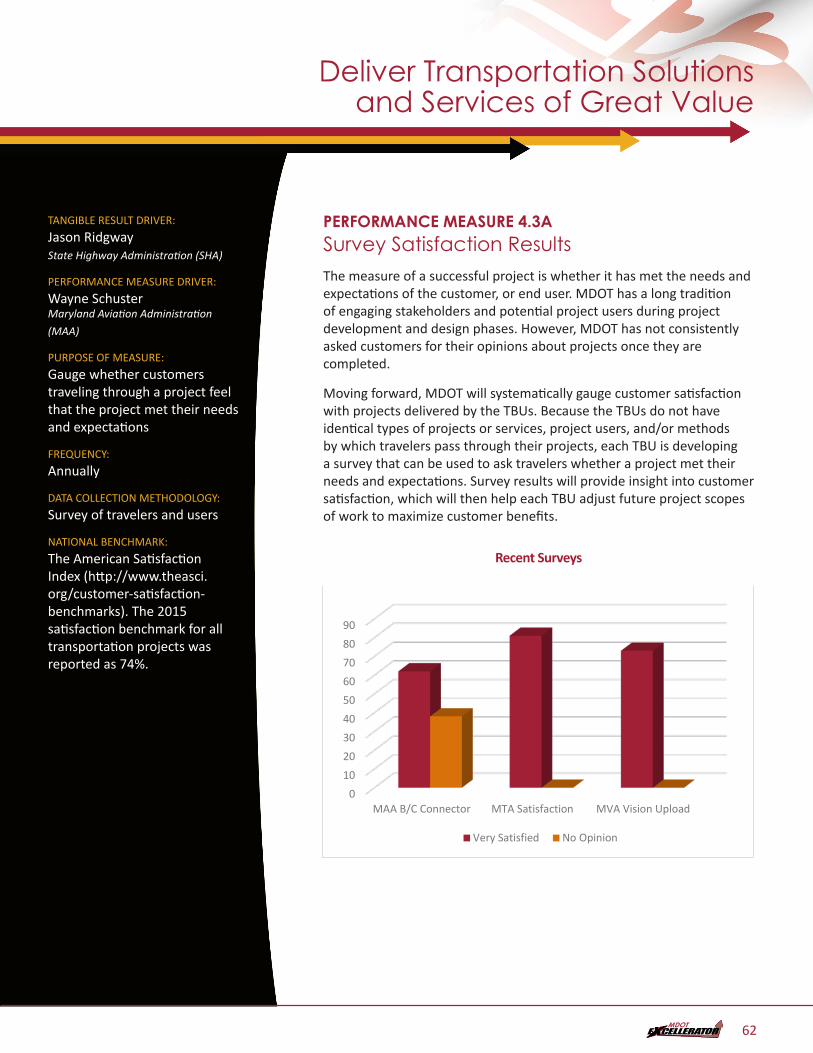
TANGIBLE RESULT DRIVER:
Jason Ridgway State Highway Administration (SHA)
PERFORMANCE MEASURE DRIVER:
Wayne Schuster Maryland Aviation Administration
(MAA)
PURPOSE OF MEASURE:
Gauge whether customers traveling through a project feel that the project met their needs and expectations
FREQUENCY:
Annually
DATA COLLECTION METHODOLOGY:
Survey of travelers and users
NATIONAL BENCHMARK:
The American Satisfaction Index (http://www.theasci.org/customer-satisfaction-benchmarks). The 2015 satisfaction benchmark for all transportation projects was reported as 74%.
PERFORMANCE MEASURE 4.3ASurvey Satisfaction ResultsThe measure of a successful project is whether it has met the needs and expectations of the customer, or end user. MDOT has a long tradition of engaging stakeholders and potential project users during project development and design phases. However, MDOT has not consistently asked customers for their opinions about projects once they are completed.
Moving forward, MDOT will systematically gauge customer satisfaction with projects delivered by the TBUs. Because the TBUs do not have identical types of projects or services, project users, and/or methods by which travelers pass through their projects, each TBU is developing a survey that can be used to ask travelers whether a project met their needs and expectations. Survey results will provide insight into customer satisfaction, which will then help each TBU adjust future project scopes of work to maximize customer benefits.
Recent SurveysPM4.3a - Recent Surveys - DONE
0102030405060708090
MAA B/C Connector MTA Satisfaction MVA Vision Upload
Very Satisfied No Opinion
Deliver Transportation Solutions and Services of Great Value
62
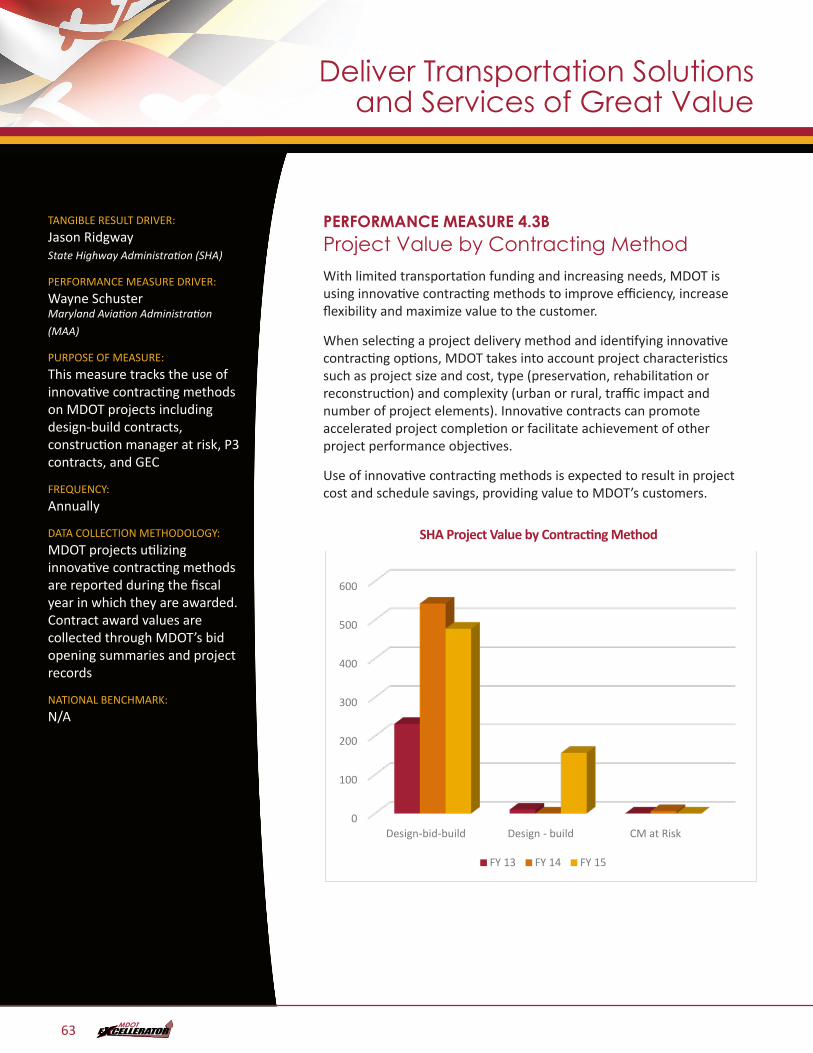
TANGIBLE RESULT DRIVER:
Jason Ridgway State Highway Administration (SHA)
PERFORMANCE MEASURE DRIVER:
Wayne Schuster Maryland Aviation Administration
(MAA)
PURPOSE OF MEASURE:
This measure tracks the use of innovative contracting methods on MDOT projects including design-build contracts, construction manager at risk, P3 contracts, and GEC
FREQUENCY:
Annually
DATA COLLECTION METHODOLOGY:
MDOT projects utilizing innovative contracting methods are reported during the fiscal year in which they are awarded. Contract award values are collected through MDOT’s bid opening summaries and project records
NATIONAL BENCHMARK:
N/A
PERFORMANCE MEASURE 4.3BProject Value by Contracting MethodWith limited transportation funding and increasing needs, MDOT is using innovative contracting methods to improve efficiency, increase flexibility and maximize value to the customer.
When selecting a project delivery method and identifying innovative contracting options, MDOT takes into account project characteristics such as project size and cost, type (preservation, rehabilitation or reconstruction) and complexity (urban or rural, traffic impact and number of project elements). Innovative contracts can promote accelerated project completion or facilitate achievement of other project performance objectives.
Use of innovative contracting methods is expected to result in project cost and schedule savings, providing value to MDOT’s customers.
SHA Project Value by Contracting MethodPM4.3b - SHA Project Value by Contracting Method - DONE
0
100
200
300
400
500
600
Design-bid-build Design - build CM at Risk
FY 13 FY 14 FY 15
Deliver Transportation Solutions and Services of Great Value
63
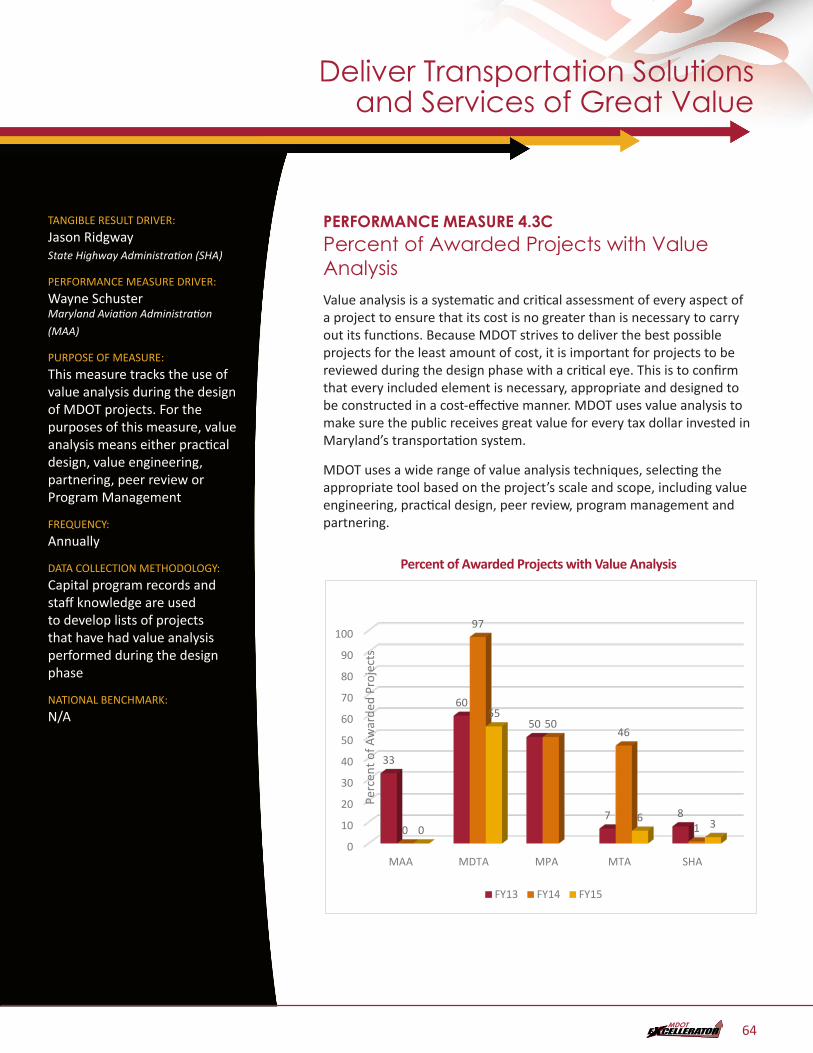
TANGIBLE RESULT DRIVER:
Jason Ridgway State Highway Administration (SHA)
PERFORMANCE MEASURE DRIVER:
Wayne Schuster Maryland Aviation Administration
(MAA)
PURPOSE OF MEASURE:
This measure tracks the use of value analysis during the design of MDOT projects. For the purposes of this measure, value analysis means either practical design, value engineering, partnering, peer review or Program Management
FREQUENCY:
Annually
DATA COLLECTION METHODOLOGY:
Capital program records and staff knowledge are used to develop lists of projects that have had value analysis performed during the design phase
NATIONAL BENCHMARK:
N/A
PERFORMANCE MEASURE 4.3CPercent of Awarded Projects with Value AnalysisValue analysis is a systematic and critical assessment of every aspect of a project to ensure that its cost is no greater than is necessary to carry out its functions. Because MDOT strives to deliver the best possible projects for the least amount of cost, it is important for projects to be reviewed during the design phase with a critical eye. This is to confirm that every included element is necessary, appropriate and designed to be constructed in a cost-effective manner. MDOT uses value analysis to make sure the public receives great value for every tax dollar invested in Maryland’s transportation system.
MDOT uses a wide range of value analysis techniques, selecting the appropriate tool based on the project’s scale and scope, including value engineering, practical design, peer review, program management and partnering.
Percent of Awarded Projects with Value AnalysisPM4.3c - Percent of Awarded Projects with Value Analysis - DONE
0
10
20
30
40
50
60
70
80
90
100
MAA MDTA MPA MTA SHA
33
60
50
7 80
97
5046
10
55
6 3
Perc
ent o
f Aw
arde
d Pr
ojec
ts
FY13 FY14 FY15
Deliver Transportation Solutions and Services of Great Value
64
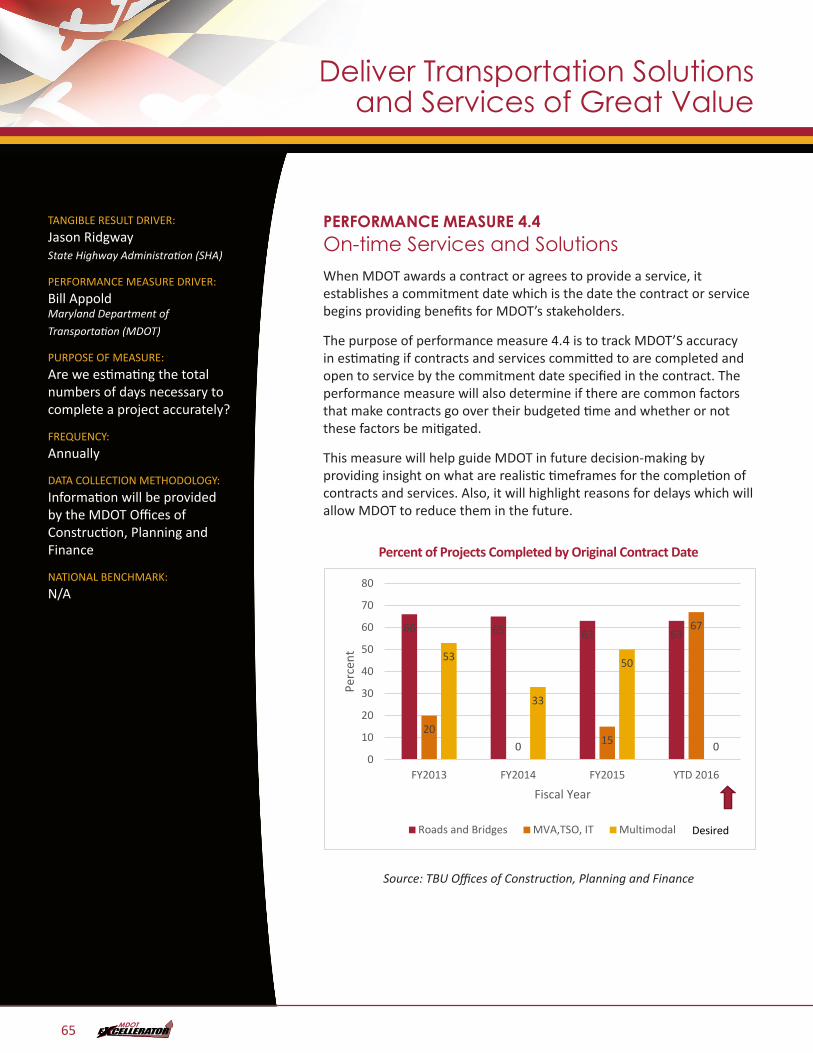
TANGIBLE RESULT DRIVER:
Jason Ridgway State Highway Administration (SHA)
PERFORMANCE MEASURE DRIVER:
Bill Appold Maryland Department of
Transportation (MDOT)
PURPOSE OF MEASURE:
Are we estimating the total numbers of days necessary to complete a project accurately?
FREQUENCY:
Annually
DATA COLLECTION METHODOLOGY:
Information will be provided by the MDOT Offices of Construction, Planning and Finance
NATIONAL BENCHMARK:
N/A
PERFORMANCE MEASURE 4.4On-time Services and SolutionsWhen MDOT awards a contract or agrees to provide a service, it establishes a commitment date which is the date the contract or service begins providing benefits for MDOT’s stakeholders.
The purpose of performance measure 4.4 is to track MDOT’S accuracy in estimating if contracts and services committed to are completed and open to service by the commitment date specified in the contract. The performance measure will also determine if there are common factors that make contracts go over their budgeted time and whether or not these factors be mitigated.
This measure will help guide MDOT in future decision-making by providing insight on what are realistic timeframes for the completion of contracts and services. Also, it will highlight reasons for delays which will allow MDOT to reduce them in the future.
Percent of Projects Completed by Original Contract DatePM4.4 - Percent of Projects Completed by Original Contract Date - DONE
66 65 63 63
200 15
67
53
33
50
00
10
20
30
40
50
60
70
80
FY2013 FY2014 FY2015 YTD 2016
Perc
ent
Fiscal Year
Roads and Bridges MVA,TSO, IT Multimodal Desired
Source: TBU Offices of Construction, Planning and Finance
Deliver Transportation Solutions and Services of Great Value
65
TANGIBLE RESULT DRIVER:
Jason Ridgway State Highway Administration (SHA)
PERFORMANCE MEASURE DRIVER:
Pat Keller Maryland Transit Administration (MTA)
PURPOSE OF MEASURE:
The measure tracks the average cost of common transportation services and solutions. The costs are analyzed and solutions to reduce costs where appropriate will be undertaken
FREQUENCY:
Annually
DATA COLLECTION METHODOLOGY:
Through the Capital Program Management System (CPMS) ;
The Consolidated Transportation Plan (CTP) &
MDOT Capital Budget, Finance and Procurement Offices
BENCHMARK:
Benchmarks are based upon trends to reduce costs and have been provided for each graph.
PERFORMANCE MEASURE 4.5Average Cost of Common Transportation Solutions and ServicesIt is MDOT’s responsibility to provide transportation solutions to the public that are of great value.
The purpose of this measure is to track, assess, analyze and then provide solutions for reducing the cost of transportation services. There are certain measures that are identifiable between TBUs such as paving, decking, bridge replacement, etc. Tracking these measures will allow some comparison across TBUs and also allow individual business units to track, analyze and provide solutions to reduce cost of services unique to the TBU, which all provide greater value to the public.
Performance measure 4.5 has nine separate measurements. These measurements include minor and major road resurfacing cost, interstate road resurfacing cost, bridge replacement cost and major bridge redecking cost. MTA’s measurements include Operating Cost Per Passenger Trip, Operating Cost Per Revenue Vehicle Mile, Passenger Trips Per Revenue Vehicle Mile and Farebox Recovery while MVA measures by using Cost Per Transaction.
Tracking of these measures is based upon actual costs associated with contracts issued for various road and bridge projects. Because data for these projects is tracked annually, in any given year there may not be an award for this type of project as can be seen from some of the MDTA data. Regardless, the data does provide a good basis for comparison and analysis.
Benchmarks are based upon year to year comparisons and, regarding cost measures, the goal is to trend towards reducing cost while providing exceptional service. Benchmarks have been provided for each of the measures.
Deliver Transportation Solutions and Services of Great Value
66
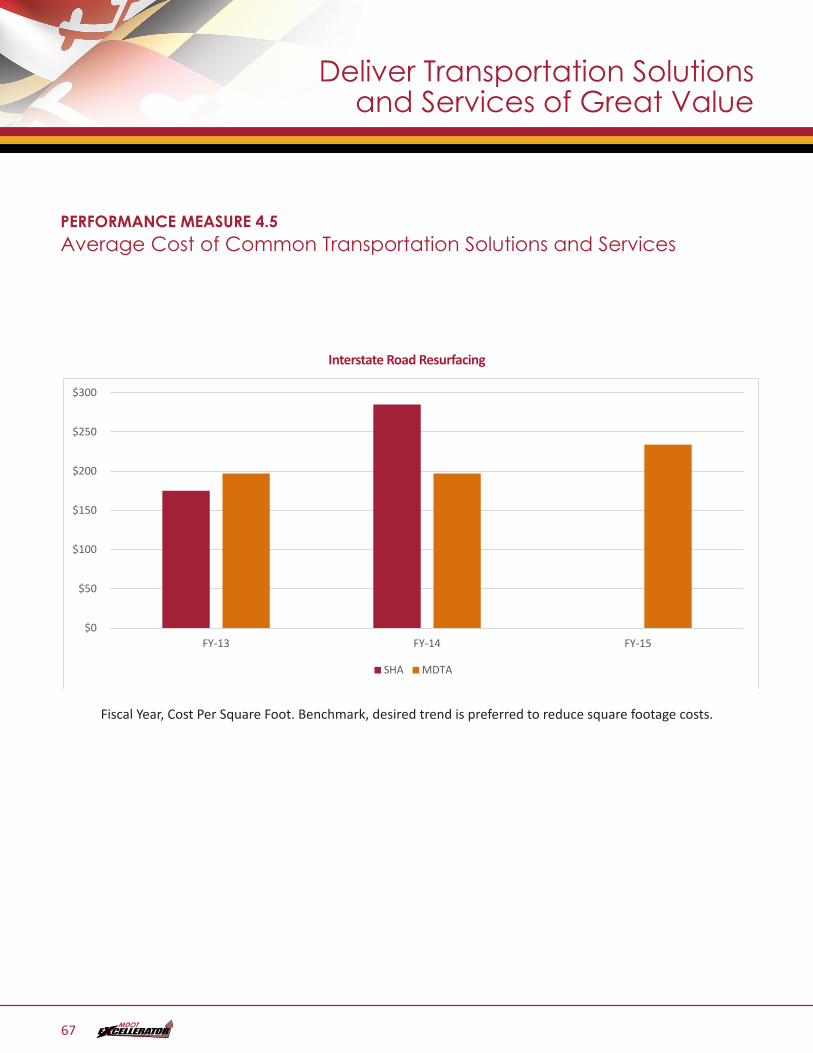
PERFORMANCE MEASURE 4.5Average Cost of Common Transportation Solutions and Services
Interstate Road ResurfacingPM4.5b
$0
$50
$100
$150
$200
$250
$300
FY-13 FY-14 FY-15
SHA MDTA
Fiscal Year, Cost Per Square Foot. Benchmark, desired trend is preferred to reduce square footage costs.
Deliver Transportation Solutions and Services of Great Value
67
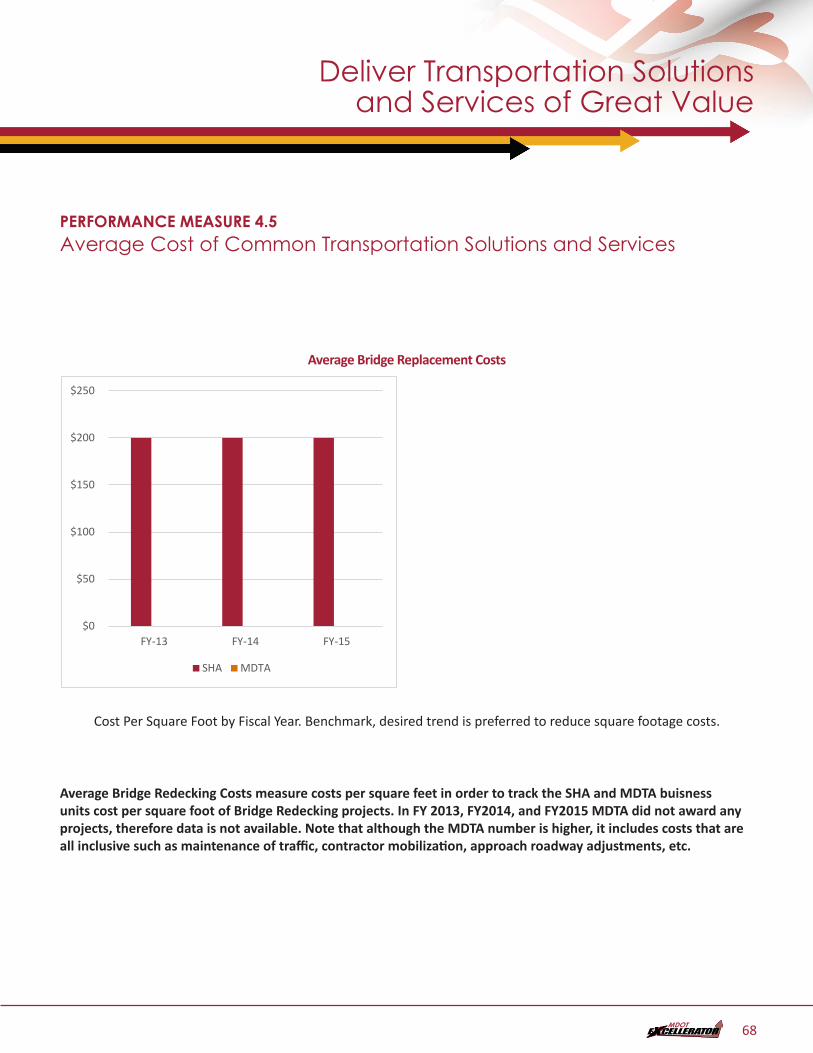
PERFORMANCE MEASURE 4.5Average Cost of Common Transportation Solutions and Services
Average Bridge Replacement CostsPM4.5c
$0
$50
$100
$150
$200
$250
FY-13 FY-14 FY-15
SHA MDTA
Cost Per Square Foot by Fiscal Year. Benchmark, desired trend is preferred to reduce square footage costs.
Deliver Transportation Solutions and Services of Great Value
Average Bridge Redecking Costs measure costs per square feet in order to track the SHA and MDTA buisness units cost per square foot of Bridge Redecking projects. In FY 2013, FY2014, and FY2015 MDTA did not award any projects, therefore data is not available. Note that although the MDTA number is higher, it includes costs that are all inclusive such as maintenance of traffic, contractor mobilization, approach roadway adjustments, etc.
68
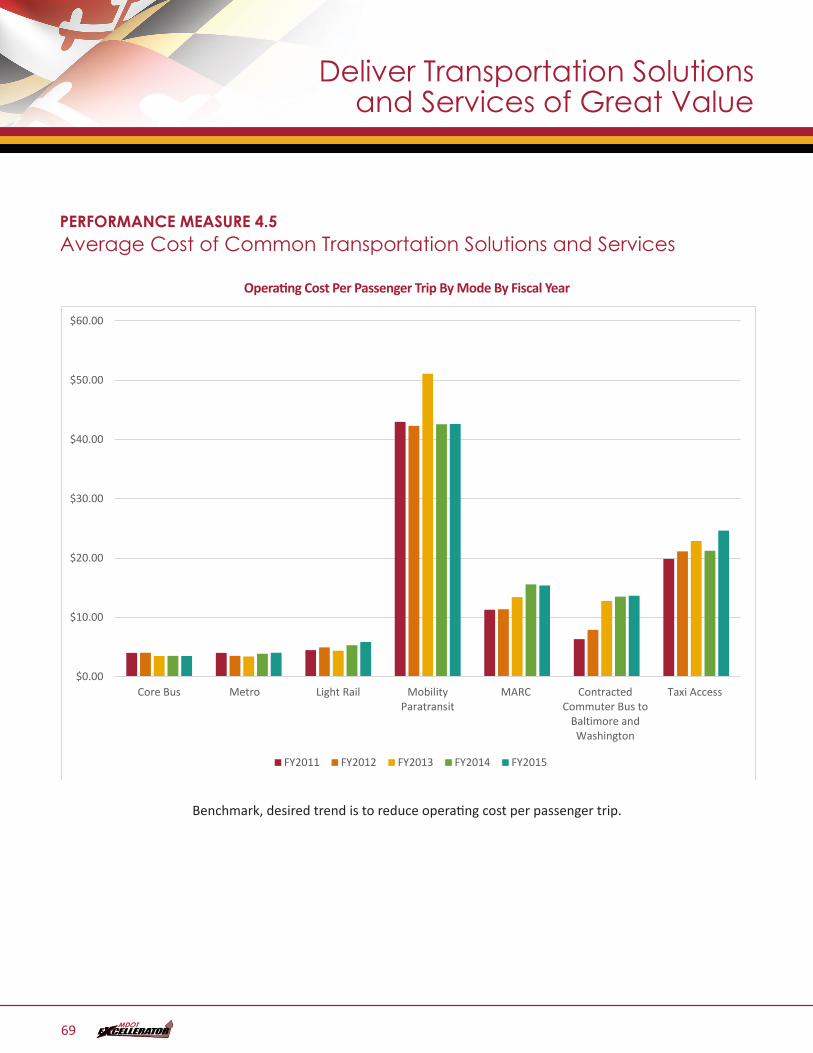
PERFORMANCE MEASURE 4.5Average Cost of Common Transportation Solutions and Services
Operating Cost Per Passenger Trip By Mode By Fiscal Year PM4.5e
$0.00
$10.00
$20.00
$30.00
$40.00
$50.00
$60.00
Core Bus Metro Light Rail MobilityParatransit
MARC ContractedCommuter Bus to
Baltimore andWashington
Taxi Access
FY2011 FY2012 FY2013 FY2014 FY2015
Benchmark, desired trend is to reduce operating cost per passenger trip.
Deliver Transportation Solutions and Services of Great Value
69
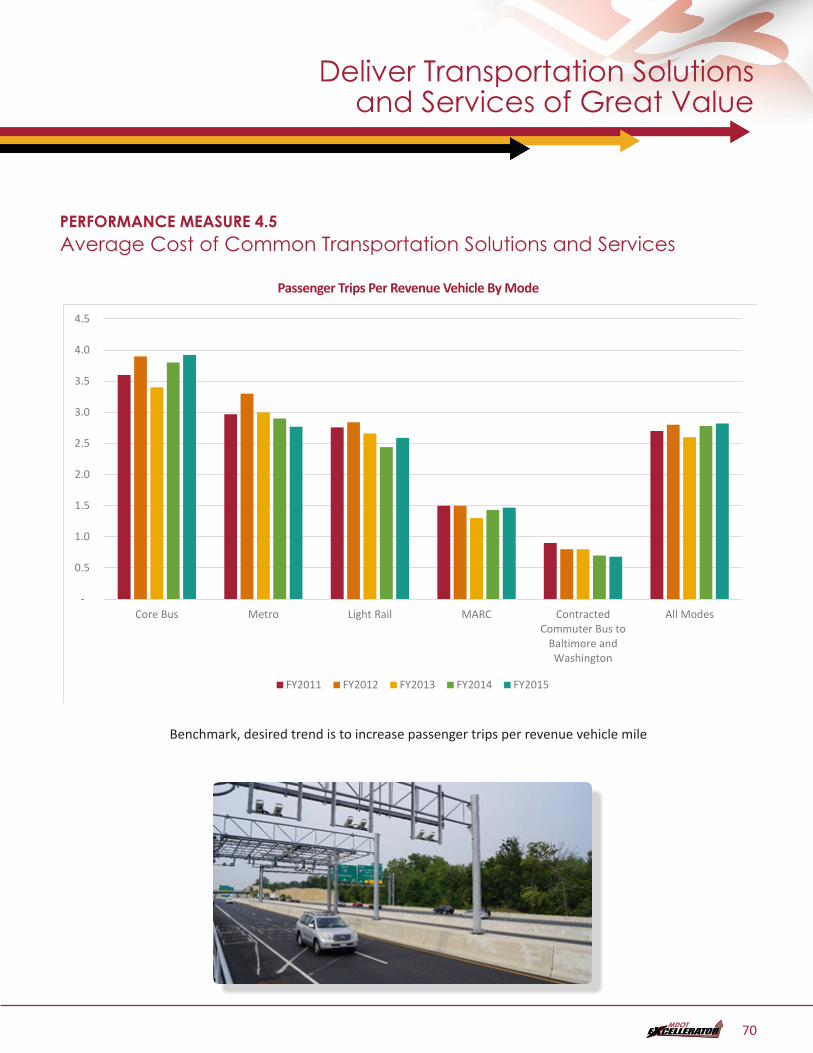
PERFORMANCE MEASURE 4.5Average Cost of Common Transportation Solutions and Services
Passenger Trips Per Revenue Vehicle By ModePM4.5f
-
0.5
1.0
1.5
2.0
2.5
3.0
3.5
4.0
4.5
Core Bus Metro Light Rail MARC ContractedCommuter Bus to
Baltimore andWashington
All Modes
FY2011 FY2012 FY2013 FY2014 FY2015
Benchmark, desired trend is to increase passenger trips per revenue vehicle mile
Deliver Transportation Solutions and Services of Great Value
70
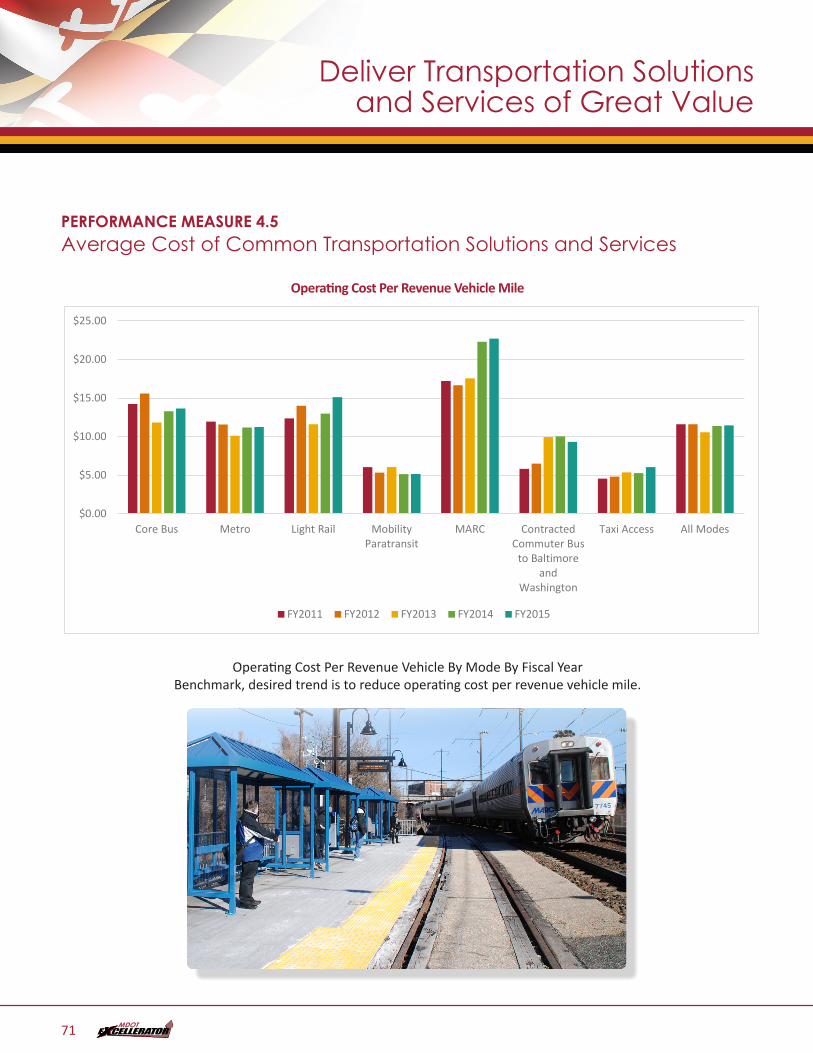
PERFORMANCE MEASURE 4.5Average Cost of Common Transportation Solutions and Services
Operating Cost Per Revenue Vehicle MilePM4.5f
$0.00
$5.00
$10.00
$15.00
$20.00
$25.00
Core Bus Metro Light Rail MobilityParatransit
MARC ContractedCommuter Bus
to Baltimoreand
Washington
Taxi Access All Modes
FY2011 FY2012 FY2013 FY2014 FY2015
Operating Cost Per Revenue Vehicle By Mode By Fiscal Year Benchmark, desired trend is to reduce operating cost per revenue vehicle mile.
Deliver Transportation Solutions and Services of Great Value
71
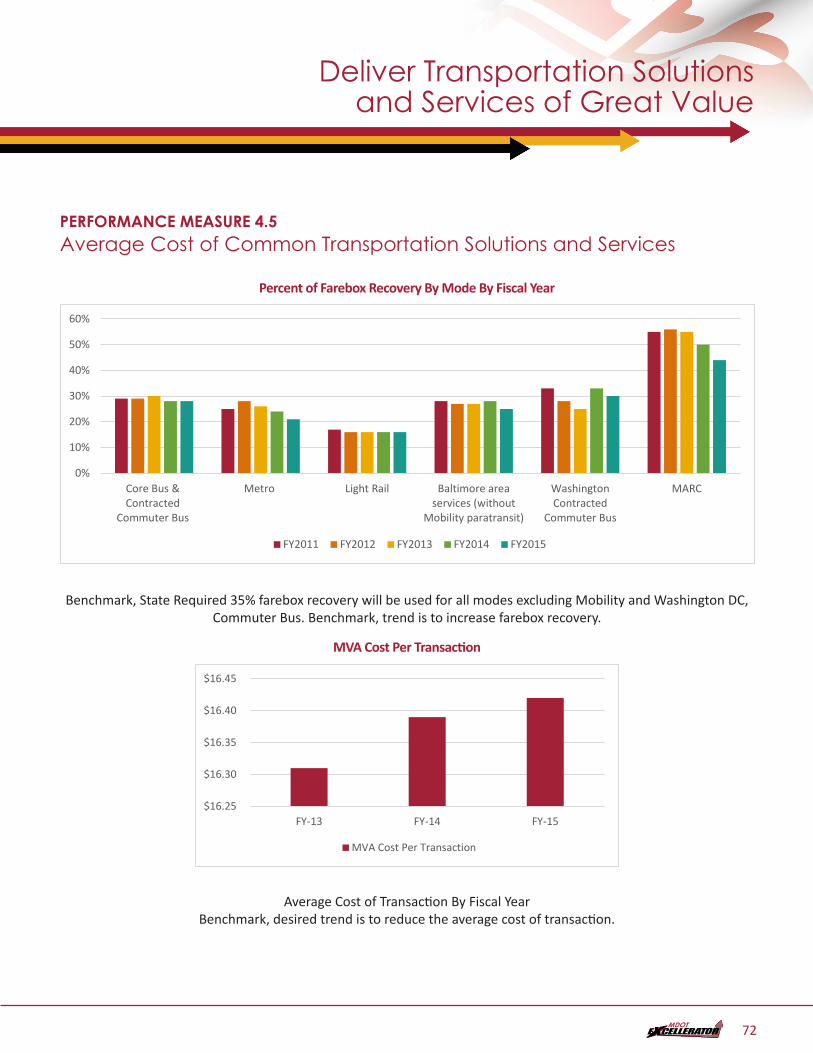
PERFORMANCE MEASURE 4.5Average Cost of Common Transportation Solutions and Services
Percent of Farebox Recovery By Mode By Fiscal YearPM4.5g
0%
10%
20%
30%
40%
50%
60%
Core Bus &Contracted
Commuter Bus
Metro Light Rail Baltimore areaservices (without
Mobility paratransit)
WashingtonContracted
Commuter Bus
MARC
FY2011 FY2012 FY2013 FY2014 FY2015
Benchmark, State Required 35% farebox recovery will be used for all modes excluding Mobility and Washington DC, Commuter Bus. Benchmark, trend is to increase farebox recovery.
MVA Cost Per Transaction
$16.25
$16.30
$16.35
$16.40
$16.45
FY-13 FY-14 FY-15
MVA Cost Per Transaction
Average Cost of Transaction By Fiscal Year Benchmark, desired trend is to reduce the average cost of transaction.
Deliver Transportation Solutions and Services of Great Value
72
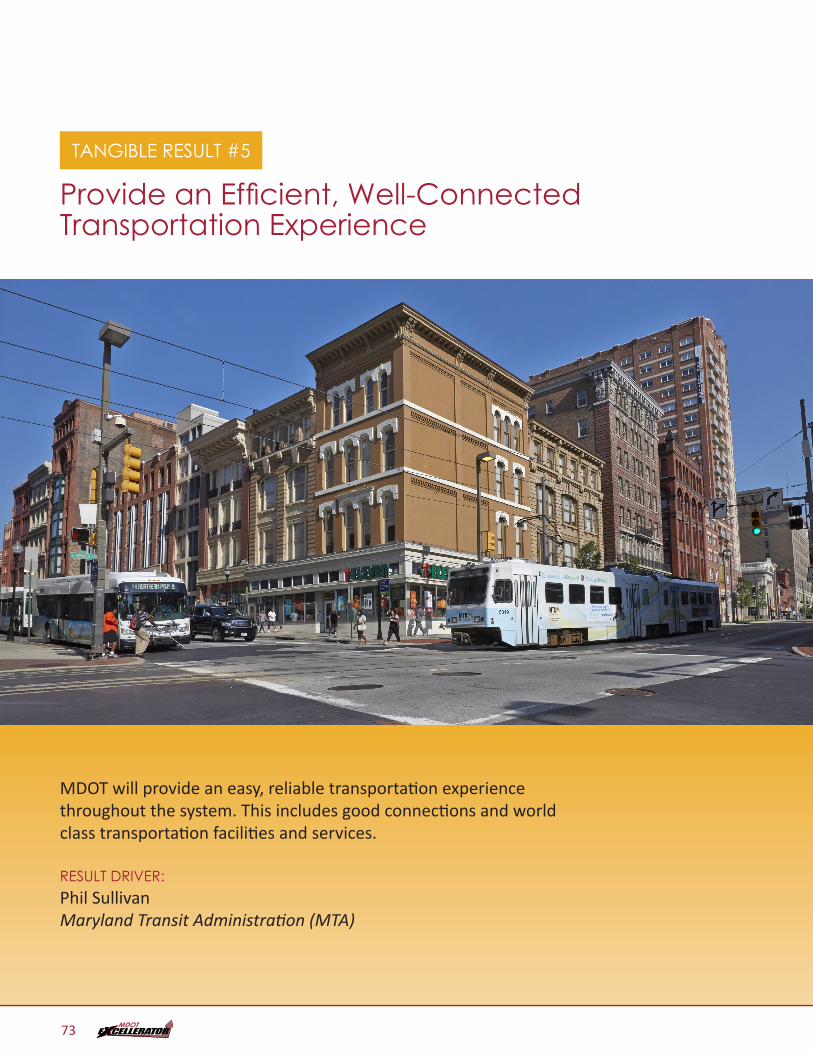
TANGIBLE RESULT #5
Provide an Efficient, Well-Connected Transportation Experience
MDOT will provide an easy, reliable transportation experience throughout the system. This includes good connections and world class transportation facilities and services.
RESULT DRIVER:Phil Sullivan Maryland Transit Administration (MTA)
73
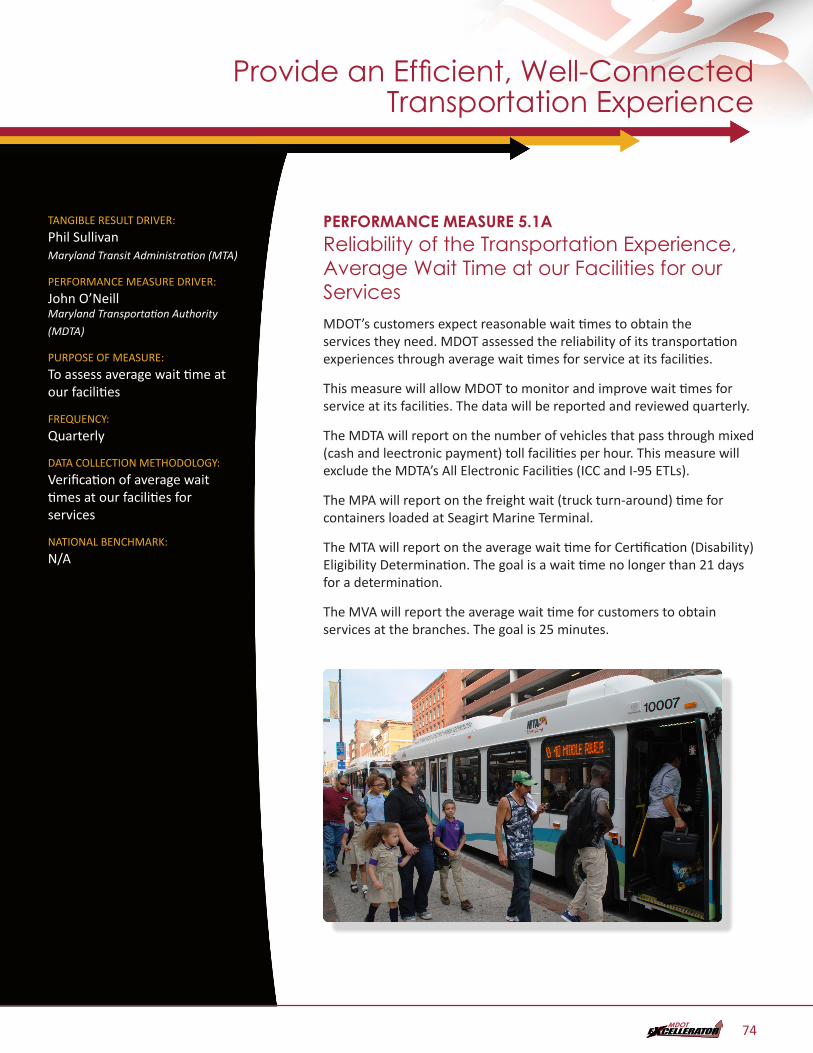
Provide an Efficient, Well-Connected Transportation Experience
TANGIBLE RESULT DRIVER:
Phil Sullivan Maryland Transit Administration (MTA)
PERFORMANCE MEASURE DRIVER:
John O’Neill Maryland Transportation Authority
(MDTA)
PURPOSE OF MEASURE:
To assess average wait time at our facilities
FREQUENCY:
Quarterly
DATA COLLECTION METHODOLOGY:
Verification of average wait times at our facilities for services
NATIONAL BENCHMARK:
N/A
PERFORMANCE MEASURE 5.1AReliability of the Transportation Experience, Average Wait Time at our Facilities for our ServicesMDOT’s customers expect reasonable wait times to obtain the services they need. MDOT assessed the reliability of its transportation experiences through average wait times for service at its facilities.
This measure will allow MDOT to monitor and improve wait times for service at its facilities. The data will be reported and reviewed quarterly.
The MDTA will report on the number of vehicles that pass through mixed (cash and leectronic payment) toll facilities per hour. This measure will exclude the MDTA’s All Electronic Facilities (ICC and I-95 ETLs).
The MPA will report on the freight wait (truck turn-around) time for containers loaded at Seagirt Marine Terminal.
The MTA will report on the average wait time for Certification (Disability) Eligibility Determination. The goal is a wait time no longer than 21 days for a determination.
The MVA will report the average wait time for customers to obtain services at the branches. The goal is 25 minutes.
74
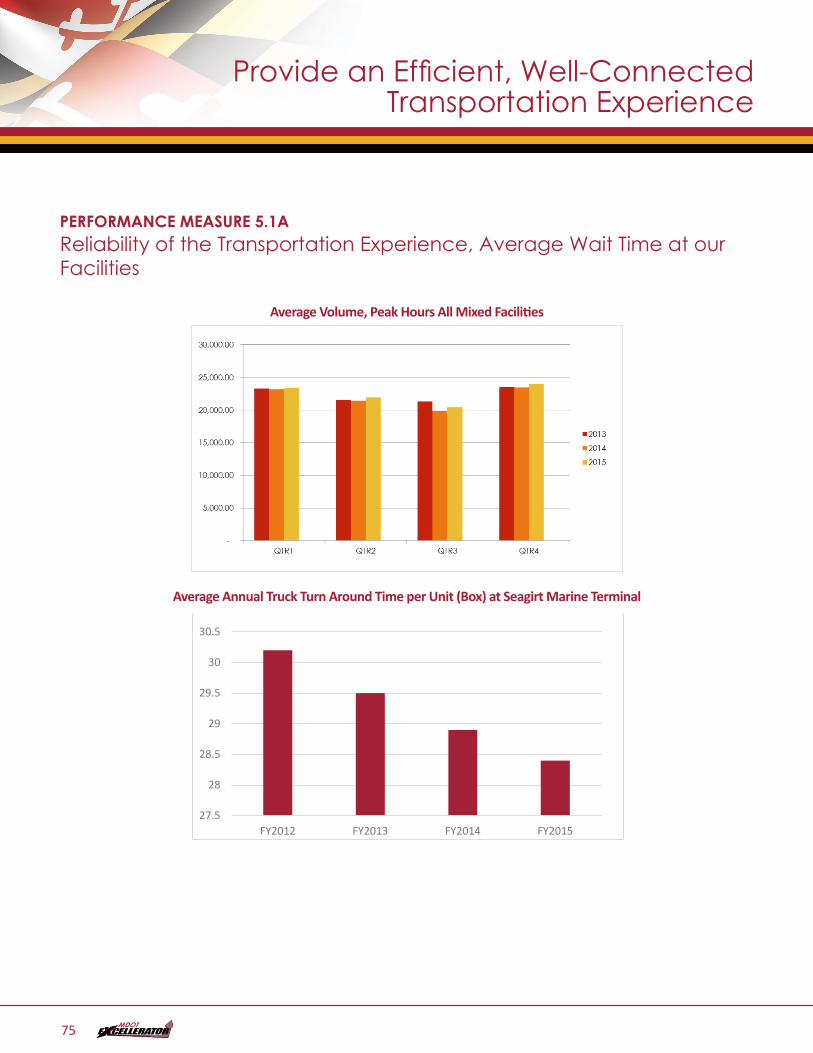
PERFORMANCE MEASURE 5.1AReliability of the Transportation Experience, Average Wait Time at our Facilities
Average Volume, Peak Hours All Mixed Facilities
PM5.1a1
Average Annual Truck Turn Around Time per Unit (Box) at Seagirt Marine TerminalPM5.1a2 - Average Annual Truck Turn Around Time per Unit (Box) at Seagirt Marine Terminal - DONE
27.5
28
28.5
29
29.5
30
30.5
FY2012 FY2013 FY2014 FY2015
Provide an Efficient, Well-Connected Transportation Experience
75
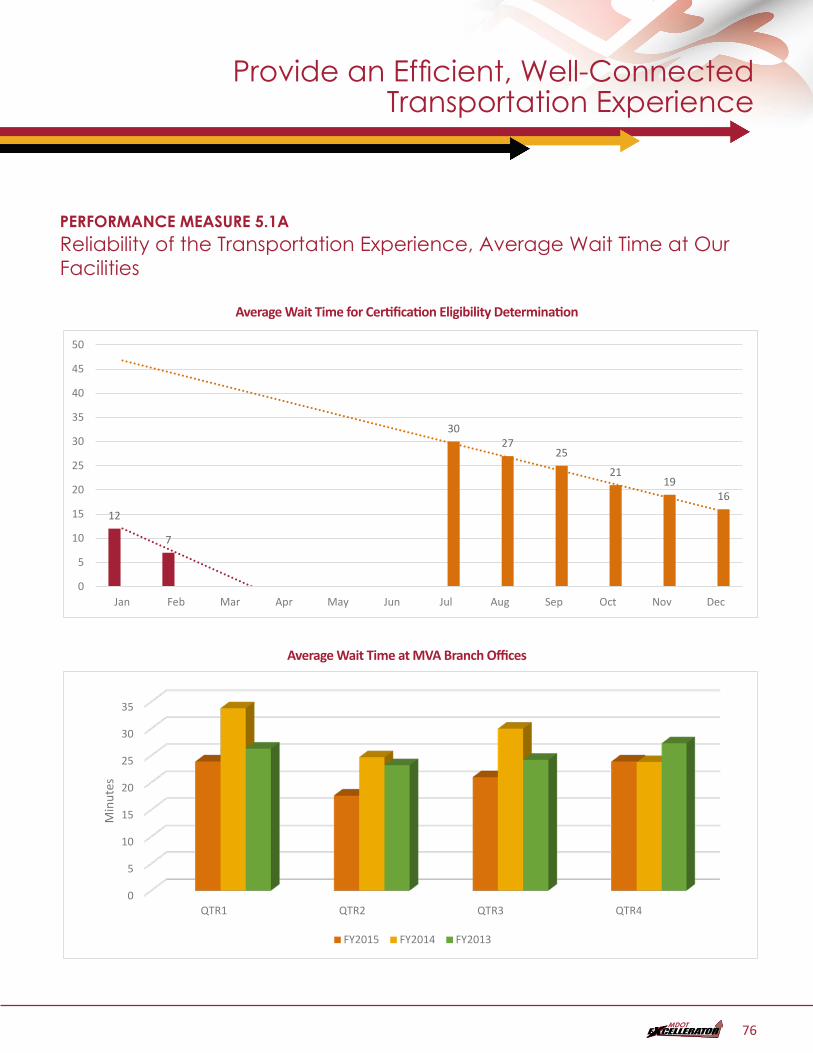
PERFORMANCE MEASURE 5.1AReliability of the Transportation Experience, Average Wait Time at Our Facilities
Average Wait Time for Certification Eligibility DeterminationPM5.1a3
12
7
3027
25
2119
16
0
5
10
15
20
25
30
35
40
45
50
Jan Feb Mar Apr May Jun Jul Aug Sep Oct Nov Dec
Average Wait Time at MVA Branch OfficesPM5.1a4 - Average Wait Time at MVA Branch Offices - DONE
0
5
10
15
20
25
30
35
QTR1 QTR2 QTR3 QTR4
Min
utes
FY2015 FY2014 FY2013
Provide an Efficient, Well-Connected Transportation Experience
76
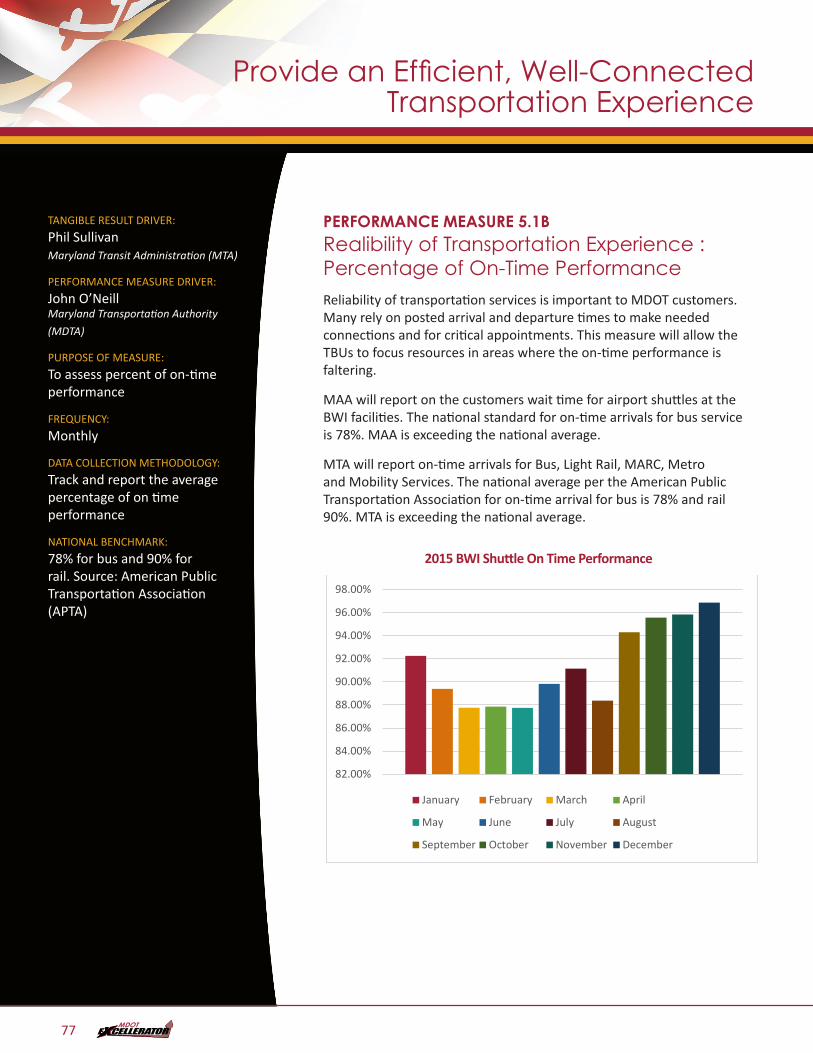
TANGIBLE RESULT DRIVER:
Phil Sullivan Maryland Transit Administration (MTA)
PERFORMANCE MEASURE DRIVER:
John O’Neill Maryland Transportation Authority
(MDTA)
PURPOSE OF MEASURE:
To assess percent of on-time performance
FREQUENCY:
Monthly
DATA COLLECTION METHODOLOGY:
Track and report the average percentage of on time performance
NATIONAL BENCHMARK:
78% for bus and 90% for rail. Source: American Public Transportation Association (APTA)
PERFORMANCE MEASURE 5.1BRealibility of Transportation Experience : Percentage of On-Time PerformanceReliability of transportation services is important to MDOT customers. Many rely on posted arrival and departure times to make needed connections and for critical appointments. This measure will allow the TBUs to focus resources in areas where the on-time performance is faltering.
MAA will report on the customers wait time for airport shuttles at the BWI facilities. The national standard for on-time arrivals for bus service is 78%. MAA is exceeding the national average.
MTA will report on-time arrivals for Bus, Light Rail, MARC, Metro and Mobility Services. The national average per the American Public Transportation Association for on-time arrival for bus is 78% and rail 90%. MTA is exceeding the national average.
2015 BWI Shuttle On Time PerformancePM5.1b - 2015 BWI Shuttle On Time Performance - DONE
82.00%
84.00%
86.00%
88.00%
90.00%
92.00%
94.00%
96.00%
98.00%
January February March April
May June July August
September October November December
Provide an Efficient, Well-Connected Transportation Experience
77
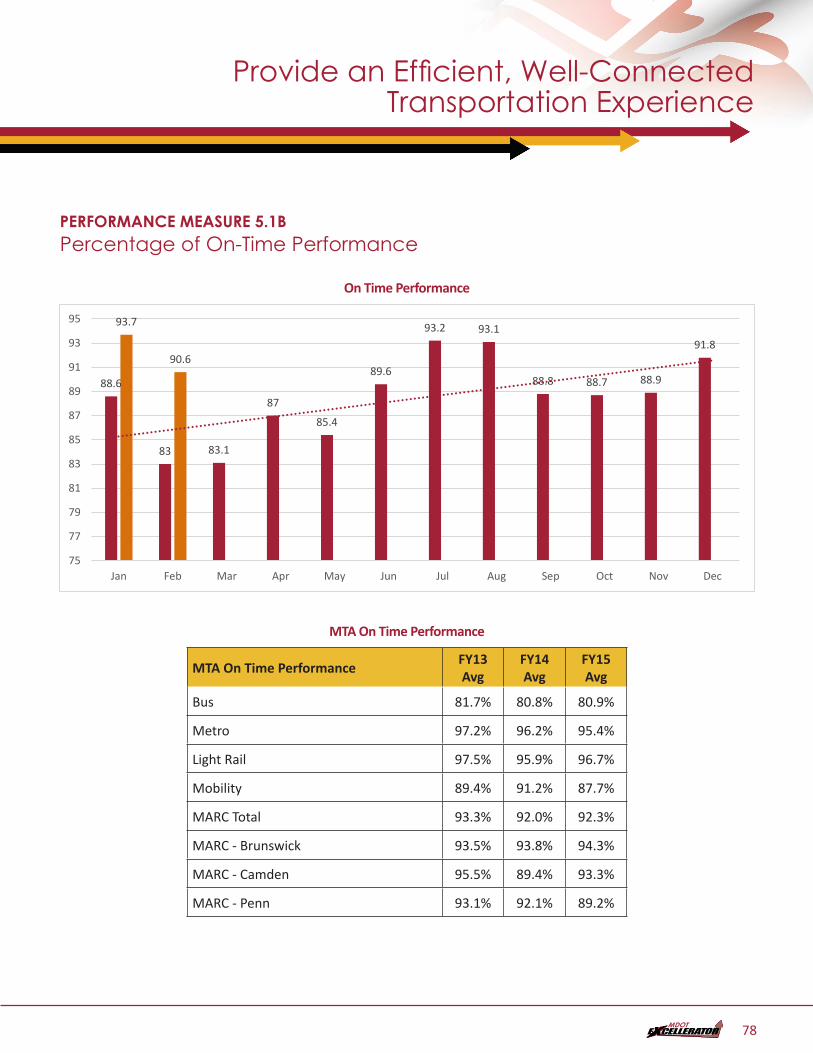
PERFORMANCE MEASURE 5.1BPercentage of On-Time Performance
On Time PerformancePM5.1b
88.6
83 83.1
87
85.4
89.6
93.2 93.1
88.8 88.7 88.9
91.8
93.7
90.6
75
77
79
81
83
85
87
89
91
93
95
Jan Feb Mar Apr May Jun Jul Aug Sep Oct Nov Dec
MTA On Time Performance
MTA On Time PerformanceFY13 Avg
FY14 Avg
FY15 Avg
Bus 81.7% 80.8% 80.9%
Metro 97.2% 96.2% 95.4%
Light Rail 97.5% 95.9% 96.7%
Mobility 89.4% 91.2% 87.7%
MARC Total 93.3% 92.0% 92.3%
MARC - Brunswick 93.5% 93.8% 94.3%
MARC - Camden 95.5% 89.4% 93.3%
MARC - Penn 93.1% 92.1% 89.2%
Provide an Efficient, Well-Connected Transportation Experience
78
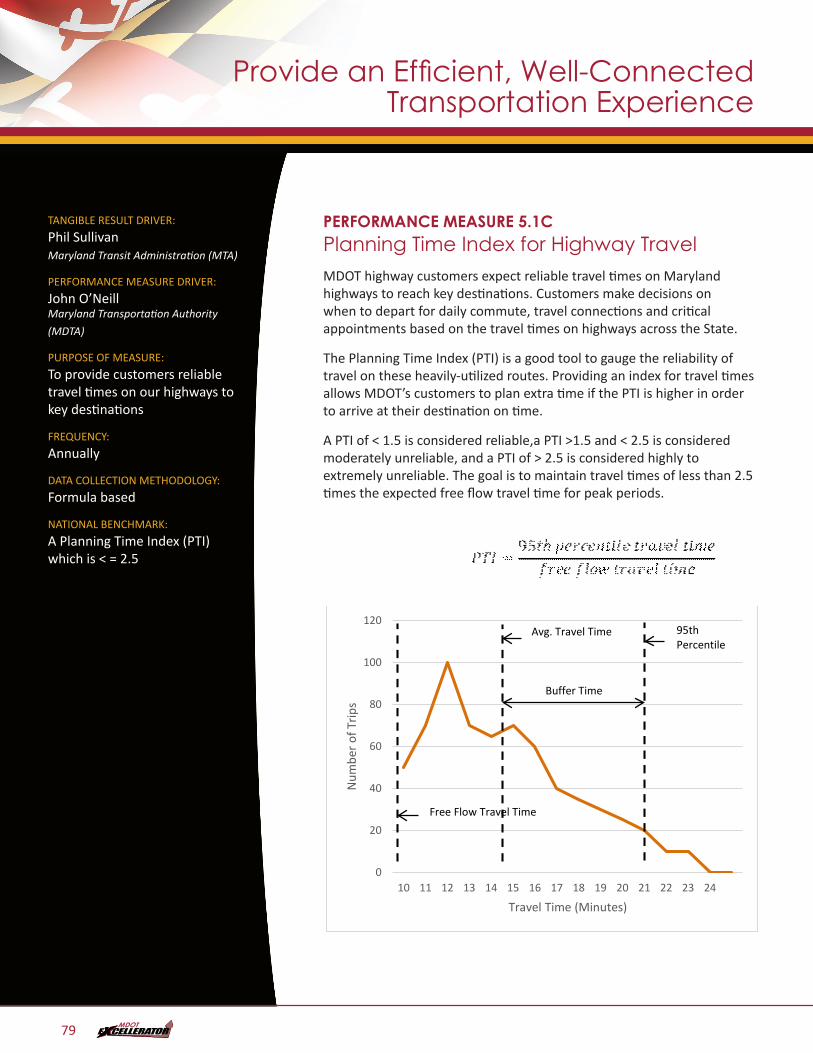
TANGIBLE RESULT DRIVER:
Phil Sullivan Maryland Transit Administration (MTA)
PERFORMANCE MEASURE DRIVER:
John O’Neill Maryland Transportation Authority
(MDTA)
PURPOSE OF MEASURE:
To provide customers reliable travel times on our highways to key destinations
FREQUENCY:
Annually
DATA COLLECTION METHODOLOGY:
Formula based
NATIONAL BENCHMARK:
A Planning Time Index (PTI) which is < = 2.5
PERFORMANCE MEASURE 5.1CPlanning Time Index for Highway TravelMDOT highway customers expect reliable travel times on Maryland highways to reach key destinations. Customers make decisions on when to depart for daily commute, travel connections and critical appointments based on the travel times on highways across the State.
The Planning Time Index (PTI) is a good tool to gauge the reliability of travel on these heavily-utilized routes. Providing an index for travel times allows MDOT’s customers to plan extra time if the PTI is higher in order to arrive at their destination on time.
A PTI of < 1.5 is considered reliable,a PTI >1.5 and < 2.5 is considered moderately unreliable, and a PTI of > 2.5 is considered highly to extremely unreliable. The goal is to maintain travel times of less than 2.5 times the expected free flow travel time for peak periods.
PM5.1c
0
20
40
60
80
100
120
10 11 12 13 14 15 16 17 18 19 20 21 22 23 24
Num
ber o
f Trip
s
Travel Time (Minutes)
Free Flow Travel Time
Buffer Time
Avg. Travel Time 95th Percentile
Provide an Efficient, Well-Connected Transportation Experience
79
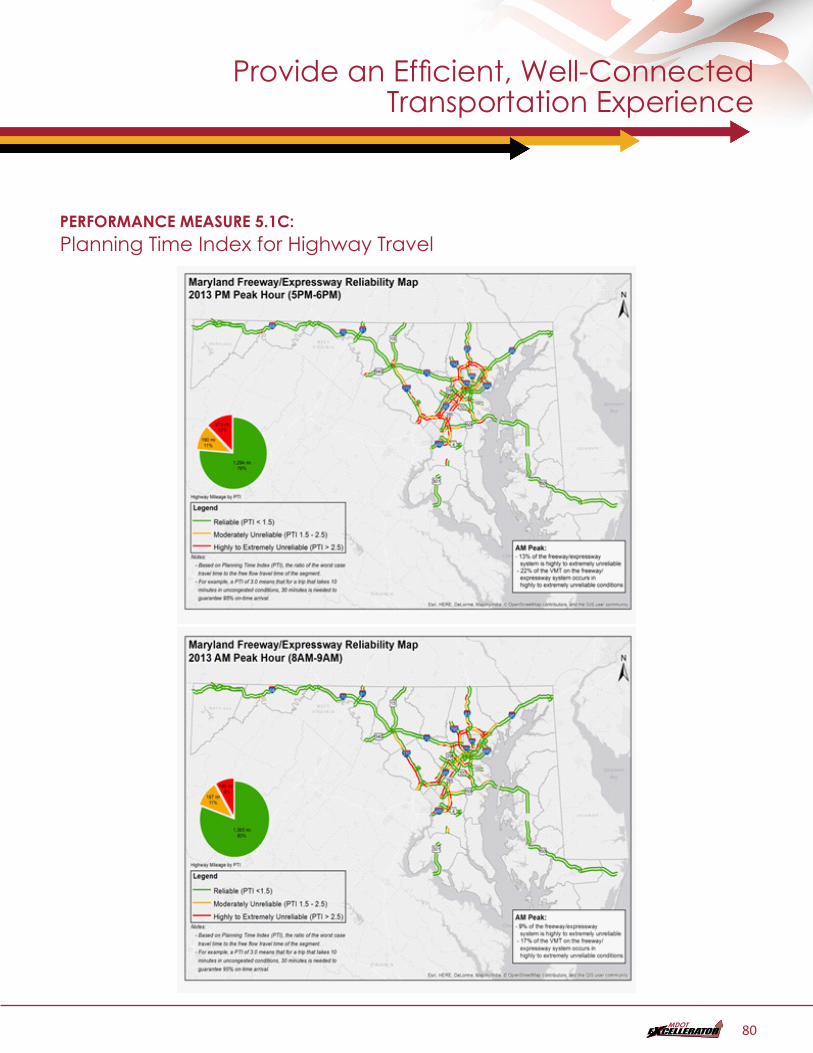
PERFORMANCE MEASURE 5.1C: Planning Time Index for Highway Travel
Provide an Efficient, Well-Connected Transportation Experience
80
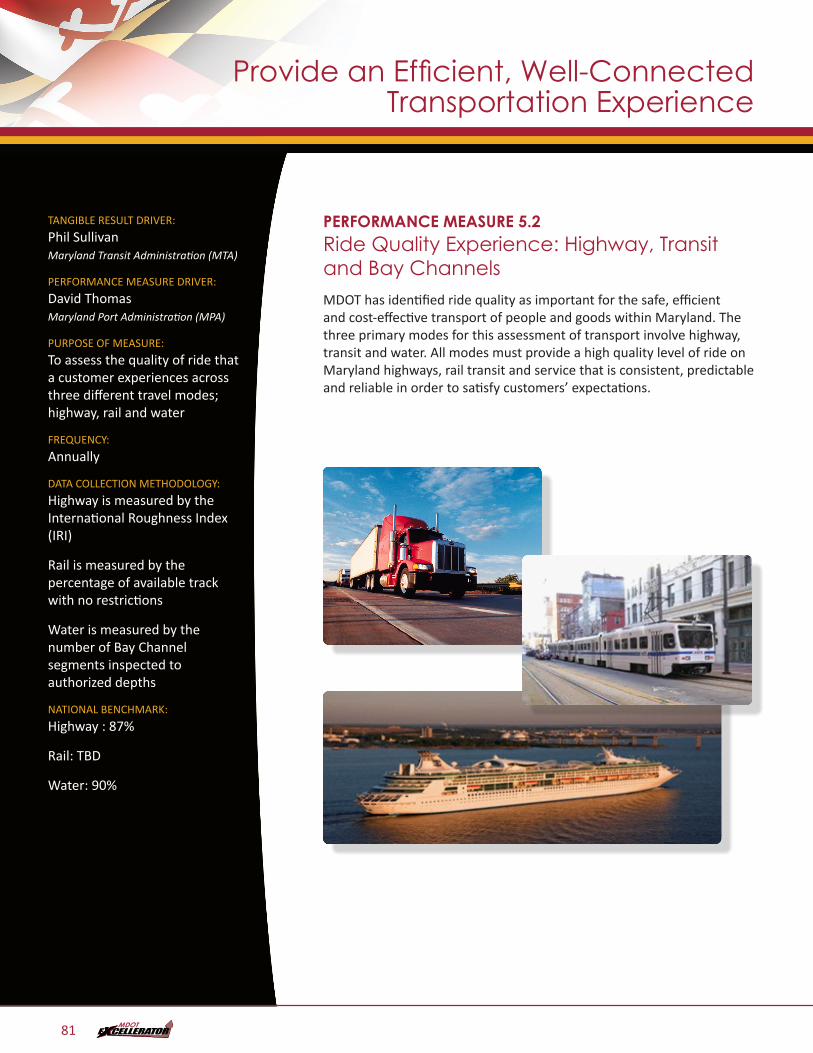
TANGIBLE RESULT DRIVER:
Phil Sullivan Maryland Transit Administration (MTA)
PERFORMANCE MEASURE DRIVER:
David Thomas Maryland Port Administration (MPA)
PURPOSE OF MEASURE:
To assess the quality of ride that a customer experiences across three different travel modes; highway, rail and water
FREQUENCY:
Annually
DATA COLLECTION METHODOLOGY:
Highway is measured by the International Roughness Index (IRI)
Rail is measured by the percentage of available track with no restrictions
Water is measured by the number of Bay Channel segments inspected to authorized depths
NATIONAL BENCHMARK:
Highway : 87%
Rail: TBD
Water: 90%
PERFORMANCE MEASURE 5.2Ride Quality Experience: Highway, Transit and Bay ChannelsMDOT has identified ride quality as important for the safe, efficient and cost-effective transport of people and goods within Maryland. The three primary modes for this assessment of transport involve highway, transit and water. All modes must provide a high quality level of ride on Maryland highways, rail transit and service that is consistent, predictable and reliable in order to satisfy customers’ expectations.
Provide an Efficient, Well-Connected Transportation Experience
81
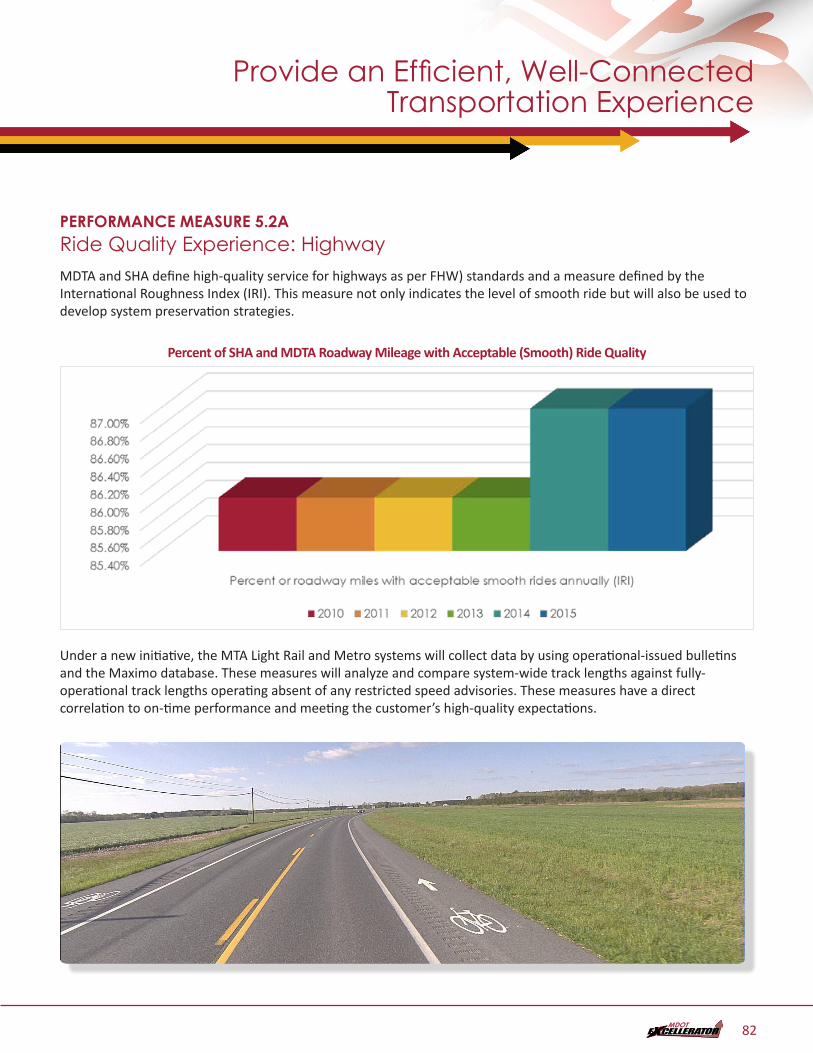
PERFORMANCE MEASURE 5.2ARide Quality Experience: Highway MDTA and SHA define high-quality service for highways as per FHW) standards and a measure defined by the International Roughness Index (IRI). This measure not only indicates the level of smooth ride but will also be used to develop system preservation strategies.
Percent of SHA and MDTA Roadway Mileage with Acceptable (Smooth) Ride Quality
PM5.2a – No data
Under a new initiative, the MTA Light Rail and Metro systems will collect data by using operational-issued bulletins and the Maximo database. These measures will analyze and compare system-wide track lengths against fully-operational track lengths operating absent of any restricted speed advisories. These measures have a direct correlation to on-time performance and meeting the customer’s high-quality expectations.
Provide an Efficient, Well-Connected Transportation Experience
82
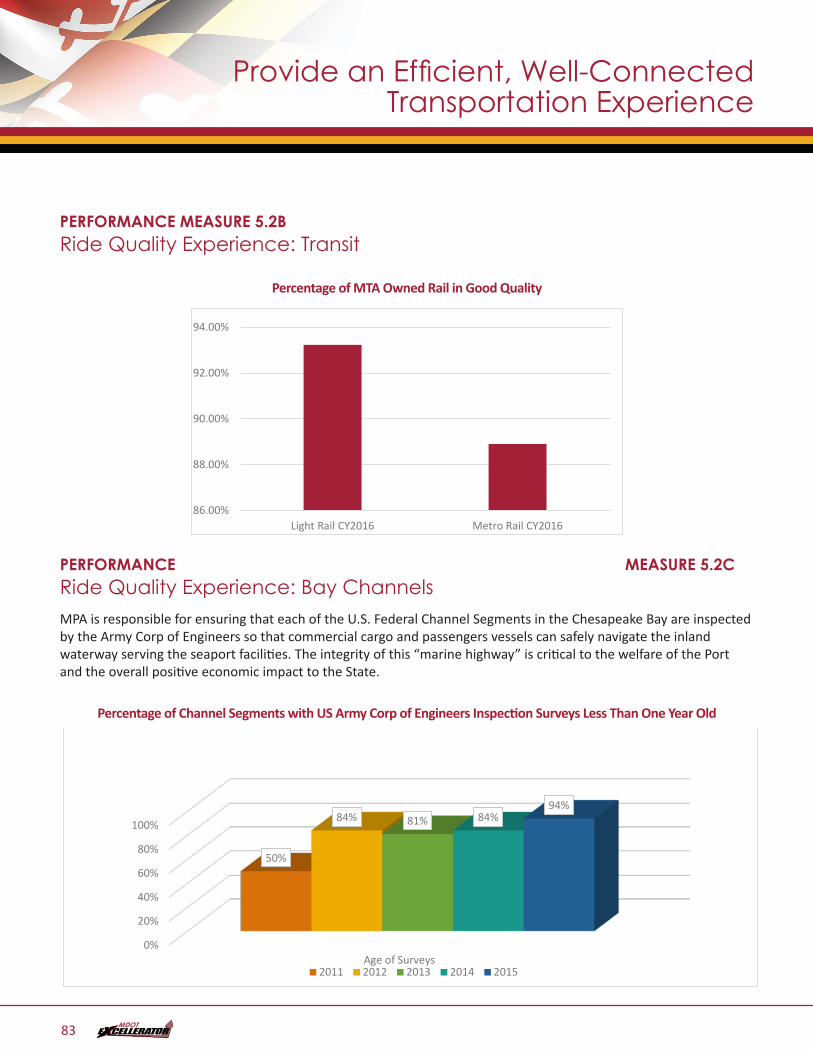
PERFORMANCE MEASURE 5.2BRide Quality Experience: Transit
Percentage of MTA Owned Rail in Good QualityPM5.2b – Ride Quality Experience: Percentage of MTA Owned Rail in Good Quality - DONE
86.00%
88.00%
90.00%
92.00%
94.00%
Light Rail CY2016 Metro Rail CY2016
PERFORMANCE MEASURE 5.2CRide Quality Experience: Bay ChannelsMPA is responsible for ensuring that each of the U.S. Federal Channel Segments in the Chesapeake Bay are inspected by the Army Corp of Engineers so that commercial cargo and passengers vessels can safely navigate the inland waterway serving the seaport facilities. The integrity of this “marine highway” is critical to the welfare of the Port and the overall positive economic impact to the State.
Percentage of Channel Segments with US Army Corp of Engineers Inspection Surveys Less Than One Year OldPM5.2c - 5.2c: Percentage of channel segments with Army Corps of Engineers channel inspection surveys ≤ 1 year old - DONE
0%
20%
40%
60%
80%
100%
Age of Surveys
50%
84% 81% 84%94%
2011 2012 2013 2014 2015
Provide an Efficient, Well-Connected Transportation Experience
83
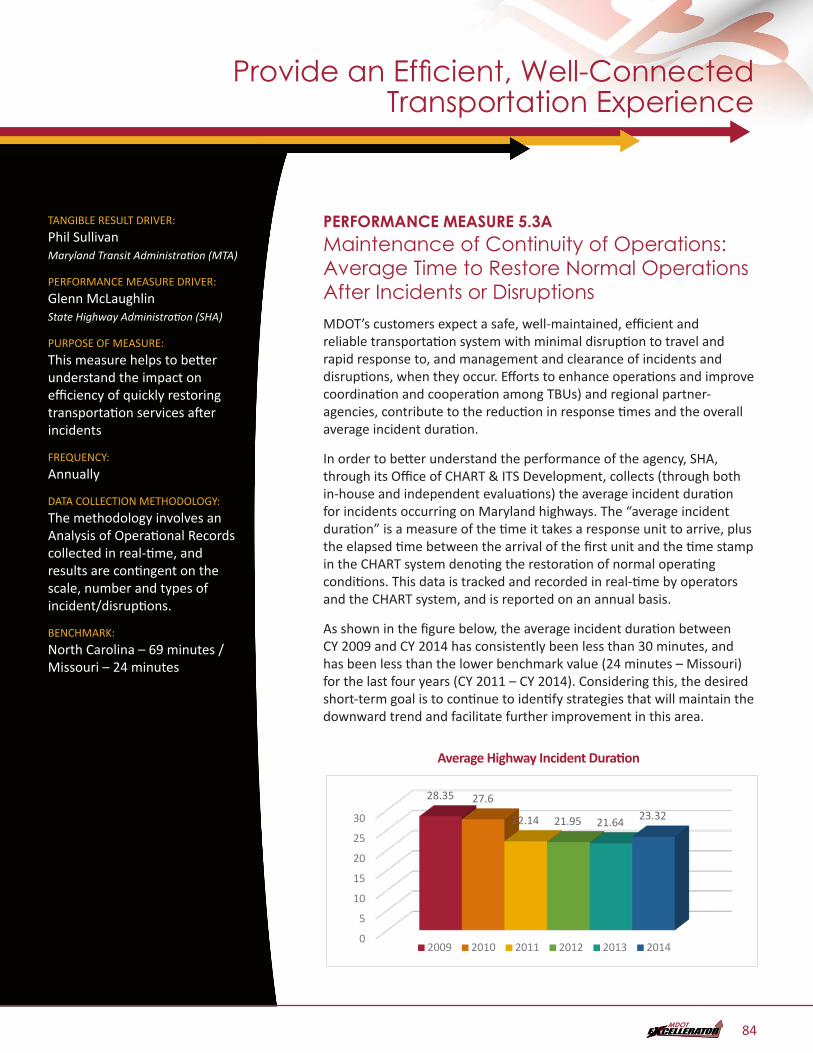
TANGIBLE RESULT DRIVER:
Phil Sullivan Maryland Transit Administration (MTA)
PERFORMANCE MEASURE DRIVER:
Glenn McLaughlin State Highway Administration (SHA)
PURPOSE OF MEASURE:
This measure helps to better understand the impact on efficiency of quickly restoring transportation services after incidents
FREQUENCY:
Annually
DATA COLLECTION METHODOLOGY:
The methodology involves an Analysis of Operational Records collected in real-time, and results are contingent on the scale, number and types of incident/disruptions.
BENCHMARK:
North Carolina – 69 minutes / Missouri – 24 minutes
PERFORMANCE MEASURE 5.3AMaintenance of Continuity of Operations: Average Time to Restore Normal Operations After Incidents or Disruptions MDOT’s customers expect a safe, well-maintained, efficient and reliable transportation system with minimal disruption to travel and rapid response to, and management and clearance of incidents and disruptions, when they occur. Efforts to enhance operations and improve coordination and cooperation among TBUs) and regional partner-agencies, contribute to the reduction in response times and the overall average incident duration.
In order to better understand the performance of the agency, SHA, through its Office of CHART & ITS Development, collects (through both in-house and independent evaluations) the average incident duration for incidents occurring on Maryland highways. The “average incident duration” is a measure of the time it takes a response unit to arrive, plus the elapsed time between the arrival of the first unit and the time stamp in the CHART system denoting the restoration of normal operating conditions. This data is tracked and recorded in real-time by operators and the CHART system, and is reported on an annual basis.
As shown in the figure below, the average incident duration between CY 2009 and CY 2014 has consistently been less than 30 minutes, and has been less than the lower benchmark value (24 minutes – Missouri) for the last four years (CY 2011 – CY 2014). Considering this, the desired short-term goal is to continue to identify strategies that will maintain the downward trend and facilitate further improvement in this area.
Average Highway Incident DurationPM5.3a - DONE
0
5
10
15
20
25
30
28.35 27.6
22.14 21.95 21.64 23.32
2009 2010 2011 2012 2013 2014
Provide an Efficient, Well-Connected Transportation Experience
84
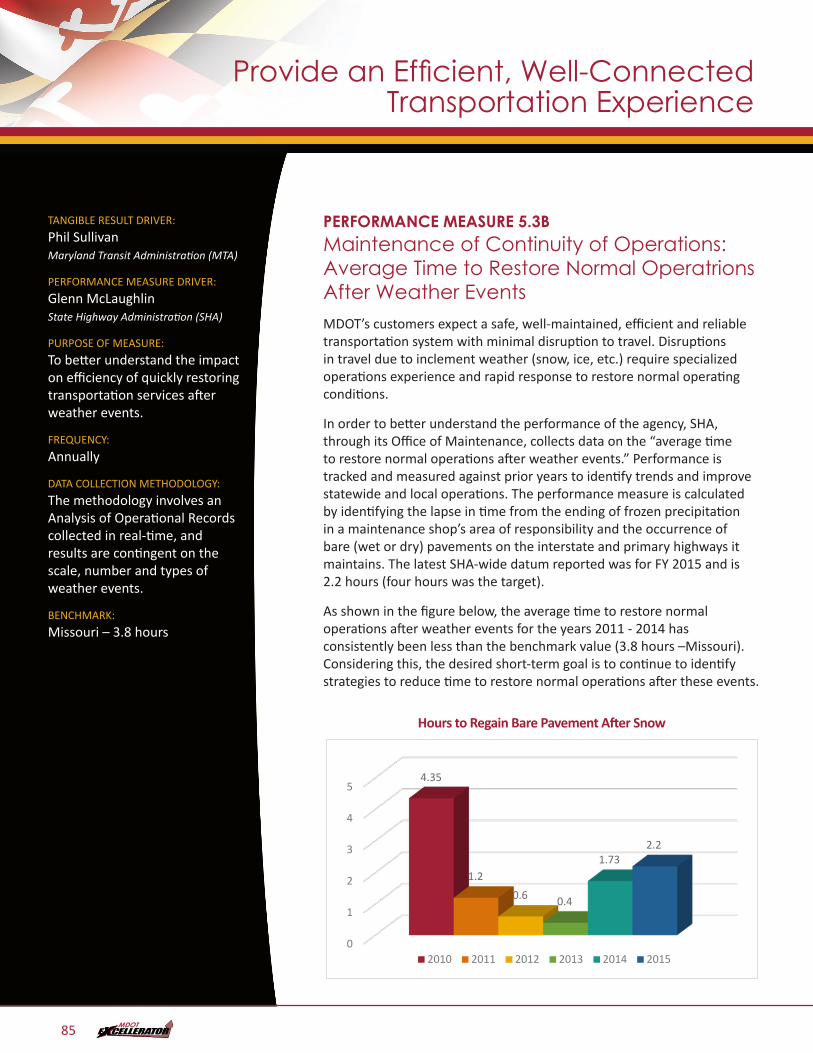
TANGIBLE RESULT DRIVER:
Phil Sullivan Maryland Transit Administration (MTA)
PERFORMANCE MEASURE DRIVER:
Glenn McLaughlin State Highway Administration (SHA)
PURPOSE OF MEASURE:
To better understand the impact on efficiency of quickly restoring transportation services after weather events.
FREQUENCY:
Annually
DATA COLLECTION METHODOLOGY:
The methodology involves an Analysis of Operational Records collected in real-time, and results are contingent on the scale, number and types of weather events.
BENCHMARK:
Missouri – 3.8 hours
PERFORMANCE MEASURE 5.3BMaintenance of Continuity of Operations: Average Time to Restore Normal Operatrions After Weather Events MDOT’s customers expect a safe, well-maintained, efficient and reliable transportation system with minimal disruption to travel. Disruptions in travel due to inclement weather (snow, ice, etc.) require specialized operations experience and rapid response to restore normal operating conditions.
In order to better understand the performance of the agency, SHA, through its Office of Maintenance, collects data on the “average time to restore normal operations after weather events.” Performance is tracked and measured against prior years to identify trends and improve statewide and local operations. The performance measure is calculated by identifying the lapse in time from the ending of frozen precipitation in a maintenance shop’s area of responsibility and the occurrence of bare (wet or dry) pavements on the interstate and primary highways it maintains. The latest SHA-wide datum reported was for FY 2015 and is 2.2 hours (four hours was the target).
As shown in the figure below, the average time to restore normal operations after weather events for the years 2011 - 2014 has consistently been less than the benchmark value (3.8 hours –Missouri).Considering this, the desired short-term goal is to continue to identify strategies to reduce time to restore normal operations after these events.
Hours to Regain Bare Pavement After SnowPM5.3b – DONE
0
1
2
3
4
54.35
1.20.6 0.4
1.732.2
2010 2011 2012 2013 2014 2015
Provide an Efficient, Well-Connected Transportation Experience
85
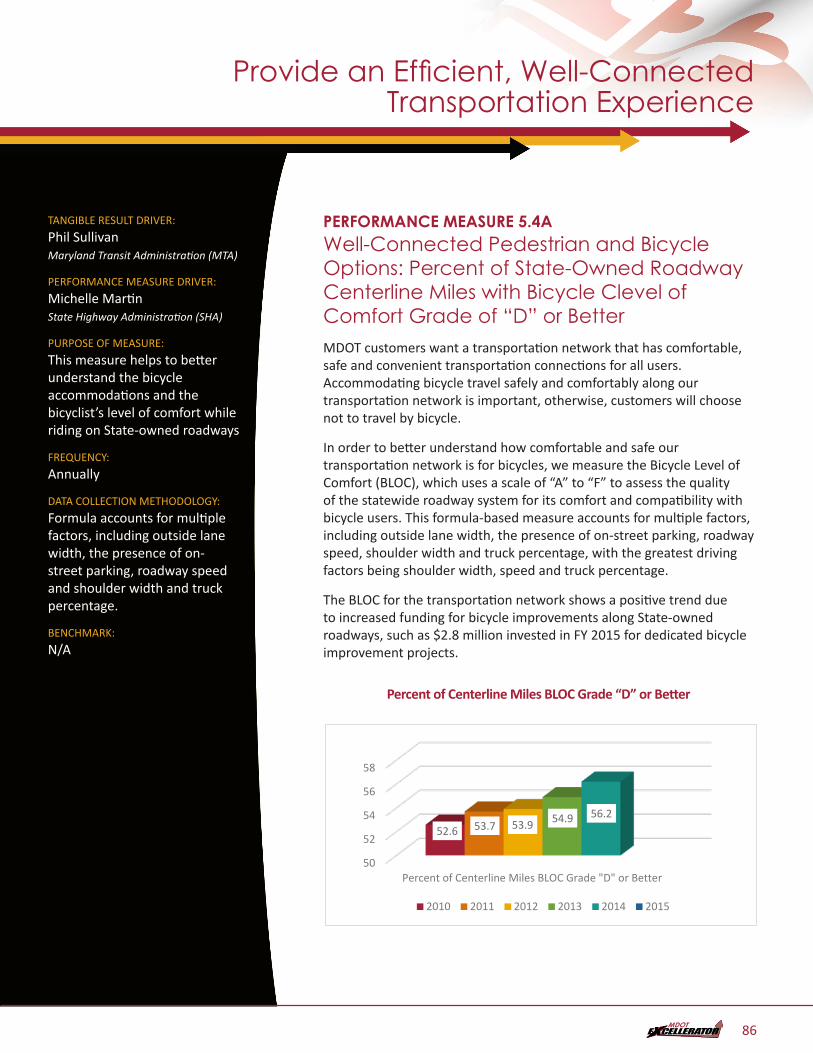
TANGIBLE RESULT DRIVER:
Phil Sullivan Maryland Transit Administration (MTA)
PERFORMANCE MEASURE DRIVER:
Michelle Martin State Highway Administration (SHA)
PURPOSE OF MEASURE:
This measure helps to better understand the bicycle accommodations and the bicyclist’s level of comfort while riding on State-owned roadways
FREQUENCY:
Annually
DATA COLLECTION METHODOLOGY:
Formula accounts for multiple factors, including outside lane width, the presence of on-street parking, roadway speed and shoulder width and truck percentage.
BENCHMARK:
N/A
PERFORMANCE MEASURE 5.4AWell-Connected Pedestrian and Bicycle Options: Percent of State-Owned Roadway Centerline Miles with Bicycle Clevel of Comfort Grade of “D” or Better MDOT customers want a transportation network that has comfortable, safe and convenient transportation connections for all users. Accommodating bicycle travel safely and comfortably along our transportation network is important, otherwise, customers will choose not to travel by bicycle.
In order to better understand how comfortable and safe our transportation network is for bicycles, we measure the Bicycle Level of Comfort (BLOC), which uses a scale of “A” to “F” to assess the quality of the statewide roadway system for its comfort and compatibility with bicycle users. This formula-based measure accounts for multiple factors, including outside lane width, the presence of on-street parking, roadway speed, shoulder width and truck percentage, with the greatest driving factors being shoulder width, speed and truck percentage.
The BLOC for the transportation network shows a positive trend due to increased funding for bicycle improvements along State-owned roadways, such as $2.8 million invested in FY 2015 for dedicated bicycle improvement projects.
Percent of Centerline Miles BLOC Grade “D” or BetterPM5.4a NO 2015 DATA
50
52
54
56
58
Percent of Centerline Miles BLOC Grade "D" or Better
52.6 53.7 53.9 54.9 56.2
2010 2011 2012 2013 2014 2015
Provide an Efficient, Well-Connected Transportation Experience
86
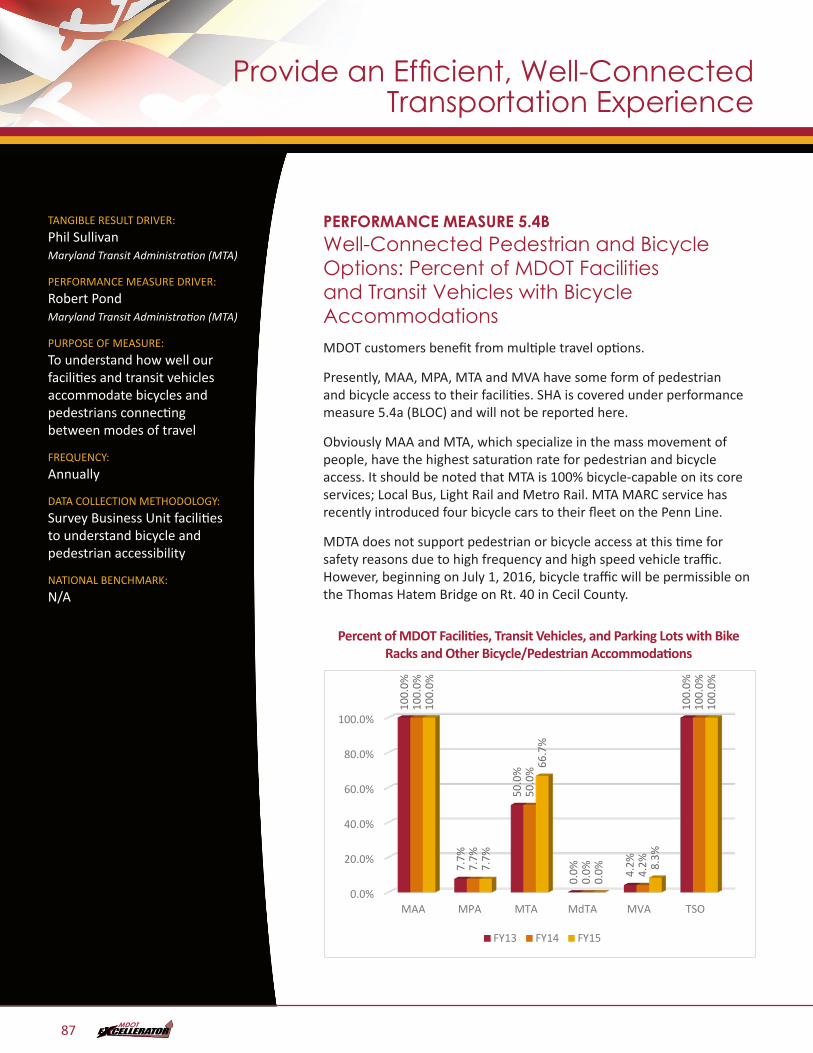
TANGIBLE RESULT DRIVER:
Phil Sullivan Maryland Transit Administration (MTA)
PERFORMANCE MEASURE DRIVER:
Robert Pond Maryland Transit Administration (MTA)
PURPOSE OF MEASURE:
To understand how well our facilities and transit vehicles accommodate bicycles and pedestrians connecting between modes of travel
FREQUENCY:
Annually
DATA COLLECTION METHODOLOGY:
Survey Business Unit facilities to understand bicycle and pedestrian accessibility
NATIONAL BENCHMARK:
N/A
PERFORMANCE MEASURE 5.4BWell-Connected Pedestrian and Bicycle Options: Percent of MDOT Facilities and Transit Vehicles with Bicycle AccommodationsMDOT customers benefit from multiple travel options.
Presently, MAA, MPA, MTA and MVA have some form of pedestrian and bicycle access to their facilities. SHA is covered under performance measure 5.4a (BLOC) and will not be reported here.
Obviously MAA and MTA, which specialize in the mass movement of people, have the highest saturation rate for pedestrian and bicycle access. It should be noted that MTA is 100% bicycle-capable on its core services; Local Bus, Light Rail and Metro Rail. MTA MARC service has recently introduced four bicycle cars to their fleet on the Penn Line.
MDTA does not support pedestrian or bicycle access at this time for safety reasons due to high frequency and high speed vehicle traffic. However, beginning on July 1, 2016, bicycle traffic will be permissible on the Thomas Hatem Bridge on Rt. 40 in Cecil County.
Percent of MDOT Facilities, Transit Vehicles, and Parking Lots with Bike Racks and Other Bicycle/Pedestrian Accommodations
PM5.4b - 5.4b. Percent of MDOT Facilities, Transit Vehicles, and Parking Lots with Bike Racks and Other Bicycle/Pedestrian Accommodations - DONE
0.0%
20.0%
40.0%
60.0%
80.0%
100.0%
MAA MPA MTA MdTA MVA TSO
100.
0%
7.7%
50.0
%
0.0% 4.
2%
100.
0%
100.
0%
7.7%
50.0
%
0.0% 4.
2%
100.
0%
100.
0%
7.7%
66.7
%
0.0% 8.
3%
100.
0%
FY13 FY14 FY15
Provide an Efficient, Well-Connected Transportation Experience
87
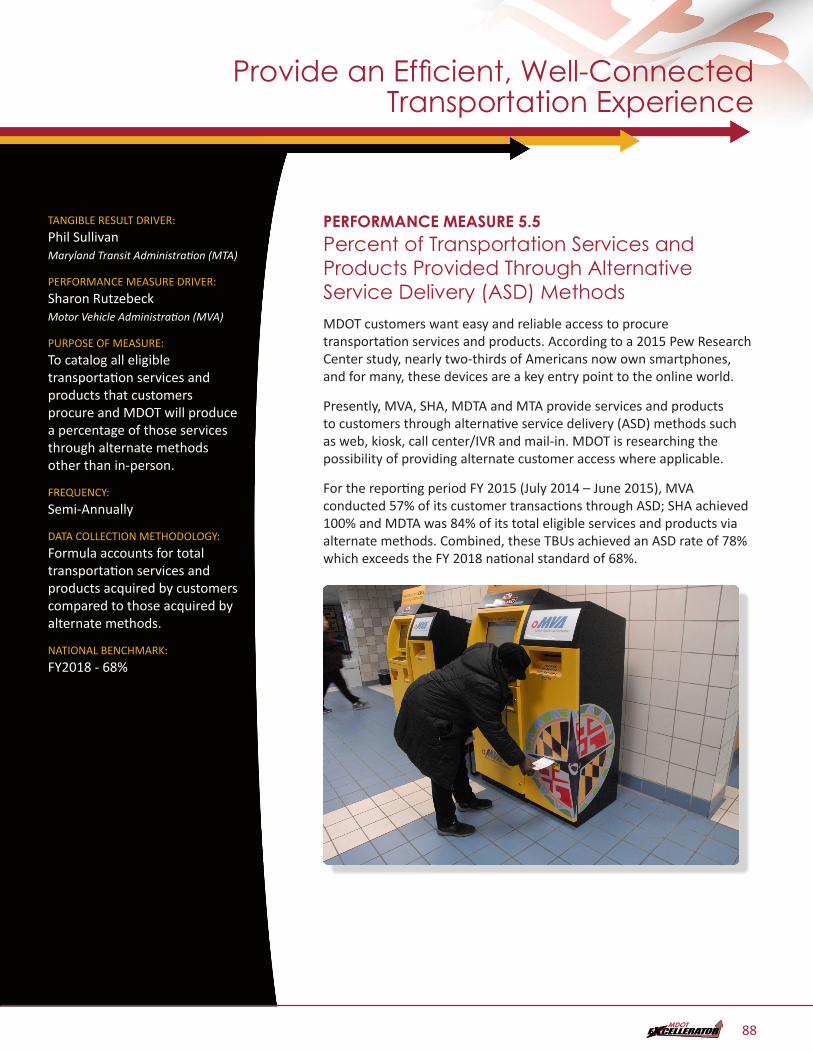
TANGIBLE RESULT DRIVER:
Phil Sullivan Maryland Transit Administration (MTA)
PERFORMANCE MEASURE DRIVER:
Sharon Rutzebeck Motor Vehicle Administration (MVA)
PURPOSE OF MEASURE:
To catalog all eligible transportation services and products that customers procure and MDOT will produce a percentage of those services through alternate methods other than in-person.
FREQUENCY:
Semi-Annually
DATA COLLECTION METHODOLOGY:
Formula accounts for total transportation services and products acquired by customers compared to those acquired by alternate methods.
NATIONAL BENCHMARK:
FY2018 - 68%
PERFORMANCE MEASURE 5.5Percent of Transportation Services and Products Provided Through Alternative Service Delivery (ASD) Methods MDOT customers want easy and reliable access to procure transportation services and products. According to a 2015 Pew Research Center study, nearly two-thirds of Americans now own smartphones, and for many, these devices are a key entry point to the online world.
Presently, MVA, SHA, MDTA and MTA provide services and products to customers through alternative service delivery (ASD) methods such as web, kiosk, call center/IVR and mail-in. MDOT is researching the possibility of providing alternate customer access where applicable.
For the reporting period FY 2015 (July 2014 – June 2015), MVA conducted 57% of its customer transactions through ASD; SHA achieved 100% and MDTA was 84% of its total eligible services and products via alternate methods. Combined, these TBUs achieved an ASD rate of 78% which exceeds the FY 2018 national standard of 68%.
Provide an Efficient, Well-Connected Transportation Experience
88
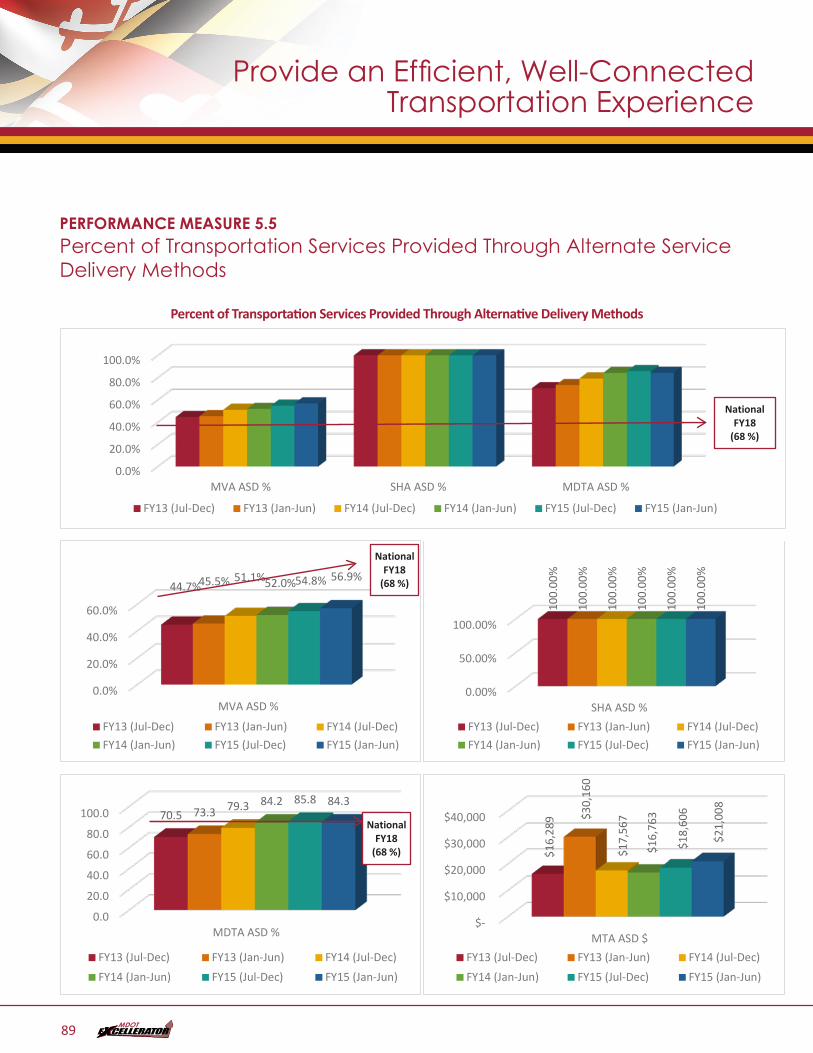
PERFORMANCE MEASURE 5.5Percent of Transportation Services Provided Through Alternate Service Delivery Methods
Percent of Transportation Services Provided Through Alternative Delivery MethodsPM5.5
0.0%
20.0%
40.0%
60.0%
80.0%
100.0%
MVA ASD % SHA ASD % MDTA ASD %
FY13 (Jul-Dec) FY13 (Jan-Jun) FY14 (Jul-Dec) FY14 (Jan-Jun) FY15 (Jul-Dec) FY15 (Jan-Jun)
National FY18
(68 %)
0.0%
20.0%
40.0%
60.0%
MVA ASD %
44.7%45.5% 51.1%52.0%54.8% 56.9%
FY13 (Jul-Dec) FY13 (Jan-Jun) FY14 (Jul-Dec)FY14 (Jan-Jun) FY15 (Jul-Dec) FY15 (Jan-Jun)
National FY18
(68 %)
0.00%
50.00%
100.00%
SHA ASD %
100.
00%
100.
00%
100.
00%
100.
00%
100.
00%
100.
00%
FY13 (Jul-Dec) FY13 (Jan-Jun) FY14 (Jul-Dec)FY14 (Jan-Jun) FY15 (Jul-Dec) FY15 (Jan-Jun)
0.0
20.0
40.0
60.0
80.0
100.0
MDTA ASD %
70.5 73.3 79.3 84.2 85.8 84.3
FY13 (Jul-Dec) FY13 (Jan-Jun) FY14 (Jul-Dec)FY14 (Jan-Jun) FY15 (Jul-Dec) FY15 (Jan-Jun)
National FY18
(68 %)
$-
$10,000
$20,000
$30,000
$40,000
MTA ASD $
$16,
289 $3
0,16
0
$17,
567
$16,
763
$18,
606
$21,
008
FY13 (Jul-Dec) FY13 (Jan-Jun) FY14 (Jul-Dec)FY14 (Jan-Jun) FY15 (Jul-Dec) FY15 (Jan-Jun)
Provide an Efficient, Well-Connected Transportation Experience
89
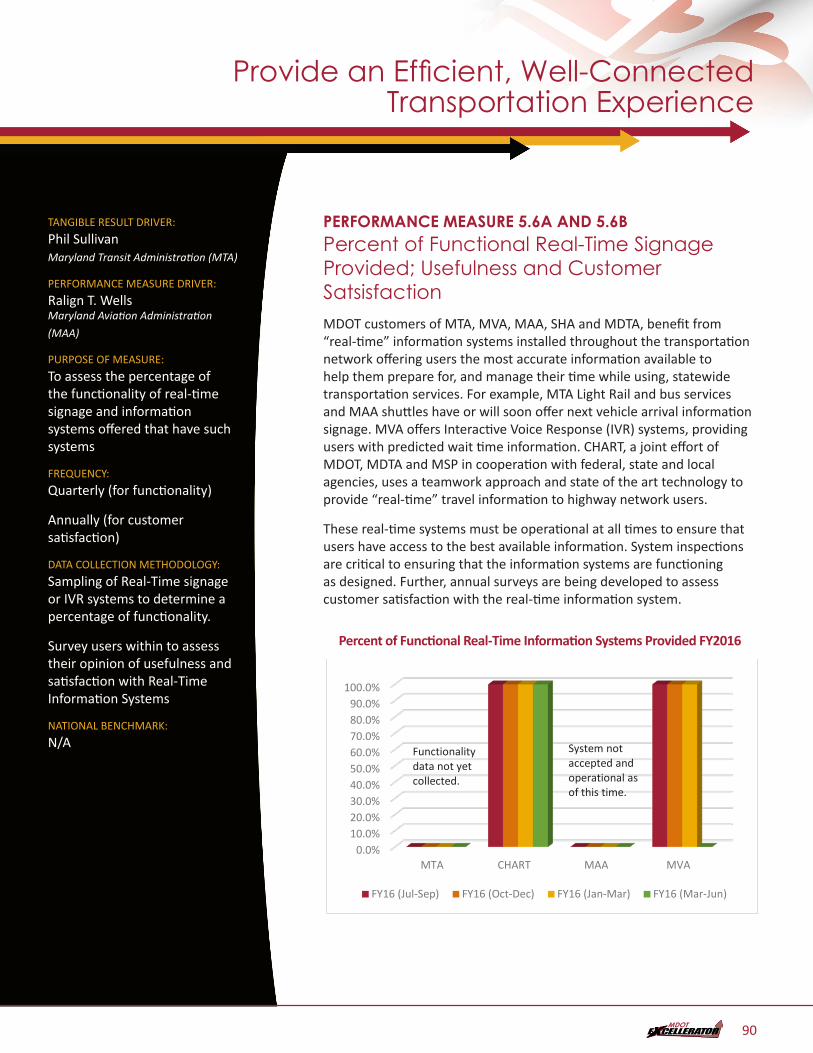
TANGIBLE RESULT DRIVER:
Phil Sullivan Maryland Transit Administration (MTA)
PERFORMANCE MEASURE DRIVER:
Ralign T. Wells Maryland Aviation Administration
(MAA)
PURPOSE OF MEASURE:
To assess the percentage of the functionality of real-time signage and information systems offered that have such systems
FREQUENCY:
Quarterly (for functionality)
Annually (for customer satisfaction)
DATA COLLECTION METHODOLOGY:
Sampling of Real-Time signage or IVR systems to determine a percentage of functionality.
Survey users within to assess their opinion of usefulness and satisfaction with Real-Time Information Systems
NATIONAL BENCHMARK:
N/A
PERFORMANCE MEASURE 5.6A AND 5.6BPercent of Functional Real-Time Signage Provided; Usefulness and Customer SatsisfactionMDOT customers of MTA, MVA, MAA, SHA and MDTA, benefit from “real-time” information systems installed throughout the transportation network offering users the most accurate information available to help them prepare for, and manage their time while using, statewide transportation services. For example, MTA Light Rail and bus services and MAA shuttles have or will soon offer next vehicle arrival information signage. MVA offers Interactive Voice Response (IVR) systems, providing users with predicted wait time information. CHART, a joint effort of MDOT, MDTA and MSP in cooperation with federal, state and local agencies, uses a teamwork approach and state of the art technology to provide “real-time” travel information to highway network users.
These real-time systems must be operational at all times to ensure that users have access to the best available information. System inspections are critical to ensuring that the information systems are functioning as designed. Further, annual surveys are being developed to assess customer satisfaction with the real-time information system.
Percent of Functional Real-Time Information Systems Provided FY2016PM5.6a - Percent (%) of Functional Real-Time Information Systems Provided FY 2016 - DONE
0.0%10.0%20.0%30.0%40.0%50.0%60.0%70.0%80.0%90.0%
100.0%
MTA CHART MAA MVA
FY16 (Jul-Sep) FY16 (Oct-Dec) FY16 (Jan-Mar) FY16 (Mar-Jun)
Functionalitydata not yet collected.
System not accepted and operational asof this time.
Provide an Efficient, Well-Connected Transportation Experience
90
TANGIBLE RESULT #6
Communicate Effectively With Our Customers
Every MDOT employee has to communicate with our customers, some on a daily basis. It is critical that we communicate clearly, concisely, timely and accurately with our customers.
RESULT DRIVER:Diane Langhorne The Secretary’s Office (TSO)
91
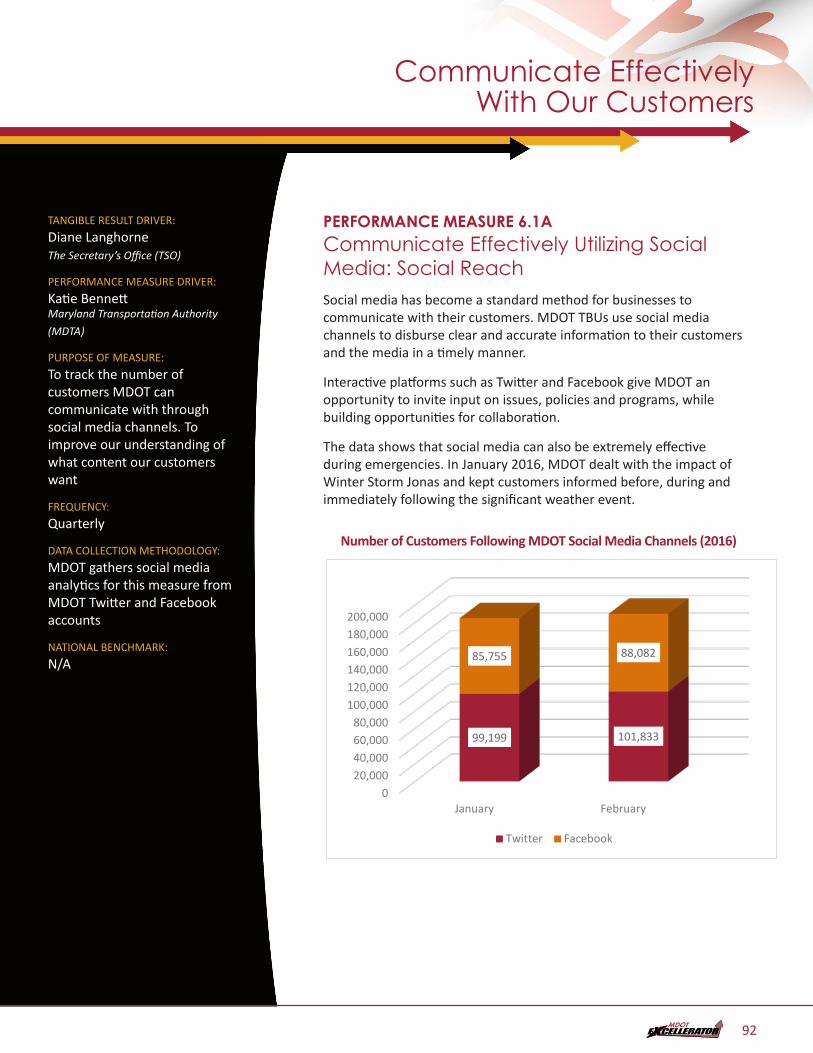
TANGIBLE RESULT DRIVER:
Diane Langhorne The Secretary’s Office (TSO)
PERFORMANCE MEASURE DRIVER:
Katie Bennett Maryland Transportation Authority
(MDTA)
PURPOSE OF MEASURE:
To track the number of customers MDOT can communicate with through social media channels. To improve our understanding of what content our customers want
FREQUENCY:
Quarterly
DATA COLLECTION METHODOLOGY:
MDOT gathers social media analytics for this measure from MDOT Twitter and Facebook accounts
NATIONAL BENCHMARK:
N/A
PERFORMANCE MEASURE 6.1ACommunicate Effectively Utilizing Social Media: Social ReachSocial media has become a standard method for businesses to communicate with their customers. MDOT TBUs use social media channels to disburse clear and accurate information to their customers and the media in a timely manner.
Interactive platforms such as Twitter and Facebook give MDOT an opportunity to invite input on issues, policies and programs, while building opportunities for collaboration.
The data shows that social media can also be extremely effective during emergencies. In January 2016, MDOT dealt with the impact of Winter Storm Jonas and kept customers informed before, during and immediately following the significant weather event.
Number of Customers Following MDOT Social Media Channels (2016)PM6.1a - Number of Customers Following MDOT Social Media Channels (2016) - DONE
020,00040,00060,00080,000
100,000120,000140,000160,000180,000200,000
January February
99,199 101,833
85,755 88,082
Twitter Facebook
Communicate Effectively With Our Customers
92
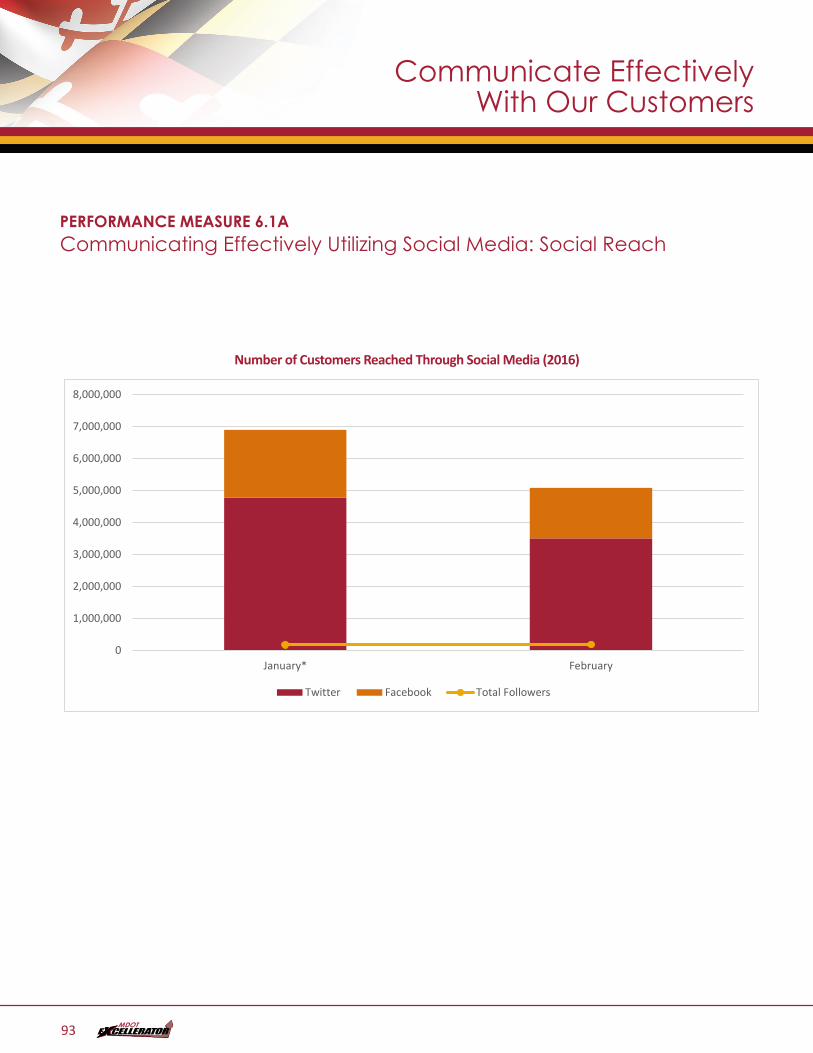
PERFORMANCE MEASURE 6.1ACommunicating Effectively Utilizing Social Media: Social Reach
Number of Customers Reached Through Social Media (2016)PM6.1a2 - Number of Customers Reached Through Social Media (2016) - DONE
0
1,000,000
2,000,000
3,000,000
4,000,000
5,000,000
6,000,000
7,000,000
8,000,000
January* February
Twitter Facebook Total Followers
Communicate Effectively With Our Customers
93
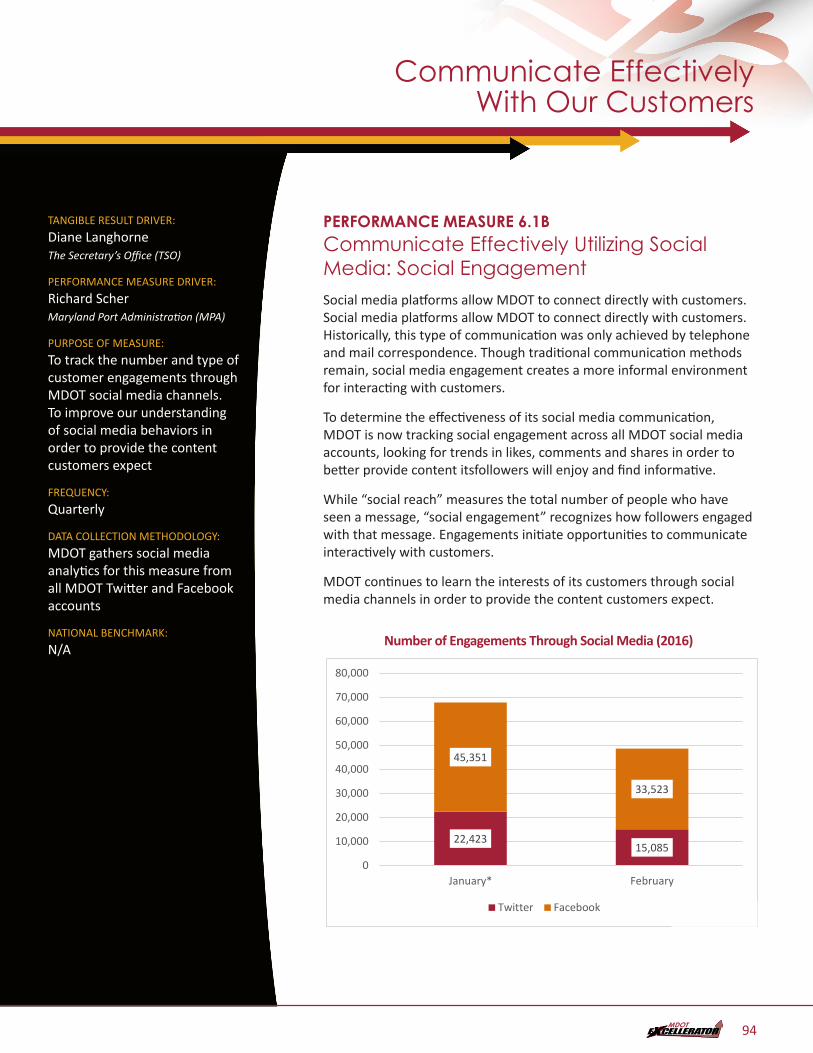
TANGIBLE RESULT DRIVER:
Diane Langhorne The Secretary’s Office (TSO)
PERFORMANCE MEASURE DRIVER:
Richard Scher Maryland Port Administration (MPA)
PURPOSE OF MEASURE:
To track the number and type of customer engagements through MDOT social media channels. To improve our understanding of social media behaviors in order to provide the content customers expect
FREQUENCY:
Quarterly
DATA COLLECTION METHODOLOGY:
MDOT gathers social media analytics for this measure from all MDOT Twitter and Facebook accounts
NATIONAL BENCHMARK:
N/A
PERFORMANCE MEASURE 6.1BCommunicate Effectively Utilizing Social Media: Social EngagementSocial media platforms allow MDOT to connect directly with customers. Social media platforms allow MDOT to connect directly with customers. Historically, this type of communication was only achieved by telephone and mail correspondence. Though traditional communication methods remain, social media engagement creates a more informal environment for interacting with customers.
To determine the effectiveness of its social media communication, MDOT is now tracking social engagement across all MDOT social media accounts, looking for trends in likes, comments and shares in order to better provide content itsfollowers will enjoy and find informative.
While “social reach” measures the total number of people who have seen a message, “social engagement” recognizes how followers engaged with that message. Engagements initiate opportunities to communicate interactively with customers.
MDOT continues to learn the interests of its customers through social media channels in order to provide the content customers expect.
Number of Engagements Through Social Media (2016)
PM6.1b - Number of Engagements Through Social Media (2016) - DONE
22,42315,085
45,351
33,523
0
10,000
20,000
30,000
40,000
50,000
60,000
70,000
80,000
January* February
Twitter Facebook
Communicate Effectively With Our Customers
94
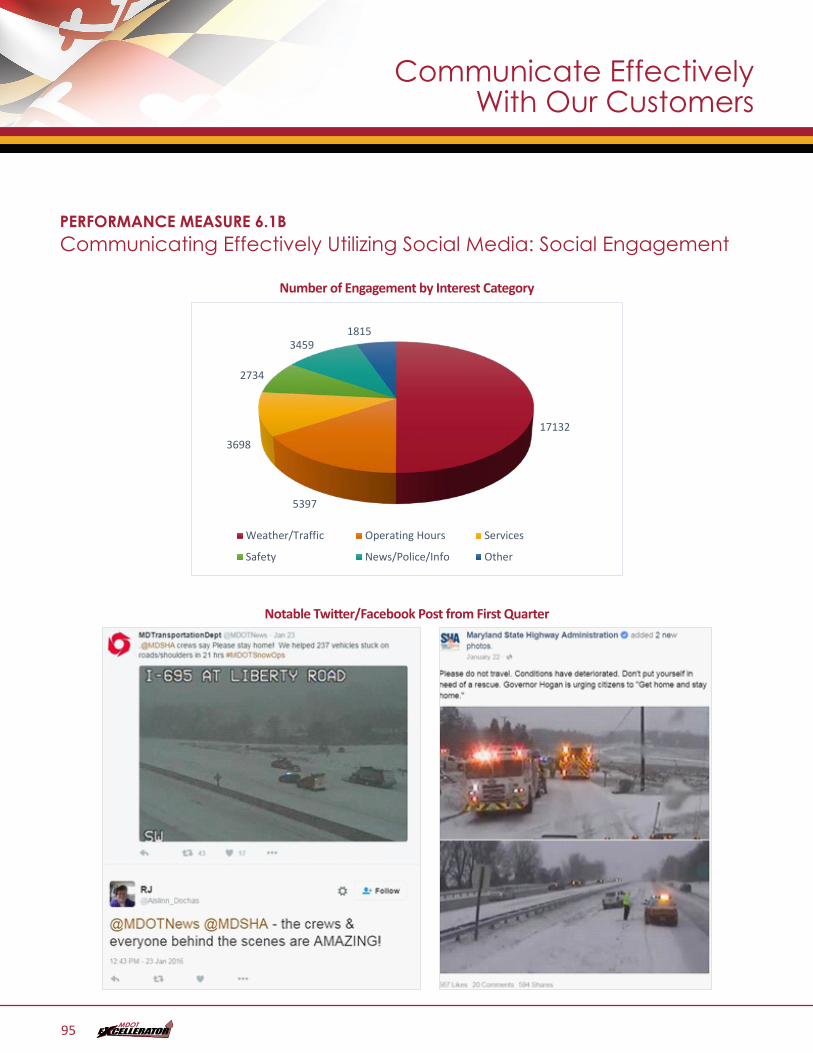
PERFORMANCE MEASURE 6.1BCommunicating Effectively Utilizing Social Media: Social Engagement
Number of Engagement by Interest Category
17132
5397
3698
2734
34591815
Weather/Traffic Operating Hours Services
Safety News/Police/Info Other
PM6.1b2 - Number of Engagements by Interest Category* - DONE
Notable Twitter/Facebook Post from First Quarter
Communicate Effectively With Our Customers
95
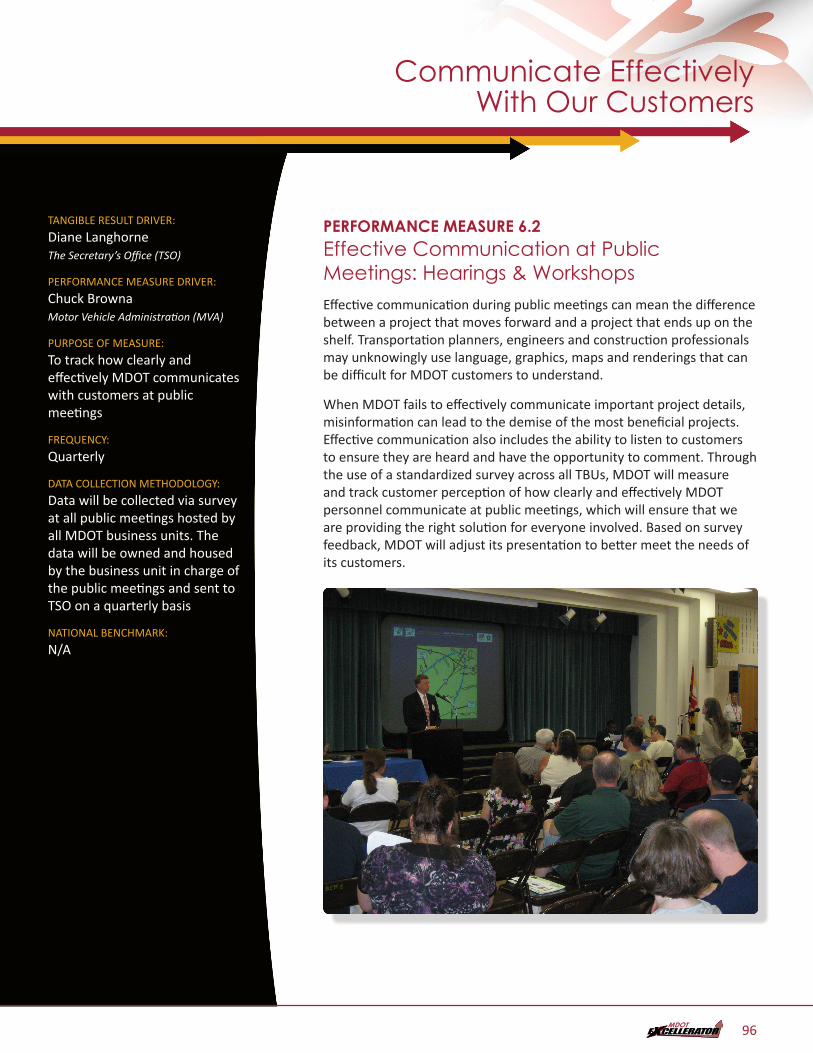
TANGIBLE RESULT DRIVER:
Diane Langhorne The Secretary’s Office (TSO)
PERFORMANCE MEASURE DRIVER:
Chuck Browna Motor Vehicle Administration (MVA)
PURPOSE OF MEASURE:
To track how clearly and effectively MDOT communicates with customers at public meetings
FREQUENCY:
Quarterly
DATA COLLECTION METHODOLOGY:
Data will be collected via survey at all public meetings hosted by all MDOT business units. The data will be owned and housed by the business unit in charge of the public meetings and sent to TSO on a quarterly basis
NATIONAL BENCHMARK:
N/A
PERFORMANCE MEASURE 6.2Effective Communication at Public Meetings: Hearings & WorkshopsEffective communication during public meetings can mean the difference between a project that moves forward and a project that ends up on the shelf. Transportation planners, engineers and construction professionals may unknowingly use language, graphics, maps and renderings that can be difficult for MDOT customers to understand.
When MDOT fails to effectively communicate important project details, misinformation can lead to the demise of the most beneficial projects. Effective communication also includes the ability to listen to customers to ensure they are heard and have the opportunity to comment. Through the use of a standardized survey across all TBUs, MDOT will measure and track customer perception of how clearly and effectively MDOT personnel communicate at public meetings, which will ensure that we are providing the right solution for everyone involved. Based on survey feedback, MDOT will adjust its presentation to better meet the needs of its customers.
Communicate Effectively With Our Customers
96
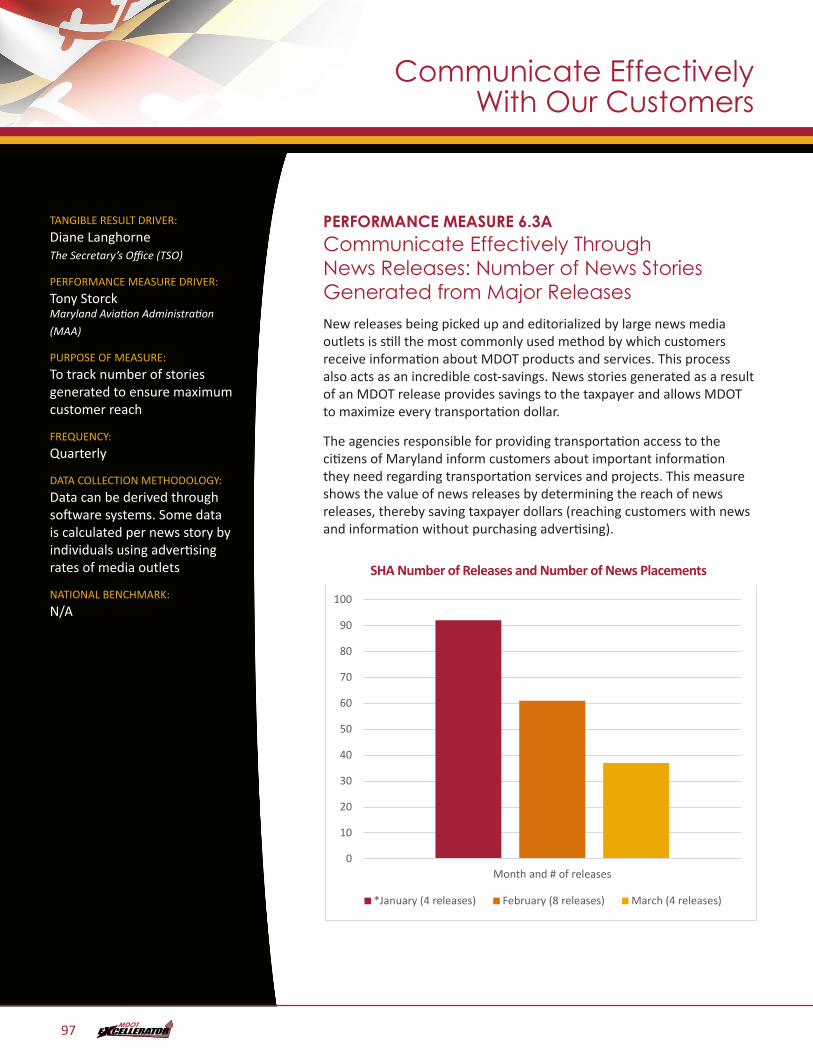
TANGIBLE RESULT DRIVER:
Diane Langhorne The Secretary’s Office (TSO)
PERFORMANCE MEASURE DRIVER:
Tony Storck Maryland Aviation Administration
(MAA)
PURPOSE OF MEASURE:
To track number of stories generated to ensure maximum customer reach
FREQUENCY:
Quarterly
DATA COLLECTION METHODOLOGY:
Data can be derived through software systems. Some data is calculated per news story by individuals using advertising rates of media outlets
NATIONAL BENCHMARK:
N/A
PERFORMANCE MEASURE 6.3ACommunicate Effectively Through News Releases: Number of News Stories Generated from Major ReleasesNew releases being picked up and editorialized by large news media outlets is still the most commonly used method by which customers receive information about MDOT products and services. This process also acts as an incredible cost-savings. News stories generated as a result of an MDOT release provides savings to the taxpayer and allows MDOT to maximize every transportation dollar.
The agencies responsible for providing transportation access to the citizens of Maryland inform customers about important information they need regarding transportation services and projects. This measure shows the value of news releases by determining the reach of news releases, thereby saving taxpayer dollars (reaching customers with news and information without purchasing advertising).
SHA Number of Releases and Number of News PlacementsPM6.3a – SHA Number of Releases and Number of News Placements - DONE
• Excludes significant news during blizzard.
0
10
20
30
40
50
60
70
80
90
100
Month and # of releases
*January (4 releases) February (8 releases) March (4 releases)
Communicate Effectively With Our Customers
97
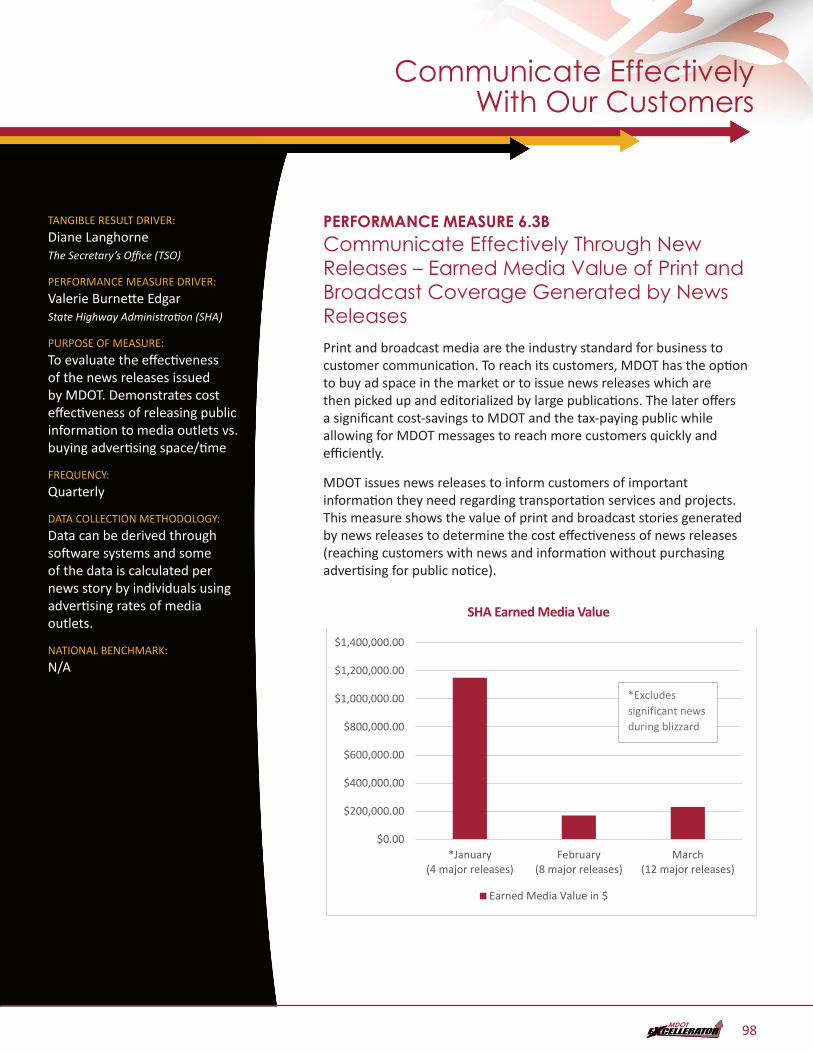
TANGIBLE RESULT DRIVER:
Diane Langhorne The Secretary’s Office (TSO)
PERFORMANCE MEASURE DRIVER:
Valerie Burnette Edgar State Highway Administration (SHA)
PURPOSE OF MEASURE:
To evaluate the effectiveness of the news releases issued by MDOT. Demonstrates cost effectiveness of releasing public information to media outlets vs. buying advertising space/time
FREQUENCY:
Quarterly
DATA COLLECTION METHODOLOGY:
Data can be derived through software systems and some of the data is calculated per news story by individuals using advertising rates of media outlets.
NATIONAL BENCHMARK:
N/A
PERFORMANCE MEASURE 6.3BCommunicate Effectively Through New Releases – Earned Media Value of Print and Broadcast Coverage Generated by News ReleasesPrint and broadcast media are the industry standard for business to customer communication. To reach its customers, MDOT has the option to buy ad space in the market or to issue news releases which are then picked up and editorialized by large publications. The later offers a significant cost-savings to MDOT and the tax-paying public while allowing for MDOT messages to reach more customers quickly and efficiently.
MDOT issues news releases to inform customers of important information they need regarding transportation services and projects. This measure shows the value of print and broadcast stories generated by news releases to determine the cost effectiveness of news releases (reaching customers with news and information without purchasing advertising for public notice).
SHA Earned Media Value
PM6.3b – SHA Earned Media Value – DONE Not sure of data
$0.00
$200,000.00
$400,000.00
$600,000.00
$800,000.00
$1,000,000.00
$1,200,000.00
$1,400,000.00
*January(4 major releases)
February(8 major releases)
March(12 major releases)
Earned Media Value in $
*Excludes significant news during blizzard
Communicate Effectively With Our Customers
98
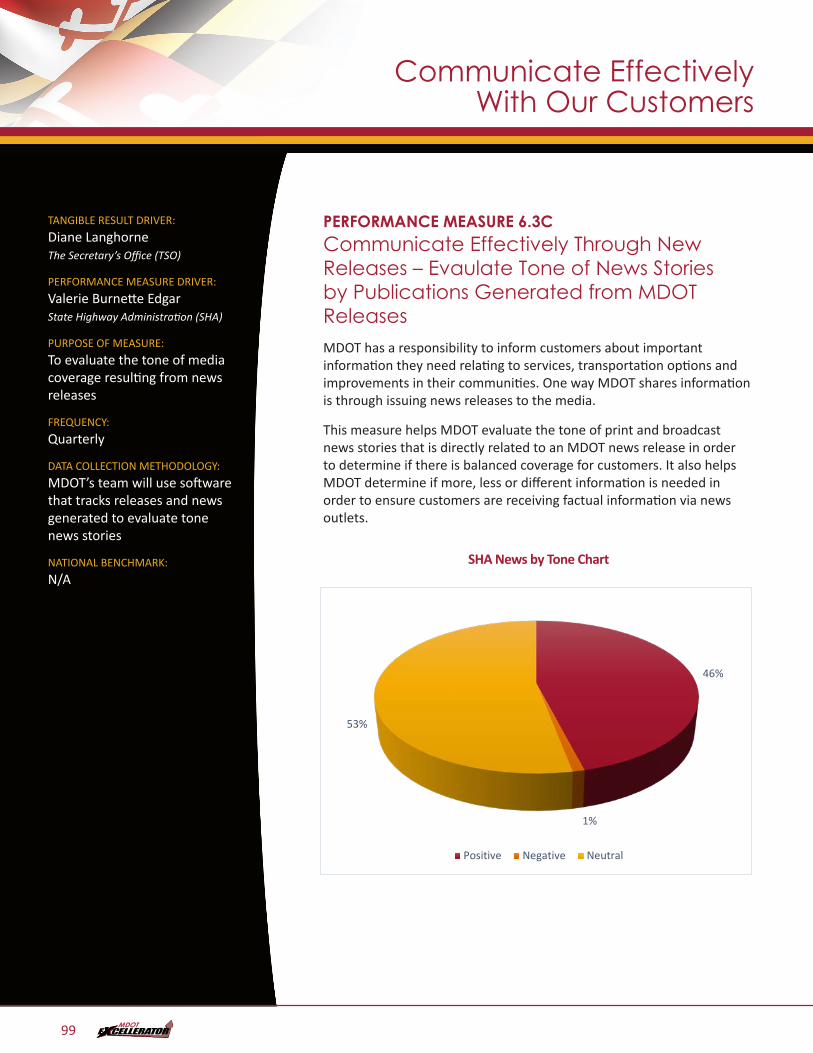
TANGIBLE RESULT DRIVER:
Diane Langhorne The Secretary’s Office (TSO)
PERFORMANCE MEASURE DRIVER:
Valerie Burnette Edgar State Highway Administration (SHA)
PURPOSE OF MEASURE:
To evaluate the tone of media coverage resulting from news releases
FREQUENCY:
Quarterly
DATA COLLECTION METHODOLOGY:
MDOT’s team will use software that tracks releases and news generated to evaluate tone news stories
NATIONAL BENCHMARK:
N/A
PERFORMANCE MEASURE 6.3CCommunicate Effectively Through New Releases – Evaulate Tone of News Stories by Publications Generated from MDOT ReleasesMDOT has a responsibility to inform customers about important information they need relating to services, transportation options and improvements in their communities. One way MDOT shares information is through issuing news releases to the media.
This measure helps MDOT evaluate the tone of print and broadcast news stories that is directly related to an MDOT news release in order to determine if there is balanced coverage for customers. It also helps MDOT determine if more, less or different information is needed in order to ensure customers are receiving factual information via news outlets.
SHA News by Tone ChartPM6.3c – SHA News by Tone Chart 1/1/2016 – 3/21/2016 - DONE
46%
1%
53%
Positive Negative Neutral
Communicate Effectively With Our Customers
99
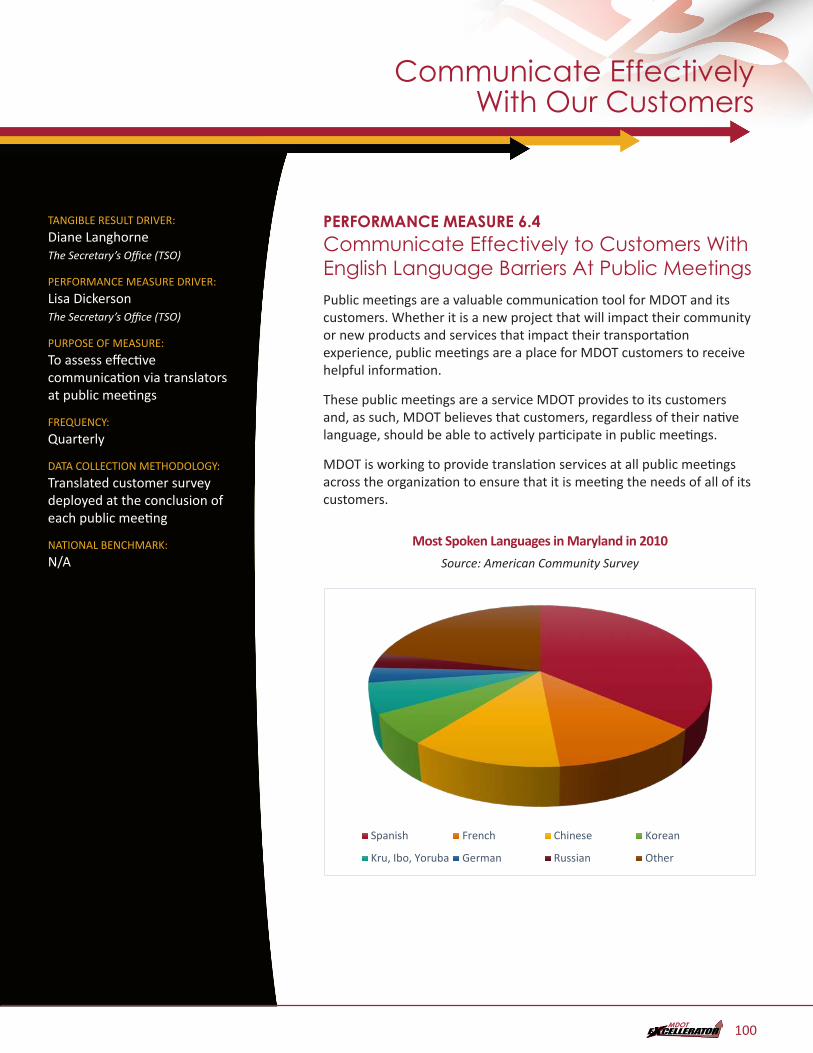
TANGIBLE RESULT DRIVER:
Diane Langhorne The Secretary’s Office (TSO)
PERFORMANCE MEASURE DRIVER:
Lisa Dickerson The Secretary’s Office (TSO)
PURPOSE OF MEASURE:
To assess effective communication via translators at public meetings
FREQUENCY:
Quarterly
DATA COLLECTION METHODOLOGY:
Translated customer survey deployed at the conclusion of each public meeting
NATIONAL BENCHMARK:
N/A
PERFORMANCE MEASURE 6.4Communicate Effectively to Customers With English Language Barriers At Public MeetingsPublic meetings are a valuable communication tool for MDOT and its customers. Whether it is a new project that will impact their community or new products and services that impact their transportation experience, public meetings are a place for MDOT customers to receive helpful information.
These public meetings are a service MDOT provides to its customers and, as such, MDOT believes that customers, regardless of their native language, should be able to actively participate in public meetings.
MDOT is working to provide translation services at all public meetings across the organization to ensure that it is meeting the needs of all of its customers.
Most Spoken Languages in Maryland in 2010
Source: American Community Survey
PM6.4
Spanish French Chinese Korean
Kru, Ibo, Yoruba German Russian Other
Communicate Effectively With Our Customers
100
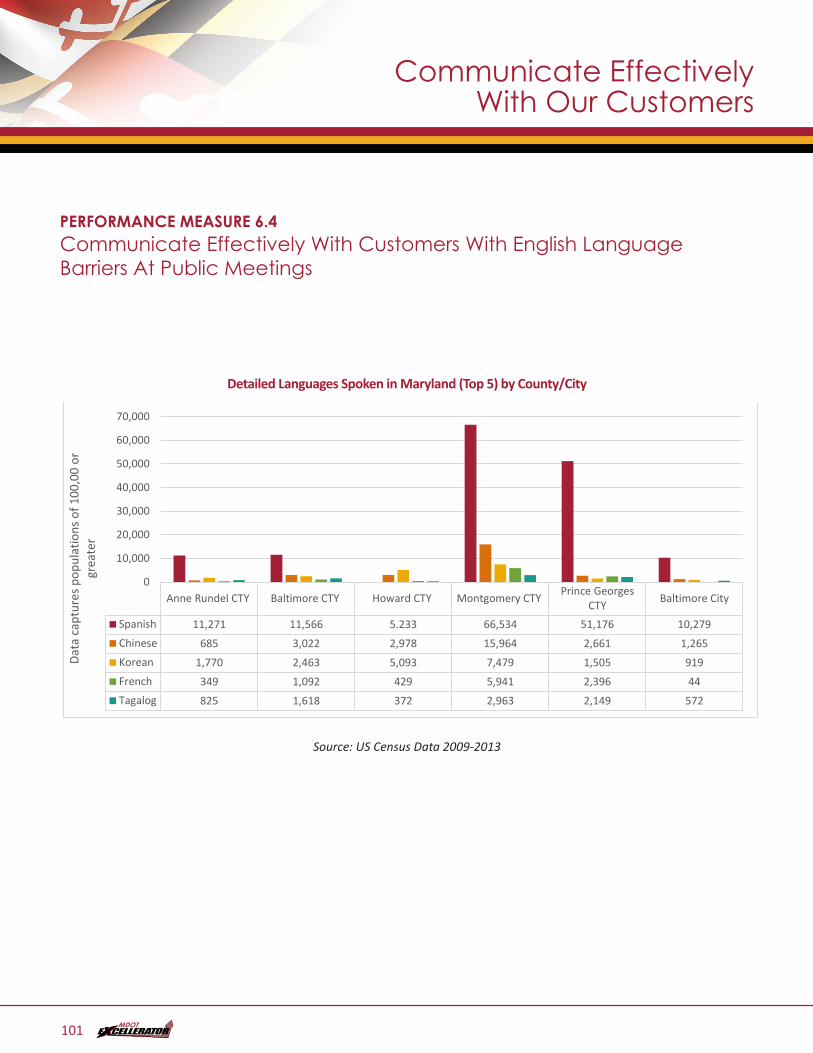
PERFORMANCE MEASURE 6.4Communicate Effectively With Customers With English Language Barriers At Public Meetings
Detailed Languages Spoken in Maryland (Top 5) by County/CityPM6.4.q - Detailed Languages Spoken In Maryland (top 5) BY County/City, United States Census Data 2009-2013 Title - DONE
Anne Rundel CTY Baltimore CTY Howard CTY Montgomery CTY Prince GeorgesCTY Baltimore City
Spanish 11,271 11,566 5.233 66,534 51,176 10,279Chinese 685 3,022 2,978 15,964 2,661 1,265Korean 1,770 2,463 5,093 7,479 1,505 919French 349 1,092 429 5,941 2,396 44Tagalog 825 1,618 372 2,963 2,149 572
0
10,000
20,000
30,000
40,000
50,000
60,000
70,000
Data
cap
ture
s pop
ulat
ions
of 1
00,0
0 or
gr
eate
r
Source: US Census Data 2009-2013
Communicate Effectively With Our Customers
101
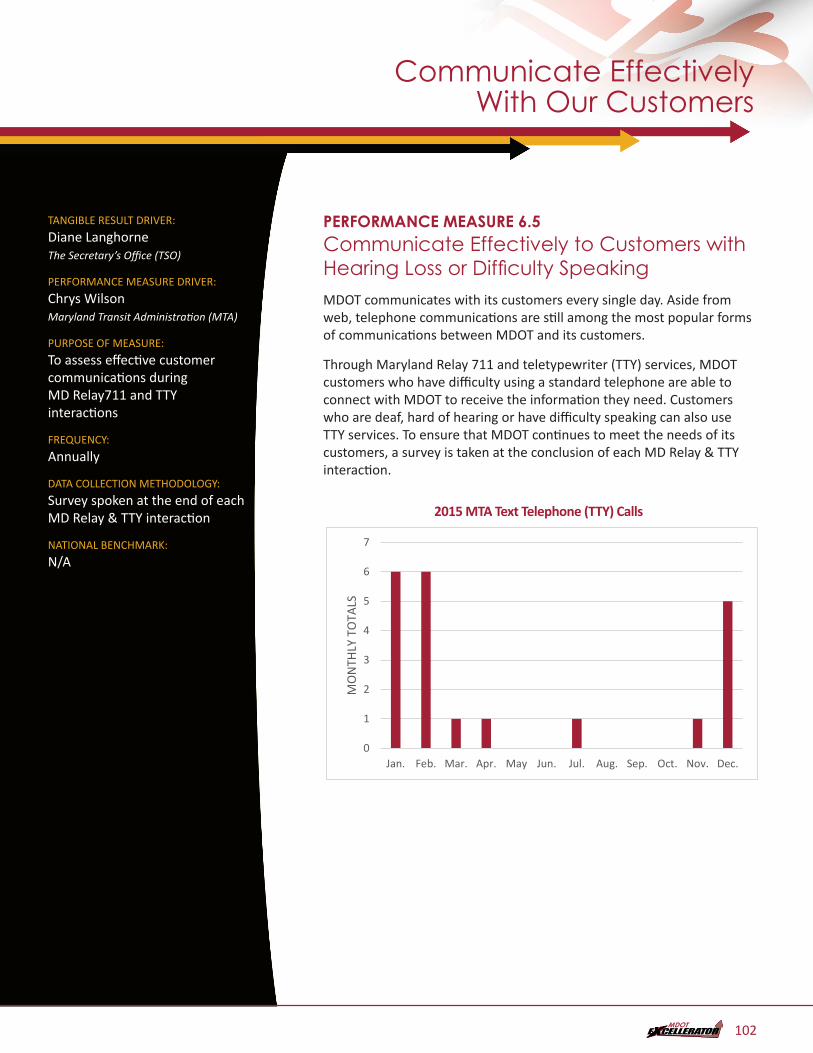
TANGIBLE RESULT DRIVER:
Diane Langhorne The Secretary’s Office (TSO)
PERFORMANCE MEASURE DRIVER:
Chrys Wilson Maryland Transit Administration (MTA)
PURPOSE OF MEASURE:
To assess effective customer communications during MD Relay711 and TTY interactions
FREQUENCY:
Annually
DATA COLLECTION METHODOLOGY:
Survey spoken at the end of each MD Relay & TTY interaction
NATIONAL BENCHMARK:
N/A
PERFORMANCE MEASURE 6.5Communicate Effectively to Customers with Hearing Loss or Difficulty SpeakingMDOT communicates with its customers every single day. Aside from web, telephone communications are still among the most popular forms of communications between MDOT and its customers.
Through Maryland Relay 711 and teletypewriter (TTY) services, MDOT customers who have difficulty using a standard telephone are able to connect with MDOT to receive the information they need. Customers who are deaf, hard of hearing or have difficulty speaking can also use TTY services. To ensure that MDOT continues to meet the needs of its customers, a survey is taken at the conclusion of each MD Relay & TTY interaction.
2015 MTA Text Telephone (TTY) CallsPM6.5 - 2015 MTA Text Telephone (TTY) Calls Total: 21 Calls - DONE
0
1
2
3
4
5
6
7
Jan. Feb. Mar. Apr. May Jun. Jul. Aug. Sep. Oct. Nov. Dec.
MO
NTH
LY T
OTA
LS
Communicate Effectively With Our Customers
102

TANGIBLE RESULT #7
Be Fair and Reasonable to Our Partners
MDOT will provide an easy, reliable procurement experience throughout the system.
RESULT DRIVER:Betty Conners State Highway Administration (SHA)
103
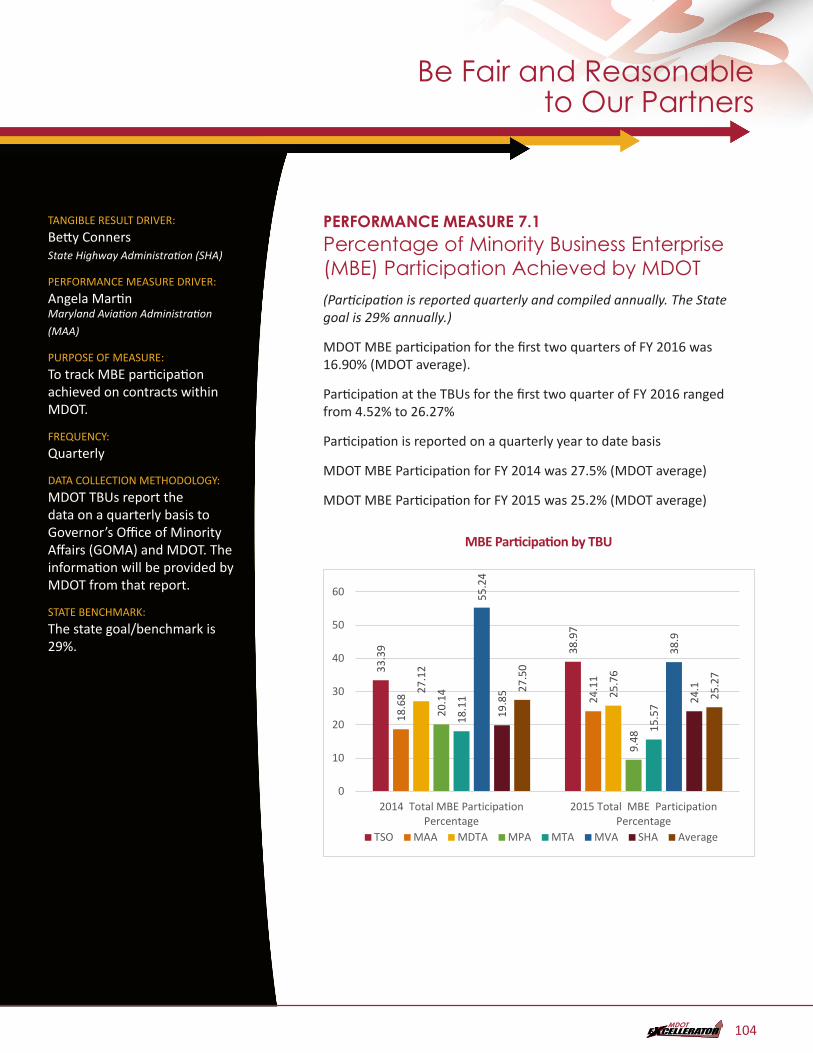
TANGIBLE RESULT DRIVER:
Betty Conners State Highway Administration (SHA)
PERFORMANCE MEASURE DRIVER:
Angela Martin Maryland Aviation Administration
(MAA)
PURPOSE OF MEASURE:
To track MBE participation achieved on contracts within MDOT.
FREQUENCY:
Quarterly
DATA COLLECTION METHODOLOGY:
MDOT TBUs report the data on a quarterly basis to Governor’s Office of Minority Affairs (GOMA) and MDOT. The information will be provided by MDOT from that report.
STATE BENCHMARK:
The state goal/benchmark is 29%.
PERFORMANCE MEASURE 7.1Percentage of Minority Business Enterprise (MBE) Participation Achieved by MDOT(Participation is reported quarterly and compiled annually. The State goal is 29% annually.)
MDOT MBE participation for the first two quarters of FY 2016 was 16.90% (MDOT average).
Participation at the TBUs for the first two quarter of FY 2016 ranged from 4.52% to 26.27%
Participation is reported on a quarterly year to date basis
MDOT MBE Participation for FY 2014 was 27.5% (MDOT average)
MDOT MBE Participation for FY 2015 was 25.2% (MDOT average)
MBE Participation by TBUPM7.1.1 - MBE Participation by TBU – DONE Missing data
33.3
9 38.9
7
18.6
8 24.1
1
27.1
2
25.7
6
20.1
4
9.48
18.1
1
15.5
7
55.2
4
38.9
19.8
5 24.127
.50
25.2
7
0
10
20
30
40
50
60
2014 Total MBE ParticipationPercentage
2015 Total MBE ParticipationPercentage
TSO MAA MDTA MPA MTA MVA SHA Average
6.6
17.59
5.12
20.47
16.3519.37
28.9426.27
20.52
4.526.24
12.81
21.72
17.29
0
5
10
15
20
25
30
35
2016 1st Qtr. MBE ParticipationPercentage
2016 2nd Qtr. Cum. MBE ParticipationPercentage
TSO MAA MDTA MPA MTA MVA SHA
Be Fair and Reasonable to Our Partners
104
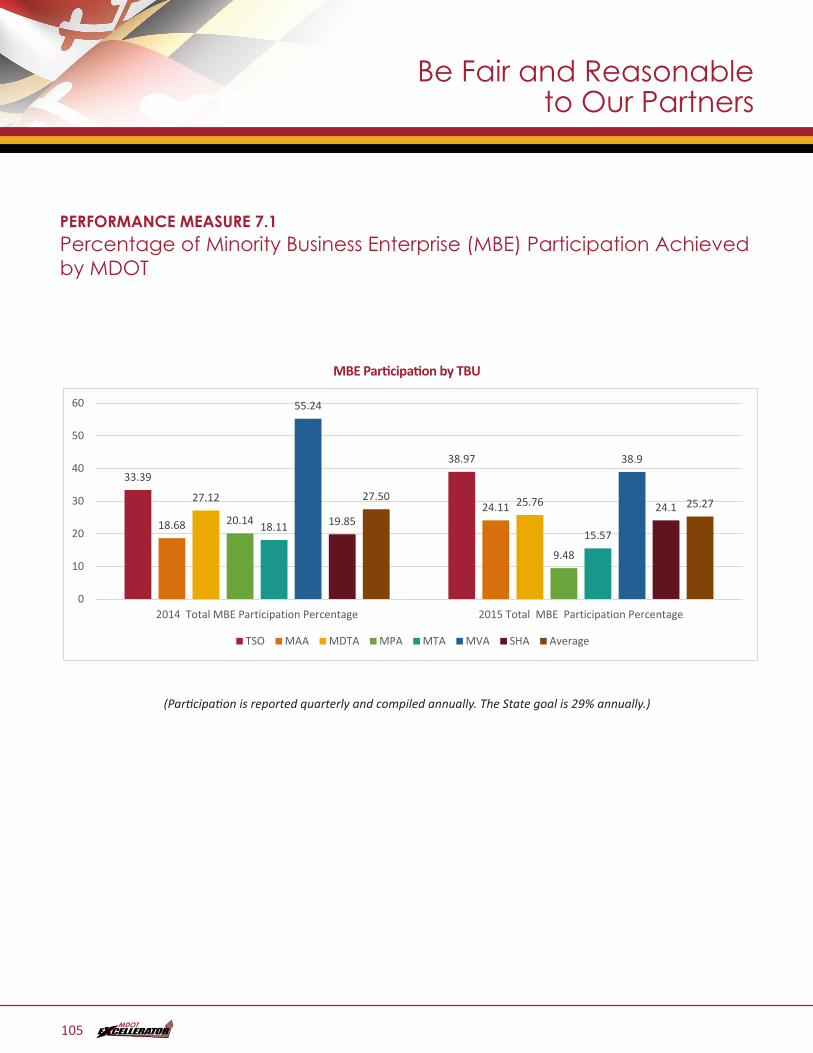
PERFORMANCE MEASURE 7.1Percentage of Minority Business Enterprise (MBE) Participation Achieved by MDOT
MBE Participation by TBU
PM7.1.2 - MBE Participation by TBU - DONE
33.3938.97
18.6824.11
27.12 25.7620.14
9.48
18.1115.57
55.24
38.9
19.8524.1
27.50 25.27
0
10
20
30
40
50
60
2014 Total MBE Participation Percentage 2015 Total MBE Participation Percentage
TSO MAA MDTA MPA MTA MVA SHA Average
(Participation is reported quarterly and compiled annually. The State goal is 29% annually.)
Be Fair and Reasonable to Our Partners
105
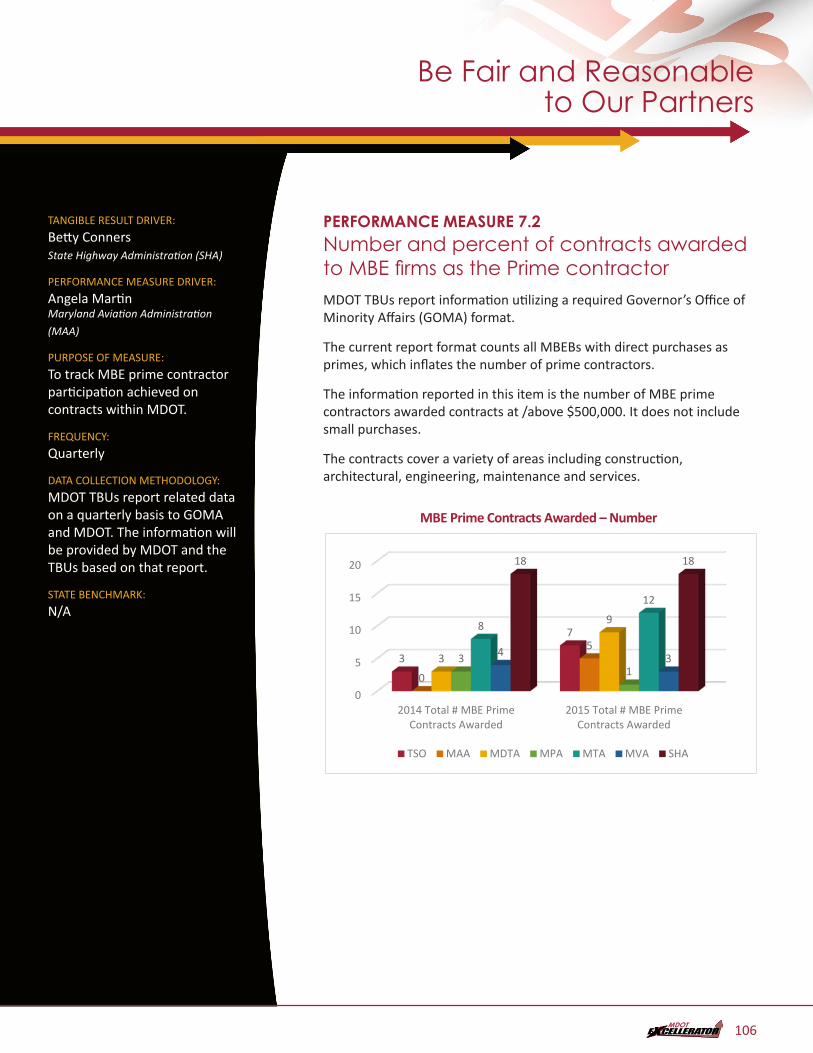
TANGIBLE RESULT DRIVER:
Betty Conners State Highway Administration (SHA)
PERFORMANCE MEASURE DRIVER:
Angela Martin Maryland Aviation Administration
(MAA)
PURPOSE OF MEASURE:
To track MBE prime contractor participation achieved on contracts within MDOT.
FREQUENCY:
Quarterly
DATA COLLECTION METHODOLOGY:
MDOT TBUs report related data on a quarterly basis to GOMA and MDOT. The information will be provided by MDOT and the TBUs based on that report.
STATE BENCHMARK:
N/A
PERFORMANCE MEASURE 7.2Number and percent of contracts awarded to MBE firms as the Prime contractorMDOT TBUs report information utilizing a required Governor’s Office of Minority Affairs (GOMA) format.
The current report format counts all MBEBs with direct purchases as primes, which inflates the number of prime contractors.
The information reported in this item is the number of MBE prime contractors awarded contracts at /above $500,000. It does not include small purchases.
The contracts cover a variety of areas including construction, architectural, engineering, maintenance and services.
MBE Prime Contracts Awarded – NumberPM7.2.1 - MBE Prime Contracts Awarded – Number - DONE
0
5
10
15
20
2014 Total # MBE PrimeContracts Awarded
2015 Total # MBE PrimeContracts Awarded
3
7
0
53
9
31
8
12
4 3
18 18
TSO MAA MDTA MPA MTA MVA SHA
Be Fair and Reasonable to Our Partners
106
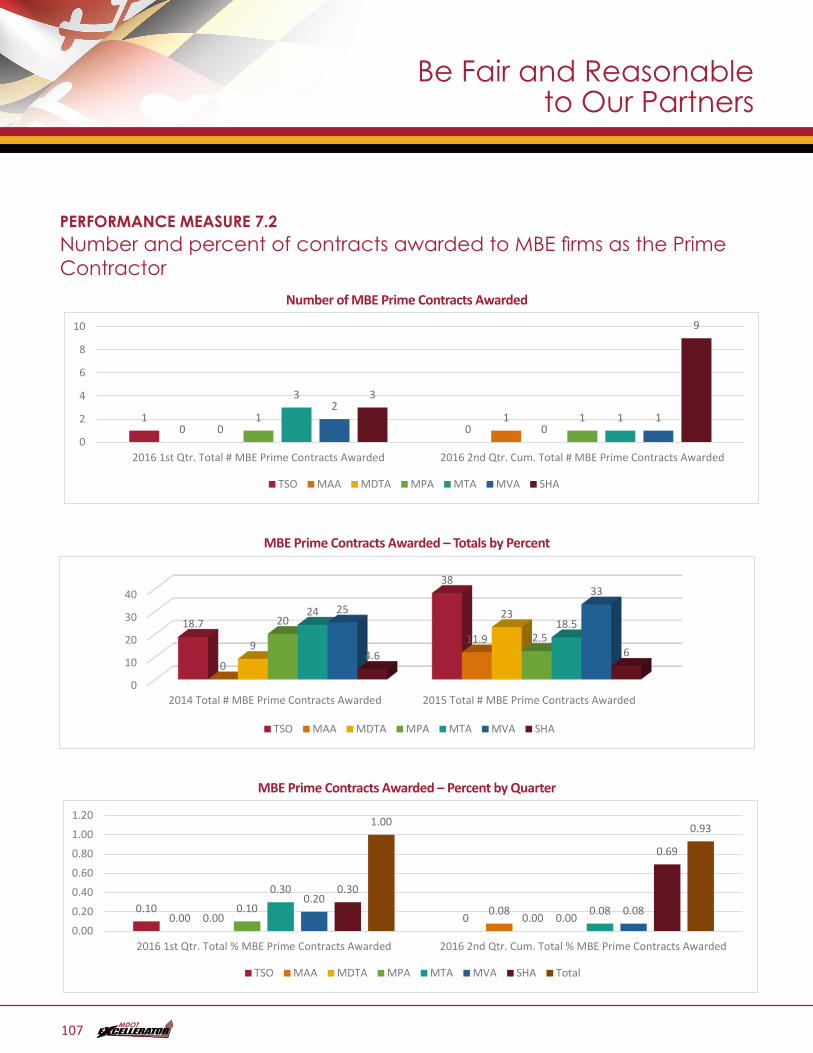
PERFORMANCE MEASURE 7.2Number and percent of contracts awarded to MBE firms as the Prime Contractor
Number of MBE Prime Contracts Awarded
PM7.2.2 - Number of MBE Prime Contracts Awarded – DONE Missing data
100
10 0
1 1
3
12
1
3
9
0
2
4
6
8
10
2016 1st Qtr. Total # MBE Prime Contracts Awarded 2016 2nd Qtr. Cum. Total # MBE Prime Contracts Awarded
TSO MAA MDTA MPA MTA MVA SHA
MBE Prime Contracts Awarded – Totals by PercentPM7.1.3 - MBE Prime Contracts Awarded –Percent - DONE
0
10
20
30
40
2014 Total # MBE Prime Contracts Awarded 2015 Total # MBE Prime Contracts Awarded
18.7
38
0
11.99
232012.5
2418.5
2533
4.6 6
TSO MAA MDTA MPA MTA MVA SHA
MBE Prime Contracts Awarded – Percent by Quarter
PM7.1.4 - Percent of MBE Prime Contracts Awarded – DONE Missing data
0.1000.00 0.080.00 0.00
0.100.00
0.30
0.080.20
0.08
0.30
0.69
1.00 0.93
0.00
0.20
0.40
0.60
0.80
1.00
1.20
2016 1st Qtr. Total % MBE Prime Contracts Awarded 2016 2nd Qtr. Cum. Total % MBE Prime Contracts Awarded
TSO MAA MDTA MPA MTA MVA SHA Total
Be Fair and Reasonable to Our Partners
107
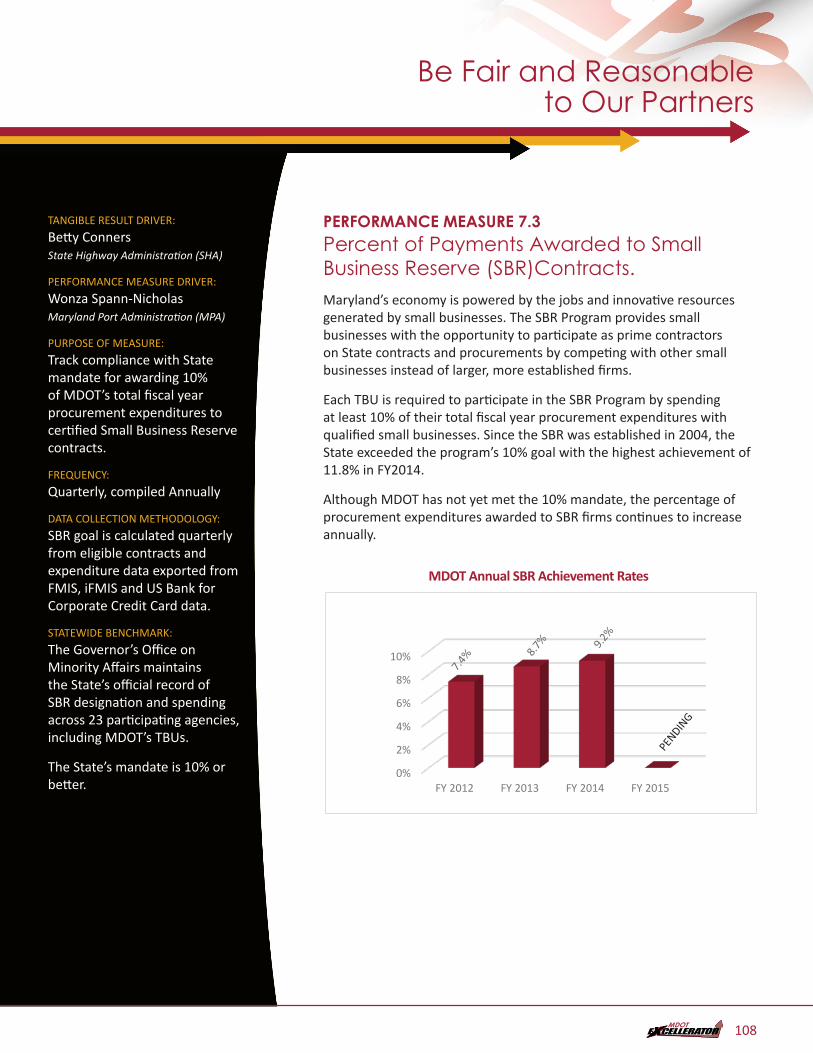
TANGIBLE RESULT DRIVER:
Betty Conners State Highway Administration (SHA)
PERFORMANCE MEASURE DRIVER:
Wonza Spann-Nicholas Maryland Port Administration (MPA)
PURPOSE OF MEASURE:
Track compliance with State mandate for awarding 10% of MDOT’s total fiscal year procurement expenditures to certified Small Business Reserve contracts.
FREQUENCY:
Quarterly, compiled Annually
DATA COLLECTION METHODOLOGY:
SBR goal is calculated quarterly from eligible contracts and expenditure data exported from FMIS, iFMIS and US Bank for Corporate Credit Card data.
STATEWIDE BENCHMARK:
The Governor’s Office on Minority Affairs maintains the State’s official record of SBR designation and spending across 23 participating agencies, including MDOT’s TBUs.
The State’s mandate is 10% or better.
PERFORMANCE MEASURE 7.3Percent of Payments Awarded to Small Business Reserve (SBR)Contracts.Maryland’s economy is powered by the jobs and innovative resources generated by small businesses. The SBR Program provides small businesses with the opportunity to participate as prime contractors on State contracts and procurements by competing with other small businesses instead of larger, more established firms.
Each TBU is required to participate in the SBR Program by spending at least 10% of their total fiscal year procurement expenditures with qualified small businesses. Since the SBR was established in 2004, the State exceeded the program’s 10% goal with the highest achievement of 11.8% in FY2014.
Although MDOT has not yet met the 10% mandate, the percentage of procurement expenditures awarded to SBR firms continues to increase annually.
MDOT Annual SBR Achievement RatesPM7.3.1 - MDOT Annual SBR Achievement Rates - DONE
0%
2%
4%
6%
8%
10%
FY 2012 FY 2013 FY 2014 FY 2015
Be Fair and Reasonable to Our Partners
108
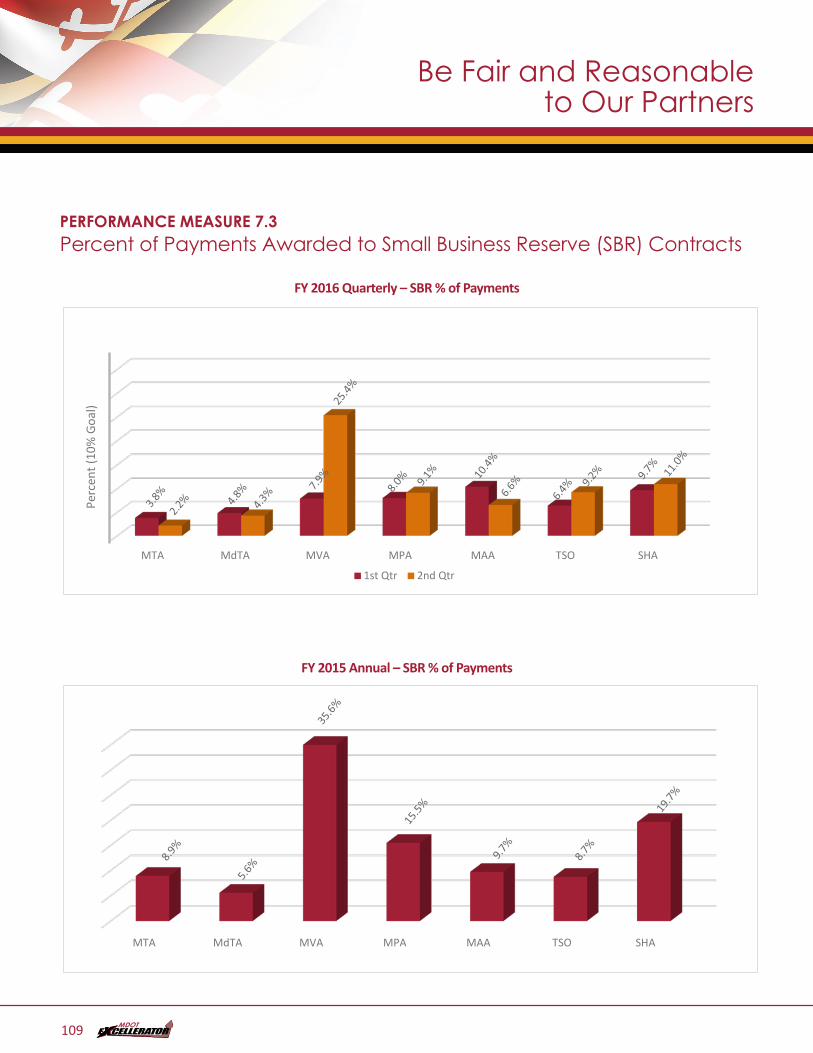
PERFORMANCE MEASURE 7.3Percent of Payments Awarded to Small Business Reserve (SBR) Contracts
FY 2016 Quarterly – SBR % of PaymentsPM7.3.2 - FY 2016 Quarterly – SBR % of Payments - DONE
MTA MdTA MVA MPA MAA TSO SHA
Perc
ent (
10%
Goa
l)
1st Qtr 2nd Qtr
FY 2015 Annual – SBR % of PaymentsPM7.3.3 - FY 2015 Annual – SBR % of Payments - DONE
MTA MdTA MVA MPA MAA TSO SHA
Be Fair and Reasonable to Our Partners
109
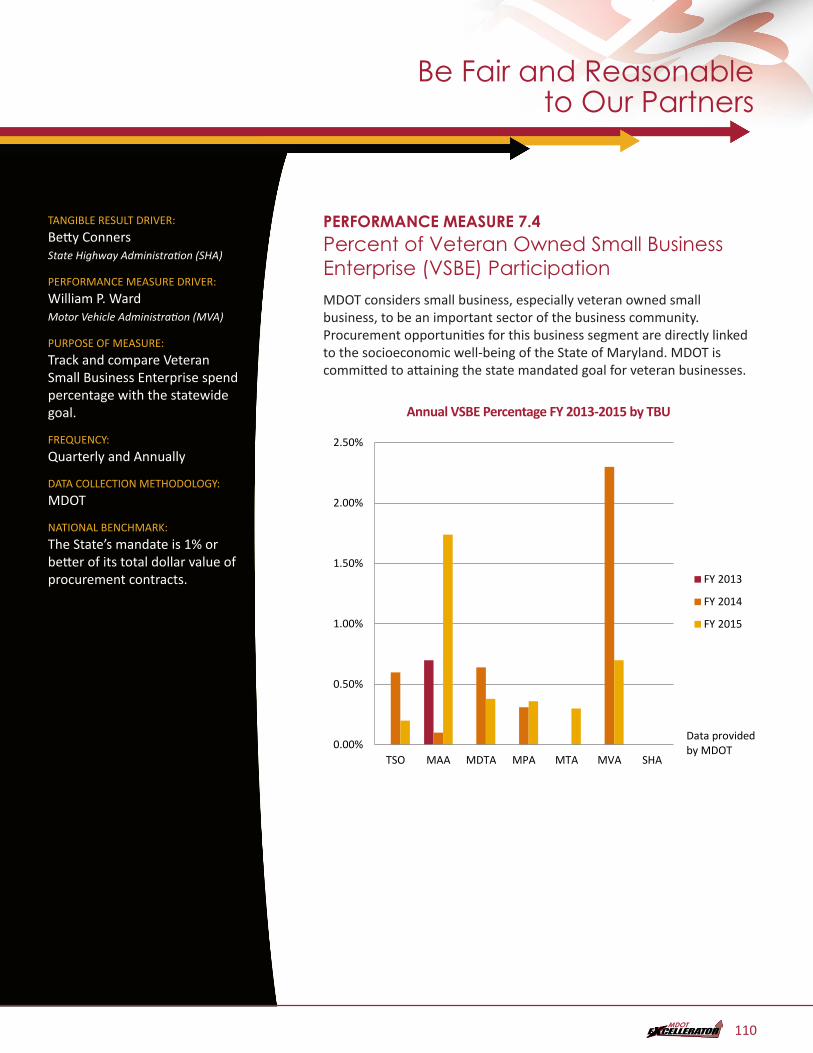
TANGIBLE RESULT DRIVER:
Betty Conners State Highway Administration (SHA)
PERFORMANCE MEASURE DRIVER:
William P. Ward Motor Vehicle Administration (MVA)
PURPOSE OF MEASURE:
Track and compare Veteran Small Business Enterprise spend percentage with the statewide goal.
FREQUENCY:
Quarterly and Annually
DATA COLLECTION METHODOLOGY:
MDOT
NATIONAL BENCHMARK:
The State’s mandate is 1% or better of its total dollar value of procurement contracts.
PERFORMANCE MEASURE 7.4Percent of Veteran Owned Small Business Enterprise (VSBE) ParticipationMDOT considers small business, especially veteran owned small business, to be an important sector of the business community. Procurement opportunities for this business segment are directly linked to the socioeconomic well-being of the State of Maryland. MDOT is committed to attaining the state mandated goal for veteran businesses.
Annual VSBE Percentage FY 2013-2015 by TBUPM7.4 - Annual VSBE Percentage FY 2013-2015 By TBU - DONE
0.00%
0.50%
1.00%
1.50%
2.00%
2.50%
TSO MAA MDTA MPA MTA MVA SHA
FY 2013
FY 2014
FY 2015
Data providedby MDOT
Be Fair and Reasonable to Our Partners
110
TANGIBLE RESULT DRIVER:
Betty Conners State Highway Administration (SHA)
PERFORMANCE MEASURE DRIVER:
Donna DiCerbo Maryland Transportation Authority
(MDTA)
PURPOSE OF MEASURE:
To determine the level of satisfaction of MDOT’s business partners that attend outreach events, seminars, etc.; and satisfaction with processes MDOT-wide
FREQUENCY:
Quarterly for outreach, etc.; and Annually for MDOT-wide
DATA COLLECTION METHODOLOGY:
Survey
NATIONAL BENCHMARK:
N/A
PERFORMANCE MEASURE 7.5Level of Satisfaction of Our Business Partners Tracking business partner satisfaction will allow MDOT to determine how satisfied its partners are with current business processes. Partners include contractors, consultants, vendors, other state agencies, federal, state, and local government, trade associations, commissions, etc. This data can be used to improve those processes that may be ambiguous or cumbersome, and make them user-friendly. It is important that people who avail themselves of this opportunity know that their comments are taken seriously.
In 2015, three business units (MDTA’s Office of Civil Rights & Fair Practices (CRFP); TSO’s Office of Human Resources (OHR); and TSO’s Office of Minority Business Enterprise (OMBE)) conducted business partner surveys. MDTA’s CRFP survey was conducted upon completion of an MBE/SBR/VSBE Outreach; TSO’s OHR survey was conducted upon completion of employee in-house training; and TSO’s OMBE survey was conducted on the MBE certification process).
For all of the surveys conducted, data was compiled and analyzed. In the case of MDTA’s CRFP, they made improvements to the next outreach event based on suggestions received within the survey results. In the case of TSO’s OHR, the information was used to improve employee development programs; and in the case of TSO’s Office of MBE, the information was used to assess how customers received information about the programs, determined areas of the state where they need to promote the programs, the value of the information provided at workshops and at certification interviews, and how well they are delivering customer service.
In addition to obtaining the survey information MDOT-wide, a request for transportation department-related survey samples was submitted through the National Institute of Governmental Purchasing (NIGP)’s website “NSite” to NIGP’s national, state and local members. No responses have been provided to date.
Be Fair and Reasonable to Our Partners
111
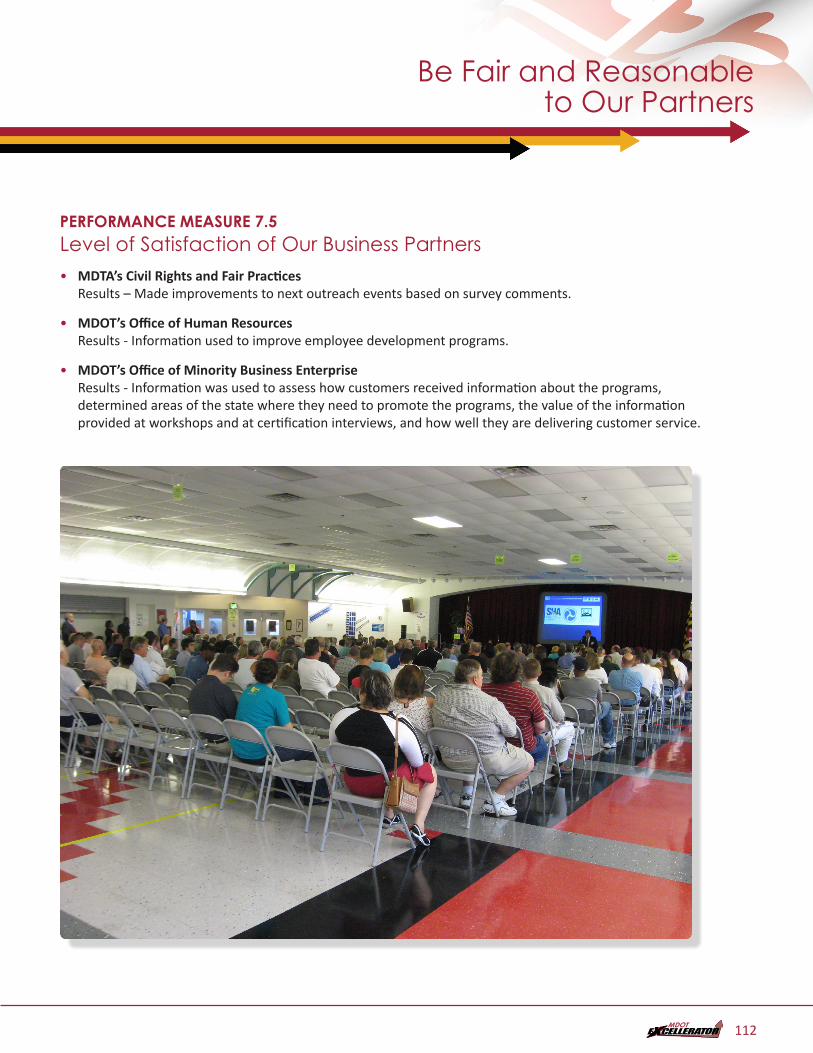
PERFORMANCE MEASURE 7.5Level of Satisfaction of Our Business Partners• MDTA’s Civil Rights and Fair Practices
Results – Made improvements to next outreach events based on survey comments.
• MDOT’s Office of Human ResourcesResults - Information used to improve employee development programs.
• MDOT’s Office of Minority Business Enterprise Results - Information was used to assess how customers received information about the programs, determined areas of the state where they need to promote the programs, the value of the information provided at workshops and at certification interviews, and how well they are delivering customer service.
Be Fair and Reasonable to Our Partners
112
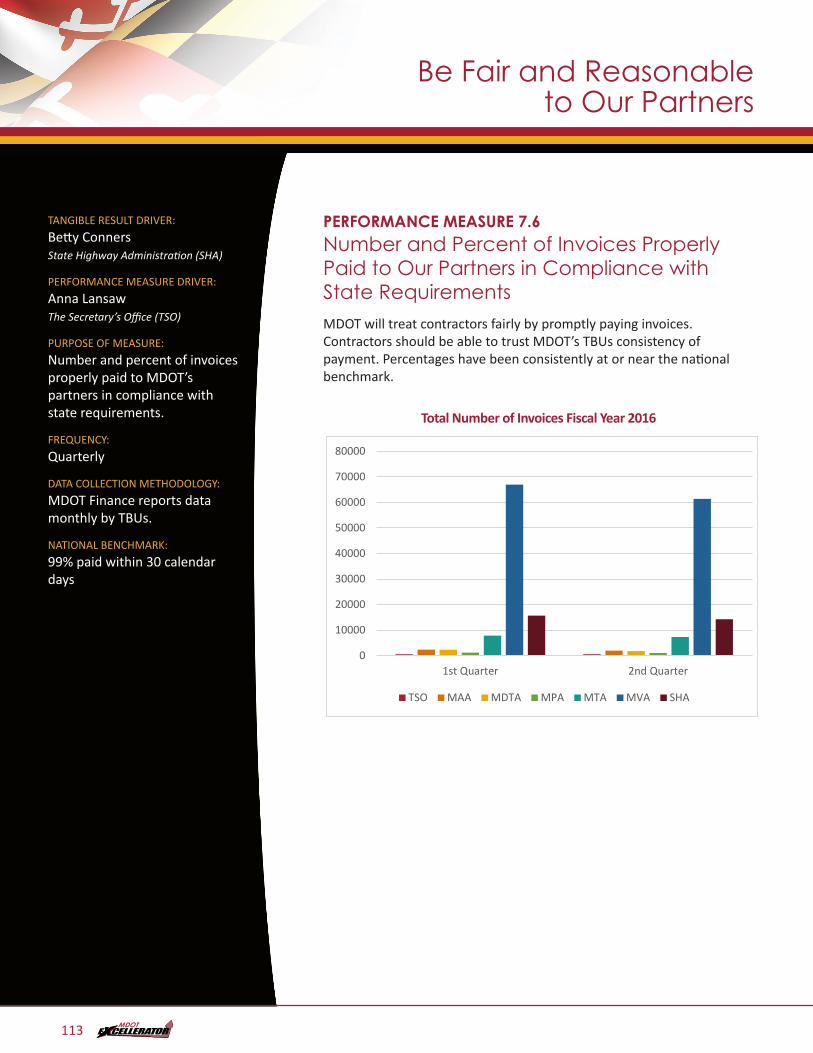
TANGIBLE RESULT DRIVER:
Betty Conners State Highway Administration (SHA)
PERFORMANCE MEASURE DRIVER:
Anna Lansaw The Secretary’s Office (TSO)
PURPOSE OF MEASURE:
Number and percent of invoices properly paid to MDOT’s partners in compliance with state requirements.
FREQUENCY:
Quarterly
DATA COLLECTION METHODOLOGY:
MDOT Finance reports data monthly by TBUs.
NATIONAL BENCHMARK:
99% paid within 30 calendar days
PERFORMANCE MEASURE 7.6Number and Percent of Invoices Properly Paid to Our Partners in Compliance with State RequirementsMDOT will treat contractors fairly by promptly paying invoices. Contractors should be able to trust MDOT’s TBUs consistency of payment. Percentages have been consistently at or near the national benchmark.
Total Number of Invoices Fiscal Year 2016 PM7.6.2 – No title - DONE
0
10000
20000
30000
40000
50000
60000
70000
80000
1st Quarter 2nd Quarter
TSO MAA MDTA MPA MTA MVA SHA
Be Fair and Reasonable to Our Partners
113
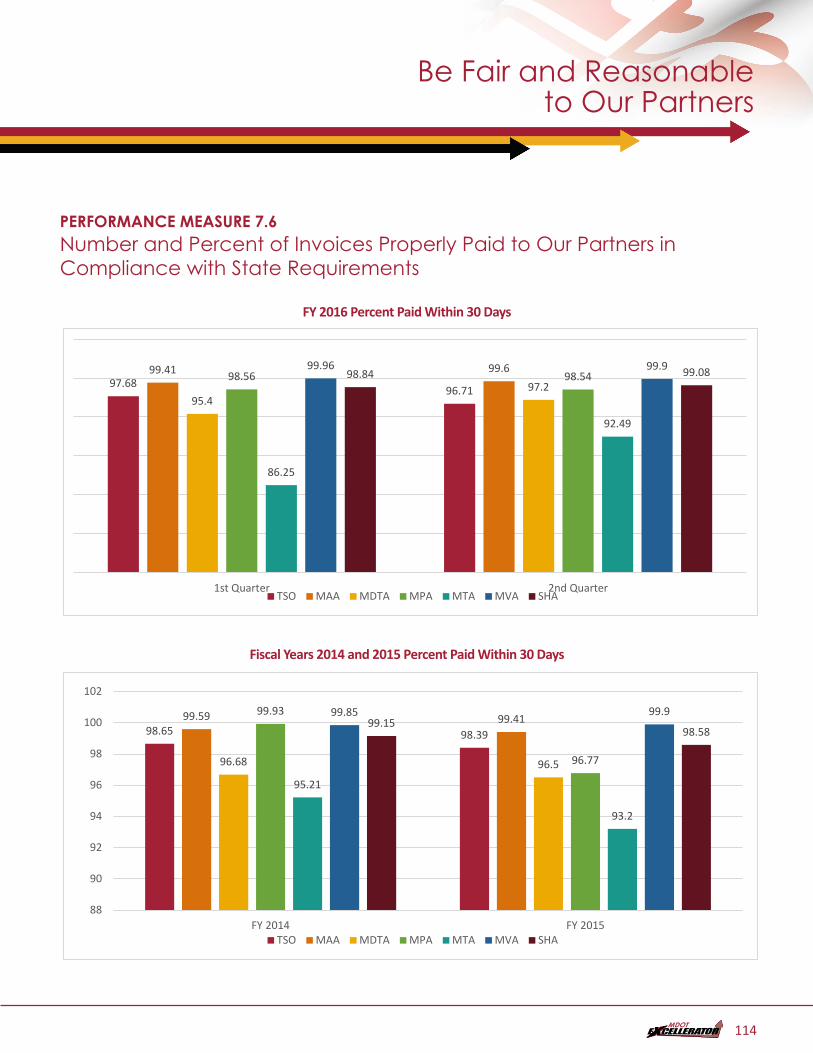
PERFORMANCE MEASURE 7.6Number and Percent of Invoices Properly Paid to Our Partners in Compliance with State Requirements
FY 2016 Percent Paid Within 30 DaysPM7.6.1 - Fiscal Year 2016 Percent Paid Within 30 Days - DONE
97.68 96.71
99.41 99.6
95.497.2
98.56 98.54
86.25
92.49
99.96 99.998.84 99.08
1st Quarter 2nd QuarterTSO MAA MDTA MPA MTA MVA SHA
Fiscal Years 2014 and 2015 Percent Paid Within 30 DaysPM7.6.3 – No title - DONE
98.65 98.3999.59 99.41
96.68 96.5
99.93
96.77
95.21
93.2
99.85 99.999.15
98.58
88
90
92
94
96
98
100
102
FY 2014 FY 2015TSO MAA MDTA MPA MTA MVA SHA
Be Fair and Reasonable to Our Partners
114
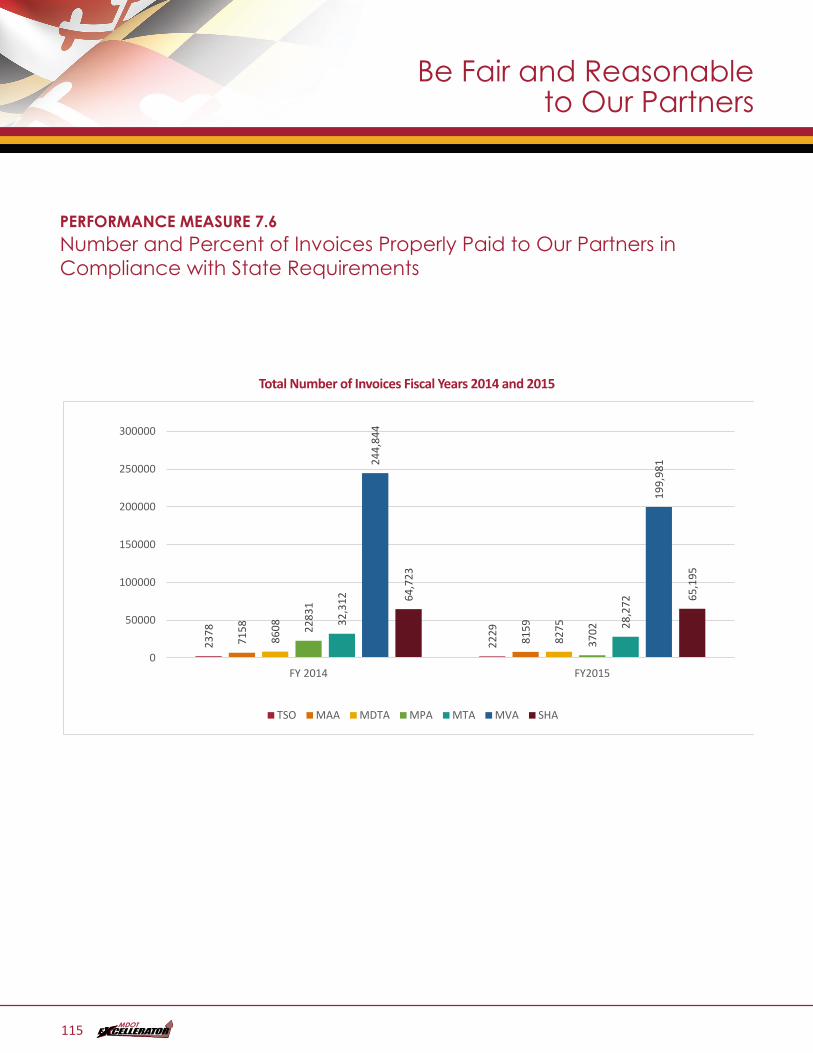
PERFORMANCE MEASURE 7.6Number and Percent of Invoices Properly Paid to Our Partners in Compliance with State Requirements
Total Number of Invoices Fiscal Years 2014 and 2015
PM7.6.4 – No title - DONE
2378
2229
7158
8159
8608
827522
831
3702
32,3
12
28,2
72
244,
844
199,
981
64,7
23
65,1
95
0
50000
100000
150000
200000
250000
300000
FY 2014 FY2015
TSO MAA MDTA MPA MTA MVA SHA
Be Fair and Reasonable to Our Partners
115
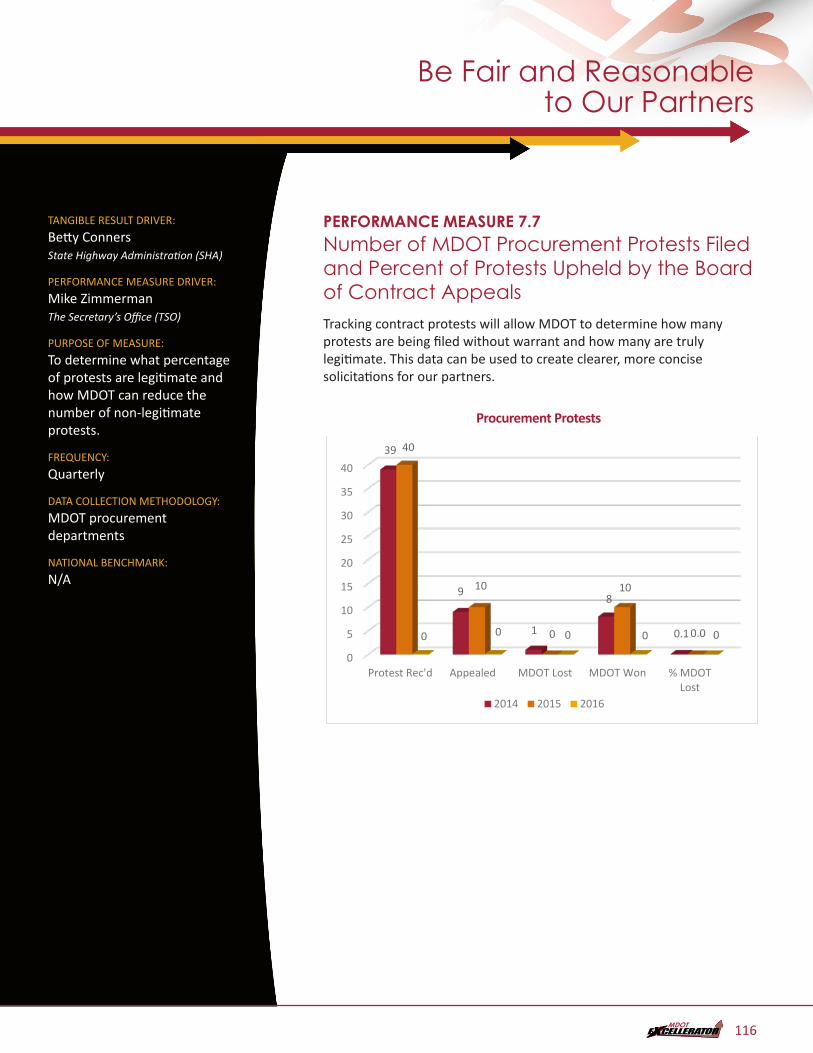
TANGIBLE RESULT DRIVER:
Betty Conners State Highway Administration (SHA)
PERFORMANCE MEASURE DRIVER:
Mike Zimmerman The Secretary’s Office (TSO)
PURPOSE OF MEASURE:
To determine what percentage of protests are legitimate and how MDOT can reduce the number of non-legitimate protests.
FREQUENCY:
Quarterly
DATA COLLECTION METHODOLOGY:
MDOT procurement departments
NATIONAL BENCHMARK:
N/A
PERFORMANCE MEASURE 7.7Number of MDOT Procurement Protests Filed and Percent of Protests Upheld by the Board of Contract AppealsTracking contract protests will allow MDOT to determine how many protests are being filed without warrant and how many are truly legitimate. This data can be used to create clearer, more concise solicitations for our partners.
Procurement Protests
PM7.7 - PROCUREMENT PROTESTS - DONE
0
5
10
15
20
25
30
35
40
Protest Rec'd Appealed MDOT Lost MDOT Won % MDOTLost
39
9
1
8
0.1
40
10
0
10
0.00 0 0 0 0
2014 2015 2016
Be Fair and Reasonable to Our Partners
116
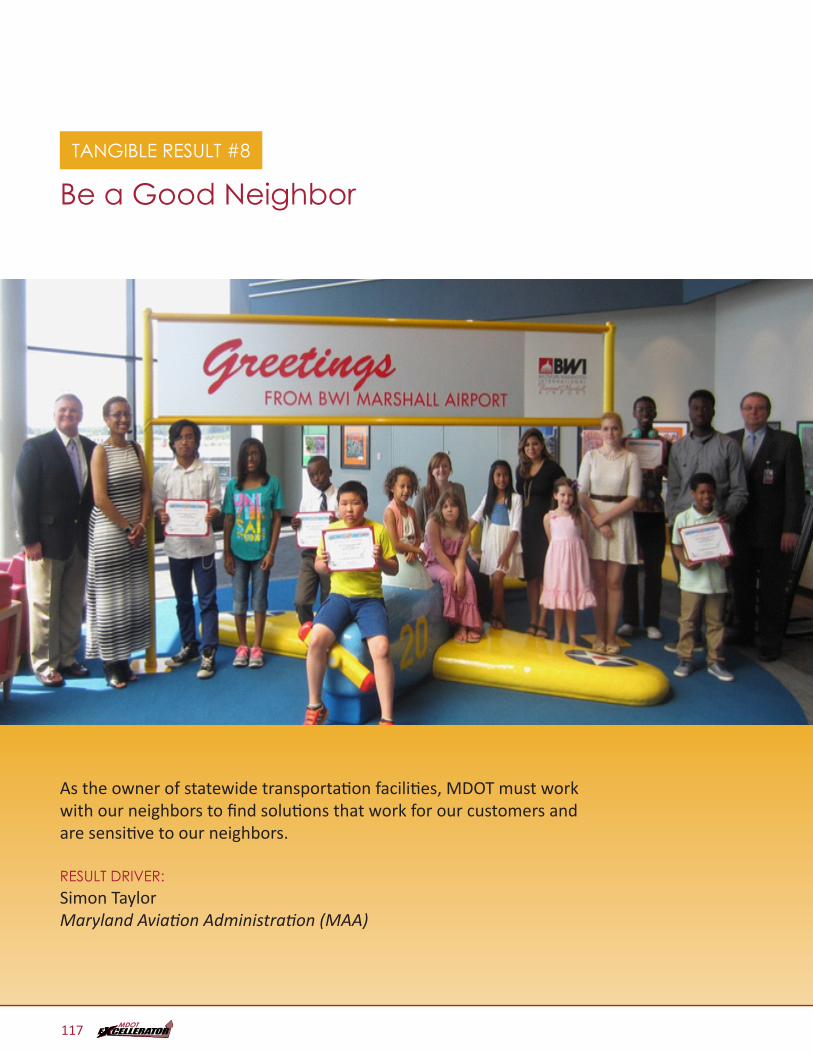
TANGIBLE RESULT #8
Be a Good Neighbor
As the owner of statewide transportation facilities, MDOT must work with our neighbors to find solutions that work for our customers and are sensitive to our neighbors.
RESULT DRIVER:Simon Taylor Maryland Aviation Administration (MAA)
117
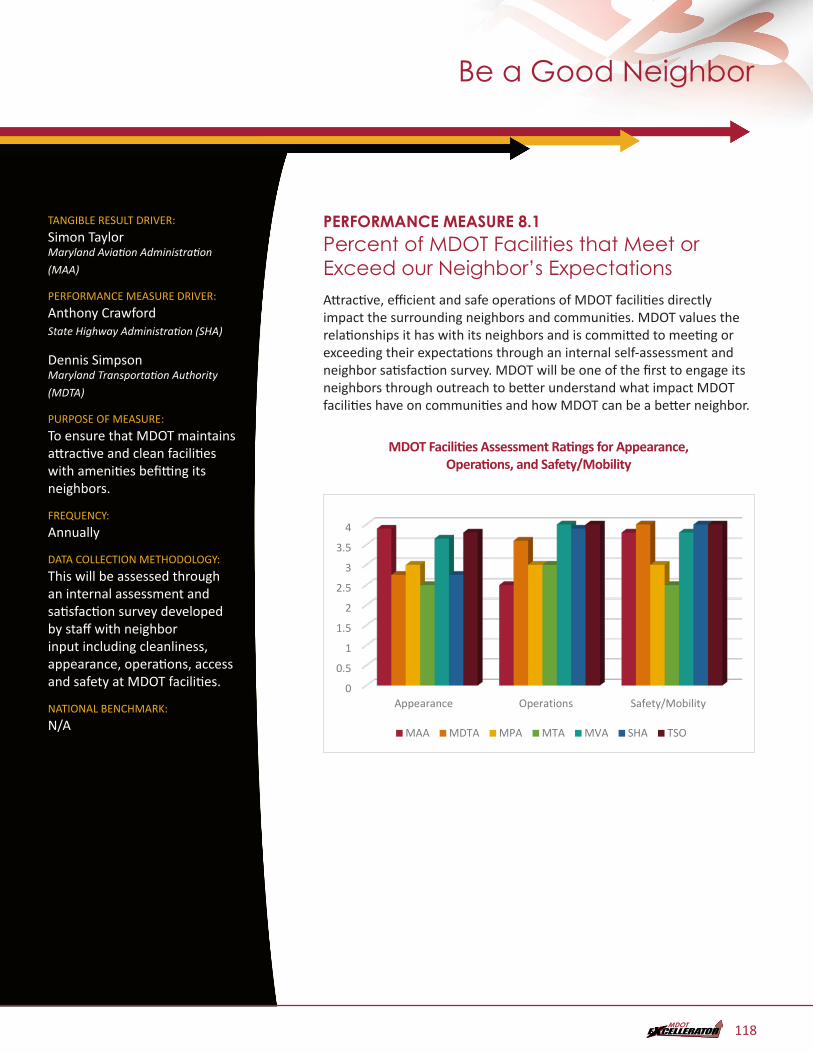
TANGIBLE RESULT DRIVER:
Simon Taylor Maryland Aviation Administration
(MAA)
PERFORMANCE MEASURE DRIVER:
Anthony Crawford State Highway Administration (SHA)
Dennis Simpson Maryland Transportation Authority
(MDTA)
PURPOSE OF MEASURE:
To ensure that MDOT maintains attractive and clean facilities with amenities befitting its neighbors.
FREQUENCY:
Annually
DATA COLLECTION METHODOLOGY:
This will be assessed through an internal assessment and satisfaction survey developed by staff with neighbor input including cleanliness, appearance, operations, access and safety at MDOT facilities.
NATIONAL BENCHMARK:
N/A
PERFORMANCE MEASURE 8.1Percent of MDOT Facilities that Meet or Exceed our Neighbor’s ExpectationsAttractive, efficient and safe operations of MDOT facilities directly impact the surrounding neighbors and communities. MDOT values the relationships it has with its neighbors and is committed to meeting or exceeding their expectations through an internal self-assessment and neighbor satisfaction survey. MDOT will be one of the first to engage its neighbors through outreach to better understand what impact MDOT facilities have on communities and how MDOT can be a better neighbor.
MDOT Facilities Assessment Ratings for Appearance, Operations, and Safety/Mobility
PM8.1 - MDOT Facilities Assessment Ratings for Appearance, Operations and Safety/Mobility*
* The data presented here is for an internal assessment of one facility from each business unit - DONE
0
0.5
1
1.5
2
2.5
3
3.5
4
Appearance Operations Safety/Mobility
MAA MDTA MPA MTA MVA SHA TSO
Be a Good Neighbor
118
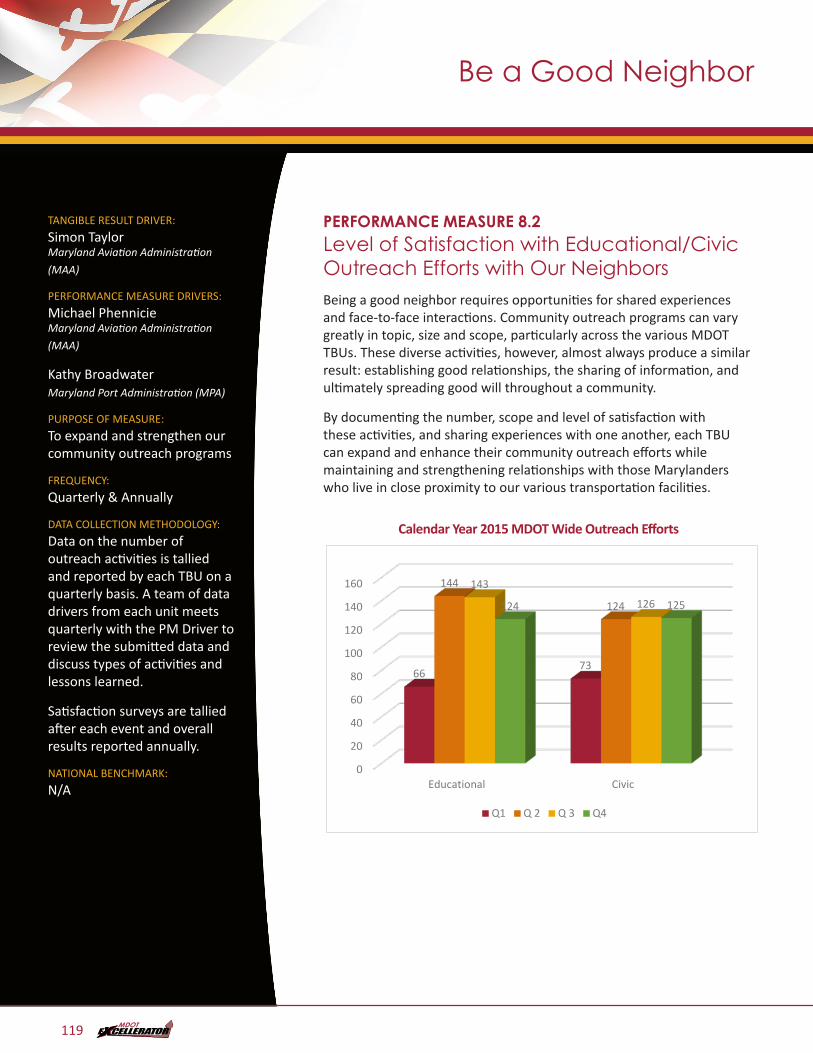
TANGIBLE RESULT DRIVER:
Simon Taylor Maryland Aviation Administration
(MAA)
PERFORMANCE MEASURE DRIVERS:
Michael Phennicie Maryland Aviation Administration
(MAA)
Kathy Broadwater Maryland Port Administration (MPA)
PURPOSE OF MEASURE:
To expand and strengthen our community outreach programs
FREQUENCY:
Quarterly & Annually
DATA COLLECTION METHODOLOGY:
Data on the number of outreach activities is tallied and reported by each TBU on a quarterly basis. A team of data drivers from each unit meets quarterly with the PM Driver to review the submitted data and discuss types of activities and lessons learned.
Satisfaction surveys are tallied after each event and overall results reported annually.
NATIONAL BENCHMARK:
N/A
PERFORMANCE MEASURE 8.2Level of Satisfaction with Educational/Civic Outreach Efforts with Our NeighborsBeing a good neighbor requires opportunities for shared experiences and face-to-face interactions. Community outreach programs can vary greatly in topic, size and scope, particularly across the various MDOT TBUs. These diverse activities, however, almost always produce a similar result: establishing good relationships, the sharing of information, and ultimately spreading good will throughout a community.
By documenting the number, scope and level of satisfaction with these activities, and sharing experiences with one another, each TBU can expand and enhance their community outreach efforts while maintaining and strengthening relationships with those Marylanders who live in close proximity to our various transportation facilities.
Calendar Year 2015 MDOT Wide Outreach EffortsPM8.2 - Calendar Year 2015 MDOT Wide Outreach Efforts - DONE
0
20
40
60
80
100
120
140
160
Educational Civic
6673
144
124
143
126124 125
Q1 Q 2 Q 3 Q4
Be a Good Neighbor
119
Be a Good Neighbor
120
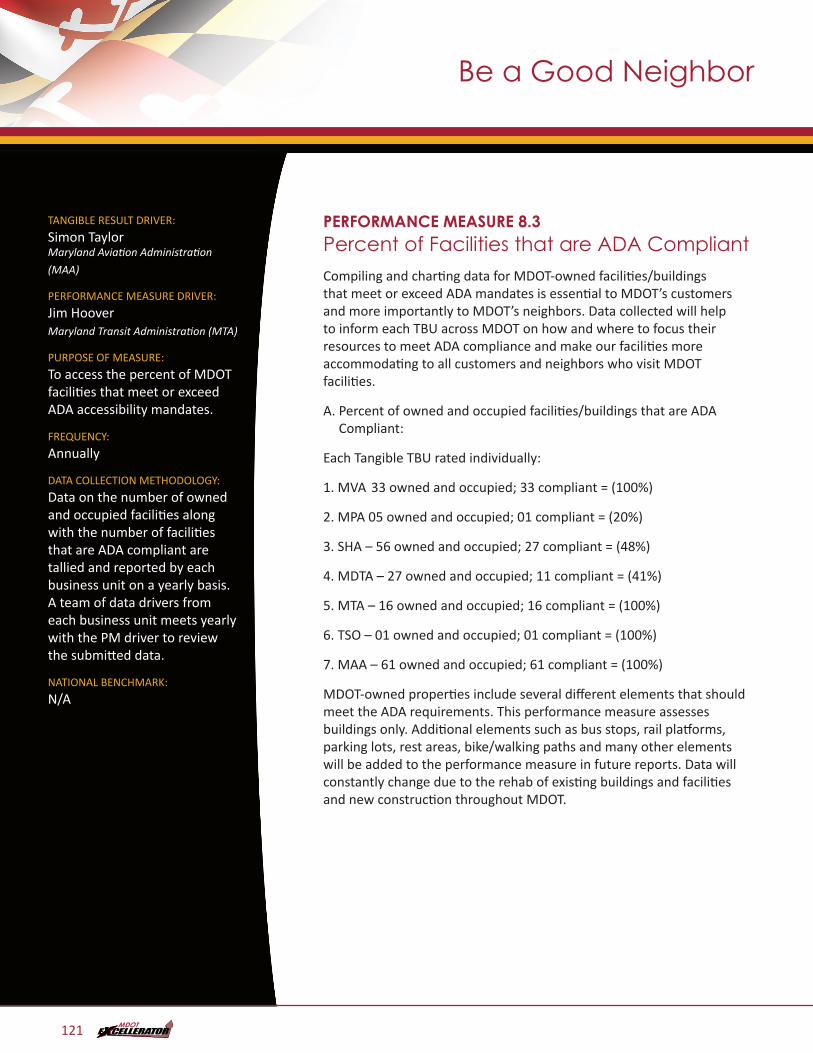
TANGIBLE RESULT DRIVER:
Simon Taylor Maryland Aviation Administration
(MAA)
PERFORMANCE MEASURE DRIVER:
Jim Hoover Maryland Transit Administration (MTA)
PURPOSE OF MEASURE:
To access the percent of MDOT facilities that meet or exceed ADA accessibility mandates.
FREQUENCY:
Annually
DATA COLLECTION METHODOLOGY:
Data on the number of owned and occupied facilities along with the number of facilities that are ADA compliant are tallied and reported by each business unit on a yearly basis. A team of data drivers from each business unit meets yearly with the PM driver to review the submitted data.
NATIONAL BENCHMARK:
N/A
PERFORMANCE MEASURE 8.3Percent of Facilities that are ADA CompliantCompiling and charting data for MDOT-owned facilities/buildings that meet or exceed ADA mandates is essential to MDOT’s customers and more importantly to MDOT’s neighbors. Data collected will help to inform each TBU across MDOT on how and where to focus their resources to meet ADA compliance and make our facilities more accommodating to all customers and neighbors who visit MDOT facilities.
A. Percent of owned and occupied facilities/buildings that are ADA Compliant:
Each Tangible TBU rated individually:
1. MVA 33 owned and occupied; 33 compliant = (100%)
2. MPA 05 owned and occupied; 01 compliant = (20%)
3. SHA – 56 owned and occupied; 27 compliant = (48%)
4. MDTA – 27 owned and occupied; 11 compliant = (41%)
5. MTA – 16 owned and occupied; 16 compliant = (100%)
6. TSO – 01 owned and occupied; 01 compliant = (100%)
7. MAA – 61 owned and occupied; 61 compliant = (100%)
MDOT-owned properties include several different elements that should meet the ADA requirements. This performance measure assesses buildings only. Additional elements such as bus stops, rail platforms, parking lots, rest areas, bike/walking paths and many other elements will be added to the performance measure in future reports. Data will constantly change due to the rehab of existing buildings and facilities and new construction throughout MDOT.
Be a Good Neighbor
121
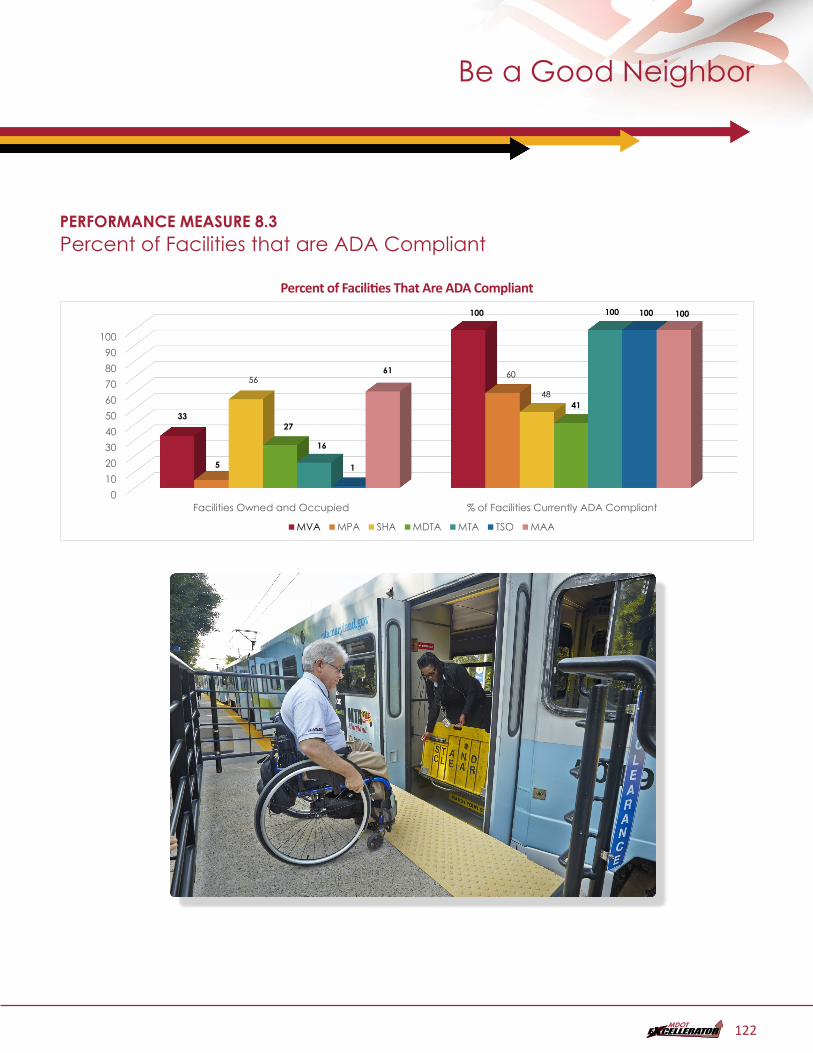
PERFORMANCE MEASURE 8.3Percent of Facilities that are ADA Compliant
Percent of Facilities That Are ADA Compliant
0102030405060708090
100
Facilities Owned and Occupied % of Facilities Currently ADA Compliant
33
100
5
605648
27
41
16
100
1
100
61
100
Percent of Facilities that are ADA Compliant
MVA MPA SHA MDTA MTA TSO MAA
Be a Good Neighbor
122
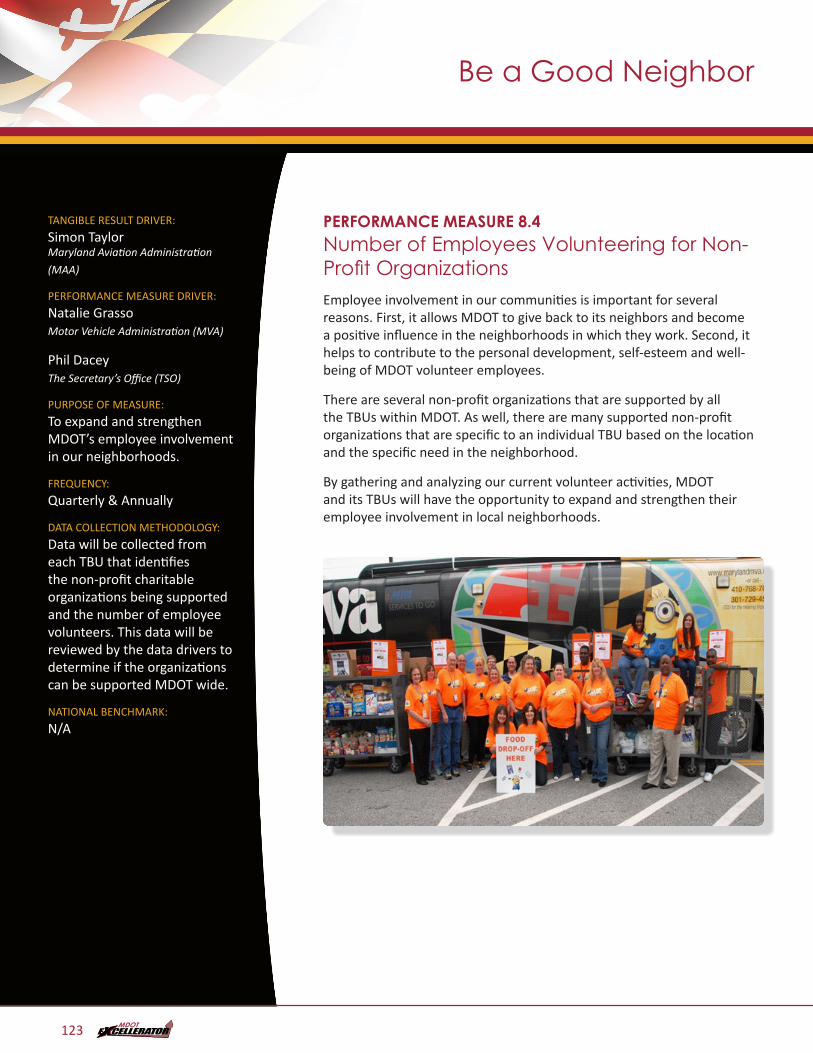
TANGIBLE RESULT DRIVER:
Simon Taylor Maryland Aviation Administration
(MAA)
PERFORMANCE MEASURE DRIVER:
Natalie Grasso Motor Vehicle Administration (MVA)
Phil Dacey The Secretary’s Office (TSO)
PURPOSE OF MEASURE:
To expand and strengthen MDOT’s employee involvement in our neighborhoods.
FREQUENCY:
Quarterly & Annually
DATA COLLECTION METHODOLOGY:
Data will be collected from each TBU that identifies the non-profit charitable organizations being supported and the number of employee volunteers. This data will be reviewed by the data drivers to determine if the organizations can be supported MDOT wide.
NATIONAL BENCHMARK:
N/A
PERFORMANCE MEASURE 8.4Number of Employees Volunteering for Non-Profit OrganizationsEmployee involvement in our communities is important for several reasons. First, it allows MDOT to give back to its neighbors and become a positive influence in the neighborhoods in which they work. Second, it helps to contribute to the personal development, self-esteem and well-being of MDOT volunteer employees.
There are several non-profit organizations that are supported by all the TBUs within MDOT. As well, there are many supported non-profit organizations that are specific to an individual TBU based on the location and the specific need in the neighborhood.
By gathering and analyzing our current volunteer activities, MDOT and its TBUs will have the opportunity to expand and strengthen their employee involvement in local neighborhoods.
Be a Good Neighbor
123
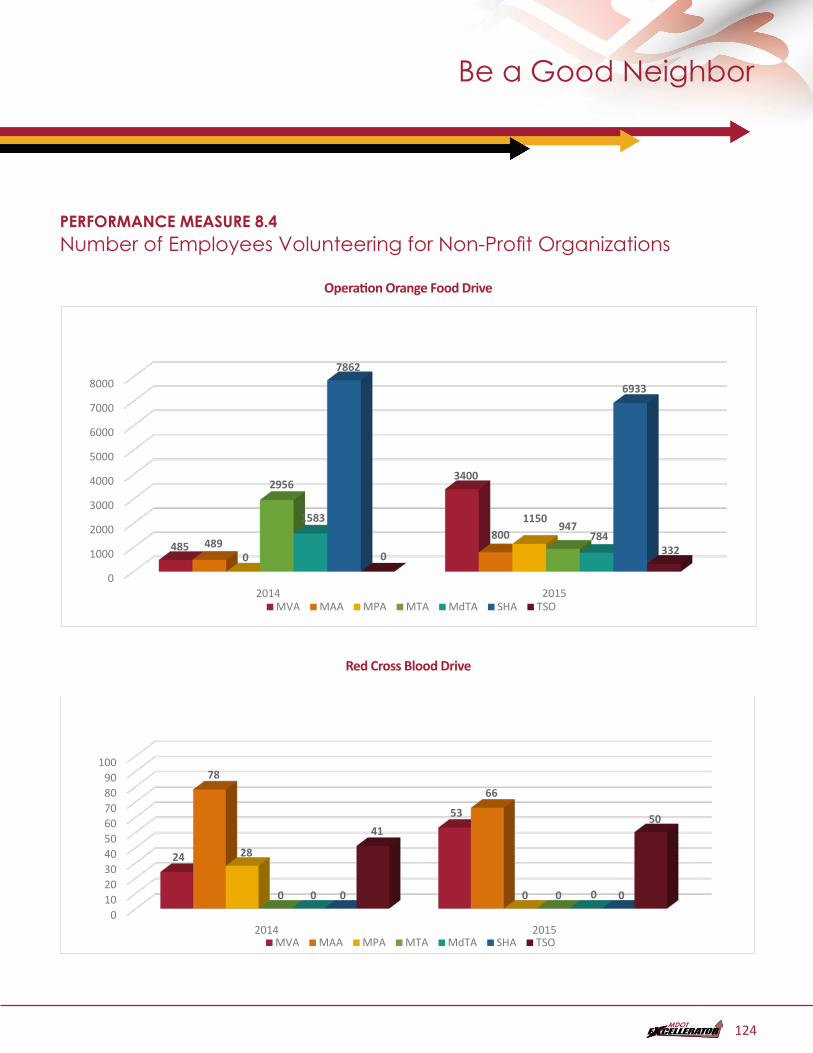
Be a Good Neighbor
PERFORMANCE MEASURE 8.4Number of Employees Volunteering for Non-Profit Organizations
Operation Orange Food Drive
PM8.4.2 - Operation Orange Food Drive 2014 / 2015
(Pounds of Food) - DONE
0
1000
2000
3000
4000
5000
6000
7000
8000
2014 2015
485
3400
489800
0
1150
2956
9471583
784
7862
6933
0 332
MVA MAA MPA MTA MdTA SHA TSO
Red Cross Blood DrivePM8.4.3 - Red Cross Blood Drive 2014 / 2015
(Number of Donors) - DONE
0102030405060708090
100
2014 2015
24
53
7866
28
00 00 00 0
4150
MVA MAA MPA MTA MdTA SHA TSO
124

TANGIBLE RESULT #9
Be a Good Steward of Our Environment
MDOT will be accountable to our customers for the wise use of limited resources and our impacts on the environment when designing, building, operating and maintaining a transportation system.
RESULT DRIVER:Dorothy Morrison The Secretary’s Office (TSO)
125
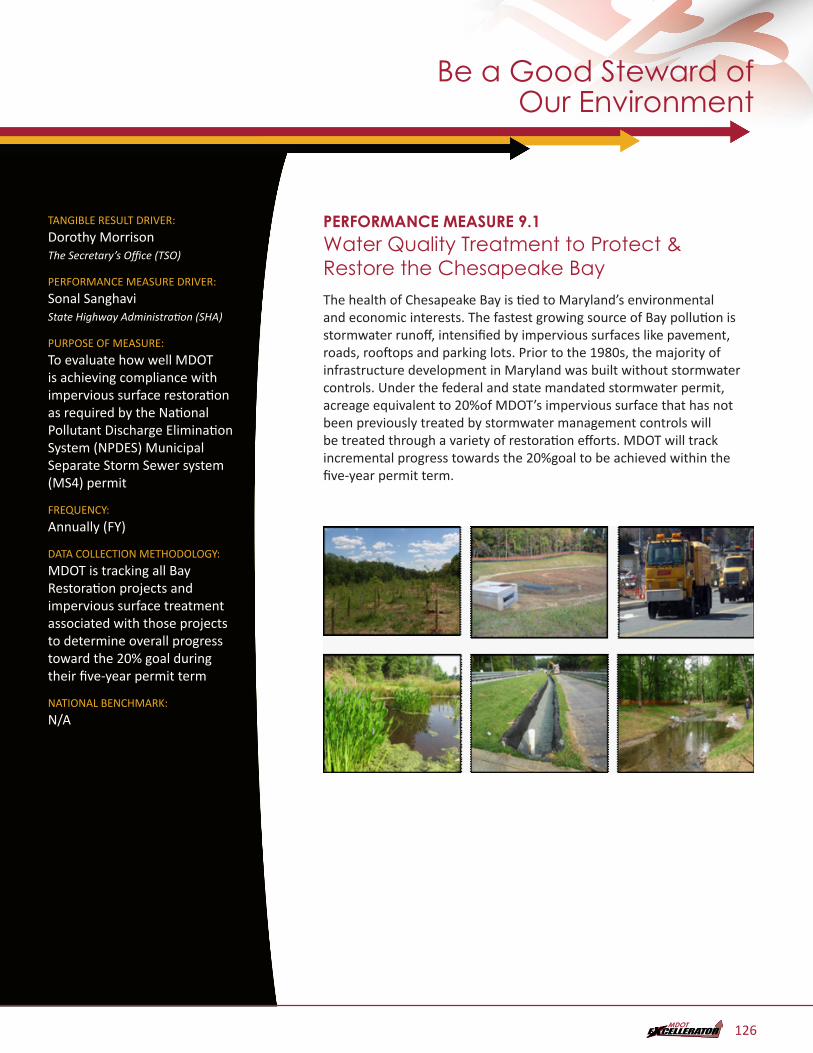
Be a Good Steward of Our Environment
TANGIBLE RESULT DRIVER:
Dorothy Morrison The Secretary’s Office (TSO)
PERFORMANCE MEASURE DRIVER:
Sonal Sanghavi State Highway Administration (SHA)
PURPOSE OF MEASURE:
To evaluate how well MDOT is achieving compliance with impervious surface restoration as required by the National Pollutant Discharge Elimination System (NPDES) Municipal Separate Storm Sewer system (MS4) permit
FREQUENCY:
Annually (FY)
DATA COLLECTION METHODOLOGY:
MDOT is tracking all Bay Restoration projects and impervious surface treatment associated with those projects to determine overall progress toward the 20% goal during their five-year permit term
NATIONAL BENCHMARK:
N/A
PERFORMANCE MEASURE 9.1Water Quality Treatment to Protect & Restore the Chesapeake BayThe health of Chesapeake Bay is tied to Maryland’s environmental and economic interests. The fastest growing source of Bay pollution is stormwater runoff, intensified by impervious surfaces like pavement, roads, rooftops and parking lots. Prior to the 1980s, the majority of infrastructure development in Maryland was built without stormwater controls. Under the federal and state mandated stormwater permit, acreage equivalent to 20%of MDOT’s impervious surface that has not been previously treated by stormwater management controls will be treated through a variety of restoration efforts. MDOT will track incremental progress towards the 20%goal to be achieved within the five-year permit term.
126
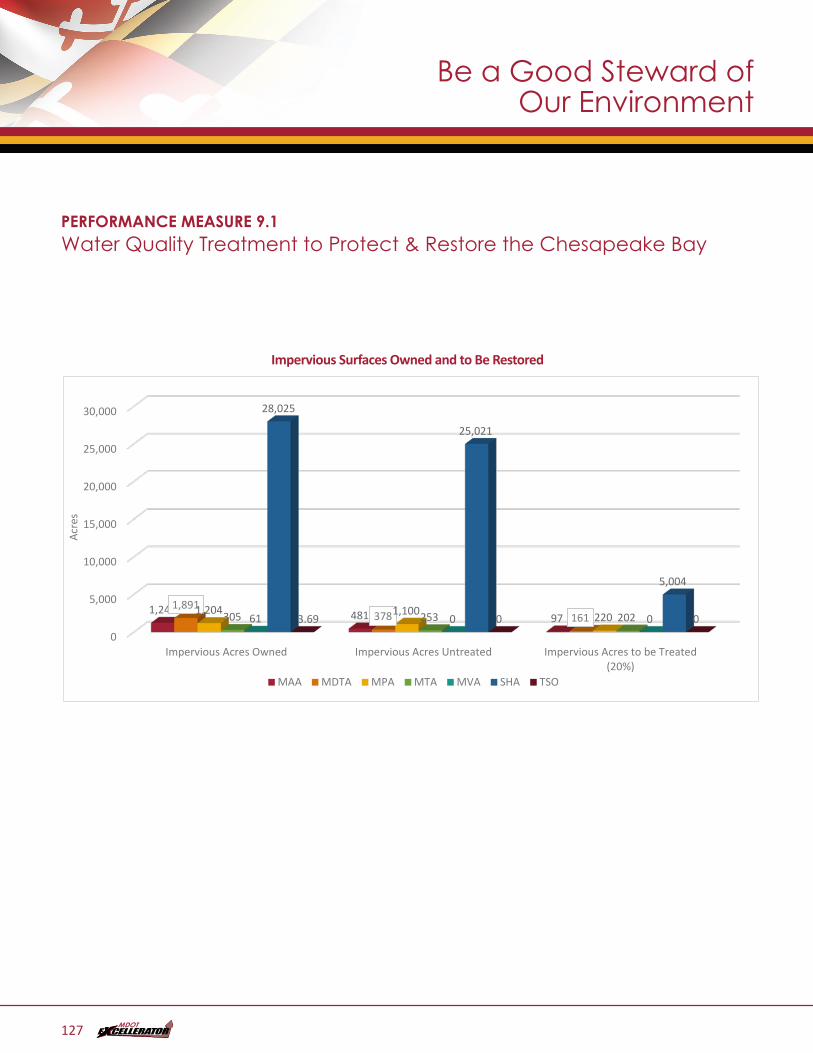
PERFORMANCE MEASURE 9.1Water Quality Treatment to Protect & Restore the Chesapeake Bay
Impervious Surfaces Owned and to Be RestoredPM9.1 - Impervious Surfaces Owned and to be Restored - DONE
0
5,000
10,000
15,000
20,000
25,000
30,000
Impervious Acres Owned Impervious Acres Untreated Impervious Acres to be Treated(20%)
1,249 481 971,891
378 1611,204 1,100 220305 253 20261 0 0
28,025
25,021
5,004
3.69 0 0
Acre
s
MAA MDTA MPA MTA MVA SHA TSO
Be a Good Steward of Our Environment
127
TANGIBLE RESULT DRIVER:
Dorothy Morrison The Secretary’s Office (TSO)
PERFORMANCE MEASURE DRIVER:
Paul Truntich Jr. Maryland Transportation Authority
(MDTA)
PURPOSE OF MEASURE:
To track overall fuel economy of fleet vehicles. Fuel economy data will be used to evaluate driving patterns as well as when the procurement of new fleet vehicles is considered.
FREQUENCY:
Semi-Annually
DATA COLLECTION METHODOLOGY:
Fleet MPG data will be obtained from the State of Maryland’s fuel service vendor.
NATIONAL BENCHMARK:
N/A
PERFORMANCE MEASURE 9.2AFuel Efficiency: Miles Per GallonCurrently, there is no uniform approach to evaluating miles per gallon (MPG) of MDOT fleet vehicles. Mansfield Oil Company (statewide fueling vendor) has been contacted regarding developing a means of tracking this data. While reducing fuel consumption through improved fleet fuel economy is a benefit to tracking this data (cost savings and resource conservation), it does not come without limitations. Incorrect vehicle mileage entry at the time of vehicle refueling will skew all resulting MPG data for the vehicle in question. Additionally, police vehicles, snow fighting equipment, courtesy patrol vehicles and maintenance of traffic equipment, depending on their situation, can spend significant amounts of time idling which also taints MPG data. Finally, traditional heavy equipment does not always refuel at a dispenser, but are refueled by intermediate methods, so in these instances Mansfield Oil would have no means of tracking and recording MPG.
Be a Good Steward of Our Environment
128
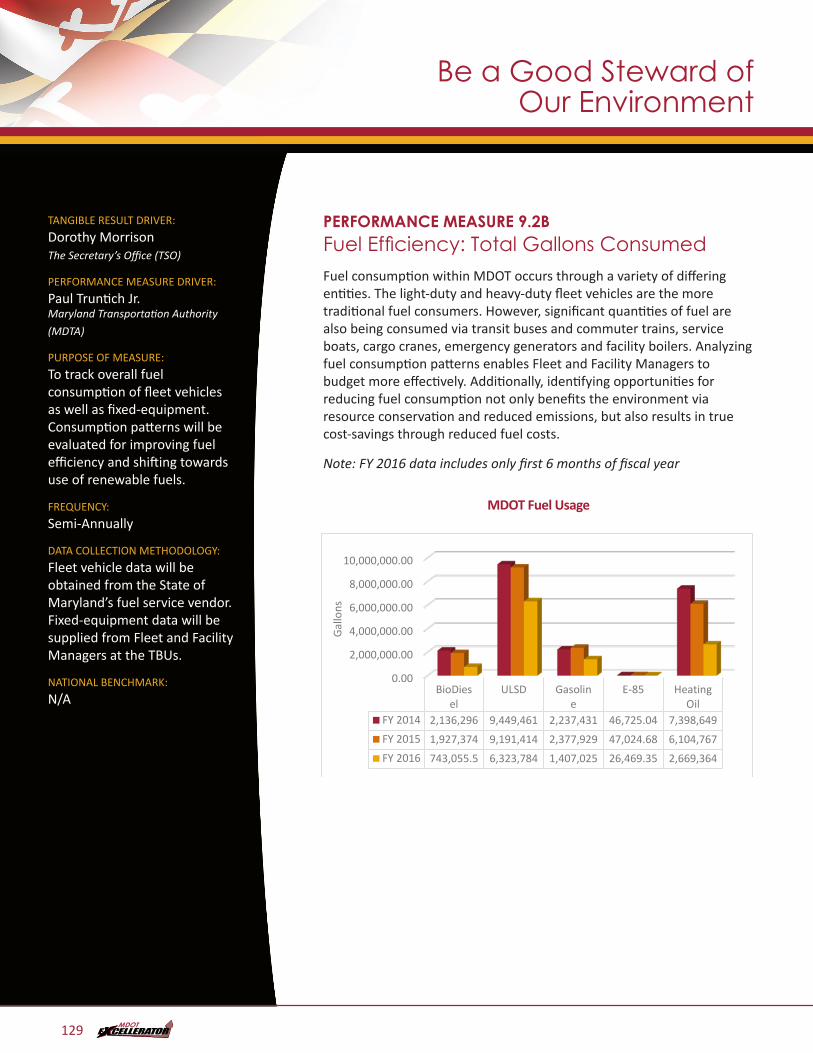
TANGIBLE RESULT DRIVER:
Dorothy Morrison The Secretary’s Office (TSO)
PERFORMANCE MEASURE DRIVER:
Paul Truntich Jr. Maryland Transportation Authority
(MDTA)
PURPOSE OF MEASURE:
To track overall fuel consumption of fleet vehicles as well as fixed-equipment. Consumption patterns will be evaluated for improving fuel efficiency and shifting towards use of renewable fuels.
FREQUENCY:
Semi-Annually
DATA COLLECTION METHODOLOGY:
Fleet vehicle data will be obtained from the State of Maryland’s fuel service vendor. Fixed-equipment data will be supplied from Fleet and Facility Managers at the TBUs.
NATIONAL BENCHMARK:
N/A
PERFORMANCE MEASURE 9.2BFuel Efficiency: Total Gallons ConsumedFuel consumption within MDOT occurs through a variety of differing entities. The light-duty and heavy-duty fleet vehicles are the more traditional fuel consumers. However, significant quantities of fuel are also being consumed via transit buses and commuter trains, service boats, cargo cranes, emergency generators and facility boilers. Analyzing fuel consumption patterns enables Fleet and Facility Managers to budget more effectively. Additionally, identifying opportunities for reducing fuel consumption not only benefits the environment via resource conservation and reduced emissions, but also results in true cost-savings through reduced fuel costs.
Note: FY 2016 data includes only first 6 months of fiscal year
MDOT Fuel UsagePM9.2b - MDOT Fuel Usage - DONE
0.00
2,000,000.00
4,000,000.00
6,000,000.00
8,000,000.00
10,000,000.00
BioDiesel
ULSD Gasoline
E-85 HeatingOil
FY 2014 2,136,296 9,449,461 2,237,431 46,725.04 7,398,649FY 2015 1,927,374 9,191,414 2,377,929 47,024.68 6,104,767FY 2016 743,055.5 6,323,784 1,407,025 26,469.35 2,669,364
Gallo
ns
Be a Good Steward of Our Environment
129
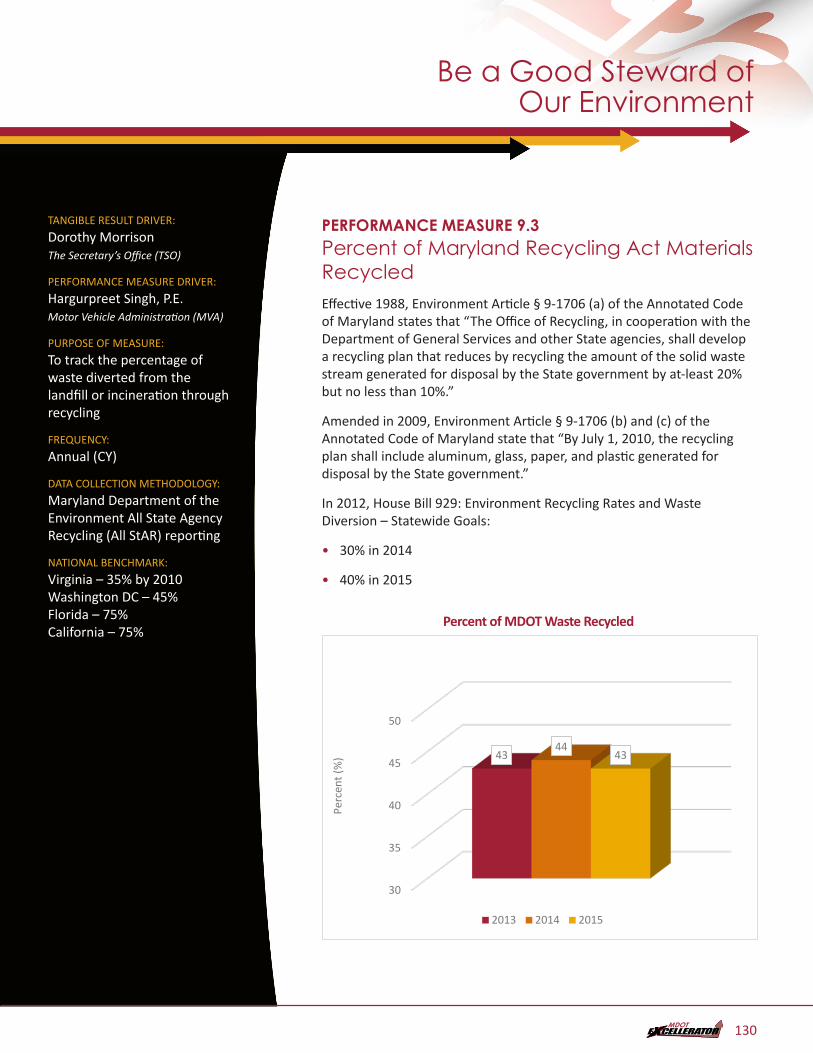
TANGIBLE RESULT DRIVER:
Dorothy Morrison The Secretary’s Office (TSO)
PERFORMANCE MEASURE DRIVER:
Hargurpreet Singh, P.E. Motor Vehicle Administration (MVA)
PURPOSE OF MEASURE:
To track the percentage of waste diverted from the landfill or incineration through recycling
FREQUENCY:
Annual (CY)
DATA COLLECTION METHODOLOGY:
Maryland Department of the Environment All State Agency Recycling (All StAR) reporting
NATIONAL BENCHMARK:
Virginia – 35% by 2010 Washington DC – 45% Florida – 75% California – 75%
PERFORMANCE MEASURE 9.3Percent of Maryland Recycling Act Materials RecycledEffective 1988, Environment Article § 9-1706 (a) of the Annotated Code of Maryland states that “The Office of Recycling, in cooperation with the Department of General Services and other State agencies, shall develop a recycling plan that reduces by recycling the amount of the solid waste stream generated for disposal by the State government by at-least 20% but no less than 10%.”
Amended in 2009, Environment Article § 9-1706 (b) and (c) of the Annotated Code of Maryland state that “By July 1, 2010, the recycling plan shall include aluminum, glass, paper, and plastic generated for disposal by the State government.”
In 2012, House Bill 929: Environment Recycling Rates and Waste Diversion – Statewide Goals:
• 30% in 2014
• 40% in 2015
Percent of MDOT Waste RecycledPM9.3.1 - Percent of MDOT Waste Recycled - DONE
30
35
40
45
50
4344
43
Perc
ent (
%)
2013 2014 2015
Be a Good Steward of Our Environment
130
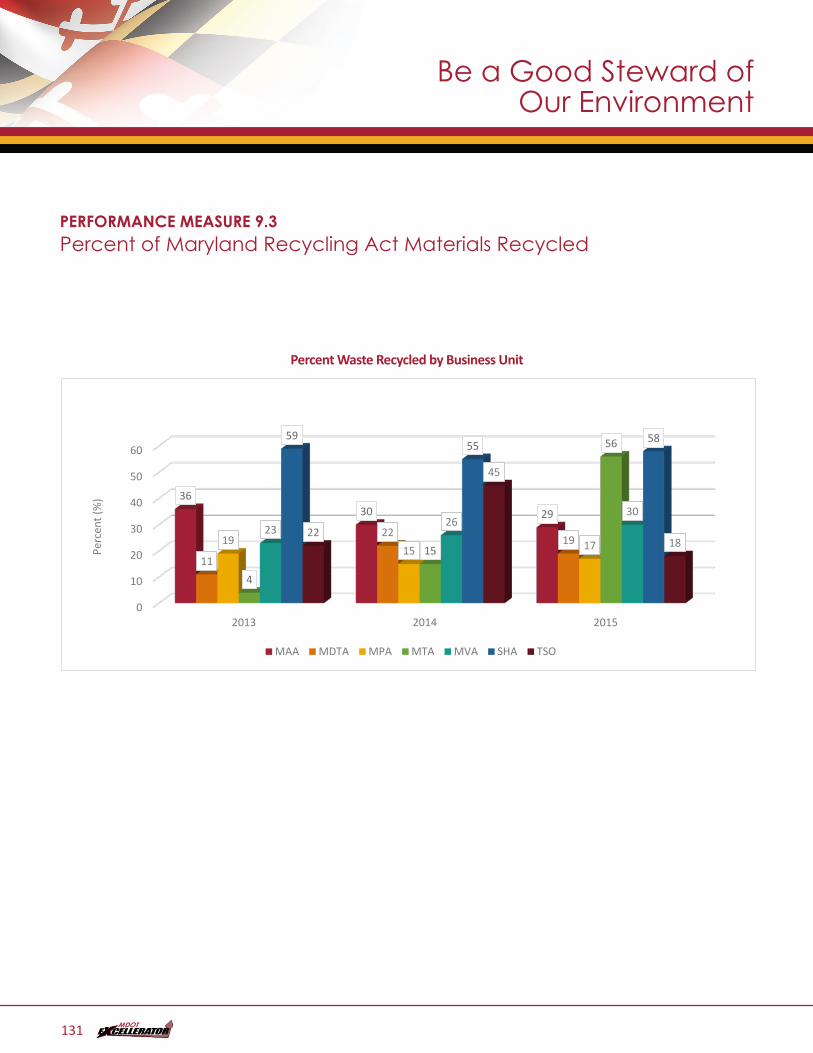
PERFORMANCE MEASURE 9.3Percent of Maryland Recycling Act Materials Recycled
Percent Waste Recycled by Business UnitPM9.3.2 - Percent Waste Recycled by Business Unit - DONE
0
10
20
30
40
50
60
2013 2014 2015
3630 29
11
221919
15 17
4
15
56
2326
30
5955
58
22
45
18
Perc
ent (
%)
MAA MDTA MPA MTA MVA SHA TSO
Be a Good Steward of Our Environment
131
TANGIBLE RESULT DRIVER:
Dorothy Morrison The Secretary’s Office (TSO)
PERFORMANCE MEASURE DRIVER:
Barbara McMahon Maryland Port Administration (MPA)
PURPOSE OF MEASURE:
To reduce the Business Units’ impact on solid waste landfill through recycling/reuse of steel, asphalt and concrete
FREQUENCY:
Annually
DATA COLLECTION METHODOLOGY:
The data collection methodology will include disposal weights (via bill of ladings) by Business Unit’s Facility Maintenance and Engineering Departments. The data are and/or should be reported on the annual Non-Maryland Recycling Act Report.
NATIONAL BENCHMARK:
N/A
PERFORMANCE MEASURE 9.4Recycled/Reused Materials from Maintenance Activities and Construction/Demolition ProjectsMDOT is committed to reducing its impact on solid waste, non-hazardous landfills, potentially resulting in reduction of the number of waste disposal facilities in Maryland as stated in the Maryland Department of the Environment’s “Zero Waste” Action Plan. If not already in place, the TBUs will establish policy and procedures to recycle and/or reuse their solid waste: steel, asphalt and concrete. These materials are generated during maintenance/repair activities and capital construction/demolition projects. In both instances of generation of these materials, the policy/procedure should require the TBUs to collect, weigh and recycle; this will generally result in a payment by a recycler to the TBU, in particular steel. The benefits of recycling/reusing these materials include saving energy and natural resources, preserving the capacity of landfills, reducing waste disposal costs, generating revenue for materials and reducing pollutants generated by landfill process.
There are several possible barriers to success, including the following:
• Recognizing that there will be variability among reporting periods and TBUs. Some may have more maintenance and construction/demolition activities than others.
• Establish data collection mechanisms in each TBU.
• Developing contractual language that requires contractors to segregate, collect, weigh and recycle these materials.
• Ensuring commitment to this goal and its positive impact on the environment, including training employees and contractors.
Be a Good Steward of Our Environment
132
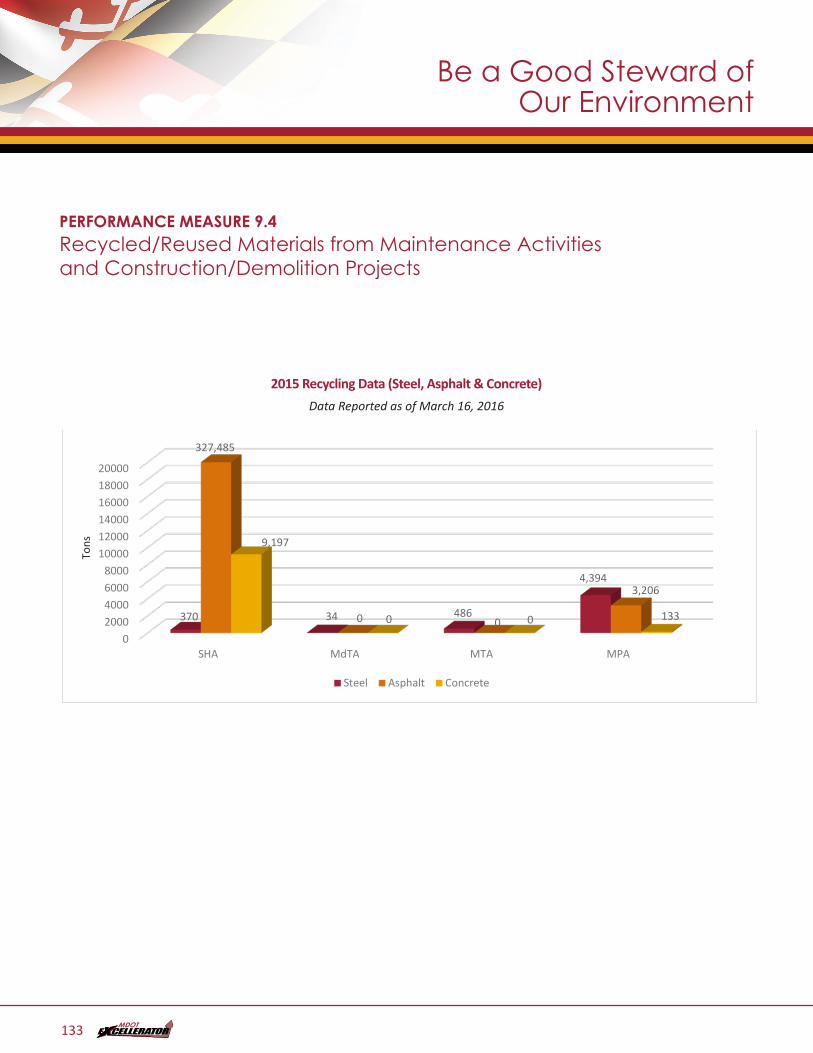
PERFORMANCE MEASURE 9.4Recycled/Reused Materials from Maintenance Activities and Construction/Demolition Projects
2015 Recycling Data (Steel, Asphalt & Concrete)
Data Reported as of March 16, 2016PM9.4 – No title - DONE
02000400060008000
100001200014000160001800020000
SHA MdTA MTA MPA
370 34 486
4,394
327,485
0 0
3,206
9,197
0 0 133
Steel Asphalt Concrete
Tons
Be a Good Steward of Our Environment
133
TANGIBLE RESULT DRIVER:
Dorothy Morrison The Secretary’s Office (TSO)
PERFORMANCE MEASURE DRIVER:
Robin Bowie Maryland Aviation Administration
(MAA)
PURPOSE OF MEASURE:
To provide consistent monitoring of TBU compliance with environmental requirements
FREQUENCY:
Annually
DATA COLLECTION METHODOLOGY:
Enterprise Environmental Information Management System
NATIONAL BENCHMARK:
International Organization for Standardization (ISO) 14001
PERFORMANCE MEASURE 9.5Compliance with Environmental RequirementsMDOT activities and operations are subject to various federal, state and local environmental regulations. Adherence to the environmental requirements minimizes the potential for activities and operations of transportation facilities to adversely impact the environment and the surrounding communities. Tracking audits and audit results is an effective mechanism for monitoring compliance with environmental requirements. Compliance with the environmental requirements that govern MDOT activities and operations is key to being a good steward of the environment.
MDOT participated in third party audits as part of an agreement with EPA Region 3. As noted in the data below, the frequency of audits conducted since the EPA third party audits has varied for each TBU. This initial round of information collection and review also revealed a difference in the type (internal vs. external) of audits that have been conducted by each TBU. Several TBUs are in the process of formalizing audit processes and/or procuring audit contracts. On an annual basis, MDOT will share audit results.
Be a Good Steward of Our Environment
134
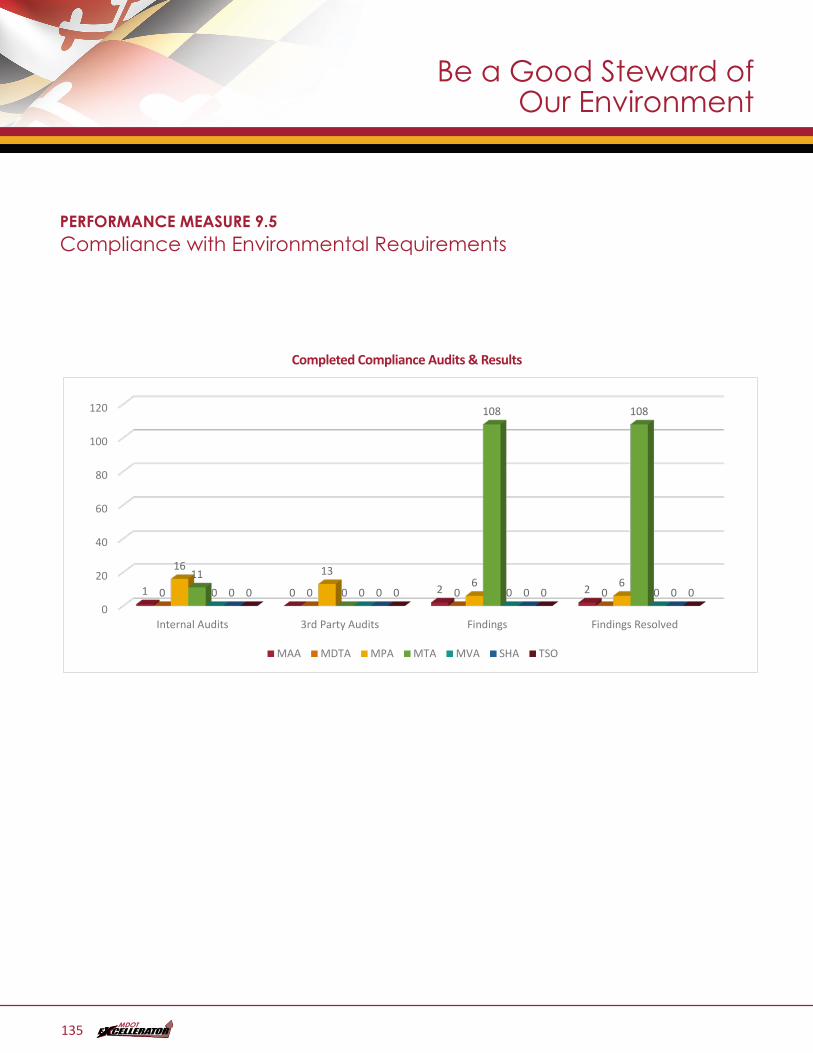
Be a Good Steward of Our Environment
PERFORMANCE MEASURE 9.5Compliance with Environmental Requirements
Completed Compliance Audits & Results
PM9.5 - Completed Compliance Audits & Results
Post EPA Audit (2013) – present - DONE
0
20
40
60
80
100
120
Internal Audits 3rd Party Audits Findings Findings Resolved
1 0 2 20 0 0 0
16 136 6
110
108 108
0 0 0 00 0 0 00 0 0 0
MAA MDTA MPA MTA MVA SHA TSO
135
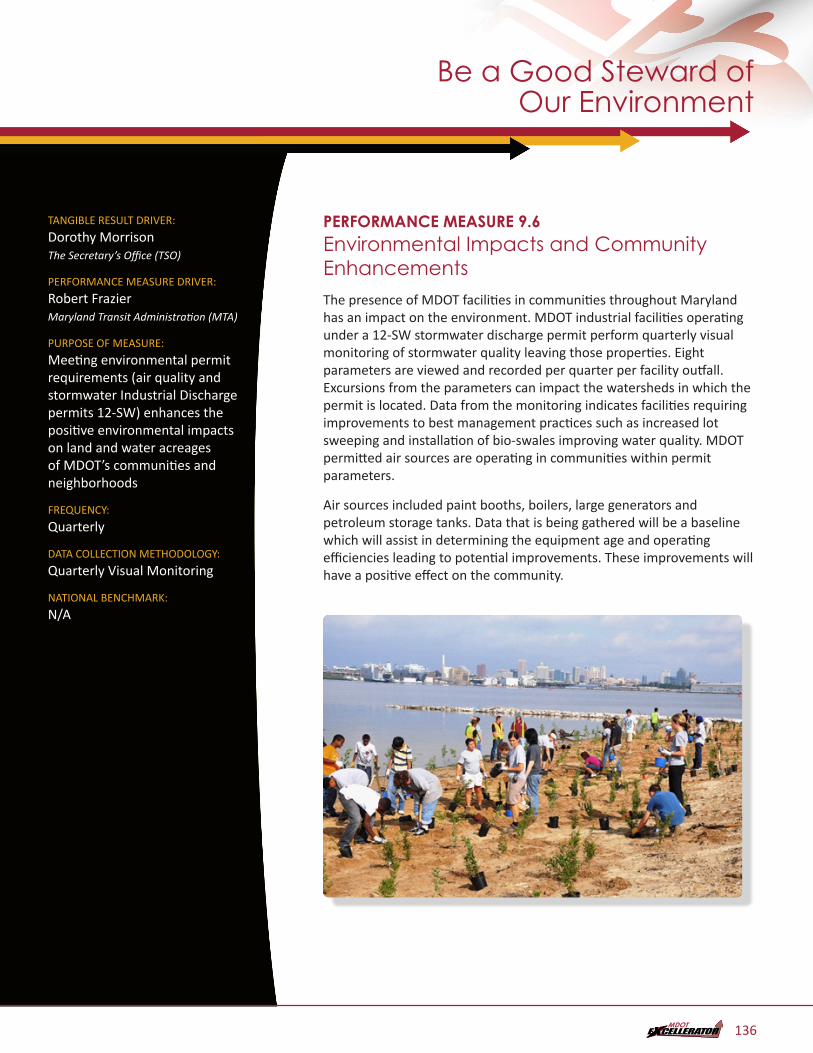
TANGIBLE RESULT DRIVER:
Dorothy Morrison The Secretary’s Office (TSO)
PERFORMANCE MEASURE DRIVER:
Robert Frazier Maryland Transit Administration (MTA)
PURPOSE OF MEASURE:
Meeting environmental permit requirements (air quality and stormwater Industrial Discharge permits 12-SW) enhances the positive environmental impacts on land and water acreages of MDOT’s communities and neighborhoods
FREQUENCY:
Quarterly
DATA COLLECTION METHODOLOGY:
Quarterly Visual Monitoring
NATIONAL BENCHMARK:
N/A
PERFORMANCE MEASURE 9.6Environmental Impacts and Community Enhancements The presence of MDOT facilities in communities throughout Maryland has an impact on the environment. MDOT industrial facilities operating under a 12-SW stormwater discharge permit perform quarterly visual monitoring of stormwater quality leaving those properties. Eight parameters are viewed and recorded per quarter per facility outfall. Excursions from the parameters can impact the watersheds in which the permit is located. Data from the monitoring indicates facilities requiring improvements to best management practices such as increased lot sweeping and installation of bio-swales improving water quality. MDOT permitted air sources are operating in communities within permit parameters.
Air sources included paint booths, boilers, large generators and petroleum storage tanks. Data that is being gathered will be a baseline which will assist in determining the equipment age and operating efficiencies leading to potential improvements. These improvements will have a positive effect on the community.
Be a Good Steward of Our Environment
136
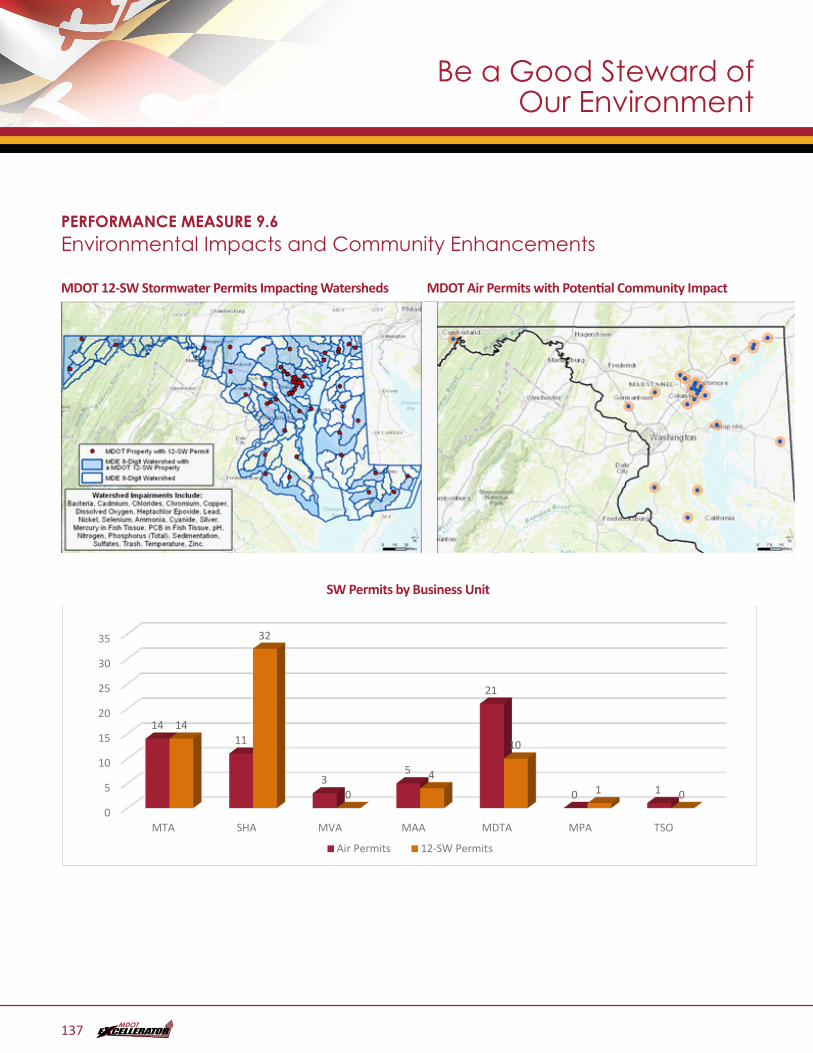
PERFORMANCE MEASURE 9.6Environmental Impacts and Community Enhancements
MDOT 12-SW Stormwater Permits Impacting Watersheds MDOT Air Permits with Potential Community Impact
SW Permits by Business UnitPM9.6.1 - Air & 12-SW Permits by Business Unit - DONE
0
5
10
15
20
25
30
35
MTA SHA MVA MAA MDTA MPA TSO
1411
35
21
0 1
14
32
0
4
10
1 0
Air Permits 12-SW Permits
Be a Good Steward of Our Environment
137
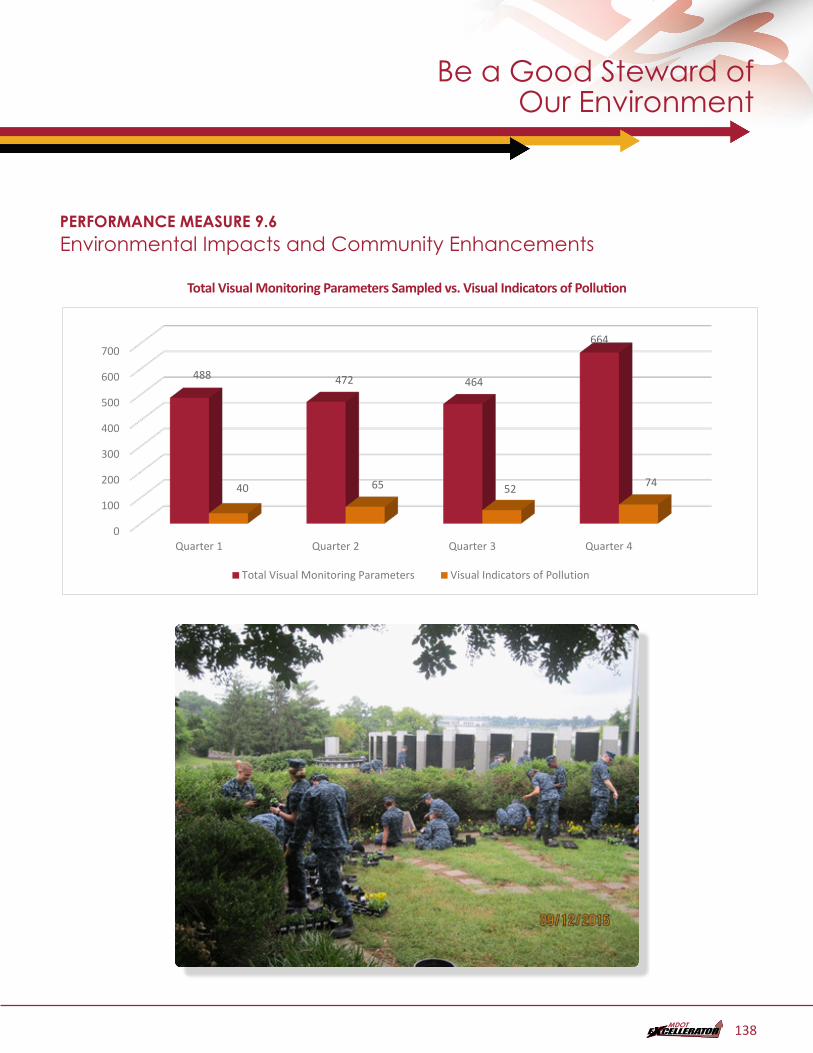
Be a Good Steward of Our Environment
PERFORMANCE MEASURE 9.6Environmental Impacts and Community Enhancements
Total Visual Monitoring Parameters Sampled vs. Visual Indicators of PollutionPM9.6.2 - 2015 Total Visual Monitoring Parameters Sampled vs. Visual Indicators of Pollution - DONE
0
100
200
300
400
500
600
700
Quarter 1 Quarter 2 Quarter 3 Quarter 4
488 472 464
664
40 65 52 74
Total Visual Monitoring Parameters Visual Indicators of Pollution
138
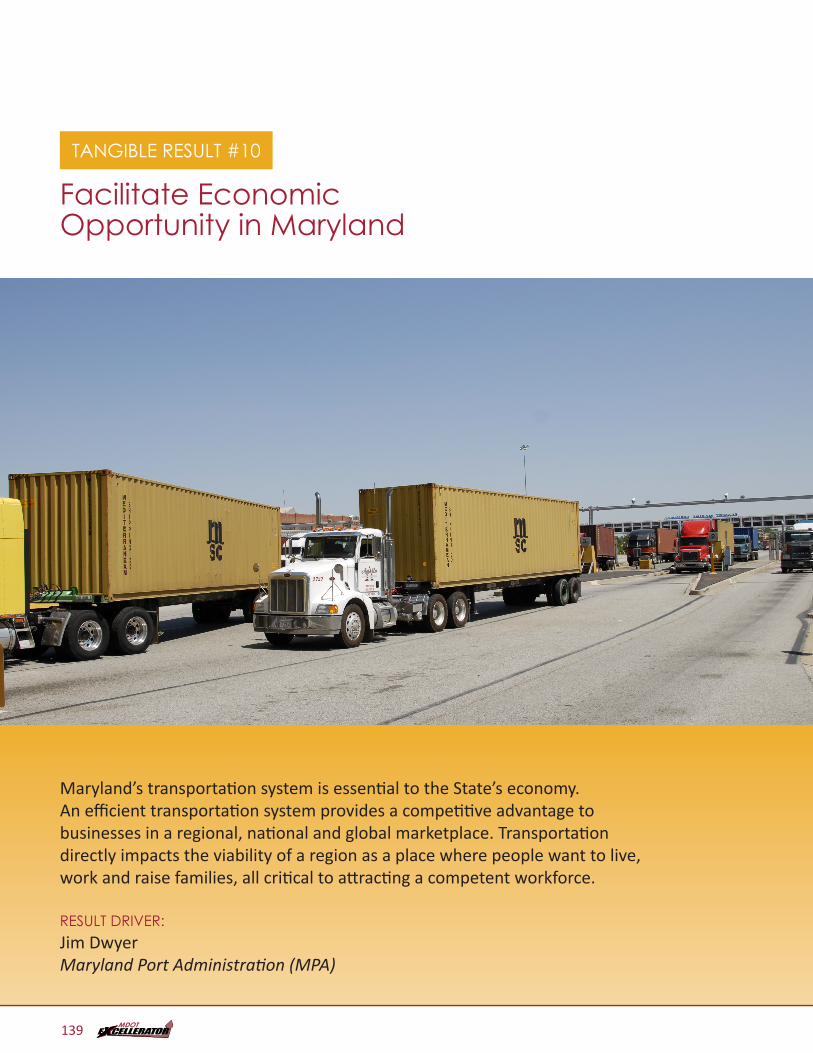
TANGIBLE RESULT #10
Facilitate Economic Opportunity in Maryland
Maryland’s transportation system is essential to the State’s economy. An efficient transportation system provides a competitive advantage to businesses in a regional, national and global marketplace. Transportation directly impacts the viability of a region as a place where people want to live, work and raise families, all critical to attracting a competent workforce.
RESULT DRIVER:Jim Dwyer Maryland Port Administration (MPA)
139
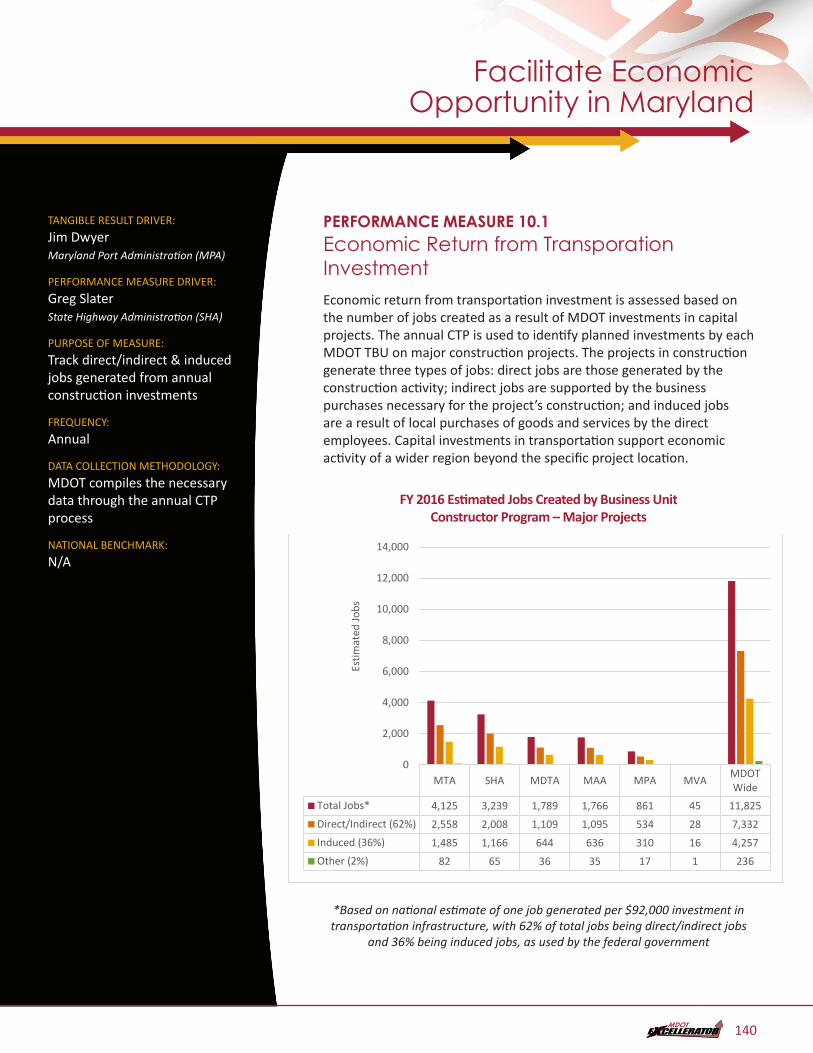
TANGIBLE RESULT DRIVER:
Jim Dwyer Maryland Port Administration (MPA)
PERFORMANCE MEASURE DRIVER:
Greg Slater State Highway Administration (SHA)
PURPOSE OF MEASURE:
Track direct/indirect & induced jobs generated from annual construction investments
FREQUENCY:
Annual
DATA COLLECTION METHODOLOGY:
MDOT compiles the necessary data through the annual CTP process
NATIONAL BENCHMARK:
N/A
PERFORMANCE MEASURE 10.1Economic Return from Transporation InvestmentEconomic return from transportation investment is assessed based on the number of jobs created as a result of MDOT investments in capital projects. The annual CTP is used to identify planned investments by each MDOT TBU on major construction projects. The projects in construction generate three types of jobs: direct jobs are those generated by the construction activity; indirect jobs are supported by the business purchases necessary for the project’s construction; and induced jobs are a result of local purchases of goods and services by the direct employees. Capital investments in transportation support economic activity of a wider region beyond the specific project location.
FY 2016 Estimated Jobs Created by Business Unit Constructor Program – Major Projects
PM10.1 - FY 2016 Estimated Jobs Created by Business Unit Construction Program - Major Projects - DONE
MTA SHA MDTA MAA MPA MVA MDOTWide
Total Jobs* 4,125 3,239 1,789 1,766 861 45 11,825Direct/Indirect (62%) 2,558 2,008 1,109 1,095 534 28 7,332Induced (36%) 1,485 1,166 644 636 310 16 4,257Other (2%) 82 65 36 35 17 1 236
0
2,000
4,000
6,000
8,000
10,000
12,000
14,000
Estim
ated
Jobs
*Based on national estimate of one job generated per $92,000 investment in transportation infrastructure, with 62% of total jobs being direct/indirect jobs
and 36% being induced jobs, as used by the federal government
Facilitate Economic Opportunity in Maryland
140
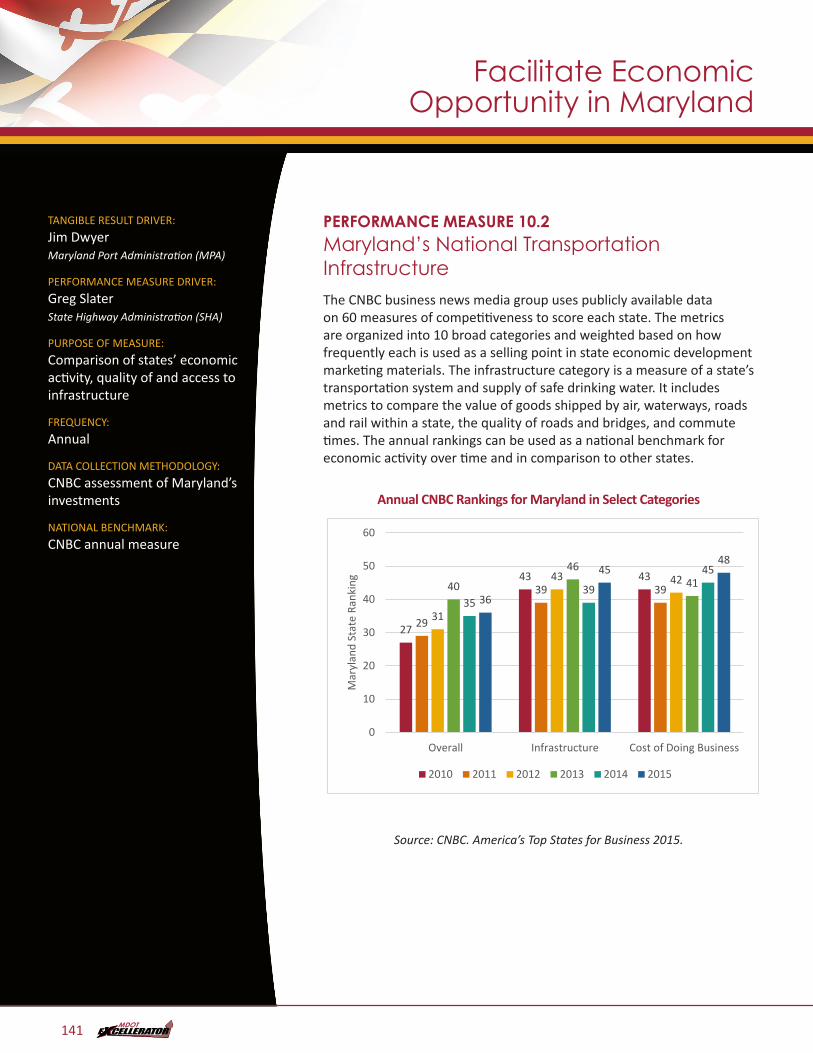
TANGIBLE RESULT DRIVER:
Jim Dwyer Maryland Port Administration (MPA)
PERFORMANCE MEASURE DRIVER:
Greg Slater State Highway Administration (SHA)
PURPOSE OF MEASURE:
Comparison of states’ economic activity, quality of and access to infrastructure
FREQUENCY:
Annual
DATA COLLECTION METHODOLOGY:
CNBC assessment of Maryland’s investments
NATIONAL BENCHMARK:
CNBC annual measure
PERFORMANCE MEASURE 10.2Maryland’s National Transportation Infrastructure The CNBC business news media group uses publicly available data on 60 measures of competitiveness to score each state. The metrics are organized into 10 broad categories and weighted based on how frequently each is used as a selling point in state economic development marketing materials. The infrastructure category is a measure of a state’s transportation system and supply of safe drinking water. It includes metrics to compare the value of goods shipped by air, waterways, roads and rail within a state, the quality of roads and bridges, and commute times. The annual rankings can be used as a national benchmark for economic activity over time and in comparison to other states.
Annual CNBC Rankings for Maryland in Select CategoriesPM10.2 - Annual CNBC Rankings for Maryland in Select Categories - DONE
27
43 43
29
39 39
31
43 4240
4641
3539
45
36
4548
0
10
20
30
40
50
60
Overall Infrastructure Cost of Doing Business
Mar
ylan
d St
ate
Rank
ing
2010 2011 2012 2013 2014 2015
Source: CNBC. America’s Top States for Business 2015.
Facilitate Economic Opportunity in Maryland
141
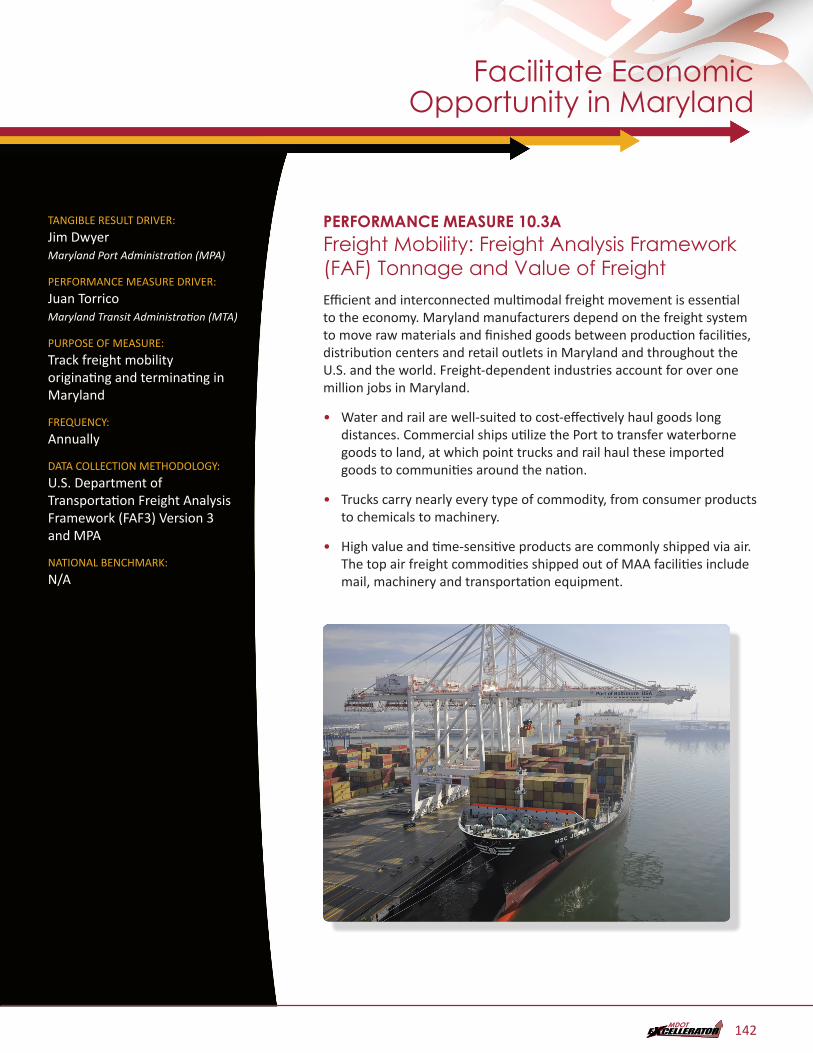
TANGIBLE RESULT DRIVER:
Jim Dwyer Maryland Port Administration (MPA)
PERFORMANCE MEASURE DRIVER:
Juan Torrico Maryland Transit Administration (MTA)
PURPOSE OF MEASURE:
Track freight mobility originating and terminating in Maryland
FREQUENCY:
Annually
DATA COLLECTION METHODOLOGY:
U.S. Department of Transportation Freight Analysis Framework (FAF3) Version 3 and MPA
NATIONAL BENCHMARK:
N/A
PERFORMANCE MEASURE 10.3AFreight Mobility: Freight Analysis Framework (FAF) Tonnage and Value of FreightEfficient and interconnected multimodal freight movement is essential to the economy. Maryland manufacturers depend on the freight system to move raw materials and finished goods between production facilities, distribution centers and retail outlets in Maryland and throughout the U.S. and the world. Freight-dependent industries account for over one million jobs in Maryland.
• Water and rail are well-suited to cost-effectively haul goods long distances. Commercial ships utilize the Port to transfer waterborne goods to land, at which point trucks and rail haul these imported goods to communities around the nation.
• Trucks carry nearly every type of commodity, from consumer products to chemicals to machinery.
• High value and time-sensitive products are commonly shipped via air. The top air freight commodities shipped out of MAA facilities include mail, machinery and transportation equipment.
Facilitate Economic Opportunity in Maryland
142
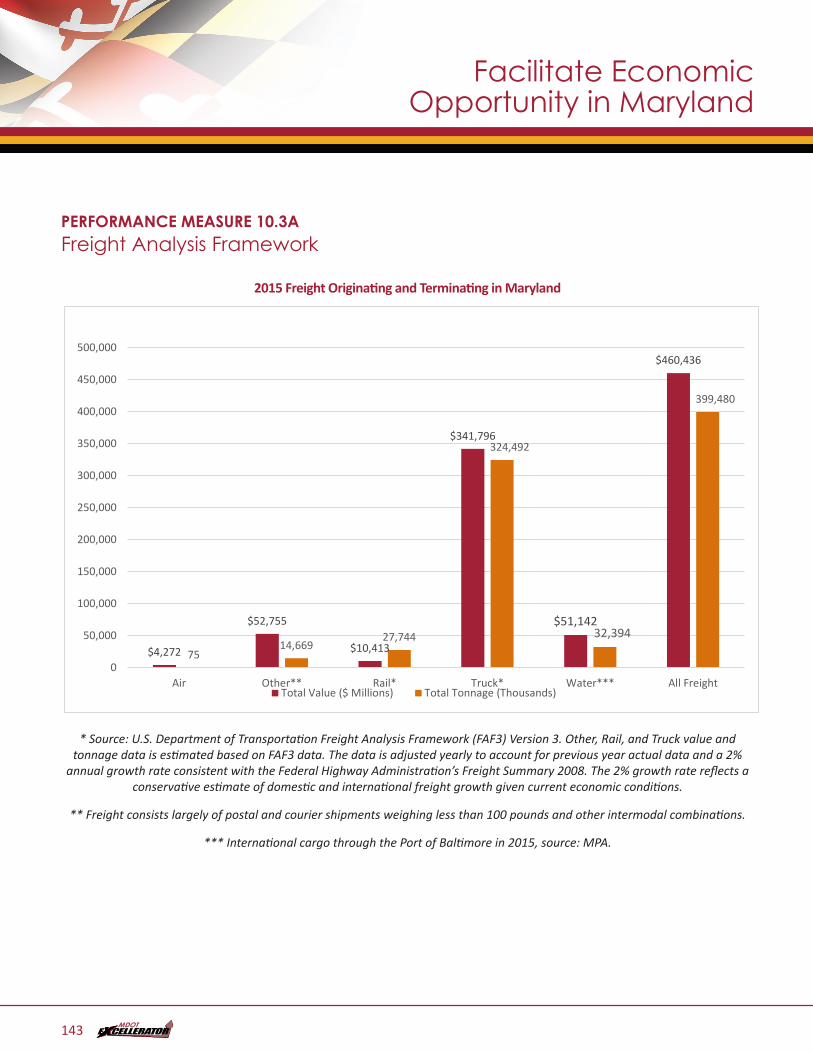
PERFORMANCE MEASURE 10.3AFreight Analysis Framework
2015 Freight Originating and Terminating in MarylandPM10.3 - 2015 Freight Originating and Terminating in Maryland - DONE
$4,272
$52,755
$10,413
$341,796
$51,142
$460,436
7514,669
27,744
324,492
32,394
399,480
0
50,000
100,000
150,000
200,000
250,000
300,000
350,000
400,000
450,000
500,000
Air Other** Rail* Truck* Water*** All FreightTotal Value ($ Millions) Total Tonnage (Thousands)
* Source: U.S. Department of Transportation Freight Analysis Framework (FAF3) Version 3. Other, Rail, and Truck value and tonnage data is estimated based on FAF3 data. The data is adjusted yearly to account for previous year actual data and a 2%
annual growth rate consistent with the Federal Highway Administration’s Freight Summary 2008. The 2% growth rate reflects a conservative estimate of domestic and international freight growth given current economic conditions.
** Freight consists largely of postal and courier shipments weighing less than 100 pounds and other intermodal combinations.
*** International cargo through the Port of Baltimore in 2015, source: MPA.
Facilitate Economic Opportunity in Maryland
143
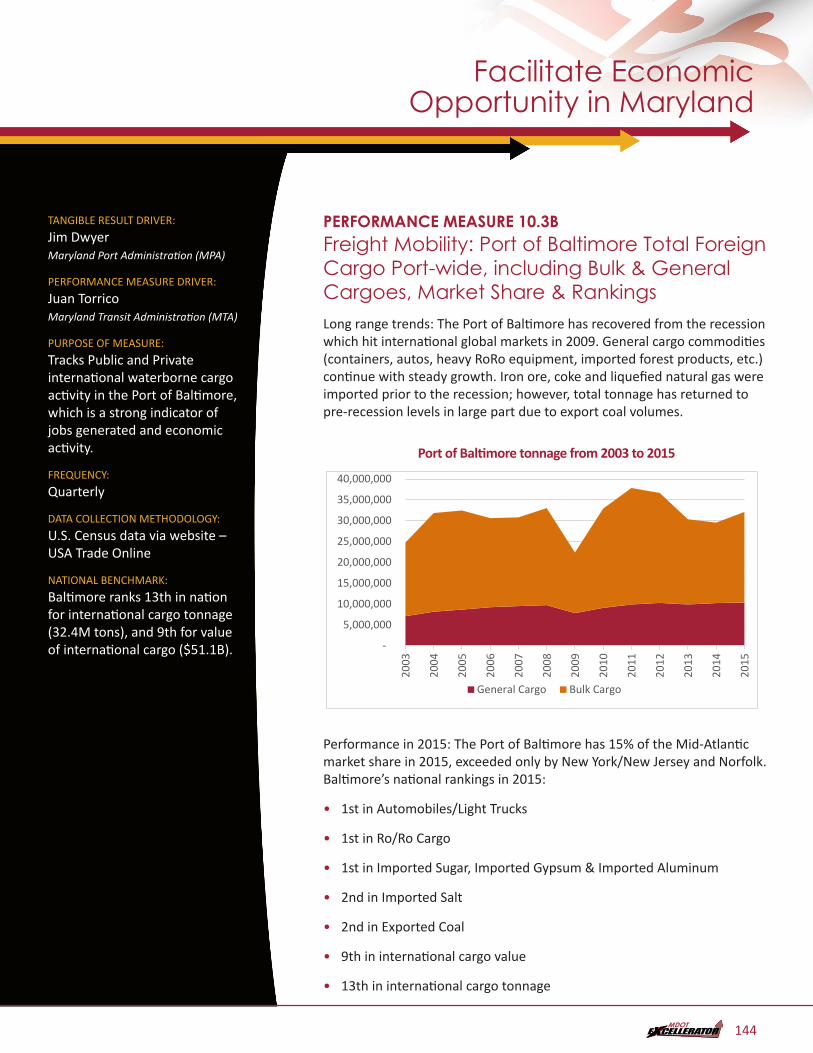
TANGIBLE RESULT DRIVER:
Jim Dwyer Maryland Port Administration (MPA)
PERFORMANCE MEASURE DRIVER:
Juan Torrico Maryland Transit Administration (MTA)
PURPOSE OF MEASURE:
Tracks Public and Private international waterborne cargo activity in the Port of Baltimore, which is a strong indicator of jobs generated and economic activity.
FREQUENCY:
Quarterly
DATA COLLECTION METHODOLOGY:
U.S. Census data via website – USA Trade Online
NATIONAL BENCHMARK:
Baltimore ranks 13th in nation for international cargo tonnage (32.4M tons), and 9th for value of international cargo ($51.1B).
PERFORMANCE MEASURE 10.3BFreight Mobility: Port of Baltimore Total Foreign Cargo Port-wide, including Bulk & General Cargoes, Market Share & RankingsLong range trends: The Port of Baltimore has recovered from the recession which hit international global markets in 2009. General cargo commodities (containers, autos, heavy RoRo equipment, imported forest products, etc.) continue with steady growth. Iron ore, coke and liquefied natural gas were imported prior to the recession; however, total tonnage has returned to pre-recession levels in large part due to export coal volumes.
Port of Baltimore tonnage from 2003 to 2015 PM10.3b.1 – No title - DONE
-
5,000,000
10,000,000
15,000,000
20,000,000
25,000,000
30,000,000
35,000,000
40,000,000
2003
2004
2005
2006
2007
2008
2009
2010
2011
2012
2013
2014
2015
General Cargo Bulk Cargo
Performance in 2015: The Port of Baltimore has 15% of the Mid-Atlantic market share in 2015, exceeded only by New York/New Jersey and Norfolk. Baltimore’s national rankings in 2015:
• 1st in Automobiles/Light Trucks
• 1st in Ro/Ro Cargo
• 1st in Imported Sugar, Imported Gypsum & Imported Aluminum
• 2nd in Imported Salt
• 2nd in Exported Coal
• 9th in international cargo value
• 13th in international cargo tonnage
Facilitate Economic Opportunity in Maryland
144
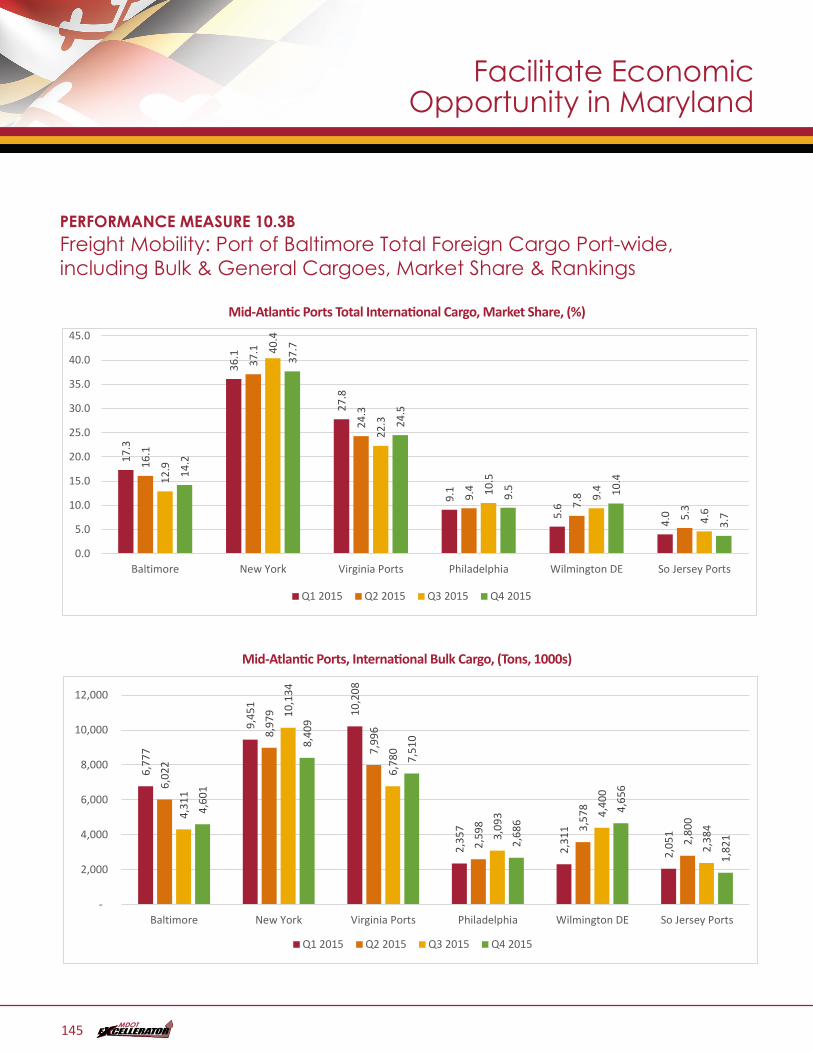
PERFORMANCE MEASURE 10.3BFreight Mobility: Port of Baltimore Total Foreign Cargo Port-wide, including Bulk & General Cargoes, Market Share & Rankings
Mid-Atlantic Ports Total International Cargo, Market Share, (%)PM10.3b.2 – No title - DONE
17.3
36.1
27.8
9.1
5.6
4.0
16.1
37.1
24.3
9.4
7.8
5.3
12.9
40.4
22.3
10.5
9.4
4.6
14.2
37.7
24.5
9.5 10
.4
3.7
0.0
5.0
10.0
15.0
20.0
25.0
30.0
35.0
40.0
45.0
Baltimore New York Virginia Ports Philadelphia Wilmington DE So Jersey Ports
Q1 2015 Q2 2015 Q3 2015 Q4 2015
Mid-Atlantic Ports, International Bulk Cargo, (Tons, 1000s)PM10.3b.3 – No title - DONE
6,77
7
9,45
1
10,2
08
2,35
7
2,31
1
2,05
1
6,02
2
8,97
9
7,99
6
2,59
8 3,57
8
2,80
0 4,31
1
10,1
34
6,78
0
3,09
3 4,40
0
2,38
4
4,60
1
8,40
9
7,51
0
2,68
6
4,65
6
1,82
1
-
2,000
4,000
6,000
8,000
10,000
12,000
Baltimore New York Virginia Ports Philadelphia Wilmington DE So Jersey Ports
Q1 2015 Q2 2015 Q3 2015 Q4 2015
Facilitate Economic Opportunity in Maryland
145
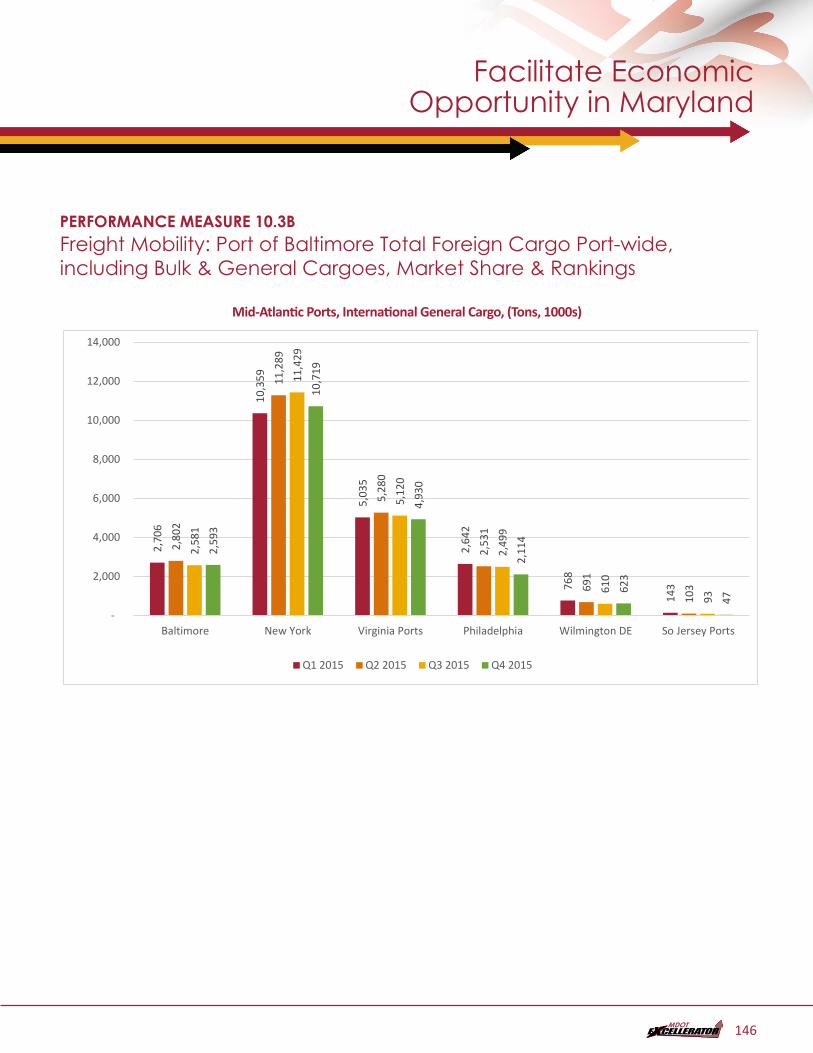
PERFORMANCE MEASURE 10.3BFreight Mobility: Port of Baltimore Total Foreign Cargo Port-wide, including Bulk & General Cargoes, Market Share & Rankings
Mid-Atlantic Ports, International General Cargo, (Tons, 1000s)PM10.3b.4 - No title - DONE
2,70
6
10,3
59
5,03
5
2,64
2
768
143
2,80
2
11,2
89
5,28
0
2,53
1
691
103
2,58
1
11,4
29
5,12
0
2,49
9
610
93
2,59
3
10,7
19
4,93
0
2,11
4
623
47
-
2,000
4,000
6,000
8,000
10,000
12,000
14,000
Baltimore New York Virginia Ports Philadelphia Wilmington DE So Jersey Ports
Q1 2015 Q2 2015 Q3 2015 Q4 2015
Facilitate Economic Opportunity in Maryland
146
TANGIBLE RESULT DRIVER:
Jim Dwyer Maryland Port Administration (MPA)
PERFORMANCE MEASURE DRIVER:
Juan Torrico Maryland Transit Administration (MTA)
PURPOSE OF MEASURE:
Data shows level of activity at Public Marine Terminals. As a rule, general Cargo creates more jobs per ton than bulk commodities.
FREQUENCY:
Monthly
DATA COLLECTION METHODOLOGY:
Data obtained from MPA cargo billing reporting and statistical system (BRASS). Historical data is available back to 1998
BENCHMARK:
N/A
PERFORMANCE MEASURE 10.3CFreight Mobility: MPA Total General Cargo Tonnage including Containers, Autos, RoRo and Imported Forest ProductsKey commodities had a strong year in 2015 at the public marine terminals in the Helen Delich Bentley Port of Baltimore. MPA had a record number of containers and imported autos while other commodities experienced good volumes for a total of over 9.629 million tons of general cargo. This nearly matched last year’s record high of 9.676 million tons. Also, for the fifth consecutive year, more autos crossed the Port of Baltimore’s piers than at any other U.S. port.
Last year, the Journal of Commerce named the Port of Baltimore as the most efficient container port in the nation.
In 2015, MPA terminals also began receiving Maersk Line, the world’s largest container shipping company. Maersk now operates three weekly container services with the Mediterranean Shipping Company involving the Port of Baltimore. The Port was also successful in signing global shipping and logistics giant Wallenius Wilhelmsen Logistics (WWL) to a new 30-year contract.
Facilitate Economic Opportunity in Maryland
147
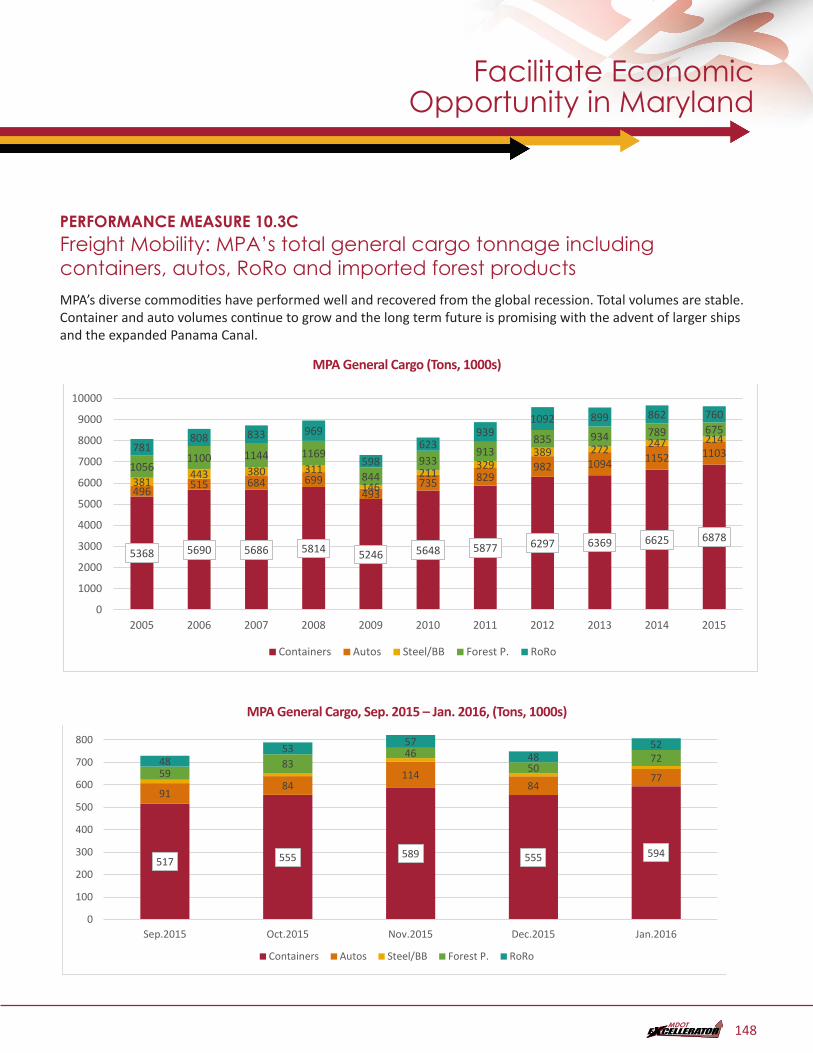
PERFORMANCE MEASURE 10.3CFreight Mobility: MPA’s total general cargo tonnage including containers, autos, RoRo and imported forest productsMPA’s diverse commodities have performed well and recovered from the global recession. Total volumes are stable. Container and auto volumes continue to grow and the long term future is promising with the advent of larger ships and the expanded Panama Canal.
MPA General Cargo (Tons, 1000s)PM10.3c.1 – MPA General Cargo, (Tons, 1000s) - DONE
PM10.3c.2 – No title - DONE
5368 5690 5686 5814 5246 5648 5877 6297 6369 6625 6878
496 515 684 699493
735 829982 1094 1152 1103
381443 380 311
146211
329389 272 247 214
10561100 1144 1169
844933
913835 934 789 675
781808 833 969
598623
9391092 899 862 760
0
1000
2000
3000
4000
5000
6000
7000
8000
9000
10000
2005 2006 2007 2008 2009 2010 2011 2012 2013 2014 2015
Containers Autos Steel/BB Forest P. RoRo
MPA General Cargo, Sep. 2015 – Jan. 2016, (Tons, 1000s)
517 555 589 555 594
9184
11484
775983
4650
724853 57
4852
0
100
200
300
400
500
600
700
800
900
Sep.2015 Oct.2015 Nov.2015 Dec.2015 Jan.2016
Containers Autos Steel/BB Forest P. RoRo
Facilitate Economic Opportunity in Maryland
148
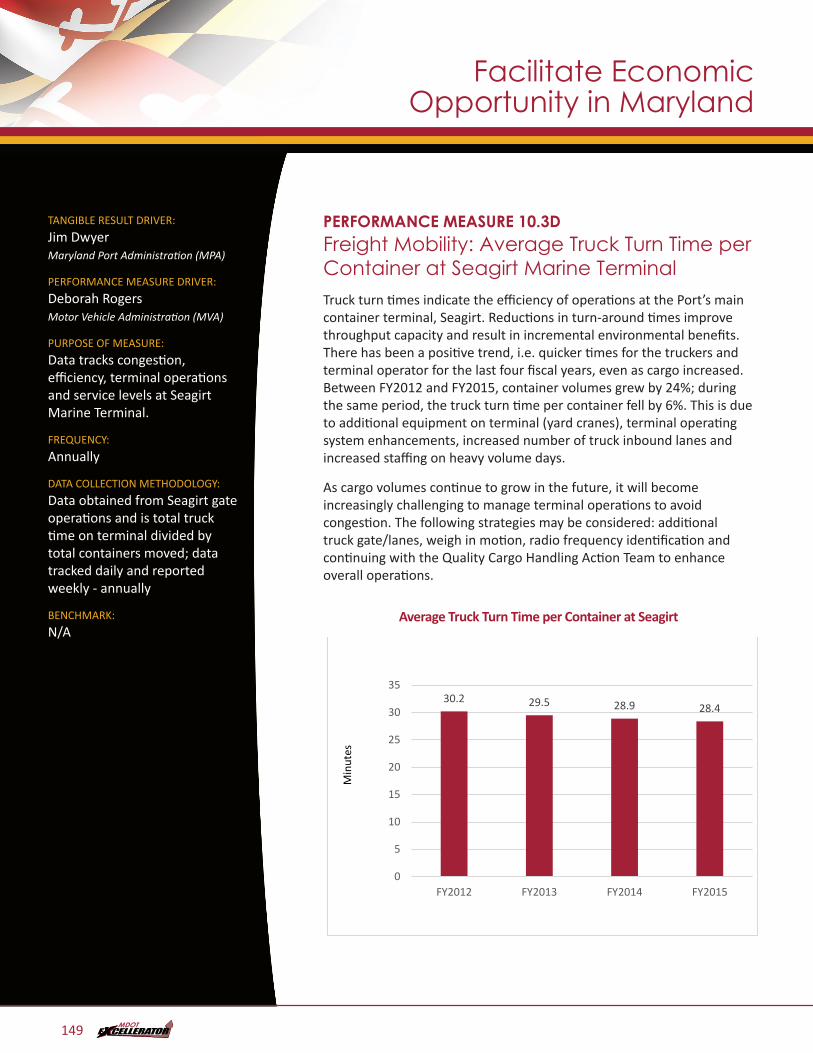
TANGIBLE RESULT DRIVER:
Jim Dwyer Maryland Port Administration (MPA)
PERFORMANCE MEASURE DRIVER:
Deborah Rogers Motor Vehicle Administration (MVA)
PURPOSE OF MEASURE:
Data tracks congestion, efficiency, terminal operations and service levels at Seagirt Marine Terminal.
FREQUENCY:
Annually
DATA COLLECTION METHODOLOGY:
Data obtained from Seagirt gate operations and is total truck time on terminal divided by total containers moved; data tracked daily and reported weekly - annually
BENCHMARK:
N/A
PERFORMANCE MEASURE 10.3DFreight Mobility: Average Truck Turn Time per Container at Seagirt Marine TerminalTruck turn times indicate the efficiency of operations at the Port’s main container terminal, Seagirt. Reductions in turn-around times improve throughput capacity and result in incremental environmental benefits. There has been a positive trend, i.e. quicker times for the truckers and terminal operator for the last four fiscal years, even as cargo increased. Between FY2012 and FY2015, container volumes grew by 24%; during the same period, the truck turn time per container fell by 6%. This is due to additional equipment on terminal (yard cranes), terminal operating system enhancements, increased number of truck inbound lanes and increased staffing on heavy volume days.
As cargo volumes continue to grow in the future, it will become increasingly challenging to manage terminal operations to avoid congestion. The following strategies may be considered: additional truck gate/lanes, weigh in motion, radio frequency identification and continuing with the Quality Cargo Handling Action Team to enhance overall operations.
Average Truck Turn Time per Container at SeagirtPM10.3d – No title - DONE
30.2 29.5 28.9 28.4
0
5
10
15
20
25
30
35
FY2012 FY2013 FY2014 FY2015
Min
utes
Facilitate Economic Opportunity in Maryland
149
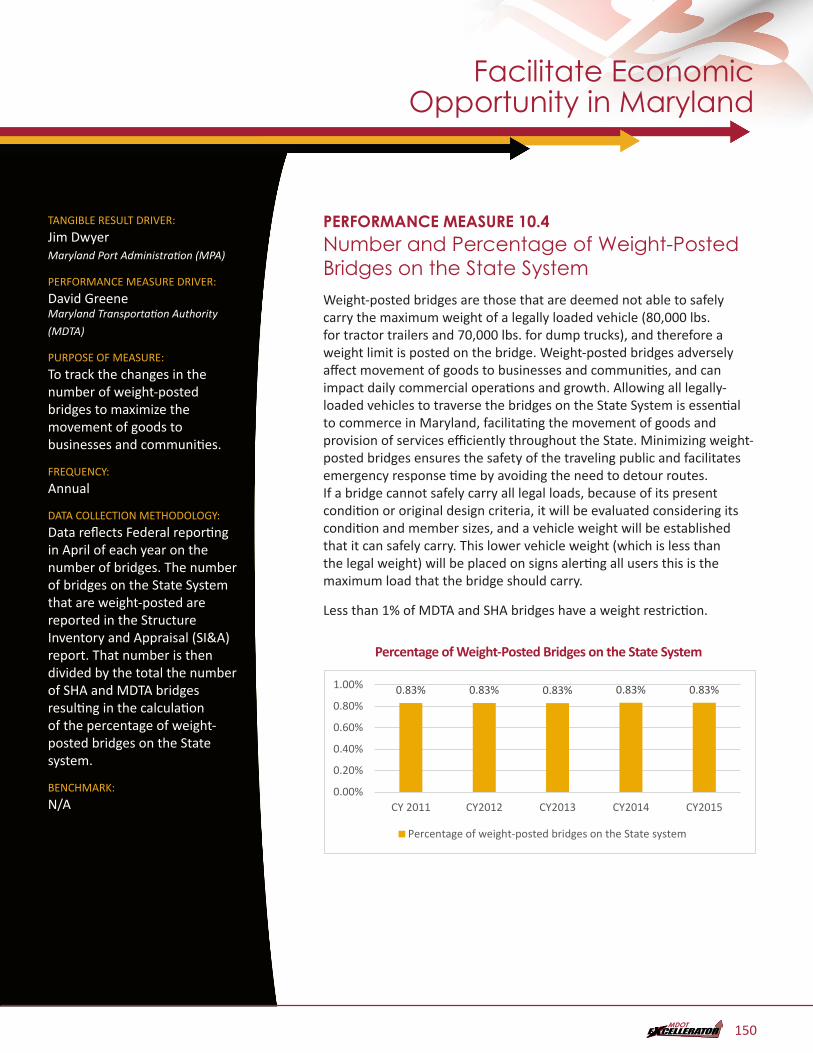
TANGIBLE RESULT DRIVER:
Jim Dwyer Maryland Port Administration (MPA)
PERFORMANCE MEASURE DRIVER:
David Greene Maryland Transportation Authority
(MDTA)
PURPOSE OF MEASURE:
To track the changes in the number of weight-posted bridges to maximize the movement of goods to businesses and communities.
FREQUENCY:
Annual
DATA COLLECTION METHODOLOGY:
Data reflects Federal reporting in April of each year on the number of bridges. The number of bridges on the State System that are weight-posted are reported in the Structure Inventory and Appraisal (SI&A) report. That number is then divided by the total the number of SHA and MDTA bridges resulting in the calculation of the percentage of weight-posted bridges on the State system.
BENCHMARK:
N/A
PERFORMANCE MEASURE 10.4Number and Percentage of Weight-Posted Bridges on the State SystemWeight-posted bridges are those that are deemed not able to safely carry the maximum weight of a legally loaded vehicle (80,000 lbs. for tractor trailers and 70,000 lbs. for dump trucks), and therefore a weight limit is posted on the bridge. Weight-posted bridges adversely affect movement of goods to businesses and communities, and can impact daily commercial operations and growth. Allowing all legally-loaded vehicles to traverse the bridges on the State System is essential to commerce in Maryland, facilitating the movement of goods and provision of services efficiently throughout the State. Minimizing weight-posted bridges ensures the safety of the traveling public and facilitates emergency response time by avoiding the need to detour routes. If a bridge cannot safely carry all legal loads, because of its present condition or original design criteria, it will be evaluated considering its condition and member sizes, and a vehicle weight will be established that it can safely carry. This lower vehicle weight (which is less than the legal weight) will be placed on signs alerting all users this is the maximum load that the bridge should carry.
Less than 1% of MDTA and SHA bridges have a weight restriction.
Percentage of Weight-Posted Bridges on the State SystemPM10.4.1 – No title - DONE
0.83% 0.83% 0.83% 0.83% 0.83%
0.00%
0.20%
0.40%
0.60%
0.80%
1.00%
CY 2011 CY2012 CY2013 CY2014 CY2015
Percentage of weight-posted bridges on the State system
Facilitate Economic Opportunity in Maryland
150
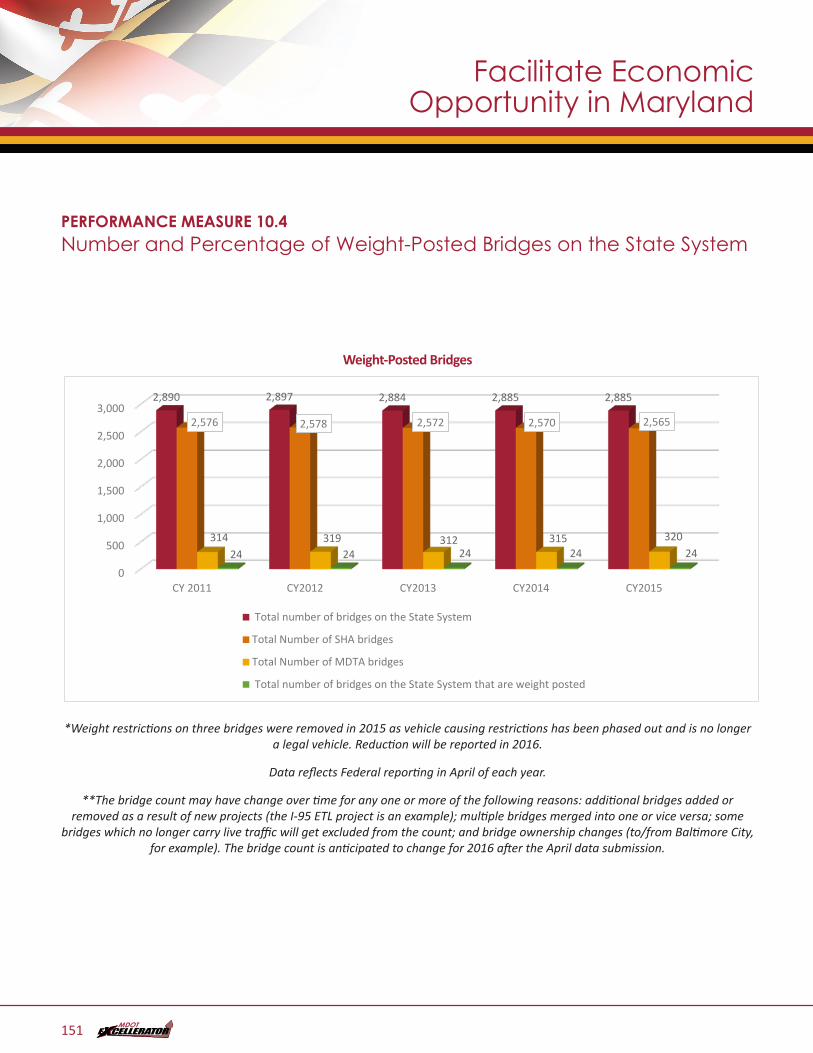
PERFORMANCE MEASURE 10.4Number and Percentage of Weight-Posted Bridges on the State System
Weight-Posted BridgesPM10.4.2 - Number of Weight-Posted Bridges - DONE
0
500
1,000
1,500
2,000
2,500
3,000
CY 2011 CY2012 CY2013 CY2014 CY2015
2,890 2,897 2,884 2,885 2,885
2,576 2,578 2,572 2,570 2,565
314 319 312 315 32024 24 24 24 24
Total number of bridges on the State System
Total Number of SHA bridges
Total Number of MDTA bridges
Total number of bridges on the State System that are weight posted
*Weight restrictions on three bridges were removed in 2015 as vehicle causing restrictions has been phased out and is no longer a legal vehicle. Reduction will be reported in 2016.
Data reflects Federal reporting in April of each year.
**The bridge count may have change over time for any one or more of the following reasons: additional bridges added or removed as a result of new projects (the I-95 ETL project is an example); multiple bridges merged into one or vice versa; some
bridges which no longer carry live traffic will get excluded from the count; and bridge ownership changes (to/from Baltimore City, for example). The bridge count is anticipated to change for 2016 after the April data submission.
Facilitate Economic Opportunity in Maryland
151
TANGIBLE RESULT DRIVER:
Jim Dwyer Maryland Port Administration (MPA)
PERFORMANCE MEASURE DRIVER:
Corey Stottlemyer The Secretary’s Office (TSO)
PURPOSE OF MEASURE:
To quantify the impacts of changes in the transportation network on the state’s economy due to transportation projects completed giving businesses and access to labor, customers and suppliers. Improved access leads to greater opportunities
FREQUENCY:
Quarterly
DATA COLLECTION METHODOLOGY:
As transportation projects are completed and the transportation network is enhanced, changes in travel demand and rider choice will be modeled using a transportation economic impact model. Numbers will be reported quarterly beginning in June 2016. This is a multimodal measure.
NATIONAL BENCHMARK:
N/A
PERFORMANCE MEASURE 10.5Change in Market Access due to Improvements in the Transportation NetworkImproving access within Maryland’s transportation network is a critical role MDOT plays in facilitating economic opportunity for the citizens of Maryland, its businesses and those who come here to do business. Currently, MDOT does not measure the impact of changes to the transportation network and its effect on market access. This measure will allow MDOT to look at how improvements in roads and multimodal access is affecting Maryland’s economy and assess whether businesses have better access to labor, customers, suppliers and international markets.
This measure includes potential impacts from:
• Business Relocation – Improved market access has the effect of strengthening an economy’s competitiveness in attracting and retaining business relative to other locations.
• Productivity Growth – Increasing an economy’s accessibility and connectivity generates agglomeration benefits from returns to scale in production, knowledge spillovers, and better matching of suppliers and employees to businesses.
• Increased Export Activity – Improving an economy’s access to international gateways can enable new import/export activity.
Facilitate Economic Opportunity in Maryland
152
TANGIBLE RESULT DRIVER:
Jim Dwyer Maryland Port Administration (MPA)
PERFORMANCE MEASURE DRIVER:
Corey Stottlemyer The Secretary’s Office (TSO)
PURPOSE OF MEASURE:
To quantify the impacts of changes in the transportation network on the productivity of people and businesses in Maryland
FREQUENCY:
Quarterly
DATA COLLECTION METHODOLOGY:
As transportation projects are completed and the transportation network is enhanced, changes in travel demand and rider choice will be modeled using a transportation economic impact model. Numbers will be reported quarterly beginning in June 2016. This is a multimodal measure.
NATIONAL BENCHMARK:
N/A
PERFORMANCE MEASURE 10.6Change in Productivity due to Improvements in the Transportation NetworkProductivity gains are essential to economic growth as businesses and people have to do more with fewer resources. The transportation network is similar to the Internet and other innovations that allow people and businesses to be more productive. Currently, MDOT does not measure the impact of changes to the transportation network and its effect on productivity.
Using a transportation economic impact model, MDOT will be able to assess four types of productivity benefits:
(1) travel cost savings,
(2) reliability benefits for industry,
(3) delivery logistics and supply chain benefits, and
(4) agglomeration effects on access to specialized skills and services.
Facilitate Economic Opportunity in Maryland
153
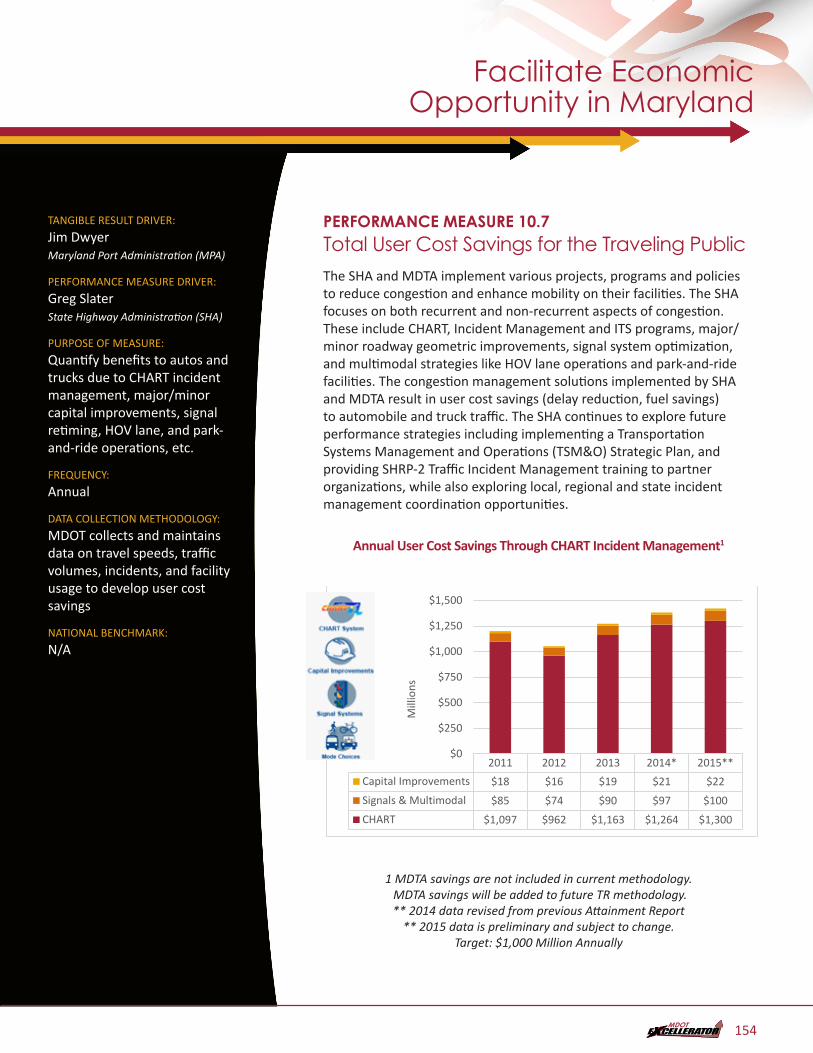
TANGIBLE RESULT DRIVER:
Jim Dwyer Maryland Port Administration (MPA)
PERFORMANCE MEASURE DRIVER:
Greg Slater State Highway Administration (SHA)
PURPOSE OF MEASURE:
Quantify benefits to autos and trucks due to CHART incident management, major/minor capital improvements, signal retiming, HOV lane, and park-and-ride operations, etc.
FREQUENCY:
Annual
DATA COLLECTION METHODOLOGY:
MDOT collects and maintains data on travel speeds, traffic volumes, incidents, and facility usage to develop user cost savings
NATIONAL BENCHMARK:
N/A
PERFORMANCE MEASURE 10.7Total User Cost Savings for the Traveling PublicThe SHA and MDTA implement various projects, programs and policies to reduce congestion and enhance mobility on their facilities. The SHA focuses on both recurrent and non-recurrent aspects of congestion. These include CHART, Incident Management and ITS programs, major/minor roadway geometric improvements, signal system optimization, and multimodal strategies like HOV lane operations and park-and-ride facilities. The congestion management solutions implemented by SHA and MDTA result in user cost savings (delay reduction, fuel savings) to automobile and truck traffic. The SHA continues to explore future performance strategies including implementing a Transportation Systems Management and Operations (TSM&O) Strategic Plan, and providing SHRP-2 Traffic Incident Management training to partner organizations, while also exploring local, regional and state incident management coordination opportunities.
Annual User Cost Savings Through CHART Incident Management1
PM10.7 - Annual User Cost Savings Through CHART Incident Management1 - DONE
2011 2012 2013 2014* 2015**Capital Improvements $18 $16 $19 $21 $22Signals & Multimodal $85 $74 $90 $97 $100CHART $1,097 $962 $1,163 $1,264 $1,300
$0
$250
$500
$750
$1,000
$1,250
$1,500
Mill
ions
1 MDTA savings are not included in current methodology. MDTA savings will be added to future TR methodology. ** 2014 data revised from previous Attainment Report
** 2015 data is preliminary and subject to change. Target: $1,000 Million Annually
Facilitate Economic Opportunity in Maryland
154
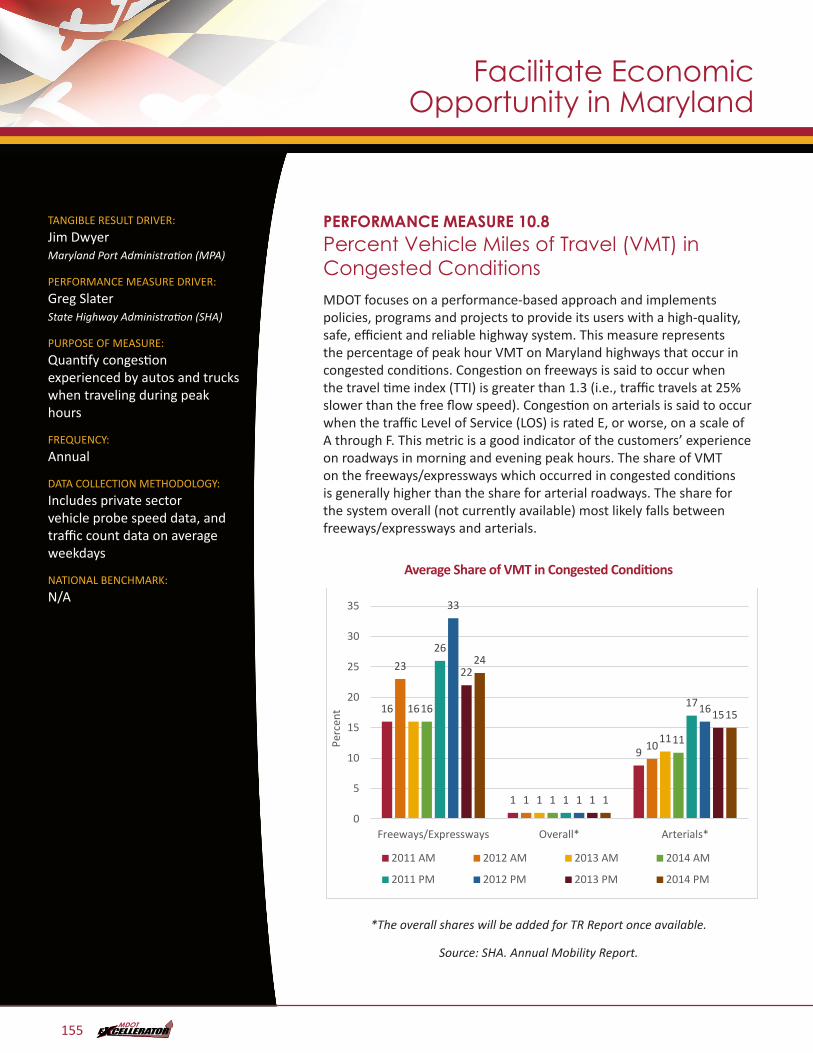
TANGIBLE RESULT DRIVER:
Jim Dwyer Maryland Port Administration (MPA)
PERFORMANCE MEASURE DRIVER:
Greg Slater State Highway Administration (SHA)
PURPOSE OF MEASURE:
Quantify congestion experienced by autos and trucks when traveling during peak hours
FREQUENCY:
Annual
DATA COLLECTION METHODOLOGY:
Includes private sector vehicle probe speed data, and traffic count data on average weekdays
NATIONAL BENCHMARK:
N/A
PERFORMANCE MEASURE 10.8Percent Vehicle Miles of Travel (VMT) in Congested ConditionsMDOT focuses on a performance-based approach and implements policies, programs and projects to provide its users with a high-quality, safe, efficient and reliable highway system. This measure represents the percentage of peak hour VMT on Maryland highways that occur in congested conditions. Congestion on freeways is said to occur when the travel time index (TTI) is greater than 1.3 (i.e., traffic travels at 25% slower than the free flow speed). Congestion on arterials is said to occur when the traffic Level of Service (LOS) is rated E, or worse, on a scale of A through F. This metric is a good indicator of the customers’ experience on roadways in morning and evening peak hours. The share of VMT on the freeways/expressways which occurred in congested conditions is generally higher than the share for arterial roadways. The share for the system overall (not currently available) most likely falls between freeways/expressways and arterials.
Average Share of VMT in Congested ConditionsPM10.8 - Average Share of VMT in Congested Conditions - DONE
16
1
9
23
1
10
16
1
11
16
1
11
26
1
17
33
1
16
22
1
15
24
1
15
0
5
10
15
20
25
30
35
Freeways/Expressways Overall* Arterials*
Perc
ent
2011 AM 2012 AM 2013 AM 2014 AM
2011 PM 2012 PM 2013 PM 2014 PM
*The overall shares will be added for TR Report once available.
Source: SHA. Annual Mobility Report.
Facilitate Economic Opportunity in Maryland
155
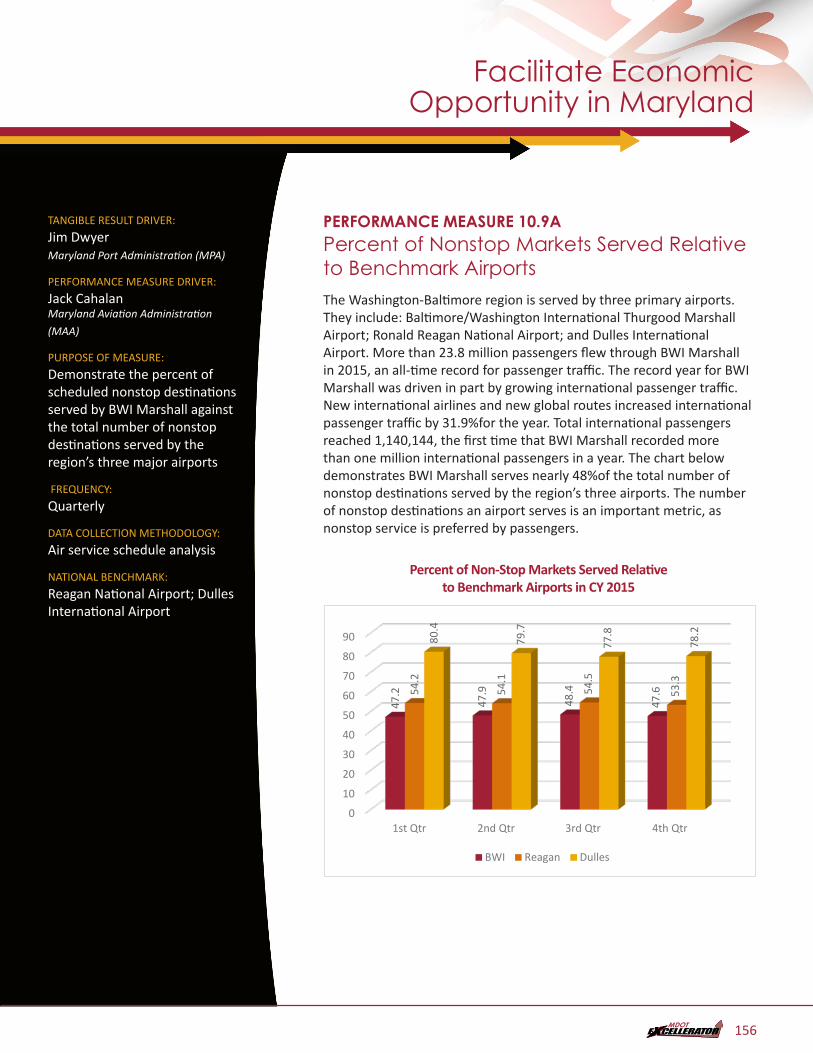
TANGIBLE RESULT DRIVER:
Jim Dwyer Maryland Port Administration (MPA)
PERFORMANCE MEASURE DRIVER:
Jack Cahalan Maryland Aviation Administration
(MAA)
PURPOSE OF MEASURE:
Demonstrate the percent of scheduled nonstop destinations served by BWI Marshall against the total number of nonstop destinations served by the region’s three major airports
FREQUENCY:
Quarterly
DATA COLLECTION METHODOLOGY:
Air service schedule analysis
NATIONAL BENCHMARK:
Reagan National Airport; Dulles International Airport
PERFORMANCE MEASURE 10.9APercent of Nonstop Markets Served Relative to Benchmark AirportsThe Washington-Baltimore region is served by three primary airports. They include: Baltimore/Washington International Thurgood Marshall Airport; Ronald Reagan National Airport; and Dulles International Airport. More than 23.8 million passengers flew through BWI Marshall in 2015, an all-time record for passenger traffic. The record year for BWI Marshall was driven in part by growing international passenger traffic. New international airlines and new global routes increased international passenger traffic by 31.9%for the year. Total international passengers reached 1,140,144, the first time that BWI Marshall recorded more than one million international passengers in a year. The chart below demonstrates BWI Marshall serves nearly 48%of the total number of nonstop destinations served by the region’s three airports. The number of nonstop destinations an airport serves is an important metric, as nonstop service is preferred by passengers.
Percent of Non-Stop Markets Served Relative to Benchmark Airports in CY 2015PM10.9a - % of Nonstop Markets Served Relative to Benchmark Airports in CY 15 - DONE
0
10
20
30
40
50
60
70
80
90
1st Qtr 2nd Qtr 3rd Qtr 4th Qtr
47.2
47.9
48.4
47.654
.2
54.1
54.5
53.3
80.4
79.7
77.8
78.2
BWI Reagan Dulles
Facilitate Economic Opportunity in Maryland
156
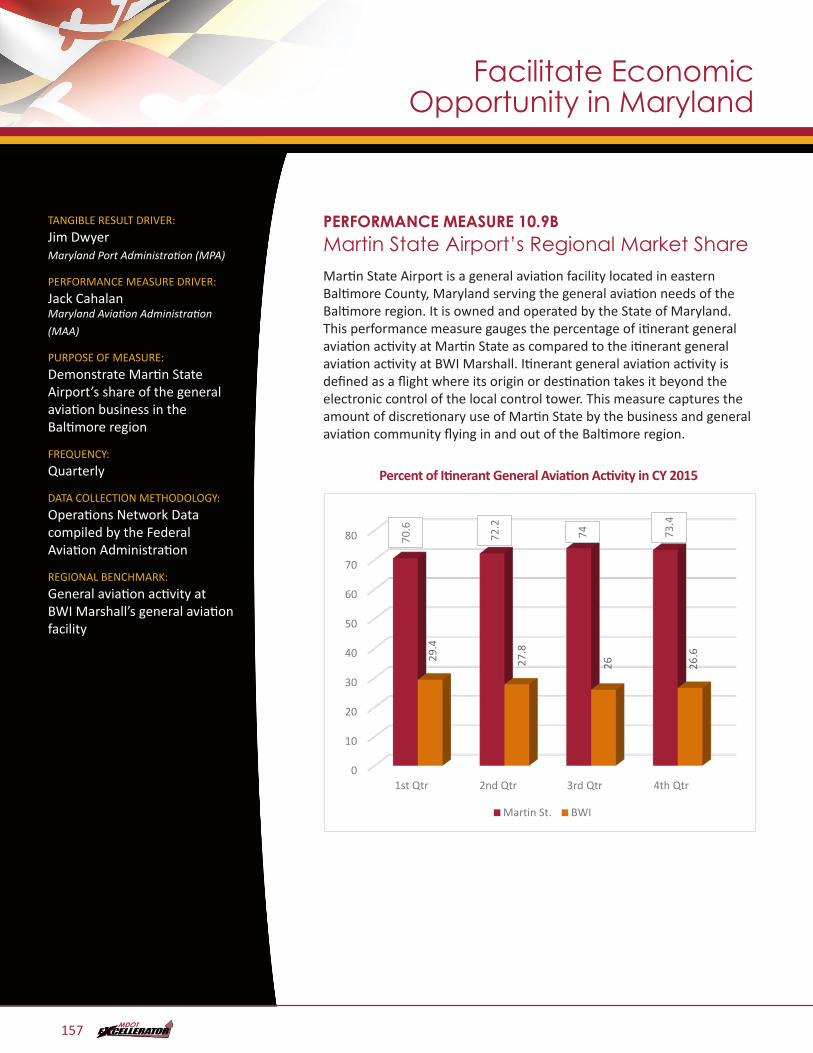
TANGIBLE RESULT DRIVER:
Jim Dwyer Maryland Port Administration (MPA)
PERFORMANCE MEASURE DRIVER:
Jack Cahalan Maryland Aviation Administration
(MAA)
PURPOSE OF MEASURE:
Demonstrate Martin State Airport’s share of the general aviation business in the Baltimore region
FREQUENCY:
Quarterly
DATA COLLECTION METHODOLOGY:
Operations Network Data compiled by the Federal Aviation Administration
REGIONAL BENCHMARK:
General aviation activity at BWI Marshall’s general aviation facility
PERFORMANCE MEASURE 10.9BMartin State Airport’s Regional Market ShareMartin State Airport is a general aviation facility located in eastern Baltimore County, Maryland serving the general aviation needs of the Baltimore region. It is owned and operated by the State of Maryland. This performance measure gauges the percentage of itinerant general aviation activity at Martin State as compared to the itinerant general aviation activity at BWI Marshall. Itinerant general aviation activity is defined as a flight where its origin or destination takes it beyond the electronic control of the local control tower. This measure captures the amount of discretionary use of Martin State by the business and general aviation community flying in and out of the Baltimore region.
Percent of Itinerant General Aviation Activity in CY 2015PM10.9b – No title - DONE
0
10
20
30
40
50
60
70
80
1st Qtr 2nd Qtr 3rd Qtr 4th Qtr
70.6
72.2
74 73.4
29.4
27.8
26 26.6
Martin St. BWI
Facilitate Economic Opportunity in Maryland
157
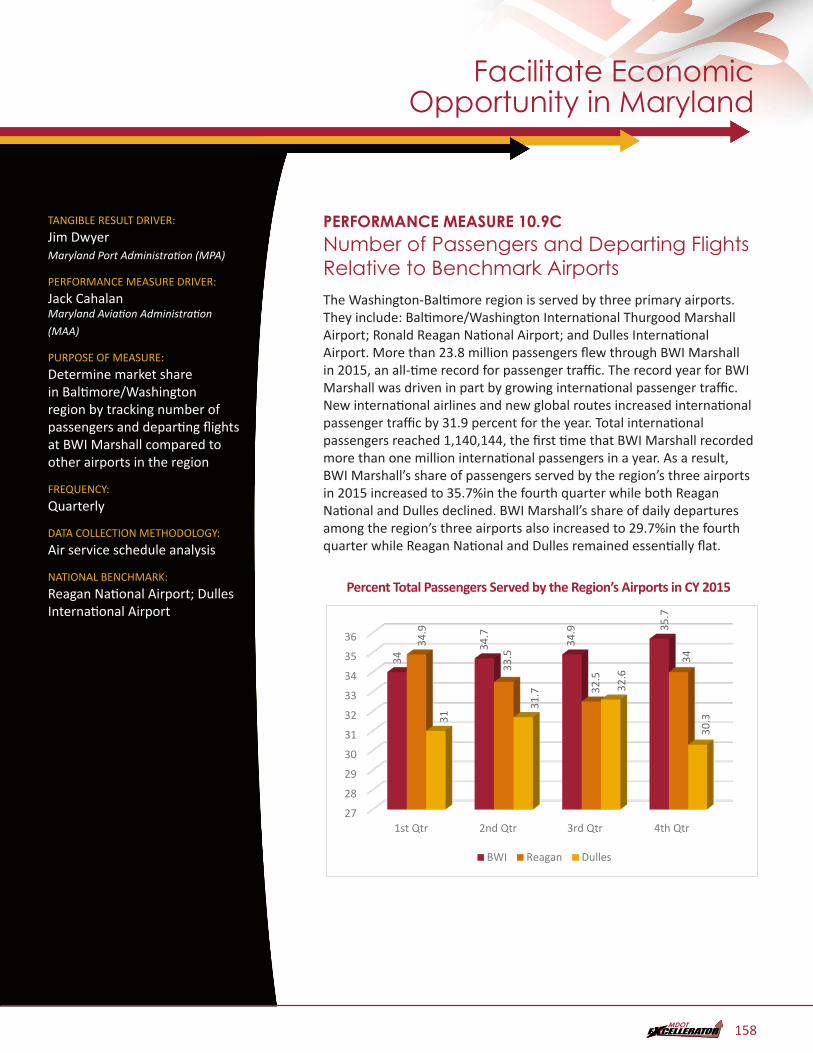
TANGIBLE RESULT DRIVER:
Jim Dwyer Maryland Port Administration (MPA)
PERFORMANCE MEASURE DRIVER:
Jack Cahalan Maryland Aviation Administration
(MAA)
PURPOSE OF MEASURE:
Determine market share in Baltimore/Washington region by tracking number of passengers and departing flights at BWI Marshall compared to other airports in the region
FREQUENCY:
Quarterly
DATA COLLECTION METHODOLOGY:
Air service schedule analysis
NATIONAL BENCHMARK:
Reagan National Airport; Dulles International Airport
PERFORMANCE MEASURE 10.9CNumber of Passengers and Departing Flights Relative to Benchmark AirportsThe Washington-Baltimore region is served by three primary airports. They include: Baltimore/Washington International Thurgood Marshall Airport; Ronald Reagan National Airport; and Dulles International Airport. More than 23.8 million passengers flew through BWI Marshall in 2015, an all-time record for passenger traffic. The record year for BWI Marshall was driven in part by growing international passenger traffic. New international airlines and new global routes increased international passenger traffic by 31.9 percent for the year. Total international passengers reached 1,140,144, the first time that BWI Marshall recorded more than one million international passengers in a year. As a result, BWI Marshall’s share of passengers served by the region’s three airports in 2015 increased to 35.7%in the fourth quarter while both Reagan National and Dulles declined. BWI Marshall’s share of daily departures among the region’s three airports also increased to 29.7%in the fourth quarter while Reagan National and Dulles remained essentially flat.
Percent Total Passengers Served by the Region’s Airports in CY 2015PM10.9c.1 – % Total Passengers Served by the Region's Airports in CY 15 - DONE
27
28
29
30
31
32
33
34
35
36
1st Qtr 2nd Qtr 3rd Qtr 4th Qtr
34
34.7
34.9 35
.7
34.9
33.5
32.5
34
31
31.7 32
.6
30.3
BWI Reagan Dulles
Facilitate Economic Opportunity in Maryland
158
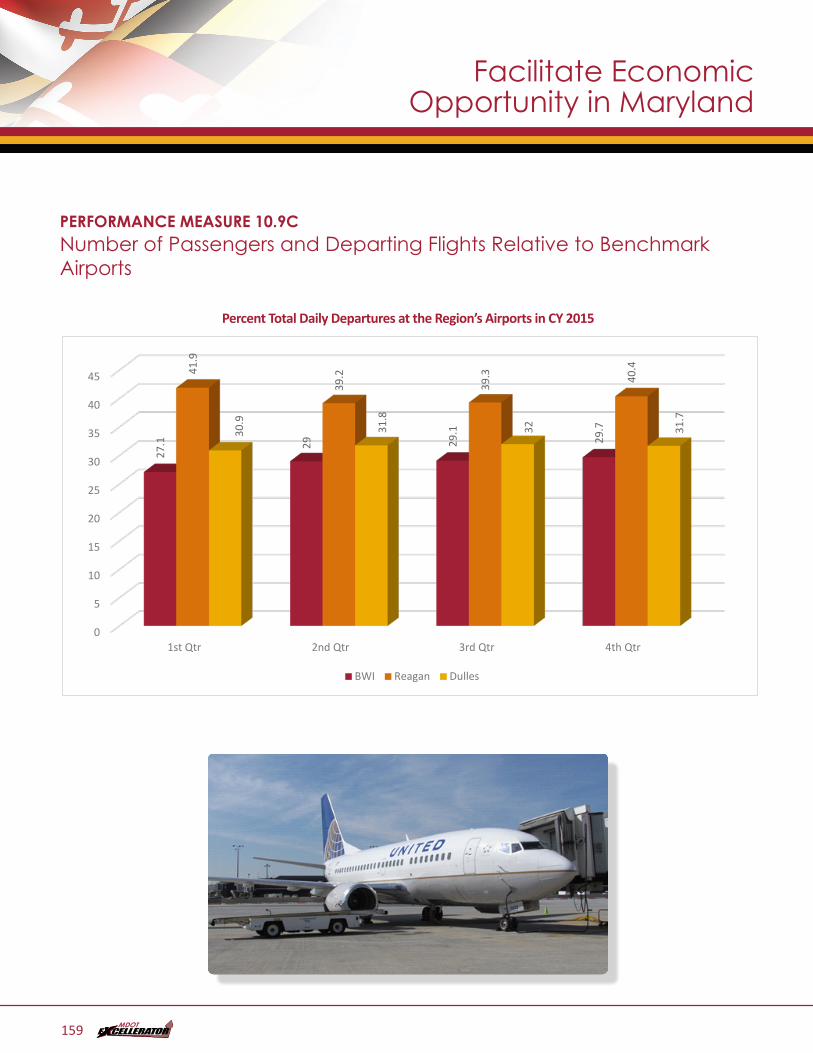
PERFORMANCE MEASURE 10.9CNumber of Passengers and Departing Flights Relative to Benchmark Airports
Percent Total Daily Departures at the Region’s Airports in CY 2015PM10.9c.2 - % Total Daily Departures at the Region's Airports in CY 15 - DONE
0
5
10
15
20
25
30
35
40
45
1st Qtr 2nd Qtr 3rd Qtr 4th Qtr
27.1 29 29
.1
29.7
41.9
39.2
39.3 40
.4
30.9
31.8
32 31.7
BWI Reagan Dulles
Facilitate Economic Opportunity in Maryland
159
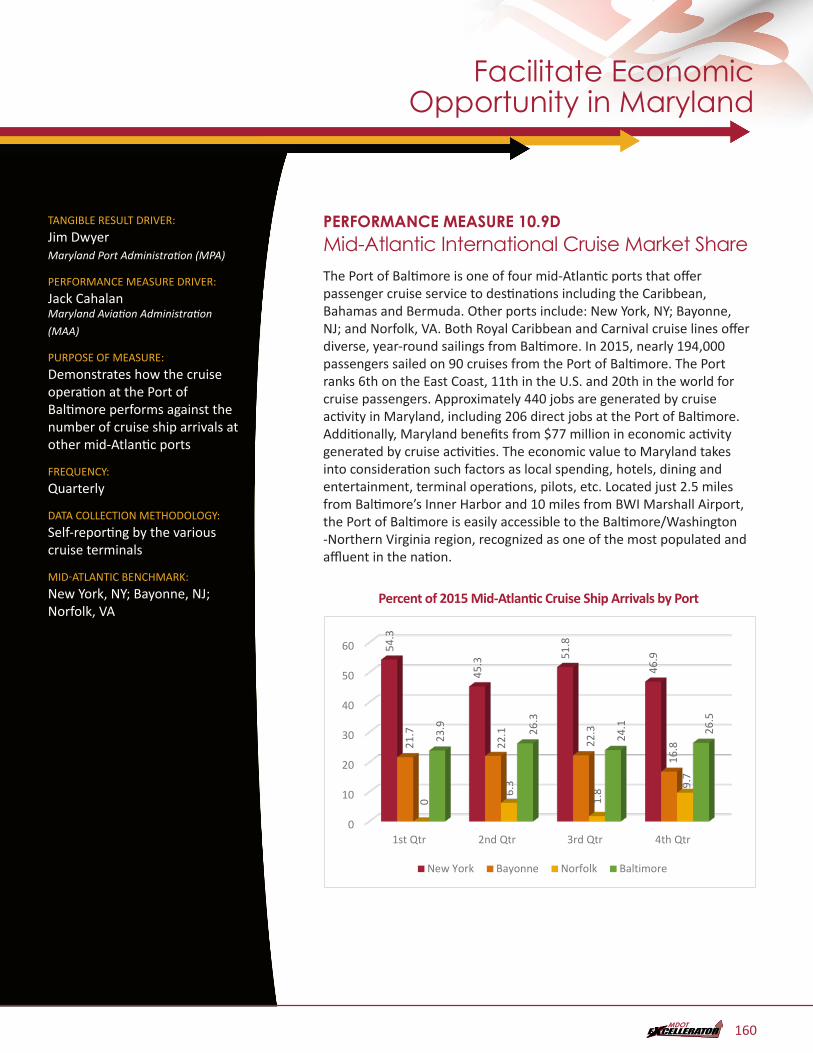
TANGIBLE RESULT DRIVER:
Jim Dwyer Maryland Port Administration (MPA)
PERFORMANCE MEASURE DRIVER:
Jack Cahalan Maryland Aviation Administration
(MAA)
PURPOSE OF MEASURE:
Demonstrates how the cruise operation at the Port of Baltimore performs against the number of cruise ship arrivals at other mid-Atlantic ports
FREQUENCY:
Quarterly
DATA COLLECTION METHODOLOGY:
Self-reporting by the various cruise terminals
MID-ATLANTIC BENCHMARK:
New York, NY; Bayonne, NJ; Norfolk, VA
PERFORMANCE MEASURE 10.9DMid-Atlantic International Cruise Market ShareThe Port of Baltimore is one of four mid-Atlantic ports that offer passenger cruise service to destinations including the Caribbean, Bahamas and Bermuda. Other ports include: New York, NY; Bayonne, NJ; and Norfolk, VA. Both Royal Caribbean and Carnival cruise lines offer diverse, year-round sailings from Baltimore. In 2015, nearly 194,000 passengers sailed on 90 cruises from the Port of Baltimore. The Port ranks 6th on the East Coast, 11th in the U.S. and 20th in the world for cruise passengers. Approximately 440 jobs are generated by cruise activity in Maryland, including 206 direct jobs at the Port of Baltimore. Additionally, Maryland benefits from $77 million in economic activity generated by cruise activities. The economic value to Maryland takes into consideration such factors as local spending, hotels, dining and entertainment, terminal operations, pilots, etc. Located just 2.5 miles from Baltimore’s Inner Harbor and 10 miles from BWI Marshall Airport, the Port of Baltimore is easily accessible to the Baltimore/Washington -Northern Virginia region, recognized as one of the most populated and affluent in the nation.
Percent of 2015 Mid-Atlantic Cruise Ship Arrivals by PortPM10.9d -% of 2015 mid-Atlantic Cruise Ship Arrivals by Port - DONE
0
10
20
30
40
50
60
1st Qtr 2nd Qtr 3rd Qtr 4th Qtr
54.3
45.3 51
.8
46.9
21.7
22.1
22.3
16.8
0
6.3
1.8 9.
7
23.9 26
.3
24.1 26
.5
New York Bayonne Norfolk Baltimore
Facilitate Economic Opportunity in Maryland
160
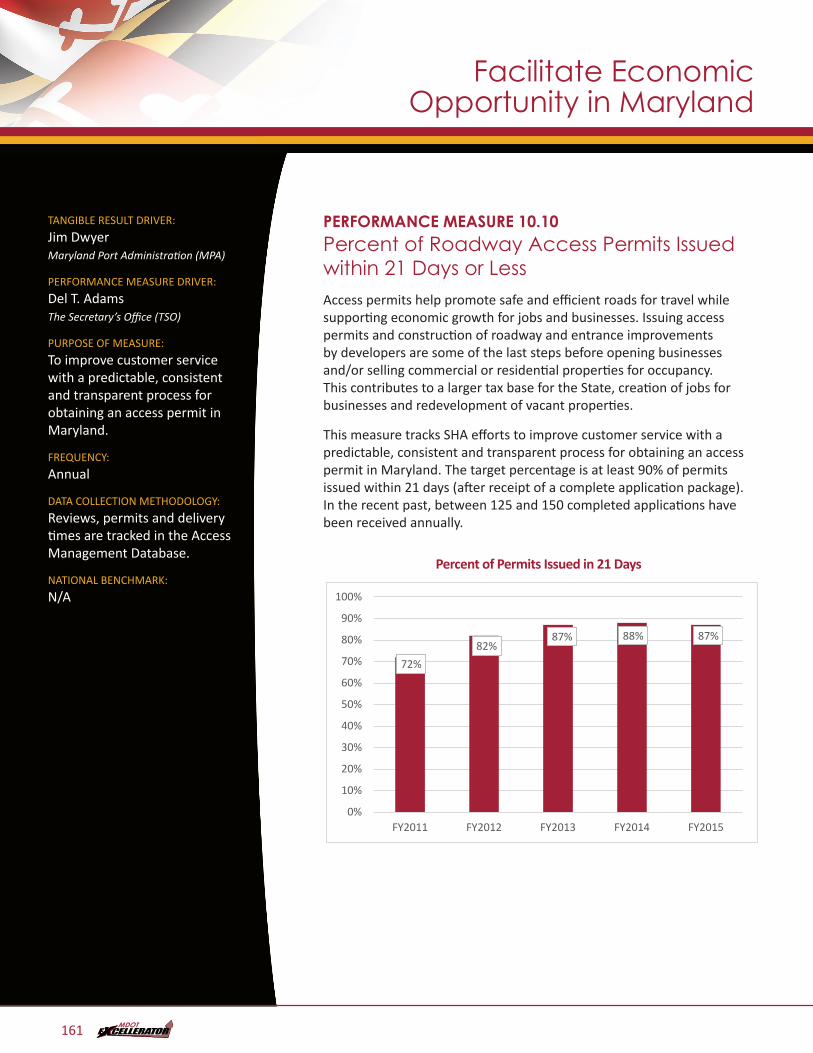
TANGIBLE RESULT DRIVER:
Jim Dwyer Maryland Port Administration (MPA)
PERFORMANCE MEASURE DRIVER:
Del T. Adams The Secretary’s Office (TSO)
PURPOSE OF MEASURE:
To improve customer service with a predictable, consistent and transparent process for obtaining an access permit in Maryland.
FREQUENCY:
Annual
DATA COLLECTION METHODOLOGY:
Reviews, permits and delivery times are tracked in the Access Management Database.
NATIONAL BENCHMARK:
N/A
PERFORMANCE MEASURE 10.10Percent of Roadway Access Permits Issued within 21 Days or Less Access permits help promote safe and efficient roads for travel while supporting economic growth for jobs and businesses. Issuing access permits and construction of roadway and entrance improvements by developers are some of the last steps before opening businesses and/or selling commercial or residential properties for occupancy. This contributes to a larger tax base for the State, creation of jobs for businesses and redevelopment of vacant properties.
This measure tracks SHA efforts to improve customer service with a predictable, consistent and transparent process for obtaining an access permit in Maryland. The target percentage is at least 90% of permits issued within 21 days (after receipt of a complete application package). In the recent past, between 125 and 150 completed applications have been received annually.
Percent of Permits Issued in 21 DaysPM10.10 - Percent of Permits Issued in 21 days - DONE
72%82%
87% 88% 87%
0%
10%
20%
30%
40%
50%
60%
70%
80%
90%
100%
FY2011 FY2012 FY2013 FY2014 FY2015
Facilitate Economic Opportunity in Maryland
161
All Electronic Tolling (AET) - Collection of tolls at highway speeds using E-ZPass transponders or video tolling; no toll booths or cash collection.
Annual Attainment Report on Transportation System Performance - Pursuant to Transportation Article Section 2-103.1 of the Annotated Code of Maryland, the State is required to develop or update an annual performance report on the attainment of transportation goals and benchmarks in the Maryland Transportation Plan (MTP) and Consolidated Transportation Program (CTP). The Attainment Report must be presented annually to the Governor and General Assembly before they may consider the MTP and CTP.
Calendar Year (CY) - The period of 12 months beginning January 1 and ending December 31 of each reporting year.
Coordinated Highways Action Response Team (CHART) - CHART is an incident management system aimed at improving real-time travel conditions on Maryland’s highway system. CHART is a joint effort of the State Highway Administration, Maryland Transportation Authority and the Maryland State Police, in cooperation with other federal, state and local agencies.
Consolidated Transportation Program (CTP) - A six-year program of capital projects, which is updated annually to add new projects and reflect changes in financial commitments.
Fiscal Year (FY) - A yearly accounting period covering the time frame between July 1 and June 30 of each reporting year.
MPA General Cargo - Foreign and domestic waterborne general cargo handled at the public (MPA) terminals.
Port of Baltimore Foreign Cargo - International (Foreign) cargo handled at public and private terminals within the Baltimore Port District. This includes bulk cargo (e.g., coal, sugar, petroleum, ore, etc. shipped in bulk) and all general cargo (e.g., miscellaneous goods shipped in various packaging).
MAA – Maryland Aviation Administration operates Baltimore/Washington International Thurgood Marshall Airport (BWI Marshall) and Martin State Airport, a general aviation/reliever airport northeast of Baltimore.
MDTA – Maryland Transportation Authority operates and maintains the State’s eight toll facilities.
Mode - Form of transportation used to move people or cargo (e.g., truck, rail, air).
MPA – Maryland Port Administration promotes the Port of Baltimore as a leading east coast hub for cargo and cruise activity.
MTA – Maryland Transit Administration provides Local Bus, Light Rail, Metro Rail, Paratransit services and regional services through commuter rail (MARC) and Commuter Bus, as well as grant funding and technical assistance.
MVA – Motor Vehicle Administration serves as the gateway to Maryland’s transportation infrastructure, providing a host of services for drivers and vehicles, including registration, licensing and highway safety initiatives.
TBU – Transportation Business Unit
TSO – The Secretary’s Office
Vehicle Miles of Travel (VMT) – A measurement of the total miles traveled by all vehicles.
Glossary
162
MARYLAND DEPARTMENT OF TRANSPORTATION7201 Corporate Center Drive, Hanover, Maryland 21076
Local (410) 865-1000 Toll Free 1- (888) 713-1414 Maryland Relay TTY 1- (800) 735-2258