Embed Size (px)
Citation preview

1082
Measuring Small Linear Displacements With a Three-Dimensional Video Motion Analysis System: Determining Its Accuracy and Precision Dirk G. Everaert, MPT, Arthur J. Spaepen, PhD, Marc J. Wouters, Karel H. Stappaerts, PhD, PT, Rob A. B. Oostendorp, PhD, PT
ABSTRACT. Everaert DG, Spaeper AJ, Wouters MJ, Stap- paerts KH, Oostendorp RAB. Measuring small linear displace- ments with a three-dimensional video motion analysis system: determining its accuracy and precision. Arch Phys Med Rehabil 1999;80:1082-9.
Objectives: To determine accuracy, precision, and smallest detectable difference for a three-dimensional (3D) video motion analysis system specifically configured for measuring small and slow displacements within a small measurement volume (0.7 × 0.5 × 0.3m).
Design: Repeated measurements with random sequence of conditions.
Setting: Rehabilitation research laboratory. Intervention: A reference sliding device was used to control
cyclic displacements of two reflective markers over 5 calibrated ranges (1, 3, 10, 30, and 60mm). Nine cycles were performed for each of 9 conditions (3 directions × 3 zones). Four cameras recorded all trials on tapes, which were digitized with a Kinemetrix system.
Main Outcome Measures: Change in distance of the moving markers relative to a third static marker was averaged over 50 frames per trial. Mean error, mean absolute error, and intertrial and intratrial standard deviations (SDs) were calcu- lated for each zone and direction.
Results: For 810 trials, mean error and absolute error were, respectively, .034ram and .094 mm. The mean intertrial and intratrial SDs and 99% confidence interval were .047mm (CI = ±.121turn) and .030ram (CI = +_ .077mm). The corre- sponding smallest detectable differences were .171 mm and .109 mm.
Conclusion: Motion analysis configured for registration within small volumes allows measurement of minuscule dis- placements with great accuracy and may therefore be suitable for many applications in rehabilitation research other than gait analysis.
© 1999 by the American Congress of Rehabilitation Medi- cine and the American Academy of Physical Medicine and Rehabilitation
From the Department of Rehabilitation Sciences (Mr. Everaert, Dr. Stappaerts) and Department of Kinesiology (Dr. Spaepen, Mr. Wouters), Faculty of Physical Education and Physiotherapy, University of Leuven, Belgium; and the Faculty of Medicine and Pharmacology, Postgraduate Program in Manual Therapy, Free University of Brussels, Belgium, and Dutch National Institute of Allied Health Professions, Amersfoot, The Netherlands (Dr. Oostendorp).
Submitted for publication November 17, 1998. Accepted in revised form March 12, 1999.
No commercial party having a direct financial interest in the results of the research supporting this article has or will confer a benefit upon the authors or upon any organization with which the authors are associated.
Reprint requests to Dirk Everaert, PT, Department of Rehabilitation Sciences, Faculty of Physical Education and Physiotherapy, Tervuursevest 101, 3001 Heverlee, Belgium.
© 1999 by the American Congress of Rehabilitation Medicine and the American Academy of Physical Medicine and Rehabilitation
0003-9993/99/8009-529853.00/0
R ESEARCH IN REHABILITATION often focuses on mea- surement of quality and quantity of motion of joints and
tissues, requiting methods that do not restrict freedom of movement. Video-based three-dimensional (3D) motion analy- sis enables measurement without mechanical restraints, but it has mostly been used for gait analysis and similar applications. In the last 10 to 15 years, 3D motion analysis has become more widespread in the area of human movement analysis, and has found both clinical and research applications.
Research l s has determined the performance of different video motion analysis systems that are commercially available. These systems are based on automatic digitization of passive (light-reflecting) or active (light-emitting) markers that are placed on reference points on the subject and that must be registered by at least two cameras. The direct linear transforma- tion (DLT) approach is used most often to calculate the 3D coordinates of the markers, because of its accuracy and flexibility in camera placement) These calculations are based on 11 transformation coefficients obtained through a calibration procedure during which a calibration frame, containing pre- cisely positioned control markers, is registered by all cameras. 10
The limits of accuracy (agreement between the measured and reference values ~1) and/or precision (agreement among re- peated measurements 11) were reported by several investigators for angular estimates, 1-3 for linear estimates, 6-8 or for both. 4,5 These studies 16,8 used a motion analysis system that was configured for gait analysis or a similar clinical purpose, except for the study by Haggard and Wing] Consequently, these studies ~-6,8 used a relatively large calibration frame and large measurement volumes to allow registration of several steps of a walking subject or sit-to-stand maneuvers. The calibration frames typically had cubelike shapes ranging from 1.63 × .72 × 1.27 meter 4 to 2 x 2 × 1.31 meter. 2
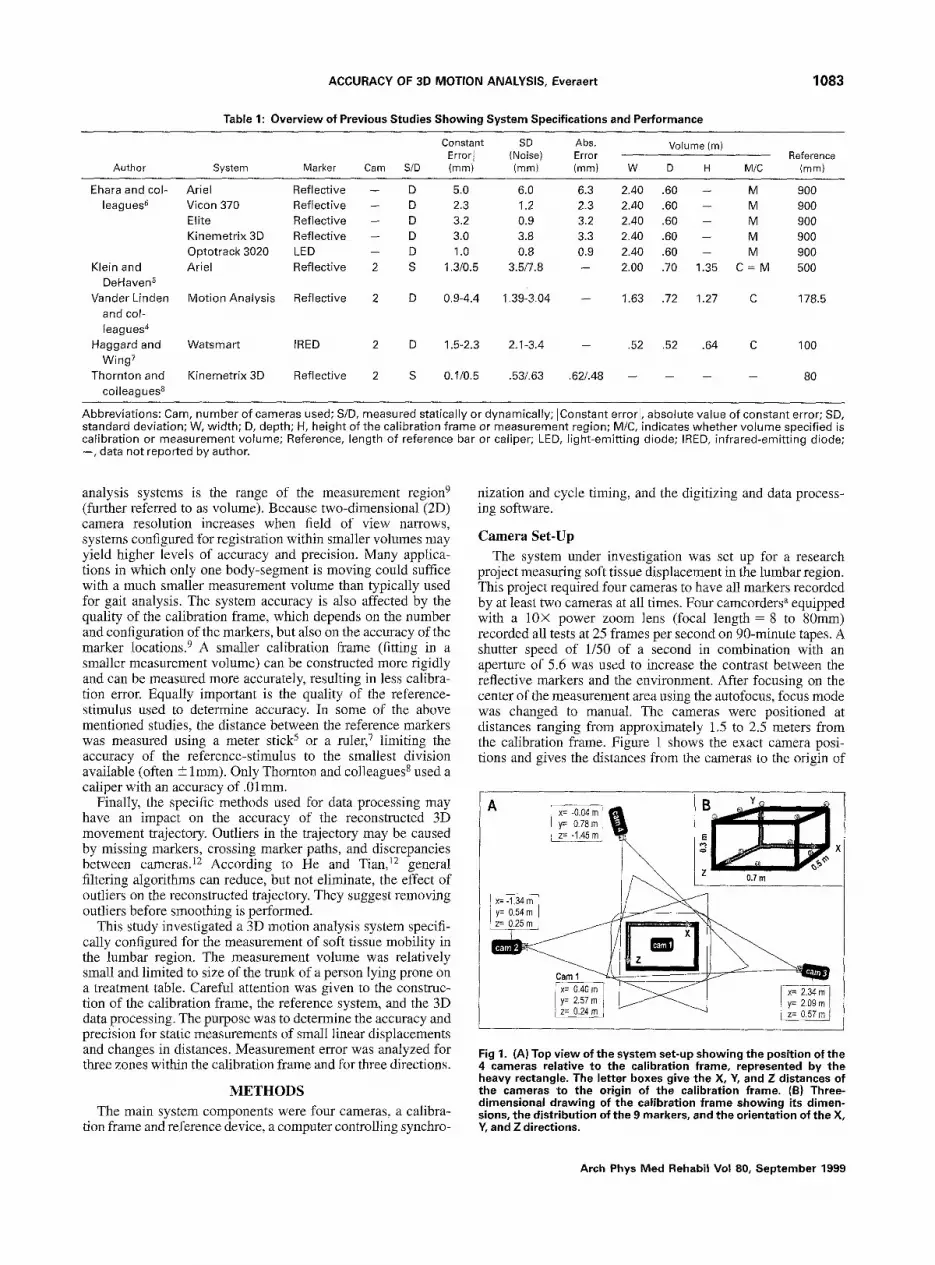
Information on system setup and associated error for the studies that measured linear estimates is summarized in table 1. Most of the studies 4,5,7,8 mentioned in table 1 used two cameras; information on the number of cameras was not reported by Ehara and colleagues. 6 In all studies, distances between two markers on a reference-bar or caliper were calculated. The length of the reference bar varied from 80ram s to 900ram. 6 The constant error (absolute value given in table) and accompanying standard deviation ranged from 0.1ram (SD .53ram) s to 5.0mm (SD 6.0ram). 6 For 7 of 9 configurations, constant error values were greater than lmm, and for 6 out of 9 systems, SDs were greater than 1ram. The absolute error ranged from .48ram s to 6.3mm, 6 but was not reported in three of the five studies. 4,5,7
Established limits of accuracy and precision as specified in table 1 are probably sufficient for clinical applications of gait analysis. A higher performance standard, however, may be required for other types of clinical or research studies measur- ing quantity and quality of movement of specific regions of the human body (eg, head and neck, spine, pelvis, upper or lower quadrant) or even single joints.
A major factor determining accuracy and precision of motion
Arch Phys Med Rehabil Vo! 80, September 1999
ACCURACY OF 3D MOTION ANALYSIS, Everaert
Table 1: Overview of Previous Studies Showing System Specifications and Performance
1083
Author
I Constant SD Abs. Volume (m) Error I (Noise) Error
System Marker Cam S/D (mm) (mm) (mm) W D H Reference
M/C (mm)
Ehara and col- leagues 6
Klein and DeHaven 5
Vander Linden and col- leagues 4
Haggard and Wing 7
Thornton and colleagues 8
Ariel Reflective -- D 5.0 6.0 6.3 2.40 .60 -- M 900 Vicon 370 Reflective -- D 2.3 1.2 2.3 2.40 .60 -- M 900 Elite Reflective -- D 3.2 0.9 3.2 2.40 .60 -- M 900 Kinemetr ix 3D Reflective -- D 3.0 3.8 3.3 2.40 .60 -- M 900 Optotrack 3020 LED -- D 1.0 0.8 0.9 2.40 .60 -- M 900 Ariel Reflective 2 S 1.3/0.5 3.5/7.8 -- 2.00 .70 1.35 C = M 500
Mot ion Analysis Reflective 2 D 0.9-4.4 1.39-3.04 -- 1.63 .72 1.27 C 178.5
Watsmart IRED 2 D 1.5-2.3 2.1-3.4 -- .52 .52 .64 C 100
Kinemetr ix 3D Reflective 2 S 0.1/0.5 .53/.63 .62/.48 . . . . 80
Abbreviat ions: Cam, number of cameras used; S/D, measured statically or dynamical ly; IConstant errorl, absolute value of constant error; SD, standard deviation; W, width; D, depth; H, height of the calibration f rame or measurement region; M/C, indicates whether vo lume specified is calibration or measurement volume; Reference, length of reference bar or caliper; LED, l ight-emitt ing diode; IRED, infrared-emitt ing diode; -- , data not reported by author.
analysis systems is the range of the measurement region 9 (further referred to as volume). Because two-dimensional (2D) camera resolution increases when field of view narrows, systems configured for registration within smaller volumes may yield higher levels of accuracy and precision. Many applica- tions in which only one body-segment is moving could suffice with a much smaller measurement volume than typically used for gait analysis. The system accuracy is also affected by the quality of the calibration frame, which depends on the number and configuration of the markers, but also on the accuracy of the marker locations. 9 A smaller calibration frame (fitting in a smaller measurement volume) can be constructed more rigidly and can be measured more accurately, resulting in less calibra- tion error. Equally important is the quality of the reference- stimulus used to determine accuracy. In some of the above mentioned studies, the distance between the reference markers was measured using a meter stick 5 or a ruler, 7 limiting the accuracy of the reference-stimulus to the smallest division available (often + lmm). Only Thornton and colleagues 8 used a caliper with an accuracy of .0 lmm.
Finally, the specific methods used for data processing may have an impact on the accuracy of the reconstructed 3D movement trajectory. Outliers in the trajectory may be caused by missing markers, crossing marker paths, and discrepancies between cameras. ~2 According to He and Tian, 12 general filtering algorithms can reduce, but not eliminate, the effect of outliers on the reconstructed trajectory. They suggest removing outliers before smoothing is performed.
This study investigated a 3D motion analysis system specifi- cally configured for the measurement of soft tissue mobility in the lumbar region. The measurement volume was relatively small and limited to size of the trunk of a person lying prone on a treatment table. Careful attention was given to the construc- tion of the calibration frame, the reference system, and the 3D data processing. The purpose was to determine the accuracy and precision for static measurements of small linear displacements and changes in distances. Measurement error was analyzed for three zones within the calibration frame and for three directions.
METHODS
The main system components were four cameras, a calibra- tion frame and reference device, a computer controlling synchro-
nization and cycle timing, and the digitizing and data process- ing software.
Camera Set-Up The system under investigation was set up for a research
project measuring soft tissue displacement in the lumbar region. This project required four cameras to have all markers recorded by at least two cameras at all times. Four camcorders a equipped with a 10× power zoom lens (focal length = 8 to 80ram) recorded all tests at 25 frames per second on 90-minute tapes. A shutter speed of 1/50 of a second in combination with an aperture of 5.6 was used to increase the contrast between the reflective markers and the environment. After focusing on the center of the measurement area using the autofocus, focus mode was changed to manual. The cameras were positioned at distances ranging from approximately 1.5 to 2.5 meters from the calibration frame. Figure 1 shows the exact camera posi- tions and gives the distances from the cameras to the origin of
D Y~
Fig 1. (A) Top view of the system set-up showing the position of the 4 cameras relative to the calibration frame, represented by the heavy rectangle. The letter boxes give the X, Y, and Z distances of the cameras to the origin of the calibration frame. (B) Three- dimensional drawing of the calibration frame showing its dimen- sions, the distribution of the 9 markers, and the orientation of the X, Y, and Z directions.
Arch Phys Med Rehabil Vol 80, September 1999

1084 ACCURACY OF 3D MOTION ANALYSIS, Everaert
the calibration frame in X, Y, and Z directions. Camera 1 was mounted down from the ceiling of the laboratory and was positioned perpendicularly above the center of the XZ-plane of the calibration frame. Cameras 2 and 3 were both oriented quasiperpendicularly to the Z-axis of the frame, but camera 3 was tilted much more downward (height = 2.09m above frame- base) than camera 2 (height = .54m above frame-base). Cam- era 4 was mainly oriented perpendicularly to the X-axis, and tilted slightly downward (height = .78m).
For purpose of camera synchronization, a light-emitting diode (LED) was mounted in the upper left comer of the field of view of each camera. Firing of the LEDs was controlled by a computer, and triggered by a manual switch. A standard spotlight (75 Watt, narrow beam) was mounted on the handle of each tripod, as close as possible to the lens of each camera.
Calibration Frame
The calibration frame was specifically designed for the clinical study and was adapted to the proportions of the upper body of a person lying on a treatment table. It had a cubelike shape, measuring 0.7m wide, 0.5m deep, and 0.3m high. The X, Y, and Z-axis of the coordinate system were defined respec- tively along the width, height, and depth of the calibration frame (fig 1). The frame was build with anodized black aluminum profiles (40 × 40ram) and linkage components of the ITEM b modular construction system. The profiles were cut with a precision circular saw, ensuring clean and right-angle cuts. During and after mounting of the beams into the frame, trueness of right angles was verified with a square. The rigid profiles in combination with the small dimensions resulted in a frame with very high stiffness and virtually no deformation when handled. Nine spherical reflective markers were attached firmly to the frame by means of wired metal pins (5ram diameter), which were screwed perpendicularly into the alumi- num profiles. The markers were made of wooden balls (diam- eter 20ram), covered with reflective tape. c As a result of the turning process, the wooden balls had a precisely centered whole, which was tapped with 5-mm screw-thread. This procedure allowed the balls to be screwed firmly and with precision onto the metal pins. The distribution of the markers is shown in figure 1. The position of the markers on the X, Y, and Z-axis was determined by measuring distances between the metal pins (without markers). All distances were measured three times using a giant caliper with an accuracy of 0. lmm. For the system under investigation, the calibration error for X, Y, and Z directions and 3D was respectively .294mm, .284mm, .407mm, and .302mm.
Reference Sliding Device Most accuracy studies mentioned above have measured
distances between two reflective markers or LEDs. This procedure requires exact determination of the distance between the physical center of the markers, to obtain an accurate measurement of the reference bar. Faulty measurements may be caused by skewed marker attachments or imperfect spherical markers. Higher accuracy for the reference system might be achieved by controlling displacement of markers, rather than distances between markers, and therefore, a sliding device was developed. The device consisted of an aluminum frame (build with 40 × 40ram aluminum profiles), mounted on a wooden board with smooth synthetic finish. Inside the frame, two stops controlled the movement of a sliding block (fig 2). One stop was permanently fixed, the other was adjustable and determined the reference displacement to be measured. All these aluminum parts were cut with a computer-controlled circular saw, ensur-
160,01 mm 159.70 mm
Open position (ti) sliding block
OIACl~
I marker bolt adjustable stop
Fig 2. In-scale drawing of the reference sliding device, showing the sliding block carrying two markers, the adjustable stop carrying one marker, and the fixation bolts. The top part of t~he figure shows the sliding block in closed position (to). In the bottom part of the figure the sliding block is moved to the open position (ti). The large arrow represents the calibrated displacement. The small arrows indicate the distances (d), changes in distance (cd), and displacements (D) for markers A and B.
ing plain faces and right-angle cuts (maximum error = .0358°). Trueness of right angles was verified with a square. To obtain the best fit between the sliding block and the two stops, these parts were cut from one beam and were mounted in the sliding device in the same way as they were cut (same order and same side upward).
The reference displacements were set by placing calibrated steel blocks, polished with an accuracy of .001mm, between the sliding block and the adjustable stop. After securing the adjustable stop, the device was manually controlled for "play" between the sliding block and the stops while the calibration block was in place. The overall accuracy of the reference device was lower than for the calibration blocks, but because the system was virtually free of "play" the error was believed to be less than .01ram. After removing the calibrated block, the sliding block could be moved freely between the two stops. The situation where the sliding block is in contact with the adjustable stop, respectively fixed stop, is further referred to as the "closed position" and "open position" (fig 2).
Two spherical markers were mounted on metal pins on the sliding block (markers A and B) and one on the adjustable stop (marker C). The distance between the center of marker A and B was 160.01mm, and between marker B and C in closed position 159.70mm. All three markers were perfectly aligned with each other. Therefore, by displacing the sliding block from the closed position (to) to the open position (ti) over the calibrated range, the change in distance (cd) between markers A and C (cd[AC]) and between markers B and C (cd[BC]) was equal to the displace- ment (D) of the markers A and B (DIAl and D[B]) (fig 2).
Data Collection Protocol
The reference sliding device was successively set for 5 displacements, using 5 different calibration blocks measuring 1.007, 3.000, 10.000, 30.000, and 60.000mm. For each setting, a series of displacement cycles was performed, using the following procedure. The reference sliding device was clamped onto the leveled surface of a solid table of which the height was
Arch Phys Med Rehabil Vol 80, September 1999

ACCURACY OF 3D MOTION ANALYSIS, Everaert 1085
situated halfway from the height of the calibration frame. The device was positioned in three different zones relative to the calibration frame (fig 3). Zones 1 and 3 covered two outer poles of the frame, while zone 2 was situated in the center. For each zone, displacements were measured in three directions: direc- tion X and Z parallel to the X-axis and Z-axis of the calibration frame, and direction O at an angle of 45 °. For each of the 9 conditions (3 zones × 3 directions), 9 repeated cycles were performed during which the sliding block was manually moved from the closed to the open position, and back. The timing of the cycles was controlled by computer-generated beeps. The 9 cycles were recorded in three consecutive test series, because the duration of digitization was limited to 13 seconds, and only 3 cycles could be completed in that time. The 5 displacement settings and 9 conditions were recorded in random sequence. To determine possible fluctuations inherent to the system, a number of static test series were recorded, during which the device remained untouched.
Data Processing The tape recordings were played back on a videorecorder, a
which was connected to the Kinemetrix 3D d system. All test
Zone 1
i ~ i~ii~ii~i~ ¸ ~ i i i i~!~;~i l ~ i~i~i!~ ¸ m
q~b
e c
Z
Zone 2
Zone 3
Fig 3. In-scale drawing of the nine positions of the reference sliding device: directions X, Z, and O for zones 1,2, and 3. The heavy square shows the relative position of the calibration frame.
series were consecutively digitized (at 50 frames/sec) for the four cameras and the digital 2D camera files were automatically synchronized, based on the appearance of the LED. Custom- built software, developed by our kinesiology department, was used for 3D reconstruction (based on DLT procedures) and for labeling of the marker trajectories. After conversion to ASCII- files, the 3D files containing X, Y, and Z coordinates over 609 frames were imported into a spreadsheet, e
The raw coordinates were first checked for outliers caused by dropped-out markers (by 3D reconstruction software set to - 1 values), and camera discrepancies (shifted path in position × time graph). A macro was programmed to detect these outliers by calculating all sequential frame to frame differences (steps) in the raw coordinates. The difference in two consecutive steps was used as uniform criterion for the presence of an outlier. The critical value for the step-difference filter- macro was set at 2ram. After removal of the outliers, the raw coordinates were smoothed using a moving average over 25 frames (each data point is replaced with the average value of 25 consecutive data points, consisting of the data point itself, 12 values before, and 12 values after the data point), and the following variables were then calculated ("D" is used for displacement, "d" for distance, and "cd" for change in distance). Displacement (D[A], D[B], D[C]) was calculated as 3D distance between the initial position of a marker (average of the first 50 frames) and the subsequent positions in time (X, Y, Z at ti) for each series of 3 cycles. Change in distance (cd[AC], cd[BC]) was calculated as the difference between the 3D distance between two markers in the initial position (d[AC] and d[BC] averaged over the first 50 frames), and the subsequent positions in time (d[AC] and d[BC] at ti) for each series of 3 cycles. An example for the change in distance during a I-ram test for 9 cycles is presented in figure 4.
For the open position of each cycle (further referred to as trial), error scores were calculated based on averages of 50 consecutive frames. The selection of these 50 frames was predetermined and based on the computer-programmed cycle timing (the frame numbers delimiting the trials are marked with a " + " at the level of the reference value in figure 4). The static series were analyzed using the same timing for frame selec- tions, also referred to as trials. The following error scores were calculated for displacement and change in distance. Error was calculated as the difference between the mean measured value for each trial (50 frames) and the reference value. The error variability within each series of trials, was expressed as the intertrial SD (equal to SD of 9 trial means). The error variability within each trial was expressed as the intratrial SD or noise (equal to SD of 50 frames). Both variability scores are schematically presented in figure 4-. Absolute error was calcu- lated as the absolute value of the error. As suggested by Furnre] 3 the overall scores for accuracy and precision were also expressed as percentage of the 3D diagonal of the meastu'ement volume, which was equal to the calibration volume in current study (3D diagonal = 911mm).
Data Analysis Data analysis was performed on 36 trials from static series
(without movement cycles) and a total of 810 trials from series with movement: 9 repeated trials for 9 conditions (3 zones × 3 directions) for 10 tests (5 displacement ranges × 2 markers). For the static series, absolute error was compared between displacement and change in distance, using a one-way repeated measures analysis of variance (ANOVA), treating displace- ments for markers A, B, C and change in distance AC, BC as five repeated measurements.
For each level of zone and direction, the variability in
Arch Phys Med Rehabil Vol 80, September 1999

1 0 8 6 ACCURACY OF 3D MOTION ANALYSIS, Everaert
Trial 1
A I" 1 0.8
8_ 0.6
" 0.4 ' " o
~= 0.0 - " . c
-0.2
Trial 2 Trial 3 Trial 4 Trial 5 Trial 6 Trial 7 Trial 8 Trial 9
Frame number
Fig 4. Example of a real output graphic for a test with 1-mm reference displacement. The graphic shows change in distance in function of frame number for 9 repeated cycles. The horizontal lines delineate the intertrial variability, the small box delineates the intratrial variability. The + marks at the 1-mm level demarcate the 50 frames selected for each trial.
measured change in distance over 9 repeated trials was evalu- ated as a measure of precision, by means of intraclass correla- tion coefficients (ICC[2,1], reliability of a single measure- ment 14) based on separate two-way ANOVAs with two repeated factors (zone × trial, and direction × trial). The relation be- tween the mean measured change in distance and the reference values was evaluated as a measure of accuracy, and was also expressed in an ICC[2,1], based on one-way repeated measures ANOVA (mean measured value and reference value as repeated measures).
The effect of zone and direction on the mean error, the mean intertrial SD, and noise were analyzed using two-way repeated measures ANOVA with two repeated factors (zone × direction). The observations for the nine conditions were considered as dependent, and therefore, zone and direction were treated as repeated factors. The statistical assumption of normality was tested for the residuals of each ANOVA procedure. Univariate ANOVA statistics were used whenever the sphericity criterion was met, otherwise, the multivariate tests were used. 15,16 The relationship between the magnitude of the reference displace- ment and the error scores was calculated using Pearson's correlation coefficients. All statistics were performed using an SAS package, f
RESULTS
Static Series For 36 trials, evenly distributed over the 3 zones and 3
directions, the overall error scores were compared between the measured displacement and change in distance. Although the reference sliding device and the supporting table were not touched during these recordings, movement was measured for the markers A, B, and C. This movement equaled the amount of error, because the reference displacement was zero. One-way repeated measures ANOVA revealed significant differences between displacement and change in distance (F[4,140] = 31.82; p < .0001). Post-hoc contrasts showed that the mean absolute displacements for the markers A, B, and C (ranging from .081ram to .097ram; table 2) were significantly greater than the mean change in distance for AC (.040mm) (F[1, 35] = 48.95, 28.28, 21.82; p < .0001) and BC (.029ram) (F[1,35] = 92.48, 77.08, 55.35; p < .0001). The overall mean intertrial SD (.041mm) and intratrial SD (.029ram) was exactly the same for displacement as for change in distance.
Series With Reference Displacements Accuracy. The analysis of the displacement variables was
limited to the static tests. Because error was analyzed at a level
of .01mm, perfect stability of the reference sliding device was an absolute condition to interpret the error scores for displace- ment. Although the reference device was clamped to a solid table, minuscule disturbances due to the manual handling of the sliding block could have interfered with the marker displace- ments. The error scores for change in distance were not sensitive to this problem, and therefore, only change in distance was analyzed for the test series with reference displacements.
The overall mean error (for all zones and all directions) for change in distance was .034mm or .0037% (table 3, fig 5) and there was no effect for zone or direction on the mean error. The overall mean absolute error for change in distance was .094ram (.0103%). Two-way repeated measures ANOVA revealed no interactions between zone and direction, and therefore the 9 conditions were pooled to 3 zones and 3 directions. Mean absolute error was not different for zones 1, 2, and 3, but there was a significant multivariate effect for direction (Wilks' lambda = 0.2, F[2,8] = 15.75; p = .0017). Contrasts showed that mean absolute error was significantly smaller for direction Z (.070ram) than for direction X (.105ram, F[1,9] = 8.05; p = .019) and O (.106ram, F[1,9] = 8.57;p = .017). The ICCs for accuracy are given in table 4. The ICCs for all zones and all directions were greater than .99999.
In figure 6, the overall mean error and overall mean absolute error (averaged for the 3 zones and 3 directions) are presented per reference displacement. Mean error for individual tests ranged from .002 to . l l2mm, and mean absolute error from .067 to. 127mm. The Pearson's correlation coefficients did not
Table 2: Comparison of Mean Absolute Error and Variability (in mm) Between Displacement and Change in Distance
for the Static Test Series
Mean Intertrial Intratrial AE p < .0001 SD SD
Displacement D[A] .097 cd[AC],cd[BC] .046 ,032 D[B] .081 cd[AC],cd[BC] .037 .025 D[C] .082 cd[AC],cd[BC] .039
Mean .087 .041 .029
Changein Distance cd[AC] .040 D[A], D[B], D[C] .049 .030 cd[BC] .029 D[A], D[B], D[C] .033 .028
Mean .034 .041 .029
Based on 36 trials. The second data column shows the significant contrasts with the other factor-levels. Abbreviations: AE, Absolute error; D[A], displacement of marker A; cd[AC], change in distance between marker A and C, and so forth.
Arch Phys Med Rehabil Vol 80, September 1999

ACCURACY OF 3D MOTION ANALYSIS, Everaert 1 0 8 7
Table 3: Comparison of Mean Error and Variability (in mrn) for Change in Distance for the Different Levels of Zone and Direction
Precision Accuracy
Measured - Reference Mean SD 99% CI
Mean Abs Error Mean Error Intertrial Intratrial Intertrial Intratrial
Zone 1 .095NS .049NS .043z3 .027z3 _+.111 -+.069 Zone 2 .099NS .031NS .044z3 .029z3 ±.113 ±.075 Zone 3 .087NS .020NS .056zl,z2 .034ztz; _+.144 -+.088
Direction X .105z .046Ns .046z .033z +, 118 ±.084 Direction Z .070x,0 .031NS .030x,0 .022×,0 _+.078 --+.057 Direction O .106z ,024NS .066z .035z --+,171 +.091
Overall .094 .034 .047 .030 ±,121 ±.077 %MVD .0103% .0037% .0052% ,0033%
The mean for each level of zone and direction is based on 270 trials (3 conditions x 9 trials × 10 tests). Subscript text shows the significant contrasts with the other factor-levels (p < .05). Abbreviations: SD, standard deviation; Cl, confidence interval; NS, not significant; %MVD, overall accuracy and precision expressed as percentage of the 3D diagonal of the measurement volume.
indicate significant correlations between the magnitude of the reference displacement and these error scores.
Precision. The data on precision are also summarized in table 3 and figure 5. The overall mean intertrial SD was .047ram (99% CI = __.121mm) or .0052%, the overall mean intratrial SD (or noise) was .030mm (99% CI = +.077mm) or .0033%. For both variables, two-way repeated measures ANOVA re- vealed no interactions between zone and direction, and there- fore, the information was pooled per zone and per direction. There was an effect for zone (F[2,18] = 4.53; p = .026) and direction (F[2,18] = 11.35; p = .0006) on the mean intertrial SD, and a similar effect on the intratrial SD (zone, F[2,18] = 21.11, p = .0001; and direction, F[2,18] = 34.46, p = .0001). Post-hoc contrasts showed that the intertrial SD was significantly greater for zone 3 (.056ram) than for zones 1 and 2 (respectively, .043mm, F[1, 9] = 12.02, p = .007; and .044mm, F[ 1,9] = 9.18, p = .014), but significantly smaller for direction Z (.030mm) than for direction X and O (respectively, .046mm, F[1,9] = 28.5, p = .0005; and .066ram, F[1,9] = 18.30, p = .002). The intratrial SD was also greater for zone 3 (.034ram) than for zone 1 and 2 (respectively, .027ram,
0.25
,~ ~ ~ x N 0 . -
0.20
0.15
0.10
0.05
E 0,00
-0.05
-0.10
-0.15
-0.20
I i i
-0,25
B Mean absolute error - inter-trial 99% CI
o Mean error + Intra-trial 99% CI
Fig. 5. Mean error scores and mean variability per level of zone and direction (Dir), and overall values. The columns represent the mean absolute error, the error bars represent the 99% intertrial and intratrial confidence interval (CI} about the mean error. The mean values for each level are based on 270 trials (3 conditions x 9 trials x 10 tests).
F[1,9] = 34.82, p = .0002; and .029ram, F[1,9] = 25.1, p = .0007), but significantly smaller for direction Z (.022mm) than for direction X and O (respectively, .033mm, F[1,9] = 47.44, p = .0001; and .035ram, F[1,9] = 56.28, p = .0001).
The ICCs for precision were also pooled per level of zone and direction, because a three-way ANOVA with 3 repeated factors (zone × direction X trial) revealed no interactions be- tween zone and direction. All ICCs were greater than .99999 (table 4). The mean intertrial and intratrial SDs per reference displacement are presented in figure 6. Both intertrial and intratrial SDs were very consistent over the individual tests, ranging respectively from .038mm to .065mm and from .025mm to .035ram. There were no correlations between the magnitude of the reference displacement and the intertrial and intratrial SDs.
DISCUSSION
From the trials without reference displacement, we con- cluded that changes in distance between two markers were measured with a higher accuracy than displacements of single markers in space, but with the same level of precision. The absolute error for measuring displacement of markers A, B, and C was more than twice as much as for measuring changes in distance between AB and AC. This phenomenon may be related to possible fluctuations in the video recording or play back components, or in the digitizing system. The minuscule displace- ments that were measured for all three markers, although not actually moving, often showed the same pattern in time, as was observed in the graphics showing position in function of time. Fluctuation of one marker resulted in measured error for that
Table 4: Intraclass Correlation Coefficients (ICC) for Accuracy and Precision Per Level of Zone and Direction
ICC[2J]
Accuracy* Precision t
Zone 1 .9999932 .9999985 Zone 2 .9999946 .9999987 Zone 3 .9999972 .9999981
Direction X .9999936 .9999989 Direction Z .9999975 .9999993 Direction O .9999982 .9999968
* Measured - reference. t Nine repeated trials.
Arch Phys Med Rehabil Vol 80, September 1999

1 0 8 8 ACCURACY OF 3D MOTION ANALYSIS, Everaert
0.25
E E E E o o
°" I 0.15 . "r
0.10 ~< .~! ~ -
o.oo
-o.o, I } I. 1 " -0.1o
-0.15
-0.20
-0.25
D Mean absolute error - Inter-trial 99% CI
o Mean error + Intra-trial 99% CI
Fig. 6. Mean error scores and mean variability for each reference displacement. The columns represent the mean absolute error, the error bars represent the 99% intertrial and intratrial confidence interval (CI) about the mean error. The mean values for each test are based on 81 trials (3 zones x 3 directions x 9 trials).
marker, but if two markers fluctuated in the same direction and the same sense, then the change in distance between those two markers was smaller than the displacement of each marker separately. Therefore, applications of 3D motion analysis in rehabilitation research might achieve higher levels of accuracy when measuring changes in relationships between markers (distances and angles), than when measuring absolute marker displacements in space.
The mean error for the measured change in distance was consistently positive for all zones and all directions. Only the mean for one test (60mm-ac) was slightly negative ( - .009mm, fig 6). The mean error, also called constant error or systematic error, represents the average magnitude of the error and indicates the direction of the error. 7J7 The positive error scores show that the system under investigation overestimated all changes in distances with an average of .034mm. The mean error, however, does not consider the amount of variability or inconsistency in the repeated measurements37 When the mean error tends towards zero, positive and negative error values will compensate for each other and mask the error of individual measurements. Therefore, the mean absolute error, eliminating the sign of the error, is a better indicator of the overall accuracy, and represents the magnitude by which the system measure- ments are "off . ''17
The mean absolute error was similar for the three zones within the calibration frame, but was affected by direction. Absolute error was smaller for measurements in direction Z, than in direction X and O. An explanation for this observation may be found in the relative dimensions of the calibration frame and the orientation of the cameras. Camera 2 was mainly oriented towards the YZ plane of the calibration frame, and therefore was most sensitive for displacements in the Z direction (fig 1). Camera 4 was mainly facing the YX plane and therefore was mainly sensitive for displacements in the X direction. Because the depth (Z) of the frame was smaller than the length (X), the field of view for camera 2 was smaller than for camera 4. Therefore, the resolution of camera 2 was higher than that of camera 4, meaning that camera 2 was capable of discriminating smaller units. The fact that camera 2 was mainly contributing to reconstruction of displacements in the Z direc-
tion, could therefore explain the higher accuracy for measure- ments in the Z direction.
The system precision is related to the inconsistency or variability among repeated measurements of the same stimulus. Variability was measured at two levels in this study: the variability among 9 trial means, and the variability among 50 consecutive frames within 1 trial (noise). The ICCs, all above .99999, indicated that the mean calculated changes in distances were extremely consistent from trial to trial. The SDs of the repeated measurements and the corresponding CIs, were consid- ered as more meaningful measures of precision because they are expressed in the same unit as the measurements. The observation that the mean intertrial and intratrial SDs were significantly smaller for direction Z than for direction X and O may also be related to the higher resolution of camera 2, as explained for the error and absolute error. Although there was no effect of zone on the accuracy scores, precision was lower in zone 3 than in zones 1 and 2. This observation could also be related to resolution. The distance to camera 2 and 4 was increasing from zone 1 to zone 3 (figs 1 and 3). Because camera resolution is greater for objects closer to the camera, the resolution was lower for two cameras while recording in zone 3.
The intertrial and intratrial SDs were used to calculate the 99% CI (_+2.58 × SD). The CI may be interpreted as a zone of variability, delineated by the upper and lower limits, and spread around the mean value. Repeated measurements of the same phenomenon will fluctuate, but will fall within this zone with 99% certainty. In order to make judgments about differences between two consecutive measurements in the same series, the smallest detectable difference (SDD) at the .01 level may be calculated as 2.58 × , ~ × SD, where SD represents the standard deviation of the repeated measurements.~a,19 Measured changes that are smaller than the SDD may be attributed to true changes or to measurement error. Changes from trial mean to trial mean that are greater than the intertrial SDD may be attributed to true displacements with 99% certainty. Accord- ingly, frame to frame changes greater than the intratrial SDD may be attributed to true displacements. Therefore, the SDD may be interpreted as the overall resolution of the 3D motion analysis system.
The smallest detectable change in trial to trial mean was .171mm, ranging from . l l 0 m m for direction Z to .241mm for direction O. Accordingly, the smallest detectable frame to frame change was . 109mm overall, ranging from .08 l mm for direc- tion Z, to . 129ram for direction O. These values are consistent with figure 4, which shows that all 9 cycles of 1-mm displace- ment were clearly delineated and that even smaller displace- ments could be discriminated from noise. An overall resolution of .11 to .17mm might be sufficient to measure for example accessory motion in joints and joint instability.
The accuracy and precision for measurements of linear change in distance obtained with our system setup were strongly different from the performance of video motion analysis systems as reported in previous studies. In table 1, the smallest value reported for absolute error is .48mm, and for intertrial SD, .53mm. s The corresponding overall values for our study were .094ram and .047ram.
The differences between our system configuration and those of other studies may explain the difference in performance. We used four cameras to cover a small measurement volume, while most studies 4,5,v,8 used only two cameras and measured much larger volumes (table 1). Further, three authors reported perfor- mance for dynamic linear measurements, while we calculated error and precision during static trials. A major factor contribut- ing to the high levels of accuracy and precision obtained in our
Arch Phys Med Rehabii Vol 80, September 1999

ACCURACY OF 3D MOTION ANALYSIS, Everaert 1089
study was the use of a moving average for raw data smoothing. A moving average may be used to smooth the reconstructed trajectory of slow movements, but will cause distortions when applied to motions with fast changes in direction. We chose to perform this accuracy study, following the same data process- ing methods that were used in an ongoing clinical research application, involving slow displacements of soft tissue. There- fore, the use of a moving average was justified.
CONCLUSION
The system used in this study, specifically configured for measuring slow motions within a small measurement volume, and data processing based on average values, resulted in levels of accuracy and precision 5 to 30 times higher than the values typically reported for motion analysis systems used for gait analysis. These levels of accuracy and precision may provide opportunities for new applications of video motion analysis in rehabilitation research projects, concentrating on minuscule displacements in a small measurement volume.
The proportions of the calibration frame, and its orientation relative to the observed movements, as well as the orientations of the cameras, may have an impact on the overall system performance. Therefore, optimum levels of accuracy and preci- sion are only achieved by careful adaptation of the system set-up to the specific phenomenon to be analyzed.
Acknowledgments: The authors thank Filip Staes and Michel Coppieters for their critical inputs regarding method and statistics.
References 1. Scholz JR Reliability and validity of the WATSMART three-
dimensional optoelectric motion analysis system. Phys Ther 1989;69:679-89.
2. Scholz JP, Milford JR Accuracy and precision of the PEAK performance technologies motion measurement system. J Motor Behav 1993;25:2-7.
3. Wilson DJ, Smith BK, Gibson JK. Accuracy of reconstructed angular estimates obtained with the Ariel performance analysis system. Phys Ther 1997;77:1741-6.
4. Vander Linden DW, Carlson S J, Hubbard RL. Reproducibility and accuracy of angle measurements obtained under static conditions with the Motion Analysis video system. Phys Ther 1992;72:300-5.
5. Klein PJ, DeHaven JJ. Accuracy of three-dimensional linear and angular estimates obtained with the Ariel performance analysis system. Arch Phys Med Rehabil 1995;76:183-9.
6. Ehara Y, Fujimoto H, Miyazaka S, Tanaka S, Yamamoto S. Comparison of the performance of 3D camera systems. Gait Posture 1995;3:166-9.
7. Haggard P, Wing AM. Assessing and reporting the accuracy of position measurements made with the optical tracking systems. J Motor Behav 1990;22:315-21.
8. Thornton MJ, Morrissey MC, Coutts FJ. Sonae effects of camera placement on the accuracy of the Kinemetrix three-dimensional motion analysis system. Clin Biomech 1998; 13:452-4.
9. Chen L, Armstrong CW, Raftopoulos DD. An investigation on the accuracy of three-dimensional space reconstruction using the direct linear transformation technique. J Biomech 1994;27:493- 500.
10. Shapiro R. Direct linear transformation method for three- dimensional cinematography. Res Q 1978;49:197-205.
11. Rothstein JM, Echternach JL. Primer on measurement: An intToduc- tory guide to measurement issues. Alexandria (VA): American Physical Therapy Association; 1993.
12. He J, Tian C. A statistical smoothness measure to eliminate outliers in motion trajectory tracking. Hum Mov Sci 1998; 17:189-200.
13. FurnOe H. Real-time motion capture systems. In: Allard R Cappozzo A, Lundberg A, Vaughan CL, editors. Three-dimen- sional analysis of human locomotion. Chichester: John Wiley & Sons; 1997. p. 85-108.
14. Shrout PE, Fleiss JL. Intraclass COlTelations: uses in assessing rater reliability. Psychol Bull 1979;86:420-8.
15. Shott S. Statistics for health professionals. Philadelphia: WB Saunders; 1990.
16. Hatcher L, Stepanski EJ. A step-by-step approach to using the SAS system for univariate and multivariate statistics. Cary (NC): SAS Institute Inc.; 1996.
17. Schmidt RA. Motor control and learning, a behavioral emphasis. Champaign (IL): Human Kinetics Publishers, Inc.; 1988.
18. Roebroeck ME, Harlaar J, Lankhorst GJ. The application of generalizability theory to reliability assessment: an illustration using isometric force measurements. Phys Ther 1993;73:386-95; discussion 396-401.
19. McNemar C. Psychological statistics. New York: John Wiley and Sons, Inc.; 1969.
Suppliers a. Hi8 Camcorder model CCD-V800E, Hi8 Videorecorder model
EV-C2000; Sony Belgium, Sint Stevens Woluwestraat 55, 1130 Brussels, Belgium.
b. ITEM; PEC Engineering Systems, Technologielaan 12, 3001 Leu- yen, Belgium.
c. 3M Scotchlite 8850 Silver; 3M Belgium, Hermeslaan 7, 1831 Diegem, Belgium.
d. Kinemetrix 3D; Orthodata Gmbh, Heidestrasse 60, 5840 Schwerte, Germany.
e. Microsoft Excel; Microsoft Corporation, One Microsoft Way, Redmond, WA 98052.
f. Statistical Analysis Systems, SAS Institute, Hertenbergstraat 6, 3080 Tervuren, Belgium.
Arch Phys Med Rehabil Vol 80, September 1999


