Embed Size (px)
Citation preview
MEASURING THEECONOMIC COSTS OFCONFLICT
Sungsup Ra and Bipul Singh
Working PaperSeries No. 2Nepal Resident MissionJune 2005
Sungsup Ra is Head, Macroeconomic, Finance, Governance, Regional and External Relationsand Senior Country Programs Specialist in the NRM; Bipul Singh is an Economics Officer in theNRM.
NRM Working Paper No. 2
MEASURING THE ECONOMIC COSTS OF CONFLICTTHE EFFECT OF DECLINING DEVELOPMENT EXPENDITURES ON
NEPAL’S ECONOMIC GROWTH
Sungsup Ra and Bipul Singh
June 2005
Opinions and materials in this publication do not necessarily reflect the official views of ADB.
In this publication, $ refers to US dollars.
Papers published under this series could be published as articles in professional journals orchapters in books.
© Asian Development Bank, June 2005
ii
PREFACE
Conflict has increasingly affected Nepal’s economic performance since 2001. Economicgrowth slowed to an average of 1.9% over the fiscal year (FY) 2002–FY2004 period compared to4.9% in the decade preceding that. More than 12,000 people have been killed, physical infrastructurehas been destroyed, thousands of people have been displaced, economic disruptions haveincreased, and development expenditures have declined sharply.
The study was undertaken by the Asian Development Bank’s Nepal Resident Mission (NRM)to measure the economic costs of the conflict, and the effect of declining development expenditureson Nepal’s economic development. This paper uses the Nepal Macroeconometric Model to measureit. The paper tries to establish the relationship between development expenditures and economicgrowth and contribute to improving the understanding of the costs of conflict in Nepal.
The paper Measuring the Economic Costs of Conflict: the Effect of Declining DevelopmentExpenditures on Nepal’s Economic Growth was prepared by Sungsup Ra, Head, Macroeconomics,Finance, Governance, Regional and External Relations, and Senior Country Programs Specialist,NRM, and Bipul Singh, Economics Officer, NRM. The editorial assistance of Arun S. Rana isappreciated, and thanks are due to Kavita Sherchan, External Relations and Civil Society LiaisonOfficer, NRM for finalizing the report.
iii
Sultan Hafeez RahmanCountry DirectorAsian Development BankNepal Resident Mission
ABBREVIATIONS
ADB Asian Development BankCPNM Communist Party of Nepal (Maoist)FY fiscal yearGDP gross domestic productNMM Nepal Macroeconometric ModelNRM Nepal Resident Mission
iv
CONTENTS
PREFACE iii
ABBREVIATIONS iv
ABSTRACT vii
I. INTRODUCTION 1
II. CONFLICT AND DEVELOPMENT: LITERATURE REVIEW 2
III. SIMULATIONS 3A. Scenarios 4B. Results 4
IV. CONCLUSION 5
REFERENCES 7
APPENDIX: THE NEPAL MACROECONOMETRIC MODEL 8
ABSTRACT
This paper attempts to measure the economic costs of conflict, focusing particularly onthe impact of continued decline in development expenditures on gross domestic product (GDP)growth. The Nepal Macroeconometric Model is used to estimate GDP growth under different conflictand no-conflict scenarios of development expenditures. Scenario analysis indicates that ifdevelopment expenditures decline at the current rate (4.2%), the total GDP growth loss is 8.3% forthe period between the fiscal years 2005 and 2009, an average loss of 1.7% of growth per annum.If the conflict intensifies and development expenditures decline at twice the current rate (8.4%),total GDP growth lost is 10.3%, an average loss of 2.1% of growth per annum.
vii
I. INTRODUCTION
The Maoist insurgency in Nepal dates back to February 1996 when the “people’s war” wasfirst launched in the hills of mid-western Nepal by the underground CommunistParty of Nepal–Maoist (CPNM), which rejects the fundamental premises of Nepal’s
constitutional monarchy and parliamentary system. The insurgency sharply escalated in 2001 andhas adversely affected economic performance since then. Economic growth slowed to an averageof 1.9% over the fiscal year (FY) 2002–FY2004 period compared to 4.9% in the decade precedingthat.
Economic performance has been affected through different channels. More than 12,000lives have been lost and physical infrastructures worth at least $250 million have been destroyed.1
Conflict related disruptions, such as strikes, security checks, blockades, shutdowns, and extortionhave increased the costs of economic activity and contributed to an economic slowdown. Theconflict has caused internal and external displacement of people. Nearly 400,000 rural familieshave been internally displaced while thousands of others have crossed over to India in search ofwork.2 The private investment rate3 has declined from 15.4% in 1996 to 12.6% in 2004, as privateinvestors have desisted from making investments and foreign investors have stayed away.
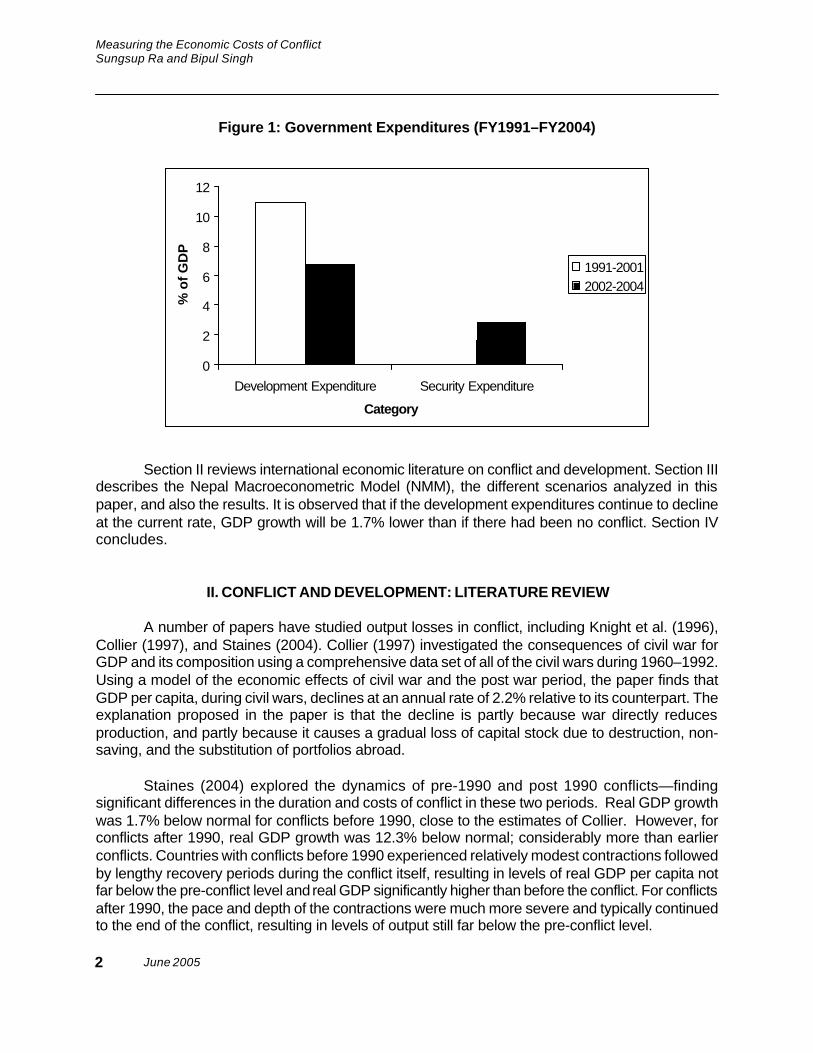
The economy has also suffered from a decline in development expenditures, which havefallen by a third since 2001. Development expenditure exceeded regular expenditure for the firsttime in the country’s history in FY2002.4 Thereafter, development expenditure declined at a rate of4.2% during FY2002–FY2004 compared with a growth of 10.4% during the period between 1991and 2001. Government development expenditures stood at about 6% of the gross domestic product(GDP) in FY2004, down from 9% of the GDP in FY2001 (Figure 1). In contrast, governmentsecurity expenditures almost doubled from 1.6% to 3% of the GDP in the same period.
This paper attempts to measure the economic costs of the conflict, focusing particularlyon the impact of continued decline in development expenditures on GDP growth. Developmentexpenditure is one of the variables under the government’s control and, therefore, most likely tobe cut as implementation challenges mount and security expenditures rise. GDP growth estimatesfor different conflict and no-conflict scenarios are compared to forecast the GDP growth lossresulting from the decline in development expenditure during the conflict. The paper will also helpestablish the relationship between development expenditures and economic growth.
1 Mahat, P. 2003. The Conflict Assessment and Implication for ADB Development Assistance in Nepal.Submitted to ADB, December 2003. Kathmandu.
2 The net effect of migration from villages to urban areas and neighboring countries on income and povertymay have been positive. The results of the National Living Standard Survey II suggests that remittances frommigrants contributed to increasing rural incomes.
3 Gross Fixed Capital Formation as a percentage of gross domestic product.4 The Government has reclassified its reporting format to capital and recurrent expenditure since fiscal year
2004. However, data in regular and development expenditure classification is also available.
June 2005
Measuring the Economic Costs of ConflictSungsup Ra and Bipul Singh
Section II reviews international economic literature on conflict and development. Section IIIdescribes the Nepal Macroeconometric Model (NMM), the different scenarios analyzed in thispaper, and also the results. It is observed that if the development expenditures continue to declineat the current rate, GDP growth will be 1.7% lower than if there had been no conflict. Section IVconcludes.
II. CONFLICT AND DEVELOPMENT: LITERATURE REVIEW
A number of papers have studied output losses in conflict, including Knight et al. (1996),Collier (1997), and Staines (2004). Collier (1997) investigated the consequences of civil war forGDP and its composition using a comprehensive data set of all of the civil wars during 1960–1992.Using a model of the economic effects of civil war and the post war period, the paper finds thatGDP per capita, during civil wars, declines at an annual rate of 2.2% relative to its counterpart. Theexplanation proposed in the paper is that the decline is partly because war directly reducesproduction, and partly because it causes a gradual loss of capital stock due to destruction, non-saving, and the substitution of portfolios abroad.
Staines (2004) explored the dynamics of pre-1990 and post 1990 conflicts—findingsignificant differences in the duration and costs of conflict in these two periods. Real GDP growthwas 1.7% below normal for conflicts before 1990, close to the estimates of Collier. However, forconflicts after 1990, real GDP growth was 12.3% below normal; considerably more than earlierconflicts. Countries with conflicts before 1990 experienced relatively modest contractions followedby lengthy recovery periods during the conflict itself, resulting in levels of real GDP per capita notfar below the pre-conflict level and real GDP significantly higher than before the conflict. For conflictsafter 1990, the pace and depth of the contractions were much more severe and typically continuedto the end of the conflict, resulting in levels of output still far below the pre-conflict level.
Figure 1: Government Expenditures (FY1991–FY2004)
0
2
4
6
8
10
12
Development Expenditure Security Expenditure
Category
% o
f GD
P
1991-20012002-2004
2
NRM Working Paper Series No.2
Section IIISimulations
Knight et al. (1996) investigated the effects of war and quantified a peace dividend using a79 country data set. The study indicates that warfare has strong negative effect on investment.This is consistent with the underlying presumption of the present paper, namely that civil warsreduce growth mainly by depleting the domestic capital stock in its various forms. Indeed, whenKnight et al control for physical and human capital, together with military spending and tradepolicy, they fail to find a significant effect of war in their growth regression.
Although no previous study has quantified the growth effects of a decline in developmentspending, some studies have roughly estimated the overall costs of the current conflict in Nepal.A Department for International Development study put the costs of conflict at 8–10% of the GDP. Astudy by National Peace Campaign (2004) put the cost of conflict at $66.2 billion for the 1996–2003period. However, no studies have, so far, attempted to disaggregate the impact of decline indevelopment spending on economic growth.
This paper attempts to provide more depth to existing analyses on the costs of conflict inNepal. It fills the gap in the existing conflict related literature on Nepal in at least three ways. Theexisting estimates of the economic costs of the conflict are not based on macroeconometricanalysis and are, therefore, mainly rough estimates. The paper uses a 37-equation Keynesianincome-expenditure model to bring rigor to estimates of costs of Nepal’s conflict. A secondshortcoming in the existing literature is tendency to lump together the different costs of conflict.This paper takes a first step towards disaggregating the costs by estimating the economic costsof decline in development expenditures. Finally, in contrast to existing literature, this paper isforward looking and attempts to forecast the costs of continued conflict over the FY2005–FY2009period.
III. SIMULATIONS
The NMM, a medium-sized annual Keynesian model, is simulated to carry out the scenarioanalysis.5 There are 20 behavioral equations, and 17 identities in the NMM. Of the 59 variables inthe system, 37 are endogenous and 22 exogenous. There are five building blocks in the NMM: finaldemand, prices, credit and money, government, and the balance of payments blocks. Final demandis the sum of private consumption, government consumption, private fixed investment, governmentfixed investment, increase in stock or inventory, and net exports. In NMM, development expenditureis a determinant in the private fixed investment, public fixed investment, and public consumptionequations.
A shock, such as a decline in development expenditure, affects the economy through thepropagation mechanism across the 5 building blocks. Adjusting to the shock, all the variables gothrough a dynamic process until the economy finds a new equilibrium with values for eachendogenous variable.6 Baseline estimates of the NMM show that 1% increase in development
5 Ra, S. and C.Y. Rhee. 2005. Nepal Macroeconometric Model. NRM Working Paper Series No.1 .Kathmandu: ADB. June 2005.
6 The model is seen to be able to track the historical development of the Nepalese economy reasonably well.The root mean square percentage error is less than 10% for most variables and, most importantly, theperformance of forecasting gross domestic product is excellent: root mean square percentage error is only 3.9.
3
June 2005
Measuring the Economic Costs of ConflictSungsup Ra and Bipul Singh
expenditure results in 1.57% increase in private fixed investment, 0.65% increase in public fixedinvestment, and 0.18% increase in public consumption. Development expenditure has a laggedand highly sensitive relation with private fixed investment. This could be because private investorsextract information about future business conditions from government development expenditure,or because government investment may have multiplier effects on the private sector. The correlationof development expenditure is stronger with public fixed investment than public consumption.
A. Scenarios
The following three scenarios are analyzed using the NMM:
(i) No-Conflict: Development expenditure grows at the historical (FY1991–FY2001)growth level of 10.4% for 5 years.
(ii) Conflict: In this scenario, development expenditure is projected to decline by4.2% for 5 years. This is the conflict level of growth as recorded during theFY2002–FY2004 period.
(iii) High Conflict: In this scenario, development expenditure is projected to declineby 8.4% for 5 years. This growth rate is twice the current rate of decline ofdevelopment expenditures to reflect further intensification of the conflict.
GDP growth estimates under the no-conflict scenario are compared with estimates underconflict scenarios. The economic cost is measured as the economic growth lost in the conflictscenarios in comparison to the no-conflict scenario.
B. Results
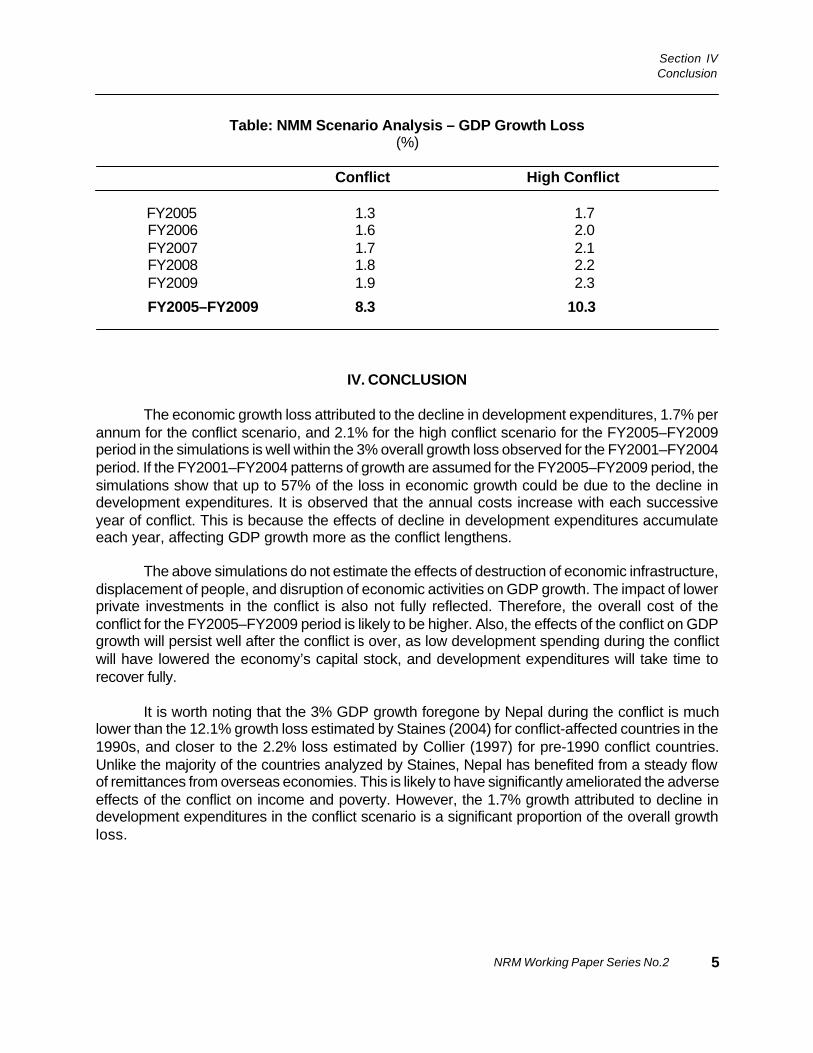
Government consumption, government investment, and private investment are explainedby development expenditure. Development expenditure is also a key component of governmentexpenditure identity in the government block. A decline in development expenditure reducesgovernment consumption, government investment, and private investment, thereby lowering GDPgrowth. This is consistent with the theoretical models of Solow (1992) and Barro (1991). If theconflict continues for the next five years and development spending declines at the current rate,the total GDP growth loss due to the decline in development spending is 8.3% for the FY2005–FY2009 period—an average loss of 1.7% of growth per annum (See table on next page). If theconflict intensifies and development expenditures decline at twice the current rate, total GDPgrowth loss is 10.3%—an average loss of 2.1% of growth per annum.
4
NRM Working Paper Series No.2
Section IVConclusion
Table: NMM Scenario Analysis – GDP Growth Loss(%)
Conflict High Conflict
FY2005 1.3 1.7 FY2006 1.6 2.0 FY2007 1.7 2.1 FY2008 1.8 2.2 FY2009 1.9 2.3
FY2005–FY2009 8.3 10.3
IV. CONCLUSION
The economic growth loss attributed to the decline in development expenditures, 1.7% perannum for the conflict scenario, and 2.1% for the high conflict scenario for the FY2005–FY2009period in the simulations is well within the 3% overall growth loss observed for the FY2001–FY2004period. If the FY2001–FY2004 patterns of growth are assumed for the FY2005–FY2009 period, thesimulations show that up to 57% of the loss in economic growth could be due to the decline indevelopment expenditures. It is observed that the annual costs increase with each successiveyear of conflict. This is because the effects of decline in development expenditures accumulateeach year, affecting GDP growth more as the conflict lengthens.
The above simulations do not estimate the effects of destruction of economic infrastructure,displacement of people, and disruption of economic activities on GDP growth. The impact of lowerprivate investments in the conflict is also not fully reflected. Therefore, the overall cost of theconflict for the FY2005–FY2009 period is likely to be higher. Also, the effects of the conflict on GDPgrowth will persist well after the conflict is over, as low development spending during the conflictwill have lowered the economy’s capital stock, and development expenditures will take time torecover fully.
It is worth noting that the 3% GDP growth foregone by Nepal during the conflict is muchlower than the 12.1% growth loss estimated by Staines (2004) for conflict-affected countries in the1990s, and closer to the 2.2% loss estimated by Collier (1997) for pre-1990 conflict countries.Unlike the majority of the countries analyzed by Staines, Nepal has benefited from a steady flowof remittances from overseas economies. This is likely to have significantly ameliorated the adverseeffects of the conflict on income and poverty. However, the 1.7% growth attributed to decline indevelopment expenditures in the conflict scenario is a significant proportion of the overall growthloss.
5
June 2005
Measuring the Economic Costs of ConflictSungsup Ra and Bipul Singh
The poverty implications of the above results are significant. At the conflict rate of decline indevelopment expenditures, GDP per capita is forecast to be 7.8% lower over the FY2005–FY2009period in the conflict scenario than the no-conflict scenario. This implies a poverty rate 4.8% higherthan the no-conflict scenario.7 The decline in development expenditures is of special concern forpoverty reduction because it reduces the future productive capacity of the economy and has long-term consequences for the country. Low expenditure in areas such as education, health, andinfrastructure suppresses private sector investment in the country, with adverse impact on incomesand the poverty situation in the country. Urgent efforts are, therefore, required to reverse the declineof development expenditures and limit the adverse effects of the conflict on the economy.
7 Nepal’s total elasticity of poverty reduction with respect to growth has been negative 0.6%, i.e. every percentin growth of per capita expenditure resulted in 0.6% reduction in the number of poor.
6
NRM Working Paper Series No.2
Reference
REFERENCES
Barro, R. J. 1991. Economic Growth in a Cross Section of Countries. Quarterly Journal ofEconomics 106 (2): 407–443.
Collier, P. 1994. Demobilization and Insecurity: a Study in the Economics of the Transition fromWar to Peace. Journal of International Development 6 (3): 343–351.
——— .1997. On Economic Consequences of Civil War. Centre for the Study of AfricanEconomies Working Paper No.97:18. Oxford University.
Center for Economic Analysis. 2003. Economic Aspects of the Insurgency in Nepal.
Knight M., N. Loayza, and D. Villanueva. 1996. The Peace Dividend: Military Spending Cuts andEconomic Growth. IMF Staff Papers 43: 1–37.
Mahat, P. 2003. The Conflict Assessment and Implications for ADB Development Assistance inNepal. Submitted to ADB, December 2003. Kathmandu.
Mankiw, N., D. R. Gregory, and D. N. Weil. 1992. A Contribution to the Empirics of EconomicGrowth. Quarterly Journal of Economics 107 (May): 407–437.
Mohammed, N. 2003. Civil Wars and Military Expenditures: A Note. Washington DC: WorldBank.
Ra, S. and C.Y. Rhee. 2005. Nepal Macroeconometric Model. NRM Working Paper Series No.1.Kathmandu: ADB.
Solow, R. M.1956. A Contribution to the Theory of Economic Growth. Quarterly Journal ofEconomics 70: 65–94.
Staines, N. 2004. Economic Performance over the Conflict Cycle. IMF Working PaperWP/04/95.
7
June 2005
Appendix
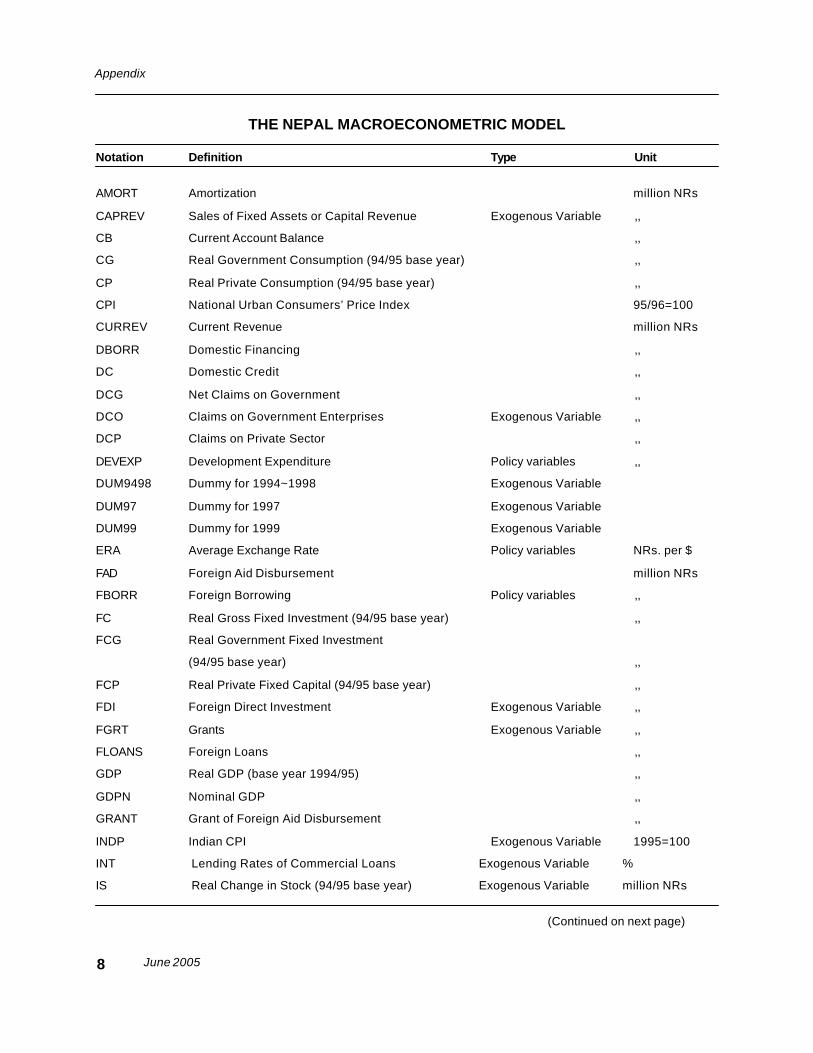
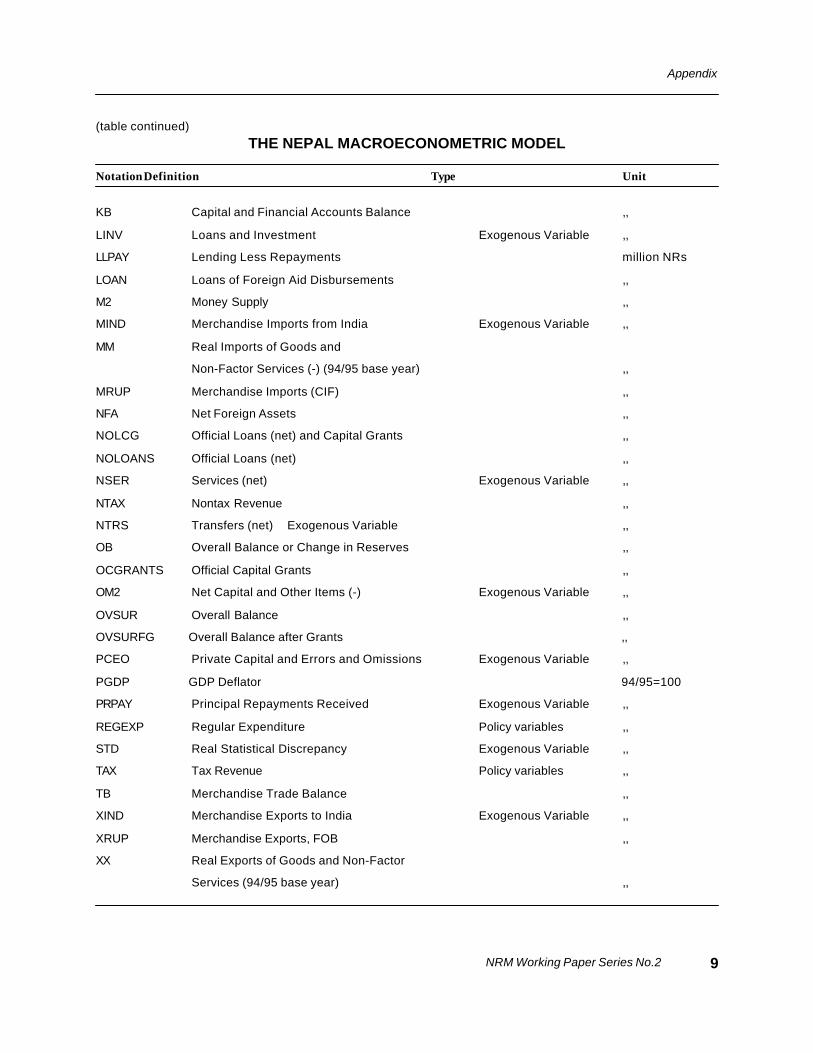
THE NEPAL MACROECONOMETRIC MODEL
Notation Definition Type Unit
AMORT Amortization million NRs
CAPREV Sales of Fixed Assets or Capital Revenue Exogenous Variable ,,
CB Current Account Balance ,,
CG Real Government Consumption (94/95 base year) ,,
CP Real Private Consumption (94/95 base year) ,,
CPI National Urban Consumers’ Price Index 95/96=100
CURREV Current Revenue million NRs
DBORR Domestic Financing ,,
DC Domestic Credit ,,
DCG Net Claims on Government ,,
DCO Claims on Government Enterprises Exogenous Variable ,,
DCP Claims on Private Sector ,,
DEVEXP Development Expenditure Policy variables ,,
DUM9498 Dummy for 1994~1998 Exogenous Variable
DUM97 Dummy for 1997 Exogenous Variable
DUM99 Dummy for 1999 Exogenous Variable
ERA Average Exchange Rate Policy variables NRs. per $
FAD Foreign Aid Disbursement million NRs
FBORR Foreign Borrowing Policy variables ,,
FC Real Gross Fixed Investment (94/95 base year) ,,
FCG Real Government Fixed Investment
(94/95 base year) ,,
FCP Real Private Fixed Capital (94/95 base year) ,,
FDI Foreign Direct Investment Exogenous Variable ,,
FGRT Grants Exogenous Variable ,,
FLOANS Foreign Loans ,,
GDP Real GDP (base year 1994/95) ,,
GDPN Nominal GDP ,,
GRANT Grant of Foreign Aid Disbursement ,,
INDP Indian CPI Exogenous Variable 1995=100
INT Lending Rates of Commercial Loans Exogenous Variable %
IS Real Change in Stock (94/95 base year) Exogenous Variable million NRs
8
(Continued on next page)
NRM Working Paper Series No.2
Appendix
(table continued)THE NEPAL MACROECONOMETRIC MODEL
NotationDefinition Type Unit
KB Capital and Financial Accounts Balance ,,
LINV Loans and Investment Exogenous Variable ,,
LLPAY Lending Less Repayments million NRs
LOAN Loans of Foreign Aid Disbursements ,,
M2 Money Supply ,,
MIND Merchandise Imports from India Exogenous Variable ,,
MM Real Imports of Goods and
Non-Factor Services (-) (94/95 base year) ,,
MRUP Merchandise Imports (CIF) ,,
NFA Net Foreign Assets ,,
NOLCG Official Loans (net) and Capital Grants ,,
NOLOANS Official Loans (net) ,,
NSER Services (net) Exogenous Variable ,,
NTAX Nontax Revenue ,,
NTRS Transfers (net) Exogenous Variable ,,
OB Overall Balance or Change in Reserves ,,
OCGRANTS Official Capital Grants ,,
OM2 Net Capital and Other Items (-) Exogenous Variable ,,
OVSUR Overall Balance ,,
OVSURFG Overall Balance after Grants ,,
PCEO Private Capital and Errors and Omissions Exogenous Variable ,,
PGDP GDP Deflator 94/95=100
PRPAY Principal Repayments Received Exogenous Variable ,,
REGEXP Regular Expenditure Policy variables ,,
STD Real Statistical Discrepancy Exogenous Variable ,,
TAX Tax Revenue Policy variables ,,
TB Merchandise Trade Balance ,,
XIND Merchandise Exports to India Exogenous Variable ,,
XRUP Merchandise Exports, FOB ,,
XX Real Exports of Goods and Non-Factor
Services (94/95 base year) ,,
9
June 2005
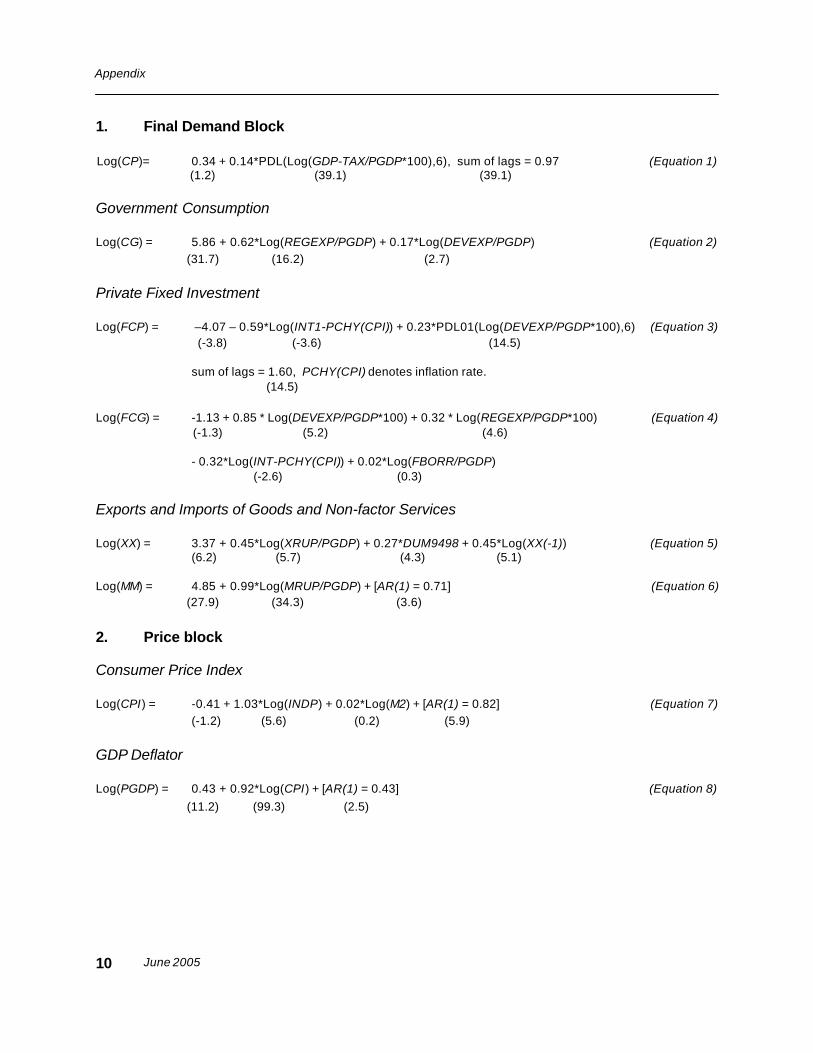
Appendix
1. Final Demand Block
Log(CP)= 0.34 + 0.14*PDL(Log(GDP-TAX/PGDP*100),6), sum of lags = 0.97 (Equation 1) (1.2) (39.1) (39.1)
Government Consumption
Log(CG) = 5.86 + 0.62*Log(REGEXP/PGDP) + 0.17*Log(DEVEXP/PGDP) (Equation 2) (31.7) (16.2) (2.7)
Private Fixed Investment
Log(FCP) = –4.07 – 0.59*Log(INT1-PCHY(CPI)) + 0.23*PDL01(Log(DEVEXP/PGDP*100),6) (Equation 3) (-3.8) (-3.6) (14.5)
sum of lags = 1.60, PCHY(CPI) denotes inflation rate. (14.5)
Log(FCG) = -1.13 + 0.85 * Log(DEVEXP/PGDP*100) + 0.32 * Log(REGEXP/PGDP*100) (Equation 4) (-1.3) (5.2) (4.6)
- 0.32*Log(INT-PCHY(CPI)) + 0.02*Log(FBORR/PGDP) (-2.6) (0.3)
Exports and Imports of Goods and Non-factor Services
Log(XX) = 3.37 + 0.45*Log(XRUP/PGDP) + 0.27*DUM9498 + 0.45*Log(XX(-1)) (Equation 5)(6.2) (5.7) (4.3) (5.1)
Log(MM) = 4.85 + 0.99*Log(MRUP/PGDP) + [AR(1) = 0.71] (Equation 6) (27.9) (34.3) (3.6)
2. Price block
Consumer Price Index
Log(CPI) = -0.41 + 1.03*Log(INDP) + 0.02*Log(M2) + [AR(1) = 0.82] (Equation 7)(-1.2) (5.6) (0.2) (5.9)
GDP Deflator
Log(PGDP) = 0.43 + 0.92*Log(CPI) + [AR(1) = 0.43] (Equation 8) (11.2) (99.3) (2.5)
10
NRM Working Paper Series No.2
Appendix
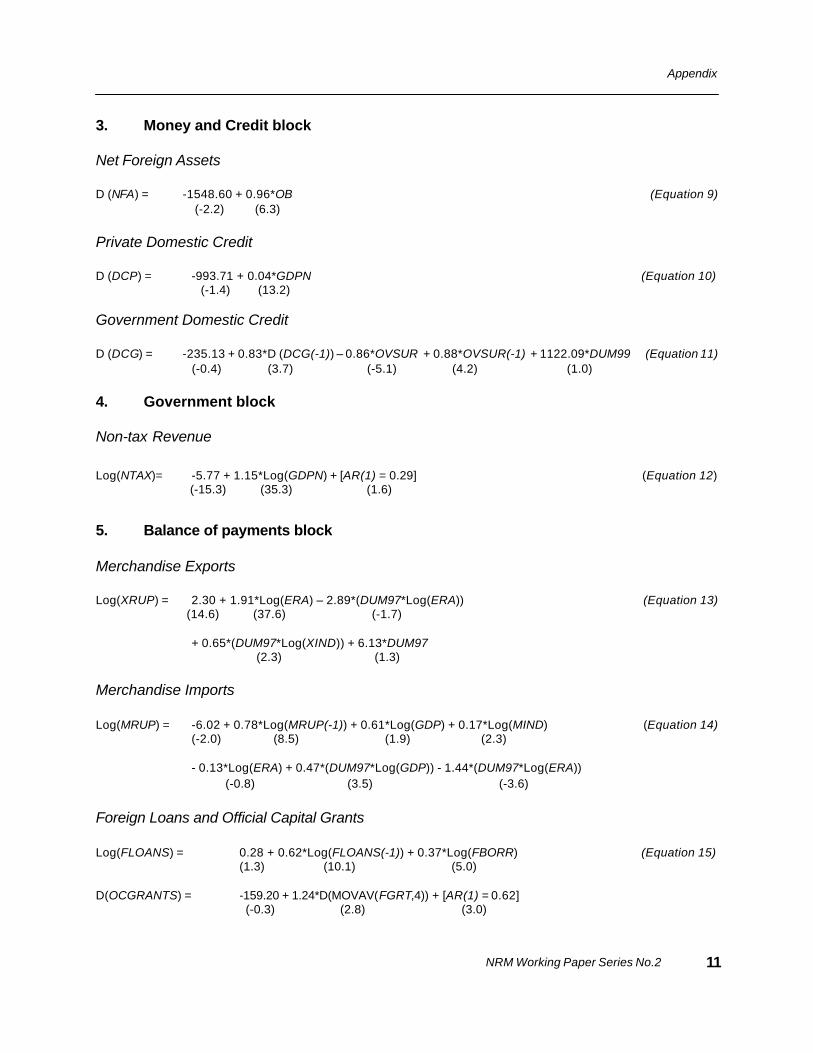
3. Money and Credit block
Net Foreign Assets
D (NFA) = -1548.60 + 0.96*OB (Equation 9) (-2.2) (6.3)
Private Domestic Credit
D (DCP) = -993.71 + 0.04*GDPN (Equation 10) (-1.4) (13.2)
Government Domestic Credit
D (DCG) = -235.13 + 0.83*D (DCG(-1)) – 0.86*OVSUR + 0.88*OVSUR(-1) + 1122.09*DUM99 (Equation 11) (-0.4) (3.7) (-5.1) (4.2) (1.0)
4. Government block
Non-tax Revenue
Log(NTAX)= -5.77 + 1.15*Log(GDPN) + [AR(1) = 0.29] (Equation 12) (-15.3) (35.3) (1.6)
5. Balance of payments block
Merchandise Exports
Log(XRUP) = 2.30 + 1.91*Log(ERA) – 2.89*(DUM97*Log(ERA)) (Equation 13) (14.6) (37.6) (-1.7)
+ 0.65*(DUM97*Log(XIND)) + 6.13*DUM97 (2.3) (1.3)
Merchandise Imports
Log(MRUP) = -6.02 + 0.78*Log(MRUP(-1)) + 0.61*Log(GDP) + 0.17*Log(MIND) (Equation 14)(-2.0) (8.5) (1.9) (2.3)
- 0.13*Log(ERA) + 0.47*(DUM97*Log(GDP)) - 1.44*(DUM97*Log(ERA)) (-0.8) (3.5) (-3.6)
Foreign Loans and Official Capital Grants
Log(FLOANS) = 0.28 + 0.62*Log(FLOANS(-1)) + 0.37*Log(FBORR) (Equation 15)(1.3) (10.1) (5.0)
D(OCGRANTS) = -159.20 + 1.24*D(MOVAV(FGRT,4)) + [AR(1) = 0.62] (-0.3) (2.8) (3.0)
11
June 2005
Appendix
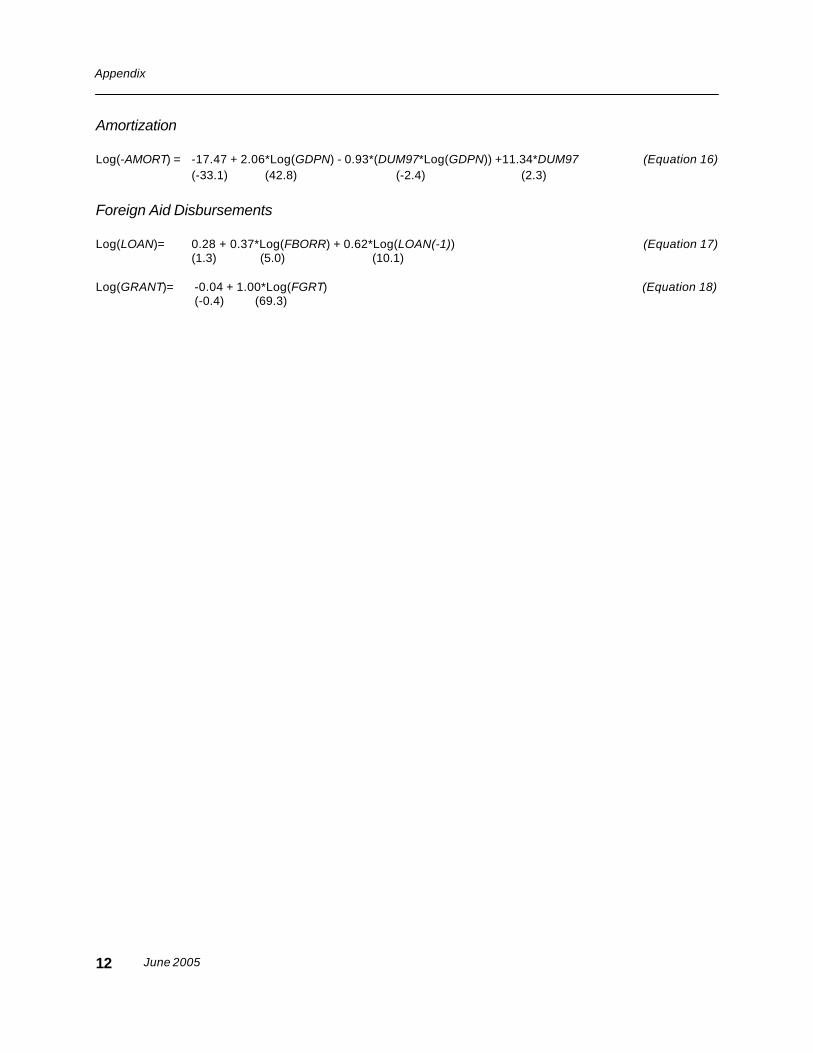
Amortization
Log(-AMORT) = -17.47 + 2.06*Log(GDPN) - 0.93*(DUM97*Log(GDPN)) +11.34*DUM97 (Equation 16)(-33.1) (42.8) (-2.4) (2.3)
Foreign Aid Disbursements
Log(LOAN)= 0.28 + 0.37*Log(FBORR) + 0.62*Log(LOAN(-1)) (Equation 17)(1.3) (5.0) (10.1)
Log(GRANT)= -0.04 + 1.00*Log(FGRT) (Equation 18) (-0.4) (69.3)
12
NRM WORKING PAPER SERIES
(Published in-house; Available through ADB/NRM and online at www. adb.org/nrm;Free of charge)
No. 1 Nepal Macroeconometric Model—Sungsup Ra and Chang Yong Rhee, June 2005
No. 2 Measuring the Economic Costs of Conflict: The Effect of Declining DevelopmentExpenditures on Nepal’s Economic Growth—Sungsup Ra and Bipul Singh, June 2005
No. 3 Nepal Regional Strategy for Development—Harka Gurung, forthcoming
No. 4 Ethnic and Caste Diversity: Implications for Development—Rajendra Pradhan and Ava Shrestha, forthcoming
Nepal Resident MissionSrikunj, Kamaladi, Ward No. 31Post Box 5017Kathmandu, NepalTel: +977 1 422 7779Fax: +977 1 422 [email protected]/nrm