Embed Size (px)
Citation preview
Superlattices and Microstructures 65 (2014) 248–255
Contents lists available at ScienceDirect
Superlattices and Microstructures
j o u r n a l h o m e p a g e : w w w . e l s e v i e r . co m / l o c a t e / s u p e r l a t t i c e s
Yellow emission of SiO2/Zn2SiO4:Mnnanocomposite synthesized by sol–gel method
0749-6036/$ - see front matter � 2013 Elsevier Ltd. All rights reserved.http://dx.doi.org/10.1016/j.spmi.2013.11.006
⇑ Corresponding author.E-mail address: [email protected] (L. El Mir).
L. El Mir a,b,⇑, K. Omri a, J. El Ghoul a, A.S. AL-Hobaib c, H. Dahman a, C. Barthou d
a Laboratory of Physics of Materials and Nanomaterials Applied at Environment (LaPhyMNE), Gabes University, Faculty of Sciences inGabes, Gabes, Tunisiab Al Imam Mohammad Ibn Saud Islamic University (IMSIU), College of Sciences, Departement of Physics, Riyadh 11623, Saudi Arabiac Institute of Atomic Energy Research, King Abdulaziz City for Science and Technology (KACST), P.O. Box 6086, Riyadh 11442, SaudiArabiad Institut of NanoSciences in Paris (INSP), UPMC Paris 6 University, CNRS UMR 7588, 140 Lourmel Street, F-75015 Paris, France
a r t i c l e i n f o
Article history:Received 7 November 2013Accepted 8 November 2013Available online 15 November 2013
Keywords:NanocompositePhotoluminescenceb-Zn2SiO4
Zinc oxideOptical materials
a b s t r a c t
A two-step sol–gel process was used for the preparation of Mndoped b-Zn2SiO4 nanoparticles embedded in silica host matrixafter the incorporation of ZnO:Mn nanoparticles in silica monolith.X-ray diffraction (XRD) and transmission electron microscopy(TEM) were used to characterize the phase purity, particle sizeand morphology. XRD results indicate that pure phase of b-Zn2SiO4
with triclinic structure was obtained after thermal treatment at1500 �C. However, photoluminescence (PL) technique was investi-gated for optical study. It was illustrated that the Mn doping con-tent influenced the degree of aggregation and luminescence of thenanocomposite. This manganese doped zinc silica phase in silicahost matrix, exhibit yellow emission centred at about 575 nm dri-ven by 4T1 to 6A1 relaxation in Mn2+. The crystallinity and lumines-cent property of nanocomposite were investigated.
� 2013 Elsevier Ltd. All rights reserved.
1. Introduction
In recent years, many studies have focused on nanomaterials due to their optical electronic, ther-mal, chemical and mechanical properties. Indeed, the synthesis of nanomaterials is now becomingincreasingly attractive in technology. Furthermore, the luminescent properties of silicate-based inor-ganic phosphors have been extensively investigated [1]. Among the silicates, one of the promising
L. El Mir et al. / Superlattices and Microstructures 65 (2014) 248–255 249
candidates is the manganese doped zinc silicate (Zn2SiO4:Mn) phosphor [2], this silicate material isuseful in many technological applications in particular for cathode ray tubes, fluorescent lamps, andplasma display panels due to its high luminescence efficiency and chemical stability [3,4].
However, zinc silicate exists in three structural polymorphs a-, b- and c-Zn2SiO4 [5]. Althoughmany research works have been reported on manganese doped zinc silicate, there are only a few re-ports on the synthesis and characterization of b-Zn2SiO4:Mn powders [6]. At this stage, Rooksby andMcKeag [7] have shown the b-phase Zn2SiO4:Mn2+ presents a yellow emission, and these results in ac-cord with the results reported by Jiang et al. [8]. Pfeiffer and Fonda [9] have synthesized the b-phaseZn2SiO4:Mn2+ powder, which has a strong yellow emission (580 nm) under ultraviolet light, similar tothe emission reported by Rooksby and McKeag [7]. Therefore Mn2+ ion could be well distributed as thesubstituents of Zn2+ in Zn2SiO4 host matrix and hence, encouraging a strong green and yellow emis-sion. The valence matching between Zn and Mn could lead to a high solid solubility [10]. On the otherhand, Mn2+ ion it acts as a luminescence center giving green-emission for a-Zn2SiO4 phase [2,11,12] oryellow-emission for b-Zn2SiO4 phase [4,13]. It is understood that the d–d transition from the 4T1(4G)excited-state to the 6A1(6S) ground-state in the 3d outermost orbital of the Mn2+ ion generates agreen- or yellow-emission depending on the strength of its surrounding crystal field [4,14]. Conven-tionally, the Mn2+ doped b-Zn2SiO4 particles are mainly synthesized by solid-state reaction of startingmaterials like ZnO, SiO2, and MnCO3 at about 1400 �C or even at higher temperatures [15]. Till nowexperimental work has been directed to a� and b-Zn2SiO4:Mn and has been performed with sol–gel synthesis [2,8,16], combustion synthesis [17], spray pyrolysis [18], chemical vapor deposition[19] and hydrothermal synthesis [20].
However, until now, the way of sol–gel synthesis has used for the elaboration of the various nano-composites or silica behave like a matrix. Our objective in this work is, in a first step the in situ syn-thesis of luminescent nanoparticles of b-Zn2SiO4:Mn in a silica matrix whose objective is to increasethe life of components and prevent contamination caused by the external environment. The reducingthe size of the particles in the matrix generally leads to aggregation and agglomeration of particlesduring annealing. Most recently, many studies have been made in the preparation of phosphor nano-composites by the sol–gel process. For example, SiO2/TiO2:Pr [21], SiO2/Zn2SiO4:V [22], ZnO/Zn2SiO4/SiO2 [2] and SiO2/Zn2SiO4:Mn [2,12,23] nanocomposites have been grown via sol–gel process forapplications in photoluminescence.
In this work, Mn-doped zinc oxide (ZnO:Mn) nanoparticles and SiO2/b-Zn2SiO4:Mn nanocompos-ites were prepared by the sol–gel process. Also, the size distribution and the morphology of the par-ticles, the crystal structure, the degree of crystallization and the luminescence properties of the SiO2/b-Zn2SiO4:Mn nanocomposite were investigated.
2. Experimental procedure
For this investigation we prepared nanocrystalline ZnO: Mn aerogels and SiO2/Zn2SiO4:Mn nano-composites samples by sol–gel technique. The source materials used were zinc acetate dehydrate(Zn(CH3COO)2�2H2O), manganese(II) chloride-4-hydrate (MnCl2�4H2O), tetraethyl orthosilicate (TEOS),distilled water, fluoride acid, methanol and ethanol (EtOH).
2.1. Preparation of SiO2/b-Zn2SiO4:Mn nanocomposites
The preparation of colloid suspension particles in silicate host matrix has been done in three steps.In the first one, nanocrystalline ZnO:Mn aerogels were prepared by a sol–gel method under supercrit-ical conditions of ethyl alcohol (EtOH) based on El Mir et al. protocol [2], where the water for hydro-lysis was slowly released by esterification reaction to control the size of the formed nanoparticles. Inthe second step, we have prepared ZnO:Mn confined in silica aerogel according to the following pro-cess: 0.5 ml of TEOS was first dissolved in EtOH. Then, with constant stirring of the mixture of TEOSand EtOH, 0.44 ml of water and 30 mg of nanoparticles powder prepared in the first step were added.The whole solution was stirred for about 30 min, resulting in the formation of a uniform sol. The solwas transferred to tube in ultrasonic bath where 100 ml of fluoride acid was added. The wet gel
250 L. El Mir et al. / Superlattices and Microstructures 65 (2014) 248–255
formed in few seconds. Monolithic white aerogel was obtained by supercritical drying in EtOH as de-scribed in the first step. Finally, silica glass containing b-Zn2SiO4:Mn particles was obtained after firingaerogel at 1500 �C for 2 h.
2.2. Characterization
The crystalline phases of our samples were identified by X-ray diffraction (XRD) using a BrukerD5005 powder X-ray diffractometer using a Co Ka source (1.78901 Å radiation). Crystallite sizes (G,in Å) were estimated from the Scherrer’s equation [24]:
G ¼ 0:9kB cos hB
ð1Þ
where k is the X-ray wavelength (1.78901 Å), hB is the maximum of the Bragg diffraction peak (in radi-ans) and B is the linewidth at half maximum.
Transmission electron microscopy (TEM, JEM-200CX) were used to study the morphology and par-ticle size of the phosphor powders. The specimens for TEM were prepared by putting the as-grownproducts in EtOH and immersing them in an ultrasonic bath for 15 min, then dropping a few dropsof the resulting suspension containing the synthesized materials onto TEM grid. The optical absor-bance of the powders was determined using a Schimadzu UV-3101 PC spectrophotometer with inte-grating sphere in the wavelength range 200–2000 nm. For photoluminescence (PL) measurements, the450-W Xenon lamp was used as an excitation source. The emitted light from the sample collected byan optical fiber on the same side as the excitation was analyzed with a Jobin–Yvon SpectrometerHR460 and a multichannel CCD detector (2000 pixels). The photoluminescence excitation (PLE) mea-surements were performed on a Jobin–Yvon Fluorolog 3–2 spectrometer.
3. Results and discussion
3.1. Structural studies
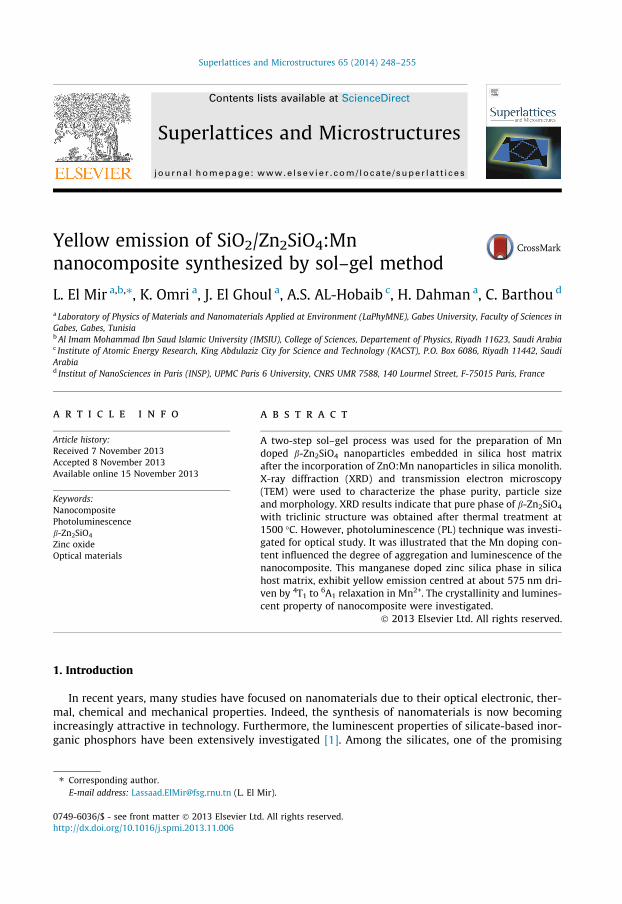
3.1.1. Formation of b-Zn2SiO4:Mn phaseThe XRD spectra of Mn-doped ZnO nanoparticles have been presented in Fig. 1. XRD pattern indi-
cates the formation of hexagonal wurtzite (groupe P63mc) phase of ZnO [25]. The lattice constants cal-culated from the XRD pattern are a = 3.252 Å and c = 5.208 Å, which are very close to wurtzite ZnOones (JCPDS No. 36-1451). The diffraction peaks of ZnO were found to shift to a smaller angle byMn doping indicating a increase in the lattice constants. It is known that the ionic radius of Zn2+ issmaller than that of Mn2+ and larger than that of Mn4+, so the XRD patterns indicate that the divalent
Fig. 1. X-ray diffraction pattern of the (a) undoped ZnO and (b) ZnO:Mn5% nanopowder.
L. El Mir et al. / Superlattices and Microstructures 65 (2014) 248–255 251
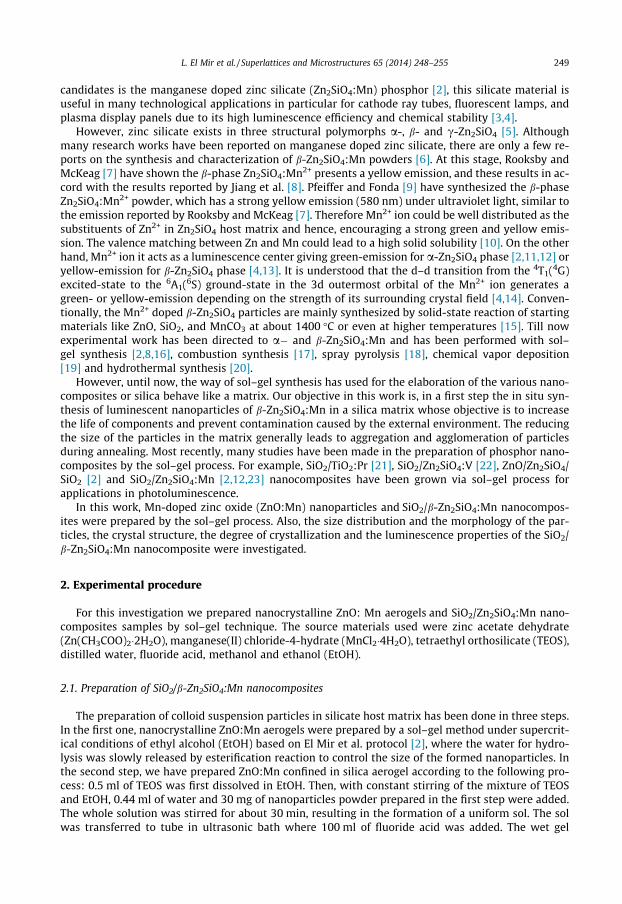
Mn2+ ions substitute for Zn2+ ions in ZnO crystal lattice and do not change the wurtzite structure [26].Similar dependencies have also been observed in ZnO:Mn systems [27]. Mn is an element with largeionic radius, which may cause poor crystallinity [28]. Average grain size (G) of the crystallites ZnO:Mnvaries from 18 nm to 32 nm [23], has been estimated using Scherrer’s formula (1). After incorporationof these nanoparticles of Mn-doped ZnO in SiO2 and heat treatment at 1500 �C for 2 h in air, new phaseb-Zn2SiO4:Mn was formed. The XRD pattern of the SiO2/b-Zn2SiO4:Mn nanocomposite as shown inFig. 2, has confirmed the b-Zn2SiO4 as the main crystalline phase. In our results the pattern ofb-Zn2SiO4, are slightly different in the peak position and the number of peaks to the results reportedby Roobsky and McKeag [7]. These b-Zn2SiO4:Mn crystallizes nanoparticles in triclinic structure(JCPDS Card 19-1479) [7,8,29]. The above results imply that the solid reaction between ZnO andSiO2 occurred and formed b-Zn2SiO4 phase during heat treatment at 1500 �C. It should be noted thatthe XRD peak positions have some deviation to those reported b-Zn2SiO4 due to the doping of Mn ions[8]. Furthermore, we observed no influence of the Mn2+ concentration on the formation of the crystalstructure. On the one hand, these results show the importance of the annealing temperature (1500 �C)for the formation of pure b-Zn2SiO4 phase. However no changes after one year in the nanocompositeb-Zn2SiO4: Mn, neither the form nor the composition of this material. At high temperature, ZnOparticles aggregates and Zn and Si spices move and diffuse inside the porous body to form b-Zn2SiO4:Mn phase. The size of the particles, calculated from the Scherrer’s formula (1) is typically 75 nm [8].
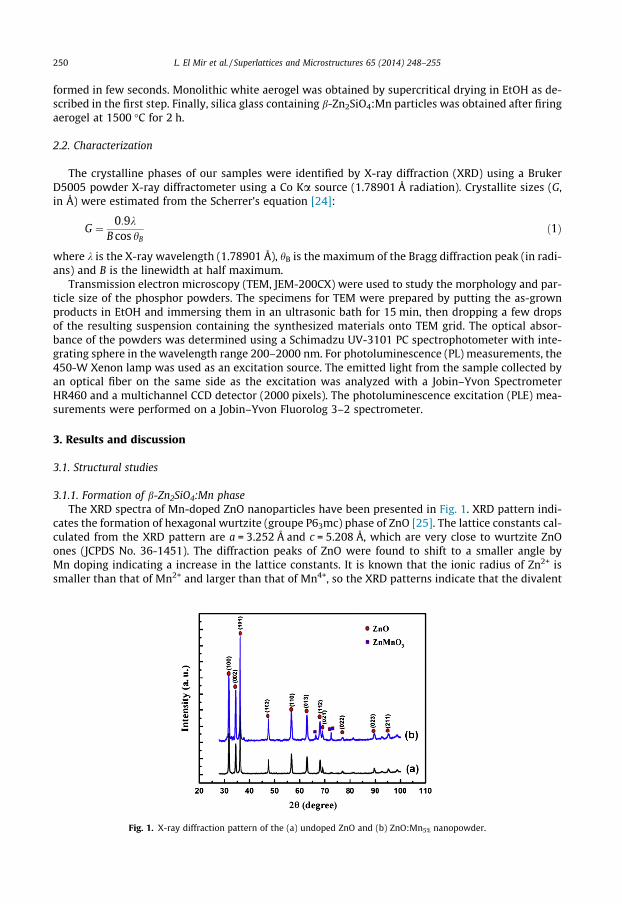
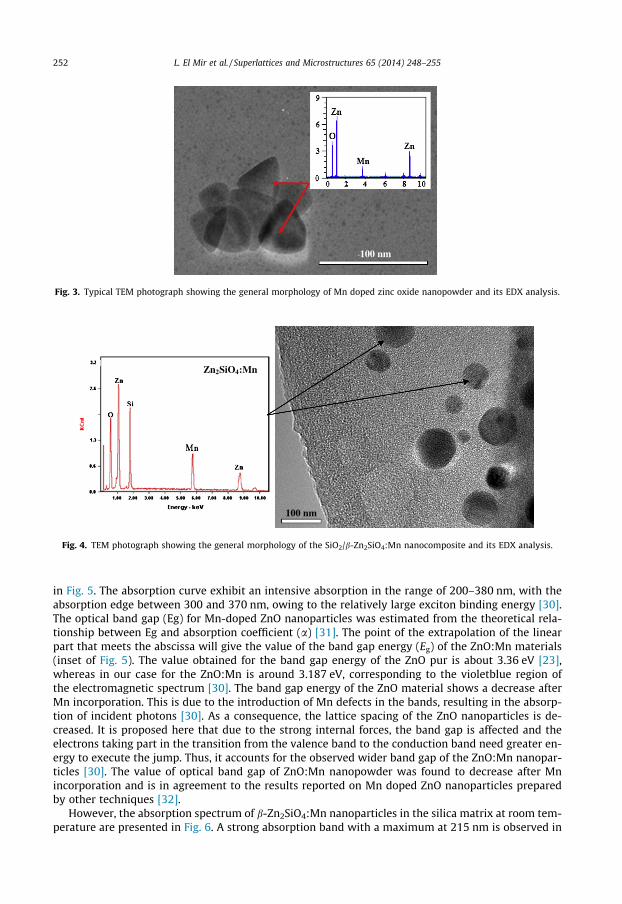
3.1.2. The morphology and size of the SiO2/b-Zn2SiO4:Mn nanocompositeWe investigated the size and morphology of our samples by TEM. The image (Fig. 3) shows that
very small Mn doped ZnO particles are present in the as-prepared aerogel powder. The morphologyof the sample is found to be nearly spherical in nature with the diameters ranging from 17 to35 nm. Taking into account the results of crystallite size measurements by XRD, it can be concludedthat the crystallite size is approximately equal to the particle size in ZnO powder prepared in the pres-ent work. Energy dispersive spectroscopy (EDX) analysis, shown in Fig. 3, confirms the presence ofmanganese (Mn), in good agreement with XRD results.
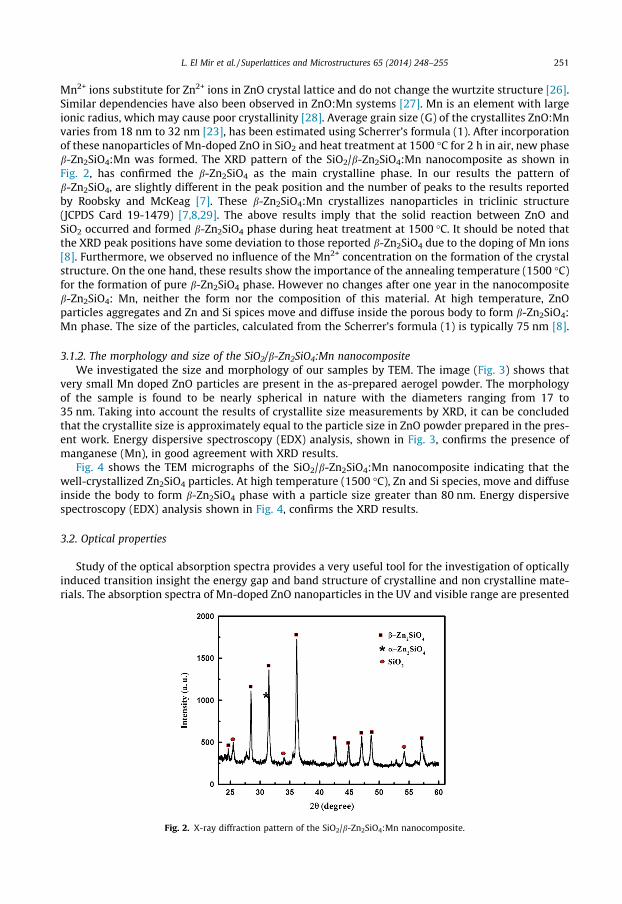
Fig. 4 shows the TEM micrographs of the SiO2/b-Zn2SiO4:Mn nanocomposite indicating that thewell-crystallized Zn2SiO4 particles. At high temperature (1500 �C), Zn and Si species, move and diffuseinside the body to form b-Zn2SiO4 phase with a particle size greater than 80 nm. Energy dispersivespectroscopy (EDX) analysis shown in Fig. 4, confirms the XRD results.
3.2. Optical properties
Study of the optical absorption spectra provides a very useful tool for the investigation of opticallyinduced transition insight the energy gap and band structure of crystalline and non crystalline mate-rials. The absorption spectra of Mn-doped ZnO nanoparticles in the UV and visible range are presented
Fig. 2. X-ray diffraction pattern of the SiO2/b-Zn2SiO4:Mn nanocomposite.
100 nm
Fig. 3. Typical TEM photograph showing the general morphology of Mn doped zinc oxide nanopowder and its EDX analysis.
Zn2SiO4:Mn
100 nm
Fig. 4. TEM photograph showing the general morphology of the SiO2/b-Zn2SiO4:Mn nanocomposite and its EDX analysis.
252 L. El Mir et al. / Superlattices and Microstructures 65 (2014) 248–255
in Fig. 5. The absorption curve exhibit an intensive absorption in the range of 200–380 nm, with theabsorption edge between 300 and 370 nm, owing to the relatively large exciton binding energy [30].The optical band gap (Eg) for Mn-doped ZnO nanoparticles was estimated from the theoretical rela-tionship between Eg and absorption coefficient (a) [31]. The point of the extrapolation of the linearpart that meets the abscissa will give the value of the band gap energy (Eg) of the ZnO:Mn materials(inset of Fig. 5). The value obtained for the band gap energy of the ZnO pur is about 3.36 eV [23],whereas in our case for the ZnO:Mn is around 3.187 eV, corresponding to the violetblue region ofthe electromagnetic spectrum [30]. The band gap energy of the ZnO material shows a decrease afterMn incorporation. This is due to the introduction of Mn defects in the bands, resulting in the absorp-tion of incident photons [30]. As a consequence, the lattice spacing of the ZnO nanoparticles is de-creased. It is proposed here that due to the strong internal forces, the band gap is affected and theelectrons taking part in the transition from the valence band to the conduction band need greater en-ergy to execute the jump. Thus, it accounts for the observed wider band gap of the ZnO:Mn nanopar-ticles [30]. The value of optical band gap of ZnO:Mn nanopowder was found to decrease after Mnincorporation and is in agreement to the results reported on Mn doped ZnO nanoparticles preparedby other techniques [32].
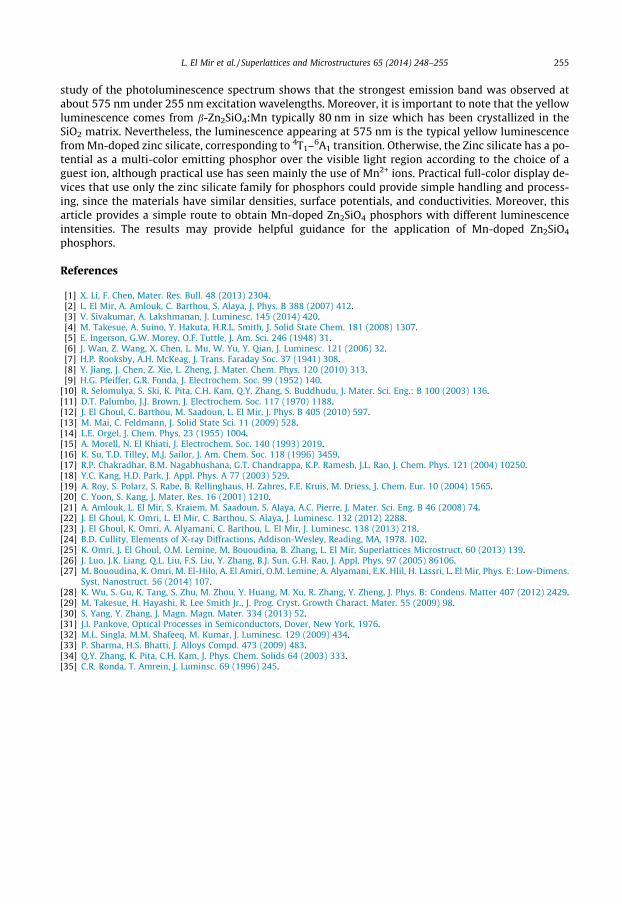
However, the absorption spectrum of b-Zn2SiO4:Mn nanoparticles in the silica matrix at room tem-perature are presented in Fig. 6. A strong absorption band with a maximum at 215 nm is observed in
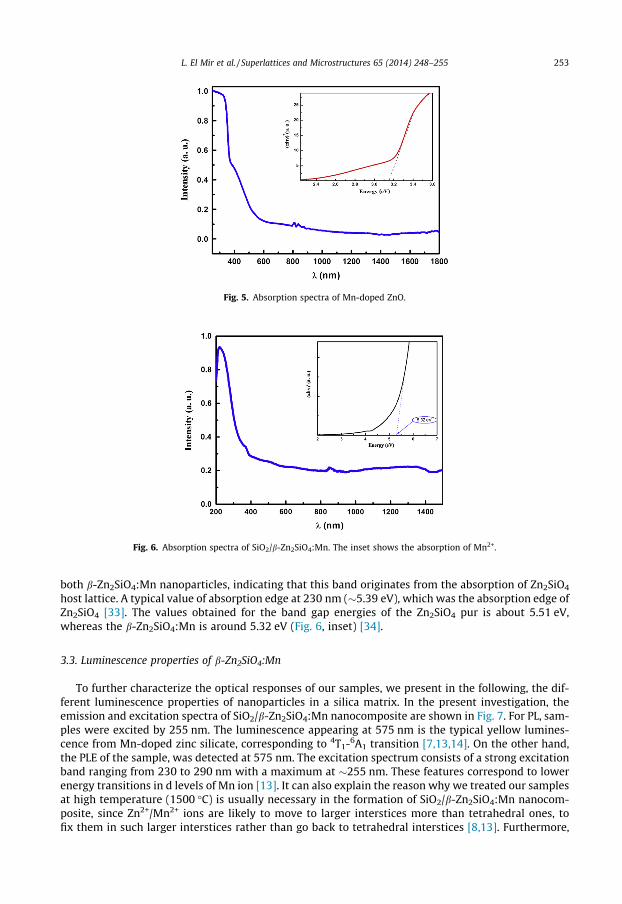
Fig. 5. Absorption spectra of Mn-doped ZnO.
Fig. 6. Absorption spectra of SiO2/b-Zn2SiO4:Mn. The inset shows the absorption of Mn2+.
L. El Mir et al. / Superlattices and Microstructures 65 (2014) 248–255 253
both b-Zn2SiO4:Mn nanoparticles, indicating that this band originates from the absorption of Zn2SiO4
host lattice. A typical value of absorption edge at 230 nm (�5.39 eV), which was the absorption edge ofZn2SiO4 [33]. The values obtained for the band gap energies of the Zn2SiO4 pur is about 5.51 eV,whereas the b-Zn2SiO4:Mn is around 5.32 eV (Fig. 6, inset) [34].
3.3. Luminescence properties of b-Zn2SiO4:Mn
To further characterize the optical responses of our samples, we present in the following, the dif-ferent luminescence properties of nanoparticles in a silica matrix. In the present investigation, theemission and excitation spectra of SiO2/b-Zn2SiO4:Mn nanocomposite are shown in Fig. 7. For PL, sam-ples were excited by 255 nm. The luminescence appearing at 575 nm is the typical yellow lumines-cence from Mn-doped zinc silicate, corresponding to 4T1-6A1 transition [7,13,14]. On the other hand,the PLE of the sample, was detected at 575 nm. The excitation spectrum consists of a strong excitationband ranging from 230 to 290 nm with a maximum at �255 nm. These features correspond to lowerenergy transitions in d levels of Mn ion [13]. It can also explain the reason why we treated our samplesat high temperature (1500 �C) is usually necessary in the formation of SiO2/b-Zn2SiO4:Mn nanocom-posite, since Zn2+/Mn2+ ions are likely to move to larger interstices more than tetrahedral ones, tofix them in such larger interstices rather than go back to tetrahedral interstices [8,13]. Furthermore,
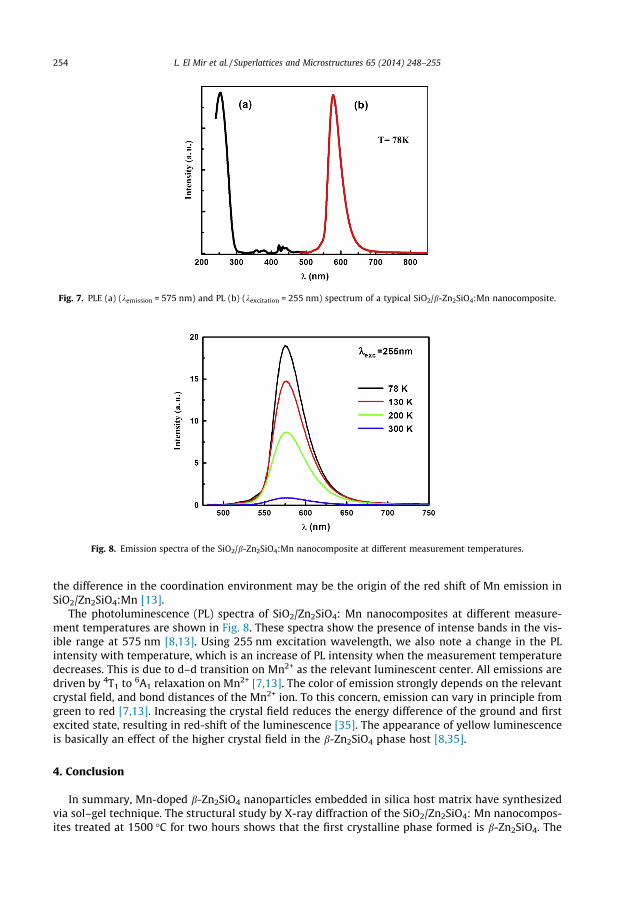
Fig. 7. PLE (a) (kemission = 575 nm) and PL (b) (kexcitation = 255 nm) spectrum of a typical SiO2/b-Zn2SiO4:Mn nanocomposite.
Fig. 8. Emission spectra of the SiO2/b-Zn2SiO4:Mn nanocomposite at different measurement temperatures.
254 L. El Mir et al. / Superlattices and Microstructures 65 (2014) 248–255
the difference in the coordination environment may be the origin of the red shift of Mn emission inSiO2/Zn2SiO4:Mn [13].
The photoluminescence (PL) spectra of SiO2/Zn2SiO4: Mn nanocomposites at different measure-ment temperatures are shown in Fig. 8. These spectra show the presence of intense bands in the vis-ible range at 575 nm [8,13]. Using 255 nm excitation wavelength, we also note a change in the PLintensity with temperature, which is an increase of PL intensity when the measurement temperaturedecreases. This is due to d–d transition on Mn2+ as the relevant luminescent center. All emissions aredriven by 4T1 to 6A1 relaxation on Mn2+ [7,13]. The color of emission strongly depends on the relevantcrystal field, and bond distances of the Mn2+ ion. To this concern, emission can vary in principle fromgreen to red [7,13]. Increasing the crystal field reduces the energy difference of the ground and firstexcited state, resulting in red-shift of the luminescence [35]. The appearance of yellow luminescenceis basically an effect of the higher crystal field in the b-Zn2SiO4 phase host [8,35].
4. Conclusion
In summary, Mn-doped b-Zn2SiO4 nanoparticles embedded in silica host matrix have synthesizedvia sol–gel technique. The structural study by X-ray diffraction of the SiO2/Zn2SiO4: Mn nanocompos-ites treated at 1500 �C for two hours shows that the first crystalline phase formed is b-Zn2SiO4. The
L. El Mir et al. / Superlattices and Microstructures 65 (2014) 248–255 255
study of the photoluminescence spectrum shows that the strongest emission band was observed atabout 575 nm under 255 nm excitation wavelengths. Moreover, it is important to note that the yellowluminescence comes from b-Zn2SiO4:Mn typically 80 nm in size which has been crystallized in theSiO2 matrix. Nevertheless, the luminescence appearing at 575 nm is the typical yellow luminescencefrom Mn-doped zinc silicate, corresponding to 4T1–6A1 transition. Otherwise, the Zinc silicate has a po-tential as a multi-color emitting phosphor over the visible light region according to the choice of aguest ion, although practical use has seen mainly the use of Mn2+ ions. Practical full-color display de-vices that use only the zinc silicate family for phosphors could provide simple handling and process-ing, since the materials have similar densities, surface potentials, and conductivities. Moreover, thisarticle provides a simple route to obtain Mn-doped Zn2SiO4 phosphors with different luminescenceintensities. The results may provide helpful guidance for the application of Mn-doped Zn2SiO4
phosphors.
References
[1] X. Li, F. Chen, Mater. Res. Bull. 48 (2013) 2304.[2] L. El Mir, A. Amlouk, C. Barthou, S. Alaya, J. Phys. B 388 (2007) 412.[3] V. Sivakumar, A. Lakshmanan, J. Luminesc. 145 (2014) 420.[4] M. Takesue, A. Suino, Y. Hakuta, H.R.L. Smith, J. Solid State Chem. 181 (2008) 1307.[5] E. Ingerson, G.W. Morey, O.F. Tuttle, J. Am. Sci. 246 (1948) 31.[6] J. Wan, Z. Wang, X. Chen, L. Mu, W. Yu, Y. Qian, J. Luminesc. 121 (2006) 32.[7] H.P. Rooksby, A.H. McKeag, J. Trans. Faraday Soc. 37 (1941) 308.[8] Y. Jiang, J. Chen, Z. Xie, L. Zheng, J. Mater. Chem. Phys. 120 (2010) 313.[9] H.G. Pfeiffer, G.R. Fonda, J. Electrochem. Soc. 99 (1952) 140.
[10] R. Selomulya, S. Ski, K. Pita, C.H. Kam, Q.Y. Zhang, S. Buddhudu, J. Mater. Sci. Eng.: B 100 (2003) 136.[11] D.T. Palumbo, J.J. Brown, J. Electrochem. Soc. 117 (1970) 1188.[12] J. El Ghoul, C. Barthou, M. Saadoun, L. El Mir, J. Phys. B 405 (2010) 597.[13] M. Mai, C. Feldmann, J. Solid State Sci. 11 (2009) 528.[14] L.E. Orgel, J. Chem. Phys. 23 (1955) 1004.[15] A. Morell, N. El Khiati, J. Electrochem. Soc. 140 (1993) 2019.[16] K. Su, T.D. Tilley, M.J. Sailor, J. Am. Chem. Soc. 118 (1996) 3459.[17] R.P. Chakradhar, B.M. Nagabhushana, G.T. Chandrappa, K.P. Ramesh, J.L. Rao, J. Chem. Phys. 121 (2004) 10250.[18] Y.C. Kang, H.D. Park, J. Appl. Phys. A 77 (2003) 529.[19] A. Roy, S. Polarz, S. Rabe, B. Rellinghaus, H. Zahres, F.E. Kruis, M. Driess, J. Chem. Eur. 10 (2004) 1565.[20] C. Yoon, S. Kang, J. Mater. Res. 16 (2001) 1210.[21] A. Amlouk, L. El Mir, S. Kraiem, M. Saadoun, S. Alaya, A.C. Pierre, J. Mater. Sci. Eng. B 46 (2008) 74.[22] J. El Ghoul, K. Omri, L. El Mir, C. Barthou, S. Alaya, J. Luminesc. 132 (2012) 2288.[23] J. El Ghoul, K. Omri, A. Alyamani, C. Barthou, L. El Mir, J. Luminesc. 138 (2013) 218.[24] B.D. Cullity, Elements of X-ray Diffractions, Addison-Wesley, Reading, MA, 1978. 102.[25] K. Omri, J. El Ghoul, O.M. Lemine, M. Bououdina, B. Zhang, L. El Mir, Superlattices Microstruct. 60 (2013) 139.[26] J. Luo, J.K. Liang, Q.L. Liu, F.S. Liu, Y. Zhang, B.J. Sun, G.H. Rao, J. Appl. Phys. 97 (2005) 86106.[27] M. Bououdina, K. Omri, M. El-Hilo, A. El Amiri, O.M. Lemine, A. Alyamani, E.K. Hlil, H. Lassri, L. El Mir, Phys. E: Low-Dimens.
Syst. Nanostruct. 56 (2014) 107.[28] K. Wu, S. Gu, K. Tang, S. Zhu, M. Zhou, Y. Huang, M. Xu, R. Zhang, Y. Zheng, J. Phys. B: Condens. Matter 407 (2012) 2429.[29] M. Takesue, H. Hayashi, R. Lee Smith Jr., J. Prog. Cryst. Growth Charact. Mater. 55 (2009) 98.[30] S. Yang, Y. Zhang, J. Magn. Magn. Mater. 334 (2013) 52.[31] J.I. Pankove, Optical Processes in Semiconductors, Dover, New York, 1976.[32] M.L. Singla, M.M. Shafeeq, M. Kumar, J. Luminesc. 129 (2009) 434.[33] P. Sharma, H.S. Bhatti, J. Alloys Compd. 473 (2009) 483.[34] Q.Y. Zhang, K. Pita, C.H. Kam, J. Phys. Chem. Solids 64 (2003) 333.[35] C.R. Ronda, T. Amrein, J. Luminsc. 69 (1996) 245.


