Embed Size (px)
Citation preview

Original Research
Model-Based Registration for Dynamic CardiacPerfusion MRI
Ganesh Adluru, BE,1,2 Edward V.R. DiBella, PhD,2,3* and Matthias C. Schabel, PhD2
Purpose: To assess the accuracy of a model-based ap-proach for registration of myocardial dynamic contrast-enhanced (DCE)-MRI corrupted by respiratory motion.
Materials and Methods: Ten patients were scanned for myo-cardial perfusion on 3T or 1.5T scanners, and short- andlong-axis slices were acquired. Interframe registration wasdone using an iterative model-based method in conjunctionwith a mean square difference metric. The method was testedby comparing the absolute motion before and after registra-tion, as determined from manually registered images. Re-gional flow indices of myocardium calculated from the man-ually registered data were compared with those obtained withthe model-based registration technique.
Results: The mean absolute motion of the heart for theshort-axis data sets over all the time frames decreased from5.3 � 5.2 mm (3.3 � 3.1 pixels) to 0.8 � 1.3 mm (0.5 � 0.7pixels) in the vertical direction, and from 3.0 � 3.7 mm(1.7 � 2.1 pixels) to 0.9 � 1.2 mm (0.5 � 0.7 pixels) in thehorizontal direction. A mean absolute improvement of 77%over all the data sets was observed in the estimation of theregional perfusion flow indices of the tissue as compared tothose obtained from manual registration. Similar resultswere obtained with two-chamber-view long-axis data sets.
Conclusion: The model-based registration method for DCEcardiac data is comparable to manual registration and of-fers a unique registration method that reduces errors in thequantification of myocardial perfusion parameters as com-pared to those obtained from manual registration.
Key Words: dynamic MR; cardiac perfusion; motion cor-rection; registration; respiratory motion; compartmentmodelsJ. Magn. Reson. Imaging 2006;24:1062–1070.© 2006 Wiley-Liss, Inc.
DYNAMIC MR EVALUATION of myocardial perfusion isbecoming a powerful tool for the detection of coronaryartery disease (1–3). The standard approach is to rap-idly acquire T1-weighted images to track the uptakeand washout of the contrast agent Gd-DTPA. Multiple2D images are acquired each heartbeat. The slices areacquired using ECG-gated sequences so that a givenslice is always acquired during the same phase of thecardiac cycle. The time-series data are analyzed visu-ally or with semiquantitative or quantitative models(4,5). Depending on the analysis technique used, atleast 20–40 seconds of data are needed to determineregional perfusion values in the left ventricular (LV)myocardium. Many patients cannot hold their breathlong enough to provide a motion-free study. A breath-hold of any appreciable length becomes more difficultwhen pharmacological stress is induced by vasodilatingagents, which is necessary for detection of coronaryartery disease. Respiration causes motion of the heart,which makes qualitative visual analysis difficult andcan cause incorrect estimation of semiquantitative andquantitative parameters.
A number of registration methods have been pro-posed to correct the motion of the heart in dynamiccontrast MRI acquisitions (6–10). In the method ofBidaut and Vallee (6), the mean squared difference be-tween images in the perfusion sequence and a referenceimage in a region defined by a cardiac mask is mini-mized. The initial reference image is chosen to be anearly image from the perfusion sequence, which doesnot show any contrast agent. After all of the frames areregistered to the reference frame, the reference image isupdated iteratively by taking the average of all of theregistered images in the previous iteration. Gallippi etal (7) correct for motion using a statistical approachwhereby an image in the temporal center of the se-quence is chosen as the reference, and the images areregistered using a matching metric based on intensityvariations and edge directions. Dornier et al (8) mini-mize the mean squared difference proposed in (9) be-tween the perfusion images within tightly cropped myo-cardial masks. Bracoud et al (10) use the mutualinformation (11) metric to register. The above methodsregister the perfusion images to a single reference im-age, which may not give the best results since contrastcan vary greatly between the images. This was partlytaken into account in the study by Bidaut and Vallee
1Electrical and Computer Engineering Department, University of Utah,Salt Lake City, Utah, USA.2UCAIR, Department of Radiology, University of Utah, Salt Lake City,Utah, USA.3Department of Bioengineering, University of Utah, Salt Lake City,Utah, USA.*Address reprint requests to: E.D., Utah Center for Advanced ImagingResearch (UCAIR)/Radiology, 729 Arapeen Dr., Salt Lake City, UT84108. E-mail: [email protected] grant sponsor: NIH/NIBIB; Contract grant number: R01EB000177.Received October 5, 2005; Accepted July 28, 2006.DOI 10.1002/jmri.20756Published online 9 October 2006 in Wiley InterScience (www.interscience.wiley.com).
JOURNAL OF MAGNETIC RESONANCE IMAGING 24:1062–1070 (2006)
© 2006 Wiley-Liss, Inc. 1062
(6), in which an average reference frame was updatediteratively; however, a better strategy might be to per-form the registration with multiple reference frames.
Recently Stegmann et al (12) proposed the use ofactive-appearance models to register the perfusion im-
ages. The active-appearance models capture the shapevariability of the heart from a representative training setand use the models to fit the new perfusion images andregister them. Generating the models involves extrac-tion of shape contours of the objects of interest and
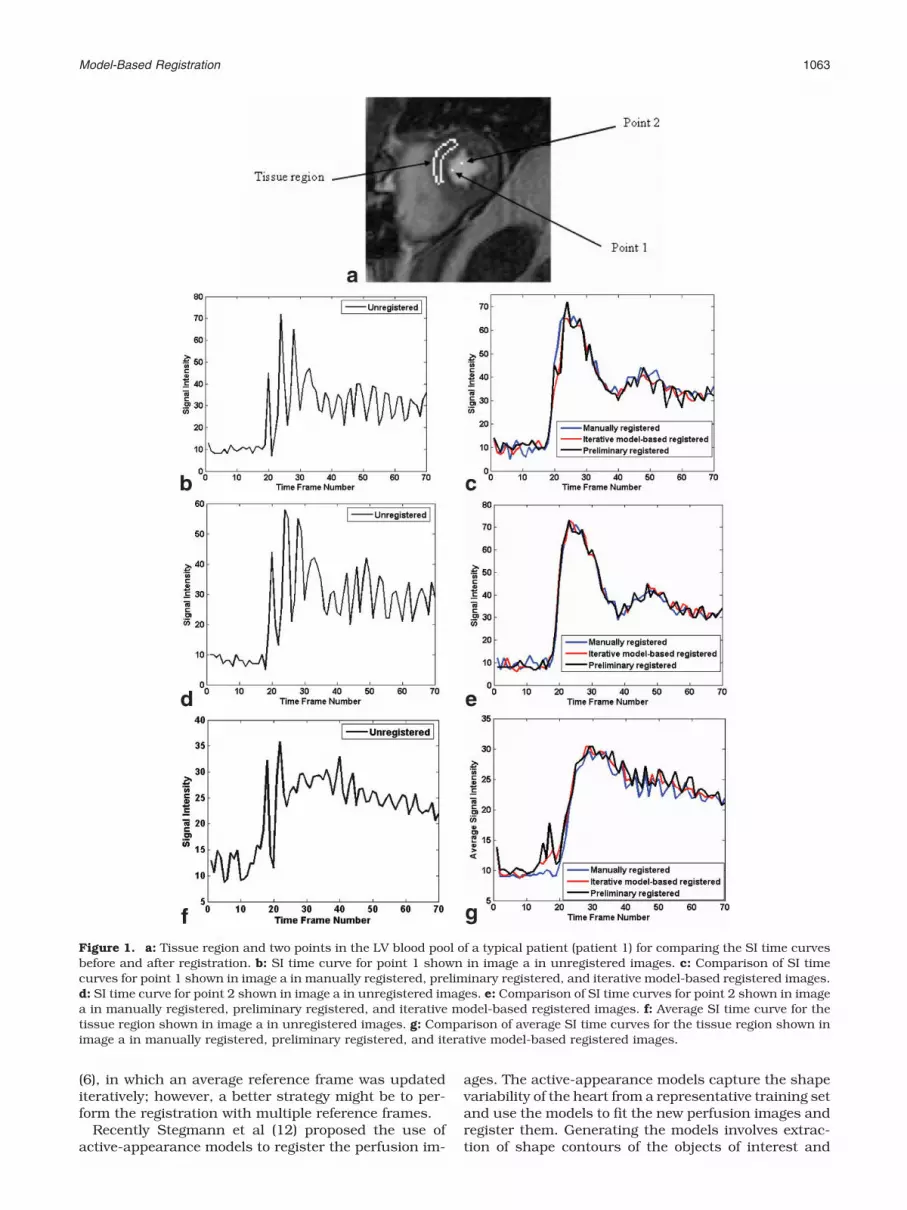
Figure 1. a: Tissue region and two points in the LV blood pool of a typical patient (patient 1) for comparing the SI time curvesbefore and after registration. b: SI time curve for point 1 shown in image a in unregistered images. c: Comparison of SI timecurves for point 1 shown in image a in manually registered, preliminary registered, and iterative model-based registered images.d: SI time curve for point 2 shown in image a in unregistered images. e: Comparison of SI time curves for point 2 shown in imagea in manually registered, preliminary registered, and iterative model-based registered images. f: Average SI time curve for thetissue region shown in image a in unregistered images. g: Comparison of average SI time curves for the tissue region shown inimage a in manually registered, preliminary registered, and iterative model-based registered images.
Model-Based Registration 1063

definition of landmark correspondences across the setof contours from the training data sets. This type ofmethod, which is based on spatial features of the per-fusion images, may perform poorly on some frames dueto noise and the lack of well-defined features in someframes.
We propose an iterative model-based registrationmethod based on a temporal parametric model for eachpixel. The method uses the minimization of the meansquared difference, with a spatial weighting, to registereach image in the perfusion sequence to its correspond-ing “model image” instead of registering all the imagesto a single reference image. This process is iterated toyield improved registrations. A similar idea was recentlyproposed for application to dynamic contrast-enhanced(DCE)-MRI tumor data (13).
MATERIALS AND METHODS
Data Acquisition
Perfusion data were acquired from 10 patients onSiemens Trio 3T or Siemens Avanto 1.5T scannerswith a multi-element coil designed for cardiac imag-ing. Informed consent from the patients was obtainedin accordance with the University of Utah Institu-tional Review Board. Using a saturation-recoveryturbo fast low-angle shot (FLASH) sequence, three tofour short-axis slices and one long-axis slice wereacquired for different patients to follow the uptake ofthe contrast agent Gd-DTPA. The Gd-DTPA doses fordifferent studies varied from 0.025–0.1 mmol/kg andwere injected at a rate of 6 mL/second. The patientswere instructed to hold their breath at end-expirationfor as long as possible during the contrast uptake andto breathe shallowly thereafter. The parameters forthe scans were TR � 2 msec; TE � 0.95–1.28 msec;TI � 100 msec; FOV � (255–380) � (192–285) mm2;and slice thickness � 7–8 mm. The acquisition ma-trix for different scans varied between 160 � 96 and192 � 72. The reconstructed pixel size varied between1.6 and 2.0 mm for different scans.
Preprocessing
The acquired data contain a lot of motion of the heart(as high as 2.5 cm) due to respiration. Most of themotion in the data sets appears to be in-plane, althougha few images have out-of-plane motion. Handling out-of-plane motion is a challenging problem that cannot becorrected postacquisition with current acquisitionmethods, and is not considered in this work. The mo-tion of the heart is observed to be predominantly a rigidtranslation. A few frames have small rotational motion,which is not modeled for this work.
A rectangular mask that roughly encompasses theheart is first defined. The mask is large enough toinclude the heart in all of the images in the sequence.The binary mask is multiplied with all of the images toremove unwanted objects, such as the chest wall,which can move in a direction different from theheart.
Model-Based Method
The main idea of the model-based method is to makeuse of the fact that for perfectly registered perfusionimages, the signal intensity (SI) time curves for eachpixel are relatively smooth in time. Motion typicallycauses the time curves to have outliers (for example,see the time curves for the points in the LV blood pooland those for the tissue region in an unregistered andregistered data set in Fig. 1a–g). Thus a smooth “fit”to the curve can provide a measure of motion byidentifying outliers. Models with a large number ofparameters can fit time curves with even largeamounts of motion well, defeating the idea of model-based registration by overfitting. To achieve a balancebetween smoothness and overfitting, a two-compart-ment model (14) is used to fit the data. Other models,such as the B-splines in Ref. 15, could possibly beused instead. The basic form of the two-compartmentmodel is given by
Figure 2. Flow chart for the iterative model-based registrationalgorithm.
1064 Adluru et al.

dCpix�t�dt
� KtransCinput�t� � kepCpix �t�
Since the model “expects” gadolinium (Gd) concentra-tion curves, the SI time curves for each pixel are con-verted to be proportional to Gd concentration timecurves by subtracting the precontrast signal, which isthe average SI of approximately eight precontrastframes from each curve. In Eq. [1], Cpix(t) is this signal
difference time curve for each pixel, and Cinput(t) is theinput function that is chosen as the average of thesignal difference time curves in a small region in theright ventricular (RV) blood pool. The parameters Ktrans
and kep are the rate constants for the exchanges ofcontrast agent between plasma and the extravascularextracellular space (16).
This type of model is widely used in DCE-MRI. Includ-ing a vascular term and time delay in Eq. [1] gives
ddt
�Cpix�t� � vpCinput�t � �� � KtransCinput�t � ��
� kep�Cpix�t� � vpCinput�t � ��
where vP and � represent blood volume per unit volumeof tissue and time delay in the input function, respec-tively. Each modified signal difference time curve ismodeled according to Eq. [2].
It is computationally intensive to use the standardmethod of fitting the solution of Eq. [2] in the model-based registration approach. The standard solution ofEqs. [1] and [2] is obtained by convolving the input
Figure 3. a: Original precontrast frame from the perfusionsequence for a typical patient (patient 1, cropped). b: Modelimage for the corresponding precontrast frame in a. c: Originalpostcontrast frame from the perfusion sequence for a typicalpatient (patient 1). d: Model image for the corresponding post-contrast frame in c.
Figure 4. a: Original precontrast frame from the perfusionsequence for a typical two-chamber-view long-axis data set(cropped). b: Model image for the corresponding precontrastframe in a. c: Original postcontrast frame from the perfusionsequence for a typical two-chamber-view long-axis data set. d:Model image for the corresponding postcontrast frame in c.
Figure 5. The myocardium is divided into eight regions toestimate the flow indices by performing a two-compartmentmodel analysis for a typical patient (patient 1).
Table 1Comparison of Average Absolute Motion in Vertical (Y) andHorizontal (X) Directions Before and After Registration for aTypical Short Axis Slice with 70 Frames from a Patient(Patient #1)*
Registration method
Mean � SD ofthe absolute
translation in Y(mm)
Mean � SD ofthe absolute
translation in X(mm)
Unregistered 3.9 � 3.8 4.6 � 3.6Preliminary registered 1.8 � 1.7 2.9 � 2.5Iterative model-based 1.2 � 1.1 2.5 � 1.7
*Pixel size � 1.8 mm.
Model-Based Registration 1065

function Cinput with a decaying exponential. Each pre-processed image has on the order of 10,000 pixels, andeach pixel has a time curve of approximately 70 points.Since every pixel must be fit multiple times to evaluatedifferent shifts in X and Y, it can be relatively slow touse the standard solution. A more rapid fitting methodwas recently used for MRI (17), and has been used forpositron emission tomography (PET) (18). In thismethod, the problem is linearized by integrating bothsides of Eq. [2], which is given by
Cpix�t� � �Ktrans � kepvp� �0
t
Cinput� � ��d
� kep �0
t
Cpix��d � vpCinput�t � ��
The parameters in Eq. [3] are chosen such that thechi-squared error between the fit and the originalcurves is minimized. This form without the time delayterm (17) is much faster than standard nonlinear leastsquares. In application to dynamic cardiac MRI data,the delay � is critical for providing reasonable fits fordifferent regions. For example, fitting the time curve fora pixel in the LV blood pool requires a delay of the RVinput function for accurate representation.
To include the time delay �, Eq. [3] is solved rapidlywith a matrix inversion to obtain the three parametersKtrans, kep, and vp, while the time delay � is held fixed. Afirst approximation of the time delay is obtained byusing a coarse one-dimensional search grid and recom-puting the three fit parameters Ktrans, kep, and vp ateach delay value. The grid is then made finer to find theoptimal delay value that produces the best fit to thedata. The model representation of the dynamic imagesis then generated by replacing each time curve with theparameterized curves obtained as above and addingback the precontrast signal.
The implementation of the model-based registrationmethod is summarized by the flow chart in Fig. 2. Afterthe preprocessing masking step, a relatively conven-tional initial registration is performed. This initial reg-istration reduces the amount of blurring in the subse-
quently generated model images caused by pixels withhighly varying intensities due to motion. This initialregistration is done by registering all of the originaldynamic images to a single reference frame. The refer-ence frame is chosen to have good contrast between themyocardium and the ventricle blood pools, as well assufficient contrast uptake for some definition of theepicardium. Registration is done by minimizing themean square difference between the reference imageand all of the other perfusion images. For each imageframe, a 2D raised cosine function, the Hanning win-dow, is used to weight the squared differences. TheHanning window penalizes the square of the intensitydifference in the center region more than in the outerregions of the image. The weighting function was cho-sen empirically from several different weighting func-tions, and made a substantial difference for some of thedata.
Model images are then generated as outlined aboveusing the preliminary registered images. Figure 3
Figure 6. Comparison of the average absolute motion (mm) ofthe heart over all the time frames for short-axis slices from 10patients before and after registration in the Y (vertical) direc-tion.
Figure 7. Comparison of the average absolute motion (mm) ofthe heart over all of the time frames for short-axis slices from10 patients before and after registration in the X (horizontal)direction.
Table 2Comparison of Flow Indices for the Eight Regions Shown in Fig. 5Obtained by Performing Two-Compartment Model Analysis Beforeand After Registration (Patient #1)
RegionFlow indices
manuallyregistered
Flow indicesunregistered
Flowindices
preliminaryregistered
Flow indicesiterativeModel-based
1 0.85 1.19 1.11 1.042 0.99 0.48 1.14 1.093 1.16 0.61 1.04 1.144 1.03 1.35 0.78 0.965 0.86 1.18 0.73 0.836 0.81 1.11 0.71 0.657 0.51 1.15 0.61 0.558 0.66 1.29 0.71 0.66
1066 Adluru et al.

shows the model images and the corresponding originalimages in a typical data set.
Each original unregistered image in the perfusionsequence is then registered with its correspondingmodel image by minimizing their mean square differ-ence, with the spatial weighting (i.e., Fig. 3a is regis-tered with Fig. 3b as the reference image, Fig. 3c isregistered with Fig. 3d as the reference image, and soon). The above method is iterated. After a few iterations,no significant change occurs in the fits to the timecurves of the pixels, and hence the reference images inthe current iteration and those in the previous iterationare not very different. Consequently, when the unreg-istered images are registered to the reference images inthe current iteration, the translation parameters ob-tained in X and Y directions for each unregistered frameare the same as those obtained in the previous itera-tion. That is, the algorithm is repeated until there are nochanges in the translation parameters obtained in Xand Y directions in the current and previous iterationsfor all the image frames.
Ten short-axis perfusion data sets (five rest perfusionand five adenosine stress perfusion), with 60–100 timeframes each, are processed with the iterative model-based registration algorithm. Each of the 10 data sets isderived from a different patient. Seven are from patientsbeing evaluated for coronary artery disease, and threeare obtained from normal volunteers.
In addition, the algorithm is tested on 10 two-chamber-view long-axis perfusion data sets. The long-axis data setsare obtained from seven different patients. Long-axis im-ages can contain other structures, such as the atrialblood pools. It is important to assess whether the modelused in the model-based registration method can repre-
sent such features. Also, since the RV does not appear inthe images, a different input function must be chosen.The input function Cinput used in Eq. [3] to generate themodel images is obtained in the same way as for theshort-axis slices, but from a region chosen in the LV bloodpool of the heart. Figure 4 represents the model images fora typical long-axis data set.
Analysis
Motion is estimated to the nearest pixel manually for eachframe using custom software with user-drawn contours.The shifts obtained using manual registrations are com-pared with those obtained using the automatic method,and the reduction in motion is estimated. The percentage
improvement in motion is calculated as �1 �MR
MUR�
� 100%, where MR is the absolute measure of motionpresent after registration, and MUR is the absolute of mo-tion present before registration, assuming that the man-ually registered images are free of motion. In addition, themyocardium is divided into regions of interest (ROIs) anda kinetic analysis with a two-compartment model is per-formed to determine the blood flow indices. This is theKtrans parameter in Eqs. [1]–[3]. The division of the tissueinto regions is done on a single frame and the same re-gions are used for all of the frames. The flow indicescalculated for manually registered images are comparedwith those from automatically registered data. The per-centage improvement in the estimation of perfusion indi-
ces is calculated according to �1 �ER
EUR� � 100, where ER
is the average absolute value of the differences in theperfusion flow indices between automatically registeredand manually registered images, and EUR is the absolutevalue of the difference in perfusion flow indices betweenunregistered and registered images. The average relativeerror of the flow indices is defined as ER divided by the flowvalues from the manually registered images. Paired t-testswith Bonferroni correction are used to compare the flowvalues at a significance level of P � 0.05.
RESULTS
The complete results for a short-axis slice from a typicalpatient (patient 1) with 70 time frames are presented inFigs. 1, 3, 5, and Tables 1–2. Table 1 compares theaverage absolute motion for each image frame in the Xand Y directions before and after registration. There isan improvement of 71% in registration by using theiterative model-based method as compared to an im-provement of 54% after preliminary registration using asingle reference image for the absolute mean shifts inthe vertical or Y direction. An improvement of 46% is
Figure 8. Comparison of the average relative error in the flowindices for the eight tissue regions before and after registrationfor short-axis slices from 10 patients.
Table 3Comparison of Flow Indices of the Regions in the Myocardium Before and After Registration for the 10 Short Axis Slices from 10Patients Using Paired t-Tests with Bonferroni Correction
Paired t-tests with Bonferronicorrection for flow indices
Manually registered vs.unregistered
Iterative model- based vs.unregistered
Manual registration vs. iterativemodel-based registration
P 0.00066 0.00093 1
Model-Based Registration 1067

observed using the iterative model-based method ascompared to a 36% improvement after preliminary reg-istration for the absolute mean shifts in the horizontalor X direction. Figure 1a–g shows two points chosen inthe LV blood pool and a region in the tissue, and com-pare the respective SI time curves before and after reg-istration.
In Fig. 5 the division of the myocardium into eightROIs is shown. Table 2 compares the flow indices foreach of the eight regions. The flow indices are obtainedby performing a separate two-compartment modelanalysis before and after registration. The input func-tion is obtained by subtracting the precontrast inten-sity for approximately eight frames from the average ofSI time curves for a region in the LV blood pool. There isa total absolute improvement by 68% in the estimationof flow indices of eight regions after preliminary regis-tration, and 83% improvement after using the iterativemodel-based method as compared to those from themanual registration.
The results for all 10 short-axis slices from 10 differ-ent patients are summarized in Figs. 6–8. Typically,three to five iterations are required before registration iscompleted. The average absolute motion in Y and Xdirections per frame for unregistered and registeredimages is compared in Figs. 6 and 7, respectively. Themean absolute motion per frame of the heart over all ofthe data sets decreased from 5.3 � 5.2 (mean � SD) mmto 0.8 � 1.3 mm along the Y direction, and from 3.0 �3.7 mm to 0.9 � 1.2 mm along the X direction. Figure 8gives the average relative errors in flow indices for theeight regions in myocardium before and after registra-tion for all of the 10 patients. An overall mean absoluteimprovement of 77% in the estimation of perfusion flowindices is observed as compared to those from manualregistration. Table 3 summarizes the results of pairedt-tests with Bonferroni correction. The flow values be-fore and after registration are significantly different.
Registration of two-chamber-view data sets was sim-ilar in performance to the short-axis images. In thelong-axis data sets the motion is mostly in the vertical
direction and negligible motion is observed in the hor-izontal direction (on the order of 1 mm). The results for10 different long-axis data sets are shown in Figs. 9–11.Figure 9 compares the mean absolute motion over all ofthe time frames in the vertical or Y direction before andafter registration. Significant motion reduction is ob-tained after registration. Also, the myocardium in eachlong-axis data set is divided into ROIs as shown in Fig.10, and perfusion flow indices to the tissue regions areobtained by fitting the time curves of the regions to thetwo-compartment model. Figure 11 shows the averagerelative error in the estimation of perfusion flow indicesfor the long-axis data sets before and after registrationby comparing them with those obtained from manualregistration. Table 4 shows the results of the pairedt-tests with Bonferroni correction by comparing the flowindices for the long-axis data sets. We again see that
Figure 9. Comparison of the average absolute motion (mm) ofthe heart over all of the time frames for 10 two-chamber long-axis data sets before and after registration in the Y (vertical)direction. Negligible motion is observed in the X direction andis not shown.
Figure 10. The myocardium in the two-chamber-view long-axis data set is divided into regions to estimate the flow indicesby performing a two-compartment model analysis for a typicalpatient. Note that region 1 is blood pool and is not used. Theregion in the blood pool chosen to compute the input functionfor estimating the perfusion flow indices is also shown in thecenter of the LV blood pool.
Figure 11. Comparison of the average relative error in the flowindices for the eight tissue regions before and after registrationfor 10 two-chamber long-axis data sets.
1068 Adluru et al.

model-based registration makes a significant differencein the estimation of the flow indices.
Time Factor
The algorithm required at most five iterations for thedata sets to converge. For our Matlab implementations,the time taken by the iterative model-based methodusing the linearized model in Eq. [3] to find the opti-mum parameters for fitting the time curves is three tofour times less than that required for a conventionalnonlinear least-squares method. The time taken by thealgorithm to register a data set with approximately6000 pixels per frame and 70 time frames is 1.7 min-utes per iteration on a Linux machine with an AMD 270dual core and 4G RAM. This amount of time is notprohibitive for offline processing of cardiac perfusionstudies, and could be substantially reduced with opti-mized implementations.
DISCUSSION
The iterative model-based method improves registra-tion compared to the more standard mean square dif-ference methods by using model reference images foreach frame. The intuitive reasoning is that a singlereference frame does not well represent the changingdistribution of Gd, and creating reference frames foreach time frame can prevent misregistrations of theframes. Another advantage to the use of model-basedregistration is the inherent denoising by the fitting pro-cess. The reduced noise likely contributes to more ro-bust registrations. It is of particular interest that thedynamic image data outside of the LV can be relativelywell represented by a two-compartment model with aninput function taken from the RV for short-axis datasets, and an input function from the LV for long-axisdata sets. This is a new finding that could be applied inother ways, such as for denoising dynamic myocardialperfusion images. Another useful finding is that themodel-based approach does not require a large dose ofcontrast agent. A range of doses were used successfullyhere, which implies that the method is applicable formost practical doses.
Correction of rotational motion was not addressedin this study; however, the method could readily beextended to handle rotational motion. For the datasets we used there appeared to be negligible rotationmotion. Others have corrected for translational androtational motion and used results obtained frommanual registration without rotation as the goldstandard (6,8). Bidaut and Vallee (6) reported that therelative motion of the anatomical landmarks at theextremities and center of the mid-wall segment is
reduced compared to manual registration after cor-rection for rotational motion is incorporated.
Performing a comparison with manually shifted im-ages is a good way to determine how well differentimage registration methods perform. The idealmethod is to use task-dependent metrics. For exam-ple, in the case of myocardial perfusion images, theflow indices of the tissue when used in diagnosis orprognosis are a more relevant gauge of registrationperformance. A useful surrogate for the ideal methodis to compare perfusion values from the unregisteredand registered data, as in Table 2. The flows are notexpected to be a sensitive measure of registration. Forexample, it is possible that even though the heartmoves, the same or similar pixel intensities will beshifted into the ROI. However, a comparison of flowsis more relevant clinically than a comparison ofshifts. Also, image frames with out-of-plane motioncan affect the regional flow indices of the tissue. De-spite these limitations, there is an improvement inthe flow indices calculated with model-based regis-tration in that the values more closely match theresults from manually registered data.
In conclusion, model-based registration provides arobust method for estimating in-plane shifts to registerDCE myocardial images for short-axis and two-cham-ber long-axis data sets. In contrast to methods thatregister all of the image frames to a single referenceimage, the model-based method provides a uniquemeans of creating a reference image for each timeframe. Since many of the time frames bear little resem-blance to the single reference image, improved registra-tion can be achieved with the use of model-based reg-istration.
ACKNOWLEDGMENTS
We appreciate the help of Chris McGann, M.D., HenryBuswell, Melody Johnson, and Nate Pack with dataacquisition.
REFERENCES
1. Schwitter J, Nanz D, Kneifel S, et al. Assessment of myocardialperfusion in coronary artery disease by magnetic resonance: acomparison with positron emission tomography and coronary an-giography. Circulation 2001;103:2230–2235.
2. Al-Saadi N, Nagel E, Gross M, et al. Noninvasive detection of myo-cardial ischemia from perfusion reserve based on cardiovascularmagnetic resonance. Circulation 2000;101:1379–1383.
3. Bertschinger KM, Nanz D, Buechi M, et al. Magnetic resonancemyocardial first-pass perfusion imaging: parameter optimizationfor signal response and cardiac coverage. J Magn Reson Imaging2001;14:556–562.
Table 4Comparison of Flow Indices of the Tissue Regions Before and After Registration for the 10 Long Axis Datasets Using Paired t-Tests withBonferroni Correction
Paired t-tests with Bonferronicorrection for flow indices
Manually registered vs.unregistered
Iterative model- based vs.unregistered
Manual registration vs. iterativemodel-based registration
P 0.0117 0.0126 1
Model-Based Registration 1069

4. Vallee JP, Sostman HD, MacFall JR, et al. Quantification of myo-cardial perfusion by MRI after coronary occlusion. Magn Reson Med1998;40:287–297.
5. Cullen JH, Horsfield MA, Reek CR, Cherryman GR, Barnett DB,Samani NJ. A myocardial perfusion reserve index in humans usingfirst-pass contrast-enhanced magnetic resonance imaging. J AmColl Cardiol 1999;33:1386–1394.
6. Bidaut LM, Vallee JP. Automated registration of dynamic MR im-ages for the quantification of myocardial perfusion. J Magn ResonImaging 2001;13:648–655.
7. Gallippi CM, Kramer CM, Hu YL, Vido DA, Reichek N, Rogers WJ.Fully automated registration and warping of contrast-enhanced first-pass perfusion images. J Cardiovasc Magn Reson 2002;4:459–469.
8. Dornier C, Ivancevic MK, Thevenaz P, Vallee JP. Improvement in thequantification of myocardial perfusion using an automatic spline-based registration algorithm. J Magn Reson Imaging 2003;18:160–168.
9. Thevenaz P, Ruttimann UE, Unser M. A pyramid approach to sub-pixel registration based on intensity. IEEE Trans Image Process1998;7:27–41.
10. Bracoud L, Vincent F, Pachai C, Canet E, Croisille P, Revel D.Automatic registration of MR first-pass myocardial perfusion im-ages. Lect Notes Comput Sci 2003;2674:215–223.
11. Viola P, Wells III WM. Alignment by maximization of mutual infor-mation. Int J Comput Vis 1997;24:137–154.
12. Stegmann MB, Olafsdottir H, Larsson HBW. Unsupervised motion-compensation of multi-slice cardiac perfusion MRI. Med ImageAnal 2005;9:394–410.
13. Buonaccorsi GA, Roberts C, Cheung S, Watson Y, Parker GJ. Anovel method of model-based rigid registration for dynamic con-trast enhanced MRI studies. In: Proceedings of 13th Annual Meet-ing of ISMRM, Miami Beach, FL, USA, 2005. Abstract 742.
14. Tofts PS, Brix G, Buckley DL, Evelhoch JL, et al. Estimating kineticparameters from dynamic contrast-enhanced T1-weighted MRI of adiffusable tracer: Standardized quantities and symbols. J MagnReson Imaging 1999;10:223–232.
15. Jerosch-Herold M, Swingen C, Seethamraju RT. Myocardial bloodflow quantification with MRI by model-independent deconvolution.Med Phys 2002;29:886–897.
16. Choyke PL, Dwyer AJ, Knopp MV. Functional tumor imaging withdynamic contrast-enhanced magnetic resonance imaging. J MagnReson Imaging 2003;17:509–520.
17. Murase K. Efficient method for calculating kinetic parameters us-ing T1-weighted dynamic contrast-enhanced magnetic resonanceimaging. Magn Reson Med 2004;51:858–862.
18. Feng D, Wang ZZ, Huang SC. A study on statistically reliable andcomputationally efficient algorithms for generating local cerebralblood flow parametric images with positron emission tomography.IEEE Trans Med Imaging 1993;12:182–188.
1070 Adluru et al.


