Embed Size (px)
Citation preview
University of CaliforniaSanta Barbara
Modeling Financial Behaviors Online
A dissertation submitted in partial satisfaction
of the requirements for the degree
Doctor of Philosophy
in
Computer Science
by
Xinyi Zhang
Committee in charge:
Professor Heather Zheng, Co-ChairpersonProfessor Ben Y. Zhao, Co-ChairpersonProfessor William Wang
September 2019
The Dissertation of
Xinyi Zhang is approved:
William Wang
Ben Y. Zhao, Co-Chairperson
Heather Zheng, Co-Chairperson
May 2019

Modeling Financial Behaviors Online
Copyright © 2019
by
Xinyi Zhang
iii

To my grandparents, parents and my loved ones.
iv

Acknowledgements
First of all, I would like to thank my wonderful advisors Ben Y. Zhao and Haitao
Zheng for mentoring me throughout the PhD program. They are attentive to my progress,
always able to give insightful comments while also making sure that I have an enjoyable
PhD life. I’m thankful of the friendly and collaborative environment they established in
SAND Lab, which makes the entire journey a delightful experience. Second, I would also
like to thank my committee member, William Wang, for giving valuable advice on my
projects and on choosing research directions. Finally, I want to thank my mentors in my
previous internship: Ennan Zhai and Hongqiang Liu from Alibaba.
I am very grateful that I get to work with all my collaborators, without whom this
thesis would never have been possible. First, I would like to thank the members of SAND
Lab: Gang Wang, Shiliang Tang, Bolun Wang, Shawn Shan, Jenna Cryan, Zhijing Li,
Ana Nika, Yanzi Zhu, Kevin Yao, Qinyun Liu, Yun Zhao, Xiaohan Zhao, Christo Wilson,
Emily Willson and Olivia Sturman. Second, to Xiaojuan Ma and Ziming Wu from Hong
Kong University of Science and Technology, to Da Yu from Brown University, to Chen
Tian and Bingchuan Tian from Nanjing University, and to Miriam Metzger from the
Department of Communications at UC Santa Barbara. Third, to our collaborators from
the industry Xin Wu, Zhiming Ji, Qiaobo Ye and Ming Zhang from Alibaba, and Ulas
Bardak at Whisper Inc. Fourth, to my collaborators during my undergraduate years,
Weili Han, Zheran Fang, Yuliang Yin, Liangxing Liu and Tao Zhou from Fudan Univer-
sity, to Yan Chen, Zhengyang Qu and Vaibhav Rastogi from Northwestern University; I
wouldn’t be taking this journey without you.
I would also like to express my thanks to the other members at SANDLab, Bimal
Viswanath, Zhujun Xiao, Yibo Zhu, Yuxin Chen, Huiying Li, Max Liu, Zengbin Zhang,
Megan McQueen and Divya Sambasivan. I have learned so many things through the
v

discussions we have had; thank you all for making SANDLab the great place it is.
Finally, I would like to thank my family, my friends, and my loved ones for your
unconditional support. Thank you for always being there for me.
vi
Curriculum VitæXinyi Zhang
Education
2014-2019 Ph.D. in Computer Science (Expected), University of California,Santa Barbara.
2010-2014 Bachelor of Engineering in Software School, Fudan University, Shang-hai, China.
Conference Publications
• Bingchuan Tian*, Xinyi Zhang*, Da Yu, Ennan Zhai, Hongqiang Harry Liu,Qiaobo Ye, Chunsheng Wang, Xin Wu, Zhiming Ji, Yihong Sang, Chen Tian, BenY. Zhao, Heather Zheng, Ming Zhang (* equal contribution). In Proceedings ofSIGCOMM, 2019.
• Shiliang Tang, Ziming Wu, Xinyi Zhang, Gang Wang, Xiaojuan Ma, Haitao Zhengand Ben Y. Zhao. “Towards Understanding the Adoption and Social Experience ofDigital Wallet Systems.” In Proceedings of HICSS, 2019.
• Xinyi Zhang, Shawn Shan, Shiliang Tang, Haitao Zheng, and Ben Y. Zhao. “PennyAuctions are Predictable: Predicting and Profiling User Behavior on DealDash(short paper).” In Proceedings of Hypertext, 2018.
• Shiliang Tang, Xinyi Zhang, Jenna Cryan, Miriam Metzger, Haitao Zheng, andBen Y. Zhao. “Gender Bias in the Job Market: A Longitudinal Analysis.” InProceedings of CSCW, 2018.
• Xinyi Zhang, Shiliang Tang, Yun Zhao, Gang Wang, Haitao Zheng, and Ben Y.Zhao. “Cold Hard E-Cash: Friends and Vendors in the Venmo Digital PaymentsSystem.” In Proceedings of ICWSM, 2017.
• Zhijing Li, Ana Nika, Xinyi Zhang, Yanzi Zhu, Yuanshun Yao, Ben Y. Zhao andHaitao Zheng. “Identifying Value in Crowdsourced Wireless Signal Measurements.”In Proceedings of WWW, 2017.
• Bolun Wang, Xinyi Zhang, Gang Wang, Haitao Zheng, Ben Y. Zhao. “Anatomyof a Personalized Livestreaming System.” In Proceedings of IMC, 2016.
• Qingyun Liu, Shiliang Tang, Xinyi Zhang, Xiaohan Zhao, Ben Y. Zhao, HaitaoZheng. “Network Growth and Link Prediction Through an Empirical Lens.” InProceedings of IMC, 2016.
• Gang Wang, Xinyi Zhang, Shiliang Tang, Haitao Zheng, Ben Y. Zhao. “Unsuper-vised Clickstream Clustering for User Behavior Analysis.” In Proceedings of CHI,2016.
vii
• Zhengyang Qu, Vaibhav Rastogi, Xinyi Zhang, Yan Chen, Tiantian Zhu, ZhongChen. “AutoCog: Measuring the Description-to-permission Fidelity in AndroidApplications.” In Proceedings of CCS, 2014.
• Xinyi Zhang, Weili Han, Zheran Fang, Yuliang Yin, Hossen Mustafa. “Role MiningAlgorithm Evaluation and Improvement in Large Volume Android Applications.” InProceedings of the First International Workshop on Security in Embedded Systemsand Smartphones (SESP’13), conjunction with ASIACCS, 2013.
Journals
• Gang Wang, Xinyi Zhang, Shiliang Tang, Christo Wilson, Haitao Zheng, and BenY. Zhao. “Clickstream User Behavior Models.” ACM Transactions on the Web(TWEB), 2017.
• Liangxing Liu, Weili Han, Tao Zhou, Xinyi Zhang. “SCout: Prying into SupplyChains via a Public Query Interface.” IEEE Systems Journal, 2014.
viii
Abstract
Modeling Financial Behaviors Online
by
Xinyi Zhang
Financial activities have been central to the survival and prosperity of human soci-
eties. In modern days, we humans are carrying out financial activities on a daily basis,
from setting up retirement funds to purchasing a cup of coffee from the local store. Every
financial decision we made is in some way contributing to the invisible hand that propels
the market forward.
The studying of financial behavior has been a long and hard battle. Starting from
the realization that participants in economic activities are human and thus not fully
rational, researchers from many fields have tried to shed lights on the financial behavior of
individuals, ranging from psychology, neuroscience and behavioral economics. However,
for many years, due to the sensitive nature of financial information, and the resulting lack
of large-scale data, the studies of financial behavior are typically in the forms of small-
scale lab experiments, an environment that is quite different from real-world economic
settings.
Fortunately, with the digital age, financial activities are increasingly moving online,
exemplified by the proliferation of e-commerce and digital wallets. Research opportuni-
ties arise from the accompanying emergence of large-scale datasets about users’ online
financial activities in the wild.
Yet challenges still remain as to how to effectively utilize such datasets to truly
understand the financial behaviors. The first challenge is the scale of data. With millions
or even billions of users involved, it is important to find the appropriate methodology to
ix
make sense of such large-scale data. Second, the depth of understanding. Observational
studies are limited by what is observable while a full understanding requires one to touch
upon the hidden drivers behind the behavior. The third challenge is in how to transform
the understanding into actionable knowledge.
In this thesis, we tackle the challenges one by one, measuring and understanding
users online financial behavior and finally using our understanding in making financial
decisions. We begin with a serious of measurement studies that explore the different
dimensions in online financial behavior, going from collaborative and friendly social pay-
ments to the competitive auction biddings. We show that the relationship between users
plays a key role in forming their behavioral patterns and that financial behaviors are
highly distinct even within the same system, potentially driven by different sets of moti-
vations.
Next, we deepen our understanding by exploring the underlying motivations behind
user behaviors. Leveraging existing works in social science and behavioral economics,
we develop hypotheses regarding users financial behavior and verify our hypotheses us-
ing surveys, interviews as well as empirical measurement. We uncover various aspects
that shape financial behaviors such as the cultural differences in user behaviors during
the adoption of digital wallets and how auction mechanisms affect users reactions to
competitions.
Finally, we explore how to use our models to guide financial decisions. By building a
faithful model of bid-by-bid behavior during penny auctions, we have essentially built a
testing platform to experiments with both prediction-based and learning-based decision
strategies. Using such models, we are able to identify a prisoners’ dilemma embedded in
the penny auction environment when multiple bidders adopt the same strategy.
In summary, this thesis presents how a combination of data-driven approach and be-
havioral theories can help understand and guide financial behaviors. We have developed
x

methods to identify diverse sets of behavioral patterns in financial systems, introduced
ways incorporate existing theories into the study of online financial behavior, and show
how developed models can help navigate the vast decision space in the financial systems.
xi
Contents
Curriculum Vitae vii
Abstract ix
List of Figures xv
List of Tables xvii
1 Introduction 11.1 Dissertation Overview . . . . . . . . . . . . . . . . . . . . . . . . . . . . . . . . 21.2 Measuring Online Financial Behavior . . . . . . . . . . . . . . . . . . . . . . . 31.3 Understanding Online Financial Behavior . . . . . . . . . . . . . . . . . . . . 41.4 Using Understanding to Guide Financial Actions . . . . . . . . . . . . . . . . 61.5 Contributions . . . . . . . . . . . . . . . . . . . . . . . . . . . . . . . . . . . . . 61.6 Thesis Organization . . . . . . . . . . . . . . . . . . . . . . . . . . . . . . . . . 9
2 Measuring Online Financial Behavior 102.1 The Interplay between Social and Financial Systems . . . . . . . . . . . . . 11
2.1.1 Introduction . . . . . . . . . . . . . . . . . . . . . . . . . . . . . . . . . 112.1.2 Background & Related Work . . . . . . . . . . . . . . . . . . . . . . . 132.1.3 Data & Initial Analysis . . . . . . . . . . . . . . . . . . . . . . . . . . . 152.1.4 Transaction & Social Graphs . . . . . . . . . . . . . . . . . . . . . . . 202.1.5 Users & Communities . . . . . . . . . . . . . . . . . . . . . . . . . . . . 262.1.6 Payment Types & Dynamics . . . . . . . . . . . . . . . . . . . . . . . 342.1.7 Conclusion . . . . . . . . . . . . . . . . . . . . . . . . . . . . . . . . . . 37
2.2 Behaviors in Competitive Auctions . . . . . . . . . . . . . . . . . . . . . . . . 372.2.1 Introduction . . . . . . . . . . . . . . . . . . . . . . . . . . . . . . . . . 372.2.2 Background & Related Work . . . . . . . . . . . . . . . . . . . . . . . 392.2.3 Initial Analysis . . . . . . . . . . . . . . . . . . . . . . . . . . . . . . . . 402.2.4 Profiling User Bidding Behavior . . . . . . . . . . . . . . . . . . . . . 432.2.5 Discussion and Conclusions . . . . . . . . . . . . . . . . . . . . . . . . 46
xii
3 Understanding Online Financial Behavior 493.1 Understanding the Adoption and Experience of Digital Wallets . . . . . . . 50
3.1.1 Introduction . . . . . . . . . . . . . . . . . . . . . . . . . . . . . . . . . 503.1.2 Background . . . . . . . . . . . . . . . . . . . . . . . . . . . . . . . . . . 523.1.3 Theoretical Background and Related Work . . . . . . . . . . . . . . . 543.1.4 Research Methodology . . . . . . . . . . . . . . . . . . . . . . . . . . . 583.1.5 Adoption and Usage of Digital Wallets . . . . . . . . . . . . . . . . . 623.1.6 Social Ties Affect User Experience . . . . . . . . . . . . . . . . . . . . 653.1.7 Social Interactions Affect User Experience . . . . . . . . . . . . . . . 683.1.8 Transactions Affect Social Relationship . . . . . . . . . . . . . . . . . 733.1.9 Discussion . . . . . . . . . . . . . . . . . . . . . . . . . . . . . . . . . . 753.1.10 Conclusion . . . . . . . . . . . . . . . . . . . . . . . . . . . . . . . . . . 77
3.2 Psychological factors behind Penny Auction Behaviors . . . . . . . . . . . . 783.2.1 Introduction & Related Works . . . . . . . . . . . . . . . . . . . . . . 783.2.2 Hypotheses . . . . . . . . . . . . . . . . . . . . . . . . . . . . . . . . . . 803.2.3 Observing Psychological Phenomenon . . . . . . . . . . . . . . . . . . 813.2.4 Discussions & Conclusions . . . . . . . . . . . . . . . . . . . . . . . . . 84
4 Using Understanding to Guide Financial Actions: The Case of PennyAuctions 864.1 Introduction . . . . . . . . . . . . . . . . . . . . . . . . . . . . . . . . . . . . . . 874.2 Background and Related Work . . . . . . . . . . . . . . . . . . . . . . . . . . . 894.3 Profitability and Sustainability . . . . . . . . . . . . . . . . . . . . . . . . . . 92
4.3.1 Our Dataset . . . . . . . . . . . . . . . . . . . . . . . . . . . . . . . . . 924.3.2 Inferring Retail Prices . . . . . . . . . . . . . . . . . . . . . . . . . . . 934.3.3 Estimating Profits . . . . . . . . . . . . . . . . . . . . . . . . . . . . . . 944.3.4 Per-user Profits and Sustainability . . . . . . . . . . . . . . . . . . . . 95
4.4 Bid-level Simulation of Penny Auctions . . . . . . . . . . . . . . . . . . . . . 974.4.1 Basic Bid Prediction Model . . . . . . . . . . . . . . . . . . . . . . . . 974.4.2 Powering Simulation with LSTMs . . . . . . . . . . . . . . . . . . . . 1004.4.3 Trace-based Simulator Validation . . . . . . . . . . . . . . . . . . . . . 102
4.5 How to Bid and Win Penny Auctions . . . . . . . . . . . . . . . . . . . . . . 1044.5.1 Automated Bidding Agents . . . . . . . . . . . . . . . . . . . . . . . . 1054.5.2 Adversarial Strategies . . . . . . . . . . . . . . . . . . . . . . . . . . . . 1064.5.3 Evaluating Strategies . . . . . . . . . . . . . . . . . . . . . . . . . . . . 1084.5.4 Competitive Adversarial Bidding . . . . . . . . . . . . . . . . . . . . . 110
4.6 Limitations and Ongoing Work . . . . . . . . . . . . . . . . . . . . . . . . . . 111
5 Conclusions and Discussions 1135.1 Summary . . . . . . . . . . . . . . . . . . . . . . . . . . . . . . . . . . . . . . . 1145.2 Lessons . . . . . . . . . . . . . . . . . . . . . . . . . . . . . . . . . . . . . . . . . 1155.3 Future Directions . . . . . . . . . . . . . . . . . . . . . . . . . . . . . . . . . . . 118
xiii

A Appendix 120A.1 Appendix: Questionnaire used in Digital Wallet Survey . . . . . . . . . . . . 120A.2 Appendix: Semi-structured Interview Script for Digital Wallet Systems . . 129
Bibliography 133
xiv

List of Figures
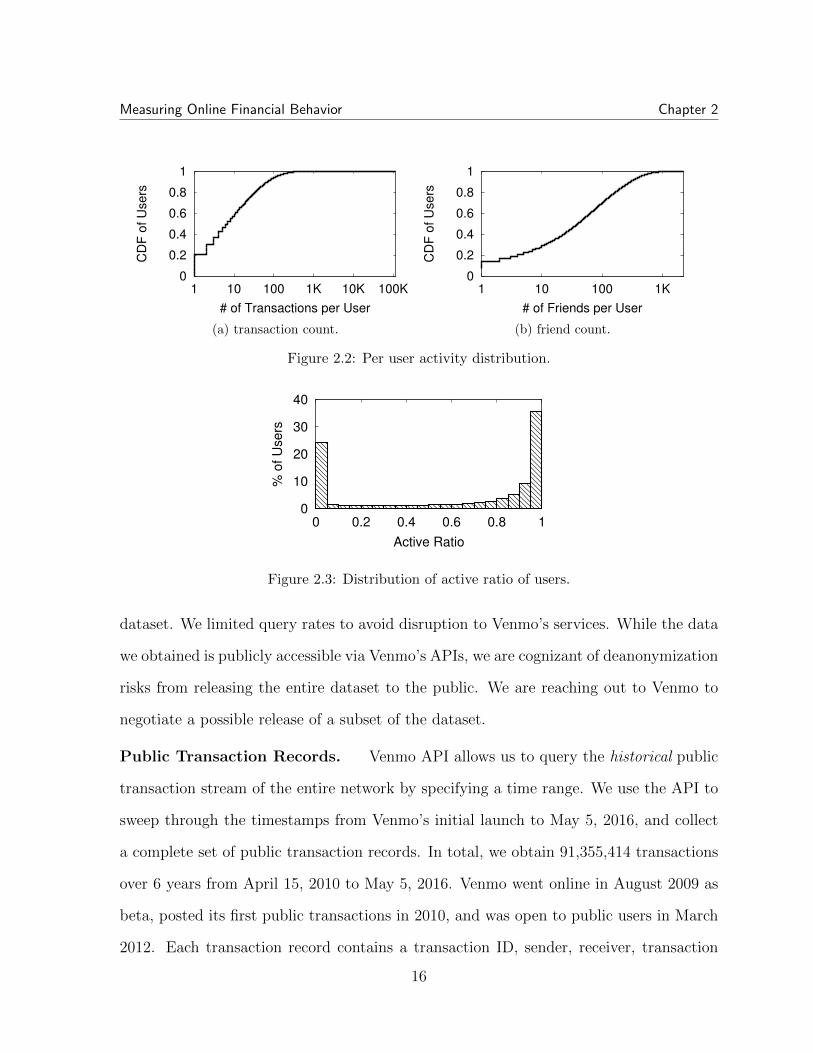
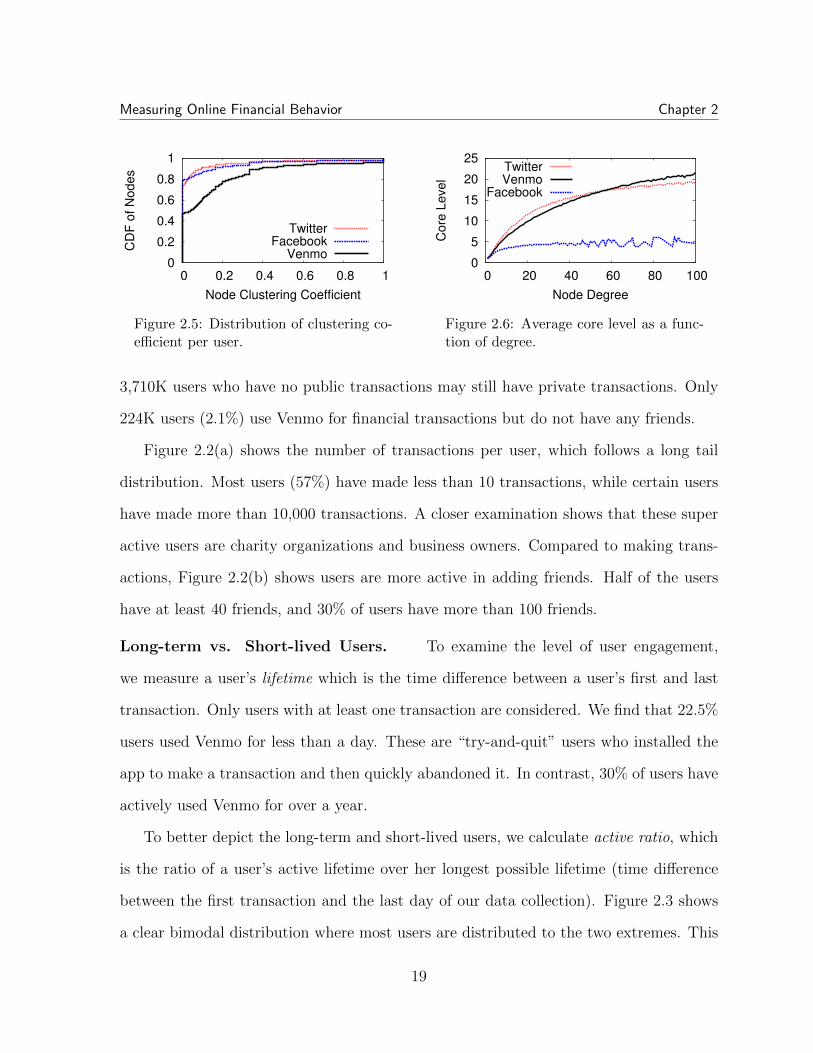
2.1 Venn diagram: social and transaction network. . . . . . . . . . . . . . . . . . 152.2 Per user activity distribution. . . . . . . . . . . . . . . . . . . . . . . . . . . . 16
(a) transaction count. . . . . . . . . . . . . . . . . . . . . . . . . . . . . . . . 16(b) friend count. . . . . . . . . . . . . . . . . . . . . . . . . . . . . . . . . . . 16
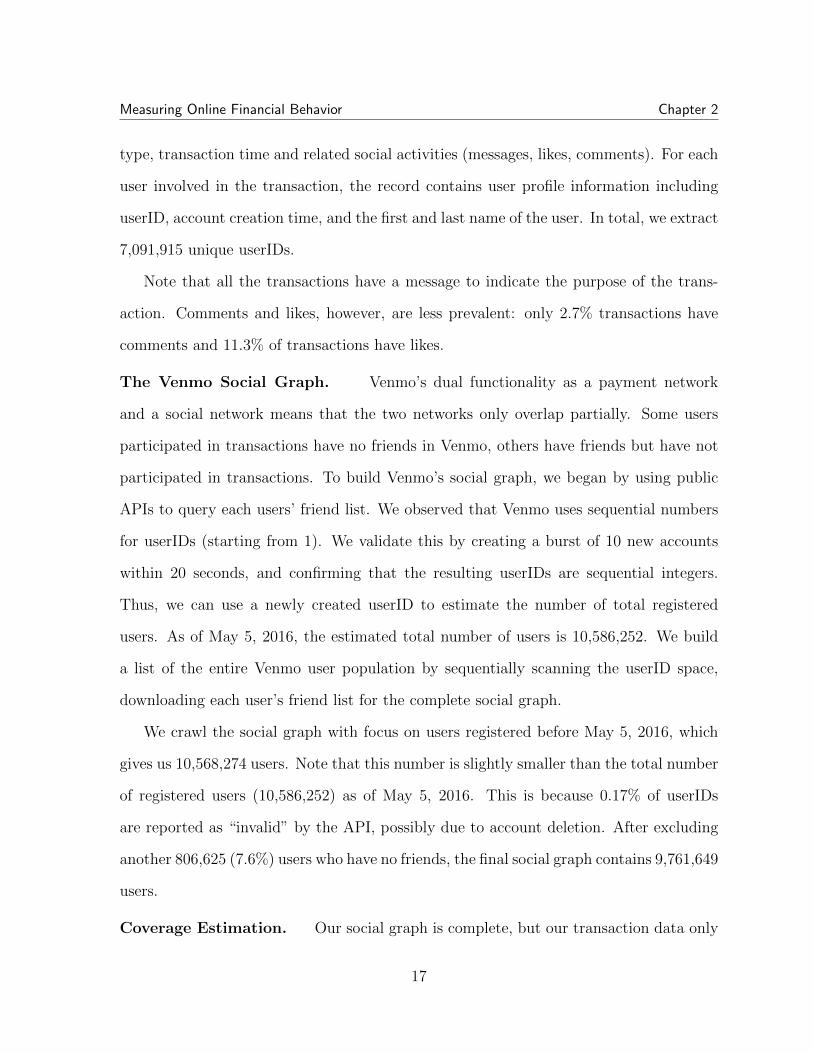
2.3 Distribution of active ratio of users. . . . . . . . . . . . . . . . . . . . . . . . . 162.4 Weekly growth trend of Venmo. . . . . . . . . . . . . . . . . . . . . . . . . . . 18
(a) Number of new users. . . . . . . . . . . . . . . . . . . . . . . . . . . . . . 18(b) Number of new transactions. . . . . . . . . . . . . . . . . . . . . . . . . 18
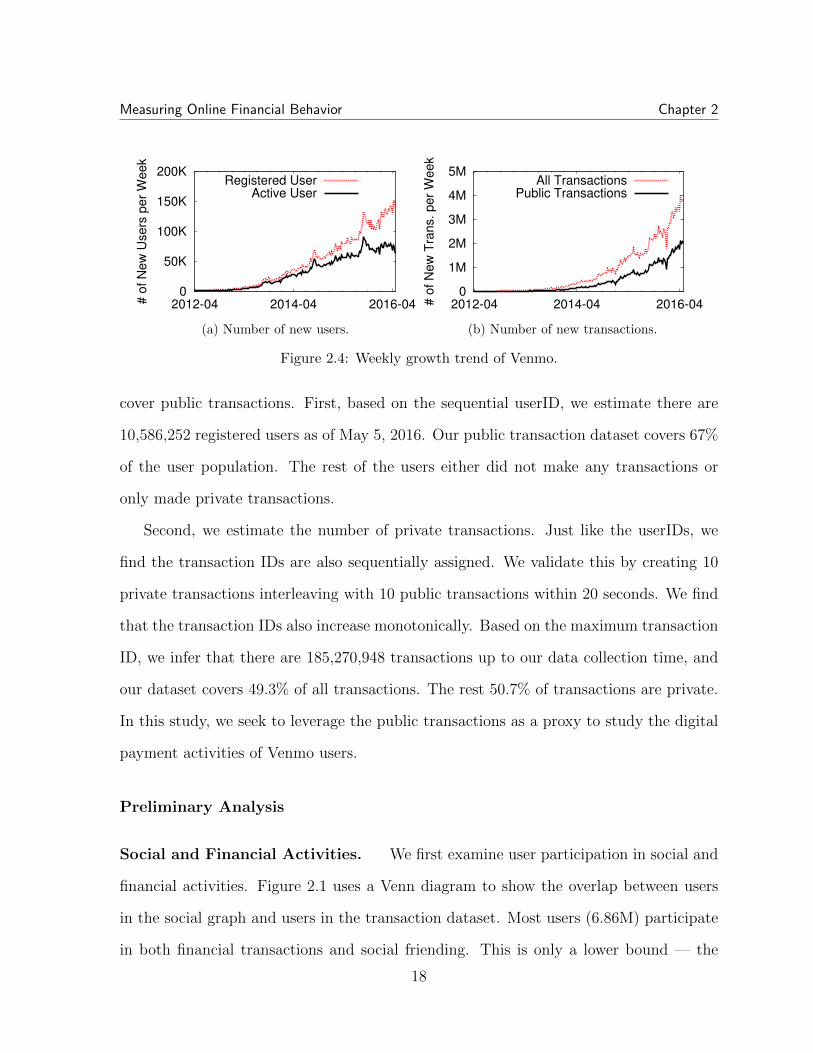
2.5 Distribution of clustering coefficient per user. . . . . . . . . . . . . . . . . . . 192.6 Average core level as a function of degree. . . . . . . . . . . . . . . . . . . . . 192.7 Comparing different clusters on 3 key features. We depict each distribution
with box plot quantiles (5%, 25%, 50%, 75%, 95%). . . . . . . . . . . . . . . 292.8 Size distribution of communities. . . . . . . . . . . . . . . . . . . . . . . . . . 302.9 Clustering coefficient of financial communities. . . . . . . . . . . . . . . . . . 302.10 Transaction burstiness in financial communities. . . . . . . . . . . . . . . . . 312.11 Number of words per message. . . . . . . . . . . . . . . . . . . . . . . . . . . . 342.12 Cumulated # of messages hit by top keywords. . . . . . . . . . . . . . . . . . 342.13 Recurrence period distribution among user pairs. . . . . . . . . . . . . . . . 342.14 Distribution of time waited until the next bid. . . . . . . . . . . . . . . . . . 402.15 Bids placed per auction, for auctions winners or across all bidders. . . . . . 402.16 Distribution of price paid relative to product value. . . . . . . . . . . . . . . 402.17 Distribution of time gap between each users’ first and last bid. . . . . . . . 402.18 Distribution of feature value for each cluster and for short-term bidders.
We depict each distribution with box plot quantiles (5%, 25%, 50%, 75%,95%). . . . . . . . . . . . . . . . . . . . . . . . . . . . . . . . . . . . . . . . . . . 43
2.19 Distribution of earnings per auction for different types of bidders. . . . . . 43
xv
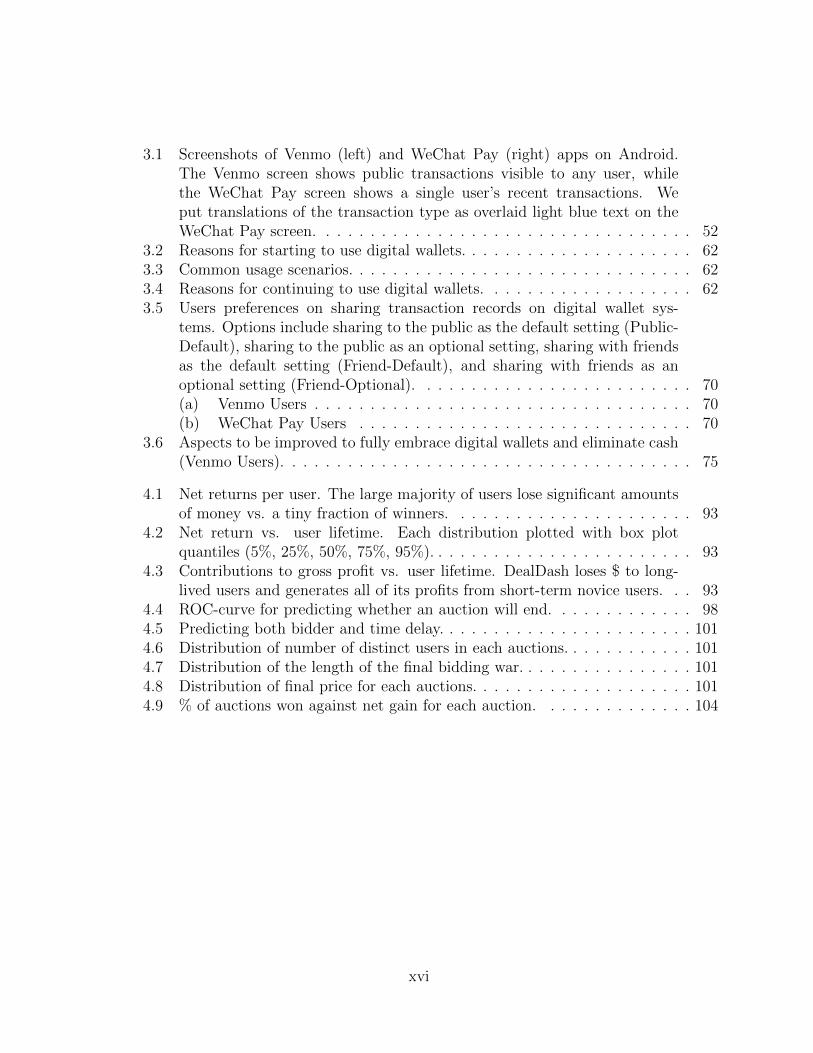
3.1 Screenshots of Venmo (left) and WeChat Pay (right) apps on Android.The Venmo screen shows public transactions visible to any user, whilethe WeChat Pay screen shows a single user’s recent transactions. Weput translations of the transaction type as overlaid light blue text on theWeChat Pay screen. . . . . . . . . . . . . . . . . . . . . . . . . . . . . . . . . . 52
3.2 Reasons for starting to use digital wallets. . . . . . . . . . . . . . . . . . . . . 623.3 Common usage scenarios. . . . . . . . . . . . . . . . . . . . . . . . . . . . . . . 623.4 Reasons for continuing to use digital wallets. . . . . . . . . . . . . . . . . . . 623.5 Users preferences on sharing transaction records on digital wallet sys-
tems. Options include sharing to the public as the default setting (Public-Default), sharing to the public as an optional setting, sharing with friendsas the default setting (Friend-Default), and sharing with friends as anoptional setting (Friend-Optional). . . . . . . . . . . . . . . . . . . . . . . . . 70(a) Venmo Users . . . . . . . . . . . . . . . . . . . . . . . . . . . . . . . . . . 70(b) WeChat Pay Users . . . . . . . . . . . . . . . . . . . . . . . . . . . . . . 70
3.6 Aspects to be improved to fully embrace digital wallets and eliminate cash(Venmo Users). . . . . . . . . . . . . . . . . . . . . . . . . . . . . . . . . . . . . 75
4.1 Net returns per user. The large majority of users lose significant amountsof money vs. a tiny fraction of winners. . . . . . . . . . . . . . . . . . . . . . 93
4.2 Net return vs. user lifetime. Each distribution plotted with box plotquantiles (5%, 25%, 50%, 75%, 95%). . . . . . . . . . . . . . . . . . . . . . . . 93
4.3 Contributions to gross profit vs. user lifetime. DealDash loses $ to long-lived users and generates all of its profits from short-term novice users. . . 93
4.4 ROC-curve for predicting whether an auction will end. . . . . . . . . . . . . 984.5 Predicting both bidder and time delay. . . . . . . . . . . . . . . . . . . . . . . 1014.6 Distribution of number of distinct users in each auctions. . . . . . . . . . . . 1014.7 Distribution of the length of the final bidding war. . . . . . . . . . . . . . . . 1014.8 Distribution of final price for each auctions. . . . . . . . . . . . . . . . . . . . 1014.9 % of auctions won against net gain for each auction. . . . . . . . . . . . . . 104
xvi

List of Tables
2.1 Comparison between Venmo transaction graph and the interaction graphsin Facebook [1] and Twitter [2]. Venmo transaction graph is further di-vided into friend- and stranger-transaction graphs based on whether atransaction is made between friends. . . . . . . . . . . . . . . . . . . . . . . . 47
2.2 Comparing Venmo, Facebook [1], Renren [3] social graphs. . . . . . . . . . 472.3 Top keywords (after stemming) for user clusters. . . . . . . . . . . . . . . . . 482.4 Transaction categorization using keywords and emoji. Messages without
any word or emoji are not included. If a transaction belongs to multiplecategories, we count it multiple times. Thus the sum of each row may begreater than 100%. . . . . . . . . . . . . . . . . . . . . . . . . . . . . . . . . . . 48
3.1 Ratio of users who “Agree” or “Strongly Agree” on the social networkrelated statements in mobile digital wallets. . . . . . . . . . . . . . . . . . . . 75
3.2 Results of logistic regression model measuring pseudo-endowment effect(H1). Note: *** p<0.01, ** p<0.05, * p<0.1. . . . . . . . . . . . . . . . . . . 82
3.3 Results of logistic regression model measuring sunk cost fallacy and self-justification (H2). . . . . . . . . . . . . . . . . . . . . . . . . . . . . . . . . . . 82
3.4 Results of logistic regression model measuring competitive arousal andherding (H3). . . . . . . . . . . . . . . . . . . . . . . . . . . . . . . . . . . . . . 82
3.5 Results of linear regression model measuring item value and overbidding.Bids are calculated as 12 cents each (H4). . . . . . . . . . . . . . . . . . . . . 82
3.6 Results of logistic regression model measuring all effects combined. . . . . . 84
4.1 Average value of auctioned product in comparison to Buy-It-Now price. . . 914.2 Revenue generated in comparison to value of products auctioned/sold. . . . 914.3 Distribution of users in DealDash and length of active lifetimes observed
in our trace (101,936 users total). . . . . . . . . . . . . . . . . . . . . . . . . . 964.4 AUC in predicting auction ending. Top-1 accuracy and perplexity in pre-
dicting next bidder. . . . . . . . . . . . . . . . . . . . . . . . . . . . . . . . . . 984.5 Results of linear regression correlating auction metadata with # of unique
bidders (‡p<0.01, †p<0.05.). . . . . . . . . . . . . . . . . . . . . . . . . . . . . 103
xvii

4.6 Performance of learning-based strategy (without BidBuddy) when used bymultiple bidders. . . . . . . . . . . . . . . . . . . . . . . . . . . . . . . . . . . . 104
xviii
Chapter 1
Introduction
Financial behavior has long been a topic of interest for many different fields, ranging from
behavioral economics, psychology to neural science. In behavioral economics, researchers
look into what factors influence individual humans in their economic decisions. Using
carefully designed experiments, they highlight how humans as economic agents are con-
stantly under the influence of irrational value models. This observation is then used to
guide of design of various real-world programs, like pension schemes, and organ donation
systems. The field of psychology has also taken great interest in how people’s feeling
governs their financial decisions. Professor Daniel Kahneman is one of the pioneers in
this area and won a Nobel prize for his work on prospect theory, which helps explains
many anomalous behaviors observed on economics. Even researchers from neural science
are interested in how our brains work when dealing with money.
However, most of these studies are either looking at aggregated data or are based on
small-scale surveys or lab experiments. This is partially due to inherent concerns with
the privacy of financial data, which lead to the scarcity of large-scale datasets for peoples
financial activities.
This gloomy picture has shifted significantly with the rise of the internet. Starting
1
Introduction Chapter 1
with the emergence of e-commerce, users started to buy things and hold auctions online,
leaving traces of their financial life on the internet. But it was not until the advance in
mobile payment that things really started to change. People started paying for everyday
things using their phones, which means a large portion of payment activities are moving
online. Now, there are even these social payment apps like Venmo, which combines
the functionality of social network with mobile wallet. These advances present great
opportunities for researchers, as the digitalization of everyday financial activities presents
a wealth of data that were previously hard to explore.
Key Challenges. During the attempts to understand financial behavior, we need
to address a few key challenges. The first challenge is the magnitude of data. Today’s
financial systems often involve millions or even billions of users and activity records, it
is a vital to identify the appropriate measurement methodology suitable for the various
questions we have about financial behavior.
The second challenge is depth of the understanding. Insights directly drawn from
observed behavior may be may not be able to reach the underlying motivations behind
the behavior exhibited. Hence, we need to apply methodologies that can help us gain
insight into the hidden factors behind financial behavior.
Finally, there remains the question of how the behavioral models can be applied.
By its nature, financial behaviors involve the exchange of money, making testing of in-
the-wild behavioral models expensive and difficult to control. We need to address such
challenge when putting our understanding to actual application.
1.1 Dissertation Overview
In this dissertation, we seek to further our understanding of users’ financial behavior
by taking advantage of the vast number of behavioral traces brought about by the digital
2
Introduction Chapter 1
age. We formalize the statement of this dissertation as follows:
Using data modeling techniques and behavioral theories, we extracted and
made sense of highly distinct patterns in online financial behavior, applying
it to guide future actions.
As described in this statement, we adopt two approaches that complement each other,
the data-driven approach where we derive insights by designing large-scale measurements
and analysis on behavioral traces; and the human-centered approach where we take a
deeper dive into the underlying motives backed by psychology literature. Finally, we
show how such understanding may be used guide further financial activities.
1.2 Measuring Online Financial Behavior
In Chapter 2, we demonstrate how large-scale online financial systems can provide
user behavior records which contain rich information about users behavioral patterns. By
measuring each financial system through a variety of approaches, we are able to answer
some important questions with regard to the nature of users’ financial behavior. For
example, how do social relationships factor into financial behavior? How users behave
differently in a competitive setting?
Social payments. We study what are the characteristics of payment activities
by looking at Venmo. Venmo is a popular person-to-person mobile payment app that
incorporate the social elements into its payments. With the growing market of mobile
payments, apps like Venmo presents a unique window into the daily activities of its
millions of users. One of the key advantages of Venmo is that it has leveraged a symbiotic
relationship between the financial system and the underlying social network. On one
hand, social relationships among Venmo users facilitate its fast adoption [4], while the
person-to-person payment system returns the favor by reducing the friction between
3
Introduction Chapter 1
friends surrounding financial matters.
In this thesis, we adopt a measurement-based approach to identify what effects such
symbiotic relationship has on the social and financial behavior of users. We show that
there are two main types of activities on Venmo, the business-client payments and the
social payment, which exhibit highly distinct structural patterns. The social payments
form a graph structure denser than the typical social interactions. Meanwhile, communi-
ties of very different use cases are observed on Venmo, many driven by specific transaction
types, e.g., rent, utilities, or betting pools, showcasing the diversity in Venmo.
Competitive Auctions. Penny auctions involves intense competition among users,
with the final winner often able to obtain the auctioned item at a heavy discount. We
examine a popular penny auction site DealDash to study users’ financial behavior in such
a winner-take-all setting.
In this thesis, we perform similarity analysis to identify the common patterns in users’
bidding strategies and examine how each of the strategies fare for the adopter. Our
analysis and experiments show that most users optimize their bid timing in accordance
with the design of the penny auction system. In addition, by grouping together bidders
with similar bidding behaviors, we identified five distinct categories, representing different
bidding strategies, with the aggressive and persistent bidders winning a large share of
auctions, and the budget bidders ending in losses.
1.3 Understanding Online Financial Behavior
In Chapter 3, we seek to further our understanding of financial behavior by borrowing
techniques from social science to examine the underlying motivations. Building on es-
tablished theories of behavioral models, we examine their applicability in online financial
systems. In this thesis, we examine a range of topics from technology acceptance model
4
Introduction Chapter 1
to prospect theory.
Adoption of financial systems. We examine the reasons behind users’ adoption
of financial system using the example of mobile payments apps. Mobile payments apps
have been expanding their user base at astonishing speed, with the prominent examples
being Venmo from United States and WeChat Pay from China; both are person-to-person
payments apps which have successfully taken advantage of their tight integration with the
social network. However, other major attempts to connect social features with financial
transactions by companying like Facebook [5], Snapchat [6] and Alipay [7] have been less
than successful.
In this thesis, we seek to explain Venmo and WeChat Pay’s success through a deeper
understanding of how the social factors affect the adoption of digital wallets. And how
the digital wallets, in turn, shape users’ experience and social relationships. To answer
these questions, we adopt a mixed method approach which include an online survey and
an in-depth interview, from which we identified that social factors are central to the
adoption of these wallets, while the wallets can then benefit the existing friendships by
providing a smoother payment experience.
The (ir)rationalities in decision making. By examining penny auctions bidders,
we seek to examine users’ less than rational mental models as described by prior literature
in behavioral economics. It is suggested that one of the main drivers behind the successful
operation of penny auction sites is the irrationalities of its users [8]. With factors like
sunk cost fallacy and risk-seeking tendencies all potentially contributing to the revenue
of penny auction sites, penny auction bidders become the prefect subject of our study.
In this thesis, we seek to validate or to reject hypothesis derived from behavior models
using traces of penny auction observed in the wild. We identified supporting evidence
for sunk cost fallacy and pseudo-endowment effect from auction records while rejecting
5
Introduction Chapter 1
herding theory. Understandings derived from the analysis can be used to develop bidding
strategies consistent with winning strategies in penny auctions [8]. In addition, we have
also observed mechanisms used by penny auction sites who can potentially serve to
reinforce such fallacies.
1.4 Using Understanding to Guide Financial Actions
In Chapter 4, we address the gap between understanding of financial behavior and the
application of such knowledge. By building highly faithful models of users’ behavior, we
are able to learn the likely outcome our decisions and thus tests out different strategies.
Learning winning strategies. We build a faithful model of bidder behavior to win
the game of penny auctions, showcasing how a good understanding of opponents can be
useful in competitive economics environment.
In this thesis, we use deep learning techniques to learn the behavioral models of
normal bidders and how they would react to incoming bids. The model is found to be
able to predict the next bidder and the bidding time with high accuracy, which is then
used to train and test various strategies in playing penny auctions. In the end, we are
able to identify successful bidding strategies yielding a simulated average return of $18.7
per auction and uncover a prisoner’s dilemma underneath the penny auction system.
1.5 Contributions
In this dissertation, our key contributions show how computer science and social sci-
ence can work synergistically together to obtain and utilize an understanding of financial
behavior. We employ a variety of methodologies to organize vast quantities of data into
meaningful structures and thus surfacing behaviors of different types, facilitating the dis-
6
Introduction Chapter 1
covery of behavioral phenomena; on the other hand, established models in social science
serve to guide us in the exploration. In addition, we are able to confirm or reject a
number of existing theories around user behavior in the setting of economic activities.
Finally, we build highly accurate models of users’ financial behavior and apply it to the
development of decision strategies.
Pattern extraction techniques. We have applied a set of data mining techniques
to extract common patterns from financial behaviors. In Chapter 2.1, we engineered
three key features to capture users’ payment patterns and build a similarity graph based
on these features. Due to the vast number of users involved, we developed an incremental
clustering approach where we first perform clustering on a sampled set of users and then
insert the remaining users into the cluster based on nearest neighbor. We validated this
methodology using KolmogorovSmirnov test [9] and show that the approach is valid. To
help interpret the resulting clusters, we used Chi-square statistics [10] to identify key-
words associated with each of the cluster. In addition, we perform community detection
on both the transaction graph and the social graph, identifying distinct types of com-
munities showing completely different structural properties based on the purposed of the
community. Also, in Chapter 2.2, we designed five different features to capture the differ-
ent bidding patterns. Using an approach similar to the similarity graph-based approach
in Chapter 2.1, we identified distinct bidding strategies and show that different strategies
lead to vastly different auction outcomes. By applying pattern extraction techniques, we
can effectively surface hidden patterns from behavioral traces there are worthy of further
investigation, thus facilitating the analysis process.
Behavior and social relationships. Prior theories in social science have long ar-
gued that social relationships have significant impact on user behavior. In this thesis, we
examine the impact of social relationships on financial behavior through data analysis,
7
Introduction Chapter 1
surveys and interviews. In Chapter 2.1, we separate payment activities into two types
based on the social relationship on which the transaction took place, the social payments
and the non-social payments. Graph analysis on social payment graph and non-social
payment graph shows surprisingly big structural difference, indicating users’ payment
behavior is significantly governs by the underlying relationship. Similarly, when examin-
ing different communities, the communities knitted through social relationships display
highly distinct behavioral patterns from the non-social communities. In Chapter 3.1, we
employ a mixed-method approach of surveys and interviews to examine how social rela-
tionships impact users’ adoption behavior. We find that social relationships influence the
usage experience of financial system and the experience in turn influences users’ social
relationships.
Validating or rejecting existing behavioral theories. In this thesis, we have
drawn from a number of established theories on user behavior and adapted them to the
current economic setting, validating some while rejecting others. In Chapter 3.1, we
employed technology acceptance model to the case of mobile wallets, identifying network
effect in US users and cluster effect for Chinese users through surveys and interviews. In
Chapter 3.2, we design hypothesis around users’ bidding behavior based on a number of
theories in behavioral economics and find evidence supporting the sunk cost fallacy and
pseudo-endowment effect while rejecting herding theory in penny auction.
Building behavior simulator. Finally, in Chapter 4, we discuss how we designed
and trained deep learning models to learn the bidding behavior of penny auction bidders,
to the point where we can accurately predict both the next bidder and the time of the
next bid. To achieve this end, a novel model structure is designed as an adaptation of
the traditional LSTM [11] model, where the predicted bidder is used as the input to the
timing prediction. The model is shown to be closely resembling real user behavior. We
8
Introduction Chapter 1
are the first to empirically study the predictability penny auctions traces and to develop
adversarial algorithms to win the auctions.
1.6 Thesis Organization
My dissertation consists of 5 highly related projects. In Chapter 2, we present two
studies which measure users’ financial behaviors in a social [12] and a competitive set-
ting [13]. Then, in Chapter 3, we examine how users’ mental models drive the adoption [4]
and irrational actions [8] of financial systems. Finally, Chapter 4 demonstrates how we
can apply the learned behavioral models to help users make better decisions in a compet-
itive financial environment [8]. And in Chapter 5 we summarize the conclusions found,
the lessons learned and the promising future directions in modeling online financial be-
havior.
9
Chapter 2
Measuring Online Financial
Behavior
In this chapter, we introduce how large-scale online financial system can be used as a
vantage point from which we can observe the characteristics of various online financial
activities. By performing measurement on users’ online financial behavior we are able
to answer several important questions regarding the nature of online financial activities.
First, what are financial activities like in the social age? When financial systems are
built on top of an online social network, what would from the interaction between the
financial context and the social context? How would the resulting system shape users’
financial and social behavior? Second, how do users behave in a competitive financial
environment? Are there distinct patterns in users’ competitive financial behavior and
how does such behavior relate the final outcome of the competition?
In the following, we use two case studies to demonstrate how we are able to answer
the above questions by measuring behavioral traces left by online financial activities. In
particular, how graph analysis, clustering and text analysis can all be jointly used to
present a more complete picture of financial behaviors.
10
Measuring Online Financial Behavior Chapter 2
2.1 The Interplay between Social and Financial Sys-
tems
2.1.1 Introduction
The mobile revolution has transformed how people handle financial payments, through
a variety of mobile payment apps that are replacing cash and credit cards. These apps
can be classified into several groups based on their target functionality. Digital wallets are
essentially mobile wrappers around physical credit cards, including Apple Pay, Google
Wallet, and Visa Checkout. Others, like PayPal, Stripe and Square focus on simplifying
payments for vendors. Finally, apps like Venmo bring a unique blend of convenience
and social interactions into payments, by supporting simple (and free) person-to-person
payments [14].
The Venmo model for interpersonal payments has had tremendous success in the last
few years. Venmo has 11 million users as of May 2016, and has seen transaction volume
triple in 2015, reaching $1 billion USD in monthly transactions as of January 2016. Its
success in the US has led to the very recent development of Zelle, a competing system
created by major US banks including Chase, Citi and Bank of America [15], as well as
similar systems from Square [16], Apple, and Facebook. In China, a similar person-to-
person payment system exists in WeChat, which now includes more than 400 million
users and $11 billion RMB ($1.65B USD) in transactions in 2014.
Beyond the convenience of a mobile app, what makes person-to-person payment apps
like Venmo interesting is their tight integration with a symbiotic social network. On
one hand, there is ample evidence that usage in social groups is a critical component of
Venmo’s fast adoption [17]. Friends who are users provide free advertising and awareness,
and even peer pressure whenever payments are involved (e.g. sharing a meal). On the
11
Measuring Online Financial Behavior Chapter 2
other hand, Venmo reduces friction between friends in financial matters, and its social
features (comments on transactions) serve to reinforce social links with creativity and
inside jokes.
But how has this symbiotic relationship affected users’ social and financial behavior?
This is the key question we seek to answer. In the first part of this chapter, we report the
results of a large-scale analysis of Venmo transactions, analyzing all public transactions in
Venmo1 totalling 91 million transactions over 6 years, all in the context of an underlying
social network connecting 10.5 million users (all friend relationships are public in Venmo).
From these traces, we can analyze both the Venmo social graph (composed of friendship
links connecting Venmo users) and the Venmo transaction graph (composed of links
representing transactions between users).
Our results include a number of surprising findings. First, we find that both normal
users and businesses populate the Venmo transaction graph, and exhibit dramatically
distinctive (and easy to identify) patterns in their transactions with others. Second,
Venmo users form exceptionally dense communities in the transaction graph, with much
higher than expected clustering coefficients. Using k-core decomposition, we find that
Venmo transaction communities are similar to or denser than to all available datasets of
user interactions (Twitter retweets, Facebook messages). Third, analysis of properties of
communities show that many are “niche groups” that revolve entirely around a single
type of transaction, e.g. rent, utilities, gambling or betting pools. Some of these groups
are ephemeral and users turn dormant once the specific event (e.g. NFL Super Bowl)
passes. This suggests Venmo is used by many as a specific application-driven utility
rather than a social payment network.
To the best of our knowledge, this is the first large-scale analysis of financial transac-
1By default, Venmo users have privacy settings set to share transactions (users, time, comments butno amounts) with all users.
12
Measuring Online Financial Behavior Chapter 2
tions on person-to-person payment systems like Venmo. In the remainder of this section,
we give background on mobile payments and the Venmo app, then describe our data
collection and initial analysis. Next, we analyze the structure of Venmo’s social and
transaction graphs and show how they overlap. We use unsupervised learning to clas-
sify users by their transaction and social behavior; identify and study patterns found in
communities in the transaction graph. Finally, we analyze Venmo transactions by both
payment types and temporal dynamics.
2.1.2 Background & Related Work
Mobile Payments. Mobile payments fall into two general categories, one being
mobile extension of credits cards, the other being mobile wallet services. For contact-less
extensions of credit cards like Apple Pay, Samsung Pay and Android Pay, they only act
as a wireless layer over credit cards. In comparison, mobile wallet services are heavier
in functionality. Traditional mobile wallets such as PayPal and Alipay are spawn from
large online shopping sites, with ecosystems built around merchants and customers.
Usage on mobile wallet services also attracts extensive research efforts. A lot of
studies focus on the use case of different services in different countries, e.g. M-PESA in
Kenya [18], Bristol Pound in England [19], bKash in Bangladesh [20], and mobile money
offered by Network Operators in Uganda [21]. These studies typically deploy survey or
interview to gather user data. Other study leverages on a theoretical framework called
Technology Acceptance Model [22], and looks at how different factors affect user adoption
of these services [23].
In recent years, there emerges a new trend of social payments where a wallet builds
a social network within itself. These services are eating into the market of traditional
mobile wallets, examples being Venmo and WeChat Pay. Known for its convenient peer-
13
Measuring Online Financial Behavior Chapter 2
to-peer transfer, Venmo quickly spread through word of mouth. In the year 2015, Venmo
increased its transaction volume by 200% [24], taking up 19% of the market share of
mobile user-to-user payments in US [25].
The Venmo App. Venmo has two main functions: making transactions and social-
izing. First, Venmo lets user pay each other simply by specifying the receiver’s Venmo
ID, the amount, and a short descriptive text message associated to the payment. Trans-
action is made easy as users can quickly locate the receiver by searching among her
Venmo friends. Second, Venmo users have the option to share their payments with their
friends or with the public. Once shared, these transactions are streamed into a feed with
the time, recipient, and message displayed to the audience. Fortunately, Venmo pro-
vides APIs to query public transactions and social connections, which makes it feasible
to gather a dataset of all public activities on Venmo, and thus performing large-scale
quantitative analysis on financial behaviors.
Interactions on Social Network. As a payment platform built on a social net-
work, Venmo introduced a brand-new type of social interaction: making transactions.
There have been extensive works studying different types of interactions in Online Social
Networks. Interactions being studied including wall-post on Facebook [1, 26], retweets
on Twitter [27], reblog on Pinterest [28] and Tumblr [29], editing on Wikipedia [30],
just to name a few. There are also works using detailed clickstreams to study latent
behavior that are not directly visible online, e.g., profile browsing [31, 32, 33]. Our work
differs from theirs because our topic of study is a combination of financial activity and
social activity, which introduces an interaction incentive that has long been present in
the financial world, yet never seen in social networks.
Digital Transactions. Besides Venmo, Bitcoin is the only source of large-scale
public records of transaction data. Most previous works utilizing this dataset is oriented
14
Measuring Online Financial Behavior Chapter 2
Transaction NetworkSocial Network
6,858K
users
3,710K
users
224K
users
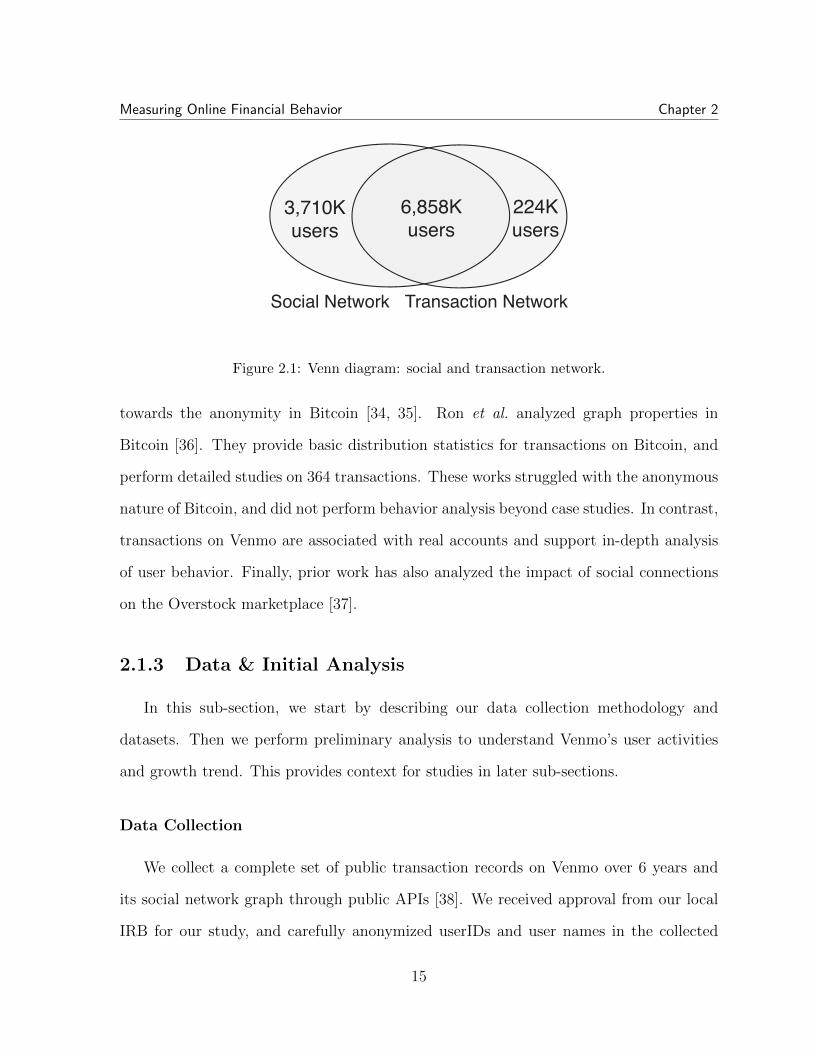
Figure 2.1: Venn diagram: social and transaction network.
towards the anonymity in Bitcoin [34, 35]. Ron et al. analyzed graph properties in
Bitcoin [36]. They provide basic distribution statistics for transactions on Bitcoin, and
perform detailed studies on 364 transactions. These works struggled with the anonymous
nature of Bitcoin, and did not perform behavior analysis beyond case studies. In contrast,
transactions on Venmo are associated with real accounts and support in-depth analysis
of user behavior. Finally, prior work has also analyzed the impact of social connections
on the Overstock marketplace [37].
2.1.3 Data & Initial Analysis
In this sub-section, we start by describing our data collection methodology and
datasets. Then we perform preliminary analysis to understand Venmo’s user activities
and growth trend. This provides context for studies in later sub-sections.
Data Collection
We collect a complete set of public transaction records on Venmo over 6 years and
its social network graph through public APIs [38]. We received approval from our local
IRB for our study, and carefully anonymized userIDs and user names in the collected
15
Measuring Online Financial Behavior Chapter 2
0
0.2
0.4
0.6
0.8
1
1 10 100 1K 10K 100K
CD
F o
f U
sers
# of Transactions per User
(a) transaction count.
0
0.2
0.4
0.6
0.8
1
1 10 100 1K
CD
F o
f U
sers
# of Friends per User
(b) friend count.
Figure 2.2: Per user activity distribution.
0
10
20
30
40
0 0.2 0.4 0.6 0.8 1
% o
f U
sers
Active Ratio
Figure 2.3: Distribution of active ratio of users.
dataset. We limited query rates to avoid disruption to Venmo’s services. While the data
we obtained is publicly accessible via Venmo’s APIs, we are cognizant of deanonymization
risks from releasing the entire dataset to the public. We are reaching out to Venmo to
negotiate a possible release of a subset of the dataset.
Public Transaction Records. Venmo API allows us to query the historical public
transaction stream of the entire network by specifying a time range. We use the API to
sweep through the timestamps from Venmo’s initial launch to May 5, 2016, and collect
a complete set of public transaction records. In total, we obtain 91,355,414 transactions
over 6 years from April 15, 2010 to May 5, 2016. Venmo went online in August 2009 as
beta, posted its first public transactions in 2010, and was open to public users in March
2012. Each transaction record contains a transaction ID, sender, receiver, transaction
16
Measuring Online Financial Behavior Chapter 2
type, transaction time and related social activities (messages, likes, comments). For each
user involved in the transaction, the record contains user profile information including
userID, account creation time, and the first and last name of the user. In total, we extract
7,091,915 unique userIDs.
Note that all the transactions have a message to indicate the purpose of the trans-
action. Comments and likes, however, are less prevalent: only 2.7% transactions have
comments and 11.3% of transactions have likes.
The Venmo Social Graph. Venmo’s dual functionality as a payment network
and a social network means that the two networks only overlap partially. Some users
participated in transactions have no friends in Venmo, others have friends but have not
participated in transactions. To build Venmo’s social graph, we began by using public
APIs to query each users’ friend list. We observed that Venmo uses sequential numbers
for userIDs (starting from 1). We validate this by creating a burst of 10 new accounts
within 20 seconds, and confirming that the resulting userIDs are sequential integers.
Thus, we can use a newly created userID to estimate the number of total registered
users. As of May 5, 2016, the estimated total number of users is 10,586,252. We build
a list of the entire Venmo user population by sequentially scanning the userID space,
downloading each user’s friend list for the complete social graph.
We crawl the social graph with focus on users registered before May 5, 2016, which
gives us 10,568,274 users. Note that this number is slightly smaller than the total number
of registered users (10,586,252) as of May 5, 2016. This is because 0.17% of userIDs
are reported as “invalid” by the API, possibly due to account deletion. After excluding
another 806,625 (7.6%) users who have no friends, the final social graph contains 9,761,649
users.
Coverage Estimation. Our social graph is complete, but our transaction data only
17
Measuring Online Financial Behavior Chapter 2
0
50K
100K
150K
200K
2012-04 2014-04 2016-04# o
f N
ew
Users
per
Week
Registered UserActive User
(a) Number of new users.
0
1M
2M
3M
4M
5M
2012-04 2014-04 2016-04# o
f N
ew
Tra
ns. per
Week
All TransactionsPublic Transactions
(b) Number of new transactions.
Figure 2.4: Weekly growth trend of Venmo.
cover public transactions. First, based on the sequential userID, we estimate there are
10,586,252 registered users as of May 5, 2016. Our public transaction dataset covers 67%
of the user population. The rest of the users either did not make any transactions or
only made private transactions.
Second, we estimate the number of private transactions. Just like the userIDs, we
find the transaction IDs are also sequentially assigned. We validate this by creating 10
private transactions interleaving with 10 public transactions within 20 seconds. We find
that the transaction IDs also increase monotonically. Based on the maximum transaction
ID, we infer that there are 185,270,948 transactions up to our data collection time, and
our dataset covers 49.3% of all transactions. The rest 50.7% of transactions are private.
In this study, we seek to leverage the public transactions as a proxy to study the digital
payment activities of Venmo users.
Preliminary Analysis
Social and Financial Activities. We first examine user participation in social and
financial activities. Figure 2.1 uses a Venn diagram to show the overlap between users
in the social graph and users in the transaction dataset. Most users (6.86M) participate
in both financial transactions and social friending. This is only a lower bound — the
18
Measuring Online Financial Behavior Chapter 2
0
0.2
0.4
0.6
0.8
1
0 0.2 0.4 0.6 0.8 1
CD
F o
f N
odes
Node Clustering Coefficient
TwitterFacebook
Venmo
Figure 2.5: Distribution of clustering co-efficient per user.
0
5
10
15
20
25
0 20 40 60 80 100
Core
Level
Node Degree
TwitterVenmo
Figure 2.6: Average core level as a func-tion of degree.
3,710K users who have no public transactions may still have private transactions. Only
224K users (2.1%) use Venmo for financial transactions but do not have any friends.
Figure 2.2(a) shows the number of transactions per user, which follows a long tail
distribution. Most users (57%) have made less than 10 transactions, while certain users
have made more than 10,000 transactions. A closer examination shows that these super
active users are charity organizations and business owners. Compared to making trans-
actions, Figure 2.2(b) shows users are more active in adding friends. Half of the users
have at least 40 friends, and 30% of users have more than 100 friends.
Long-term vs. Short-lived Users. To examine the level of user engagement,
we measure a user’s lifetime which is the time difference between a user’s first and last
transaction. Only users with at least one transaction are considered. We find that 22.5%
users used Venmo for less than a day. These are “try-and-quit” users who installed the
app to make a transaction and then quickly abandoned it. In contrast, 30% of users have
actively used Venmo for over a year.
To better depict the long-term and short-lived users, we calculate active ratio, which
is the ratio of a user’s active lifetime over her longest possible lifetime (time difference
between the first transaction and the last day of our data collection). Figure 2.3 shows
a clear bimodal distribution where most users are distributed to the two extremes. This
19
Measuring Online Financial Behavior Chapter 2
indicates users would either like Venmo thus stay on the network for a long time, or
quickly give it up after the initial try.
Venmo’s Growth. Finally, we examine the growth trend of Venmo. In Fig-
ure 2.4, we can observe a super linear growth for both Venmo user population and the
transaction count. The total number of registered users over time follows a power series
model (P (x) ∝ axb) with b=3.05 (R2 = 0.9999). The total number of transactions fol-
lows a power series model with steeper increase, b=4.30 (R2 = 0.9999). The growth of
transaction count is highly consistent (R2 = 0.997) with the reported growth in transac-
tion volume (2013–2016) [39], showing that our dataset is a faithful reflection of Venmo
activities.
When measuring per user activity, we find users’ average transaction frequency almost
tripled in the four years since Venmo came exited beta in April 2012. Venmo is showing
healthy growth in both overall scale and user engagement.
2.1.4 Transaction & Social Graphs
We now analyze our data to study the interplay between social relationships and
financial transactions on Venmo. We seek to understand the role of social relationships
in the adoption and usage of Venmo. In the rest of the section, we focus on three sets of
related questions. First, how much has Venmo’s social component affected its function-
ality and design? What are the key differences between Venmo and other online social
networks? How do social relationships shape the way users make financial transactions?
We address these questions in this sub-section. Second, how much do users’ social friends
and transaction patterns reveal about their identity as vendors or normal users? What
drive users to form distinct social and financial communities? We answer these questions
in the next sub-section, Users & Communities. Third, what do users use Venmo to pay
20
Measuring Online Financial Behavior Chapter 2
for? How does such spending pattern change over time? These questions are discussed
in the sub-section after, Payment Types & Dynamics.
In this sub-section, we focus on the first set of questions, to examine whether and
how Venmo differs from traditional online social networks. We build both a social graph
and a financial transaction graph from Venmo, and compare the graph properties with
those of existing online social networks. To further explore how social relationships
impact financial transactions, we use social connections to divide Venmo’s transaction
graph into a friend-only transaction graph, and a stranger-based transaction graph. We
examine the key differences between the two and their implications.
Transaction Graph
We start by constructing a financial transaction graph for Venmo, where each node is
a user and each edge (directed) represents a payment relationship between two users. The
weight of the edge represents the total number of (directed) financial transactions between
the two users. While building the graph, we find 0.35% of the transactions reported their
target as “a phone number” or “an email address,” thus cannot be directed to any single
entity. We omit these transactions from the graph.
We compare key graph properties of the Venmo transaction graph with interaction
graphs of Facebook wall-posts [1] and Twitter retweets [2] in the top half of Table 2.1.
We find that Venmo’s transaction graph shows strong “small-world” properties [40] with
high degree and clustering coefficient, small average path length and densely connected
core user groups. These properties are commonly observed in social networks where a
group of friends closely interact with each other. More importantly, compared to pure
social interactions, Venmo displays a much higher local clustering, reflecting the structure
of stronger friendships often required by financial relationships. Next, we briefly explain
and compare key graph properties.
21
Measuring Online Financial Behavior Chapter 2
Clustering Coefficient. Clustering coefficient is the number of edges between a
user’s immediate neighbors divided by all possible connections that could exist among
them. It measures the level of local connectivity between users. Venmo’s clustering
coefficient (0.147) is much higher than Facebook (0.059) and Twitter (0.048) (Figure 2.5).
However, even in Venmo, a significant number of users have clustering coefficients of
0. One major reason is that transactions in Venmo follow a long-tail distribution, with
many Venmo users (29.34%) partaking in only one transaction, resulting in a clustering
coefficient of 0. Despite that, we find 39.09% of Venmo users have clustering coefficients
more than 0.1, whereas the numbers are only 12.84% and 9.42% for Facebook and Twitter,
indicating that Venmo users are more likely to make financial transactions within tightly
connected groups or communities.
K-core Decomposition. K-core decomposition examines network connectivity by
recursively stripping off peripheral nodes from the network. K-cores exist when users
at level k have made transactions with at least k peers who are also at level k. Fig-
ure 2.6 compares K-core connectivity of Venmo, Twitter retweets and Facebook wall
posts. Venmo and Twitter both show very dense local interaction groups of highly active
users, while the local clusters for Facebook are much weaker. Prior analysis has shown
that Twitter retweets form densely connected groups that capture real-world social rela-
tionships [41]. The similarly dense local clusters in Venmo’s transaction graph suggest a
strong correlation between real offline friendships and transactions.
Average Path Length. Average path length is the average shortest path length
between all node pairs in the largest connected component. To estimate average path
length, we randomly sample 1000 nodes and compute their shortest path to all the nodes
in the graph. Venmo’s average path length (6.98) is higher than Twitter’s 5.52, indicating
more focus on local connectivity; yet it is lower than Facebook’s 10.13, possibly a result
22
Measuring Online Financial Behavior Chapter 2
of Facebook’s lower average degree.
Average Reciprocity. Reciprocity measures how likely interactions occur on both
directions for a user pair. Venmo’s reciprocity (0.147) is similar to Facebook (0.126)
and higher than Twitter (0.025). This shows Venmo users are more likely to engage in
bidirectional interactions — both sending (and receiving) money to (from) the other user,
suggesting that person-to-person transactions are more prevalent than customer-vendor
payments.
Assortativity. Assortativity measures the probability for nodes to connect to other
nodes of similar degrees. A more positive assortativity indicates users tend to inter-
act with other users of similar degrees. Venmo’s assortativity is nearly zero (-0.0022)
and lower than friend-only graphs like Facebook (0.116). This because interactions ex-
ist between both similar-degree nodes (e.g., friends) and dissimilar-degree nodes (e.g.
Vendors).
Additional Validation. Since the above analysis uses the interaction graphs from
Facebook and Twitter covering only a three-month period, we further validate the con-
clusions by constructing a smaller Venmo graph using Venmo transactions in the most
recent three months of our dataset. Both average degree and tie strength for Venmo
show a notable dip (due to the reduced data volume); for all other features, we obtain
the same conclusions as above.
Social Graph
Next, we compare Venmo’s social graph with those datasets of existing online so-
cial networks, Facebook and Renren (Chinese Facebook), provided by [1, 32]. We also
compare it to a more recent and complete Facebook social graph [42], leading to similar
results (omitted for brevity). We did not include Twitter since its asymmetric follow re-
23
Measuring Online Financial Behavior Chapter 2
lationships do not reflect offline friendships. Table 2.2 lists the key graph properties. We
see that Venmo’s social graph is very similar to traditional online social networks in clus-
tering coefficient and average path lengths, with a slightly higher average degree. This
can be partially attributed to the fact that Venmo allows user to import their Facebook
friends to bootstrap their social network.
Notably, Venmo’s social graph has an extremely high assortativity (0.38) compared
to Facebook (0.17) and Renren (0.0045). This indicates that Venmo users have strong
inclination to befriend users of similar degree. This high level of local homophily is also
a key property of offline social relationships [43]. In addition, its assortativity is much
higher than that of the financial transaction graph (-0.0022). This is likely because users
might have transactions with high-degree nodes like merchants and vendors, but typically
do not add them as friends.
Transactions Between Friends
Venmo’s social and transaction graphs resemble existing online social networks in
some metrics, but differ in other key metrics. Next, we seek to better understand such
differences by further exploring the impact of social relationships on financial transac-
tions, examining key differences in transactions made between friends and strangers.
We first compare and contrast social and transaction graphs to see what portion of
transactions take place between friends. Among all edges in the social graph, only 3.55%
overlap with transaction graph. Even accounting for the possible private transactions,
this still indicates users only make transactions with a small portion of their friends. In
fact, most users (70%) only transfer money to or from less than 10% of their friends. On
the other hand, among all edges in the transaction graph, 80% of them overlap with the
social graph. This indicates transactions among friends are more common than those
among strangers. This also explains why Venmo transactions exhibit similar properties
24
Measuring Online Financial Behavior Chapter 2
to social interactions as observed in transaction graph analysis.
To understand the different transaction patterns among friends and strangers, we
divide the transaction graph into two subgraphs: a friend transaction graph that cap-
tures transactions between social friends, and a stranger transaction graph that captures
transactions between non-friends (strangers). Key graph properties are shown at bottom
of Table 2.1. The friend transaction graph shows clear person-to-person transaction pat-
terns with strong network effects, while the stranger graph captures a customer-vendor
model.
Degree and Tie Strength. Tie strength measures the average number of transac-
tions for all edges. The friend transaction graph has a much higher degree (7.83) and
tie strength (3.82) than the stranger graph (4.75 and 1.92). This indicates sustainable
financial relationships among friends. In contrast, transactions between strangers are
more likely one-time payments between customers and vendors.
Assortativity. The friend transaction graph has an extremely high assortativity
(0.389). This suggests a network effect on Venmo where users’ financial transactions are
heavily influenced by their friends, leading to strong local homophily. And the stranger
graph’s assortativity is close to zero (−0.00552), indicating no significant influence from
strangers. It is worth noting that, while most Venmo transactions take place between
friends, the high assortativity of friend transaction is hidden when inspecting the overall
transaction graph (−0.0022). This demonstrates the benefit of integrating social infor-
mation into transaction analysis.
Clustering Coefficient. The clustering coefficient of the stranger graph (0.036) is
much lower than that of the friend graph (0.140). This is likely the result of customer-
vendor relationships in the stranger graph. Intuitively, a vendor’s customer is unlikely
to have financial transactions with other customers. Similarly, different vendors of the
25
Measuring Online Financial Behavior Chapter 2
same customer are unlikely to transact with each other.
Average Reciprocity. The low reciprocity of the stranger graph (0.087) is only
half of the friend graph (0.164), indicating a vendor-customer relationship: financial
transactions between a customer and a vendor are highly directional. This also suggests
the possibility of identifying distinct roles (e.g., users vs. vendors) in the Venmo network.
Dynamics. Venmo also shows an increasing trend in stranger transactions, growing
from 5.5% from the start of 2014 to 24.4% by May 2016, highlighting the importance of
studying the different natures of interaction.
2.1.5 Users & Communities
Our graph analysis showed distinctive patterns in how social relationships affected
user behavior. In this section, we explore whether and how much users’ social relation-
ships and transaction patterns reveal who they are.
In the following, we use various techniques to profile (or classify) users into semanti-
cally meaningful user groups. By analyzing these groups, we seek to understand different
user types and communities on Venmo. More specifically, we experiment with three dif-
ferent ways to group users. First, we group users based on their behavioral features.
By clustering users with similar behavioral patterns, we identify distinct user types in
Venmo. Second, we search for communities in the financial transaction graph that cap-
ture frequent transactions within a group. We explore key factors that drive users to
form such communities. Third, we use similar methods to identify communities in the
social graph, and examine differences between social and financial communities.
26
Measuring Online Financial Behavior Chapter 2
Clustering Users based on Behavior
To identify prevalent user types in Venmo, we cluster users based on their behavior.
Then we analyze identified clusters to infer and understand different user types.
Behavior Clustering via Similarity Graph. We cluster distinct user behaviors by
constructing and partitioning a behavioral similarity graph [44]. Each node is a Venmo
user and each edge captures the similarity in behavioral traces of its two endpoints. We
can identify groups of users with similar behavior by partitioning this similarity graph,
with no need of pre-defined labels.
To build the similarity graph, we need to measure the behavioral similarity between
any two users, capturing key aspects of user behavior. Based on results in the previous
section, we select three key features:
• Activity Level: The number of transactions the user had.
• Local Connectivity: Clustering coefficient of the user in the transaction graph.
• Transactions w/ friends: Portion of the user’s transactions that involved friends.
We compute a feature vector for each user (min-max normalized) and measure the simi-
larity between any two users based on the Euclidean distance of their feature vectors and
construct the similarity graph.
We detect clusters in the similarity graph by partitioning it using the Divisive Hier-
archical Clustering algorithm [45]. This algorithm divides the similarity graph into small
subgraphs by minimizing edge weight cut. We stop the graph partitioning process when
the overall clustering quality, measured by modularity, plateaus.
We apply this clustering methodology to all Venmo users except those “try-and-quit”
users (active ratio <0.23 in Figure 2.3), leaving 5,046,348 users. Directly clustering all
27
Measuring Online Financial Behavior Chapter 2
5 million users is computationally challenging. Instead, we apply incremental cluster-
ing. We first randomly sample 100K users, and perform clustering to generate the initial
clusters. Then we incrementally assign the remaining users to existing clusters based on
their nearest neighbors in the sampled set. To validate our results, we calculate proba-
bility distributions of all features before and after incremental clustering. Results from
the KolmogorovSmirnov test [46] show that the difference of distributions is insignificant
(p> 0.18 for all features).
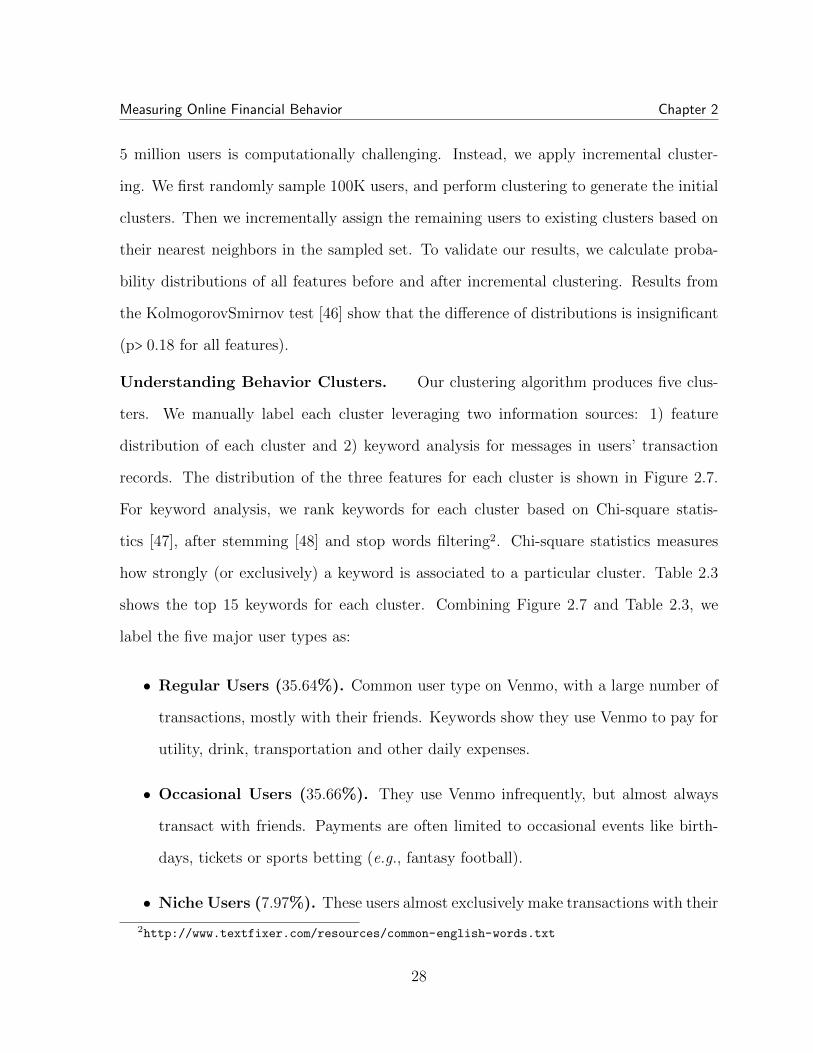
Understanding Behavior Clusters. Our clustering algorithm produces five clus-
ters. We manually label each cluster leveraging two information sources: 1) feature
distribution of each cluster and 2) keyword analysis for messages in users’ transaction
records. The distribution of the three features for each cluster is shown in Figure 2.7.
For keyword analysis, we rank keywords for each cluster based on Chi-square statis-
tics [47], after stemming [48] and stop words filtering2. Chi-square statistics measures
how strongly (or exclusively) a keyword is associated to a particular cluster. Table 2.3
shows the top 15 keywords for each cluster. Combining Figure 2.7 and Table 2.3, we
label the five major user types as:
• Regular Users (35.64%). Common user type on Venmo, with a large number of
transactions, mostly with their friends. Keywords show they use Venmo to pay for
utility, drink, transportation and other daily expenses.
• Occasional Users (35.66%). They use Venmo infrequently, but almost always
transact with friends. Payments are often limited to occasional events like birth-
days, tickets or sports betting (e.g., fantasy football).
• Niche Users (7.97%). These users almost exclusively make transactions with their
2http://www.textfixer.com/resources/common-english-words.txt
28
Measuring Online Financial Behavior Chapter 2
1
10
100
1000
# of Transactions
RegularOccasional
NicheBusiness
Diverse
0
0.2
0.4
0.6
0.8
1
ClusteringCoefficient
0
20
40
60
80
100
% Transactionswith Friends
Figure 2.7: Comparing different clusters on 3 key features. We depict each distributionwith box plot quantiles (5%, 25%, 50%, 75%, 95%).
friends in tight-knit communities. Payments focus on utility bills and groceries,
indicating they are groups of close friends or even roommates.
• Business Owners (1.78%). These users are likely to transact with strangers.
However, people they interact with are also making transactions with each other
(high clustering coefficients). We suspect these are “small business owners” dealing
within a group of customers.
• Diverse Users (18.95%). These users mostly make transactions with strangers,
and the people they interact with don’t interact with each other (low clustering
coefficient). We suspect they are mostly vendors.
Case Studies. Although Venmo is designed for person-to-person payments between
friends, we find distinct clusters that may represent vendors and business owners. For
more insights on these users, we take a closer look at related behavior clusters (Business
Owners and Diverse Users).
The Business Owners cluster contains small business owners. For example, one user
we examined had 88 transactions, a clustering coefficient of 0.81 and 51% transactions
conducted with friends. Since September 2015, this user started to charge fees from
7 other users (possible tenants) on a monthly basis. Many transactions are related to
29
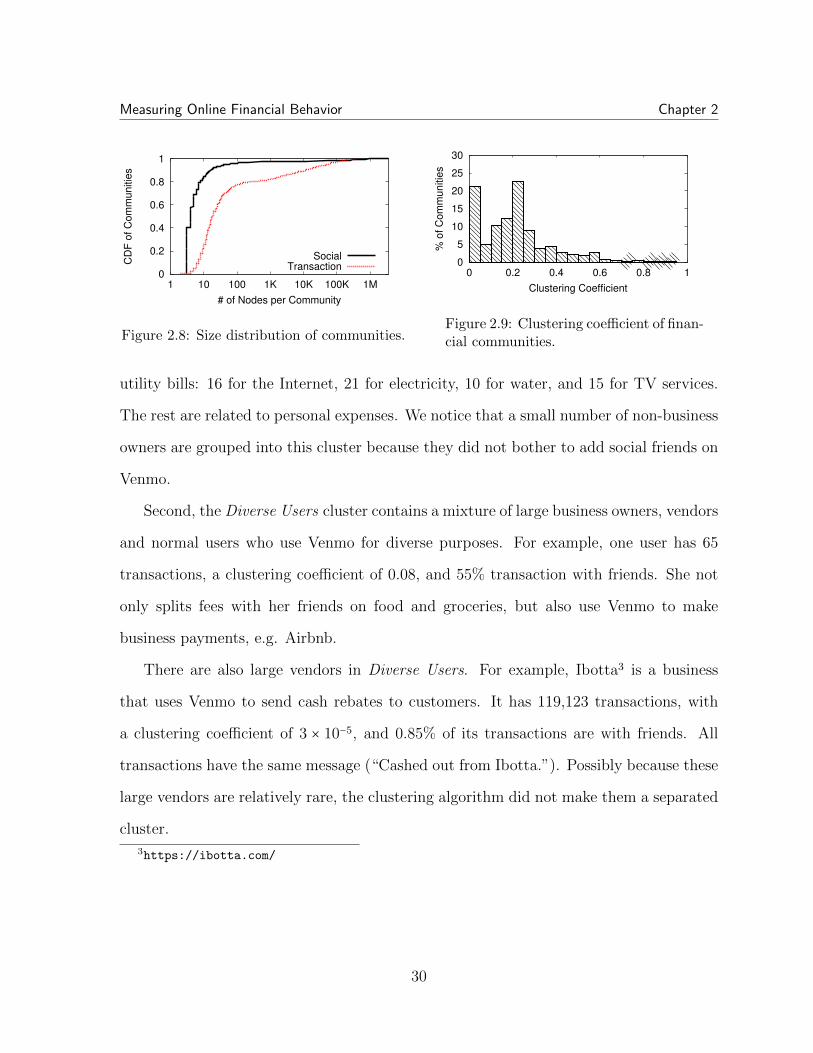
Measuring Online Financial Behavior Chapter 2
0
0.2
0.4
0.6
0.8
1
1 10 100 1K 10K 100K 1M
CD
F o
f C
om
munitie
s
# of Nodes per Community
SocialTransaction
Figure 2.8: Size distribution of communities.
0
5
10
15
20
25
30
0 0.2 0.4 0.6 0.8 1
% o
f C
om
munitie
s
Clustering Coefficient
Figure 2.9: Clustering coefficient of finan-cial communities.
utility bills: 16 for the Internet, 21 for electricity, 10 for water, and 15 for TV services.
The rest are related to personal expenses. We notice that a small number of non-business
owners are grouped into this cluster because they did not bother to add social friends on
Venmo.
Second, the Diverse Users cluster contains a mixture of large business owners, vendors
and normal users who use Venmo for diverse purposes. For example, one user has 65
transactions, a clustering coefficient of 0.08, and 55% transaction with friends. She not
only splits fees with her friends on food and groceries, but also use Venmo to make
business payments, e.g. Airbnb.
There are also large vendors in Diverse Users. For example, Ibotta3 is a business
that uses Venmo to send cash rebates to customers. It has 119,123 transactions, with
a clustering coefficient of 3 × 10⁻⁵, and 0.85% of its transactions are with friends. All
transactions have the same message (“Cashed out from Ibotta.”). Possibly because these
large vendors are relatively rare, the clustering algorithm did not make them a separated
cluster.
3https://ibotta.com/
30
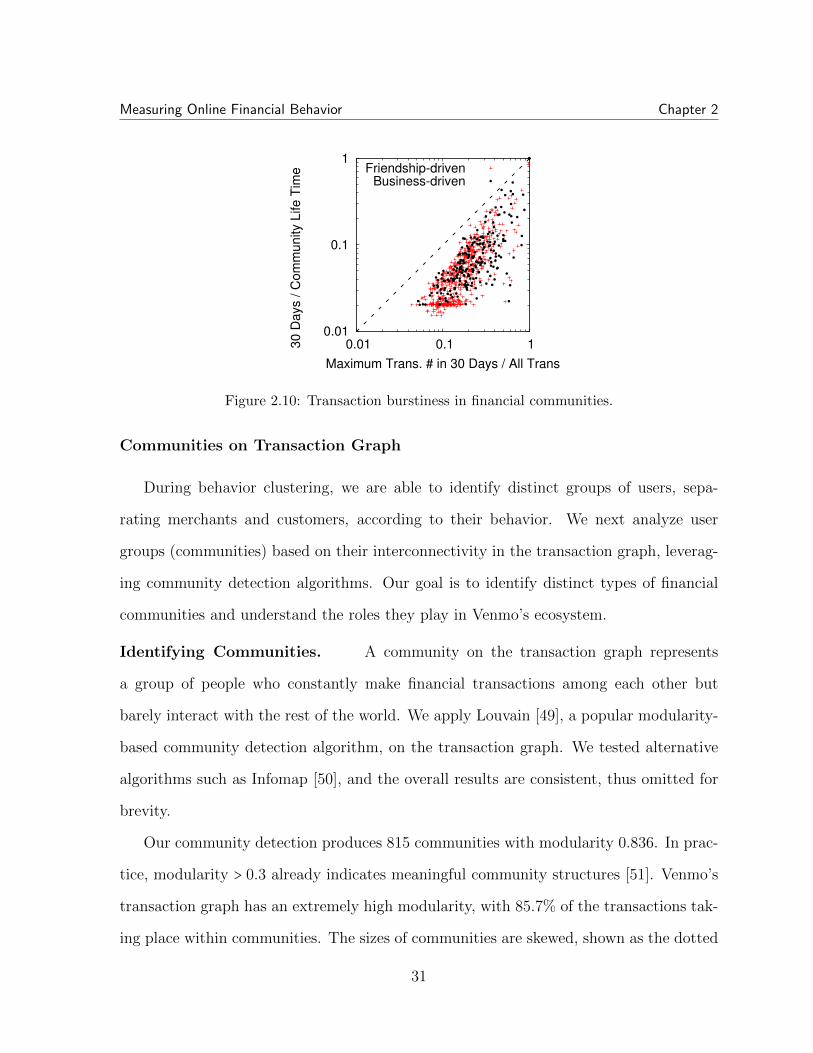
Measuring Online Financial Behavior Chapter 2
30 D
ays / C
om
munity L
ife T
ime
Maximum Trans. # in 30 Days / All Trans
Friendship-drivenBusiness-driven
0.01
0.1
1
0.01 0.1 1
Figure 2.10: Transaction burstiness in financial communities.
Communities on Transaction Graph
During behavior clustering, we are able to identify distinct groups of users, sepa-
rating merchants and customers, according to their behavior. We next analyze user
groups (communities) based on their interconnectivity in the transaction graph, leverag-
ing community detection algorithms. Our goal is to identify distinct types of financial
communities and understand the roles they play in Venmo’s ecosystem.
Identifying Communities. A community on the transaction graph represents
a group of people who constantly make financial transactions among each other but
barely interact with the rest of the world. We apply Louvain [49], a popular modularity-
based community detection algorithm, on the transaction graph. We tested alternative
algorithms such as Infomap [50], and the overall results are consistent, thus omitted for
brevity.
Our community detection produces 815 communities with modularity 0.836. In prac-
tice, modularity > 0.3 already indicates meaningful community structures [51]. Venmo’s
transaction graph has an extremely high modularity, with 85.7% of the transactions tak-
ing place within communities. The sizes of communities are skewed, shown as the dotted
31
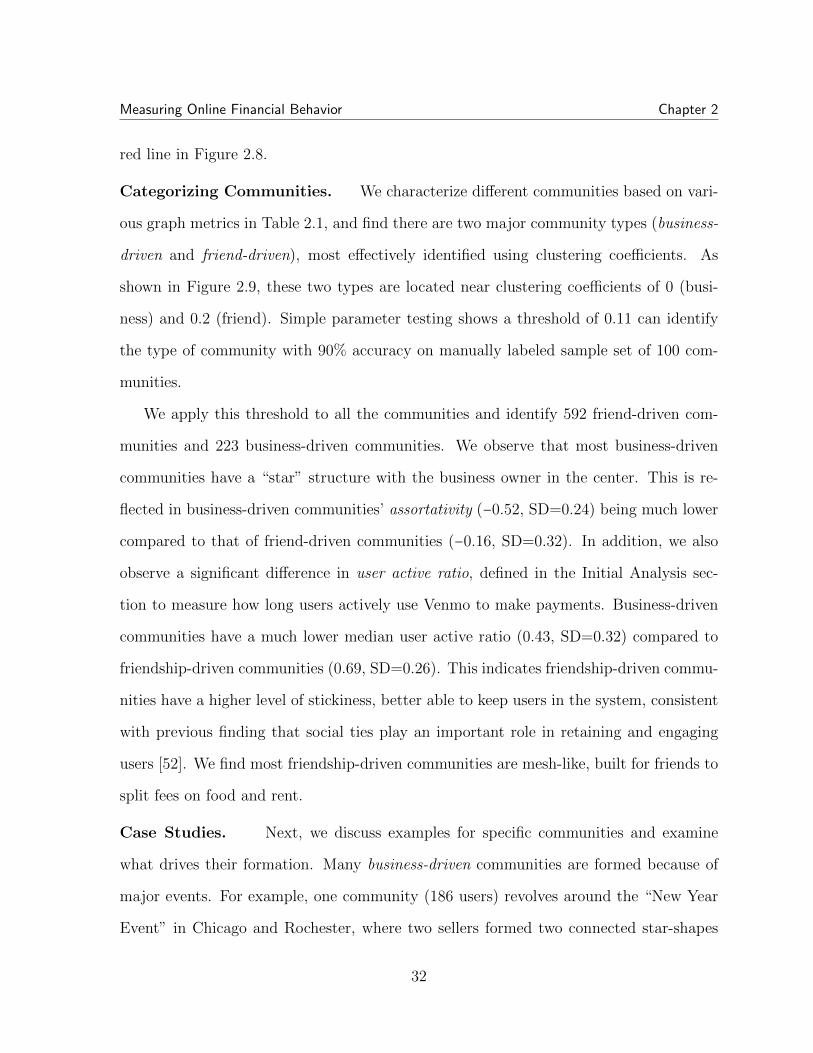
Measuring Online Financial Behavior Chapter 2
red line in Figure 2.8.
Categorizing Communities. We characterize different communities based on vari-
ous graph metrics in Table 2.1, and find there are two major community types (business-
driven and friend-driven), most effectively identified using clustering coefficients. As
shown in Figure 2.9, these two types are located near clustering coefficients of 0 (busi-
ness) and 0.2 (friend). Simple parameter testing shows a threshold of 0.11 can identify
the type of community with 90% accuracy on manually labeled sample set of 100 com-
munities.
We apply this threshold to all the communities and identify 592 friend-driven com-
munities and 223 business-driven communities. We observe that most business-driven
communities have a “star” structure with the business owner in the center. This is re-
flected in business-driven communities’ assortativity (−0.52, SD=0.24) being much lower
compared to that of friend-driven communities (−0.16, SD=0.32). In addition, we also
observe a significant difference in user active ratio, defined in the Initial Analysis sec-
tion to measure how long users actively use Venmo to make payments. Business-driven
communities have a much lower median user active ratio (0.43, SD=0.32) compared to
friendship-driven communities (0.69, SD=0.26). This indicates friendship-driven commu-
nities have a higher level of stickiness, better able to keep users in the system, consistent
with previous finding that social ties play an important role in retaining and engaging
users [52]. We find most friendship-driven communities are mesh-like, built for friends to
split fees on food and rent.
Case Studies. Next, we discuss examples for specific communities and examine
what drives their formation. Many business-driven communities are formed because of
major events. For example, one community (186 users) revolves around the “New Year
Event” in Chicago and Rochester, where two sellers formed two connected star-shapes
32
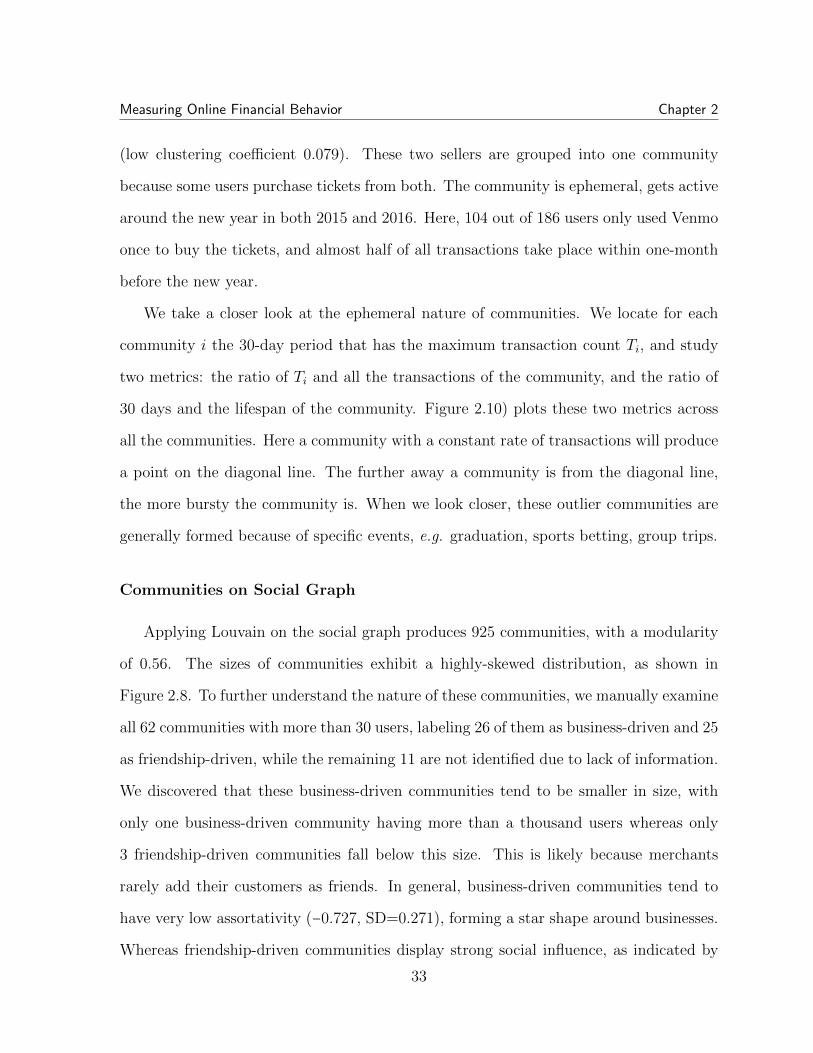
Measuring Online Financial Behavior Chapter 2
(low clustering coefficient 0.079). These two sellers are grouped into one community
because some users purchase tickets from both. The community is ephemeral, gets active
around the new year in both 2015 and 2016. Here, 104 out of 186 users only used Venmo
once to buy the tickets, and almost half of all transactions take place within one-month
before the new year.
We take a closer look at the ephemeral nature of communities. We locate for each
community i the 30-day period that has the maximum transaction count Ti, and study
two metrics: the ratio of Ti and all the transactions of the community, and the ratio of
30 days and the lifespan of the community. Figure 2.10) plots these two metrics across
all the communities. Here a community with a constant rate of transactions will produce
a point on the diagonal line. The further away a community is from the diagonal line,
the more bursty the community is. When we look closer, these outlier communities are
generally formed because of specific events, e.g. graduation, sports betting, group trips.
Communities on Social Graph
Applying Louvain on the social graph produces 925 communities, with a modularity
of 0.56. The sizes of communities exhibit a highly-skewed distribution, as shown in
Figure 2.8. To further understand the nature of these communities, we manually examine
all 62 communities with more than 30 users, labeling 26 of them as business-driven and 25
as friendship-driven, while the remaining 11 are not identified due to lack of information.
We discovered that these business-driven communities tend to be smaller in size, with
only one business-driven community having more than a thousand users whereas only
3 friendship-driven communities fall below this size. This is likely because merchants
rarely add their customers as friends. In general, business-driven communities tend to
have very low assortativity (−0.727, SD=0.271), forming a star shape around businesses.
Whereas friendship-driven communities display strong social influence, as indicated by
33
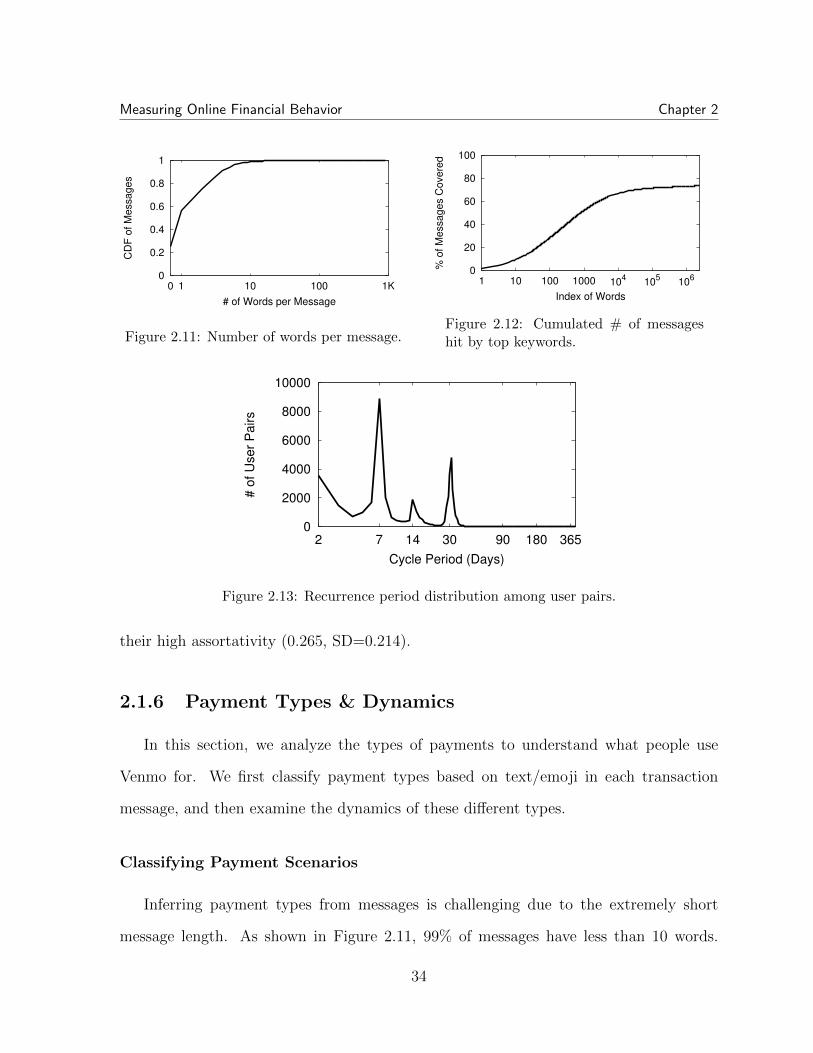
Measuring Online Financial Behavior Chapter 2
0
0.2
0.4
0.6
0.8
1
0 1 10 100 1K
CD
F o
f M
essages
# of Words per Message
Figure 2.11: Number of words per message.
0
20
40
60
80
100
1 10 100 1000 104
105
106
% o
f M
essages C
overe
d
Index of Words
Figure 2.12: Cumulated # of messageshit by top keywords.
0
2000
4000
6000
8000
10000
2 7 14 30 90 180 365
# o
f U
se
r P
airs
Cycle Period (Days)
Figure 2.13: Recurrence period distribution among user pairs.
their high assortativity (0.265, SD=0.214).
2.1.6 Payment Types & Dynamics
In this section, we analyze the types of payments to understand what people use
Venmo for. We first classify payment types based on text/emoji in each transaction
message, and then examine the dynamics of these different types.
Classifying Payment Scenarios
Inferring payment types from messages is challenging due to the extremely short
message length. As shown in Figure 2.11, 99% of messages have less than 10 words.
34
Measuring Online Financial Behavior Chapter 2
Meanwhile, emojis are very helpful for classifying transactions: 34% messages contain at
least one emoji. Here, we analyze both keywords and emoji to classify payment types.
We first identify key categories of payments by manually examining top keywords and
all the emojis. Six most used categories are thus identified:
• Food & drink: dining, groceries, liquor, etc.
• Transportation: gas, parking, airfare, etc.
• Utilities: cleaning, electricity, phone, etc.
• Entertainment: game, sports, movie, music, etc.
• Life: gifts, clothing, insurance, medical, etc.
• Home: electronics, furniture, rent, etc.
We use a list of keywords and emojis for each category to classify transactions. We build
the keyword list by manually assigning the most frequently used 500 English words in
Venmo into the above categories. For example, we have keyword “food” under Food &
Drink category, and “uber” under Transportation. 165 words out of 500 were classified,
and the remaining words were generic terms such as “thanks” and “great.” For emojis, we
manually assign categories to 247 emojis and emoji combinations. For example, “ ”
is interpreted as “rent” and thus belongs to Home.
Using keywords and emojis, we are able to classify 47% of all transaction messages
(results in Table 2.4). Note that a single message can be classified into multiple categories,
e.g. “gas + rent” belongs to both Transportation and Home. Remaining unidentified
messages either have no English words/emojis or refer to inside jokes or acronyms. Even
labeling a thousand more keywords still would not significantly increase classification
coverage (Figure 2.12).
35
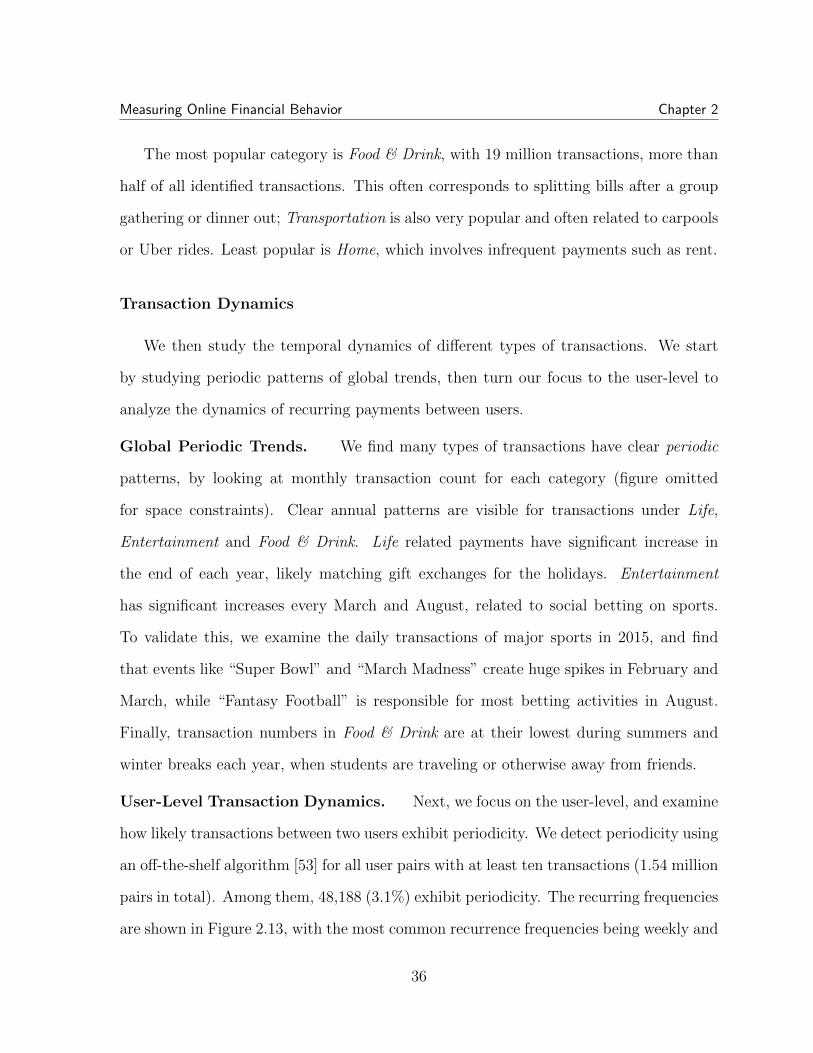
Measuring Online Financial Behavior Chapter 2
The most popular category is Food & Drink, with 19 million transactions, more than
half of all identified transactions. This often corresponds to splitting bills after a group
gathering or dinner out; Transportation is also very popular and often related to carpools
or Uber rides. Least popular is Home, which involves infrequent payments such as rent.
Transaction Dynamics
We then study the temporal dynamics of different types of transactions. We start
by studying periodic patterns of global trends, then turn our focus to the user-level to
analyze the dynamics of recurring payments between users.
Global Periodic Trends. We find many types of transactions have clear periodic
patterns, by looking at monthly transaction count for each category (figure omitted
for space constraints). Clear annual patterns are visible for transactions under Life,
Entertainment and Food & Drink. Life related payments have significant increase in
the end of each year, likely matching gift exchanges for the holidays. Entertainment
has significant increases every March and August, related to social betting on sports.
To validate this, we examine the daily transactions of major sports in 2015, and find
that events like “Super Bowl” and “March Madness” create huge spikes in February and
March, while “Fantasy Football” is responsible for most betting activities in August.
Finally, transaction numbers in Food & Drink are at their lowest during summers and
winter breaks each year, when students are traveling or otherwise away from friends.
User-Level Transaction Dynamics. Next, we focus on the user-level, and examine
how likely transactions between two users exhibit periodicity. We detect periodicity using
an off-the-shelf algorithm [53] for all user pairs with at least ten transactions (1.54 million
pairs in total). Among them, 48,188 (3.1%) exhibit periodicity. The recurring frequencies
are shown in Figure 2.13, with the most common recurrence frequencies being weekly and
36
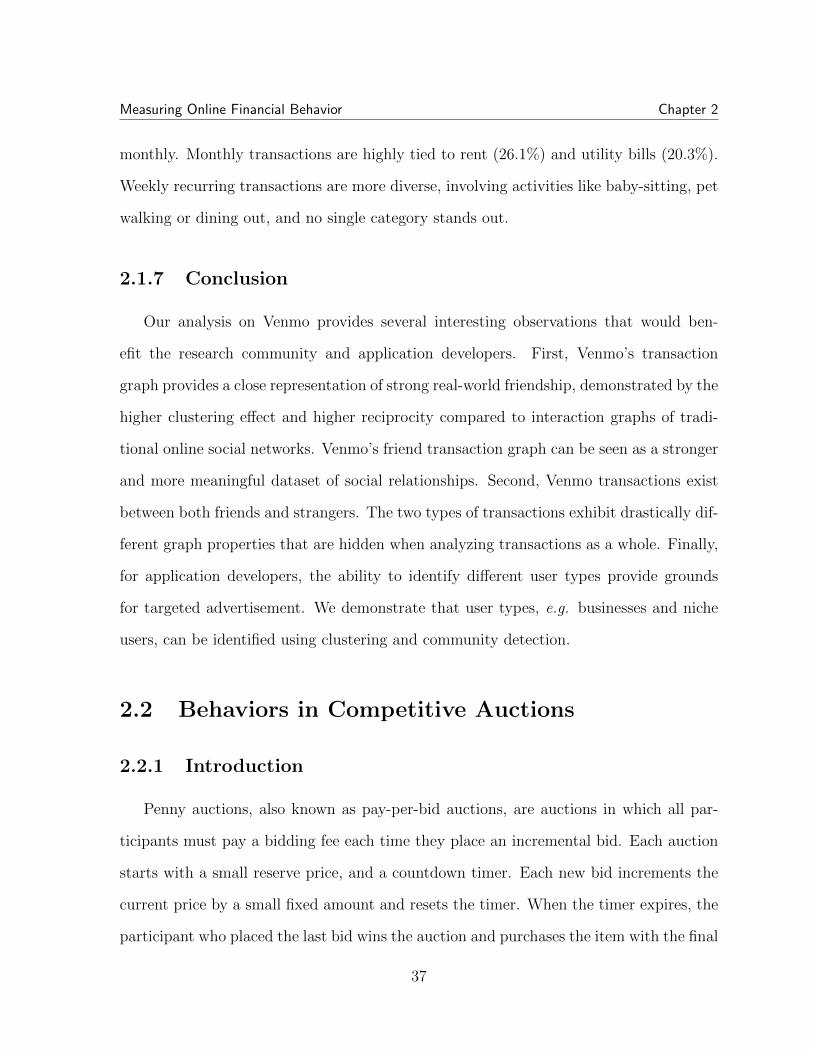
Measuring Online Financial Behavior Chapter 2
monthly. Monthly transactions are highly tied to rent (26.1%) and utility bills (20.3%).
Weekly recurring transactions are more diverse, involving activities like baby-sitting, pet
walking or dining out, and no single category stands out.
2.1.7 Conclusion
Our analysis on Venmo provides several interesting observations that would ben-
efit the research community and application developers. First, Venmo’s transaction
graph provides a close representation of strong real-world friendship, demonstrated by the
higher clustering effect and higher reciprocity compared to interaction graphs of tradi-
tional online social networks. Venmo’s friend transaction graph can be seen as a stronger
and more meaningful dataset of social relationships. Second, Venmo transactions exist
between both friends and strangers. The two types of transactions exhibit drastically dif-
ferent graph properties that are hidden when analyzing transactions as a whole. Finally,
for application developers, the ability to identify different user types provide grounds
for targeted advertisement. We demonstrate that user types, e.g. businesses and niche
users, can be identified using clustering and community detection.
2.2 Behaviors in Competitive Auctions
2.2.1 Introduction
Penny auctions, also known as pay-per-bid auctions, are auctions in which all par-
ticipants must pay a bidding fee each time they place an incremental bid. Each auction
starts with a small reserve price, and a countdown timer. Each new bid increments the
current price by a small fixed amount and resets the timer. When the timer expires, the
participant who placed the last bid wins the auction and purchases the item with the final
37
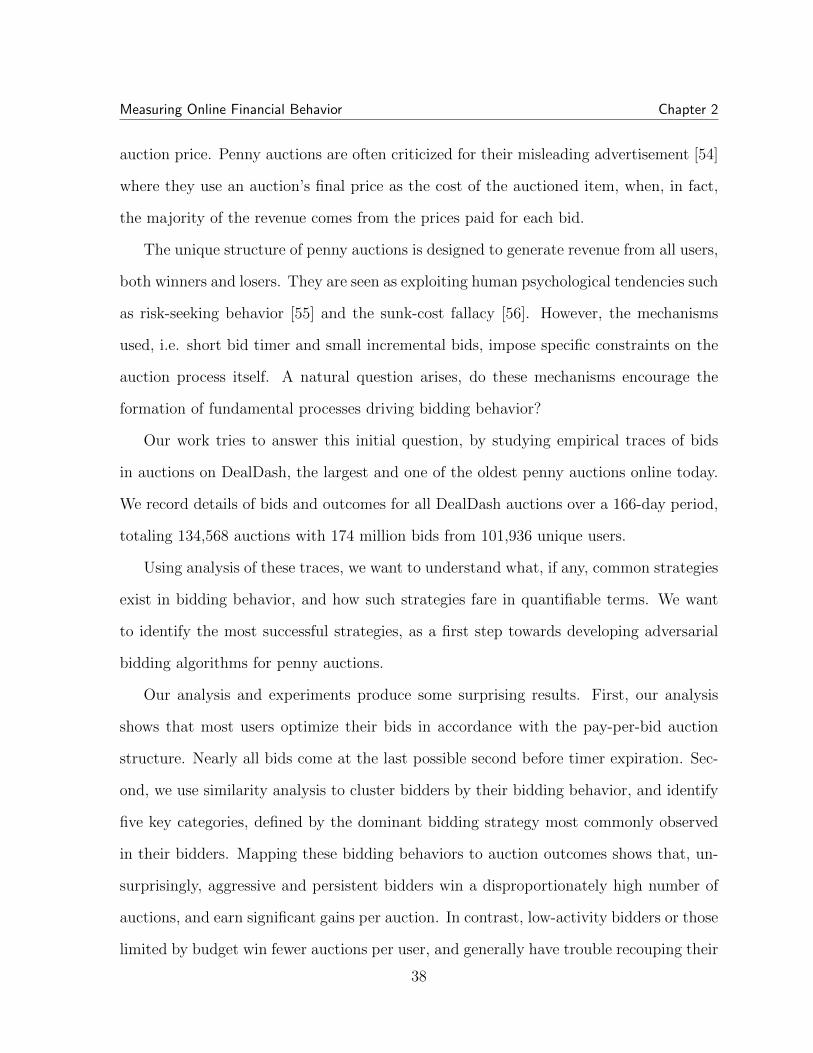
Measuring Online Financial Behavior Chapter 2
auction price. Penny auctions are often criticized for their misleading advertisement [54]
where they use an auction’s final price as the cost of the auctioned item, when, in fact,
the majority of the revenue comes from the prices paid for each bid.
The unique structure of penny auctions is designed to generate revenue from all users,
both winners and losers. They are seen as exploiting human psychological tendencies such
as risk-seeking behavior [55] and the sunk-cost fallacy [56]. However, the mechanisms
used, i.e. short bid timer and small incremental bids, impose specific constraints on the
auction process itself. A natural question arises, do these mechanisms encourage the
formation of fundamental processes driving bidding behavior?
Our work tries to answer this initial question, by studying empirical traces of bids
in auctions on DealDash, the largest and one of the oldest penny auctions online today.
We record details of bids and outcomes for all DealDash auctions over a 166-day period,
totaling 134,568 auctions with 174 million bids from 101,936 unique users.
Using analysis of these traces, we want to understand what, if any, common strategies
exist in bidding behavior, and how such strategies fare in quantifiable terms. We want
to identify the most successful strategies, as a first step towards developing adversarial
bidding algorithms for penny auctions.
Our analysis and experiments produce some surprising results. First, our analysis
shows that most users optimize their bids in accordance with the pay-per-bid auction
structure. Nearly all bids come at the last possible second before timer expiration. Sec-
ond, we use similarity analysis to cluster bidders by their bidding behavior, and identify
five key categories, defined by the dominant bidding strategy most commonly observed
in their bidders. Mapping these bidding behaviors to auction outcomes shows that, un-
surprisingly, aggressive and persistent bidders win a disproportionately high number of
auctions, and earn significant gains per auction. In contrast, low-activity bidders or those
limited by budget win fewer auctions per user, and generally have trouble recouping their
38

Measuring Online Financial Behavior Chapter 2
losses from paying for bids, resulting in net loss.
2.2.2 Background & Related Work
DealDash. DealDash [57] is one of the largest and longest-running penny auction
websites (since 2009). Its functionality is typical of other penny auctions. On DealDash,
the typical bid fee is 12-15 cents, and the fixed price increment is restricted to 1 cent.
The countdown clock expires in 10 seconds. DealDash supports a buy-it-now function,
by which a losing bidder can purchase the item with a posted retail price and have
all the previously placed bids refunded. DealDash also provides a helper function called
BidBuddy, which is a script that takes a fixed amount of budget from the participant and
automatically place bids whenever the countdown clock reaches 1 second and someone
else holds the last bid.
Related Work. Prior work noted that penny auctions are very profitable for the
sellers [55, 56]. Most studies of penny auctions aim at finding theoretical explanations
of the high revenue, e.g., information asymmetry [58], risk-loving nature of bidders [55]
and sunk cost fallacy [56]. Other studies have made great effort to predict the final price
of an auction, either statically [59, 60] or dynamically [61, 62], using machine learning
and various modeling tools.
While significant progress has been made on developing economic models on auction
process and auctioneer profits, few have examined individual bidder behavior in these
systems. In contrast, our work predicts whether a bid will appear and who will place the
bid, which is more similar to individual behavior models for sequence synthesis done on
small-scale English auctions [63, 64].
Some studies have identified different types bidding behavior in “traditional” auction
settings such as English or Dutch auctions. The behaviors identified include jumping [65],
39
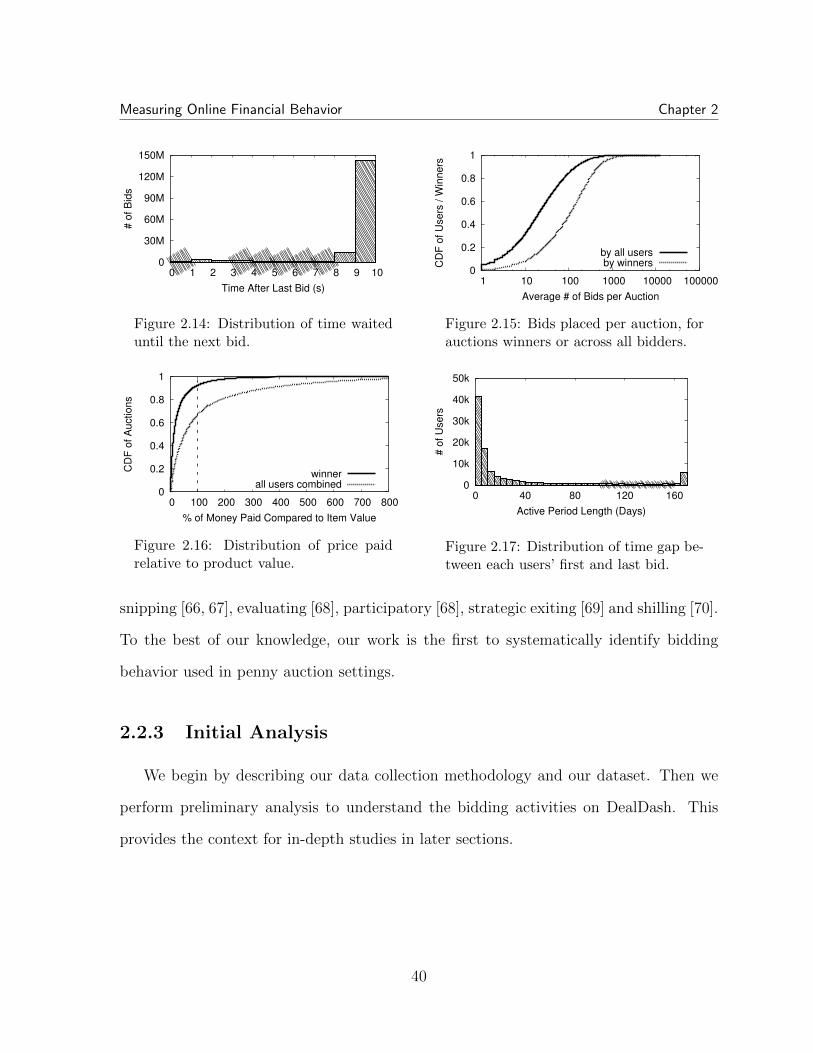
Measuring Online Financial Behavior Chapter 2
0
30M
60M
90M
120M
150M
0 1 2 3 4 5 6 7 8 9 10
# o
f B
ids
Time After Last Bid (s)
Figure 2.14: Distribution of time waiteduntil the next bid.
0
0.2
0.4
0.6
0.8
1
1 10 100 1000 10000 100000
CD
F o
f U
sers
/ W
inners
Average # of Bids per Auction
by all usersby winners
Figure 2.15: Bids placed per auction, forauctions winners or across all bidders.
0
0.2
0.4
0.6
0.8
1
0 100 200 300 400 500 600 700 800
CD
F o
f A
uctions
% of Money Paid Compared to Item Value
winnerall users combined
Figure 2.16: Distribution of price paidrelative to product value.
0
10k
20k
30k
40k
50k
0 40 80 120 160
# o
f U
sers
Active Period Length (Days)
Figure 2.17: Distribution of time gap be-tween each users’ first and last bid.
snipping [66, 67], evaluating [68], participatory [68], strategic exiting [69] and shilling [70].
To the best of our knowledge, our work is the first to systematically identify bidding
behavior used in penny auction settings.
2.2.3 Initial Analysis
We begin by describing our data collection methodology and our dataset. Then we
perform preliminary analysis to understand the bidding activities on DealDash. This
provides the context for in-depth studies in later sections.
40
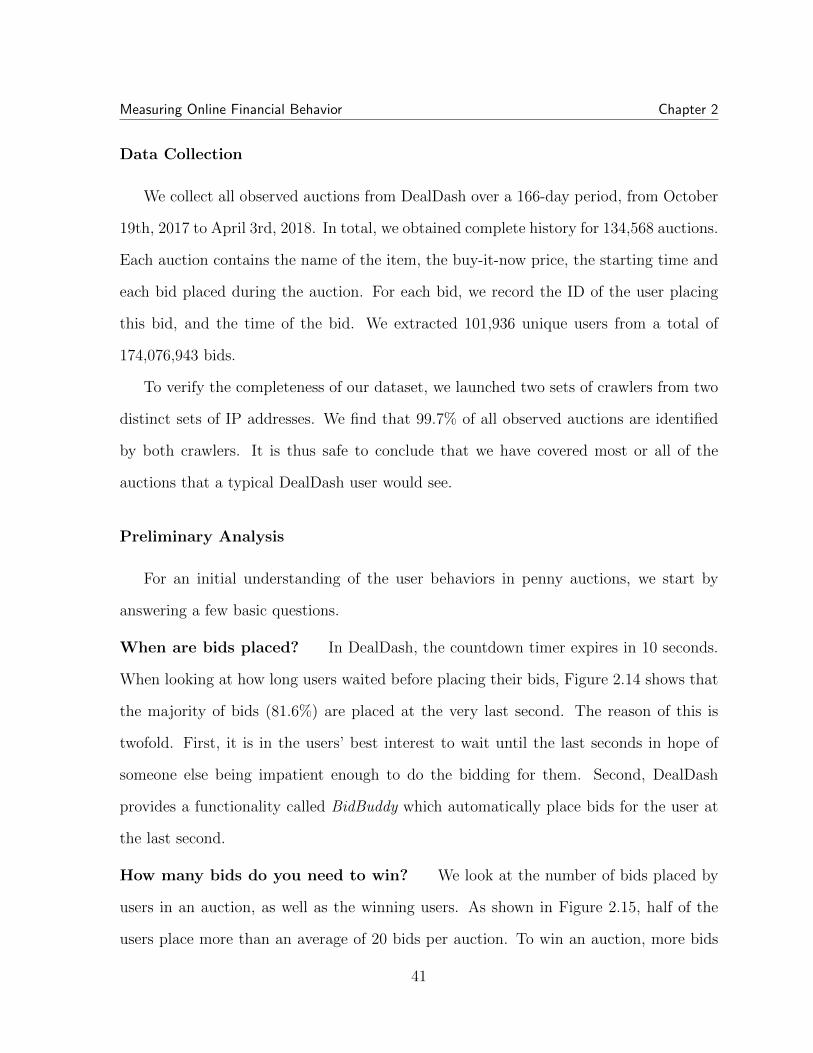
Measuring Online Financial Behavior Chapter 2
Data Collection
We collect all observed auctions from DealDash over a 166-day period, from October
19th, 2017 to April 3rd, 2018. In total, we obtained complete history for 134,568 auctions.
Each auction contains the name of the item, the buy-it-now price, the starting time and
each bid placed during the auction. For each bid, we record the ID of the user placing
this bid, and the time of the bid. We extracted 101,936 unique users from a total of
174,076,943 bids.
To verify the completeness of our dataset, we launched two sets of crawlers from two
distinct sets of IP addresses. We find that 99.7% of all observed auctions are identified
by both crawlers. It is thus safe to conclude that we have covered most or all of the
auctions that a typical DealDash user would see.
Preliminary Analysis
For an initial understanding of the user behaviors in penny auctions, we start by
answering a few basic questions.
When are bids placed? In DealDash, the countdown timer expires in 10 seconds.
When looking at how long users waited before placing their bids, Figure 2.14 shows that
the majority of bids (81.6%) are placed at the very last second. The reason of this is
twofold. First, it is in the users’ best interest to wait until the last seconds in hope of
someone else being impatient enough to do the bidding for them. Second, DealDash
provides a functionality called BidBuddy which automatically place bids for the user at
the last second.
How many bids do you need to win? We look at the number of bids placed by
users in an auction, as well as the winning users. As shown in Figure 2.15, half of the
users place more than an average of 20 bids per auction. To win an auction, more bids
41

Measuring Online Financial Behavior Chapter 2
need to be placed. Only 8.1% of the users can win an auction with less than 10 bids. In
half of the auctions, more than 21.3% of all bids are placed by the auction winner. This
shows that winning an auction is more than being at the right place at the right time. It
takes repeated bids to convince the other bidders to give up. In Section 2.2.4, we delve
into detail about the behavior patterns of auction winners.
How much does an auction winner gain? As discussed in Section 4.1, the
actual savings from penny auction are often unclear to users. We examine how much
money is “won” in each DealDash auction. When calculating the value of the item won,
we estimate the retail price using the price of the same item offered on Amazon.com.
Note that the price of each bid ranges from 12 to 15 cents. Here we use 12 cents as an
estimation of the bid cost for each user. Using 13, 14 or 15 cents per auction produces
similar results.
Figure 2.16 shows a CDF of the proportion of money paid by the winners and all
participants during each auction. In the majority of the cases, even after accounting for
the price of bids, the winner pays significantly less than retail for the item won. Half of
the winners win the item after spending 12.3% of the retail price. Even accounting for
bids placed by the losing bidders, DealDash is only able to generate profit out of 32.5%
of the auctions. One thing to note is that certain bidders will pay more than the retail
price to win auctions. For example, a user called “leilani2” placed 169,223 bids on a
Lawn Mower with retail price of $3,099. The bids would cost approximately $20,307.
This behavior is commonly associated with power bidders [71]. Power bidders establish
a reputation by not giving up an auction even when the price goes unreasonably high.
They hope that experienced users will learn to avoid the power bidders, and they can then
win auctions at a very low price. We show in Section 2.2.4 that in the case of DealDash,
most power bidders still need to put in a large number of bids to win auctions.
42
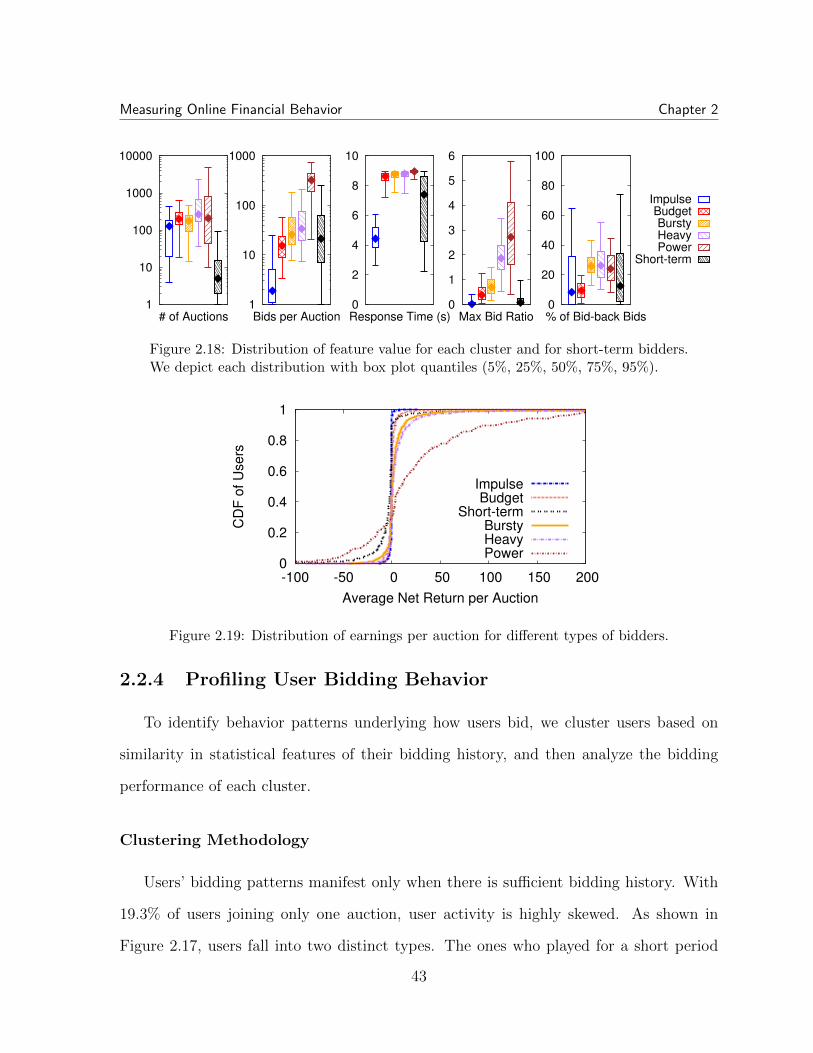
Measuring Online Financial Behavior Chapter 2
1
10
100
1000
10000
# of Auctions
ImpulseBudgetBurstyHeavyPower
Short-term
1
10
100
1000
Bids per Auction 0
2
4
6
8
10
Response Time (s) 0
1
2
3
4
5
6
Max Bid Ratio0
20
40
60
80
100
% of Bid-back Bids
Figure 2.18: Distribution of feature value for each cluster and for short-term bidders.We depict each distribution with box plot quantiles (5%, 25%, 50%, 75%, 95%).
0
0.2
0.4
0.6
0.8
1
-100 -50 0 50 100 150 200
CD
F o
f U
se
rs
Average Net Return per Auction
ImpulseBudget
Short-termBurstyHeavyPower
Figure 2.19: Distribution of earnings per auction for different types of bidders.
2.2.4 Profiling User Bidding Behavior
To identify behavior patterns underlying how users bid, we cluster users based on
similarity in statistical features of their bidding history, and then analyze the bidding
performance of each cluster.
Clustering Methodology
Users’ bidding patterns manifest only when there is sufficient bidding history. With
19.3% of users joining only one auction, user activity is highly skewed. As shown in
Figure 2.17, users fall into two distinct types. The ones who played for a short period
43
Measuring Online Financial Behavior Chapter 2
and quit, and those who are active for most of the crawling period. This high user churn
is common in penny auction sites [72]. Using Figure 2.17, we thus filter out users who
are active for less than 128 days, which we call short-term bidders. This leaves us with
9,105 users.
We quantify user behavior using the following features with the aim of capturing
behaviors relevant to bidding performance while removing correlation between features.
• Number of auctions. Activity level of a user defined by number of auctions user
has participated in.
• Bids per auction. Average number of bids placed by the user in each auction.
• Bid response time. Average time gap between a user’s bid and the prior bid.
• Max bid ratio. Maximum ratio of value of bids placed against the value of the
product, across all auctions participated in by the user. A value above 1 means the
bidder paid more in bids than the value of the product in at least one auction.
• Bid-back rate. Bid-back is when a user is out-bid and she places the immediate
next bid. This measures the user’s aggressiveness in auctions.
We compute the feature vector for each user (z-score normalized), and measure the
Euclidean distance between user pairs. We then applied Divisive Hierarchical Cluster-
ing [45] to cluster the 9,105 active users. When breaking the users into five clusters, we
achieves the best clustering quality as indicated by modularity [73].
Cluster Analysis
We manually label each cluster based on the feature values they exhibit, as shown in
Figure 2.18. To measure performance, we show, in Figure 2.19, on average how much
44

Measuring Online Financial Behavior Chapter 2
each user is wining from each auction. Each user’s net return is calculated as the total
worth of items won in auctions minus the final auction price and minus the cost of bids.
• Impulse Bidders (9.79% of users). Contrary to common practice, these users do
not wait until the last second to place their bids. Instead, their bids are placed
at random points during the countdown, with a median wait time of 4.4 seconds.
Most in this group failed to make money from auctions, losing a median of $0.20
per auction.
• Budget Bidders (55.8%). They only place a few bids in each auction, and rarely
bid back when outbid. These users are not aggressive enough, and most win less
than 1% of the auctions they join. This is the user cluster with the largest median
net loss, losing more than $0.47 per auction.
• Bursty Bidders (19.6%). These users avoid spending too many bids in any auction,
but are still able to maintain a high bid-back rate. They tend to concentrate their
bids to a short period, either ending in winning the auction or running out of bids.
Most users in this group produce net gains, with a median return of $0.48 per
auction.
• Heavy Bidders (12.5%). These users join a lot of auctions and are willing to place
substantial number of bids to win the auction. Median return per auction is $0.63.
• Power Bidders (2.22%). They are similar to heavy bidders, but place an order of
magnitude more bids, characterized by a high max bid ratio. Given more bids
placed per auction, it is unsurprising that they are much more likely to win their
auctions, with a median of 14.8% chance of winning. Median return per auction
for these users is $9.38.
45
Measuring Online Financial Behavior Chapter 2
By observing the clusters, we find that most DealDash bidders are actually losing
money, while a small number of winners earn significant profit. The most successful
users (power bidders and heavy bidders) win 13.08% and 27.00% of all auctions, despite
making up less than 15% of the long-term user population. While other groups win their
share of auctions, they lose far more auctions, and are generally unable to recoup their
losses from the cost of bids.
2.2.5 Discussion and Conclusions
Our analysis of penny auctions and their users focused identifying common bidding
behaviors in penny auctions and the results of these behaviors.
We find that most bidders tend to fall into one of a handful of clear behavioral
categories, based on how patient they are, how aggressive they are, and how much money
they have and are willing to use to win. We show that the large majority of users lose
money, and the winnings go disproportionately to a small portion of the users (mostly
power bidders willing and able to use large bid volumes to win auctions).
Finally, our results suggest that penny auctions themselves could possibly be gamed
adversarially. It seems intuitive that drawing from our results, a reasonably complex
model could emulate power bidder behavior while avoiding unnecessary bids. In Chap-
ture 4, we achieve exactly that by modeling the bidder behavior using a modified LSTM
model and identified winning strategies that bear striking resemblance to the power bid-
der model.
46
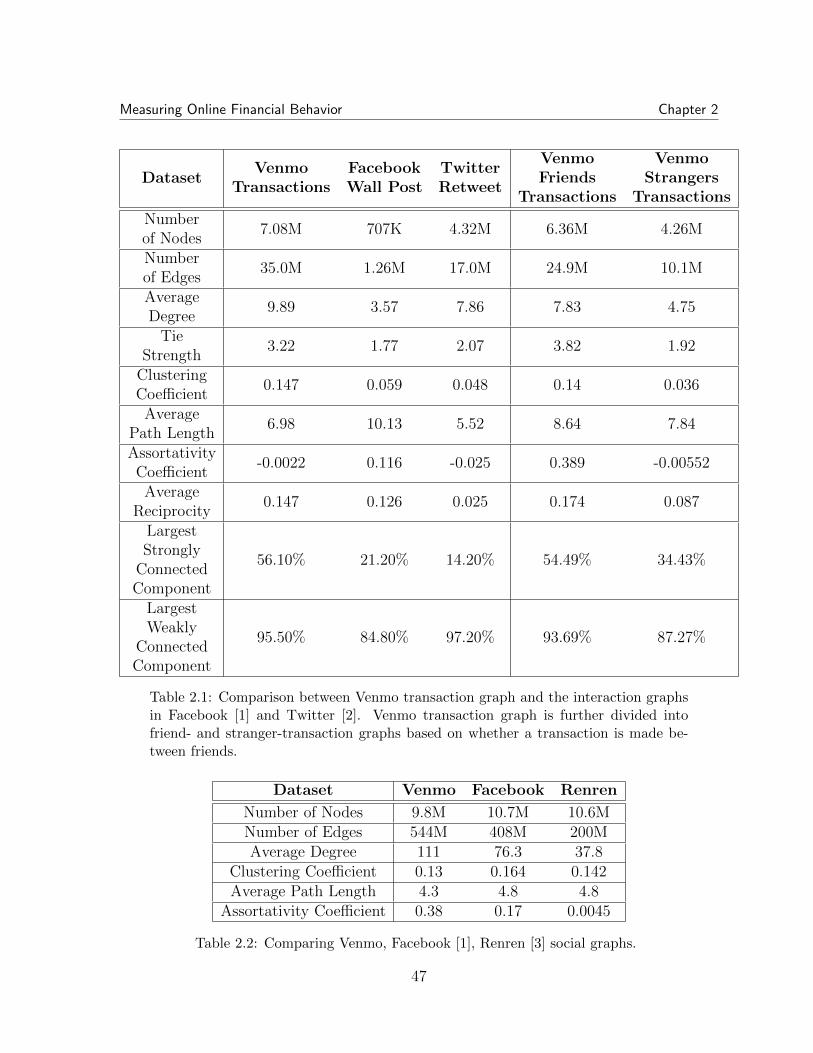
Measuring Online Financial Behavior Chapter 2
DatasetVenmo
TransactionsFacebookWall Post
TwitterRetweet
VenmoFriends
Transactions
VenmoStrangers
Transactions
Numberof Nodes
7.08M 707K 4.32M 6.36M 4.26M
Numberof Edges
35.0M 1.26M 17.0M 24.9M 10.1M
AverageDegree
9.89 3.57 7.86 7.83 4.75
TieStrength
3.22 1.77 2.07 3.82 1.92
ClusteringCoefficient
0.147 0.059 0.048 0.14 0.036
AveragePath Length
6.98 10.13 5.52 8.64 7.84
AssortativityCoefficient
-0.0022 0.116 -0.025 0.389 -0.00552
AverageReciprocity
0.147 0.126 0.025 0.174 0.087
LargestStrongly
ConnectedComponent
56.10% 21.20% 14.20% 54.49% 34.43%
LargestWeakly
ConnectedComponent
95.50% 84.80% 97.20% 93.69% 87.27%
Table 2.1: Comparison between Venmo transaction graph and the interaction graphsin Facebook [1] and Twitter [2]. Venmo transaction graph is further divided intofriend- and stranger-transaction graphs based on whether a transaction is made be-tween friends.
Dataset Venmo Facebook Renren
Number of Nodes 9.8M 10.7M 10.6MNumber of Edges 544M 408M 200MAverage Degree 111 76.3 37.8
Clustering Coefficient 0.13 0.164 0.142Average Path Length 4.3 4.8 4.8
Assortativity Coefficient 0.38 0.17 0.0045
Table 2.2: Comparing Venmo, Facebook [1], Renren [3] social graphs.
47
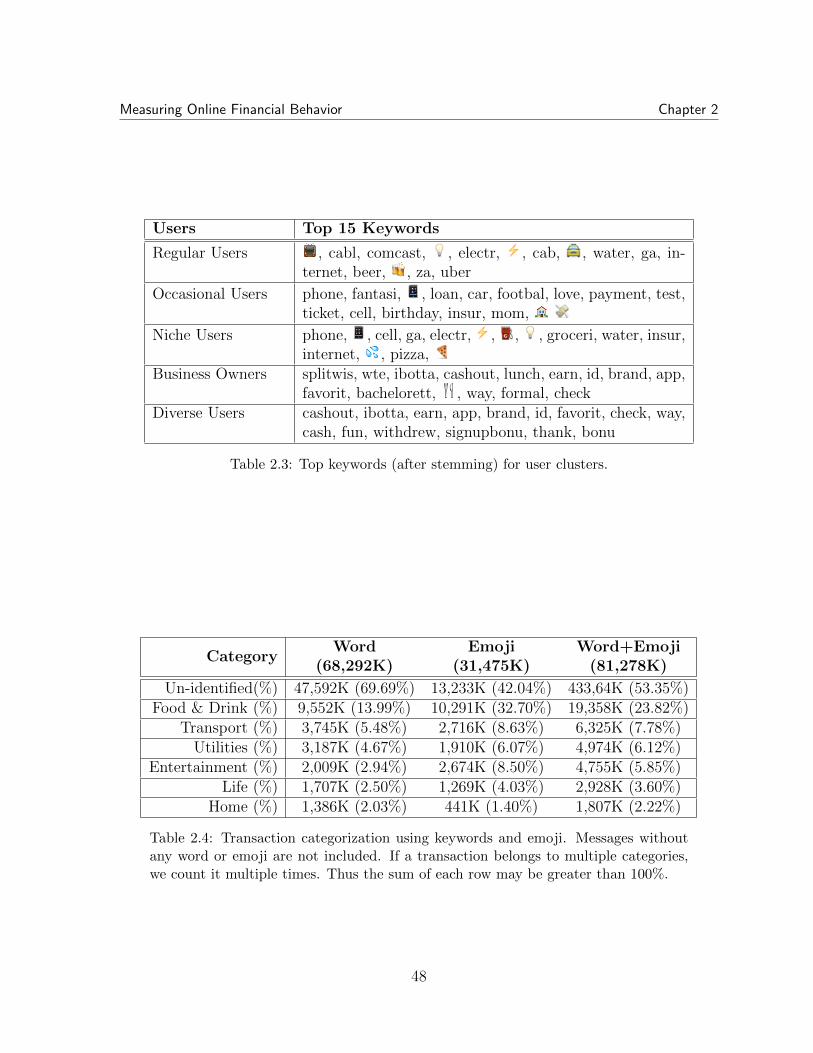
Measuring Online Financial Behavior Chapter 2
Users Top 15 Keywords
Regular Users , cabl, comcast, , electr, , cab, , water, ga, in-ternet, beer, , za, uber
Occasional Users phone, fantasi, , loan, car, footbal, love, payment, test,ticket, cell, birthday, insur, mom,
Niche Users phone, , cell, ga, electr, , , , groceri, water, insur,internet, , pizza,
Business Owners splitwis, wte, ibotta, cashout, lunch, earn, id, brand, app,favorit, bachelorett, , way, formal, check
Diverse Users cashout, ibotta, earn, app, brand, id, favorit, check, way,cash, fun, withdrew, signupbonu, thank, bonu
Table 2.3: Top keywords (after stemming) for user clusters.
CategoryWord
(68,292K)Emoji
(31,475K)Word+Emoji
(81,278K)
Un-identified(%) 47,592K (69.69%) 13,233K (42.04%) 433,64K (53.35%)Food & Drink (%) 9,552K (13.99%) 10,291K (32.70%) 19,358K (23.82%)
Transport (%) 3,745K (5.48%) 2,716K (8.63%) 6,325K (7.78%)Utilities (%) 3,187K (4.67%) 1,910K (6.07%) 4,974K (6.12%)
Entertainment (%) 2,009K (2.94%) 2,674K (8.50%) 4,755K (5.85%)Life (%) 1,707K (2.50%) 1,269K (4.03%) 2,928K (3.60%)
Home (%) 1,386K (2.03%) 441K (1.40%) 1,807K (2.22%)
Table 2.4: Transaction categorization using keywords and emoji. Messages withoutany word or emoji are not included. If a transaction belongs to multiple categories,we count it multiple times. Thus the sum of each row may be greater than 100%.
48
Chapter 3
Understanding Online Financial
Behavior
In the previous chapter, we have discussed how empirical measurements can be used to
create a clear picture of online financial behaviors. In this chapter, we discuss how we to
incorporate methods commonly used in social science to go one step further, and examine
the underlying motivations behind financial behaviors.
In the following, we present two case studies employing two different approaches to
further our understanding. First, we use a survey-and-interview-driven discovery to iden-
tify hidden motivations and rationalities behind the adoption and usage of social wallets.
Second, we seek to examine existing theories in behavioral science, using empirical data
to either verify or reject hypothesis about the psychology behind behaviors in auctions.
49
Understanding Online Financial Behavior Chapter 3
3.1 Understanding the Adoption and Experience of
Digital Wallets
3.1.1 Introduction
Today’s Internet has dramatically reshaped the way in which people make payments
and transfer money. The biggest paradigm shift is the emergence of online and mobile
payment services, which have started to replace cash and/or credit cards around the
globe. For example, PayPal, which began as an offshoot of eBay in 1998, has built up a
210 million user base by 2017. Alipay, PayPal’s counterpart in China reached 450 million
users in 2017.
More recently, Venmo (USA) and WeChat Pay (China) entered the market as digital
wallet services that target peer-to-peer (P2P) payments, where users send and receive
money from each other digitally. These new services quickly gained significant market
shares, surprising many in the finance industry with their rapid growth. WeChat Pay
has reached 200 million users in only three years, and Venmo (acquired by PayPal in
2013) has attracted 10 million active users within the same time span. Compared to
conventional online payment systems, the most distinctive feature that distinguishes
P2P digital wallets is the integration of established social networks to facilitate payments
between friends.
There have been many attempts to connect social features with financial transac-
tions, by leveraging the potential power of social networks in attracting and retaining
users. The results have been mixed at best. For example, Facebook has integrated P2P
payments into Facebook Messenger [5]; Snapchat also offers a money transfer feature in
their messaging app [6]; and Alipay is experimenting with a new social network service
over its already successful e-commerce system [7].
50
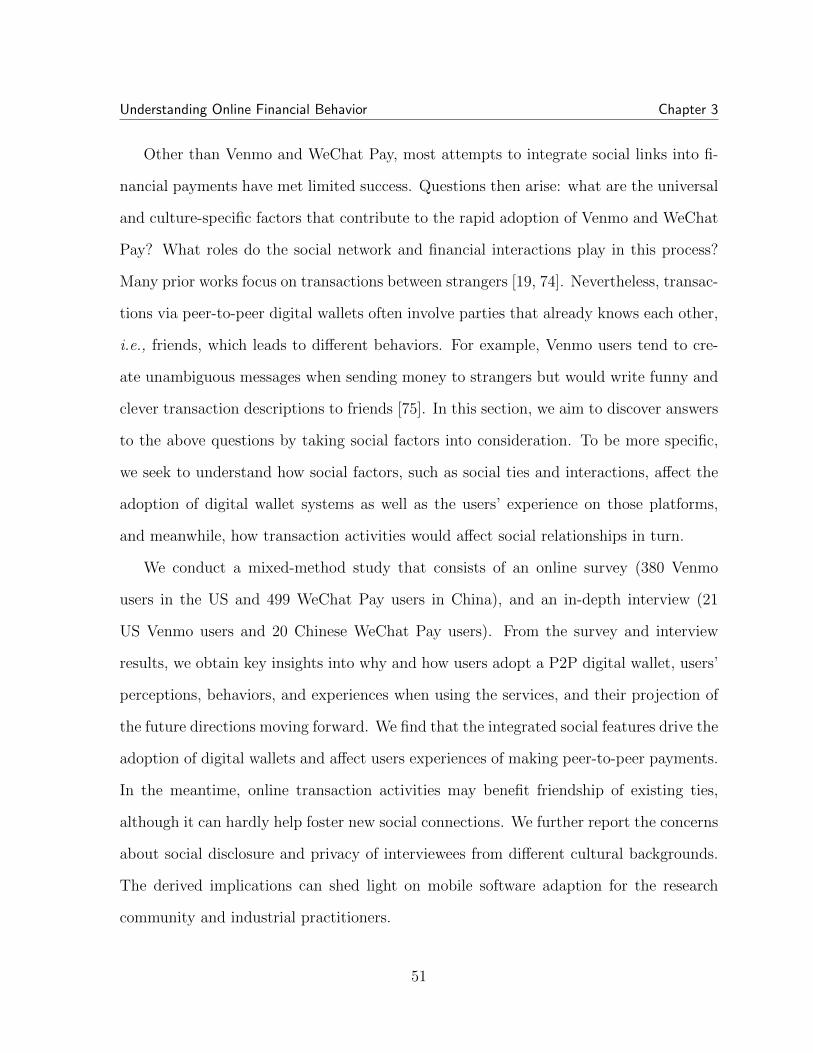
Understanding Online Financial Behavior Chapter 3
Other than Venmo and WeChat Pay, most attempts to integrate social links into fi-
nancial payments have met limited success. Questions then arise: what are the universal
and culture-specific factors that contribute to the rapid adoption of Venmo and WeChat
Pay? What roles do the social network and financial interactions play in this process?
Many prior works focus on transactions between strangers [19, 74]. Nevertheless, transac-
tions via peer-to-peer digital wallets often involve parties that already knows each other,
i.e., friends, which leads to different behaviors. For example, Venmo users tend to cre-
ate unambiguous messages when sending money to strangers but would write funny and
clever transaction descriptions to friends [75]. In this section, we aim to discover answers
to the above questions by taking social factors into consideration. To be more specific,
we seek to understand how social factors, such as social ties and interactions, affect the
adoption of digital wallet systems as well as the users’ experience on those platforms,
and meanwhile, how transaction activities would affect social relationships in turn.
We conduct a mixed-method study that consists of an online survey (380 Venmo
users in the US and 499 WeChat Pay users in China), and an in-depth interview (21
US Venmo users and 20 Chinese WeChat Pay users). From the survey and interview
results, we obtain key insights into why and how users adopt a P2P digital wallet, users’
perceptions, behaviors, and experiences when using the services, and their projection of
the future directions moving forward. We find that the integrated social features drive the
adoption of digital wallets and affect users experiences of making peer-to-peer payments.
In the meantime, online transaction activities may benefit friendship of existing ties,
although it can hardly help foster new social connections. We further report the concerns
about social disclosure and privacy of interviewees from different cultural backgrounds.
The derived implications can shed light on mobile software adaption for the research
community and industrial practitioners.
51
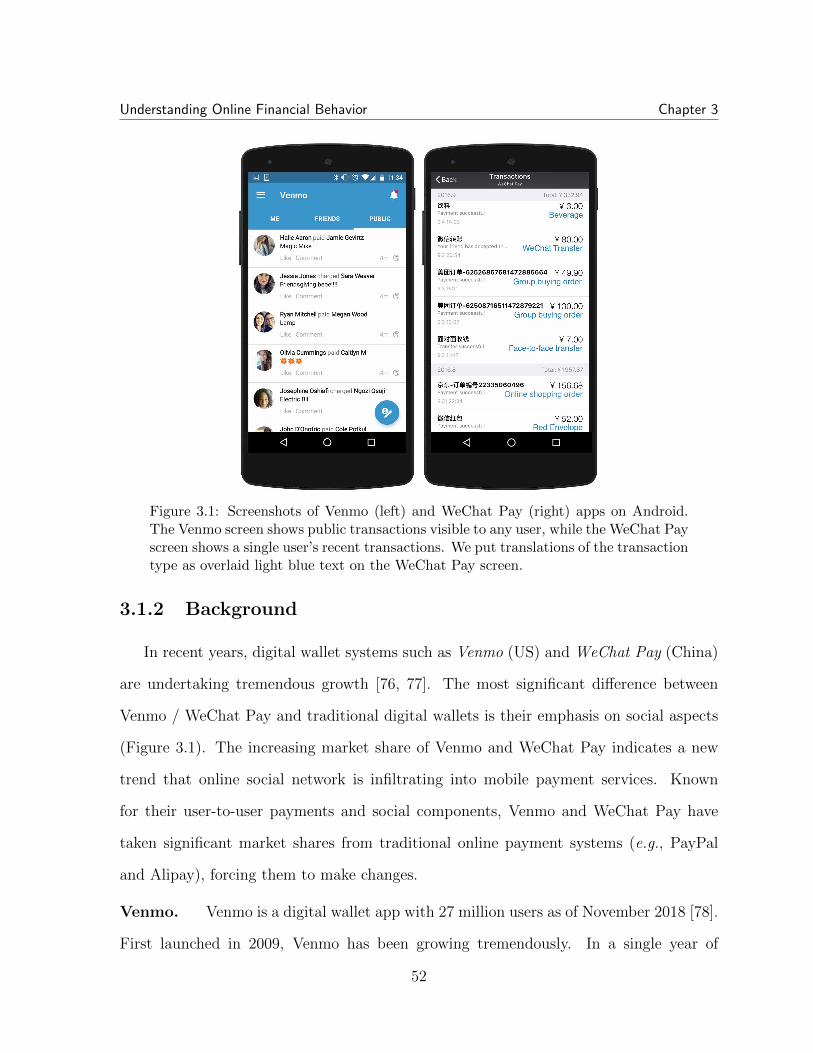
Understanding Online Financial Behavior Chapter 3
Figure 3.1: Screenshots of Venmo (left) and WeChat Pay (right) apps on Android.The Venmo screen shows public transactions visible to any user, while the WeChat Payscreen shows a single user’s recent transactions. We put translations of the transactiontype as overlaid light blue text on the WeChat Pay screen.
3.1.2 Background
In recent years, digital wallet systems such as Venmo (US) and WeChat Pay (China)
are undertaking tremendous growth [76, 77]. The most significant difference between
Venmo / WeChat Pay and traditional digital wallets is their emphasis on social aspects
(Figure 3.1). The increasing market share of Venmo and WeChat Pay indicates a new
trend that online social network is infiltrating into mobile payment services. Known
for their user-to-user payments and social components, Venmo and WeChat Pay have
taken significant market shares from traditional online payment systems (e.g., PayPal
and Alipay), forcing them to make changes.
Venmo. Venmo is a digital wallet app with 27 million users as of November 2018 [78].
First launched in 2009, Venmo has been growing tremendously. In a single year of
52
Understanding Online Financial Behavior Chapter 3
2015, Venmo increased its transaction volume by 200%, and reached 19 billion dollars
in quarterly transaction volume in 2018 [76]. On Venmo, users can transfer money to
each other and build social links. Users can either pay or charge another user for some
given amount, and attach a short message (e.g., “my rent”). A unique feature of Venmo
is social sharing. For each transaction, users can choose to share the transaction record
to the “public” (default) or with “friends.” The transaction information, excluding the
actual amount, will be visible in the public stream or their friends’ news feed. Other
users can like or comment on shared transactions. Finally, users can use the app to pay
for online/offline services (e.g., restaurants) that have registered Venmo accounts.
WeChat Pay. WeChat Pay is another fast-growing social digital wallet. It has
gained 900 million users in only five years since its launch in 2013 [79]. WeChat Pay is
built into WeChat, the largest social messaging network in China, which has more than
one billion monthly active users [80]. Similar to Venmo, WeChat Pay allows users to
transfer money with friends and pay for various online or offline services from e-commerce
sites to hospitals and taxis. Usually, a user starts a transaction by posting a message
in another user’s chatbox or scan the user’s payment QR code. Unlike Venmo, WeChat
Pay does not support social sharing of transaction records. Instead, WeChat Pay has
a unique feature called “Moment” that supports sharing feature within a limited social
scope. Besides, it develops a feature called “Red Packet” which mimics the Chinese
tradition that people give red envelopes (with cash in it) to friends and family members
for best wishes. This WeChat Pay feature allows users to send digital red envelopes to
friends or use the money to start a lottery draw among a group of friends (each gets a
random amount). During the Chinese New Year of 2018, 688 million users sent and/or
received red envelopes through WeChat Pay [81].
Impact on Traditional Online Payment Systems. Traditional payment systems
53
Understanding Online Financial Behavior Chapter 3
like PayPal (US) and Alipay (China) are taking actions in response to Venmo and WeChat
Pay’s launch. PayPal acquired Venmo (in 2013), and launched another user-to-user
payment service called PayPal.Me targeting global users. In China, Alipay’s market
share dropped from 82% to 68% during 2014 to 2015 when the 1-year old WeChat Pay
doubled its own market share [77]. As a response, Alipay also launches its own social
network function, which is very similar to that in WeChat [82]. However, the reason
behind the popularity of Venmo and WeChat Pay is still overlooked, especially when
they are also serving as social platforms. In this section, we thereby would like to study
the adoption of those payment systems and their symbiosis relationship to the underlying
social network.
3.1.3 Theoretical Background and Related Work
Social Factors Drive Technology Adoption
One of our key goals is to understand how P2P digital wallets become so widely-
adopted in a short period of time, especially how social aspects contribute to the adoption
process. Theories in diffusion and adoption of technology may provide possible insights
into this question.
Diffusion of Innovation (DOI) theory [83] postulates the detailed mechanisms of how
a newly innovated technology spreads across populations. It identifies four elements
of diffusion: (1) the innovation itself, (2) channels through which it is communicated,
(3) over time, and (4) among members of a social system. Designs related to each of
these elements may speed up or slow down the diffusion process. In this section, we
are particularly interested in the role that the integration of social functions into digital
wallets may play in this process.
Literatures on social science and marketing have shown that an online social net-
54
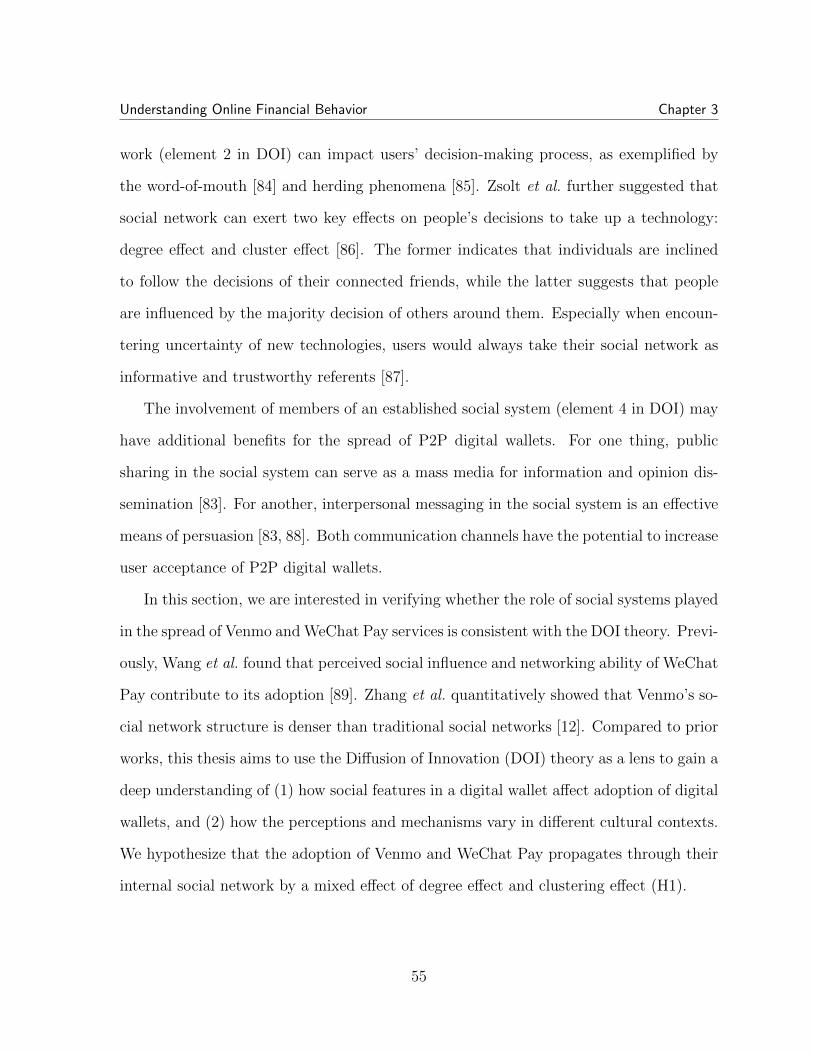
Understanding Online Financial Behavior Chapter 3
work (element 2 in DOI) can impact users’ decision-making process, as exemplified by
the word-of-mouth [84] and herding phenomena [85]. Zsolt et al. further suggested that
social network can exert two key effects on people’s decisions to take up a technology:
degree effect and cluster effect [86]. The former indicates that individuals are inclined
to follow the decisions of their connected friends, while the latter suggests that people
are influenced by the majority decision of others around them. Especially when encoun-
tering uncertainty of new technologies, users would always take their social network as
informative and trustworthy referents [87].
The involvement of members of an established social system (element 4 in DOI) may
have additional benefits for the spread of P2P digital wallets. For one thing, public
sharing in the social system can serve as a mass media for information and opinion dis-
semination [83]. For another, interpersonal messaging in the social system is an effective
means of persuasion [83, 88]. Both communication channels have the potential to increase
user acceptance of P2P digital wallets.
In this section, we are interested in verifying whether the role of social systems played
in the spread of Venmo and WeChat Pay services is consistent with the DOI theory. Previ-
ously, Wang et al. found that perceived social influence and networking ability of WeChat
Pay contribute to its adoption [89]. Zhang et al. quantitatively showed that Venmo’s so-
cial network structure is denser than traditional social networks [12]. Compared to prior
works, this thesis aims to use the Diffusion of Innovation (DOI) theory as a lens to gain a
deep understanding of (1) how social features in a digital wallet affect adoption of digital
wallets, and (2) how the perceptions and mechanisms vary in different cultural contexts.
We hypothesize that the adoption of Venmo and WeChat Pay propagates through their
internal social network by a mixed effect of degree effect and clustering effect (H1).
55
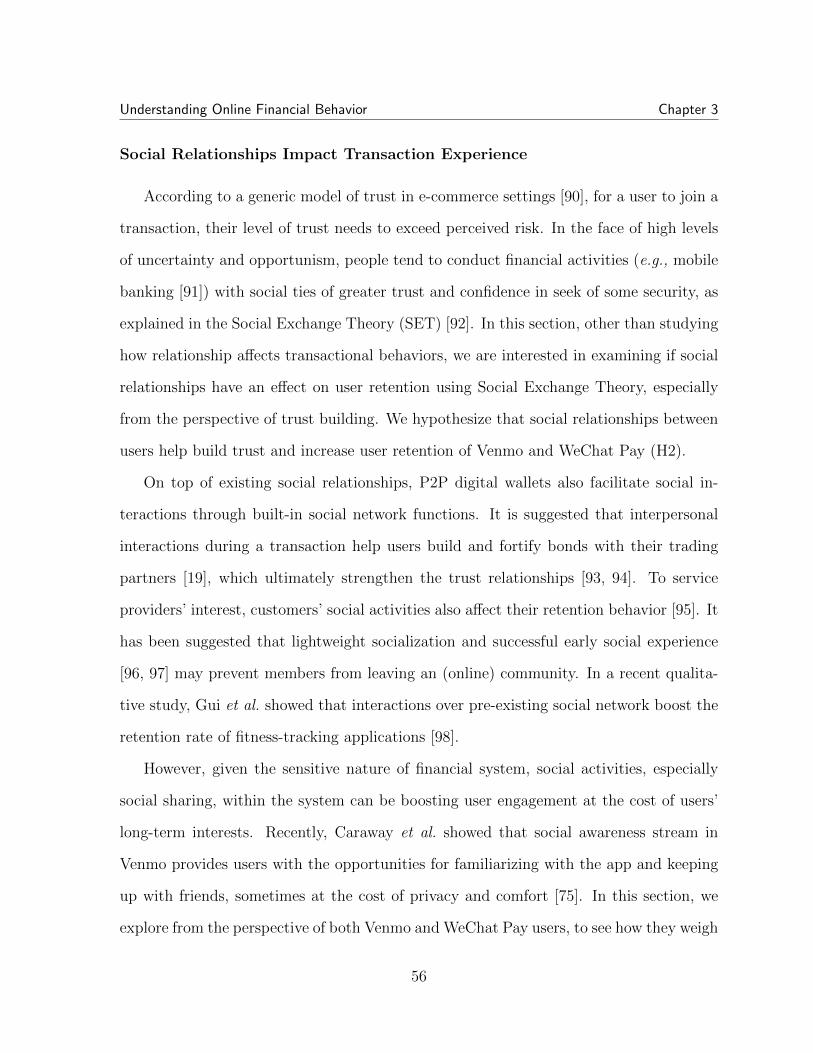
Understanding Online Financial Behavior Chapter 3
Social Relationships Impact Transaction Experience
According to a generic model of trust in e-commerce settings [90], for a user to join a
transaction, their level of trust needs to exceed perceived risk. In the face of high levels
of uncertainty and opportunism, people tend to conduct financial activities (e.g., mobile
banking [91]) with social ties of greater trust and confidence in seek of some security, as
explained in the Social Exchange Theory (SET) [92]. In this section, other than studying
how relationship affects transactional behaviors, we are interested in examining if social
relationships have an effect on user retention using Social Exchange Theory, especially
from the perspective of trust building. We hypothesize that social relationships between
users help build trust and increase user retention of Venmo and WeChat Pay (H2).
On top of existing social relationships, P2P digital wallets also facilitate social in-
teractions through built-in social network functions. It is suggested that interpersonal
interactions during a transaction help users build and fortify bonds with their trading
partners [19], which ultimately strengthen the trust relationships [93, 94]. To service
providers’ interest, customers’ social activities also affect their retention behavior [95]. It
has been suggested that lightweight socialization and successful early social experience
[96, 97] may prevent members from leaving an (online) community. In a recent qualita-
tive study, Gui et al. showed that interactions over pre-existing social network boost the
retention rate of fitness-tracking applications [98].
However, given the sensitive nature of financial system, social activities, especially
social sharing, within the system can be boosting user engagement at the cost of users’
long-term interests. Recently, Caraway et al. showed that social awareness stream in
Venmo provides users with the opportunities for familiarizing with the app and keeping
up with friends, sometimes at the cost of privacy and comfort [75]. In this section, we
explore from the perspective of both Venmo and WeChat Pay users, to see how they weigh
56
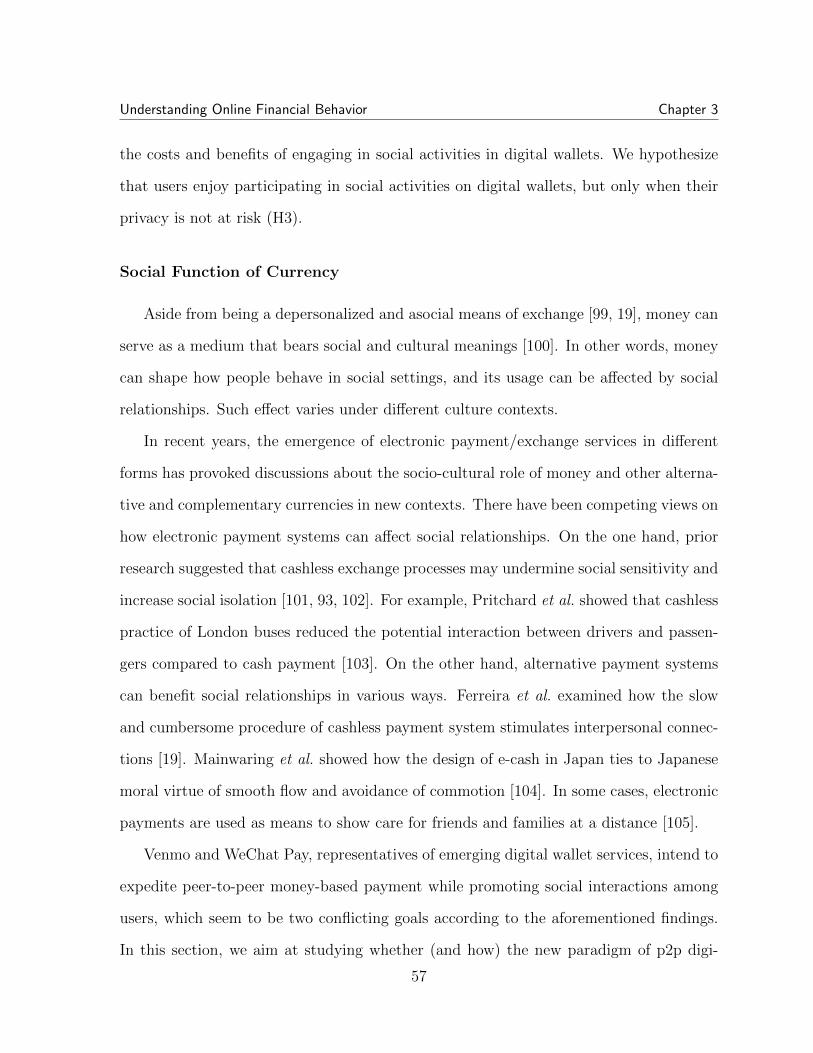
Understanding Online Financial Behavior Chapter 3
the costs and benefits of engaging in social activities in digital wallets. We hypothesize
that users enjoy participating in social activities on digital wallets, but only when their
privacy is not at risk (H3).
Social Function of Currency
Aside from being a depersonalized and asocial means of exchange [99, 19], money can
serve as a medium that bears social and cultural meanings [100]. In other words, money
can shape how people behave in social settings, and its usage can be affected by social
relationships. Such effect varies under different culture contexts.
In recent years, the emergence of electronic payment/exchange services in different
forms has provoked discussions about the socio-cultural role of money and other alterna-
tive and complementary currencies in new contexts. There have been competing views on
how electronic payment systems can affect social relationships. On the one hand, prior
research suggested that cashless exchange processes may undermine social sensitivity and
increase social isolation [101, 93, 102]. For example, Pritchard et al. showed that cashless
practice of London buses reduced the potential interaction between drivers and passen-
gers compared to cash payment [103]. On the other hand, alternative payment systems
can benefit social relationships in various ways. Ferreira et al. examined how the slow
and cumbersome procedure of cashless payment system stimulates interpersonal connec-
tions [19]. Mainwaring et al. showed how the design of e-cash in Japan ties to Japanese
moral virtue of smooth flow and avoidance of commotion [104]. In some cases, electronic
payments are used as means to show care for friends and families at a distance [105].
Venmo and WeChat Pay, representatives of emerging digital wallet services, intend to
expedite peer-to-peer money-based payment while promoting social interactions among
users, which seem to be two conflicting goals according to the aforementioned findings.
In this section, we aim at studying whether (and how) the new paradigm of p2p digi-
57
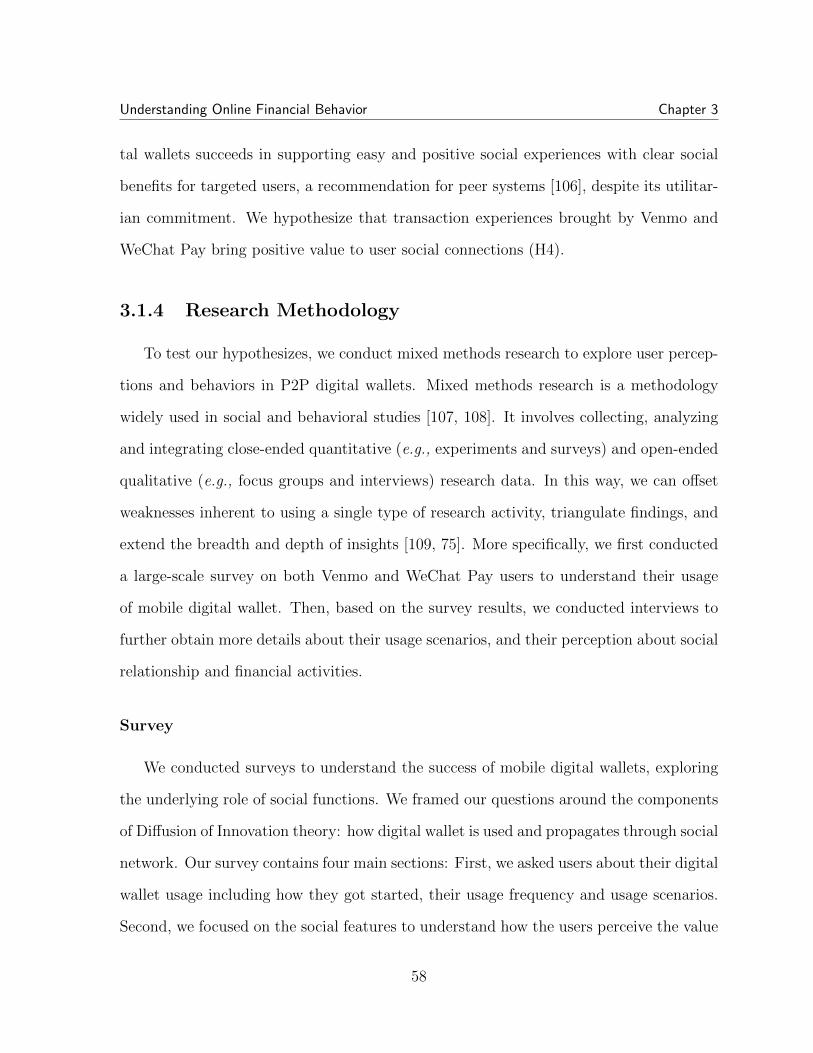
Understanding Online Financial Behavior Chapter 3
tal wallets succeeds in supporting easy and positive social experiences with clear social
benefits for targeted users, a recommendation for peer systems [106], despite its utilitar-
ian commitment. We hypothesize that transaction experiences brought by Venmo and
WeChat Pay bring positive value to user social connections (H4).
3.1.4 Research Methodology
To test our hypothesizes, we conduct mixed methods research to explore user percep-
tions and behaviors in P2P digital wallets. Mixed methods research is a methodology
widely used in social and behavioral studies [107, 108]. It involves collecting, analyzing
and integrating close-ended quantitative (e.g., experiments and surveys) and open-ended
qualitative (e.g., focus groups and interviews) research data. In this way, we can offset
weaknesses inherent to using a single type of research activity, triangulate findings, and
extend the breadth and depth of insights [109, 75]. More specifically, we first conducted
a large-scale survey on both Venmo and WeChat Pay users to understand their usage
of mobile digital wallet. Then, based on the survey results, we conducted interviews to
further obtain more details about their usage scenarios, and their perception about social
relationship and financial activities.
Survey
We conducted surveys to understand the success of mobile digital wallets, exploring
the underlying role of social functions. We framed our questions around the components
of Diffusion of Innovation theory: how digital wallet is used and propagates through social
network. Our survey contains four main sections: First, we asked users about their digital
wallet usage including how they got started, their usage frequency and usage scenarios.
Second, we focused on the social features to understand how the users perceive the value
58
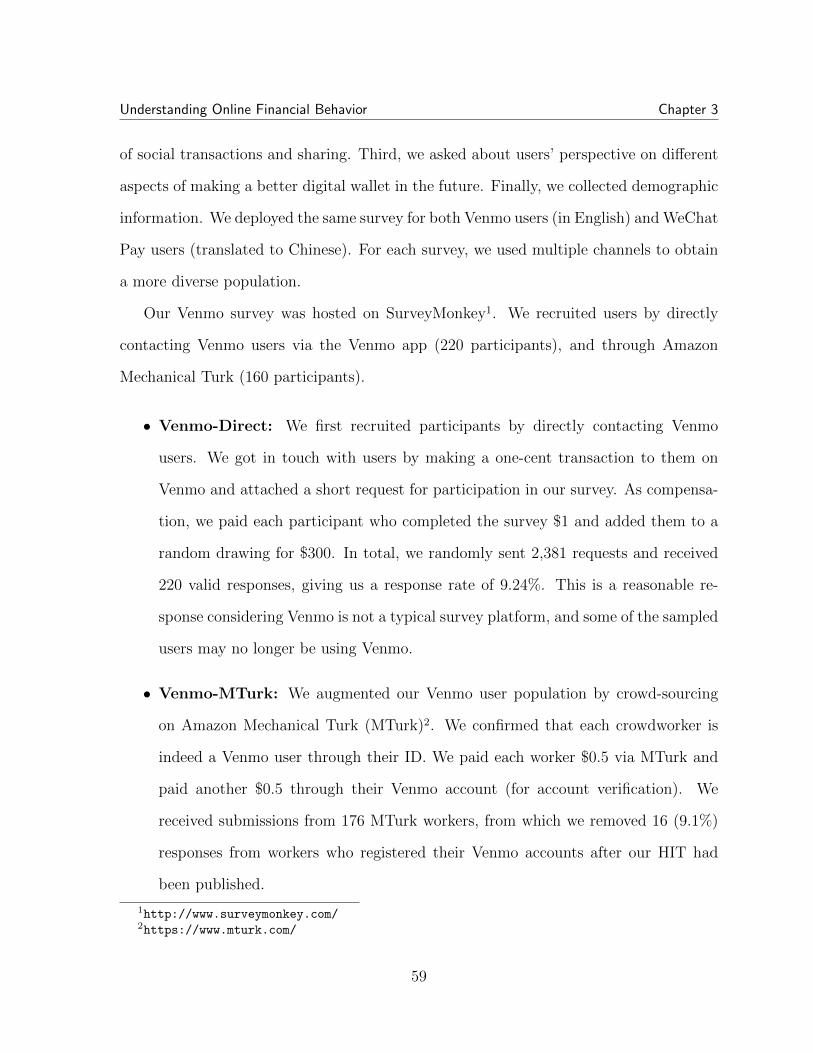
Understanding Online Financial Behavior Chapter 3
of social transactions and sharing. Third, we asked about users’ perspective on different
aspects of making a better digital wallet in the future. Finally, we collected demographic
information. We deployed the same survey for both Venmo users (in English) and WeChat
Pay users (translated to Chinese). For each survey, we used multiple channels to obtain
a more diverse population.
Our Venmo survey was hosted on SurveyMonkey1. We recruited users by directly
contacting Venmo users via the Venmo app (220 participants), and through Amazon
Mechanical Turk (160 participants).
• Venmo-Direct: We first recruited participants by directly contacting Venmo
users. We got in touch with users by making a one-cent transaction to them on
Venmo and attached a short request for participation in our survey. As compensa-
tion, we paid each participant who completed the survey $1 and added them to a
random drawing for $300. In total, we randomly sent 2,381 requests and received
220 valid responses, giving us a response rate of 9.24%. This is a reasonable re-
sponse considering Venmo is not a typical survey platform, and some of the sampled
users may no longer be using Venmo.
• Venmo-MTurk: We augmented our Venmo user population by crowd-sourcing
on Amazon Mechanical Turk (MTurk)2. We confirmed that each crowdworker is
indeed a Venmo user through their ID. We paid each worker $0.5 via MTurk and
paid another $0.5 through their Venmo account (for account verification). We
received submissions from 176 MTurk workers, from which we removed 16 (9.1%)
responses from workers who registered their Venmo accounts after our HIT had
been published.
1http://www.surveymonkey.com/2https://www.mturk.com/
59
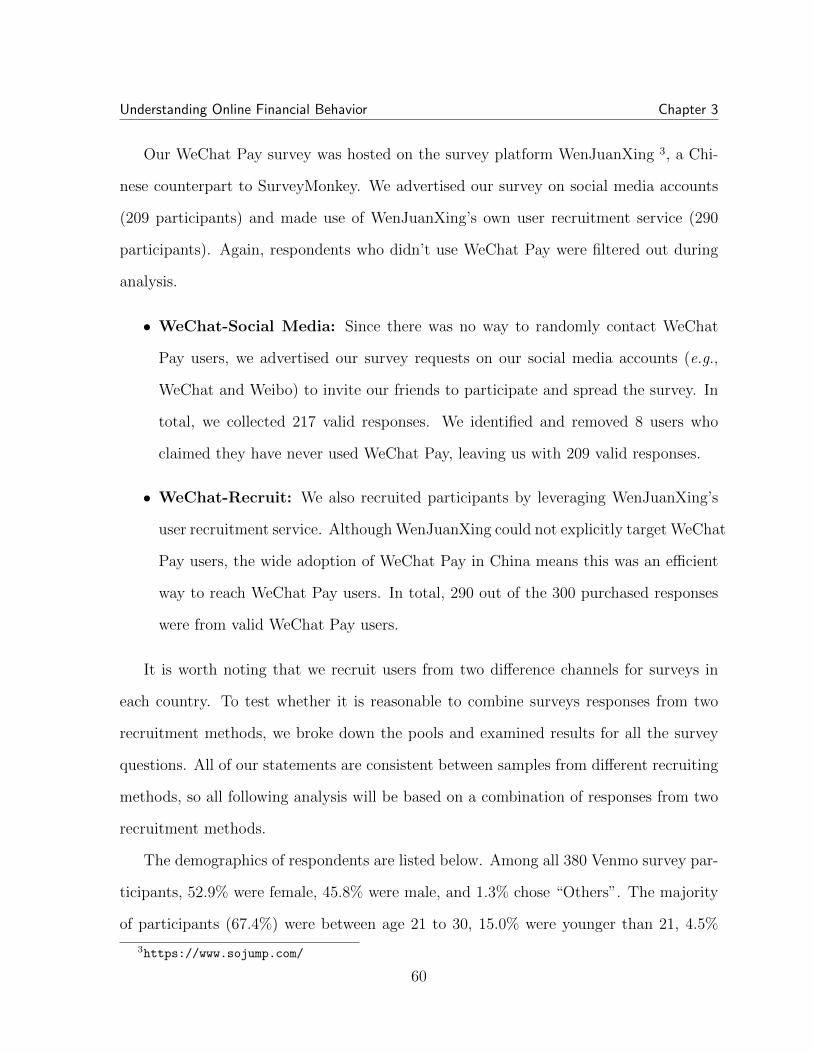
Understanding Online Financial Behavior Chapter 3
Our WeChat Pay survey was hosted on the survey platform WenJuanXing 3, a Chi-
nese counterpart to SurveyMonkey. We advertised our survey on social media accounts
(209 participants) and made use of WenJuanXing’s own user recruitment service (290
participants). Again, respondents who didn’t use WeChat Pay were filtered out during
analysis.
• WeChat-Social Media: Since there was no way to randomly contact WeChat
Pay users, we advertised our survey requests on our social media accounts (e.g.,
WeChat and Weibo) to invite our friends to participate and spread the survey. In
total, we collected 217 valid responses. We identified and removed 8 users who
claimed they have never used WeChat Pay, leaving us with 209 valid responses.
• WeChat-Recruit: We also recruited participants by leveraging WenJuanXing’s
user recruitment service. Although WenJuanXing could not explicitly target WeChat
Pay users, the wide adoption of WeChat Pay in China means this was an efficient
way to reach WeChat Pay users. In total, 290 out of the 300 purchased responses
were from valid WeChat Pay users.
It is worth noting that we recruit users from two difference channels for surveys in
each country. To test whether it is reasonable to combine surveys responses from two
recruitment methods, we broke down the pools and examined results for all the survey
questions. All of our statements are consistent between samples from different recruiting
methods, so all following analysis will be based on a combination of responses from two
recruitment methods.
The demographics of respondents are listed below. Among all 380 Venmo survey par-
ticipants, 52.9% were female, 45.8% were male, and 1.3% chose “Others”. The majority
of participants (67.4%) were between age 21 to 30, 15.0% were younger than 21, 4.5%
3https://www.sojump.com/
60
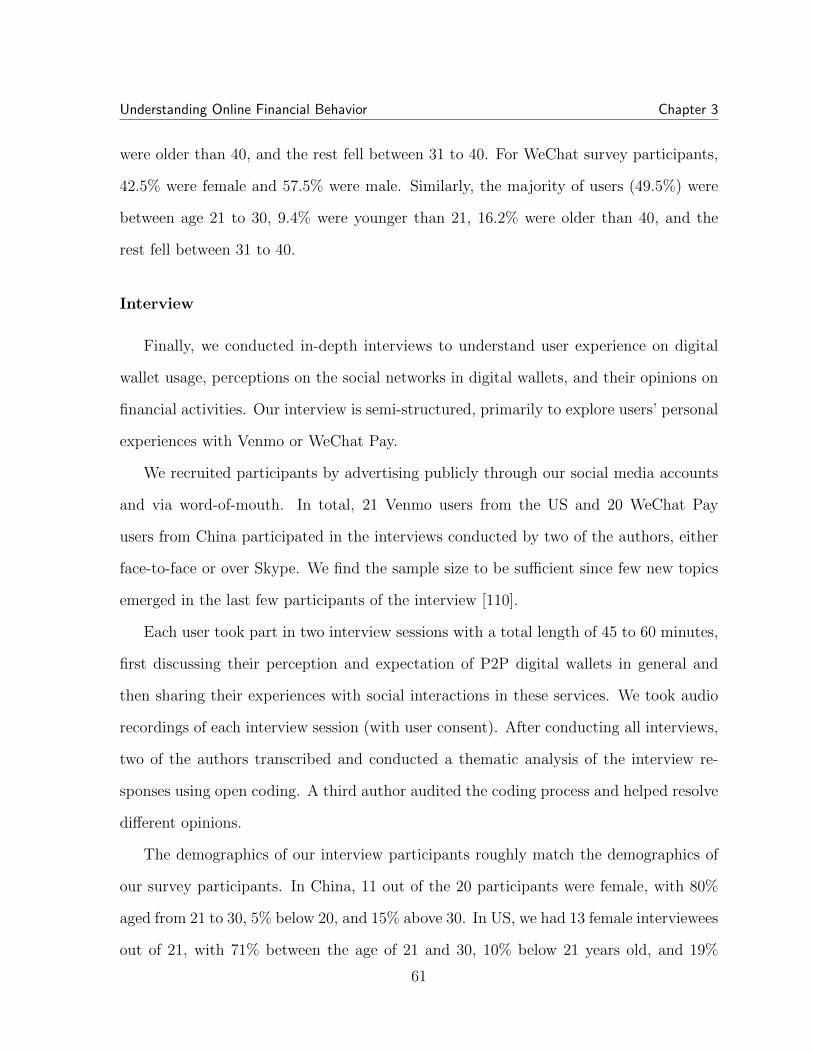
Understanding Online Financial Behavior Chapter 3
were older than 40, and the rest fell between 31 to 40. For WeChat survey participants,
42.5% were female and 57.5% were male. Similarly, the majority of users (49.5%) were
between age 21 to 30, 9.4% were younger than 21, 16.2% were older than 40, and the
rest fell between 31 to 40.
Interview
Finally, we conducted in-depth interviews to understand user experience on digital
wallet usage, perceptions on the social networks in digital wallets, and their opinions on
financial activities. Our interview is semi-structured, primarily to explore users’ personal
experiences with Venmo or WeChat Pay.
We recruited participants by advertising publicly through our social media accounts
and via word-of-mouth. In total, 21 Venmo users from the US and 20 WeChat Pay
users from China participated in the interviews conducted by two of the authors, either
face-to-face or over Skype. We find the sample size to be sufficient since few new topics
emerged in the last few participants of the interview [110].
Each user took part in two interview sessions with a total length of 45 to 60 minutes,
first discussing their perception and expectation of P2P digital wallets in general and
then sharing their experiences with social interactions in these services. We took audio
recordings of each interview session (with user consent). After conducting all interviews,
two of the authors transcribed and conducted a thematic analysis of the interview re-
sponses using open coding. A third author audited the coding process and helped resolve
different opinions.
The demographics of our interview participants roughly match the demographics of
our survey participants. In China, 11 out of the 20 participants were female, with 80%
aged from 21 to 30, 5% below 20, and 15% above 30. In US, we had 13 female interviewees
out of 21, with 71% between the age of 21 and 30, 10% below 21 years old, and 19%
61
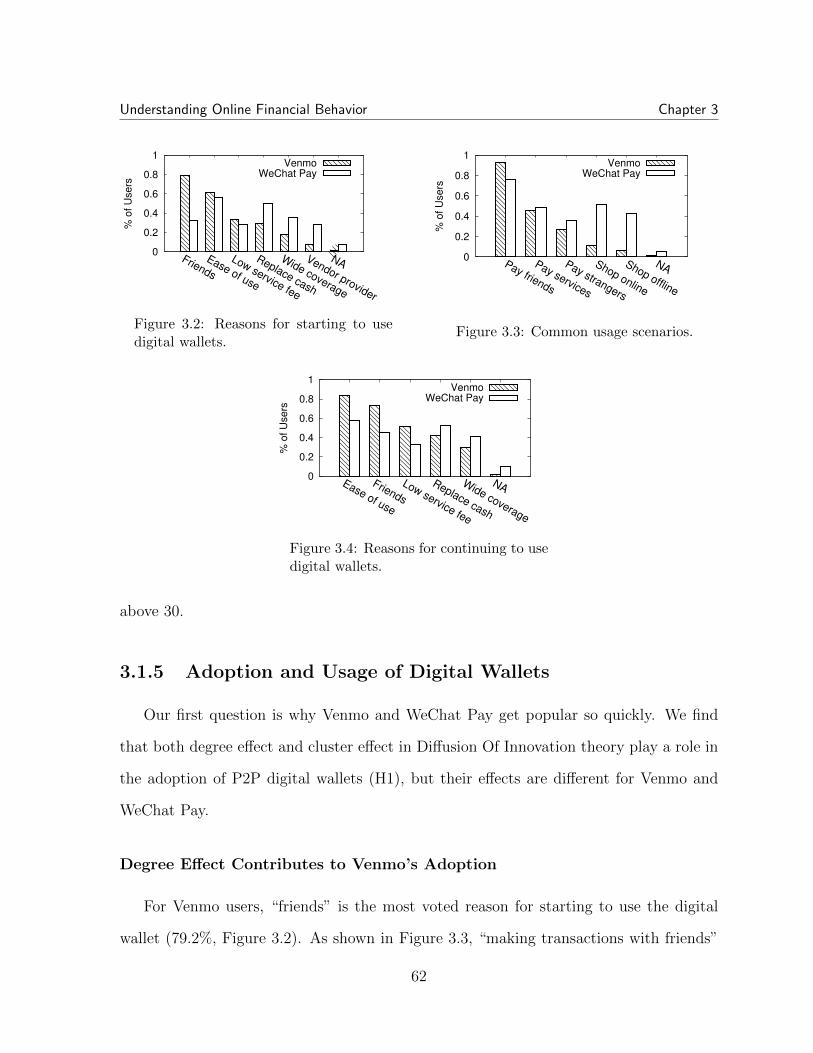
Understanding Online Financial Behavior Chapter 3
0
0.2
0.4
0.6
0.8
1
Friends
Ease of use
Low service fee
Replace cash
Wide coverage
Vendor provider
NA
% o
f U
sers
VenmoWeChat Pay
Figure 3.2: Reasons for starting to usedigital wallets.
0
0.2
0.4
0.6
0.8
1
Pay friends
Pay services
Pay strangers
Shop online
Shop offline
NA
% o
f U
sers
VenmoWeChat Pay
Figure 3.3: Common usage scenarios.
0
0.2
0.4
0.6
0.8
1
Ease of use
Friends
Low service fee
Replace cash
Wide coverage
NA
% o
f U
sers
VenmoWeChat Pay
Figure 3.4: Reasons for continuing to usedigital wallets.
above 30.
3.1.5 Adoption and Usage of Digital Wallets
Our first question is why Venmo and WeChat Pay get popular so quickly. We find
that both degree effect and cluster effect in Diffusion Of Innovation theory play a role in
the adoption of P2P digital wallets (H1), but their effects are different for Venmo and
WeChat Pay.
Degree Effect Contributes to Venmo’s Adoption
For Venmo users, “friends” is the most voted reason for starting to use the digital
wallet (79.2%, Figure 3.2). As shown in Figure 3.3, “making transactions with friends”
62
Understanding Online Financial Behavior Chapter 3
is also the most common usage scenario voted by Venmo users (93%). In particular, 37%
of users chose “making transactions with friends” as their only usage case of Venmo,
indicating the importance of social network in their wallet usage.
We further explore how social influence affects adoption in the interviews. The result
is straightforward: many Venmo users accepted the app because of direct recommenda-
tions from their friends (US except 2, 8, 9, 14, 15).
A bunch of us have gone on a trip, so we wanted to split expenses. A few of
them were already using Venmo, so they were just like “oh, there is this app
you can download, and it’s super easy to send money to each other.” (US10,
female, age 21-30)
In other words, the adoption in Venmo largely fits the description of degree effect,
i.e., individuals are inclined to follow the decision of their connected friends.
Cluster Effect Contributes to WeChat Pay’s Adoption
Unlike for Venmo, our survey results show that WeChat Pay users do not feel strongly
that they embrace the service because of their friends’ usage. However, in the interviews,
we find that social effect does exist in the adoption process of WeChat Pay, but in a more
implicit manner. It hides largely behind a cultural feature called “red envelope”.
To be more specific, in our survey, more WeChat Pay users stated that their primary
intents to use the service were “easy to use” and “avoid carrying cash”, rather than
“friends” (Figure 3.2). This seems to suggest a less powerful network effect on the initial
adoption of WeChat Pay. We also find that, although “making transactions with friends”
is one of the most common activities on WeChat Pay (Figure 3.3), only 8% of users put it
as the sole usage scenario. This may be because in addition to P2P transactions WeChat
63
Understanding Online Financial Behavior Chapter 3
Pay supports many Customer-to-Business payment activities, which relate less to users’
social network.
However, when we try to verify this finding in the interview, we discovered that
WeChat Pay also benefits greatly from the social network effect, through its “Red Packet”
feature. It turns out that most people became aware of the payment system in WeChat
because they received Red Packets from others or got involved in Red Packet grabbing
activities in WeChat groups (CN2, 3, 4, 7, 8, 9, 10, 11, 13, 15, 20).
At the beginning, lots of my friends sent red envelopes in WeChat groups to
celebrate Spring Festival. It looked interesting and entertaining which got me
attracted to participating in those activities. But it required me to bind a bank
card to WeChat Pay. I did so. And after that, I found it convenient to use
WeChat Pay to pay and transfer money. (CN3 female, age 21-30)
Red envelope activities in this sense raised user awareness of its payment function,
lowering the entry barriers. This phenomenon fits the description of cluster effect, i.e.,
users start using a technology under the influence of the majority decision of others
around. WeChat Pay users built a sense of “community usage” when the Red Packet
became a national fad during the Chinese New Year.
Overall, we reveal that the social features help to accelerate the adoption of both
Venmo and WeChat Pay, but the underlying mechanisms are slightly different for the US
and Chinese users. More specifically, Venmo users build their confidence in the system
based on actions and opinions of their close friends (strong ties), while the Chinese users
are likely to be influenced by the community (Red Packet usage in various discussion
groups).
64
Understanding Online Financial Behavior Chapter 3
3.1.6 Social Ties Affect User Experience
Besides initial adoption, we find that social relationships also impact user interactions
with and through the digital wallets in several aspects. In general, social relationships
help build trust and increase user retention (H2), but the user experiences can be different
between different types of social relationships.
Social Relationship Builds Trust During Transactions
According to a generic model of trust in e-commerce settings [90], for users to join a
transaction, their level of trust needs to exceed the perceived risk.
In the context of digital wallets, first, social relationships help users overcome security
concerns in digital wallets and establish trust in the control mechanism. Our interviews
show that some users hesitated to use digital wallets at first (US1, 17, 20, 21, CN 3,
4, 5, 7, 8, 9, 12, 15). People worried that digital wallets make money transfer too easy
(US12, 13, 17). Chinese users (CN1, 5, 7, 9, 15, 18) mentioned that WeChat Pay gives
them a sense of “insecurity” because it grows out of an open social network service. It
is the trust on other digital wallet users, e.g., faith in the friend who recommended the
service or confidence built upon the app’s large user base, that turned apprehension into
acceptance (US1, 3, 7, 10, 13, 14, 17, 19, 21, CN 11, 13).
I trusted it [Venmo] because the person who suggested it to me is very knowl-
edgeable about computer security, so I trusted his opinion. (US7, female, age
31-40)
Second, trust developed in offline social relationships can be transferred online, adding
an additional layer of protection against potential risks. People felt that even if an online
payment was unsuccessful, they could still find the associated friend offline and fix the
transaction (US5, 7, 21).
65
Understanding Online Financial Behavior Chapter 3
I don’t need to worry about how to recall the money back. I can just knock
on his door. If I know this person well, I don’t really worry about Venmo’s
safety issue. (US21, male, age 21-30)
Social Ties Affect Retention
“Friends” is one of the most important reasons for Venmo users to keep the app
(Figure 3.4). Those who reported “making transactions with friends” to be the sole
purpose of Venmo claimed that they would definitely leave the service if their friends
stopped using it (US except 2, 5, 11, 18).
It’s just like any other social network. If more people are on one thing than
another, then I will just end up switching. I just use whatever people are
using. Because you have to connect them, rather than convert them. (US9,
female, age 31-40)
However, social ties do not seem to play as significant a role in WeChat Pay as they
do in Venmo. Convenience seems to be a stronger incentive for WeChat Pay users to
stay engaged. They put “easy to use” and “replacing cash” over “friends” as the top
two reasons for retaining the service (Figure 3.4). On the one hand, 90% of the Chinese
respondents claimed that they will still use WeChat Pay even if some friends drop the
service. It is because WeChat Pay provides other convenient payment functions that
they use quite frequently, e.g., paying phone bills, calling taxi, etc. (CN2, 3, 4, 6, 14).
On the other hand, one of the WeChat Pay users indicated that if a considerable
number of people stop using the service round them or even across the country, she
would consider terminating it, thinking that there are some problems with the system
(CN17).
66
Understanding Online Financial Behavior Chapter 3
In a word, user feedback suggests that degree effect occurs in the retention of Venmo
users, while user engagement in WeChat Pay exhibits sings of cluster effect, which is
similar to the findings about adoption.
Types of Social Relationships Impact Transactional Experiences
Although social ties bring trust to the digital service, they may experience social
awkwardness during transactions. We hypothesize that social intimacy affects the ease
with which users undertake transactions. In our interview, we define three groups of
people based on their social distance to the interviewees, i.e., close friends, normal friends
and acquaintances, from strong to weak ties. For each of our participants, we asked them
about their transaction experience with the three groups respectively. We focused on how
their perceived level of comfort varies with the strength of each social tie. We find that
people feel different levels of comfort when receiving or issuing payments with persons in
each social group.
First, discussing money and participating in transactions with acquaintances – those
with weak social ties – are generally considered comfortable (US1, 10, 15, 19, 20, CN6,
7, 20), involving little social obligation:
For people I don’t really know, for strangers, for landlords, I am very comfort-
able to talk about money. Because I think those are fair transactions. (US19,
female, 21-30)
These transactions only happen when necessary, e.g., paying rent each month. Users
generally do not build social connections with these acquaintances. They do not add
them to Venmo/WeChat Pay contact lists, or talk about topics beyond the ongoing
transaction itself (US1, 2, 10, 21, CN 1, 2, 5, 6, 7, 9, 10, 11 ,12, 13, 15, 17).
67
Understanding Online Financial Behavior Chapter 3
On the other end of the social spectrum are close friends. Participants replied that
their transaction frequency with close friends was much higher than with acquaintances.
Close friends almost always add each other to their contact lists, in case they want to
send/receive money in the future. Although awkwardness arises from time to time when
people are unsure of whether money should be involved in dealings with friends (US1, 14,
15, 19, 20, CN6, 10), most participants feel that making transactions with close friends
is comfortable and natural (US2, 7, 10, 13, 15, 17, 21, CN1, 2, 8, 9, 11, 13, 19).
Finally, participants mentioned that they feel most uncomfortable when talking about
money with normal friends, i.e., day-to-day friends who fill the gap between close friends
and mere acquaintances (US2, CN2, 3, 11). They cannot chat naturally as they do with
close friends. They cannot directly talk about money as they do with acquaintances,
because there are potential negative social consequences. Thus, dealing with normal
friends about money requires some initial social lubrication, i.e., small talk.
It feels odd to pay ordinary friends on WeChat since you have to start with
conversations while often you just want to make the payment. But it is not
the case when paying close friends with whom you often chat. (CN11, female,
under 20)
The results show that the respondents tend to be comfortable with transferring money
with close friends or mere acquaintances, while transactions between ordinary friends are
perceived to be more socially awkward.
3.1.7 Social Interactions Affect User Experience
Social interactions in Venmo go beyond communication between transaction partners.
A very important social feature in Venmo is sharing transaction records with the public
or with Venmo friends only. In WeChat, there is no equivalent mechanism, but WeChat
68
Understanding Online Financial Behavior Chapter 3
is like a traditional social network (e.g., Facebook) with a normal sharing feature (a.k.a.
Moment). We specifically look into how social sharing plays a role in those platforms.
We discover that social sharing, if happened, is effective in promoting user engagement.
However, both Venmo and WeChat Pay users are reluctant to share their own transactions
due to concerns about privacy risks (H3). It is worth noting that, the US and Chinese
participants exhibit different perceptions towards social disclosure and privacy.
User Preference on Social Sharing about Transactions
We start by exploring users’ general attitude towards sharing their transaction records
socially, by scoping out what is considered acceptable and what is not.
In our survey, we ask users if they are willing to share transaction records to the
public or friends, under circumstances that this is a default or optional function. The
results (Figure 3.5) show that people are against sharing in general, whether publicly or
privately with friends only. For Venmo users, the idea of sharing with friends is slightly
more acceptable if it is optional.
One explanation to the “optional friend sharing” preference is that users want to
control the types of information to share. We find that the respondents are more com-
fortable with sharing certain types of information than others. For Venmo users, they
are comfortable to share the purpose (95%) or the recipient (72%) of transactions rather
than the actual amount of money (24%) or when the transaction happened (43%). In
the current Venmo design, only the transaction amount is omitted, and users have no
choice but to share transaction time. This shows Venmo’s honest yet not satisfactory
effort at meeting users’ sharing preference. In comparison, the WeChat Pay users are
more comfortable sharing the purpose (65%) and amount (63%) of the payment, while
less so about the time (45%) and recipient (30%).
69
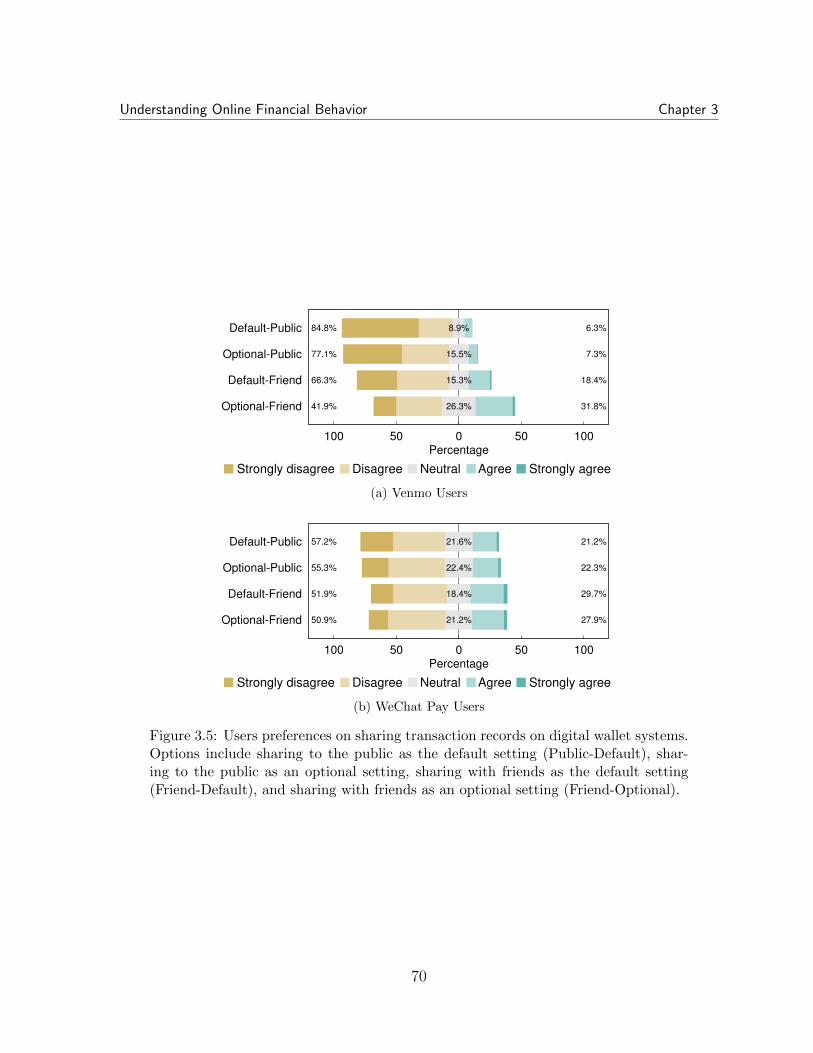
Understanding Online Financial Behavior Chapter 3
Default-Public
Optional-Public
Default-Friend
Optional-Friend
100 50 0 50 100Percentage
Strongly disagree Disagree Neutral Agree Strongly agree
. . . . .84.8%
77.1%
66.3%
41.9%
6.3%
7.3%
18.4%
31.8%
8.9%
15.5%
15.3%
26.3%
(a) Venmo Users
Default-Public
Optional-Public
Default-Friend
Optional-Friend
100 50 0 50 100Percentage
Strongly disagree Disagree Neutral Agree Strongly agree
. . . . .
57.2%
55.3%
51.9%
50.9%
21.2%
22.3%
29.7%
27.9%
21.6%
22.4%
18.4%
21.2%
(b) WeChat Pay Users
Figure 3.5: Users preferences on sharing transaction records on digital wallet systems.Options include sharing to the public as the default setting (Public-Default), shar-ing to the public as an optional setting, sharing with friends as the default setting(Friend-Default), and sharing with friends as an optional setting (Friend-Optional).
70
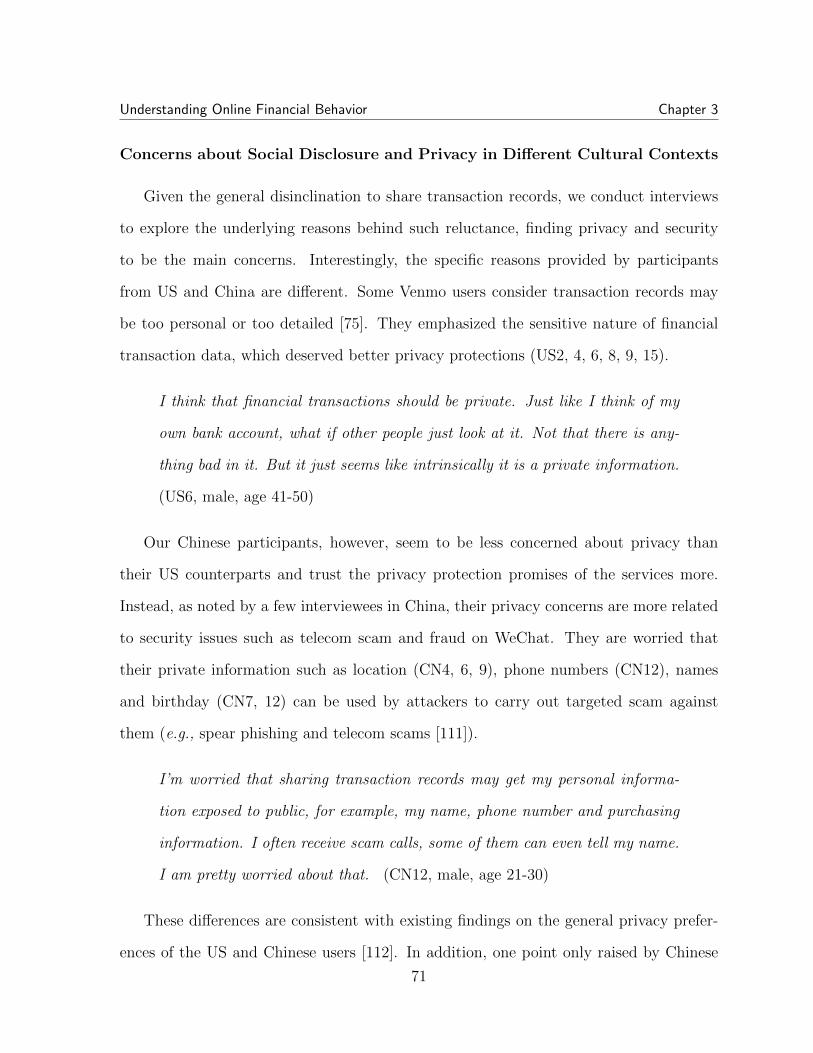
Understanding Online Financial Behavior Chapter 3
Concerns about Social Disclosure and Privacy in Different Cultural Contexts
Given the general disinclination to share transaction records, we conduct interviews
to explore the underlying reasons behind such reluctance, finding privacy and security
to be the main concerns. Interestingly, the specific reasons provided by participants
from US and China are different. Some Venmo users consider transaction records may
be too personal or too detailed [75]. They emphasized the sensitive nature of financial
transaction data, which deserved better privacy protections (US2, 4, 6, 8, 9, 15).
I think that financial transactions should be private. Just like I think of my
own bank account, what if other people just look at it. Not that there is any-
thing bad in it. But it just seems like intrinsically it is a private information.
(US6, male, age 41-50)
Our Chinese participants, however, seem to be less concerned about privacy than
their US counterparts and trust the privacy protection promises of the services more.
Instead, as noted by a few interviewees in China, their privacy concerns are more related
to security issues such as telecom scam and fraud on WeChat. They are worried that
their private information such as location (CN4, 6, 9), phone numbers (CN12), names
and birthday (CN7, 12) can be used by attackers to carry out targeted scam against
them (e.g., spear phishing and telecom scams [111]).
I’m worried that sharing transaction records may get my personal informa-
tion exposed to public, for example, my name, phone number and purchasing
information. I often receive scam calls, some of them can even tell my name.
I am pretty worried about that. (CN12, male, age 21-30)
These differences are consistent with existing findings on the general privacy prefer-
ences of the US and Chinese users [112]. In addition, one point only raised by Chinese
71
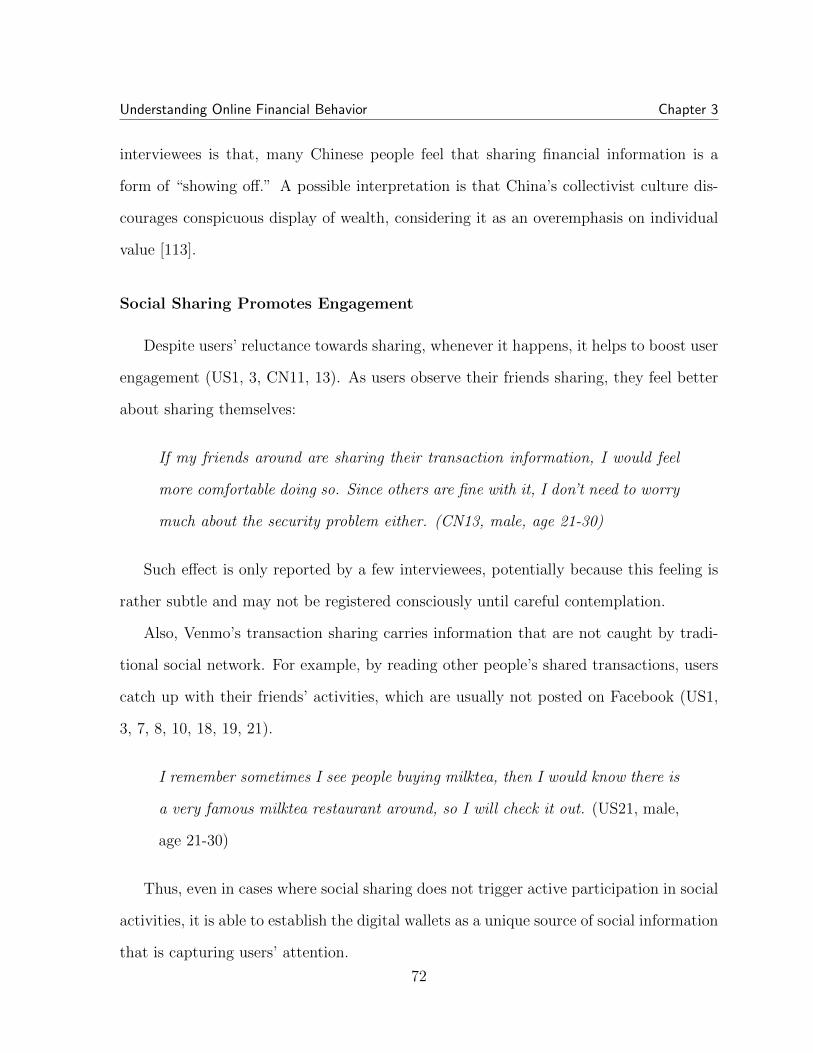
Understanding Online Financial Behavior Chapter 3
interviewees is that, many Chinese people feel that sharing financial information is a
form of “showing off.” A possible interpretation is that China’s collectivist culture dis-
courages conspicuous display of wealth, considering it as an overemphasis on individual
value [113].
Social Sharing Promotes Engagement
Despite users’ reluctance towards sharing, whenever it happens, it helps to boost user
engagement (US1, 3, CN11, 13). As users observe their friends sharing, they feel better
about sharing themselves:
If my friends around are sharing their transaction information, I would feel
more comfortable doing so. Since others are fine with it, I don’t need to worry
much about the security problem either. (CN13, male, age 21-30)
Such effect is only reported by a few interviewees, potentially because this feeling is
rather subtle and may not be registered consciously until careful contemplation.
Also, Venmo’s transaction sharing carries information that are not caught by tradi-
tional social network. For example, by reading other people’s shared transactions, users
catch up with their friends’ activities, which are usually not posted on Facebook (US1,
3, 7, 8, 10, 18, 19, 21).
I remember sometimes I see people buying milktea, then I would know there is
a very famous milktea restaurant around, so I will check it out. (US21, male,
age 21-30)
Thus, even in cases where social sharing does not trigger active participation in social
activities, it is able to establish the digital wallets as a unique source of social information
that is capturing users’ attention.
72
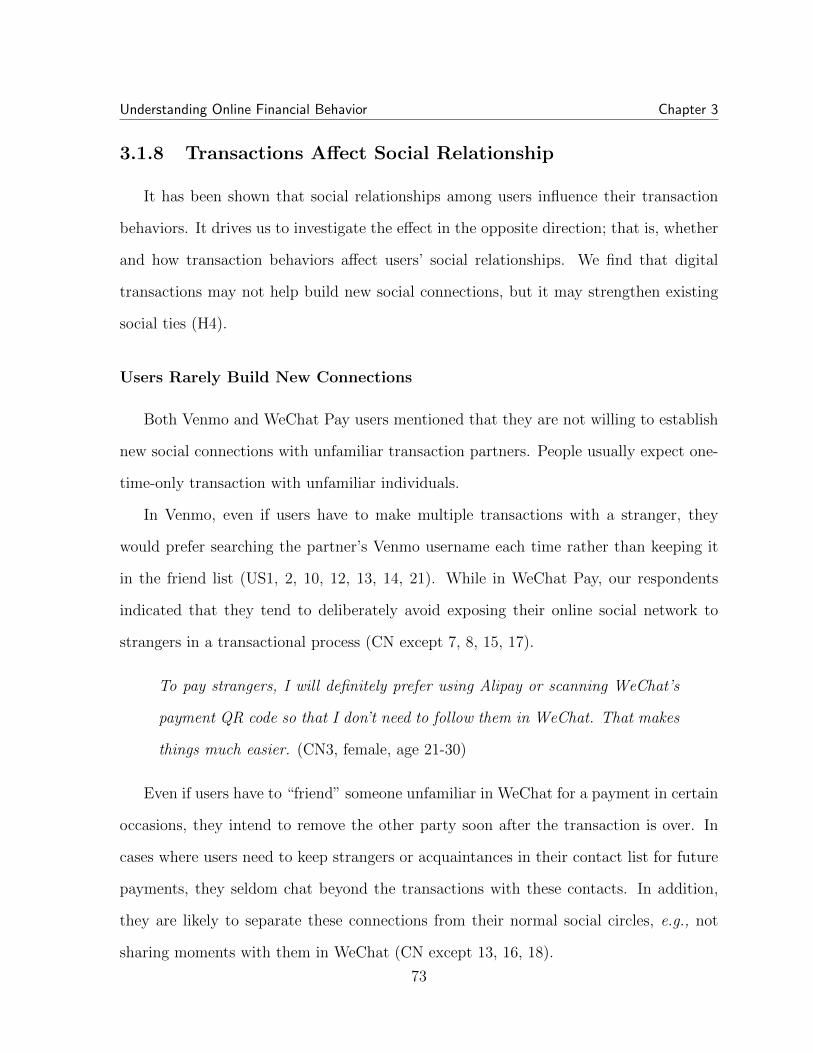
Understanding Online Financial Behavior Chapter 3
3.1.8 Transactions Affect Social Relationship
It has been shown that social relationships among users influence their transaction
behaviors. It drives us to investigate the effect in the opposite direction; that is, whether
and how transaction behaviors affect users’ social relationships. We find that digital
transactions may not help build new social connections, but it may strengthen existing
social ties (H4).
Users Rarely Build New Connections
Both Venmo and WeChat Pay users mentioned that they are not willing to establish
new social connections with unfamiliar transaction partners. People usually expect one-
time-only transaction with unfamiliar individuals.
In Venmo, even if users have to make multiple transactions with a stranger, they
would prefer searching the partner’s Venmo username each time rather than keeping it
in the friend list (US1, 2, 10, 12, 13, 14, 21). While in WeChat Pay, our respondents
indicated that they tend to deliberately avoid exposing their online social network to
strangers in a transactional process (CN except 7, 8, 15, 17).
To pay strangers, I will definitely prefer using Alipay or scanning WeChat’s
payment QR code so that I don’t need to follow them in WeChat. That makes
things much easier. (CN3, female, age 21-30)
Even if users have to “friend” someone unfamiliar in WeChat for a payment in certain
occasions, they intend to remove the other party soon after the transaction is over. In
cases where users need to keep strangers or acquaintances in their contact list for future
payments, they seldom chat beyond the transactions with these contacts. In addition,
they are likely to separate these connections from their normal social circles, e.g., not
sharing moments with them in WeChat (CN except 13, 16, 18).
73
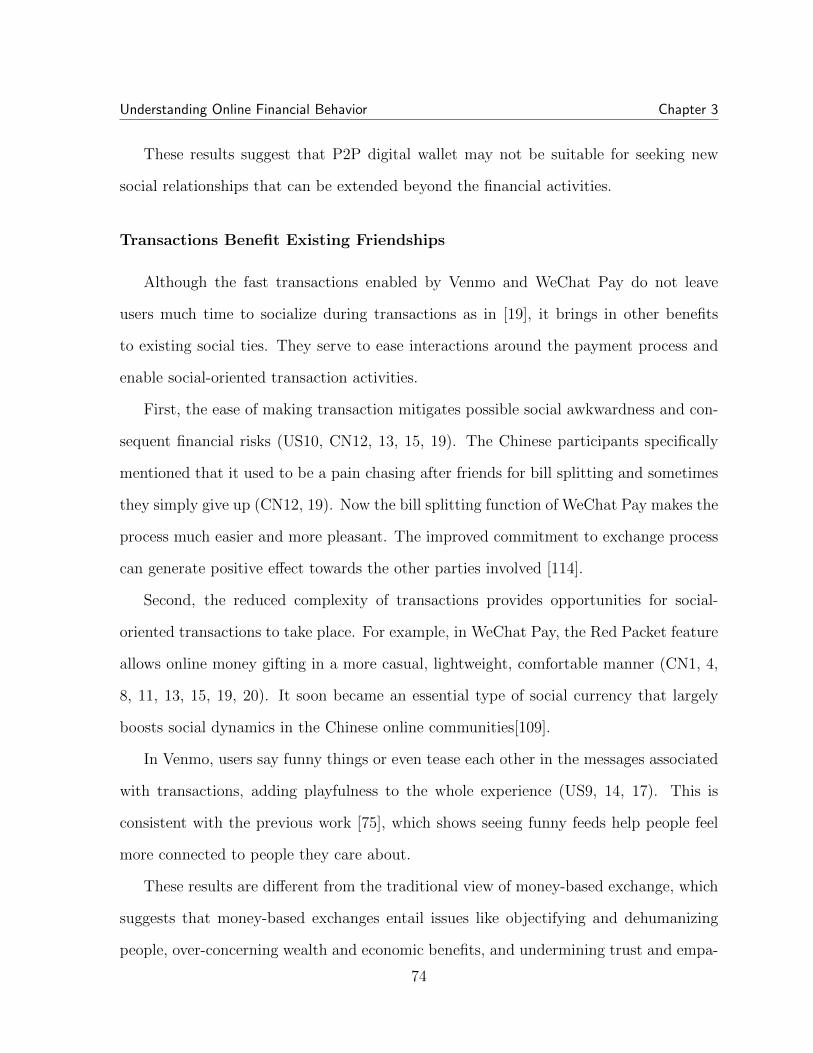
Understanding Online Financial Behavior Chapter 3
These results suggest that P2P digital wallet may not be suitable for seeking new
social relationships that can be extended beyond the financial activities.
Transactions Benefit Existing Friendships
Although the fast transactions enabled by Venmo and WeChat Pay do not leave
users much time to socialize during transactions as in [19], it brings in other benefits
to existing social ties. They serve to ease interactions around the payment process and
enable social-oriented transaction activities.
First, the ease of making transaction mitigates possible social awkwardness and con-
sequent financial risks (US10, CN12, 13, 15, 19). The Chinese participants specifically
mentioned that it used to be a pain chasing after friends for bill splitting and sometimes
they simply give up (CN12, 19). Now the bill splitting function of WeChat Pay makes the
process much easier and more pleasant. The improved commitment to exchange process
can generate positive effect towards the other parties involved [114].
Second, the reduced complexity of transactions provides opportunities for social-
oriented transactions to take place. For example, in WeChat Pay, the Red Packet feature
allows online money gifting in a more casual, lightweight, comfortable manner (CN1, 4,
8, 11, 13, 15, 19, 20). It soon became an essential type of social currency that largely
boosts social dynamics in the Chinese online communities[109].
In Venmo, users say funny things or even tease each other in the messages associated
with transactions, adding playfulness to the whole experience (US9, 14, 17). This is
consistent with the previous work [75], which shows seeing funny feeds help people feel
more connected to people they care about.
These results are different from the traditional view of money-based exchange, which
suggests that money-based exchanges entail issues like objectifying and dehumanizing
people, over-concerning wealth and economic benefits, and undermining trust and empa-
74
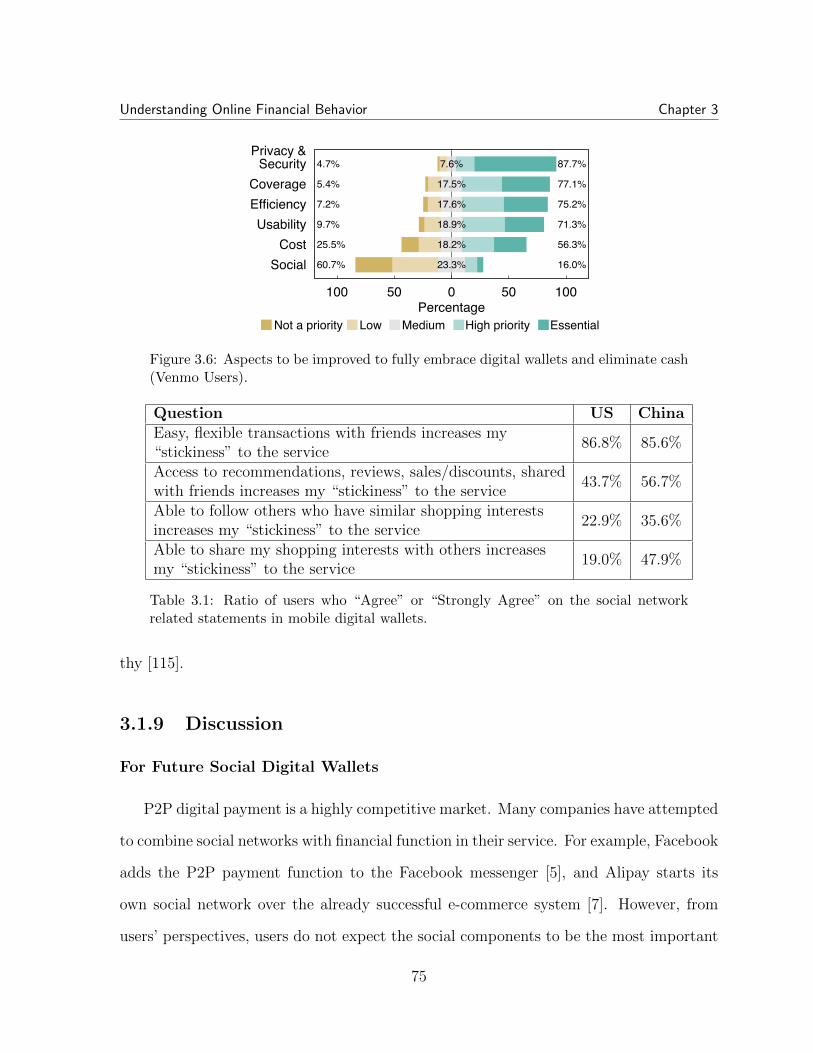
Understanding Online Financial Behavior Chapter 3
Privacy &Security
Coverage
Efficiency
Usability
Cost
Social
100 50 0 50 100Percentage
Not a priority Low Medium High priority Essential
. . . . .4.7%
5.4%
7.2%
9.7%
25.5%
60.7%
87.7%
77.1%
75.2%
71.3%
56.3%
16.0%
7.6%
17.5%
17.6%
18.9%
18.2%
23.3%
Figure 3.6: Aspects to be improved to fully embrace digital wallets and eliminate cash(Venmo Users).
Question US ChinaEasy, flexible transactions with friends increases my“stickiness” to the service
86.8% 85.6%
Access to recommendations, reviews, sales/discounts, sharedwith friends increases my “stickiness” to the service
43.7% 56.7%
Able to follow others who have similar shopping interestsincreases my “stickiness” to the service
22.9% 35.6%
Able to share my shopping interests with others increasesmy “stickiness” to the service
19.0% 47.9%
Table 3.1: Ratio of users who “Agree” or “Strongly Agree” on the social networkrelated statements in mobile digital wallets.
thy [115].
3.1.9 Discussion
For Future Social Digital Wallets
P2P digital payment is a highly competitive market. Many companies have attempted
to combine social networks with financial function in their service. For example, Facebook
adds the P2P payment function to the Facebook messenger [5], and Alipay starts its
own social network over the already successful e-commerce system [7]. However, from
users’ perspectives, users do not expect the social components to be the most important
75
Understanding Online Financial Behavior Chapter 3
feature for the digital wallets. In our survey, we asked users to assess a few statements
related to social networks (Table 3.1) and describe their expectations for the future digital
wallet systems (Figure 3.6). Results show that the utility value (i.e., coverage, efficiency,
usability and costs for making payment) is the most important considerations. In our
interview, participants also suggested that completely removing Venmo’s social sharing
function would not affect their usage (US except 1, 5, 16). WeChat Pay users mentioned
that they would not socialize with contacts added merely for making payments (CN
except 13, 16, 18).
Users’ expectation of the social feature is to help to facilitate more convenient P2P
payments, rather than “making friends.” Our interviewees have responded positively to
the ease of locating their friends in Venmo through the Facebook social graph (US1, 6,
8, 10, 14, 19, 20, 21) or making payments through WeChat chatting box (CN11, 13,
18). Several WeChat Pay users (CN 3, 4, 17, 20) stated that paying through the social
network service was convenient because they did not need to open another app. This
is why they prefer WeChat Pay over other payment systems, such as Alipay and online
banks.
Limitations
Our work has several limitations. First, we only study Venmo and WeChat Pay to ex-
emplify the most successful P2P digital wallets. Other online P2P payment systems that
support social transactions such as Chirpify and Dwolla may also have interesting design
features to investigate. Second, recruiting survey/interview participants from Amazon
MTurk or social media may entail potential biases [116], as both are nonprobability
sampling methods [117]. To alleviate this problem, we incorporate multiple channels to
recruit participants in both US and China, to further ensure that our findings are reliable
and generalizable. Third, it is inherently difficult to make direct comparisons between
76
Understanding Online Financial Behavior Chapter 3
WeChat Pay and Venmo, since the two digital wallets have different designs and are
introduced in different social contexts. Hence, we mainly provide plausible explanations
based on existing theories to any difference observed between the two services in terms
of usage and user behaviors.
3.1.10 Conclusion
In the first part of this chapter, we conduct a mixed-method study to examine the
key factors that contribute to the rapid adoption of P2P digital wallets in the US and
China. We particularly focus on the roles and impacts of the built-in social networks in
P2P digital wallets. We summarize our key findings and contributions as follows:
• Our survey confirms that the introduction of social features indeed helps to accel-
erate the initial adoption of Venmo and WeChat Pay. The social feature plays a
positive role in mitigating users’ security concerns by creating a sense of critical
mass, building trusts between users, and facilitating information dissemination and
interpersonal persuasion.
• There is a key difference between the US and Chinese users regarding their initial
adoption of the digital wallets. Venmo (US) users’ adoption decision is more influ-
enced by their close tie(s) (i.e. the “degree effect” ), whereas WeChat Pay users
are more likely to be persuaded by the collective opinions and the wide usage in a
community (i.e. the “cluster effect” ).
• Social relationships can affect users’ experiences of making peer-to-peer payments.
Users are more comfortable transferring money with close friends (strong ties) or
acquaintances (weak ties), than with normal friends (those between strong and
weak ties).
77
Understanding Online Financial Behavior Chapter 3
• Social sharing in P2P digital wallets has helped to boost user engagement by pro-
voking new social conversations around transaction activities. However, most users
are conservative towards sharing payment details due to privacy or security con-
cerns.
• Social connections that are built specifically for making payments can hardly trans-
form into real social relationships. Users often deliberately separate these connec-
tions from regular social circles. However, friendship of existing ties may benefit
from transferring money via P2P digital wallets, since the experience is more com-
fortable and fun compared to the conventional payment methods.
• Users weigh the utility value of the P2P digital wallet over its social value. The
general perception is that social features are not required but can be beneficial
when facilitating the utilitarian functions.
3.2 Psychological factors behind Penny Auction Be-
haviors
3.2.1 Introduction & Related Works
Prior work has studied in detail psychological factors that drive user behavior during
auctions. Some of these fit into the framework of prospect theory [118], which suggests
that losses hurt more than gains feel good. This leads to the endowment effect [119], where
people value things more when they own them, since losing an item is more painful than
failing to get it. In the general setting of auctions, endowment effects exist for bidders,
since status as the current top bidder gives them a false sense of ownership. This is
termed the pseudo- or quasi-endowment effect, which makes a bidder unwilling to give
78
Understanding Online Financial Behavior Chapter 3
up an auction [120, 121]. It is unclear whether this effect exists in online auctions. One
study found some support by correlating data from eBay auctions and user surveys [121],
while another study [122] found no evidence to support this.
The higher impact of losses also exacerbates the “sunk cost fallacy.” As a bidder
puts more money into an auction, winning the auction becomes more about recovering
their losses than simply winning the item. Based on a survey of 479 online bidders [123],
sunk cost fallacy can explain user behaviors in traditional online auctions. For penny
auctions, Augenblick designed theoretical models that explain the profitability of penny
auctions by incorporating sunk-cost fallacy, and empirically verified the model using
166,000 penny auctions [56]. Another effect called self-justification describes a similar
phenomenon, where as the user put more bids into an auction, he/she feels a stronger
desire to win the auction as to justify the money already spent [120, 123].
The presence of other bidders can trigger irrational behavior. Simonsohn et al.
observed herding behavior in 8,333 eBay auctions where users tend to select auctions
that seem more popular, despite the fact that popularity of auctions does not indi-
cate quality of the item sold [124]. Other studies found that intense competitions in
auctions can trigger a state called competitive arousal, which leads to more irrational
bidding [125, 123, 126].
Finally, how much money is at stake also influences how users make decisions. Prior
work found users behave more rationally when high stakes are involved, through anal-
ysis of overbidding behavior in 432 auctions [126], and experiments involving 164 auc-
tions [127].
Although much work has been done on understanding user psychology in different
auction settings, few have studied these behaviors in penny auctions. In this section, we
focus on the effects that are measurable using action history and validate these behaviors
in penny auctions using large-scale traces. By analyzing our detailed bidding traces for
79

Understanding Online Financial Behavior Chapter 3
evidence of impact of psychological biases like sunk-cost fallacy on bidding behavior, we
find evidence consistent with the pseudo-endowment effect and sunk-cost fallacy, and
find data inconsistent with theories of competitive arousal.
3.2.2 Hypotheses
We identify the psychological effects that are empirically measurable, and design
corresponding hypotheses about the phenomenon we expect to observe based on the
psychology theories.
Pseudo-endowment effect indicates that bidders are more likely to continue partici-
pating in an auction if he/she has been the highest bidder for a longer period.
H1: An increase in time spent as the highest bidder will lead to an increase in the
likelihood to remain in an auction.
Sunk cost fallacy and self-justification indicates that bidders are less likely to leave
an auction if he/she has spent a lot of money in the auction.
H2: An increase in the amount of money spent will lead to an increase in the likelihood
to remain in the auction.
Herding effect and competitive arousal show that users are more likely to overbid
when an auction involves many competing parties.
H3a: An increase in number of competing bidders will lead to an increase in the likeli-
hood of a user to place bids in the auction.
H3b: An increase in the total number of bids already placed will lead to an increase in
the likelihood of a user to place bids in the auction.
80

Understanding Online Financial Behavior Chapter 3
When auction stake is high, bidders are less likely to overbid. In the context of penny
auction, overbidding means the combined cost of all bidders exceeds the item’s worth [58].
H4: An increase in the value of the auctioned item leads to a decreased likelihood of
combined bidder cost exceeding item value.
3.2.3 Observing Psychological Phenomenon
Pseudo-endowment Effect To test H1, we observe the bidding history for each auc-
tion, which consists of a sequence of bids, then compute the following metrics for each
time t:
• Leading time: the time a user spent as the highest bidder up to time t.
• Bidding: whether this user has placed a bid in the auction after t, with 0 meaning
no future bids are place, and 1 meaning the user will bid after t.
Given the volume size of our data, we sample t every 10 minutes and randomly down-
sample the data points by a factor of 10. Even after down-sampling, we still find suffi-
ciently small p-value to prove statistical significance.
To test if time spent as the highest bidder has any correlation with the users’ future
bids, we perform a logistic regression using leading time against bidding. To remove
confounding factors, we control for the price of the item auctioned. In addition, we use
clustered standard errors [128] across auctions to remove the effect of individual auctions.
As shown in Table 3.2, leading time does have a significant effect on whether a user
will continue to bid in an auction. With a coefficient of 0.0002, a leading time of one hour
correlate with an increase in probability of bidding from 50% to 67%. This validates H1
and suggests the existence of pseudo-endowment effect in penny auctions.
81
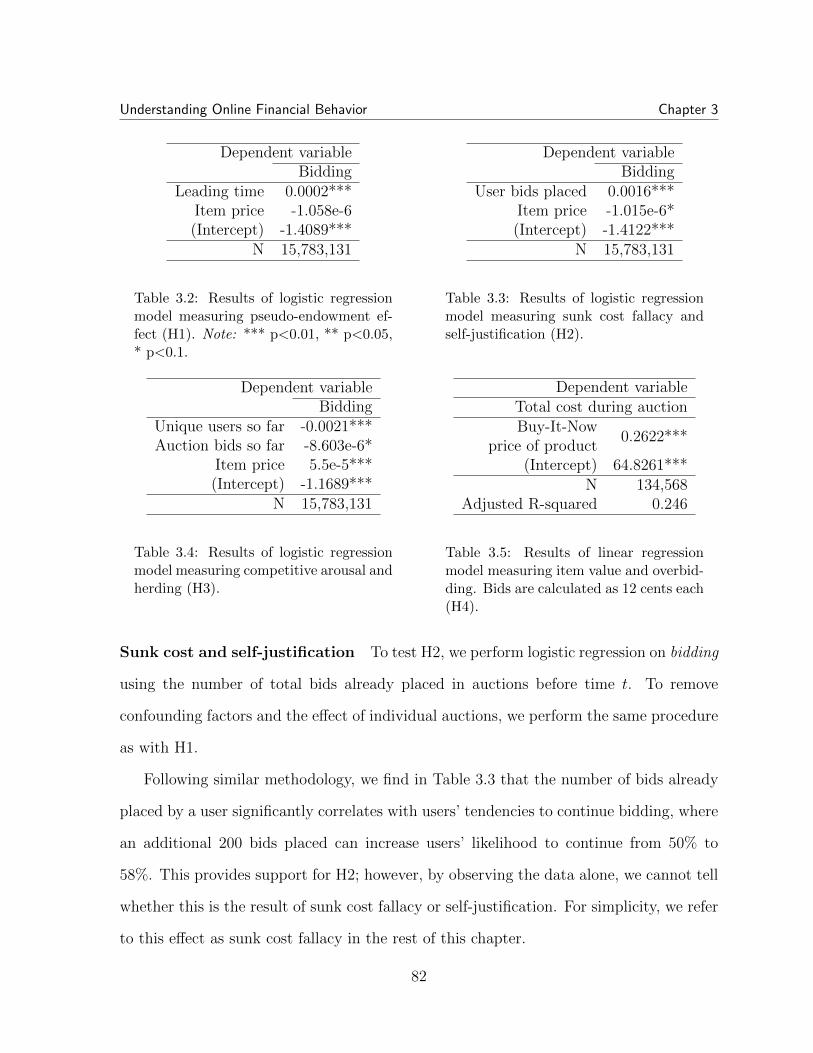
Understanding Online Financial Behavior Chapter 3
Dependent variableBidding
Leading time 0.0002***Item price -1.058e-6(Intercept) -1.4089***
N 15,783,131
Table 3.2: Results of logistic regressionmodel measuring pseudo-endowment ef-fect (H1). Note: *** p<0.01, ** p<0.05,* p<0.1.
Dependent variableBidding
User bids placed 0.0016***Item price -1.015e-6*(Intercept) -1.4122***
N 15,783,131
Table 3.3: Results of logistic regressionmodel measuring sunk cost fallacy andself-justification (H2).
Dependent variableBidding
Unique users so far -0.0021***Auction bids so far -8.603e-6*
Item price 5.5e-5***(Intercept) -1.1689***
N 15,783,131
Table 3.4: Results of logistic regressionmodel measuring competitive arousal andherding (H3).
Dependent variableTotal cost during auctionBuy-It-Now
price of product0.2622***
(Intercept) 64.8261***N 134,568
Adjusted R-squared 0.246
Table 3.5: Results of linear regressionmodel measuring item value and overbid-ding. Bids are calculated as 12 cents each(H4).
Sunk cost and self-justification To test H2, we perform logistic regression on bidding
using the number of total bids already placed in auctions before time t. To remove
confounding factors and the effect of individual auctions, we perform the same procedure
as with H1.
Following similar methodology, we find in Table 3.3 that the number of bids already
placed by a user significantly correlates with users’ tendencies to continue bidding, where
an additional 200 bids placed can increase users’ likelihood to continue from 50% to
58%. This provides support for H2; however, by observing the data alone, we cannot tell
whether this is the result of sunk cost fallacy or self-justification. For simplicity, we refer
to this effect as sunk cost fallacy in the rest of this chapter.
82
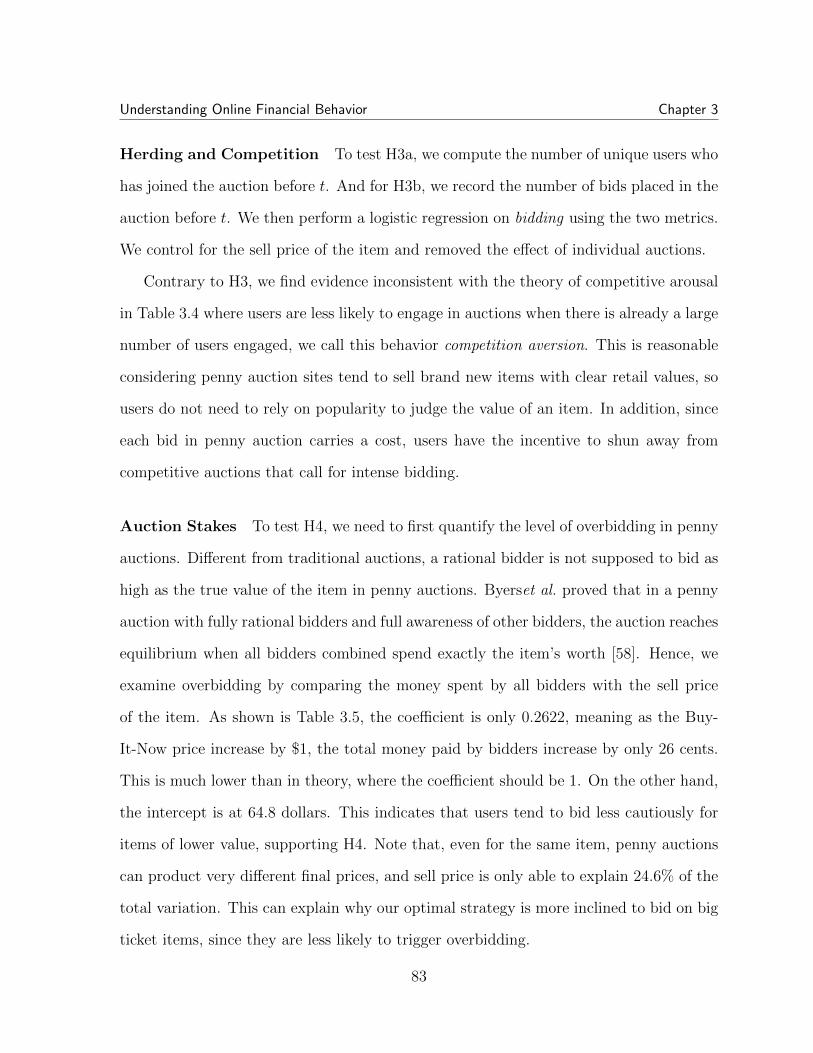
Understanding Online Financial Behavior Chapter 3
Herding and Competition To test H3a, we compute the number of unique users who
has joined the auction before t. And for H3b, we record the number of bids placed in the
auction before t. We then perform a logistic regression on bidding using the two metrics.
We control for the sell price of the item and removed the effect of individual auctions.
Contrary to H3, we find evidence inconsistent with the theory of competitive arousal
in Table 3.4 where users are less likely to engage in auctions when there is already a large
number of users engaged, we call this behavior competition aversion. This is reasonable
considering penny auction sites tend to sell brand new items with clear retail values, so
users do not need to rely on popularity to judge the value of an item. In addition, since
each bid in penny auction carries a cost, users have the incentive to shun away from
competitive auctions that call for intense bidding.
Auction Stakes To test H4, we need to first quantify the level of overbidding in penny
auctions. Different from traditional auctions, a rational bidder is not supposed to bid as
high as the true value of the item in penny auctions. Byerset al. proved that in a penny
auction with fully rational bidders and full awareness of other bidders, the auction reaches
equilibrium when all bidders combined spend exactly the item’s worth [58]. Hence, we
examine overbidding by comparing the money spent by all bidders with the sell price
of the item. As shown is Table 3.5, the coefficient is only 0.2622, meaning as the Buy-
It-Now price increase by $1, the total money paid by bidders increase by only 26 cents.
This is much lower than in theory, where the coefficient should be 1. On the other hand,
the intercept is at 64.8 dollars. This indicates that users tend to bid less cautiously for
items of lower value, supporting H4. Note that, even for the same item, penny auctions
can product very different final prices, and sell price is only able to explain 24.6% of the
total variation. This can explain why our optimal strategy is more inclined to bid on big
ticket items, since they are less likely to trigger overbidding.
83
Understanding Online Financial Behavior Chapter 3
Dependent variableBidding
Endowment effect Leading time -0.0006***Sunk cost fallacy& self-justification
User bids placed 0.0071***
Competition aversionUnique users so far -0.0017***Auction bids so far -1.979e-5***
Confounding factor Item price 5.952e-5***(Intercept) -1.6271***
N 15,783,131
Note: *** p<0.01, ** p<0.05, * p<0.1.
Table 3.6: Results of logistic regression model measuring all effects combined.
Joint Psychological Effect Finally, we examine all the psychological factors, aside
from auction stake, together in Table 3.6. We find that, while the tendency to avoid
competition is still strong, sunk cost and pseudo-endowment effect are strongly mixed.
The effect of sunk cost fallacy overshadows the pseudo-endowment effect. A negative
coefficient on leading time indicates that, with the same number of bids placed, a user
who quickly gets outbid is more likely to stay in the auction. For the tendency to avoid
competition, the number of bids placed in the auction observes a more than two-fold
increase in magnitude and becomes statistically significant. This indicates that, when we
control for the number of bids placed by a user, a higher level of total bidding activity
in an auction is more likely to drive the user away.
3.2.4 Discussions & Conclusions
Our above analysis discovers signs of psychological traits like sunk cost fallacy and
pseudo-endowment effect, which lead to higher cost for the bidders.
Certain elements in the design of DealDash are taking advantage of these traits to
increase revenue. When a user become the current top bidder, the site shows “YOU ARE
84
Understanding Online Financial Behavior Chapter 3
THE HIGHEST BIDDER” with colored background to enforce the message. DealDash
also keeps track of bidders’ time spent as the highest bidder at the bottom of the page.
These can potentially be contributing factors to the pseudo-endowment effect.
DealDash also displays the number of bids placed in an auction, in association with
the Buy-It-Now function, saying things like “Buy it Now for $129 & Get 104 Bids Back”.
Users who are under sunk cost effect may decide to buy the product from DealDash
under unfavorable prices just to avoid the pain of losing their bids.
For competition level, DealDash’s design is sending mixed messages. On one hand, it
seems to be aware of bidder’s tendency to avoid auctions with too many unique bidders
in that it actually does not allow new bidders to enter into auctions beyond a fixed price.
On the other hand, it displays all the unique bidders in the auction as avatars, which will
make users more aware of the competition present in the auction. Potentially, DealDash
can limit the display of unique bidders to a smaller number, i.e. displaying only the most
recent 10 bidders, thus reducing user’s tendency of competition avoidance.
To conclude, we have examined prior theories about auction psychology. Based on
the theories, we have designed multiple hypothesis about users’ behavior during penny
auctions. Using empirical traces from DealDash, we are able to find evidence that sup-
ports sunk cost fallacy, pseudo-endowment effect as well as the effect of higher auction
stake. However, we find evidence against competitive arousal; instead, users tend exhibit
competition avoidance in the penny auction setting. Finally, we find that DealDash is
already taking advantage of some of the fallacies in their website design, suggesting that
the penny auction site is preying on users’ irrationalities.
85
Chapter 4
Using Understanding to Guide
Financial Actions: The Case of
Penny Auctions
In Chapter 2 and 3, we have introduced how measurement of behavioral traces and
exploration of the underlying reasons can both contribute to our understanding of online
financial behavior. However, although a deep understanding is intellectually gratifying
by itself, it is even more valuable as a means to guide future actions. In this chapter,
we address the challenge of how understanding about financial behaviors can be used to
assist decision making.
In the following, we use the example of penny auction to demonstrate, how, through
a deep understanding of the dynamics in penny auctions, adversarial strategies can be
designed and tested to win penny auctions.
86
Using Understanding to Guide Financial Actions: The Case of Penny Auctions Chapter 4
4.1 Introduction
Whether it is art, real estate, automobiles or electronics, auctions provide an efficient
marketplace mechanism with the goal of selling goods to buyers willing to pay the highest
price for each item. For their part in facilitating the transaction, auction providers like
Sotheby’s or eBay collect a transaction fee generally calculated as a function of the selling
price. Traditional auctions are transparent processes where buyers have deterministic
controls over their expenses, i.e. given an initial budget, they will either successfully
purchase the target item, or fail and spend nothing.
Following the great recession of 2008–2009, a very different type of online auctions
rose in popularity, by attracting new buyers with TV or online ads that promote massive
bargains like digital cameras for pennies and iPhones for a few dollars [129, 130]. Penny
auctions, or pay-per-bid auctions, offer a significantly different model, where auction
participants pay to purchase non-refundable bids, and each new bid increases the item’s
purchase price by some small increment, e.g. $0.01. Auctions end only when some preset
time period passed with no new bids, at which time the winner can buy the item at the
current purchase price. While the final sale price can be a small fraction of retail prices,
the auction provider can collect far more revenue than the retail price, from sales of bids
used by both the winner and losers.
Penny auctions are non-transparent by design. There are no caps on how much a
user can expend on bids used in a single auction, with no guarantee of success. There
is little known about auction providers themselves, their profitability, or how much do
cost of bids contribute to their revenue stream. Are penny auctions a different form
of “entertainment shopping” as they claim [131, 129], or are they gambling sites in
disguise, “the evil stepchild of game theory and behavioral economics” described by the
Washington Post [130]? Do penny auctions prey on users’ irrational tendencies like sunk-
87
Using Understanding to Guide Financial Actions: The Case of Penny Auctions Chapter 4
cost fallacy [56] and risk-seeking behavior [55]? Are there bidding strategies that will
consistently win auctions at a low cost?
There have been relatively few empirical studies of penny auctions in the decade
since their introduction. Three prior studies used empirical measurements of the Swoopo
penny auction system to validate their analytical models [56, 58, 55], focusing on the
profitability of these systems and the impact of factors like sunk-cost fallacy and infor-
mation asymmetry. Surprisingly, Swoopo closed its doors in 2011, while its competitor
DealDash survived and remains the largest penny auction platform today.
In this chapter, we seek to bring more transparency to penny auction systems using
a data driven approach. We use detailed measurements to generate a detailed, 166-
day trace from DealDash, covering 174 million bids made by 101,936 unique users in
134,568 auctions. Our work seeks to answer three questions surrounding how to make
money in penny auctions. First, for the platform’s perspective, we seek to perform an
updated analysis of profitability of penny auctions since earlier studies of Swoopo auctions
from 2009-2011. Then, we look into individual behaviors by modeling them using data-
driven learning models. Finally, we develop adversarial strategies that would succeed in
consistently winning auctions and maximizing user gain.
Our work produces several key findings, as follows.
• Using online prices to approximate cost of goods, we estimate that DealDash is
generates a gross profit with margins similar to other retailers. Analyzing the flow
of revenue shows DealDash is heavily dependent on new users who provide nearly
all of their revenue, and offers an explanation for the earlier demise of other penny
auction systems.
• We find that bidding behavior can be accurately modeled using a parameterized
deep neural network (LSTM), which is capable of predicting detailed properties like
88

Using Understanding to Guide Financial Actions: The Case of Penny Auctions Chapter 4
number of distinct bidders or length of bidding wars.
• We explore the value of multiple approaches to adversarial bidding strategies. We
find that iterative learning using cross-entropy can produce consistent auction wins,
and identify 2 key features with strong correlation to success. We also find that a
simple strategy based on persistent bidding using automated bidding agents is also
quite successful.
• We empirically confirm that when bidders using adversarial strategies compete in
the same auction, they produce a scenario similar to Prisoner’s Dilemma, and both
end up overpaying for the product. These cases maximize profit for the auction
provider.
To the best of our knowledge, our work is the first to develop adversarial bidding
strategies for penny auctions. We identify consistently successful strategies, some of
which seem to be utilized by long-term “power bidders” who manage to generate profits
at the expense of DealDash.
4.2 Background and Related Work
We begin with a brief introduction to penny auctions and some prior work on auto-
mated bidding agents in auctions.
Penny auctions, also called pay-per-bid auctions, is an auction format where a par-
ticipant must pay a non-refundable bidding fee when he/she places a bid. Each auction
begins with a reserve price and a countdown timer. Unlike regular auctions where bids
determine the sale price, each new bid only increases the sale price of the item by a
(small) fixed amount. The timer resets after each bid, and bidding terminates when the
89

Using Understanding to Guide Financial Actions: The Case of Penny Auctions Chapter 4
timer expires, and the person who made the last bid wins the auction and buys the item
at the final price.
Some recent research has studied penny auctions, finding them to be highly profitable
for auctioneers [56, 55]. The majority of prior works focus on using economics model to
explain the reason behind the high profit. Byers et al. argues that information asymmetry
across players can increase the auction duration significantly [58]. Further, it is found
that penny auction bidders are risk-lovers [55], and bidding behavior can be explained by
sunk cost fallacy [56]. As a result, the majority of the bidders lose money in penny auction
and leave the platform quickly, and these users are the main sources of the auctioneer’s
profit [72].
Our study focuses DealDash1, one of the largest and longest-lived penny auction
sites, as a representative of this class of systems. On DealDash, the reserve price is
0, and the bid timer is reset to 10 seconds after each bid. Each bid costs $0.12-$0.15,
and when applied, raises the sale price by 1 cent. DealDash provides two additional
functions common in penny auction sites. One is an automated bidding assistant called
BidBuddy, which takes some budget from a participant, and if the user has been outbid,
automatically places a bid one second before timer expiration. Another is called buy-it-
now, with which an auction loser can buy the item at a preset retail price, and have all
their expended bids refunded.
Autonomous Bidding Agents. Given the wide applications of auctions in areas
like spectrum allocation, electricity markets and trading, there is extensive analysis on
the design of autonomous bidding agents. Some propose bidding agents using heuristic-
based algorithms [132, 133]. Others show that reinforcement learning can successfully
drive autonomous agents [134, 135]. Still others have applied reinforcement learning to
evaluate auction designs in energy markets [136] and to improve bidding efficiency in
1https://www.dealdash.com/
90
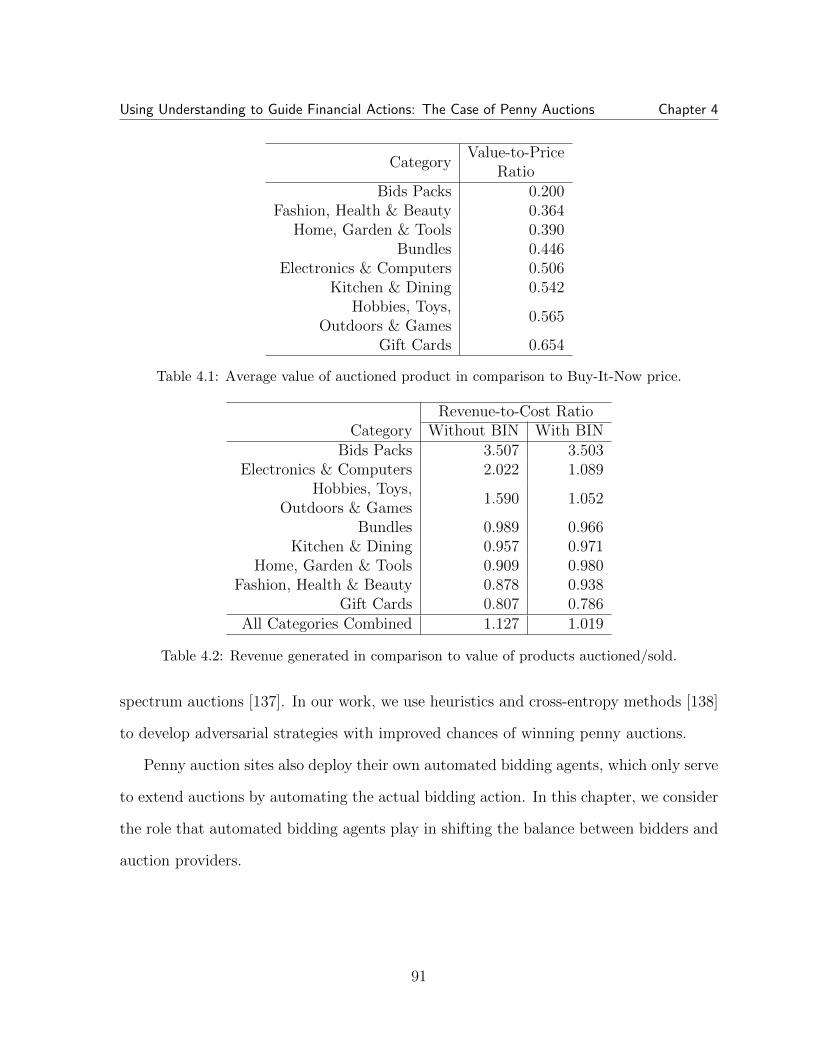
Using Understanding to Guide Financial Actions: The Case of Penny Auctions Chapter 4
CategoryValue-to-Price
RatioBids Packs 0.200
Fashion, Health & Beauty 0.364Home, Garden & Tools 0.390
Bundles 0.446Electronics & Computers 0.506
Kitchen & Dining 0.542Hobbies, Toys,
Outdoors & Games0.565
Gift Cards 0.654
Table 4.1: Average value of auctioned product in comparison to Buy-It-Now price.
Revenue-to-Cost RatioCategory Without BIN With BIN
Bids Packs 3.507 3.503Electronics & Computers 2.022 1.089
Hobbies, Toys,Outdoors & Games
1.590 1.052
Bundles 0.989 0.966Kitchen & Dining 0.957 0.971
Home, Garden & Tools 0.909 0.980Fashion, Health & Beauty 0.878 0.938
Gift Cards 0.807 0.786All Categories Combined 1.127 1.019
Table 4.2: Revenue generated in comparison to value of products auctioned/sold.
spectrum auctions [137]. In our work, we use heuristics and cross-entropy methods [138]
to develop adversarial strategies with improved chances of winning penny auctions.
Penny auction sites also deploy their own automated bidding agents, which only serve
to extend auctions by automating the actual bidding action. In this chapter, we consider
the role that automated bidding agents play in shifting the balance between bidders and
auction providers.
91
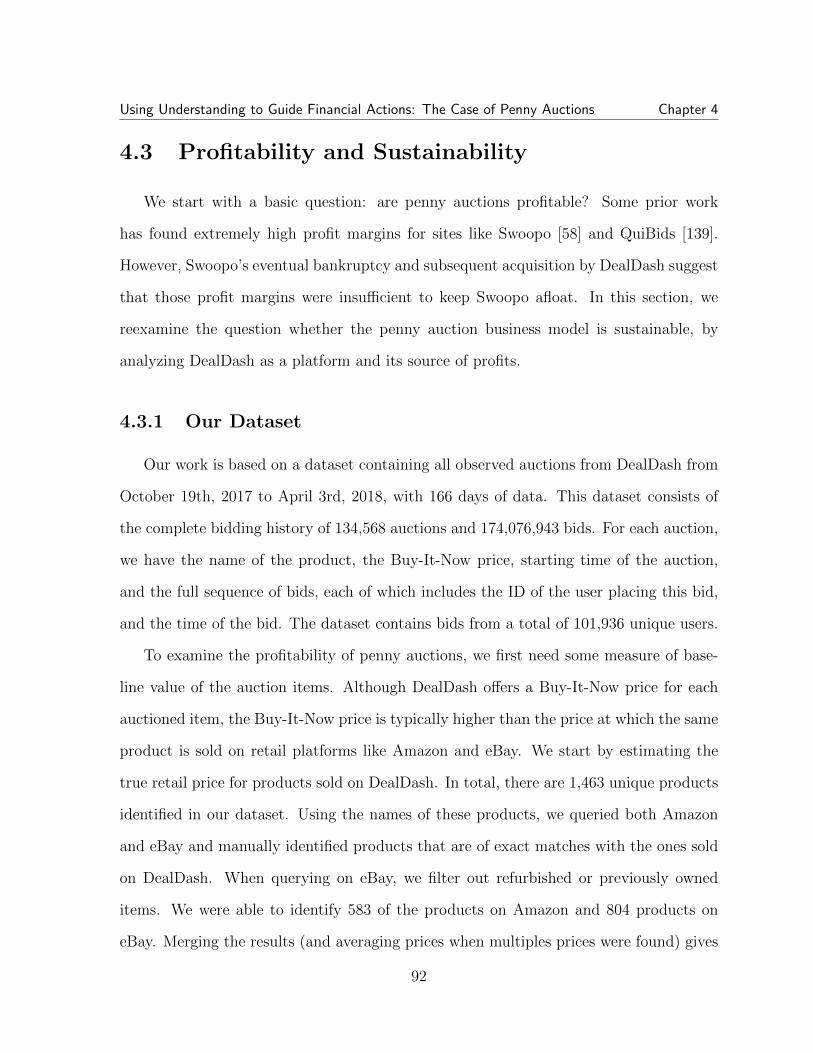
Using Understanding to Guide Financial Actions: The Case of Penny Auctions Chapter 4
4.3 Profitability and Sustainability
We start with a basic question: are penny auctions profitable? Some prior work
has found extremely high profit margins for sites like Swoopo [58] and QuiBids [139].
However, Swoopo’s eventual bankruptcy and subsequent acquisition by DealDash suggest
that those profit margins were insufficient to keep Swoopo afloat. In this section, we
reexamine the question whether the penny auction business model is sustainable, by
analyzing DealDash as a platform and its source of profits.
4.3.1 Our Dataset
Our work is based on a dataset containing all observed auctions from DealDash from
October 19th, 2017 to April 3rd, 2018, with 166 days of data. This dataset consists of
the complete bidding history of 134,568 auctions and 174,076,943 bids. For each auction,
we have the name of the product, the Buy-It-Now price, starting time of the auction,
and the full sequence of bids, each of which includes the ID of the user placing this bid,
and the time of the bid. The dataset contains bids from a total of 101,936 unique users.
To examine the profitability of penny auctions, we first need some measure of base-
line value of the auction items. Although DealDash offers a Buy-It-Now price for each
auctioned item, the Buy-It-Now price is typically higher than the price at which the same
product is sold on retail platforms like Amazon and eBay. We start by estimating the
true retail price for products sold on DealDash. In total, there are 1,463 unique products
identified in our dataset. Using the names of these products, we queried both Amazon
and eBay and manually identified products that are of exact matches with the ones sold
on DealDash. When querying on eBay, we filter out refurbished or previously owned
items. We were able to identify 583 of the products on Amazon and 804 products on
eBay. Merging the results (and averaging prices when multiples prices were found) gives
92
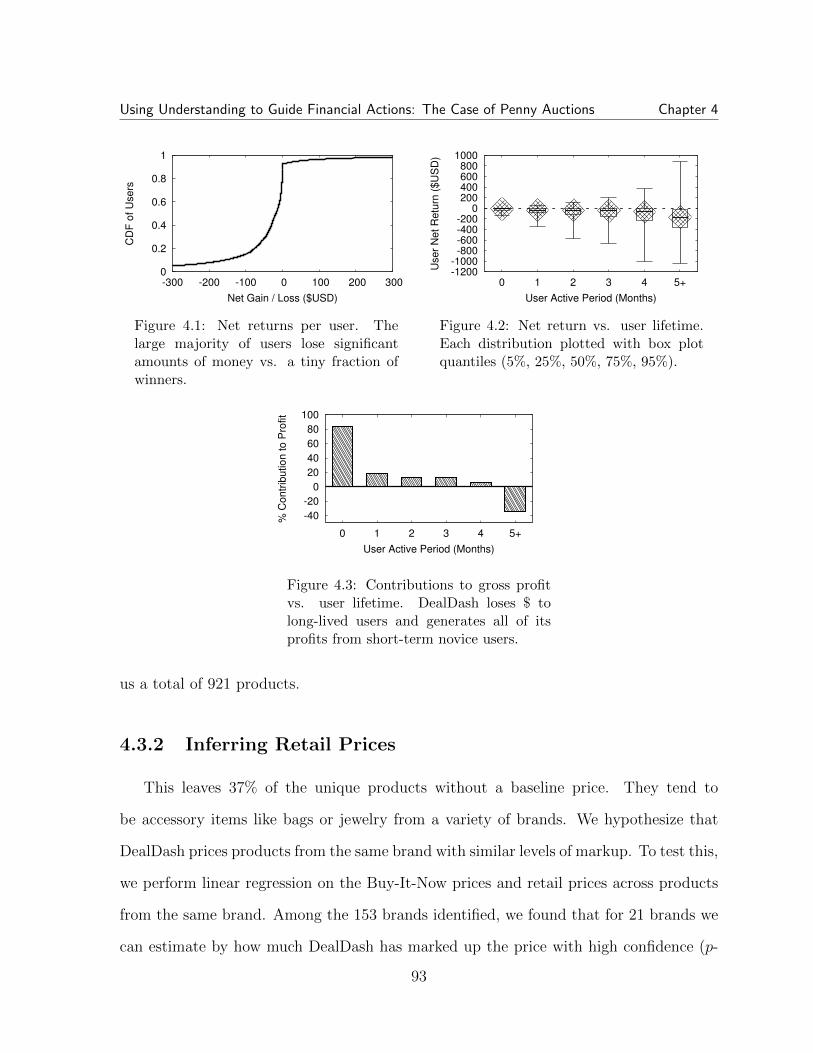
Using Understanding to Guide Financial Actions: The Case of Penny Auctions Chapter 4
0
0.2
0.4
0.6
0.8
1
-300 -200 -100 0 100 200 300
CD
F o
f U
sers
Net Gain / Loss ($USD)
Figure 4.1: Net returns per user. Thelarge majority of users lose significantamounts of money vs. a tiny fraction ofwinners.
-1200-1000-800-600-400-200
0 200 400 600 800
1000
0 1 2 3 4 5+
User
Net R
etu
rn (
$U
SD
)
User Active Period (Months)
Figure 4.2: Net return vs. user lifetime.Each distribution plotted with box plotquantiles (5%, 25%, 50%, 75%, 95%).
-40
-20
0
20
40
60
80
100
0 1 2 3 4 5+
% C
ontr
ibution to P
rofit
User Active Period (Months)
Figure 4.3: Contributions to gross profitvs. user lifetime. DealDash loses $ tolong-lived users and generates all of itsprofits from short-term novice users.
us a total of 921 products.
4.3.2 Inferring Retail Prices
This leaves 37% of the unique products without a baseline price. They tend to
be accessory items like bags or jewelry from a variety of brands. We hypothesize that
DealDash prices products from the same brand with similar levels of markup. To test this,
we perform linear regression on the Buy-It-Now prices and retail prices across products
from the same brand. Among the 153 brands identified, we found that for 21 brands we
can estimate by how much DealDash has marked up the price with high confidence (p-
93
Using Understanding to Guide Financial Actions: The Case of Penny Auctions Chapter 4
value < 0.006). We thus estimate retail prices of these products using the linear regression
models. In total, we are able to generate baseline prices for 1,335 unique products on
DealDash, or 91.3% of all auction items.
We discovered significant level of overpricing across all categories, shown in Table 4.1.
Besides “Bids Packs” being marked at 5x their normal price, other categories like “Fash-
ion, Health & Beauty” (handmade jewelry and bags) are overpriced at 3x markup.
4.3.3 Estimating Profits
Given a reasonable estimate of the retail product prices sold on DealDash, we estimate
DealDash’s profit margins relative to products’ retail prices, using the following:
Revenue = ΣAuctions(Total Bids Cost + Final Price)
Where total bids cost is the value of all bids placed in the auctions, assuming bid cost is
12 cents (roughly stable price for a single bid). The cost for DealDash is computed as:
Cost = ΣAuctionsProduct Retail Price
For each category, we divide the revenue by the cost, which represents how much of
a wholesale discount DealDash needs to start earning money. We also consider the case
where some of the users decide to use Buy-It-Now (BIN), which affects both the revenue
and the cost:
RevenueBIN = Revenue +ΣAuctionΣBIN User(BIN Price −Bids Cost)
CostBIN = Cost +ΣAuctionΣBIN UserProduct Retail Price
94
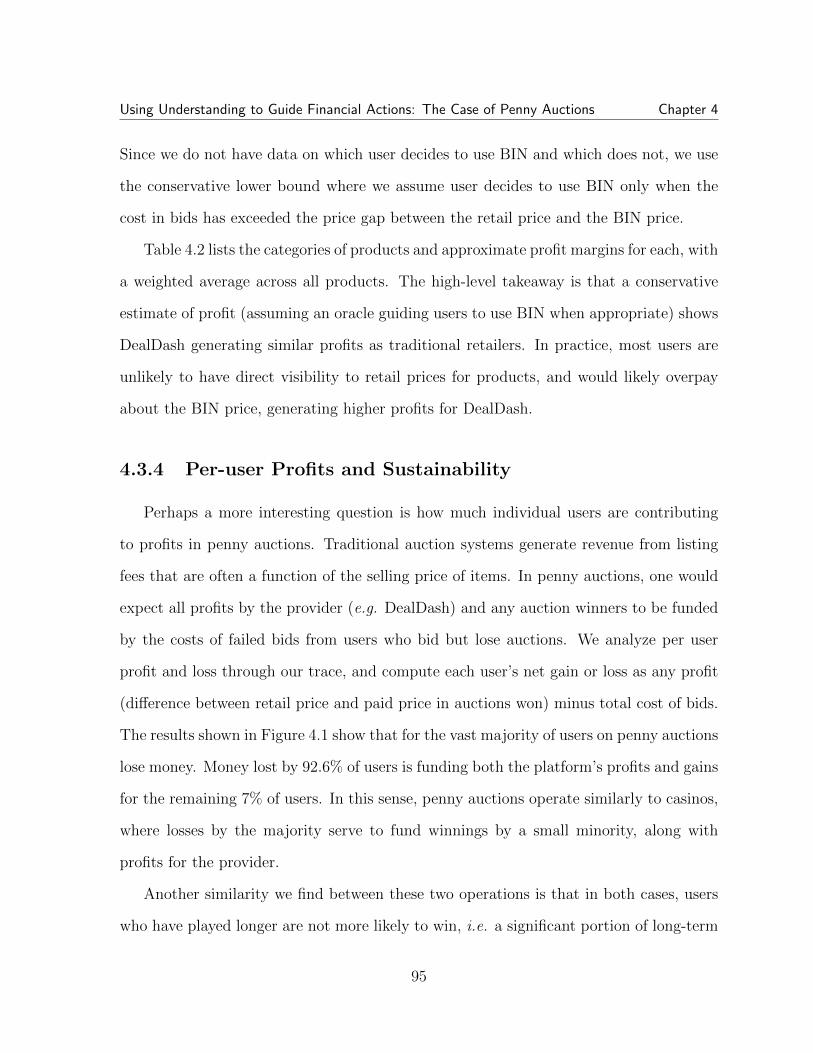
Using Understanding to Guide Financial Actions: The Case of Penny Auctions Chapter 4
Since we do not have data on which user decides to use BIN and which does not, we use
the conservative lower bound where we assume user decides to use BIN only when the
cost in bids has exceeded the price gap between the retail price and the BIN price.
Table 4.2 lists the categories of products and approximate profit margins for each, with
a weighted average across all products. The high-level takeaway is that a conservative
estimate of profit (assuming an oracle guiding users to use BIN when appropriate) shows
DealDash generating similar profits as traditional retailers. In practice, most users are
unlikely to have direct visibility to retail prices for products, and would likely overpay
about the BIN price, generating higher profits for DealDash.
4.3.4 Per-user Profits and Sustainability
Perhaps a more interesting question is how much individual users are contributing
to profits in penny auctions. Traditional auction systems generate revenue from listing
fees that are often a function of the selling price of items. In penny auctions, one would
expect all profits by the provider (e.g. DealDash) and any auction winners to be funded
by the costs of failed bids from users who bid but lose auctions. We analyze per user
profit and loss through our trace, and compute each user’s net gain or loss as any profit
(difference between retail price and paid price in auctions won) minus total cost of bids.
The results shown in Figure 4.1 show that for the vast majority of users on penny auctions
lose money. Money lost by 92.6% of users is funding both the platform’s profits and gains
for the remaining 7% of users. In this sense, penny auctions operate similarly to casinos,
where losses by the majority serve to fund winnings by a small minority, along with
profits for the provider.
Another similarity we find between these two operations is that in both cases, users
who have played longer are not more likely to win, i.e. a significant portion of long-term
95
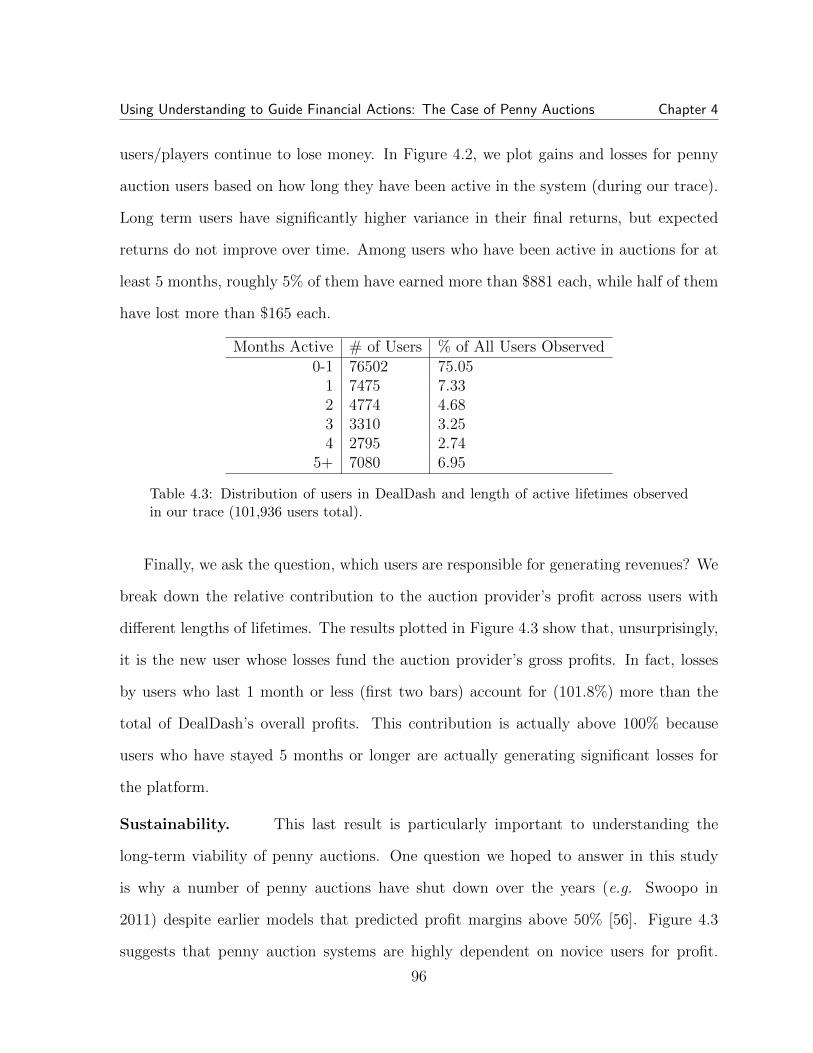
Using Understanding to Guide Financial Actions: The Case of Penny Auctions Chapter 4
users/players continue to lose money. In Figure 4.2, we plot gains and losses for penny
auction users based on how long they have been active in the system (during our trace).
Long term users have significantly higher variance in their final returns, but expected
returns do not improve over time. Among users who have been active in auctions for at
least 5 months, roughly 5% of them have earned more than $881 each, while half of them
have lost more than $165 each.
Months Active # of Users % of All Users Observed0-1 76502 75.05
1 7475 7.332 4774 4.683 3310 3.254 2795 2.74
5+ 7080 6.95
Table 4.3: Distribution of users in DealDash and length of active lifetimes observedin our trace (101,936 users total).
Finally, we ask the question, which users are responsible for generating revenues? We
break down the relative contribution to the auction provider’s profit across users with
different lengths of lifetimes. The results plotted in Figure 4.3 show that, unsurprisingly,
it is the new user whose losses fund the auction provider’s gross profits. In fact, losses
by users who last 1 month or less (first two bars) account for (101.8%) more than the
total of DealDash’s overall profits. This contribution is actually above 100% because
users who have stayed 5 months or longer are actually generating significant losses for
the platform.
Sustainability. This last result is particularly important to understanding the
long-term viability of penny auctions. One question we hoped to answer in this study
is why a number of penny auctions have shut down over the years (e.g. Swoopo in
2011) despite earlier models that predicted profit margins above 50% [56]. Figure 4.3
suggests that penny auction systems are highly dependent on novice users for profit.
96
Using Understanding to Guide Financial Actions: The Case of Penny Auctions Chapter 4
After experimenting with the system, a small portion of users figure out how to win
auctions (more on this in Section 4.5) and stay in the system for personal profit, while
the vast majority of users lose money and leave the system altogether. Roughly 7% of
all users remain after 5 months in the system, and those users as a whole, generate a net
loss for the platform. Thus, sustaining the platform requires consistently adding large
numbers of users to the platform, perhaps explaining in part their consistent marketing
campaigns [140]. It is also a possible explanation for why penny auction sites like Swoopo
shut their doors despite high per-item profit margins. This conclusion is consistent with
an earlier paper [72] that suggested that penny auctions needed a revolving door of users
to maintain profitability.
4.4 Bid-level Simulation of Penny Auctions
A key goal of our work is to understand how adversarial strategies can work in the
context of penny auctions. Ideally, developing and validating these strategies would be
done either through experiments in the wild. Unfortunately, active experiments in the
wild face challenges in terms of reproducibility as well as ethical questions. Instead, we
choose to develop a reliable simulation platform that accurately reproduces auctions that
match real auctions in both high level and fine grain features. In this section, we describe
the development of this simulator using deep neural networks (LSTM in particular), and
present validation results that show our simulated auctions are extremely realistic on
fine-grain features like final prices and length of bidding wars.
4.4.1 Basic Bid Prediction Model
For an accurately simulator to be feasible, users’ bidding behavior needs to be pre-
dictable. Therefore, we start by studying the predictability of bidders in penny auctions.
97

Using Understanding to Guide Financial Actions: The Case of Penny Auctions Chapter 4
0
0.2
0.4
0.6
0.8
1
0 0.2 0.4 0.6 0.8 1
Tru
e P
ositiv
e R
ate
False Positive Rate
LSTM (AUC 0.89)5-gram (AUC 0.84)
Figure 4.4: ROC-curve for predicting whether an auction will end.
AUC Top-1 Accuracy Perplexity3-gram 0.831 0.875 1.5574-gram 0.843 0.886 1.6535-gram 0.844 0.890 1.8276-gram 0.839 0.891 2.0637-gram 0.831 0.890 2.318LSTM 0.890 0.900 1.259
Table 4.4: AUC in predicting auction ending. Top-1 accuracy and perplexity inpredicting next bidder.
We achieve this by building machine learning models to predict bidding behavior and
evaluating them using our DealDash traces. More specifically, we use n-gram [141] and
recurrent neural network (2-layer LSTM [11]) models, and show that bidding behavior
in penny auctions are actually highly predictable.
Methodology
Our prediction models use a sequence-based framework. An auction with n bids forms
a sequence S = (U1, U2, ..., Un,End), where Ui is the username of the user who placed
the ith bid in the auction, and End is a token that indicates auction has ended. Our
model takes in any subsequence (U1, U2, ..., Uk) where k ≤ n and predicts the value of
Sk+1, either the username of the k + 1th bidder or that the auction has ended.
98

Using Understanding to Guide Financial Actions: The Case of Penny Auctions Chapter 4
A bidder who has recently placed a bid in an auction is likely to bid again soon. Hence,
we introduce the concept of “relative position,” as the position difference between the
current bid and the most recent bid placed by the same user. We can then transform a
bidding sequence into a sequence of relative positions of the bidder who placed each bid.
When a user has not previously placed any bid in the auction, her relative position will
be regarded as infinite.
For example, a bidding sequence S = (A,B,A,C,B,A,End) can be transformed
into Srel = (Inf, Inf,2, Inf,3,3,End), which is then used in prediction. We find the
performance is better when we treat different relative positions as separate classes instead
of as a numeric value. Given that most relative bids (95.5%) are below 20, we enforce a
cap of 20 on the maximum relative position. Experiments show different threshold values
of 10, 20 and 50 have minimal impact on prediction results.
Prediction Results
We separate our data trace by time, auctions that concluded at least 14 days before
the end of the trace (120,671 auctions), and auctions taking place during the last 14 days
(13,842 auctions). We use the older auctions for training, and the newer auctions for
testing.
We first use the probability on the class “End” to predict whether an auction will
end or not. In Table 4.4, the best performing n-gram model is 5-gram with an AUC of
0.844. The LSTM model beats it by a large margin with an AUC of 0.890, as shown in
Figure 4.4.
We evaluate bidder prediction using top-1 accuracy, which is the percent of time our
model correctly predicts whom the next bidder is. As shown in Table 4.4, the LSTM
achieves a slightly higher top-1 accuracy of 0.900. In addition, we evaluated each model’s
perplexity. It is formulated as exp(−∑i (log pi)/n), where pi is the predicted probability
99
Using Understanding to Guide Financial Actions: The Case of Penny Auctions Chapter 4
of the i-th relative position in the test set of n bids. A lower perplexity indicates a better
model. LSTM significantly outperforms the rest.
The high accuracy in bid prediction indicates strong underlying processes that drive
bidder behavior.
4.4.2 Powering Simulation with LSTMs
However, simply being able to predict the next bids based on previous traces is not
enough to simulate actual auctions. As auction outcome is heavily influenced by metadata
such as type of product being auctioned, e.g. bidder behave differently for items like cars
and toys. In addition, to effectively simulate auction environments, we need to accurately
predict exactly when bids occur.
It is clear that we needed a much more detailed and accurate model, one that pre-
dicted not only the next bidder, but gaps between bids as well as longer-term behaviors
like bidding wars. Since events in auctions are highly dependent on previous events,
small errors in the sequence of bids tend to cascade into larger errors. Given an item,
only a consistently accurate simulator would be able to accurately predict the entire bid
sequence, and produce final results (final sale price and auction end time) consistent with
real auctions.
We build a new model using a two-layer LSTM model, that considers a number of
key features:
• Buy-It-Now price of the product being auctioned.
• “Category” of the product.
• Time (time of day and day of week) of the last bid.
• Delay between current bid and previous bid.
100
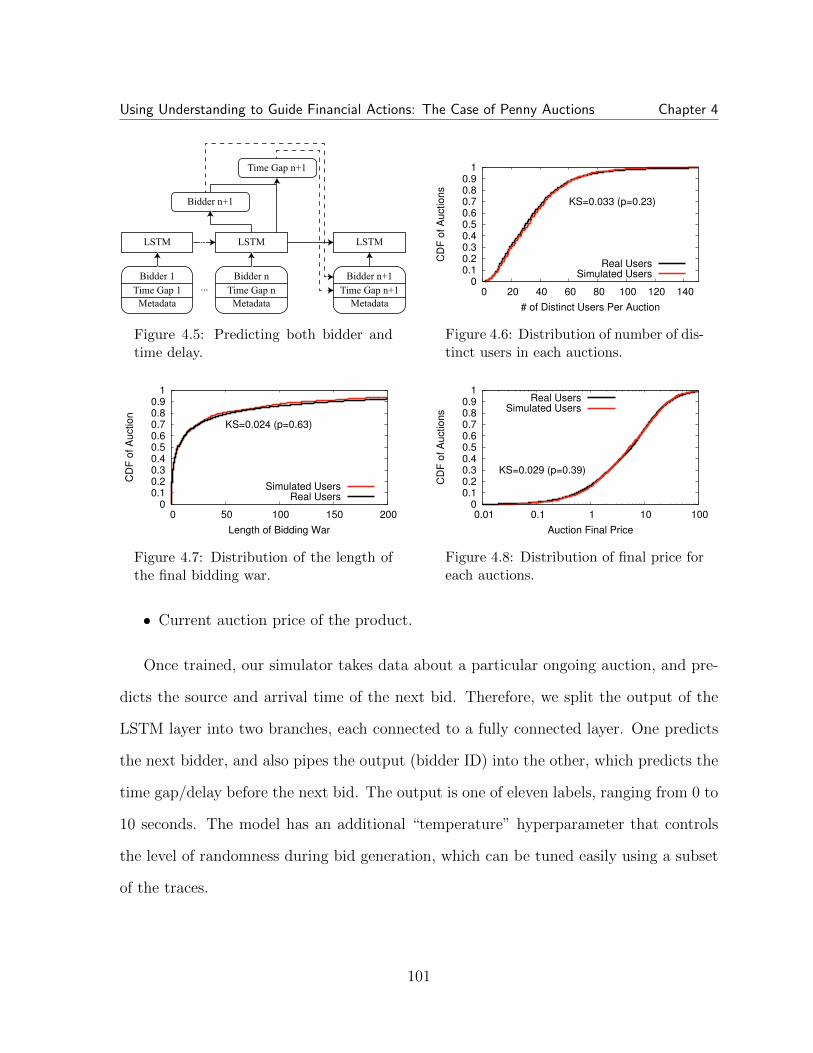
Using Understanding to Guide Financial Actions: The Case of Penny Auctions Chapter 4
Bidder 1
Time Gap 1
Metadata
Bidder n
Time Gap n
Metadata
Bidder n+1
Time Gap n+1
Metadata
LSTM LSTM LSTM
Bidder n+1
Time Gap n+1
...
...
Figure 4.5: Predicting both bidder andtime delay.
0 0.1 0.2 0.3 0.4 0.5 0.6 0.7 0.8 0.9
1
0 20 40 60 80 100 120 140
CD
F o
f A
uctio
ns
# of Distinct Users Per Auction
KS=0.033 (p=0.23)
Real UsersSimulated Users
Figure 4.6: Distribution of number of dis-tinct users in each auctions.
0 0.1 0.2 0.3 0.4 0.5 0.6 0.7 0.8 0.9
1
0 50 100 150 200
CD
F o
f A
uctio
n
Length of Bidding War
KS=0.024 (p=0.63)
Simulated UsersReal Users
Figure 4.7: Distribution of the length ofthe final bidding war.
0 0.1 0.2 0.3 0.4 0.5 0.6 0.7 0.8 0.9
1
0.01 0.1 1 10 100
CD
F o
f A
uctio
ns
Auction Final Price
KS=0.029 (p=0.39)
Real UsersSimulated Users
Figure 4.8: Distribution of final price foreach auctions.
• Current auction price of the product.
Once trained, our simulator takes data about a particular ongoing auction, and pre-
dicts the source and arrival time of the next bid. Therefore, we split the output of the
LSTM layer into two branches, each connected to a fully connected layer. One predicts
the next bidder, and also pipes the output (bidder ID) into the other, which predicts the
time gap/delay before the next bid. The output is one of eleven labels, ranging from 0 to
10 seconds. The model has an additional “temperature” hyperparameter that controls
the level of randomness during bid generation, which can be tuned easily using a subset
of the traces.
101

Using Understanding to Guide Financial Actions: The Case of Penny Auctions Chapter 4
4.4.3 Trace-based Simulator Validation
We evaluate our simulator in three ways: a) single bid prediction accuracy, b) dis-
tributions over generated full auctions, and c) comparisons of parameters from linear
regression. First, we test bid prediction accuracy by training a model on 90% of auction
traces, and testing on the remaining 10%. Our model accurately predicts the next bidder
90.6% of the time, and predicts arrival time of the next bid with a mean absolute error
of 0.035 seconds.
Next, we quantify the accuracy of the simulator by looking at its ability to generate
full auction traces that match real auctions in key characteristics. We generate 1,000 full
auction traces (using initial metadata chosen to match real traces), and compare them
with real world traces on three key features: Auction final price, a measure of how long
the auctions last; unique bidders per auction, and length of bidding wars, which measures
the length of any bidding wars between two final bidders. The distribution of these key
features in our synthetic traces are plotted together with the distributions of real traces,
in Figures 4.6, 4.7 and 4.8. Each plot includes a Kolmogorov-Smirnov test (K-S value)
and a p-value. As we can see, our simulator’s synthetic bidding traces match the real
samples nearly perfectly visually as well as using K-S and p-values, across three key
features.
Finally, we examine whether our model is able to capture the different contributions
of different metadata features in each auction, by performing a linear regression between
metadata and number of unique bidders on both real world and simulated traces. This is
one way to test similarity of the two sets of traces (real measurement traces vs. synthetic
traces generated by our simulator) across different subsets defined by varying metadata
values. As shown in Table 4.5, our simulator is able to produce a set of coefficients quite
similar to that in the actual world across a wide range of metadata values. We mark
102
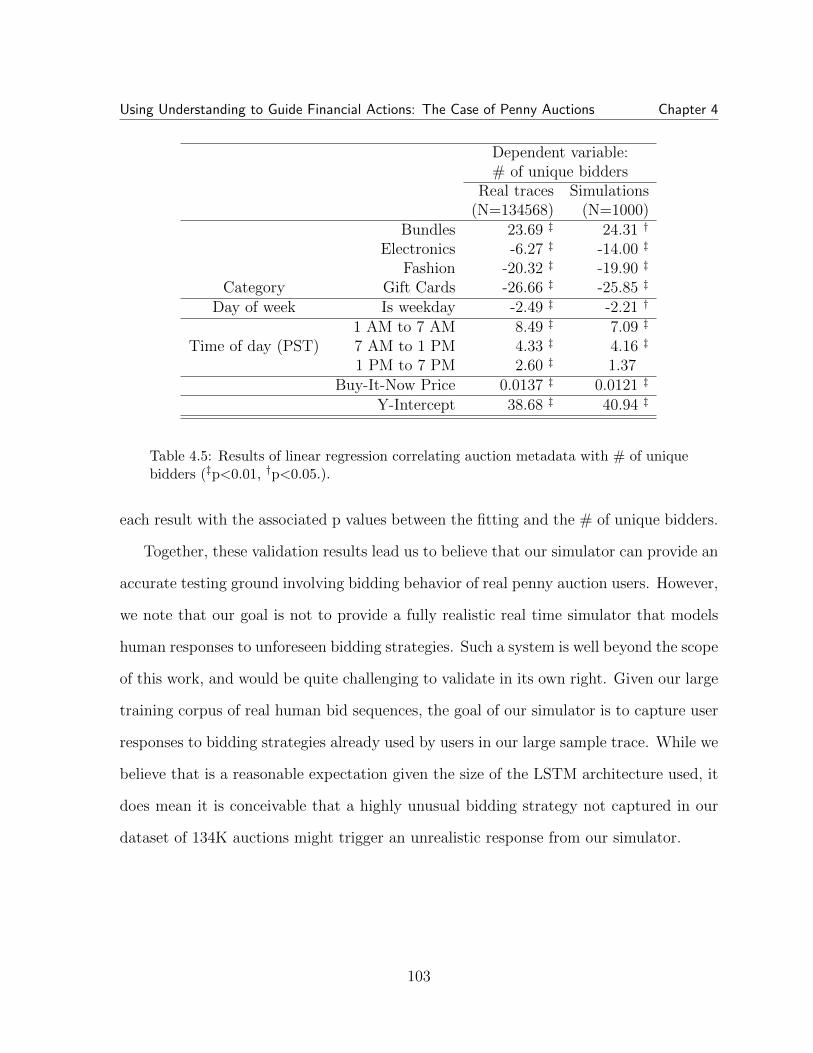
Using Understanding to Guide Financial Actions: The Case of Penny Auctions Chapter 4
Dependent variable:# of unique bidders
Real traces(N=134568)
Simulations(N=1000)
Category
Bundles 23.69 ‡ 24.31 †
Electronics -6.27 ‡ -14.00 ‡
Fashion -20.32 ‡ -19.90 ‡
Gift Cards -26.66 ‡ -25.85 ‡
Day of week Is weekday -2.49 ‡ -2.21 †
Time of day (PST)1 AM to 7 AM 8.49 ‡ 7.09 ‡
7 AM to 1 PM 4.33 ‡ 4.16 ‡
1 PM to 7 PM 2.60 ‡ 1.37Buy-It-Now Price 0.0137 ‡ 0.0121 ‡
Y-Intercept 38.68 ‡ 40.94 ‡
Table 4.5: Results of linear regression correlating auction metadata with # of uniquebidders (‡p<0.01, †p<0.05.).
each result with the associated p values between the fitting and the # of unique bidders.
Together, these validation results lead us to believe that our simulator can provide an
accurate testing ground involving bidding behavior of real penny auction users. However,
we note that our goal is not to provide a fully realistic real time simulator that models
human responses to unforeseen bidding strategies. Such a system is well beyond the scope
of this work, and would be quite challenging to validate in its own right. Given our large
training corpus of real human bid sequences, the goal of our simulator is to capture user
responses to bidding strategies already used by users in our large sample trace. While we
believe that is a reasonable expectation given the size of the LSTM architecture used, it
does mean it is conceivable that a highly unusual bidding strategy not captured in our
dataset of 134K auctions might trigger an unrealistic response from our simulator.
103
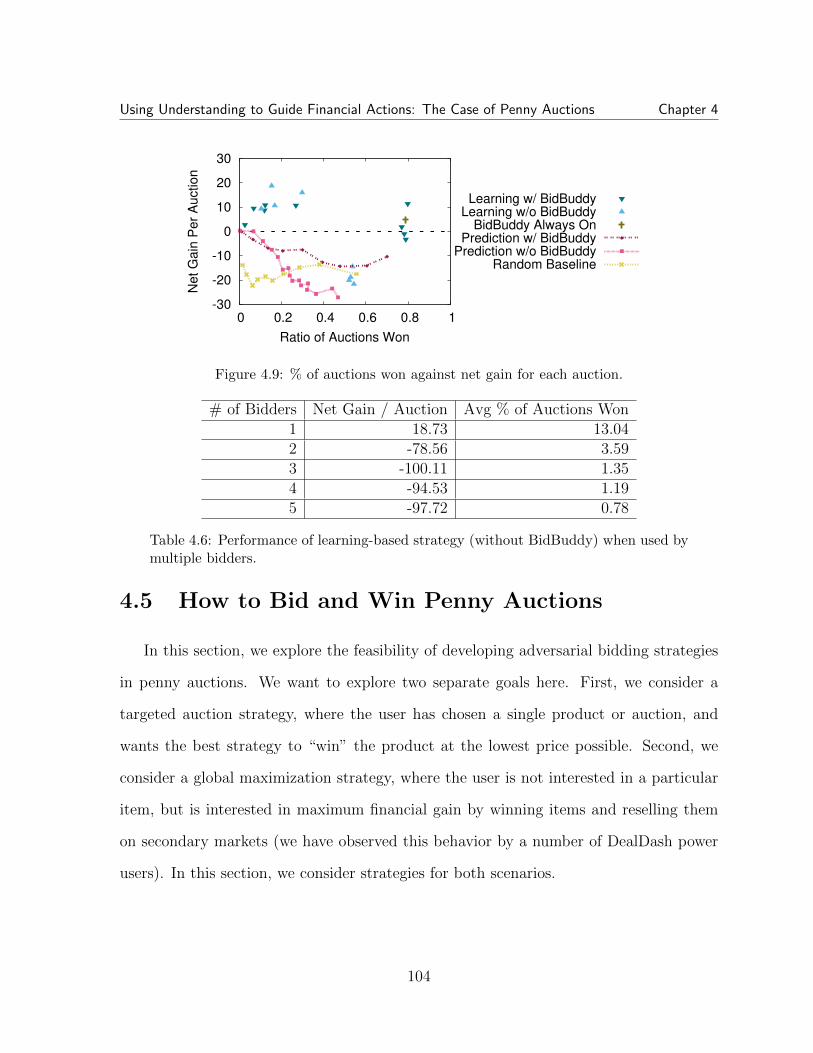
Using Understanding to Guide Financial Actions: The Case of Penny Auctions Chapter 4
-30
-20
-10
0
10
20
30
0 0.2 0.4 0.6 0.8 1
Ne
t G
ain
Pe
r A
uctio
n
Ratio of Auctions Won
Learning w/ BidBuddyLearning w/o BidBuddy
BidBuddy Always OnPrediction w/ BidBuddy
Prediction w/o BidBuddyRandom Baseline
Figure 4.9: % of auctions won against net gain for each auction.
# of Bidders Net Gain / Auction Avg % of Auctions Won1 18.73 13.042 -78.56 3.593 -100.11 1.354 -94.53 1.195 -97.72 0.78
Table 4.6: Performance of learning-based strategy (without BidBuddy) when used bymultiple bidders.
4.5 How to Bid and Win Penny Auctions
In this section, we explore the feasibility of developing adversarial bidding strategies
in penny auctions. We want to explore two separate goals here. First, we consider a
targeted auction strategy, where the user has chosen a single product or auction, and
wants the best strategy to “win” the product at the lowest price possible. Second, we
consider a global maximization strategy, where the user is not interested in a particular
item, but is interested in maximum financial gain by winning items and reselling them
on secondary markets (we have observed this behavior by a number of DealDash power
users). In this section, we consider strategies for both scenarios.
104
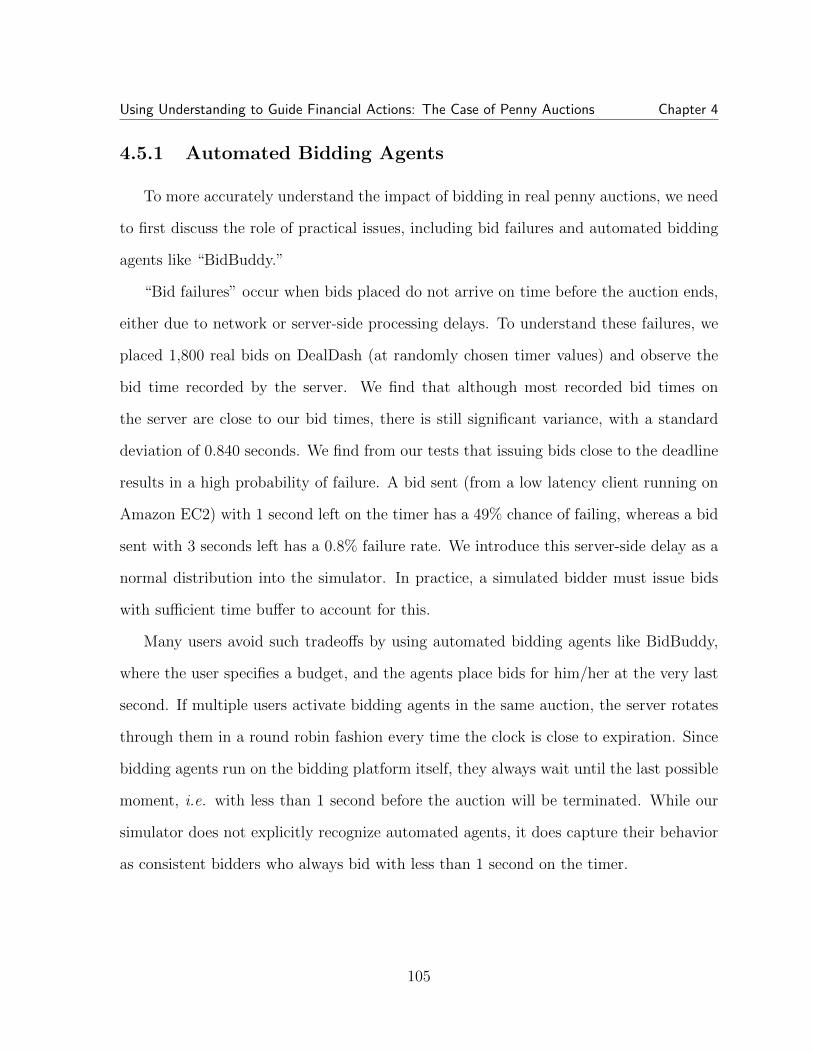
Using Understanding to Guide Financial Actions: The Case of Penny Auctions Chapter 4
4.5.1 Automated Bidding Agents
To more accurately understand the impact of bidding in real penny auctions, we need
to first discuss the role of practical issues, including bid failures and automated bidding
agents like “BidBuddy.”
“Bid failures” occur when bids placed do not arrive on time before the auction ends,
either due to network or server-side processing delays. To understand these failures, we
placed 1,800 real bids on DealDash (at randomly chosen timer values) and observe the
bid time recorded by the server. We find that although most recorded bid times on
the server are close to our bid times, there is still significant variance, with a standard
deviation of 0.840 seconds. We find from our tests that issuing bids close to the deadline
results in a high probability of failure. A bid sent (from a low latency client running on
Amazon EC2) with 1 second left on the timer has a 49% chance of failing, whereas a bid
sent with 3 seconds left has a 0.8% failure rate. We introduce this server-side delay as a
normal distribution into the simulator. In practice, a simulated bidder must issue bids
with sufficient time buffer to account for this.
Many users avoid such tradeoffs by using automated bidding agents like BidBuddy,
where the user specifies a budget, and the agents place bids for him/her at the very last
second. If multiple users activate bidding agents in the same auction, the server rotates
through them in a round robin fashion every time the clock is close to expiration. Since
bidding agents run on the bidding platform itself, they always wait until the last possible
moment, i.e. with less than 1 second before the auction will be terminated. While our
simulator does not explicitly recognize automated agents, it does capture their behavior
as consistent bidders who always bid with less than 1 second on the timer.
105
Using Understanding to Guide Financial Actions: The Case of Penny Auctions Chapter 4
4.5.2 Adversarial Strategies
Next, we describe three different approaches to developing adversarial bidding strate-
gies in penny auctions: prediction (based on predicting the auction end time), learning
(iteratively learns when to bid based on multiple iterations), and random. For each ap-
proach, we explore dual strategies both with and without the use of automated bidding
agents like BidBuddy.
Prediction-based Bidding. Our first strategy tries to predict when the last bid
will occur and place a bid afterwards. It reasons that even if the bidding continues, this
strategy reduces costs of bidding by skipping the large majority of bids in the auction.
To predict when the last bid will occur, we build a binary LSTM model with the
output being whether the auction will end or not. The LSTM predicts if the auction
will end in real-time, using a sequence of the most recent 50 bids. Following each new
bid, the new bid is fed into the predictor which generates a probability of the auction
ending immediately. If the result is higher than some predefined likelihood threshold T ,
we either place a bid or turn on BidBuddy for automated bidding. Otherwise, we wait
for the next bid and iterate the process once again. If the predictor fails to predict the
end of the auction, we lose.
The prediction strategy can work with a standalone user-bidding process or rely on
BidBuddy to reduce the chance of bid failures.
Learning-based strategy. Our second strategy makes use of iterative learning,
using the Cross-Entropy (CE) Method, an efficient optimization algorithm which can
be adapted to learn the optimal bidding strategy [138]. The CE method builds a good
bidding strategy by starting with a model with multiple parameters, each with some
learned prior probability distribution. In each learning iteration, the model generates
some number of model parameters, tests them with multiple simulated auctions, chooses
106

Using Understanding to Guide Financial Actions: The Case of Penny Auctions Chapter 4
a small subset of best performing parameters, and updates the mean and variance of
the distribution. The model repeats the learning iteration with the updated distribution
until the parameters converge.
For our purposes, we need to choose a parameterized model, key parameters, and an
initial prior distribution. Since CE works well with simple distributions, we choose logistic
regression as the parameterized model. For our parameters, we identify key features that
most strongly correlate with the winning bid of auctions. We train a random forest using
a collection of winning bids and non-winning bids, and use the resulting classifier to
identify the most important features, which we list below. Finally, as is common when
using CE, we choose the Gaussian(0,1) as the prior distribution for parameters.
• Current price: The current price of the auction.
• Last bidder ratio in 10/50: The number of bids placed by the last bidder in the
most recent 10/50 bids.
• Recent unique bidders: Number of unique bidders among those who placed the last
10 bids.
• Last bidder ratio in all: What percentage of bids in the auction is placed by the
last bidder.
• Last bidder dominance: The percentage of bids placed by the last bidder minus
that of the second to last bidder.
• Buy-It-Now price: The Buy-It-Now price of the product.
We build two versions of the algorithm, one intended to work with BidBuddy and
one with users sending in bids. In the iterative parameter learning phase, the BidBuddy
107
Using Understanding to Guide Financial Actions: The Case of Penny Auctions Chapter 4
version is evaluated while using BidBuddy in the simulated test runs; the user-version is
evaluated with users sending in bids.
Random Baseline. Finally, to serve as the baseline, we randomly place bids with
a fixed probability. Just as the others, there are two versions of this strategy, using and
not-using BidBuddy for bidding.
4.5.3 Evaluating Strategies
To evaluate the performance of different strategies, we use each strategy to participate
and make bidding decisions in 5,000 simulated auctions. We compute two metrics. One
is the percent of auctions won using the strategy. When the money spent in the auction
exceeds the Buy-It-Now price, we consider the auction lost (recall that our data shows
the Buy-It-Now price is generally higher than the online retail price). The other is net
return per auction, where we compare the retail price of the item won and the total cost
paid (total cost of bids and final auction price). We assume that when a user’s cost of
bids exceeds the price gap between the Buy-It-Now price and retail price, she exits the
auction by buying the item for the Buy-It-Now price, and gets her bids refunded.
In our tests using the prediction-based strategy, we tuned the bidding threshold be-
tween 0 and 1 to compute its optimal performance. Similarly for the learning-based
strategy, we trained different strategies while setting the optimization goal as a weighted
combination of number of auctions won and net return.
We plot the performance of all strategies shown in Figure 4.9. First, we note that
learning-based strategies produces generally very good results that are optimized for one
of two outcomes. If we optimize for net return, we win less auctions while getting a high
net return. But if we focus on winning each auction, the optimal learned strategy is very
close to the baseline case where we bid persistently. If we set the optimization goal to a
108

Using Understanding to Guide Financial Actions: The Case of Penny Auctions Chapter 4
combination of both goals, the learned strategies naturally converge to one of the two.
This indicates that there are two convergent behaviors in winning penny auctions with
iterative learning, either to bid persistently on all items, or being high selective, winning
less auctions but getting a higher net return. Attempts to strike a balance between the
two are likely to yield worse results.
As for the prediction-based strategy, it performs worse than learning-based strategy
regardless of whether BidBuddy was used. It likely is too heavily dependent on prediction
accuracy, since a single failure to predict the auction end will lose the auction. Given the
reliance on catching near-auction-end events, it is unsurprising that using BidBuddy to
reduce bid failures has a significant impact in net gain per user.
Surprisingly, the baseline random case, where BidBuddy is always on, performs rea-
sonably well, and is actually able to win $4.7 per auction. This suggests that even without
sophisticated strategies, a persistent bidder can perform quite well in penny auctions. In
fact, when looking at the percent of auctions won, the Random Baseline grows super lin-
early with bidding probability, consistent with previous work which finds the persistent
bidders, a.k.a. power bidders, to be the best performers in penny auctions [13]. In the
limit, this suggests an extremely aggressive bidding approach will produce good results:
Theorem 1 For a resourceful bidder whose budget is no less than the Buy-It-Now price
of the auction item, the optimal strategy to acquire the item is to bid persistently. The
bidder’s finally auction cost is upper bounded by the Buy-It-Now price.
Proof: If the resourceful bidder is the only bidder who bids persistently, then it will
win the auction in the end and receive the item because it is the last bidder who submits
bids. If there are more than one resourceful bidder who bid persistently, then they will
form a bidding war and drive up the price to reach the value of the Buy-It-Now price.
When this happens, these bidders will all pay the Buy-It-Now price to stop the auction
109
Using Understanding to Guide Financial Actions: The Case of Penny Auctions Chapter 4
(since each penny auction can have multiple winners, and each winner receives a copy of
the auction item).
Next, we are interested in what are the best strategies chosen by the learning ap-
proach. We examine the coefficients used by the best performing strategy with the
highest net return. All features are z-score normalized before training. We find the most
important feature is the Buy-It-Now price of the item, with a coefficient of 18.9. This
indicates that based on our trace data, the best way to maximize gains is to engage in
auctions of big-ticket items. The second most important feature is the percent of bids
placed by the last bidder, with a negative coefficient of -4.91 on bidding decisions. This
shows that we can maximize success by avoiding auctions with a single dominating bid-
der. That scenario is likely to end in a costly bidding war. Beyond these two dominating
factors, no other feature has a consistent strong impact on bidding success.
In summary, we observe two different bidding strategies depending on the specific
goal. To optimize the number of auctions own (or to maximize the chance of acquiring
a given item), the best strategy is simply to bid persistently while using BidBuddy. To
achieve better aggregate gains, it is best to pursue expensive items while avoiding power
bidders.
4.5.4 Competitive Adversarial Bidding
Our earlier discussion assumed that the adversarial bidding strategy was utilized by a
single user at an auction. But what happens when adoption of more advantageous strate-
gies gains traction, and multiple bidders utilize similar strategies at the same auction?
Our observation is that penny auction sites are the ultimate winners when adversarial
bidding strategies collide.
We experiment with this scenario, by simulating competing bidders using the same
110
Using Understanding to Guide Financial Actions: The Case of Penny Auctions Chapter 4
strategy in the same 5000 auctions. We begin with the strategy that maximizes win
probability per auction, the persistent bidding strategy using BidBuddy. Having two
bidders both adopting the strategy in the same auction triggers a bidding war that
results in both bidders placing bids nonstop, until the cost in bids exceeds the item’s
Buy-It-Now price. It is then preferable to simply stop bidding and buy the auctioned
item from DealDash. Our simulation shows that net gain per auction drops from $10.9 to
$-227.5 by having multiple adversarial bidders in the same auctions, which is essentially
the result of using Buy-It-Now for every single auction the bidder has joined.
We then test the strategy with the highest net return, which is our CE-learned strat-
egy that did not train together with BidBuddy. As before, performance still plummets
when multiple bidders adopting the strategy are in the same auctions. As seen in in
Table 4.6, the bidders are losing an average of eighty dollars by participating in each
auction, and the situation gets even worse as more such bidders enter into the auction.
Essentially, DealDash has created a prisoner’s dilemma [142] type of situation. For
any single user, persistently placing bids using BidBuddy is an easy way to win auctions
and gain money. However, when other users in the same auction decide to use the same
strategy, they will then drive up the final price of the auction and all end up losing money
to DealDash.
4.6 Limitations and Ongoing Work
In this chapter, we described our efforts to understand who are and how to profit
from penny auctions. In addition to updating profitability studies, our analysis of profit
distributions empirically confirm that penny auctions rely on a steady stream of new
users to generate revenue, possibly explaining the downfall of many penny auctions in
the past. Next, we develop a detailed and highly accurate auction simulation platform,
111
Using Understanding to Guide Financial Actions: The Case of Penny Auctions Chapter 4
and use it to develop multiple adversarial bidding strategies for different assumptions.
Prisoner’s Dilemma. Intentionally or not, DealDash has created a Prisoner’s
Dilemma-like situation, where, for any single user, bidding more persistently yields higher
average return, especially in big ticket items. By providing BidBuddy as a functionality,
DealDash reduces the effort needed to be a persistent bidder, while eliminating of acci-
dentally failed bids, making it very easy for users to bid persistently. Meanwhile, per-user
returns plummet when multiple users adopt the strategy, and profits are maximized for
the penny auction provider.
Limitations. Our work is fundamentally limited by the lack of controlled experiments
for adversarial bidding strategies in real settings. We note that even if ethical concerns
were fully addressed, it is infeasible to perform a truly controlled and reproducible A/B
test in the wild. Instead, we plan to validate bidding strategies by conducting user
studies in a controlled setting, in the form of auction games. Designed correctly, these
studies can replicate the biases that trigger actions in the wild, and offer an opportunity
to understand the bidder’s decision process through detailed interviews.
Finally, our analyses confirm that penny auction exhibit similar properties as some
regulated industries, e.g. the gambling industry. We plan to share our data and soft-
ware with the research community, and with contacts at federal agencies for potential
oversight.
112
Chapter 5
Conclusions and Discussions
In this dissertation, we have illustrated how the increasing digitalization of financial activ-
ities has empowered us to study financial behavior at a large scale, while still maintaining
the ability to study the phenomenon in depth. Our methodology consists of three main
themes. First, in Chapter 2 we ground our analysis on vast quantities of real-worlds
financial activity traces to ensure a board coverage and to surface previous unknown
patterns. Second, in Chapter 3 we take advantage of established theories in social science
and behavioral economics to explore the hidden drivers behinds user behavior. Finally,
in Chapter 4 we demonstrated how knowledge of users’ behavior can be translated into
future actions. Given the ultimate trend of moving financial life online, we believe that
our works are only the start of a thriving field of research and that our methodology can
be generalized to an even wider range of applications.
In this chapter, we summarize the key findings of this dissertation, discuss what we
have learned during the research process and explore the future directions surrounding
the study of financial behavior.
113
Conclusions and Discussions Chapter 5
5.1 Summary
First, we seek to obtain an unbiased picture of users’ financial behavior through
measurement studies. Thanks to the growing trends of digitalization and even socializa-
tion of financial activities, we have been able to analyze individual financial behavior at
unprecedented scale. Using records of all public transactions on Venmo, we show that
Venmo’s transaction graph provide a close representation of strong real-world friendship
as indicated through the high clustering coefficient and reciprocity in comparison to in-
teractions on traditional online social networks. Venmo’s social payment graph can serve
as a stronger and perhaps more meaningful dataset of social relationships. In addition,
we demonstrate key differences between social payments and business payments, which
shed lights on how one may identify different target users within the network based on
their behavior.
Similarly, we find that most penny auction bidders fall into a limited number of
behavioral categories based on how patient or aggressive they are and how much money
they are willing to use to win auctions. We show that the large majority of users lose
money, while a small portion of users are winning disproportionately whose behaviors
exhibit high distinct characteristics.
Second, as the existence of naturally grouped behavior patterns suggests that users’
financial behaviors are driven by a limited set of common motivations, we then seek to
understand the common drivers behind these behaviors. We achieve this by borrowing
theories from social science and behavioral economics. Using a mixed-method study with
surveys and interviews, we find the presence of degree effect among Venmo users’ and
cluster effect among users of WeChat Pay. In addition, we identify a U-shape in the
relationship between strength of social relationship and ease of payments. Transactions
between normal friends turn out to be more awkward then those with close friends or
114
Conclusions and Discussions Chapter 5
casual acquaintances. Using digital wallet during payments, however, may actually help
alleviate some of such awkwardness. Consistent with our expectation, we find that users
are reluctant to share their financial activities dur to privacy and security concerns, and
the utility value of a mobile wallet is much more important than its social value.
Building on prior theories around auction behavior [120, 121, 122, 123, 56, 124, 125,
126, 127], we examine their applicability in the penny auctions setting, finding confirma-
tion of sunk cost fallacy and endowment effect, while identifying evidence against herding
in penny auctions. Furthermore, when examining the auction sites, we identified (poten-
tial) designs that take advantage of the irrationality in bidder behavior to the advantage
of the auction sites.
Finally, by applying data-driven learning models of penny auction bidding behavior,
we are able to build an accurate simulator for the bidding environment, which can then
be used to develop and test adversarial strategies that can consistently win auctions and
maximize user gain. By exploring a variety of adversarial strategies, we find iterative
learning to produce the best results, with the learned strategy behaving similarly to
power bidders identified in Chapter 2.2.4. Interestingly, the learned strategy seems to
be taking advantage of irrationalities discovered in Chapter 3.2.3 without us telling it
to. We also show that when multiple users use such strategy to compete in auctions, a
prisoner’s dilemma would appear and end up benefiting the penny auction sites. This
again illustrates the hidden complexities of financial systems.
5.2 Lessons
During our study of financial behavior, we have accumulated many lessons. Here, we
select and describe a few of them.
115
Conclusions and Discussions Chapter 5
Users behave differently, in similar ways. One key conclusion keeps surfacing
throughout our analysis is the inherent differences that are present in financial behavior.
Highly distinct usage patterns are observed through clustering, graph analysis as well as
community detection, which highlights again and again that not all financial behaviors
are the same, and treating them as such will result in misconceptions about the behavioral
patterns.
One prominent example is the differences in the graph structure of social payments
and non-social payments as discussed in Chapter 2.1.4. When the Venmo transactions
graph is treated as a whole, its graph properties fail to reflect the true structure of the
payments, concealing the extremely high assortativity of the social payments and the
low clustering coefficient of the non-social payments. Only when we learn to separate
payments of different nature, do we realize the true uniqueness of financial behaviors.
On the other hand, users tend to fall into fixed set behavioral groups, with users in the
same group behaving very similarly to one another. This phenomenon is observed through
clustering on behavioral features both in financial behavior on Venmo [12], DealDash [13]
and on social network sites like Whisper and RenRen [44]. Before aggregating user
behavior during data analysis, it is always useful to realize the fact that users are driven
by a diverse set of motivations, and by distinguishing different users’ intentions, the
aggregated behavioral patterns would provide deeper insight into users’ actual behavior.
Research problems are in daily life, waiting for those who can catch it. Mea-
surement studies are unique in the sense they are almost always about large-scale activ-
ities and thus the subject of the study often comes to you naturally without having to
look for it. For example, Venmo came to our attention because it has been used by our
friends to split meal expenses. I have now adopted the habit of asking myself “can this
be turned into a research project?” every time something new catches my eye.
116
Conclusions and Discussions Chapter 5
However, one thing to keep in mind is that simply conceiving a project idea is not
enough. The important thing is to take steps to execute the idea solidly. One should not
hesitate to take on new projects simply because there is an existing project that his/she
is working on. The nature of large-scale measurement projects entails that there will be
periods where one has to wait for the analysis run to finish. Such periods can be utilized
when there are parallel projects going on. Another reason why not to wait is that, if
a measurement study ides comes to you naturally, then it is very likely also coming to
someone else, and it is always easier and more fun when you are the first.
Dealing with challenges in obtaining data. To model user behavior, one would
need large quantities of user data. Over the years, we have used different methods
to collect data, ranging from web crawling, reverse engineering, collaboration with the
industry, to user surveys and interviews. For web crawling, there has always been an
underlying struggle with the service providers who are unwelcoming if not hostile to the
probing eyes of the researchers. Escalating degree of crawling and anti-crawling has went
on in the community, going from rate limiting, captcha, to returning fake data.
Given the sensitive nature of financial activities, one would expect the future to be
less than promising for the crawling-based approaches. Nonetheless, there remains two
promising approaches in the future. First, enhanced collaboration with the industry. In
this age of accelerating growth, research topics are popping up constantly along with
plethora of data. Both the research community and the industry would benefit greatly
from a collaboration. Second, go narrow and go deep. Traditional measurement papers
are often looking at a large and general population. This provides the benefit of having
a complete picture of a large system. However, the strive for completeness often hides
individual differences which sometimes carry profound insights into user behavior. By
limiting the scale of the study, a wider set of tools are applicable and even anti-crawling
117
Conclusions and Discussions Chapter 5
mechanisms become less of a problem. Keep in mind that the narrow-and-deep approach
is by no means easier than the comprehensive approach, as it requires the researchers to
be able to intelligently identify the right angle.
5.3 Future Directions
Moving forward, I plan to continue research into financial behavior, looking at dra-
matic changes induced by digitalized payments and understand their implications on user
behavior and on research methodologies.
Modeling users of crypto currencies. Over the recent decade, crypto currencies
have emerged as an alternative to fiat currency. Users rush into the realm with varying
intentions, there are black market dwellers seeking to purchase illegal goods [143], hackers
extorting their victims while hiding their identity [144], investors busy building castles
in the air, as well as enthusiasts excited to experience new technology.
I plan to investigate into this diverse set of population, examine their perceptions
and usage patterns of different crypto currencies, and understand the implications to
the community, while dealing with the challenge of the potential bias introduced in the
methodology.
Monetization models on the Internet. The Internet is not the first industry
to adopt the advertisement-base revenue model, however, it is definitely the one that
took it to a whole new level. Nowadays, most of the major players on the Internet
make their earnings through ads. From Internet giants like Facebook and Google, to
individual contributors on YouTube, advertisement has been the most widely adopted
way of monetization. However, the ad-based model is facing challenges in three directions.
Firstly, there have long been complaints that the ad-based revenue model is creating
an economy focused on grabbing people attention instead of provide long-lasting benefits
118

Conclusions and Discussions Chapter 5
to the audience. Rather than spending time to improve the quality of content, news sites
like to use sensational headlines or even click baits to trigger users’ interests.
Secondly, with the advancements in digital payments, users are less and less resistant
to the idea of spending money on intangible goods, which enables the introduction of
new revenue models to challenge the ad-based model. Netflix’s subscription-based model
has generated $15.79 billion in revenue, proving how subscription-based services can
also make money in the digital age. In addition, donation-based model is also a viable
alternative used by a number of streaming services [145].
Finally, digital payments carry the promise a completely new pricing model as it can
support micro payments with arbitrarily small monetary value. Basic Attention Token
(BAT) [146] is an example that take advantage of this fact and promise to pay websites
based on the exact time spent. Although BAT is still built on the advertising model, one
can easily see how such capability may be transformed to enables other revenue models.
The future will be a battle ground between a diverse set of revenue models and it is
highly interesting to see what effects different models have on the content, and how to
design completely new revenue model given the new capability of digital payments.
119
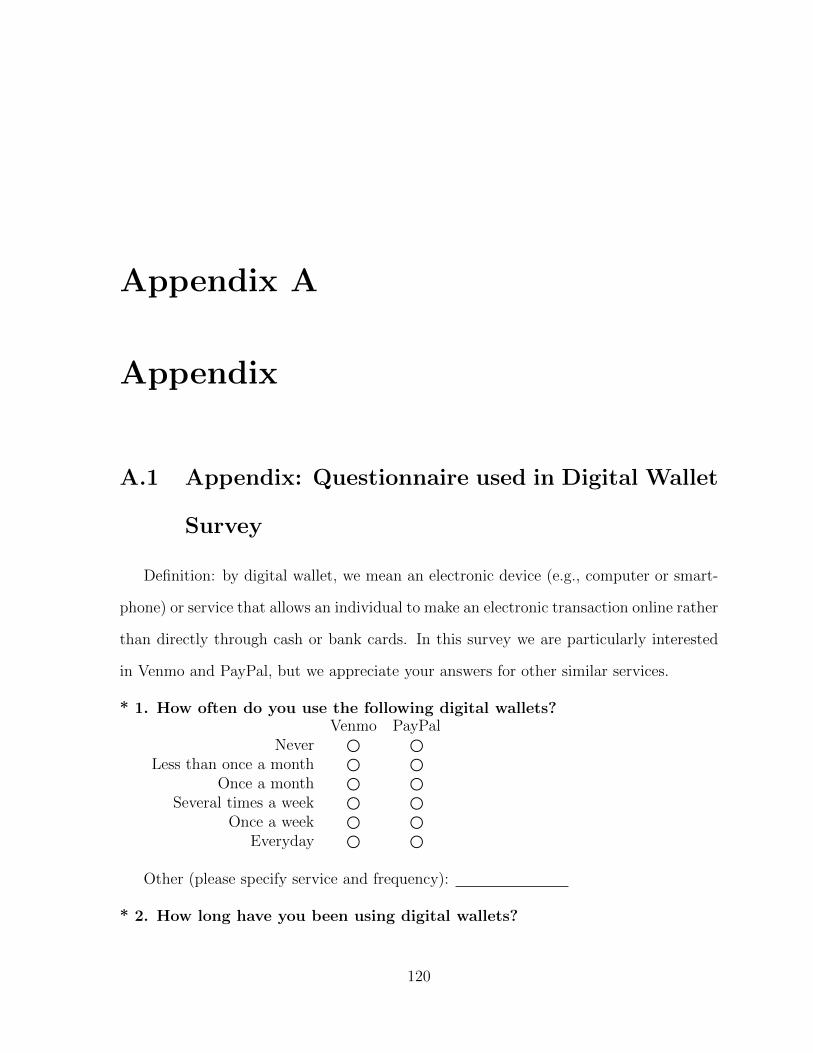
Appendix A
Appendix
A.1 Appendix: Questionnaire used in Digital Wallet
Survey
Definition: by digital wallet, we mean an electronic device (e.g., computer or smart-
phone) or service that allows an individual to make an electronic transaction online rather
than directly through cash or bank cards. In this survey we are particularly interested
in Venmo and PayPal, but we appreciate your answers for other similar services.
* 1. How often do you use the following digital wallets?Venmo PayPal
Never ◯ ◯Less than once a month ◯ ◯
Once a month ◯ ◯Several times a week ◯ ◯
Once a week ◯ ◯Everyday ◯ ◯
Other (please specify service and frequency):
* 2. How long have you been using digital wallets?
120

Appendix Chapter A
Venmo PayPalNever ◯ ◯
< 3 months ◯ ◯3 - 6 months ◯ ◯
6 - 12 months ◯ ◯1 - 2 years ◯ ◯3 - 4 years ◯ ◯> 4 years ◯ ◯
Other (please specify service and time length):
* 3. What have you used digital wallets for (multiple choices)?Venmo PayPal
Not applicable ◻ ◻Online shopping ◻ ◻Offline shopping ◻ ◻
Paying bills / rent ◻ ◻Paying for services (e.g., taxi/uber, restaurants) ◻ ◻
Send money to/from friends ◻ ◻Send money to/from strangers ◻ ◻
Other (please specify below) ◻ ◻
Other (please specify):
* 4. What motivated you to start using digital wallets (your first transaction
or main reason for linking it to your bank account or credit card, multiple
choice)?Venmo PayPal
Not applicable ◻ ◻Asked to by friends/relatives ◻ ◻
Asked to by a vendor/service provider ◻ ◻No/low service fees ◻ ◻
Ease of use ◻ ◻Wide coverage ◻ ◻
To replace carrying cash ◻ ◻Unique functionality ◻ ◻
Other (please specify below) ◻ ◻
Other (please specify):
* 5. What are the major reasons why you continue to use digital wallets
121
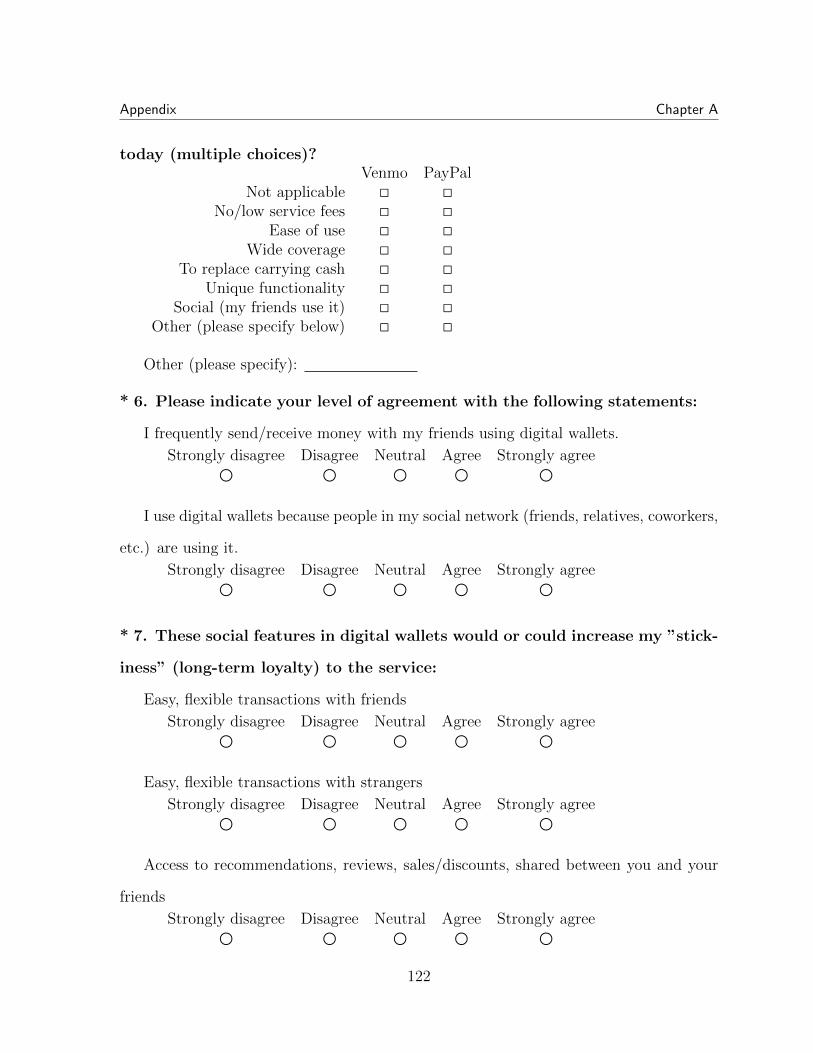
Appendix Chapter A
today (multiple choices)?Venmo PayPal
Not applicable ◻ ◻No/low service fees ◻ ◻
Ease of use ◻ ◻Wide coverage ◻ ◻
To replace carrying cash ◻ ◻Unique functionality ◻ ◻
Social (my friends use it) ◻ ◻Other (please specify below) ◻ ◻
Other (please specify):
* 6. Please indicate your level of agreement with the following statements:
I frequently send/receive money with my friends using digital wallets.
Strongly disagree Disagree Neutral Agree Strongly agree
◯ ◯ ◯ ◯ ◯
I use digital wallets because people in my social network (friends, relatives, coworkers,
etc.) are using it.
Strongly disagree Disagree Neutral Agree Strongly agree
◯ ◯ ◯ ◯ ◯
* 7. These social features in digital wallets would or could increase my ”stick-
iness” (long-term loyalty) to the service:
Easy, flexible transactions with friends
Strongly disagree Disagree Neutral Agree Strongly agree
◯ ◯ ◯ ◯ ◯
Easy, flexible transactions with strangers
Strongly disagree Disagree Neutral Agree Strongly agree
◯ ◯ ◯ ◯ ◯
Access to recommendations, reviews, sales/discounts, shared between you and your
friends
Strongly disagree Disagree Neutral Agree Strongly agree
◯ ◯ ◯ ◯ ◯
122

Appendix Chapter A
Access to recommendations, reviews, sales/discounts, shared between you and your
followers
Strongly disagree Disagree Neutral Agree Strongly agree
◯ ◯ ◯ ◯ ◯
Able to follow others who have similar shopping interests
Strongly disagree Disagree Neutral Agree Strongly agree
◯ ◯ ◯ ◯ ◯
Able to share my shopping interests with others
Strongly disagree Disagree Neutral Agree Strongly agree
◯ ◯ ◯ ◯ ◯
Other (please specify):
* 8. If a digital wallet shared my transaction records with my friends by
default, I would keep that setting.
Strongly disagree Disagree Neutral Agree Strongly agree
◯ ◯ ◯ ◯ ◯
* 9. If a digital wallet allowed me to share (some of) my transaction records
with my friends, I would make use of that feature.
Strongly disagree Disagree Neutral Agree Strongly agree
◯ ◯ ◯ ◯ ◯
* 10. Specify the types of transactions you are willing to share with your
friends (multiple choices).
◻ Purchases
◻ Money transfers
◻ Billing / Charging others
◻ Gifts
◻ Donations
◻ Other (please specify)
123

Appendix Chapter A
* 11. Specify the types of information you are willing to share with your
friends (multiple choices).
◻ Purpose (e.g., food, entertainment, etc.)
◻ Recipient
◻ Amount
◻ Time
◻ Other (please specify)
* 12. If a digital wallet shared my transaction records with the public by
default, I would keep the setting.
Strongly disagree Disagree Neutral Agree Strongly agree
◯ ◯ ◯ ◯ ◯
* 13. If a digital wallet allowed me to share my transactions with the public,
I would use it.
Strongly disagree Disagree Neutral Agree Strongly agree
◯ ◯ ◯ ◯ ◯
* 14. Specify the types of transactions you are willing to share with public
(multiple choices)
◻ Purchases
◻ Money transfers
◻ Billing / Charging others
◻ Gifts
◻ Donations
◻ Other (please specify)
124

Appendix Chapter A
* 15. Specify the type of information you are willing to share publicly (mul-
tiple choices)
◻ Purpose of Transaction (e.g., food, entertainment, etc.)
◻ Recipient
◻ Amount of Transaction
◻ Time of Transaction
◻ Other (please specify)
* 16. I would be interested to hear about other peoples transactions shared
on digital wallet platforms.
Strongly disagree Disagree Neutral Agree Strongly agree
◯ ◯ ◯ ◯ ◯
* 17. Specify the types of transactions you are interested in hearing about
(multiple choices):
◻ Purchases
◻ Money transfers
◻ Billing / Charging others
◻ Gifts
◻ Donations
◻ Other (please specify)
* 18. Specify the types of information you are interested in hearing about
(multiple choices):
◻ Purpose of transaction (e.g., food, entertainment, etc.)
◻ Recipient
125

Appendix Chapter A
◻ Amount of transaction
◻ Time of transaction
◻ Other (please specify)
* 19. I think cash will be fully replaced by digital wallets by 2026
Strongly disagree Disagree Neutral Agree Strongly agree
◯ ◯ ◯ ◯ ◯
* 20. What are the most attractive (and hard to replace) properties of cash
that make you reluctant to go completely cashless?
◻ Cash is more secure
◻ Cash transactions are more private
◻ Cash is universally accepted
◻ Cash does not require mobile network connection
◻ Other (please specify)
* 21. Why do you think digital wallets are better than cash?
◻ Fast transactions
◻ Transactions can be any amount
◻ Remote transactions
◻ No need to carry cash
◻ Social (sharing with friends)
◻ Other (please specify)
* 22. I think use of digital wallets will exceed that of credit cards and debit
cards by 2026
126
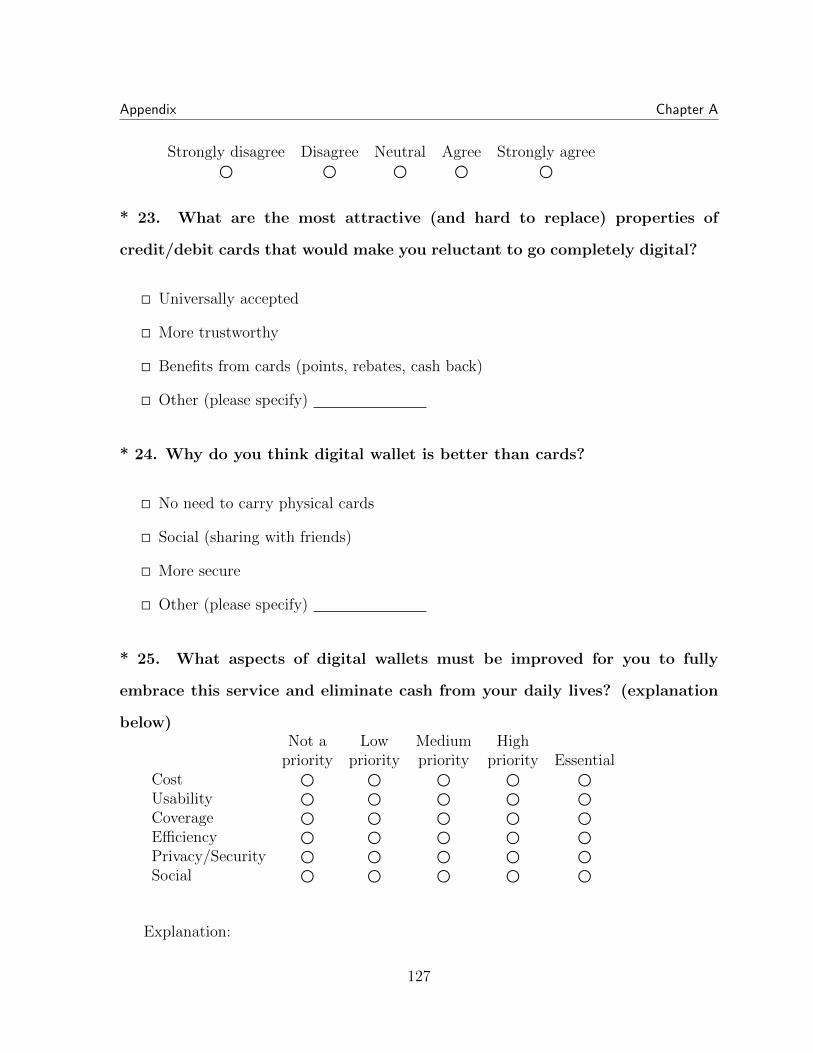
Appendix Chapter A
Strongly disagree Disagree Neutral Agree Strongly agree
◯ ◯ ◯ ◯ ◯
* 23. What are the most attractive (and hard to replace) properties of
credit/debit cards that would make you reluctant to go completely digital?
◻ Universally accepted
◻ More trustworthy
◻ Benefits from cards (points, rebates, cash back)
◻ Other (please specify)
* 24. Why do you think digital wallet is better than cards?
◻ No need to carry physical cards
◻ Social (sharing with friends)
◻ More secure
◻ Other (please specify)
* 25. What aspects of digital wallets must be improved for you to fully
embrace this service and eliminate cash from your daily lives? (explanation
below)Not a Low Medium High
priority priority priority priority EssentialCost ◯ ◯ ◯ ◯ ◯Usability ◯ ◯ ◯ ◯ ◯Coverage ◯ ◯ ◯ ◯ ◯Efficiency ◯ ◯ ◯ ◯ ◯Privacy/Security ◯ ◯ ◯ ◯ ◯Social ◯ ◯ ◯ ◯ ◯
Explanation:
127
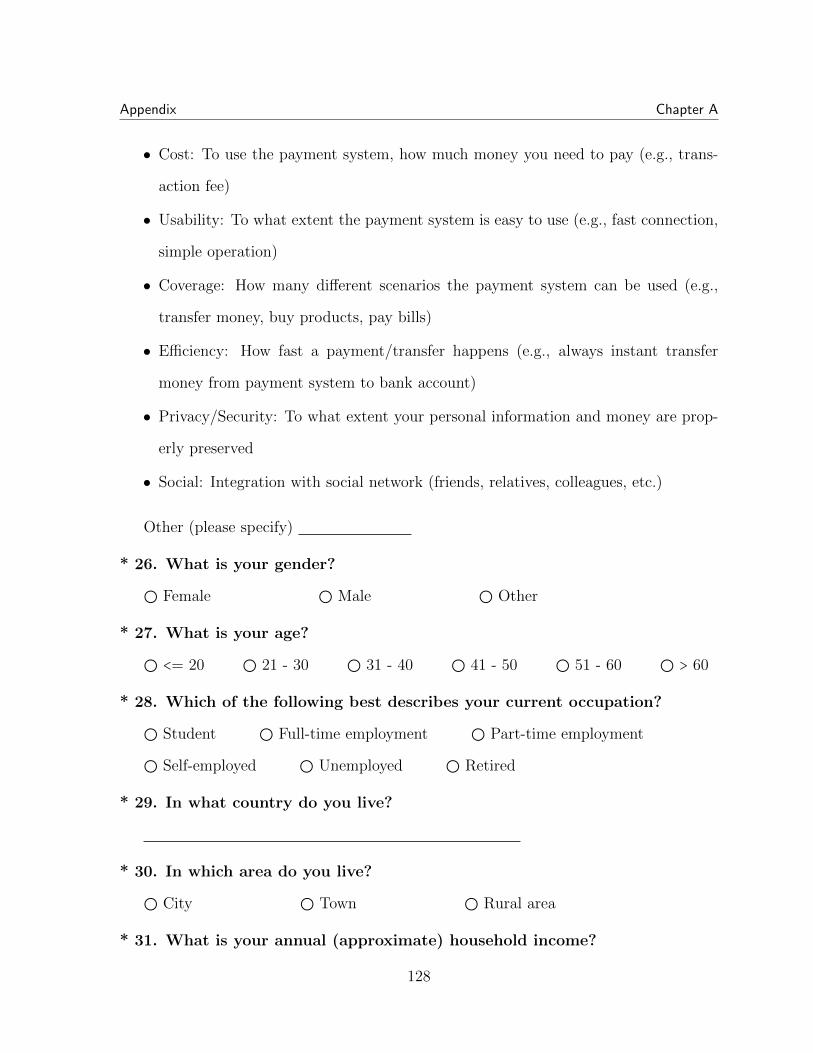
Appendix Chapter A
• Cost: To use the payment system, how much money you need to pay (e.g., trans-
action fee)
• Usability: To what extent the payment system is easy to use (e.g., fast connection,
simple operation)
• Coverage: How many different scenarios the payment system can be used (e.g.,
transfer money, buy products, pay bills)
• Efficiency: How fast a payment/transfer happens (e.g., always instant transfer
money from payment system to bank account)
• Privacy/Security: To what extent your personal information and money are prop-
erly preserved
• Social: Integration with social network (friends, relatives, colleagues, etc.)
Other (please specify)
* 26. What is your gender?
◯ Female ◯ Male ◯ Other
* 27. What is your age?
◯ <= 20 ◯ 21 - 30 ◯ 31 - 40 ◯ 41 - 50 ◯ 51 - 60 ◯ > 60
* 28. Which of the following best describes your current occupation?
◯ Student ◯ Full-time employment ◯ Part-time employment
◯ Self-employed ◯ Unemployed ◯ Retired
* 29. In what country do you live?
* 30. In which area do you live?
◯ City ◯ Town ◯ Rural area
* 31. What is your annual (approximate) household income?
128
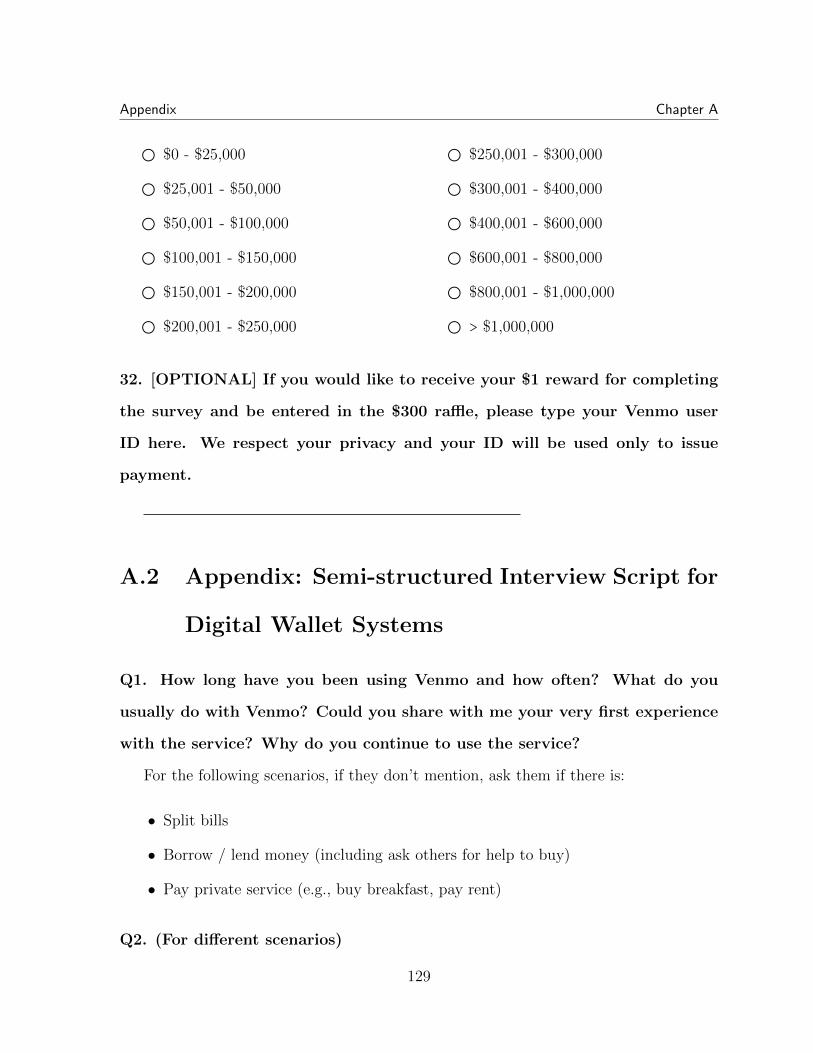
Appendix Chapter A
◯ $0 - $25,000
◯ $25,001 - $50,000
◯ $50,001 - $100,000
◯ $100,001 - $150,000
◯ $150,001 - $200,000
◯ $200,001 - $250,000
◯ $250,001 - $300,000
◯ $300,001 - $400,000
◯ $400,001 - $600,000
◯ $600,001 - $800,000
◯ $800,001 - $1,000,000
◯ > $1,000,000
32. [OPTIONAL] If you would like to receive your $1 reward for completing
the survey and be entered in the $300 raffle, please type your Venmo user
ID here. We respect your privacy and your ID will be used only to issue
payment.
A.2 Appendix: Semi-structured Interview Script for
Digital Wallet Systems
Q1. How long have you been using Venmo and how often? What do you
usually do with Venmo? Could you share with me your very first experience
with the service? Why do you continue to use the service?
For the following scenarios, if they don’t mention, ask them if there is:
• Split bills
• Borrow / lend money (including ask others for help to buy)
• Pay private service (e.g., buy breakfast, pay rent)
Q2. (For different scenarios)
129
Appendix Chapter A
• Can you give us more detail about the scenario? (ask more detail)
• Who is the other person?
• How do both of you agree to use Venmo as the payment method?
• How do you become Venmo friends?
• How frequent do similar payments happen?
(Some transactions are with friends, while some are with strangers. We classify
different transactions and tell the interviewee which is which)
Lets forget about Venmo, we will ask your opinion about general financial
activities with different kinds of people.
Some definitions:
• Close friends are people you have known a lot time with strong familiarity, like
family members, significant others, roommates, best friends
• Acquaintances are people you are familiar with, but perhaps only have weak rela-
tionships with little attachment, like your bank teller, your postman, your barber,
or your landlord.
• Normal friends cover a broad range of friends, who you might see semi-regularly
at work/school, after work, people you might enjoy hanging out with but might
not share personal stories with.
Q3. Are you comfortable bringing up the topic of money with your close
friends? your acquaintances? your normal friends?
• What are the payment scenarios with close friends/acquaintances/normal friends?
(Other than the scenarios we talked about)
• (for each) How often?
• (scenario dependent) Is a similar scenario apply to other types of people?
130

Appendix Chapter A
Q4. Do you think you would prefer different ways to pay or receive money
depending on your relationship with a friend, e.g. cash, check, apps by bank
(Chase), payment apps (Venmo), social apps (Facebook)?
• If yes. What are the ways for each of them? Why the difference?
• If no. What is the way? Why do you choose this one?
Q5. Do you have any security concern about Venmo when you bind your
debit/credit card to Venmo? If so, how do you overcome the concern?
Now lets look at Venmos sharing function.
Q6. What do you think about the sharing design? Have you ever shared your
payment to your friends?
• If yes. What did you share? What do other people think of the shared payment?
Do you have security concern when sharing payments? What about sharing to the
public? Have you used emoji in shared message?
• If no. Why?
Q7. What do you know about the default sharing setting in Venmo? When
did you notice? What do you think of this default setting?
Q8. Have you ever looked at the news-feed of your friends?
• If no. Why? Is it because your friends are not using Venmo? How do you know if
your friends are using Venmo?
• If yes.
• What about public feeds? What are you interested in? Any stories?
• Do you think thats a lot of your friends or just a few?
• What do you think when you look at these payments?
131

Q9. Suppose one day you find that none of your friends are sharing their
records, what will you do?
132

Bibliography
[1] C. Wilson, B. Boe, A. Sala, K. P. Puttaswamy, and B. Y. Zhao, User interactionsin social networks and their implications, in Proc. of EuroSys, 2009.
[2] T. Xu, Y. Chen, L. Jiao, B. Y. Zhao, P. Hui, and X. Fu, Scaling microbloggingservices with divergent traffic demands, in Proc. of Middleware, 2011.
[3] X. Zhao, A. Sala, C. Wilson, X. Wang, S. Gaito, H. Zheng, and B. Y. Zhao,Multi-scale dynamics in a massive online social network, in Proc. of IMC, 2012.
[4] S. Tang, Z. Wu, X. Zhang, G. Wang, X. Ma, H. Zheng, and B. Zhao, Towardsunderstanding the adoption and social experience of digital wallet systems, inProceedings of the 52nd Hawaii International Conference on System Sciences(HICSS), 2019.
[5] “Send money to friends in messenger.” https:
//newsroom.fb.com/news/2015/03/send-money-to-friends-in-messenger/,March, 2015.
[6] “Introducing snapcash.”https://www.snap.com/en-US/news/post/introducing-snapcash/, November,2014.
[7] H. Wei, “Social networks ’not a way out of trouble’ for alipay.” http:
//www.chinadailyasia.com/business/2017-03/30/content_15593625.html,March, 2017.
[8] X. Zhang, S. Tang, S. Shan, H. Zheng, and B. Y. Zhao, “Winners use bots:Behavior, biases and adversarial strategies in penny auctions.” Unpublishedmanuscript, 2019.
[9] F. J. Massey Jr, The kolmogorov-smirnov test for goodness of fit, Journal of theAmerican statistical Association 46 (1951), no. 253 68–78.
[10] K. Pearson, X. on the criterion that a given system of deviations from theprobable in the case of a correlated system of variables is such that it can bereasonably supposed to have arisen from random sampling, The London,
133
Edinburgh, and Dublin Philosophical Magazine and Journal of Science 50 (1900),no. 302 157–175.
[11] S. Hochreiter and J. Schmidhuber, Long short-term memory, Neural computation9 (1997), no. 8 1735–1780.
[12] X. Zhang, S. Tang, Y. Zhao, G. Wang, H. Zheng, and B. Y. Zhao, Cold harde-cash: Friends and vendors in the venmo digital payments system, in Proceedingsof International AAAI Conference on Web and Social Media (ICWSM 2017),2017.
[13] X. Zhang, S. Shan, S. Tang, H. Zheng, and B. Y. Zhao, Penny auctions arepredictable: Predicting and profiling user behavior on dealdash, in Proc. of ACMHyperText, 2018. Short paper.
[14] R. Sidel and T. Demos, “The battle heats up in person-to-person payments.”Wall Street Journal, July, 2016.
[15] J. D. Rey, “Americas biggest banks have announced their venmo competitor,zelle.” Recode, October, 2016.
[16] S. Perez, “Square cashs fast payments app can now hold a balance.” TechCrunch,February, 2016.
[17] J. Bird, “How venmo won in one of the most crowded spaces in tech.”TechCrunch, November, 2015.
[18] T. Suri et. al., Documenting the birth of a financial economy, PNAS 109 (2012),no. 26 10257–10262.
[19] J. Ferreira et. al., Spending time with money: From shared values to socialconnectivity, in Proc. of CSCW, 2015.
[20] M. M. Hasan and M. R. Islam, Assessing service quality of mobile money transferin bangladesh: A case study on bkash, International Journal of InnovativeResearch and Development 2 (2013), no. 7.
[21] A. Ndiwalana et. al., Mobile money use in uganda: A preliminary study, M4D121 (2010).
[22] F. D. Davis et. al., User acceptance of computer technology: A comparison of twotheoretical models, Management Science 35 (1989), no. 8 982–1003.
[23] A. Park and K. J. Lee, Critical success factor of noble payment system: Multiplecase studies, Journal of Intelligence and Information Systems 20 (2014), no. 459–87.
134
[24] PayPal, Paypal annual report 2015, January, 2016.
[25] R. Sidel and D. Wakabayashi, “Apple, banks in talks on mobile person-to-personpayment service.” Wall Street Journal, November, 2015.
[26] C. Wilson, A. Sala, K. P. N. Puttaswamy, and B. Y. Zhao, Beyond social graphs:User interactions in online social networks and their implications, ACMTransactions on the Web 6 (Nov., 2012).
[27] H. Kwak, C. Lee, H. Park, and S. B. Moon, What is twitter, a social network or anews media?, in Proc. of WWW, 2010.
[28] E. Gilbert et. al., I need to try this?: a statistical overview of pinterest, in Proc. ofCHI, 2013.
[29] Y. Chang et. al., What is tumblr: A statistical overview and comparison, ACMSIGKDD Explorations Newsletter 16 (2014), no. 1 21–29.
[30] D. Crandall et. al., Feedback effects between similarity and social influence inonline communities, in Proc. of KDD, 2008.
[31] F. Schneider et. al., Understanding online social network usage from a networkperspective, in Proc. of IMC, 2009.
[32] J. Jiang, C. Wilson, X. Wang, P. Huang, W. Sha, Y. Dai, and B. Y. Zhao,Understanding latent interactions in online social networks, in Proc. of IMC, 2010.
[33] M. Metzger, C. Wilson, and B. Y. Zhao, Passive social interaction in socialnetworking sites, in Proc. of International Communication AssociationConference (ICA), May, 2017.
[34] M. Ober et. al., Structure and anonymity of the bitcoin transaction graph, Futureinternet 5 (2013), no. 2 237–250.
[35] S. Meiklejohn et. al., A fistful of bitcoins: characterizing payments among menwith no names, in Proc. of IMC, 2013.
[36] D. Ron and A. Shamir, Quantitative analysis of the full bitcoin transaction graph,in Financial Cryptography, pp. 6–24, 2013.
[37] G. Swamynathan, C. Wilson, B. Boe, K. C. Almeroth, and B. Y. Zhao, Do socialnetworks improve e-commerce: a study on social marketplaces, in Proc. of WOSN,2008.
[38] Venmo, Venmo public API, September, 2016. https://developer.venmo.com/.
[39] PayPal, “Paypal financial releases.”https://investor.paypal-corp.com/releases.cfm/, September, 2016.
135
[40] D. J. Watts and S. H. Strogatz, Collective dynamics of ‘small-world’ networks,Nature 393 (1998), no. 6684 409–10.
[41] D. R. Bild et. al., Aggregate characterization of user behavior in twitter andanalysis of the retweet graph, ACM Trans. Internet Technol. 15 (Mar., 2015)4:1–4:24.
[42] J. Ugander et. al., The anatomy of the facebook social graph, arXiv preprintarXiv:1111.4503 (2011).
[43] M. McPherson et. al., Birds of a feather: Homophily in social networks, AnnualReview of Sociology 27 (2001), no. 1 415–444.
[44] G. Wang, X. Zhang, S. Tang, H. Zheng, and B. Y. Zhao, Unsupervised clickstreamclustering for user behavior analysis, in Proc. of CHI, 2016.
[45] L. Kaufman and P. J. Rousseeuw, Finding groups in data: an introduction tocluster analysis. John Wiley & Sons, 2009.
[46] I. M. Chakravarti and R. G. Laha, Handbook of methods of applied statistics,John Wiley & Sons, 1967.
[47] Y. Yang and J. O. Pedersen, A comparative study on feature selection in textcategorization, in Proc. of ICML, 1997.
[48] M. F. Porter, An algorithm for suffix stripping, Program 14 (1980), no. 3 130–137.
[49] V. D. Blondel et. al., Fast unfolding of communities in large networks, Journal ofstatistical mechanics: theory and experiment 2008 (2008), no. 10.
[50] M. Rosvall and C. T. Bergstrom, Maps of random walks on complex networksreveal community structure, Proceedings of the National Academy of Sciences 105(2008), no. 4 1118–1123.
[51] H. Kwak et. al., Mining communities in networks: a solution for consistency andits evaluation, in Proc. of IMC, 2009.
[52] Z. Katona et. al., Network effects and personal influences: The diffusion of anonline social network, Journal of marketing research 48 (2011), no. 3 425–443.
[53] M. Vlachos et. al., On periodicity detection and structural periodic similarity, inProc. of SDM, 2005.
[54] P. Collinson, “Six auction sites’ ads banned over misleading savings claims.” TheGuardian, February, 2017. https://www.theguardian.com/money/2017/feb/22/auction-sites-ads-banned-claims-madbid-asa.
136
[55] B. C. Platt, J. Price, and H. Tappen, The role of risk preferences in pay-to-bidauctions, Management Science 59 (2013), no. 9 2117–2134.
[56] N. Augenblick, The sunk-cost fallacy in penny auctions, The Review of EconomicStudies 83 (2015), no. 1 58–86.
[57] Dealdash, October, 2017. https://dealdash.com/.
[58] J. W. Byers, M. Mitzenmacher, and G. Zervas, Information asymmetries inpay-per-bid auctions, in Proc. of ACM EC, 2010.
[59] R. Ghani, Price prediction and insurance for online auctions, in Proc. of KDD,2005.
[60] D. Van Heijst, R. Potharst, and M. van Wezel, A support system for predictingebay end prices, Decision Support Systems 44 (2008), no. 4 970–982.
[61] W. Jank, G. Shmueli, and S. Wang, Dynamic, real-time forecasting of onlineauctions via functional models, in Proc. of KDD, 2006.
[62] S. Wang, W. Jank, and G. Shmueli, Explaining and forecasting online auctionprices and their dynamics using functional data analysis, Journal of Business &Economic Statistics 26 (2008), no. 2 144–160.
[63] Y.-H. Park and E. T. Bradlow, An integrated model for bidding behavior ininternet auctions: Whether, who, when, and how much, Journal of MarketingResearch 42 (2005), no. 4 470–482.
[64] E. T. Bradlow and Y.-H. Park, Bayesian estimation of bid sequences in internetauctions using a generalized record-breaking model, Marketing Science 26 (2007),no. 2 218–229.
[65] R. F. Easley and R. Tenorio, Jump bidding strategies in internet auctions,Management Science 50 (2004), no. 10 1407–1419.
[66] A. E. Roth and A. Ockenfels, Last-minute bidding and the rules for endingsecond-price auctions: Evidence from ebay and amazon auctions on the internet,American Economic Review 92 (2002), no. 4 1093–1103.
[67] M. Backus, T. Blake, D. V. Masterov, and S. Tadelis, Is sniping a problem foronline auction markets?, in Proc. of WWW, 2015.
[68] R. Bapna, P. Goes, A. Gupta, and Y. Jin, User heterogeneity and its impact onelectronic auction market design: An empirical exploration, Mis Quarterly (2004)21–43.
137
[69] C. M. Angst, R. Agarwal, and J. Kuruzovich, Bid or buy? individual shoppingtraits as predictors of strategic exit in on-line auctions, International Journal ofElectronic Commerce 13 (2008), no. 1 59–84.
[70] J. Trevathan and W. Read, Detecting shill bidding in online english auctions,Handbook of research on social and organizational liabilities in informationsecurity 46 (2009) 446–470.
[71] D. R. Konkel, Costing a pretty penny: Online penny auctions revive the pestilenceof unregulated lotteries, Seattle University Law Review 36 (2012) 1967.
[72] Z. Wang and M. Xu, Selling a dollar for more than a dollar? evidence fromonline penny auctions, Information Economics and Policy 36 (2016) 53–68.
[73] M. E. Newman, Modularity and community structure in networks, Proceedings ofthe National Academy of Sciences 103 (2006), no. 23.
[74] K.-Y. Lin, Y.-T. Wang, and T. K. Huang, What drives continued intention formobile payment?-an expectation cost benefit theory with habit, in Proceedings ofthe 51st Hawaii International Conference on System Sciences, 2018.
[75] M. Caraway, D. A. Epstein, and S. A. Munson, Friends dont need receipts: Thecurious case of social awareness streams in the mobile payment app venmo,PACM on Human-Computer Interaction 1 (2017), no. 1.
[76] PayPal, “Paypal reports fourth quarter and full year 2018 results.” https:
//investor.paypal-corp.com/news-releases/news-release-details/
paypal-reports-fourth-quarter-and-full-year-2018-results, January,2019.
[77] J. Osawa, “China mobile-payment battle becomes a free-for-all.”http://www.wsj.com/articles/
china-mobile-payment-battle-becomes-a-free-for-all-1463945404, May,2016.
[78] G. Fleishman, “Hit by fraud, venmo suffered a big loss and shut down features,report says.” http://fortune.com/2018/11/26/
venmo-fraud-loss-paypal-shut-down-features/, November, 2018.
[79] H. Jacobs, “One photo shows that china is already in a cashless future.”https://www.businessinsider.com/
alipay-wechat-pay-china-mobile-payments-street-vendors-musicians-2018-5,May, 2018.
[80] Tencent, “Tencent announces 2018 third quarter results.”https://www.tencent.com/en-us/articles/15000721534381804.pdf,November, 2018.
138
[81] M. Brennan, “Wechat red packets data report of 2018 new year eve.” https:
//chinachannel.co/2018-wechat-red-packets-data-report-new-year-eve/,February, 2018.
[82] S. Wang, “Ant financial unveils alipay 9.0 super app.” http:
//www.alizila.com/ant-financial-unveils-alipay-9-0-super-app-2/,July, 2015.
[83] E. M. Rogers, Diffusion of innovations. Simon and Schuster, 2010.
[84] M. Trusov, R. E. Bucklin, and K. Pauwels, Effects of Word-of-Mouth VersusTraditional Marketing: Findings from an Internet Social Networking Site, Journalof Marketing 73 (2009), no. 5 90–102.
[85] A. K. Shah and D. M. Oppenheimer, Easy does it: The role of fluency in cueweighting, Judgment and Decision Making 2 (2007), no. 6 371.
[86] Zsolt Katona, Peter Pal Zubcsek, and M. Sarvary, Network Effects and PersonalInfluences: The Diffusion of an Online Social Network, Journal of MarketingResearch 48 (2011), no. 3 425–443.
[87] D. G. Taylor, T. A. Voelker, and I. Pentina, Mobile application adoption by youngadults: A social network perspective, International Journal of Mobile Marketing 6(2011), no. 2 60–70.
[88] H. Lou, P. Y. Chau, and D. Li, Understanding individual adoption of instantmessaging: An empirical investigation, Journal of the Association for informationsystems 6 (2005), no. 4 5.
[89] J. Wang and L. Gu, Why is wechat pay so popular?, Issues in InformationSystems 18 (2017), no. 4.
[90] W. T. Yao-Hua Tan, Toward a generic model of trust for electronic commerce,International Journal of Electronic Commerce 5 (2000), no. 2 61–74.
[91] O. Morawczynski and G. Miscione, Trustworthy mobile transactions: alongitudinal study on m-pesa in kenya, Latusek, & Gerbasi (Eds.), Trust andTechnology (2010) 160–173.
[92] K. S. Cook and E. Rice, Social Exchange Theory, pp. 53–76. Springer US, Boston,MA, 2006.
[93] P. SHIPTON, Money and the morality of exchange. jonathan parry and mauricebloch, eds, American Ethnologist 18 (1991), no. 3 631–631.
[94] J. Boyd, In community we trust: Online security communication at ebay, Journalof Computer-Mediated Communication 7 (2002), no. 3 0–0.
139
[95] I. Nitzan and B. Libai, Social effects on customer retention, Journal of Marketing75 (2011), no. 6 24–38.
[96] G. L. Ciampaglia and D. Taraborelli, Moodbar: Increasing new user retention inwikipedia through lightweight socialization, in Proceedings of the 18th ACMConference on Computer Supported Cooperative Work & Social Computing,CSCW ’15, (New York, NY, USA), pp. 734–742, ACM, 2015.
[97] M. Burke, C. Marlow, and T. Lento, Feed me: Motivating newcomer contributionin social network sites, in Proceedings of the SIGCHI Conference on HumanFactors in Computing Systems, CHI ’09, (New York, NY, USA), pp. 945–954,ACM, 2009.
[98] X. Gui, Y. Chen, C. Caldeira, D. Xiao, and Y. Chen, When fitness meets socialnetworks: Investigating fitness tracking and social practices on werun, inProceedings of the 2017 CHI Conference on Human Factors in ComputingSystems, CHI ’17, (New York, NY, USA), pp. 1647–1659, ACM, 2017.
[99] G. Simmel and D. Frisby, The philosophy of money. Psychology Press, 2004.
[100] V. A. Zelizer, The social meaning of money:” special monies”, American journalof sociology 95 (1989), no. 2 342–377.
[101] K. D. Vohs, N. L. Mead, and M. R. Goode, The psychological consequences ofmoney, science 314 (2006), no. 5802 1154–1156.
[102] E. S. Poole, C. A. Le Dantec, J. R. Eagan, and W. K. Edwards, Reflecting on theinvisible: Understanding end-user perceptions of ubiquitous computing, inProceedings of the 10th International Conference on Ubiquitous Computing,UbiComp ’08, (New York, NY, USA), pp. 192–201, ACM, 2008.
[103] G. Pritchard, J. Vines, and P. Olivier, Your money’s no good here: Theelimination of cash payment on london buses, in Proceedings of the 33rd AnnualACM Conference on Human Factors in Computing Systems, CHI ’15, (New York,NY, USA), pp. 907–916, ACM, 2015.
[104] S. Mainwaring, W. March, and B. Maurer, From meiwaku to tokushita!: Lessonsfor digital money design from japan, in Proceedings of the SIGCHI Conference onHuman Factors in Computing Systems, CHI ’08, (New York, NY, USA),pp. 21–24, ACM, 2008.
[105] Y. M. Kow, X. Gui, and W. Cheng, Special digital monies: The design of alipayand wechat wallet for mobile payment practices in china, in IFIP Conference onHuman-Computer Interaction, pp. 136–155, 2017.
140
[106] V. Bellotti, A. Ambard, D. Turner, C. Gossmann, K. Demkova, and J. M. Carroll,A muddle of models of motivation for using peer-to-peer economy systems, inProceedings of the 33rd Annual ACM Conference on Human Factors inComputing Systems, CHI ’15, (New York, NY, USA), pp. 1085–1094, ACM, 2015.
[107] C. Teddlie and A. Tashakkori, Foundations of mixed methods research:Integrating quantitative and qualitative approaches in the social and behavioralsciences. Sage, 2009.
[108] R. B. Johnson and A. J. Onwuegbuzie, Mixed methods research: A researchparadigm whose time has come, Educational researcher 33 (2004), no. 7 14–26.
[109] Z. Wu and X. Ma, Money as a social currency to manage group dynamics: Redpacket gifting in chinese online communities, in Proceedings of the 2017 CHIConference Extended Abstracts on Human Factors in Computing Systems, CHIEA ’17, (New York, NY, USA), pp. 2240–2247, ACM, 2017.
[110] J. J. Francis, M. Johnston, C. Robertson, L. Glidewell, V. Entwistle, M. P.Eccles, and J. M. Grimshaw, What is an adequate sample size? operationalisingdata saturation for theory-based interview studies, Psychology and Health 25(2010), no. 10 1229–1245.
[111] BBC-News, “The massive phone scam problem vexing china and taiwan.”http://www.bbc.com/news/world-asia-36108762, April, 2016.
[112] Y. J. Zhang, J. Q. Chen, and K.-W. Wen, Characteristics of Internet Users andTheir Privacy Concerns, Journal of Internet Commerce 1 (2002), no. 2 1–16.
[113] C. L. Wang and X. Lin, Migration of chinese consumption values: traditions,modernization, and cultural renaissance, Journal of business ethics 88 (2009),no. 3 399–409.
[114] L. D. Molm, N. Takahashi, and G. Peterson, Risk and trust in social exchange:An experimental test of a classical proposition, American Journal of Sociology105 (2000), no. 5 1396–1427.
[115] J. M. Carroll and V. Bellotti, Creating value together: The emerging design spaceof peer-to-peer currency and exchange, in Proceedings of the 18th ACMConference on Computer Supported Cooperative Work & Social Computing,CSCW ’15, (New York, NY, USA), pp. 1500–1510, ACM, 2015.
[116] R. A. Berk, An introduction to sample selection bias in sociological data,American Sociological Review (1983) 386–398.
[117] L. S. Connaway and R. R. Powell, Basic research methods for librarians.ABC-CLIO, 2010.
141
[118] D. Kahneman and A. Tversky, Prospect theory: An analysis of decision underrisk, in Handbook of the fundamentals of financial decision making: Part I,pp. 99–127. 2013.
[119] D. Kahneman, J. L. Knetsch, and R. H. Thaler, Anomalies: The endowmenteffect, loss aversion, and status quo bias, Journal of Economic perspectives 5(1991), no. 1 193–206.
[120] D. Ariely and I. Simonson, Buying, bidding, playing, or competing? valueassessment and decision dynamics in online auctions, Journal of ConsumerPsychology 13 (2003), no. 1-2 113–123.
[121] J. R. Wolf, H. R. Arkes, and W. A. Muhanna, “Is overbidding in online auctionsthe result of a pseudo-endowment effect?.” Unpublished manuscript, 2005.
[122] U. Malmendier and Y. H. Lee, The bidder’s curse, American Economic Review101 (2011), no. 2 749–87.
[123] S. C. Park, J. Kim, and G. W. Bock, Understanding a bidder’s escalation ofcommitment in the online c2c auction, in European Mediterranean Conference onInformation Systems (EMCIS), 2008.
[124] U. Simonsohn and D. Ariely, When rational sellers face nonrational buyers:evidence from herding on ebay, Management science 54 (2008), no. 9 1624–1637.
[125] C.-C. Chang and C.-W. Chen, Examining hedonic and utilitarian biddingmotivations in online auctions: Impacts of time pressure and competition,International Journal of Electronic Commerce 19 (2015), no. 2 39–65.
[126] C. Feng, S. Fay, and K. Sivakumar, Overbidding in electronic auctions: factorsinfluencing the propensity to overbid and the magnitude of overbidding, Journal ofthe Academy of Marketing Science 44 (2016), no. 2 241–260.
[127] J. A. List and D. Lucking-Reiley, Bidding behavior and decision costs in fieldexperiments, Economic Inquiry 40 (2002), no. 4 611–619.
[128] J. M. Wooldridge, Cluster-sample methods in applied econometrics, AmericanEconomic Review 93 (2003), no. 2.
[129] D. Kato, “’penny auction’ sites offer chance for big bargains.” The Mercury News,May, 2009. https://www.mercurynews.com/2009/05/22/penny-auction-sites-offer-chance-for-big-bargains.
[130] M. Gimein, “The big money: The pennies add up at Swoopo.com.” WashingtonPost, July, 2009.
[131] Mind the pennies, 2009.
142
[132] M. He, H.-f. Leung, and N. R. Jennings, A fuzzy-logic based bidding strategy forautonomous agents in continuous double auctions, IEEE Transactions onKnowledge and Data Engineering 15 (2003), no. 6 1345–1363.
[133] R. Das, J. E. Hanson, J. O. Kephart, and G. Tesauro, Agent-human interactionsin the continuous double auction, in International Joint Conference on ArtificialIntelligence, vol. 17, pp. 1169–1178, 2001.
[134] V. Mnih, K. Kavukcuoglu, D. Silver, A. Graves, I. Antonoglou, D. Wierstra, andM. Riedmiller, Playing atari with deep reinforcement learning, in NIPS DeepLearning Workshop. 2013.
[135] D. Silver, J. Schrittwieser, K. Simonyan, I. Antonoglou, A. Huang, A. Guez,T. Hubert, L. Baker, M. Lai, A. Bolton, Y. Chen, T. Lillicrap, F. Hui, L. Sifre,G. van den Driessche, T. Graepel, and D. Hassabis, Mastering the game of gowithout human knowledge, Nature 550 (10, 2017).
[136] V. Nanduri and T. K. Das, A reinforcement learning model to assess marketpower under auction-based energy pricing, IEEE transactions on Power Systems22 (2007), no. 1.
[137] Y. Teng, Y. Zhang, F. Niu, C. Dai, and M. Song, Reinforcement learning basedauction algorithm for dynamic spectrum access in cognitive radio networks, inVehicular Technology Conference Fall, pp. 1–5, 2010.
[138] P.-T. De Boer, D. P. Kroese, S. Mannor, and R. Y. Rubinstein, A tutorial on thecross-entropy method, Annals of operations research 134 (2005), no. 1 19–67.
[139] E. Stix, An empirical study of online penny auctions, Brown University:Providence, RI (2012).
[140] P. Collinson, “Six auction sites’ ads banned over misleading savings claims.” TheGuardian, February, 2017. https://www.theguardian.com/money/2017/feb/22/auction-sites-ads-banned-claims-madbid-asa.
[141] P. F. Brown, P. V. Desouza, R. L. Mercer, V. J. D. Pietra, and J. C. Lai,Class-based n-gram models of natural language, Computational linguistics 18(1992), no. 4 467–479.
[142] A. Rapoport, A. M. Chammah, and C. J. Orwant, Prisoner’s dilemma: A studyin conflict and cooperation, vol. 165. University of Michigan press, 1965.
[143] N. Christin, Traveling the silk road: A measurement analysis of a largeanonymous online marketplace, in Proceedings of the 22nd internationalconference on World Wide Web (WWW), pp. 213–224, ACM, 2013.
143
[144] S. Mohurle and M. Patil, A brief study of wannacry threat: Ransomware attack2017, International Journal of Advanced Research in Computer Science 8 (2017),no. 5.
[145] S. Radocchia, “Tipping streamers: The donation economy is being built, but canit last?.” Forbes https://www.forbes.com/sites/samantharadocchia/2019/
03/26/can-the-donation-economy-last, March, 2019.
[146] B. A. Token, Basic attention token, May, 2019.https://basicattentiontoken.org/.
144