Embed Size (px)
Citation preview
ARCTIC
VOL. 62, NO. 1 (MARCH 2009) P. 13–24
Movement and Aggregation of Eastern Hudson Bay Beluga Whales(Delphinapterus leucas): A Comparison of Patterns Found through Satellite Telemetry
and Nunavik Traditional Ecological KnowledgeA.E. LEWIS,1,2,3 M.o. HAMMILL,4 M. PoWER,3 D.W. DoIDGE1 and V. LESAGE4
(Received 8 January 2007; accepted in revised form 4 April 2008)
ABSTRACT. Traditional Ecological Knowledge (TEK) consists of the collective knowledge, experience, and values of subsistence communities, while Western science relies on hypothesis testing to obtain information on natural processes. Both approaches provide important ecological information, but few studies have directly compared the two. We compared information on movements and aggregation of beluga whales obtained from TEK interview records (n = 3253) and satellite telemetry records of 30 whales tagged in eastern Hudson Bay, Canada, using geographic information system (GIS) approaches that allowed common formatting of the data sets. Estuarine centres of aggregation in the summer were evident in both data sets. The intensive use of offshore areas seen in the telemetry data, where 76% of the locations were more than 15 km from mainland Quebec, was not evident in the TEK data, where only 17% of the records indicated offshore locations. Morisita’s index of similarity indicated that TEK and telemetry data distributions varied with season, with the highest similarity in winter (0.74). Location and movement data from the telemetry study were limited by small sample size and short tag deployment times, while TEK data were biased by spatial coverage and coastal travel habits. Although the two data sets can provide complementary information, both suffer from weaknesses that need to be acknowledged when these data are adapted for use in resource management.
Key words: Traditional Ecological Knowledge (TEK), telemetry, beluga whales, home range, kernel, Hudson Bay, Hudson Strait, Ungava Bay, Labrador Sea, resource management
RÉSUMÉ. Les connaissances écologiques traditionnelles (CÉT) consistent en l’ensemble des connaissances, de l’expérience et des valeurs des communautés de subsistance, tandis que la science occidentale s’appuie sur la mise à l’épreuve d’hypothèses dans le but d’obtenir de l’information sur les processus naturels. Bien que ces deux démarches permettent d’obtenir d’importants renseignements sur l’écologie, peu d’études ont établi une comparaison directe entre ces deux démarches. Nous avons comparé des données sur les mouvements et le rassemblement des bélugas, données obtenues à partir de CÉT prélevées au moyen d’entrevues (n = 3253) ainsi qu’à partir de résultats de télémétrie par satellite sur 30 baleines marquées dans l’est de la baie d’Hudson, au Canada, à l’aide de systèmes d’information géographique (SIG) qui ont permis le formatage commun des ensembles de données. Pendant l’été, les centres de rassemblement en estuaire étaient évidents dans les deux ensembles de données. L’utilisation intensive des zones au large en ce qui a trait aux données de télémétrie, où 76 % des localisations se situaient à plus de 15 km du continent québécois, n’était pas évidente dans le cas des données des CÉT, où seulement 17 % des résultats indiquaient des localisations au large. L’indice de similarité de Morisita indiquait que la répartition des données obtenues par CÉT et par télémétrie variait d’une saison à l’autre, la similarité la plus grande ayant été atteinte l’hiver (0,74). Les données de localisation et de mouvement découlant de l’étude de télémétrie étaient limitées par la petite taille de l’échantillon et les courtes durées de déploiement des étiquettes, tandis que les données provenant des CÉT étaient biaisées par l’espace à couvrir et les habitudes de déplacement sur la côte. Bien que les deux ensembles de données puissent fournir de l’information complémentaire, tous deux possèdent des faiblesses qu’il y a lieu de reconnaître lorsque ces données sont adaptées à des fins de gestion des ressources.
Mots clés : connaissances écologiques traditionnelles (CÉT), télémétrie, béluga, territoire, noyau, baie d’Hudson, détroit d’Hudson, baie d’Ungava, mer du Labrador, gestion des ressources
Traduit pour la revue Arctic par Nicole Giguère.
1 Nunavik Research Centre, Makivik Corporation, C.P. 179, Kuujjuaq, Quebec J0M 1C0, Canada 2 Corresponding author: [email protected] 3 Department of Biology, University of Waterloo, 200 University Avenue West, Waterloo, ontario N2L 3G1, Canada 4 Department of Fisheries and oceans, Box 1000, Mont-Joli, Quebec G5H 3Z4, Canada © The Arctic Institute of North America
14 • A.E. LEWIS et al.
INTRoDUCTIoN
TEK has been defined as the knowledge claims of persons who have a lifetime of observation and experience of a par-ticular environment, and as a result function effectively in that environment, but are untutored in the conventional sci-entific paradigm (Usher, 2000). As a result of policy devel-opments in Canada, TEK is increasingly being incorporated into environmental assessment and resource management in northern communities (Usher, 2000). Many promote the use of TEK and its integration with science because it reflects the long observational experience and resource use of local people and provides a longer historical record than scientific data in remote areas (Ferguson and Messier, 1997). How-ever, TEK and science differ in the ecological information they provide. These differences in both observational inten-sity and geographic coverage may lead to different conclu-sions about the environment and the size of populations and thus influence management decisions. To date, few studies have attempted to compare and contrast these two data sets, or to examine critically the differences in ecological under-standing of beluga whales arising from the use of TEK ver-sus Western scientific data.
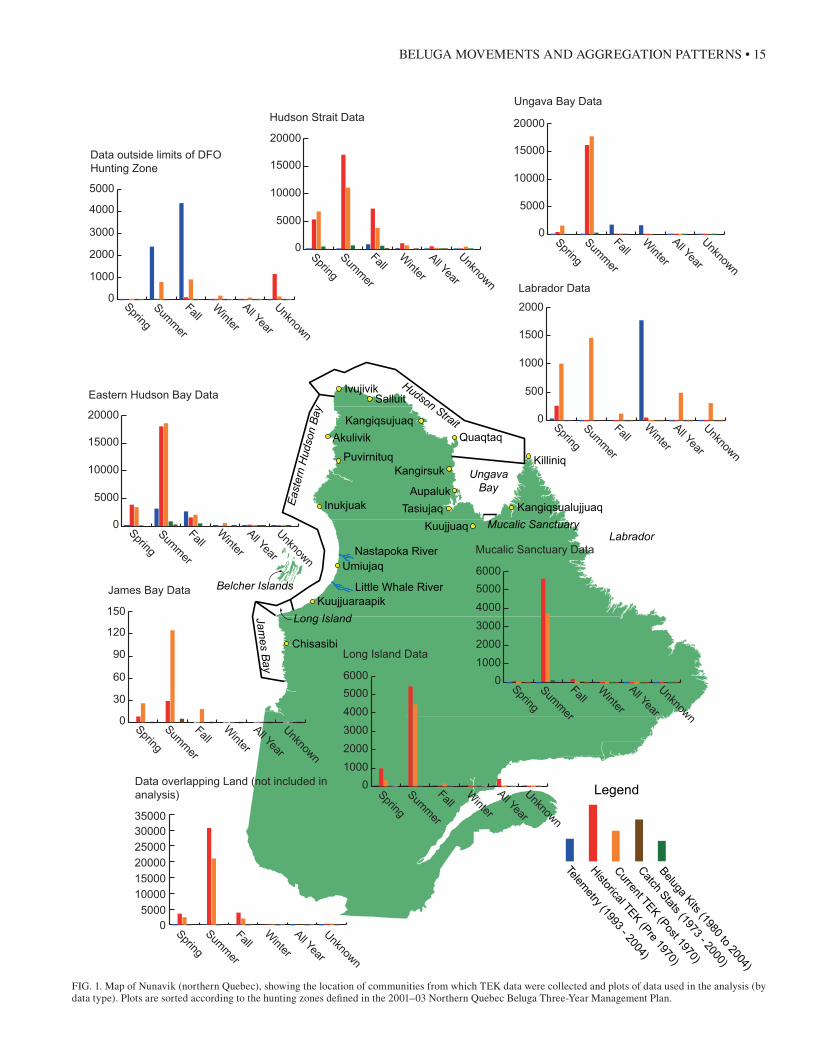
The beluga whale, Delphinapterus leucas, is a medium-sized, toothed whale widely distributed throughout Arctic waters (Finley et al., 1982; Smith et al., 1985; Hammill et al., 2004). Within the waters surrounding northern Que-bec (Nunavik), seasonal aggregations of at least three populations of beluga whales that appear to be genetically identifiable have been defined by their summer distribu-tions (Fig. 1) (de March, 2001, 2003). For management in this area, the most important are the Eastern Hudson Bay (EHB), the Ungava Bay (UB), and the Western Hudson Bay (WHB) populations. Beluga whales of the EHB population summer within the Hudson Bay arc, which extends from 54 4̊0' N to 58 4̊0' N (Kingsley et al., 2001), and frequent the Little Whale (56˚00' N, 76 4̊6' W) and Nastapoka estuar-ies (56˚54' N, 76˚32' W) (Smith, 2004). Beluga whales from UB occur in the Mucalic (58˚16' N, 67˚23' W), the George (58 4̊6' N, 66˚8' W), and the Whale estuaries (58˚15' N, 67˚36' W) (Fig. 1) (Smith, 2004). The WHB population, which could consist of more than one stock, summers in James Bay and along the ontario, Manitoba, and Nunavut coasts of Hudson Bay, and overwinters in Hudson Strait and Ungava Bay (Richard et al., 1990). All populations are hunted by the Inuit communities in Nunavik.
Concern over the apparent low numbers of whales in the waters adjoining Nunavik (Smith and Hammill, 1987) led to harvesting limits (quotas, and seasonal and regional closures) that were imposed in 1988 to allow the stocks to recover (Reeves and Mitchell, 1989; Hammill et al., 2004). In spite of harvest restrictions, aerial surveys continue to indicate that beluga whale numbers in eastern Hudson Bay and Ungava Bay are low (Hammill et al., 2004), and the Committee on the Status of Endangered Wildlife in Canada (CoSEWIC) has designated the EHB and UB beluga whale populations as “endangered.”
Information on the movements and distribution of whales around Nunavik has been passed to successive generations of Inuit through traditional ecological knowledge (TEK). In contrast to the observational history of TEK, the scientific study of beluga whales has used systematic aerial surveys and satellite telemetry to examine beluga distribution and movement (Kingsley, 2000; Kingsley et al., 2001; Hammill et al., 2004).
Drawing on available data sets from both forms of knowl-edge, we compare the movements and aggregation patterns of beluga whales obtained from TEK interview records (n = 3253) and from the satellite telemetry records of 30 whales tagged between 1993 and 2003 at three locations in eastern Hudson Bay. Specifically, we test the hypothesis that the two data sets result in significantly different characteri-zations of beluga whale movement and aggregation patterns in Nunavik.
MATERIAL AND METHoDS
Study Area
Fourteen Inuit communities are located north of the 55th parallel in Nunavik. Their population in 2001 was 9632 (Table 1), and 90% were of Inuit descent. The communities are spread along the coast and all border the shores of major water bodies or rivers (Fig. 1).
TEK Database
After the signing of the James Bay and Northern Que-bec Agreement (JBNQA) in November 1975, the Makivik Corporation (the Inuit organization established to manage the Agreement compensation funds) established a research department with a mandate to develop a TEK database (see Kemp and Brooke, 1995). TEK was collected during inter-views held in 11 Inuit communities, as well as in Chisasibi (53 4̊6' N, 78˚54' W), a Cree community with a small number of Inuit residents, and in Killiniq, a community located on Killiniq Island (60˚25' N, 64˚39' W) that was abandoned in 1978. Interviews, which began in the late 1970s, used one interview template for elders (the older, influential members of a community) and another for non-elders. The two inter-view templates facilitated the collection of both historical data (based on pre-1970 knowledge of elders) and current data (based on post-1970 observations by active hunters).
Each template consisted of a series of questions in Inuk-titut about hunting practices. The responses, recorded on standard cassette tapes, were later transcribed into English and stored in ASCII text files. Both spatial and non-spatial questions were posed during the interviews. Responses to spatial questions were recorded on a mylar/map combination for later digitization. The TEK interview process is com-parable to a semi-directive interview (Huntington, 1998); hunters were encouraged to expand on topics, but directed through a series of pre-determined questions. Community
BELUGA MOVEMENTS AND AGGREGATION PATTERNS • 15
0
30
60
90
120
150
Unknown
All Year
Winter
FallSum
mer
Spring
James Bay Data
0
5000
10000
15000
20000
Unknown
All Year
Winter
FallSum
mer
Spring
Hudson Strait Data
0
5000
10000
15000
20000
Unknown
All Year
Winter
FallSum
mer
Spring
Ungava Bay Data
0
1000
2000
3000
4000
5000
6000
Unknown
All Year
Winter
FallSum
mer
Spring
Mucalic Sanctuary Data
0
1000
2000
3000
4000
5000
6000
Unknown
All Year
Winter
FallSum
mer
Spring
Long Island Data
0
5000
10000
15000
20000
Unknown
All Year
Winter
FallSum
mer
Spring
Eastern Hudson Bay Data
0
500
1000
1500
2000
Unknown
All Year
Winter
FallSum
mer
Spring
Labrador Data0
1000
2000
3000
4000
5000
Unknown
All Year
Winter
FallSum
mer
Spring
Data outside limits of DFO Hunting Zone
05000
10000
15000
20000
25000
3000035000
Data overlapping Land (not included in analysis)
Unknown
All Year
Winter
FallSum
mer
Spring
Historical TEK (Pre 1970)
Telemetry (1993 - 2004)
Current TEK (Post 1970)
Catch Stats (1973 - 2000)
Beluga Kits (1980 to 2004)
Legend
James B
ay
Long Island
Eas
tern
Hud
son
Bay
Hudson Strait
Ungava Bay
Mucalic SanctuaryLabrador
Chisasibi
Kuujjuaraapik
Umiujaq
Inukjuak
Puvirnituq
Akulivik
Ivujivik
Little Whale River
Nastapoka River
Salluit
Kangiqsujuaq
Quaqtaq
Kangirsuk
Aupaluk
Tasiujaq
Kuujjuaq
Kangiqsualujjuaq
Killiniq
Belcher Islands
FIG. 1. Map of Nunavik (northern Quebec), showing the location of communities from which TEK data were collected and plots of data used in the analysis (by data type). Plots are sorted according to the hunting zones defined in the 2001–03 Northern Quebec Beluga Three-Year Management Plan.
16 • A.E. LEWIS et al.
booklets were created from the digitized data and returned to the communities for verification of accuracy and interpre-tation. A total of 427 hunters have been interviewed to date. of those hunters, 205 have given both historical and cur-rent interviews, for a total of 286 historical and 346 current interviews (Table 1).
Records in the database were coded by time period (his-torical or current), community, type of record (see below), and season. The database contains 86 693 spatial records in the form of points and lines representing species (e.g., bel-uga, seal), routes, ice conditions, ecology, and sites. of these records, 3253 (3.7%), 1702 historical, 1548 current, and 3 unknown, pertain to beluga whales.
Canadian Inuit recognize six seasons based on natural phenomena associated with weather or animal movements. The two extra seasons cannot be readily translated into Eng-lish, but can be defined as pre-fall and pre-summer. In the design of the TEK database, these two extra seasons were incorporated into the four-season structure, with pre-fall reclassified as fall and pre-summer reclassified as summer. Accordingly, the seasons are not directly related to a calen-dar date, and can vary in length from year to year. However, to standardize data for subsequent analysis, we defined sea-sons as spring (April to June), summer (July and August), fall (September to November), and winter (the longest sea-son, from December to March).
Telemetry Database
Beluga whales (n = 30) were captured using six-inch shore-anchored nets, and satellite-linked time-depth record-ers were secured to the dorsal ridge (Richard et al., 1997; Kingsley et al., 2001) (See Table 2). Most animals were tagged in July or August at the Little Whale River (LWR) (n = 24) or the Nastapoka River (n = 5), while one ani-mal was captured in october in Hudson Strait, near the community of Ivujivik (62˚25' N, 77˚54' W). Transmitter
deployments lasted from three days to seven months, with a mean deployment of 98 days (Table 2).
Signals from the transmitters (also referred to as tags) were received by the polar orbiting satellites of the ARGoS network (Toulouse, France) and transmitted to ground sta-tions (Fancy et al., 1988; ARGoS User’s Manual online at http://www.cls.fr/manuel). The satellite transmitter data were arranged by whale identification number, date, and time of reception. Records consisted of a location point and associated attributes, such as depth and water temperature; however, only the location data were used in the present study. ARGoS files from the SPoT and SDR-T16 tags (Wildlife Computers Ltd., Redmond, Washington, USA) were processed using SATPAK and SATPAK2003 appli-cations provided by Wildlife Computers Ltd. The SMRU tag data are processed automatically at the Sea Mammal Research Unit (SMRU), St. Andrews, UK, and are available in a standardized database format. A total of 28 571 records were recovered from 30 tags.
The accuracy of the locations depends on the presence and position of orbiting satellites, as well as the strength and number of consecutive signals received by a satellite from a transmitter in a single pass (Goulet et al., 1999). To minimize location errors, data were filtered using a three-step method to remove questionable locations prior to com-parison with the TEK data (Austin et al., 2003). The filter removed 9163 (32%) of the location records, leaving 19 408 for analysis. Reception date was then used to classify each location record according to the seasonal time structure used in analyzing the TEK database.
Verification Databases
Locations from both the catch statistics for 1974 to 2000 (Lesage et al., 2001) and tissue sampling kit data were used to cross-check and validate the locations of TEK data. These data include the number of whales hunted per community
TABLE 1. Population, number of Inuit hunters interviewed, and number of TEK interviews completed in Nunavik communities. Popula-tion data are from the Statistics Canada, 2001 census. Where no numbers are recorded for interviews, the data were either unavailable or not transcribed.
Community Population 2001 # Hunters Interviewed # Historical Interviews # Current Interviews
Kuujjuaraapik 555 80 53 68Inukjuak 1294 41 39 36Akulivik 472 21 14 19Puvirnituq 1287 4 – –Ivujivik 298 43 11 37Salluit 1072 35 24 28Kangiqsujuaq 536 25 21 18Quaqtaq 305 14 18 11Kangirsuk 436 33 17 28Aupaluk 159 13 13 9Tasiujaq 228 16 15 14Kuujjuaq 932 33 24 29Kangiqsualujjuaq 710 35 35 29Killiniq N/A 11 – –Chisasibi 3467 6 0 6Umiujaq 348 17 2 14Total 13099 427 286 346
BELUGA MOVEMENTS AND AGGREGATION PATTERNS • 17
per season. of the 9148 records in the catch statistics data-base, 5076 were not classifiable to month. These were not used in subsequent analysis because of the missing harvest date. The remaining 4072 data points were then also clas-sified by season in the same way as the TEK data to allow direct comparison.
The tissue sampling kit data are from a sampling pro-gram for hunters in Nunavik started in 1980. Since partici-pation is voluntary, the amount and quality of data obtained vary between years. The data set contains 1002 records. of those, 863 contained month, year, and location information. The 139 remaining records, which lacked information on location or mortality date (or both), were not used for verifi-cation purposes. The complete records were organized into the same seasonal structure used for the TEK data.
ANALYSIS
We used home range analysis to compare summer and over-winter distributions of beluga whales based on TEK and on telemetry data. The telemetry data represent a series of locations that can be analyzed within the context of a home range. However, the TEK data, which were not collected in a form immediately suitable for home range analysis, were converted from lines to locational points at their vertices (the point at which the sides of an angle intersect). Attribute data such as time period and season were preserved in the
resulting file. After conversion, the 3253 original TEK lines created 233 956 points (125 650 historical and 108 306 cur-rent). Historical records representing periods before the 1970s were removed from the TEK dataset; thus, only post-1970 data were used in the analyses that follow.
Summer and winter home ranges were calculated, using the Animal Movement Analysis Extension (AMAE) (Hooge et al., 1998) in ArcView (ESRI, Redlands, California) and a fixed kernel estimator. Least Squares Cross Validation (LSCV) was used as the smoothing parameter, as suggested by Seaman and Powell (1996). Probability contours of 50%, 90%, and 95% were created and exported in polygon for-mat. Seasonal home ranges (summer and winter) were cal-culated for whales and communities for which there were 25 or more pieces of location information either from telemetry data or from TEK (Seaman and Powell, 1996). Locations found erroneously on land (Natural Resources Canada, 2005, 1:2000000 basemaps) were excluded from the calculation. Because summer data produced the large majority of points in the TEK database for each community, we selected a random number of points (n = 500) to calculate the seasonal home range for each community. Winter TEK records were not as abundant. Therefore, all winter records that existed in the original database were used in seasonal home range calcula-tions, except for communities with fewer than 25 data points (Inukjuak, Umiujaq), where home ranges were not calculated. Limiting home range analysis to summer and winter was necessary because of the complications posed by migrations
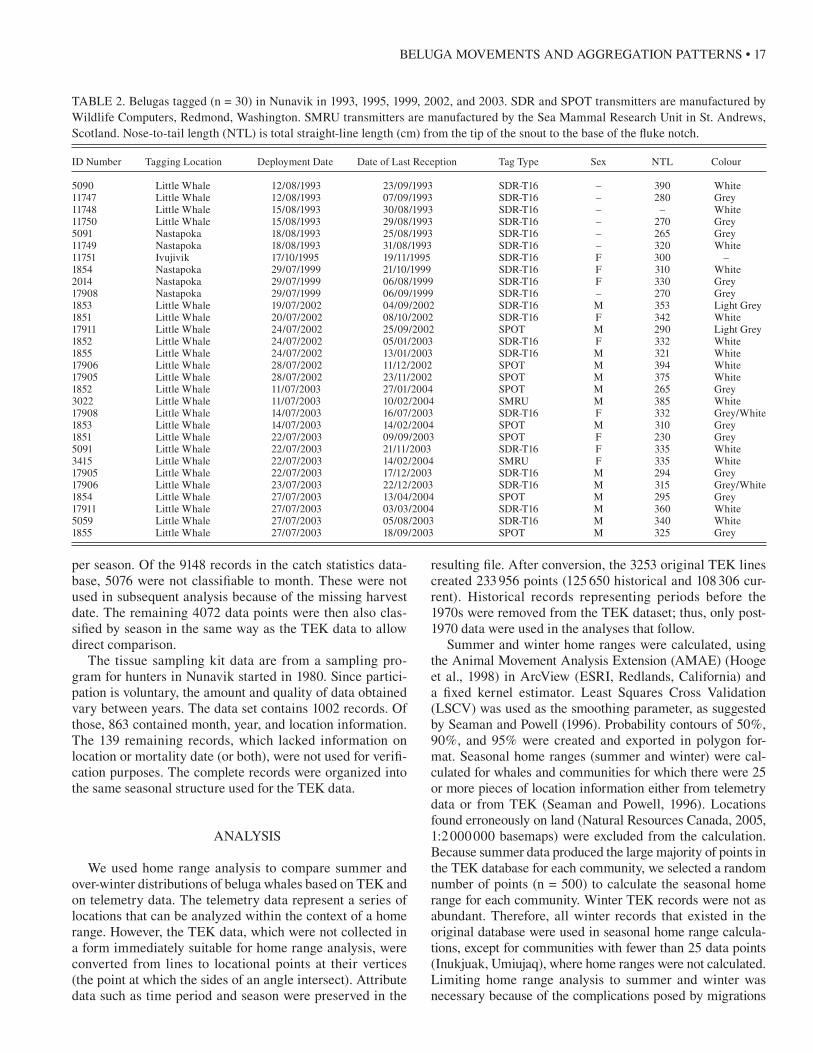
TABLE 2. Belugas tagged (n = 30) in Nunavik in 1993, 1995, 1999, 2002, and 2003. SDR and SPoT transmitters are manufactured by Wildlife Computers, Redmond, Washington. SMRU transmitters are manufactured by the Sea Mammal Research Unit in St. Andrews, Scotland. Nose-to-tail length (NTL) is total straight-line length (cm) from the tip of the snout to the base of the fluke notch.
ID Number Tagging Location Deployment Date Date of Last Reception Tag Type Sex NTL Colour
5090 Little Whale 12/08/1993 23/09/1993 SDR-T16 – 390 White11747 Little Whale 12/08/1993 07/09/1993 SDR-T16 – 280 Grey11748 Little Whale 15/08/1993 30/08/1993 SDR-T16 – – White11750 Little Whale 15/08/1993 29/08/1993 SDR-T16 – 270 Grey5091 Nastapoka 18/08/1993 25/08/1993 SDR-T16 – 265 Grey11749 Nastapoka 18/08/1993 31/08/1993 SDR-T16 – 320 White11751 Ivujivik 17/10/1995 19/11/1995 SDR-T16 F 300 –1854 Nastapoka 29/07/1999 21/10/1999 SDR-T16 F 310 White2014 Nastapoka 29/07/1999 06/08/1999 SDR-T16 F 330 Grey17908 Nastapoka 29/07/1999 06/09/1999 SDR-T16 – 270 Grey1853 Little Whale 19/07/2002 04/09/2002 SDR-T16 M 353 Light Grey1851 Little Whale 20/07/2002 08/10/2002 SDR-T16 F 342 White17911 Little Whale 24/07/2002 25/09/2002 SPoT M 290 Light Grey1852 Little Whale 24/07/2002 05/01/2003 SDR-T16 F 332 White1855 Little Whale 24/07/2002 13/01/2003 SDR-T16 M 321 White17906 Little Whale 28/07/2002 11/12/2002 SPoT M 394 White17905 Little Whale 28/07/2002 23/11/2002 SPoT M 375 White1852 Little Whale 11/07/2003 27/01/2004 SPoT M 265 Grey3022 Little Whale 11/07/2003 10/02/2004 SMRU M 385 White17908 Little Whale 14/07/2003 16/07/2003 SDR-T16 F 332 Grey/White1853 Little Whale 14/07/2003 14/02/2004 SPoT M 310 Grey1851 Little Whale 22/07/2003 09/09/2003 SPoT F 230 Grey 5091 Little Whale 22/07/2003 21/11/2003 SDR-T16 F 335 White3415 Little Whale 22/07/2003 14/02/2004 SMRU F 335 White17905 Little Whale 22/07/2003 17/12/2003 SDR-T16 M 294 Grey17906 Little Whale 23/07/2003 22/12/2003 SDR-T16 M 315 Grey/White1854 Little Whale 27/07/2003 13/04/2004 SPoT M 295 Grey17911 Little Whale 27/07/2003 03/03/2004 SDR-T16 M 360 White5059 Little Whale 27/07/2003 05/08/2003 SDR-T16 M 340 White1855 Little Whale 27/07/2003 18/09/2003 SPoT M 325 Grey
18 • A.E. LEWIS et al.
from Hudson Bay to Ungava Bay for the definition of a home range.
To identify areas of overlap between the home ranges cal-culated from TEK and those calculated from telemetry data, the geometric intersection of home range polygons (prob-ability contours of 50%, 90%, and 95%) was calculated using the INTERSECT command in ArcInfo (ESRI, Red-lands, California). The XTools extension in ArcView was used to calculate the equivalent in km2 of each overlapping area (DeLaune, 2000).
Morisita’s index of similarity (Morisita, 1959) and Man-ly’s selection ratio test (Manly et al., 1993) were used to investigate distributional similarities in the TEK and telem-etry data. Before the tests were applied, buffer zones were created around the coasts of mainland Quebec and the Belcher Islands, as shown in Table 3. The resulting polygon was used in a query to determine the number of points that occurred within or outside the defined buffer zones. TEK and telemetry points within each zone were tallied for each season for use in Morisita’s index of similarity, calculated following Krebs (1999).
To apply Manly’s selection ratio test (Manly et al., 1993) for the determination of zone selection preferences in the TEK and telemetry data, buffer zone areas were converted to proportions. These proportions were compared to pro-portionate-use values determined from TEK and telemetry location data by means of standardized selection indices (Bi):
and
where wi is the selection ratio for the ith zone, n is the number of zones and Pi and oi, respectively, express the proportional availability of the zone and its use (number of points per zone) as indicated by TEK and telemetry data. Values above and below 1/n indicate relative zone preference and avoid-ance, and ratios of 1/n indicate no zone preference (Manly et al., 1993). Selection ratios were then tested for statisti-cal significance under the null hypothesis that beluga select zones randomly (Manly et al., 1993). Significant differences among multiple calculated selection indices were estab-lished using Bonferroni-adjusted confidence limits (Manly et al., 1993).
The seasonal distribution of beluga whale kills from the catch records was compared with that of the seasonal TEK locations. Chi-square tests were used to test the similarity (Zar, 1999). Zero entries for winter were deleted from the seasonal analysis except for Kangiqsualujjuaq, where winter kills were reported. A chi-square test was also used to com-pare the seasonal distribution of home range areas.
Finally, frequencies of kill sites were counted in each buffer zone. The areas from the 50% and 90% probability home ranges were then overlaid on the buffer zones to cre-ate a new spatial file of seasonal home range areas defined as distance zones. This allowed us to use chi-square tests to compare seasonal distributions of home range areas and to determine how the distribution of recorded summer kills com-pared with the summer home range calculated from current TEK. We expected that the location of kill sites would have a spatial distribution similar to that of the recorded TEK.
RESULTS
Seasonal Distribution of Whales in Nunavik
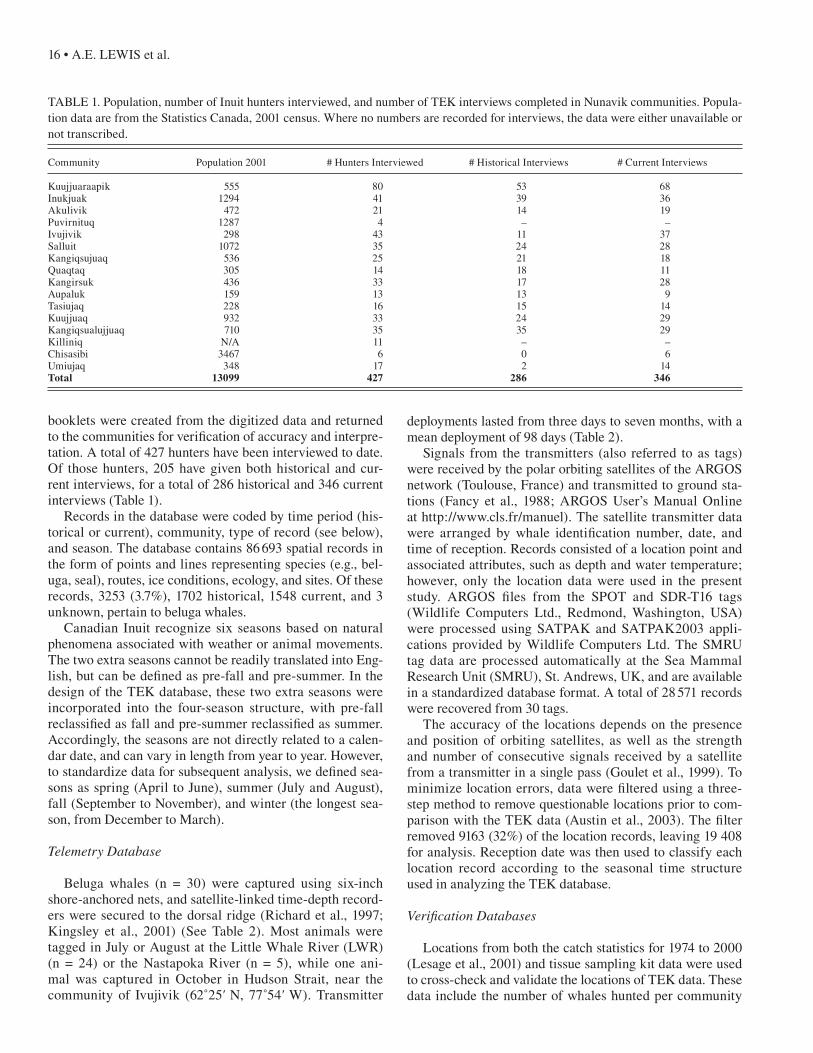
For spring, there was no similarity in the spatial distri-bution of whales in the TEK and telemetry data (Morisita’s index = 0.04); however, spring telemetry data were limited to a single EHB whale located in the Labrador Sea that indi-cated a preference for areas 25–75 km from the shore. TEK-based observations were mainly distributed along the coast of Nunavik (≤ 5 km), and on the basis of the TEK data, whales showed a distinct preference for the inshore 0–5 km zone (p < 0.05) (Fig. 2a). These coastal distributions were located in EHB, Hudson Strait near Ivujivik, and near Quaqtaq at the northwestern tip of Ungava Bay (Fig. 1). EHB commu-nities indicate that whales arrive in spring from no particu-lar direction. Hudson Strait hunters indicate that whales are traveling from Hudson Bay, where they overwinter.
For summer, low similarity was found between the distri-butions of whales in the TEK and telemetry data (Morisita’s index = 0.39). The TEK data indicated that whales were dis-tributed along the coast of Nunavik, with a preference for inshore areas (0–5 km zone, p < 0.05) in eastern Hudson Bay, Hudson Strait, and Ungava Bay (Fig. 2b). The telem-etry locations also indicated that whales were distributed along the eastern Hudson Bay coast, between Inukjuak in the north and Kuujjuaraapik to the south. However, the telemetry data also indicated that whales occurred in off-shore regions, sometimes as much as 230 km from the Que-bec coast, to the west of the Belcher Islands. Thus, tagged whales showed preferences for a broad range of habitat zones (0–75 km).
Fall and winter distributions of animals in the TEK and satellite telemetry databases showed the greatest similarity (Morisita’s index = 0.52 and 0.74). Fall TEK observations were more concentrated along the eastern Hudson Bay coast and near Ivujivik in Hudson Strait, with a preference for the inshore area (0–5 km zone) (Fig. 2c). TEK respondent data also indicated that beluga whales move northward along the EHB coast, east through HS, and are recorded moving both northwest and southeast from Quaqtaq. Fall telemetry observations in eastern Hudson Bay showed a distribution of offshore locations comparable to the summer distribution. Animals occurred between the mainland and the Belcher Islands, with a preference for the 0 – 50 km offshore zone
€
Bi = wi
wii = 1
n
∑
€
wi = oi
Pi
BELUGA MOVEMENTS AND AGGREGATION PATTERNS • 19
(Fig. 2c). Tagged whales began migrating northward as early as September 20, and completely exited eastern Hudson Bay into Hudson Strait by early November. Animals remained in Hudson Strait for only a short period (mean 10 days, range 5–28 days). Thereafter, whales moved from Hudson Strait into Ungava Bay between late october and late Novem-ber and were located along the Ungava coast to Killiniq in northeastern Ungava Bay.
TEK records indicated that whales occurred in winter along the Hudson Bay coast, with most locations near Ivu-jivik in Hudson Strait. The habitat preference was for the 0–25 km zone (Fig. 2d). Interviews indicate whales were often trapped in polynyas. However, TEK data showing polynyas in southern Ungava Bay (n = 10) located at the mouths of rivers such as the Koksoak (58˚32' N, 68˚9' W)
and Dancelou (58˚53' N, 68 4̊3' W) did not overlap with TEK whale records. In contrast, telemetry locations in Ungava Bay indicated that whales did not remain along the coast, but moved offshore (with a preference for the 5–50 km zone) and traveled along the edge of the fast ice as they moved through Ungava Bay in November and December. From early to late December, whales migrated past Killiniq to deep-water troughs (> 600 m) in the Labrador Sea, where they overwin-tered (56˚7' N, 59˚29' W). Some whales, however, remained in Ungava Bay as late as February, typically at the ice edge.
Seasonal Home Ranges
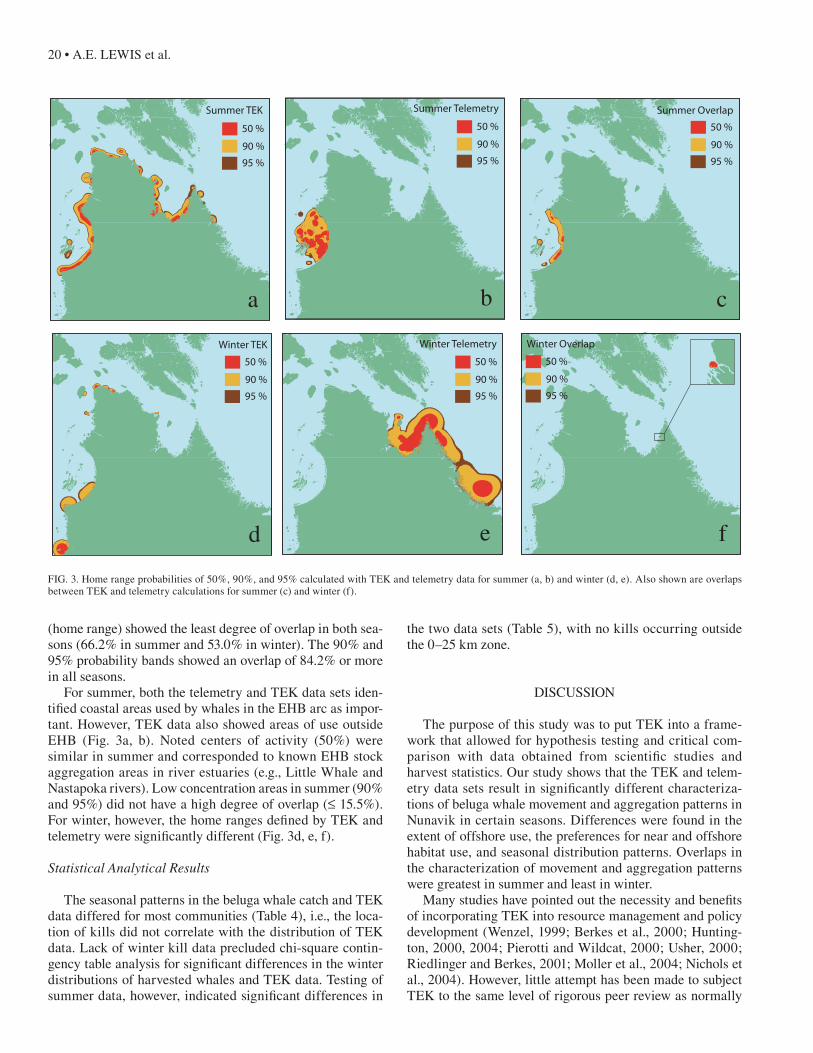
Seasonal home ranges showed a large degree of overlap in summer and winter (Fig. 3d, f). The 50% probability band
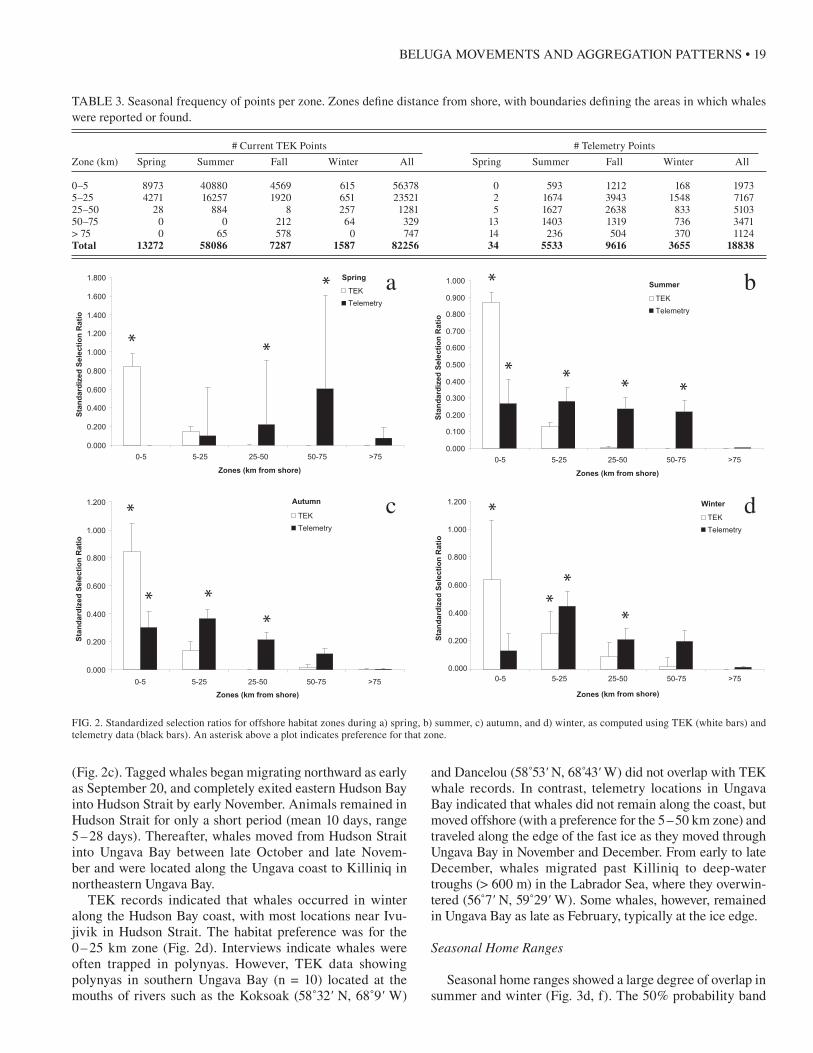
TABLE 3. Seasonal frequency of points per zone. Zones define distance from shore, with boundaries defining the areas in which whales were reported or found.
# Current TEK Points # Telemetry Points
Zone (km) Spring Summer Fall Winter All Spring Summer Fall Winter All
0–5 8973 40880 4569 615 56378 0 593 1212 168 19735–25 4271 16257 1920 651 23521 2 1674 3943 1548 716725–50 28 884 8 257 1281 5 1627 2638 833 510350–75 0 0 212 64 329 13 1403 1319 736 3471> 75 0 65 578 0 747 14 236 504 370 1124Total 13272 58086 7287 1587 82256 34 5533 9616 3655 18838
0.000
0.200
0.400
0.600
0.800
1.000
1.200
1.400
1.600
1.800
0-5 5-25 25-50 50-75 >75
Zones (km from shore)
Sta
nd
ard
ized
Sel
ecti
on
Rat
io
TEK
Telemetry
* *
* Spring
0.000
0.100
0.200
0.300
0.400
0.500
0.600
0.700
0.800
0.900
1.000
0-5 5-25 25-50 50-75 >75
Zones (km from shore)
Sta
nd
ard
ized
Sel
ecti
on
Rat
io
TEK
Telemetry
*
* * * *
Summer
0.000
0.200
0.400
0.600
0.800
1.000
1.200
Zones (km from shore)
Sta
nd
ard
ized
Sel
ecti
on
Rat
io
TEK
Telemetry
*
* **
0-5 5-25 25-50 50-75 >75
Autumn
Zones (km from shore)
Sta
nd
ard
ized
Sel
ecti
on
Rat
io
TEK
Telemetry
*
**
*
0.000
0.200
0.400
0.600
0.800
1.000
1.200
0-5 5-25 25-50 50-75 >75
Winter
FIG. 2. Standardized selection ratios for offshore habitat zones during a) spring, b) summer, c) autumn, and d) winter, as computed using TEK (white bars) and telemetry data (black bars). An asterisk above a plot indicates preference for that zone.
a b
c d
20 • A.E. LEWIS et al.
(home range) showed the least degree of overlap in both sea-sons (66.2% in summer and 53.0% in winter). The 90% and 95% probability bands showed an overlap of 84.2% or more in all seasons.
For summer, both the telemetry and TEK data sets iden-tified coastal areas used by whales in the EHB arc as impor-tant. However, TEK data also showed areas of use outside EHB (Fig. 3a, b). Noted centers of activity (50%) were similar in summer and corresponded to known EHB stock aggregation areas in river estuaries (e.g., Little Whale and Nastapoka rivers). Low concentration areas in summer (90% and 95%) did not have a high degree of overlap (≤ 15.5%). For winter, however, the home ranges defined by TEK and telemetry were significantly different (Fig. 3d, e, f).
Statistical Analytical Results
The seasonal patterns in the beluga whale catch and TEK data differed for most communities (Table 4), i.e., the loca-tion of kills did not correlate with the distribution of TEK data. Lack of winter kill data precluded chi-square contin-gency table analysis for significant differences in the winter distributions of harvested whales and TEK data. Testing of summer data, however, indicated significant differences in
50 %
90 %
95 %
50 %
90 %
95 %
50 %
90 %
95 %
50 %
90 %
95 %
50 %
90 %
95 %
50 %
90 %
95 %
Summer TEK Summer Telemetry Summer Overlap
Winter TEK Winter Telemetry Winter Overlap
FIG. 3. Home range probabilities of 50%, 90%, and 95% calculated with TEK and telemetry data for summer (a, b) and winter (d, e). Also shown are overlaps between TEK and telemetry calculations for summer (c) and winter (f).
the two data sets (Table 5), with no kills occurring outside the 0–25 km zone.
DISCUSSIoN
The purpose of this study was to put TEK into a frame-work that allowed for hypothesis testing and critical com-parison with data obtained from scientific studies and harvest statistics. our study shows that the TEK and telem-etry data sets result in significantly different characteriza-tions of beluga whale movement and aggregation patterns in Nunavik in certain seasons. Differences were found in the extent of offshore use, the preferences for near and offshore habitat use, and seasonal distribution patterns. overlaps in the characterization of movement and aggregation patterns were greatest in summer and least in winter.
Many studies have pointed out the necessity and benefits of incorporating TEK into resource management and policy development (Wenzel, 1999; Berkes et al., 2000; Hunting-ton, 2000, 2004; Pierotti and Wildcat, 2000; Usher, 2000; Riedlinger and Berkes, 2001; Moller et al., 2004; Nichols et al., 2004). However, little attempt has been made to subject TEK to the same level of rigorous peer review as normally
a b c
d e f
BELUGA MOVEMENTS AND AGGREGATION PATTERNS • 21
occurs with Western science-based information. Such efforts are needed if TEK is to be used effectively for assessment and management purposes (Usher, 2000).
It has been argued that early studies did not formally include TEK because it was generally not considered sci-entifically reliable, or was difficult to access (Huntington, 2000; Nichols et al., 2004). Nonetheless, TEK has been used extensively in the development of new research direc-tions and to improve our understanding of natural phenom-ena. For example, one has only to read early descriptions of the subnivean snow structures maintained by ringed seals (Phoca hispida) to realize that these studies are based on increased understanding of events gained through transfer of knowledge between Inuit hunters and Western research-ers (McLaren, 1958; Smith and Stirling, 1975).
In remote areas, the ecological knowledge of indige-nous peoples is often geographically and temporally more extensive than scientific knowledge (Ferguson and Mess-ier, 1997). In Nunavik, the TEK database dating from the 1970s provides a longer historical record than the scien-tific data, which are the result of sporadic satellite tagging studies. However, limitations linked to collection methods, data type, and storage hinder the use of TEK. The use of lines on TEK maps and the unknown accuracy of these lines increase the uncertainty associated with the location and source (sampling or hunting efforts) of the data. Fur-thermore, it is difficult to interpret line data when minimal
supporting information has been recorded. For example, the TEK data did not include any specific indications of whale movement direction, or statements as to whether a recorded line was the outer boundary of an aggregation area. Convert-ing these line data into a form suitable for an analytical con-text remains a challenge. Errors occur in the calculated TEK seasonal home range after lines are converted to points. At a technical level, the density of points is a function of the number of vertices per line, and not the number of records in a given area. In one instance, the 50% probability area was significantly correlated in shape with the distribution of points created from a curved line. TEK data are also limited to the range of the hunter’s experience, so the data tend to cluster around the community in which the hunter resides. Movements, aggregation areas, and ecology beyond these hunting ranges are generally not known and are therefore not reported. To obtain a more complete understanding of beluga whales, information from additional communities is needed, which increases the financial and logistical sam-pling effort. Although this additional sampling will extend the spatial and temporal extent of information, the quality of these observations will be limited by the cultural history of the villages involved. For example, Inuit along parts of eastern Hudson Bay and Ungava Bay have alternative food resources, including waterfowl, fish, and terrestrial mam-mals, which reduce their reliance on beluga. Application of management measures will also limit or alter hunter experi-ence: some hunters may reduce their participation in beluga hunting, while others will travel to new areas to maintain access to beluga resources.
In cases where data are available about wildlife beyond the hunter’s or community’s hunting range, the source may be word-of-mouth reports. In some interviews, hunters reported specific areas where they had heard whales were located. Such reports can mean that a hunter may record a location well beyond his hunting range on the basis of the collective knowledge of the community. Transcription errors may also occur. In some instances, a location was mentioned during the TEK discussion but was not drawn on the map. In instances where the record was mapped, the location records were flagged when a sighting was out of the hunter’s range. These observations may also be one-time sightings made while traveling. Such data may reflect an extreme event that might be useful in some analyses, but should be avoided in others. However, there is no a priori means of assessing the utility of such single observations. In
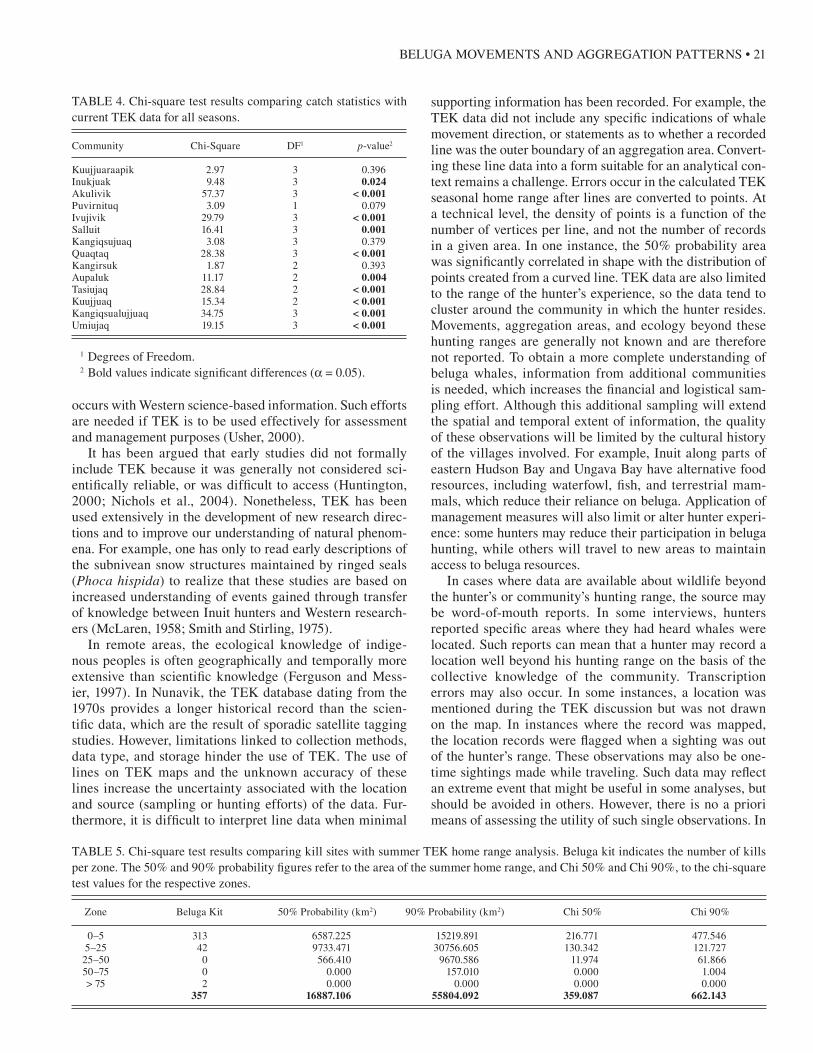
TABLE 4. Chi-square test results comparing catch statistics with current TEK data for all seasons.
Community Chi-Square DF1 p-value2
Kuujjuaraapik 2.97 3 0.396Inukjuak 9.48 3 0.024Akulivik 57.37 3 < 0.001Puvirnituq 3.09 1 0.079Ivujivik 29.79 3 < 0.001Salluit 16.41 3 0.001Kangiqsujuaq 3.08 3 0.379Quaqtaq 28.38 3 < 0.001Kangirsuk 1.87 2 0.393Aupaluk 11.17 2 0.004Tasiujaq 28.84 2 < 0.001Kuujjuaq 15.34 2 < 0.001Kangiqsualujjuaq 34.75 3 < 0.001Umiujaq 19.15 3 < 0.001
1 Degrees of Freedom. 2 Bold values indicate significant differences (a = 0.05).
TABLE 5. Chi-square test results comparing kill sites with summer TEK home range analysis. Beluga kit indicates the number of kills per zone. The 50% and 90% probability figures refer to the area of the summer home range, and Chi 50% and Chi 90%, to the chi-square test values for the respective zones.
Zone Beluga Kit 50% Probability (km2) 90% Probability (km2) Chi 50% Chi 90%
0–5 313 6587.225 15219.891 216.771 477.546 5–25 42 9733.471 30756.605 130.342 121.727 25–50 0 566.410 9670.586 11.974 61.866 50–75 0 0.000 157.010 0.000 1.004 > 75 2 0.000 0.000 0.000 0.000 357 16887.106 55804.092 359.087 662.143
22 • A.E. LEWIS et al.
the present study, outliers were not omitted from the anal-ysis as they were infrequent and they did not significantly affect analytical results (e.g., standardized selection ratios).
Individual interviews tend to be less biased than multi-ple-person interviews. However, group interviews are usu-ally more cost-effective in remote areas, where travel is expensive and time-consuming. The resulting degree of bias depends on the questions asked, the interviewer’s skills (which include establishing rapport with the subject), and the interviewer’s biases. In some individual interviews, the subject can provide the answers he or she thinks the inter-viewer wants to hear. In other instances, a person might reveal more detail in an individual interview than in a group interview, either because peer pressure is absent or because there is more opportunity to talk and expand on the details. Huntington (1998) found that in group interviews, partici-pants were able to encourage each other to recall specific events, to spur each other’s memories, and to discuss the details of a particular item that led to a consensus based on their knowledge of the area and of each other. other factors that may bias interviews include the reluctance of inform-ants to reveal proprietary or sensitive knowledge (of par-ticular concern in situations involving species experiencing conservation concern, such as beluga); withholding of infor-mation that the informant assumes is known or obvious to the interview team; lack of recall of specific facts during the interview; intentional deference to other informants, who may be seen as more knowledgeable; inadequate or inap-propriate questioning by the interview team; and inadequate comprehension by the interview team of the information provided (Ferguson and Messier, 1997).
TEK is also often based on unusual events; out-of-the ordinary circumstances are easily remembered and recorded in Inuit cultures (Krupnik and Jolly, 2002; Moller et al., 2004). Thus the seasonal ranges in our study that do not correlate with telemetry may result from the capture of abnormal events or the lack of telemetry data. Late migra-tion for some whales evident in the telemetry data, however, may represent the unusual events captured during some sea-sons in the TEK data.
The telemetry studies provided new knowledge that was unavailable through TEK, most notably from tags that recorded dive information, temperature, and salinity. Another important attribute of telemetry data is that col-lection was independent of the observer, and information from offshore or heavily ice-covered areas was provided for regions where hunters do not travel because of logistical or safety concerns. The transmitter data can also be linked directly to a specific population or group, whereas the TEK data tend to group all belugas together. However, telemetry results are limited by small sample size, temporal and spa-tial distribution of the sampling effort, and possible changes in the behaviour of animals resulting from their capture and the deployment of instruments. There is often little appreci-ation for the uncertainty associated with the deployment of 30 transmitters at one or two locations, over a period of sev-eral years, to describe the movement and activity patterns
of a population of approximately 3000 animals (Hammill et al., 2005). For example, animals caught in eastern Hud-son Bay during summer do not provide summer informa-tion on beluga in Hudson Strait. The number of transmitter deployments is typically limited by high transmitter cost and by the ability to capture animals. A data gap was also evident in the records when the tags ceased to transmit or fell off. In some areas, capturing animals was not possible. Study results were punctual, and because developments of this technology were recent, no historical record was avail-able to help us understand how beluga movements might have changed over time. Finally, since the information was transmitted via satellite, the data can be difficult to interpret because ancillary information, such as oceanography or ice conditions, pod size, distribution of food resources, or the presence of predators, is not available.
Treatment of telemetry data is also problematic. The quality of satellite position data can be variable owing to a combination of signal strength, the number of signals received by the satellite per pass, and the location of the sat-ellite (Goulet et al., 1999). To eliminate positions of poor quality, the data are often filtered (Austin et al., 2003). The choice of filter and data preparation may result in subjective bias in the telemetry data that is not readily quantifiable. For example, estimates of home range size are affected by auto-correlation between consecutive observations and by the total number of points used in the estimation procedure.
Differences between TEK and telemetry results increase with distance from the coast. In the EHB region, along the coast where Inuit hunt, home ranges from both datasets overlap extensively. Summer TEK and telemetry home range data show many aggregation areas. TEK indicates aggrega-tion areas exclusively in coastal regions throughout Nuna-vik, while the telemetry data indicate additional aggregation areas off the coast in EHB. Aerial surveys flown in eastern Hudson Bay have also detected large numbers of animals offshore, underlining the importance of offshore areas to the population (Smith et al., 1985; Kingsley, 2000; Hammill et al., 2004).
Winter TEK and telemetry home range estimates were sig-nificantly different. Winter TEK observations were limited because of limited daylight and limited hunting activity in the broken ice areas inhabited by beluga at this time. In fact, most winter observations were associated with winter entrapments, of the sort described in Heide-Jørgenson et al. (2002). How-ever, winter information from the satellite telemetry must also be considered as limited because transmitter failure during the winter months resulted in small sample sizes.
The catch statistics from 1974 to 2000 differed from TEK estimates, with the degree of difference varying by com-munity. our assumption was that the number of actual kills would correlate to the number of beluga sightings reported in a given season. Simple pair-wise comparisons showed a significant seasonal difference in 10 of 14 communities. The differences were attributed primarily to the recollective nature of the interview process; hunters were asked a ques-tion that pertained to a decade or more prior. Smith (1989)
BELUGA MOVEMENTS AND AGGREGATION PATTERNS • 23
has similarly noted that many communities exhibit incon-sistent data reporting in which times of sightings do not cor-relate with maximum harvests.
The survival of hunters and their ability to provide for the needs of their communities—food, clothing, and shelter—are evidence of the utility of their knowledge, particularly when it pertains directly to hunting success (Huntington, 1998). The frequency of kills in shallow-water areas and estuaries underlines the importance of applying this knowl-edge by taking advantage of beluga coastal and estuarine use to increase hunting success and minimize personal loss. However, when used alone for management decision making on a larger spatial scale, TEK is incomplete because of the coastal nature of hunter movements and the limited displace-ment of hunters from the community. Both TEK and telem-etry approaches are subject to sampling bias, which if not taken into consideration can have serious implications for the management and policy process. Scientists must remem-ber that the number of deployments represents only a small proportion of a population and reflects the age class, sex, and individual differences between animals in studied areas. Hunters must remember that their observations have spatial and temporal limitations, which can lead to erroneous inter-pretations as to the importance of habitat use. Although we have underlined the shortcomings in both approaches, we believe that management in Nunavik would benefit from the synthesis of TEK and scientific data aimed at providing a more comprehensive understanding of beluga ecology.
ACKNoWLEDGEMENTS
We would like to thank the Nunavik Inuit for allowing us access to the TEK database and the Makivik Corporation, which serves on behalf of the Nunavik Inuit as the repository of the data. Many thanks to the people of Umiujaq, Kuujjuaraapik, and Ivu-jivik who have assisted in tagging whales. The Department of Fisheries and oceans (Mont-Joli) has funded much of the beluga research in Nunavik, and the Nunavik Research Centre has facili-tated much of the planning and updating. Thanks also to Stas olpinski and Cheryl MacDonald for their comments on earlier drafts of this paper, and for the continued support from ArcticNet.
REFERENCES
Austin, D., McMillan, J.I., and Bowen, W.D. 2003. A three-stage algorithm for filtering erroneous ARGoS satellite locations. Marine Mammal Science 19(2):371–383.
Berkes, F., Colding, J., and Folke, C. 2000. Rediscovery of traditional ecological knowledge as adaptive management. Ecological Applications 10(5):1251–1262.
Delaune, M.G. 2000. XTools ArcView Extension (Version 10/18/2000). Salem: oregon Department of Forestry.
De March, B.G.E., and Maiers, L.D. 2001. Stock discrimination of belugas (Delphinapterus leucas) hunted in eastern Hudson Bay, northern Quebec, Hudson Strait, and Sanikiluaq (Belcher
Islands), using mitochondrial DNA and 15 nuclear microsatellite loci. Research Document 2001/050. ottawa: Canadian Science Advisory Secretariat, Fisheries and oceans Canada. 31 p.
De March, B.G.E., and Postma, L.D. 2003. Molecular genetic stock discrimination of belugas (Delphinapterus leucas) hunted in eastern Hudson Bay, northern Quebec, Hudson Strait, and Sanikiluaq (Belcher Islands), Canada, and comparisons to adjacent populations. Arctic 56(2):111–124.
Fancy, S.C., Pank, L.F., Douglas, D.C., Curby, C.H., Garner, G.W., Amstrup, S.C., and Regelin, W.L. 1988. Satellite telemetry: A new tool for wildlife research and management. U.S. Fish and Wildlife Service Resource Publication No. 172. 54 p.
Ferguson, M.A.D., and Messier, F. 1997. Collection and analysis of traditional ecological knowledge about a population of Arctic tundra caribou. Arctic 50(1):17–28.
Finley, K.J., Miller, G.W., Allard, M., Davis, R.A., and Evans, C.A. 1982. The belugas (Delphinapterus leucas) of northern Quebec: Distribution, abundance, stock identity, catch history and management. Canadian Technical Report of Fisheries and Aquatic Sciences 1123. 57 p.
Goulet, A.M., Hammill, M.o., and Barette, C. 1999. Quality of satellite telemetry locations of gray seals (Halichoerus grypus). Marine Mammal Science 15:589–594.
Hammill, M.o., Lesage, V., Gosselin, J.-F., Bourdages, H., De March, B.G.E., and Kingsley, M.C.S. 2004. Evidence for a decline in Northern Quebec (Nunavik) belugas. Arctic 57(2): 183–195.
Hammill, M.o., Lesage, V., and Gosselin, J.-F. 2005. Abundance of Eastern Hudson Bay belugas. Research Document 2005/010. ottawa: Canadian Science Advisory Secretariat, Fisheries and oceans Canada. 21 p.
Heide-Jørgensen, M.P., Richard, P., Ramsay, M., and Akeeagok, S. 2002. Three recent ice entrapments of Arctic cetaceans in West Greenland and the eastern Canadian High Arctic. NAMMCo Scientific Publications 4:143–148.
Hooge, P.N., Eichenlaub, W., and Solomon, E. 1998. The animal movement program. Anchorage: Alaska Science Center – Biological Science office, U.S. Geological Survey.
Huntington, H.P. 1998. observations on the utility of the semi-directive interview for documenting traditional ecological knowledge. Arctic 51(3):237–242.
———. 2000. Using traditional ecological knowledge in science: Methods and applications. Ecological Applications 10(5): 1270–1274.
———. 2004. Traditional knowledge and satellite tracking as complementary approaches to ecological understanding. Envi-ronmental Conservation 31(3):177–180.
Kemp, W.B., and Brooke, L.F. 1995. Towards information self-sufficiency: The Nunavik Inuit gather information on ecology and land use. Cultural Survival Quarterly 18(4):25–28.
Kingsley, M.C.S. 2000. Numbers and distribution of beluga whales, Delphinapterus leucas, in James Bay and Ungava Bay in Canada during the summer of 1993. Fishery Bulletin 98:736–747.
Kingsley, M.C.S., Gosselin, S., and Sleno, G.A. 2001. Movements and dive behavior of belugas in northern Quebec. Arctic 54(3):262–275.
24 • A.E. LEWIS et al.
Krebs, C.J. 1999. Ecological methodology, 2nd ed. Menlo Park, California: Addison, Wesley, Longman. 620 p.
Krupnik, I., and Jolly, D., eds. 2002. The earth is faster now: Indigenous observations of Arctic environmental change. Fairbanks, Alaska: Arctic Research Consortium of the United States.
Lesage, V., Doidge, D.W., and Fibich, R. 2001. Harvest statistics for beluga whales in Nunavik, 1974–2000. Research Document 2001/022. Canadian Science Advisory Secretariat, Fisheries and oceans Canada.
Manly, B.F.J., McDonald, L.L., and Thomas, D.L. 1993. Resource selection by animals: Statistical design and analysis for field studies. London: Chapman and Hall.
McLaren, I.A. 1958. The biology of the ringed seal (Phoca hispida) in the eastern Canadian Arctic. Fisheries Research Board of Canada Bulletin 118.
Moller, H., Berkes, F., o’Brian Lyver, P., and Kislalioglu, M. 2004. Combining science and traditional ecological knowledge: Monitoring populations for co-management. Ecology and Society 9(3):2. [online] URL: http://www.ecologyandsociety.org/vol9/iss3/art2.
Morisita, M. 1959. Measuring of interspecific association and similarity between communities. Memoirs of the Faculty of Science, Kyushu University, Series E (Biology) 3:65–80.
Natural Resources Canada. 2005. The atlas of Canada. ottawa: Centre for Remote Sensing, Geoaccess Division. http://atlas.nrcan.gc.ca/site/english/index.html.
Nichols, T., Berkes, F., Jolly, D., Snow, N.B., and the Community of Sachs Harbour. 2004. Climate change and sea ice: Local observations from the Canadian Western Arctic. Arctic 57(1):68–79.
Pierotti, R., and Wildcat, D. 2000. Traditional ecological knowledge: The third alternative (commentary). Ecological Applications 10(5):1333–1340.
Reeves, R.R., and Mitchell, E. 1989. Status of white whales, Delphinapterus leucas, in Ungava Bay and eastern Hudson Bay. Canadian Field-Naturalist 103:220–239.
Richard, P.R., orr, J.R., and Barber, D.G. 1990. The distribution and abundance of belugas, Delphinapterus leucas, in eastern Canadian Subarctic waters: A review and update. In: Smith,
T.G., St. Aubin, D.J., and Geraci, J.R., eds. Advances in research on the beluga whale, Delphinapterus leucas. Canadian Bulletin of Aquatic Sciences 224. 23–38.
Richard, P.R., Heide-Jørgensen, M.P., and St. Aubin, D. 1997. Fall movements of belugas (Delphinapterus leucas) with satellite-linked transmitters in Lancaster Sound, Jones Sound, and northern Baffin Bay. Arctic 51(1):5–16.
Riedlinger, D., and Berkes, F. 2001. Contributions of traditional knowledge to understanding climate change in the Canadian Arctic. Polar Record 37(203):315–328.
Seaman, D.E., and Powell, R.A. 1996. An evaluation of the accuracy of kernel density estimators for home range analysis. Ecology 77(7):2075–2085.
Smith, T.G. 1989. Seasonal movements and migrations of belugas, Delphinapterus leucas, along the Nunavik coastlines: Evidence from harvest statistics, game reports, local knowledge and scientific studies. Available from the Institut Maurice Lamontagne, Box 1000, Mont Joli, Quebec G5H 3Z4. 31 p.
———. 2004. Beluga whale populations in Canada. CoSEWIC Status Report, February 2004. http://www.sararegistry.gc.ca/document/dspDocument_e.cfm?documentID=410.
Smith, T.G., and Hammill, M.o. 1987. Population estimates of white whale, Delphinapterus leucas, in James Bay, eastern Hudson Bay and Ungava Bay. Canadian Journal of Fisheries and Aquatic Sciences 43:1982–1987.
Smith, T.G., and Stirling, I. 1975. The breeding habitat of the ringed seal (Phoca hispida): The birth lair and associated structures. Canadian Journal of Zoology 53:1297–1305.
Smith, T.G., Hammill, M.o., Burrage, D.J., and Sleno, G.A. 1985. Distribution and abundance of belugas, Delphinapterus leucas, and narwhals, Monodon monoceros, in the Canadian High Arctic. Canadian Journal of Fisheries and Aquatic Sciences 42:1653–1663.
Usher, P.J. 2000. Traditional ecological knowledge in environmental assessment and management. Arctic 53(2):183–193.
Wenzel, G.W. 1999. Traditional ecological knowledge and Inuit: Reflections on TEK research and ethics. Arctic 52(2): 113–124.
Zar, J.H. 1999. Biostatistical analysis. Upper Saddle River, New Jersey: Prentice Hall.