Embed Size (px)
Citation preview
HUDSON RIVER WATERSHED 2002 WATER QUALITY ASSESSMENT REPORT
COMMONWEALTH OF MASSACHUSETTS EXECUTIVE OFFICE OF ENVIRONMENTAL AFFAIRS
ROBERT W. GOLLEDGE, JR, SECRETARY MASSACHUSETTS DEPARTMENT OF ENVIRONMENTAL PROTECTION
ARLEEN O’DONNELL, ACTING COMMISSIONER BUREAU OF RESOURCE PROTECTION
GLENN HAAS, ACTING ASSISTANT COMMISSIONER DIVISION OF WATERSHED MANAGEMENT
GLENN HAAS, DIRECTOR
NOTICE OF AVAILABILITY
LIMITED COPIES OF THIS REPORT ARE AVAILABLE AT NO COST BY WRITTEN REQUEST TO:
MASSACHUSETTS DEPARTMENT OF ENVIRONMENTAL PROTECTION DIVISION OF WATERSHED MANAGEMENT
627 MAIN STREET WORCESTER, MA 01608
This report is also available from the MassDEP’s home page on the World Wide Web at: http://www.mass.gov/dep/water/resources/wqassess.htm Furthermore, at the time of first printing, eight copies of each report published by this office are submitted to the State Library at the State House in Boston; these copies are subsequently distributed as follows: • On shelf; retained at the State Library (two copies); • Microfilmed retained at the State Library; • Delivered to the Boston Public Library at Copley Square; • Delivered to the Worcester Public Library; • Delivered to the Springfield Public Library; • Delivered to the University Library at UMass, Amherst; • Delivered to the Library of Congress in Washington, D.C. Moreover, this wide circulation is augmented by inter-library loans from the above-listed libraries. For example a resident in Marlborough can apply at their local library for loan of any MassDEP/DWM report from the Worcester Public Library. A complete list of reports published since 1963 is updated annually and printed in July. This report, entitled, “Publications of the Massachusetts Division of Watershed Management – Watershed Planning Program, 1963-(current year)”, is also available by writing to the Division of Watershed Management (DWM) in Worcester. Cover Photo: North Branch Hoosic River, upstream from Henderson Road, Clarksburg Photo Credit: Katie O’Brien-Clayton, DWM, 2002
DISCLAIMER
References to trade names, commercial products, manufacturers, or distributors in this report constituted neither endorsement nor recommendations by the Division of Watershed Management for use.
HUDSON RIVER WATERSHED
2002 WATER QUALITY ASSESSMENT REPORT
Prepared by:
Katie A. O’Brien-Clayton
Department of Environmental Protection Division of Watershed Management
Report Number:
11/12/13-AC-2
DWM Control Number: 139.5
Massachusetts Department of Environmental Protection Division of Watershed Management
Worcester, Massachusetts
June 2006
ACKNOWLEDGEMENTS The Massachusetts watershed approach is a collaborative effort between state and federal environmental agencies, municipal agencies, citizens, non-profit groups, businesses and industries in the watershed. We would like to thank Tom O’Brien (formerly of the Executive Office of Environmental Affairs) and the Hoosic River Watershed Association for their efforts to facilitate that process. Data and information used in this report were provided in part by the following agencies and organizations:
Federal • Environmental Protection Agency (EPA) • United States Geological Survey (USGS)
− Water Resources Division • United States Army Corps of Engineers (ACOE) • United States Fish and Wildlife Service (USFWS) • National Oceanic and Atmospheric Administration (NOAA)
State
• Massachusetts Department of Environmental Protection (MassDEP): − Bureau of Strategic Policy and Technology, Wall Experiment Station (WES) − Bureau of Resource Protection (BRP) − Bureau of Waste Prevention (BWP) − Bureau of Waste Site Cleanup (BWSC)
• Massachusetts Department of Public Health (MA DPH) • Department of Fish and Game (MA DFG)
− Division of Fisheries and Wildlife − Riverways Program − Public Access Board
• Massachusetts Department of Conservation and Recreation, Division of State Parks and Recreation (MA DCR)
Regional
• Hoosic River Watershed Association (HooRWA) • Berkshire Regional Planning Commission (BRPC)
Much appreciation is also extended to several MassDEP employees for their contributions: Jim Bumgartner, Deidre Cabral, Richard Chase, Ken Dominick, John Fiorentino, Richard McVoy, Bob Nuzzo, Jane Ryder, and Arthur Screpetis. It is impossible to thank everyone who contributed to the assessment report process: field, laboratory, data management, writing, editing, and graphics, as well as meetings, phone calls, and many e-mails. All of these contributions are very much appreciated. Cover photo credits: Katie O’Brien-Clayton, DWM, 2002
Hudson River Basin 2002 W ater Quality Assessment Report i 11wqar06.doc DWM CN 139.5
TABLE OF CONTENTS Table of Contents ...................................................................................................................................... i List of Appendices .................................................................................................................................... ii List of Tables and Figures ......................................................................................................................... ii List of Acronyms and Abbreviations ...........................................................................................................iii List of Units ..............................................................................................................................................iii Table of Fish Scientific Names ..................................................................................................................iv Executive Summary .................................................................................................................................. v Introduction .............................................................................................................................................. 1 Massachusetts Integrated List of Waters .................................................................................................... 2 Hudson River Watershed Description......................................................................................................... 3 Hoosic River {South branch} Subwatershed ............................................................................................... 7
Berkshire Pond (Segment MA11001)................................................................................................ 12 Cheshire Reservoir, South Basin (Segment MA11019) ...................................................................... 13 Cheshire Reservoir, Middle Basin (Segment MA11018)..................................................................... 15 Cheshire Reservoir, North Basin (Segment MA11002)....................................................................... 17 Hoosic River (Segment MA11-03) .................................................................................................... 20 Thunder Brook (Segment MA11-10) ................................................................................................. 25 Kitchen Brook (Segment MA11-24) .................................................................................................. 26 South Brook (Segment MA11-15) ..................................................................................................... 28 McDonald Brook (Segment MA11-16).............................................................................................. 30 Bassett Brook (Segment MA11-17) .................................................................................................. 32 Dry Brook (Segment MA11-13) ........................................................................................................ 34 Pecks Brook (Segment MA11-18) .................................................................................................... 37 Tophet Brook (Segment MA11-19) ................................................................................................... 40 Hoosic River (Segment MA11-04) .................................................................................................... 43 Windsor Lake (Segment MA11016) .................................................................................................. 47
North Branch Hoosic River Subwatershed................................................................................................ 48 North Branch Hoosic River (Segment MA11-01)................................................................................ 50 North Branch Hoosic River (Segment MA11-01)................................................................................ 51 North Branch Hoosic River (Segment MA11-02)................................................................................ 54 Mauserts Pond (Segment MA11009)................................................................................................ 56
Hoosic River Subwatershed .................................................................................................................... 57 Hoosic River (Segment MA11-05) .................................................................................................... 61 Notch Reservoir (Segment MA11011)............................................................................................... 65 Mount Williams Reservoir (Segment MA11010)................................................................................. 66 Paull Brook (Segment MA11-20) ...................................................................................................... 67 Hemlock Brook (Segment MA11-09)................................................................................................. 70 Broad Brook (Segment MA11-23)..................................................................................................... 73
Green River Subwatershed ..................................................................................................................... 74 Green River (Segment MA11-06) ..................................................................................................... 77 East Branch Green River (Segment MA11-21) .................................................................................. 81 West Branch Green River (Segment MA11-22) ................................................................................. 82
The Kinderkook Subwatershed ................................................................................................................ 84 Kinderhook Creek (Segment MA12-01) ............................................................................................ 85
The Bashbish Subwatershed................................................................................................................... 87 Literature Cited....................................................................................................................................... 88
Hudson River Basin 2002 W ater Quality Assessment Report ii 11wqar06.doc DWM CN 139.5
LIST OF APPENDICES
Appendix A Assessment Methodology for Evaluating Designated Use Status of Massachusetts Surface Waters ............................................................................................A1
Appendix B Hudson River Basin 2002 Water Quality Technical Memorandum TM -11-06 ...........................B1 Appendix C DWM 2002 Hudson River Basin Lakes Survey Data .............................................................C1 Appendix D The Hudson Watershed 2002 Biological Assessment ............................................................D1 Appendix E Summary of NPDES and WMA Permitting Information, Hudson River.....................................E1 Appendix F Fish Toxics Monitoring in the Hudson River Basin (2002) ....................................................... F1 Appendix G MASSDEP Grant and Loan Programs ..................................................................................G1 Appendix H 21E Tier Classified Sites in the Hudson River Basin ..............................................................H1 Appendix I Solid Waste Facilities in the Hudson River Basin..................................................................... I1
LIST OF TABLES AND FIGURES
Table 1: Hudson River Watershed Designated Use Status Summary 1997 and 2002 ................................ xvii Figure 1. Hoosic River Subwatershed Aquatic Life Use Assessment Summary Map………………………....... xi Figure 2. Hoosic River Subwatershed Primary Contact Recreational Use Assessment Summary Map…. .....xiii Figure 3. Hoosic River Subwatershed Secondary Contact Recreational Use and Aesthetics Use.....................
Assessment Summary Map. .......................................................................................................xv Figure 4. Upper Hudson River Watershed Location showing the Hoosic River, Kinderhook, and Bashbish .......
subwatersheds locations ............................................................................................................. 3 Figure 5. Hoosic River Subwatershed Stream Network ............................................................................... 5 Figure 6. Hoosic River {South Branch} Subwatershed ................................................................................. 9 Figure 7. Massachusetts Portion of the North Branch Hoosic River Subwatershed...................................... 50 Figure 8. Hoosic River Subwatershed ...................................................................................................... 60 Figure 9. Green River Subwatershed………………………………………………………………………………. .. 76 Figure 10. Kinderhook Subwatershed Stream Network ............................................................................. 84 Figure 11. Bashbish Subwatershed Stream Network ................................................................................. 87
Hudson River Basin 2002 W ater Quality Assessment Report iii 11wqar06.doc DWM CN 139.5
LIST OF ACRONYMS AND ABBREVIATIONS 7Q10’………..Lowest mean flow for seven consecutive days to be
expected once in ten years ACOE ...........Army Corps of Engineers ACOP………..Administrative Consent Order With Penalty ADB.............. Assessment Database BRP………….Bereau of Resource Protection BMP.............. Best Management Practices BRPC ........... Berkshire Regional Planning Commission BWP…………Bereau of Waste Prevention BWSC……….Bureau of Waste Site Cleanup CERCLA ....... Comprehensive Environmental Response,
Compensation, and Liability Act C-NOEC ....... Chronic No Observe Effect Concentration CWA............. Clean Water Act DDE.............. Dichlorodipheyldichloroethylene DMR ............. Discharge Monitoring Report DO................ Dissolved Oxygen DPW ............ Department of Public Works DWM............. Division of Watershed Management DWP…………Drinking Water Program EOEA ........... Executive Office of Environmental Affairs EPA .............. United States Environmental Protection Agency EMS…………Environmental Management System FERC............ Federal Energy Regulatory Commission HooRWA ...... Hoosic River Watershed Association HWQD ......... Hoosac Water Quality District LC50 .............. Lethal concentration to 50% of the test organisms MA DCR Massachusetts Department of Conservation and
Recreation
MassDEP...... Massachusetts Department of Environmental
Protection MA DFG........ Department of Fish and Game (formerly the
Department of Fisheries, Wildlife and Environmental Law Enforcement)
MassGIS ....... Massachusetts Geographic Information System MA DPH........ Massachusetts Department of Public Health MDL .............. Method Detection Limit NOAA………..National Oceanic and Atmospheric Adminsitration NPDES ......... National Pollutant Discharge Elimination System PAH………….Polyaromatic Hydrocarbons PALIS ........... Pond and Lake Information System PCB .............. Polychlorinated Biphenyl QAPP............ Quality Assurance Project Plan RBP.............. Rapid Bioassessment Protocol SARIS ........... Stream and River Inventory System SMI............... Specialty Minerals Inc. SWAP……….Surface Water Assessment Program SWQS........... Surface Water Quality Standards TMDL............ Total Maximum Daily Load TOXTD.......... MassDEP DWM Toxicity Testing Database TSS .............. Total Suspended Solids USGS ........... United States Geological Survey WBID ............ Waterbody Identification Code WBS ............. Waterbody System Database WMA............. Water Management Act WWTP .......... Wastewater treatment plant VOC ............. Volatile Organic Compound
LIST OF UNITS cfs.....................cubic feet per second cfu.....................colony forming unit gal/min…………gallons per minute GPD..................gallons per day mg/kg................milligram per kilogram MGD .................million gallons per day mg/L..................milligram per liter NTU..................nephelometric turbidity units ppm...................parts per million SU ....................standard units µS/cm...............microsiemens per centimeter
Hudson River Basin 2002 W ater Quality Assessment Report iv 11wqar06.doc DWM CN 139.5
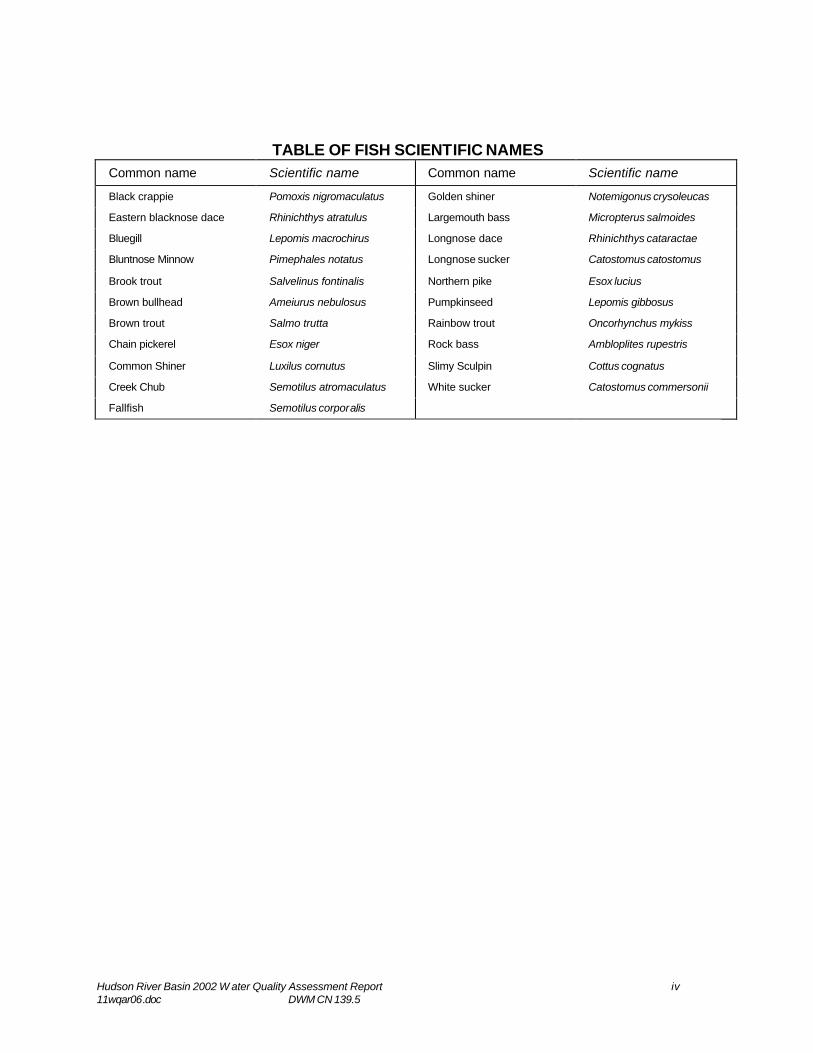
TABLE OF FISH SCIENTIFIC NAMES Common name Scientific name Common name Scientific name
Black crappie Pomoxis nigromaculatus Golden shiner Notemigonus crysoleucas
Eastern blacknose dace Rhinichthys atratulus Largemouth bass Micropterus salmoides
Bluegill Lepomis macrochirus Longnose dace Rhinichthys cataractae
Bluntnose Minnow Pimephales notatus Longnose sucker Catostomus catostomus
Brook trout Salvelinus fontinalis Northern pike Esox lucius
Brown bullhead Ameiurus nebulosus Pumpkinseed Lepomis gibbosus
Brown trout Salmo trutta Rainbow trout Oncorhynchus mykiss
Chain pickerel Esox niger Rock bass Ambloplites rupestris
Common Shiner Luxilus cornutus Slimy Sculpin Cottus cognatus
Creek Chub Semotilus atromaculatus White sucker Catostomus commersonii
Fallfish Semotilus corporalis
Hudson River Basin 2002 W ater Quality Assessment Report v 11wqar06.doc DWM CN 139.5
EXECUTIVE SUMMARY HUDSON WATERSHED 2002
WATER QUALITY ASSESSMENT REPORT
The Hudson River Watershed encompasses 13,400 square miles in New York, Massachusetts, and Vermont (Hudson Basin River Watch undated). In Massachusetts, the watershed encompasses 202 square miles and is divided into three subwatersheds: the Hoosic River subwatershed, the Kinderhook subwatershed, and the Bashbish subwatershed. This assessment report presents a summary of current water quality data and information used to assess the status of the designated uses as defined in the Massachusetts Surface Water Quality Standards (SWQS) for the Hudson River Watershed for reporting to EPA in the Integrated List of Waters, updates the assessments from the 1997 Water Quality Assessment Report (Kennedy and Weinstein 2000), and provides basic information that can be used to focus resource protection and remediation activities later in the watershed management planning process. The SWQS designate the most sensitive uses for which surface waters in the Commonwealth shall be protected. The designated uses, where applicable, include: Aquatic Life, Fish Consumption, Drinking Water, Shellfish Harvesting, Primary and Secondary Contact Recreation and Aesthetics. The assessment of current water quality conditions provides a determination of whether or not each designated use of a particular water body is supported or impaired. When too little current data/information exist or quality-assured data are unavailable, the use is not assessed. However, if there is some indication of water quality impairment, which is not considered to be naturally occurring, the use is identified with an “Alert Status”. It is important to note that not all waters are assessed. The status of the designated uses of these unassessed waters has never been reported to the EPA in the Commonwealth’s Summary of Water Quality Report (305(b) Report) nor is information on these waters maintained by the Massachusetts Department of Environmental Protection in the Water Body System (WBS) or Assessment Database (ADB). These small and/or unnamed rivers and lakes have never been assessed. In 2002 the Massachusetts Department of Environmental Protection (MassDEP), Division of Watershed Management (DWM), conducted water quality sampling, baseline lakes sampling, macroinvertebrate and fish population community assessments, and fish toxics monitoring in the Hudson River Watershed under Environmental Protection Agency (EPA) approved Quality Assurance Project Plans (QAPPs). The water quality monitoring data are available in a technical memorandum (O’Brien-Clayton 2005, Appendix B). The fish toxics data are available in the technical memorandum entitled 2002 Fish Toxics Monitoring Public Request and Year 2 Watershed Surveys (Maietta et al. 2004, Appendix E). The lakes data are available in the technical memorandum entitled 2002 Baseline Lakes Survey Tech Memo (Mattson in preparation, Appendix C). The macroinvertebrate data are presented in a technical memorandum (Nuzzo 2006, Appendix D). The data generated by DWM, together with other sources of information, were utilized to assess the status of water quality conditions of rivers and lakes in the Hudson River Watershed in accordance with EPA’s and MassDEP’s use assessment methods. For informal purposes, a table at the end of this section summarizes the 1997 assessments and the 2002 assessments (Table 1). It is important to note that assessment methodologies have changed and a direct comparison between the assessments is not possible. There are a total of 61 freshwater rivers, streams, or brooks (the term “rivers” will hereafter be used to include all) in the Massachusetts portion of the Hudson River Watershed. This report includes information on 23 of these rivers, including the mainstem Hoosic River, North Branch Hoosic River, Green River, and Hemlock Brook in the Hoosic River subwatershed and Kinderhook Creek-the only segment included in the Kinderhook subwatershed. No segments have ever been assessed in the Bashbish subwatershed, although the majority of the subwatershed is protected in state forests and reservations. The assessed rivers represent approximately 65% (95.8 river miles) of an estimated 146.7 river miles in the Hudson Watershed. The remaining rivers are small, have never been assessed, and are not included in this report. This report also includes information on 8 of the 28 lakes, ponds, or impoundments (the term
Hudson River Basin 2002 W ater Quality Assessment Report vi 11wqar06.doc DWM CN 139.5
Aquatic Life Use Assessment-Rivers (Total length included in report – 95.8 miles)
Hoosic River Subwatershed (90.3 miles)
Ø Support – 74.4 miles (82%) Ø Impaired – 7.9 miles (9%) Ø Not Assessed –8.0 miles (9%)
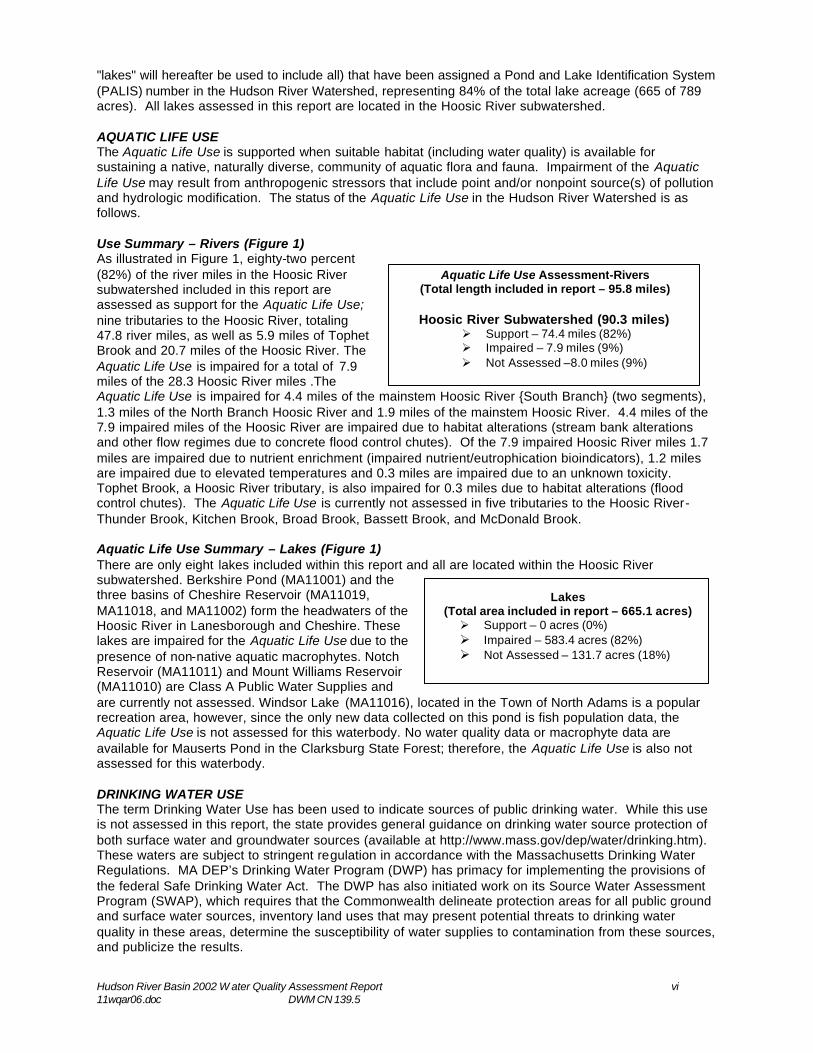
"lakes" will hereafter be used to include all) that have been assigned a Pond and Lake Identification System (PALIS) number in the Hudson River Watershed, representing 84% of the total lake acreage (665 of 789 acres). All lakes assessed in this report are located in the Hoosic River subwatershed. AQUATIC LIFE USE The Aquatic Life Use is supported when suitable habitat (including water quality) is available for sustaining a native, naturally diverse, community of aquatic flora and fauna. Impairment of the Aquatic Life Use may result from anthropogenic stressors that include point and/or nonpoint source(s) of pollution and hydrologic modification. The status of the Aquatic Life Use in the Hudson River Watershed is as follows.
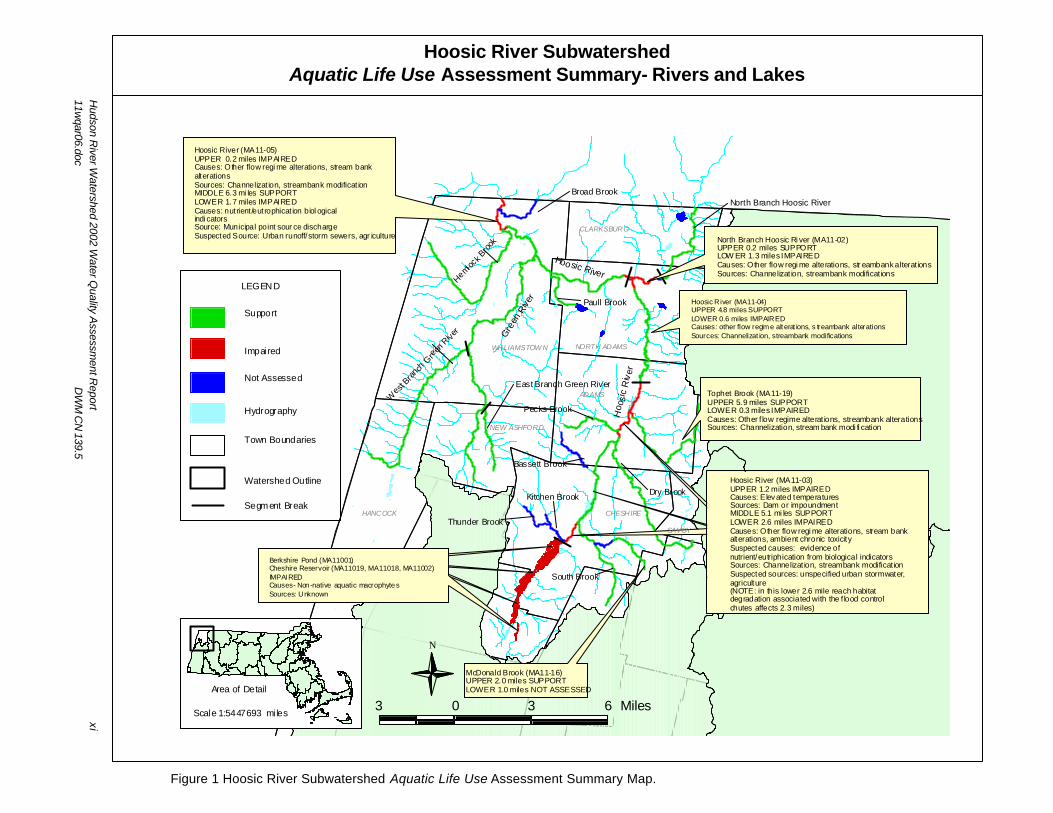
Use Summary – Rivers (Figure 1) As illustrated in Figure 1, eighty-two percent (82%) of the river miles in the Hoosic River subwatershed included in this report are assessed as support for the Aquatic Life Use; nine tributaries to the Hoosic River, totaling 47.8 river miles, as well as 5.9 miles of Tophet Brook and 20.7 miles of the Hoosic River. The Aquatic Life Use is impaired for a total of 7.9 miles of the 28.3 Hoosic River miles .The Aquatic Life Use is impaired for 4.4 miles of the mainstem Hoosic River {South Branch} (two segments), 1.3 miles of the North Branch Hoosic River and 1.9 miles of the mainstem Hoosic River. 4.4 miles of the 7.9 impaired miles of the Hoosic River are impaired due to habitat alterations (stream bank alterations and other flow regimes due to concrete flood control chutes). Of the 7.9 impaired Hoosic River miles 1.7 miles are impaired due to nutrient enrichment (impaired nutrient/eutrophication bioindicators), 1.2 miles are impaired due to elevated temperatures and 0.3 miles are impaired due to an unknown toxicity. Tophet Brook, a Hoosic River tributary, is also impaired for 0.3 miles due to habitat alterations (flood control chutes). The Aquatic Life Use is currently not assessed in five tributaries to the Hoosic River- Thunder Brook, Kitchen Brook, Broad Brook, Bassett Brook, and McDonald Brook. Aquatic Life Use Summary – Lakes (Figure 1) There are only eight lakes included within this report and all are located within the Hoosic River subwatershed. Berkshire Pond (MA11001) and the three basins of Cheshire Reservoir (MA11019, MA11018, and MA11002) form the headwaters of the Hoosic River in Lanesborough and Cheshire. These lakes are impaired for the Aquatic Life Use due to the presence of non-native aquatic macrophytes. Notch Reservoir (MA11011) and Mount Williams Reservoir (MA11010) are Class A Public Water Supplies and are currently not assessed. Windsor Lake (MA11016), located in the Town of North Adams is a popular recreation area, however, since the only new data collected on this pond is fish population data, the Aquatic Life Use is not assessed for this waterbody. No water quality data or macrophyte data are available for Mauserts Pond in the Clarksburg State Forest; therefore, the Aquatic Life Use is also not assessed for this waterbody. DRINKING WATER USE The term Drinking Water Use has been used to indicate sources of public drinking water. While this use is not assessed in this report, the state provides general guidance on drinking water source protection of both surface water and groundwater sources (available at http://www.mass.gov/dep/water/drinking.htm). These waters are subject to stringent regulation in accordance with the Massachusetts Drinking Water Regulations. MA DEP’s Drinking Water Program (DWP) has primacy for implementing the provisions of the federal Safe Drinking Water Act. The DWP has also initiated work on its Source Water Assessment Program (SWAP), which requires that the Commonwealth delineate protection areas for all public ground and surface water sources, inventory land uses that may present potential threats to drinking water quality in these areas, determine the susceptibility of water supplies to contamination from these sources, and publicize the results.
Lakes (Total area included in report – 665.1 acres) Ø Support – 0 acres (0%) Ø Impaired – 583.4 acres (82%) Ø Not Assessed – 131.7 acres (18%)
Hudson River Basin 2002 W ater Quality Assessment Report vii 11wqar06.doc DWM CN 139.5
Fish Consumption Use Assessment-Rivers (Total length included in report – 95.8 miles)
Hoosic River Subwatershed (90.3 miles)
Ø Impaired – 8 miles (9%) Ø Not Assessed –82.3 miles (91%)
Lakes (Total area included in report – 665.1 acres)
Not Assessed – 715.1 acres (100%)
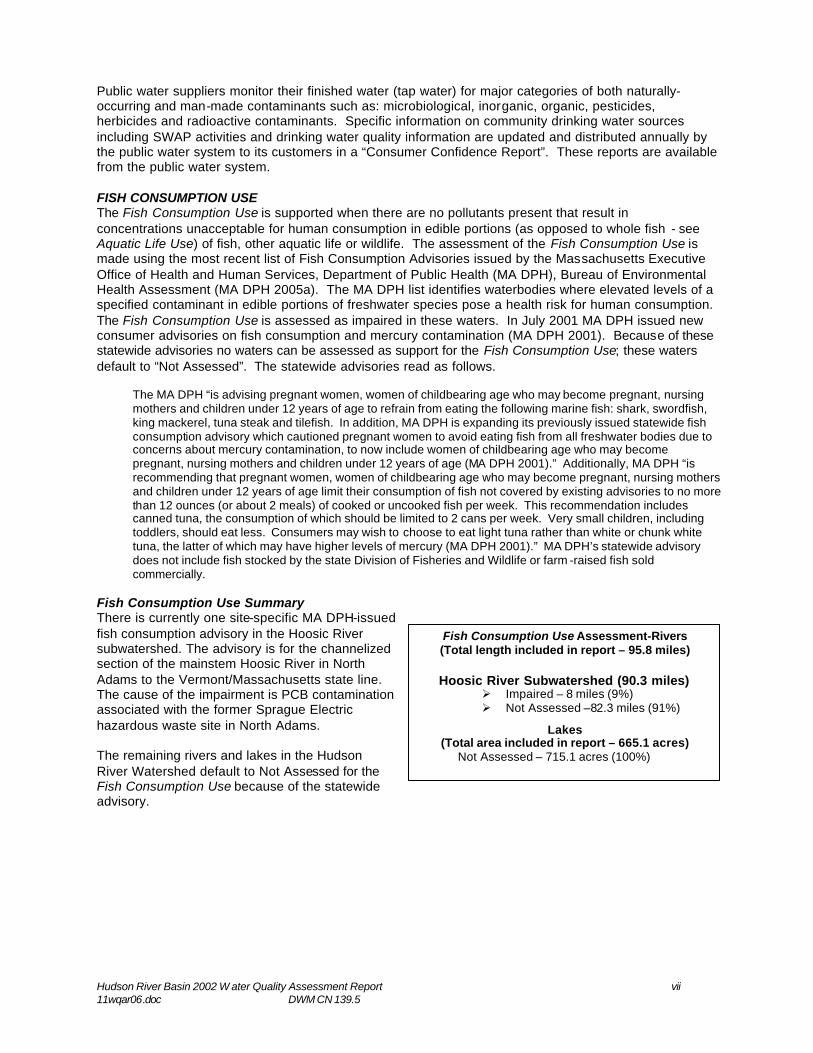
Public water suppliers monitor their finished water (tap water) for major categories of both naturally-occurring and man-made contaminants such as: microbiological, inorganic, organic, pesticides, herbicides and radioactive contaminants. Specific information on community drinking water sources including SWAP activities and drinking water quality information are updated and distributed annually by the public water system to its customers in a “Consumer Confidence Report”. These reports are available from the public water system. FISH CONSUMPTION USE The Fish Consumption Use is supported when there are no pollutants present that result in concentrations unacceptable for human consumption in edible portions (as opposed to whole fish - see Aquatic Life Use) of fish, other aquatic life or wildlife. The assessment of the Fish Consumption Use is made using the most recent list of Fish Consumption Advisories issued by the Massachusetts Executive Office of Health and Human Services, Department of Public Health (MA DPH), Bureau of Environmental Health Assessment (MA DPH 2005a). The MA DPH list identifies waterbodies where elevated levels of a specified contaminant in edible portions of freshwater species pose a health risk for human consumption. The Fish Consumption Use is assessed as impaired in these waters. In July 2001 MA DPH issued new consumer advisories on fish consumption and mercury contamination (MA DPH 2001). Because of these statewide advisories no waters can be assessed as support for the Fish Consumption Use; these waters default to “Not Assessed”. The statewide advisories read as follows.
The MA DPH “is advising pregnant women, women of childbearing age who may become pregnant, nursing mothers and children under 12 years of age to refrain from eating the following marine fish: shark, swordfish, king mackerel, tuna steak and tilefish. In addition, MA DPH is expanding its previously issued statewide fish consumption advisory which cautioned pregnant women to avoid eating fish from all freshwater bodies due to concerns about mercury contamination, to now include women of childbearing age who may become pregnant, nursing mothers and children under 12 years of age (MA DPH 2001).” Additionally, MA DPH “is recommending that pregnant women, women of childbearing age who may become pregnant, nursing mothers and children under 12 years of age limit their consumption of fish not covered by existing advisories to no more than 12 ounces (or about 2 meals) of cooked or uncooked fish per week. This recommendation includes canned tuna, the consumption of which should be limited to 2 cans per week. Very small children, including toddlers, should eat less. Consumers may wish to choose to eat light tuna rather than white or chunk white tuna, the latter of which may have higher levels of mercury (MA DPH 2001).” MA DPH’s statewide advisory does not include fish stocked by the state Division of Fisheries and Wildlife or farm -raised fish sold commercially.
Fish Consumption Use Summary There is currently one site-specific MA DPH-issued fish consumption advisory in the Hoosic River subwatershed. The advisory is for the channelized section of the mainstem Hoosic River in North Adams to the Vermont/Massachusetts state line. The cause of the impairment is PCB contamination associated with the former Sprague Electric hazardous waste site in North Adams. The remaining rivers and lakes in the Hudson River Watershed default to Not Assessed for the Fish Consumption Use because of the statewide advisory.
Hudson River Basin 2002 W ater Quality Assessment Report viii 11wqar06.doc DWM CN 139.5
Primary Contact Recreational Use Assessment-Rivers (Total length included in report – 95.8 miles)
Hoosic River Subwatershed (90.3 miles)
Ø Support – 40.4 miles (45%) Ø Impaired – 29.7 miles (33%) Ø Not Assessed –11.3 miles (13%)
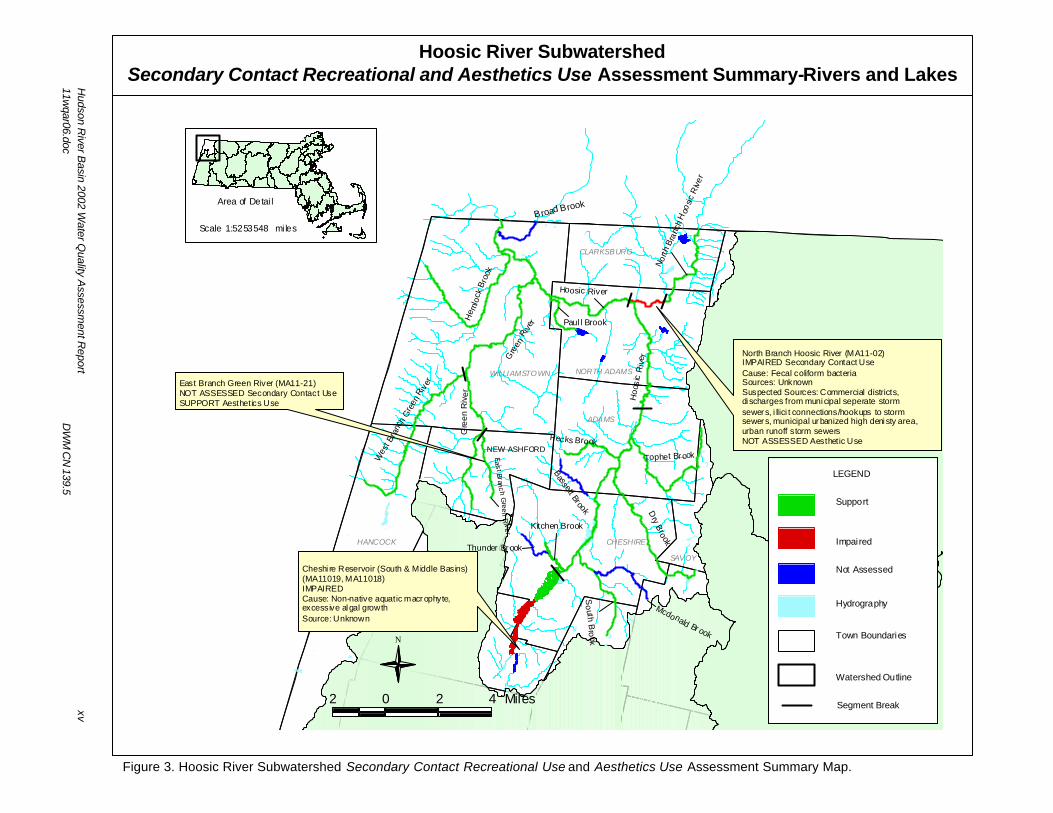
Secondary Contact Recreational Use Assessment-Rivers
(Total length included in report – 95.8 miles)
Hoosic River Subwatershed (90.3 miles) Ø Support – 77.5 miles (86%) Ø Impaired – 1.5 miles (2%) Ø Not Assessed –11.3 miles (13%)
Aesthetics Use Assessment-Rivers (Total length included in report – 95.8 miles)
Hoosic River Subwatershed (90.3 miles)
Ø Support – 80.2 miles (89%) Ø Impaired – 0 miles (0%) Ø Not Assessed –10.1 miles (11%)
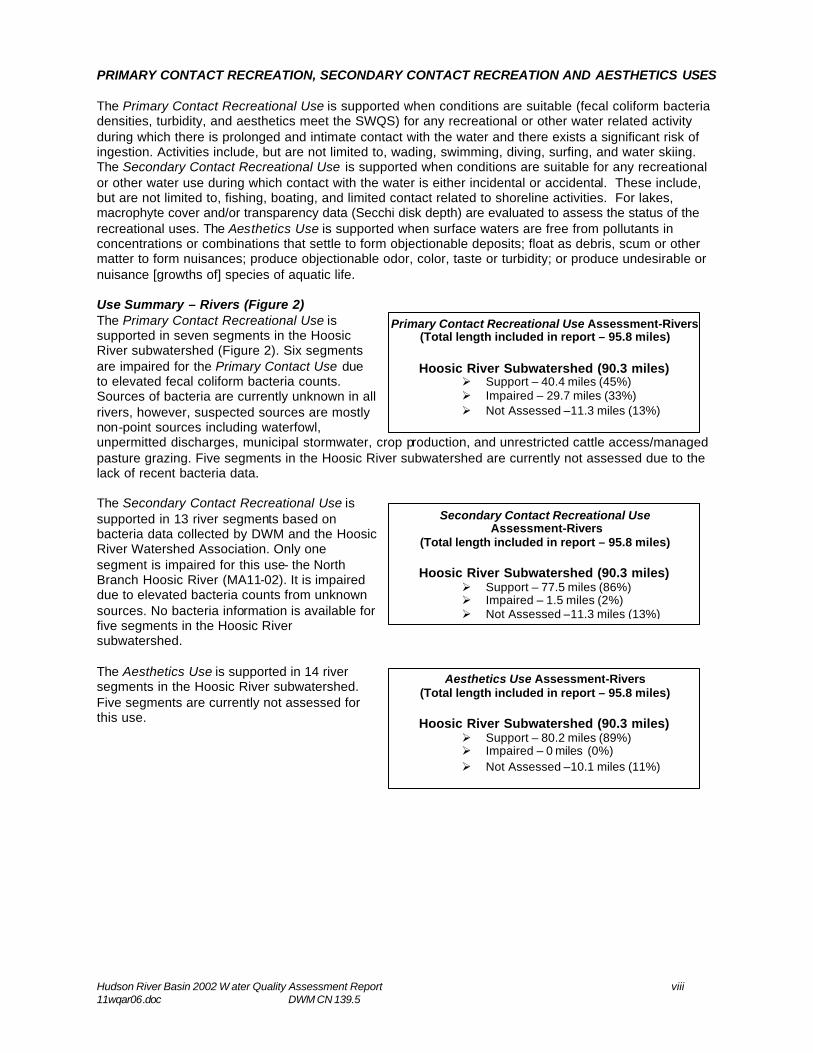
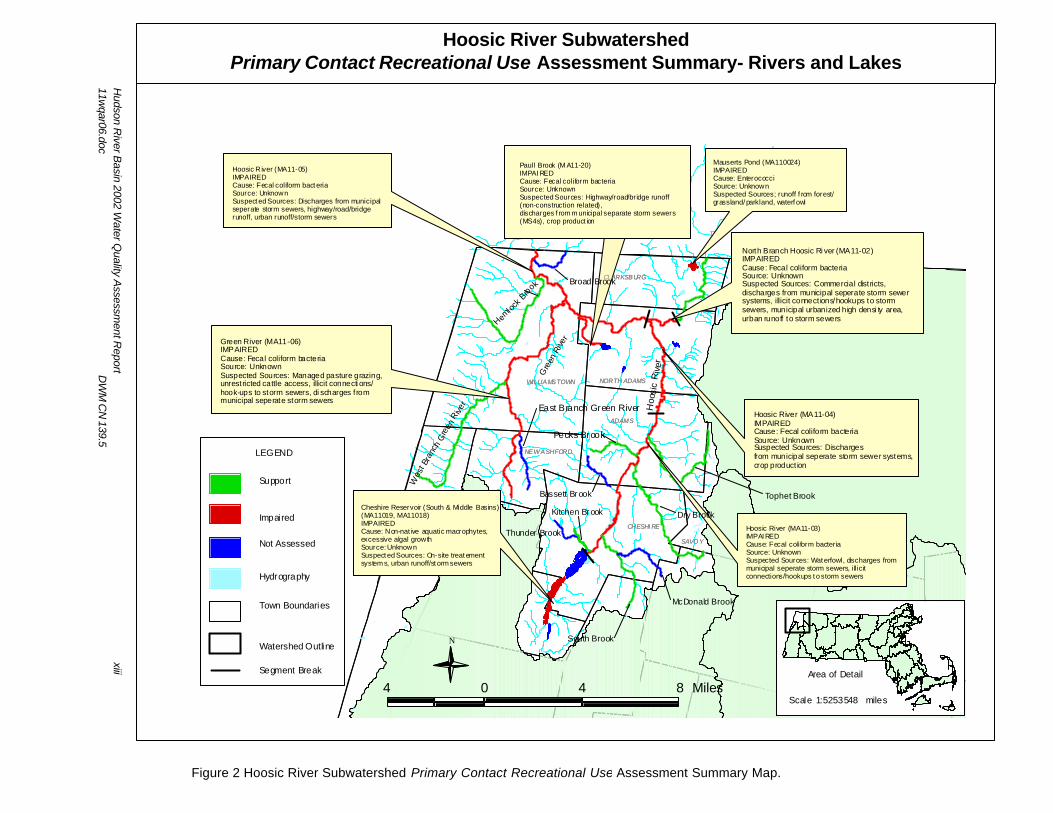
PRIMARY CONTACT RECREATION, SECONDARY CONTACT RECREATION AND AESTHETICS USES The Primary Contact Recreational Use is supported when conditions are suitable (fecal coliform bacteria densities, turbidity, and aesthetics meet the SWQS) for any recreational or other water related activity during which there is prolonged and intimate contact with the water and there exists a significant risk of ingestion. Activities include, but are not limited to, wading, swimming, diving, surfing, and water skiing. The Secondary Contact Recreational Use is supported when conditions are suitable for any recreational or other water use during which contact with the water is either incidental or accidental. These include, but are not limited to, fishing, boating, and limited contact related to shoreline activities. For lakes, macrophyte cover and/or transparency data (Secchi disk depth) are evaluated to assess the status of the recreational uses. The Aesthetics Use is supported when surface waters are free from pollutants in concentrations or combinations that settle to form objectionable deposits; float as debris, scum or other matter to form nuisances; produce objectionable odor, color, taste or turbidity; or produce undesirable or nuisance [growths of] species of aquatic life. Use Summary – Rivers (Figure 2) The Primary Contact Recreational Use is supported in seven segments in the Hoosic River subwatershed (Figure 2). Six segments are impaired for the Primary Contact Use due to elevated fecal coliform bacteria counts. Sources of bacteria are currently unknown in all rivers, however, suspected sources are mostly non-point sources including waterfowl, unpermitted discharges, municipal stormwater, crop production, and unrestricted cattle access/managed pasture grazing. Five segments in the Hoosic River subwatershed are currently not assessed due to the lack of recent bacteria data. The Secondary Contact Recreational Use is supported in 13 river segments based on bacteria data collected by DWM and the Hoosic River Watershed Association. Only one segment is impaired for this use- the North Branch Hoosic River (MA11-02). It is impaired due to elevated bacteria counts from unknown sources. No bacteria information is available for five segments in the Hoosic River subwatershed. The Aesthetics Use is supported in 14 river segments in the Hoosic River subwatershed. Five segments are currently not assessed for this use.
Hudson River Basin 2002 W ater Quality Assessment Report ix 11wqar06.doc DWM CN 139.5
Secondary Contact Recreational and Aesthetics Use Assessment-Lakes
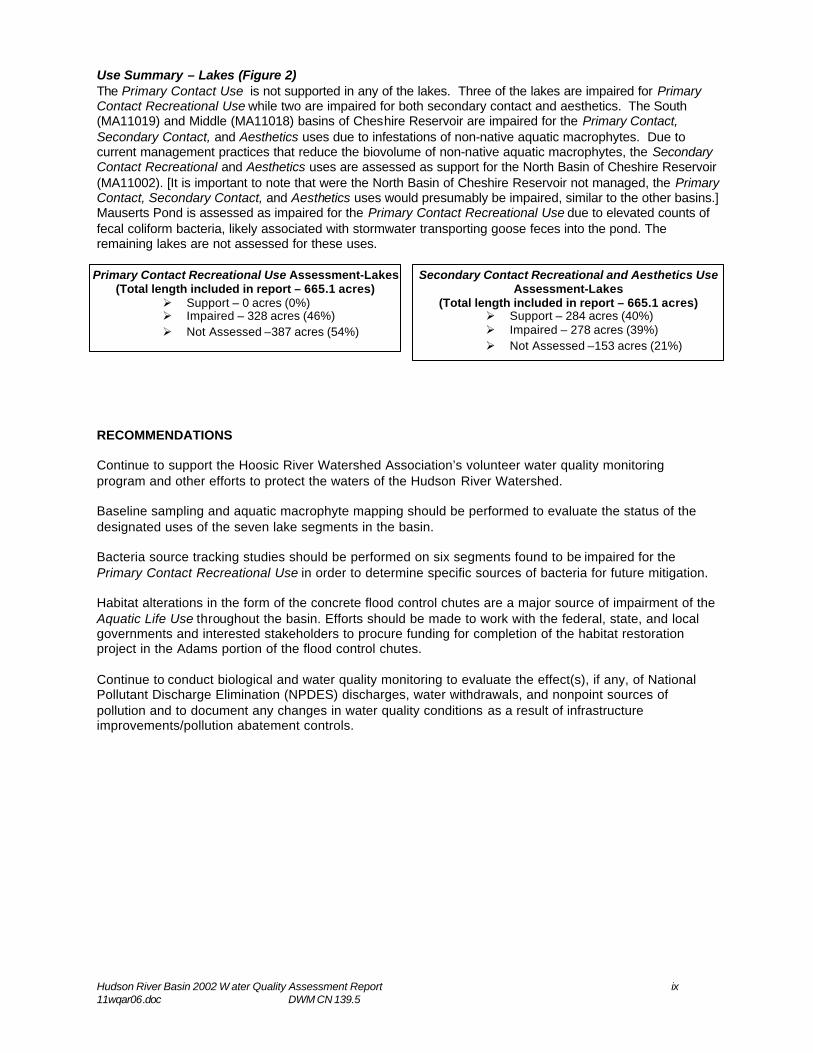
(Total length included in report – 665.1 acres) Ø Support – 284 acres (40%) Ø Impaired – 278 acres (39%) Ø Not Assessed –153 acres (21%)
Primary Contact Recreational Use Assessment-Lakes (Total length included in report – 665.1 acres)
Ø Support – 0 acres (0%) Ø Impaired – 328 acres (46%) Ø Not Assessed –387 acres (54%)
Use Summary – Lakes (Figure 2) The Primary Contact Use is not supported in any of the lakes. Three of the lakes are impaired for Primary Contact Recreational Use while two are impaired for both secondary contact and aesthetics. The South (MA11019) and Middle (MA11018) basins of Cheshire Reservoir are impaired for the Primary Contact, Secondary Contact, and Aesthetics uses due to infestations of non-native aquatic macrophytes. Due to current management practices that reduce the biovolume of non-native aquatic macrophytes, the Secondary Contact Recreational and Aesthetics uses are assessed as support for the North Basin of Cheshire Reservoir (MA11002). [It is important to note that were the North Basin of Cheshire Reservoir not managed, the Primary Contact, Secondary Contact, and Aesthetics uses would presumably be impaired, similar to the other basins.] Mauserts Pond is assessed as impaired for the Primary Contact Recreational Use due to elevated counts of fecal coliform bacteria, likely associated with stormwater transporting goose feces into the pond. The remaining lakes are not assessed for these uses.
RECOMMENDATIONS Continue to support the Hoosic River Watershed Association’s volunteer water quality monitoring program and other efforts to protect the waters of the Hudson River Watershed. Baseline sampling and aquatic macrophyte mapping should be performed to evaluate the status of the designated uses of the seven lake segments in the basin. Bacteria source tracking studies should be performed on six segments found to be impaired for the Primary Contact Recreational Use in order to determine specific sources of bacteria for future mitigation. Habitat alterations in the form of the concrete flood control chutes are a major source of impairment of the Aquatic Life Use throughout the basin. Efforts should be made to work with the federal, state, and local governments and interested stakeholders to procure funding for completion of the habitat restoration project in the Adams portion of the flood control chutes. Continue to conduct biological and water quality monitoring to evaluate the effect(s), if any, of National Pollutant Discharge Elimination (NPDES) discharges, water withdrawals, and nonpoint sources of pollution and to document any changes in water quality conditions as a result of infrastructure improvements/pollution abatement controls.

Hudson River Basin 2002 W ater Quality Assessment Report x 11wqar06.doc DWM CN 139.5
Intentionally Left Blank
Hudson R
iver Watershed 2002 W
ater Quality A
ssessment R
eport
xi
11wqar06.doc
DW
M C
N 139.5
Figure 1 Hoosic River Subwatershed Aquatic Life Use Assessment Summary Map.
Hoosic River Subwatershed Aquatic Life Use Assessment Summary- Rivers and Lakes
LEGEND
Support
Impaired
Not Assessed
Hydrography
Town Boundaries
Watershed Outline
Segment Break
ChesrhireCheshireCheshireBerkshire Pond (MA11001)
Cheshire Reservoir (MA11019, MA11018, MA11002)IMPAIREDCauses- Non -native aquatic macrophytesSources: Unknown
WILLIAMSTOW N
CLARKSBURG
NORTH ADAMS
ADAMS
NEW ASHFORD
HANCOCK CHESHIRE
SAVOY
Hoosic River (MA11-04)UPPER 4.8 miles SUPPORTLOWER 0.6 miles IMPAIREDCauses: other flow regim e alt erat ions, s treambank alterationsSources: Channelizat ion, streambank modifications
McDonald Brook (MA11-16)UPPER 2.0 miles SUPPORTLOWER 1.0 miles NOT ASSESSED
Hoosic River (MA11-05)UPPER 0.2 miles IMPAIREDCauses: Other flow regi me alterations, stream bankalterationsSources: Channelizat ion, streambank modificat ionMIDDLE 6.3 mi les SUPPORTLOWER 1.7 miles IMPAIREDCauses: nutrient /eutrophicat ion biol ogical indi catorsSource: Municipal point sour ce dischargeSuspected Source: Urban runoff/storm sewers, agr iculture North Branch Hoosic Ri ver (MA11-02)
UPPER 0.2 miles SUPPORTLOW ER 1.3 miles IMPAIREDCauses: Other flow regi me alterations, str eambank alterat ionsSources: Channelizat ion, streambank modificat ions
Ho o
sic
Ri v
er
Gre
en R
iver
Hoosic River
Tophet Brook (MA11-19)UPPER 5.9 miles SUPPORTLOWER 0.3 miles IMPAIREDCauses: Other f low regime alterat ions, streambank alterationsSources: Channelization, stream bank modi fi cation
Hoosic River (MA11-03)UPPER 1.2 miles IMPAIREDCauses: Elevated temperaturesSources: Dam or impoundmentMIDDLE 5.1 mi les SUPPORTLOWER 2.6 miles IMPAIREDCauses: Other flow regi me alterations, stream bankalterations, ambient chronic toxicitySuspected causes: evidence of nutrient/eutriphication from biological indicatorsSources: Channelizat ion, streambank modificat ionSuspected sources: unspecified urban stormwater,agriculture (NOTE: in this lower 2.6 mile reach habitat degradation associated with the f lood controlchutes affects 2.3 miles)
#
Broad Brook
#
North Branch Hoosic River
#
Hemlock B
rook
#
West
Branch
Gre
en R
iver
#
East Branch Green River
#
Pecks Brook
#
Bassett Brook
#
Kitchen Brook
#
Thunder Brook
#
Dry Brook
#
South Brook
#
Paull Brook
Area of Detail
1:5447693Scale miles
N
3 0 3 6 Miles
Int Intentionally Left Blank
Hudson R
iver Basin 2002 W
ater Quality A
ssessment R
eport
xii 11w
qar06.doc
D
WM
CN
139.5
Hudson R
iver Basin 2002 W
ater Quality A
ssessment R
eport
xiii 11w
qar06.doc
D
WM
CN
139.5
Figure 2 Hoosic River Subwatershed Primary Contact Recreational Use Assessment Summary Map.
Hoosic River Subwatershed Primary Contact Recreational Use Assessment Summary- Rivers and Lakes
WILLIAMSTOWN
CLARKSBURG
NORTH ADAMS
ADAMS
NEW ASHFORD
HANCOCK CHESHI RE
SAVO YSAVO Y
CHESHI REHANCOCK
NEW ASHFORD
ADAMS
NORTH ADAMSWILLIAMSTOWN
Hoosic River (MA11-04)IMPAIREDCause: Fecal coliform bacteriaSource: UnknownSuspected Sources: Dischargesfrom municipal seperate storm sewer systems,crop product ion
North Branch Hoosic Ri ver (MA11-02)IMPAIREDCause: Fecal coliform bacteriaSource: UnknownSuspected Sources: Commercial dist ricts,discharges from municipal seperate storm sewer systems, illicit connect ions/hookups to storm sewers, municipal urbanized high densi ty area, urban runoff to storm sewers
Green River (MA11-06)IMPAIREDCause: Fecal coliform bacteriaSource: UnknownSuspected Sources: Managed pasture grazing, unrestricted cattle access, illicit connecti ons/hook-ups to storm sewers, di scharges f rom municipal seperate storm sewers
Hoosic River (MA11-03)IMPAI REDCause: Fecal coliform bacteriaSource: UnknownSuspected Sources: Wat erfowl, discharges frommunicipal seperate storm sewers, illicitconnections/hookups t o storm sewers
Cheshire Reservoir (South & Middle Basins)(MA11019, MA11018)IMPAIREDCause: Non-nat ive aquatic macrophytes,excessive algal growthSource: UnknownSuspect ed Sources: On-site treat ement system s, urban runoff/st orm sewers
Hoosic R iver (MA11-05)IMPAIREDCause: Fecal coliform bact eriaSource: UnknownSuspect ed Sources: Discharges from municipalseperate storm sewers, highway/road/bridgerunoff, urban runoff/storm sewers
Mauserts Pond (MA110024)IMPAIREDCause: EnterococciSource: UnknownSuspected Sources; runoff f rom forest/grassland/ parkland, waterf owl
Paull Brook (M A11-20)IMPAI REDCause: Fecal coliform bacteriaSource: UnknownSuspected Sources: Highway/road/bridge runoff(non-construction related), discharges f rom m unicipal separate storm sewers(MS4s), crop product ion
#
Broad Brook#
Hemloc
k Bro
ok
#
East Branch Green River
#
Pecks Brook
#
Bassett Brook
#
Kitchen Brook
#
South Brook
#
McDonald Brook
#
Tophet Brook
CLARKSBURG
#
Dry Brook
Wes
t Bra
nch
Gre
en R
iver
Gre
en R
iver
Hoo
s ic
Riv
er
Thunder Brook
Area of Detail
1:5253548Scale miles4 0 4 8 Miles
N
LEGEND
Support
Impaired
Not Assessed
Hydrography
Town Boundaries
Watershed Outline
Segment Break
Intentionally Left Blank
Hudson R
iver Basin 2002 W
ater Quality A
ssessment R
eport
xiv 11w
qar06.doc
D
WM
CN
139.5
Hudson R
iver Basin 2002 W
ater Quality A
ssessment R
eport
xv
11wqar06.doc
D
WM
CN
139.5
Hoosic River Subwatershed Secondary Contact Recreational and Aesthetics Use Assessment Summary-Rivers and Lakes
Figure 3. Hoosic River Subwatershed Secondary Contact Recreational Use and Aesthetics Use Assessment Summary Map.
WILLIAMSTOWN
CLARKSBURG
NORTH ADAMS
ADAMS
NEW ASHFORD
HANCOCK CHESHIRE
SAVOYCheshi re Reservoir (South & Middle Basins) (MA11019, MA11018)IMPAIREDCause: Non-native aquatic macrophyte, excessive algal growthSource: Unknown
East Branch Green River (MA11-21)NOT ASSESSED Secondary Contact UseSUPPORT Aesthetics Use
Wes
t Bra
nch
Gre
en R
iver
Gre
en R
iver
Broad Brook
Ea s t B ran c h Green R
i ve r
Paul l Brook
Hoo
sic
Riv
e r
Tophet Brook
Pecks Brook
Dry Bro ok
Mcdonald Br ook
So u th B
ro ok
North
Bra
nch
Hoo
sic R
iver
#
Thunder Brook #
#
#
North Branch Hoosic River (MA11-02)IMPAIRED Secondary Contact UseCause: Fecal coliform bacteriaSources: UnknownSuspected Sources: Commercial districts, di scharges from municipal seperate storm sewers, i llici t connections/hookups to stormsewers, municipal urbanized high denisty area, urban runoff storm sewersNOT ASSESSED Aesthetic Use
Bassett Brook
#
#
Hoosic River
#
Gre
en R
iver
Kitchen Brook
#
He m
lock
Bro
ok
Area of Detai l
1:5253548Scale mi les
LEGEND
Support
Impaired
Not Assessed
Hydrography
Town Boundaries
Watershed Outline
Segment Break2 0 2 4 Miles
N

Hudson R
iver Basin 2002 W
ater Quality A
ssessment R
eport
xvi
11wqar06.doc
D
WM
CN
139.5
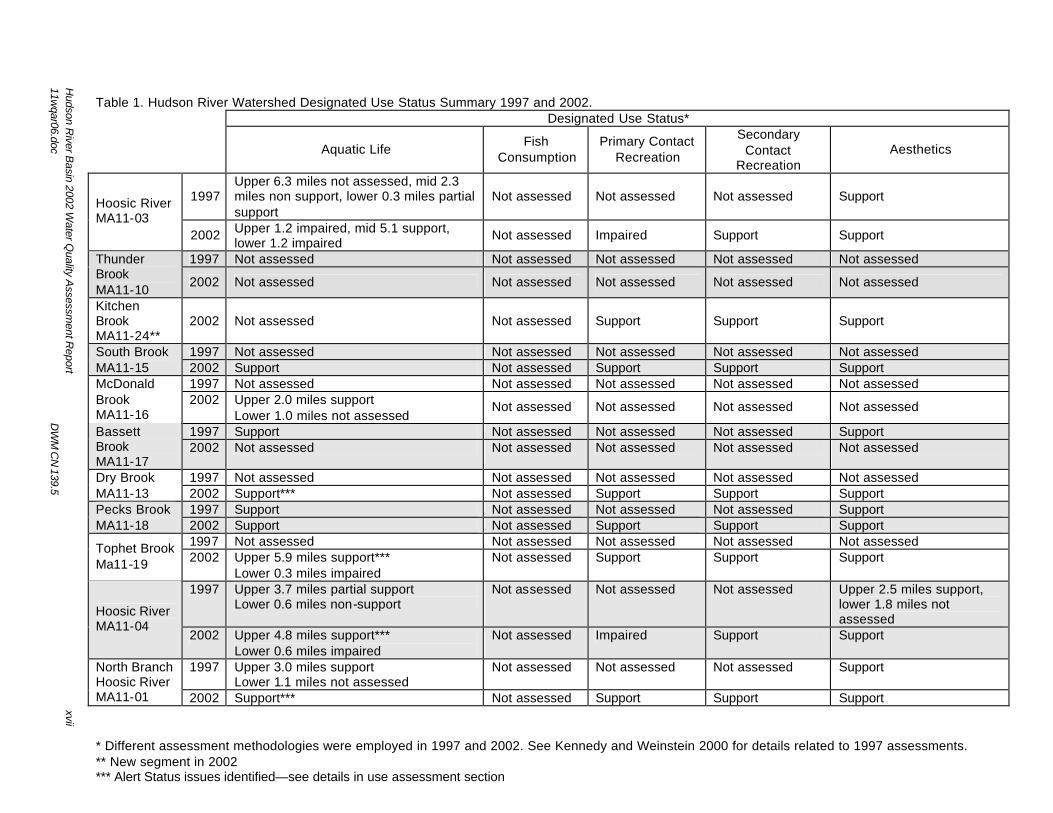
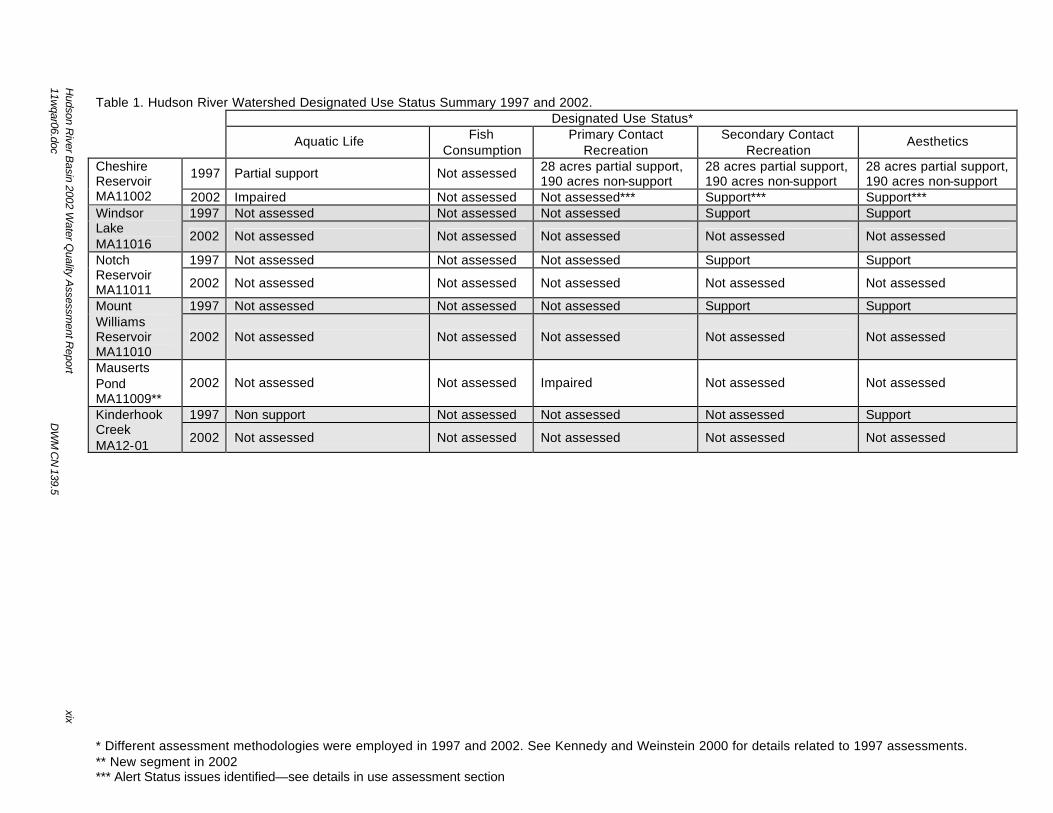
* Different assessment methodologies were employed in 1997 and 2002. See Kennedy and Weinstein 2000 for details related to 1997 assessments. ** New segment in 2002 *** Alert Status issues identified—see details in use assessment section
Table 1. Hudson River Watershed Designated Use Status Summary 1997 and 2002. Designated Use Status*
Aquatic Life Fish
Consumption Primary Contact
Recreation
Secondary Contact
Recreation Aesthetics
1997 Upper 6.3 miles not assessed, mid 2.3 miles non support, lower 0.3 miles partial support
Not assessed Not assessed Not assessed Support Hoosic River MA11-03
2002 Upper 1.2 impaired, mid 5.1 support, lower 1.2 impaired
Not assessed Impaired Support Support
1997 Not assessed Not assessed Not assessed Not assessed Not assessed Thunder Brook MA11-10
2002 Not assessed Not assessed Not assessed Not assessed Not assessed
Kitchen Brook MA11-24**
2002 Not assessed Not assessed Support Support Support
1997 Not assessed Not assessed Not assessed Not assessed Not assessed South Brook MA11-15 2002 Support Not assessed Support Support Support
1997 Not assessed Not assessed Not assessed Not assessed Not assessed McDonald Brook MA11-16
2002 Upper 2.0 miles support Lower 1.0 miles not assessed
Not assessed Not assessed Not assessed Not assessed
1997 Support Not assessed Not assessed Not assessed Support Bassett Brook MA11-17
2002 Not assessed Not assessed Not assessed Not assessed Not assessed
1997 Not assessed Not assessed Not assessed Not assessed Not assessed Dry Brook MA11-13 2002 Support*** Not assessed Support Support Support
1997 Support Not assessed Not assessed Not assessed Support Pecks Brook MA11-18 2002 Support Not assessed Support Support Support
1997 Not assessed Not assessed Not assessed Not assessed Not assessed Tophet Brook Ma11-19 2002 Upper 5.9 miles support***
Lower 0.3 miles impaired Not assessed Support Support Support
1997 Upper 3.7 miles partial support Lower 0.6 miles non-support
Not assessed Not assessed Not assessed Upper 2.5 miles support, lower 1.8 miles not assessed
Hoosic River MA11-04
2002 Upper 4.8 miles support*** Lower 0.6 miles impaired
Not assessed Impaired Support Support
1997 Upper 3.0 miles support Lower 1.1 miles not assessed
Not assessed Not assessed Not assessed Support North Branch Hoosic River MA11-01 2002 Support*** Not assessed Support Support Support
Hudson R
iver Basin 2002 W
ater Quality A
ssessment R
eport
xvii
11wqar06.doc
D
WM
CN
139.5
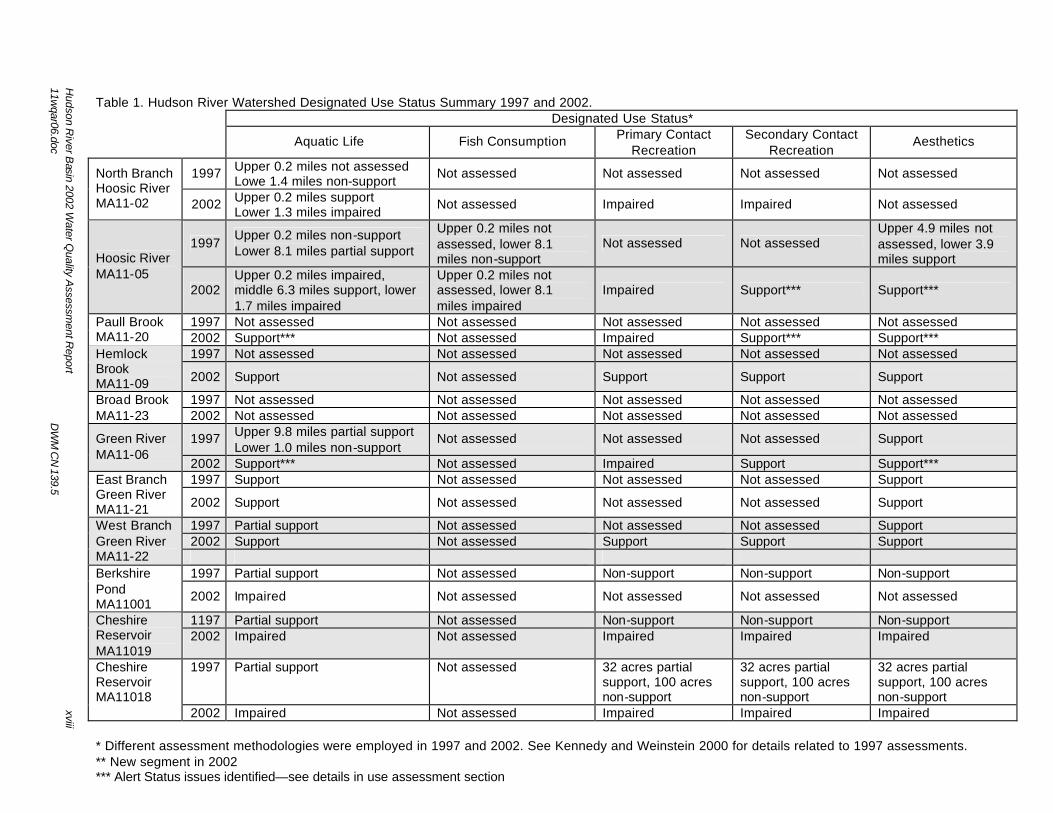
* Different assessment methodologies were employed in 1997 and 2002. See Kennedy and Weinstein 2000 for details related to 1997 assessments. ** New segment in 2002 *** Alert Status issues identified—see details in use assessment section
Table 1. Hudson River Watershed Designated Use Status Summary 1997 and 2002. Designated Use Status* Aquatic Life Fish Consumption Primary Contact
Recreation Secondary Contact
Recreation Aesthetics
1997 Upper 0.2 miles not assessed Lowe 1.4 miles non-support
Not assessed Not assessed Not assessed Not assessed North Branch Hoosic River MA11-02 2002 Upper 0.2 miles support
Lower 1.3 miles impaired Not assessed Impaired Impaired Not assessed
1997 Upper 0.2 miles non-support Lower 8.1 miles partial support
Upper 0.2 miles not assessed, lower 8.1 miles non-support
Not assessed Not assessed Upper 4.9 miles not assessed, lower 3.9 miles support Hoosic River
MA11-05 2002
Upper 0.2 miles impaired, middle 6.3 miles support, lower 1.7 miles impaired
Upper 0.2 miles not assessed, lower 8.1 miles impaired
Impaired Support*** Support***
1997 Not assessed Not assessed Not assessed Not assessed Not assessed Paull Brook MA11-20 2002 Support*** Not assessed Impaired Support*** Support***
1997 Not assessed Not assessed Not assessed Not assessed Not assessed Hemlock Brook MA11-09 2002 Support Not assessed Support Support Support
1997 Not assessed Not assessed Not assessed Not assessed Not assessed Broad Brook MA11-23 2002 Not assessed Not assessed Not assessed Not assessed Not assessed
1997 Upper 9.8 miles partial support Lower 1.0 miles non-support
Not assessed Not assessed Not assessed Support Green River MA11-06
2002 Support*** Not assessed Impaired Support Support*** 1997 Support Not assessed Not assessed Not assessed Support East Branch
Green River MA11-21 2002 Support Not assessed Not assessed Not assessed Support
1997 Partial support Not assessed Not assessed Not assessed Support 2002 Support Not assessed Support Support Support
West Branch Green River MA11-22
1997 Partial support Not assessed Non-support Non-support Non-support Berkshire Pond MA11001
2002 Impaired Not assessed Not assessed Not assessed Not assessed
1197 Partial support Not assessed Non-support Non-support Non-support Cheshire Reservoir MA11019
2002 Impaired Not assessed Impaired Impaired Impaired
1997 Partial support Not assessed 32 acres partial support, 100 acres non-support
32 acres partial support, 100 acres non-support
32 acres partial support, 100 acres non-support
Cheshire Reservoir MA11018
2002 Impaired Not assessed Impaired Impaired Impaired
Hudson R
iver Basin 2002 W
ater Quality A
ssessment R
eport
xiii
11wqar.doc
D
WM
CN
139.5
Hudson R
iver Basin 2002 W
ater Quality A
ssessment R
eport
xviii
11wqar06.doc
D
WM
CN
139.5
* Different assessment methodologies were employed in 1997 and 2002. See Kennedy and Weinstein 2000 for details related to 1997 assessments. ** New segment in 2002 *** Alert Status issues identified—see details in use assessment section
Table 1. Hudson River Watershed Designated Use Status Summary 1997 and 2002. Designated Use Status* Aquatic Life Fish
Consumption Primary Contact
Recreation Secondary Contact
Recreation Aesthetics
1997 Partial support Not assessed 28 acres partial support, 190 acres non-support
28 acres partial support, 190 acres non-support
28 acres partial support, 190 acres non-support
Cheshire Reservoir MA11002 2002 Impaired Not assessed Not assessed*** Support*** Support***
1997 Not assessed Not assessed Not assessed Support Support Windsor Lake MA11016
2002 Not assessed Not assessed Not assessed Not assessed Not assessed
1997 Not assessed Not assessed Not assessed Support Support Notch Reservoir MA11011 2002 Not assessed Not assessed Not assessed Not assessed Not assessed
1997 Not assessed Not assessed Not assessed Support Support Mount Williams Reservoir MA11010
2002 Not assessed Not assessed Not assessed Not assessed Not assessed
Mauserts Pond MA11009**
2002 Not assessed Not assessed Impaired Not assessed Not assessed
1997 Non support Not assessed Not assessed Not assessed Support Kinderhook Creek MA12-01
2002 Not assessed Not assessed Not assessed Not assessed Not assessed
Hudson R
iver Basin 2002 W
ater Quality A
ssessment R
eport
xiv
11wqar.doc
D
WM
CN
139.5
Hudson R
iver Basin 2002 W
ater Quality A
ssessment R
eport
xix
11wqar06.doc
D
WM
CN
139.5
Hudson River Basin 2002 Water Quality Assessment Report 1 11wqar06.doc DWM CN 139.5
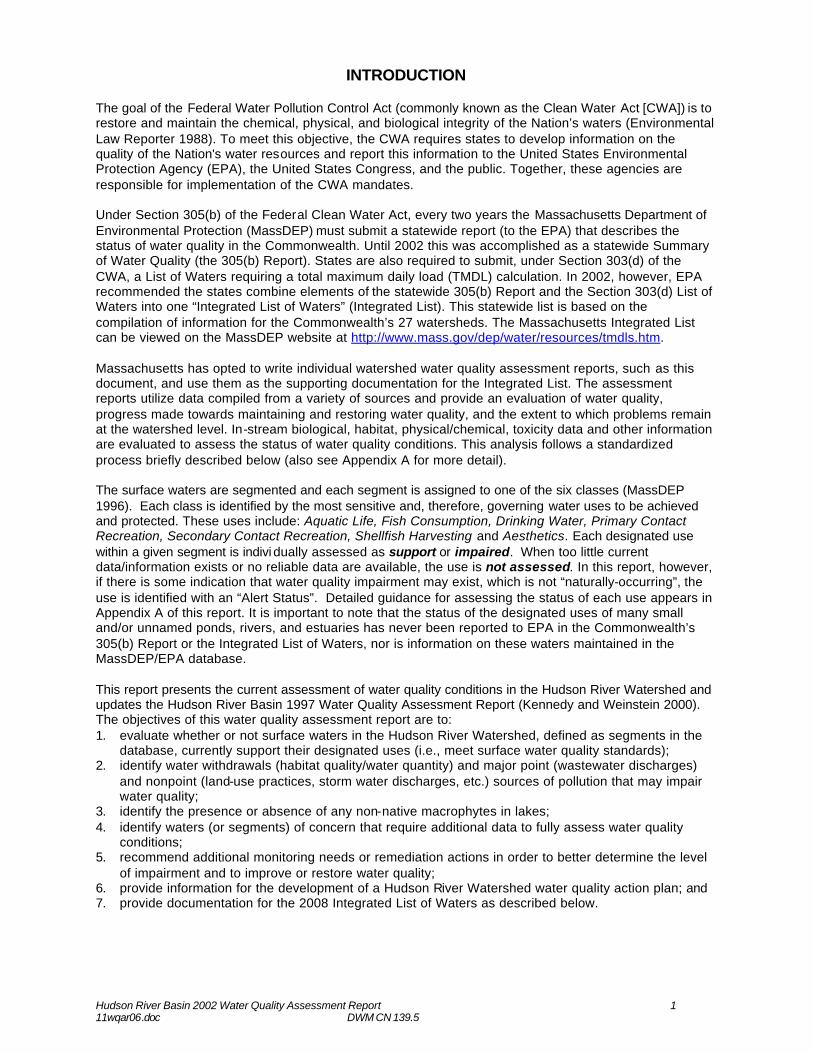
INTRODUCTION The goal of the Federal Water Pollution Control Act (commonly known as the Clean Water Act [CWA]) is to restore and maintain the chemical, physical, and biological integrity of the Nation’s waters (Environmental Law Reporter 1988). To meet this objective, the CWA requires states to develop information on the quality of the Nation's water resources and report this information to the United States Environmental Protection Agency (EPA), the United States Congress, and the public. Together, these agencies are responsible for implementation of the CWA mandates. Under Section 305(b) of the Federal Clean Water Act, every two years the Massachusetts Department of Environmental Protection (MassDEP) must submit a statewide report (to the EPA) that describes the status of water quality in the Commonwealth. Until 2002 this was accomplished as a statewide Summary of Water Quality (the 305(b) Report). States are also required to submit, under Section 303(d) of the CWA, a List of Waters requiring a total maximum daily load (TMDL) calculation. In 2002, however, EPA recommended the states combine elements of the statewide 305(b) Report and the Section 303(d) List of Waters into one “Integrated List of Waters” (Integrated List). This statewide list is based on the compilation of information for the Commonwealth’s 27 watersheds. The Massachusetts Integrated List can be viewed on the MassDEP website at http://www.mass.gov/dep/water/resources/tmdls.htm. Massachusetts has opted to write individual watershed water quality assessment reports, such as this document, and use them as the supporting documentation for the Integrated List. The assessment reports utilize data compiled from a variety of sources and provide an evaluation of water quality, progress made towards maintaining and restoring water quality, and the extent to which problems remain at the watershed level. In-stream biological, habitat, physical/chemical, toxicity data and other information are evaluated to assess the status of water quality conditions. This analysis follows a standardized process briefly described below (also see Appendix A for more detail). The surface waters are segmented and each segment is assigned to one of the six classes (MassDEP 1996). Each class is identified by the most sensitive and, therefore, governing water uses to be achieved and protected. These uses include: Aquatic Life, Fish Consumption, Drinking Water, Primary Contact Recreation, Secondary Contact Recreation, Shellfish Harvesting and Aesthetics. Each designated use within a given segment is indivi dually assessed as support or impaired. When too little current data/information exists or no reliable data are available, the use is not assessed. In this report, however, if there is some indication that water quality impairment may exist, which is not “naturally-occurring”, the use is identified with an “Alert Status”. Detailed guidance for assessing the status of each use appears in Appendix A of this report. It is important to note that the status of the designated uses of many small and/or unnamed ponds, rivers, and estuaries has never been reported to EPA in the Commonwealth’s 305(b) Report or the Integrated List of Waters, nor is information on these waters maintained in the MassDEP/EPA database. This report presents the current assessment of water quality conditions in the Hudson River Watershed and updates the Hudson River Basin 1997 Water Quality Assessment Report (Kennedy and Weinstein 2000). The objectives of this water quality assessment report are to: 1. evaluate whether or not surface waters in the Hudson River Watershed, defined as segments in the
database, currently support their designated uses (i.e., meet surface water quality standards); 2. identify water withdrawals (habitat quality/water quantity) and major point (wastewater discharges)
and nonpoint (land-use practices, storm water discharges, etc.) sources of pollution that may impair water quality;
3. identify the presence or absence of any non-native macrophytes in lakes; 4. identify waters (or segments) of concern that require additional data to fully assess water quality
conditions; 5. recommend additional monitoring needs or remediation actions in order to better determine the level
of impairment and to improve or restore water quality; 6. provide information for the development of a Hudson River Watershed water quality action plan; and 7. provide documentation for the 2008 Integrated List of Waters as described below.
Hudson River Basin 2002 Water Quality Assessment Report 2 11wqar06.doc DWM CN 139.5
MASSACHUSETTS INTEGRATED LIST OF WATERS Section 305(b) of the CWA defines the process whereby states monitor and assess the quality of their surface and groundwater and report on the status of those waters every two years. Section 303(d) of the CWA requires states to periodically identify and list those waterbodies for which existing controls on point and nonpoint sources of pollutants are not stringent enough to attain or maintain compliance with applicable surface water quality standards. Through the year 2000 the MassDEP fulfilled the 305(b) and 303(d) reporting requirements in two completely separate documents. In 2001 the EPA released guidance that provided states with the option of preparing a single Integrated List of Waters to be submitted in 2002 that would meet the reporting requirements of both sections 305(b) and 303(d) of the CWA. The Massachusetts Year 2004 Integrated List of Waters was submitted to EPA (MassDEP 2005). In that report each waterbody segment was placed in one of five major categories. Category 1 included those waters that were meeting all designated uses. No Massachusetts waters were listed in Category 1 because a statewide health advisory pertaining to the consumption of fish precludes any waters from being in full support of the fish consumption use. Waters listed in Category 2 were found to support some of the uses for which they were assessed but other uses were unassessed. Finally, Category 3 contained those waters for which insufficient or no information was available to assess any uses. Waters exhibiting impairment for one or more uses were placed in either Category 4 (impaired but not requiring a Total Maximum Daily Load (TMDL) report) or Category 5 (impaired and requiring one or more TMDLs) according to the EPA guidance. Category 4 was further divided into three sub-categories – 4A, 4B and 4C – depending upon the reason that TMDLs were not needed. Category 4A included waters for which the required TMDL(s) had already been completed and approved by the EPA. However, since segments could only appear in one category waters that had an approved TMDL for some pollutants, but not others, remained in Category 5. Category 4B was to include waters for which other pollution control requirements were reasonably expected to result in the attainment of the designated use before the next listing cycle (i.e., 2006). Because of the uncertainty related to making predictions about conditions in the future the MassDEP made a decision not to utilize Category 4B in the 2002 Integrated List. Finally, waters impaired by factors, such as flow modification or habitat alteration, that are not subjected to TMDL calculations because the impairment is not related to one or more pollutants were included in Category 4C.
Please refer to the individual segment assessment for information pertaining to the listing category and causes of impairment.
Hudson River Basin 2002 Water Quality Assessment Report 3 11wqar06.doc DWM CN 139.5
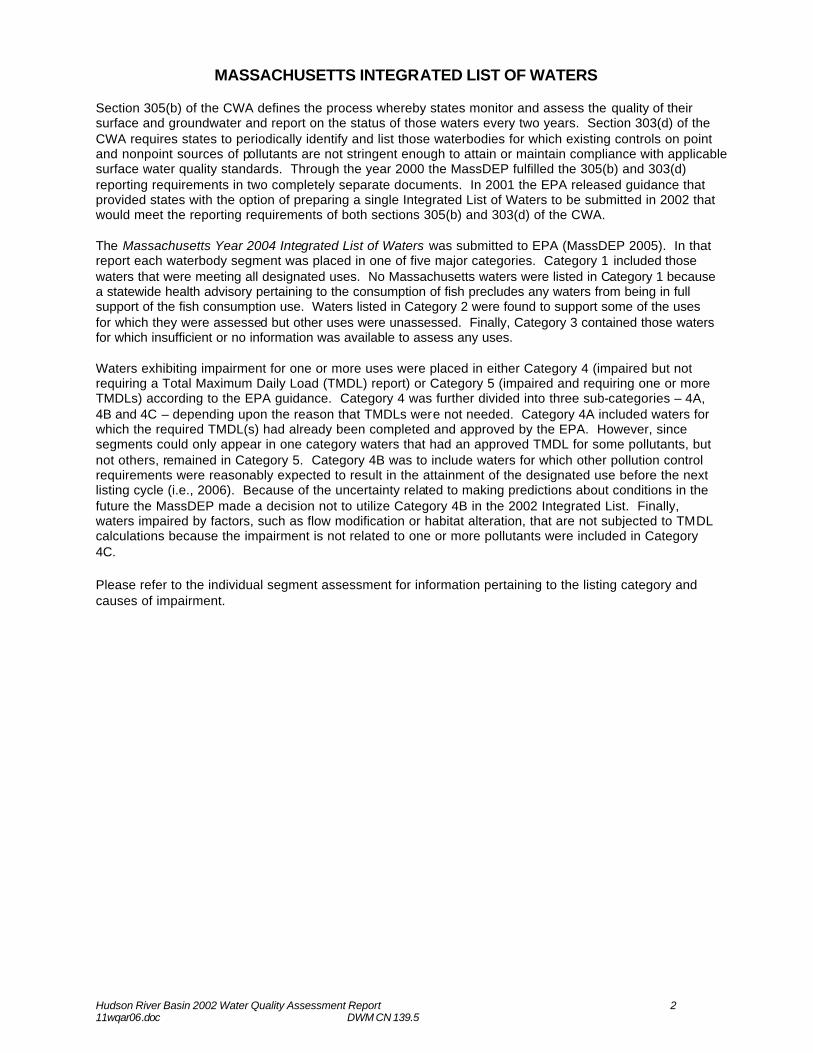
Basbish Subwatershed
Hoosic River Subwatershed
Kinderhook Subwatershed
10 0 10 20 Miles
N
EW
S
Figure 4. Upper Hudson River Watershed location showing the Hoosic River, Kinderhook, and Bashbish subwatersheds locations.
HUDSON RIVER WATERSHED DESCRIPTION Three river basins along the western border of Massachusetts, the Hoosic, Kinderhook, and Bashbish, flow into the larger Hudson River Watershed (Figure 4). The Hoosic River drains approximately 165 square miles in Massachusetts, all located within Berkshire County. The communities of Cheshire, Adams, North Adams, Clarksburg, New Ashford, and Williamstown lie almost entirely within the basin boundaries. Hancock, Lanesborough, Pittsfield, Dalton, Windsor, Savoy and Florida also have a small portion of their land area within the Hoosic River subwatershed. The Kinderhook subwatershed, bordered by New York State on the west, the Hoosic River subwatershed to the north and the Housatonic River Basin on the southeast, drains approximately 22 square miles in Massachusetts. The drainage area includes portions of Hancock, Lanesborough, and Richmond. This area drains west into the Hudson River in New York. The Bashbish River subwatershed is located in the southwest corner of Massachusetts draining 15 square miles of Egremont and Mount Washington. The flow from Bashbish Brook also drains west into New York State and eventually into the Hudson River. [Note: From its origin at the outlet of Cheshire Reservoir to its confluence with the North Branch Hoosic River, the Hoosic River is locally known as the South Branch Hoosic River. However, it is referred to as the Hoosic River in this report.] Fourteen vernal pools (Harding 2003) have received full certification from the Natural Heritage and Endangered Species Program in the Hudson River Watershed. These are located in the towns of Williamstown and Adams. Species of special concern observed in the watershed include the longnose sucker, bridle shiner, spring salamander, Jefferson salamander, appalachian brook crayfish, lake emerald dragonfly, and the Tule bluet dragonfly. Additional information is available from the Natural Heritage and Endangered Species Program website: http://www.mass.gov/dfwele/dfw/nhesp/nhesp.htm
Hudson River Basin 2002 Water Quality Assessment Report 4 11wqar06.doc DWM CN 139.5
This report has been organized by the three major subwatersheds within the Hudson River Watershed- Hoosic, Kinderhook, and Bashbish. The Hoosic River Subwatershed has been further organized by tributary subwatersheds- South Branch Hoosic River, North Branch River, Hoosic River mainstem, and the Green river. Each river and lake assessed in this report has been assigned a Water Body Identification code (WBID). Following the Massachusetts Stream and River Inventory System (SARIS, Halliwell et al. 1982) the streams are presented in hydrological order, from most upstream to downstream. Where appropriate, lakes have been included in the hierological order; otherwise they are listed at the end of the subwatershed section in which they are located.
SUBWATERSHED/DRAINAGE AREA INFORMATION General description, list of segments within the subwatershed/drainage area, issues pertinent to water quality (i.e., existing conditions and problems at the subwatershed level), land use changes, summary of actions since previous assessment, subwatershed/drainage area- wide recommendations, list of segments not assessed due to lack of sufficient/current data
SEGMENT IDENTIFICATION
Name, water body identification number (WBID), location, length/size (Dallaire 1999a), classification (MassDEP 1996).
SEGMENT DESCRIPTION
Integrated List category (MassDEP 2005) and other descriptive information as pertinent.
WATER WITHDRAWALS AND WASTEWATER DISCHARGE PERMIT INFORMATION
List of water withdrawals subject to the Water Management Act, list of NPDES wastewater discharges
OTHER
Brief description of FERC hydropower facilities, CERCLA (Superfund) sites, landfills
USE ASSESSMENT Aquatic Life, Fish Consumption, Primary Contact, Secondary Contact, and Aesthetics.
SUMMARY
Use summary table (uses, status, causes and sources of impairment). RECOMMENDATIONS
Additional monitoring needs .
Hudson River Basin 2002 Water Quality Assessment Report 5 11wqar06.doc DWM CN 139.5
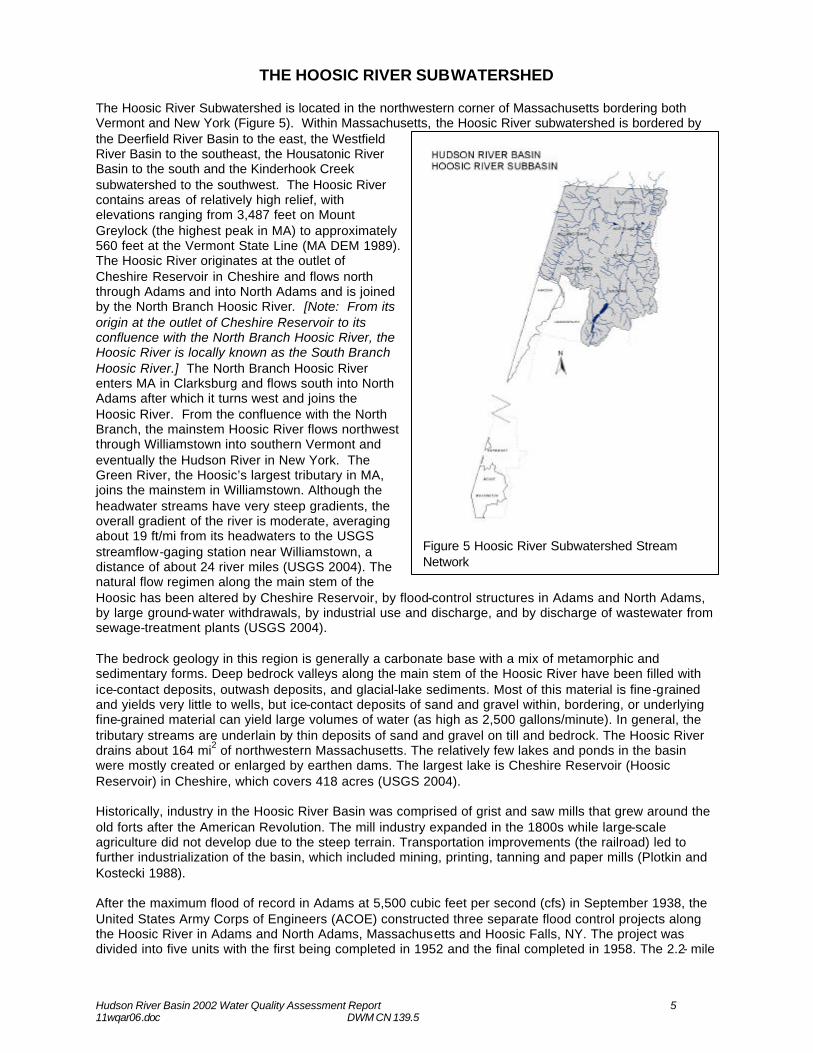
THE HOOSIC RIVER SUBWATERSHED The Hoosic River Subwatershed is located in the northwestern corner of Massachusetts bordering both Vermont and New York (Figure 5). Within Massachusetts, the Hoosic River subwatershed is bordered by the Deerfield River Basin to the east, the Westfield River Basin to the southeast, the Housatonic River Basin to the south and the Kinderhook Creek subwatershed to the southwest. The Hoosic River contains areas of relatively high relief, with elevations ranging from 3,487 feet on Mount Greylock (the highest peak in MA) to approximately 560 feet at the Vermont State Line (MA DEM 1989). The Hoosic River originates at the outlet of Cheshire Reservoir in Cheshire and flows north through Adams and into North Adams and is joined by the North Branch Hoosic River. [Note: From its origin at the outlet of Cheshire Reservoir to its confluence with the North Branch Hoosic River, the Hoosic River is locally known as the South Branch Hoosic River.] The North Branch Hoosic River enters MA in Clarksburg and flows south into North Adams after which it turns west and joins the Hoosic River. From the confluence with the North Branch, the mainstem Hoosic River flows northwest through Williamstown into southern Vermont and eventually the Hudson River in New York. The Green River, the Hoosic’s largest tributary in MA, joins the mainstem in Williamstown. Although the headwater streams have very steep gradients, the overall gradient of the river is moderate, averaging about 19 ft/mi from its headwaters to the USGS streamflow-gaging station near Williamstown, a distance of about 24 river miles (USGS 2004). The natural flow regimen along the main stem of the Hoosic has been altered by Cheshire Reservoir, by flood-control structures in Adams and North Adams, by large ground-water withdrawals, by industrial use and discharge, and by discharge of wastewater from sewage-treatment plants (USGS 2004). The bedrock geology in this region is generally a carbonate base with a mix of metamorphic and sedimentary forms. Deep bedrock valleys along the main stem of the Hoosic River have been filled with ice-contact deposits, outwash deposits, and glacial-lake sediments. Most of this material is fine-grained and yields very little to wells, but ice-contact deposits of sand and gravel within, bordering, or underlying fine-grained material can yield large volumes of water (as high as 2,500 gallons/minute). In general, the tributary streams are underlain by thin deposits of sand and gravel on till and bedrock. The Hoosic River drains about 164 mi2 of northwestern Massachusetts. The relatively few lakes and ponds in the basin were mostly created or enlarged by earthen dams. The largest lake is Cheshire Reservoir (Hoosic Reservoir) in Cheshire, which covers 418 acres (USGS 2004). Historically, industry in the Hoosic River Basin was comprised of grist and saw mills that grew around the old forts after the American Revolution. The mill industry expanded in the 1800s while large-scale agriculture did not develop due to the steep terrain. Transportation improvements (the railroad) led to further industrialization of the basin, which included mining, printing, tanning and paper mills (Plotkin and Kostecki 1988). After the maximum flood of record in Adams at 5,500 cubic feet per second (cfs) in September 1938, the United States Army Corps of Engineers (ACOE) constructed three separate flood control projects along the Hoosic River in Adams and North Adams, Massachusetts and Hoosic Falls, NY. The project was divided into five units with the first being completed in 1952 and the final completed in 1958. The 2.2- mile
Figure 5 Hoosic River Subwatershed Stream Network
Hudson River Basin 2002 Water Quality Assessment Report 6 11wqar06.doc DWM CN 139.5
long project in Adams begins upstream from Commercial Street and continues downstream to the Lime Street bridge. The upper portion of this Adams project begins as an earthen channel with rip rapping and concrete walls; the middle portion is a 6,200 foot long concrete paved chute; the next section (2,300 feet) consists of a gravel/natural streambed with concrete walls, and the lowest section (3,000 feet) consists of a natural streambed with rip rapped sides. Tophet Brook is also enclosed in a concrete chute from Summer Street to the Mill Street bridge in Adams. The North Branch Hoosic River flood control structure in North Adams extends for 1.3 miles from the Eclipse Dam (near the Route 8/Route 2 split) to the confluence with the mainstem Hoosic River. The mainstem is further encased in concrete for approximately 0.2 miles. This encasement has led to the impairment of the river along these sections due to habitat alterations and thermal pollution (increased in-stream temperatures). The Hoosic River Watershed Association (HooRWA) was founded in 1986 as a private, non-profit 501(c) organization dedicated to the restoration, conservation and enjoyment of the Hoosic River and its watershed, through education, research, and advocacy. HooRWA envisions a watershed that is ecologically sound and adds to the quality of life of its residents. Further information on the activities of HooRWA can be found on their website: www.hoorwa.org. HooRWA volunteers have collected water samples at numerous sites throughout the watershed since 1996. Samples are analyzed for bacteria, total suspended solids, turbidity, total phosphorus, and total nitrogen. HooRWA also conducts in-situ sampling to examine dissolved oxygen concentrations, temperatures, pH, and conductivity. HooRWA volunteers also conduct macroinvertebrate sampling. Data collected by the HooRWA monitoring program under an approved EPA/Mass DEP Quality Assurance Project Plan (QAPP) have been utilized throughout this report. The Berkshire Regional Planning Commission, established under Chapter 40B of the Massachusetts General Laws, is the official area-wide planning agency in Berkshire County. BRPC responsibilities for comprehensive planning include land use, transportation, economic development, and environmental management (http://www.berkshireplanning.org/). BRPC has received three grants from MassDEP to conduct work in the Hudson River Watershed. In 1998 BRPC prepared an Assessment of Land Use Activities and Nonpoint Source Pollution in the Hoosic River Watershed under a 604(b) Water Quality Management Planning Grant. In 1999 BRPC prepared a Stormwater Assessment in the Hoosic and Housatonic Watersheds with funds from the former Massachusetts Watershed Initiative. In 2002 BRPC and the Town of Adams worked together to conduct a stormwater management assessment and prepare a comprehensive stormwater management plan for the town, under a 604(b) grant. Details on the grant projects are available in Appendix G. There are a total of 47 named streams in the Hoosic River subwatershed; 15 of which (representing 90.3 river miles) are included in this report. Twenty lakes, ponds, or impoundments (the term "lakes" will hereafter be used to include all) have been identified and assigned PALIS code numbers (Pond and Lake Information System, Ackerman 1989) in the Hoosic River subwatershed. Seventeen of the lakes are less than or equal to 50 acres in total surface area; ten are less than or equal to ten acres. The total surface acreage of the Hoosic River subwatershed lakes is 765 acres. Only eight lakes are included in this report and represent 93%, or 714.5 acres, of the lake acreage in the Hoosic River subwatershed. Designated water supplies (i.e., Class A) accounted for only 8% (or 58 acres) of the assessed acreage.
Hudson River Basin 2002 Water Quality Assessment Report 7 11wqar06.doc DWM CN 139.5
HOOSIC RIVER {SOUTH BRANCH} SUBWATERSHED Cheshire Reservoir is comprised of three separate basins (south, middle, and north). Tributaries to the Reservoir include Muddy, Gore, Pettibone and Collins brooks. The mainstem Hoosic River (locally known as the South Branch Hoosic River) begins at the outlet of Cheshire Reservoir in Cheshire. “The Jungle” is an extensive wetland that begins approximately 1.2 miles north of Cheshire Reservoir and continues for about 2 miles, ending just upstream from Cheshire Harbor. The river flows northeast between Mt. Greylock (Taconic Range) to the northwest and Lenox Mountain in the Hoosac Range on the southeast. Nine tributaries, including Kitchen, South, Penniman, Bassett (via an unnamed tributary), Dry, Pecks (via an unnamed tributary), Hoxie, Tophet, and Southwick brooks discharge to the Hoosic River {South Branch}. The Hoosic River receives the effluent from the Adams Waste Water Treatment Plant (WWTP). Three tenths of a mile downstream from the Adams WWTP discharge the Specialty Minerals, Inc. facility discharges treated process, non-contact cooling, quarry water and stormwater runoff into the Hoosic River. The river meanders through the Zylonite area of Adams and enters North Adams. It crosses under Hodges Cross Road and passes by the Southview Cemetery. The river passes under Hunter Foundry Road, downstream from which it has been channelized for flood control purposes (grassy bermed banks) for a distance of 0.7 miles. Within this reach a railroad yard sits in close proximity to the eastern bank of the river. Slightly north of Haskins School yard, the Hoosic River is once again encased in a concrete channel for the 0.6 mile reach to its confluence with the North Branch Hoosic River. The ACOE is authorized under Section 1135 of the Water Resources Development Act to modify structures and operations of ACOE projects to improve the quality of the environment and restore degraded environments. ACOE partnered with the Town of Adams, Specialty Minerals, the Hoosic River Watershed Association, the Massachusetts Department of Fisheries and Wildlife, Trout Unlimited, MassDEP, and the EPA to conduct a habitat restoration project in the Adams flood control structures. The goal of the restoration project is to reduce the overall in-stream temperatures and mak e available the 2.2 miles of the flood control flumes, as well as the unaltered downstream portion that is also adversely effected by the temperature increase, to trout use, including spawning (migrations begin in August). Additionally, the project would restore natural stream conditions along the channel bottom and sides to improve habitat for food organisms and create areas of refuge where fish could escape the heat and seek food and shelter in a more natural setting. Options to be considered for implementing the project include the creation of additional stream cover, the construction of a pilot or diversion channel, or the application of innovative bioengineering modifications. The estimated cost of the project is $1.1 million. The Preliminary Restoration Plan was approved by ACOE in June of 2000. An Ecosystem Restoration Report/feasibility study was initiated in February 2002, but has been suspended due to funding shortfalls (ACOE undated). The Assessment of Land Use Activities and Nonpoint Source Pollution in the Hoosic River Watershed (BRPC 1998) identified and inventoried existing and potential nonpoint source pollution. In this subwatershed the report identified twenty four underground storage tanks, seven solid waste facilities, two illegal dump sites, nine auto salvage yards, four small and abandoned junkyards, four DPW facilities, three large groundwater discharges (septic systems), eight NPDES permitted stormwater discharges, two streambank erosion sites, one golf course, two roads where stormwater is purposely directed into a waterway with no treatment, and three areas of livestock impacts. The flood control chutes were also identified as a “potential” source (BRPC 1998). The Berkshire Regional Planning Commission (BRPC) was awarded a Massachusetts Watershed Initiative Grant (Project No. 99-10/MWI) in 1999 to identify stormwater problems in the Hoosic and Housatonic Watersheds. Stormwater problems were defined as “conditions where storm-related runoff accelerates erosion, impairs water quality and clarity, causes frequent flooding and visible sedimentation, has the potential to disrupt aquatic habitat, or negatively affects waterways for human recreational use.” The report Stormwater Assessment in the Hoosic and Housatonic Watersheds (BRPC 2000) identified the Bushika Gravel Pits on Rte 8 and Sand Mill Road as sources of sediment to the river and nearby streams through road runoff in the town of Cheshire. (The problem at the gravel pit has been identified, traced to the source, and the owner is working under MassDEP oversight to address the problem and bring the facility into compliance with regulations (Schleeweis 2006)). In Adams three areas of concern were identified. A high percentage of impervious surfaces, steep sloping banks, and little riparian buffering was found within these three sections. There are 15 companies identified with stormwater “discharges”, of
Hudson River Basin 2002 Water Quality Assessment Report 8 11wqar06.doc DWM CN 139.5
which only five have NPDES Multi-sector general stormwater permits. (The Town of Adams received a 604(b) grant in 2002 to develop a stormwater management plan to address some of the issues identified in the BRPC report (See Appendix D and the individual segment for more information.) The town of North Adams contains the largest contiguous impervious surface area in the watershed (>70 acres) with numerous commercial, industrial, and multi-family residential properties. The Wal-Mart parking lot, Coury’s Auto Sales, Mass MoCA (Museum of Contemporary Arts), downtown North Adams, Gateway Heritage State Park, and Houghton Street were identified as areas of concern.
From upstream to downstream the following segments are included in the Hoosic River {South Branch} Subwatershed (Figure 6): Berkshire Pond (Segment MA11001) ................................................................................................. 12 Cheshire Reservoir, South Basin (Segment MA11019)........................................................................ 13 Cheshire Reservoir, Middle Basin (Segment MA11018) ...................................................................... 15 Cheshire Reservoir, North Basin (Segment MA11002) ........................................................................ 17 Hoosic River (Segment MA11-03) ...................................................................................................... 20 Thunder Brook (Segment MA11-10)................................................................................................... 25 Kitchen Brook (Segment MA11-24) .................................................................................................... 26 South Brook (Segment MA11-15) ...................................................................................................... 28 McDonald Brook (Segment MA11-16) ............................................................................................... 30 Bassett Brook (Segment MA11-17) .................................................................................................... 32 Dry Brook (Segment MA11-13) .......................................................................................................... 34 Pecks Brook (Segment MA11-18) ...................................................................................................... 37 Tophet Brook (Segment MA11-19)..................................................................................................... 40 Hoosic River (Segment MA11-04) ...................................................................................................... 43 Windsor Lake (Segment MA11016).................................................................................................... 47
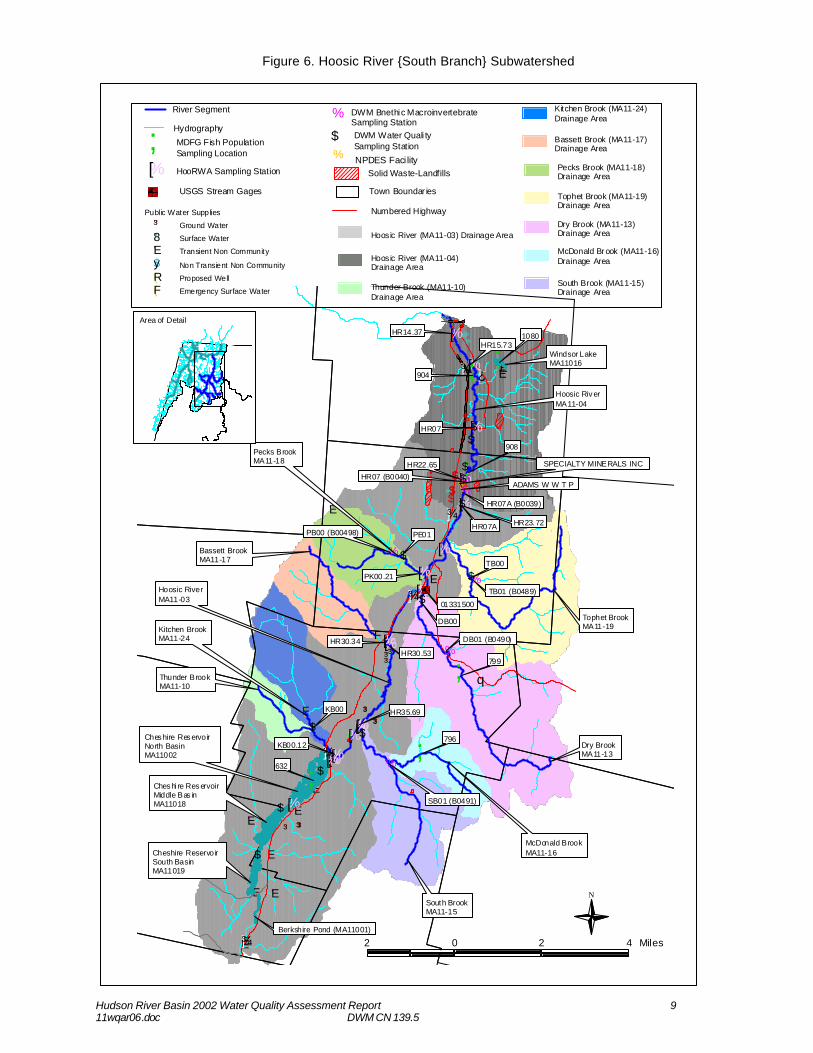
Hudson River Basin 2002 Water Quality Assessment Report 9 11wqar06.doc DWM CN 139.5
Figure 6. Hoosic River {South Branch} Subwatershed
"³"³
'E
'E
'E
"³
"³ "³"³
"³"³
'E
'E
'E
'E
'E
'E'E
'E
'E
(F
(F
'E
"³"³
%
%
%
%
%
%
%
%
%
%
%
$$$$$$
$
$
%[
%[
%[
%[
%[
%[
%[
%[
%[
%[
%[
%[
%[
%[
%[%[
%[
%%
;
;
;
;
;
;
%%
%
%
%
%
]¾ ]¿
]¾
q̂
]¾
]¾
]¾
$$
$
$
$
$$
$
$
$
$
$
$
799
796
632
1080
904
HR07A
TB00
PE01
DB00
KB00
HR14.37
HR15.73
HR22.65
HR23.72
PK00.21
HR30.34
HR30.53
HR35.69
KB00.12
01331500
SB01 (B0491)
TB01 (B0489)
DB01 (B0490)
PB00 (B00498)
HR07A (B0039)
HR07 (B0040)
HR07
908
Berkshire Pond (MA11001)
Cheshire ReservoirSouth BasinMA11019
Ches hi re Res ervoirMiddle Bas inMA11018
Ches hire Res ervoir North BasinMA11002
Thunder BrookMA11-10
Kitchen BrookMA11-24
South BrookMA11-15
McDonald BrookMA11-16
Dry BrookMA11-13
Tophet BrookMA11-19
Bassett BrookMA11-17
Pecks BrookMA11-18
Hoosic RiverMA11-03
ADAMS W W T P
SPECIALTY MINERALS INC
Windsor Lake MA11016
Hoosic Riv erMA11-04
2 0 2 4 Miles
N
Numbered Highway
DWM Water Quali ty Sampling Station
$
% DWM Bnethic MacroinvertebrateSampling Station
MDFG Fish Population Sampling Location
USGS Stream Gages
Hydrography
;HooRWA Sampling Station%[
River Segment
Solid Waste-Landfills
Town Boundar ies
Public Water Supplies
Ground Water"³Surface Water"8Transient Non Community'ENon Transient Non Community$yProposed Well(REmergency Surface Water(F
Hoosic River (MA11-03) Drainage Area
Hoosic River (MA11-04)Drainage Area
Thunder Brook (MA11-10)Drainage Area
Kitchen Brook (MA11-24)Drainage Area
Bassett Brook (MA11-17)Drainage Area
Pecks Brook (MA11-18)Drainage Area
Tophet Brook (MA11-19)Drainage Area
Dry Brook (MA11-13)Drainage Area
McDonald Br ook (MA11-16)Drainage Area
South Brook (MA11-15)Drainage Area
% NPDES Faci lity
Area of Detail
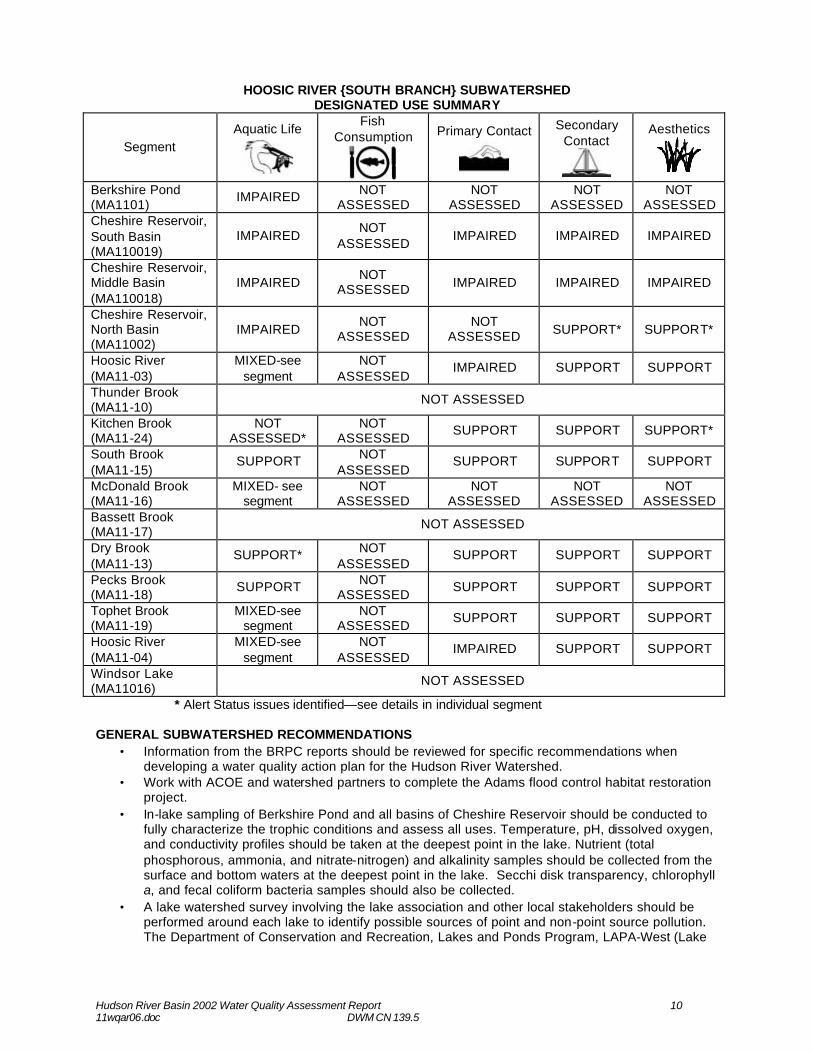
Hudson River Basin 2002 Water Quality Assessment Report 10 11wqar06.doc DWM CN 139.5
HOOSIC RIVER {SOUTH BRANCH} SUBWATERSHED
DESIGNATED USE SUMMARY
Segment Aquatic Life
Fish Consumption
Primary Contact
Secondary Contact
Aesthetics
Berkshire Pond (MA1101)
IMPAIRED NOT ASSESSED
NOT ASSESSED
NOT ASSESSED
NOT ASSESSED
Cheshire Reservoir, South Basin (MA110019)
IMPAIRED NOT
ASSESSED IMPAIRED IMPAIRED IMPAIRED
Cheshire Reservoir, Middle Basin (MA110018)
IMPAIRED NOT
ASSESSED IMPAIRED IMPAIRED IMPAIRED
Cheshire Reservoir, North Basin (MA11002)
IMPAIRED NOT
ASSESSED NOT
ASSESSED SUPPORT* SUPPORT*
Hoosic River (MA11-03)
MIXED-see segment
NOT ASSESSED
IMPAIRED SUPPORT SUPPORT
Thunder Brook (MA11-10)
NOT ASSESSED
Kitchen Brook (MA11-24)
NOT ASSESSED*
NOT ASSESSED
SUPPORT SUPPORT SUPPORT*
South Brook (MA11-15)
SUPPORT NOT ASSESSED
SUPPORT SUPPORT SUPPORT
McDonald Brook (MA11-16)
MIXED- see segment
NOT ASSESSED
NOT ASSESSED
NOT ASSESSED
NOT ASSESSED
Bassett Brook (MA11-17)
NOT ASSESSED
Dry Brook (MA11-13)
SUPPORT* NOT ASSESSED
SUPPORT SUPPORT SUPPORT
Pecks Brook (MA11-18)
SUPPORT NOT ASSESSED
SUPPORT SUPPORT SUPPORT
Tophet Brook (MA11-19)
MIXED-see segment
NOT ASSESSED
SUPPORT SUPPORT SUPPORT
Hoosic River (MA11-04)
MIXED-see segment
NOT ASSESSED
IMPAIRED SUPPORT SUPPORT
Windsor Lake (MA11016)
NOT ASSESSED
* Alert Status issues identified—see details in individual segment GENERAL SUBWATERSHED RECOMMENDATIONS
• Information from the BRPC reports should be reviewed for specific recommendations when developing a water quality action plan for the Hudson River Watershed.
• Work with ACOE and watershed partners to complete the Adams flood control habitat restoration project.
• In-lake sampling of Berkshire Pond and all basins of Cheshire Reservoir should be conducted to fully characterize the trophic conditions and assess all uses. Temperature, pH, dissolved oxygen, and conductivity profiles should be taken at the deepest point in the lake. Nutrient (total phosphorous, ammonia, and nitrate-nitrogen) and alkalinity samples should be collected from the surface and bottom waters at the deepest point in the lake. Secchi disk transparency, chlorophyll a, and fecal coliform bacteria samples should also be collected.
• A lake watershed survey involving the lake association and other local stakeholders should be performed around each lake to identify possible sources of point and non-point source pollution. The Department of Conservation and Recreation, Lakes and Ponds Program, LAPA-West (Lake
Hudson River Basin 2002 Water Quality Assessment Report 11 11wqar06.doc DWM CN 139.5
and Pond Association- West), and MassDEP may be contacted for assistance in coordinating the survey.
• Tributaries to lakes should be sampled for nutrients or other parameters that are determined to be directly or indirectly causing impairment. To determine relative loads of pollutants, multiple sampling events should be conducted simultaneously with flow measurements, emphasizing high flow periods during the course of the year.
• A survey of on-site wastewater practices around lake perimeters should be conducted. • Implement the recommendations of the Town of Adams Stormwater Management Strategic Plan. • Continue to conduct water quality monitoring, biological sampling, and bacteria sampling
throughout the subwatershed. Particular emphasis should be placed on collecting data from waterbodies that are currently not assessed for the designated uses and on identifying causes and sources of impaired waters.
• Increase awareness about the threats of non-native and invasive aquatic species through education and outreach. Signage at boat ramps can help to increase awareness of the measures that boaters can take to lessen the introduction and spread of these species through waterways.
Hudson River Basin 2002 Water Quality Assessment Report 12 11wqar06.doc DWM CN 139.5
BERKSHIRE POND (SEGMENT MA11001) Location: Lanesborough. Size: 21.4 acres Classification: Class B There is one permanent inlet (unnamed) to Berkshire Pond at the southern tip and an intermittent inlet (unnamed) on the northeastern shore. The outlet of the pond is at the northern end near Old State Road and flows directly into the south basin of Cheshire Reservoir. Berkshire Pond is listed on the 2004 Integrated List of Waters in Category 4c. This segment was assessed (Kennedy and Weinstein 2000) as impaired due to exotic (non-native) species, which is not a pollutant requiring calculations of a TMDL (MassDEP 2005). WMA WATER WITHDRAWALS AND NPDES SURFACE WATER DISCHARGE SUMMARY Based on the available information there are no WMA regulated water withdrawals from or permitted surface water discharges to this subwatershed. OTHER DISCHARGES The Berkshire Mall Group is permitted (350-2, October 2000) to discharge 0.07 MGD of treated sanitary wastewater from an on-site wastewater treatment facility located at Route 8 and Old State Road, Lanesborough to the ground. The permit expired October 2005. USE ASSESSMENT AQUATIC LIFE
Biology The presence of the aquatic non-native species Myriophyllum spicatum (Eurasian milfoil) was noted during a 12 August 1997 DWM synoptic survey (MassDEP 1997). The invasive species results in an imbalance to the biological community and, therefore, this use is impaired.
Berkshire Pond (MA11001) Use Summary Table
Designated Uses Status
Aquatic Life
IMPAIRED Causes: Non-native aquatic macrophytes Sources: Unknown
Fish Consumption
Primary Contact
Secondary Contact
Aesthetics
NOT ASSESSED
RECOMMENDATIONS An updated, detailed macrophyte mapping of percent cover and species identification (particularly non-natives), location, and frequency of occurrence is needed for the entire lake. In-lake sampling should be conducted to fully characterize the trophic conditions and assess all uses. Temperature, pH, dissolved oxygen, and conductivity profiles should be taken at the deepest point in the lake. Nutrient (total phosphorous, ammonia, and nitrate nitrogen) and alkalinity samples should be collected from the surface and bottom waters at the deepest point in the lake. Secchi disk transparency, chlorophyll a, and fecal coliform bacteria samples should also be collected. A lake watershed survey involving the lake association and other local stakeholders should be performed to identify possible sources of point and non-point source pollution.
Hudson River Basin 2002 Water Quality Assessment Report 13 11wqar06.doc DWM CN 139.5
CHESHIRE RESERVOIR, SOUTH BASIN (SEGMENT MA11019) Location: Cheshire/Lanesborough Size: 91.7 acres Classification: Class B Cheshire Reservoir, South Basin, is one of the three ponds making up the Cheshire Reservoir. There are three permanent inlets including Muddy Brook, the outlet from Berkshire Pond and an unnamed tributary on the eastern shore just south of the town boundary. Muddy Brook enters the southwest corner of Cheshire Reservoir and the outlet of Berkshire Pond enters the southeast corner. The outlet of the South Basin is at the northern end near Ingalls Crossing (Nobody’s Road). This segment of Cheshire Reservoir is listed on the 2004 Integrated List of Waters in Category 4c. This segment was assessed as impaired due exotic species (non-native aquatic macrophytes), which is not a pollutant requiring calculations of a TMDL (MassDEP 2005). WMA WATER WITHDRAWALS AND NPDES WASTEWATER DISCHARGE SUMMARY Based on the available information there are no WMA regulated groundwater or surface water withdrawals from this segment or permitted surface water discharges to this segment. USE ASSESSMENT AQUATIC LIFE
Biology The presence of the non-native aquatic macrophyte species, M. spicatum was noted during the September 2002 DWM synoptic survey (MassDEP 2002c). Heavy algal mats, indicative of productivity, were also observed over most of the surface area (MassDEP 2002c). During the 1997 synoptic survey the non-native aquatic macrophyte Potamogeton crispus (curly leaf pondweed) was also documented. This species dies back early in the season and is often missed in late summer surveys (McVoy 2006). DWM collected grab samples from the outlet of the South Basin of Cheshire Reservoir in July, August, and September 2002 as part of the baseline lake sampling for TMDL development (Appendix C). Samples were analyzed for total phosphorus. Concentrations ranged from 0.015 to 0.022 mg/L (n=3).
Due to the presence of the non-native aquatic macrophyte and excessive algal growth, the Aquatic Life Use is assessed as impaired. Although sources are unkown, septic system inputs may contribute to enriched conditions. Dirt road erosion was also noted during field surveys. PRIMARY CONTACT RECREATION, SECONDARY CONTACT RECREATION, AND AESTHETICS
During the September 2002 DWM synoptic survey, the entire pond was observed to have a very dense cover of all types of vegetation, including emergents encroaching from the shores (75-100% covered) and the non-native macrophyte species M. spicatum. The non-native species dominated the biovloume. Heavy algal mats were observed over most of the surface area (MassDEP 2002c).
The Recreational and Aesthetic uses are impaired due to excessive algal growth and high percentage of biovolume occupied by non-native aquatic macrophytes. Although sources are unknown, septic system inputs may contribute to enriched conditions. Dirt road erosion was also noted during field surveys.
Hudson River Basin 2002 Water Quality Assessment Report 14 11wqar06.doc DWM CN 139.5
Cheshire Reservoir, South Basin (MA11019) Use Summary Table
Designated Uses Status
Aquatic Life
IMPAIRED Causes: Non-native aquatic macrophytes, excessive algal growth Sources: Unknown Suspected sources: On-site treatment systems
Fish Consumption
NOT ASSESSED
Primary Contact
Secondary
Contact
Aesthetics
IMPAIRED Causes: Non-native aquatic macrophytes, excessive algal growth Sources: Unknown Suspected sources: On-site treatment systems
RECOMMENDATIONS In-lake sampling should be conducted to fully characterize the trophic conditions and assess all uses. Temperature, pH, dissolved oxygen, and conductivity profiles should be taken at the deepest point in the lake. Nutrient (total phosphorous, ammonia, and nitrate-nitrogen) and alkalinity samples should be collected from the surface and bottom waters at the deepest point in the lake. Secchi disk transparency, chlorophyll a, and fecal coliform bacteria samples should also be collected. A lake watershed survey involving the lake association and other local stakeholders should be performed to identify possible sources of point and non-point source pollution.
Hudson River Basin 2002 Water Quality Assessment Report 15 11wqar06.doc DWM CN 139.5
CHESHIRE RESERVOIR, MIDDLE BASIN (SEGMENT MA11018) Location: Cheshire/Lanesborough Size: 186.3 acres Classification: Class B Cheshire Reservoir, Middle Basin, is one of the three ponds making up the Cheshire Reservoir. There are three permanent inlets to the Middle Basin: the outlet from the South Basin at the southern tip, Gore Brook on the southeastern shore and Pettibone Brook on the southwestern shore. The outlet of the Middle Basin is at the northern end at Farnums Causeway. This segment is listed on the 2004 Integrated List of Waters in Category 5. This segment was assessed as impaired due to noxious aquatic plants and turbidity and requires a TMDL. An additional cause of impairment that does not require the calculation of a TMDL is exotic (non-native) species (MassDEP 2005). WMA WATER WITHDRAWALS AND NPDES WASTEWATER DISCHARGE SUMMARY Based on the available information there are no WMA regulated groundwater or surface water withdrawals from this segment or permitted surface water discharges to this segment. USE ASSESSMENT AQUATIC LIFE
Biology The presence of non-native aquatic species, Myriophyllum spicatum and Potamogeton crispus, were noted during the 17 September 2002 DWM synoptic survey (MassDEP 2002c).
Chemistry-water DWM collected grab samples from the deep hole of the Middle Basin of Cheshire Reservoir (Station B, Unique ID W0975) in July, August, and September 2002 for the purpose of TMDL development. Samples were analyzed for total phosphorus, chlorophyll a, and apparent color. An in-situ profile for dissolved oxygen, temperature, conductivity, and pH was also conducted at the deep hole of the basin in September (Appendix C). Th ese data were not collected during worse case, pre-dawn conditions. The Hoosic River Watershed Association (HooRWA) collected in-situ (DO, temperature, pH, conductivity) and grab samples (total phosphorus, total suspended solids) from the outflow of the Middle Basin of Cheshire Reservoir into the North Basin at Farnum’s Causeway (Station CL02.48) May through October 2002 (HooRWA undated). These data were not collected during worst case, pre-dawn conditions.
Due to the presence of non-native aquatic macrophytes, the Aquatic Life Use is assessed as impaired. PRIMARY CONTACT RECREATION, SECONDARY CONTACT RECREATION, AND AESTHETICS
DWM observed 75-100% of the bottom covered with macrophytes during the September 2002 aquatic macrophyte survey (MassDEP 2002c). Macrophyte growth was most prolific in the southern end where biovolume was categorized as dense (50-75%) to very dense (75-100%). M. spicatum was “very common” throughout the lake, affecting approximately 25% of the lake (MassDEP 2002c). Secchi disk depths measured by DWM personnel during the water quality surveys in July, August, and September 2002 ranged between 2.1 and 2.4 m (Appendix C).
Station DO (mg/L)
DO saturation
(%)
Temperature (°C)
pH (SU)
Conductivity at 25°C (µS/cm)
Total Phosphorus
(mg/L)
Total Suspended
Solids (mg/L)
Chl-a (mg/m3)
B 9.4 and 9.1 (n=2)
110 and 106 (n=2) 23.4 (n=2) 8.5 (n=2) 291 and 292
(n=2) 0.021 – 0.027
(n=6) 3.2 - 6.6 (n=3)
CL02.48 6.5 – 10.5 (n=7)
68.3-91.4 (n=7)
9.2 – 23.6 (n=7)
7.8 - 8.3 (n=7)
210- 300 (n=7) <0.02 – 0.04 (n=4)
1 – 2 (n=4)
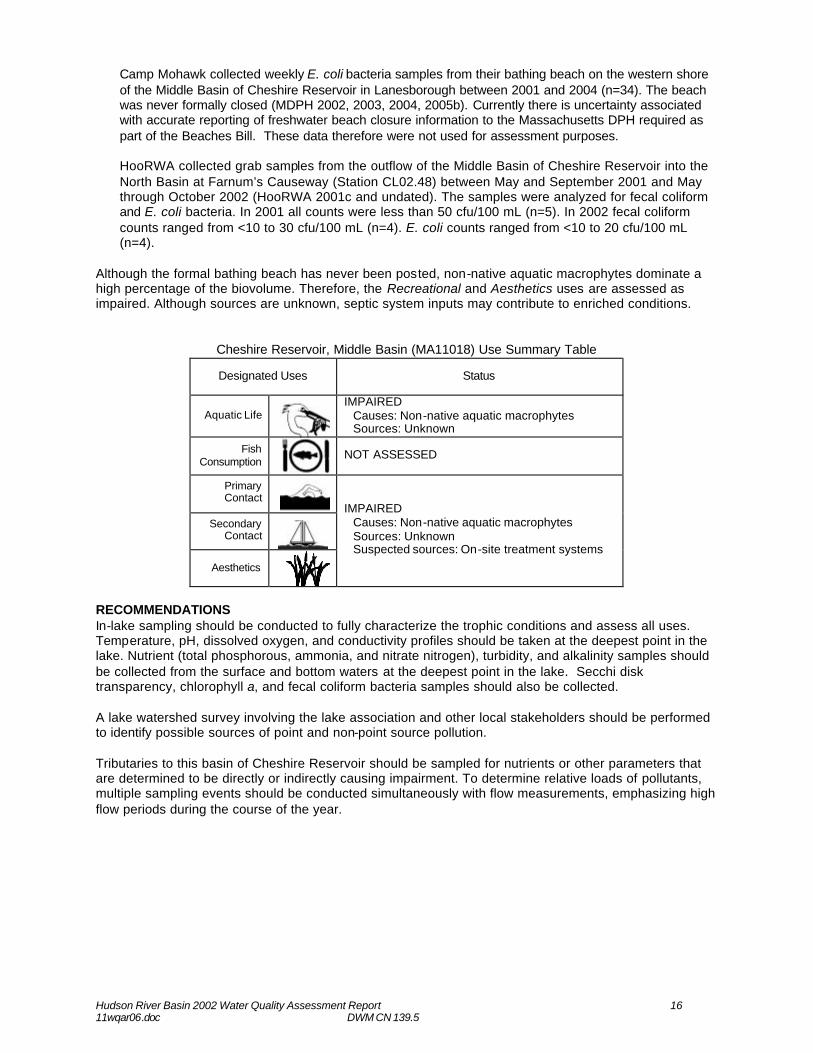
Hudson River Basin 2002 Water Quality Assessment Report 16 11wqar06.doc DWM CN 139.5
Camp Mohawk collected weekly E. coli bacteria samples from their bathing beach on the western shore of the Middle Basin of Cheshire Reservoir in Lanesborough between 2001 and 2004 (n=34). The beach was never formally closed (MDPH 2002, 2003, 2004, 2005b). Currently there is uncertainty associated with accurate reporting of freshwater beach closure information to the Massachusetts DPH required as part of the Beaches Bill. These data therefore were not used for assessment purposes. HooRWA collected grab samples from the outflow of the Middle Basin of Cheshire Reservoir into the North Basin at Farnum’s Causeway (Station CL02.48) between May and September 2001 and May through October 2002 (HooRWA 2001c and undated). The samples were analyzed for fecal coliform and E. coli bacteria. In 2001 all counts were less than 50 cfu/100 mL (n=5). In 2002 fecal coliform counts ranged from <10 to 30 cfu/100 mL (n=4). E. coli counts ranged from <10 to 20 cfu/100 mL (n=4).
Although the formal bathing beach has never been posted, non-native aquatic macrophytes dominate a high percentage of the biovolume. Therefore, the Recreational and Aesthetics uses are assessed as impaired. Although sources are unknown, septic system inputs may contribute to enriched conditions.
Cheshire Reservoir, Middle Basin (MA11018) Use Summary Table
Designated Uses Status
Aquatic Life
IMPAIRED Causes: Non-native aquatic macrophytes Sources: Unknown
Fish Consumption
NOT ASSESSED
Primary Contact
Secondary
Contact
Aesthetics
IMPAIRED Causes: Non-native aquatic macrophytes Sources: Unknown Suspected sources: On-site treatment systems
RECOMMENDATIONS In-lake sampling should be conducted to fully characterize the trophic conditions and assess all uses. Temperature, pH, dissolved oxygen, and conductivity profiles should be taken at the deepest point in the lake. Nutrient (total phosphorous, ammonia, and nitrate nitrogen), turbidity, and alkalinity samples should be collected from the surface and bottom waters at the deepest point in the lake. Secchi disk transparency, chlorophyll a, and fecal coliform bacteria samples should also be collected. A lake watershed survey involving the lake association and other local stakeholders should be performed to identify possible sources of point and non-point source pollution. Tributaries to this basin of Cheshire Reservoir should be sampled for nutrients or other parameters that are determined to be directly or indirectly causing impairment. To determine relative loads of pollutants, multiple sampling events should be conducted simultaneously with flow measurements, emphasizing high flow periods during the course of the year.
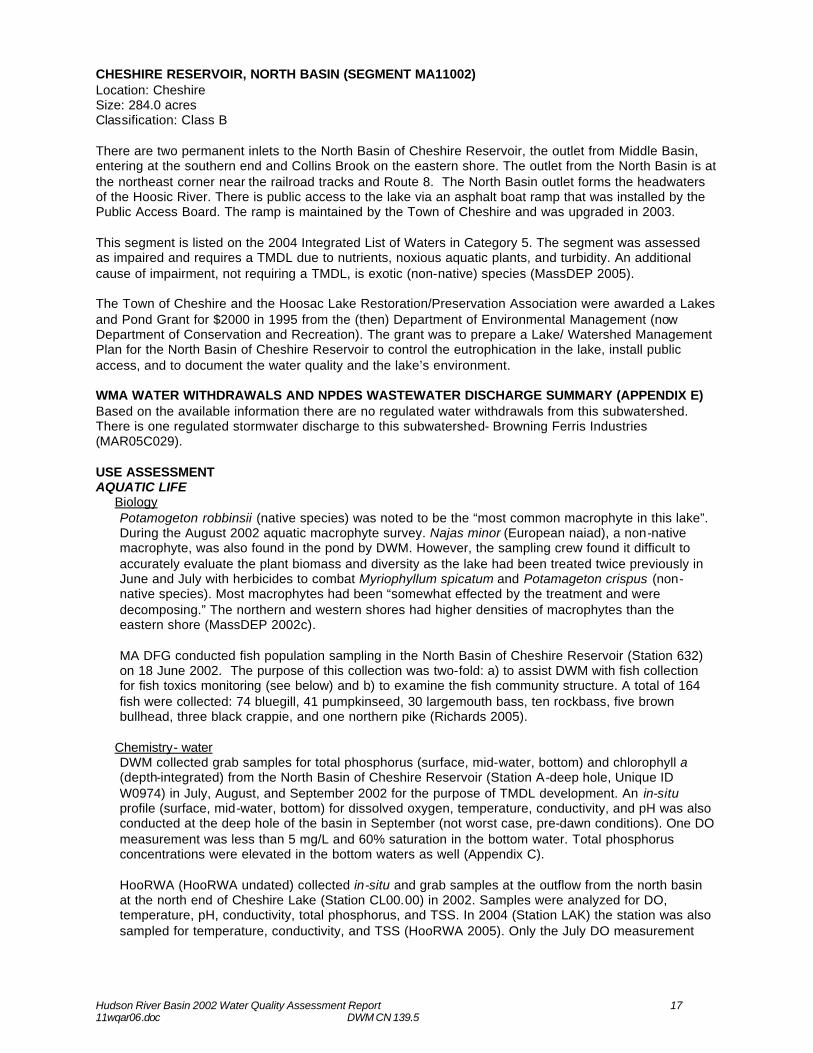
Hudson River Basin 2002 Water Quality Assessment Report 17 11wqar06.doc DWM CN 139.5
CHESHIRE RESERVOIR, NORTH BASIN (SEGMENT MA11002) Location: Cheshire Size: 284.0 acres Classification: Class B There are two permanent inlets to the North Basin of Cheshire Reservoir, the outlet from Middle Basin, entering at the southern end and Collins Brook on the eastern shore. The outlet from the North Basin is at the northeast corner near the railroad tracks and Route 8. The North Basin outlet forms the headwaters of the Hoosic River. There is public access to the lake via an asphalt boat ramp that was installed by the Public Access Board. The ramp is maintained by the Town of Cheshire and was upgraded in 2003. This segment is listed on the 2004 Integrated List of Waters in Category 5. The segment was assessed as impaired and requires a TMDL due to nutrients, noxious aquatic plants, and turbidity. An additional cause of impairment, not requiring a TMDL, is exotic (non-native) species (MassDEP 2005). The Town of Cheshire and the Hoosac Lake Restoration/Preservation Association were awarded a Lakes and Pond Grant for $2000 in 1995 from the (then) Department of Environmental Management (now Department of Conservation and Recreation). The grant was to prepare a Lake/ Watershed Management Plan for the North Basin of Cheshire Reservoir to control the eutrophication in the lake, install public access, and to document the water quality and the lake’s environment. WMA WATER WITHDRAWALS AND NPDES WASTEWATER DISCHARGE SUMMARY (APPENDIX E) Based on the available information there are no regulated water withdrawals from this subwatershed. There is one regulated stormwater discharge to this subwatershed- Browning Ferris Industries (MAR05C029). USE ASSESSMENT AQUATIC LIFE
Biology Potamogeton robbinsii (native species) was noted to be the “most common macrophyte in this lake”. During the August 2002 aquatic macrophyte survey. Najas minor (European naiad), a non-native macrophyte, was also found in the pond by DWM. However, the sampling crew found it difficult to accurately evaluate the plant biomass and diversity as the lake had been treated twice previously in June and July with herbicides to combat Myriophyllum spicatum and Potamageton crispus (non-native species). Most macrophytes had been “somewhat effected by the treatment and were decomposing.” The northern and western shores had higher densities of macrophytes than the eastern shore (MassDEP 2002c). MA DFG conducted fish population sampling in the North Basin of Cheshire Reservoir (Station 632) on 18 June 2002. The purpose of this collection was two-fold: a) to assist DWM with fish collection for fish toxics monitoring (see below) and b) to examine the fish community structure. A total of 164 fish were collected: 74 bluegill, 41 pumpkinseed, 30 largemouth bass, ten rockbass, five brown bullhead, three black crappie, and one northern pike (Richards 2005).
Chemistry- water DWM collected grab samples for total phosphorus (surface, mid-water, bottom) and chlorophyll a (depth-integrated) from the North Basin of Cheshire Reservoir (Station A-deep hole, Unique ID W0974) in July, August, and September 2002 for the purpose of TMDL development. An in-situ profile (surface, mid-water, bottom) for dissolved oxygen, temperature, conductivity, and pH was also conducted at the deep hole of the basin in September (not worst case, pre-dawn conditions). One DO measurement was less than 5 mg/L and 60% saturation in the bottom water. Total phosphorus concentrations were elevated in the bottom waters as well (Appendix C). HooRWA (HooRWA undated) collected in-situ and grab samples at the outflow from the north basin at the north end of Cheshire Lake (Station CL00.00) in 2002. Samples were analyzed for DO, temperature, pH, conductivity, total phosphorus, and TSS. In 2004 (Station LAK) the station was also sampled for temperature, conductivity, and TSS (HooRWA 2005). Only the July DO measurement
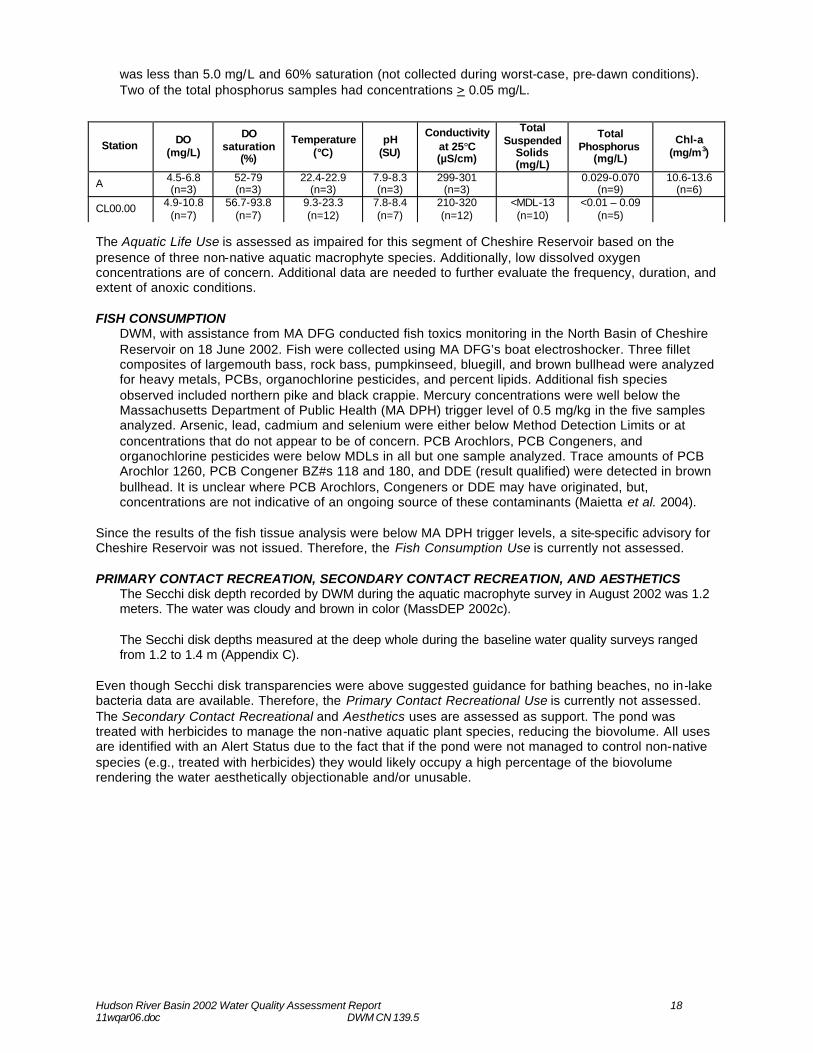
Hudson River Basin 2002 Water Quality Assessment Report 18 11wqar06.doc DWM CN 139.5
was less than 5.0 mg/L and 60% saturation (not collected during worst-case, pre-dawn conditions). Two of the total phosphorus samples had concentrations > 0.05 mg/L.
The Aquatic Life Use is assessed as impaired for this segment of Cheshire Reservoir based on the presence of three non-native aquatic macrophyte species. Additionally, low dissolved oxygen concentrations are of concern. Additional data are needed to further evaluate the frequency, duration, and extent of anoxic conditions. FISH CONSUMPTION
DWM, with assistance from MA DFG conducted fish toxics monitoring in the North Basin of Cheshire Reservoir on 18 June 2002. Fish were collected using MA DFG’s boat electroshocker. Three fillet composites of largemouth bass, rock bass, pumpkinseed, bluegill, and brown bullhead were analyzed for heavy metals, PCBs, organochlorine pesticides, and percent lipids. Additional fish species observed included northern pike and black crappie. Mercury concentrations were well below the Massachusetts Department of Public Health (MA DPH) trigger level of 0.5 mg/kg in the five samples analyzed. Arsenic, lead, cadmium and selenium were either below Method Detection Limits or at concentrations that do not appear to be of concern. PCB Arochlors, PCB Congeners, and organochlorine pesticides were below MDLs in all but one sample analyzed. Trace amounts of PCB Arochlor 1260, PCB Congener BZ#s 118 and 180, and DDE (result qualified) were detected in brown bullhead. It is unclear where PCB Arochlors, Congeners or DDE may have originated, but, concentrations are not indicative of an ongoing source of these contaminants (Maietta et al. 2004).
Since the results of the fish tissue analysis were below MA DPH trigger levels, a site-specific advisory for Cheshire Reservoir was not issued. Therefore, the Fish Consumption Use is currently not assessed. PRIMARY CONTACT RECREATION, SECONDARY CONTACT RECREATION, AND AESTHETICS
The Secchi disk depth recorded by DWM during the aquatic macrophyte survey in August 2002 was 1.2 meters. The water was cloudy and brown in color (MassDEP 2002c). The Secchi disk depths measured at the deep whole during the baseline water quality surveys ranged from 1.2 to 1.4 m (Appendix C).
Even though Secchi disk transparencies were above suggested guidance for bathing beaches, no in-lake bacteria data are available. Therefore, the Primary Contact Recreational Use is currently not assessed. The Secondary Contact Recreational and Aesthetics uses are assessed as support. The pond was treated with herbicides to manage the non-native aquatic plant species, reducing the biovolume. All uses are identified with an Alert Status due to the fact that if the pond were not managed to control non-native species (e.g., treated with herbicides) they would likely occupy a high percentage of the biovolume rendering the water aesthetically objectionable and/or unusable.
Station DO (mg/L)
DO saturation
(%)
Temperature (°C)
pH (SU)
Conductivity at 25°C (µS/cm)
Total Suspended
Solids (mg/L)
Total Phosphorus
(mg/L)
Chl-a (mg/m3)
A 4.5-6.8 (n=3)
52-79 (n=3)
22.4-22.9 (n=3)
7.9-8.3 (n=3)
299-301 (n=3) 0.029-0.070
(n=9) 10.6-13.6
(n=6)
CL00.00 4.9-10.8 (n=7)
56.7-93.8 (n=7)
9.3-23.3 (n=12)
7.8-8.4 (n=7)
210-320 (n=12)
<MDL-13 (n=10)
<0.01 – 0.09 (n=5)
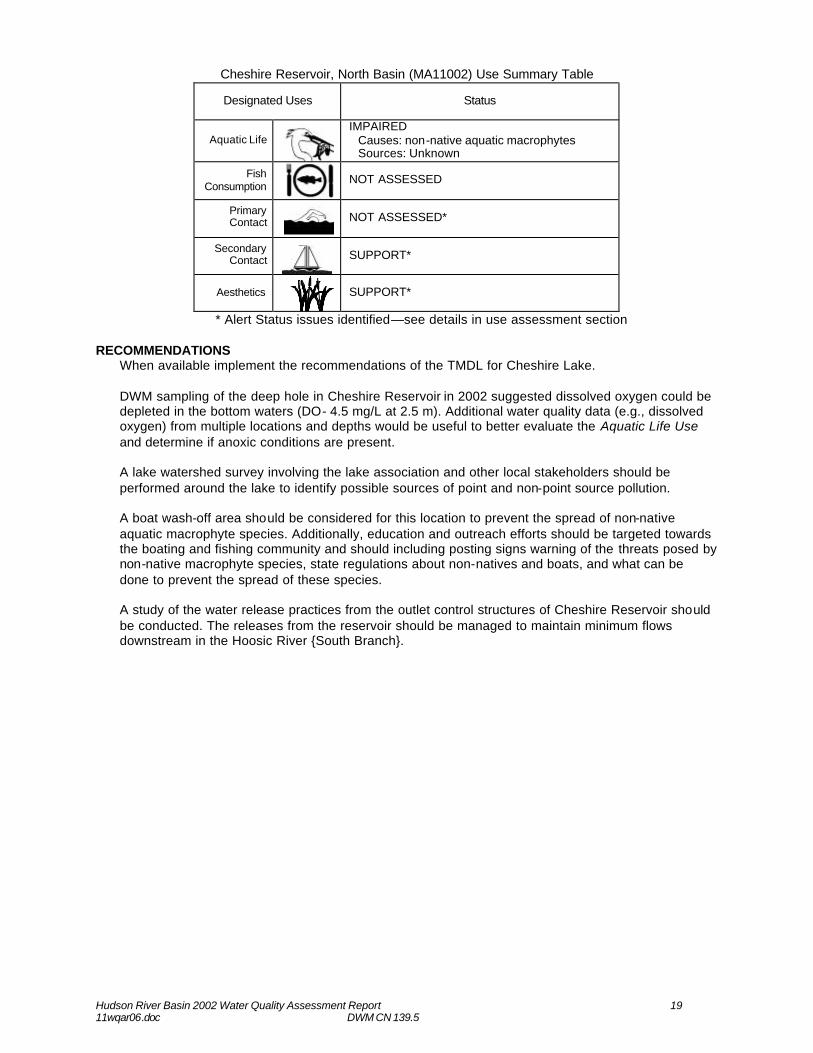
Hudson River Basin 2002 Water Quality Assessment Report 19 11wqar06.doc DWM CN 139.5
Cheshire Reservoir, North Basin (MA11002) Use Summary Table
Designated Uses Status
Aquatic Life
IMPAIRED Causes: non-native aquatic macrophytes Sources: Unknown
Fish Consumption
NOT ASSESSED
Primary Contact
NOT ASSESSED*
Secondary Contact
SUPPORT*
Aesthetics
SUPPORT*
* Alert Status issues identified—see details in use assessment section
RECOMMENDATIONS When available implement the recommendations of the TMDL for Cheshire Lake. DWM sampling of the deep hole in Cheshire Reservoir in 2002 suggested dissolved oxygen could be depleted in the bottom waters (DO- 4.5 mg/L at 2.5 m). Additional water quality data (e.g., dissolved oxygen) from multiple locations and depths would be useful to better evaluate the Aquatic Life Use and determine if anoxic conditions are present. A lake watershed survey involving the lake association and other local stakeholders should be performed around the lake to identify possible sources of point and non-point source pollution. A boat wash-off area should be considered for this location to prevent the spread of non-native aquatic macrophyte species. Additionally, education and outreach efforts should be targeted towards the boating and fishing community and should including posting signs warning of the threats posed by non-native macrophyte species, state regulations about non-natives and boats, and what can be done to prevent the spread of these species. A study of the water release practices from the outlet control structures of Cheshire Reservoir should be conducted. The releases from the reservoir should be managed to maintain minimum flows downstream in the Hoosic River {South Branch}.
Hudson River Basin 2002 Water Quality Assessment Report 20 11wqar06.doc DWM CN 139.5
HOOSIC RIVER (SEGMENT MA11-03) Location: Outlet of Cheshire Reservoir, Cheshire, to Adams WWTP discharge, Adams. Segment Length: 8.9 miles Classification: Class B, Cold Water Fishery This segment of the Hoosic River is listed on the 2004 Integrated List of Waters in Category 5. This segment was assessed as impaired and requires a TMDL due to unknown causes and pathogens. This segment is also additionally impaired due to other habitat alterations that do not require the calculation of a TMDL (MassDEP 2005). LIST OF WMA WATER WITHDRAWALS (APPENDIX E, TABLE E5) -- Cheshire Water Department (two sources) -- Adams Fire District (all four sources) LIST OF NPDES WASTEWATER DISCHARGES (APPENDIX E, TABLES E5 AND E6) -- Polyfibron Technologies, Inc. (MAG250007) -- Berkshire Mill Residences (MA0031046) USE ASSESSMENT AQUATIC LIFE
Habitat and flow Stream gaging data for the Hoosic River are available from the USGS gage 01331500 located 500 feet downstream from the confluence with Dry Brook and 0.4 miles upstream from the confluence with Pecks Brook in Adams from 1931 to 30 September 2004. The drainage area at this gage is 46.7 mi2 and the average annual discharge over the period of record is 90.0 cubic feet per second (cfs). According to the USGS water is diverted upstream for the municipal supply of Adams and flow is also regulated at Cheshire Reservoir located 5.1 miles upstream (Socolow et al. 2005). The estimated 7Q10 at this gage is 8.53 cfs (Hansen et al. 1973). DWM conducted a habitat assessment along this segment of the Hoosic River near Lime Street (Station HR07A) as part of the benthic macroinvertebrate survey. The reach was devoid of rooted aquatic vegetation, although approximately 90% of the rocks in the reach were very slippery—typically an indication of thin-film periphyton growth—and filamentous green algae were also seen attached to rocks. The reach received a habitat score of 146 out of 200 due to a lack of stable fish cover, low water levels (<75% channel covered with water- natural drought conditions) and evidence of embeddedness and sedimentation (Appendix D). The concrete flood control structures/riprap streambed along a 2.1-mile reach of this segment of the Hoosic River (between the USGS gage and Lime Street Bridge in Adams) has resulted in a loss of habitat for aquatic life.
Biology In July 2002 DWM conducted biomonitoring along this segment of the Hoosic River (Station HR07A) near the Lime Street bridge in Adams. RBP III analysis indicated that this segment was slightly impacted when compared to the regional reference station on Pecks Brook (Appendix D). DWM biologists noted that one filter-feeding caddisfly species hyperdominated the assemblage and filtering collectors dominated the community (Appendix D). This invertebrate community structure indicates a heavy load of suspended solids and organics that often reflects urban-runoff. (Appendix D).
Toxicity Ambient Between July 1999 and May 2005, the Adams WWTP staff collected water from the Hoosic River at the Lime Street Bridge, approximately ¼ mile upstream from outfall #001, for use as a site control in the facility’s whole effluent toxicity tests. Survival of Ceriodaphnia dubia exposed (7-day) to the river water ranged from 20 to 100% (n=26). Two test events (May 2002, 20%, and August 2003, 70%) did not meet the use assessment criteria of 75% survival (TOXTD database).
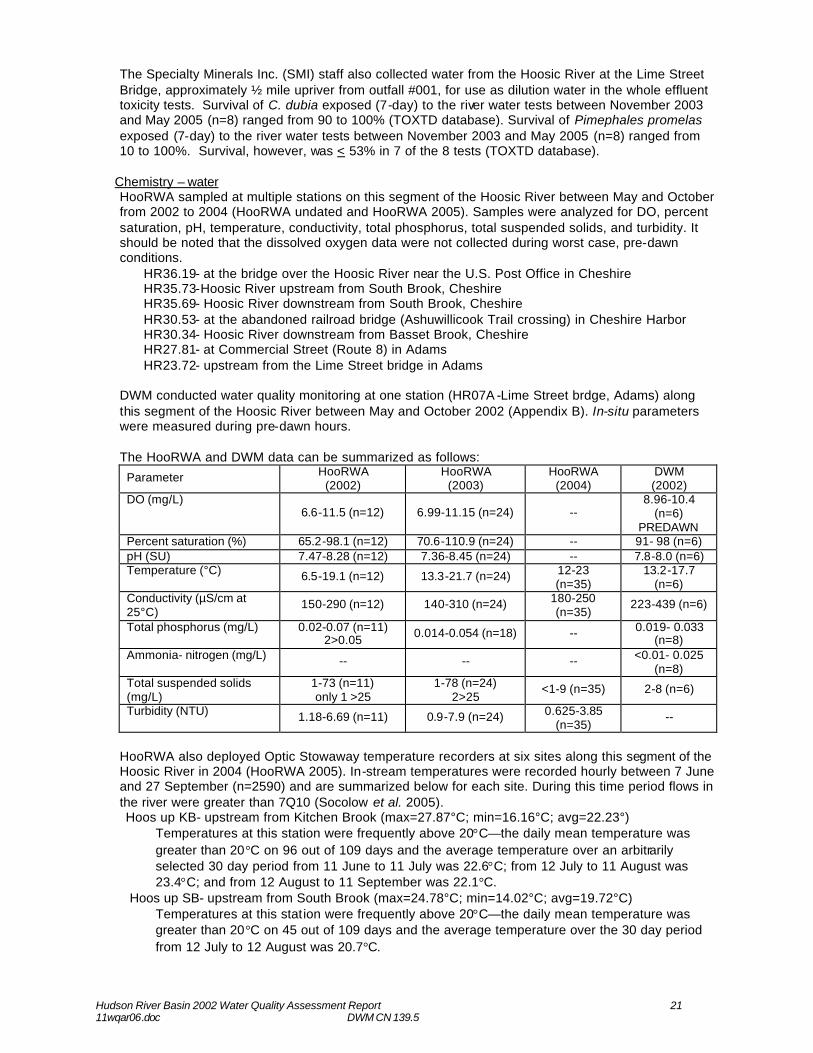
Hudson River Basin 2002 Water Quality Assessment Report 21 11wqar06.doc DWM CN 139.5
The Specialty Minerals Inc. (SMI) staff also collected water from the Hoosic River at the Lime Street Bridge, approximately ½ mile upriver from outfall #001, for use as dilution water in the whole effluent toxicity tests. Survival of C. dubia exposed (7-day) to the river water tests between November 2003 and May 2005 (n=8) ranged from 90 to 100% (TOXTD database). Survival of Pimephales promelas exposed (7-day) to the river water tests between November 2003 and May 2005 (n=8) ranged from 10 to 100%. Survival, however, was < 53% in 7 of the 8 tests (TOXTD database).
Chemistry – water HooRWA sampled at multiple stations on this segment of the Hoosic River between May and October from 2002 to 2004 (HooRWA undated and HooRWA 2005). Samples were analyzed for DO, percent saturation, pH, temperature, conductivity, total phosphorus, total suspended solids, and turbidity. It should be noted that the dissolved oxygen data were not collected during worst case, pre-dawn conditions. HR36.19- at the bridge over the Hoosic River near the U.S. Post Office in Cheshire HR35.73-Hoosic River upstream from South Brook, Cheshire HR35.69- Hoosic River downstream from South Brook, Cheshire HR30.53- at the abandoned railroad bridge (Ashuwillicook Trail crossing) in Cheshire Harbor HR30.34- Hoosic River downstream from Basset Brook, Cheshire HR27.81- at Commercial Street (Route 8) in Adams HR23.72- upstream from the Lime Street bridge in Adams DWM conducted water quality monitoring at one station (HR07A -Lime Street brdge, Adams) along this segment of the Hoosic River between May and October 2002 (Appendix B). In-situ parameters were measured during pre-dawn hours. The HooRWA and DWM data can be summarized as follows:
Parameter HooRWA (2002)
HooRWA (2003)
HooRWA (2004)
DWM (2002)
DO (mg/L) 6.6-11.5 (n=12) 6.99-11.15 (n=24) --
8.96-10.4 (n=6)
PREDAWN Percent saturation (%) 65.2-98.1 (n=12) 70.6-110.9 (n=24) -- 91- 98 (n=6) pH (SU) 7.47-8.28 (n=12) 7.36-8.45 (n=24) -- 7.8-8.0 (n=6) Temperature (°C) 6.5-19.1 (n=12) 13.3-21.7 (n=24) 12-23
(n=35) 13.2-17.7
(n=6) Conductivity (µS/cm at 25°C)
150-290 (n=12) 140-310 (n=24) 180-250 (n=35)
223-439 (n=6)
Total phosphorus (mg/L) 0.02-0.07 (n=11) 2>0.05 0.014-0.054 (n=18) -- 0.019- 0.033
(n=8) Ammonia- nitrogen (mg/L) -- -- -- <0.01- 0.025
(n=8) Total suspended solids (mg/L)
1-73 (n=11) only 1 >25
1-78 (n=24) 2>25
<1-9 (n=35) 2-8 (n=6)
Turbidity (NTU) 1.18-6.69 (n=11) 0.9-7.9 (n=24) 0.625-3.85 (n=35)
--
HooRWA also deployed Optic Stowaway temperature recorders at six sites along this segment of the Hoosic River in 2004 (HooRWA 2005). In-stream temperatures were recorded hourly between 7 June and 27 September (n=2590) and are summarized below for each site. During this time period flows in the river were greater than 7Q10 (Socolow et al. 2005). Hoos up KB- upstream from Kitchen Brook (max=27.87°C; min=16.16°C; avg=22.23°)
Temperatures at this station were frequently above 20°C—the daily mean temperature was greater than 20°C on 96 out of 109 days and the average temperature over an arbitrarily selected 30 day period from 11 June to 11 July was 22.6°C; from 12 July to 11 August was 23.4°C; and from 12 August to 11 September was 22.1°C.
Hoos up SB- upstream from South Brook (max=24.78°C; min=14.02°C; avg=19.72°C) Temperatures at this station were frequently above 20°C—the daily mean temperature was greater than 20°C on 45 out of 109 days and the average temperature over the 30 day period from 12 July to 12 August was 20.7°C.
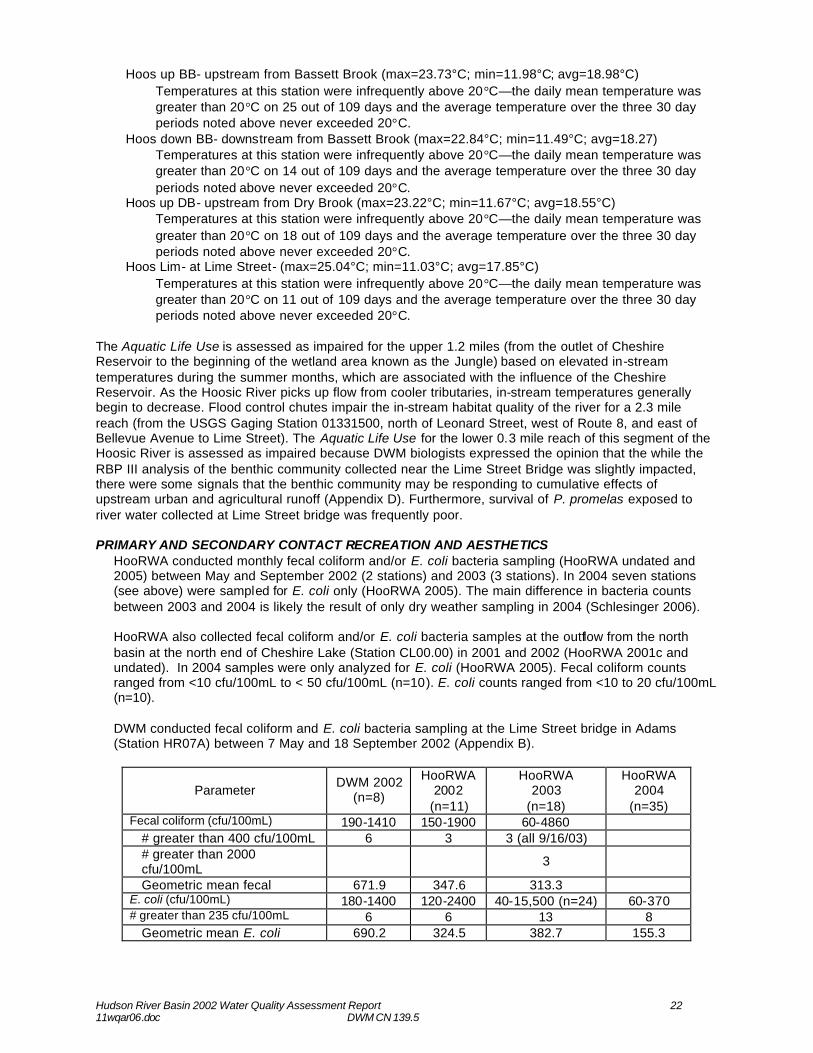
Hudson River Basin 2002 Water Quality Assessment Report 22 11wqar06.doc DWM CN 139.5
Hoos up BB- upstream from Bassett Brook (max=23.73°C; min=11.98°C; avg=18.98°C) Temperatures at this station were infrequently above 20°C—the daily mean temperature was greater than 20°C on 25 out of 109 days and the average temperature over the three 30 day periods noted above never exceeded 20°C.
Hoos down BB- downstream from Bassett Brook (max=22.84°C; min=11.49°C; avg=18.27) Temperatures at this station were infrequently above 20°C—the daily mean temperature was greater than 20°C on 14 out of 109 days and the average temperature over the three 30 day periods noted above never exceeded 20°C.
Hoos up DB- upstream from Dry Brook (max=23.22°C; min=11.67°C; avg=18.55°C) Temperatures at this station were infrequently above 20°C—the daily mean temperature was greater than 20°C on 18 out of 109 days and the average temperature over the three 30 day periods noted above never exceeded 20°C.
Hoos Lim- at Lime Street- (max=25.04°C; min=11.03°C; avg=17.85°C) Temperatures at this station were infrequently above 20°C—the daily mean temperature was greater than 20°C on 11 out of 109 days and the average temperature over the three 30 day periods noted above never exceeded 20°C.
The Aquatic Life Use is assessed as impaired for the upper 1.2 miles (from the outlet of Cheshire Reservoir to the beginning of the wetland area known as the Jungle) based on elevated in-stream temperatures during the summer months, which are associated with the influence of the Cheshire Reservoir. As the Hoosic River picks up flow from cooler tributaries, in-stream temperatures generally begin to decrease. Flood control chutes impair the in-stream habitat quality of the river for a 2.3 mile reach (from the USGS Gaging Station 01331500, north of Leonard Street, west of Route 8, and east of Bellevue Avenue to Lime Street). The Aquatic Life Use for the lower 0.3 mile reach of this segment of the Hoosic River is assessed as impaired because DWM biologists expressed the opinion that the while the RBP III analysis of the benthic community collected near the Lime Street Bridge was slightly impacted, there were some signals that the benthic community may be responding to cumulative effects of upstream urban and agricultural runoff (Appendix D). Furthermore, survival of P. promelas exposed to river water collected at Lime Street bridge was frequently poor. PRIMARY AND SECONDARY CONTACT RECREATION AND AESTHETICS
HooRWA conducted monthly fecal coliform and/or E. coli bacteria sampling (HooRWA undated and 2005) between May and September 2002 (2 stations) and 2003 (3 stations). In 2004 seven stations (see above) were sampled for E. coli only (HooRWA 2005). The main difference in bacteria counts between 2003 and 2004 is likely the result of only dry weather sampling in 2004 (Schlesinger 2006). HooRWA also collected fecal coliform and/or E. coli bacteria samples at the outflow from the north basin at the north end of Cheshire Lake (Station CL00.00) in 2001 and 2002 (HooRWA 2001c and undated). In 2004 samples were only analyzed for E. coli (HooRWA 2005). Fecal coliform counts ranged from <10 cfu/100mL to < 50 cfu/100mL (n=10). E. coli counts ranged from <10 to 20 cfu/100mL (n=10). DWM conducted fecal coliform and E. coli bacteria sampling at the Lime Street bridge in Adams (Station HR07A) between 7 May and 18 September 2002 (Appendix B).
Parameter DWM 2002
(n=8)
HooRWA 2002
(n=11)
HooRWA 2003
(n=18)
HooRWA 2004
(n=35) Fecal coliform (cfu/100mL) 190-1410 150-1900 60-4860
# greater than 400 cfu/100mL 6 3 3 (all 9/16/03) # greater than 2000 cfu/100mL
3
Geometric mean fecal 671.9 347.6 313.3 E. coli (cfu/100mL) 180-1400 120-2400 40-15,500 (n=24) 60-370 # greater than 235 cfu/100mL 6 6 13 8
Geometric mean E. coli 690.2 324.5 382.7 155.3
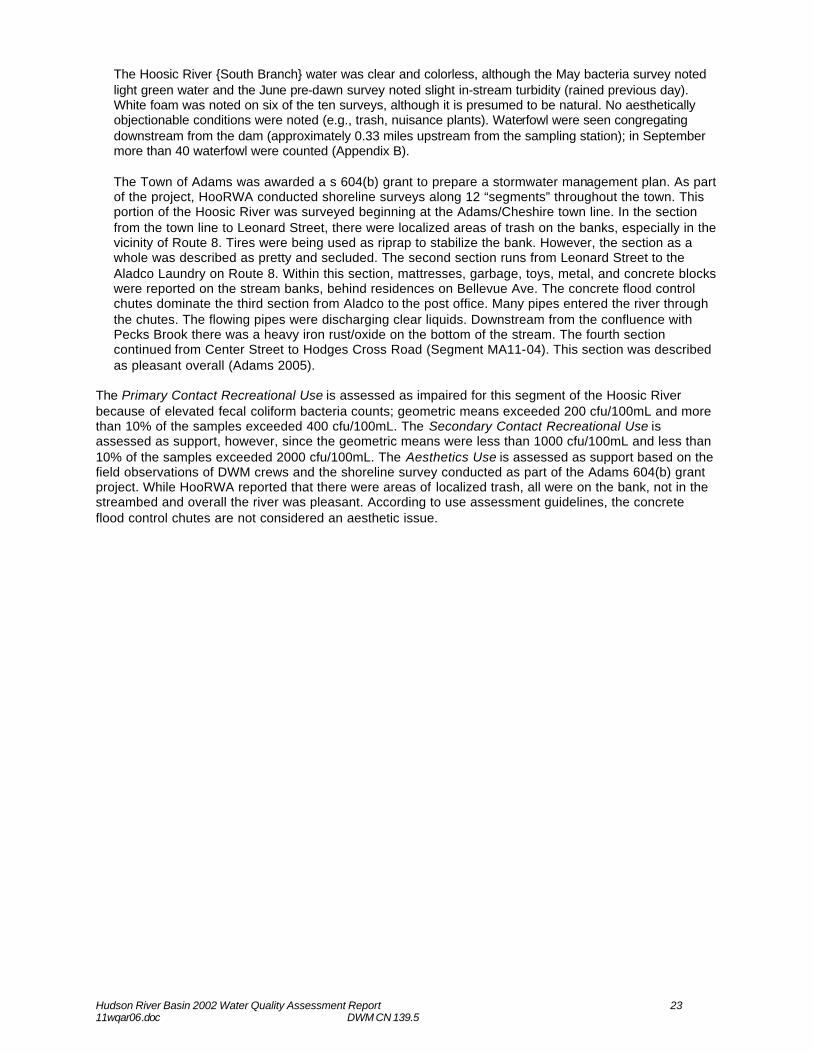
Hudson River Basin 2002 Water Quality Assessment Report 23 11wqar06.doc DWM CN 139.5
The Hoosic River {South Branch} water was clear and colorless, although the May bacteria survey noted light green water and the June pre-dawn survey noted slight in-stream turbidity (rained previous day). White foam was noted on six of the ten surveys, although it is presumed to be natural. No aesthetically objectionable conditions were noted (e.g., trash, nuisance plants). Waterfowl were seen congregating downstream from the dam (approximately 0.33 miles upstream from the sampling station); in September more than 40 waterfowl were counted (Appendix B).
The Town of Adams was awarded a s 604(b) grant to prepare a stormwater management plan. As part of the project, HooRWA conducted shoreline surveys along 12 “segments” throughout the town. This portion of the Hoosic River was surveyed beginning at the Adams/Cheshire town line. In the section from the town line to Leonard Street, there were localized areas of trash on the banks, especially in the vicinity of Route 8. Tires were being used as riprap to stabilize the bank. However, the section as a whole was described as pretty and secluded. The second section runs from Leonard Street to the Aladco Laundry on Route 8. Within this section, mattresses, garbage, toys, metal, and concrete blocks were reported on the stream banks, behind residences on Bellevue Ave. The concrete flood control chutes dominate the third section from Aladco to the post office. Many pipes entered the river through the chutes. The flowing pipes were discharging clear liquids. Downstream from the confluence with Pecks Brook there was a heavy iron rust/oxide on the bottom of the stream. The fourth section continued from Center Street to Hodges Cross Road (Segment MA11-04). This section was described as pleasant overall (Adams 2005).
The Primary Contact Recreational Use is assessed as impaired for this segment of the Hoosic River because of elevated fecal coliform bacteria counts; geometric means exceeded 200 cfu/100mL and more than 10% of the samples exceeded 400 cfu/100mL. The Secondary Contact Recreational Use is assessed as support, however, since the geometric means were less than 1000 cfu/100mL and less than 10% of the samples exceeded 2000 cfu/100mL. The Aesthetics Use is assessed as support based on the field observations of DWM crews and the shoreline survey conducted as part of the Adams 604(b) grant project. While HooRWA reported that there were areas of localized trash, all were on the bank, not in the streambed and overall the river was pleasant. According to use assessment guidelines, the concrete flood control chutes are not considered an aesthetic issue.
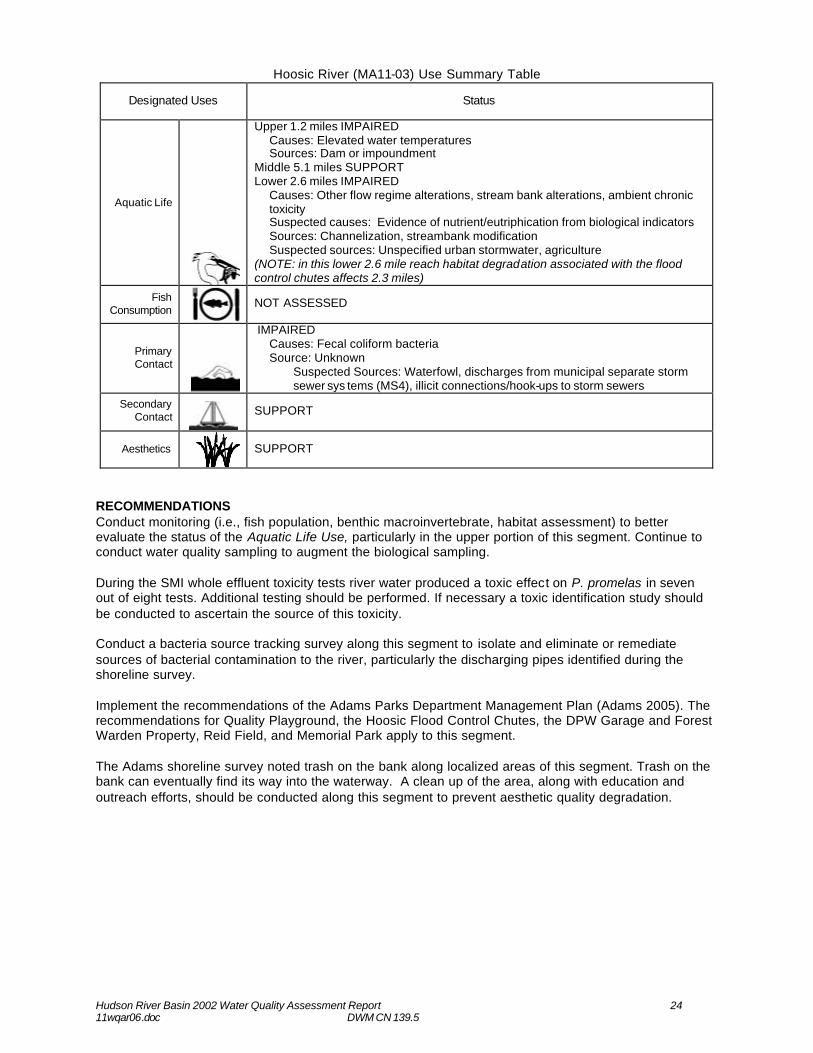
Hudson River Basin 2002 Water Quality Assessment Report 24 11wqar06.doc DWM CN 139.5
Hoosic River (MA11-03) Use Summary Table
Designated Uses Status
Aquatic Life
Upper 1.2 miles IMPAIRED Causes: Elevated water temperatures Sources: Dam or impoundment
Middle 5.1 miles SUPPORT Lower 2.6 miles IMPAIRED
Causes: Other flow regime alterations, stream bank alterations, ambient chronic toxicity Suspected causes: Evidence of nutrient/eutriphication from biological indicators Sources: Channelization, streambank modification Suspected sources: Unspecified urban stormwater, agriculture
(NOTE: in this lower 2.6 mile reach habitat degradation associated with the flood control chutes affects 2.3 miles)
Fish Consumption
NOT ASSESSED
Primary Contact
IMPAIRED Causes: Fecal coliform bacteria Source: Unknown
Suspected Sources: Waterfowl, discharges from municipal separate storm sewer sys tems (MS4), illicit connections/hook-ups to storm sewers
Secondary Contact
SUPPORT
Aesthetics
SUPPORT
RECOMMENDATIONS Conduct monitoring (i.e., fish population, benthic macroinvertebrate, habitat assessment) to better evaluate the status of the Aquatic Life Use, particularly in the upper portion of this segment. Continue to conduct water quality sampling to augment the biological sampling. During the SMI whole effluent toxicity tests river water produced a toxic effect on P. promelas in seven out of eight tests. Additional testing should be performed. If necessary a toxic identification study should be conducted to ascertain the source of this toxicity. Conduct a bacteria source tracking survey along this segment to isolate and eliminate or remediate sources of bacterial contamination to the river, particularly the discharging pipes identified during the shoreline survey. Implement the recommendations of the Adams Parks Department Management Plan (Adams 2005). The recommendations for Quality Playground, the Hoosic Flood Control Chutes, the DPW Garage and Forest Warden Property, Reid Field, and Memorial Park apply to this segment. The Adams shoreline survey noted trash on the bank along localized areas of this segment. Trash on the bank can eventually find its way into the waterway. A clean up of the area, along with education and outreach efforts, should be conducted along this segment to prevent aesthetic quality degradation.
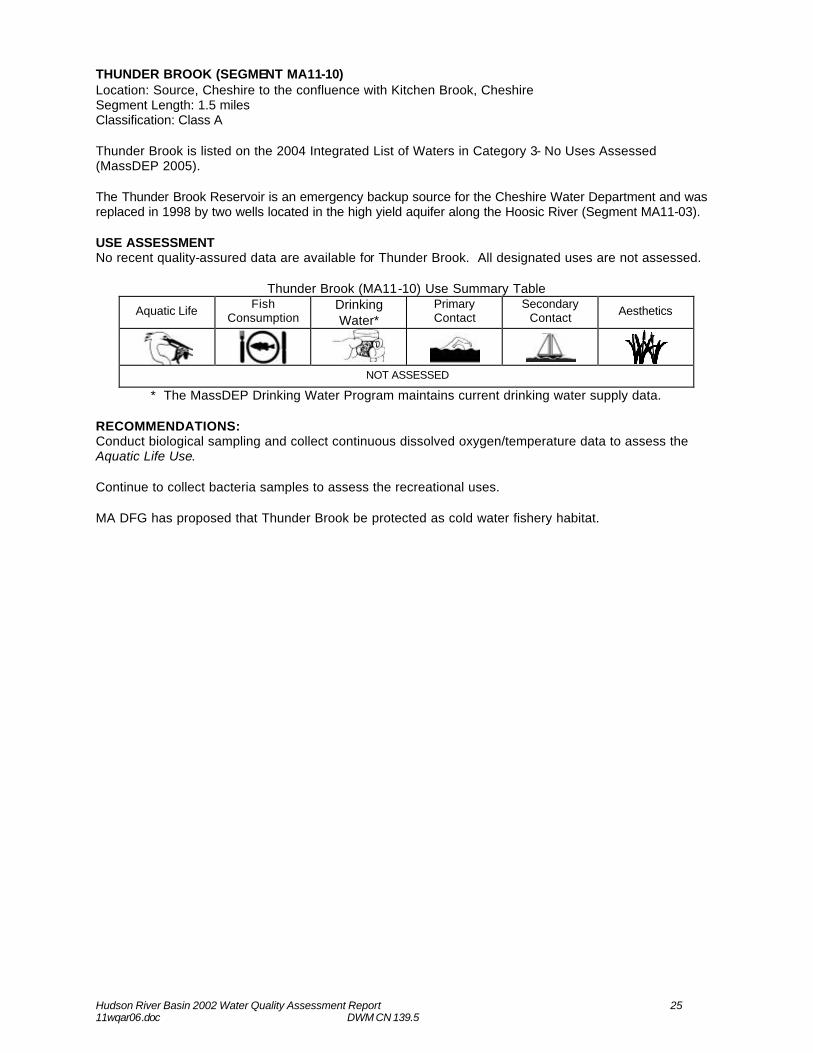
Hudson River Basin 2002 Water Quality Assessment Report 25 11wqar06.doc DWM CN 139.5
THUNDER BROOK (SEGMENT MA11-10) Location: Source, Cheshire to the confluence with Kitchen Brook, Cheshire Segment Length: 1.5 miles Classification: Class A Thunder Brook is listed on the 2004 Integrated List of Waters in Category 3- No Uses Assessed (MassDEP 2005). The Thunder Brook Reservoir is an emergency backup source for the Cheshire Water Department and was replaced in 1998 by two wells located in the high yield aquifer along the Hoosic River (Segment MA11-03). USE ASSESSMENT No recent quality-assured data are available for Thunder Brook. All designated uses are not assessed.
Thunder Brook (MA11-10) Use Summary Table
Aquatic Life Fish Consumption
Drinking Water*
Primary Contact
Secondary Contact Aesthetics
NOT ASSESSED
* The MassDEP Drinking Water Program maintains current drinking water supply data. RECOMMENDATIONS: Conduct biological sampling and collect continuous dissolved oxygen/temperature data to assess the Aquatic Life Use. Continue to collect bacteria samples to assess the recreational uses. MA DFG has proposed that Thunder Brook be protected as cold water fishery habitat.
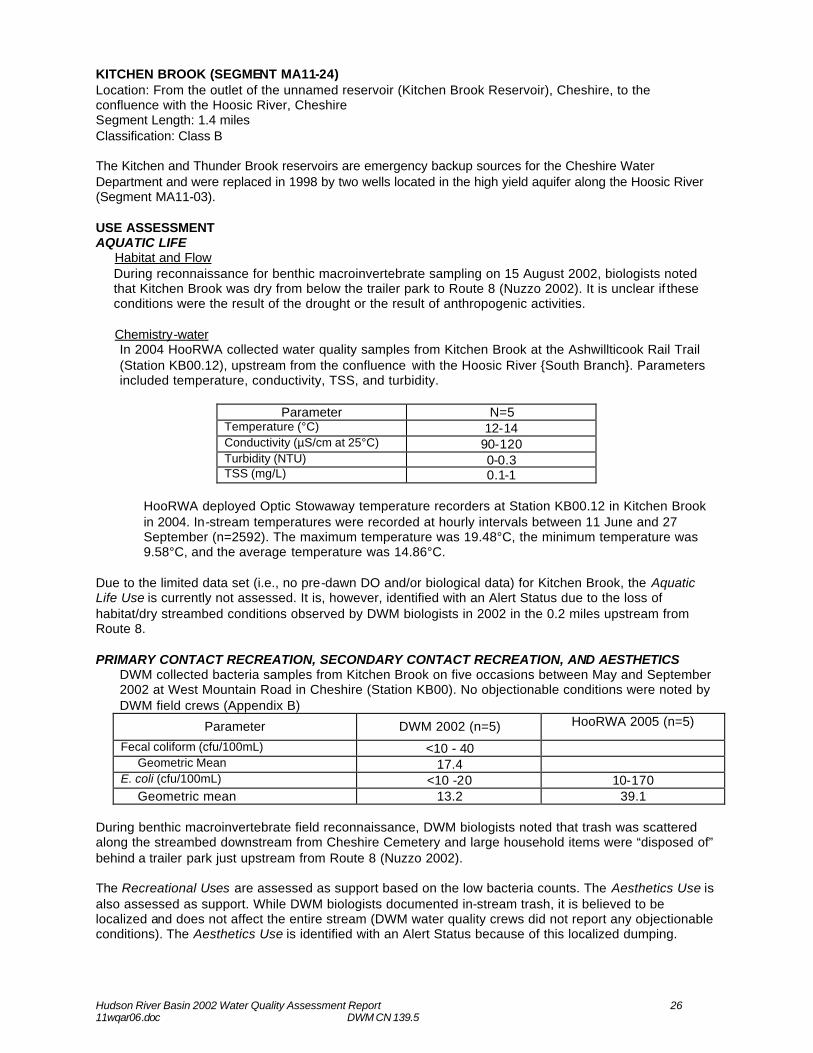
Hudson River Basin 2002 Water Quality Assessment Report 26 11wqar06.doc DWM CN 139.5
KITCHEN BROOK (SEGMENT MA11-24) Location: From the outlet of the unnamed reservoir (Kitchen Brook Reservoir), Cheshire, to the confluence with the Hoosic River, Cheshire Segment Length: 1.4 miles Classification: Class B The Kitchen and Thunder Brook reservoirs are emergency backup sources for the Cheshire Water Department and were replaced in 1998 by two wells located in the high yield aquifer along the Hoosic River (Segment MA11-03). USE ASSESSMENT AQUATIC LIFE
Habitat and Flow During reconnaissance for benthic macroinvertebrate sampling on 15 August 2002, biologists noted that Kitchen Brook was dry from below the trailer park to Route 8 (Nuzzo 2002). It is unclear if these conditions were the result of the drought or the result of anthropogenic activities.
Chemistry-water In 2004 HooRWA collected water quality samples from Kitchen Brook at the Ashwillticook Rail Trail (Station KB00.12), upstream from the confluence with the Hoosic River {South Branch}. Parameters included temperature, conductivity, TSS, and turbidity.
Parameter N=5
Temperature (°C) 12-14 Conductivity (µS/cm at 25°C) 90-120 Turbidity (NTU) 0-0.3 TSS (mg/L) 0.1-1
HooRWA deployed Optic Stowaway temperature recorders at Station KB00.12 in Kitchen Brook in 2004. In-stream temperatures were recorded at hourly intervals between 11 June and 27 September (n=2592). The maximum temperature was 19.48°C, the minimum temperature was 9.58°C, and the average temperature was 14.86°C.
Due to the limited data set (i.e., no pre-dawn DO and/or biological data) for Kitchen Brook, the Aquatic Life Use is currently not assessed. It is, however, identified with an Alert Status due to the loss of habitat/dry streambed conditions observed by DWM biologists in 2002 in the 0.2 miles upstream from Route 8. PRIMARY CONTACT RECREATION, SECONDARY CONTACT RECREATION, AND AESTHETICS
DWM collected bacteria samples from Kitchen Brook on five occasions between May and September 2002 at West Mountain Road in Cheshire (Station KB00). No objectionable conditions were noted by DWM field crews (Appendix B)
Parameter DWM 2002 (n=5) HooRWA 2005 (n=5)
Fecal coliform (cfu/100mL) <10 - 40 Geometric Mean 17.4
E. coli (cfu/100mL) <10 -20 10-170 Geometric mean 13.2 39.1
During benthic macroinvertebrate field reconnaissance, DWM biologists noted that trash was scattered along the streambed downstream from Cheshire Cemetery and large household items were “disposed of” behind a trailer park just upstream from Route 8 (Nuzzo 2002). The Recreational Uses are assessed as support based on the low bacteria counts. The Aesthetics Use is also assessed as support. While DWM biologists documented in-stream trash, it is believed to be localized and does not affect the entire stream (DWM water quality crews did not report any objectionable conditions). The Aesthetics Use is identified with an Alert Status because of this localized dumping.
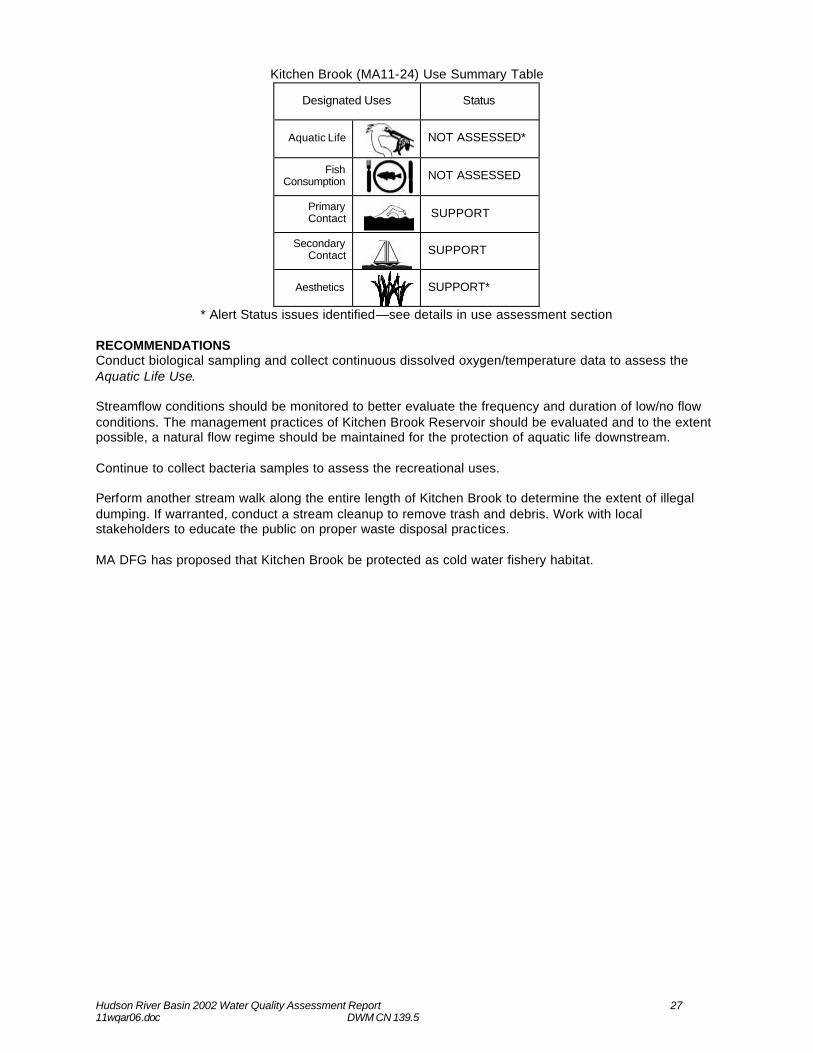
Hudson River Basin 2002 Water Quality Assessment Report 27 11wqar06.doc DWM CN 139.5
Kitchen Brook (MA11-24) Use Summary Table
Designated Uses Status
Aquatic Life
NOT ASSESSED*
Fish Consumption
NOT ASSESSED
Primary Contact
SUPPORT
Secondary Contact
SUPPORT
Aesthetics
SUPPORT*
* Alert Status issues identified—see details in use assessment section RECOMMENDATIONS Conduct biological sampling and collect continuous dissolved oxygen/temperature data to assess the Aquatic Life Use. Streamflow conditions should be monitored to better evaluate the frequency and duration of low/no flow conditions. The management practices of Kitchen Brook Reservoir should be evaluated and to the extent possible, a natural flow regime should be maintained for the protection of aquatic life downstream. Continue to collect bacteria samples to assess the recreational uses. Perform another stream walk along the entire length of Kitchen Brook to determine the extent of illegal dumping. If warranted, conduct a stream cleanup to remove trash and debris. Work with local stakeholders to educate the public on proper waste disposal practices. MA DFG has proposed that Kitchen Brook be protected as cold water fishery habitat.
Hudson River Basin 2002 Water Quality Assessment Report 28 11wqar06.doc DWM CN 139.5
SOUTH BROOK (SEGMENT MA11-15) Location: Source, west of Weston Mountain, Dalton, to confluence with the Hoosic River, Cheshire Segment Length: 4.1 miles Classification: Class B South Brook originates between North and Weston Mountains in the Chalet State Wildlife Management Area in Dalton and flows through a steep ravine in a northerly direction into Cheshire. The topography changes slightly (grade lessens) and the brook turns west and then northwest, flowing adjacent to Notch Road. South Brook receives the flow from McDonald Brook after crossing under Notch Road. South Brook continues to flow northwest to its confluence with the Hoosic River. South Brook is listed on the 2004 Integrated List of Waters in Category 5. This segment was assessed as impaired and requires the calculation of TMDL for pathogens (MassDEP 2005). WMA WATER WITHDRAWALS AND NPDES WASTEWATER DISCHARGE SUMMARY Based on the available information there are no WMA regulated water withdrawals from or permitted surface water discharges to this subwatershed. USE ASSESSMENT AQUATIC LIFE
Habitat and Flow DWM performed habitat assessments of South Brook in 2002 as part of the benthic macroinvertebrate and fish population surveys (stations described below). The DWM fish biologists gave the site a habitat score of 168/200 (MassDEP 2002a). The riparian zone on the right bank was clear cut/slashed prior to the fish survey and was just beginning to regrow (MassDEP 2002a). The benthic station SB01 (B0491) received a total habitat score of 153 out of 200 due to water covering less than 75% of the stream channel and cobble and other coarse substrates being surrounded (40-50%) by fine sediments (Appendix D). Downstream from Wells Road in Cheshire, a small portion of the left bank of the brook was channelized by a concrete retaining wall that had been undermined slightly (Appendix A). Biology DWM conducted fish population sampling along South Brook near Windsor Road in Cheshire in 2002. On 17 June five species of fish were collected from South Brook including 29 slimy sculpin, 17 eastern blacknose dace, 16 eastern brook trout (46-255 mm in length), five brown trout (118-322 mm in length), and two longnose dace (MassDEP 2002a). South Brook is stocked with trout by MA DFG (MA DFG undated). Fluvial dependent/specialist species dominated the assemblage of fish collected (Bain and Meixler 2000). The slimy sculpin and two trout species are considered intolerant to pollution, while the eastern blacknose dace and the longnose dace are considered tolerant and moderately tolerant to pollution, respectively (Halliwell et al 1999). DWM conducted RBP III benthic macroinvertebrate sampling at Station SB01 approximately 100 m upstream from Notch Road, Cheshire, in 2002. When compared to the Pecks Brook regional reference station the South Brook macroinvertebrate community was slightly impacted (Appendix D). DWM biologists identified low water levels (natural drought conditions) and non-point source pollution (e.g., road runoff) as possible stressors (Appendix D).
Chemistry-water HooRWA deployed Optic Stowaway temperature recorders at near the mouth of South Brook in 2004 (HooRWA 2005). In-stream temperatures were recorded hourly between 11 June and 27 September (n=2590). The maximum temperature was 21.64°C, the minimum temperature was 9.6°C, and the average temperature was 16.12°C. Temperatures at this station were infrequently above 20°C with most of the exceedances occurring during the afternoon hours between 1200 and 1800 h and only on 11 out of 109 days (not consecutively).
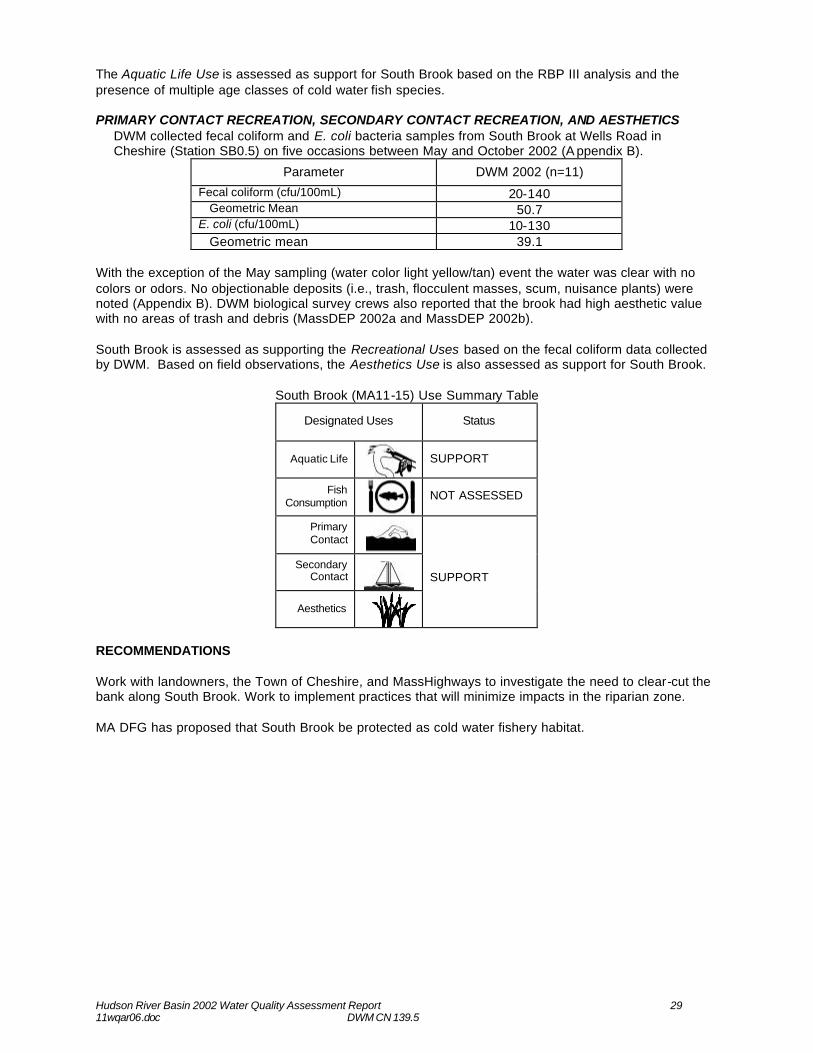
Hudson River Basin 2002 Water Quality Assessment Report 29 11wqar06.doc DWM CN 139.5
The Aquatic Life Use is assessed as support for South Brook based on the RBP III analysis and the presence of multiple age classes of cold water fish species. PRIMARY CONTACT RECREATION, SECONDARY CONTACT RECREATION, AND AESTHETICS
DWM collected fecal coliform and E. coli bacteria samples from South Brook at Wells Road in Cheshire (Station SB0.5) on five occasions between May and October 2002 (A ppendix B).
Parameter DWM 2002 (n=11)
Fecal coliform (cfu/100mL) 20-140 Geometric Mean 50.7
E. coli (cfu/100mL) 10-130 Geometric mean 39.1
With the exception of the May sampling (water color light yellow/tan) event the water was clear with no colors or odors. No objectionable deposits (i.e., trash, flocculent masses, scum, nuisance plants) were noted (Appendix B). DWM biological survey crews also reported that the brook had high aesthetic value with no areas of trash and debris (MassDEP 2002a and MassDEP 2002b). South Brook is assessed as supporting the Recreational Uses based on the fecal coliform data collected by DWM. Based on field observations, the Aesthetics Use is also assessed as support for South Brook.
South Brook (MA11-15) Use Summary Table
Designated Uses Status
Aquatic Life
SUPPORT
Fish Consumption
NOT ASSESSED
Primary Contact
Secondary
Contact
Aesthetics
SUPPORT
RECOMMENDATIONS Work with landowners, the Town of Cheshire, and MassHighways to investigate the need to clear-cut the bank along South Brook. Work to implement practices that will minimize impacts in the riparian zone. MA DFG has proposed that South Brook be protected as cold water fishery habitat.
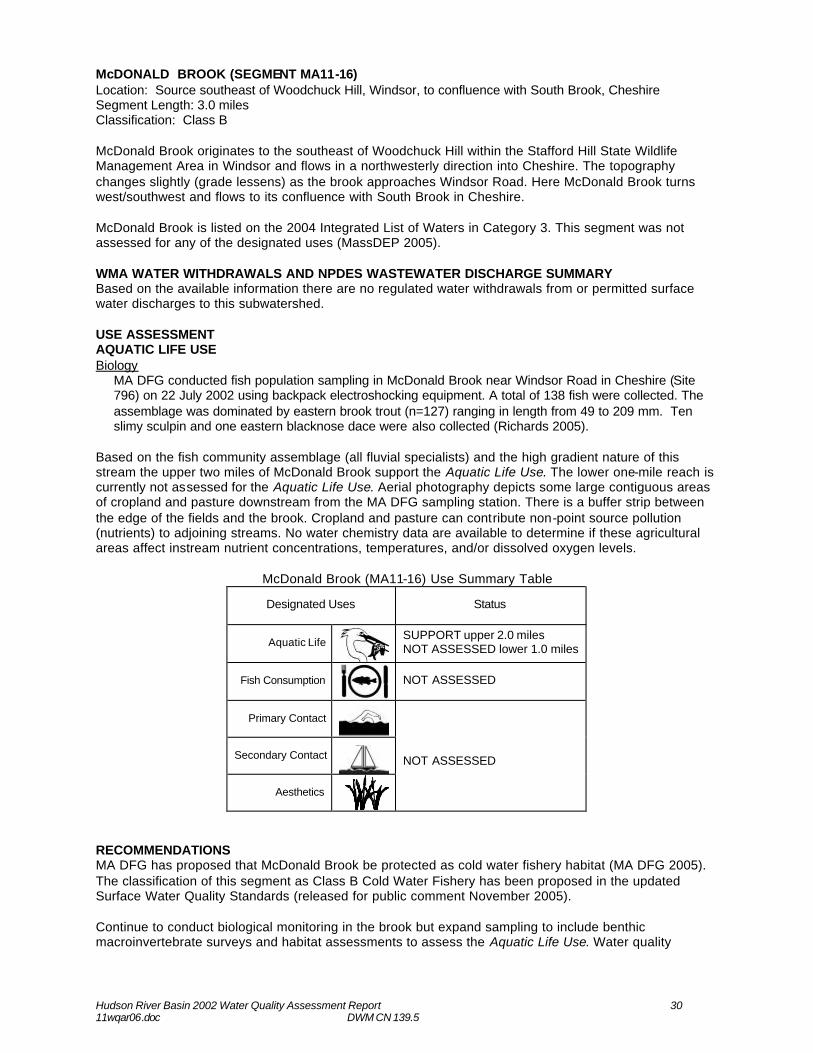
Hudson River Basin 2002 Water Quality Assessment Report 30 11wqar06.doc DWM CN 139.5
McDONALD BROOK (SEGMENT MA11-16) Location: Source southeast of Woodchuck Hill, Windsor, to confluence with South Brook, Cheshire Segment Length: 3.0 miles Classification: Class B McDonald Brook originates to the southeast of Woodchuck Hill within the Stafford Hill State Wildlife Management Area in Windsor and flows in a northwesterly direction into Cheshire. The topography changes slightly (grade lessens) as the brook approaches Windsor Road. Here McDonald Brook turns west/southwest and flows to its confluence with South Brook in Cheshire.
McDonald Brook is listed on the 2004 Integrated List of Waters in Category 3. This segment was not assessed for any of the designated uses (MassDEP 2005). WMA WATER WITHDRAWALS AND NPDES WASTEWATER DISCHARGE SUMMARY Based on the available information there are no regulated water withdrawals from or permitted surface water discharges to this subwatershed. USE ASSESSMENT AQUATIC LIFE USE Biology
MA DFG conducted fish population sampling in McDonald Brook near Windsor Road in Cheshire (Site 796) on 22 July 2002 using backpack electroshocking equipment. A total of 138 fish were collected. The assemblage was dominated by eastern brook trout (n=127) ranging in length from 49 to 209 mm. Ten slimy sculpin and one eastern blacknose dace were also collected (Richards 2005).
Based on the fish community assemblage (all fluvial specialists) and the high gradient nature of this stream the upper two miles of McDonald Brook support the Aquatic Life Use. The lower one-mile reach is currently not assessed for the Aquatic Life Use. Aerial photography depicts some large contiguous areas of cropland and pasture downstream from the MA DFG sampling station. There is a buffer strip between the edge of the fields and the brook. Cropland and pasture can contribute non-point source pollution (nutrients) to adjoining streams. No water chemistry data are available to determine if these agricultural areas affect instream nutrient concentrations, temperatures, and/or dissolved oxygen levels.
McDonald Brook (MA11-16) Use Summary Table
Designated Uses Status
Aquatic Life
SUPPORT upper 2.0 miles NOT ASSESSED lower 1.0 miles
Fish Consumption
NOT ASSESSED
Primary Contact
Secondary Contact
Aesthetics
NOT ASSESSED
RECOMMENDATIONS MA DFG has proposed that McDonald Brook be protected as cold water fishery habitat (MA DFG 2005). The classification of this segment as Class B Cold Water Fishery has been proposed in the updated Surface Water Quality Standards (released for public comment November 2005). Continue to conduct biological monitoring in the brook but expand sampling to include benthic macroinvertebrate surveys and habitat assessments to assess the Aquatic Life Use. Water quality
Hudson River Basin 2002 Water Quality Assessment Report 31 11wqar06.doc DWM CN 139.5
sampling, including continuous dissolved oxygen and temperature sampling, should be conducted to augment the biological sampling. Collect bacteria samples from McDonald Brook to assess the recreational uses. Evaluate the effects, if any, of agricultural land use on McDonald Brook.
Hudson River Basin 2002 Water Quality Assessment Report 32 11wqar06.doc DWM CN 139.5
BASSETT BROOK (SEGMENT MA11-17) Location: Headwaters on the southeast slope of Saddle Ball Mountain, Adams, to the inlet of Bassett Reservoir, Cheshire Segment Length: 1.9 miles Classification: Class A, Public Water Supply, Outstanding Resource Water Bassett Brook originates on the southeast slope of Saddle Ball Mountain in the Mount Greylock State Reservation in Adams. The brook flows southeast down a steep ravine and crosses under Fred Mason Road prior to entering Bassett Reservoir in Cheshire. Bassett Brook is listed on the 2004 Integrated List of Waters in Category 2. This segment supported some designated uses (Aquatic Life and Aesthetics) and was not assessed for others (MassDEP 2005). WMA WATER WITHDRAWALS AND NPDES SURFACE WATER DISCHARGES Bassett Brook Reservoir is an emergency water supply for the Adams Fire District. Based on the available information there are no permitted surface water discharges to this subwatershed.
USE ASSESSMENT No current water quality information is available for Bassett Brook, so all uses are currently not assessed.
Bassett Brook (MA11-17) Use Summary Table
Aquatic Life Fish Consumption Primary Contact Secondary Contact Aesthetics
NOT ASSESSED
The following information is provided for informational purposes.
In 2001 Bassett Reservoir was drained and the sides were power washed with all materials being washed downstream. In 2002 the Adams Fire District and MassDEP signed an Administrative Consent Order with Penalty (ACOP) to resolve wetlands violations at Bassett Reservoir. A penalty was assessed with a portion suspended pending successful implementation of an Environmental Management System(EMS) for the District's routine maintenance, inspection, dredging, watershed protection, permitting, and drawdown of Bassett Reservoir. An ACOP was also finalized with a contractor hired by the District who performed some excavation in wetlands. The contractor was assessed a penalty with a portion suspended contingent upon future compliance (MassDEP undated b).
HooRWA deployed Optic Stowaway temperature recorders at one site (BAS00.02) on the unnamed tributary to Bassett Reservoir (locally referred to as Bassett Brook) in 2004. In-stream temperatures were recorded hourly between 7 June and 27 September (n=2590). The maximum temperature was 19.86°C, the minimum was 9.63°C and the average temperature was 14.8°C (HooRWA 2005). HooRWA also conducted limited water quality sampling at this station, BAS00.02 (HooRWA 2005).
Parameter n=5 Temperature (°C) 9.5-13.5 Conductivity (µS/cm at 25°C) 65-110 Turbidity (NTU) 0-0.4 TSS (mg/L) 1-3 E. coli bacteria (cfu/100mL) <10
RECOMMENDATIONS MA DFG has proposed that Bassett Brook be protected as cold water fishery habitat. Additional data (e.g., temperature) are needed before this segment can be listed as a Cold Water Fishery in the Surface Water Quality Standards.
Hudson River Basin 2002 Water Quality Assessment Report 33 11wqar06.doc DWM CN 139.5
During the 2007 assessment sampling, conduct biological sampling (benthic macroinvertebrate, habitat assessment, fish population) in Bassett Brook to assess the Aquatic Life Use. Also conduct bacteria monitoring to assess the Recreational Uses.
Hudson River Basin 2002 Water Quality Assessment Report 34 11wqar06.doc DWM CN 139.5
DRY BROOK (SEGMENT MA11-13) Location: Headwaters, west of Jackson Road (in the Savoy Wildlife Management Area), Savoy, to the confluence with the Hoosic River, Adams Segment Length: 6.7 miles Classification: Class B Dry Brook originates near the Windsor/Savoy line west of Jackson Road in Windsor. The brook flows southwest through a small wetland and continues to flow west along Cheshire Road, Windsor/Sand Mill Road, Cheshire. The brook continues in a northwesterly direction, past the Hoosac Valley High School in Cheshire to its confluence with the Hoosic River just upstream from the USGS gage (01331500) in Adams. Dry Brook is listed on the 2004 Integrated List of Waters in Category 3. This segment was not assessed for any of the designated uses (MassDEP 2005). WMA WATER WITHDRAWALS AND NPDES WASTEWATER DISCHARGE SUMMARY Based on the available information there are no regulated water withdrawals from or permitted surface water discharges to this subwatershed. USE ASSESSMENT AQUATIC LIFE
Habitat and Flow DWM conducted a habitat assessment of Dry Brook as part of the benthic macroinvertebrate survey on 12 August 2002. Station DB01 (B0490) was located upstream from Hoosac Valley High School where Route 116 crosses the brook in two locations. DB01 received a habitat score of 148 out of 200 due to low water levels (natural drought conditions), embeddedness, sediment deposition, and width of the riparian vegetated zone (Appendix D). During reconnaissance on 5 August 2002 DWM biologists found that Dry Brook at Route 116 would have sufficient water for sampling while they found that at Bellevue Cemetery the water was spread to a “shallow depth with no riffles/depth sufficient for RBP kicks” and that the water at Leonard Street “had all but dried up” or was “at least scattered into isolated pools and trickles” (Nuzzo 2002). DWM collected samples for bacterial analysis from Dry Brook downstream from Leonard Street between May and October 2002. During the 14 August 2002 bacteria surveys, the streambed was completely dry (Appendix B).
In-stream sedimentation has long been a problem in Dry Brook. The BRPC (2000) Stormwater Assessment in the Hoosic and Housatonic Watersheds identified Sand Mill Road as a source of sediment to Dry Brook. BRPC recommended the use of BMPs (combination of water diversion berms and turnouts) to minimize sedimentation to the streambed. However, the report states that the Town did not deem this a priority action. Biology MA DFG conducted fish population sampling in Dry Brook on 22 July 2002 near the Sand Mill Road crossing in Adams (Site 799). A total of 94 fish were collected. Eastern blacknose dace (n=38) and slimy sculpin (n=31) dominated the sample, but 12 eastern brook trout (62 to 205 mm), ten longnose dace, one bluegill, one brown bullhead, and one pumpkinseed were also collected (Richards 2005). With the exception of the brook trout (fluvial dependent), dace (fluvial specialists) and slimy sculpin (regional fluvial specialist), all species collected are classified as macrohabitat generalists (Bain and Meixler 2000, Maietta 2006). Slimy sculpin and brook trout are classified as intolerant to pollution. The remaining species are tolerant to moderately tolerant (Halliwell et al. 1999).
DWM conducted benthic macroinvertebrate sampling in Dry Brook between the Route 116 road crossings, near Hoosac Valley High School (Station DB01, B0490) on 12 August 2002 (Appendix D). RBP III analysis revealed that the benthic community in Dry Brook is slightly impacted when compared to the regional reference station (PB00).
Hudson River Basin 2002 Water Quality Assessment Report 35 11wqar06.doc DWM CN 139.5
Based on the biological data, Dry Brook is assessed as supporting the Aquatic Life Use. However, due to the apparent dewatering in the lower 1.6 miles between Route 116 and Leonard Street and in-stream sedimentation, this use is identified with an Alert Status. In 2002 Massachusetts was under drought advisories, so it is possible that this no flow event was the result of natural conditions (i.e., no precipitation, low groundwater).
PRIMARY CONTACT RECREATION, SECONDARY CONTACT RECREATION AND AESTHETICS
DWM collected water samples from Dry Brook downstream from Leonard Street in Adams (Station DB00) on five occasions between May and October 2002 and analyzed them for fecal coliform and E. coli bacteria (Appendix B).
Parameter DWM 2002 (n=4) Fecal coliform (cfu/100mL) 50-310
Geometric mean 160.6 E. coli (cfu/100mL) 30-350
Geometric mean 138.5 DWM survey crews reported a stormwater outfall pipe approximately 30 feet upstream from the sampling location. Erosion is problematic on the left bank 150 feet downstream from the bridge. A large uncovered sand pile was located at the end of the road used to access the station. No in-stream trash or debris was noted at the sampling station, although copious amounts were noted on the left bank behind a residence. The water was clear and colorless. With the exception of the July survey (fishy odor), no odors were reported (Appendix B). As a component of the Town of Adams 604(b) grant project (Stormwater Management Strategic Plan) the Hoosic River Watershed Association conducted shoreline surveys of the perennial streams in the town. Dry Brook was surveyed from the confluence with the mainstem Hoosic River to the town line. There were some localized areas of trash along the reach, but nothing that, in the opinion of the surveyors, warranted a stream cleanup. The surveyors noted a swimming hole “half way up through the cemetery”, which they estimated to be seven to eight feet deep. The water was clear with no odors. Three iron pipes ranging in size from 8-12” were documented discharging clear liquid during the survey (Adams 2005). [The stormwater management plan superimposed the findings of the stream team over the stormwater system. It appears that these three pipes are stormwater outfalls.]
The Recreational Uses and the Aesthetics Use are all assessed as support for Dry Brook as bacteria counts were low and no objectionable conditions were reported.
Dry Brook (MA11-13) Use Summary Table
Aquatic Life Fish Consumption Primary Contact Secondary Contact Aesthetics
SUPPORT* NOT ASSESSED SUPPORT SUPPORT SUPPORT
RECOMMENDATIONS Determine cause of the stream running dry. As a first step a stream walk should be completed along the reach between Route 116 and Leonard Street during the low flow months of July, August, or September. MA DFG has proposed that Dry Brook be protected as cold water fishery habitat. Additional data are needed before the implementation of this recommendation. Fish population sampling should occur along multiple reaches in Dry Brook. Continuous instream temperature monitoring should also be conducted. Comprehensive Environmental Inc. and BRPC developed a Management Plan for the Town of Adams Parks Department in June 2004 (Adams 2005). Bellevue Cemetery is a 47-acres site maintained by the town that borders Dry Brook. Specific BMP recommendations outlined in the plan included utilizing hay bales around catch basins and swales in disturbed areas until vegetation is fully established and
Hudson River Basin 2002 Water Quality Assessment Report 36 11wqar06.doc DWM CN 139.5
sweeping roadways, inspecting and maintaining on-site drainage structures at least annually. According to the Town’s Drainage and Sewer Map (Adams 2005), there are greater than ten stormwater outfalls along the eastern side of the brook. There is an approximately 150’ buffer zone between the brook and the cemetery. It is unclear if the outfalls discharge directly to the brook. Bacteria sampling should be conducted to evaluate the discharging pipes identified during the shoreline survey. Work with HooRWA and the Town of Adams to implement the recommendations from the shoreline survey report and the stormwater management plan.
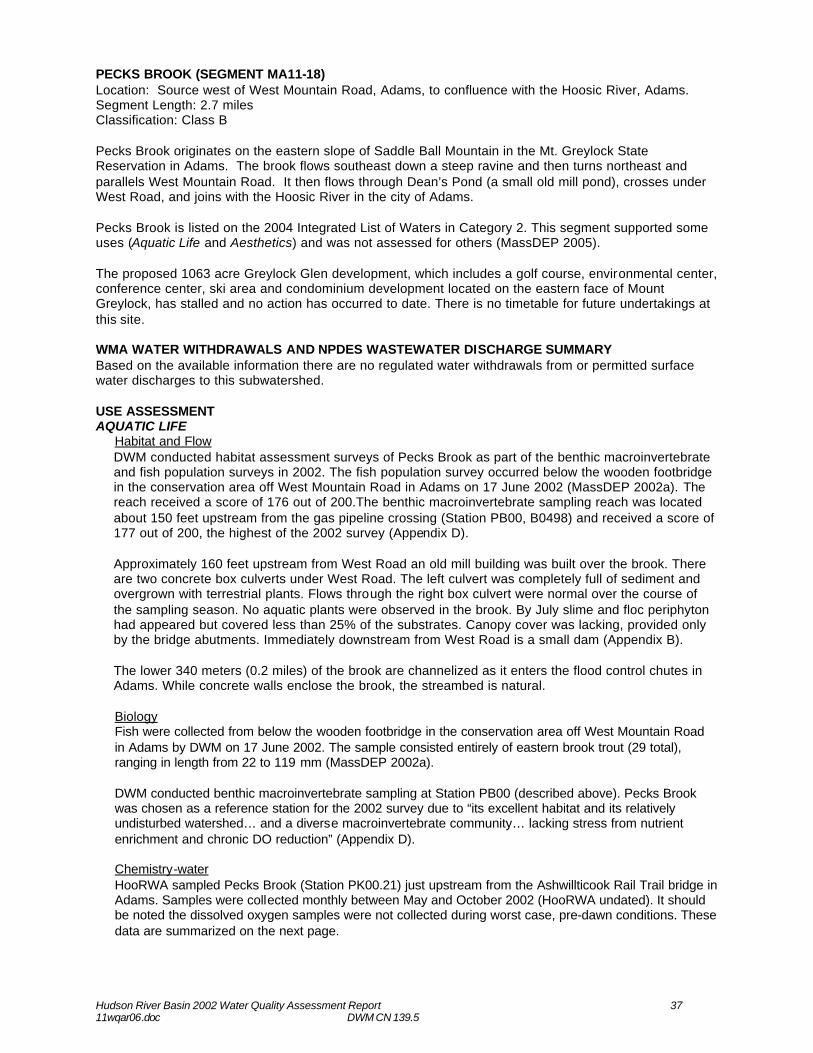
Hudson River Basin 2002 Water Quality Assessment Report 37 11wqar06.doc DWM CN 139.5
PECKS BROOK (SEGMENT MA11-18) Location: Source west of West Mountain Road, Adams, to confluence with the Hoosic River, Adams. Segment Length: 2.7 miles Classification: Class B Pecks Brook originates on the eastern slope of Saddle Ball Mountain in the Mt. Greylock State Reservation in Adams. The brook flows southeast down a steep ravine and then turns northeast and parallels West Mountain Road. It then flows through Dean’s Pond (a small old mill pond), crosses under West Road, and joins with the Hoosic River in the city of Adams.
Pecks Brook is listed on the 2004 Integrated List of Waters in Category 2. This segment supported some uses (Aquatic Life and Aesthetics) and was not assessed for others (MassDEP 2005).
The proposed 1063 acre Greylock Glen development, which includes a golf course, environmental center, conference center, ski area and condominium development located on the eastern face of Mount Greylock, has stalled and no action has occurred to date. There is no timetable for future undertakings at this site. WMA WATER WITHDRAWALS AND NPDES WASTEWATER DISCHARGE SUMMARY Based on the available information there are no regulated water withdrawals from or permitted surface water discharges to this subwatershed. USE ASSESSMENT AQUATIC LIFE
Habitat and Flow DWM conducted habitat assessment surveys of Pecks Brook as part of the benthic macroinvertebrate and fish population surveys in 2002. The fish population survey occurred below the wooden footbridge in the conservation area off West Mountain Road in Adams on 17 June 2002 (MassDEP 2002a). The reach received a score of 176 out of 200.The benthic macroinvertebrate sampling reach was located about 150 feet upstream from the gas pipeline crossing (Station PB00, B0498) and received a score of 177 out of 200, the highest of the 2002 survey (Appendix D). Approximately 160 feet upstream from West Road an old mill building was built over the brook. There are two concrete box culverts under West Road. The left culvert was completely full of sediment and overgrown with terrestrial plants. Flows through the right box culvert were normal over the course of the sampling season. No aquatic plants were observed in the brook. By July slime and floc periphyton had appeared but covered less than 25% of the substrates. Canopy cover was lacking, provided only by the bridge abutments. Immediately downstream from West Road is a small dam (Appendix B).
The lower 340 meters (0.2 miles) of the brook are channelized as it enters the flood control chutes in Adams. While concrete walls enclose the brook, the streambed is natural.
Biology Fish were collected from below the wooden footbridge in the conservation area off West Mountain Road in Adams by DWM on 17 June 2002. The sample consisted entirely of eastern brook trout (29 total), ranging in length from 22 to 119 mm (MassDEP 2002a). DWM conducted benthic macroinvertebrate sampling at Station PB00 (described above). Pecks Brook was chosen as a reference station for the 2002 survey due to “its excellent habitat and its relatively undisturbed watershed… and a diverse macroinvertebrate community… lacking stress from nutrient enrichment and chronic DO reduction” (Appendix D). Chemistry-water HooRWA sampled Pecks Brook (Station PK00.21) just upstream from the Ashwillticook Rail Trail bridge in Adams. Samples were collected monthly between May and October 2002 (HooRWA undated). It should be noted the dissolved oxygen samples were not collected during worst case, pre-dawn conditions. These data are summarized on the next page.
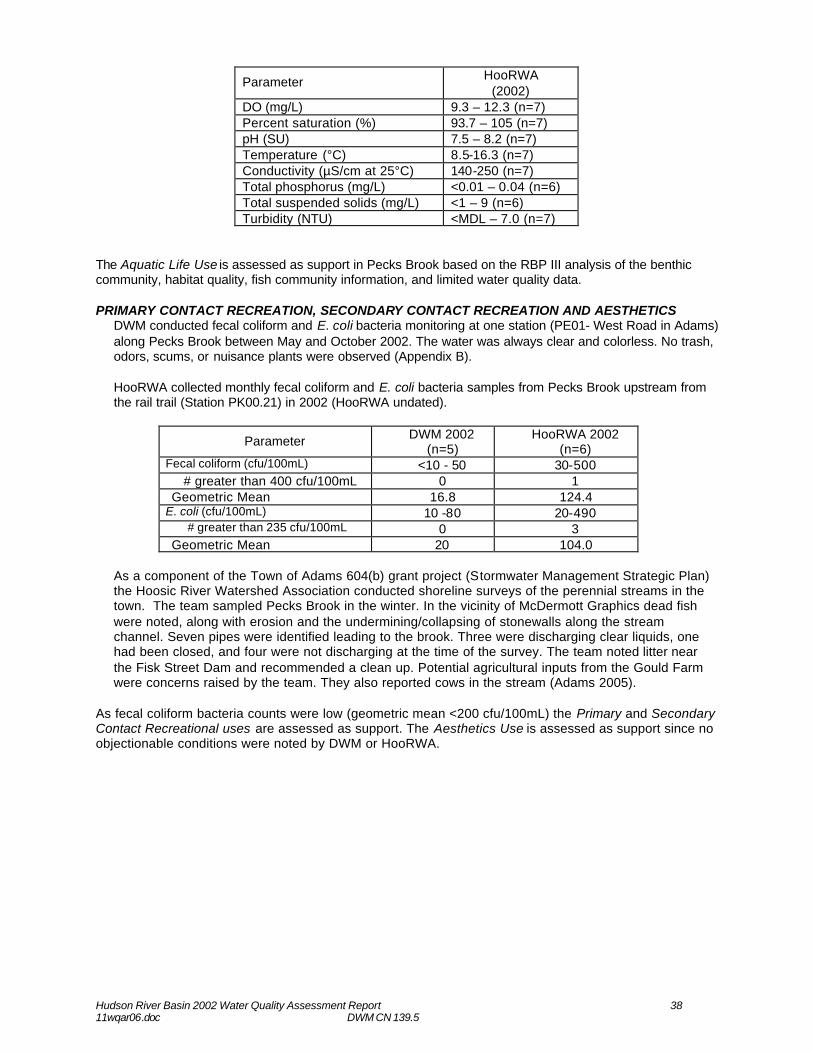
Hudson River Basin 2002 Water Quality Assessment Report 38 11wqar06.doc DWM CN 139.5
Parameter HooRWA (2002)
DO (mg/L) 9.3 – 12.3 (n=7) Percent saturation (%) 93.7 – 105 (n=7) pH (SU) 7.5 – 8.2 (n=7) Temperature (°C) 8.5-16.3 (n=7) Conductivity (µS/cm at 25°C) 140-250 (n=7) Total phosphorus (mg/L) <0.01 – 0.04 (n=6) Total suspended solids (mg/L) <1 – 9 (n=6) Turbidity (NTU) <MDL – 7.0 (n=7)
The Aquatic Life Use is assessed as support in Pecks Brook based on the RBP III analysis of the benthic community, habitat quality, fish community information, and limited water quality data. PRIMARY CONTACT RECREATION, SECONDARY CONTACT RECREATION AND AESTHETICS
DWM conducted fecal coliform and E. coli bacteria monitoring at one station (PE01- West Road in Adams) along Pecks Brook between May and October 2002. The water was always clear and colorless. No trash, odors, scums, or nuisance plants were observed (Appendix B). HooRWA collected monthly fecal coliform and E. coli bacteria samples from Pecks Brook upstream from the rail trail (Station PK00.21) in 2002 (HooRWA undated).
Parameter DWM 2002 (n=5)
HooRWA 2002 (n=6)
Fecal coliform (cfu/100mL) <10 - 50 30-500 # greater than 400 cfu/100mL 0 1
Geometric Mean 16.8 124.4 E. coli (cfu/100mL) 10 -80 20-490
# greater than 235 cfu/100mL 0 3 Geometric Mean 20 104.0
As a component of the Town of Adams 604(b) grant project (Stormwater Management Strategic Plan) the Hoosic River Watershed Association conducted shoreline surveys of the perennial streams in the town. The team sampled Pecks Brook in the winter. In the vicinity of McDermott Graphics dead fish were noted, along with erosion and the undermining/collapsing of stonewalls along the stream channel. Seven pipes were identified leading to the brook. Three were discharging clear liquids, one had been closed, and four were not discharging at the time of the survey. The team noted litter near the Fisk Street Dam and recommended a clean up. Potential agricultural inputs from the Gould Farm were concerns raised by the team. They also reported cows in the stream (Adams 2005).
As fecal coliform bacteria counts were low (geometric mean <200 cfu/100mL) the Primary and Secondary Contact Recreational uses are assessed as support. The Aesthetics Use is assessed as support since no objectionable conditions were noted by DWM or HooRWA.
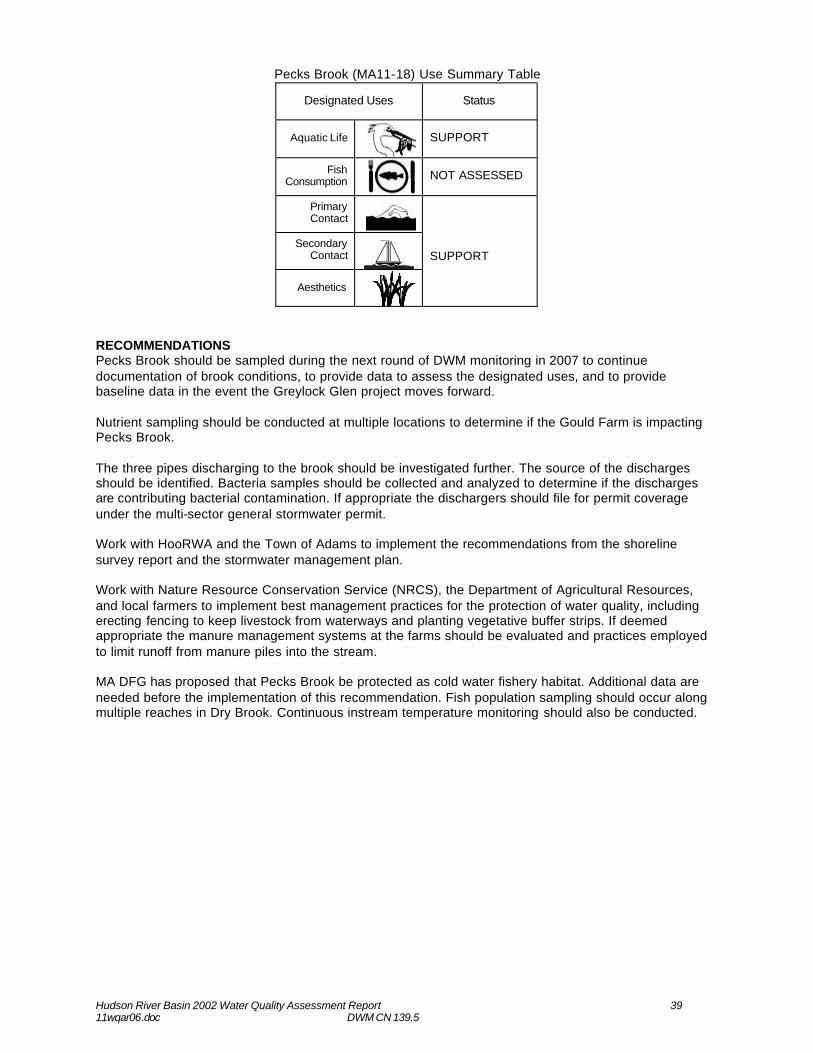
Hudson River Basin 2002 Water Quality Assessment Report 39 11wqar06.doc DWM CN 139.5
Pecks Brook (MA11-18) Use Summary Table
Designated Uses Status
Aquatic Life
SUPPORT
Fish Consumption
NOT ASSESSED
Primary Contact
Secondary
Contact
Aesthetics
SUPPORT
RECOMMENDATIONS Pecks Brook should be sampled during the next round of DWM monitoring in 2007 to continue documentation of brook conditions, to provide data to assess the designated uses, and to provide baseline data in the event the Greylock Glen project moves forward. Nutrient sampling should be conducted at multiple locations to determine if the Gould Farm is impacting Pecks Brook. The three pipes discharging to the brook should be investigated further. The source of the discharges should be identified. Bacteria samples should be collected and analyzed to determine if the discharges are contributing bacterial contamination. If appropriate the dischargers should file for permit coverage under the multi-sector general stormwater permit. Work with HooRWA and the Town of Adams to implement the recommendations from the shoreline survey report and the stormwater management plan. Work with Nature Resource Conservation Service (NRCS), the Department of Agricultural Resources, and local farmers to implement best management practices for the protection of water quality, including erecting fencing to keep livestock from waterways and planting vegetative buffer strips. If deemed appropriate the manure management systems at the farms should be evaluated and practices employed to limit runoff from manure piles into the stream. MA DFG has proposed that Pecks Brook be protected as cold water fishery habitat. Additional data are needed before the implementation of this recommendation. Fish population sampling should occur along multiple reaches in Dry Brook. Continuous instream temperature monitoring should also be conducted.
Hudson River Basin 2002 Water Quality Assessment Report 40 11wqar06.doc DWM CN 139.5
TOPHET BROOK (SEGMENT MA11-19) Location: Source west of Burnett Road, Savoy (in the Savoy Mountain State Forest), to the confluence with the Hoosic River, Adams Segment Length: 6.2 miles Classification: Class B Tophet Brook originates in the Hoosac Range along the Savoy/Adams municipal boundary. The brook flows due south and crosses under East Hoosac Street /Adams Road and then turns southwest. Here the brook flows down a steep ravine and receives the flow from Patton Brook. Tophet Brook turns northwest towards its confluence with the Hoosic River in the city of Adams. Two other tributaries, Reed and Miller Brooks also join Tophet Brook in its lower reach. Tophet Brook is listed on the 2004 Integrated List of Waters in Category 3- No Uses Assessed (MassDEP 2005). MA DFG sampled the fish population of Tophet Brook at two locations on 8 August 2005- Walling Road and East Street (Madden 2005). Data from this survey are not yet available. WMA WATER WITHDRAWALS AND NPDES WASTEWATER DISCHARGE SUMMARY Based on the available information there are no regulated water withdrawals from or permitted surface water discharges to this subwatershed. USE ASSESSMENT AQUATIC LIFE
Habitat and Flow On 17 June 2002 DWM conducted a habitat assessment of Tophet Brook upstream from East Street in Adams as part of the fish population survey. The reach received a score of 162 out of 200. The fish survey crew noted clear water, but the substrates had a very slippery film of algae (MassDEP 2002a). DWM also conducted a habitat assessment of Tophet Brook about 150 feet upstream from East Street in Adams (Station TB01, B0489) as part of the benthic macroinvertebrate survey. The habitat score was 162 out of 200 due to low water levels (natural drought conditions), sediment deposition that affected about 30% of the stream bottom, and small areas of erosion on the eastern bank affecting bank stability (Appendix D). Shoreline surveys conducted along Tophet Brook noted that the East Road bridge constricts the flow of Tophet Brook, resulting in back ups and gravel deposition above the bridge. A small tributary entering Tophet Brook below High Bridge Cascade in the Little Egypt area was described as highly turbid and carried sediment from a gravel road upstream (Adams 2005). The lower 490 meters (0.3 miles) of Tophet Brook are encased in concrete flood control structures. In the flood control chutes the brook seemed to the team to carry less water than upstream (Adams 2005).
Biology On 17 June 2002, DWM conducted fish population sampling in Tophet Brook upstream from East Street in Adams using battery-powered backpack electroshocking equipment. Four species were collected including 24 eastern brook trout (36 to 198 mm in length), 16 eastern blacknose dace, two longnose dace, and one white sucker (MassDEP 2002a). Eastern brook trout and white sucker are classified as fluvial dependent species; eastern blacknose and longnose dace are fluvial specialists (Bain and Meixler 2000). The brook trout is intolerant to pollution while the white sucker and eastern blacknose dace are tolerant to pollution. The longnose dace is moderately tolerant to pollution (Halliwell et al 1999). DWM conducted RBP III benthic macroinvertebrate sampling upstream from East Road at Station TB01 (B0489) in Tophet Brook. When compared to the regional reference station on Pecks Brook, the RBP III analysis indicated the macroinvertebrate community was slightly to moderately impacted (Appendix D). Upstream agricultural activities and associated NPS pollution appeared to be impacting the benthic community at station TB01 (Appendix D).
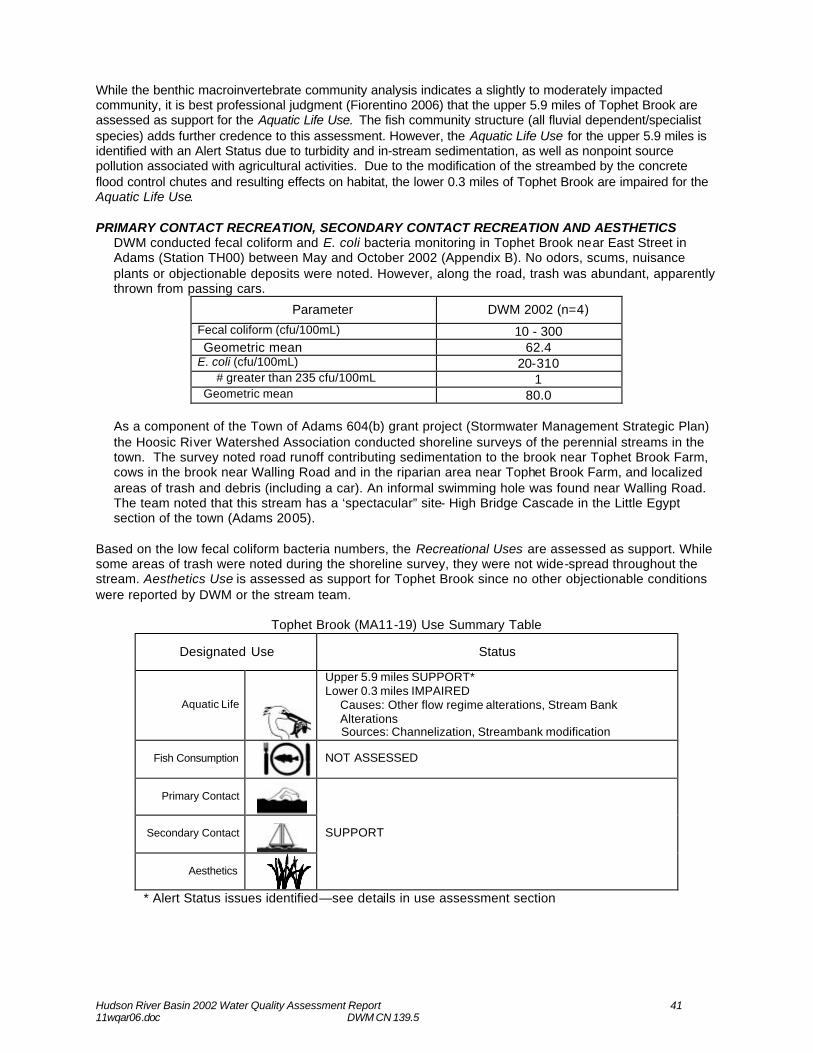
Hudson River Basin 2002 Water Quality Assessment Report 41 11wqar06.doc DWM CN 139.5
While the benthic macroinvertebrate community analysis indicates a slightly to moderately impacted community, it is best professional judgment (Fiorentino 2006) that the upper 5.9 miles of Tophet Brook are assessed as support for the Aquatic Life Use. The fish community structure (all fluvial dependent/specialist species) adds further credence to this assessment. However, the Aquatic Life Use for the upper 5.9 miles is identified with an Alert Status due to turbidity and in-stream sedimentation, as well as nonpoint source pollution associated with agricultural activities. Due to the modification of the streambed by the concrete flood control chutes and resulting effects on habitat, the lower 0.3 miles of Tophet Brook are impaired for the Aquatic Life Use.
PRIMARY CONTACT RECREATION, SECONDARY CONTACT RECREATION AND AESTHETICS
DWM conducted fecal coliform and E. coli bacteria monitoring in Tophet Brook near East Street in Adams (Station TH00) between May and October 2002 (Appendix B). No odors, scums, nuisance plants or objectionable deposits were noted. However, along the road, trash was abundant, apparently thrown from passing cars.
Parameter DWM 2002 (n=4)
Fecal coliform (cfu/100mL) 10 - 300 Geometric mean 62.4
E. coli (cfu/100mL) 20-310 # greater than 235 cfu/100mL 1
Geometric mean 80.0 As a component of the Town of Adams 604(b) grant project (Stormwater Management Strategic Plan) the Hoosic River Watershed Association conducted shoreline surveys of the perennial streams in the town. The survey noted road runoff contributing sedimentation to the brook near Tophet Brook Farm, cows in the brook near Walling Road and in the riparian area near Tophet Brook Farm, and localized areas of trash and debris (including a car). An informal swimming hole was found near Walling Road. The team noted that this stream has a ‘spectacular” site- High Bridge Cascade in the Little Egypt section of the town (Adams 2005).
Based on the low fecal coliform bacteria numbers, the Recreational Uses are assessed as support. While some areas of trash were noted during the shoreline survey, they were not wide-spread throughout the stream. Aesthetics Use is assessed as support for Tophet Brook since no other objectionable conditions were reported by DWM or the stream team.
Tophet Brook (MA11-19) Use Summary Table
Designated Use Status
Aquatic Life
Upper 5.9 miles SUPPORT* Lower 0.3 miles IMPAIRED
Causes: Other flow regime alterations, Stream Bank Alterations Sources: Channelization, Streambank modification
Fish Consumption
NOT ASSESSED
Primary Contact
Secondary Contact
Aesthetics
SUPPORT
* Alert Status issues identified—see details in use assessment section
Hudson River Basin 2002 Water Quality Assessment Report 42 11wqar06.doc DWM CN 139.5
RECOMMENDATIONS MA DFG has proposed that Tophet Brook be protected as cold water fishery habitat. Additional data are needed before the implementation of this recommendation. Fish population sampling should occur along multiple reaches in Dry Brook. Continuous in-stream temperature monitoring should also be conducted. Work with HooRWA and the Town of Adams to implement the recommendations from the shoreline survey report and the stormwater management plan. DWM field crews reported dense film periphyton on the substrates, suggesting elevated nutrient concentrations. Nutrient sampling should be conducted in Tophet Brook to determine if concentrations are elevated and, if possible, identify sources of the inputs. Work with Nature Resource Conservation Service (NRCS), the Department of Agricultural Resources, and local farmers to implement best management practices for the protection of water quality, including erecting fencing to keep livestock from waterways and planting vegetative buffer strips. If deemed appropriate the manure management systems at the farms should be evaluated and practices employed to limit runoff from manure piles into the stream. The shoreline survey noted that gravel roads were increasing sedimentation and in-stream turbidity in a tributary to Tophet Brook. Efforts should be made to implement BMPs to reduce non-point source pollution from road runoff to the watershed. Additional bacteria sampling at multiple locations along Tophet Brook should be conducted to further assess the recreational uses. Particular attention should be paid to bracket the areas where the shoreline survey reported bovine in the stream and the informal swimming hole.
Hudson River Basin 2002 Water Quality Assessment Report 43 11wqar06.doc DWM CN 139.5
HOOSIC RIVER (SEGMENT MA11-04) Location: Adams WWTP discharge, Adams, to the confluence with the North Branch Hoosic River, North Adams Segment Length: 5.4 miles Classification: Class B, Warm Water Fishery This segment of the Hoosic River is listed on the 2004 Integrated List of Waters in Category 5- Waters Requiring a TMDL due to unknown causes and pathogens. An additional cause of impairment, not requiring the calculation of a TMDL, is other habitat alterations (MassDEP 2005). WMA WATER WITHDRAWAL SUMMARY (APPENDIX E, TABLE E7) Specialty Minerals (9P10100402, 10100402) Curtis Fine Paper (10100401) North Adams Water Department (10120901) Mount Greylock Natural Springs Water Corp (10100403) NPDES SURFACE WATER DISCHARGES (APPENDIX E, TABLES E1 AND E3) The Town of Adams WWTP (MA0100315) Specialty Minerals Inc. (MA0005991) USE ASSESSMENT AQUATIC LIFE
Habitat and Flow DWM conducted a habitat assessment as part of the benthic macroinvertebrate survey in 2002 at Station HR07 (Hodges Cross Road, North Adams). The reach received a total habitat score of 133 out of 200 due to a lack of stable in-stream fish cover, sediment deposition and embededdness, and agricultural activities within 12 m on the east side of the river (Appendix D). Rooted aquatic vegetation and mosses were absent but slippery rocks indicated thin-film algae growths over about 95% of the stream bottom. A filamentous alga (Cladophora sp.) was also found, occupying about 10% of the riffle habitat (Appendix D). Physical alteration (flood control structures) of the streambed and banks has resulted in a reduction of habitat available for aquatic life along the lower 0.6 miles of this segment.
Biology On 2 July 2002 Curtis Fine Papers released three red dyes from their paper-making processes to the Adams WWTP, resulting in the pass through of the dye into the River. Color was seen from the Adams WWTP discharge to Pownal, VT. No adverse impacts to the aquatic life were observed (MassDEP undated a). MA DFG conducted fish population sampling near the Zylonite facility (Site 908) along this segment of the Hoosic River on 18 July 2003 using a barge mounted electroshocking equipment (Richards 2005). Two hundred seventy-one (271) eastern blacknose dace, 113 white sucker, 57 brown trout (51 to 400 mm in length), 57 longnose dace, one common shiner, and one pumpkinseed were collected (500 fish total). With the exception of the pumpkinseed, which is classified as a macrohabitat generalist, all species collected are classified as fluvial dependent/specialists (Bain and Meixler 2000). Aside from the brown trout, all species are moderately tolerant to tolerant of pollution (Halliwell et al 1999). DWM conducted benthic macroinvertebrate sampling along one reach of this segment of the Hoosic River upstream from Hodges Cross Road, North Adams (Station HR07, B0040), in August 2002. This station coupled with Station HR07A bracketed the Adams WWTP discharge. When compared to the regional reference station (PB00) the RBP III analysis indicated the benthic community was considered to be slightly impacted. When compared to the upstream bracket site (HR07) the community at Station HR07A was considered to be non-impacted (Appendix D).
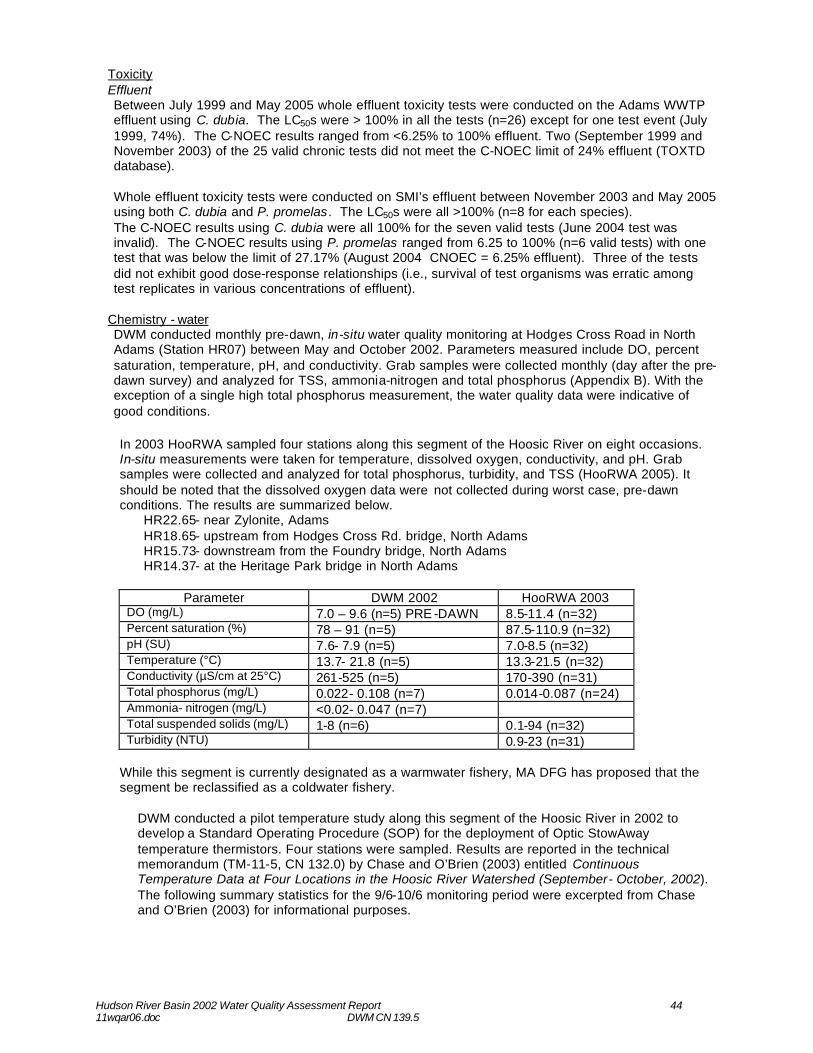
Hudson River Basin 2002 Water Quality Assessment Report 44 11wqar06.doc DWM CN 139.5
Toxicity Effluent Between July 1999 and May 2005 whole effluent toxicity tests were conducted on the Adams WWTP effluent using C. dubia. The LC50s were > 100% in all the tests (n=26) except for one test event (July 1999, 74%). The C-NOEC results ranged from <6.25% to 100% effluent. Two (September 1999 and November 2003) of the 25 valid chronic tests did not meet the C-NOEC limit of 24% effluent (TOXTD database). Whole effluent toxicity tests were conducted on SMI’s effluent between November 2003 and May 2005 using both C. dubia and P. promelas. The LC50s were all >100% (n=8 for each species). The C-NOEC results using C. dubia were all 100% for the seven valid tests (June 2004 test was invalid). The C-NOEC results using P. promelas ranged from 6.25 to 100% (n=6 valid tests) with one test that was below the limit of 27.17% (August 2004 CNOEC = 6.25% effluent). Three of the tests did not exhibit good dose-response relationships (i.e., survival of test organisms was erratic among test replicates in various concentrations of effluent).
Chemistry - water DWM conducted monthly pre-dawn, in-situ water quality monitoring at Hodges Cross Road in North Adams (Station HR07) between May and October 2002. Parameters measured include DO, percent saturation, temperature, pH, and conductivity. Grab samples were collected monthly (day after the pre-dawn survey) and analyzed for TSS, ammonia-nitrogen and total phosphorus (Appendix B). With the exception of a single high total phosphorus measurement, the water quality data were indicative of good conditions.
In 2003 HooRWA sampled four stations along this segment of the Hoosic River on eight occasions. In-situ measurements were taken for temperature, dissolved oxygen, conductivity, and pH. Grab samples were collected and analyzed for total phosphorus, turbidity, and TSS (HooRWA 2005). It should be noted that the dissolved oxygen data were not collected during worst case, pre-dawn conditions. The results are summarized below.
HR22.65- near Zylonite, Adams HR18.65- upstream from Hodges Cross Rd. bridge, North Adams HR15.73- downstream from the Foundry bridge, North Adams HR14.37- at the Heritage Park bridge in North Adams
Parameter DWM 2002 HooRWA 2003
DO (mg/L) 7.0 – 9.6 (n=5) PRE -DAWN 8.5-11.4 (n=32) Percent saturation (%) 78 – 91 (n=5) 87.5-110.9 (n=32) pH (SU) 7.6- 7.9 (n=5) 7.0-8.5 (n=32) Temperature (°C) 13.7- 21.8 (n=5) 13.3-21.5 (n=32) Conductivity (µS/cm at 25°C) 261-525 (n=5) 170-390 (n=31) Total phosphorus (mg/L) 0.022- 0.108 (n=7) 0.014-0.087 (n=24) Ammonia- nitrogen (mg/L) <0.02- 0.047 (n=7) Total suspended solids (mg/L) 1-8 (n=6) 0.1-94 (n=32) Turbidity (NTU) 0.9-23 (n=31)
While this segment is currently designated as a warmwater fishery, MA DFG has proposed that the segment be reclassified as a coldwater fishery.
DWM conducted a pilot temperature study along this segment of the Hoosic River in 2002 to develop a Standard Operating Procedure (SOP) for the deployment of Optic StowAway temperature thermistors. Four stations were sampled. Results are reported in the technical memorandum (TM-11-5, CN 132.0) by Chase and O’Brien (2003) entitled Continuous Temperature Data at Four Locations in the Hoosic River Watershed (September- October, 2002). The following summary statistics for the 9/6-10/6 monitoring period were excerpted from Chase and O’Brien (2003) for informational purposes.
Hudson River Basin 2002 Water Quality Assessment Report 45 11wqar06.doc DWM CN 139.5
Summary Statistic Hoosic River
(upstream) #1
Upper SMI Discharge Canal
#2
SMI Discharge Canal Outlet
#3
Hoosic River (downstream)
#4 Maximum 23.8 31.0 29.6 23.2 Minimum 11.9 20.9 18.5 13.0 Mean 16.7 26.0 24.5 17.9 Median time of daily MAX 16:04 15:40 15:48 18:30 Avg. daily duration > 20° C 2.6 hrs 24 hrs 23.0 hrs 4.4 hrs % of days daily MAX >20° C 55% 100% 100% 48% Avg. daily duration > 28.3° C 0 2.3 hrs 0.7 hrs 0 % of days daily MAX >28.3° 0 29% 10% 0
HooRWA also deployed Optic Stowaway temperature recorders in the Hoosic River at Hodges Cross Road. In-stream temperatures were recorded hourly between 7 June and 27 September 2004 (n=2590). The maximum temperature was 24.7°C, the minimum temperature was 11.1°C, and the average temperature was 18.2°C with exceedances generally occurring between 1200 and 2200h. Mean daily temperatures exceeded 20°C on only 13 out of 109 days.
The Aquatic Life Use is assessed as support for the upper 4.8 miles of this segment of the Hoosic River based on the RBP III analyses, the presence of multiple age classes of brown trout, the good water quality, and the whole effluent toxicity test evaluations. Chronic toxicity of the SMI effluent to P. promelas is of concern. The lower 0.6 miles are assessed as impaired due to the habitat alteration associated with the flood control chutes. PRIMARY CONTACT RECREATION, SECONDARY CONTACT RECREATION, AND AESTHETICS
DWM conducted monthly bacteria sampling (E. coli and fecal coliform) between May and October 2002 at Station (HR07), Hodges Cross Road, North Adams (Appendix B). HooRWA sampled two stations for bacteria on this segment of the Hoosic River between May and September 2001.Three of the ten samples had counts greater than 400 cfu/100mL, but none exceeded 2000 cfu/100mL (HooRWA November 2001c). HR18.65- upstream from Hodges Cross Rd. bridge Hr15.73- downstream from Foundry bridge
Parameter DWM 2002 (n=7)
Fecal coliform (cfu/100mL) 230-1800 # greater than 400 cfu/100mL 5 # greater than 2000 cfu/100mL 0
Geometric Mean 648.6 E. coli (cfu/100mL) 210-1200
# greater than 235 cfu/100mL 6 Geometric mean 546.2
As part of the Town of Adams 604(b) grant project, Stormwater Management Strategic Plan, HooRWA conducted a shoreline survey of this segment from the Adams Wastewater Treatment Plant to Hodges Cross Road in North Adams (Adams 2005). The team noted that near road crossings trash and debris was problematic. They also noted that downstream from the WWTP, a milky discharge from SMI (calcium carbonate) entered the river via the discharge canal. Overall, the team determined that this was “a pleasant section of river” (Adams 2005). During the DWM water quality monitoring surveys, the water in the river near Hodges Cross Road was noted to be slightly turbid on five occasions. On one occasion (not associated with the turbidity) the water was a brownish color. Generally no scums were noted. A large logjam trapped trash and debris; the {former} EOEA Watershed Team conducted a cleanup after the July 2002 survey and the fire department removed the trees. Under the bridge (downstream from the sampling location) a pipe was observed to be discharging clear liquid in both wet and dry weather. Potential non-point sources of
Hudson River Basin 2002 Water Quality Assessment Report 46 11wqar06.doc DWM CN 139.5
pollution upstream from Station HR07 include cropland and the McCann Technical High School athletic fields (Appendix B).
The Primary Contact Recreational Use is assessed as impaired because of elevated fecal coliform bacteria counts (geometric mean of the samples exceeded 200 cfu/100mL). The Secondary Contact Recreational Use is assessed as support since the geometric mean was less than 1000 cfu/100mL and no samples exceeded 2000 cfu/100mL. The Aesthetics Use is also assessed support since DWM and HooRWA identified no objectionable conditions.
Hoosic River (MA 11-04) Use Summary Table
Designated Uses Status
Aquatic Life
Upper 4.8 miles SUPPORT* Lower 0.6 miles IMPAIRED
Causes: Other flow regime alterations, Stream bank alterations Sources: Channelization, Streambank modification
Fish Consumption
NOT ASSESSED
Primary Contact
IMPAIRED Causes: Fecal coliform bacteria Source: Unknown Suspected sources: Discharges from municipal separate storm sewer systems (MS4), crop production
Secondary Contact
SUPPORT
Aesthetics
SUPPORT
* Alert Status issues identified—see details in the use assessment section RECOMMENDATIONS In 1998 EPA conducted sediment sampling at two locations on this segment of the Hoosic River. Review of these data during the last assessment (Weinstein and Kennedy 2000) found elevated concentrations of PCBs and PAHs (Polyaromatic Hydrocarbons) between Hodges Cross Road and Haskins Park in North Adams. No sources were identified. Additional sampling between Hodges Cross Road and Haskins Park in North Adams is warranted to determine if an additional source of PCB contamination exists.
Conduct a source tracking study along this segment of the Hoosic River to identify, eliminate and/or remediate bacterial sources to this segment. Potential sources include stormwater discharges and the pasture/cropland adjacent to the river. Investigate possible ways to increase habitat for aquatic life in the sections of this segment that are impacted by the flood control chutes. Continue to conduct stream clean-ups along this segment as needed. Total phosphorus concentrations were somewhat elevated along this segment of the Hoosic River. The Adams WWTP has added equipment to upgrade the facility for phosphorus removal. Additional sampling should be conducted to determine the success of these upgrades on in-stream concentrations.
Hudson River Basin 2002 Water Quality Assessment Report 47 11wqar06.doc DWM CN 139.5
WINDSOR LAKE (SEGMENT MA11016) Location: North Adams Size: 24 acres Classification: Class B Windsor Lake is listed on the 2004 Integrated List of Waters in Category 2- Attaining Some Uses (Secondary Contact Recreation and Aesthetics); Others Not Assessed (MassDEP 2005). The City of North Adams was awarded a Lakes and Pond Grant from the former Department of Environmental Management (now Department of Conservation and Recreation) in 1997 and 2000. In 1997 $8,000 was awarded to the City to manage stormwater runoff entering the lake by paving and regrading the access road and parking lot. Runoff was diverted to the City’s stormwater system. The $10,000 project in 2000 was to improve water quality by evaluating the nutrient/pollutant loading from the watershed and develop best management practices to reduce algal growth. WMA WATER WITHDRAWALS AND NPDES WASTEWATER DISCHARGE SUMMARY Based on the available information there are no regulated water withdrawals from or permitted surface water discharges to this subwatershed. USE ASSESSMENT AQUATIC LIFE
Biology MA DFG conducted fish population sampling in Windsor Lake on 7 July 2004 using an electric shock boat. Forty-three bluegill, 41 pumpkinseed, 19 largemouth bass, 21 yellow perch seven rockbass, two chain pickerel, one black crappie (134 fish total) were collected (Richards 2005).
The Aquatic Life Use is not assessed due to the lack of current water quality data. PRIMARY CONTACT RECREATION, SECONDARY CONTACT RECREATION, AND AESTHETICS
As required under the Beach Act, the City of North Adams conducted weekly E. coli bacteria testing at the bathing beach on Windsor Lake in 2002 and 2003 (n=13). In 2004 the bathing beach was tested bi-weekly for E. coli bacteria (n=7). The beach was never posted (MA DPH 2003, 2004, 2005).
Currently there is uncertainty associated with accurate reporting of freshwater beach closure information to the Massachusetts DPH required as part of the Beaches Bill. Therefore no Primary or Secondary Contact Recreational Use assessments (either support or impairment) decisions will be made using Beaches Bill data for freshwaterbodies. Due to the lack of current transparency data, non-native aquatic macrophyte biovolume data, and aesthetic quality data, the Aesthetics Use is not assessed.
Windsor Lake (MA11016) Use Summary Table
Aquatic Life Fish Consumption Primary Contact Secondary Contact Aesthetics
NOT ASSESSED
RECOMMENDATIONS Conduct water quality monitoring in Windsor Lake to assess the Aquatic Life Use and to evaluate the success of the grant project in reducing nutrient and pollutant loading. Continue to review beaches bill data provided to MA DPH to assess the recreational uses. Conduct a shoreline survey of Windsor Lake to identify potential sources of pollution to the waterbody.
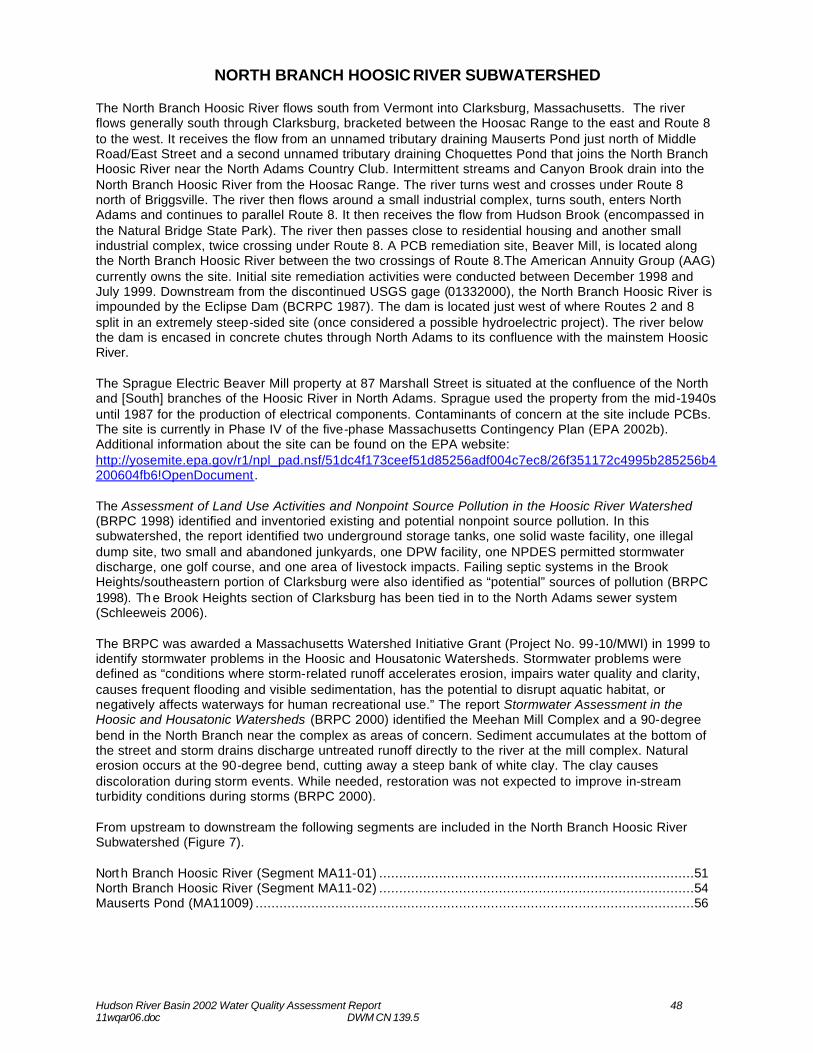
Hudson River Basin 2002 Water Quality Assessment Report 48 11wqar06.doc DWM CN 139.5
NORTH BRANCH HOOSIC RIVER SUBWATERSHED The North Branch Hoosic River flows south from Vermont into Clarksburg, Massachusetts. The river flows generally south through Clarksburg, bracketed between the Hoosac Range to the east and Route 8 to the west. It receives the flow from an unnamed tributary draining Mauserts Pond just north of Middle Road/East Street and a second unnamed tributary draining Choquettes Pond that joins the North Branch Hoosic River near the North Adams Country Club. Intermittent streams and Canyon Brook drain into the North Branch Hoosic River from the Hoosac Range. The river turns west and crosses under Route 8 north of Briggsville. The river then flows around a small industrial complex, turns south, enters North Adams and continues to parallel Route 8. It then receives the flow from Hudson Brook (encompassed in the Natural Bridge State Park). The river then passes close to residential housing and another small industrial complex, twice crossing under Route 8. A PCB remediation site, Beaver Mill, is located along the North Branch Hoosic River between the two crossings of Route 8.The American Annuity Group (AAG) currently owns the site. Initial site remediation activities were conducted between December 1998 and July 1999. Downstream from the discontinued USGS gage (01332000), the North Branch Hoosic River is impounded by the Eclipse Dam (BCRPC 1987). The dam is located just west of where Routes 2 and 8 split in an extremely steep-sided site (once considered a possible hydroelectric project). The river below the dam is encased in concrete chutes through North Adams to its confluence with the mainstem Hoosic River. The Sprague Electric Beaver Mill property at 87 Marshall Street is situated at the confluence of the North and [South] branches of the Hoosic River in North Adams. Sprague used the property from the mid-1940s until 1987 for the production of electrical components. Contaminants of concern at the site include PCBs. The site is currently in Phase IV of the five-phase Massachusetts Contingency Plan (EPA 2002b). Additional information about the site can be found on the EPA website: http://yosemite.epa.gov/r1/npl_pad.nsf/51dc4f173ceef51d85256adf004c7ec8/26f351172c4995b285256b4200604fb6!OpenDocument. The Assessment of Land Use Activities and Nonpoint Source Pollution in the Hoosic River Watershed (BRPC 1998) identified and inventoried existing and potential nonpoint source pollution. In this subwatershed, the report identified two underground storage tanks, one solid waste facility, one illegal dump site, two small and abandoned junkyards, one DPW facility, one NPDES permitted stormwater discharge, one golf course, and one area of livestock impacts. Failing septic systems in the Brook Heights/southeastern portion of Clarksburg were also identified as “potential” sources of pollution (BRPC 1998). The Brook Heights section of Clarksburg has been tied in to the North Adams sewer system (Schleeweis 2006). The BRPC was awarded a Massachusetts Watershed Initiative Grant (Project No. 99-10/MWI) in 1999 to identify stormwater problems in the Hoosic and Housatonic Watersheds. Stormwater problems were defined as “conditions where storm-related runoff accelerates erosion, impairs water quality and clarity, causes frequent flooding and visible sedimentation, has the potential to disrupt aquatic habitat, or negatively affects waterways for human recreational use.” The report Stormwater Assessment in the Hoosic and Housatonic Watersheds (BRPC 2000) identified the Meehan Mill Complex and a 90-degree bend in the North Branch near the complex as areas of concern. Sediment accumulates at the bottom of the street and storm drains discharge untreated runoff directly to the river at the mill complex. Natural erosion occurs at the 90-degree bend, cutting away a steep bank of white clay. The clay causes discoloration during storm events. While needed, restoration was not expected to improve in-stream turbidity conditions during storms (BRPC 2000). From upstream to downstream the following segments are included in the North Branch Hoosic River Subwatershed (Figure 7). North Branch Hoosic River (Segment MA11-01) ...............................................................................51 North Branch Hoosic River (Segment MA11-02) ...............................................................................54 Mauserts Pond (MA11009) ..............................................................................................................56
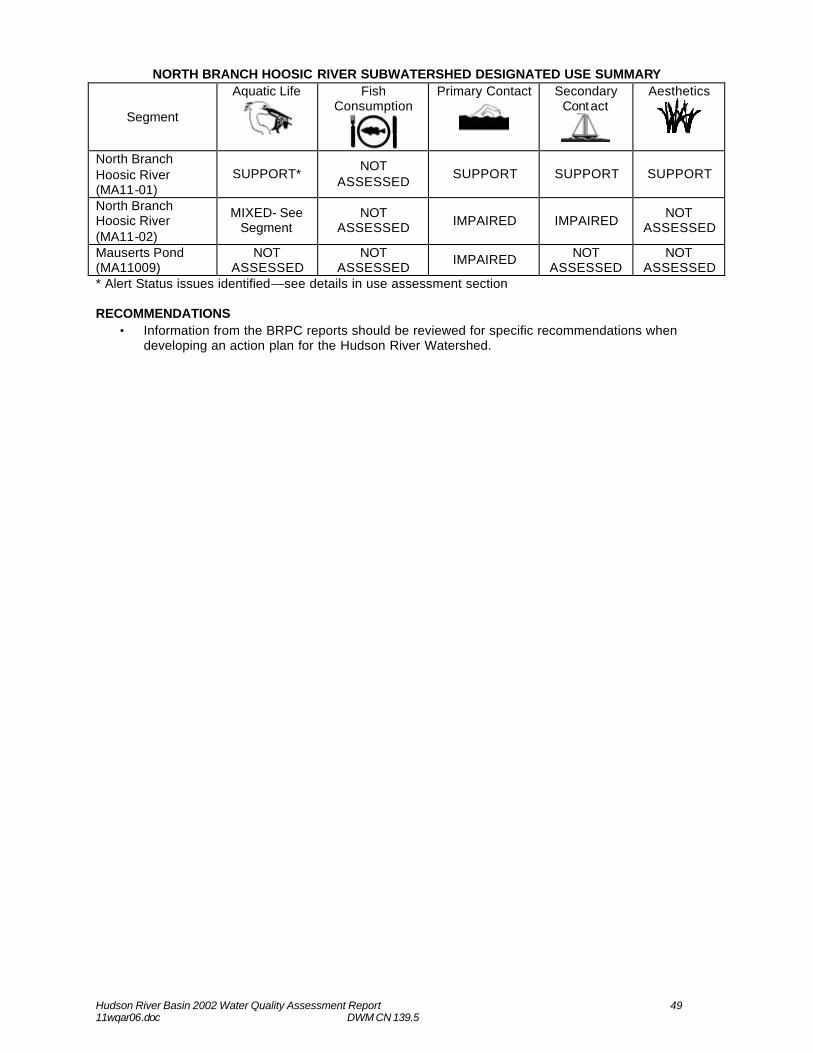
Hudson River Basin 2002 Water Quality Assessment Report 49 11wqar06.doc DWM CN 139.5
NORTH BRANCH HOOSIC RIVER SUBWATERSHED DESIGNATED USE SUMMARY
Segment
Aquatic Life
Fish Consumption
Primary Contact
Secondary Contact
Aesthetics
North Branch Hoosic River (MA11-01)
SUPPORT* NOT
ASSESSED SUPPORT SUPPORT SUPPORT
North Branch Hoosic River (MA11-02)
MIXED- See Segment
NOT ASSESSED IMPAIRED IMPAIRED
NOT ASSESSED
Mauserts Pond (MA11009)
NOT ASSESSED
NOT ASSESSED
IMPAIRED NOT ASSESSED
NOT ASSESSED
* Alert Status issues identified—see details in use assessment section RECOMMENDATIONS
• Information from the BRPC reports should be reviewed for specific recommendations when developing an action plan for the Hudson River Watershed.
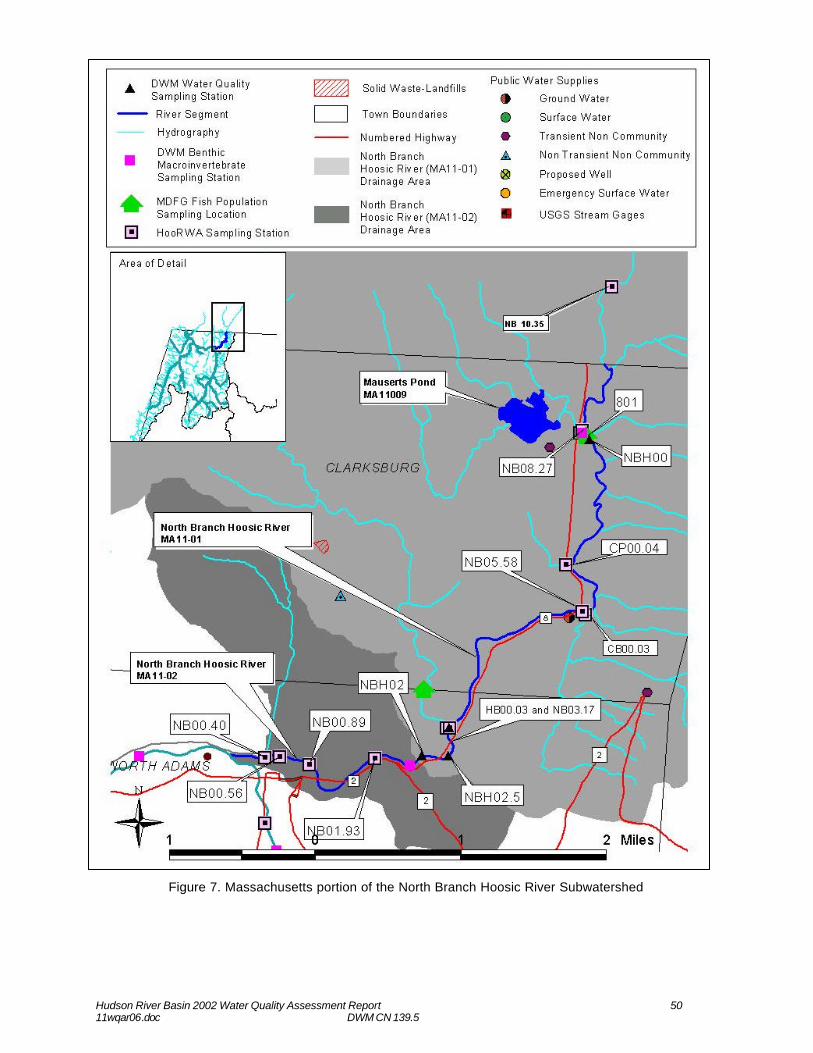
Hudson River Basin 2002 Water Quality Assessment Report 50 11wqar06.doc DWM CN 139.5
Figure 7. Massachusetts portion of the North Branch Hoosic River Subwatershed
Hudson River Basin 2002 Water Quality Assessment Report 51 11wqar06.doc DWM CN 139.5
NORTH BRANCH HOOSIC RIVER (SEGMENT MA11-01) Location: Vermont State Line, Clarksburg to the USGS Gage, North Adams Segment Length: 4.3 miles Classification: B, Cold Water Fishery This segment is listed on the 2004 Integrated List of Waters in Category 5- Waters Requiring a TMDL- due to siltation and pathogens (MassDEP 2005). WMA WATER WITHDRAWALS AND NPDES WASTEWATER DISCHARGE SUMMARY Based on the available information there are no WMA regulated water withdrawals from or permitted surface water discharges to this subwatershed. USE ASSESSMENT AQUATIC LIFE Habitat and Flow
DWM conducted habitat assessments of the North Branch Hoosic River upstream from Henderson Road in Clarksburg (Station NBH00 (B0258)) as part of the 2002 benthic macroinvertebrate and fish population surveys. The benthic sampling reach, sampled in August 2002, received a habitat score of 174 out of 200. This was due to low water levels associated with natural drought conditions and the width of the riparian zone on the west bank (Appendix D). The fish sampling reach, sampled 19 June 2002, received a habitat score of 165 out of 200 due to slight channelization, sediment deposition, and lack of bank vegetative protection (MassDEP 2002a). The USGS Gage (01332000) was discontinued in 1990 (USGS 2006).
Biology DWM conducted a benthic macroinvertebrate survey upstream from Henderson Road in Clarksburg (B0258) in 2002 (Appendix D). RBP III analysis indicated that the North Branch Hoosic River was slightly to moderately impacted when compared to the regional reference station on Pecks Brook (PB00). DWM biologists noted that the strong presence of filtering-collectors and a moderately high Hilsenhoff Biotic Index (HBI) suggested NPS impacts resulting from elevated loadings of organic particulates and nutrients. On 19 June 2002 DWM in conjunction with MA DFG, conducted fish population sampling upstream from Henderson Road in Clarksburg using backpack electroshocking equipment. Twelve species were collected including 81 eastern blacknose dace, 40 common shiner, 15 longnose dace, ten brown trout (104 to 285 mm in length), four white sucker, four longnose sucker, three slimy sculpin, two eastern brook trout (107 and 126 mm in length) and one individual bluegill, brown bullhead, fallfish, and creek chub (MassDEP 2002a). The North Branch Hoosic River is stocked with trout by MA DFG (MA DFG undated). Eastern blacknose dace and longnose dace are classified as fluvial specialists while common shiner, brown trout, white sucker, and brook trout are classified as fluvial dependent species (Bain and Meixler 2000). Slimy sculpin are considered to be regional fluvial specialists (Maietta 2006). Longnose sucker, slimy sculpin, brown trout, and brook trout are considered intolerant to pollution; all other species are moderately tolerant to tolerant (Halliwell et al. 1999).
Chemistry – water
DWM conducted monthly pre-dawn, in-situ water quality monitoring at two stations (NBH00- Henderson Road, Clarksburg and NBH02-near Beaver Street, North Adams) between May and October 2002. Station NBH02 was changed to NBH02.5 due to safety concerns for the September and October surveys. Grab samples were collected the following day and analyzed for TSS, ammonia-nitrogen, and total phosphorus (Appendix B). These data can be summarized as follows.
Hudson River Basin 2002 Water Quality Assessment Report 52 11wqar06.doc DWM CN 139.5
Parameter DWM 2002
DO (mg/L) 7.6 – 10.6 (n=9) PRE-DAWN Percent Saturation (%) 82 – 96 (n=9) pH (SU) 6.5- 7.7 (n=9) Temperature (°C) 10.8 - 20.3 (n=9)
1>20°C at NBH00 Conductivity (µS/cm at 25°C) 44.9 – 157 (n=9) Total phosphorus (mg/L) <0.01- 0.022(n=10) Ammonia- nitrogen (mg/L) <0.01- 0.023 (n=10) Total suspended solids (mg/L) <1-4 (n=10)
The Aquatic Life Use is assessed as support based on the RBP III analysis of the benthic macroinvertebrate community and the water chemistry data. However, this use is identified with an Alert Status. The fish community structure was more diverse in the North Branch Hoosic River than at other stations, but the relative low numbers of eastern brook trout and slimy sculpin are of concern given this segment is a designated cold water fishery. The habitat score was very close to that of the reference station, indicating the benthic community was not limited by habitat. Since nutrient concentrations were relatively low, dissolved oxygen concentrations met standards, and total suspended solids concentrations were low it was best professional judgment that the RBP analysis be interpreted as slightly impacted (Fiorentino 2006). PRIMARY CONTACT RECREATION, SECONDARY CONTACT RECREATION, AND AESTHETICS
DWM conducted monthly fecal coliform and E. coli bacteria monitoring along the North Branch Hoosic River at two stations between May and October 2002. As with the water chemistry sampling, the site at NBH02 was moved to NBH02.5 (Appendix B). NBH00- Henderson Road in Clarksburg NBH02- Near Beaver Street, North Adams NBH02.5- across from the arts cooperative, North Adams
HooRWA sampled three stations in Massachusetts and one station in Vermont (see below) for fecal coliform bacteria along this segment of the North Branch Hoosic River. The stations were sampled monthly between May and September 2001 (HooRWA November 2001c). With the exception of one count at Station NB05.58 in June (wet weather, >600 cfu/100mL), all counts were less than 200 cfu/100mL (n=20). NB10.35- downstream from the bridge at the Lane in Stamford, VT NB08.27- just upstream from Beaver Creek NB05.58- just downstream from Canyon Brook NB03.17- just upstream from Hudson Brook
The water at Station NBH00 was clear, colorless, and odorless on each of the ten occasions DWM visited the sampling site. However, the water at Station NBH02 was reported to be a colored (grayish/green/blue-green) and/or highly turbid/murky on most of the sampling dates (Appendix B). This is likely the result of a spring draining a clay pit in the vicinity of Briggsville, about one mile upstream from the sampling location (Kennedy and Weinstein 2000). In August the water at Station NBH02.5 was clear but had a fishy odor (two dead fish were found on the dam, believed left by fishermen) while in September the water was blue-green and murky with no odor. No scums, trash, or other objectionable conditions were reported at any of the stations (Appendix B).
Parameter DWM 2002 (n=10)
Fecal coliform (cfu/100mL) 20-310 Geometric Mean 86.1 E. coli (cfu/100mL) 30-330 Geometric mean 96.1
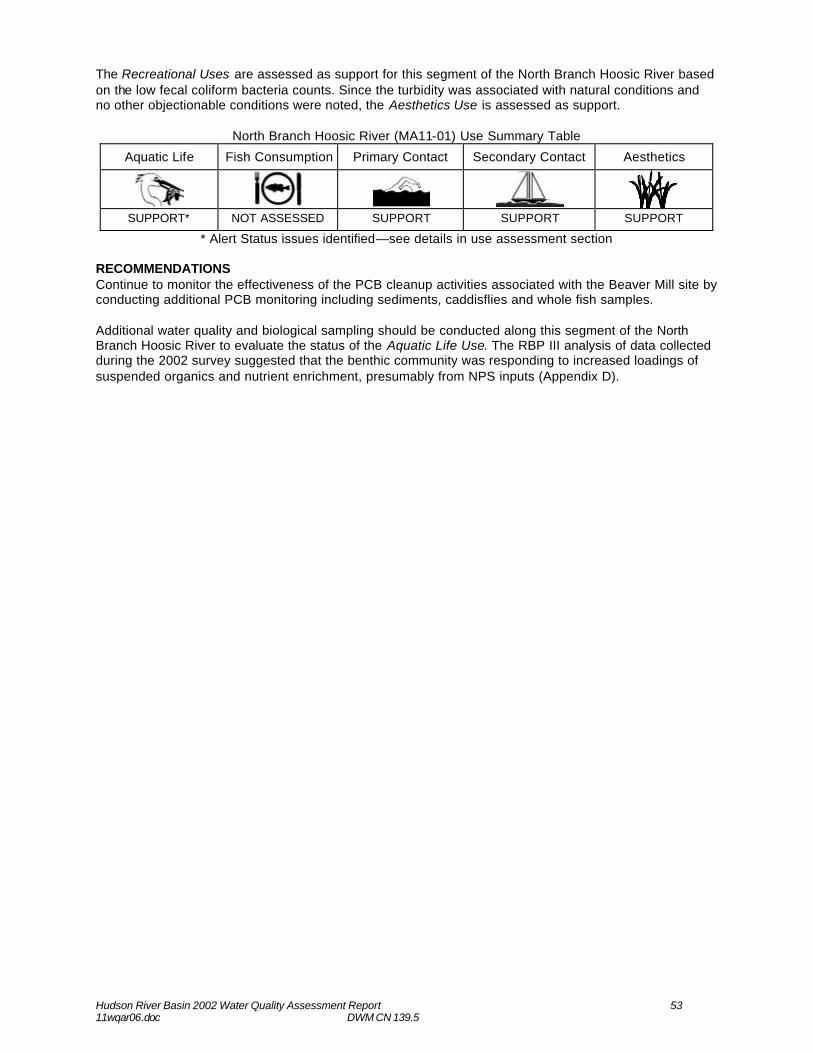
Hudson River Basin 2002 Water Quality Assessment Report 53 11wqar06.doc DWM CN 139.5
The Recreational Uses are assessed as support for this segment of the North Branch Hoosic River based on the low fecal coliform bacteria counts. Since the turbidity was associated with natural conditions and no other objectionable conditions were noted, the Aesthetics Use is assessed as support.
North Branch Hoosic River (MA11-01) Use Summary Table
Aquatic Life Fish Consumption Primary Contact Secondary Contact Aesthetics
SUPPORT* NOT ASSESSED SUPPORT SUPPORT SUPPORT
* Alert Status issues identified—see details in use assessment section RECOMMENDATIONS Continue to monitor the effectiveness of the PCB cleanup activities associated with the Beaver Mill site by conducting additional PCB monitoring including sediments, caddisflies and whole fish samples. Additional water quality and biological sampling should be conducted along this segment of the North Branch Hoosic River to evaluate the status of the Aquatic Life Use. The RBP III analysis of data collected during the 2002 survey suggested that the benthic community was responding to increased loadings of suspended organics and nutrient enrichment, presumably from NPS inputs (Appendix D).
Hudson River Basin 2002 Water Quality Assessment Report 54 11wqar06.doc DWM CN 139.5
NORTH BRANCH HOOSIC RIVER (SEGMENT MA11-02) Location: From the USGS Gage, North Adams to confluence with the Hoosic River, North Adams Segment Length: 1.5 miles Classification: Class B, Cold Water Fishery This segment is listed on the 2004 Integrated List of Waters in Category 5- Waters Requiring a TMDL- due to priority organics, siltation, pathogens, and suspended solids. “Other habitat alterations” is an additional cause of impairment to this segment that does not require the calculation of a TMDL (MassDEP 2005). WMA WATER WITHDRAWALS AND NPDES WASTEWATER DISCHARGE SUMMARY Based on the available information there are no regulated water withdrawals from or permitted surface water discharges to this subwatershed. USE ASSESSMENT AQUATIC LIFE
Habitat and Flow Habitat quality conditions in the lower 1.3 miles of this segment of the North Branch Hoosic River are compromised by concrete flood control structures (between the dam and the confluence with the mainstem Hoosic River).
Chemistry-water DWM conducted water quality sampling at two stations (NBH02 and NBH02.5) slightly upstream from this segment (Appendix B) during pre-dawn hours between May and October 2002 (n=4). No water quality problems were identified. These data are considered representative of water quality conditions in the upper 0.2 miles of this segment. HooRWA conducted monthly water quality sampling on this segment of the North Branch Hoosic River between May and October in 2002 and 2003 (HooRWA 2005). In-situ sampling measured temperature, dissolved oxygen, percent saturation, temperature, pH, and conductivity. Grab samples were collected and analyzed for total phosphorus, turbidity, and TSS. Both in-situ and grab samples were not collected during worst case, pre-dawn conditions. NB01.93 – just downstream from the Eclipse Dam in North Adams NB00.89- at Eagle Street, North Adams NB00.56- at Holden Street, North Adams NB00.40- at the Marshall Street Bridge, North Adams
Parameter HooRWA (n=15) DO (mg/L) 7.9-11.7 Percent saturation (%) 87-104 pH (SU) 6.7-8.7 Temperature (°C) 7.5-21.1 (3>20 all on same day) Conductivity (µS/cm at 25°C) 40-190 Total phosphorus (mg/L) <0.01-0.04 Total suspended solids (mg/L) <1-47
The upper 0.2 miles are assessed as support based on the generally good water quality data. The lower 1.3 miles of this segment of the North Branch Hoosic River are impaired for the Aquatic Life Use as a result of habitat modification (concrete flood control chutes). PRIMARY CONTACT RECREATION, SECONDARY CONTACT RECREATION, AESTHETICS HooRWA sampled monthly for fecal coliform bacteria between May and September 2001, 2002, and 2003. Samples were collected during both wet and dry weather conditions (HooRWA November 2001, HooRWA undated, HooRWA 2005).
NB01.93 – just downstream from the Eclipse Dam in North Adams (2002, 2003) NB00.89- at Eagle Street, North Adams (2003) NB00.56- at Holden Street, North Adams (2003)
NB00.40- at the Marshall Street Bridge, North Adams (2001, 2002, 2003)
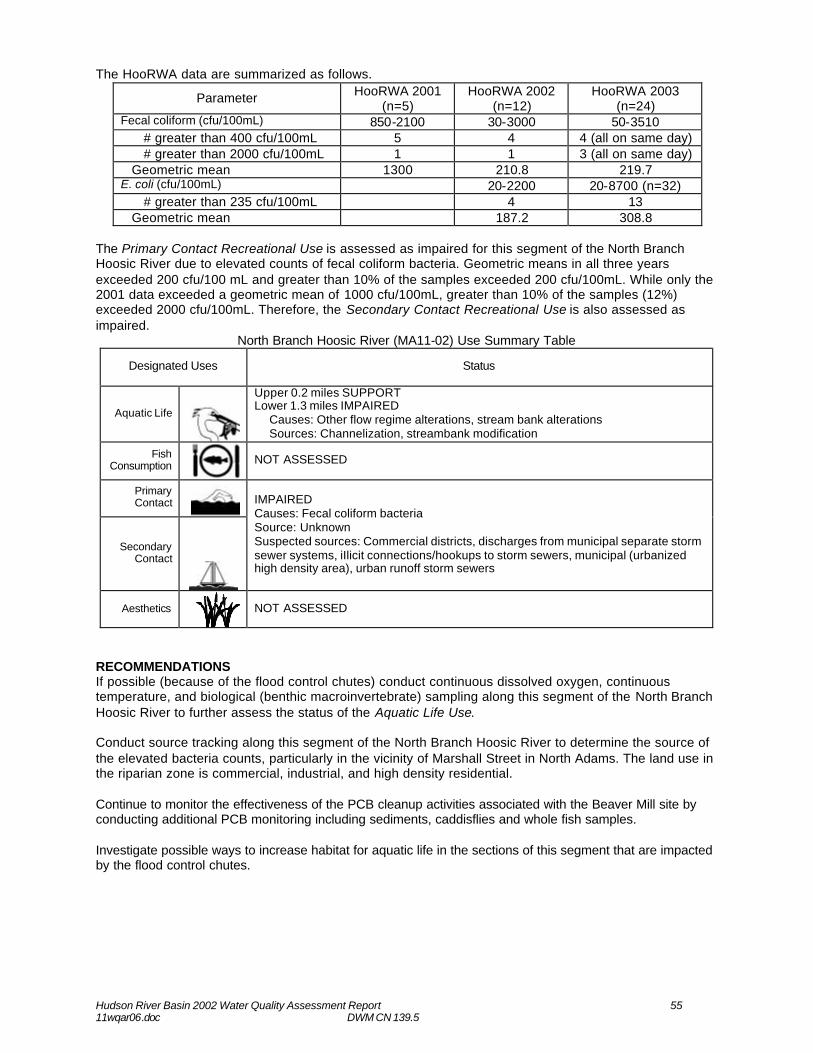
Hudson River Basin 2002 Water Quality Assessment Report 55 11wqar06.doc DWM CN 139.5
The HooRWA data are summarized as follows.
Parameter HooRWA 2001 (n=5)
HooRWA 2002 (n=12)
HooRWA 2003 (n=24)
Fecal coliform (cfu/100mL) 850-2100 30-3000 50-3510 # greater than 400 cfu/100mL 5 4 4 (all on same day) # greater than 2000 cfu/100mL 1 1 3 (all on same day)
Geometric mean 1300 210.8 219.7 E. coli (cfu/100mL) 20-2200 20-8700 (n=32)
# greater than 235 cfu/100mL 4 13 Geometric mean 187.2 308.8
The Primary Contact Recreational Use is assessed as impaired for this segment of the North Branch Hoosic River due to elevated counts of fecal coliform bacteria. Geometric means in all three years exceeded 200 cfu/100 mL and greater than 10% of the samples exceeded 200 cfu/100mL. While only the 2001 data exceeded a geometric mean of 1000 cfu/100mL, greater than 10% of the samples (12%) exceeded 2000 cfu/100mL. Therefore, the Secondary Contact Recreational Use is also assessed as impaired.
North Branch Hoosic River (MA11-02) Use Summary Table
Designated Uses Status
Aquatic Life
Upper 0.2 miles SUPPORT Lower 1.3 miles IMPAIRED
Causes: Other flow regime alterations, stream bank alterations Sources: Channelization, streambank modification
Fish Consumption
NOT ASSESSED
Primary Contact
Secondary Contact
IMPAIRED Causes: Fecal coliform bacteria Source: Unknown Suspected sources: Commercial districts, discharges from municipal separate storm sewer systems, iIlicit connections/hookups to storm sewers, municipal (urbanized high density area), urban runoff storm sewers
Aesthetics
NOT ASSESSED
RECOMMENDATIONS If possible (because of the flood control chutes) conduct continuous dissolved oxygen, continuous temperature, and biological (benthic macroinvertebrate) sampling along this segment of the North Branch Hoosic River to further assess the status of the Aquatic Life Use. Conduct source tracking along this segment of the North Branch Hoosic River to determine the source of the elevated bacteria counts, particularly in the vicinity of Marshall Street in North Adams. The land use in the riparian zone is commercial, industrial, and high density residential. Continue to monitor the effectiveness of the PCB cleanup activities associated with the Beaver Mill site by conducting additional PCB monitoring including sediments, caddisflies and whole fish samples. Investigate possible ways to increase habitat for aquatic life in the sections of this segment that are impacted by the flood control chutes.
Hudson River Basin 2002 Water Quality Assessment Report 56 11wqar06.doc DWM CN 139.5
MAUSERTS POND (SEGMENT MA11009) Location: Clarksburg Segment Area: 50 acres Classification: Class B USE ASSESSMENT PRIMARY AND SECONDARY CONTACT RECREATION AND AESTHETICS
Mauserts Pond is located within the confines of Clarksburg State Forest in Clarksburg, MA. The Massachusetts Department of Conservation and Recreation conducted weekly Enterococci bacteria testing at the day use beach on Mauserts Pond during the recreational season in 2002, 2003, and 2004 (MA DPH 2003, 2004, 2005b). In 2002 the beach was not reported as being posted, however, of the 19 tests conducted, three exceeded the MA DPH bathing beach single sample standard of 61 cfu/100mL for Enterococci. In 2003 the beach was sampled 22 times with 5 exceedances reported. The beach was also posted five times. In 2004 the beach was sampled 15 times for Enterococci bacteria. Two exceedances were reported and the beach was subsequently posted twice. The report Mauserts Pond Watershed Study (GeoSyntec, 2003) evaluated bacterial and nutrient loading to the pond from watershed sources. The report surmised that stormwater runoff transporting goose feces into the beach area was the primary source of bacterial contamination.
Based on the frequency and duration of bathing beach closures, the Primary Contact Recreational Use is assessed as impaired for Mauserts Pond.
Mauserts Pond (MA11009) Use Summary Table
Designated Uses Status
Aquatic Life
NOT ASSESSED
Fish Consumption
NOT ASSESSED
Primary Contact
IMPAIRED Causes: Enterococci Source: Unknown Suspected sources: Runoff from forest/grassland/parkland, waterfowl
Secondary Contact
NOT ASSESSED
Aesthetics
NOT ASSESSED
RECOMMENDATIONS: Coordinate with MA DCR to generate quality-assured in-lake data for Mauserts Pond in order to evaluate the status of designated uses. Evaluate effectiveness of best management practices being implemented to control bacteria source(s).
Hudson River Basin 2002 Water Quality Assessment Report 57 11wqar06.doc DWM CN 139.5
HOOSIC RIVER SUBWATERSHED From the confluence of the {South Branch} Hoosic and the North Branch Hoosic River, the mainstem Hoosic River flows in a generally west northwest direction around the south and southwest slopes of East Mountain (Clarksburg, North Adams and Williamstown). Concrete flood control structures channelize the Hoosic River for approximately 0.2 miles beginning at the confluence with the North Branch Hoosic. The river then passes the former Sprague Electric Company (see below). The river flows under the Boston and Maine Railroad and is crossed by Route 2 twice as it loops south. The railroad runs along the north bank of the Hoosic River for the majority of its length. Notch Brook (draining Notch Reservoir) flows north to discharge into the mainstem just upstream from a dam. Sherman Brook drains south. A roll dam is present just upstream from the site of the old North Adams WWTP, which has been dismantled. Paull Brook also flows north through the Harriman Airport, draining Mount Williams Reservoir. The Widen Tannery site is located on the north side of the river just upstream from Ashton Ave in North Adams. A USGS gaging station (01332500) is located in Williamstown near the North Adams border. At this point the river is flowing primarily northwest and is bordered by a section of cropland and forests, receives the flow from the Green River and then passes north of Williamstown proper. The river flows past the Williams College playing fields, passes under Route 7, and receives the treated discharge from the Hoosac Water Quality District wastewater treatment plant just upstream of its confluence with Hemlock Brook. Hemlock Brook is the last tributary draining the Taconics that discharges into the Hoosic River just downstream from Route 7 in Williamstown. Downstream from Hemlock Brook, the river is bordered by forests to the west while the eastern bank is bordered by a gravel pit (and town dump) and a small industrial complex in the vicinity of Broad Brook. After passing a farm, the Hoosic River leaves Massachusetts and enters Pownal, VT. Immediately below the North Adams flood control structures sits the former Sprague Electric Company property at 65 Brown Street. The approximately 3-acre property is currently owned by the American Annuity Group (AAG) and consists of a manufacturing facility producing paper and metalized film foil-wound capacitors. The property is currently in Phase V remediation as part of waste site cleanup #1-0000126. Remedial activities, including operation of a soil vapor extraction system, are ongoing. Surface water samples have been collected from three locations in the river on an annual basis and analyzed for VOC concentrations (EPA 2002a). The following description was excerpted from the EPA website: http://yosemite.epa.gov/r1/npl_pad.nsf/51dc4f173ceef51d85256adf004c7ec8/5504ed1d6282354485256b4200604fc3!OpenDocument
Polychlorinated biphenyls (PCBs) were detected in soils in all source areas, including sediments along the Hoosic River. Groundwater occurs in overburden at a depth of 13 feet below ground surface, and flows north towards the Hoosic River. On-site groundwater monitoring conducted since 1984 indicates the presence of a groundwater VOC contamination plume beneath the property that extends to, but has not crossed, the Hoosic River. Stormwater runoff from the property is expected to flow toward the Hoosic River located approximately 400 feet north of the property. The entire 15-mile downstream surface water pathway is contained along the Hoosic River. Analytical results of surface water samples indicated that cis-1,2-dichloroethylene (cis-1,2-DCE) and TCE are likely being discharged to the river from a VOC groundwater plume located on the property. PCBs have also been detected in fish tissue samples collected downstream of the property.
A Snapshot of PCB Levels in the Hoosic River PCB Levels in Sediment, Crayfish, and Brown Trout in the Tri-State Area (Denny 2004) presents the results of a study conducted by a Williams College student in 2003 following the cleanup of the Sprague site. Twelve sites along the mainstem Hoosic River from North Adams to the Vermont/New York border were sampled for riverbank soil analysis of PCB content. Two sites along the Hoosic River {South Branch} were also sampled for soil content. Bioaccumulation of PCBs in crayfish was examined at five sites along the river. Brown trout were collected in conjunction with the Massachusetts Department of Fish and Game, Western District; skinless fillets from the trout were analyzed for PCB concentrations. Results from this study suggest that PCB levels in riverbank soil were below EPA action levels of 1 ppm, concentrations of PCBs in brown trout fillets still remain greater than 1 ppm, with some concentrations greater than 2 ppm, and bioaccumulation of PCBs in crayfish seems to have decreased (Denny 2004). The Assessment of Land Use Activities and Nonpoint Source Pollution in the Hoosic River Watershed (BRPC 1998) identified and inventoried existing and potential nonpoint source pollution. In this
Hudson River Basin 2002 Water Quality Assessment Report 58 11wqar06.doc DWM CN 139.5
subwatershed the report identified 23 underground storage tanks, 13 solid waste facilities (seven of which are in the Hemlock Brook subwatershed), four auto salvage yards (one in Hemlock Brook subwatershed), three small and abandoned junkyards, three DPW facilities, three NPDES permitted stormwater discharges, two streambank erosion sites (both in the Hemlock Brook subwatershed), one road where stormwater is purposely directed into a waterway with no treatment (see below), and three areas of livestock impacts (Hemlock Brook subwatershed). The flood control chutes, and abandoned industrial sites were also identified as a “potential” source (BRPC 1998). The BRPC was awarded a Massachusetts Watershed Initiative Grant (Project No. 99-10/MWI) in 1999 to identify stormwater problems in the Hoosic and Housatonic Watersheds. The report Stormwater Assessment in the Hoosic and Housatonic Watersheds (BRPC 2000) identified Petersburg Road and Bee Hill Road as areas of concern in Williamstown. Bee Hill Road is in the watershed of Hemlock Brook. Petersburg Road is in the watershed of Buxton Brook, which is a tributary to Hemlock Brook. Both roads are unpaved and have steep grades. Runoff discharges directly to the streams. If grant funds were available, the Town would be interested in installing unpaved road BMPs (BRPC 2000). The Western Regional Office of MassDEP is unaware of any actions taken to mitigate erosion/sedimentation problems on Bee Hill and Petersburg Roads (Schleeweis 2006). In 1989 the Photech Imaging Systems Inc abandoned their mill at 330 Cole Avenue in Williamstown. The company manufactured photographic chemicals and paper. In 1997 the EPA oversaw a $500,000 Superfund cleanup at this site. In 2003 the building's roof collapsed, creating an unsightly rubbish pile along the Hoosic River and containing potentially dangerous asbestos. The remediation at this brownfields site included the demolition of the building and removal of asbestos in August 2005 (Berkshire Eagle 2005). From upstream to downstream the following segments are included in the Hoosic River Subwatershed (Figure 8):
Hoosic River (Segment MA11-05) ...................................................................................................... 61 Notch Reservoir (Segment MA11011) ................................................................................................ 65 Mount Williams Reservoir (Segment MA11010) ................................................................................... 66 Paull Brook (Segment MA11-20)........................................................................................................ 67 Hemlock Brook (Segment MA11-09) .................................................................................................. 70 Broad Brook (Segment MA11-23) ...................................................................................................... 73
Notch Reservoir (12 acres) and Mount Williams Reservoir (45.8 acres) are Class A public water supplies for the town of North Adams. The reservoirs are listed on the 2004 Integrated List of Waters in Category 2. Some of the designated uses (Secondary Contact and Aesthetics) were assessed as support and others were not assessed. No recent quality-assured information is available for Mount Williams Reservoir; so all uses are currently unassessed
In October of 2001, a leak in a pipe near Notch Brook led to the loss of 600,000 gallons of water per day over the course of ten days from Notch Reservoir, drawing it down more than eight feet. The water from the break was discharged into the brook (Berkshire Eagle 2001). No long-term effects to the brook or the reservoir were observed. No other information is available; so all uses of Notch Reservoir are currently unassessed.
Broad Brook, from the Massachusetts/Vermont state line in Williamstown to the confluence with the Hoosic River, Williamstown (2 miles) is currently classified as a Class A public water supply. However, the actual intake is located in Vermont. MassDEP has reclassified the segment (Class B by default) in the proposed water quality standards released for public comment in November 2005. Broad Brook is listed on the 2004 Integrated List of Waters in Category 3. This segment was not assessed for any of the designated uses (MassDEP 2005).
Hudson River Basin 2002 Water Quality Assessment Report 59 11wqar06.doc DWM CN 139.5
HOOSIC RIVER SUBWATERSHED DESIGNATED USE SUMMARY
Segment Aquatic Life
Fish Consumption
Primary Contact
Secondary Contact
Aesthetics
Hoosic River (MA11-05)
MIXED (see segment)
MIXED (see segment)
IMPAIRED SUPPORT SUPPORT
Notch Reservoir (MA11011)
NOT ASSESSED
Mount Williams Reservoir (MA11010)
NOT ASSESSED
Paull Brook (MA11-20)
SUPPORT* NOT ASSESSED
IMPAIRED SUPPORT* SUPPORT*
Hemlock Brook (MA11-09)
SUPPORT NOT ASSESSED
SUPPORT SUPPORT SUPPORT
Broad Brook (MA11-23)
NOT ASSESSED
* Alert Status issues identified—see details in the use assessment section RECOMMENDATIONS Information from the BRPC reports should be reviewed for specific recommendations when developing a water quality action plan for the Hudson River Watershed. Continue monitoring the progress of the PCB remediation including conducting additional fish toxics sampling, sediment sampling, and water column sampling for PCBs. Additionally, confirm if the VOC contaminated groundwater plume is discharging to the river.
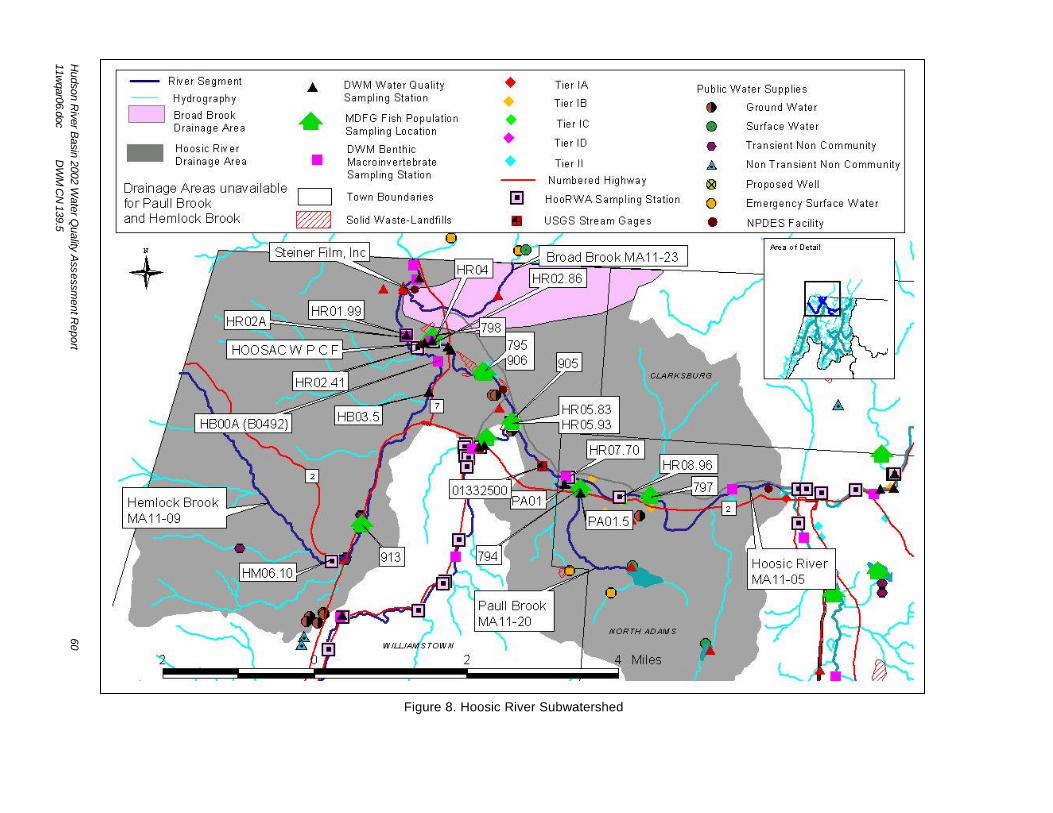
Hudson R
iver Basin 2002 W
ater Quality A
ssessment R
eport
60 11w
qar06.doc D
WM
CN
139.5
Figure 8. Hoosic River Subwatershed
Mt. Williams Reservoir MA11010
Notch Reservoir MA11011
Hudson River Basin 2002 Water Quality Assessment Report 61 11wqar06.doc DWM CN 139.5
HOOSIC RIVER (SEGMENT MA11-05) Location: Confluence with the North Branch Hoosic River, North Adams to the Vermont State Line, Williamstown Segment Length: 8.2 miles Classification: Class B, Warm Water Fishery This segment of the Hoosic River is on the 2004 Integrated List of Waters in Category 5- Waters Requiring a TMDL due to unknown causes, priority organics, nutrients, and pathogens. An additional cause of impairment to this segment that does not require the calculation of a TMDL is other habitat alterations (MassDEP 2005). WMA WATER WITHDRAWAL SUMMARY (APPENDIX E, TABLE E7) North Adams Water Department (10120901) Williamstown Water Department (9P310134104, 10134101) Steinerfilm, Inc. (9P10134103, 10134102) NPDES SURFACE WATER DISCHARGES (APPENDIX E, TABLE E6) Commonwealth Sprague Capacitor, Inc. MA0005924 Boston & Main Corporation- Cole Ave. Williamstown MA0034177 USE ASSESSMENT AQUATIC LIFE
Habitat and Flow Along this segment of the Hoosic River, concrete flood control structures/riprap streambed exist from the confluence with the North Branch Hoosic River to just north of the rear parking lot of the American Annuity Group, Inc. Brown Street Plant (upper 0.2 miles), adversely affecting habitat quality. Stream gaging data for the Hoosic River are available from the USGS gage 01332500 located downstream from Sherman Brook and 2.7 miles east of the Route 7/Route 2 junction in Williamstown from 1940 to the present. The drainage area at this gage is 126 mi2 and the average annual discharge over the period of record is 274 cfs. According to USGS, there is some regulation by Cheshire Reservoir located 16 miles upstream. Prior to June 1979, the USGS gage was located 1.2 miles downstream in Williamstown (Socolow et al. 2005). In 2002 DWM performed habitat assessments at two locations on this segment of the Hoosic River, bracketing the Hoosac Water Quality District (HQWD) outfall. Station HR03 (B0041) is upstream from the discharge and Station HR02 (B0042) is downstream. Station HR03 received a total habitat score of 153 out of 200. HR02 received a total habitat score of 162 out of 200. A lack of in-stream fish cover and sediment deposition reduced the habitat scores at both stations (Appendix D).
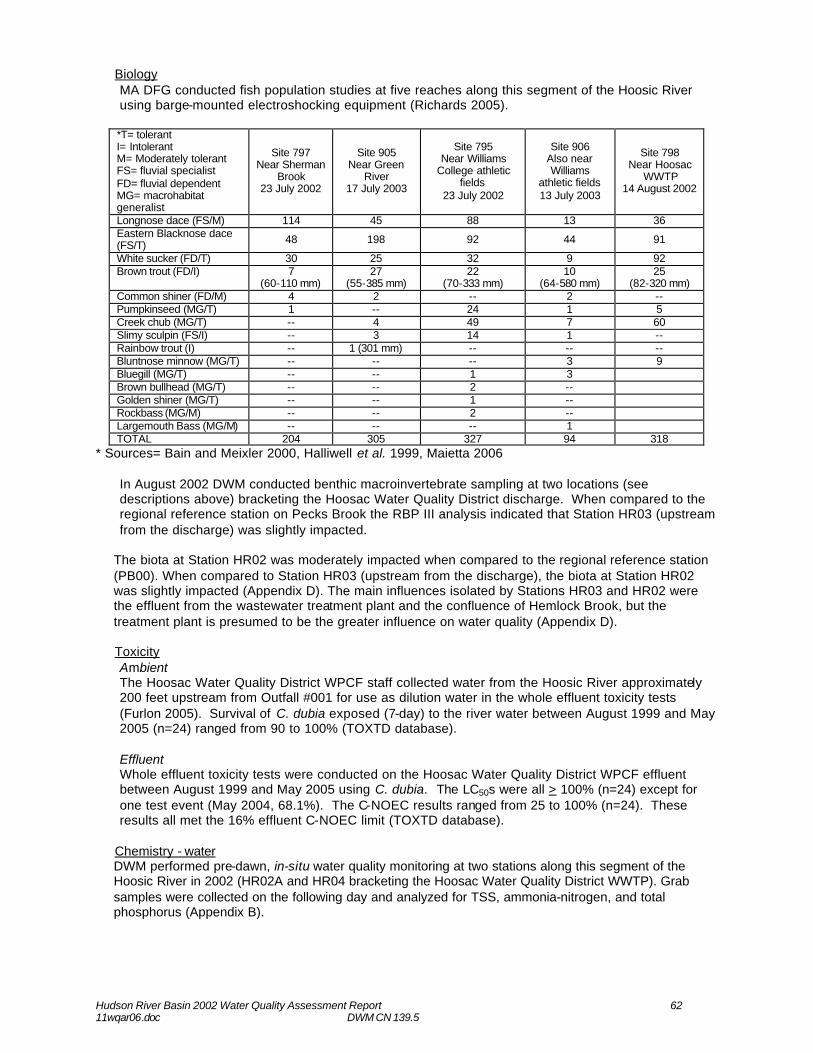
Hudson River Basin 2002 Water Quality Assessment Report 62 11wqar06.doc DWM CN 139.5
Biology MA DFG conducted fish population studies at five reaches along this segment of the Hoosic River using barge-mounted electroshocking equipment (Richards 2005). *T= tolerant I= Intolerant M= Moderately tolerant FS= fluvial specialist FD= fluvial dependent MG= macrohabitat generalist
Site 797 Near Sherman
Brook 23 July 2002
Site 905 Near Green
River 17 July 2003
Site 795 Near Williams
College athletic fields
23 July 2002
Site 906 Also near Williams
athletic fields 13 July 2003
Site 798 Near Hoosac
WWTP 14 August 2002
Longnose dace (FS/M) 114 45 88 13 36 Eastern Blacknose dace (FS/T) 48 198 92 44 91
White sucker (FD/T) 30 25 32 9 92 Brown trout (FD/I) 7
(60-110 mm) 27
(55-385 mm) 22
(70-333 mm) 10
(64-580 mm) 25
(82-320 mm) Common shiner (FD/M) 4 2 -- 2 -- Pumpkinseed (MG/T) 1 -- 24 1 5 Creek chub (MG/T) -- 4 49 7 60 Slimy sculpin (FS/I) -- 3 14 1 -- Rainbow trout (I) -- 1 (301 mm) -- -- -- Bluntnose minnow (MG/T) -- -- -- 3 9 Bluegill (MG/T) -- -- 1 3 Brown bullhead (MG/T) -- -- 2 -- Golden shiner (MG/T) -- -- 1 -- Rockbass (MG/M) -- -- 2 -- Largemouth Bass (MG/M) -- -- -- 1 TOTAL 204 305 327 94 318
* Sources= Bain and Meixler 2000, Halliwell et al. 1999, Maietta 2006
In August 2002 DWM conducted benthic macroinvertebrate sampling at two locations (see descriptions above) bracketing the Hoosac Water Quality District discharge. When compared to the regional reference station on Pecks Brook the RBP III analysis indicated that Station HR03 (upstream from the discharge) was slightly impacted.
The biota at Station HR02 was moderately impacted when compared to the regional reference station (PB00). When compared to Station HR03 (upstream from the discharge), the biota at Station HR02 was slightly impacted (Appendix D). The main influences isolated by Stations HR03 and HR02 were the effluent from the wastewater treatment plant and the confluence of Hemlock Brook, but the treatment plant is presumed to be the greater influence on water quality (Appendix D).
Toxicity Ambient The Hoosac Water Quality District WPCF staff collected water from the Hoosic River approximately 200 feet upstream from Outfall #001 for use as dilution water in the whole effluent toxicity tests (Furlon 2005). Survival of C. dubia exposed (7-day) to the river water between August 1999 and May 2005 (n=24) ranged from 90 to 100% (TOXTD database). Effluent Whole effluent toxicity tests were conducted on the Hoosac Water Quality District WPCF effluent between August 1999 and May 2005 using C. dubia. The LC50s were all > 100% (n=24) except for one test event (May 2004, 68.1%). The C-NOEC results ranged from 25 to 100% (n=24). These results all met the 16% effluent C-NOEC limit (TOXTD database).
Chemistry - water DWM performed pre-dawn, in-situ water quality monitoring at two stations along this segment of the Hoosic River in 2002 (HR02A and HR04 bracketing the Hoosac Water Quality District WWTP). Grab samples were collected on the following day and analyzed for TSS, ammonia-nitrogen, and total phosphorus (Appendix B).
Hudson River Basin 2002 Water Quality Assessment Report 63 11wqar06.doc DWM CN 139.5
HooRWA conducted water quality sampling at stations along this segment of the Hoosic River between 2002 and 2003. Stations were sampled for in-situ parameters, as well as total phosphorus, TSS, and turbidity (HooRWA undated and 2005). It should be noted that the dissolved oxygen data were not collected during worst case, pre-dawn conditions.
HR08.96 downstream from the roll dam and USGS gaging station in North Adams (2002, 2003) HR07.70-Galvin Road, North Adams (2003) HR02.86-at Lauren’s Launch, upstream from Hoosac WQD WWTP, Williamstown (2003) HR02.41-upstream from the confluence with Hemlock Brook, Williamstown (2003)
HooRWA also deployed Optic Stowaway temperature recorders in the Hoosic River opposite Treets Cleaners near the USGS gage (HooRWA 2005). In-stream temperatures were recorded hourly between 7 June and 27 September (n=2590). The maximum temperature was 25.05°C, the minimum temperature was 11.15°C, and the average temperature was 18.64°C.
The Aquatic Life Use is assessed as impaired for the upper 0.2 miles due to habitat modifications associated with the flood control structures. The middle 6.3 miles are assessed as support based on the RBP III analysis, fish community data, water chemistry data, and the high survival of test organisms exposed to river water. The lower 1.7 miles are assessed as impaired based on the RBP III analysis. The benthic community in this lower portion of the river showed clear signs of pollution stress (the most degraded site in the watershed). While nonpoint source pollution is likely problematic (e.g., Hemlock Brook likely contributes nutrient and/or suspended solids loadings), the Hoosac WQD treatment plant discharge is considered to be the primary source of water quality degradation. FISH CONSUMPTION In 1994 the MA DPH updated their fish consumption advisory for the Hoosic River. The advisory recommends that people should refrain from eating all fish from the Hoosic River caught below the channelized section in North Adams to the state line (Celona 2005). Because of this fish consumption advisory, the lower 8.1-mile reach of this segment does not support the Fish Consumption Use due to PCB contamination. PCBs were detected in 1997 samples collected by DWM in this segment of the Hoosic River. PRIMARY CONTACT RECREATION, SECONDARY CONTACT RECREATION AND AESTHETICS DWM conducted fecal coliform and E. coli bacteria monitoring at two stations upstream and downstream (Stations HR04 and HR02A, respectively) from the Hoosac Water Quality District WWTP (Appendix B). Although some slight turbidity and musty odors were noted in the river upstream from the Hoosac WQD discharge (Station HR04), no other objectionable conditions were noted. Downstream from the discharge (Station HR02A) the water column ranged from slightly to highly turbid and a septic odor was occasionally noted. No objectionable scums, trash, or nuisance aquatic plants were reported, however. HooRWA also collected fecal coliform and E. coli samples at their stations noted above between 2002 and 2003 (HooRWA undated and 2005).
Parameter DWM 2002 HooRWA 2002 HooRWA 2003 DO (mg/L) 6.9 – 9.8 (n=10)
PRE- DAWN 8.3-11.3 (n=7) 8.4-14.0 (n=32)
Percent saturation (%) 77 – 91 (n=10) 92-102 (n=7) 91-134 pH (SU) 7.5- 8.1 (n=10) 7.9-8.2 (n=7) 7.5-8.2 (n=32) Temperature (°C) 13.1- 22.6 (n=10) 9.8-20.1 (n=7) 13.5-20.4 (n=32) Conductivity (µS/cm at 25°C) 209 – 433 (n=10) 150-340 (n=7) 120-400 (n=32) Total phosphorus (mg/L) 0.021- 0.075 (n=12) 0.01-0.06 (n=6) 0.011-0.075 (n=24) Ammonia- nitrogen (mg/L) <0.01- 0.032 (n=12) Total suspended solids (mg/L) <1-8 (n=12) 1-24 (n=6) 1-56 (n=32) Turbidity (NTU) 1.67-24.0 (n=6) 1.6-12 (n=32)
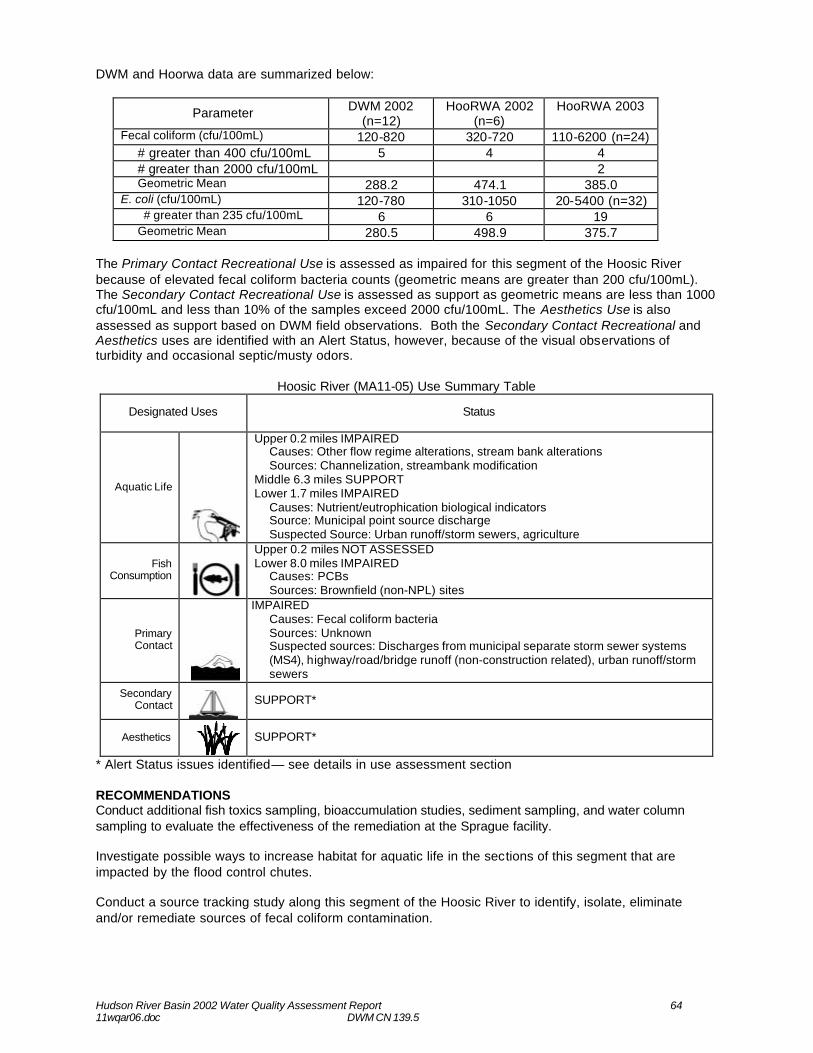
Hudson River Basin 2002 Water Quality Assessment Report 64 11wqar06.doc DWM CN 139.5
DWM and Hoorwa data are summarized below:
Parameter DWM 2002 (n=12)
HooRWA 2002 (n=6)
HooRWA 2003
Fecal coliform (cfu/100mL) 120-820 320-720 110-6200 (n=24) # greater than 400 cfu/100mL 5 4 4 # greater than 2000 cfu/100mL 2 Geometric Mean 288.2 474.1 385.0
E. coli (cfu/100mL) 120-780 310-1050 20-5400 (n=32) # greater than 235 cfu/100mL 6 6 19
Geometric Mean 280.5 498.9 375.7 The Primary Contact Recreational Use is assessed as impaired for this segment of the Hoosic River because of elevated fecal coliform bacteria counts (geometric means are greater than 200 cfu/100mL). The Secondary Contact Recreational Use is assessed as support as geometric means are less than 1000 cfu/100mL and less than 10% of the samples exceed 2000 cfu/100mL. The Aesthetics Use is also assessed as support based on DWM field observations. Both the Secondary Contact Recreational and Aesthetics uses are identified with an Alert Status, however, because of the visual observations of turbidity and occasional septic/musty odors.
Hoosic River (MA11-05) Use Summary Table
Designated Uses Status
Aquatic Life
Upper 0.2 miles IMPAIRED Causes: Other flow regime alterations, stream bank alterations Sources: Channelization, streambank modification
Middle 6.3 miles SUPPORT Lower 1.7 miles IMPAIRED
Causes: Nutrient/eutrophication biological indicators Source: Municipal point source discharge Suspected Source: Urban runoff/storm sewers, agriculture
Fish Consumption
Upper 0.2 miles NOT ASSESSED Lower 8.0 miles IMPAIRED
Causes: PCBs Sources: Brownfield (non-NPL) sites
Primary Contact
IMPAIRED Causes: Fecal coliform bacteria Sources: Unknown Suspected sources: Discharges from municipal separate storm sewer systems (MS4), highway/road/bridge runoff (non-construction related), urban runoff/storm sewers
Secondary Contact
SUPPORT*
Aesthetics
SUPPORT*
* Alert Status issues identified— see details in use assessment section RECOMMENDATIONS Conduct additional fish toxics sampling, bioaccumulation studies, sediment sampling, and water column sampling to evaluate the effectiveness of the remediation at the Sprague facility. Investigate possible ways to increase habitat for aquatic life in the sections of this segment that are impacted by the flood control chutes. Conduct a source tracking study along this segment of the Hoosic River to identify, isolate, eliminate and/or remediate sources of fecal coliform contamination.
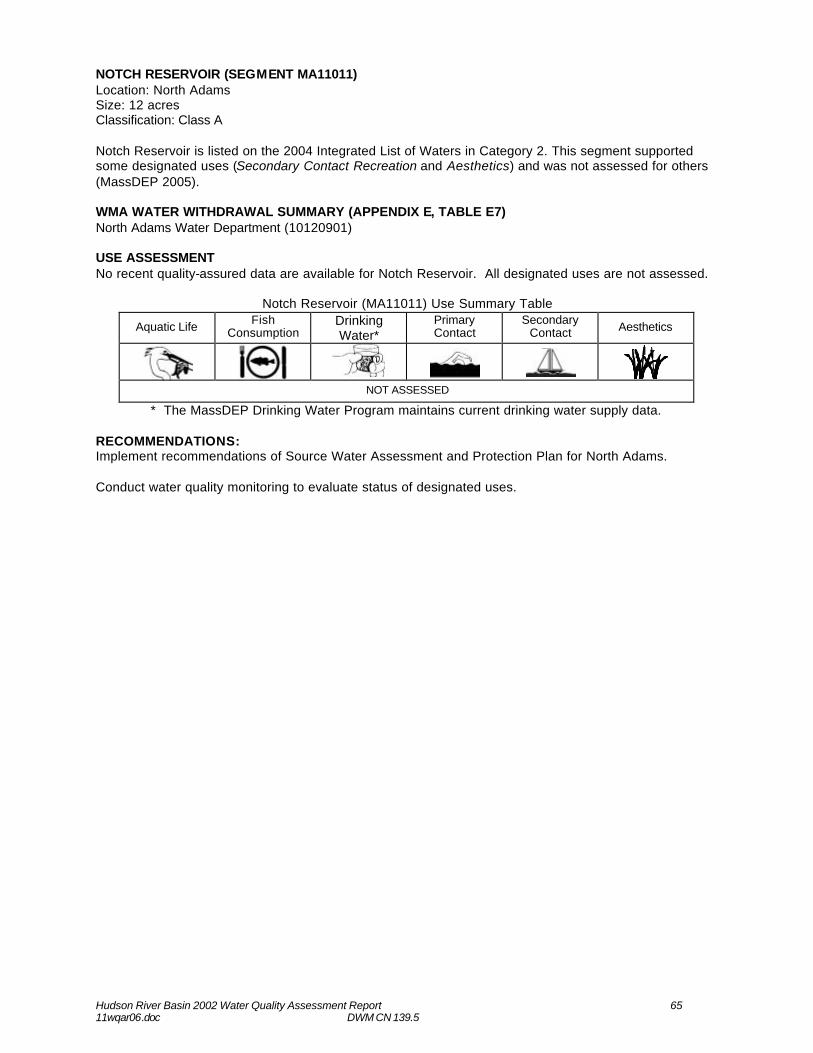
Hudson River Basin 2002 Water Quality Assessment Report 65 11wqar06.doc DWM CN 139.5
NOTCH RESERVOIR (SEGMENT MA11011) Location: North Adams Size: 12 acres Classification: Class A Notch Reservoir is listed on the 2004 Integrated List of Waters in Category 2. This segment supported some designated uses (Secondary Contact Recreation and Aesthetics) and was not assessed for others (MassDEP 2005). WMA WATER WITHDRAWAL SUMMARY (APPENDIX E, TABLE E7) North Adams Water Department (10120901) USE ASSESSMENT No recent quality-assured data are available for Notch Reservoir. All designated uses are not assessed.
Notch Reservoir (MA11011) Use Summary Table
Aquatic Life Fish Consumption
Drinking Water*
Primary Contact
Secondary Contact Aesthetics
NOT ASSESSED
* The MassDEP Drinking Water Program maintains current drinking water supply data. RECOMMENDATIONS: Implement recommendations of Source Water Assessment and Protection Plan for North Adams. Conduct water quality monitoring to evaluate status of designated uses.
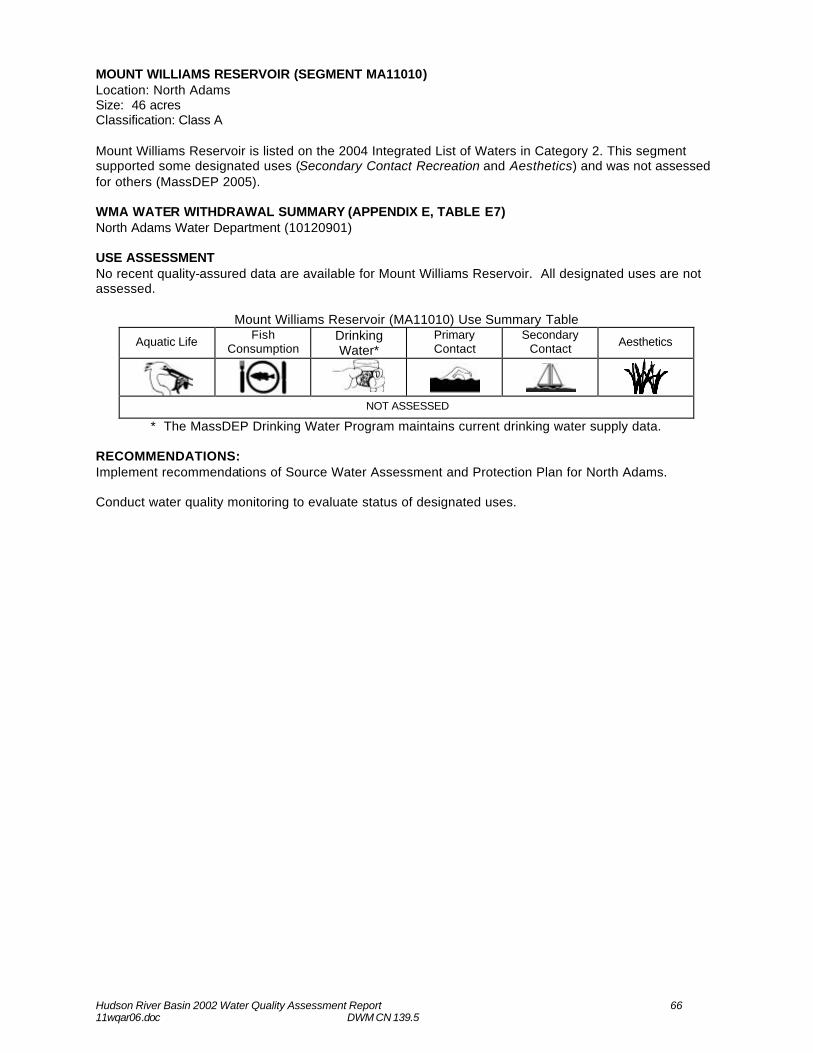
Hudson River Basin 2002 Water Quality Assessment Report 66 11wqar06.doc DWM CN 139.5
MOUNT WILLIAMS RESERVOIR (SEGMENT MA11010) Location: North Adams Size: 46 acres Classification: Class A Mount Williams Reservoir is listed on the 2004 Integrated List of Waters in Category 2. This segment supported some designated uses (Secondary Contact Recreation and Aesthetics) and was not assessed for others (MassDEP 2005). WMA WATER WITHDRAWAL SUMMARY (APPENDIX E, TABLE E7) North Adams Water Department (10120901) USE ASSESSMENT No recent quality-assured data are available for Mount Williams Reservoir. All designated uses are not assessed.
Mount Williams Reservoir (MA11010) Use Summary Table
Aquatic Life Fish Consumption
Drinking Water*
Primary Contact
Secondary Contact Aesthetics
NOT ASSESSED
* The MassDEP Drinking Water Program maintains current drinking water supply data. RECOMMENDATIONS: Implement recommendations of Source Water Assessment and Protection Plan for North Adams. Conduct water quality monitoring to evaluate status of designated uses.
Hudson River Basin 2002 Water Quality Assessment Report 67 11wqar06.doc DWM CN 139.5
PAULL BROOK (SEGMENT MA11-20) Location: Outlet of Mt. Williams Reservoir, North Adams to confluence with unnamed tributary, Williamstown Segment Length: 2.1 miles Classification: Class B From the outlet of Mt. Williams Reservoir, in North Adams, Paull Brook flows in a northwesterly direction, down a steep gradient through forest and cropland. The brook then passes under the Harriman Airport in North Adams, continues north flowing under Route 2, where it turns west and runs along a medium density neighborhood to its confluence with an unnamed tributary in Williamstown. This tributary then flows into the Hoosic River in Williamstown just downstream from the North Adams border. This segment is listed on the 2004 Integrated List of Waters in Category 5- Waters Requiring a TMDL- due to other inorganics, nutrients, pathogens, and oil and grease (MassDEP 2005). WMA WATER WITHDRAWAL SUMMARY (APPENDIX E, TABLE E7) Williamstown Water Department (9P310134104, 10134101) Filter backwash from the Mount Williams Water Treatment Facility is discharged to the North Adams sewer collection system and processed at the Hoosac Wat er Quality District WWTP. NPDES SURFACE WATER DISCHARGES (APPENDIX E, TABLE E5) Harriman Airport (MAR05A616, MAR05A61, MAR05A619) USE ASSESSMENT AQUATIC LIFE
Habitat and Flow According to the MassDEP Drinking Water Program, there are no minimum flow requirements at Mt. Williams Reservoir. The flashboards at the dam are maintained at the highest level. When the water level in the reservoir gets below the height of the flashboards, no flow is released into the brook (Prendergast 2006). On one occasion (August 2002 pre-dawn survey) the brook was completely dry upstream from Galvin Road in Williamstown (Appendix B). The frequency and duration of low/no flow in this brook, however, is not known at this time. In-stream habitat quality is of concern in Paull Brook in the reach downstream from Route 2 in Williamstown (see station observations for Paull Brook in Appendix B which include a limited/impacted riparian zone). Biology MA DFG conducted fish population sampling in Paull Brook near Route 2 in Williamstown (Site 794) on 10 September 2002 using a backpack electro-shocker (Richards 2005). Thirty-two eastern blacknose dace, five fallfish, one brook trout, one brown trout, and one creek chub were collected (40 fish total).
Chemistry - water DWM performed monthly in-situ (pre-dawn) water quality monitoring along Paull Brook at Station PA01, Galvin Road, North Adams, between May and September in 2002. On the day after in-situ sampling, grab samples were collected from the brook and analyzed for TSS, ammonia-nitrogen, and total phosphorus (Appendix B). These data are summarized below.
Parameter DWM
DO (mg/L) 8.7-10.3 (n=4) PRE -DAWN Percent saturation (%) 90-93 (n=4) pH (SU) 7.6- 8.1 (n=4) Temperature (°C) 11.62- 18.72 (n=4) Conductivity (µS/cm at 25°C) 166-351 (n=4) Total phosphorus (mg/L) 0.008-0.049 (n=4) Ammonia- nitrogen (mg/L) <0.01- <0.02 (n=4) Total suspended solids (mg/L) 2-30 (n=3)
Hudson River Basin 2002 Water Quality Assessment Report 68 11wqar06.doc DWM CN 139.5
The Aquatic Life Use is assessed as support for Paull Brook based on the physico-chemical and fish data. This use is identified with an Alert Status, however, due to habitat quality issues (low flow and an isolated area with a limited/impacted riparian zone). PRIMARY CONTACT RECREATION, SECONDARY CONTACT RECREATION AND AESTHETICS DWM conducted fecal coliform and E. coli bacteria monitoring in Paull Brook upstream from Galvin Road in North Adams between May and October 2002 (Appendix B). As a result of no flow in Paull Brook at Galvin Road, the August event was conducted upstream from Route 2 in North Adams (Station PA01.5). This sample had counts much higher than at Galvin Road (1500 and 1300 cfu/100mL). With the exception of the June bacteria survey (slightly cloudy), the water in Paull Brook was clear, odorless, and colorless. An old bicycle was discarded in the middle of the stream and remained there for the majority of the sampling event, trapping other trash and debris (e.g., soda cans, plastic toys, logs).
Parameter DWM 2002 (n=5)
Fecal coliform (cfu/100mL) 90-1500 # greater than 400 cfu/100mL 2 # greater than 2000 cfu/100mL --
Geometric mean 311.1 E. coli (cfu/100mL) 40-1300
# greater than 235 cfu/100mL 3 Geometric mean 266.6
The Primary Contact Use is assessed as impaired due to elevated fecal coliform bacteria concentrations (i.e., geometric mean >200 cfu/100mL). While DWM staff indicated an area of illegal dumping, it is thought to be isolated to the sampling reach. Therefore, the Secondary Contact Recreational Use and the Aesthetics Use are assessed as support. These uses are identified with an Alert Status, however, because of the potential for aesthetic quality degradation.
Paull Brook (MA11-20) Use Summary Table
Designated Uses Status
Aquatic Life
SUPPORT*
Fish Consumption
NOT ASSESSED
Primary Contact
IMPAIRED Causes: Fecal coliform bacteria Source: Unknown Suspected Sources: Highway/road/bridge runoff (non-construction related), discharges from municipal separate storm sewers (MS4s), crop production
Secondary Contact
Aesthetics
SUPPORT*
* Alert Status issues identified—see details in use assessment section RECOMMENDATIONS Conduct biological monitoring and additional water quality sampling in Paull Brook, particularly downstream from Mt. Williams Reservoir to better evaluate the status of the Aquatic Life Use. Conduct a stream walk to identify possible sources of erosion, NPS runoff (below the water supply intake at Mt. Williams Reservoir), undocumented discharges, and other potential sources of bacteria. Conduct a stream cleanup to improve the aesthetic quality of Paull Brook.
Hudson River Basin 2002 Water Quality Assessment Report 69 11wqar06.doc DWM CN 139.5
Conduct a bacterial source tracking study to identify and eliminate bacterial contamination in Paull Brook. Determine if impacts to habitat quality are associated with water withdrawals, either for agricultural purposes or manipulation of the outlet control structure of Mount Williams Reservoir. Examine management practices at Mt Williams Reservoir and determine if minimum flow requirements should be required for the protection of aquatic life in Paull Brook. If impacts are identified, work with local stakeholders to institute water conservation measures and educate landowners about the importance of maintaining adequate baseflows in streams.
Hudson River Basin 2002 Water Quality Assessment Report 70 11wqar06.doc DWM CN 139.5
HEMLOCK BROOK (SEGMENT MA11-09) Location: Headwaters south of Route 2 in Taconic Trail State Park to the confluence with the Hoosic River, Williamstown Segment Length: 7.1 miles Classification: Class B The headwaters of Hemlock Brook are located at the border of New York and Massachusetts draining the eastern slope of Mt. Raimer. The brook flows in a southerly direction, surrounded on both banks by forest, around a small impoundment (the Margaret Lindley Park swimming area) and receives the flow from Sweet Brook just north of the intersection of Taconic Trail and Route 2. During the summer a portion of the water from the brook is diverted to the swimming area. Continuing in a northerly direction, the brook crosses back and forth under Route 2 a number of times, flowing through a small commercial development, and receives the flow from another small tributary (Flora Glen). Upon entering downtown Williamstown, Hemlock Brook flows through low/medium density residential neighborhoods and open land, crosses under Route 2 for the last time, and joins the Hoosic River just downstream from the Hoosac Water Quality District Wastewater Treatment Plant. Hemlock Brook is listed on the 2004 Integrated List of Waters in Category 3- No Uses Assessed (MassDEP 2005). WMA WATER WITHDRAWALS AND NPDES WASTEWATER DISCHARGE SUMMARY Based on the available information there are no WMA regulated water withdrawals from or permitted surface water discharges to this subwatershed. USE ASSESSMENT
Habitat and Flow DWM conducted a habitat survey of Hemlock Brook near Torrey Woods Road in June 2002 as part of the fish population survey. The fish sampling reach received a habitat score of 167 out of 200 and was most limited by bank instability and areas of erosion (MassDEP 2002a). As part of the RBP III sampling of Hemlock Brook, DWM also conducted a habitat assessment at Station HB00A (described below) on Hemlock Brook in 2002. The reach received a habitat score of 132 out of 200 due to a lack of stable fish cover, embeddedness, low water levels (natural drought conditions), and the width (<6 m) of the riparian vegetative zone (Appendix D).
Biology DWM conducted fish population sampling along Hemlock Brook near Torrey Woods Road in Williamstown on 19 June 2002 (MassDEP 2002a). Only three species (63 fish total) were collected-- thirty-nine eastern brook trout (including young-of year-- 94-183 mm in length), 23 slimy sculpin, and one brown trout (154 mm in length). All species are classified as fluvial specialists/dependents, are intolerant to pollution, and represent the expected community composition of this high-gradient, upper perennial stream. On 30 July 2003 MA DFG conducted fish population sampling approximately 0.7 miles downstream from the Margaret Lindley Park (Station 913) using a backpack electroshocker (Richards 2005). Two hundred twelve slimy sculpin, 134 brown trout (51 to 210 mm in length), 134 eastern blacknose dace, 18 longnose dace, and two brook trout (59 mm in length) were collected (500 fish total). MA DFG stocks Hemlock Brook with trout (MA DFG undated). DWM conducted RBP III benthic macroinvertebrate sampling on Hemlock Brook approximately 0.5 miles downstream from Bulkley Street, behind the Hemlock Brook Development, at Station HB00A (B0492) in 2002. When compared to the Pecks Brook reference station, the benthic community was slightly impacted (Appendix D). Chemistry - water HooRWA conducted water quality sampling at one station on Hemlock Brook in 2002 (HM06.10- at Margaret Lindley Park). Parameters measured include DO, percent saturation, temperature, pH, conductivity, total suspended solids, total phosphorus, and ammonia-nitrogen (HooRWA undated). It
Hudson River Basin 2002 Water Quality Assessment Report 71 11wqar06.doc DWM CN 139.5
should be noted that the dissolved oxygen data were not collected during worst case, pre-dawn conditions. DWM conducted monthly, pre-dawn, in-situ water quality monitoring along Hemlock Brook at Bulkley Street in Williamstown (Station HB03.5) between May and September 2002. Parameters measured included DO, percent saturation, pH, temperature, and conductivity. Grab samples were also collected and analyzed for TSS, ammonia-nitrogen, and total phosphorus (Appendix B).
Parameter HooRWA DWM
DO (mg/L) 8.6-11.6 (n=7) 8.7-10.8 (n=5) PRE -DAWN Percent saturation (%) 89 – 103 (n=7) 90 – 95 (n=5) pH (SU) 6.9-7.9 (n=7) 7.4- 7.9 (n=5) Temperature (°C) 9.3-17.0 (n=7) 11.0-18.1 (n=5) Conductivity (µS/cm at 25°C) 120-180 (n=7) 158-287 (n=5) Total phosphorus (mg/L) <MDL– 0.04 (n=6) <0.01- 0.02 (n=5) Ammonia- nitrogen (mg/L) -- <0.01- <0.02 (n=5) Total suspended solids (mg/L) <MDL – 6 (n=6) 1-7 (n=5) Turbidity (NTU) 0.3-7.6 (n=7) --
In 2003 HooRWA also deployed Optic Stowaway temperature monitors at five stations on Hemlock Brook in Williamstown (HooRWA 2005). Temperatures were recorded hourly between 24 June and 17 September (HooRWA 2005). Flows at the time of the survey were above 7Q10. HM06.21- upstream from Margaret Lindley Park (n=2039; max=19.5; min=11.0; avg=15.7)
HM06.09- downstream from Margaret Lindley Park (n=814; max=22.0; min=14.1; avg=17.3) HM04.37- Sheep Hill (n=2039; max=22.3; min=11.8; avg=16.9) HM02.36- Main Street bridge (n=2039; max=24.0; min=11.8; avg=17.2) HM00.06- confluence with the Hoosic River (n=2039; max=24.5; min=11.6; avg=17.6)
The Aquatic Life Use is assessed as support for Hemlock Brook based on the fish assemblage, the RBP III analysis, and water chemistry data.
PRIMARY CONTACT RECREATION, SECONDARY CONTACTRECREATION, AND AESTHETICS
HooRWA conducted monthly bacteria sampling at their water quality station HM06.10 in 2002 (HooRWA undated). DWM conducted monthly fecal coliform and E. coli sampling at one station (HB03.5) on Hemlock Brook between May and October 2002 (Appendix B).
Parameter HooRWA 2002 (n=6)
DWM 2002 (n=5)
Fecal coliform (cfu/100mL) 10-90 40-350 Geometric Mean 31.7 103.3 E. coli (cfu/100mL) <10 – 60 (n=6) 40-290 # greater than 235 cfu/100mL -- 2 Geometric Mean 25.7 99.3
The Town of Williamstown conducted weekly E. coli testing at the Margaret Lindley Park beach on Hemlock Brook between mid-June and Labor Day in 2002 and 2003 (n=22). Counts in 2002 ranged from 10 –180 cfu/100mL. In 2004 the beach was sampled bi-monthly for E. coli (n=7). The beach was never posted (MA DPH 2003, 2004, 2005b).
Neither the DWM fish population crew nor the benthic sampling crew noted any objectionable scums, odors, colors, or deposits along their respective sampling reaches of Hemlock Brook (MassDEP 2002a and MassDEP 2002b). DWM water quality field crews noted that with the exception of the June bacteria sampling event, the water was clear, colorless, and odorless. In June the water was grayish in color and slightly turbid to highly cloudy. No objectionable conditions or erosion were recorded (Appendix B).
Based on the low bacteria counts documented by DWM and HooRWA, and the generally high aesthetic quality, the Primary and Secondary Contact Recreational and Aesthetics uses are assessed as support.
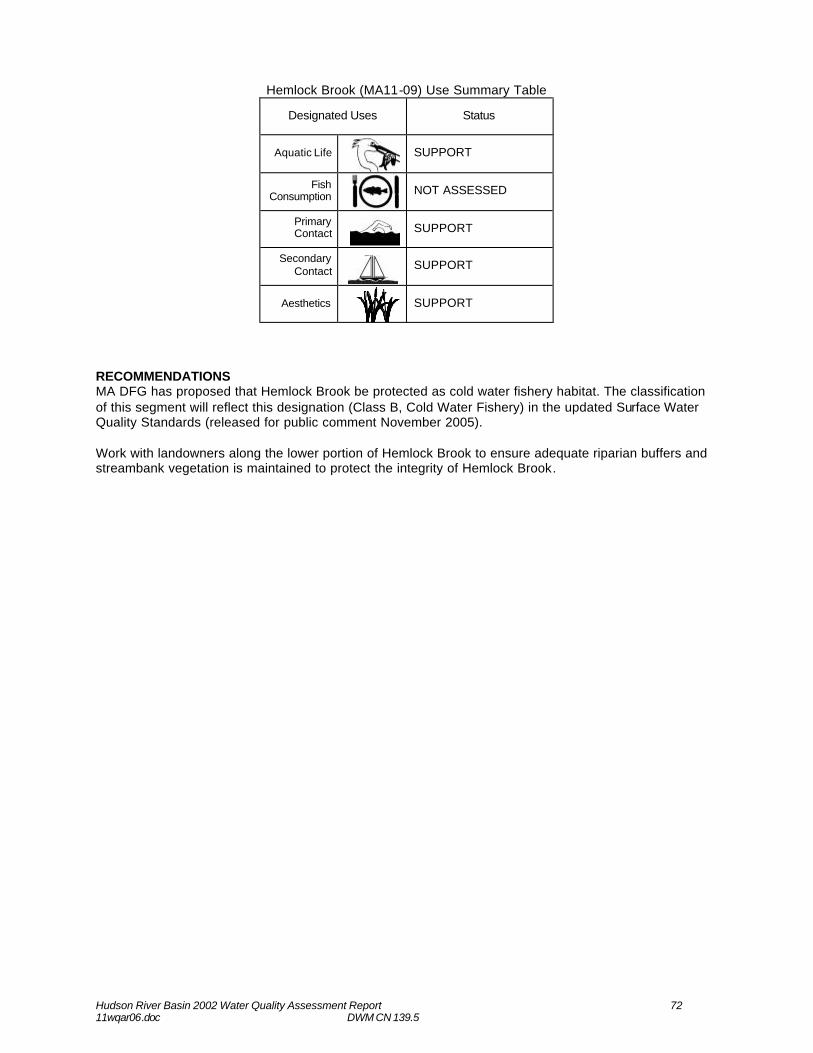
Hudson River Basin 2002 Water Quality Assessment Report 72 11wqar06.doc DWM CN 139.5
Hemlock Brook (MA11-09) Use Summary Table
Designated Uses Status
Aquatic Life
SUPPORT
Fish Consumption
NOT ASSESSED
Primary Contact
SUPPORT
Secondary Contact
SUPPORT
Aesthetics
SUPPORT
RECOMMENDATIONS MA DFG has proposed that Hemlock Brook be protected as cold water fishery habitat. The classification of this segment will reflect this designation (Class B, Cold Water Fishery) in the updated Surface Water Quality Standards (released for public comment November 2005). Work with landowners along the lower portion of Hemlock Brook to ensure adequate riparian buffers and streambank vegetation is maintained to protect the integrity of Hemlock Brook.
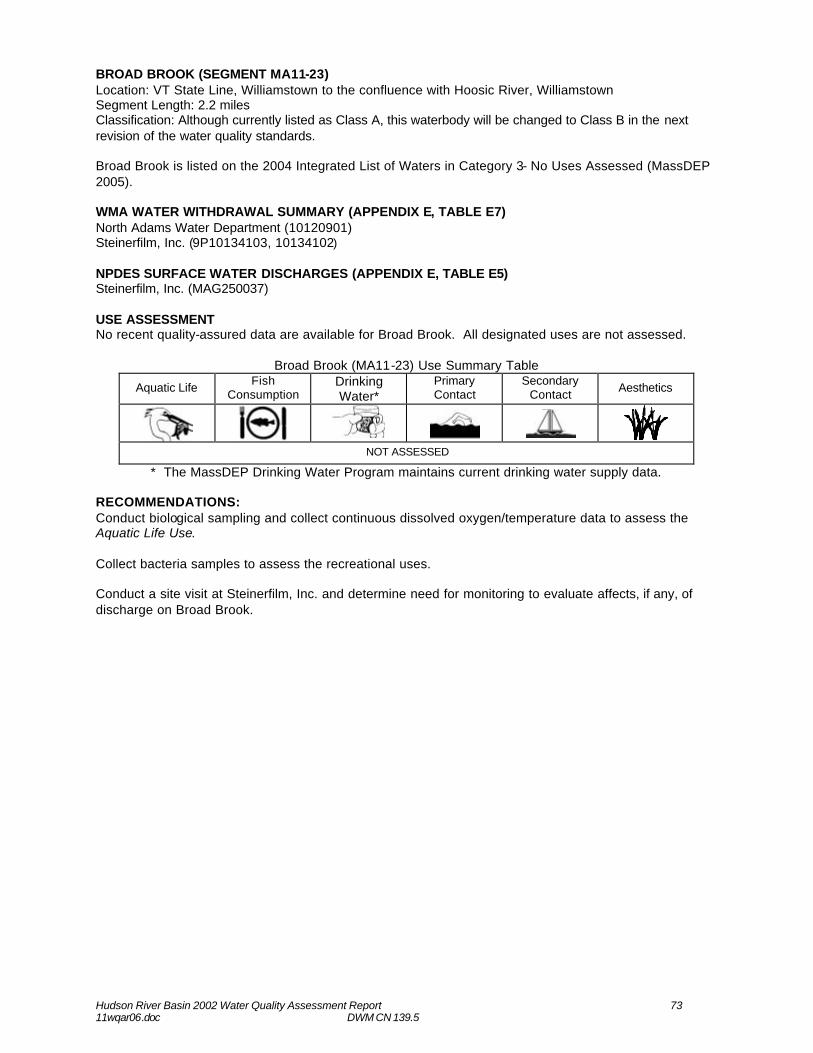
Hudson River Basin 2002 Water Quality Assessment Report 73 11wqar06.doc DWM CN 139.5
BROAD BROOK (SEGMENT MA11-23) Location: VT State Line, Williamstown to the confluence with Hoosic River, Williamstown Segment Length: 2.2 miles Classification: Although currently listed as Class A, this waterbody will be changed to Class B in the next revision of the water quality standards. Broad Brook is listed on the 2004 Integrated List of Waters in Category 3- No Uses Assessed (MassDEP 2005). WMA WATER WITHDRAWAL SUMMARY (APPENDIX E, TABLE E7) North Adams Water Department (10120901) Steinerfilm, Inc. (9P10134103, 10134102) NPDES SURFACE WATER DISCHARGES (APPENDIX E, TABLE E5) Steinerfilm, Inc. (MAG250037) USE ASSESSMENT No recent quality-assured data are available for Broad Brook. All designated uses are not assessed.
Broad Brook (MA11-23) Use Summary Table
Aquatic Life Fish Consumption
Drinking Water*
Primary Contact
Secondary Contact Aesthetics
NOT ASSESSED
* The MassDEP Drinking Water Program maintains current drinking water supply data. RECOMMENDATIONS: Conduct biological sampling and collect continuous dissolved oxygen/temperature data to assess the Aquatic Life Use. Collect bacteria samples to assess the recreational uses. Conduct a site visit at Steinerfilm, Inc. and determine need for monitoring to evaluate affects, if any, of discharge on Broad Brook.
Hudson River Basin 2002 Water Quality Assessment Report 74 11wqar06.doc DWM CN 139.5
GREEN RIVER SUBWATERSHED The headwaters of the Green River originate southwest of Sugarloaf Mountain and west of Ingraham Road in New Ashford. The river flows north towards the center of New Ashford. Just upstream from Route 7 it receives flow from an unnamed tributary. The Green River continues to flow in a northerly direction, crossing back and forth under Route 7. Two tributaries, Thompson Brook and the East Branch Green River, join the mainstem southeast of Brodie Mountain. The East Branch Green River originates on the northeastern slope of Sugarloaf Mountain in a ravine north of Greylock Road. The East Branch Green River flows north, receiving the flow from several unnamed tributaries and Mitchell Brook. It joins the mainstem Green River near Roys Road in New Ashford (just south of the New Ashford/Williamstown line). The mainstem Green River receives flow from Roaring Brook (draining the northwestern slope of Saddle Ball Mountain. The West Branch Green River originates near the New York Border in Hancock, north of the Kinderhook/Hoosic River Subwatershed divide, and is bordered on the west by the Taconic Range and on the east by Brodie Mountain. After flowing east through Gardner Hollow, the West Branch Green River flows under Route 43 and turns north, receiving flow from numerous unnamed tributaries draining the Taconic Range. It parallels Route 43 into South Williamstown, flows adjacent to the Waubeeka Golf Links course, and crosses under Route 7 before joining the mainstem Green River. The mainstem Green River next loops towards the east following Green River Road. At Sweets Corner it receives the flow from Hopper Brook. After crossing under Blair Road, the river receives flow from two additional unnamed tributaries and continues north towards the center of Williamstown, passing a golf course and an industrial complex. The Green River turns sharply east, passes the USGS gaging station (01333000) and flows under Route 2 before its confluence with the Hoosic River. The Assessment of Land Use Activities and Nonpoint Source Pollution in the Hoosic River Watershed (BRPC 1998) identified and inventoried existing and potential nonpoint source pollution. The report identified eight underground storage tanks, four solid waste facilities, one small and abandoned junkyard, two DPW facilities, two streambank erosion sites, two golf courses, one road where stormwater is purposely directed into a waterway with no treatment, and three areas of livestock impacts In this subwatershed. Failing septic systems in the Buxton School/Gale Road area were also identified as “potential” sources. The report states that Williamstown determined that the cost of extending sewers to these areas was prohibitive and that the residents would be required to remediate the problem within five years (BRPC 1998). The Gale Road/Buxton Road area individual septic systems were replaced with a force main system that was connected to the town’s sewer system (Schlesinger 2006). The BRPC was awarded a Massachusetts Watershed Initiative Grant (Project No. 99-10/MWI) in 1999 to identify stormwater problems in the Hoosic and Housatonic Watersheds. The report Stormwater Assessment in the Hoosic and Housatonic Watersheds (BRPC 2000) identified Route 43, the Christmas Brook Culvert under Latham Street, and Facilities and Grounds parking lot at Williams College as areas of concern in the Green River subwatershed. MassHighways had scheduled plans for bridge replacements and road reconstruction of Route 43 (See- http://www.mhd.state.ma.us//default.asp?pgid=BridgeIndex&sid=wrapper&iid=http://www.mhd.state.ma.us//ProjectInfo/). Flooding upstream from the Christmas Brook culvert needs further investigation. Storm drains discharge directly to Christmas Brook from the Williams College lot. Additional monitoring is needed to document sediment build-up and/or water quality impacts downstream from the parking lot (BRPC 2000). Keene Development Corp. is in the middle of a major project with the Berkshire Housing Development Corp. to turn the former General Cable mill building, a brownfields site on Water Street in Williamstown, into 83 new housing units. Major demolition work at the site, along the Green River, began in the summer of 2005. Some units at the site are expected to be ready by fall 2006 (Berkshire Eagle 2005).
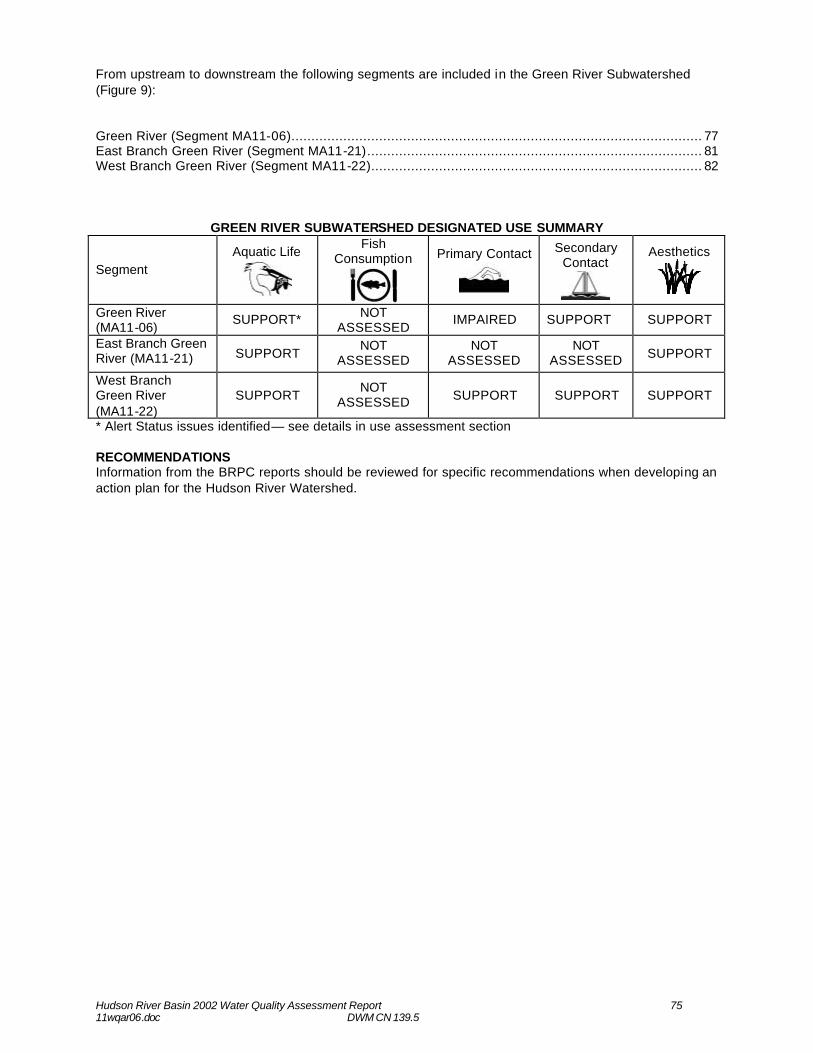
Hudson River Basin 2002 Water Quality Assessment Report 75 11wqar06.doc DWM CN 139.5
From upstream to downstream the following segments are included in the Green River Subwatershed (Figure 9): Green River (Segment MA11-06)....................................................................................................... 77 East Branch Green River (Segment MA11-21).................................................................................... 81 West Branch Green River (Segment MA11-22)................................................................................... 82
GREEN RIVER SUBWATERSHED DESIGNATED USE SUMMARY
Segment Aquatic Life
Fish Consumption
Primary Contact
Secondary Contact
Aesthetics
Green River (MA11-06)
SUPPORT* NOT ASSESSED
IMPAIRED SUPPORT SUPPORT
East Branch Green River (MA11-21) SUPPORT
NOT ASSESSED
NOT ASSESSED
NOT ASSESSED SUPPORT
West Branch Green River (MA11-22)
SUPPORT NOT
ASSESSED SUPPORT SUPPORT SUPPORT
* Alert Status issues identified— see details in use assessment section RECOMMENDATIONS Information from the BRPC reports should be reviewed for specific recommendations when developing an action plan for the Hudson River Watershed.
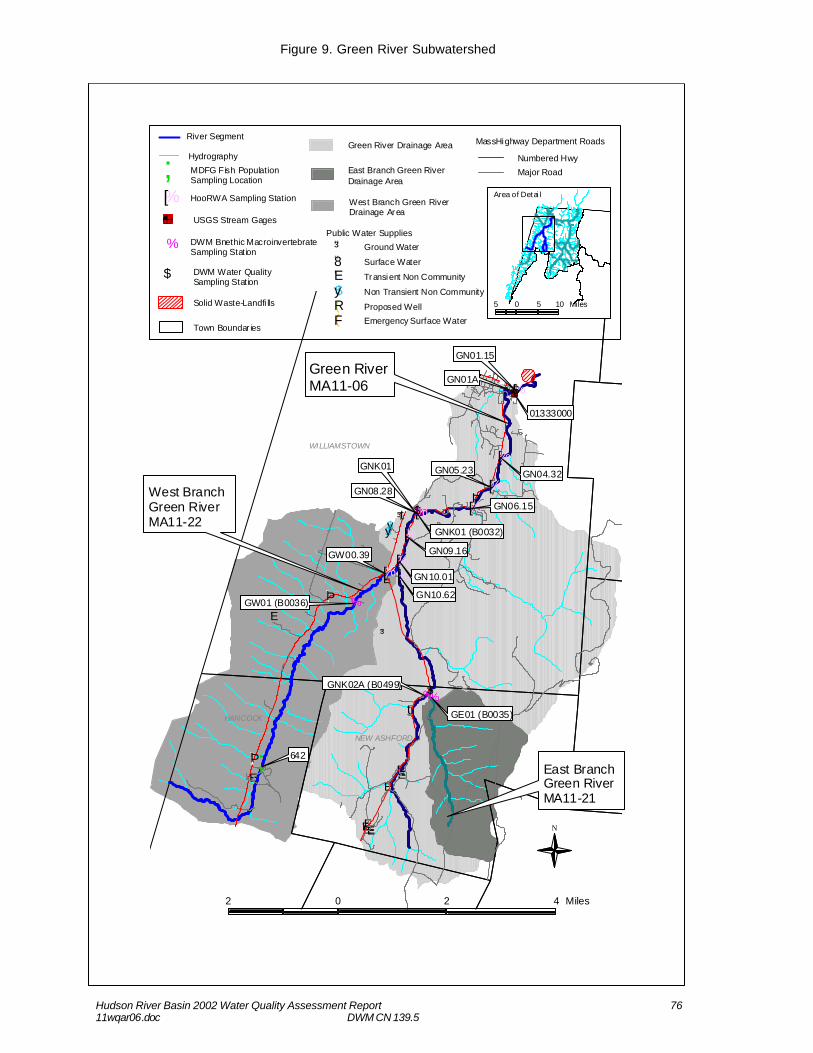
Hudson River Basin 2002 Water Quality Assessment Report 76 11wqar06.doc DWM CN 139.5
'E
"³
'E'E'E'E
'E
'E
'E
"³
$y$y
'E
'E'E
'E
%[
%[
%[
%[%[
%[
%[%[%[
;
%
%
%
%
$
$
$
]ÞIt
]Þ
]Þ
It
GW00.39
GN10.62
GN10.01
GN09.16
GN08.28
GN05.23
GN01A
GNK01GN04.32
GN06.15
01333000
GNK01 (B0032)
GE01 (B0035)
GNK02A (B0499)
GW01 (B0036)
GN01.15
642
WILLIAMSTOWN
HANCOCK
NEW ASHFORD
MassHighway Department Roads
Numbered Hwy
Major Road
DWM Water Quality Sampling Station
$
DWM Bnethic MacroinvertebrateSampling Station
%
MDFG Fish Population Sampling Location;HooRWA Sampling Station%[
Solid Waste-Landfi lls
USGS Stream Gages
Town Boundar ies
Public Water Supplies
Ground Water"³Surface Water"8Transient Non Community'ENon Transient Non Community$yProposed Well(REmergency Surface Water(F
Green River Drainage Area
East Branch Green RiverDrainage Area
West Branch Green RiverDrainage Area
5 0 5 10 Miles
Area of Detai l
N
2 0 2 4 Miles
Green RiverMA11-06
River Segment
Hydrography
East BranchGreen RiverMA11-21
West Branch Green RiverMA11-22
Figure 9. Green River Subwatershed
Hudson River Basin 2002 Water Quality Assessment Report 77 11wqar06.doc DWM CN 139.5
GREEN RIVER (SEGMENT MA11-06) Location: Headwaters, southwest of Sugarloaf Mountain (west of Ingraham Road), New Ashford, to confluence with the Hoosic River, Williamstown Segment Length: 12.5 miles Classification: Class B, Cold Water Fishery NOTE: The upper 1.2 miles of this segment are not classified as a Cold Water Fishery under the current SWQS (MassDEP 1996). They only designate the reach from the Springs Restaurant to the mouth. The proposed standards, released for public comment on November 2005, designate the entire Green River as Class B, Cold Water Fishery. This segment is listed on the 2004 Integrated List of Waters in Category 5. This segment was assessed as impaired and requires the calculation of a TMDL due to unknown causes, organic enrichment/low DO, and pathogens (MassDEP 2005). WMA WATER WITHDRAWALS Based on the available information there are no WMA regulated water withdrawals from this subwatershed. NPDES SURFACE WATER DISCHARGES (APPENDIX E, TABLE E6) The Mallory Restaurant (MA0022233) USE ASSESSMENT AQUATIC LIFE Habitat and Flow
DWM conducted habitat assessments at two stations on the Green River as part of the RBP III benthic macroinvertebrate sampling in 2002. Station GNK02A (B0499) is upstream from the confluence with the East Branch Green River in New Ashford and Station GNK01 (B0032) is upstream from the lower Route 43 bridge in Williamstown (Appendix D).
GNK02A received a total habitat score of 142 out of 200 due to very low water in the river (natural drought conditions), significant deposition of fine sediment and sand in about 30% of the reach, and the width of the riparian vegetative zone on the west bank (<6 m). GNK01 received a habitat score of 132 out of 200 due to low water levels, sediment deposition, and bank instability. Thin-film and filamentous algae covered virtually the entire stream bottom.
DWM also conducted a habitat assessment as part of the fish population survey conducted on 19 June 2002. The sampling reach was located upstream from Route 2 and the USGS Gage. The reach received a habitat score of 143 out of 200 and was impacted by human disruptions, channelization, sediment deposition, some bank instability, and a limited riparian vegetative zone width (MassDEP 2002a). Stream gaging data for the Green River are available from the USGS gage 01333000 located upstream from the Route 2 bridge in Williamstown from 1949 to 30 September 2004. The drainage area at this gage is 42.6 mi2 and the average annual discharge over the period of record is 83.5 cfs (Socolow et al 2005). According to USGS there is a slight diurnal flow fluctuation at times due to a mill upstream. The 7Q10 at this gage is 4.57 cfs (Ries 1998).
Biology
DWM conducted benthic macroinvertebrate sampling at two stations, GNK02A and GNK01 (described above), on the Green River in 2002. RBP III analysis indicated that when compared to the reference station on the West Branch Green River both station GNK02A and GNK01 were slightly-moderately impacted. Given the dramatically low water conditions, it is likely that the related habitat limitations played a significant role in the RBP outcome at the upstream sampling Station GNK02A. NPS effects related to agricultural land use practices were considered problematic at Station GNK01 (Appendix D).
Hudson River Basin 2002 Water Quality Assessment Report 78 11wqar06.doc DWM CN 139.5
Fish population sampling was conducted by DWM, in conjunction with MA DFG, in the Green River upstream from Route 2/USGS Gage in Williamstown on 19 June 2002. Using battery-powered, backpack electrofishing equipment 187 fish were collected; 105 eastern blacknose dace, 45 slimy sculpin, 24 brown trout (33 to 310 mm in length), nine longnose dace, five white sucker, and one fallfish (MassDEP 2002a). MA DFG also sampled the fish population of the Green River downstream from Route 2 on 30 July 2002 (Richards 2005). Eighty blacknose dace, 73 slimy sculpin, 71 longnose dace, 42 brown trout (73 to 306 mm in length), four white sucker, one creek chub, and one pumpkinseed were collected (n=272). MA DFG stocks the Green River with trout (MA DFG undated). Fallfish, creek chub, and pumpkinseed are classified as macrohabitat generalists; all other fish species collected are classified as fluvial specialist or dependent (Bain and Meixler 2000). Slimy sculpin are classified as a regional fluvial specialist (Maietta 2006). Slimy sculpin and brown trout are considered intolerant to pollution; all other species are moderately tolerant to tolerant (Halliwell et al. 1999).
Chemistry - water
DWM conducted monthly pre-dawn, in-situ water quality monitoring at three stations along the Green River between May and October 2002. Parameters measured included DO, percent saturation, pH, temperature and conductivity. Grab samples were also collected and analyzed for TSS, ammonia-nitrogen, and total phosphorus (Appendix B). GNK02- Route 7, downstream from Roy’s Road, New Ashford GNK01- Rte 43, at Trustees of the Reservation Land, Williamstown GN01A- upstream from the Route 2 bridge (Eastlawn Cemetery), Williamstown HooRWA collected monthly samples from three stations on the Green River in 2002. Parameters measured included DO, percent saturation, pH, temperature and conductivity. Grab samples were also collected and analyzed for TSS, turbidity, and total phosphorus (HooRWA undated). It should be noted that the dissolved oxygen data were not collected during worst case, pre-dawn conditions. GN10.62-opposite Southlawn Cemetery, upstream from active farm, Williamstown
GN09.16- at Deer Run Rd., downstream from active farm, Williamstown GN01.15- on Green River off Eastlawn Cemetery just upstream from Rt. 2 bridge, Williamstown
Parameter DWM HooRWA DO (mg/L) 8.3-11.0 (n=17) PRE-DAWN 8.0-11.5 (n=21) Percent saturation (%) 88-97 (n=17) 87-101 (n=21) pH (SU) 7.4-8.2 (n=17) 7.2 –8.0 (n=18) Temperature (°C) 10.3-20.5 (n=17) 10.0-20.3 (n=21) Conductivity (µS/cm at 25°C) 156-309 (n=17) 120-340 (n=21) Total phosphorus (mg/L) 0.007-0.027 (n=18) <0.01-0.05 (n=18) Ammonia- nitrogen (mg/L) <0.01-0.02 (n=18) -- Total suspended sol ids (mg/L) <1 – 5.4 (n=16) <1 – 24 (n=18) Turbidity (NTU) -- <MDL - 3.96 (n=21)
In 2003 HooRWA deployed Optic Stowaway temperature monitors at eight stations on the Green River in Williamstown between 24 June and 17 September. The unit at Station GN00.03 only recorded until 7 August (HooRWA 2005). Flows in the Green River during this time were above 7Q10 (Socolow et al. 2004). GN10.62- Southlawn Cemetery (n=2037, max=21.48; min=11.95; avg=16.42) GN10.01- downstream from Green River farm (n=2037; max=23.33; min=12.08; avg=17.08) GN08.28- Sucker Hole, Route 43 bridge (n=2037; max=25.58, min=12.08; avg=17.63) GN06.15- Mt. Hope Park (begins 7/28/03;n=1223; max=23.05; min=11.98; avg=17.01) GN05.23- Blair Rd. bridge (n=2037; max=24.3; min=12.1; avg=17.7) GN04.32- Rte 43 pull off, downstream from Blair (n=2037; max=24.5; min=12.1; avg=17.7) GN01.15- Eastlawn Cemetery (n=2037; max=25.5; min=12.3; avg=18.2) GN00.03- confluence with the Hoosic River (n=1049; max=26.5; min=14.8; avg=19.4°C)
Hudson River Basin 2002 Water Quality Assessment Report 79 11wqar06.doc DWM CN 139.5
Temperature excursions from the cold water fishery standard of 20°C were neither frequent nor prolonged.
The Aquatic Life Use is assessed as support for the Green River based on the presence of multiple age classes of cold water fish species and the water chemistry data indicative of excellent water quality conditions. Although the RBP III analyses indicated slightly-moderately impacted benthic communities at both sampling locations, the dramatically low water conditions were thought to influence the upstream sampling station, while NPS effects related to agricultural land use practices were considered problematic further downstream. The Aquatic Life Use is identified with an Alert Status because of these issues. PRIMARY CONTACT RECREATION, SECONDARY CONTACT RECREATION, AND AESTHETICS
DWM conducted monthly fecal coliform and E. coli sampling at three stations (GNK02, GNK01 and GN01A) on the Green River between May and October 2002 (Appendix B). It should be noted that the highest counts were obtained on 12 June 2002 at Station GN01A, upstream from the Route 2 bridge in Eastlawn Cemetery in Williamstown. In 2002 HooRWA conducted monthly fecal coliform and E. coli bacteria monitoring at three stations (GN01.15, GN09.16, GN10.62, described above) on the Green River. HooRWA noted that a tributary to the Green River, Christmas Brook, historically contributed to elevated bacteria levels in the Green River near the Eastlawn Cemetery sampling location. According to HooRWA extensive work has been performed on the sewer infrastructures on Gale Rd. and Spring St. leading to decreased bacteria levels in the tributary (HooRWA undated). HooRWA also noted, however, that fecal coliform counts in Christmas Brook still ranged from 50-1900 cfu/100 mL with the highest counts occurring during wet weather (HooRWA undated).
Parameter DWM 2002 (n=15) HooRWA (n=18)
Fecal coliform (cfu/100mL) 20-1300 <10 –690 # greater than 400 cfu/100mL 4 (all on one day) 3
Geometric Mean 151.3 129.0 E. coli (cfu/100mL) 10-1800 <10-740
# greater than 235 cfu/100mL 5 5 Geometric Mean 122.5 111.3
The water at Station GNK02 was clear, colorless, and odorless on each of the ten sampling events between May and September. The water at Station GNK01 was described as having a grayish color during the May, June, and August survey (pre-dawn only) and was slightly turbid during the May pre-dawn and bacteria surveys, as well as the June pre-dawn survey. DWM sampling crews described the water at Station GN01A as grayish and slightly turbid during the May, June, and September pre-dawn surveys and the June bacteria survey. Trash, nuisance plants, or scums were never observed at any of the sampling stations. Cattle were observed to be in the river during five of the ten sampling events at Station GNK01. The pasture for these cows is approximately 1700 feet upstream from Station GNK01 and fences have not been installed to restrict access to the river. This land is leased to the farmer from the Trustees of the Reservation. Additional farms further upstream have implemented BMPs (i.e., fencing) to keep livestock out of the water. Phelps’ Knoll (former pasture) has been converted into cropland (Appendix B).
While the geometric mean of the fecal coliform bacteria samples does not exceed 200 cfu/100mL, greater than 10% of the samples (21%) exceed 400 cfu/100mL. Therefore, the Primary Contact Recreation Use is assessed as impaired. The Secondary Contact Recreation Use, however, is assessed as support because the geometric mean is less than 1000 cfu/100mL and no sample exceeded 2000 cfu/100mL. The Aesthetics Use is assessed as support based on DWM field observations but is identified with an Alert Status. While grayish water is an aesthetic concern, it seemed to only occur during pre-dawn hours. The source of the gray water during pre-dawn hours should be investigated further.
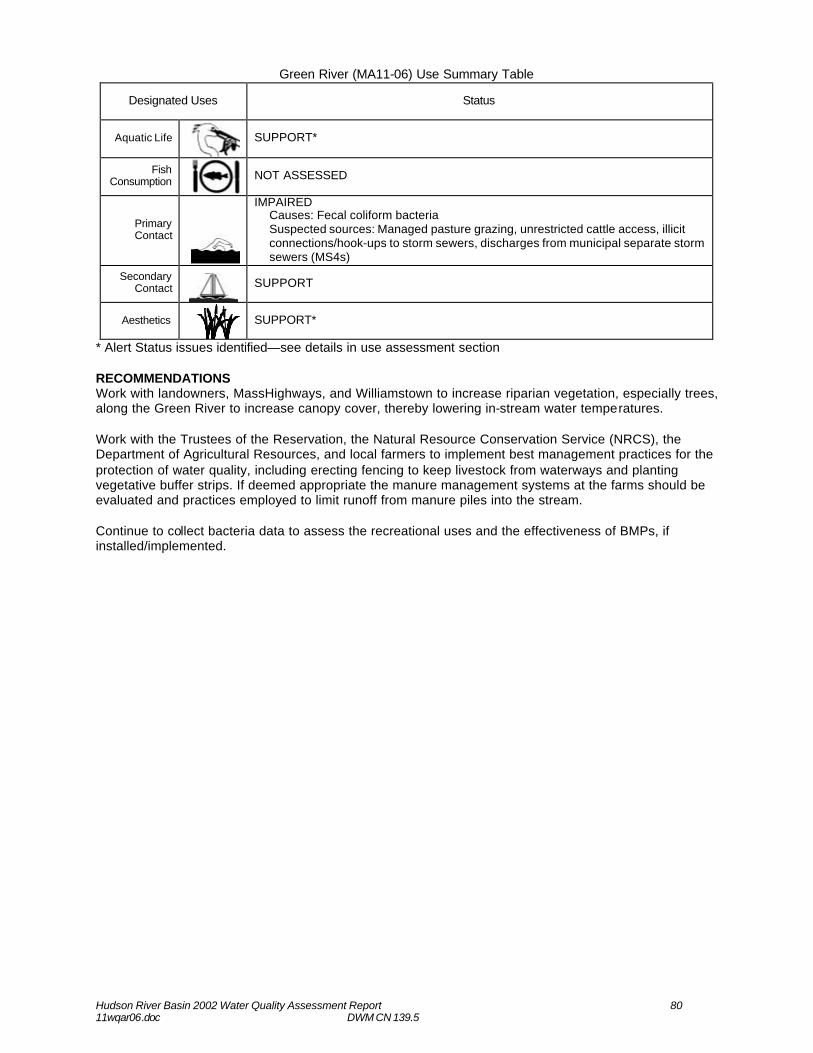
Hudson River Basin 2002 Water Quality Assessment Report 80 11wqar06.doc DWM CN 139.5
Green River (MA11-06) Use Summary Table
Designated Uses Status
Aquatic Life
SUPPORT*
Fish Consumption
NOT ASSESSED
Primary Contact
IMPAIRED Causes: Fecal coliform bacteria Suspected sources: Managed pasture grazing, unrestricted cattle access, illicit connections/hook-ups to storm sewers, discharges from municipal separate storm sewers (MS4s)
Secondary Contact
SUPPORT
Aesthetics
SUPPORT*
* Alert Status issues identified—see details in use assessment section RECOMMENDATIONS Work with landowners, MassHighways, and Williamstown to increase riparian vegetation, especially trees, along the Green River to increase canopy cover, thereby lowering in-stream water temperatures. Work with the Trustees of the Reservation, the Natural Resource Conservation Service (NRCS), the Department of Agricultural Resources, and local farmers to implement best management practices for the protection of water quality, including erecting fencing to keep livestock from waterways and planting vegetative buffer strips. If deemed appropriate the manure management systems at the farms should be evaluated and practices employed to limit runoff from manure piles into the stream. Continue to collect bacteria data to assess the recreational uses and the effectiveness of BMPs, if installed/implemented.
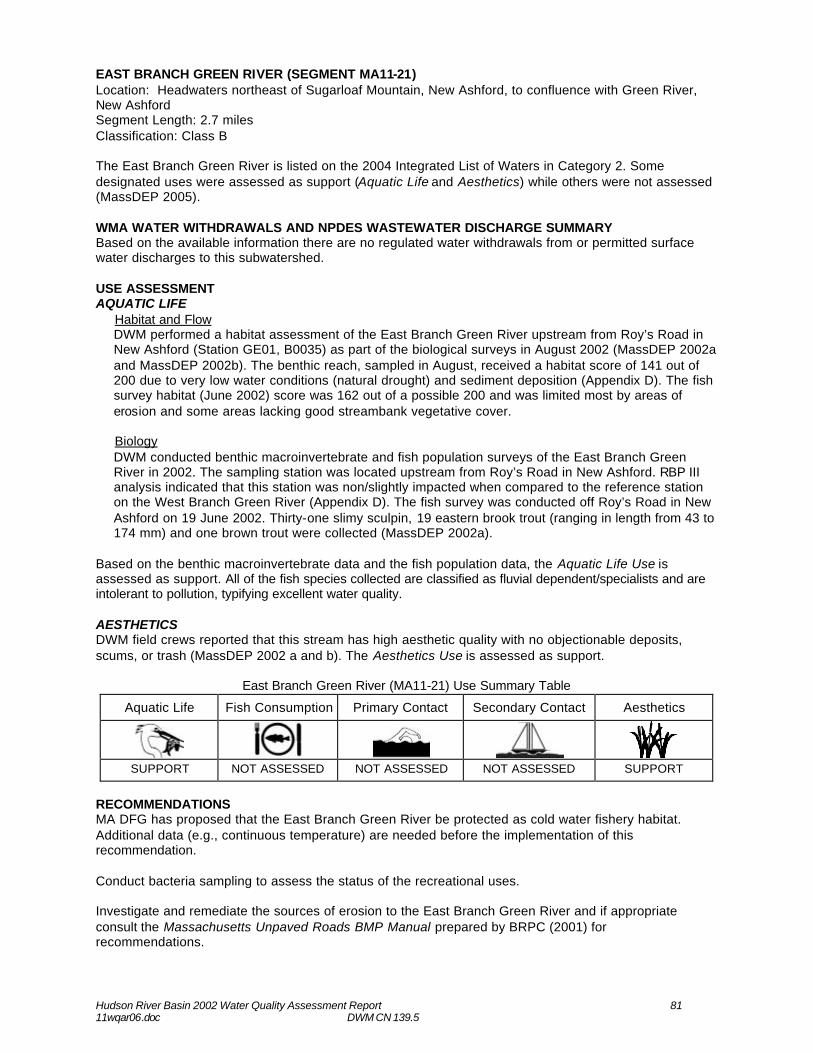
Hudson River Basin 2002 Water Quality Assessment Report 81 11wqar06.doc DWM CN 139.5
EAST BRANCH GREEN RIVER (SEGMENT MA11-21) Location: Headwaters northeast of Sugarloaf Mountain, New Ashford, to confluence with Green River, New Ashford Segment Length: 2.7 miles Classification: Class B The East Branch Green River is listed on the 2004 Integrated List of Waters in Category 2. Some designated uses were assessed as support (Aquatic Life and Aesthetics) while others were not assessed (MassDEP 2005). WMA WATER WITHDRAWALS AND NPDES WASTEWATER DISCHARGE SUMMARY Based on the available information there are no regulated water withdrawals from or permitted surface water discharges to this subwatershed. USE ASSESSMENT AQUATIC LIFE
Habitat and Flow DWM performed a habitat assessment of the East Branch Green River upstream from Roy’s Road in New Ashford (Station GE01, B0035) as part of the biological surveys in August 2002 (MassDEP 2002a and MassDEP 2002b). The benthic reach, sampled in August, received a habitat score of 141 out of 200 due to very low water conditions (natural drought) and sediment deposition (Appendix D). The fish survey habitat (June 2002) score was 162 out of a possible 200 and was limited most by areas of erosion and some areas lacking good streambank vegetative cover.
Biology DWM conducted benthic macroinvertebrate and fish population surveys of the East Branch Green River in 2002. The sampling station was located upstream from Roy’s Road in New Ashford. RBP III analysis indicated that this station was non/slightly impacted when compared to the reference station on the West Branch Green River (Appendix D). The fish survey was conducted off Roy’s Road in New Ashford on 19 June 2002. Thirty-one slimy sculpin, 19 eastern brook trout (ranging in length from 43 to 174 mm) and one brown trout were collected (MassDEP 2002a).
Based on the benthic macroinvertebrate data and the fish population data, the Aquatic Life Use is assessed as support. All of the fish species collected are classified as fluvial dependent/specialists and are intolerant to pollution, typifying excellent water quality. AESTHETICS DWM field crews reported that this stream has high aesthetic quality with no objectionable deposits, scums, or trash (MassDEP 2002 a and b). The Aesthetics Use is assessed as support.
East Branch Green River (MA11-21) Use Summary Table
Aquatic Life Fish Consumption Primary Contact Secondary Contact Aesthetics
SUPPORT NOT ASSESSED NOT ASSESSED NOT ASSESSED SUPPORT
RECOMMENDATIONS MA DFG has proposed that the East Branch Green River be protected as cold water fishery habitat. Additional data (e.g., continuous temperature) are needed before the implementation of this recommendation. Conduct bacteria sampling to assess the status of the recreational uses. Investigate and remediate the sources of erosion to the East Branch Green River and if appropriate consult the Massachusetts Unpaved Roads BMP Manual prepared by BRPC (2001) for recommendations.
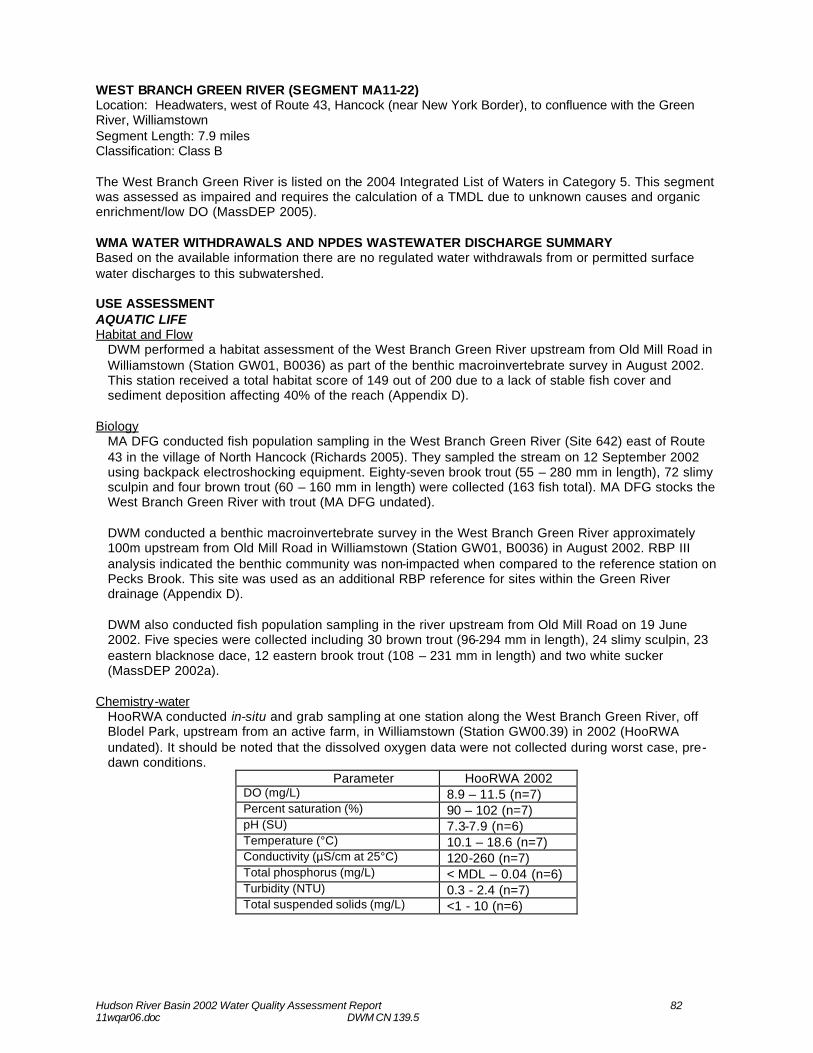
Hudson River Basin 2002 Water Quality Assessment Report 82 11wqar06.doc DWM CN 139.5
WEST BRANCH GREEN RIVER (SEGMENT MA11-22) Location: Headwaters, west of Route 43, Hancock (near New York Border), to confluence with the Green River, Williamstown Segment Length: 7.9 miles Classification: Class B The West Branch Green River is listed on the 2004 Integrated List of Waters in Category 5. This segment was assessed as impaired and requires the calculation of a TMDL due to unknown causes and organic enrichment/low DO (MassDEP 2005). WMA WATER WITHDRAWALS AND NPDES WASTEWATER DISCHARGE SUMMARY Based on the available information there are no regulated water withdrawals from or permitted surface water discharges to this subwatershed. USE ASSESSMENT AQUATIC LIFE Habitat and Flow
DWM performed a habitat assessment of the West Branch Green River upstream from Old Mill Road in Williamstown (Station GW01, B0036) as part of the benthic macroinvertebrate survey in August 2002. This station received a total habitat score of 149 out of 200 due to a lack of stable fish cover and sediment deposition affecting 40% of the reach (Appendix D).
Biology
MA DFG conducted fish population sampling in the West Branch Green River (Site 642) east of Route 43 in the village of North Hancock (Richards 2005). They sampled the stream on 12 September 2002 using backpack electroshocking equipment. Eighty-seven brook trout (55 – 280 mm in length), 72 slimy sculpin and four brown trout (60 – 160 mm in length) were collected (163 fish total). MA DFG stocks the West Branch Green River with trout (MA DFG undated). DWM conducted a benthic macroinvertebrate survey in the West Branch Green River approximately 100m upstream from Old Mill Road in Williamstown (Station GW01, B0036) in August 2002. RBP III analysis indicated the benthic community was non-impacted when compared to the reference station on Pecks Brook. This site was used as an additional RBP reference for sites within the Green River drainage (Appendix D). DWM also conducted fish population sampling in the river upstream from Old Mill Road on 19 June 2002. Five species were collected including 30 brown trout (96-294 mm in length), 24 slimy sculpin, 23 eastern blacknose dace, 12 eastern brook trout (108 – 231 mm in length) and two white sucker (MassDEP 2002a).
Chemistry-water
HooRWA conducted in-situ and grab sampling at one station along the West Branch Green River, off Blodel Park, upstream from an active farm, in Williamstown (Station GW00.39) in 2002 (HooRWA undated). It should be noted that the dissolved oxygen data were not collected during worst case, pre-dawn conditions.
Parameter HooRWA 2002 DO (mg/L) 8.9 – 11.5 (n=7) Percent saturation (%) 90 – 102 (n=7) pH (SU) 7.3-7.9 (n=6) Temperature (°C) 10.1 – 18.6 (n=7) Conductivity (µS/cm at 25°C) 120-260 (n=7) Total phosphorus (mg/L) < MDL – 0.04 (n=6) Turbidity (NTU) 0.3 - 2.4 (n=7) Total suspended solids (mg/L) <1 - 10 (n=6)
Hudson River Basin 2002 Water Quality Assessment Report 83 11wqar06.doc DWM CN 139.5
In 2003 HooRWA also deployed Optic Stowaway temperature monitors at one station (GW00.39- Blodel Park) on the West Branch Green River (HooRWA 2005). Temperatures were recorded hourly between 24 June and 17 September. The maximum temperature was 23.3°C, the minimum temperature was 12.1°C, and the average temperature was 17.3°C (n=2037). Flows during this time did not approach 7Q10 (Socolow et al. 2004). Temperatures at this station exceeded 20°C 186 times. Since this segment is not currently designated as a cold water fishery and multiple age classes of cold water species were documented during fish population surveys, this does not appear to be a concern. It is important to note that this station is located only 360 meters from the confluence with the mainstem Green River and downstream from the Waubeeka Golf Course. Review of color orthophotographic images and pictometry images finds that as the stream runs through the golf course, a buffer zone between the greens and the river is lacking. This lack of shading from riparian vegetation could contribute to increased in-stream temperatures. Another possible cause of elevated temperatures is a large beaver pond located just north of the Hancock town line. The beavers are no longer active and the landowners are in the process of obtaining a permit to remove the dam (Schlesinger 2006). The Aquatic Life Use is assessed as support for the West Branch Green River. The benthic community was determined to be representative of “least impacted” conditions and was chosen as the reference station for the Green River subwatershed. The fish community was composed of fluvial dependent/specialist species indicative of excellent water quality. PRIMARY CONTACT RECREATION, SECONDARY CONTACT RECREATION AND AESTHETICS
HooRWA conducted fecal coliform and E. coli bacteria sampling along the West Branch Green River at Station GW00.39 in 2002 (HooRWA undated).
Parameter HooRWA 2002 (n=6)
Fecal coliform (cfu/100mL) 60-180 Geometric Mean 102.5
E. coli (cfu/100mL) 30-190 Geometric Mean 85.9
DWM biologists observed no objectionable conditions during the benthic or fish sampling events in 2002.
Based on the low bacteria counts, the Primary and Secondary Recreational Uses are assessed as support. The Aesthetics Use is also assessed as support based on the lack of any objectionable conditions noted by DWM sampling crews.
West Branch Green River (MA11-22) Use Summary Table
Aquatic Life Fish Consumption Primary Contact Secondary Contact Aesthetics
SUPPORT NOT ASSESSED SUPPORT SUPPORT SUPPORT
RECOMMENDATIONS MA DFG has proposed that the West Branch Green River be protected as cold water fishery habitat. This recommendation should be reviewed in light of data presented in this report. Additional temperature data from multiple stations would also be helpful to evaluate this recommendation. HooRWA documented elevated in-stream temperatures in the lower portion of this segment (9% of the measurements were greater than 20°C). Additional continuous temperature data at multiple locations would be useful to determine if these conditions exist throughout this eight mile segment or are localized to areas where riparian habitat has been degraded by anthropogenic activities (e.g., golf course mows right down to water with no buffer zone of trees/vegetation to provide shading). Work with the Waubeeka Golf Course to maintain a proper buffer zone between the fairways and the river. Educate other landowners on the importance of maintaining vegetated buffers for the protection of aquatic life and water quality.
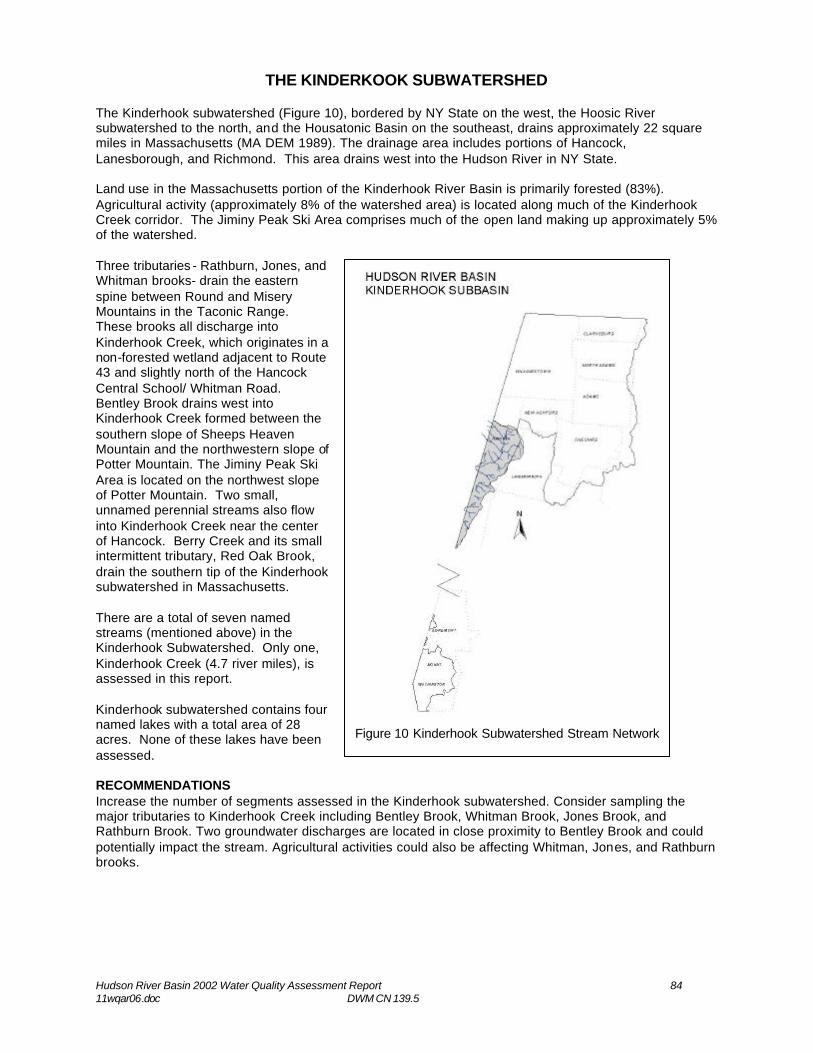
Hudson River Basin 2002 Water Quality Assessment Report 84 11wqar06.doc DWM CN 139.5
THE KINDERKOOK SUBWATERSHED The Kinderhook subwatershed (Figure 10), bordered by NY State on the west, the Hoosic River subwatershed to the north, and the Housatonic Basin on the southeast, drains approximately 22 square miles in Massachusetts (MA DEM 1989). The drainage area includes portions of Hancock, Lanesborough, and Richmond. This area drains west into the Hudson River in NY State. Land use in the Massachusetts portion of the Kinderhook River Basin is primarily forested (83%). Agricultural activity (approximately 8% of the watershed area) is located along much of the Kinderhook Creek corridor. The Jiminy Peak Ski Area comprises much of the open land making up approximately 5% of the watershed. Three tributaries - Rathburn, Jones, and Whitman brooks- drain the eastern spine between Round and Misery Mountains in the Taconic Range. These brooks all discharge into Kinderhook Creek, which originates in a non-forested wetland adjacent to Route 43 and slightly north of the Hancock Central School/ Whitman Road. Bentley Brook drains west into Kinderhook Creek formed between the southern slope of Sheeps Heaven Mountain and the northwestern slope of Potter Mountain. The Jiminy Peak Ski Area is located on the northwest slope of Potter Mountain. Two small, unnamed perennial streams also flow into Kinderhook Creek near the center of Hancock. Berry Creek and its small intermittent tributary, Red Oak Brook, drain the southern tip of the Kinderhook subwatershed in Massachusetts. There are a total of seven named streams (mentioned above) in the Kinderhook Subwatershed. Only one, Kinderhook Creek (4.7 river miles), is assessed in this report. Kinderhook subwatershed contains four named lakes with a total area of 28 acres. None of these lakes have been assessed. RECOMMENDATIONS Increase the number of segments assessed in the Kinderhook subwatershed. Consider sampling the major tributaries to Kinderhook Creek including Bentley Brook, Whitman Brook, Jones Brook, and Rathburn Brook. Two groundwater discharges are located in close proximity to Bentley Brook and could potentially impact the stream. Agricultural activities could also be affecting Whitman, Jones, and Rathburn brooks.
Figure 10 Kinderhook Subwatershed Stream Network
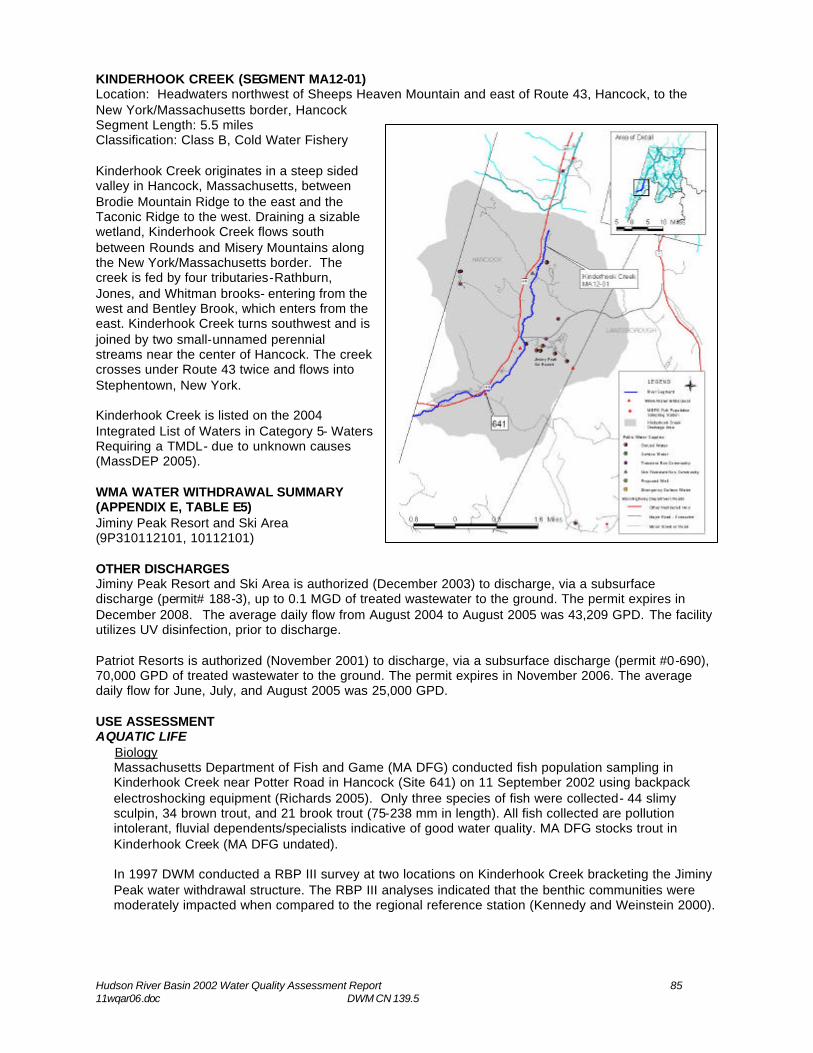
Hudson River Basin 2002 Water Quality Assessment Report 85 11wqar06.doc DWM CN 139.5
KINDERHOOK CREEK (SEGMENT MA12-01) Location: Headwaters northwest of Sheeps Heaven Mountain and east of Route 43, Hancock, to the New York/Massachusetts border, Hancock Segment Length: 5.5 miles Classification: Class B, Cold Water Fishery Kinderhook Creek originates in a steep sided valley in Hancock, Massachusetts, between Brodie Mountain Ridge to the east and the Taconic Ridge to the west. Draining a sizable wetland, Kinderhook Creek flows south between Rounds and Misery Mountains along the New York/Massachusetts border. The creek is fed by four tributaries-Rathburn, Jones, and Whitman brooks- entering from the west and Bentley Brook, which enters from the east. Kinderhook Creek turns southwest and is joined by two small-unnamed perennial streams near the center of Hancock. The creek crosses under Route 43 twice and flows into Stephentown, New York. Kinderhook Creek is listed on the 2004 Integrated List of Waters in Category 5- Waters Requiring a TMDL- due to unknown causes (MassDEP 2005). WMA WATER WITHDRAWAL SUMMARY (APPENDIX E, TABLE E5) Jiminy Peak Resort and Ski Area (9P310112101, 10112101) OTHER DISCHARGES Jiminy Peak Resort and Ski Area is authorized (December 2003) to discharge, via a subsurface discharge (permit# 188-3), up to 0.1 MGD of treated wastewater to the ground. The permit expires in December 2008. The average daily flow from August 2004 to August 2005 was 43,209 GPD. The facility utilizes UV disinfection, prior to discharge. Patriot Resorts is authorized (November 2001) to discharge, via a subsurface discharge (permit #0-690), 70,000 GPD of treated wastewater to the ground. The permit expires in November 2006. The average daily flow for June, July, and August 2005 was 25,000 GPD. USE ASSESSMENT AQUATIC LIFE
Biology Massachusetts Department of Fish and Game (MA DFG) conducted fish population sampling in Kinderhook Creek near Potter Road in Hancock (Site 641) on 11 September 2002 using backpack electroshocking equipment (Richards 2005). Only three species of fish were collected- 44 slimy sculpin, 34 brown trout, and 21 brook trout (75-238 mm in length). All fish collected are pollution intolerant, fluvial dependents/specialists indicative of good water quality. MA DFG stocks trout in Kinderhook Creek (MA DFG undated). In 1997 DWM conducted a RBP III survey at two locations on Kinderhook Creek bracketing the Jiminy Peak water withdrawal structure. The RBP III analyses indicated that the benthic communities were moderately impacted when compared to the regional reference station (Kennedy and Weinstein 2000).
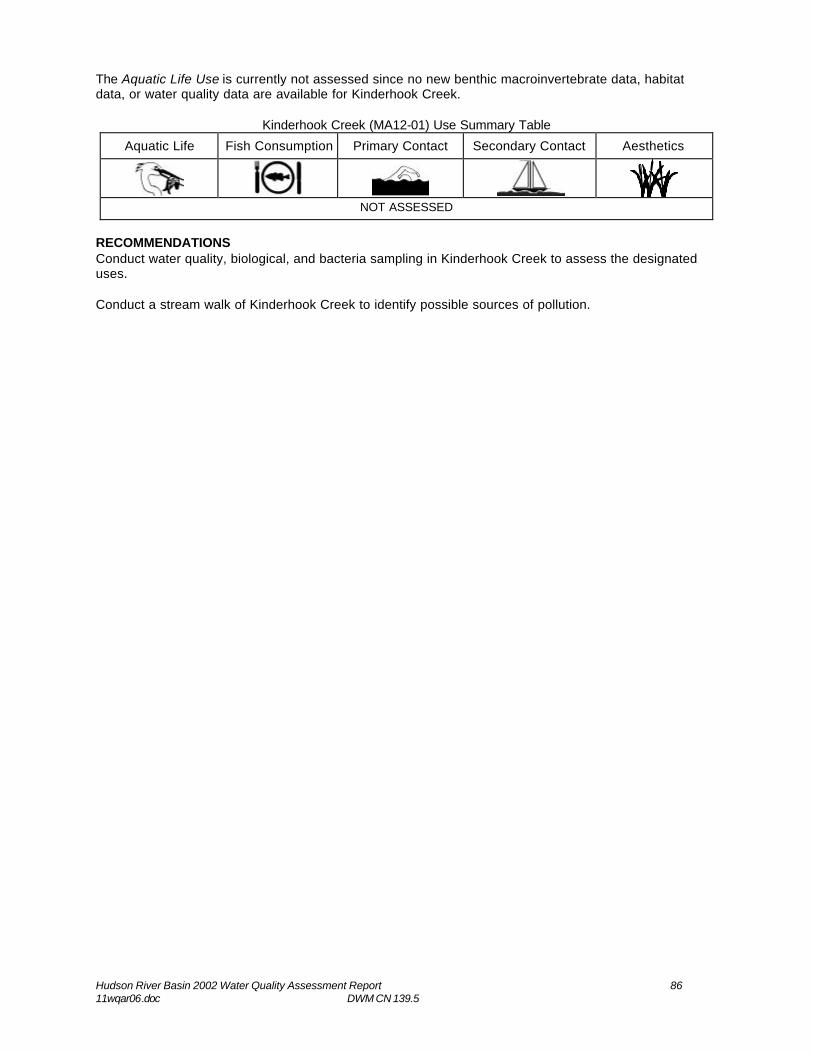
Hudson River Basin 2002 Water Quality Assessment Report 86 11wqar06.doc DWM CN 139.5
The Aquatic Life Use is currently not assessed since no new benthic macroinvertebrate data, habitat data, or water quality data are available for Kinderhook Creek.
Kinderhook Creek (MA12-01) Use Summary Table
Aquatic Life Fish Consumption Primary Contact Secondary Contact Aesthetics
NOT ASSESSED
RECOMMENDATIONS Conduct water quality, biological, and bacteria sampling in Kinderhook Creek to assess the designated uses. Conduct a stream walk of Kinderhook Creek to identify possible sources of pollution.
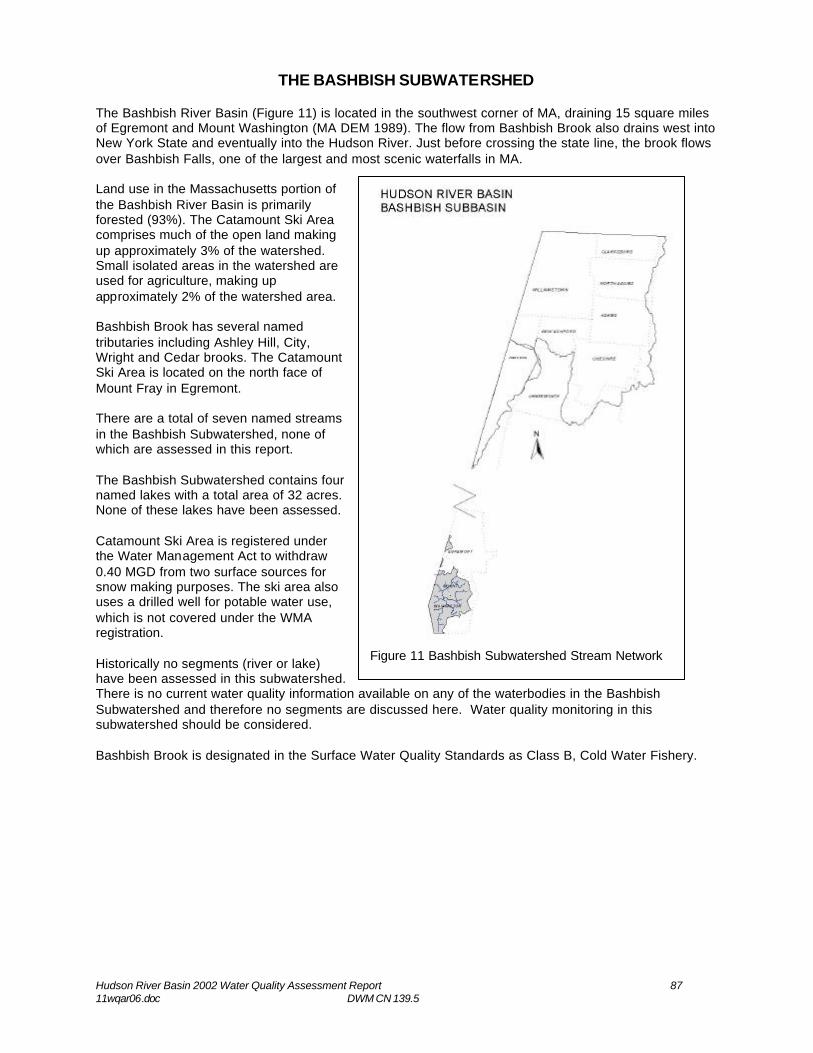
Hudson River Basin 2002 Water Quality Assessment Report 87 11wqar06.doc DWM CN 139.5
THE BASHBISH SUBWATERSHED The Bashbish River Basin (Figure 11) is located in the southwest corner of MA, draining 15 square miles of Egremont and Mount Washington (MA DEM 1989). The flow from Bashbish Brook also drains west into New York State and eventually into the Hudson River. Just before crossing the state line, the brook flows over Bashbish Falls, one of the largest and most scenic waterfalls in MA. Land use in the Massachusetts portion of the Bashbish River Basin is primarily forested (93%). The Catamount Ski Area comprises much of the open land making up approximately 3% of the watershed. Small isolated areas in the watershed are used for agriculture, making up approximately 2% of the watershed area. Bashbish Brook has several named tributaries including Ashley Hill, City, Wright and Cedar brooks. The Catamount Ski Area is located on the north face of Mount Fray in Egremont. There are a total of seven named streams in the Bashbish Subwatershed, none of which are assessed in this report. The Bashbish Subwatershed contains four named lakes with a total area of 32 acres. None of these lakes have been assessed. Catamount Ski Area is registered under the Water Management Act to withdraw 0.40 MGD from two surface sources for snow making purposes. The ski area also uses a drilled well for potable water use, which is not covered under the WMA registration. Historically no segments (river or lake) have been assessed in this subwatershed. There is no current water quality information available on any of the waterbodies in the Bashbish Subwatershed and therefore no segments are discussed here. Water quality monitoring in this subwatershed should be considered. Bashbish Brook is designated in the Surface Water Quality Standards as Class B, Cold Water Fishery.
Figure 11 Bashbish Subwatershed Stream Network
Hudson River Basin 2002 Water Quality Assessment Report 88 11wqar06.doc DWM CN 139.5
LITERATURE CITED
ACOE. undated. Hoosic River Restoration, Adams, Massachusetts. Project Modifications for Improvement of the Environment. Fact Sheet . US Army Corps of Engineers, New York District, New York, NY. Adams. 2005. Stormwater Management Strategic Plan. Project Number 2002-02/604. Prepared by Comprehensive Environmental, Inc., Berkshire Regional Planning Commission, and the Town of Adams. Adams, MA. Ackerman, M.T. 1989. Compilation of Lakes, Ponds, Reservoirs and Impoundments Relative to the Massachusetts Lake Classification Program. Technical Services Branch, Massachusetts Division of Water Pollution Control, Department of Environmental Quality Engineering, Westborough, MA. Bain, M. B., and M. S. Meixler. 2000. Defining a target fish community for planning and evaluating enhancement of the Quinebaug River in Massachusetts and Connecticut. Final report by the New York Cooperative Fish and Wildlife Research Unit, Cornell University, Ithaca, NY to the New England Interstate Water Pollution Control Commission, Lowell, MA. 51 p. Berkshire Eagle. 2001. Notch Reservoir leak repaired. Millions of gallons of N. Adams water lost through broken pipe. Pittsfield, MA. Berkshire Eagle. 2005. Cleanup of Photech site likely to start next week . Pittsfield, MA. Brown, T. 2005. Specialty Minerals Inc. Facility and Toxicity Testing Information. Specialty Minerals, Incorporated. North Adams, MA. Personal communication to Rick Alden, Massachusetts Department of Environmental Protection, Division of Watershed Management, Worcester, MA. BRPC. 1987. The Hoosic River Action Plan. Berkshire County Regional Planning Commission. Pittsfield, MA. BRPC. 1998. Assessment of Land Use Activities and Nonpoint Source Pollution in the Hoosic River Watershed. Nonpoint source project number 96-01/604. Berkshire Regional Planning Commission. Pittsfield MA. BRPC. 2000.Stormwater Assessment in the Hoosic and Housatonic Watersheds. Massachusetts Watershed Initiative Project Number 99-10/MWI. Berkshire Regional Planning Commission. Pittsfield MA. BRPC. 2001. The Massachusetts Unpaved Roads BMP Manual. Prepared for MassDEP and US EPA., Berkshire Regional Planning Commission, Pittsfield, MA. Chase, R. and O’Brien, K. 2003. Continuous Temperature Data at Four Locations in the Hoosic River Watershed (September- October, 2002)TM-11-5 CN132.0. Massachusetts Department of Environmental Protection, Division of Watershed Management, Worcester, MA. Celona, M. ([email protected]) 2005. RE: Hoosic River Fish Consumption Advisory Clarification. Massachusetts Department of Public Health, Boston, MA. Email to Robert Maietta, Massachusetts Department of Environmental Protection, Division of Watershed Management, Worcester, MA. Dated 27 July 2005. Dallaire, T.D. 1999. Water Body Identification. Clean Water Act Section 305(b), Water Body System Database – (WBS). Foxpro Application. 1999. Massachusetts Department of Environmental Protection, Division of Watershed Management, Watershed Planning and Permitting Program, Database Manager. Worcester, MA.
Hudson River Basin 2002 Water Quality Assessment Report 89 11wqar06.doc DWM CN 139.5
Denny, E. 2004. A Snapshot of PCB Levels in the Hoosic River PCB Levels in Sediment, Crayfish, and Brown Trout in the Tri-State Area. A thesis submitted in partial fulfillment of the requirements for the Degree of Bachelor of Arts with Honors in Chemistry, Williams College, Williamstown, MA Environmental Law Reporter. 1988. Clean Water Deskbook . Environmental Law Institute. Washington, DC. EPA. 2002a. [Online] Sprague Electric Company, North Adams, 65 Brown Street. Massachusetts Site Awaiting National Priorities Listing (SAND) Fact Sheet United States Environmental Protection Agency Region 1, Boston, MA. http://yosemite.epa.gov/r1/npl_pad.nsf/51dc4f173ceef51d85256adf004c7ec8/5504ed1d6282354485256b4200604fc3!OpenDocument webpage last updated 15 July 2002, visited 17 January 2006. EPA. 2002b. [Online] Sprague Electric Company, North Adams, 87 Marshall Street. Massachusetts Site Awaiting National Priorities Listing (SAND) Fact Sheet United States Environmental Protection Agency Region 1, Boston, MA. http://yosemite.epa.gov/r1/npl_pad.nsf/51dc4f173ceef51d85256adf004c7ec8/26f351172c4995b285256b4200604fb6!OpenDocument webpage last updated 15 July 2002, visited 17 January 2006. Fiorentino, J. 2006. Personal communication. Interpretation of Hudson River Watershed 2002 biomonitoring results. Massachusetts Department of Environmental Protection, Division of Watershed Management, Worcester, MA. Furlon, B. 2005. Personal Communication. Hoosac Water Quality District operational status. Communication with Richard Alden, Massachusetts Department of Environmental Protection, Division of Watershed Management, 14 June 2005. Chief Operator, Hoosac Water Quality District. GeoSyntec. 2003. Mauserts Pond Watershed Study SC DEM 9000 3RFR803. GeoSyntec Consultants, Boxborough, MA. Halliwell, D.B., W.A. Kimball and A.J. Screpetis. 1982. Massachusetts Stream Classification Program Part I: Inventory of Rivers and Streams. Massachusetts Division of Fisheries and Wildlife, Department of Fisheries, Wildlife, and Recreational Vehicles and Massachusetts Division of Water Pollution Control, Department of Environmental Quality Engineering. Westborough, MA. Halliwell, D.B, Langdon, R.W., Daniels, R.A., Kurtenbach, J.P., and R.A. Jacobson. 1999. Classification of Freshwater Fish Species of the Northeastern United States for Use in the Development of Indices of Biological Integrity, with Regional Applications. pp. 301-338 in T. P. Simon (ed.). Assessing the Sustainability and Biological Integrity of Water Resources Using Fish Communities. CRC Press, Boca Raton, FL. 671 p. Hansen, B.P., Toler, L.G., and Gay, F.B. 1973. Hydrology and Water Resources of the Hoosic River Basin, Massachusetts U.S. Geological Survey Hydrologic Investigations Atlas, HA-481, 2 sheets, scale 1:48, 000 as referenced online at USGS MA-RI Stream Stats at http://ststdmamrl.er.usgs.gov/streamstats/expert.htm Harding, S. 2003. Certified Vernal Pool Information Massachusetts Department of Fisheries, Wildlife, and Environmental Law Enforcement, Natural Heritage and Endangered Species Program, Westborough, MA. HooRWA undated. Hoosic River Watershed Water Quality Monitoring Program Project Number 02-09/MWI. Hoosic River Watershed Association. Williamstown, MA. HooRWA 2001a. How Clean the Green Part I. Hoosic River Watershed Association. Williamstown, MA. HooRWA 2001b. How Clean the Green Part II. Hoosic River Watershed Association. Williamstown, MA.
Hudson River Basin 2002 Water Quality Assessment Report 90 11wqar06.doc DWM CN 139.5
HooRWA 2001c. Monitoring the Hoosic: North Branch and Main Stem in 2001 Hoosic River Watershed Association. Williamstown, MA. HooRWA 2005. 2003 and 2004 Hoosic River Watershed Monitoring Data. Microsoft Excel Spreadsheets. Emails from Richard Schlesinger ([email protected] ), Monitoring Coordinator, Hoosic River Watershed Association, Williamstown, MA to Katie O’Brien-Clayton, MassDEP, dated 31 March 2005, 15 April 2005, 19 April 2005, and 3 June 2005. Hudson Basin River Watch. Undated. [online] Hudson River Basin Info. http://www.hudsonbasin.org/basininfo.html Kennedy, L.E., Weinstein, M.J. 1997. Hudson River Basin: 1997 Water Quality Assessment Report. DWM CN 15. Department of Environmental Protection, Division of Watershed Management, Worcester, MA. Madden, A ([email protected]) 2005. 2005 Survey Sites. Microsoft Excel Spreadsheet. Massachusetts Department of Fish and Game, Division of Fisheries and Wildlife, Pittsfield, MA. Email to Katie O’Brien-Clayton, Massachusetts Department of Environmental Protection, Division of Watershed Management, Worcester, MA dated 28 November 2005. MA DEM. 1989. Hudson River Basin Volume I: Inventory and Analysis of Current and Projected Water Use. Commonwealth of Massachusetts, Executive Office of Environmental Affairs, Department of Environmental Management. Boston, MA. MA DFG. undated. [Online] Massachusetts Trout Stocked Waters- 2005. Massachusetts Department of Fish and Game, Division of Fisheries and Wildlife, Boston, MA. http://www.mass.gov/dfwele/dfw/dfw_trout_waters.htm MA DFG. 2005. Letter from Mark Tisa, Assistant Director of Fisheries, Massachusetts Department of Fish and Game, Division of Fisheries and Wildlife, Westborough, MA to Marcia Sherman, Massachusetts Department of Environmental Protection, Boston, MA. dated 22 December 2005. MA DPH. 2001. Public Health Statewide Fish Consumption Advisory issued July 2001. The Commonwealth of Massachusetts, Bureau of Environmental Health Assessment, Boston, MA. MA DPH. 2002. Marine and Freshwater Beach Testing in Massachusetts 2001 Season. Prepared by Massachusetts Department of Public Health, Center for Environmental Health, Environmental Toxicology Program in collaboration with MA DPH Bureau of Health Quality Management, Division of Community Sanitation. Boston, MA MA DPH. 2003. Marine and Freshwater Beach Testing in Massachusetts Annual Report 2002 Season. Prepared by Massachusetts Department of Public Health, Center for Environmental Health, Environmental Toxicology Program in collaboration with MA DPH Bureau of Health Quality Management, Division of Community Sanitation. Boston, MA MA DPH. 2004. Marine and Freshwater Beach Testing in Massachusetts Annual Report 2003 Season. Prepared by Massachusetts Department of Public Health, Center for Environmental Health, Environmental Toxicology Program in collaboration with MA DPH Bureau of Health Quality Management, Division of Community Sanitation. Boston, MA MA DPH. 2005a. [Online] Freshwater Fish Consumption Advisory List – Searchable Database. Massachusetts Department of Public Health, Bureau of Environmental Health Assessment. Boston, MA. http://db.state.ma.us/dph/fishadvisory/ MA DPH. 2005b. Marine and Freshwater Beach Testing in Massachusetts Annual Report 2004 Season. Prepared by Massachusetts Department of Public Health, Center for Environmental Health, Environmental Toxicology Program in collaboration with MA DPH Bureau of Health Quality Management, Division of Community Sanitation. Boston, MA
Hudson River Basin 2002 Water Quality Assessment Report 91 11wqar06.doc DWM CN 139.5
Maietta, R., Ryder, J. and Chase, R. 2004. 2002 Fish Toxics Monitoring Public Request and Year 2 Watershed Surveys. DWM CN 099.0. Massachusetts Department of Environmental Protection, Division of Watershed Management, Worcester, MA Maietta, R. 2006. Personal communication- classification and tolerance of slimy sculpin. Massachusetts Department of Environmental Protection, Division of Watershed Management, Worcester, MA MassDEP. 1996. (Revision of 1995 report). Massachusetts Surface Water Quality Standards. Massachusetts Department of Environmental Protection, Division of Water Pollution Control, Technical Services Branch. Westborough, MA (Revision of 314 CMR 4.00, effective June 23, 1996). MassDEP. 1997. Open lake survey files . Massachusetts Department of Environmental Protection, Division of Watershed Management. Worcester, MA. MassDEP. 2002a. Open fish population survey files. Massachusetts Department of Environmental Protection, Division of Watershed Management. Worcester, MA. MassDEP. 2002b. Open benthic macroinvertebrate survey files. Massachusetts Department of Environmental Protection, Division of Watershed Management, Worcester, MA. MassDEP. 2000c. Open lake survey files. Massachusetts Department of Environmental Protection, Division of Watershed Management, Worcester, MA. MassDEP. 2005. Massachusetts Year 2004 Integrated List of Waters - Final listing of the condition of Massachusetts’ waters pursuant to Sections 303(d) and 305(b) of the Clean Water Act. CN 175. Massachusetts Department of Environmental Protection, Division of Watershed Management, Worcester, MA MassDEP. undated a. [Online] Enforcement Actions- 2002. 8/19/2002 Curtis Papers, Inc. Massachusetts Department of Environmental Protection, Boston, MA. http://www.mass.gov/dep/public/press/enf02.htm MassDEP. undated b. [Online] Enforcement Actions- 2002. 12/3/2002: The Adams Fire District. Massachusetts Department of Environmental Protection, Boston, MA. http://www.mass.gov/dep/public/press/enf02.htm Mattson, M. in preparation. Baseline Lake Survey 2002 Technical Memorandum. CN 204.0. Massachusetts Department of Environmental Protection, Division of Watershed Management, Worcester, MA McVoy, R. 2006. Personal communication. Massachusetts Department of Environmental Protection, Division of Watershed Management, Worcester, MA. Nuzzo, R. 2002. Hudson Watershed Reconn Notes. Massachusetts Department of Environmental Protection, Division of Watershed Management, Worcester, MA Nuzzo, R. 2006. The Hudson Watershed 2002 Biological Assessment (Technical Memorandum TM-11-7). CN193.0. Massachusetts Department of Environmental Protection, Division of Watershed Management, Worcester, MA O’Brien-Clayton, K. 2005. Hudson River Basin 2002 Water Quality Technical Memorandum TM-11-06. CN139.0. Massachusetts Department of Environmental Protection, Division of Watershed Management, Worcester, MA. Plotkin, S.P., and P.T. Kostecki. 1988. Environmental Risk Assessment for the Hoosic River: Point Source Discharge Data. Water Resources Research Center. University of Massachusetts, Amherst, MA.
Hudson River Basin 2002 Water Quality Assessment Report 92 11wqar06.doc DWM CN 139.5
Prendergast, W. 2006. Massachusetts Department of Environmental Protection, Western Regional Office, Drinking Water Program Personal communication to Matthew Poach, Massachusetts Department of Environmental Protection, Western Regional Office, Division of Watershed Management. Ries, K.G. III, 1998. Streamflow measurements, basin characteristics, and streamflow statistics for low-flow partial record station operated in Massachusetts from 1989 through 1996 USGS Water Resources Investigations Report 98-4006. as referenced online at USGS MA-RI Stream Stats at http://ststdmamrl.er.usgs.gov/streamstats/expert.htm Richards, T. ([email protected]) 2005. Hudson River Watershed Fish Population Data. Massachusetts Department of Fish and Game, Division of Fisheries and Wildlife, Westborough, MA. Email to Peter Mitchell, Massachusetts Department of Environmental Protection, Division of Watershed Management, Worcester, MA dated 31 October 2005. Schleeweis, M. 2006. Comments on the Draft Hudson River Watershed 2002 Water Quality Assessment Report. Massachusetts Department of Environmental Protection, Western Regional Office, Springfield, MA. Schlesinger, R. ([email protected]) 2006. RE: Any comments on Water Quality Assessment Report. Hoosic River Watershed Association. Williamstown, MA. Email to Katie O’Brian-Clayton. Mitchell, Massachusetts Department of Environmental Protection, Division of Watershed Management, Worcester, MA dated 27 February 2006. Socolow, R.S. , Zanca, J.L., Driskell, T.R., and Rambsey, L.R. 2004. Water Resources Data for Massachusetts and Rhode Island, Water Year 2003. U.S. Geological Survey Report MA-RI-03-1. Water Resources Division. Northborough, MA. Socolow, R.S., L.Y. Comeau, and D. Murino, Jr.. 2005. Water Resources Data for Massachusetts and Rhode Island, Water Year 2004. U.S. Geological Survey Report MA-RI-04-1. Water Resources Division. Northborough, MA. TOXTD Database. “NPDES Toxicity testing discharge monitoring report summary”. Toxicity Testing Database -- TOXTD. Dbase Application. 1999. Massachusetts Department of Environmental Protection, Division of Watershed Management, Watershed Planning and Permitting Program, Database Manager. Worcester, MA. USGS. 3 September 2004. [Online] Hudson River Drainage Basin United States Geological Survey, Northborough, MA. Accessed 17 January 2006. http://ma.water.usgs.gov/basins/hudson.htm USGS. 2006. [Online] USGS 01332000 North Branch Hoosic River At North Adams, MA United States Geological Survey, Northborough, MA. Accessed 10 April 2006. http://waterdata.usgs.gov/ma/nwis/inventory/?site_no=0133200