Embed Size (px)
Citation preview
ORIGINAL ARTICLE
Vasker Bhattacherjee . Partha Mukhopadhyay .
Saurabh Singh . Charles Johnson . John T. Philipose .
Courtney P. Warner . Robert M. Greene .
M. Michele Pisano
Neural crest and mesoderm lineage-dependent gene expression inorofacial development
Received May 9, 2006; accepted in revised form July 31, 2006
Abstract The present study utilizes a combination ofgenetic labeling/selective isolation of pluripotent em-bryonic progenitor cells, and oligonucleotide-basedmicroarray technology, to delineate and compare the‘‘molecular fingerprint’’ of two mesenchymal cellpopulations from distinct lineages in the developingembryonic orofacial region. The first branchial arches—bi-lateral tissue primordia that flank the primitive oralcavity—are populated by pluripotent mesenchymal cellsfrom two different lineages: neural crest (neuroecto-derm)- and mesoderm-derived mesenchymal cells.These cells give rise to all of the connective tissue elem-ents (bone, cartilage, smooth and skeletal muscle, den-tin) of the orofacial region (maxillary and mandibularportion), as well as neurons and glia associated with thecranial ganglia, among other tissues. In the presentstudy, neural crest- and mesoderm-derived mesenchy-mal cells were selectively isolated from the first bran-chial arch of gestational day 9.5 mouse embryos usinglaser capture microdissection (LCM). The two differentembryonic cell lineages were distinguished through util-ization of a novel two component transgenic mouse
model (Wnt1Cre/ZEG) in which the neural crest cellsand their derivatives are indelibly marked (i.e., express-ing enhanced green fluorescent protein, EGFP)throughout the pre- and post-natal lifespan of the or-ganism. EGFP-labeled neural crest-derived, and non-fluorescent mesoderm-derived mesenchymal cells fromthe first branchial arch were visualized in frozen tissuesections from gestational day 9.5 mouse embryos andindependently isolated by LCM under epifluorescenceoptics. RNA was extracted from the two populations ofLCM-procured cells, and amplified by double-strandedcDNA synthesis and in vitro transcription. Gene ex-pression profiles of the two progenitor cell populationswere generated via hybridization of the cell-type specificcRNA samples to oligo-based GeneChip microarrays.Comparison of gene expression profiles of neural crest-and mesoderm-derived mesenchymal cells from the firstbranchial arch revealed over 140 genes that exhibitedstatistically significant differential levels of expression.The gene products of many of these differentially ex-pressed genes have previously been linked to the devel-opment of mesoderm- or neural crest-derived tissues inthe embryo. Interestingly, however, hitherto uncharac-terized coding sequences with highly significant differ-ences in expression between the two embryonicprogenitor cell types were also identified. These lin-eage-dependent mesenchymal cell molecular finger-prints offer the opportunity to elucidate additionalmechanisms governing cellular growth, differentiation,and morphogenesis of the embryonic orofacial region.The chemokine stromal cell-derived factor 1, (SDF-1),was found to exhibit greater expression in meso-derm-derived mesenchyme in the branchial arch whencompared with neurectoderm, suggesting a possiblechemotactic role for SDF-1 in guiding the migratoryneural crest cells to their destination. The novel
Vasker Bhattacherjee ( .*) � Partha Mukhopadhyay �Saurabh Singh � John T. Philipose � Courtney P. Warner �Robert M. Greene � M. Michele PisanoDepartment of MolecularCellular and Craniofacial BiologyUniversity of Louisville Birth Defects CenterULSD, Louisville, KY 40292, U.S.A.Tel: 11 502 852 0042Fax: 11 502 852 4702E-mail: [email protected]
Charles JohnsonDepartment of Biochemistry and Molecular BiologyUniversity of Louisville School of MedicineLouisville, KY 40292, U.S.A.
Differentiation (2007) 75:463–477 DOI: 10.1111/j.1432-0436.2006.00145.xr 2007, Copyright the AuthorsJournal compilation r 2007, International Society of Differentiation
combination of genetic labeling of the neural crest cellpopulation by EGFP coupled with isolation of cells byLCM for gene expression analysis has enabled, for thefirst time, the generation of gene expression profiles ofdistinct embryonic cell lineages.
Key words mesenchyme � mesoderm � neural crest �lineage � craniofacial � embryo � gene expression �microarray
Introduction
Craniofacial development involves the precise tem-poral–spatial orchestration of numerous cellular pro-cesses such as migration, differentiation, proliferation,and apoptosis. A crucial element contributing to cra-niofacial morphogenesis and histodifferentiation is theemergence from the neural folds, and subsequent di-rected migration, of the neural crest. Neural crest cellscomprise a unique stem cell population that possesses adevelopmental potential intermediate between that ofclassically defined mesoderm and ectoderm. Neuralcrest cells originate, at the earliest stages of develop-ment (approximately day 20 of human and day 8 ofmurine gestation), from the neural plate (neural ecto-derm) at all axial levels along the antero-posterior axisof the embryo (Lumsden et al., 1991; Serbedzija et al.,1992; Kontges and Lumsden, 1996). These pluripotentcells produce ectodermal-type structures such as neu-rons and glia of the peripheral nervous system, whilealso producing mesodermal-type derivatives such asbone, dermis, and cartilage forming cells of the orofa-cial region (Hall and Horstadius, 1988; Hall, 1999; LeDouarin and Kalcheim, 1999). Neural crest cells mi-grate widely in the embryo along characteristic path-ways. Cranial neural crest (CNC) cells, in particular,migrate from the neuroectoderm of the developingforebrain, midbrain, and hindbrain into the developingcranio- and orofacial regions. More rostral CNC cellsmigrate and give rise to the frontonasal skeleton andsome portions of the skull vault, whereas the more pos-terior CNC cells migrate into the first two branchialarches of the developing embryo where they differenti-ate into the connective tissue components of the oro-facial region; mandibular and maxillary cartilage andbone; and cranial parasympathetic ganglia (Hall andHorstadius, 1988; Noden, 1988; Le Douarin and Kalc-heim, 1999). The skeletal muscles of the face and lowerjaw, however are derived from mesodermal cells (Nodenand Trainor, 2005).
In vertebrates, the first and second branchial arch-es—tissue primordia of the embryonic head and neck—develop into various elements of the orofacial region,pharynx, and the outer and middle ear. The embryonicendoderm, ectoderm, and mesoderm all contribute to
the formation of the branchial arches. Each branchialarch contains a central blood vessel, an aortic arch,surrounded by paraxial mesodermal cells which are, inturn, surrounded by peripherally localized post-migra-tory neural crest cells. By the 22-somite stage in themouse embryo (gestational day 9.5), the branchial arch-es show a distinctive swelling caused by the proliferativeactivity of post-migratory CNC.
Development of the first branchial arch also involvesparaxial mesodermal cells that have migrated into thearch (Couly et al., 1993). Mesodermal cells in thefrontocranium have migrated ventrolaterally from thesomitomeres, which are loosely associated clusters ofmesodermal cells located ventral to the neural tube(Meier, 1979; Meier and Tam, 1982; Tam and Meier,1982; Jacobson, 1993). Somitomeres in the presomiticmesoderm are regarded as the primordial structures forsomites (reviewed by Tam and Trainor, 1994). Differ-ential cell labeling of neuroectoderm and somitomericmesoderm in one- to five- somite mouse embryos (ges-tational day 8–8.5) revealed co-migration of CNC fromthe midbrain–hindbrain junction and mesodermal cellsfrom somitomere III into the first branchial arch (Trai-nor and Tam, 1995). A unique feature of the branchialarch is the continued spatial segregation of the somito-meric mesoderm and CNC after migration. This situ-ation contrasts with the extensive mixing of these two-cell lineages outside the branchial arches (Trainor et al.,1994; Trainor and Tam, 1995). Tissue sections of thebranchial arch after migration reveal a non-neural crestcore of mesodermal cells surrounded by peripherallylocalized CNC.
The recent application of Wnt1-Cre/R26R transgenicembryos to follow the CNC lineage has provided newinsights into the development of cranial tissues. Jianget al. (2002) showed that the mammalian frontal bonesare CNC-derived while the parietal bones are mesoder-mal in origin. Using the same transgenic system, Chaiet al. (2000) showed that while tooth formation is ini-tially induced in oral epithelium, the CNC reside only inthe peripheral mesenchyme and that while the dentalmesenchyme becomes heavily populated with CNC, theenamel epithelium remains free of CNC. Such studieshave revealed complex interactions between CNC andnon-CNC cells in the developing craniofacial regionand have resulted in a re-examination of the respectivecontributions of neural crest-derived and mesodermallyderived cells to developing craniofacial tissues.
The present study examined differences in the geneexpression profiles between mesoderm- and neuralcrest-derived mesenchymal cells in the first branchialarch of the developing craniofacial region. Analysis ofthe two different gene expression profiles may explainhow these two adjacent, but spatially segregated,progenitor cell types interact to form first branchialarch-derived structures in the craniofacial region. Addi-tionally, knowledge of the developmental signaling
464
pathways that are active in each cell population mayreveal the extent to which extracellular cues, versus pro-grammed cell fate, determine terminal differentiation ofthese two cell populations. The experimental strategyutilized in the present study involved generation of anovel two component transgenic mouse model (Wnt1-Cre/ZEG) in which the neural crest cells and their de-rivatives are genetically (indelibly) labeled withenhanced green fluorescent protein (EGFP) throughoutthe pre- and post-natal lifespan of the organism (Bha-ttacherjee et al., 2004; Singh et al., 2005). EGFP-labeledCNC cells and non-fluorescent mesodermal cells fromthe first branchial arch were visualized in frozen tissuesections from gestational day 9.5 mouse embryos andindependently isolated by laser capture microdissection(LCM) under epifluorescence optics. Cell-lineage specif-ic cRNA samples were prepared and gene expressionprofiles of the two progenitor cell populations weregenerated using oligo-based GeneChip microarrays.Such molecular-genomic lineage analyses, as those con-ducted in the present study, offer the promise of expand-ing our understanding of the molecular complexities ofthese neural crest- and mesoderm-derived multipotentembryonic progenitor cells and revealing the etiology ofvarious craniofacial birth defects.
Methods
Generation of a two-component animal model
Wnt1-Cre mice were generously provided by Dr. Andrew McMa-hon (Harvard University; Cambridge, MA) and Z/EG mice (Tg[ACTB-Bgeo/GFP] 21Lbe) were obtained commercially from Jack-son Laboratory (Bar Harbor, ME). The engineering and develop-mental analyses of these transgenic mouse strains have beendescribed previously (Danielian et al., 1998; Novak et al., 2000).Mature male and female mice of both strains were housed at atemperature of 201C–251C in a room with a 12-hr alternating lightand dark cycle and were maintained on Purina mouse chow andwater ad libitum. Timed pregnancies were obtained by overnightmating of a single mature Z/EG1/� male with two nulliparousWnt1-Cre1/� females. The presence of a vaginal plug was consid-ered evidence of mating and the time designated as 0.5 days post-coition (dpc). Developmental staging was conducted following themethod of Theiler (1989). All studies were reviewed and approved,before their conduct, by the University of Louisville InstitutionalAnimal Care and Use Committee (IACUC). Pregnant female micewere euthanized on 9.5 dpc by carbon dioxide asphyxiation, thegravid uteri were removed, and individual embryos were dissectedfrom decidual tissue and placed into ice-cold phosphate-bufferedsaline (PBS). Genotyping of two-component Wnt1-Cre/Z/EGtransgenic embryos was performed on individual yolk sacs by po-lymerase chain reaction (PCR) as described by Danielian et al.(1998) for the Wnt1-Cre allele and as reported by Novak et al.(2000) for the Z/EG allele.
Visualization of EGFP-labeled CNC cells
EGFP-labeled CNC cells were visualized in intact embryos using aNikon SMZ1500 stereo microscope (Fryer Co., Inc., Cincinnati,OH) equipped with epifluorescence optics (470–490 nm [excitation]
and 525–550 nm [emission]), and photographed using a NikonDXM 1200 digital camera (Fryer Co. Inc.). During LCM, EGFP-labeled CNC in cryosections were visualized and photographedusing an Arcturus PixCell IIe LCM system equipped with epiflu-orescence optics (455–495/5101nm excitation/emission; ArcturusEngineering, Mountain View, CA).
Preparation of frozen tissue sections
9.5-dpc Wnt1-Cre/Z/EG-positive embryos were dissected free fromdecidual tissue and rinsed in cold calcium-magnesium-free PBS (pH7.2), fixed by immersion in cold 4% paraformaldehyde solution (inPBS) for 5min; rinsed twice in PBS and frozen in optimal cuttingtemperature compound (Tissue-Tek 4583, Sakura Finetek USAInc., Torrance, CA) on dry ice. Seven micrometer thick transversesections of the embryos were cut and mounted on uncoated, un-charged, RNase-free slides using a Leica CM1900 cryostat (LeicaInc., Bannockburn, IL).
LCM of EGFP-labeled neural crest- and non-fluorescentmesoderm-derived mesenchyme
Tissue sections were stored at � 801C until utilized for LCM. Tis-sue sections were allowed to thaw at room temperature for no morethan 30 sec before immersion in 75% ethanol for 30 sec. Tissuesections were then further dehydrated by immersion in 95% and100% ethanol for 30 sec each, followed by 5min in xylene. Tissuesections were then air dried for 2–5min at room temperature beforecommencing LCM.The two mesenchymal cell lineages in the first branchial arch of
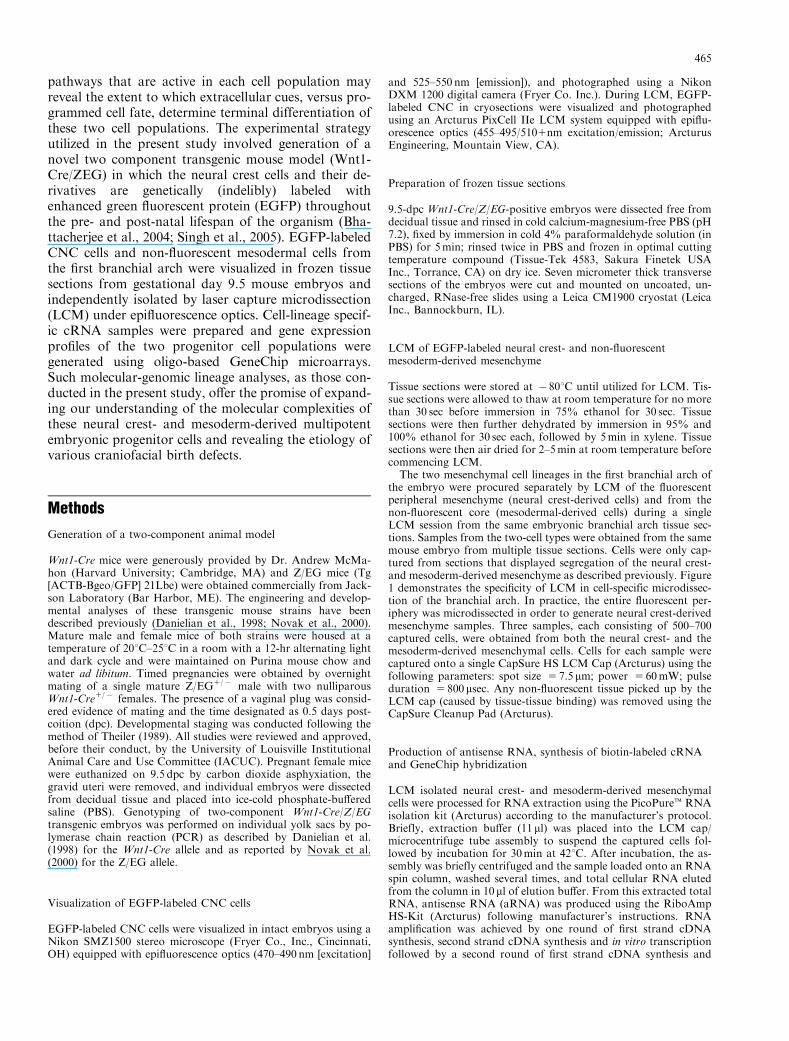
the embryo were procured separately by LCM of the fluorescentperipheral mesenchyme (neural crest-derived cells) and from thenon-fluorescent core (mesodermal-derived cells) during a singleLCM session from the same embryonic branchial arch tissue sec-tions. Samples from the two-cell types were obtained from the samemouse embryo from multiple tissue sections. Cells were only cap-tured from sections that displayed segregation of the neural crest-and mesoderm-derived mesenchyme as described previously. Figure1 demonstrates the specificity of LCM in cell-specific microdissec-tion of the branchial arch. In practice, the entire fluorescent per-iphery was microdissected in order to generate neural crest-derivedmesenchyme samples. Three samples, each consisting of 500–700captured cells, were obtained from both the neural crest- and themesoderm-derived mesenchymal cells. Cells for each sample werecaptured onto a single CapSure HS LCM Cap (Arcturus) using thefollowing parameters: spot size 5 7.5 mm; power 5 60mW; pulseduration 5 800 msec. Any non-fluorescent tissue picked up by theLCM cap (caused by tissue-tissue binding) was removed using theCapSure Cleanup Pad (Arcturus).
Production of antisense RNA, synthesis of biotin-labeled cRNAand GeneChip hybridization
LCM isolated neural crest- and mesoderm-derived mesenchymalcells were processed for RNA extraction using the PicoPuret RNAisolation kit (Arcturus) according to the manufacturer’s protocol.Briefly, extraction buffer (11 ml) was placed into the LCM cap/microcentrifuge tube assembly to suspend the captured cells fol-lowed by incubation for 30min at 421C. After incubation, the as-sembly was briefly centrifuged and the sample loaded onto an RNAspin column, washed several times, and total cellular RNA elutedfrom the column in 10 ml of elution buffer. From this extracted totalRNA, antisense RNA (aRNA) was produced using the RiboAmpHS-Kit (Arcturus) following manufacturer’s instructions. RNAamplification was achieved by one round of first strand cDNAsynthesis, second strand cDNA synthesis and in vitro transcriptionfollowed by a second round of first strand cDNA synthesis and
465
second strand cDNA synthesis. Finally, the double-stranded cDNAwas transcribed in vitro using the Bioarray High-Yield RNA Tran-script Labeling Kit (Enzo; Farmingdale, NY) according to themanufacturer’s instructions using biotinylated CTP and UTP(Enzo). Following a 5 hr incubation at 371C, the resultant biotin-labeled cRNA was purified with RNA spin columns from theRiboAmp HS kit and eluted in 30 ml of RNase-free water. Theconcentration of biotin-labeled cRNA was determined by spectro-photometric ultraviolet (UV) absorbance at 260/280 nm. Fifteenmicrograms of labeled cRNA was fragmented in 40 ml of fragmen-tation buffer (40mmol/l tris-acetate pH 8.1, 100mmol/l K-acetate,and 30mmol/l Mg-acetate) for 33min at 941C and assessed byagarose gel electrophoresis. Fragmented cRNA was increased to atotal volume of 300 ml with hybridization buffer (100mmol/l MES,1mol/l NaCl, 20mmol/l EDTA, 0.01% Tween 20), 100 mg/ml her-ring sperm DNA, 500 mg/ml acetylated BSA, 50 pmol/l biotinylatedcontrol oligonucleotide B2, and eukaryotic hybridization controls(1.5 pmol/l BioB, 5.0 pmol/l BioC, 25 pmol/l BioB, and 100 pmol/lcre; Affymetrix; Santa Clara, CA). Target cRNAs corresponding toeither EGFP-labeled neural crest-derived or non-fluorescent meso-derm-derived mesenchymal cell populations were hybridized to in-dividual GeneChips from an identical lot of Affymetrix MurineGenome 430A GeneChip arrays (Affymetrix) for 16 hr. GeneChiparrays were washed and stained using antibody-mediated signal am-plification and the Affymetrix Fluidics Station’s standard EukaryoticGE Wash 2/ protocol. Three independent biological samples wereprepared for each mesenchymal cell lineage, and then each of thethree biological replicates was hybridized to a single GeneChip.
Gene expression profiling data analysis
All gene expression-profiling studies were conducted using Affy-metrix Murine Genome 430A GeneChip arrays (Affymetrix). TheseGeneChip arrays contain � 22,700 probes of which � 12,700 are
fully annotated genes, with unannotated expressed sequence tags(ESTs) making up the remainder of the probes. All arrays wereprocessed and quantified according to standard Affymetrix proto-cols (http:// www.affymetrix.com/support/technical/) using Affy-metrix MicroArray Suite (MAS) software version 5.0. Afterscanning the GeneChips, the resulting binary image files were cre-ated using MAS 5.0 software and the results saved as AffymetrixCel files. For each Cel file, background subtraction, expressionsummary, normalization, and log base 2 transformation of probesignals were carried out using the Robust MultiChip Average(RMA) method developed by Irizarry et al. (2003; Bolstad et al.,2003). Irizarry et al. (2003) demonstrated that RMA has betterprecision for lower expression values and provides a greater thanfivefold reduction of the within-replicate variance as compared withdChip (www.biostat.harvard.edu/complab/dchip/) and MAS 5.0.All values were calculated with RMAExpress version 2.0 (http://statwww.berkeley.edu/users/bolstad/RMAExpress/RMAExpress.html). This implementation of RMA has three steps. Firstly, thereis a probe-specific correction, which uses a model assuming thatobserved intensity is the sum of signal and noise, resulting in a base2 logarithm of each background-corrected intensity. Then, allvalues were quantile normalized, and finally expression measureswere calculated using the median polish method. The normalizedintensities for each probe for all three mesoderm-derived and allthree neural crest-derived mesenchymal cell arrays were importedinto Microsoft Excel as log base 2 values where a two-tailed Stu-dent’s t-test was applied and a p-value assigned to each probe.Probes with p-values of less than 0.05 were considered to be ex-pressed significantly above background. For each probe, the meanwas found for the mesoderm-derived cell hybridization signal in-tensities and for the neural crest-derived cell hybridization signalintensities, and then converted from log base 2 values into realnumbers. A ratio of the mean neural crest-derived cell to the meanmesoderm-derived cell sample intensity was calculated to find thefold differences for each probe. Probes with fold differences >1.5
Fig. 1 Laser capture microdissection (LCM) of enhanced greenfluorescent protein (EGFP)-labeled neural crest-derived mesen-chyme and non-fluorescent mesoderm-derived mesenchyme fromthe first branchial arch of a 9.5 dpc Wnt1-Cre/Z/EG transgenicmouse embryo. Tissue sections were visualized under brightfield(A–C) and epifluorescence (D–F) optics. Transverse section of thefirst branchial arch before LCM (A, D) demonstrating peripherally
localized, fluorescent neural crest-derived mesenchyme (ncm) sur-rounding a non-fluorescent mesodermal core (mc). The identicalbranchial arch section is shown after LCM of the peripheral EGFP-labeled neural crest-derived mesenchyme cells (B, E) and after LCMof the non-fluorescent mesoderm-derived mesenchyme cells (C, F).Magnification � 200.
466
and with p-values less than 0.05 were considered significantly, dif-ferentially expressed between the two cell lineages. This two-stepselection method was done to reduce the number of multiple testingerrors caused by doing several thousand statistical tests without anyfalse discovery rate p-value adjustment.
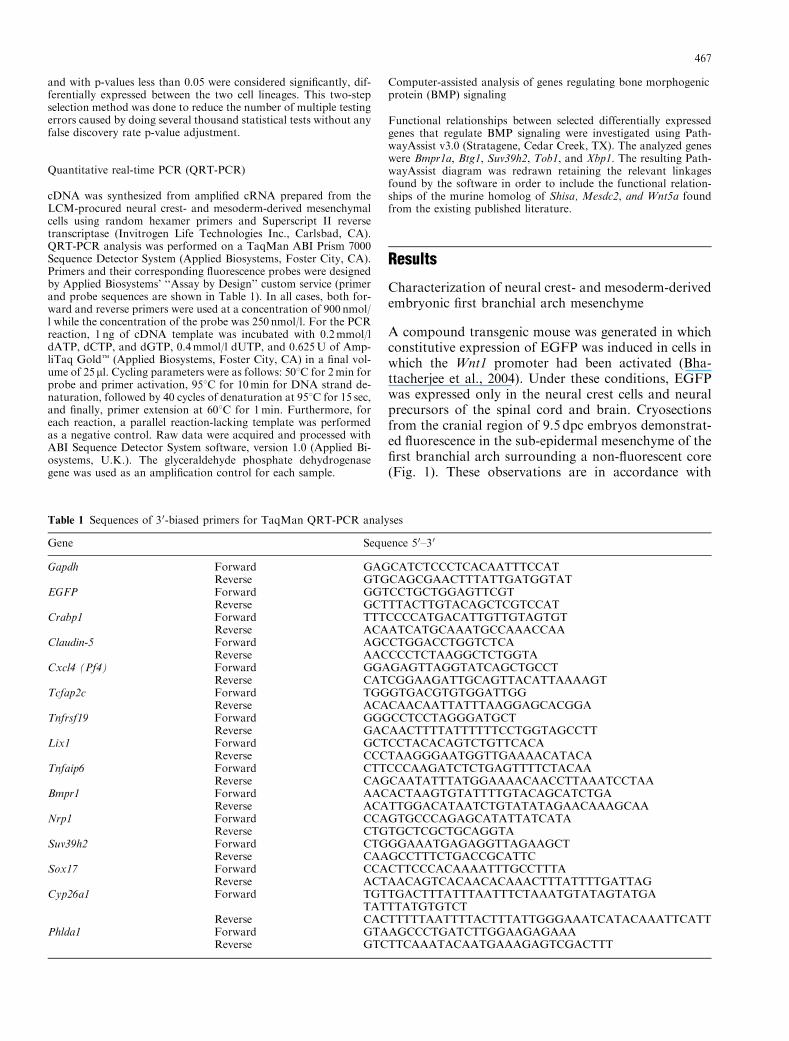
Quantitative real-time PCR (QRT-PCR)
cDNA was synthesized from amplified cRNA prepared from theLCM-procured neural crest- and mesoderm-derived mesenchymalcells using random hexamer primers and Superscript II reversetranscriptase (Invitrogen Life Technologies Inc., Carlsbad, CA).QRT-PCR analysis was performed on a TaqMan ABI Prism 7000Sequence Detector System (Applied Biosystems, Foster City, CA).Primers and their corresponding fluorescence probes were designedby Applied Biosystems’ ‘‘Assay by Design’’ custom service (primerand probe sequences are shown in Table 1). In all cases, both for-ward and reverse primers were used at a concentration of 900 nmol/l while the concentration of the probe was 250 nmol/l. For the PCRreaction, 1 ng of cDNA template was incubated with 0.2mmol/ldATP, dCTP, and dGTP, 0.4mmol/l dUTP, and 0.625U of Amp-liTaq Goldt (Applied Biosystems, Foster City, CA) in a final vol-ume of 25ml. Cycling parameters were as follows: 501C for 2min forprobe and primer activation, 951C for 10min for DNA strand de-naturation, followed by 40 cycles of denaturation at 951C for 15 sec,and finally, primer extension at 601C for 1min. Furthermore, foreach reaction, a parallel reaction-lacking template was performedas a negative control. Raw data were acquired and processed withABI Sequence Detector System software, version 1.0 (Applied Bi-osystems, U.K.). The glyceraldehyde phosphate dehydrogenasegene was used as an amplification control for each sample.
Computer-assisted analysis of genes regulating bone morphogenicprotein (BMP) signaling
Functional relationships between selected differentially expressedgenes that regulate BMP signaling were investigated using Path-wayAssist v3.0 (Stratagene, Cedar Creek, TX). The analyzed geneswere Bmpr1a, Btg1, Suv39h2, Tob1, and Xbp1. The resulting Path-wayAssist diagram was redrawn retaining the relevant linkagesfound by the software in order to include the functional relation-ships of the murine homolog of Shisa, Mesdc2, and Wnt5a foundfrom the existing published literature.
Results
Characterization of neural crest- and mesoderm-derivedembryonic first branchial arch mesenchyme
A compound transgenic mouse was generated in whichconstitutive expression of EGFP was induced in cells inwhich the Wnt1 promoter had been activated (Bha-ttacherjee et al., 2004). Under these conditions, EGFPwas expressed only in the neural crest cells and neuralprecursors of the spinal cord and brain. Cryosectionsfrom the cranial region of 9.5 dpc embryos demonstrat-ed fluorescence in the sub-epidermal mesenchyme of thefirst branchial arch surrounding a non-fluorescent core(Fig. 1). These observations are in accordance with
Table 1 Sequences of 30-biased primers for TaqMan QRT-PCR analyses
Gene Sequence 50–30
Gapdh Forward GAGCATCTCCCTCACAATTTCCATReverse GTGCAGCGAACTTTATTGATGGTAT
EGFP Forward GGTCCTGCTGGAGTTCGTReverse GCTTTACTTGTACAGCTCGTCCAT
Crabp1 Forward TTTCCCCATGACATTGTTGTAGTGTReverse ACAATCATGCAAATGCCAAACCAA
Claudin-5 Forward AGCCTGGACCTGGTCTCAReverse AACCCCTCTAAGGCTCTGGTA
Cxcl4 (Pf4) Forward GGAGAGTTAGGTATCAGCTGCCTReverse CATCGGAAGATTGCAGTTACATTAAAAGT
Tcfap2c Forward TGGGTGACGTGTGGATTGGReverse ACACAACAATTATTTAAGGAGCACGGA
Tnfrsf19 Forward GGGCCTCCTAGGGATGCTReverse GACAACTTTTATTTTTTCCTGGTAGCCTT
Lix1 Forward GCTCCTACACAGTCTGTTCACAReverse CCCTAAGGGAATGGTTGAAAACATACA
Tnfaip6 Forward CTTCCCAAGATCTCTGAGTTTTCTACAAReverse CAGCAATATTTATGGAAAACAACCTTAAATCCTAA
Bmpr1 Forward AACACTAAGTGTATTTTGTACAGCATCTGAReverse ACATTGGACATAATCTGTATATAGAACAAAGCAA
Nrp1 Forward CCAGTGCCCAGAGCATATTATCATAReverse CTGTGCTCGCTGCAGGTA
Suv39h2 Forward CTGGGAAATGAGAGGTTAGAAGCTReverse CAAGCCTTTCTGACCGCATTC
Sox17 Forward CCACTTCCCACAAAATTTGCCTTTAReverse ACTAACAGTCACAACACAAACTTTATTTTGATTAG
Cyp26a1 Forward TGTTGACTTTATTTAATTTCTAAATGTATAGTATGATATTTATGTGTCT
Reverse CACTTTTTAATTTTACTTTATTGGGAAATCATACAAATTCATTPhlda1 Forward GTAAGCCCTGATCTTGGAAGAGAAA
Reverse GTCTTCAAATACAATGAAAGAGTCGACTTT
467
previous studies wherein transplantation of mesodermalcells expressing lacZ, and injection of fluorescentcarbocyanine dyes into pre-migration mesodermal so-mitomeres demonstrated the localization of neuralcrest-derived tissue surrounding mesoderm-derivedtissue in the first branchial arch at this embryonic stage(Trainor et al., 1994: Trainor and Tam, 1995). Fluo-rescent labeling of neural crest-derived mesenchyme andthe differential spatial localization of the two mesen-chymal cell lineages allowed the isolation by LCM ofsufficient numbers of cells for adequate RNA extractionand amplification for hybridization to Affymetrix Gene-Chip microarrays.
Differential gene expression between neural crest- andmesoderm-derived mesenchyme
All genes and ESTs differentially expressed betweenneural crest- and mesoderm-derived mesenchyme by atleast 1.5-fold are listed in Tables 2 and 3. Using Gene-Spring software (Agilent Technologies, Palo Alto, CA),a clustered image map was generated of the sub-set ofdifferentially expressed genes that demonstrated con-sistent differences between the two cell lineages (Fig. 2).Sixty-nine genes and ESTs demonstrated higher expres-sion in neural crest-derived mesenchyme (Table 2),while 73 genes were more highly expressed in meso-derm-derived cells (Table 3) out of a total of � 1700sequences that were significantly expressed on the basisof a p-value o0.05. Differentially expressed genes andESTs were manually clustered into functional categoriesaccording to the published literature (Fig. 3): extracel-lular matrix proteins and receptors; growth and differ-entiation factors; transcription factors; stress/hormone-induced proteins; kinases/phosphatases; metabolism;other miscellaneous genes encoding trafficking proteins,electron transport proteins and proteins of unknownfunctions; ESTs not assigned to a named gene. Moregenes encoding extracellular matrix/receptor proteins,kinases/phosphatases, and stress-induced proteins wereexpressed at a higher level in neural crest-derived mes-enchymal cells when compared with mesoderm-derivedcells. In contrast, more genes encoding transcriptionfactors and growth/differentiation factors wereexpressed at higher levels in mesoderm.
QRT-PCR
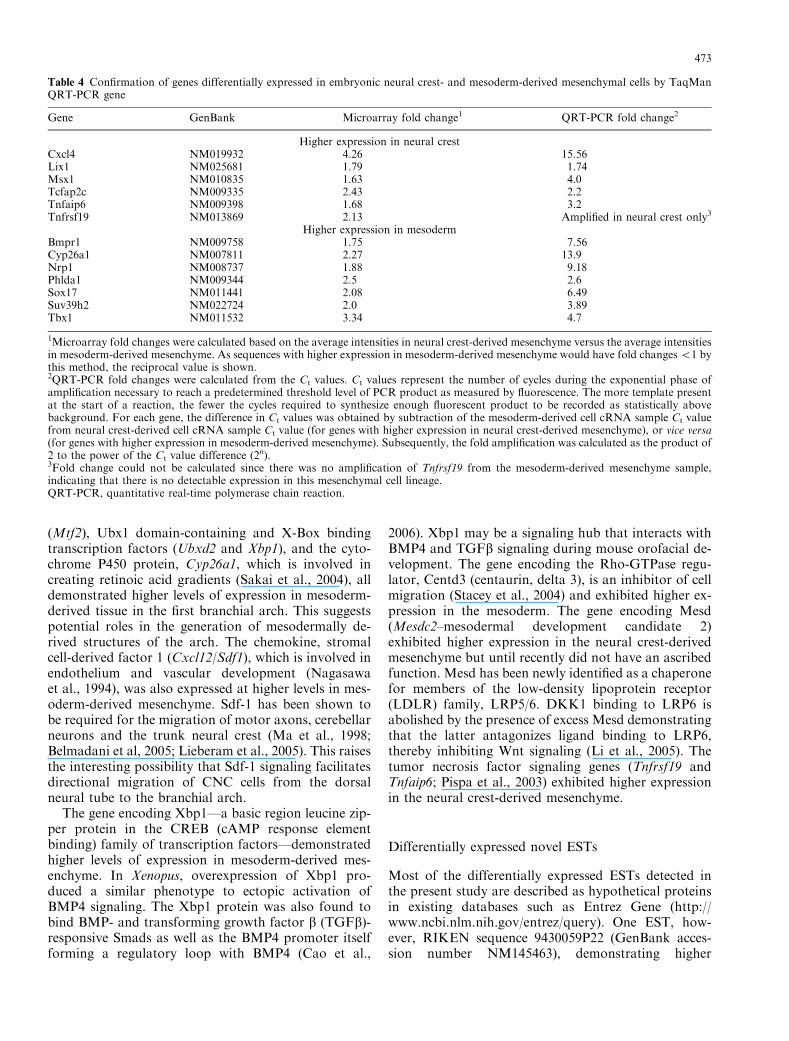
The differential expression of selected genes betweenneural crest- and mesoderm-derived mesenchymal cellswas confirmed using QRT-PCR. Target genes were se-lected from those listed in Tables 2 and 3 based upontheir having potential roles in development of the mes-enchyme of the branchial arch, but which had not beenpreviously characterized in this tissue (Table 4). Theseinclude Cxcl4, Tcfap2c, Lix1 and Tnfaip6 which all ex-
hibited higher expression in the neural crest-derivedmesenchyme; and Nrp1, Suv39h2, and Cyp26a1, whichexhibited higher expression in the mesoderm-derivedmesenchyme. Bmpr1 and Sox17 also were included asgenes that have known roles in development and areexpressed at higher levels in mesoderm. QRT-PCRanalyses of the selected genes validated their respectivedifferential expression by the two-cell lineages as dem-onstrated by microarray. The neural crest-specificEGFP transgene, the neural crest marker Crabp1 (cel-lular retinoic acid binding protein 1) and the mesoder-mal marker Cldn-5 (claudin 5) were used to validate thepurity of the two LCM-captured cell types and speci-ficity of the LCM procedure. EGFP was expressed ex-clusively in the neural crest-derived cell sample, whileCrabp1 was differentially expressed with significantlyhigher expression levels in the neural crest-derived cellsample. Cldn-5 was differentially expressed with signifi-cantly higher expression levels in the mesoderm-derivedcell sample.
Discussion
Genes involved in neural crest-derived mesenchymedevelopment
The Affymetrix Murine Genome 430A GeneChip arraycontains � 22,600 probes of which 4140 genes andESTs were determined to be significantly differentiallyexpressed between neural crest- and mesoderm-derivedmesenchyme. Genes that were expressed in neural crest-derived mesenchymal cells and known to be involved inneural crest-derived mesenchymal development in-cluded Msx1 (Han et al., 2003) and Tcfap2c (Ap2-g,Werling and Schorle, 2002). The mouse homolog of thechick Lix1 gene, a marker for developing brain tissue(Moeller et al., 2002) as well as Pak1 (p21-CDKN1A-activated kinase), implicated in neuronal development(Hayashi et al., 2002) also exhibited higher expression inthe neural crest-derived mesenchyme. The chemokine,Pf4/Cxcl4 (platelet-derived factor 4), which is an inhib-itor of vascular endothelial growth factor (VEGF) sig-naling (Sulpice et al., 2004), exhibited the highestexpression based on the microarray analyses in theneural crest-derived mesenchymal cells. The metal re-sponse genes for metallothionein (Mt1/2), up-regulatedin response to stress and nitric oxide signal transduction(St Croix et al., 2002), and Wnt5a, a target of sonichedgehog signaling in hair follicle morphogenesis(Reddy et al., 2001), also demonstrated higher expres-sion in the neural crest-derived mesenchyme. The mu-rine homolog of the Drosophila gene, lunatic fringe orLnfg which encodes a glycosyl transferase, has an es-tablished role in the regulation of the Notch pathwayduring epithelial morphogenesis of teeth from the E13.5stage (Mustonen et al., 2002). Significantly higher ex-
468
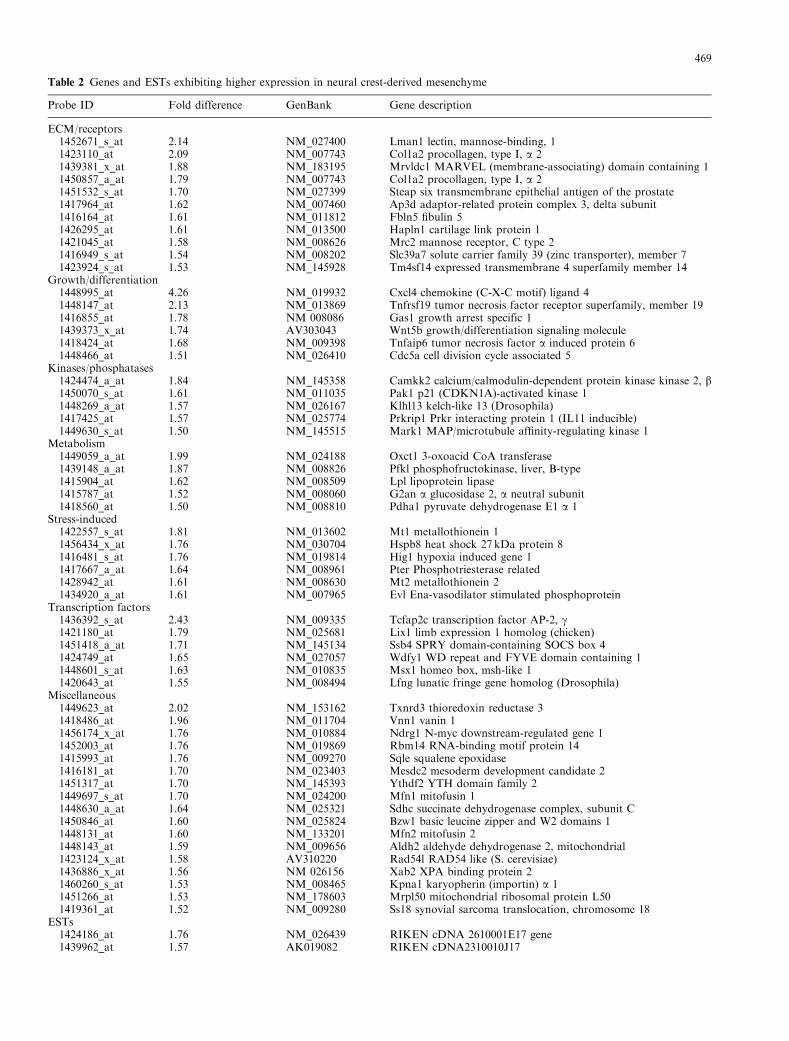
Table 2 Genes and ESTs exhibiting higher expression in neural crest-derived mesenchyme
Probe ID Fold difference GenBank Gene description
ECM/receptors1452671_s_at 2.14 NM_027400 Lman1 lectin, mannose-binding, 11423110_at 2.09 NM_007743 Col1a2 procollagen, type I, a 21439381_x_at 1.88 NM_183195 Mrvldc1 MARVEL (membrane-associating) domain containing 11450857_a_at 1.79 NM_007743 Col1a2 procollagen, type I, a 21451532_s_at 1.70 NM_027399 Steap six transmembrane epithelial antigen of the prostate1417964_at 1.62 NM_007460 Ap3d adaptor-related protein complex 3, delta subunit1416164_at 1.61 NM_011812 Fbln5 fibulin 51426295_at 1.61 NM_013500 Hapln1 cartilage link protein 11421045_at 1.58 NM_008626 Mrc2 mannose receptor, C type 21416949_s_at 1.54 NM_008202 Slc39a7 solute carrier family 39 (zinc transporter), member 71423924_s_at 1.53 NM_145928 Tm4sf14 expressed transmembrane 4 superfamily member 14
Growth/differentiation1448995_at 4.26 NM_019932 Cxcl4 chemokine (C-X-C motif) ligand 41448147_at 2.13 NM_013869 Tnfrsf19 tumor necrosis factor receptor superfamily, member 191416855_at 1.78 NM 008086 Gas1 growth arrest specific 11439373_x_at 1.74 AV303043 Wnt5b growth/differentiation signaling molecule1418424_at 1.68 NM_009398 Tnfaip6 tumor necrosis factor a induced protein 61448466_at 1.51 NM_026410 Cdc5a cell division cycle associated 5
Kinases/phosphatases1424474_a_at 1.84 NM_145358 Camkk2 calcium/calmodulin-dependent protein kinase kinase 2, b1450070_s_at 1.61 NM_011035 Pak1 p21 (CDKN1A)-activated kinase 11448269_a_at 1.57 NM_026167 Klhl13 kelch-like 13 (Drosophila)1417425_at 1.57 NM_025774 Prkrip1 Prkr interacting protein 1 (IL11 inducible)1449630_s_at 1.50 NM_145515 Mark1 MAP/microtubule affinity-regulating kinase 1
Metabolism1449059_a_at 1.99 NM_024188 Oxct1 3-oxoacid CoA transferase1439148_a_at 1.87 NM_008826 Pfkl phosphofructokinase, liver, B-type1415904_at 1.62 NM_008509 Lpl lipoprotein lipase1415787_at 1.52 NM_008060 G2an a glucosidase 2, a neutral subunit1418560_at 1.50 NM_008810 Pdha1 pyruvate dehydrogenase E1 a 1
Stress-induced1422557_s_at 1.81 NM_013602 Mt1 metallothionein 11456434_x_at 1.76 NM_030704 Hspb8 heat shock 27 kDa protein 81416481_s_at 1.76 NM_019814 Hig1 hypoxia induced gene 11417667_a_at 1.64 NM_008961 Pter Phosphotriesterase related1428942_at 1.61 NM_008630 Mt2 metallothionein 21434920_a_at 1.61 NM_007965 Evl Ena-vasodilator stimulated phosphoprotein
Transcription factors1436392_s_at 2.43 NM_009335 Tcfap2c transcription factor AP-2, g1421180_at 1.79 NM_025681 Lix1 limb expression 1 homolog (chicken)1451418_a_at 1.71 NM_145134 Ssb4 SPRY domain-containing SOCS box 41424749_at 1.65 NM_027057 Wdfy1 WD repeat and FYVE domain containing 11448601_s_at 1.63 NM_010835 Msx1 homeo box, msh-like 11420643_at 1.55 NM_008494 Lfng lunatic fringe gene homolog (Drosophila)
Miscellaneous1449623_at 2.02 NM_153162 Txnrd3 thioredoxin reductase 31418486_at 1.96 NM_011704 Vnn1 vanin 11456174_x_at 1.76 NM_010884 Ndrg1 N-myc downstream-regulated gene 11452003_at 1.76 NM_019869 Rbm14 RNA-binding motif protein 141415993_at 1.76 NM_009270 Sqle squalene epoxidase1416181_at 1.70 NM_023403 Mesdc2 mesoderm development candidate 21451317_at 1.70 NM_145393 Ythdf2 YTH domain family 21449697_s_at 1.70 NM_024200 Mfn1 mitofusin 11448630_a_at 1.64 NM_025321 Sdhc succinate dehydrogenase complex, subunit C1450846_at 1.60 NM_025824 Bzw1 basic leucine zipper and W2 domains 11448131_at 1.60 NM_133201 Mfn2 mitofusin 21448143_at 1.59 NM_009656 Aldh2 aldehyde dehydrogenase 2, mitochondrial1423124_x_at 1.58 AV310220 Rad54l RAD54 like (S. cerevisiae)1436886_x_at 1.56 NM 026156 Xab2 XPA binding protein 21460260_s_at 1.53 NM_008465 Kpna1 karyopherin (importin) a 11451266_at 1.53 NM_178603 Mrpl50 mitochondrial ribosomal protein L501419361_at 1.52 NM_009280 Ss18 synovial sarcoma translocation, chromosome 18
ESTs1424186_at 1.76 NM_026439 RIKEN cDNA 2610001E17 gene1439962_at 1.57 AK019082 RIKEN cDNA2310010J17
469
pression of Lngf was found in the neural crest-derivedmesenchyme indicating that this gene may also play anearlier and as yet unidentified role in orofacial devel-opment.
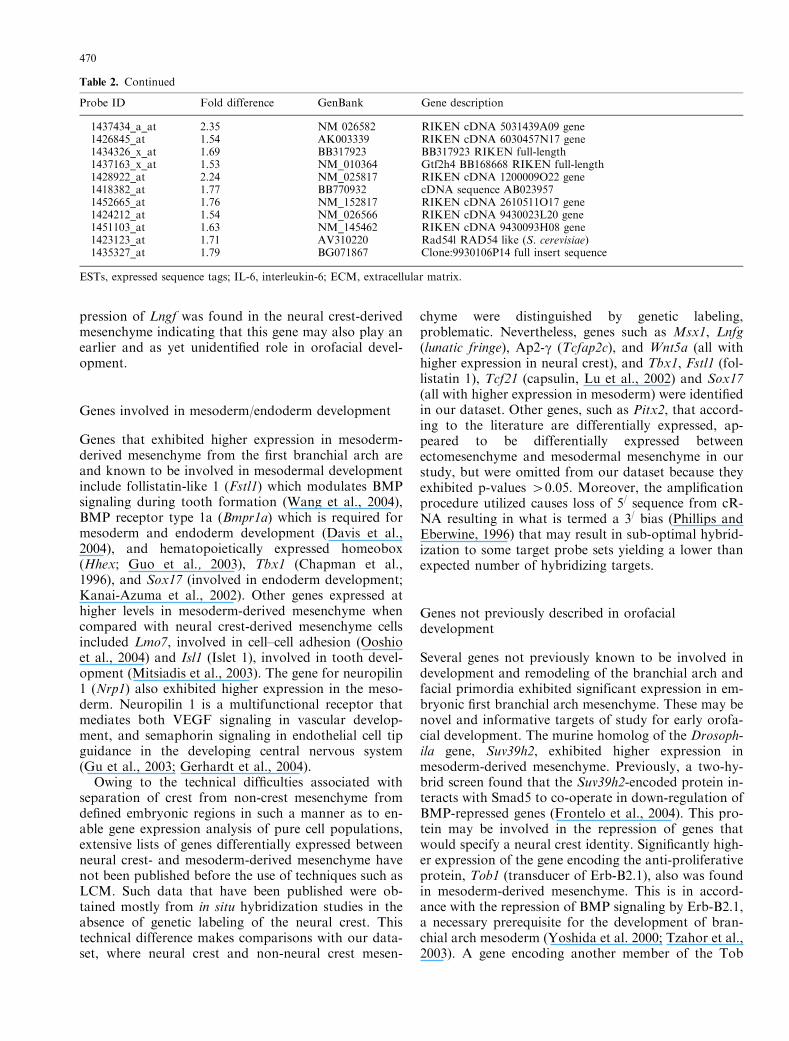
Genes involved in mesoderm/endoderm development
Genes that exhibited higher expression in mesoderm-derived mesenchyme from the first branchial arch areand known to be involved in mesodermal developmentinclude follistatin-like 1 (Fstl1) which modulates BMPsignaling during tooth formation (Wang et al., 2004),BMP receptor type 1a (Bmpr1a) which is required formesoderm and endoderm development (Davis et al.,2004), and hematopoietically expressed homeobox(Hhex; Guo et al., 2003), Tbx1 (Chapman et al.,1996), and Sox17 (involved in endoderm development;Kanai-Azuma et al., 2002). Other genes expressed athigher levels in mesoderm-derived mesenchyme whencompared with neural crest-derived mesenchyme cellsincluded Lmo7, involved in cell–cell adhesion (Ooshioet al., 2004) and Isl1 (Islet 1), involved in tooth devel-opment (Mitsiadis et al., 2003). The gene for neuropilin1 (Nrp1) also exhibited higher expression in the meso-derm. Neuropilin 1 is a multifunctional receptor thatmediates both VEGF signaling in vascular develop-ment, and semaphorin signaling in endothelial cell tipguidance in the developing central nervous system(Gu et al., 2003; Gerhardt et al., 2004).
Owing to the technical difficulties associated withseparation of crest from non-crest mesenchyme fromdefined embryonic regions in such a manner as to en-able gene expression analysis of pure cell populations,extensive lists of genes differentially expressed betweenneural crest- and mesoderm-derived mesenchyme havenot been published before the use of techniques such asLCM. Such data that have been published were ob-tained mostly from in situ hybridization studies in theabsence of genetic labeling of the neural crest. Thistechnical difference makes comparisons with our data-set, where neural crest and non-neural crest mesen-
chyme were distinguished by genetic labeling,problematic. Nevertheless, genes such as Msx1, Lnfg(lunatic fringe), Ap2-g (Tcfap2c), and Wnt5a (all withhigher expression in neural crest), and Tbx1, Fstl1 (fol-listatin 1), Tcf21 (capsulin, Lu et al., 2002) and Sox17(all with higher expression in mesoderm) were identifiedin our dataset. Other genes, such as Pitx2, that accord-ing to the literature are differentially expressed, ap-peared to be differentially expressed betweenectomesenchyme and mesodermal mesenchyme in ourstudy, but were omitted from our dataset because theyexhibited p-values 40.05. Moreover, the amplificationprocedure utilized causes loss of 5/ sequence from cR-NA resulting in what is termed a 3/ bias (Phillips andEberwine, 1996) that may result in sub-optimal hybrid-ization to some target probe sets yielding a lower thanexpected number of hybridizing targets.
Genes not previously described in orofacialdevelopment
Several genes not previously known to be involved indevelopment and remodeling of the branchial arch andfacial primordia exhibited significant expression in em-bryonic first branchial arch mesenchyme. These may benovel and informative targets of study for early orofa-cial development. The murine homolog of the Drosoph-ila gene, Suv39h2, exhibited higher expression inmesoderm-derived mesenchyme. Previously, a two-hy-brid screen found that the Suv39h2-encoded protein in-teracts with Smad5 to co-operate in down-regulation ofBMP-repressed genes (Frontelo et al., 2004). This pro-tein may be involved in the repression of genes thatwould specify a neural crest identity. Significantly high-er expression of the gene encoding the anti-proliferativeprotein, Tob1 (transducer of Erb-B2.1), also was foundin mesoderm-derived mesenchyme. This is in accord-ance with the repression of BMP signaling by Erb-B2.1,a necessary prerequisite for the development of bran-chial arch mesoderm (Yoshida et al. 2000; Tzahor et al.,2003). A gene encoding another member of the Tob
Table 2. Continued
Probe ID Fold difference GenBank Gene description
1437434_a_at 2.35 NM 026582 RIKEN cDNA 5031439A09 gene1426845_at 1.54 AK003339 RIKEN cDNA 6030457N17 gene1434326_x_at 1.69 BB317923 BB317923 RIKEN full-length1437163_x_at 1.53 NM_010364 Gtf2h4 BB168668 RIKEN full-length1428922_at 2.24 NM_025817 RIKEN cDNA 1200009O22 gene1418382_at 1.77 BB770932 cDNA sequence AB0239571452665_at 1.76 NM_152817 RIKEN cDNA 2610511O17 gene1424212_at 1.54 NM_026566 RIKEN cDNA 9430023L20 gene1451103_at 1.63 NM_145462 RIKEN cDNA 9430093H08 gene1423123_at 1.71 AV310220 Rad54l RAD54 like (S. cerevisiae)1435327_at 1.79 BG071867 Clone:9930106P14 full insert sequence
ESTs, expressed sequence tags; IL-6, interleukin-6; ECM, extracellular matrix.
470
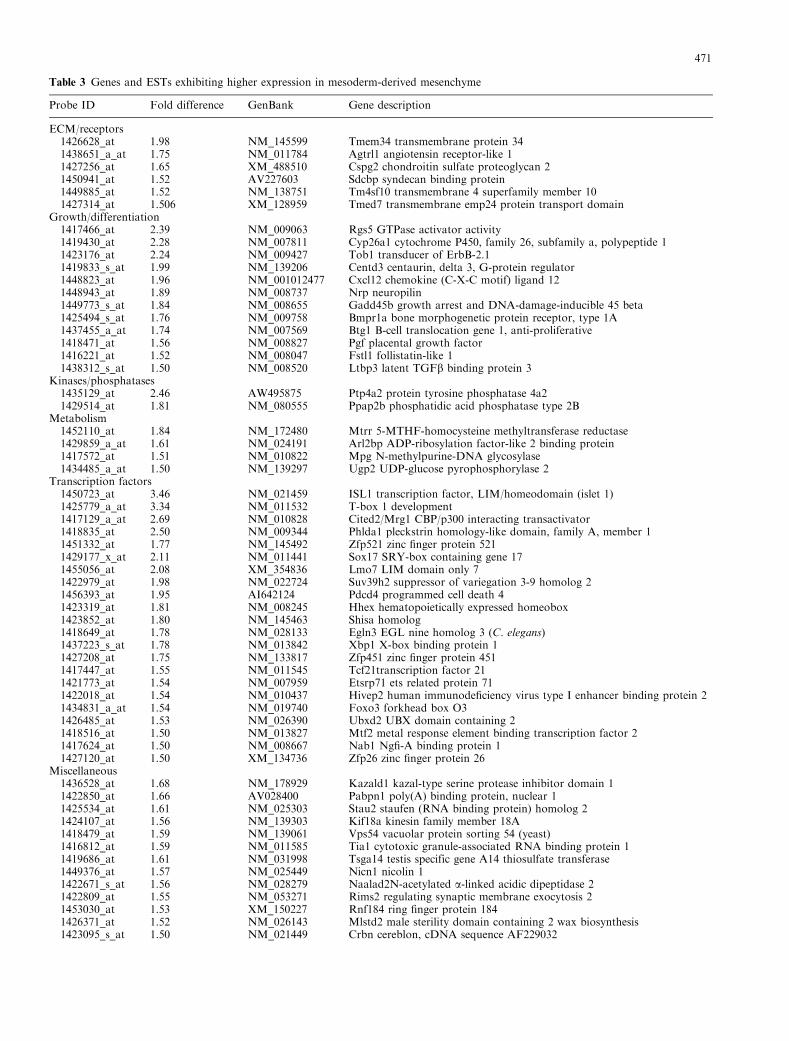
Table 3 Genes and ESTs exhibiting higher expression in mesoderm-derived mesenchyme
Probe ID Fold difference GenBank Gene description
ECM/receptors1426628_at 1.98 NM_145599 Tmem34 transmembrane protein 341438651_a_at 1.75 NM_011784 Agtrl1 angiotensin receptor-like 11427256_at 1.65 XM_488510 Cspg2 chondroitin sulfate proteoglycan 21450941_at 1.52 AV227603 Sdcbp syndecan binding protein1449885_at 1.52 NM_138751 Tm4sf10 transmembrane 4 superfamily member 101427314_at 1.506 XM_128959 Tmed7 transmembrane emp24 protein transport domain
Growth/differentiation1417466_at 2.39 NM_009063 Rgs5 GTPase activator activity1419430_at 2.28 NM_007811 Cyp26a1 cytochrome P450, family 26, subfamily a, polypeptide 11423176_at 2.24 NM_009427 Tob1 transducer of ErbB-2.11419833_s_at 1.99 NM_139206 Centd3 centaurin, delta 3, G-protein regulator1448823_at 1.96 NM_001012477 Cxcl12 chemokine (C-X-C motif) ligand 121448943_at 1.89 NM_008737 Nrp neuropilin1449773_s_at 1.84 NM_008655 Gadd45b growth arrest and DNA-damage-inducible 45 beta1425494_s_at 1.76 NM_009758 Bmpr1a bone morphogenetic protein receptor, type 1A1437455_a_at 1.74 NM_007569 Btg1 B-cell translocation gene 1, anti-proliferative1418471_at 1.56 NM_008827 Pgf placental growth factor1416221_at 1.52 NM_008047 Fstl1 follistatin-like 11438312_s_at 1.50 NM_008520 Ltbp3 latent TGFb binding protein 3
Kinases/phosphatases1435129_at 2.46 AW495875 Ptp4a2 protein tyrosine phosphatase 4a21429514_at 1.81 NM_080555 Ppap2b phosphatidic acid phosphatase type 2B
Metabolism1452110_at 1.84 NM_172480 Mtrr 5-MTHF-homocysteine methyltransferase reductase1429859_a_at 1.61 NM_024191 Arl2bp ADP-ribosylation factor-like 2 binding protein1417572_at 1.51 NM_010822 Mpg N-methylpurine-DNA glycosylase1434485_a_at 1.50 NM_139297 Ugp2 UDP-glucose pyrophosphorylase 2
Transcription factors1450723_at 3.46 NM_021459 ISL1 transcription factor, LIM/homeodomain (islet 1)1425779_a_at 3.34 NM_011532 T-box 1 development1417129_a_at 2.69 NM_010828 Cited2/Mrg1 CBP/p300 interacting transactivator1418835_at 2.50 NM_009344 Phlda1 pleckstrin homology-like domain, family A, member 11451332_at 1.77 NM_145492 Zfp521 zinc finger protein 5211429177_x_at 2.11 NM_011441 Sox17 SRY-box containing gene 171455056_at 2.08 XM_354836 Lmo7 LIM domain only 71422979_at 1.98 NM_022724 Suv39h2 suppressor of variegation 3-9 homolog 21456393_at 1.95 AI642124 Pdcd4 programmed cell death 41423319_at 1.81 NM_008245 Hhex hematopoietically expressed homeobox1423852_at 1.80 NM_145463 Shisa homolog1418649_at 1.78 NM_028133 Egln3 EGL nine homolog 3 (C. elegans)1437223_s_at 1.78 NM_013842 Xbp1 X-box binding protein 11427208_at 1.75 NM_133817 Zfp451 zinc finger protein 4511417447_at 1.55 NM_011545 Tcf21transcription factor 211421773_at 1.54 NM_007959 Etsrp71 ets related protein 711422018_at 1.54 NM_010437 Hivep2 human immunodeficiency virus type I enhancer binding protein 21434831_a_at 1.54 NM_019740 Foxo3 forkhead box O31426485_at 1.53 NM_026390 Ubxd2 UBX domain containing 21418516_at 1.50 NM_013827 Mtf2 metal response element binding transcription factor 21417624_at 1.50 NM_008667 Nab1 Ngfi-A binding protein 11427120_at 1.50 XM_134736 Zfp26 zinc finger protein 26
Miscellaneous1436528_at 1.68 NM_178929 Kazald1 kazal-type serine protease inhibitor domain 11422850_at 1.66 AV028400 Pabpn1 poly(A) binding protein, nuclear 11425534_at 1.61 NM_025303 Stau2 staufen (RNA binding protein) homolog 21424107_at 1.56 NM_139303 Kif18a kinesin family member 18A1418479_at 1.59 NM_139061 Vps54 vacuolar protein sorting 54 (yeast)1416812_at 1.59 NM_011585 Tia1 cytotoxic granule-associated RNA binding protein 11419686_at 1.61 NM_031998 Tsga14 testis specific gene A14 thiosulfate transferase1449376_at 1.57 NM_025449 Nicn1 nicolin 11422671_s_at 1.56 NM_028279 Naalad2N-acetylated a-linked acidic dipeptidase 21422809_at 1.55 NM_053271 Rims2 regulating synaptic membrane exocytosis 21453030_at 1.53 XM_150227 Rnf184 ring finger protein 1841426371_at 1.52 NM_026143 Mlstd2 male sterility domain containing 2 wax biosynthesis1423095_s_at 1.50 NM_021449 Crbn cereblon, cDNA sequence AF229032
471
protein family, Btg1, also exhibited higher expressionin the mesoderm-derived mesenchyme with possibleimplications in orofacial development. A Xenopushomolog of this gene, xBtg-x, was recently shown tobe up-regulated by Notch and b-catenin signaling topromote mesoderm formation (Wessely et al., 2005).Owing to the similarity between Btg1 and Tob, Btg1may also have function in the inhibition of BMP sig-naling in the branchial arch mesoderm. The gene en-coding the nuclear transactivator, Cited2/Mrg1, whichinteracts with the Ap2a transcription factor and is es-
sential for normal neural tube and cardiac development(Braganca et al., 2003), exhibited higher expression inmesoderm-derived mesenchyme indicating that it playsan additional role in early orofacial development. Fox-o3a, encoding forkhead transcription factor O3, whichfunctions as part of the Akt and inflammation responsepathways (Hosaka et al., 2004; Hu et al., 2004) andPhlda1 (pleckstrin homology-like domain a1), encodinga mediator of programmed cell death (Hossain et al.,2003) were both expressed at higher levels in the mes-oderm-derived mesenchyme when compared to that de-rived from neural crest. Placental growth factor (Pgf), amember of the VEGF family, which plays a role in an-giogenesis and is a downstream target of FoxD1 (Zhanget al., 2003), the metal response transcription factor
Table 3. Continued
Probe ID Fold difference GenBank Gene description
ESTs1455517_at 2.25 BB419586 Transcribed sequence1431830_at 2.15 NM_026046 RIKEN cDNA 2810439M05 gene1452183_a_at 1.68 NM_144513 GTL2, imprinted maternally expressed mRNA1451415_at 1.63 NM_026931 RIKEN cDNA 1810011O10 gene1424243_at 1.63 NM_203507 RIKEN cDNA 1700009J181452869_at 1.62 NM_025845 RIKEN cDNA 1110021E09 gene1460359_at 1.62 NM_027870 RIKEN cDNA 1200004E24 gene1433512_at 1.59 BB138212 Fli1 friend leukemia integration 11451536_at 1.59 NM_026182 RIKEN cDNA 1300002C08 gene1427672_a_at 1.58 NM_009483 Utx ubiquitously transcribed tetratricopeptide repeat gene, X chromosome1435357_at 1.55 NM_023665 D4Wsu53e DNA segment, Chr 4, 53, expressed1426510_at 1.54 NM_178653 RIKEN cDNA C330023F11 gene1449699_s_at 1.54 NM_172616 RIKEN cDNA C330027C09 gene1449755_at 1.50 BG066235 Transcribed sequence
ESTs, expressed sequence tags; ECM, extracellular matrix; TGFb, transforming growth factor b .
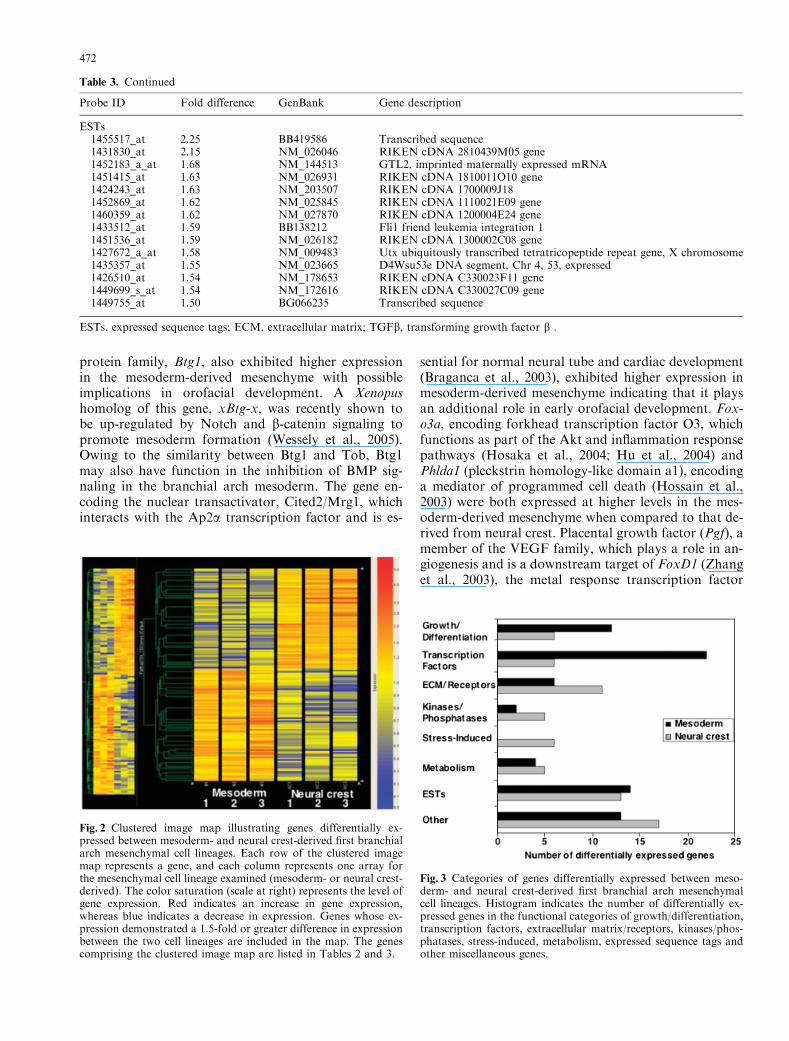
Fig. 2 Clustered image map illustrating genes differentially ex-pressed between mesoderm- and neural crest-derived first branchialarch mesenchymal cell lineages. Each row of the clustered imagemap represents a gene, and each column represents one array forthe mesenchymal cell lineage examined (mesoderm- or neural crest-derived). The color saturation (scale at right) represents the level ofgene expression. Red indicates an increase in gene expression,whereas blue indicates a decrease in expression. Genes whose ex-pression demonstrated a 1.5-fold or greater difference in expressionbetween the two cell lineages are included in the map. The genescomprising the clustered image map are listed in Tables 2 and 3.
Fig. 3 Categories of genes differentially expressed between meso-derm- and neural crest-derived first branchial arch mesenchymalcell lineages. Histogram indicates the number of differentially ex-pressed genes in the functional categories of growth/differentiation,transcription factors, extracellular matrix/receptors, kinases/phos-phatases, stress-induced, metabolism, expressed sequence tags andother miscellaneous genes.
472
(Mtf2), Ubx1 domain-containing and X-Box bindingtranscription factors (Ubxd2 and Xbp1), and the cyto-chrome P450 protein, Cyp26a1, which is involved increating retinoic acid gradients (Sakai et al., 2004), alldemonstrated higher levels of expression in mesoderm-derived tissue in the first branchial arch. This suggestspotential roles in the generation of mesodermally de-rived structures of the arch. The chemokine, stromalcell-derived factor 1 (Cxcl12/Sdf1), which is involved inendothelium and vascular development (Nagasawaet al., 1994), was also expressed at higher levels in mes-oderm-derived mesenchyme. Sdf-1 has been shown tobe required for the migration of motor axons, cerebellarneurons and the trunk neural crest (Ma et al., 1998;Belmadani et al, 2005; Lieberam et al., 2005). This raisesthe interesting possibility that Sdf-1 signaling facilitatesdirectional migration of CNC cells from the dorsalneural tube to the branchial arch.
The gene encoding Xbp1—a basic region leucine zip-per protein in the CREB (cAMP response elementbinding) family of transcription factors—demonstratedhigher levels of expression in mesoderm-derived mes-enchyme. In Xenopus, overexpression of Xbp1 pro-duced a similar phenotype to ectopic activation ofBMP4 signaling. The Xbp1 protein was also found tobind BMP- and transforming growth factor b (TGFb)-responsive Smads as well as the BMP4 promoter itselfforming a regulatory loop with BMP4 (Cao et al.,
2006). Xbp1 may be a signaling hub that interacts withBMP4 and TGFb signaling during mouse orofacial de-velopment. The gene encoding the Rho-GTPase regu-lator, Centd3 (centaurin, delta 3), is an inhibitor of cellmigration (Stacey et al., 2004) and exhibited higher ex-pression in the mesoderm. The gene encoding Mesd(Mesdc2–mesodermal development candidate 2)exhibited higher expression in the neural crest-derivedmesenchyme but until recently did not have an ascribedfunction. Mesd has been newly identified as a chaperonefor members of the low-density lipoprotein receptor(LDLR) family, LRP5/6. DKK1 binding to LRP6 isabolished by the presence of excess Mesd demonstratingthat the latter antagonizes ligand binding to LRP6,thereby inhibiting Wnt signaling (Li et al., 2005). Thetumor necrosis factor signaling genes (Tnfrsf19 andTnfaip6; Pispa et al., 2003) exhibited higher expressionin the neural crest-derived mesenchyme.
Differentially expressed novel ESTs
Most of the differentially expressed ESTs detected inthe present study are described as hypothetical proteinsin existing databases such as Entrez Gene (http://www.ncbi.nlm.nih.gov/entrez/query). One EST, how-ever, RIKEN sequence 9430059P22 (GenBank acces-sion number NM145463), demonstrating higher
Table 4 Confirmation of genes differentially expressed in embryonic neural crest- and mesoderm-derived mesenchymal cells by TaqManQRT-PCR gene
Gene GenBank Microarray fold change1 QRT-PCR fold change2
Higher expression in neural crestCxcl4 NM019932 4.26 15.56Lix1 NM025681 1.79 1.74Msx1 NM010835 1.63 4.0Tcfap2c NM009335 2.43 2.2Tnfaip6 NM009398 1.68 3.2Tnfrsf19 NM013869 2.13 Amplified in neural crest only3
Higher expression in mesodermBmpr1 NM009758 1.75 7.56Cyp26a1 NM007811 2.27 13.9Nrp1 NM008737 1.88 9.18Phlda1 NM009344 2.5 2.6Sox17 NM011441 2.08 6.49Suv39h2 NM022724 2.0 3.89Tbx1 NM011532 3.34 4.7
1Microarray fold changes were calculated based on the average intensities in neural crest-derived mesenchyme versus the average intensitiesin mesoderm-derived mesenchyme. As sequences with higher expression in mesoderm-derived mesenchyme would have fold changeso1 bythis method, the reciprocal value is shown.2QRT-PCR fold changes were calculated from the Ct values. Ct values represent the number of cycles during the exponential phase ofamplification necessary to reach a predetermined threshold level of PCR product as measured by fluorescence. The more template presentat the start of a reaction, the fewer the cycles required to synthesize enough fluorescent product to be recorded as statistically abovebackground. For each gene, the difference in Ct values was obtained by subtraction of the mesoderm-derived cell cRNA sample Ct valuefrom neural crest-derived cell cRNA sample Ct value (for genes with higher expression in neural crest-derived mesenchyme), or vice versa(for genes with higher expression in mesoderm-derived mesenchyme). Subsequently, the fold amplification was calculated as the product of2 to the power of the Ct value difference (2n).3Fold change could not be calculated since there was no amplification of Tnfrsf19 from the mesoderm-derived mesenchyme sample,indicating that there is no detectable expression in this mesenchymal cell lineage.QRT-PCR, quantitative real-time polymerase chain reaction.
473
expression in mesoderm-derived mesenchyme of thefirst branchial arch, is the murine homolog of a novelsequence in Xenopus, termed Shisa. Shisa encodes aninhibitor of Wnt and fibroblast growth factor (FGF)(Yamamoto et al., 2005). Members of both the Wnt andFGF superfamilies are expressed and play critical rolesin cellular signaling during various aspects of craniofa-cial morphogenesis including development of structuresderived from the first branchial arch such as the tooth,lip and palate, maxilla, and mandible (Sarkar andSharpe, 1999; Warner et al., 2005a, 2005b; Lan et al.,2006, Nie et al., 2006).
Functional relationships between differentiallyexpressed genes
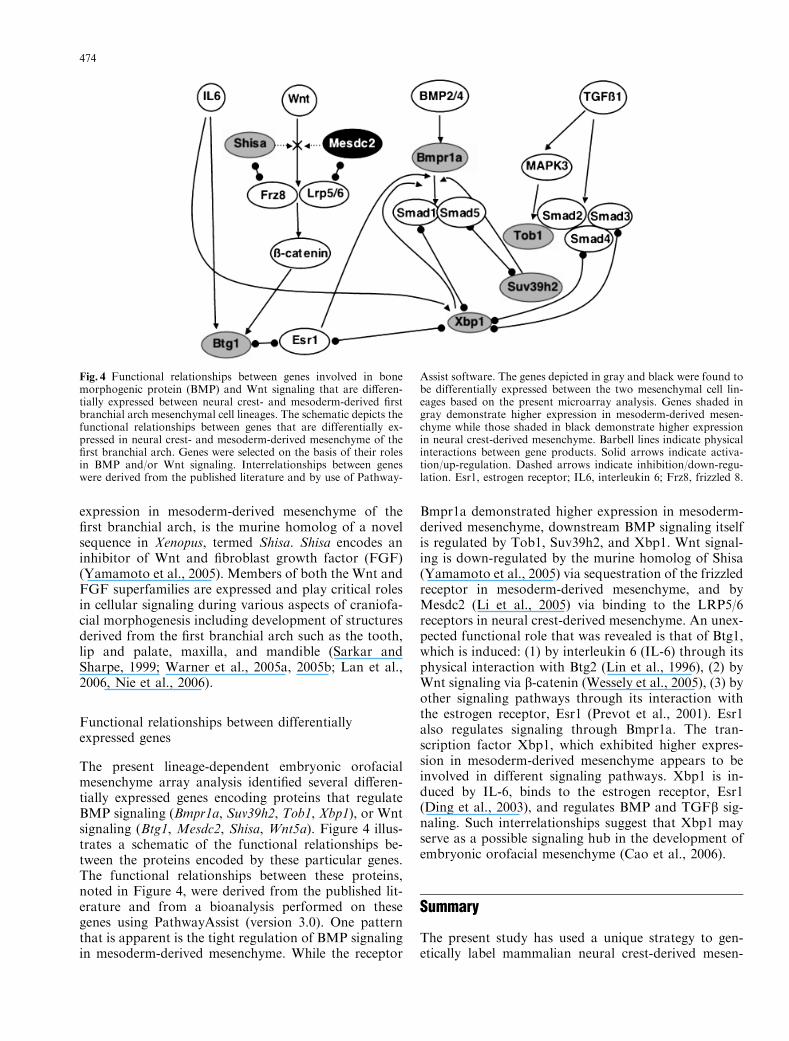
The present lineage-dependent embryonic orofacialmesenchyme array analysis identified several differen-tially expressed genes encoding proteins that regulateBMP signaling (Bmpr1a, Suv39h2, Tob1, Xbp1), or Wntsignaling (Btg1, Mesdc2, Shisa, Wnt5a). Figure 4 illus-trates a schematic of the functional relationships be-tween the proteins encoded by these particular genes.The functional relationships between these proteins,noted in Figure 4, were derived from the published lit-erature and from a bioanalysis performed on thesegenes using PathwayAssist (version 3.0). One patternthat is apparent is the tight regulation of BMP signalingin mesoderm-derived mesenchyme. While the receptor
Bmpr1a demonstrated higher expression in mesoderm-derived mesenchyme, downstream BMP signaling itselfis regulated by Tob1, Suv39h2, and Xbp1. Wnt signal-ing is down-regulated by the murine homolog of Shisa(Yamamoto et al., 2005) via sequestration of the frizzledreceptor in mesoderm-derived mesenchyme, and byMesdc2 (Li et al., 2005) via binding to the LRP5/6receptors in neural crest-derived mesenchyme. An unex-pected functional role that was revealed is that of Btg1,which is induced: (1) by interleukin 6 (IL-6) through itsphysical interaction with Btg2 (Lin et al., 1996), (2) byWnt signaling via b-catenin (Wessely et al., 2005), (3) byother signaling pathways through its interaction withthe estrogen receptor, Esr1 (Prevot et al., 2001). Esr1also regulates signaling through Bmpr1a. The tran-scription factor Xbp1, which exhibited higher expres-sion in mesoderm-derived mesenchyme appears to beinvolved in different signaling pathways. Xbp1 is in-duced by IL-6, binds to the estrogen receptor, Esr1(Ding et al., 2003), and regulates BMP and TGFb sig-naling. Such interrelationships suggest that Xbp1 mayserve as a possible signaling hub in the development ofembryonic orofacial mesenchyme (Cao et al., 2006).
Summary
The present study has used a unique strategy to gen-etically label mammalian neural crest-derived mesen-
Fig. 4 Functional relationships between genes involved in bonemorphogenic protein (BMP) and Wnt signaling that are differen-tially expressed between neural crest- and mesoderm-derived firstbranchial arch mesenchymal cell lineages. The schematic depicts thefunctional relationships between genes that are differentially ex-pressed in neural crest- and mesoderm-derived mesenchyme of thefirst branchial arch. Genes were selected on the basis of their rolesin BMP and/or Wnt signaling. Interrelationships between geneswere derived from the published literature and by use of Pathway-
Assist software. The genes depicted in gray and black were found tobe differentially expressed between the two mesenchymal cell lin-eages based on the present microarray analysis. Genes shaded ingray demonstrate higher expression in mesoderm-derived mesen-chyme while those shaded in black demonstrate higher expressionin neural crest-derived mesenchyme. Barbell lines indicate physicalinteractions between gene products. Solid arrows indicate activa-tion/up-regulation. Dashed arrows indicate inhibition/down-regu-lation. Esr1, estrogen receptor; IL6, interleukin 6; Frz8, frizzled 8.
474
chymal cells of the first branchial arch with a fluorescentmarker, selectively, and independently isolate the la-beled neural crest-derived and non-labeled mesoderm-derived cells of the first branchial arch by LCM, andprepare RNA from these cell populations for high den-sity gene expression analyses using oligo-based micro-arrays. Results of these lineage-dependent geneexpression-profiling analyses of embryonic orofacialmesenchyme identified several previously uncharacter-ized but differentially regulated genes and ESTs. Suchdifferential gene expression in mesoderm- and neuralcrest-derived mesenchyme warrants further investiga-tion owing to possible lineage-selective functions ofthese genes in early orofacial development. Furthercharacterization would necessitate identification of thegenes or the closest characterized murine homologs ofthese ESTs, followed by QRT-PCR analysis and in situhybridization of these novel sequences in mesoderm-and neural crest-derived embryonic orofacial tissue. Thepresent study also establishes the utility of LCM toisolate progenitor cell populations in the developingcraniofacial region in order to establish ‘‘molecular fin-gerprints’’ of key cell lineages. Such analyses could beexpanded to establish temporo-spatial ‘‘molecular finger-prints’’ of various cell lineages as they populate and giverise to defined structures of the craniofacial region. Suchmolecular-genomic lineage analyses offers the promise ofexpanding our understanding of the molecular complex-ities of cranial embryonic progenitor cells and revealingthe etiology of various craniofacial birth defects.
Acknowledgments We thank Dr. Andrew P. McMahon (Depart-ment of Molecular and Cellular Biology, Harvard University,Cambridge, MA) for provision of the Wnt1-Cre mice. This workwas supported in part by NIH Grants DE05550 and DE12858 toR. M. G., ES11775 to M.M. P., NIH Grant P20RR017702 from theCOBRE Program of the National Center for Research Resourcesand PHS Grant CCU420170 from the Centers for Disease Controland Prevention. J. T. P. is currently supported by NIH Grant K08DE014845. Additional support was provided by the Kentucky Sci-ence and Engineering Foundation and the Commonwealth of Ken-tucky Research Challenge Trust Fund.
References
Belmadani, A., Tran, P.B., Ren, D., Assimacopoulos, S., Grove,E.A. and Miller, R.J. (2005) The chemokine stromal cell-derivedfactor-1 regulates the migration of sensory neuron progenitors. JNeurosci 25:3995–4003.
Bhattacherjee, V., Mukhopadhyay, P., Singh, S., Roberts, E.A.,Hackmiller, R.C., Greene, R.M. and Pisano, M.M. (2004) Lasercapture microdissection of fluorescently labeled embryoniccranial neural crest cells. Genesis 39:58–64.
Bolstad, B., Irizarry, R., Astrand, M. and Speed, T. (2003) A com-parison of normalization methods for high density oligonucleo-tide array data based on variance and bias. Bioinformatics19:185–193.
Braganca, J., Eloranta, J.J., Bamforth, S.D., Ibbitt, J.C., Hurst,H.C. and Bhattacharya, S. (2003) Physical and functional inter-actions among AP-2 transcription factors, p300/CREB-bindingprotein, and CITED2. J Biol Chem 278:16021–16029.
Cao, Y., Knochel, S., Oswald, F., Donow, C., Zhao, H. andKnochel, W. (2006) XBP1 forms a regulatory loop with BMP-4and suppresses mesodermal and neural differentiation in Xenopusembryos. Mech Dev 123:84–96.
Chai, Y., Jiang, X., Ito, Y., Bringas, P. Jr., Han, J., Rowitch, D.H.,Soriano, P., McMahon, A.P. and Sucov, H.M. (2000) Fate of themammalian cranial neural crest during tooth and mandibularmorphogenesis. Development 127:1671–1679.
Chapman, D.L., Garvey, N., Hancock, S., Alexiou, M., Agulnik,S.I., Gibson-Brown, J.J., Cebra-Thomas, J., Bollag, R.J., Silver,L.M. and Papaioannou, V.E. (1996) Expression of the T-boxfamily genes, Tbx1–Tbx5, during early mouse development. DevDyn 206:379–390.
Couly, G.F., Coltey, P.M. and le Douarin, N.M. (1993) The tripleorigin of the skull in higher vertebrates: a study in chick-quailchimeras. Development 117:409–429.
Danielian, P.S., Muccino, D., Rowitch, D.H., Michael, S.K. andMcMahon, A.P. (1998) Modification of gene activity in mouseembryos in utero by a tamoxifen-inducible form of Cre-recom-binase. Curr Biol 98:1323–1326.
Davis, S., Miura, S., Hill, C., Mishina, Y. and Klingensmith, J.(2004) BMP receptor IA is required in the mammalian embryofor endodermal morphogenesis and ectodermal patterning. DevBiol 270:47–63.
Ding, L., Yan, J., Zhu, J., Zhong, H., Lu, Q., Wang, Z., Huang, C.and Ye, Q. (2003) Ligand-independent activation of estrogenreceptor alpha by XBP-1. Nucleic Acids Res 31:5266–5274.
Frontelo, P., Leader, J.E., Yoo, N., Potocki, A.C., Crawford, M.,Kulik, M. and Lechleider, R.J. (2004) Suv39h histone methyl-transferases interact with Smads and cooperate in BMP-inducedrepression. Oncogene 23:5242–5251.
Gerhardt, H., Ruhrberg, C., Abramsson, A., Fujisawa, H., Shima,D. and Betsholtz, C. (2004) Neuropilin-1 is required for endo-thelial tip cell guidance in the developing central nervous system.Dev Dyn 231:503–509.
Gu, C., Rodriguez, E.R., Reimert, D.V., Shu, T., Fritzsch, B., Ri-chards, L.J., Kolodkin, A.L. and Ginty, D.D. (2003) Neuropilin-1 conveys semaphorin and VEGF signaling during neural andcardiovascular development. Dev Cell 5:45–57.
Guo, Y., Chan, R., Ramsey, H., Li, W., Xie, X., Shelley, W.C.,Martinez-Barbera, J.P., Bort, B., Zaret, K., Yoder, M. and Hro-mas, R. (2003) The homeoprotein Hex is required for heman-gioblast differentiation. Blood 102:2428–2435.
Hall, B.K. (1999) The neural crest in development and evolution.Oxford University Press, London.
Hall, B.K. and Horstadius, S. (1988) The neural crest. OxfordUniversity Press, London.
Han, J., Ito, Y., Yeo, J.Y., Sucov, H.M., Maas, R. and Chai, Y.(2003) Cranial neural crest-derived mesenchymal proliferation isregulated by Msx1-mediated p19(INK4d) expression duringodontogenesis. Dev Biol 261:183–196.
Hayashi, K., Ohshima, T. and Mikoshiba, K. (2002) Pak1 is in-volved in dendrite initiation as a downstream effector of Rac1 incortical neurons. Mol Cell Neurosci 20:579–594.
Hossain, G.S., van Thienen, J.V., Werstuck, G.H., Zhou, J., Sood,S.K., Dickhout, J.G., de Koning, A.B., Tang, D., Wu, D., Falk, E.,Poddar, R., Jacobsen, D.W., Zhang, K., Kaufman, R.J. and Aus-tin, R.C. (2003) TDAG51 is induced by homocysteine, promotesdetachment-mediated programmed cell death, and contributesto the development of atherosclerosis in hyperhomocysteinemia.J Biol Chem 278:30317–30327.
Hosaka, T., Biggs, W.H. III, Tieu, D., Boyer, A.D., Varki, N.M.,Cavenee, W.K. and Arden, K.C. (2004) Disruption of forkheadtranscription factor (FOXO) family members in mice revealstheir functional diversification. Proc Natl Acad Sci USA101:2975–2980.
Hu, M.C., Lee, D.F., Xia, W., Golfman, L.S., Ou-Yang, F., Yang,J.Y., Zou, Y., Bao, S., Hanada, N., Saso, H., Kobayashi, R. andHung, M.C. (2004) I-kappa-B kinase promotes tumorigenesisthrough inhibition of forkhead FOXO3a. Cell 117:225–237.
475
Irizarry, R.A., Hobbs, B., Collin, F., Beazer-Barclay, Y.D., An-tonellis, K.J., Scherf, U. and Speed, T.P. (2003) Exploration,normalization and summaries of high density oligonucleotidearray probe level data. Biostatistics 4:249–264.
Jacobson, A.G. (1993) Somitomeres: mesodermal segments in thehead and trunk. In: Hanken, J. and Hall, B. eds. The vertebrateskull. Vol. 1, University of Chicago press, Chicago, pp. 42–76.
Jiang, X., Iseki, S., Maxson, R.E., Sucov, H.M. and Morriss-Kay,G.M. (2002) Tissue origins and interactions in the mammalianskull vault. Dev Biol 241:106–116.
Kanai-Azuma, M., Kanai, Y., Gad, J.M., Tajima, Y., Taya, C.,Kurohmaru, M., Sanai, Y., Yonekawa, H., Yazaki, K., Tam,P.P. and Hayashi, Y. (2002) Depletion of definitive gut endodermin Sox17-null mutant mice. Development 129:2367–2379.
Kontges, G. and Lumsden, A. (1996) Rhombencephalic neuralcrest segmentation is preserved throughout craniofacialontogeny. Development 122:3229–3242.
Lan, Y., Ryan, R.C., Zunyi Zhang, Z., Bullard S, A., Bush, J.O.,Maltby, K.M., Lidral, A.C. and Jiang, R. (2006) Expression ofWnt9b and activation of canonical Wnt signaling during midfa-cial morphogenesis in mice. Dev Dyn 235:1448–1454.
Le Douarin, N.M. and Kalcheim, C. (1999) The neural crest. 2ndedn. Cambridge University Press, Cambridge.
Li, Y., Chen, J., Lu, W., McCormick, L.M., Wang, J. and Bu, G.(2005) Mesd binds to mature LDL-receptor protein-6 and an-tagonizes ligand binding. J Cell Sci 118:5305–5314.
Lieberam, I., Agalliu, D., Nagasawa, T., Ericson, J. and Jessell,T.M. (2005) A Cxcl12-Cxcr4 chemokine signaling pathway de-fines the initial trajectory of mammalian motor axons. Neuron47:667–679.
Lin, W.J., Gary, J.D., Yang, M.C., Clarke, S. and Herschman,H.R. (1996) The mammalian immediate-early TIS21 proteinand the leukemia-associated BTG1 protein interact with aprotein-arginine N-methyltransferase. J Biol Chem 271:15034–15044.
Lu, J.R., Bassel-Duby, R., Hawkins, A., Chang, P., Valdez, R.,Wu, H., Gan, L., Shelton, J.M., Richardson, J.A. and Olson,E.N. (2002) Control of facial muscle development by MyoR andcapsulin. Science 298:2378–2381.
Lumsden, A., Sprawson, N. and Graham, A. (1991) Segmental or-igin and migration of neural crest cells in the hindbrain region ofthe chick embryo. Development 113:1281–1291.
Ma, Q., Jones, D., Borghesani, P.R., Segal, R.A., Nagasawa, T.,Kishimoto, T., Bronson, R.T. and Springer, T.A. (1998) Im-paired B-lymphopoiesis, myelopoiesis, and derailed cerebellarneuron migration in CXCR4- and SDF-1-deficient mice. ProcNatl Acad Sci USA 95:9448–9453.
Mitsiadis, T.A., Angeli, I., James, C., Lendahl, U. and Sharpe, P.T.(2003) Role of Islet1 in the patterning of murine dentition.Development 130:4451–4460.
Meier, S. (1979) Development of the chick mesoblast. Formation ofthe embryonic axis and the establishment of the metameric pat-tern. Dev Biol 38:73–90.
Meier, S. and Tam, P.P.L. (1982) Metameric pattern developmentin the embryonic axis of the mouse I. Differentiation of the cra-nial segments. Differentiation 21:95–108.
Moeller, C., Yaylaoglu, M.B., Alvarez-Bolado, G., Thaller, C. andEichele, G. (2002) Murine Lix1, a novel marker for substantianigra, cortical layer 5, and hindbrain structures. Brain Res GeneExpr Patterns 1:199–203.
Mustonen, T., Tummers, M., Mikami, T., Itoh, N., Zhang, N.,Gridley, T. and Thesleff, I. (2002) Lunatic fringe, FGF, and BMPregulate the Notch pathway during epithelial morphogenesis ofteeth. Dev Biol 248:281–293.
Nagasawa, T., Kikutani, H. and Kishimoto, T. (1994) Molecularcloning and structure of a pre-B-cell growth-stimulating factor.Proc Natl Acad Sci USA 91:2305–2309.
Nie, X., Luukko, K. and Kettunen, P. (2006) FGF signalling incraniofacial development and developmental disorders. Oral Dis12:102–111.
Noden, D.M. (1988) Interactions and fates of avian neural cranio-facial mesenchyme. Development. 103 (Suppl.):121–140.
Noden, D.M. and Trainor, P.A. (2005) Relations and interactionsbetween cranial mesoderm and neural crest populations. J Anat207:575–601.
Novak, A., Guo, C., Yang, W., Nagy, A. and Lobe, C.G. (2000) Z/EG, a double reporter mouse line that expresses enhanced greenfluorescent protein upon Cre-mediated excision. Genesis 28:147–155.
Ooshio, T., Irie, K., Morimoto, K., Fukuhara, A., Imai, T. andTakai, Y. (2004) Involvement of LMO7 in the association of twocell-cell adhesion molecules, nectin and E-cadherin, through afa-din and alpha-actinin in epithelial cells. J Biol Chem 279:31365–31373.
Phillips, J. and Eberwine, J.H. (1996) Antisense RNA amplifica-tion: a linear amplification method for analyzing the mRNApopulation from single living cells. Methods 10:283–288.
Pispa, J., Mikkola, M.L., Mustonen, T. and Thesleff, I. (2003) Ec-todysplasin, Edar and TNFRSF19 are expressed in complemen-tary and overlapping patterns during mouse embryogenesis.Gene Expr Patterns 3:675–679.
Prevot, D., Morel, A.P., Voeltzel, T., Rostan, M.C., Rimokh, R.,Magaud, J.P. and Corbo, L. (2001) Relationships of the anti-proliferative proteins BTG1 and BTG2 with CAF1, the humanhomolog of a component of the yeast CCR4 transcriptionalcomplex: involvement in estrogen receptor alpha signaling path-way. J Biol Chem 276:9640–9648.
Reddy, S., Andl, T., Bagasra, A., Lu, M.M., Epstein, D.J., Mor-risey, E.E. and Millar, S.E. (2001) Characterization of Wnt geneexpression in developing and postnatal hair follicles and identi-fication of Wnt5a as a target of Sonic hedgehog in hair folliclemorphogenesis. Mech Dev 107:69–82.
St Croix, C.M., Wasserloos, K.J., Dineley, K.E., Reynolds, I.J.,Levitan, E.S. and Pitt, B.R. (2002) Nitric oxide-induced changesin intracellular zinc homeostasis are mediated by metallothio-nein/thionein. Am J Physiol Lung Cell Mol Physiol 282:185–192.
Sakai, Y., Luo, T., McCaffery, P., Hamada, H. and Drager, U.C.(2004) CYP26A1 and CYP26C1 cooperate in degrading retinoicacid within the equatorial retina during later eye development.Dev Biol 276:143–157.
Sarkar, L. and Sharpe, P.T. (1999) Expression of Wnt signallingpathway genes during tooth development. Mech Dev 85:197–200.
Serbedzija, G.N., Bronner-Fraser, M. and Fraser, S.E. (1992) Vitaldye analysis of cranial neural crest cell migration in the mouseembryo. Development 116:297–307.
Singh, S., Bhattacherjee, V., Mukhopadhyay, P., Worth, C.A.,Wellhausen, S.R., Warner, C.P., Greene, R.M. and Pisano,M.M. (2005) Fluorescence-activated cell sorting of EGFP-la-beled neural crest cells from murine embryonic craniofacial tis-sue. J Biomed Biotechnol 2005:232–237.
Stacey, T.T., Nie, Z., Stewart, A., Najdovska, M., Hall, N.E., He,H., Randazzo, P.A. and Lock, P. (2004) ARAP3 is transientlytyrosine phosphorylated in cells attaching to fibronectin and in-hibits cell spreading in a RhoGAP-dependent manner. J Cell Sci117:6071–6084.
Sulpice, E., Contreres, J.O., Lacour, J., Bryckaert, M. and Tobe-lem, G. (2004) Platelet factor 4 disrupts the intracellular signal-ling cascade induced by vascular endothelial growth factor byboth KDR dependent and independent mechanisms. Eur J Bio-chem 271:3310–3318.
Tam, P.P.L. and Meier, S. (1982) The establishment of a somito-meric pattern in the mesoderm of the gastrulating mouse embryo.Am J Anat 164:209–225.
Tam, P.P. and Trainor, P.A. (1994) Specification and segmenta-tion of the paraxial mesoderm. Anat Embryol (Berl) 189:275–305.
Theiler, K. (1989) The house mouse. Springer-Verlag, Amsterdam.Trainor, P.A. and Tam, P.P.L. (1995) Cranial paraxial mesodermand neural crest cells of the mouse embryo: co-distribution in the
476
craniofacial mesenchyme but distinct segregation in the branchialarches. Development 121:2569–2582.
Trainor, P.A., Tan, S-S. and Tam, P.P.L. (1994) Cranial paraxialmesoderm: regionalisation of cell fate and impact on craniofacialdevelopment in mouse embryos. Development 120:2397–2408.
Tzahor, E., Kempf, H., Mootoosamy, R.C, Poon, A.C., Abzhanov,A., Tabin, C.J., Dietrich, S. and Lassar, A.B. (2003) Antagonistsof Wnt and BMP signaling promote the formation of vertebratehead muscle. Genes Dev 17:3087–3099.
Wang, X.P., Suomalainen, M., Jorgez, C.J., Matzuk, M.M., Wan-kell, M., Werner, S. and Thesleff, I. (2004) Modulation of ac-tivin/bone morphogenetic protein signaling by follistatin isrequired for the morphogenesis of mouse molar teeth. DevDyn 231:98–108.
Warner, D.R., Greene, R.M. and Pisano, M.M. (2005a) Interactionbetween Smad 3 and Dishevelled in murine embryonic cranio-facial mesenchymal cells. Orthodont Craniofac Res 8:123–130.
Warner, D.R., Greene, R.M. and Pisano, M.M. (2005b) Cross-talkbetween the TGFbeta and Wnt signaling pathways in murineembryonic maxillary mesenchymal cells. FEBS Lett 579:3539–3546.
Werling, U. and Schorle, H. (2002) Transcription factor gene AP-2gamma essential for early murine development. Mol Cell Biol22:3149–3156.
Wessely, O., Kim, J.I., Trana, U., Fuentealba, L. and De Robertis,E.M. (2005) xBtg-x regulates Wnt/b-Catenin signaling duringearly Xenopus development. Dev Biol 283:17–28.
Yamamoto, A., Nagano, T., Takehara, S., Hibi, M. and Aizawa, S.(2005) Shisa promotes head formation through the inhibition ofreceptor protein maturation for the caudalizing factors, Wnt andFGF. Cell 120:223–235.
Yoshida, Y., Tanaka, S., Umemori, H., Minowa, O., Usui, M.,Ikematsu, N., Hosoda, E., Imamura, T., Kuno, J., Yamashita,T., Miyazono, K., Noda, M., Noda, T. and Yamamoto, T.(2000) Negative regulation of BMP/Smad signaling by Tob inosteoblasts. Cell 103:1085–1097.
Zhang, H., Palmer, R., Gao, X., Kreidberg, J., Gerald, W., Hsiao,L., Jensen, R.V., Gullans, S.R. and Haber, D.A. (2003) Tran-scriptional activation of placental growth factor by the forkhead/winged helix transcription factor FoxD1. Curr Biol 13:1625–1629.
477


![The chevalier of the splendid crest [microform]](https://img.pdfslide.net/doc/110x75/631dbc1d1aedb9cd850f6db6/the-chevalier-of-the-splendid-crest-microform.jpg)


