Embed Size (px)
Citation preview

NOTE TO USER
Page not included in the original manuscript are unavailable from the author or university. The
manuscript was microfilmed as received.
This is reproduction is the best copy available

Structures, thermochemistry, and dynamics of negative gas phase
cluster ions studied by pulsed-ionization high pressure rnass
spectrometry and computational quantum chemistry techniques
Bogdan Bogdanov
A thesis
presented to the University of Waterloo
in filfilment of the
thesis requirement for the degree of
Doctor of Philosophy
in
Chemistry
Waterloo, Ontario, Canada, 200 1
O Bogdan Bogdanov 200 1

National Library I*I of Canada Bibliothèque nationale du Canada
Acquisitions and Acquisitions et Bibliographic Services services bibliographiques 395 Wellington Street 395. rue Wellington Ottawa ON K1A O N 4 Ottawa ON K 1 A ON4 Canada Canada
The author has granted a non- L'auteur a accordé une licence non exclusive licence dowing the exclusive permettant a la National Library of Canada to Bibliothèque nationale du Canada de reproduce, loan, distnibute or seli reproduire, prêter, distIibuer ou copies of this thesis in microform, vendre des copies de cette thèse sous paper or electronic formats. la forme de microfiche/nlm, de
reproduction sur papier ou sur format électronique.
The author retains ownership of the L'auteur conserve la propriété du copyright in this thesis. Neither the droit d' auteur qui protège cette thèse. thesis nor substantial extracts fkom it Ni la thèse ni des extraits substantiels may be printed or otherwise de celle-ci ne doivent être imprimés reproduced without the author's ou autrement reproduits sans son permission. autorisation.

The University of Waterloo requires the signatures of al1 persons using or
photocopying this thesis. Please sign below, and give address and date.
Abstract
The interactions between halide ions and a variety of organic molecules have been
investigated using pulsed-ionization high pressure mass spectrometry (PHPMS), and a
variety of oh inirio, density functional theory (DFT), and composite quantum chemistry
methods. The organic substrates include alcohols, alkyl halides, trifluoromethyl halides,
and fluorinated ether and acetones. The computations were performed to get more insight
into the structures of the ion-molecule complexes and transition states, to mode1 the
experi mental thermochemistry and IR characteristics of neutrals and ion-molecule
complexes, and to obtain information on the potential energy surfaces for some reactions.
The standard enthalpy (AH*) and entropy (AS? changes associated with the formation
of the halide ion-alcohol complexes, X(ROH), (X = F, CI, Br, 1; R = CH3, CH~CHZ,
(CH&CH, (CH3)3C; n = 1 , 2, 3), show that observed trends are mainly due to the radius
of the halide ion, the alcohol polarizability, and the dipole-dipole repulsion and steric
interactions when X, R and n are the different variables, respectively. The AH' and AS'
values obtained from the PHPMS experiments could be modeled accurately by
computations at the MP2(fÙ11)/6-3 1 I ++G(d,p)//B3LYP/6-3 1 1 +G(d,p) level of theory. In
addition, scaled MP2(fÙ11)/6-31 l++G(d,p) and B3LYP16-311+G(d,p) normal mode
vibrational fiequencies were in good agreement with the limited arnount of results
obtained b y others fiom vibrational predissociation spectroscopy (WDS) expenments.
Experimental kinetic data and computations show that the formation of the Cl'(HOCH3)
complex proceeds through a more complex mechanism than initially expected.
For a series of solvated Sy2 complexes, (S)X(RY) (X, Y = Cl, Br; R = (CH&CH; S =
CH30H, CH3CN, (CH&CO, CH3CF2H), the AH0 and AS* values associated with their
formation were detennined using PHPMS and solvent effects were observed. In addition,
ob bzitio computations on a series of solvated SN2 reactions confirm solvent effects on the
energetics of these micro-solvated systems, as well as different binding charactenstics in
the solvated Su2 complexes and transition states, indicating solvent reorganization.
Nucleophilic displacement reactions between halide ions and trifluoromethyl halides
proceed through a back-side attack SN^ mechanism. while complex formation proceeds
t hrough a front-side attack mechanism. For the Cl-(BrCF3), CI-(ICF3), and Bi(BrCF3)
complexes the AH" and ASO values associated with their formation were determined by
PHPMS. Good to excellent agreement was obtained with results fiom calculations at the
B3 LYP/6-3 1 1 +G(3df)/B'iLYP/6-3 1 1 +G(d) level of theory. The SN2 reaction proceeds
through a direct mechanism and is initiated by electron transfer. Results from potential
energy surface computations indicate that at ion kinetic energies above the threshold the
reaction can take place without going through the [XCF3Y]- transition state. Simulated
cross sections show qualitative agreement with results obtained from FT-KR
experiments.
The thermochernistry measured by PHPMS for the formation of a series of chloride
ion-fluorinated ether and acetone chsters shows the distinct influence of the number of
fluorine atoms and the substitution pattern. Insights into the structures and
t hermochernistry was obtained from computations at the MP2/[6-3 1 1 ++G(3df 3dp)l
6-3 1 1 +G(2df,p)]//MP2/[6-3 1 +G(d)/6-3 1 G(d) level of theory. In general, excellent
agreement was obtained. Formation of the CI-(CF2HOCF2H), CI-(CF3C(0)CF2H), and
the Cl-(CF3C(0)CF3) complexes gave rise to large negative ASO values, indicating
hindrance of the methyl group rotations. The G3(MP2) was successfiilly applied to
reproduce experimental deprotonation enthalpy changes, ~ ~ ~ ~ ~ " 2 9 8 , accurately for a large
series of (in)organic acids. Finaliy, new Fourier-transfomi infrared (FT-IR) spectra of
fluoroacetone and pentafluoroacetone were recorded, while computations at the
HH6-3 IG(d) and B3LYP/6-3 1 l++G(3d,3p) levels of theory were used to mode1 the IR
spectra of a series of fluorinated acetones.
Acknowledgemen ts
AAer a little bit more than five years of graduate school 1 have almost corne to the
end of a period in my life where I have spend most of my time in schools. Looking back
it almost seems iike yesterday when my parents took me for my first school day. Overall
those years have been usefid, interesting, and fin, but long. Fortunately, learning and
teaching wi t 1 not stop once 1 will leave the school world to enter the "real" world.
1 would like to thank Professor T. B. McMahon for giving me the opportunity to
corne to Canada to continue my scientific training by doing research in an interesting
field of chemistry. Also thank you Teny for your trust in my capabilities, for the
encouragements when 1 was uncertain if things were OK, for nominating me for awards,
for the many small hints, for corrections made to this thesis and the manuscripts that
made them better, and the many great dinner parties and interesting non-scientific talks.
Also thanks to my Ph-D. Advisory Committee members Professors M. Barra, W. P.
Power, and A. L. Schwan for listening to me once a year and for reading my (morbidly
obese) thesis.
Without financial assistance fi-om the University of Waterloo and the Department of
Chemistry 1 could not have started and continued my graduate studies, especially when 1
was still an international student, neither have aîtended various conferences that have
been a very usehl part of my scientific training.
1 would like to thank my family for their constant love, support and trust, and for
providing me with a solid base in life fiom which it is easy to explore and develop. We
have always been so close, but by being far away for a while we have even become
closer. 1 hope we will spend many more years together.
Also thanks to my relatives, friends, and ex-colleagues for their support and interest
during my stay here.
1 have been extremely fonunate to have met many very nice people in and outside of
the University of Waterloo over the years that I have been here. Al1 of them have
contnbuted in their own unique way to my whole experience. First and most of al1 I

would like t o thank Ms. Dorothy Sherk and Ms. Mavis Skelton for havins given me a
home away from home. Your love, tindness, friendship, support, wisdom, and so much
more have been just wonderful, not just to me o r rny family, but to so many people. Also
many thanks to Harvey and Gladys Stickley, and Kathleen Sherk for the time when they
were in Vermont Street. May God Hess you now and forever. 1 would to thank my initial
"shadow student" Helen for giving me a smooth start when I came here, and for her
advice and friendship. Without you my stay would have been so much different. Also
many thanks to Cor and Tine AmbacI- i i sk î for ~ h e nice visits and lunches, and for
helping me being a little bit less poor. To al1 of you 1 did not mention, thank you and 1
know and wilf not forçet you and your contributions.
1 would also like to thank my (ex-) colleagues in the lab for their contributions to the
friendly atrnosphere, and for help and advice: Eugene, Feng, Graham, Guillaume, Kion,
Jackie, Jan, J e K Jon, Mahmoud, Michael, Pauline, Sasha, Scott, Steven, Tanya, Tiffany,
Tim, and Travi S.
Special thanks to Kion, who was my office mate for over one year in total, and during
those periods 1 had the most fun of my whole stay here in the lab. Also thank you for
introducing me to the wonderfül world o f Gaussian. In addition, the numerous afiemoon
patio visits, and visits to the Grad House, movies, The Huether, The Fox, Failte, and so
on were always fun and interesting. You are one of the few people 1 have met with a tme
passion for quality and science. and 1 hope you can enjoy the latter one unti1 you retire.
Skaal and have a beer and G&T on me!
Dave Bowen and Dave Rieder from the Science Shop, and Sander Mommers have
been very helpfùl during the hardest penod o f my stay here, when the 8-80 provided me
with lots of frustration and no signals and data, but also with an opportunity to learn new
things that have given me a new look on chemistry and gas phase ion chemistry.
Colin Campbell o f IST has been on numerous occasions a tremendous help when 1
had Mathcad problems.
Without the help o f Professor R. J. LeRoy, Greg Clark, Doug Weir, and Michael
Miao no Gaussian computations could have been performed on Watsci, Scienide, and
Isenguard.
Dustin Dickens is thanked for his helped with recording the FT-IR spectra of the
fluorinated acetones in Chapter 7.
1 would Iike to thank Dozia, Steve, and Carey, and the many students for their
contributions to making being a chemistry TA a pleasant and valuable experience. 1 never
could have imagined that 1 would ever be a Dutch TA or Zwarte Piet. Thank you Dr.
Zweers (Sander) and Geertje for giving me the unique opportunity to help many students
with learning my native language. In addition, 1 would like to thank Dr. Zweers for given
me the opportunity to becorne more cultured by the visits to the Concertgebouw Orkest
and Stratford Festival performances, and for keeping my Dutch taste by visiting the
Toko.
Toni thanks a lot for al1 Our talks about soccer. politics, Europe, and so on. 1 will miss
looking for news and making prints for you.
1 would like to thank Professors J. D. Goddard and F. TureCek, and Drs. Y. Okuno
and T. Sslling (Theis) for giving me valuable advice to nin certain types of computations.
Without the help, advice, and support of Professor N. M. M. Nibbering (Nico) and
Drs. J. C. KIeingeld (Jan) and H. E. K. Matimba (Henri) 1 never would have come here.
1 would tike to thank Professor S. Hammerum and Dr. S. Ingemann (Steen) for
having me participate in their fluorophenol and anis01 project.
It is also time to acknowledge al1 the good and inspiring teachers 1 had and
fortunately 1 have already known for a long time how fortunate 1 have been in that
respect. Thank you. 1 have tried hard to be a good teacher myself as 1 have tned to be a
good student.
Thanks to al1 my (ex-) roornmates who have made my stay when 1 was not in the
office or lab nice, interesting, and memorable.
Thank you Martina for giving me the initial inspiration and courage to do what 1 have
done, and 1 hope 1 have given you the same to follow your dreams. Hab ein schones
Leben.
Also thanks to the inventors of the telephone, e-mail, Internet, and Gaussian. Wit hout
them my stay would have been lonelier and less interesting, and my thesis a lot thinner
and more blah blah blah.
Last. but not Ieast. 1 would like to thank my dearest Jen for al1 her help and support.
Your love and friendship have given me new energy, courage, creativity, motivation. and
hope to finish this project in time and with pride and joy.
AAer acknowledging a lot of other people, it is also time to acknowledge myself To
date 1 have not seen any thesis where this was done. It is time to say that 1 am proud of
what 1 have accomplished, not only scientifically, but most of al1 a s a person. Very few
decisions in a life may be made with 100% certainty. This has not been one of them. But
1 think it has been a good one, despite that I had to sacrifice other things that are and/or
were very dear to me. Since 1 have been here 1 have worked in a very dedicated and
consistent manner, always trying to look for something more interesting and pushing
myself. At least 1 know that 1 want to be a chemist, and being a physical chemist for a
while has made me a better chemist. It is a pity that some o f the ideas that 1 got at the end
of rny thesis could not be explored by me, but 1 am already happy that 1 got the ideas. 1
am also glad that 1 have made time and spent money to d o al1 kinds of other things like
sports, travelling, movies, getting my driver's license, and enjoying al1 kinds of bigger
and smaller things. I d o not want to deny that there have also been many moments of
doubt about my capability, about being here, about what 1 really want, about where 1
want to be, about what else 1 could have been, about how 1 could have used this time
learning other things instead of focussing more and more on less and less. At least this
whole experience has not made me bitter and 1 know that years frorn now a smile will
appear when 1 think o f the time 1 have spent here.
1 had some realistic expectations that could not be fulfilled due to circumstances
beyond rny control, but the ttue joy came fiom the unexpected things and people that
came into my life. In addition, it brought me back in touch with the younger me, and
closer to both my cultural backgrounds. Finally, it got many times confirmed that the
unconditional love my parents gave/give me is one o f the most important and most
beautifil things in a person's Iife. Thank you!

To my parents
Aan mijn ouders
M o j e ~ P O ~ N T ~ J ~ H M ~
Table of Contents
Abstract
Acknowledgements
Table of Contents
List of Tables
List of Illustrations
List o f Abbreviations
Chapter 1 Introduction
1 .1 Gas Phase Cluster Ions
1 .1 .1 Generation
1.1.2 Structures
1.1.3 Reactivity
1.2 Ion Solvation
1.2. I Condensed Phase
1.2.2 Gas Phase
1 Ion Thermochemistry
1.3.1 Definitions
1.3.2 Methods
1.3-2.1 Equilibnum Reactions
1.3.2.2 Threshold CID
1 -3.2.3 Light Induced Reactions
1 -3.2.4 Kinetic Method
1.4 Uni- and Bimolecular Gas Phase Ion-Molecule Reactions
1.4.1 RRKMTheory
1.4.2 AD0 Theory
1 .5 Ion Spectroscopy
1.6 Scope of Thesis
1 .7 References
xvii
xxvii
xlvii
Chapter 2 Experimental
2.1 Pulsed-ionization High Pressure Mass Spectrometry
2.2 Pulsed-ionization High Pressure Mass Spectrometer
2.3 Ion and Cluster Ion Formation
2.4 References
Chapter 3 Computational methods
3.1 Introduction
3.2 Hartree-Fock
3.3 MP2
3.4 B3LYP
3.5 Composite Methods
3.6 Basis Sets
3.7 Geometry Optimizations
3.8 Normal Mode Vibrational Frequencies and IR Intensities
3.9 Thermochemistry
3.10 NPACharge
3.1 1 Software and Hardware
3.12 References
Chapter 4 Structures, thermochemistry, dynamics, and spectroscopy of halide
ion and bihatide ion-alcohol clusters in the gas phase
4.1 Introduction
4.2 Experimental
4.3 Cornputational
4.4 Results and Discussion
4.4.1 Experimental Therrnochemistry
4.4.2 Cornputational Therrnochemistry
4 -4.3 Computations versu s Experiments
4.4.4 Other Cornputational Work
4.4.5 Structures
4.4.6 Natural Population Anal ysis Charges versus
Thermochemistry
4.4.7 Kinetics of Complex Formation
4.4.8 Vibrat ional Frequencies
4.4.9 Vibrational Frequencies versus Thermochemistry
4.4.1 0 Potential Energy Surfaces
4.5 Conclusions
4.6 References and Notes
Chapter 5 Thermochemistry and structures of solvated SN^ complexes and
transition states in the gas phase 132
5.1 Introduction 132
5.2 Experimental 139
5.3 Computational 141
5.4 Results and Discussion 142
5.4.1 Structures 142
5.4.2 Experimental Thermochemistry 157
5 -4.3 Computational Thermochemistry 167
5.4.4 Potential Energy Surfaces 180
5.5 Conclusions 183
5.6 References and Notes 184
Chapter 6 Gas phase Sy2 reactions of halide ions and trifluoromethyl halides:
front- and backside attack versus complex formation 189
6.1 Introduction 189
6.2 Experimental 196
6.3 Computational 197
6.4 Results and Discussion 198
6.4.1 Structures 198
6.4.2 Experimental and Computational Thermochemistry 2 10
6.4.3 Normal Mode Vi brational Frequencies 23 1
6.4.4 Natural Population Analysis Charges 233
6.4.5 Potential Energy Surfaces 234
6.5 Conclusions 246
6.6 References 247
Chapter 7 Thermochemistry, structures, dynamics, and infrared spectroscopy
of chloride ion-fluorinated ether and acetone complexes and neutrals
in the gas phase
7.1 Introduction
7.2 Experimental
7.3 Cornputational
7.4 Resufts and Discussion
7.4.1 Structures
7.4.2 Experimental Therrnochemistry
7.4.3 Cornputational Therrnochemistry
7.4.4 Experiment versus Computations
7.4.5 Gas Phase Acidit ies of Fluorinated Acetones
7.4.6 Vibrational Frequencies of Fluorinated Acetones
7.4.7 Rotational Barriers
7.4.8 Natural Population Analysis Charges
7.4.9 Potent ial Energy Surfaces
7.5 Conc~usions
7.6 References
Chapter 8 Conclusions
Appendix A Electronic Energies
Table Al
Table A2
Table A3
xiv
TabIe A4
TabIe AS
Table A6
Table A7
Table A8
Table A9
Table A 1 O
Table A l 1
Table A 12
Table A 13
Table A 14
Table A 15
Table A 16
Table A 1 7
Table A 18
Table A 19
Appendix B Gaussian Input Files
B 1 Frequency Calculation
B2 Transition State Calculation
B3 ECP Calculation
B4 Scan Calculation
Appendix C Simulated IR spectra
C l CH30H
C2 F(CH30H)
C3 Cl-(CH30H)
C4 Br-(CH30H)
C5 r(CH3OH)
C6 (CH30H)F(CH3OH)
C7 F(CH30H)(CH30H)
xvi
List of Tables
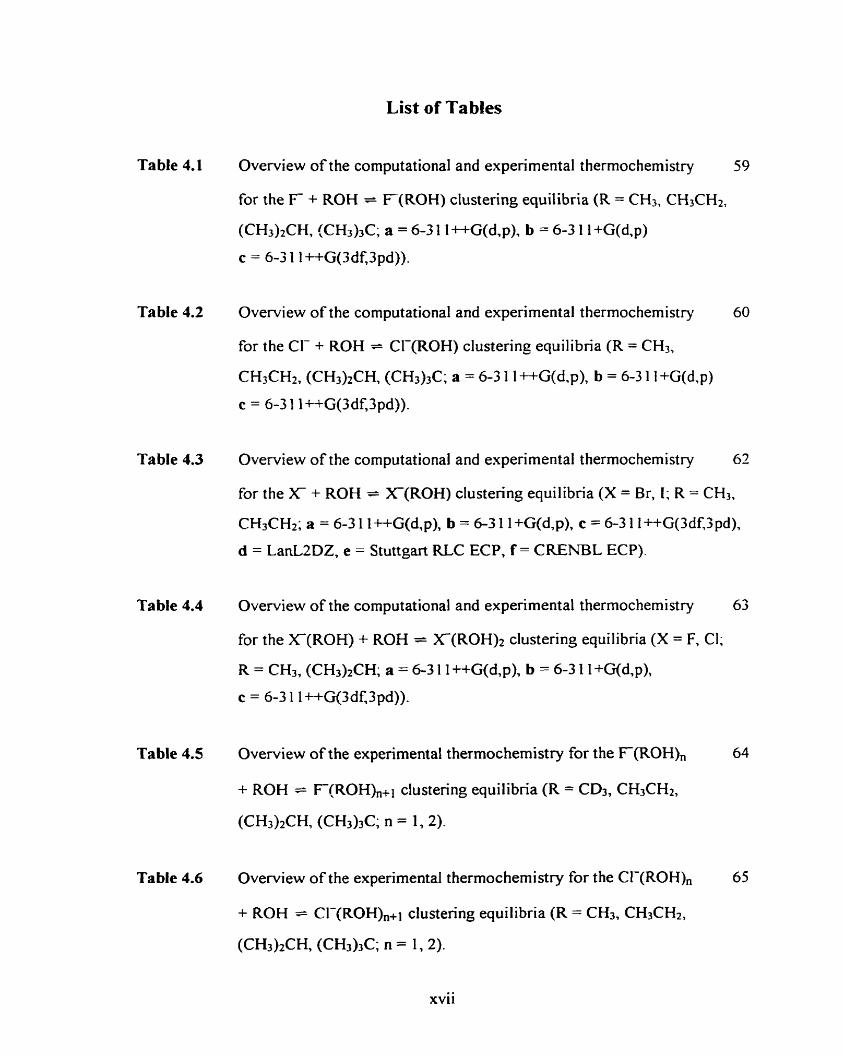
Table 4.1 Overview of the computational and experimental thermochemistry 59
for the F + ROH = F ( R 0 H ) clustering equilibria (R = CH3, CH3CH2,
(CH&CH, <CH3)3C; a = 6-3 1 1 ++G(d,p), b = 6-3 1 1 +G(d,p)
c = 6-3 1 1 ++G(3df,3pd)).
Table 4.2 Overview of the computational and experimental thermochemistry 60
for the Cl- + ROH = Cl-(ROH) clustering equilibria (R = CH3,
CH3CH2, (CH3)2CH, (CH3)3C; a = 6-3 1 1 ++G(d,p), b = 6-3 1 1 +G(d,p)
c = 6-3 1 l++G(3df,3pd)).
Table 4.3 Overview of the computational and experimental thermochemistry 62
for the X + ROH = X(R0H) clustering equilibria (X = Br, 1; R = CH3,
CH3CH2; a = 6-3 1 1 ++G(d,p), b = 6-3 1 1 +G(d,p), c = 6-3 1 1 ++G(3df3 pd),
d = LanL2DZ, e = Stuttgart RLC ECP, f = CRENBL ECP).
Table 4.4 Overview of the computational and experirnental thermochemi st ry 63
for the X ( R 0 H ) + ROH = X(ROH)* clustering equilibria (X = F, CI;
R = CH3, (CH3)2CH; a = 6-3 1 l++G(d,p), b = 6-3 1 l+G(d,p),
c = 6-3 1 1 ++G(3df,3pd)).
Table 4.5 Overview of the expenmental thermochemistry for the F(ROH), 64
+ ROH = F[ROH),+] clusterhg equilibria (R = CD3, CH3CH2,
(CH3)2CH, (CH3l3C; n = 1, 2).
Table 4.6 Overview of the experimental thermochemistry for the Cf-(ROH), 65
+ ROH = CI-(ROH),+l clustering equilibria (R = CH3, CH3CH2,
(CH3)2CH, (CH3)3C; n = 1, 2).
xvii
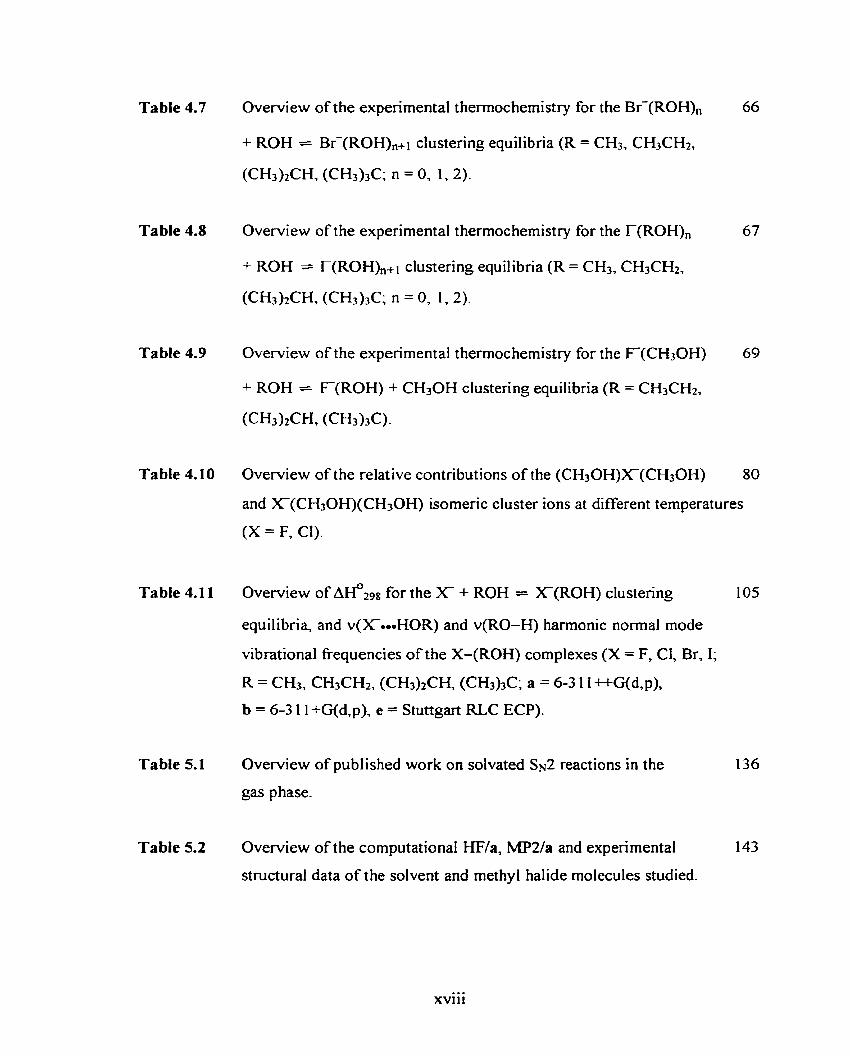
Table 4.7
Table 4.8
Table 4.9
Table 4.1 O
Table 4.1 1
Table 5.1
Table 5.2
Overview of the expenmental thermochemistry for the Br-(ROH),
+ ROH = Br-(ROH)n+l clustering equiIibria (R = CH3, CH~CHI,
(CH3)2CH, (CH3)3C; n = 0, 1, 2).
Overview of the experimental thermochernistry for the r(ROH),
+ ROH = T(ROH),,+l clustering equilibria (R = CH3, CH3CH2,
(CH3)tCH, (CH3)3C; n = 0, 1, 2).
Overview of the experimental thermochemistry for the F(CH30H)
+ ROH = F ( R 0 H ) + CH30H clustering equilibria (R = CH3CH2,
(CH3)2CH, (CH3)3C)-
Overview of the relative contributions of the (CH30H)X(CH30H)
and X-(CH30H)(CH3OH) isomeric cluster ions at different temperatures
(X = F, Cl).
Overview of ~ I f 2 9 8 for the X + ROH = X(R0H) clustering 105
equilibria, and v(X.-HOR) and v(R0-H) harmonic normal mode
vibrational frequencies of the X-(ROH) complexes (X = F, Cl, Br, 1;
R = CH3, CH3CH2, (CH3)2CH, (CH3)3C; a = 6-3 1 1 ++G(d,p),
b = 6-3 1 1 +G(d,p), e = Stuttgart RLC ECP).
Ovewiew of published work on solvated Sy2 reactions in the 136
gas phase.
Overview of the computational HWa, MP2/a and expenmental 143
structural data of the solvent and methyl halide molecules studied.
xvi i i
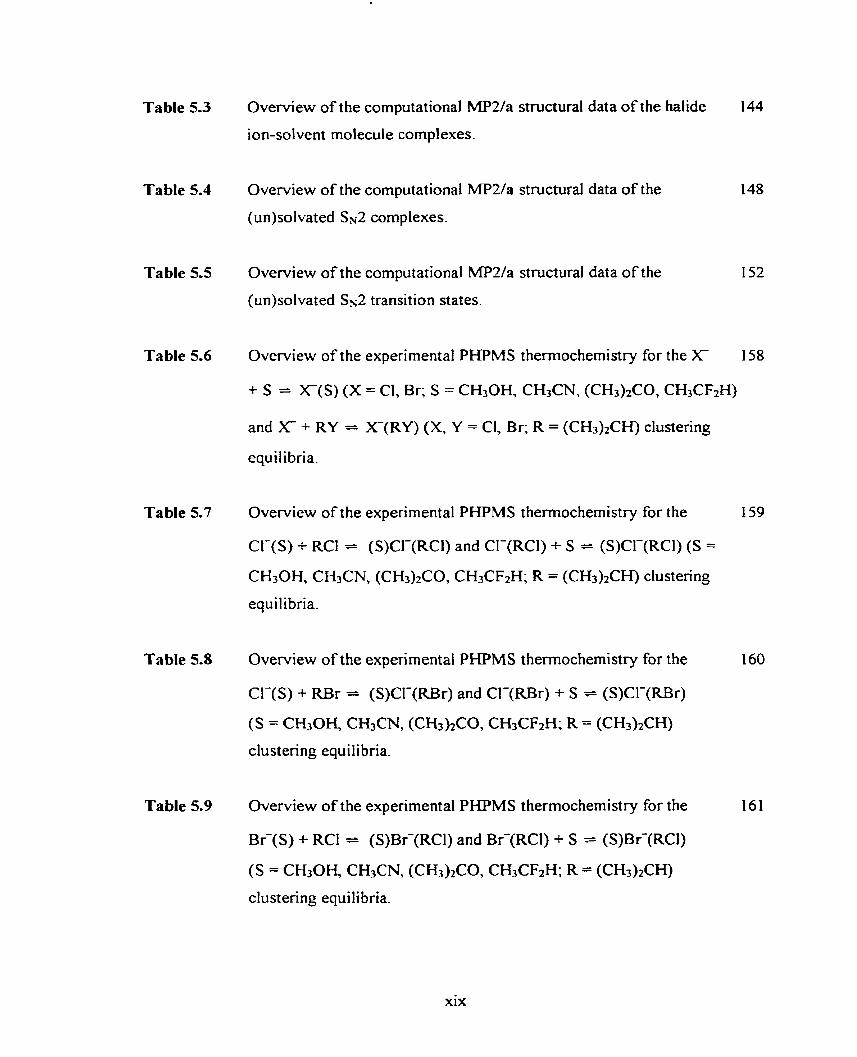
Table 5.3
Table 5.4
Table 5.5
Table 5.6
Table 5.7
Table 5.8
Table 5.9
Overview of the computational MP2/a structural data of the halide 144
ion-solvent molecule complexes.
Overview of the computational MP2/a structural data of the 148
(un)solvated SN2 cornpiexes.
Overview of the computational MP2/a structural data of the 152
(un)soIvated SN2 transition States.
Overview of the experimental PHPMS thermochemistry for the X 1 58
+ S = X-(S) (X = Cl, Br; S = CH30H, CH3CN, (CH3)2CO, CH3CF2H)
and X- + RY = X-(RY) (X, Y = CI, Br; R = (CH3)2CH) clustering
equilibria.
Overview of the experimental PHPMS thermochemistry for the
CIc(S) + RCI = (S)CI-(RCl) and CI-(RCl) + S = (S)CI-(RCl) (S =
CH3OH, CH3CN, (CH3)2C0, CH3CF2H; R = (CH3)2CH) cIustenng
equilibria.
Overview of the experimental PHPMS thermochemistry for the
C14(S) -t RBr = (S)CI-(Ri3r) and CI-(RBr) + S = (S)CI-(RBr)
(S = CH30Y CH3CN, (CH3)2C0, CH3CF2H; R = (CH3)zCI-I)
clustering equilibria.
Overview of the experimental PHPMS thermochemistry for the
B i ( S ) + RCI = (S)Br-(RCI) and Bf (RCI) + S = (S)Br-(RCl)
(S = CH3OR CH3CN, (CH3)2CO, CH3CF2H; R = (CH3)tCH)
clustering equilibria.
xix
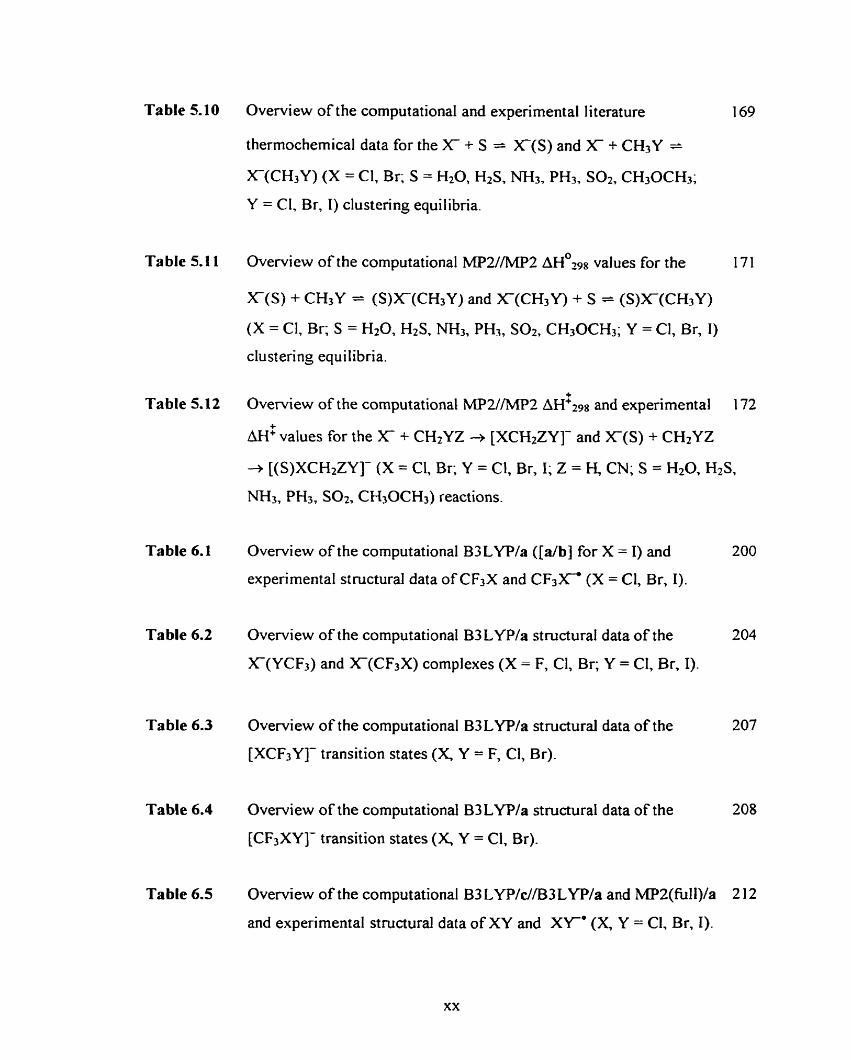
Table 5.10 Overview of the computational and experimental literature 1 69
thermochemical data for the X + S = X(S) and X + CH3Y =
X-(CH3Y) (X = Cl, Br; S = HzO, HzS, NH3, PH3, SOz, CH3OCH3;
Y = CI, Br, 1) clustering equilibria.
Table 5.1 1 Overview of the computational MPZ//MP2 ~ ~ ' ~ 9 8 values for the 171
X-(S) + CH3Y = (S)XI(CH3Y) and X(CH3Y) + S = (S)X(CH3Y)
(X = Cl, Br; S = H20, HzS, NH3, PH3, Sot, CH30CH3; Y = CI, Br, 1)
clustering equilibria.
Table 5.12 Overview of the cornputational MP2//MP2 A&@ and experimental 1 72
AH'values for the X- + CHIYZ + [XCH2ZY]- and X(S) + CH2YZ
+ [(S)XCH2ZY]- (X = Cl, Br; Y = CI, Br, 1; Z = H, CN; S = HzO, HzS,
NH3, PHs, Sot, CH30CH3) reactions.
Table 6.1 Overview of the cornputational B3LYP/a ([db] for X = 1) and 200
experimental structural data of CF3X and C F 3 r (X = Cl, Br, 1).
Table 6.2 Overview of the computationat B3 LYP/a structural data of the 204
X(YCF3) and X(CF3X) complexes (X = F, Cl, Br; Y = CI, Br, 1).
Table 6.3 Overview of the computational B3LYP/a structural data of the 207
[XCF3Y]- transition states (X, Y = F, Cl, Br).
Table 6.4 Overview of the computational B3LYP/a structural data of the 208
[CF3XY]- transition states (X, Y = Cl, Br).
Table 6.5 Overview of the computational B3LYP/c//B3LYP/a and MPZ(full)/a 2 12
and experimental structural data of XY and XY' (X, Y = CI, Br, 1).
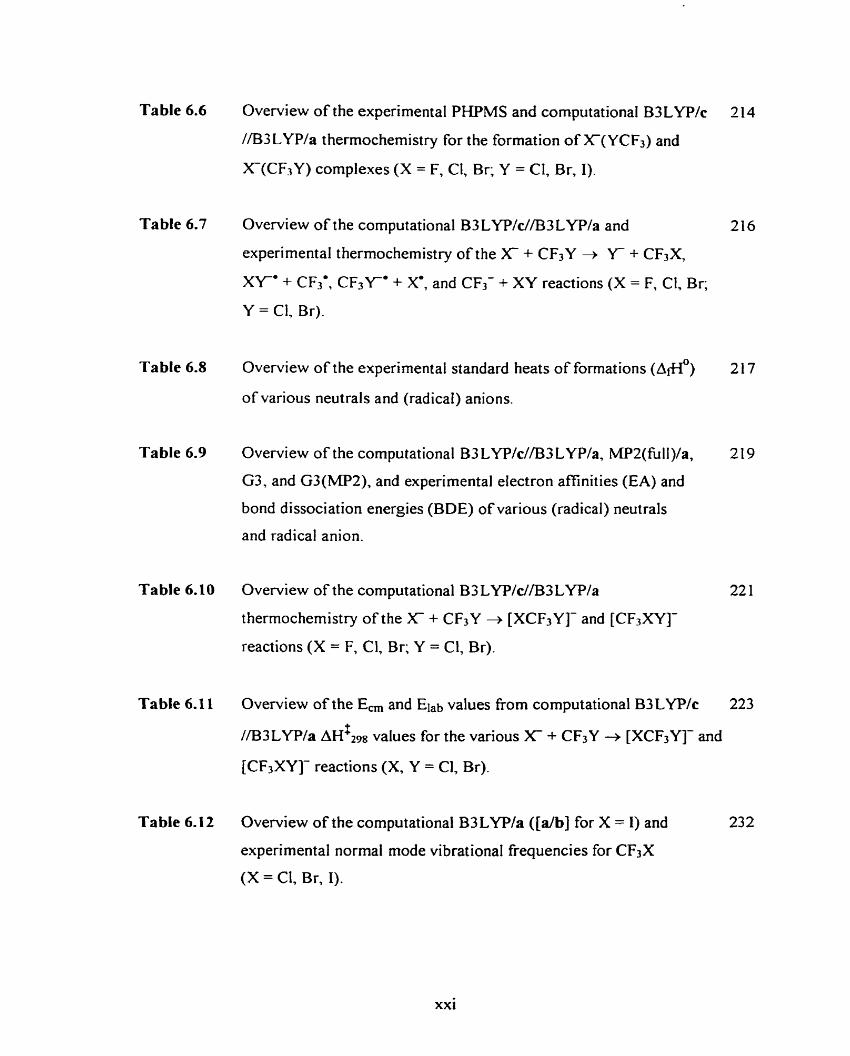
Table 6.6
Table 6.7
Table 6-8
Table 6.9
Table 6.10
Table 6.1 1
Table 6.12
Overview of the experimental PHPMS and cornputational B3LYPIc
//B3 LYP/a thermochemistry for the formation of X-(YCF3) and
X(CF3Y) complexes (X = F, Cl, Br; Y = CI, Br, 1).
Overview of the computational B3 LYP/c//B3 LYPIa and
experimental thermochemistry of the X + CF3Y + Y- + CF,X,
X k " + CF3', CF3Y0 + X*, and CF3- + X Y reactions (X = F, CI, Br;
Y = Cl, Br).
Overview of the experirnental standard heats of formations (dflO)
of various neutrals and (radical) anions.
Overview of the computational B3 LYPIc//B3 LYPIa, MPZ(full)Ia,
G3, and G3(MP2), and experimental electron afinities (EA) and
bond dissociation energies (BDE) of various (radical) neutrals
and radical anion.
Overview of the computational B3 LYP/c//B3 L W / a
thermochemistry ofthe X + CF3Y + [XCF3Y]- and [CF3XY]-
reactions (X = F, Cl, Br; Y = Cl, Br).
Overview of the E, and EIab values from computational B3LYPIc
//B3LYP/a ~ ~ ' 2 9 8 values for the various X- + CFlY + [XCF3Y]- and
fCF3XY]- reactions (X, Y = Cl, Br).
Overview of the computational B3 LYP/a ([db] for X = 1) and
experimental normal mode vibrational fiequencies for CF3X
(X = Cl, Br, 1).
xxi
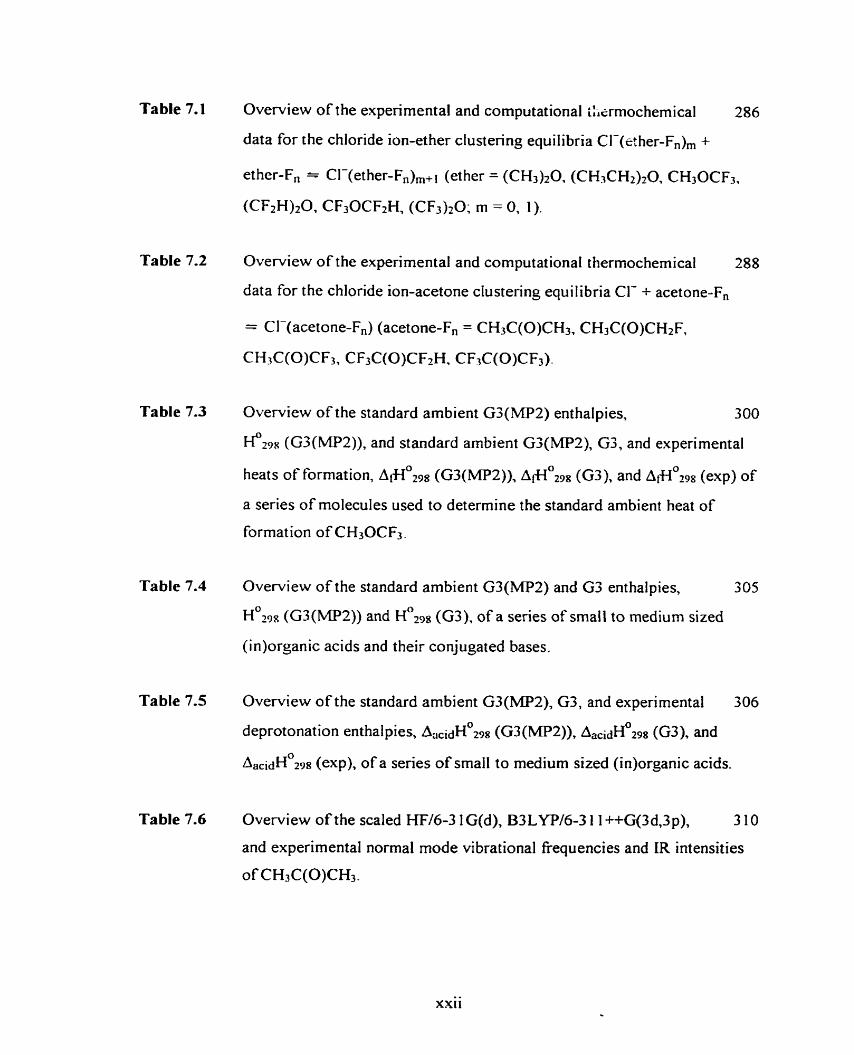
Table 7.1 Overview of the experimental and computational i:~anochemical 286
data for the chloride ion-ether clustering equilibria CI-@ her-F,), +
ether-F, = CI-(ether-Fn),+l (ether = (CH3)zO. (CH,CH1)20, CH~OCFJ,
(CF2H)20, CF3OCF+i, (CF3);?O; rn = 0, 1).
Table 7.2 Overview of the experimental and computational therrnochemical 288
data for the chloride ion-acetone clustering equilibria CI- + acetone-F,
= Cl-(acetone-F,) (acetone-F, = CH3C(0)CH3, CH3C(O)CHzF,
CH3C(O)CF3, CF3C(O)CF?H, CF3C(O)CF3).
Table 7.3 Overview of the standard ambient G3(MP2) enthalpies, 300
H029n (G3(MP2)), and standard arnbient Gj(MP2). G3, and experimental
heats of formation, A & - I ~ ~ P ~ (G3(MP2)), ~ i + 1 ~ 2 9 8 (G3), and A+Io2ss (exp) of
a series of molecules used to determine the standard ambient heat of
format ion of CH30CF3.
Table 7.4 Overview of the standard ambient G3(MP2) and G3 enthalpies, 305
H O Z ~ ~ (G3(MP2)) and ~ ~ ~ p g (G3). of a series of srnall to medium sized
(in)organic acids and their conjugated bases.
Table 7.5 Overview of the standard arnbient G3(MP2), G3, and experimental 306
deprotonation enthalpies, ~ ~ ~ ~ ~ ~ ~ 2 9 % (G3(MP2)), A ~ ~ ~ ~ H ~ ~ ~ ~ (G3), and
~ a c i d ~ O 2 9 8 (exp), of a series of small to medium sited (in)organic acids.
Table 7.6 Overvi ew of t he scaled HW6-3 1 G(d), B3 LYP/6-3 1 1 ++G(3 d,3 p), 310
and experimental normal mode vibrational frequencies and IR intensities
of CH3C(0)CH3.
xxii
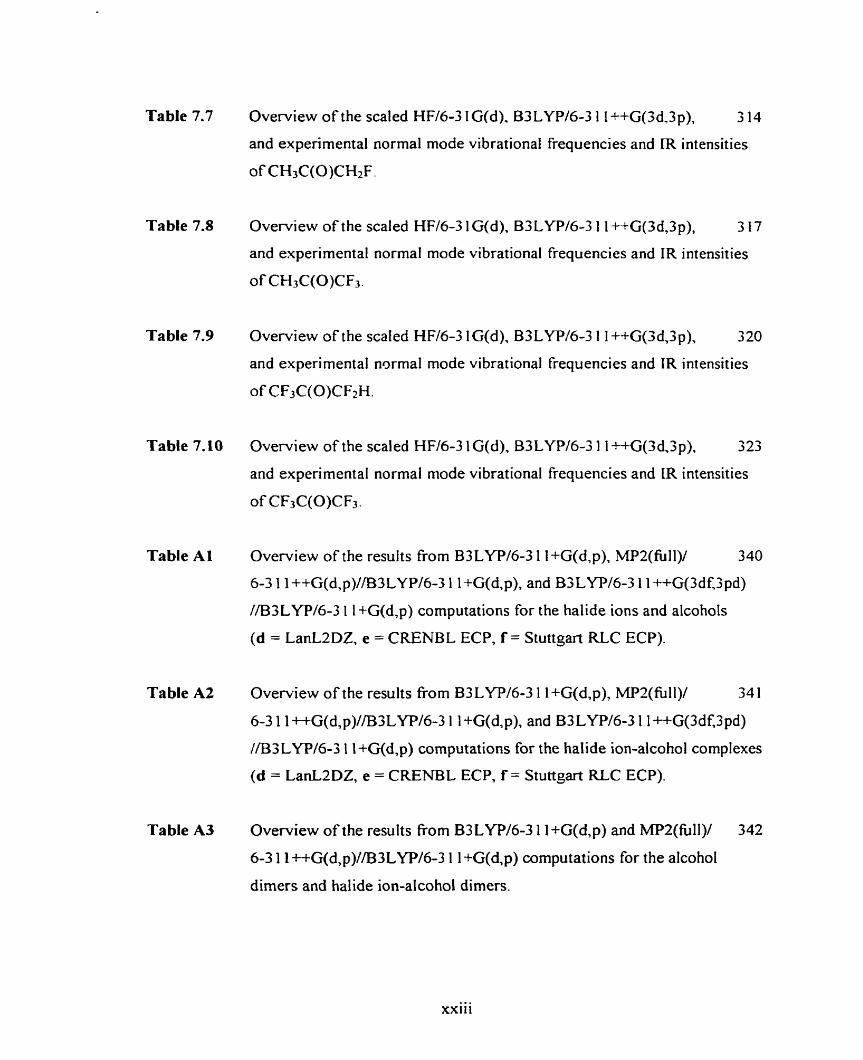
Table 7.7 Overview of the scaled HFl6-3 1 G(d). B3 LYP16-3 1 1 ++G(3dS3p), 3 14
and experirnental normal mode vibrationai frequencies and R intensities
of CH3C(O)CH2F.
Table 7.8 Overview of the scaled HFl6-3 1 G(d), B3 LYPl6-3 1 1 ++G(3d,3p), 317
and experirnental normal mode vibrational frequencies and IR intensities
of CH3C(O)CF3.
Table 7.9 Overview of the scaied HF/6-3 1 G(d), B3 LYP/6-3 1 1 ++G(3 d,3 p), 3 20
and experimental nwmal mode vibrational frequencies and IR intensities
of CF3C(O)CF2M.
Table 7-10 Overview of the scaled HFl6-3 1 G(d), B3LYPl6-3 1 1 ++G(3d,3p), 323
and experimental norrnai mode vibrational frequencies and IR intensities
of CF3C(O)CF3.
Table A 1 Overview of the results frorn B3 LYPl6-3 1 1 +G(d,p), MP2(fiill)/ 340
6-3 1 1 ++G(d,p)/B3LYP/6-3 1 1 +G(d,p). and B3LYPl6-3 1 1 ~ G ( 3 d f . 3 p d )
//B3LYP/6-3 1 1 +G(d,p) computations for the halide ions and alcohoIs
(d = LantaDZ, e = CRENBL ECP, f = Stuttgart RLC ECP).
Table A2 Overview of the results frorn B3LYP/6-3 1 l+G(d,p), MP2(fùll)/ 34 1
6-3 1 1 ++G(d, p)//B3LYP/6-3 1 I +G(d, p), and B3 LYP/6-3 1 1 uG(3df.3 pd)
/A33LYP/6-3 1 1+G(d,p) computations for the halide ion-alcohol complexes
(d = LanL2DZ, e = CRENBL ECP, f = Stuttgart RLC ECP).
Table A3 Overview of the results Rom B3LYP/6-3 1 1 +G(d,p) and MPZ(fÙ1I)I 342
6-3 1 1 ++G(d,p)//B3LYP/6-3 1 1 +G(d,p) computations for the alcohoi
dimers and halide ion-alcohol dimers.
xxi i i
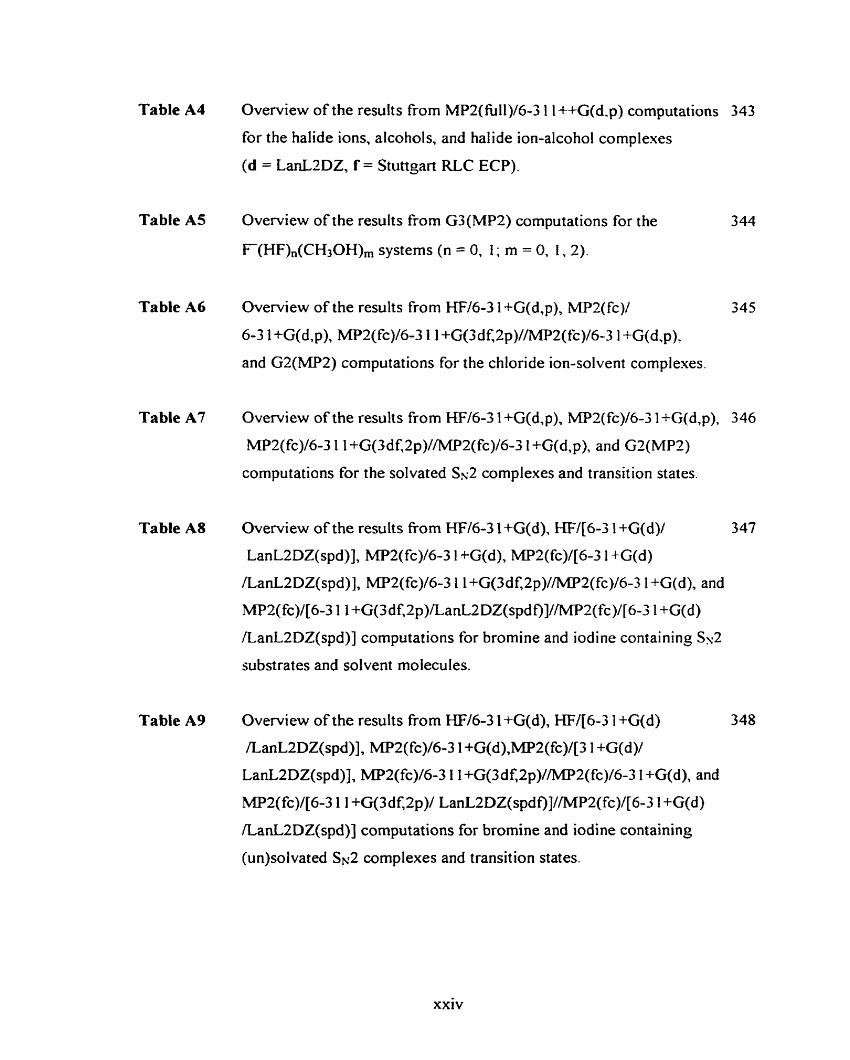
Table A4 Overview of the results from MP2(fÙ11)/6-3 1 I++G(d.p) computations 343
for the halide ions, alcohols. and ha1 ide ion-alcohol complexes
(d = LanUDZ, f = Stuttgart RLC ECP).
Table A5 Overview of the resdts from G3(MP2) computations for the 344
F(HF),(CH30H), systems (n = O, I ; m = 0, 1. 2).
Table A6 Overview of the results from HW6-3 1 +G(d,p), MP2(fc)/ 345
6-3 1 +G(d, p), MP2(fc)/6-3 1 1 +G(3 df,2p)//MP2(f~)/6-3 1 +G(d,p),
and G2(MP2) computations for the chloride ion-solvent complexes.
Table A7 Overview of the results from W/6-3 1 +G(d,p), W2(fc)/6-3 1 +G(d,p), 346
MP2(fc)/6-3 1 1 +G(3df, 2p)//MP2(fc)/6-3 1 +G(d, p), and GZ(MP2)
computations for the solvated Ss2 complexes and transition states.
Table A8 Overview of the results fiom H F 6 3 1+G(d), HF/[6-3 1 +G(d)/ 347
LanL2DZ(spd)], MP2(fc)/6-3 1 +G(d), MP2(fc)/[6-3 1 +G(d)
/LanL2DZ(spd)], MP2(fc)/6-3 1 1 +G(3df,2p)//MP2(fc)/6-3 1 +G(d), and
MP2(fc)/[6-3 1 1 +G(3df,2p)/LanL2DZ(spdf)]l/MP2(fc)l[6-3 1 +G(d)
/LanL2DZ(spd)] computations for bromine and iodine containing Ss2
substrates and solvent molecuIes.
Table A9 Overview of the results from W/6-3 1 +G(d), HF/[6-3 1 +G(d) 348
/LanL2DZ(spd)], MP2(fc)/6-3 1 +G(d),MPS(fc)/[3 1 +G(d)/
LanLZDZ(spd)], MP2(fc)/6-3 1 1 +G(3 d f, 2p)//MP2(fc)/6-3 1 +G(d), and
MPZ(fc)/[6-3 1 1 +G(3 df,2p)/ LanL2DZ(spdf)]//MP2(fc)/[6-3 1 +G(d)
/LanL2DZ(spd)] computations for bromine and iodine containing
(un)soivated SN2 complexes and transition states.
xxiv
Table A10 Overview of the results fiom B3LYP/[6-3 1 +G(d)/LanL2DZ(spd)] 349
and B3 LYP/[6-3 1 1 +G(3df.2p)/LanL2DZ(spdf)]l/B3LYPl[6-3 1 +G(d)
/LanL'DZ(spd)] computations for the CH3Y and [CIC&Y]- systems
(Y = Br, 1).
Table A 1 1 Overview of the results from B3LYPl6-3 1 1 +G(d) and 8 3 LYP/ 350
6-3 1 1 +G(3df)//B3 LYPl6-3 1 1 +G(d) computations for halide ions and
radicals, and some fluorinated hydrocarbons.
Table A12 Overview of the results from B3LYP/6-3 1 I +G(d) and B3LYP/ 351
6-3 1 I +G(3df)//B3 LYPl6-3 1 1 +G(d) computations for dihalides,
trifluoromethyl halides, and their corresponding radical anions
(d = LanL2DZ(spd) and LanL2DZ(spdf)//LanL2DZ(spd), f = LanL2DZ).
Table A 13 Overview of the results from B3LYPl6-3 1 1 +G(d) and B3LYPl 352
6-3 1 I+G(3df)// B3LYPl6-3 1 l+G(d) computations for halide ion-
trifluoromethyl halide complexes.
Table AI4 Overview of the results from B3LYPl6-3 1 l+G(d) and B3LYP/ 353
6-3 1 1 +G(3df)// B3LYPl6-3 1 1 +G(d) computations for halide ion-
trifluoromethyl halide transition States.
Table A15 Overview of the results fiom MPZ(fu11)/6-3 1 1 +G(d), G3, and 354
G3(MP2) computations for halide ions and radicals, bihalide neutrals
and radical anions, and trifluoromethyl halides and radical anions.
Table A1 6 Overview of the results fiom HFl6-3 1 G(d), MP2(fc)/6-3 1 Qd) , 3 5 5
and MP2(fc)/6-3 1 1 +G(Zdf,p)//MP2(fc)/6-3 1 G(d) computations
of (fluorinated) ethers.
xxv
Table A 1 7 Overview of the results fiom HF/[6-3 1 +G(d)/6-3 1 G(d)], 357
MPZ(fc)/[6-3 1 +G(d)/6-3 1 G(d)], and MP2(fc)/[6-3 1 1 *G(3 df,3 pd)/
6-3 1 I +G(Zdf p)]//MP2(fc)/[6-3 1 +G(d)/6-3 1 G(d)] computations of
chloride ion-(fluorinated) ether complexes.
Table A 18 Overview of the results From HFf6-3 1 G(d), MP2(fc)/6-3 1 G(d), 359
and MPZ(fc)/6-3 1 1 +G(Zdf,p)//MP2(fc)/6-3 1 G(d) computations of
(fluorinated) acetones, and HF/[6-3 l+G(d)/6-3 1 G(d)], MP2(fc)/
[6-3 1 +G(d)/6-3 1 G(d) J, and MP2(fc)/[6-3 1 1 ++G(3 df 3 pd)//
6-3 1 1 +G(Zdf,p)]//MP2(fc)/[6-3 1 +G(d)/6-3 1 G(d)] computations of
chloride ion-(fluorinated) acetone complexes.
Table A 19 Overview of the results from HF and d 2 ( f c ) computations for 361
chloride ion and radical using various basis sets.
xxvi
List of Illustrations
Figure 2.1
Figure 2.2
Figure 3.1
Figure 4.1
Figure 4.2
Figure 4.3
Figure 4.4
Figure 4.5
Qualitative display of the regions for various modes of diffusion in a
typical PHPMS experiment with initially high ionization density.
Schematic of the PHPMS instrument used.
Flowchart for quasi-Newton algorithms for geometry optimizations.
Experimental Van't Hoff plots for the halide ion-alcohol clustering
equilibria X(ROHX, + ROH = X(ROH),+l (X = F, Br; R = CH3;
n = O , 1, 2).
Experimental Van't Hoff plots for the halide ion-alcohol clustering
equilibria XmOHX, + ROH = X(ROEQ,,i (X = C, 1; R = CH3;
n = 0, 1, 2).
Experimental Van't Hoff plots for the halide ion-alcohol clustering
equilibria X(ROH), + ROH = X(ROH),+ (X = F, Br; R = CH3CH2;
n = 0, 1, 2) (F,O is a calculated Van't Hoff plot).
Experimental Van't Hoff plots for the halide ion-alcohol clustenng 56
equilibria X(ROHX, + ROH = X(ROH),+l (X = C, 1; R = CH3CH2;
n = 0, 1, 2).
Experirnental Van't Hoff plots for the halide ion-alcohol clustering 57
equilibria X(ROHX, + ROH = X(ROH)n+I (X = F, Br; R = (CH3)2CH;
n = 0, 1, 2) (F,O is a calculated Van't Hoff plot).
xxvii
Figure 4.6
Figure 4.7
Figure 4.8
Figure 4.9
Figure 4.10
Figure 4.1 1
Figure 4.12
Figure 4.13
Experirnental Van't Hoff plots for the halide ion-alcohol clustering
equilibria X(ROH), + ROH = X-(ROH),ii (X = C, 1; R = (CH3)2CH;
n = 0, 1, 2).
Experimental Van't Hoff plots for the halide ion-alcohol dustering
equilibria X(ROHX, + ROH = X-(ROH),&l (X = F, Br; R = (CH3)3C;
n = 0, 1. 2) (F.0 is a calculated Van't Hoff plot).
Experimental Van't Hoff plots for the halide ion-alcohol clustering
equilibria X(ROH), + ROH = X(ROH)nAI (X = C, 1; R = (CH,),C;
n = 0, 1, 2) .
Experimental Van't Hoff plots for the fluoride ion-methanoValcohol
complex exchange equilibria F(CH30H) + ROH = F(R0H) +
C H G H (R = CH3CHz (CH3)2CH, (CH3)JC)-
Plot of the the negative standard enthalpy change for the X + ROH
= X ( R 0 H ) clustenng equil ibria, -AH' (X(ROH)), versus the
alcohol polarizability, ~ R O H .
Plot of the deprotonation enthalpy difference between ROH and HX.
AacidH(ROH) - AacidH(HX) versus the negative standard enthalpy
change for the X + ROH = X(R0H) clustering equilibria, -&
(WROH)) -
Single well potential energy surface for the halide ion-alcohol adducts.
Optimized MPZ(fùll)/a structure of F(CH3OH).
Figure 4.14 Optimized MPZ(full)/a structure of CI-(CH30H). 83
Figure 4.15 Optimized MP2(fiill)/a structure of Br-(CH30H). 83
Figure 4.16 Optimized MPZ(fÙll)/[de] structure of T(CH30H). 84
Figure 4.1 7 Plot of the MP2(ftll)/a ([de] for X = 1) calculated XI-H-OCH3 84
angle, A(X--..H-OCH3), versus the X . O ~ H O C H ~ di stance,
R(X---HOCH3), (X = F, Cl, Br, 1).
Figure 4.18 Optimized B3 LYP/b stmcture of F((CH3)3COH). 86
Figure 4.19 Optirnized B3 LYP/b structure of CI-((CH3)3COH). 86
Figure 4.20 Optimized B3LYPJb structure of (CH30H)(CH30H). 87
Figure 4.2 1 Optimized B3LYP/b structure of (CH30H)F(CH30H). 88
Figure 4.22 Optimized B3LYP/b structure of F(CH30H)(CH30H). 88
Figure 4.23 Optimized B3LYP/b structure of (CH30H)C1-(CH30H). 91
Figure 4.24 Optimized B3LYP/b structure of Cl-(CH30H)(CH30H). 91
Figure 4.25 Optimized MP2(fUli)/6-3 1 G(d) structure of HFz-(CH30H). 92
Figure 4.26 Optimized MP2(fb11)/6-3 1 G(d) structure of (CH30H)HF2-(CH30H). 92
xxix
Figure 4.27 Plot of the MPUa ([de] for X = i ) negative standard ambient 94
enthalpy for the X + CH3OH = Xm(CH30H) clustering equilibrium,
- m 0 2 9 8 (X(CH30H)), versus the NPA charges on the halide ion,
-q(-NPA)(X), (X = F, Cl, Br, 1).
Figure 4.28 High pressure ion source mass spectmm at the following experimental 97
conditions: Pion ,,, = 4.0 TOIT, Ti, ,,, = 298 K, P(CH4) = 765 Torr,
P(CH30H) = 0.25 Ton-, P(CCI4) < 0.05 Torr
Figure 4.29 Time-intensity profiles for the 3 5 ~ ~ - , 3 S ~ l - ( ~ ~ , ~ ~ ) , and 3 5 CI-(CH3OH)î ions at the ions source condition of Figure 4.28.
Figure 4.30 Normalized time-intensity profi les of Figure 4.29.
Figure 4.31 Plot of 1 /kapp versus II[C&].
Figure 4.32 Plot of ln(ktff2) versus UT (S&C = Su and Chesnavich).
Figure 4.33 Simulated IR spectmm of (CH3OH)CI-(CH3OH) calculated at the
B3LYPib level of theory and scaled by 0.9640.
Figure 4.34 Simulated IR spectmm of CI-(CH30H)(CH30H) calculated at the
B3LYPlb level of theory and scaled by 0.9640.
Figure 4.35 Simulated IR spectmm of (CH30H)(CH30H) calculated at the
B3LYP/b level of theory and scaled by 0.9640.
XXX
Figure 4.36 Plot of the MP2/a ( [ d e ] for X = 1) calculated. X--HOCH3 and 106
CH30-H normal mode vibrational frequencies, v(XoOmHOCH~) and
v(CH30-H), respectively, versus the negative standard arnbient
enthalpy of association to form X(CH30H), AHO OZ^^ (X-(CH3OH)),
(X = F, CI, Br, 1).
Figure 4.37 Plot of the calculated B3LYP/b X-HOR and RO-H normal mode 108
vibrational frequencies, V(XO-HOR) and v(R0-H), respectively,
versus the MP2(fùll)/a//83LYP/b negative standard ambient enthalpy
change to forrn X(ROH), -AH0298 (X(R0H)) (X = F. Cl, Br; R = CH3,
Figure 4.38 Definition of the X-o-oHOCH3 distance, R(X==-HOCH3), and the
X4-i-OCH3 angle, A(X-=H-OCH3), parameters used for the
normal two-dimensional potential energy surface scans at the MP2/a
( [ d e ] for X = 1) level of theory (X = F, Cl, Br, 1).
Figure 4.39 Plot of the MP2/a F(CH3OH) two-dimensional potential energy
surface (contour lines in kcal mol-').
Figure 4.40 Plot of the MP2/a Cl-(CH30H) two-dimensional potential energy
surface (contour lines in kcal mol-').
Figure 4.41 Plot of the MP2/a BrV(CH3OH) two-dimensional potential energy
surface (contour lines in kcal mol-').
Figure 4.42 Plot of the MPZ/[a/e] T(CH30H) two-dimensionai potential energy
surface (contour lines in kcal mol-').
xxxi
Figure 4.43 Plot of the MPZ(fc)/g energy. EWm(fcy6-3~ +gd,pl, versus the
F-HOCH:, distance, R(Foo-HOCH3), fiom a relaxed scan
computation.
Figure 4.44 Plot of the MPZ(fc)/g energy, E ~ t ~ l ( f ~ ~ 6 - 3 1 +~(d,,), versus the
CI-oooHOCH3 distance, R(Cl-oooHOCH3), fiom a relaxed scan
computation.
Figure 4.47 MPZ(fc)/g energy profile for the Cl- + CF3OH -+ CF30- + HCI gas 120
phase proton transfer reaction.
Figure 5.1 Condensed phase unimodal reaction energy profile (R = reactants, 133
TS = transition state, P = products).
Figure 5.2 Condensed phase double-well reaction energy profile for weak 133
solvation (RC = reactants complex, PC = products complex).
Figure 5.3 Condensed phase double-well reaction energy profile for strong and 134
asynchronous desolvation and ion-molecule complexation (desolv =
desolvation).
Figure 5.4 Gas phase double-well reaction energy profile.
xxxii
Figure 5.5
Figure 5.6
Figure 5.7
Figure 5.8
Figure 5.9
Figure 5.10
Figure 5.1 1
Figure 5-12
Figure 5-13
Figure 5.14
Figure 5.15
Figure 5.16
Figure 5.1 7
Figure 5.18
Figure 5.19
Optirnized MP2(fc)/a structure of CH3Cl.
Optimized MPZ(fc)/a structure of Cl-(H2O).
Optimized MP2(fc)/a structure of CI-(H2S).
Optimized MP2(fc)/a structure of Cl-(TM3).
Optimized MP2(fc)/a structure of Cl-(PH3).
Optimized MP2(fc)/a structure of Cl-(SOz).
Optimized MPZ(fc)/a structure of (H20)CI-(CH3CI).
Optimized MP2(fc)/a structure of (H2S)CI-(CH3Cl).
Optimized MPZ(fc)/a structure of @Hs)CI-(CHaCI).
Optimized MP2(fc)/a structure of (PH3)CI-(CH3CI).
Optimized MP2(fc)/a structure of (SO2)C1-(CH3C1).
Optimized MP2(fc)/[dd] structure of (H20)Cl-(CHiBr).
Optimized MPZ(fc)/[c/d] structure of (H20)Br-(CH3CI).
Optimized MPZ(fc)la structure of [(H20)ClCH3CI]-.
Optimized MPZ(fc)/a structure of [(H2S)CICH3Cl]-.
xxxi i i
Figure 5.20 Optimized MP2(fc)/a structure of [(NH3)ClCH3CI]-.
Figure 5.21 Optimized MP2(fc)/a structure of [(PH3)CICH3Cl]-.
Figure 5.22 Optimized MP2(fc)/a stnicture of [(SO2)CICH3C1]-.
Figure 5.23 Optimized MPZ(fc)/[c/d] structure of [(H2O)ClCH3Br]-.
Figure 5.24 Optimized MPZ(fc)/[c/d] structure of [(H2O)BrCH3CI]-.
Figure 5.25 Optimized MPZ(fc)/[c/d] structure of [(W20)ClCHtCNBr]-.
Figure 5.26 Van't Hoff plots for the Cl- + S = CI-(S) (S = (CH3)2C0,
CH3CF2H) clustering equilibria.
Figure 5.27 Van't Hoff plots for the B i + S -- B i ( S ) (S = (CH3)2CO.
CH3CF2H) clustering equilibria.
Figure 5.28 Van't Hoff plots for the Cl-(S) + RCI = (S)CL-(RCl) and CI-@Cl) 163
+ S = (S)CI-(RCl) (S = CH30H; R = (CH3)2CH) clustering equilibna.
Figure 5.29 Van't Hoff plots for the Cl-(S) + RCI = (S)Cl-(RCI) and Cl-(RC1) 163
+ s = (S)Cl-(RCl) (S = CH3CN; R = (CH3)2CH) clustering equilibria.
Figure 5.30 Van't Hoff plots for the Cl-(S) + RCI = (S)Cl-(RCl) and Cl-(RCI) 164
+ S = (S)CI-(RCI) (S = (CH3)1CO; R = (CH3)2CH) clusterhg equilibria.
xxxiv
Figure 5.31 Van't Hoff plots for the Cl-(S) + RCl = (S)CI-@Cl) and Cl-(RCI) 1 64
+ S = (S)Cl-(RCl) (S = CH3CF2H; R = (CH&CH) clustering equilibria.
Figure 5.32 Van't Hoff plots for the CI-(S) + RBr = (S)CI-(RBr) and CI-@Br) 165
+ S = (S)Cl-(RBr) (S = CH3OH; R = (CH3)tCH) clustering equilibria.
Figure 5.33 Van't Hoff plots for the Cl-(S) + iU3r = (S)Cl-(RBr) and Cl-(RBr) 165
+ S = (S)CI-(RBr) (S = CH3CN; R = (CH3)2CH) clustering equilibria.
Figure 5.34 Van't Hoff plots for the CI-(S) + RBr = (S)CI-(RBr) and Cl-(RBr) 166
+ S = (S)Clb(RBr) (S = (CH3)lCO; R = (CH3)2CH) clustenng equilibria.
Figure 5.35 Van't Hoff plots for the CI-(S) + RBr = (S)CI-(RBr) and Cl-(RBr) 166
+ S = (S)Cl-(RBr) (S = CH3CF2H; R = (CH3)2CH) clustering equilibria.
Figure 5.36 Thermochemical cycle for the formation of solvated SN2 complexes. 167
Figure 5.37 Plot of -AH?Z~~ for the formation of Cl-(S) versus -&298 for the 175
formation of (S)CI-(CH3Cl) and [(S)ClCH3Cl]- (S = H20, HzS,
NH3, PH3, S 0 2 ) . (the open circle and dotted Iine represent the expected
value and trend line for S = Sot based on the other four solvent
molecules).
Figure 5.38 Schematic MP2/b//MPZ/a potential energy profiles for the Cl- + 176
CH3Cl and Cl-(S) + CH3CI reactions (S = H20, H2S, NH3, PH3, S02).
xxxv
Figure 5.39 MP2[c/d] potential energy profiles for the Cl- + CHzBr + Br- + CH3CI and CI-(H20) + CH3Br + Br- + (CH3CI)(H20) and
Br-(H20) + CH3Cl reactions.
Figure 6.1 Hypothetical porential energy profile for a condensed phase
Ss2 reaction.
Figure 6.2 Hypothetical potential energy profile for a gas phase S:s2 reaction.
Figure 6.3 Optimized B3 LYP/6-3 1 1 + a d ) structure of CF3CI.
Figure 6.4 Optimized B3LYPl6-3 1 i +G(d) structure of CF3Br.
Figure 6.5 Optimized B3LYP/[6-3 1 I +G(d)lLanL2DZ] structure of CF31.
Figure 6.6 Optimized B3LYPl6-3 1 1 +G(d) structure of CF3C14.
Figure 6.7 Optimized B3LYPl6-3 1 1 +G(d) structure of F-(BrCF3).
Figure 6.8 Optimized B3 LYP16-3 1 1 +G(d) structure of F(CF3Br).
Figure 6.9 Optimized B3LYPl6-3 1 1 +G(d) structure of CI-(CICF,).
Figure 6.10 Optimized B3LYPl6-3 1 1 +G(d) structure of Ci-(CF3Cl).
Figure 6.1 1 Optimized B3 LYPl6-3 1 1 +G(d) structure of pCF,Br]-.
Figure 6.12 Optimized B3LYP/6-3 1 1 +G(d) structure of [ClCF3Cl]-.
Figure 6.13 Optirnized B3LYPl6-3 1 l+G(d) structure of [CF3C12]-.
xxxvi
Figure 6.14
Figure 6.15
Figure 6.16
Figure 6.17
Figure 6.18
Figure 6.19
Figure 6.20
Figure 6.2 1
Figure 6.22
Figure 6.23
Figure 6.24
Atom labeling in the [CF3XY]- transition States. 209
Optimized B3LYPl6-3 1 1 +G(d) structure of [BrCF2CI2]-.
Optimized B3LYP/6-3 1 1 +G(d) structure of [CF2CIZBr]-.
Van't Hoff plots for the halide ion-trifluoro methyl halide clustering
equilibria X -t CF3Y = X(CF3Y) (X = CI, Br; Y = Br).
Schematic B3 LYP/c//B3LYP/a potential energy profile for the
various Cl- + CFJCI reactions.
Schematic B3 LYPIdE33 LYPIa potential energy profile for the
various CI- + CF3Br reactions.
Schematic B3 LYPId/B3 LYP/a potential energy profile for the
various Br- + CF3Br reactions.
Gas phase double well potential energy diagram with the definitions
of AE' and AE for the Marcus expression applied to SN^ reactions.
State correlation diagram for the non-identity SN^ reaction Y + RX
-+ X-+ RY.
B3LYPla potential energy surfaces for the F + CF3Br + B r + CF4
and F + CF3Br = F(BrCF3) reactions.
B3LYPla potential energy scans for the Cl- + CF3Br = Cl-@CF3)
and Cl- + CF3Br = CI-(BrCF,) clustering equilibria.
xxxvii
Figure 6.25
Figure 6.26
Figure 6.27
Figure 6.28
Figure 6.29
Figure 6-30
Figure 6.31
KF/6-3 lG(d) potential energy surface for the Cl- + CF3Cl back-side
attack SN^ reaction (O 5 E E I F ~ ) ~ C ~ < ~ ) c 80 kcal mol-'. contour lines in
5 kcal mol-' increments).
W/6-3 lG(d) potential energy surface for the CI- + CF3Cl back-side
attack Ss2 reaction (-5 2 EIIi.,u-3~sd, 5 O kcal mol-', contour lines in
0.25 kcal mol-' increments).
B3LYP/a threshold energy pathway for the Cl- + CF3Cl 4
[CICF3Cl]- + CICF3 + Cl- back-side attack Sh'2 reaction.
HH6-3 1 G(d) threshold energy pathway hard-sphere line-of-centre
cross section for the Cl- + CF3Cl + [CICF3CI]- -+ ClCF3 + Cl-
back-side attack Sx2 reaction as a fùnction of CI- centre-of-mass
kinetic energy.
Experimental relative Cl- intensity as a hnction of the Br-
centre-of-mass kinetic energy of the Br- + CFzClz + CI- +
CFzClBr Ss2 reaction (from Reference 88).
HW6-3 1 G(d) barrier height as a fùnction of the CI-C-Cl angle
from the Cl- + CF3Cl potential energy surface in Figure 6.24.
HFI6-3 1 G(d) angle-corrected hard-sphere line-of-centre cross
section for the Cl- + CF3Cl T, [ClCF3Cl]- + ClCF3 + Cl- back-side
attack SNZ reaction as a fùnction of Cl- centre-of-mass kinetic energy.
xxxvii i
Figure 7.1
Figure 7.2
Figure 7.3
Figure 7.4
Figure 7.5
Figure 7.6
Figure 7.7
Figure 7.8
Figure 7.9
Figure 7.10
Figu te 7.1 1
Figure 7.12
Figure 7.13
Figure 7.14
Time-intensity profile for the CI-((CF#) 2 0 ) + (CF2H) ,O =
C1-((CF2H)20)2 cIustering equilibrium at the following experimental
conditions: Pion ,,,,,, = 4.00 Torr, Tl,, ,,,, = 352 K, P(CH4) = 3.97
Torr, P((CF2H);?O) = 0.03 Torr, P(CC14) << 0.0 1 Torr.
Norrnalized time-intensity profile of Figure 7.1.
Optimized MP2/6-3 1 G(d) stmcture of (CH3)20.
Optimized MP2/6-3 1 a d ) structure of (CH3CHz)zO (rotamer 1 ).
Optimized MP2/6-3 1 G(d) structure of (CH3CH2)20 (rotamer 2).
Optimized MP216-3 1 G(d) structure of CH30CF3.
Optimized MP2/6-3 1 G(d) structure of (CFzH)zO (rotamer 1 ).
Optimized MP2/6-3 1 G(d) structure of (CF2H)zO (rotamer 2).
Optimized MP2/6-3 1 G(d) structure of (CF2H)zO (rotamer 3).
Optimized MP216-3 1 G(d) structure of CF3OCFzH (rotamer 1).
Optimized MP2/6-3 1 G(d) structure of CF~OCFZH (rotamer 2).
Optimized MP2/6-3 1 G(d) structure of (CF3)20.
Optimized MP2/6-3 1 G(d) structure of CH3C(O)CH3.
Optimized MP2/6-3 1 Gfd) structure of CH3C(O)CH2F (rotamer 1 ).
xxxix
Figure 7.15 Optimized MP216-3 1 G(d) structure of CH3C(0)CH2F (rotamer 2).
Figure 7.16 Optimized MP2/6-3 1 G(d) structure of CHzC(OH)CH2F.
Figure 7.17 Optimized MP2/6-3 1 G(d) structure of CH3C(0)CF3.
Figure 7.18 Optimized MP216-3 1 G(d) structure of CH2FC(O)CHtF.
Figure 7.19 Optimized MP2/6-3 1 G(d) structure of CF3C(O)CF2H.
Figure 7.20 Optimized MP216-3 1 G(d) structure of CFJC(O)CF~.
Figure 7.2 1 Optimized MP2/[6-3 1 +G(d)/6-3 1 G(d)] structure of CI-((CH3)zO).
Figure 7.22 Optimized MP2/[6-3 1 +G(d)/6-3 1 G(d)] structure of CI-((CH3CH2)20) 270
(rot amer 1 ) .
Figure 7.23 Optimized MP2/[6-3 1 +G(d)/6-3 1 G(d)] structure of Cl-((CH3CH2)tO) 270
(rot amer 2).
Figure 7.24 Optimized MP2/[6-3 1 +G(d)l6-3 1 G(d)] structure of Cl-(CH3OCF3).
Figure 7.25 Optimized MP2/[6-3 1 +G(d)l6-3 1 G(d)] structure of Cl-((CF2H)zO)
(rot amer 1 ).
Figure 7.26 Optimized MP2/[6-3 1 +G(d)l6-3 1 G(d)] structure of CI-((CF2H)20)
(rotamer 2, isorner 1).
Figure 7.27 Optimized MP2/[6-3 l+G(d)/6-3 1 G(d)] structure of CI-((CF2H)20)
(rotamer 2, isomer 2).
Figure 7.28 Optimized MP2/[6-3 1 +G(d)/6-3 1 G(d)] stxucture of CT((CF2H)zO) 272
(rotarner 4).
Figure 7.29 Optimized MP2/[6-3 1 +G(d)/6-3 I G(d)] structure of CI-(CF30CF2H) 272
(rotamer 1 ).
Figure 7.30 Optimized MP2/[6-3 1 +G(d)/6-3 1 G(d)] structure of CI-(CFiOCFzH) 273
(rotamer 2).
Figure 7.31 Optimized MP2/[6-3 1 +G(d)/6-3 1 G(d)] structure of CI-((CF&O). 273
Figure 7.32 Optimized MP2/[6-3 1 +G(d)/6-3 1 G(d)] structure of CI-(CH30CF3)2. 275
Figure 7.33 Optimized MP2/[6-3 1 +G(d)/6-3 1 G(d)] structure of Cl-((CF*H)20)2. 275
Figure 7.34 Optimized MP2/[6-3 1 +G(d)/6-3 1 G(d)] structure of CI-(CH3C(0)CH3). 275
Figure 7.35 Optimized MP2/[6-3 1 +G(d)/6-3 1 G(d)] structure of
CI-(CH3C(O)CH2F) (rotamer 1 ).
Figure 7.36 Optimized MP2/[6-3 1 +G(d)/6-3 1 G(d)] structure of
CI-(CH3C(0)CH2F) (rotamer 2).
Figure 7.37 Optimized MP2/[6-3 1 +G(d)/6-3 1 G(d)] structure of
CI-(CHtC(OH)CH2F).
Figure 7.38 Optimized MP2/[6-3 1 +G(d)/6-3 1 G(d)] structure of
Cl-(CH3C(0)CF3).
Figure 7.39 Optimized MP2/[6-3 1 +G(d)/6-3 1 Qd)] structure of
CI-(CF2HC(0)CF2H).
Figure 7.40 Optimized MP2/[6-3 1+G(d)/6-3 1 G(d)] structure of
C 1-(CF3C(O)CFtH).
Figure 7.41 Optimized MP2/[6-3 l+G(d)/6-3 1 G(d)] structure of
Cl-(CF3C(O)CF3).
Figure 7.42 Proposed covalent and electrostatic chloide ion-hexafluoroacetone
complexes.
Figure 7.43 Optimized MP2(fu11)/6-3 1 G(d) structure of CH3C(0)CH2-
Figure 7.44 Optimized MPZ(fù1 I)/6-3 1 G(d) structure of CH3C(O)CHF.
Figure 7.45 Optimized MP2(fb11)/6-3 1G(d) structure of CH2C(O)CH2F.
Figure 7.46 Optimized MP2(tii11)/6-3 1 G(d) structure of CF3C(0)CH2-.
Figure 7.47 Optimized MPZ(fù11)/6-3 1 G(d) structure of CF3C(0)CF2-.
Figure 7.48 Optimized MPZ(fÙI1)/6-3 1G(d) structure of CF3O-.
Figure 7.49 Optimized MP2(fü11)/6-3 1 G(d) structure of C F30-(CH3CI).
Figure 7.50 Optimized MP2(fÙ11)/6-3 1 G(d) structure of [CICH30CF3]-.
xlii
Figure 7.51 Van't Hoff plots for the chlonde ion-ether clustenng equilibria
Cl- + ether-F, = Cl-(ether-F,) (ether-F, = (CH3h0, (CH3CH2)20,
CH30CF3, (CF2H)2O7 CF30CFzH).
Figure 7.52 Van't Hoff plots for the chIoride ion-ether clustering equilibria
Cl-(ether-F,) + ether-F, = C1-(ether-F,)2 (ether-F, = CH30CF3,
(CF2W20) -
Figure 7.53 Van't Hoff plots for the chloride ion-acetone clustering equilibria
Cl- + acetone-F, = Cl-(acetone-F,) (acetone-F, = CH3C(0)CH3,
CH,C(O)CH2F, CH3C(O)CF3, CF3C(0)CF2H, CF3C(0)CF3).
Figure 7.54 Schematic G3(MP2) energy profile for the Cl- + CH30CF3 + CF30- + CH3CI gas phase Sx2 reaction.
Figure 7.55 Simulated IR spectrum of CH3C(0)CH3 fiom HF/6-3 1 G(d)
computations.
Figure 7.56 Simulated ïR spectrum of CH3C(0)CH3 from B3LYP/
6-3 1 1 ++G(3d,3p) computations.
Figure 7.57 Expenmental FT-IR spectmm of CH3C(0)CH2F
Figure 7.58 Simulated IR spectrum of CH3C(O)CH*F (rotamer 1) of HF/
6-3 1 G(d) computations.
Figure 7.59 Simulated IR spectrum of CH3C(0)CH2F (rotamer 1) of B3LYPl
6-3 1 1 +G(3d,3p) computations.
Figure 7.60 Simulated IR spectrum of CH3C(0)CH2F (rotamer 2) of HF/
6-3 1 G(d) computations.
Figure 7.61 Simulated IR spectmm of CH3C(O)CH2F (rotamer 2) of B3LYP/ 313
6-3 1 1 ++G(3d,3p) computations.
Figure 7.62 Simulated IR spectmm of CH2C(OH)CH2F (enol) of HF/6-3 1 G(d) 3 13
cornputations.
Figure 7.63 Experimental FT-IR spectnim of CH3C(0)CF3.
Figure 7.64 Simulated iR spectrum of CH3C(0)CF3 from HW6-3 1 G(d)
computations.
Figure 7.65 Simulated LR spedmm of CH3C(0)CF3 from B3LYP/
6-3 1 1 ++G(Sd,3p) cornputations.
Figure 7.66 Experimental FT-IR spectrum of CF3C(O)CF2H.
Figure 7.67 Simulated IR spectrum of CF3C(0)CF2H from HW6-3 1 G(d)
computations.
Figure 7.68 Simulated IR spectrum of CF3C(0)CF2H from B3LYP/
6-3 1 1 ++G(3d,3 p) computations.
Figure 7.69 Experimental FT-IR spectnim of CF3C(0)CF3.
Figure 7.70 Simulated IR spectmm of CF3C(0)CF3 from HW6-3 1 G(d)
computat ions.
xliv
Figure 7.71 Simulated IR spectrum of CFtC(O)CF3 from B3LYP/
6-3 1 1 ++G(3d,3p) computations.
Figure 7.72 Simulated IR spectrum of CF,C(0)CF3) (solid line) and
CI-(CF,C(0)CF3) (dotted line) from B3 LYP/[6-3 1 1 ++G(3df.3 pd)/
6-3 1 1 ++G(3d,3 p)] computations.
Figure 7.73 Plot of the MPU[a/b] energy, E ~ p 2 ( r ~ y b 3 ~ + c I ( ~ Y ~ - 3 l ~ l d ) . versus the 329
CI--CO distance in CI-(CH,C(0)CH3), R(C1--CO), from a relaxed
potential energy surface scan.
Figure 7.74 Plot of the MPU[a/b] energy, E ~ p ~ ( f ~ ~ ~ - 3 ~ + ~ ( d y 6 3 1 ~ ( d ) , versus the 329
CI-.*.CO distance in CI-(CF3C(O)CF3), R(C1--*CO), from a relaxed
potential energy surface scan.
xlv

NOTE TO USER
Page not included in the original manuscript are unavailable from the author or university. The
manuscript was microfilmed as received.
This is reproduction is the best copy available
List of Abbreviations
A D 0
B
B3LYP
BDE
BSSE
C D
DEC
DFT
E
El
E2
Ecm
ECP
EI
Elab
EPDS
ES1
FA
FT-ICR
FT-IR
G2
standard deprotonation enthalpy change or gas phase acidity
standard heat of formation
standard Gibbs' fiee energy change
standard ent halpy change
standard reaction enthalp y
standard entropy change
average dipole orientation
magnetic sector
Becke three-parameter Lee, Yang, and Parr non-local exchange functional
bond dissociation energy
basis set superposition error
collision induced dissociation
dissociative electron capture
density functional theory
electric sector
unimoIecular dimination reaction
bimolecular etimination reaction
electron afinity
center-of-mass ion kinetic energy
effective core potential
electron ionization
laboratory-frame ion kinetic energy
electron photodetachment spectroscopy
electrospray ionization
flowing afiergiow
Fourier transform ion cyclotron resonance
Fourier transforrn infrared
Gcncssian 2 t heory
xlvii
G2(MP2)
G3
G3(MP2)
GUMS
GIB
HF
HPMS
K R
IR
M D
ITMS
KIMMS
LUMO
MCA
MCS
MD
MIKE
MO
MP2
MS
MSiMS
NA
NTPES
MST
NMR
NPA
PA
PD
PES
PHPMS
QCISD(T)
Gaussran 2 MP2 theop/
Gazasian 3 theory
Gmssinrr 3 MP2 theory
gas chromatography-mass spectrometry
guided ion beam
Hartree-Fock
high pressure mass spectrometry
ion cyclotron resonance
in frared
infiared multiphoton dissociation
ion trap mass spectrometry
kinetic ion mobility mass spectrometry
lowest unoccupied molecular orbital
methyl cation afinity
multi channel scalar
molecular dynamics
mass-anal yzed ion kinetic energy spectrometry
molecular orbital
second-order Msller-Plesset perturbation
mass spectrometry
tandem mass spectrometry
not available
negative ion photoelectron spectroscopy
National Institute of Science and Technology
nuclear magnet ic resonance
natural population analysis
proton affinity
photodissociation
potential energy surface
pulsed-ionization high pressure mass spectrornetq
quadratic configuration interaction singles doubles (triples)
xlviii
QQQ RRKM
SIFT
SN 1
s ~ 2 TCID
TIPPS
TOF
TST
UVNIS
VPDS
VT
ZPE
Z T r n
triple quadrupole
Rice-Ramsperger-Kassel-Marcus
seiected ion flow tube
unimolecular nucleophilic substitution
bimolecular nucleophilic substitution
threshold collision induced dissociation
threshold ion pair production spectroscopy
time-of-flight
transition state t heory
ultraviolet/visible
vibrational predissociation spectroscopy
variable-tempearture
zero point energy
zero-pressure thermal radiation induced dissociation
xlix
Chapter 1
1.1 Gas Phase Cluster Ions
Clusters can be considered intermediate states of matter, and they have important
relevance in many fields of science. The field of cluster research is too large to give a
cornplete overview in this section,' and the emphasis here will be placed on gas phase
ionic clusters. This is still a very large subject, and thus no emphasis will be put on
aerosols, and metal cluster ions. Biological cluster ions will not be considered either,
even though these are very important and interesting. Most work on gas phase ionic
clusters has focussed on water cluster ions, both positively and negatively charged, mixed
water clusters, or clusters containing other organic molecules.
1.1.1 Generation
Cluster ion sources can be divided into two main categories, neutral/ion hybrid
sources and cluster ion sources.' In the first group, neutral clusters are primarily
generated by supersonic expansion nozzle sources, both pulsed and continuous, and
subsequent ionization can be achieved by discharges, electrons, or photons. Flow
tubes,' high pressure mass spectrometry (HPMS) ion s o ~ r c e s , ~ and, recently,
electrospray ionization (ESI) ion sources are examples of the second Details
on the exact mechanisms for cluster ion formation in these various examples will not
be discussed further here, since some of them involve subsequent reaction schernes.
In addition, monosolvated negative cluster ions have been generated by ion-
molecule reactions at low pressures in ion cyclotron resonance (ICR) and Founer-
transfonn ion cyclotron resonance (FT-ICR) instr~ments.~
1-1.2 Structures
lnsights into stnictures of cluster ions has been obtained from computations, both
eiectronic structure and molecular dynamics (MD),? thermochemical measurements, 8 reactivity studies (see section 1.1.3). and ion rnobility e ~ ~ e n r n e n t s . ~
A t e m closely related to clusters is the so-called "magic numbers". In general,
cluster ions are produced in a wide distribution, A'(B)~. Magic numben are
associated with certain clusters that have higher than expected intensities in the
observed distribution.' These increased intensities are closely related to energetically
favorable structures. A prime example is &(HZO)21, in which a H30' core is
surrounded by a cage of 20 water molecules, three of them interacting with the three
HiO' hydrogen atoms and al1 of them forming hydrogen bonds among thern~elves.'~
For mixed cluster ions, systems with series of magic numbers have been found in
which the identity of the core ion may change. Changes in thermochemical
parameters like the standard enthalpy change (AH? and the standard entropy change
AS'),^ l or the electron afinity (EA) l2 have been associated with changes in the
stmcture or formation of new solvation sheIls.
1.1-3 Reactivity
In many areas of chemistry the relationship between structure and reactivity plays
a central role. For cluster ions, reactivity studies may include metastable unimolecular
dissociations, ion-molecule reactions, and interaction with photons. Differences in the
various observations as a fùnction of the cluster size may be indicative of different
st maures. For these three types of reactivit y various illust rat ive examples will be
given.
Castleman and CO-workers found that mixed protonated ammonia clusters,
(NH,),(X),H+ with X = C&C(O)CH3, CH>CN, and CH3C(O)H, have different
metastable dissociation pathways depending on n (Reactions 1.1 and 1.2) as measured
by reflectron time-of-flight (TOP) techniques."
Frorn the sarne group, for a series of N H ~ ( C ~ H + ~ ~ H + cluster ions (rn = 1-5) the
following metastable dissociation pathways were observed (Reactions 1 -3 and 1 .4).13
NH~(c~H~N),H+ + (c~H~N),H+ + NH3 for m c 4 (1 -3)
+ N H ~ ( C ~ H ~ N ) , H ~ -+ NH~(C~HIN),-~H + C5HsN for rn 2 4
These results were explained by the fact that for m 4 the proton will be bonded
to the pyridine nitrogen atom due to its higher proton affinity (PA) than ammonia,
while for r n > 4 NK+ wili be the core ion, providing four sites for hydrogen
bondi ng. ' Viggiano and CO-workers reacted halide ion-water clusters, X(D20), (X = F, Cl,
Br, 1; n = 1-16) with Cl2 at 140 K in a variable-temperature selected ion fiow tube
(VT-SIFT) instrument (Reaction 1. 5).14
Frorn ab inifio l5-I9 and MD 20-25 computations it has been show that the halide
ion can be located on the surface or within the interior of a water cluster. Size-
dependent kinetics might be indicative of a transition in the structure, and it was
assumed beforehand that the surface solvated state would be more reactive than the
interior solvated state. For X = F a substantial decrease in the rate constants was
observed for n r 4 and for X = Cl at n = 6. For X = Br and 1 no substantial changes
were observed up to n = 16 and 13, respectively. These results do not aiways agree
with a b ini,io andor M D computations, which sometimes predict transitions at
different cluster sizes. A similar kind of study was performed for 0K(H20)* with
HBr at 100 K (Reaction 1.6), and for n 5 7 the reaction proceeded at the collision rate
constant, dropping to one third of the collision rate constant for n = 1 1 .26
In addition, H/D exchange reactions have also revealed cluster size dependent
kinetics (Reaction 1 .7).27
Finally, Lineberger and CO-workers showed the cluster size dependence of the
photodissociation (PD) products for X2'(C02)n clusters (X = Br, 1; n = l - 2 0 ) . ~ ' * ~ ~
Reaction 1.8 was observed for uncaged clusten, while Reaction 1.9 took place for
caged clusters. For X = Br, the transformation took place at n = 12, and at n = 16 for
X = 1.
1.2 Ion Solvation
1.2.1 Condensed phase
The degree of solvation of ionic compounds in vanous organic solvents is
strongly dependent on the dielectric constant, E, of a particular solvent. Based on the
dielectric constant. solvents can be divided into two broad categories: polar and non-
polar.30 In non-polar solvents, with E c 15, ionic cornpounds will be highly
associated. Quatemary ammonium salts, N&+x, are an example of some exceptions,
since the R groups are very soluble in non-polar s o ~ v e n t s . ~ ~ The two rnost important
solvent properties are the dipole moment, p, and the molecular polarizability, a.
Solvent molecules will orient themselves around positive and negative ions
differently. This orientation will be most pronounced in the innermost shell of solvent
molecules, and will become increasingly random as the distance from the ion
increases. Depending upon the structure of the solvent molecule, positive and
negative ions may interact more or less strongly, thus giving rise to different degrees
of solvation. The polarizability of a solvent will become more important for high
molecular weight polar solvents and for large ions like T. Polar solvents can be
further divided into two categories: protic and aprotic. The first group has the ability
to form hydrogen bonds, and so negative ions will be strongly solvated by protic
solvents. Dipolar aprotic polar solvents tend to interact more strongly with positive
ions than with negative ions, since the positive ends of the dipole moment are more or
less located in the middle of the molecule.
The reactivity of ions in the condensed phase can be strongly affected by the
nearby presence of its counter ion. These so-caIled ion-pairs rnay exist in two distinct
types: the contact ion-pair, M+X, and the solvent separated ion-pair, M+ 1 S 1 X.
From nuclear magnetic resonance (NMR) ' and ultraviolet/visible (UVNIS) 32
experiments it has been shown that these two species may be in equilibrium (Reaction
1.1 O).
Closely associated with the interactions in solvent separated ion-pairs are cation
complexing agents like crown ethers and c ~ y ~ t a n d s . ~ ~ Cations bind very strongly with
these molecules by multiple contacts, also known as chelation, mainly by ion-di pole
interactions. Recently, research on anion selective receptor molecuIes and ions has
gained popularity, and the main interactions in these systems are by hydrogen 34.35 bonding and ion-dipole interactions. One of the most usehl and weII-known
synthetic organic applications of ion solvation and ion-pair formation is phase
transfer c a t a ~ ~ s i s . ~ ~
1.2.2 Gas phase
Gas phase ion solvation studied by mass spectrometric techniques has confirrned
that many condensed phase phenomena are aIso operational in the gas phase.
Exarnples are the different therrnochemistry of cation and anion solvat ion by different
solvents, the existence of solvation shells, intrinsic binding affinities for various
cations ont0 crown ethers and cryptands, the existence of ion-nuitter ion complexes,
and qualitative information on chelation. Unfortunately, no information on solvent
separated ion-pairs has be obtained.
1.3 Ion Thermochemistry
1.3.1 Definitions
The thermochemistry of ions and neutrals in the gas phase is closely associated
with their structures and reactivities, and consequently it has been one of the most
important fields of study in gas phase ion chemistry over the last three decades. It is
beyond the scope of this section to give a complete ovetview of gas phase ion
thermochemistry, and so only the four most important quantities associated with
negative ions will be briefly discussed.
The EA of a neutral molecule is the negative reaction enthalpy for the following
reaction (Reaction 1 - 1 1 )."
M + e - + M + EA = -A,HO (1 . I l )
The PA of a neutral molecule is the negative reaction enthalpy for the following
reaction (React ion 1 - 1 z) . )~
The gas phase acidity or deprotonation enthalpy, for a neutral molecule is
the negative reaction enthalpy for the following reaction (Reaction 1 .13)."
Finally, the heat of formation for a negative ion M', A~@(M'), is given by
Equation 1-14." According to the Electron Convention, A~H'(~-) is defined as 0.75 1
kcal mol-' (0.033 eV) at 298 K, denved from Fermi-Dirac s t a t i~ t i c s .~~
Since most t hermochemical data in this thesis are associated with binding
enthalpies of anions ont0 neutral molecules studied by pulsed-ionization high
pressure mass spectrometry (PHPMS), in the following sections a brief overview will
be given of the various expenmental methods used to obtain similar data. Ernphasis
will be placed on the various advantages and disadvantages of the methods, and the
consequences for the reliability of the obtained themochemical data, as well as the
relative overall performance of the various methods.
1.3.2 Methods
1.3.2.1 Equilibrium Reactions
The two most common gas phase equilibrium reactions are clustering
(Reaction 1.1 5) and exchange (Reaction 1.16) reactions.
A'@) + C + M = A-(C) + B + M
The first one is nomally only observed at elevated pressures like in PHPMS,~
high pressure drift c e l ~ s , ~ ~ or selected ion flow tube (SIFT) i n s t r ~ r n e n t s . ~ ~ By
measuring the equilibrium constants for Reactions 1.15 and 1.16 at different
temperatures one can directly obtain AHO and AS' values. In general, PHPMS is
restricted to volatile compounds, but Kebarie and CO-workers coupled an ES1
source to an HPMS source to measure equilibria involving ions of biological
molecules and mult ipl y c harged (in)organic ions? The advantage of measuring
A s 0 is that it rnay provide insights into the structure of the cluster ion.
Exchange equilibria have been perfomed on IcR,'" both the drift cell and
trapped ion types, and PT-ICR i n s t r ~ r n e n t s . ~ ~ From the equilibrium constants of
these experiments standard Gibbs' fiee energy changes (AG') values at one
temperature, in most cases at 298 K, can be obtained. By using an estimated or
calculated AS' value, the AH' value can be determined, and this is referred to as
the "third l a k 7 method.13 In Section 2.1 various possible errors in PHPMS
experiments are discussed that may give rise to errors in the thermochemical data
obtained. In general, the agreement between AG' values from PHPMS and ICR or
FT-[CR expenments is good. It has been argued that the "third law" method can
give uncertainties in AI? values that are considerably better than those obtained
from Van't off plots.43
1.3.2.2 Threshold CID
Binding enthalpies may also be obtained from low kinetic energy resolved
threshold collision induced dissociation (TCID) experiments (Reaction 1.17). 44-48
For these types of experiments guided ion beam (GIB), 4548 FT-ICS~' and
flowing afterglow-triple quadrupole (FA-QQQ) " instruments have been used. By
measuring the cross sections o f Reaction 1.17, extrapolated to zero target gas
pressures, as a hnction o f the centre-of-mass collision energy (E,), the binding
or threshold energy at O K can be obtained by fitting the threshold region of the
curve to Equation 1 .1 8.47
In Equation 1.18, u(E) is the cross section for formation of the product ion at
centre-of-mass energy E, Er is the desired threshold energy, a is a scaling factor,
n is an adjustable parameter related to the shape of the cross section, PD is the
probability o f an ion with a given arnount of energy dissociating within the
experimental time window, and i denotes the ro-vibrational States having energy
Ei and population gi. In genera!. the results of these types o f experiments agree
well with data frorn equilibrium experiments, if available. Unfortunately, input
fiom a b ilririo or density functional theory (DFT) computations is required,
making this method not purely experimental. In addition, the presence of a
centrifbgal barrier for the reverse reaction rnay overestimate the binding enthalpy
obtained.
lA2.3 Light Induced Reactions
Binding enthalpies of various cluster ions have been determined using photon
induced processes, like electron photodetachment spectroscopy (EPDS), negative
ion photo-electron spectroscopy (NIPES), and zero-pressure thermal radiation
induced dissociation (ZTRID).
In EPDS experiments the complex ion population (A-(B)) is being monitored
as a fünction of the energy (wavelength) o f the irradiated laser light (Reaction
1 . l9) .
A-(B) + hv + A' + B + e-
These kinds of experiments have been performed on ICR 50 and FT-ICR
instruments. Yang et ai. derived that at threshold the cross section for optical
detachment of an electron, o(E), is directly proportional to the square root of the
energy in excess of the threshold (Equation 1 .zo)?
For a series of halide alcohol complexes, X(ROH), the binding energies
determined were in general more negative than fiom other methods."
In NIPES the kinetic energy of the photo-electron is measured, and Bowen
and CO-workers showed that the binding energy, D(A-(B),+..B), of a anion
complex A-(B), can be approximated by Equation 1 . ~ l , ~ ~ where EA, is the
adiabatic electron affinity (Equation 1.22)
EA, = hv,,, - KE(e-) (0,O) (1 -22)
The (0.0) t e m corresponds to the transition fi-om v = O in the negative ion
ground state to v = O in the neutral ground state. In general, there is close
agreement between data fiom NIPES experiments with other experimental data, if
available.
Large cluster ions, i.e. with many vibrational modes, trapped in a FT-ICR ce11
can absorb blackbody radiation irradiated fiom the ion source wall until the
interna1 energy is above the threshold for dissociation (Reaction 1-23)."
A'(B). + nhv + A'@L, + B
At zero background pressure. the unimolecular dissociation constant. k,, will
be equal to kab,[hv], where kabs is the rate at which the cluster absorbs photons,
and [hv] is the photon concentration. By performing these kinds of experiments at
different FT-KR cell temperatures, T, and plotting In(k,) versus 1/T, the
activation energy, E,, can be obtained from the slope (Equation 1-24}, where A is
the frequency factor, and R is the universal gas constant.
In general, there is excellent agreement with data from PHPMS experiments,
since the activation energy corresponds to the weIl depth of the cluster formation
reaction. Furthermore, it has been shown by this method that dissociation
energetics of large biological ions can be obtained.
1 .XîA Kinetic Method
The kinetic method was introduced by Cooks and CO-worker over two decades
ago to obtain thermochemical parameters for ions derived from large and non-
volatile rnolec~les.'~ In this section a bnef overview of the kinetic method will be
çiven. For a more detailed discussion of the kinetic method and its applications,
the reader is referred to a review by ~ooks."
A metastable proton-bound dimer, (B,)H+ (B2), cm dissociate in the field fiee
region of a rnass spectrorneter into (B I)H+ and (B~)H+ (Reaction 1.25).
The unimolecular rate constant for each reaction path is given by Equation
1 2 6 , 55 where R is the universal gas constant, T,fr is the effective temperature, h is
Planck's constant, Q' and Q are the partition functions of the activated complex
and the proton bound dimer, respectively, and EO is the activation energy.
For the two competing
written as Equation 1.27?
dissociations in Reaction 1.25, Equation 1-26 can be
Since both reaction channels originate from the sarne ion, QI = Q2. In
addition, if it is assumed that the two frequencies along the reaction coordinate in
the activated cornplex are equal, that the difference in the entropy change for both
reaction channels is negligible, and that the relative abundance of the (B,)H+ and
(B~)H+ ions in the metastable ion kinetic energy (MIKE) spectrum is determined
by the relative rates of dissociation, k i and kt, then Equation 1.27 can be written
as follows (Equation 1 . ~ 8 ) , ~ ' where APA is the difference in proton affinity
between BI and BZ.
Despite its usehlness for many systems investigated, the kinetic method has
received significant cnticism, conceming the concept of the effective temperature 5 6 and the neglect of the entropy t e n d 7 Various groups have developed
procedures to deconvolute the enthalpy and entropy changes by comparing results
from MtKE and MIKEKID experiments, which correspond to different effective 58.59 temperatures. For fiirther details the reader is referred to the cited articles.

1.4 Uni- and Bimolecular Gas Phase Ion-Molecule Reactions
The understanding of the rates for chemical transformation o f gas phase ions into
products, whether by unimolecular dissociation or ion-molecule reactions, has been one
o f the central thernes in gas phase ion chemistry from the early days. Understanding the
appearance o f mass spectra o f simple orsanic ions in terms o f ion structures and
mechanisms for the formation o f the various products, both ionic and neutral, has been a
major driving force in developing theories t o understand unimolecular dissociations.
In the following two sections the basic formulas and assumptions for the two most
well known theories t o explain unimolecular and bimolecular rate constants, the RRKM
and A D 0 theories, respectively, will be presented.
The Rice-Ramsperger-Kassel-Marcus (RRKM) theoiy is the most widely used
method to calculate unimolecular rate constants, k(E), of systems with an internat
energy distribution above the threshold for dissociation (Equation 1 . ~ 9 ) ~ ~ where o is
a symmetry factor that indicates the number of identical pathways that can be taken,
N ~ ( E - Eo) is the sum o f vibrational and rotational quantum states for the transition
state up t o intemal energy E - Eo, h is Planck's constant, p(E) is the density of
vibrational and rotational quantum states in the dissociation ion, and Eo is the
threshold energy for dissociation.
The RRKM theory is a statistical theory and it assumes that al1 states can
contribute their non-fixed energy t o the reaction. The redistnbut ion of the vibrational
energy is a fast and statistical process. Rotational energy may also contribute to a
reaction, although limitations due to conservation of angular momentum may prevent
this from happening.
1.4.2 A D 0 Theory
In low pressure environments, iike in a FT-ICR the initial internally excited
reactants complex [A'(B)]* cannot be stabilized by third-body collisions o r radiative
stabilization, although the latter process has been observed for certain special
systems6' Consequently it will have a short lifetirne, and it will either dissociate back
to the reactants A' and B through a "loose" transition state, or pass through a "tight"
transition state to the produas complex [c'(O)]*. The "tight" transition state can only
be passed if its energy is lower than o f the reactants. The dissociation rate constant o f
the [A'(B)]* complex can be calculated using the RRKM expression. In order to
calculate the rate constant for formation o f the [A'(B)]* cornplex the average dipole
orientation (ADO) theory expression (Equation 1-30) can be used.12
In Equation 1.30, k.- is the collision rate constant (in cm3 rnolecule-' s-'), q is
the charge o f the ion (in cmIR), a is the molecular polarizability (in cm3), p is
the reduced mass o f the systern (in g), C is an experimental constant (function of
I.idai'2), iç the permanent dipole moment o f the neutral (in ergi" cm3"), ke is
Boltzmann's constant (in erg K I ) , and T is the absolute temperature (in K).
The eflkiency of a reaction can be determined by dividing the experimenta1 rate
constant over the collision rate constant.
Finally, it has to be mentioned that other theories have been developed that, in
many cases, provide results closer to expenmental data, but they will not be discussed
here.
1.5 Ion Spectroscopy
lsomeric distinction based o n differences in thermochemistry and reactivity, both uni-
and bimolecular, has been one of central themes in chemistry. Even before the
introduction o f modem spectroscopie techniques, various chernical methods were
available to help chemists t o distinguish isomers. Spectroscopic techniques like infrared
(IR), NMR, UVNIS, and mass spectrometry (MS) have been and continue to be
indispensable tools for many fields o f chemistry and other sciences. Until the widespread
introduction o f quantum chemistry software the field o f gas phase ion chemistry had to
do without many o f the tools condensed phase chemists benefited from. On the other
hand, using the available techniques most of the problems couId be solved, and
condensed phase chemists were experiencing problems gas phase ion chemists did not
worry about.
Ion spectroscopy is still a relatively new and small field of study, and it has the
potential to become more important and help solve problems present day gas phase ion 63.64 chemistry techniques cannot deal with. It has already become a usehl tool t o test
quantum theoretical models by comparing available experirnental and calculated normal
mode vibrational fiequencies o f gas phase ions, and to confirm the existence of one
dominant isomer or various isomers simultaneously.
In this section a few techniques will be briefly discussed that have been used to date
to study systems related t o research presented in this thesis.
Halide ion-water complexes, with or without argon atoms, X ( H 2 0 ) , and
X(HtO),(Ar),, respectively, (X = F, Cl, Br, 1; n = 1-6; m = 1-4), have been among the
most extensiveIy studied systems by vibrational predissociation spectroscopy (VPDS). 65-74 In most cases the IR region fiom 2900-3700 cm-' is covered, corresponding to the
O-H stretch vibrations. By comparing experimental data of the cluster ions with results
for "ftee" water and from ab initio computations, the influence o f the halide ion on the
shifts o f O-H stretch vibrations, the exact identification of the O-H stretch vibrations,
and consequently structural assignment o f the cluster ions have been accomplished.
Similar experiments have also been performed on the C1-(HOCH3X, (n = 1-8,10,12),~~
r(HOR)(Ar), (R = CH,, CH,CH2, (CH3)zCH; m = 4-6)," and Cl-(NH3) " systems.
Riveros and Eyler measured indirectly the IR absorption spectra of some halide ion-
alcohol complexes by infrared multiphoton dissociation (IRMPD) experiments in the 78 920-1060 cm-' region. Some spectral shifis relative to "free" methanol could be
observed. Eventually, high resolution Fourier-transform infrared (FT-R) spectra of ions
trapped in a FT-ICR ce11 will give gas phase ion chemists and theoretica1 chemists a new
tool to investigate present day challenges in ion structures and to test computational
results.
Finally, it has to be rnentioned that IR spectra of ions have been recorded using
matrix-isolation spectroscopy "-*' and N I P E S . ~ ~
1.6 Scope of Thesis
The main scope of this thesis is to determine the thermochemistry of formation for a
variety of negative gas phase cluster ions by PHPMS and computational quantum
chemistry methods, as well as getting more insights into their structures and
spectroscopic properties.
Most systems investigated have relevance in various fields of chemistry. A large
portion of the work presented will provide new data, and has both confirmed some
previously known theories, but has also given new and different insights into accepted
observations and explanations of previously published work.
In Chapter 1 a general overview of the various aspects in this thesis has been given,
trying to put the research performed in a larger context. In Chapters 2 and 3 descriptions
of the experimental and theoretical methods used will be given. In Chapter 4 halide ion-
alcohol clusters will be the main subject, while in Chapters 5, 6, and 7, the focus will be
on solvated SN2 complexes and transition states, halide ion-trifluoromethyl halide SN^
reactions, and chloride ion-fluorinated ethers and acetones complexes, respectively.
Finally in Chapter 8 the main conclusions of this thesis will be summarized, as well as
suggestions for fùture research will be mentioned.
1.7 References
Castleman, Jr., A. W.; Bowen, Jr., K. H. J. Phys. Chem. 1996, 100, 129 1 1 and
references cited t herein.
Bohme, D. K. hf. J. Mass Spectrom. 2000, 200, 97 and references cited therein.
Kebarl e, P. "Pzrised High Pressure Mass Spectrometry ". In " Techniques for the
Stuc& of Iorz-Moleclde Reactiorls"; Farrer, J . M . ; Saunders, Jr., W. H., Eds.; Wiley-
Interscience, New York, NY, 1988, 221 and references cited therein.
Lee, S.-W.; Cox, H., Goddard, III, W. A.; Beauchamp, J. L. J. Am Chem. Soc.
2000, 122, 920 1.
Takashima, K.; Riveros, J. M. Mnss Spectrom. Rev. 1998, 17, 409 and references
cited therein.
Pliego, Jr., J. R.; Riveros, J. M. J. Chern. Phys. 2000, 112, 4095.
Tuckerman, M.; Laasonen, K.; Sprik, M.; Pamnello, M. J. Chem. Phys. 1995, 103,
150.
Meot-Ner (Mautner), M.; Speller, C. V. J. Phys. Chem. 1986, 90, 66 16.
Gotts, N. G.; von Helden, G.; Bowers, M. T. Inl. J. Mass Speclrom. Ion Processes
1995, 149 i M , 2 1 7.
Yang, X.; Castleman, Jr., A. W. J. Am. Chem. Soc. 1989, 11 i, 6845.
Yamdagni, R.; Kebarle, P. J. Am. Chem. Soc. 1972, 91, 2940.
Markovich, G.; Giniger, R.; Levin, M.; Chesnovsky, O. Phys. D 1991, 95, 94 16.
Tzeng, W. B.; Wei, S.; Castleman, Jr., A. W. J. Phys. Chem. 1991, 95, 585.
Seeley, J. V.; Moms, R. A.; Viggiano, A. A. J. Phys. Chem. 1996, 100, 15821.
Xantheas, S. S.; Dunning, Jr., T. H. J. Phys. Chem. 1994, 98, 13489.
Combariza, J. E.; Kestner, N. R.; Jortner, J. Chem. Phys. Lezz. 1993, 203,423.
Combariza, J. E.; Kestner, N. R- J. Phys. Chem. 1994, 98,351 3.
Combariza, J. E.; Kestner, N. R.; Jortner, J. J. Chem. Phys. 1994, 100,285 1 .
Combariza, J. E.; Kestner, N. R.; Jortner, J. Chem. Phys. Leu. 1994, 221, 156.
Perera, L.; Berkowitz, M. L. J. Chern. Phys. 1993, 99,4222.
Perera, L.; Berkowitz, M. L. J. Chern. Phy.~. 1994, 100, 3085.
Asada, T.; Nishimoto, K.; Kitaura, K. J. Phys. Chem. 1993,97, 7724.
Dang, L. X.; Garret, B. C. J. Chem. Phys. 1993, 99,2972.
Jorgensen, W. L.; Severance, D. L. J. Chem. Phys. 1993, 99,4233.
Sremaniak, L. S.; Perera, L.; Berkowitz, M. L. J. Phys. Chem. 1996, 100, 1350.
Arnold, S. T.; Viggiano, A. A. J. Phys. Chem. 1997, 101, 2859.
Paulson, J. F.; Henchman, M. J. Bull. Am. Phys. Soc. 1982,27, 108.
Alexander, M. L.; Levinger, N. E.; Johnson, M. A.; Ray, D. R.; Lineberger, W. C.
J. Chern. Phys. l988,88,62OO-
Papanikolas, J . M.; Gord, J. R.; Levinger, N. E.; Ray, D. R.; Vorsa, V.; Lineberger,
W. C. J Phys. Chrm. 1991,95, 8028.
Lowry, T. H.; Schueller Richardson, K. "Mechanisrns and Theory in Organic
Chrrnistry "; Harper & Row, Publishers, New York NY, 1987, Chapter 2.
O'Brien, D. H.; Russell, C. R.; Hart, A. J. J. Am. Chern. Soc. 1979, 101,633.
Simon, J. D.; Peters, K. S. Acc. Chem. Res. 1984, 17, 277.
Pedersen, C . J.; Frensdorff, H. K. Angew- Chern. h t . M. Engi. 1972, 11, 16.
Scheerder, J . ; Engbersen, F. J.; Reinhoudt, D. N. Red. Trax Chim. Pays-Bas 1996,
115, 307 and references cited therein.
Schmidtchen, F. P.; Berger, M. Chem. Ree 1997, 97, 1609 and references cited
therein.
Jones, R. A. AIdrichimica Acta 1976, 9(3), 35.
http://webbook.nist .gov/chemistry/ion
Kemper, P. R.; Bowers, M. T. J Am. Soc. Muss Sprctrom. 1990, 1, 197.
Seeley, J. V.; Morris, R. A.; Viggiano, A. A. J. Phys. Chern. 1997, 101, 4598.
Blades, A. T.; Klassen, J. S.; Kebarle, P. J. Am. Chem. Soc. 1996, 118, t 2437.
Larson, J. W.; McMahon, T. B. J. Am. Chern. Soc. 1983, 105,2944.
Tanabe, F. K. J.; Morgon, N. H.; Riveros, J. M. J. Phys. Chern. 1996,100,2862-
Mason, R. S.; Anderson, P. D. J. hi. J. Mass Spectrom. Ion Processes 1997, 161,
L1.
Chyall. L. J.; Squires, R. R. J. Phys. Chern. 1996, 100, 16435.
DeTuri, V. F.; Hintz, P. A.; Ervin, K. M . J. Phys. Chern. A 1997, 101, 5969.
DeTuri, V. F.; Ervin, K. M . J. Phys. Chem. A 1999, 103,691 1.
Gailbreath. B. C. D.; Pommerening, C. A.; Bachrach, S. M.; Sunderlin, L. S.
J. Phys. ('hem. A 2000,îOJ, 2958.
Artau, A.: Nizzi, K. E.; Hill, B. T.; Sunderlin, L. S.; Wenthold, P. G. J. Am. Chem.
Soc. 2000, 122, 10667.
van den Berg, K. J. PhD. Thesis, Ur~iversiîy ofAmsterdam, 1994.
MihaIick, J. E.; Gatev, G. G.; Brauman, J. 1. J. Am. Chem. Soc. 1996, 118, 12424.
Yang, Y.; Linnen, H. V.; Riveros, J. M.; Williams, K. R.; Eyler, J. R. J. Phys-
Chem. A 1997, 101, 2371.
Coe, J. V.; Snodgrass, J. T.; Freidhoff, C. B.; McHugh, K. M.; Bowen, K. J. J.
Chrm. PItys. 1985, 83, 3 169.
Dunbar, R. C.; McMahon, T. B. Scieme 1998, 279, 194 and references cited therein.
Cooks, R. G.; Kruger, T. L. J. Am. Chern. Soc. 1977,99, 7 4 .
Cooks, R. G.; Patrick, J . S.; Kothiaho, T.; McLuckey, S. A. Mass Spectrom. Rev.
1994, 13, 287.
Ervin, K. M. h t . J. Mass Spectrom. 2000, 195/196, 27 1 and references cited therein.
Armentrout, P. J. Am. Soc. Mass Spectrom. 2000, 11, 371 and references cited
t herei n.
Cheng, X.; Wu, Z.; Fenselau, C. J. Am. Chem. Soc. 1993,115,4844.
Cerda, B. A.; Wesdemiotis, C. J. Am. Chem. Soc. 1996, 118, 1 1 884.
Marcus, R. A. ; Ri ce, O. K. J. Phys. CoZZoid Chern. 1951, 55, 894.
Fisher, J. J. PhD. mesis, lJniversity of Waterloo, 1990.
.Su, T . ; Bowers, M. T. J. Chem. Phys. 1973,58, 3027.
Baer, T. (Ed.) im J, Mass Spectrom. ion Processes 1996, 159, 1 -26 1 and references
cited therein.
Duncan, M. A. int. J . Mass Specmm. 2000, 200, 571 and references cited therein.
Ayotte, P.; Nielsen, S. B.; Weddle, G. H.; Johnson, M. A.; Xantheas, S. S. J. Phys.
C'hem. A 1999, 103, 10665.
Ayotte, P.; Weddle, G. H.; Kim, J.; Kelley, J.; Johnson, M. A. J. Phys. Chem. A
1999, 103,443.
Ayotte, P.; Weddle, G. H.; Johnson, M. A. J. Chem. Phys. 1999, 110, 7129.
Cabarcos, O. M.; Weinheimer, C. J.; Lisy, J. M.; Xantheas, S. S. J. Chem. Phys.
1999, 110, 5 .
Ayotte, P.; Bailey, C. G.; Weddle, G. H.; Johnson, M. A. J. Phys. Chem. A 1998,
102,3067.
Ayotte, P.; WeddIe, G. H.; Kim, J; Johnson, M. A. Chern. Phys. 1998, 239,485.
Ayotte, P.; Weddle, G. H.; Kim, J; Johnson, M. A. J. Am. Chern. Soc. 1998, 120,
12361.
Choi, J.-H.; Kuwata, K. T.; Cao, Y.-B.; Okxmura, M. J. Phys. Chem. A 1998, 102,
503.
Bailey, C. G.; Kim, J.; Dessent, C. E. H.; Johnson, M. A. Chrm. Phys. Left. 1997,
269. 122.
Johnson, M. S.; Kuwata, K. T.; Wong, C.-K.; Okumura, M. O e m . Phys. Lett 1996,
260, 55 1.
Cabarcos, O. M.; Weinheimer, C. J.; Martinez, T. J.; Lisy, J. M. J. Chem. Phys.
1999, 110,9516.
Nielsen, S. B.; Ayotte, P.; Kelley, J. A.; Johnson, M. A. J. Chem. Phys. 1999, 111,
9593.
Weiser, P. S.; Wild, D. A.; Wolynec, P. P.; Bieske, E. J. J. Phys. Chem. A 2000,
104, 2562.
Peiris, D. M.; Riveros, J. M.; Eyler, J. R. hl. J. Mass Specfrorn. Ion Processes 1996,
159, 169.
Zhou, M.; Citra, A.; Liang, B.; Andrews, L. J. Phys. Chem. A 2000, 104,3457.
Fridgen, T. D.; Zhang, X. K.; Pamis, J. M.; March, R. E. J. Phys. Chern. A 2000,
104,3487.
Hudgins, D. M.; Bauschlicher, Jr., C. W.; Allamandola, L. J.; Fetzer, J C. J Phys.
Chem. A 2000, IO4,3655.
Zanni, M. T.; Taylor, T. R.; Greenblatt, B. J.; Soep, B.; Neurnark, D. M. J. C h .
Phys. 1997, 107, 7613.
Chapter 2
Experimental
2.1 Puised-ionization High Pressure Mass Spectrometry
Pulsed-ionization high pressure mass spectrometry (PHPMS) is the most successfùl
technique to date to study gas phase ion-molecule equilibria and rates of approach to
equilibrium.' In addition, ion-molecule reaction kinetics and temperature dependence of
ion-molecule rates can be studied. This technique, among some others, has been used to
construct themochemical ladders for proton affinities (PA), gas phase acidities (A, ,~~HO), electron affinities (EA), methyl cation affhities (MCA), and stepwise solvation of
positive and negative gas phase ions by neutral ligands2 The ions, generated in the field-
fiee ion source by a variety of processes (see Section 2.3), diffuse through the gas to
reach the ion source wall, where neutralization takes place. The trapping of the ions by
the bath gas increases their lifetime to the rns regime, allowing fu l l thermalkation of the
ion populations to take place. The thermal conductivity of the gas helps to equalize the
temperature throughout the entire ion source. Ion sampling takes place by allowing
considerable amounts of gas and ions to escape the ion source by molecular flow through
the exit aperture or slit. One of the assumptions made with PHPMS to calculate
equilibrium and rate constants is that the intensity of a given ion A' at time t, (A'),, is
proportional to the concentration of A' in the ion source, [A']. This applies to al1 ions
present, and both time-independence and equality of the proportionality constants is
assumed.
The diffusion current density, T, for the ions and electrons present in the ion source is
composed of a fiee diffusion tem, DVN, due to a number density gradient, and a field
induced particle drift, NpE (Equations 2.1-2.3). '-'
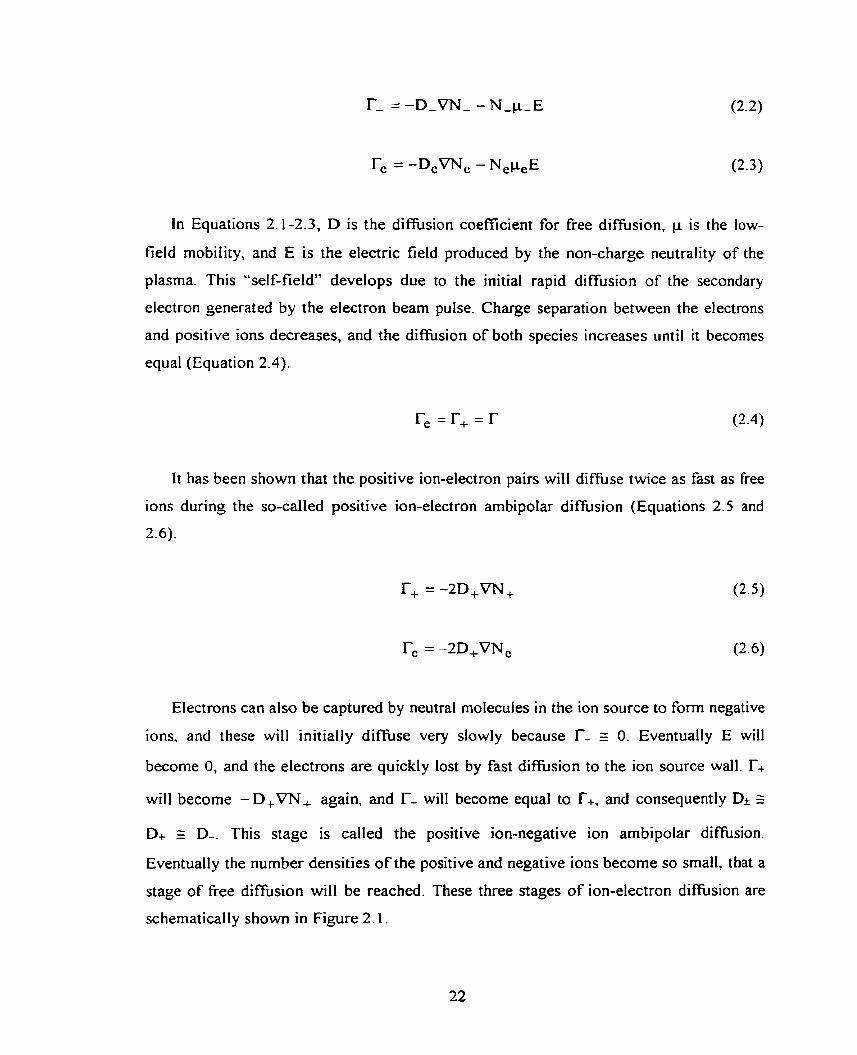
In Equations 2.1-2.3, D is the diffision coefficient for free diffusion, p is the low-
field mobility, and E is the elenric field produced by the non-charge neutrality of the
plasma. This "self-field" develops due to the initial rapid diffusion of the secondary
electron generated by the electron beam pulse. Charge separation between the electrons
and positive ions decreases, and the difiùsion of both species increases until it becornes
equal (Equation 2.4).
It has been shown that the positive ion-electron pairs will diffuse twice as fast as free
ions during the so-called positive ion-electron ambipolar diffusion (Equations 2.5 and
2.6).
Electrons can also be captured by neutral molecules in the ion source to forrn negative
ions, and these will initially diffise very slowly because T- z O. Eventually E will
become 0, and the electrons are quickly lost by fast difision to the ion source wall. L
will become - D+VN+ again, and T- will become equal to T+, and consequently D* z
D+ 1 D-. This stage is called the positive ion-negative ion ambipolar diffision.
Eventually the number densities of the positive and negative ions becorne so small, that a
stage of free diffision will be reached. These three stages of ion-electron diffision are
schematically shown in Figure 2.1.
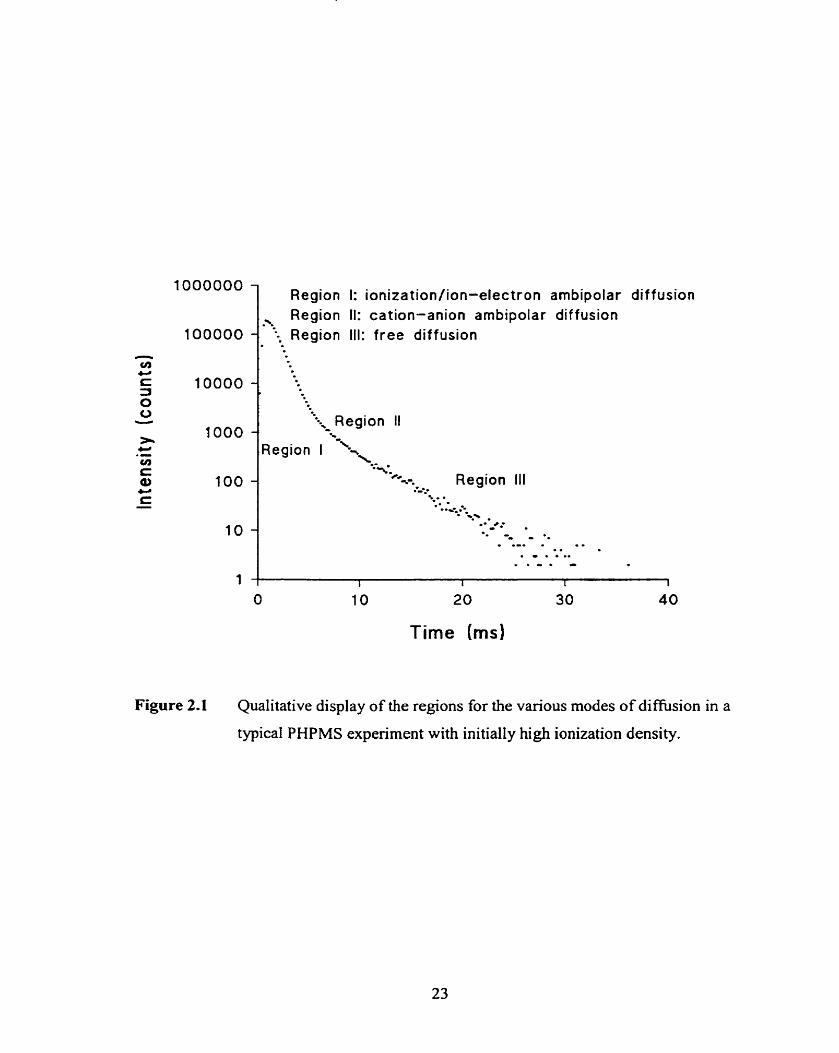
Region 1: ionization/ion-electron ambipolar diffusion Region II: cation-anion ambipolar diffusion
:-, Region III: free diffusion . .
I Regi
Time [ms)
Figure 2.1 Qualitative display of the regions for the various modes of difision in a
typical PHPMS experiment with initially high ionization density.
In general, ions are lost by diffision to the walI or by ion-molecule reactions. The rate
can be given by Equation 2.7.
It is assumed that a!I ions d i f i s e through the ion source with the same diffision
coefficient D. In reaiity there is a slight mass dependence (Equation 2.8), but it has no
practical consequences for results corn PHPMS experiments.
In Equation 2.8, k is the Boltzmann constant, T is the absolute temperature, e is the
charge of the ion, a is the polarizabiiity of the bath gas, and m, is the reduced mass.
Neutra1 molecules present in the ion source may also show mass dependent difision,
and, as a consequence, concentration enrichment can take place, leading to incorrect
equilibrium constants and rate constants. Grirnsrud and CO-workers showed that no
enrichment was obtained with near-viscous fl ow, and that accurate rate constants for ion-
molecule reactions could be ~btained.~"
There are a few aspects of PKPMS that may give rise to errors in therrnochemical and
kinetic data.' These include the occurrence of non-equilibrium steady States,
isomerization, isomerization following chemical ionization, pyrolysis of ions and
neutrals, non-reactive systems and slow reactions, impurities and extraneous reactions,
reactions outside the ion source, inaccurate vapor pressures, and mass coincidences. For
most problems simple and practical solutions are available, and these have been
summarized by Meot-Ner and ~ieck.' In addition, PHPMS is not able to selectively
generate ions, no selective ejection of ions can take place, and in general no information
on ion structures is directly available. These shortcomings have been solved by injecting
mass-selected ions into a low field, variation of the temperature, high pressure drift ce11
and by using a reversed geometry, double focussing mass spectrometer or a triple
quadru pole mass sp ectrorneter to perform MlKE or C D experiment s, respective1 y.
Finally. the errors associated with AG' measurements mainly come From errors in the
absolute temperature, concentrations, and discrimination of ion transmission and
detection, while errors in AH? values come from differential errors in the temperature,
and changes in the concentrations during variable temperature studies. AHo can be
measured accurately even in the presence of significant errors in AG', because the
sources of errors are independent. The standard deviations o f the slope and intercept in
Van't Hoff plots represent errors associated with random scatter.
More specific details on obtaining thermochemistry and kinetics are described in the
relevant chapters.
2.2 Pulsed-ionization High Pressure Mass Spectrorneter
Ail PHPMS experiments described in this thesis have been performed on an
instrument constructed at the University of ~ a t e r l o o . ~ A schematic is shown in Figure
2.2.
Gas mixtures were prepared in a 5 L heated, stainless steel reservoir. For specific
conditions and mixture compositions, see the relevant chapters for more detail. The
sample reservoir pressure was measured with a Valydine Instruments AP-10 capacitance
manometer. Methane bath gas and other gases were introduced from gas cylinders, while
volatile liquids were introduced by injecting a known volume into the reservoir through a
septum. The pressures of the liquids were determined from the ideal gas law. After
mixing for 30 minutes, the gas mixture was allowed to flow through a heated stainless
steel inlet line via a fine metering valve into the ion source. The ion source block was
made of non-magnetic stainless steel and the ion source volume is approximately 1 cm3.
The ion source pressure was measured with a Valydine Instruments AP-IO capacitance
manometer attached to the gas inlet Iine. The ion source temperature was variable fiom
arnbient to 350°C using cartridge heaters embedded in a stainless steel sheath
surrounding the ion source block. The ion source temperature was measured by an iron-
constantan thermocouple embedded in the stainless steel block close to the ion source
volume.
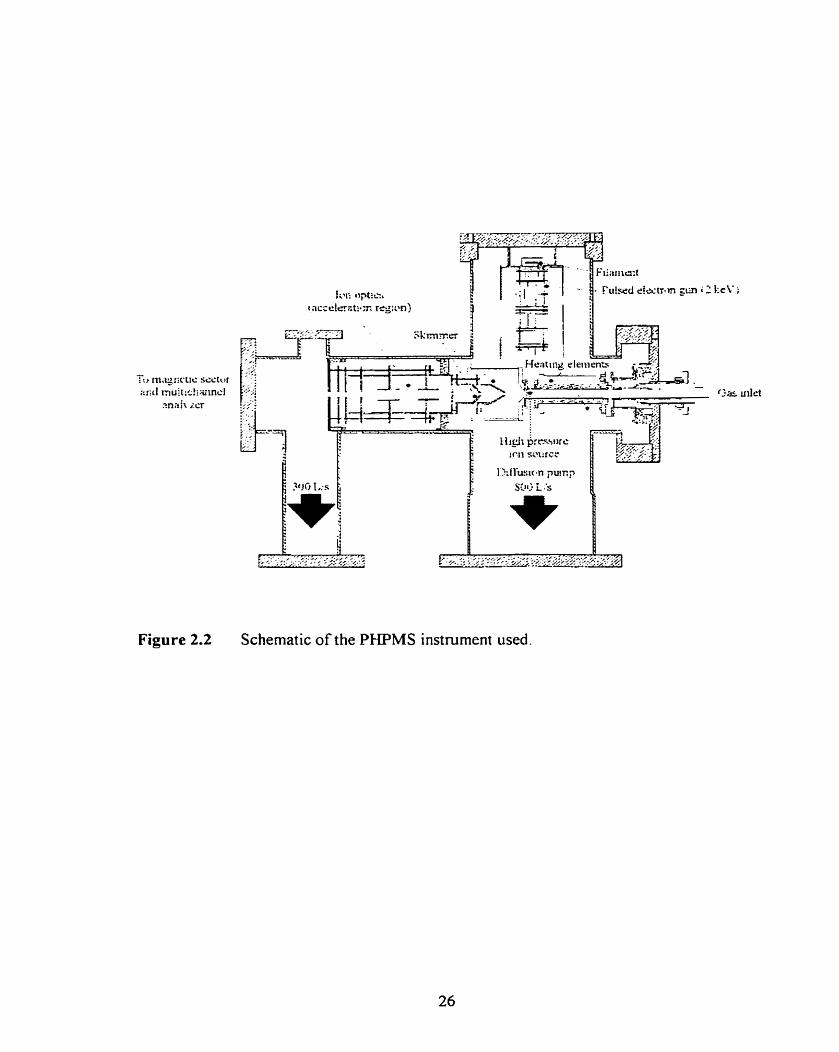
Figure 2.2 Schematic of the PHPMS instrument used.
Electrons with 2 kV kinetic energy from an extemally mounted electron gun
assembly initiated ionization of the gas mixture. Einzel lenses and deflection electrodes
aIlowed focussing of the electron beam ont0 a small spot centred on a 150 Pm P a r
electron entrance aperture. The electron gun assembly was surrounded by a MU metal
shield. Perpendicuiar to the electron entrance aperture, a similar ion exit aperture was
located. Approximately 104 of the total number of ions exited the ion source through this
aperture into the main housing, and they were accelerated fhally by an ion lens assembly
to -1 500 V. The main housing was pumped by an Edwards 160M. 800 L s-' Diffstak
difision pump.
The ion acceleration region was mated to the main housing via a Teflon ring seal
around one lens element containing a 2 mm aperture for ion transmission. The ion
acceleration region was differentially pumped by an Edwards 63M7 200 L s-' Diffstak
difision pump. Mass analysis or selection was done by a VG Instrument MM 8-80
magnetic sector mass spectrometer, with a mass resolution of around 200. A magnetic
sector actually selected ions according to their impulse (Equation 2.9).
mv r= - Bze
In Equation 2.9, r is the radius of the magnetic sector, m is the mass of the ion, v is
the speed of the ion, B is the magnetic field strength, z is the nominal charge of the ion,
and e is the elementary charge.
Ions were collected and counted by an off-axis Galileo channeltron electron
multiplier assembly with deflection dynode. The electron beam pulse gated an Ortec
7150 multichannel analyzer configured in the multichannel scaling (MCS) mode to
obtain time-resolved ion signals. The output of the channeltron electron multiplier was
sent to a charge-sensitive prearnplifier with a fixed voltage output pulse, which was sent
to an Ortec amplifier-discriminator, and tinally to an Ortec rate meter and muhichanne1
analyzer. Ion-intensity profiles afier collection were sent via an RS-232 interface to a PC,
where data were normalised, stored, and plotted.
Finally, determination of equilibrium constants, rate constants, and thermochemicai
data were done by in-house software.
2.3 Ion and Cluster Ion Formation
The formation of anions and cluster ions in the ion source takes place through a series
of r e a c t i ~ n s . ~ The 2 kV electron beam will mainly ionize methane bath gas molecules
(M) in a small volume just below the electron entrance aperture by cascade electron
ionization (ET) (Reaction 2.10).
e - ( 2 keV) + M -+e-(<2 keV) + e-(0-10 eV) + Mt* (2.10)
The secondary electrons forrned will undergo numerous collisions (r: 106) with
methane molecules, and thermalisation takes place (Reaction 2.1 1).
e- (0-10 eV) + M -+ e- (0-1 eV) + M (2.1 1)
The rate of themalisation will be fast relative t o the rate of electron loss by arnbipolar
d i f i s ion to the walls and pnor to electron capture."
Halide ions are formed by dissociative electron capture (DEC) of the thermalised
secondary electron by appropriate halogen containing molecules that are present in the
gas mixture in trace arnounts (Reaction 2.1 2) .
CC14 + e- (0-1 eV) -+ CI- + CC13* (2.12)
Finally, equilibrium cluster ion formation or exhange reactions in the presence of a
third body molecule, usually methane bath gas, takes place in the ion source (Reactions
2.13 and 2.14).
In addition, ionlion and radicalhadical, and ionhadical recombination, neutralization,
electron detachment, and electron radio1 ysis react ion can take place (Reaction 2.1 5-2-20),
but these processes cannot be observed directly by the mass spectrometer. The presence
of cluster ions containing neutrals generated by these processes may indicate their
occurrence. However, the probability of these processes taking place is very srnaIl, due to
the low concentrations of the ionic species involved in the ion source.
2.4 References
1 Kebarle, P. "Pulsed High Pressure Mars Spectrometry". In "Techniques for the
Sfndy of lorz-Molende Reactiorts "; Farrer, J. M. ; Saunders, Jr., W. H., Eds. ; W iley-
Interscience, New York, NY, 1988, 22 1 and references cited therein.
2 McMahon, T. B. Int. J. Mass Spectrom. 2000, 200, 187 and references cited therein.
3 Hiraoka, K.; Monse, K.; Shoda, T. Int. J Mass Spectrom. /or? Processes 1985, 67, 1 1
and references cited therein.
4 Knighton, W. B.; Grimsrud, E. P. h r . J. Mass Spectrom. lot7 Processes 1991, 109, 83.
5 McGrew, D. S.; Knighton, W. B.; Bognar, f . A.; Grirnsmd, E. P. Int. J. Mass
Spectrom. /on Processes 1994, 139,47.
6 Williamson, D. H.; Knighton, W. B.; Grimsrud, E. P. Inr. J. Mass Spectrom. Ion
Processes 1996, 15-1, 15.
7 Meot-Ner (Mautner), M.; Sieck, L. W. Inî. J. Mass Spectrom. /on Processes 1991,
109, 187 and references cited therein.
8 Szulejko, J. E.; Fisher, J . J.; McMahon, T. B.; Wronka, J. Int. J. Mass Specfrorn. Ion
Processes 1988, 83, 147 and references cited therein.
9 Oster, T.; Kühn, A.; Illenberger, E. hi. J. Mass Spectrom. luit Processes 1989, 89, 1
and references cited therein.
Chapter 3
Computational methods
3.1 Introduction
Over the past decade the application of quantum chernical computational methods has
become an integral part o f experimental gas phase ion chemistry o f small to medium
sized systems.' Results from these computations have provided significant insights into
the stmctures, energetics, and kinetics of gas phase ions. Several methods are available
and have been applied with varying degrees of success. Still, the only real test for the
quality o f a certain method for a variety o f related systems is the extent of agreement with
available and reliable experimental data.
In this chapter a brief overview o f the various methods and basis sets used, and
properties calculated in this thesis, including some important basic formulae, will be
given.
3.2 Hartree-Fock
Ab inztio electronic structure calculations use methods, solely based on quantum
mechanics. to solve approximations t o the Schrodinger equation (Equation 3. I ) . ~
In Equation 3.1, H is the Hamiltonian operator, is the wavehnction, and E is the
energy o f the system. For a molecular system, Y is a fùnction o f the positions of the
electrons (? ) and nuclei ( a ) within the molecule. The Hamiltonian is made up of kinetic
(T) and potential energy (V) terms (Equation 3 . ~ ) . ~
By applying the Born-Oppenheimer approximation. which States that the electron
distribution within a molecular system depends on the position of the nuclei, the
wavefunction can be simplified (Equation 3.3).3
The electronic Hamiltonian c m be written as follows (Equation 3.4).'
electrons
2 i
Two requirements for Y are that it should be normalized and anti-symmetric.
According to molecular orbital (MO) theory, Y will be a linear combination of molecular
orbitals. The Hartree product (Equation 3.5) is a method to form Y, but it is not anti-
syrnmetric.)
A determinant is an anti-symmetric function that qualifies as a suitable linear
combination of molecular orbitals. In addition, the electron spin must be taken into
account. By substituting Equation 3.5 into Equation 3.4, and solving for Equation 3.1, an
approximate wavefunction is obtained with an energy higher than the energy
corresponding to the exact wavefunction. This is also known as the variational principle.
By solving the Roothan-Hall equation iteratively (Equation 3.6),4*5 at convergence the
energy will be minimized.
F is called the Fock matrix and S is the overlap integral. In the Hartree-Fock @F)
approximation there is a correction for electron-electron repulsion, in a way that every
electron interacts with al1 other electrons in an average field.
Maller-Plesset (MP) perturbation theory is an approach to electron correlation by
addi ng higher order excitations to Hartree-Fock t heory as a non-i terative ~orrection.~ This
can be done by dividing the Hamiltonian into two parts (Equation 3.7).
The hV term adds a small perturbation to the Ho, which will give the HF solution, and
thus gives the electron correlation. The second-order correction to the energy is given by
Equation 3.flI7 with Vos = ( @ ~ ) I v I @ ~ ) ) , O!) is the ground state wavefunction of the
unperturbed problem, and the sh excited state wavefunction. 7
&) = vos vso O
s>O EO - Es
Higher order corrections are possible that subsequently alter the sign of the energy
correction term, but they also increase drarnatically the cornputational costs.
Density functional theory (DFT) computations have become increasingly popular in
recent years as alternative methods to conventional post-HF ab itzitio c~m~uta t ions .~ The
main advantages are in the reduced computational costs, the larger size of systerns
accessible, and the chemical accuracy obtainable. DFT computations treat the electron
correlation using functionals o f the electron density (p) in a system. According to Kohn
and Sham, the electronic energy is partitioned in several t e m s (Equation 3.9),' where E~
is the kinetic energy term, E' includes t e m s describing the potential energy o f the
nuclear-electron attraction and o f the repulsion between pairs of nuclei, E' is the electron-
electron repulsion t e m , and E" + E' (or E") is the exchange-correlation term.
The latter term arises from the exchange energy from the anti-symmetry of the
quantum mechanical wavefunction and the dynamic correlation in the motion of the
individual electrons.' Various types o f functionals for ET, Ex, and E' have been
developed over the years, including the so-called hybrid functionals. The popular Becke
three-parameter Lee, Yang and Parr non-local exchange functional (B3LYP) method 'O-"
comprises functionals that are a mixture of HF and DFT exchange along with DFT
correlation (Equation 3.10 and 3.1 1 ) .3
This method provides accurate geometries and normal mode vibrational frequencies
for large size systems, as well as reasonable therm~chemis t ry . '~ Unfortunately, it has
been noticed t hat transition state energies are systemat icall y underestimated. l 3
3.5 Composite Methods
The development of composite quantum chemical procedures to calculate rnolecular
energies like bond energies, enthalpies of formation, ionization potentials, electron and
proton afinities, and gas phase acidities to chemical accuracy (+1-2 kcal mol-') had an
important impact on the thermochemistry of small to medium sized molecules and ions.
The Gatrssim-n (Gn) theones are the most well-known o n e ~ , ' ~ * ' ~ and they consist of a
sequence of well defined calculations to amve at a total energy of a given system. in
general these methods are relatively expensive. In this thesis the G ~ ( M P ~ ) , ' ~ ~ 3 , ' ~ and
G3(MP2) l7 methods have been used to test their suitability for the systems investigated,
and to compare with the results of lower level computations. The G2 and G3 energies
effectively correspond to the quadratic configuration interaction single double (triple)
(QCISD(T)) or QCISD(T)/6-3 1 1 +G(2df.2p) l 5 and QCISD(T,full)/G3 Large l 7 levels of
theory, respectively. For the G2(MP2) and GS(MP2) methods, a series of MP4 single
point energy calcuIations have been replaced by one single MP2 calculations, hereby
providing signi ficant savings in computational costs, plus larger systems can be handled .
3.6 Basis Sets
A basis set is a pre-defined mathematical description of the orbitals within a system,
used to perform the computation. By linear combinations of these one-electron functions
the molecular orbitals can be approximated. The basis functions are centered on the
atornic nuclei, and bear some resemblance to atomic orbitals. The Gaussian suite of
programs uses Gaussian-type atornic functions as basis functions (Equation 3.1 2).3
In Equation 3.12, i is composed of x, y, and z, and a is a constant determining the
radial extent of the fùnction. Al1 Gaussian functions are normalized (Equation 3. l)).'
Linear combinations of these primitive Gaussians are used to form the actual basis
functions, also called contracted Gaussians (Equation 3-14),' where dPp7s are fixed
constants within a given basis set. For molecular orbitals the expression is as follows
(Equation 3.1 9.'
Split vaIence basis sets (3-2 1 G or 6-3 1 G) have two or more sizes of basis functions
for each valence orbitaL3 A triple split valence basis set, indicated here as A-BCD, A
orbitals are used to describe the core shell, and three basis sets, B-D, to describe the
valence electrons. B, C, and D are the number of Gaussian fùnctions to describe the
orbitals. For instance, the 6-3 1 1 G basis set uses 6 orbitals to descnbe the core electrons
of the heavy atoms and 3 for hydrogen, while three basis sets are used to describe the
valence electrons, each consisting of 3, 1, and 1 Gaussian function(s), respectively. The
split valence basis sets allow the orbitals to change size, but aot shape. Polarized
functions are constnicted by adding orbitals with higher angular momenta beyond that
required for the ground state description of the atorn. DifTüse functions are large size
versions of s- and p-type functions. They allow orbitals to occupy a larger region of
space, and they are important for systems where the electrons are relatively far from the
nucleus, e.g. (radical) anions and excited States, and to describe absolute acidities
accuratel y.
In addition, multiple polarized functions are also used frequently to describe the
interactions between electrons in electron correlation methods. Finally, basis sets for
atoms beyond the third row of the periodic table using a so-called effective core potential
(ECP) are very important and popular.18.'9 For these large atoms, the electrons near the
nucleus are treated in an approximate way, which include some relativistic effects. For
instance, the 6-3 1 l++G(d,p) basis set adds diffise function of both the hydrogen (+) and
heavy atoms (+), while p and d polarized functions are added to the hydrogen and heavy
atoms, respectively. In addition, polarized and d i f i s e hnctions can also be added to
ECP's.
3.7 Geometry Optimizations
A potential energy surface is a mathematical relationship between the molecuiar
structure (bond lengths, valence angle, torsions, and other interna] coordinates) and the
correspond i ng energy. 3.20.2 1 It arises in a natural way from the Born-Oppenheimer
approximation. Since there can be many degrees of freedom, it is impossible to visualize
a complete potential energy. On such a surface there can be minima (local and global),
maxima (local and global), and saddle points. Geometry optimizations are performed to
locate minima or equilibrium structures on the potential energy surface(s). In Figure 3.1,
a flowchart for quasi-Newton algorithms for geometry optimizations is s h o ~ n . ~ ~ In order
to locate a minimum, the gradient o r the forces must be zero, and al1 eigenvalues of the
Hessian, or second derivative rnatrix or force constant matrix, must be positive. The
optimization is completed if four convergence criteria have been satisfied. For very
weakly bound systems the potential energy surface near the global minimum is very flat,
and for these "floppy systems" it can be hard to meet the convergence criteria. Locating a
transition state structure follows the same route as for a minimum structure, except that
one of the eigenvalues of the Hessian must be negative.
3.8 Normal Mode Vibrational Frequencies and IR Intensities
Calculation of the normal mode vibrational frequencies and IR intensities of the
optimized geometries of molecules, cluster ions, and transition States is a useh l tool to
identi@ the nature o f the systerns o f interest on the potential energy surface. Minimum
structures are characterized by the presence of zero imaginary frequencies, while saddle
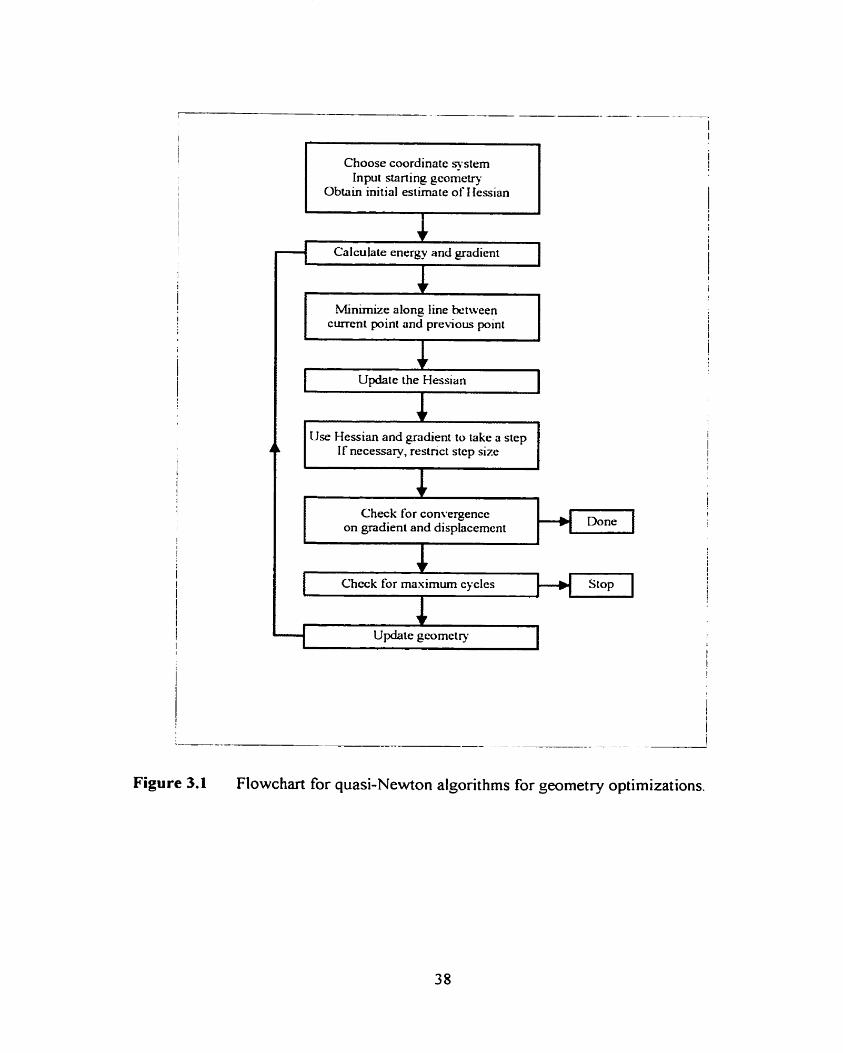
Choose coordinate -.stem Input stiining gcomeq
Obtain initial estimate of 1 Iessian
Calculate energy and gradient
I I
Minimize along Iine ktween
I Use Hessian and gradient to take a step I f necessary, restrict stcp size
I Check for convergence on gradient and displacement
- --
Update gcometry I
.-- - - - -- - - - - - - - . - -
Figure 3.1 Flowchart for quasi-Newton algonthms for geometry optimizations.
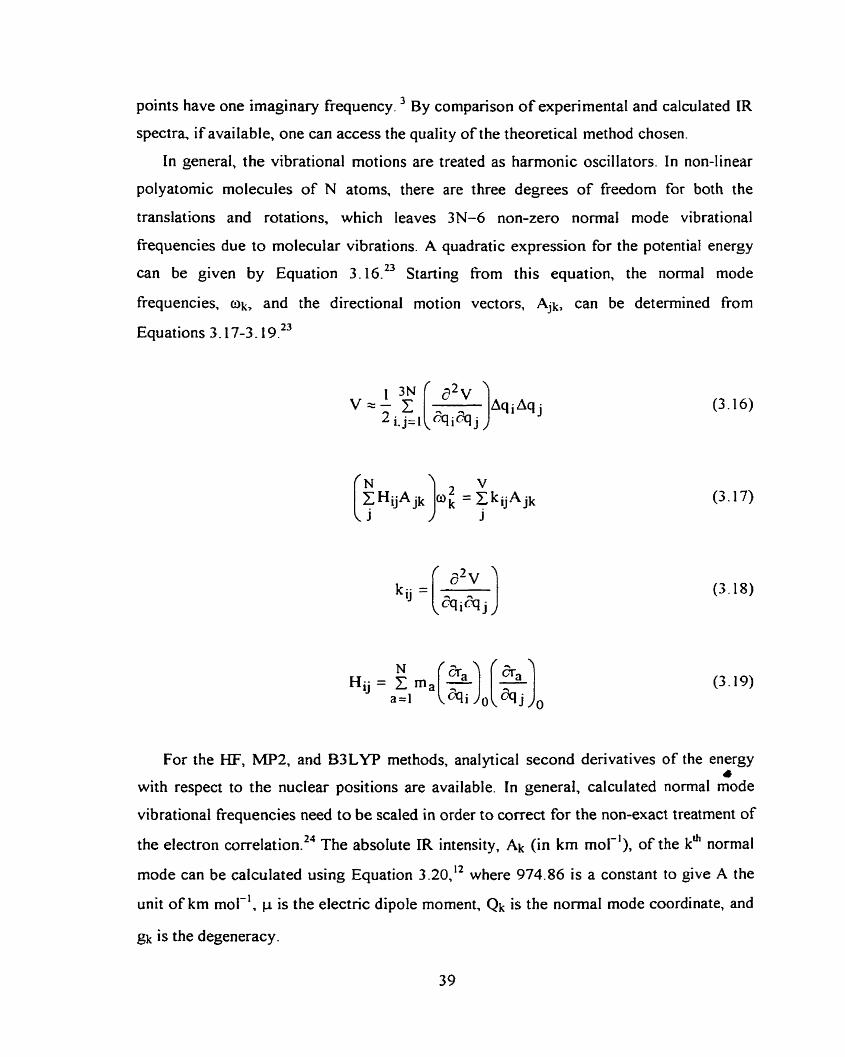
points have one imaginary frequency By cornparison of expenmental and calculated IR
spectra, if available, one can access the quality of the theoretical method chosen.
In general, the vibrational motions are treated as harmonic oscillators. In non-linear
polyatomic molecules of N atoms, there are three degrees of freedorn for both the
translations and rotations, which leaves 3N-6 non-zero normal mode vibrational
frequencies due to molecular vibrations. A quadratic expression for the potential energy
can be given by Equation 3 . 1 6 . ~ Starting from this equation, the normal mode
frequencies, ok, and the directional motion vectors, Ajk, can be determined from
Equations 3.1 7-3.1 9.23
ô'v
For the HF, MP2, and B3LYP methods, analytical second derivatives of the energy 4
with respect to the nuclear positions are available. In general, calculated normal mode
vibrational fiequencies need to be scaled in order to correct for the non-exact treatment of
the electron c~r re la t ion .~~ The absolute IR intensity, Ak (in km mol-'), of the kh normal
mode can be calculated using Equation 3 .20 , '~ where 974.86 is a constant to give A the
unit of km mol-', p is the electnc dipole moment, Q k is the normal mode coordinate, and
gk is the degeneracy.
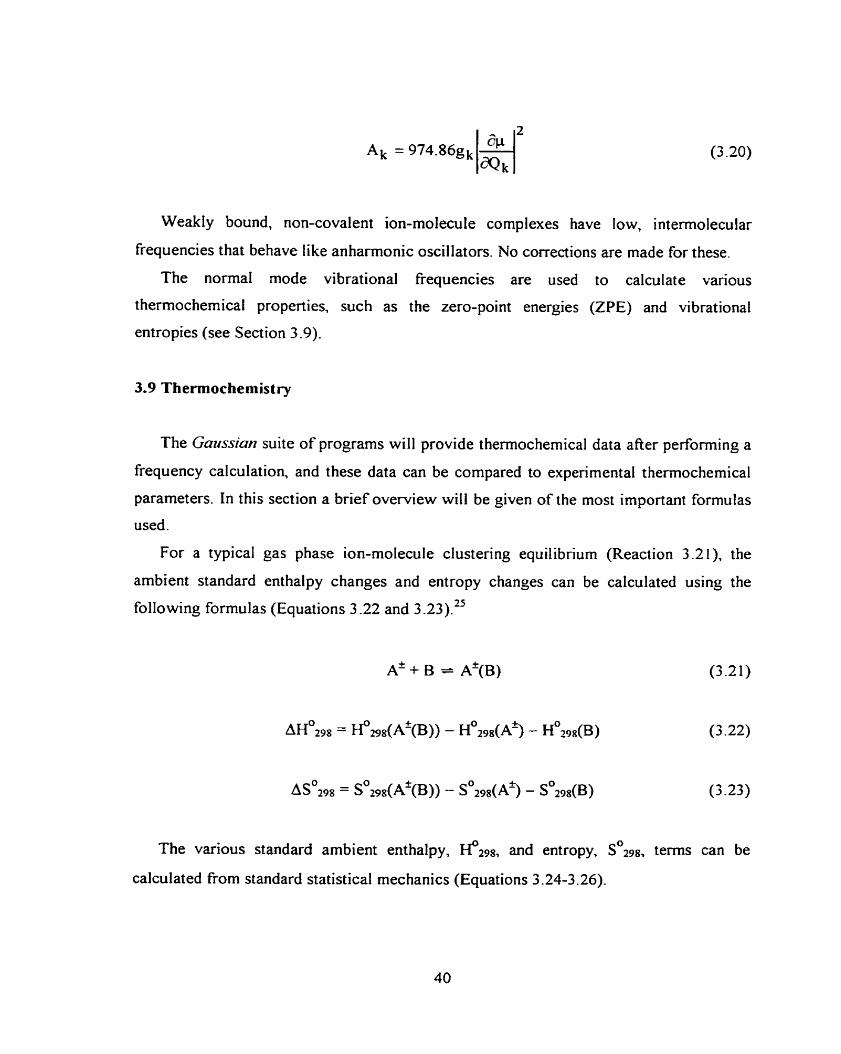
Weakly bound, non-covalent ion-molecule complexes have low, intermolecular
frequencies that behave like anharmonic oscillators. No corrections are made for these.
The normal mode vibrational frequencies are used to calculate various
thermochemical properties, such as the zero-point energies (ZPE) and vibrational
entropies (see Section 3.9).
3.9 Thermochemistry
The Gazmian suite of programs will provide thermochemical data after performing a
frequency calculation, and these data can be compared to experimental thermochemical
parameters. In this section a brief overview will be given of the most important formulas
used.
For a typical gas phase ion-rnolecule clustering equilibrium (Reaction 3.21). the
ambient standard enthalpy changes and entropy changes can be calculated using the
following formulas (Equations 3 -22 and 3 .23).25
The various standard ambient enthalpy, f l 2 9 8 , and entropy, ~ ~ 2 9 8 , terms can be
calculated from standard statistical mechanics (Equations 3.24-3.26).
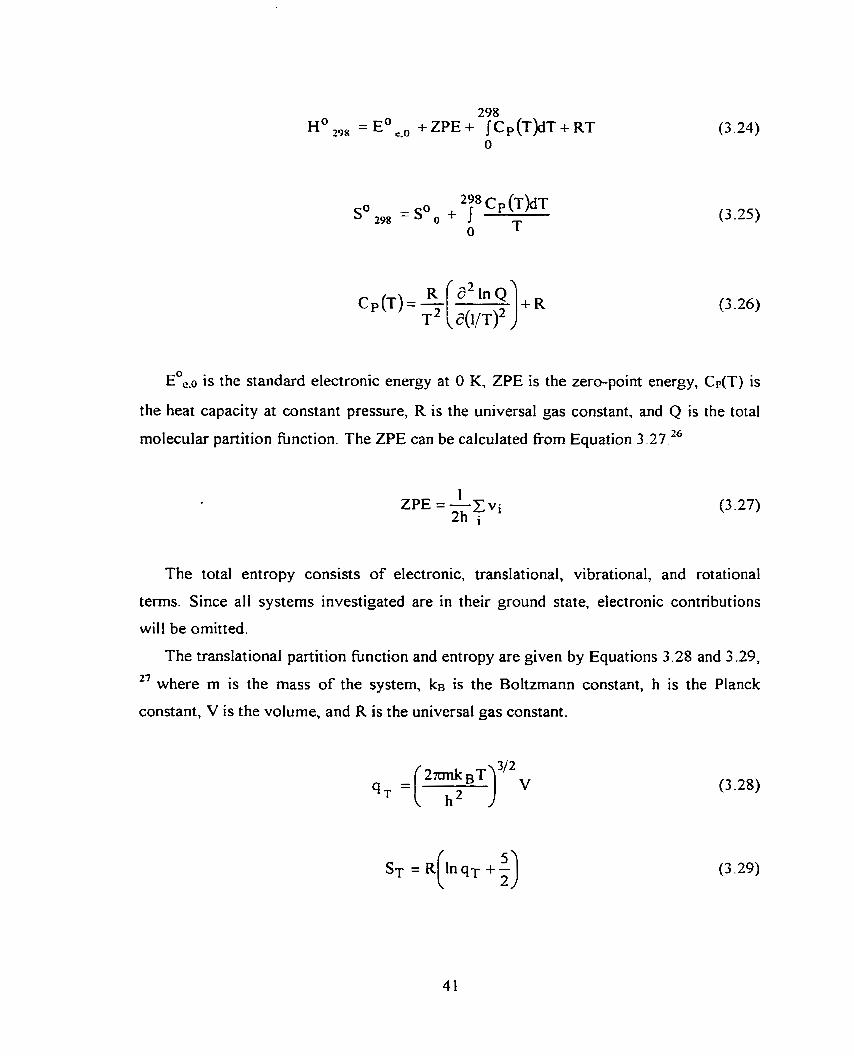
E ~ ~ . ~ is the standard electronic energy at O K, ZPE is the zero-point energy, Cp(T) is
the heat capacity at constant
molecular partition fùnction.
pressure, R is the universal gas constant, and Q is the total
The ZPE can be calculated fiom Equation 3.27.26
1 ZPE = -Cvi
2h i
The total entropy consists of electronic, translational, vibrational, and rotational
terms. Since al1 systems investigated are in their ground state, electronic contributions
wilI be omitted.
The translational partition function and entropy are given by Equations 3.28 and 3.29, 27 where m is the mass of the system, ke is the Boltzmann constant, h is the Planck
constant, V is the volume, and R is the universal gas constant.
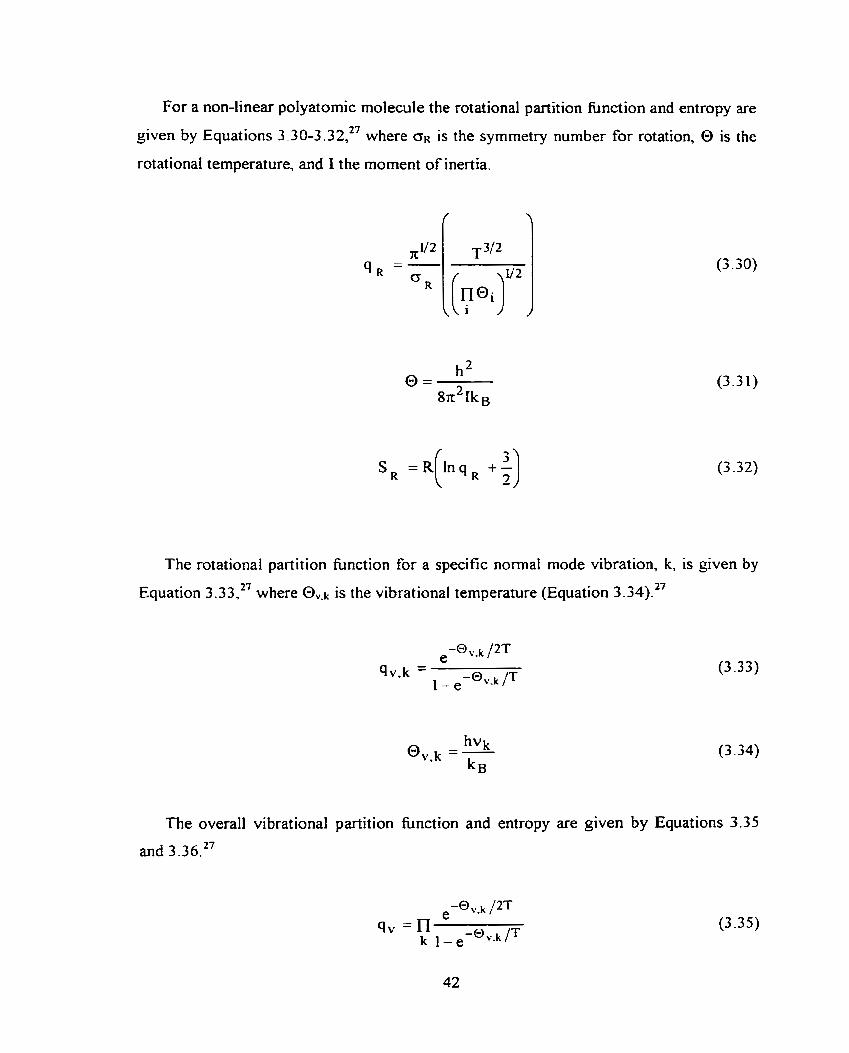
For a non-linear polyatomic molecule the rotational partition hinction and entropy are
given by Equations 3 -30-3 .32,27 where GR is the symmetry number for rotation, O is the
rotational temperature, and 1 the moment of inertia.
The rotational partition function for a specific normal mode vibration, k, is given by
Equation 3.33." where @,k is the vibrational temperature (Equation 3.34).27
The overall vibrational partition function and entropy are given by Equations 3.35
and 3.36.27
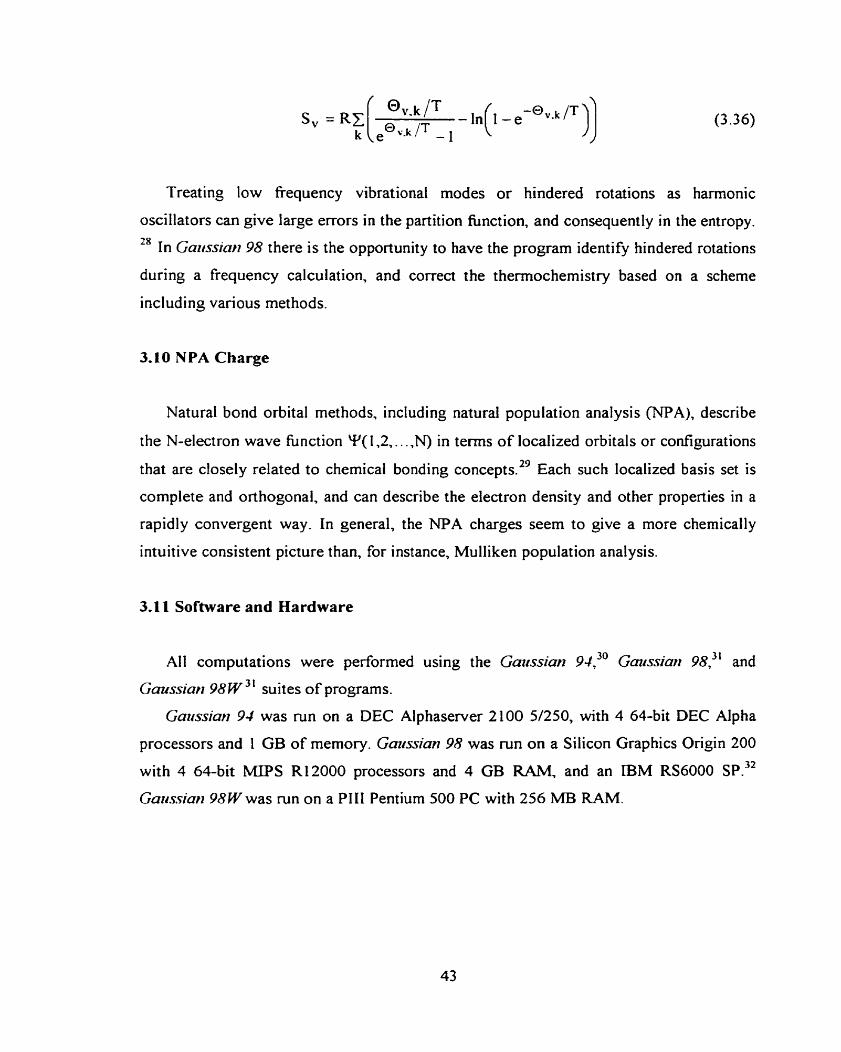
Treating low Frequency vibrational modes or hindered rotations as harmonic
oscillators can give large errors in the partition fûnction, and consequently in the entropy. 28 In Gartssiart 98 there is the opportunity to have the program identify hindered rotations
during a frequency calculation, and correct the themochemistry based on a scheme
including various rnethods.
3.10 NPA Charge
Natural bond orbital methods, including natural population analysis (NPA), describe
the N-electron wave hnction Y(1,2,. . . ,N) in tems of localized orbitals or configurations
that are closely related to chernical bonding concepts.29 Each such localized basis set is
complete and orthogonal, and can describe the electron density and other properties in a
rapidly convergent way. In general, the NPA charges seem to give a more chemically
intuitive consistent picture than, for instance, Mulliken population analysis.
3.1 1 Software and Hardware
AH computations were performed using the Gatrssian 94,30 Goussian 98,)' and
Gaussimt 98 w ' suites of programs.
Gmssian 94 was run on a DEC Alphaserver 2 100 5/250, with 4 64-bit DEC Alpha
processors and 1 GB of memory. Gmssian 98 was mn on a Silicon Graphics Origin 200
with 4 64-bit MIPS R12000 processors and 4 GB RAM, and an iBM RS6000 S P . ~ ~
Gazrssia~r 98W was run on a PI11 Pentium 500 PC with 256 MB RAM.
3.12 References
Koch, W.; Hase, W. L. (Eds.) Int. J. Mms Spectrom. 2000, 201, 1-336 and
references cited t herein.
Schrodinger, E. Ann. Physik 1926, 79, 36 1.
Foresman, J . B. ; Frisch, Æ. Expioring Chemistty with Eiectroriic Sînfc~ure Methods,
2nd ed.; Gaussian Inc.; Pittsburgh, P 4 1996.
Roothaan, C. C. Rev. Mod Phys. 1951, 23, 69.
Hall, G. G. Proc. Roy. Soc. (Lordon) 1951, A205, 541.
Mdler, C.; Plesset, M. S. Phys. Rev. 1934, 71, 159.
Cremer, D. Etzcyclopedia of Compulatior~ai Chernistry; von R. Schleyer, P;
Allinger, N. C.; Clark, T.; Gasteiger, J.; Kollman, P. A.; Schaefer III, H. F.;
Schreiner, P. R. (Eds.); John Wiley & Sons; Chichester, UK. 1998, 1706 and
references cited therein.
Gill, P. M. W. in reference 7, 678 and references cited therein.
Kohn, W.; Sham, L. J. Phys. Rev. 1965,140, A1133.
Lee, C.; Yang, W.; Parr, R. G. Phys. Rev. B 1988, 37, 785.
Becke, A. D. J. Chem. Phys. 1993,98, 1372,5648.
Hu, C.-H.; Chong, D. P. from reference 7, 664 and references cited therein.
Glukhovtsev, M. N.; Bach, R. D.; Pross, A.; Radom, L. Chem. Phys. Leu. 1996,
260, 558.
Pople, J. A.; Head-Gordon, M.; Fox, D. J.; Raghavachari, K.; Curtiss, L. A. J.
Chern. Phys. 1989, 90, 5622.
Curtiss, L. A.; Raghavachari, K.; Trucks, G. W.; Pople, J. A. J. Chem. Phys. 1991,
91, 722 1.
Curtiss, L. A.; Raghavachari, K.; Pople, J. A. J. C h . Phys. 1993, 98, 1293.
Curtiss, L. A.; Raghavachari, K.; Redferm, P. C.; Rassolov, V.; Pople, J. A. J .
Chem. Phys. 1998, 109, 7764.
Wadt, W. R.; Hay, P. J. J. Chem. Phys. 1985, 82, 284 and references cited therein.
Stevens, W. J.; Kraus, M.; Basch, H.; Jasien, P. G. Can. J. Chem. 1992, 70, 6 12.
Schlegel, H. B. in reference 7, 1 136.
Shlick, T. in reference 7, 1 142.
Reproduced from reference 20.
Comell, W.; Louise-May, S. in reference 7, 1904.
Scott, A. P.; Radom. L. J. Phys. Chern. 1996, 100, 16502.
Bogdanov, B.; McMahon, T. B. J. Phys. Chern. A 2000, 104, 7871.
From reference 7, 3265.
ht tp ://www.gaussian.com/thermo. htm and references cited therein.
Ayala, P. Y .; Schlegel, H. B. J. C'hem. Phys. 1998, 108, 23 14 and references cited
therein.
Reed, A. E.; Curtiss, L. A.; Weinhold, F. Chern. Rev. 1988,88, 899.
Frisch, M. J.; Trucks, G. W.; Schlegel, H. B.; Gill, P. M. W-; Johnson, B. G.; Robb,
M. A.; Cheeseman, J . R.; Keith, T.; Petersson, G. A.; Montgomery, J. A.;
Raghavachari, K.; Al-Laham, M. A.; Zakrzewski, V. G.; Ortiz, J. V.; Foresman, J .
B.; Peng, C. Y .; Ayala, P. Y.; Chen, W.; Wong, M. W.; Andres, J . L.; Replogle, E.
S.; Gomperts, R.; Martin, R. L.; Fox, D. J.; Binkley, J. S.; Defiees, D. J.; Baker, J. ;
Stewart, J. P.; Head-Gordon, M.; Gonzales, C.; Pople, J. A- Gcnrssian 94, Revision
83, Gaussian Inc., Pittsburgh PA, 1995.
Frisch, M. J.; Tmcks, G. W.; Schlegei, H. B.; Scuseria, G. E.; Robb, M. A.;
Cheeseman, J. R.; Zakrzewski, V. G.; Montgomery, Jr., J. A.; Stratmann, R. E.;
Burant, J . C.; Dapprich, S.; MiIIam, J. M.; Daniels, A. D.; Kudin, K. N.; Strain, M.
C.; Farkas, O.; Tomasi, J.; Barone, V.; Cossi, M.; Cammi, R.; Mennucci, B.;
Pomelli, C.; Adamo, C.; Clifford, S.; Ochterski, J.; Petersson, G. A.; Ayala, P. Y.;
Cui, Q.; Morokuma, K.; Malick, D. K.; Rabuck, A. D.; Raghavachari, K.;
Foresman, J. B.; Cioslowski, J.; Ortiz, J. V.; Baboul, A. G.; Stefanov, B. B.; Liu, G.;
Liashenko, A.; Piskorz, P.; Komaromi, 1.; Gomperts, R.; Martin, R. L.; Fox, D. J.;
Keith, T.; Al-Laham, M. A.; Peng, C. Y.; Nanayakkara, A.; Gonzalez, C.;
Challacombe, M.; Gill, M. W.; Johnson, B.; Chen, W.; Wong, M. W.; Andres, J. L.;
Gonzalez, C.; Head-Gordon, M.; Replogle, E. S.; Pople, J. A. Gaussiar~ 98,
Revision A.7 Gaussian, Inc., Pittsburgh PA 1998.
http://www.ibmsp.uwaterloo.ca/hardware. html
Chapter 4
Structures, thermochemistry, dynamics, and spectroscopy of
halide ion and bihalide ion-alcohol clusters in the gas phase
4.1 Introduction
In the condensed phase, solvent effects are among the most important factors that
determine structure-activity relationships. Examples include the lifetimes of biradicals,'
the (non-) occurrence of e ~ c i ~ l e x e s , ~ the energies of excited states,' the reactivity of
nucleophiles and leaving groups,' ion-pair seParation,' acidities and basicities;
photosensitization,7 and final1 y the effects on SN 1, Su2, E 1, and E2 types of rea~tions.~"~
In electrochemistry the degree of ion solvation detemines the ion activity and mobility,
and consequently the conductivity of the electrolyte solutions. In biochemistry one of the
most important solvat ion phenomena is the solvat ion of zwittenonic amino acids which
renders these species significantIy more stabilized than their uncharged isomers. 23.24
Insights into condensed phase phenomena have been gained from thermodynamic
measurements for the transfer of ions from the gas phase (Reaction 4.1) or From one
solution into another (Reaction 4.2).
X' (gas) -t X' ( solvent) (4.1)
X' (solvent 1) + X' (solvent 2) (4.2)
The most common quantity experimentally investigated is the free energy change of
transfer, AUG, and a large amount of data conceming many different ions and solvents 25.26 has been obtained. These fiee energies of transfer fiequently reveal the importance of
hydrogen bonding to ion solvation. Water is the most comrnon solvent and many of its
unique chemi cal and physical properties are determined by the hydrogen-bonded
network. Halide ions, especially chloride ion, are among the most common and important
anions in organic chemistry, biochemistry and mass spectrometry, and consequently 27-45 halide ion-water interactions are among the most extensively studied . Gas phase ion
chemistry has, for many decades, played an important role in studying ionic clusters and
powerful techniques to generate and study micro-soivated ionic species have been 46-52 developed. Much insight into bulk behavior has been obtained by deducing solvent
effects at a micro-solvated level. This has been done by investigating the
thermochemistry, reactivity, and structures of so 1 vated ions, and comparing these data
with results fiom bare or non-solvated ions. 27.53
One of the most extensively studied phenornena with halide ion-water clusters is the
occurrence and possible competition between interior and surface solvation. Most
information to date has been obtained from ab inirzo 36.4 1 S-58 and MD
computations, 37.39.53-61 but recently, ion spectroscopy has also been used to prove
existence of features that had been either speculative or based upon computations. 28-34.38.40.62-64 For the last three decades an impressive amount of data on ion solvation in
the gas phase has been obtained that has proven to be usehl in many fields of science
such as atmospheric chemistry, surface science, and ~ a t a l ~ s i s . ~ ' " ~ Most of these data deal
with relatively small systems, but the fundamental knowledge obtained fiom these small
systems, by analogy, can be used readily for larger, more complex systems. One example
is in the field of supramolecular chemistry, where the development of anion specific, 68-78 host-guest systems is gaining more interest and importance. Understanding these
systems in the condensed phase would be difficult without the full understanding of
smaller systems in the gas phase and in micro-solvated environments. There are niIl
rnany features that have not received sufficient attention.
Alcohols represent a class of protic solvents for which the halide ion complexes have
recently received a renewed interest, both experimentally and theoretically. 63.64.79-8 1
polar, monoprotic alcohol molecules do not form extensive, hydrogen-bonded networks
such as occurs with water molecules. One of the main questions for these systems is
whether interior soivation will take place in the larger halide alcohol clusters. Carbacos et
a/. recently showed by vibrational predissociation spectroscopy (VPDS) on CI-(CH30H),
clusters that for n = 4 one of the methanol molecules is bonded to one of the three other
methanol molecules that make up the so-called first solvation shell around the chloride
ion.63 It then would seem to be a logical step for future VPDS experiments to find out
whether this asymmetnc solvation is dependent on both the shape of the alcohol molecule
and the type of halide ion. Among the experirnental techniques used to study halide ion-
protic solvent molecule clusters are HPMs,~-*' PHPMS, 79-86-93 ICR~"~'.~~ FT-ICR., 9 1.96-99
E ~ D s , ~ ~ ~ - ~ ~ ~ NLPES, IRmD, '07-10" VPDS, 104-106 28-34.38.30.62-64 and TC ID.^^**' In general,
reasonable agreement is observed when comparing data obtained From these different
techniques.
Surprisingly, thermochemical data for the equilibrium clustering of many halide ion-
alcohol systems has never been determined. This is especially true for the higher order
clusters (more than two solvent moIecules) of the fluoride ion and the heavier halide ions
( B t and 1-) with larger alcohol molecules ( C H 3 C H 2 0 H , (CH~)ICHOH, (CH3)3COH).
In the present work, a systematic study has been performed to obtain new
experimental data as well as to evaIuate existing thermochemical data, and to obtain
computational data on mono- and some disolvated halide ion-alcohol complexes. For
most of these species little or no computational data were previously available. In some
cases the available computational data were obtained at higher levels of theory than the
work presented here. 79.97.104.109.1 10 One of the objectives was to find a single level of
theory that is relatively fast, and that can reproduce expenrnental data for the halide ion-
alcohol complexes well. Mono- and disolvated halide ion-alcohol complexes of course
cannot be considered good model systems for halide ion solvation, but if it will be
possible to model mono- and di-solvation accurately by obtaining, for instance, reliable
thermochemical data, extension to larger halide ion-alcohol complexes can be made wit h
more confidence. Those results may provide an accurate input for modehg the kinetics
of the thermal unimo1ecular dissociation of halide ion-alcohol complexes, and to help in
interpreting VPDS experi ments on halide ion-alcohol complexes.
In addition, more insights into the details and trends of the structures, the
t hermochemistry, the lR spectroscopic characteristics, and the electronic nature of the
hydrogen bond($ forrned would be desirable. It may, apriori, be expected that changing
the halide ion, the alcohot ligand, and the number of ligands will have a pronounced
effect on the thermochemistry. Identieing the intrinsic molecular and ionic properties
responsible for the observed trends will provide insight into the different interactions
within the cluster ions. For these kinds of systems it seemed most logical, opriori, to use
theoretical methods that included electron correlation, and consequently the Msller-
Plesset second-order perturbation theory including al1 electrons ( ~ ~ 2 ( f u l l ) ) , " ~ and the
Becke three-parameter Lee, Yang, and Parr non-local, exchange correlation fünctional 112-1 14 (B3LYP) methods seemed good choices in this respect. As well, these methods
had been successfully applied to similar systems in the past. 34.64.7~.~0.~1.9~.104,109.1 IO The
MP2 method is a very time and memory intensive method compared to B3LYP. and its
use is limited to systems containing a relatively small number of heavy atoms. The
BSLYP method, on the other hand, can handle Iarge systems well, while using a
relatively small amount of CPU time. Extended basis sets including polarization and
d i f i s e functions were used since these have been shown to mode1 the relatively weak
non-covalent interactions within the halide ion-alcohol complexes relatively well.
Finally, one- and two-dimensional potential energy surface (PES) scans were
performed on the halide ion-methanoi complexes to try to obtain some insights into the
possible dynamics of halide ion-methanol complex formation, and the dynamics within
the halide ion-methanol complexes.
Al1 experirnents were camed out on two PHPMS instmments configured around either
a VG 8-80 or a reversed VG 70-70 (magnetic sector (B)-electrical sector (E) geometry)
mass spectrometer. The instruments, both constmcted at the University of Waterloo, have
been described in detaiI previousl y 115.1 16 and in Chapter 2.
Gas mixtures were prepared in a 5 L heated stainless steel reservoir (60-85°C) using
methane as the bath gas at pressures between 135-835 Torr. The halide ions, F, Cl-, Br-,
and r were generated fiom NF3 (0.05-0.20% partial pressure), CC14 (< O.OF%), CH3Br
(0.25-MO%), and CH31 (c 0.01%), respectively, by DEC of thermalized electrons from
300 ps pulses of a 2 keV electron gun bearn.
The four alcohols, CHsOH, CH~CHZOH, (CH3)2CHOH, and (CH+COH were added
to give relative amounts between 0.01% and 20%, depending on the temperature and the
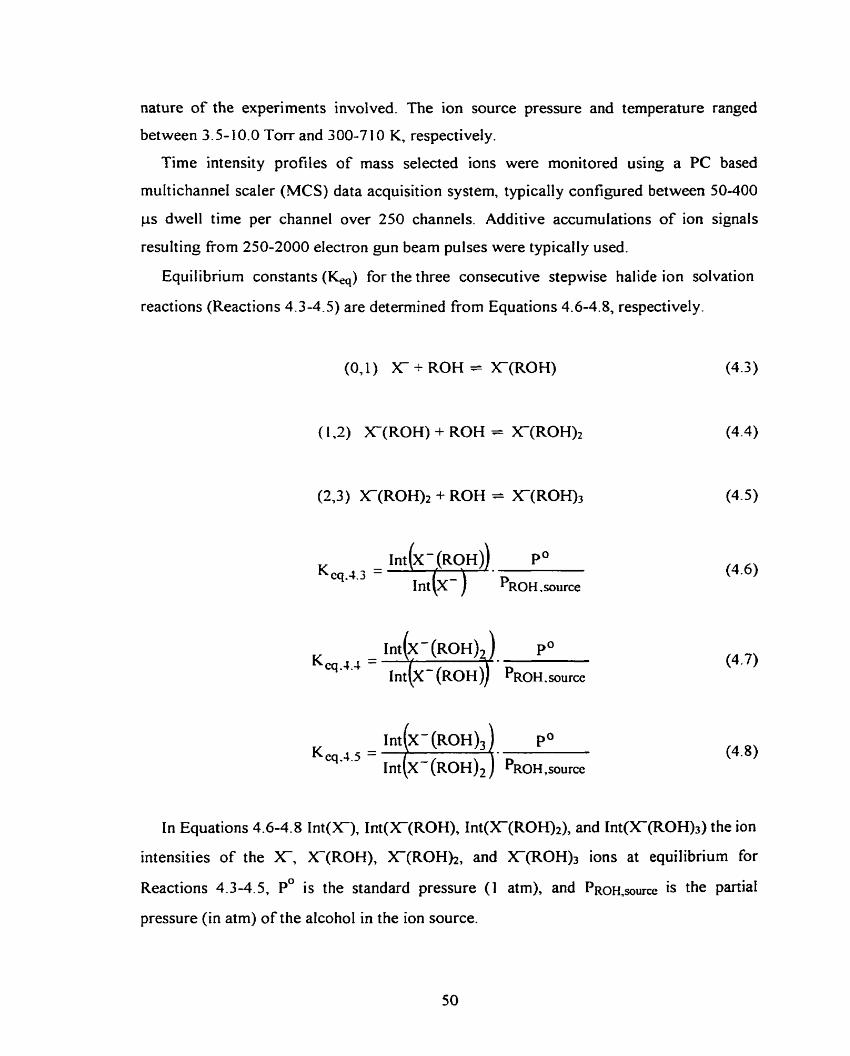
nature of the experiments involved. The ion source pressure and temperature ranged
between 3.5- 10.0 Torr and 300-7 10 K, respectively.
Time intensity profiles of mass selected ions were monitored using a PC based
muItichanneI scaler (MCS) data acquisition system, typically configured between 50400
ps dwell time per channel over 250 channels. Additive accumulations of ion signals
resulting fiom 250-2000 electron gun beam pulses were typicalIy used.
Equilibnum constants (kg) for the three consecutive stepwise halide ion solvation
reactions (Reactions 4.3-4.5) are determined from Equations 4.6-4.8, respectively.
(0,l) X_ + ROH = X-(ROH)
( 1,2) X-(ROH) + ROH = X_(ROH)2
(2,3) X-(ROH)2 + ROH = X(ROH)3
In Equations 4.6-4.8 Int(X), Int(X(ROH), Int(X(ROH)t), and Int(X(ROH)3) the ion
intensities of the X-, X(ROH), X(ROHh, and X(ROH)a ions at equilibrium for
Reactions 4.3-4.5, PO is the standard pressure (1 atm), and PROH,sourFe is the partial
pressure (in atm) of the alcohol in the ion source.
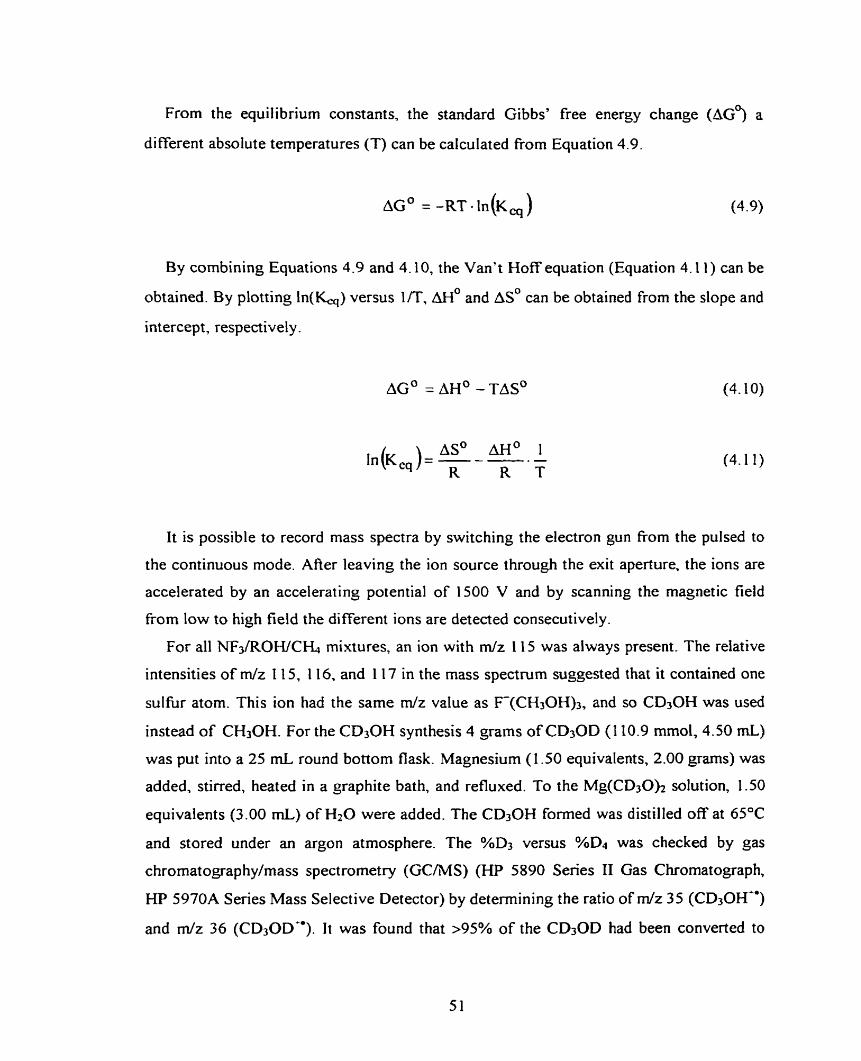
From the equilibrium constants, the standard Gibbs' free energy change (AG? a
different absolute temperatures (T) can be calculated from Equation 4.9.
By combining Equations 4.9 and 4.10, the Van't Hoff equation (Equation 4.1 1) can be
obtained. By plotting In(&q) versus l m , AH0 and AS' can be obtained from the slope and
intercept, respectively .
It is possible to record mass spectra by switching the electron gun fiom the pulsed to
the continuous mode. After leaving the ion source through the exit aperture, the ions are
accelerated by an accelerating potential of 1500 V and by scanning the magnetic field
From Iow to high field the different ions are detected consecutively.
For al1 NF3/ROWCH;i mixtures, an ion with d z 11 5 was always present. The relative
intensities o f m/z 1 15, 1 16, and 1 17 in the mass spectrum suggested that it contained one
sulfùr atom. This ion had the same d z value as F-(CH30H)3, and so C&OH was used
instead of CH30H. For the CD30H synthesis 4 grams of CD30D ( I 10.9 mmol, 4.50 mL)
was put into a 25 mL round bottom flask. Magnesium (1 -50 equivalents, 2.00 grams) was
added. stirred, heated in a graphite bath, and refluxed. To the Mg(CD30)2 solution, 1.50
equivalents (3.00 mL) of H z 0 were added. The CD30H formed was distilled off at 65°C
and stored under an argon atmosphere. The %D3 versus %D4 was checked by gas
chromatography/mass spect rometry (GCIMS) (HP 5890 Senes II Gas Chromatograph,
HP 5970A Series Mass Selective Detector) by determining the ratio of m/z 35 (CD3OH")
and m/z 36 (CD30D"). It was found that >95% of the CD30D had been converted to
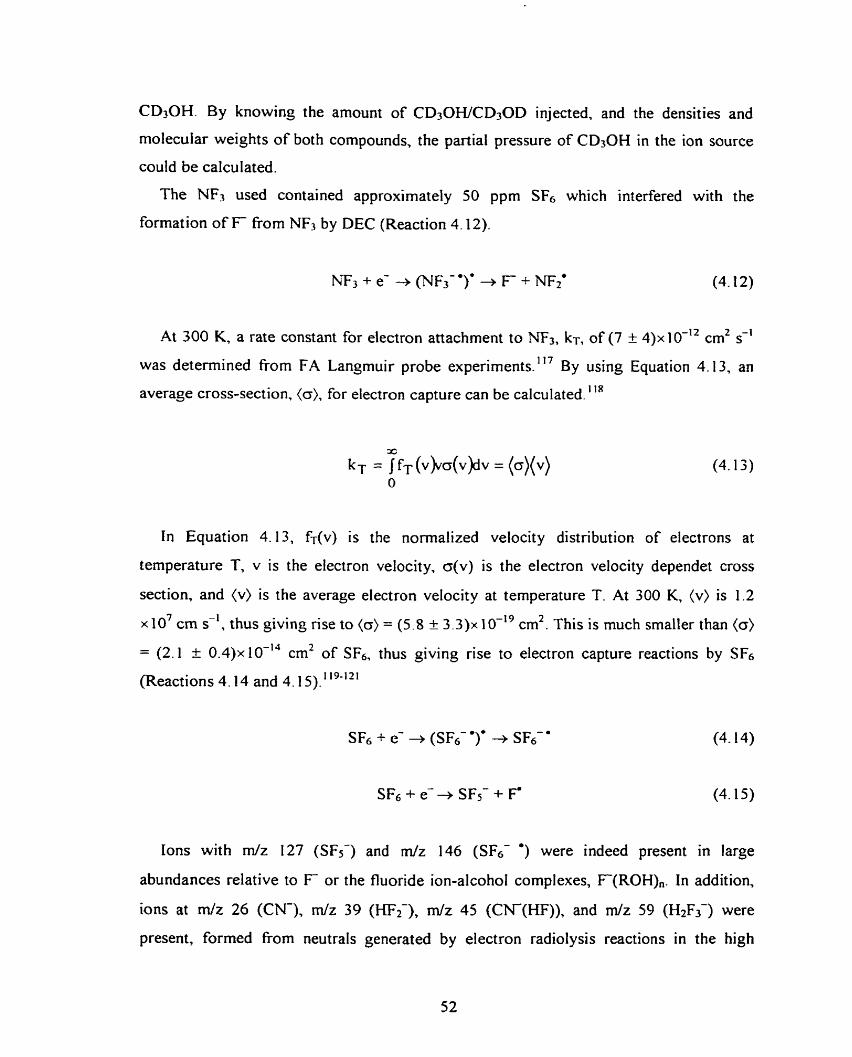
CD3OH. By knowing the amount of CD30WCD,0D injected, and the densities and
molecular weights of both compounds, the partial pressure of CD3OH in the ion source
could be calculated.
The NF3 used contained approximately 50 ppm SF6 which interfered with the
formation of F from NF3 by DEC (Reaction 4.12).
At 300 K, a rate constant for electron anachment to NF3, k ~ , of (7 I 4)x 10-12 cm2 S-1
was determined from FA Langmuir probe e~~er i rnen t s . "~ By using Equation 4.13. an
average cross-section, (O), for electron capture can be calculated. ' "
In Equation 4.13, fT(v) is the nonnalized velocity
(4.13)
distribution of electrons at
temperature T, v is the electron velocity, o(v) is the electron velocity dependet cross
section, and (v) is the average electron velocity at temperature T. At 300 K. (v) is 1.2
x lo7 cm s-', thus giving rise to (a) = (5 .8 f 3 . 3 ) ~ 10-l9 cm2. This is much smaller than (a)
= (2.1 k 0.4)xlo-l4 cm2 of SF6, thus giving rise to electron capture reactions by S h
(Reactions 4.14 and 4.15). 119-121
Ions with m/z 127 (SFs-) and d z 146 (SFs- ') were indeed present in large
abundances relative to F or the fluoride ion-alcohol complexes, F(ROH).. In addition,
ions at rn/z 26 (CN) , m/z 39 (HF2'), m/z 45 (CK(HF)), and m/z 59 (H2F3-) were
present, formed from neutrals generated by electron radiolysis reactions in the high
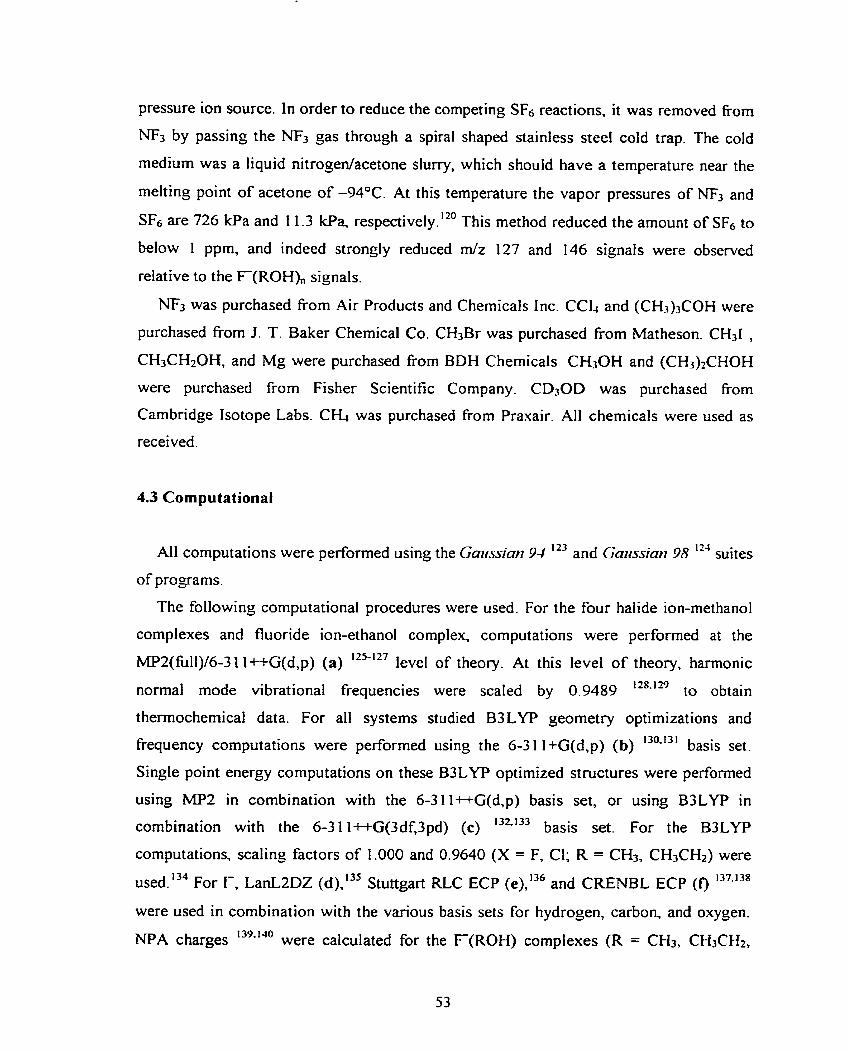
pressure ion source. In order to reduce the competing SF6 reactions, it was removed from
NF3 by passing the NF3 gas through a spiral shaped stainless steel cold trap. The cold
medium was a liquid nitrogedacetone slurry, which should have a temperature near the
melting point of acetone of -94°C. At this temperature the vapor pressures of NF3 and
SF6 are 726 kPa and 11.3 kPa, r e ~ ~ e c t i v e l ~ . l * ~ This method reduced the amount of SF6 to
below 1 ppm, and indeed strongly reduced m/z 127 and 146 signais were observed
relative to the F(ROH), signals.
NF3 was purchased 60m Air Produas and Chemicals Inc. CC14 and (CH&COH were
purchased corn J. T. Baker Chemical Co. CH3Br was purchased from Matheson. CH31 ,
CH3CH20H, and Mg were purchased from BDH Chemicals. CH3OH and (CH3)zCHOH
were purchased from Fisher Scientific Company. CD30D was purchased fiom
Cambridge Isotope Labs. C h was purchased from Prauair. AI1 chemicals were used as
received.
4.3 Computational
Al1 computations were performed using the Gazcssimi 94 12' and Gatrssian 98 12' suites
of programs.
The following computational procedures were used. For the four halide ion-methanol
complexes and fluoride ion-ethanol complex, computations were performed at the
MP2(fÙ11)/6-3 1 1 ++G(d,p) (a) 125-127 level of theory. At this level of theory, harmonic
normal mode vibrational fi-equencies were scaled by 0.9489 128.129 to obtain
thermochemical data. For al1 systems studied B3LYP geometry optimizations and
frequency computations were performed using the 6-3 1 l+G(d,p) (b) 130.131 basis set.
Single point energy computations on these B3LYP optimized structures were performed
using MP2 in combination with the 6-3 1 l*G(d,p) basis set, or using B3LYP in
combination with the 6-3 1 1 ++G(3df,3pd) (c) 132.133 basis set. For the B3LYP
computations, scaling factors of 1.000 and 0.9640 (X = F, Cl; R = CH3, CH3CH2) were
u ~ e d . ' ~ ~ For r, LanL2DZ (d),I3' Stuttgart RLC ECP (e),136 and CRENBL ECP (0 '37~138
were used in combination with the various basis sets for hydrogen, carbon, and oxygen.
NPA charges 139.140 were calculated for the F ( R 0 H ) complexes (R = CH3, CH3CH2,
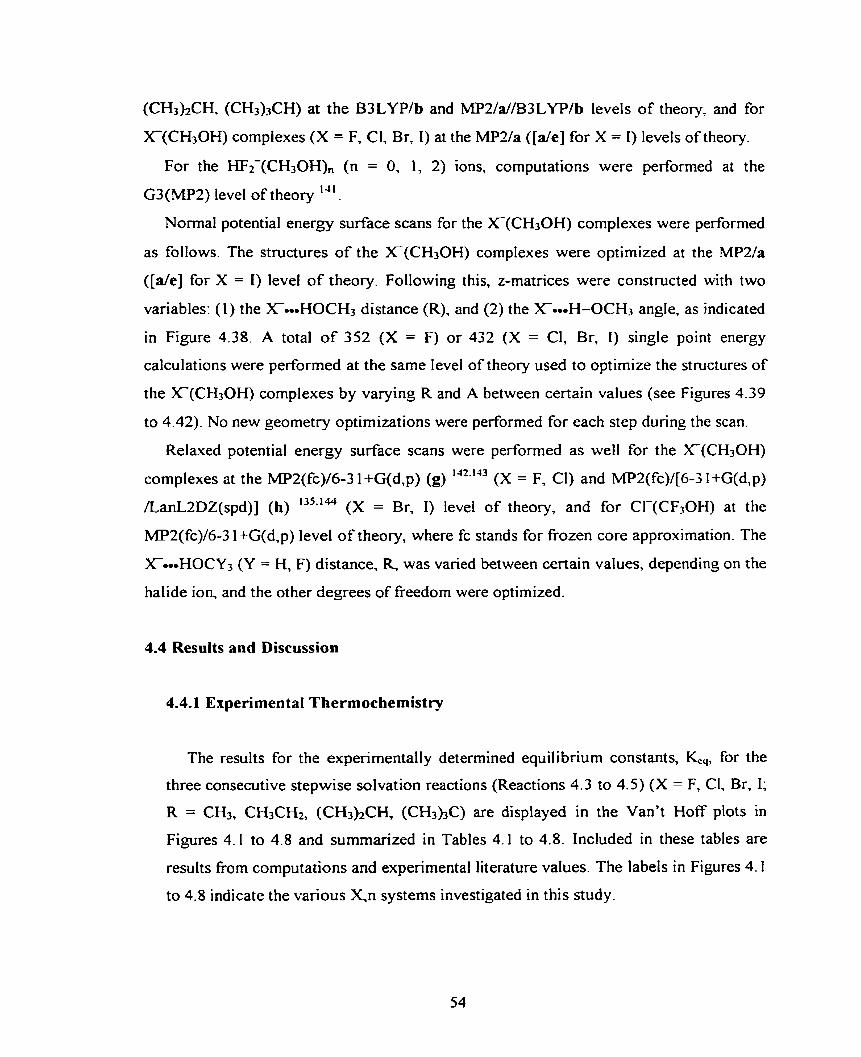
(CH3)zCH. (CH3)3CH) at the B3LYPlb and MPUaUE33LYPIb levels of theory, and for
X-(CH3OH) complexes (X = F, Cl, Br, 1) at the MPYa ([de] for X = 1) levels of theory.
For the HF2-(CH30H), (n = 0, 1, 2) ions, computations were performed at the
G3(MP2) level of theory '4.
Normal potential energy surface scans for the X(CH30H) complexes were performed
as follows. The structures of the X(CH30H) complexes were optimized at the MP2la
( [ d e ] for X = 1) level o f theory. Following this, z-matrices were constructed with two
variables: (1) the X-...HOCH3 distance (R), and (2) the XeeeH-OCH3 angle, as indicated
in Figure 4.38. A total o f 352 (X = F) or 432 (X = Cl, Br, 1) single point energy
calculations were performed at the same level of theory used to optimize the structures of
the X(CH30H) complexes by varying R and A between certain values (see Figures 4.39
to 4.42). No new geometry optimizations were performed for each step during the scan.
Relaxed potential energy surface scans were performed as well for the X(CH30H)
complexes at the MP2(fc)/6-3 1 +G(d,p) (g) 142.143 (X = F, Cl) and MP2(fc)/[6-3 l+G(d,p)
/LanLZDZ(spd)] (h) m.'" (X = Br, 1) level of theory, and for CI-(CF3OH) at the
MP2(fc)/6-3 l+G(d,p) level o f theory, where fc stands for frozen core approximation. The
X--HOCY3 (Y = H, F) distance, R, was varied between certain values, depending on the
halide ion, and the other degrees of fieedom were optimized.
4.4 Resuits and Discussion
4.4.1 Experimental Thermochemistry
The results for the experimentally determined equilibrium constants, k,, for the
three consecutive stepwise solvation reactions (Reactions 4.3 to 4.5) ( X = F, CI, Br, 1;
R = CH3, CH3CH2, (CH3)2CH, (CH3bC) are displayed in the Van't Hoff plots in
Figures 4.1 to 4.8 and summarized in Tables 4.1 to 4.8. Included in these tables are
results from computations and experimental literature values. The labels in Figures 4.1
to 4.8 indicate the various X,n systems investigated in this study.
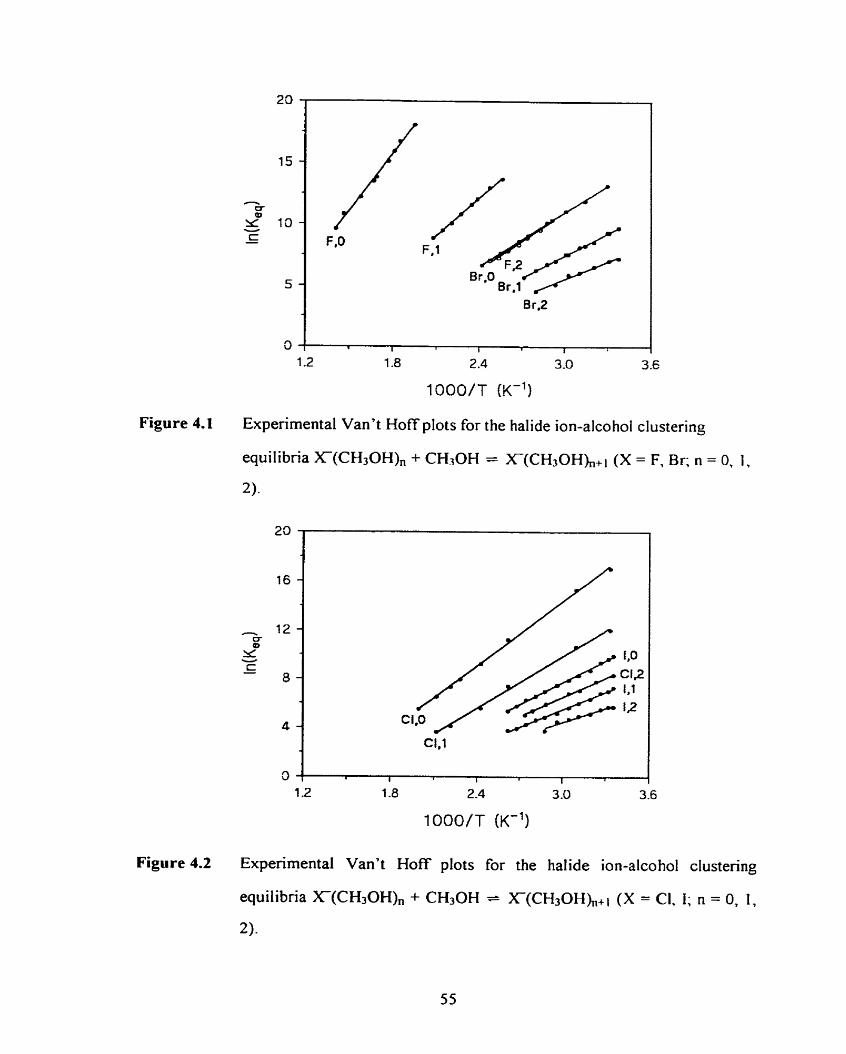
1.2 1.8 2.4 3.0 3 -6
1000/T (K-')
Figure 4.1 Experimental Van't Hoff plots for the ha1 ide ion-alco ho1 clustering
equilibna X(CH3OH), + CH3OH = X ( C H 3 0 H h + i (X = F, Br; n = 0, 1,
2)-
Figure 4.2 Experimental Van't Hoff plots for the halide ion-alcohol clustering
equilibria X(CH,OH), + CH3OH = X-(CH30H),,+i (X = CI, i; n = 0, 1,
2) -
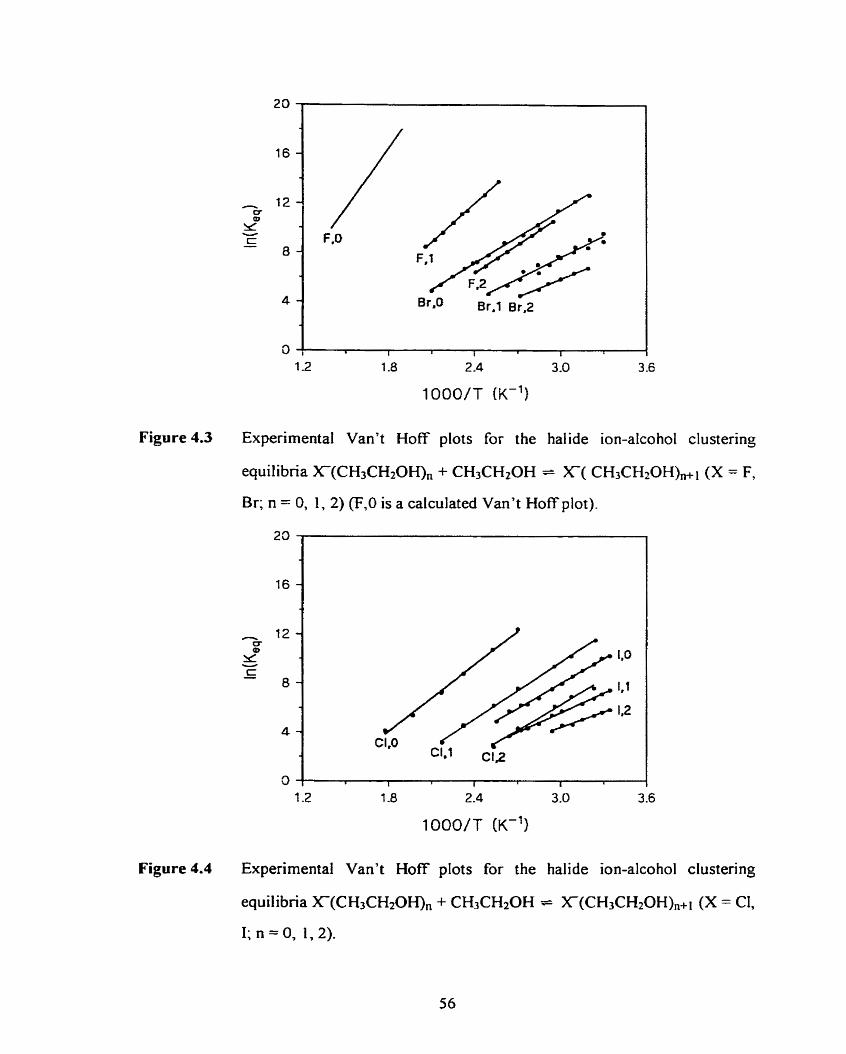
Figure 4.3 Experimental Van't Hoff plots for the halide ion-alcohol clustering
equilibria X(CH3CH20H), + CH3CH20H = X( CH,CHZOH)~+, (X = F,
Br; n = 0, 1 , 2) (F,O is a calculated Van't Hoff plot).
1
Figure4.4 Experimental Van't Hoff plots for the halide ion-alcohol clustering
equilibria X-(CH3CH2OH), + CHiCH2OH == X(CH3CH20H)n+l (X = CI,
1; n = 0, 1,2).
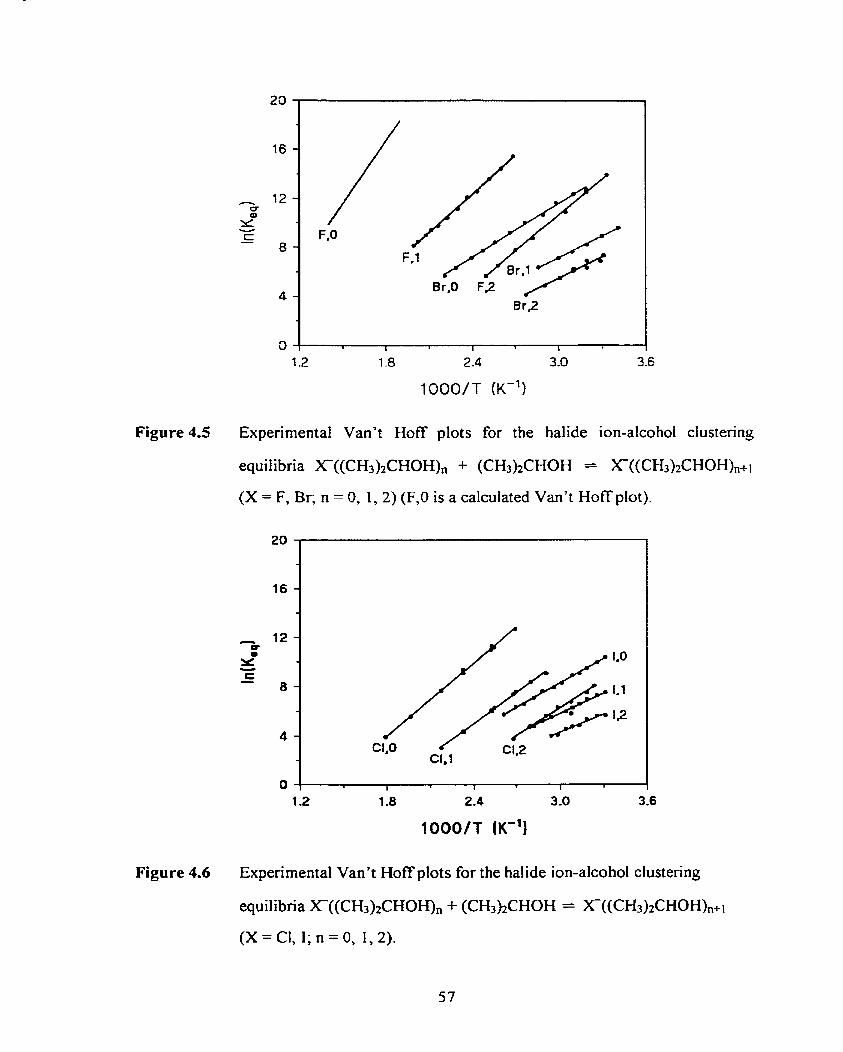
Figure 4.5 Experimental Van't Hoff plots for the haiide ion-alcohoi dustering
equilibria X((CH3)2CHOHh + (CH&CHOH = X((CH3)2CHOH),+I
(X = F, Br; n = 0, 1, 2) (F,O is a calculated Van't Hoff plot).
Figure 4.6 Experimental Van't Hoff plots for the halide ion-alcohol clustering
equilibria X-((CH3)zCHOH), + (CH3)2CHOH = X-((CH3)2CHOH)mi
(X = Cl, 1; n = 0, 1, 2).
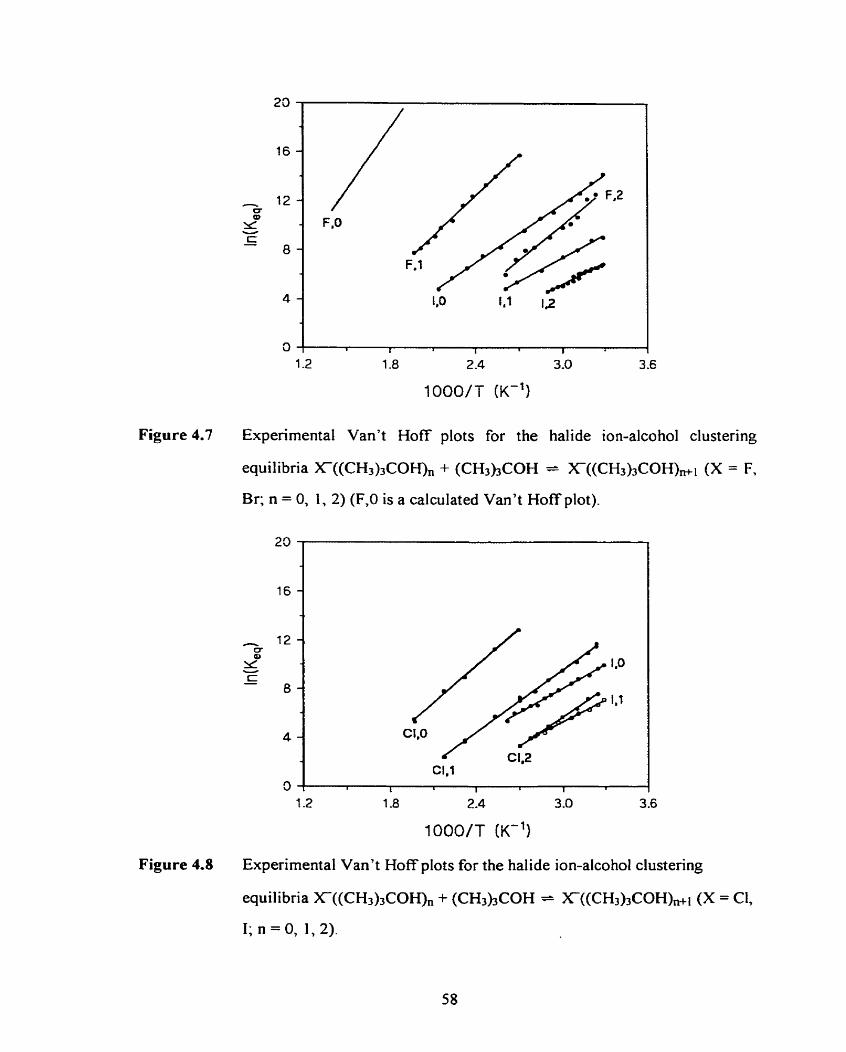
Figure 4.7 Experimental Van't Hoff plots for the halide ion-alcohol clustering
equilibria X((CH3)3COH), + (CH3hCOH = X((CH3)3COH)wi (X = F,
Br; n = 0, 1 , 2) (F,O is a calculated Van't Hoff plot).
23
1.2 1 -8 2.4 3 .O 3.6
1000/T K1)
Figure 4.8 Experimental Van't Hoff plots for the halide ion-alcohol clustering
equilibria X((CH+COH), + (CH3)JCOH -- X((CH3)3COH)mI (X = Cl,
1; n = 0 , 1 , 2).
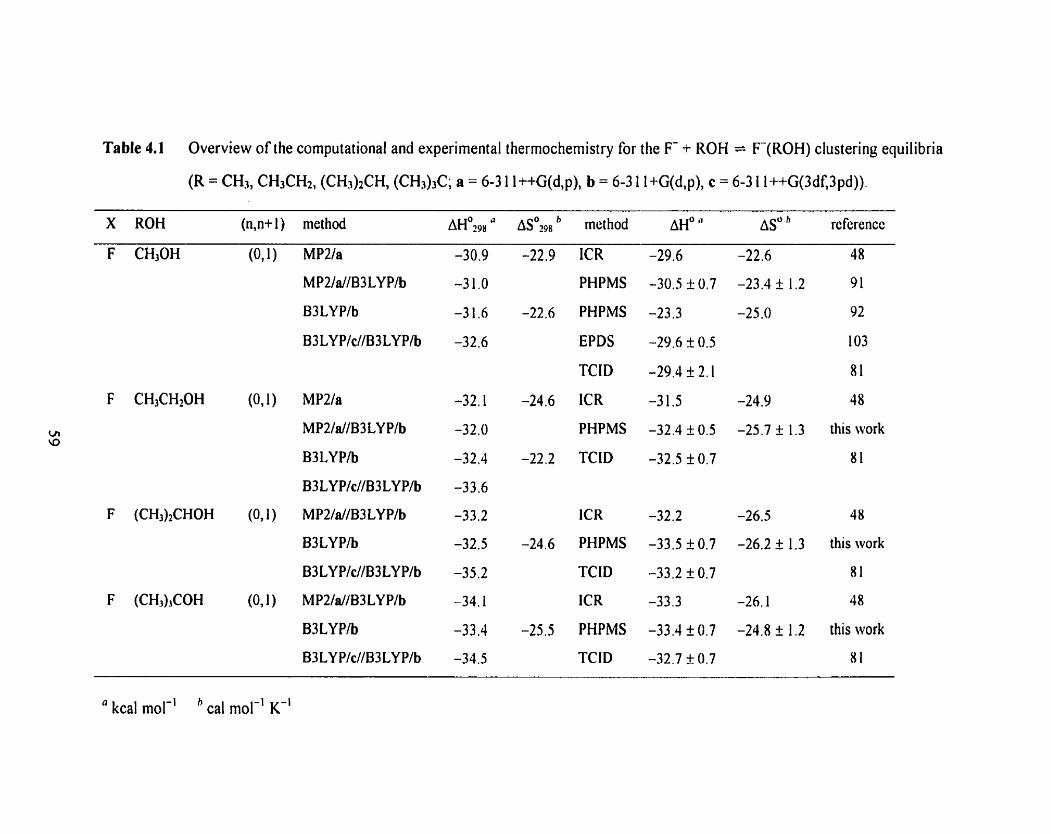
Table 4.1 Overview of the computational and experirnental therrnochernistry for the F- + ROH = F-(ROH) clustering equilibria
X ROH (n,n+ 1) method AH^^^^ a ASO?~~ method AH' AS" rcferencc
F CH3OH (0,l) MP2la -30.9 -22.9 ICR -29.6 -22.6 48
M P2/d/B3 LY P/b -3 1 .O PHPMS -30.5 k 0.7 -23.4 + 1.2 91
B3 LY P/b -3 1.6 -22.6 PHPMS -23.3 -25 .O 9 2
B3LY P/d/B3LYP/b -32.6 EPDS -29.6 If: 0.5 1 03
TClD -29.4 k 2.1 8 1
F CH3CH20H (0,I) MP2/a -32.1 -24.6 ICR -3 1.5 -24.9 48
MP2/a//B3LY Plb -32.0 PHPMS -32.4 k 0.5 -25.7 k 1.3 this work
B3LYPIb -32.4 -22.2 TCID -32.5 1 0 . 7 8 1
B3LYP/c//B3LYP/b -33.6
F (CH3)2CHOH (O, 1 ) MP2/al/B3 LYP/b -33.2 ICR -32.2 -26.5 48
B3LY P/b -32.5 -24.6 PHPMS -33.5 + 0.7 -26.2 + 1.3 this work
B3LYP/d/B3LYP/b -35.2 TCID -33.2 f 0.7 8 1
F (CH3)JCOH (0,l) MP2/d/B3 LYPh -34.1 ICR -33.3 -26.1 48
B3LY P/b -33.4 -25.5 PHPMS -33.4 f 0.7 -24.8 f 1.2 this work
B3LY P/c//B3LYP/b -34.5 TCID -32.7 k 0.7 8 1
h " kcal mol-' cal mol-' K"
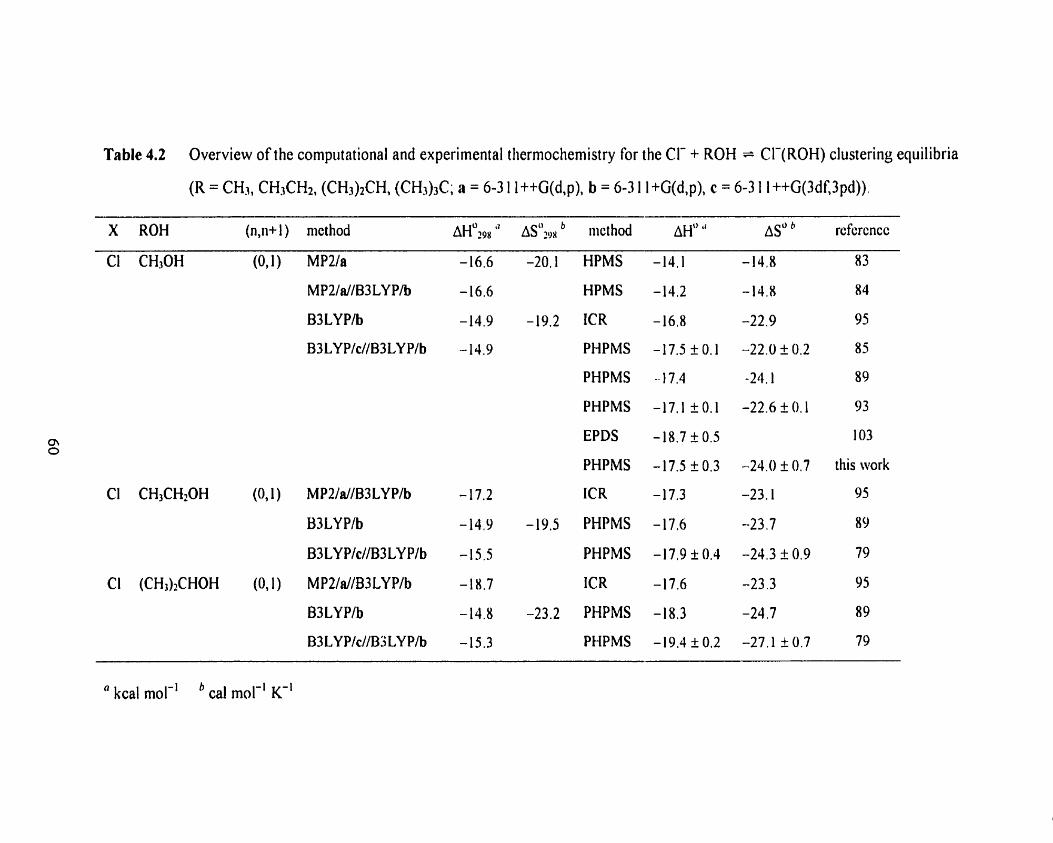
Table 4.2 Overview of the computational and experimental tliermochemistry for the CI- + ROH = CI-(ROH) clustering equilibria
(R = CHJ, CHJCHI, (CH,)2CH, (CH& a = 6-3 1 I++G(d,p). b = 6-3 1 I +G(d,p), c = 6-3 1 1 ++G(3df 3pd)).
X ROH (n,n+l) method AH'?^^ " ~ticthod AH' '' AS" refcrcncc
-20.1 HPMS
HPMS
-19.2 ICR
PHPMS
PHPMS
PHPMS
EPDS
PHPMS
ICR
-19,5 PHPMS
PHPMS
1CR
-23.2 PHPMS
PHPMS
83
8 4
95
85
89
9 3
103
this work
95
8 9
79
9 5
89
79
kcal mol-' cal mol-' K-'
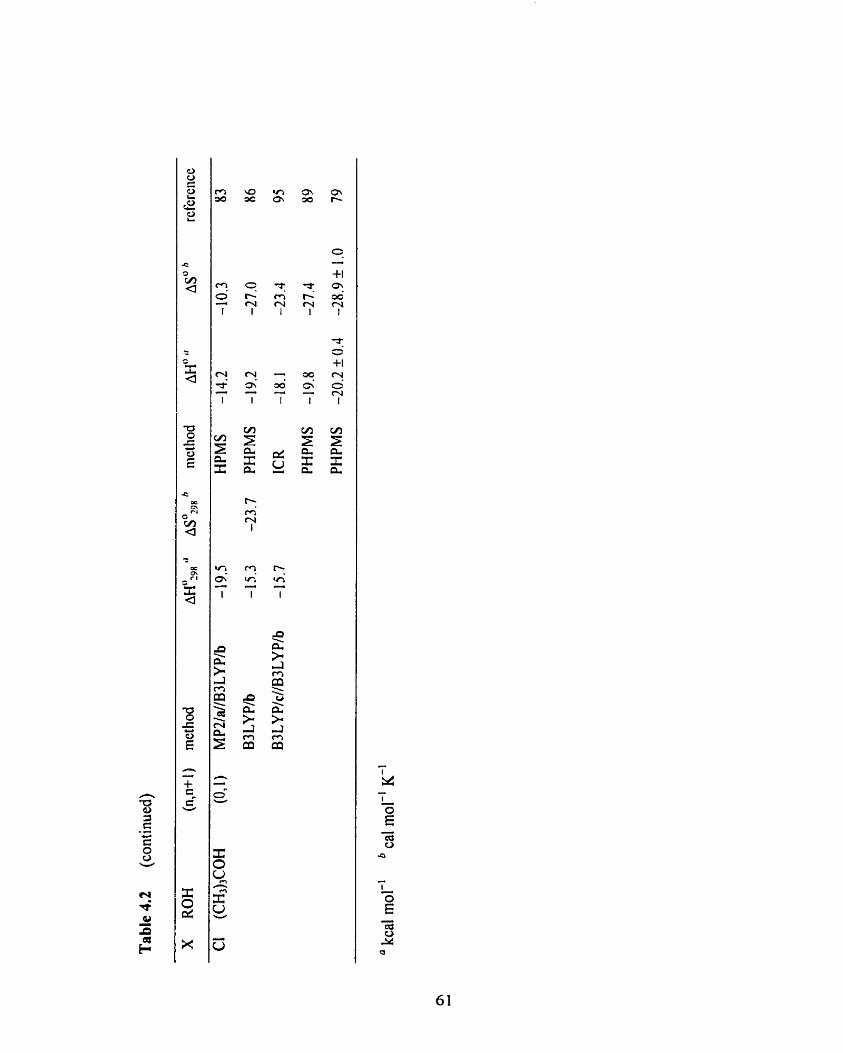
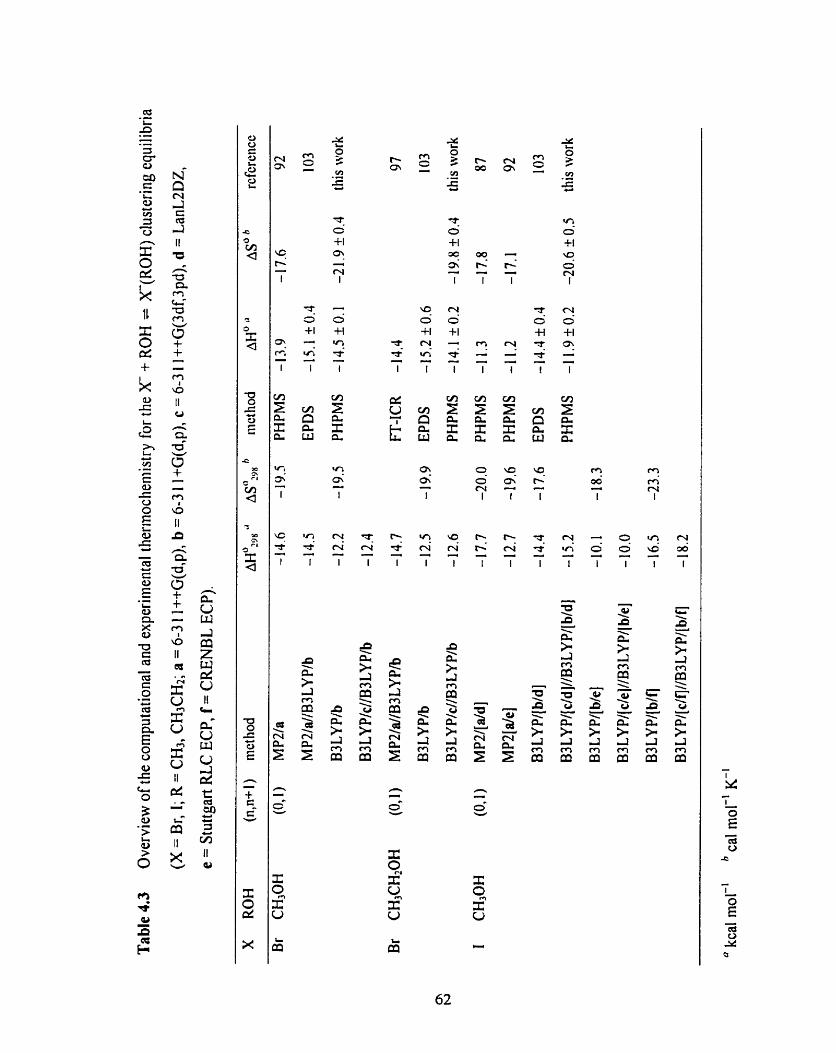
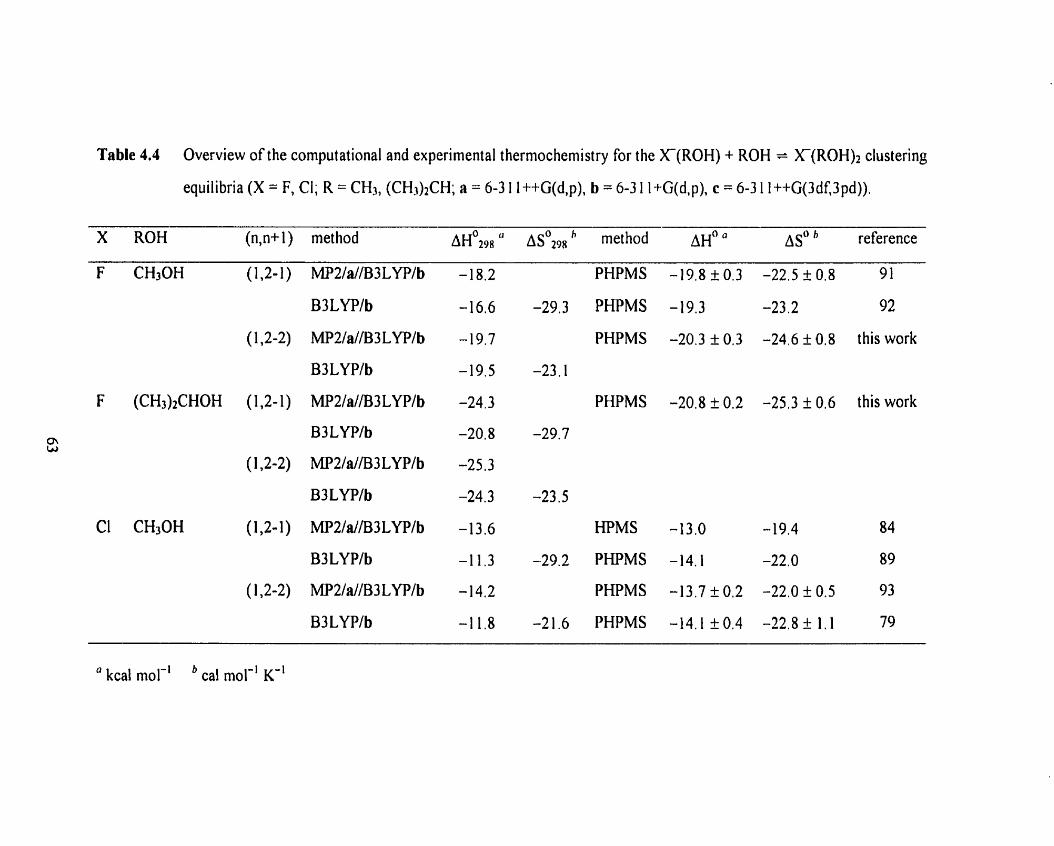
Table 4.4 Overview of the computational and experimental thermochemistry for the X-(ROH) + ROH = X-(ROH)2 clustering
equilibria (X = F, CI; R = CH3, (CH3)lCH; a = 6-3 1 l++G(d,p), b = 6-3 1 I+G(d,p), c = 6-3 1 I++G(3df',3pd)).
X ROH (n,n+ 1) method ~ ~ 4 9 8 lJ AS^^^^ method AH' a AS' reference
F CH30H ( 2 1 ) MP2la//03LYP/b -1 8.2 PHPMS -19.8 k 0.3 -22.5 f 0.8 9 1
B3LYPlb -16.6 -29.3 PHPMS -19.3 -23.2 92
(1,2-2) MP2la//i33LYP/b -19.7 PHPMS -20.3 f 0.3 -24.6 f 0.8 this work
B3LYPlb -19.5 -23.1
F (CH3)zCHOH ( 1 2 1 ) MP2/al/B3LYP/b -24.3 PHPMS -20.8 2 0.2 -25.3 I 0.6 this work
B3LYP/b -20.8 -29.7
(1,2-2) MP2IaIh33LYPlb -25.3
B3 LYP/b -24.3 -23.5
Cl CH30H ( 1 2 ) MP2IaIIB3LYPlb -13.6 HPMS -13.0 -19.4 84
B3LYPlb -1 1.3 -29.2 PHPMS -14.1 -22.0 89
( 1,2-2) MP2ld/B3LYP/b - 14.2 PHPMS -13.7 2 0.2 -22.0 I 0.5 93
B3LYPlb -1 1.8 -21.6 PHPMS -14.1-tO.4 -22.8-i-1.1 79
" kcal mol-' b cal mol-' K-'
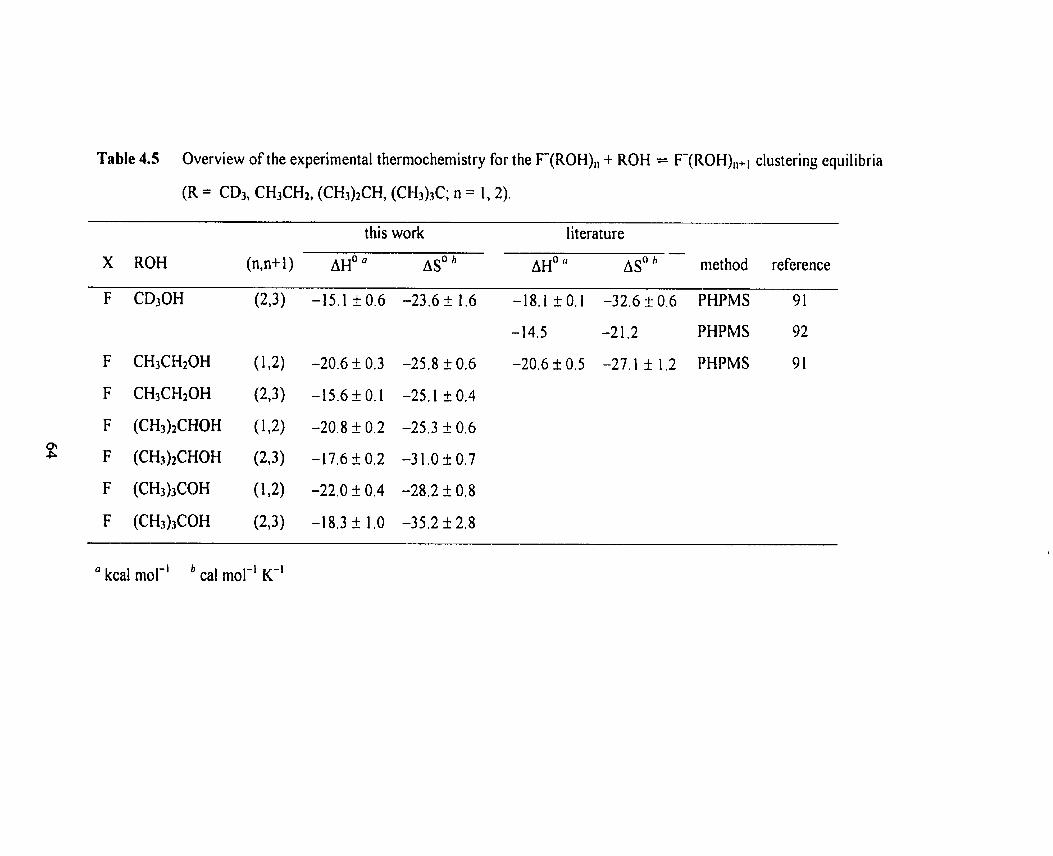
Table 4.5 Overview of the experimental thermochemistry for the F-(ROH),, + ROH = F'(ROH),,+] clustering equilibria
this work literature -
X ROH (n,n+l) AH' " AS' AH' a AS' ' met hod reference
F CD30H (2,3) -1 5-1 f 0.6 -23.6 f 1.6 -18.1 + 0.1 -32.6 -t- 0.6 PHPMS 91
-14.5 -21.2 PHPMS 92
F CH3CH20H (1,2) -20.6 f 0.3 -25.8 + 0.6 -20.6 + 0.5 -27.1 + 1.2 PHPMS 9 1
F CH3CH20H (2J) -15,6fO,1 -25.1'0.4
F (CH3)2CHOH (1,2) -20.8 i 0.2 -25.3 1: 0.6
F (CH3)2CHOH ( L 3 ) - 17.6 f 0.2 -3 1 .O t 0.7
F (CH3)3COH (1,2) -22.0 f 0.4 -28.2 f 0.8
F (CHj),COH (Z3) -18.3 i 1.0 -35.2 f 2.8
" kcal mol-' b cal mol-' K-'
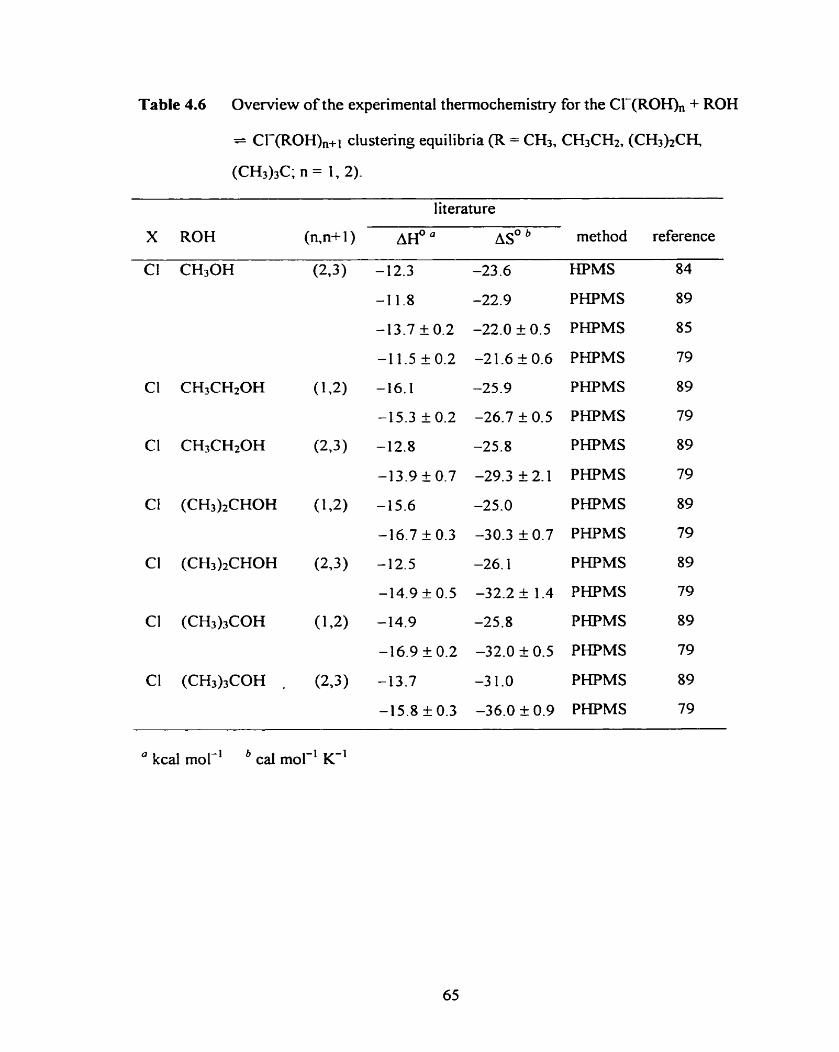
Table 4.6 Ovewiew of the experimental therrnochemistry for the Clb(ROHX, + ROH
= CI-(ROH)n+i clustering equilibria (R = CH3, CH3CH2, (CH3)2CH,
literature
X ROH (n,n+ 1 ~r-f' " AS' method reference
HPMS
PHPMS
PHPMS
PI-LPMS
PHPMS
PHPMS
PHPMS
PHPMS
PHPMS
PHPMS
PHPMS
PHPMS
PHPMS
PHPMS
PHPMS
PHPMS
b " kcal mol-' c d mol-' K-'
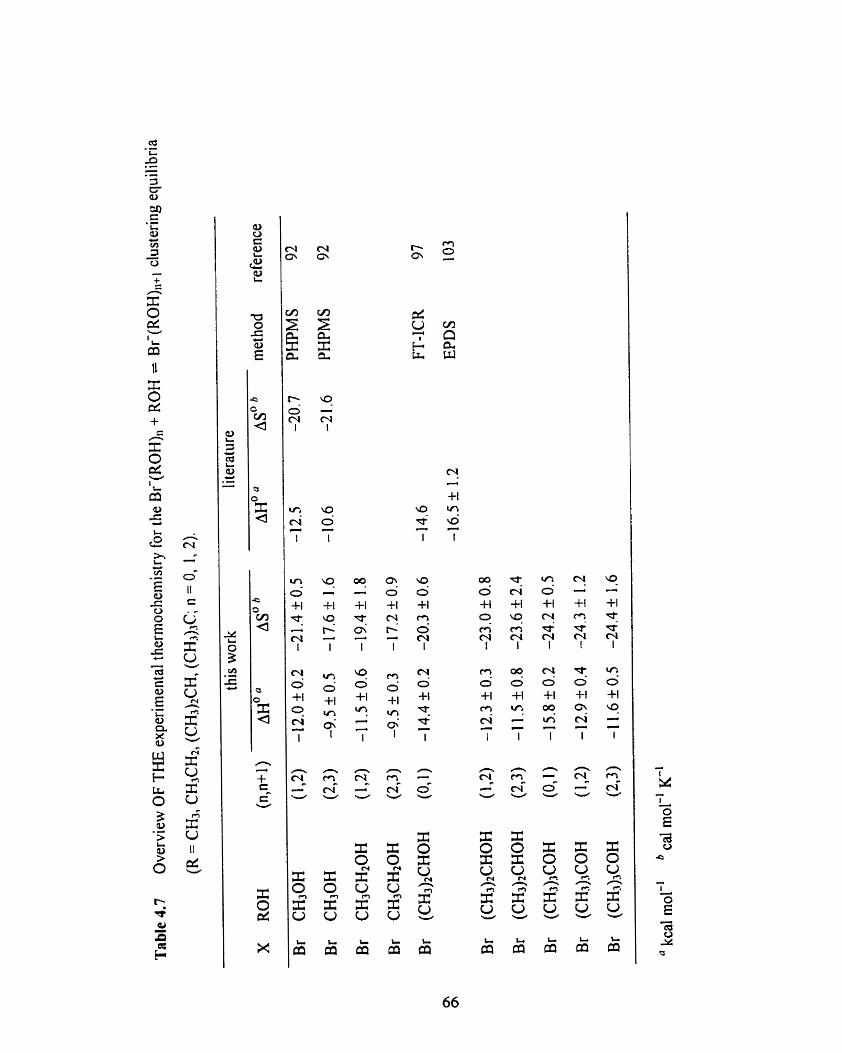
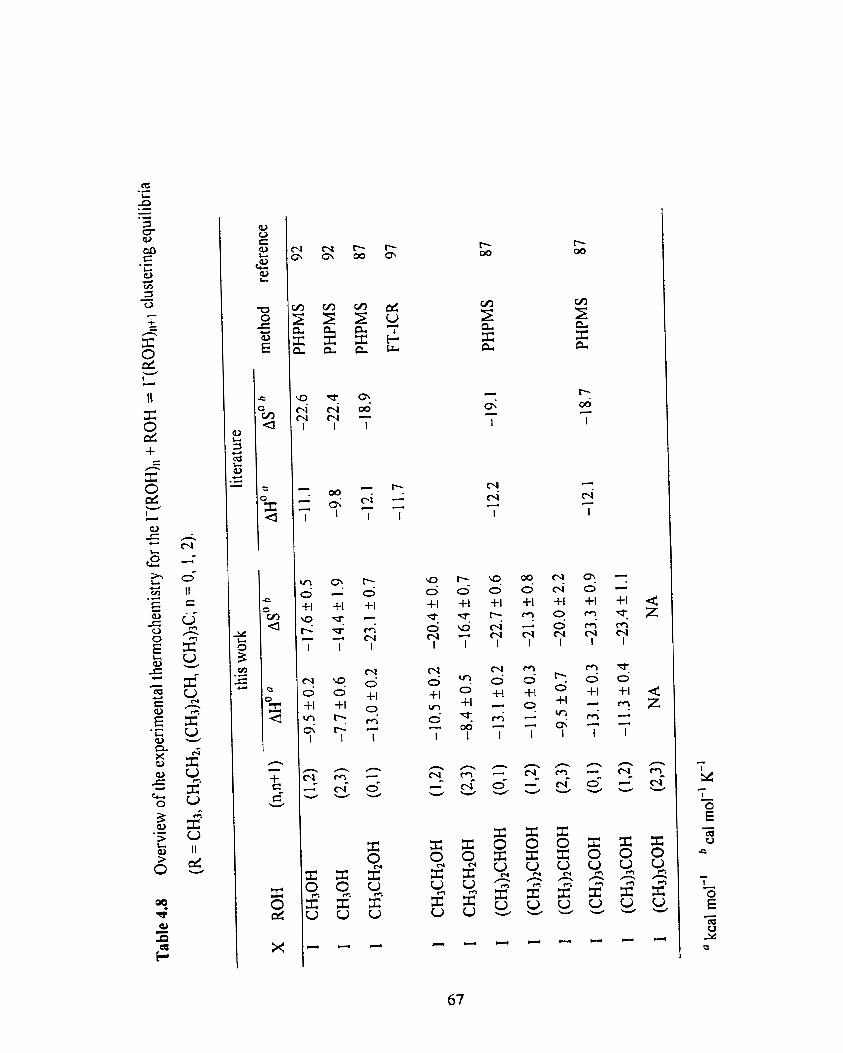
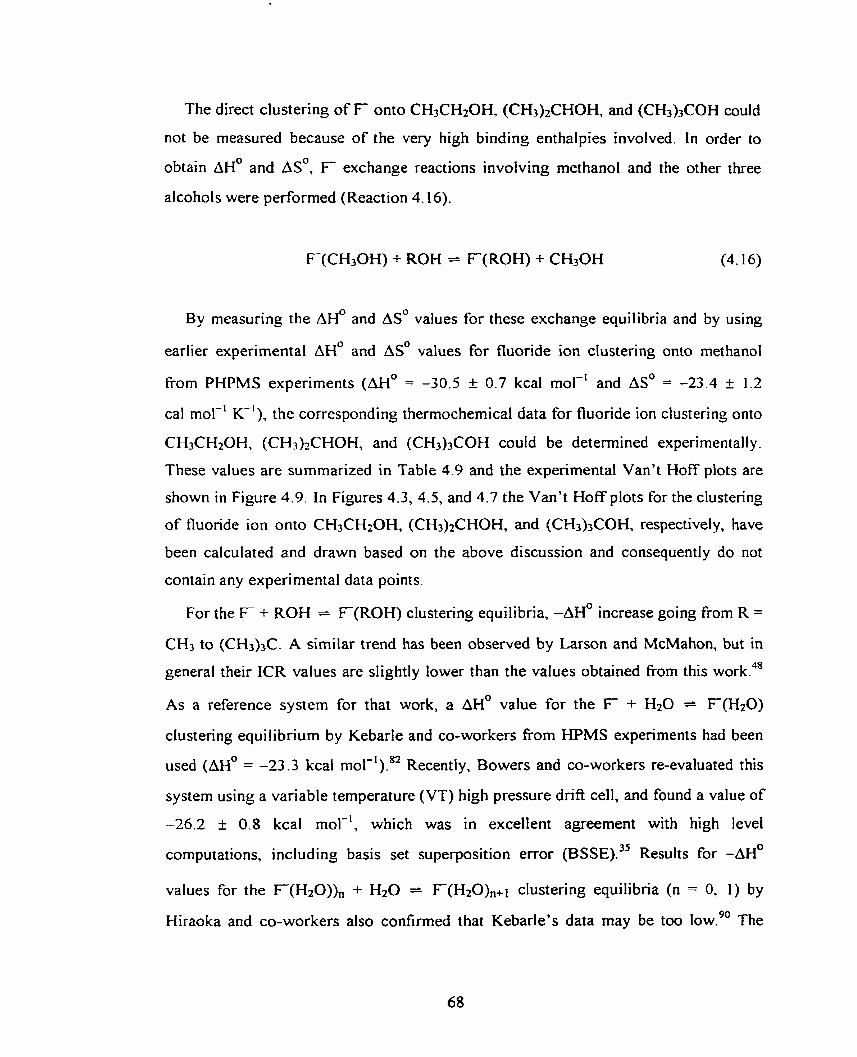
The direct clustering of F ont0 CH3CH20H, (CH3)2CHOH, and (CH3)3COH could
not be measured because of the very high binding enthalpies involved. In order to
obtain ~ l - f and AS', F exchange reactions involving methanol and the other three
alcohols were performed (Reaction 4.16).
F(CH3OH) + ROH + F ( R 0 H ) + CH30H
By measuring the AH' and AS" values for these exchange equilibria and by using
earlier experirnental AH' and AS" values for fluoride ion clustering ont0 rnethanol
li-om PHPMS experiments (AH0 = -30.5 k 0.7 kcal mol-' and AS' = -23.4 + 1.2
cal mol-' Ki), the corresponding thermochemical data for fluoride ion clustering ont0
CH3CH20H, (CH3)zCHOH, and (CH3)3COH could be determined experimentally.
These values are summarized in Table 4.9 and the experimental Van't Hoff plots are
shown in Figure 4.9. In Figures 4.3, 4.5, and 4.7 the Van't Hoff plots for the clustering
of fluoride ion ont0 CH3CH20H. (CH3)2CHOH, and (CH3)3COH, respectively, have
been calculated and drawn based on the above discussion and consequently do not
contain any experimental data points.
For the F + ROH = F ( R 0 H ) clustering equilibria, -AH' increase going from R =
CH3 to (CH3)3C. A similar trend has been observed by Larson and McMahon, but in
general their K R values are slightly lower than the values obtained from this worke4*
As a reference system for that work, a AHO value for the F + Hz0 = F(H20)
clustering equilibrium by Kebarle and co-workers from HPMS experiments had been
used (AH? = -23.3 kcal mol-').82 Recently, Bowers and co-workers re-evaluated this
system using a variable temperature (VT) high pressure drift cell, and found a value of
-26.2 t 0.8 kcal mol-', which was in excellent agreement with high level
cornputations, including basis set superposition error (BSSE).~' Results for -AH0
values for the F(H20) ) , + Hfl = F(H20)n+i clustering equilibria (n = 0, 1) by
Hiraoka and co-workers also confirmed that Kebarle's data may be too 10w.~' The
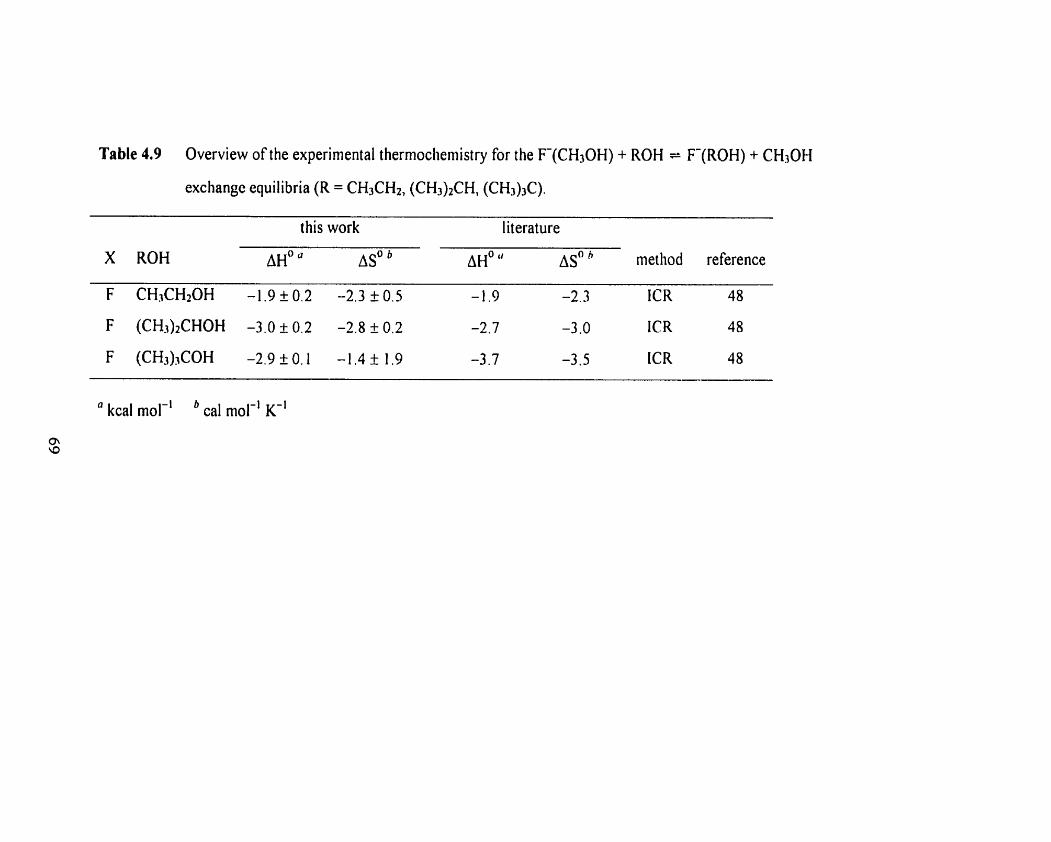
Table 4.9 Overview o f the experimental thermochemistry for the F-(CH30H) + ROH = F-(ROH) + CHsOH
exchange equilibria (R = CH3CH2, (CH3)2CH, (CHJ)~C).
X ROH
this work literature
AH' AS' AH* AS' method reference
K R
ICR
E R
a kcal mol-' b cal mol-' K"
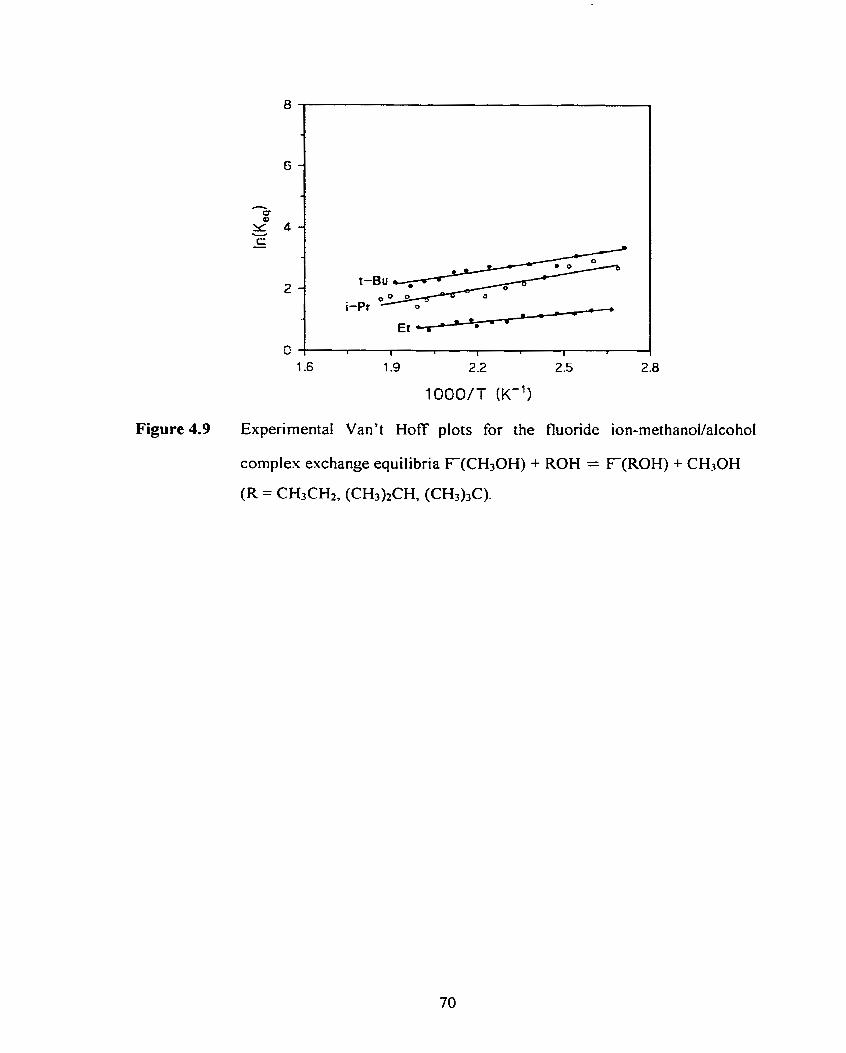
Figure 4.9 Experimental Van't Hoff plots for the fluoride ion-methanol/alcohoI
cornplex exchange equilibria F(CH30H) + ROH = F ( R 0 H ) + CHlOH
(R = CH3CH2, (CH3)2CH, (CH3)3C).
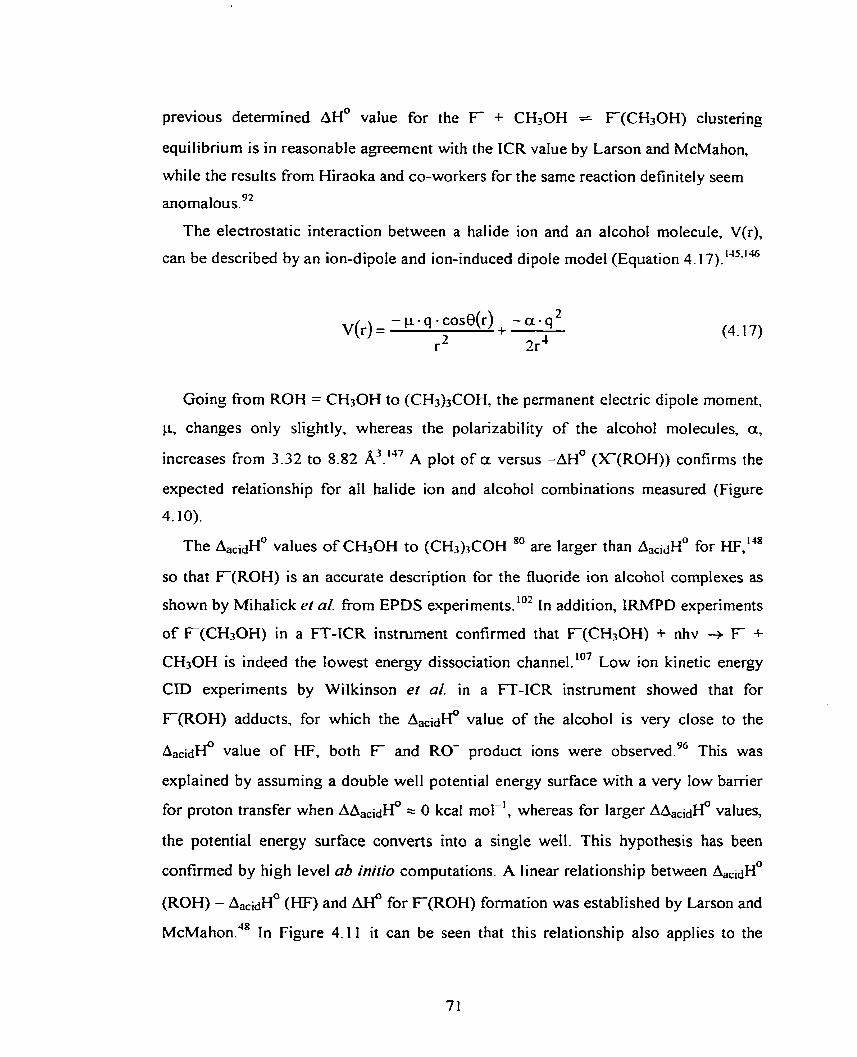
previous detennined AH* value for the F + CH3OH + F(CH20H) clustenng
equilibrium is in reasonable agreement with the ICR value by Larson and McMahon,
while the results from Hiraoka and CO-workers for the same reaction definitely seem
a r ~ o r n a l o u s . ~ ~
The elecîrostatic interaction between a halide ion and an alcohol molecule, V(r),
can be described by an ion-dipole and ion-induced dipole mode1 (Equation 4.17). 1-15.1 46
Going from ROH = CH30H to (CH3hCOH, the permanent electric dipole moment,
p, changes only slightly, whereas the polarizability of the alcohol molecules, a,
3 117 increases from 3.32 to 8.82 A . A plot of a versus -A# (X(R0H)) confirms the
expected relationship for al1 halide ion and alcohol combinations measured (Figure
4.1 O).
The Aacid~O values of CH30H t o (CH3),COH are larger than A , ~ ~ ~ H ~ for HF,"~
so that F ( R 0 H ) is an accurate description for the fluoride ion alcohol cornpIexes as
shown by Mihalick et al. from EPDS e ~ ~ e r i r n e n t s . ' ~ ~ In addition, IRMPD experiments
of F(CH30H) in a F T - K R instrument confirmed that F (CH30H) + nhv -+ F +
CH3OH is indeed the lowest energy dissociation channel.lo7 Low ion kinetic energy
CID experiments by Wilkinson et al. in a FT-ICR instrument showed that for
F(R0H) adducts, for which the AaCiàHO value of the alcohol is very close to the
A , , ~ ~ H O value o f HF, both F and RO- product ions were o b s e r ~ e d . ~ ~ This was
explained by assuming a double well potential energy surface with a very low barrier
for proton transfer when A A ~ ~ ~ ~ H ~ 2 O kcal mol-', whereas for Iarger A A ~ ~ ~ ~ H ~ values,
the potential energy surface convens into a single well. This hypothesis has been
confirmed by high level a b initio cornputations A linear relationship between AaCidHO
(ROH) - AaCid~O (HF) and AIf for F ( R 0 H ) formation was established by Larson and
~ c ~ a h o n . " ~ In Figure 4.11 it can be seen that this relationship also applies to the
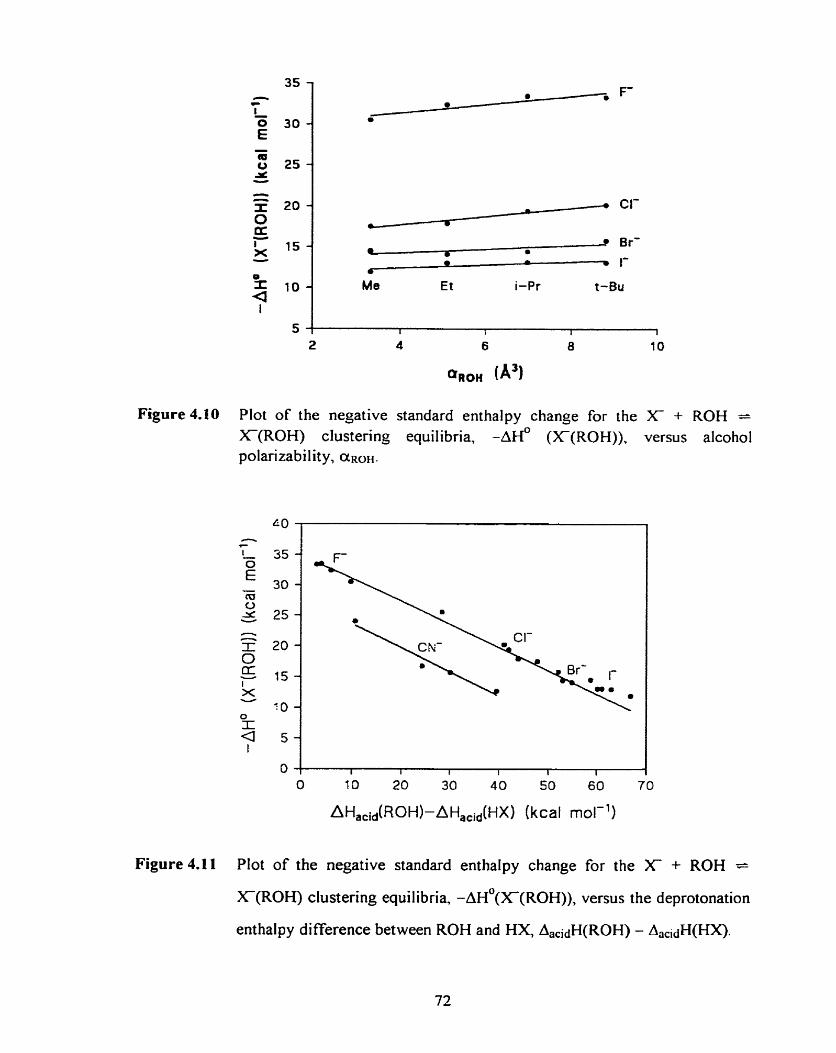
Br' O 0
6 * 1-
Me Et i - Pr t-Bu
Figure 4.10 Plot of the negative standard enthalpy change for the X- + ROH = X-(ROH) clustering equil ibria, if (X-(ROH)), versus alcohol polarizability, ~ R O H .
O 1 O 20 30 40 50 60 70
AHacid(ROH)-A HaCid(HX) (kcal mol-')
Figure 4.11 Plot of the negative standard enthalpy change for the X + ROH --
X ( R 0 H ) clustering equilibria, -AH'(~-(ROH)), versus the deprotonation
enthalpy difference between ROH and HX, AacidH(ROH) - AacidH(HX).
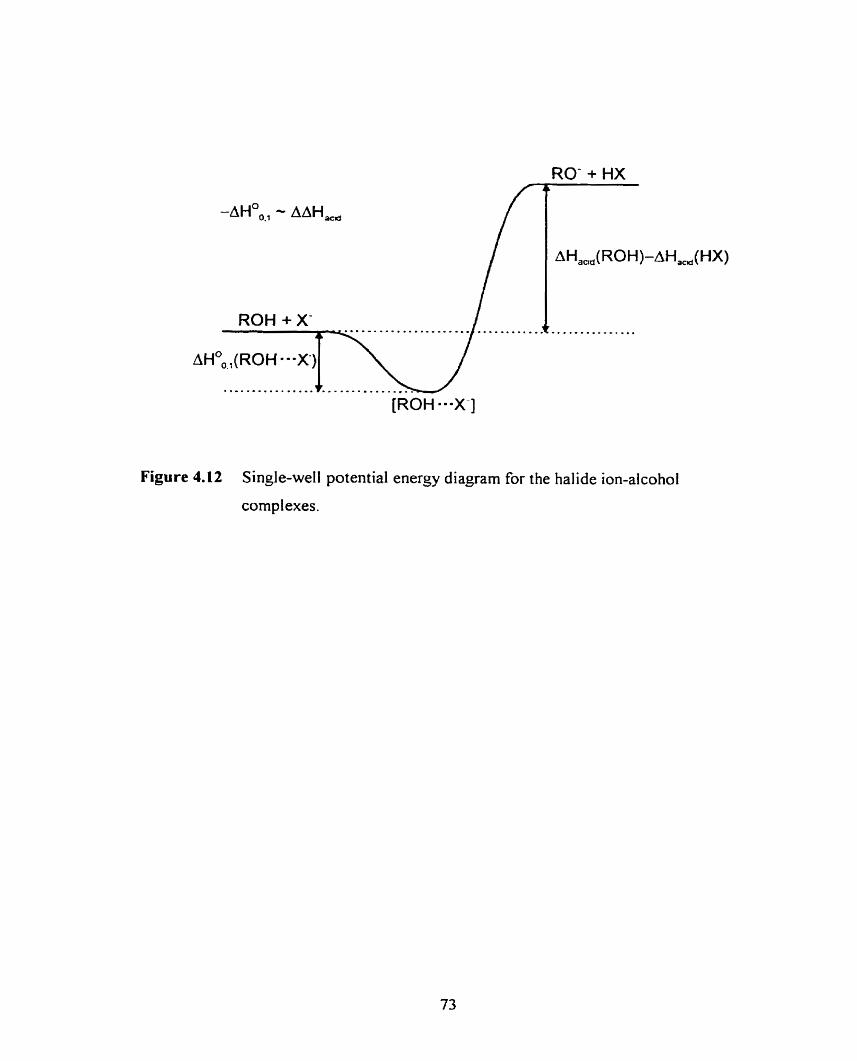
-AHO,., - AAH,
[ROH *=-X-]
Figure 4.12 Single-well potential energy diagram for the ha1 ide ion-alcohol
complexes.
other three halide ions. This relationship might indicate the existence of a single well
potential energy surface as shown in Figure 4.12. A similar kind of potentia! energy
surface was suggested by Yang el although they did not propose any linearity or
extension to larger molecules.
For the fluoride ion-alcohol molecule dimer clustering equilibria (Reaction 4.18), it
can be seen in Tables 4.4 and 4.5 that -AH' is considerably smaller than for the
fluoride ion mono-solvated, and that AH0 becomes slightly more negative going from
CH30H to (CH3)3COH.
F(R0H) + ROH = F(ROH)2 (4.1 8)
The A@ = -20.3 + 0.3 kcal mol-' for (CH30H)F(CHpOH) is in reasonable
- 1 92 agreement with data from Hiraoka and CO-workers (-1 9.3 kcal mol ) and earlier -1 91 data fiom our laboratory (-19.8 + 0.3 kcal mol ). For the other three alcohol
molecules, no data are available in the literature, but the consistency in the observed
trends is a good indication that the AH' values are of the correct magnitude. The main
reason for the smaller A@ values of the (1.2) type of equilibria compared to the (0,l)
type of equilibria can be found mainly in the increased dipole-dipole interaction 1.19
and steric effects between the alkyl groups. The dipole-dipole interaction is expected
to be the main factor, and repulsion will be Iargest for the F(R0H)z clusters and
smallest for the T(ROH)Z clusters. This observation can be understood by the fact that
the alcohol molecules will be closer together when bonded to F instead of T. For the
(2,3) type of equilibria, similar trends are observed as for the corresponding (1,S) type
equilibria. -AH0 increases going from CH30H to (CHS)~COH and al1 values are
smaller than for Reaction (4.18).
The clustering of chloride ion ont0 methanol (Reaction 4.19) has been studied
extensive1 y. 83.84.85.89.93,95,103
The result for AH' from the present work of -17.5 + 0.3 kcal mol-' is in excellent
agreement with most other PHPMS determinations. Kebarle's HPMS value of -14.1 83.84 kcal mol-' is definitely too low, whereas the estimated ICR value of Larson and
McMahon (-16.8 kcal mol-') is in reasonable agreementqg5 The EPDS value by Yang
et al. (- 18.7 + 0.5 kcal mol-') seems too high cornpared to al1 other values.'03 The
obsewed trend in the & values going from CH30H to (CH3)3COH can be explained
by the increase in the polarizability of the alcohol molecule, as shown for X = F in
Figure 4.10. For the other three alcohol molecules most values, except those from
HPMS, in general agree fairly well. For the chloride ion-alcohol (1.2) and (2,;)
clustenng equilibria, similar trends as for the corresponding fluoride ion systems can
be obsewed, and the same arguments can be used to explain these trends qualitatively.
To this point, discussion of the trends of AS' has been deliberately delayed. In
general, experimentally determined entropy changes can give some additional
information on structural features of gas phase cluster ions. Good illustrative examples 150 are the occurrence of bidentate clustering of chloride ion ont0 a,o-diols and the
existence of electrostatic and covalent bound isomers of (CH3),C* with small organic
molecules at different ten~~eratures.'~' In general, the variations for the observed
entropy changes can be attributed to interna1 rotational and vibrational contributions.
Unfortunately no clear and consistent general trends in the A s 0 values as a function of
X, R, and (n,n+l) are observable. In addition, without cornputational structures and
normal mode vibrational fiequencies, discusson of changes in AS' is speculative. In
the case of possible isomers with very different calculated A S O ~ ~ ~ values, one may be
more likely to choose one based on close resernblance with the experirnental AS'
value. It seems likely that upon complex formation, methyl group rotations will be
hindered and that, especially for the higher order clusters with bulky alkyl groups, this
effect will be even stronger. Based on computations on halide ion-water clusters, it has
been show that low (< 200 cm-') intrarnolecuiar normal mode vibrational frequencies
are introduced, and that their number increases and their value decreases by increasing
the number of water molecules. 56.58v62*152 It may be expected that this will have a large
impact on the vibrational entropy change. Finally it is obvious that in general there is a
larger spread in the experirnental ASO values from PHPMS than in the AH0 values.
As already mentioned, there is surprisingly little thermochemical data in the
literature on bromide and iodide ion-alcohol clusters. 97.92.97. IO3 For both the bromide
and iodide ion (0.1) clustering equilibria (Reactions 4.20 and 4-21), the -& values
increase slightly going from CHiOH to (CH&COH.
BF + ROH = Br-(ROH)
In Figure 4.10 it can be seen that for Br- and r AH0 is almost independent of the
polarizability, unlike for F and Cl-. Due to the larger ionic radii, the X-HOR 87.92 interactions wiil be weaker. In general there is good agreement with PHPMS and
FT-KR 97 results in the literature, while EPDS results show larger d i s ~ r e ~ a n c i e s . ' ~ ~
For the FT-KR results it was mentioned by the authors that the Br- and r alcohol
complexes undergo rapid dissociation by ZTRID, 153-155 and that this may introduce
some uncertainty in the results. For the (1,2) and (2,3) clustering equilibria, only
results for the rnethanol clusters are available from PHPMS.'~ These are slightly more
exothermic, but the same overall trends are observable. As mentioned before, no clear
and consistent trends in the ASO values are observable, including literature values. It
rnay be expected that due to the relatively weak bonding the alcohoI molecules are
fairIy mobile, making the stmctures more dynamical and realistic.
For the Bï-((H20)n and T(H2O), clusters the halide ions are bonded to the surface of
a hydrogen-bonded water lust ter.^^-'^.'^^ it rnay not be excluded, that in the PKPMS
ion source, halide ion-alcohol clusters are also generated with surface solvated
features. VPDS, in combination with a b initia computations, would be an exceHent
tool to investigate this.
4.4.2 Computational Thermochemistry
In Tables 4. I to 4.4 overviews are given of the computational results for the
association thermochemistry, together with the available experimental literature data.
The A H O ~ ~ ~ data for the MP2/a and MP2/a//B3LYP/b computations for the formation
of X(CH3OH) (X = F, Cl, Br) and F(CH3CH20H) are identical. In general it took
Iess CPU time to run the MP2/a//B3LYP/b computations than to nrn the MP2/a
computations. Comparing the ~ ~ ' 2 9 ~ data of MPUa ([dd] and [ale] for X = 1) to the
B3LYP/b results ([b/d], [b/e], and [bif'j for X = 1) for computations for the formation
of X(CH30H) (X = F, CI, Br, 1), in general the MP2/a values are more negative than
the B3LYPlb values (except for X = F). The MP2/a and B3LYP/b A S O ~ ~ S values for
the formation of F(CH30H) and Br-(CH30H) are in excellent agreement, while for
F(CH3CH20H) and CI-(CH30H) there are srnall differences. The MPZ/[a/d] and [ d e ]
AH^^^^ values for T(CH30H) show a large basis set effect, while for the AS^^^^ results
there is no real difference. The large iodide ion basis set effects on the m o 2 9 8 results
for the B3LYP computations remain, with [ale] performing the best compared to
experimental results. For AS^^^^, the results of [b/d] and [b/e] are nearly identical,
while for [b/q they are quite different, as was the case for the AHoz98 values. Use of a
modified LanL2DZ basis set,'56 the Stuttgart Dresden ECP (SSD) 157.158 basis set, or
Truhlar's SVP+ basis set ' 5 9 might improve the results because of satisfjing results
when applied to anion systems. Comparing &298 results for B3LYP/b and
B3LYP/d/B3LYP/b computations shows that there are no real improvements. Only
for the fluoride ion complexes with (CH3)2CHOH and (CH3)3COH do the AH0298
values become 2.7 and 1.1 kcal mol-' more exothermic, respectively.
Finally, the effect of clustering on the barrier for CH3 group rotation must be
addressed. The non-linear X-...H-OCH, bond angle for al1 halide ions, but especially
far X = Cl, Br, and 1 has been viewed as if the halide ion is interacting with the methyl
gïoup hydrogen atoms. At the MPZa ( [ d e ] for X= 1) level of theory the barriers for
methyl group rotation for CH30H, F(HOCH3), Cl-(HOCH,), Br-(HOCH,), and
r(HOCH3) have been calculated to be 1.18, 0.44, 0.5 1, 0.55, and 0.8 1 kcal mol-',
respectively. These data do not include ZPE or thermal corrections. Obviously, the
barrier for methyl group rotation is increasing, and this is in qualitative agreement
with the fact that it is believed that the X-*OH-CH20H interaction is increasing going
from X = F to 1. On the other hand this may actually not be true, because on going
from X = F to 1 the X**oH-CHîOH distance actually increases from 3.105 A to 3 -9 19
A. These values themselves are in good agreement with experimental data on CH30H 1 160 (1.1 kcal mol- ) and cornputations by Wladkowski et al. on F(HOCH3) (0.5 kcal
- 1 109 mol ). DeTuri and Emin calculated the barriers for methyl group rotation in
CH3OH, CH~CHZOH, (CH&CHOH, and (CH&COH and the corresponding fluoride
ion complexes at the MP2/6-3 1 1 +G(2df 2p)//MP2/6-3 1 G(d) level of theory," a
method described by East and ~ a d o m . ' ~ ' For the neutrals, barrïer heights of 1.05, 1.36,
1.3 1, and 1.24 kcal mol-' were found, while for the fluoride ion complexes values of
0.29, 2.27, 2.12, and 2.1 1 kcal mol-' were obtained. For CH3OH and F(CH3OH) the
barrier heights are close to the computational results from this work and the
experirnental data, but relatively different fiom the work by Wladkowski et a1..'09 It is
interesting that for the other three alcohol molecules the barrier for methyi group
rotation actually increases upon complex formation with the fluoride ion. This may be
caused by a stronger interaction hetween F and the methyl group hydrogen atoms due
to closer interatornic distances. Unfortunately no other work on the other X(ROH)
complexes has been perfomed to observe such trends and the intrinsic parameters that
determine them.
4.4.3 Computations versus Experiments
It is of interest to compare the computational results ficm this thesis with the
PHPMS data fi-om this laboratory, since the latter comprise the most extensive study
of halide ion-alcohol clusters to date. Frorn Tables 4.1 to 4.4 it can be readiIy observed
that, in general, there is good to excellent agreement between the PHPMS data and the
resutts from MP21a and MP2/a//B3LYP/b computations, but that in some cases
B3LYP/b also performs very well. Some inconsistencies exist between the agreement
of AHO and &f2gs, and AS' and A S O ~ ~ ~ J , especially for T(CH3Oi-Q where iodide ion
basis set effect is clearly observable.
Comparing these cornputations with other experimental results from various
methods also aids in the understanding of the general performance of the different
methods used for this study. If k1.0 kcal mol-' is taken as indicating good agreement
between computational and experimental values, it can be concluded that
MP2/a//B3LYP/b perforrns best overall. There is good agreement with most PHPMS
(88%), E P D S (50%), TCLD, (50%), ICR (38%), and FT-ICR (100%) data. B3LYPlb
performs much more poorly with good agreement only in 75% of the TCID and KR
data, while B3 LYPIdlB3LYPIb in general agrees poorly with al 1 experimental data.
To compare the calculated AS^^^^ values with A s 0 values from other experiments,
it can be seen from Tables 4.1 to 4.4 that only HPMS and P H P M S experiments
provide AS' data. Most HPMS data are in poor agreement with al1 computations, and
consequently they will not be considered here. The AS' values from ICR experiments
are actually values calculated from simple statistical rnechanics, and these were only
used as estimates. In generaf there is good agreement between the MP2/a and
B3LYPIb AS^^^^ values and the corresponding ICR values for most W O H ) (X = F,
CI) clustering reactions. The spread in ASO values from PHPMS for Cl-@OH) is fairly
small, and consequently the same argument applies as in cornparing A S O ~ ~ ~ J and the
AS' values from this work. For Br-(CH30H) and r(CH3OH) there are too few
PHPMS AS' values available to have a usefùl comparison. A general conclusion for
these systems could be that it depends on the method used and the data set in order to
get a good or reasonable agreement.
For the two calculated (1,2) equiIibria in Table 4.4 it can be seen that for the
formation of (CH30H)X-(CH3OH) (X = F, Cl) the A S O ~ ~ ~ J and AS' values show much
better agreement than for the formation of X(CH30H)(CH30H). In Table 4.10 it can
be seen that the relative population of the X(CH30H)(CH30H) clusters is small
compared to the relative population of the (CHSOH)X(CHSOH) clusters, and
consequently it rnay be expected that the observed thermochemistry for the (1,Z)
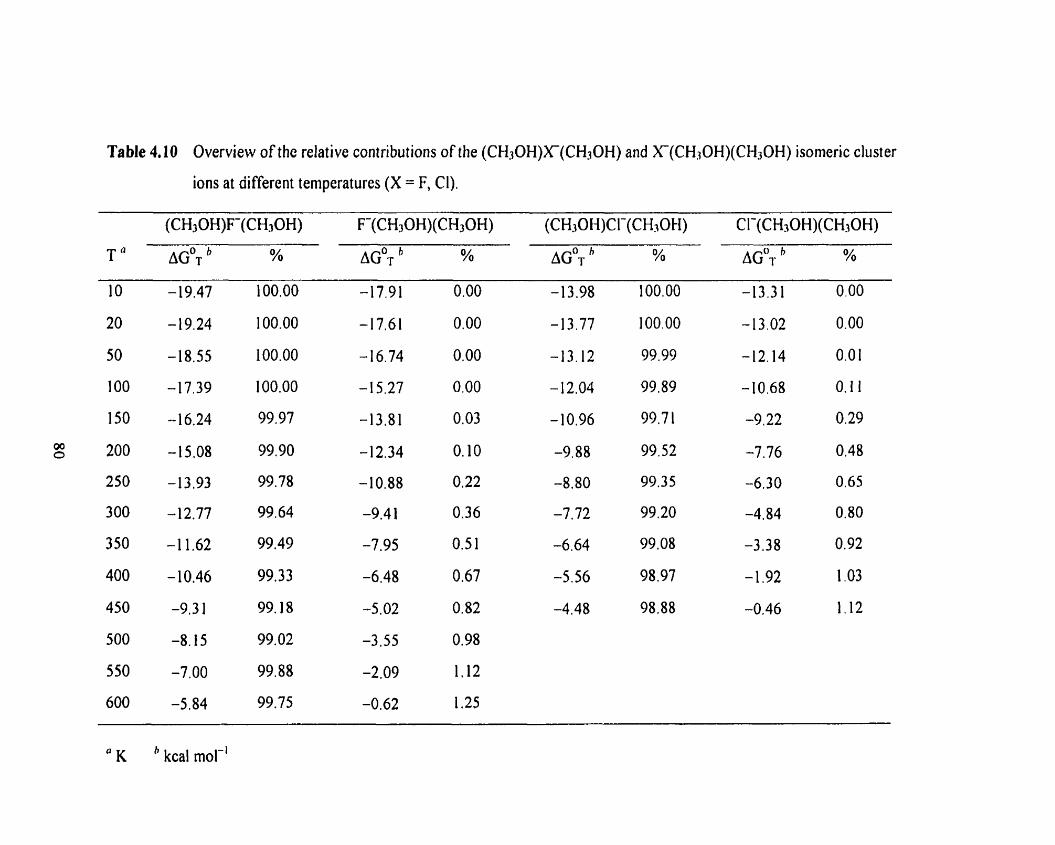
Table 4.10 Overview of the relative contributions of the (CH30H)X(CH30H) and ZC(CH30H)(CH30H) isomeric cluster
ions at ciifferent temperatures (X = F, CI).
" K h kcal molh'
cluster equilibria is mainly composed of the (CH30H)X(CH30H) clusters
therrnochemistry.
AI1 B3LYPIb AH^^^^ and AS^^^^ values were calculated using a scaling factor of
1.0000 as described earlier. For some X-(ROH) systems (X = F, CI, Br; R = CH3,
CH3CH2) M~~~~ and AS^^^^ were also calculated using a scaling factor of 0.9640. For
AH^^^^ in general this resulted in a change of &O. 1 kcal mol-', while for AS^^^^ there
was a change of smaller than 0.2 cal mol-' K-'.
4.4.4 Other Computational Work
Various studies have been reported in the literature which deal with halide ion-
alcohol molecule complexes. However. the focus here will be confined to high level
a h it~ifio results. F(CH30H) has been the subject of several computational studies.
The closest result to the PHPMS data fiom this laboratory is corn high level
cornputations at the MPZ(fÙll)/[l3s8p6d4f,8~6p4d](+) + C C S D ( T ) / Q Z ( + ) ( ~ ~ , ~ ~ ) level - 1 109 of theory by Wladkowski et al. (AHozs8 = -30.0 kcal mol ). Other high level
computations on F(CH30H) include ~ 2 , ' ~ and MP4(SDTQ)(fc)/6-3l++G(d,p)//
MP2(fÙ 11)/6-3 1 1 ++G(d,p) (fc = frozen core), lM but, surprisingl y, these very high level
computations do not give results that are more accurate than, for instance, the
MP2/a//B3LYP/b results. It is possible that G2(MP2)(+) (plus ECP for B r and r containing complexes) would be more accurate than G2. 144.156.162 Recentl y, DeTun
cr al. published results on F ( R 0 H ) complexes.8' At the MP2(fc)/6-3 1 1+G(2d,p)
//MP2(fc)/6-3 1G(d) + (ZPE + ACp(298 K) at the HF/6-3 1G(d) level of theory, and
using a scaling factor of 0.8953) they found values of -3 1.8, -25.5, -33.7, and
-33.2 kcal mol-' for CH30H to (CH&COH, respectively. With the exception of the
unusual F(CH3CH20H) result, the generaI trend is quite reasonable. These
computations could be improved by using HF/6-3 1 l++G(d,p) for ZPE + ACp(298 K),
and MP2(fu11)/6-3 1+G(d,p) for the geometry optimizations, but, on the other hand,
this would make the computations more time-consuming.
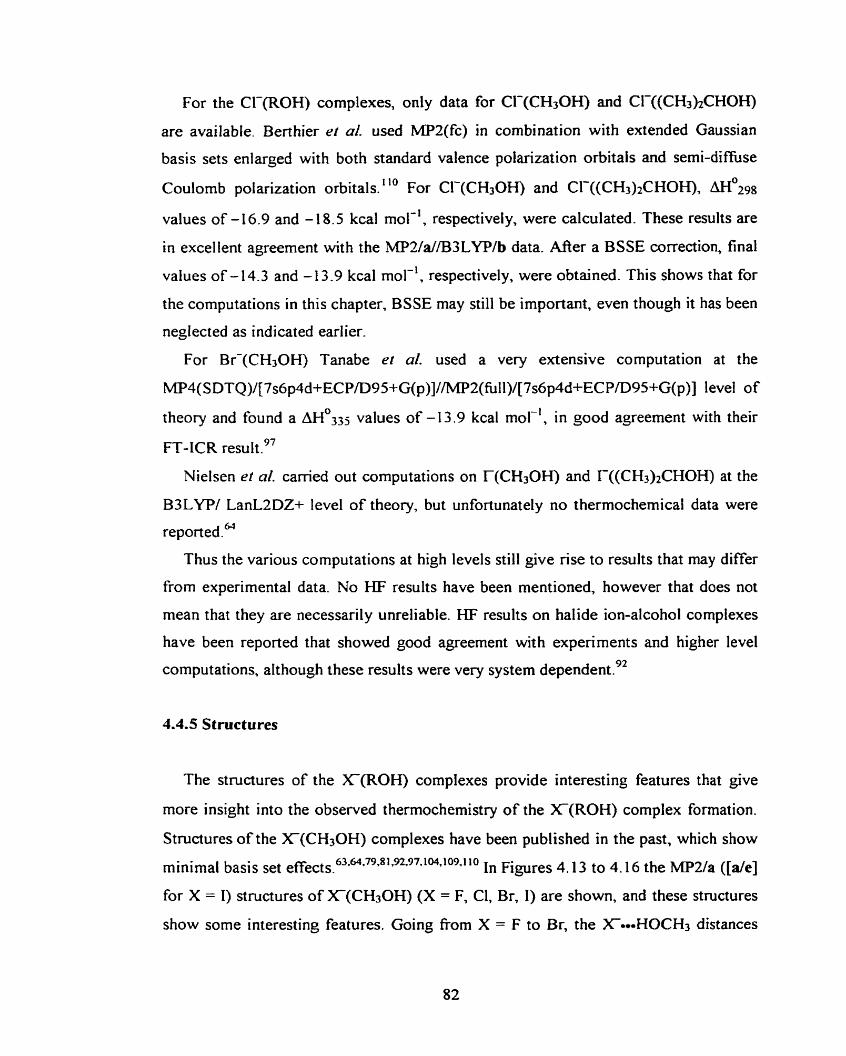
For the Cl-(ROH) complexes, only data for CI-(CH30H) and Cl-((CH3)zCHOH)
are availabie. Berthier rr al. used MP2(fc) in combination with extended Gaussian
basis sets enlarged with both standard valence polarization orbitals and semi-dimise
Coulomb polarization orbitals. l I o For Cl-(CH30H) and Cl-((CH3)2CHOH),
values of - 16.9 and - 18.5 kcal mol-', respectively, were calculated. These results are
in excellent agreement with the MP2/a//B3LYP/b data. M e r a BSSE correction, final
values of - 14.3 and - 13 -9 kcal mol-', respectively, were obtained. This shows that for
the computations in this chapter, BSSE may still be important, even though it has been
neglected as indicated earlier.
For Br-(CH30H) Tanabe et al. used a very extensive computation at the
MP~(SDTQ)/[~S~~~~+ECP/D~~+G(~)]//MP~(~~~I)[~S~~~+ECP/D~~+G(~)] level of
theory and found a AH0335 values of -13.9 kcal mol-', in good agreement with their
FT-KR resu~t.~'
Nielsen et al. camed out computations on r(CH30H) and T((CH3)2CHOH) at the
B3LYP/ LanL2DZ+ level of theory, but unfortunately no thermochemical data were
reponed.&
Thus the various computations at high levels still give rise to results that may differ
from experimental data. No HF results have been mentioned, however that does not
rnean that they are necessarily unreliable. HF results on halide ion-alcohol complexes
have been reported that showed good agreement with experiments and higher level
computations, although these results were very system dependent9*
4.4.5 Structures
The structures of the X-(ROH) complexes provide interesting features that give
more insight into the observed thermochernistry of the X ( R 0 H ) complex formation.
Structures of the X(CH30H) complexes have been published in the past, which show
minimal basis set effects. 63.64.79,81,92.97.104,109.110 In Figures 4.13 to 4.16 the MP2/a ( [ d e ]
for X = 1) structures of X(CH3OH) (X = F, Cl, Br, 1) are shown, and these structures
show some interesting features. Going from X = F to Br, the X-HOCH3 distances
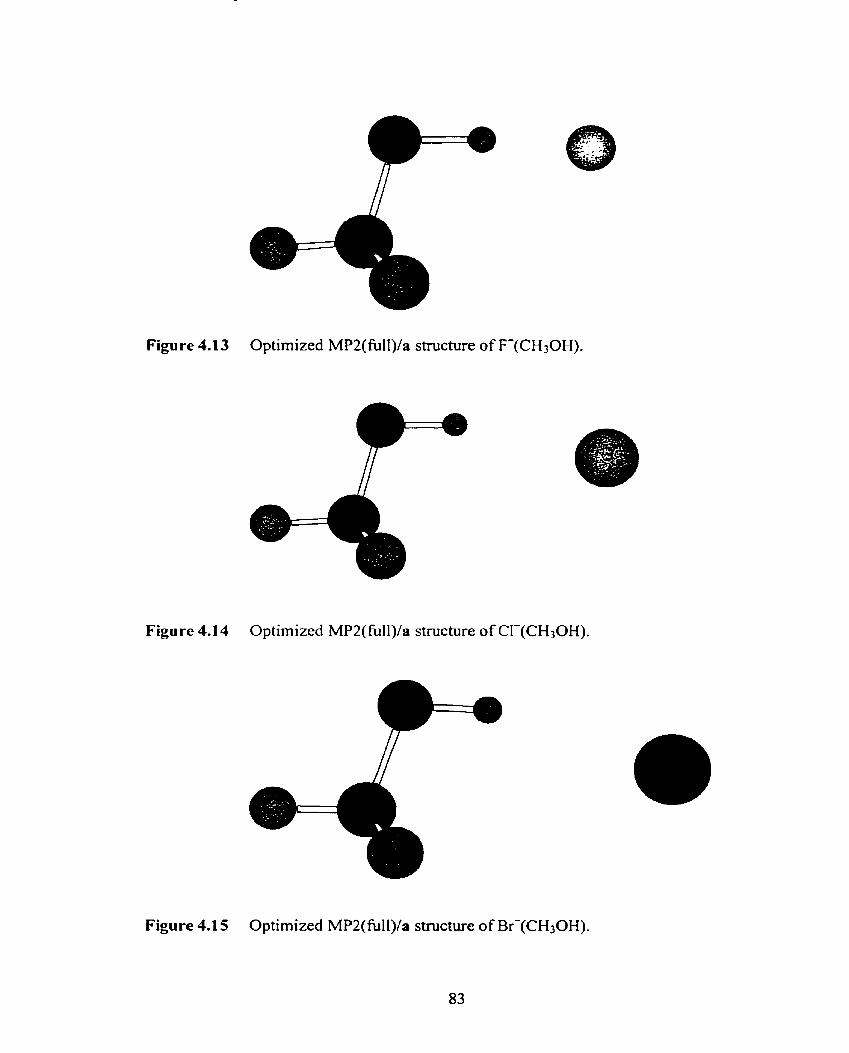
Figure 4.1 3 Optimized MP2(full)/a structure of F-(CH30H).
Figure 4.14 Optimized MP2(full)/a structure of ClF(CH30H).
Figure 4.1 5 Optimized MP2(füll)/a structure of Brd(CH30H).
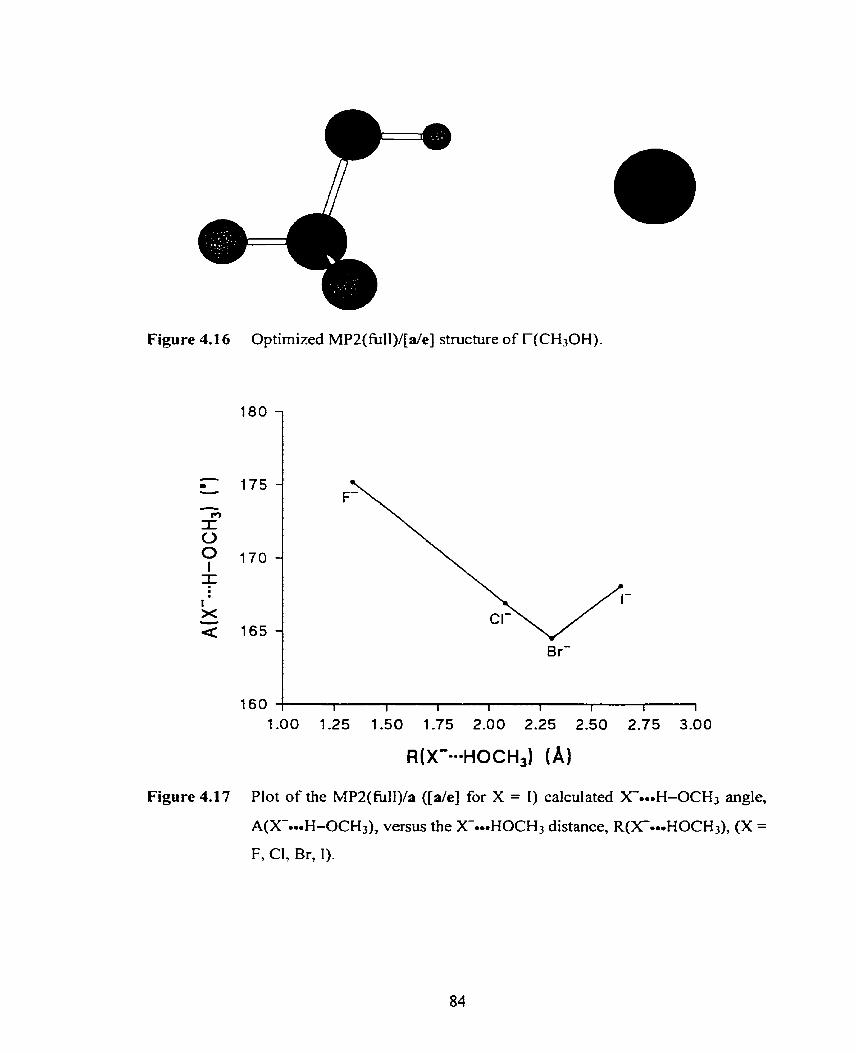
Figure 4.1 6 Optimized MP2(fùll)/[a/e] structure of I-(CH30H).
Figure 4.1 7
Br'
1.00 1.25 1.50 1-75 2.00 2.25 2.50 2.75 3.00
R(X--=-HOCHI) (A)
Plot of the MP2(full)/a ( [ d e ] for X = 1 ) calculated X--OH-0CH3 angle,
A(X-me-H-0CH3), versus the X---HOCH3 distance, R(X---*HOCH3), (X =
F, Cl, Br, 1).
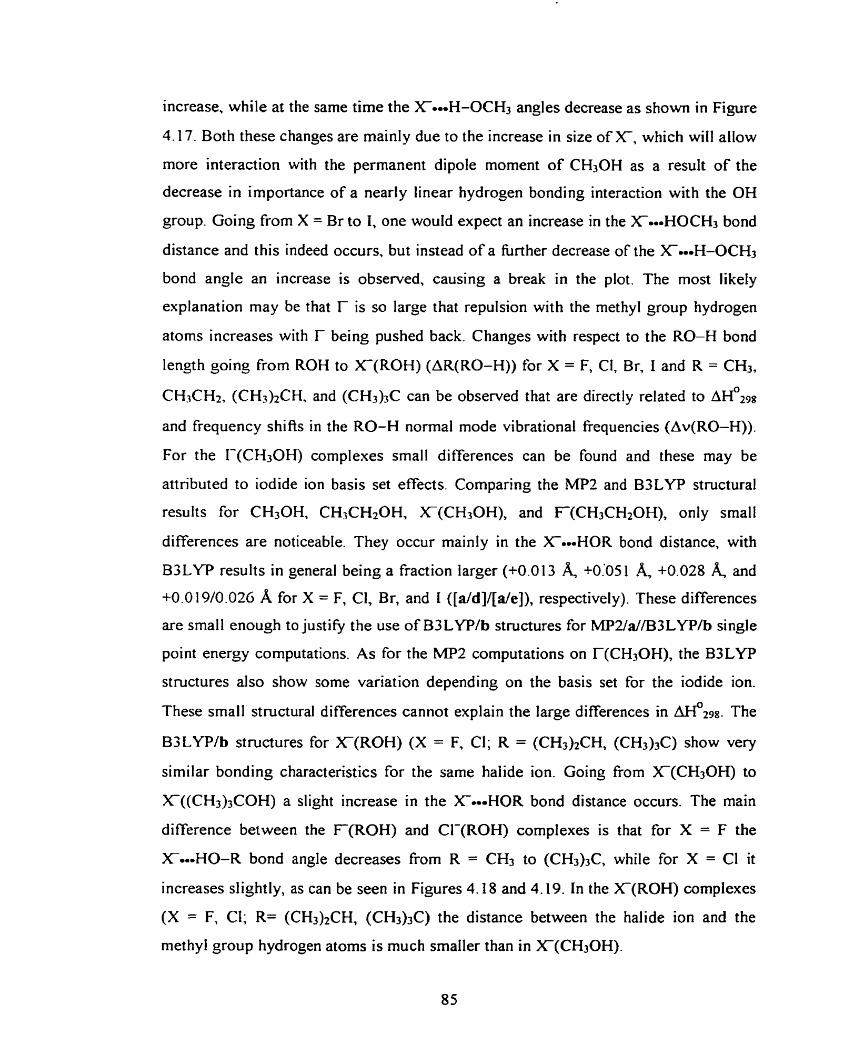
increase, while at the same time the X---H-OCH3 angles decrease as shown in Figure
4.1 7. Both these changes are main1 y due to the increase in size of X, which will allow
more interaction with the permanent dipole moment of CH30H as a result of the
decrease in importance of a nearly linear hydrogen bonding interaction with the OH
group. Going from X = Br to 1, one would expect an increase in the XmmmHOCH3 bond
distance and this indeed occurs, but instead of a fùrther decrease of the X--H-0CH3
bond angle an increase is observed, causing a break in the plot. The most likely
explanation may be that r is so large that repulsion with the methyl group hydrogen
atoms increases with r being pushed back. Changes with respect to the RO-H bond
length going from ROH to X-(ROH) (AR(R0-H)) for X = F, CI, Br, 1 and R = CH3,
CHjCH2, (CH3)2CH, and (CH3)sC can be observed that are directly related to ~ ~ ~ 2 9 8
and frequency shifis in the RO-H normal mode vibrational fiequencies (Av(R0-H)).
For the 1-(CH30H) complexes small differences can be found and these may be
attributed to iodide ion basis set effects. Comparing the MP2 and B3LYP structural
results for CH30H, CH3CH20H, X(CH30H), and F(CH3CH20H), only small
differences are noticeabIe. They occur rnainly in the X--HOR bond distance, with
B3LYP results in general being a fraction larger (+0.0 13 +0:05 1 & +0.028 and
+0.019/0.026 A for X = F, Cl, Br, and 1 ([a/d]/[a/e]), respectively). These differences
are small enough to justie the use of B3LYPIb structures for MP2/a//B3LYP/b single
point energy computations. As for the MP2 computations on r(CH30H), the B3LYP
structures also show some variation depending on the basis set for the iodide ion.
These small structural differences cannot explain the large differences in AH?298. The
B3LYP/b structures for X ( R 0 H ) (X = F, CI; R = (CH3)2CH, (CH3)3C) show very
similar bonding characteristics for the same haiide ion. Going fiom X(CH30H) to
X((CH3)3COH) a slight increase in the X-HOR bond distance occurs. The main
difference between the F ( R 0 H ) and CI-(ROH) complexes is that for X = F the
X---HO-R bond angle decreases from R = CH3 to (CH3)3C, while for X = CI it
increases slightly, as can be seen in Figures 4.18 and 4.19. In the X(R0H) complexes
(X = F, CI; R= (CH&CH, (CH3)3C) the distance between the halide ion and the
methyi group hydrogen atoms is rnuch smaller than in X(CH30H).
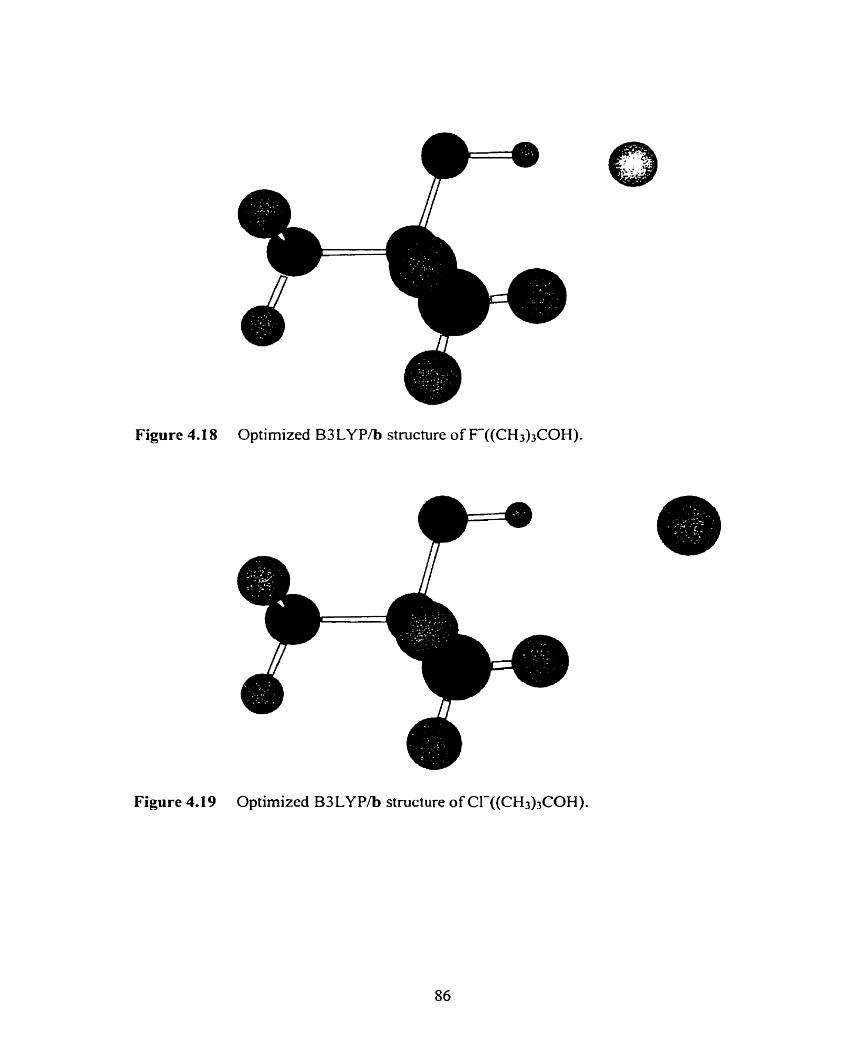
Figure 4.1 8 Optimized B3 LY P h structure of F-((CH3)3COH).
Figure 4.1 9 Optimized B3 LYP/b structure of Cl-((CH3)3COH).
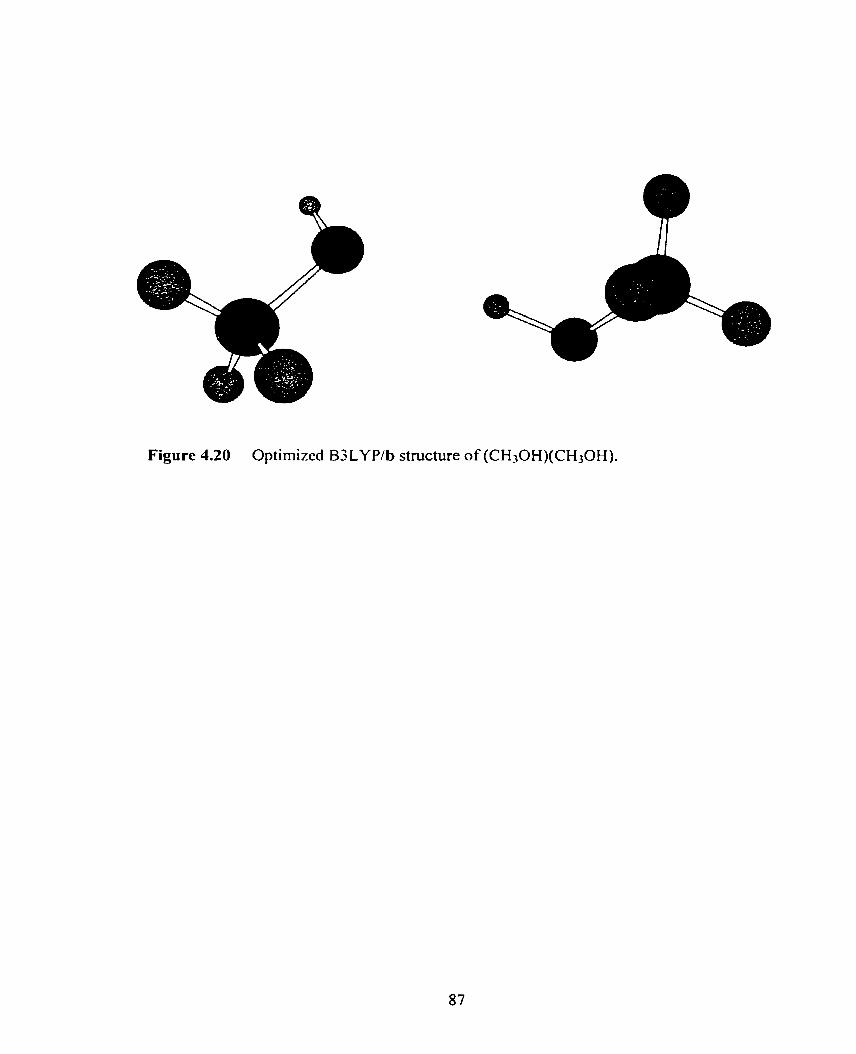
Figure 4.20 Optimized B3LYPlb structure of (CH30H)(CH30H).
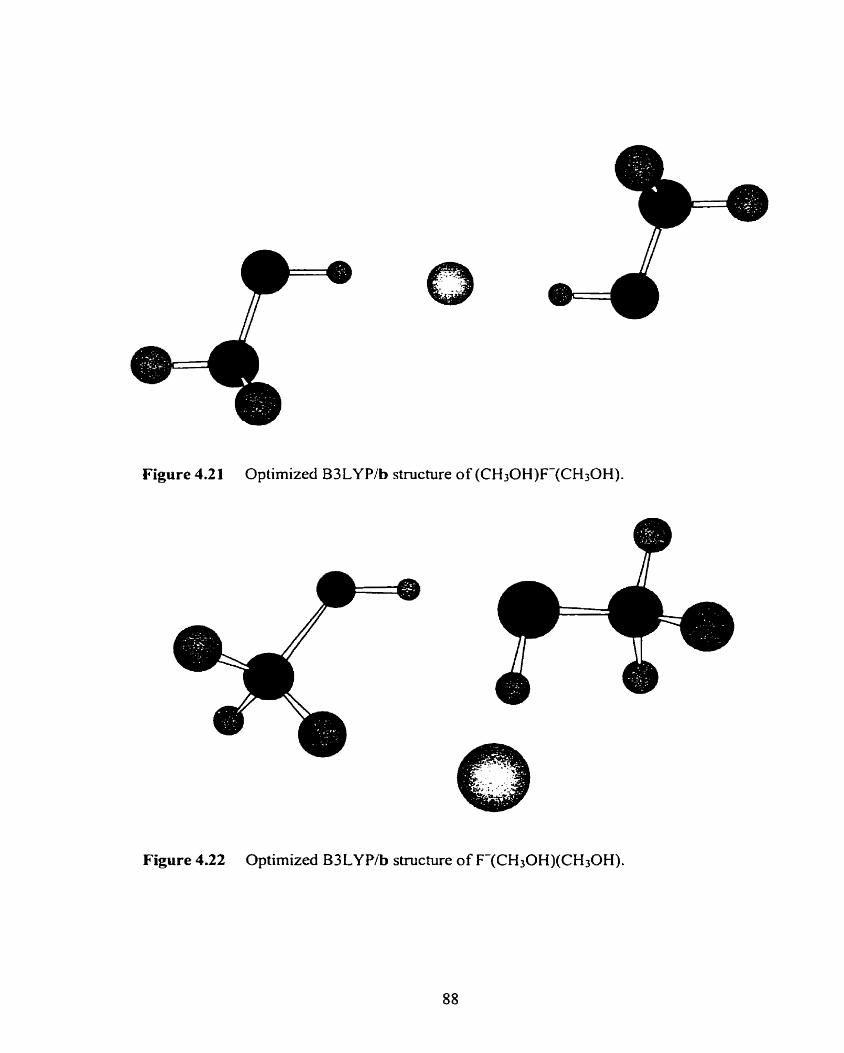
Figure 4.21 Optimized B3LYP/b structure of (CH30H)F-(CH30H).
Figure 4.22 Optimized B3 LY P/b structure of F-(CH,0H)(CH30H).
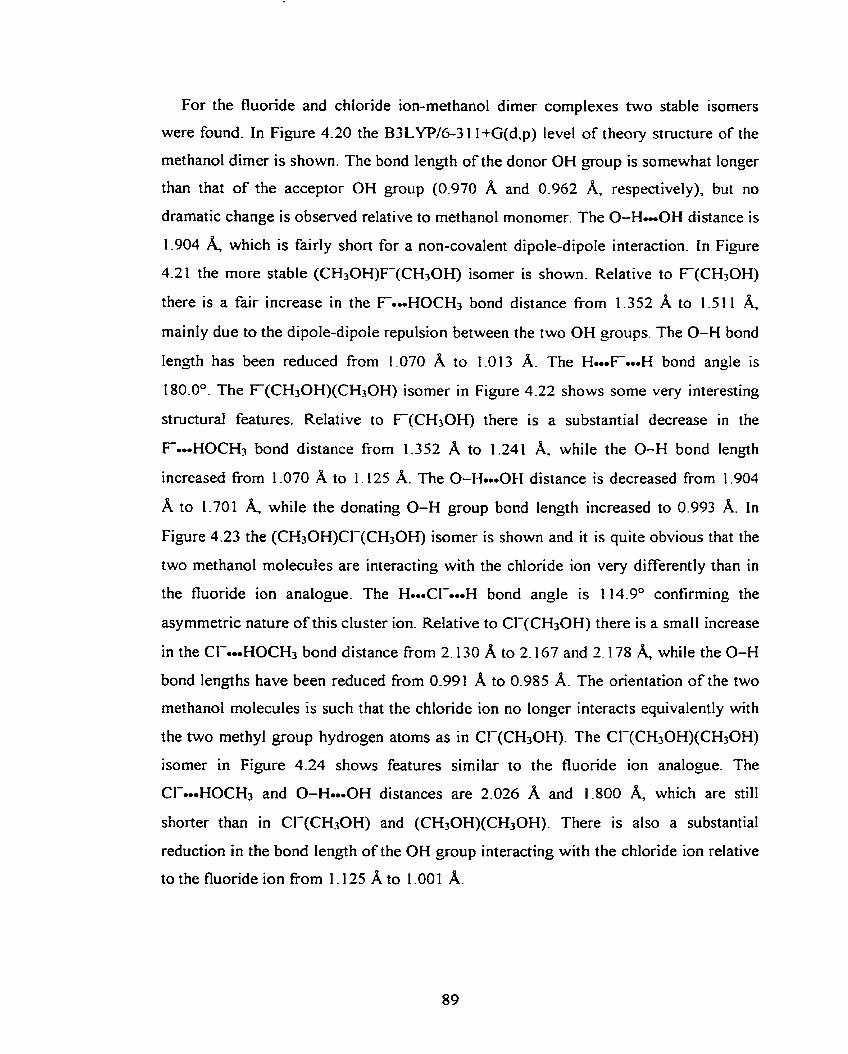
For the fluonde and chloride ion-methanol dimer complexes two stable isomers
were found. In Figure 4.20 the B3LYP/6-3 1 1 +G(d,p) level of theory structure of the
rnethanol dimer is shown. The bond length of the donor OH group is somewhat longer
than that of the acceptor OH group (0.970 A and 0.962 A, respectively), but no
dramatic change is observed relative to methanol monomer. The O-He-OH distance is
1.904 which is fairly short for a non-covalent dipole-dipole interaction. in Figure
4.21 the more stable (CH30H)F(CH30H) isomer is shown. Relative to F ( C H a H )
there is a fair increase in the FWe-HOCH, bond distance from 1.352 A to 1.51 1 & mainly due to the dipole-dipole repulsion between the two OH groups. The O-H bond
length has been reduced fiom 1 .O70 A to 1.013 A. The H--F--H bond angle is
180.0". The F(CH3OH)(CH30H) isomer in Figure 4.22 shows some very interesting
structural features. Relative to F(CH3Of-I) there is a substantial decrease in the
Fe-HOCHp bond distance corn 1.352 A to 1.241 A, while the O-H bond length
increased from 1 .O70 A to 1.125 A. The O-HeeeOH distance is decreased from 1.904
A to 1-70 1 & while the donating O-H group bond length increased to 0.993 A. In
Figure 4.23 the (CH30H)Cl-(CH30H) isomer is shown and it is quite obvious that the
two methanol molecules are interacting with the chloride ion very differently than in
the fluoride ion analogue. The H*-wCl--*eH bond angle is 114.9" confirming the
asymmetric nature of this cluster ion. Relative to CI-(CH30H) there is a small increase
in the Cl-mmeHOCH3 bond distance fiom 2.130 A to 2.167 and 2.178 & while the O-H
bond lengths have been reduced fiom 0.991 A to 0.985 A. The orientation of the two
rnethanol molecules is such that the chlonde ion no longer interacts equivalently with
the two methyl group hydrogen atoms as in CI-(CH30H). The CI-(CH30H)(CH30H)
isomer in Figure 4.24 shows features similar to the fluoride ion analogue. The
Cl--eHOCH3 and O-Hem-OH distances are 2.026 A and 1.800 & which are still
shorter than in CI-(CH30H) and (CH30H)(CH30H). There is also a substantial
reduction in the bond length of the OH group interacting with the chloride ion relative
to the fluoride ion fiom 1 .l2S A to 1 .O0 1 A.
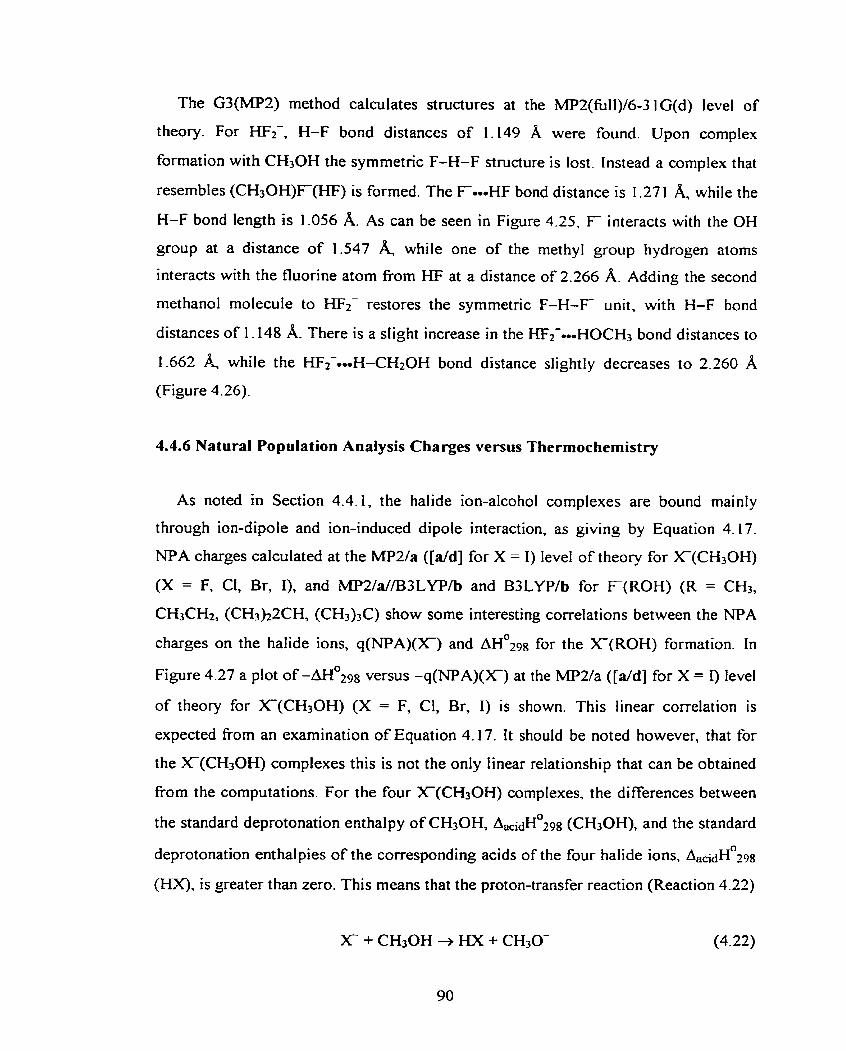
The G3(MP2) method calculates structures at the MPZ(fu11)/6-3 1 G(d) level of
theory. For HFz-, H-F bond distances of 1.149 A were found. Upon complex
formation with CH3OH the symmetric F-H-F structure is lost. Instead a complex that
resembles (CH3OH)F(HF) is formed. The F4-F bond distance is 1.271 while the
H-F bond length is 1 -056 A. As can be seen in Figure 4.25, F interacts with the OH
group at a distance of 1.547 while one of the methyl group hydrogen atoms
interacts with the fluorine atom fiorn KF at a distance of 2.266 A. Adding the second
methanol molecule to HF2- restores the symmetric F-H-F unit. with H-F bond
distances of 1.148 A. There is a slight increase in the HF2-mmmHOCH3 bond distances to
1.662 while the HF2-4-I-CH20H bond distance slightly decreases to 2.260 A (Figure 4.26).
4.4.6 Natural Population Analysis Charges versus Thermochemistry
As noted in Section 4.4.1, the halide ion-alcohol complexes are bound mainly
through ion-dipole and ion-induced di pole interaction, as giving by Equat ion 4.1 7.
NPA charges calculated at the MP2/a ([dd] for X = 1) level of theory for X(CH3OH)
(X = F, CI, Br, 1), and MP2/a//B3LYP/b and B3LYPIb for F ( R 0 H ) (R = CH3,
CH3CH2, (CH&ZCH, (CH3)3C) show some interesting correlations between the NPA
charges on the halide ions, q W A ) ( X ) and A H O ~ C J ~ for the X ( R 0 H ) formation. In
Figure 4.27 a plot of AI-^^^^ versus -q(NPA)(X-) at the MP2/a ( [ d d ] for X = 1) level
of theory for X(CH30H) (X = F, Cl, Br, 1) is shown. This linear correlation is
expected from an examination of Equation 4.17. It should be noted however, that for
the X(CH30H) complexes this is not the only linear relationship that can be obtained
from the computations. For the four X(CH30H) complexes, the differences between
the standard deprotonation enthalpy of CH3OH, (CH3OH). and the standard
deprotonation enthalpies of the corresponding acids of the four halide ions. ~ a « d ~ ~ ~ 9 8
0, is greater than zero. This means that the proton-transfer reaction (Reaction 4.22)
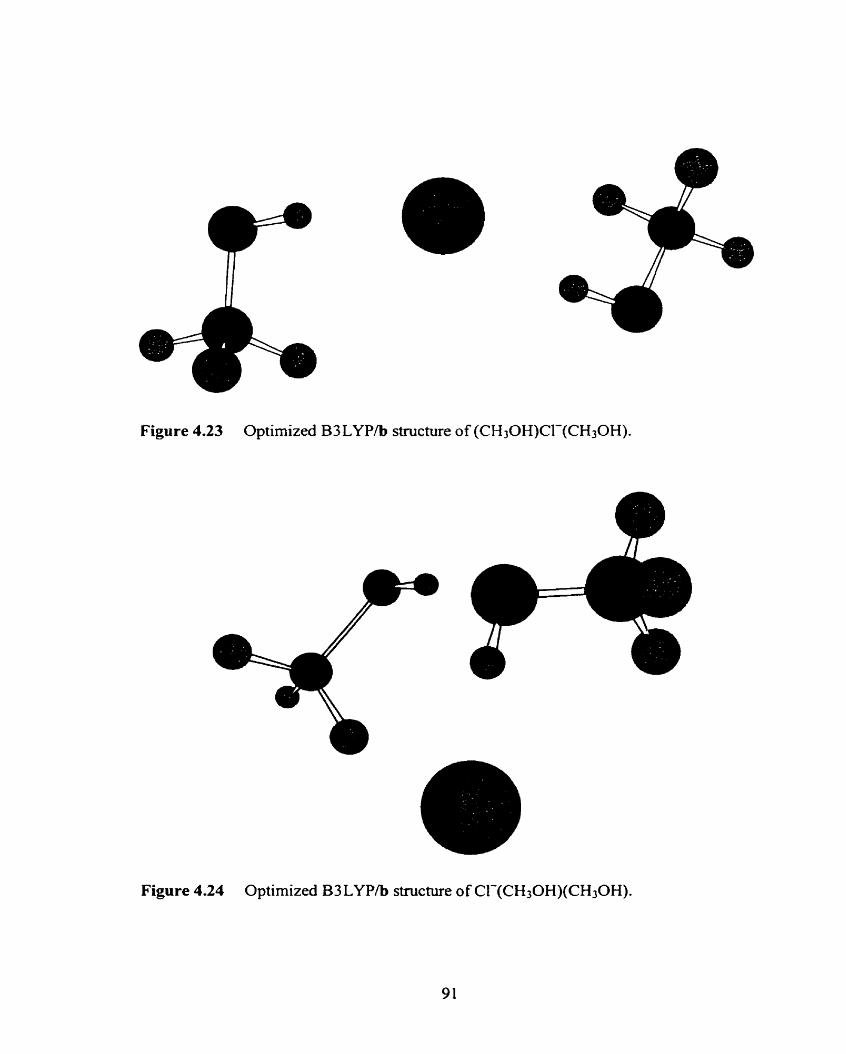
Figure 4.23 Optimized B3 LYP/b structure of (CH30H)Cl-(CH30H).
Figure 4.24 Optimized 8 3 LYP/b structure of CI'(CIi30H)(CH30H).
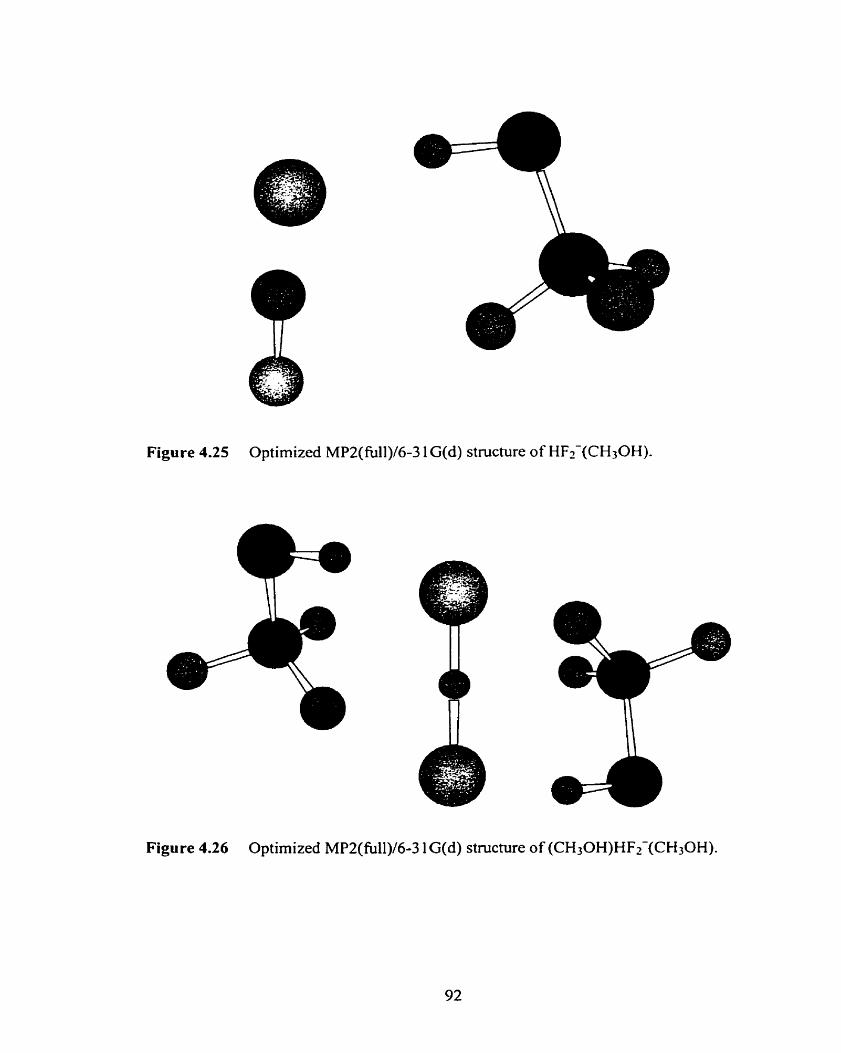
Figure 4.25 Optimized MP2(fu11)/6-3 1 G(d) structure of HF2-(CH30H).
Figure 4.26 Optimized MPZ(fu11)/6-3 1 G(d) structure of (CH30H)HF2-(CH30H).
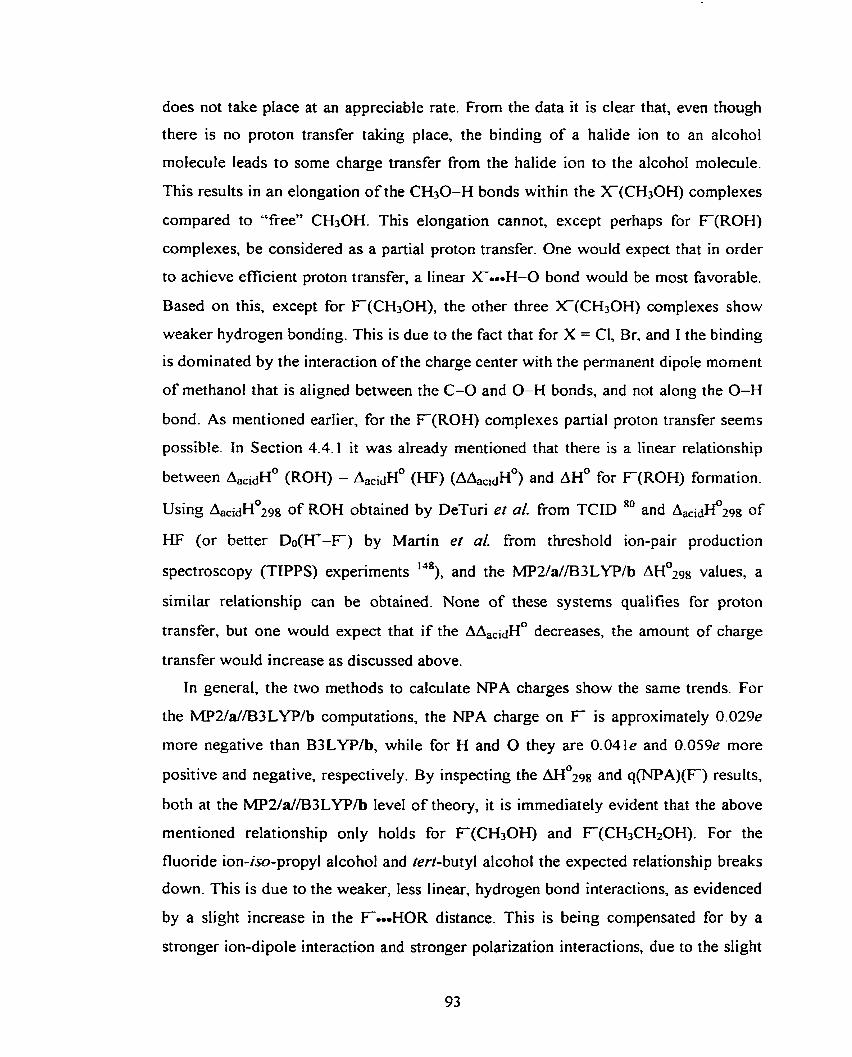
does not take place at an appreciable rate. From the data it is clear that, even though
there is no proton transfer taking place, the binding of a halide ion to an alcohol
molecuIe leads to some charge transfer fiom the halide ion to the alcohol molecule.
This results in an elongation of the CH30-H bonds within the X ( C H 3 0 H ) complexes
compared to "free" CH30H. This elongation cannot, except perhaps for F (R0H)
complexes, be considered as a partial proton transfer. One would expect that in order
to achieve efficient proton transfer, a linear X-.-H-O bond would be most favorable.
Based on this, except for F(CH30H), the other three X(CH30H) complexes show
weaker hydrogen bonding. This is due to the fact that for X = Cl, Br, and 1 the binding
is dominated by the interaction of the charge center with the permanent dipole moment
of rnethanol that is aligned between the C-O and O-H bonds, and not dong the O-H
bond. As mentioned earlier, for the F(R0H) complexes partial proton transfer seems
possible. In Section 4.4.1 it was already mentioned that there is a linear relationship
between A a C i d ~ O (ROH) - A ~ ~ ~ ~ H O (HF) (AA,,~~H*) and AH0 for F ( R 0 H ) formation.
Using ~ a , i d ~ ~ ~ ~ ~ of ROH obtained by DeTuri et al. fiorn TCID and A ~ ~ ~ ~ H ~ ~ ~ ~ of
HF (or better Do(H+-F) by Martin et al. from threshold ion-pair production
spectroscopy (TIPPS) expenments '48)7 and the MP2/a//B3LYP/b A H O ~ C J ~ values, a
similar relationship can be obtained. None of these systems qualifies for proton
transfer, but one would expect that if the A A ~ ~ ~ ~ H ~ decreases, the amount of charge
transfer would increase as discussed above.
In general, the two methods to calculate NPA charges show the same trends. For
the MP2/a//B3LYP/b computations, the NPA charge on F is approximately 0.029e
more negative than B3LYP/b, while for H and O they are 0.04 le and 0.059e more
positive and negative, respectively. By inspecting the AHo2ss and q(NPA)(F) results,
both at the MP2/a//B3LYP/b level of theory, it is immediately evident that the above
mentioned relationship only holds for F(CH3OH) and F(CH3CHzOH). For the
fluonde ion-iso-propyl alcohol and tert-butyl alcohol the expected relationship breaks
down. This is due to the weaker, less linear, hydrogen bond interactions, as evidenced
by a slight increase in the F.-HOR distance. This is being compensated for by a
stronger ion-dipole interaction and stronger polarization interactions, due to the slight
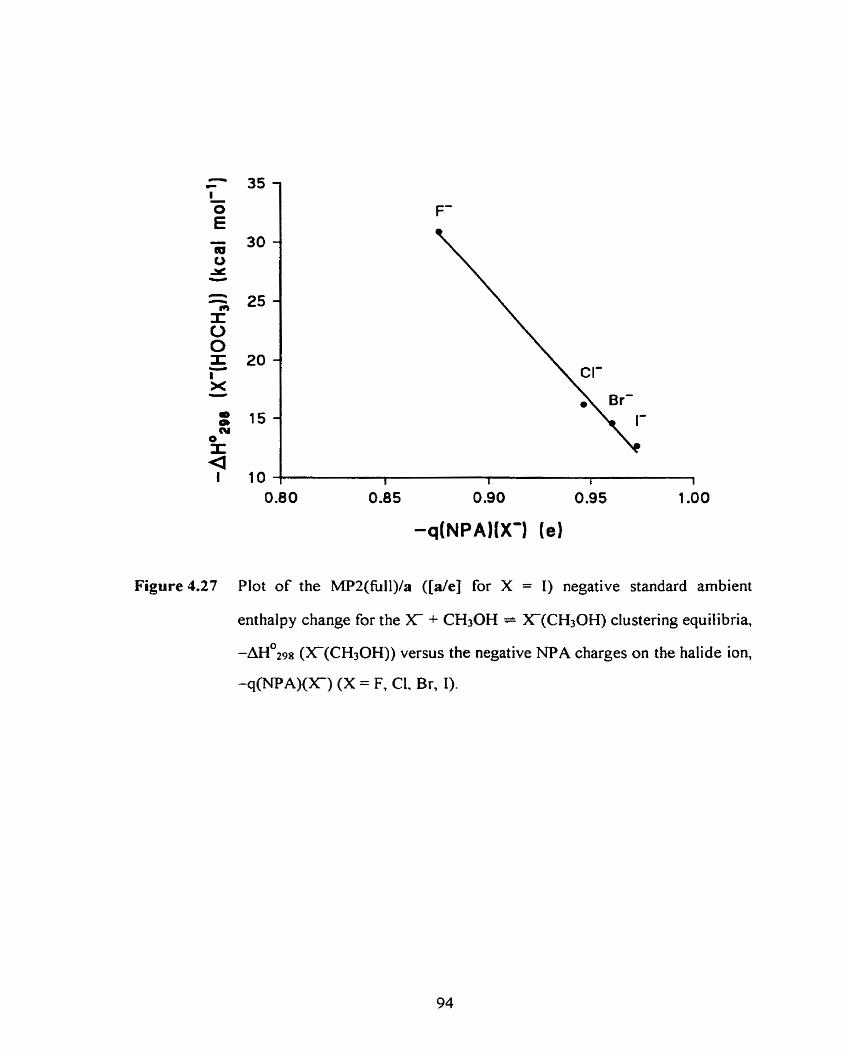
Figure 4.27 Plot of the MPZ(full)/a ( [ d e ] for X = 1) negative standard ambient
enthalpy change for the X- + CH3OH = Xh(CH30H) clustet-ing eguilibria,
- ~ ~ O 2 s s (X-(CHIOH)) versus the negative NPA charges on the halide ion,
-q(NPA)(X) (X = F, Cl, Br, 1).
decrease in the F.-H-OR angle, and a large decrease in the Fm-HC distance,
respective1 y.
4.4.7 Kinetics of Complex Formation
The complex formation of the chloride ion methanol cluster is thought to proceed
by the reaction mechanism shown in Scheme 4.23.
A similar mechanism has been suggested for the formation of CHJO-(CH~OH).~~ It
can be shown that formation of Cl-(HOCH3) does not proceed directly by clustering of
Cl- and CH,OH, but instead it goes through another ion-neutral complex, indicated
here as [Cl-(CH30H)Im. Wnting a steady-state expression for Scheme 4.23 gives
Equation 4.24,16) which can be re-written as Equation 4.25.
By plotting Ik,,, versus 1/@U], with M = C h , one c m obtain kr fiom the intercept.
The latter assumption can be made because [C&] » [CH30H]. In Figure 4.28 a
typical mass spectrum is shown for a CH4/CH30WCC14 mixture. As can be seen the
Cl- and Cl-(CH30H), (n = 1-3) ions are present, as well as some chloride ion-water
complexes. In order to obtain kinetic data on the complex formation of Cl-(CH3OH),
one has to take into account that it is formed by the reactions in Scheme 4.23, but that
it is consumed by formation of the chloride ion-methanol dimer (Reaction 4.26)
In Figure 4.29 typical raw data mass-selected tirne-intensity profiles for the three
ions of interest are shown. The large dynarnic range of the PHPMS technique is very
nicely illustrated. In Figure 4.30 the normalized time-intensity profiles are shown.
From the dope of the 3 5 ~ ~ - normalized time-intensity profile kW, can be determined.
By performing this kind of experiment at different ion source temperatures and
pressures, Figure 4.3 1 c m be constructed. From the intercepts, where l/[CI+] is zero
or [ C h ] is infinite, kf can be determined. At 297 K, 303 K, and 308 K values o f 5.00
x 10-l l cm3 s-', 3 . 7 0 ~ 10-l1 cm3 S-', and 2 . 6 2 ~ 1 O-" cm3 s-l, respectively, have been
determined. The relative error for these values is around 50%. From transition state
theory (TST) Equation 4.27 can be derived.Ig
In Figure 4.32 Equation 4.27 is plotted for the kr values determined, and fiom this
plot AH: and AS: values of -9.7 kcal mol-' and -2.2 cal mol-' K-', respectively, can
be determined. These values do not seem unreasonable, although it may be expected
that associated large et-rors can be associated with them (52.0 kcal mol-' and M.0 cal
mol-' K-', respectively). The fact that a AHHt value has been determined that is less
negative than the AH0 value for the ion-molecule complex in the well, Cl-(CH30H),
indicates that the PES is indeed more complex than shown in Figure 4.12. This wiil be
discussed hrther in section 4.4.1 0.
4.4.8 Vibrational Frequencies
Scaling factors were introduced to the MP2/a and B3LYP/b harmonic normal mode
vibrational fiequencies of CH30H in order to match the experimental values.164 These
scaling factors were used for al1 subsequent ROH and X(ROH), cornputations and, in
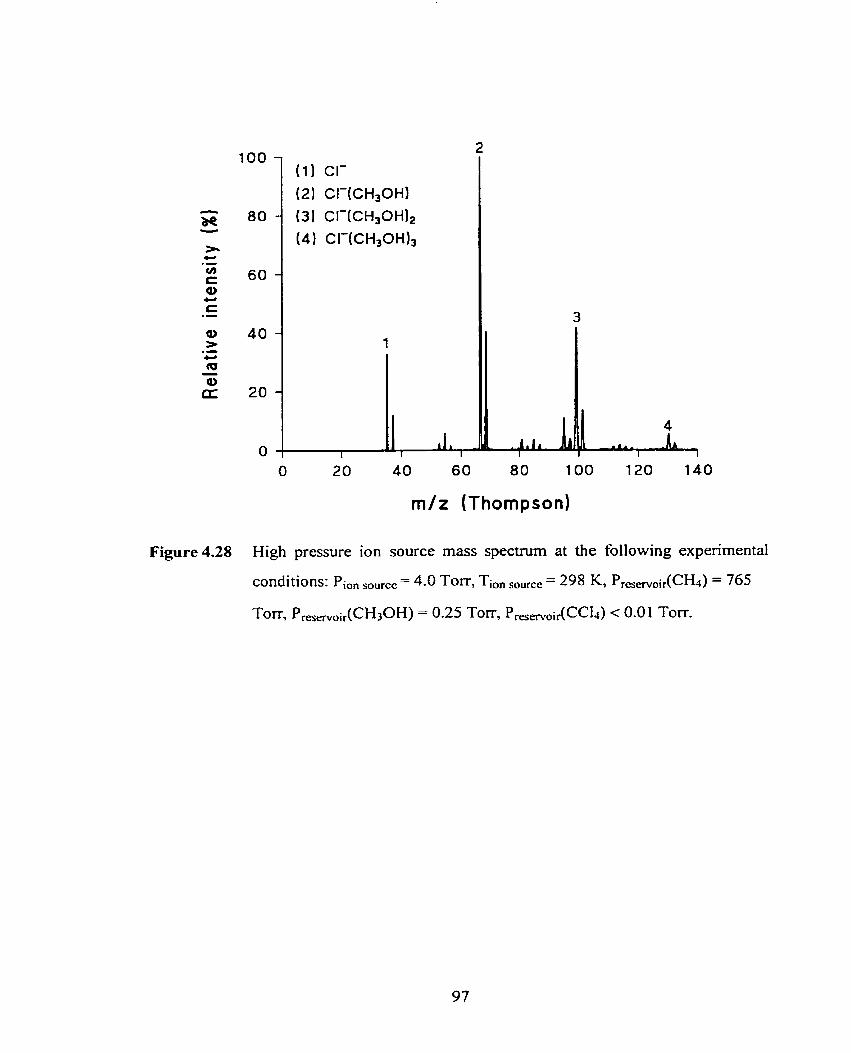
Figure 4.28
( 1 ) CI-
(2) CI-(CH,OH)
(3) CI-(CH~OH)~
(4) CI-(CH30H)j
m /z (Thompson)
High pressure ion source mass spectrum at the following experïmental
conditions: Pion ,,,,, = 4.0 Tom, Tien source = 298 K, Pramoir(CHs) = 765
Tom, P ,,,, i,(CH30H) = 0.25 Torr, PramiXCCl~) < 0.01 Torr.
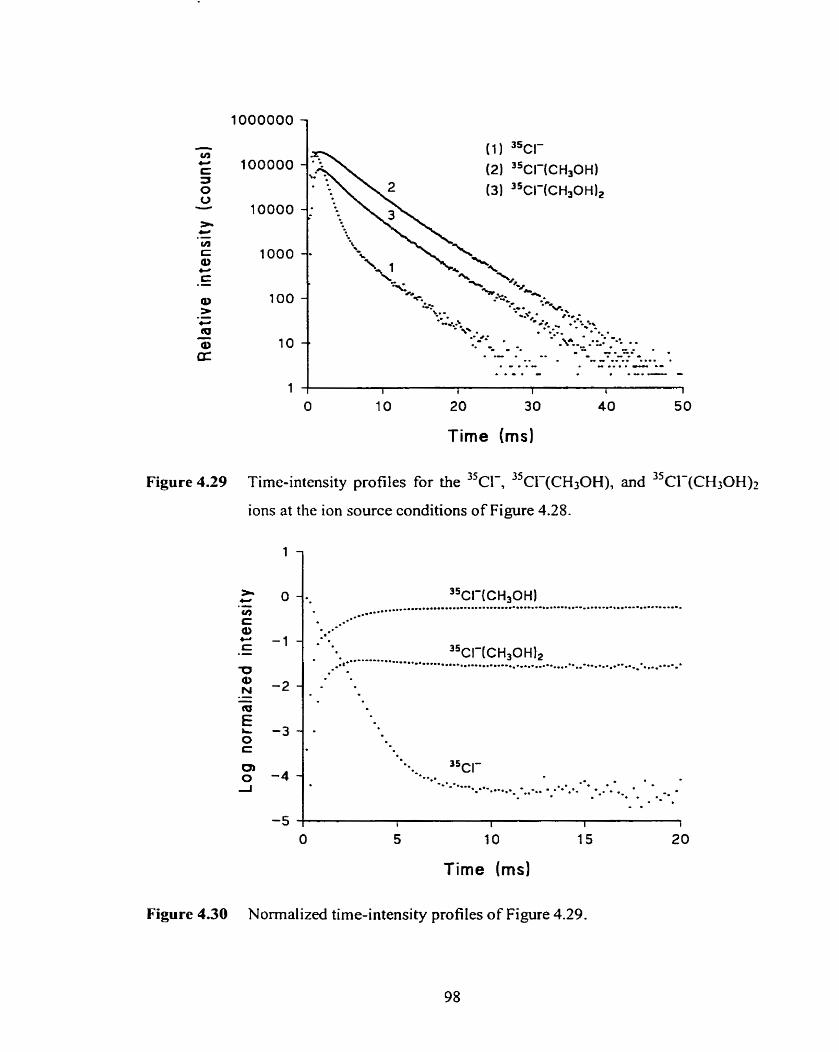
20 30
Time (ms)
35 Figure 4.29 Time-intensity profiles for the 3 5 ~ ~ - , CI-(CHIOH), and 3 5 ~ ~ - ( ~ ~ 3 ~ ~ ) 2
ions at the ion source conditions of Figure 4.28.
1 O
Time (ms)
Figure 4.30 Normalized time-intensity profiles of Figure 4.29.
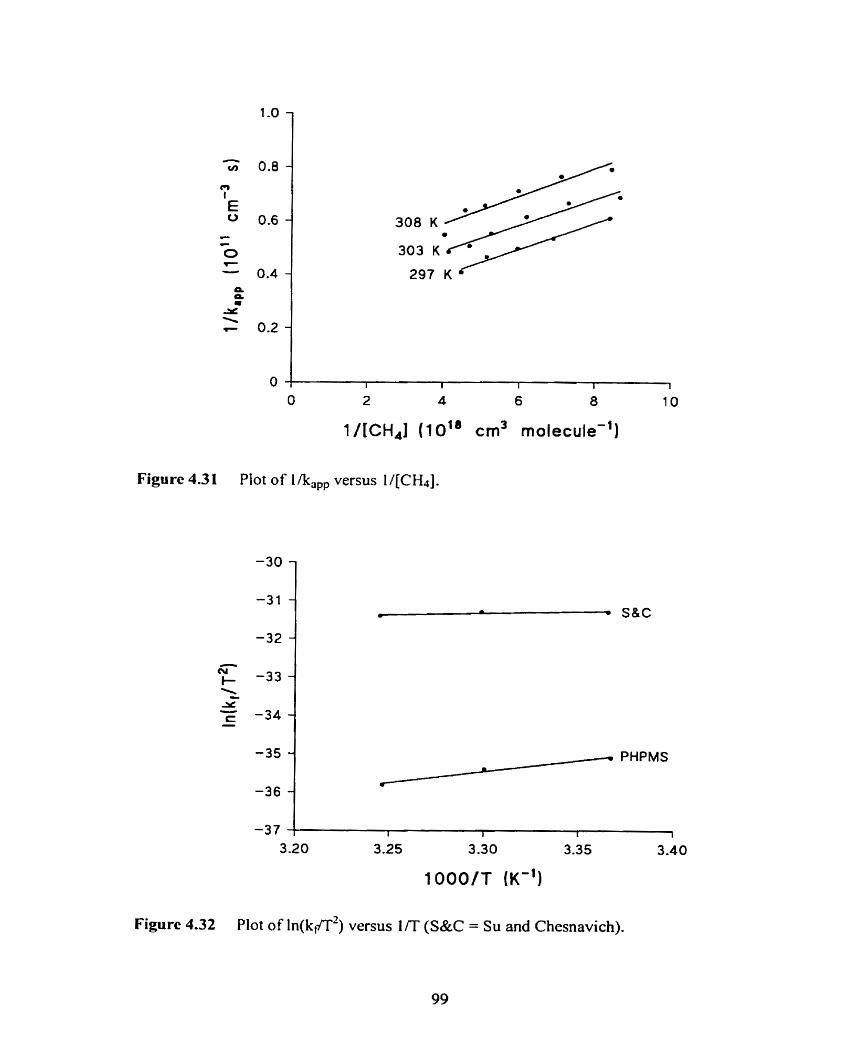
Figure 4.3 1 Plot of 1 Acapp versus 1 /[CH4].
Figure 4.32 Plot of 1n(kfl2) versus 1 / T (S&C = Su and Chesnavich).
general, good agreement was found between the results fiom this work and results
from a scaled quantum mechanical (SQM) force field method,Iw and W/6-31G(d)
scaled by 0.8953 .81 For CHsCH20H, (CH3)zCHOH, and (CH&COH in general there
is good agreement between the scaled MP2/a, B3LYP/b, and HF/6-3 1 G(d) results. For
the normal mode vibrational frequencies of the F(CH3OH) cornplex, various results
have been published in the literature, and most data show some spread in individual
frequencies caused by basis set effects. None of the methods used produced extreme
deviations however. 81.104.109 Based on matching thermochemical data such as &298, it
wouid be hard to assess the quality of the vibrational frequencies. It would be better of
course to have experimental vibrational data on F(CH30H) and other F(R0H)
complexes. Unfortunately these are not available, and the nature of these systems,
mainly due to the very strong bond involved, causes the F(ROH)2 and F(ROHl3
complexes to be formed at room temperature. For the F(R0H) complexes (R =
CH3CH2, (CH3hCH, (CH3)3C) only the MPZa (R = CH3CH2 only) and B3LYP/b data
from this work, and the HF/6-3 1 G(d) data from DeTuri et al. are available.'l Once
again the agreement is in general good, except for the lowest vibrational frequencies
of F(CH3OH) and F((CH3)3COH). The Gaussian 94 and 98 suites of programs treat
the hindered methyl group rotations as harrnonic vibrations, while the HFK-3 1 G(d)
results by DeTuri et ai. were corrected for free methyl group rotations, which is more
accurate at temperatures normally used for PHPMS experiments on these kinds of
systerns.
For the CI-(CH3OH) and Cl-(CH30H)t clusters, experirnental VPDS data are
avai 1 able,63 and t his is an excellent opportunity to test the different theoretical models.
For the intermolecular CI-.ooHOCH3 stretch, Carbacos et al. found, indirectiy, a value
of 232 cm-', while for the CHsO-H stretch a value of 3 162 cm-' was obtained. Both
the MP2/a (190 cm-') and B3LYP/b (190 cm-') results for the Cl--HOCH3 stretch
are closer to the experimental VPDS results than the LMP2/cc-pVDZ result of 307
cm-' obtained by the same authors. For the CH30-H stretch the B3LYPlb result is in
very good agreement (3 186 cm-') as is the LMP2kc-pVDZ result (3 198 cm-'), while
the MP2/a result is somewhat off (3223 cm-'). For the CI-(CH30H)2 cluster an
experimental CH@--H stretch value of 3241 cm-' was found. Introduction of the
second methanol molecule Ieads to a shifi in the OH stretch of +79 cm-'. In principal
two isomers exist, (CH3OH)Cl-(CH30H) and Cl-(CH30H)(CH30H). In Section 4.4.4
it was shown already that (CH30H)Cl-(CH30H) is the more abundant isomer. As may
be expected, both clusters have distinct IR spectra (Figures 4.33 and 4.34). The y-axis
represents absorption and the unit is km mol-'. In (CH30H)Cl-(CH30H), both OH
groups can be involved in symmetric (33 10 cm-') and asymrnetric stretches (3277
cm-'). The asymmetric OH stretch is in good agreement with the VPDS results. In the
experimental VPDS spectra a small peak around 3300 cm-' is also visible, but there is
significant overlap due to the broad peak width of the symmetric OH stretch around
324 1 cm-'. At the LMP2kc-pVDZ level of theory, scaled values of 3337 cm-' and
3372 cm-', respectively, are calculated. For the second isomer the B3LYPlb normal
mode OH stretches are at 3003 cm-' (Cl-(CH30-H)(CH30H)) and 3360 c d
(CI-(CH30H)(CH30-H)). Compared to the (CH3OH)(CH#H) dimer, the first OH
(acceptor) group is shifted -402 cm-', while the second (donor) one is shifled by -196
cm-' (Figure 4.35). In the neutral methanol dimer the two O-H stretches are 3705
cm-' (acceptor) and 3556 cm-' (donor), respectively. This is in excellent agreement
with data from molecular beam depletion spectroscopy experiments. which give
results of 3684 cm-' and 3574 cm-', r e ~ ~ e c t i v e l ~ . ' ~ ~ Compared to free neutral
methanol, the acceptor OH group is shified by only -1 cm-' (3705 cm-' versus 3706
cm"). while the donor OH group is shified by -150 cm-' (3556 cm-'). The
experimental OH stretch for rnethanol is 3162 cm-'. Unfortunately for the other
Ci-(ROH) complexes, and both Br-@OH) complexes, no VPDS data are available.
Comparison of the MP2/a and B3LYPlb hamonic vibrational frequencies with results 97 from MP2(fÙ11)/[7s6p4d+ECP/D95+(p)] computations shows varying agreement.
For T(R0H) (R = CH3, CHICH% (CH3)2CH) recent VPDS data have been published.
Scaled B3LYP/LanL2DZ+ frequencies. based on matching the CH30-H stretch in the
gas phase, gave excellent agreement for both the Te--HOCHs stretch (166 cm-' versus -1 64 157 cm-') and the CH3O-H stretch (3331 cm-' versus 3365 cm ). It is dificult to
determine why the MP2/[a/e] and B3LYP/[b/e] results are somewhat different, since it
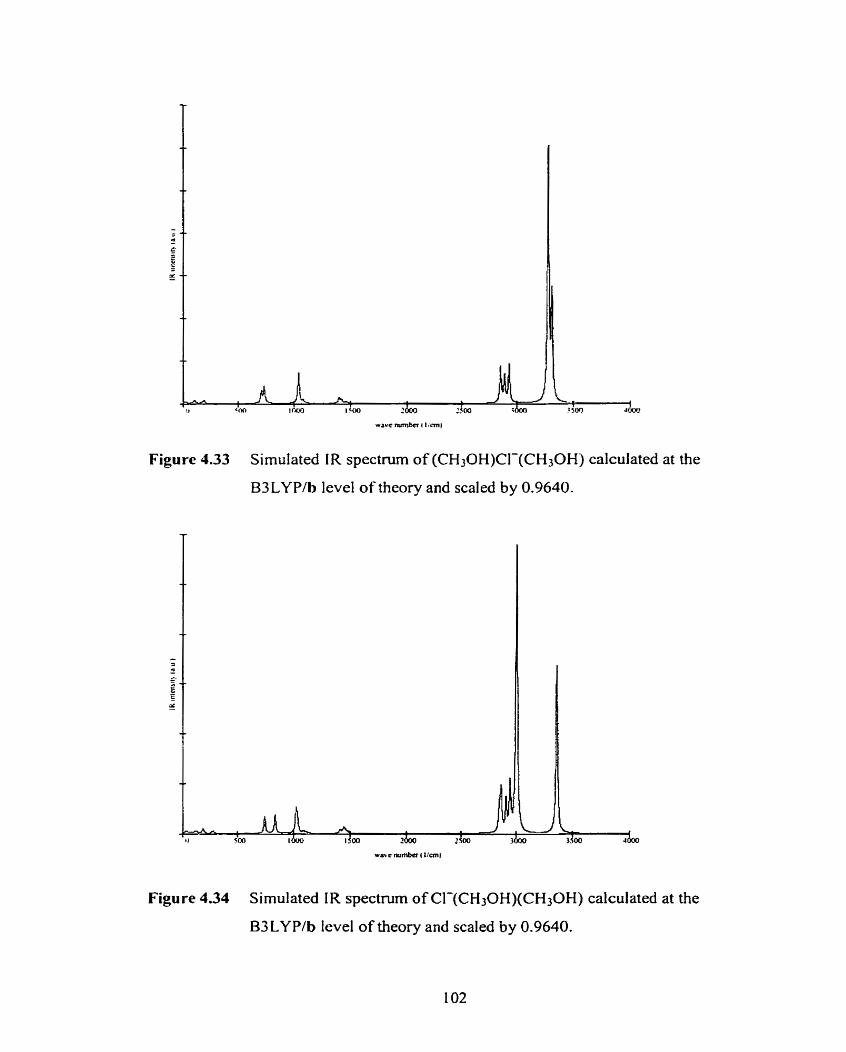
Figure 4.33 Simulated IR spectrum of (CH30H)CI-(CH30H) calculated at the
B3 LY P/b level of theory and scaled by 0.9640.
Figure 4.34 Simulated IR spectrum of CI-(CH30H)(CH30H) calculated at the
B3LY P/b level of theory and scaled by 0.9640.
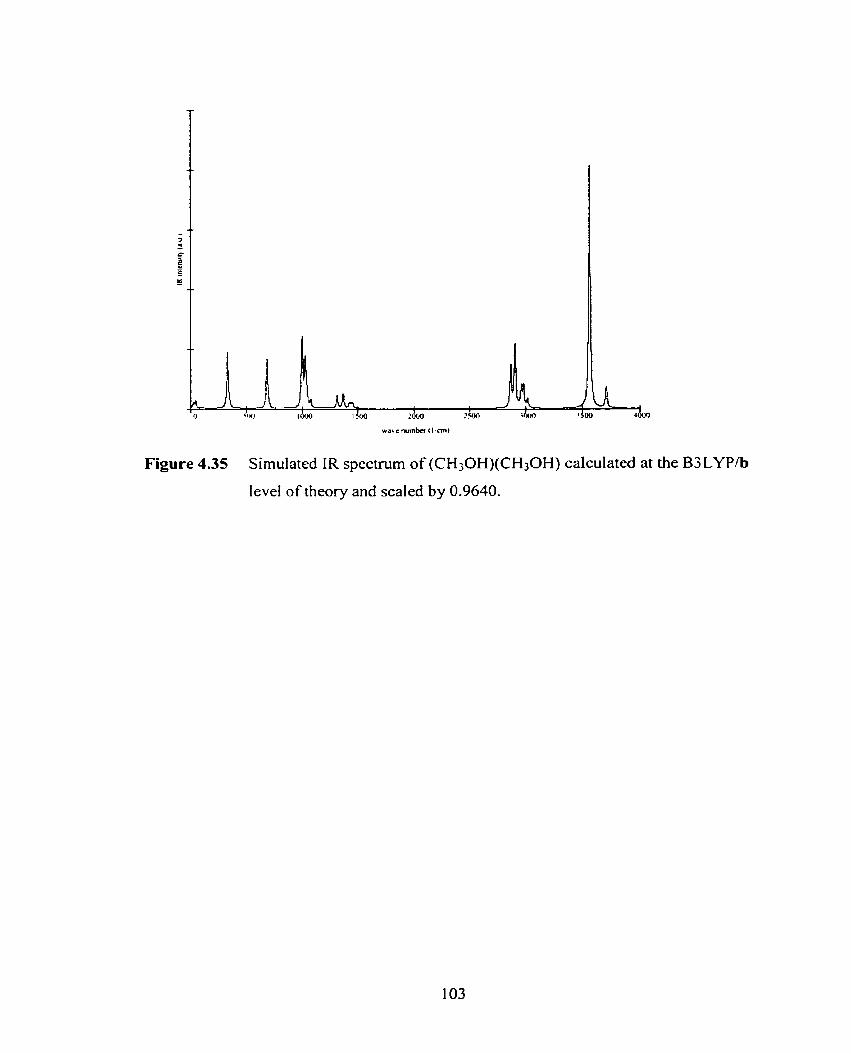
Figure 4.35 Sirnulated IR spectrum of (CH30H)(CH30H) calculated at the B3 LYPh
kvel of theory and scaled by 0.9640.
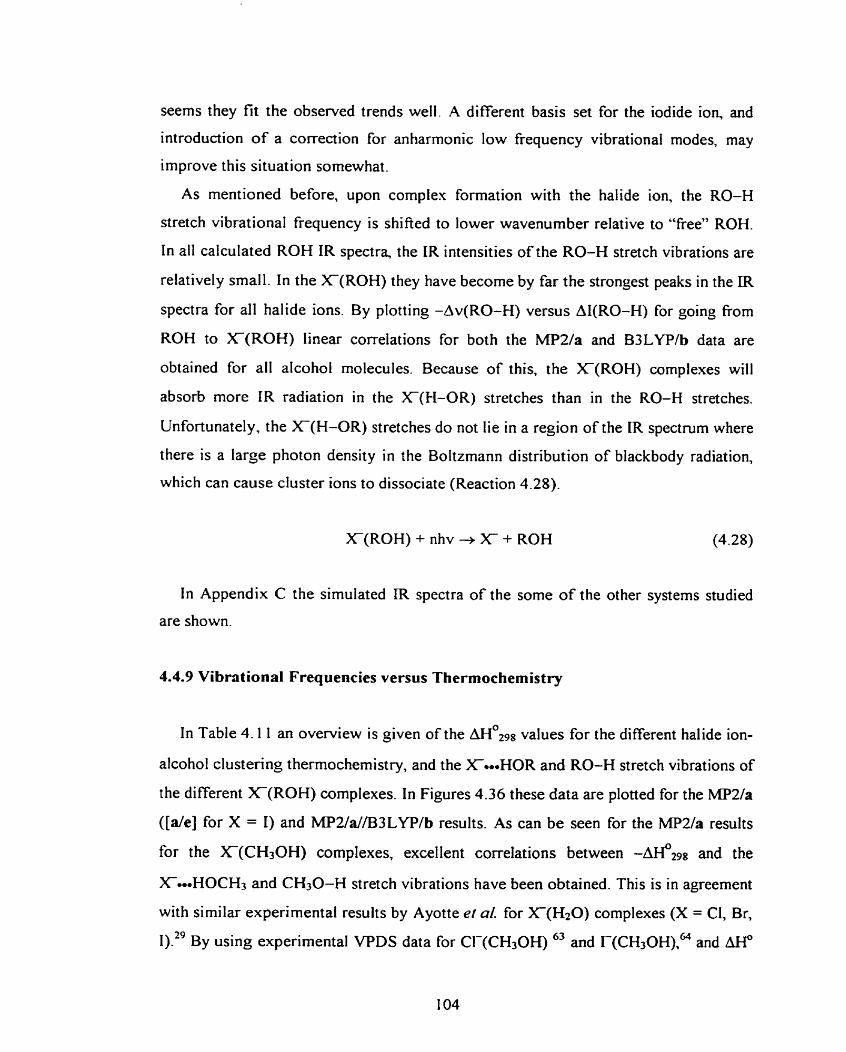
seems they fit the observed trends well. A different basis set for the iodide ion, and
introduction of a correction for anharmonic low frequency vibrational modes, may
improve this situation somewhat.
As mentioned before, upon cornplex formation with the halide ion, the RO-H
stretch vibrational frequency is shified to lower wavenumber relative to "free" ROH.
In al1 calculated ROH IR spectra, the IR intensities of the RO-H stretch vibrations are
relatively small. In the X(R0H) they have become by far the strongest peaks in the IR
spectra for al1 halide ions. By plotting -Av(RO-H) versus AI(R0-H) for going fiom
ROH to X ( R 0 H ) Iinear correlations for both the MP2/a and B3LYPlb data are
obtained for al1 alcohol molecules. Because of this, the X(R0H) complexes will
absorb more IR radiation in the X(H-OR) stretches than in the RO-H stretches.
Unfortunately, the X-(H-OR) stretches do not lie in a region of the IR spectrum where
there is a large photon density in the Boltzmann distribution of blackbody radiation,
which can cause cluster ions to dissociate (Reaction 4.28).
X(R0H) + nhv + X_ + ROH (4.28)
In Appendix C the simulated IR spectra of the some of the other systems studied
are shown.
4.4.9 Vibrational Frequencies versus Thermochemistry
In Table 4.1 1 an overview is given of the AHots8 values for the different halide ion-
alcohol clustenng thermochemistry, and the X..-HOR and RO-H stretch vibrations of
the different X-(ROH) complexes. In Figures 4.36 these data are plotted for the MP2/a
([de] for X = 1) and MP2/a//B3LYP/b results. As can be seen for the MP2/a results
for the X(CH3OH) complexes, excellent correlations between -&298 and the
X-HOCH3 and CH30-H stretch vibrations have been obtained. This is in agreement
with sirnilar experirnental results by Ayotte et al. for X(H20) complexes (X = CI, Br,
I ) .*~ By using experimental VPDS data for CI-(CH30H) 63 and I-(cH~oH),~~ and
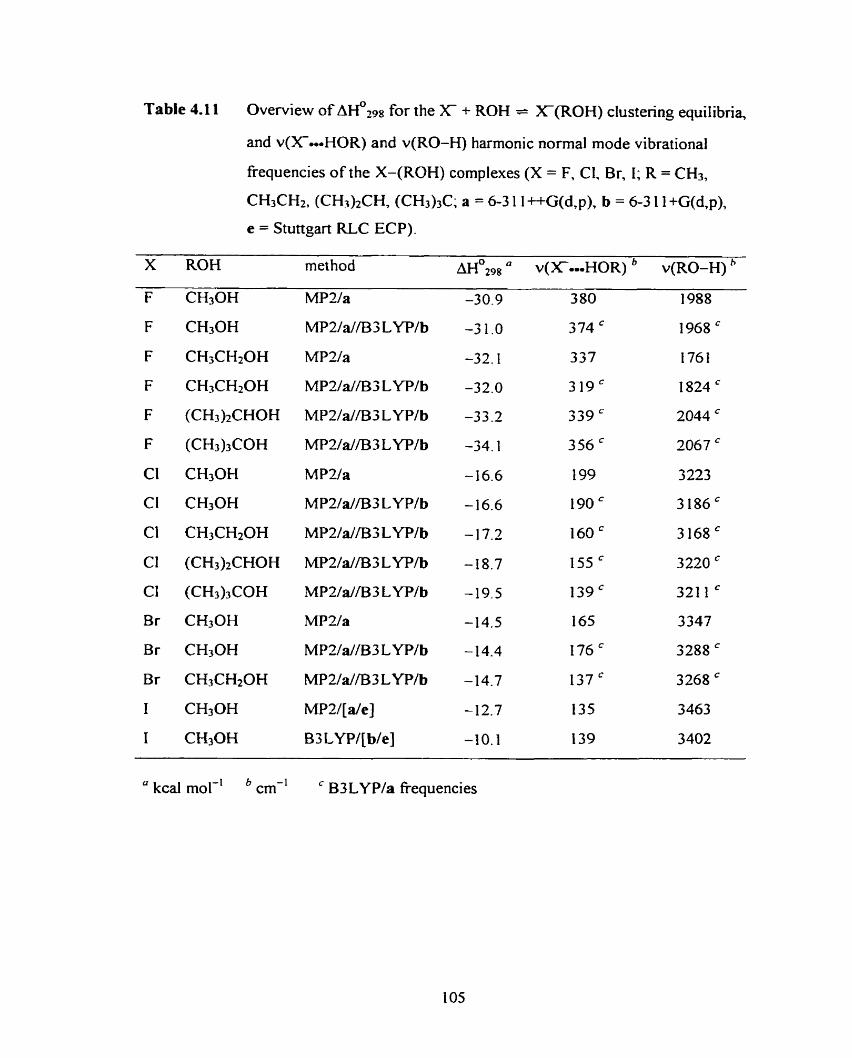
Table 4.1 1 Overview of bH029g for the X- + ROH = XO(0H) clustering equilibria,
and v(X-HOR) and v(R0-H) harmonic normal mode vibrational
frequencies of the X-(ROH) complexes (X = F, CI, Br, 1; R = CHs,
CHKH2, (CH3hCH, (CH3)iC; a = 6-3 1 1 ++G(d,p), b = 6-3 11 +G(d,p),
e = Stuttgart RLC ECP).
X ROM method moZ9* a v(X-OHOR) v(R0-H) ' F CH3OH MPWa -30.9 380 1988
F CH3OH MP2/a//E33 LYP/b -3 1.0 374 ' 1968 "
F CH3CHzOH MPWa -32.1 337 1761
F CH3CH20H MP2/a//B2 LYP/b -32.0 319" 1824 '
F (CH3)zCHOH MP2/a//B3 LYP/b -33.2 339 ' 2044 ' F (CH3)3COH MP2/a//E33LYP/b -34.1 356 ' 2067 "
CI CH3OH MP2/a -16.6 199 3223
CI CH30H MP2/d/B3 LYP/b -16.6 190 " 3186'
Cl CH3CH20H MP2/a//B3LYP/b -17.2 160 ' 3168 ' Cl (CH3)2CHOH MP2/d/E33 LYP/b -18.7 155' 3220 ' CI (CH3)3COH MP2/a//B3 LYP/b -19.5 139 ' 321 1 '
Br CH30H MP2/a -14.5 165 3347
Br CH3OH MP2/a//B3 LYP/b - 14.4 176 ' 3288 '
Br CH3CH20H MP2/a//E33LYP/b - 14.7 137 3268 '
1 CH3OH MP2/[a/e] -12.7 135 3463
I CM30H B3 LYP/[b/e] -10.1 139 3402
" kcal mol-' cm-' ' B3LYP/a fiequencies
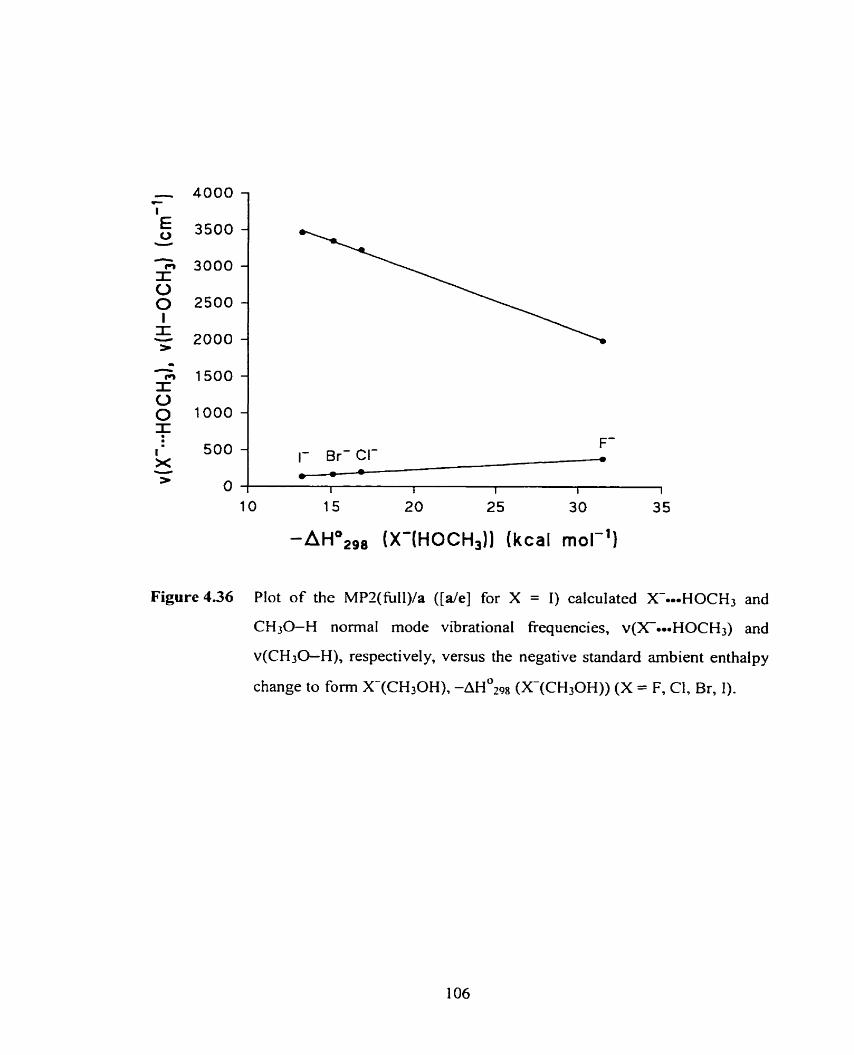
-AH0298 (X-(HOCHI)) (kcal mol-')
500 -
O
Figure 4.36 Plot o f the MP'>(fùll)/a ( [ d e ] for X = 1) calculated Xe-HOCH3 and
CH30-H normal mode vibrational fiequencies, v(X-.H0CH3) and
v(CH30-H), respective1 y, versus the negative standard arnbient enthal p y
change to forrn X-(CHIOH), - A H * Z ~ ~ (X-(CH30H)) (X = F, CI, Br, 1) .
1- Br- CI- F
O - - -
I f 1 I 1
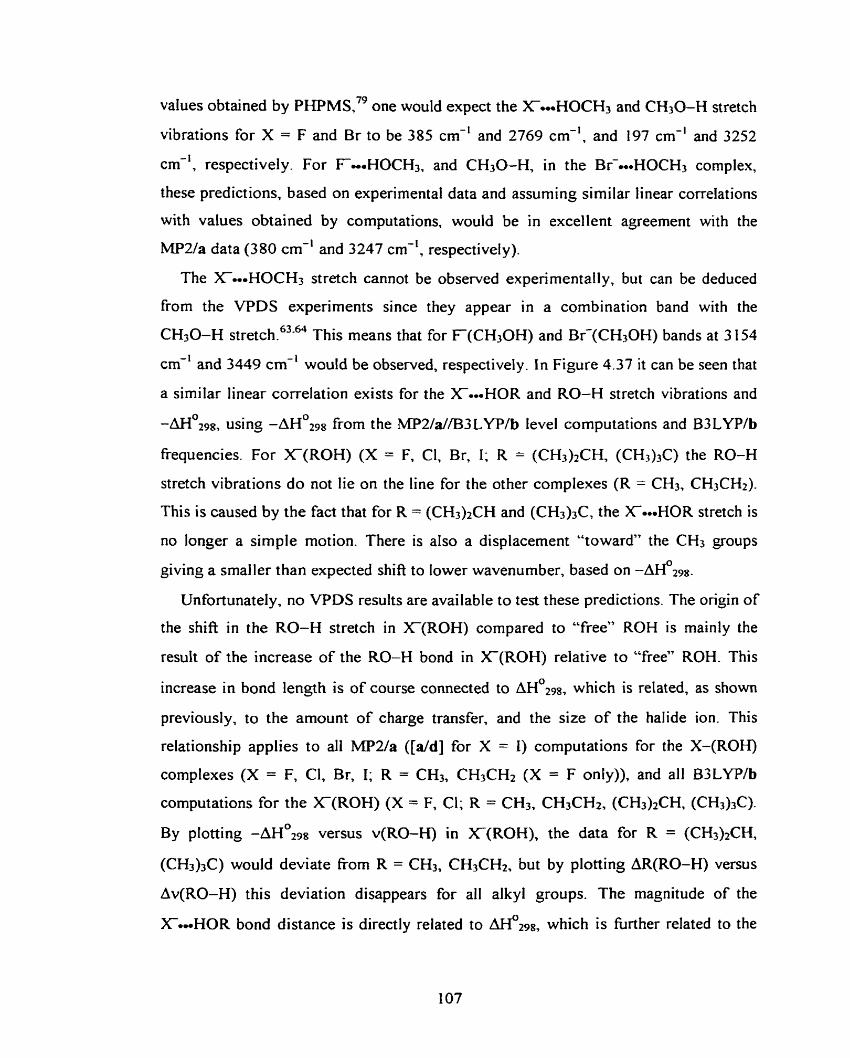
values obtained by PHPMS,'~ one would expect the X-~HOCHI and CH3O-H çtretch
vibrations for X = F and Br to be 385 cm-' and 2769 cm-', and 197 cm-' and 3252
cm-', respectively. For FeomHOCH3. and CH30-H, in the Br--HOCH3 cornplex,
these predict ions. based on experimental data and assuming similar linear correlations
with values obtained by computations, would be in excellent agreement with the
MPUa data (380 cm-' and 3247 cm-', respectively).
The X-HOCH3 stretch cannot be observed experirnentally, but can be deduced
fiorn the VPDS experiments since they appear in a combination band with the
CH30-H s t r e t ~ h . ~ ~ . ~ ' This means that for F(CH30H) and Br-(CH3OH) bands at 3 154
cm-' and 3449 cm-' would be observed, respectively. In Figure 4.37 it can be seen that
a similar linear correlation exists for the X-ooHOR and RO-H stretch vibrations and
-AHo2sa, using - A H O ~ ~ * from the MPZ/a//B3 LYP/b level computations and B3 LYPIb
frequencies. For X ( R 0 H ) (X = F, CI, Br, 1; R = (CH&CH, (CH3)3C) the RO-H
stretch vibrations do not lie on the line for the other complexes (R = CH3, CH3CH2).
This is caused by the fact that for R = (CH3)~CH and (CH3)3C, the X-HOR stretch is
no longer a simple motion. There is aIso a displacement "toward the CH3 groups
giving a smaller than expected shift to lower wavenumber, based on -AH'z~~.
Unfortunately, no VPDS results are available to test these predictions. The ongin of
the shift in the RO-H stretch in X-(ROH) compared to "free" ROH is mainly the
result of the increase of the RO-H bond in X ( R 0 H ) relative to "free" ROH. This
increase in bond length i s of course connected to A H O ~ ~ H , which is related, as shown
previously, to the amount of charge transfer, and the size of the halide ion. This
relationship applies to all MP2/a ([dd] for X = 1) computations for the X-(ROH)
complexes (X = F, Cl, Br, 1; R = CH3, CH3CH2 (X = F oniy)), and al1 B3LYPlb
computations for the X(R0H) (X = F, Cl; R = CH3, CH3CH2, (CH&CH, (CH+C).
By p io~ ing - A H 0 2 9 g versus v(R0-H) in X-(ROH), the data for R = (CHp)zCH,
(CH3)3C) would deviate fkom R = CH3, CH3CH2, but by ploîting AR(R0-H) versus
Av(R0-H) this deviation disappears for al1 alkyl groups. The magnitude of the
X-.HOR bond distance is directly related to AH OZ^^, which is further related to the
Figure 4.37 Plot of the calculated B3LYP/b X---HOR and Rû-H normal mode
vibrational frequencies, v(X--HOR) and v(RO-H), respectively, versus
the MP2(full)/a//B3 LY P/b negative standard ambient enthalpy change to
form X(ROH), - A H O ~ ~ * (X-(ROH)) (X = F, Cl, Br; R = CH3, CH3CH2,
(CH3)2CH, (CH3)3C).
size of the halide ion. One main conclusion in this respect may be that by sirnply
changing the halide ion no other property in the halide ion-alcohol complexes changes.
Thus different parameters are related and they cooperate in such a rnanner that the net
result may look like one linear correlation.
4-4-10 Potential Energy Surfaces
In Figure 4.38 the two parameters that are used to obtain the four MP2/a ( [ d e ] for
X = 1) potential energy surfaces for X(CH30H), shown in Figures 4.39 to 4.42, are
defined. The contour lines represent the energies in kcal mol-', relative to the
minimum energy position. It is very clear that the curve for X = F shows the most
symrnetric potential energy surface features. This is what one would expect from a
hydrogen bonded system, with a linear or near linear X-.eeH-OCH3 alipment. For X
= Cl, Br, and 1 the potential energy surfaces are less steep, due to the smaller AWZ~S
value compared to X = F, and there are more asymmetric features visible. Converting
the intramolecular X=--H-OCH-, stretch vibration from cm-' into kcal mol-' (E =
1.08, 0.57, 0.47, and 0.39 kcal mol-' for X = F, Cl, Br, and 1, respectively), shows that
if this motion is in its ground state, the halide ion can move freely across a fairly large
distance and angle. It had been hoped that from these potential energy surfaces some
clear and distinct features would be observable that would indicate how the halide ion
gets captured by methanol. Only for the F(CH30H) formation does this appear
evident. The more asymmetric nature of the potential energy surfaces for the other
three halide ions makes such a simplistic approach impossible.
The relaxed scan potential energy surface computations for the four X(CH3OH)
complexes at the MPZ(fc)/6-3 I+G(d,p) (X = F, Cl) level of theory (MPZ(fc)l
[6-3 I+G(d,p)/LanLZDZ(spd)] for X = Br, 1) and CI-(CF3OH) actually show a more
realistic picture of the capture of the halide ions by ths methano! ~olecule. In Figures
4.43 to 4.46 the potential energy surfaces along the X-HOCY3 coordinate are
shown. What are very interesting are the transition state and the second, higher energy,
saddle point. These are not artifacts, but tme intermediates on the potential energy
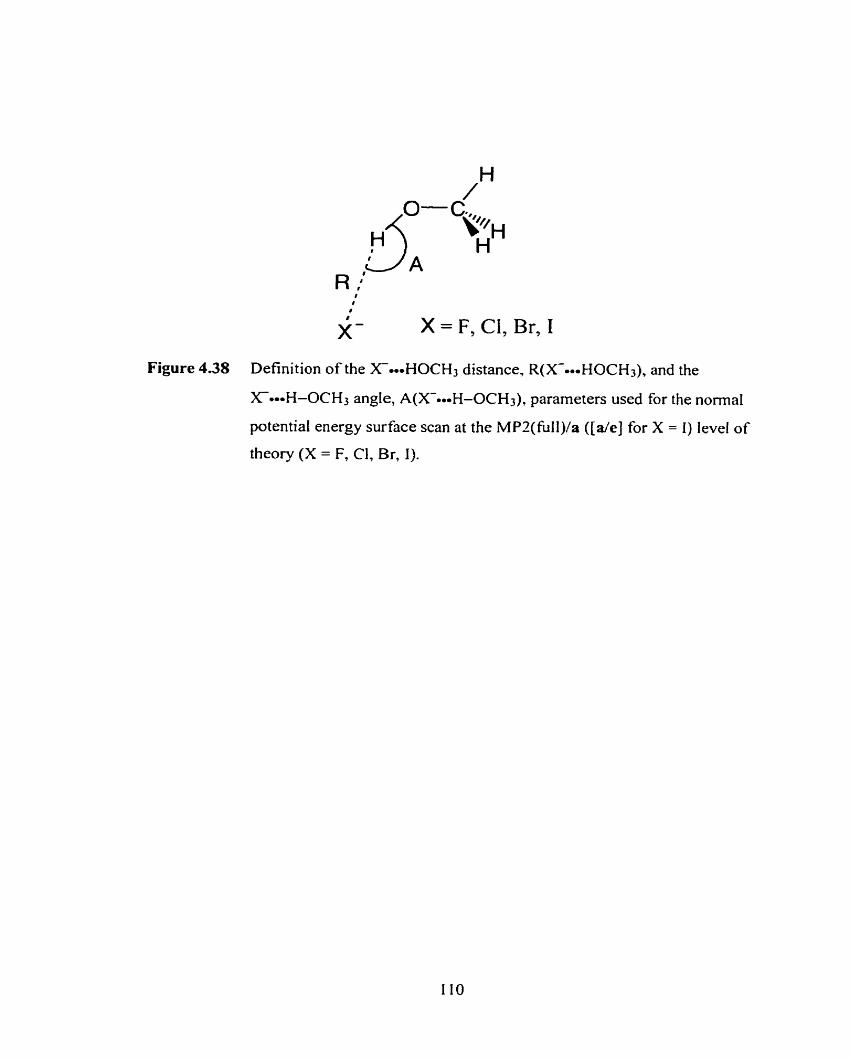
R ' I
I
X- X = F, Cl, Br, I
Figure 4.38 Definition of the X..,HOCH3 distance, R(X-.-HOCH3), and the
X-0-H-0CH3 angle, A(X---H-0CH3), parameters used for the noma1
potential energy surface scan at the MP?(fulI)la ( [ d e ] for X = 1) level of
theory (X = F, Cl, Br, 1).
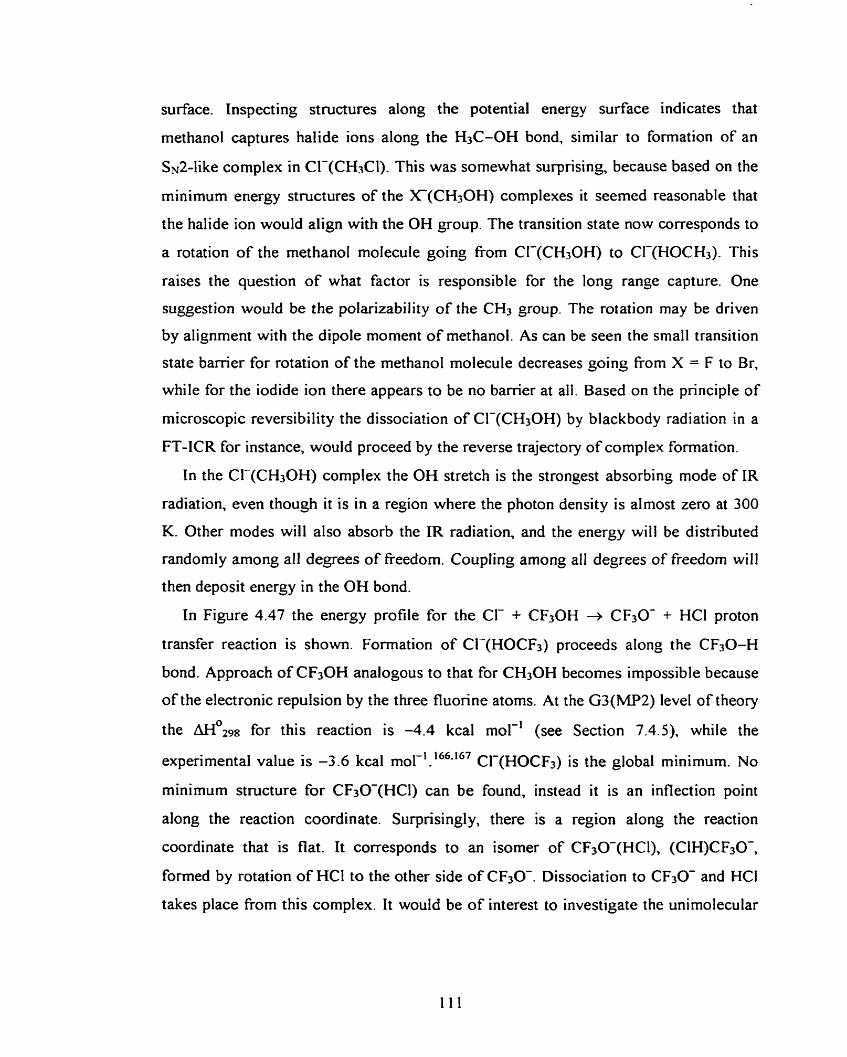
surface. Inspecting structures along the potential energy surface indicates that
methanol captures halide ions along the H3C-OH bond, similar to formation of an
Sy2-like complex in Cl-(CH3Cl). This was somewhat surprising, because based on the
minimum energy stmctures of the X(CH30H) complexes it seemed reasonable that
the halide ion would align with the OH group. The transition state now corresponds to
a rotation of the methano1 molecule going fiom Cl-(CH30H) to CI-(HOCH3). This
raises the question of what factor is responsible for the long range capture. One
suggestion would be the polarizability of the CH3 group. The rotation may be driven
by alignment with the dipole moment of methanol. As can be seen the srnall transition
state barrier for rotation of the methanol molecule decreases going from X = F to Br,
while for the iodide ion there appears to be no barrier at all. Based on the principle of
rnicroscopic reversibility the dissociation of CI-(CH30H) by blackbody radiation in a
FT-ICR for instance, would proceed by the reverse trajectory of complex formation.
In the Cl-(CH3OH) complex the OH stretch is the strongest absorbing mode of IR
radiation, even though it is in a region where the photon density is almost zero at 300
K. Other modes will also absorb the IR radiation, and the energy wi11 be distributed
randomly among a11 degrees of freedom. Coupling among al1 degrees of freedom will
then deposit energy in the OH bond.
In Figure 4.47 the energy profile for the Cl- + CF30H + CF30- + HCl proton
transfer reaction is shom. Formation of Cl-(HOCF3) proceeds along the CF30-I-i
bond. Approach of CF30H analogous to that for CH30H becomes impossible because
of the electronic repulsion by the three fluorine atoms. At the G3(MP2) level of theory
the m 0 z 9 8 for this reaction is -4.4 kcal mol-' (see Section 7 . 4 9 , while the
i 166.167 experimental value is -3.6 kcal mol- . Cl-(HOCF3) is the global minimum. No
minimum structure for CRO-(HCI) can be found, instead it is an inflection point
along the reaction coordinate. Surprisingly, there is a region along the reaction
coordinate that is flat. It corresponds to an isomer of CF30-(HCI), (CIH)CF30-,
formed by rotation of HCI to the other side of CF30-. Dissociation to CF3O- and HCI
takes place fiom this complex. It would be of interest to investigate the unimolecular
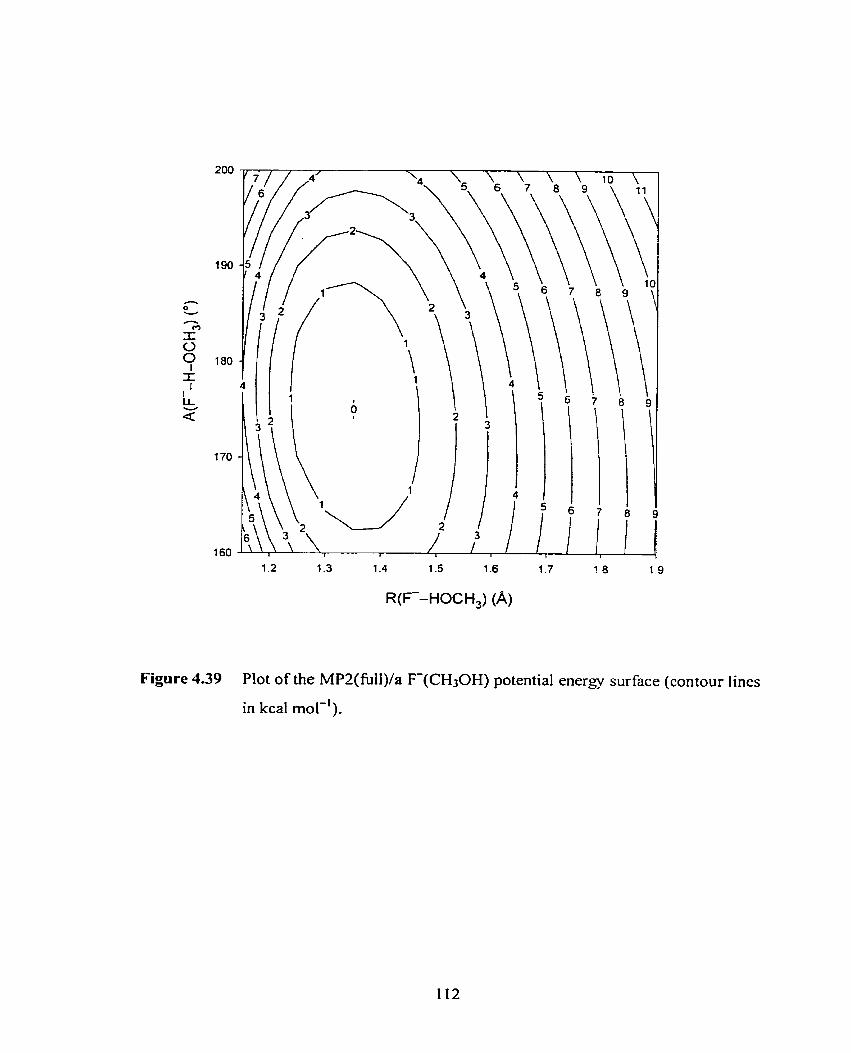
1.2 1.3 1.4 1.5 1.6 1.7 ! .8 1.9
R(F-HOCH,) (A)
Figure 4.39 Plot of the MP2(full)/a F-(CH30H) potential energy surface (contour lines
in kcal mol-').
2.0 2.2 2.4 2.6
R(CI--HOCH,) (A)
Figure 4.40 Plot o f the MP2(full)/a Cl-(CH30H) poiential energy surface (contour
lines in kcal mol-').
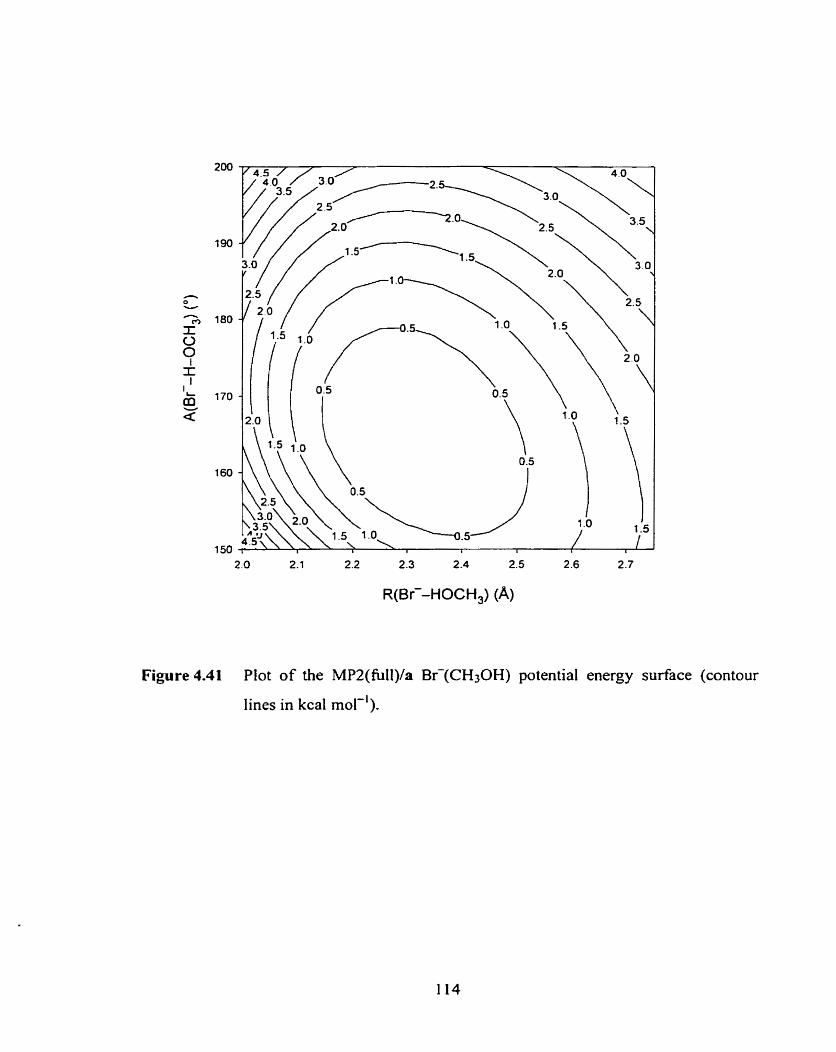
2.0 2.1 2.2 2.3 2.4 2.5 2.6 2.7
R(Br--HOCH,) (A)
Figure 4.41 Plot of the MP2(full)/a Br-(CH30H) potential energy surface (contour
lines in kcal mol-').
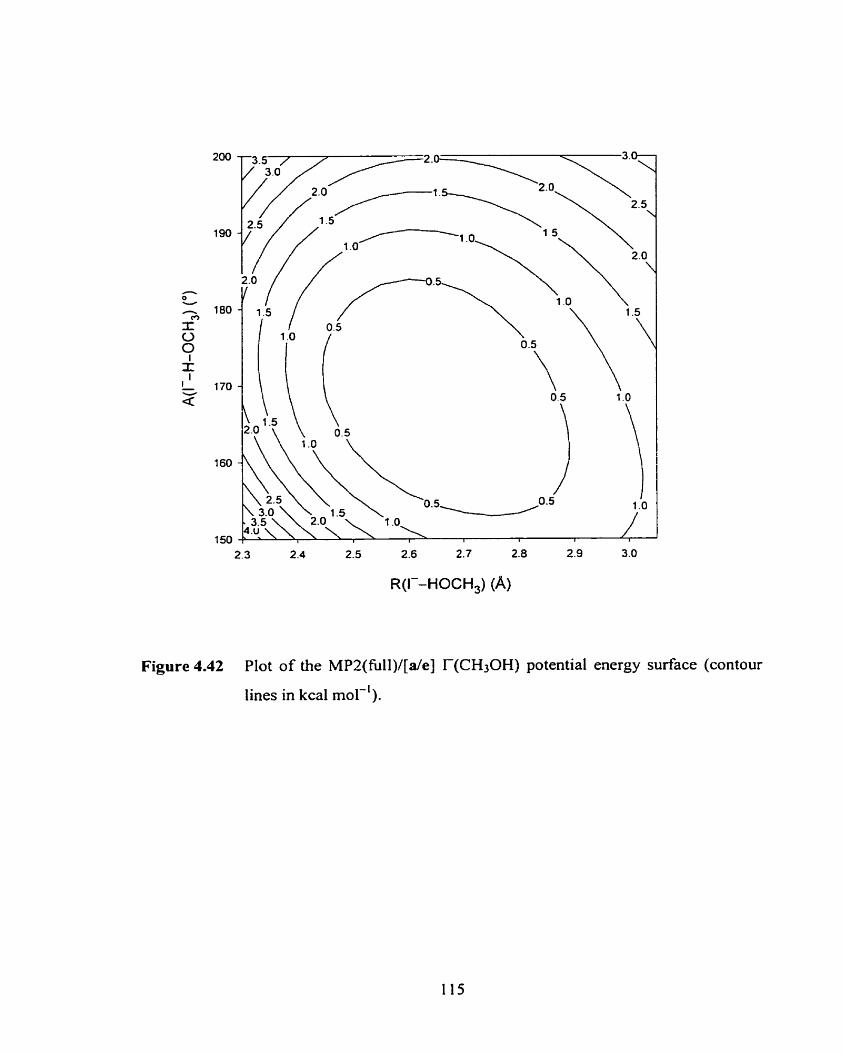
2.3 2.4 2.5 2.6 2.7 2.8 2.9 3.0
R(IY-HOCH,) (A)
Figure 4.42 Plot of the MPZ(fÜll)/[a/e] r(CH30H) potential energy surface (contour
lines in kcal mol-').
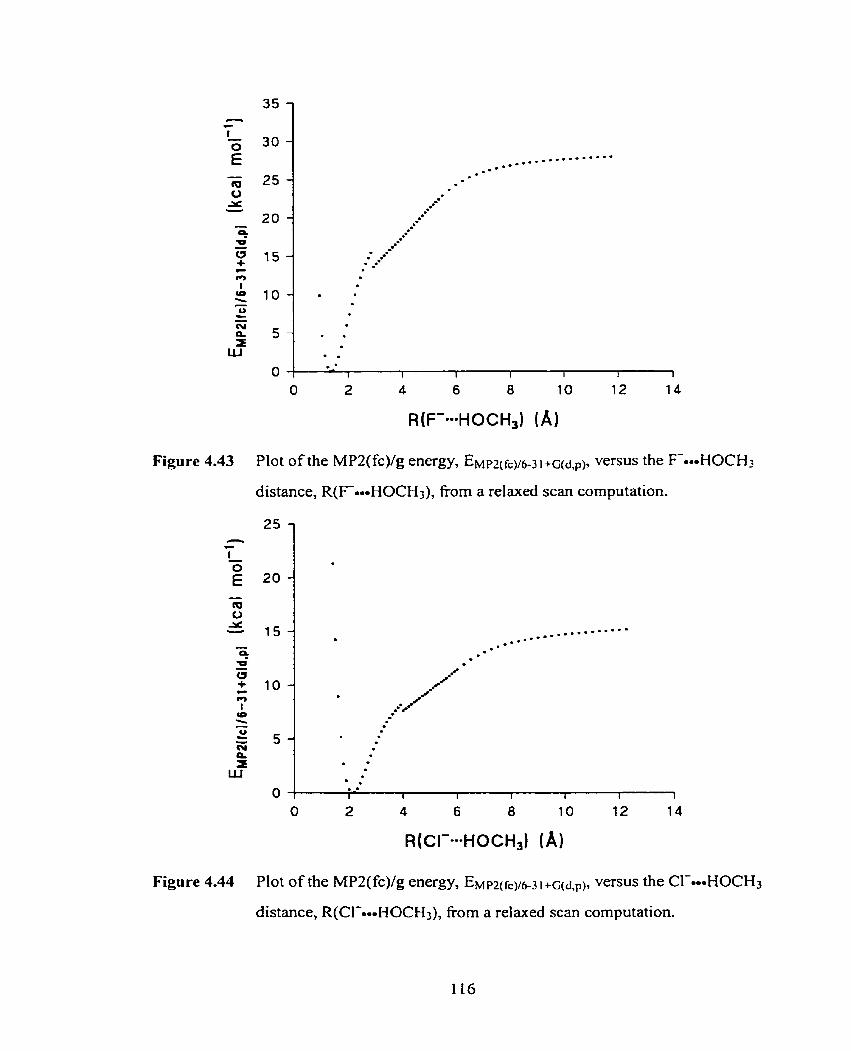
R(F-0--HOCH,) ( A )
Figure 4.43 Plot o f the MPZ(fc)/g energy, EMPZ(fc)/b-3 ~ + û ( d , ~ ) , versus the F-.-HOCH,
distance, R(F-0-HOCH3), fiom a relaxed scan computation.
Figure 4.44 Plot o f the MPZ(fc)/g energy, EMp2(fc)/b-3 1 + ~ ( d , ~ ) , versus the Cl--HOCH3
distance, R(C1--HOCH3), frorn a relaxed scan computation.
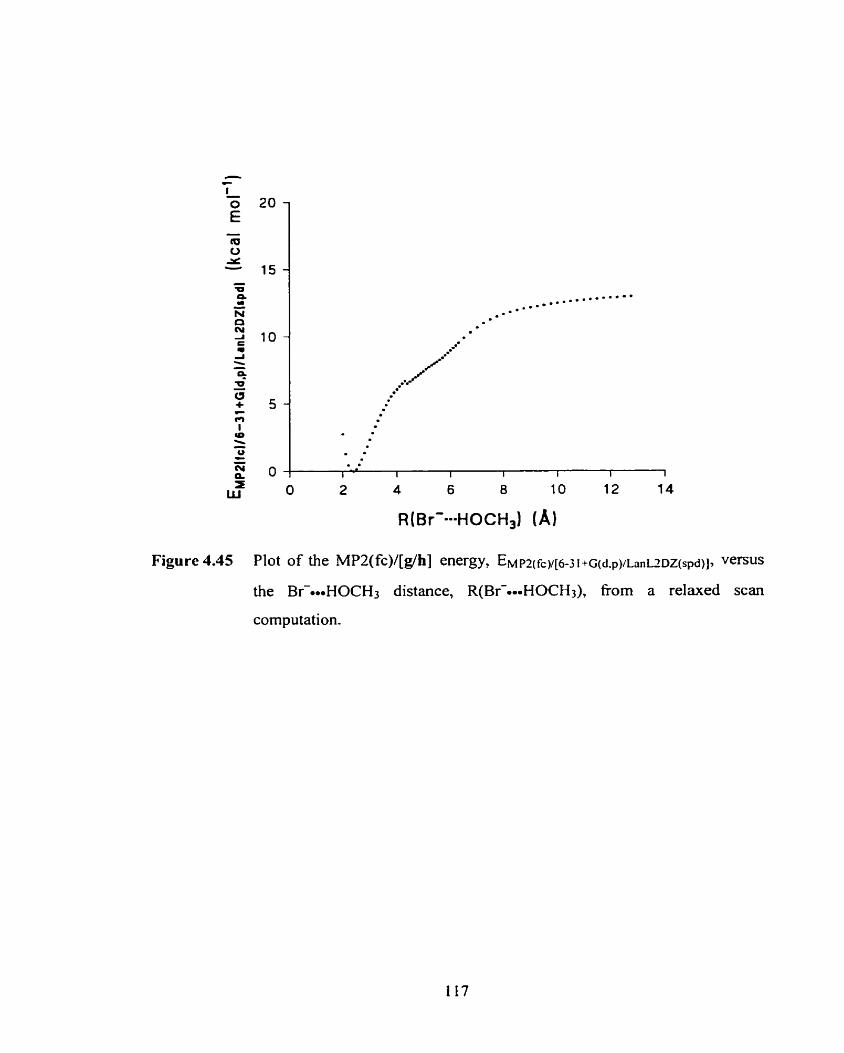
Figure 4-45 Plot of the MP2( fc)/[g/h] energy, EM p z ( f ~ y[6-3 I +G(d.p)/Lan CDZ(SP~)], VerSUS
the Br-ammHOCH3 distance, R(Br-.mmHOCH3), From a relaxed scan
computation.
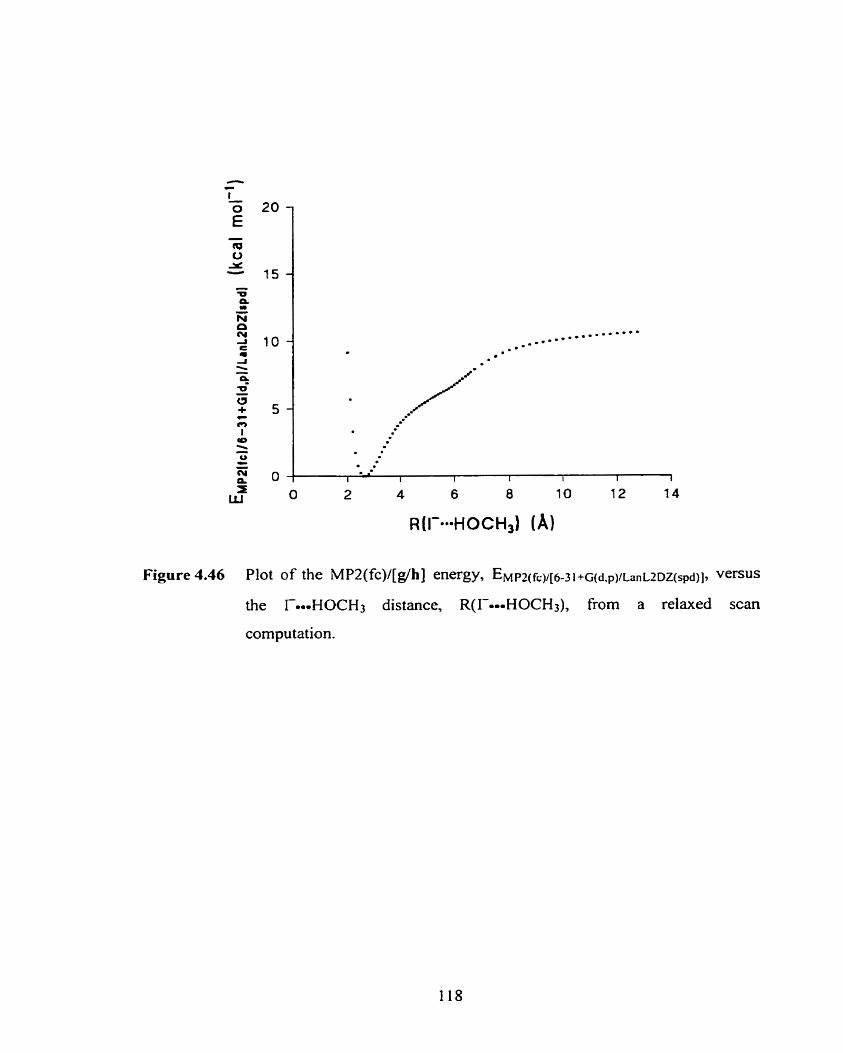
Figure 4.46 Plot of the MP2(fc)/[g/h] energy, EM ~2(fc) l [6-3 1 + G ( ~ . ~ ) / L ~ ~ I L ~ D Z ( ~ ~ ) ] ~ VerSUS
the Tm.-HOCH3 distance, R(L-HOCH3), from a relaxed scan
computation.
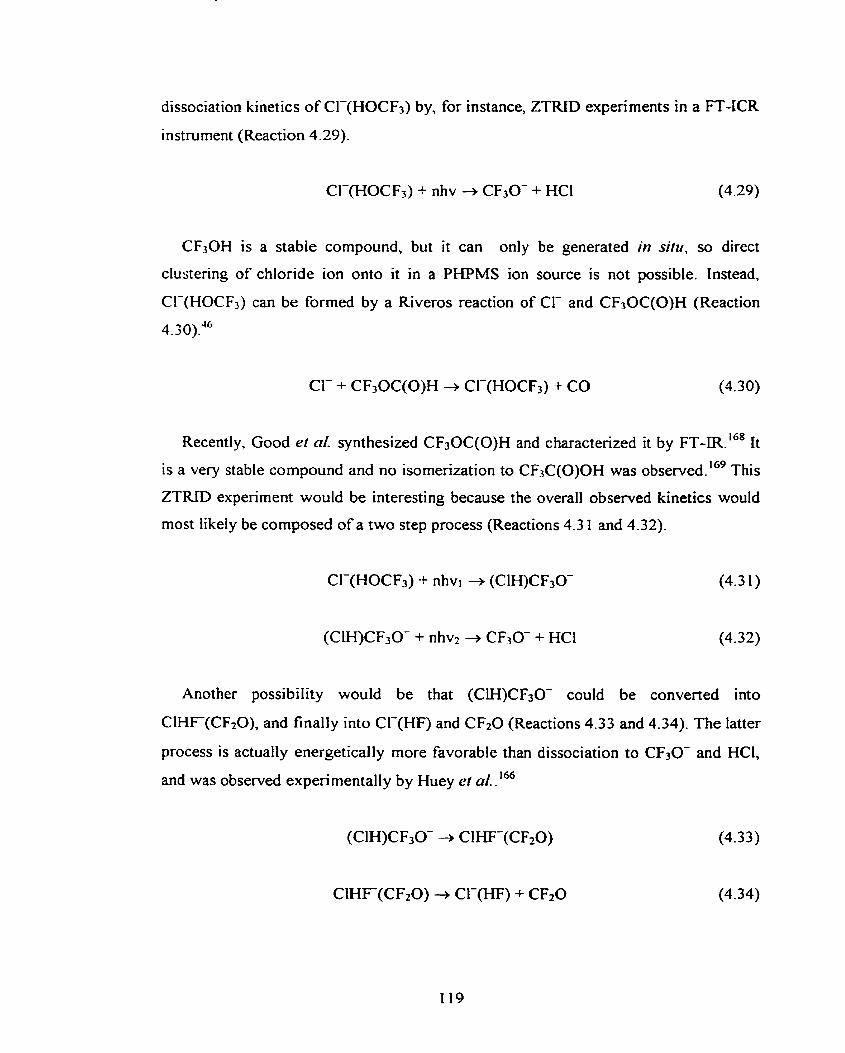
dissociation kinetics of CI-(HOCF3) by, for instance, ZTIUD experiments in a FT-ICR
instrument (Reaction 4.29).
Cl-(HOCF3) + nhv + CF30- + HCl (4.29)
CF30H is a stable compound, but it can only be generated in situ, so direct
clustering of chloride ion onto it in a PHPMS ion source is not possible. Instead,
CI-(HOCF3) can be forrned by a Riveros reaction of Cl- and CF30C(O)H (Reaction
4-30}."'
Recently, Good ri al. synthesized CF30C(0)H and characterized it by FT-IR. '~~ It
is a very stable compound and no isornerization to CF3C(0)OH was o b ~ e r v e d . ' ~ ~ This
ZTFUD experiment would be interesting because the overall observed kinetics would
most likely be composed of a two step process (Reactions 4.3 1 and 4.32).
(CLH)CF3O- + nhv2 + CF30- + HCI (4.32)
Another possibility would be that (CiH)CF30- could be converted into
CIHF(CF20), and finally into Cl-(HF) and CF20 (Reactions 4.33 and 4.34). The latter
process is actually energetically more favorable than dissociation to CF3W and HCI,
and was observed experi mental1 y by Huey et a/. . '66
CIHF(CF20) + CI-(HF) + CFzO (4.34)
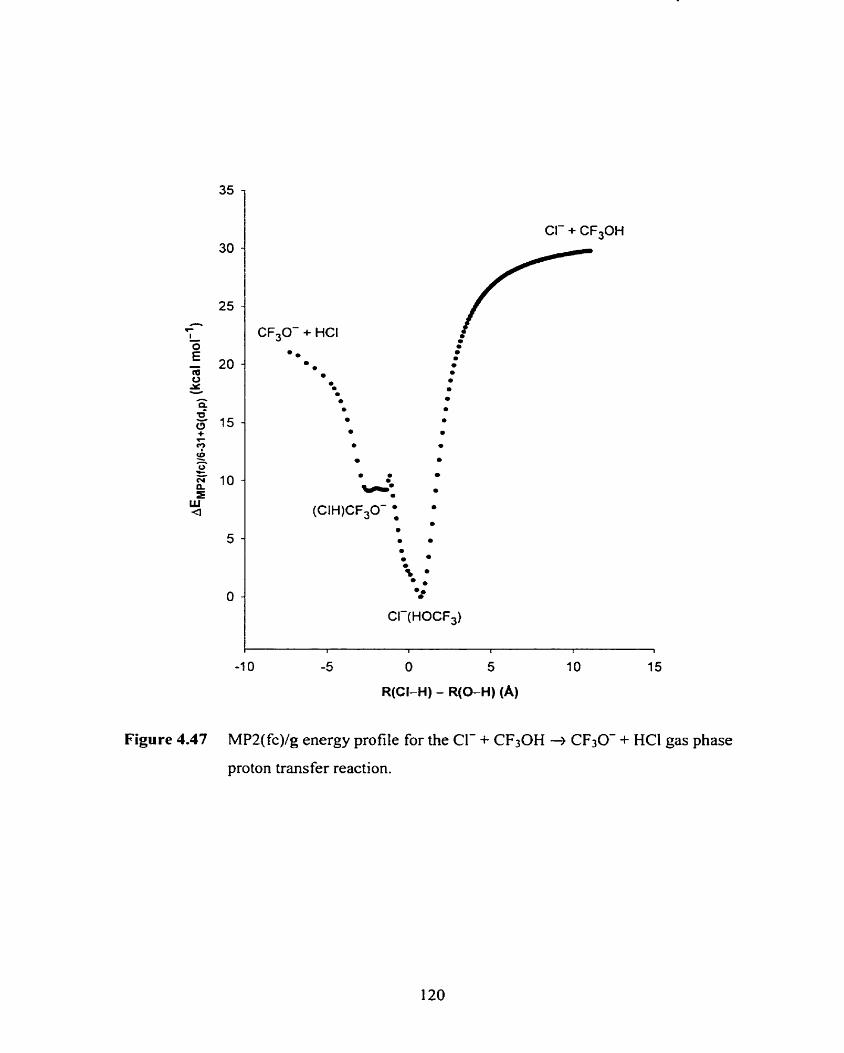
CF,O- -t HCI
CI- + CF30H
-1 O -5 O 5 10 15
R(CI-H) - R(O-H) (A)
Figure 4.47 MP2(fc)/g energy profile for the Cl- + CF30H CF30- + HCI gas phase
proton transfer reaction.
4.5 Conclusions
The different sections in this chapter have discussed a vanety of aspects of halide ion-
alcohol clusters in the gas phase studied by PHPMS and computational a b initzo and DFT
methods.
The X(CH30H) clusters (X = F, Cl, Br, I) show an increase in the X.-HOCH3
distance going from X = F to 1, and a decrease in the X;-H-OCH3 angle going from X =
F to Br and a small increase from X = Br to 1. For al1 alcohol molecules investigated,
there is an increase in the RO-H bond length (R) going fi-om "free" ROH to X(ROH),
and this increase is related to the enthalpy of binding of the halide ion to the alcohol. At
the B3LYP/b level of theory, two isomers for the fluoride and chlonde ion-methanol
dimer clusters were found, (CH30H)X(CH30H) and X(CH3OH)(CH3OH) (X = F, CI).
The two (CH30H)X(CH30H) clusters show very di fferent relative orientations of the
two methanol molecules. In the X(R0H) complexes (X = F, Cl; (CH&CH, (CH&C)
there is a stronger interaction between the halide ion and the methyl group hydrogen
atoms, accompanied by a shorter XeeeH-CH2 distance. Computations at the MP2(fÙlI)/
6-3 1 G(d) level of theory for the two HF2-(CH30H), (n = 1, 2) clusters indicate that for n
= 1 the cluster can be described as (FH)F(HOCH3), while for n = 2 this is
(CH3OH)HF2-(HOCH3).
For the various X(ROH), + ROH = X(ROH)n+l clustering equilibria measured,
good agreement was obtained for the AH' values with existing data, and the new data
followed expected trends. Trends can be explained based on the radii of the halide ions,
and the polarizability and gas phase acidity of the alcohol molecules. In the higher order
clusters, dipole-dipole interactions becorne more imponant. Trends in the AS' values are
less clear and no statements can be made to use these to assign structures.
The MP2/a and MPUa//B3LYP/b cornputations provide AH?298 and ~ ~ ' 2 9 8 values that
agree very well with most PHPMS results and other computational results using higher
levels of theory. For the X(CH30H) complexes the barrier height for methyl group
rotation increases going from X = F to 1, as calculated at the MP21a ( [ d e ] for X = 1) level
of theory. NPA charges indicate that in the X-(CHsOH) complexes some charge transfer
takes place, even though there is no proton transfer.
Pressure and temperature dependent kinetics measurements for the formation of the
CI-(CH30H) complex indicate that its formation involves a more cornplex potential
energy surfhce including a transition state that was determined to be around -9.0 kcai
mol-' below the reactants.
The scaled MP2/a and B3LYP/b normal mode vibrational fiequencies for the alcohol
molecules ROH agree well with experimental IR and results from other computations.
Similar observations can be made for the halide ion-alcohol clusters compared to
available experimental VPDS data and results from other computations. Some of the
computational results can be used to interpret friture VPDS data.
Large shifts in OH stretch frequencies and IR intensities can be observed upon halide
ion- alcohol cornplex formation relative to the "fiee" alcohol molecule. There is a clear
correlation between the AHo2g8 for X-(ROH) formation and the X--HOR and RO-H
normal mode vibrationaI frequencies.
Finally, one- and two-dimensional potential energy surfaces have been calculated for
the X(CH30H) complexes at the MP2 level of theory. From the relaxed scan it has been
shown that the halide ion is captured by methanol on the backside by interaction with the
three methyl group hydrogen atoms. The transition state corresponds to rotation of the
methanol molecule, thereby allowing the halide ion to interact with the dipole moment of
methanol and the OH group. The normal scan results reveal the mobility of the halide ion
in the complex.
Chloride ion approaches CF30H along the O-H, because backside approach as found
for methanol is impossible. Cl-(HOCF3) is the minimum structure along the potential
energy surface. After proton transfer the CF30-(HCl) structure, which is only an
inflection point, will undergo isomerization to (C1H)CF30-. Conversion to
(FH)CI'(CF20), followed by dissociation into CI-(HF) and CFIO will be energetically
more favorable than into CF30- and HCl.
4.6 References and Notes
Scaiano, J . C . Acc. Chem. Res. 1982, 15, 252.
Eriksen, J.; Foote, C. S. J. Am. Chem. Soc. 1980, 102,6083.
Wagner, P. J.; May, M. J.; Haug, A. Graber, D. R. J. Am. Chern. Soc. 1970, 92,
5269.
Bernasconi, C. F. Acc. Chem. Res. 1978, 11, 147.
Landini, D.; Maia, A.; Montanari, F.; Rolla, F. J. Org. Chem. 1983, 48, 3774.
Io)] a ~ d lot1 Pair in Orgmzc Rendons; Szwarc, M., Ed.; Wiley: New York, 1972
and 1974; Vol. 1 and Vol. 2.
Mechotirsms md nteory in Organic Chrrnisrry, 3rd ed.; Lowry, T. H.; Schueller-
Richardson, K., Ed.; Harper & Row: New York, 1987; Chapter 3.
Ladwig, C. C.; Lui, R. S. H. J. Am. Chern. Soc. 1974, 96, 6210 and references
therein.
Grunwald, E.; Winstein, S. J. Am. Chem. Soc. 1948, 70, 1948.
Schleyer, P. v. R.; Raber, D. J.; Harris, J. M. J Am. Chem. Soc. 1971, 93,4829 and
references cited therein.
BentIey, T. W.; Carter, G. E. J. Am. Chem. Soc. 1982, 104, 7541.
Parker, A. J.; Mayer, U.; Schmidt, R.; Gutmann, V. J. Org. Chem. 1978,43, 1843.
Shaik,S. S.J.Am.Chern.Soc. 1984,106, 1227.
Cooper, K. A.; Hughes, E. D.; Ingold, C. K. J. Chem. Soc. 1973, 1280.
Seib, R. C.; Shiner, V. J.; Sendijarevic, V.; Humski, J. J. Am. Chem. Soc. 1978,
100, 8 133 and references cited therein.
Richard, J. P.; Jencks, W.P. J Am. Chem. Soc. 1984, 106, 1383.
Cohen, T.; Daniewski, A. R. J. Am. Chem. Soc. 1969,91,533.
Skell, P. S.; Hall, W. L. ./. Am. Chem. Soc. 1963, 85, 2851.
Bunnett, J. F. Allgew. C h . I . z . Ed fi7gL 1962, 1. 225.
Baciocchi, E.; Pemci, P.; Rol, C . J. Chem. Soc. Perkin Tram. 2 1975, 2, 329.
Beltrame, P.; Biale, G.; Lloyd, D. J.; Parker, A. .Je; Ruane, M; Winstein, S. J. Am.
Chem. Soc. 1972, 91, 2240.
Ford, W. T.; Pietsek. D. J. J. J. Am. Chem. Soc. 1975, 97, 2 194 and references cited
therein.
Jensen, J. H.; Gordon, M. S. J. Am. Chrrn. Soc. 1995,117,8 1 59.
Jensen, F. J. Am. Chem. Soc. 1992, 114,9533.
Marcus, Y. Pwe Appl. Chern. 1983, 55, 977.
Marcus, Y. Pwe Appl Chem. 1985, 57, 1 103.
Takashima, K.; Riveros, J. M. Mnss Sprctrom. Rev. 1998, 17, 409 and references
cited therein.
Bailey, C. G.; Kim, J.; Dessent, C. E. H.; Johnson, M. A. Chem. Phys. Lett. 1997,
269, 122.
Ayotte, P.; Bailey, C. G.; Weddle, G. H.; Johnson, M. A. J. Phys. Chem. A 1998,
102,3067.
Choi, J.-H.; Kuwata, K. T.; Cao, Y.-B.; Okumura, M.J. Phys. Chem. A 1998, 102,
503.
Ayotte, P.; Weddle, G. H.; Kim, J.; Johnson, M. A. Chem. Phys. 1998, 239,485.
Ayotte, P.; Weddle, G. H.; Kim, J.; Johnson, M. A. J. Am. Chem. Soc- 1998, 120,
12361.
Ayotte, P.; Weddle, G. H.; Kim, J.; Kelly, J.; Johnson, M. A. J. Phys. Chern. A
1999,103,443.
Cabarcos, O. M.; Weinheimer, C. J.; Lisy, J. M.; Xantheas, S. S. J. Chem. Phys.
1999, 110, 5.
Weis, P.; Kemper, P. R.; Bowers, M. T.; Xantheas, S. S. J. Am. C'hem. Soc. 1999,
121,357 1.
Dorsett, H. E.; Watts, R. O.; Xantheas, S. S. J. Phys. Chem. A 1999, 103,335 1.
Bryce, R. A.; Vincent, M. A.; Hillier, 1. A. J. Phys. Chem. A 1999, 103,4094.
Ayotte, P.; Weddle, G. H.; Johnson, M. A. J. C h . Phys. 1999, 110, 71 29.
Stuart, S. J.; Berne, B. J. J. Phys. Chem. A 1999, 103, 10300 and reference cited
therein.
Ayotte, P.; Nielsen, S. B.; Weddle, G. H.; Johnson, M. A.; Xantheas, S. S. J. Phys.
Chem. A 1999, 103, 10665.
Topol. 1. A.; Tawa. G. I.; Burt. S. K.; Rashin, A. A. J. Chem. Phys. 1999, 111,
10998.
Majumdar, D.; Kim. J.; Kim, K. S . J. C h . Phys. 2000, 112, 101.
Thompson, W. H.; Hynes, J. T. J. Am. C'hem Soc. 2000, 122,6278.
Chen, H.-Y.; Sheu, W.-S. Am. C'hem. Soc. 2000, 122,7534.
Roeselova, M.; Kaldor, U.; Jungwirth, P. J. Phys. C'hem. A 2000, 104,6523.
Blair, L. K.; Isolani, P. C.; Riveros, J. M. J. Am. Chem. Soc. 1973, 95, 1057.
Ridge, D. P.; Beauchamp, J . L. ./. Am. Chem. Soc. 1974,96, 3595.
Larson, J. W.; McMahon, T. B. J. Am. C'hem. Soc. 1983, 105,2944.
Larson, J. W.; McMahon, T. B. Cart. J. rhem. 1984, 62,675.
Riveros, J . M.; Ingemann, S.; Nibbering, N. M. M. J. Am. C'hem. Soc. 1991, 113,
1053.
Haberland, H.; Schindler, H. G.; Worsnop, D. R. Ber. Btrnsertges. Phys. Chem.
1984, 88, 270.
Coe, J. C.; Snodgrass, H. G.; Freidhoff, C. B.; McHugh, K. M.; Bowen, K. H. J.
Chem. Phys. 1987,87,4302.
Viggiano, A. A.; Arnold, S. A.; Monis, R. A. I ~ Z - Rev. Phys. Chem. 1998, 17, 147
and references cited therein.
Combariza, J. E.; Kestner, N. R.; Jortner, J. Chem. Phys. Lett. 1993, 203,423.
Combariza, J. E.; Kestner, N. R.; Jortner, J. J. Chern. Phys. 1994, 100, 285 1.
Xantheas, S. S.; Dunning, T. H., fr. J. Phys. Chem. 1994, 98, 13489.
Xantheas, S. S.; Dang, L. X. J. Phys. Chern. 1996, 100, 3989.
Xantheas, S. S. ./. Phys. Chem. 1996, 100, 9703.
Asada, T.; Nishimoto, K.; Kitaura, K. J. Phys. Chem. 1993, 97, 7724.
Sremaniak, L. S.; Perera, L.; Berkowitz, M. L. Chem. Phys. Lerr. 1994, 218, 377.
Tufion, 1.; Martins-Costa, M. T. C.; Millot, C.; Ruiz-Lopez, M. F. Chem. Phys. Lerf.
1995, 241,450.
Johnson, M. S.; Kuwata, K. T.; Wong, C.-K.; Okumura, M. Chern. Phys. Left
1996, 260, 5 5 1 .
Carbacos, O. M.; Weinheimer, C. J.; Martinez, T. J.; Lisy, J. M. J. Chem. Phys.
1999, 110, 9516.
Nielsen, S. B.; Ayotte. P.; Kelley, J . A.. Johnson, M. A. J. Chem. Phys. 1999, 111,
9593.
Castleman, A. W., Jr. It7/. J. Mass SpecZrom. lori. Proc. 1992, 11 8,'f 19, 167.
Castleman, A. W., Jr.; Wei, S. A m . Rev- Phys. Chrm 1994, 45, 685
Castleman, A. W., Jr.; Bowen, K. H. J. Phys- Chern. 1996, 100, 1291 1.
Jung, M. E.; Xia, H. iTètrnhedror;r Leri. 1988, 29, 297.
Brodbelt, J.; Maleknia, S.; Liou, C.-C.; Lagow, R. J. Am. Chem. Soc. 1991, 113,
5913.
Brodbelt, J.; Maleknia, S.; Lagow, R.; Lin, T. Y. J. Chem. Soc. Chern. Cornrnzrn.
1991, 1705.
Scheerder, J.; Fochi, M.; Engbersen, J . F. J.; Reinhoudt, D. N. J. Org. Chem. 1994,
59, 78 1 5.
Savage, P. B.; Holmgren, S. K.; Gellman, S. H. J, Am. Chem. Soc. 1994, 116,4069.
Worm, K.; Schmidtchen, F. P. Angew. Chem. 1nz. FA. Etigl. 1995,34, 65.
Scheerder, J.; Engbersen, J. F. J.; Casnati, A.; Ungaro, R.; Reinhoudt, D. N. J. Org.
Chern, 1995, 60,6448.
Scheerder, J.; Engbersen, J. F. J.; Reinhoudt, D. N. Red Trav. Chim. Pays-Rcrys
1996, 115,307.
Tamao, K.; Hayashi, T.; Ito, Y. J . Orgnmmerai. Chern. 1996, 506, 85.
Antonisse, M. M. G.; Snellink-Ruël, B. H. M.; Yigit, 1.; Engbersen, J. F. J.;
Reinhoudt, D. N . J. Org. C'hem. 1997, 62,9034.
Schmidtchen, F. P.; Berger, M. Chem. Rev- 1997, 97, 1609.
Bogdanov, B.; Peschke, M.; Tonner, D. S.; Smlejko, J. E.; McMahon, T. B. htt . J .
Mass Spectrom. 1999, 185'186287, 707 and references cited therein.
DeTuri, V. F.; Su, M. A.; Ewin, K. M. J. Phys. Chem. A 1999, 103, 1468 and
references cit ed therei n.
DeTuri, V. F.; Ervin, K. M. J. Phys. Chem. A 1999 103,691 1.
Arshadi, M.; Yarndagni, R.; Kebarle, P. J. Phys. Chem. 1970, 74, 1475.
Yamdagni, R.; Kebarle, P. J. Ani. Chem. Soc 1971, 93, 7139
Yamdagni, R.; Payzant, J. D.; Kebarle, P. C h i . -1. Chern. 1973, ZI, 2507.
Keesee, R. G.; Castleman, A. W., Jr. Chem Phys. Leir. 1980, 74, 139.
Kebarle, P. Ann. Rev. Phys. Chem. 1977, 28.
Caldwell, G.; Kebarle, P.J. Am. ('hem. Soc. 1984, 106, 967.
Sieck, L. W. J. Phys. Chem. 1985, 89, 5552 .
Hiraoka, K.; Misuze, S. Chem. Phyx 1987. 118, 457.
Hiraoka, K.; Misuze, S. Yarnabe, S. J. Phys. Chem. 1988, 92, 3943.
Szulejko, J. E.; Wilkinson, F. E.; McMahon, T. B. Proceedhgs of the 3Yh A M
Cotference on Muss Specfrornrtry ami Allied Topics, May 2 1-26, 1989, Miami
Beach, FL, p. 333.
Hiraoka, K.; Yamabe, S. hi. J. Mass Spectrom. lott. Proc. 1991, 109, 133.
Evans, D. H.; Keesee, R. G.; Castleman, A. W., Jr. J. Phys. Chem. 1991,95, 3 3 5 8 .
Faigle, J. F. G.; Isolani, P . C.; Riveros, J . M. ./. Am. Cllem. Soc. 1976, 98, 2049.
Larson, J. W .; McMahon, T, B. .J- Am. C'hem. Soc. 1984, 106, 5 1 7.
Wilkinson, F. E.; Szulejko, J. E.; Allison, C. E.; McMahon, T. B. hf. J. Mass
Spectrom. ion Proc. 1992, 11 7,487.
Tanabe, F. K. J.; Morgan, N. H.; Riveros, J. M. J. Phys. C h . 1996, 100,2862.
Wilkinson, F. E.; Peschke, M.; Szulejko, J. E.; McMahon, T. B. 1111. J. Mass
Specrrom. ion Proc. 1998, 1 75, 22 5.
Wilkinson, F. E.; McMahon, T. B. h7f. J. MQSS Spectrom. 2000, 199, 127.
Moylan, C. R.; Dodd, J. A.; Brauman, J. 1. C'hem. Phys. Lerr. 1985, 118, 38.
Moylan, C. R.; Dodd, J. A.; Han, C. C.; Brauman, J. 1. J. Chern. Phys. 1987, 86,
5350.
Mihalick, J. E.; Gatev, G. G.; Brauman, J. 1. J. Am. Chem. Soc. 1996, 118, 12424.
Yang, Y.; Linnert, H. V.; Riveros, J. M.; Williams, K. R.; EyIer, J. R. J. Phys.
Chern. A 1997, 101, 2371.
Bradforth, S. E.; Arnold, D. W.; Metz, R. B.; Weaver, A.; Neumark, D. M. J.
Phys. C'hern. 1991, 95, 8066.
Markovich, G.; Pollack, S.; Giniger, R.; Cheshnovsky, O. J. Chem. Phys. 1994,
101,9344.
Bassmann, C.; Boest, U.; Yang, D.; Drechsler, G.; Schlag, E. W. Int. J. Mass
Spectrom. ion Proc. 1996, 159, 1 53.
Rosenfeld, R. N.; Jasinski, J. M.; Brauman, J. 1. Chem. Phys. Lert. 1980, 71, 400.
Peiris, D. M.; Riveros, J. M.; Eyler, J. R. 1111. J. Mass Spectrom. l o ~ Proc. 1996,
159, 169.
Wladkowski, B. D.; East, A. L. L.; Mihalick, J. E.; Allen, W. D.; Brauman, J. 1. J.
Chem. Phys. 1994, 100, 2058.
Berthier, G.; Savinelli, R.; Pullman, A. Irrt. J. Qziarrtzrrn Chern. 1997, 63, 567.
Maller, C.; Plesset, M. S. Phys. Rev. 1934, 46,618.
Lee, C.; Yang, W.; Parr, R. G. Phys. Rev. R 1988,37,785.
Becke, A. D. J. Chem. Phys. 1993,98, 1372
Becke, A. D. J. Chem. Phys. 1993, 98, 5648.
Smlejko, J. E.; Fisher, J . J.; McMahon, T. B.; Wronka, J. hrt. ./. Mass Spectrom.
lm Proc. f 988,83, 147.
SzuIej ko, 3. E.; McMahon, T. B. ]nt. J. Mass ,Spectrom. Ior~ Proc. 1991, 109,279.
Miller, T. M.; Friedman, J. F.; Stevens-Miller, A. E.; Paulson, J . F. h r . J. Mass
Specrrom. Ion Processes 1995, 149 '150, 1 1 1 .
Oster, T.; Kühn, A.; Illenberger, E. Int. Mass Sprctrom. lori Proc. 1989,89, 1.
Fehsenfeld, F. C. J. Chern. Phys. 1970.53, 2000.
Mothes, K. G.; Schindler, R. N. Ber.Brrrtst.tiges. Phys. Chem. 1971, 75, 938.
Chrktophorou, L. G.; Mathis, R. A.; James, D. R.; McCorkle, D. L. J. Phys. D
1981, 14, 1889.
71ICVP. Vapur Pres.vire Databa.~e. ?4rsion 2.2P, Thermod ynamics Researc h
Center, Texas A&M University, College Station, TX.
Frisch, M. J.; Trucks, G. W.; Schlegel, H. B.; Gill, P. M. W.; Johnson, B. G.; Robb,
M. A.; Cheeseman, J. R.; Keith, T.; Petersson, G. A.; Montgomery, J. A.;
Raghavachari, K.; Al-Laham, M. A.; Zakrzewski, V. G.; Ortiz, J. V.; Foresman, J.
B.; Peng, C. Y.; Ayala, P. Y.; Chen, W.; Wong, M. W.; Andres, J. L.; Replogle, E.
S.; Gomperts, R.; Martin, R. L.; Fox, D. J.; Binkley, J. S.; Defiees, D. J.; Baker, J.;
Stewart, J. P.; Head-Gordon, M.; Gonzales, C.; Pople, J. A. Gatcssimr 94, Revision
B3, Gaussian Inc., Pittsburgh PA 1995.
Frisch, M. J.; Trucks, G. W.; Schlegel, H. B.; Scuseria, G. E.; Robb, M. A.;
Cheesemrn, J. R.; Zakrzewski, V. G.; Montgomery, Jr., J. A.; Stratmann, R. E.;
Burant, J. C.; Dapprich, S.; Millam, J. M.; Daniels, A. D.; Kudin, K. N.; Strain, M.
C.; Farkas, O.; Tomasi, J.; Barone. V.; Cossi, M.; Cammi, R.; Mennucci, B.;
Pomelli, C.; Adamo, C.; Clifford, S.; Ochterski, J.; Petersson, G. A.; Ayala, P. Y.;
Cui, Q.; Morokuma, K.; Malick, D. K.; Rabuck, A. D.; Raghavachari, K.;
Foresman, J. B.; Cioslowski, J.; Ortiz, J. V.; Baboul, A. G.; Stefanov, B. B.; Liu,
G.; Liashenko, A.; Piskorz, P.; Komaromi, 1.; Gomperts, R.; Martin, R. L.; Fox, D.
J.; Keith, T.; Al-Laham, M. A.; Peng, C. Y.; Nanayakkara, A.; Gonzalez, C.;
Challacombe, M.; Gill, M. W.; Johnson, B.; Chen, W.; Wong, M. W.; Andres, J.
L.; Gonzalez, C.; Head-Gordon, M.; Replogle, E. S.; Pople, J. A. Gazrssiarr 98,
Revision A.7 Gaussian, Inc., Pittsburgh PA, 1998.
Head-Gordon, M.; PopIe, J. A.; Frisch, M. J. Chern. Phys. Left. 1988, 153, 503.
Frisch, M. J.; Head-Gordon, M.; Pople, J . A. CIhern. Phys. Lerr. 1990, 166, 275.
Frisch, M. J.; Head-Gordon, M.; Pople, J . A. Chern. Phys. Let,. 1990, 166, 280.
Scott, A. P.; Radom, L. J. Pbys. Che.m. 1996, 100, 16503. A value of 0.9489 was
obtai ned by subtracting the scal ing factor difference of MPZ(fc)/6-3 1 G(d) and
MP2(hlI)/6-3 1G(d) (0.9434 and 0.9427, respectively) fiom the scaling factor of
MP2(fc)/6-3 1 1 G(d,p) (0.9496).
From a least-squares fit of unscaled MP2(fÙ11)/6-3 1 l++G(d,p) normal mode
vibrational fiequencies of CH30H versus experimental frequencies, a scaling factor
of 0.9454 was obtained (Av = 26 + 15 cm-' (0.9454) versus Av = 27 f 16 cm-'
(O. 9489)).
Kiishnan, R.; Binkley, J. S.; Seeger, R. Pople, J. A. J. Chern. Phys. 1980, 72, 650.
Clark, T.; Chandrasekhar, J.; Schleyer, P. von R. J. Cornpl. Chem. 1983, 4, 294.
Gill, P. M. W.; Johnson, B. G.; Pople, J. A.; Frisch, M. J. Chem. Phys. Letr. 1992,
197, 499.
Frisch, M. J.; Pople, J. A.; Binkley, J. S. J. Chem. Phys. 1984, 80, 3265.
From a least-squares fit of unscaled B3 LYP/6-3 1 1 +G(d, p) normal mode vibrational
fiequencies of CHIOH versus experimental fiequencies, a scaling factor of 0.9640
was obtained (Av = 28 + 12 cm-' (0.9640) versus Av = 50 f 59 cm-' (1 -0000)).
Hay, P. J.; Wadt, W. R. J . Chem. Phys. 1985,82,284.
Bergner, A.; Dolg, M.; Kuechle, W.; Stoll, H.; Preuss, H. Mol. Phys. 1983, 80,
143 1.
137 LaJohn, L. A.; Christiansen, P. A.; Ross, R. B.; Atashroo, T.; Ermler, W. C. ./.
Chem. Phys. 1987,87, 2812.
13 8 Basis sets were obtained from the Extensible Computational Chernistry
Environment Basis Set Database, Version 1.0, as developed and distnbuted by the
Molecular Science Computing Facility, Environmental and Molecular Sciences
Laboratory, which is part of the Pacific Northwest Laboratory, P.O. Box 999,
Richland, Washington 99352, U S 4 and fùnded by the U.S. Depanment of Energy.
The Pacific Nonhwest Laboratory is a multi-program laboratory operated by
Battelle Memonal Institute for the U. S. Department of Energy under contract DE-
AC06-76RLO 1830.
139 Reed, A. E.; Weinstock, R. B.; Weinhold, F. J. Chem. Phys. 1985.83, 7 3 5 .
140 Reed, A. E.; Curtiss, L. A.; Weinhold, F. Chem. Rev. 1988, 88, 899.
14 1 Curtiss, L. A; Raghavachari, K.; Redfern, P. C.; Rassolov, V.; Pople, J. A. J. (Ilem.
Phys. 1998, 109,7764.
142 Hariharan, P. C.; Pople, J. A. irheoretica C h . Acm 1973, 28, 2 13.
143 Francl, M. M.; Petro, W. J.; Hehre, W. J.; Binkley, M. S.; Gordon, M. S.; DeFrees,
D. J.; Pople, 1. A. J. Chem. Phys. 1982, 77, 3654.
144 Glukhovtsev, M. N.; Pross, A.; McGrath, M. P.; Radom, L. J. Chem. Phys. 1995,
103, 1878.
145 Su, T.; Bowers, M. T. Inl. J. MassSpec~rom. Ion Phys. 1973, 12,347.
146 Grabowski, J. J.; Bierbaum, V. M.; DePuy, C. H. J. Am. Chem. Soc. 1983, 105,
2565.
147 CRC Ha,~dhook of Cheniisfry and Physics, Rej Data . 761h ed , Lide, D. R., Ed. ;
CRC, Boca Raton, FL, 1995, 9-42/50, 10- 196, 10-202/204, 1 2- 14.
148 Martin, J. D. D. Ph.D. Dissertation, University of Waterloo, 1998.
149 Gong, S. L.; Jervis, R. E. J. Chern. Phys. 1995, 103, 708 1.
150 Zhang, W.; Beglinger, Ch.; Stone, J. A. J. Phys. cher??. 1995, 99, 1 1673.
1 5 1 Norman, K.; McMahon, T. B. J. Am. Chem. Soc. 1997, 118,2449.
152 Dunbar, R. C.; McMahon, T. B.; Tholmann, O.; 'ïomer, D. S.; Salahub, D. R.;
Wei, D. J. Am. Chern. Suc. 1995, 117, 12819.
153 Tholmann, D.; Tonner, D. S.; McMahon, T. B. J. Phys. Chem. 1994, 98,2002.
Sena. M.; Riveros, J. M. Rapid Cornmm Mecs Specfrom. 1994,8, 1 03 1.
Dunbar, R. C. J. Phys. Chem. 1994, 98, 8705.
Glukhovtsev, M. N.; Pross, A.; Radom, L. J. Am- Chem. Soc. 1995, 11 7, 2024.
v. Szeentpaly, L.; Fuentealba, P.; Preuss, H.; Stoll, H. Chem. Phys. Lett. 1982, 93,
555.
Leiniger, T.; Nicklass, A.; Stoll, H.; Dolg, M. Schwerdtfelger, P. J. Chem. Phys.
1996, 105, 1052.
Hu, W. P.; Truhtar, D. G.J. Phys. Chem. 1994, 98, 1049.
Chao, J.; Hall, K. R.; Marsh, K. N.; Wilhoit, J. Chem. Ref: Data 1986, 15, 1369.
East, A. L. L.; Radom, L. J. Chern. Phys. 1997, 106,6655.
Glukhovtsev, M. N.; Pross, A.; Radom, L. J , Am. Chem. Soc. 1996, 118,6273.
Li, C.; Ross, P.; Szulejko, J. E.; McMahon, T. B. J. Am. Chem. Soc. 1996, 118,
9360.
Shimanouchi, T. Tables of Molectrlar Vibrational Frepettcies Consolidaieci
Volume 1; National Bureau of Standards: Washington, DC, 1972; p. 1.
Huisken, F.; Kulcke, A.; Laush, C. Lisy, J. M. J. Chem. Phys. 1991, 95,3924.
Huey, L.G.; Dunlea, E.J.; Howard, C.J. J. Phys. Chem., 1996, 100, 6504.
http://webbook.nist .gov/chemistry/
Good, D. A.; Kamboures, M.; Santiano, R.; Francisco, J. S. J. Phys. Chem. A 1999,
103, 9230.
169 Francisco, J. S. Persona1 communication, 2000.
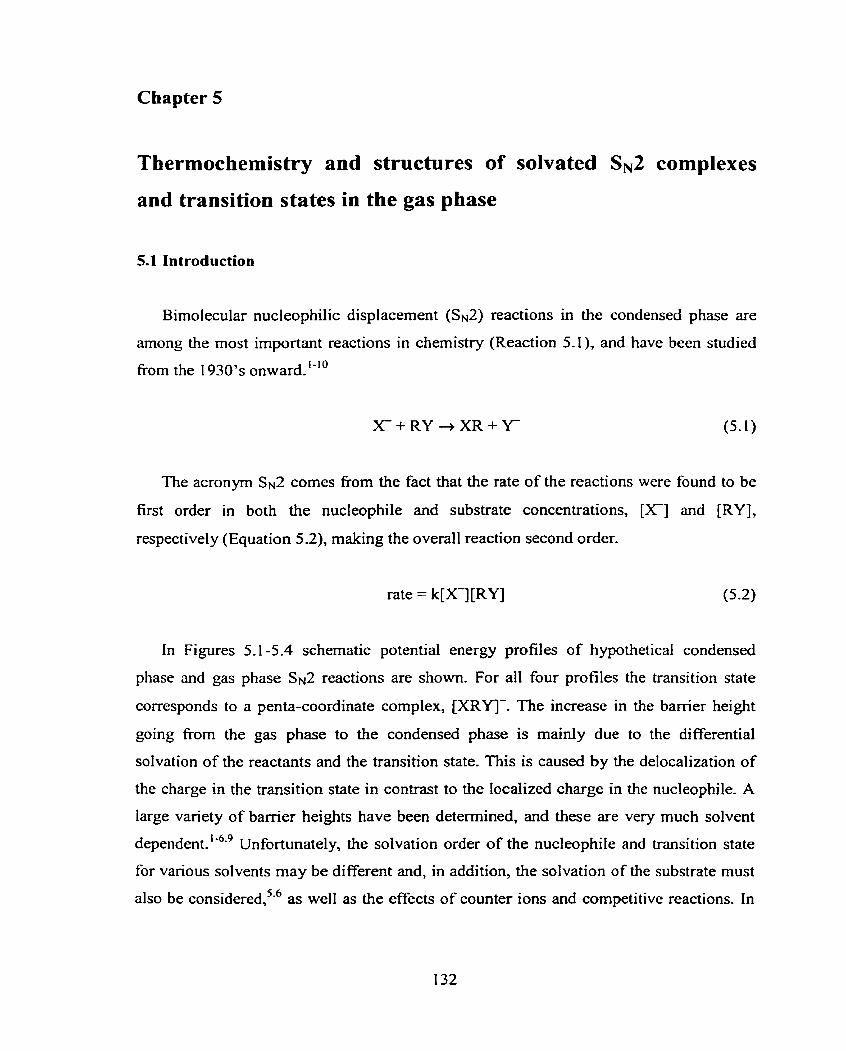
Chapter 5
Thermochemistry and structures of solvated SN2 complexes
and transition states in the gas phase
5.1 Introduction
Bimolecular nucleophilic displacement (SN2) reactions in the condensed phase are
among the most important reactions in chemistry (Reaction 5.1), and have been studied
from the 1930's onward.'-'O
The acronym SN2 comes from the fact that the rate of the reactions were found to be
first order in both the nucleophile and substrate concentrations, [XI and [RY],
respectively (Equation 5.2), making the overall reaction second order.
rate = k [ q [RYJ
In Figures 5.1-5.4 schematic potential energy profiles of hypothetical condensed
phase and gas phase SN2 reactions are shown. For al1 four profiles the transition state
corresponds to a penta-coordinate complex, [XRYI-. The increase in the banier height
going from the gas phase to the condensed phase is mainly due to the differential
solvation of the reactants and the transition state. This is caused by the delocalization of
the charge in the transition state in contrast to the localized charge in the nucleophile. A
large variety of bamer heights have been determined, and these are very much solvent
dependent.'".9 Unfortunately, the solvation order of the nucleophile and transition state
for various solvents may be different and, in addition, the solvation of the substrate must
also be ~onsidered,'.~ as well as the effects of counter ions and cornpetitive reactions. In
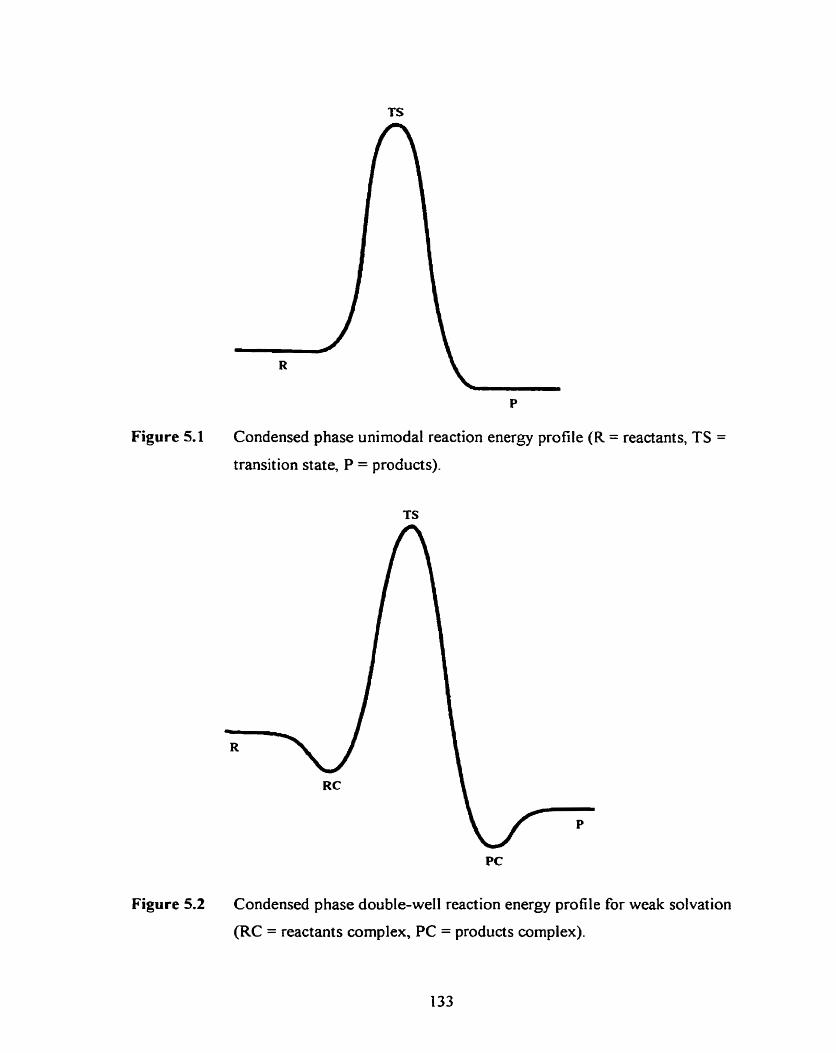
Figure 5.1 Condensed phase unimodal reaction energy profile (R = reactants, TS =
transition state, P = products).
Figure 5.2 Condensed phase double-well reaction energy profile for weak solvation
(RC = reactants complex, PC = products complex).
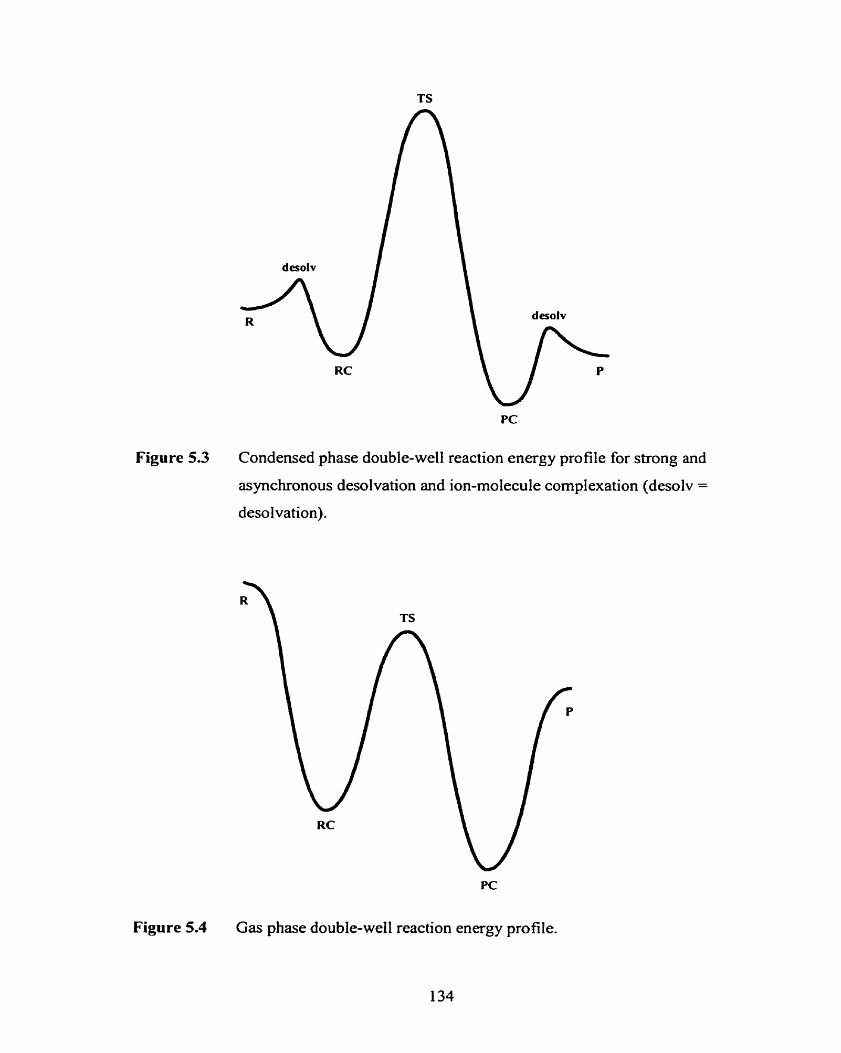
Figure 5.3 Condensed phase double-well reaction energy profile for strong and
asynchronous desolvation and ion-molecule complexation (desolv =
desolvation).
PC
Figure 5.4 Gas phase double-well reaction energy profile.
the condensed phase SNI and E2 reactions may compete with SN2 reactions, and the
extent to which this occurs is very sensitive to the nature of the alkyl group R.
In order to bridge the gap between the gas and condensed phases. micro-solvated SN2
reactions have been performed in the gas phase (Reaction 5.3) using a variety of 1 1-26 experimental techniques. By performing these kinds of experiments one hopes to get
more insights into the intrinsic contribution of the solvent moIecules.
X-(S), + RY -+ Y-(S), + RX + (n-m)S
In Table 5.1 an overview is given of the systems investigated to date. As can be seen,
the main focus has been on obtaining kinetic data, although isotope effects, cross
sections, and product ion distributions were also studied and reported. The main
conclusion of this research is that dramatic effects in the reactivity change can be
observed with the addition of only one solvent molecule, and that most reactions become
too slow to measure with the addition of two or more solvent molecules. With respect to
the product ion distributions, some interesting results have been reported. For most
mono-solvated reactions only a small fraction of the leaving groups are solvated ( ~ ~ ~ ~ ~ i ~ ~ ~.~),11-16.19-22.~.25 even though this reaction pathway is more exothermic than
formation of the unsolvated leaving group (Reaction 5.5).
X-(S) + RY + Y-(S) + RX (5-4)
X-(S) + R Y + Y + RX+ S (5-5)
For higher order solvated nucleophiles (n 2 2), complex formation (Reaction 5.6) and
ligand-switching (Reaction 5.7) become more important. 24 ,îs
X-(S), + RY + M + (S),X-(RY) + M
X-(S), + RY + (S),-, X-(RY) + S
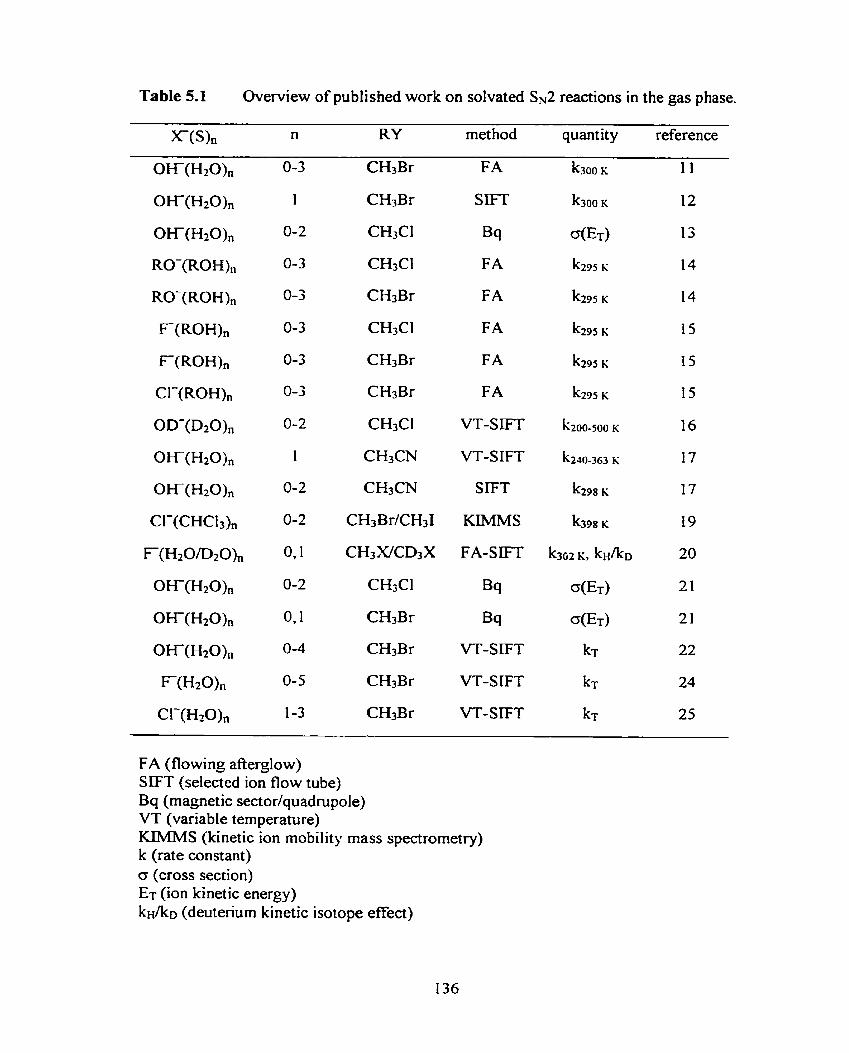
Table 5.1 Overview of published work on solvated SN2 reactions in the gas phase.
ms), n RY method quantity reference
CH3Br FA
SET
Bq
FA
FA
FA
FA
FA
VT-SET
VT-SET
SIFT
KIMMS
F A - S m
Bq
Bq
VT-SIFT
VT-SIFT
VT-SET
FA (flowing afterglow) SIFT (selected ion flow tube] Bq (magnetic sector/quadmpole) VT (variable temperature) KIMMS (kinetic ion mobility mass spectrometry) k (rate constant) O (cross section) ET (ion kinetic energy) k ~ / k ~ (deuterium kinetic isotope effect)
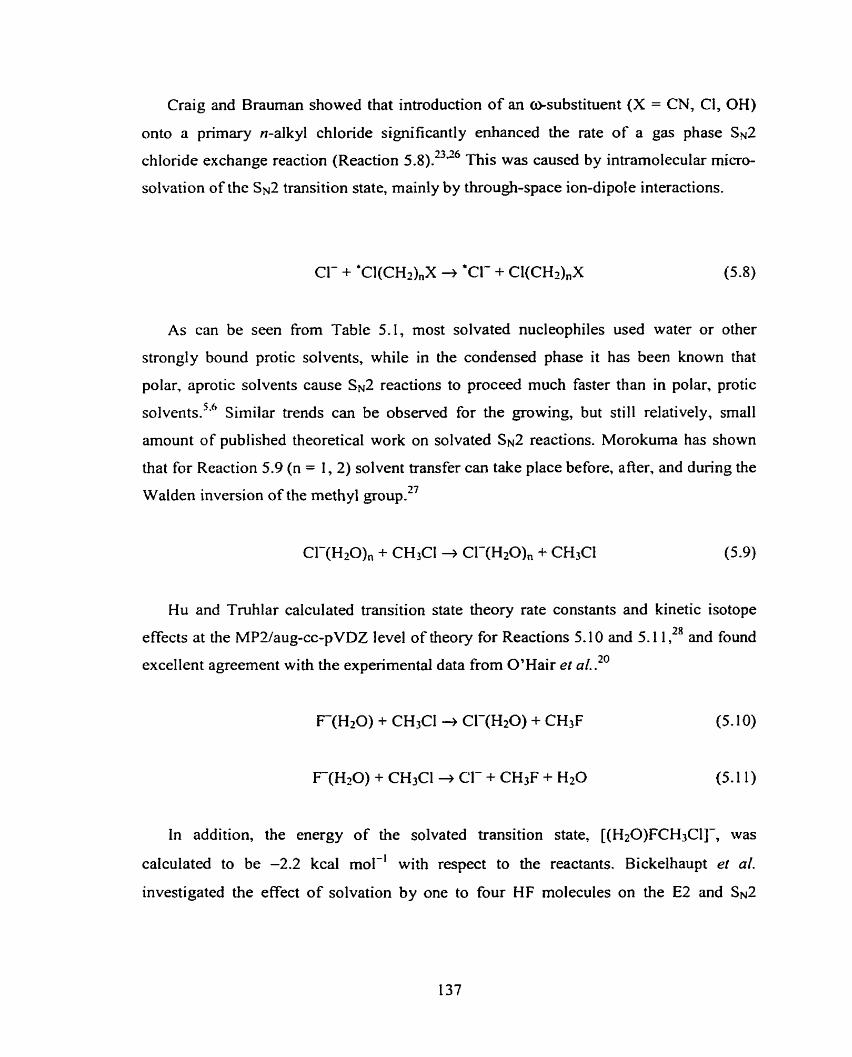
Craig and Brauman showed that introduction of an osubstituent (X = CN, Cl, OH)
ont0 a primary n-alkyl chloride significantly enhanced the rate of a gas phase SN2 23.26 chloride exchange reaction (Reaction 5.8). This was caused by intramolecular rnicro-
solvation of the SN2 transition state, mainly by through-space ion-dipote interactions.
Cl- + *Cl(CH2),,X -t 'Cl- + Cl(CH2).X (5-8)
As can be seen from Table 5.1, most solvated nucleophiles used water or other
strongly bound protic solvents, while in the condensed phase it has been known that
polar, aprotic solvents cause SN2 reactions to proceed much faster than in polar, protic
sol vent^.^.^ Similar trends can be observed for the growing, but still relatively, small
amount of published theoretical work on solvated SN2 reactions. Morokurna has shown
that for Reaction 5.9 (n = 1,2) solvent transfer c m take place before, afier, and during the
Walden inversion of the methyl group.27
Hu and Truhlar calculated transition state theory rate constants and kinetic isotope
effects at the MPZaug-cc-pVDZ level of theory for Reactions 5.10 and 5.1 1 ,28 and found
excellent agreement wi th the experirnental data from O' Hair et al. .*O
F-(H20) + CH3Cl + Cl- + CH3F + H20 (5.1 1)
In addition, the energy of the solvated transition state, [(H20)FCH3C1]-, was
calculated to be -2.2 kcal mol-' with respect to the reactants. Bickelhaupt et al.
investigated the effect of solvation by one to four HF molecules on the E2 and SN2
reaction of F and c ~ H ~ F . ~ ~ The main observation was the increased importance of the
SN2 over the E2 pathway as the number of solvent molecules increased.
Recently, some very interesting articles have been published that reported results on
ab irzitio dynamical computations for solvated SN2 reactions. Tachikawa showed that the
reaction between F-(H20) and CH3CI can proceed through three pathways (Reactions
5.1 2-5. I4), and that the branching ratios are dependent on the centre-of-mass collision
energy .30.3 '
At a collision energy of 10.0 kcal mol-', the branching ratios are 0.55:0.04:0.41,
while at 17.7 and 25.0 kcal mol-' they are 0.46:0.18:0.36 and 0.35:0.43:0.22,
r e ~ ~ e c t i v e l ~ . ~ ' These results show that solvent transfer c m be increased. It was also
shown that solvent transfer only takes place in a very narrow range of the
HO-He-F---CH3Cl angles, thereby explaining why solvent transfer has not been
observed oflen in experiments. Finally, Raugei et a/. reported data on the energy profiles
and stationary points of Reactions 5.15 (n = 0-2)?~
Cl-(HiO), + CH3Br + products (5.15)
Using molecular dynamics (MD) computations they were able to confirm reports by
Seeley et al. on similar reactions?' who observed for both n = 1 and 2 ligand switching
reactions. In addition, for the n = 1 reaction, an activation energy of 2.5 kcal mol-' was
measured, while at the B3LYPl6-3 1 I +G(d,p) level of theory a value of - 1 -9 kcal mol-'
was found. Finally, it is noteworthy that other work on solvated SN2 reactions has been
published, but the main focus was on equilibrium and non-equilibrium solvent effects,
33-38 and kinetic soIvent isotope effects. These important topics will not be discussed here
however.
As can be seen in Figures 5.2 and 5.3 and fiom Reaction 5.6, the solvated SN2
complexes, (S),X-(RY), are intermediates on the potential energy surfaces of SN2
reactions in the condensed phase and in micro-solvated gas phase reactions. Surprisingly,
no experimental themochemical data on these important cluster ions have been
determined to date. As mentioned earlier, most computational data on solvated SN2
reactions used water as a solvent, while it seems more logical to investigate other
practical solvents as well.
In this chapter, a combined PHPMS and computational ab initio study will be
presented to obtain information on the therrnochemistry and structures of solvated SN2
complexes and transition States. Various solvents were investigated to gain more insight
into the intrinsic solvent effects at the microsolvation level. Some of the solvents used in
both the experiments and computations do not have any practical use, but it was expected
that they could nonetheiess provide insight.
AI1 measurements were camied out on a pulsed-ionization high pressure mass
spectrometer, configured around a VG 8-80 mass ~ ~ e c t r o r n e t e r . ~ ~ The instrument,
constructed at the University of Waterloo, has been described in detail in Chapter 2.
Gas mixtures were prepared in a 5 L heated stainless steel reservoir at 350-380 K
using CH4 as a bath gas at pressures of 300-800 Torr. Chloride ion was generated from
trace amounts of CC14 by DEC of themalized electrons from 500 ps pulses of a 2 keV
electron gun beam. Two methods to generate bromide ion were used. Initially bromide
ion was gcncrated h m CBr4 by DEC by injeçting 3 pl of a CBrdC6H6 solution, with
[CBra] = 0.287 M, into the reservoir. The second method to generate bromide ion more
efficiently is by a SN2 reaction between Cl- and n-butyl bromide (Reaction 5.16).
The two alkyl halides ((CH3)zCHCI and (CHp)2CHBr) and the four solvents (CH30H,
CHKN, (CH3)2CO, and CH3CF2H) were added in a variety of relative amounts,
depending on the ion source temperature and the nature of the experïrnent involved. The
ion source pressure and temperature ranged between 4.0-7.5 Torr and 300-380 K,
respective1 y.
Time-intensity profiles of mass selected ions were monitored using a PC based multi-
channel scalar (MCS) data acquisition system, configured at 50-200 ps dwell tirne per
channel over 250 channels. Additive accumulations of ion signals from 1000-2000
electron gun beam pulses were used.
Equilibrium constants (&,) at different absolute temperatures for the various halide
ion-solvent (Reaction 5-17), solvated SN^ (Reaction 5-18), and SN^ cornplex solvation
(Reaction 5.1 9) clustering equilibria are determined from Equations 5.20-5.22,
respectivel y.
In Equations 5 -20-5.22 Int(X-(S))Ant(X), Int((S)X-(RY))/Int(X(S)), and
Int((S)X(RY)) /Int(X(RY)) are the ion intensity ratios of the X ( S ) and X, (S)X(RY)
and X(S), and (S)>C(RY) and X ( R Y ) ions at equilibrium, respectively, PO is the
standard pressure (1 atm), and PS-,,, and PRy-,,, are the partial pressures (in atm)
of the solvent (S) and the SN^ substrate (RY) in the ion source, respectively.
Equil ibrium constants were calculated for various isotope pairs. e.g.
3 5 ~ ~ - ( ~ ) / ( ~ ) 3 5 ~ l - ( ~ 3 S ~ 1 ) and 3 5 ~ ~ - ( ~ ) / ( ~ ) 3 5 ~ ~ - ( ~ 3 7 ~ 1 ) , and 3 S ~ ~ - ( ~ ) / ( ~ ) 3 S ~ l - ( ~ 7 9 ~ r ) and
"CI-(S) / (S)~~CI-(R~'B~) . Only the 7 9 ~ r - ( ~ ) / ( ~ ) 7 9 ~ r - ( ~ 3 5 ~ ~ ) isotope pair was measured.
The equilibrium constants for al1 these isotope pairs need to be corrected for the fact that
the partial pressure of RCI and Fü3r introduced into the reservoir consists of 75% of R~'CI
and 25% R ~ ~ C I , and 50% R ' ~ B ~ and 50% R* 'B~. In addition, one has to correct for the
fact that the peak at the m/z value corresponding to (S)~~CI-(R.'~CI) also contains the
(S)~~CI-(R. '~CI) (50% of the total ion intensity). The peak at the m/z value corresponding
to (S). '~CI-(R~'B~) also contains ( s )~~c I - (R~ 'B~) (25% of the total ion intensity). For the
above mentioned isotope pairs the corrected equilibrium constants are K = (4/3)&bs,
ZKob,, 2&b,, (3/2)kbS, and (4/3)hk, respectively. The equilibrium constants for
Reaction 5.19 do not need to be corrected.
Carbon tetrabromide, iso-propyl bromide and chloride, n-butyl bromide, and 1,l-
difluoroethane were purchased from Aldrich Chemical Company, Inc.. Acetonitrile and
benzene were purchased fiorn BDH. Acetone and rnethanol were purchased from Fisher
Scientific. Carbon tetrachloride was purchased fkom J. T. Baker Chemical Co.. Methane
was purchased from Praxair. Al1 chemicals were used as received.
5.3 Computational
All cornputations were performed using the Gmssiun 98 and 98W suites of
programs. Geometries were optimized using the HF 4' and MPZ(fc) 42 methods in
combination with the 6-3 I +G(d,p) (a) 444 7 basis set. Normal mode vibrational 48-50 frequencies were calculated at the HF level of theory, scaled by 0.8930, while for
some systems the MP2 level o f theory was used, scaled by 0 . 9 0 . ~ ~ Single point energy
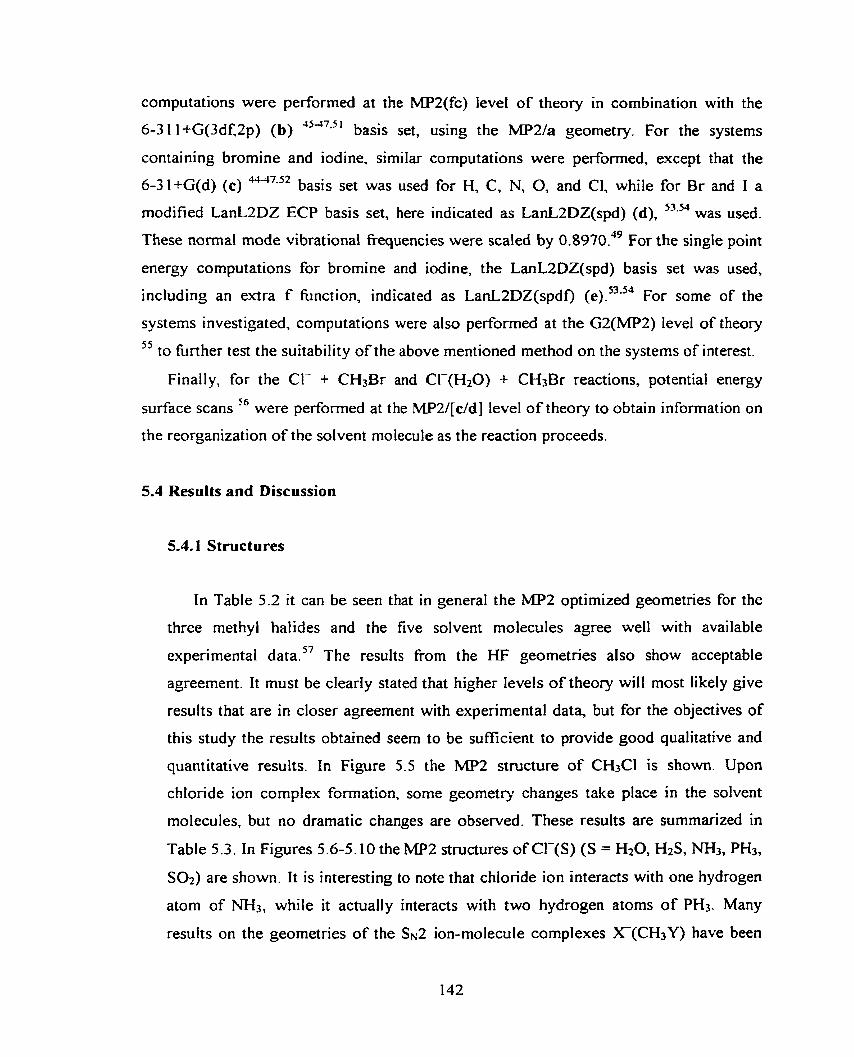
computations were performed at the MP2(fc) level of theory in combination with the
6-3 1 1 +G(3df,2p) (b) 45-"7.5' basis set, using the MP2/a geometry. For the systems
containing bromine and iodine, similar computations were performed, except that the
6-3 1 +G(d) (c) 4447.52 basis set was used for H, C, N, 0, and Cl, while for Br and I a
modified LanL2DZ ECP basis set, here indicated as LanLZDZ(spd) (d), 5334 was used.
These normal mode vibrational fiequencies were scaled by 0.8970.~~ For the single point
energy computations for bromine and iodine, the LanLZDZ(spd) basis set was used,
including an extra f function, indicated as LanLZDZ(spdf) (e)."'4 For some of the
systems investigated, computations were also performed at the G2(MP2) level of theory
5 5 to hrther test the suitability of the above mentioned method on the systems of interest.
Finally, for the Cl- + CH3Br and CI-(H20) + CH3Br reactions, potential energy
surface scans '6 were performed at the MPZ/[e/d] level of theory to obtain information on
the reorganization of the solvent rnoIecule as the reaction proceeds.
5.4 Results and Discussion
5.4.1 Structures
In Table 5.2 it can be seen that in general the MP2 optimized geometries for the
three methyl haiides and the five solvent molecules agree well with available
experimental data?' The results £Yom the HF geometries also show acceptable
agreement. It must be clearly stated that higher levels of theory wili most likely give
results that are in closer agreement with experimental data, but for the objectives of
this study the results obtained seem to be sufficient to provide good qualitative and
quantitative results. In Figure 5.5 the MP2 structure of CH3Cl is shown. Upon
chloride ion complex formation, some geometry changes take place in the solvent
molecules, but no dramatic changes are observed. These results are summarized in
Table 5.3. In Figures 5 -6-5.10 the MP2 structures of CI-(S) (S = H20, HzS, NH3, PH3,
S02) are shown. It is interesting to note that chloride ion interacts with one hydrogen
atom of NH3, while it actually interacts with two hydrogen atoms of PH3. Many
results on the geornetnes of the &2 ion-molecule complexes X-(CH3Y) have been
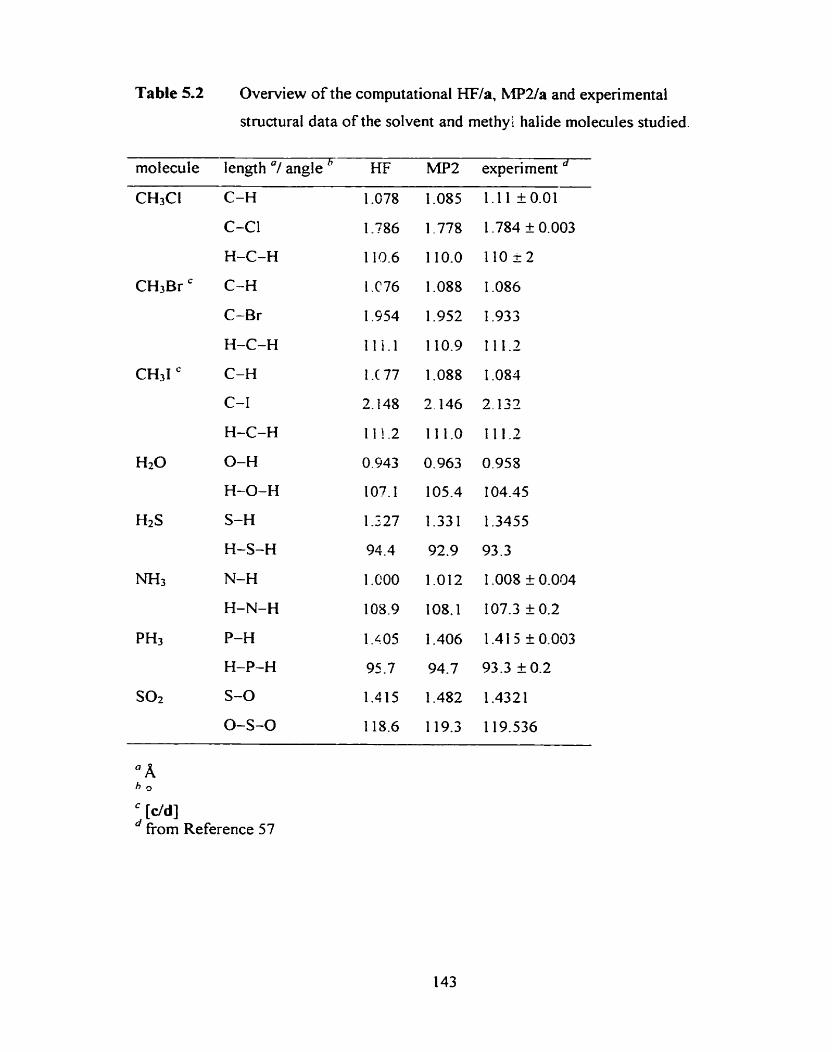
Table 5.2 Overview of the computational HFfa, hlP2fa and expenmental
structura1 data of the solvent and methyi halide molecules studied.
molecule length "1 angle HF MP2 experïment
C-H
C-Cl
H-C-H
C-H
C-Br
H-C-H
C-H
C-1
H-C-H
O-H
H-O-H
S-H
H-S-H
N-H
H-N-H
P-H
H-P-H
S-O
0-S-O
1.678
1 .?86
1 10.6
1 .C76
1.954
1 1 i.1
1 .( 77
2.148
1 1 1.2
0.943
1 O?. 1
1-3-27
94.4
1 .CO0
108.9
1 .LOS
95.7
1.415
118.6
" A h 9
= WdI d fiom Reference 57
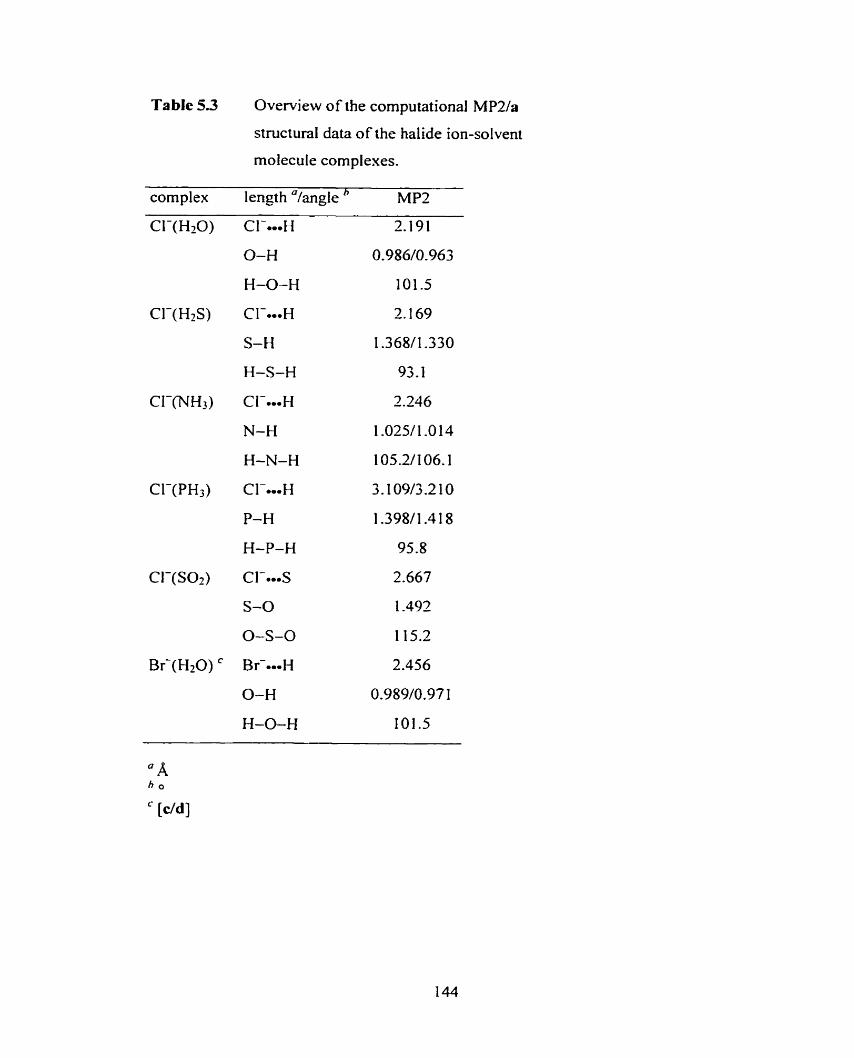
Table 53 Overview o f the cornputational MP2la
structural data of the halide ion-solvent
rnolecule complexes.
complex length =/angle " MP2
CI-a--H
O-H
H-O-H
C 1-0-H
S-H
H-S-H
C I-.--H
N-H
H-N-H
CI-*-OH
P-H
H-P-H
CI-...S
S-O
O-S-O
Brb(H20) Br-.-.H 2.456
O-H 0.989/0.97 1
H-O-H 101.5
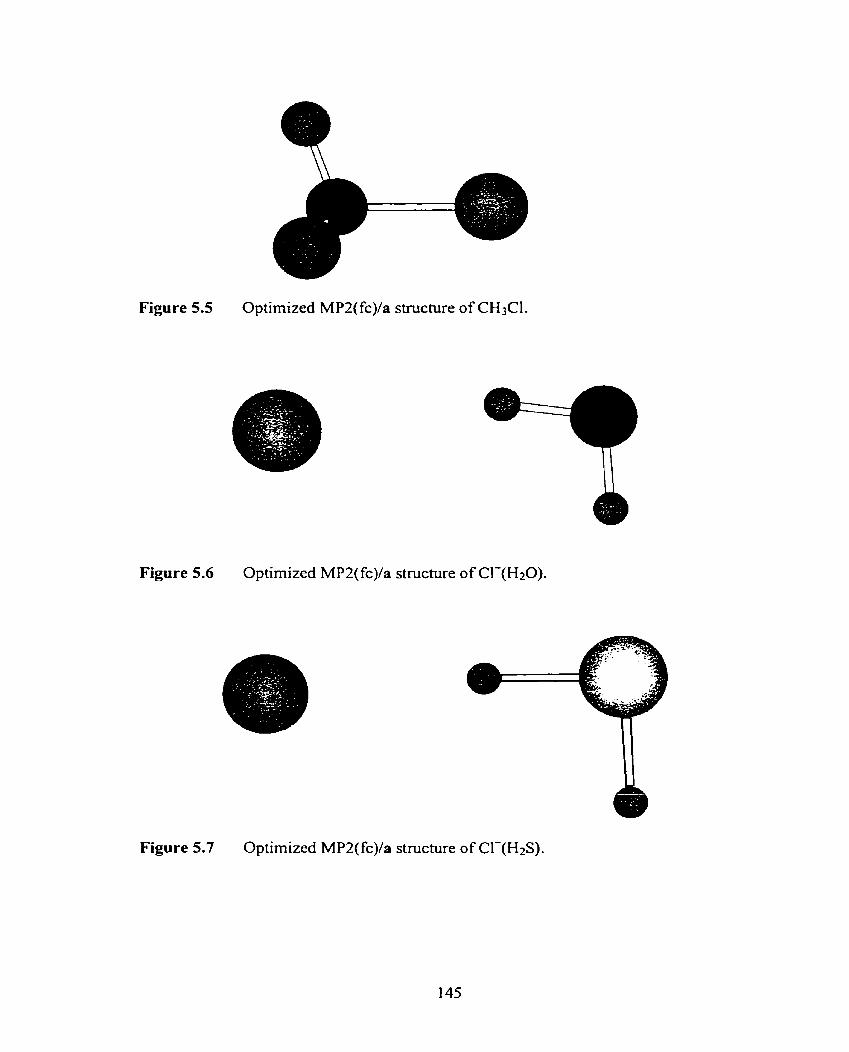
Figure 5.5 Optimized MP2(fc)/a structure of CH3Cl.
Figure 5.6 Optimized MP2(fc)/a structure of CI-(H20).
Figure 5.7 Optimized MP2(fc)/a structure of Cl-(H2S).
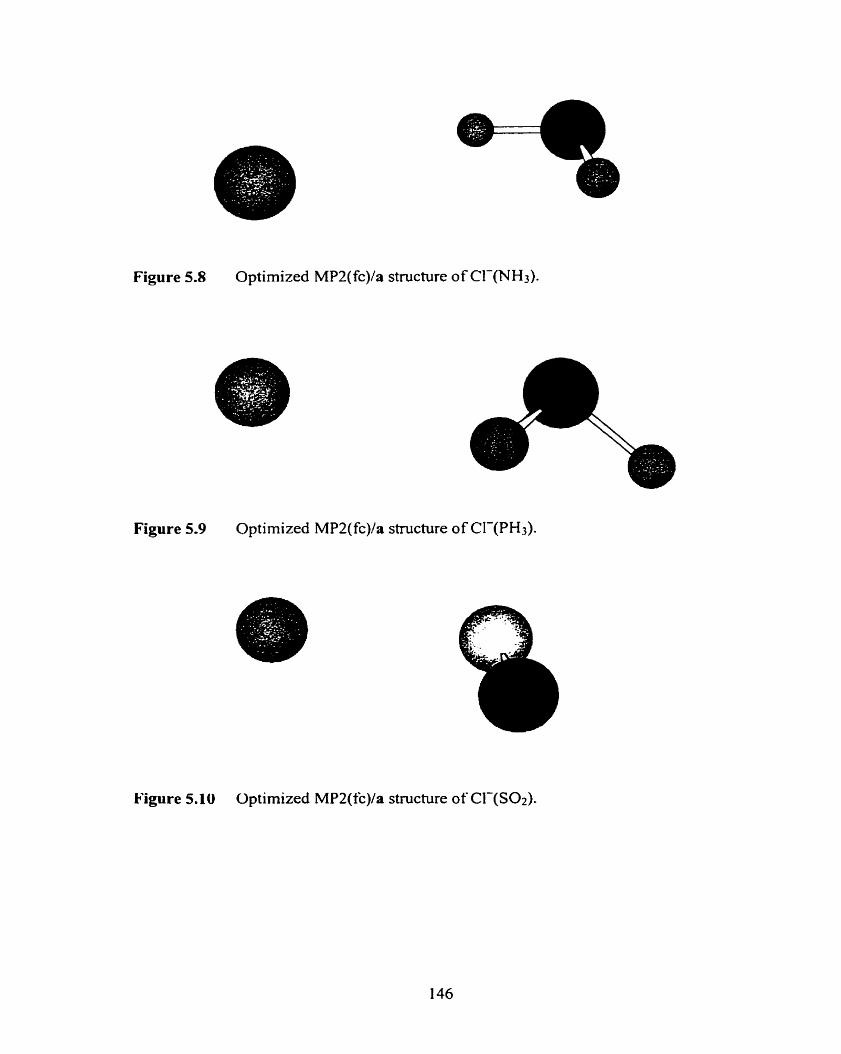
Figure 5.8 Optimized MP2(fc)/a structure of Cl-(NH3).
Figure 5.9 Optimized MP2(fc)/a structure of Cl-(PH3).
Figure 5.10 Optimized MP2(fc)/a structure of CI-(S02).
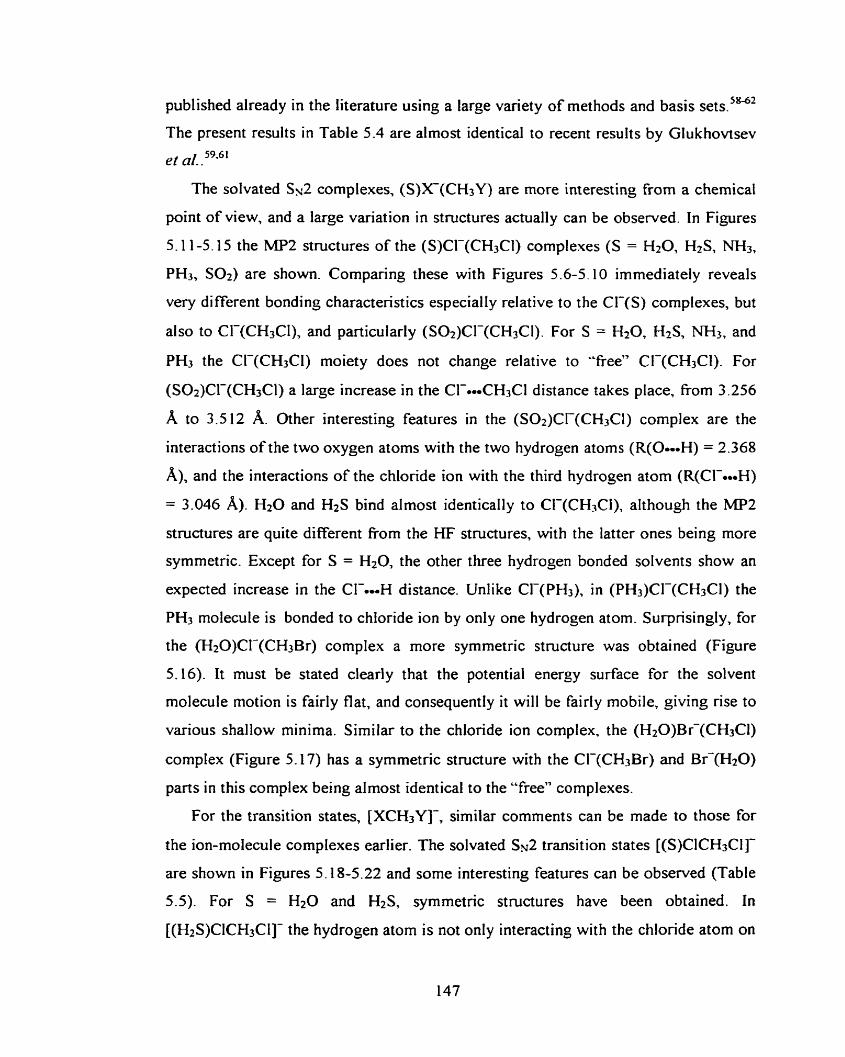
published already in the literature using a large variety of methods and basis sets. 5802
The present results in Table 5.4 are almost identical to recent results by Glukhovtsev
et a/. .59.61
The solvated SN^ complexes, (S)X(CH3Y) are more interesting from a chernical
point of view, and a large variation in structures actually can be observed. In Figures
5.1 1-5.15 the MP2 structures of the (S)Cl-(CH3Cl) complexes (S = H20, HzS, NH3,
PH3, S02) are shown. Cornparhg these with Figures 5.6-5.10 immediately reveals
very di fferent bondinç characteristics especially relative to the CI-(S) compIexes, but
also to Cl-(CH,CI), and particularly (S02)CI-(CH3CI). For S = HlO, HzS, N H 3 , and
PH3 the Cl-(CH3CI) moiety does not change relative to "free" CI-(CH3Cl). For
(S02)Cl-(CH3Cl) a large increase in the CL.CH3CI distance takes pIace, fiom 3.256
A to 3.512 A. Other interesting features in the (S02)CI-(CH3CI) cornplex are the
interactions of the two oxygen atoms with the two hydrogen atoms (R(0-H) = 2.368
A), and the interactions of the chloride ion with the third hydrogen atom (R(C1--OH)
= 3.046 A). H 2 0 and H2S bind almost identically to CI-(CHJCi), although the MP2
structures are quite different fiom the HF structures, with the latter ones being more
symmetric. Except for S = H20, the other three hydrogen bonded solvents show an
expected increase in the CI--*H distance. Unlike CI-(PH3), in (PH3)CI-(CH3Cl) the
PH3 molecule is bonded to chloride ion by only one hydrogen atom. Surprisingly, for
the (H20)CId(CH3Br) complex a more symmetric structure was obtained (Figure
5.16). It must be stated clearl y that the potential energy surface for the solvent
molecule motion is fairly flat, and consequently it will be fair1y mobile, giving rise to
various shallow minima. Similar to the chloride ion cornplex, the (H20)Br-(CH3CI)
complex (Figure 5.17) has a symmetric structure with the Cl-(CH3Br) and BrA(H2O)
parts in this cornplex being almost identical to the "free" complexes.
For the transition states, [XCH3Y]-, similar comments can be made to those for
the ion-molecule complexes earlier. The solvated SN^ transition states [(S)CICH3CIJ-
are shown in Figures 5.1 8-5.22 and some interesting features can be observed (Table
5.5). For S = Hz0 and H2S, symmetric structures have been obtained. In
[(H2S)CICH3Cl]- the hydrogen atom is not only interacting with the chloride atom on
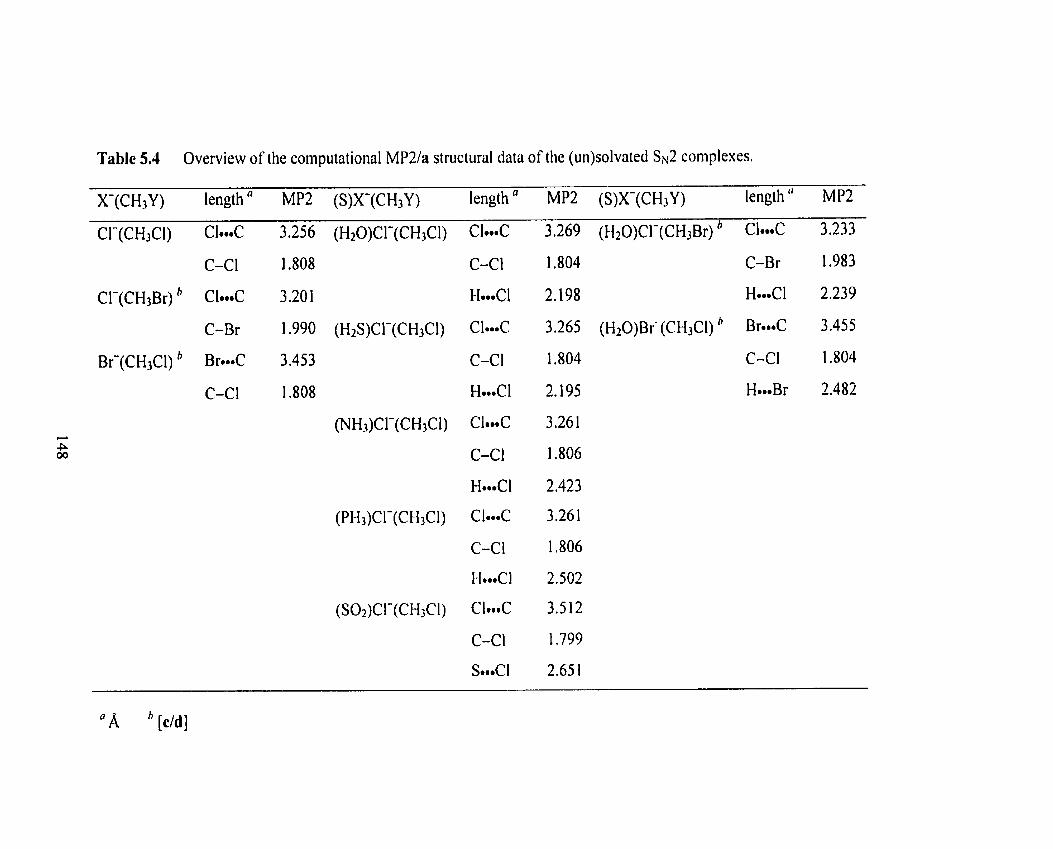
Table 5.4 Overview of the computational MP2/a structural data of the (un)solvated $42 coniplexes.
X-(CH3Y) length ' MP2 (S)X-(CH3Y) length MP2 (S)X-(CH3Y) length '' MP2
C-CI
Cl.0.C
C-CI
kI...Cl
Cl*-c
C-CI
H.*.CI
C1.d
C-CI
H-.Cl
CI...C
C-CI
II...CI
CI...C
C-Cl
S...CI
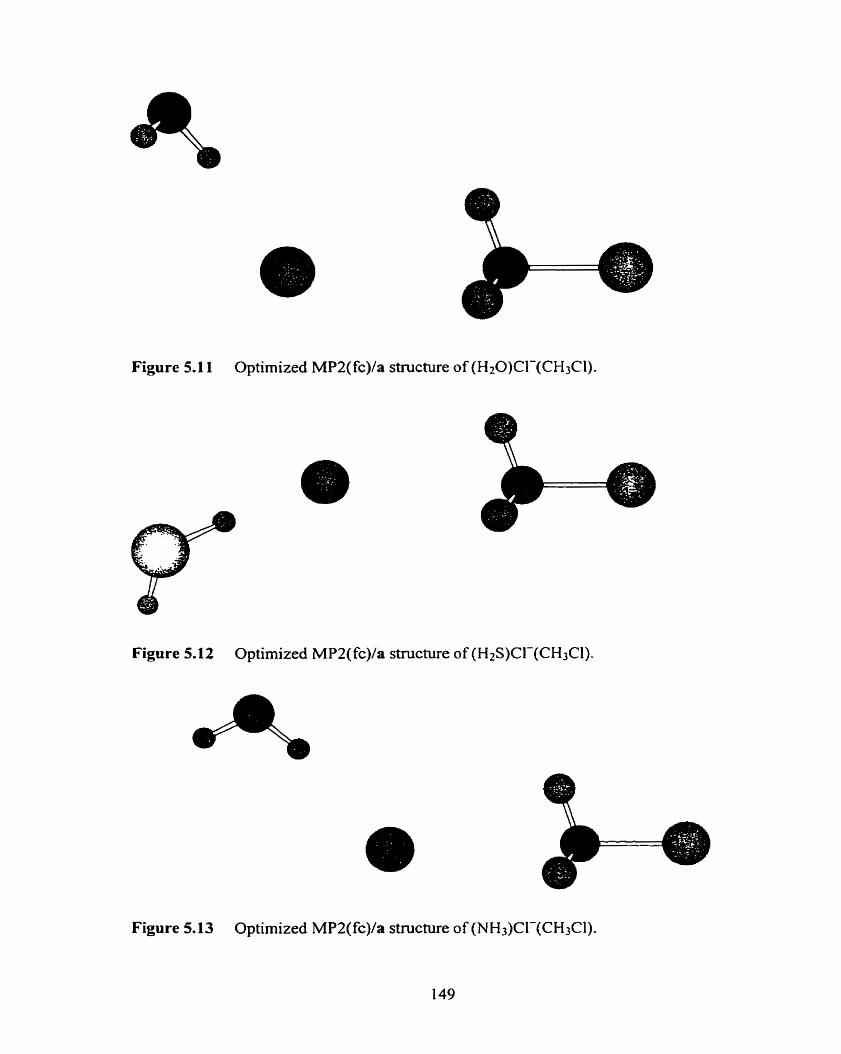
Figure 5.1 1 Optimized MP2(fc)/a structure of (H20)CI-(CH3CI).
Figure 5.12 Optimized MPZ(fc)la structure of (H2S)Cl-(CH3Cl).
Figure 5.13 Optimized MP2(fc)/a structure of (NH3)CI-(CH3CI).
149
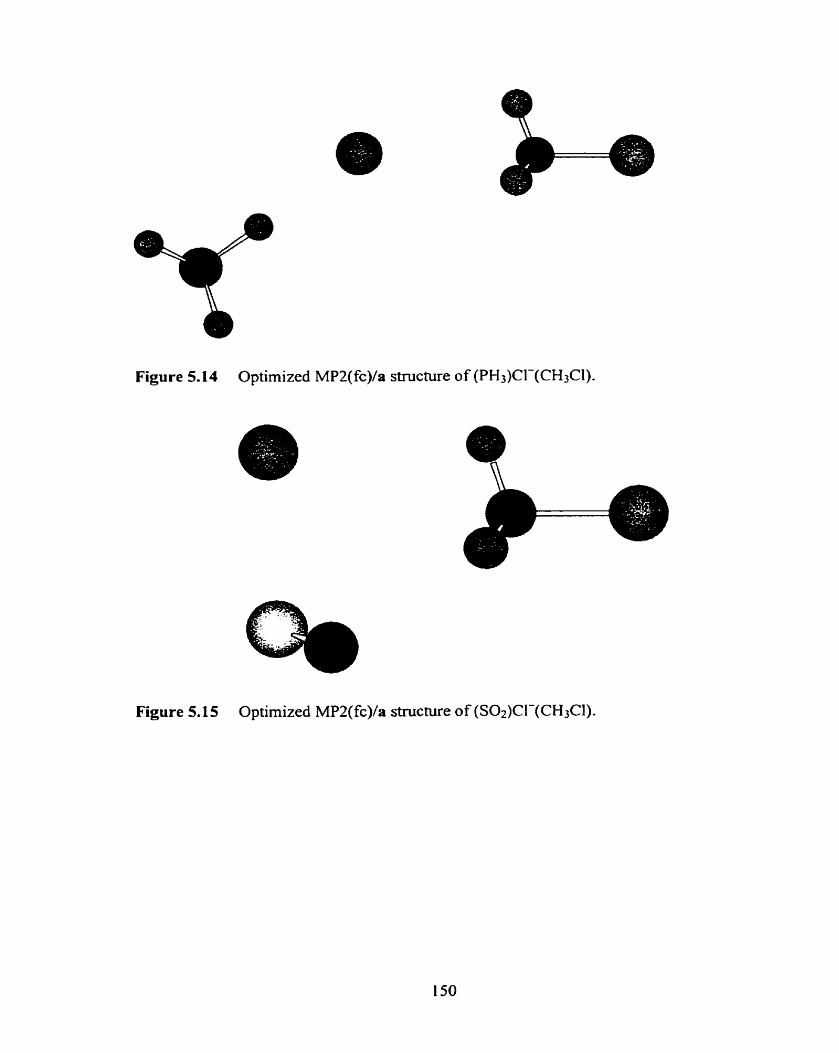
Figure 5.14 Optimized MPZ(fc)/a structure of (PH3)Cl-(CH3CI).
Figure 5.15 Optimized MPZ(fc)/a structure of (SO2)C1-(CH3Cl).
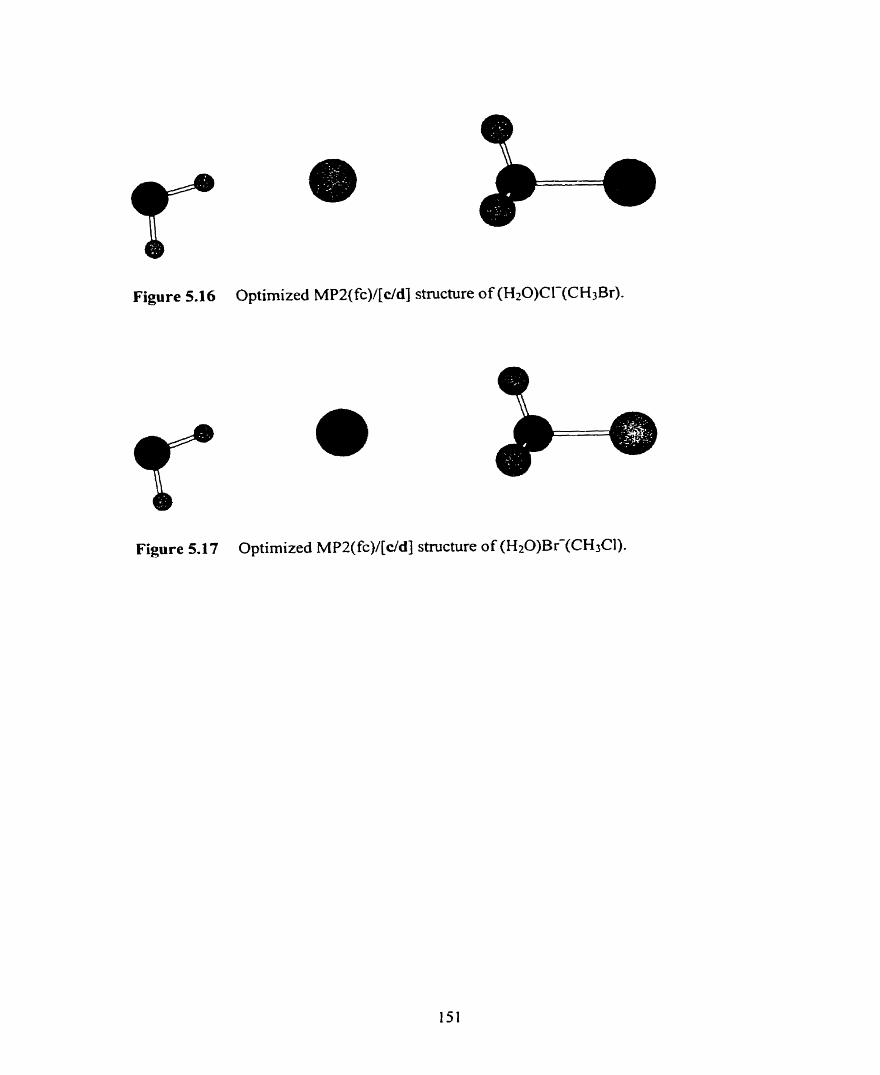
Figure 5.1 6 Optimized MPZ(fc)/[dd] smicture of (H20)Cl-(CH3Br).
Figure 5.17 Optimized MPZ(fc)/[c/d] structure of (H20)Br-(CH3CI).
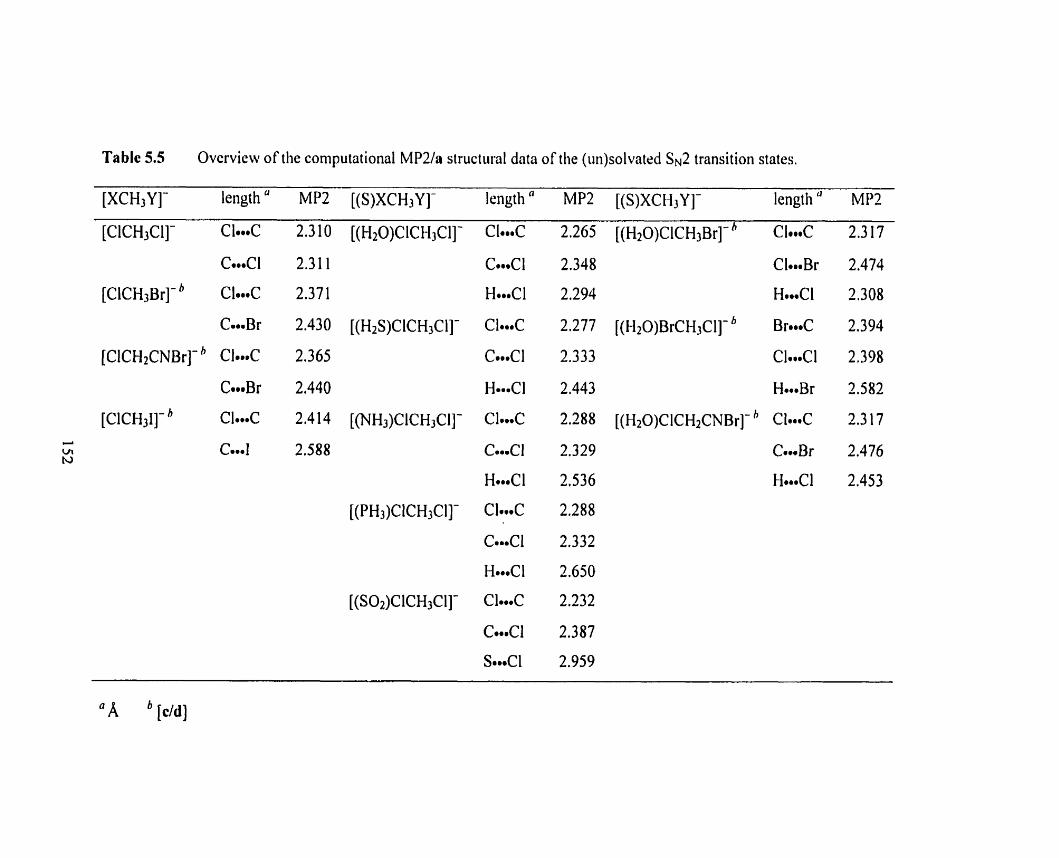
Table 5.5 Overview of the computational M P 2 h structuml data of the (un)solvated $42 transition States.
[XCH3Y]- length " MP2 [(S)XCHIY]- length " MP2 [(S)XCH3Y]- length " MP2
[ClCH3Cl]- Cl-mC 2.3 10 [(H20)ClCH3Cl]- Cl-C 2.265 [(H~o)cIcH~B~]- "1.e.~ 2.3 17
CO-CI 2.311 C d 1 2.348 Cl-Br 2.474
[ C I C H ~ B ~ I - C L C 2.37 1 He-Cl 2.294 HmCl 2.308
Cm-Br 2.430 [(H2S)ClCH3CI]- CI-C 2.277 [ (H~o)B~cH~c~] - Br@-C 2.394
[CICH~CNB~I- ' CI& 2.365 C&l 2.333 Cl-*Cl 2,398
CmmnBr 2.440 HmmmCI 2.443 He-Br 2.582
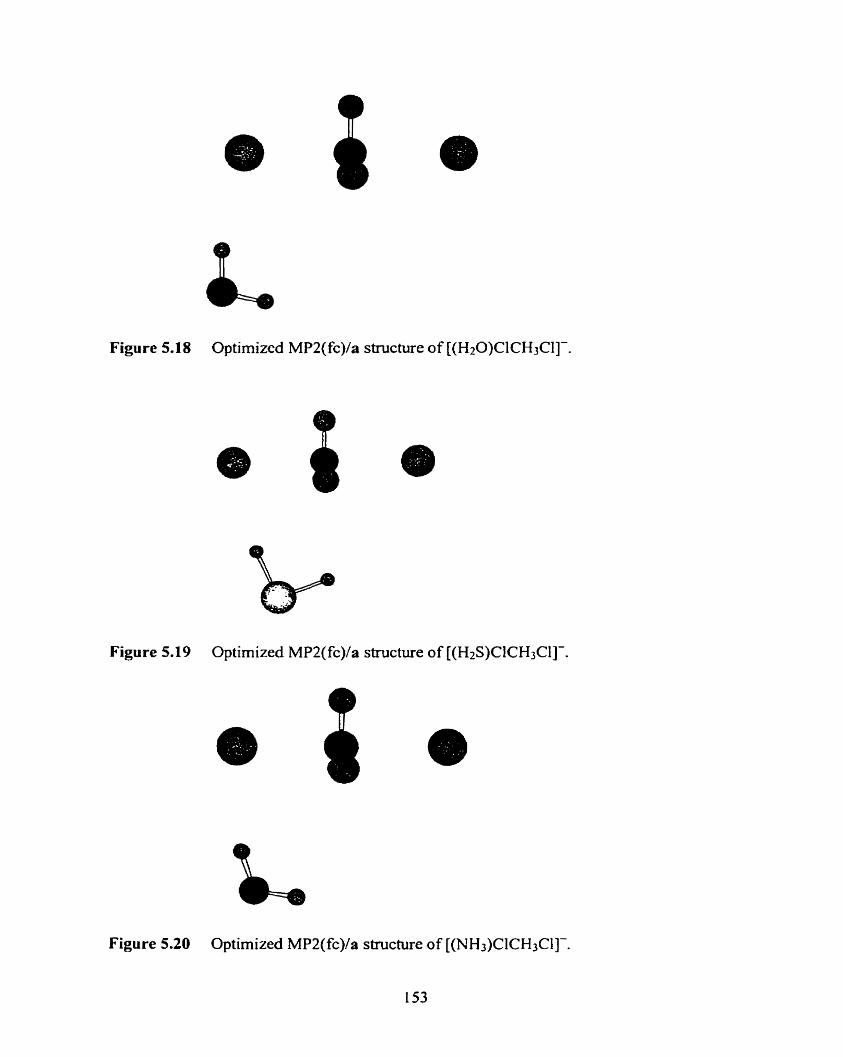
Figure 5.18 Optimized MPZ(fc)/a structure of [(H20)ClCH3Cl]-.
Figure 5.19 Optirnized MP2(fc)/a structure of [(H2S)CICH3Cl]-.
Figure 5.20 Optimized MPZ(fc)/a structure of [(NH3)C1CH3CI]-.
153
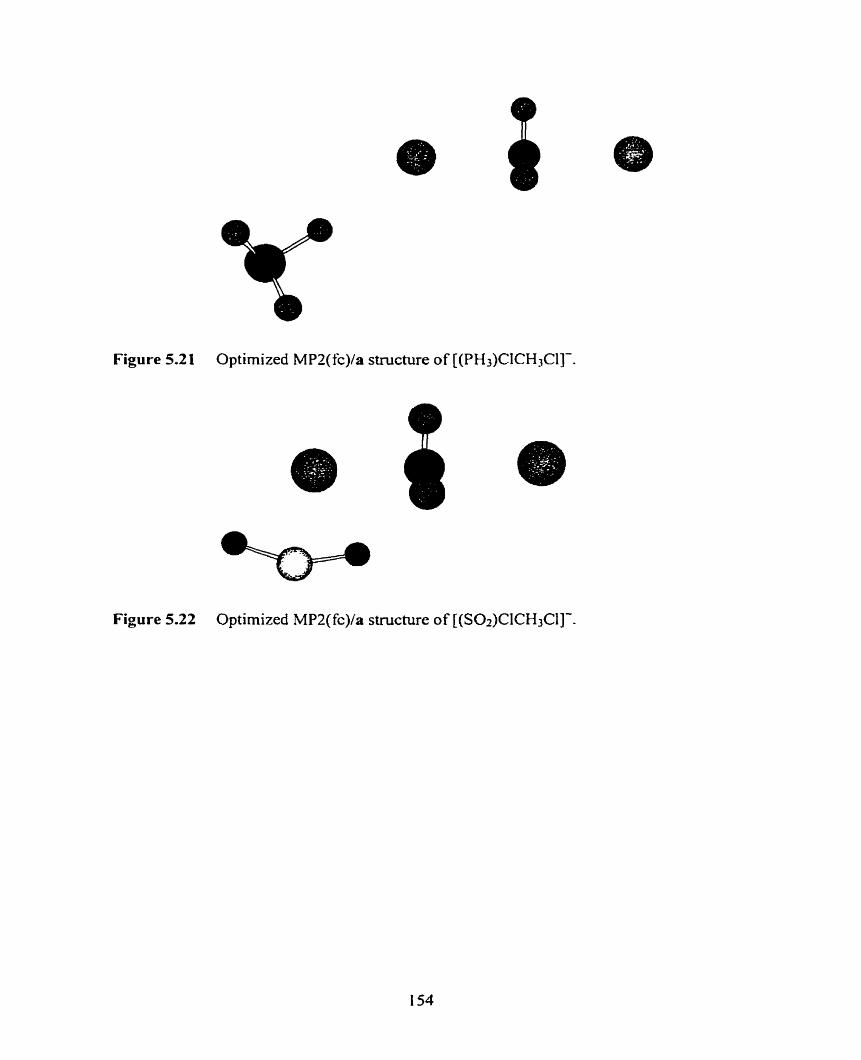
Figure 5.2 1 Optimized MPZ( fc)/a structure of [(PH3)CICH3Cl]-.
Figure 5.22 Optirnized MP2(fc)/a structure of [(S02)ClCH,CI]-.
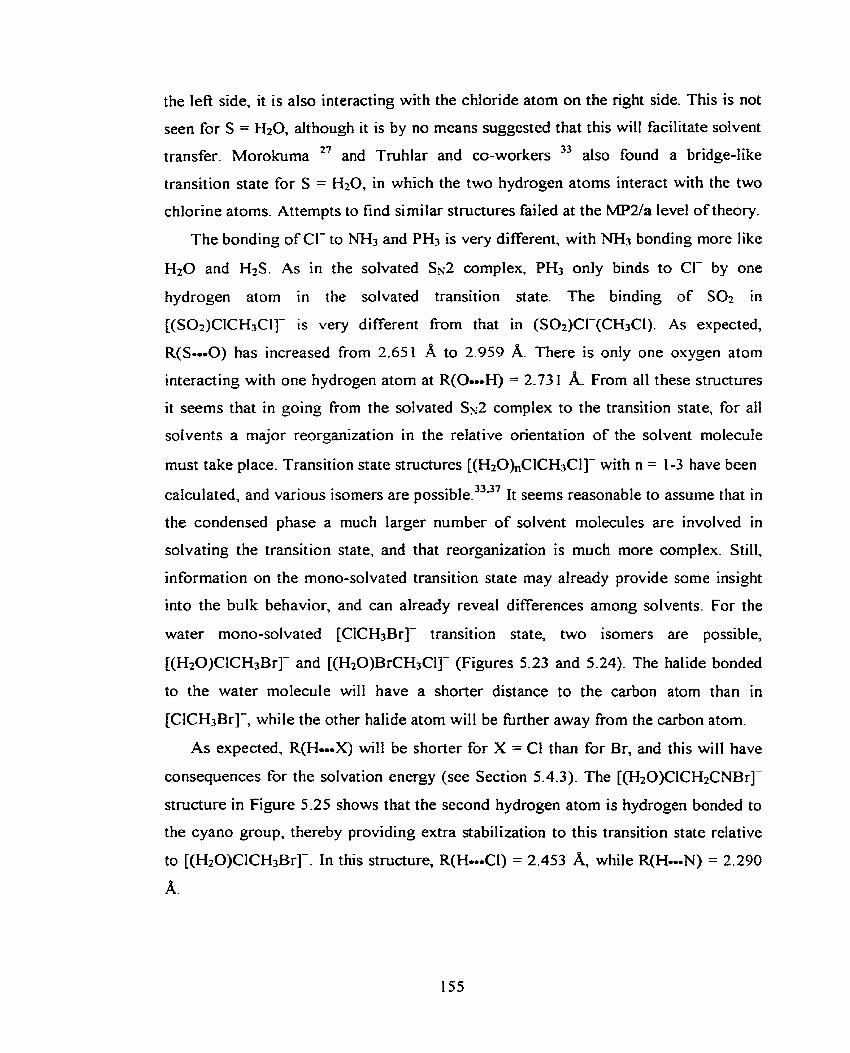
the left side, it is also interacting with the chloride atom on the nght side. This is not
seen for S = HtO, although it is by no means suggested that this will facilitate solvent 27 transfer. Morokuma and Truhlar and CO-workers 33 also found a bridge-like
transition state for S = H20, in which the two hydrogen atoms interact with the two
chlorine atoms. Attempts to find similar structures failed at the MP2Ia level of theory.
The bonding of Cl- to NH3 and PH3 is very different, with NH3 bonding more like
HtO and H2S. As in the solvated SN^ complex, PH3 only binds to Cl- by one
hydrogen atom in the solvated transition state. The binding of S 0 2 in
[(S02)CICH3CIJ- is very di fferent from that in (S0t)Cl-(CH3CI). As expected,
R(S-O) has increased from 2.65 1 A to 2.959 A. There is only one oxygen atom
interacting with one hydrogen atom at R(0.-H) = 2.73 1 A. From al1 these structures
it seems that in going from the solvated Sx2 complex to the transition state, for al1
solvents a major reorganization in the relative orientation of the solvent molecule
must take place. Transition state structures [(H20hClCH3CI]- with n = 1-3 have been 33.37 calculated, and various isomers are possible. It seems reasonable to assume that in
the condensed phase a much larger number of solvent molecules are involved in
solvating the transition state, and that reorganization is much more complex. Still,
information on the mono-solvated transition state may already provide some insight
into the bulk behavior, and c m already reveal differences among solvents. For the
water mono-solvated [CICH3Br]- transition state, two isomers are possible,
[(H20)CICH3Br]- and [(H20)BrCH3CI]- (Figures 5.23 and 5.24). The halide bonded
to the water molecule will have a shorter distance to the carbon atom than in
[ClCH3Br]-, while the other halide atom will be fùrther away from the carbon atom.
As expected, R(H-X) wi l l be shorter for X = Cl than for Br, and this will have
consequences for the solvation energy (see Section 5.4.3). The [(HzO)CICH~CNB~]-
structure in Figure 5.25 shows that the second hydrogen atom is hydrogen bonded to
the cyano group, thereby providing extra stabilization to this transition state relative
to [(H20)CICH3Br]-. In this structure, R(H-CI) = 2.453 while R(H..=N) = 2.290
A.
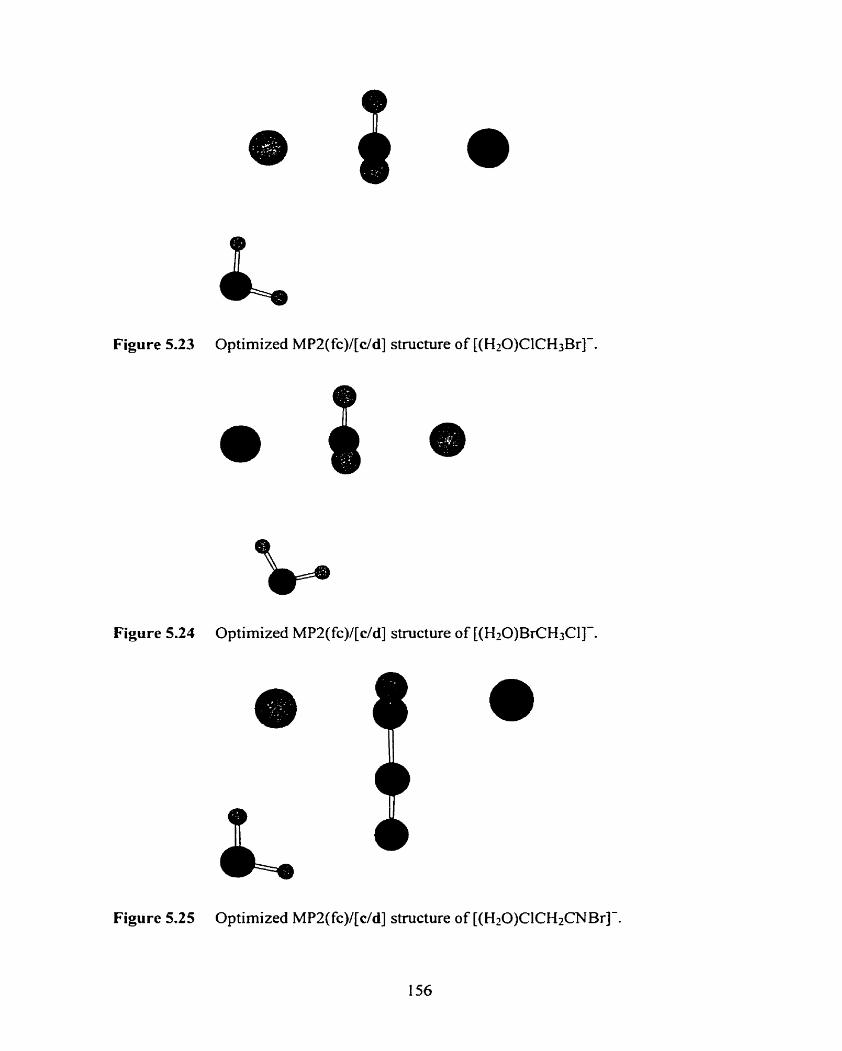
Figure 5.23 Optimized MP2(fc)/[c/d] structure of [(H20)ClCH3Br]-.
Figure 5.24 Optirnized MPZ(fc)/[c/d] structure of [(H20)BrCbCI]-.
Figure 5.25 Optimized MPZ(fc)/[c/d] structure of [(H20)ClCH2CNBr]-.
Finally, it must be mentioned that increasing the number of solvent molecules will
provide more and perhaps new insights into the cooperative bonding of the solvents
in the ion-molecule complexes and transition States.
5.4.2 Experimental Thermochemistry
In Tables 56-59 the experirnental PHPMS thermochemistry from this work on
solvated Sx2 complexes together with available literature values are shown. The
corresponding Van't Hoff plots of the systems measured for this study are shown in
Figures 5.26-5.3 5.
Li el d rneasured the well-depths and some transition state energies for a large
number of Ss2 reactions by P H P M S , ~ ~ and some of these data are shown in Table 5.6.
As already mentioned in Section 5.2, there are two different reactions that can take
place that give the solvated SN2 cornpIex (S)X(RY), Reaction 3 and 4. In Figure
5.36, a thermochemical cycle is shown for the formation of the (S)X(RY) complex
fiom X, RY, and S. The data in Tables 5.6-5.9 in general show good agreement with
what might be expected based on the data from Table 5.6. Some systems show some
unexpected -AH' and -AS' values, and a reason for this cannot be given. It seerns
unlikely that this is due to some unusual structural change. The AH' values for the
bromide ion containing SN2 complexes, (S)Br-((CHa)zCHCI), are calculated from
measured ~ ~ ' 3 0 0 values and an estimated AS' value, -18.0 cal mol-' K-', based on
AS' values from Tables 5.7 and 5.8. The general conclusions from these experiments
is that Reactions 5.18 and 5.19 indeed have different thermochemistry, and that at the
mono-solvated level intrinsic solvent effects are already present and observable.
5.4.3 Computational Thermochemistry
In Table 5.10, the computational thermochemistry for a large variety of halide
ion-solvent molecule and SN2 substrate clustering equilibria, together with available 64 experimental data are shown. In general, the agreement between ~ ~ ~ 2 9 8 values
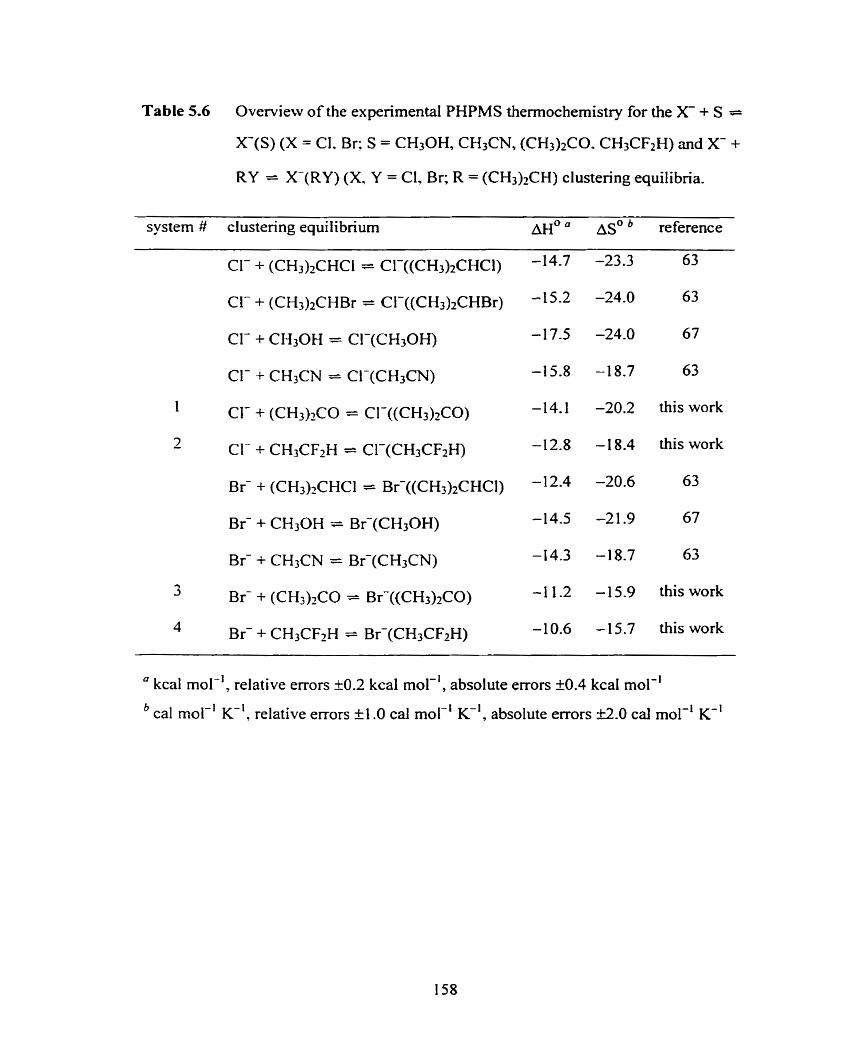
Table 5.6 Overview of the experimental PHPMS themochemistry for the X + S =
X-(S) (X = Cl. Br: S = CH30H, CH3CN, (CH3)2C0. CH3CF2H) and X- +
RY -- X-(RY) (X. Y = Cl, Br; R = (CH3)?CH) clustenng equilibria.
system # clustering equilibrium AH0 a AS' reference
CI- + (CH3)2CHCl = Cl-((CH3)2CHCI)
Cl- + (CH3)2CHBr = CI-((CH3)2CHBr)
Cl- + CH30H = Cl-(CH30H)
Cl- + CH3CN = CI-(CW3CN)
1 Cl- + (CH3)2C0 = Cl-((CH3)2CO)
2 Cl- + CH3CFfi = Cl-(CH3CF2H)
B r + (CH3)?CHC1 = Br-((CH3)2CHCI)
Br- + CH30H = Br-(CH30H)
B r + CH3CN = Br-(CH3CN)
3 Br- + (CH;)?CO = Bi((CH3)2CO)
4 Br- + CH3CF2H = Br-(CH3CF2H)
63
67
63
this work
this work
63
67
63
this work
this work
" kcal mol-', relative errors k0.2 kcal mol-', absolute errors k0.4 kcal mol-'
cal mol-' K-', relative errors +I .O cal mol-' K-', absolute enors f2.O cal mol-' K-'
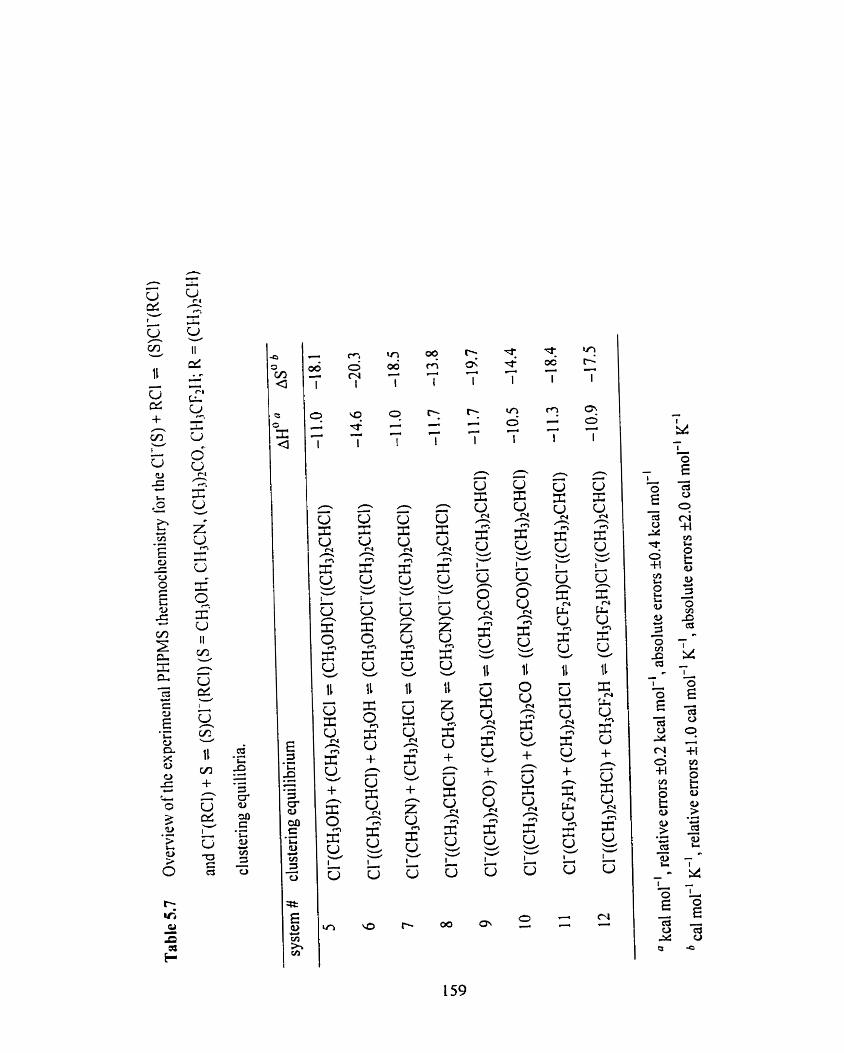
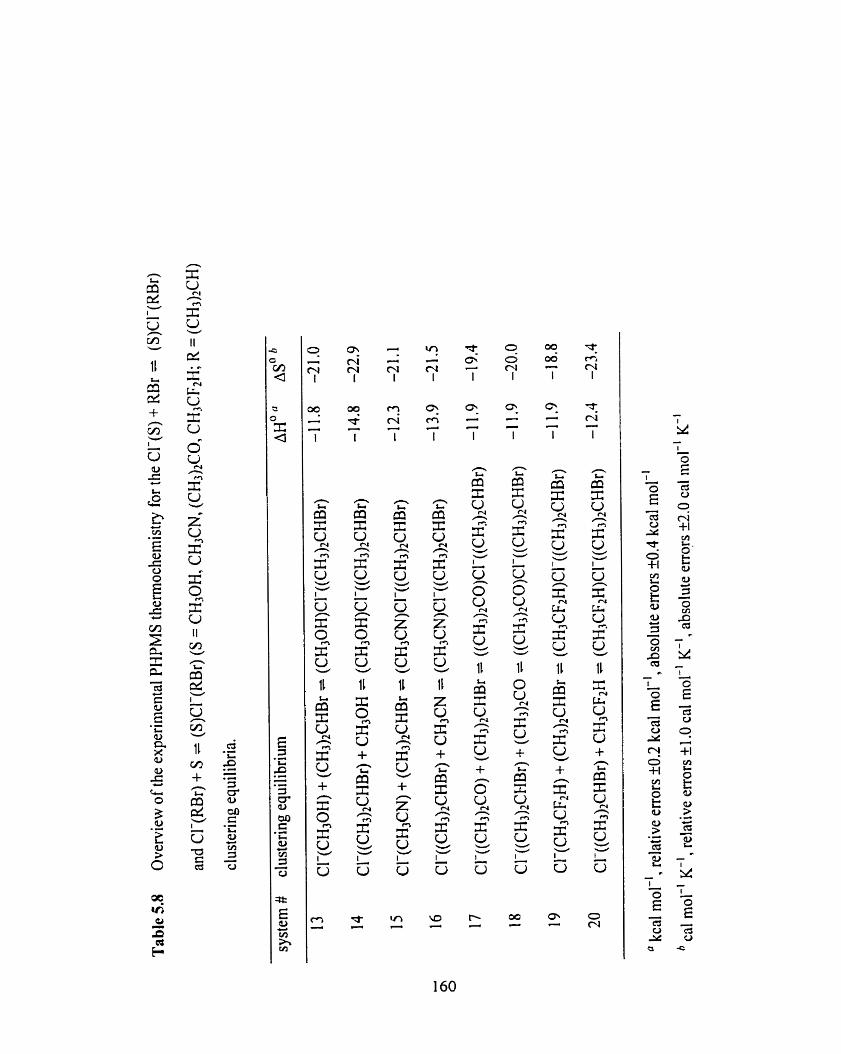
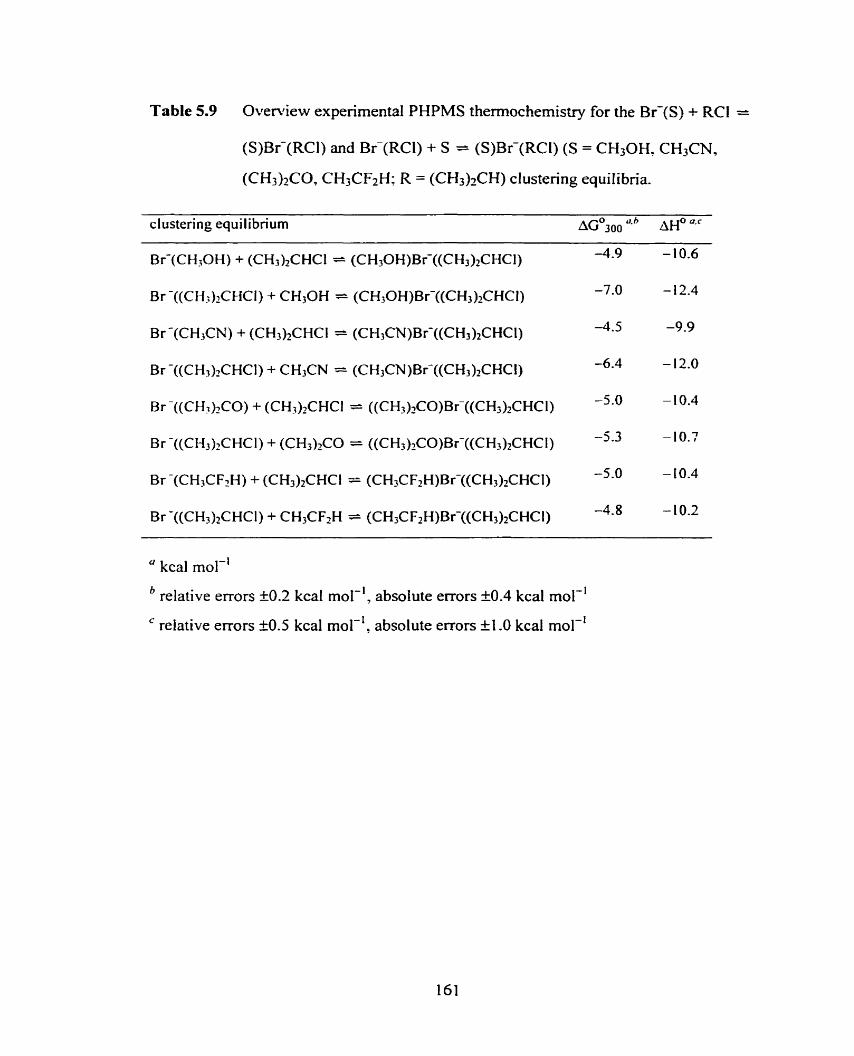
Table 5.9 OvenTiew experirnental PHPMS thermochemistry for the Br-(S) + RCI =
(S)Br-(RCl) and Br-(RCI) + S = (S)Br-(RCI) (S = CH30H, CH3CN,
(CH3)2C0, CH3CF2H: R = (CH3)~CH) clustering equilibria.
clustering equilibrium AG^^^^ AH'
" kcal mol-'
relative errors k0.2 kcal mol-', absolute errors f 0.4 kcal mol-'
relative errors f 0.5 kcal molAL, absolute errors il .O kcal mol-'
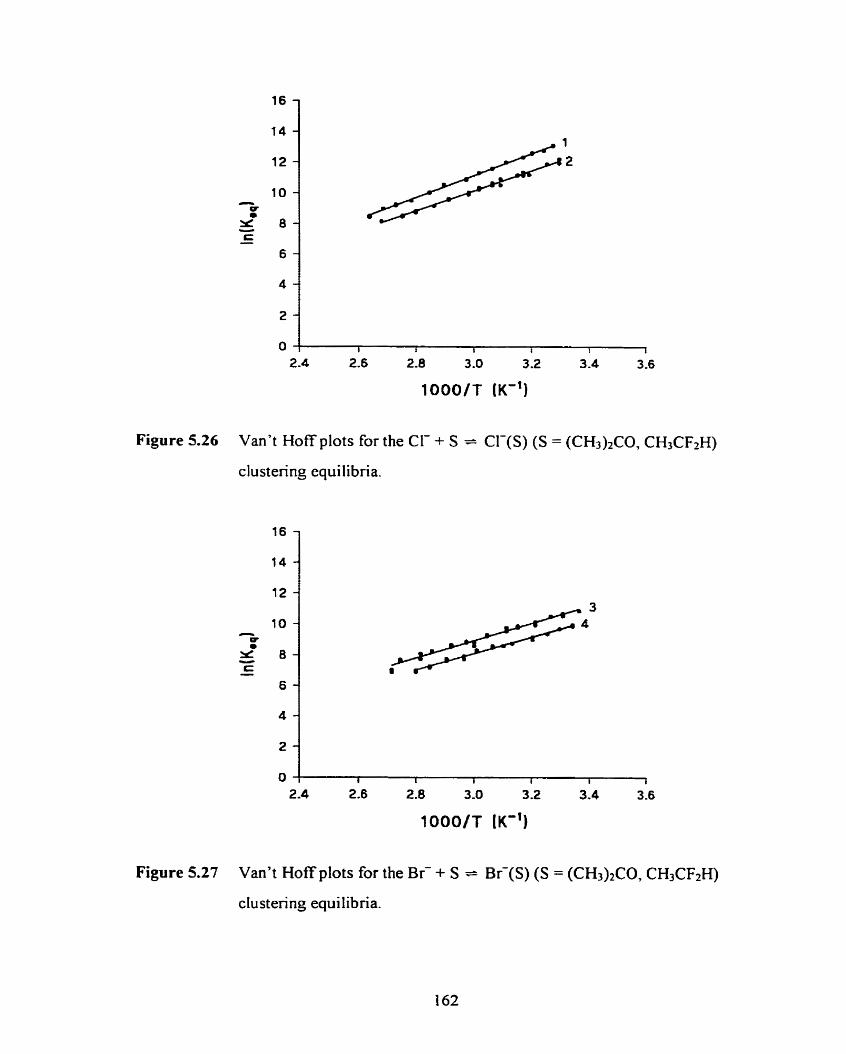
Figure 5.26 Van't Hoff plots for the CI- + S = CI-(S) (S = (CH&CO, CHaCFzH)
clustering equilibria.
Figure 5.27 Van't Hoff plots for the Br- + S == Br-@) (S = (CH3)*C0, CfiCF2H)
dustering equilibria.
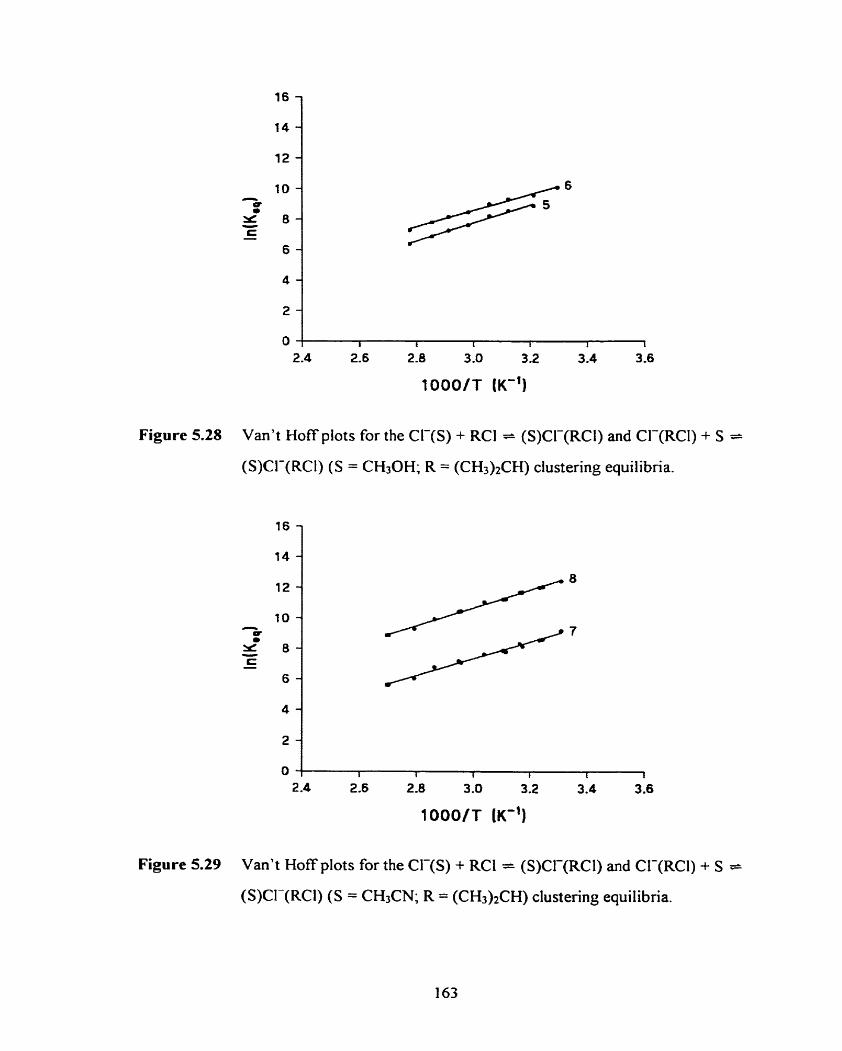
Figure 5.28 Van't Hoff plots for the Cl-@) + RCI = (S)Cl-(RCl) and CI-(RCI) + S =
(S)CI-(RCI) (S = CH3OH; R = (CH,)2CH) clustering equilibria.
Figure 5.29 Van't Hoff plots for the CI-(S) + RCl = (S)Cl-(RCI) and CI-(RCI) + S =
(S)CI-(RCI) (S = CHFN; R = (CH&CH) clustering equilibria.
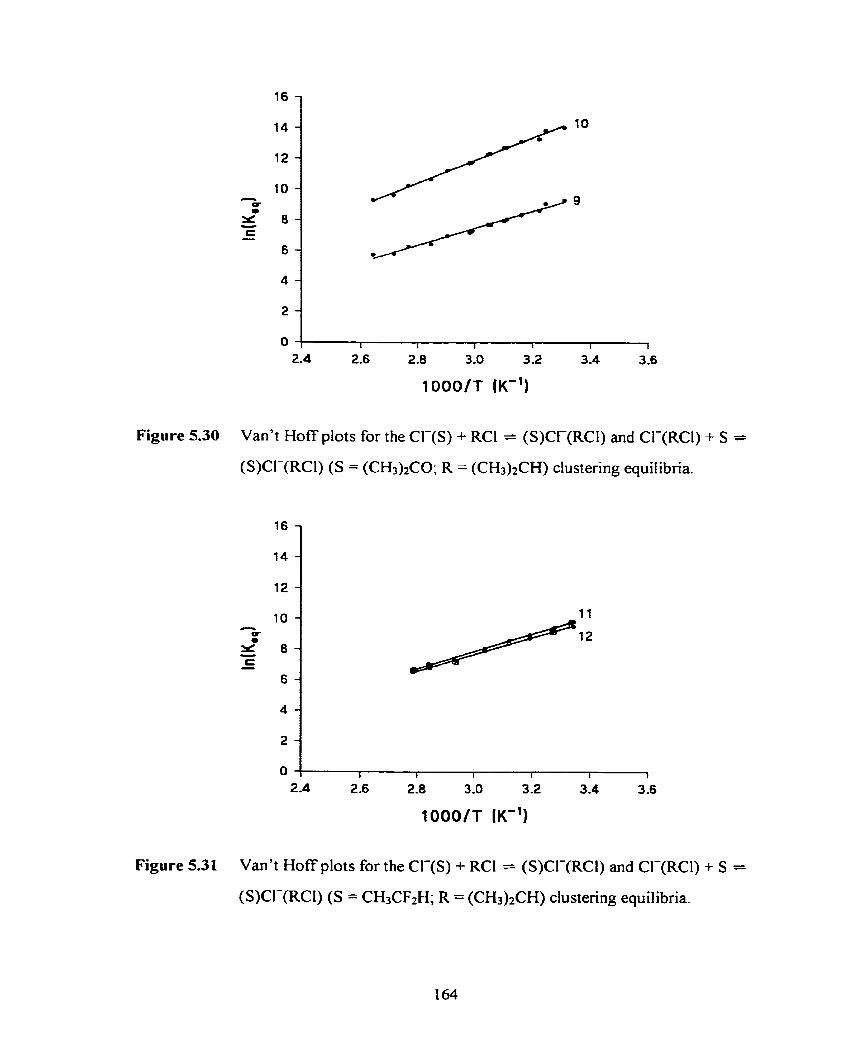
Figure 5.30 Van't Hoff plots for the CI-(S) + RCI = (S)Cl-(RCI) and CI-(RCI) + S =
(S)CI-(RCl) (S = (CH,)2CO; R = (CH&CH) clustering equilibria.
Figure 5.31 Van't Hoff plots for the CI-(S) + RCl = (S)Cl-@CI) and CI-(RCI) + S =
(S)Cl-(RCI) (S = CH3CF2H; R = (CH&CH) clustering equilibria.
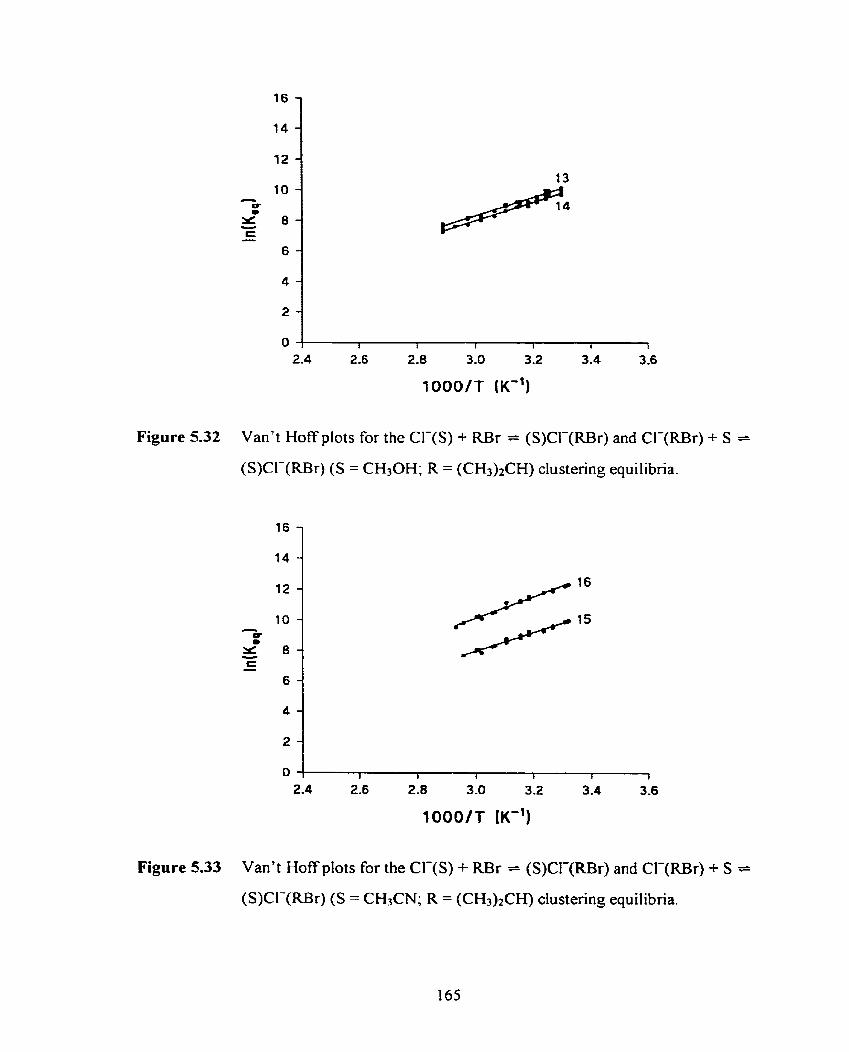
Figure 5.32 Van't Hoff plots for the CI-(S) + RBr = (S)Cl-(RBr) and Cl-(RBr) + S =
(S)Cl-(RBr) (S = CH3OH; R = (CH&CH) clustering equilibria.
Figure 5.33 Van't Hoff plots for the CI-(S) + RBr = (S)CI-(RBr) and CI-(RBr) + S =
(S)CI-(RBr) (S = CH3CN; R = (CH,)*CH) clustering equilibria.
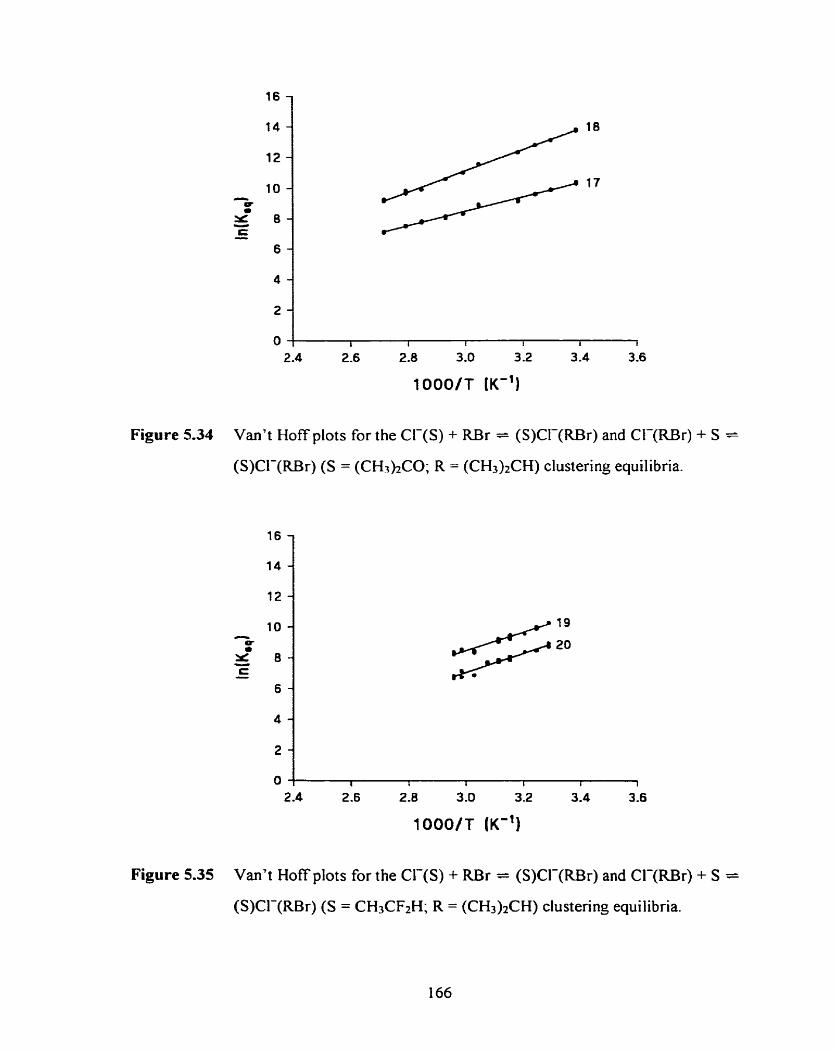
Figure 5-34 1 Van't Hoff plots for the Cl-(S) + RBr = (S)CI-(RBr) and CI-(RBr) + S =
(S)Ci-(RBr) (S = (CH&CO; R = (CH3)zCH) clustering equilibria.
Figure 5.35 Van't Hoff plots for the CI-(S) + RBr = (S)Cl-(RBr) and Cl-(Rh) + S =
(S)Cl-(RBr) (S = CH3CF2H; R = (CH3)zCH) clustenng equilibria.
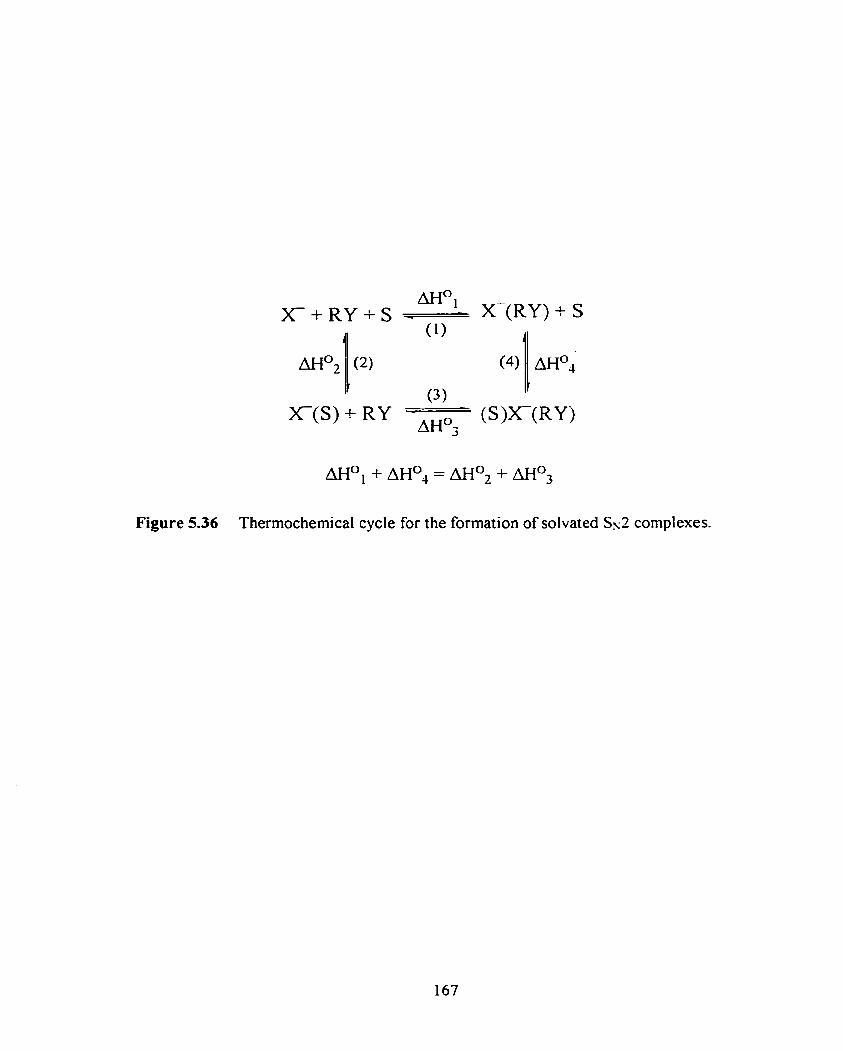
Figure 5.36 Thermochemical cycle for the formation of solvated Ss2 complexes.
from the MP2/b//MP2/a and G2(MP2) computations and AH" values from PHPMS
experiments are good to excellent. This gave confidence that the results from the
MP2/b//MP2/a for the solvated SN2 systems should give reliable results and trends.
For the A S O ~ ~ ~ values from HF/a computations and AH0 values from PHPMS
experiments the agreement is very much system dependent. Systems containing
bromine and iodine atoms gave varying results. For most systems studied, the
agreement with other available computational data was good.
In Table 5.1 1 the AH^^^^ values for the formation of solvated Ss2 complexes from
the MP2/b//MP3/a computations are shown. For these weakly bound systems the
calculated ~ ~ ' 2 9 8 values show large inconsistencies with the experimental PHPMS
data. The low frequency intermolecular vibrational modes, and their anharmonic
character are !ikely causing the discrepancies, and consequently the ~ ~ ' 2 9 8 values
have been omitted. As expected, al1 values confirm the thermochemical cycle in
Figure 5.36. As already mentioned in Section 5.4.1, some structural changes can take
place in the X-(RY) complexes after aitachment by a solvent molecule, and this may
give rise to unexpected AH0 and AS' values. Tucker and Truhlar found for Reaction
5.23 at the MP2/6-3 lG(d,p) level of theory a ~ ~ ' 2 9 ~ value of -10.1 kcal mol-', while
for Reaction 5 -24 a ~ H 0 2 9 g value of -9.3 kcal mol-' was ~ b t a i n e d . ~ ~
No other computations with solvents other than water are available for the X ( S )
+ RY reactions.
In Table 5.12 the results of the ~ ~ $ 9 8 values for the progress from the reactants to
the transition states for some (un)solvated Ss2 reactions (Reactions 5.25 and 5.26) are
present ed.
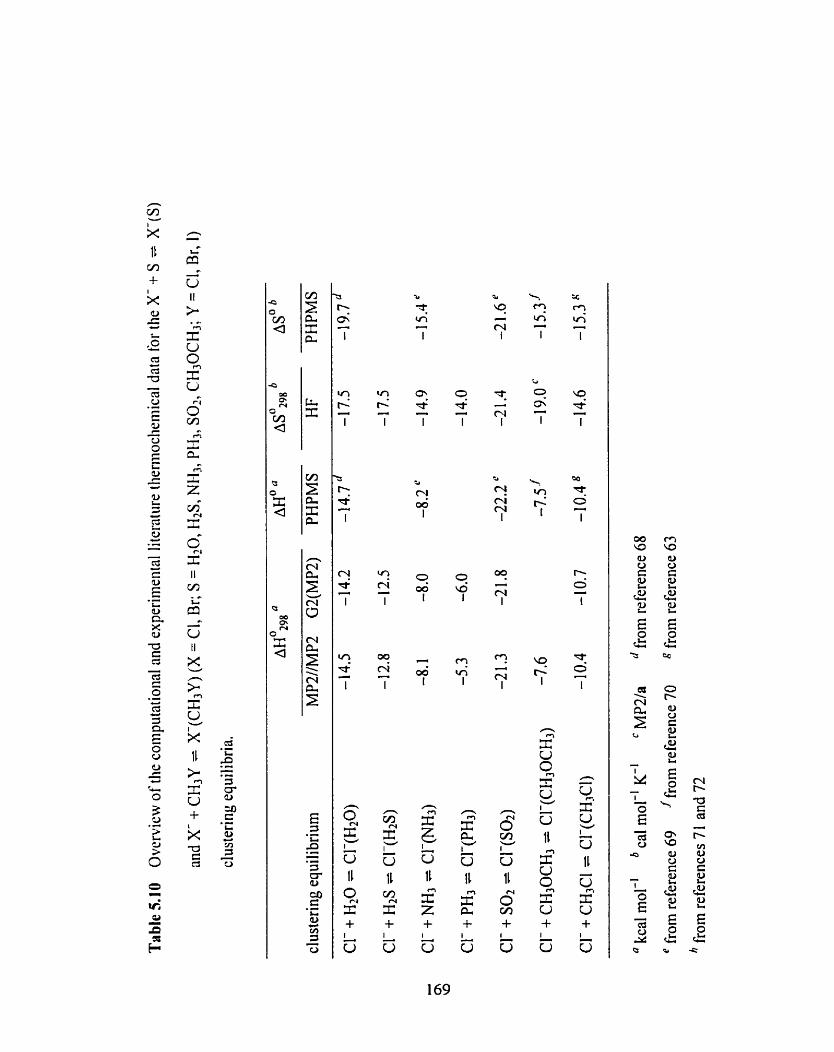
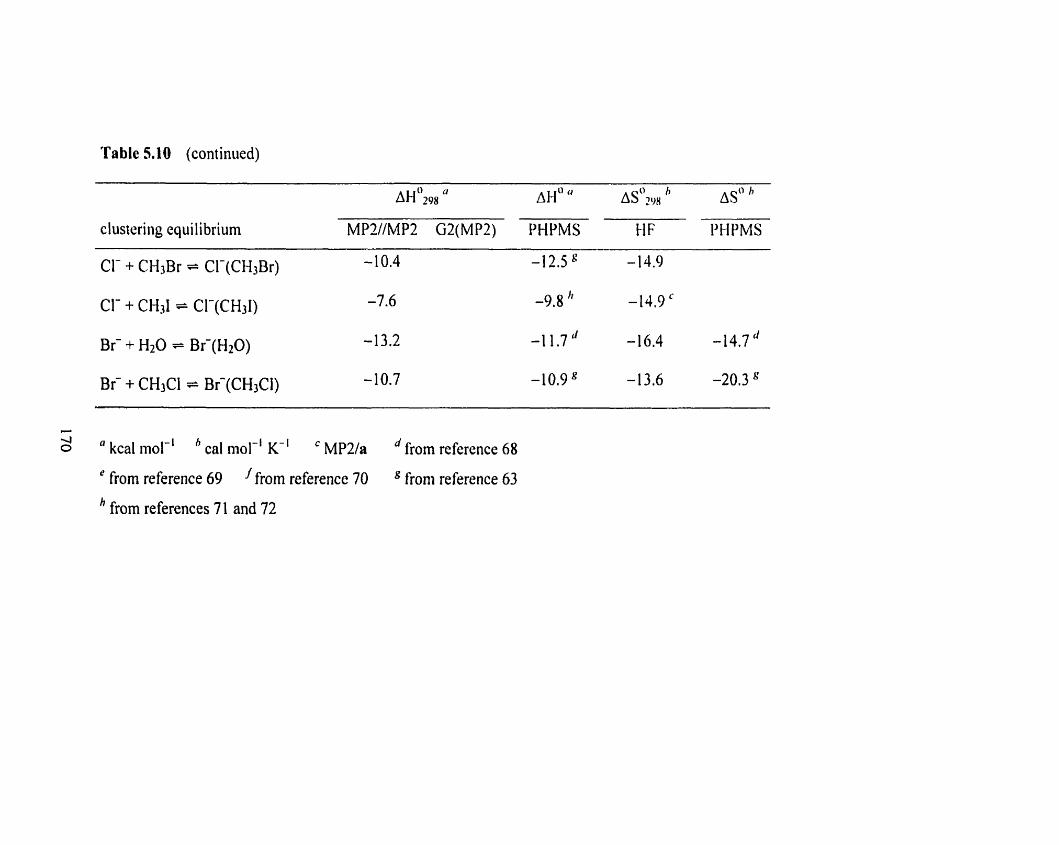
Tablc 5.10 (continued)
clustering equilibrium MP2llMP2 G2(MP2) PHPMS 11 F PI-IPMS
CI- + CH3Br -- CI-(CN3Br) -10.4 -12.5 " - 14.9
Br- + H20 = Bf(H20)
Br- + CHICI = Br-(CHICI)
C
4 0 a kcal mol-' cal mol-' K-' M P 2 h from reference 68
' from reference 69 from reference 70 froni reference 63
from references 7 1 and 72
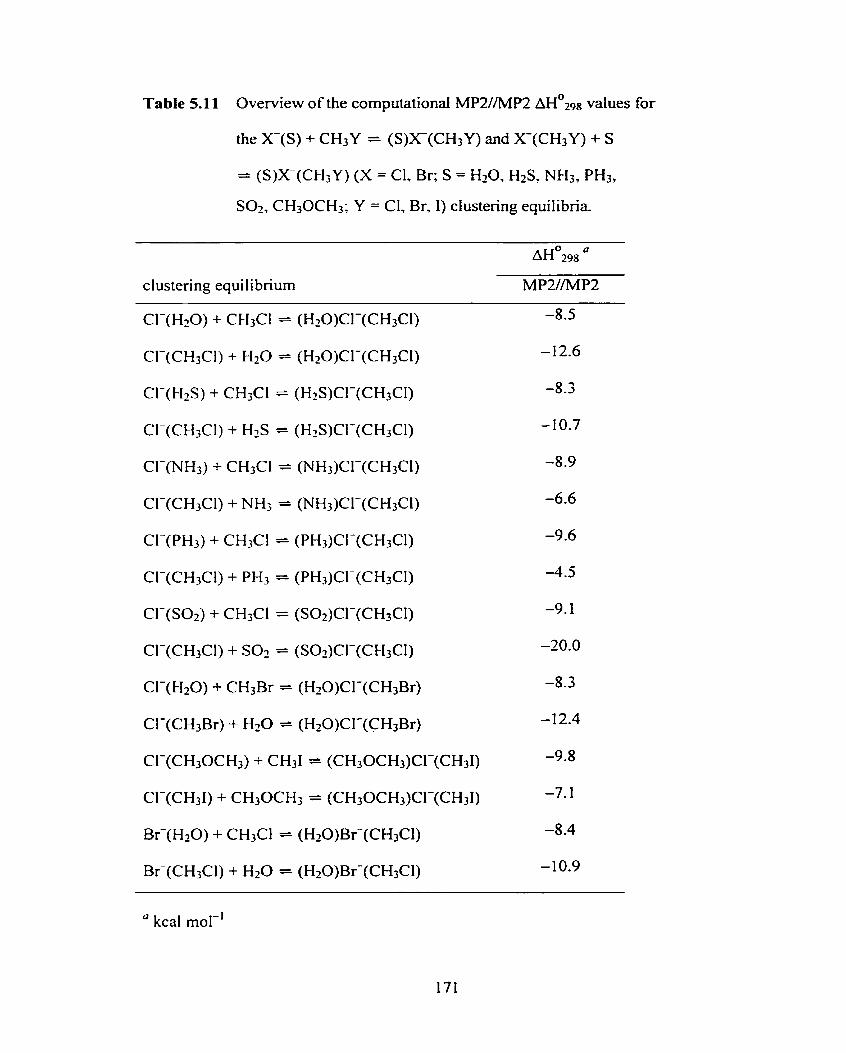
Table 5.1 1 Overview of the computational MPZ//MP2 ~ ~ ' 2 9 8 values for
thex-(S)+CH3Y = (S)X-(CH3Y)andX-(CH3Y)+S
= (S)X-(CH3Y) (X = Cl. Br; S = HzO, H2Sz NH3, PH3,
SO?, CH30CH3; Y = CI, Br, 1) clustering equilibria.
clustering equilibrium MPYMP2
" kcal mol-'
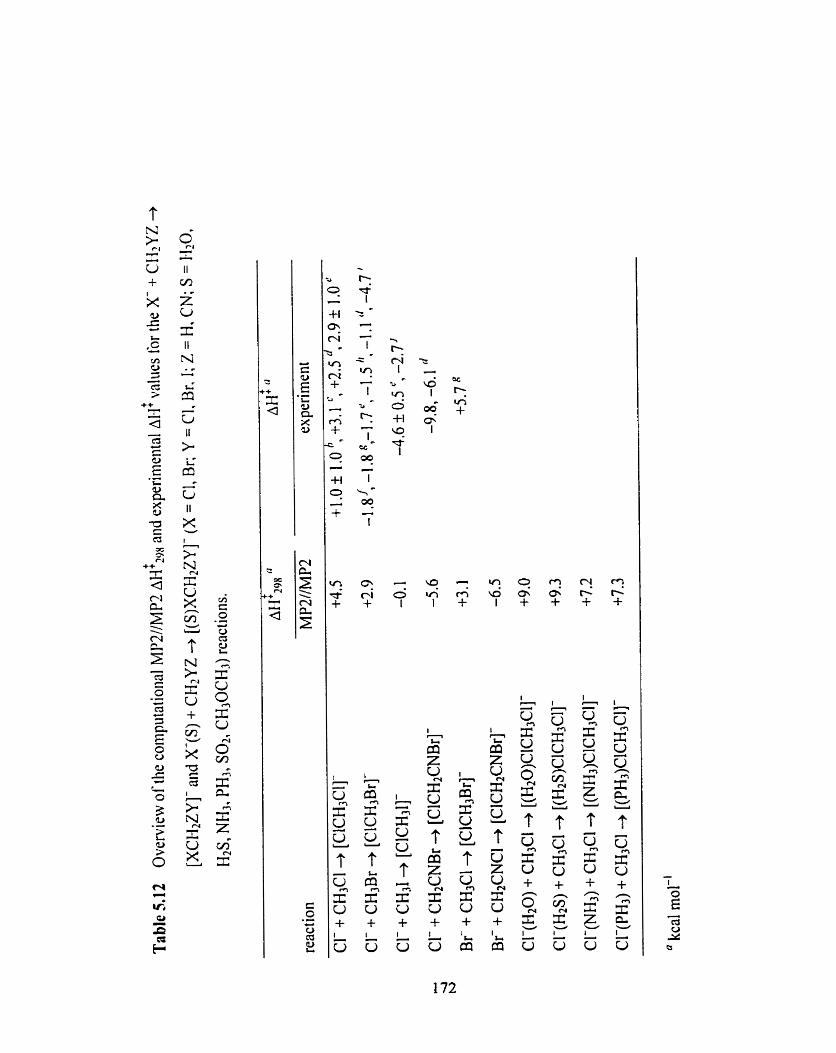
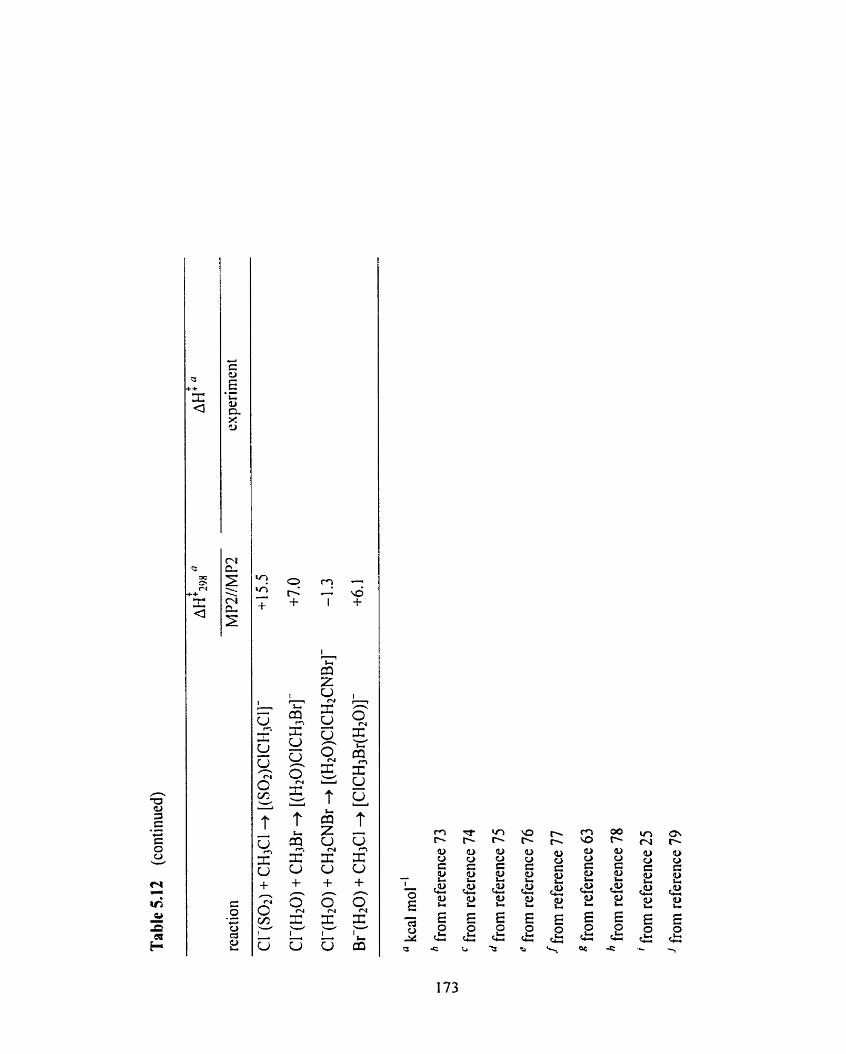
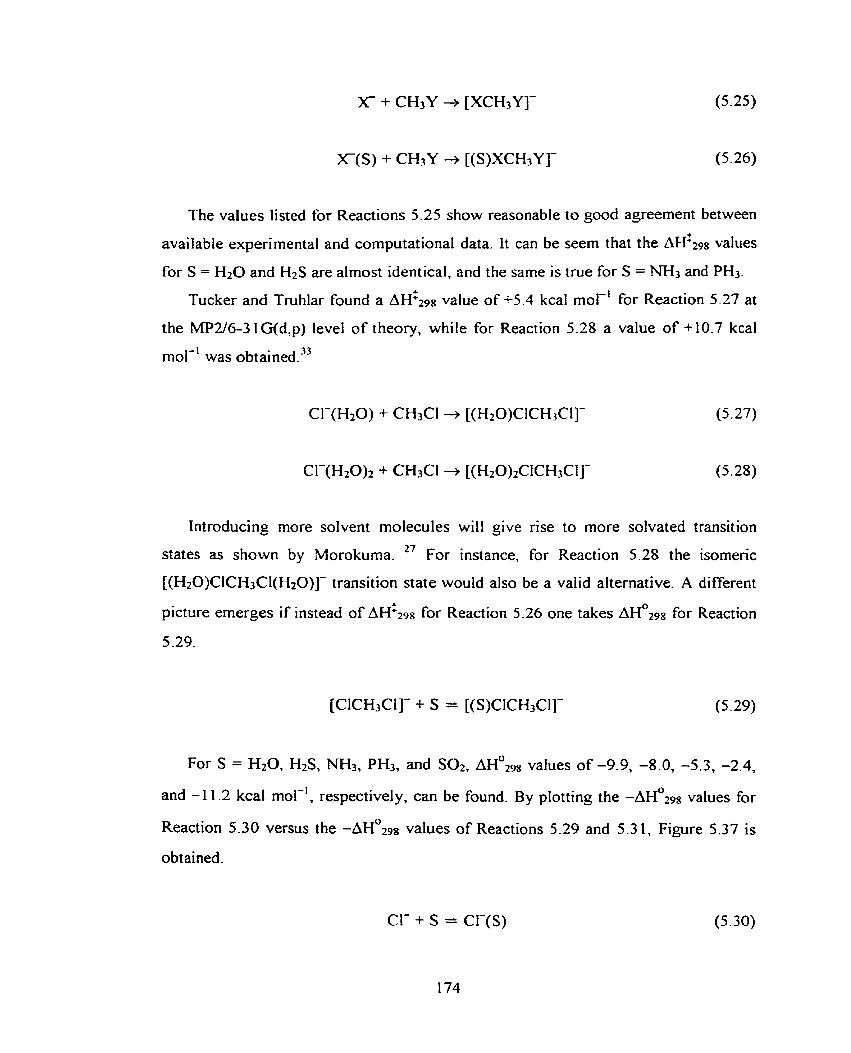
The values listed for Reactions 5.25 show reasonable to good agreement between
available experimental and computational data. It can be seem that the ~ ~ $ 2 9 8 values
for S = H 2 0 and H2S are almost identical, and the same is true for S = NH3 and PH3.
Tucker and Truhlar found a A H ' Z ~ ~ value of +5.4 kcal mol-' for Reaction 5.27 at
the MP2/6-3 1 G(d,p) level of theory, while for Reaction 5.28 a value of + 10.7 kcal
mol-' was ~ b t a i n e d . ~ ~
Introducing more solvent molecuIes will give rise to more solvated transition 27 States as shown by Morokuma. For instance, for Reaction 5.28 the isomeric
[(HzO)C1CH3C1(H20)]- transition state would also be a valid alternative. A different
picture emerges if instead of ~ ~ ' 2 9 8 for Reaction 5.26 one takes ~ ~ ' 2 9 8 for Reaction
5.29.
For S = H20, H2S, NH3, PH3, and S02, ~ ~ ' 2 9 8 values of -9.9, -8.0, -5.3, -2.4,
and - 1 1.2 kcal mol-', respectively, can be found. By plotting the -AH0298 values for
Reaction 5.30 versus the - A H O ~ ~ I ~ values of Reaction~ 5.29 and 5.3 1, Figure 5.37 is
obtained.
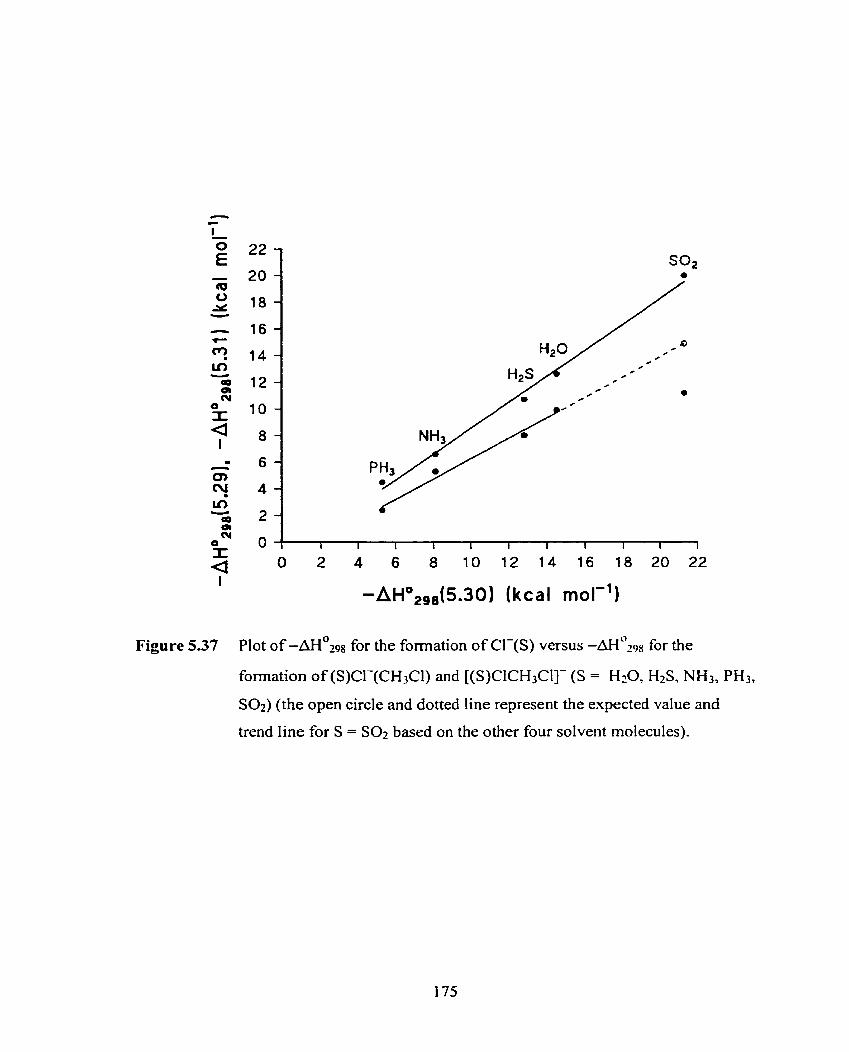
-AH0298(5.30) (kcal mol-')
Figure 5.37 Plot o f -AH0298 for the formation of Cl-(S) versus -AH''z~~ for the
formation of (S)CI-(CH3CI) and [(S)ClCH3Cl]- (S = H-O, H2S, NH3, PH3,
S02) (the open circle and dotted line represent the expected value and
trend Iine for S = S 0 2 based on the other four solvent molecules).
Interestingly, both plots appear to show a linear correlation, except for the
transition state solvation by S02. From the dopes of the two lines it is confirmed that
the soIvation of the transitions state is less exotherrnic than the solvation of the Sy2
ion-molecule complex, which is less exothermic than the solvation of the solvent
molecule. In Figure 5.38 al1 data for Reactions 5.14-5.16 from Tables 5.10-5.12 are
shown together as schematic potential energy profiles. For al1 hydrogen bonded
solvents, except PH,, and SOî the transition States [(S)CICH3CI]- are lower in ~ ~ ~ ~ 9 8
than CI- + CHKI + S. This means that it would be possible to kinetically excite
"CI-(s) for instance and watch for the formation of "CI- or 3 7 ~ 1 - ( ~ ) from CH3CI
(Reactions 5.32 and 5.33).
Unfoitunately, at lower centre-of-mass ion kinetic energies for "CI-(s), chloride
ion transfer to CH3CI will occur (Reaction 5.34). Furthermore, this is not a direct
method to obtain AH&, since it requires ab it~ilio input parameters to fit the cross-
sections as a fbnction of the centre-of-mass kinetic energies in order to obtain the
threshold energy. In addition, because of the competition of Reaction 5.34 with
Reactions 5.32 and 5.33, the cross-sections of the latter two reaction will be very
small.
For the water mono-solvated transition state of [CICH3Br]-, two isomers are
possible, [(H20)ClCH3Br]- and [(H20)BrCHaCI]-. At the MP2/[ble]/lMPZ/[dd] level
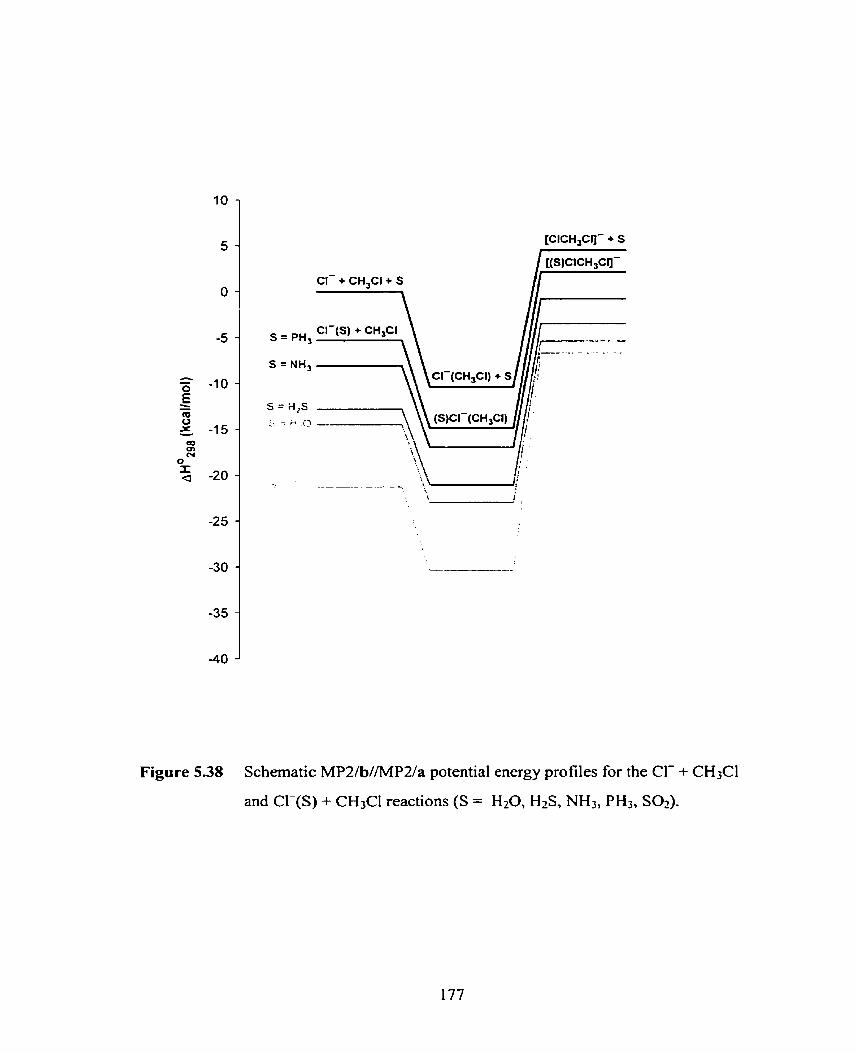
S = PH,
S = NH,
Figure 5.38 Schernatic MP2/b//MP2/a potential energy profiles for the Cl- + CH3Cl
and Cl-(S) + CH3C1 reactions (S = HzO, H2S, NH3, PH3, SOI).
of theory, including zero-point energies and thermal corrections at the MPî/[dd]
ievel o f theory, the first one is only 0.4 kcal mol-' more favorable. Still the bamer, if
present, for the water transfer reaction will be expected to be considerably higher in
~ ~ ~ ~ 9 8 , mainly due to the unfavorable entropy associated with the bridged transition
state for water transfer. Seeley e! al. found an activation energy for Reaction 5.3 5 of
+2.7 kcal mol-'.'5
By correcting the calculated activation energy (+2.9 kcal mol-') for the non-
solvated Su2 reaction to match the experimental value of -1.8 kcal mol-'. and
applying this correction to the calculated activation energy for Reaction 5.35 a value
of + 2 S kcal mol-' is obtained. Even though the agreement is close, the values cannot
be compared since they represent different processes. From the potential energy
surface in Section 5.4.4 it can be seen that ligand switching is indeed energetically
more favorable than the solvated SN2 reaction.
The main question is, are there, besides the already observed solvated Sx2
mentioned in Section 5.1. other systems possible for which true solvated SX2
reactions can be observed? Good candidates might be Reactions 5.36 and 5.37.
Both reactions have, in their unsolvated counterparts, negative AH: values. From
Table 5.12 it can be seen that Reaction 5.35 with water as a solvent has a ~ $ 9 1
value, calculated at the MPZ/[b/e]//M.PZ/[a/d] level o f theory, of -0.1 kcal mol-'. Any
monosolvated Ss2 reaction will proceed through the (S )X(RY) ion-molecule
complex, but unless the solvent molecule donates X to RY, no Sx2 reaction will take
place. In other words, RY should have a larger X affinity than S. In addition, the
transition state [(S)XRY]- should be below the reactants X ( S ) and RY, and the
overall energetics of the reaction should be fairly exothermic. This rneans that overall
solvent transfer from X- to Y will favor the reaction, but the reaction may still
proceed if this does not take place. In the case of the most commonly used solvent,
water, X binds more strongly to it than most SN2 substrates. Consequently, the
probability of passing through the ion-molecule complex and transition state wi1l be
low. For solvated Ss2 reactions with barriers slightly above the reactants, it should
still be possible to observe them by performing these reactions at elevated
temperatures. Problems rnay arise if the solvated nudeophile dissociates by ZTRID,
and one would actually observe the non-solvated SN2 reaction (Reactions 5.38 and
5.39).
X ( S ) + nhv + X_ + S ( 5 -3 8)
This problem can be solved by continuously ejecting X from the FT-ICR cell,
thus preventing Reaction 5.39 from taking place. Dimethyl ether and diethyl ether
bind less strongly to chloride ion than d o methyl iodide and bromoacetonitrile, and so
they would be ideal candidates. By performing the reactions at different temperatures
and measuring the rate constants, the activation energy, Ea, and fi-equency factor, A,
can be obtained from the Arrhenius equation (Equation 5-40), and fFom these, the AH'
and AS$ (Equations 5.4 1 and 5.42) can be calculated.
It does not seem unreasonable to assume that monosolvated Sy2 reactions in the
gas phase, even if possible t o perform, are the closest one can get to the condensed
phase counterparts. Obtaining reliable expenmental data is the only possibility to test
computational methods, which are very method and/or system dependent and already
approach the limit of what is cornputationally possible. The reactivity o f most larger
clusters investigated to date shows that no SN^ processes are taking place.
Producing less strongiy bound clusters that will still show some reactivity seems
unlikeIy, especially if one wishes to investigate mechanistic features. Still, this kind
o f research wili be usefùl and may contribute to renewed interest and research.
5.4.4 Potential Energy Surfaces
In Figure 5.39 the results for the potential energy surface scans for Reactions
5.43-5.45 are shown.
For the reaction coordinate the difference in the C-Br and C-Cl distances was
taken. For Reaction 5.43 the expected profiIe has been obtained, even though the
barrier height relative to the reactants does not seem t o agree with experimental data,
and with various computational results that support the experirnental data. TureCek
and CO-workers found that accurate PA'S can be determined by taking the average PA 65.66 of two W 2 and B3LYP computations. The reason for this was the fact that, in
general, MP2 overestirnates the PA, while B3LYP underestimates the PA. A similar
observation has been made for Ss2 transition state energies. For the [CICH3Br]-
transit ion state, usi ng the average of MP2/[ble]//MPU[eld] and B3 LYP/[b/e]//
B3LYP/[c/d] cornputations, a AH& value of -1.5 kcal mol-' can be found, in
excellent agreement with the experimental value o f -1.8 kcal mol-'.63 Similarly, for
the [ClCH31]- transition state a value o f -3.9 kcal mol-' has been found. On the other
hand, the main focus here was t o obtain more qualitative insight. For Reactions 5.44
and 5.45, two different potential energy surfaces have been obtained, but the
difference only appears on the product side. For Reaction 5.45 the same reaction
coordinate can be used like for Reaction 5.43. For Reaction 5.44, on the other hand,
going from Bi(CH3CI)(H20) to (H20)Br-(CH3CI) some reaction coordinate for the
water transfer should be taken into account. This transfer can be viewed as a rotation
of the Br-(CH3CI) moiety of the complex. This seems to be an accessible alternative
to the symmetric bridge-like transition state that connects the [(H20)ClCH3Br]- and
[CICH3Br(HzO)]- transition States. The expected increase in the transition state for
the solvated Sx2 reaction is clearly observable. The occurrence of rotations in ion-
molecule clusters to facilitate isomerization is not uncommon. In Chapter 4 the
unimolecular dissociation o f the Cl-(HOCF3) complex into Cl-(HF) and CF20 was
mentioned. Close examination shows that this reaction takes place through a series of
steps that include intemal rotations in some of the intermediates (Scheme 5.46).
It does not seem unlikely, if the lifetime of the Y ( R X ) ( S ) complex is long enough
and excess intemal energy can be redistributed efficiently, that isomerization to the
more stable (S)Y(RX) cornplex may become more feasible, and consequently the
relative amount of observable soivated product ions, \ T ( S ) , may increase.
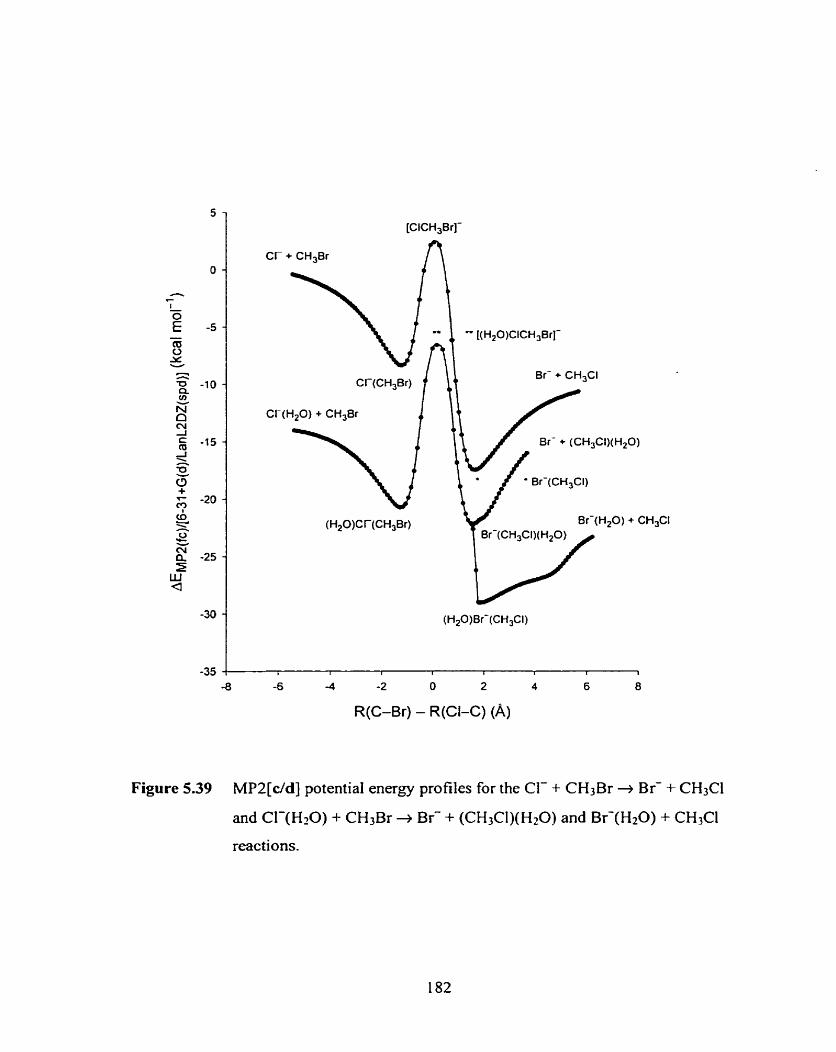
[CICH,Br]-
C r + CH3Br
* ,, [(H20)CICH,Br]-
Br- + CHBCl
CI-(H20) + CH3&
Br- + (CH3CI)(H20)
(H20)CT(CH,Br) Br-(H20) + CH,Cl
R(C-Br) - R(CI-C) (A)
Figure 5.39 MP2[c/d] potential energy profiles for the Cl- + CH3Br + Br- + CH3Cl
and CI-(H20) + CH3Br + B r + (CH3CI)(H20) and Br-(H20) + CH3CI
reactions.
5.5 Conclusions
In this chapter various aspects of the structures and thermochemistry of sotvated Ss2
complexes and transition states have been investigated using PHPMS and ab ;nirio
computational methods.
The structures of solvated SNZ complexes, (S)X(CH3Y), and transition states,
[(S)XCH3Y]-, can show very different bonding characteristics than the halide ion-
solvent, X(S), and SNZ complexes, X-(CH3Y), depending on the solvent. In the
[(H20)ClCH2CNBr]- transition state, the water molecule interacts with the nitrogen atom
of the cyano substituent.
The experimental thermochemistry shows solvent effects. The two different
equilibria, solvation of Sh.2 complexes and solvated Ss2 reactions, have different
thermochemistry, and can be understood in tenns of a thermochemical cycle. Most data
presented are completely new, and may provide a basis to test theoretical models on these
systems.
The MP2/b//MPZ/a and GZ(MP2) computations provide close agreement with
experimental thermochemical data for the formation of X(S) complexes. The ~ H 0 2 9 8
values for the formation of the (S)X(CH3Cl) complexes investigated seem to be
reasonable, as opposed to the ~ ~ ' 2 9 8 values. For both the non-solvated and solvated SN2
transition states investigated, [XCH,Y]- and [(S)XCH3Y]-, respectively, the
MPZIb//MP2/a computations seern to overestimate the enthalpies of activation. Two test
computations show that an average of B3LYP/b//B3LYP/a and MP2/b//MP2/a
computations can provide reliable enthalpies of activation. Linear correlations between
enthalpy changes for the formation of CI-(S) (S = H20, H2S, NH3, PH,, SOI), and
enthalpy changes and enthalpies of activation for the formation of (S)Cl-(CHaCI) and
[(S)ClCH3Cl]-, respectively have been found, except for the enthalpy of activation with S
= S02.
To date only a few systems have shown real solvated SN2 reactivity, notably the
F ( R 0 H ) + CH3X reactions (R = H, alkyl; X = Br, 1). It is believed that reactions between
CI-(CH30CH3) and CH2CNBr and CH31 may also show s ~ 2 reactivity .
The potential energy profiles for the solvated SN2 reaction between CI-(H20) and
CH3Br, calculated at the MPZl[dd] level of theory, show that formation of Br- and
Br-(H20) proceed through two different profiles. Isomerization from Br-(CHiCI)(H20) to
(H20)Br-(CHpCI) can be accomplished by a rotation of the Br-(CH3CI) moiety. This
process is energetically favorable and may lead to a net solvent transfer.
5.6 References and Notes
Ingold, C. K. "Structure and Reactivity in Organrc Chemistry ", 2"d ed., Corne11
University Press, It haca, NY, 1969 and references cited therein.
Aziz, F.; Moelwyn-Hughes, E. A. J. Chern. Soc. 1959, 2635.
Marshall, B. W.; Moelwyn-Hughes, E. A. J. Chem. Soc. 1959,2640.
Bathgate, R. H.; Moelwyn-Hughes, E. A. J. C'hem. Soc. 1959, 2642.
Alexander, R.; Ko, E. C . F.; Parker, A. J.; Broxton, T. J. J. Am. Chem. Soc. 1968,
90, 5049 and references cited therein.
Parker, A. J . Chem. Rev. 1969, 69, 1 and references cited therein.
Hartshom, S. R. "Aiipha~ic Ndeophiiic Subsritutio~t ", Cambridge University
Press, London, 1973.
Streitweiser, Jr., A. *Solvoiytic Displacement Reaczions ", McGraw-Hill, New York,
NY, 1973.
Albery, W. J.; Kreevoy, M. M. Adv. Phys. Org. Chem. 1978, 16, 87 and references
cited therein.
Shaik, S. S.; Schlegel, H. B.; Wolfe, S. "7heore~ical A~pecls of Physical Organ~c
Chemistry. n e SN^ Mechanism ", Wiley, New York, NY, 1992 and references cited
t herei n.
Bohme, D. K.; Mackay, G. I .J . Am. C h . Soc. 1981,103,978.
Henchman, M.; Paulson, J. F.; Hierl, P. M. J. Am. Chem. Soc. 1983, 105, 5509.
Henchman, M.; Hierl, P. M.; Paulson, J. F. J. Am. Chem. Soc. 1985, 107,28 12.
Bohme, D. K.; Raksit, A. B. J. Am. Chem. Soc. 1984, 106,3447.
Bohme, D. K.; Raksit, A. B. Can. J. Chem. 1985, 63,3007.
Hierl. P. M.; Ahrens. A. F.; Henchman. M.; Viggiano. A. A.; Paulson, J. F.; Clary,
D. C. .J. Am. Chern. Soc. 1986,108.3 142.
Hierl. P. M.; Ahrens, A. F.; Henchman, M.; Viggiano, A. A.; Paulson, J. F. Inz. J. Muss Spectrom. Ion Processes 1 987, 81, 1 O 1 .
Hierl, P. M.; Ahrens, A. F.; Henchman, M. J.; Viggiano, A. A.; Paulson, J. F.
firadny Disolss. Chem. Soc. 1988, 85, 3 7.
Giles, K.; Grimsrud, E. P. .L Phys. Chem. 1993, 97, 13 18.
07Hair, R. A. J.; Davico, G. E.; Hacaloglu, J.; Dang. T. T.; DePuy, C. H.;
Bierbaum, V. M. J Am. Chern. Soc. 1994, 116,3609.
Hierl, P. M.; Paulson, J. F.; Henchman, M. J. J. Phys. Chern. 1995, 99, 15655.
Viggiano, A. A.; Arnold, S. T.; Moms, R. A.; Ahrens, A. F.; Hierl, P. M. J. Phys.
Chem. 1996, 100, 14397.
Craig, S. L.; Brauman, J. 1. J Am. Chem. Soc. 1996, 118, 6786.
Seeley, J. V.; Moms, R. A.; Viggiano, A. A. J. Phys. Chem. A 1997, 101,4598.
Seeley, J. V.; Moms, R. A.; Viggiano, A. A.; Wang, H.; Hase, W. L. J. Am. Chem.
Soc. 1997,119, 577.
Craig, S. L.; Brauman, J. 1. J Am. Chem. Soc. 1999, 121, 6690.
Morokuma, K. J. Am. C'hem. Soc. 1982,104,3732.
Hu, W.-P.; Truhlar, D. G. J. Am. Chern. Soc. 1994, 116,7797.
Bickeihaupt, F. M.; Baerends. E. J.; Nibbenng, N. M. M. Chem. Eur. J. 1996, 2,
196.
Tachikawa, H. J. Phys. Chern. A 2000, 101,497.
Tachikawa, H. Phys. Chern. A 2001, 105, 1260.
Raugei, S.; Cardini, G.; Schettino, V. J. Chem. Phys. 2001, 114,4089.
Tucker, S. C.; Truhlar, D. G. J. Am. Chem. Soc. 1990, 112, 3347.
Zhao, X. G.; Tucker, S. C-; Truhlar, D. G.J. Am. Chern. Soc. 1991, 113,826.
Zhao, X. G.; Lu, D.-H.; Liu, Y.-P.; Lynch, G. C.; Truhlar, D. G. J. Chern. Phys.
1992, 97,6369.
Re, M.; Laria, D. J. Chem. Phys. 1996, 105,4584.
Okuno, Y. J. Chem. Phys. 1996,105,58 17.
Okuno, Y. J. Am. Chem. Soc. 2000, 122,2925.
Szulejko, J. E.; Fisher, J. J.; McMahon, T. B.; Wronka, J. Inl. .j. Mass Spectrom. ion
Processes l988,83, 147.
Frisch, M. J.; Trucks, G. W.; Schlegel, H. B.; Scuseria, G. E.; Robb, M. A.;
Cheeseman, J . R.; Zakrzewski, V. G.; Montgomery, Jr., J. A.; Stratmann, R. E.;
Burant, J. C.; Dapprich, S.; Millam, J. M.; Daniels, A. D.; Kudin, K. N.; Strain, M.
C.; Farkas, O.; Tomasi, J.; Barone, V.; Cossi, M.; Cammi, R.; Mennucci, B.;
Pomelli, C.; Adamo, C . ; Clifford, S.; Ochterski, J.; Petersson, G. A.; Ayala, P. Y.;
Cui, Q.; Morokuma, K.; Malick, D. K.; Rabuck, A. D.; Raghavachari, K.;
Foresman, J . B.; Cioslowski, J.; Ortiz, J. V.; Baboul, A- G.; Stefanov, B. B.; Liu, G.;
Liashenko, A.; Piskorz, P.; Komarorni, 1.; Gomperts, R.; Martin, R. L.; Fox, D. J.;
Keith, T.; Al-Laham, M. A.; Peng, C. Y.; Nanayakkara, A.; Gonzalez, C.;
Challacombe, M.; Gill, M. W.; Johnson, B.; Chen, W.; Wong, M. W.; Andres, J. L.;
Gonzafez, C.; Head-Gordon, M.; Replogle, E. S.; Pople, J. A. Gcrzrssinn 98,
Revision A.7 Gaussian, Inc., Pittsburgh PA, 1998.
Roothan, C. C. J. Rev. Mod Phys. 1951,23,69.
Msller, C.; Plesset, M. S. Phys. Rev. 1934, 46, 6 18.
Hehre, W. J.; Ditchfield, R.; Pople, J. A. J. C'hem. Phys. 1972, 56, 2257.
Franc], M. M.; Petro, W. J.; Hehre, W. J.; Binkley, J. S.; Gordon, M. S.; DeFrees, D.
J.; Pople, J. A. .I. Chem. Phys. 1982, 77, 3654.
Clark, T.; Chandrasekhar, J.; Schleyer, P. v. R. J. C o q . Chern. 1983, 4, 294.
Krishnam, R.; Binkley, J. S.; Seeger, R.; Pople, J. A. J. Chem. Phys. 1980, 72, 650.
Gill, P. M. W.; Johnson, B. G.; Pople, I. A.; Frisch, M. J. Chem. Phys. Lett. 1992,
97, 499.
Scott, A. P.; Radom, L. J. Phys. Chem. 1996, 100, 16502.
From a least-squares fit of unscaled HF/6-31+G(d,p) normal mode vibrational
frequencies of CH3Cl, H20, H2S, NH3, PH3, and S02 versus experimental
frequencies fiorn reference 50.
S himanouchi, T. Tables of Molenrlar Vibrational Freqtrencies Consolidated
V o h e 1; National Bureau of Standards: Washington, DC, 1972; p. 1.
Frisch, M. J.; Pople, I. A.; Binkley, J. S. J. C h Phys. 1984, 80, 3265.
Hariharan, P. C.; Pople, J. A. Kheoretica Chim. Acta 1973, 28, 213.
Hay. P. J.: Wadt, W. R. 1 C h . Phys. 1985.82, 284.
Glukhovtsev. M. N.; Pross, A.; McGrath, M. P.; Radom, L. J. Chem. Phys. 1995,
103, 1878.
Curtiss, L. A.; Raghavachari, K.; Pople, J. A. J. C M . Phys. 1993, 9-1, 7221.
Gazrssiat~ 98 User's Reference, Second Edition, Gaussian Inc., 1999.
CRRC Haricibook of Chernistry and Pftysics, Ref: Barn, 76h ed., Lide, D. R., Ed.;
CRC, Boca Raton, FL, 1995.
Deng, L.; Branchadeil, V.; ZiegIer, T. J. Am. Chem. Soc. 1994, 116, 10645 and
references cited therein.
Glukhovtsev, M. N.; Pross, A.; Radom. L. J. Am. Chern. Soc. 1995, 117, 2024 and
references cited t herein.
GIukhovtsev, M. N.; Bach, R. D.; Pross, A.; Radom. L. C'hem. Phys. Lw. 1996,
260, 558.
Glukhovtsev, M. N.; Pross, A.; Radom. L. J. An?. Chem. Soc. 1996, 118, 6273 and
references cited therein.
Parthiban, S.; de Oliveira, G.; Martin, J. M. L. J. Phys. Chem. A 2001, 105, 895 and
references cited therein.
Li, C.; Ross, P.; Szulejko, J. E.; McMahon, T. B. J. Am. C'hem. Soc. 1996, 118,
9360.
http://webbook.nist.gov/chemistry/
Tureeek, F. J. Phys. Chem. A 1998, 102,4703.
PolaSek, M.; TureCek, F. J. Am. Soc. M m Spectrom. 2000, 11 ,380 .
Bogdanov, B.; Peschke, M.; Tonner, D. S.; Szulejko, J. E.; McMahon, T. B. /nt. J .
Mass Spectrom. 1999, iBj/l86/'18 7, 707.
Hiraoka, K.; Mizuse, S.; Yamabe, S. J. Phys. Chem. 1988, 92,3943.
Evans, D. H.; Keesee, R. G.; CastIernan, Jr., A. W. J. Chern. Phys. 1987,86,2927.
Bogdanov, B.; Lee, H. J. S.; McMahon, T. B. Accepted in h t . J . Mass Spectrom..
Dougherty, R. C.; Dalton, J.; Roberts, J. D. Org. Mass Spectrom. 1974, 8, 77.
Dougherty, R. C.; Roberts, I. D. Org. M a s Spectrom. 1974.8, 81.
Barlow, S. E.; Van Doren, J. M.; Bierbaum, V. M. J. Am. Chern. Soc. 1988, 110,
7240.
74 Tucker, S. C.; Truhlar, D. G. ' Am. Chern. Soc. 1990, 11 2, 3338.
75 Wladkowski, B. D.; Brauman, J. 1. ./. Phys. Chern. 1993,97, 13 158.
76 Graui, S. T.; Bowers, M. T. J. Am. Chem. Suc. 1994, 116, 3875.
77 Caldwell, G.; Magnera, T. F.; Kebarle, P. J. Am. Chern. Soc. 1984, 106,959.
78 Knighton, W. B.; Bognar, J . A.; O'Connor, P. M.; Gnmsmd, E. P. J. Am. Chem.
Soc. 1993, 11j,ZZO79.
79 Hu, W.-P.; Tmhlar, D. G. Am. Chern. Soc. 1995, 11 7, 10726.
Chapter 6
Gas phase SN2 reactions of halide ions and trifluoromethyl
halides: front- and backside attack versus complex formation
6.1 Introduction
Bimolecular nucleophilic displacement (Ss2) reactions in the gas phase between
halide ions and halomethanes (Reaction 6.1 ) have been studied extensive1 y for over three 2647 decades, both experimentall y ' - 2 5 and theoreticall y, by both electronic structure and
trajectory 4 x 4 9 computations. In the condensed phase this type o f reaction had already
received substantial attention from the 1930's on. 70-73
In Figure 6.1 a typical schematic potential energy profile is shown for a condensed
phase Sr2 reaction. Due to the high central barrier of 15-30 kcal mol-', rnost reactions
proceed very slowly. This is mainly caused by strong solvation effects, which are
masking the intrinsic reactivity of the species involved. By performing Ss2 reactions in
the gas phase, information on energetics, dynam i CS, and kinetics can be obtained, thereby
exposing the role of the solvent in condensed phase reactions. Many experiments and
computations have shown that in the gas phase Ss2 reactions proceed through a double-
well potential,6 a s shown in Figure 6.2. A large vanety of rates and reaction efficiencies
have been observed and these are mainly due to variations in the central barrier height
relative to the reactants.
Reaction 6.1 proceeds by three consecut ive, elementary processes: (1 ) formation of an
entrance channel ion-molecule complex from the reactants (Reaction 6.2);
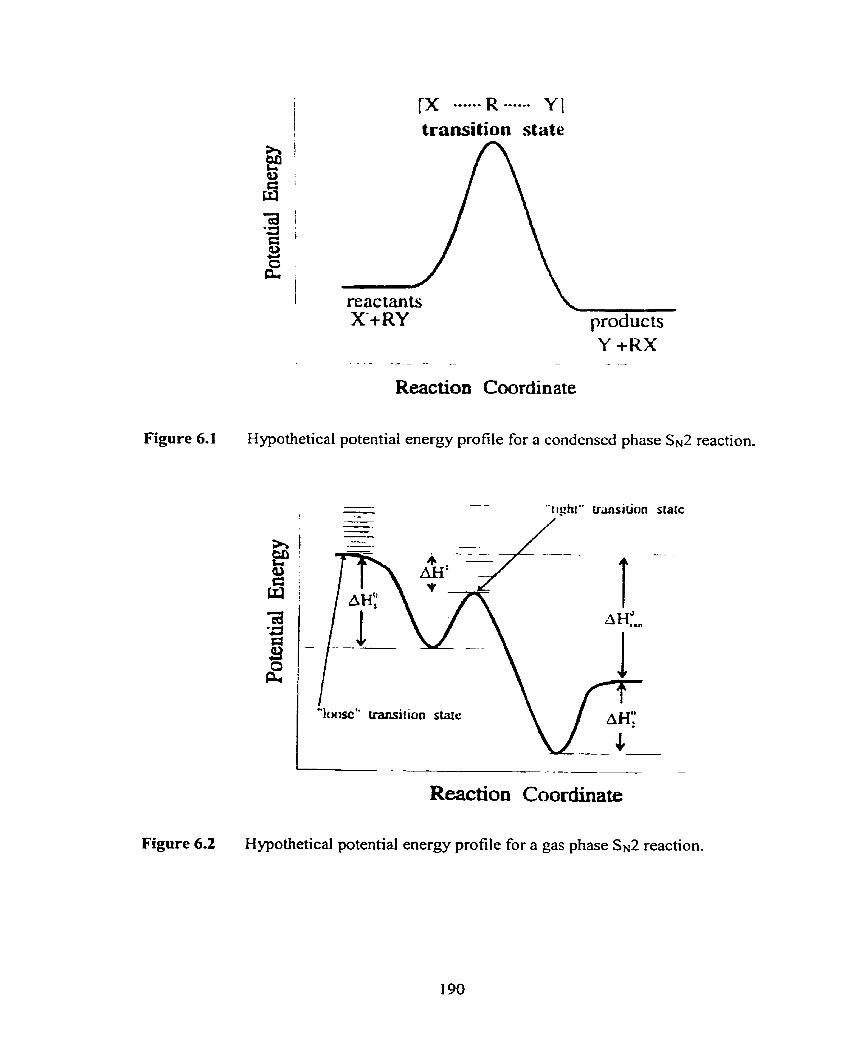
transitton state
Reaction Coordinate
Figure 6.1 Hypothetical potential energy profile for a condensed phase SN2 reaction.
Figure 6.2 Hypothetical potential energy profile for a gas phase SN2 reaction.
(2) conversion of the entrance channel ion-molecule cornplex to the exit channel ion-
molecu! e compl ex t hrough a transit ion state (Reaction 6.3);
(3) dissociation of the exit channel ion-moIecule complex into the producîs (Reaction
6-4).
The transition state is represented by [XCH3Y]-, indicating synchronous formation
and breaking of the X-C and C-Y bonds, respectively. Under thermal and low-pressure
conditions Sx2 reactions proceed through the so-called back-side attack mechanisrn as
indicated by Reaction 6.2.
Frorn many experirnents and trajectory computations it has been shown that the energy
redistribution in the entrance channel ion-molecule complex may be non-statistical. 13.1 5.16.49.52-54. 56.60.63.74-78 This is rnainly due to the short lire-time, and the poor energy
transfer between the intermolecular and intramolecular vibrat ional modes in certain
cases. As a consequence of this the neutral CH3X product is often in vibrationally excited
states. 13."
Barlow et al. studied the rate coefficients of Reaction 6.5 as a fùnction of the kinetic
energy of )'CI- using a flowing afterglow-selected ion flow tube (FA-SET) instrument,
and observed an exponential increase going fiom 0.4 to 2.0
This was explaioed by assurning a higher energy mechanism with a [CH~~~C~"CI]-
transition state, in which the two chlorine atoms are equivalent. The possibility of this so-
called front-side attack mechanism has been also confirmed experimentally by Johnson
and CO-workers, 1 1.80-83 and by Ervin and CO-workers,15 and theoretically by Radom and
c o - ~ o r k e r s , ~ ~ and b y Ziegler and CO-worker~.'~
Cyr el al. observed, besides displacernent reaction products, formation of C l B r and
12-• (Reactions 6.6 and 6.7) at elevated centre-of-mass ion kinetic energies (E,) of the
nucle~philes.~~
Johnson and CO-wockers observed a higher energy identity reaction channel for
r(cH3'1) and formation of B r r from T(CH2Br2) upon photo-excitation (Reactions 6.8
and 6.9).1'-8'43
Emin and CO-workers also investigated Reaction 6.5 using GIB-tandem mass
spectrometry (MS/MS) techniques, and observed a process that closely resernbled the
data from Barlow et al., but ngorous statistical modeling indicated that t h e observed
reaction proceeded by back-side attack.I5 In addition, formation of C12-' was observed at
Em = (4.3 f 0.4) eV (Reaction 6.10).
(6. IO)
In another study on the reaction between fluoride ion and methyl chloride, proton
abstraction and formation of FCI-' was observed at higher centre-of-mass kinetic energies
of F, besides the Sx2 reaction (Reactions 6.1 1-1 3).25
Radom and CO-workers showed that at the G2(+) level of theory the back-side
[CICHJCII- transition state is 2.7 kcal mol-' higher in energy than the r e a ~ t a n t s , ~ ~ which
is in good agreement with experï mental results, whi le the front-side [CH3C12]- transition
state is 46.3 kcal mol-' higher in energy.39 Interestingly, [CH3C12]- was formed from
Cl-(CH3CI), and not from CI-(CICH3), which was not located as a stable minimum. On
the other hand, stable minima were located for Br-(BrCH3) and r(ICH3) at the
GZ(+)(ECP) level of t h e ~ t - y ' ~ The binding energies for these two complexes are much
lower than for Br-(CH3Br) and r(CH31) (1 -7 kcal mol-' vs. 9.8 kcal mol-', and 4.6 kcal
mol-' vs. 8.6 kcal mol-', respectively).
Halide ion-halide interactions are not uncommon in chemistry, although the trihalide
anions. X3- (X = F, CI, Br, I), are hypervalent species and actually covalently b ~ u n d . ' ~
Recently the bond dissociation energies were determined for these four species. Values of
(23.5 c 2.5) kcal mol-' (~33 , " (23.6 + 1.2) kcal mol-' (CI,-)," (30.3 f 1.7) kcal mol-'
(~r3-) , '~ and (30.1 f 1.4) kcal mol-' (13-) " were obtained. Recent photodissociation (PD)
experiments and DFT computations on BrICI- and Br lBr show interesting dynamics and
chemistry for these novel species."
It seems reasonable to assume that by replacing the CH3 by a CF3 group it may be
possible to make front side attack the main mechanisrn for the SN2 reaction. The
electronic repulsion between the nucIeophile and the fluorine atoms may prevent back-
side attack fiom taking place. In the literature a relatively small number of articles have
been published concerning ion-moIecule reactions between ha1 ide ions and some other
anion and trifluoromethyl halide. A short summary will be given here.
Hop and McMahon studied the endothermic SN2 reaction between bromide ion and
dichlorodi fluoromethane by FT-KR (Reaction 6.1 4).88
By following the abundance of the chloride ion as a fùnction of the centre-of-mass
kinetic energy of the bromide ion, the threshold energy could be obtained after analyzing
the data using an empirical mode1 by Armentrout and CO-w~rkers .~~ A threshold value of
(2 1 .O + 1.2) kcal mol-' was found. The authors speculated that the reaction proceeded
through a front-side attack mechanism, involving a penta-coordinate transition state
[CF2C12BrJ-. Final1 y it was mentioned that "the rapid and linear increase in cross-section
at energies slight ly above the threshold suggests non-statistical behavior and a collision
complex which is either not bound or very weakly b~und". '~
Monis studied the reactions of oxide (O4) and superoxide (O2-*) anions, and halide
ions (X-) with various trifluoromethyl halides (CF3X) using a variable-temperature-
selected ion flow tube (VT-SET) in~tnirnent .~~ Large varieties of products, rate
constants, and reaction efflciencies were observed. For the reactions between halide ions
and trifluoromethyl halides, formation of adduct ions was observed (Reaction 6.15 and
6-14), as well as formation of Br- and r (Reaction 6.17).
F + CF3X + F-(XCF3) (X = Cl, Br, 1)
X_ + CF3X + X(XCF3) (X = Cl, Br, 1)
F + CF3X --+ X- + CF4 (X = Br, 1)
In general, the kinetics and efficiencies for these reactions were both low, except for
Reaction 6.17 with X = Br and 1. In a follow-up study, Morris and Viggiano fûrther
investigated the latter two reactions as a fùnction of temperature, kinetic energy, interna1
temperature, and pressure using a VT-SIFT instr~ment.~' Under al1 conditions the
association reaction was the major reaction channel. It was concluded that Reactions 6.4
and 6.6 proceed by two different, non-competing complexes, and that the displacement
reaction proceeds statistically by the classical Walden inversion mechanisrn.
Staneke et d performed FT-ICR experiments between various negative ions and
chlorofluoro and bromofluoro methanes." For the reactions between O H and CF3Cl and
CF3Br no formation of CI- and B r was observed. Formation of Br-(BrCF3) was observed
from secondary react ions (Reaction 6.1 8 and 6.1 9).
In another study using SIFT, Morris et al. investigated the reactions between a large
variety of anions (A-) and the four trifluoromethyl halides (CF3X) at 300 K.') Non-
reactivity and complex formation were observed, as well as reactions initiated by electron
transfer, which in rnost cases were fast and efficient.
Surprisingly, to date no themochemical data for formation of the F(XCF3) and
X(XCF3) complexes (X= Cl, Br, 1), either experimentally or computationally, are
available. In addition, no data are available on the thermochemistry of the transition
States for both back and front side attack. Even though replacing the CH3 group by a CF3
group appears to favor formation of a front side attack complex, it cannot be mled out a
priori that back side attack is not possible, or even still more favorable for an SN2
reaction, as suggested by Moms and ~ i ~ ~ i a n o . ~ '
In this work the thermochemistry for the equilibrium clustenng of chlonde and
bromide ion onto trifluoromethyl bromide and iodide (Reactions 6.20-6.22) was studied
by PHPMS.
In addition, high level DFT and a b Ïnitio computations were performed to get more
insight into the structures o f the ion-molecule complexes and the transition States, and to
constnict potential energy profiles for the fiont- and back-side attack mechanisms, as
well as other possible mechanisms. The quality of the calculated thermochemistry was
also evaluated by the agreement with the limited experimental data available t o date.
6.2 Experimental
Al1 measurements were carried out on a pulsed-ionization high pressure rnass
spectrometry (PHPMS) instrument, configured around a VG 8-80 mass ~ ~ e c t r o r n e t e r . ~ ~
The instrument, constructed at the University o f Waterloo, has been described in detail in
Chapter 2.
Gas mixtures were prepared in a 5 L heated stainless steel reservoir at 370 K, by using
CH4 as a bath gas at pressures o f 700-800 Torr. Chloride ion was generated from trace
amounts o f CCI4 by dissociative electron capture o f thermalized electrons From 500 ps
pulses o f a 2 keV electron gun beam. Brornide ion was efficiently generated by an Sx2
reaction between Cl- and n-butyl bromide (Equation 6.23).
The two trifluoromethyl halides (CF3Br and C F d ) were added to give relative amounts
between O. 1% and 1.6%, depending on the ion source temperature and the nature of the
experiment involved. The ion source pressure and temperature ranged between 4.0-5.0
Torr and 300-445 K, respectively.
Time intensity profiles o f mass selected ions were monitored by using a PC based
multichannel scalar (MCS) data acquisition system, configured at 100 ps dwell time per
channel over 250 channels. Additive accumulations of ion signals from 2000 electron gun
beam pulses were used-
Equilibrium constants (b) at different absolute temperatures for the various halide
ion-trifluoromethyl halide clustering equilibria (Reactions 6.20-6.22) are determined
from Equation 6.24.
In Equation 6.24, Int(X(YCF3))/lnt(X) is the ion intensity ratio of the X(YCF3) and
X- ions at equilibrium, PO is the standard pressure ( 1 atm), and PCF3 Y-souruî is the partial
pressure (in atm) of the trifluoromethyl halide in the ion source.
Equilibrium constants were calculated for various isotope pairs, e.g.
3 5 ~ ~ - / 3 5 ~ ~ - ( 7 9 ~ r ~ ~ 3 ) and 3 S ~ l - / 3 5 ~ B ~ c F ~ ) . and 7 9 ~ r - / 7 9 ~ ~ ( 7 9 ~ r ~ ~ 3 ) and 7 9 ~ r - / 79 B ~ - ( ~ ' B ~ C F ~ ) . The observed equilibrium constants obtained for these isotope pairs need
to be corrected for the fact that the partial pressure of CF3Br introduced into the reservoir
consists for 50°/0 of C F ~ ~ ~ B ~ and 50% of C F ~ ~ ' B ~ . In addition, one has to correct for the
fact that the peak at the m/z value corresponding to " c I - (~ 'B~cF~) also contains the
3 7 ~ 1 - ( 7 % 3 r ~ ~ 3 ) isotope pair (2SoA of the total ion intensity). For the 3 5 ~ ~ - / 3 5 ~ l - ( 7 9 ~ r ~ ~ ~ )
isotope pair K = 2 k b s , while for 3 5 ~ ~ 7 3 5 ~ 1 - ( 8 ' ~ r ~ ~ 3 ) K = 1.5KObs. Similarly for
7 9 ~ r 7 7 9 ~ r - ( 7 9 ~ r ~ ~ 3 ) and ' g~ r - / 79~r - (8 'E3 r~~3) K's of 2KbS and kbs, respectively, can be
derived. The equilibrium constants obtained showed very close agreement, indicating that
this correction is valid. The equilibriurn constants used to calculate the & and AS*
values were the averages o f six different equilibrium constants from the two isotope
pairs.
Trifluoromethyl bromide and iodide were purchased from SCM Specialty Chemical.
Methane was purchased fiom Praxair. Carbon tetrachloride was purchased Iiom J. T.
Baker Chemical Co. n-Butyl bromide was purchased fiom Aldrich. Al1 chernicals were
used as received.
6.3 Computational
Al1 computations were performed using the Gaussian Y 4 " and 98 % suites of 97.98 programs. Geometries were optimized using the B3LYP method in combination with
99.1 O 0 the 6-3 1 1 +G(d) (a) basis set for C, F, Cl, and Br, and the LanL2DZ (b) basis set for 1
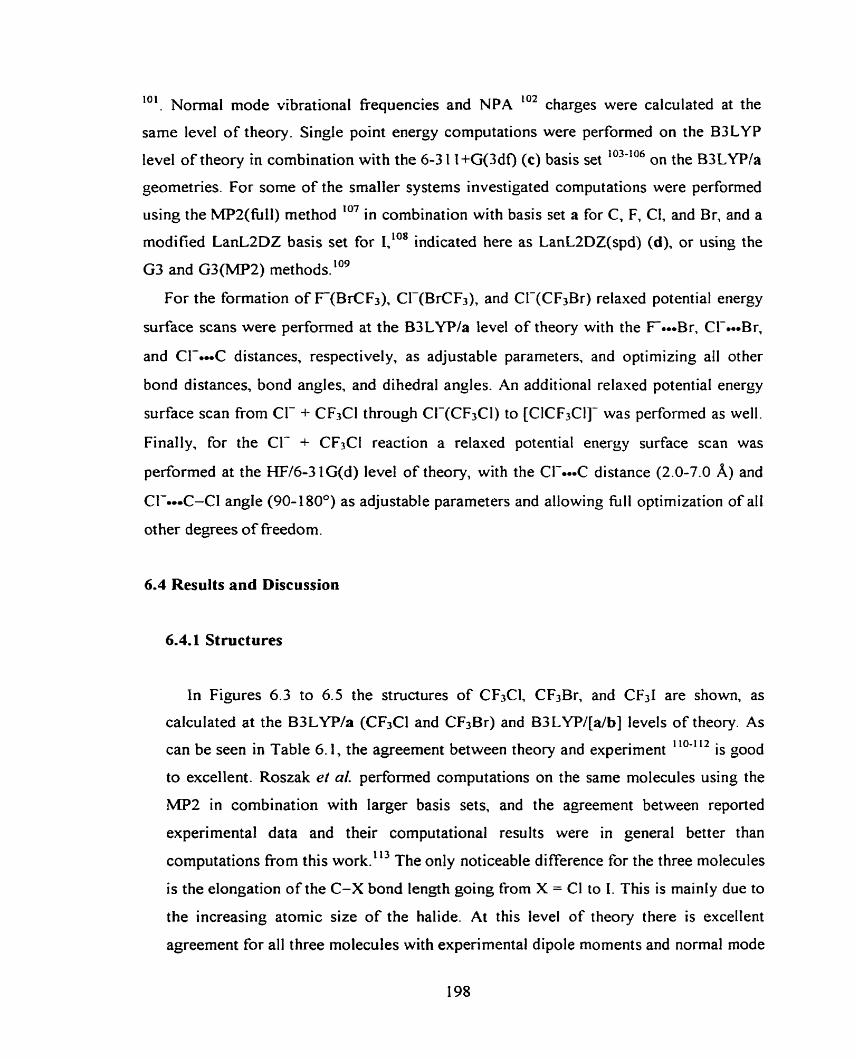
'O1. Normal mode vibrational frequencies and NPA ' O 2 charges were calculated at the
same level of theory. Single point energy computations were performed on the B3LYP
level of theory in combination with the 6-3 1 1+G(3df) (c) basis set 103-106 on the B3LYP/a
geometries. For some of the smaller systems investigated computations were performed
using the MP2(full) method 'O7 in combination with basis set a for C, F, CI, and Br, and a
rnoditied LanL2DZ basis set for I,"* indicated here as LanLZDZ(spd) (d), or using the
G3 and G3(MP2) methods.lo9
For the formation of F(BrCF3), CI-(BrCF3), and CI-(CF3Br) relaxed potential energy
surface scans were performed at the B3LYP/a level of theory with the Fm-Br, CI-.-Br,
and CI--C distances, respectively, as adjustabte parameters. and optimizing a11 other
bond distances, bond angles, and dihedral angles. An additional relaxed potential energy
surface scan from CI- + CF3Cl through CI-(CF3CI) to [CICF3CI]- was performed as well.
Finally, for the Cl- + CF3CI reaction a relaxed potential energy surface scan was
performed at the W l 6 - 3 1 G(d) level of theory, with the Cl-.-C distance (2.0-7.0 A) and
CI-0-C-CI angle (90-180°) as adjustable parameters and allowing ful l optimization of all
other degrees of freedom.
6.4 Results and Discussion
6.4.1 Structures
In Figures 6.3 to 6.5 the structures of CFJCI, CF3Br, and CF31 are shown, as
calculated at the E33LYPla (CF3Cl and CF3Br) and B3LYP/[a/b] levels of theory. As
can be seen in Table 6.1, the agreement between theory and expet-iment 110-1 12 is good
to excellent. Roszak et al. performed computations on the same molecules using the
MP2 in combination with Iarger basis sets, and the agreement between reported
experimental data and their computational results were in general better than
computations from this work.l13 The only noticeable di fference for the three molecules
is the elongation of the C-X bond length going from X = Cl to 1. This is mainIy due to
the increasing atomic size of the halide. At this level of theory there is excellent
agreement for al1 three molecules with experimental dipole moments and normal mode
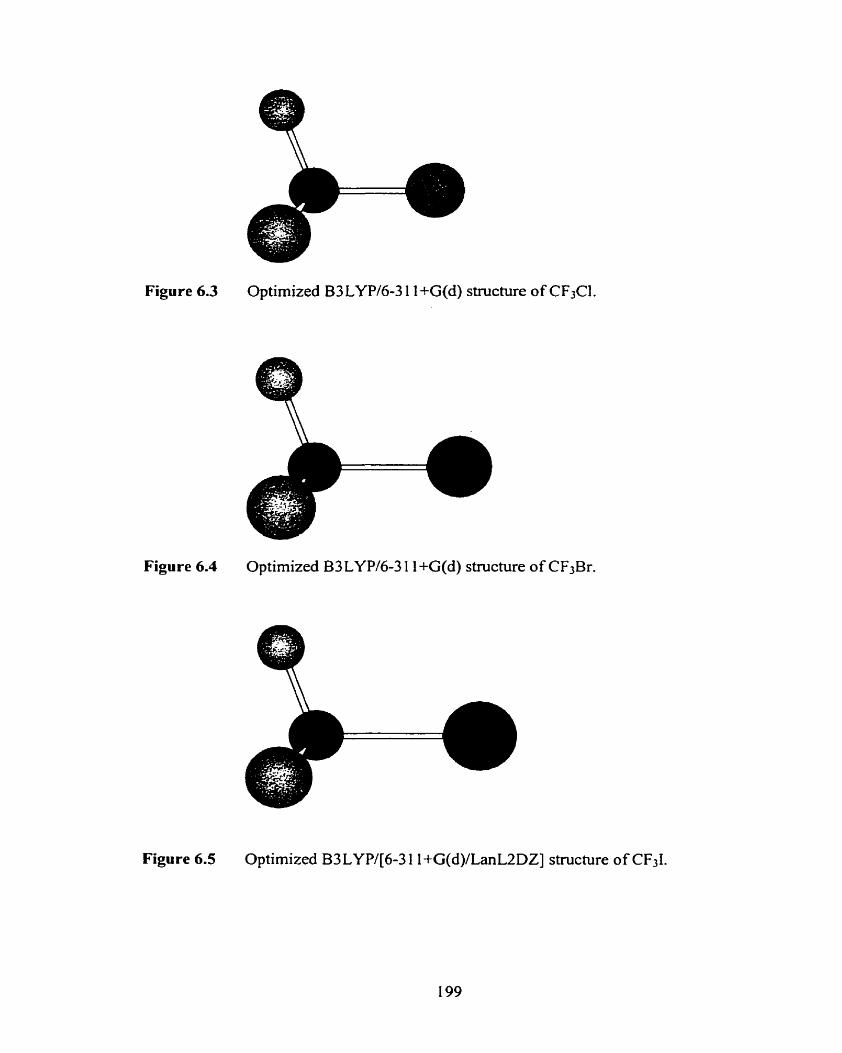
Figure 6.3 Optimized B3LYP/6-3 1 1 +G(d) structure of CF3CI.
Figure 6.4 Optimized B3LYP/6-3 1 1+G(d) structure of CF3Br.
Figure 6.5 Optimized B3LYP/[6-3 1 l+G(d)/LanLZDZ] structure of CF31.
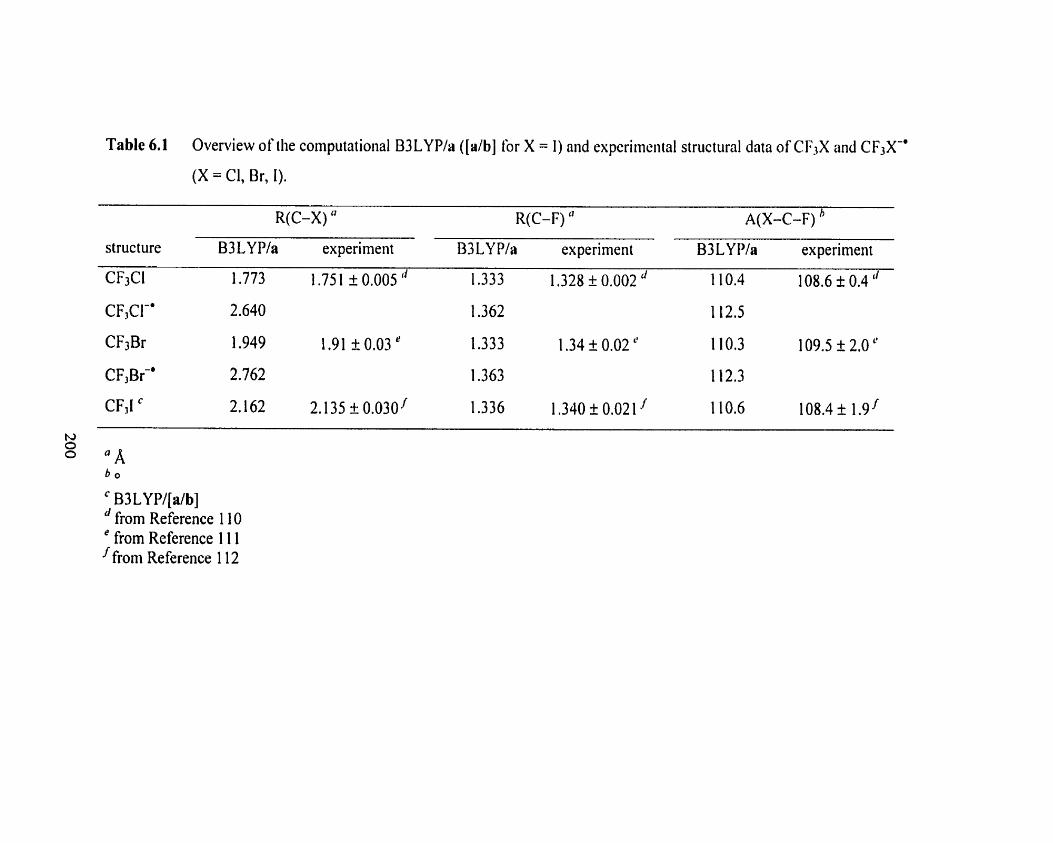
Table 6.1 Overview of the computational B3LYPh ([db] for X = 1) and experiincnial structural data of CFjX and CF3X-'
(X = Cl, Br, 1).
R(C-X) " R(C-F) " A(X-C-F) " structure B3 LY Pla experiment B3 LY P/a experiment B3LYPla experiment
CF3CI 1.773 1.75 1 f 0.005 " 1.333 1.328 k 0.002 " 1 10.4 108.6 f 0.4 "
' B3LYPl[alb] from Reference 1 10 from Reference 1 1 1 from Reference 1 12
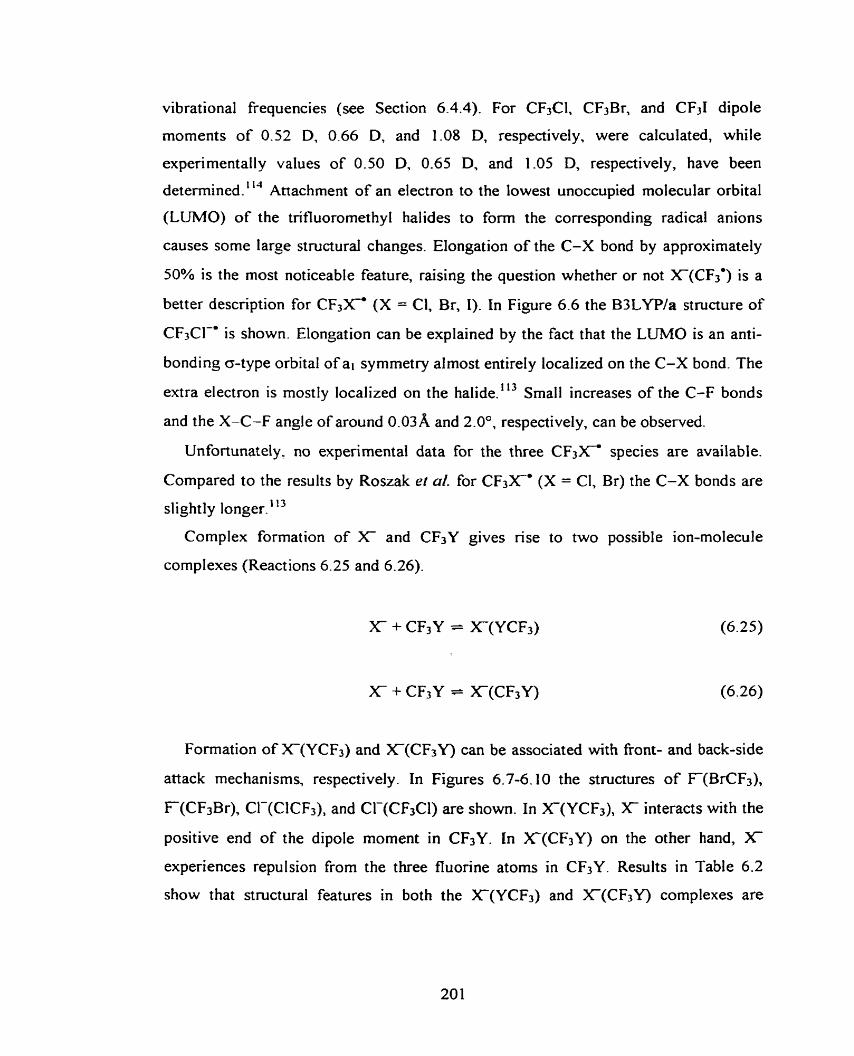
vibrational frequencies (see Section 6.4.4). For CF3Cl, CF3Br, and CF31 dipole
moments of 0.52 D, 0.66 D, and 1-08 D, respectively, were calculated, while
experimentally values of 0.50 D, 0.65 D, and 1.05 D, respectively, have been
determined. ' l4 Attachment of an electron to the lowest unoccupied molecular orbital
(LLJMO) of the trifluoromethyl halides to fom the corresponding radical anions
causes sorne large structural changes. Elongation of the C-X bond by approximately
50% is the most noticeable feature, raising the question whether or not X(CF3*) is a
better description for CF3>C (X = CI, Br, 1). In Figure 6.6 the B3LYP/a structure of
CF3Cl-' is shown. Elongation can be explained by the fact that the LUMO is an anti-
bonding o-type orbital of ai symmetry alrnost entirely localized on the C-X bond. The
extra electron is mostly localized on the halide.'13 Small increases of the C-F bonds
and the X-C-F angle of around 0.03A and 2.0°, respectively, can be observed.
Unfortunately. no experimental data for the three CF3Xm species are available.
Compared to the results by Roszak et al. for CF3Xm (X = CI, Br) the C-X bonds are
slightly longer1 " Complex formation of X- and CF3Y gives rise to two possible ion-molecule
complexes (Reactions 6.25 and 6.26).
Formation of X(YCF3) and X(CF3Y) can be associated with Front- and back-side
attack mechanisms, respectively. In Figures 6.7-6.10 the structures of F(BrCF3),
F(CF3Br), CI-(ClCF3), and Cl-(CF3Cl) are shown. In X'(YCF3), X interacts with the
positive end of the dipole moment in CF3Y. In X-(CF3Y) on the other hand, X
experiences repulsion from the three fluorine atoms in CF3Y. Results in Table 6.2
show that structural features in both the X(YCF3) and X(CF3Y) complexes are
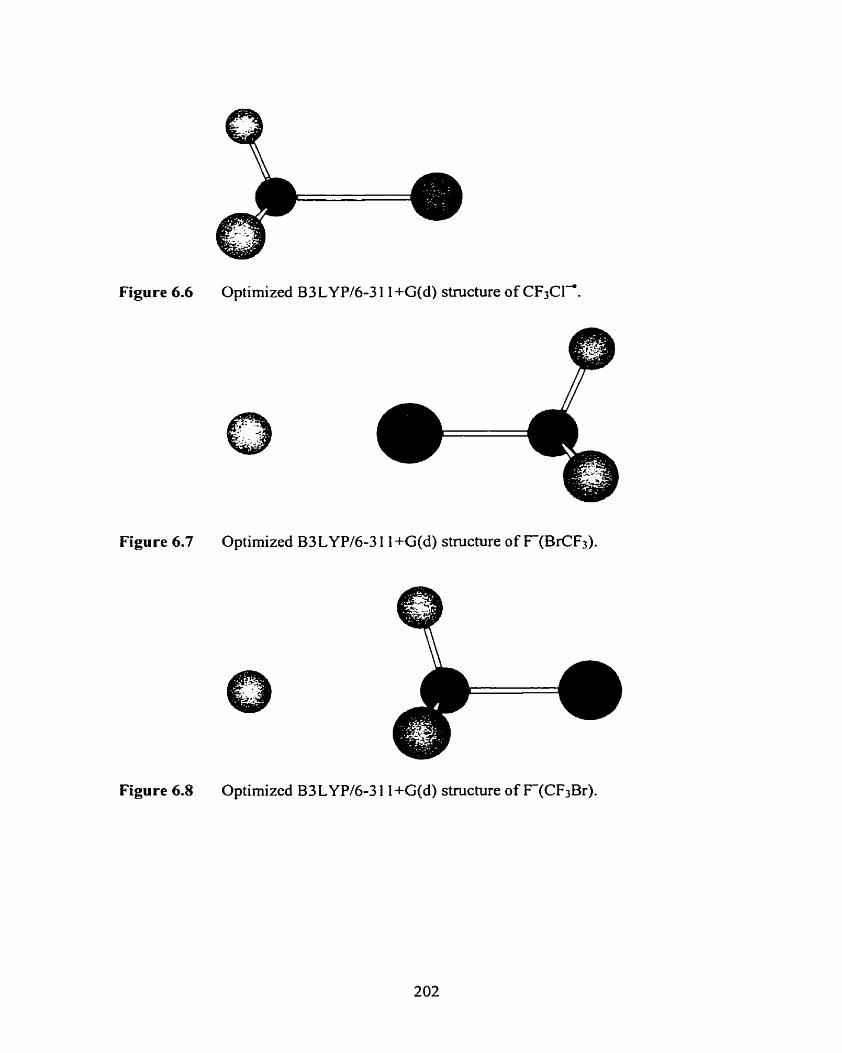
Figure 6.6 Optirnized 8 3 LYP/6-3 1 1 +G(d) structure of CF3Cl'.
Figure 6.7 Optimized B3LYP/6-3 1 l+G(d) structure of F(BrCF3).
Figure 6.8 Optimized B3LYP/6-3 1 1+G(d) structure of F-(CF3Br).
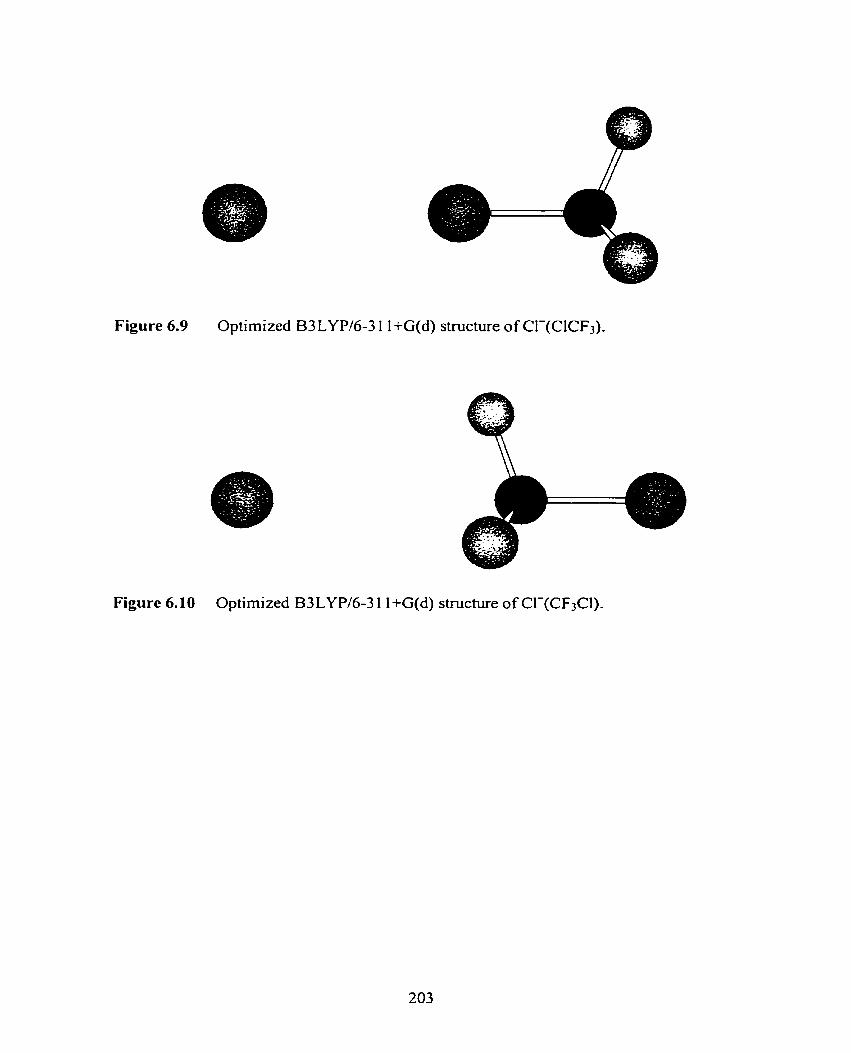
Figure 6.9 Optimized B3LYP/6-3 1 1 +G(d) structure of Cl-(CICF3).
Figure 6.10 Optimized B3 LYP/6-3 1 1 +G(d) structure of CI-(CF3CI).
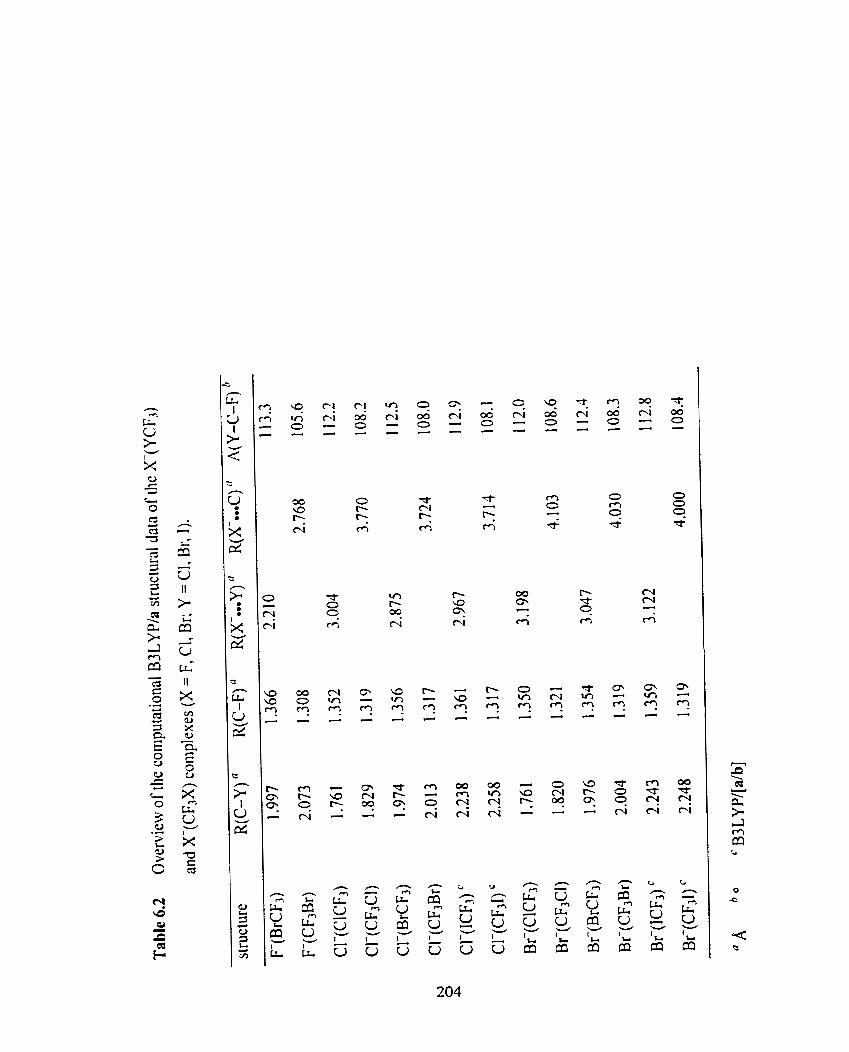
cc)
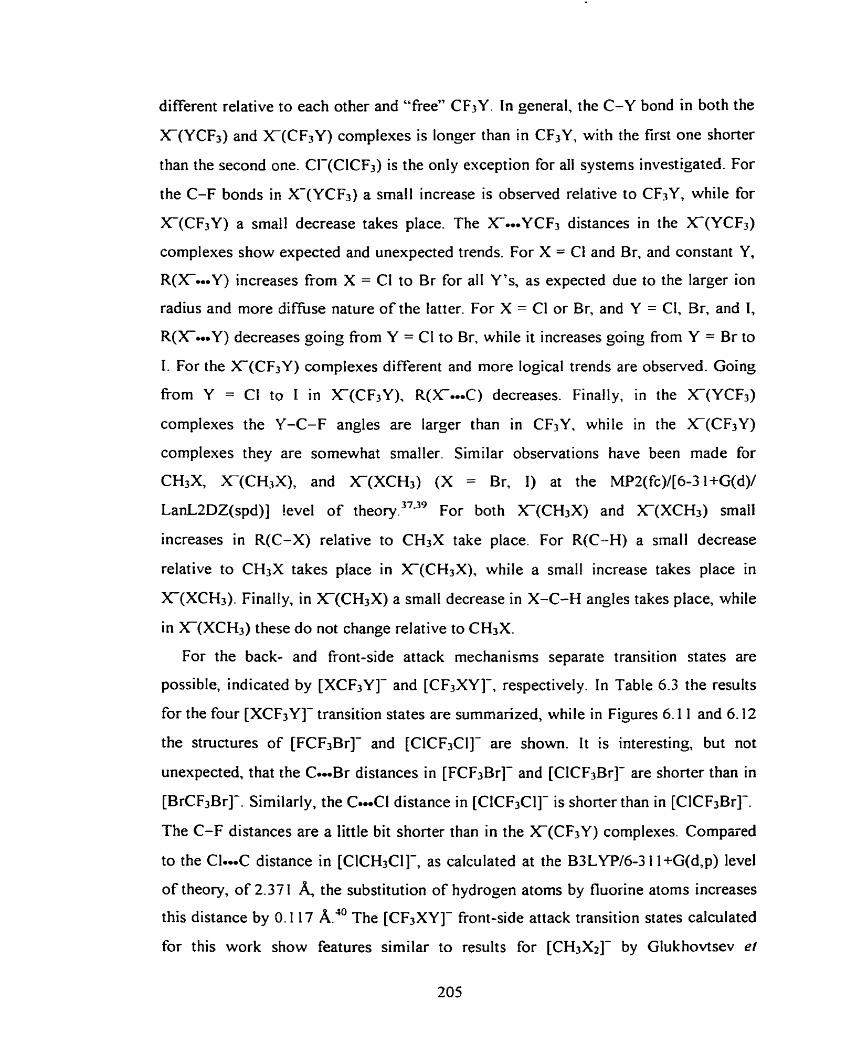
different relative to each other and "free" CF3Y. In general, the C-Y bond in both the
X(YCF3) and X(CF3Y) complexes is longer than in CF3Y, with the first one shorter
than the second one. CI-(CICS) is the only exception for al1 systems investigated. For
the C-F bonds in X(YCF3) a smail increase is observed relative to CF3Y, while for
X(CF3Y) a small decrease takes place. The XmemYCF3 distances in the X(YCF3)
complexes show expected and unexpected trends. For X = CI and Br, and constant Y,
R(X-Y) increases from X = Cl to Br for al1 Y's, as expected due to the larger ion
radius and more d i f i s e nature of the latter. For X = Cl or Br, and Y = Cl, Br, and 1,
R(X--Y) decreases going from Y = Cl to Br, while it increases going from Y = Br to
1. For the X(CF3Y) complexes different and more logical trends are observed. Going
from Y = Cl to 1 in X(CF3Y), R(XmoeC) decreases. Finally, in the X(YCF3)
complexes the Y-C-F angles are larser than in CF3Y, while in the X(CF3Y)
complexes they are somewhat smaller. Similar observations have been made for
CH3X, X(CH3X), and X(XCH3) (X = Br, 1) at the MP2(fc)/[6-31+G(d)/
LanL2DZ(spd)] !evel of theory. 3739 For both X-(CH3X) and X(XCH3) srnaIl
increases in R(C-X) relative to CH3X take place. For R(C-H) a small decrease
relative to CH3X takes place in X(CH3X), while a small increase takes place in
X(XCH3). Finally, in X(CH3X) a small decrease in X-C-H angles takes place, while
in X(XCH3) these do not change relative to CH3X.
For the back- and front-side attack mechani sms separate transit ion states are
possible, indicated by [XCF3Y]- and [CF,XY]-, respectively. In Table 6.3 the results
for the four [XCF3Y]- transition states are summanzed, while in Figures 6.1 1 and 6.12
the structures of [FCF3Br]- and [CICF3CI]- are shown. It is interesting, but not
unexpected, that the C-Br distances in [FCF3Br]- and [ClCF3Br]- are shorter than in
[BrCF3Br]-. Similarly, the C-CI distance in [CKF3Cl]- is shorter than in [CICF,Br]-.
The C-F distances are a little bit shorter than in the X(CF3Y) complexes. Compâred
to the Cl-OC distance in [ClCH3CI]-, as calculated at the B3tYP/6-3 1 l+G(d,p) level
of theory, of 2.37 1 4 the substitution of hydrogen atoms by fluorine atoms increases
this distance by 0.117 A." The [CF3XY]- front-side attack transition states calculated
for this work show features similar to results for [CH3X2]- by Glukhovtsev et
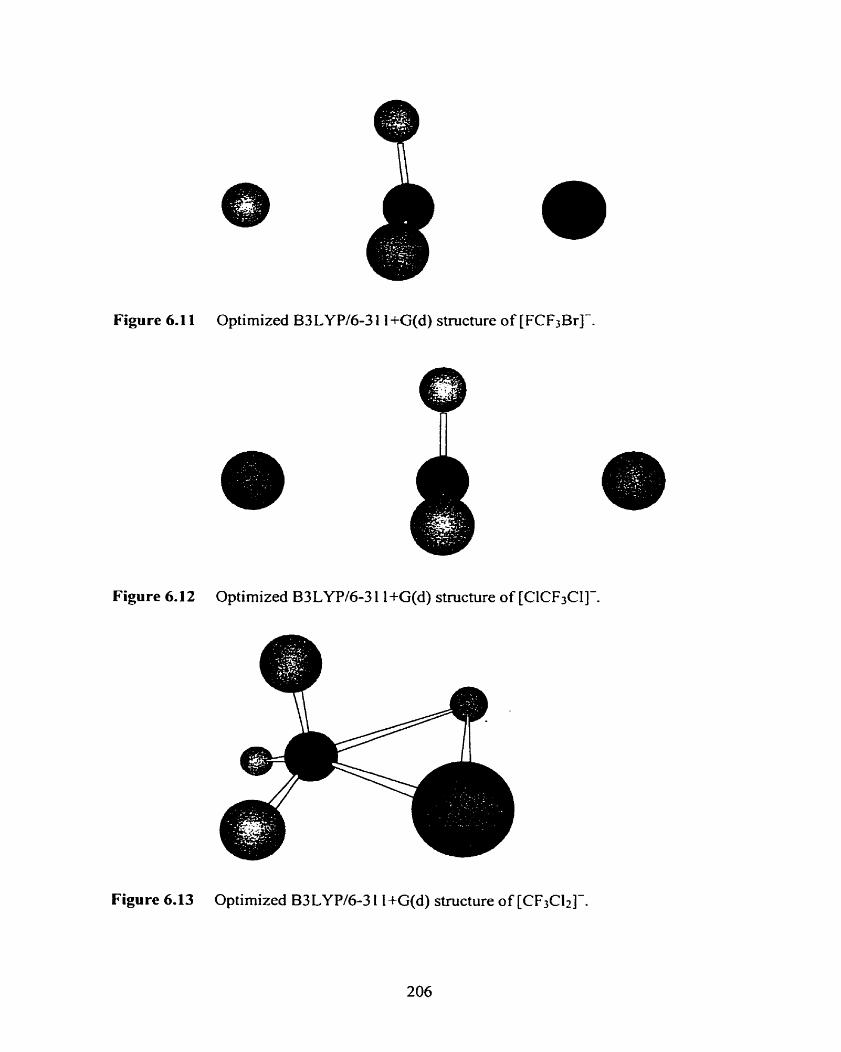
Figure 6.1 1 Optimized B3LYP/6-3 1 1+G(d) structure of [FCF3Br]-.
Figure 6.12 Optimized B3 LYP/6-3 1 1 +G(d) structure of [ClCF3Cl]-.
Figure 6.13 Optimized B3 LYP/6-3 1 1 +G(d) structure of [CF3C12]-.
206
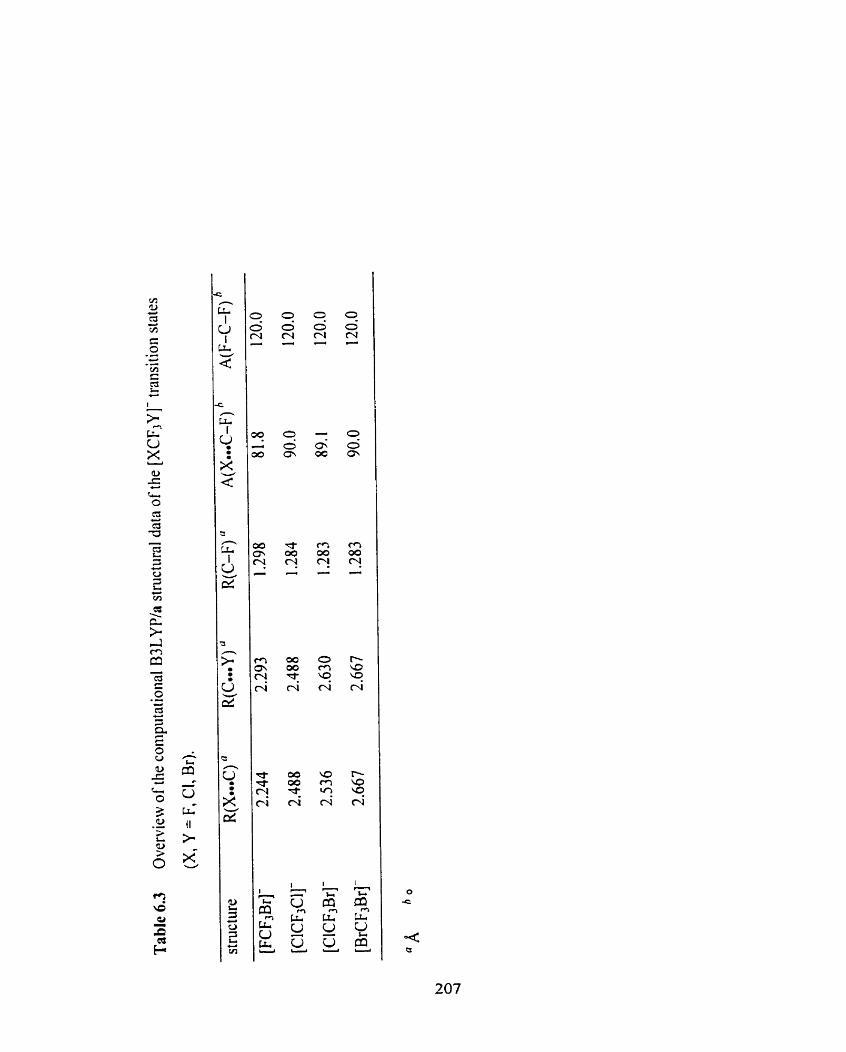
9 " O
Z) r -! I
CI 3 2 3
Tl- * N TU
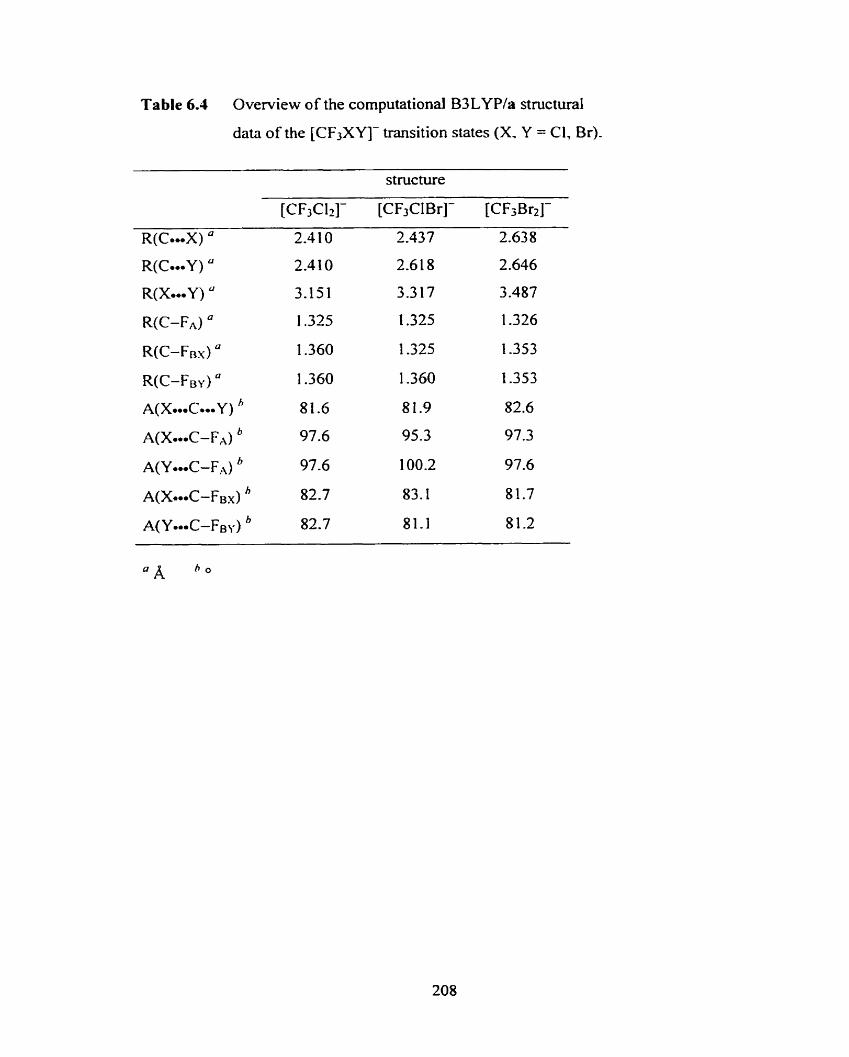
Table 6.4 Overview of the computational B3LYP/a structural
data of the [CF3XY]- transition States (X. Y = Cl, Br).
structure
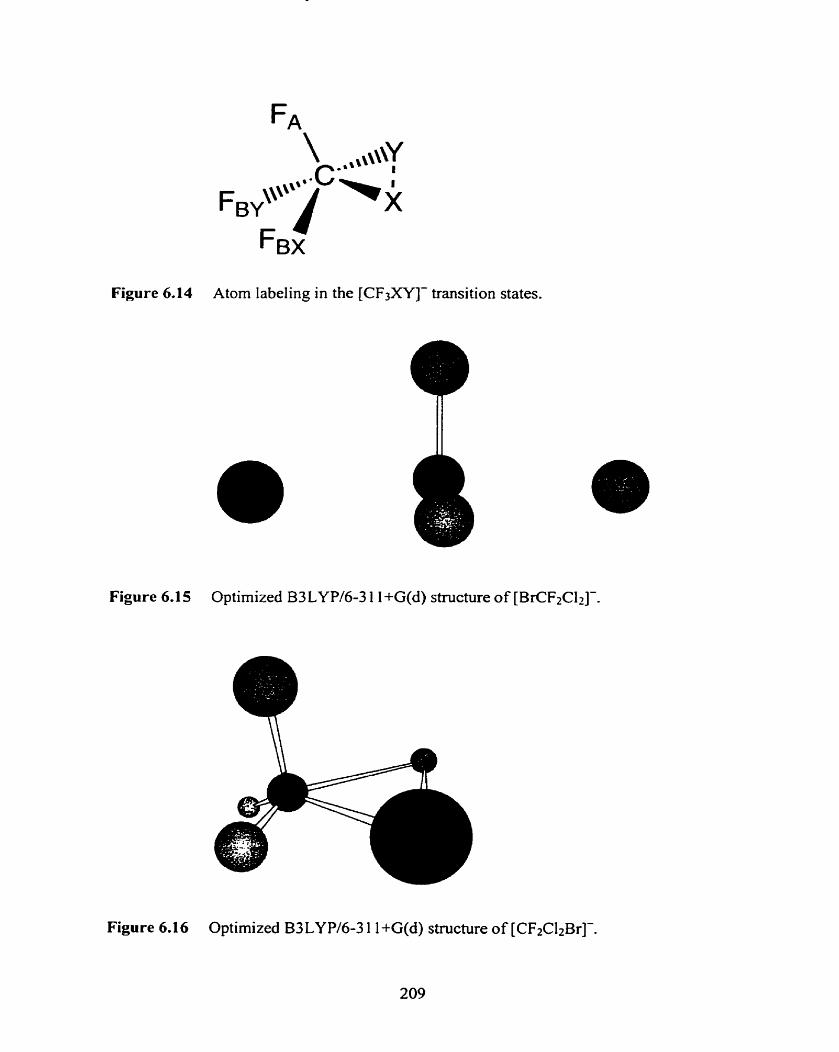
Figure 6.14 Atom labeling in the (CF3XYJ- transition States.
Figure 6.1 5 Optimized B3 LYP/6-3 1 1 +G(d) stnicture of [BrCF2C12]-.
Figure 6.1 6 Optimized B3 LY P/6-3 1 1 +G(d) structure of [CF2CI2Br]-.
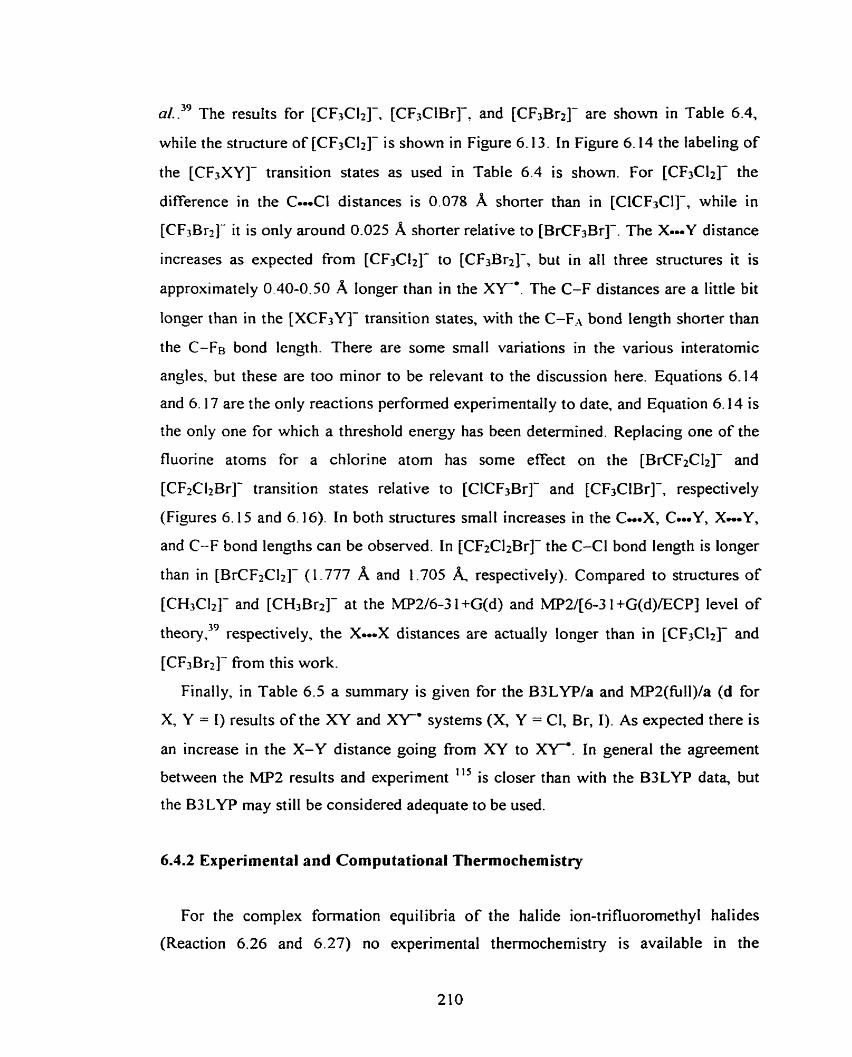
39 al.. The resuIts for [CF3C12]-, [CF3ClBrj-, and [CF3Brt]- are sho~vn in Table 6.4,
whife the structure of [CF3C12]- is shown in Figure 6.13. In Figure 6.14 the labeling of
the [CF3XY]- transition states as used in Table 6.4 is shown. For [CF3C12IA the
difference in the C--.CI distances is 0.078 A shorter than in [ClCF3Cl]-, while in
[CF,Br2]- it is only around 0.025 A shorter relative to prCF3Br]-. The Xo-Y distance
increases as expected from [CF3CI2]- to [CF3Br2]-, but in al1 three structures it is
approximately 0.40-0.50 A longer than in the XY'. The C-F distances are a little bit
longer than in the [XCF3Y]- transition states, with the C-F,, bond length shorter than
the C-FB bond length. There are some srna11 variations in the various interatomic
angles, but these are too minor to be relevant to the discussion here. Equations 6.14
and 6.17 are the only reactions perfonned experimentally to date, and Equation 6.14 is
the only one for which a threshold energy has been determined. Replacing one of the
fluorine atoms for a chlorine atom has some effect on the [BrCF2C12]- and
[CF2C12Br]- transition states relative to [ClCF3Br]- and [CF3CIBr]-, respectively
(Figures 6.15 and 6.16). In both structures small increases in the C...X, C.-Y, X-Y,
and C-F bond lengths can be observed. In [CF2CI2Br]- the C-Cl bond length is longer
than in [BrCF2C12]- ( 1.777 A and 1.705 respectively). Compared to structures of
[CH3Clz]- and [CHiBrzI- at the MP2/6-3 1 +G(d) and MP2/[6-3 1 +G(d)/ECP] level of
theory," respectively. the X-X distances are actually longer than in [CF3CI~]- and
[CF3Br2]- from this work.
Finally, in Table 6.5 a summary is given for the B3LYP/a and MP2(full)/a (d for
X, Y = 1) results of the XY and XY' systems (X, Y = CI, Br, 1). As expected there is
an increase in the X-Y distance going frorn XY to W . In general the agreement
between the MP2 results and experiment '15 is closer than with the B3LYP data, but
the B3LYP may still be considered adequate to be used.
6.4.2 Experimental and Computational Thermochemistry
For the complex formation equilibria of the halide ion-tnfluoromethyl halides
(Reaction 6.26 and 6.27) no experïmental thermochernistry is available in the
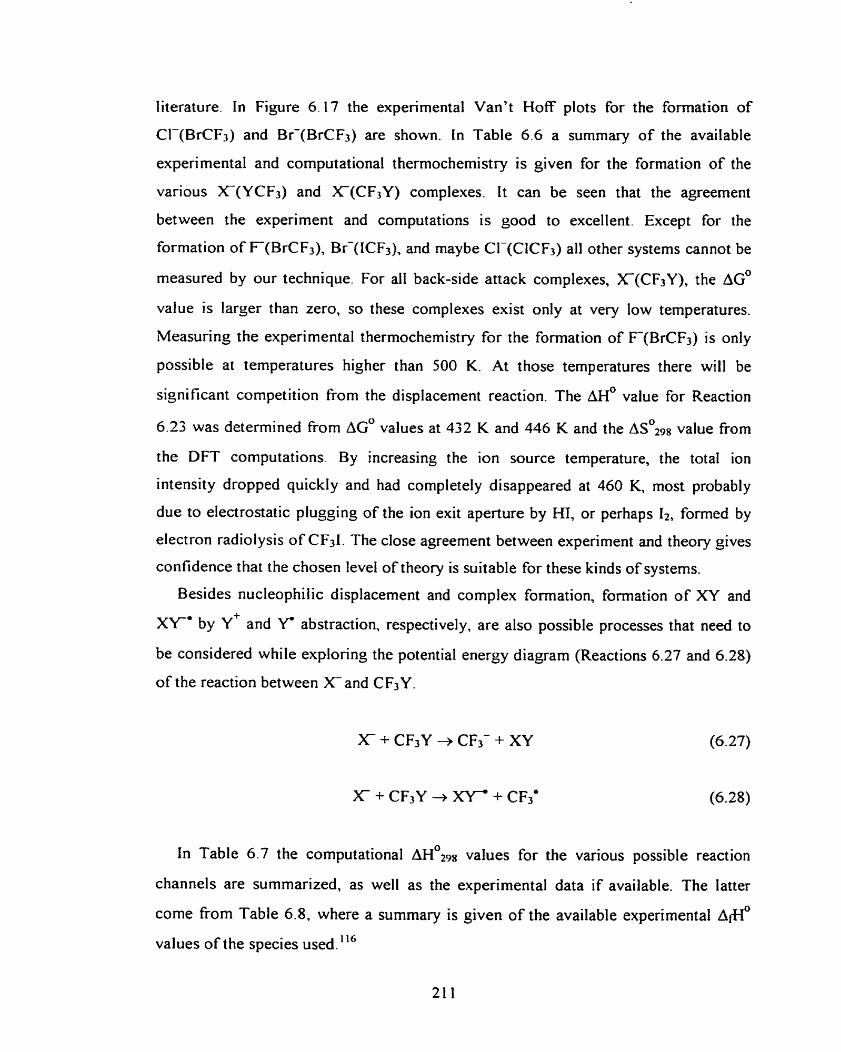
literature. In Figure 6.1 7 the experimental Van't Hoff plots for the formation of
CI-(BrCF3) and Br-(BrCF3) are shown. in Table 6.6 a sumrnary o f the available
experimental and computational thermochemistry is given for the formation of the
various X(YCF3) and X-(CF3Y) complexes. It can be seen that the agreement
between the experirnent and computations is good to excellent. Except for the
formation o f F(BrCF3), Br-(ICF3), and maybe Cl-(CICF3) al1 other systems cannot be
rneasured by our technique. For al1 back-side attack complexes, X(CF3Y), the AG'
value is larger than zero, so these complexes exist only at very low temperatures.
Measuring the experimental thermochemistry for the formation of F(BrCF3) is only
possible at temperatures higher than 500 K. At those temperatures there will be
signi fkant compet ition from the displacement reaction. The AH0 value for Reaction
6.23 was determined from AG' values at 432 K and 446 K and the ~ ~ ' ~ 9 8 value h m
the DFT computations. By increasing the ion source temperature, the total ion
intensity dropped quickly and had completely disappeared at 460 K, most probably
due to electrostatic plugging of the ion exit aperture by HI, o r perhaps 12, forrned by
electron radiolysis o f C K I . The close agreement between experiment and theory gives
contidence that the chosen level o f theory is suitable for these kinds o f systems.
Besides nucleophiiic displacement and complex formation, formation o f XY and
X Y ' by Y+ and Y abstraction, respectively, are also possible processes that need to
be considered while exploring the potential energy diagram (Reactions 6.27 and 6.28)
o f the reaction between XI and CF3Y.
In Table 6.7 the computational AH0298 values for the various possible reaction
channels are summarized, as well a s the experimental data if available. The latter
come from Table 6.8, where a sumrnary is given of the available experimental fi' values o f the species used. ' 1 6
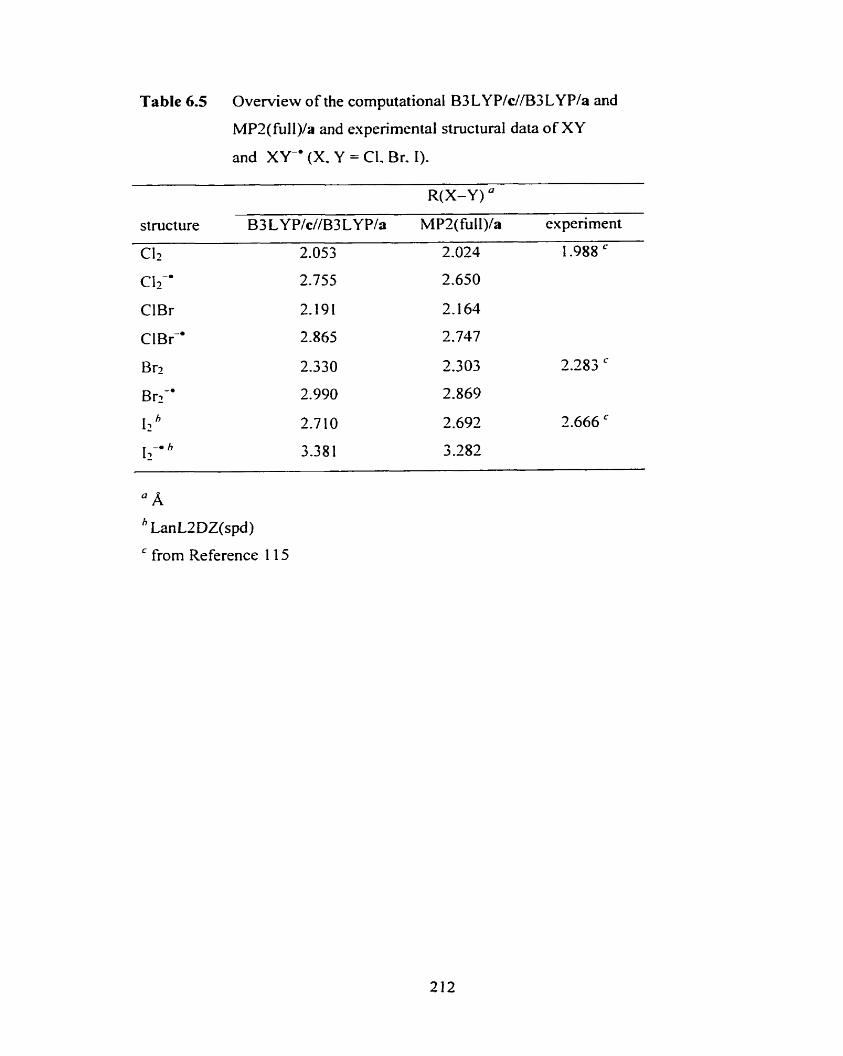
Table 6.5 Overview of the computational B3 LY P/c//B3 LYPIa and
MP2(full)/a and experimental structural data o f XY
and XY-• (X. Y = Cl. Br. 1).
R(X-Y) "
structure B3 LYP/c//B3LYP/a MP2(fuIl)la expenment
cl2 2.053 2.024 I .988 ' CI2-' 2.755 2.650
ClBr 2.191 2. I 64
C 1 Br-' 2.865 2.747
Br2 2.330 2.303 2.283 '
Br2-. 2.990 2.869
h 11 2.7 1 O 2.692 2.666 '
[?-O 3.38 1 3 -282
" A LanLZDZ(spd)
' from Reference 1 15
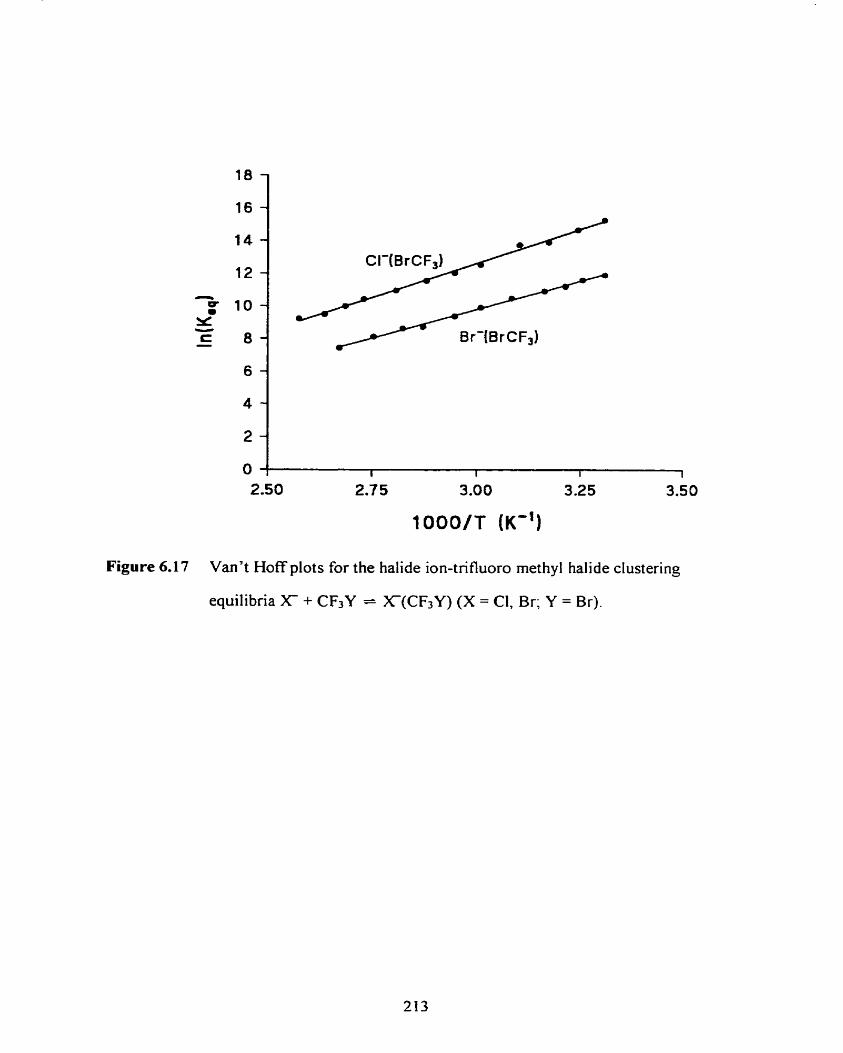
Figure 6.17 Van't Hoff plots for the halide ion-tnfluoro methyl halide clustering
equilibria X + CF3Y = X(CF3Y) (X = Cl, Br; Y = Br).
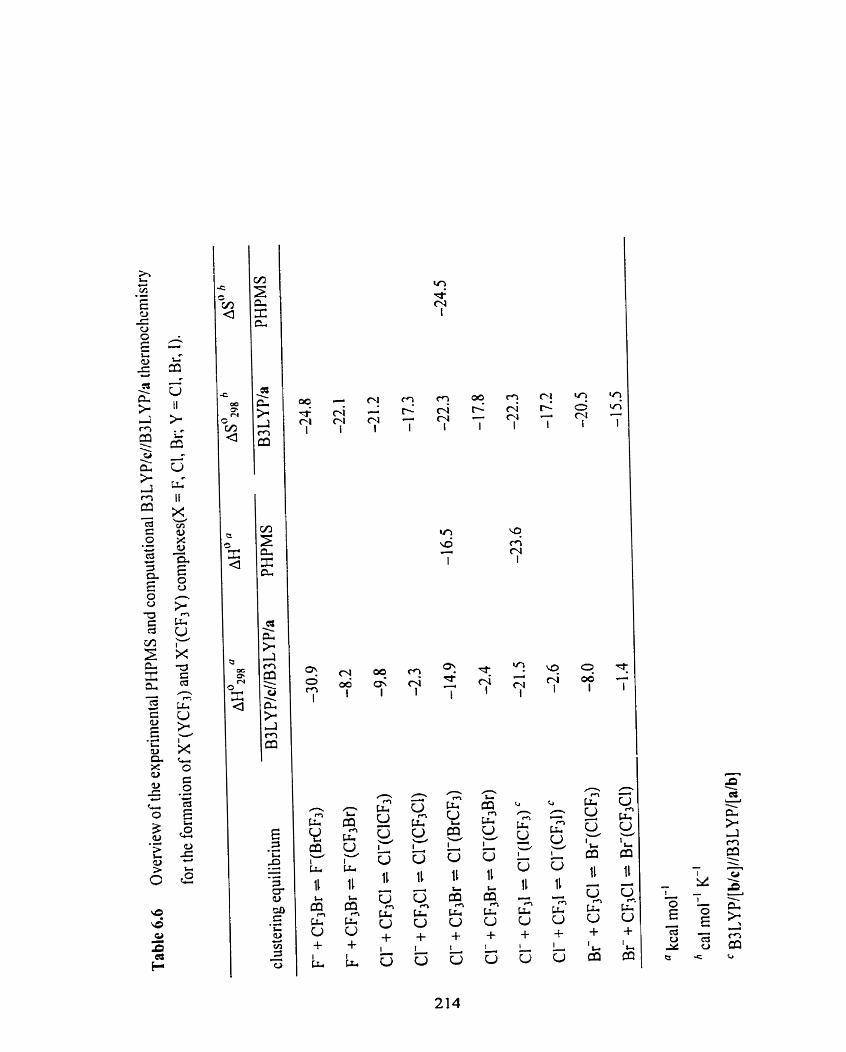
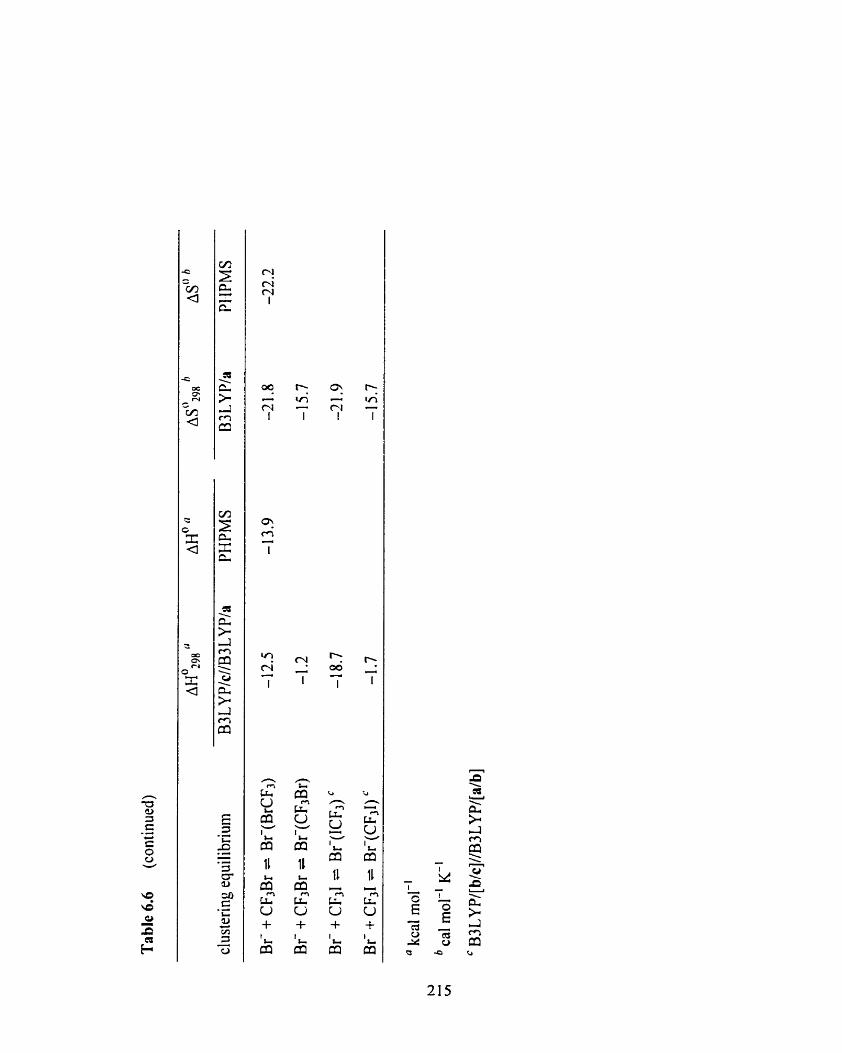
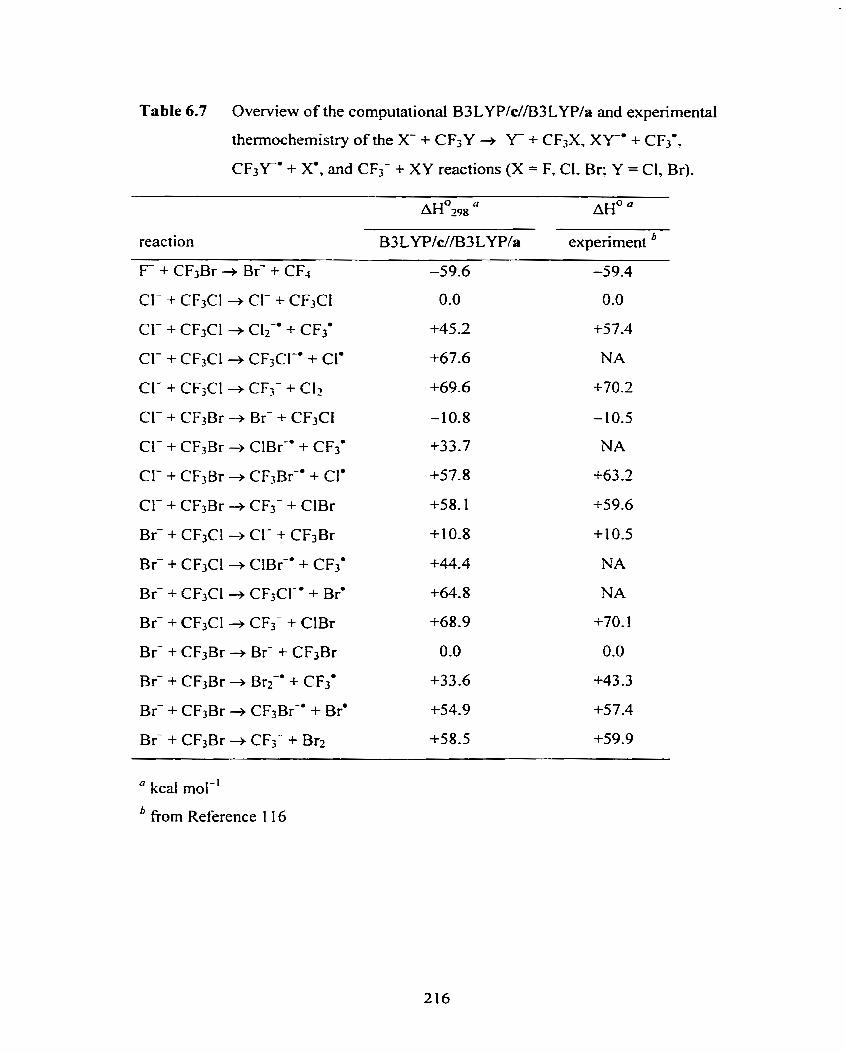
Table 6.7 Overview of the computational B3 LYP/c//B3 LYPIa and experimental
thennochemistry of the X- + CF3Y + Y- + CF3X, X Y ' + CF3'.
CF3Ym + X', and CF3- + XY reactions (X = F. CI. Br: Y = Cl, Br).
reaction B3 LYP/c//B3 LY Pla experirnent b
F- + CF3Br + Br- + CF1 -59.6 -59.4
CI- + CF3Cl + Cl2-' + CF3'
CI- + CF3Cl + CF3Cl-' + Cl' +67.6
Cl- + CF;Cl + CF3- + CI2 +69.6
Cl- + CF;Br -+ Br- + CF3CI -10.8 -10.5
Cl- + CF3Br + ClBr-' + CF3'
Cl- + CF3Br + CFsBr-' + CI'
Br- + CF3CI 4 Cl- + CF3Br
B r + CF3Cl 4 CF3Cl-' + Br' +64.8
Br- + CF3Cl + CF3- + ClBr +68.9
B r + CF3Br -P Br- + CF3Br 0.0 0.0
Br- + CF3Br + CF3Br-' + Br* t54.9 t57.4
B r + CF3Br 4 CF3- + Brz +58S +59.9
" kcal mol-'
from Reference 1 16
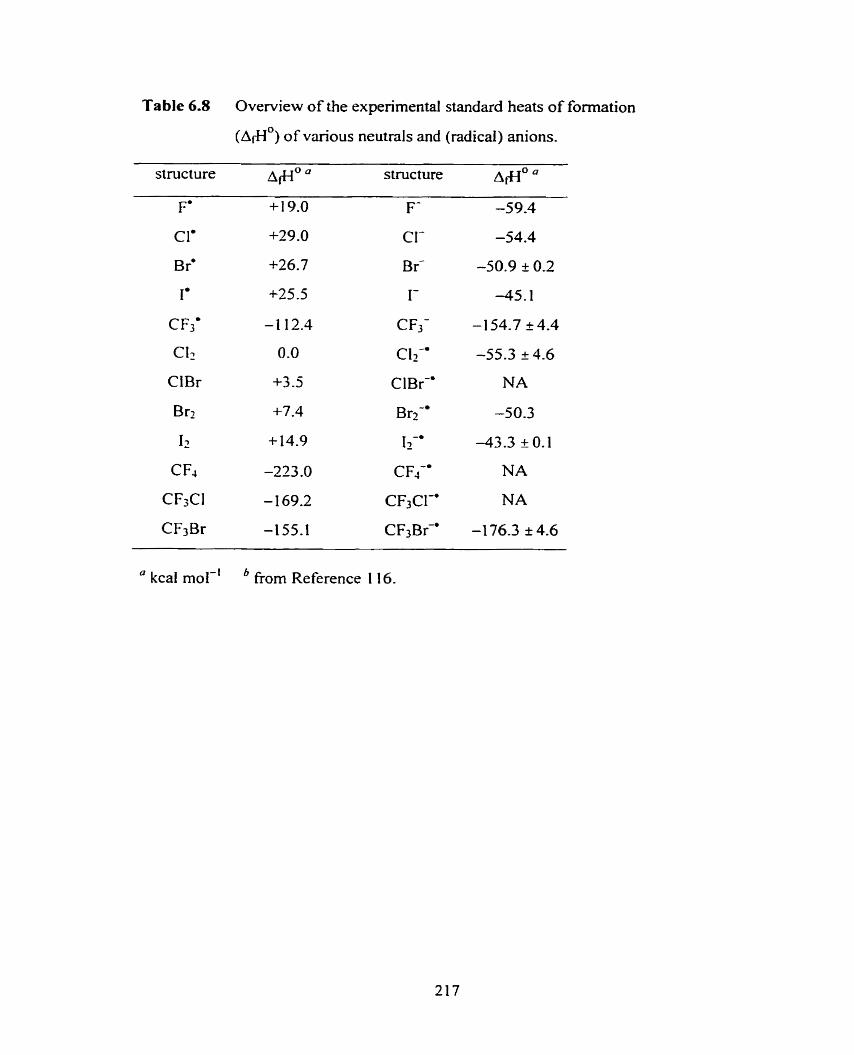
Table 6.8 Overview of the expenmental standard heats of formation
( A ~ O ) of various neutrals and (radical) anions.
structure A@" a structure A&IO a
Fm + 1 9.0 F- -59.4
C 1' +29.0 CI- -54.4
Br* t26.7 Br- -50.9 k 0.2
1' t25.5 1 - 4 5 . 1
C F3' - 1 12.4 CF3- - 1 54.7 + 4.4
CI3 0.0 CI2-* -55.3 _+ 4.6
CIBr +3.5 ClBr-' NA
Brz +7.4 Br2-' -50.3
IZ + 14.9 Iz-' -43.3 1 O. 1
CF4 -223.0 C F4-• NA
CF;CI - 169.2 CF3CI-• NA
CF3Br -1 55.1 CF3Bf0 -1 76.3 I 4.6
" kcal mol-' fiom Reference 1 16.
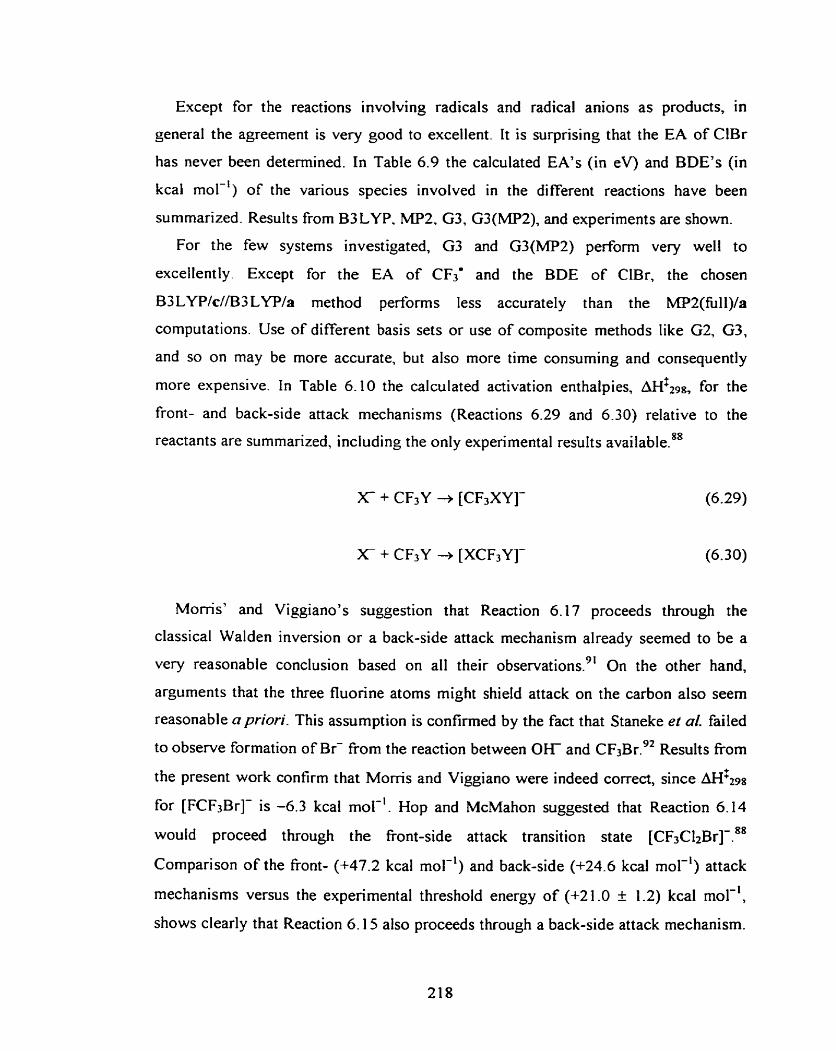
Except for the reactions involving radicals and radical anions as products, in
general the agreement is very good to excellent. It is surprising that the EA of ClBr
has never been determined. In Table 6.9 the calculated EA7s (in eV) and BDE7s (in
kcal mol-') of the various species involved in the different reactions have been
summarized- Results from B3LYP. MP2, G3, G3(MP2), and experiments are shown.
For the few systerns investigated, G3 and G3(MP2) perform very well to
excellently. Except for the EA of CF3' and the BDE of ClBr, the chosen
B3 LYP/c//B3 LYP/a method performs less accurately t han the MPZ(fÙll)/a
computations. Use of different basis sets or use of composite rnethods Iike G2, G3,
and so on may be more accurate, but also more time consuming and consequently
more expensive. In Table 6.10 the calculated activation enthalpies, A H f 2 9 g , for the
front- and back-side attack mechanisms (Reactions 6.29 and 6.30) relative to the
reactants are summarized, including the only experimental results a~ailable. '~
Moms' and Viggiano's suggestion that Reaction 6.17 proceeds through the
classical Walden inversion or a back-side attack mechanism already seemed to be a
very reasonable conclusion based on al1 their obser~ations.~' On the other hand,
arguments that the three fluorine atoms might shield attack on the carbon also seem
reasonable a prion'. This assumption is confirmed by the fact that Staneke et al. failed
to observe formation of B r from the reaction between O H and CF,B~.'* Results h m
the present work confirm that Morris and Viggiano were indeed correct, since AH&
for [FCF,Br]- is -6.3 kcal mol-'. Hop and McMahon suggested that Reaction 6.14
would proceed through the front-side attack transition state [cF,cI~B~]-.*~
Cornparison of the Front- (+47.2 kcal mol-') and back-side (+24.6 kcal mol-') attack
mechanisms versus the experirnental threshold energy of (+2 1 .O + 1 -2) kcal mol-',
shows clearly that Reaction 6.15 also proceeds through a back-side attack rnechanism.
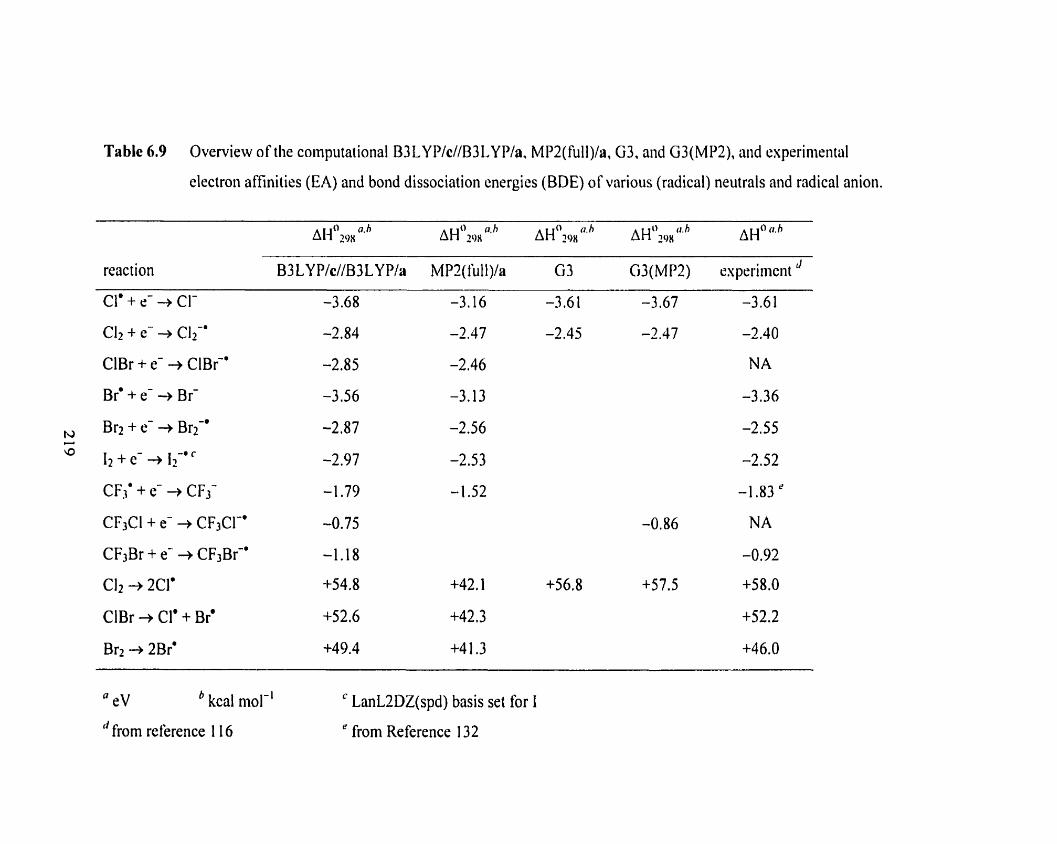
Table 6.9 Overview of the computational B3 LY P/c//B3 LY P/a, MP2(full)la, G3, and G3(MI12). aiid experinwital
electron affinities (EA) and bond dissociation energies (BDE) of various (radical) neutrals and radical anion.
reaction B3LY P/c//B3LYP/a MP2(full)/a G3 G3(MP2) esprriment d
Cl' + e- -+ CI- -3.68 -3.16 -3.61 -3.67 -3.61
Cl2 + e- -, Cl2-' -2.84 -2.47 -2.45 -2.47 -2.40
ClBr + e- + ClBr-' -2.85 -2.46 NA
Br '+ e- -+ Br- -3 .56 -3.13 -3,36
N Br2 + +- -+ Br2-' -2.87 -2.56 -2.55 C
9 I 2 + e- -+ 12-0 -2.97 -2.53 -2.52
CF3' + ë + CF3- -1 -79 -1 .52 -1.83 '
CF3CI + e- + CF3Cl-' -0.75 -0.86 NA
CF3Br + e- + CF3Br-' -1.18 -0.92
CI2 -t 2C1' +54.8 +42,I +56.8 t57.5 +58.0
ClBr + Cl' + Br' +52.6 +42,3 -1-52.2
Brz -+ 2Br0 +49.4 +41.3 -1-46.0
" eV kcal niol-' ' LanLZDZ(spd) basis set for I d from reference 1 16 " from Reference 132
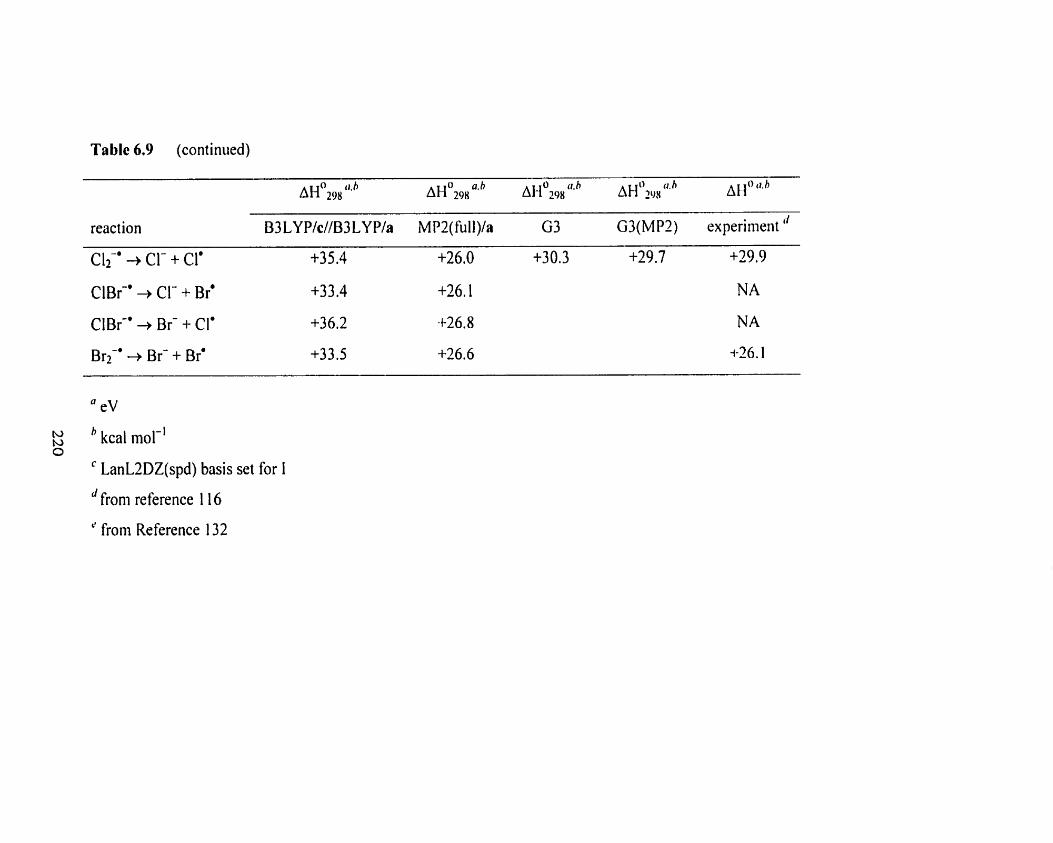
Table 6.9 (continued)
reaction B3LYP/c//B3LYP/a MP2(full)/a G3 G3(MP2) experiineiit "
CIT' + Cl- + Cl' +35.4 t26.0 t30.3 +29.7 +29,9
ClBr-' + Cl- + Br' +33.4 +26.1 NA
ClBr-' + Br- + CI' +36.2 +26.8 NA
Bry' + Br- + Br' +33.5 +26.6 4-26.1 - - - -- -- - - - - - -- -
" eV
2 kcal mol-' O
' LanLZDZ(spd) basis set for 1
from reference 1 16
' frorii Reference 132
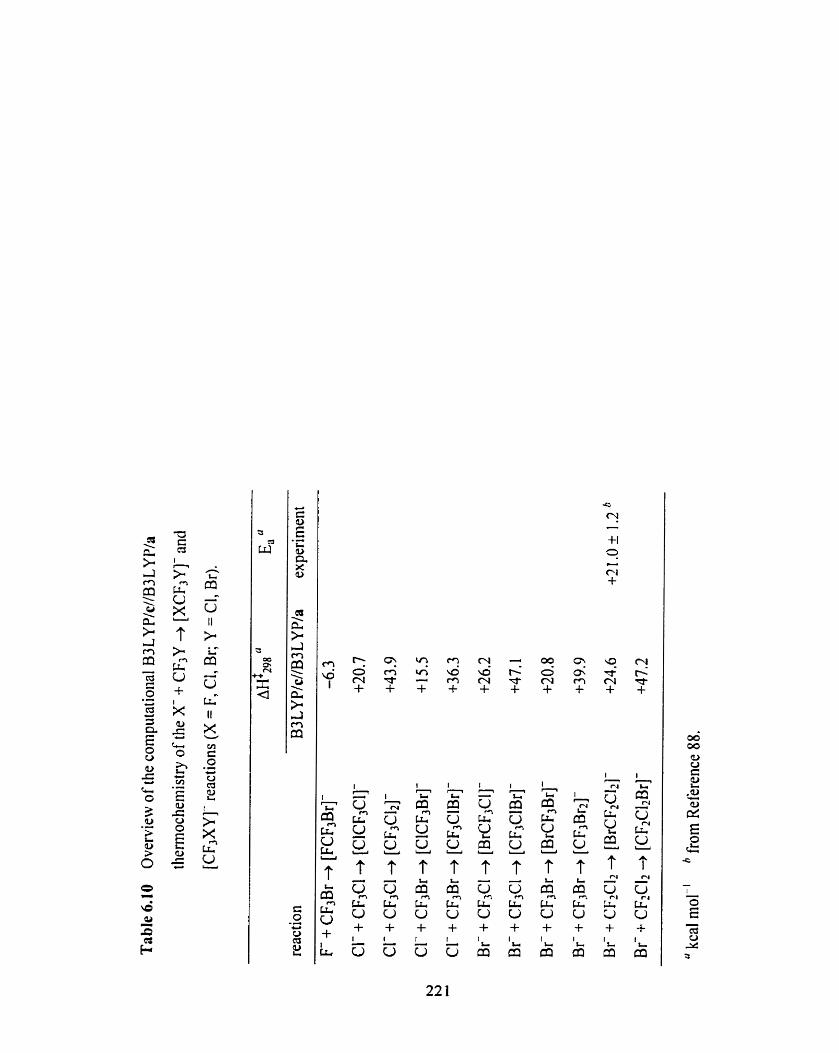
Since AG' for the X(CF3Y) cornplex is larger than zero at room temperature, it is
clear that Reaction 6.14 proceeds through a so-cailed direct mechanism, Le. there is no
formation of an entrance channel ion-molecule complex. This then actually resembles
a condensed phase SN^ reaction (Reaction 6.3 1 ).
In Table 6.10 al1 transition states for back-side attack are lower in energy than for
the front-side attack mechanism. Unfortunately it was not possible to test the
computations by performing similar experiments to those of Hop and McMahon on a
FT-KR. GLB experiments like Ervin and CO-workers pefionned on Reaction 6.5
would probably be a better altemative,I5 since this technique provides much more
sensitive measurements of cross sections and threshold energies.
The higher energy transition state [CF3XY]- may also be deterrnined
experimentally. Close inspection of the NPA charges (see Section 6.4.4 for more
details) indicates that it closely resembles a [CF; me] complex. Monitoring the
cross section of XY' as a function of the centre-of-mass energy of >C may give
information of the energy of [CF3XY]- relative to the reactants X and CF3Y. In Table
6.11 the AH:?^* values for the various transition states investigated have been
summarized in terms of centre-of-mass (E,) and laboratory-frame (Elab) ion kinetic
energy of the nucleophiles. Ecm and E I ~ ~ are related by Equation 6.32, where MC^, y
is the mass of the CF3Y neutral, and Mx- is the mass of the halide ion. These values
may be used a starting points for fbture threshold CID experiments.
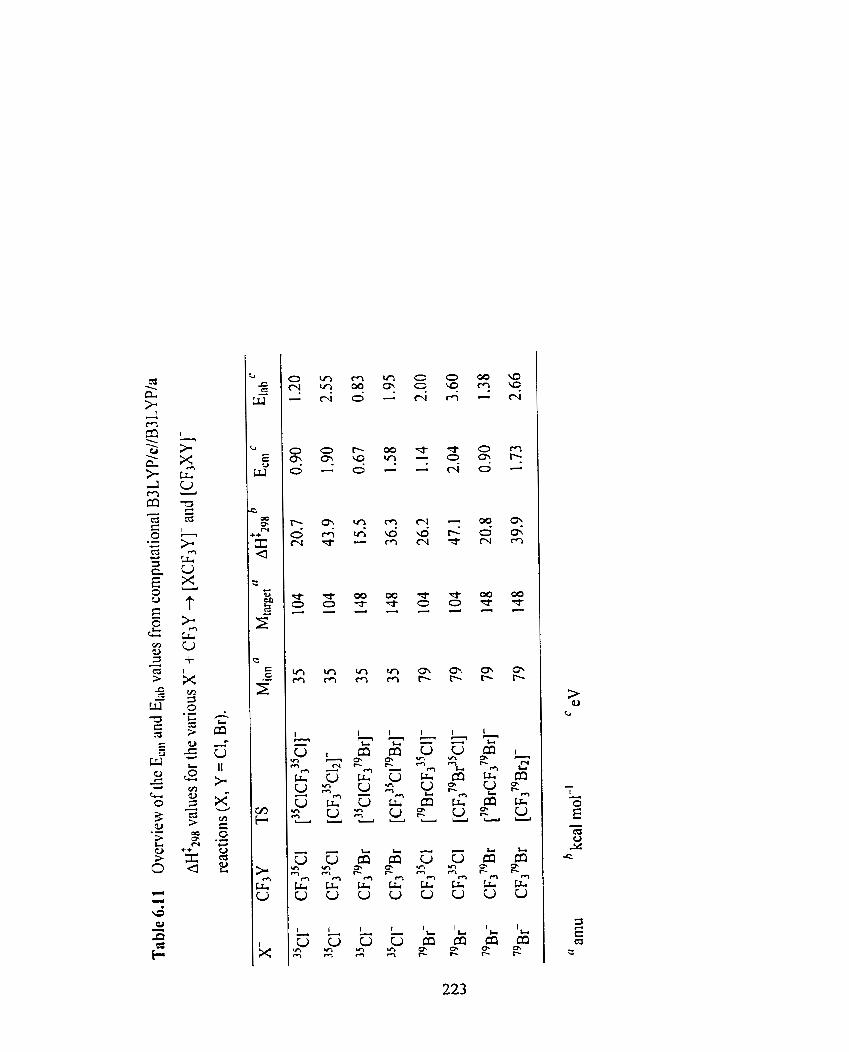
In Figures 6.18-6.20, al1 computational B3LYPIdB3LYPIa ~ ~ ' 2 9 8 and ~ f l 2 9 8
values for the various reactions are summarized in schematic potential energy
diagrams.
Even though the substitution o f fluorine atoms for hydrogen atoms cannot reverse
the order o f back- and front-side attack mechanisms in gas phase Ss2 reactions, the
difference between the two transition States has been reduced considerably. This is
mainly due to the large increase in the &298 values for back-side attack, and a small
decrease in the ~ ~ ' 2 9 8 values for front-side attack.
The relationship between kinetics and therrnodynamics plays an important role in
chemistry. Marcus derived an expression, the Marcus equation, that relates the
activation energy t o the thermod ynamics of electron-tram fer reactions in solution
(Equation 6 .33 ) . ' l 6
In Figure 6.21 a typical gas phase Sx2 double well potential energy diagram is
z shown together with the definitions of AET and AE shown in Equation 6.33 . AEocan
be determined frorn the Marcus additivity postulate (Equation 6.34).'16
2 + In Equation 6.34 AEXXand are the intrinsic kinetic contributions to the
activation energy for the metathetical gas phase SN2 Reactions 6.3 5 and 6.36.
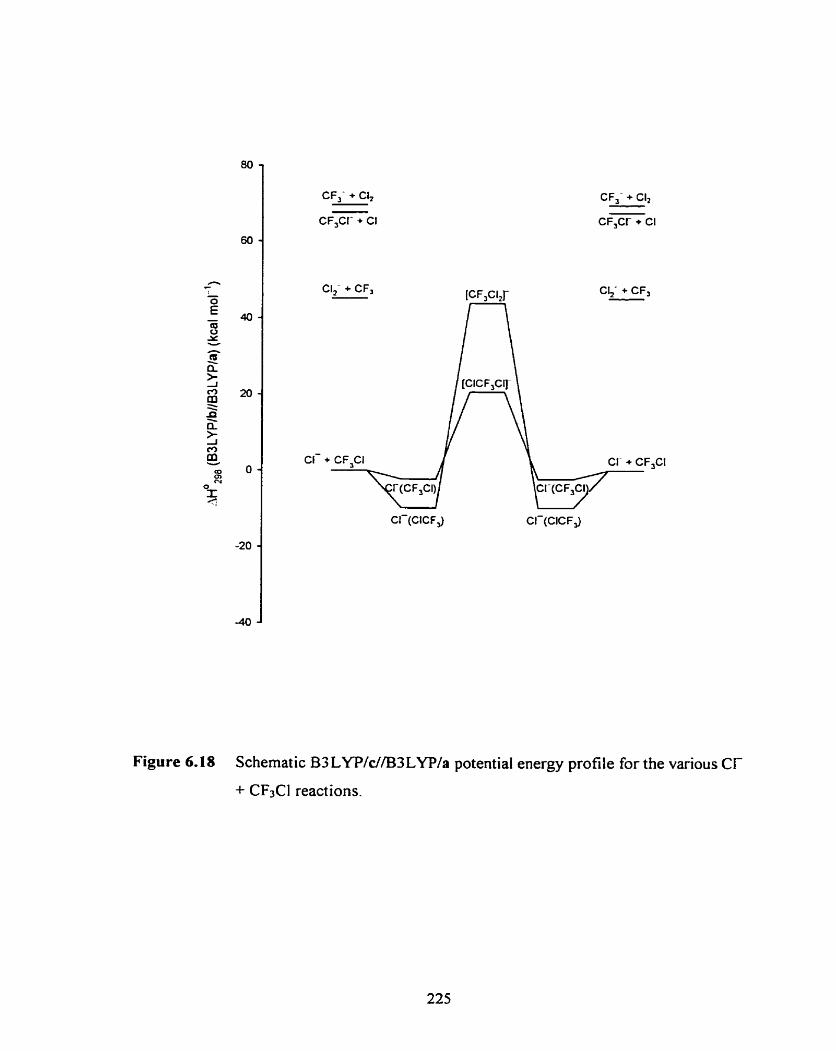
CF,- + CI,
Cl2- + CF, -
Figure 6.18 Schematic B3 LYP/d/B3LYP/a potential energy profile for the various Ci-
+ CF3C1 reactions.
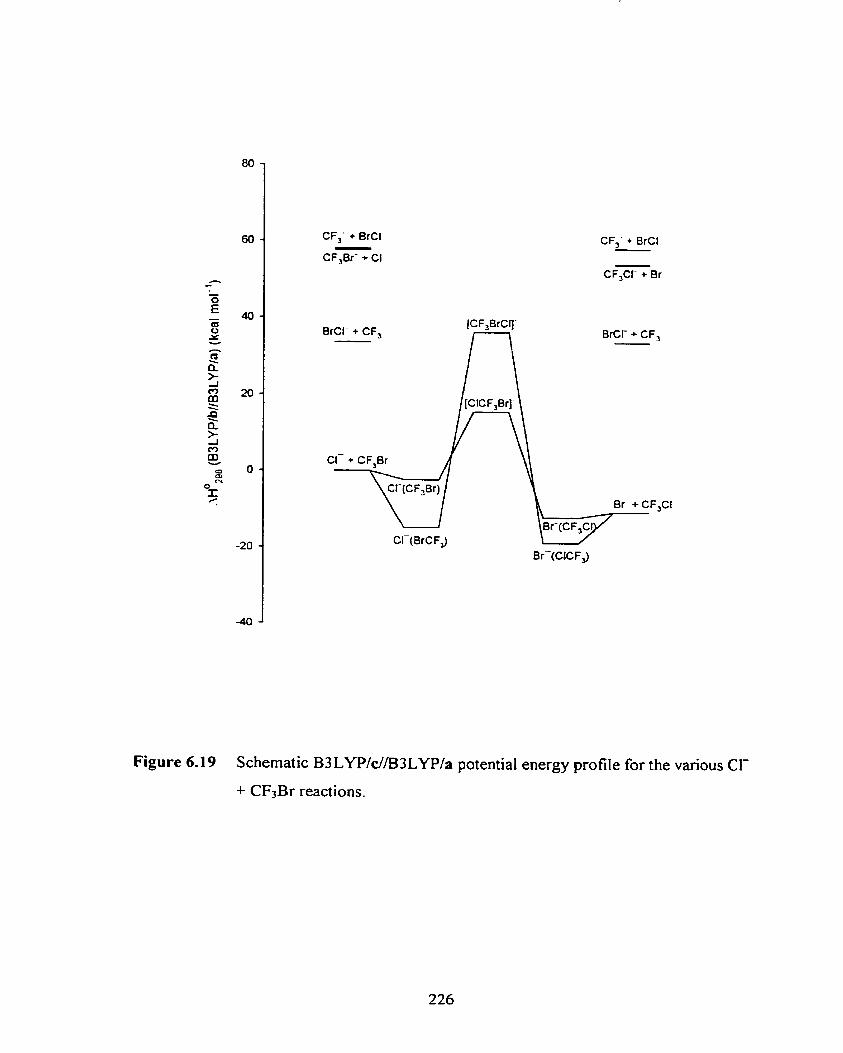
CF; + BrCl -
&CI' + CF, BrCr + CF, -
Figure 6.19 Schematic B3LYP/c//B3LYP/a potential energy profile for the vanous Cl-
+ CF3Br reactions.
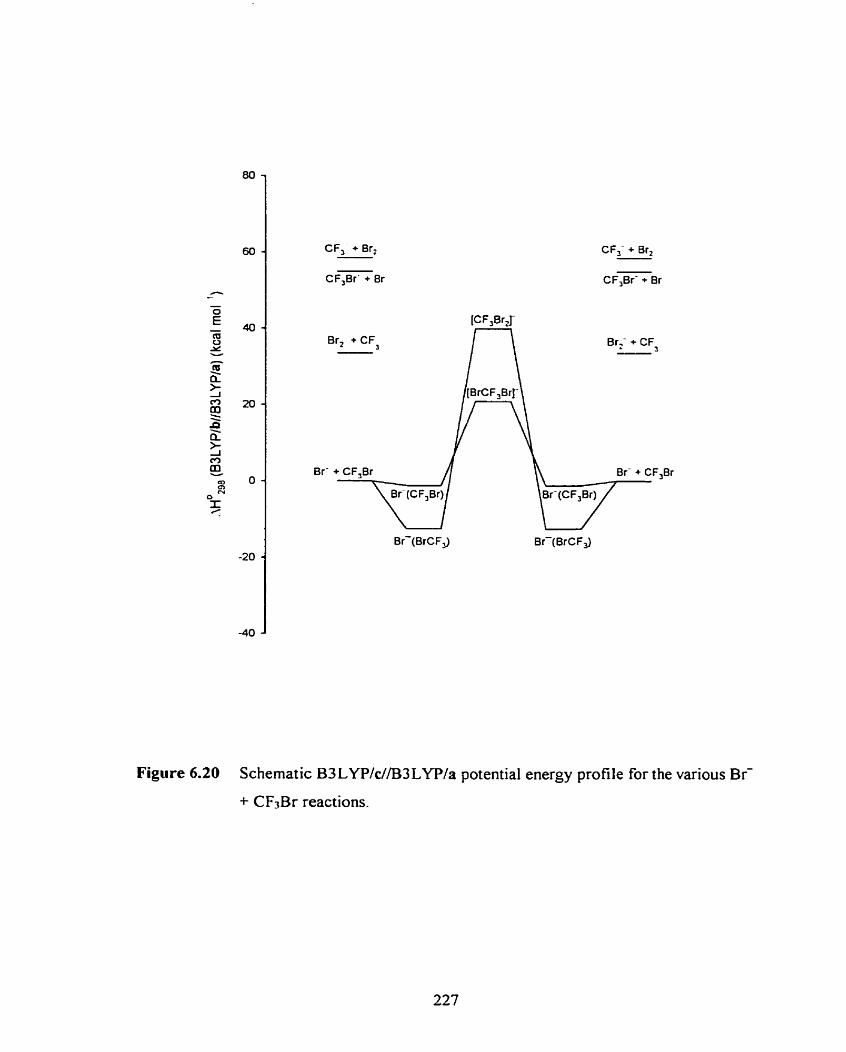
CF, + Brt
Br, + CF3
CF; + Br,
Br'
Figure 6.20 Schematic B3LYP/c//B3LYPla potential energy profile for the various Br-
+ CF3Br reactions.
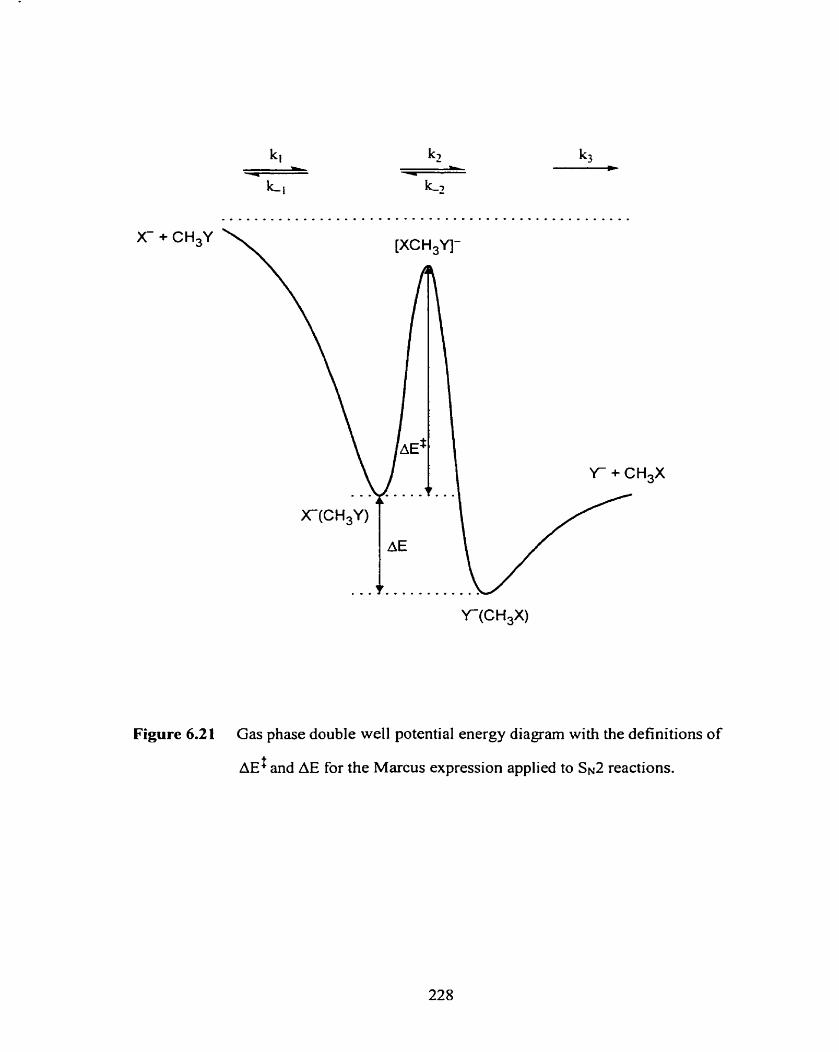
Figure 6.21 Gas phase double well potential energy diagram with the definitions of
A E ~ and AE for the Marcus expression applied to SN2 reactions.
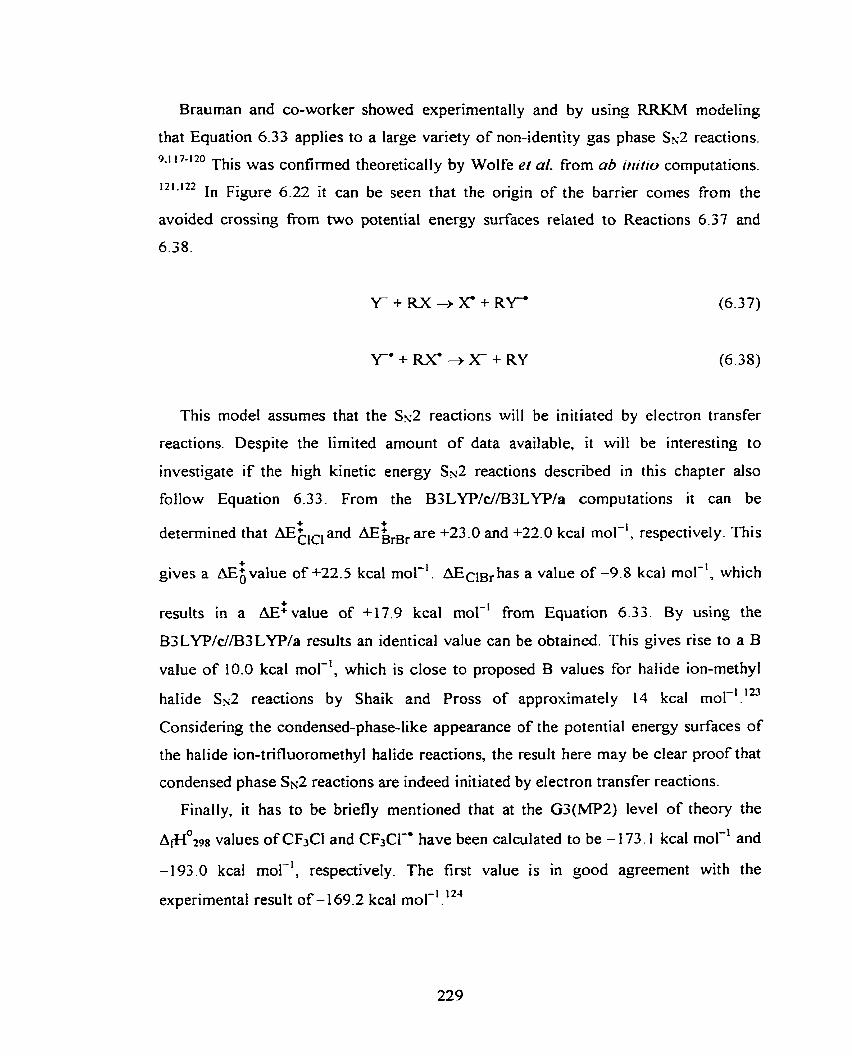
Brauman and CO-worker showed experimentally and by using RRKM modeling
that Equation 6.33 applies to a large variety of non-identity gas phase Sh.2 reactions. 9.1 17-120 This was confirmed theoretically by Wolfe el a[. from a b t ~ N t i o cornputations.
'21.122 In Figure 6.22 it can be seen that the origin of the barrier cornes from the
avoided crossing fiom two potential energy surfaces related to Reactions 6.37 and
6.38.
This mode1 assumes that the Sx2 reactions will be initiated by electron transfer
reactions. Despite the Iimited amount of data available, it will be interesting to
investigate if the high kinetic energy Sx2 reactions described in this chapter also
follow Equation 6.33. From the B3LYP/c//B3LYP/a computations it can be + $ determined that AECICl and AE BrBr are +23 -0 and +22.0 kcal mol-', respectively. This
+ gives a AEh value of +2Z5 kcal mol-'. AECIBr has a value of -9.8 kcal mol-', which
results in a AEt value of c17.9 kcal mol-' h m Equation 6.33 . By using the
B3LYP/c//BSLYP/a results an identical value can be obtained. This gives rise to a B
value of 10.0 kcal mol-', which is close to proposed B values for halide ion-methyl -1 123 halide Sy2 reactions by Shaik and Pross of approximately 14 kcal mol .
Considering the condensed-phase-like appearance of the potential energy surfaces of
the halide ion-trifluoromethyl halide reactions, the result here may be clear proof that
condensed phase SN^ reactions are indeed initiated by electron transfer reactions.
Finally. it has to be briefly mentioned that at the G3(MP2) level of theory the
~ f - & s g values of CF3CI and CSCI-' have been calculated to be - 173.1 kcal mol-' and
-193.0 kcal mol-', respectively. The first value is in good agreement with the -1 12.1 experimental result of - 169.2 kcal mol -
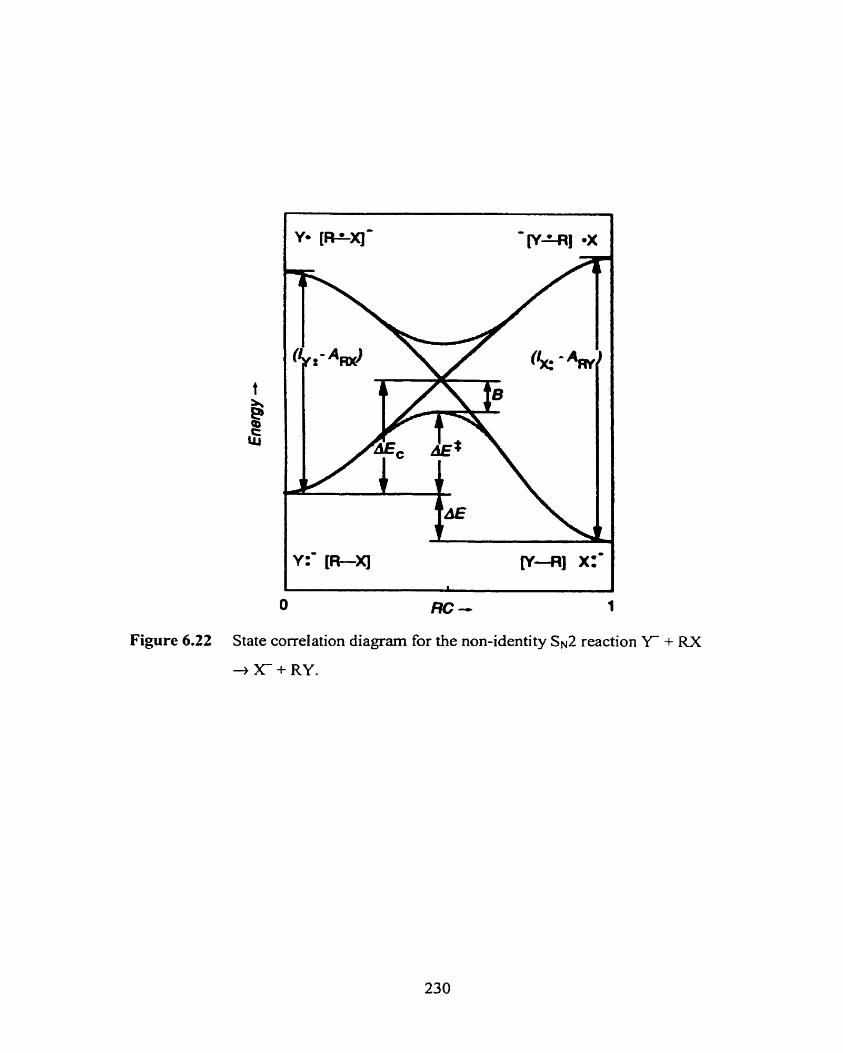
Figure 6.22 State correlation diagrarn for the non-identity SN2 reaction Y- + RX
+ X- + RY.
6.4.3 Normal Mode Vibrational Frequencies
In Section 6.4.1 it was shown that the B3LYP/a level of theory ([db] for Chi) is
able to generate structures and dipole moments of the CF3X molecules that are in good
to excellent agreement with experimental data. This agreement was the main reason to
use this level of theory for the subsequent computations on the ion-rnoIecule
complexes and transition States.
Unlike in Chapter 4 there will no extended discussion on the trends in normal mode
vibrational frequencies and the agreement with experimental data, if available, for the
various X(YCF3) and X(CF3Y) complexes, or the different XY molecules and their
corresponding radical anions, W . In Table 6.12 an overview is given of the
calculated and experimental normal mode vibrational frequencies of CF3C1, CF& 125 and C h i . The excellent agreement confirms once again that the B3LYP/a level of
theoiy seems to be an acceptable choice.
As mentioned in Section 6.4.2, the [CF3XY]- transition state seems to closely
resemble a [CF; XT'] complex, and it may be not only the transition state for a high
kinetic energy Sx2 reaction (Reaction 6-39), but it may also be the transition state for
X Y ' formation (Reaction 6.40).
X + CF,Y -+ [CF3Xv- + XY* + CF3' (6.40)
In the [CF3XY]- transition state, the imaginary fiequency corresponds to a
combined C t X and C+Y motion. In addition, there is a X-Y motion, and the
corresponding fiequency is very close to the fiequency in "free" W . In [CF3Cl$,
[CF,CIBr]-, and [CF3Br2]- the values are 179 cm-', 140 cm-', and 100 cm-',
respectively, while in Cl2", ClBr-., and Br2+ the values are 198 cm-', 1 63 cm-', and
1 18 cm-', respectively. This is not a strong evidence, for formation of X Y * can
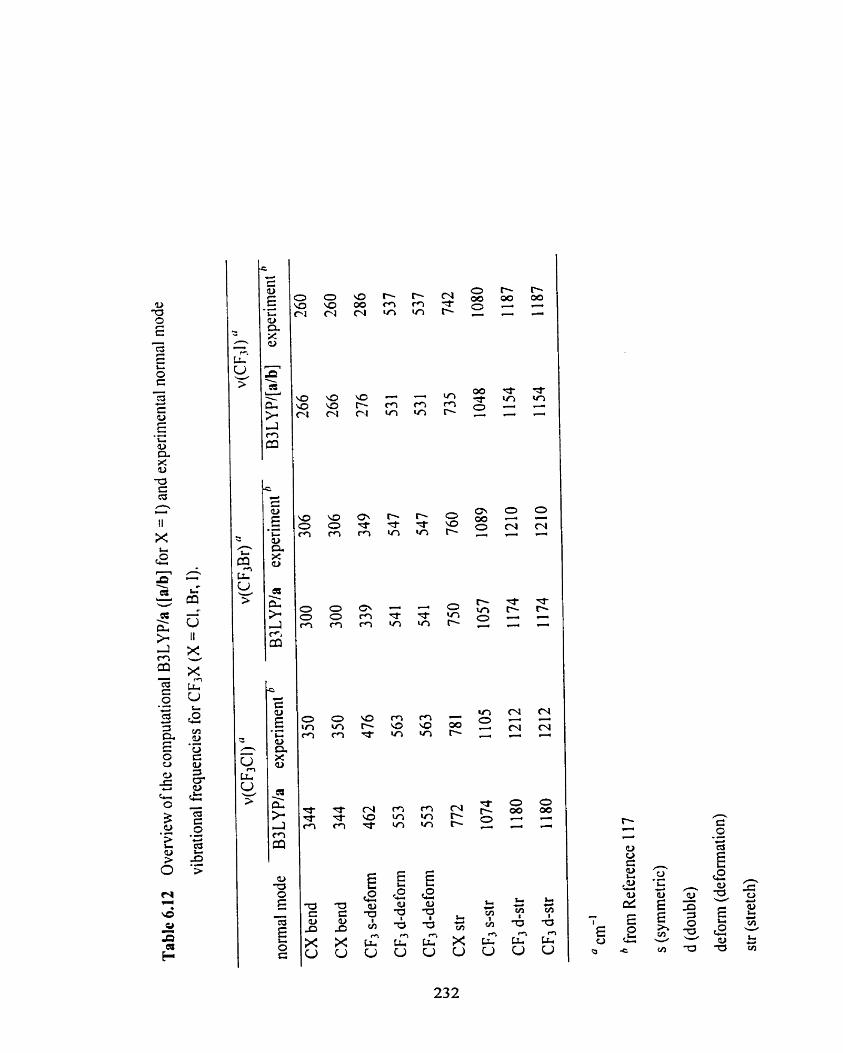
proceed through another transition state (Reaction 6.4 1 ), as to where Y transfer takes
place.
The imaginary frequency in the [XCF3Y]- transition state is larger than in the
isomeric [CF3XY]- transition state. For al1 three systems investigated it is consistently
around 5 1 Oi, while for the front-side attack transition state it decreases fiom 2 101 to
185 to 163i. Examination of the motion of the imaginary frequency in the [XCF3Y]-
transition state shows that it is an umbrella-Iike inversion of the CF3 group as in NH3.
This may be indicative of a direct mechanism, and it may explain the constant value
for the three systerns investigated. This rnay also explain the increased barrier height,
relative to CH3. Substitution of one of the fluorine atoms by a chlorine atom decreases
the imaginary Frequencies in [C1CF2CIBr]- and [CF2CltBr]- to 4283 and 176i,
respective1 y.
Finally, it should be possible to obtain thermochemical and kinetics data on the
X-(YCF,) clusters by ZTRID. This is possible due to the strong absorption of black-
body IR radiation by the C-F normal mode vibrations, causing the cluster to dissociate
on a relatively fast time scale despite the medium to strong bonding (Reaction 6.42)
X-(YCF3) + nhv + X- + CF3Y (6.42)
6.4.4 Natural Population Analysis Charges
When going from CF3CI to CF31 the NPA charge on the halide atom increases from
0.00 e to +O. 15 e . As expected, al1 fluorine atoms bear considerable negative charge,
around -0.33 e, while the carbon atom is positively charged, ranging fiom +0.88 e in
CF31 to + 1.00 e in CF3CI. This explains why X prefers to interact with Y in ChY, but
that back-side attack on carbon is possible. Upon formation of the X(YCF3) complex
some charge redistribution takes place. First of all, charge transfer fiom X- to the
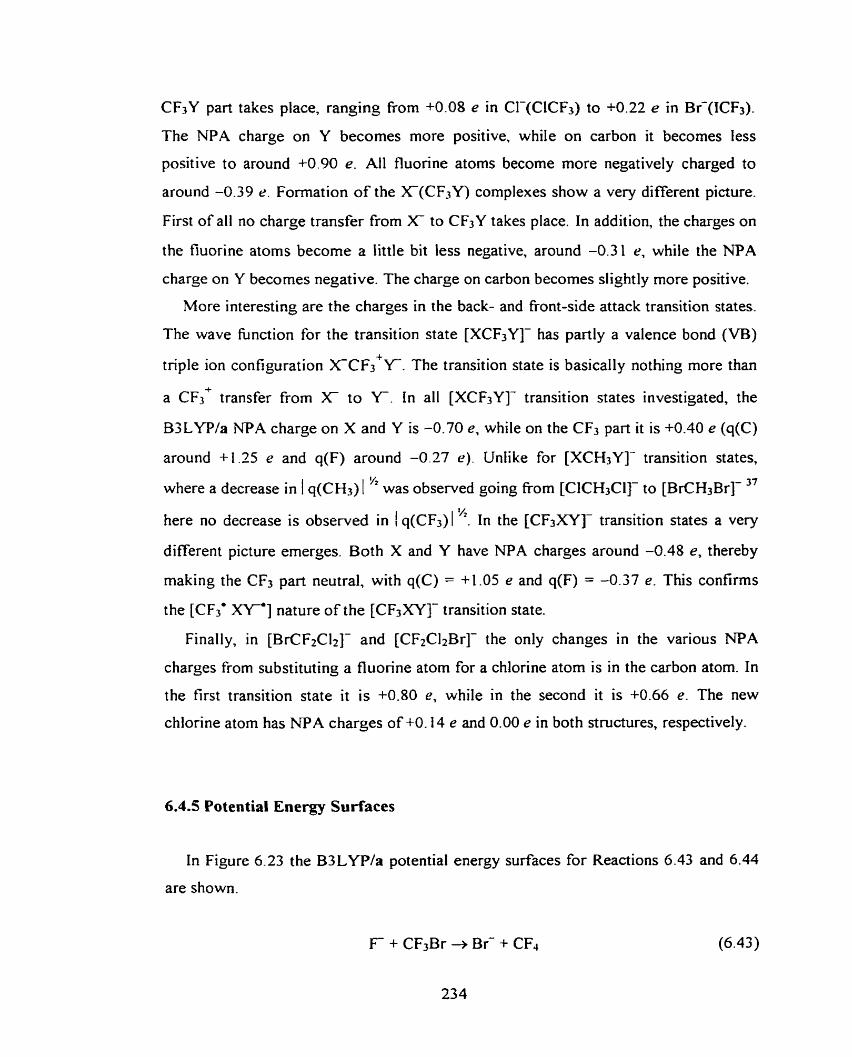
CF3Y part takes place, ranging fiom +O.OS e in CI-(ClCF3) to t0.22 e in Br-(KF3).
The NPA charge on Y becomes more positive, while on carbon it becomes less
positive to around +0.90 e. Al1 fluorine atoms become more negatively charged to
around -0.39 r . Formation of the X(CF3Y) complexes show a very different picture.
First of al1 no charge transfer from X to CF3Y takes place. In addition, the charges on
the fluorine atoms become a Iittle bit less negative, around -0.3 1 e, while the NPA
charge on Y becomes negative. The charge on carbon becomes slightly more positive.
More interesting are the charges in the back- and front-side attack transition states.
The wave fünction for the transition state [XCF3Y]- has partly a valence bond (VB)
triple ion configuration XCF,+Y. The transition state is basically nothing more than
a CF,+ transfer from X to Y. In al1 [XCF3Y]- transition states investigated, the
B3LYP/a NPA charge on X and Y is -0.70 e, while on the CF3 part it is +0.40 e (q(C)
around +1.25 e and q(F) around -0.27 e). Unlike for [XCH3Y]- transition states,
where a decrease in 1 q(CH3) 1 " was observed going fkom [ClCHnCII- to [BrCH3Br]- 37
here no decrease is observed in 1 q(CF3) 1 ". In the [CFaXYI- transition states a very
different picture emerges. Both X and Y have NPA charges around -0.48 e, thereby
making the CF3 part neutral, with q(C) = +1.05 e and q(F) = -0.37 e. This confirrns
the [CF,' XT'] nature of the [CF3XY]- transition state.
Finally, in [BrCF2CI2]- and [CF2C12Br]- the only changes in the various NPA
charges from substituting a fluorine atom for a chlorine atom is in the carbon atom. In
the first transition state it is +0.80 e, while in the second it is +0.66 e. The new
chlorine atom has NPA charges of +O. 14 e and 0.00 e in both structures, respectively.
6.4.5 Potential Energy Surfaces
In Figure 6.23 the B3LYPla potential energy surfaces for Reactions 6.43 and 6.44
are shown.
F + CF3Br -+ Br- + CF4
234
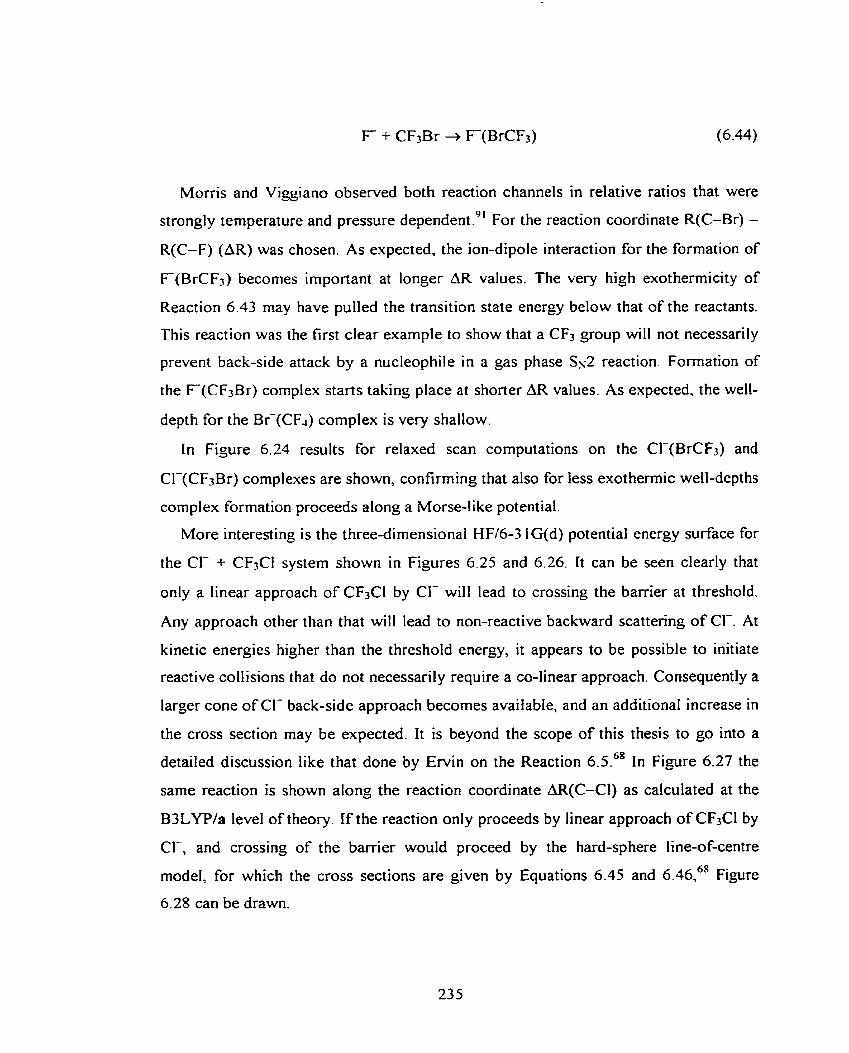
Moms and Viggiano observed both reaction channels in relative ratios that were
strongly temperature and pressure dependent.9' For the reaction coordinate R(C-Br) -
R(C-F) (AR) was chosen. As expected, the ion-dipole interaction for the formation of
F(BrCF3) becomes important at longer AR values. The very high exothermicity of
Reaction 6.43 may have pulled the transition state energy below that of the reactants.
This reaction was the first clear example to show that a CF3 group will not necessarily
prevent back-side attack by a nucleophile in a gas phase Ss2 reaction. Formation of
the F(CF3Br) complex starts taking place at shorter AR values. As expected, the well-
depth for the Bf(CF4) complex is very shallow.
In Figure 6.24 results for relaxed scan computations on the Cl-(BrCfi) and
Cl-(CF3Br) complexes are shown, confirming that also for less exothermic well-depths
complex formation proceeds along a Morse-tike potential.
More interesting is the t hree-dimensional HF/6-3 1 G(d) potential energy surface for
the Cl- + CF3Cl system shown in Figures 6.25 and 6.26. It can be seen clearly that
only a linear approach of CFiCI by CI- will lead to crossing the barrier at threshold.
Any approach other than that will lead to non-reactive backward scattenng of CI-. At
kinetic energies higher than the threshold energy, it appears to be possible to initiate
reactive collisions that do not necessarily require a CO-linear approach. Consequently a
larger cone of CI- back-side approach becomes available, and an additional increase in
the cross section may be expected. It is beyond the scope of this thesis to go into a
detailed discussion like that done by Ervin on the Reaction 6 . ~ ~ ~ ~ In Figure 6.27 the
same reaction is shown along the reaction coordinate AR(C-Cl) as calculated at the
B3LYP/a level of theory. If the reaction only proceeds by linear approach of ChCl by
Cl-, and crossing of the barrier would proceed by the hard-sphere line-of-centre
model, for which the cross sections are given by Equations 6.45 and 6.46,68 Figure
6.28 can be drawn.
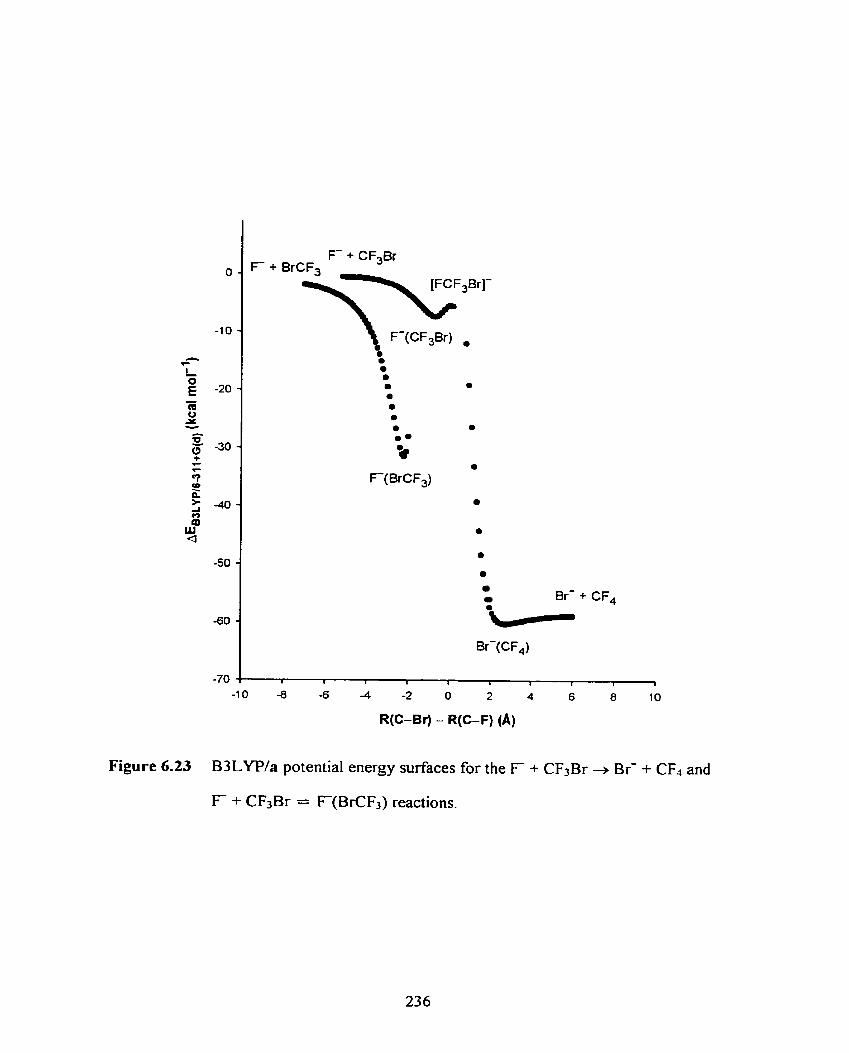
Br- + CF,
-10 -8 -6 4 -2 O 2 4 6 8 10
R(C-Br) - R(C-F) (A)
Figure 6.23 B3LYPla potential energy surfaces for the F + CF3Br + Br- + CF4 and
F + CF3Br = F(BrCF3) reactions.
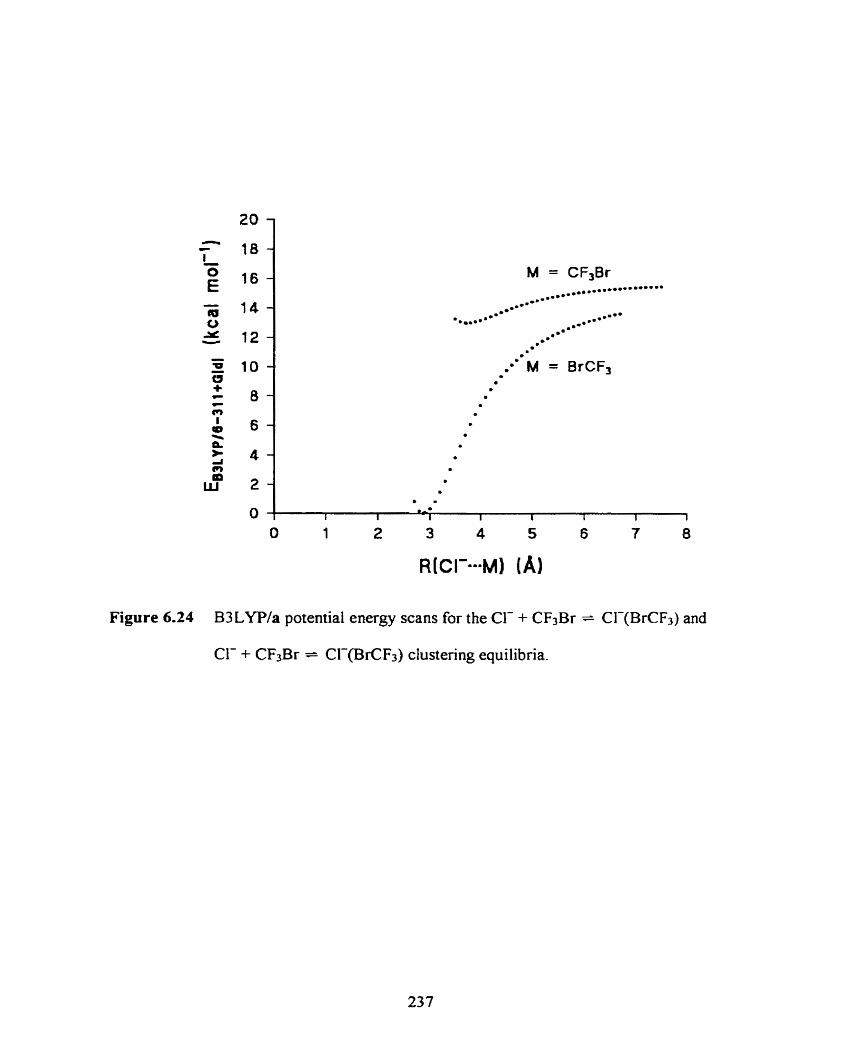
Figure 6.24 B3LYP/a potential energy scans for the Cl- + CF3Br = CF(BrCF3) and
Cl- + C S B r = Cl-(BrCF3) clustenng equilibria.
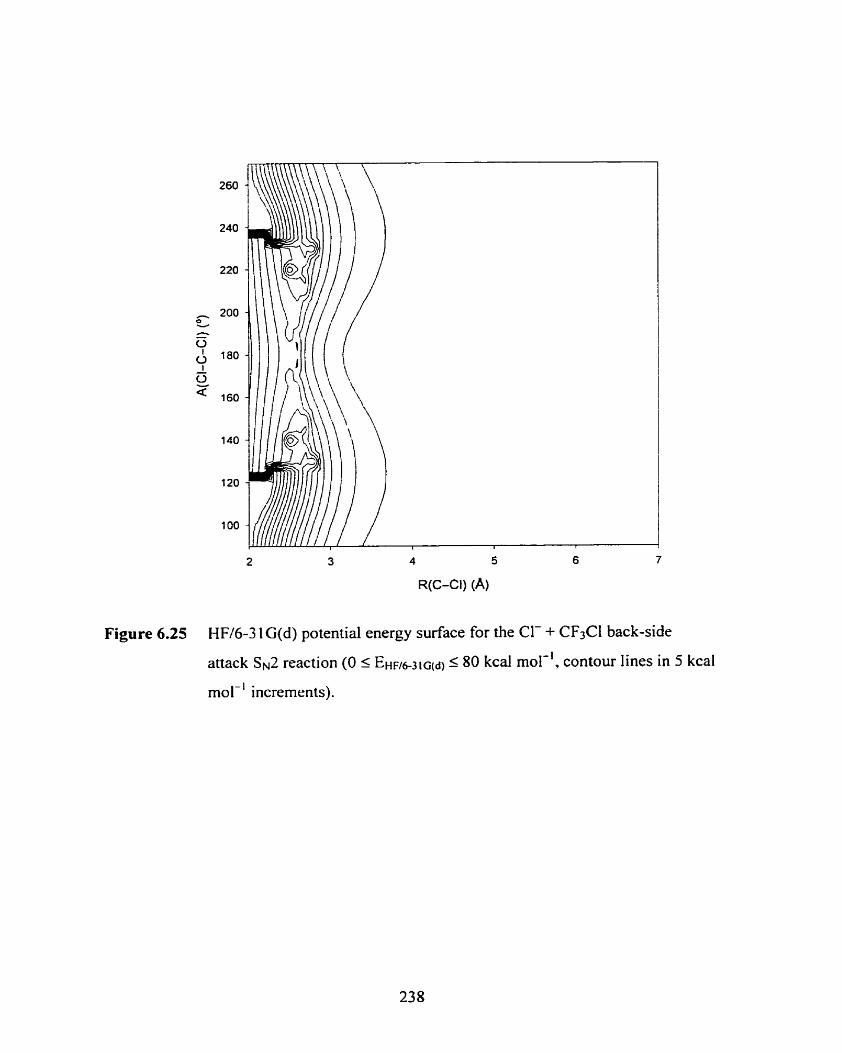
260
240
220
200 O- h - y IBO - z a 160
140
120
1 00
2 3 4 5 6 7
R(C-CI) (A)
Figure 6.25 HF/6-3 1 Gfd) potential energy surface for the Cl- + CF3CI back-side
attack SN2 reaction (O < E ~ ~ ~ ~ ~ ~ ~ ( ~ ) 5 80 kcal mol-', contour iines in 5 kcal
mol-' increments).
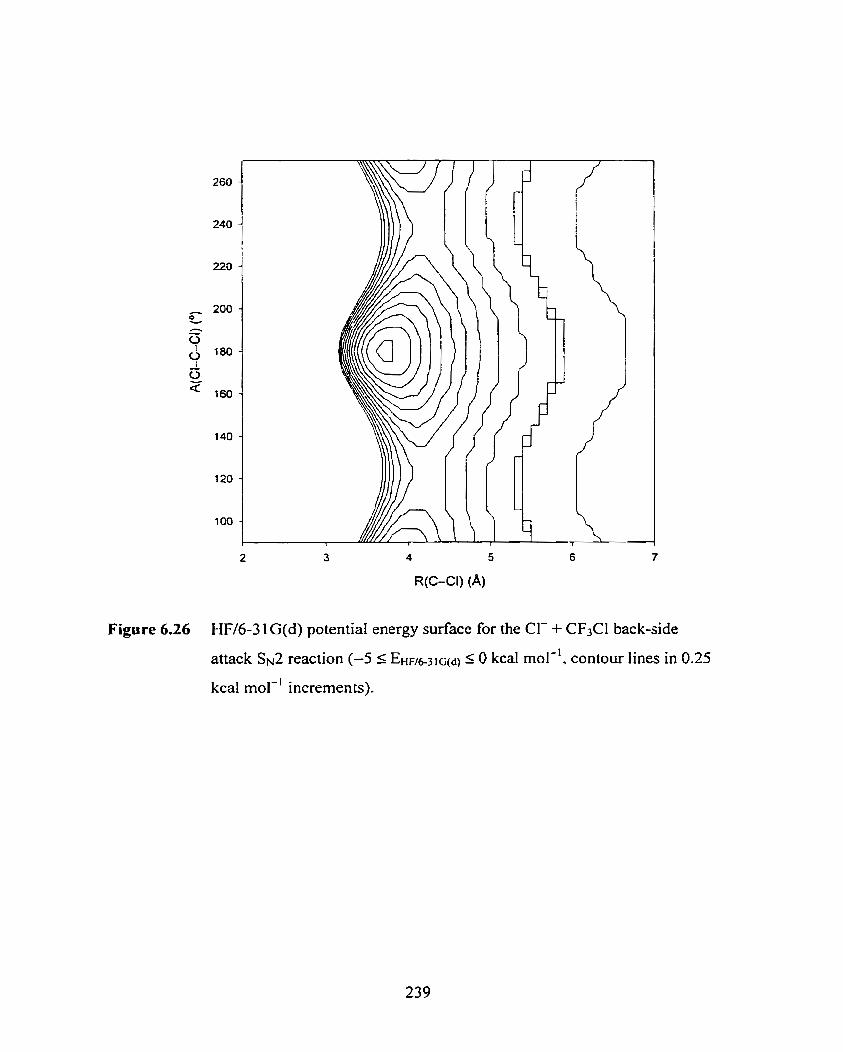
2 3 4 5 6 7
R(C-CI) (A)
Figure 6.26 HFl6-3 1 G(d) potential energy surface for the Cl- + CF3Cl back-side
attack SN2 reaction (-5 5 E ~ ~ , ~ ~ ~ ~ ( ~ ) c O kca~ mol-', contour lines in 0.25
kcal mol-' incremen ts).
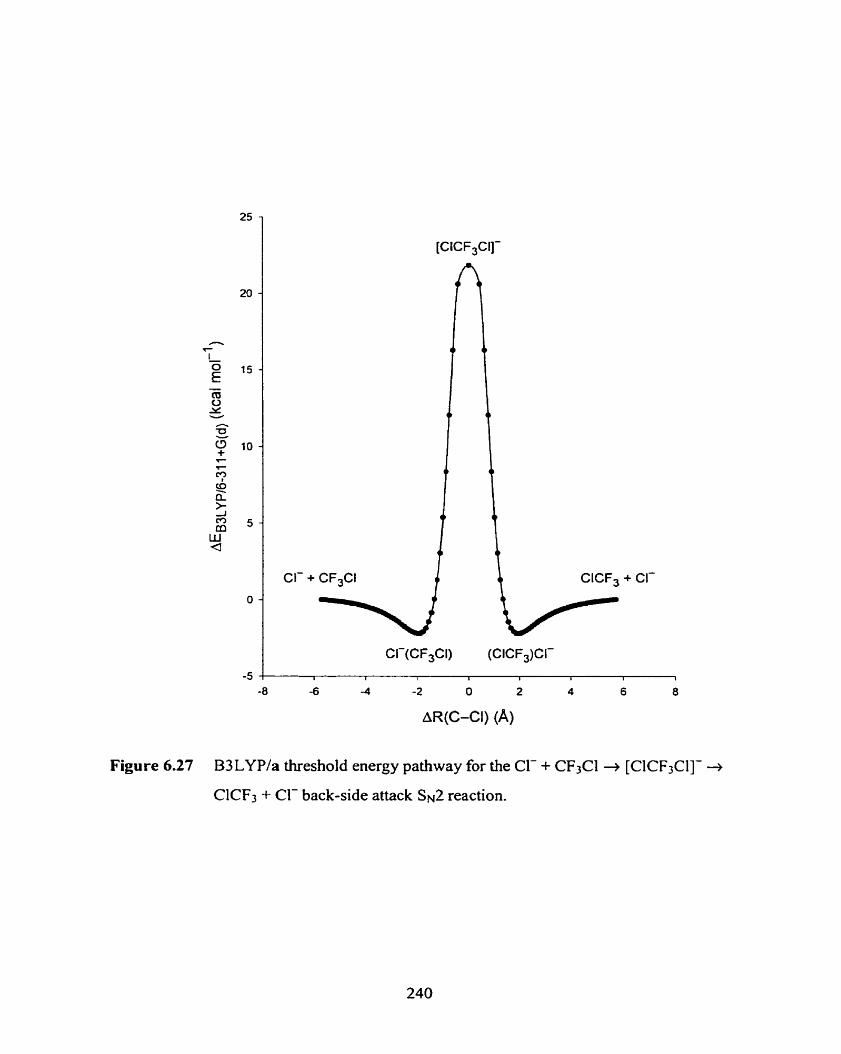
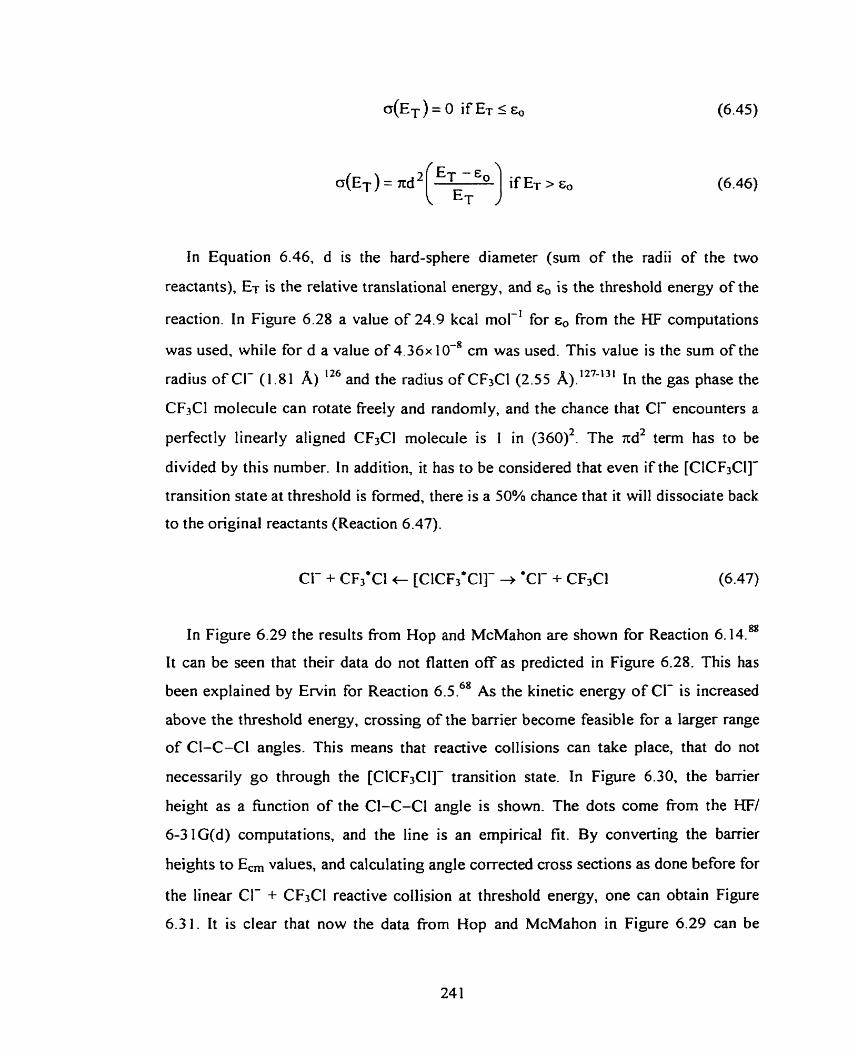
In Equation 6.46, d is the hard-sphere diameter (sum of the radii of the two
reactants), ET is the relative translational energy, and E, is the threshold energy of the
reaction. In Figure 6.28 a value of 24.9 kcal mol-' for E, from the HF computations
was used. while for d a value of 4 . 3 6 ~ cm was used. This value is the surn of the
radius of CI- (1.81 A) ' 26 and the radius of CF3Cl (2.55 A).'''"' In the gas phase the
CF3C1 molecule can rotate freely and randomIy, and the chance that CI- encounters a
perfectly linearly aligned CF3Cl molecule is 1 in (360)~. The xd2 term has to be
divided by this number. In addition, it has to be considered that even if the [ClCF3Cl]-
transition state at threshold is formed, there is a 50% chance that it will dissociate back
to the original reactants (Reaction 6.47).
CI- + CF,*C~ + [cICF~*CI]- + 'Cl- + CF3Cl (6.47)
In Figure 6.29 the results from Hop and McMahon are shown for Reaction 6.14."
It can be seen that their data do not flatten off as predicted in Figure 6.28. This has
been explained by Ervin for Reaction 6.5.68 AS the kinetic energy of Cl- is increased
above the threshold energy, crossing of the barrier become feasible for a larger range
of Cl-C-Cl angles. This means that reactive collisions can take place, that do not
necessarily go t hrough the [ClCF3Cl]- transition state. In Figure 6.30, the barrier
height as a function of the CI-C-Cl angle is shown. The dots corne from the HF/
6-3 lG(d) computations, and the line is an empirical fit. By converting the barrier
heights to E, values, and calculating angle correded cross sections as done before for
the linear Cl- + CFJCI reactive collision at threshold energy, one can obtain Figure
6.3 1. It is clear that now the data fiom Hop and McMahon in Figure 6.29 can be
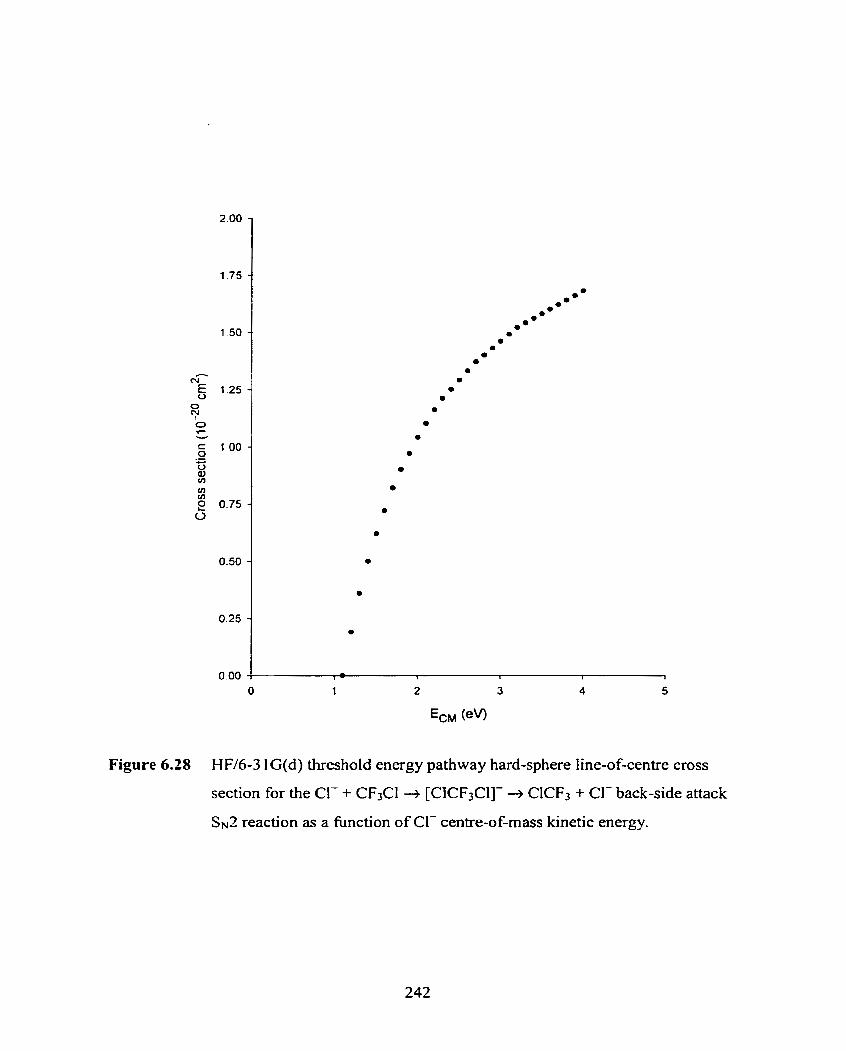
Figure 6.28 HF/6-3 1 G(d) threshold energy pathway hard-sphere line-of-centre cross
section for the Cl- + CF3Cl + [CICF3CI]- -+ CICFs + Cl- back-side attack
SN2 reaction as a function of Cl- centre-of-mass kinetic energy.
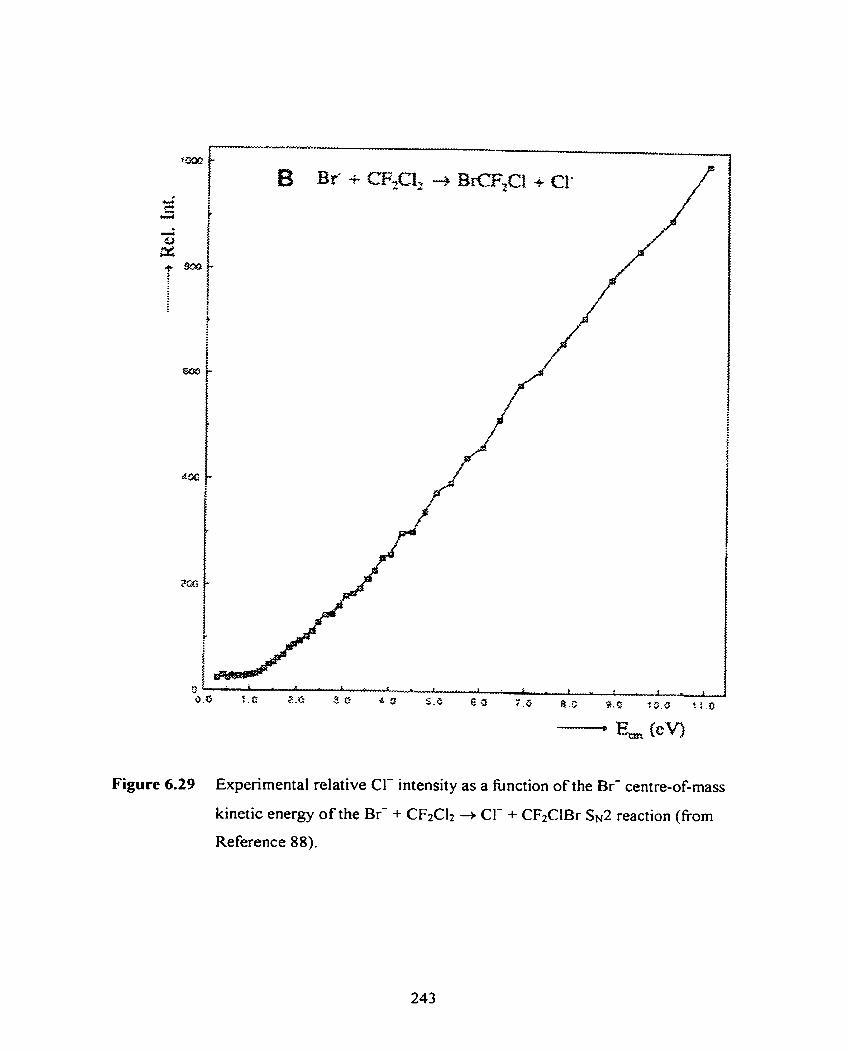
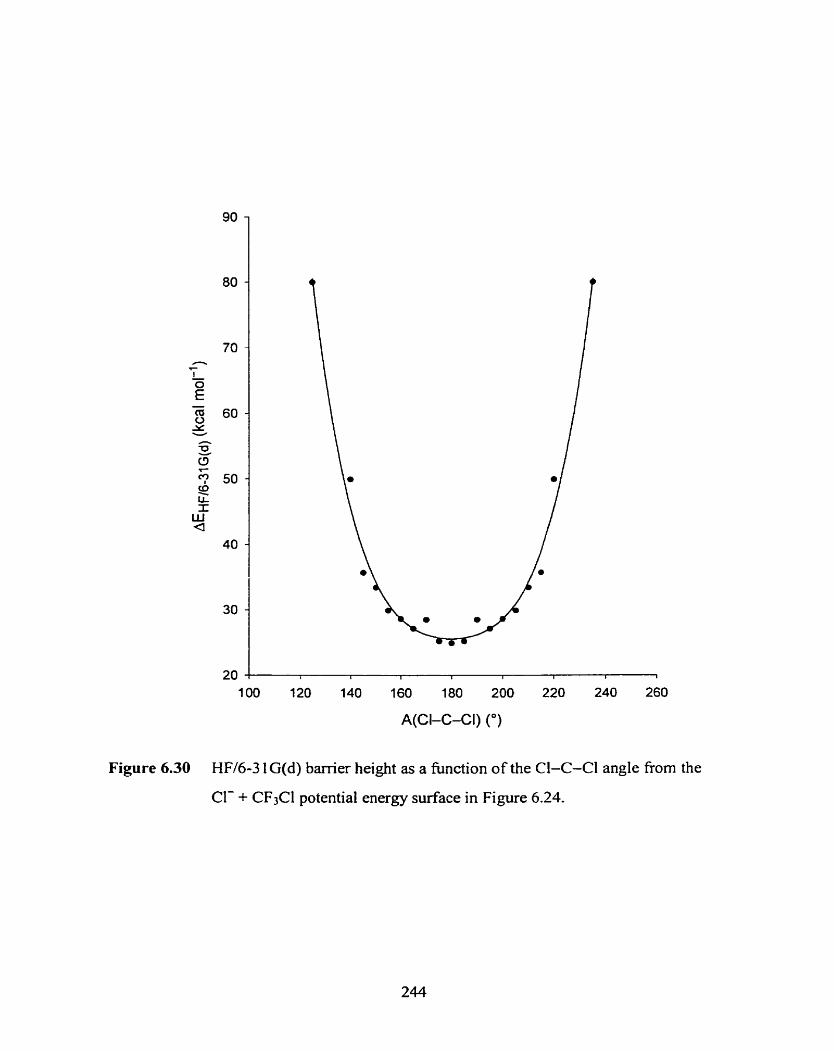
Figure 6.30 HF/6-3 1 G(d) barrier height as a function of the Cl-C-CI angle fiom the
Cl- + CF3CI potential energy surface in Figure 6.24.
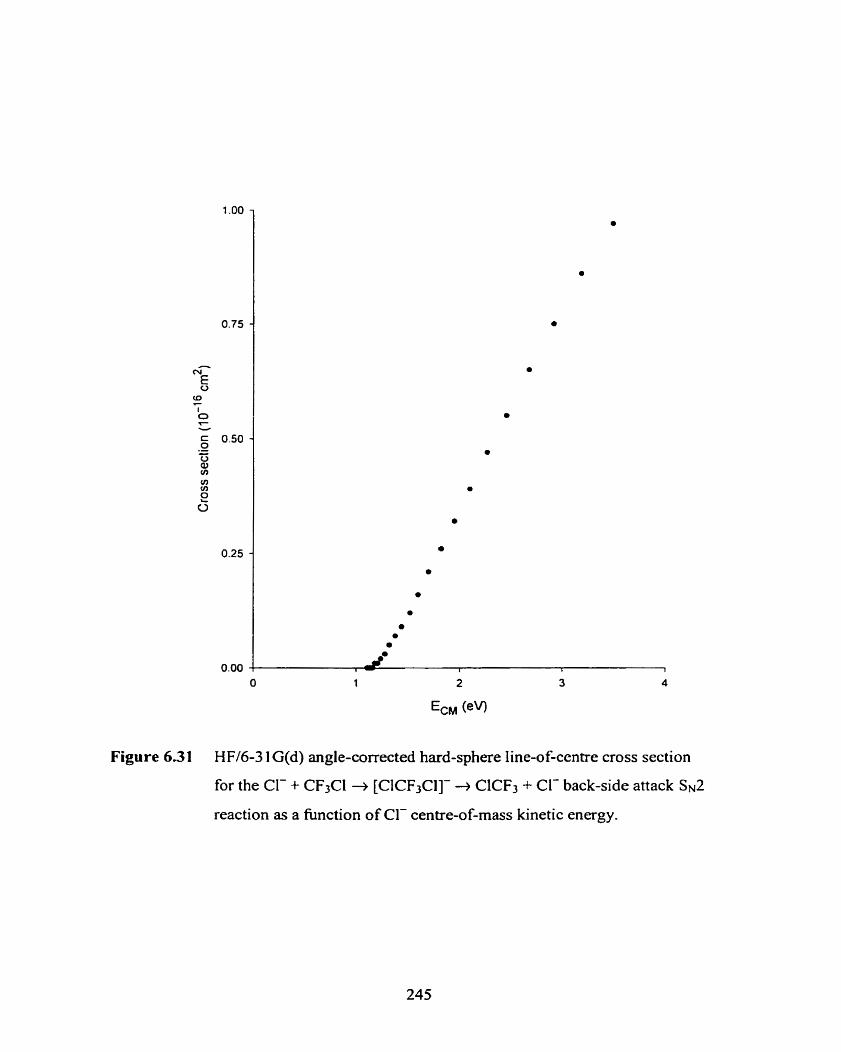
Figure 6.3 1 HF/6-3 I G(d) angle-corrected hard-sphere line-of-centre cross section
for the CI- + CFsCI + [ClCF3Cl]- + CICF, + Cl- back-side attack SN^
reaction as a fùnction of Cl- centre-of-mass kinetic energy.
reproduced qualitatively, and that the values are in the correct range as measured by
DeTuri er al.. l 5 It would be interesting to see these experiments done and to treat the
data as E ~ i n had, and to use the potential energy data to perform trajectory calculation
to get more insight into kinetics and dynamics of this direct mechanism reaction.
Finally it would be interesting to perform a crossed-beam expenment of a kinetic
energy resolved CI- beam and a perpendicular CF~*CI beam. Angle resolved detection
of the 'CI- product ions from the Sw2 reaction may be expected to show a wider
distribution as the kinetic energy of Cl- is increased.
6.5 Conclusions
The B3LYP/a level of theory is able to calculate structures, dipole moments, and
normal mode vibrational frequencies of CF3X (X = F, Cl, Br, 1) that are in good
agreement with experimental data. Two isomeric cluster ions of the halide ions with the
trifluoromethyl halides were found, X(YCF3) and X(CF3Y). These correspond to front-
and back-side attack mechanism complexes, respectively. Associated with these two
different mechanisms are two transition state structures, [XCF3Y]- and [CF3XY]-.
From PHPMS experiments, AH' and AS' values for the formation of the Cl-(BrCR),
CIe(ICF3) (AHO only), and Br-(BrCF3) complexes were determined. There was good
agreement with &O298 values fiom B3LYP/d/B3LYP/a computations, and ~ ~ ' 2 9 8 values
fiom the B3 LYP/a computations. In addition to the thermochemistry of the Sy2 reactions,
the thermochemistry of other, higher energy pathways was determined. The agreement of
the B3LYP/e/IB3LYPla computations when the reaction includes radicals and radical
anions is poorer than in case of closed shell species. It was shown that the Sx2 reaction
between a halide ion and a trifluoromethyl halide proceeds through a back-side attack
transition state. The Cl- + CF3Br + B r + CF3CI reaction was shown to follow the
Marcus theory, which means that even at high kinetic energies the back-side SN^ reaction
may be initiated by electron transfer. From normal mode vibrational analysis and NPA
charges it was shown that the [CF3XY]- transition state closely resembles a [CFi' X T ]
cornplex. The back-side attack SN2 reaction through the [XCF3Y]- transition state
appears to be a direct mechanism, since the irnaginary frequency is independent of the
identity of X and Y.
Finally, potential energy surfaces have been determined for a few reactions and
clustering equilibria. The suggestion by Morris and Viggiano that the formation of Br-
from the reaction between F and CF3Br cornes from back-side nucleophilic displacement
is indeed correct, showing that the CF3 group does not have to hinder aîtack on the
carbon atom despite the presence of three electronegative fluorine atoms. At threshold,
the back-side SN2 reaction between kinetically excited CI- and CF3CI proceeds through a
[ClCF3CI]- transition state. Above the threshold, CO-linear approach of CF3Cl by Cl- is no
longer necessary to initiate the reaction. Bamer crossing can occur at a wider range of
Cl-C-CI angles, hereby increasing the cross section. Correcting the hard-sphere line-of-
centre cross section reproduces experimental data by Hop and McMahon, and the data are
in the proper range of published G[B cross section data.
6.6 References
Bohme, D. K.; Young, L. B. J. Am. Chern. Suc. 1970,92,7354.
Young, L. B.; Lee-Ruff, E.; Bohme, D. K. C h . Commw~. 1973,35.
Bohme, D. K.; Mackay, G. 1.; Payzant, J. D. J. Am. C h . Soc. 1974,96,4027.
Tanaka, K.; Mackay, G. 1.; Payzant, J. D.; Bohme, D. K. Carr. J . Chem. 1976, 54,
1 643.
Brauman, J. 1.; Olmstead, W. M.; Lieder, C. A. J. Am. Chern. Soc. 1974, 96,4030.
OImstead, W. N.; Brauman, J. 1. J. Am. Chern. Soc. 1977, 99, 4219 and references
cited therein.
Caldwell, G.; Magnera, T. F.; Kebarle, P. J. Am. Chem. Soc. 1984, 106,959.
De Puy, C. H.; Gronert, S.; Muilin, A.; Bierbaum, V. M. J. Am. Chem. Soc. 1990,
112, 8650.
Wladkowski, B. D.; Brauman, J. 1. J. Phys. Chern. 1993, 97, 13 158 and references
cited therein.
Knighton, W. B.; Bognar, J. A.; O'Connor, P. M.; Grimsrud, E. P. J. Am. Chern.
Soc. 1993, 115, 12079 and references cited therein.
Cyr, D. M.; Scarton, M. G.; Johnson, M. A. J- Chem. Phys. 1993.99.4869.
Viggiano, A. A.; Morris, R. A.; Su, T. J. Am. Chem. Soc. 1994, 116, 2213.
Grau!, S. T.; Bowers, M. T. J. Am. Chern. Soc. 1994, 116, 3875 and references cited
therein.
Li, C.; Ross, P.; Smlejko. J. E.; McMahon. T. B. J. Am. Chern. Soc. 1996, 118,
9360 and references cited therein
DeTuri, V. F.; Hintz, P. A.; Ervin, K. E. J. Phys. Chern. A 1997, 101, 5969 and
references cited therein.
Craig, S. L.; Braurnan, J. 1. Science 1997, 276, 1536 and references cited therein.
Dessent, C. E. H.; Johnson, M. A. Am. Chern. Soc. 1997,119,5067.
Lehman, L.; Matejcik. S.; Illenberger. E. Ber. Bwlsenges. Phys. Chem. 1997, 101,
287.
Ayotte, P.; Kim, J.; Kelley, J. A.; Nielsen, S. B.; Johnson, M. A. J. Am. Chem. Soc.
1999, 121, 6950 and references cited therein.
Kuznetsov, A. M. J. Phys, C'hem. A 1999, iû3, 1239.
Flores, A. E.; Gronert, S. J. Am. Chem. Soc. 1999, 121, 2627.
Lehman, L. ; Illenberger, E. Int. J . Mass Spectrom. 1999, 18Y186/18 7 ,463 .
Bierbaum, V. M.; Davico, G. E. J. Am. Chem. Soc. 2000, 122, 1740.
Langer, J.; Matejcik, S.; Illenberger, E. Phys. Chern. Chern. Phys. 2000, 2, 1001.
Angel, L. A.; Ervin, K . M . ProceedÏngs of the -/gh AWS Conference on Mars
Spectrornetty atrd Aflied Topics, June 1 1 - 15,2000, Long Beach, CA, WPB 060.
Shi, 2.; Boyd, R. J. J. Am. Chem. Soc. 1989, 111, 1575 and references cited therein.
Tucker, S. C.; Truhlar, D. G. J. Phys. Chem. 1989, 93, 8 138 and references cited
therein.
Zulicke, L.; Vetter, R. J. Am. Chem. Soc. 1990, 112, 5 136.
Shi, Z.; Boyd, R. J. J. Am. Chem Soc. 1990, 112,6789 .
Shi, 2.; Boyd, R. J . J . Am. Chern. Soc. 1991,113, 1072.
Shi, 2.; Boyd, R. J. J. Am. Chem. Soc. 1991,113,2434.
Gronert, S . J. Am. Chern. Soc. 1991, 11 3,604 1.
Jensen, F. Chem. Phys. Lert. 1992, 196, 368.
Lee, 1.; Kim, C. K.; Lee, B.-S. .J. Org. Chern. 1994,59,4490.
Wladkowski, B. D.; Allen, W. D.; Brauman, J. 1. J. Phys. Chem. 1994, 98, 13532
and references cited therein.
Deng, L.; Branchadell, V.; Ziegler, T J. Am. C'hem. Soc. 1994, 116, 10645 and
references cited t herein.
Glukhotsev, M. N.; Pross, A.; Radom, L. J. Am. Chem. Soc. 1995, / 17, 2024 and
references cited therein.
Glukhotsev, M. N.; Pross, A.; Radom, L. J. Am. Chem. Soc. 1995, 118, 6273 and
references cited therein.
Glukhotsev, M. N.; Pross, A.; Schlegel, H. B.; Bach, R. B.; Radom, L. J. Am. Chern.
SOC- 1996, 118, 1 1258 and references cited therein.
Glukhotsev, M. N.; Bach, R. D.; Pross, A.; Radom, L. Chem. Phys. Leu. 1996, 260,
5 5 8 .
McKee, M. L. ./. Org. rhem- 1997, 62, 7942.
Uggerud, E. ./. Chern. Soc. Perkn Tram 1999, 1459.
Hoz, S.; Basch, H.; Wolk, J. L.; Hoz, T.; Rozental, E. J. Am. Chern. Soc. 1999, 121,
7724.
Gronert, S.; Fong, L.-M. /nt. J. Mms Spectrom. 1999, 192, 1 85.
Moliner, V.; Williams, 1. H. J. Am. Chem. Soc. 2000, 122, 10895.
Safi, B.; Choho, K.; Geerlings, P. J , Phys- Chern. A 2001, 105, 591.
Parthiban, S.; de Oliveira, G.; Martin, J. M. L. J. Phys. Chern. A 2001, 105, 895 and
references cited t herein.
Vande Linde, S. R.; Hase, W. L. J. Phys. Chern. 1990, 94, 2778 and references cited
t herei n .
Vande Linde, S. R.; Hase, W. L. J. Phys. Chem. 1990, 9 4 6 148.
Tucker, S. C.; TmhIar, D. G.J. Am. Chem. Soc. 1990, 112,3338.
Hase, W. L.; Cho, Y. J. J. Chem. Phys. 1993,98,8626.
Wang, H . ; Peslherbe, G. H.; Hase, W. L. J. Am. Chem. Soc. 1994, 116,9644.
Wang, F i . ; Zhu, L.; Hase, W. L. J. Phys. Chern. 1994, 98, 1608.
Hase, W. L. Science 1994, 266, 998.
Peslherbe, G. H.; Wang, H.; Hase, W. L. .I. Chern. Phys. 1995, 102, 5626.
Wang, H.; Hase, W. L. .J- Am. Chem. Soc. 1995, 11 7, 9347 and references cited
therein.
Hu, W.-P.;Truhlar, D. G.J. Am. C'hem. Soc. 1995, 117, 10726.
Wang, H.; Hase, W. L. CYiem. Phys. 1996, 212, 247.
Peslherbe, G. H.; Wang, Fi.; Hase, W. L. J. Am. Chern. Soc. 1996, 118,2257.
Wang, H.; Goldfield, E. M.; Hase, W. L. J. Chem. Soc. Faraday Tratzs. 1997, 737
and references cited therein.
Wang, H.; Hase, W. L. .J. Am- C'hem. Soc. 1997, 119, 3093 and references cited
therein.
Mann, D. J . ; Hase, W. L. J. Phys- ('hem. A 1998, 102, 6208.
Su, T.; Wang, H.; Hase, W. L. J. Phys- Chern. A 1998, 102, 9819 and references
cited therein.
Igarashi, M.; Tachi kawa, H. hf. J. hfass S;oec!rom. /on. Processes 1998, 181, 15 1.
Li, G.; Hase, W. L. ./. Am. Chem. Soc. 1999, 121, 7 124 and references cited therein.
Raugei, S.; Cardini, G.; Schettino, V. ,/. Chem. Phys. 1999, 111, 10887 and
references cited therein.
Hernandez, M. 1.; Campos-Martinez, J.; Villarreal, P.; Schmatz, S.; Clary, D. C.
P&. Chern. Chem. Phys. 1999, 1, 1 197.
Ervin, K. M. htt. J. Mass Spectrom. 1999, 185'186J87, 343.
Schmatz, S. Chem. Phys. Leu. 2000, 330, 188.
Gleave, J . L.; Hughes, E. D.; IngoId, C. K . J. Chem. Soc. 1935,236.
Ingold, C . K. "Stntcrztre mzd Reaczivity itt Organic Chemistry", 2nd ed., Comell
University Press, Ithaca, NY, 1969.
Hart s hom, S. R. "A iiphatic Nztcleophiiic St(bstitrrtioit ", Cam bridge University
Press, London, 1973.
S treitwei ser, Jr., A. "Solvolyfic Disphcement Reactior~s ", McGraw-Hill, New York,
NY, 1973.
Viggiano, A. A.; Moms, R. A.; Paschkewitz, J. S.; Paulson, J. J. Am. Chem. Soc.
1992, 114, 10477.
Seeley, J.; Moms, R. A.; Viggiano, A. A.; Wang, H.; Hase, W. L. J. Am. Chern.
Soc. 1997, 119, 571.
Craig, S. L.; Zhong, M.; Brauman, J . 1. J. Am. Chem. Soc. 1998, 120, 12 125.
Ren, J.; Braurnan, J. 1. Procerding~ of the 48'h ASMS Cotferetice on Mass
Spectrornetry and Allied Topics, June 1 1 - 1 5, 2000, Long Beach, CA, ThPB 265.
Tonner, D. S.; McMahon, T. B. J. Am. rhern. Soc. 2000, 122,8783.
Barlow, S. E.; Van Doren, J. M.; Bierbaum, V. M. J. Am. Chem. Soc. 1988, 110,
7240.
Cyr, D. M.; Scarton, M. G.; Wiberg, K. B.; Johnson, M. A.; Nonose, S.; Hirokawa,
J.; Tanaka, H.; Kondow, T.; Moms. R. A.; Viggiano, A. A. .I. Am. ('hem. Soc. 1995,
11 7 , 1828.
Cyr, D. M.; Posey, L. A.; Bishea, G. A.; Han, C.-C.; Johnson, M. A. J. Am. Chem.
Soc. 1991, 113,9697.
Cyr, D. M.; Bishea, G . A.; Scarton, M. G.; Johnson, M. A. J. (-hem. /,hys. 1992, 97,
5991.
Cyr, D. M.; Bishea, G. A.; Han, C.-C.; Posey, L. A.; Johnson, M. A. Soc. Photo-
ml. itzstrrrm. Eng. @PIE) Proc. 1992, 1638, 74.
Artau, A.; Niui, K. A.; Hill, B. T.; Sunderlin, L. S.; Wenthold, P. G . Am. Chem.
Soc. 2000, 122, 10667 and references cited therein.
Nizzi, K. E.; Pommerening, C. A.; Sunderlin, L. S. J. Phyx Chem. A 1998, 102,
7674.
Niui, K. E.; Pomrnerening, C. A.; Sunderlin, L. S. Do, K.; Klein, T. P.;
Pommerening, C. A.; SunderIin, L. S. J Am. Soc. Mass Specrrorn. 1997, 8, 688.
Sanov, A.; Sanford, T.; Butler, L. J . ; Vala, J.; Kosloff, R.; Lineberger, W. C. J.
Phys. Chem. A 1999, 103, 10244.
Hop, C. E. C. A.; McMahon, T. B. J. Phys. Chem. 1991,95, 10582.
Sunderlin, L. S.; Aristov, N.; Armentrout, P. B. J. Am. Chem. Soc. 1987, 109, 78
and references cited therein.
Morris, R. A. J. C'hem. Phys. 1992, 97, 2372.
Morris, R. A.; Viggiano, A. A. J. Phys. Chem. 1994,98,3740.
Staneke, P . O.; Groothuis, G.; Ingemann, S.; Nibbering, N. M. M. h r . ./. Mass
Specrrorn. iotr Processes 1 995, I-/9.'150, 99.
Morris, R. A.; Viggiano, A. A.; Miller, T. M.; Seeley, J. V.; Arnold, S. T.; Paulson,
J. F.; Van Doren, J. M.. J. Phys. Chem. 1996, 100, 10641.
Szulejko, J. E.; Fisher, J. J.; McMahon, T. B.; Wronka, J. hzz- J. Mnss Spticrrom. Ion
Processes l988,83, 147.
Frisch, M. J.; Tmcks, G. W.; Schlegel, H. B.; Gill, P. M. W.; Johnson, B. G.; Robb,
M. A.; Cheeseman, J. R.; Keith, T.; Petersson, G. A.; Montgomery, J . A.;
Raghavachari, K.; Al-Laham, M. A.; Zakrzewski, V. G.; Ortiz, J. V.; Foresman, J.
B.; Peng, C. Y.; Ayala, P. Y.; Chen, W.; Wong, M. W.; Andres, J. L.; Replogle, E.
S.; Gomperts, R.; Martin, R. L.; Fox, D. J.; Binkley, J . S.; Defrees, D. J.; Baker, J.;
Stewart, J. P.; Head-Gordon, M.; Gonzales, C.; Pople, J . A. (;a2issïmz 94, Revision
B3, Gaussian Inc., Pittsburgh PA, 1995.
Frisch, M. J.; Trucks, G. W.; Schlegel, H. B.; Scuseria. G. E.; Robb. M. A.;
Cheeseman, J. R.; Zakrzewski, V. G.; Montgomery, Jr., J. A.; Stratmann, R. E.;
Burant, J. C.; Dapprich, S.; Millam, J . M.; Daniels, A. D.; Kudin, K. N.; Strain, M.
C.; Farkas, O.; Tomasi, J.; Barone, V.; Cossi, M.; Cammi, R.; Mennucci, B.;
Pomelli, C.; Adamo, C.; CIifford, S.; Ochterski, J.; Petersson, G. A.; Ayala, P. Y.;
Cui, Q.; Morokuma, K.; Malick, D. K.; Rabuck, A. D.; Raghavachari, K.;
Foresman, J. B.; Cioslowski, J.; Ortiz, J. V.; Baboul, A. G.; Stefanov, B. B.; Liu, G.;
Liashenko, A.; Piskorz, P.; Komaromi, 1.; Gomperts, R.; Martin, R. L.; Fox, D. 1.;
Keith, T.; Al-Laham, M. A.; Peng, C . Y.; Nanayakkara, A.; Gonzalez, C.;
Challacombe, M.; GiIl, M. W.; Johnson, B.; Chen, W.; Wong, M. W.; Andres, J. L.;
Gonzalez, C.; Head-Gordon, M.; Replogle, E. S.; Pople, J. A. Gnrrssiarz 98,
Revision A.7 Gaussian, Inc., Pittsburgh PA, 1998.
Lee, C.; Yang, W.; Parr, R. G. Phys. Rev. B 1988, 37, 785.
Becke, A. D. J. Chem. Phys. 1993,98, 1372, 5648.
Krishnan, R.; Binkley, J. S.; Seeger, R.; Pople, J. A. J. Chern. Yhys. 1980, 72, 650.
100 Clark, T.; J. Chandrasekhar, J.; Schleyer, P.v.R. J. Comp. Chern. 1983, 4, 294.
10 1 Hay P. J.; Wadt, W . R. J. Chern. Phys. 1985,82,284.
102 Reed, A. E.; Curtiss, L. A.; Weinhold, F, Chem. Rev. 1988, 88, 899 and references
cited therein.
103 Krishnan, R.; Binkley, J.S.; Seeger, R.; Pople, J.A. J. Chetn. Phys. 1980, 72, 650.
Clark, T.; Chandrasekhar, J.; Spitznagel, G.W.; Schleyer, P. von R. J. Cornp. Chern.
1983, 4, 294.
Gill, P.M.W.; Johnson, B.G.; Pople, J.A.; Frisch, M.J. Chem. Phys. Leu. 1992, 197,
499.
Frisch, Md.; Pople, J.A.; Binkley, J.S. J. Chem. Phys. 1984, 80, 3265.
Mdler, C.; Plesset, M. S. Phys. Rev. 1934, 46, 6 18.
Glukhovtsev, M. N.; Pross, A.; McGrath, M. P. Radom, L. J. C'hem. Phys. 1995,
103, 1878.
Curtiss, L. A.; Raghavachari, K.; Redfern, P. C.; Rassolov, V.; Pople, J. A. J. C'hem.
Phys. 1998, 109,7764.
Bartell, L. S.; Brockway, L. O. J. C'hem. Phys. 1955, 23, 1860.
Bowen, H. J. M. 7 h x FaraJay Soc. 1954,50,444.
Wong, C . ; Schomaker, V. J. Chem. Phys. 1958,28, 10 10.
Roszak, S.; Koski, W. S.; Kaufman, J. J.; Balasubramanian, K. J. Chern. Phyx 1997,
106, 7709.
CRC Hamibook of Chernistry and Physics, Ref. Data, 761h ed., Lide, D. L. (Ed),
CRC, Boca Raton, FL, 1995.
Herzberg, G. "'Mofec~ilar Spectra and M o l e d m Stnicture. I. Spectra of Diatornic
Moleczrles ", znd ed., Van Nostrand Reinhold Company, New York, NY, 1950.
Marcus, R. A. A11171i. Rev. Phys. Chem. 1964, 15, 1 5 5 .
Pellerite, M. J . ; Brauman, J . 1. J. Am. Chem. Soc. 1980, 102, 5993.
Pellerite, M. J.; Brauman, J. 1. J. Am. Chern. Soc. 1983, 105, 2672.
Dodd, J . A.; Brauman, J. 1. ./. Am. Chern. Soc. 1984, 106, 5356.
Dodd, J. A.; Brauman, J, 1. J. Phys. Chem. 1986, 90,3559.
Wolfe, S.; Mitchell, D. J.; Schlegel, H. B. J. Am. Chern. Soc. 1981, 103, 7692.
Wolfe, S.; Mitchell, D. J.; Schlegel, H. B. J. Am. Chem. Soc. 1981, 103, 7694.
Shaik, S. S.; Pross, A. J Am. Chem. Soc. 1982, 104, 2708.
http://webbook.nist.gov/chemistry/
Shi manouchi, T. Tables of Moleclrlar Vibratiorzal Frequer~cies Consolidated
Volume 1; National Bureau of Standards: Washington, DC, 1972, 1 .
Batana, A.; Bruno, J.; Munn, R. W. Mol. Phys. 1997, 92, 1029.
127 Hirschfelder, J . O.; CI ss. C. F.; Bird, R. B. "'Molectilar Theory of Gasses und
Liquids" John Wiley & Sons, Inc, 1954. The cross section of CF3CI was estirnated
fiom the experimental cross sections of CC14 (reference 128), CC13F (reference
I29), CClzFl (reference 130), and CF4 (reference 13 1) .
128 Landolt-Bomstein, Physikalisch-Chernische ïàbeiien, Springer in Reference 127.
129 7hem&.rtamic Properries of Trichlororomonofz~orometha~~e, Kinetic Chernical, Inc.
1938 in Reference 127.
1 3 0 Thermo+namic Properties of Bichlorodrf7uorometha~te, Circu 1 ar 1 2, Am. Soc.
Refrig. Eng. 1931 in Reference 127.
13 1 MacCormack, K. E.; Schneider, W. G. J. Chem. Phys. 1951, 19, 849 in Reference
127.
132 Deyerl, H.-J.; Alconcel, L. S.; Continetti, R. E. .I Phys. Chem. A 2001, 105, 552.
Chapter 7
Thermochernistry, structures, dynamics, and infrared
spectroscopy of chloride ion-fluorinated ether and acetone
complexes and neutrals in the gas phase
7.1 Introduction
The study of structures and thermochemistry of solvated gas phase ions continues to
be an active field of research, providing insight into solvation processes, and the
di fference in intrinsic react ivity between the gas and condensed phases. l 4 Especiall y
interesting are systems where multiple bonding interactions are possible. In both the gas
and condensed phases,6-" metal ion-crown ether complexes have been studied
extensively, both experimentally and the~re t i ca l l~ . '~ Less attention bas been paid to
weakly bound anion-containing complexes, where multiple bonding interactions may be 13-22 23.24 present. Various articles and reviews have described condensed phase systems in
which anions are interacting with the host moIecule mainly by multiple hydrogen
bonding or by ion-dipole interactions. Similar gas phase systems are fairly rare, and are
mainly limited to perfluorinated crown ethers 25 and cryptands 26 binding to F and 0 2 ?
Larson and McMahon speculated on the possibility of multiple site interactions in
CI-((CF2H)20) complexes based on AG^^^^ values from exchange equilibria relative to
Cl-(CF,OCFzH), studied by I C R . ~ ~ NO information on standard entropy changes (AS?
could be obtained, thus preventing a more definitive proof for the occurrence of
chelation. In addition, Larson and McMahon also rneasured by ICR the ~ ~ ~ 2 9 8 values for
three CI- + acetone-F, -- Cl-(acetone-F,) equilibria (acetone-F, = CFZHC(O)CF~H,
CF3C(O)CFlH, CF3C(O)CF3). Zhang et ai. used PHPMS to deduce that in chIoride ion-
di01 complexes bidentate interactions take place.28 This was shown experimentally by the
standard entropy change accompanying the clustenng reactions. PHPMS is one of the
few experimental techniques able to provide AS' values for gas phase clustering
reactions, and an excellent example that illustrate the use of AS' is the work by Norman
and ~ c ~ a h o n . ' ~ . ~ ~ Frorn different AS' values, obtained by deconvoluting the relevant
Van't Hoff plots, they showed the existence of low and high temperature isomers for the
gas phase clustering of & C a 9 * onto various small organic rnolecules,2g and the folding of
CH3(CH&C02- to give intramolecular sol~ation.'~
In this work, the clustering of chloride ion ont0 various (fluorinated) ethers and
acetones has been investigated by PHPMS and high level ab znirio and DFT
computational methods. By varying the number and positions of the electronegative
fluorine atoms, and the functionality of the molecules, one would expect, a priori,
changes in the structures of the cluster ions, accompanied by changes in the
therrnochemistry. The computations were perforrned to obtain more insight into the
structures, especiaily where various rotamers and isomers are possible, to find a method
to mode1 the thermochemistry of these systems accurately compared to experiment, to
obtain more insight into the change in normal mode vibrational frequencies and IR
intensities upon complex formation, to test the suitability of the G3(MP2) composite
method to obtain A , ~ H O Z ~ ~ values of the various fluorinated acetones, and to get more
insight into the dynamics of the complex formation by performing relaxed potential
energy surface scans.
Recently there has been a fair amount of interest in fluonnated ethers."" This class of
compounds has been developed to replace chlorofluorocarbons (CFC). Unfortunately
these compounds may also contnbute to global waming by their long atmospheric
lifetimes, and their strong absorbtion of thermal radiation between 800 and 1400 c d .
The occurrence of chloride ion-fluorinated ether complexes in the atmosphere, and
especially in the ionosphere, seems very unlikely, mainly due to the low concentrations
of both chloride ions and the fluorinated ethers at those altitudes.
Fi na1 1 y. the Fourier-transform IR (FT-IR) spectra of CH3C(O)CH2F7 CF3C(O)CH3,
CFJC(O)CF~H, and CF3C(O)CF3 were recorded. This was done to test the quality of the
computations, and because no IR spectra of the first and third cornpounds are available in
the National Institute of Science and Technology (NIST) EPA Gas-Phase Infiared
~atabase . '~
Al1 measurements were camed out on a PHPMS instrument, configured around a VG
8-80 rnass spectrometer. The instrument, constructed at the University of Waterloo, has
been described in detail in Chapter 2.'"
Gas mixtures were prepared in a 5 L heated stainless steel reservoir at 370 K, by using
C h as a bath gas at pressures of 40-900 Torr. Chloride ion was generated fiom trace
amounts of CC14 by DEC of thermalized electrons from 500 ps pulses of a 2 keV electron
gun beam.
The five ethers ((CH3)20, (CH3CH2)20, CH30CF3, (CF2H)20, and CF30CF2H) and
five acetones (CH3C(O)CM,, CH3C(O)CHzF, CF3C(O)CH3, CF~C(O)CFZH, and
CF3C(0)CF3) were added to give relative amounts between 0.06% and 75%, and 0.05%
and 5.5% (partial pressure), respectively, depending on the ion source temperature and
the nature of the experiment involved. The ion source pressure and temperature ranged
between 4.0-8.0 Torr and 300-600 K, respectively.
Time intensity profiles of mass selected ions were monitored by using a PC based
rnulti-channel scalar (MCS) data acquisition system, configured between 50 and 200 ps
dweIl time per channel over 250 channels. Additive accumulations of ion signals
resulting corn 500-2000 electron gun beam pulses were typically used. Figures 7.1 and
7.2 illustrate typical data obtained from the equilibrium expenments.
Equilibrium constants (&,) at different absolute temperatures for the various chlonde
ion-ether (Reactions 7.1 and 7.2) and acetone (Reaction 7.3) clustering equilibria
can be detennined from Equation 7.4 and 7.5:
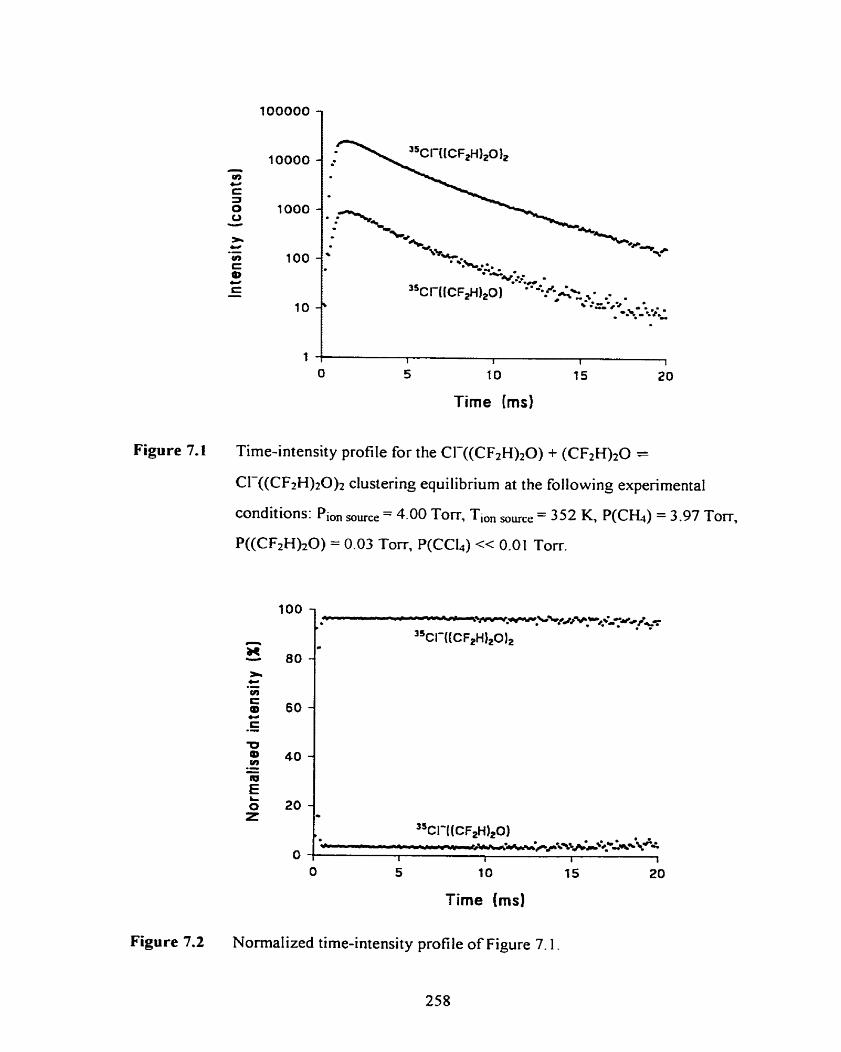
Figure 7.1 Time-intensity profile for the CI-((CF2H)20) + (CF2H)20 =
Cl-((CFzH)20)2 clustering equilibrium at the following experirnental
conditions: Pion ,, = 4.00 Ton; Ti,, ,,, = 352 K, P(C&) = 3 -97 Torr,
P((CF2H)20) = 0.03 Torr, P(CCI4) << 0.01 Torr.
Figure 7.2 Normalized time-intensity profile of Figure 7.1.
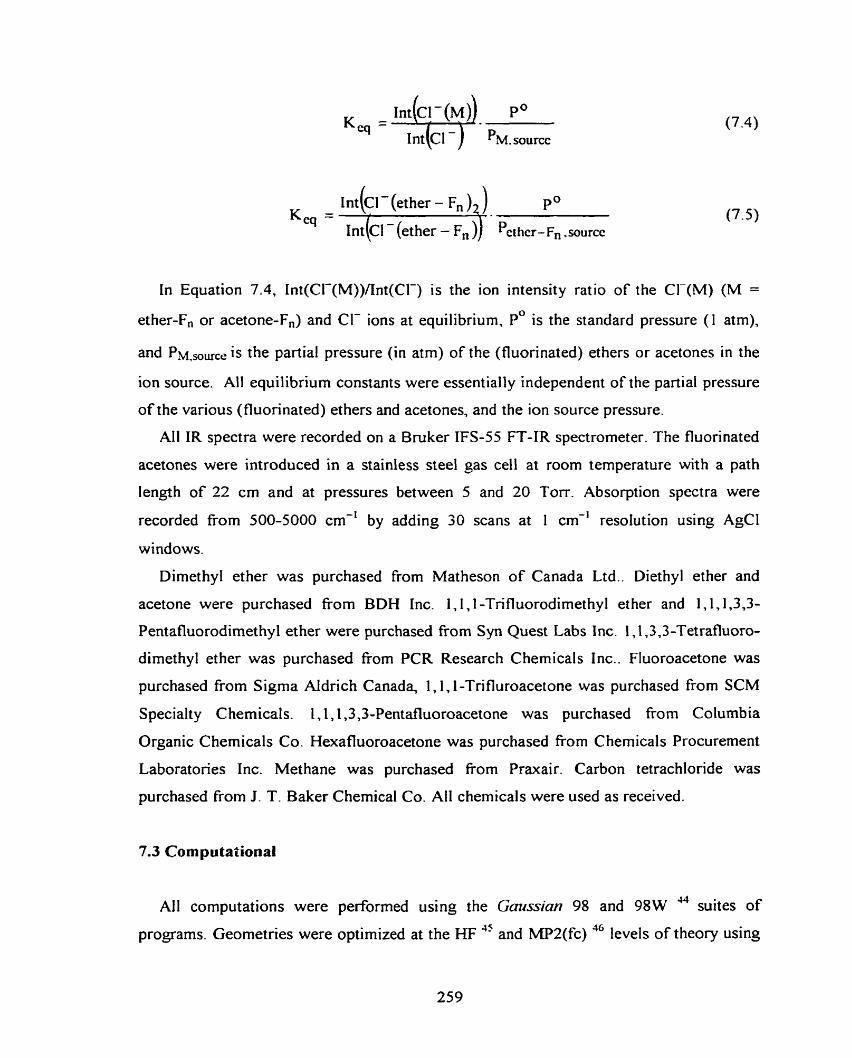
In Equation 7.4, Int(C1-(M))/Int(CI-) is the ion intensity ratio of the CI-(M) (M =
ether-F, or acetone-F,) and CI- ions at equilibrium, PO is the standard pressure ( 1 atm),
and PM,,,, is the partial pressure (in atm) of the (fluorinated) ethers or acetones in the
ion source. All equilibriurn constants were essentially independent of the partial pressure
of the various (fluorinated) ethers and acetones, and the ion source pressure.
A11 IR spectra were recorded on a Bmker IFS-55 FT-IR spectrometer. The fluorinated
acetones were introduced in a stainless steel gas ce11 at room temperature with a path
length of 22 cm and at pressures between 5 and 20 Torr. Absorption spectra were
recorded from 500-5000 cm-' by adding 30 scans at 1 cm-' resolution using AgCl
windows.
Dimethyl ether was purchased from Matheson of Canada Ltd.. Diethyl ether and
acetone were purchased from BDH Inc. 1,1,1 -Trifluorodimethyl ether and 1,1,1,3,3-
Pentafluorodimethyl ether were purchased fiom Syn Quest Labs Inc. 1,1,3,3-Tetrafluoro-
dimethyl ether was purchased from PCR Research Chemi cals Inc.. Fluoroacetone was
purchased from Sigma Aldrich Canada, l , l , 1-Trifluroacetone was purchased from SCM
Specialty Chemicals. 1,1,1,3,3-Pentafluoroacetone was purchased from Columbia
Organic Chemicals Co. Hexafluoroacetone was purchased from Chemicals Procurement
Laboratories Inc. Methane was purchased from Praxair. Carbon tetrachloride was
purchased fi-om J. T. Baker Chemical Co. Ail chemicals were used as received.
7.3 Computational
Al1 computations were performed using the Gcn~ssian 98 and 98W " suites of
programs. Geometries were optimized at the HF '' and MPZ(fc) '"evels of theory using
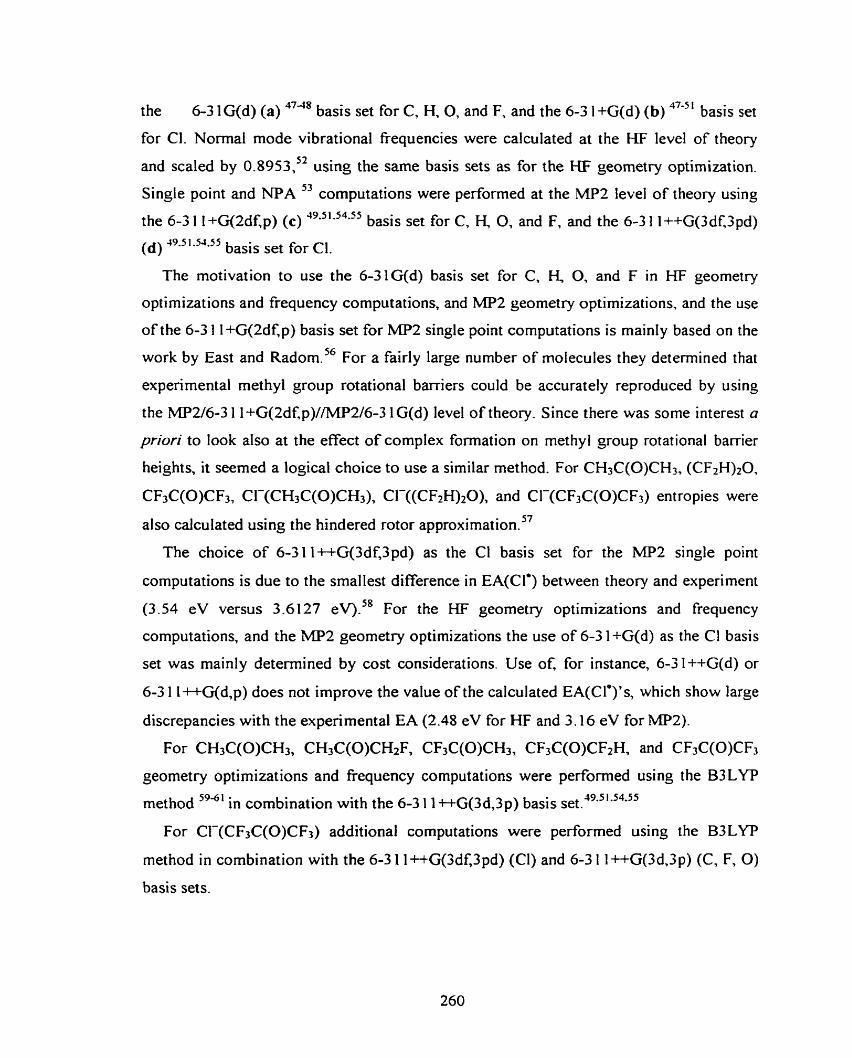
the 6-3 1 G(d) (a) 47-'8 basis set for C, H, 0, and F, and the 6-3 1 +G(d) (b) 47-51 basis set
for Cl. Normal mode vibrational frequencies were calculated at the HF level of theory
and scaled by 0.8953,'~ using the sarne basis sets as for the HF geometry optimization.
Single point and NPA 53 computations were performed at the MP2 level of theory using
the 6-3 1 i+G(Zdf.p) ( c ) 49.51-54-'5 basis set for C, H, 0, and F, and the 6-3 1 1 ++G(3df,3pd) 49.5 1.54.55 basis set for CI.
The motivation to use the 6-31G(d) basis set for C, fi 0, and F in HF geometry
optimizations and frequency computations, and MP2 geometry optimizations, and the use
of the 6-3 1 1+G(2df,p) basis set for MP2 single point cornputations is mainly based on the
work by East and ~ a d o m ? For a fairly large number of molecules they determined that
experimental methyl group rotational barriers could be accuratel y reproduced by using
the MP2/6-3 1 1 +G(2df,p)//MF2/6-3 1 G(d) level of theory. Since there was some interest a
priori to look also at the effect of cornplex formation on methyl group rotational barrier
heights, it seemed a logical choice to use a similar method. For CH3C(0)CH3, (CF2H)20,
CF3C(O)CF,, CI-(CH3C(O)CH3), CI-((CF2H)20), and CI-(CF3C(O)CF3) entropies were
also caiculated using the hindered rotor approximation.57
The choice of 6-31 l++G(3df,3pd) as the Cl basis set for the MP2 single point
computations is due to the smallest difference in EA(Cl0) between theory and experiment
(3.54 eV versus 3.6127 e ~ ) ? For the HF geometry optirnizations and frequency
computations, and the MF2 geometry optimizations the use of 6-3 1 +G(d) as the Cl basis
set was mainly determined by cost considerations. Use of, for instance, 6-3 1 ++G(d) or
6-3 1 I++G(d,p) does not improve the value of the calculated EA(Cl0)'s, which show large
discrepancies with the experimental EA (2.48 eV for HF and 3.16 eV for MP2).
For CH3C(0)CH3, CH3C(O)CHîF, CF3C(O)CH3, CF3C(0)CF2H, and CF3C(O)CF3
geometry optimizations and fiequency computations were performed using the B3LYP
method 59"1 in combination with the 6-3 1 1 +G(3d,3p) basis set. 49.5 1.54.55
For CI-(CF3C(0)CF3) additional computations were performed using the B3LYP
method in combination with the 6-3 1 l++G(3df,3pd) (CI) and 6-3 1 l++G(3d,3p) (C, F, O)
basis sets.
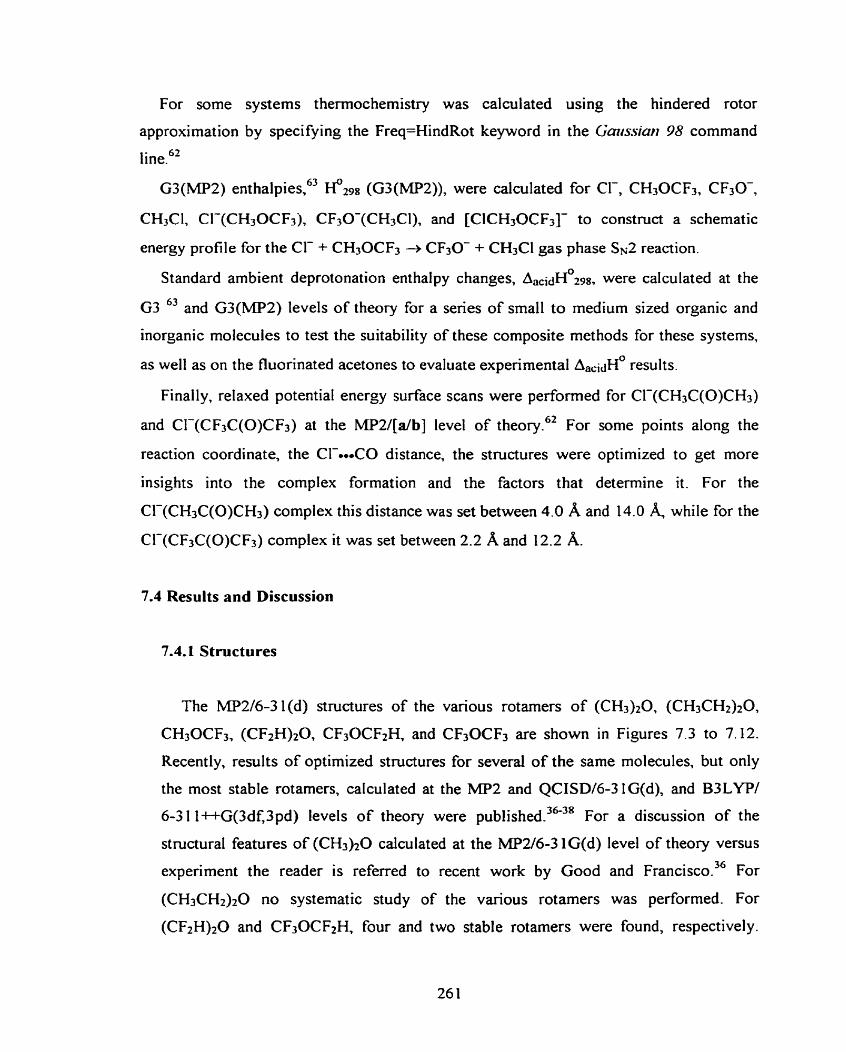
For some systems thermochemistry was calculated using the hindered rotor
approximation by specifying the Freq=HindRot keyword in the Gatis.sian 98 command
~ ine .~ '
G3(MP2) enthalpies,63 If298 (G3(MP2)), were calculated for Cl-, CH30CF3, CF30-,
CHKI, CI-(CH3OCF3 ), CF30-(CH3Cl), and [CICH30CF3]- to constmct a schematic
energy profile for the Cl- + CH30CF3 d F 3 O - + CH3C1 gas phase SN2 reaction.
Standard ambient deprotonation enthalpy changes, were calculated at the
G3 63 and G3(MP2) levels of theory for a series of small to medium sized organic and
inorganic molecules to test the suitability of these composite methods for these systems,
as well as on the fluorinated acetones to evaluate experimental A ~ ~ ~ ~ H ~ results.
Finally, relaxed potential energy surface scans were performed for Cl-(CH3C(0)CH3)
and CI-(CSC(O)CF,) at the MPZ/[alb] level of the~ry!~ For some points along the
reaction coordinate, the Cl--CO distance, the structures were optimized to get more
insights into the complex formation and the factors that determine it. For the
CI-(CH3C(0)CH3) cornplex this distance was set between 4.0 A and 14.0 while for the
CI-(CF3C(0)CF3) complex it was set between 2.2 A and 12.2 A.
7.4 Results and Discussion
7.4.1 Structures
The MP2/6-3 1(d) structures of the various rotamers of (CH3)20, (CH3CHt)20,
CH30CF3, (CFzH)zO, CF30CF2H, and CF30CF3 are shown in Figures 7.3 to 7.12.
Recently, results of optimized structures for several of the same molecules, but only
the most stable rotamers, calculated at the MP2 and QCISD/6-3 IG(d), and B3LYP/
6-3 1 1 ++G(3df,3pd) levels of theory were published. 36-3g For a discussion of the
structural features of (CH3)zO cdculated at the MP2/6-3 lG(d) level of theory versus
experiment the reader is referred to recent work by Good and ~ r a n c i s c o . ~ ~ For
(CH3CH2)zO no systematic study of the various rotamers was performed. For
(CF2H)zO and CROCFZH, four and two stable rotamers were found, respectively.
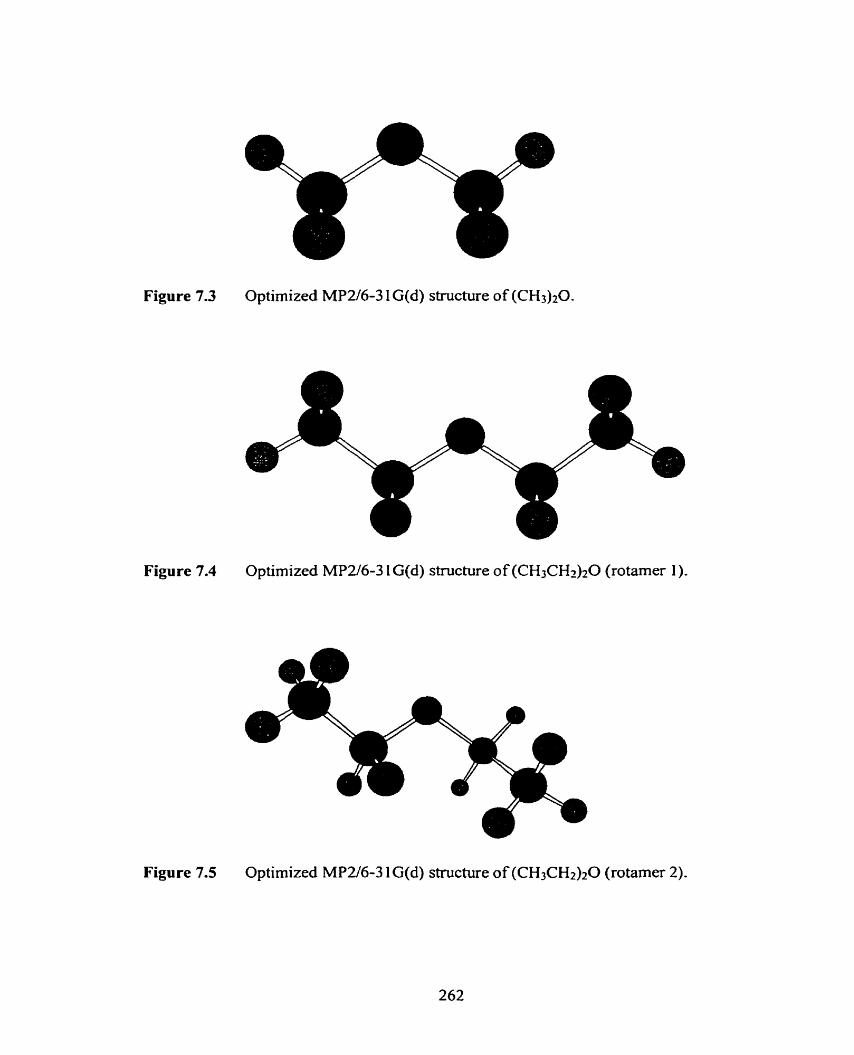
Figure 7.3 Optimized MP2/6-3 1 G(d) structure of (CH&O.
Figure 7.4 Optimized MP2/6-3 1 G(d) structure of (CH3CHz)z0 (rotamer 1).
Figure 7.5 Optimized MP2/6-3 1 G(d) structure of (CH3CH2)20 (rotamer 2).
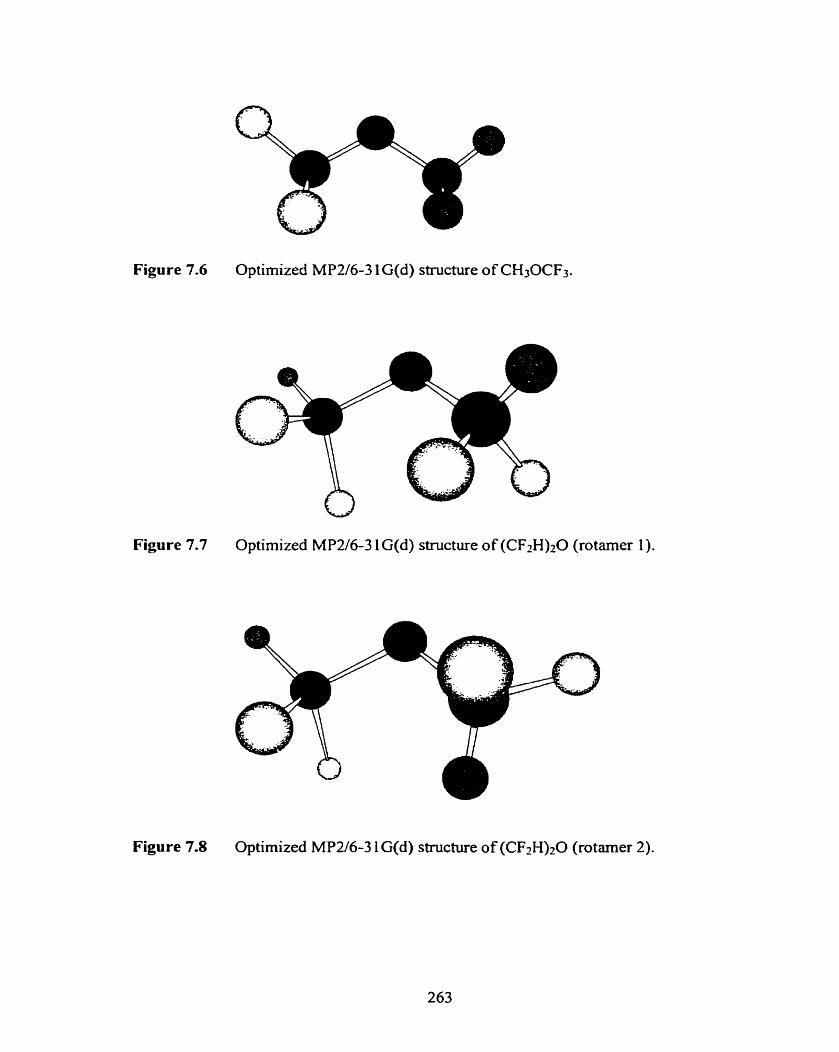
Figure 7.6 Optimized MP2/6-3 1 G(d) structure of CH30CF3.
Figure 7.7 Optimized MPU6-3 1 G(d) stnicture of (CF2H)20 (rotamer 1 ).
Figure 7.8 Optimized MP2/6-3 1 G(d) stnichire of (CF2H)20 (rotamer 2).
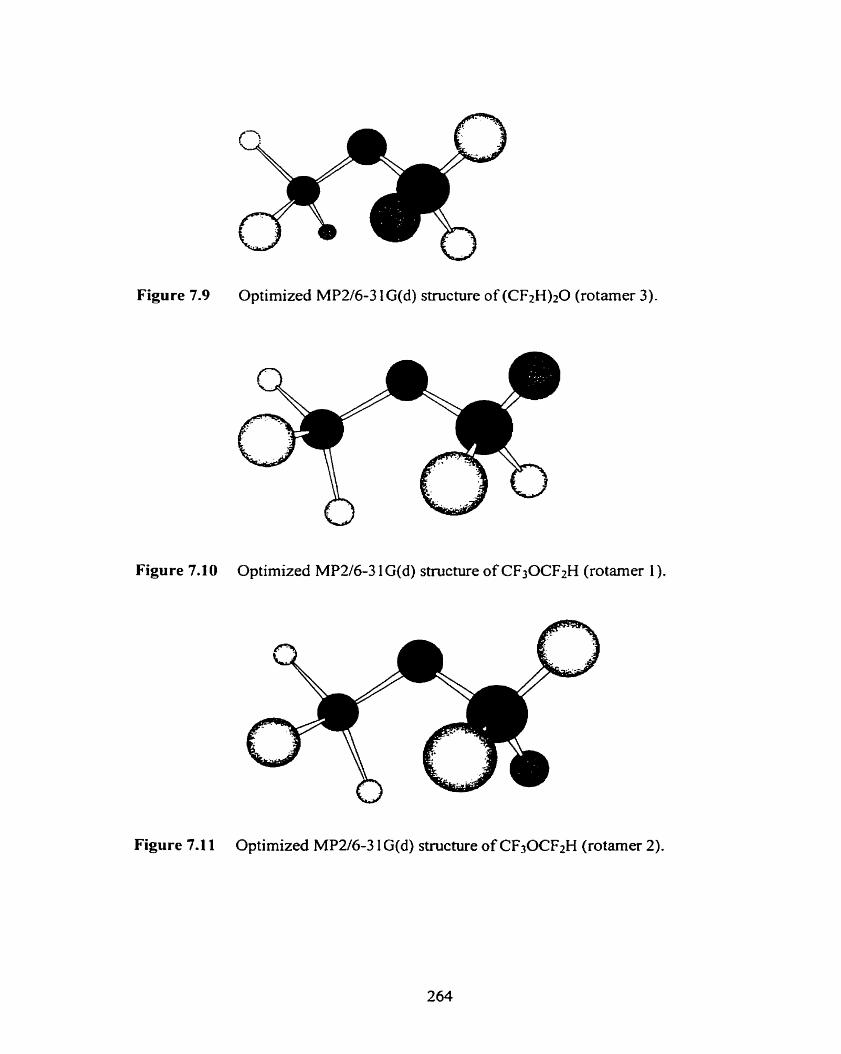
Figure 7.9 Optimized MP2/6-3 1G(d) structure of (CF2H)20 (rotarner 3).
Figure 7.1 0 Optimized MP2/6-3 1 G(d) structure of CF30CF2H (rotamer I ).
Figure 7.1 1 Optimized MP2/6-3 1 G(d) structure of CF30CF2H (rotamer 2).
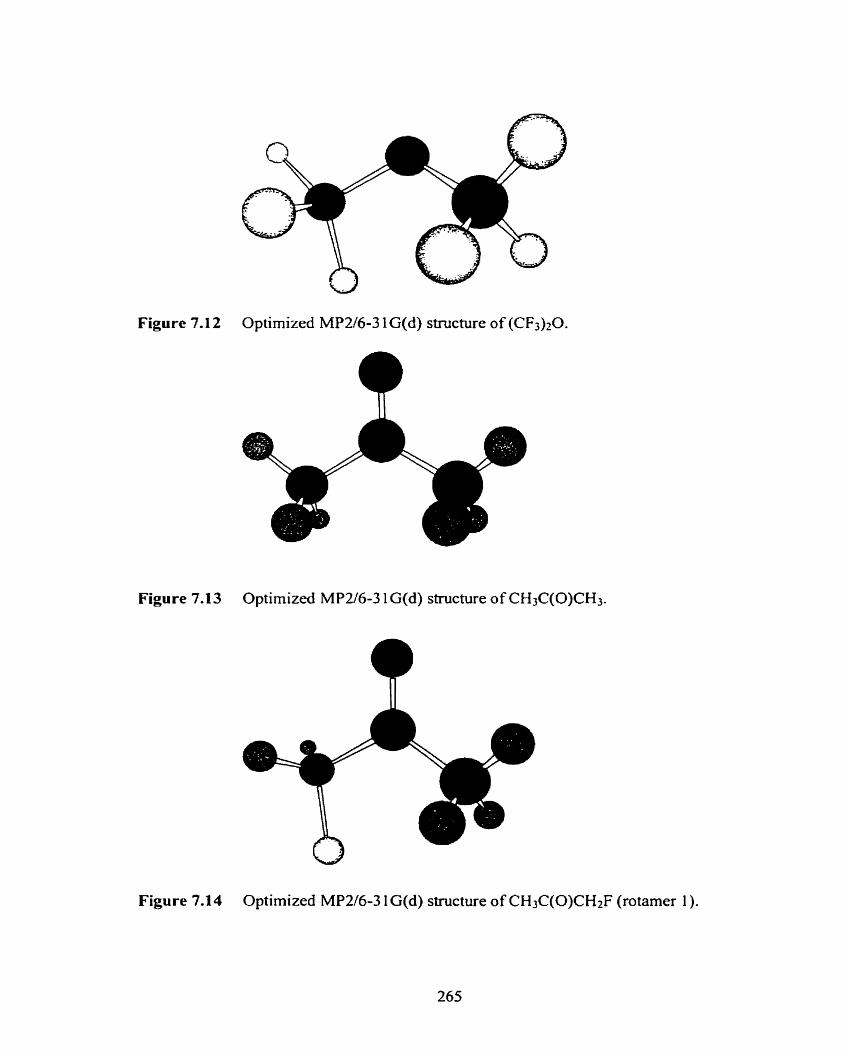
Figure 7.1 2 Optimized MP2/6-3 1 G(d) structure of (CF3)t0.
Figure 7.1 3 Optimized MP2/6-3 1 G(d) structure of CH3C(0)CH3.
Figure 7.14 Optimized MP2/6-3 1 G(d) structure of CH3C(0)CH2F (rotamer 1 ).
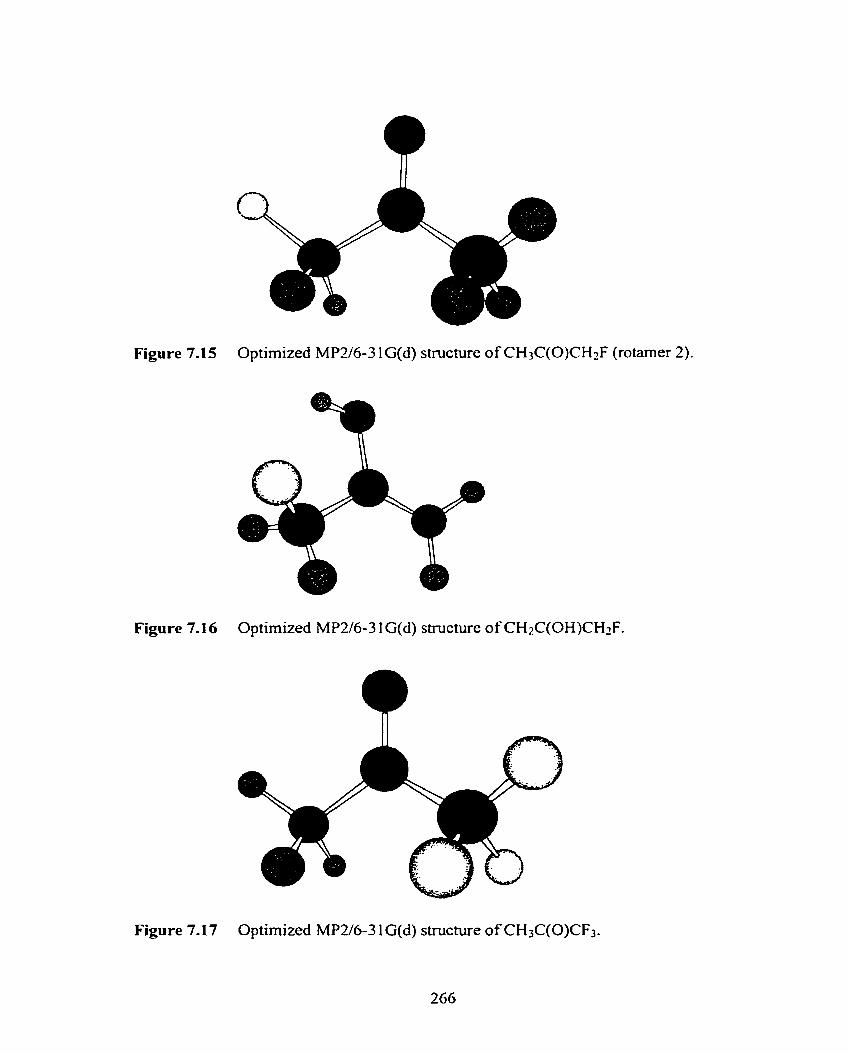
Figure 7.15 Optimized MP2/6-3 lG(d) structure of CH3C(0)CH2F (rotamer 2).
Figure 7.16 Optimized MP216-3 1 G(d) structure of CH2C(OH)CH2F.
Figure 7.17 Optimized MP2/6-3 1 G(d) structure of CH3C(0)CF3.
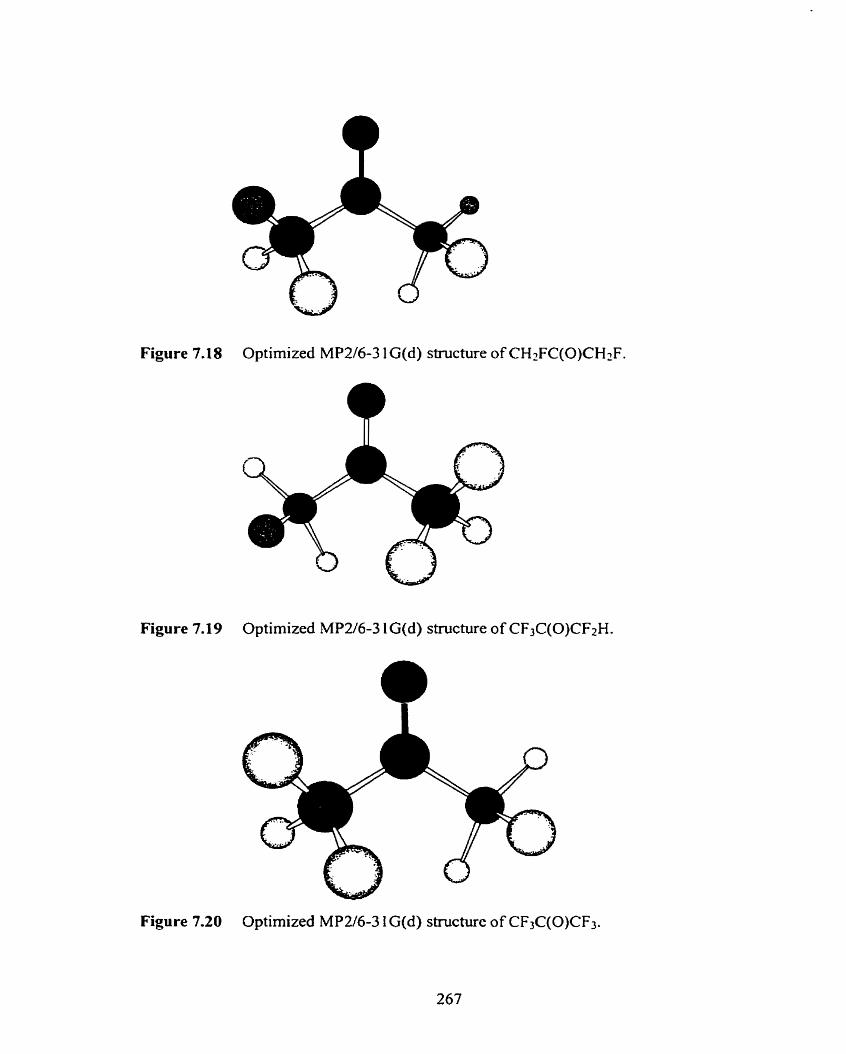
Figure 7.18 Optimized MP216-3 1 G(d) structure of CH2FC(0)CH2F.
Figure 7.19 Optimized MP2/6-3 1 G(d) structure of CF3C(0)CF2H.
w Figure 7.20 Optimized MPU6-3 1 G(d) structure of CF3C(0)CF3.
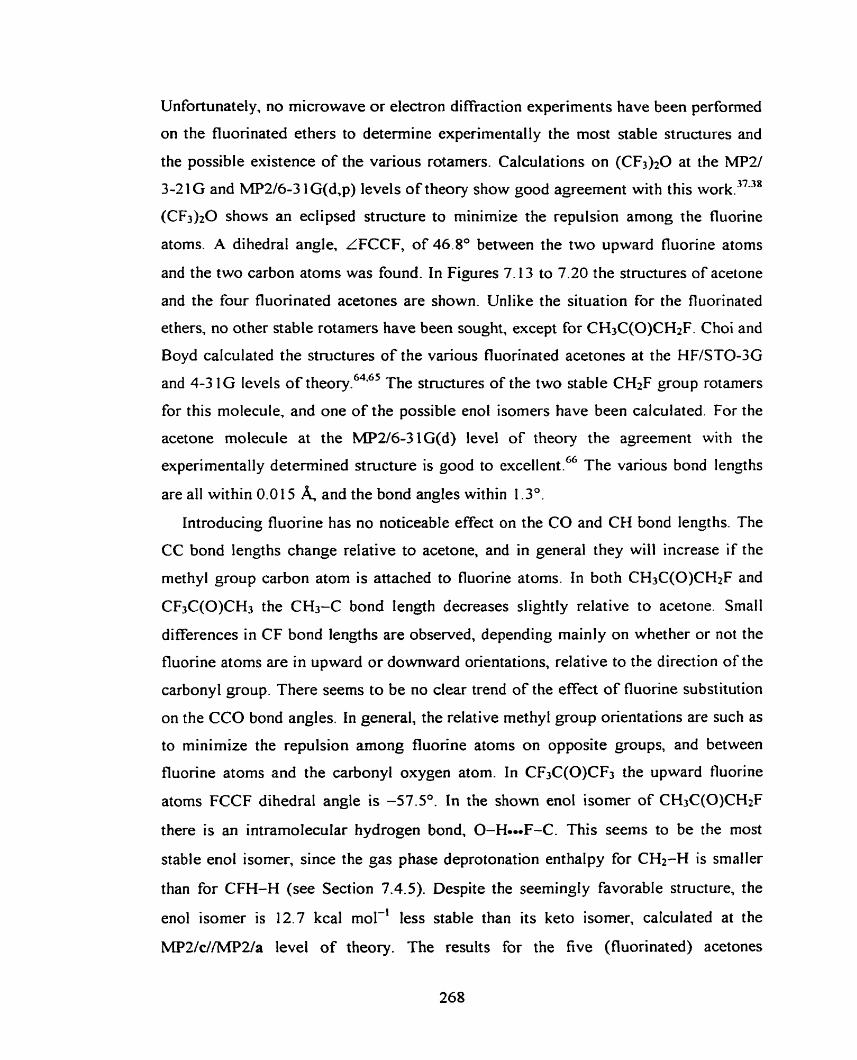
Unfortunately, no microwave or electron diffraction experiments have been performed
on the fluotinated ethers to detemine experimentally the most stable structures and
the possible existence of the various rotamers. Calculations on (CF3)*0 at the MP2/
3-2 1 G and MP2/6-3 1 G(d,p) levels of theory show good agreement with t his work. 37.38
(CF3)20 shows an eclipsed structure to minimize the repulsion among the fluorine
atoms. A dihedral angle, LFCCF, of 46.8" between the two upward fluorine atoms
and the two carbon atoms was found. In Figures 7.1 3 to 7.20 the structures of acetone
and the four fluorinated acetones are shown. Unlike the situation for the fluorinated
ethers, no other stable rotamers have been sought, except for CH3C(0)CH2F. Choi and
Boyd calculated the structures of the various fluorinated acetones at the HWSTO-3G 64.65 and 4-3 1G levels of theory. The structures of the two stable CH2F group rotamers
for this molecule, and one of the possible en01 isomers have been calculated. For the
acetone molecule at the MP2/6-31G(d) level of theory the agreement with the
experimentally determined stmcture is good to excellent.66 The various bond lengths
are al1 within 0.0 15 and the bond angles within 1 . 3 O .
Introducing fluorine has no noticeable effect on the CO and CH bond lengths. The
CC bond lengths change relative to acetone, and in general they will increase if the
methyl group carbon atom is attached to fluorine atoms. In both CH3C(O)CHzF and
CF3C(0)CH3 the CH3-C bond length decreases slightly relative to acetone. Small
differences in CF bond lengths are observed, depending mainly on whether or not the
fluorine atoms are in upward or downward orientations, relative to the direction of the
carbonyl group. There seems to be no clear trend of the effect of fluorine substitution
on the C C 0 bond angles. In general, the relative methyl group orientations are such as
to minimize the repulsion among fluorine atoms on opposite groups, and between
fluorine atoms and the carbonyl oxygen atom. In CF3C(0)CF3 the upward fluorine
atoms FCCF dihedral angle is -57.5". In the shown en01 isomer of CH3C(O)CH2F
there is an intramolecular hydrogen bond, O-Hoo.F-C. This seems to be the most
stable en01 isomer, since the gas phase deprotonation enthalpy for CH*-H is smaller
than for CFH-H (see Section 7.4.5). Despite the seemingly favorable structure, the
en01 isomer is 12.7 kcal mol-' less stable than its keto isomer, calculated at the
MPZ/c//MPZ/a level of theory. The results for the five (fluorinated) acetones
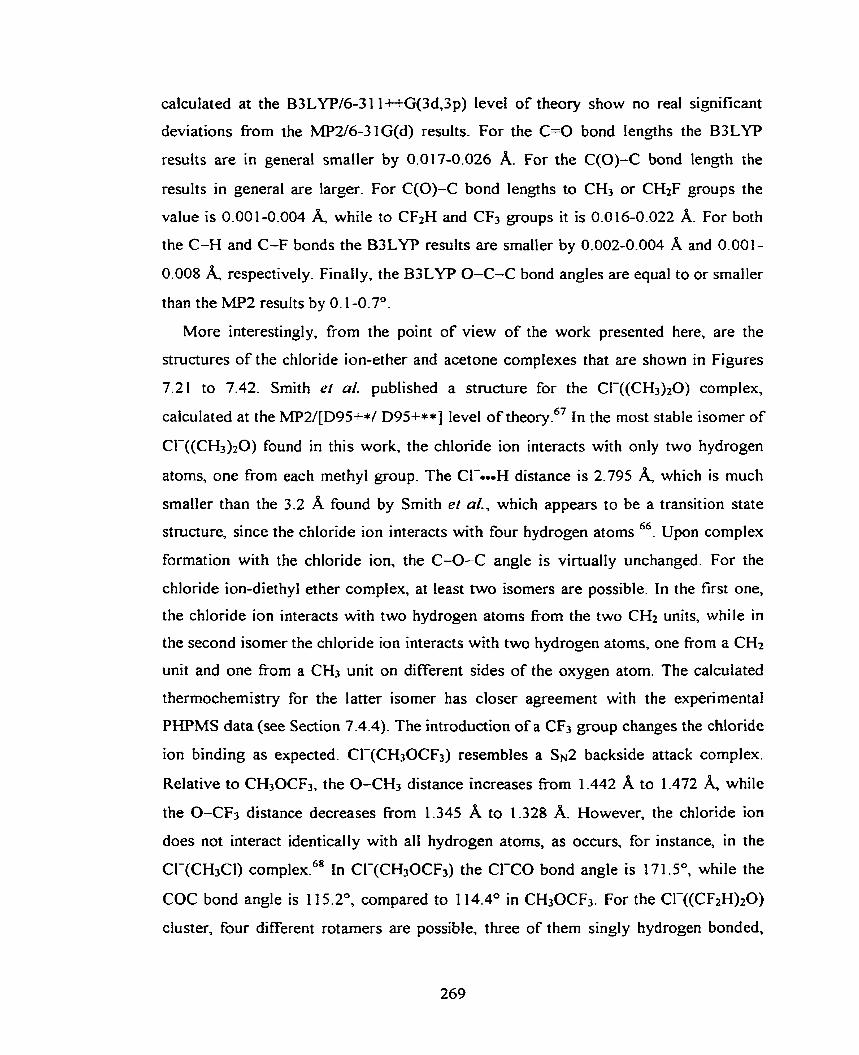
calculated at the B3LYFV6-31 l*G(3d,3p) level of theory show no real significant
deviations fiom the MP2/6-3'IG(d) results. For the C=O bond lengths the B3LYP
results are in general smaller by 0.0 17-0.026 A. For the C(0)-C bond length the
results in general are larger. For C(0)-C bond lengths to CH3 or CH2F groups the
value is 0.001 -0.004 A, while to CF2H and CF3 groups it is 0.0 16-0.022 A. For both
the C-H and C-F bonds the B3LYP results are smaller by 0.002-0.004 A and 0.001-
0.008 respectively. Finally, the B3LYP O-C-C bond angles are equal to or smaller
than the MP2 results by 0.1-0.7".
More interestingly, from the point of view of the work presented here, are the
structures of the chloride ion-ether and acetone complexes that are shown in Figures
7.21 to 7.42. Smith el al. published a structure for the CI-((CH3)20) complex,
calculated at the MP2/[D95+*/ D95+**] level of theory6' In the most stable isomer of
Cl-((CH&O) found in this work, the chloride ion interacts with only two hydrogen
atoms, one from each methyl group. The Cl--H distance is 2.795 & which is much
smaller than the 3.2 A found by Smith et al., which appears to be a transition state
structure, since the chloride ion interacts with four hydrogen atoms 66. Upon complex
formation with the chloride ion, the C-O-C angle is virtually unchanged. For the
chloride ion-diethyl ether complex, at Ieast two isomers are possible. In the first one,
the chloride ion interacts with two hydrogen atoms fiom the two CH2 units, while in
the second isomer the chloride ion interacts with two hydrogen atoms, one from a CH2
unit and one from a CH3 unit on different sides of the oxygen atom. The calculated
thermochemistry for the latter isomer has closer agreement with the experimental
PKPMS data (see Section 7.4.4). The introduction of a CFs group changes the chlonde
ion binding as expected. Cl-(CH30CF3) resembles a SN2 backside attack complex.
Relative to CH,0CF3, the O-CH3 distance increases fkom 1.442 A to 1.472 while
the O-CF3 distance decreases from 1.345 A to 1.328 A. However, the chloride ion
does not interact identically with ali hydrogen atorns, as occurs, for instance, in the
CI-(CH3Cl) ~ o m ~ l e x . ' ~ In Cl-(CH30CF3) the CI-CO bond angle is 171S0, while the
COC bond angle is 11 5.2", compared to 114.4O in CH30CF3. For the Cl-((CF2H)20)
cluster, four different rotamers are possible, three of thern singly hydrogen bonded,
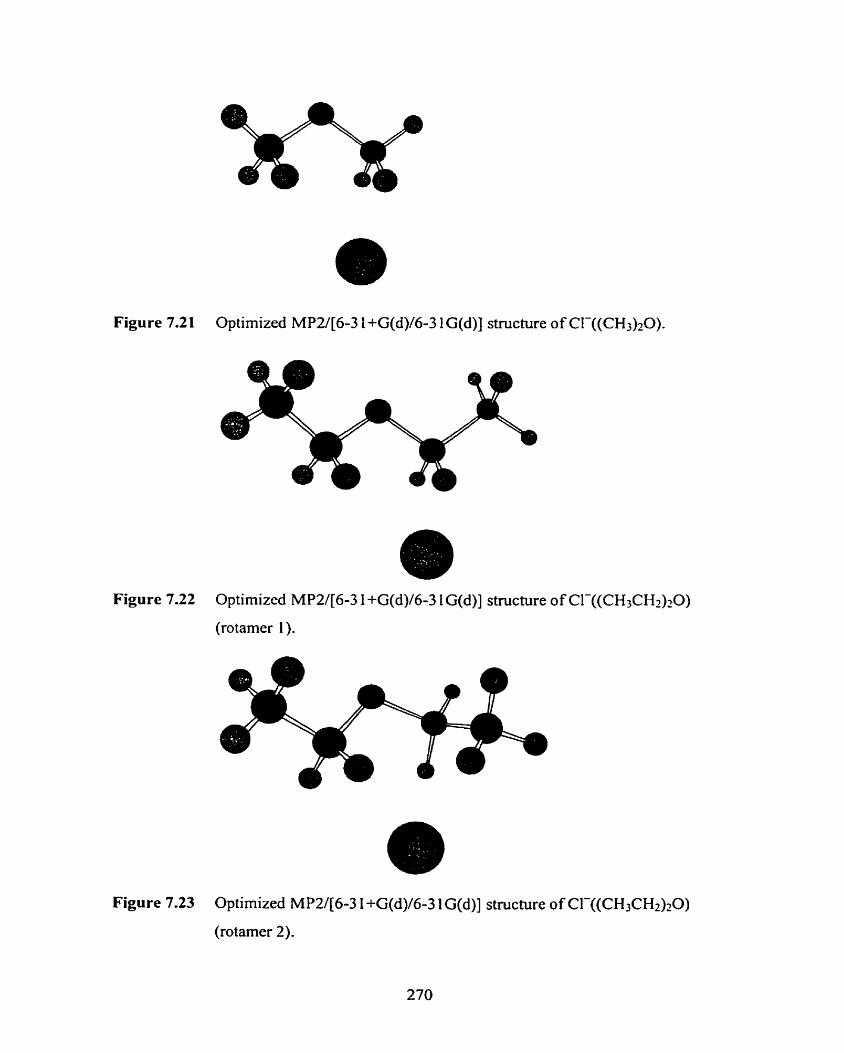
Figure 7.21 Optimized MP2/[6-3 1 +G(d)/6-3 1 G(d)] structure of C1-((CH3)20).
Figure 7.22 Optimized MP2/[6-3 1 +G(d)/6-3 1 G(d)] structure of Cl-((CH3CH2)20)
(rotamer 1 ),
Figure 7.23 Optimized MP2/[6-3 I +G(d)/6-3 I G(d)] structure of CI-((CH3CH2)20)
(rotamer 2).
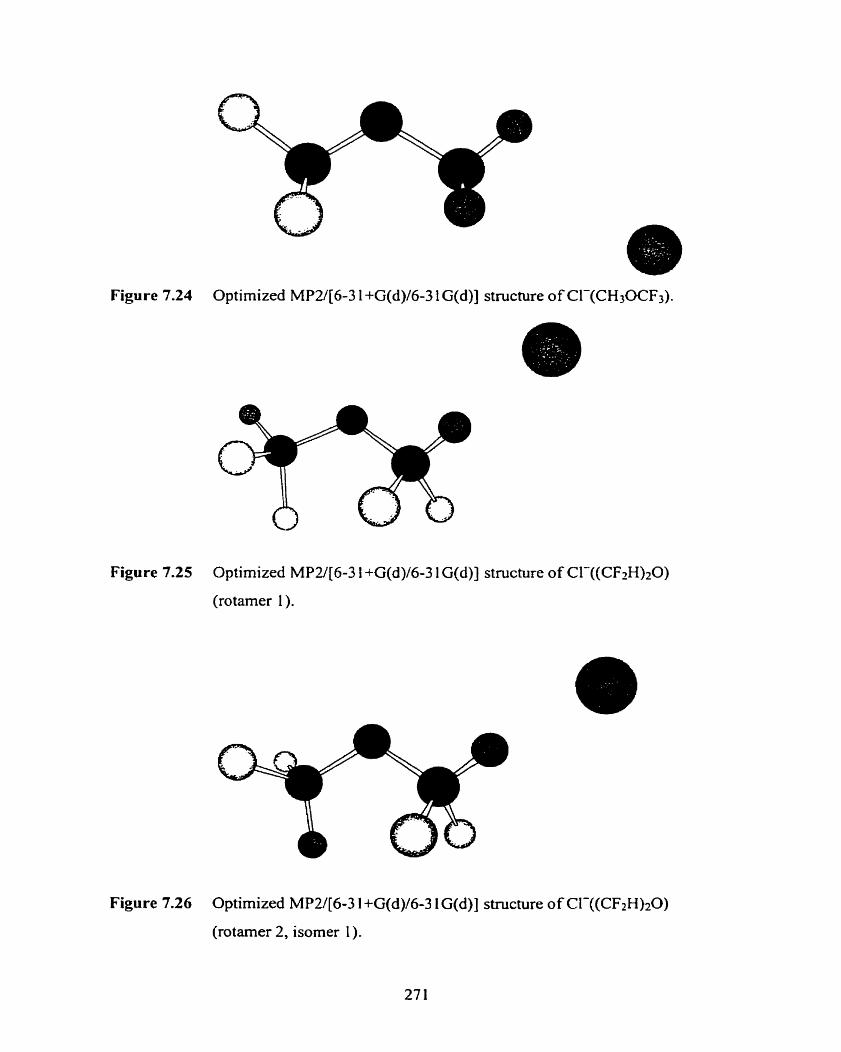
Figure 7.24 Optimized MP2/[6-3 1 +G(d)/6-3 1 G(d)] structure of CI-(CH30CF3).
Figure 7.25 Optimized MP2/[6-3 i +G(d)/6-3 1 G(d)] structure o f CI-((CF2H)20)
(rotamer 1).
Figure 7.26 Optimized MP2/[6-3 1 +G(d)/6-3 1 G(d)] stmcture of Cl-((CF2H)tO)
(rotarner 2, isomer 1).
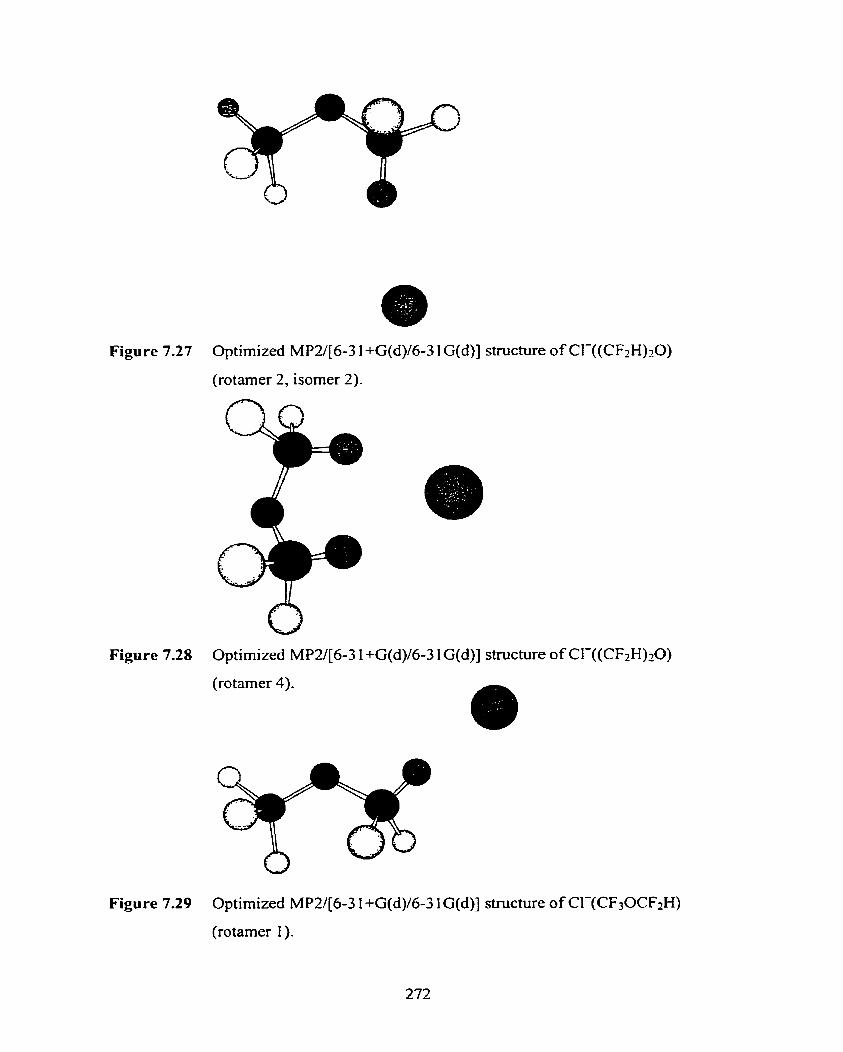
Figure 7.27 Optimized MP2/[6-3 1 +G(d)/6-3 1 G(d)] structure of CI-((CF2H)z0)
(rotamer 2, isomer 2).
Figure 7.28 Optimized MP2/[6-3 1 +G(d)/6-3 1 G(d)] stnicture of CI-((CF2H)20)
(rotamer 4).
Figure 7.29 Optimized MP2/[6-3 1 +G(d)/6-3 f G(d)] structure of CI-(CF30CF2H)
(rotamer I ).
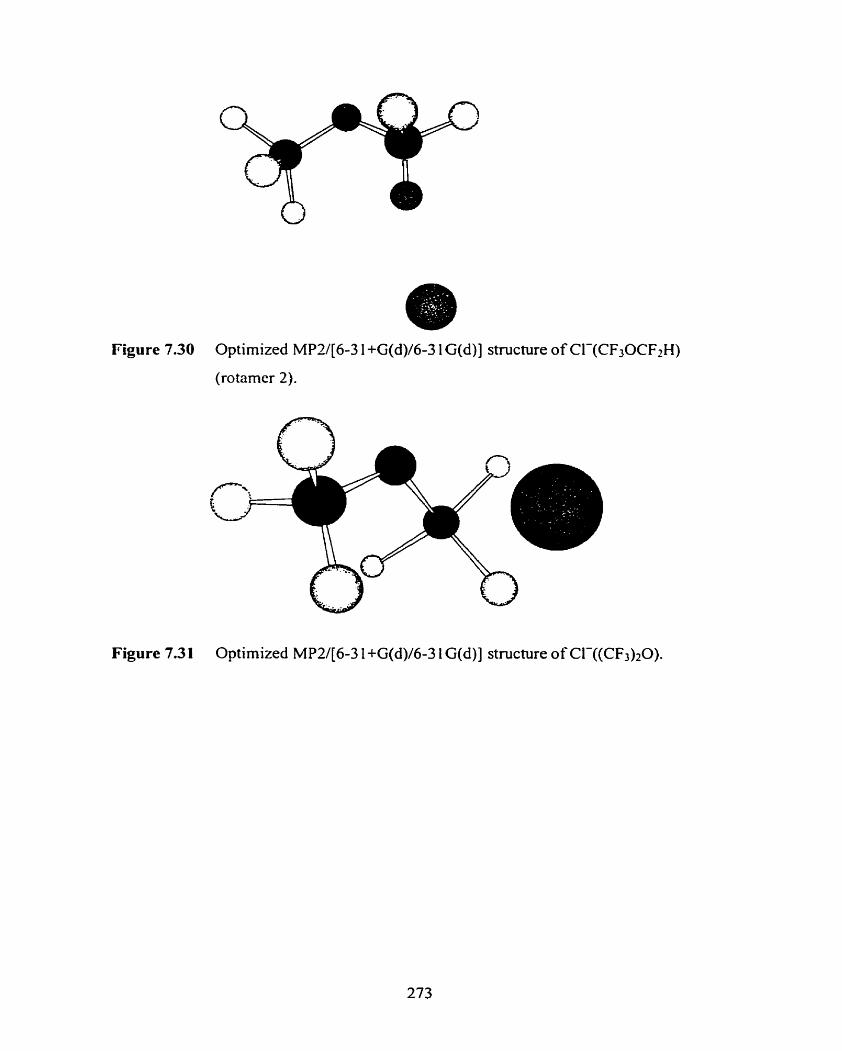
Figure 7.30 Optimized MP2/[6-3 1 +G(d)/6-3 1 G(d)] structure of Cl-(CF30CF2H)
(rotamer 2).
Figure 7.31 Optimized MP2/[6-3 1 +G(d)/6-3 1 G(d)] structure of Cl-((CF3)20).
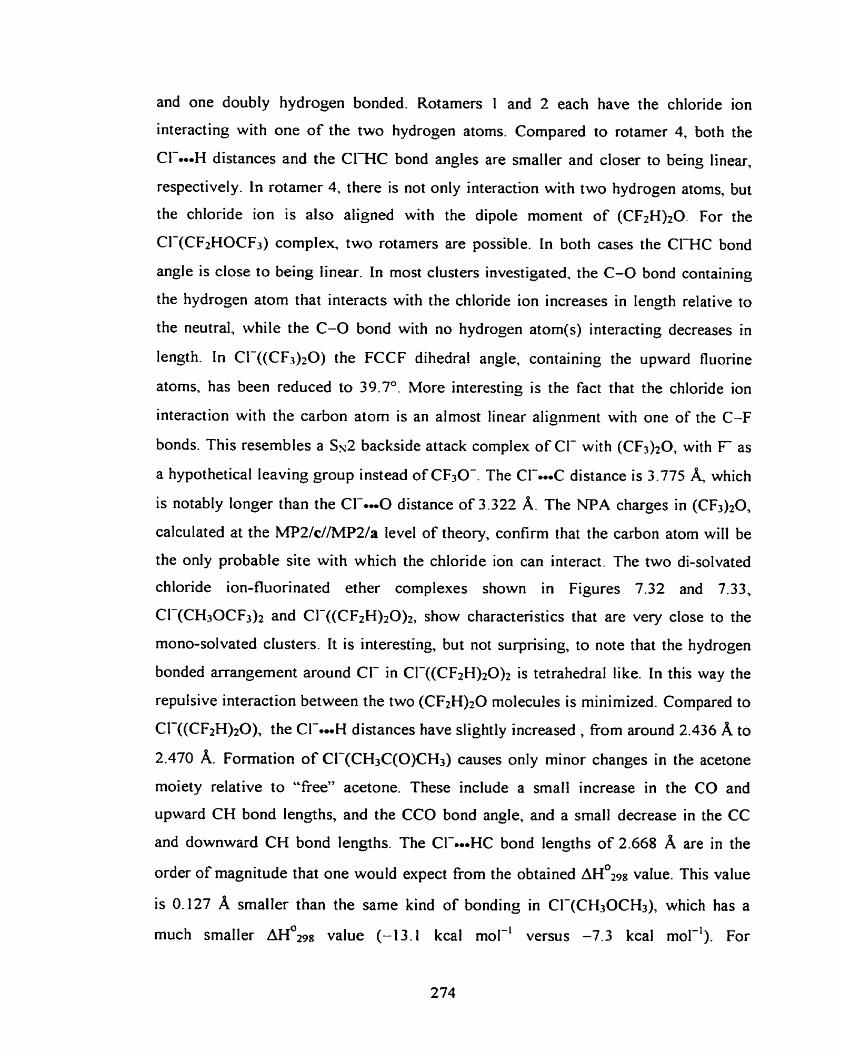
and one doubly hydrogen bonded. Rotamers 1 and 2 each have the chloride ion
interacting with one of the two hydrogen atoms. Compared to rotamer 4, both the
C L . H distances and the CIHC bond angles are smaller and closer to being linear,
respectively. In rotamer 4, there is not only interaction with two hydrogen atoms, but
the chloride ion is also aligned with the dipole moment of (CFZH)20. For the
CI-(CF2HOCF3) complex, two rotamers are possible. In both cases the CIHC bond
angle is close to being linear. In most clusters investigated, the C-O bond containing
the hydrogen atom that interacts with the chloide ion increases in length relative to
the neutral, while the C-O bond with no hydrogen atom(s) interacting decreases in
length. In CI-((CF3)zO) the FCCF dihedral angle, containing the upward fluorine
atoms, has been reduced to 39.7". More interesting is the fact that the chlonde ion
interaction with the carbon atom is an almost linear alignment with one of the C-F
bonds. This resembles a S s 2 backside attack complex of CI- with (CF3)20, with F as
a hypothetical leaving group instead of CF3O-. The CI-*.OC distance is 3.775 which
is notably longer than the Cl-*==O distance of 3.322 A. The NPA charges in (CF&O,
calculated at the MP2/c//MP2/a level of theory, confirm that the carbon atom will be
the only probable site with which the chloride ion can interact. The two di-solvated
chloride ion-fluorinated ether complexes shown in Figures 7 .32 and 7.33,
CI-(CH30CF3)2 and CI-((CF2H)20)2, show charactenstics that are very close to the
mono-solvated clusters. It is interesting, but not surpnsing, to note that the hydrogen
bonded arrangement around CI- in C1-((CF2H)20)2 is tetrahedral like. In this way the
repulsive interaction between the two (CF2H)20 molecules is minimized. Compared to
Cl-((CF2H)*O), the CI-.ooH distances have slightly increased , from around 2.436 A to
2.470 A. Formation of Cl-(CHiC(0)CH3) causes only minor changes in the acetone
moiety relative to "free" acetone. These include a small increase in the CO and
upward CH bond lengths, and the CC0 bond angle, and a srnall decrease in the CC
and downward CH bond lengths. The Cl-=..HC bond lengths of 2.668 A are in the
order of magnitude that one would expect from the obtained ~ ~ ~ 2 9 s value. This value
is 0.127 A smaller than the same kind of bonding in Cl-(CH,OCH,), which has a
much smaller ~ ~ ' 2 9 8 value (-13.1 kcal mol-' versus -7.3 kcal mol-'). For
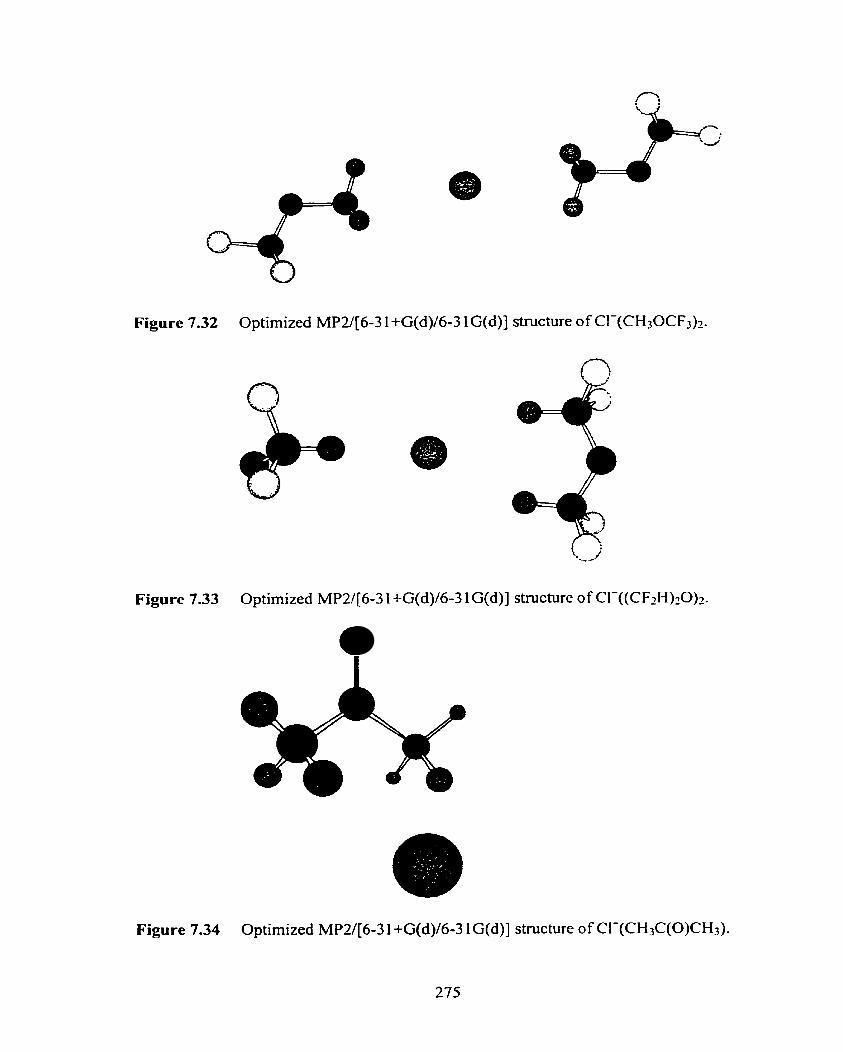
Figure 7.32 Optimized MP2/[6-3 1 +G(d)/6-3 1 G(d) J structure of Cl-(CH30CF,)2.
Figure 7.33 Optirnized MP2/[6-3 1 +G(d)/6-3 1 G(d) J structure of Cl-((CF2H)t0)2.
Figure 7.34 Optimized MP2/[6-3 1 +G(d)/6-3 1 G(d)] structure of CI-(CH3C(0)CH3).
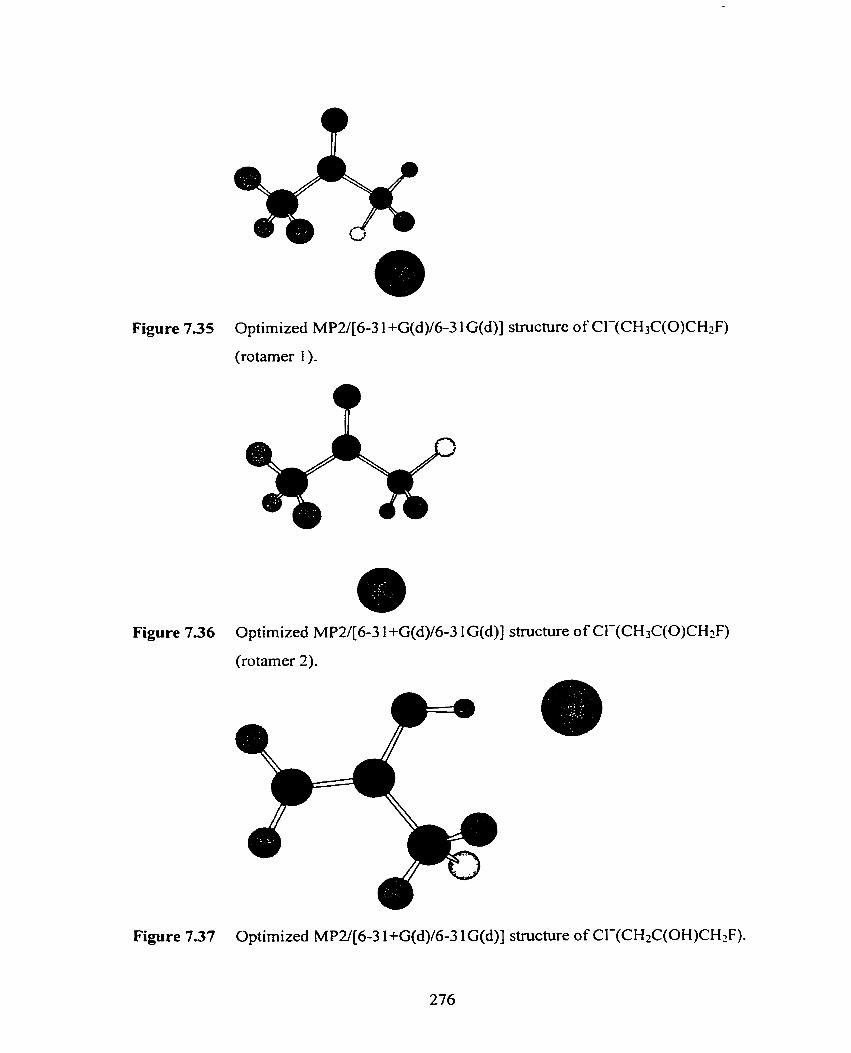
Figure 7.35 Optimized MP2/[6-3 1 +G(d)/6-3 1 G(d) J struchre of Cl-(CH3C(0)CH2F)
(rotamer 1).
0 n
Figure 7.36 Optimized MP2/[6-3 1 +G(d)/6-3 1 G(d) J structure of CI-(CH3C(0)CH2F)
(ro tamer 2).
Figure 7.37 Optimized MP2/[6-3 1 +G(d)/6-3 1 G(d)] stnicture of CI-(CH2C(OH)CH2F)-
276
CI-(CHsC(O)CH2F) two stable rotarners are possible, which are closely associated
with the neutral rotamers. In Figure 7.35 the CI-*eeH-CH2 and CI---H-CHF bond
lengths are 2.715 A and 2.560 4 respectively, while in Figure 7.36 they are 2.589 A and 2.642 respectively. These are the two most significant differences between
these two stmctures. The Cl-(CH2C(OH)CH2F) complex shows some interesting
features compared to its neutral counterpart. Firstly, the chloride ion is interacting with
both the OH group and one of the hydrogen atoms in the CH2F group. The latter
interaction has replaced the intrarnolecular hydrogen bond, O-He-F-C, in the neutral
en01 isomer. The Cl--HO bond length of 2.088 A is almost identical to the same
bond length in Cl-(HOCH3) at the MPZ(fÙ11)/6-31 l*G(d,p) Ievel of theory. The
Cl--H-CHF bond length of 2.666 A is much smaller than the CI--0H-CH2 bond
length in CI-(HOCH3) of 3.413 A. Upon formation of the chlonde ion complex the
O-H bond length increases from 0.975 A to 1.002 A while the C-O bond length
decreases from 1 272 A to 1.355 A. Finally, the Cl--.H-O bond angle of 173.0" is
very close to the Fm-H-O bond angle in F(HOCH3). The structure of the
CI-(CH3C(O)CF3) complex is quite different from the corresponding ether complex
CI-(CH30CF3). The chloride ion interacts with only one of the CH3 hydrogen atoms.
The CI--OH-CH2 bond length of 2.375 A is much smaller than that in the chloride ion-
acetone complex, CI-(CH3C(0)CH3), while the CI-mmœH-C bond angle is close to
linear. Formation of the chloide ion complex does not change the CHaC(O)CF3
structure to any significant extent. The bonding in the CI-(CF2HC(O)CFJ-Q complex
is fairly sirnilar to Cl-(CFtHOCF2H), although some important differences are present.
In the CI-(CF2HOCF2H) complex the two CL.HCF2 bond lengths are 2.436 A and
2.438 respectively, while in CI-(CF2HC(0)CF2H) they are 2.700 A and 2.726
respectively. The latter two are even somewhat larger than those in CI-(CH3C(0)CH3).
At first this seems surprising, since going from CI-(CH30CH3) to CI-(CF2HOCF2H)
there is a large decrease in the CI-.-H-CF2 bond lengths. In the CI-(CFzHC(O)CF2H)
complex the CI--CO distance is 2.800 and so it seems that interaction of the
chloride ion with the carbonyl group carbon atom is important as well, such as for the
hydrogen bonding interactions with the two CF2H groups. The Cld-H-CF2 bond
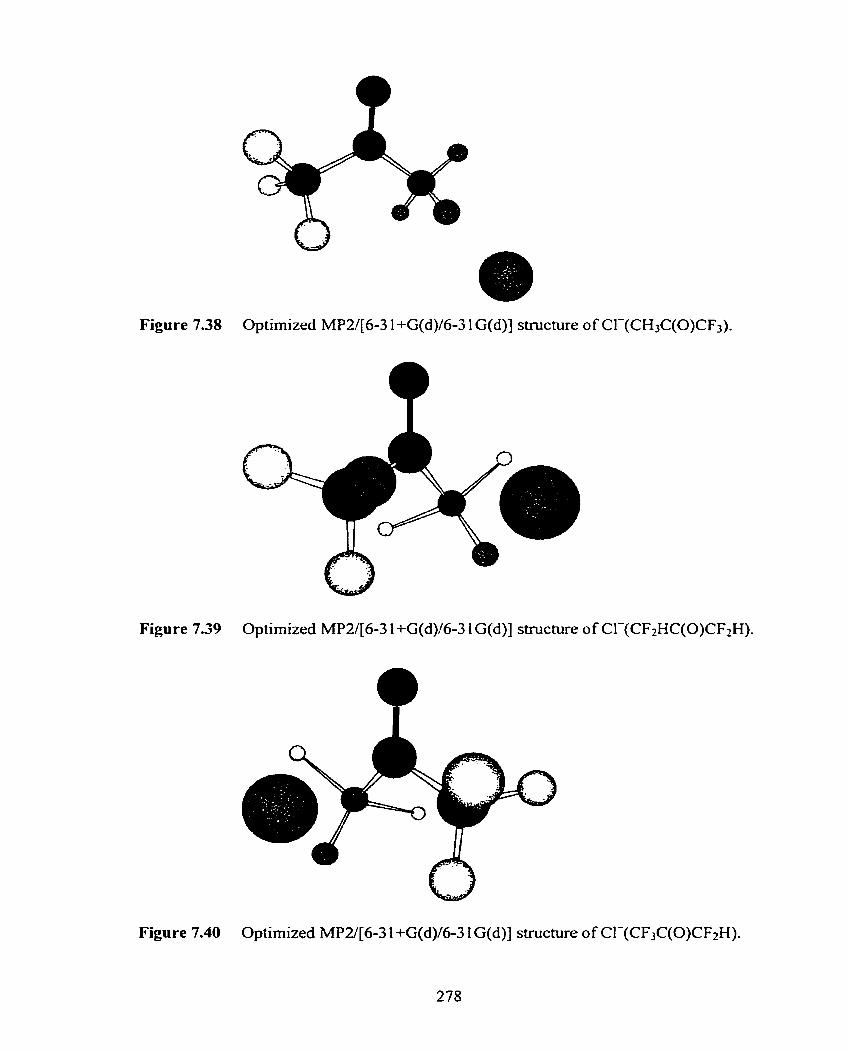
Figure 7.38 Optimized MP2/[6-3 1 +G(d)/6-3 1 G(d)] structure of CI-(CH,C(0)CF3).
Figure 7.39 Optimized MP2/[6-3 1 +G(d)/6-3 1 G(d)] structure of Cl-(CF2HC(0)CF2H).
Figure 7.40 Optimized MP2/[6-3 1 +G(d)/6-3 1 G(d)] structure of CI-(CF3C(0)CF2H).
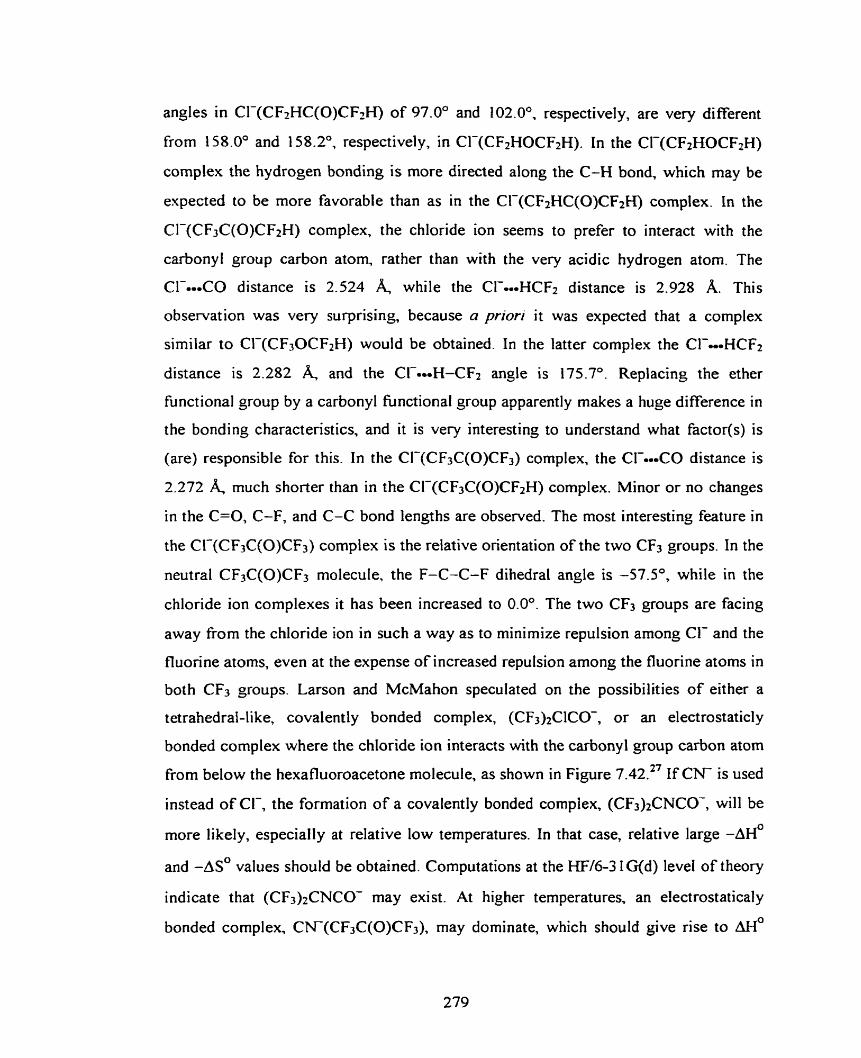
angles in Cl-(CF2HC(O)CF2H) of 97. O* and 1 02.0". respective1 y, are very di fferent
from 1 58.0° and 1 58.2", respectively, in Cl-(CF2HOCF2H). In the Cl-(CF2HOCF2H)
complex the hydrogen bonding is more directed along the C-H bond, which may be
expected to be more favorable than as in the CI-(CF2HC(0)CFzH) complex. In the
CI-(CF,C(O)CF2H) complex, the chloride ion seems to prefer to interact with the
carbonyl group carbon atom, rather than with the very acidic hydrogen atom. The
CI-.-.CO distance is 2.524 4 while the CI---HCFa distance is 2.928 A. This
observation was very surprising, because a priori it was expected that a complex
similar to Cl-(CF30CF2H) would be obtained. In the latter complex the CI-eooHCF2
distance is 2.282 and the Cl-*--H-CFz angle is 175.7"- Replacing the ether
functional group by a carbonyl functional group apparently makes a huge difference in
the bonding characteristics, and it is very interesting to understand what factor(s) is
(are) responsible for this. In the CI-(CF3C(0)CF3) complex, the CI-.eoCO distance is
2.272 4 much shorter than in the CI-(CF3C(O)CFzH) complex. Minor or no changes
in the C=O, C-F, and C-C bond lengths are observed. The most interesting feature in
the Cl-(CF3C(0)CF3) complex is the relative orientation of the two CF3 groups. In the
neutral CF3C(0)CF3 molecule, the F-C-C-F dihedral angle is -57S0, while in the
chloride ion complexes it has been increased to 0.0". The two CF3 groups are facing
away from the chloride ion in such a way as to minimize repuIsion among CI- and the
fluorine atoms, even at the expense of increased repulsion among the fluorine atoms in
both CF3 groups. Larson and McMahon speculated on the possibilities of either a
tetrahedral-like, covalently bonded complex, (CF3)2ClCO-, or an electrostaticly
bonded complex where the chloride ion interacts with the carbonyl group carbon atom
€rom below the hexafluoroacetone molecule, as shown in Figure 7.42.27 If C N is used
instead of Cl-, the formation of a covalently bonded complex, (CF3)2CNCO-, will be
more likely, especially at relative low temperatures. In that case, relative large -A@
and -AS* values should be obtained. Computations at the W/6-3 lG(d) level of theory
indicate that (CF3)2CNCO- may exist. At higher temperatures, an electrostaticaly
bonded complex, CN(CF3C(O)CF,), may dominate, which should give rise to AH0
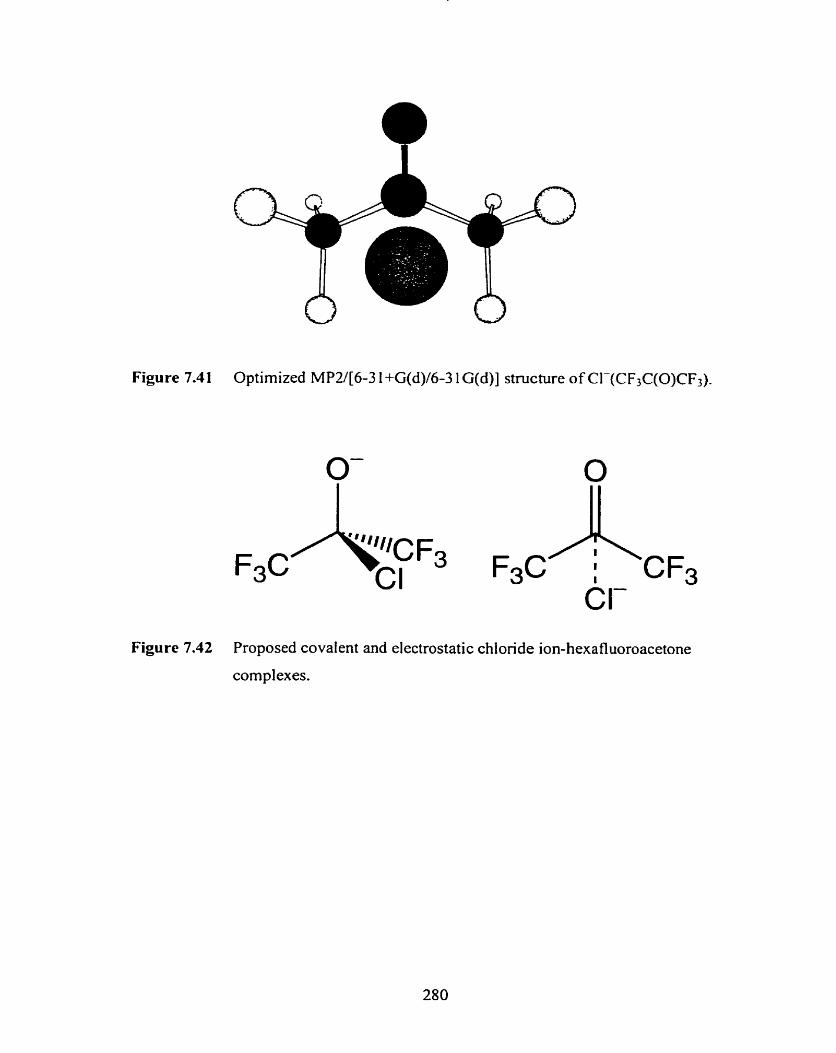
Figure 7.41 Optimized MP2/[6-3 1 +G(d)/6-3 1 G(d)] structure o f Cl-(CF3C(0)CF3).
Figure 7.42 Proposed covalent and electrostatic chloride ion-hexafluoroacetone
complexes.
Figure 7.43 Optimized MP2(fu11)/6-3 1 G(d) structure of CH3C(0)CH2-.
Figure 7.44 Optimized MP2(tÙ11)/6-3 1 G(d) structure of CH3C(0)CHF.
Figure 7.45 Optimized MP2(fu11)/6-3 1 G(d) structure of CH2C(0)CH2F7.
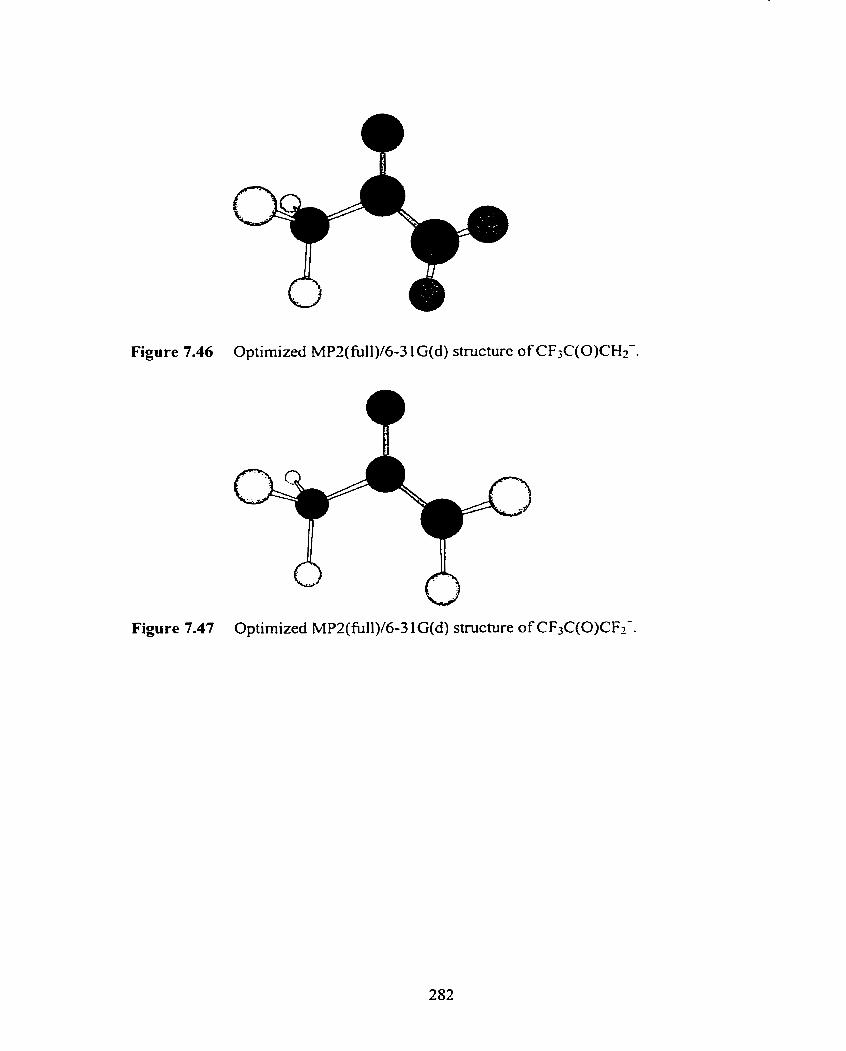
Figure 7.46 Optimized MPZ(fÙ11)/6-3 1 G(d) structure of CF3C(0)CHz-.
Figure 7.47 Optimized MP2(fÙ11)/6-3 lG(d) structure of CF3C(0)CF2-.
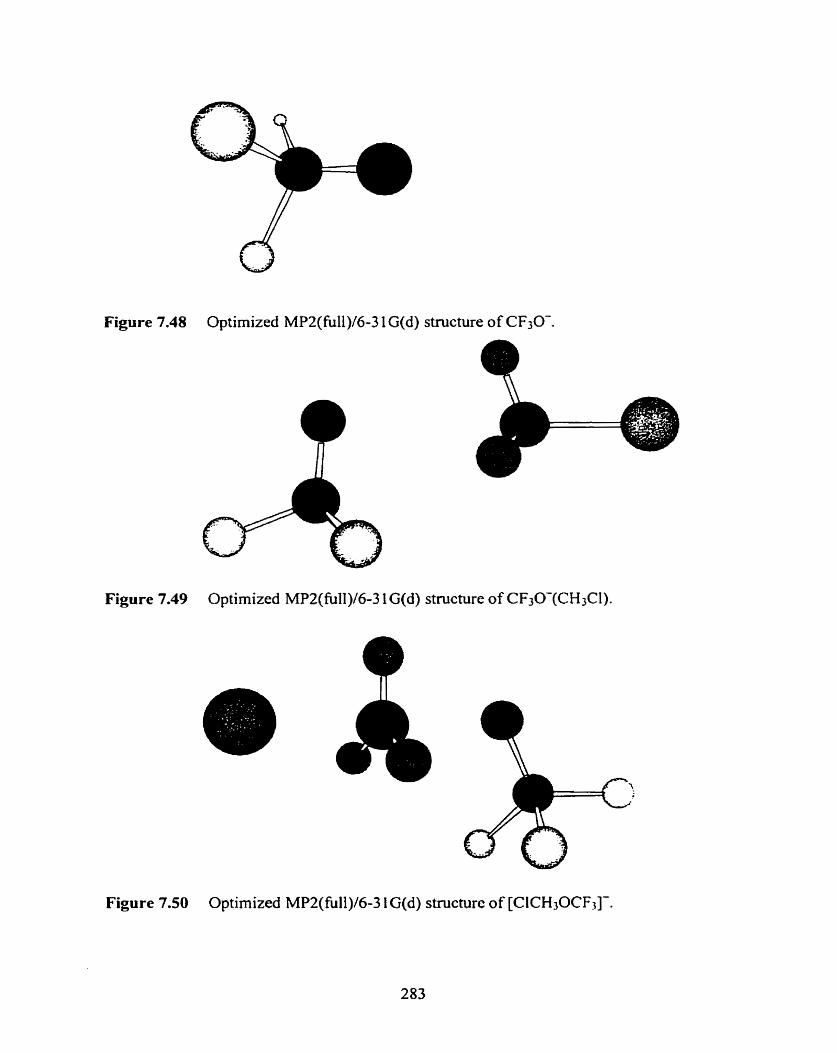
Figure 7.48 Optimized MP2(iÙ11)/6-3 1 G(d) structure of CF30-.
Figure 7.49 Optimized MP2(fu11)/6-3 1 G(d) structure of CF30-(CH3CI).
Figure 7.50 Optimized MP2(fu11)/6-3 I G(d) structure of [ClCH3OCF3]-.
and AS' values closer to CI-(CF3C(0)CF3). For the B3LYP/[6-31 l++G(3df3pd)l
6-3 1 1 ++G(3d,3p)] structure of Cl-(CF,C(O)CF3), no big changes are observed relative
to the MP2 structure. The Cl--CO distance is 2.291 4 and there is a small increase
in the C=O bond length fiom 1.188 A in CF3C(0)CF3 to 1.220 A in CI-(CF3C(0)CF3).
In Figures 7.43 to 7.47 the MPZ(fù11)/6-3 1 G(d) structures of deprotonated acetone,
fluoroacetone (2 isomers), 1,1,1 -trifluoroacetone, and pentafluoroacetone are shown.
The structures of the corresponding neutral conjugated acids are essentially identical
to the same structures caIculated at the MPZ(fc)/6-3 lG(d) level of theory. Upon
deprotonation the C-C bond length will decrease, while the C-O bond length will
increase. Delocalization of the negative charge wiI1 give both the C-C and C-O bonds
a bond order of 1.5, as predicted fiom Lewis theory. The O-C-C bond angle
containing the carbon atom from which the proton was abstracted will increase to
around (1 29 + 3)", while the other O-C-C bond angle will decrease to around ( 1 13 + 3)". No drarnatic changes in the C-H, C-F, or C-C bond lengths, other than the ones
mentioned before, have been observed.
The MP2(fù11)/6-31G(d) structure of CF30- in Figure 7.48 is closest to
B3LYP/DZP++ results from Morris et al. who used various other rnethods as we11.~~
The CF30-(CH3CI) complex in Figure 7.49 has an almost linear CF3O--C-C1
alignment. In addition, there may be some interaction between two hydrogen atoms
and two fluorine atoms, which are separated by only 2.447 shorter than the
CF30--C and CF30-oo~H distances of 2.883 A and 2.738 A, respectively. The
[CICH30CF3]- transition state in Figure 7.50 shows no unexpected features. The
CI-CH3 and CHpmOCF3 distances are 2.301 A and 1.928 respectively. The
Cl.-CH3-.0CF3 angle is 176.7". In the CF30- moiety the C-O bond length has
increased, while the C-F bond lengths have decreased relative to CF3O-.
7.4.2 Experimentai Thermochemistry
In Tables 7.1 and 7.2, overviews are given of the experimental thermochemical
data obtained for the chloride ion-(fluorinated ) ether and acetone complex clustering
equilibria. As can be seen fi-om these two Tables, the AH0 and AS' values depend very
much on the number of fluorine atoms and the substitution pattern. In Figures 7.5 1 to
7.53, the Van't Hoff plots frorn which the AI^ and AS' values are determined are
shown. As seen in Figures 7.21 to 7.42, very different bonding characteristics can be
observed in the various chloride ion- (fluorinated) et her and acetone complexes, which
should be reflected in characteristic AIf and AS' values. PHPMS is one of the few
experimental techniques to obtain AS' values directly, and these can be a very usefid
tool to assign structural features of gas phase ions. The AH0 and ASO values for
chloride ion binding to dimethyl and diethyl ether can be compared to data obtained
recently in our laboratory on chloride ion binding to cyclic and linear alkanes
(Reaction 7.6).70
For R = c-CsHio and n-CsHiz, AH0 and AS' values of -7.4 and -7.9 kcal mol-', and
- 16.4 and - 18.1 cal mol-' K-', respective1 y, were determined. These values seem
reasonable for the weak, mainly ion-induced dipole, interactions in these types of
clusters. The difference between (CH3)20 and (CH3CH2)20 is mainly due to a larger
polarizability of the latter (a = 5.8 A' versus 10.2 AS can be seen in Figures
7.22 and 7.23 there are at least two rotamers and isomers of CI-((CH3CH&0), each
with their own distinct thermochemistry . In Section 7.4.3 the computational results
will be discussed in more detail. It cannot be excluded, in fact it seems reasonable to
assume, that the CI-((CH3CHÎ)20) complexes in the high pressure ion source consist
of a statistical distribution of the various isomers and rotamers. Close resemblance of
experirnental and theoretical data for a specific rotamer/isomer, by no means proves
that it would be the main structure in the high pressure ion source. The example of the
Cl-((CH3CH2)20) complex shows that t hese weakly bound systems can be stabilized
by multiple, non-classical hydrogen bonds. It may be expected that this effect will
become even more pronounced if the alkyl chain length in, for instance CH3OR (R =
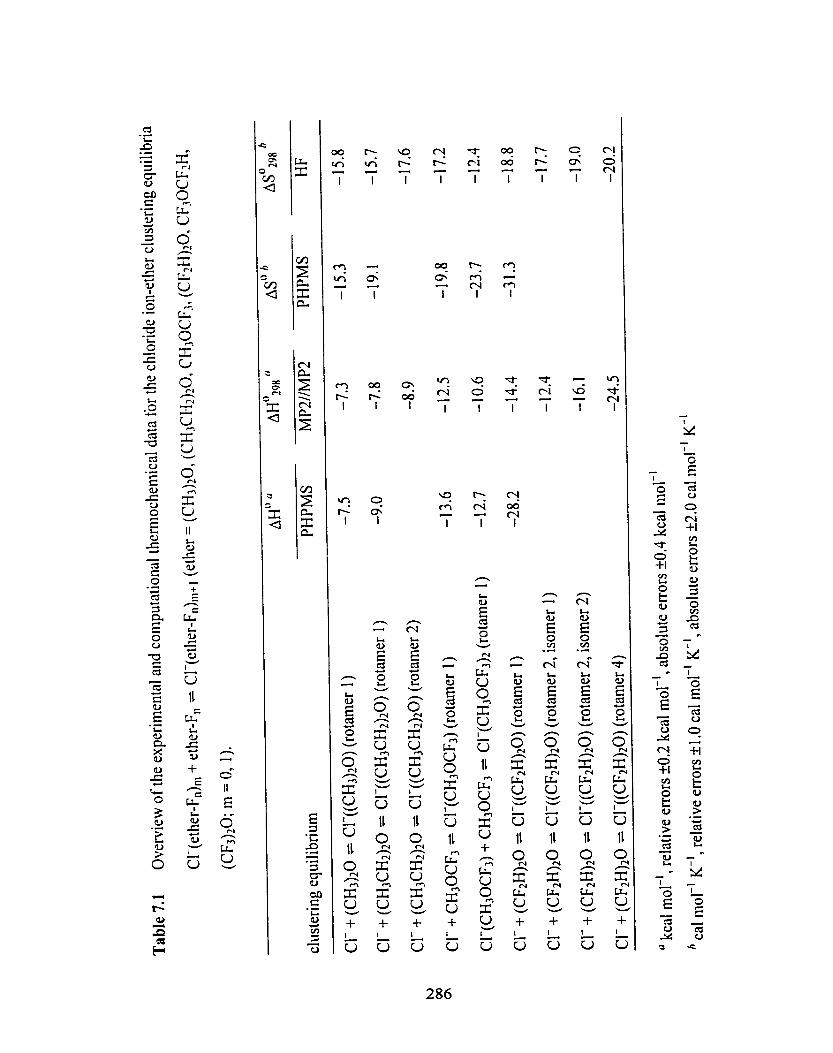
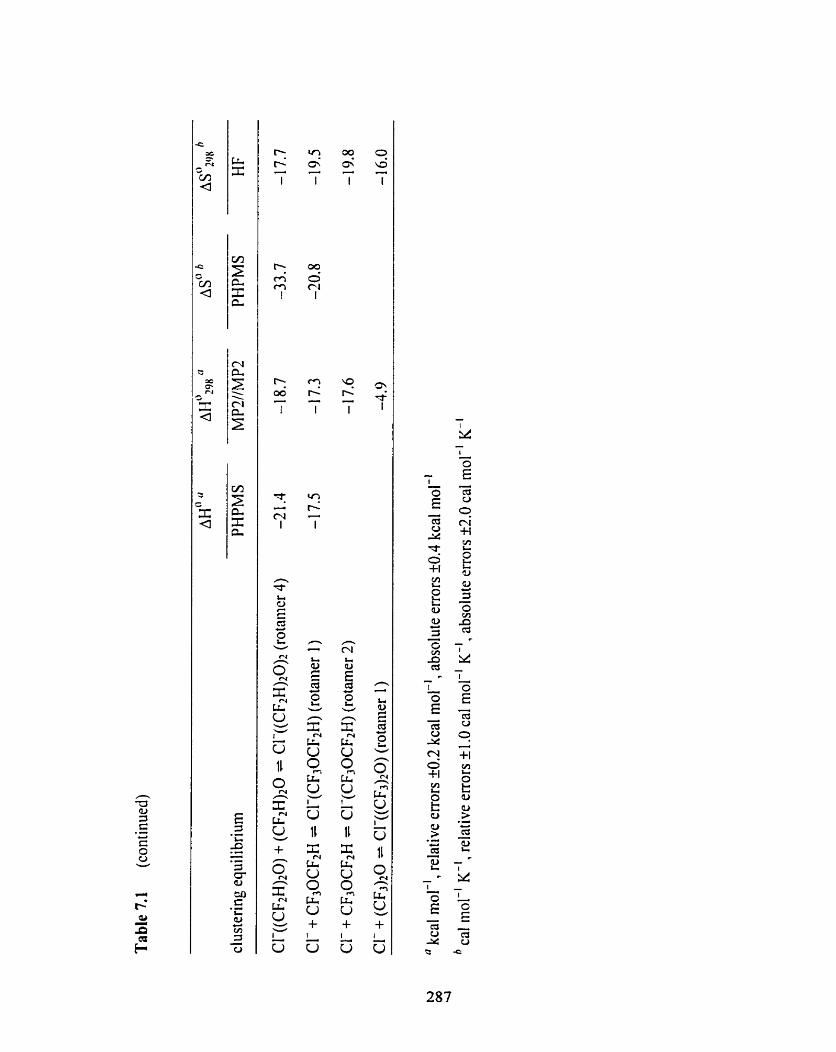
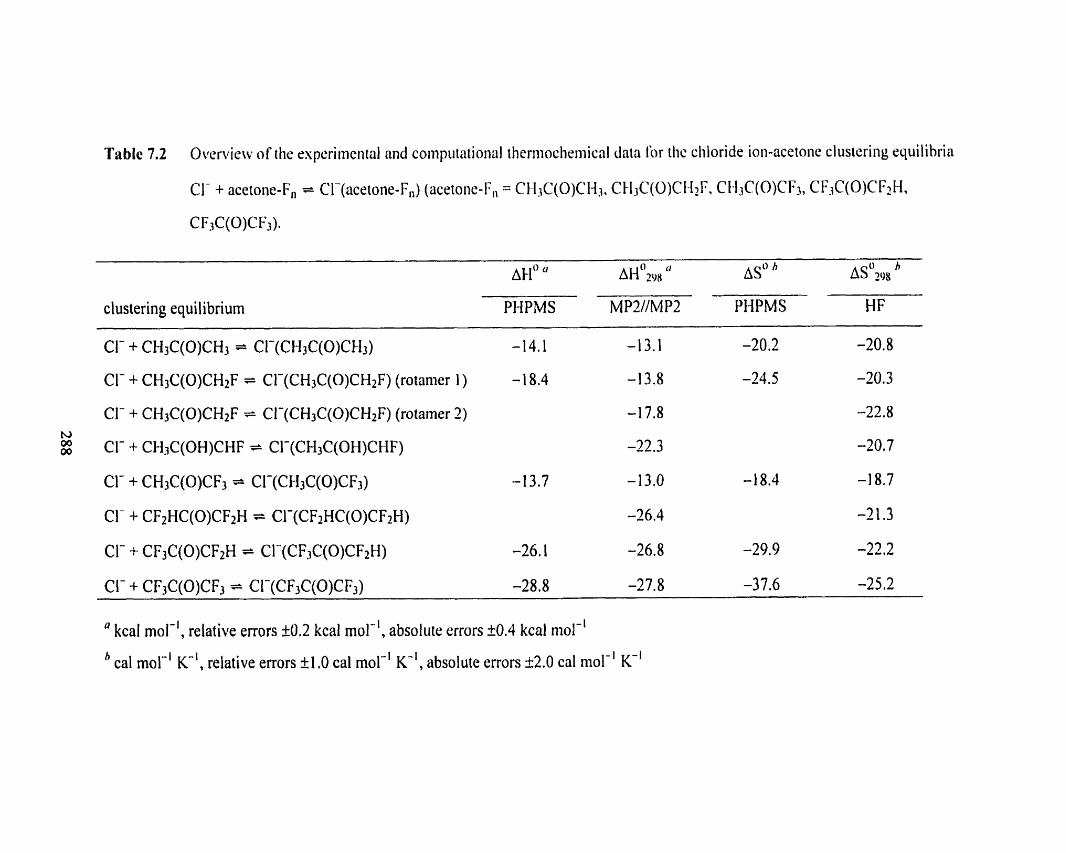
Table 7.2 Ovenkw of the rspcriiiicntal and coinpiiintional thcrmochemical data Ior tlic cliloride ion-acetone clusiering cyuilihria
clustering equilibrium PHPMS MP2IIM P2 PHPMS HF
CI- + CH3C(0)CH3 = CI-(CH3C(0)CH3) -14.1
Cl- + CH3C(0)CH2F = Cl-(CH3C(0)CH2F) (rotamer 1 ) -1 8.4
Cl- + CH3C(0)CH2F = CI-(CH3C(0)CH2F) (rotamer 2)
CI- + CH3C(0)CF3 * CI-(CH3C(0)CF3) -1 3.7
CI- + CF2HC(0)CF2H = Cl-(CF2HC(0)CF2H)
CI- + CF3C(0)CF2H * CI-(CF3C(0)CF2H) -26.1
CI- + CF3C(0)CF3 * CI-(CF3C(0)CF3) -28.8
a kcal mol-', relative mors f 0.2 kcal mol-', absolute errors k0.4 kcal mol-'
%al mol-' K-', relative errors I l .O cal mol-' K", absolute errors k2.0 cal mol-' K-'
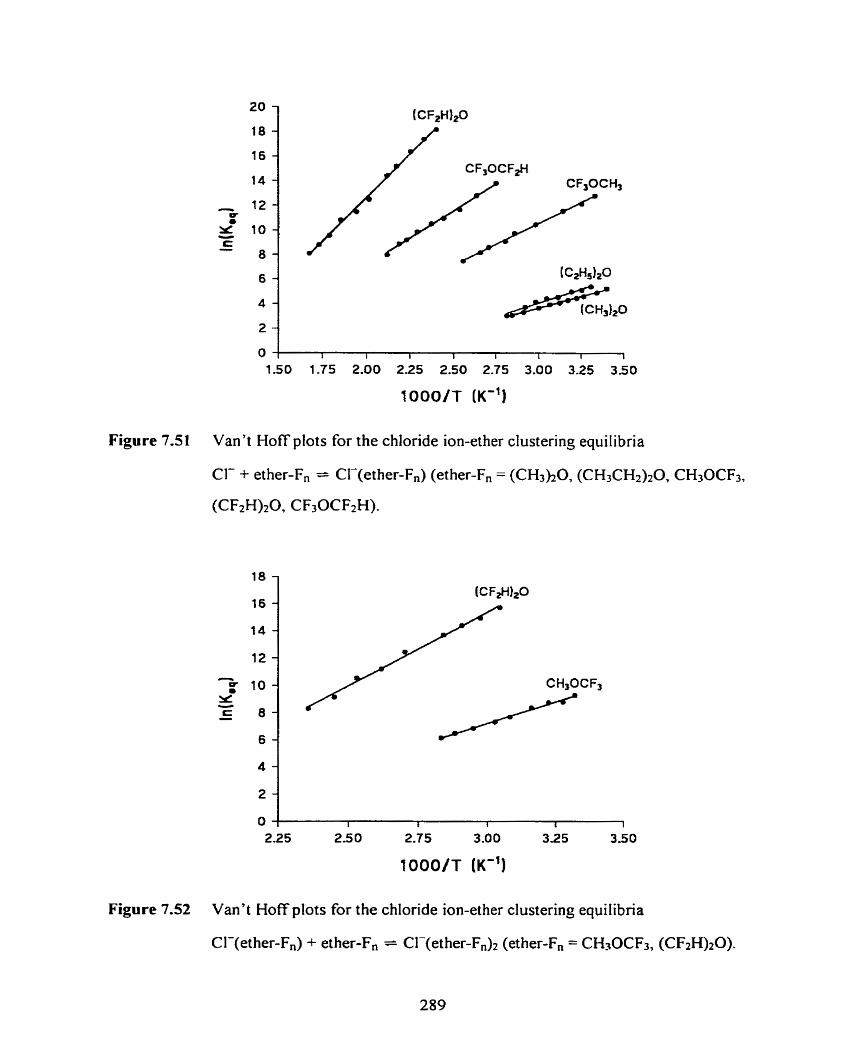
Figure 7.5 1 Van't Hoff plots for the chloride ion-ether clustering equilibria
CI- + ether-F, = CI-(ether-F.) (ether-Fn = (CH&O, (CH3CH2)20, CH30CF3,
Figure 7.52 Van't Hoff plots for the chloride ion-ether clustering equilibria
CI-(ether-F,) + ether-F, = CI-(ether-Fn)2 (ether-F. = CH3OCF3, (CFzH)20).
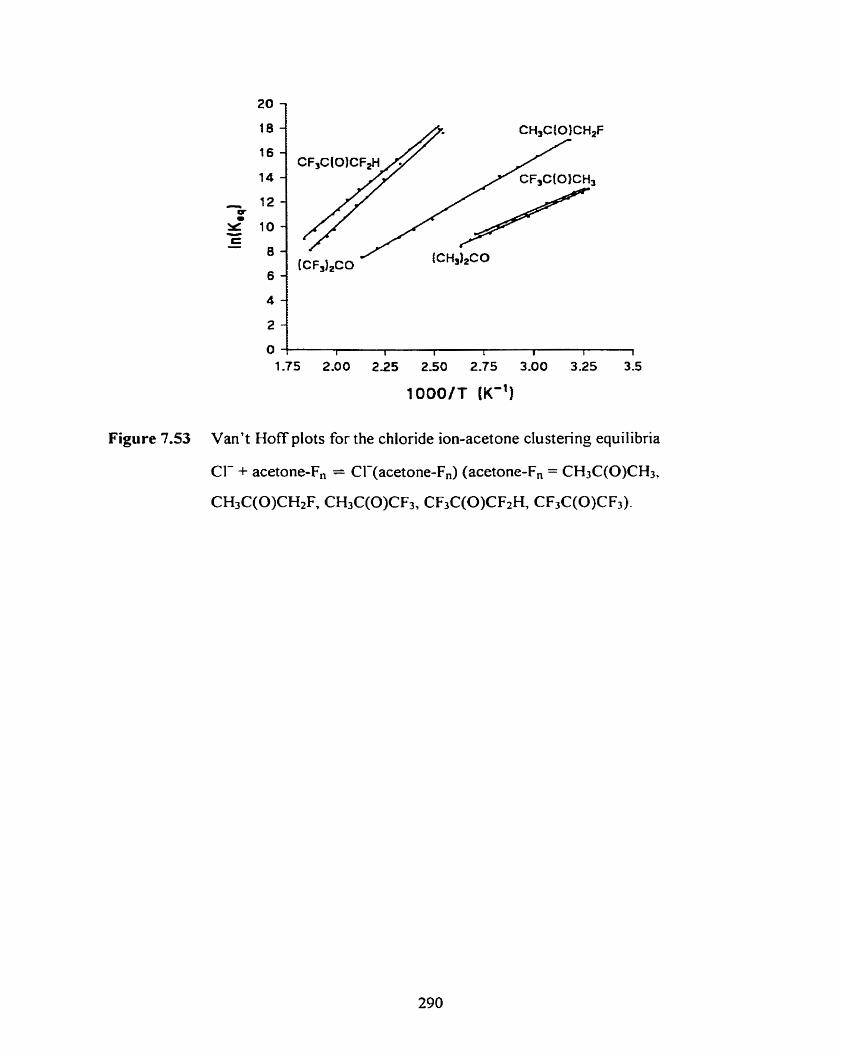
Figure 7.53 Van't Hoff plots for the chloride ion-acetone clustenng equilibria
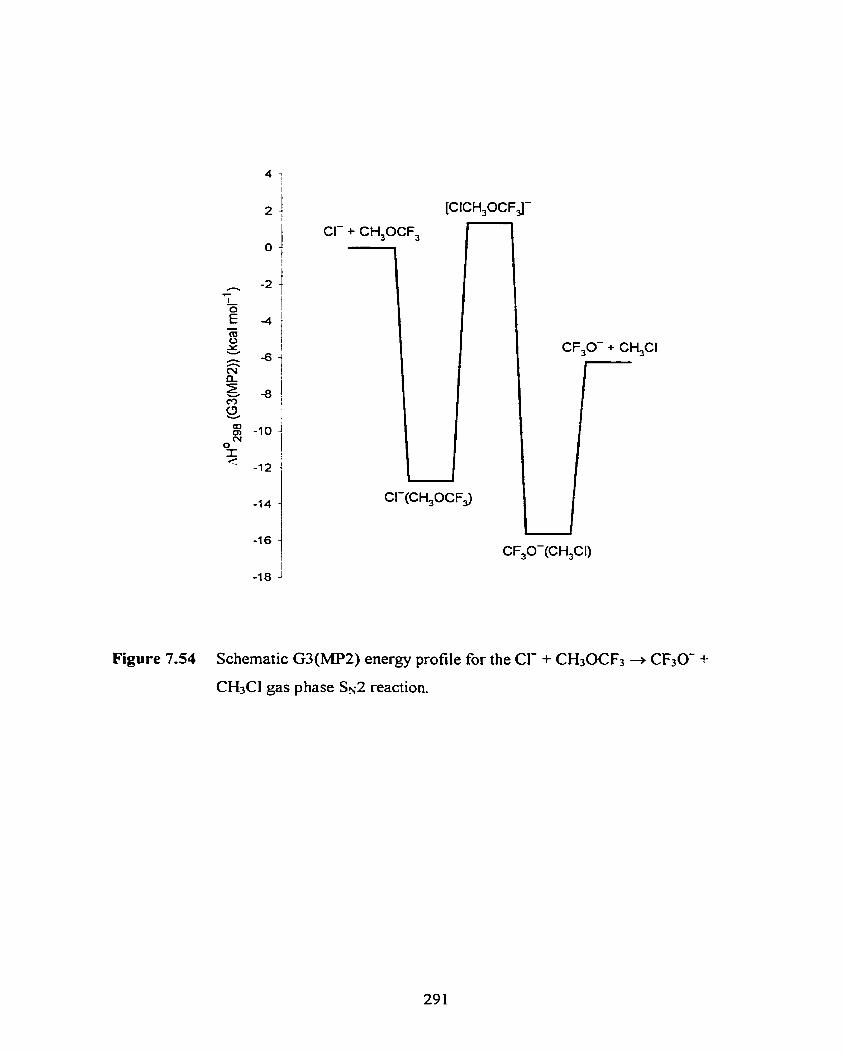
CI- + CH,OCF,
Figure 7.54 Schematic G3(MP2) energy profiIe for the Cl- + CH30CFs + CF30m +
CH3Cl gas phase SN^ reaction.
alkyl), increases. There are some problerns associated with obtaining more qualitative
data on this. First of al1 it may be that the folding of the alkyl group around the
chloride ion will be slow on the scale of the PHPMS experiments, thus preventing
attainment of an equilibrium population. Second of all, there will be many conformers
possible for both the neutral and chloride ion complex, and it seems almost impossible
to abstract the distinct thermochemistry from the overall data. As already mentioned,
the CI-(CH30CF3) complex resembles a SN2 backside attack complex, even though
the binding is not completely symmetric. For a similar, true SN2 system, Reaction 7.7,
values for AH' and ASO of -12.5 kcal mol-' 71 and - 19.0 cal mol-' K-', 72 respectively,
were determined, with the latter obtained from a b inifio computations.
Cl- + CH3Br = CI-(CH3Br) (7-7)
CF30- was present in the ion source, and from a schematic energy profile
calculated at the G3(MP2) level of theory, shown in Figure 7.54, it seems reasonable
to assume that it has been formed by a SN2 type reaction. (Reaction 7.8).
In the literature other reactions have been described to generate CF30-, and these
are shown in Reactions 7.9 to 7.1 1 .69
Each of these reactions involve ions that are relatively more difficult to generate
than Cl-, or they involve chernicals that are more unpleasant than CH3OCF3. The
energy profile of Reaction 7.8 and its accompanying thermochemistry will be
discussed in more detail in Section 7.4.3. The CF30- formed can also cluster with
CH30CF3, forming CF30-(CH30CF3). The latter ion is present in very small intensity,
but nonetheless equilibrium was observed. It seems unlikely that CF3O- may also be
generated through dissociative electron capture by CH30CF3 (Reaction 7.12).
Electron radiolysis of CH30CF3 into CFaOm and CH;, followed by electron capture
by CF3O9 also seems a very unlikely process (Reactions 7.13 and 7.14). The tirst
process is 95.7 kcal mol-' endothermic, while the second process is 101.2 kcal mol-'
exothermic, making the overall process 5.5 kcal mol-' exothem~ic.'~ The probability
of the two step process is low, despite the favorable overall energetics, mainly due to
the low concentrations of the species involved.
CH30CF3 + e- + CF3O9 + CH; (7.1 3)
Larson and McMahon measured AG^^^^ for the clustering of chloride ion ont0
1,1,3,3-tetrafluorodimethyl ether (Reaction 5.1 5) and pentafluorodimethyl ether
(Reaction 7.16) by [CR. from exchange equilibria with various chloride ion cl~sters.~'
CI- + CF3OCF2H = CI-(CF30CF2H) (5.16)
Values of -17.0 kcal mol-' and -12.1 kcal mol-', respectively were obtained. From
the present PiiPMS data, ~ ~ ~ 2 9 8 values of (- 18.8 f 1 .O) kcal mol-' and (-1 1.3 + 1 .O)
kcal mol-', respectively, can be determined, in reasonable to good agreement with the
ICR values. The relatively large negative values for & and AS' for Reaction 7.18
seem very reasonable. Zhang et al. measured the thermochemistry by PHPMS for the
equilibrium clustering reaction of chloride ion ont0 1,)-propanediol (Reaction 7-17),
and found AH0 and AS' values of (-28.3 + 1.7) kcal mol-' and (-34.0 k 0.7) cal mol-'
K- ' , respective] y. 28
The AH' value for Reaction 7.16 of -17.5 kcal mol-' is equal to the AHO value for
chloride ion bonding to methanol? The difference in AS' values for both equilibria is
mainly due to the fact that in the CI-(CH30H) cornplex, chloide ion has some
interaction with two methyl group hydrogen atoms, thereby hindering the methyl
group rotation to a certain degree.
In general, it is expected that multiple hydrogen bonding interactions will be
thermodynamically more favorable than single hydrogen bonding. If one compares the
AHO and AS" values for Reactions 7.15 and 7.16, which give rise to double and single
hydrogen bonding, respectively, one can make an estirnate of the changes in AH' and
AS' for going from a single to a double hydrogen bond. From the PHPMS data, A A ~
and AAS' values of -10.7 kcal mol-' and - 10.5 cal mol-' K-', respectively, can be
deterrnined. Converting these values to ~ ~ ' 2 9 8 (-7.4 kcal mol-') gives excellent
agreement with the A A G ~ ~ ~ ~ value of -7.4 kcal mol-' by Larson and McMahon from
their ICR e~~er iments .~ ' The AH' and As0 values for the two disolvation equilibria,
Reaction 7.2, with ether = CH30CF3 and CF30CF2H, also seem reasonable compared
to similar systems reported in the Iiterature. Zhang et al. also determined the thermo-
chemistry for the equilibrium clustering reaction between chloride ion and two
molecules of 1,3-propanediol (Reaction 7.18), and found & and AS' values of
(-20.8 + 0.7) kcal mol-' and (-36.2 f 0.3) cal mol-' K-', r e ~ ~ e c t i v e l ~ . ~ ~
The data for formation of Cl-((CFtH)20)2 shows a similar trend as Reaction 7.18,
e - g a decrease in -AHO of approximately 8 kcal mol-', and a small increase in -AS' of
approximately 2 cal mol-' K-'. Additional hindrance of two more CFzH rotations is
the main factor for this more negative AS' value.
In the CI-((CF2H)20)2 cluster the bonding to the chloride ion seems so favorable,
that it is reasonable to assume that a third (CF2H)20 molecule may not directly interact
with t h e chloride ion. Instead, this third solvent molecule may start making up the so-
called second solvation shell. If this is actually true, it will bind to one or both
(CF2H)zO solvent molecule(s), most likely by hydrogen bonding. The two types of
hydrogen bonds that are rnost likely to occur have one, or maybe both, hydrogen
atom(s) interacting with eit her a fluorine atom, CFtHOCF2-H-0-F-CFHOCF2H, or the
oxygen atom, CF2HOCF2-H-e-O(CF2H)2. It may then be expected that the AHo and
AS' values for the tri-solvation of chloride ion by 1,1,3,3-tetrafluorodimethyl ether
(Reaction 7.19) will both be substantially less negative than the corresponding
disolvat ion.
From Tables 7.1 and 7.2 it can be seen that changing the fiinctional g o u p fiom
alkoxy to carbonyl has an important influence on the effect of fluorine substitution to
the chloride ion affinities and the types of binding in the corresponding clusters. As
mentioned already in Section 7.4.1, the chloride affinity for acetone is much larger
than for dimethyl ether. This is mainly due to the larger polarizability (6.4 A3 versus 3 66 5.5 A ), but more importantly, the larger dipole moment of acetone (2.88 D versus
1.69 D ) . ~ ~ The AH' and AS* values from this work are in excellent agreement with
earlier data fiom our laboratory (-14.2 kcal mol-' and -21.9 cal mol-' K-',
r e ~ ~ e c t i v e l ~ ) . ~ ~ and data from Kebarle and CO-workers (-1 3.7 kcal mol-' and 19.6 cal t 75 mol-' K- ).
The substitution of only one hydrogen atom for fluorine has a significant impact on
the observed thermochemistry. A more detailed discussion of this system will be given
in Section 7.4.3. Going from CH30CH3 to CH30CF3, a large change in LIHO and ASO
values was observed. Furthermore there is a large change in the type of chloride
interaction. This larger change is not observed when going €rom CH,C(O)CHi to
CH,C(O)CF,. lnstead, both AHO and AS' become less negative. As can be seen in
Figure 7.38, the chloride ion only interacts with one of the hydrogen atoms in
Cl-(CH3C(0)CF3) as compared to two in CI-(CH3C(0)CH3). For Reaction 7.20 only a
A G O ~ ~ R result from ICR experirnents by Larson and McMahon is available for
cornparison. 27
A ~ ~ ~ 2 9 % value of -1 8.1 kcal mol-' was found, but unfortunately no AS' value is
available In Figure 7.39 it could already be seen that in the CI-(CFZHC(O)CF~H)
cornplex the bonding is different from the corresponding ether cornplex
CI-(CF2HOCF2H). Based on these two structures it seerns reasonable to assume that
for Reactions 7.15 and 7.20 the AS' values will be fairly close.
For reactions 7.21 and 7.22 Larson and McMahon obtained ~ ~ ~ 2 9 8 values by ICR
for both of -16.3 kcal mol-'.27
CI- + CF3C(O)CF3 = CI-(CF3C(0)CF3) (7.22)
From Figures 7.40 and 7.4 1 it can be seen that the binding charactenstics in both
complexes are very similar. The AH' values of -26.1 kcal mol-' and -28.8 kcal mol-',
respectively, show the very strong binding in these complexes. The large Mo values
of -29.9 cal mol-' K-' and -37.6 cal mol-' K-', respectively, indicate that upon
complex formation the CF2H a n d o r CF3 group rotations become hindered. Using the
AH0 and AS' values from PHPMS, ~ ~ ' 1 9 8 values for Reactions 24 and 25 of (-17.6 + 1 .O) kcal mol-' and (-1 7.2 2 1.0) kcal mol-', respectively. can be found. These are in
good agreement with the ICR results by Larson and McMahon.
In Section 7.4.5 there will be a discussion o f the influence of the fluorine
substitution on A a c i d ~ ' and it will be shown that for the fluorinated acetones there is
no correlation between t his quantity and AHO. The electric dipoie moment seems t o be
a logical first choice. In CI-(CH3C(0)CH3) the chloride ion is not aligned along the
C=O bond, the direction o f the electric dipole moment in acetone. Sirnilar to one
isomer of Cl-(CH30CH3), that particular structure would represent a transition state.
An identical argument can b e made for other chloride ion-acetone complexes. In
addition to the orientation o f the electric dipole moment, the magnitude o f the electric
dipole moment for the various acetones studied does not seem to correlate with the
observed AH' values, under the assurnption of only ion-dipole interactions taking
place. The introduction o f fluorine atoms in general increases the polarizability, as can
be seen going from CH4 to CF4 (a(CH4) = 2.59 A3, a(CH3F) = 2.97 A', a(CF3H) =
3.57 A3, and a(CF4) = 3.84 A3)? This increase works out to be approximately 0.3 1
A3 per fluorine atom. It seems reasonable to assume that this kind of behavior applies
to the fluorinated acetones a s well, relative to acetone itself. Surprisingly, going from
ethane to 1 , 1,l -trifluoroethane gives rise to a small decrease in the polarizability, corn
4.47 2 to 4.40 A'. Going fùrther to hexafluoroethane increases the polarizability to
6.82 A3. This corresponds to an increase o f 0.39 A3 per fluorine atom. From ethane to
acetone the polarizability increases to 6.39 A3. These trends may indicate that the ion-
induced dipole moment interactions rnay be mainly responsible for the observed trends
in the AH" values. Unfortunately, no reliable values for the polarizabilities from the
HF/6-3 1 G(d) rnay be expected, but computations at, for instance, the QCISD(T)/aug-
cc-pVTZ level o f theory are not feasible. The influence o f an ion-quadrupole
interaction. especially in CI-(CF3C(0)CF3), rnay not be excluded, but the exact
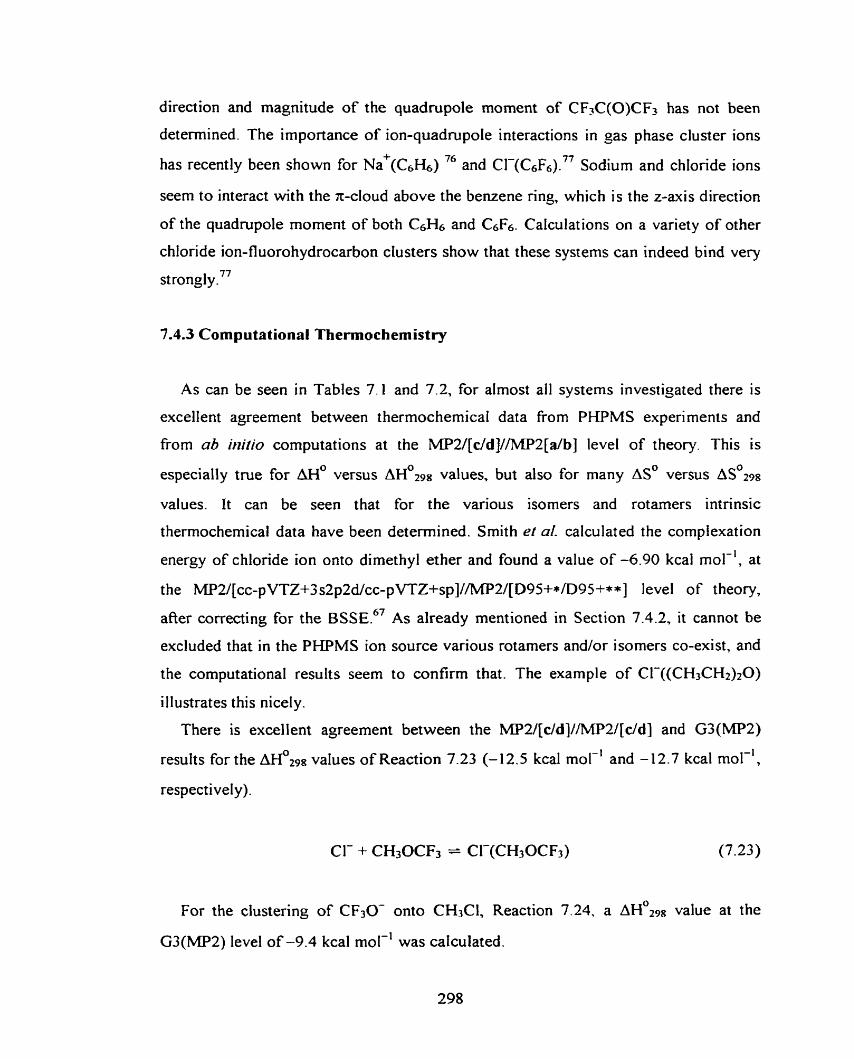
direction and magnitude of the quadrupole moment of CF3C(0)CF3 has not been
determined. The importance of ion-quadmpole interactions in gas phase cluster ions
has recently been s h o w for N~+(CGH~) 76 and CI-(C~F~)." Sodium and chloride ions
seem to interact with the x-cloud above the benzene ring, which is the z-axis direction
of the quadrupole moment of both CG& and C6F6. Cahlations on a variety of other
chloride ion-fluorohydrocarbon clusters show that these systems can indeed bind very
~ t r o n ~ l ~ . ~ '
7.4.3 Computational Thermochemistry
As can be seen in Tables 7.1 and 7.2, for almost al1 systems investigated there is
excellent agreement between thermochemical data from PHPMS experiments and
from a b Nzitio computations at the MP2/[c/d]//MPZ[a/b] level of theory. This is
especially tme for AH* versus ~ ~ ' 2 9 8 values. but also for many ASO versus ~ ~ ' 2 9 8
values. It can be seen that for the various isorners and rotamers intrinsic
thermochemical data have been determined. Smith et al. calculated the compiexation
energy of chloride ion onto dimethyl ether and found a value of -6.90 kcal mol-', at
the MP2/[cc-pVTZ+3 s~~Z~/CC-~VTZ+S~]//MP~/[D~~+*/D~~+*+~ level of t heory,
after correcting for the BSSE." As already mentioned in Section 7.4.2, it cannot be
excluded that in the PHPMS ion source various rotamers and/or isomers CO-exist, and
the computational results seem to confirm that. The example of CI-((CH,CH~)ZO)
illustrates this nicely.
There is excellent agreement between the MP2/[dd]llMPZ/[dd] and G3(MP2)
results for the &298 values of Reaction 7.23 (-12.5 kcal mol-' and - 12.7 kcal mol-',
respective1 y).
For the clustering of CF30- ont0 CH3C1, Reaction 7,24, a AH^^^^ value at the
G3(MP2) level of -9.4 kcal mol-' was calculated.
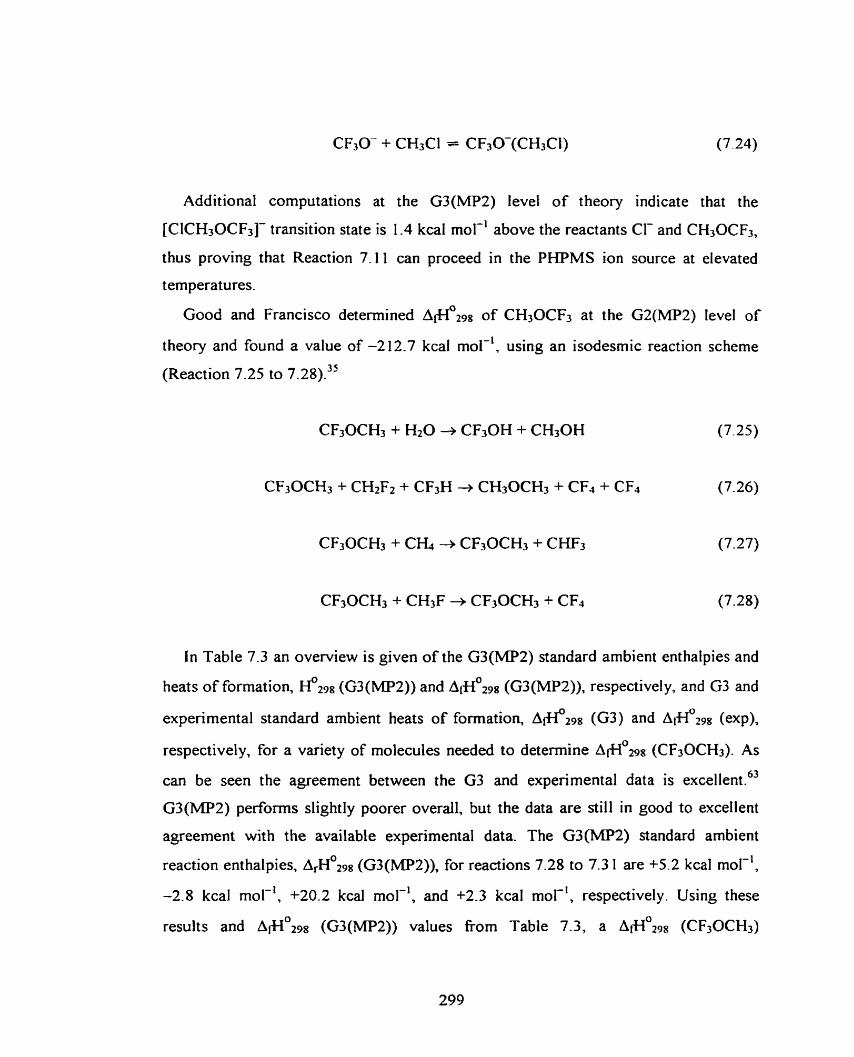
Additional computations at the G3(MP2) level of theory indicate that the
[ClCH30CF3]- transition state is 1.4 kcal mol-' above the reactants Cl- and CH30CF3,
thus proving that Reaction 7.11 can proceed in the PHPMS ion source at etevated
temperatures.
Good and Francisco determined ~ & 9 8 of CH30CF3 at the G2(MP2) level of
theory and found a value of -2 12.7 kcal mol-', using an isodesmic reaction scheme
(Reaction 7.25 to 7.28).35
in Table 7.3 an overview is given of the G3(MP2) standard ambient enthalpies and
heats of formation, &98 (G3(MP2)) and A ~ H ~ ~ ~ ~ (G3(MP2)), respectively, and G3 and
experimental standard ambient heats of formation, ~ & 9 8 (G3) and ~ ~ ~ ~ 2 9 8 (exp),
respectively, for a variety of molecules needed to determine bf1°298 (CF30CH3). As
can be seen the agreement between the G3 and experimental data is exce l~en t .~~
G3(MP2) performs slightly poorer overall, but the data are still in good to excellent
agreement with the available experimental data. The G 3 W 2 ) standard ambient
reaction enthalpies, A ~ H ~ ~ I ~ (G3(MP2)), for reactions 7.28 to 7.3 1 are +5.2 kcal mol-',
-2.8 kcal mol-', +20.2 kcal mol-', and +2.3 kcal mol-', respectively. Using these
results and hfio298 (G3(MP2)) values fiom Table 7.3, a ~ f l ' 2 9 8 (CF30CH3)
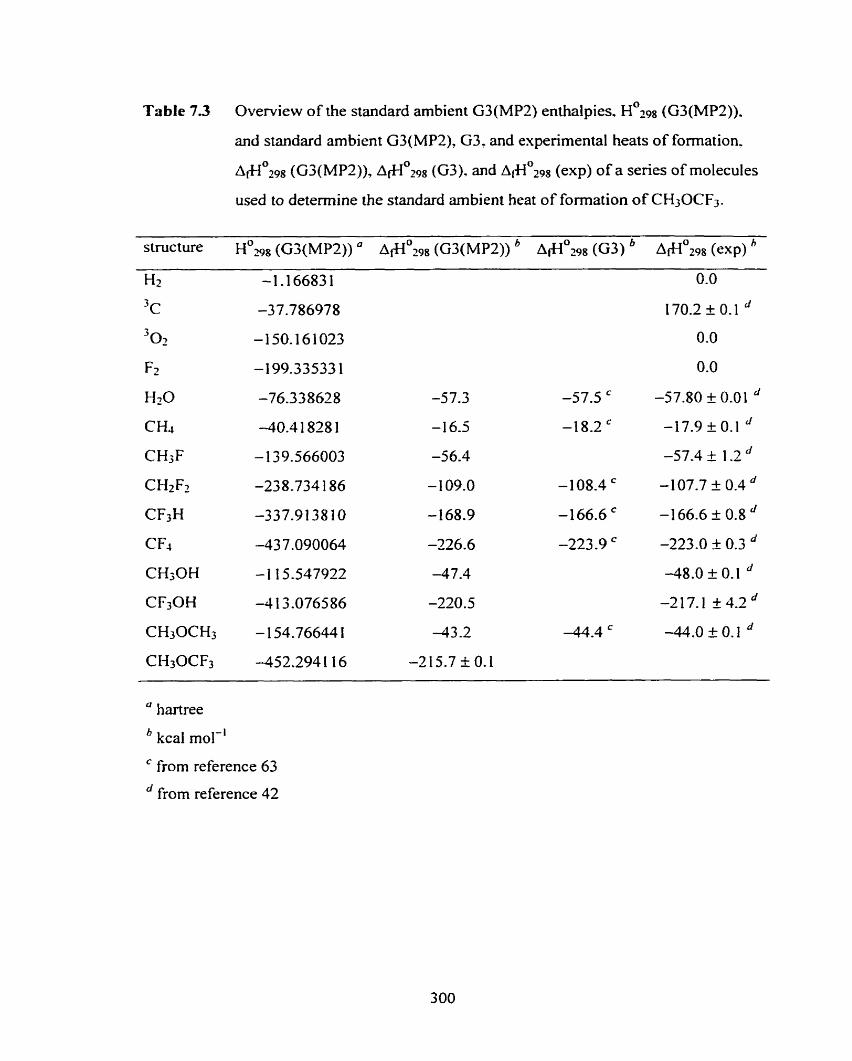
Table 7.3 Overview of the standard ambient G3(MP2) enthalpies. H~~~~ (G3(MP2)).
and standard ambient G3(MP2), G3, and experimental heats of formation.
~ i f 1 ~ ~ 9 ~ (G3(MP2)), ~ f l ~ z ~ ~ (G3). and ~ f l ~ ~ ~ ~ (exp) of a series of molecules
used to deterrnine the standard arnbient heat of formation of CH30CF3.
stmcture I-I0s8 (G3(MP2)) a ~ f l ~ z 9 8 (G3(MP2)) ~ f l O 2 9 8 (G3) ~ ~ ~ ~ 2 9 8 (exp) " Hz -1.166831 0.0
3~ -37.786978 170.2k0.1 3
0 2 -150.161023 0.0
F 2 -199.33533 1 0.0
HzO -76.338628 -5 7.3 -57.5 ' -57.80 & 0.01
CH4 -40.4 1828 1 -16.5 -18.2 -17.9 + 0.1 c f
CH3F - 139.566003 -56.4 -57.4 + 1.2 d
CHzF;! -238.734 1 86 - 109.0 - 108.4 ' -107.7 f 0.4
CF3H -337.913810 - 168.9 -166.6 ' -1 66.6 + 0.8
CF4 -43 7.090064 -226.6 -223.9 ' -223.0 _+ 0.3
CH;OH -1 15.547922 -47.4 -48.0 I 0.1
CF30H -41 3.076586 -220.5 -217.1 +4.2d
CH30CH3 - 154.76644 1 -43 -2 -44.4 -44.0 t 0.1
CH30CF3 -452.294 1 16 -31 5.7 f O. 1 - --
a hartree
kcal mol-'
' from reference 63
" frorn reference 42
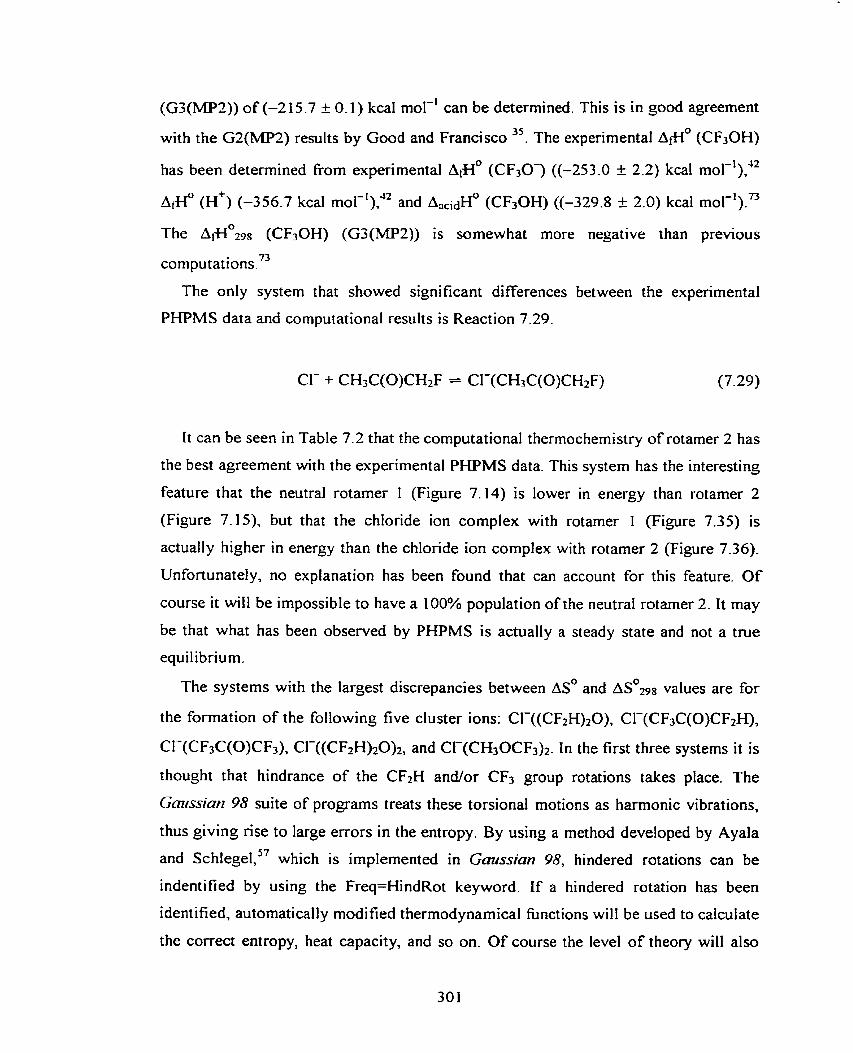
(G)(MP?)) of (-215.7 k 0.1) kcal mol-' can be determined. This is in good agreement
with the G2(MP2) results by Good and Francisco 35. The experimental A*' (CF30H)
has been determined from experimental ~r)10 (CF30-) ((-253.0 + 2.2) kcal mol-'),42
-1 73 A@ (H+) (-3 56.7 kcal and A X i d ~ ' (CF3OH) ((-329.8 f 2.0) kcal mol ).
The A+I0zg8 (CFiOH) (G3(MP2)) is somewhat more negative rhan previous
c ~ r n ~ u t a t i o n s . ~ ~
The onty system that showed significant differences between the experimental
PHPMS data and computational results is Reaction 7.29.
1t can be seen in Table 7.2 that the computational thermochemistry of rotamer 2 has
the best agreement with the experimental PKPMS data. This system has the interesting
feature that the neutral rotamer 1 (Figure 7.14) is lower in energy than rotamer 2
(Figure 7.15), but that the chlonde ion complex with rotamer 1 (Figure 7.35) is
actually higher in energy than the chloride ion complex with rotamer 2 (Figure 7.36).
Unfortunately, no explanation has been found that can account for this feature. Of
course it will be impossible to have a 100% population of the neutral rotamer 2 . It may
be that what has been observed by PHPMS is actually a steady state and not a true
equilibrium.
The systerns with the largest discrepancies between AS' and ~ ~ ' 2 9 8 values are for
the formation of the following five cluster ions: CI-((CF2H)20), CI-(CF3C(0)CF2H),
CI-(CF3C(O)CF3), CI-((CFZH)~O)~, and Cl-(CH30CF3)2. In the fi rst three systems it is
rhought that hindrance of the CF2H andor CF3 group rotations takes place. The
Gmssiati 98 suite of programs treats these torsional motions as harmonic vibrations,
thus giving rise to large erron in the entropy. By using a method developed by Ayala
and ~ c h l e ~ e l , ~ ' which is implemented in Gaussiun 98, hindered rotations can be
indentified by using the Freq=HindRot keyword. I f a hindered rotation has been
identified, automatically modified thermodynamical functions will be used to calculate
the correct entropy, heat capacity, and so on. Of course the level of theory wilf also
have a large influence. For instance, using the B3LYP/[6-311*G(3df3pd)/
6-3 1 1 ++G(3d,3 p)] level of t heory, a ~ ' 1 9 8 value for CI-(CF3C(0)CF3) of 102.4 1 5 cal
mol-' K-' was calculated using the harmonic oscillator approximation. Using the
hindered rotor approximation a value of 102.695 cal mol-' K-' was determined. For
the same cluster, but using the HF/[6-3 1 +G(d)/6-3 1 G(d)] level of theory a value of
1 06.944 cal mol-' K-' was determined using the harmonic oscillator approximation.
while a value of 11 1.788 cal mol-' K-' was obtained using the hindered rotor
approximation.
?.4.4 Experiment versus Computations
In general the agreement between the experimental and computational
thermochemistry is very good, especially for the AH^^^^ values. For the clustering of
chIoride ion onto I,1,3,3-tetrafluoroacetone, Reaction 7.30, Larson and McMahon
determined ~ ~ ' 2 9 8 to be -16.3 kcal mol-'.27
By using ~ ~ ' 2 9 8 frorn the MPZ/[c/d]/~Z/[a/b] cornputations (-27.0 kcal mol-'),
a ~ ~ O 2 p g value of -29.9 cal mol-' K-' can be determined. This value is somewhat
smaller than the AS' value by PHPMS for Reaction 23 of -31 -3 cal mol-' K? This
difference can be understood based on the difference in the structures of
CI-(CF2HOCF2H) and CI-(CF2HC(0)CF2H), as discussed in Section 7.4.1. As already
discussed in Section 7-43 , for some systems the AS^^^^ values calculated at the
HF/[a/b] level o f theory agree well with experimental results. Systems where
hindrance of methyl group rotations takes place can be treated successfÙIly within the
hindered rotor approximation by applying a higher level of theory. It cannot be
expected that computations will always provide almost perfect agreement with
experiment in order to consider them suitable. On the other hand it would have been
much more dificult to interpret the experimental results without the computations.
7.4-5 Gas Phase Acidities of Fluonnated Acetones
Farid and McMahon measured the standard ambient gas phase deprotonation
enthalpies. ~ X i d ~ O 2 9 8 , for acetone and five fluorinated acetones by bracketing
experi ments on an K R instrument .79 The results indicated that fluorine substitution
provides a net stability effect of planar carbanions, although the increase in stability
can be considered irregular. Initially it was assumed that there might be a direct
correlation between the standard ent halpy change for the various chloide ion acetone
complexation equilibria (Reaction 3). AH0, and the deprotonation enthalpy for
0 73.80 Reaction 7.30, A,,dH .
A a C i d ~ O Z 9 8 values for acetone and the four fluorinated acetones were cafculated at
the G3(MP2) level of theory. In order to verify the suitability of G3(MPZ) to calculate
accurate ~ ~ ~ ~ ~ ~ ~ 2 s n values, test cornputations on a series of small to medium sized
(in)organic acids were performed ai the G3 and G3(MP2) level of theory and
compared to literature data." In Table 7.4 an overview is given of the calculated G3
and G3(MP2) standard ambient enthalpies, H"298 (G3) and ~ ' 2 9 8 (G3(MP2)), for the
various acids and their conjugate bases. In order to convert these values to
~ ÿ ~ ~ d ~ ~ 2 9 8 values for Reaction 7.3 1, Equation 7.32 was used.
In Equation 7.35- HOle8 (H+) is taken as 0.002360 hartree. As c m be seen from
Table 7.5. there is good to excellent agreement between the G3 and G3(MP2) results,
and in most cases between the computational and expenmental data. DeTufi and Ervin
showed that for H20, CH30H, C2H2, and HF, MP2 in combination with the
6-3 1 1 +G(d.p) and 6-3 1 1 ++G(d,p) basis sets, G2 and GZ(MP2) gave mean absolute
deviations with experimental data of 0.5, 0.5. 0.7, and 0.7 kcal mol-'. r e ~ ~ e c t i v e l ~ . ~ '
For the values of CH3C(O)CHF-H and CF3C(0)CF2-H there seem to be
large discrepancies with the K R data from Fand and McMahon, but for CF,C(O)CH3
there is perfect agreement.79 As already discussed in Section 7.4.1, there is hydrogen
bonding taking place in the chloride ion-acetone complexes investigated, but it is less
pronounced than expected. Especially the chloride ion-pentafluoroacetone complex,
CI-(CF3C(0)CF2H), seems to conflict with the ICR results of Farid and ~ c ~ a h o n . ' ~
Under low pressure ICR conditions, the following equilibrium was observed (Reaction
7.33)
CF3C(O)CFz- + HCl = CF3C(0)CF2H + Cl- (7.33)
Proton transfer in the CI-(CF,C(0)CF2H) complex, as shown in Figure 7.40, seems
to be an unfavorable process. In addition, the difference in G3(MP2) Aacid~O298 values
between HCI and CF3C(0)CFîH would prevent an exothermic proton transfer. The
difference is too large for the reaction to be perhaps entropy driven, i. e. A,~G'Z~R < O
kcal mol-'. The presence of a higher energy cornplex, CI-(H-CF2C(O)CF,), fi-om
which the proton transfer occurs might be another possibil ity. Under low pressure ICR
condit ions there is no stabilization of the intermediate CI-(CF3C(O)CF2H) complex, as
takes place in the high pressure source.
Finally, it is surprising that in the Cl-(CHsC(0)CH2F) complex the chloride ion
prefers to interact with two hydrogens fiom both methyl groups, even though the
G3(MP2) AacidH0298 value of the CH, group is 19.0 kcal mol-' lower than the CHzF
group. Attempts to locate other stable minima where chloride ion interacts exclusively
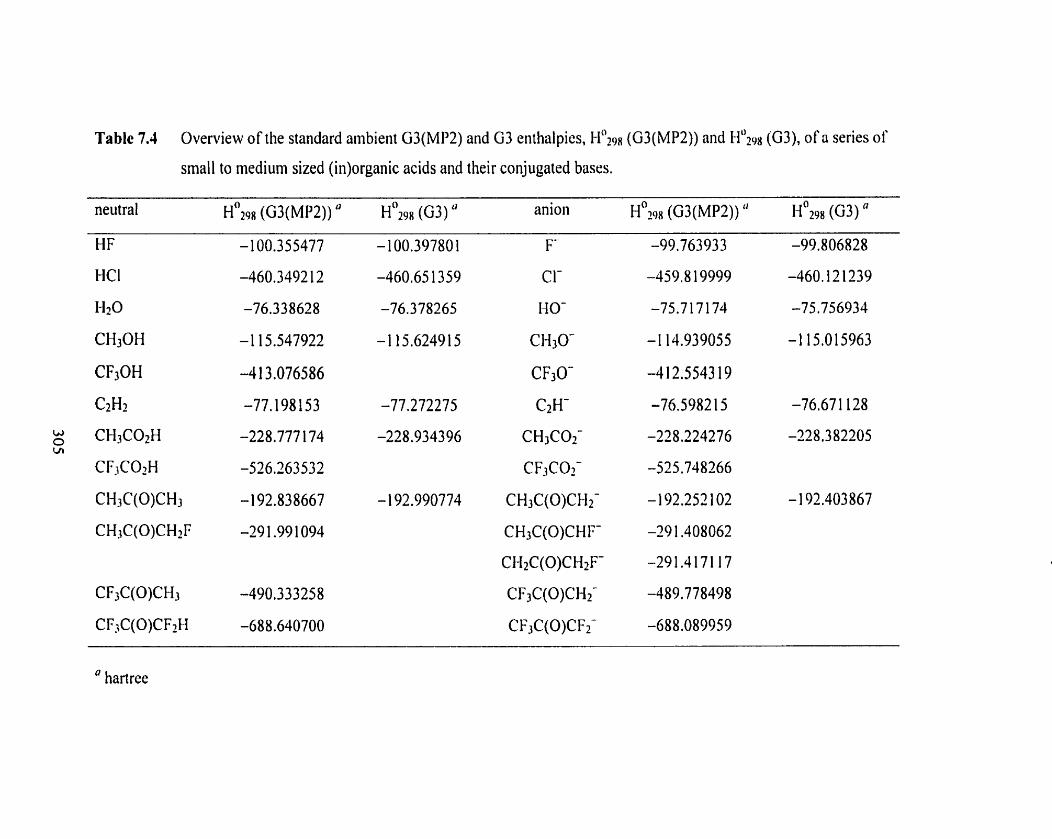
Table 7.4 Overview of the standard ambient G3(MP2) and G3 enthalpies, (G3(MP2)) and (G3), of a series of
small to medium sized (in)organic acids and their conjugated bases.
- 100.39780 1 F-
-460.65 1359 Cl-
-76.378265 HO-
-1 15.624915 CH30-
CF30-
-77.272275 C2H-
-228.934396 CHJC02-
CF3C02-
- 192.990774 CH3C(0)CFf2-
CH3C(0)CHF-
CH2C(0)CH2F-
CF3C(0)CH2-
CFjC(0)CF2-
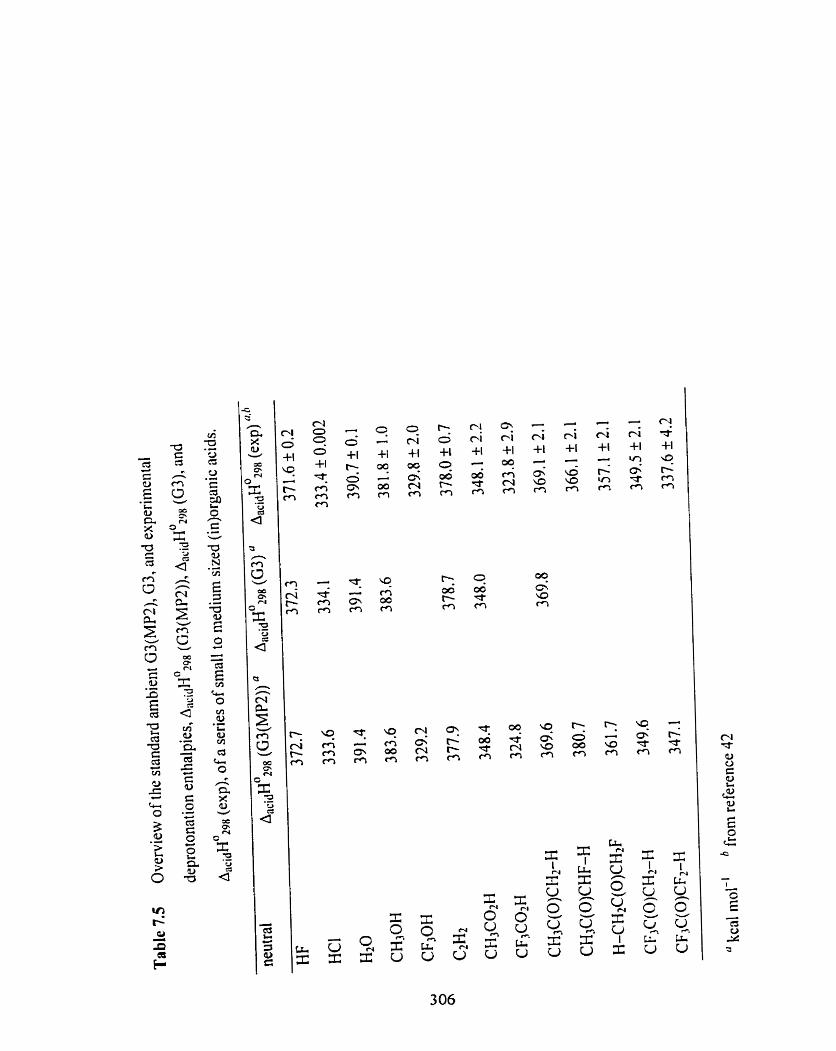
2 -1 Cr)
with hydrogen atoms fiom the CH3 group, like in CI-(CH30CF3), either by single or
multiple hydrogen bonding, failed.
7.4.6 Vibrational Frequencies of Fiuorinated Acetones
Recently Good and Francisco measured the FT-IR spectra of CH30CF3, (CF2H)20,
and CF30CF2H and calculated the nomal mode vibrational frequencies at various
levels of t h e ~ r y . ~ ~ The best agreement ( m s error of 2.7%) between experîrnent and
theory was obtained using the B3LYP/6-3 1 I++G(3df,3pd) level of theory, and these
results were used to assign the various modes. The HF/6-3 1G(d) results scaled by
0.8953 from this work in generai agree very well. Surprisingly, no experimental FT-IR
spectra of CH3C(0)CH2F and CF3C(O)CFlH are available in the NISTEPA Gas-
Phase Infrared Database. There are FT-IR spectra available for CH3C(O)CH3,
CH3C(0)CF3, and CF~C(O)CF~. '~ The quality of the calculated normal mode
vibrational frequencies relative to experimental results is not so important for
calculating thermochernicai data. They may become more important for instance when
doing Master Equation modeling to interpret the kinetics of ZTRID experiments or
RRKM modeling for calculating unimolecular dissociation constants.82 In those cases
both the frequency and the lR intensities need to be known. Unfortunately the absolute
IR intensities have only been determined for a few fluonnated ethers and perfluoro
alkanes. 40.83'87 These results can be used to find a level of theory that gives good
agreement with both the fi-equencies and the IR intensities. De Oliveira and co-
workers found that for CI& CH3F, CH2F2, CHF3, and CF4 83LYPl6-3 1 l+-tG(3d,3p)
computations performed bestAS3 Applying this level of theory to C2F6 gives good
agreement with experimental data on C2F6 by Ballard and CO-workers? They found
values of 7 14 cm-' ((3 7.9 k 1 - 2 ) km mol-'), 1 1 16 cm-' (L284.8 -1: 4.2) km mol-'), and
1250 cm-' ((1020.1 f 18.1) km mol-'), while the B3LYP/6-3 1 1 ++G(3d73p)
computation gives values of 703 cm-' (32 km mol-'), 1099 cm-' (285 km mol-'), and
1250 cm-' (1 O96 km mol-'). Calculations at the MP216-3 1 G(d,p) level of theory by
Papasawa el al. showed very good agreement with experimental IR intensities, but the
normal mode vibrational frequencies deviate more t han the B3 LYPl6-3 1 1 ++G(3d,3p)
re~ults . '~ No attempts were made to assign the various normal mode vibrational
frequencies as done by Good and ~ r a n c i s c o . ~ ~ In Figures 7.55 to 7.71 the expenmental
FT-IR and simulated IR W/6-3 1 G(d) and B3 LYPl6-3 1 1 ++G(3d,3p) spectra of
CH3C(O)CH,, CH3C(0)CH2Fl CH~C(O)CFJ, CF3C(0)CF2Hl and CF,C(O)CF3 are
shown. The normal mode vibrational frequencies and IR intensities for al1 these
spectra have been summarized in Tables 7.6 to 7.10. The CH3C(0)CF3 and
CF3C(O)CF3 spectra are identical to the spectra in the NiSTEPA Gas-Phase Infiared
Database, thus providing more confidence in the other two spectra. It has to be noted
that the FT-IR spectra and the simulated IR spectra from Good and Francisco in
general showed the same main features, but that individual peak intensities differed,
depending on the compound of interest. A similar comment applies to the spectra
discussed in this section, In addition it has to be mentioned that no detailed discussion
will be provided on the differences between the two methods relative to each other and
relative to the experirnental data. Only general trends will be discussed.
Going from CH3C(0)CH3 to CF3C(0)CF3 the frequency of the CO stretch
increases by approximately 80 cm-: and both the HW6-3 1G(d) and B3LYPI
6-3 1 1 ++G(3d,3 p) results follow that sarne trend, even though the absolute values may
differ by as much as 80 cm-'. More important is the fact that the relative intensity of
the CO stretch decreases in favor of C-C and C-F stretches in the 800-1500 cm-'
range. This makes chloride ion complexes of these fluorinated acetones and some
ethers ideal mode1 systems for ZTRID experiments in a FT-ICR instmrnent. The
strong blackbody IR absorption in this region will most likely promote fast
dissociation kinetics of even relatively strongly bound complexes. The introduction of
more fluorine atoms also causes the absolute IR intensities of the CO stretch of the
W/6-3 1 G(d) and B3LYP/6-3 1 1++G(3d73p) results to corne doser together.
The general appearances of al1 simulated HFl6-31G(d) and B3LYP/
6-3 1 1 ++G(3d,3p) LR spectra relative to the FT-IR spectra shows no clear trend, and a
similar statement can be made for the individual peaks and their calculated absolute IR
intensities. HI%-3 lG(d) computations use a lot less CPU time than the B 3 L W
6-3 1 l++G(3d,3p) computations, but of course quality of the results will be the first
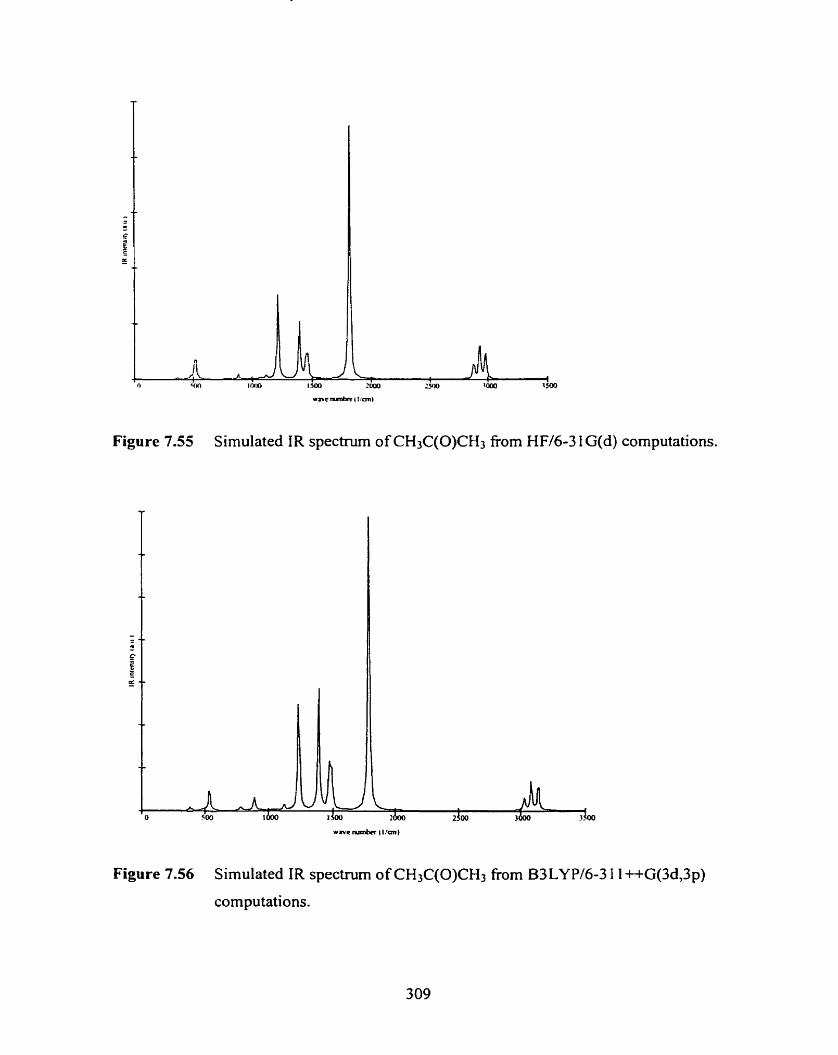
w a v c n m b a ~ 1 l m l
Figure 7.55 Simulated IR spectrum of CH3C(0)CH3 from HF/6-3 1 G(d) computations.
Figure 7.56 Simulated IR spectnim of CH3C(0)CH3 fiorn B3LYP/6-3 1 1 ++G(3d,3p)
computations.
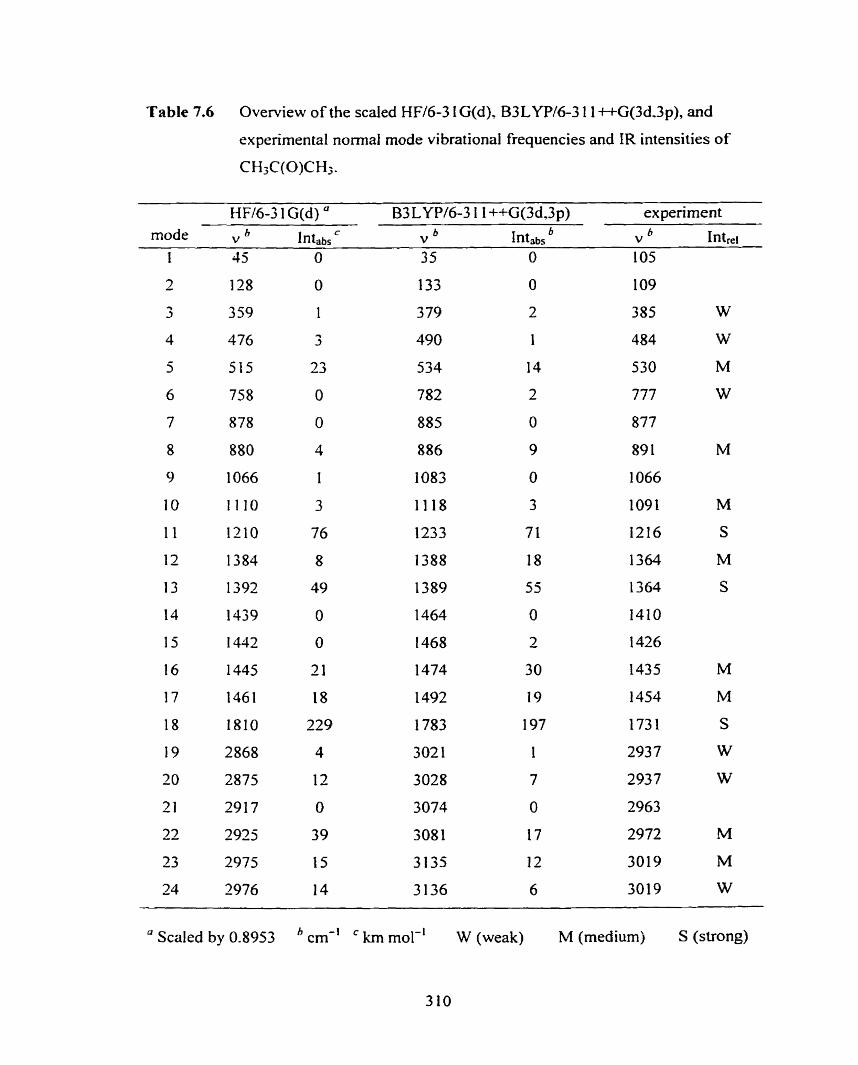
Table 7.6 Overview of the scaied HF/6-3 1 G(d), B3LYP/6-3 1 1 ++G(3d,3p), and
experimental normal mode vibrational frequencies and IR intensities of
HFl6-3 1 G(d) " B3 LYP/6-3 1 I ++G(3d.3~) experiment
" Scaled by 0.8953 cm-' km mol-' W (weak) M (medium) S (strong)
3 10
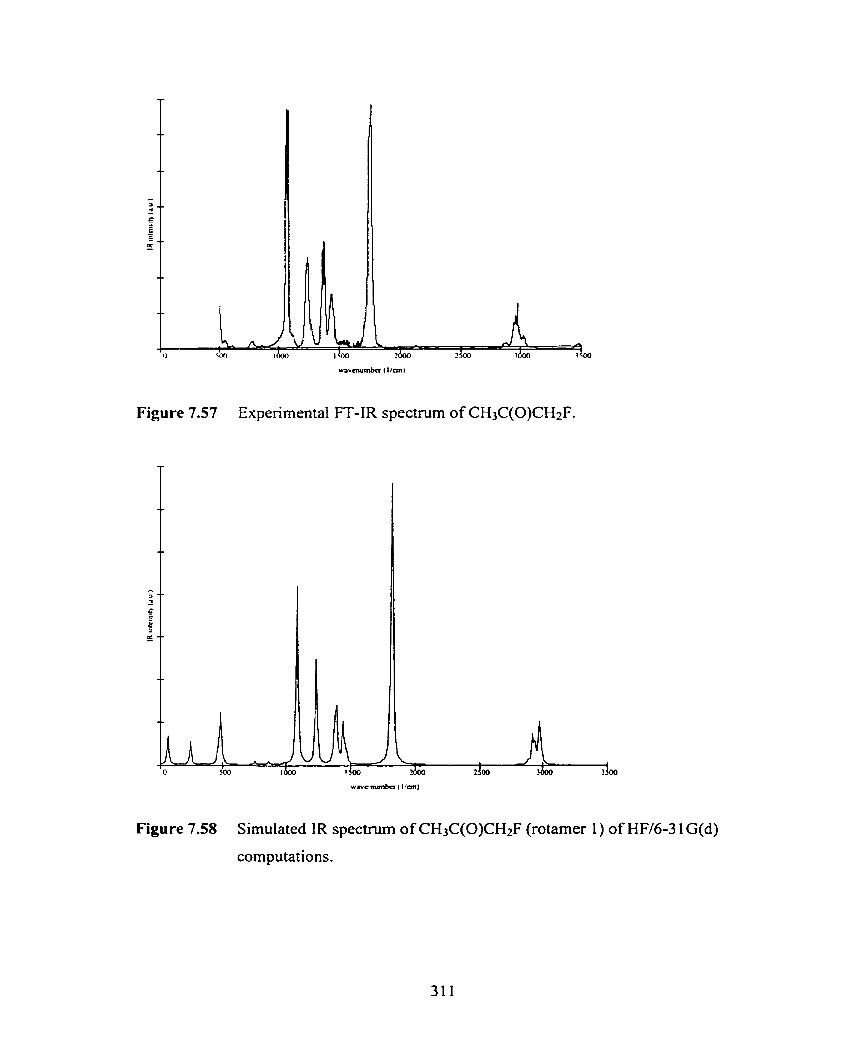
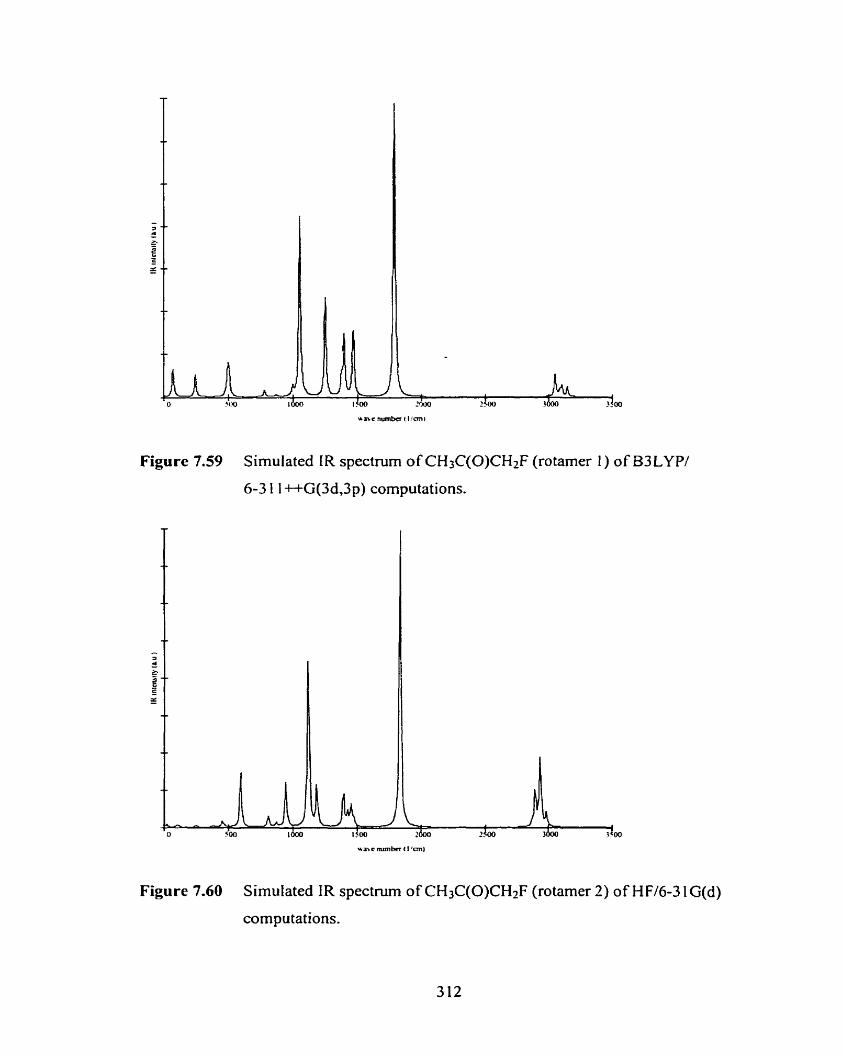
u s e mmikr ( I!ml
Figure 7.59 Simulated IR spectrum of CH3C(0)CH2F (rotamer 1 ) of 8 3 LY PI
6-3 1 1 ++G(3d,3p) computations.
Figure 7.60 Simutated IR spectrum of CH3C(0)CH2F (rotamer 2) of HF/6-3 1 G(d)
computations.
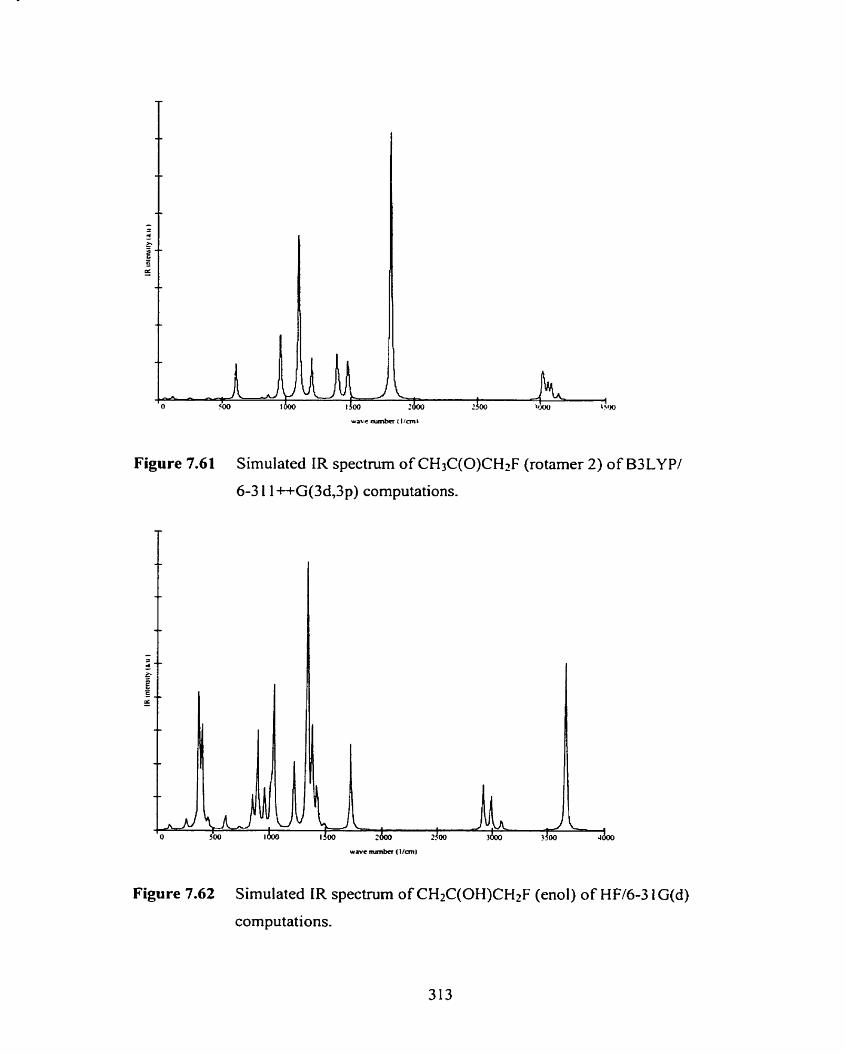
W ~ W numbn t ~/mr
Figure 7.61 Simulated IR spectrum of CH3C(0)CH2F (rotamer 2) o f B3LYPl
6-3 1 1 ++G(3d,3p) cornputations.
Figure 7.62 Simulated IR spectrum o f CH2C(OH)CHtF (enol) of HF/6-3 1 G(d)
computations.
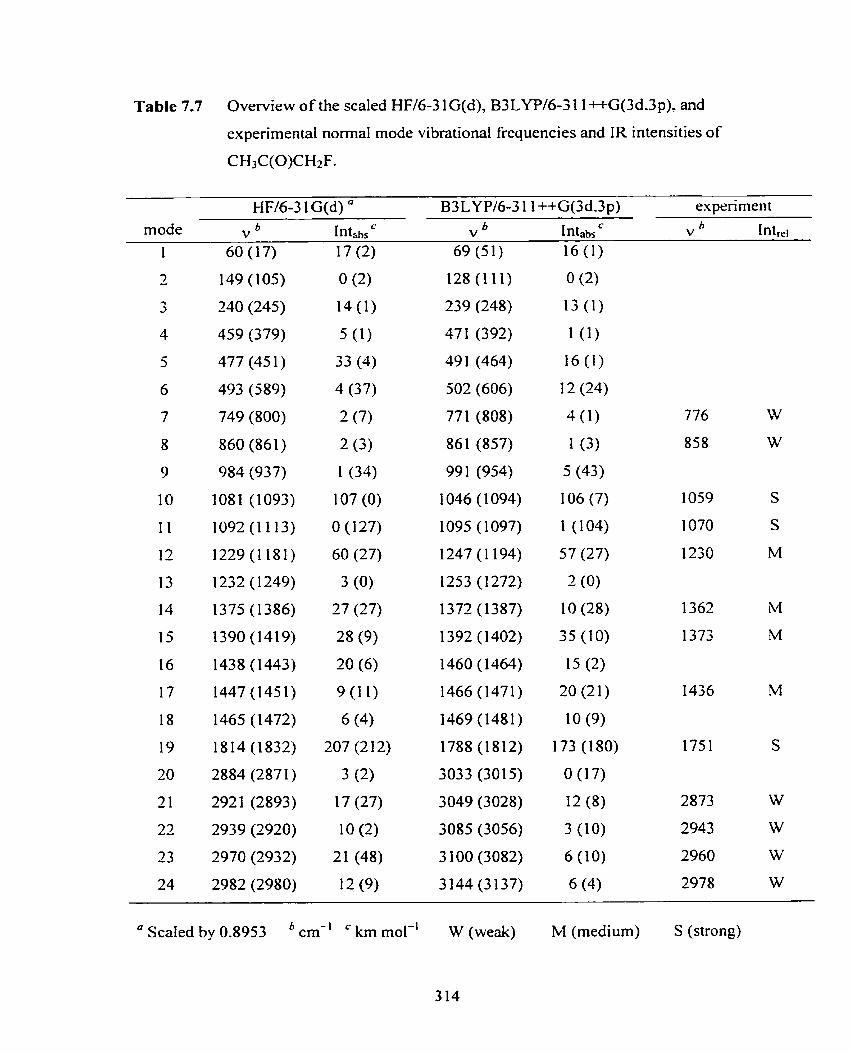
Table 7.7 Overview of the scaled HF/6-3 1 G(d), B3 LYP/6-3 1 1 ++G(3d-3p)- and
expenmental normal mode vibrational frequencies and IR intensities of
HF/6-3 1 G{d) " B3LYPl6-3 1 1 ++G(3d.3p) experiment
17 (2)
0 (2)
14 (1)
5 (1)
33 (4)
4 (37)
2 (7)
2 (3)
1 (34)
107 (O)
O (127)
60 (27)
3 (0)
27 (27)
28 (9)
20 (6)
9 (1 1)
6 (4)
207 (2 f 2)
3 (3)
17 (27)
10 (2)
21 (48)
12 (9)
16 (1)
0 (2)
13 (1)
16 (1)
12 (24)
4 ( 1 )
1 (3)
5 (43)
106 (7)
1 (104)
57 (27)
2 (0)
1 O (28)
35 (IO)
15 (2 )
20 (21)
10 (9)
173 (180)
0 (17)
12 (8)
3 (10)
6 (10)
6 (4)
" Scaled by 0.8953 cm-' km mol-' W (weak) M (medium) S (strong)
314
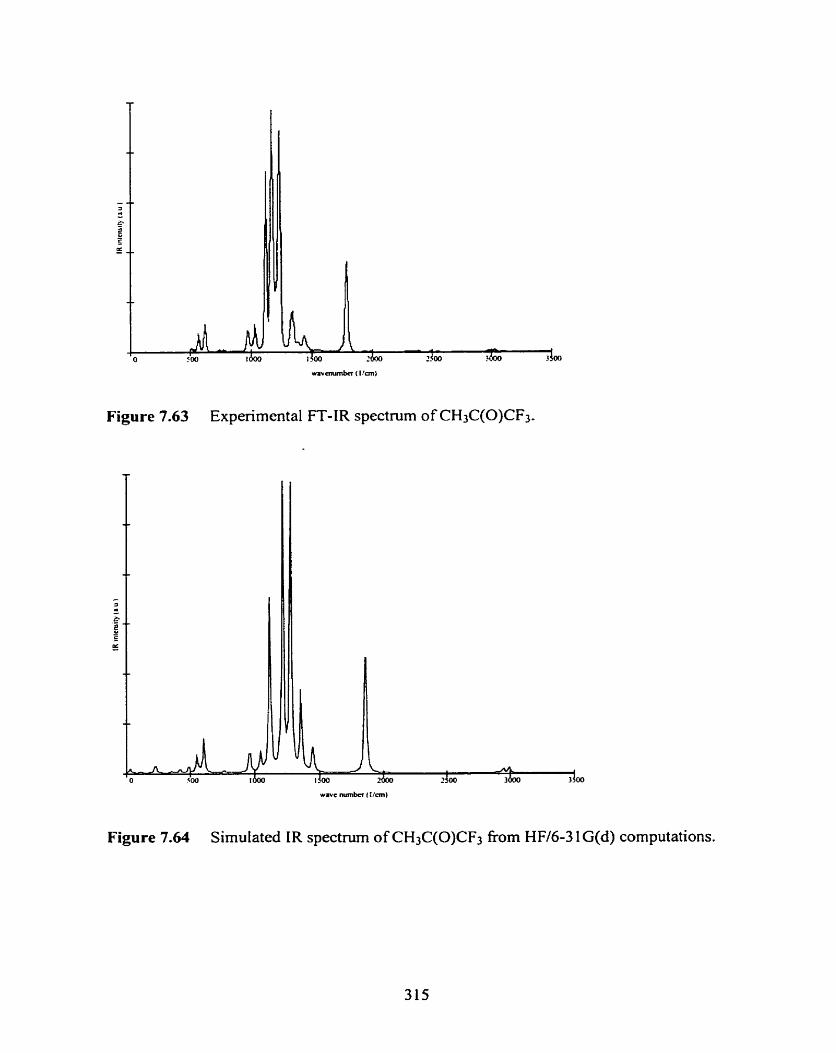
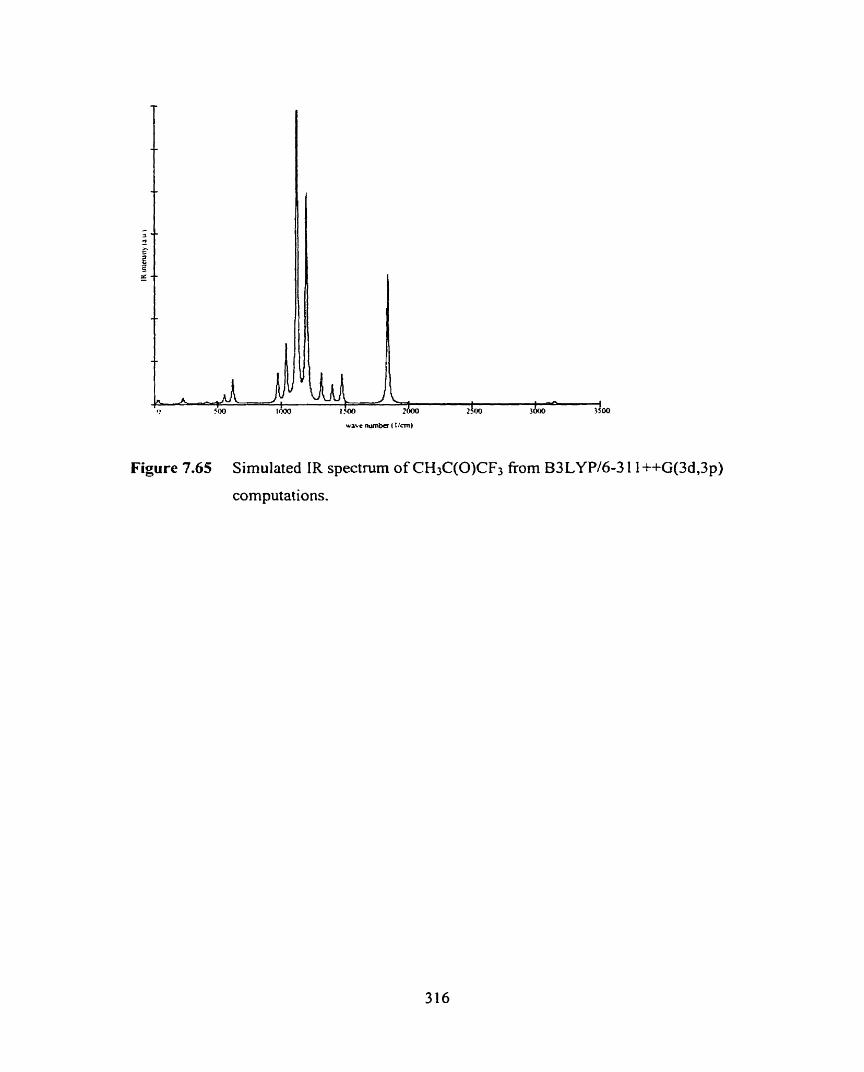
Figure 7.65 Simulated IR spectrum of CH3C(0)CF3 fiom B3LYP/6-3 1 1 ++G(3d,3p)
computations.
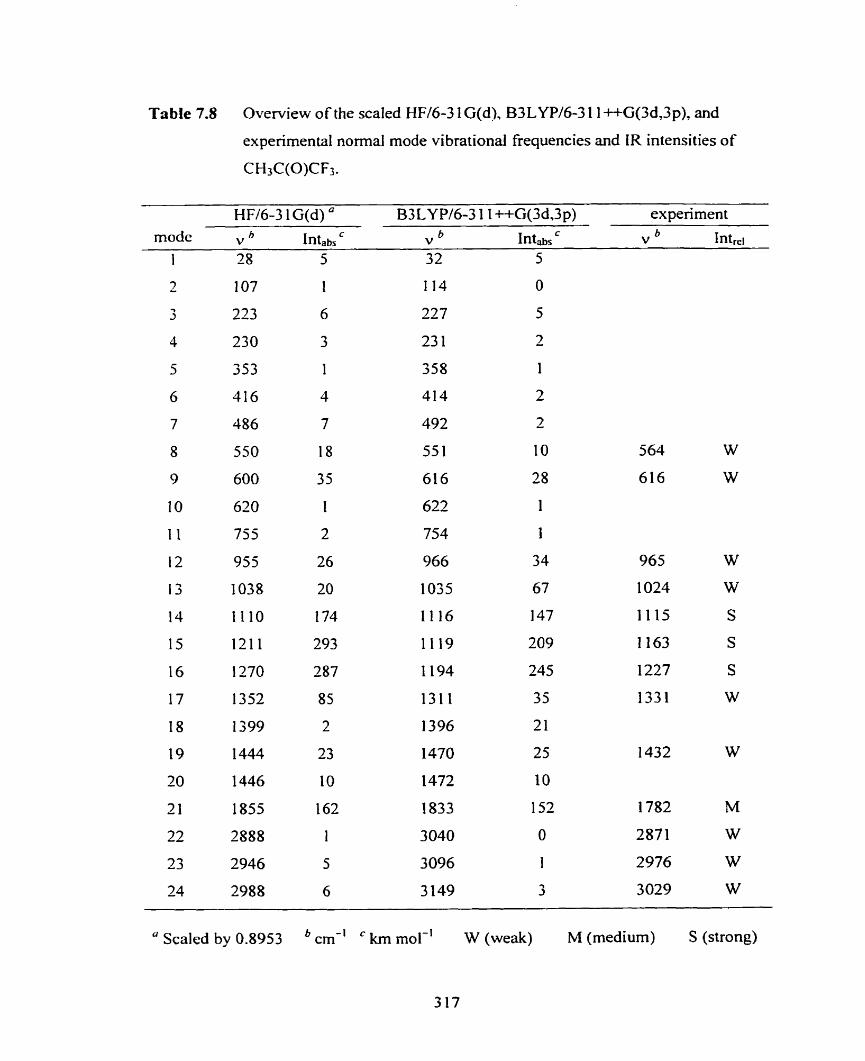
Table 7.8 Overview of the scaled HF/6-3 1 G(d), B3LYP/6-3 1 1 ++G(3d,3p), and
experirnental normal mode vibrational frequencies and IR intensities of
. , . mode v h Intabs v b Intabs v b Intrci
5 32 5
" Scaled by 0.8953 cm-' km mol-' W (weak) M (medium) S (strong)
317
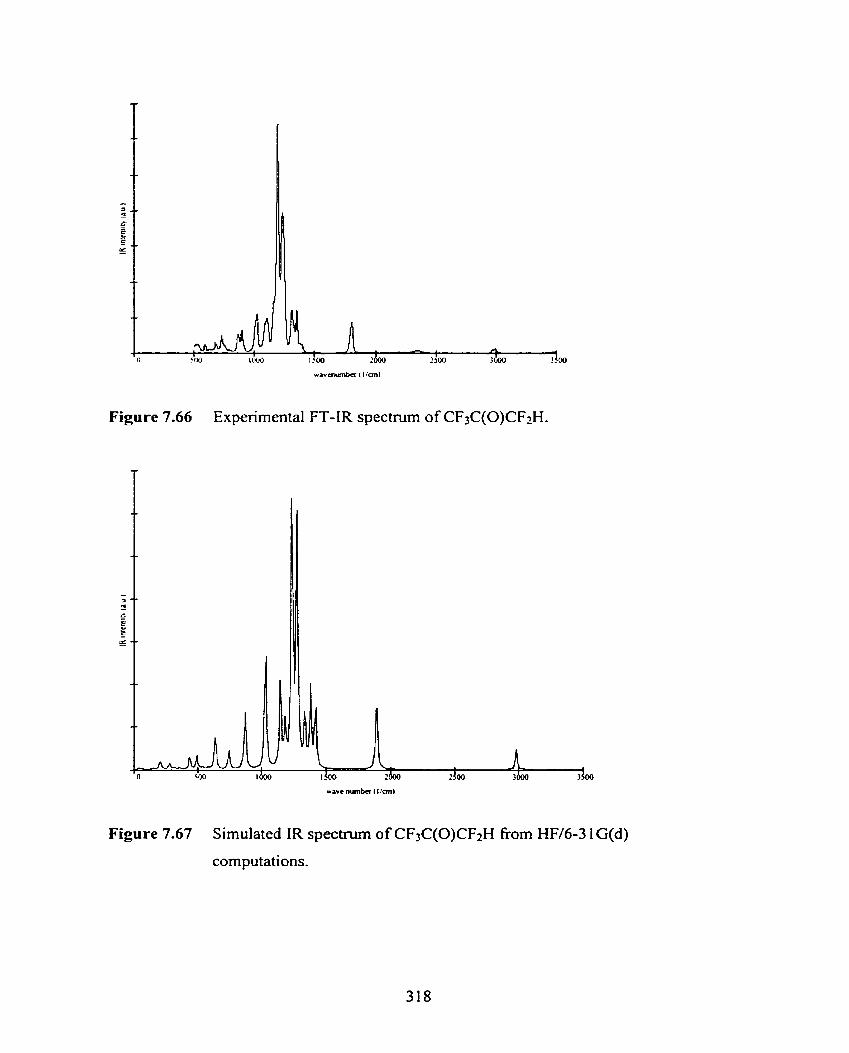
Figure 7.66 Experimental FT-IR spectrum of CF3C(0)CF2H.
Figure 7.67 Simulated IR spectnim of CF3C(0)CF2H fiom HF/6-3 1 G(d)
computations.
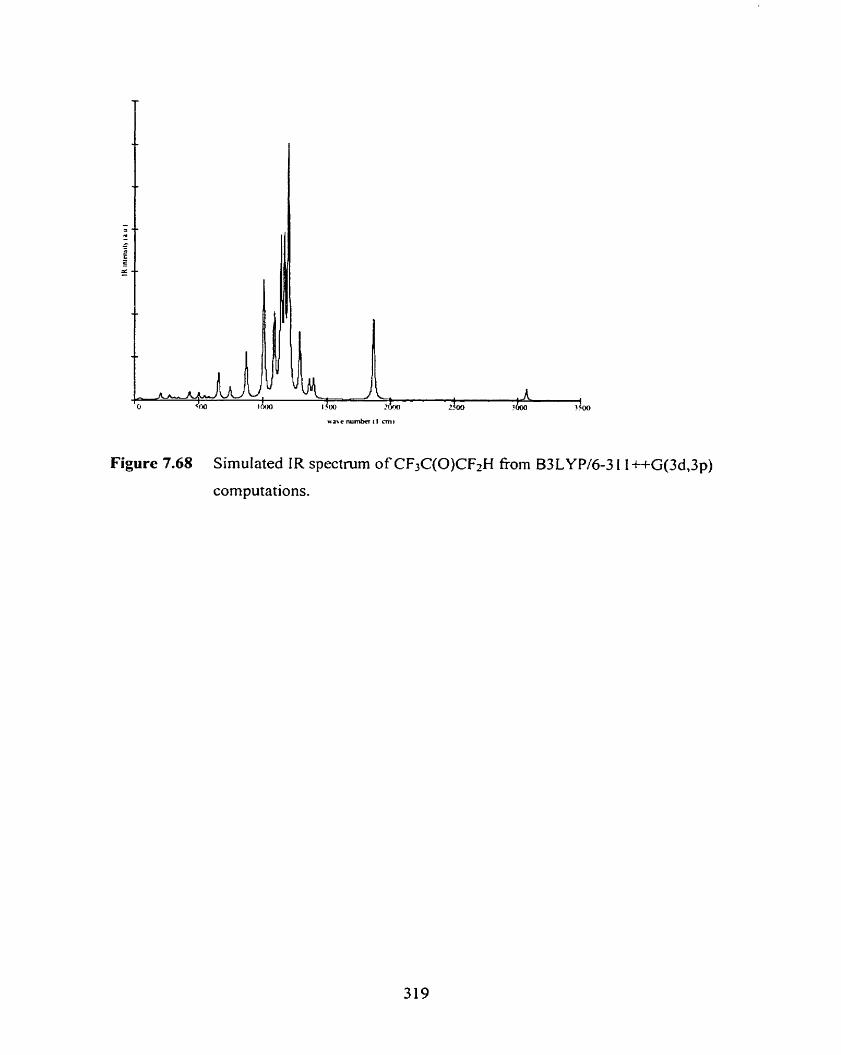
Figure 7.68 Simulated IR spectrum of CF3C(0)CFtH fiom B3LYPh-3 1 1 ++G(3d,3p)
cornputations.
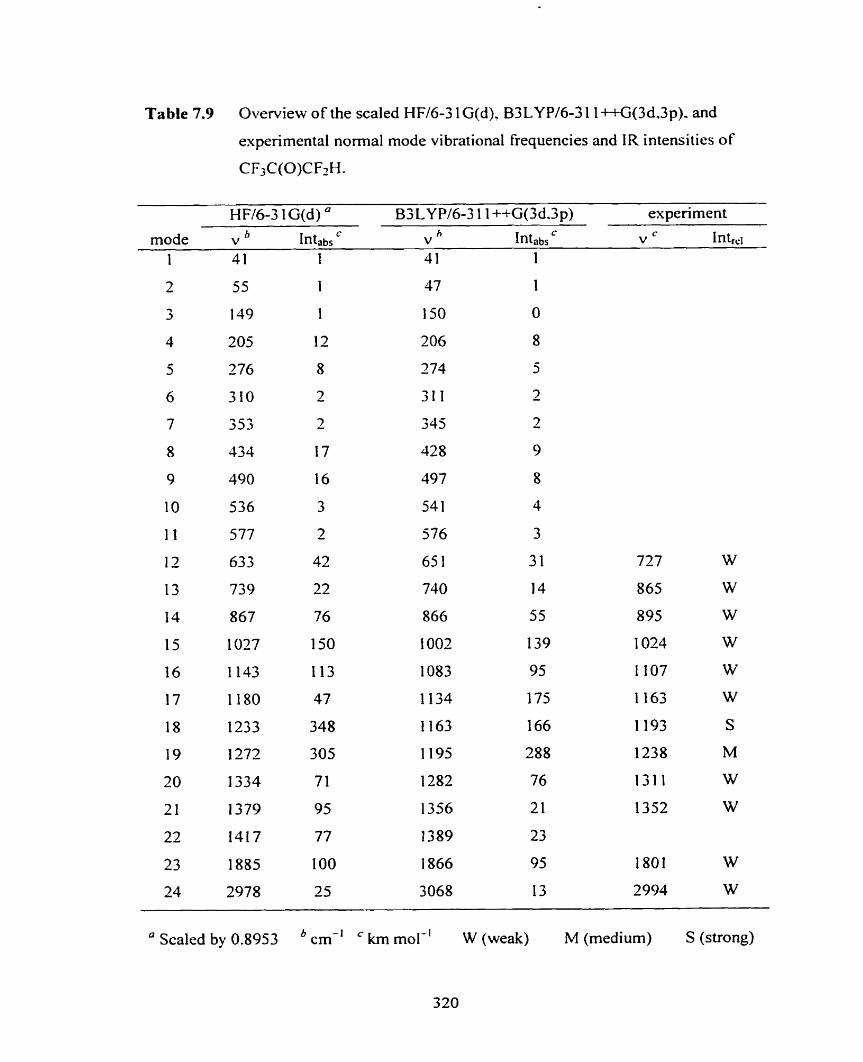
Table 7.9 Overview of the scaled HFI6-3 1 G(d). B3 LY P16-3 1 1 s+G(3d,3p). and
experïmentaf normal mode vibrational frequencies and IR intensitics of
H Fl6-3 1 G(d) " BS LY Pl6-3 1 1 ++G(3d.3 p) experiment
mode b V Intabs v h Intabs v C Intre1
-- - - - - -
" Scaled by 0.8953 cm-' km mol-' W (weak) M (medium) S (strong)
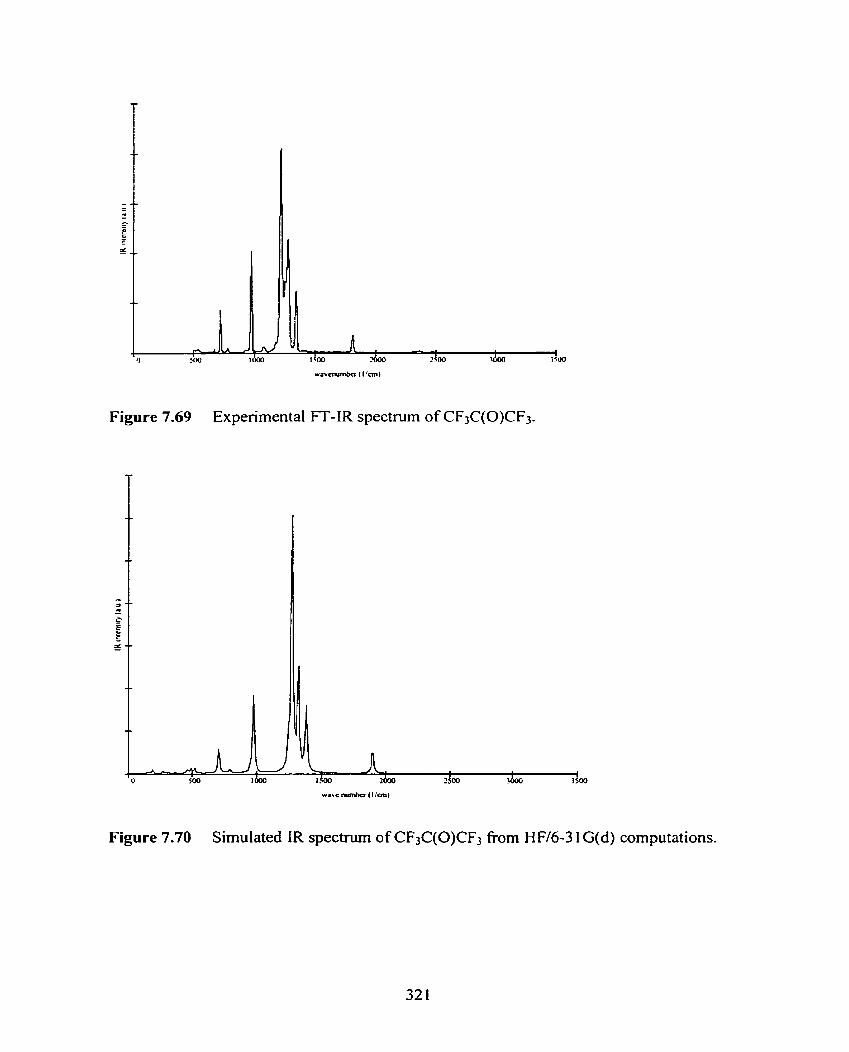
Figure 7.69 Expenmental FT-IR spectrum of CF3C(0)CF3.
w a b c ~ ( l / c m )
Figure 7.70 SimuIated IR spectm of CF3C(0)CF3 fiom HF/6-3 1 G(d) computations.
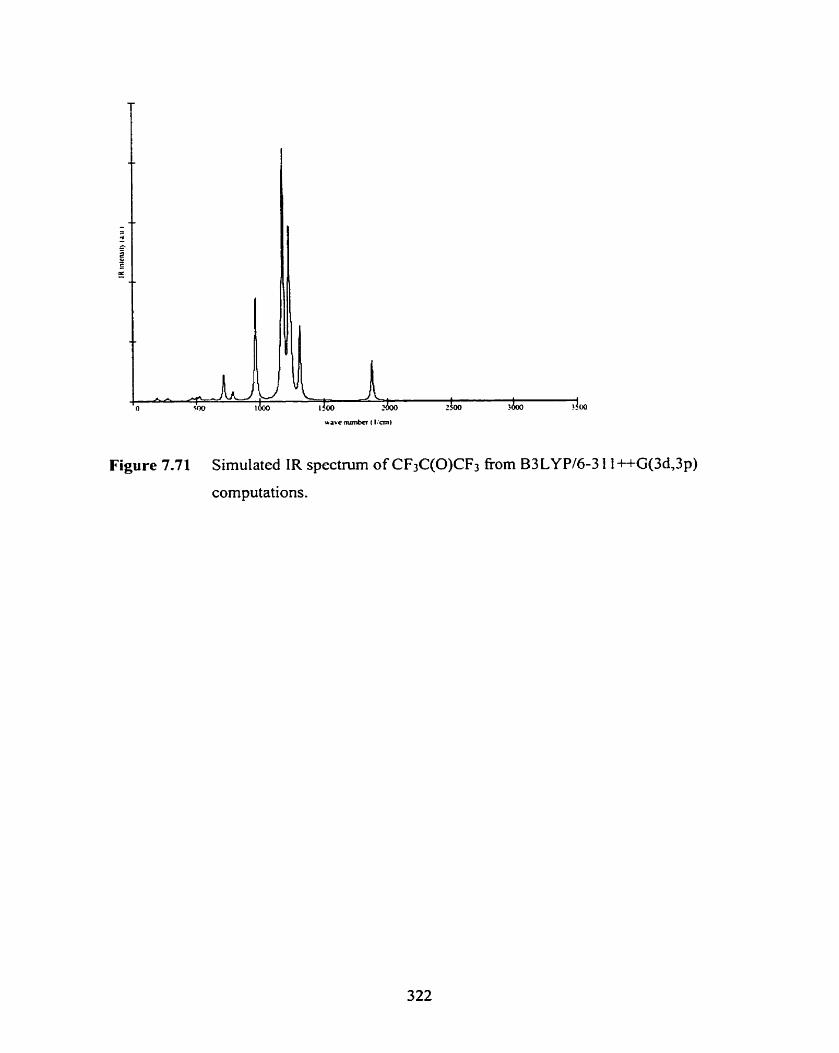
Figure 7.71 Simulated IR spectnim of CF3C(0)CF3 from B3LYP16-3 1 1 ++G(3d,3p)
computations.
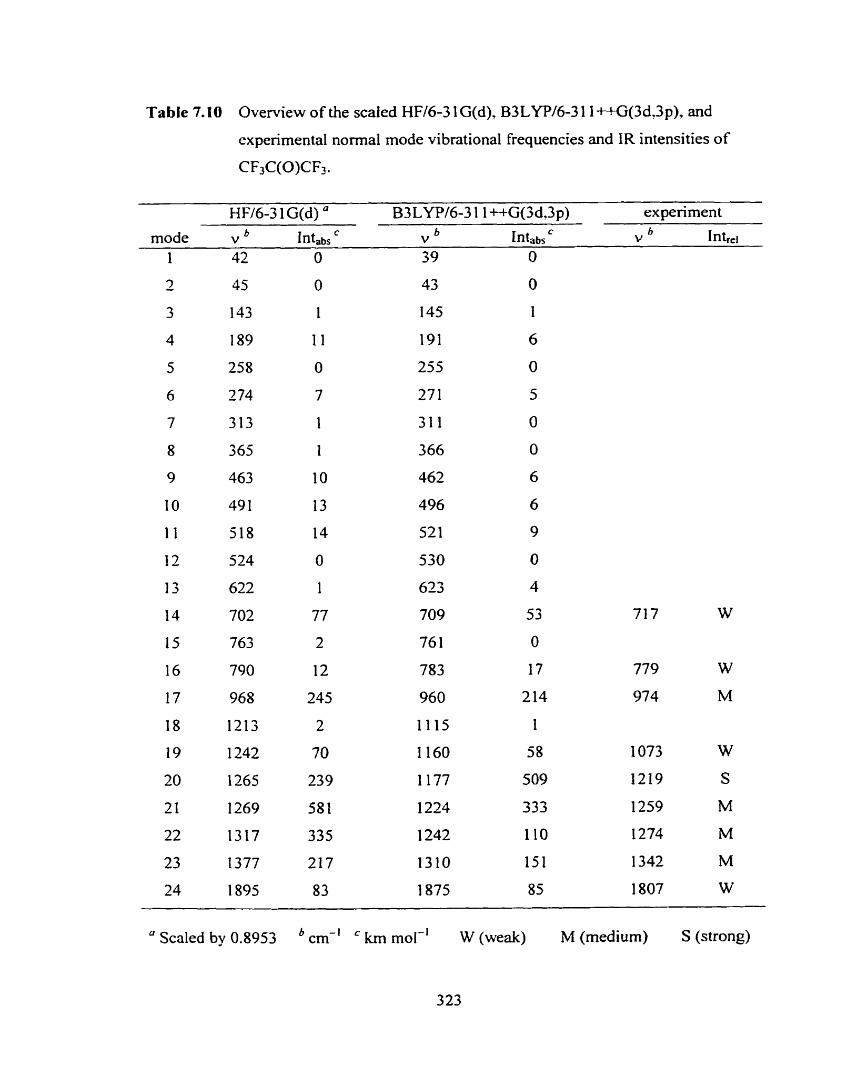
Table 7.10 Overview of the scaled HF/6-3 1 G(d), B3 LYP/6-3 1 1 +G(3d73p), and
experimental normal mode vibrational frequencies and IR intensities of
HF/6-3 1 G(d) " B3 LYP/6-3 1 1 ++G(3d,3p) experiment
mode b Inf abs b
h b s c V b v v 1 ntre~
O
" Scaled by 0.8953 cm-' km mol-' W (weak) M (medium) S (strong)
priorîty. As long as there are no experimental absolute IR intensities of these
compounds available a thorough test of the two methods will be impossible.
More interesting and not investigated experimentally is the effect of chlotide ion
complex formation upon the IR spectrum of the neutral. In Figure 7.72 the simulated
IR spectra of CF3C(0)CF3 at the B3 LYP/6-3 1 1 ++G(3d73p) level of theory (solid) and
CI-(CF3C(O)CF3) at the R3LYP/[6-3 1 1 ++G(3df,3pd)/6-3 1 1 ++G(3d,3p)] level of
theory (dotted) are shown. The most obvious change is the large shifl in the CO stretch
frequency of -215 cm-', and a large increase in the absolute IR intensity of +239 km
mol-'. Most other peaks in the 600-1400 cm-' range show shifts to smaller wave
numbers. while both increases and decreases in the absolute IR intensities take place.
These features make the CI-(CF3C(0)CF3) an interesting systems on which to perform
ZTRID experiments (Equation 7.34).
CI-(CF3C(0)CF3) + nhv + CI- + CF3C(0)CF3 (7.34)
Obtaining the unimolecular dissociation constants, kmi(T), at different absolute
temperatures and performing Master Equation modeling using the DFT data for input
of the normal mode vibrational frequencies and corresponding absolute IR intensities
will provide a good test for the quality of the computations. Another test would be
when one day it will be possible to record FT-IR spectra of trapped ions in a FT-ICR
or ion trap mass spectrometer (ITMS). Upon cornplex formation with chloride ion
three new, intramoIecular normal mode vibrations are introduced, and both red and
blue shifls are observed for the other vibrations already present in the neutrals. There
is no clear correlation between the shift in C-H normal mode vibrations, Av(C-H),
and AH0298, as was observed for Av(R0-H) in X-(HOR) clusters (X = F, Cl, Br, 1; R =
CH3, CH3CH2, (CH&CH, (cH~)~c)." At this point in time VPDS would be an
excellent tool to investigate the C-H stretches in the different Cl-(ether) and
Cl-(acetone) complexes.89
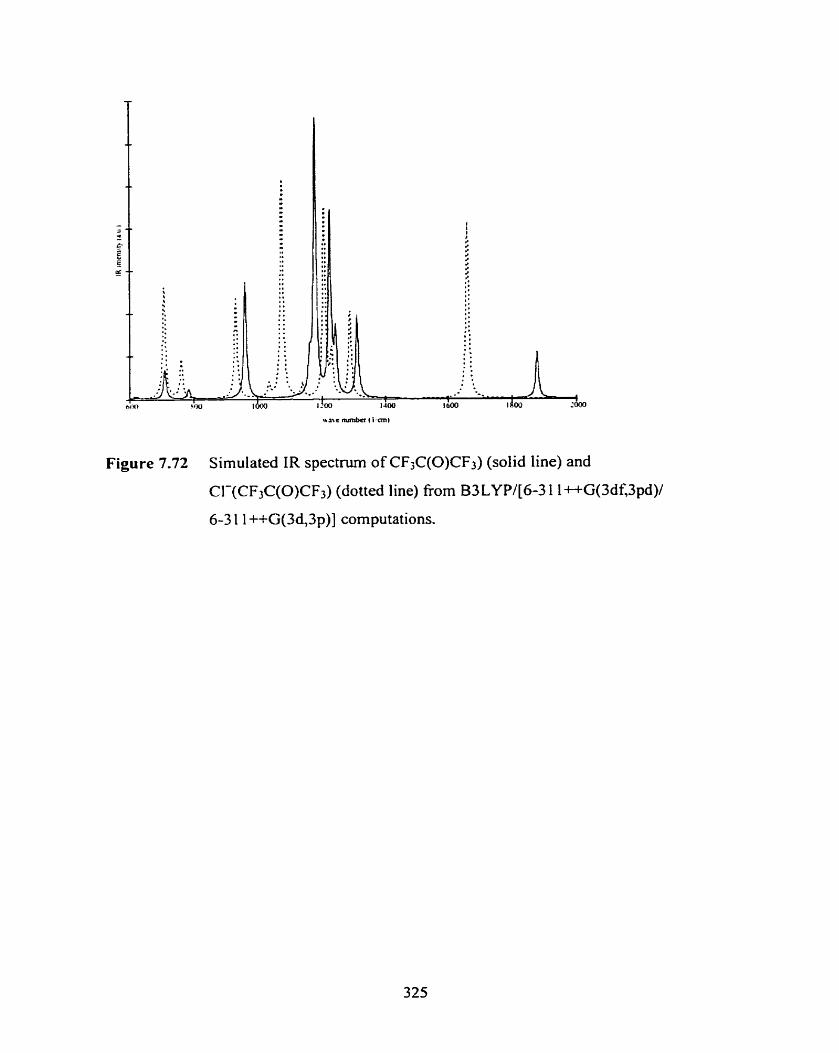
Figure 7.72 Simulated IR spectm of CF3C(0)CF3) (solid line) and
Cl-(CF,C(0)CF3) (dotted line) fiom B3LYP/[6-3 1 1 ++G(3df,3pd)/
6-3 1 1 ++G(3d,3p)] computations.
7.4.7 Rotational Barriers
For CH30CF3, rotational barriers of 1.20 kcal mol-' (CH3) and 3.08 kcal mol-'
(CF,) were calculated at the MP2/c//MPZ/a levels of theory. In the CT(CH3OCF3)
cornplex, rotational barriers of 1 .O2 kcal mol-' (CHp) and 2.87 kcal mol-' (CF3) were
calculated at the MPl?/[dd]//MPZ/[a/b] level of theory. Recently, Good and Francisco
calculated the rotational barriers for the methyl groups in (CH3)20, CH30CF3,
(CFZH)20, and CF30CF2H at the B3LYP/6-3 1 I*(3df 3pd) level of theory. 36 Values
of 2.4, 1 . 1 , 3 6 . and 2.9 kcal mol-', respectively, were obtained. Except for (CH3)zO.
no experimental microwave data are a~aiiable.~' In reality, the rotations of the CH,,
CF,, and CF2H groups in the four molecules will most Iikely show coupling of both
methyl groups present. This will give rise to complicated two-dimensional potential
energy surfaces.
Very little theoretical work has been published on the influence of complex
formation on barrier heights of methyl group rotations. De Tun and Ervin showed
that going from ROH to F(HOR) (R = CH3, CH3CH2, (CH3)2CH, (CH3)3C), only for
R = CH3 does the rotational barrier, calculated at the MP26-3 1 1 +G(Zdf,Zp)// - 1 91
RiIP2/6-3 1 G(d) level, decrease (fiom 1 . 1 kcal mol-' to 0.3 kcal mol ). For the other
three alcohol molecules, the rotational barriers increase by -0.9 kcal mol-'. The main
source for the decrease in the rotational barriers of the CH3 and CF3 groups are the
increases of the C-O and C-F distances, upon cornplex formation with Cl- and
CH30CF3. For CI-((CH3)20), no structure for the so-called staggered-eclipsed
conformation was found, thus making determination of the CH3 barrier in this
complex impossible. Of course the binding in CI-((CH3)20) is completely different
fiom CI-(CH30CF3). It does not seem unreasonable to assume that the bamer for CH3
rotation in Cl-((CH3)zO) will be somewhat larger than in (CH3)*0. In Cl-((CF2H)20)
a large increase in the rotational bamer compared to (CF2H)20 can be observed, from
1 .O kcal mol-' to 7.5 kcal mol-', thus adding to the suggestion that the CF2H
rotations get locked in the chloride ion complex.
In CH3C(0)CH2F the rotational barrier going from rotamer 1 to 2 is 4.4 kcal
rnol-', as calculated at the MPZ/c//MP2/a level of theory. Going from rotamer 2 to 1
the barrier is 2.2 kcal rnol-'. In the Cl-(CH3C(0)CH2F) complex the barriers have
been changed to 0.5 kcal mol-' and 2.3 kcal mol-', as calculated at the
MP2/[c/d]I/MPZ/[a/b] level of theory. This may indicate that upon chloride ion
complex formation methyl group rotations do not necessarily become more hindered.
I t would be very interesting to determine the barriers for the CF3 groups' rotations in
CF3C(O)CF, and CI-(CF3C(0)CF3), but that would be computationally too
expensive.
7.4.8 Natural Population Analysis Charges
NPA charges calculated at the MPUc//MP2/a level of theory indicated that
replacing hydrogen atoms by fluorine atoms hardly changes the NPA charges on the
remaining hydrogen atom(s). In fact the NPA charge of the hydrogen atoms in
(CF2H)20 and CF30CF2H are sornewhat less positive than in (CH3)~0. For CF30CH3
there is a small increase in the NPA charges on the three hydrogen atoms relative to
(CH3)zO. The NPA charges in the chloride ion-(fluorinated) ether complexes were
caiculated at the MP2/[c/d]//MP2/[a/bl level of theory . In CI-((CH&O) no charge
transfer from CI- to the hydrogen atoms interacting with it is observed. In fact, the
hydrogen atoms interacting with Cl- will have a smaller NPA charge, while the
upward hydrogen atoms will have a substantially larger NPA charge (fiom O. 15e to
0.20e). In the CI-((CF2H)zO) and Ci-(CF30CF2H) ctusters more charge transfer corn
Cl- can be observed. More interesting is the fact that a fairly large increase in the
NPA of the hydrogen atom(s) interacting with Cl- is observed. The smallest increase
is, as expected, for Cl-(CH3OCF3), followed by Cl-((cF~H)20) (rotamers 1 and 2
more than rotamer 4), and CI-(CF30CF2H). Hardly any changes in NPA charges are
observed on the carbon, oxygen, and fluorine atoms upon complex formation with
chloride ion.
7.4.9 Potential Energy Surfaces
In Figures 7.73 and 7.74 the MP2(fc)/[6-31+G(d)/6-31G(d)] potential energy
surfaces for the formation of the CI-(CH3C(0)CH3) and Cl-(CFiC(O)CF,) complexes
are shown. For the reaction coordinate the Cl--XO distance was chosen. It has to be
stated clearly that from the level of theory used, no reliable energetics can be
determined, but the general trend will be maintained if a higher level single point
energy computations would be performed.
In Sections 7.4.2 and 7.4.3 it was already shown that chloride ion binds much more
strongly to hexafiuoroacetone than to acetone itself. From Figure 7.73 and 7.74 it can
be seen that the well for Cl-(CFaC(0)CF3) progresses more steeply at relatively short
distances and then flattens off at around 6 A from the equilibrium CI--CO distance.
The well for the Cl-(CH3C(0)CH3) complex progresses less steeply and flattens off
around 8-10 A from the equilibrium CI--CO distance. Inspection of structures along
the two reaction coordinates clearly indicates that the chloride ion approaches
CH3C(O)CH3 and CF3C(0)CF3 very differently. At distances longer than 8.0 A chloride ion interacts with acetone as if it is aligned with the C=O bond, which is also
the direction of the dipole moment of acetone. As the chloride ion gets closer it
deviates from the original approach and the interaction with the two hydrogen atoms,
as in the equilibrium structure, becomes more important. For the hexafluoroacetone a
completely different picture emerges. Even though the dipole moment of CF3C(0)CF3
is still aligned along the C=O bond, chloride ion will not approach from along this
bond, because of repulsion with the electronegative fluorine atoms. Instead, it will
approach fiom the side, thereby perhaps interacting with the quadrupole moment of
hexafluoroacetone. As the chloride ion gets closer to the C=O carbon atom, the CF3
groups start rotating away to minimize the repulsion among chloride ion and the
fluorine atoms. This process starts taking place around a C L - C O distance of 4.0 A.
These two examples nicely illustrate that the whole process of complex formation can
be quite cornplicated. By simply looking at the equilibrium structure of an ion-
molecule complex, one cannot tell how these two entities formed the complex and
what factors were mainly responsible. Of course the reverse trajectory will be
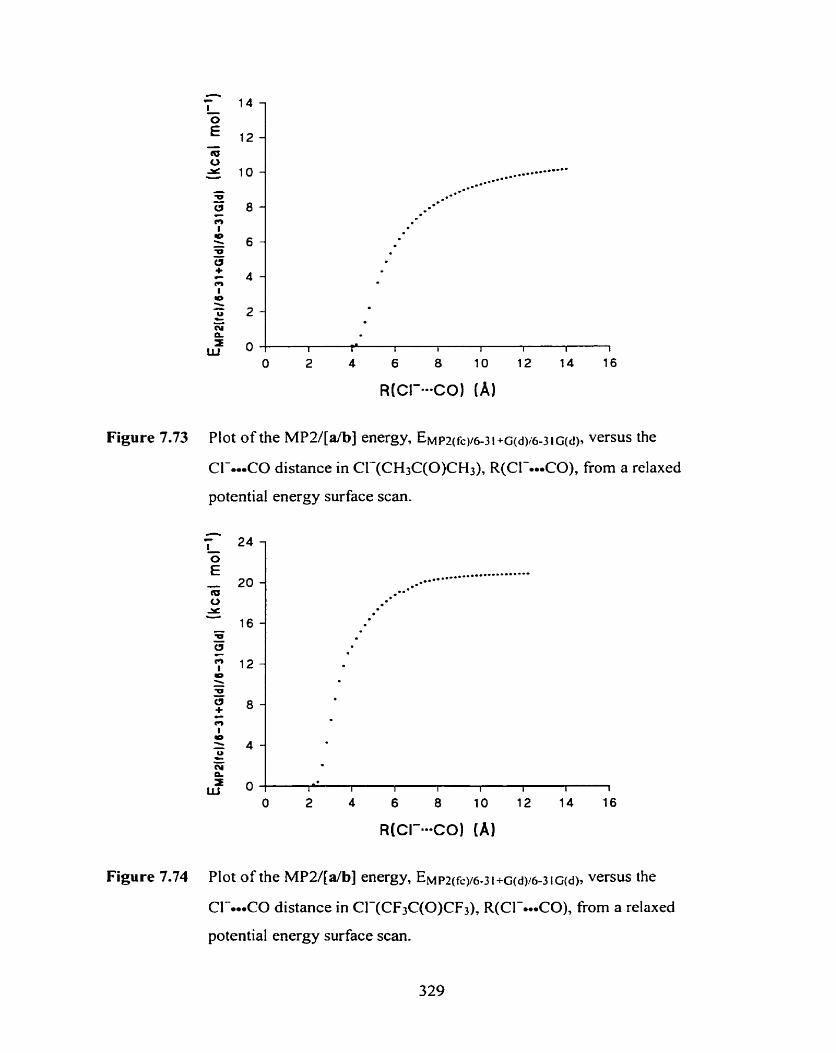
R(CI'*=CO) ( A )
Figure 7.73 Plot of the MPZ/[a/b] energy, EMPz(fc,16-3 +G(d)i6-3 G(d)> versus the
Cl--CO distance in CI-(CH3C(0)CH3), R(C1-.-CO), from a relaxed
potential energy surface scan.
R(CIc-CO) (A)
Figure 7.74 Plot of the MPU[alb] energy, EMPZ(fcy6-3 1 + ~ ( 4 , 6 - 3 1 ~ ( d ) , versus the
CL-CO distance in Cl-(CF3C(0)CF3), R(Cl-oomCO), fiom a relaxed
potential energy surface scan.
followed when the two chloride ion complexes dissociate under the influence of
collisions or light.
7.5 Conclusions
In this chapter various aspects conceming the structures, thermochemistry, gas phase
acidity, spectroscopy, and dynamics of chloride ion-(fluor-inated) ether and acetone
complexes and their neutrals have been investigated using PHPMS, FT-IR, and
computational a b h~irio and DFT methods.
For the various neutral ethers and acetones the MP2/6-3 1G(d) stmctures agree well
with other computational results in literature. For the ethers various rotamers were
considered. For the acetones the MP2/6-3 l G(d) and B3LYP/6-3 1 1 ++G(3d,3p) results
were nearly identical. The different chloride ion-ether and acetone complexes showed
some interesting features. For the ethers various rotamers and isomers were found. The
CI-(CH30CF3) resembles a SN2 backside attack complex, and formation of CF3O-
actuaily takes place in the high pressure ion source.
In the most stable structure of the CI-((CF2H)20) complex the chloride ion interacts
with both hydrogen atorns. As for the neutral CH3C(O)CHzF, the corresponding chloride
ion complex also has two rotamers, but the relative stabilities have been reversed. In the
CI-(CF3C(0)CF2H) complex the chloride ion does not interact with the very acidic
hydrogen atom. Instead it prefers to interact with the CO carbon atom. In the
Cl-(CF3C(0)CF3) complex the chloride ion also interacts with the CO carbon atom. The
two CF3 groups have rotated away from the chloride ion.
The fluorine atom substitution also introduces a large variety in the experimental and
computational thermochemistry. In general there is good to excellent agreement between
AHO from PHPMS and A H ? z ~ ~ from MP2/[dd]//MPZl[a/b] computations. For rnost of the
systems studied the HF/[a/b] computations provide values that are in good
agreement with AS' values from PHPMS. For the formation of the CI-((CF2H)zO) and
CI-(CF3C(0)CF3) complexes there are large discrepancies between AS' and 6s02sn. In
these two systems the CF2H and CF3 group rotations get hindered upon complex
formation. Attempts were made to correct for this by using the hindered rotor
approximation instead of the harmonic oscillator approximation for the torsional motions.
In general, there is good to excellent agreement between the A G O ~ M values from ICR
experiments by Larson and McMahon, and hs0298 values calculated frorn the AH0 and
AS' from this work. The general trends in A$ can be rationalized on the trends in the
polarizability.
At the G3(MP2) level of theory, a ~ ~ ~ ~ 2 e s for CH30CFi of (-2 1 5.7 + 0.1) kcal mol-'
was determined. The G3 and G3(MP2) methods provide values that are in
excellent agreement with experimental data. For CF3C(0)CF2H a large discrepancy with
the AaCid~O value o f Fand and McMahon, determined by K R was found.
FT-IR spectra were recorded for CH3C(0)CH2F, CH3C(0)CF3, CF3C(0)CF2H, and
CF3C(0)CF3. For the first and third ketones, no data were previously available, while
spectra recorded for the second and fourth ketones were identical to literature spectra. In
general, good agreement can be obtained between the experimental and computations at
HF/6-3 1 G(d) (scaled by 0.8953) and B3LYP/6-3 1 1 ++G(3d73p) levels of theory.
Formation of the chloride ion complex of CF3C(0)CF3 causes a large shift in the C=O
normal mode vibrational fiequency and the IR intensity.
For a few systems it was shown by computations that the barrier height of
(fluorinated) methyl group rotations wil1 be lowered upon chloride ion compIex
format ion.
FinaIly, relaxed potential energy surface scan computations at the MPZ/[a/b] level of
theory indicate that CI-(CH3C(O)CH3) is formed by initial approach of Cl- along the
C=O bond of the acetone molecules, hereby interacting with the dipole moment. The
CI-(CF3C(O)CF3) complex conversely is being formed by approach of Cl- fi-orn the side
of the hexafluoro acetone molecule while perhaps interacting with the quadrupole
moment of t he neutral.
7.6 References
Koch, W .; Hase, W. L. (Eds) In! J. Mass Spectrorn. 2000, 201, 1-3 36.
Bouchoux, G.; Hoppilliard, Y.; Tabet, J.-C. (Eds) Ini. J. Mass Spectrom. 2000, 199,
1-286.
Bowers, M. T.; Graul, S.; Kenttiimaa, H. 1. (Eds) lnt. J. Mass Spectrom. 2000,
195 196, 1-698.
Schwarz, H. (Ed) I~z- ./. Mass Spectrom. 1999, 1 85/186/J'187, 1 - 1002.
Takashima, K. ; Riveros, J. M. M a s Spectrom. Rev. 1998, / 7,409.
Blair, S. M.; Brodbelt, J. S.; Marchand, A. P.; Kumar, K. A.; Chong, H A . Anal.
Chern. 2000, 72, 2433 and references cited therein.
More, M.; Ray, D.; Armentrout, P. D. .J. Am. Cllem. Soc. 1999, 121, 417 and
references cited therein.
Barlow, S. E.; Tinkle, M . D . Rapid Comm. Mass Spectrurn. 1999, 13, 390 and
references cited therein.
Mele, A.; Peuetta, D.; Selvaa, A. Inf. J. Mass Spectrom. 1999, 193, L 1 -L6.
Reiche, K. B.; Starke, 1.; Kleinpeter, E.; Holdt, H.-J. Ra* Cornm. Mass Spectrom.
1998, 1 2, 1 OS 1 and references cited therein.
Dearden, D. V.; Chu, 1.-H. J. hlclsn. Pherrorn. Mol. Recog- Chm. 1997,29, 269 and
references cited therein.
Hill, S. E.; Feller, D. h t . J. Mass Specmm. 2000, 201, 41 and references cited
t herein-
Cattani, A.; Schmidtchen, F. P.J. Prak. Chem. Chem. Zeit. 1999,341, 291.
Antonisse, M. M. G.; Snellink-Ruël, B. M. H.; Yigit, 1.; Engbersen, J . F. J.;
Reinhoudt, D. N. J. Org. Chern. 1997, 62,9034.
Tamao, K.; Hayashi, T.; ho, Y. J. Organomet. Chem. 1996, 506, 85 .
Scheerder, J.; Engbersen, J. F. J.; Casnati, A.; Ungaro, R.; Reinhoudt, D. N. J Org.
Chem. 1995, 60,6448.
Savage, P. B.; Holingren, S. K.; Gellman, S. H. J. Am. Chem. Soc. 1994, 116,4069.
Scheerder, J.; Fochi, M.; Engbersen, J. F. I.; Reinhoudt, D. N. J. Org. Chem. 1994,
59, 781 5 .
Kaufman, D. E., Otten, A. Angew. Chern. 1994, 33, 1832.
Hawtorne, M. F.; Yang, X.; Zheng, 2. Pwz AppL Chem. 1994,66,245.
Farnham, W . B.; Roe, D. C.; Dixon, D. A.; Calabrese, J. C.; Harlow, R. L. J. Am.
Chem. Soc. 1990, 1 12, 7707.
Jung, M. E.; Xia, H. Tetrahedron Lerr. 1988, 29, 297.
Schmidtchen, F. P.; Berger, M. Chern. Rev. 1997, 97, 1609.
Scheerder, J.; Engbersen, J. F. J.; Reinhoudt, D. N. Reci. 7''. Chim. Pays-Bas
1996, 115, 307.
Brodbelt, J. S.; Makknia, S.; Liou, C.-C.; Lagow, R J. Am. Chem. Soc. 1991, 113,
5913.
Brodbelt, J. S.; Maleknia, S.; Lagow, R. Lin, T. Y. J. Chem. Soc. Chern. Commun.
1991, 1705.
Larson, J. W.; McMahon, T. B. J. Phys. Chem. 1984,88, 1083.
Zhang, W.; Beglinger, Ch.; Stone, J. A. J. Phys. Chem. 1995, 99, 1 1673.
Norman, K.; McMahon, T. B. J. Am. Chem- Soc. 1997, 118,2449.
Norman, K.; McMahon, T. B. J. Phys. Chem A 1999,103,7008.
Good, D. A.; Kamboures, M.; Santiano, R.; Francisco, J. S. J. Phys. Chem. A 1999,
103, 9230.
Good, D. A.; Li, Y.; Francisco, J. S. Chern. Phys. L e l ~ 1999, 313, 267.
Good, D. A.; Francisco, J. S. J . Phys. Chem. A 1999, 103, 501 1.
Christensen, L. K.; Wallington, T. J.; Guschin, A.; Hurley, M. D. J. Phys. Chem. A
1999, 103,4202.
Good, D. A.; Francisco, J. S. J. Phys. Chem. A 1998, 102, 7143.
Good, D. A.; Francisco, J. S. J. Phys. Chern. A 1998,102, 1854.
Orsel, V. B.; Ball, D. W.; Zehe, M. I. J. Mol. Sfn(ct. (ïheochem) 1997, 417, 195.
Buono, R. A; Zauhar, R. i.; Venanzi, C. A. J. Mol. Strucr. (Theochem) 1996, 370,
97.
Hsu, K.-J.; DeMore, W. B.J . Phys. Chem. 1995, 99, 11141.
Suga, A.; Mochizuki, Y.; Nagasaki, N.; Gotoh, Y.; Ito, H.; Yamashita, S. Uchimam,
T.; Sugie, M.; Sekiya, A.; Kondo, S.; Aoyagi, M. Chern. Leu. 1994, 2365.
Zhang, 2.; Saini, R. D.; Kurylo, M. J.; Huie, R. E. J. Phys. Chern. 1992, 96, 9301.
http-//webbook.nist.gov/chemistry/
Szulejko, J. E.; Fisher, J. 1.; McMahon, T. B.; Wronka, J. h t - J Mass Specrrom. ion
Processes 1 988,83, 1 47.
Frisch, M. J . ; Trucks, G. W.; Schlegel, H. B.; Scuseria, G. E.; Robb, M. A.;
Cheeseman, J. R.; Zakrzewski, V. G.; Montgomery, Jr., J. A.; Stratmann, R. E.;
Burant, J . C.; Dapprich, S.; Millarn, f . M.; Daniels, A. D.; Kudin, K. N.; Strain, M.
C.; Farkas, O.; Tomasi, J.; Barone, V.; Cossi, M.; Carnmi, R.; Mennucci, B.;
Pomelli, C.; Adamo, C.; Clifford, S.; Ochterski, J.; Petersson, G. A.; Ayala, P. Y.;
Cui, Q.; Morokuma, K.; Malick, D. K.; Rabuck, A. D.; Raghavachari, K.;
Foresman, J. B.; Cioslowski, J.; Ortiz, J. V.; Baboul, A. G.; Stefanov, B. B.; Liu, G.;
Liashenko, A.; Piskorz, P.; Komaromi, 1.; Gomperts, R.; Martin, R. L.; Fox, D. J.;
Keith, T.; Al-Laham, M. A.; Peng, C. Y.; Nanayakkara, A.; Gonzalez, C.;
Challacombe, M.; Gill, M. W.; Johnson, B.;Chen, W.; Wong, M. W.; Andres, J. L.;
Gonzalez, C.; Head-Gordon, M.; Repiogle, E. S.; Pople, J. A. Gazrssian 98,
Revision A.7 Gaussian, Inc., Pittsburgh PA, 1998.
Roothan, C. C- J. Rev. M d Phys. 1951, 23,69.
Msller, C.; Plesset, M. S. Phys. Rev. 1934, 46, 618.
Hari haran, P. C. ; Pople, J . A. 73eorefica Chim. Acta 1973, 28, 2 1 3.
Francl, M. M.; Petro, W. J.; Hehre, W. J.; Binkley, J. S.; Gordon, M. S.; DeFrees, D.
J.; Pople, J. A. ./, Chern. Phys. 1982, 77, 3654.
Clark, T.; Chandrasekhar, J.; von R. Schleyer, P. J. Comp. Chern. 1983, -1,294.
Krishnam, R.; Binkley, J . S.; Seeger, R.; Pople, J. A. J. Chem. Phys. 1980, 72, 650.
Gill, P. M. W.; Johnson, B. G.; Pople J. A.; Frisch, M.J. Chem. Phys. Lett. 1992,
197,499
Scott, A. P.; Radom, L. J. Phys. Chem. 1996,100, 16502.
Reed, A. E.; Weinstock, R. B.; Weinhold, F. J. J. C h Phys. 1985,83, 735.
Krishnan, R.; Binkley, J. S.; Seeger R.; Pople, J. A. J. Chem. Phys. 1980, 72, 650
Frisch, M. J.; Popie J. A.; Binkley J. S. J. Chem. Phys. 1984, 80 3265.
East, A. L. L.; Radom, L. J. Chern. Phys. 1997, 106,6655.
Ayala. P. Y .; Schlegel, H. B. J. Chern. Phys 1998, 108, 23 14 and references cited
t herei n.
Trainham, R.; Fletcher, G.D.; Larson, D.J. .L Phy.~. B. 1987. 20. L777.
Lee, C.; Yang, W.; Parr, R. G. Phys. Rev. B. 1988, 3 7, 785.
Becke, A. D. J. Chern. Phys. 1993, 98, 1372.
Becke, A. D. ./. Chem. Phys. 1993, 98, 5648.
C3cltissiczn 98 User's Reference, Second Edition, Gaussian Inc., 1999.
Curtiss, L. A.; Raghavachari, K.; Redfem, P. C.; Rasolov, V.; Pople, J. A. J. Chem.
Ph-VX 1998, 109, 7764.
Choi, S. C.; Boyd, R. J . Ca)]. J. ('hem. 1985, 63, 836.
Choi, S. C.; Boyd, R. J . CC1I7. J. rhern. 1986, 64, 2042.
CRC Hat~dbook of Ç'hrmistry a d Physics, Ref. Data, 76h ed., Lide, D. L. (Ed),
CRC, Boca Raton, FL, 1995.
Smith, G. D.; Jaffe, R. L.; Panridge, H. Phys Chem. A 1997, 101, 1705.
Glukhovtsev, M. N.; Pross, A.; Radom, L. .J. Am. Chem. Soc. 1995, / / 7, 2024 and
references cited therein.
Morris, R. A.; Miller, T. M.; Paulson, J. F.; Viggiano, A. A.; Feldmann, M. T.;
King, R. A.; Schaefer III, H. F. J. Chem. Phys. 1999, 110, 8436.
Gambie, T. N. M.Sc Thesis, University of Waterloo, 2000.
Li, C.; Ross, P.; Smlejko, J. E.; McMahon, T. B. J. Am. Chem. Soc. 1996, 118,
9360.
Wang, H.; Peslherbe, G. H.; Hase, W. L. J. Am. Chem. Soc. 1994, 116,9644.
Bogdanov, B.; Peschke, M.; Tonner, D. S.; Smlejko, J. E.; McMahon, T. B. h i . 1
M a s Spectrom. 1 999, 18.W86.W 7, 707.
Smlejko, J. E. Urpzitblished resirlts, University of Waterloo, 1995.
French, M. A.; Ikuta, S.; Kebarle, P. Can. J. Chern. 1982, 60, 1907.
Hoyau, S.; Nonman, K.; Ohanessian, G.; McMahon, T. B. ./. Am. Chem. Soc. 1999,
121, 8864.
Bogdanov, B. Utpziblished resul~s, University of Waterloo, 2000.
Huey, L.G.; Dunlea, E.J.; Howard, C.J. J. Phys. Chem., 1996, 100, 6504 and
references cited therein.
Farid, R.; McMahon, T. B. Cari. J. Chem. 1980, 58, 2307.
Larson, J. W.; McMahon, T. B. J. Am. Chern. Soc. 1983, 105,2944.
DeTuri, V. F.; Su, M. A.; Ewin, K . M . J. Phys. Chern. A 1999,103, 1468.
Dunbar, R. C . ; McMahon, T. B.; Thollman, D.; Tonner, D. S.; Salahub, D. R.; Wei,
D. J Am. C'hem. Soc. 1995, 117, 12819.
de Oliveira, A. E.; Haiduke, R. L. A.; Bruns, R. E Sprctrochirnica Acra P m A
2000,56, 1329.
Ballard, J.; Knight, R. J.; Newnham, D. A. J. Qim~r. Specrrosc. Radiat. Trarger
2000, 66, 199.
Heathfield, A. E.; Anastasi, C.; Ballard, J.; Newnham, D. A.; McCulloch, A. J.
Qziatit. Specrrosc. Radinf. Tronsfer 1 998, 59, 9 1 .
McKean, D. C.; Kindness, A.; Wilkie, N.; Murphy, W. F. Spectrochimica Acfa Parr
A 1996,52 ,445.
Papasavva, S.; Illinger, K. H.; Kenny, J. F. J. Phys. Chem. 1996, 100, 10 100.
Bogdanov, B.; McMahon. T. B. .I. Phys. Chem. A 2000, 104. 7871.
Kelley, J. A.; Weber, J . M.; Lisle, K. M.; Robertson, W. H.; Ayotte, P.; Johnson, M.
A. Chem. Phys. Lett. 2000, 32 7, 1.
Fately, W. G.; Miller, F. A. Spectrochimica Acta 1962, 18, 977.
DeTuri, V. F.; Ervin, K . M. J. Phys. C'hem. A 1999, 103, 69 1 1 .
Chapter 8
Conclusions
In Chapter 4 the thermochemistry and structures of halide ion-alcohol complexes,
X(ROH),, were studied. The main conclusions are that the HF2-(HOCH3), clusters for n
= 1 can be described as (FH)F(HOCH3), and for n = 2 as (CH30H)KF2-(HOCH3). For
the various X(ROH), + ROH = X(ROHh+l clustering equilibria measured, good
agreement was obtained for the AIf values with existing data. and the new data followed
expected trends. Results fiom computations at the MP2(fÙ11)/6-31 l++G(d.p) and
MP2(full)/6-3 1 1 ++G(d,p)//B3LYP/6-3 1 1 + G ( d levels of theory provided AH029n and
~ ~ ' ~ 9 8 values that agree very well with most PHPMS results. Pressure and temperature
dependent kinetics measurements for the formation of the Cl-(CH30H) indicate that a
more complex potential energy surface than initially expected is involved. Scaled
MP2(h11)/6-311*G(d.p) and B3LYP/6-311+G(d,p) normal mode vibrational
frequencies agree well with available IR and VPDS results for neutral alcohol and halide
ion-methanol complexes, respectively.
In Chapter 5 the thermochemistry and structures of solvated SN^ complexes,
(S)X(RY), and transition states, [(S)XRY]-, were studied. It was found that the
structures of (S)X(CH3Y) and [(S)XCH3Y]- can be very different frorn the halide ion-
solvent, )(T(S), and Sy2 complexes, X(CH3Y), depending on the solvent. The
experimental PHPMS thermochemistry shows solvent effects, and the solvation c f a Ss2
complexes and a solvated SN2 reaction have different AH' and AS' values. The
MP2(fc)/6-3 1 1 +G(3df2p)//MP2(fc)/6-3 1 +G(d,p) computations provide good ~ ~ ~ 2 9 8
values compared to available experimental data for the formation of Cl-(S) and
(S)CI-(CH3CI) complexes, but the ~ ' ~ 9 8 values for the [(S)ClCH3Cl]- transition states
seem to be overestimated. Linear correlations for the ~ ~ ' 2 9 8 values for the formation of
CI-(S) (S = H20. H2S, NH3, PH3, SOî), and and ~ ~ ' ~ 9 8 for the formation of
(S)Cl-(CH,Ci) and [(S)ClCH3Cl]- have been found, except for ~ ~ 2 9 , with S = S 0 2 .
Finally the potential energy profile for the solvated Sx2 reaction between CI-(H20) and
CHiBr has been calculated at the MP2(fc)/[6-3 l+G(d)LanL2DZ(spd)] level of theory.
Formation of B r and Br-(HtO) proceeds through two different profiles. Isomerization
fiom Br-(CH3CI)(H20) to (H20)Bi(CH3C1) is energetically favorable, and can be
accomplished by rotation of the BT(CH3CI) part.
In Chapter 6 the reactions between halide ions and trifluoromethyl halides were
studied. For the formation of the CI-(BrCF3), Cl-(ICF3), and Br-(BrCF3) complexes the
thermochemistry was detemined by PHPMS. Good agreement with A H ~ ~ W I and A S O ~ ~ %
values calculated at the B3LYPl6-3 1 l+G(3df)//B3LYP/6-3 1 I+G(d) and the B3LYPf
4-31 l+G(d) levels of theory, respectively, was obtained. For the halide ion-
trifluoromethyl halide complexes, two isomers have been found, X(YCF3) and
X(CF3Y). These correspond to front- and backside SN2 mechanism complexes,
respectively. Associated with these two different mechanisms are two transition states,
[CF3XYJ- and [XCF3Y]-. The Ss2 reaction between halide ions and tnfluoromethyl
halides proceeds through a backside attack transition state. The Cl- + CF3Br -+ B r +
CF3CI reaction was shown to follow the Marcus theory, indicating that at high kinetic
energies of X the backside SN2 reaction may still be initiated by electron transfer. In
addition, it appears to be a direct mechanism. The frontside SN2 transition state closely
resembles a [CF; r] complex. At threshold, the backside attack SN2 reaction between
kinetically excited Cl- and CF3CI proceeds through the [ClCF3CI]- transition state.
Above the threshold, a CO-linear approach is no longer necessary to initiate the reaction,
and barrier crossing can occur at a wider range of Cl-C-Ct angles, thereby increasing the
cross section.
In Chapter 7 the structures, thermochemistry, gas phase acidity, and IR spectroscopy
of chloride ion-(fluorinated) ether and acetone complexes and the corresponding neutrak
have been studied. The CI-(CH30CF3) complex resembles a SN2 complex, and formation
of CF30- was observed in the PHPMS source. In the most stable Cl-(CF2H)20) complex
the chloride ion interacts with both hydrogen atoms, thereby hindering the CF2H group
rotations. In the Cl-(CF3C(0)CF2H) complex, the chloride ion does not interact with the
very acidic hydrogen atom. Instead it interacts with the carbonyl group carbon atorn. In
the CI-(CF3C(0)CF3) complex a similar kind o f binding is observed, and the two CF3
groups have rotated away fiom the chloride ion. The agreement between the AH? and AS'
values from PHPMS, and the AH0298 values from MPZ(fc)/[6-3 1 l+G(3df,3pd)l
6-3 1 1 +G(2df,p)]//MP2(fc)/[6-3 1 +G(d)/6-3 1 G d ) computations and the AH0298 values
from HF/[6-3 1 +G(d)/6-3 1 G(d)] computations, respectively, is very close except for
systerns with hindered methyl group rotations. Attempts to correct for this did not
improve them to any useh l extent. New FT-iR spectra for CH3C(0)CH2F and
CF3C(O)CF*H were recorded, and literature spectra for CF3C(O)CH3 and CF3C(O)CF3
could be reproduced. Good agreement between the experiments and scaled HF/6-3 1 G(d)
and unscaled B3LYP16-3 1 l++G(3d,3p) computations was obtained.
The PHPMS experiments performed for this thesis have provided new and additional
insights into the structures of a variety o f negative gas phase cluster ions, and in
combination with computational quantum chemistry methods characteristics o f various
potential energy surfaces have been elucidated.
AAer summarizing what has been learned fiom the research performed for this thesis,
it seems more than appropriate to provide some outlook on what kind of fùture research
may be possible. 1 would have loved to perform these experiments myself, but that would
have added at least another 200 pages to this thesis. In addition, 1 would have been a
graduate student for another one to two years.
The study o f the kinetics o f the unimolecular dissociation by ZTRD of chloride ion-
alcohol complexes in a FT-ICR (Reaction 8.1) will be a good test case to nirther
investigate the influence o f the number o f IR absorbing vibrations on the rate of
dissociation for a series o f systems with fairly identical binding energies.
Modeling the kinetics by a program like VARIFLEX will require input parameters
like normal mode vibrational fiquencies, IR intensities, and s o on from computations like
performed in Chapter 4. The same input parameters will be required to mode1 the intemal
energy distributions of the chloride ion-alcohol complexes.
It would be very interesting if VPDS spectra of the various halide ion-alcohol
complexes will be measured in the future, not only to test the cornputations published in
this thesis, but also to get more insights into the anharmonic character, and the coupling
of various vibrations.
Measuring the standard enthalpy (m and entropy (AS? changes for the clustering
of the HF2- ion ont0 Hz0 and CH30H will test the G3(MP2) computations in Chapter 4.
It seems that drift cell experiments, as can be performed by Bowers and CO-workers, are
more appropriate than PHPMS experiments, mainly due to the small intensities of the
HF*- ions in the high pressure ion source using a NF31CH4 mixture.
The ion-molecule reaction between chloride ion and CF30C(0)H (Reaction 8.2), and
the subsequent unimolecular dissociation of the CI-(HOCF3) cluster ion (Reaction 8 -3)
seem worthwhile to perfom, even though they will most likely not provide new insights
into existing knowledge on ion-molecule reactions or unimolecular dissociation Cjust for
the fun of them).
CI- + CF30C(O)H + Cl-(HOCF3) + CO (8-2)
Perforrning solvated SN2 reactions in a FT-ICR between solvated chioride ions and
bromoacetonitrile (Reaction 8.4), in combination with MP2 and B3LYP level o f theory
computations, will provide additional insights into the influence of solvation and the type
of solvent on the kinetics and thermochemistry of gas phase and condensed phase
reactions.
In addition, these reactions would provide a real opportunity to test various
computations.
It would please me if, in the near future, Professor Kent Ervin and his CO-workers will
use their guided ion beam instrument to study the SN2 reactions between halide ions and
trifluoromethyl halide molecules (Reaction 8.5).
Not only will these experiments provide data to test the computations performed for
Chapter 6, but 1 believe that these systems have the potential to show some unexpected
chemistry. From a fundamental point of view, they are important enough to be
investigated in more detail, and 1 know they will be sooner than later.
The research described in Chapter 7 has also provided ideas for future research. First
of al! it would be interesting to pefiorm ZTRID experiments on the following cluster
ions: CI-(CF2HOCF2H), CI-(CH3C(0)CH3), CI-(CH,C(O)CF3), and CI- (CF3C(O)CF3).
Especially the first and fourth clusters have very strong bonding between chloride ion and
the neutral. The C-F vibrations strongly absorb IR radiation, and consequently relatively
fast unimolecular dissociation may be expected. The second and third cluster ions have
identical binding enthalpies, but the presence of the three C-F bond may have the third
one dissociate faster. Preliminary calculations where the blackbody radiation distribution
at room temperature was deconvoluted with the calculated B3LYP level of theory KR
spectra of the Cl-(CH,C(0)CH3) and CI-(CH3C(0)CF,) cluster ions showed that the
second one will absorb approximately four times more photons, and consequently a faster
uni molecular dissociation rate will be expected.
Experimental determination of the central barrier height for the SN^ reaction between
chloride ion and CH3OCF3 (Reaction 8.6) by ion kinetic energy resolved experiments in
for instance a guided ion beam instrument will test the accuracy of the G3(MP2) result
for the new Ss2 reaction.
Finally, it would be interesting to measure the thermochemistry of the clustering of
chloride ion ont0 FC(0)CF2CF2CF3 and FC(0)CF2CF2CF2C(O)F (Reaction 8.7 and 8.8).
CI- + FC(0)CFtCF2CF3 = CI-(FC(0)CF2CF2CF3)
High level a b ir~itio computations, like used in Chapter 7, have s h o w that that the
cyclic, bidentate isomer of the Cl-(FC(0)CF2CF2CF2C(O)F) cluster ion is approximately
7.5 kcal mol-' more stable than the isorner in which chlonde ion interacts with only one
carbonyl group carbon atorn. The differences in the AH' and AS' values, obtained by
PHPMS, for Reactions 8.7 and 8.8 will provide the AHo and AS' values to fom the cyclic
isomer.
These are al1 the ideas 1 couId think of, but I have no doubt that a more experienced
eye will see much more than mine in al1 ofthis.
Appendix A
Electronic energies
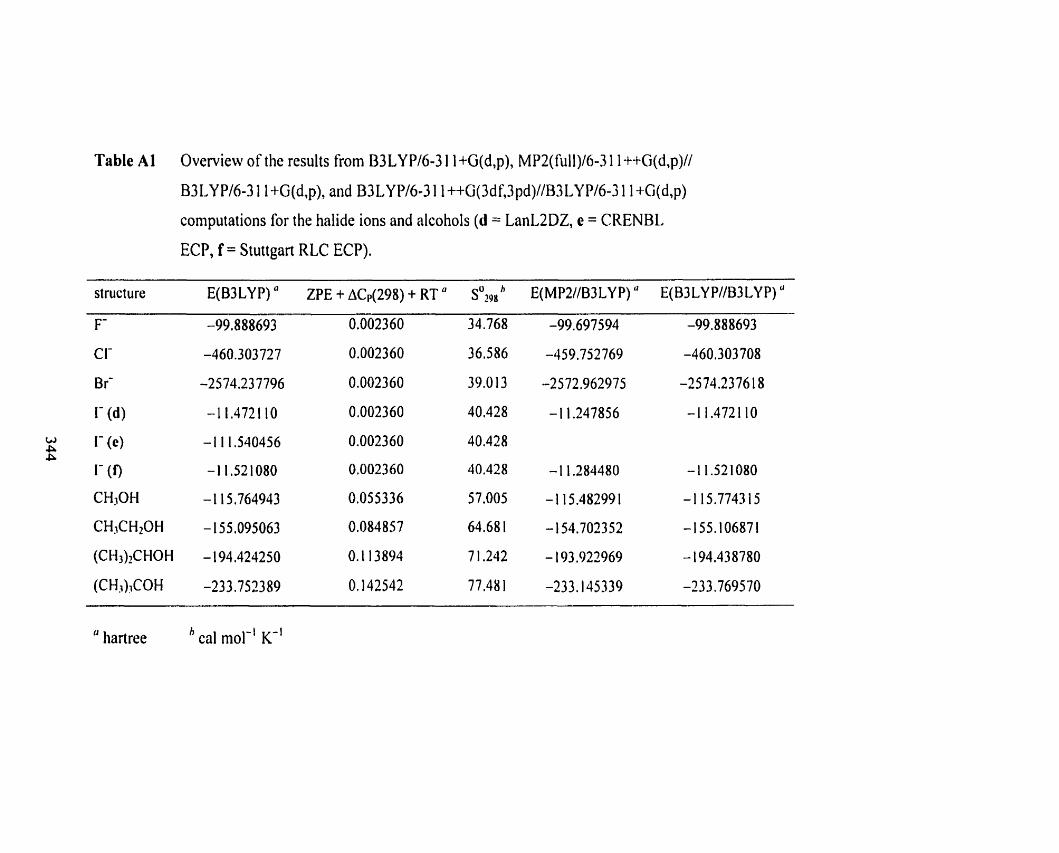
Table Al Overview of the results from B3LYP16-3 1 1 +G(d,p), MP2(fu11)16-3 1 1 ++G(d,p)//
83 LY P16-3 1 1 +G(d,p), and B3 LY P16-3 1 1 ++G(3df,3 pd)llB3 LY P16-3 1 1 +G(d,p)
computations for the halide ions and alcohols (d = LanLZDZ, e = CRENBL
ECP, f = Stuttgart RLC ECP).
structure E(B3LY P) " ZPE + ACp(298) + RT " s~~~~ "(MPZIlB3LY P) " E(B3 LY PIlB3 LY P) *
F- -99.888693 0.002360 34.768 -99.697594 -99.888693
CI- -460.303727 0.002360 36.586 -459.752769 -460.303708
Bt- -2574.23 7796 0.002360 39.0 13 -2572.962975 -2574.237618
" hartree cal mol-' K-'
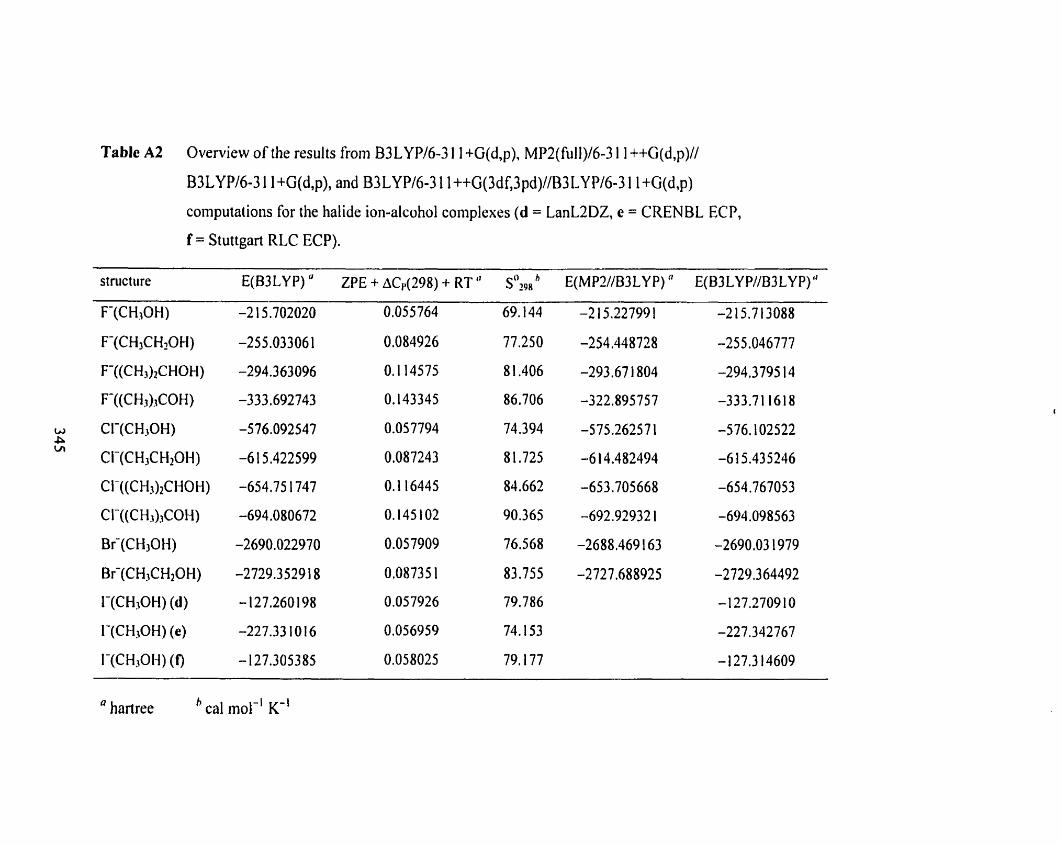
Table A2 Overview of the results from B3LYW6-3 1 1 +G(d,p), MP2(fu11)/6-3 1 1 ++G(d,p)//
B3LYPl6-3 1 l+G(d,p), and B3LYP16-3 1 1 ++G(3df,3pd)//B3LY P16-3 1 1 +G(d,p)
computations for the halide ion-alcohol complexes (d = LanLZDZ, e = CRENBL ECP,
f = Stuttgart RLC ECP).
structure E(B3LY P) ZPE + ~ C ~ ( 2 9 8 ) + RT s;,~ E(MPWB3LY P) " E(B3LY P//B3LY P)"
hartree cal mol-' K-'
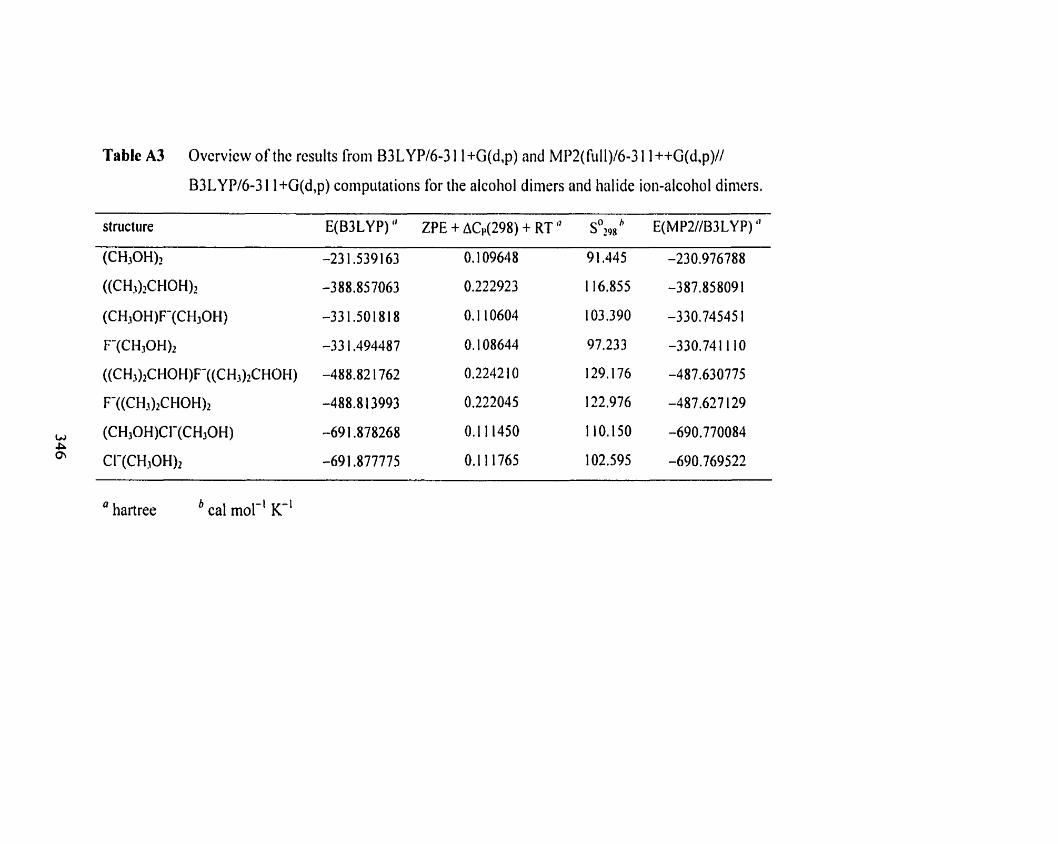
Table A3 Overview of the results froni B3LYP16-3 1 1 +G(d,p) and MP2(fu11)/6-3 1 1 ++G(d,p)//
B3LYP/6-3 1 l+G(d,p) coinputaiions for the alcoliol dimers and halide ion-alcohol dimers.
structure E(B3LY P) " ZPE t ~C,,(298) + RT " s~~~~ E(MP2//B3LYP) "
(WOH)2 -23 1.539 163 O. 1 09648 9 1,445 -230.976788
a hartree cal mol-' K-'
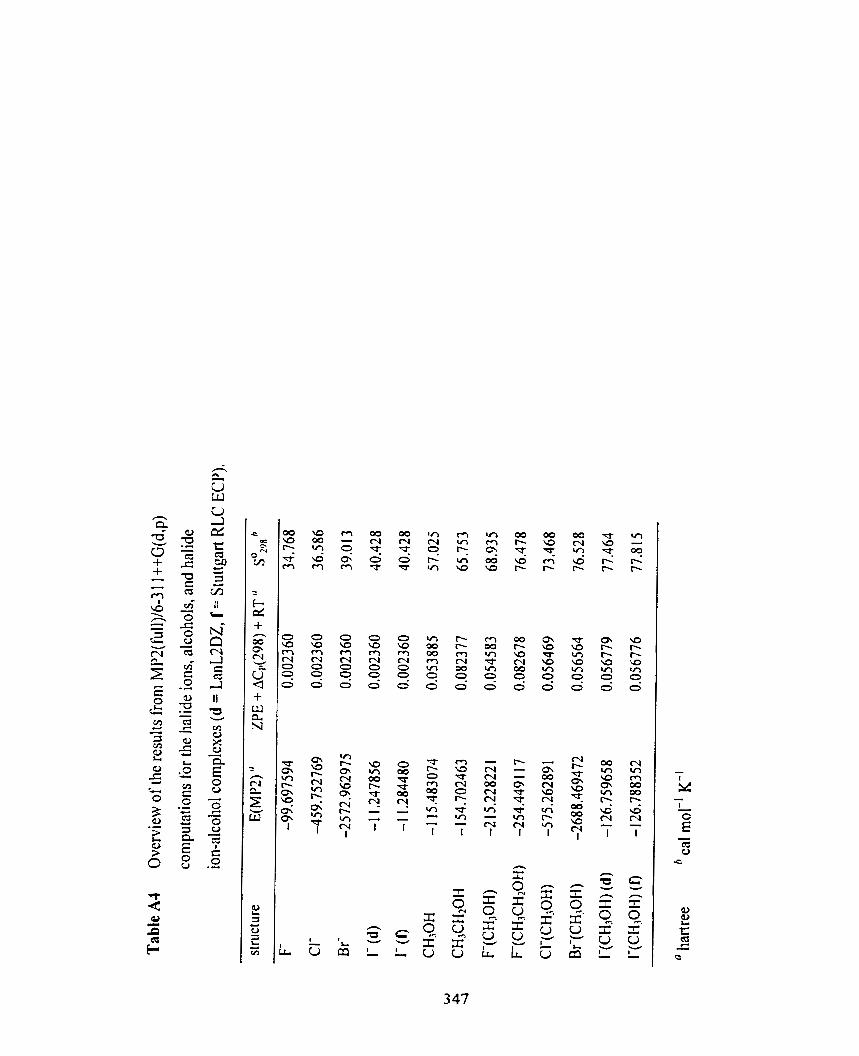
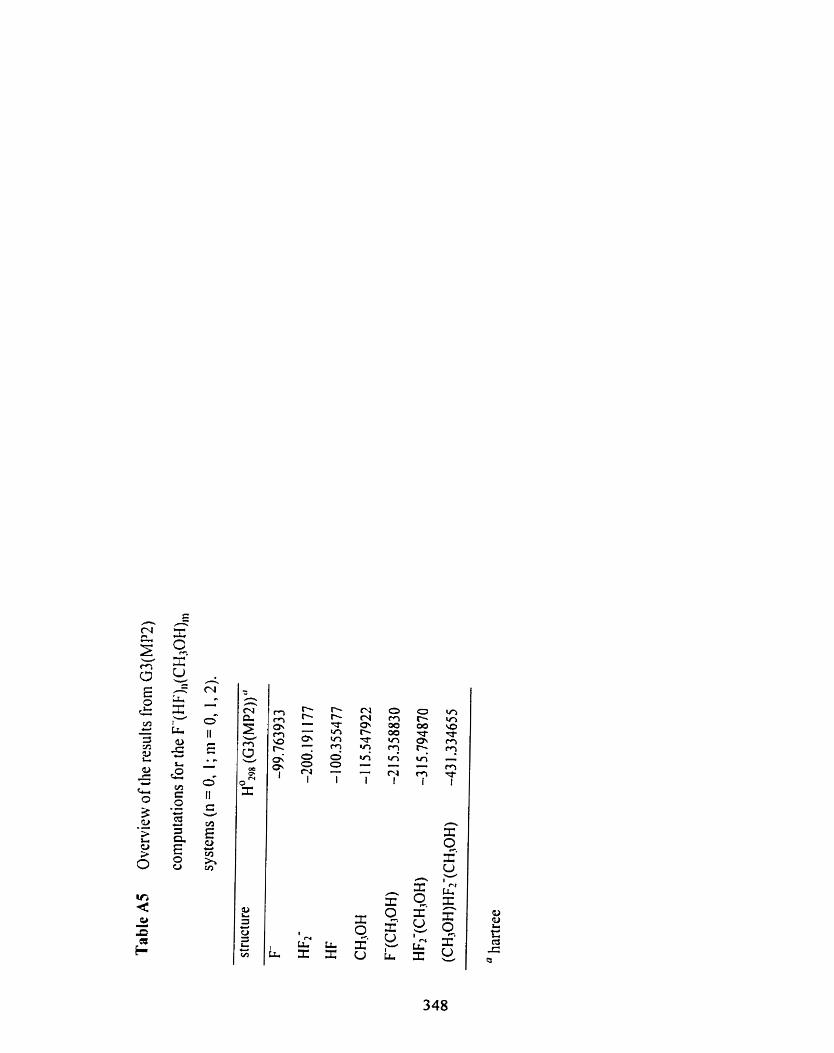
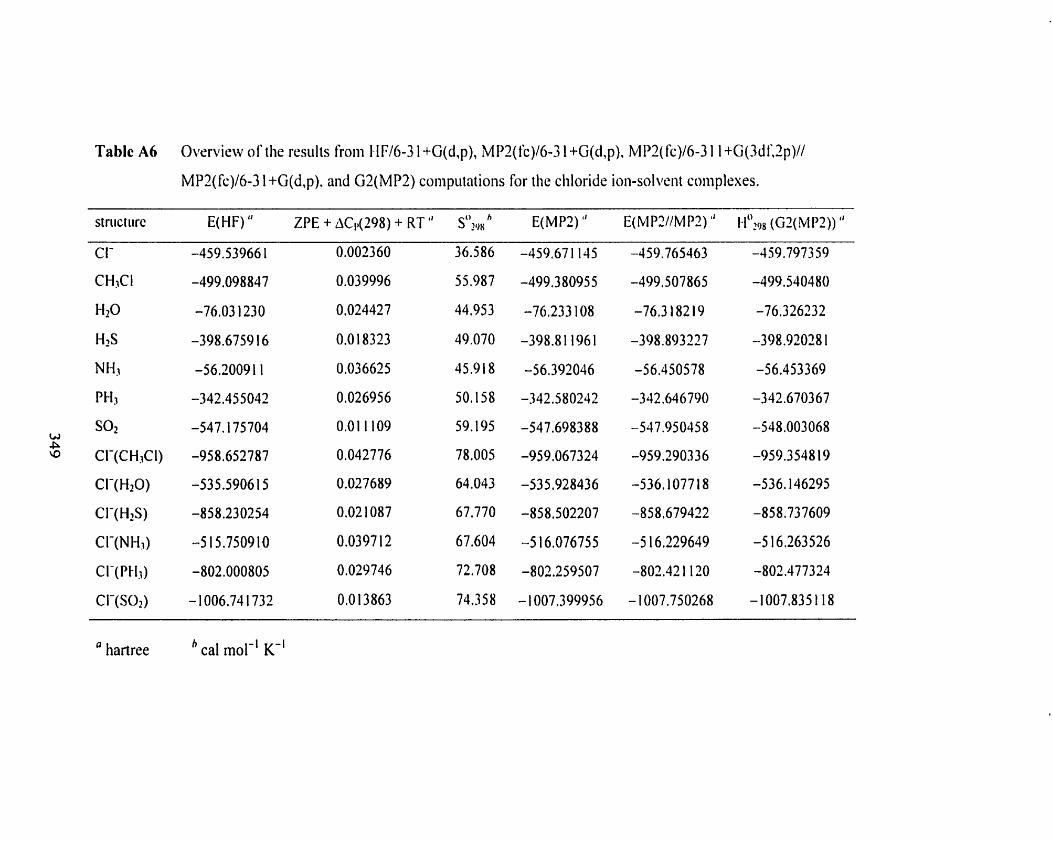
Table A6 Ovcrview of the results froiii 1-IFl6-3 1 +G(d,p), MP2(fc)/6-3 1 +G(d,p). M1'2(fc)/6-3 1 I +G(3dl:Zp)//
MP2(fc)/6-3 1 +G(d,p). and G2(MP2) comp~iiatioiis for the cliloride ion-solveii~ c«mplrses.
ZPE + ACp(298) + R T " ~"p)y,
CI-
CH3CI
H2O
H2S
NH.3
PH3
W soz
P CI-(CH$!)
CI-(HzO)
CI-(H2S)
CI-(NH3)
c 1-(P t13)
CI-(SO*)
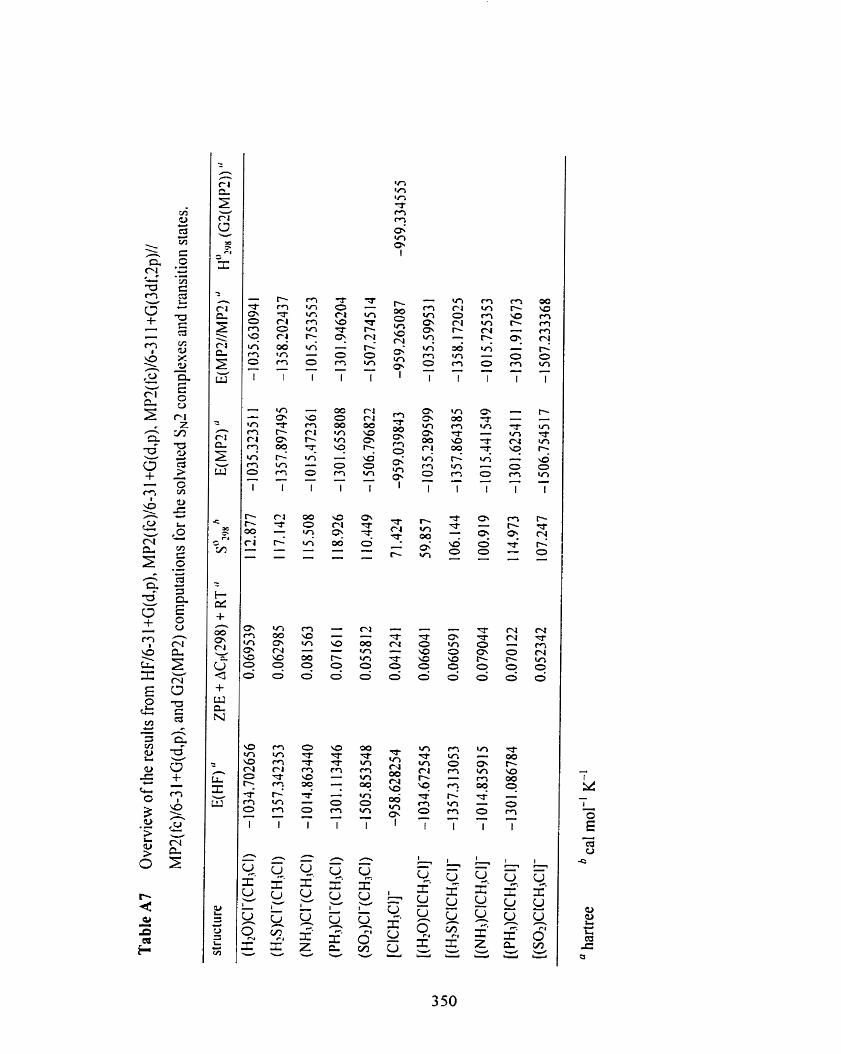
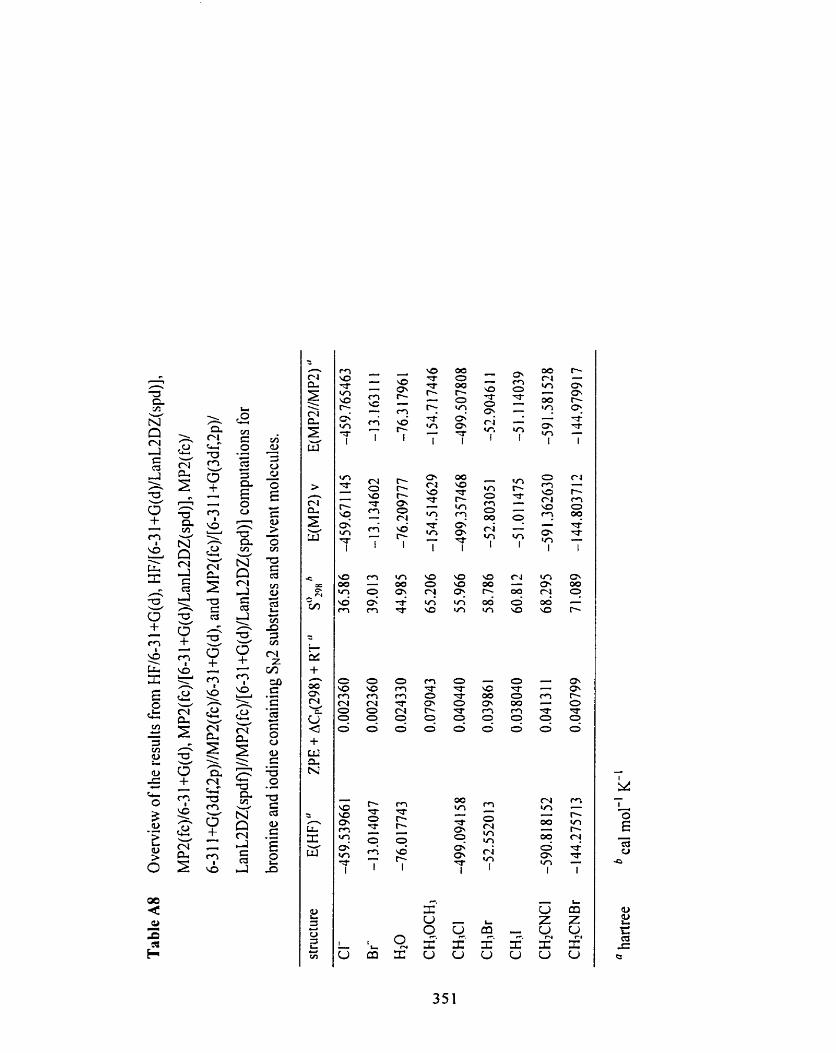
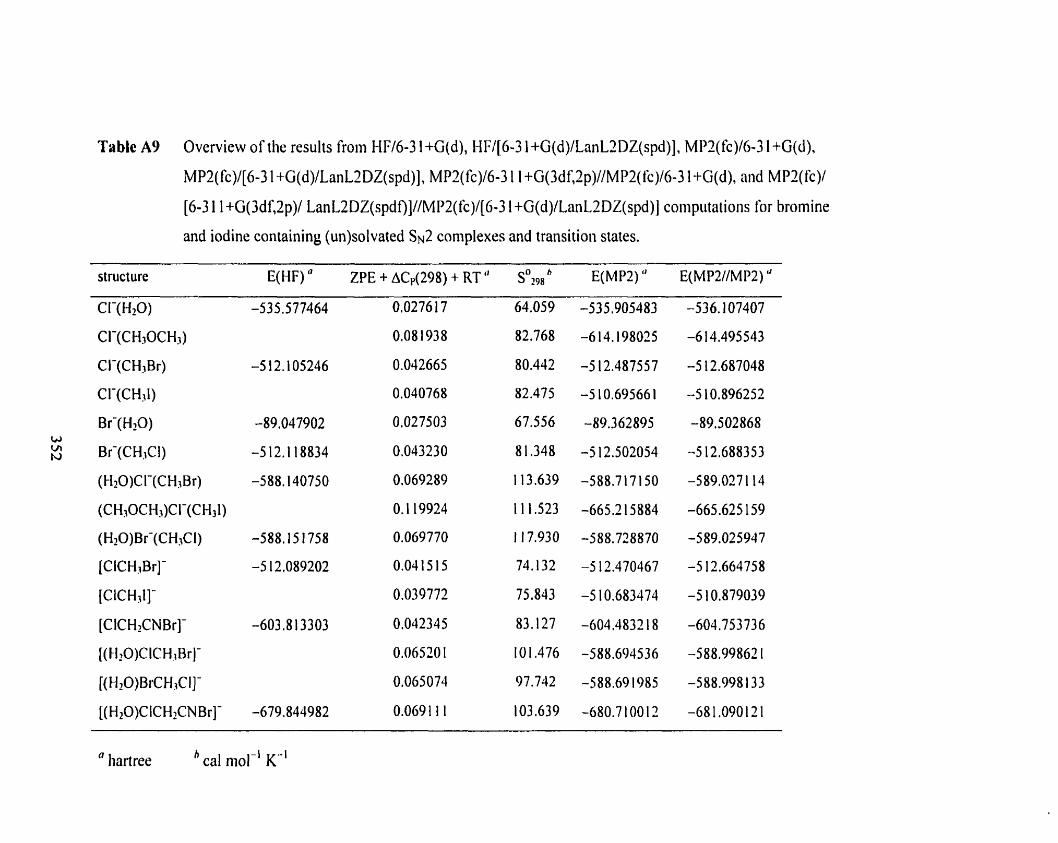
Table A9 Overview of the results froiii Hl%-3 1 +G(d), HF/[6-3 I +G(d)lLanL?DZ(spd)], MP2(fc)l(>-3 I +G(d).
[6-3 1 l+G(3df,2p)l LanL2DZ(spdf)]//MP2(fc)/[6-3 1 +G(d)/LaiiLZDZ(spd)] coinpiitatioiis for broiiiine
and iodine containing (un)solvated SN2 complexes and traiisitioii States.
structure E(HF) " ZPE + ACp(298) + RT " sDlls "
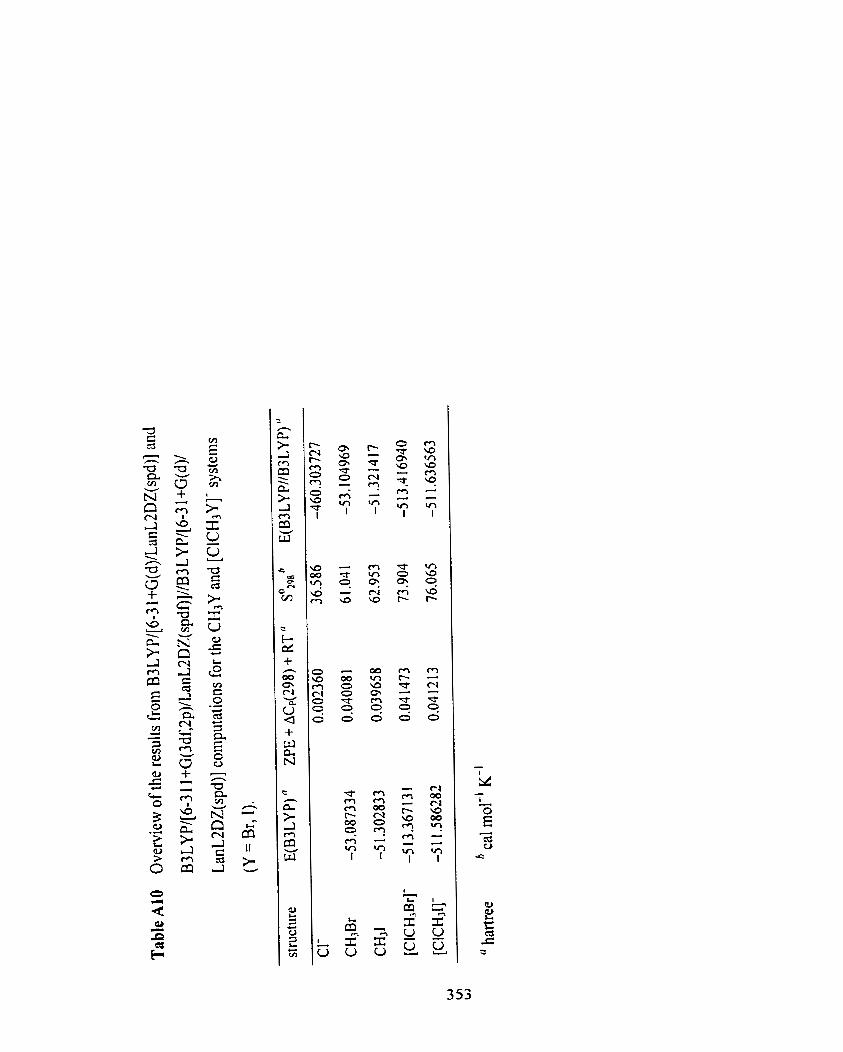
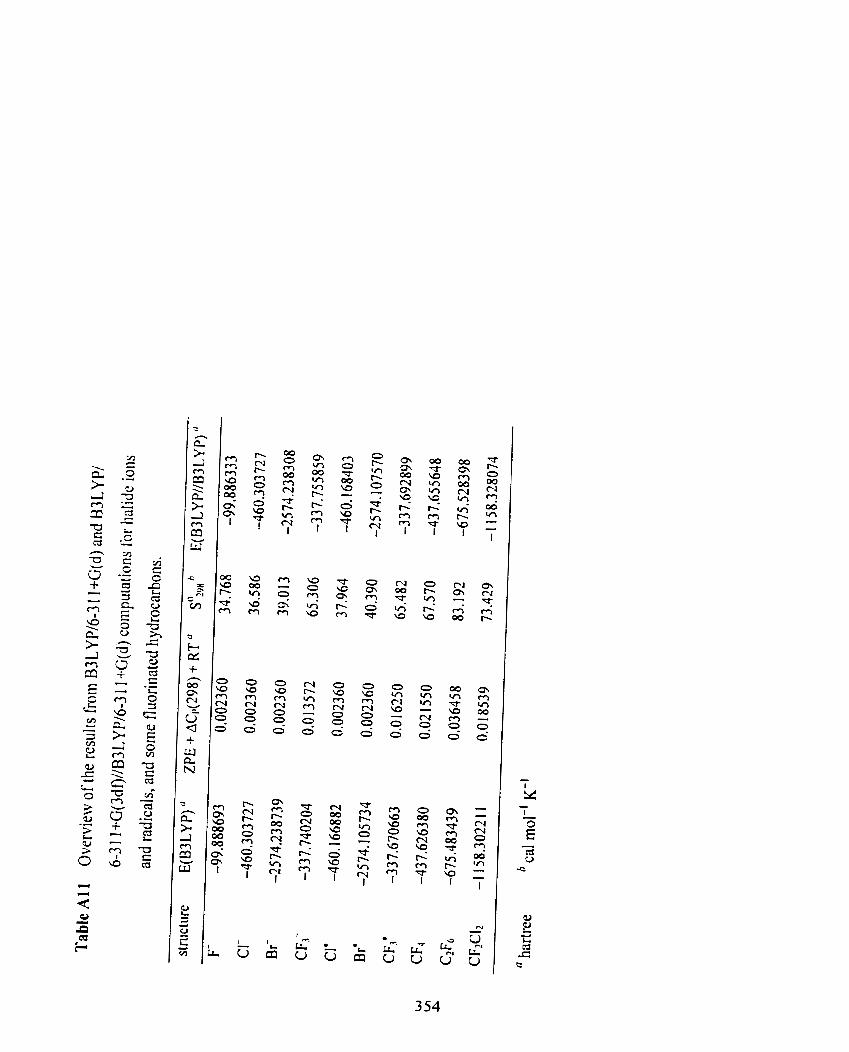
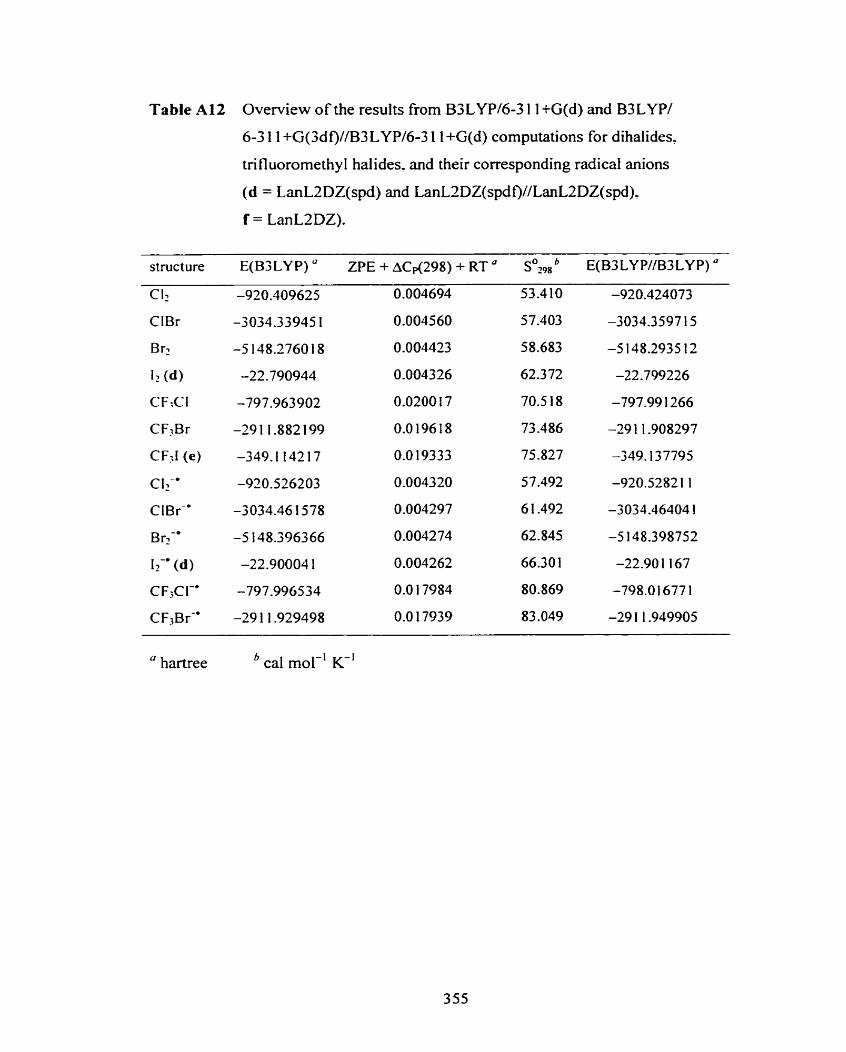
Table A 12 Overview o f the results from B3 LYP/6-3 1 1 +G(d) and B3 LYP/
6-3 1 1 +G(3df)//B3 LY P/6-3 1 1 +G(d) computations for dihalides,
trifluoromethyl halides. and their corresponding radical anions
(d = LanL2DZ(spd) and LanL2DZ(spdf)//LanL2DZ(spd).
f = LanL2DZ).
structure E(B3LY P) "
C I 2 -920.409625
ClBr -3034.33945 1
Bri -5 148.2760 18
12 (d) -22.790944
CF;CI -797.963902
CF3Br -29 1 1.882 199
CF;[ ( e ) -349.1 142 17
Cl1-' -920.526203
CI Br-' -3034.46 1578
Br2-* -5 148.396366
Iz-' (d) -22.90004 1
C F;C 1-• -797.996534
CF3Br-• -29 1 1.929498
ZPE + ACp(298) + RT " s~~~~
" hartree cal mol-' K-'
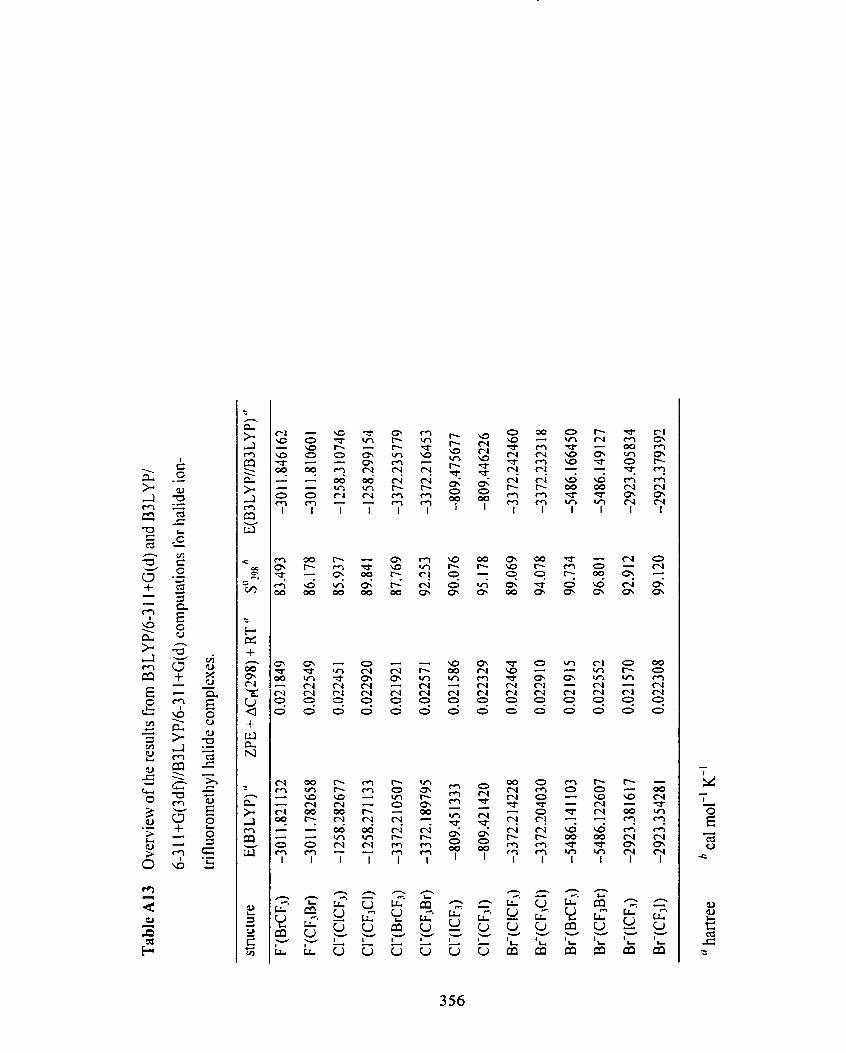
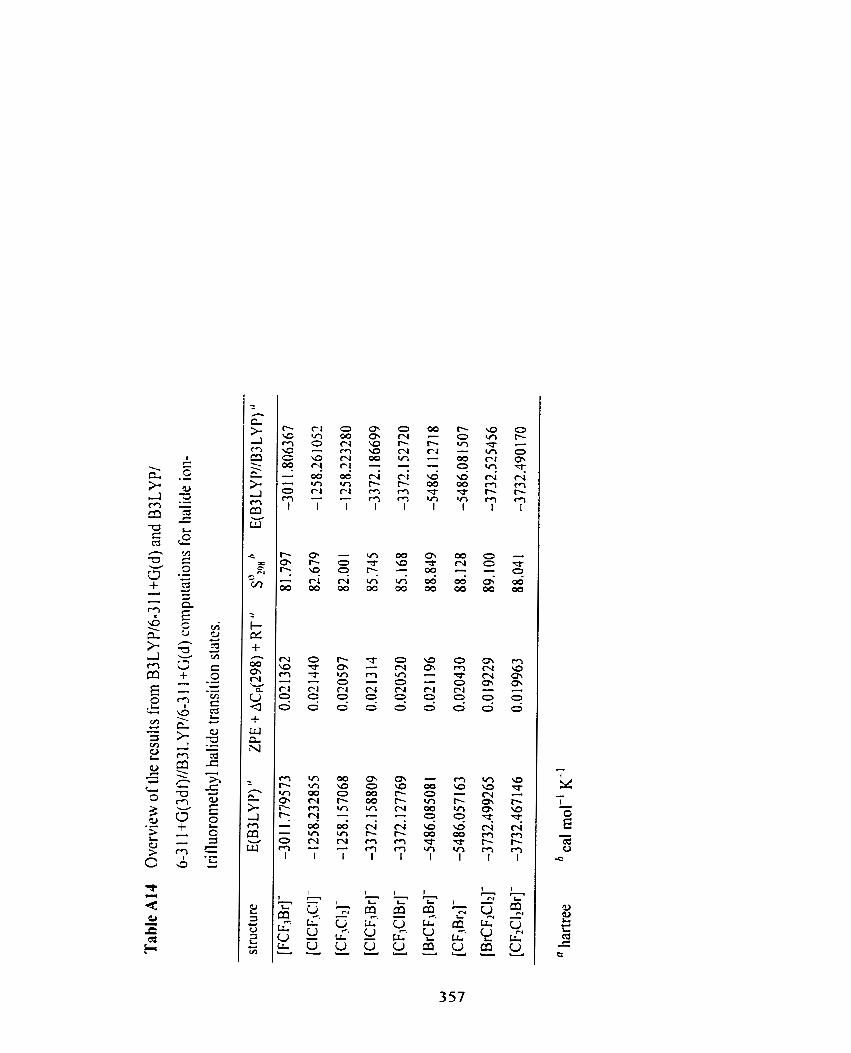
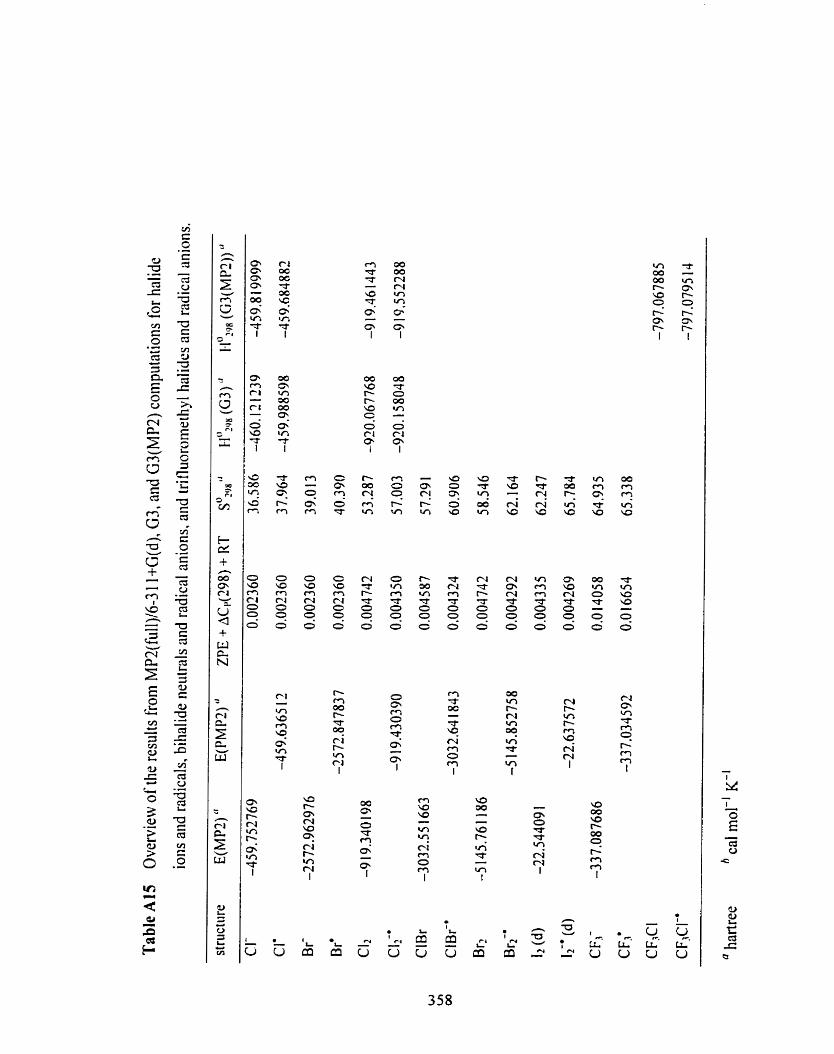
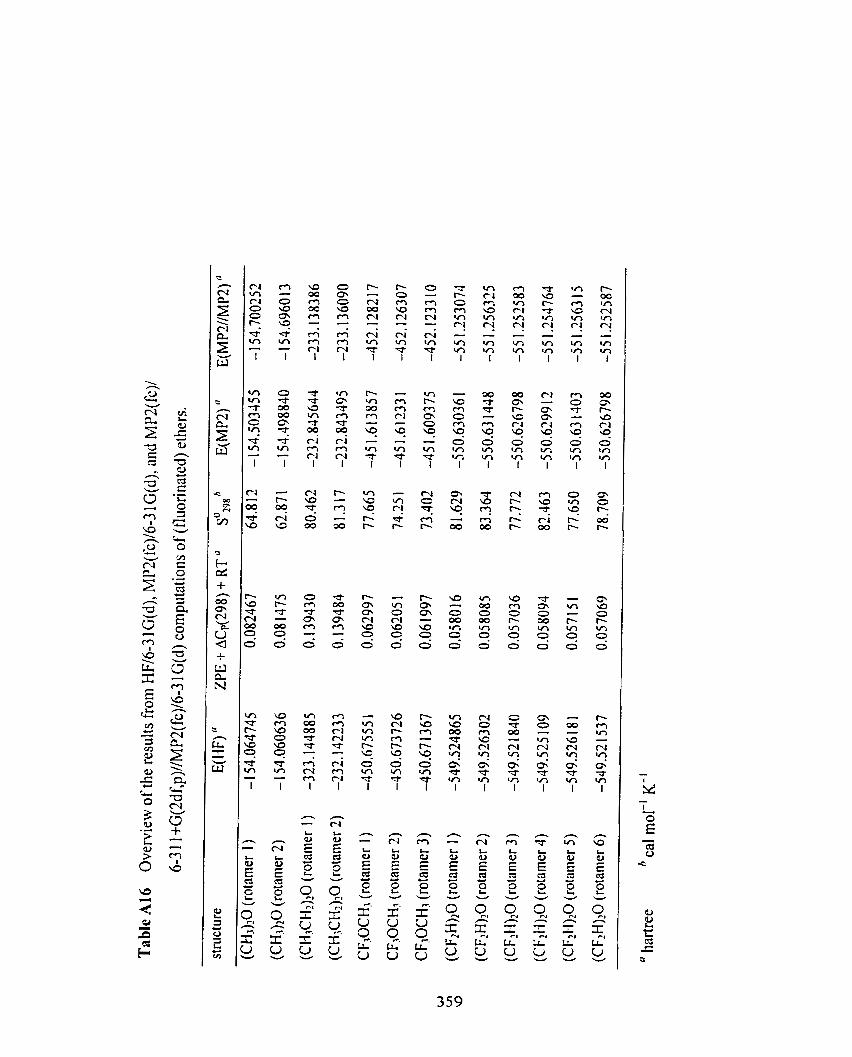
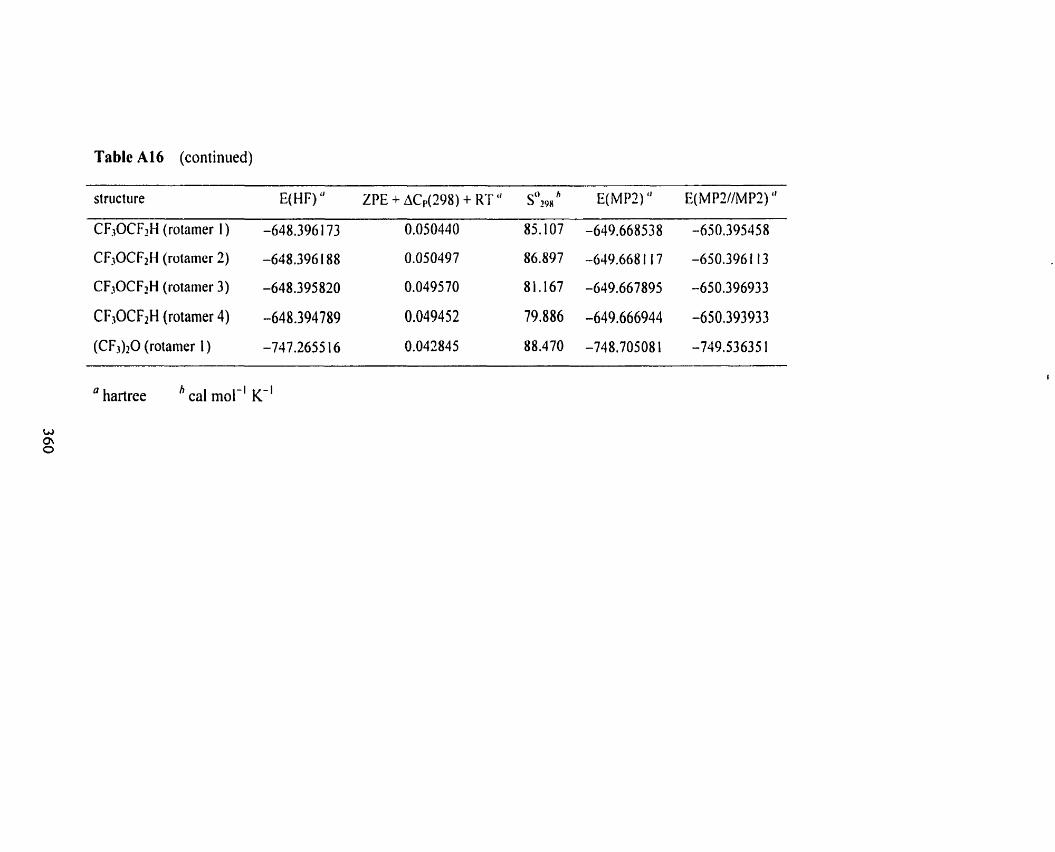
Table A16 (continued)
structure E(HF) " ZpE + ~C, , (298) + Kr " s ~ ' ~ ~ ~ E(MP2) " E(MPWMP2) "
CF30CF2H (rotainer 1 ) -648,396 173 0,050440 85.1 07 -649.668538 -650.395458
CF.OCF2H (rotamer 2) -648.396 188 0.050497 86.897 -639.668 1 17 -650.396 1 13
CF.0CFd-J (rotamer 3) -648.395820 0.049570 8 1.167 -649.667895 -650.396933
C F W F 2 H (rotamer 4) -648.394789 0.049452 79.886 -649.666944 -650.393933
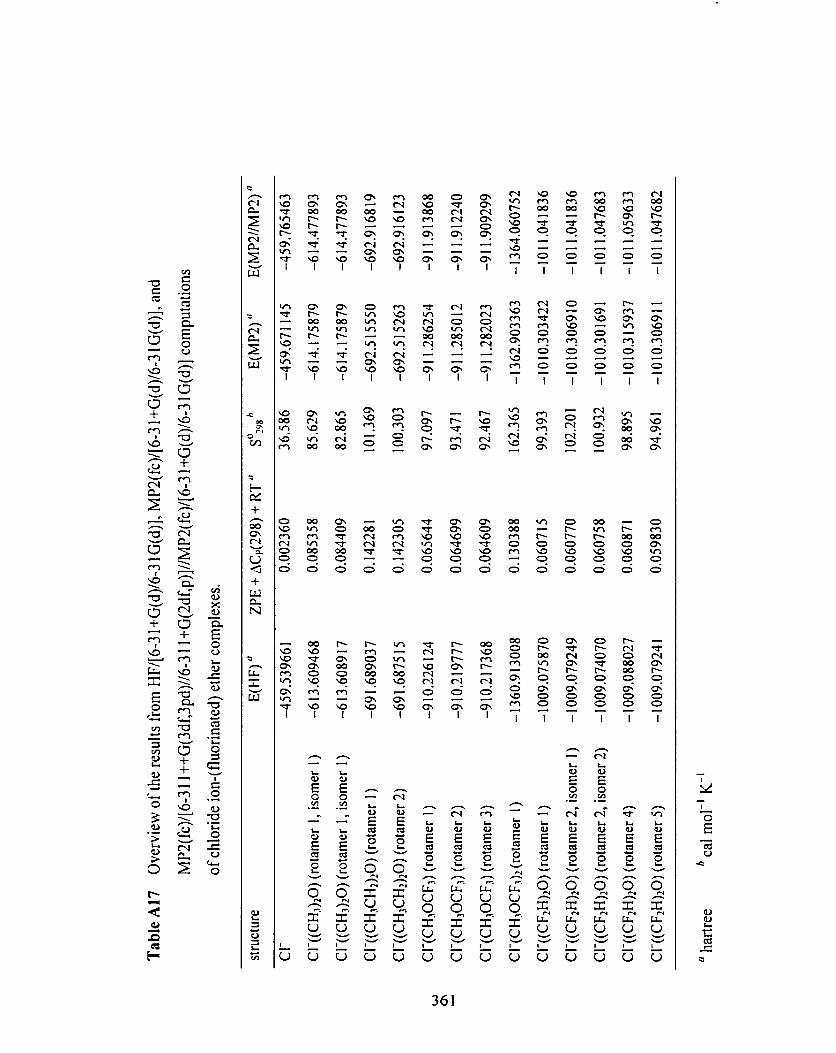
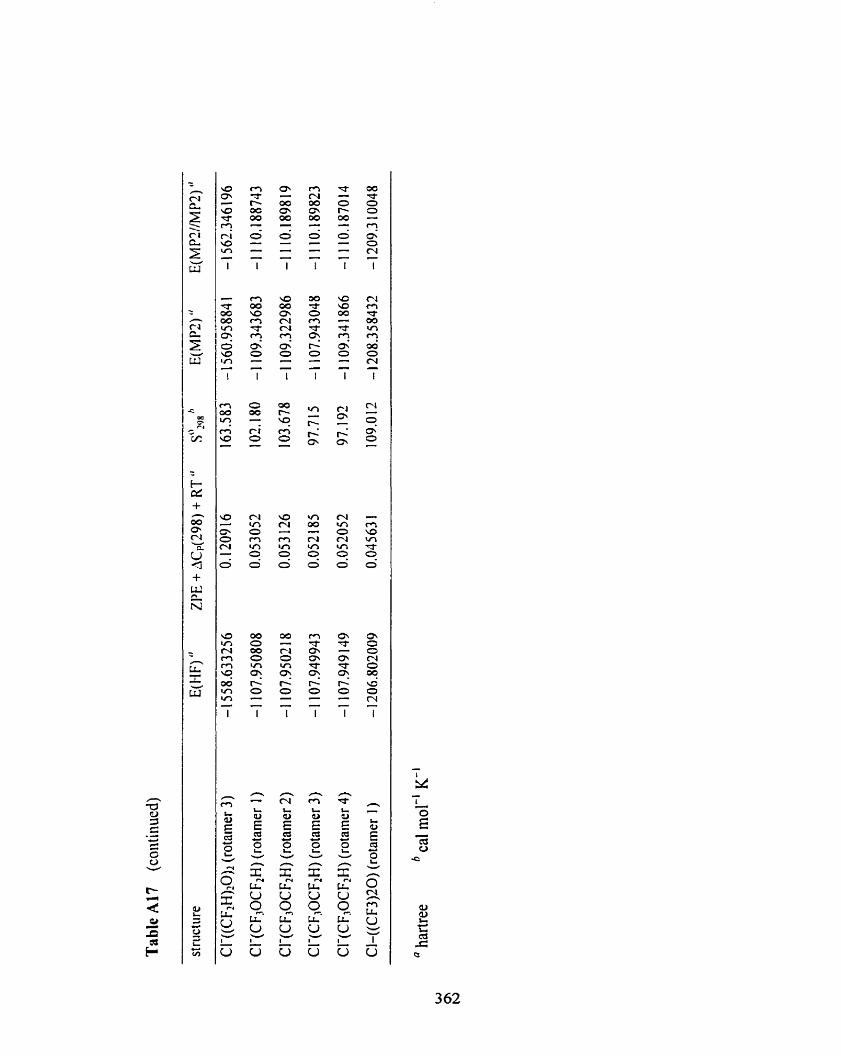
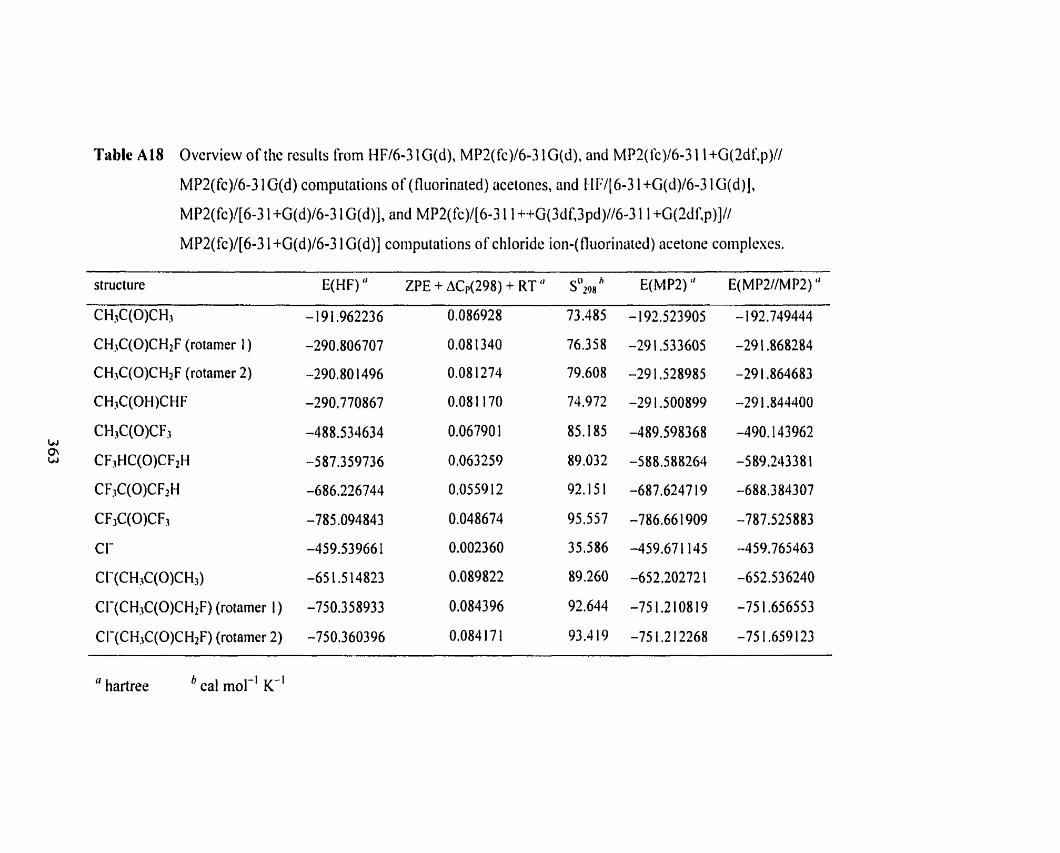
Table A18 Overview of the results froin H F / M lG(d), MPZ(fc)/6-3 lG(d). and MP2(k)16-3 1 I+G(2df.p)//
MP2(fc)/6-3 1 G(d) computations of ( fluorinated) acetoiies, and HI:1[6-3 1 +G(d)/6-3 1 ü(d)],
MP2(fc)/[6-3 1 +G(d)/6-3 1 G(d)], and MP2(1C)/[6-3 1 1 ++G(3df,3pd)//6-3 1 I +G(îdf,p)]//
MP2(fc)/[6-3 1 +G(d)16-3 1 G(d)] coiiiputations of chloride ion-( fluoriiiüted) acetone coiiiplcses.
structiire E(HF) " ZPE + ACp(298) + RT "
CHK(O)CH.I - 19 1.962236 0.086928
CH3C(0)CH2F (rotarner 1 ) -290.806707 0.08 1340
CHJC(0)CH2F (rotamer 2) -290.80 1496 0.08 1274
CI-(CHjC(0)CH2F) (rotamer 1 ) -750.358933 0,084396
CI-(CH3C(0)CH2F) (rotamer 2) -750.360396 0,084 17 1
a hartree cal mol-' K-'
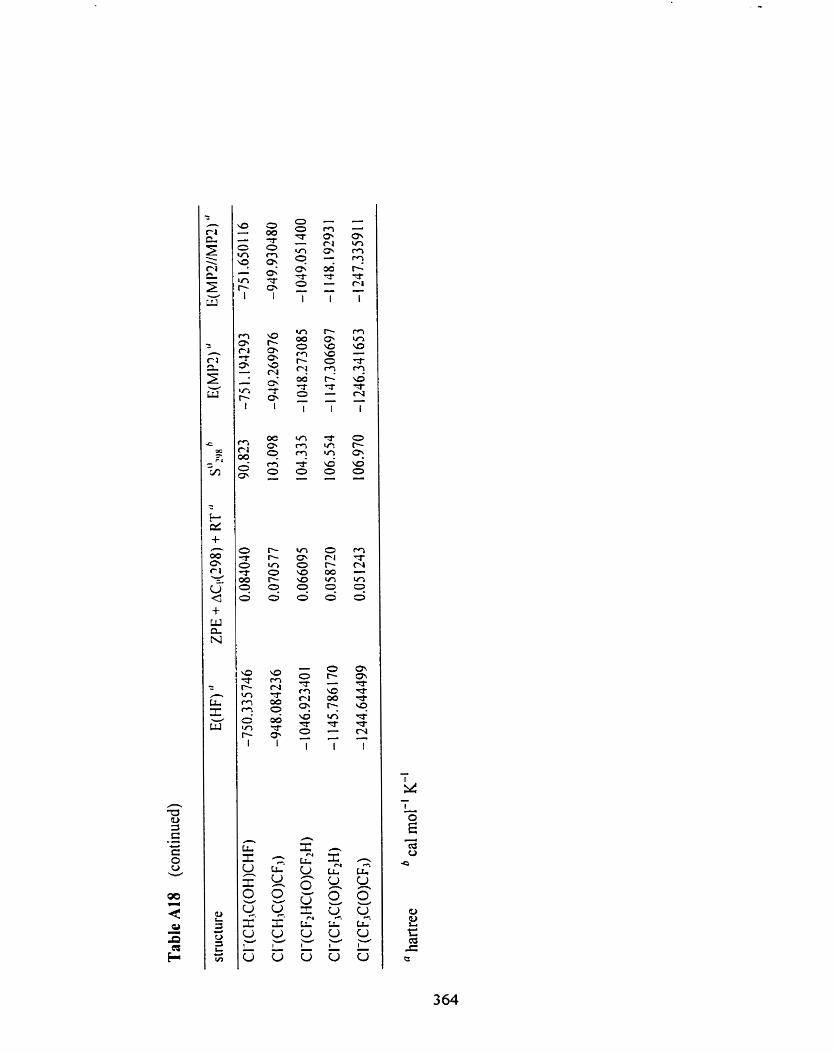
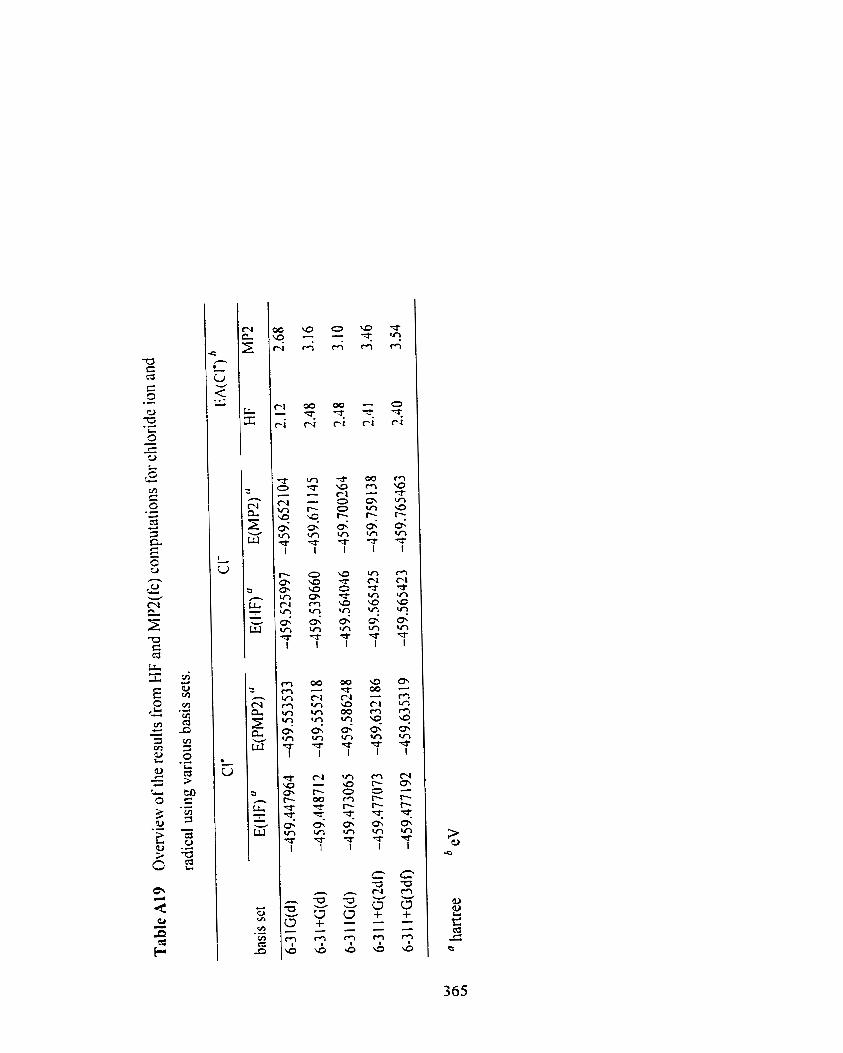

Appendix B
Gaussian input files
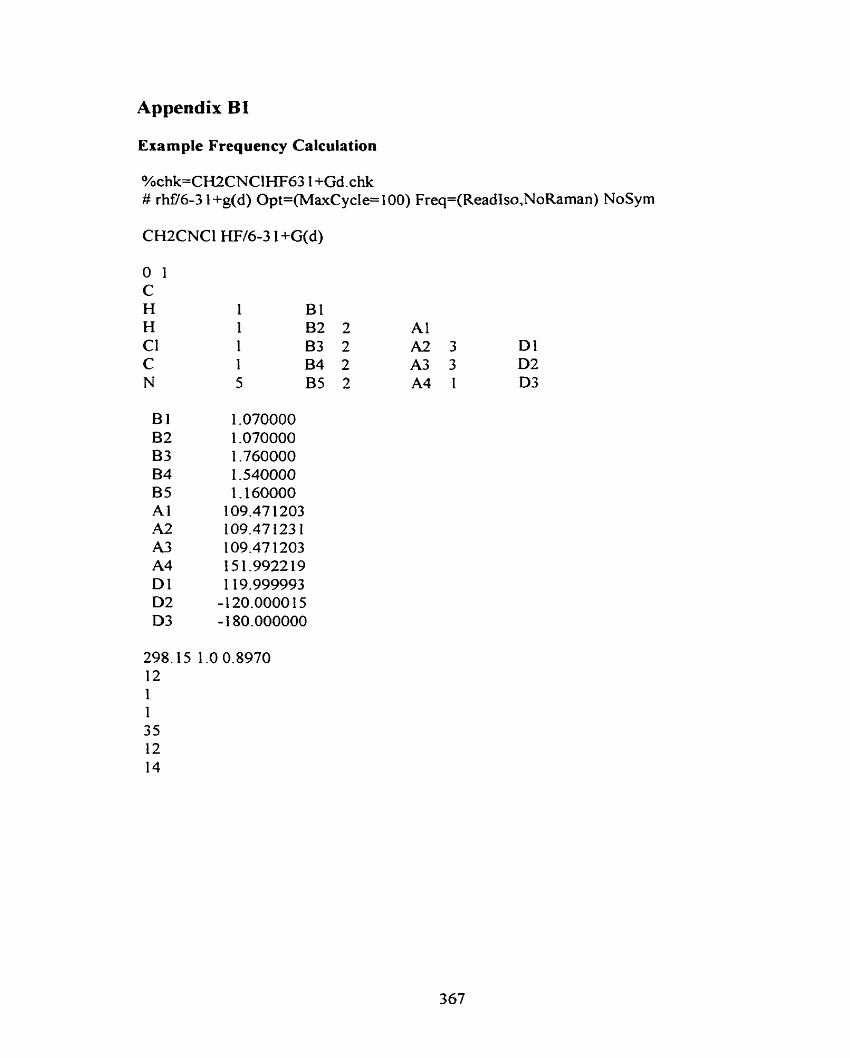
Appendiw B1
Example Frequency Calculation
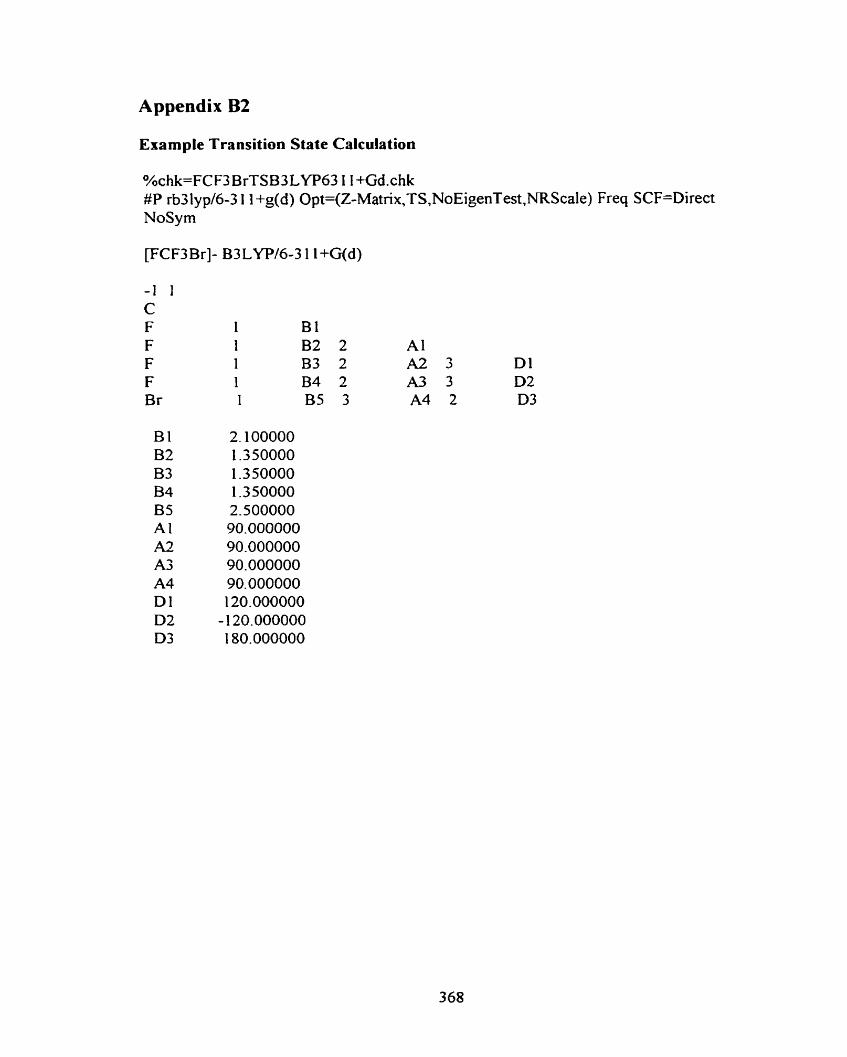
Appendix B2
Example Transition State Calculation
%chk=FCF3BrTSB3LYP63 1 I+Gd.chk #P rb3lyp16-3 1 1 +g(d) Opt=(Z-Matrix,TS,NoEigenTest,NRScale) Freq SCF=Direct NoSym
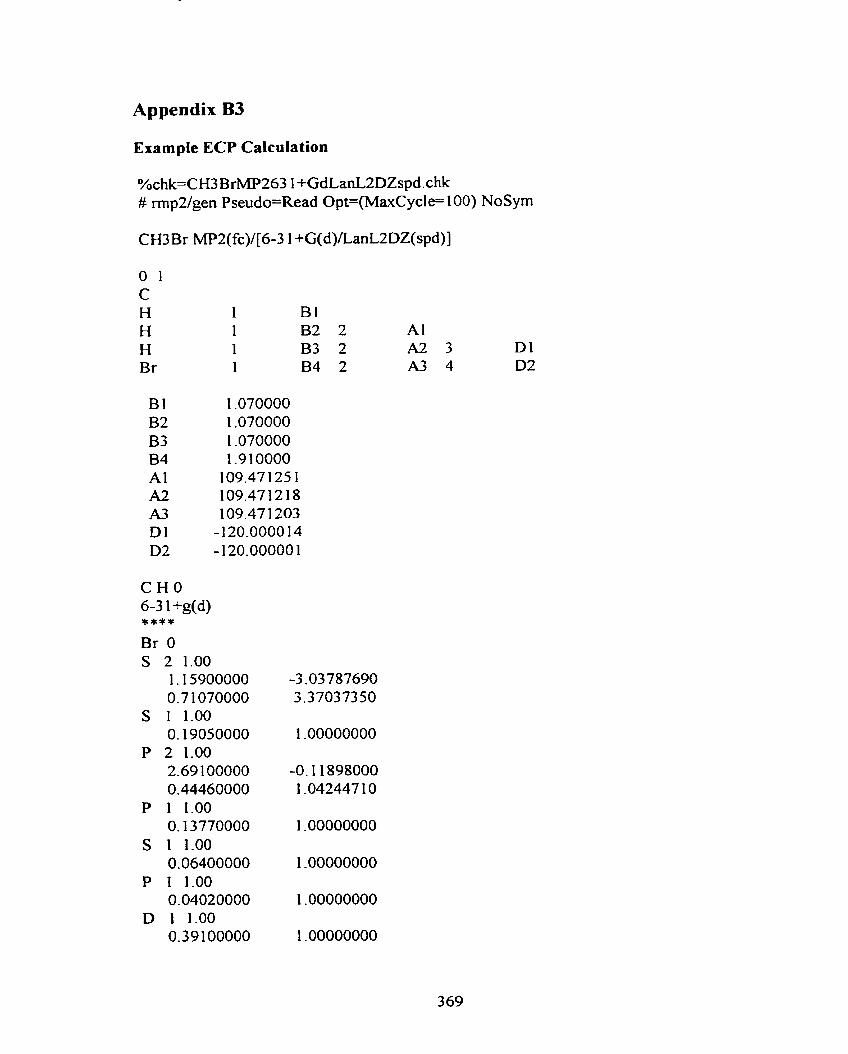
Appendix B3
Example ECP Calculation
%chk=CH3BrMP263 1 +GdLanLZDZspd.chk # rmp2/gen Pseudo=Read Opt=(MaxCycle= 100) NoSym
C H O 6-3 1 +&d) a***
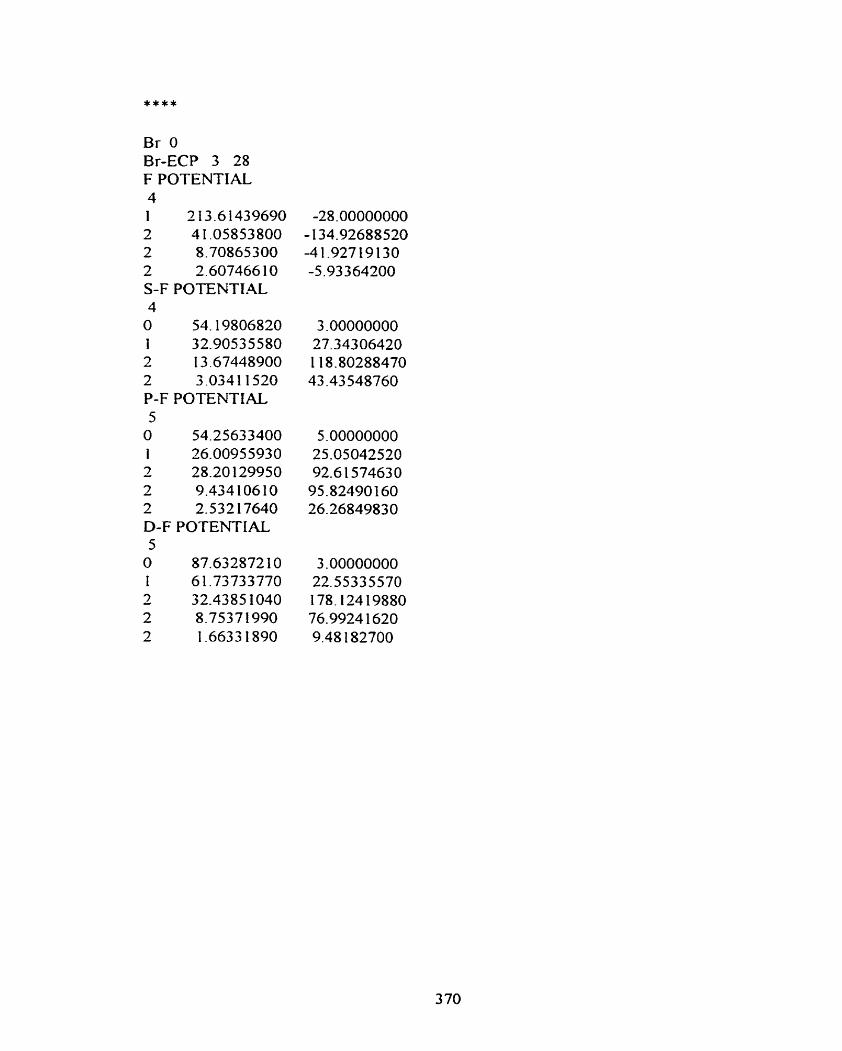
Br O Br-ECP 3 28 F POTENTIAL 4 1 2 13.61439690 2 4 1 .O5853800 2 8.70865300 2 2.607466 1 O S-F POTENTIAL 4 O 54.19806820 I 32.90535580 2 13.67448900 2 3.0341 1520 P-F POTENTIAL 5 O 54.25633400 1 26.00955930 2 28.20 129950 2 9.434 1 06 1 O 2 2.532 17640 D-F POTENTIAL
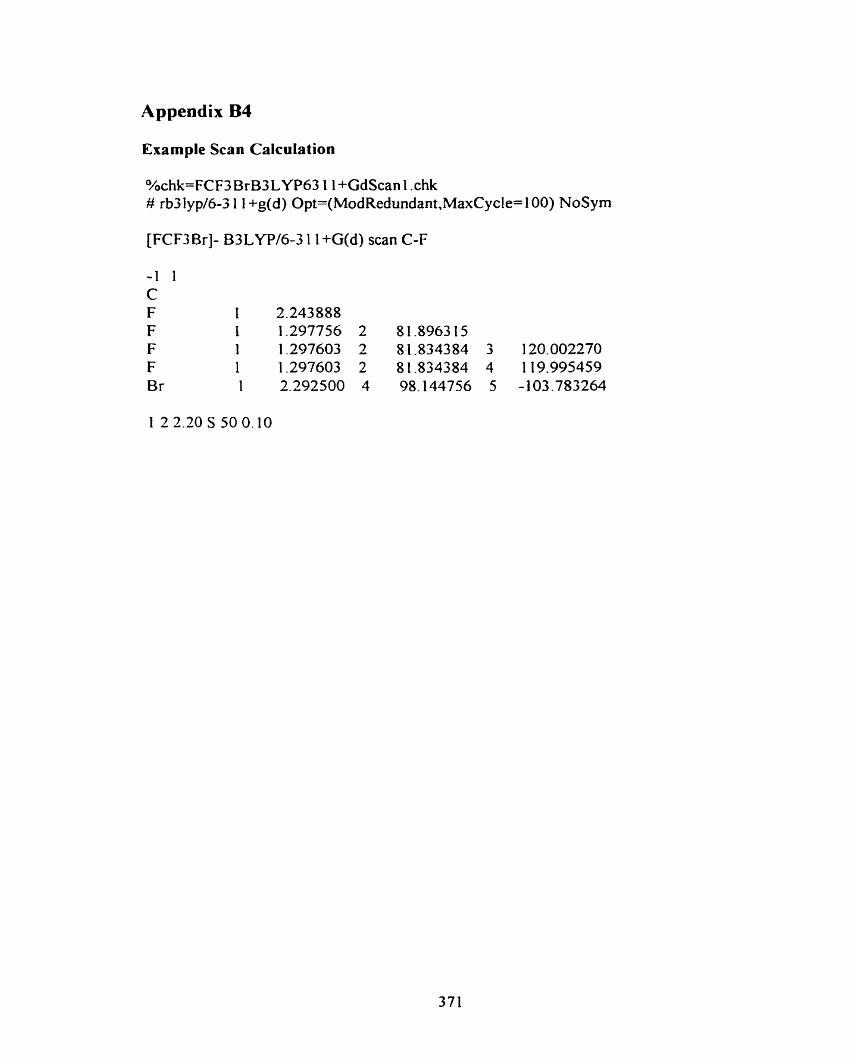
Appendix B4
Erample Scan Calculation
%chk=FCF3 BrB3LYP63 1 1 +GdScan 1 .chk # rb31yp/6-3 1 1 +g(d) Opt=(ModRedundant,MaxCycle= 100) NoSym
[FCF3Br]- 83LYP/6-3 1 1 +G(d) scan C-F

Appendix C
Simulated IR spectra
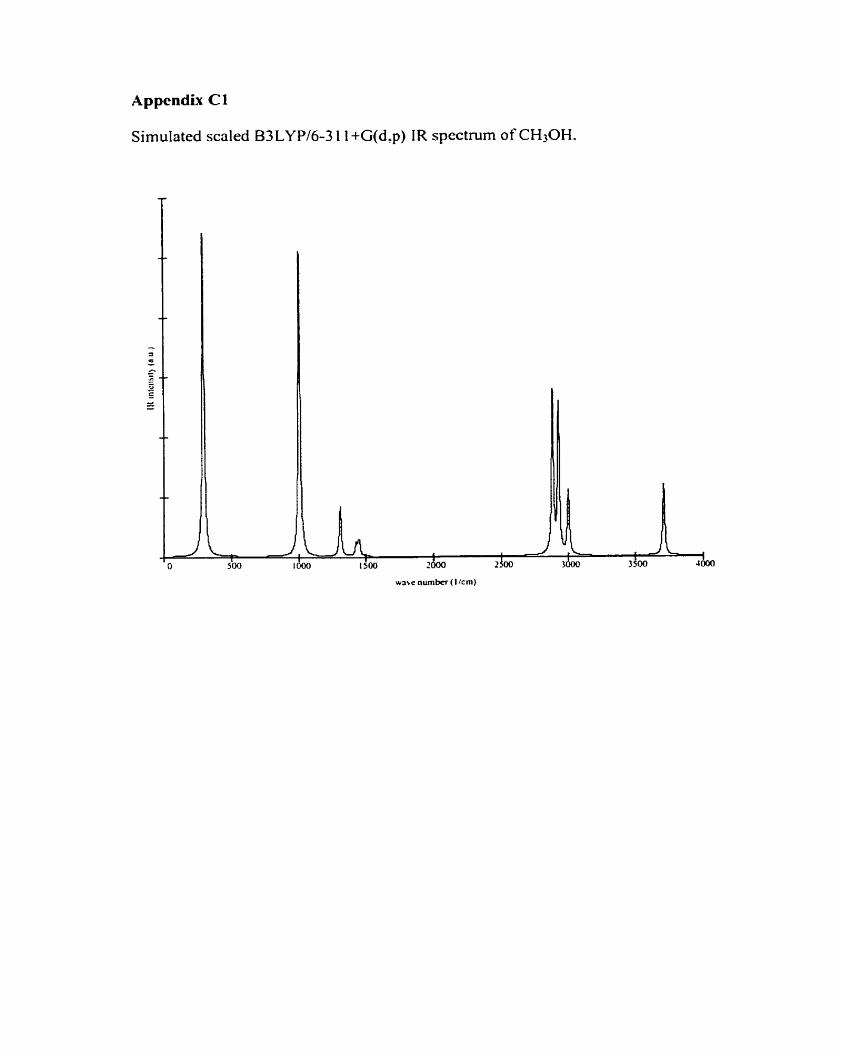
Appendix Cl
Simulated scûled B3LYP/6-3 1 1 +G(d.p) 1 R spectrum of CH30H.
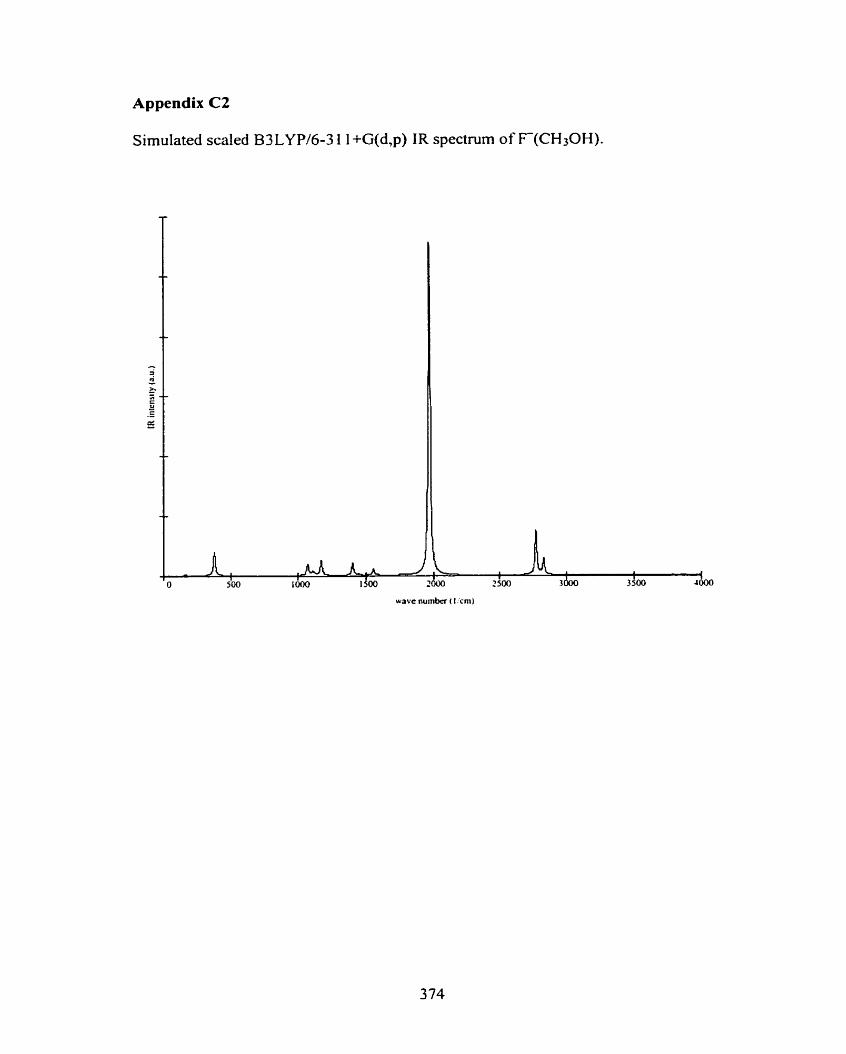
Appendix C2
Simulated scaled B3LYP/6-3 1 1 +G(d,p) IR spectrum of Fm(CH30H).
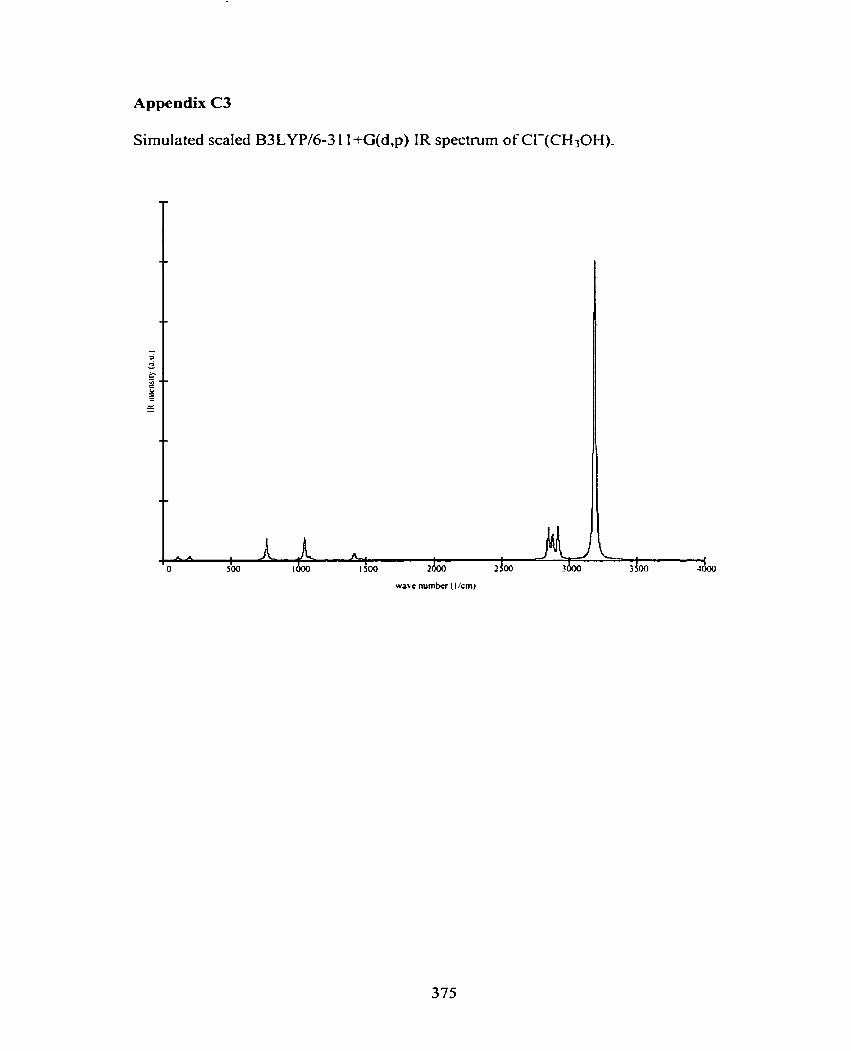
Appendix C3
Simulated scaled B3LYP/6-3 1 1 +G(d,p) IR spectrum of CI-(CH30H).
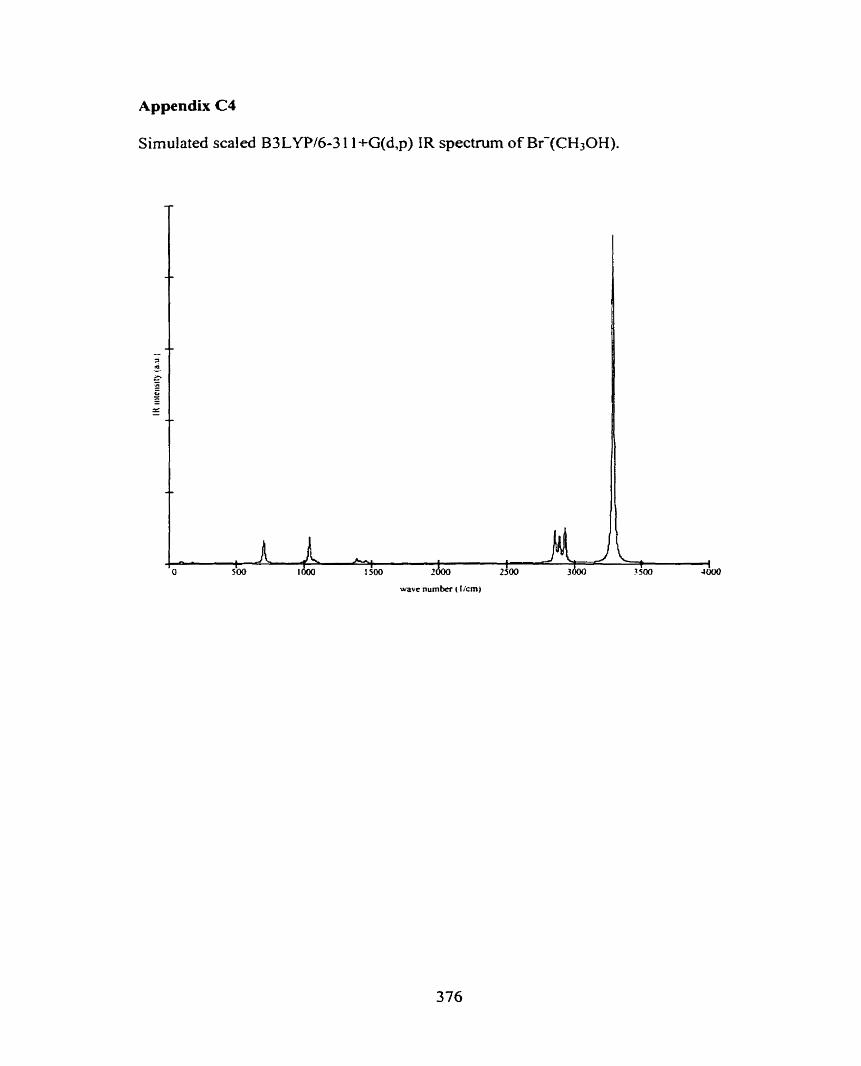
Appendix C4
Simulated scaled B3LYP/6-3 1 1 +G(d,p) IR spectmm of Br-(CH30H).
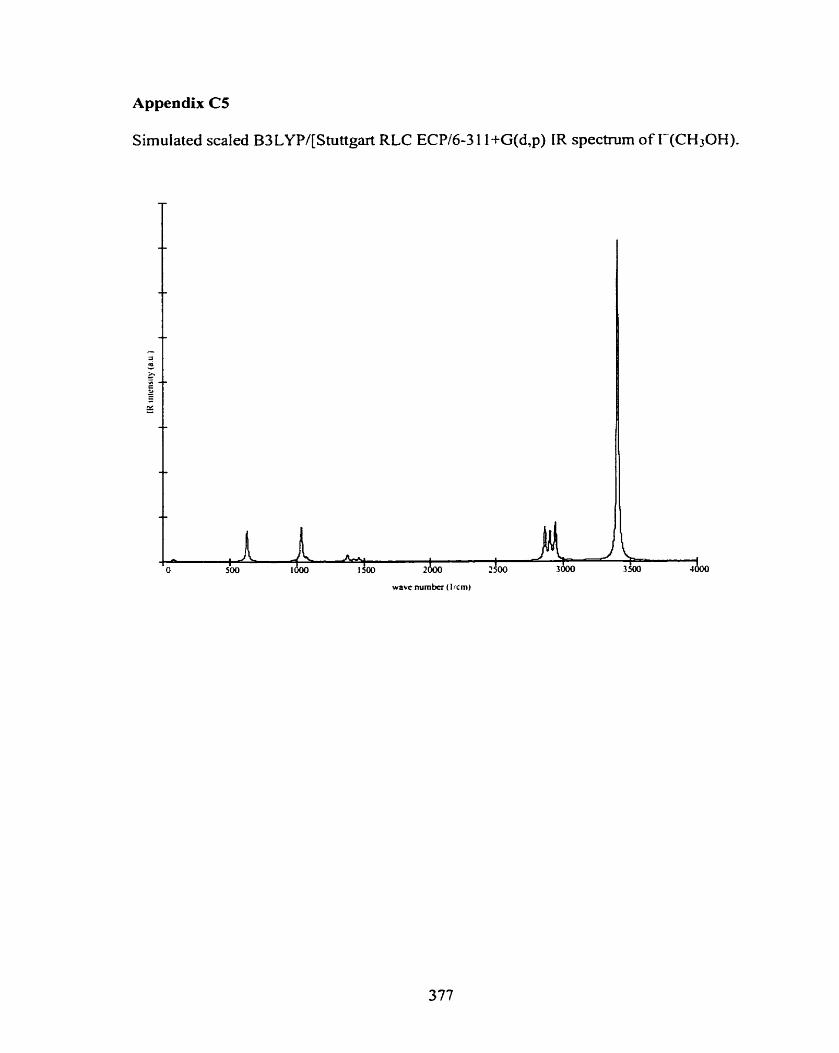
Appendix CS
Simulated scaled B3LYP/[Stuttgart RLC ECP/6-3 1 1 +G(d,p) IR spectrum of I-(CKOH).
wavc numbcr ( l !cm)
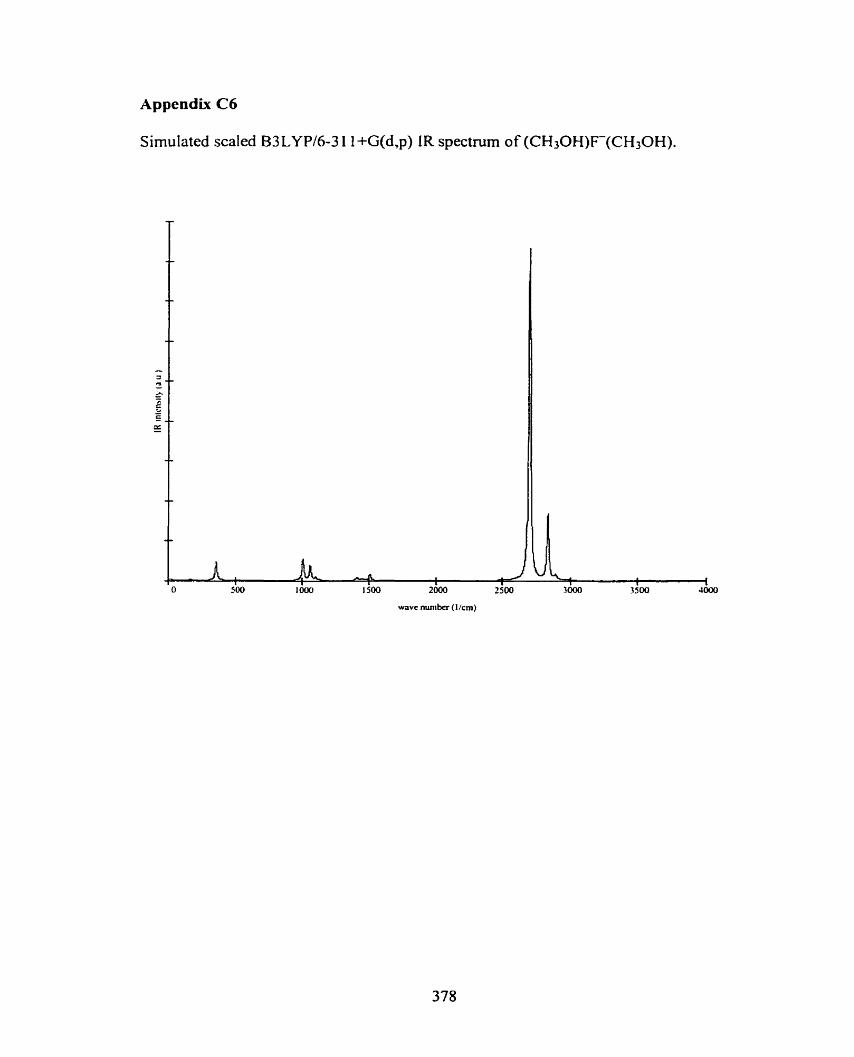
Appendix C6
Simulated scaled B3LYP/6-3 1 1 +G(d,p) IR spectrum of (CH30H)F-(CH30H).
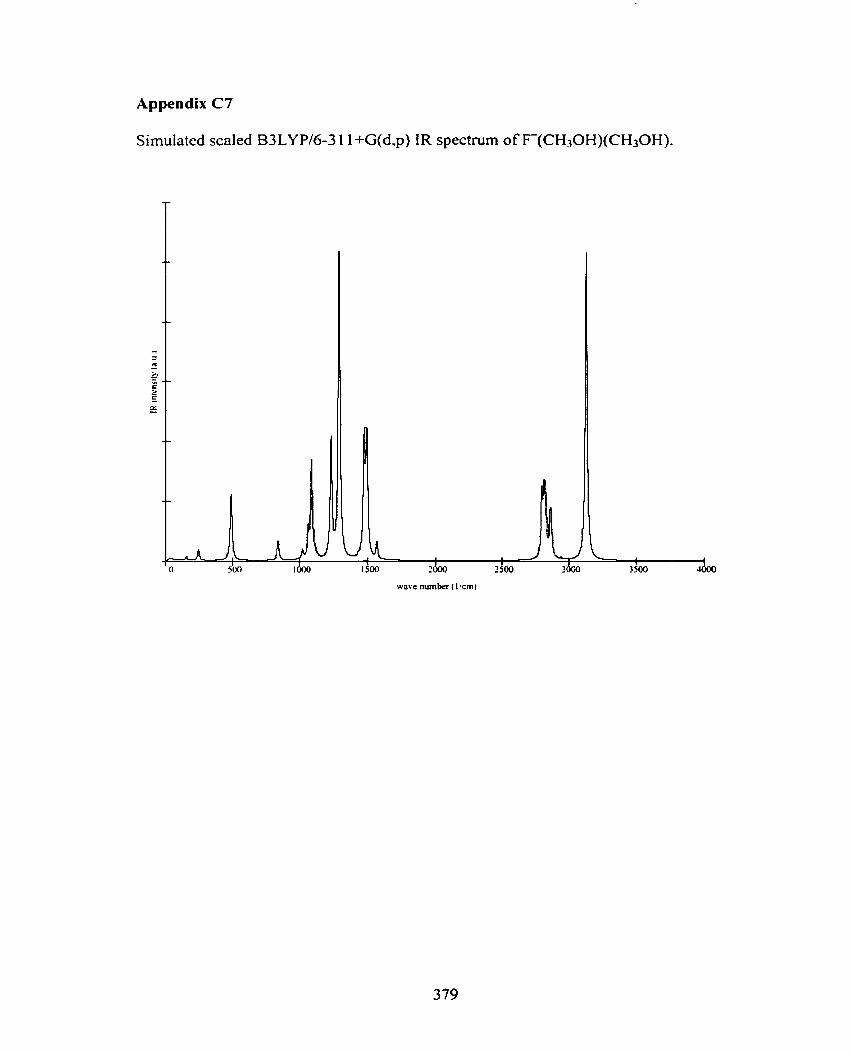
Appendix C7
Simulated scaled B3 LYP/6-3 1 1 +G(d,p) IR spectnirn of F(CH30H)(CH30H).
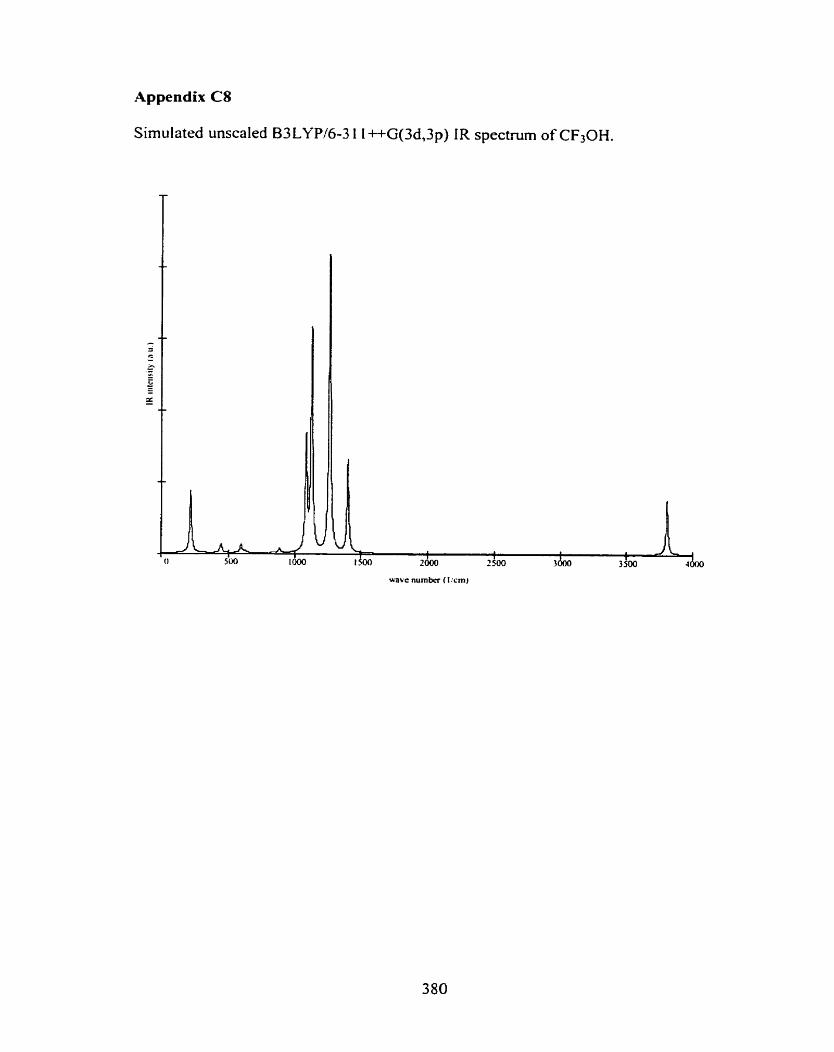
Appendix CS
Sirnulated unscaled B3LYP/6-3 1 1 ++G(3d,3p) IR spectnim of CF,OH.
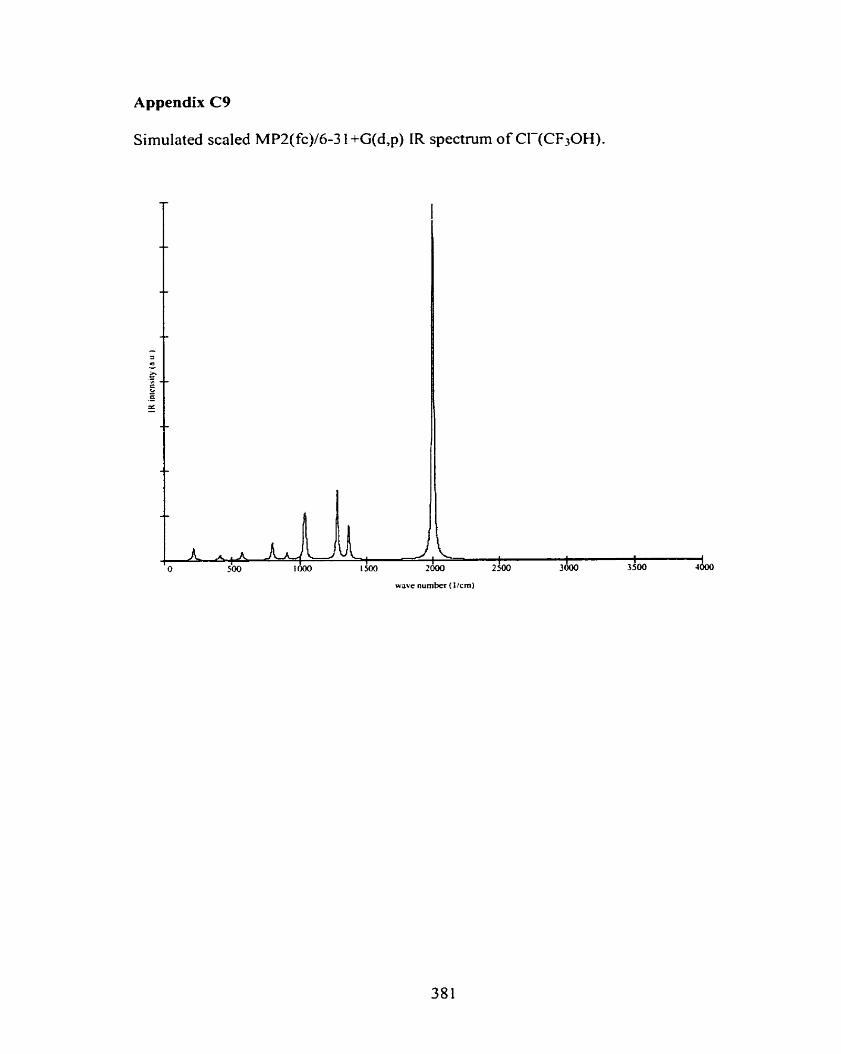
Appendix C9
Simulated scaled MP2(fc)/6-3 1 +G(d,p) IR spectrum of CI-(CF30H).
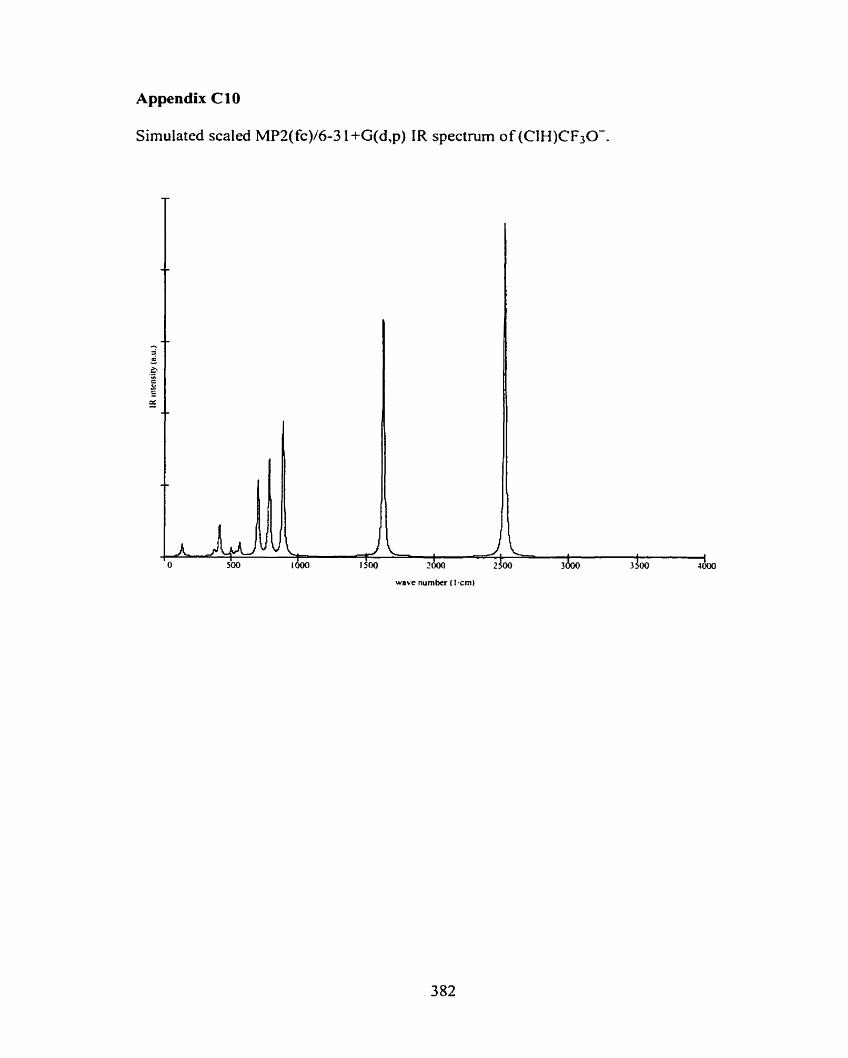
Appendix Cl0
Simulated scaled MPZ(fc)/6-3 1 +G(d,p) IR spectrum of (CIH)CF30-.
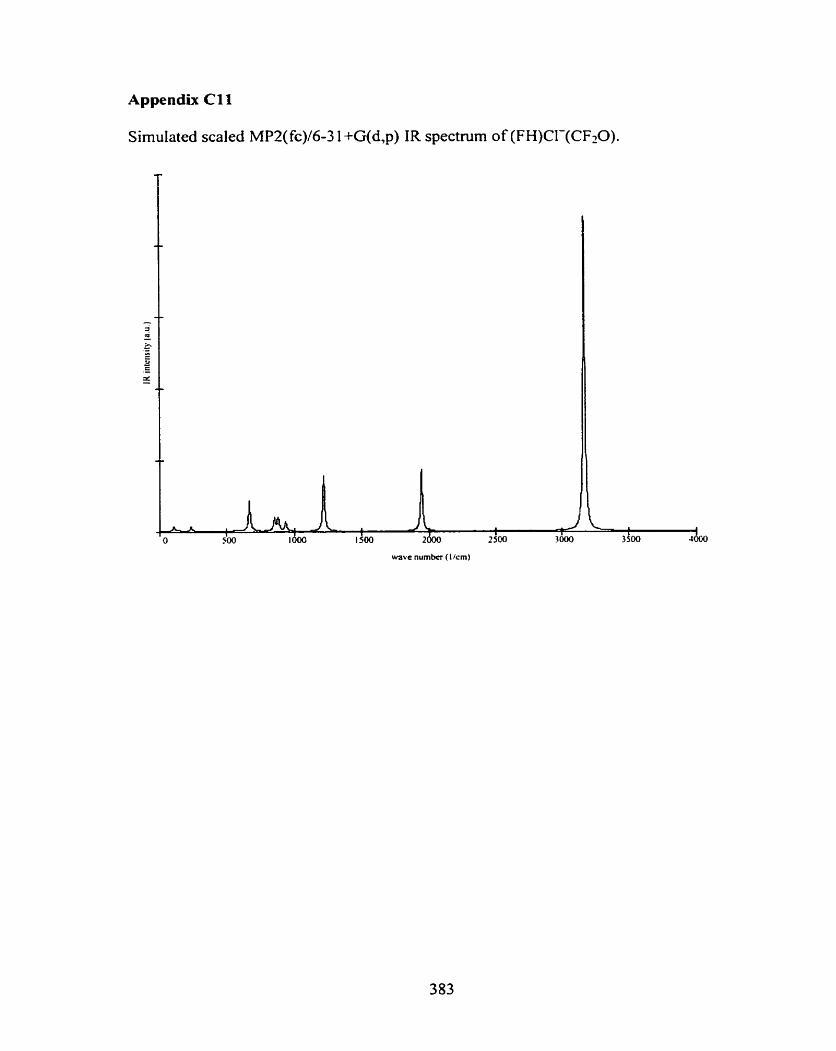
Appendix Cl 1
Simulated scaled MPZ(fc)/d-3 1 +G(d,p) IR spectrum of (FH)CI-(CF-O).
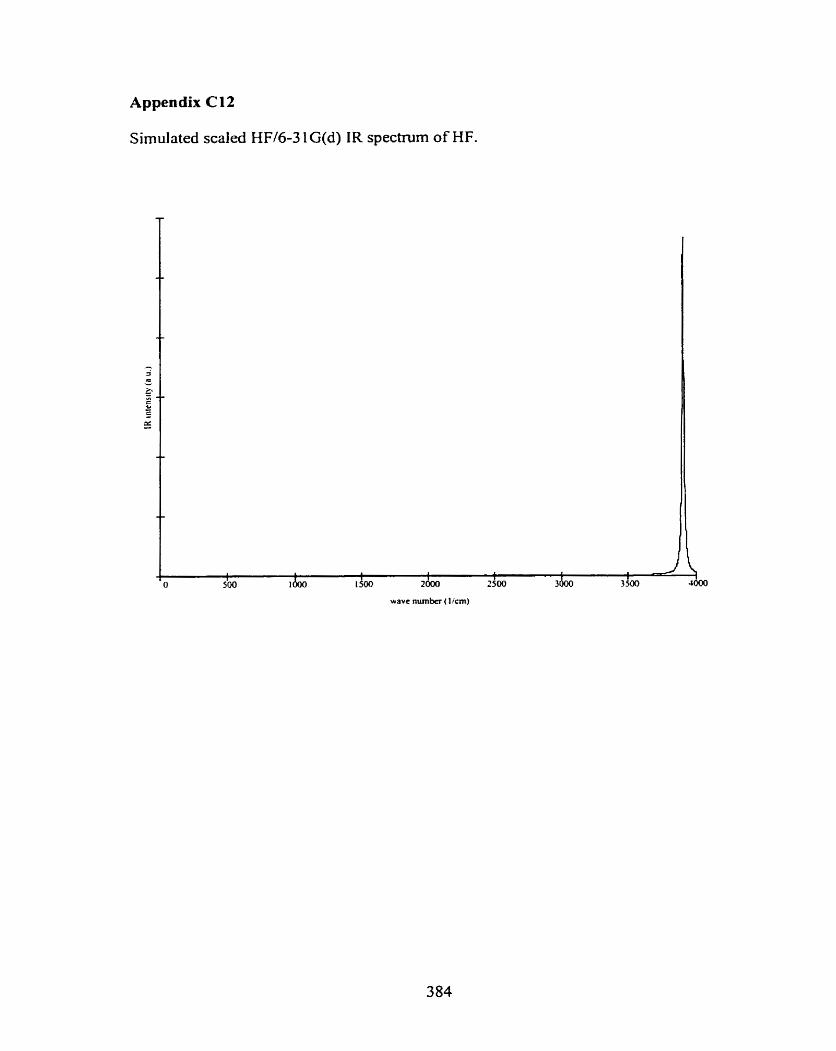
Appendix C 12
Simulated scaled HF/6-3 1 G(d) IR spectnim of HF.
wave n u m k ( ]/cm)
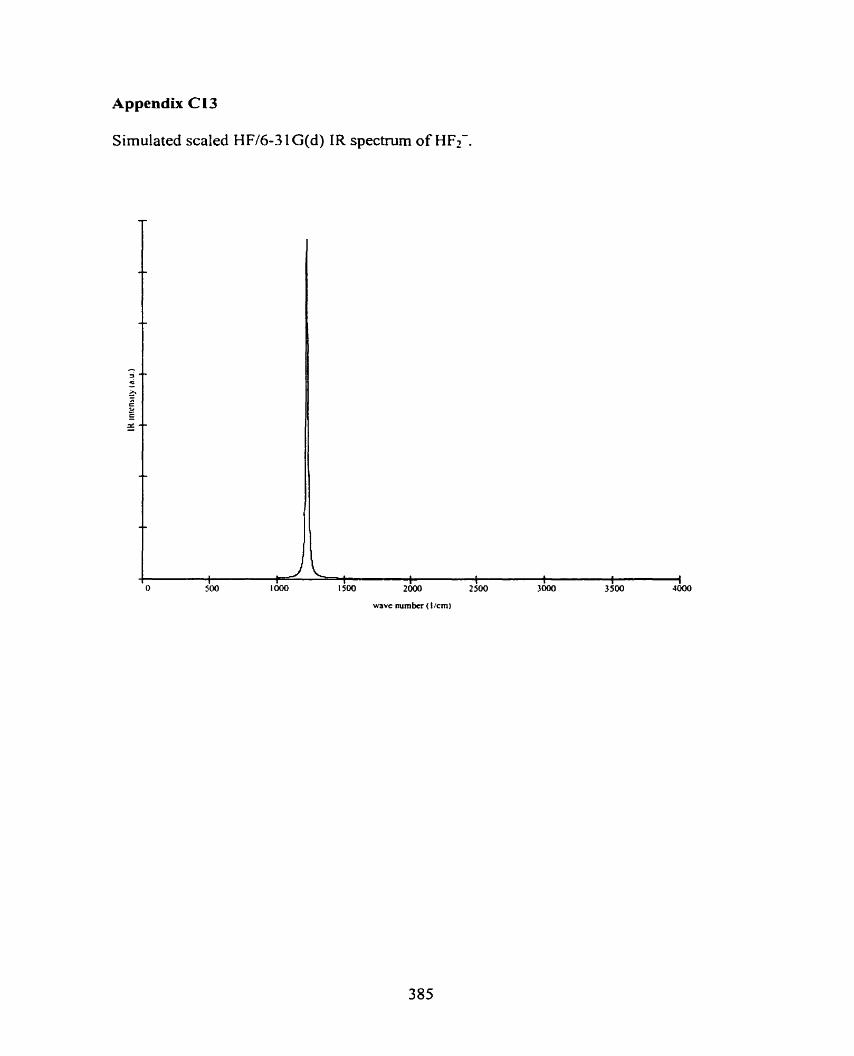
Appendix Cl3
Simulated scaled HF/6-3 1 G(d) IR spectrum of HF2-.
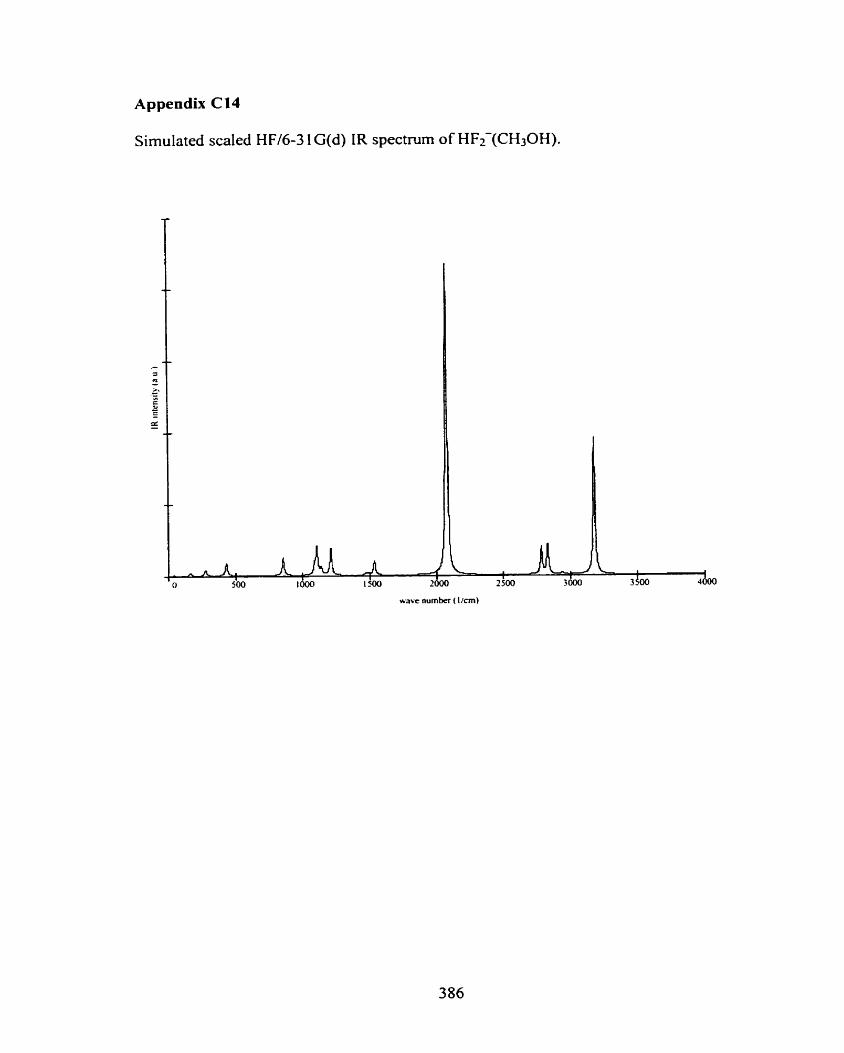
Appendix Cl4
Simulated scaled HF/6-3 1 G(d) IR spectrum of HF2-(CH30H).
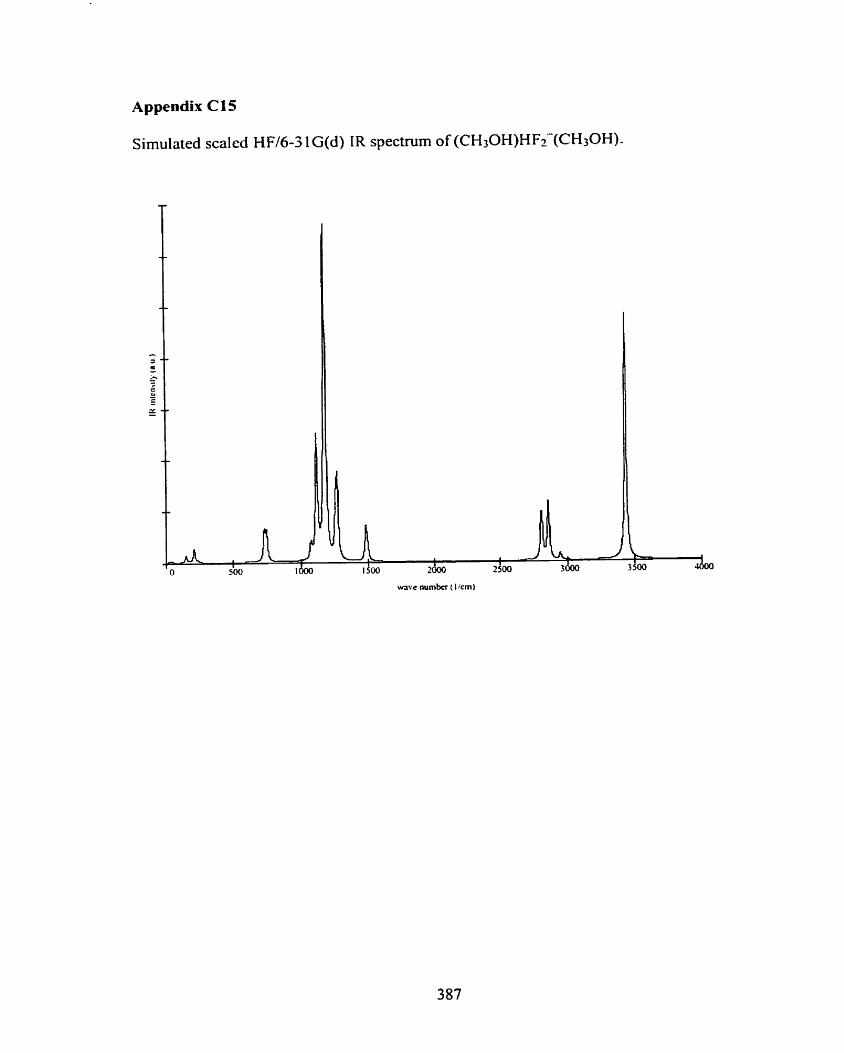
Appendix Cl 5
Simulated scaled HFI6-3 1 G(d) IR spectrum of (CH30H)HFr-(CH30H).