Embed Size (px)
Citation preview

Chemical Engineering Journal 260 (2015) 240–257
Contents lists available at ScienceDirect
Chemical Engineering Journal
journal homepage: www.elsevier .com/locate /ce j
Numerical study of particle segregation in a coal beneficiation fluidizedbed by a TFM–DEM hybrid model: Influence of coal particle sizeand density
http://dx.doi.org/10.1016/j.cej.2014.08.0521385-8947/� 2014 Elsevier B.V. All rights reserved.
⇑ Corresponding authors.E-mail addresses: [email protected] (Y. Feng), [email protected]
(J. Lu).
Qinggong Wang a, Yuqing Feng b,⇑, Junfu Lu a,⇑, Weidi Yin a, Hairui Yang a, Peter J. Witt b, Man Zhang a
a Key Laboratory for Thermal Science and Power Engineering of Ministry of Education, Department of Thermal Engineering, Tsinghua University, Beijing 100084, Chinab CSIRO Mineral Resources Flagship, Clayton, VIC 3169, Australia
h i g h l i g h t s
� A TFM–DEM hybrid model is introduced to describe the multiphase flow in CBFB.� The fluidized carrier phases are modeled by TFM while coal particles by DEM.� The validity of the model is proved by experimental results.� Influence of coal particle size and density are mainly studied.� Segregation mechanisms are explained by the hydrodynamic forces acting on particles.
a r t i c l e i n f o
Article history:Received 18 June 2014Received in revised form 13 August 2014Accepted 16 August 2014Available online 25 August 2014
Keywords:ModelingCoal beneficiationSegregationTFM–DEMHybrid model
a b s t r a c t
Particle segregation behavior in a coal beneficiation fluidized bed (CBFB) is numerically studied using aTFM–DEM hybrid model, in which the gas and the dense solid phases are modeled using a Eulerian–Eule-rian or two fluid model (TFM), while the beneficiated coal particles are modeled as a dilute phase by thediscrete element method (DEM). For validation purpose, the numerical model was setup using geometricand operating conditions similar to a laboratory experimental model with the bed thickness set to oneparticle diameter to save computational cost. For a fixed gas injection velocity, the influence of particlesize and density of the beneficiated samples was studied. It was found that the particles would segregatealong the bed height due to the density differences with the degree of segregation being strongly influ-enced by particle size. Obvious segregation occurs for the coarse samples (6.7 mm and 4.3 mm) and littlesegregation occurs for the particles smaller than 3 mm. The flow patterns and segregation kinetics werequalitatively comparable with those observed in physical experiments conducted under similar condi-tions. On this basis, the underlying mechanisms governing particle segregation have been explained interms of the hydrodynamic forces acting on individual particles. It was demonstrated that the segregationof coarse particles was mainly controlled by the balance between gravity and the local pressure force,while fine particles were more strongly affected by the direct drag forces from the gas phase and the con-tinuum solid phase, thus making them difficult to separate.
� 2014 Elsevier B.V. All rights reserved.
1. Introduction However, the separation mechanism is not exactly the same as
Among the dry methods for coal preparation, the coal benefici-ation fluidized bed (CBFB) is a potential technology developed inrecent decades for coal upgrading and/or size/density separation.The flotation and sedimentation behavior of coal particles in thebed are mainly based on the pseudo-fluid characteristics of thegas–solid flow in CBFB that is analogous to the wet process.
the conventional wet dense medium separator due to the existenceof the bubble phase. For example, bed density can reach valuessimilar to that used in the wet processes by adjusting propertiesof the bed material and the air velocity, but the viscosity of thepseudo-fluid phase is much lower [1]. Many studies have been per-formed on CBFB technology since its inception and can be roughlydivided into two categories. The first category involves the engi-neering application, in which a number of potential apparatus havebeen developed by different organizations and parametric studiesundertaken on changes to geometries, material properties and

Q. Wang et al. / Chemical Engineering Journal 260 (2015) 240–257 241
operating variables with the objective of enhancing the beneficia-tion efficiency on a global scale [2–6]. The second category concen-trates on the separation mechanism, where the objective is tounderstand the influence that coal particle size and/or density haveon the detailed separation behavior [7–10]. Generally speaking,particle segregation behavior is attributed to the balance betweengravity and the effective hydrostatic buoyancy for coarse particles.For fine particles there is an additional surface friction force fromthe solids. However, there is still no reliable theory to supportthe potential separation mechanism due to a lack of clear demon-stration of the dynamic forces exerted on the beneficiated parti-cles. Up until now, studies have been confined to macroscopicobservations from which the underlying mechanisms controllingparticle separation cannot be obtained with such traditional phys-ical modeling approaches.
Alternatively, numerical simulation has become a powerfulmethod for understanding the interplay of different fundamentalforces and thus provides an understanding of the separation mech-anisms. However, the multiphase flow characteristics involved inCBFB present large difficulties to the numerical studies becauseat least four phases have to be taken into consideration to describethe coal beneficiation process in detail. These phases are the gasphase, the bed material particle phase and at least two beneficiatedcoal particle phases with different sizes and/or densities. Due tothe flow complexity and a lack of reliable methods, there is stillno report on the CBFB modeling for realistic coal beneficiationprocesses.
In the field of computational fluid dynamics (CFD), a number ofmethods have been developed to model multiphase flow in gas–solid systems. The most widely used modeling approaches can beclassified into two categories, Eulerian–Eulerian (EE) methodsand Eulerian–Lagrangian (EL) methods, as shown in Fig. 1. The EEmethod, referred in this work as the two fluid model (TFM), treatsboth the gas phase and solid phase as fully interpenetrating contin-uums with generalized Navier–Stokes equations applied to bothphases [11]. The concept of volume averaging has been introducedto derive the continuum equations, and by applying concepts fromthe kinetic theory of dense gases to the particles, the kinetic theoryof granular flow (KTGF) has been derived for solid phase stresses toclose the momentum equations [12–15]. The TFM approach hasbecome a widely used method for fluidization simulation in densesuspensions due to its reliability as well as low computational
Mul�-solid phase
Gas-Phase
Con�nuous fluid field
Volume/ensembleaveraging
Con�nuous solid field
TFM
DD
KTGF Dien
Coarse-grid
CD
Dense solid phase Dilute solid phaseTFM D
TFM-DEM Hybrid Model
Inter-exchange
2
1 5
4
EE methods EL methods
CFD
Filter size
MDSLBPPM
Fig. 1. Realizations of multi-phase flow modeling of gas-
costs [16–20]. However, the TFM is still limited to engineeringscale reactors due to the accuracy restriction on the CFD cell size.To extend the TFM to large-scale industrial application, thecoarse-grain model has been developed recently by introducingthe filtered two-fluid equations with modified closure relations[21,22]. An alternate approach is to treat particles as separate dis-crete entities as in either the discrete element method (DEM) ordiscrete particle method (DPM). In these methods the gas phaseis still considered as a continuum and solved by a conventionalCFD method but a Lagrangian method is used to track the particlesand thus the so called CFD–DEM methods, which are EL schemes,are proposed [23–31]. When solving the gas phase the Euleriangrid can be set to a size larger than the particle diameter and a dragmodel such as that proposed by Gidaspow [11] used for momen-tum transfer between the phases. Alternately the grid size can berefined to be one or more orders of magnitude smaller than theparticle size so that molecular dynamic simulation (MDS), latticeBoltzmann (LB) or pseudo-particle methods (PPM) are used withthe gas-particle interaction handled by non-slip wall boundaryconditions at the surface of the solid phase. Such methods arereferred to as direct numerical simulation (DNS–DEM) [32–34].However, the computational cost of DEM is very expensive whena large number of particles are involved. In recent years, themulti-phase particle-in-cell (MP-PIC) methodology has been intro-duced, in which particles with same properties are grouped intoparcels and the collisions between these parcels are modeled byan ad-hoc solid stress term in order to reduce the high computa-tional costs in treating a large number of particles [35].
For multiphase gas–solid flow in a CBFB, the main solid phase isthe particles making up the bed material and these particles can onaverage be as fine as 200 microns. A consideration of DEM relatednumerical models will require millions of particles even for a smallbed. The computational costs are beyond the present computercapability. Even for the MP-PIC method, which can save computa-tional cost to a large extend, the numerical algorithm used in themethod when aiming to modeling large scale reactors requires thatthe local structure of the flow is filtered and lost. Thus, the bub-bling phenomenon and the particle segregation in CBFB cannotbe accurately modeled [36]. On the other hand, the considerationof the particle size/density difference for the beneficiated particlesin CBFB is still a challenge for TFM simulations. Even if the multi-phase flow in CBFB could be accurately modeled by TFMs with
EM/PM
screte ��es
FD-EM
EM
Tradi�onal
Alterna�ve
Com
puta
�ona
l cos
t (in
exp
onen
�al i
ncre
ase)
Length Scale
3
1
3
4
6MP-PIC
DNS-DEM
1m
10m
0.1m
0.01m
6
5
2
particle systems by various numerical descriptions.

242 Q. Wang et al. / Chemical Engineering Journal 260 (2015) 240–257
proper solid–solid interaction models, the separation mechanismwould still be modeled at the macro-scale and thus details of par-ticle–particle and particle–gas interactions cannot be obtained forthe discrete beneficiated particles.
To make best use of the strengths of TFM and DEM, a coupledTFM–DEM hybrid model is proposed in this work to predict themultiphase flow in CBFB. The gas phase and the dense particulatephase of the bed material are modeled using the TFM model,while the beneficiated coal particles in the dilute phase are mod-eled by DEM. Coupling between the two continuous phases andthe discrete phase are realized using interphase momentumtransfer terms. In such a hybrid model, both the advantages ofthe DEM and the TFM are combined. The TFM can give a reliabledescription of the dense gas–solid flow for the continuous carrierphases, whose pseudo-fluid properties are typically used as amedium in CBFB to obtain flotation or sedimentation of theadded particles. The discrete beneficiated coal particles, modeledby DEM, can readily vary in size and density in the Lagrangianframework, and their trajectories as well as segregation behaviorscan be clearly demonstrated in the results. By analyzing theforces exerted on each particle, the separation mechanism canbe better explained. Under these considerations, this paper aimsto make a detailed investigation of particle separation processesin a CBFB using a TFM–DEM hybrid model. The work focuseson the effects of two variables: the particle size and density ofthe beneficiated coal samples. The numerical simulations wereconducted using geometric and operating conditions similar toa laboratory experimental model in order to check the accuracyof simulation results with experimental measurement. Followingmodel validation, a better understanding of the underlying mech-anisms governing particle segregation has been achieved throughdetailed analysis of the hydrodynamic forces acting on individualparticles.
Table 1Models used in the TFM with KTGF.
Key conditions Models or values
Granular energy Granular energy transport equation(PDE) [37]
Frictional viscosity Schaeffer [38]Solid phase stress model Lun et al. [39]Angle of internal friction 30Restitution coefficient for
particle–particle collisions0.9
Wall boundary conditions Modified Johnson and Jacksonpartial slip BC [40]
Restitution coefficient forparticle–wall collisions
0.2
Specularity coefficient forparticle–wall collisions
0.05
Gas phase turbulence k–e Turbulence modelTurbulence interaction terms Simonin model [41]Gas–solid drag Gidaspow [11]Packed bed void fraction 0.4
2. Model description and simulation conditions
2.1. TFM–DEM hybrid model
An Eulerian–Eulerian two fluid model (TFM) is used in the sim-ulation for the gas phase and the bed medium particulate phase.The continuum models for the solid phase is based on the kinetictheory of granular flow (KTGF), which provides a set of constitutiverelations developed for dense gas–solid flows and creates an anal-ogy between the granular phase and the kinetic theory of densegases [11–15]. The beneficiated particles are modeled using aDEM model. In the hybrid method, the interactions between (1)the gas phase and the continuum solid phase, (2) the gas phaseand the discrete solid phase and (3) the continuum solid phaseand discrete solid phase all need to be modeled by interphasemomentum transfer terms. Both TFM and DEM model have beenwell documented in the literature, the extra term for the hybridmodel is the interphase momentum transfer between the contin-uum solid phase and discrete solid particles. Therefore, only thekey governing equations are introduced here.
2.1.1. Gas phaseThe governing equations for the gas-phase continuity and
momentum conservation in the absence of phase change andchemical reactions are:
@
@tðegqgÞ þ r � ðegqgvgÞ ¼ 0 ð1Þ
DDtðegqgvgÞ ¼ r � Sg þ egqgg�
XM
m¼1
Igm ð2Þ
where eg is the gas-phase volume fraction and obtained by subtract-ing the solid volume fraction of both the continuum solid phase andthe discrete solid phase in the computational volume, qg is the ther-modynamic gas density, vg is the volume-averaged gas velocity, Igm
is the momentum transfer term between the gas and the mth solidphase (including the continuum solid phase and the discrete solidphase) and Sg is the gas-phase stress tensor.
2.1.2. Continuum solid phaseThe solid phase continuity equation has a similar form to the
gas phase continuity Eq. (1), and the solid phase momentum equa-tion is given by:
DDtðecsqcsvcsÞ ¼ r � Scs þ ecsqcsgþ Igc � Icd ð3Þ
where Scs is the stress tensor for the continuum solid phase, theterm Igc represents the momentum exchange between the gasphase and the continuum solid phase. The term Icd represents themomentum exchange between the continuum solid phase and thediscrete solid phase, and will be discussed in Section 2.1.4. Closureof the basic equations for the gas phase and the continuum solidphase is through a group of constitutive equations obtained usingthe KTGF. Validation and a mesh resolution study of the TFM com-bined with KTGF for the gas and medium solid flow in a CBFB sim-ilar to that of the current model has been performed in the author’sformer work [36,37]. Some key sub-models used in this work arelisted in Table 1 and the detailed equations for the TFM and KTGFmodels are well documented in the former publications [36,37].
2.1.3. Discrete solid phaseIn the DEM approach, particles are treated as individual solid
objects and their behaviors are modeled by Newton’s second lawof motion. Each particle is represented in a Lagrangian frame ofreference by {x(i), v(i), x(i), dds
(i), qds(i)}, where x(i) denotes the ith
particle’s position, v(i) and x(i) are its linear and angular velocities,dðiÞds represents the particle diameter of discrete solid, and qðiÞds is itsdensity. Thus, the particle motion is controlled by:
dxðiÞðtÞdt
¼ vðiÞðtÞ ð4Þ
mðiÞdvðiÞðtÞ
dt¼ FðiÞT ¼ mðiÞgþ FðiÞgdðtÞ þ FðiÞcdðtÞ þ FðiÞc ðtÞ ð5Þ
IðiÞdxðiÞðtÞ
dt¼ TðiÞ ð6Þ

Table 2Models and values used in the DEM modeling.
Key conditions Models or values
Collision model Linear spring dashpot modelNormal spring stiffness coefficient (kn) 1.0 � 105
Tangential spring stiffness coefficient (kt) 2/7 kn
Coefficient of restitution (en) 0.9Normal dashpot damping coefficient (gn) Calculated by Eq. (7)Tangential damping coefficient (gt) 1/2 gn
Sliding friction coefficient (c) 0
Q. Wang et al. / Chemical Engineering Journal 260 (2015) 240–257 243
where m(i), I(i) are the particle mass and moment of inertia, respec-tively. FðiÞgd is the total drag force (pressure and viscous) on the dis-crete particle from the gas phase in its residing computationalcell, FðiÞcd is the drag force from the continuum solid phase, and FðiÞc
is the net contact force as a result of contact with other discrete par-ticles. Then, T(i) is the total torques and FðiÞT is the total forces actingon an individual discrete particle.
Possible collisions between the discrete particles and betweenparticles and walls are calculated based on a soft-sphere method.Specifically the linear spring dashpot model, proposed by Cundalland Strack [42] is used in this work to model discrete particle col-lisions. The parameters used in the model are listed in Table 2. Thenormal dashpot damping coefficient gn is calculated from the coef-ficient of restitution using the relationship in Eq. (7). The tangentialdamping coefficient is taken to be half of the normal damping coef-ficient [45]. As the discrete particles are a dilute phase and parti-cle–particle interactions are very rare, no sliding frictioncoefficient was set for the particle–particle contact and particle–wall contact to simplify the calculation.
gn ¼2
ffiffiffiffiffiffiffiffiffiffiffiffiffimeff kn
pj ln enjffiffiffiffiffiffiffiffiffiffiffiffiffiffiffiffiffiffiffiffiffiffiffi
p2 þ ln2en
q ð7Þ
where meff = m(i)m(j)/(m(i) + m(j)) is the effective mass of the collisionparticles.
2.1.4. Interphase couplingThe inter-phase momentum exchange between the gas phase
and continuum solid phase is coupled by the drag model of Gidas-pow [11] in this work, which is actually a combination of Wen-Yumodel [43] and Ergun equation [44] with the following forms asshown in Eqs. (8–10).
b ¼150 e2
s ð1�eg Þlg
e2g d2
sþ 1:75 qges jvg�vs j
eg dseg 6 0:8
3Cdegesqg jvs�vg j4d e�2:65
g eg > 0:8
8<: ð8Þ
Cd ¼24Res½1þ 0:15ðResÞ0:687� Res 6 1000
0:44 Res > 1000
(ð9Þ
Res ¼qgeg jvg � vsjds
lgð10Þ
The drag force from the gas phase to the discrete particle i isrepresented as
FðiÞgd ¼ �rPgðxðiÞÞV ðiÞ þbgdV ðiÞ
edsvgðxðiÞÞ � vðiÞ� �
ð11Þ
where Pg(x(i)) and vg(x(i)) are the gas-phase mean pressure andvelocity fields at the particle location, V(i) is the particle volume,eds is the volume fraction of the discrete particle phase in the com-putational cell, and bgd is the momentum transfer coefficientbetween the gas phase and the discrete solid phase. Then the
gas–solid (discrete) momentum transfer term Igd in the gas phasemomentum conservation (Eq. (2)) is computed as
Igd ¼1Vc
XN
i¼1
FðiÞgdK xðiÞ; xc� �
ð12Þ
where Vc is the geometric volume of the computational cell, xc is thecell location, N is the particle number in the cell, and K(x(i), xc) is ageneric kernel with compact contact support and determines theinfluence of the particle force at x(i) on a computational cell locatedat xc [46].
In the drag force calculation of Eq. (11), the mean gas phasevelocity is interpolated to the particle location, and then the dragforce on each particle is projected back onto the Eulerian gas phasegrid using Eq. (12). However, in order to simplify the numericalalgorithm, the pressure drag force term is evaluated at the cell cen-ter, which results in equal pressure drag force on all particleswithin the same computational cell. The gas–solid (discrete)momentum transfer term Igd in interpolation method then has afinal expression as
Igd ¼ �edsrPgðxcÞ þ 1Vc
XN
i¼1
bgdVi
edsvgðxðiÞÞ � vðiÞ� �
K xðiÞ; xc� �
ð13Þ
The Gidaspow model as shown in Eqs. (8–10) is used for bgd inthis work.
The drag force or momentum transfer term between the contin-uum solid phase and the discrete particle phase has a similar formto the gas-particle system. However, the non-interpolated methodis used for the FðiÞcd calculation. Rather than interpolating the meanvelocity of the continuum solid phase at the particle location, acell-centered value of vcs is used. Similarly, the local averagedvelocity of the discrete solid phase vds is used instead of the veloc-ity of each particle v(i). With this simplification, the solid–soliddrag force FðiÞcd and the momentum transfer term Icd have the fol-lowing form
FðiÞcd ¼ �rPgðxcÞV ðiÞ þ bcdV ðiÞ
edsvcsðxcÞ � vc
ds
� �ð14Þ
Icd ¼ �edsrPgðxcÞ þ bcd vcsðxcÞ � vcds
� �ð15Þ
Similarly, correlations for bcd still resort to an empirical formula.The solid–solid drag coefficient derived by Syamlal [47] and givenbelow in Eq. (16) was used.
bcd ¼3ð1þ ecdÞðp=2þ Cf p2=8Þecsqcsedsqdsðdcs þ ddsÞ2g0cdjvcs � vdsj
2pðqcsd3cs þ qdsd
3dsÞ
þ C1P�
ð16Þ
where ecd and Cf are the coefficient of restitution and coefficient offriction, respectively, between the continuum solid phase and thediscrete solid phase and g0cd is the radial distribution function atcontact, with a form derived by Lebowitz [48]
g0cd ¼1egþ 3dcsdds
e0gðdcs þ ddsÞ
X es
dsð17Þ
In this work, the ecd and Cf are set as 0.9 and 0.1, respectively.The first term on the right side of Eq. (16) accounts for the momen-tum transfer between the phases due to collisions and sliding. Thesecond term, however, is required to consider the ‘‘hindranceeffect’’ in dense particulate flow by a segregation slope coefficientC1 and the granular pressure P⁄ [49]. Gera et al. [49] used a threephase model with two continuum particle phases of 1.5 mm and2.5 mm diameter to predict segregation in a gas–solid fluidizedbed using Eq. (16) and found good agreement with experiment.
The modeling accuracy is largely dependent on the momentumexchanges among these three phases. For the momentum

244 Q. Wang et al. / Chemical Engineering Journal 260 (2015) 240–257
exchange between the gas and continuum solid phase, andbetween the gas and discrete solid phase, the Gidaspow model[11] is widely used. The accuracy is generally acceptable for densefluidized bed systems with mono-sized particles. Development ofalternative interphase momentum exchange terms is an activeresearch area for complex particulate multiphase flow systems,e.g., for circulating fluidized bed with clusters [50,51] and formulti-sized and shaped particle systems [31,52]. There is noreported work to check the relative accuracy for the coupling termsbetween the continuum solid phase and the discrete particlephase. The comparison between experiment and model simulationin this work demonstrates a level of validation of the proposedapproach.
Table 3Physical parameters used in the simulation.
Parameters Units Values
(a) Bed geometryBed width m 0.5Bed height m 0.8Width of CFD cell m 0.005a
Height of CFD cell m 0.005a
Gas distribution – Uniform
(b) TFMGas viscosity (lg) kg/m s 1.8 � 10�5
Gas density (qg) kg/m3 1.205Gas velocity m/s 0.1Solid density (qcs) kg/m3 4200Solid diameter (dcs) m 0.0002
(c) DEMParticle diameter considered (dds) mm 1.5; 3.0; 4.3; 6.7Particle density considered (qds) kg/m3 1400; 1700; 2000; 2300; 2700
2.2. Simulation conditions
For model validation purposes, the numerical simulation wasconducted under conditions similar to our previously publishedexperiment [53]. Therefore, only a brief description of the experi-mental work is provided here and further details are given in[53]. The experimental setup is schematically shown in Fig. 2.The body of the fluidized bed was made of plexiglass with across-sectional area of 0.5 � 0.05 m2, and a height of 1.0 m. The flu-idized air was supplied by a fan blower and sent to the bottom ofthe fluidized bed through an air distributor. Uniformity of the flu-idized air was ensured through the use of an air distributor plateand a compensated sand layer. Magnetite powder of Geldart typeB was used as the bed medium in the experiments. It had a mate-rial density of 4181 kg/m3 and a size distribution of 10-600 lmwith a mean particle diameter of 204 lm. Both a clean coal sampleand a refused gangue sample with apparent density differenceswere considered as the beneficiated samples in the experiments,in order to reflect particle motion and distributions of both lightproduct and heavy product in CBFB beneficiation. Three fine sizefractions were selected for each sample, e.g., 1–2 mm, 3–5.5 mmand 5.5–8 mm in narrow range. The average particle density forthe coal sample and the gangue samples were 1384 kg/m3 and2661 kg/m3, respectively. The initial bed height of magnetite pow-der was 0.3 m for each experiment. A 1 kg sample of coal and/organgue was then added into the bed for each experiment. Afterrunning the experiment for 15 min the air supply was suddenlyshut off so that the dense bed collapsed quickly to a packed bed.The dense bed was then divided into seven layers from the bottomto the top and samples in each layer were collected and sieved. Dis-tributions of particle mass proportion, particle size and averageparticle density were determined and illustrated in detail in theprevious publication [53].
In this work, the same geometrical CBFB model shown in Fig. 2was used. Given that the experimental bed is quite thin, to save
Fig. 2. Schematic drawing of the experimental system of the coal beneficiationfluidized bed. (1) fluidized bed; (2) air box; (3) air distributor; (4) sand layer; (5) fanblower; (6) rotameter; (7) U-tube water manometer group.
computational costs, simulations were conducted using a twodimensional (2D) geometry representing one slice of the bed. Forthe DEM, the bed thickness was set to one diameter of the discreteparticle phase. The physical parameters used in the simulation(seen in Table 3), were set according to the experimental condi-tions [53] and mean particle diameters used for the continuumsolid phase and the discrete solid phase. Each of the three experi-mental cases focuses on one particular particle size with a meanvalue of 6.7 mm, 4.3 mm and 1.5 mm, respectively. All of the threeexperimental cases are considered in this work. In the experimen-tal results, 3.0 mm was shown to be the beneficiation limit. Thusan additional simulation with 3.0 mm particles was performed todemonstrate the segregation pattern in such a condition. For eachcase, five separate density distributions, e.g., 1400 kg/m3, 1700 kg/m3, 2000 kg/m3, 2300 kg/m3 and 2700 kg/m3 were considered inthe simulations in order to represent the wide density range ofraw coal samples and to demonstrate the density stratificationclearly and continuously. The discrete particles were set with afixed particle size with five specified densities for each simulationcase. The influence of particle size can be identified by comparingdifferent simulation cases. Table 4 shows the particle size and den-sities for the four simulation cases. The gas injection velocity wasset as 0.1 m/s in each case as in the experiments, which is about1.5 times the minimum fluidization velocity of the dense solidmedium. The 6.7 mm case and 4.3 mm case were mainly used formodel validation. The particle number was determined accordingto the bed expansion in the experiment. For the 6.7 mm case 500particles were used and 1000 particles used for the 4.3 mm case.In the other two cases, 1000 particles were used to save computa-tional time.
a The cell size is enlarged to about 0.007 m when the DEM particle of 6.7 mm wasused to hold the particles.
Table 4Simulation cases.
Casenumber
dds
(mm)qds (kg/m3) Particle number (n)
1 6.7 1400; 1700; 2000;2300; 2700
500 (100 for each densityfraction)
2 4.3 1400; 1700; 2000;2300; 2700
1000 (200 for each densityfraction)
3 3.0 1400; 1700; 2000;2300; 2700
1000 (200 for each densityfraction)
4 1.5 1400; 1700; 2000;2300; 2700
1000 (200 for each densityfraction)

Table 5Numerical technique used in the simulation.
Numerical parameters Methods/values
Maximum number of iterations 500Maximum residual (continuity and
momentum)1 � 10�4
Number of iterations in the linear equationsolver
300 for all equations
Method used in the linear equation solver BiCGSTAB [56]Tolerance used in linear equation solvers 1 � 10�6
Discretization scheme Superbee (second order) [57]Time step (s) Between 1.0 � 10�6 and
1.0 � 10�5
Q. Wang et al. / Chemical Engineering Journal 260 (2015) 240–257 245
2.3. Numerical platform
The open source code, MFIX, was used as the numerical plat-form in this study [46]. An extension of the SIMPLE [54] algorithmis used to formulate the discretized equations for multiphase flowin the code. The presence of inter-phase transfer terms is a distin-guishing feature of multiphase flow equations, which results in alarger, non-standard matrix when solving all the discretized equa-tions for a certain component together in the entire computationaldomain. The Partial Elimination Algorithm of Spalding [55] is usedin the code as an effective alternative that maintains a higherdegree of coupling between the equations while giving the stan-dard septa-diagonal matrix. To prevent compaction of the solidsbeyond the physical packing limit, a solid pressure is introducedto retard the particles’ compressibility. A solid volume fraction cor-rection equation is developed in MFIX for the solid pressure inorder to stabilize the computation. Time steps for the transientgas–solids flow are automatically adjusted to reduce the computa-tional time. A group of numerical parameters/criteria were refinedin the simulation to enhance the accuracy of the results, as listed inTable 5.
3. Results and discussion
2.1. Gas–solids flow patterns and particle distributions
Fig. 3 shows the instantaneous gas–solid flow pattern at differ-ent times for the four cases. For better visualization, smaller parti-cles, which cannot be clearly presented in their real dimension,including 4.3 mm, 3.0 mm and 1.5 mm, are enlarged for visualiza-tion purposes by 1.2 times, 1.5 times and 2.5 times, respectively. Inthe initial state, discrete particles are packed above the static bedin a random order for different density fractions. The gas is thenintroduced to the bed from the bottom. Discrete particles beginto fall to the bed surface at the start of the simulation. Bubbling flu-idization appears in the bed with small bubbles in the bed bottomand the bubble size increases as they float to the bed surfacethrough continuous coalescence. Bubbles with concave shapedbases can be clearly observed. Such a bubble configuration is quiteclose to the experimental observations as reported in the literature[7,53]. A wake region forms behind the bubble, causing mixing ofparticles in the wake region as bubbles are flowing up. The meanbed density is about 2.3 g/cm3 at the air velocity used in this work.The discrete coal particles with different density and/or size arebeneficiated in such a dense bubbling fluidized bed. After a periodof 10 s, all cases have reached a state of dynamic equilibrium andthe simulation proceeds to 25 s.
Coal separation in CBFB mainly depends on the density differ-ence between the beneficiated sample and the bed itself. Coal sam-ples with different densities, i.e., the light clean coal sample andheavy tailing gangue sample, will segregate under this condition
[2]. At the same time, the particle segregation behavior and bene-ficiation efficiency in CBFB is a strong function of the particle size[7]. As seen from Fig. 3, when the discrete particles are large,6.7 mm, clear segregation occurs for particles of different densities.Heavy particles start to sink to the bed bottom and light ones floatto the bed surface once the bed fluidized (seen at the time of 2 s).Once the flow reaches a pseudo-steady state, after about 10 s, par-ticles of 2.7 g/cm3 with a larger density than the bed density, dom-inate in the lower part of the dense bed and a significant fraction ofthese heavy particles have settled on the bottom of the bed. Parti-cles lighter than the bed density, such as particles of 1.4 g/cm3,1.7 g/cm3, 2.0 g/cm3, are mainly distributed at the top part of thebed. Particles with the same density as the bed density, e.g.,2.3 g/cm3, are relatively evenly distributed in the bed. At the sametime, due to mixing generated by bubbles, there are always someheavy particles in the top layers and occasionally some light onesmoving to the bottom layers. Such a phenomenon is referred toas the ‘‘mismatch distribution’’ in CBFB separation [6]. For the4.3 mm case, the flow process is similar to the 6.7 mm case andparticle segregation is still quite clear. However, the mismatch dis-tribution of particles is greater, i.e., there are more heavy particlesemerging at the top layers and more light ones in the bottom lay-ers. When the particles are as smaller as 3.0 mm or 1.5 mm, parti-cles with different densities show trajectories close to that of thebed material in the initializing period and no clear segregationcan be observed in the pseudo-steady period. The results demon-strated that the segregation degree is strongly affected by the sizeof beneficiated particles size. The model predicts that effective sep-aration is not possible for particles smaller than 3.0 mm in CBFB,which is in agreement with the experimental findings [53].
To obtain detailed particle distributions along the bed height,results at each height have been time averaged between 15 s and25 s. The time averaged weight proportion (number density inthe simulation) of particles in each density fraction is shown inFig. 4. The experimental results are also shown in the figure toquantitatively validate the simulation results. Similar to the exper-iments, the dense bed is divided into 7 layers with 5 cm for eachlayer from the bottom to the top. Since bed expansion varies withflow conditions the 7th layer is usually less than 5 cm, thus adecrease of particle weight proportion can be seen in this layerin Fig. 4.
For 6.7 mm particles, the light particle fractions, e.g., 1.4 g/cm3,1.7 g/cm3 and 2.0 g/cm3, show a sharp increase in proportion withan increase in height from the base. The rate of increase reduces asthe particle density increases. The tendency for particles to migrateto the bed top can also be seen for particles of 2.3 g/cm3, but par-ticles of 2.7 g/cm3, which are denser than the bed density show thereverse trend with particle proportion increasing toward the bot-tom of the bed. In the experiment, a clean coal sample with a par-ticle size of 5.5–8 mm and a density of 1.37 g/cm3, and a ganguesample with the same size range and a density of 2.68 g/cm3 wereused. It can be seen that the distribution of the light fractions in thesimulations have a similar pattern to coal samples in the experi-ments, despite some discrepancies between them. The experimen-tally measured distribution is closer to the predicted densityfraction of 1.7 g/cm3 rather than that of 1.4 g/cm3. For the ganguesamples on the other hand, a large fraction of particles sediment inthe bed bottom and then a slightly increased distribution tendencyis shown in the experiment. In the simulated results, however, aslightly increased tendency is obtained for the 2.3 g/cm3 fractionwhile a total decrease tendency is obtained for the 2.7 g/cm3 frac-tion. This indicates that the experimental result for gangue parti-cles is between the distributions of these two heavy particlefractions in the simulation. Similar tendencies can be observedfor the 4.3 mm particles but the steepness in the vertical distribu-tion of particles is less. For discrete particles as small as 3.0 mm,
0s 2s 5s 10s 25s(a)
0s 2s 5s 10s 25s(b)
0s 2s 5s 10s 25s(c)
0s 2s 5s 10s 25s(d)
Fig. 3. The gas–solids flow pattern predicted by the TFM–DEM simulation for different cases. (a) Discrete particle size in 6.7 mm; (b) 4.3 mm (discrete particle size increasedby 1.2 times for better visualization); (c) 3.0 mm (1.5 times); and (d) 1.5 mm (2.5 times).
246 Q. Wang et al. / Chemical Engineering Journal 260 (2015) 240–257
the segregation features are still being captured by the model asvariations in the particle vertical distributions is still noticeablefor the heave density fractions and light fractions as shown inFig. 4c. However, for the 1.5 mm particles in Fig. 4d there is no
separation of different density fractions. Similarly, in the experi-ment, coal particles and gangue particles of 1.5 mm particles werealso hard to separate, but there was a slight increase in the propor-tion of less dense particles towards the top of the bed. Results in

(a)
(b)
0%
20%
40%
60%
80%
0 5 10 15 20 25 30 35
Prop
ortio
n (w
t)
Height (cm)
Experiment-coal1.41.72.0
g/cm3
g/cm3
g/cm3
In experiment:Coal particles dds= 5.5-8mmρds= 1.37 g/cm3
0%
20%
40%
60%
80%
0 5 10 15 20 25 30 35
Prop
ortio
n (w
t)
Height (cm)
Experiment-gangue2.72.3
g/cm3
g/cm3 In experiment:Gangue particles dds= 5.5-8mmρds= 2.68g/cm3
0%
20%
40%
60%
80%
0 5 10 15 20 25 30 35
Prop
ortio
n (w
t)
Height (cm)
Experiment-coal1.41.72.0
g/cm3
g/cm3
g/cm3
In experiment:Coal particles dds= 3-5.5mmρds= 1.38 g/cm3
0%
20%
40%
60%
80%
0 5 10 15 20 25 30 35Pr
opor
tion
(wt)
Height (cm)
Experiment-ganuge2.72.3
g/cm3
g/cm3 In experiment:Gangue particles dds= 3-5.5mmρds= 2.65g/cm3
(c)
(d)
0%
20%
40%
60%
80%
0 5 10 15 20 25 30 35
Prop
ortio
n (w
t)
Height (cm)
Experiment-coal1.41.72.0
g/cm3
g/cm3
g/cm3
In experiment:Coal particles dds= 3-5.5mmρds= 1.38 g/cm3
0%
20%
40%
60%
80%
0 5 10 15 20 25 30 35
Prop
ortio
n (w
t)
Height (cm)
Experiment-gangue2.72.3
g/cm3
g/cm3 In experiment:Gangue particles dds= 3-5.5mmρds= 2.65g/cm3
0%
20%
40%
60%
80%
0 5 10 15 20 25 30 35
Prop
ortio
n (w
t)
Height (cm)
Expriment-coal1.41.72.0
g/cm3
g/cm3
g/cm3
In experiment:Coal particles dds= 1-2mmρds= 1.40 g/cm3
0%
20%
40%
60%
80%
0 5 10 15 20 25 30 35
Prop
ortio
n (w
t)
Height (cm)
Experiment-gangue2.72.3 In experiment:
Gangue particles dds= 1-2mmρds= 2.65 g/cm3
g/cm3
g/cm3
Fig. 4. Distributions of particle mass along the bed height for each density fraction. (a) 6.7 mm; (b) 4.3 mm; (c) 3.0 mm and (d) 1.5 mm.
Q. Wang et al. / Chemical Engineering Journal 260 (2015) 240–257 247
Fig. 4 show that with a decrease in the beneficiated particle size,the vertical segregation of particles with different densities is seri-ously weakened. The results are consistent with the observationsin Fig. 3, but are in a more quantitative form. The inconsistencybetween the simulated and experimental results, as discussedabove, is not large and mainly attributed to the following reasons.On the modeling aspect, the parameters selected for simulation donot fully represent the particle properties in the experiment. Forexample, a mean particle size is used in the model for the medium
sized solids to represent a wide particle size distribution (PSD) inthe experimental sample. The PSD for the discrete particles, eventhough considered narrow in experiment, is still wide when com-pared to the single size substitution in the simulation. Other prop-erties of the coal particles, e.g., the sphericity, vary betweenparticles, are not easily considered in the inter-phase drag models.Most importantly, a 2D simplification is used for the gas phase andthe solid phases, which would also lose some accuracy when com-pared to a fully 3D simulation. In the experiment, the increasing

1.4
1.6
1.8
2.0
2.2
2.4
2.6
2.8
3.0
0 5 10 15 20 25 30 35
Ave
rage
den
sity
(g/
cm3 )
Height (cm)
6.7mm4.3mm3.0mm1.5mm
dds
Fig. 5. The time-averaged particle density distribution for the different cases.
248 Q. Wang et al. / Chemical Engineering Journal 260 (2015) 240–257
distribution tendency of the gangue particles was thought to orig-inate from the uneven fluidization near the vicinity of the sidewalls even though a sand layer had been used to improve unifor-mity of air distribution. Big bubbles mainly passed through thecentral area of the bed width, increasing the degree of fluidizationof gangue particles for sedimentation, while other gangue particlescloser to the side walls were not fully beneficiated as they settledinto the under-fluidized medium near the walls [53]. For the samereason, the fluidized bed density could be underestimated as thepressure taps were set along two lines at the central part of thebed width [53]. However, a uniform air injection condition in thesimulation results in an ideal fluidization state across the bedwidth. Consequently, the simulated bed density is higher thanthe measured value, and the flotation effect is inevitably strongerfor the beneficiated particles. Considering all these factors, thenumerical results are still quite comparable to the physical exper-imental results and sufficiently reliable enough to demonstrate theparticle beneficiation characteristics. The present TFM–DEM modelhas captured the key features of the gas–solids flow in CBFB pro-cess and further analysis of the results is performed on this basis.
Using results shown in Fig. 4, the time-averaged (between 15 sand 25 s) particle density distribution along the bed height isshown in Fig. 5. A continuous average density distribution isobtained from the five different density particle groups and plottedalong the bed height in Fig. 5 and shows the effect known as den-sity stratification. The particle density is generally correlated to theash content in the coal sample [58]. Density stratification patternsin CBFBs can be effectively used to remove high ash content parti-cles in the raw coal so as to upgrade low rank coals. Clearly, densitystratification is strongly weakened with a decrease in particle size.When the particle size is smaller than 3.0 mm, the variation of par-ticle density along bed height is indistinct. Separating the cleancoal and the heavy gangue by density difference is then impossiblein a dry CBFB for particles smaller this cut size. For small particles,some other methods such as magnetic technology [59] or froth flo-tation [60] need to be used to separate gangue from coal.
To date, explanation of the separation mechanism is mainlyobtained through experimental findings. For example, as we havediscussed in the former publication [53], the density ratio betweenthe particle density and the mean bed density is an important fac-tor to determine the particle segregation [61–64]. Flotation of par-ticles by the medium is mainly due to the difference betweenmedium density and particle density and determines the generaldistribution tendency of coarse particles in CBFB. Additionallyswarms of rising bubbles have a considerable effect and occasion-ally push light particles down and lift heavy particles up. However,particle segregation in a CBFB is not a simple function of the beddensity ratio and/or the particle properties. The fluidization stateand bubbling regime show considerable influences to the benefici-ation quality [53], especially for coal particles in the finer sizerange. Experimental approaches have given wide reports on the
influence of particle size and density but cannot give furtherinsights to underlying mechanisms. In this work, the trajectoriesand controlling forces acting on each individual particle are readilyavailable. By analyzing the gas–solid flow dynamics and the con-trolling forces exerted on the particles, the separation mechanismcan be explained in detail and is discussed in Sections 3.3 and 3.4.
3.2. Segregation kinetics
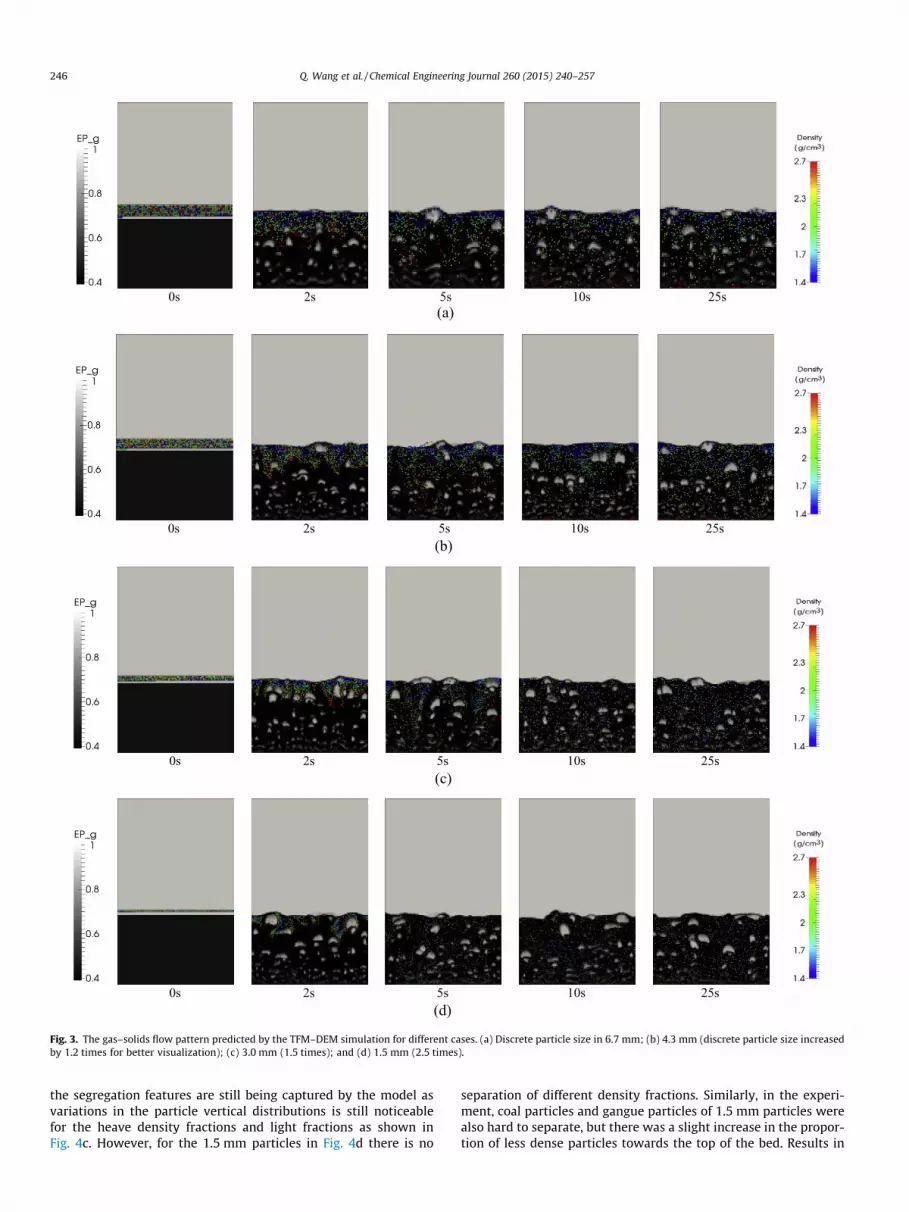
To quantify the degree of segregation and mixing, the meanheight of each type of particle is calculated. Fig. 6 shows themean height as function of time for different density fractionsin each size case. The initial starting positions for all discrete par-ticles are above the bed surface and a period of time is requiredfor particle segregation to occur. The time to reach an equilibriumperiod is different for different sized particles, as well as for dif-ferent density fractions. For example, for the 6.7 and 4.3 mm par-ticle systems, the heavy particles take about 10–15 s to reach adynamically equilibrium state as some of them travel a longerdistance from the top surface to the bottom section, while thelight particles take quite a short time to reach their equilibriumstate because most of them stay in the top section. When theparticle size reduces, the time to reach an equilibrium statebecomes shorter due to the increased mixing effect, and the timeto reach a stable state for different density fractions is very sim-ilar. During the equilibrium period, a steady gap can be observedbetween the mean heights of different density fractions. Only theparticle fraction of 2.7 g/cm3 has a mean height below the middlelevel of the dense bed (about 16 cm), while the other particlefractions are above the middle level. Bed density is about 2.3 g/cm3 and flotation of the particles lighter than this value is obvi-ous. In CBFB processing, the bed is usually divided as two layersfor collection of the flotsam and jetsam. Based on the densitystratification shown in Fig. 6a, clean coal with different densityfractions can be obtained by cutting the bed at the desired height.As the discrete particle size is reduced the mean heights of differ-ent density fractions converge, indicating that density stratifica-tion becomes increasingly difficult and nearly impossible whenthe particle size is less than 3.0 mm. For the 1.5 mm size particlesthe mean heights of different density fractions converge at themiddle level of the bed (about 15 cm). Thus a well mixed condi-tion is obtained for 1.5 mm particles even though the density dif-ference is the same as for the large sized particles.
3.3. Gas and solid dynamics
Pressure drop over the bed and pressure fluctuations are oftenrecorded in experiments as a tool for identifying different charac-teristics in experiments at different operating states [65]. Pressurefluctuations at the center of the bed bottom are recorded and plot-ted in Fig. 7; these resemble a typical fluidized bed system [66]. Asthe same gas injection velocity is applied and bed mass is almostthe same for all cases, the bed pressure drops are all of a similarscale. A close inspection of the figure shows a slight effect due toparticle sizes can be identified. The total pressure drop shows aslight reduction as the particle size reduces. This is attributed tothe different weights of the discrete particles introduced to thebed. Pressure fluctuations originating from the bubbling effectbecome stronger as the particle size reduces, as evidenced by theirstandard deviation. As the particle size reduces, the particlesappear to have less effect in damping fluctuations in the gas andsolid flows, which leads to stronger mixing of the continuumsolids.
Fig. 8 shows the instantaneous velocity distributions for the gasphase, continuum solid phase and discrete particle phase. The gasphase is evenly introduced to the bed from the bed bottom,
(a) (b)
(c) (d)
0
20
40
60
80
0 5 10 15 20 25
Mea
n H
eigh
t (cm
)
Time (s)
1.41.72.02.32.7
ρds (g/cm3)dds=6.7mm
0
20
40
60
80
0 5 10 15 20 25
Mea
n H
eigh
t (cm
)
Time (s)
1.41.72.02.32.7
ρds (g/cm3)dds=4.3mm
0
20
40
60
80
0 5 10 15 20 25
Mea
n H
eigh
t (cm
)
Time (s)
1.41.72.02.32.7
ρds (g/cm3)dds=3.0mm
0
20
40
60
80
0 5 10 15 20 25
Mea
n H
eigh
t (cm
)
Time (s)
1.41.72.02.32.7
ρds (g/cm3)dds=1.5mm
Fig. 6. The mean height of discrete particles in the segregation process. (a) 6.7 mm; (b) 4.3 mm; (c) 3.0 mm and (d) 1.5 mm.
(a) (b)
(c) (d)
6800
6900
7000
7100
7200
7300
7400
7500
0 5 10 15 20 25
Pres
sure
(Pa)
Time (s)
dp= 6.7mm mp=0.159kg
Pmean= 7172 Pa σ = 60.03
6800
6900
7000
7100
7200
7300
7400
7500
0 5 10 15 20 25
Pres
sure
(Pa)
Time (s)
dp= 4.3mm mp=0.084kg
Pmean= 7126 Pa σ = 65.73
6600
6700
6800
6900
7000
7100
7200
7300
0 5 10 15 20 25
Pres
sure
(Pa)
Time (s)
dp= 3.0mm mp=0.029kg
Pmean= 6927 Pa σ = 74.19 6400
6500
6600
6700
6800
6900
7000
7100
0 5 10 15 20 25
Pres
sure
(Pa)
Time (s)
dp= 1.5mm mp=0.004kg
Pmean= 6770 Pa σ = 77.12
Fig. 7. The pressure fluctuation at the center point of the bed bottom in different cases. (a) 6.7 mm; (b) 4.3 mm; (c) 3.0 mm and (d) 1.5 mm. (mp is the mass of total discreteparticles; Pmean is the mean pressure and r is the standard deviation of the pressure fluctuation.)
Q. Wang et al. / Chemical Engineering Journal 260 (2015) 240–257 249

(i) (ii) (iii) (iv)(a)
(i) (ii) (iii) (iv)(b)
Width (cm)
Hei
ght(
cm)
0 10 20 30 40 500
20
40
60
80d =6.7mm
0.5m/s
t=25sds
Width (cm)
Hei
ght(
cm)
0 10 20 30 40 500
20
40
60
80d =4.3mm
0.5m/s
t=25sds
Width (cm)
Hei
ght(
cm)
0 10 20 30 40 500
20
40
60
80d =3.0mm
0.5m/s
t=25sds
Width (cm)
Hei
ght(
cm)
0 10 20 30 40 500
20
40
60
80d =1.5mm
0.5m/s
t=25sds
Width (cm)
Hei
ght(
cm)
0 10 20 30 40 500
20
40
60
80d =6.7mm
0.5m/s
t=25sds
Width (cm)
Hei
ght(
cm)
0 10 20 30 40 500
20
40
60
80d =4.3mm
0.5m/s
t=25sds
Width (cm)
Hei
ght(
cm)
0 10 20 30 40 500
20
40
60
80d =3.0mm
0.5m/s
t=25sds
Width (cm)H
eigh
t(cm
)0 10 20 30 40 500
20
40
60
80d =1.5mm
0.5m/s
t=25sds
(i) (ii) (iii) (iv)(c)Width (cm)
Hei
ght(
cm)
0 10 20 30 40 500
20
40
60
80
1.3 1.5 1.7 1.9 2.1 2.3 2.5 2.7 2.9
50
d =6.7mm0.5m/s
t=25sds
1.4 1.7 2.0 2.3 2.7
Width (cm)
Hei
ght(
cm)
0 10 20 30 40 500
20
40
60
80
1.3 1.5 1.7 1.9 2.1 2.3 2.5 2.7 2.9
50
d =4.3mm0.5m/s
t=25sds
1.4 1.7 2.0 2.3 2.7
Width (cm)
Hei
ght(
cm)
0 10 20 30 40 500
20
40
60
80
1.3 1.5 1.7 1.9 2.1 2.3 2.5 2.7 2.9
50
d =3.0mm0.5m/s
t=25sds
1.4 1.7 2.0 2.3 2.7
Width (cm)
Hei
ght(
cm)
0 10 20 30 40 500
20
40
60
80
1.3 1.5 1.7 1.9 2.1 2.3 2.5 2.7 2.9
50
d =1.5mm0.5m/s
t=25sds
1.4 1.7 2.0 2.3 2.7
Fig. 8. The distribution of instantaneous velocity for (a) the gas phase, (b) the continuum solid phase and (c) the discrete solid phase for different cases (t = 25 s). (i) 6.7 mm;(ii) 4.3 mm; (iii) 3.0 mm and (iv) 1.5 mm.
250 Q. Wang et al. / Chemical Engineering Journal 260 (2015) 240–257
strongly interacts with both solid phases and then flows out fromthe dense bed surface. Regions of high gas velocity, shown bylonger vectors in Fig. 8a, occur at the location of bubbles. Due tomixing of the solid phase in bubbling fluidization, some vorticescan be clearly observed that continue into the free board as previ-ously predicted [67]. The continuum solid phase shows velocitydistributions that are consistent with that of the gas phase. Witha decrease in the discrete particle size, the strength of solid flow
tends to be stronger as seen from both the instantaneous solidvelocity in Fig. 8b and the averaged velocity magnitude as seenin Fig. 9. Both the increased pressure fluctuations and greatervelocity magnitude indicate increased back-mixing effects in thecontinuum solids as the particle size decreases. The large discreteparticles and their retarding effect on motion in the medium havea counteractive effect to the flow of the continuum phases, result-ing in the suppression of gas and solid velocity fluctuations and

0
0.05
0.1
0.15
0.2
0.25
0.3
0 5 10 15 20 25
Ave
rage
vel
ocity
mag
itude
(m/s)
Time (s)
6.7mm 4.3mm3.0mm 1.5mm
Fig. 9. The average velocity magnitude of the continuum solid phase in differentcases.
Q. Wang et al. / Chemical Engineering Journal 260 (2015) 240–257 251
reduced back-mixing of the continuum phase. However, when theparticles are smaller, they show closer fluidization characteristicsto the continuum solids, and thus they are more easily driven byflow of the medium as seen in Fig. 8c. Under such conditions, smallparticles of different densities are mixed together in the bed withlarge velocity magnitudes and are hard to separate.
3.4. Segregation/mixing mechanism
The motion and segregation of particles in a CBFB is determinedby many interactions including between gas and beneficiated par-ticles, between dense medium and beneficiated particles, betweenbeneficiated particles themselves and between particles and walls,as well as by the gravitational force. For coarse particles, the parti-cle motion is mainly controlled by the balance between gravity andthe effective hydrostatic buoyancy with other forces being negligi-ble, thus Archimede’s principle can generally explain the separa-tion mechanism [68]. But for the fine particles, interactionsbetween the coal particles and the bed medium as well as theinteractions between the coal particles and the bubble phasebecome relatively significant, thus the separation mechanism ismore complicated [69]. To date, detailed information is not avail-able from experimental studies using current measurement tech-niques. Therefore the separation mechanism for fine particle sizeranges, as investigated in this work, is still not clear. Informationof these interaction forces is readily obtained from the presentTFM–DEM modeling of CBFB. Following a similar approach to ana-lyze these forces at particle scale [70,71], a better understanding ofthe underlying mechanisms responsible for fine coal particle sepa-ration in a CBFB can be achieved.
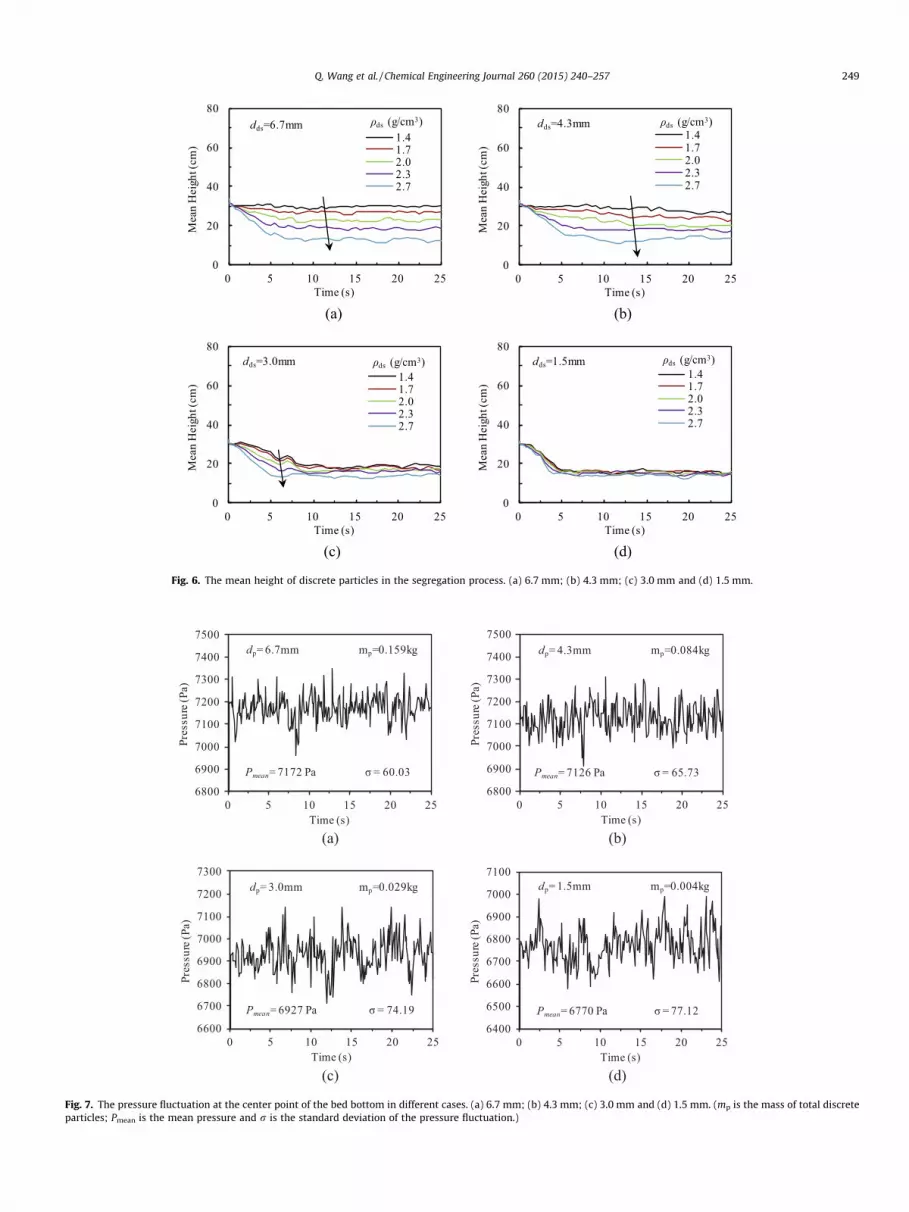
Fig. 10 shows the instantaneous spatial distribution of forcefields for different cases at their dynamically equilibrium state.As the beneficiated discrete particles are in dilute phase, the inter-actions between discrete particles and between particle and wallsare very small and not discussed here. The main forces exerted onthe discrete particles are: the drag force from gas phase (G–Dforce), the drag force from continuum solid phase (C–D force)and the total pressure force. These forces have been non-dimen-sionalized by the gravity force of the respective discrete particles.As seen in Fig. 10, the drag force from the gas phase, the G–D force,on the discrete particles are in very small scale, e.g., less than 1% ofthe gravity force. The dominant force comes from the pressureforce originating from the pressure gradient (as seen in the firstterm of Eqs. (13) and (15)) in the pseudo-fluid flow of the gas phaseand continuum solid phase. This kind of pressure drag provides avertical force to the discrete particles that balances the gravityforce and realizes flotation of the coarse particles, which cannotbe fluidized by the gas phase directly. Under this condition, theC–D force has a reverse direction to the discrete particle flow and
acts to retard the motion of the discrete particles. The C–D forcevaries significantly from particle to particle, as it is determinedby the instantaneous velocity difference between the discrete par-ticles and the surrounding continuum solid as shown in Fig. 8b andc. The instantaneous spatial distribution of these forces at the par-ticle scale highlights the complexity of the system, but does notfully explain the segregation process. As the segregation is a collec-tive behavior of all particles, the time- and space-averaged valuesof these forces are calculated for a better explanation of the sepa-ration or mixing phenomena for different particle sizes.
As coal segregation takes place in the vertical direction inCBFB, the vertical component of the interaction forces are quan-tified and their variation with time are shown in Fig. 11. Theforces have been averaged over all particles in each density frac-tion. To more clearly show the behavior in the initial time periodfor the different fractions, results before and after 1 s are plottedwith different horizontal scaling. Particles of different densityfractions are well mixed in the initial packing and it is only afterthey drop to the bed surface (about 0.2 s) that segregation startsto occur. The absolute value of the G–D force for particles of eachsize is similar for different density fractions because it is deter-mined by the particle diameter, slip velocity and gas properties.The non-dimensionalized differences shown are attributed tonon-dimensionalizing with respect to the gravity force which var-ies for each density fraction (Fig. 11i in each case). The discreteparticles are not in a fluidized state at the commencement ofthe simulations and results in particles dropping rapidly in theinitial time period; this causes the C–D force to start from a highvalue and decreases quickly as the difference between the dis-crete particle velocity and the bed velocity reduces (Fig. 11ii ineach case). The pressure force increases rapidly as the particlebecomes further immersed into the dense bed (Fig. 11iii of eachcase). As a result, the total upward force controlling the particlesmotion is relatively greater than gravity for the light particles andless than gravity for heavy particles (Fig. 11-iv of each case). Thisprovides a driving force for density segregation, with light frac-tions rising to the top and heavy fractions sinking to the bottomof the bed. After rearrangement and segregation of particles, adynamically stable period is finally reached, with each forcereaching close to steady values for each density fraction due tothe continuous flotation and/or sedimentation effects on discreteparticles in the bubbling fluidized state. During this period, thecontinuous upward motion of light fractions and the downwardflow of heavy fractions are hindered by the C–D force, whichshows a counteracting effect to the particle flows arising frombuoyancy effects for each density fraction.
Comparing the different cases in Fig. 11, the influence of particlediameters on changes of these forces can be addressed. At the com-mencement of the simulation (for example, 0.2 s, when the dis-crete particles have touched the fluidized medium), thedifference type of forces started with different values followingthe change of particle size: The relative G–D force (on average)shows an obvious increase with the decrease of dds, with smallerparticles being more strongly influenced by the gas phase; the C–D force starts from a smaller value and the pressure force from ahigher value when the dds reduces; and the total force shows lessdifference between the different density fractions as the particlesize reduces, especially when the particle size is smaller than3.0 mm. Such changes in the averaged forces during the segrega-tion period significantly reduce the degree of segregation with adecrease of particle size as demonstrated in the former sections.During the steady period, both the C–D drag force and the pressureforce show larger differences between the different density frac-tions. These changes mainly occur on the light fractions as theyhave become immersed deeper into the bed with a decrease of par-ticle size as seen in Fig. 6.
(a)
(b)
Width (cm)
Hei
ght(
cm)
0 10 20 30 40 500
20
40
60
80
7.25735.2573.25212.250.25788.1527.15265.14.1
0.01 unit of gravity
1.4 1.7 2.0 2.3 2.7
d =6.7mm t=25sds
G-D force
Discrete particle density (g/cm )3
Width (cm)
Hei
ght(
cm)
0 10 20 30 40 500
20
40
60
80
7.25735.2573.25212.250.25788.1527.15265.14.1
1 unit of gravity
1.4 1.7 2.0 2.3 2.7
d =6.7mm t=25sds
C-D force
Discrete particle density (g/cm )3
Width (cm)
Hei
ght(
cm)
0 10 20 30 40 500
20
40
60
80
7.25735.2573.25212.250.25788.1527.15265.14.1
2 unit of gravity
1.4 1.7 2.0 2.3 2.7
d =6.7mm t=25sds
Pressure force
Discrete particle density (g/cm )3
Width (cm)
Hei
ght(
cm)
0 10 20 30 40 500
20
40
60
80
7.25735.2573.25212.250.25788.1527.15265.14.1
0.01 unit of gravity
1.4 1.7 2.0 2.3 2.7
d =4.3mm t=25sds
G-D force
Discrete particle density (g/cm )3
Width (cm)
Hei
ght(
cm)
0 10 20 30 40 500
20
40
60
80
7.25735.2573.25212.250.25788.1527.15265.14.1
1 unit of gravity
1.4 1.7 2.0 2.3 2.7
d =4.3mm t=25sds
C-D force
Discrete particle density (g/cm )3
Width (cm)
Hei
ght(
cm)
0 10 20 30 40 500
20
40
60
80
7.25735.2573.25212.250.25788.1527.15265.14.1
2 unit of gravity
1.4 1.7 2.0 2.3 2.7
d =4.3mm t=25sds
Pressure force
Discrete particle density (g/cm )3
(c)
(d)
Width (cm)
Hei
ght(
cm)
0 10 20 30 40 500
20
40
60
80
7.25735.2573.25212.250.25788.1527.15265.14.1
0.015 unit of gravity
1.4 1.7 2.0 2.3 2.7
d =3.0mm t=25sds
G-D force
Discrete particle density (g/cm )3
Width (cm)
Hei
ght(
cm)
0 10 20 30 40 500
20
40
60
80
7.25735.2573.25212.250.25788.1527.15265.14.1
1 unit of gravity
1.4 1.7 2.0 2.3 2.7
d =3.0mm t=25sds
C-D force
Discrete particle density (g/cm )3
Width (cm)
Hei
ght(
cm)
0 10 20 30 40 500
20
40
60
80
7.25735.2573.25212.250.25788.1527.15265.14.1
2 unit of gravity
1.4 1.7 2.0 2.3 2.7
d =3.0mm t=25sds
Pressure force
Discrete particle density (g/cm )3
Width (cm)
Hei
ght(
cm)
0 10 20 30 40 500
20
40
60
80
7.25735.2573.25212.250.25788.1527.15265.14.1
0.05 unit of gravity
1.4 1.7 2.0 2.3 2.7
d =1.5mm t=25sds
G-D force
Discrete particle density (g/cm )3
Width (cm)
Hei
ght(
cm)
0 10 20 30 40 500
20
40
60
80
7.25735.2573.25212.250.25788.1527.15265.14.1
1 unit of gravity
1.4 1.7 2.0 2.3 2.7
d =1.5mm t=25sds
C-D force
Discrete particle density (g/cm )3
Width (cm)
Hei
ght(
cm)
0 10 20 30 40 500
20
40
60
80
7.25735.2573.25212.250.25788.1527.15265.14.1
2 unit of gravity
1.4 1.7 2.0 2.3 2.7
d =1.5mm t=25sds
Pressure force
Discrete particle density (g/cm )3
Fig. 10. The instantaneous nondimensional forces on the discrete particles in different cases. (a) 6.7 mm; (b) 4.3 mm (discrete particle size in 1.2 times for bettervisualization); (c) 3.0 mm (1.5 times); and (d) 1.5 mm (2.5 times). (G–D force: gas to discrete solid viscous drag force; C–D force: continuum solid to discrete solid viscousdrag force.)
252 Q. Wang et al. / Chemical Engineering Journal 260 (2015) 240–257

(i) (ii)
(iii) (iv)(a)
0
0.001
0.002
0.003
0.004
0.005
0.006
0.2 1 5 9 13 17 21 25
Dim
ensi
onle
ss fo
rce (
-)
Time (s)
1.41.72.02.32.7
Stable
ρds (g/cm3)G-D Forcedds=6.7mm
mean value0.00220.00180.00150.00140.0013
-0.5
-0.25
0
0.25
0.5
0.75
1
1.25
1.5
0.2 1 5 9 13 17 21 25
Dim
ensi
onle
ss fo
rce (
-)
Time (s)
1.41.72.02.32.7
Transient Stable
ρds (g/cm3)C-D Forcedds=6.7mm
mean value-0.085-0.072-0.0510.0360.137
0.0
0.5
1.0
1.5
2.0
2.5
3.0
0.2 1 5 9 13 17 21 25
Dim
ensi
onle
ss fo
rce (
-)
Time (s)
1.41.72.02.42.7
Transient Stable
ρds (g/cm3)Pressure Forcedds=6.7mm
mean value1.1121.0951.0620.9540.821
0.0
0.5
1.0
1.5
2.0
2.5
3.0
0.2 1 5 9 13 17 21 25
Dim
ensi
onle
ss fo
rce (
-)
Time (s)
1.41.72.02.32.7
Transient Stable
ρds (g/cm3)Total Forcedds=6.7mm
(i) (ii)
(iii) (iv)(b)
0
0.002
0.004
0.006
0.008
0.01
0.012
0.2 1 5 9 13 17 21 25
Dim
ensi
onle
ss fo
rce (
-)
Time (s)
1.41.72.02.32.7
Transient Stable
ρds (g/cm3)G-D Forcedds=4.3mm
mean value0.00380.00330.00290.00270.0025
-0.75-0.5
-0.250
0.250.5
0.751
1.251.5
0.2 1 5 9 13 17 21 25
Dim
ensi
onle
ss fo
rce (
-)
Time (s)
1.41.72.02.32.7
Transient Stable
ρds (g/cm3)C-D Forcedds=4.3mm
mean value-0.309-0.185-0.1030.0120.138
0.0
0.5
1.0
1.5
2.0
2.5
3.0
0.2 1 5 9 13 17 21 25
Dim
ensi
onle
ss fo
rce (
- )
Time (s)
1.41.72.02.32.7
Transient Stable
ρds (g/cm3)Pressure Forcedds=4.3mm
mean value1.3251.2071.1080.9790.842
0.0
0.5
1.0
1.5
2.0
2.5
3.0
0.2 1 5 9 13 17 21 25
Dim
ensi
onle
ss fo
rce (
-)
Time (s)
1.41.72.02.32.7
Transient Stable
ρds (g/cm3)Total Forcedds=4.3mm
Fig. 11. The non-dimensional forces on the discrete particles in the segregation process in different cases. (a) 6.7 mm; (b) 4.3 mm; (c) 3.0 mm and (d) 1.5 mm. In each case, (i)gas to discrete solid drag force; (ii) continuum solid to discrete solid drag force; (iii) pressure force and (iv) total force.
Q. Wang et al. / Chemical Engineering Journal 260 (2015) 240–257 253
As particle size reduces, back mixing of the continuum solids isstrengthened, which has been shown in Fig. 9. Meanwhile, motionof particles is more strongly influenced by the surrounding gas and
continuum solids. This is further checked in terms of the meanforce for each type of particles. Fig. 12 plots the variation of themean drag forces for each type of particles received from the gas

(i) (ii)
(iii) (iv)(c)
0
0.003
0.006
0.009
0.012
0.015
0.018
0.1 1 5 9 13 17 21 25
Dim
ensi
onle
ss fo
rce (
-)
Time (s)
1.41.72.02.32.7
Transient Stable
ρds (g/cm3)G-D Forcedds=3.0mm
mean value0.00650.00570.00500.00460.0042
-1
-0.5
0
0.5
1
1.5
0.1 1 5 9 13 17 21 25
Dim
ensi
onle
ss fo
rce (
-)
Time (s)
1.41.72.02.32.7
Transient Stable
ρds (g/cm3)C-D Forcedds=3.0mm
mean value-0.611-0.372-0.184-0.0410.095
0.0
0.5
1.0
1.5
2.0
2.5
3.0
3.5
0.2 1 5 9 13 17 21 25
Dim
ensi
onle
ss fo
rce (
-)
Time (s)
1.41.72.02.32.7
ρds (g/cm3)Pressure Forcedds=3.0mm
mean value1.6741.3881.1771.0320.874
Transient Stable0.0
0.5
1.0
1.5
2.0
2.5
3.0
0.2 1 5 9 13 17 21 25
Dim
ensi
onle
ss fo
rce (
-)
Time (s)
1.41.72.02.32.7
Transient Stable
ρds (g/cm3)Total Forcedds=3.0mm
(i) (ii)
(iii) (iv)(d)
0
0.01
0.02
0.03
0.04
0.05
0.1 1 5 9 13 17 21 25
Dim
ensi
onle
ss fo
rce (
-)
Time (s)
1.41.72.02.32.7
ρds (g/cm3)G-D Forcedds=1.5mm
mean value0.02360.01970.01730.01560.0138
Transient Stable-1.5
-1
-0.5
0
0.5
1
1.5
2
0.1 1 5 9 13 17 21 25
Dim
ensi
onle
ss fo
rce (
-)
Time (s)
1.41.72.02.32.7
ρds (g/cm3)C-D Forcedds=1.5mm
mean value-0.775-0.457-0.238-0.0870.057
Transient Stable
0.0
0.5
1.0
1.5
2.0
2.5
3.0
3.5
0.2 1 5 9 13 17 21 25
Dim
ensi
onle
ss fo
rce (
-)
Time (s)
1.41.72.02.32.7
ρds (g/cm3)Pressure Forcedds=1.5mm
mean value1.7311.4341.2241.0740.908
Transient Stable0.0
0.5
1.0
1.5
2.0
2.5
3.0
0.2 1 5 9 13 17 21 25
Dim
ensi
onle
ss fo
rce (
-)
Time (s)
1.41.72.02.32.7
Transient Stable
ρds (g/cm3)Total Forcedds=1.5mm
Fig. 11 (continued)
254 Q. Wang et al. / Chemical Engineering Journal 260 (2015) 240–257
phase and continuum solid phase with time. At each time, themean forces is non-dimensionalized by the particle gravity force,and calculated as 1
Npmpg
PNp
i¼1jFj, where Np is the number of one typeof particle, and jFj is the magnitude of each specified type of force.The comparison is based on the largest and smallest size systems
only. Clearly, for the G–D force, the value in the small sized systemis higher than that in the large sized system (Fig. 12a), but thevalue is much smaller than the C–D force, which indicates thatthe dominant driver for the solid motion is from the fluidized con-tinuum solid phase. For the light fractions, the non-dimensioned

6.7mm 1.5mm(a)
6.7mm 1.5mm(b)
0
0.01
0.02
0.03
0.04
0.05
0 5 10 15 20 25
Non
dim
ensio
nal f
orce
mag
nitud
e (-
)
Time (s)
1.41.72.02.32.7
ρds (g/cm3)dds=6.7mmG-D force
Mean value0.00220.00180.00160.00150.0014
0
0.01
0.02
0.03
0.04
0.05
0 5 10 15 20 25
Non
dim
ensio
nal f
orce
mag
nitud
e (-
)
Time (s)
1.41.72.02.32.7
ρds (g/cm3)dds=1.5mmG-D force
Mean value0.02420.02020.01770.01580.0140
0
0.5
1
1.5
2
2.5
0 5 10 15 20 25
Non
dim
ensio
nal f
orce
mag
nitud
e ( -
)
Time (s)
1.41.72.02.32.7
ρds (g/cm3)dds=6.7mmC-D force
Mean value0.4710.3980.3370.2680.256
0
0.5
1
1.5
2
2.5
0 5 10 15 20 25
Non
dim
ensio
nal f
orce
mag
nitud
e ( -
)
Time (s)
1.41.72.02.32.7
ρds (g/cm3)dds=1.5mmC-D force
Mean value0.9270.6470.4730.3400.299
Fig. 12. The magnitude of the non-dimensional forces on the discrete particles in different cases. (a) the G–D force and (b) the C–D force. (The conditions for the cases ofdiscrete particles in 4.3 mm and 3.0 mm are between the results of the above two cases in this figure.)
Q. Wang et al. / Chemical Engineering Journal 260 (2015) 240–257 255
C–D force is much larger in the 1.5 mm case than in the 6.7 mmcase. This explains why the light fractions do not float to the topof the bed in the 1.5 mm case. For the heavy fraction particles,whose density is close to the bed density, the segregation patternis not significant for both the 6.7 mm and 1.5 mm cases, as shownin Figs. 3 and 4. However, the slightly greater C–D force magnitudefor the 1.5 mm case probably contributes to the reduced segrega-tion of the 1.5 mm particles in comparison to the 6.7 mm case.
The segregation and mixing phenomena observed in both theexperiments and simulations can reasonably be explained by theabove analysis. Obviously, the mixing/segregation process is verycomplicated, further studies under a wide range of operatingparameters is necessary to build a full picture of particle separationpatterns that occur in CBFB processes. Such studies largely repre-sent our on-going research effort.
4. Conclusions
A coupled TFM–DEM hybrid model was used to study particlesegregation behavior in a coal beneficiation fluidized bed, in whichthe gas phase and the dense solid phase bed materials were mod-eled by the TFM, while the beneficiated coal particles in the dilutephase were modeled by DEM. For model validation purposes, sim-ulations were conducted under similar conditions to physicalexperiments. Four cases are simulated with each case having afixed particle size and five different densities of beneficiated sam-ples so as to represent typical industrial operating conditions. Thepresent TFM–DEM hybrid model was capable of modeling the coalbeneficiation process by producing solid segregation patterns com-parable to the experiment. The key results from the present workcan be summarized as follows:
(1) In CBFB, beneficiated coal particles segregated in the verticaldirection due to the differences between particle density andthe bed density, while the segregation degree was stronglyinfluenced by the particle size. Under the chosen air velocityof 1.5 umf of the solids medium, clear segregation could beachieved for coal particles of 6.7 mm and 4.3 mm diameter.The beneficiation quality strongly deteriorated with adecrease in particle size. When particles were as small as3 mm, the density stratification was not obvious and a wellmixing state was obtained for even smaller particles of1.5 mm.
(2) Segregation kinetics were analyzed using the mean heightsof the different sized particles and 5–10 s of simulated timewas needed to reach a dynamically stable state. Due to thestrong interaction between discrete particles and continuousgas and solid phases, the bubbling behavior and back mixingeffect had a stronger influence on fine particles than largerparticles, which resulted in greater segregation of largerparticles.
(3) The segregation mechanisms were demonstrated on micro-scale level by analyzing the forces exerted on the beneficiat-ed particles from the gas phase, the continuum solid phaseand the bed pressure, on both a spatial scale and time scale.The upward force controlling the particles motion is greaterthan gravity for the light particles and less than gravity forheavy particles, and thus segregation occurred during theinitial period. With a decrease of discrete particle size, boththe drag force from the gas phase and the drag force fromthe continuum solids showed a stronger influence on theparticle flow behavior, resulting in the significantly reduceddegree of segregation.
256 Q. Wang et al. / Chemical Engineering Journal 260 (2015) 240–257
Simulation results obtained demonstrate the feasibility of thepresent modeling approach as an effective numerical tool for thestudy of CBFB processes. Further work will be focused on the inves-tigation of the likely effect of different design and operatingparameters on particle separation efficiency, with an ultimate goalto develop correlations to support industrial operations.
Acknowledgments
Financial support of this work by the National Program on KeyBasic Research Project (973 Program) of China (No. 2012CB214900)is gratefully acknowledged. Qinggong Wang thanks the ChinaScholarship Council (CSC) for a visiting PhD scholarship.
References
[1] N.C. Lockhart, Dry beneficiation of coal, Powder Technol. 40 (1984) 17–42.[2] S. Mohanta, C.S. Rao, A.B. Daram, S. Chakraborty, B.C. Meikap, Air dense
medium fluidized bed for dry beneficiation of coal: technological challengesfor future, Part. Sci. Technol. 31 (2013) 16–27.
[3] Q. Chen, L. Wei, Development of coal dry beneficiation with air-dense mediumfluidized bed in China, China Particuol. 3 (2005) 42.
[4] A.K. Sahu, S.K. Biswal, A. Parida, Development of air dense medium fluidizedbed technology for dry beneficiation of coal—a review, Int. J. Coal Prep. Util. 29(2009) 216–241.
[5] H. Katalambula, R. Gupta, Low-grade coals: a review of some prospectiveupgrading technologies, Energy Fuels 23 (2009) 3392–3405.
[6] R.K. Dwari, K.H. Rao, Dry beneficiation of coal—a review, Miner. Process. Extr.Metall. Rev. 28 (2007) 177–234.
[7] S. Mohanta, S. Chakraborty, B.C. Meikap, Influence of coal feed size on theperformance of air dense medium fluidized bed separator used for coalbeneficiation, Ind. Eng. Chem. Res. 50 (2011) 10865–10871.
[8] M.G. Rasul, V. Rudolph, F.Y. Wang, Particles separation using fluidizationtechniques, Int. J. Miner. Process. 60 (2000) 163–179.
[9] Z. Luo, Y. Zhao, Q. Chen, X. Tao, M. Fan, Separation lower limit in a magneticallygas–solid two-phase fluidized bed, Fuel Process. Technol. 85 (2003) 173–178.
[10] J. He, Y. Zhao, Z. Luo, Y. He, C. Duan, Numerical simulation and experimentalverification of bubble size distribution in an air dense medium fluidized bed,Int. J. Min. Sci. Technol. 23 (2013) 387–393.
[11] D. Gidaspow, Multiphase Flow and Fluidization: Continuum and KineticTheory Descriptions, Academic, Boston, 1994.
[12] J. Ding, D. Gidaspow, A bubbling fluidization model using kinetic theory ofgranular flow, AIChE J. 36 (1990) 523–538.
[13] V. Taivassalo, S. Kallio, J. Peltola, On time-averaged CFD modeling of circulatingfluidized beds, Int. J. Nonlinear Sci. Numer. Simul. 13 (2012) 363–373.
[14] M.F. Rahaman, J. Naser, P.J. Witt, An unequal granular temperature kinetictheory: description of granular flow with multiple particle classes, PowderTechnol. 138 (2003) 82–92.
[15] V. Verma, J.T. Padding, N.G. Deen, J.A.M. Kuipers, Bubble formation at a centralorifice in a gas–solid fluidized bed predicted by three-dimensional two-fluidmodel simulations, Chem. Eng. J. 245 (2014) 217–227.
[16] P.J. Witt, J.H. Perry, M.P. Schwarz, A numerical model for predicting bubbleformation in a 3D fluidized bed, Appl. Math. Model. 22 (1998) 1071–1080.
[17] N. Yang, W. Wang, W. Ge, L. Wang, J. Li, Simulation of heterogeneous structurein a circulating fluidized-bed riser by combining the two-fluid model with theEMMS approach, Ind. Eng. Chem. Res. 43 (2004) 5548–5561.
[18] T. Samruamphianskun, P. Piumsomboon, B. Chalermsinsuwan, Effect of ringbaffle configurations in a circulating fluidized bed riser using CFD simulationand experimental design analysis, Chem. Eng. J. 210 (2012) 237–251.
[19] L. Huilin, D. Gidaspow, J. Bouillard, W. Liu, Hydrodynamic simulation of gas–solid flow in a riser using kinetic theory of granular flow, Chem. Eng. J. 95(2003) 1–13.
[20] Y.Q. Feng, T. Swenser-Smith, P.J. Witt, C. Doblin, S. Lim, M.P. Schwarz, CFDmodelling of gas–solids flow in an internally circulating fluidized bed, PowderTechnol. 219 (2012) 78–85.
[21] A.T. Andrews IV, P.N. Loezos, S. Sundaresan, Coarse-grid simulation of gasparticle flows in vertical risers, Ind. Eng. Chem. Res. 44 (2005) 6022–6037.
[22] X. Chen, J. Wang, J. Li, Coarse grid simulation of heterogeneous gas–solid flowin a CFB riser with polydisperse particles, Chem. Eng. J. 234 (2013) 173–183.
[23] Y. Tsuji, T. Kawaguchi, T. Tanaka, Discrete particle simulation of twodimensional fluidized bed, Powder Technol. 77 (1993) 79–87.
[24] B.P.B. Hoomans, J.A.M. Kuipers, W.J. Briels, W.P.M. van Swaaij, Discrete particlesimulation of bubble and slug formation in a two-dimensional gas-fluidizedbed: a hard sphere approach, Chem. Eng. Sci. 47 (1996) 99–108.
[25] B.H. Xu, A.B. Yu, Numerical simulation of the gas–solid flow in a fluidized bedby combining discrete particle method with computational fluid dynamics,Chem. Eng. Sci. 52 (1997) 2785–2809.
[26] A.B. Yu, B.H. Xu, Particle-scale modeling of gas–solid flow in fluidisation, J.Chem. Technol. Biotechnol. 78 (2003) 111–121.
[27] H.P. Zhu, Z.Y. Zhou, R.Y. Yang, A.B. Yu, Discrete particle simulation ofparticulate systems: theoretical developments, Chem. Eng. Sci. 62 (2007)3378–3396.
[28] H.P. Zhu, Z.Y. Zhou, R.Y. Yang, A.B. Yu, Discrete particle simulation ofparticulate systems: a review of major applications and findings, Chem. Eng.Sci. 63 (2008) 5728–5770.
[29] Y.Q. Feng, A.B. Yu, An assessment of model equations in the discrete particlesimulation of gas solid flow, Ind. Eng. Chem. Res. 43 (2004) 8378–8390.
[30] X. Sun, M. Sakai, M.T. Sakai, Y. Yamada, A Lagrangian–Lagrangian coupledmethod for three-dimensional solid–liquid flows involving free surfaces in arotating cylindrical tank, Chem. Eng. J. 246 (2014) 122–141.
[31] J.E. Hilton, L.R. Mason, P.W. Cleary, Dynamics of gas–solid fluidised beds withnon-spherical particle geometry, Chem. Eng. Sci. 65 (2010) 1584–1596.
[32] S. Chen, G.D. Doolen, Lattice Boltzmann method for fluid flows, Annu. Rev.Fluid Mech. 30 (1998) 329–364.
[33] W. Ge, J.H. Li, Macro-scale pseudo-particle modelling for particle–fluidsystems, Chin. Sci. Bull. 46 (2001) 1503–1507.
[34] D. Pelessone, Discrete element simulations using macro-particles, in: K.J.Bathe (Ed.), Proceedings Second MIT Conference on Compurational Fluid andSolid Mechanics, Elsevier, 2003, pp. 2089–2092.
[35] M.J. Andrews, P.J. O’rourke, The multiphase particle-in-cell (MP-PIC) methodfor dense particulate flows, Int. J. Multiphase Flow 22 (2) (1996) 379–402.
[36] Q.G. Wang, W.D. Yin, J.F. Lu, H.R. Yang, L.B. Wei, Predictions of gas–solid flow ina coal beneficiation fluidized bed by KTGF and CPFD methods, Submitted toInt. J. Miner. Process. (2014).
[37] Q.G. Wang, J.F. Lu, W.D. Yin, H.R. Yang, L.B. Wei, Numerical study of gas–solidflow in a coal beneficiation fluidized bed using kinetic theory of granular flow,Fuel Process. Technol. 111 (2013) 29–41.
[38] D.G. Schaeffer, E.B. Pitman, Ill-Posedness in three-dimensional plastic flow,Commun. Pure Appl. Math. 41 (1988) 879–890.
[39] C.K.K. Lun, S.B. Savage, D.J. Jeffrey, N. Chepurniy, Kinetic theories for granularflow: inelastic particles in Couette flow and slightly inelastic particles in ageneral flow field, J. Fluid Mech. 140 (1984) 223–256.
[40] P.C. Johnson, R. Jackson, Frictional-collisional constitutive relations forgranular materials, with application to plane shearing, J. Fluid Mech. 176(1987) 67–93.
[41] O. Simonin, Continuum modeling of dispersed two-phase flows, Combustionand Turbulence in Two-Phase Flows, vol. 2, Von Karman Institute of FluidDynamics Lecture Series, 1996.
[42] P.A. Cundall, O.D.L. Strack, The Distinct Element Method as a Tool for Researchin Granular Media, National Science Foundation, 1978 (Tech. Rep. NSF GrantENG76-20711).
[43] C.Y. Wen, Y.H. Yu, Mechanics of fluidization, Chem. Eng. Prog. Symp. Ser. 62(1966) 100.
[44] S. Ergun, Fluid flow through packed columns, Chem. Eng. Prog. 48 (1952) 89–94.
[45] R. Garg, J. Galvin, T. Li, S. Pannala, Documentation of open-source MFIX–DEMsoftware for gas–solids flows, From URL <https://mfix.netl.doe.gov/documentation/dem_doc_2012-1.pdf>.
[46] M. Syamlal, W. Rogers, T.J. O’Brien, MFIX Documentation: Volume 1, TheoryGuide, National Technical Information Service, Springfield, 1993.
[47] M. Syamlal, The Particle–Particle Drag Term in a Multiparticle Model ofFluidization, DOE/MC/21353-2373, NTIS/DE87006500, 1987.
[48] J.L. Lebowitz, Exact solution of generalized Percus–Yevick equation for amixture of hard spheres, Phys. Rev. A 133 (1964) 895–899.
[49] D. Gera, M. Syamlal, T.J. O’Brien, Hydrodynamics of particle segregation influidized beds, Int. J. Multiphase Flow 30 (2004) 419–428.
[50] N. Yang, W. Wang, W. Ge, J. Li, CFD simulation of concurrent-up gas�solid flowin circulating fluidized beds with structure-dependent drag coefficient, Chem.Eng. J. 96 (2003) 71–80.
[51] S. Wang, G.B. Zhao, G.D. Liu, H.L. Lu, F.X. Zhao, T.Y. Zhang, Hydrodynamics ofgas–solid risers using cluster structure-dependent drag model, PowderTechnol. 254 (2014) 214–227.
[52] S. Sarkar, M.A. vander Hoef, J.A.M. Kuipers, Fluid–particle interaction fromlattice Boltzmann simulations for flow through polydisperse random arrays ofspheres, Chem. Eng. Sci. 64 (2009) 2683–2691.
[53] Q.G. Wang, W.D. Yin, B. Zhao, H.R. Yang, J.F. Lu, L.B. Wei, The segregationbehaviors of fine coal particles in a coal beneficiation fluidized bed, FuelProcess. Technol. 124 (2014) 28–34.
[54] S.V. Patankar, Numerical Heat Transfer and Fluid Flow, Hemisphere PublishingCorporation, New York, 1980.
[55] D.B. Spalding, Numerical computation of multi-phase fluid flow and heattransfer, in: C. Taylor et al. (Eds.), Recent Advances in Numerical Methods inFluids, Pineridge Press, 1980.
[56] H.A. Van der Vorst, Bi-CGSTAB: a fast and smoothly converging variant of Bi-CG for the solution of nonsymmetric linear systems, SIAM J. Sci. Stat. Comput.13 (1992) 631–644.
[57] P.K. Sweby, High resolution schemes using flux limiters for hyperbolicconservation laws, SIAM J. Numer. Anal. 21 (1984) 995–1011.
[58] C. Zhang, G. Chen, T. Yang, G. Lu, C. Mak, D. Kelly, Z. Xu, An investigation onmercury association in an Alberta sub-bituminous coal, Energy Fuels 21 (2007)485–490.
[59] Z. Luo, Y. Zhao, Q. Chen, M. Fan, X. Tao, Separation characteristics for fine coalof the magnetically fluidized bed, Fuel Process. Technol. 79 (2002) 63–69.
[60] A. Guney, G. Onal, O. Ergut, Beneficiation of fine coal by using the free jetflotation system, Fuel Process. Technol. 75 (2002) 141–150.

Q. Wang et al. / Chemical Engineering Journal 260 (2015) 240–257 257
[61] F. Garcia, A. Romero, J. Villar, A. Bello, A study of segregation in a gas solidfluidized bed: particles of different density, Powder Technol. 58 (1989) 169–174.
[62] A. Nienow, P. Rowe, L. Cheung, A quantitative analysis of the mixing of twosegregating powders of different density in a gas-fluidised bed, PowderTechnol. 20 (1978) 89–97.
[63] A. Rao, J. Curtis, B. Hancock, C. Wassgren, Classifying the fluidization andsegregation behavior of binary mixtures using particle size and density ratios,AIChE J. 57 (2011) 1446–1458.
[64] F.P. Di Maio, A. Di Renzo, V. Vivacqua, Extension and validation of the particlesegregation model for bubbling gas-fluidized beds of binary mixtures, Chem.Eng. Sci. 97 (2013) 139–151.
[65] F. Johnsson, R.C. Zijerveld, J.C. Schouten, C.M. Van den Bleek, B. Leckner,Characterization of fluidization regimes by time-series analysis of pressurefluctuations, Int. J. Multiphase Flow 26 (2000) 663–715.
[66] L.T. Fan, T.C. Ho, S.P.W.W. Hiraoka, W.P. Walawender, Pressure fluctuations ina fluidized bed, AIChE J. 27 (1981) 388–396.
[67] S. Vun, J.A. Naser, P.J. Witt, W. Yang, Measurements and numerical predictionsof gas vortices formed by single bubble eruptions in the freeboard of afluidised bed, Chem. Eng. Sci. 65 (2010) 5808–5820.
[68] M.G. Rasul, V. Rudolph, F.Y. Wang, Particles separation using fluidizationtechniques, Int. J. Miner. Process. 60 (2000) 163–179.
[69] X. Yang, Y. Zhao, Z. Luo, S. Song, C. Duan, L. Dong, Fine coal dry cleaning using avibrated gas-fluidized bed, Fuel Process. Technol. 106 (2013) 338–343.
[70] Y.Q. Feng, A.B. Yu, Microdynamic modelling and analysis of the fluidisationand segregation of binary mixtures of particles, Chem. Eng. Sci. 62 (2007) 256–268.
[71] Y.Q. Feng, S.J. Zhang, B.H. Xu, A.B. Yu, P. Zulli, Discrete particle simulation ofgas fluidization of particle mixtures, AIChE J. 50 (2004) 1713–1728.


![Heat and mass transfer in the vicinity of a devolatilizing coal particle. [In boundary layer during devolatilization and combustion]](https://img.pdfslide.net/doc/110x75/634c88b7c64cf0e3560cac37/heat-and-mass-transfer-in-the-vicinity-of-a-devolatilizing-coal-particle-in-boundary.jpg)