Embed Size (px)
Citation preview
EU~OPEAN 0 GANISATION FOR THE SAFETY OF AIR NAVIGATION
EUROCONTROL Experimental Centre
ODID IV SIMULATION
REPORT
EEC Task No. AS08 EEC Report No. 269/94
Approved for publication by Head of Division B1.
Issued: June 1994
The information contained in this report is the property of the EUROCONTROL Agency
does not necessarily represent the official policy of the Agency. and no part should be reproduced in any form without the Agency's permission. It
e authd) Name/LocatEon EEC Division B1 Experimental Centre
91222 Bretigny-sur-Orge CEDEX
Telephone: (1) 69 88 75 00
sponsorc Sponsor (Contract Authow) NanWLocatmn EUROCONTROL EUROCONTROL Agency DED2 72 rue de la Loi
BP 1040 BRUXELLES Telephone: 32 (2) 233 02 1
TITLE: ODlD IV SIMULATION REPORT
Author Date Pages
I 06/94 I 344 11 R V Graham 64 EEC
Photo AS08 B1
I EEC Task No
AS08
Appendices
12
D Young I Pichancourt A Marsden A IrwU:
ODID IV Specification Sept/Oct 1993
Distribution Statement
Task Spec Period
(a) Controlled by: (b) Special Limitations (if any): (c) Copy to NTIS:
Originator
Head of Division B1 None Yes
Descriptors (keywords) ODID, Air Traffic Control, Colour displays, HMI, Input Devices, Multi-Window Operation, Conflict Prediction, System Assisted Coordination, Approach Metering, STCA.
Abstract: The ODID IV simulation evaluated the HMI aspects of an advanced stripless ATC system. An extensive simulation environment including approach control, lower and upper airspace sectors was used to test a set of conflict detection aids based on through-sector aircraft profiles updated according to the controller's plan. ODlD IV also included a dynamic interactive radar label for notation and data input, STCA, system assisted coordination, colour planning states, a flight leg providing conflict information and text windows for advance planning information. By the end of the simulation the majority of controllers had commented that they associated an ATC instruction with a data input and were quite comfortable with the requirement to update the system. They did not consider that this distracted them from their primary task of separating aircraft (provided they are not affected by deteriorating system response times). A series of Industry briefings and short familiarisation exercises for visiting controllers have been conducted using a reduced version of the ODlD IV simulation facility. 734 professional visitors were received by the EUROCONTROL Experimental Centre during the ODID IV simulation and the subsequent familiarisation exercises (designated ODID IV
, Bis).
EEC Report No. 269/94 EEC Task No. AS08 Date: June 1994
ODlD IV SIMULATION REPORT
Executive Summary
INTRODUCTION
The ODlD IV real time simulation was conducted at the EUROCONTROL Experimental Centre (EEC) during September and October 1993. It was the fourth in a series of Human Machine Interface (HMI) study simulations mounted at the EEC for the Operational Display and Input Development Group (ODID Group). These simulations are sponsored under the EUROCONTROL STAR (Studies, Test and Applied Research) program.
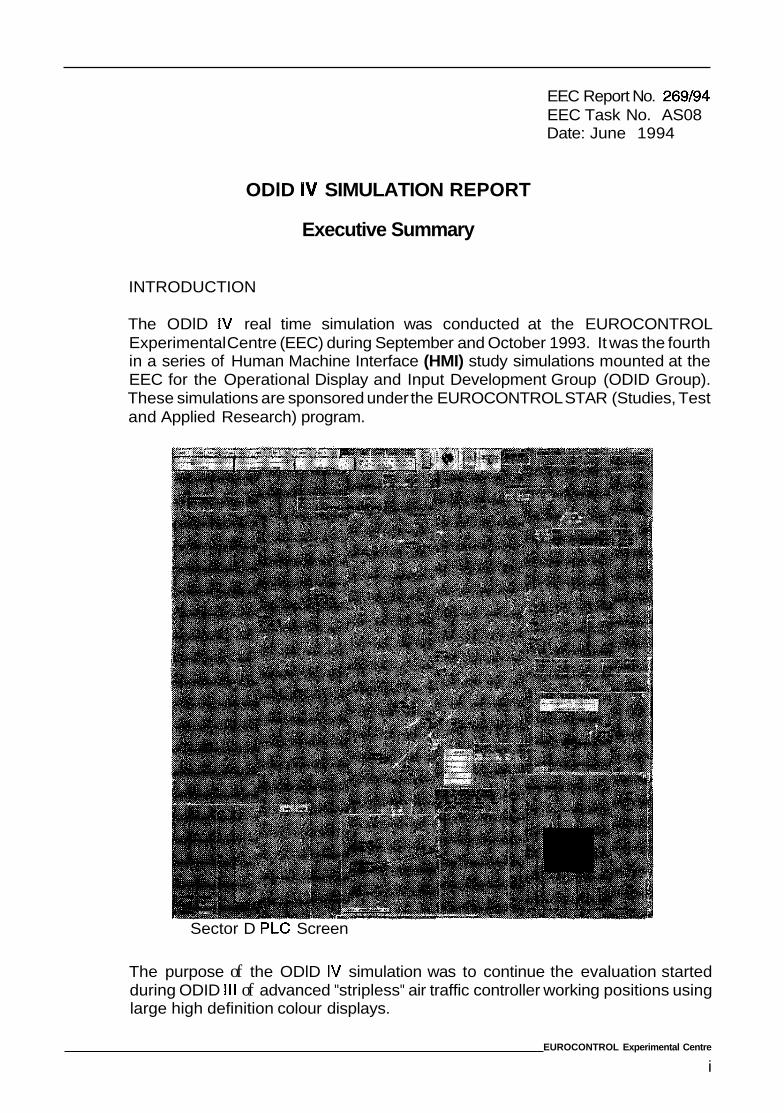
Sector D PLC Screen
The purpose of the ODlD IV simulation was to continue the evaluation started during ODID Ill of advanced "stripless" air traffic controller working positions using large high definition colour displays.
EUROCONTROL Experimental Centre
i
~
Specifically, the ODlD IV simulation was designed to :
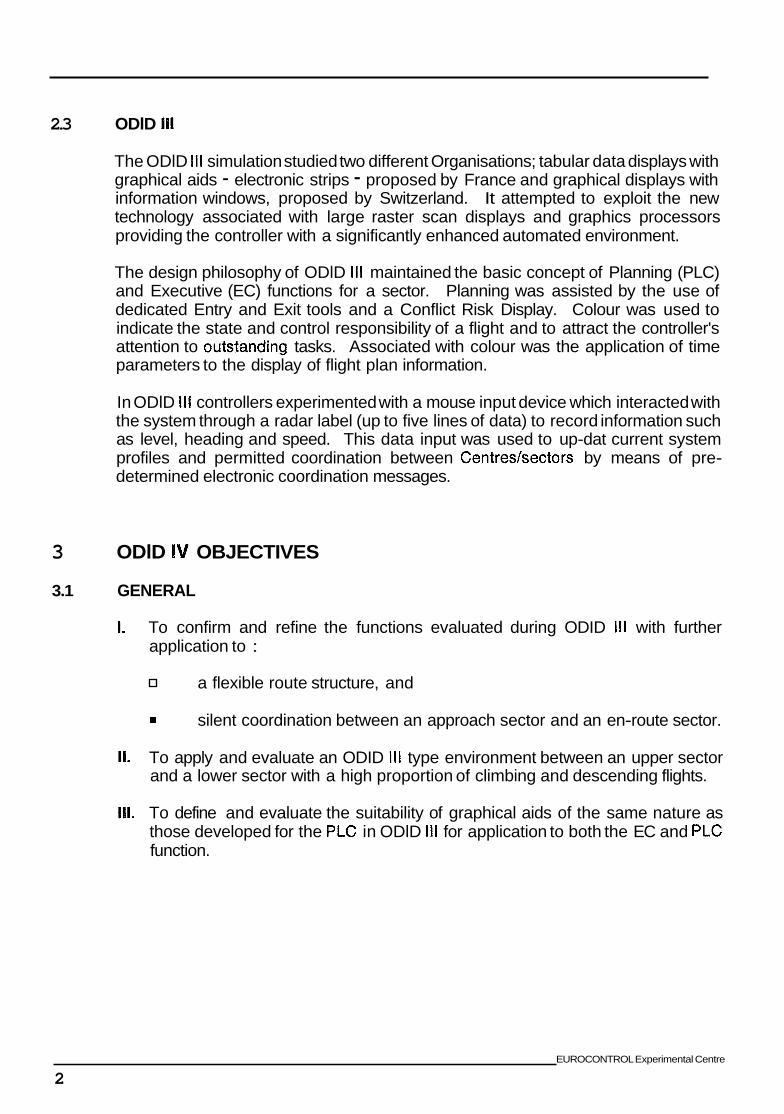
confirm and refine the functions evaluated during ODlD 111 with further application to:
0
0
a flexible route structure, and silent coordination between an approach sector and an en-route sector;
apply and evaluate an ODlD 111 type environment between an upper sector and a lower sector with a high proportion of climbing and descending flights;
= define and evaluate the suitability of graphical aids of the same nature as those developed for the planning controller in ODlD 111 for application to both the executive controller function and the planning controller function.
Due to time constraints and the technical complexity of ODlD IV, the simulation facility was not fully operational in time for the simulation and, as a result, the system performed at less than optimum levels. Despite this, a considerable amount of valuable information was collected.
CONDUCT
The simulation was conducted over a four week period. During this time controllers were trained and participated in reference and evaluation exercises. A daily schedule of 4 exercises was designed to meet the demands of the simulation and an extensive visitor programme.
Individual exercises lasted for 90 minutes which ensured a measured period of one hour.
Various measurement and analysis techniques were used during the simulation, including:
=
= Simulation Questionnaire;
= Non-intrusive observation;
NASA TLX, ISA and a modified MBB calculation (workload assessment); Pilot and controller input order analysis;
Post exercise debriefings and one to one interviews;
Ergonomic study of the use of ODlD HMI.
This report is based on analysis of the information collated from the observations measurements and recordings described above.
EUROCONTROL Experimental Centre
iii
STAFFING
The ODlD IV control positions were staffed by operational controllers from Denmark, Sweden, Bremen and Maastricht. In addition, controllers from the FAA participated under a Memorandum of Cooperation between €U ROCONTROL and the FAA. Their function was to assure the non-intrusive observation task. FAA controllers also participated in simulation exercises (during the visitor presentations) which provided the FAA with an opportunity to effect their own ODlD IV evaluation.
A controller from the Austrian CAA assisted the FAA in the non-intrusive observation task and took part in exercises.
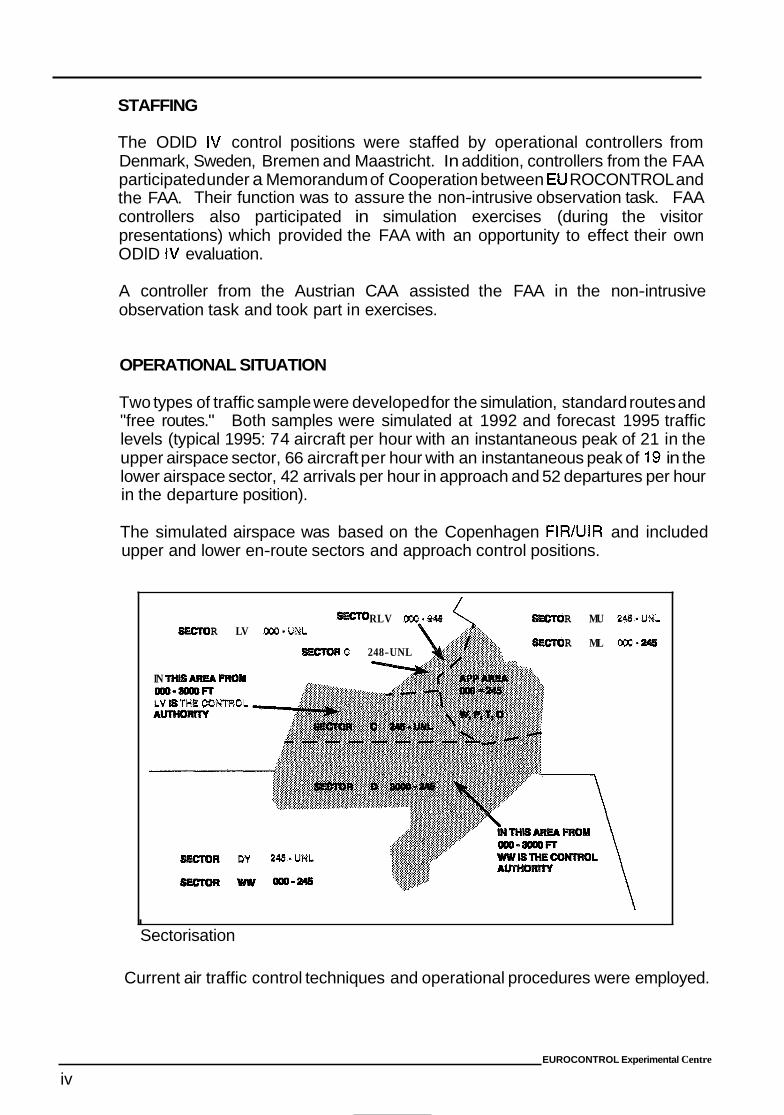
OPERATIONAL SITUATION
Two types of traffic sample were developed for the simulation, standard routes and "free routes." Both samples were simulated at 1992 and forecast 1995 traffic levels (typical 1995: 74 aircraft per hour with an instantaneous peak of 21 in the upper airspace sector, 66 aircraft per hour with an instantaneous peak of 19 in the lower airspace sector, 42 arrivals per hour in approach and 52 departures per hour in the departure position).
The simulated airspace was based on the Copenhagen FIR/UIR and included upper and lower en-route sectors and approach control positions.
RLV m0-248 R MU W - U N L R LV m0-UNL
R ML OOQ- C 248-UNL
IN THBAFfEA FROM OOQ-BWOFT LV is THlE CONTROL AUrHORIIY
SECroR w W - U N L
BUCTMI ww WO-245
I
Sectorisation
Current air traffic control techniques and operational procedures were employed.
EUROCONTROL Experimental Centre
iv
SIMULATION FACILITY
Each simulation position employed a large high definition colour raster scan display (2000 X 2000) and a three button mouse input device. All control positions (measured and feed sectors) were ODlD IV equipped. A total of thirteen positions were simulated of which six were "measured."
The new EUROCONTROL Experimental Centre simulation facility, SIM5+, (operating for the first time) was used to support the evaluation. The simulator encompasses :
= a supervisory system;
an air sub-system (MASS) providing the aircraft navigation function and pilot input interface; a ground sub-system providing flight plan processing and STCA calculation;
CWPs providing data display, controller input interface and MTCA calculation.
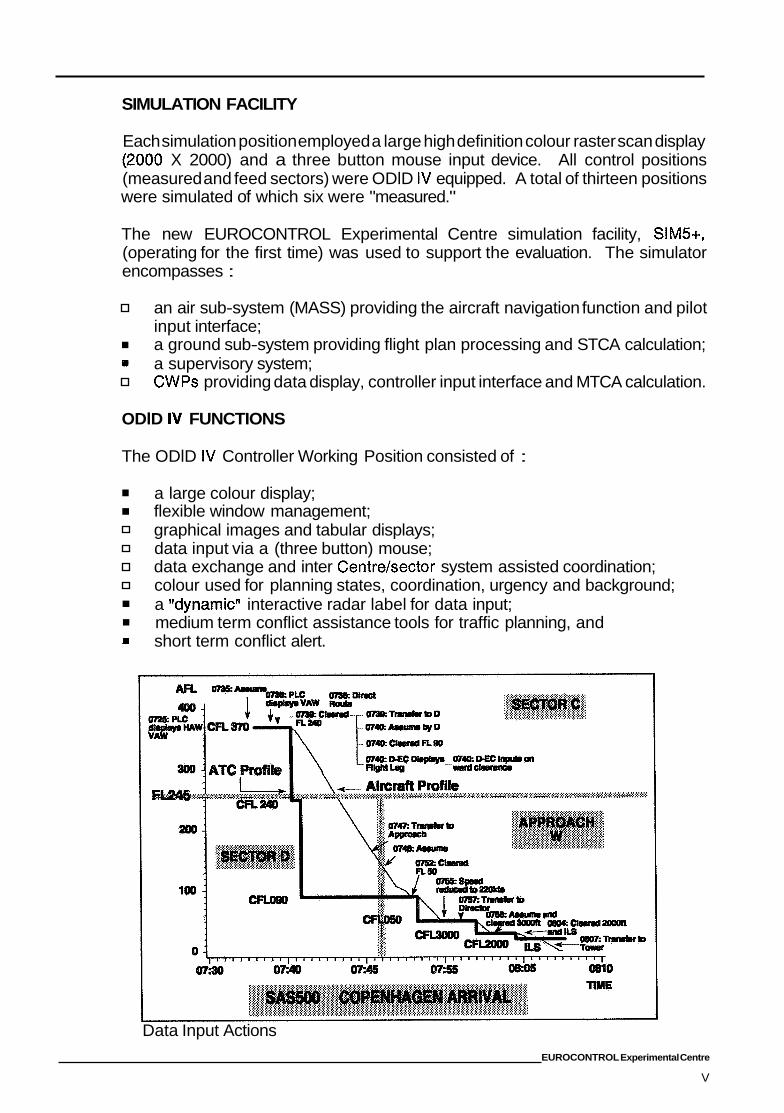
ODlD IV FUNCTIONS
The ODlD IV Controller Working Position consisted of :
a large colour display; flexible window management;
a interactive radar label for data input;
= short term conflict alert.
graphical images and tabular displays; data input via a (three button) mouse; data exchange and inter Centrehector system assisted coordination; colour used for planning states, coordination, urgency and background;
medium term conflict assistance tools for traffic planning, and
Data Input Actions EUROCONTROL Experimental Centre
V
ODlD provided the controller with a working environment where essential data was displayed on a priority basis with supplementary information available on request. The controller was required to input data which reflected the ATC instructions passed to aircraft. In return, the system provided conflict prediction, system assisted coordination, recording of instructions and visual cues for planning and coordination requirements to assist the controller in the ATC task.
Planning tools were designed to replicate the function of paper strips by providing the controller with system interpreted traffic situations in a graphical form. These graphics were displayed on call down by the controller when required.
A full description of the ODlD IV functions is provided in the main body of the report (Annex 111).
VISITORS
ODlD simulations have attracted a considerable amount of International interest and during the ODlD IV simulation a total of 294 visitors were recorded.
Following the simulation, a series of briefings were held for Industry, Administrations and members of the Press. In addition, twelve weeks of controller "hands on" experience and evaluation exercises were provided by the EUROCONTOL Experimental Centre for 80 controllers from 15 different Administrations.
A total of 734 visitors to the simulation and the subsequent supplementary exercises and presentations were recorded.
SIMULATION CONCLUSIONS
Mouse
The three button mouse was appreciated by the participants. However, the click time differentiating between a "simple click" and a "press and hold" action was insufficient. This is an important function and an optimum "click time" should be evaluated. It was also noted that the structure and layout of a sector as displayed on a large screen can significantly influence the amount of mouse movement required to move the cursor across the screen. It is recommended that the use of an acceleration factor used to assist the movement of the cursor over the screen is evaluated.
Window Management
The window management functions were found to be useful and easy to use. Dynamic re-sizing of system managed windows was appreciated.
EUROCONTROL Experimental Centre
vi
Controllers designed their window layout with attention to possible overlap problems and also to the need to minimise eye movement. Similarity in window design suggests that a selection of "sector oriented" default settings designed by controllers would cater for most individual controller requirements.
Cobur
ODID participants felt that the use of colour can support the ATC task, specifically when determining task priorities and recognising coordination or urgency situations.
However, the use of too many colours for primary functions can make it difficult for the controller to assimilate the meaning of individual colours.
Controllers did not like the use of large blocks of strong colour as used in the ODlD IV MTCA tools under certain conditions. This was found to be distracting.
Sys&m A d CoordJnorlpon (SAC)
SAC was considered to be one of the best functions in ODID IV. Controllers felt that SAC provided them with additional time by reducing the number of telephone calls and also by reducing the possibility of error due to misunderstanding of verbal messages.
Typical controller response times to new messages were achieved within 30 seconds of the message being posted at the sector. This is considered to be quite a good response time. It was observed, however, that controllers were not always aware that a new message had arrived.
Further development of System Assisted Coordination is recommended.
Radar Window and Button Bar Functions
The ODlD IV radar window was considered to be comfortable and easy to use. Controllers appreciated the application of button bar functions.
Participants criticised the automatic radar label anti-overlap function. This is an important aspect of a display system which uses potentially large (up to 5 lines) radar data blocks. It is recommended that research into an acceptable automatic label anti-overlap function is effected.
The "on screen" telephone window was considered to be helpful. However, controllers insisted that a standard telecommunication panel should always be available as a back-up, separate from the main display system. Although this requirement may be a result of system problems encountered during the simulation, it also probably highlights the controllers concern about "back-up" facilities in future "stripless" systems.
EUROCONTROL Experimental Centre
vi i
It was concluded that the dynamic radar label provided a positive and exploitable interface for system dialogue. Controllers found that the need to update the system did not distract them from their primary task of separating aircraft. The shape of the radar label and the use of colour planning states assisted the controller in determining task priorities. Analysis shows that the majority of data input was effected through the radar label.
The application of "minimum information display" was important. This would appear to be an essential function when the radar label is designed to dynamically change size. Controllers did not like the label to extend to more than three lines (this may have been influenced by the poor performance of the label anti-overlap function in areas of dense traffic) and wanted the system to remove historical route data.
The use of cursor defaulting was highly appreciated and perceived to reduce the time taken to find standard "repetitive" values in the pop-up windows. However, the design of pop-up windows requires careful consideration in relation to data manipulation and character size. Of equal importance is the number of values available. Insufficient values can result in excessive use of scrolling and therefore a reduction in efficiency.
Controllers omitted to effect data input for some repetitive tasks. This type of omission must be evaluated and the consequences understood in order to help with system design. The consequences of such "neglect" might be a reduction in conflict prediction accuracy and in the system's ability to provide coordination assistance.
One of the most favoured input mechanisms was the elastic vector. This permitted the controller to input a heading or a direct route whilst at the same time informing the system how far it should progress conflict prediction on the heading value before regaining the flight plan route.
It is clear from the results of the simulation that data input must not be influenced by slow response times. The controller must have immediate access to data input fields and subsequent input should be treated without noticeable delay.
By the end of the simulation controllers stated that they associated data input with ATC instructions.
Tabular Data Dlspbys
The tabular data displays (SIL, Landing List and Departure Window) were considered to provide sufficient information. However, the approach control participants criticised the lack of interaction available with the Landing list and Departure windows.
EUROCONTROL Experimental Centre
viii
MTCA Tools
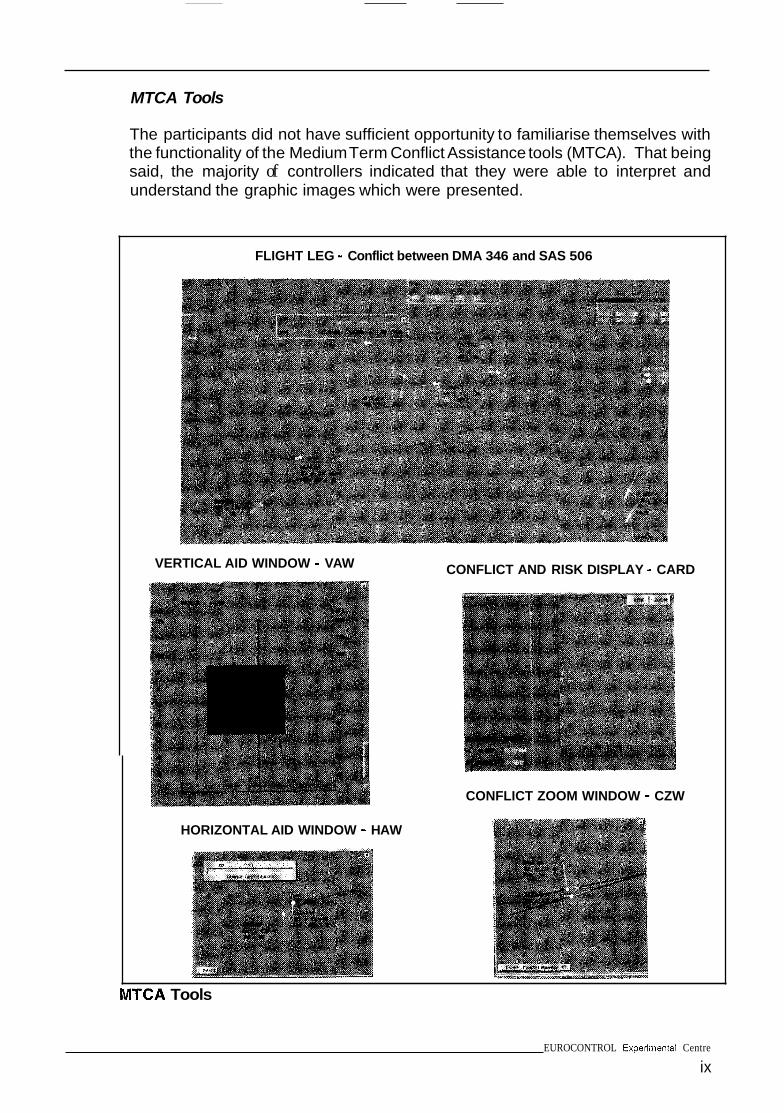
The participants did not have sufficient opportunity to familiarise themselves with the functionality of the Medium Term Conflict Assistance tools (MTCA). That being said, the majority of controllers indicated that they were able to interpret and understand the graphic images which were presented.
FLIGHT LEG - Conflict between DMA 346 and SAS 506
VERTICAL AID WINDOW - VAW CONFLICT AND RISK DISPLAY - CARD
CONFLICT ZOOM WINDOW - CZW
HORIZONTAL AID WINDOW - HAW
ATCA Tools
EUROCONTROL Experimental Centre
ix
It is apparent that controllers are apprehensive about the use of graphics to display system interpreted traffic situations. The ODID participants felt that this form of data presentation may reduce their ability to build a "mental" picture of the traffic situation .
This concern is partially supported by a potentially negative aspect of colour use in MTCA tools. It was observed that controllers only appeared to be looking for colour in the MTCA windows when validating sector entry and exit conditions. The flight details provided in textual and graphic form were not always read which caused a problem of memorisation, potentially affecting the controllers traffic situation awareness ("the picture").
The CARD and CZW were considered to be two of the most important MTCA windows. The CARD provided the controller with conflict monitoring information but it was also used as a planning tool for traffic entering the sector. Participants expressed the opinion that the CZWgave a clear indication of predicted conflicts which assisted the controller with the formulation of conflict resolutions.
The VAWwas also considered to be a useful planning tool. Controllers stated that they could identify "conflict free airspace" for planning level changes by reference to the VAW.
Construction of the CARD and VAWwindows was criticised. There were problems of text overlap and poor spacing between graphic lines and window frames.
An additional function, the dynamic Flight Leg (showing conflict prediction information) was considered to be a better planning tool than the HAW. The Right Leg was displayed in the radar window and was related directly to the subject aircraft's radar label and current traffic situation.
Apprvach Multi Input D e w (AMID)
A multi input device incorporating heading, cleared level and speed input options was developed for use by approach controllers. This specific device was rejected by the participants. Nevertheless, the concept of a multi input device was accepted and research into such a mechanism is recommended.
It is clear that careful consideration needs to be given to the development of conflict prediction algorithms, particularly in lower airspace. The MTCA tools displayed numerous conflicts which could not be explained or which would normally be "deemed" separated.
The prediction used during the simulation did not consider sector specific situations such as holding, "deemed separations" and reduced separation standards. It is essential for future evaluations of conflict prediction tools that appropriate conflict prediction rules are defined.
EUROCONTROL Experimental Centre
xi
The development of an Operational Display system such as ODlD provides a structure within which future studies and tests may be supported. Such a system provides a framework to which additional packages may be added.
Some of the possible future programmes and their relevance to ODlD are listed below. This is by no means a comprehensive list but it provides an indication of the requirements for future generations of colour displays and graphic generators in sophisticated ATC systems.
ODlD (or similar facilities) can assist in the presentation of conflict information, actual or potential, using vertical or horizontal view images. Through ODlD work, the ability to use a graphical display facility with controller interaction now exists at the EUROCONTROL Experimental Centre. This will be implemented in future EATCH IP study simulations where multi-window displays and controller/system interaction are required.
ODID used common PC type functions which provide direct access to information eg button bar, icons, menus etc, and can help to make the enhanced controller working environment easier to operate.
Dimct Contml&r/System Interface
ODlD provides interaction with the system via direct input on a data field or by use of a menu driven dialogue facility. This could provide air traffic controllers with the capability to move confidently into the era of data-linking. The updating of the system also opens up the possibility for more accurate and, therefore, more reliable profile creation providing better conflict detection and ultimately conflict resolution prediction.
Data Exchange = System Asswed Coordination
ODlD provides the display facility for access to current flight plan information using data exchange as envisaged in on-line data interchange (OLDI) and system assisted coordination (SYSCO) systems currently being developed within the framework of EATCHIP.
n Making Tools
ODlD provides the vehicle for the display of Decision Making Tools. Implementation of data linking and the provision of accurate flight profiles will improve conflict detection and prediction allowing for greater accuracy of situation interpretation and resolution proposal by the system.
EUROCONTROL Experimental Centre
xiii

It is apparent that controllers are apprehensive about the use of graphics to display system interpreted traffic situations. The ODlD participants felt that this form of data presentation may reduce their ability to build a "mental" picture of the traffic situation.
This concern is partially supported by a potentially negative aspect of colour use in MTCA tools. It was observed that controllers only appeared to be looking for colour in the MTCA windows when validating sector entry and exit conditions. The flight details provided in textual and graphic form were not always read which caused a problem of memorisation, potentially affecting the controllers traffic situation awareness ("the picture").
The CARD and CZW were considered to be two of the most important MTCA windows. The CARD provided the controller with conflict monitoring information but it was also used as a planning tool for traffic entering the sector. Participants expressed the opinion that the CZW gave a clear indication of predicted conflicts which assisted the controller with the formulation of conflict resolutions.
The VAWwas also considered to be a useful planning tool. Controllers stated that they could identify %onflict free airspace" for planning level changes by reference to the VAW.
Construction of the CARD and VAWwindows was criticised. There were problems of text overlap and poor spacing between graphic lines and window frames.
An additional function, the dynamic Flight Leg (showing conflict prediction information) was considered to be a better planning tool than the HAW. The Flight Leg was displayed in the radar window and was related directly to the subject aircraft's radar label and current traffic situation.
Appnoach Multi Input D e w (AMID)
A multi input device incorporating heading, cleared level and speed input options was developed for use by approach controllers. This specific device was rejected by the participants. Nevertheless, the concept of a multi input device was accepted and research into such a mechanism is recommended.
It is clear that careful consideration needs to be given to the development of conflict prediction algorithms, particularly in lower airspace. The MTCA tools displayed numerous conflicts which could not be explained or which would normally be "deemed" separated.
The prediction used during the simulation did not consider sector specific situations such as holding, "deemed separations" and reduced separation standards. It is essential for future evaluations of conflict prediction tools that appropriate conflict prediction rules are defined.
EUROCONTROL Experimental Centre
xi
d
The ODlD IV simulation has not been able to produce any significant quantitative information to indicate that the controllers workload is affected by the requirements of data input or if a system such as ODlD can provide a potential capacity gain. However, participants expressed the opinion that, with adequate response times and no system problems, the data input required to update an advanced ATC controller working position can be achieved without affecting the controllers ability to accomplish the ATC task.
Controllers did not deviate from the standard EC / PLC division of tasks. It was observed however, that the PLC was willing to effect executive data input when necessary.
Training
It was identified at the beginning of the project that controller training for future systems would require special attention. ODlD IV addressed this requirement by implementing a training program which included traditional classroom teaching, "home learning" and CBT (Computer Based Training).
The application of pre-simulation training was considered to be effective and adequately prepared controllers for the requirements of the simulation. CBT (Computer Based Training) was found to be particularly useful for this task.
FUTURE
The cost benefit of developing (and implementing at an operational level) the functions proposed in the ODlD IV simulation (or similar functions) has not been clearly identified by the simulation. It is important that such benefit be determined to provide Planners, ATC Managers and Industry with the confidence to continue with research and development in this area.
It is also important to provide evidence to the controller population that advanced CWP systems are feasible and hold no mystery.
It is recommended that additional simulation be effected to determine :
the extent to which data input can be achieved under excessive traffic load conditions;
the usefulness of planning aids such as those proposed for the ODlD IV simulation;
the capacity gain (or limit) associated with the ODlD IV working environment (or a similar facility).
EUROCONTROL Experimental Centre
xii
The development of an Operational Display system such as ODlD provides a structure within which future studies and tests may be supported. Such a system provides a framework to which additional packages may be added.
Some of the possible future programmes and their relevance to ODlD are listed below. This is by no means a comprehensive list but it provides an indication of the requirements for future generations of colour displays and graphic generators in sophisticated ATC systems.
Graph& D Capability
ODlD (or similar facilities) can assist in the presentation of conflict information, actual or potential, using vertical or horizontal view images. Through ODlD work, the ability to use a graphical display facility with controller interaction now exists at the EUROCONTROL Experimental Centre. This will be implemented in future EATCHIP study simulations where multi-window displays and controller/system interaction are required.
Data Access
ODID used common PC type functions which provide direct access to information eg button bar, icons, menus etc, and can help to make the enhanced controller working environment easier to operate.
Dimet Contivlbr/System In&r&ce
ODlD provides interaction with the system via direct input on a data field or by use of a menu driven dialogue facility. This could provide air traffic controllers with the capability to move confidently into the era of data-linking. The updating of the system also opens up the possibility for more accurate and, therefore, more reliable profile creation providing better conflict detection and ultimately conflict resolution prediction.
Data Exchange - Sy-m Assristed CwdinaacOn
ODlD provides the display facility for access to current flight plan information using data exchange as envisaged in on-line data interchange (OLDI) and system assisted coordination (SYSCO) systems currently being developed within the framework of EATCHIP.
Decision Making Tools
ODlD provides the vehicle for the display of Decision Making Tools. Implementation of data linking and the provision of accurate flight profiles will improve conflict detection and prediction allowing for greater accuracy of situation interpretation and resolution proposal by the system.
EUROCONTROL Experimental Centre
xiii
ODlD GROUP
The ODID group's work will continue under the auspices of EATCHIP. ODlD IV and the three previous simulations will provide a basis for the development of future controller working positions and ATC systems which are currently under development in several European countries.
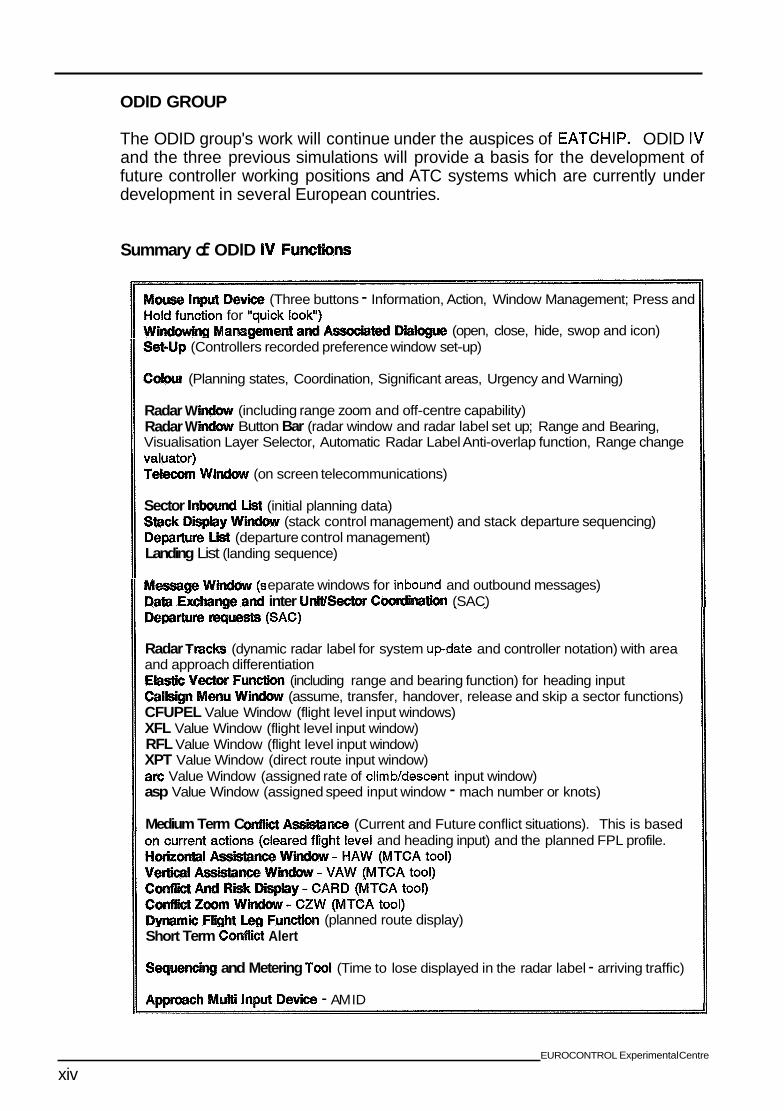
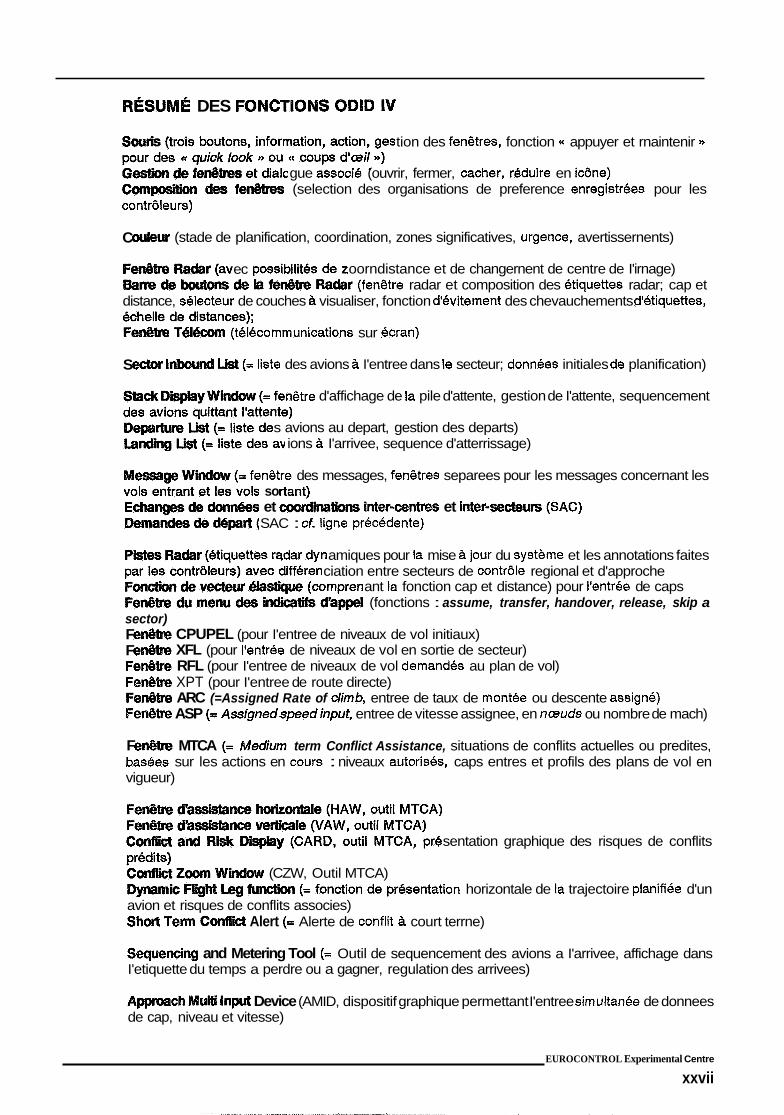
Summary of ODlD IV Functions
D e w (Three buttons - Information, Action, Window Management; Press and for am (open, close, hide, swop and icon)
SebUp (Controllers recorded preference window set-up)
(Planning states, Coordination, Significant areas, Urgency and Warning)
Radar W Radar W Visualisation Layer Selector, Automatic Radar Label Anti-overlap function, Range change
(including range zoom and off-centre capability) Button Bar (radar window and radar label set up; Range and Bearing,
w (on screen telecommunications)
Sector lnbouind Lbt (initial planning data)
Departure Lbt (departure control management) Landing List (landing sequence)
(stack control management) and stack departure sequencing)
eparate windows for inbound and outbound messages) inter UnyUSectw CoorrlinatkKl (SAC)
Radar Tmdcr (dynamic radar label for system update and controller notation) with area and approach differentiation Elastic Vector Function (including range and bearing function) for heading input
CFUPEL Value Window (flight level input windows) XFL Value Window (flight level input window) RFL Value Window (flight level input window) XPT Value Window (direct route input window) arc Value Window (assigned rate of climb/descent input window) asp Value Window (assigned speed input window - mach number or knots)
(assume, transfer, handover, release and skip a sector functions)
Medium Term C nce (Current and Future conflict situations). This is based el and heading input) and the planned FPL profile.
nctfon (planned route display) Short Term Conflict Alert
Sequendng and Metering Tod (Time to lose displayed in the radar label - arriving traffic)
Approach Multi Input Device - AM ID
EUROCONTROL Experimental Centre
xiv
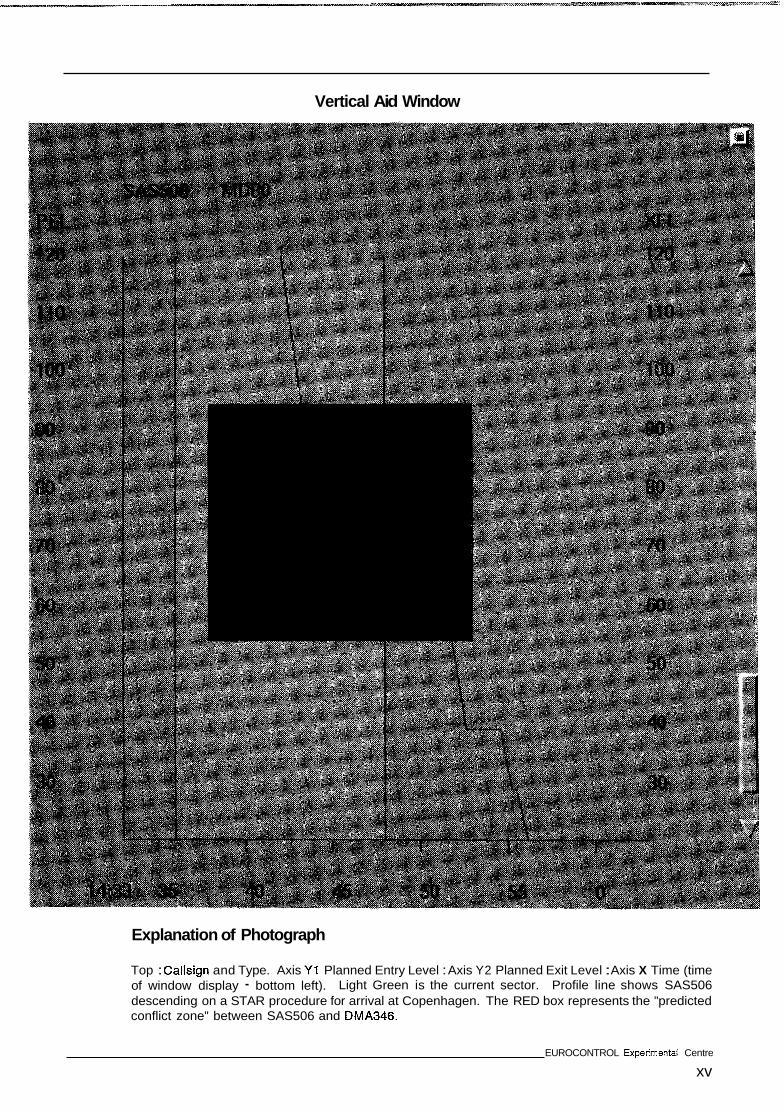
Vertical Aid Window
Explanation of Photograph
Top : Callsign and Type. Axis Y1 Planned Entry Level : Axis Y2 Planned Exit Level : Axis X Time (time of window display - bottom left). Light Green is the current sector. Profile line shows SAS506 descending on a STAR procedure for arrival at Copenhagen. The RED box represents the "predicted conflict zone" between SAS506 and DMA346.
EUROCONTROL Experimental Centre
xv
TRADUCTION en FRANCAlS dt? P EX€CUT/V€ S
INTRODUCTION
La simulation en temps r6el ODlD IV a 6t6 effectuee au Centre Experimental d'EUROCONTROL (CEE) en septembre et octobre 1993. II s'agissait de la quatrihme d'une s6rie de simulations d'6tudes sur I'interface homme-machine (Human Machine lnterface .- HMI) entreprises au CEE pour le compte du Groupe ODlD (Operational Display and lnput Development). Ces simulations ont lieu dans le cadre du Programme STAR d'EUROCONTROL (Studies, Test and Applied Research: Etudes, Essais et Recherche appliqu6e).
L'objet de la simulation ODlD IV 6tait la poursuite de I'6valuation, commenc6e au cours de la simulation ODlD 111, de I'utilisation de positions de travail 6volu6es "sans strips" pour les contr6leurs de la circulation atjrienne et dotees d'tjcrans couleur de grandes dimensions et de haute r6solution.
Plus spbcifiquement, la simulation ODlD IV avait 6t6 mandat6e pour : . confirmer et affiner les fonctions soumises Zi 6valuation pendant la simulation ODlD I l l en y ajoutant les dispositions suivantes :
0
I3
un r6seau de routes libres (free route) et une coordination par I'intermtjdiaire du systhme sans utilisation du t6l6phone entre un secteur d'approche et un secteur de contrale regional;
mettre en amvre et tjvaluer un environnement de type ODlD 111 entre un secteur de I'espace suptjrieur et un secteur de I'espace inf6rieur comportant une grande proportion de vols en mont6e et descente;
d6finir et 6valuer I'utilisation des aides graphiques de meme nature que celles du contr6leur planning d'ODID 111, mais appliqu6es dans le cadre des fonctions du contr6leur ex6cutif et de celles du contraleur planning.
A cause de contraintes de temps et de la complexit6 technique d'ODID IV, I'environnement de simulation n'a pu &re rendu pleinement op6rationnel en temps utile, ce qui eut pour cons6quence de ne pas conferer au dispositif simultj un niveau optimal de performance. Ntjanmoins une quantit6 considtjrable d'enseignements utiles ont 6t6 recueillis.
CONDUITE DE L'EXPERI
La simulation s'est dtjroultje sur une p6riode de quatre semaines, au cours de laquelle les contraleurs ont 6t6 entra'in6s et ont particip6 aux exercices de rtjf6rence et aux exercices d'6valuation. Un programme journalier de quatre exercices devait permettre de r6pondre aux problhmes soumis Zi I'CStude et au nombre important de visiteurs attendus.
EUROCONTROL Experimental Centre
xvi i
Chaque exercice durait 90 minutes, ce qui assurait une p6riode mesur6e d'une heure.
Divers types de mesures et de techniques d'analyse ont 6tB mises en a3uvre durant la simulation, 8 savoir :
m6thodes NATA TLX, ISA et MBB modifiee (pour I'analyse des charges de t r avai I) ; analyse des ordres clavier entres par les op6rateurs pilotes et les contrbleurs; debriefings aprbs exercice et interviews individuels des participants; relev6s effect& par des observateurs ext6rieurs aux positions d'exploitation ((( non intrusive observation U); 6tude ergonomique de I'emploi des outils d'interface homme-machine (HMI) d'O D I D.
Le present rapport est base sur les analyses des informations d6coulant des observations et enregistrements ainsi collationn6.s.
PERSONNEL§
Les positions d'exploitation d'ODID IV ont 6t6 tenues par des contraleurs operationnels venant du Danemark, de Suede, de BrBme et de Maastricht. De plus des contrgleurs de la FAA ont particip6 aux exercices suivant un Memorandum de Cooperation conch entre EUROCONTROL et la FAA. Leur r61e consistait 8 assurer les fonctions d'observateurs exterieurs. Des contrbleurs de la FAA ont aussi pris part directement B des exercices de simulation plus particulierement d6dies B des presentations aux visiteurs, pour donner 8 la FAA I'occasion de r6aliser ses propres 6valuations d'ODID IV.
Un contrbleur de la CAA autrichienne a assist4 la FAA dans la t k h e d'observateur exterieur et a pris part 8 des exercices.
DISPOSITIF OPERATIONNEL
Deux 6chantillons de trafic ont 6t6 d6velopp6s pour la simulation, Pun avec des routes standard, I'autre avec un systeme de routes libres (free routes). Les deux 6chantillons ont 6t6 simul6s avec deux niveaux de trafic, I'un correspondant au trafic reel de 1992, I'autre tel que d6termin6 pour 1995 (ce dernier comprenait : 74 avions par heure avec une pointe instantanbe de 21 dans I'espace aerien superieur, 66 avions par heure avec une pdinte instantanbe de 19 dans I'Espace a6rien inf6rieur, 42 vols par heure B la position Approche et 52 vols par heure B la position DBpart.
L'espace a6rien simul6 6tait base sur la FIR/UIR de Copenhague et comprenait des secteurs de contrble regional d'espace superieur et d'espace inf6rieur ainsi que des positions de contrble d'approche.
EUROCONTROL Experimental Centre
xviii
Les techniques de contrble et les proc6dures d'exploitation habituelles ont 6t6 d'application.
Chaque position de simulation 6tait dot6e d'un 6cran graphique couleur de grande dimension et B haute r6solution (2000 x 2000) et d'une souris B trois boutons comme dispositif d'entr6e d'ordres. Toutes les positions de contrble (<< mesur6es N ou non) avaient le m6me 6quipement ODID. I I y avait au total treize positions dont six 6taient <( mesur6es >L
Le nouveau simulateur du Centre Expbrimental EUROCONTROL, SIM5+, (en service pour la premiere fois), constitua le support de la simulation. Ce simulateur comprend :
un systeme de supervision;
un sous-systhme <( Air >> (appel6 MASS) qui r6git la fonction de navigateur des avions et d'interface des entrees d'ordres pilotes; un sous-systeme (< Sol '>, qui assure le traitement plans de vol et le calcul des conflits B court terme (SCTA = Short Term Conflict Alert);
des positions de travail de contrble (CWP = Controller Working Position) fournissant les affichages sur I'ecran, I'interface des entr6es d'ordres contrbleurs et le calcul des conflits B moyen terme (MTCA = Medium Term Conflict Assistance).
FONCTIONS ODID IV
La position de travail de contrbleur ODlD IV (CWP) se caracterisait par :
I
I
I
un grand &ran couleur; un systeme souple de gestion des fen6tres; des images graphiques et des affichages tabulaires; une souris (A trois boutons) comme dispositif d'entr6e d'ordres; un systeme d'6changes d'informations et de coordination inter-centres et inter- secteurs assist6 par ordinateur; I'emploi de la couleur pour indiquer les 6tats des avions (en cours de planification, en cours de coordination, en situation d'urgence) et I'environnement; des outils d'assistance pour les conflits B moyen terme; I'alerte des conflits B court terme.
ODID plaGait le contraleur dans un environnement d'exploitation 00 les donn6es essentielles 6taient affichees en priorit6, les informations suppl6mentaires &ant disponibles B la demande. Le contrbleur devait informer le systhme des instructions qu'il d6livrait aux avions. En retour, le systeme fournissait la pr6vision des conflits, I'assistance dans les coordinations, I'enregistrement des instructions et des signaux visuels d'aide au contraleur pour ses besoins en matiere de planification et de coordination.
EUROCONTROL Experimental Centre
xix
Des outils de planification ont 6th r6alis6s afin de jouer le rble des strips-papier; ils prbsentaient au contrbleur sous forme graphique des situations de trafic interprbtbes par le systhme. Ces graphiques 6taient affich6s B la demande du contr6leur suivant ses besoins.
VlSlTEURS
Les simulations ODlD ont suscite un int6ret considbrable sur le plan international; durant la simulation ODlD IV on enregistra un total de 294 visiteurs.
A la suite de la simulation, un certain nombre de pr6sentations ont 6t6 organis6es pour I'lndustrie, les Administrations et la Presse. De plus, pendant douze semaines le systhme a 6t6 mis successivement ii la disposition de 80 contrbleurs relevant de 15 administrations diff6rentes pour des exercices r6alistes d'exp6rimentation pratique et d'6valuation.
Au total 734 visiteurs furent d6compt6s pendant la simulation et les exercices suppl6mentaires qui I'ont suivie.
CONCLUSIONS DE LA SI
sou*
La souris B trois boutons a 6t6 favorablement appr6ci6e par les participants. N6anmoins le laps de temps diffbrentiant I'action << simple clic ') de I'action (< appuyer et maintenir >> 6tait insuffisant. Ceci commandant une fonction importante, il conviendrait de d6finir par Bvaluation un << temps de clic s) optimum. II a 6t6 aussi not6 que la structure et la disposition d'un secteur telles qu'affichees sur un grand &ran peuvent avoir une influence significative sur le nombre de mouvements A effectuer avec la souris pour mouvoir le curseur B travers I'6cran. II est recommand6 de rechercher et d'6valuer un dispositif qui permettrait sur demande d'affecter les mouvements du curseur d'un facteur d'acc616ration adequate.
Gestbn de fenQtres
Les fonctions de gestion de fenetres ont 6t6 reconnues utiles et d'une utilisation ais6e. Le redimensionnement dynamique de fenetres g6r6es par le systhme a et6 bien appr6ci6. Des contrbleurs ont r6alis6 des dispositions de fenetres 6vitant les problhmes 6ventuels de chevauchement et cherchant ii limiter au mieux les mouvements oculaires. Les similitudes de comportement relevees tendraient ii sugg6rer qu'un assortiment de dispositions des fenetres predefinies, en fonction de la nature du secteur concern& satisferait sans doute la plupart des besoins particuliers des contraleurs.
EUROCONTROL Experimental Centre
xx
CouEeur
Les participants h ODlD ont trouv6 que I'emploi de la couleur peut constituer une aide dans les tiiches ATC, tout particuli8rement pour determiner les priorit6s des taches et pour signaler les situations de coordination ou d'urgence.
Cependant le recours un nombre trop grand de couleurs pour des fonctions primaires peut conduire le contr6leur h 6prouver des difficult& B assimiler en permanence la signification de chacune des couleurs.
Des contr8leurs n'ont pas aim6 les grands blocs de couleur vive tels que ceux employbs dans certaines circonstances pour I'affichage des conflits moyen terme (MTCA) d'ODID. Cela a 6t6 ressenti comme une distraction d'attention facheuse.
Coordination a e par ordinateur (SAC = System A d Coordination)
La Coordination assistee par ordinateur (SAC) a 6t6 consid6r6e comme I'une des meilleures fonctions d'ODID IV. Les contrdleurs ont 6t6 d'avis qu'elle constituait pour eux un gain de temps car elle reduisait le nombre de communications t616phoniques et les risques d'erreurs dus aux mauvaises interprbtations des messages verbaux.
Les temps de reaction type d'un contraleur un nouveau message ont 6t6 inf6rieurs B 30 secondes apr8s I'envoi du message au secteur concernd. Cela est consid6r6 comme un temps de reponse tout B fait bon, mais on a observ6 que des contr6leurs n'ont pas toujours eu conscience de I'arriv6e d'un nouveau message.
II est recommand6 de poursuivre le dbveloppement de la coordination assist6e par ordinateur.
FenQltm radar et barn de boutons
La fenetre presentant I'image radar d'ODID IV a 6t6 jugbe confortable et d'un emploi ais6. Les contraleurs ont appr6ci6 favorablement I'utilisation des fonctions de la << barre de boutons 3'.
Des participants furent critiques h I'encontre de la fonction d'6vitement automatique des chevauchements d'btiquettes. Cela constitue un aspect important pour un syst8me d'affichage mettant en oeuvre des paves de donn6es radar de taille potentiellement importante (pouvant comporter jusqu'a5 lignes). II est recommand6 de chercher B realiser une fonction d'6vitement des chevauchements d'etiquettes qui soit acceptable.
La fendtre << commandes de t6l6phone de 1'6cran a 6t6 consid6r6e comme utile. NBanmoins des contr6leurs ont fait remarquer avec insistance qu'un panneau de telecommunications classique distinct de I'affichage principal devrait toujours atre disponible h titre de secours. Bien que I'expression de ce besoin puisse avoir trouv6 son origine dans les problhmes de systeme rencontr6s au cours de la simulation, elle illustre aussi sans doute les preoccupations des contraleurs en faveur de moyens de secours dans le contexte futur de systemes << sans-strips >>.
EUROCONTROL Experimental Centre
xxi
ustte radar dynam
I I ressort de la simulation que I'etiquette radar dynamique constitue une interface interessante et exploitable pour le dialogue avec le systbme. Les contr6leurs estiment que la necessite d'informer le systbme pour les mises 9 jour ne d6tourne pas leur attention de leur mission premiere, la separation des avions. La taille de I'etiquette radar et I'emploi de la couleur pour signaler le stade des avions au point de vue planification ont aide le contrbleur 9 determiner les priorites des taches 9 effectuer. L'analyse montre que la plupart des entrees de donnees ont et6 effectuees par Pintermediaire de I'etiquette radar.
L' affichage du minimum d'informations >) a et6 employ4 frequemment. Cette disposition appara7t comme une fonction essentielle lorsque la taille des btiquettes radar peut &re soumise 9 des changements dynamiques. Les contrbleurs se sont prononces contre I'extension 9 plus de trois lignes pour ces etiquettes (cette opinion peut avoir et6 influencee par les performances reduites du programme d'evitement automatique des chevauchements d'etiquettes dans les zones 9 fort trafic) et ont demand6 la suppression de I'affichage des donnees sur I' << historique des routes >>.L'emploi du << cursor defaulting )) (= pr6sentation dans les menus des valeurs dont la selection est la plus probable) a et6 beaucoup apprecie; ce dispositif fut reconnu comme reduisant le temps necessaire 9 la recherche de valeurs standard et << systematiques '' (= 9 effectuer pour tous les avions) dans les fengtres (< pop-up )) (= fen6tre normalement fermee et que I'on ouvre 9 la demande en cliquant sur son << ic6ne .). Cependant la creation de fenatres << pop-up )' est 9 considerer avec soin, en prenant en compte les aspects manipulation de donnees et taille des caracteres. I I en est de mbme pour le nombre des valeurs disponibles 9 I'affichage. Car si ces valeurs sont en nombre insuffisant, cela conduit ii un recours excessif au <( scrolling )) (= manipulations successives de la souris pour atteindre par defilement I'affichage de la donnee recherchhe) et par consequent une reduction d'efficacitb.
Des contr6leurs oublihrent d'effectuer des entrees de donnbes pour certaines t%ches systbmatiques (= 9 faire pour tous les avions). Ce type d'omission doit etre cSvalu6 et ses consequences apprbciees, afin d'en chercher des remhdes dans la conception du systeme. De telles negligences peuvent avoir comme consequence de reduire la justesse des predictions de conflits et la qualit6 de I'assistance par ordinateur pour les coordinations.
L'un des m6canismes d'entree des plus prises fut le (( vecteur dlastique >'. II permettait au contrbleur d'entrer un cap ou une route directe tout en precisant au systeme jusqu'9 quel point sur ce cap ou cette route la recherche de conflits etait 21 effectuer avant de revenir 9 la route du plan de vol.
II ressort clairement des r6sultats de la simulation que les entrees de donnees ne doivent pas &re influencees par des temps de reponse excessifs de la part du systhme. II importe que les contrbleurs aient un acces immediat aux champs utilisables pour I'entree des donnees et les entrees successives doivent pouvoir &re traitees sans delai perceptible.
EUROCONTROL Experimental Centre
xxii
Vers la fin de la simulation des contrdleurs ont dlSclarcS qu'ils arrivaient A associer dans un mBme temps Pentree d'une donnee et la delivrance de I'instruction ATC correspondante.
Les affichages tabulaires de donntjes (SIL, liste des avions A I'atterrissage et fenBtre des departs) ont 6t6 reconnus comme fournissant suff isamment d'informations. Cependant les participants du contrdle d'approche ont regrette le manque d'interactivite entre la liste des avions A I'atterrissage et la fenBtre des departs.
Outb MTCA (C B myens terme)
Les participants n'ont pas eu assez de temps pour se familiariser convenablement avec les outils de I'assistance dans la recherche des conflits A moyen terme (MTCA). Cependant la majorit6 des contrdleurs ont indique qu'ils avaient 6tc! capables d'interprc5ter et de comprendre les images graphiques qui leur 6taient presentees.
II s'avbre que les contrbleurs ont une certaine mefiance envers les representations graphiques de situations de trafic daborees par le systbme. Les participants A ODlD ont estime que cette forme de presentation de donnees risquait de diminuer leur capacite A se construire une bonne image << mentale >' de la situation du trafic.
Ce jugement est partiellement conforte par I'aspect plutdt nbgatif de I'utilisation faite de la couleur dans les outils MTCA. II fut observe que les contrbleurs se sont contenttjs de consulter seulement la couleur dans la fenetre MTCA, lorsqu'il s'agissait de valider des conditions d'entrbe ou de sortie de secteur. Les details des vols fournis dans ces fenBtres sous forme de texte ou de graphique n'ont pas toujours et6 examines, ce qui fut A I'origine d'un problbme de memorisation susceptible d'affecter I'image du trafic que les contrbleurs se cr6ent dans leur esprit.
La fen6tre des conflits et des risques de conflit (CARD = Conflict and Risk Display) et celle du << zoom '> des conflits (CZW = Conflict Zoom Window) ont 6t6 consid6rbes comme deux des plus importantes fenetres MTCA. Le CARD procurait au contrbleur des informations sur la surveillance des conflits potentiels, mais il servit aussi comme outil de planification pour le trafic A Pentree du secteur; Les participants d6clarbrent que le CZW donnait une indication claire sur les conflits prtjdits et assistait le contrdleur dans I'elaboration de la resolution des conflits.
La fenBtre d'assistance verticale (VAW = Vertical Assistance Window) fut aussi qualifi6e d'outil de planification utile. Les contrdleurs d6clarhrent qu'ils pouvaient, grace A la VAW, identifier << I'espace libre de tout conflit '> lorsqu'il s'agissait pour la planification de decider d'un changement de niveau.
La conception pratique des fenBtres CARD et VAW fut critiquee. II y eut des problbmes de chevauchement de textes et de manque de place entre les traces graphiques et les bordures de fenBtre.
EUROCONTROL Experimental Centre
xxiii
Une fonction suppl6mentaire, le dynamique cc Flight Leg (trace sur I'image radar mbme de la trajectoire future d'un vol design6 avec I'information sur les risques de conflits qui I'affectent) a 6t6 jugee comme un outil de planification meilleur que la fenCStre d'assistance horizontale ou HAW (Horizontal Aid Window). Le Flight Leg etait present6 dans la fen6tre radar et se rapportait ainsi directement iA 1'6tiquette radar de I'avion concern6 et il la situation de trafic en cours.
II s'agissait d'un dispositif original destin6 il faciliter les entrees de donn6es pour les contrbleurs d'Approche, qui pouvaient s'en servir pour informer le systbme sur les autorisations de cap, de niveau et de vitesse. Ce dispositif a et6 rejet6 par les participants, mais le concept d'une aide <( multi input " a 6tte reconnu comme interessant et meritant la poursuite des recherches en vue d'une realisation pratique.
Pr&dZcZion des conflits
II est clair qu'il faut accorder beaucoup de soin au developpement des algorithmes de prediction de conflit, particulibrement en espace infhrieur. Les outils MTCA ont affiches nombre de conflits qui ne trouvaient pas de justification ou dont la separation entre les avions impliques aurait normalement 6t6 considBr6e comme bonne par les contrbleurs.
La prediction utilisee pendant la simulation ne prend pas en compte des situations sp6cifiques telles que des procedures d'attente, ni des cc deemed separations " (= routes dont I'espacement gbographique est repute suffisant) et des standards de separations reduites. II est essentiel pour les Ctvaluations futures de prediction de conflit d'avoir defini prcSalablement des rbgles de prediction de conflits bien approprihes.
Charge de travail
La simulation ODID IV n'a pas permis de reunir des informations en quantite significative pour indiquer si la charge de travail des contraleurs a et6 affectbe par I'obligation d'effectuer des entrees de donnees ou si un systbme comme ODID peut induire un gain potentiel de capacite. Cependant les participants ont exprim6 I'opinion selon laquelle, si les temps de reponse sont adequats et si le systbme n'a pas de problbme de fonctionnement, les entrees de donn6es pour la mise il jour necessaires une position evolu6e de travail de contrble ATC peuvent atre realisees sans affecter la capacith des contrbleurs 9 accomplir leurs taches ATC.
Les contrbleurs s'en sont tenus aux normes habituelles de division de travail entre contraleur planning et contrbleur executif. II a et6 not6 cependant que le contraleur planning effectuait volontiers des entrees de donnees relevant du contrale executif, lorsque cela etait necessaire.
EUROCONTROL Experimental Centre
xxiv
II avait et6 reconnu dbs le debut du projet que I'entra'inement des contrbleurs pour le futur systeme necessiterait une attention speciale. ODlD IV a satisfait ce besoin en mettant en muvre un programme d'entra'lnement qui comprenait de I'instruction traditionnelle en salle de classe, des legons ;1 apprendre chez soi et de la formation par ordinateur (CBT = Computer Based Training).
Les exercices d'entra'inemen: qui ont pr6cede la simulation furent reconnus efficaces et adequats pour la familiarisation des contrdleurs avec les besoins specifiques de la simulation. La formation CBT a et6 trouvee particulierement utile pour cette tache.
LE FUTUR
II n'a pas et6 possible de clairement identifier le b6nefice susceptible d'etre tire du developpement (et de I'implantation ;1 un niveau operationnel) des fonctions proposees dans la simulation ODlD IV (ou de fonctions similaires). II importe qu'un tel benefice soit determine, afin d'encourager les responsables des Plans, de I'ATC et de I'lndustrie ;1 continuer les recherches et les developpements dans ce domaine.
I1 est aussi important d'apporter & I'ensemble des contrBleurs de la circulation aerienne la preuve que les systemes de positions de travail bvoluees (CWP) sont viables et ne contiennent aucun mystere.
II est recommande que de nouvelles simulations soient mises en Oeuvre afin de determiner :
= jusqu'si quel point les entrees de donnkes peuvent etre effectuees sous des conditions de trafic tres dense; quel inter& comportent des aides si la planification telles que celles proposees pour la simulation ODID IV; quel gain en capacite (ou limite) peut &re escomptb de I'environnement de travail d'ODID IV (ou d'un systeme similaire).
Le developpement d'un systeme d'affichage operationnel tel qu'ODID comporte une structure I'intdrieur de laquelle des etudes futures et des essais peuvent trouver place. Un tel systeme constitue une ossature sur laquelle d'autres experimentations peuvent venir se greffer.
Certains des developpements futurs possibles et leur rapport avec ODlD sont 6numbr6s ci-dessous. Ce n'est aucunement une liste exhaustive, mais cela fournit une indication quant aux besoins ;1 satisfaire pour les generations & venir d'6cran couleur et de g6nerateurs de graphiques destinbs ;1 des syst&mes ATC sophistiques.
EUROCONTROL Experimental Centre
xxv
PO
ODlD (ou des syst&mes similaires) peuvent fournir une assistance dans la presentation d'informations sur les conflits reels ou potentiels, au moyen d'images de vues verticales ou horizontales. Grdce il ODID, il est maintenant possible de mettre en oeuvre au Centre Experimental EUROCONTROL des moyens d'affichage graphique interactifs pour le controleur. Cela sera inclus dans les futures simulations d'etudes EATCHIP, 00 sont demand& des affichages multi-fenWes et des outils d'interaction controleur / systbme.
A&s aux donMes
ODlD a utilise des fonctions qui sont d'un usage courant dans les ordinateurs de type PC, qui donnent un acc& direct aux informations, telles que barre de boutons, icbnes, menus, etc. et qui facilitent les operations B accomplir sur une position de travail de contrbleur dans un environnement perfectionne.
Interface directe Contrf)
ODlD permet des interactions avec le systbme au moyen d'un dispositif d'entree directe dans un champ de donnees ou d'un dialogue genere par un menu. Cela pourrait aider les contrbleurs B entrer sans apprehension dans I'tire du data-link. La mise B jour du systbme ouvre la voie B une prediction des trajectoires plus precise, donc plus sore et B une meilleure detection des conflits et finalement h une meilleure resolution de conflits.
Echanges de donnees - Coordinatkn assistee par ordlnateur
ODlD comporte des moyens d'affichage permettant I'accbs aux informations de plan de vol en cours, et des 6changes de donn6es tels que ceux envisages dans le systbmes OLD1 et SYSCO (System Assisted Coordination) qui sont actuellement en phase de developpement dans le cadre d'EATCHIP.
ODlD fournit la base adequate pour I'affichage d'outils d'aide h la decision. La mise en service de data link et la realisation de profils de vols precis am6lioreront la detection et la pr6diction de conflits, ce qui ambnera une plus grande justesse de I'interpretation de la situation et des propositions pour la resolution de ces conflits qui pourront &re faites par le systbme.
Le groupe ODlD
Le travail du groupe ODlD va continuer sous les auspices de EATCHIP. ODlD IV et les trois simulations qui I'ont prechdee apporteront une base pour la conception de futures positions de travail de contrbleur et des systbmes ATC actuellement en cours de developpement dans plusieurs Etats europeens.
EUROCONTROL Experimental Centre
xxvi
RESUM@ DES FONCTIONS ODlD IV
tion des feniitres, fonction c( appuyer et rnaintenir L)
gue associe (ouvrir, fermer, cachet-, rcSduire en ic6ne) (selection des organisations de preference enregistrees pour les
contrtlleurs)
C (stade de planification, coordination, zones significatives, urgence, avertissernents)
ec PO dela
oorndistance et de changernent de centre de I'irnage) r (feniitre radar et composition des Btiquettes radar; cap et
distance, selecteur de couches visualiser, fonction d'eviternent des chevauchements d'dtiquettes,
T6l;r5com (t4lecornmunications sur &ran)
S (E liste des avions h I'entree dans Is secteur; donnees initiales de planification)
iitre d'affichage de la pile d'attente, gestion de I'attente, sequencement
s avions au depart, gestion des departs) ions & I'arrivee, sequence d'atterrissage)
= feniitre des messages, feniitres separees pour les messages concernant les so et Inter-centtes et inter- SAC : cf. ligne precedente)
amiques pour la mise B jour du systhme et les annotations faites ciation entre secteurs de contr6le regional et d'approche
ant la fonction cap et distance) pour i'entree de caps (fonctions : assume, transfer, handover, release, skip a
sector) F F Fed&) RFL (pour I'entree de niveaux de vol dernandes au plan de vol) Fed&) XPT (pour I'entree de route directe) Fen(jtre ARC (=Assigned Rate of climb, entree de taux de montee ou descente assign&) Fedtre ASP (= Assignedspeedinpuf, entree de vitesse assignee, en nmuds ou nombre de mach)
CPUPEL (pour I'entree de niveaux de vol initiaux) XFL (pour I'entree de niveaux de vol en sortie de secteur)
F MTCA (= Medium term Conflict Assistance, situations de conflits actuelles ou predites, basees sur les actions en cours : niveaux autorisbs, caps entres et profils des plans de vol en vigueur)
sentation graphique des risques de conflits
(CZW, Outil MTCA) tation horizontale de la trajectoire planifiee d'un
avion et risques de conflits associes) Short Term. Conflict Alert (= Alerte de conflit a court terrne)
Sequencing and Metering Tool (= Outil de sequencement des avions a I'arrivee, affichage dans I'etiquette du temps a perdre ou a gagner, regulation des arrivees)
ch MUM Input Device (AMID, dispositif graphique permettant I'entree simultanee de donnees de cap, niveau et vitesse)
EUROCONTROL Experimental Centre
xxvii
6 .*'.*.*''*' SNOlllSOd a333 - SIN3 W3tlln83tl lVNOIlVtl3dO L.9 8 '*'.*' SNOlllSOd a3tlnSV3W - SIN3W3tllnO3tl lVNOIlVtl3dO 9.9
tl3AOaNVH tlVaVtl 9.9 lN3W31VBV 3SION P'S
NOllVA113V 33VdStllV AtlVllllW 8'9 Sl3A31 IHDIlA AtllN3 aNV 11x3 2'9
lndNl VlW C'S
....................................
....................................
.........................
.........................
..........................................
......................... SlN3UY3UlflD3tl lOtllN03 3IJJVtll tllV 9
.....................................
.......................... S3ldWVS 3133Vtll 2'P NOllVSltlO133S ClNV 33VdStllV C'P
................................... lN3UUNOUlAN3 NOllVlflUYlS P
............................................
............................................ 313133dS 2'8 lVtl3N39 1'8
$
........................................ s3Aii33rao AI aiao t:
..............................................
..............................................
............................................... III aiao c"z II aiao z-z I aiao rz
......................................... aNnotlomtlEl aiao z
............................................. N0113naOUlNI c ....................................... SNOllVlA3U99V
........................................ ! AtlVUUWflS 3Allfl33X3
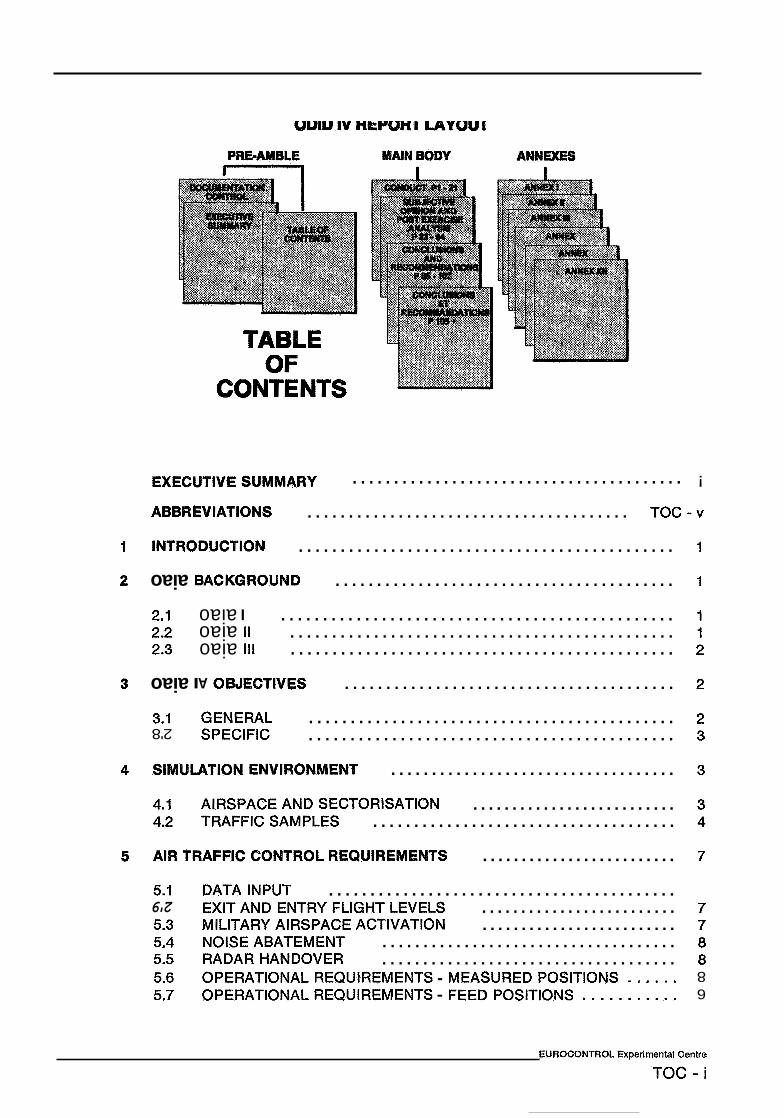
SlN31NO3 A0
319Vl
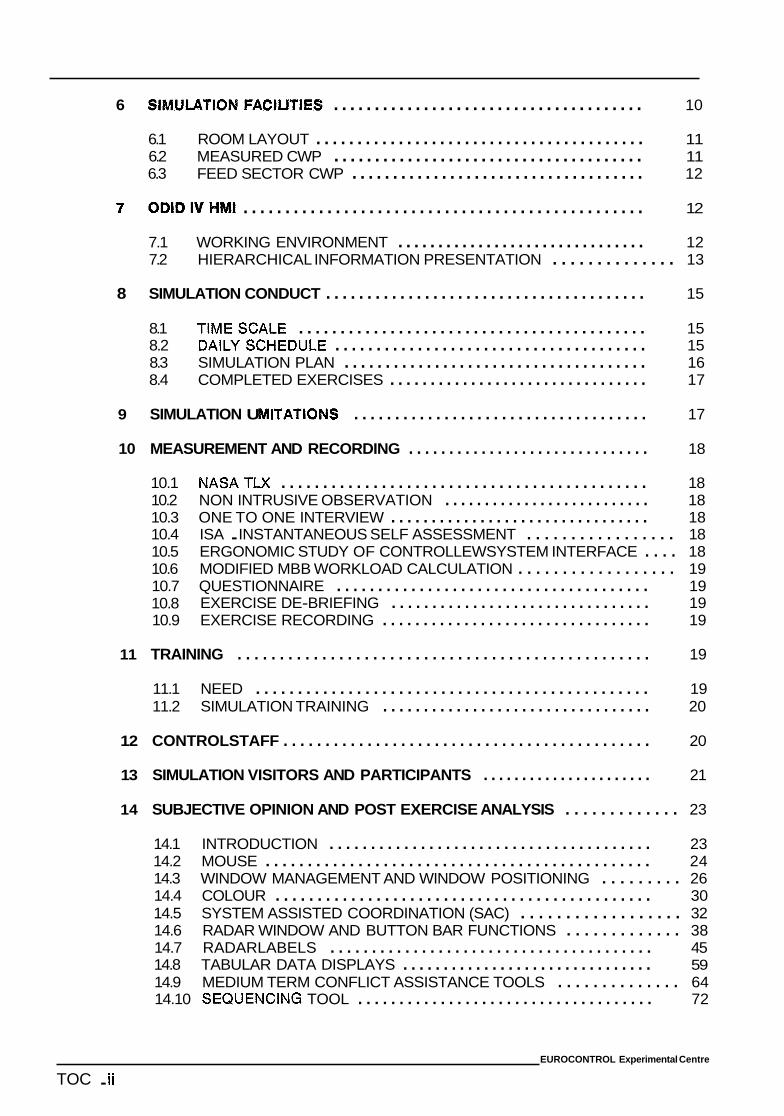
6 SlMULATlON FAClUTlES ...................................... 10
6.1 ROOM LAYOUT ........................................ 11 6.2 MEASURED CWP ...................................... 11 6.3 FEED SECTOR CWP .................................... 12
7 ODlD1\1HMI ................................................ 12
7.1 WORKING ENVIRONMENT ............................... 12 7.2 HIERARCHICAL INFORMATION PRESENTATION .. . . . . . . . . . . . . 13
8 SIMULATION CONDUCT ....................................... 15
8.1 TIMESCALE .......................................... 15 8.2 DAILYSCHEDULE ...................................... 15 8.3 SIMULATION PLAN ..................................... 16 8.4 COMPLETED EXERCISES ................................ 17
9 SIMULATION U ITATIONS .................................... 17
10 MEASUREMENT AND RECORDING .............................. 18
10.1 10.2 10.3 10.4 10.5 10.6 10.7 10.8 10.9
NASATU ............................................ 18 NON INTRUSIVE OBSERVATION .......................... 18 ONE TO ONE INTERVIEW ................................ 18
ERGONOMIC STUDY OF CONTROLLEWSYSTEM INTERFACE . . . . 18 MODIFIED MBB WORKLOAD CALCULATION . . . . . . . . . . . . . . . . . . 19 QUESTIONNAIRE ...................................... 19
EXERCISE RECORDING ................................. 19
ISA . INSTANTANEOUS SELF ASSESSMENT . . . . . . . . . . . . . . . . . 18
EXERCISE DE-BRIEFING ................................ 19
11 TRAINING . . . . . . . . . . . . . . . . . . . . . . . . . . . . . . . . . . . . . . . . . . . . . . . . . 19
11.1 NEED ............................................... 19 11.2 SIMULATION TRAINING ................................. 20
12 CONTROLSTAFF ............................................ 20
13 SIMULATION VISITORS AND PARTICIPANTS ...................... 21
14 SUBJECTIVE OPINION AND POST EXERCISE ANALYSIS . . . . . . . . . . . . . 23
14.1 INTRODUCTION ....................................... 23 14.2 MOUSE .............................................. 24 14.3 WINDOW MANAGEMENT AND WINDOW POSITIONING . . . . . . . . . 26 14.4 COLOUR ............................................. 30 14.5 SYSTEM ASSISTED COORDINATION (SAC) . . . . . . . . . . . . . . . . . . 32 14.6 RADAR WINDOW AND BUTTON BAR FUNCTIONS . . . . . . . . . . . . . 38 14.7 RADARLABELS ....................................... 45 14.8 TABULAR DATA DISPLAYS ............................... 59 14.9 MEDIUM TERM CONFLICT ASSISTANCE TOOLS . . . . . . . . . . . . . . 64 14.10 SEQUENCING TOOL .................................... 72
EUROCONTROL Experimental Centre
TOC . ii
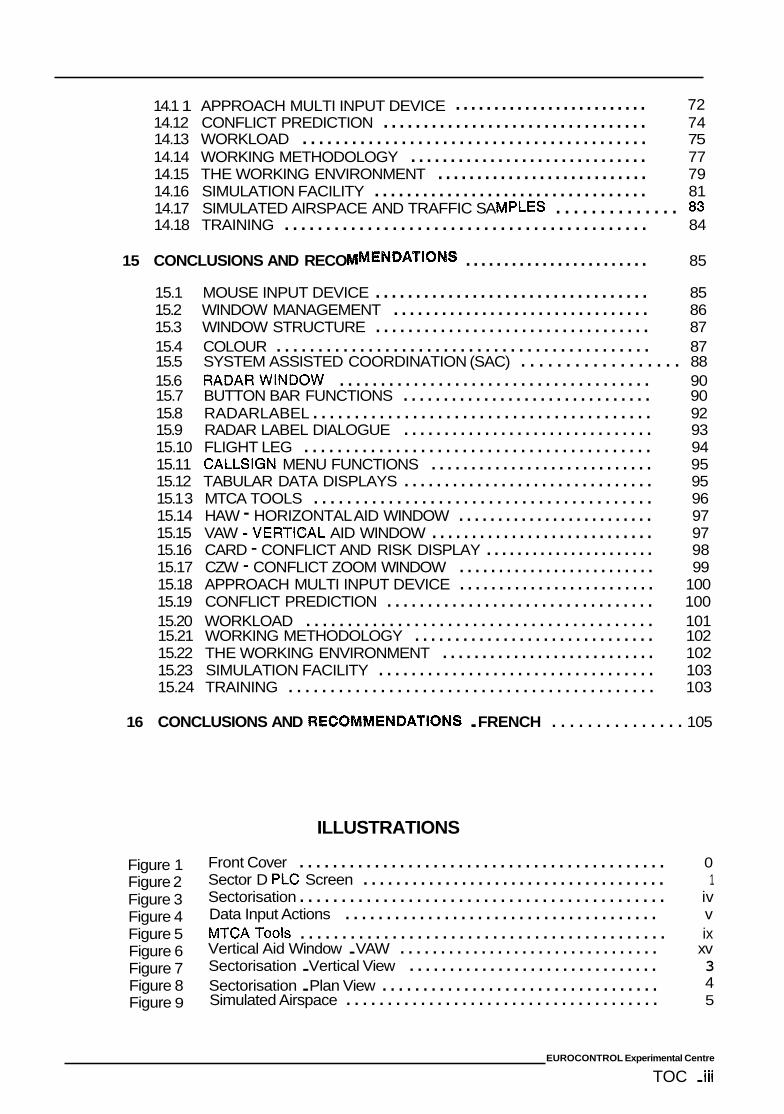
14.1 1 APPROACH MULTI INPUT DEVICE ......................... 72 14.12 CONFLICT PREDICTION ................................. 74 14.13 WORKLOAD .......................................... 75 14.14 WORKING METHODOLOGY .............................. 77 14.15 THE WORKING ENVIRONMENT ........................... 79 14.16 SIMULATION FACILITY .................................. 81 14.17 SIMULATED AIRSPACE AND TRAFFIC SA PLES .............. 83 14.18 TRAINING ............................................ 84
15 CONCLUSIONS AND RECO MENDATIONS ........................ 85
15.1 MOUSE INPUT DEVICE .................................. 85 15.2 WINDOW MANAGEMENT ................................ 86 15.3 WINDOW STRUCTURE .................................. 87 15.4 COLOUR ............................................. 87 15.5 SYSTEM ASSISTED COORDINATION (SAC) . . . . . . . . . . . . . . . . . . 88 15.6 RADARWINDOW ...................................... 90 15.7 BUTTON BAR FUNCTIONS ............................... 90 15.8 RADARLABEL ......................................... 92 15.9 RADAR LABEL DIALOGUE ............................... 93 15.10 FLIGHT LEG .......................................... 94 15.11 CALLSIGN MENU FUNCTIONS ............................ 95 15.12 TABULAR DATA DISPLAYS ............................... 95 15.1 3 MTCA TOOLS ......................................... 96 15.14 HAW - HORIZONTAL AID WINDOW ......................... 97 15.15 VAW -VERTICAL AID WINDOW ............................ 97 15.16 CARD - CONFLICT AND RISK DISPLAY ...................... 98 15.17 CZW - CONFLICT ZOOM WINDOW ......................... 99 15.18 APPROACH MULTI INPUT DEVICE ......................... 100 15.19 CONFLICT PREDICTION ................................. 100 15.20 WORKLOAD .......................................... 101 15.21 WORKING METHODOLOGY .............................. 102 15.22 THE WORKING ENVIRONMENT ........................... 102 15.23 SIMULATION FACILITY .................................. 103 15.24 TRAINING ............................................ 103
16 CONCLUSIONS AND RECO~MENDATIONS . FRENCH . . . . . . . . . . . . . . . 105
ILLUSTRATIONS
Figure 1 Figure 2 Figure 3 Figure 4 Figure 5 Figure 6 Figure 7 Figure 8 Figure 9
Front Cover ............................................ 0 Sector D PLC Screen ..................................... 1 Sectorisation ............................................ iv Data Input Actions ...................................... v MTCATools ............................................ ix Vertical Aid Window . VAW ................................ xv Sectorisation . Vertical View ............................... 3 Sectorisation . Plan View .................................. 4 Simulated Airspace ...................................... 5
EUROCONTROL Experimental Centre
TOC . iii
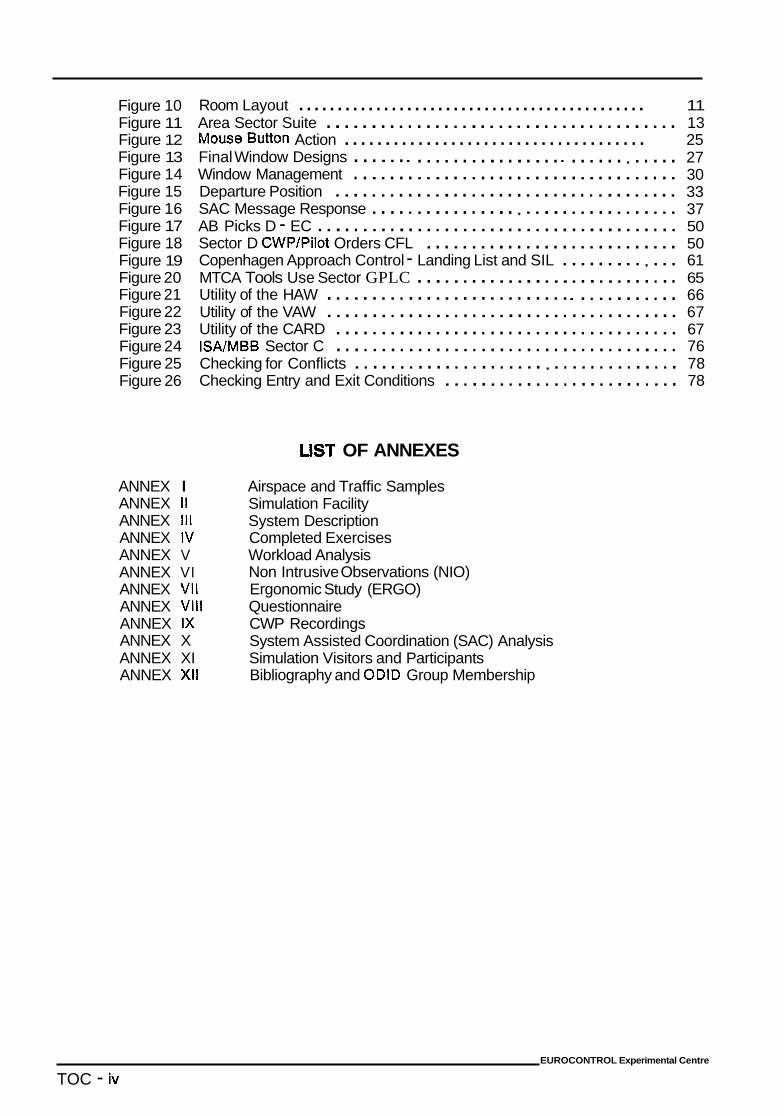
Figure 10 Figure 11 Figure 12 Figure 13 Figure 14 Figure 15 Figure 16 Figure 17 Figure 18 Figure 19 Figure 20 Figure 21 Figure 22 Figure 23 Figure 24 Figure 25 Figure 26
ANNEX I ANNEX I I ANNEX I l l ANNEX IV ANNEX V ANNEX VI ANNEX VII ANNEX Vlll ANNEX IX ANNEX X ANNEX XI ANNEX XI1
Room Layout ............................................. 11 Area Sector Suite . . . . . . . . . . . . . . . . . . . . . . . . . . . . . . . . . . . . . . . 13 MouseButton Action ..................................... 25 Final Window Designs . . . . . . . . . . . . . . . . . . . . . . . . . . . . , . . . . . 27 Window Management . . . . . . . . . . . . . . . . . . . . . . . . . . . . . . . . . . . . 30 Departure Position . . . . . . . . . . . . . . . . . . . . . . . . . . . . . . . . . . . . . . 33 SAC Message Response . . . . . . . . . . . . . . . . , . . . . . . . . . . . . . . . . . 37 AB Picks D - EC . . . . . . . . . . . . . . . . . . . . . . . . . . . . . . . . . . . . . . . . 50 Sector D CWP/Pilot Orders CFL . . . . . . . . . . . . . . . . . . . . . . . . . . . . 50 Copenhagen Approach Control - Landing List and SIL . . . . . . . . . , . . . 61 MTCA Tools Use Sector GPLC . . . . . . . . . . . . . . . . . . . . . . . . . . . . . 65 Utility of the HAW . . . . . . . . . . . . . . . . . . . . . . . . . . . . . . . . . . . . . . 66 Utility of the VAW . . . . . . . . . . . . . . . . . . . . . . . . . . . . . . . . . . . . . . . 67 Utility of the CARD . . . . . . . . . . . . . . . . . . . . . . . . . . . . . . . . . . . . . . 67 ISNMBB Sector C . . . . . . . . . . . . . . . . . . . . . . . . . . . . . . . . . . . . . . 76 Checking for Conflicts . . . . . . . . . . . . . . . . . . . . . , . . . . . . . . . . . . . . 78 Checking Entry and Exit Conditions . . . . . . . . . . . . . . . . . . . . . . . . . . 78
LIST OF ANNEXES
Airspace and Traffic Samples Simulation Facility System Description Completed Exercises Workload Analysis Non Intrusive Observations (NIO) Ergonomic Study (ERGO) Questionnaire CWP Recordings System Assisted Coordination (SAC) Analysis Simulation Visitors and Participants Bibliography and ODlD Group Membership
EUROCONTROL Experimental Centre
TOC - iv
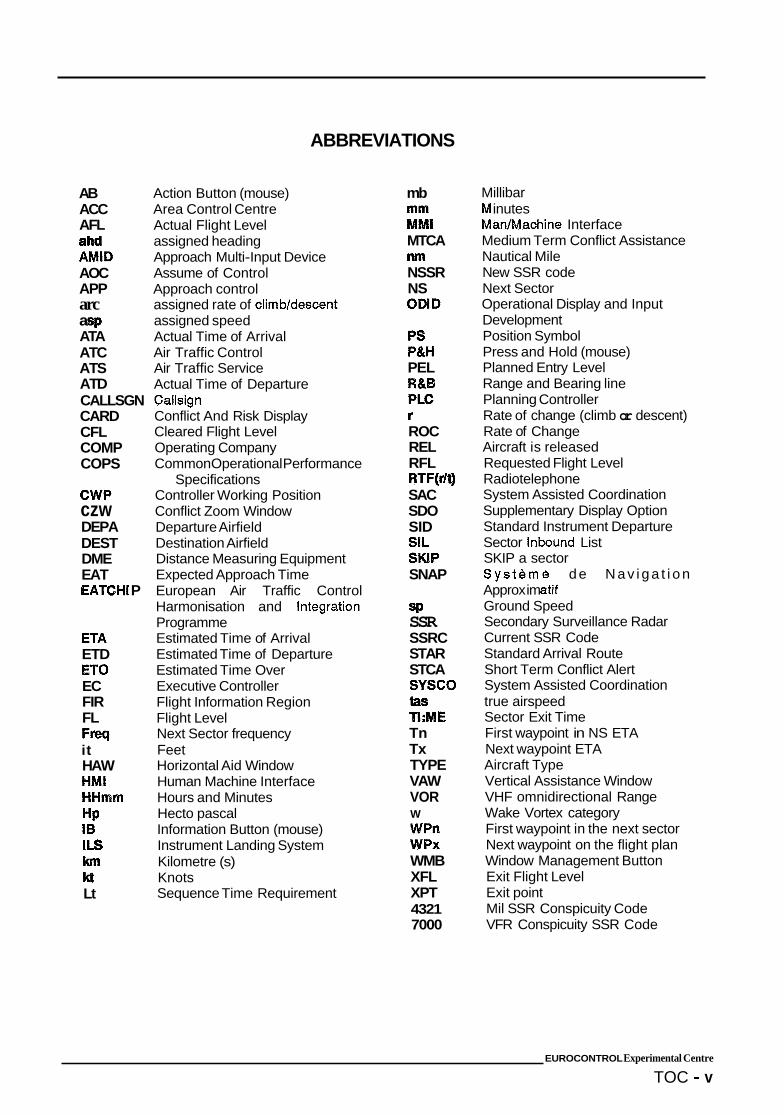
ABBREVIATIONS
AB ACC AFL ahd AMID AOC APP arc a ATA ATC ATS ATD CALLSGN CARD CFL COMP COPS
CWP czw DEPA DEST DME EAT EATCHI P
€TA ETD ET0 EC FIR FL Freq it HAW HMI HHmm HP IB 11s km k.t Lt
Action Button (mouse) Area Control Centre Actual Flight Level assigned heading Approach Multi-Input Device Assume of Control Approach control assigned rate of climb/descent assigned speed Actual Time of Arrival Air Traffic Control Air Traffic Service Actual Time of Departure Callsign Conflict And Risk Display Cleared Flight Level Operating Company Common Operational Performance
Specifications Controller Working Position Conflict Zoom Window Departure Airfield Destination Airfield Distance Measuring Equipment Expected Approach Time European Air Traffic Control Harmonisation and Integration Programme Estimated Time of Arrival Estimated Time of Departure Estimated Time Over Executive Controller Flight Information Region Flight Level Next Sector frequency Feet Horizontal Aid Window Human Machine Interface Hours and Minutes Hecto pascal Information Button (mouse) Instrument Landing System Kilometre (s) Knots Sequence Time Requirement
mb mm MMl MTCA
NSSR NS OMD
PS P&H PEL R&B PLC r ROC REL RFL RTF(r7t) SAC SDO SID SIL SKIP SNAP
SP SSR SSRC STAR STCA SYSCO taS
Tn Tx TYPE VAW VOR
WPn WPX WMB XFL XPT 4321 7000
nm
W
Millibar inutes
Man/Machine Interface Medium Term Conflict Assistance Nautical Mile New SSR code Next Sector Operational Display and Input Development Position Symbol Press and Hold (mouse) Planned Entry Level Range and Bearing line Planning Controller Rate of change (climb or descent) Rate of Change Aircraft is released Requested Flight Level Radiotelephone System Assisted Coordination Supplementary Display Option Standard Instrument Departure Sector lnbound List SKIP a sector S y s t e m e d e N a v i g a t i o n Approx im atif Ground Speed Secondary Surveillance Radar Current SSR Code Standard Arrival Route Short Term Conflict Alert System Assisted Coordination true airspeed Sector Exit Time First waypoint in NS ETA Next waypoint ETA Aircraft Type Vertical Assistance Window VHF omnidirectional Range Wake Vortex category First waypoint in the next sector Next waypoint on the flight plan Window Management Button Exit Flight Level Exit point Mil SSR Conspicuity Code VFR Conspicuity SSR Code
EUROCONTROL Experimental Centre
TOC - v
The EUROCONTROL Experimental Centre wishes to thank the Administrations and controllers who participated in ODlD IV.
Members of the ODlD Group, ODlD IV sub-group, DED2 and the Danish Civil Aviation Authority are thanked for their considerable assistance during the development and conduct of the simulation.
The EUROCONTROL Experimental Centre would like to thank CENA for their permission to use MAESTRO in the ODID IV simulation facility.
1
2
INTRODUCTION
The ODlD IV real time simulation took place at the EUROCONTROL Experimental Centre (EEC) during September and October of 1993. It was the fourth in a series of Human Machine Interface (HMI) study simulations mounted at the EEC for the Operational Display and Input Development Group (ODID Group).
ODlD IV was preceded by a System Validation exercise which was conducted in May 1993. This simulation was primarily staged to introduce and "debug" the Experimental Centre's new SIM5+ simulation facility. At the same time it provided an opportunity to train ODlD IV participants in the operation of the ODlD environment whilst validating the HMI applications.
The ODlD simulations have aroused a considerable amount of international interest and as a result a full visitors program was provided during the simulation.
Due to the considerable demand for access to the simulation, a series of briefings and short familiarisation exercises were subsequently conducted during the period October 1993 to February 1994 using a reduced version of the ODlD IV simulation facility .
ODID BACKGROUND
The ODlD Group was set up in 1986 by the European Expert Group (now dissolved) on Colour Displays and Stripless Systems. Its task was to investigate the means by which stripless ATC systems might be established. The ODlD Group has provided specifications for a series of real-time simulations which have been carried out at the Eurocontrol Experimental Centre (EEC).
Since the creation of the ODlD Group, the EUROCONTROL Experimental Centre at BrcStigny has run four ODlD simulations.
2.1 ODlD I
The first ODID simulation studied coordination procedures using electronic transmission of data and methods of data display where colour represented direction of flight and outstanding tasks. A three line radar data block in monochrome was also evaluated.
2.2 ODlD II
ODlD II used the findings of the first simulation on colour and coordination and further evaluated data displays and input functions under different traffic loads. Two coordination methods were studied: on a systematic basis and on receiving controller initiation. A colour radar displayed was evaluated.
EUROCONTROL Experimental Centre
1
2.3 ODlD 111
3
The ODlD 111 simulation studied two different Organisations; tabular data displays with graphical aids - electronic strips - proposed by France and graphical displays with information windows, proposed by Switzerland. It attempted to exploit the new technology associated with large raster scan displays and graphics processors providing the controller with a significantly enhanced automated environment.
The design philosophy of ODlD Ill maintained the basic concept of Planning (PLC) and Executive (EC) functions for a sector. Planning was assisted by the use of dedicated Entry and Exit tools and a Conflict Risk Display. Colour was used to indicate the state and control responsibility of a flight and to attract the controller's attention to outstanding tasks. Associated with colour was the application of time parameters to the display of flight plan information.
In ODlD 111 controllers experimented with a mouse input device which interacted with the system through a radar label (up to five lines of data) to record information such as level, heading and speed. This data input was used to up-dat current system profiles and permitted coordination between Centreskectors by means of pre- determined electronic coordination messages.
ODlD IV OBJECTIVES
3.1 GENERAL
1. To confirm and refine the functions evaluated during ODID Ill with further application to :
a flexible route structure, and
rn silent coordination between an approach sector and an en-route sector.
II. To apply and evaluate an ODID 111 type environment between an upper sector and a lower sector with a high proportion of climbing and descending flights.
Ill. To define and evaluate the suitability of graphical aids of the same nature as those developed for the PLC in ODlD 111 for application to both the EC and PLC function.
EUROCONTROL Experimental Centre
2
3.2 SPECIFIC
The simulation was designed to evaluate :
i. the application of ODlD features to a "standard" route structure and a "free" route structure;
a display system for interfacing a metering tool between approach control and en-route sectors;
1PL the contents of radar labels and the use of colour in both approach control and en-route sectors;
hr. a tool for silent coordination of departure clearances from local aerodromes;
v. tools for the identification of "conflicts1t and "conflict riskt1 problems and their priority for treatment;
vi. the application of ODlD features to coordination mechanisms between upper and lower sectors.
Ei.
4
4.1
SIMULATION ENVl RONM ENT
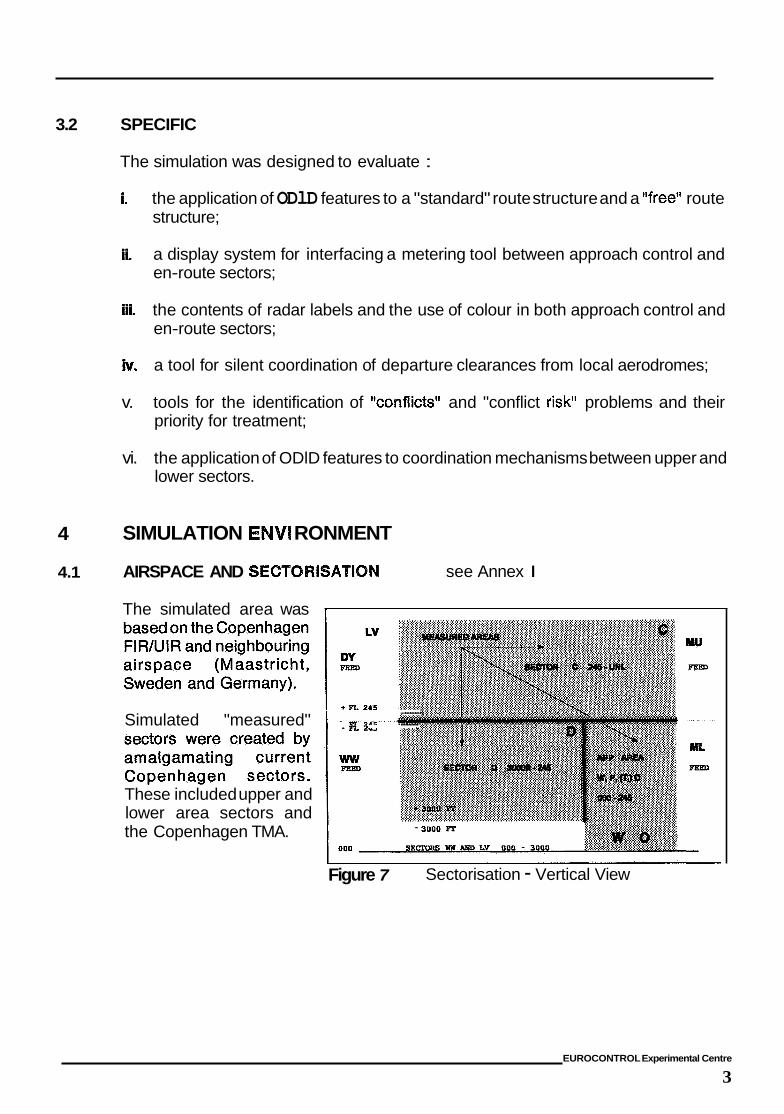
AIRSPACE AND SECTORISATION
The simulated area was I
see Annex I
................ ........ Simulated "measured" I m 3.2 - --- ............ ' ,,
- 3000 FT
These included upper and lower area sectors and the Copenhagen TMA.
Figure 7 Sectorisation - Vertical View
EUROCONTROL Experimental Centre
3
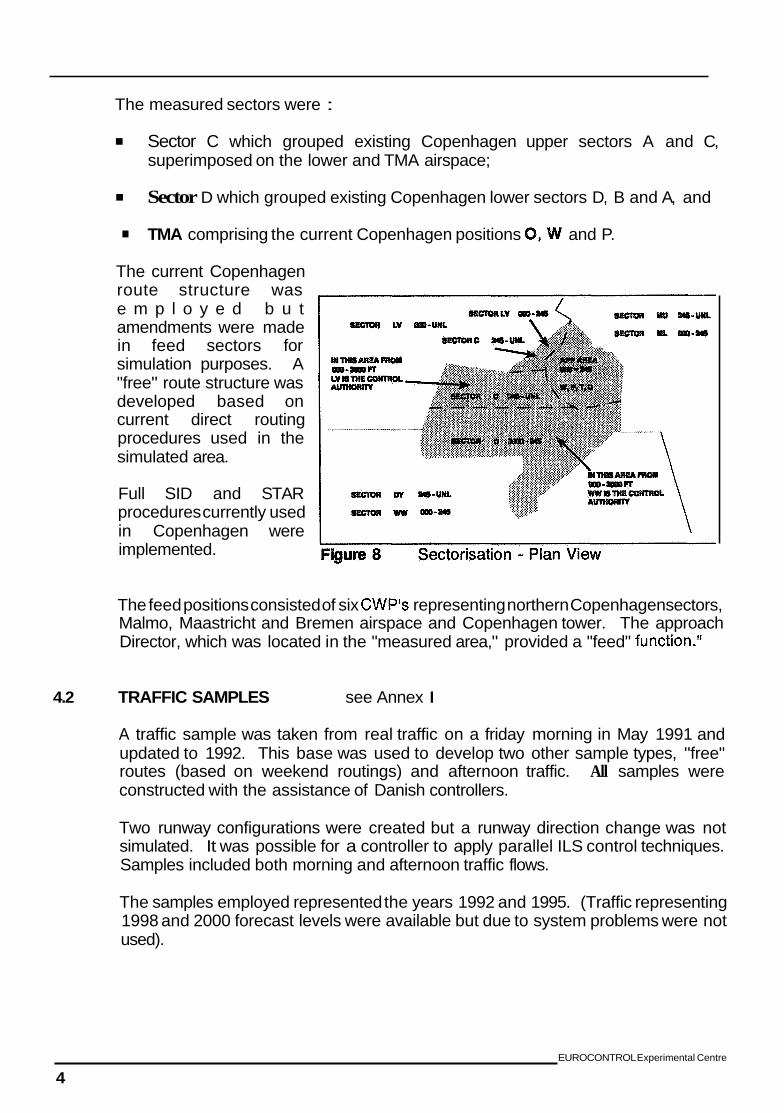
The measured sectors were :
Sector C which grouped existing Copenhagen upper sectors A and C, superimposed on the lower and TMA airspace;
Sector D which grouped existing Copenhagen lower sectors D, B and A, and . TMA comprising the current Copenhagen positions 0, VV and P.
The current Copenhagen route structure was e m p l o y e d b u t amendments were made in feed sectors for simulation purposes. A "free" route structure was developed based on current direct routing procedures used in the simulated area.
Full SID and STAR procedures currently used in Copenhagen were implemented.
The feed positions consisted of six CWP's representing northern Copenhagen sectors, Malmo, Maastricht and Bremen airspace and Copenhagen tower. The approach Director, which was located in the "measured area," provided a "feed" function."
4.2 TRAFFIC SAMPLES see Annex I
A traffic sample was taken from real traffic on a friday morning in May 1991 and updated to 1992. This base was used to develop two other sample types, "free" routes (based on weekend routings) and afternoon traffic. All samples were constructed with the assistance of Danish controllers.
Two runway configurations were created but a runway direction change was not simulated. It was possible for a controller to apply parallel ILS control techniques. Samples included both morning and afternoon traffic flows.
The samples employed represented the years 1992 and 1995. (Traffic representing 1998 and 2000 forecast levels were available but due to system problems were not used).
EUROCONTROL Experimental Centre
4
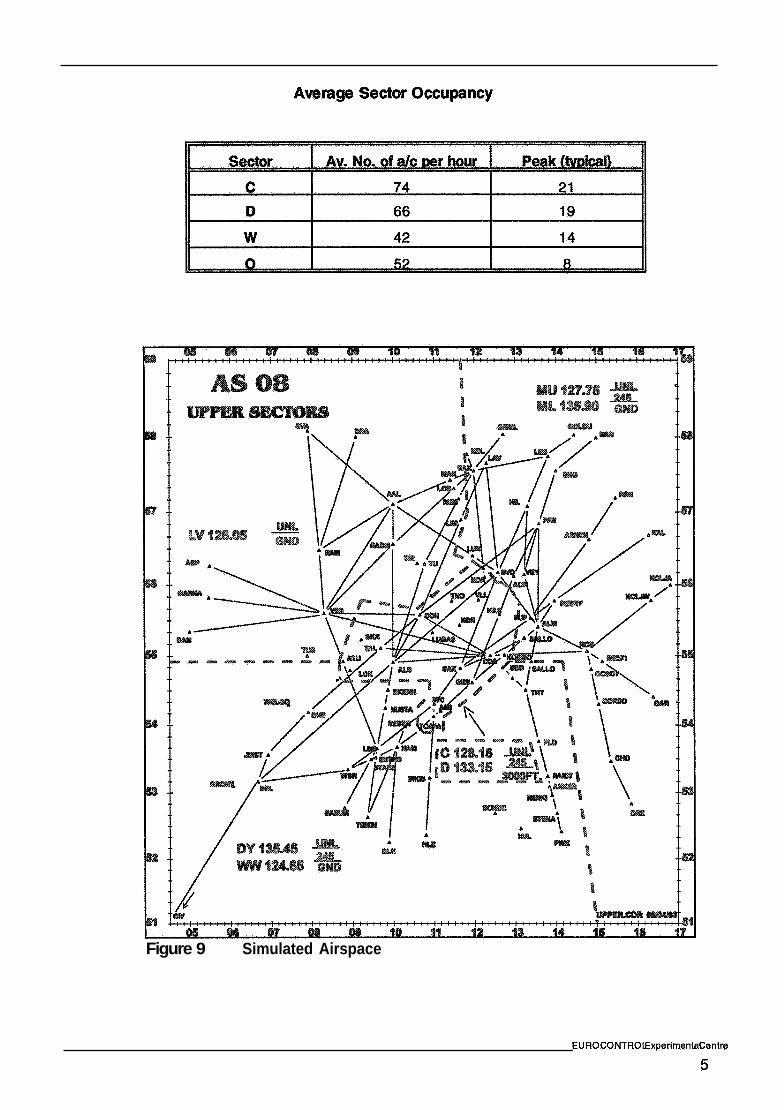
Average Sector Occupancy
Figure 9 Simulated Airspace
EUROCONTROExperimentaCentre
5 AIR TRAFFIC CONTROL REQUIRE
The current control techniques and operational procedures laid down in local instructions, letters of agreement and the appropriate national Alps applicable to the simulated airspace were employed. Control instructions issued to pilots which had a corresponding input field displayed in the radar label or elsewhere on the display were required to be entered into the system by the controller.
5.1 DATA INPUT
All participants at measured and feed sectors, were required to input data as required to
te the system; effect coordination, and
note control information.
5.2 EXIT AND ENTRY FLIGHT LEVELS
With the exception of the arrival radar label in the approach and director positions, each label displayed an Exit Flight Level (XFL). This level was applicable to the current sector and was related to the subsequent sector's Planned Entry Level (PEL) for coordination purposes.
The XFL allocation was as follows :
departures from EKCH (Copenhagen), EKRK (Roskilde), EKVL (Vmlose) and ESMS (Malmo) to airfields within the simulated area were allocated an initial XFL related to the SID. A manual XFL input was always possible; departures from airfields in the simulated area other that those mentioned above were allocated an XFL of FL 240 (or their RFL if lower); arrivals to EKCH, EKRK, EKVL and ESMS were allocated the appropriate STAR gate level (or current Flight Level if lower); from a Lower to Upper sector, FL 240; from an Upper to Lower sector, FL 250, and en-route overflying traffic, RFL
5.3 I LITA R Y AI R SPACE ACTIVATI 0 N
There was no special military airspace activation. However, military airspace was displayed to the controller in the form of a video map.
EUROCONTROL Experimental Centre
7
5.4
5.5
5.6
5.6.1
5.6.2
5.6.3
NOISE ABATE
The Copenhagen departure noise abatement procedures were not simulated.
RADARHANDOVER
Radar handover was at the discretion of the controller. However, the ODID radar label displayed heading, speed and rate of climb/descent restrictions giving the accepting controller advance warning of transfer conditions. An automated radar handover function defined for the simulation was not available.
OPERATIONAL REQUIREMENTS - EASURED POSITIONS
Executive Tasks En-Route (EC)
The controller was required to : . . . assist the PLC, and input data.
maintain separation between assumed aircraft within the area of responsibility; maintain radio communication with the aircraft under control; achieve exit conditions at transfer of control or effect coordination as required;
Planning Tasks En-Route (PLC)
The controller was required to : . confirm Entry and Exit conditions; effect coordination as required; . provide warnings to the EC; . assist the EC, and input data.
Approach Control Tasks
The controller was required to :
coordinate the approach sequence; coordinate with En Route, Departure, Arrival and adjacent sectors/agencies; maintain separation between assumed aircraft within the area of responsibility; maintain radio communication with the aircraft under control; ensure separation between departing and arriving traffic in conjunction with the departure controller; control the initial approach sequence; assist the director, and input data.
EUROCONTROL Experimental Centre
8
5.6.4 Departurn Ta
The controller was required to :
coordinate with Tower (including EKRK and EKVL), Approach control, En Route and adjacent sectors/agencies; maintain separation between assumed aircraft within the area of responsibility; ensure separation between departing and arriving traffic in conjunction with Approach control; maintain radio communication with the aircraft under control, and input data.
.
5.7 OPERATIONAL REQUIREMENTS - FEED POSITIONS
5.7.1 En-Roub Control Tasks - General
The controller was required to : . .
input data.
confirm exit conditions from measured sectors; maintain separation between assumed aircraft en-route to a measured sector; maintain radio communication with the aircraft under control; achieve exit conditions at transfer of control or effect coordination as required,and
5.7.2 S Feed Tasks
5.7.2.1 Dimcfor Confrvl Task
The controller was required to :
.
. control and ensure separation of Copenhagen final approach sequence; maintain separation between assumed aircraft within the area of responsibility; maintain radio communication with the aircraft under control; coordinate with approach control as appropriate, and provide the approach control function (arrivals) for EKVL and EKRK.
5.7.2.2 Tower Control Tasks
The controller was required to :
ensure the Copenhagen departure sequence; provide the tower function (departures) for EKVL and EKRK, and coordinate with departure control as appropriate.
EUROCONTROL Experimental Centre
9
Sector LV provide Tower/Approach control functions for EKBl and EKOD. The sector ensured the approach sequence and operated holding when required for Copenhagen approach area arrivals via TNO.
provide Tower/Approach control functions for EKSB and EKSP. The sector coordinated EDDH arrivals from sector D (PEL FL 150), coordinated Copenhagen arrivals via TRT (XFL FL 200) and coordinated departures from EDDH into sector D (XFL FL 240 or RFL if lower).
Secfor DY provide coordination for Copenhagen arrivals via TRT (XFL FL 250) early to WW for transfer to D descending FL 200.
Sector ML provide Tower/Approach control functions for ES S. The sector coordinated ESMS arrivals from sector 0 (PEL FL 150), from D or WW (FL 240 or RFL if lower). It ensured the approach sequence and operated holding when required for Copenhagen approach area arrivals at SVD and ALM.
6 ULATION FACILITIES see Annex II.
The SIM5+ simulation facility used during ODID IV comprised the following systems:
m individual air and ground Local Area Networks (LANs); air sub-system (MASS) providing aircraft navigation and pilot data input; ground sub-system (flight plan following, STCA, profile (re)calculation); supervisory system (providing start, stop and freeze functions); controller working positions (CWP) providing data display, controller input, MTCA calculation.
A supplementary facility called SNAP (Systeme de Navigation Approximatif) was used during periods when the real time simulator (SIM5+) was not available. SNAP is a complete (but pilotless) simulation system. It provides a "stand alone" capability where aircraft navigation follows controller (ATC instruction) input.
EUROCONTROL Experimental Centre
10
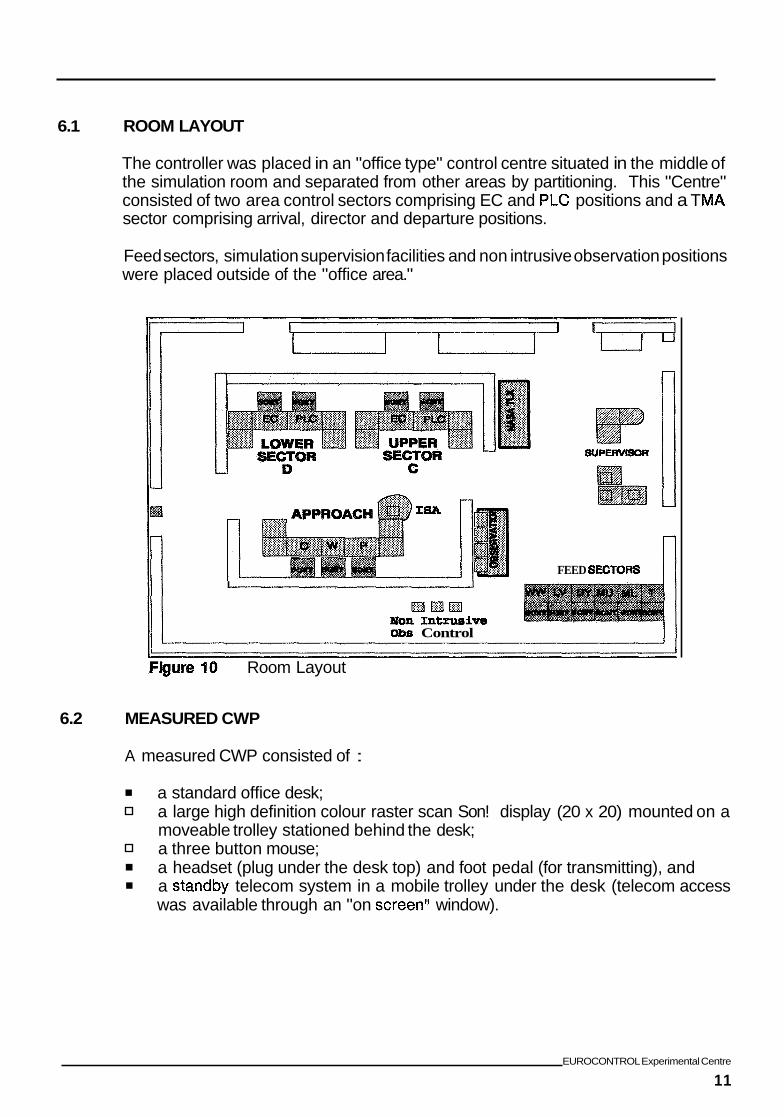
6.1 ROOM LAYOUT
The controller was placed in an "office type" control centre situated in the middle of the simulation room and separated from other areas by partitioning. This "Centre" consisted of two area control sectors comprising EC and PLC positions and a T sector comprising arrival, director and departure positions.
Feed sectors, simulation supervision facilities and non intrusive observation positions were placed outside of the "office area."
EKIPE-R
FEED SECTORS I I
p-J[c3m Mon Intruerim
I I -6 Control I
jure 10 Room Layout
6.2 MEASURED CWP
A measured CWP consisted of :
a standard office desk;
a three button mouse;
a large high definition colour raster scan Son! moveable trolley stationed behind the desk;
display (20 x 20) mounted on a
a headset (plug under the desk top) and foot pedal (for transmitting), and a standby telecom system in a mobile trolley under the desk (telecom access was available through an "on screen" window).
EUROCONTROL Experimental Centre
11
6.3 FEED SECTOR C
A Feed Sector CWP consisted of :
7
7.1
a colour screen (as above) set in a purpose built housing which also contained the telecom facility. This housing permitted the controller to adjust the screen height and position, and to raise and lower the working desk top. the input device, headset and transmit pedal were the same as those used in the measured CWP.
ODID IV HMI see Annex 111.
WQRIUNG ENVIRON
ODID IV provided the controller with a working environment where essential data was displayed on a priority basis with supplementary information available on request.
The controller was required to input data which reflected the ATC instructions passed to aircraft. In return the system provided conflict prediction, system supported coordination, recording of instructions and visual cues for planning and coordination requirements to assist the controller in hidher task.
Planning tools were designed to replicate the function of paper strips by providing the controller with system interpreted traffic situations in a graphical form. These graphics were displayed by the controller when required.
The simulation working environment consisted of :
a large colour screen with a multi-window capability; flexible window management; graphical images and tabular displays; data input via a (three button) mouse; data exchange and inter Centrehector system supported coordination; colour used for planning states, coordination, urgency and background; a "dynamic" interactive radar label for data input; medium term conflict assistance tools for traffic planning, and short term conflict alert.
The experiment was conducted in an operational environment which included approach, lower and upper airspace sectors with varying levels of traffic intensity. Area sectors operated with a planning and executive configuration whilst approach control consisted of departure, arrival and director positions.
A complete system description is provided in Annex 111.
EUROCONTROL Experimental Centre
12
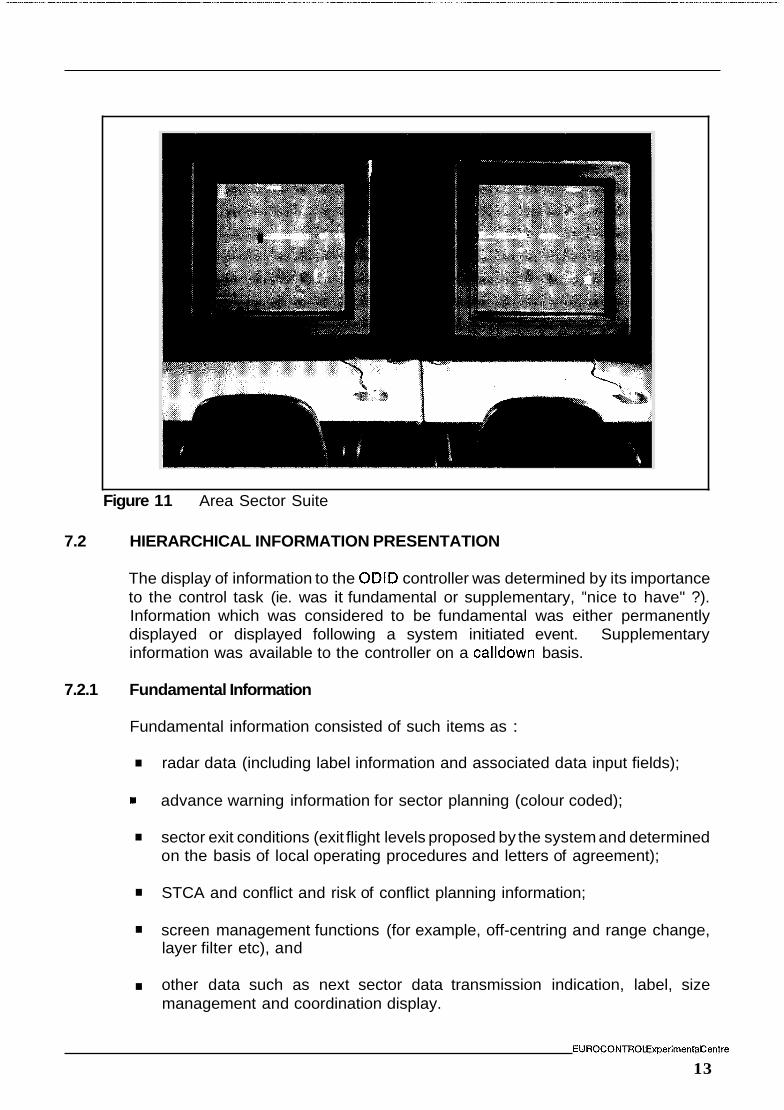
Figure 11 Area Sector Suite
7.2 HIERARCHICAL INFORMATION PRESENTATION
The display of information to the ODlD controller was determined by its importance to the control task (ie. was it fundamental or supplementary, "nice to have" ?). Information which was considered to be fundamental was either permanently displayed or displayed following a system initiated event. Supplementary information was available to the controller on a calldown basis.
7.2.1 Fundamental Information
Fundamental information consisted of such items as : . radar data (including label information and associated data input fields);
advance warning information for sector planning (colour coded); . sector exit conditions (exit flight levels proposed by the system and determined on the basis of local operating procedures and letters of agreement); . STCA and conflict and risk of conflict planning information; . screen management functions (for example, off-centring and range change, layer filter etc), and . other data such as next sector data transmission indication, label, size management and coordination display.
EUROCONTROExperimentaCentre
13
Supplementary information consisted of such items as:
flight plan details (for example, RFL, route information, destination etc..); . display of planning information in the MTCA windows; . display of conflict "close-ups," and . calldown of data for radar set-up.
8 ULATION CONDUCT
8. I
The simulation was conducted over a four week period from the 13th September to the 8th October 1993. Four stages of simulation progression were planned during this period :
training and (re) familiarisation with the working environment (planned to take 3 days);
reference exercises (at 1992 traffic levels for both normal and free-route samples);
1995 exercises, and
augmented traffic levels (determined by controllerlsystem capacity).
Due to the simulation limitations described in section 4, only the 1995 traffic levels were attained. It was also necessary to return to the reference levels following the introduction of profile re-calculation in order to afford the participants sufficient opportunity to familiarise themselves with the MTCA tools.
8.2 DAILY SCHEDULE
The daily simulation schedule was designed to cope with four simulation exercises (two of which were for the benefit of visitors but which also provided a training opportunity for FAA personnel who participated in the simulation).
Visits to the simulation commenced during the second week of simulation (week one was reserved exclusively for the ODID participants).
EUROCONTROL Experimental Centre
15
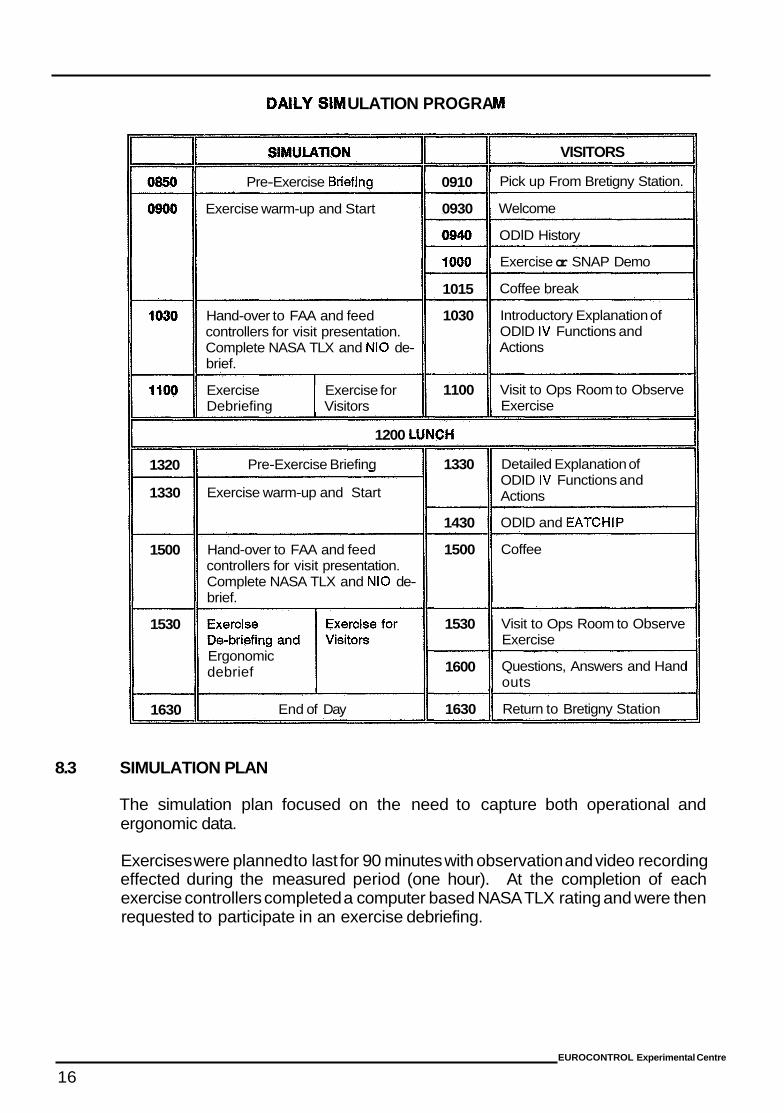
ULATION PROGRA
I 1320
1330
1500
1530
1630
Pre-Exercise Briefinn
Exercise warm-up and Start
Hand-over to FAA and feed controllers for visit presentation. Complete NASA TLX and NI0 de- brief.
Exercise Exercise for Debriefing Visitors
0910
0930
0940
loo0
1015
1030
1100
1200 LUNCH
Pre-Exercise Briefing
Exercise warm-up and Start
Hand-over to FAA and feed controllers for visit presentation. Complete NASA TLX and NI0 de- brief.
Ergonomic debrief
End of Day
1330
1430
1500
1530
1600
1630
VISITORS
Pick up From Bretigny Station.
Welcome
ODlD History
Exercise or SNAP Demo
Coffee break
Introductory Explanation of ODlD IV Functions and Actions
Visit to Ops Room to Observe Exercise
Detailed Explanation of ODID IV Functions and Actions
ODlD and EATCHIP
Coffee
Visit to Ops Room to Observe Exercise
Questions, Answers and Hand outs
Return to Bretigny Station
8.3 SIMULATION PLAN
The simulation plan focused on the need to capture both operational and ergonomic data.
Exercises were planned to last for 90 minutes with observation and video recording effected during the measured period (one hour). At the completion of each exercise controllers completed a computer based NASA TLX rating and were then requested to participate in an exercise debriefing.
EUROCONTROL Experimental Centre
16
The post exercise debriefings were directed towards all participants during the first week. This was reduced to either area or approach controllers only (alternating) after week two with representatives from the non-majority group and the feed controllers also invited to participate.
At the end of the afternoon exercise the controller who provided the control service in sector D PLC position was interviewed by the simulation ergonomist. This interview was conducted with the aid of a video recording of the morning exercise and was intended to obtain further insight into the controllers' comportment during the exercise.
During the final week of simulation each "measured" participant was interviewed on a one to one basis by an HMI expert.
8.4 COMPLETED €X€RClSES see Annex IV.
The number of exercises completed (excluding exercises for visitors) during the simulation period was : 42.
Approximately 22 exercises were sufficiently complete for analysis (however, only 7 exercises were retained for analysis of CWP data input orders due to the excessive amount of extra clicks recorded resulting from slow system response time).
9 SIMULATION LIMITATIONS
Due to time constraints and the technical complexity of ODlD IV, the SIM5+ simulation facility was not fully operational in time for the simulation and, as a result, the system performed at less than optimum levels.
This significantly affected the controllers' ability to work normally and to adequately evaluate the facility. The main problems were :
a significant number of software "bugs" were discovered during the first weeks of simulation;
flight plan trajectory re-calculation was only available for seven exercises;
the re-calculation of a profile occasionally changed an aircraft's expected sector sequence;
aircraft performance was criticised as being unrealistic, particularly in lower airspace (for certain aircraft types), and
response times as experienced by the controllers for common ODlD type actions such as calling down information and inputting data were considered to be unacceptable.
EUROCONTROL Experimental Centre
17
10
10.1
10.2
10.3
10.4
10.5
The project team and the participating controllers agreed that the facility was not sufficiently operational for "officially measured" exercises to be declared.
Despite these problems a considerable amount of subjective opinion has been collected and collated.
ENT AND RECORQING
Analysis of the ODlD IV simulation was planned to cover both subjective comment and quantitative recorded values. A brief description of the data collection and recording methods is provided below.
NASA TLX see Annex V
NASA TLX is a subjective technique used in assessing workload. The technique uses a rating scale considered to be sensitive to changes in the participants workload. The TLX was applied at the end of an exercise.
NON INTRUSIVE OBSERVATION see Annex VI
The non intrusive observation facility comprising video cameras, sound and vision recording equipment and monitoring positions was used to obtain information on the behaviour of controllers and the content of their verbal coordination during the course of an exercise.
ONE TO ONE INTERVIEW
A One to One interview with each participant took place towards the end of the simulation. This provided the experimenter with the opportunity to obtain further insight into individual controller opinion of the facility.
ISA - I~§TANTA~EOUS SELF ASSESS see Annex V
The ISA technique permitted the participants to assess their workload during the course of a simulation exercise. Each measured participant was required to assess hislher workload every two minutes by selecting a value (from one to five representing spare capacity to overloaded) on a desk mounted panel. This measurement facility is similar to that developed at the UK ATC Evaluation Unit.
ERGONOMIC STUDY OF CONTROLLEWSYSTEM INTERFACE see Annex VII
An ergonomic study of the controllerlsystem interface using video recording has been effected.
EUROCONTROL Experimental Centre
18
10.6
10.7
10.8
10.9
11
11.1
see Annex V
A modified MBB (Messerschmitt Bolkow-Blohm) workload calculation was applied to exercise recordings.
QUESTIONNAIRE see Annex Vlll
The questionnaire was used to obtain the participants' subjective opinion of the ODlD IV environment. It comprised both Human Factors and Operational content with a bias on the latter.
EXERCISE DE-BRIEFING
The post exercise de-briefing was used to obtain the participants' subjective opinion of the ODID environment and comments on the exercise.
EXERCISE RECORDING see Annex IX and X
Exercise recording involved measuring all pilot and controller input orders, the type and duration of telecom coordination and r/t use.
TRAINING
NEED
It was identified at the beginning of ODlD I l l development that controller training for future systems would require special attention. ODID IV addressed this requirement by implementing a training program which included traditional classroom teaching, "home learning" and CBT (Computer Based Training).
The ODlD system was well suited to the use of CBT. HMI functions such as "mouse" manipulation, window management and radar label data input applications were adequately covered by the CBT package.
Two workshops were held in Copenhagen for all participants. At the end of the first session controllers were provided with slide shows and a CBT course in order to continue their training. In addition to this, the system validation exercise (held in May 1993) also provided an important training gain.
All participants were therefore fully conversant with the ODlD IV HMI (except for the MTCA tools) at the start of the simulation.
EUROCONTROL Experimental Centre
19
UMTION TRAIN1
12
Three days were allocated to controller training at the start of the simulation. This took the form of notifying the participants of the latest system changes and then monitoring their progress. Additional explanation was only provided on request. It was felt that the controllers knowledge of the system was sufficiently high at the start of the simulation that a less intrusive instruction method could be used.
Controllers were encouraged to apply the current task sharing and control techniques employed in Copenhagen and adjacent units.
CONTROL STAFF
The simulation "measured" positions were staffed by controllers from the Copenhagen Area Centre and Approach unit. These participants were all "current" Copenhagen control staff.
Feed sector positions which provided a continuity of control and coordination between neighbouring "measured" sectors and adjacent Centres were manned by controllers from Sweden, Bremen and Maastricht.
The FAA participated in the ODlD simulation under a Memorandum of Cooperation between the FAA and Eurocontrol. FAA personnel assisted in the Non Intrusive Observation task and carried out their own evaluation of the ODlD IV simulation facility.
A controller from the Austrian CAA also participated, both as observer and controller.
During the simulation, supplementary exercises were staged twice a day for the benefit of visitors. These exercises were staffed by the feed controllers, FAA personnel and the Austrian CAA controller.
Participation
Copenhagen Sweden Maastricht Bremen FAA Austria
10 controllers; 2 controllers; 2 controllers; 1 controller; 7 participants (4 controllers); 1 controller.
EUROCONTROL Experimental Centre
20
13 SIMULATION VISITORS AND PARTICIPANTS see Annex XI.
The ODID simulations have attracted a considerable amount of interest. A comprehensive visitors programme had been provided for ODlD 111 and a similar programme was instituted for ODID IV. This programme included presentations and visits to a simulation exercise and in addition each visitor received an ODlD IV simulation description hand-out.
Due to the ‘demand for access to the simulation, a series of supplementary presentations and exercises (designated ODlD IV Bis) were organised during the period November 1993 to February 1994. The recorded number of participants and professional visitors (Administrations and Industry) to both the simulation and the supplementary presentations and exercises was 734.
w ODlD IV participants 23 ODlD IV visitors 294
ODlD IV Bis participants 80 ODlD IV Bis visitors 217
Industry programme 120
Total 734
EUROCONTROL Experimental Centre
21
14 SU WECTIVE OPINION AND POST EXERCISE ANALYSIS
14.1 INTRODUCTION
This chapter collects together the subjective controller opinions and post exercise analysis according to the functions provided in ODID IV. Supplementary analysis is also presented including workload, working methods and conflict prediction.
The chapter is divided into individual sections giving a summary description of the ODID IV function followed by the subjective comment and then the post exercise analysis. When appropriate, additional sub-sections are included comparing subjective and post exercise analysis.
Text printed in italics describes in outline the ODID IV function being discussed. Full details of the ODlD IV working environment are provided in Annex 111.
Subjective controller comments were collected from post exercise debriefings, discussions and the simulation questionnaire. The Post Exercise Analysis concerns data recorded during simulation exercises which includes :
Exemlse Recordinys (Annex IX and X)
0 Controller Input Orders (CWP) 0 Pilot Input Orders 0
0 Traffic Sample Analysis Telecom and Frequency Recording (Telecom)
WO& Load Assessment (Annex V)
0 NASA TLX 0 Instantaneous Subjective Assessment (ISA) cl MBB
Non Intrusive ObsenrafYbn (NIO) (Annex VI)
Egonomic Study (ERGO) of the sector D-PLC (Annex VII)
Assessment of the results of the analysis obtained from recorded CWP data must take into consideration the technical problems which were experienced during the simulation. In order to assure, as far as possible, the quality of this information, only seven exercise recordings were analysed (21 for the System Assisted Coordination). The data in each of these exercises was "manually validated" to confirm its value.
Certain recordings are effected by individual controller working methods. A notation has been made against the analysis when this effect is considered to be significant.
EUROCONTROL Experimental Centre
23
14.2 OUSE
14.2.1 Desc n see Annex 111 Pages 6 to 8
A three button mouse was used in the simulation. Mouse buttons were allocated to information display, data input and window management. A press and hold function was available for temporary call down of information.
The window management system permitted the controller to move, re-size, swop and iconify individual windows. Scrolling and zooming were also available in selected windows.
14.2.2 Subjeactive Qplnkn
All participants found the mouse easy to operate and were not confused by the use of three buttons. The use of the mouse in ODlD IV was covered in a pre-simulation computer based training (CST) package.
The controllers had a choice of two mice which differed in shape and in the pressure required to "click" a button. All controllers chose the mouse with the "softer click."
The mouse mat provided was considered by the majority to be too small. Several controllers resorted to using the desk top for mouse movement. The controllers also indicated their preference for a "personal mouse" if a mouse operated system is to be introduced.
Participants did not experience difficulty ir: placing the cursor on input fields except:
during the training period;
due to slow system response time making the cursor movement "erratic," and
when placing the cursor on certain radio buttons (small diamond shaped selection buttons) which were considered to be too small (for example the speed vector selection).
It was felt that the time difference between a simple click and a press and hold mouse action was not optimal. Some controllers found that they had to exaggerate the click action for a simple click when inputting data.
During periods of inactivity some controllers (usually planning controllers) lost (or forgot) the cursor position on the screen. They suggested that some method of cursor re-centring is required and proposed automatic re-centring by the system after a period of inactivity (pre-defined time parameter).
EUROCONTROL Experimental Centre
24
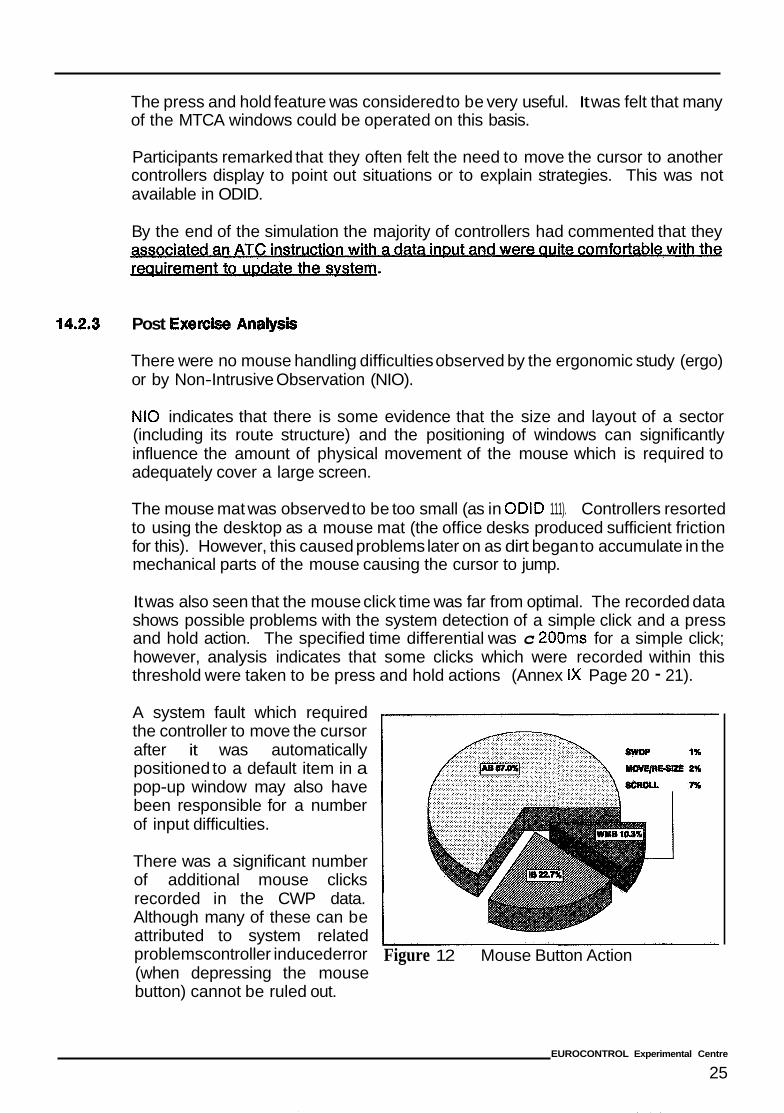
The press and hold feature was considered to be very useful. It was felt that many of the MTCA windows could be operated on this basis.
Participants remarked that they often felt the need to move the cursor to another controllers display to point out situations or to explain strategies. This was not available in ODID.
By the end of the simulation the majority of controllers had commented that they
14.2.3 Post Exem
There were no mouse handling difficulties observed by the ergonomic study (ergo) or by Non-Intrusive Observation (NIO).
NI0 indicates that there is some evidence that the size and layout of a sector (including its route structure) and the positioning of windows can significantly influence the amount of physical movement of the mouse which is required to adequately cover a large screen.
The mouse mat was observed to be too small (as in ODID 111). Controllers resorted to using the desktop as a mouse mat (the office desks produced sufficient friction for this). However, this caused problems later on as dirt began to accumulate in the mechanical parts of the mouse causing the cursor to jump.
It was also seen that the mouse click time was far from optimal. The recorded data shows possible problems with the system detection of a simple click and a press and hold action. The specified time differential was c 200ms for a simple click; however, analysis indicates that some clicks which were recorded within this threshold were taken to be press and hold actions (Annex IX Page 20 - 21).
A system fault which required the controller to move the cursor after it was automatically positioned to a default item in a pop-up window may also have been responsible for a number of input difficulties.
There was a significant number of additional mouse clicks recorded in the CWP data. Although many of these can be attributed to system related problems controller induced error (when depressing the mouse button) cannot be ruled out.
Figure 12 Mouse Button Action
EUROCONTROL Experimental Centre
25
14.3
14.3.1
14.3.2
The CWP recordings show that the majority of mouse actions were Action Button (AB - 67%), followed by Information Button (IB - 23%) and finally Window Management Button (WMB - 10%). The ECs were responsible for the majority of data input and mouse action.
Each controller was requested to answer a series of questions at the end of each exercise. For the mouse this question was :
The majority of area controller responses indicated that they "rarely" (76%) or "never" (18%) confused the functions of the mouse buttons. 40% of the approach controller responses indicated that they "rarely" confused the mouse button functions whilst wnever" received a 60% response.
This appears to show a very high confidence in the participants ability to assimilate the mouse functions. The same level of confidence was expressed during post exercise debriefings.
The ergo study indicates that there is a need for an error message to indicate why a particular field cannot be selected or why a particular function is not currently available.
WINDOW MANAGEMENT AND WINDOW POSITIONING
?he window management system permitted the controller to move, re-size, swop and iconify individual windows. Scrolling and zooming were also available in selected windows. see Annex Ill
Subjective O p i i ~ b ~
The participants considered the ability to set-up their personal window display as being "normal" in a multi-window working environment.
Participants felt that window management should be left as flexible as possible but acknowledged the need in certain circumstances for a more formal window set-up (such as at controller hand over).
They expressed satisfaction with the window management system. However, controllers were often frustrated when the system slowed down as window management became difficult.
In addition to system response affecting window management there were numerous occurrences of "accidental" re-sizing of the radar window. The controllers suggested that a "lock facility'r should be implemented as part of the preference set-up so that re-size can be locked once the optimum window size has been achieved.
EUROCONTROL Experimental Centre
26
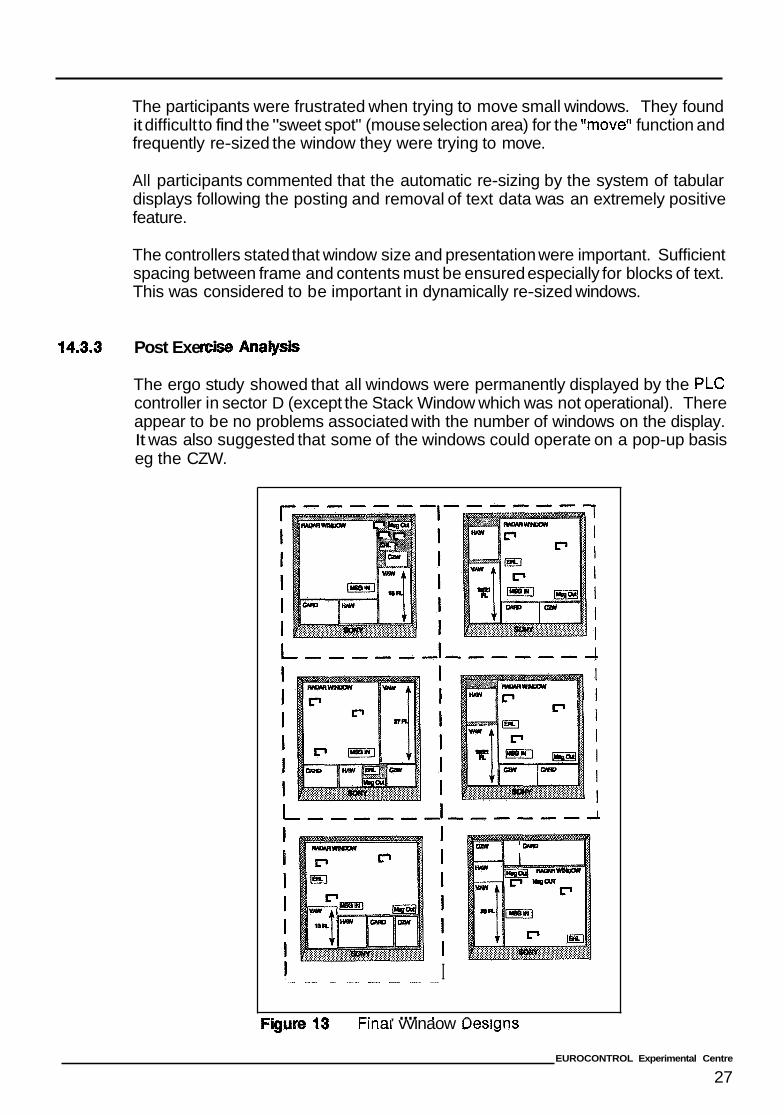
The participants were frustrated when trying to move small windows. They found it difficult to find the "sweet spot" (mouse selection area) for the "move" function and frequently re-sized the window they were trying to move.
All participants commented that the automatic re-sizing by the system of tabular displays following the posting and removal of text data was an extremely positive feature.
The controllers stated that window size and presentation were important. Sufficient spacing between frame and contents must be ensured especially for blocks of text. This was considered to be important in dynamically re-sized windows.
14.3.3 Post Exe
The ergo study showed that all windows were permanently displayed by the PLC controller in sector D (except the Stack Window which was not operational). There appear to be no problems associated with the number of windows on the display. It was also suggested that some of the windows could operate on a pop-up basis eg the CZW.
1 I
I. _ _ C. , .... I A . -gum 13 t-inai vvinaow uesigns
EUROCONTROL Experimental Centre
27
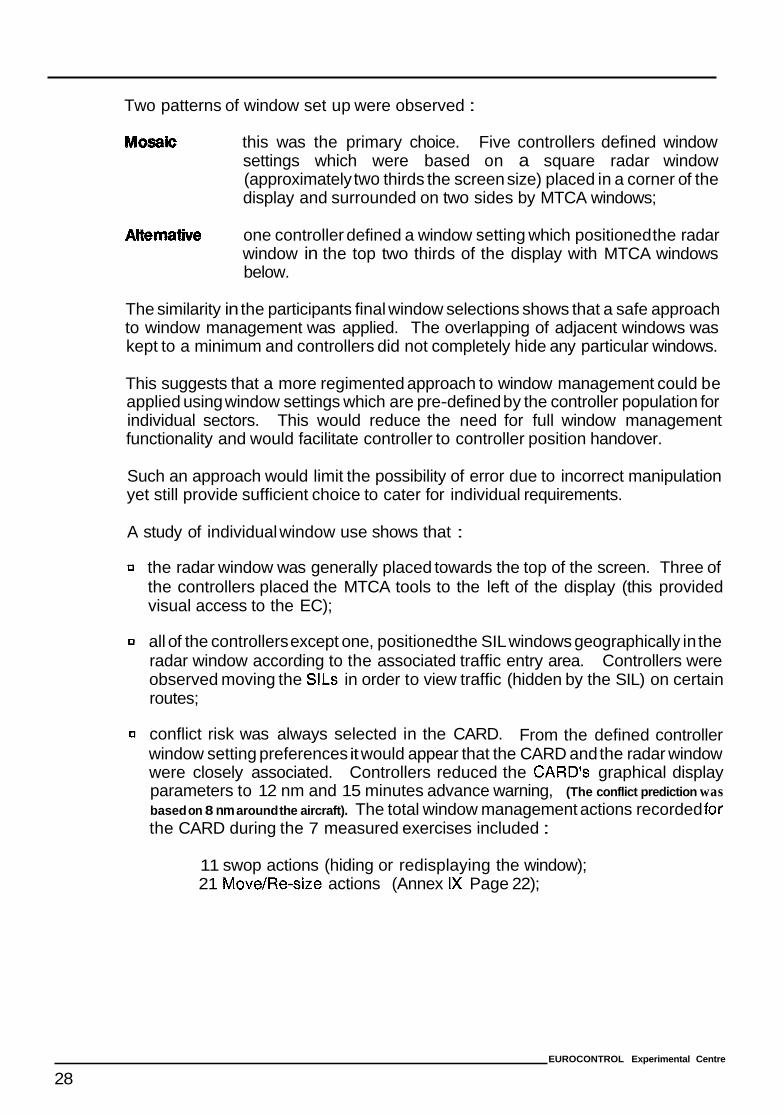
Two patterns of window set up were observed :
this was the primary choice. Five controllers defined window settings which were based on a square radar window (approximately two thirds the screen size) placed in a corner of the display and surrounded on two sides by MTCA windows;
one controller defined a window setting which positioned the radar window in the top two thirds of the display with MTCA windows below.
The similarity in the participants final window selections shows that a safe approach to window management was applied. The overlapping of adjacent windows was kept to a minimum and controllers did not completely hide any particular windows.
This suggests that a more regimented approach to window management could be applied using window settings which are pre-defined by the controller population for individual sectors. This would reduce the need for full window management functionality and would facilitate controller to controller position handover.
Such an approach would limit the possibility of error due to incorrect manipulation yet still provide sufficient choice to cater for individual requirements.
A study of individual window use shows that :
0 the radar window was generally placed towards the top of the screen. Three of the controllers placed the MTCA tools to the left of the display (this provided visual access to the EC);
0 all of the controllers except one, positioned the SIL windows geographically in the radar window according to the associated traffic entry area. Controllers were observed moving the SlLs in order to view traffic (hidden by the SIL) on certain routes;
0 conflict risk was always selected in the CARD. From the defined controller window setting preferences it would appear that the CARD and the radar window were closely associated. Controllers reduced the CARD'S graphical display parameters to 12 nm and 15 minutes advance warning, (The conflict prediction was based on 8 nm around the aircraft). The total window management actions recorded for the CARD during the 7 measured exercises included :
11 swop actions (hiding or redisplaying the window); 21 Move/Re-size actions (Annex IX Page 22);
EUROCONTROL Experimental Centre
28
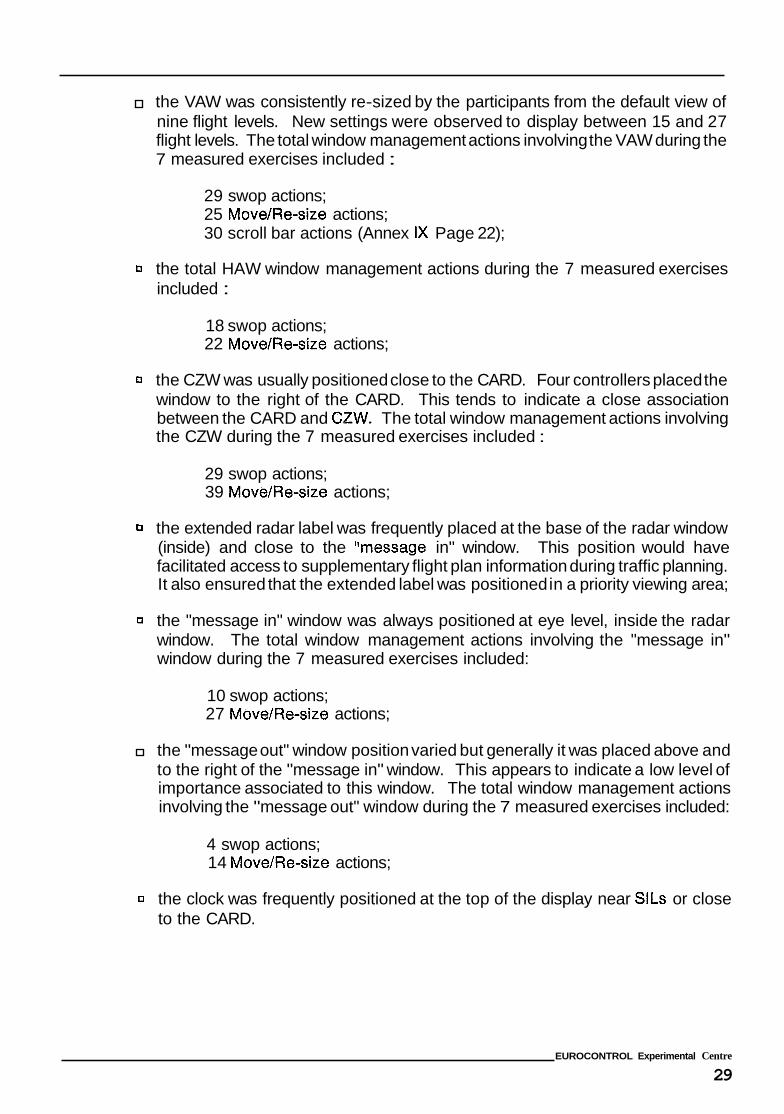
the VAW was consistently re-sized by the participants from the default view of nine flight levels. New settings were observed to display between 15 and 27 flight levels. The total window management actions involving the VAW during the 7 measured exercises included :
29 swop actions; 25 Move/Re-size actions; 30 scroll bar actions (Annex IX Page 22);
0 the total HAW window management actions during the 7 measured exercises included :
18 swop actions; 22 Move/Re-size actions;
0 the CZW was usually positioned close to the CARD. Four controllers placed the window to the right of the CARD. This tends to indicate a close association between the CARD and CZW. The total window management actions involving the CZW during the 7 measured exercises included :
29 swop actions; 39 Move/Re-size actions;
0 the extended radar label was frequently placed at the base of the radar window (inside) and close to the "message in" window. This position would have facilitated access to supplementary flight plan information during traffic planning. It also ensured that the extended label was positioned in a priority viewing area;
0 the "message in" window was always positioned at eye level, inside the radar window. The total window management actions involving the "message in" window during the 7 measured exercises included:
10 swop actions; 27 Move/Re-size actions;
the "message out" window position varied but generally it was placed above and to the right of the "message in" window. This appears to indicate a low level of importance associated to this window. The total window management actions involving the "message out" window during the 7 measured exercises included:
4 swop actions; 14 Move/Re-size actions;
0 the clock was frequently positioned at the top of the display near SILs or close to the CARD.
EUROCONTROL Experimental Centre
29
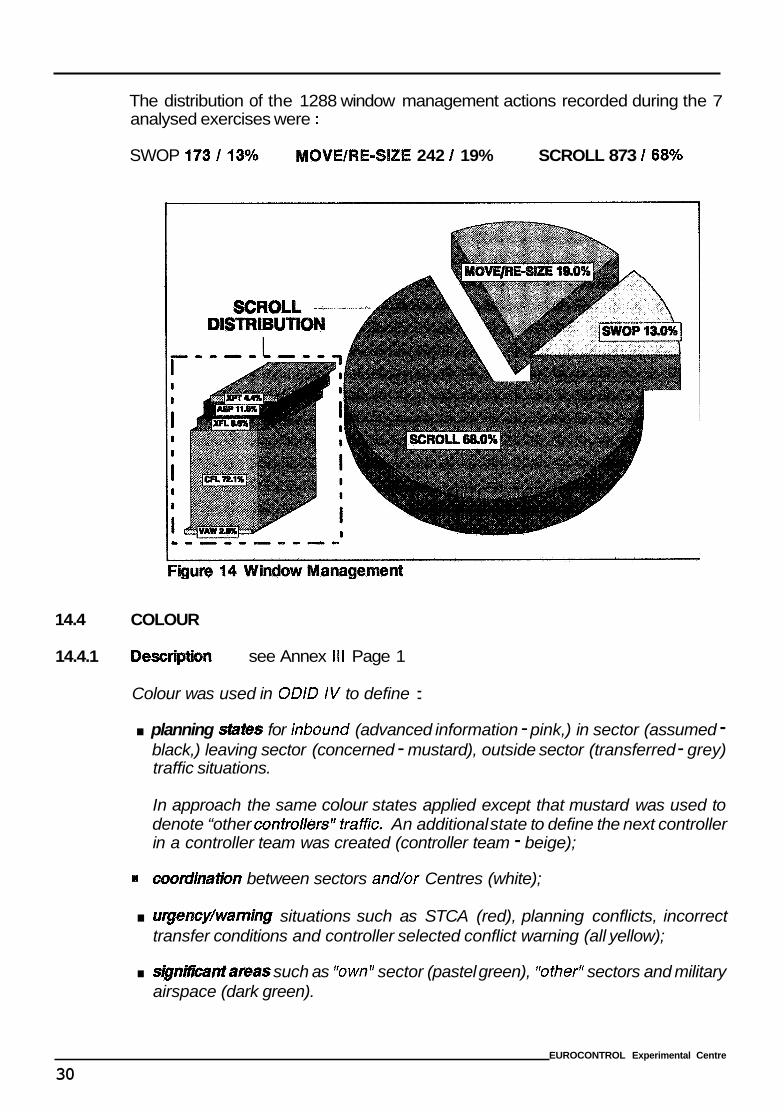
The distribution of the 1288 window management actions recorded during the 7 analysed exercises were :
SWOP 1’73 /13% OVWRE-SIZE 242 / 19% SCROLL 873 /68%
I
14.4 COLOUR
14.4.1 Description see Annex Ill Page 1
Colour was used in ODlD IV to define : . planning a t e s for inbound (advanced information - pink,) in sector (assumed - black,) leaving sector (concerned - mustard), outside sector (transferred - grey) traffic situations.
In approach the same colour states applied except that mustard was used to denote “other controllersIr traffic. An additional state to define the next controller in a controller team was created (controller team - beige);
8 coorrlinatrion between sectors andlor Centres (white); . u?gency/waming situations such as STCA (red), planning conflicts, incorrect transfer conditions and controller selected conflict warning (all yellow); . s&nikantareas such as “own“ sector (pastel green), “other“ sectors and military airspace (dark green).
EUROCONTROL Experimental Centre
30
14.4.2 Su
The consensus of subjective opinion indicates that colour can be of significant benefit to controllers specifically when determining task priorities.
None of the participants complained of discomfort or confusion due to the use of colour. However, two colours used in the radar label caused reading difficulty:
GREY used in the Yransferred" state was difficult to read depending on the background video colour;
RED used on the callsign for STCA was illegible due to a "halo" effect around the text.
Approach controllers considered that the introduction of a fifth colour state used to differentiate between different "team controllers" (approach and director) in the approach area was unnecessary and made it difficult to assimilate the colour states.
Planning States
The reaction to the use of colour to indicate planning states was extremely positive. Controllers were never in doubt about an aircraft's planning status and found that using colour in this way helped them to allocate "next task" priorities. Displaying additional coloured text in the label (warning, coordination, frequency transfer) clearly indicated a job to do or just completed and was not found to be confusing.
An additional colour state created to identify the second controller team member ("arrival" and "director") in the approach control area provided a clear indication of traffic "ownership." However, controllers found it difficult to assimilate this fifth colour state. It was suggested that team controllers should use the same label colour state with only a small colour distinction to indicate "ownership" of the traffic concerned (for example the sector or position symbol).
Controllers commented that within the radar data block it was possible to confuse the lead line and speed vector (both white) especially when several radar labels were positioned close together. This could lead to confusion of identity between radar labels and aircraft position symbols.
Coordination
The use of white to indicate a coordination in progress was appreciated. This colour was applied to the coordination text wherever that text was displayed.
A new coordination message was not always noticed when posted in the ""message in"" window but the use of white in the radar label quickly attracted attention to the coordination during the controller's conflict search.
EUROCONTROL Experimental Centre
31
ECs commented that they were not always sure that a coordination, indicated in the radar label, was incoming or outgoing and had to check this by referring to the message window. It was suggested that a colour differentiation between incoming and outgoing coordination be considered.
The use of red to indicate STCA immediately attracted the controllers attention. However the usefulness of this warning was lost due to the illegibility of the red callsign. Consideration was given to other colours to overcome this problem, but the participants felt that red should be retained due to its special significance and that a readable version could be defined.
The warning colour (yellow) was valued as a highlighting tool. Controllers suggested that this application could be further developed (for example, highlighting rogue and special significance aircraft).
Colour defined conflict types displayed by the conflict prediction and planning tools attracted the controllers' attention and generally indicated the conflict situation. However the controllers commented that large blocks of colour which were occasionally displayed in the vertical aid window (VAW) were difficult to interpret and were distracting.
The use of colour to indicate significant operating areas was considered to be extremely useful and visually "distinctive,'I requiring little interpretation.
Controllers were concerned by the possibility of room lighting causing poor screen readability and reflection. A high level of ambient light was maintained during the simulation with little adverse comment.
14.5 SYSTEM ASSISTED COO R DI N AT10 N (SAC)
14.5.1 Description see Annex 111 Page 9
System Assisted Coordination (SAC) provided the controller with pre-defined messages for coordinating sector entry and exit flight levels, direct routings, heading, speed and rate of climb/descent restrictions. This facility was accessible when advance flight information was received or sent by a sector and was available between sectors and Centres.
Messages were posted in separate ""message in"" or "message out" windows. A coordination was indicated wherever the coordinated data was displayed, for example in a radar label or sector inbound list.
White was used to represent coordination.
EUROCONTROL Experimental Centre
32
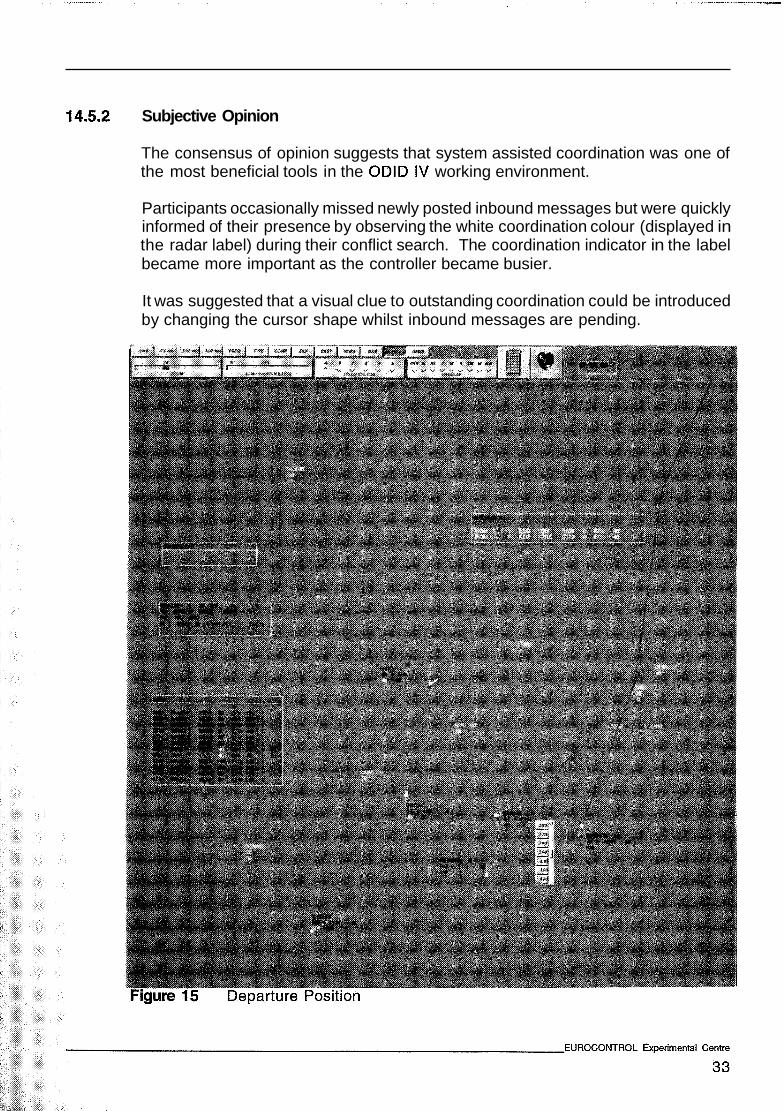
14.5.2 Subjective Opinion
The consensus of opinion suggests that system assisted coordination was one of the most beneficial tools in the ODlD IV working environment.
Participants occasionally missed newly posted inbound messages but were quickly informed of their presence by observing the white coordination colour (displayed in the radar label) during their conflict search. The coordination indicator in the label became more important as the controller became busier.
It was suggested that a visual clue to outstanding coordination could be introduced by changing the cursor shape whilst inbound messages are pending.
The perceived benefits of SAC were :
14.5.3
rn significant reduction in the use of telephone coordination and therefore a gain in time;
= reduced possibility of misunderstanding a verbal request due to incorrect phraseology; ability to leave the message pending until able to respond, and
rn reduction of telephone induced stress.
Controllers commented that they lost the "feeling" for other sectors' workload due to the reduction in telephone coordination. There was also a risk of confusion during busy traffic that the EC would not know if a coordination was inbound or outbound as both coordination types were coloured white.
It was felt that certain rules needed to be established between EC and PLC as to who answered which message (for example, PLC responds to entry and exit level coordination whilst EC is responsible for heading, direct routing, speed etc).
Participants commented that there is a need to be able to cancel or recall coordination messages. They also felt it important that SAC include both backward and forward coordination for heading, direct routing, speed and rate of climb/descent restrictions (only backward coordination was available for these features).
Approach controllers expressed the opinion that spacing and flow requirements could be coordinated using SAC. Spacing requirements for certain arrival routes could be coordinated and then posted in the sector inbound lists or stack windows. This could also indicate "no delay" or holding requirements.
Both area and approach controllers felt that the departure request coordination message was of considerable benefit to them.
Controllers were not confused by the use of pre-defined messages and found that displaying the coordination colour in the radar label quickly attracted their attention.
Post Exercb Analysis
The ergo study (Annex VII Page 23) confirms that the EC was not always sure which sector was responsible for initiating a coordination. As a result the EC had to verify the situation by confirming the message condition by reference to the message 'lint' and "out" windows. This suggests a need for differentiation between the ''in" and "out" coordination displayed in the radar label.
The "message in" window was always positioned at eye level whilst the "message out" window was placed in a less important (viewing) area on the screen. This tends to validate the design of separate message Ilin" and "out" windows and confirms the priority to conspicuously display incoming messages.
EUROCONTROL Experimental Centre
35
During the simulation it was noticed that the approach controllers adapted the heading coordination function to indicate to sector D onward clearance for holding aircraft. Normally onward clearance would have required telephone coordination.
NI0 shows that controllers were coordinating transfer or release of traffic to the next sector with supplementary information such as "released, routing direct to ...I' (Annex VI Page 5). This suggests a need for additional parameters to be available for appending to SAC messages.
NI0 also shows a considerable amount of elbow coordination between the approach and departure controllers (Annex VI Page 9). This coordination was specific to Copenhagen arriving and departing traffic and concerned climb and descent coordination. Such a function could be added to SAC, using a colour application to indicate "release for climb/decent."
Controllers frequently referred to other information sources before accepting coordination (eg the extended radar label, HAW/VAW and SIL). However, the option to call this supplementary information via mouse action on the data displayed in the message windows was rarely used.
Observations suggest that there is a need to provide an option for the recall or cancellation of coordination messages.
Between approach and the lower airspace sectors, controllers were observed coordinating flow and sequencing information. This was also discussed in post exercise debriefings; controllers considered that SAC was an ideal medium for this type of coordination.
"lessage In"
The analysis of "message in" data (Annex X) shows that sector D was much busier in terms of messages received compared to sector C (D received more than double the number that C received; C received approximately 6 to 12 messages per hour and D 16 to 26).
The ergo study shows that in sector D the majority of coordination was accepted by mouse action in the message window; coordination was infrequently accepted through the radar label.
Both sectors show the same trend in message distribution with the majority of messages received concerning PEL (74% in C and 71% in D) followed by XFL coordination (20% in C and 23% in D).
In the approach control position very few messages were received; indeed some exercises recorded no incoming messages at all. The messages that were recorded concerned PEL coordination.
EUROCONTROL Experimental Centre
36
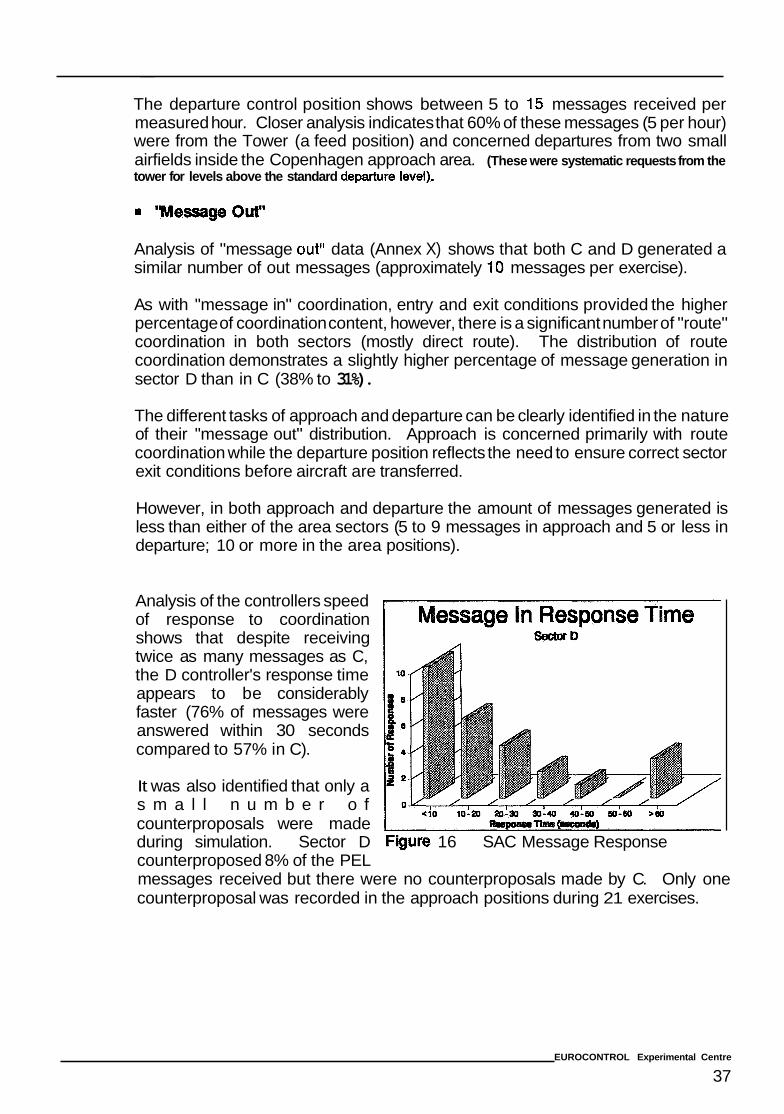
- ~ ~~~ ~
The departure control position shows between 5 to 15 messages received per measured hour. Closer analysis indicates that 60% of these messages (5 per hour) were from the Tower (a feed position) and concerned departures from two small airfields inside the Copenhagen approach area. (These were systematic requests from the tower for levels above the standard departure ievel).
"Ivlgssage0w
Analysis of "message out" data (Annex X) shows that both C and D generated a similar number of out messages (approximately 10 messages per exercise).
As with "message in" coordination, entry and exit conditions provided the higher percentage of coordination content, however, there is a significant number of "route" coordination in both sectors (mostly direct route). The distribution of route coordination demonstrates a slightly higher percentage of message generation in sector D than in C (38% to 31%).
The different tasks of approach and departure can be clearly identified in the nature of their "message out" distribution. Approach is concerned primarily with route coordination while the departure position reflects the need to ensure correct sector exit conditions before aircraft are transferred.
However, in both approach and departure the amount of messages generated is less than either of the area sectors (5 to 9 messages in approach and 5 or less in departure; 10 or more in the area positions).
Analysis of the controllers speed of response to coordination shows that despite receiving twice as many messages as C, the D controller's response time appears to be considerably faster (76% of messages were answered within 30 seconds compared to 57% in C).
It was also identified that only a s m a l l n u m b e r o f counterproposals were made during simulation. Sector D Fbum 16 SAC Message Response counterproposed 8% of the PEL messages received but there were no counterproposals made by C. Only one counterproposal was recorded in the approach positions during 21 exercises.
EUROCONTROL Experimental Centre
37
After each exercise controllers were asked
14.6
14.6.1
14.6.2
14.6.2.1
The majority of area controller responses indicated that they found the message window "quite" (45%) to flveryft (46%) useful. A similarly high acceptance was indicated by the approach control response with 87% of the responses between the categories "quite" and "extremely" (57% response was given to "very").
This concurs with the post exercise debriefing.
RADAR WINDOW AND BUTTON BAR FUNCTIONS
n see Annex 111 Page 12
The radar window displayed graphical and tabular images which used colour for background information, label states and time orientated planning events. A button bar which was an integral part of this window provided access to the radar window set-up functions, supplementary label information and on/o ff selections for the medium term conflict assistance tools (MTCA).
Button bar features included : . Quick Way Back (to last saved window settings); . three pre-set radar display ranges; . a radar display range change (ZOOM) feature; . lower and upper layer filter buttons; . a selection of supplementary label data including next sector frequency, type, company, departure and destination airfields; a video map menu button; . range and bearing line button; . automatic label anti-overlap function and a manual global label direction buttons; . a speed vector button; SDO - Selected Display Option; . telephone line selection window button; on/off buttons for the MTCA tools (HAW, VAW, CARD and CZW); . preference set-up button; a militaryNFR flight plan activation window button and, in approach control,
(. an on/off button for the approach multi input device.)
Radar Window see Annex 111 page 12
Subjvscflve Opinion
The majority of the participants appreciated the radar window and button bar features. Provided the system response was good they found it easy to manipulate the range and off centring functions. They commented that the use of colour to indicate significant operating areas was visually "clean" and easy to interpret.
EUROCONTROL Experimental Centre
38
The radar window was generally sized to approximately two thirds of the area of the Sony display by PLCs who placed most of the tools around the edges of this window, occasionally overlapping it. Sector inbound lists and the "message in" window were strategically placed for easy reference. EC used the radar window at full screen size and placed other windows (down sized) either at the bottom, hidden behind the radar window or iconified.
The majority of controllers complained of the absence of a "distance scale." It was suggested that this could be placed in the button bar area and should take the form of a cross indicating ten and five nautical miles.
Approach controllers said that they would like a second radar window which could be set at a different range to the main radar window enabling them to assess inbound traffic flows.
Participants were frustrated by the occasional accidental re-sizing of the radar window and by "flashing" of the screen which occurred when the system slowed down.
14.6.2.2 Post Exemise Ana&s&
The total window management actions involving the radar window recorded during the 7 measured exercises included :
51 swop actions; 21 Move/Re-size actions; a negligible number of X Y scroll bar actions (off centring).
These figures are similar to those recorded for the MTCA window management actions. The 51 swop actions suggests that this was a useful method for clearing the screen of superimposed windows at critical moments eg in the place of moving a SIL.
CWP data shows minimal off-centring action during the measured exercises, however, a considerable amount of radar picture range change is effected (see Radar Display Range - ZOOM below; 71 range changes during 7 measured exercises.
14.6.3 Button Bar General see Annex 111 Page 13
The button bar presentation was appreciated by the participants. There were no difficulties experienced with the mixture of Yext" and "graphic" buttons but generally the "graphic" buttons were preferred.
This feature was considered to be an easy way of managing the radar window settings and selecting other functions.
EUROCONTROL Experimental Centre
39
. QWB - Quick Way
Selection of this function returned the full display back to the last saved window set- UP.
Participants commented that the return to the last saved set-up should include all settings including details such as radar range, off-centring, layer filter etc.
Pre-Set Radar D
Provides a choice of three optimal radar range settings.
The controllers rarely used this feature but remarked that it could also be used to provide pre-defined off-set radar images with different range settings.
lay Range - ZOOM
This function permitted the controller to change the range of the radar window image by zooming the picture in or out by dragging a "valuator" button left or right with the mouse
The ZOOM function was considered to be an easy method of adjusting the radar picture range setting provided there is no delay or "jumping" of the image.
The zoom function was selected 71 times during the 7 analysed exercises. . Lower and Upper Layer Filter
This function filtered out all GREY coloured radar labels outside the selected layer band. The function operated in the same manner as the range ZOOM.
The participants found this an easy method of selecting a layer band provided there is no system delay. They appreciated the function of filtering out coloured labels but suggested access to a SSR code based filter for VFR and Military traffic may be required unless these are colour filtered too.
Controllers should be able to completely filter out the selected colour. This was not the case in the simulation; a gap of 6000ft remained when a "fully" filtered image was defined. This caused a degree of frustration.
Supplementary Radar Label Data
Selection of supplementary radar label data permitted the controller to display one of the following items on the bottom line of the radar label :
freq - next sector frequency, type - aircraft type, comp - company callsign, dep - departure airfield, and dest - destination airfield.
EUROCONTROL Experimental Centre
40
This feature was used infrequently. The participants stated that the information was available more readily through the extended radar label (either continuously or temporarily displayed). Type was selected occasionally by approach and director controllers whilst the departure controller periodically selected dest.
Provided a choice of radar window video map selections.
The video map menu was rarely used after the initial selection of maps had been made. It was fett that a pop-up menu is a valid and easy way of selecting maps and that the selection presented could be defined by traffic influences such as current runway configuration, military operations and weekend routings etc.
Range and Baring Line
Provides a measurement of bearing and distance of a selected position from a fixed point defined by the controller
Participants occasionally used the range and bearing line. It was felt that the characters were too small and that their size could be exaggerated as the range and bearing function is normally only selected for short periods.
The operation of the range and bearing line should be smooth and should never be interrupted by "system" events.
A tracking facility for linking a range and bearing line to two aircraft or linking a point and an aircraft was proposed by several of the participants. It was also suggested that it should be possible to leave the line selected on screen whilst executing other tasks.
The range and bearing line was selected 28 times during the 7 analysed exercises.
Automatic and Manual Label AntbOverlap Function
Automatic label anti-overlap was a system programme which de-con flicted overlapping radar labels. When de-selected a manual facility was available for the controller to select the label data block position in relation to the radar position symbol.
All participants criticised the automatic label anti-overlap feature. It was easily saturated in areas of high density traffic and frequently moved labels fc; no apparent reason.
As the radar labels can expand from two to five lines of data the ability to easily access data fields at all times is of extreme importance. It was also stressed by the controllers that label de-confliction must take account of radar label priorities which are indicated by colour states (for example the assumed label, black, should always be the last label to be moved when conflicting with pink, mustard or grey labels).
EUROCONTROL Experimental Centre
41
Controllers also felt that label movements should be very precise. They proposed that once data input had commenced on a particular radar label, the label direction and priority should be maintained until the input has been completed.
Approach controllers suggested that rules for label de-confliction should also take account of traffic flows. This would position the label in a particular direction related to the targets direction of flight (or linked to its flow pattern - departure/arrival).
The manual label position selection was preferred by the majority of participants. However several controllers indicated that when the traffic intensity increased they selected the automatic feature as they did not have sufficient time to manually de- conflict individual labels.
It was proposed that the ability to click and drag a label data block to a "clear area" should be considered.
Controllers felt that label overlap is sufficiently important when using dynamically sizing data blocks to merit further investigation.
The ergo study confirms that the label anti-overlap function caused a significant number of problems during the simulation. On occasion the PLC was observed inputting data for the EC.
It was suggested that there should be an option to drag a radar label data block to a free area to effect data input.
Analysis of I6 picks on the position symbol show a significant amount of manual label move action (Annex IX Page 7). (The figures have a controller effect).
Speedvector
The speed vector selected or de-selected a forward vector line attached to the radar position symbol whose length was determined by the aircraft's ground speed. A choice of one to five minutes was available.
Area controllers felt that the radio buttons were too small. They also considered that the similarity between speed vector and lead line (link between data block and position symbol) was such that it could cause problems of identification in dense traffic.
The speed vector was not used by the approach controllers.
The speed vector was selected 33 times (equally between C EC and PLC) during the 7 measured exercises.
EUROCONTROL Experimental Centre
42
When SDO was selected it caused both the HAW and VA W to close following a modification input action in either of the windows.
This function was rarely used. Controllers did not consider it to be particularly usef u I.
The telephone menu provided a list of correspondents. Incoming calls were coloured yellow. Outgoing calls were indicated by a "depressed" button state which was coloured green when the call was answered.
The participants expressed "mixed" views with regard to "on screen" telecoms. Slow system response frustrated the user.
The majority of controllers expressed the opinion that "on screen" telecoms is a positive concept; however, they were resolute that they do not want to lose access to a standard telecom facility.
All of the controllers were disappointed by access to the telecom window (positioned top right of the radar window, when opened). Comments indicate that the window should appear just below the telecom icon. It was proposed that when the telephone window is called by the controller the cursor should be defaulted to the top of the window.
The controllers stated that they used the telephone to :
confirm the SAC messages during the first weeks of the simulation whilst gaining experience and confidence in SAC; negotiate arrival flow rates and stack departures (lower sector and approach);
= coordinate direct routes or effect radar handovers.
(Telephone utilisation during simulation exercises was extremely low).
When questioned the majority of controllers were unable to recall the colour sequence for in and out calls; however, all could define the call procedures.
The ergo study indicates that controllers considered the telephone to be important for complex traffic coordination.
It was noticed that the "on Screen" communication window did not provide any feed back to the "other" sector controller when the telephone was being used.
NI0 shows very little inter sector telephone coordination (this is confirmed by the communication recordings). The majority of telephone coordination that was effected related to system problems (a significant amount of this was controllers confirming the content of SAC messages).
EUROCONTROL Experimental Centre
43
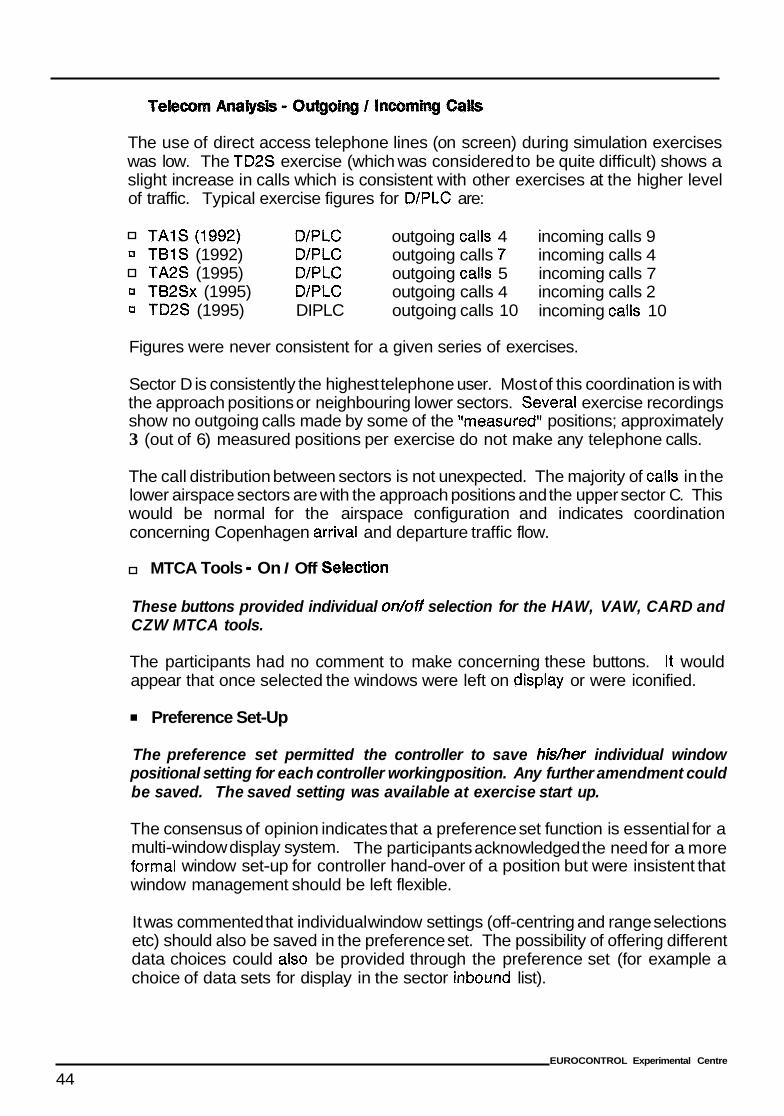
The use of direct access telephone lines (on screen) during simulation exercises was low. The TD2S exercise (which was considered to be quite difficult) shows a slight increase in calls which is consistent with other exercises at the higher level of traffic. Typical exercise figures for D/PLC are:
TAlS(1992) D/PLC outgoing calls 4 incoming calls 9 0 TB1S (1992) D/PLC outgoing calls 7 incoming calls 4
TA2S (1995) D/PLC outgoing calls 5 incoming calls 7 [f TB2Sx (1995) D/PLC outgoing calls 4 incoming calls 2 [f TD2S (1995) DIPLC outgoing calls 10 incoming calls 10
Figures were never consistent for a given series of exercises.
Sector D is consistently the highest telephone user. Most of this coordination is with the approach positions or neighbouring lower sectors. Several exercise recordings show no outgoing calls made by some of the "measured" positions; approximately 3 (out of 6) measured positions per exercise do not make any telephone calls.
The call distribution between sectors is not unexpected. The majority of calls in the lower airspace sectors are with the approach positions and the upper sector C. This would be normal for the airspace configuration and indicates coordination concerning Copenhagen arrival and departure traffic flow.
MTCA Tools = On I Off Selection
These buttons provided individual on/off selection for the HAW, VAW, CARD and CZW MTCA tools.
The participants had no comment to make concerning these buttons. It would appear that once selected the windows were left on display or were iconified.
Preference Set-Up
The preference set permitted the controller to save hidher individual window positional setting for each controller working position. Any further amendment could be saved. The saved setting was available at exercise start up.
The consensus of opinion indicates that a preference set function is essential for a multi-window display system. The participants acknowledged the need for a more formal window set-up for controller hand-over of a position but were insistent that window management should be left flexible.
It was commented that individual window settings (off-centring and range selections etc) should also be saved in the preference set. The possibility of offering different data choices could also be provided through the preference set (for example a choice of data sets for display in the sector inbound list).
EUROCONTROL Experimental Centre
44
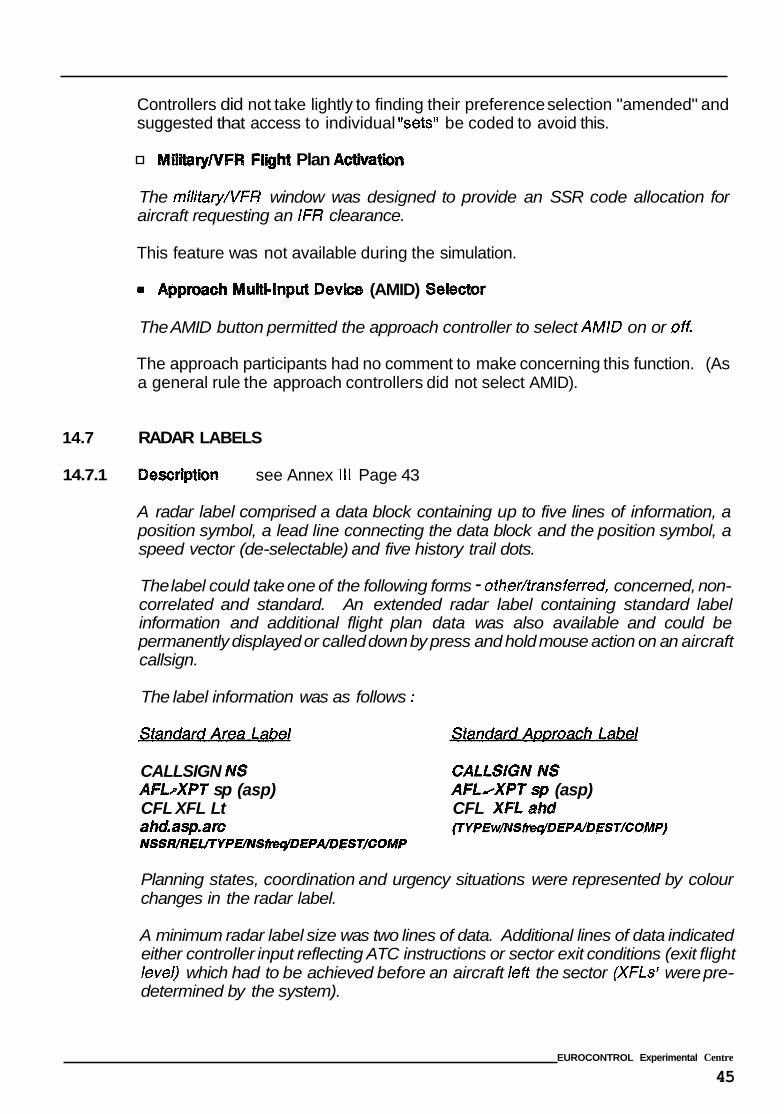
14.7
14.7.1
Controllers did not take lightly to finding their preference selection "amended" and suggested that access to individual "sets" be coded to avoid this.
ht Plan Acthra
The militaryNFR window was designed to provide an SSR code allocation for aircraft requesting an IFR clearance.
This feature was not available during the simulation.
ultblnput Dev (AMID) Selector
The AMID button permitted the approach controller to select AMID on or of%
The approach participants had no comment to make concerning this function. (As a general rule the approach controllers did not select AMID).
RADAR LABELS
Descdptbn see Annex I l l Page 43
A radar label comprised a data block containing up to five lines of information, a position symbol, a lead line connecting the data block and the position symbol, a speed vector (de-selectable) and five history trail dots.
The label could take one of the following forms - othedtransferred, concerned, non- correlated and standard. An extended radar label containing standard label information and additional flight plan data was also available and could be permanently displayed or called down by press and hold mouse action on an aircraft callsign.
The label information was as follows :
CALLSIGN NS CALLSIGN NS AFLIXPT sp (asp) CFL XFL Lt CFL XFLabd
AFLdXPT sp (asp)
ahd.asp.arr= (TYPEWNStWq5 EPADESVCOMP) NSSR/REDTYPElNStWq5EPAIDEST/COMP
Planning states, coordination and urgency situations were represented by colour changes in the radar label.
A minimum radar label size was two lines of data. Additional lines of data indicated either controller input reflecting ATC instructions or sector exit conditions (exit flight level) which had to be achieved before an aircraft left the sector (XFLs' were pre- determined by the system).
EUROCONTROL Experimental Centre
45
The controller interacted with the system through the radar label data fields. This dialogue was possible wherever the data field was displayed and was achieved by clicking one of the mouse buttons on the approprizte field to display a pop-up menu. In the majority of cases only two clicks were required to input data and complete the process.
Radar label fields are described in detail in Annex Ill, page 43.
14.7.2 General
14.7.2.1 SubBcthe Oplnbn
The consensus of opinion indicates that a colour coded and interactive radar label provides a positive and exploitable interface for controller/system dialogue.
Generally, the information displayed or available through the label was considered to be sufficient. The controllers stated that the colour planning states, coordination indications, urgency situation warnings and label shape assisted them significantly in their control task.
Several participants suggested that exit point (XPT) information should be amended to represent a direct routing when a direct route is given beyond the displayed XPT. They also felt that the system should remove direct route beacons input by the controller once the aircraft has flown over or abeam the point.
Approach controllers were disturbed by the lack of vortex wake information in the label. They suggested that this could be displayed immediately after the callsign, separated by a slash (/).
Although incorrect metering data was displayed in the radar label, several controllers commented that they were aware when the metering information was updated.
It is important that following data input, the information displayed to the other member of the controller team is quickly updated. Delay in up-dating the "other" controller's label may cause confusion with potential adverse consequences.
On several occasions controllers discovered "system defined" points (used for route definition) displayed in their radar labels. They commented that this caused unnecessary confusion and should not happen.
The participants expressed "mixed feelings" concerning the extended radar label yet all considered it to be "essential."
It was felt that data fields in the extended label should maintain their pre-defined positions. Several comments indicated that more route points (with estimates) are required to support tactical planning. Controllers were aware of and frustrated by poor updating of beacon estimates which they frequently found did not coincide with the current radar situation.
EUROCONTROL Experimental Centre
46
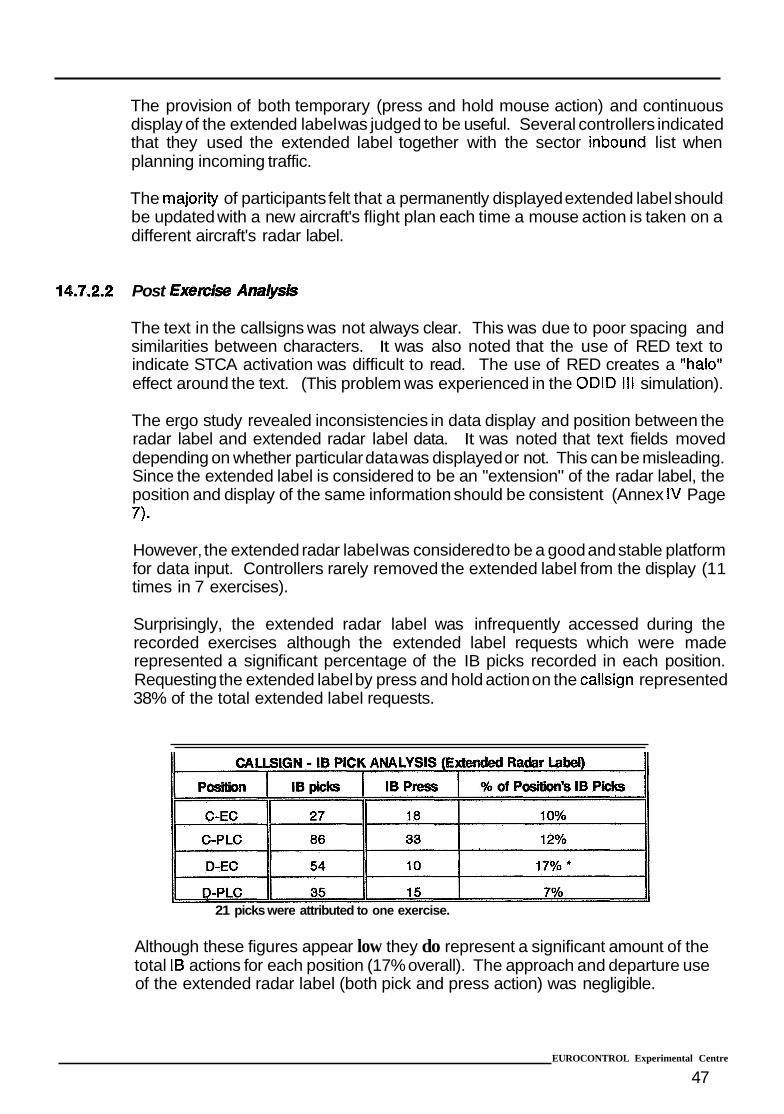
The provision of both temporary (press and hold mouse action) and continuous display of the extended label was judged to be useful. Several controllers indicated that they used the extended label together with the sector inbound list when planning incoming traffic.
The majority of participants felt that a permanently displayed extended label should be updated with a new aircraft's flight plan each time a mouse action is taken on a different aircraft's radar label.
14.7.2.2 Post Eire A m
The text in the callsigns was not always clear. This was due to poor spacing and similarities between characters. It was also noted that the use of RED text to indicate STCA activation was difficult to read. The use of RED creates a "halo" effect around the text. (This problem was experienced in the ODlD 111 simulation).
The ergo study revealed inconsistencies in data display and position between the radar label and extended radar label data. It was noted that text fields moved depending on whether particular data was displayed or not. This can be misleading. Since the extended label is considered to be an "extension" of the radar label, the position and display of the same information should be consistent (Annex IV Page 7).
However, the extended radar label was considered to be a good and stable platform for data input. Controllers rarely removed the extended label from the display (1 1 times in 7 exercises).
Surprisingly, the extended radar label was infrequently accessed during the recorded exercises although the extended label requests which were made represented a significant percentage of the IB picks recorded in each position. Requesting the extended label by press and hold action on the callsign represented 38% of the total extended label requests.
21 picks were attributed to one exercise. *
Although these figures appear low they do represent a significant amount of the total IS actions for each position (17% overall). The approach and departure use of the extended radar label (both pick and press action) was negligible.
EUROCONTROL Experimental Centre
47
14.7.3
14.7.3.1
14.7.4
14.7.4.1
14.7.4.2
n in Radar La Is see Annex 111 Page 46
The participants felt that the application of minimum information display in the radar label worked well. The removal by the system of the exit flight level (XFL) when an equivalent cleared flight level (CFL) was input and similarly removal of the cleared level when the aircraft was maintaining this level was well received. Equally, moving line four data to line three when line three was empty provided the controller with additional visual cues as to the aircraft's current state.
As a consequence, the majority of controllers expressed the opinion that different shaped radar labels helped them to decide priorities and indicated the requirements to be met at sector exit.
Radar Label Dia
Descr@tbn
Dialogue involved single click or press and hold mouse actions which displayed pop-up menus or vector lines for data display and/or input.
Subjbcthre Opinion
The majority of controllers commented that by the end of the simulation they associated an ATC instruction with a data input. They did not consider that this input requirement distracted them from their primary task of separating aircraft (provided they are not affected by deteriorating system response times).
All participants indicated that they were satisfied with the dialogue mechanisms available through the radar label. They felt confident when manipulating the label and understood the visual cues that were displayed.
With the exception of unplanned events, comments indicate that the label provided sufficient "note pad" capability for standard ATC instructions. However, all of the controllers said that they would not like to go completely paperless and would require pen and paper (and a suitable writing surface) to be available.
The controllers found the input procbs to be concise but system indi;eed delays and poor response times caused a measurable level of frustration. This frustration was increased by the poor performance of the label de-conflicting system which frequently moved a label when the controller was poised to commence a dialogue.
EUROCONTROL Experimental Centre
48
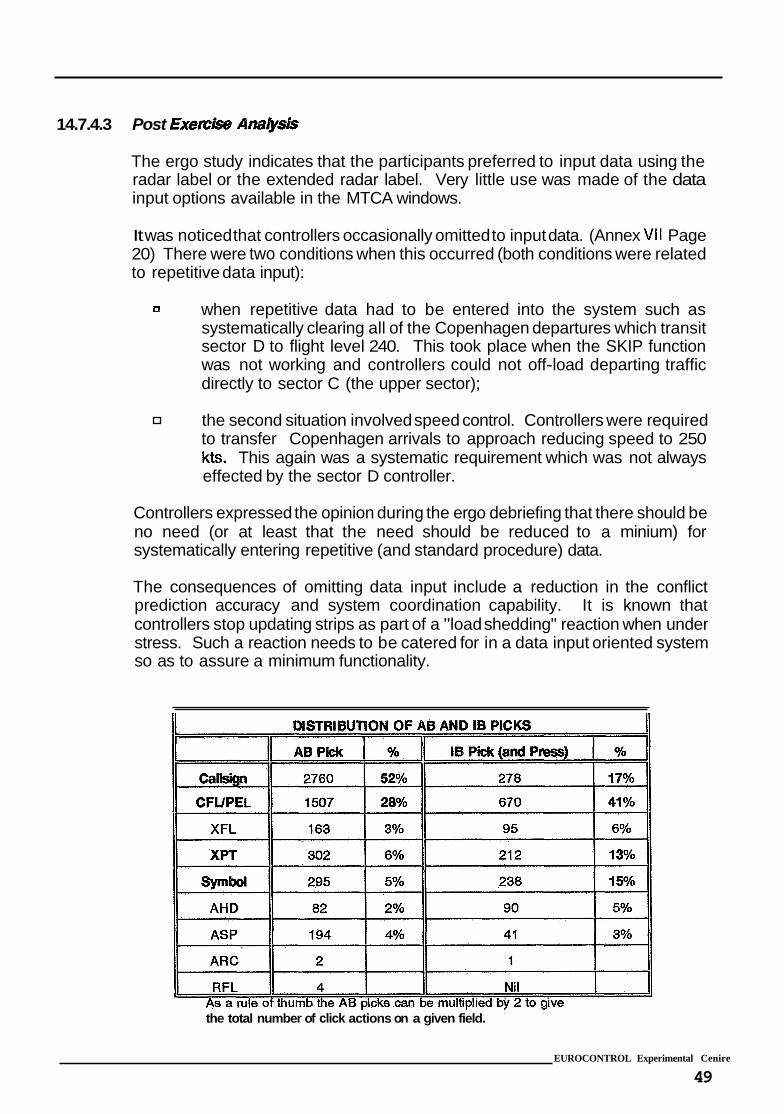
14.7.4.3 Post EX@ A m
The ergo study indicates that the participants preferred to input data using the radar label or the extended radar label. Very little use was made of the data input options available in the MTCA windows.
It was noticed that controllers occasionally omitted to input data. (Annex VII Page 20) There were two conditions when this occurred (both conditions were related to repetitive data input):
0 when repetitive data had to be entered into the system such as systematically clearing all of the Copenhagen departures which transit sector D to flight level 240. This took place when the SKIP function was not working and controllers could not off-load departing traffic directly to sector C (the upper sector);
the second situation involved speed control. Controllers were required to transfer Copenhagen arrivals to approach reducing speed to 250 kts. This again was a systematic requirement which was not always effected by the sector D controller.
Controllers expressed the opinion during the ergo debriefing that there should be no need (or at least that the need should be reduced to a minium) for systematically entering repetitive (and standard procedure) data.
The consequences of omitting data input include a reduction in the conflict prediction accuracy and system coordination capability. It is known that controllers stop updating strips as part of a "load shedding" reaction when under stress. Such a reaction needs to be catered for in a data input oriented system so as to assure a minimum functionality.
the total number of click actions on a given field.
EUROCONTROL Experimental Cenire
49
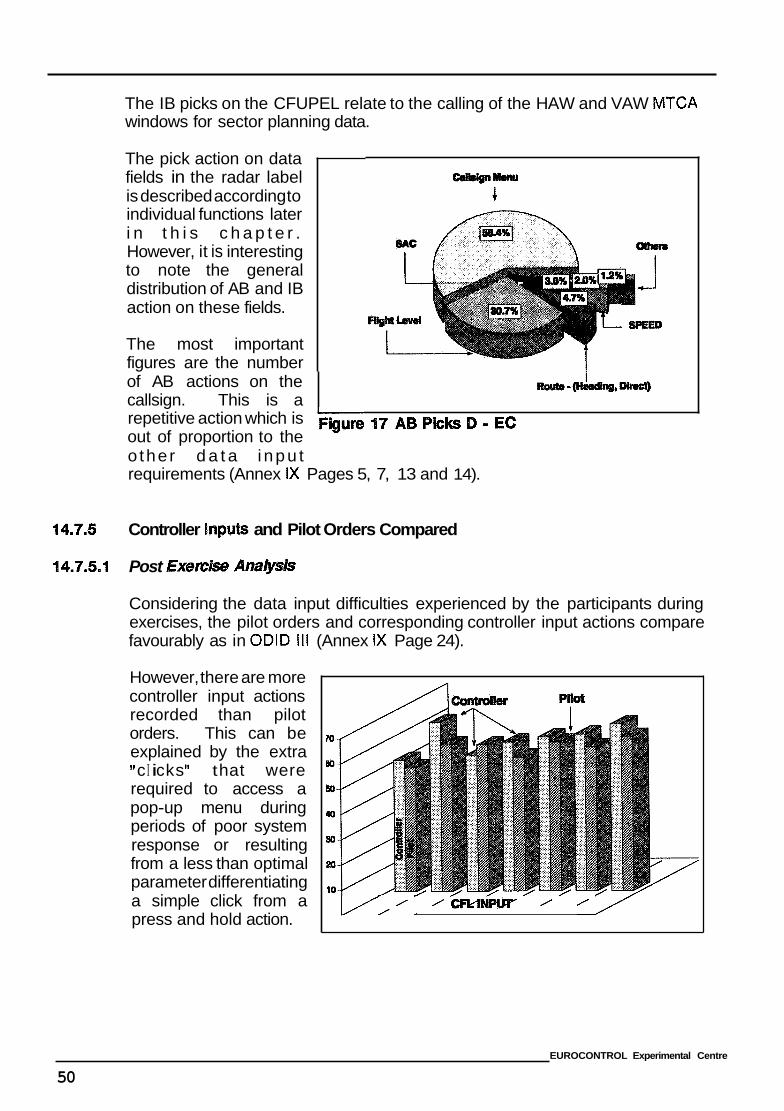
The IB picks on the CFUPEL relate to the calling of the HAW and VAW MTCA windows for sector planning data.
/ / - /-&w / / /
The pick action on data fields in the radar label is described according to individual functions later i n t h i s c h a p t e r . However, it is interesting to note the general distribution of AB and IB action on these fields.
The most important figures are the number of AB actions on the callsign. This is a repetitive action which is ;burn 17 AB p k b D Ec out of proportion to the o the r d a t a i npu t requirements (Annex IX Pages 5, 7, 13 and 14).
14.7.5 Controller Inputs and Pilot Orders Compared
14.7.5.1 Post Exercise Am&&
Considering the data input difficulties experienced by the participants during exercises, the pilot orders and corresponding controller input actions compare favourably as in ODlD 111 (Annex IX Page 24).
However, there are more controller input actions recorded than pilot orders. This can be explained by the extra 'I c I i c ks 'I t h at were required to access a pop-up menu during periods of poor system response or resulting from a less than optimal parameter differentiating a simple click from a press and hold action.
EUROCONTROL Experimental Centre
50
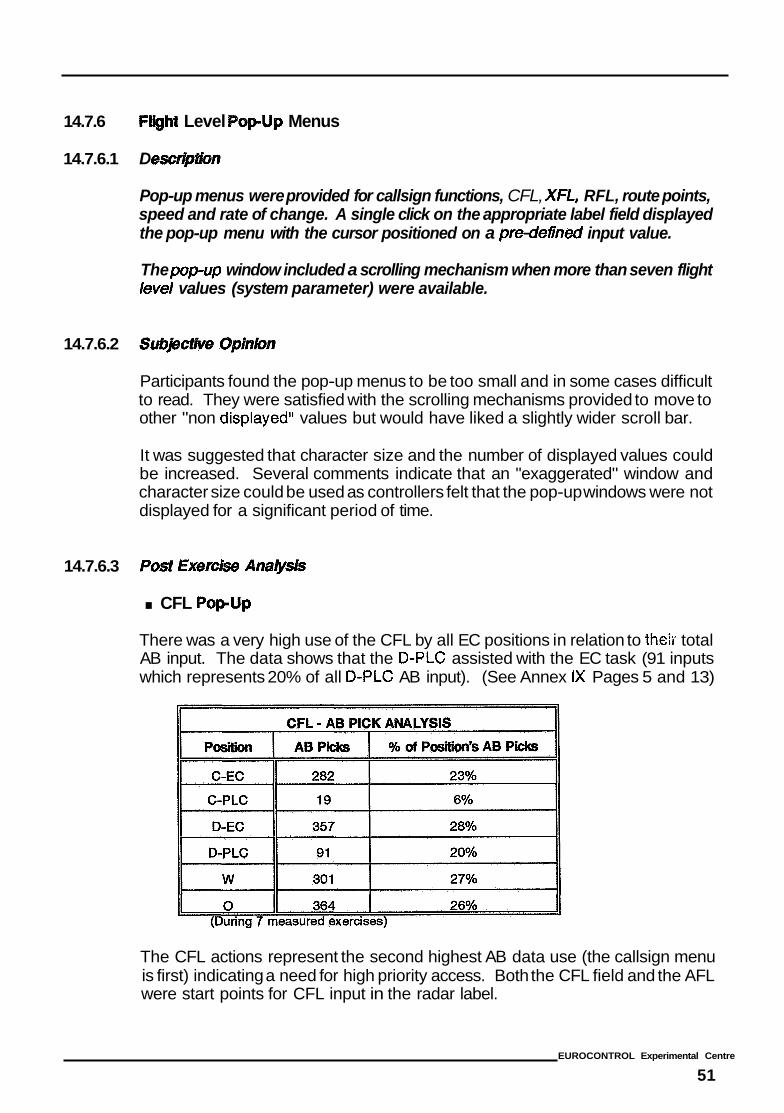
14.7.6
14.7.6.1
14.7.6.2
14.7.6.3
M Level PopUp Menus
D
Pop-up menus were provided for callsign functions, CFL, XFL, RFL, route points, speed and rate of change. A single click on the appropriate label field displayed the pop-up menu with the cursor positioned on a pre-defined input value.
The popup window included a scrolling mechanism when more than seven flight levd values (system parameter) were available.
Participants found the pop-up menus to be too small and in some cases difficult to read. They were satisfied with the scrolling mechanisms provided to move to other "non displayed" values but would have liked a slightly wider scroll bar.
It was suggested that character size and the number of displayed values could be increased. Several comments indicate that an "exaggerated" window and character size could be used as controllers felt that the pop-up windows were not displayed for a significant period of time.
Post Exembe Am&&$ . CFL PopUp
There was a very high use of the CFL by all EC positions in relation to th& total AB input. The data shows that the D-PLC assisted with the EC task (91 inputs which represents 20% of all D-PLC AB input). (See Annex IX Pages 5 and 13)
The CFL actions represent the second highest AB data use (the callsign menu is first) indicating a need for high priority access. Both the CFL field and the AFL were start points for CFL input in the radar label.
EUROCONTROL Experimental Centre
51
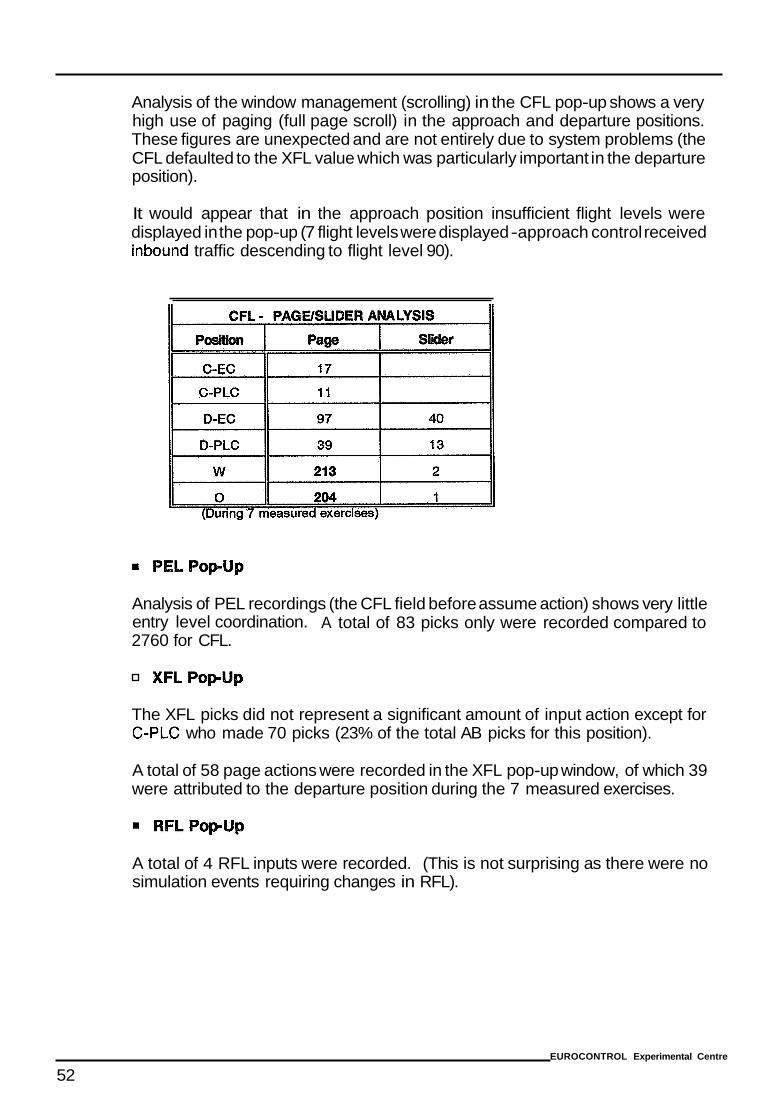
Analysis of the window management (scrolling) in the CFL pop-up shows a very high use of paging (full page scroll) in the approach and departure positions. These figures are unexpected and are not entirely due to system problems (the CFL defaulted to the XFL value which was particularly important in the departure position).
It would appear that in the approach position insufficient flight levels were displayed in the pop-up (7 flight levels were displayed -approach control received inbound traffic descending to flight level 90).
Analysis of PEL recordings (the CFL field before assume action) shows very little entry level coordination. A total of 83 picks only were recorded compared to 2760 for CFL.
XFLPopUp
The XFL picks did not represent a significant amount of input action except for C-PLC who made 70 picks (23% of the total AB picks for this position).
A total of 58 page actions were recorded in the XFL pop-up window, of which 39 were attributed to the departure position during the 7 measured exercises.
rn RFLPopUp
A total of 4 RFL inputs were recorded. (This is not surprising as there were no simulation events requiring changes in RFL).
EUROCONTROL Experimental Centre
52
14.7.7 Heading and Direct Route Input see Annex 111 pages 3'7 and 48
14.7.7.1 De
Direct route and heading were selected by clicking on the position symbol. A heading vector was displayed which the controller dragged in the required heading direction or to a beacon for direct routes. A second click input the selected heading or route point value.
Direct route could also be selected from a pop-up menu available by clicking on the XPT field in the radar label.
14.7.7.2 Subbctive Opinion
Consensus of opinion indicates that an "elastic vector" is a practical and easy method of inputting heading or direct route information.
All participants condemned the lack of smoothness in the movement of the vector and criticised the character size as being too small. This is one of the most frequently employed functions and therefore should operate without fault.
The elastic vector was used as a mechanism for informing the system of the intended direction and expected duration of a heading for conflict prediction purposes. The controllers considered this to be an effective method for up-dating the conflict prediction mechanism of their tactical decisions.
The ability to select a direct route to a point through the elastic vector was considered to be advantageous; however, the possibility of accidentally "catching" a beacon when wishing to input a heading was often frustrating. The controllers proposed that the catchment area around a beacon should be "fine tuned."
The use of the pop-up menu for selecting "direct route" was accepted; however, it would appear that the choice of route points should include points in the next sector and perhaps beyond .
14.7.7.3 Post Exembe Ana&&
The ergo study shows that the elastic vector was used by controllers to measure separation (spacing) between aircraft (Annex VII page 21). Controllers suggested that they would like to have a "ruler" on screen which can be moved around by mouse action and which will give an idea of the separation requirements relative to the selected radar display range. (There were no visible range indicators, except for the speed vector, in the radar window).
EUROGONTROL Experimental Centre
53
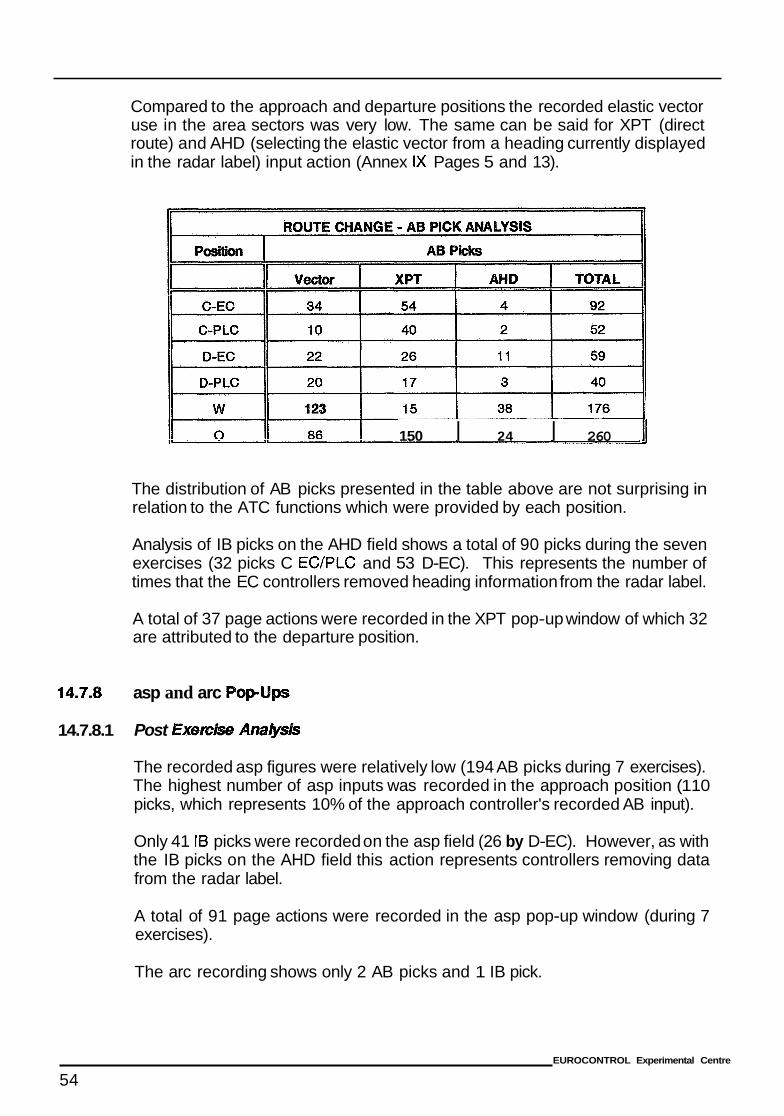
14.7.8
14.7.8.1
Compared to the approach and departure positions the recorded elastic vector use in the area sectors was very low. The same can be said for XPT (direct route) and AHD (selecting the elastic vector from a heading currently displayed in the radar label) input action (Annex IX Pages 5 and 13).
150 I 24 I 260 11
The distribution of AB picks presented in the table above are not surprising in relation to the ATC functions which were provided by each position.
Analysis of IB picks on the AHD field shows a total of 90 picks during the seven exercises (32 picks C EC/PLC and 53 D-EC). This represents the number of times that the EC controllers removed heading information from the radar label.
A total of 37 page actions were recorded in the XPT pop-up window of which 32 are attributed to the departure position.
asp and arc Popups
Post Exetcm Analpsis
The recorded asp figures were relatively low (194 AB picks during 7 exercises). The highest number of asp inputs was recorded in the approach position (1 10 picks, which represents 10% of the approach controller's recorded AB input).
Only 41 IB picks were recorded on the asp field (26 by D-EC). However, as with the IB picks on the AHD field this action represents controllers removing data from the radar label.
A total of 91 page actions were recorded in the asp pop-up window (during 7 exercises).
The arc recording shows only 2 AB picks and 1 IB pick.
EUROCONTROL Experimental Centre
54
14.7.9 Cursor Defau see Annex 111 Page 46
14.7.9.1 De
Cursor defaulting was applied to the callsign menu, CFL, XFL and speed pop-up windows. Following selection of a menu the cursor was automatically placed on a pre-defined value.
14.7.9.2 S OpInbn
The use of cursor defaulting was well received. In fact all participants wanted the use of defaulting to be extended to other input values (speed and route points).
Defaulting was perceived to reduce the time required to move the cursor and scroll to other levels especially in positions where large changes in CFL were routinely given to aircraft. Systematically having to scroll to new CFL values generated a measurable level of frustration.
The event orientated defaulting (for example, defaulting the CFL systematically to the sector exit level in area sectors) defined for the simulation worked well although several problems arose due to its global application (approach CFL defaults were not suited to low level traffic in TMA airspace). It is evident from participants comments that each sector or working position may have individual default requirements and should be considered independently.
All participants were able to define similar default requirements for different input values.
It should be noted that some controller comments suggested that they felt prompted to systematically use the defaulted level value.
14.7.10 Callsign Menu Functions see Annex I l l page 31
14.7.10.1 Desc-n
The callsign menu provided access to ASSUME of control, TRANSFER of frequency, radar HANDOVER, RELEASE of control, SKIP "my sector," FORCED AB1 (advanced boundary information) and MA (missed approach) functions.
14.7.10.2 Subjective Opinbn
The participants considered the callsign menu functions to be evident and important to their task. Selecting a function which was then reflected by colour or text in the radar label was considered to be an easy and clear method of coordinating whilst providing the controller with a reminder of hidher action.
EUROCONTROL Experimental Centre
55
Several controllers suggested that for future development these functions appeared suited to "voice recognition applications" due to their repetitive use.
0 E and TRANSFER
The consensus of opinion indicates that ASSUME and TRANSFER were important memorising functions which helped controllers to develop their awareness of the traffic situation.
These functions also provided a good visual clue during periods of heavy traffic that tasks had been completed.
01 RADAR HANDOVER
This feature did not function. It should be noted that one of the items that controllers declared for telephone use was radar handover. The NI0 observations confirm the need for a system assisted "radar handover" function.
0 RELEASE
Controllers commented that the RELEASE function should be available to initiate a request for release of control in the receiving sector and not just in the offering sector. Approach controllers considered that the application of a RELEASE function could significantly reduce the amount of "elbow'fl coordination employed in requests for further climb/descent.
U SKIP
All participants considered that the SKIP function could significantly reduce telephone coordination and therefore has a potential for reduction in workload.
It was suggested that "local operating rules" should be applied to such a function (similar to those used in "silent transfers") between sectors which would constrain heading and level changes whilst an aircraft is transitting the skipped sector.
The approach controllers considered that this would be a simple method for transferring to and from autonomous airfields aircraft which were not required on the frequency.
0 FORCED AB1
This function forced the transmission of advanced warning information to the next sector.
Participants found this to be extremely useful. They commented that it was important to be able to "force" or "break out" of the system imposed constraint.
The controllers considered that by being able to send the advance boundary information before the system defined parameter permitted them to better execute their task.
EUROCONTROL Experimental Centre
56
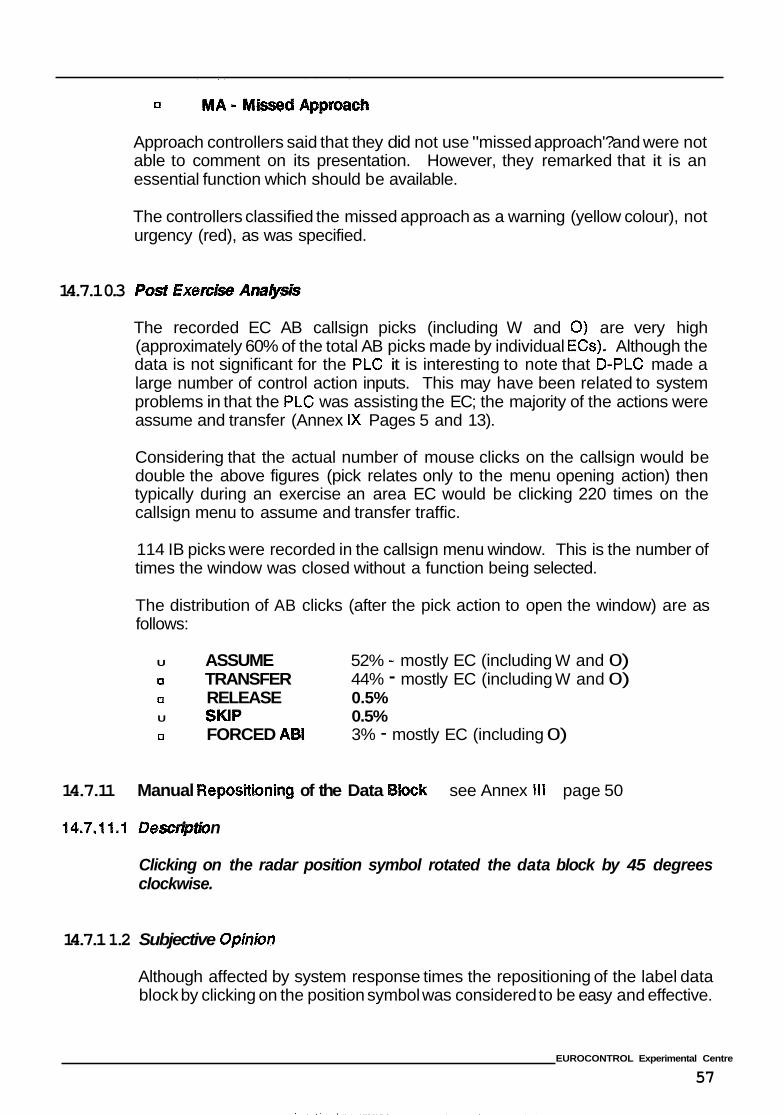
Approach controllers said that they did not use "missed approach'? and were not able to comment on its presentation. However, they remarked that it is an essential function which should be available.
The controllers classified the missed approach as a warning (yellow colour), not urgency (red), as was specified.
14.7.1 0.3 Post €x@ A M
The recorded EC AB callsign picks (including W and 0) are very high (approximately 60% of the total AB picks made by individual ECs). Although the data is not significant for the PLC it is interesting to note that D-PLC made a large number of control action inputs. This may have been related to system problems in that the PLC was assisting the EC; the majority of the actions were assume and transfer (Annex IX Pages 5 and 13).
Considering that the actual number of mouse clicks on the callsign would be double the above figures (pick relates only to the menu opening action) then typically during an exercise an area EC would be clicking 220 times on the callsign menu to assume and transfer traffic.
114 IB picks were recorded in the callsign menu window. This is the number of times the window was closed without a function being selected.
The distribution of AB clicks (after the pick action to open the window) are as follows:
U ASSUME 52% - mostly EC (including W and 0) U TRANSFER 44% - mostly EC (including W and 0) U RELEASE 0.5% U SKIP 0.5% U FORCED AB1 3% - mostly EC (including 0)
14.7.11 Manual Repositioning of the Data Block see Annex 111 page 50
14X11.1 De n
Clicking on the radar position symbol rotated the data block by 45 degrees clockwise.
14.7.1 1.2 Subjective Opinion
Although affected by system response times the repositioning of the label data block by clicking on the position symbol was considered to be easy and effective.
EUROCONTROL Experimental Centre
57
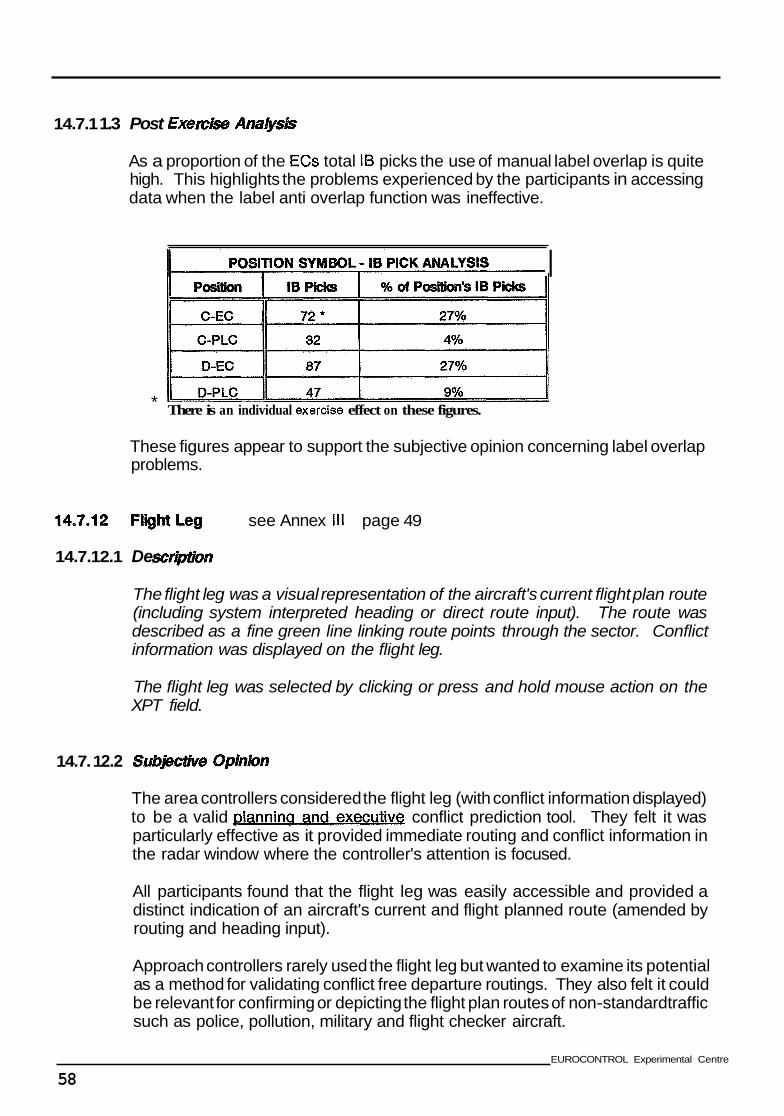
14.7.1 1.3 Post Exe A M
As a proportion of the EGs total If3 picks the use of manual label overlap is quite high. This highlights the problems experienced by the participants in accessing data when the label anti overlap function was ineffective.
I I
There is an individual exercise effect on these figures. *
These figures appear to support the subjective opinion concerning label overlap problems.
see Annex Ill page 49
14.7.12.1 De
The flight leg was a visual representation of the aircraft's current flight plan route (including system interpreted heading or direct route input). The route was described as a fine green line linking route points through the sector. Conflict information was displayed on the flight leg.
The flight leg was selected by clicking or press and hold mouse action on the XPT field.
14.7. 1 2.2 Sub#wiive QpMm
The area controllers considered the flight leg (with conflict information displayed) to be a valid conflict prediction tool. They felt it was particularly effective as it provided immediate routing and conflict information in the radar window where the controller's attention is focused.
All participants found that the flight leg was easily accessible and provided a distinct indication of an aircraft's current and flight planned route (amended by routing and heading input).
Approach controllers rarely used the flight leg but wanted to examine its potential as a method for validating conflict free departure routings. They also felt it could be relevant for confirming or depicting the flight plan routes of non-standard traffic such as police, pollution, military and flight checker aircraft.
EUROCONTROL Experimental Centre
58
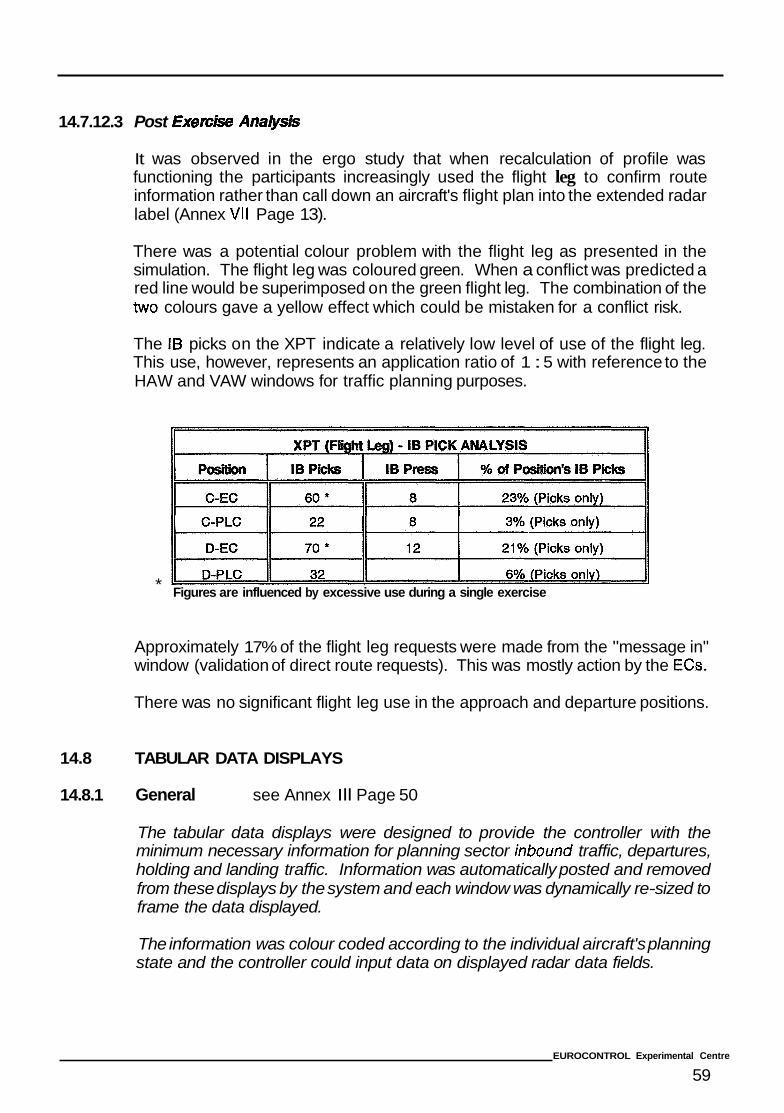
14.7.12.3 Post Ex@ Am
It was observed in the ergo study that when recalculation of profile was functioning the participants increasingly used the flight leg to confirm route information rather than call down an aircraft's flight plan into the extended radar label (Annex VII Page 13).
There was a potential colour problem with the flight leg as presented in the simulation. The flight leg was coloured green. When a conflict was predicted a red line would be superimposed on the green flight leg. The combination of the tvvo colours gave a yellow effect which could be mistaken for a conflict risk.
The I f 3 picks on the XPT indicate a relatively low level of use of the flight leg. This use, however, represents an application ratio of 1 : 5 with reference to the HAW and VAW windows for traffic planning purposes.
Figures are influenced by excessive use during a single exercise *
Approximately 17% of the flight leg requests were made from the "message in" window (validation of direct route requests). This was mostly action by the ECs.
There was no significant flight leg use in the approach and departure positions.
14.8 TABULAR DATA DISPLAYS
14.8.1 General see Annex Ill Page 50
The tabular data displays were designed to provide the controller with the minimum necessary information for planning sector inbound traffic, departures, holding and landing traffic. Information was automatically posted and removed from these displays by the system and each window was dynamically re-sized to frame the data displayed.
The information was colour coded according to the individual aircraft's planning state and the controller could input data on displayed radar data fields.
EUROCONTROL Experimental Centre
59
14.8.2 SIL - Sector Inbound List see Annex 111 page 50
The SIL was displayed in all area sectors and in the approach position. It presented the aircraft's sector entry time, callsign, planned entry level (PEL), XPT and a J when entry conditions had been validated (except approach).
14.8.2.2 S O p h h
The majority of controllers considered the SIL to be a good starting point for initial planning. Several comments indicate, however, that some controllers sought additional information such as XFL and aircraft type. Controllers said that they frequently used the extended label in conjunction with the SIL.
During discussion it appeared that a choice of SIL data (short and long display) available as a set-up option in the preference set was a good approach which could satisfy all users.
The display of a J by the system following validation of entry conditions was considered to be useful. Participants expressed the opinion that this application could be used for other functions (such as checking conflict warnings).
Data was posted in a SIL in accordance with an aircraft's point of entry into a sector. Pre-defined geographical areas were used instead of flight plan reporting points so that aircraft on direct routes could be posted in the correct SIL. The controllers did not experience any difficulty with this method of data capture.
Approach Controllers suggested that flow/acceptance rates be displayed and coordinated in the SIL in both area and approach positions. They would also like SIL's to be available to approach and departure controllers as both were affected by inbound traffic and required the information for advanced planning.
14.8.2.3 Post Exembe Ana&sis
During the ergo debriefing some controllers indicated that they would like to see the aircraft type added to the SIL. However, this was not a global requirement. The ability to add to a minimum data display could be considered as an option in the preference set.
It was observed that the controllers positioned the SlLs geographically in accordance with aircraft sector entry areas.
The total window management actions involving the SIL during 7 measured exercises included :
21 swop actions; 73 Move/Re-size actions.
EUROCONTROL Experimental Centre
60
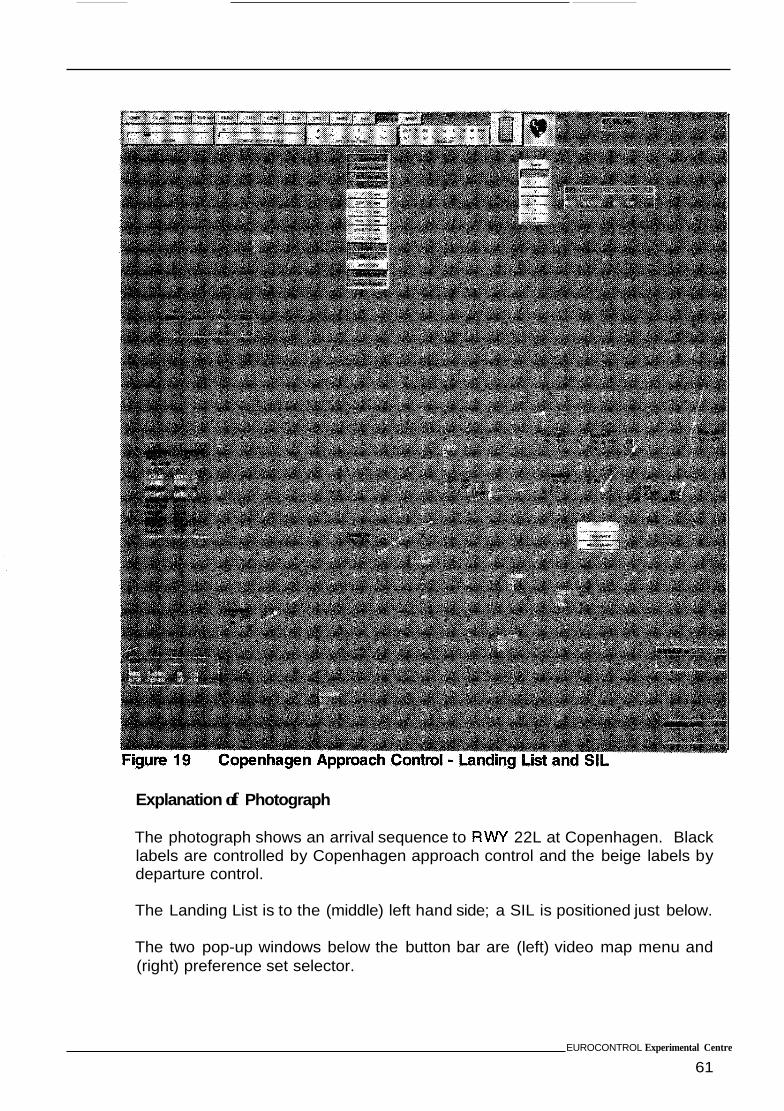
Explanation of Photograph
The photograph shows an arrival sequence to R W 22L at Copenhagen. Black labels are controlled by Copenhagen approach control and the beige labels by departure control.
The Landing List is to the (middle) left hand side; a SIL is positioned just below.
The two pop-up windows below the button bar are (left) video map menu and (right) preference set selector.
EUROCONTROL Experimental Centre
61
14.8.3
14.8.3.1
14.8.3.2
14.8.4
14.8.4.1
14.8.4.2
Landing Lbt see Annex Ill page 52
D
The landing list was designed to provide the approach, director, tower and departure controllers with a system determined approach sequence number for Copenhagen arrivals. It also displayed the landing runway, QNH, current meteorological information, aircraft callsign and type.
Subpercfhfe Opinbn
The approach controllers rejected this window essentially because the approach sequence determined by the system did not correspond to the controller organised sequence during the simulation.
During discussion it became clear that the controllers would prefer a list reflecting the landing sequence (automatically tracked by the system) which they could manually update if they decided to modify the sequence (click and drag action to new position was suggested).
They felt that a landing list is only of interest to the tower and approach controllers (and director if operating).
Departure L i i see Annex Ill page 53
De
The departure list was designed to provide the approach, tower and departure controllers with advance information of departing traffic. It displayed the departure runway, QNH, estimated and actual departure time, aircraft callsign, type CFL, standard instrument departure, sector exit level and departure sequence number.
Due to technical problems the system-determined departure number for Copenhagen departures did not correspond to the actual departure sequence during the simulation. All departures were displayed as "number one!"
Subperctive Opinbn
Except for the incorrect departure sequence number the approach controllers found this window to be satisfactory.
As with the landing list the controllers wanted to be able to manually amend the position of aircraft in the departure window in the event that the planned departure sequence had to be changed (click and drag action to new position was suggested).
EUROCONTROL Experimental Centre
63
. . . .. -- . . ... . .. .. .. ...... . . . . ,. ... . , " . . , ".. . . . . " ,.I . ." .... ".. ""." . " " " ". . .. ......... . .
It was also proposed that quick access to tools which could provide departure planning information and conflict prediction on standard instrument departures could be available from this window (a vertical aid window was suggested).
14.8.5 Stack ~~~~~ see Annex 111 Page 54
14.8.5.1 De
The stack window was designed to aid the lower airspace controllers with stack management. It displayed the landing runway, estimated beacon arrival time, a stack departure time or EAT (expected approach time), aircraft callsign, iype, stack departure sequence number or hold/on ward clearance indicator, CFL and actual flight level (AFL).
The stack window did not function during the simulation.
14.8.5.2 SubjieGtive Opinbn
Holding was implemented in several exercises. management tool is required if paper strips are to be eliminated.
It is evident that a stack
14.9 MEDIUM TERM CONFLICT ASSISTANCE TOOLS
14.9.1 General - Description see Annex 111 Page 57
The MTCA tools provided graphic images in horizontal and vertical view of conflict and conflict risk information for planning purposes. The tools were designed to help the controller plan an aircraft's entry, transit and exit conditions through his area of responsibility.
For conflict prediction the system considered all aircraft coming within 8 nautical miles of a subject aircraft's horizontal profile to be either a conflict, a risk of conflict or a potential conflict.
This classification depended on the aircra ft's cleared and planned level profile (AFL to CFL and CFL to XFL).
The conflict was classified as "REAL" (coloured RED) if detected in the AFL to XFL profile band and intersecting lire subject aircraft's defined trtijectory. A conflict risk (coloured YELLOW) was classified as any aircraft detected in the subject aircraft's CFL to XFL band, within 8 nm of its horizontal profile but not intersecting it's defined vertical trajectory.
A potential conflict (coloured green) was defined as any other flight path detected outside of the AFL to XFL band but within 8 nm the subject aircraft's defined horizontal profile.
EUROCONTROL Experimental Centre
64
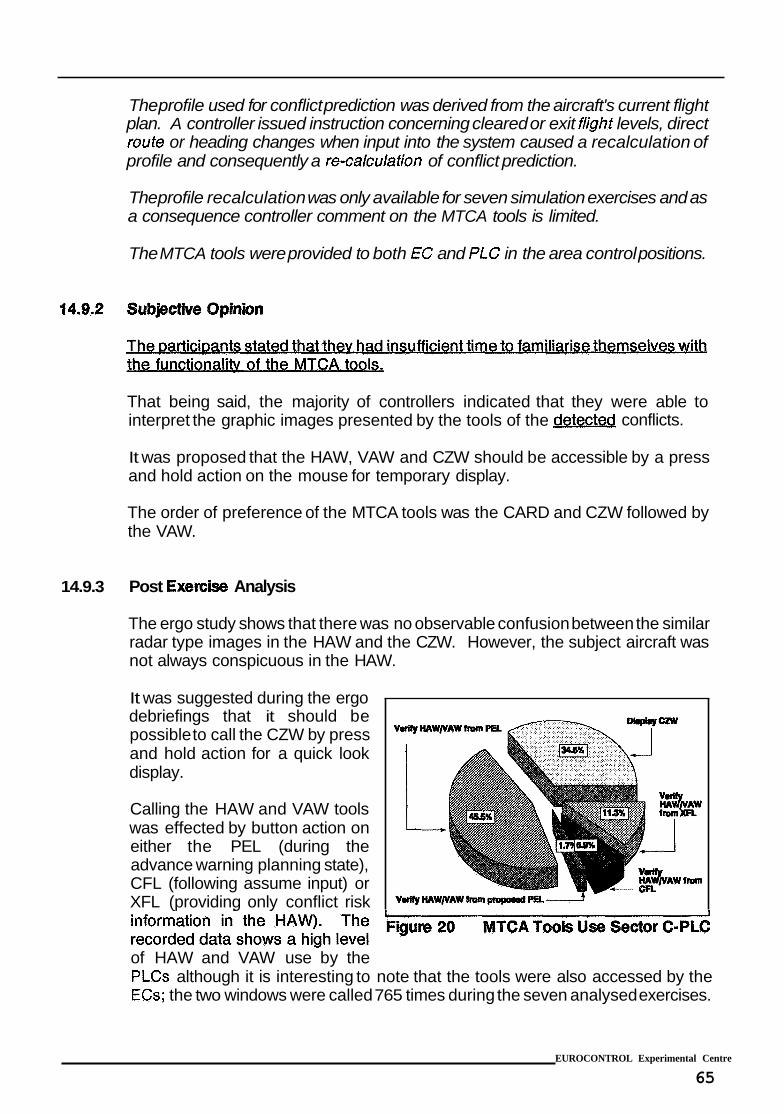
The profile used for conflict prediction was derived from the aircraft's current flight plan. A controller issued instruction concerning cleared or exit flight levels, direct route or heading changes when input into the system caused a recalculation of profile and consequently a re-calculation of conflict prediction.
It was suggested during the ergo debriefings that it should be possible to call the CZW by press and hold action for a quick look display.
Calling the HAW and VAW tools was effected by button action on either the PEL (during the advance warning planning state), CFL (following assume input) or XFL (providing only conflict risk
The profile recalculation was only available for seven simulation exercises and as a consequence controller comment on the MTCA tools is limited.
V * m W / v A w m m
~
V W H ~ W P A W ~ ~ ~ ~ ~ ~ P U . ~
The MTCA tools were provided to both €C and PLC in the area control positions.
That being said, the majority of controllers indicated that they were able to interpret the graphic images presented by the tools of the conflicts.
It was proposed that the HAW, VAW and CZW should be accessible by a press and hold action on the mouse for temporary display.
The order of preference of the MTCA tools was the CARD and CZW followed by the VAW.
14.9.3 Post Exercise Analysis
The ergo study shows that there was no observable confusion between the similar radar type images in the HAW and the CZW. However, the subject aircraft was not always conspicuous in the HAW.
of HAW and VAW use by the PLCs although it is interesting to note that the tools were also accessed by the ECs; the two windows were called 765 times during the seven analysed exercises.
EUROCONTROL Experimental Centre
65
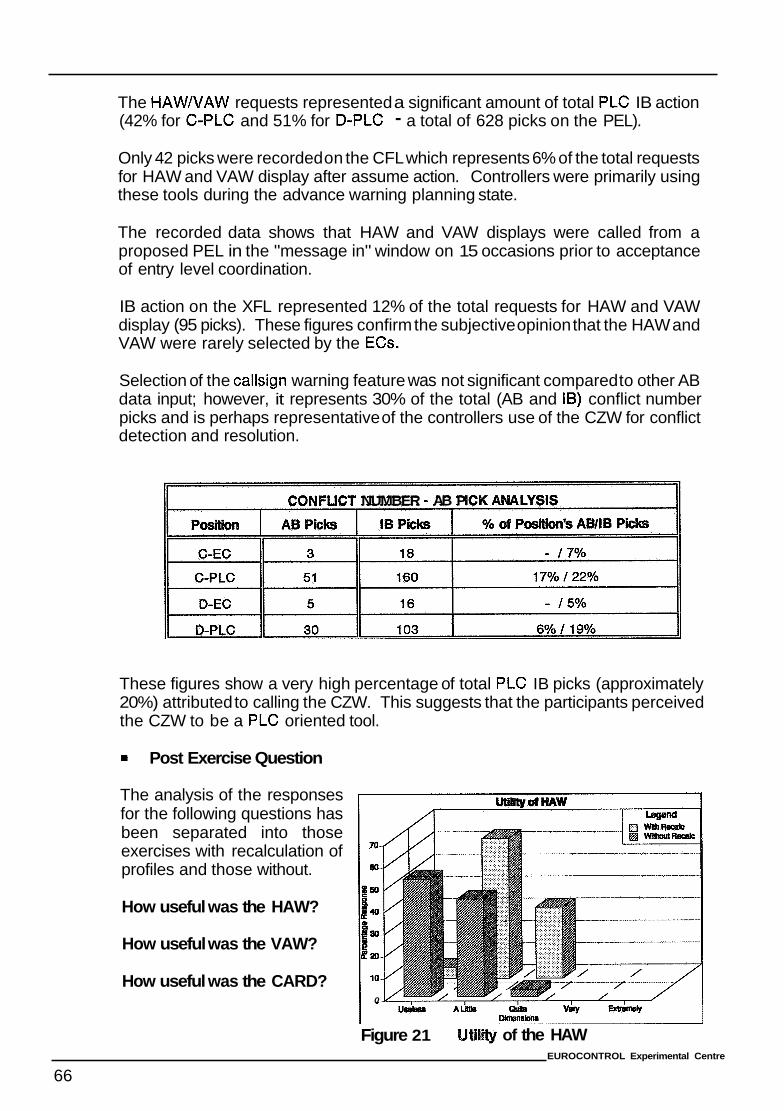
The HAWIVAW requests represented a significant amount of total PLC IB action (42% for C-PLC and 51% for D-PLC - a total of 628 picks on the PEL).
Only 42 picks were recorded on the CFL which represents 6% of the total requests for HAW and VAW display after assume action. Controllers were primarily using these tools during the advance warning planning state.
The recorded data shows that HAW and VAW displays were called from a proposed PEL in the "message in" window on 15 occasions prior to acceptance of entry level coordination.
IB action on the XFL represented 12% of the total requests for HAW and VAW display (95 picks). These figures confirm the subjective opinion that the HAW and VAW were rarely selected by the ECs.
Selection of the callsign warning feature was not significant compared to other AB data input; however, it represents 30% of the total (AB and IS) conflict number picks and is perhaps representative of the controllers use of the CZW for conflict detection and resolution.
CONFLICT NUMBER - AB P
These figures show a very high percentage of total PLC IB picks (approximately 20%) attributed to calling the CZW. This suggests that the participants perceived the CZW to be a PLC oriented tool.
Post Exercise Question
The analysis of the responses for the following questions has been separated into those exercises with recalculation of profiles and those without.
How useful was the HAW?
How useful was the VAW?
How useful was the CARD?
m M
50
40
90
20
10
0
Figure 21 UtilRy of the HAW EUROCONTROL Experimental Centre
66
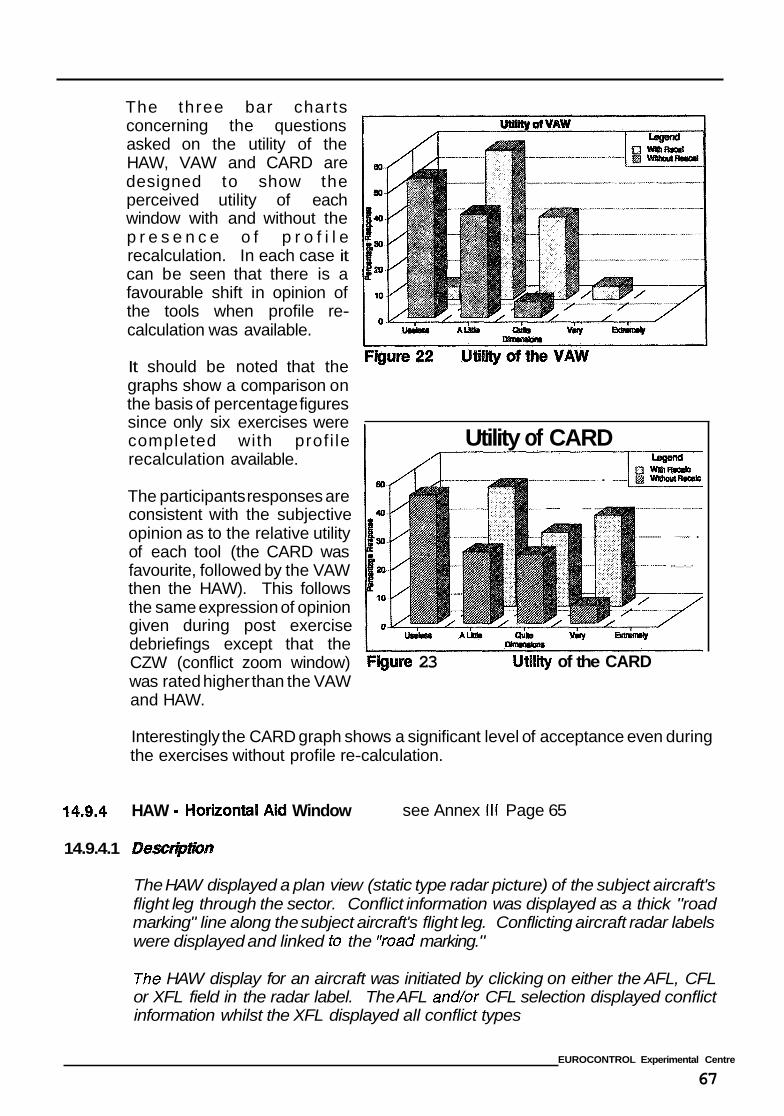
The three bar charts concerning the questions asked on the utility of the HAW, VAW and CARD are designed to show the perceived utility of each window with and without the p r e s e n c e o f p r o f i l e recalculation. In each case it can be seen that there is a favourable shift in opinion of the tools when profile re- calculation was available.
It should be noted that the graphs show a comparison on the basis of percentage figures since only six exercises were completed with profi le recalculation available.
The participants responses are consistent with the subjective opinion as to the relative utility of each tool (the CARD was favourite, followed by the VAW then the HAW). This follows the same expression of opinion given during post exercise debriefings except that the CZW (conflict zoom window) was rated higher than the VAW and HAW.
Utility of CARD .....
___ ...... ....
............. - ...
~ ~ ,I__._.
Flgum 23 Utility of the CARD
Interestingly the CARD graph shows a significant level of acceptance even during the exercises without profile re-calculation.
14.9.4 HAW - Horizonfail Aid Window see Annex 111 Page 65
14.9.4.1 Deser@tbn
The HAW displayed a plan view (static type radar picture) of the subject aircraft's flight leg through the sector. Conflict information was displayed as a thick "road marking" line along the subject aircraft's flight leg. Conflicting aircraft radar labels were displayed and linked to the "road marking."
The HAW display for an aircraft was initiated by clicking on either the AFL, CFL or XFL field in the radar label. The AFL and/or CFL selection displayed conflict information whilst the XFL displayed all conflict types
EUROCONTROL Experimental Centre
67
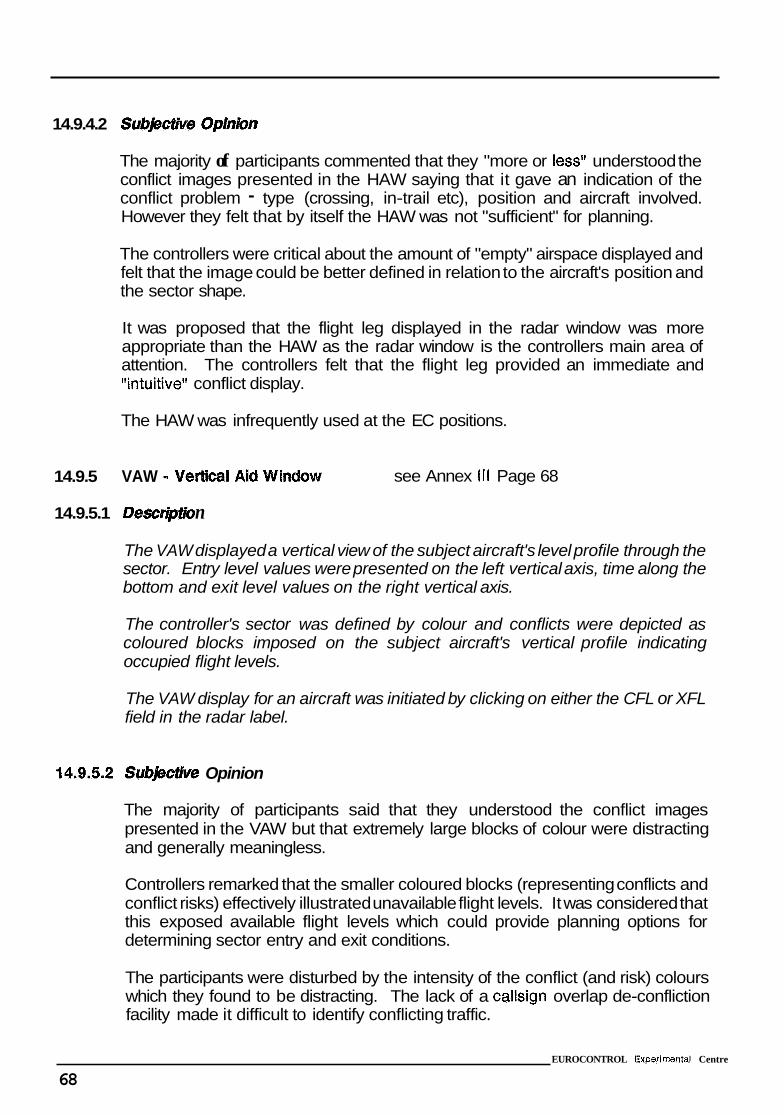
14.9.4.2 SubB
The majority of participants commented that they "more or lessf1 understood the conflict images presented in the HAW saying that it gave an indication of the conflict problem - type (crossing, in-trail etc), position and aircraft involved. However they felt that by itself the HAW was not "sufficient" for planning.
The controllers were critical about the amount of "empty" airspace displayed and felt that the image could be better defined in relation to the aircraft's position and the sector shape.
It was proposed that the flight leg displayed in the radar window was more appropriate than the HAW as the radar window is the controllers main area of attention. The controllers felt that the flight leg provided an immediate and "intuitive" conflict display.
The HAW was infrequently used at the EC positions.
14.9.5 VAW - Vertfcal Aid Window see Annex Ill Page 68
14.9.5.1 De n
The VAW displayed a vertical view of the subject aircraft's level profile through the sector. Entry level values were presented on the left vertical axis, time along the bottom and exit level values on the right vertical axis.
The controller's sector was defined by colour and conflicts were depicted as coloured blocks imposed on the subject aircraft's vertical profile indicating occupied flight levels.
The VAW display for an aircraft was initiated by clicking on either the CFL or XFL field in the radar label.
14.9.5.2 SubJ@ctAre Opinion
The majority of participants said that they understood the conflict images presented in the VAW but that extremely large blocks of colour were distracting and generally meaningless.
Controllers remarked that the smaller coloured blocks (representing conflicts and conflict risks) effectively illustrated unavailable flight levels. It was considered that this exposed available flight levels which could provide planning options for determining sector entry and exit conditions.
The participants were disturbed by the intensity of the conflict (and risk) colours which they found to be distracting. The lack of a callsign overlap de-confliction facility made it difficult to identify conflicting traffic.
EUROCONTROL Experimental Centre
68
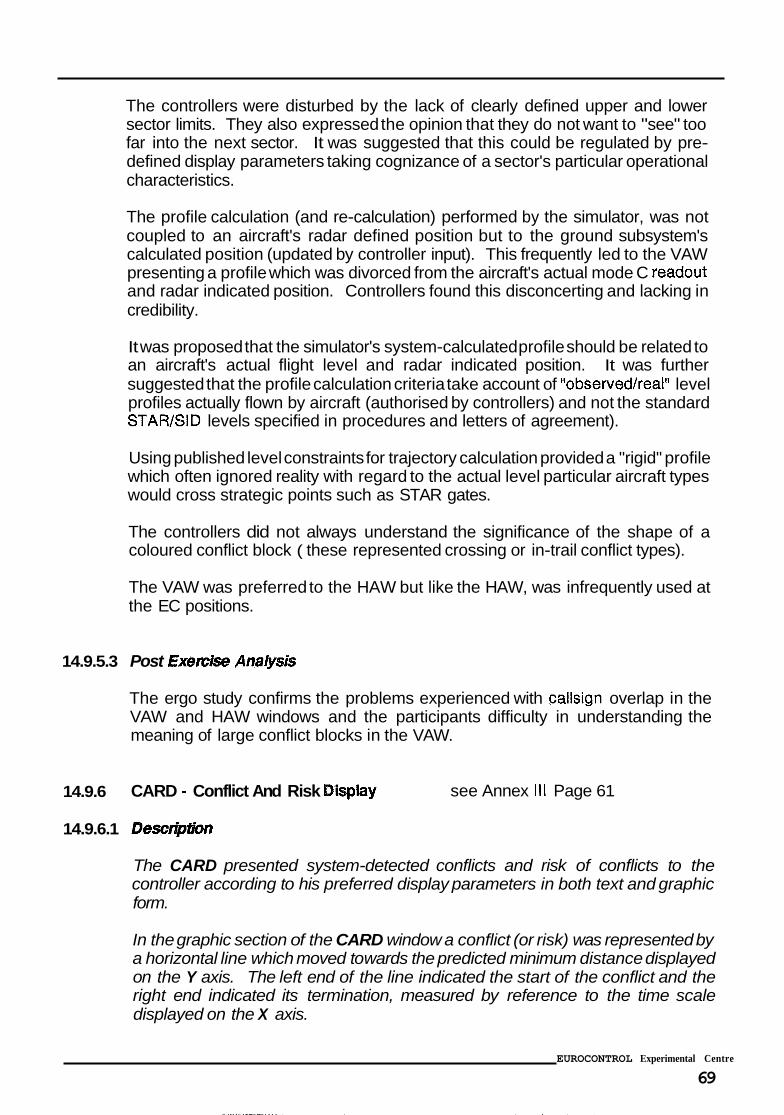
The controllers were disturbed by the lack of clearly defined upper and lower sector limits. They also expressed the opinion that they do not want to "see" too far into the next sector. It was suggested that this could be regulated by pre- defined display parameters taking cognizance of a sector's particular operational characteristics.
The profile calculation (and re-calculation) performed by the simulator, was not coupled to an aircraft's radar defined position but to the ground subsystem's calculated position (updated by controller input). This frequently led to the VAW presenting a profile which was divorced from the aircraft's actual mode C readout and radar indicated position. Controllers found this disconcerting and lacking in credibility.
It was proposed that the simulator's system-calculated profile should be related to an aircraft's actual flight level and radar indicated position. It was further suggested that the profile calculation criteria take account of "observed/real" level profiles actually flown by aircraft (authorised by controllers) and not the standard STAREID levels specified in procedures and letters of agreement).
Using published level constraints for trajectory calculation provided a "rigid" profile which often ignored reality with regard to the actual level particular aircraft types would cross strategic points such as STAR gates.
The controllers did not always understand the significance of the shape of a coloured conflict block ( these represented crossing or in-trail conflict types).
The VAW was preferred to the HAW but like the HAW, was infrequently used at the EC positions.
14.9.5.3 Post €xem& Anal@&
The ergo study confirms the problems experienced with callsign overlap in the VAW and HAW windows and the participants difficulty in understanding the meaning of large conflict blocks in the VAW.
14.9.6 CARD - Conflict And Risk Display see Annex 111 Page 61
14.9.6.1 Descripfbn
The CARD presented system-detected conflicts and risk of conflicts to the controller according to his preferred display parameters in both text and graphic form.
In the graphic section of the CARD window a conflict (or risk) was represented by a horizontal line which moved to wards the predicted minimum distance displayed on the Y axis. The left end of the line indicated the start of the conflict and the right end indicated its termination, measured by reference to the time scale displayed on the X axis.
EUROCONTROL Experimental Centre
69
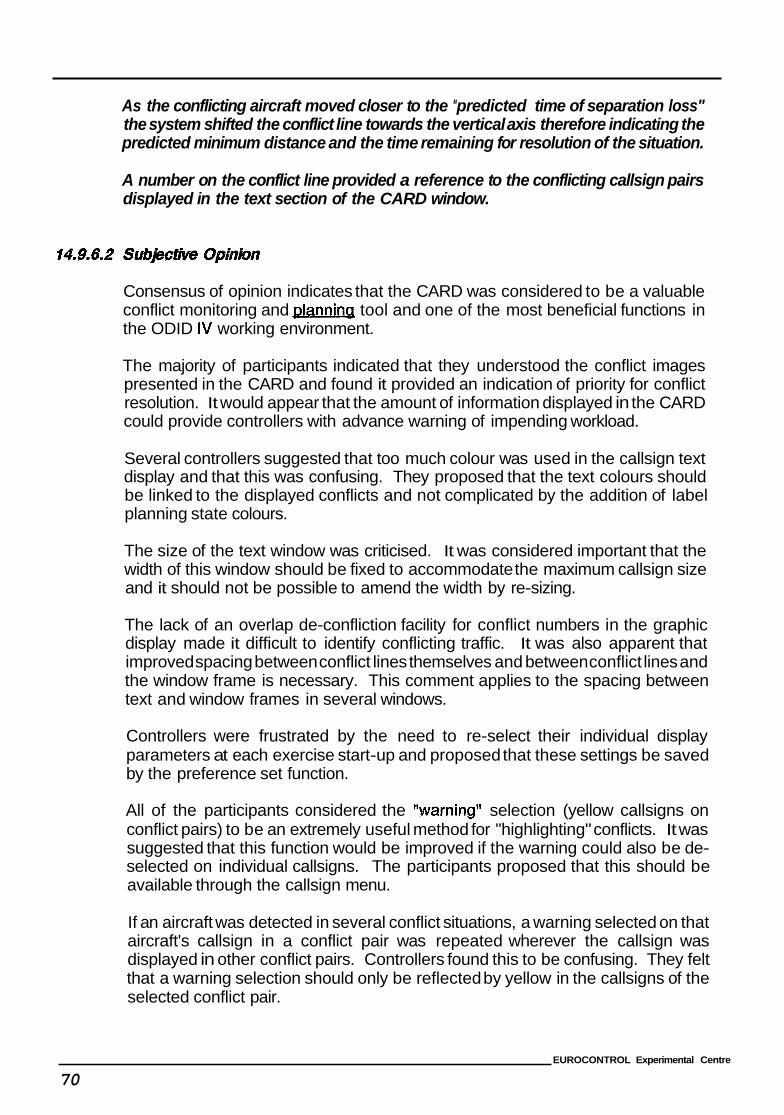
As the conflicting aircraft moved closer to the "predicted time of separation loss" the system shifted the conflict line towards the vertical axis therefore indicating the predicted minimum distance and the time remaining for resolution of the situation.
A number on the conflict line provided a reference to the conflicting callsign pairs displayed in the text section of the CARD window.
Consensus of opinion indicates that the CARD was considered to be a valuable conflict monitoring and tool and one of the most beneficial functions in the ODID IV working environment.
The majority of participants indicated that they understood the conflict images presented in the CARD and found it provided an indication of priority for conflict resolution. It would appear that the amount of information displayed in the CARD could provide controllers with advance warning of impending workload.
Several controllers suggested that too much colour was used in the callsign text display and that this was confusing. They proposed that the text colours should be linked to the displayed conflicts and not complicated by the addition of label planning state colours.
The size of the text window was criticised. It was considered important that the width of this window should be fixed to accommodate the maximum callsign size and it should not be possible to amend the width by re-sizing.
The lack of an overlap de-confliction facility for conflict numbers in the graphic display made it difficult to identify conflicting traffic. It was also apparent that improved spacing between conflict lines themselves and between conflict lines and the window frame is necessary. This comment applies to the spacing between text and window frames in several windows.
Controllers were frustrated by the need to re-select their individual display parameters at each exercise start-up and proposed that these settings be saved by the preference set function.
All of the participants considered the "warning" selection (yellow callsigns on conflict pairs) to be an extremely useful method for "highlighting" conflicts. It was suggested that this function would be improved if the warning could also be de- selected on individual callsigns. The participants proposed that this should be available through the callsign menu.
If an aircraft was detected in several conflict situations, a warning selected on that aircraft's callsign in a conflict pair was repeated wherever the callsign was displayed in other conflict pairs. Controllers found this to be confusing. They felt that a warning selection should only be reflected by yellow in the callsigns of the selected conflict pair.
EUROCONTROL Experimental Centre
70
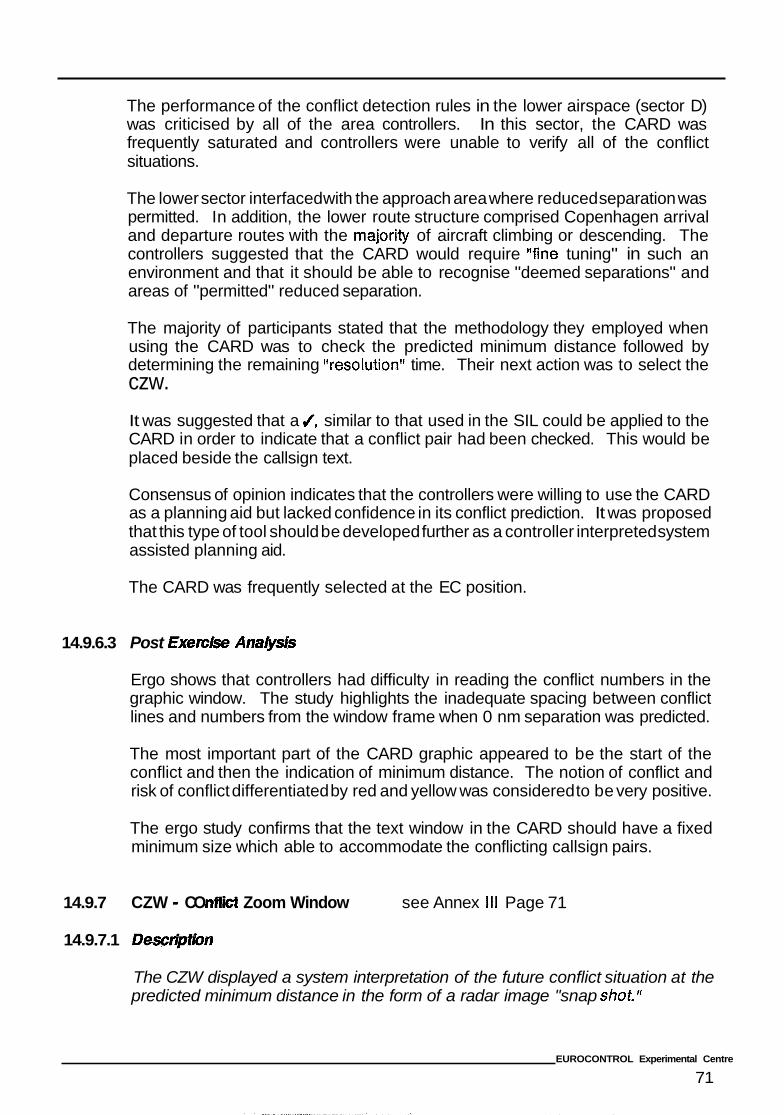
The performance of the conflict detection rules in the lower airspace (sector D) was criticised by all of the area controllers. In this sector, the CARD was frequently saturated and controllers were unable to verify all of the conflict situations.
The lower sector interfaced with the approach area where reduced separation was permitted. In addition, the lower route structure comprised Copenhagen arrival and departure routes with the major'rty of aircraft climbing or descending. The controllers suggested that the CARD would require "fine tuning" in such an environment and that it should be able to recognise "deemed separations" and areas of "permitted" reduced separation.
The majority of participants stated that the methodology they employed when using the CARD was to check the predicted minimum distance followed by determining the remaining Vesolution" time. Their next action was to select the czw.
It was suggested that a J, similar to that used in the SIL could be applied to the CARD in order to indicate that a conflict pair had been checked. This would be placed beside the callsign text.
Consensus of opinion indicates that the controllers were willing to use the CARD as a planning aid but lacked confidence in its conflict prediction. It was proposed that this type of tool should be developed further as a controller interpreted system assisted planning aid.
The CARD was frequently selected at the EC position.
14.9.6.3 Post Exemks Anal@&
Ergo shows that controllers had difficulty in reading the conflict numbers in the graphic window. The study highlights the inadequate spacing between conflict lines and numbers from the window frame when 0 nm separation was predicted.
The most important part of the CARD graphic appeared to be the start of the conflict and then the indication of minimum distance. The notion of conflict and risk of conflict differentiated by red and yellow was considered to be very positive.
The ergo study confirms that the text window in the CARD should have a fixed minimum size which able to accommodate the conflicting callsign pairs.
14.9.7 CZW - CO ict Zoom Window see Annex 111 Page 71
14.9.7.1 Desctipabn
The CZW displayed a system interpretation of the future conflict situation at the predicted minimum distance in the form of a radar image "snap shot."
EUROCONTROL Experimental Centre
71
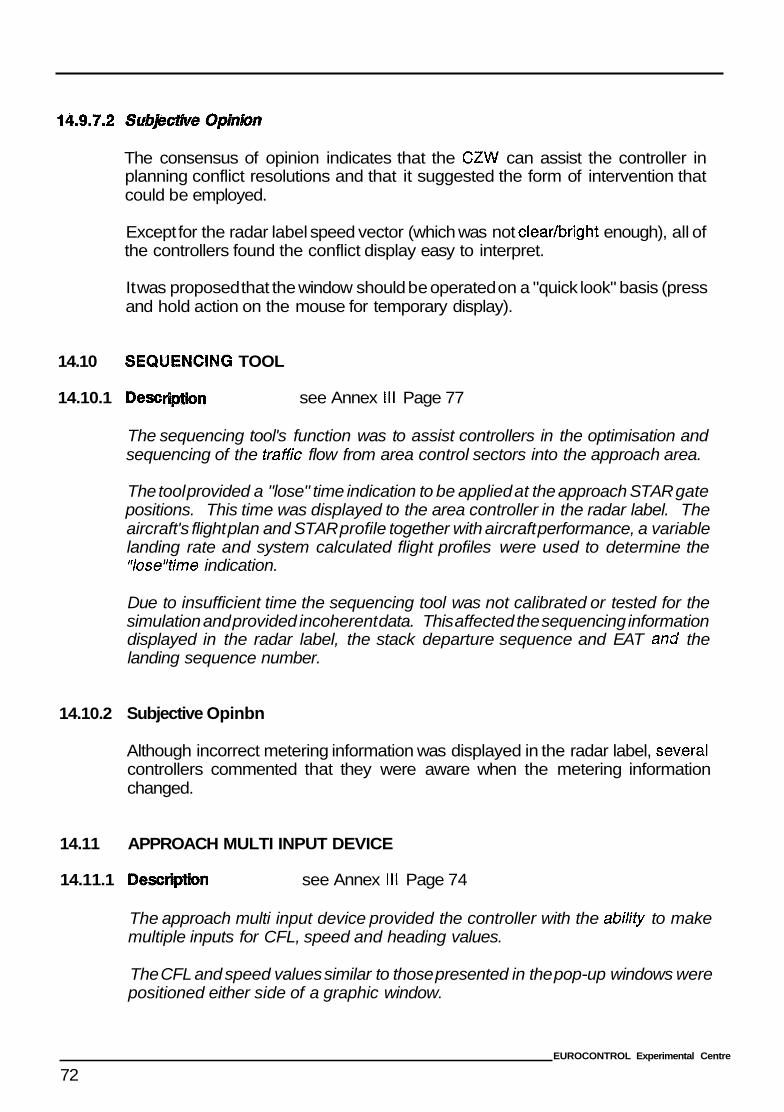
The consensus of opinion indicates that the CZW can assist the controller in planning conflict resolutions and that it suggested the form of intervention that could be employed.
Except for the radar label speed vector (which was not clear/bright enough), all of the controllers found the conflict display easy to interpret.
It was proposed that the window should be operated on a "quick look" basis (press and hold action on the mouse for temporary display).
14.10 SEQUENCING TOOL
14.10.1 Desc see Annex I l l Page 77
The sequencing tool's function was to assist controllers in the optimisation and sequencing of the traffic flow from area control sectors into the approach area.
The tool provided a "lose" time indication to be applied at the approach STAR gate positions. This time was displayed to the area controller in the radar label. The aircraft's flight plan and STAR profile together with aircraft performance, a variable landing rate and system calculated flight profiles were used to determine the "lose"time indication.
Due to insufficient time the sequencing tool was not calibrated or tested for the simulation and provided incoherent data. This affected the sequencing information displayed in the radar label, the stack departure sequence and EAT arzd the landing sequence number.
14.10.2 Subjective Opinbn
Although incorrect metering information was displayed in the radar label, sev.eral controllers commented that they were aware when the metering information changed.
14.11 APPROACH MULTI INPUT DEVICE
14.1 1.1 DescriptSon see Annex Ill Page 74
The approach multi input device provided the controller with the abilify to make multiple inputs for CFL, speed and heading values.
The CFL and speed values similar to those presented in the pop-up windows were positioned either side of a graphic window.
EUROCONTROL Experimental Centre
72
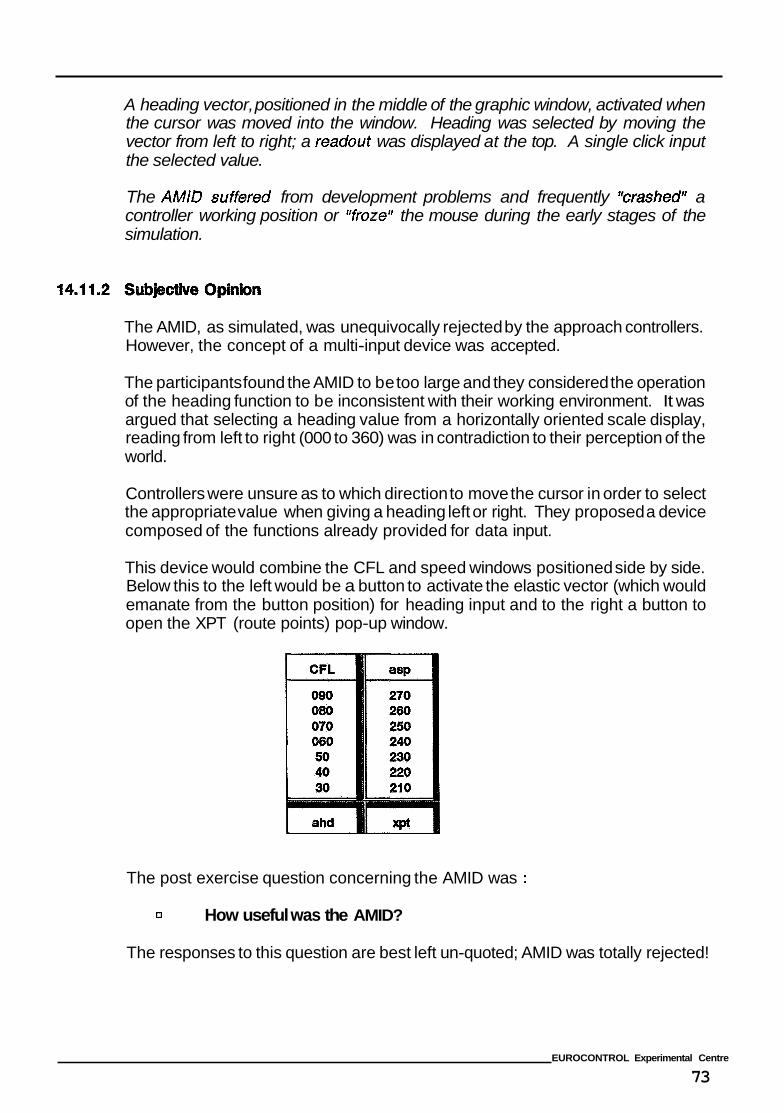
A heading vector, positioned in the middle of the graphic window, activated when the cursor was moved into the window. Heading was selected by moving the vector from left to right; a readout was displayed at the top. A single click input the selected value.
The AMID suffered from development problems and frequently trcrashed" a controller working position or "froze" the mouse during the early stages of the simulation.
The AMID, as simulated, was unequivocally rejected by the approach controllers. However, the concept of a multi-input device was accepted.
The participants found the AMID to be too large and they considered the operation of the heading function to be inconsistent with their working environment. It was argued that selecting a heading value from a horizontally oriented scale display, reading from left to right (000 to 360) was in contradiction to their perception of the world.
Controllers were unsure as to which direction to move the cursor in order to select the appropriate value when giving a heading left or right. They proposed a device composed of the functions already provided for data input.
This device would combine the CFL and speed windows positioned side by side. Below this to the left would be a button to activate the elastic vector (which would emanate from the button position) for heading input and to the right a button to open the XPT (route points) pop-up window.
The post exercise question concerning the AMID was :
cl How useful was the AMID?
The responses to this question are best left un-quoted; AMID was totally rejected!
EUROCONTROL Experimental Centre
73
14.12
14.12.1
14.1 2.2
14.12.3
CONFLICT PREDICTION
see Annex Ill Page 59
Brief&, conflict prediction in ODID IV was based on pre-defined level and horizontal separation criteria which was applied globally throughout the simulated airspace.
Three conflict types were defined. These were :
ConffAcf (concerning the full profile AFL to XFL)
R M o f (concerning the planned XFL profile)
Potent&/ CoMM (concerning the area outside of the current and planned profile)
Conflict prediction commenced three minutes prior to sector entry and ended three minutes after sector exit.
Controller input for PEL, CFL, XFL, heading and direct route was used by the simulation system to re-calculate the aircraft's profile which in turn would result in a re-generation of conflict prediction.
Subjective Opinbn
Participants commented that conflict prediction displayed numerous conflicts, especially in the lower airspace, which could not be explained or would normally be "deemed" separated in local operating instructions.
Post Exercise AnabsL
It was observed during the ergo study that controllers were not completely happy with the conflict prediction information. On several occasions it appears participants were unable to relate a conflict prediction to the traffic situation.
The conflict prediction appeared better suited to upper airspace rather than lower. In sector D a considerable amount of traffic was in evolution and in many cases had a very short through-sector time. The nature of traffic flows was much more dynamic that of sector C (upper airspace).
The conflict prediction did not take account of several important conditions including: . aircraft in the hold awaiting onward clearance into the approach area;
aircraft on opposite direction routes which were 8 nm apart which were "deemed" separated;
EUROCONTROL Experimental Centre
74
approach traffic with reduced separation (down to 3 nm) operating within three minutes of sector D boundary; departing aircraft warned to the sector (10 minute advance warning) but not yet airborne which produced conflict prediction information; departing (slow speed) aircraft from local airfields with a climb - level - descend profile which conflicted with high speed jet traffic into an out of Copenhagen.
This is a cross section of the conditions which significantly increased the number of predicted conflicts displayed to the sector D controllers.
It is evident that TMA airspace is a special case with regard to conflict prediction. A considerable amount of development will be required to produce satisfactory conflict prediction of sufficient quality on a "look ahead" basis. Such development needs to carefully consider : . how far into the future such predictions should be made;
how conditions such as holding and deemed separations should be treated; how departing aircraft should be treated; the relationship between conflict probing and conflict monitoring and their associated display.
14.13 WORKLOAD
14.13. I Description
In the context of the ODlD IV simulation, workload relates to several indicators which were used to try to determine the effect of the working environment on the controllers ability to perform their ATC task. These indicators include NASA TLX, ISA and a modified MBB calculation. In addition, there is subjective opinion, standard recorded simulation data such as traffic flow, telephone use and data input, both pilot and controller input orders, as well as effects observed by NIO.
14.1 3.2 SubBctive Opinion
The ODlD IV participants expressed the opinion, that, with adequate response times and no system problems, the data input required to update the system can be achieved without adversely affecting their ability to accomplish the ATC task.
However, the participants were frustrated in their evaluation task by the system problems affecting the simulation. They were unable to adequately assess the MTCA tools and their ability to input data under significant traffic loads.
EUROCONTROL Experimental Centre
75
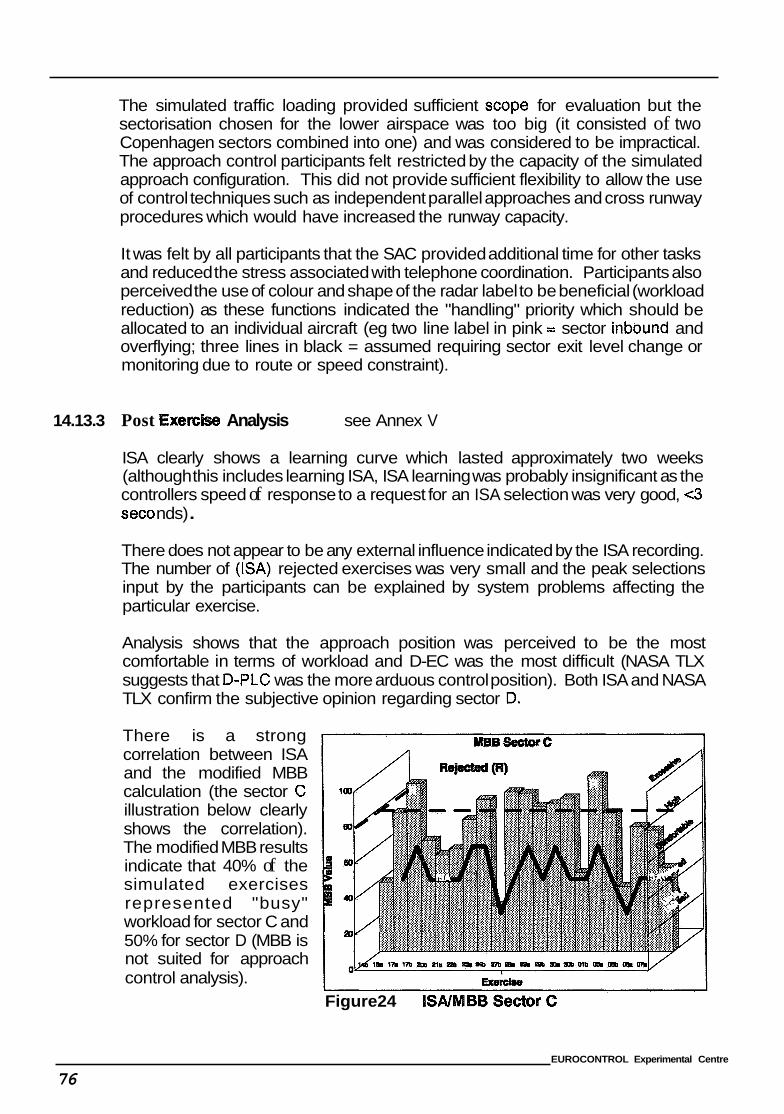
The simulated traffic loading provided sufficient scope for evaluation but the sectorisation chosen for the lower airspace was too big (it consisted of two Copenhagen sectors combined into one) and was considered to be impractical. The approach control participants felt restricted by the capacity of the simulated approach configuration. This did not provide sufficient flexibility to allow the use of control techniques such as independent parallel approaches and cross runway procedures which would have increased the runway capacity.
It was felt by all participants that the SAC provided additional time for other tasks and reduced the stress associated with telephone coordination. Participants also perceived the use of colour and shape of the radar label to be beneficial (workload reduction) as these functions indicated the "handling" priority which should be allocated to an individual aircraft (eg two line label in pink = sector inbound and overflying; three lines in black = assumed requiring sector exit level change or monitoring due to route or speed constraint).
14.13.3 Post Exercise Analysis see Annex V
ISA clearly shows a learning curve which lasted approximately two weeks (although this includes learning ISA, ISA learning was probably insignificant as the controllers speed of response to a request for an ISA selection was very good, c3 sec0 nds) .
There does not appear to be any external influence indicated by the ISA recording. The number of (SA) rejected exercises was very small and the peak selections input by the participants can be explained by system problems affecting the particular exercise.
Analysis shows that the approach position was perceived to be the most comfortable in terms of workload and D-EC was the most difficult (NASA TLX suggests that D-PLC was the more arduous control position). Both ISA and NASA TLX confirm the subjective opinion regarding sector D.
There is a strong correlation between ISA and the modified MBB calculation (the sector C illustration below clearly shows the correlation). The modified MBB results indicate that 40% of the simulated exercises represented "busy" workload for sector C and 50% for sector D (MBB is not suited for approach control analysis).
Figure24 S A /
EUROCONTROL Experimental Centre
76
14.14
14.1 4.1
NASA TLX confirms the learning period indicated by ISA. However, NASA TLX appears to be more sensitive as it shows that new scenarios were accepted after three exercises. The ''TLX" trend shows an overall reduction in perceived workload during the simulation,
As with the other indicators, sector D shows the highest NASA TLX scores.
The NI0 data shows that a stress effect was observed in the area control sectors, particularly in D-EC.
The simulation output does not show any direct benefit in terms of capacity gain which can be attributed to the working environment. The technical difficulties and simulator problems detracted from the ability to assess such benefits.
ETHODOLOGY
Post Exercise Anatysk
It was observed in the ergo study (Annex VII Pages 10 to 17) that the participants searched for data in the radar window by checking radar labels. However, system problems may have influenced the controllers work patterns. Slow response affected the length of time taken for the MTCA windows to update which suggests that it was quicker to access data from the radar label. During exercises without profile recalculation controllers would primarily have used radar information for entry and exit planning instead of the MTCA tools (Without profile recalculation the initial profile quickly became outdated). Perhaps as a result of these problems the D-PLC focused his effort on the radar window in order to assist the EC in the event of difficulties encountered with data input.
Although the participants liked the use of colour coding, because it helped to allocate task priorities there is, nevertheless, a potentially negative side to the use of colour. It would appear that controllers were not reading all of the data presented in the HAW and VAW; they were only looking for colour. As a result they appear to miss a significant amount of textual and graphical information - and were observed going back to the tools and the extended radar label to confirm or find information.
During the ergo study, controllers suggested that the VAW should be centred so as to show a PEL to XFL profile. In the event that this cannot be achieved it was suggested that the VAW should be centred on the PEL for climbing aircraft and on the XFL for descending aircraft.
On the few occasions when the D-EC CWP failed the PLC immediately re-sized the radar window to a full display to make it easier to access data (this improve the effectiveness of the label anti-overlap function due to the larger window area). When this occurred the PLC kept the MTCA tools selected. The reaction of immediately increasing the size of the radar window to facilitate data input may suggest that controllers regarded data input as extra workload.
EUROCONTROL Experimental Centre
77
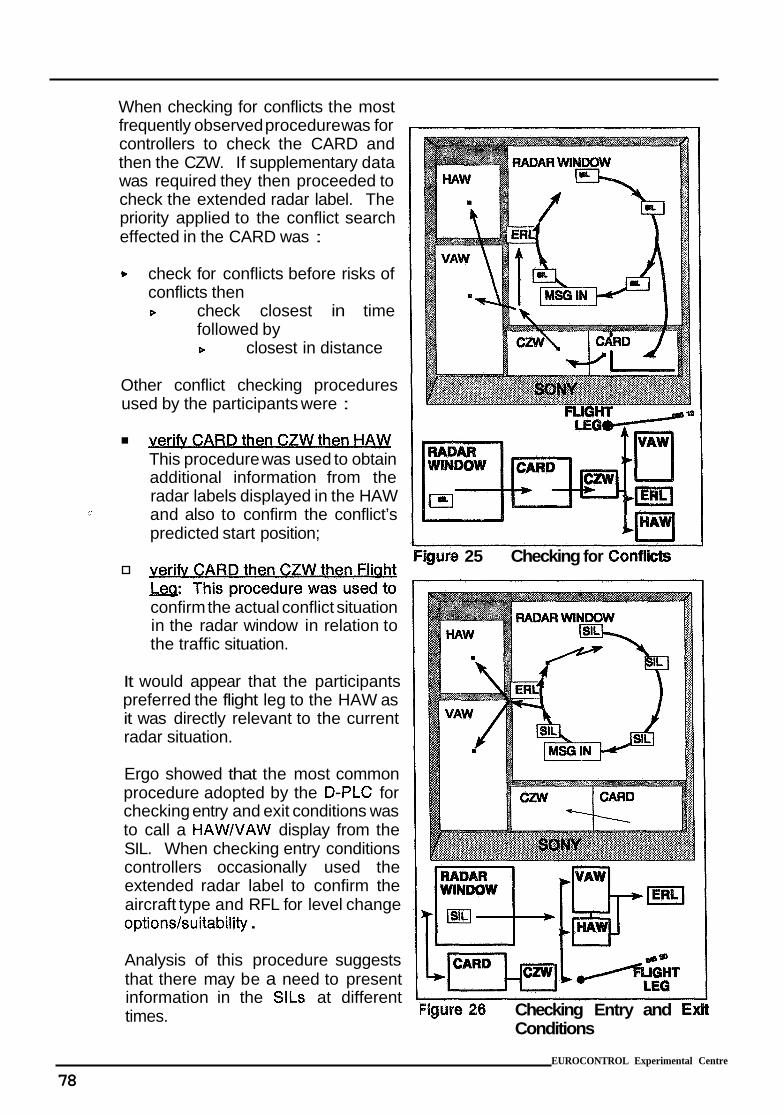
When checking for conflicts the most frequently observed procedure was for controllers to check the CARD and then the CZW. If supplementary data was required they then proceeded to check the extended radar label. The priority applied to the conflict search effected in the CARD was :
check for conflicts before risks of conflicts then D. check closest in time
followed by D. closest in distance
Other conflict checking procedures used by the participants were :
This procedure was used to obtain additional information from the radar labels displayed in the HAW and also to confirm the conflict’s predicted start position;
confirm the actual conflict situation in the radar window in relation to the traffic situation.
It would appear that the participants preferred the flight leg to the HAW as it was directly relevant to the current radar situation.
Ergo showed that the most common procedure adopted by the D-PLC for checking entry and exit conditions was to call a HAW/VAW display from the SIL. When checking entry conditions controllers occasionally used the extended radar label to confirm the aircraft type and RFL for level change options/suitability .
Analysis of this procedure suggests that there may be a need to present information in the SlLs at different times.
1 U
urn 25 Checking for Confl
Figure26 Checking Entry and E3 Conditions
EUROCONTROL Experimental Centre
78
14.15
14.1 5.1
Controllers were not interested in checking Copenhagen departures ten minutes before ETD. It was also observed that the controllers scanned the SlLs clockwise.
Controllers were seen referring back to the HAW and VAW and also to the extended radar label to confirm or find information. Controllers may only have been looking for conflict colours in the MTCA tools and did not read the textual or graphical information if no conflict colour was presented.
There is evidence to suggest that controllers did not systematically validate entry conditions using the HAW and VAW. It would appear that they were willing to experiment with the CARD, using it to indicate possible separation problems at or after sector entry, effectively using it as an entry planning aid.
There appears to be no significant difference in that way tasks were shared between EC and PLC compared to current Copenhagen operating methods. PLCs did occasionally assist the EC by entering data but this usually occurred as a result of degrading system response times which inhibited data input.
It was observed that controllers "worked" the sector as a team using the flexibility of having the same functions available to both controllers. It was also observed in NI0 that in the area sectors there was a considerable amount of discussion between controllers concerning entry and exit conditions. This supports the argument that both controllers should have access to the same functions (as opposed to ODlD 111 where controllers were restricted to planning and executive task functions by the system).
THE WORKING ENVIRONMENT
The "office type" working environment consisted of a standard office desk, chair, Sony display (2000 X 2000) placed on a mobile trolley, three buiton mouse and a stand-by telecom system (on-screen telecoms was the main telephone access).
A headset and press to transmit foot switch were used for radio telephony communications.
AN control tools, radar and other information were accessed through the display via the mouse input device.
The desks were positioned in a three sector layout comprising sector C (upper airspace) sector D (I0 werVTMA airspace) and approach control (approach, director and departure). Each area sector accommodated two controllers, an EC (radar) and PLC.
(See Control Room Plan, page 7 1 )
EUROCONTROL Experimental Centre
79
The majority of participants were comfortable with the office environment.
However, all of the controllers would like to be able to manipulate the display in order to adjust its height, to move it closer and, for several controllers, to tilt it.
The consensus of opinion indicates that an "all on screen" working environment using multi-window displays is acceptable provided back-up facilities exist and that system reliability can be guaranteed. None of the participants believed that such a guarantee would be possible and suggested that future controller working positions would include an auxiliary display.
A majority of controllers accepted the "on screen" telecom facility but insisted that a separate system "off screen'' should be available.
The head set and press to transmit foot switch provided for the simulation were rejected by the participants as being uncomfortable and heavy.
14.15.3 Post Exercise Analysis
One of the participants experienced a problem with reading glasses during the pre-simulation "shake down." It would appear that bi-focal glasses can cause a degree of discomfort when working in front of the large display. This problem was resolved (new glasses!).
During the simulation it was observed that one of the controllers found the office desk to be uncomfortable. This participant suffered bruising on the under-forearms and had difficulty in reaching the foot pedal. (The desk height was fixed; the chair height could be adjusted).
The NI0 data shows that controllers working in both the approach and D-EC positions were observed looking at adjacent displays.
In approach it would appear that the controller needed to verify information by checking the director and departure controllers displays (positioned either side of the approach controller). This suggests that provision of information might have been insufficient. It may also be related to difficulties experienced by the approach controller in differentiating the director's traffic sequence (the "team" colour application that was used in this case was rejected by the participants).
The sector D-EC controller was observed scrutinising the MTCA tools (or radar window) on the D-PLC display.
EUROCONTROL Experimental Centre
80
Both of these situations appear to reinforce a requirement to maintain visual access to adjacent displays when possible. This suggests that the strategic positioning of control positions in relation to each other was important despite the considerable amount of information that was available through the ODlD CWP. There was still a need for verbal communication between sector controllers.
ULATION FACILITY
14.16.1 Desc see Annex I I
The SIM5+ simulation facility was composed of the following subsystems : . ground sub-system providing flight planhrack deviation monitoring, STCA detection, flight plan management, flight plan trajectory calculation; . supervisory sub-system providing start, stop and freeze functions;
H air and ground local area networks;
air sub-system providing aircraft navigation, pilot input and pilotkontroller communications;
controller working position providing data display, sequencing and conflict prediction.
SIM5+ is the Experimental Centre's new simulation facility. Unfortunately, due to time constraints and the technical complexity of the ODlD IV specification, the facility was not fully operational in time for the simulation and system functions performed at less than optimum levels.
The flight plan trajectory re-calculation was only available during the last week of simulation. This meant that controllers worked the majority of exercises without correct conflict information displayed in the MTCA tools.
ODID IV played an important part in the introduction and ['shake down" of the SIM5+ simulation facility but as a result the simulation suffered the consequences of an immature and unproven system.
A considerable amount of software debugging was accomplished during the simulation period which dramatically improved the facility on a daily basis,
14.16.2 Subjecthre Opinbn
The participants expressed disappointment in the functioning and accuracy of the simulation facility. This considerably affected their ability to carry out their control task in an acceptable manner.
EUROCONTROL Experimental Centre
81
. ."." ,.. .. -;__- x--._ ' . ..... ... . .... . .... .-""l-. ~ .... ._ _.. . ".".". ..., " , " ".".. "x'_.;_l
A cross section of problems is described below.
m
E
E
E
Flight plan estimates were frequently incorrect (even after the introduction of profile re-calcu latio n).
STCA appeared to display false alerts, especially at the end of climb/descent to "separated" levels and following level changes that commenced soon after converging aircraft had crossed safely.
Profile re-calculation was not coupled to the aircraft's actual position and level but to the ground subsystems calculated position (updated by controller input). This often led to a vertical aid showing a trajectory which was unrelated to an aircraft's actual mode C and radar indicated profile.
The re-calculation of a profile occasionally changed the aircrafts expected sector sequence. This would block data input at the responsible sector for the concerned aircraft.
Aircraft performance was criticised as being unrealistic, particularly in lower airspace for certain aircraft types. Controllers were irritated by unrealistic climb and descent rates, turn rates and speed control for several common aircraft types. Approach controllers found the reaction to ATC instructions to be too slow.
System assisted messages were occasionally garbled.
Conflict prediction displayed numerous conflicts, especially in the lower airspace, which could not be explained or would normally be "deemed" separated in local operating instructions. As a result some of the control tools became overloaded with conflict images and were difficult to interpret.
On several occasions controllers found that conflict numbers and colour states (and coordination received) did not correspond on EC and PLC displays. (This may have resulted from delays in updating individual CWPs with conflict information due to system delays/response problems).
The response time as experienced by the controllers for common ODlD type actions such as calling down information and inputting data was considered to be unacceptable.
Controllers had to wait for a pop-up window to appear and they frequently experienced a further delay following a data input in that window (delay in the window closing indicating an accepted input). In addition, when the system was heavily loaded with traffic, a delay could be experienced following a request for display of information in the HAW and VAW.
The participants frequently commented that they were unable to satisfactorily carry out their primary task of separating aircraft due to the frustration provoked by such delays.
EUROCONTROL Experimental Centre
82
14.17 SIMULATED AIRSPACE AND TRAFFIC SA
14.17.1 Desc see Annex I
The simulated area was based on a modified Copenhagen FIR and included upper, lower, approach and departure sectors. The current route sfructure was used and a direct route system was developed for certain simulation exercises. The SID and STAR procedures used for Copenhagen airport were applied.
A traffic sample was taken from real traffic on a Friday morning in May 1991. From this base, traffic samples for 1992, 1995, 1998 and 2000 were developed. These samples included free routes, VFR and military traffic (VFR and military traffic were subsequently deleted due to system problems) and departures and arrivals to numerous small Danish airfields. Both runway 22 and 04 at Copenhagen were simulated.
Due to system difficulties only the 1992 and 1995 samples were used. All samples were built with the assistance of Copenhagen controllers.
14.17.2 Subjective Opinion
The participants were not satisfied with the construction of the lower airspace sector. This sector was a combination of two existing sectors and their amalgamation created too many conflict points including two busy Copenhagen arrival holding areas. This complicated the controlling of Copenhagen arrivals and departures which affected the lower sector, approach and departure controllers.
The upper sector, approach and departure airspace were generally considered acceptable for simulation purposes.
Traffic samples were considered to be representative of IFR traffic movements in Copenhagen airspace but the participants felt that the addition of VFR and military traffic would have added to sample authenticity.
A degree of boredom was expressed at the end of the simulation with the repetition of traffic samples.
14.17.3 Post Exercise Analysis
The ergonomic study confirms that the simulated sector (D) was too large. Controllers appear to have experienced difficulty in scanning the complete sector and all of the conflict points during peak traffic levels.
EUROCONTROL Experimental Centre
83
14.18
14.18.1
14.1 8.2
week of simulation.
ODD IV utilised Computer Based Training (CBT) and standard classroom techniques prior to the simulation. In addition, the participants were involved in the shake down of the SIM5+ simulation facility which employed the ODD IV interface for this purpose.
Training during the ODD simulation was limited to providing assistance when requested and explaining any changes which were implemented after the previous "shake down" exercises.
The response to the simulation questionnaire indicates that controllers were satisfied with the approach to training during the ODID simulation. It also shows that they consider the environment to be easy to train in.
A questionnaire completed by the controllers following the shake down exercise showed that they felt well prepared by the CBT for the data input requirement and that it did not take them long to adjust to the functionality of the system.
Experience from previous study simulations has highlighted the importance of preparing participants in advance. The functionality is completely new and without prior experience the majority of simulation time can be used in controller training.
ODID IV participants took approximately two weeks to fully familiarise themselves with the working environment (as seen in S A and NASA TLX). However, they expressed confidence in their ability to operate the system by the end of the first
EUROCONTROL Experimental Centre
84
15 CONCLUSIONS AND RECO ENDATIONS
15.1 OUSE INPUT DEVICE
1 5.1.1 Comlusbns
The use of a three button mouse as an input mechanism for system dialogue was well received. Controllers were able to keep the system up to date (except when blocked by system problems) in approach, lower and upper airspace sectors at the simulated traffic levels.
The mouse mat was too small (as in the ODlD Ill simulation). Some of the controllers resorted to using the desktop (which provided sufficient friction) but this caused dirt to accumulate in the mechanical parts of the mouse causing the cursor to "jump."
The positions of the supplementary windows on the screen, sector size, sector layout and route structure can significantly influence the amount of mouse manoeuvring required to move the cursor over the screen. It was also observed that during periods of inactivity controllers lost (or forgot) the cursor position on the screen; this was disconcerting.
The "click" time which differentiated a "single" click and a "press and hold" action was not optimal, causing difficulty in effecting data input.
15.1.2 Rscommendatbns
The mouse input device is recommended for use in multi-windowing Controller Working Positions.
It is recommended that a "centre cursor" or "show cursor" function is provided.
It is recommended that further research is effected to :
1. evaluate the use of an acceleration algorithm to aid the movement of the cursor over large screen areas;
2. define the size of mouse mat required in relation to a large display;
3. identify the most suitable type of mouse (mechanical, optical, remote) which provides sufficient comfort and reliability over long periods of use in the ATC workplace;
4. identify the most suitable "click time" to differentiate between a "simple click" and a "press and hold" action.
EUROCONTROL Experimental Centre
85
15.2
15.2.1 Corn
The window management functions (swop, move, re-size, iconify and scroll) are essential in a multi-window display system. Participants judged the "dynamically re-sizing" of windows according to the amount of information displayed to be a positive feature.
The window management function was prone to accidental re-sizing of windows. This was due to a poor mouse click response time and an imprecise definition of the "sensitive zones" which identified the proposed action for a window.
"Paging" (clicking on either side of the scroll button to change a complete page of values) was identified as being the preferred method of displaying new values in pop-up windows. The participants rarely employed the scroll action (press and drag) or individual clicking (one value at a time). It must be said that the amount of recorded "paging" action was excessive.
Study of the participants final window arrangements reveals a significant resemblance between five of the six designs. These designs were rational and showed a conscious effort to avoid potential hazards associated with window overlap and hidden data. The similarity in the majority of window settings suggests that a selection of controller defined defaults would be sufficient in an operational environment. On the other hand, the judicious choice of settings may also imply that an "open" window functionality can be confidently and safely used by the controller population.
15.2.2 Recommendations
Window management functions are necessary for use when multi-window displays are employed in Controller Working Positions.
It is recommended that multi-window display systems should provide the controller with either,
a sufficient choice of default settings appropriate to individual sectors (pre-defined by operational controllers), or
suitable window management functionality which will permit the controller to define an individual window preferGlice set which can be saved for repetitive use.
However, further research should be undertaken to identify suitable and reliable window management systems which can be used by the Air Traffic Controller.
EUROCONTROL Experimental Centre
86
15.3 WINDOW STRUCTURE
15.3.1 Cone
The simulation has shown the importance of carefully defined window construction.
Certain windows (eg SIL, Extended Radar Label and CARD) suffered from poor spacing between text (and graphics) and the window frame. It was also observed that in some cases the re-sizing of a window could hide important information.
Data displayed in the VAW and HAW became illegible due to overlapping of text and also of text and graphic information.
15.3.2 Recommendations
Individual windows should be designed so as to ensure that there is adequate spacing between text, graphics and window frames. Where re-size action is permitted, a minimum window size should be defined to ensure that data is not lost by the re-size action.
A text anti-overlap function is essential to ensure that textual data is always visible and accessible to the mouse cursor.
15.4 COLOUR
15.4.1 Conclusions
The potential benefits of colour cannot, of course, be measured in a quantifiable manner. Nevertheless, the ODlD IV participants felt that the use of colour supports the ATC task, specifically when determining priorities such as identifying an aircraft's planning status or recognising coordination and urgency situations.
Colour can be considered for use on Air Traffic Control displays to denote :
aircraft planning status (sector entry, assume, transfer); coordination; urgency situations; significant areas of airspace (own sector, military zones); callsign highlighting.
Colour applications are valid in both approach and en-route sectors.
The use of too many colours for primary functions can have a negative outcome. Controllers found it difficult to assimilate colour planning states following the introduction of a "fifth" colour state in the approach area.
EUROCONTROL Experimental Centre
87
In general, displaying several colours within the radar data block appears to be acceptable, but there are potential areas of concern. For example :
the use of similar colours (shades) of white to identify the speed vector and the lead line (link between data block and position symbol) caused confusion in maintaining traffic identity (the speed vector of one aircraft could appear to link data blocks and position symbols belonging to other aircraft);
the use of white to indicate coordination in the radar label occasionally confused the EC as it was not apparent without reference to the message windows whether the coordination was incoming or outgoing (ECs were observed trying to accept outgoing coordination).
The use of a red callsign to indicate an STCA alert was shown to be a very good "attention getter"; however, controllers had difficulty reading the callsign due to a tthalo" effect resulting from the combination of the saturated red and the background video colour (similar to ODlD Ill). Participants found the ability to highlight an predicted conflict (yellow callsign) to be useful and would like to see this developed as a selectable feature for use on individual callsigns; it was primarily used by the PLC to warn the EC of predicted conflict situations.
The large blocks of colour used in the VAW to define conflict areas were distracting and often difficult to interpret.
There is a need for a single authoritative European reference guide to the use of colour in air traffic control as great care must be given to the choice, mix and number of colours to be used. (Such a guide could be achieved by gathering together information from the various colour studies which have been completed by National Administrations and the results of the ODlD evaluations).
15.4.2 Recommendations
Large blocks of concentrated colour should be avoided.
European Standards for the use of colour in Air Traffic Control should be established.
15.5 SYSTEM ASSISTED COORDINATION (SAC)
15.5.1 CORClUSbRS
System Assisted Coordination (entry and exit levels, heading, direct route and speed control requested by the receiving sector) was perceived by the participants to be one of the most beneficial aspects of the ODID IV evaluation.
SAC provided controllers with an unambiguous message presentation and reduced the use of the telephone for coordination. Controllers speed of response to acknowledge SAC messages was encouraging (50% to 70% of coordination messages were answered within 30 seconds.
EUROCONTROL Experimental Centre
88
Both area and approach controllers considered that the departure request coordination message was of considerable benefit to them. Considering that a significant number of SAC messages were responded to within 30 seconds, the SAC departure coordination appears to offer significant savings in telephone coordination time.
As with ODID 111, controllers were not always aware that a new message had been received by the sector; there is a need for additional indicators to proclaim the arrival of a message. It was also noted that the EC was not always able to differentiate between incoming and outgoing coordination presented in the radar label.
It was observed that controllers paid more attention to the "message in" window than to the "message out" window. This tends to support the design of separate message windows for inbound and outbound coordination.
There is considerable scope within SAC for further development. The ODID participants felt that this should include forward coordination procedures for heading, direct route and speed. Furthermore, this development could easily encompass the requirements of traffic flow and sequencing coordination between approach control and TMA sectors and also releasing traffic for climb/descent in the approach area.
Observation of the participants use of SAC indicates a need for a recall and message cancellation function.
15.5.2 Recommendations
The development of a comprehensive System Assisted Coordination function should be encouraged. European standards of application for use of System Assisted Coordination in approach, lower and upper airspace sectors should be defined.
It is recommended that further evaluation is undertaken to :
identify a mechanism for attracting the controllers attention to the posting of a new incoming message;
fl evaluate the potential benefits of SAC with regard to :
disseminating flow control information; n
forward coordination of heading, direct route and speed control;
coordinating sequencing / metering into (and out of?) the approach area; release mechanisms between approach control positions to facilitate the coordination of climb and descent.
fl identify an appropriate cancel/recall message function.
It is also recommended that silent coordination for departure clearances from local aerodromes should be developed further and retained as a SAC function.
EUROCONTROL Experimental Centre
89
15.6 RADAR WINDOW
15.6.1 C o ~ ~ u s ~ n s
It is concluded that the radar window provided in the ODID IV simulation was comfortable and easy to use. Controllers appreciated the window management and button bar functions related to the window.
During the course of the simulation, it was noted that ECs consistently selected the radar display to full screen size. However, with the exception of one controller, the PLC choice of radar window was a square shape window, approximately two thirds the size of the full screen. All approach controllers selected a full screen radar window.
The approach control participants proposed that a second radar window should be provided; this would permit them to preview inbound traffic flows (and assess outbound direct routing possibilities) which would assist in the determination of arrival sequencing strategies.
Controllers in area positions found it difficult to estimate distance in the radar window in relation to the selected display range.
15.6.2 Recommendations
The provision of a second radar window for approach control positions should be evaluated.
A mechanism for indicating distance in relation to the selected display range should be provided.
15.7 BUTTON BAR FUNCTIONS
15.7.1 Conclusions
The button bar was suitable as an easy means of accessllig functions related to the radar window. Analysis of data and controller comment suggests that :
the QWB (Quick Way Back to the last saved setting) was infrequently used but if retained it should be linked to all saved settings;
the pre-set radar range buttons were infrequently used but if retained they should include radar picture off-centring options;
the supplementary radar label data was infrequently used - controllers found the information was more readily accessible from the extended radar label;
the speed vector selection buttons were too small; speed vector was not used by the approach controllers and rarely accessed by area controllers;
EUROCONTROL Experimental Centre
90
the automatic label anti-overlap function was unsatisfactory (this is confirmed by the amount of recorded manual label de-confliction actions). This function was heavily criticised by the participants as it frequently moved labels when an input was about to be effected and failed to satisfactorily de-conflict labels in areas of intense traffic. An efficient automatic label anti-overlap function is essential if data input via the radar label is to be used as the primary point of interaction between the controller and the system;
the range zoom valuator mechanism was easy to use (except when subject to slow system response) but was rarely accessed during an exercise;
the layer filter valuator mechanism was easy to use (except when subject to slow system response) but was rarely accessed during an exercise;
the video map selection was infrequently used but was accepted as an easy method of selecting map data;
the range and bearing line was easy to use and could be developed further to include different modes (point to aircraft and aircraft to aircraft tracking);
the telecom window was considered to be a positive idea provided a standard telecom facility is always available. If the on screen communication window is retained it should be developed further to ensure feedback to the other sector position concerning telephone communications involving the sector which are already in progress;
the preference set was considered to be extremely positive and could be developed further to provide additional functions and options for displaying information.
Although easy to use and appreciated by the participants, the button bar functions were rarely accessed during an exercise. Indeed, the participants expressed the opinion that some of the functions were more readily available through the extended radar label on an individual access basis.
It would appear that the button bar functions could be grouped together in specific menus according to their application, with each menu being accessed by way of a single button. This would reduce the size of the button bar whilst ensuring that high priority applications are more visible and therefore easier to access quickly. An example of such groupings might include:
Radar Window Settings: (QWB, Pre-Set Radar Range, Range ZOOM, Layer Filter); Supplementary Data: (Dep, Dest, Type, Speed, Company, NS Frequency); Label Overbp: (Automatic, Manual); Video Map; Range and Bearing modes; Telecom; MTCA Tools: (HAW, VAW, CARD, CZW); Preference Set.
EUROCONTROL Experimental Centre
91
15.7.2 Recommenda
It is recommended that button bars or icons should be retained for accessing functions related to the radar window in multi-windowing Controller Working Positions.
An evaluation of button bar functions grouped according to their individual application should be carried out.
Further research into automatic label anti-overlap functionality is recommended to produce an anti-label overlap algorithm which assures easy access to potentially large radar data blocks (ODID IV labels could expand to 5 lines).
The range and bearing feature should be developed to include additional functionality including :
0
0 aircraft to aircraft tracking; 0
point to aircraft tracking (with range and bearing display);
multi-operation of range and bearing and the above proposals.
It is recommended that "on screen" telecom facilities should provide feedback to the other sector team member (s) with regard to line occupancy.
15.8 RADAR LABEL
15.8.1 Conclusions
The dynamic radar label provided a positive and exploitable interface for system dialogue. The need to update the system did not distract controllers from their primary task of separating aircraft. The shape of the radar label and the use of colour planning states assisted the controller in determining task priorities. Analysis shows that the majority of data input was effected through the radar label.
The application of "minimum information display" in the radar label, in accordance with aircraft planning status, was important. Controllers did not like the label to extend to more than three lines (this may have been influenced by the poor performance of the label anti-overlap function in areas of dense traffic) and wanted the system to remove historical route data.
Recordings show controllers removing heading and speed data from the label (I9 cancellation click on the appropriate field).
The information presented in the radar label was considered to be satisfactory by the participants. However, in approach control there was a need to display the aircraft vortex wake category and the area control radar label required easy access to the XFL field when a two-line radar label was presented.
,EUROCONTROL Experimental Centre
92
The IB button was rarely used to call supplementary data (eg flight leg and extended radar label) in approach control positions.
The extended radar label was considered to be to be very useful by the area controllers. It was suggested that the presentation of a particular aircraft's flight plan in the extended label could be activated by linking the display of information with other mouse input actions. Controllers appreciated the ability to call an extended label by a "press and hold" action on the label callsign.
15.8.2 Recommendations
The radar label is recommended as the focal point for data input and access to supplementary data in advanced ATC systems which require the controller to input current flight plan and control information.
The system's ability to reduce the size of the radar label to a minimum display of essential information should be fully exploited. Where possible, the radar label size should be restricted to three lines (excluding the forced display of urgency information).
The Extended Radar Label should be retained. It provides important support information to the controller (especially the area controller). Additional methods of calling data into the extended radar label window should be explored.
15.9 RADAR LABEL DIALOGUE
15.9.1 Conclusions
Dialogue through radar label fields was satisfactory. BV the end of the simula tion
Problems associated with system response times and the label anti-overlap function highlight the need for un-restricted access to label information. The controller should never be restricted or frustrated by data input if such input functions are to be successfully adopted by the controller population. In the event that the system has to block data input, the controller should be advised accordingly.
The "cursor defaulting" application for aiding the selection of repetitive values was appreciated and perceived to reduce the time taken to find standard values in the pop-up windows.
The legibility and handling of pop-up windows requires careful development. These windows are generally displayed for a short period of time and should provide simple access for data selection and input. An excessive amount of "paging" action in pop-up windows was recorded in the approach positions (CFL, ASP and XFL) which suggests that the number of displayed flight level options was insufficient.
EUROCONTROL Experimental Centre
93
One of the more interesting dialogue functions was provided by the elastic vector. This function permitted the controller to define either a heading or direct route. Similar problems of legibility were encountered with the elastic vector as with the pop-up windows. Controllers also found it difficult to select the elastic vector although a modification to the size of the selectable area during the simulation improved the selection ability.
In certain situations controllers neglected to input data (data of a repetitive nature). This was always a conscious decision on the part of the controllers concerned which may have been driven by system problems. The consequences of such "neglect" would be a reduction in conflict prediction accuracy and in the system's ability to provide coordination assistance.
An excessive amount of data input was effected through the callsign menu. Over 50% of recorded pick actions were callsign (assume and transfer).
It is recommended that development effort is directed towards reducing to a minimum any system related delay which may adversely affect the data input operations required of the controller. In the event that the system cannot treat a data input (for whatever reason) it is recommended that the controller should be advised accordingly by some feedback mechanism.
A cursor defaulting function would assist the controller in selecting pre-defined repetitive input values and should be explored further.
It is recommended that the design of pop-up windows take into consideration the operational nature of individual sectors (vertical extent, routing possibilities and control requirements) in order to reduce the amount of scrolling (or paging) action required to find the correct input value. Pop-ups should be easy to read and manipulate (scrolling/paging).
The consequences of controllers neglecting (or being unable to) update advanced ATC systems (which require the controller to input current flight plan and control information) should be evaluated. System design should safeguard against such omission.
Wherever possible, the ability of the system to "take over" repetitive tasks should be exploited in order to reduce the controller's data input requirement to a minimum.
15.10 FLIGHT LEG
1 5.1 0.1 Conclusbns
The flight leg was perceived to be an important new tool, providing the controller with route and conflict information in the primary working area, the radar window. Use of the flight leg increased during the "re-calculation" of profile exercises and controllers expressed the opinion that they preferred the flight leg to the HAW.
EUROCONTROL Experimental Centre
94
15.10.2 Rscom
Development of a flight leg function providing conflict prediction information should be explored further.
15.1 1 EMU FUNCTIONS
15.11.1 Cowl
The repetitive nature of the "ASSUME" and "TRANSFER" functions provided through the callsign menu, were considered to be beneficial by the participants in that they assisted the controller to memorise traffic detail and improved their situation awareness. However, repetitive functions such as this would normally be considered suitable for automation.
Callsign menu input action represented an excessive number of pick actions (each aircraft generated a minimum of four mouse actions; callsign - assume : callsign - transfer). It should be possible to reduce the callsign menu data input requirement by 50% (and the overall data input by 25%) by redefining the assume and transfer actions.
The tlSKIP1f and "FORCED ABI" were perceived to be "workload" reducing functions since they facilitated the early transfer of traffic to the next sector.
15.1 1.2 Recommendatbns
The benefit of manual assume and transfer input should be evaluated. In any event it is recommended that the number of callsign mouse input actions be reduced. Single input action on the callsign menu or sector designator for assume and transfer would significantly reduce the overall data input requirement.
15.12 TABULAR DATA DISPLAYS
15.1 2.1 Conclusions
The Sector lnbound List (SIL) was used by the controller as an initial start point for sector entry and exit planning. It would appear that additional data could be made available in the SIL; controllers often moved from the SIL to the extended radar label to retrieve supplementary information. However, individual controllers had different requirements for this additional information (this would also be true of individual sectors). The use of a data selection option in the preference set-up would permit controllers to add or delete data to the default SIL information display.
EUROCONTROL Experimental Centre
95
The posting of traffic to SlLs according to the aircraft's sector entry point was appreciated by the participants. This posting mechanism appeared to correctly represent direct route traffic at sector entry. (The direct route structure employed in the simulation was similar in many respects to the current Copenhawn route structure and therefore was not particularly testing for such a mechanism).
It was observed that the majority of controllers positioned SlLs geographically according to the SlLs allocated sector entry area. A considerable amount of "move" actions were performed on the SIL windows.
Participants suggested that further development of SlLs could include the display of coordination information for example, between TMA and approach control to indicate traffic flow rates or holding constraints. As the SIL is the first point of information display for pending inbound sector traffic, conflict prediction information could be appended to the flight details thereby alleviating the need to systematically validate each aircrafts' sector inbound conditions.
The landing and departure lists were both criticised by the approach control participants for lack of data manipulation capability. Controllers wanted to interact with these windows in order to update or amend traffic sequences. Even if an automated traffic amendment function were provided in such windows it would appear necessary to cater for the eventuality that the controller will want to amend a sequence to suit his/her own planning requirements.
15.1 2.2 Recommendations
The desirability and usefulness of providing a controller option for "on line'' definition of the information to be presented in tabular data displays should be investigated.
It is recommended that the posting of advance sector warning information in a SIL according to aircraft sector entry points (when on direct routing) should be studied further in an airspace environment which provides the possibility of a diverse free route structure.
The use of tabular data windows for displaying specific coordination information (eg flow rates on an approach STAR) should be investigated.
The requirements for tabular data display specific to approach control and the associated data manipulation functions should be identified and evaluated.
15.13 MTCA TOOLS
It is to be noted that due to technical problems only six exercises were simulated using recalculation of profile. This affected the participants ability to evaluate the MTCA tools
EUROGONTROL Experimental Centre
96
15.13.1
15.13.2
15.14
15.1 4.1
15.1 4.2
15.15
15.1 5.1
Although primarily designed as a planning tool, the CARD was selected on permanent display by the majority of ECs, which suggests that the EC appreciated the availability of a conflict prediction aid. The EC rarely selected the HAW and VAW.
Although having the same functionality available as the PLC, ECs were observed viewing information on the PLC display. Indeed, the ergonomic study shows that some PLCs positioned the MTCA tools to the left side of their display apparently to provide the EC with viewing access. This suggests a close interaction between PLC and EC requiring joint access to planning tools.
Rcdcommenda
It is recommended that the use by the EC of graphical aids developed for the PLC and specifically a conflict prediction tool, should be evaluated further.
HAW - HORIZONTAL AID WINDOW
Conclusions
The HAW was the participants least favoured MTCA window. The presentation of data was too concentrated, resulting in a considerable amount of "wasted" visual space in the window. The flight leg was considered to be a more suitable conflict prediction tool than the HAW because it was displayed in the radar window and could therefore be related more easily to the current traffic situation.
The HAW was used in conjunction with the VAW by controllers to check traffic situations before accepting proposed coordination. Controllers occasionally experienced difficulty in identifying the subject aircraft.
Recommendations
If the HAW is to be retained the presentation of conflict prediction graphics should be redefined to take advantage of the visual space available in the window.
The subject aircraft should be more conspicuous in presentation.
VAW - VERTICAL AID WINDOW
Conclusions
The VAW provided the controllers with sufficient information to identify "traffic free" airspace for planning level changes.
EUROCONTROL Experimental Centre
97
15.1 5.2
15.16
15.1 6.1
However, the nature (crossing, converging, diverging) of the conflict as defined by shape and colour was not always apparent. Controllers did not like the use of large blocks of strong colour which were considered to be distracting and without meaning. It was often difficult to read callsign data due to overlapping text.
The relationship between the VAW profile and the current radar situation was considered to be too remote since the actual radar information and the calculated profile were often out of synchronisation. Updating of the displayed VAW profile needs to take account of the aircraft's actual position (3D) as determined from radar derived information.
Controllers appeared to be looking only for colour in the MTCA tools to indicate a traffic problem. This appears to have resulted in lack of memorisation of textual and graphical detail which could reduce their traffic awareness. Very little data input was effected through the VAW.
Recommendations
The graphical presentation of the VAW should be improved to represent more accurately the nature of a predicted conflict.
The calculated vertical profile displayed in the VAW should be related to the aircraft's actual position and the flight level indicated by the mode C readout in the radar label.
It is recommended that the consequences of controllers searching only for colour in the MTCA tools at the expense of memorising textual and graphical flight details be investigated.
CARD - CONFLICT AND RISK DISPLAY
Conclusions
Together with System Assisted Coordination, the CARD was considered to be one of the most important functions in ODID IV. It was perceived as a planning aid for assisting with conflict detection at sector entry and as a general conflict monitoring tool. Both the EC and PLC used the CARD.
The CARD provided a filtering function (traffic separation monitoring, including entering traffic) thereby decreasing the need for the controller to systematically validate the entry conditions for every aircraft. This may have been based on the assumption that traffic proposed to the sector should be conflict free and, if not, conflict conditions would be detected in advance by the CARD. (This also assumes that the conflict prediction algorithm is proven).
EUROCONTROL Experimental Centre
98
The significant parts of the CARD graphic display were :
the point at which separation is predicted to be lost; = the point of minimum predicted distance;
the type of conflict (ie conflict or risk of conflict).
Controllers did not seem to be interested in conflict duration (this could be determined elsewhere).
The use of colour in the callsign text window was confusing.
The CARD provided a pre-warning of potential workload.
The CARD displayed too many conflicts in the lower airspace, many of which were of uncertain nature. This resulted in an "overloaded" display of conflict information which the controller was unable to digest.
15.16.2 Recommndatbns
It is recommended that the potential of a Conflict And Risk Display as a sector entry planning tool and a traffic separation monitoring facility should be investigated further.
It is recommended that the CARD text and graphic displays should be evaluated further with regard to the presentation of:
the use of colour on callsign text; the point at which separation is predicted to be lost; the point of minimum predicted distance; the type of conflict (ie conflict or risk of conflict); the indication of future workload relative to the number of predicted conflicts.
15.17 CZW - CONFLICT ZOOM WINDOW
1 5.1 7.1 Conclusbns
The CZW was a helpful tool. It was easy to interpret and provided help in formulating a conflict resolution. The CZW was normally used in conjunction with the CARD; controllers called the CZW by action on the conflict number in the CARD and both windows were generally positioned in close proximity to each other.
Access to the CZW by press and hold action would be beneficial.
15.17.2 Recommendations
It is recommended that a CZW should be retained as an integral part of a CARD.
Operation of the CZW should include a "press and hold" option for temporary (quick look) display.
EUROCONTROL Experimental Centre
99
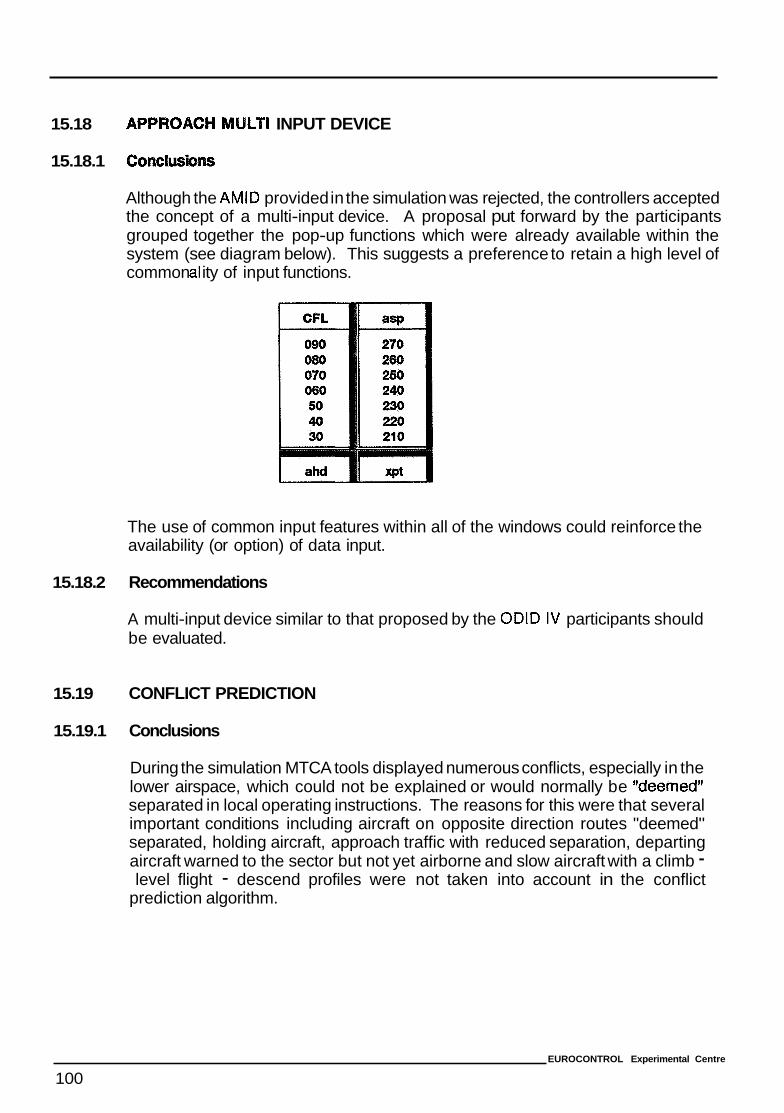
15.18
15.18.1
15.18.2
15.19
15.19.1
ULTl INPUT DEVICE
Although the AMID provided in the simulation was rejected, the controllers accepted the concept of a multi-input device. A proposal put forward by the participants grouped together the pop-up functions which were already available within the system (see diagram below). This suggests a preference to retain a high level of common al ity of input functions.
The use of common input features within all of the windows could reinforce the availability (or option) of data input.
Recommendations
A multi-input device similar to that proposed by the ODID IV participants should be evaluated.
CONFLICT PREDICTION
Conclusions
During the simulation MTCA tools displayed numerous conflicts, especially in the lower airspace, which could not be explained or would normally be tideemedit separated in local operating instructions. The reasons for this were that several important conditions including aircraft on opposite direction routes "deemed" separated, holding aircraft, approach traffic with reduced separation, departing aircraft warned to the sector but not yet airborne and slow aircraft with a climb - level flight - descend profiles were not taken into account in the conflict
prediction algorithm.
EUROCONTROL Experimental Centre
100
15.19.2 Recommenda
It is recommended that research into suitable conflict prediction algorithms for future ODlD type simulations is undertaken. The use of planning tools and conflict monitoring systems cannot be properly validated without accurate and reliable information.
15.20 WORKLOAD
15.20.1 Comlusbns
The ODlD IV simulation has not produced any significant quantitative information to identify controller workload or potential capacity gain which might be obtained from an advanced ATC Controller Working Position.
The cost benefit of developing (and implementing at an operational level) the functions proposed in ODlD IV (or similar functions) has not been clearly identified. It is important that such benefit be determined to provide Planners, ATC Managers and Industry with the confidence to continue research and development in this area. It is also important to provide evidence to the controller population that advanced CWP systems are feasible and hold no mystery.
However, there is some evidence that reduction in workload can be achieved by system assisted coordination and related reduction in telephone use in an ODID type system.
ODID IV participants expressed the opinion that, with adequate response times and no system problems, the data input required to update the system can be achieved without adversely affecting their ability to accomplish the ATC task. Participants also perceived the use of colour and shape of the radar label to be advantageous as these functions indicated the "handling" priority which should be allocated to individual aircraft thereby reducing workload.
The workload indicators used during the simulation (NASA TLX, SA, modified MBB) show normal workload for the airspace configuration simulated (this is in agreement with subjective opinion). No external influences affecting workload could be detected from the indicators although a learning period of approximately two weeks was observed.
15.20.2 Recommendations
It is recommended that additional evaluation be effected to determine :
the extent to which data input can be achieved under excessive traffic loading; the usefulness of planning aids such as those proposed in ODlD IV;
m the capacity gain (or limit) associated with the ODlD IV working environment (or a similar facility).
EUROCONTROL Experimental Centre
101
15.21 WORKING METHODOLOGY
15.21.1 Corn
It is concluded that the controllers division of responsibility and task sharing in a sector did not change from the traditional planning and executive functions current in Copenhagen today. However, both EC and PLC appeared to benefit from the availability of the same functionality at both positions. It was also observed that the PLC was willing to assist the EC with the data input task when necessary.
PLCs preferred to search for data in the radar window by checking radar labels rather than examining the MTCA tools (however, this may have been due to system limitations).
Colour appeared to help the controller to determine task handling priorities, however, when using the MTCA tools, the controllers only appeared to be looking for colour. This suggests that they did not memorise flight plan data which was available in textual and graphic form in the windows (this assumption tends to be confirmed by the observations of controllers frequently referring back to tools and the extended radar label).
15.21.2 Recommendations
It is recommended that future evaluations similar to ODlD IV should further evaluate the implications of the controller and the system sharing the planning task.
15.22 THE WORKING ENVIRONMENT
15.22.1 Conclusion
The ODlD IV participants accepted the concept of an all "On Screen" working environment with the proviso that suitable back-up facilities are always available. However, they were insistent that a telecommunication panel should always be conveniently available, even if an "on screen" telecom window is provided.
The use of large displays can result in uncomfortable working conditions for the controller. Discomfort can be related to the physical size of the contrGar and whether or not the individual wears reading glasses. Freedom of access should be assured to allow controllers to re-position and adjust the height of a large display.
Despite the considerable amount of information displayed or available through the ODID CWP, controllers still felt the need to access data from adjacent displays.
EUROCONTROL Experimental Centre
102
15.22.2
15.23
15.23.1
15.23.2
15.24
15.24.1
15.24.2
It is recommended that European ergonomic standards specific to the employment of large displays in the ATC workplace should be defined.
SIMULATION FACILITY
Conclusions
The simulation facility did not attain a satisfactory level of operation in time for the evaluation. System performance restricted the participants ability to evaluate fully the usefulness of the ODlD IV functions and as a result they were unable to assess any potential capacity benefits or limits.
Recommendation
The simulation facility should be developed to an acceptable level of operation to permit a full and comprehensive evaluation of the ODlD IV planning tools and to identify any associated capacity benefits or limits associated with the ODlD IV environment, without system induced limits.
TRAINING
Conclusions
The use of CBT and standard classroom methods for pre-simulation training ensured that the ODID IV participants were well prepared to cope with the system functionality. CBT is well suited for preparing controllers for advanced simulations of this nature.
Despite the pre-simulation training and the benefit of five weeks of simulator %hake down" exercises, controllers nevertheless took approximately two weeks to adapt to the ODlD IV simulation environment.
Recommendations
Pre-simulation training including the use of CBT is recommended as preparation for study simulations of advanced ATC systems.
EUROCONTROL Experimental Centre
103
16 CONCLUSIONS et ECOMMANDATIONS
16.1 ME MOYEN D'ENTREE
16.1.1 Comlu.
L'utilisation d'une souris & trois boutons comme moyen d'entr6e pour le dialogue avec le systbme a 6t6 bien accueillie. Les contraleurs ont 6t6 & m6me de maintenir le systbme & jour (sauf en cas de dysfonctionnement du systhme) dans les secteurs d'approche, d'espace inf6rieur et d'espace superieur avec les niveaux de trafic si m u 16s.
Le tapis de la souris 6tait trop petit (comme cela avait 6t6 le cas en simulation ODlD 111). Certains contr6leurs ont voulu le remplacer par la tablette de la position de travail, (qui 6tait suffisamment rugueuse) mais cela eut pour consbquence d'accumuler de la poussibre dans le mecanisme de la souris, ce qui occasionna des sauts intempestifs du curseur.
La positions des diverses fenetres sur I'6cran, la taille du secteur, la disposition du secteur et le r6seau de route ont une influence significative sur le nombre de manipulation de la souris n6cessaires pour mouvoir le curseur sur la surface de 1'6cran. II fut aussi observe que pendant les p6riodes d'inactivite, les contraleurs perdaient (ou oubliaient) la position du curseur sur 1'6cran; cela fut perturbant.
Le temps du << clic >> qui diffbrentiait le simple << clic >> d'une action << appuyer et maintenir )> n'6tait pas optimal, ce qui fut une cause de difficult6 pour I'entr6e des don n6es.
16.1.2 Recommandations
La souris comme moyen d'entr6e est recommand6e pour les positions de travail de contraleurs dot6es de multifenetrage.
II est recommand6 de pr6voir une fonction permettant de placer automatiquement le curseur au centre de 1'6cran ou d'en montrer sa position.
I I est recommand6 que des recherches soient poursuivies en vue :
1. d'6valuer I'utilisation d'un algorithme ayant pour objet de faciliter les mouvements du curseur sur la surface des grands 6crans;
2. de d6finir la taille 9 donner aux tapis de souris pour servir un grand 6cran;
3. d'identifier le type de souris le mieux adapt6 (mecanique, optique ou independant), afin d'obtenir un confort suffisant et une fiabilit6 sur de longues p6riodes d'utilisation dans un lieu de travail ATC;
4. d'identifier le << temps de clic +> le plus appropri6 pour differentier un << simple click >% d'une action << appuyer et maintenir >>.
EUROCONTROL Experimental Centre
105
16.2 GESTION DE FENETRES
16.2.1 Conclusbns
Les fonctions de gestion de fenlitres (bchange, d6placements, dimensionnement, mise en icane, defilement) sont essentielles dans un systeme il multifenlitrage. Les participants ont jug6 positif le (4 re-dimensionnement dynamique >> des fen6tres en fonction de la quantit6 d'informations h afficher.
La fonction de gestion des fenlitres donna lieu h des re-dimensionnements de fen6tres fortuits. Cela 6tait dQ au temps de r6ponse trop excessifs et h une d6finition imprecise des << zones sensibles >> destin6es h recevoir le c/ic d'ex6cution de chacune des diverses actions. commandables par la souris.
Le changement de page (c/ic sur I'un des c6t6s du bouton commandant le defilement pour passer 9 la page suivante de la liste) fut consid6r6 comme etant la m6thode pr6f6r6e pour afficher de nouvelles valeurs dans les fen6tres pop-up. Les participants eurent rarement recours h la commande de defilement (appuyer et glisser) ou au <<c/ic individuel >> (une valeur 9 la fois). I I convient de dire que la quantit6 des actions (< changements de page >> enregistrbes 6tait excessive.
L'6tude des arrangements de fen6tre r6alis6s par les participants en fin de simulation font apparaitre une resemblance frappante entre cinq des six organisations de fenlitres choisies. Ces organisations 6taient rationnelles et montraient le souci de leurs auteurs d'6viter les possibles risques de chevauchement de fenlitres ou de dissimulation de donn6es. Cette similarit6 dans la majorit6 des fenlitrages choisis conduit h penser qu'une selection d'arrangements pr6d6finis pourrait slaverer suffisante dans un environnement op6rationnel. D'un autre cbt6, les choix judicieux faits peuvent aussi signifier qu'une libert6 entiere en ce domaine peut litre laiss6 aux contraleurs en toute s6curit6.
16.2.2 Recommandations
Les fonctions de gestion de fenlitres sont n6cessaires lorsque I'on utilise des affichages en multifenlitrage aux positions de travail de contrBleurs.
II est recommand6 que le systeme d'affichage en multifen6trage donne au contrdleur les possibilit6s suivantes :
un choix suffisamment grand d'arrangements de fen6tres pr6d6finis (par des contraleurs opbrationnels) et adapt& aux diff6rents secteurs, ou bien
une fonctionnalit6 convenable pour I'arrangement des fenetres, qui permette ;f chaque contraleur de d6finir sa propre pr6f6rence pour I'organisation des fenlitres sur son &ran et d'enregistrer son choix pour des utilisations ult6rieures.
Cependant, des recherches devraient etre entreprises pour determiner des systemes de gestion de fenlitres pouvant litre mise en oBuvre par des contr6leurs ATC de faGon sQre, facile et rapide.
EUROCONTROL Wpsrimental Centre
106
16.3 COMPOSITION DES FENETRES
16.3.1 CQnClU
La simulation a montr6 qu'il importait de definir avec beaucoup de soin la composition des fenBtres.
Certains affichages (par exemple le SIL, I'6tiquette radar &endue, le CARD) ont subi I'inconv6nient d'un manque d'espace entre le texte (ou le graphique) et le bord de la fenetre. i l fut aussi observ6 que dans certains cas ie re-dimensionnement d'une fenetre pouvait cacher d'importantes informations.
Des donntjes contenues dans le VAW et le HAW sont devenues illisibles B cause d'un chevauchement de textes ou d'un melange de texte et d'information graphique.
16.3.2 Recommandations
Les fenBtres devraient Btre conques de manihre B ce qu'il y ait toujours un espacement convenable entre les cScritures, les graphiques et les bordures de fenetre. Lorsque le re-dimensionnement est permis, i l conviendrait de definir pour chaque fenetre une taille minimale qui garantirait qu'aucune donnee n'est perdue B la suite d'une commande.
Une fonction 6vitant automatiquement les chevauchements de textes est indipensable pour assurer que les ecritures soient toujours visibles et accessibles par le curseur de la souris.
16.4 COULEUR
16.4.1 Conclusions
Le b6ncSfice susceptible de decouler de I'usage de la couleur ne peut pas, bien sOr, &re mesurd quantitativement. Nbanmoins, les participants d'ODID IV estiment que la couleur est un avantage dans I'accomplissement des taches ATC, notamment si elle permet de signaler les priorit& d'actions B entreprendre, comme par exemple en indiquant pour chaque avion dans quel stade de la planification il se trouve presentement ou en signalant les situations de coordination et d'urgence.
La couleur peut etre utile dans les affichages ATC afin de mettre en exergue :
le statut des avions du point de w e planning (a I'entrbe du secteur, assume, en phase de transfert): la coordination; les situations d'urgence; des portions d'espace particuli6res (re secteur de la position de travail considerbe, des zones militaires); la mise en 6vidence des indicatifs d'appel.
EUROCONlROL Experimental Cenb-e
107
L'utilisation de la couleur est intbressante aussi bien pour I'approche que pour les secteurs de contrble regional.
Le recours 9 un nombre trop important de couleurs pour des fonctions primaires peut avoir des consequences negatives. Les contrbleurs ont trouve qu'il etait difficile d'assimiler la signification des couleurs utilisees pour signaler le stade de planification lorsque le nombre de ces couleurs atteignait cinq en zone d'approche.
En general le recours B plusieurs couleurs B I'interieur des dtiquettes radar apparQt acceptable, avec cependant de legbres reserves telles que celles-ci :
I'utilisation de couleurs blanches voisines (degrades) pour le vecteur vitesse et la ligne correlant I'etiquette au symbole de position fut 9 I'origine de confusions d'identitt! des avions (le vecteur vitesse d'un avion peut apparaTtre comme la ligne de correlation d'un autre);
I'utilisation de la couleur blanche pour indiquer la coordination dans I'etiquette radar & donn6 lieu par moment B des meprises pour le contrbleur executif qui ne pouvait faire la distinction, d'aprbs cette seule indication de couleur, entre les avions 9 I'entree ou B la sortie. (On vit des contr6leurs essayer d'accepter des vols en sortie de leur secteur).
La mise en couleur rouge des indicatifs d'appel des avions concern& pour signaler une alerte de conflit B court terme (SCTA) s'est averbe un trbs bon moyen pour attirer I'attention; cependant les contrbleurs ont parfois 6prouv6 des difficult& B lire ces indicatifs d'appel B cause de la presence d'un effet de halo dD & la combinaison d'un rouge satur6 (analogue B celui d'ODID 111) et de la couleur du fond de carte. Des participants ont jug6 utile la possibilit6 de mettre en evidence un conflit predit (sous forme d'un indicatif d'appel en jaune) et ont estim6 que cette presentation soit &endue et soit rendue disponible pour la designation d'un indicatif d'appel isol6; cette presentation avait et(! initialement utilisee par le contr6leur planning pour avertir le contrbleur executif de situations de conflits predits.
Les grands blocs de couleur utilis6s dans la VAW pour indiquer les endroits 00 6taient pr6vus des conflits furent une cause de distraction et ont et6 souvent difficiles 9 interpreter.
Le besoin existe d'un guide de reference faisant autorit6 sur le plan europeen qui reglementerait I'utilisation de la couleur dans I'ATC, car un soin tout particulier est requis pour choisir ou marier les couleurs et pour en d6finir le nombre. Un tel guide pourrait 6tre realis6 en rassemblant les enseignements tires des diverses etudes sur la couleur effectuees par des administrations nationales et des 6valuations ODID.
16.4.2 Recommandations
Les grands blocs de couleurs concentrees sont & 6viter.
Des normes europeennes devraient etre 6tablies pour reglementer I'utilisation des couleurs dans I'ATC.
EUROCONTROL Experimental Cent8
108
16.5 C O ~ R D I ~ A T I O ~ ASSISTE PAR ORDINATEUR (SAC)
16.5.1 Concl
La coordination assistee par ordinateur ou SAC (niveaux d'entree et de sortie, caps, routes directes et regulations de vitesse tels que demand& par le secteur recevant) fut perc;ue par les participants comme I'un des aspects les plus benhfiques de I'evaluation ODID IV.
La SAC offrait aux contr6leurs une presentation de messages sans ambiguTt6 et entralnait une reduction de I'utilisation du telephone aux fins de coordination. La rapiditit de la reaction des contrOleurs pour prendre en compte les messages SAC fut encourageante (50% &70% des messages de coordination ont et6 suivis d'une reponse dans les 30 secondes)
Les contraleurs de secteurs de contr6le regional aussi bien que les contri3leurs d'approche ont consider6 le message de coordination des vols au depart comme tr& benefique. Compte tenu du fait que pour un nombre significatif de messages le temps de reaction des contraleurs fut inferieur Z i 30 secondes, il apparait que la coordination SAC pour les departs fait faire d'importantes economies de temps pass6 en communication t616phonique.
Comme avec ODID 111, les contr6leurs ne se sont pas toujours rendu compte de I'arrivee au secteur d'un nouveau message; un dispositif particulier pour signaler une telle arrivee semble n6cessaire. II a et6 not6 que certains contraleurs executifs n'ont pas toujours su faire la difference entre les coordinations des vols en entree et en sortie telles que presentees dans I'btiquette radar.
II fut observe que les contr8leurs accordaient davantage d'attention aux messages pour les vols entrants qu'& ceux pour les vols sortants. Cela confirme I'int(trC5t de d6finir des fenetres distinctes pour ces deux categories de messages.
II y a un tres grand champ d'action pour les developpements futurs de la SAC. Les participants d'ODID 6taient d'avis qu'il serait bon d'inclure dans ces procedures les caps, les routes directes et la vitesse. De surcroit, ces developpements pourraient facilement satisfaire les besoins en matiere de regulation des flots de trafic et de sequencement entre contrale d'approche et secteurs TMA et aussi ceux relatifs aux proc6dures de C( release )) (transfer? anticipe) pour le trafic en montee et en descente dans la zone d'approche.
L'observation de I'utilisation faite de la SAC indique qu'une commande serait sou haitable, qui permettrait de rappeler sur I'ecran une information pr6cedemrnent effac6e et une autre pour I'annulation de message.
EUROCONTROL Experimental Centre
109
Le developpement d'une fonction de coordination assistee par ordinateur devrait etre poursuivi. Des normes europeennes devraient etre Btablies pour reglementer I'utilisation de telles fonctions dans les secteurs d'approche, d'espace inferieur et d'espace superieur.
II est recommand6 d'entreprendre A l'avenir de nouvelles evaluations en vue :
= de definir un mecanisme permettant d'attirer I'attention des contrbleurs sur une nouvelle arrivee de message
d'evaluer les avantages apportes par la SAC en ce qui concerne :
0
0
0
CI
la transmission de coordination de caps, routes directes et regulation de vitesse; la distribution d'informations de regulation de trafic; la coordination des sequences d'arrivde (sequencing and metering) vers (et en provenance de) la zone d'approche; les mecanismes de procedures (c release '> entre positions de contr6le d'approche pour faciliter la coordination de montdes et descentes;
de creer une fonction de suppression et de rappel de message.
II est aussi recommand6 de poursuivre le developpement de la << coordination silencieuse '% pour les autorisations de depart des aerodromes de la region et de retenir cette fonction comme une fonction SAC.
16.6 FENETRE RADAR
16.6.1 Conclusions
II ressort de la simulation que la fenetre radar utilisbe en ODlD IV etait confortable et facile A utiliser. Les contr6leurs ont apprecie favorablement la composition de cette fenetre et les fonctions de la barre des boutons qui lui etait associees.
Au cours de la simulation il a et6 note que des contr6leurs executifs ont choisi, logiquement, d'afficher I'image radar sur la totalit6 de 1'6cran. Cependant, A I'exception de I'un d'entre eux, tous les contr6leurs planning ont fait le choix de placer I'image radar dans une fenetre carree qui occupait environ les deux tiers de I'6cran.
Les contraleurs d'approche ont propos6 que leur soit offerte une seconde fenetre radar; elle leur permettraient de voir A I'avance la situation du flot de trafic B I'arrivee (et de mettre en ceuvre des procedures de routes directes) et les aiderait i?i definir les strattjgies de sbquencement de ces vols.
EUROGONTROL Experimental GenLre
110
16.6.2
16.7
16.7.1
Les contr6leurs aux positions de contrble r6gional ont eu des difficult6s pour estimer des distances dans la fenatre radar en fonction de 1'6chelle adopt6e.
Recommandatkm
L'adjonction d'une seconde fenatre radar aux positions de contr6le d'approche est 9 6tudier.
Un m6canisme est 9 d6finir qui permettrait de fournir une bonne indication des distances en fonction de 1'6chelle adopt6e pour I'image radar.
FONCTIONS DE LA BARRE DE BOUTONS
Conclusions
La barre de boutons constitua un moyen convenable et facile pour acc6der aux fonctions relatives a la fenatre radar. Des analyses et des commentaires des contr6leurs il ressort que : . le QWB (Quick Way Back = Retour rapide A la derniere configuration enregistree
de la fenbtre radar) a 6t6 utilise peu fr6quemment, mais s'il est maintenu il devrait pouvoir donner acces 9 toutes les configurations enregistrbes; . les boutons de commande des 6chelles de distances pr6d6finies ont 6t6 utilises rarement, mais s'ils sont maintenus ils devraient atre compl6t6s par des options d'excentrement de I'image radar; . le recours 9 I'affichage des donn6es suppl6mentaires sur toutes les btiquettes radar n'a pas 6t6 utilis6 souvent; les contr6leurs trouvaient que cette information 6tait plus facilement accessible sur 1'6tiquette radar &endue; . les boutons de s6lection du vecteur vitesse 6taient trop petit; le vecteur vitesse n'a pas 6t6 utilis6 par les contr6leurs d'approche et ne I'a 6t6 que rarement par les contrbleurs r6gionaux;
9 la fonction d'6vitement automatique des chevauchements d'6tiquettes n'6tait pas satisfaisante (cela est confirm6 par les enregistrements qui font etat d'un grand nombre d'actions prises par les contr6leurs pour d6placer individuellement des 6tiquettes). Les participants ont s6vGrement critiqu6 cette fonction; ils lui reprochaient d'avoir d6plac6 fr6quemment des Btiquettes alors que le contr6leur 6tait sur le point d'effectuer une action et , de plus, de n'avoir pas r6ussi 9 s6parer convenablement les 6tiquettes dans les zones 9 trafic intense. Une fonction eff icace d'bvitement des chevauchements d'btiquettes est indispensable si I'entr6e des donn6es par I'6tiquette radar doit &re le principal moyen d'interaction entre les contr6leurs et le systeme;
le mecanisme permettant de faire varier I'6chelle de I'image 6tait d'un usage facile mais fut rarement utilise en cours d'exercice;
EUROCONTROL Experimental Centre
111
il en est de meme pour le mecanisme de choix de la couche de niveaux B visualiser; . la selection de la video-map (carte des routes, zones militaires, etc.) n'a pas 6t6 utilis6e souvent, mais elle fut consid6r6e comme une m6thode facile pour le choix d'informations g6ographiques. . la fonction << cap et distance >> 6tait d'un usage commode et devrait litre d6velopp6e plus avant pour inclure d'autres modes (entre un point et un avion , entre deux avions):
la fenetre << t6l6com >> fut consid6r6e comme une id6e intbressante, B condition qu'un moyen classique de t616communication reste toujours disponible. Si I'id6e de cette fenetre est retenue, elle doit litre d6velopp6e plus avant de manibre B informer un correspondant appelant sur les communications t616phoniques d6jil en cours au secteur demand6
la possibilit6 d'enregistrer une configuration de I'image radar r6alis6e suivant les desiderata du contraleur est reconnue par les participants comme une disposition trbs positive qui pourrait utilement litre compl6t6e par des fonctions et des options additionnelles pour I'affichage d'informations.
Bien que d'un usage facile et bien appr6ci6es par les participants, les fonctions de la barre de boutons n'ont 6t6 que rarement utilis6es pendant les exercices de simulation. En effet les participants d6clarbrent que certaines de ces fonctions, lorsqu'elles concernaient un avion en particulier, Btaient plus facilement accessibles dans I'6tiquette radar &endue de cet avion.
II semble qu'il soit int6ressant de regrouper N par famille >> les fonctions de la barre de boutons dans des menus sp6cifiques, chacun de ces menus &ant accessible au moyen d'un simple bouton. Cela reduirait la taille de la barre de boutons tout en assurant une meilleure visibilit6 des applications prioritaires et donc un accbs plus rapide. Un exemple d'un tel regroupement est donn6 ci-aprbs :
Organisation de la fenetre radar (QWB, 6chelles prbdhfinies, zoom de I'6chelle, filtrage des couches de niveaux 22 visualiser); Renseignements supplementaires il ajouter dans toutes les 6tiquettes radar (a6rodromes de d6part et de destination, type d'avion, vitesse, compagnie aGrienne, frequence du secteur suivant); C h evauc h ement d'6tiquettes (auto m atiq ue , man u el) ; Carte gbographique (video-map); Cap et distance; T616communications; OutiIs MTCA (HAW, VAW, CARD, CZW); Configuration pr6f6r6e (preference set).
EUROCONTROL Experimental Centre
112
16.7.2 Recomma n s
16.8
II est recommand6 de conserver des barres de boutons ou des icanes pour acc6der aux fonctions relatives ih I'image radar aux positions de travail de contraleur dot6es de multi-fen6trage.
Le regroupement des fonctions (< par famille *> des fonctions sur la barre de boutons devrait faire I'objet d'une 6vaiuation. II est recommand6 de poursuivre les recherches sur I'6vitement automatique des chevauchements d'htiquettes en vue de produire un algorithme qui garantisse ce resultat et permette de consulter sans difficult& les blocs de donn6es contenues dans les 6tiquettes susceptibles d'atteindre une taille importante (les 6tiquettes d'ODID IV pouvaient comprendre jusqu'9 cinq lignes).
Le dispositif <( cap et distance >> devrait &re compl6t6 par des possibilit6s de d6terminer les cap et distance :
0 entre un point et un avion; 0 entre deux avions;
multiples
Lorsque les commandes de t616communications font partie de la fenbtre radar, il serait bon que toute occupation de liaison t6lephonique par I'un des membres de I'6quipe du secteur soit signalbe aux autres membres de cette 6quipe.
ETIQUETTE RADAR
16.8.1 Conclusions
Les 6tiquettes radar ont constitu6 une interface efficace et d'usage commode pour le dialogue avec le systeme. L'obligation de fournir au systeme les mises ih jour des donn6es n'a pas perturb6 les contraleurs dans I'accomplissement de leur tache premiere, la s6paration des avions. Le contenu de 1'6tiquette et I'utilisation de la couleur pour caracteriser la situation des avions dans le processus de planification ont aid6 les contraleurs 9 determiner les priorit6s des mesures B prendre. L'analyse montre que la plupart des entrbes de donn6es ont 6t6 effectu6es par I'interm6diaire des 6tiquettes radar.
Les contraleurs ont trhs souvent mis en application la configuration dite :: minimum information display )) qui reduisait le contenu des 6tiquettes au strict minimum en fonction de la situation des avions dans le processus de planification. Ils n'6taient pas en faveur d'etiquettes radar exc6dant trois lignes (cette opinion peut avoir 6t6 influenc6e par les faibles performances de I'6vitement des chevauchement des 6tiquettes dans les zone 9 fort trafic). Ils ont aussi demand6 la suppression de I' << historique '> (positions radar anterieures) sur la route suivie par les avions.
EUROCONTROL Experimental Centre
113
Les enregistrements montrent que les contrbleurs ont supprim6 de I'6tiquette les informations de cap et de vitesse (par un clic dans le champ consid6r6 de cette 6tiquette).
Les participants ont estim6 satisfaisantes les informations contenues dans les 6tiquettes radar. Cependant en contrble d'approche le besoin existe dv inclure la cat6gorie c( vortex wake " et en contrble r6gional I'affichage du niveau XFL lorsque I'6tiquette ne comporte que deux lignes.
En contr6le d'approche il fut rarement recouru B la souris pour commander I'affichage de donn6es supplhmentaires (comme le c< flight leg " ou le contenu de I'6tiquette &endue).
La possibilit6 d'6tendre I'6tiquette radar sur demande a 6t6 consid6r6e comme une disposition trbs utile par les contrbleurs r6gionaux. I I fut sugg6r6 que I'affichage du plan de vol d'un avion particulier puisse s'effectuer automatiquement en conjonction avec d'autres actions command6es par la souris. Les contruleurs ont appr6ci6 favorablement la possibilit6 de commander I'aff ichage temporaire de I'6tiquette &endue par une action (( appuyer et maintenir " exerc6e par la souris sur I'indicatif de I'avion dans 1'6tiquette.
16.8.2 R ~ ~ m m a n ~ t ~ n §
Dans les systbmes ATC 6volu6s obligeant les contrbleurs ZI tenir inform6 le systbme des changement intervenant dans les plans de vol en cours et des instructions de contrble d6livr6es, 1'6tiquette radar doit n6cessairement constituer le point de convergence des entrees de donn6es et des commandes d'affichages d'informations co m p16m en tai res.
La possibilit6 offerte par le systbme de donner aux 6tiquettes radar une taille minimale ne contenant que les informations essentielles merite d'etre exploitbe pleinement. Chaque fois que cela est possible les 6tiquettes devraient etre r6duites & trois lignes au maximum (sauf lorsqu'il s'agit d'afficher des informations urgentes).
L'6tiquette radar (( &endue '> est un concept B retenir. Elle apporte des informations compl6mentaires importantes aux contrbleurs (surtout aux contr0leurs regionaux). D'autres m6thodes devraient pouvoir &re d6finies pour commander I'aff ichage d'informations compl6mentaires dans I'6tiquette &endue.
16.9 DIALOGUE PAR CINTERMEDIAIRE DE CETIQUETTE RADAR
16.9.1 Conclusions
Le dialogue par I'interm6diaire de I'6tiquette radar s'est aver6 satisfaisant. Vers la fin de la simulation les contrbleurs ont d6clar6 qu'ils htaient parvenus & effectuer les entr6es de donn6es en meme temps qu'ils d6livraient (par radio) les instructions ATC correspondantes aux avions.
EUROGONTROL Experimental Centre
114
EUROCONTROL Experimental Centre
115
16.9.2
Les difficult& occasionnees par des temps de reponse du systbme trop importants et par les chevauchements des etiquettes radar ont mis en lumibre I'absolue necessite d'un accbs sans restriction aux informations de I'cjtiquette. II importe que les contr6leurs n'aient jamais a eprouver un sentiment de contrainte ou de frustration lorsqu'ils entrent des donnees, si I'on veut reussir a faire adopter ces fonctions d'entree par l'ensemble des contr6leurs. Dans les cas oh le systbme serait amen6 a devoir bloquer les entrees de donnees, il devrait en avertir les contr6leurs.
L'application du (4 cursor defaulting qui presente de fapn particulibre les valeurs ayant la plus grande probabilite d'Qtre selectionnees par le contr6leurs a 6th salu6e comme une disposition appreciable, faisant gagner du temps pour la recherche des valeurs standard dans les fen6tres (( pop-up " (a ouverture automatique). La lisibilite et la manipulation des fenQtres (( pop up '> doit faire I'objet de developpements bien pens&. Ces fenQtres, qui sont generalement affichees pendant un court laps de temps, doivent permettre d'accbder directement aux donnees les plus susceptibles d'6tre s6lectionnees ou d'Qtre I'objet d'une entree. On enregistra une trbs grande quantite d'actions de << changement de page '> aux positions d'approche (pour les niveaux CFL et XFL et les regulations de vitesse), ce qui indique que les valeurs presentees en premier lieu dans les menus deroulants n'htaient pas suffisantes.
L'une des fonctions de dialogue parmi les plus interessantes 6tait offerte par le << vecteur blastique ,>; cette fonction permettait au contr6leur de designer soit un cap soit une route directe. Les problbmes de lisibilit6 rencontres etaient de mQme nature que ceux qui affectaient les fenQtres (( pop-up >'. Le contr6leurs ont 6prouv6 quelque difficult6 B saisir le vecteur Blastique bien qu'une modification de la taille de la zone de selection realisbe en cours de simulation ait constitue une amelioration.
Dans certaines situations, les contraleurs ont neglige d'effectuer les entrees de donn6es (surtout celles des donnees <( systematiques >>, B faire pour tous les avions). Cette decision fut toujours prise de propos deliber6 par des contr6leurs affect& sans doute par des dysfonctionnements du systbme. Les consequences de telles c: negligences '> etaient une diminution de la pr6cision dans la prediction des conflits et dans I'assistance du systeme dans les coordinations.
Une quantit8 considerable d'entrees de donnbes ont et6 effectuees par I'intermediaire du menu deroulant lie B I'indicatif d'appel. Plus de 50% des actions de base (assume et transfer3 I'ont et6 de cette fagon.
Recommandations
II est recommande d'orienter les developpements dans ce domaine, en recherchant B reduire au maximum les delais qui peuvent affecter negativement les operations d'entree de donnees incombant aux contr6leurs. Dans le cas oh le systeme ne peut plus traiter les entrees pour quelque raison que ce soit, il importe que le contr6leur en soit averti par un mecanisme du type accuse de reception.
La fonction de CC cursor defaulting >> qui aidait le contrbleur pour les entrees << systematiques '> (= B faire pour tous les avions) merite d'8tre exploree plus avant.
16.10
16.10.1
16.10.2
16.1 1
16.11.1
II est recommand6 que la conception des fenetres prenne en compte les caract6ristiques op6rationnelles particulieres du secteur suivant (&endue verticale, routes possibles, contraintes d'exploitation) en vue de limiter le nombre d'actions de <( scrolling ') (changement de page dans les menus) necessaires pour trouver la valeur convenable B entrer. Les (< pop-up 3) devraient etre d'une lecture et d'une manipulation (parcours de liste, changement de page) ais6es.
II conviendrait d'6valuer les consequences des negligences des contrbleurs (ou de leurs empechements) dans la mise B jour des systemes ATC avanc6s qui requierent I'intewention de contrbleurs pour I'entr6e des donnees concernant les plans de voi en cours. Le concept du systhme devrait pr6voir des mesures de sauvegarde contre de telles omissions.
Chaque fois que possible, il faudrait faire effectuer par le systeme lui-meme les taches systbmatiques (A faire pour tous les avions) de maniere il r6duire au maximum les entrees manuelles des donn6es incombant aux contr8leurs.
FLIGHT LEG (TRAJECTQIRE FUTURE D'AVIQN)
Conclusbns
Le <c Flight /eg fut reconnu comme un dispositif nouveau d'importance, qui fournissait au contr6leur des informations sur la route et les conflits dans son outil de travail principal, la fenetre radar. Le nombre de recours au flight leg devint plus important dans les exercices qui mettaient en oeuvre le recalcul des profils. Les contrbleurs ont d6clar6 qu'ils pr6ftSraient le flight leg B la HAW (fenetre horizontale).
Recommandations
II est recommand6 de poursuivre I'6tude exploratoire de la fonction flight /eg comme moyen d'information sur la prediction des conflits.
FQNCTIONS DE MENU DE L'INDICATIF D'APPEL
Conclusions
Les fonctions syst6matiques cc assume et cc tranfer >) qui s'effectuaient par I'interm6diaire du menu de I'indicatif d'appel (= menu deroulant g6n6r6 par un clic dans la ligne principale de I'etiquette radar) ont et6 consid6rees par les participants comme tres profitables, car elles ont aid6 le contrbleur A memoriser les details du trafic et & maltriser mentalement la situation. On peut estimer que des fonctions systbmatiques telles que celles-ci devraient relever de I'automatisation.
En pratique le recours au menu de I'indicatif d'appel fut extremement frequent; chaque avion donnait lieu & quatre clics au moins (indicatif, assume, indicatif, transfeo. En repensant les actions assume et transfer, il devrait etre possible de reduire le nombre de clics de 50% (et I'ensemble des commandes par souris de 25% environ).
EUROGONTROL Experimental Centre
116
Les fonctions << skip '> et << AB/ force ') ont contribue & reduire la charge de travail, car elle facilitaient le transfert anticipe des avions aux secteurs suivants.
16.1 1.2 Recommanda
II conviendrait de proceder h une evaluation du profit apporte par les entrees manuelles des assume et des tranfer. I I est recommande en tout cas de reduire le nombre d'actions necessaires h I'accomplissement de ces fonctions. Ainsi un simple clic sur le champ indicatif d'appel ou secteur suivant (pour recouvrir respectivement les actions assume et transfer actuelles) diminuerait de fa(;on significative la charge globale des entrees de donnees incombant aux contrbleurs.
16.12 AFFICHAGES TABULAIRES
16.12.1 Conclusions
L'affichage SIL (Sector lnbound List) servait aux contrbleurs comme un point initial de planification pour un secteur donne. II semblerait que des donnees supplementaires pourraient utilement figurer dans le SIL, car souvent les contrbleurs passaient du SIL & I'etiquette etendue en qu8te d'une information complementaire. Cependant les contrbleurs 6mirent des souhaits differents quant h la nature de ces complements d'information. II conviendrait peut-etre d'offrir ii chaque contrbleur la possibilite d'opter, dans le cadre de la definition de son organisation prdfdree, pour un choix personnel des donnees qu'il souhaite ajouter ou supprimer dans I'affichage SI L.
L'affectation automatique des avions aux SIL en fonction de leurs points d'entree dans le secteur a et6 appreciee par les participants. Le mecanisme utilise apparut comme traitant correctement le trafic penetrant par une route directe dans le secteur.(En fait le reseau de routes directes employ6 etait voisin de celui en cours ii Copenhague et ne constitue donc pas une veritable preuve de ce bon traitement).
I I fut observe que la majorit6 des contrbleurs ont dispose les SIL sur 1'6cran en fonction de la situation geographique des points d'entrees dans les secteurs. Le nombre de deplacements des fen8tres SIL operes par les contr6leurs fut considerable.
Des participants ont suggere que les developpements futurs des SIL incluent dans I'affichage des informations de coordination, telles que, pour les vols passant de TMA en contrble d'approche, la cadence ou les contraintes affectant les procedures d'attente. Comme le SIL constituaient les premieres informations concernant les vols attendus I'entree du secteur, celles-ci pourraient comprendre des details de la prediction de conflits, ce qui permettrait de dispenser le contrbleur de I'obligation de valider systematiquement les conditions d'entree pour chaque avion.
EUROGONTROL Experimental Centre
113
Les listes des avions B I'atterrissage et au depart ont toutes deux 6t6 critiqu6es par les contribleurs d'approche qui leur reprochaient une certaine rigiditb. Ils souhaiteraient pouvoir agir sur ces listes pour mettre jour ou modifier les s6quences de trafic. Mbme stil existait dans ces fenbtres une fonction de correction automatique de ces 6l6ments, il semblerait n6cessaire de donner au contrbleur le moyen d'intervenir lui-meme dans la s6quence pour r6aliser ses propres d6cisions de planification.
16.12.2 Recomma
Le bien-fond6 et I'utilit6 d'une mesure tendant il donner B chaque contrgleur la possibilit6 de choisir B sa guise les donn6es B faire figurer dans les affichages tabulaires doivent faire I'objet d'investigations.
II est recommand6 de poursuivre 1'6tude du positionnement des SIL en fonction des points d'entrke des avions en route directe, lorsque I'environnement d'espace a6rien permet I'usage de plusieurs r6seaux de routes libres.
II conviendrait d'envisager la presentation sur les affichages tabulaires d'informations sp6cifiques de coordination (par exemple la cadence sur une STAR).
Les besoins en matihre d'affichage tabulaire particuliers au contrible d'approche et les fonctions permettant leurs manipulations devraient etre d6finis et 6valu6s.
16.13 OUTILS MTCA (PRkDICTION DE CONFLITS)
II convient de noter qu'en raison de problhmes techniques, seuls six exercices de simulation ont comport6 le recalcul permanent des profils de vol; cela rdduit 6videmment la port6e de I'6valuation des outils MTCA (Medium Term Conflict Alert = avertissements des conflits il moyen terme).
16.13.1 Conclusions
Le CARD (Conflict and Risk Display = affichage des conflits et risques de conflits) devait initialement constituer seulement une assistance B la planification. II fut pourtant affich6 en permanence par la plupart des contraleurs exbcutifs, qui indiquaient ainsi leur faveur pour une aide dans la d6tection des conflits. Les contr6leurs executifs ont rarement s6lectionn6 la VAW (image verticale affichant les conflits) ou la HAW (image horizontale affichant les conflits).
II a 6t6 not6 que certains contrbleurs executifs ont consult6 I'affichage CARD de leur voisin planning de pr6f6rence au leur. L'6tude ergonomique montre que certains plannings avaient place leur MTCA sur le cat6 gauche de leur 6cran apparemment pour permettre au contrbleur ex6cutifs de le consulter. Cela peut plaider en faveur d'une bonne collaboration entre planning et exdcutif pour I'utilisation en commun des outils de planification.
EUROCONTROL Experimental Centre
118
16.13.2 Recommanda
II est recommand6 de poursuivre I'6tude de I'utilisation par le contr6leur executif des aides graphiques definies pour la planification et notamment les outils de prediction de conflits.
16.14 LA FENETRE HORIZONTALE (HAW)
1 6.1 4.1 Conclusions
La fenetre horizontale (HAW = Horizontal Aid Window) fut la fenetre que les participants ont le moins aimb. La presentation des donnees y 6tait concentree, ce qui se traduisait par un gaspillage d'espace dans la fenetre. Le flight leg s'est impose comme un outil de prediction des conflits plus approprie que la HAW, car il s'affichait dans la fenetre radar meme, donc permettait une correlation plus ais6e avec la situation du trafic en cours.
Des contr6leurs se sont servi de la HAW en conjonction avec la fenetre VAW (verticale) pour verifier des situations de trafic avant I'acceptation d'une proposition de transfert. Ils eurent parfois quelques difficult& B y trouver I'avion objet de cette recherche d'information.
16.1 4.2 Recommandatbns
Si la fenetre HAW devait etre maintenue, les graphiques representant les conflits prbdits devraient etre redefinis afin de tirer un meilleur profit de I'espace disponible dans la fenetre. L'avion pour lequel la recherche d'informations est entreprise devrait y &re mieux mis en evidence.
16.15 LA FENETRE VERTICALE (VAW)
1 6.1 5.1 Conclusions
La fenetre verticale (VAW = Vertical Aid Window) a fourni aux contr6leurs une information suffisante pour reperer aisement les portions d'espace <( libres '3 donc utilisables pour les changements de niveaux dcScid6es en planification.
Cependant la nature des conflits (avions se croisant ou convergeant ou divergeant) qui devait etre caracterisbe par des presentations de formes et de couleurs differentes n'a pas et6 toujours bien perGue. Les contr6leurs n'ont pas aim6 les grands blocs de couleur vive ainsi constitues qui, selon eux, 6taient causes de distraction d'esprit et n'avait pas de sens. II fut souvent difficile de dechiffrer I'indicatif d'appel B cause de chevauchements de textes.
EUROCONTROL Experimental Cente
119
Profils de vol VAW et situation radar en cours ont 6t6 consid6r6s comme trop 61oignes Pun de I'autre, car souvent non synchronises. La mise B jour des profils VAW affich6s devrait prendre en compte la position actuelle instantan6e (en 3 dimensions) telle que d6riv6e de I'information radar.
II fut not6 que les contraleurs ne recherchaient dans la couleur utilis6e dans ces aff ichages qu'une indication de I'existence d'un problhme. Cela eut apparemment comme cons6quence un manque de m6morisation des d6tails de texte ou de graphique, qui auraient pu litre utile pour la ma?trise de la situation. Trhs peu d'entr6es de donn6es ont 6t6 effectu6es par I'interm6diaire de la VAW.
16.15.2 Recommanda
La presentation de la VAW devrait litre repensee de manihre B ce qu'elle repr6sente de f apn plus precise la nature des conflits pr6dits.
Le profil vertical calcul6 figurant dans la VAW devrait litre derive de la position r6elle de I'avion et du niveau de vol mode C donn6 dans 1'6tiquette radar.
II est recommand6 d'6tudier les cons6quences du fait que les contrgleurs n'ont pris en consideration sur les outils MTCA que la couleur et ont d6laiss6 les d6tails de vol qui y 6taient disponibles sous forme de texte ou de graphique.
16.16 CARD (AFFICHAGE DE CONFLITS ET RISQUES DE CONFLIT)
16.16.1 Conclusions
Avec la SAC (assistance B la coordination), le CARD (Conflict and Risk Display = affichage des conflits et des risques de conflit) fut consider6 comme I'une des plus importantes fonctions dans ODlD IV. EIle constitua aux yeux des participants 9 la fois une aide 9 la planification facilitant la dbtection des conflits des vols 9 I'entr6e dans le secteur et un outil de surveillance gen6rale des conflits et risques de conflits dans le secteur. Les contr6leurs planning et executif se sont tous deux servis du CARD.
Le CARD remplissait une fonction de filtrage (les avions n'y figurant pas 6taient des avions sans problhme) bas6e sur la surveillance permanente de I'6volution des separations entre avions, y compris pour les avions devant entrer dans le secteur. Grace & cela, le contr6leur n'avait plus & valider systbmatiquement les conditions d'entr6e proposees pour tous les avions. I I se basait sans doute sur I'hypothhse que le trafic propose au secteur 6tait exempt de conflit car sinon cela aurait 6t6 detect6 9 I'avance et signal6 sur le CARD.(Cela suppose aussi que les algorithmes de pr6diction de conflit ont 6t6 bien valid&).
EUROCONTROL Experimental Centre
120
16.1 6.2
16.17
16.1 7.1
Les contrbleurs ont;consider6 comme principaux sujets dfint6rC?t du graphique CARD les informations suivantes : . le point 9 partir duquel les normes de separation cessaient d'htre respect6es; . le point 00 I'espacement entre les avions impliques etait minimal;
le type de conflit (ou de risque de conflit).
Les contr6leurs n'ont apparemment pas et6 interess6s par la duree des conflits (cela pouvait etre d6terminS ailleurs).
Le CARD fournissait une pr6vision de la charge de travail 9 venir.
Le CARD annonGait trop de conflits en espace infbrieur, nombre d'entre eux 6taient douteux. I I s'ensuivait une surcharge de I'affichage de I'information-conflit que le contrbleur n'6tait plus en mesure d'assimiler.
Recommandations
I I est recommand4 de poursuivre les recherches de developpement du CARD comme outil de planification pour Ies vols 9 I'entr6e et comme moyen de surveillance permanente de la situation des conflits du secteur.
II est recommand6 d'ameliorer la presentation des textes et graphiques du CARD en ce qui concerne :
I'application de la couleur 9 I'indicatif d'appel ; le point 9 partir duquel la separation est reputhe perdue; le point 00 I'espacement entre avion est minimal; le type de conflit ou risque de conflit; I'information apport6e sur la charge de travail future en fonction du nombre de conflits pr6dits.
LA FENETRE CZW (ZOOM SUR LES CONFLITS)
Conclusions
La CZW (Conflict Zoom Window) fut un outil utile. II s'interpretait facilement et fournissait une assistance pour la r6solution des conflits. II s'employait normalement en conjonction avec le CARD; les contrbleurs commandaient I'affichage de la CZW par un clic sur le numero de conflit figurant dans le CARD, les deux fenetres se trouvaient generalement dispos6es A proximite I'une de I'autre.
Une commande d'affichage temporaire de type << appuyer et maintenir devrait etre profitable.
EUROCONTROL Experimental Centre
121
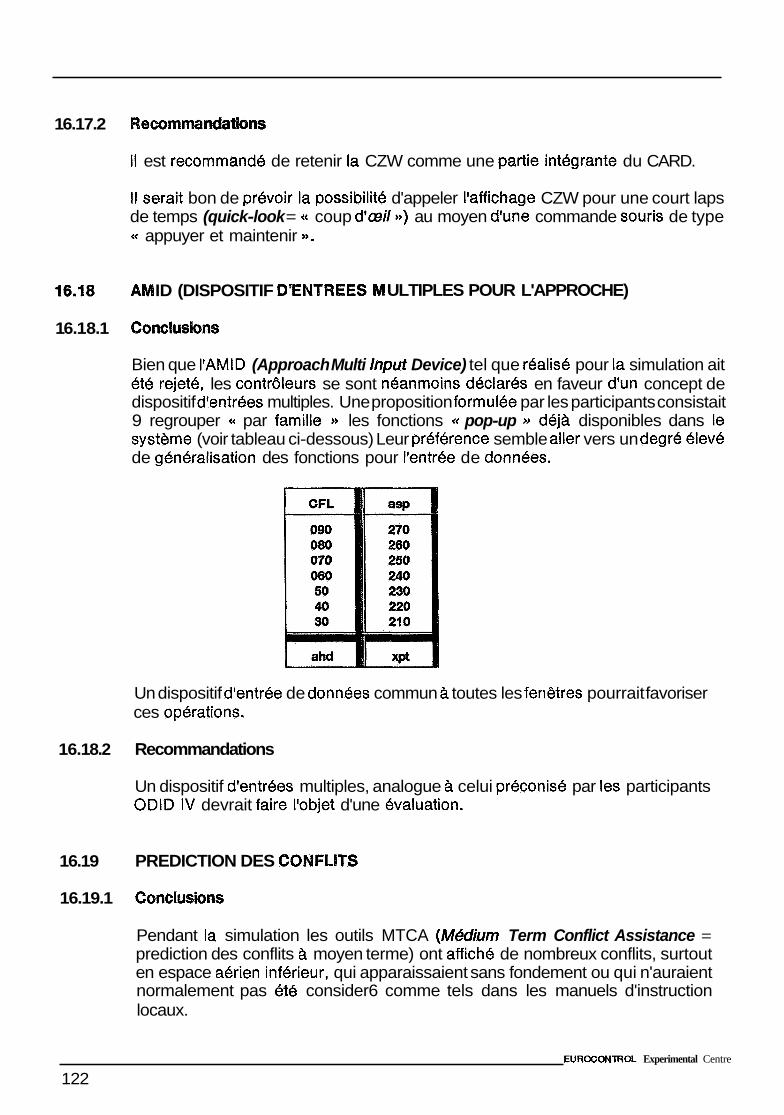
1 6.17.2 Recomma 115
I I est recommandi! de retenir la CZW comme une partie integrante du CARD.
I I serait bon de prevoir la possibilite d'appeler I'affichage CZW pour une court laps de temps (quick-look = Q coup d'GESril>>) au moyen d'une commande souris de type a appuyer et maintenir >'.
ID (DISPOSITIF DYEENTREES ULTIPLES POUR L'APPROCHE)
1 6.1 8.1 Conclwkns
Bien que I'AMID (Approach Multi lnput Device) tel que realis6 pour la simulation ait 6tte rejet& les contreleurs se sont nltanmoins d6clar6s en faveur d'un concept de dispositif d'entrees multiples. Une proposition formulee par les participants consistait 9 regrouper (4 par famille >* les fonctions <( pop-up )) d6jja disponibles dans le systhme (voir tableau ci-dessous) Leur preference semble aller vers un degr6 6lev6 de g6n6ralisation des fonctions pour I'entrC5e de donn6es.
Un dispositif d'entree de donn6es commun ja toutes les fenetres pourrait favoriser ces op6rations.
16.1 8.2 Recommandations
Un dispositif d'entrees multiples, analogue 9 celui preconise par les participants ODlD IV devrait faire I'objet d'une 6valuation.
16.19 PREDICTION DES CONFLITS
16.19.1 Conclusions
Pendant la simulation les outils MTCA (Mddiurn Term Conflict Assistance = prediction des conflits 9 moyen terme) ont affich6 de nombreux conflits, surtout en espace a6rien inferieur, qui apparaissaient sans fondement ou qui n'auraient normalement pas et6 consider6 comme tels dans les manuels d'instruction locaux.
EUROCONTROL Experimental Centre
122
16.19.2
16.20
16.20.1
Cela etait dQ au fait que plusieurs normes severes de separation avaient et4 incluses dans les algorithmes de prediction de conflits, qui declaraient en conflit des avions se trouvant sur des routes c( reputees separees ", ou en procedure d'attente, ou en zone d'approche 8 espacement rbduit, ou encore au depart, mais n'ayant pas encore ddcolle, et qui ne prenaient pas en compte les avions lents en montee, puis en palier puis en descente.
Recommanda
I I est recommand6 d'entreprendre des recherches en vue de definir, pour les simulations ODlD 8 venir, des algorithmes de prediction de conflits convenables. L'utilisation d'outils de planification et de surveillance automatique permanente des conflits ne peut &re credible tant que I'information concernant les conflits n'est pas absolument precise et sore.
CHARGES DE TRAVAIL
Conclusions
La simulation ODlD IV n'a pas permis de reunir des informations en quantite significative pour apprecier les gains en matiere de charges de travail ou de capacite potentielle susceptibles d'etre obtenus d'une position de travail cjvoluee de contraleur ATC (Advanced ATC ControNer Working Position).
Le benefice en termes de coOt du developpement (et de mise en muvre en exploitation) des fonctions proposees en ODlD IV (ou de fonctions similaires) n'a pu &re 6valu6 clairement. I I importe de determiner I'ampleur de ce benefice, afin de pouvoir encourager les autorites chargees du Plan, les cadres ATC et ceux de I'lndustrie 8 poursuivre les recherches et les developpements dans ce domaine. I I est aussi important d'apporter 8 I'ensemble des contraleurs de la circulation aerienne la preuve que les systemes de positions de travail evoluees (CWP) sont viables et ne contiennent aucun mystdre.
Cependant il est apparu qu'une reduction de la charge de travail peut &re obtenue par la coordination assistee par ordinateur, qui induit une diminution des communications telephoniques dans un systeme du type d'ODID.
Les participants ODlD IV se sont declares persuades que, si le systeme a des temps de reponse adequats et n'a pas de dysfonctionnements, les entrees de donnees requises pour mettre 8 jour le systeme peuvent etre menbes 8 bien sans consequence fiicheuse pour I'accomplissement des taches ATC. Ils ont aussi reconnu des avantages 8 I'emploi de la couleur et 8 la composition de I'etiquette radar, qui indiquaient au contraleur les priorites des mesures 8 prendre pour chacun des avions et ainsi reduisaient sa charge de travail.
EUROCONTROL Experimental Centre
123
Les moyens de mesure de charges de travail employ6s pendant la simulation (NASA TLX, ISA , m6thode MBB modifiee) ont indique que les charges de travail 6taient normaies pour la configuration d'espace simul6e (ceci est confirm6 par les opinions subjectives recueillies auprhs des participants). II ne fut detect6 aucune influence ext6rieure susceptible d'affecter la charge de travail, bien que Papprentissage des contrdleurs ait dur6 environ deux semaines.
16.20.2 Recomma
II est recommand6 que de nouvelles simulations soient mises en muvre afin de dbterminer :
jusqu'8 quel point les entrees de donnees peuvent &re effectu6es sous des conditions de trafic tr8s dense; quel interet cornportent des aides Sr. la planification telles que celles proposees pour la simulation ODID IV; quel gain en capacit6 (ou limite) peut &re escompt6 de I'environnement de travail d'ODID IV (ou d'un syst8me similaire).
16.21 METHODOLOGIE DE TRAVAIL
16.21.1 Conclusions
I I est apparu que la repartition faite en simulation des responsabilit6s et des taches des contr6leurs au sein d'un secteur n'a pas et6 diffbrente de celle existant aujourd'hui 8 Copenhague pour les fonctions planning et exbcutif. Cependant il s'av8re que I'un et I'autre des contraleurs planning et executif ont tire benefice du fait qu'ils disposaient des m6mes fonctionnalites. II fut aussi observe que le contraleur planning assistait volontiers I'ex6cutif en effectuant des entrees de donn6es Sr. sa place lorsque cela 6tait necessaire.
Les contraleurs planning ont pref6t-6 rechercher les donnbes dans la fen6tre radar sur les etiquettes radar plutat que consulter les outils MTCA (cela peut cependant etre dO aux deficiences du systeme).
La couleur a aide le contraleur Z i dbterminer les priorit6s 8 accorder aux mesures 8 prendre. Cependant, lorsqu'ils se servaient des outils MTCA, ils ne s'interessaient qu'8 la couleur. Cela laisse supposer qu'ils n'ont pas pu memoriser les donnbes de plan de vol disponibles dans ces fenetres sous forme de texte ou de graphique (cette supposition est confirmee par I'observation du comportement des contraleurs, qui ont recouru frequemment 8 I'6tiquette etendue).
16.21.2 Recommandatbns
I I est recommand6 que des evaluations futures de meme nature qu'ODID IV soient mises en ceuvre pour bvaluer les implications d'un partage de la planification entre contraleur et systeme.
EUROCONTROL Utperimental Cenire
124
16.22
16.22.1
16.22.2
16.23
16.23.1
16.23.2
LENVIRONNE ENT DE TRAVAIL
Les participants 21 ODlD IV se sont d6clar6s en faveur du concept d'un environnement de travail oir tout se passait sur &ran, sous rberve que des moyens de secours soient toujours disponibles. Ils ont insist6 en particulier sur la n6cessit6 de doubler les commandes de t616communications int6gr6es sur 1'6cran par une platine de t6lBcommunication classique.
L'emploi d'affichages de grande dimension peut induire des conditions de travail inconfortables pour le contrbleur. Cet inconfort peut &re lib 21 la taille physique du contrbleur ou encore au fait qu'il porte ou non des verres correcteur de vue. II devrait &re laiss6 21 la discr6tion du contrbleur le soin de r6gler la position de son grand Bcran.
Bien que la quantit6 d'informations figurant 21 la position de travail dans les affichages ou accessibles par une commande ait 6t6 consid6rable, des contrQleurs ont 6prouv6 le besoin de consulter des donn6es sur des 6crans de positions adjacentes.
Recomma ndatfons
II est recommand6 que des normes europeennes d'ergonomie soient definies pour I'emploi des affichages de grande taille aux positions de travail ATC.
SIMULATEUR
Conclusions
Le simulateur n'a pas pu atteindre un degr6 de bon fonctionnement satisfaisant en temps utile pour 1'6valuation. Ces limitations du systhme ont empech6 les participants d'6valuer pleinement les avantages des fonctions propos6es par ODlD IV et en cons6quence d'apprbcier les gains en capacit6 ou d'identifier les limites du systeme d'exploitation mis en muvre.
Recommandations
Le simulateur est developper pour lui conferer un niveau d'exploitation acceptable qui permette une 6valuation complhte et claire des outils de planification d'ODID IV et d'appr6cier les gains de capacit6 ou d'identifier les limites de I'environnement op6rationnel d'ODID IV, sans aucune limitation due a son fonctionnement.
EUROCONTROL Experimental Centre
125
16.24 E ~ T R A I N E ~ E ~ T DU PERSONNEL
16.24.1 C m l
La m6thode de formation par ordinateur (CBT = Computer Based Training) et I'instruction traditionnelle en salle de ciasse mis en oeuvre avant ia simulation ont permis aux participants d'htre bien pr6par6s pour satisfaire aux fonctionnalit6s du systltme simul6. La m6thode CBT est bien adaptbe pour pr6parer des contr6leurs & des simulations novatrices de cette nature.
Malgr6 I'entra'inement avant la simulation et les cinq semaines d'exercices au cours desquels eurent encore lieu des mises au point du simulateur, deux de ces semaines furent nbcessaires pour que les contr6leurs soient bien adapt& & I'environnement de simulation d'ODID.
16.24.2 R e ~ m m a ~ a t ~ n s
Avant des simulations d'6tude de systltme ATC 6volu6s il est recommand6 de soumettre les participants & un entrainement comprenant I'emploi de la m6thode CBT de formation par ordinateur.
EUROCONTROL Experimental Centre
126

ANNEX I
ODlD IV
AIRSPACE AND TRAFFIC SAMPLES

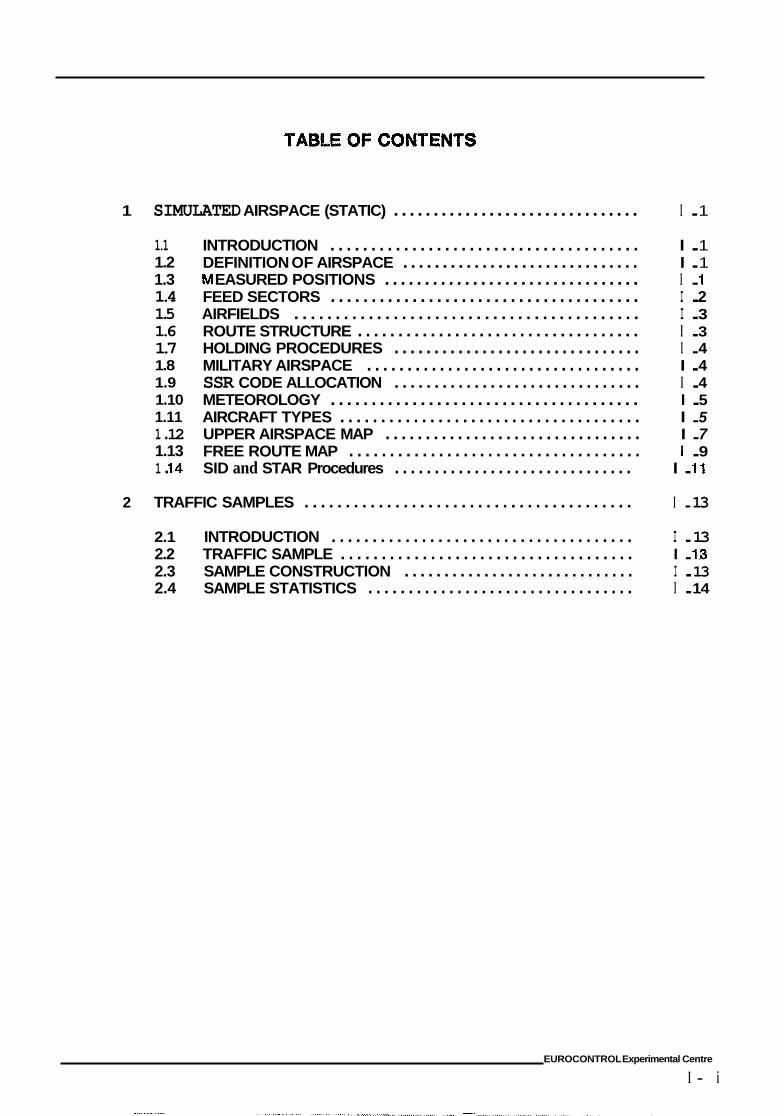
1 SIMULATED AIRSPACE (STATIC) ............................... I . 1
1.1 1.2 1.3 1.4 1.5 1.6 1.7 1.8 1.9 1.10 1.11 1 . 12 1.13 1 . 14
INTRODUCTION ...................................... I . 1 DEFINITION OF AIRSPACE .............................. I . 1
EASURED POSITIONS ................................ I . 1 FEED SECTORS ...................................... I . 2 AIRFIELDS .......................................... I . 3 ROUTE STRUCTURE ................................... I . 3 HOLDING PROCEDURES ............................... I . 4 MILITARY AIRSPACE .................................. I . 4 SSR CODE ALLOCATION ............................... I . 4 METEOROLOGY ...................................... I . 5 AIRCRAFT TYPES ..................................... I . 5 UPPER AIRSPACE MAP ................................ I . 7 FREE ROUTE MAP .................................... I . 9 SID and STAR Procedures .............................. I . 11
2 TRAFFIC SAMPLES ........................................ I . 13
2.1 INTRODUCTION ..................................... I . 13 2.2 TRAFFIC SAMPLE .................................... I . 13 2.3 SAMPLE CONSTRUCTION ............................. I . 13 2.4 SAMPLE STATISTICS ................................. I . 14
EUROCONTROL Experimental Centre
I - i
. . . . . . . ... ................ - _ , I . / . . . . . . . . . . . . . . . . . . . . . . . . . . . . . . . ~ ............................... . . . . .......
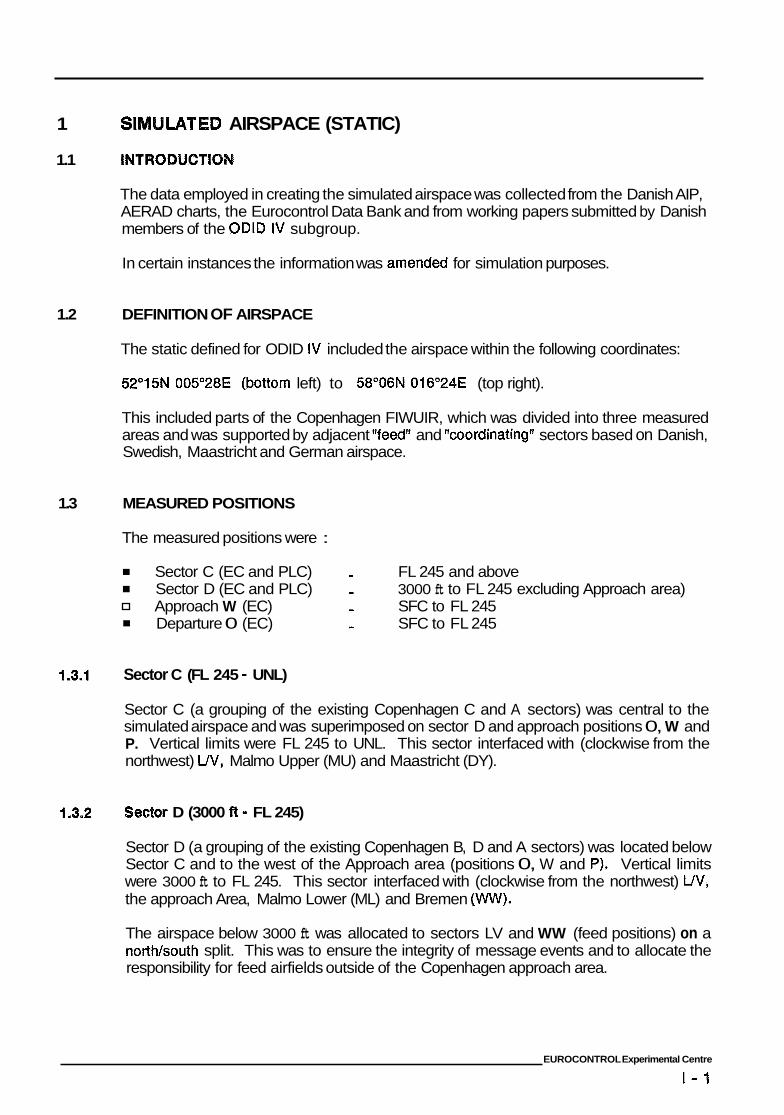
1 ULATED AIRSPACE (STATIC)
1.1 1NTRODUCTlON
The data employed in creating the simulated airspace was collected from the Danish AIP, AERAD charts, the Eurocontrol Data Bank and from working papers submitted by Danish members of the ODID IV subgroup.
In certain instances the information was amended for simulation purposes.
1.2 DEFINITION OF AIRSPACE
The static defined for ODID IV included the airspace within the following coordinates:
52'15N 005O28E (bottom left) to 58'06N 016O24E (top right).
This included parts of the Copenhagen FIWUIR, which was divided into three measured areas and was supported by adjacent "feed" and "coordinating" sectors based on Danish, Swedish, Maastricht and German airspace.
1.3 MEASURED POSITIONS
The measured positions were :
Sector C (EC and PLC) - FL 245 and above Sector D (EC and PLC) - 3000 ft to FL 245 excluding Approach area) Approach W (EC) - SFC to FL 245 Departure 0 (EC) - SFC to FL 245
1.3.1 Sector C (FL 245 - UNL)
Sector C (a grouping of the existing Copenhagen C and A sectors) was central to the simulated airspace and was superimposed on sector D and approach positions 0, W and P. Vertical limits were FL 245 to UNL. This sector interfaced with (clockwise from the northwest) UV, Malmo Upper (MU) and Maastricht (DY).
1.3.2 Sector D (3000 ft - FL 245)
Sector D (a grouping of the existing Copenhagen B, D and A sectors) was located below Sector C and to the west of the Approach area (positions 0, W and P). Vertical limits were 3000 ft to FL 245. This sector interfaced with (clockwise from the northwest) UV, the approach Area, Malmo Lower (ML) and Bremen (WW).
The airspace below 3000 ft was allocated to sectors LV and WW (feed positions) on a north/south split. This was to ensure the integrity of message events and to allocate the responsibility for feed airfields outside of the Copenhagen approach area.
EUROCONTROL Experimental Centre
1 - 1
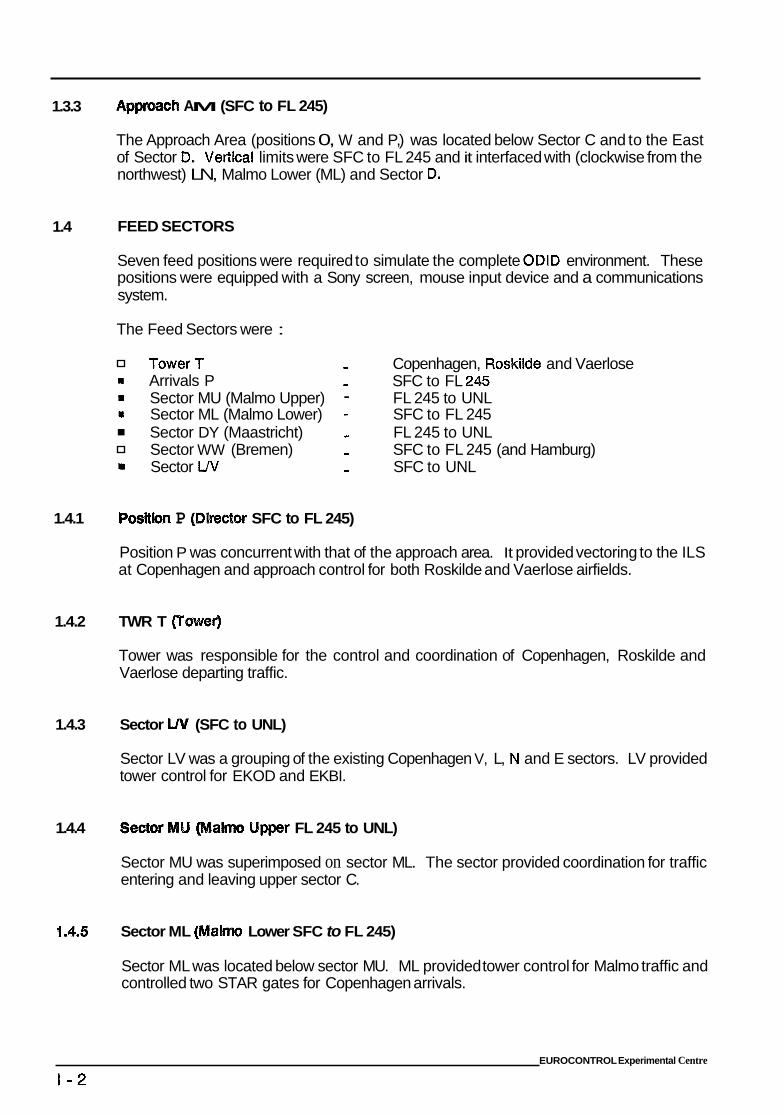
1.3.3
1.4
1.4.1
1.4.2
1.4.3
1.4.4
I .4.5
AM (SFC to FL 245)
The Approach Area (positions 0, W and P,) was located below Sector C and to the East of Sector D. Vefiical limits were SFC to FL 245 and it interfaced with (clockwise from the northwest) LN, Malmo Lower (ML) and Sector D.
FEED SECTORS
Seven feed positions were required to simulate the complete ODlD environment. These positions were equipped with a Sony screen, mouse input device and a communications system.
The Feed Sectors were :
TowerT - Copenhagen, Roskilde and Vaerlose = Arrivals P - SFC to FL 245 = Sector MU (Malmo Upper) - FL 245 to UNL = Sector ML (Malmo Lower) - SFC to FL 245
Sector DY (Maastricht) - FL 245 to UNL Sector WW (Bremen) - SFC to FL 245 (and Hamburg)
= Sector LN - SFC to UNL
P (Dhctor SFC to FL 245)
Position P was concurrent with that of the approach area. It provided vectoring to the ILS at Copenhagen and approach control for both Roskilde and Vaerlose airfields.
TWR T vower)
Tower was responsible for the control and coordination of Copenhagen, Roskilde and Vaerlose departing traffic.
Sector U11 (SFC to UNL)
Sector LV was a grouping of the existing Copenhagen V, L, N and E sectors. LV provided tower control for EKOD and EKBI.
am Upper FL 245 to UNL)
Sector MU was superimposed on sector ML. The sector provided coordination for traffic entering and leaving upper sector C.
Sector ML (hrlalmo Lower SFC to FL 245)
Sector ML was located below sector MU. ML provided tower control for Malmo traffic and controlled two STAR gates for Copenhagen arrivals.
EUROCONTROL Experimental Centre
1 -2
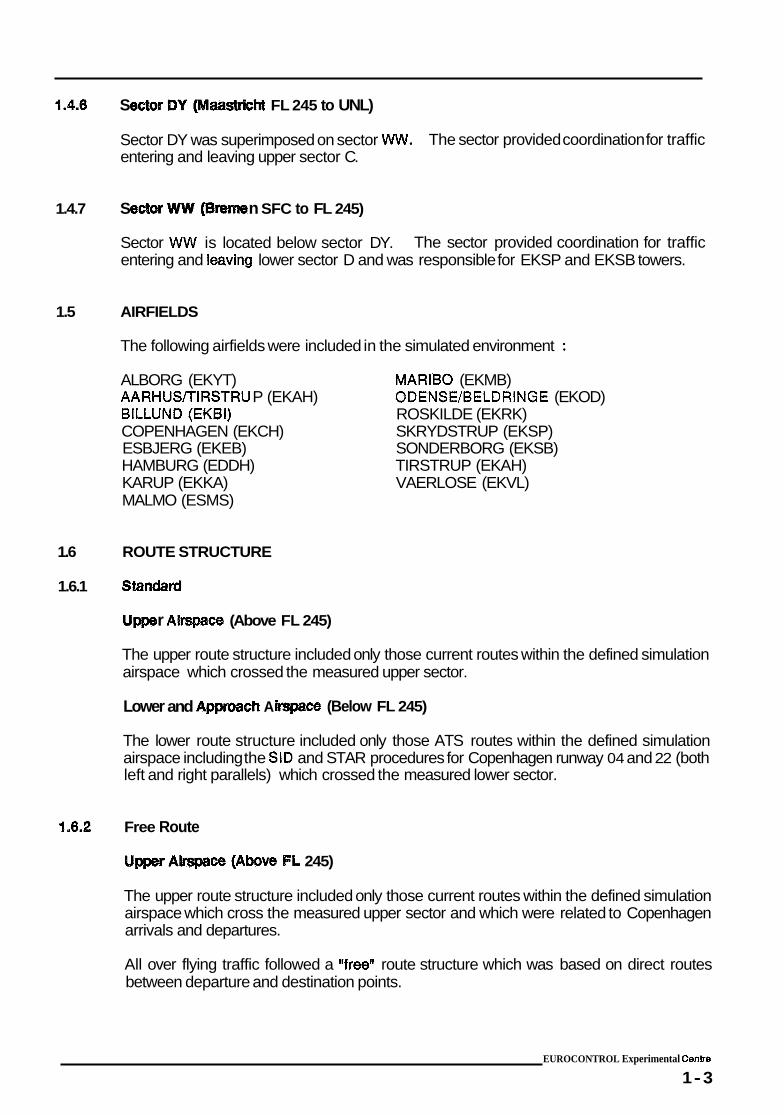
1.4.6 S FL 245 to UNL)
Sector DY was superimposed on sector W. The sector provided coordination for traffic entering and leaving upper sector C.
1.4.7 S n SFC to FL 245)
Sector W is located below sector DY. entering and leaving lower sector D and was responsible for EKSP and EKSB towers.
The sector provided coordination for traffic
1.5 AIRFIELDS
The following airfields were included in the simulated environment :
ALBORG (EKYT) MARIBO (EKMB) AARHUSKIRSTRU P (EKAH) ODENSUBELDRINGE (EKOD) BILLUND (EKBI) ROSKILDE (EKRK) COPENHAGEN (EKCH) SKRYDSTRUP (EKSP) ESBJERG (EKEB) SONDERBORG (EKSB) HAMBURG (EDDH) TIRSTRUP (EKAH) KARUP (EKKA) VAERLOSE (EKVL) MALMO (ESMS)
1.6 ROUTE STRUCTURE
1.6.1 Stanclerd
r Airspace (Above FL 245)
The upper route structure included only those current routes within the defined simulation airspace which crossed the measured upper sector.
Lower and Appr;osch A o& (Below FL 245)
The lower route structure included only those ATS routes within the defined simulation airspace including the SID and STAR procedures for Copenhagen runway 04 and 22 (both left and right parallels) which crossed the measured lower sector.
1.6.2 Free Route
c& (Above FL 245)
The upper route structure included only those current routes within the defined simulation airspace which cross the measured upper sector and which were related to Copenhagen arrivals and departures.
All over flying traffic followed a wfreell route structure which was based on direct routes between departure and destination points.
EUROCONTROL Experimental CenVe
1-3
1.7
1.8
1.8.1
1.8.2
1.9
1.9.1
1.9.2
rand bw FL 245)
The lower route structure included only those ATS routes within the defined simulation airspace including the SID and STAR procedures for Copenhagen runway 04 and 22 (both left and right parallels) which crossed the measured lower ssctor.
ACC. The second code was displayed in the radar label.
HOLDING PROCEDURES
Holding procedures were defined for the simulation using the primary and secondary holds currently employed in the Copenhagen and Swedish FIWUIR. Primary holds were those positioned at the commencement of STAR procedures for Copenhagen and Roskilde airfields.
MILITARY AIRSPACE
EKSP Area (max FL 245) Langeland Area (sfc - unl)
Restricted Amas
ED D19 (max 40000ft) ED 028 (max 46000ft) EK R30 Jagerspris
EK R25 lsefjord (max 14000ft)
SSR CODE ALLOCATION
Radar Coverage
SSR coverage for the entire area was simulated and all aircraft operating within this airspace were assumed to be SSR mode C equipped.
Code allocation followed the procedures laid down in the Danish AIP. A transfer of codes was assumed for traffic landing within the Copenhagen FIR, however overflying traffic from the Orcam code allocation region required a code change on transfer from Maastricht
EUROCONTROL Experimental Centre
1 - 4
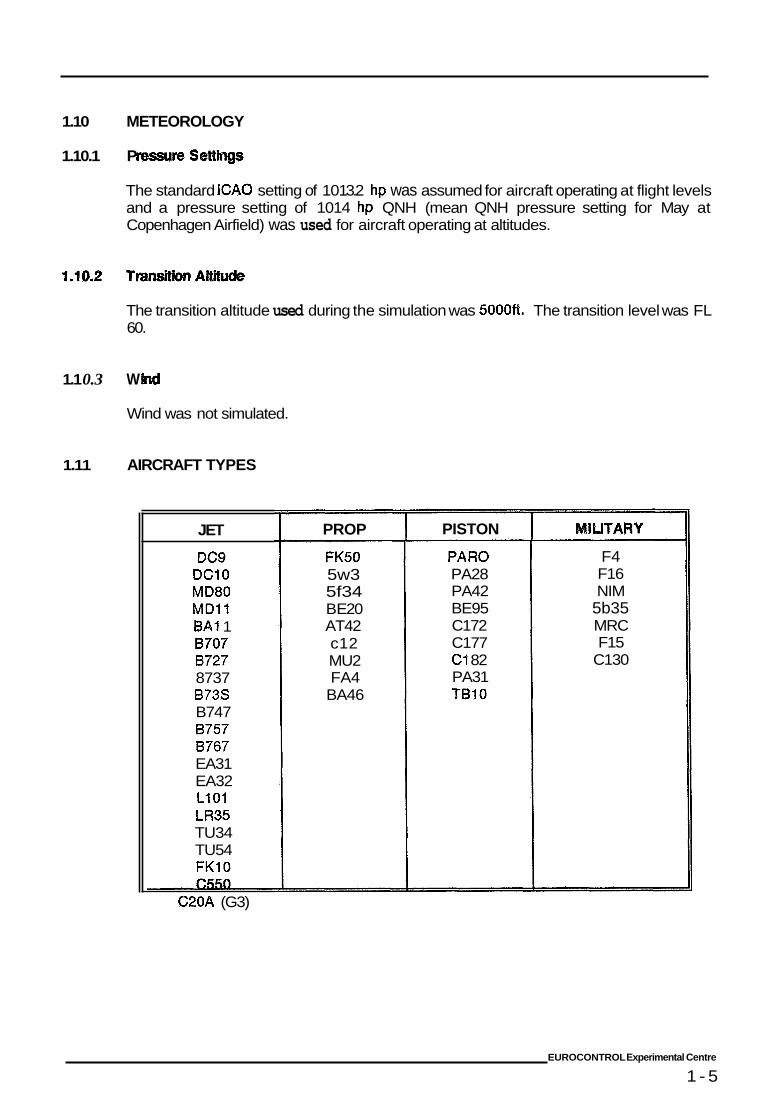
1.10 METEOROLOGY
1.10.1 P m S
The standard ICAO setting of 101 3.2 hp was assumed for aircraft operating at flight levels and a pressure setting of 1014 hp QNH (mean QNH pressure setting for May at Copenhagen Airfield) was used for aircraft operating at altitudes.
The transition altitude used during the simulation was 5000ft. The transition level was FL 60.
1.1 0.3 W
Wind was not simulated.
1.11 AIRCRAFT TYPES
JET
DC9 DClO M 080 MD11 BA1 1 8707 8727 8737 B73S B747 8757 8767 EA31 EA32 L101 LR35 TU34 TU54 FK10 A
C20A (G3)
PROP
FK50 5w3 5f34 B E20 AT42 c12 MU2 FA4 BA46
PISTON
PAR0 PA28 PA42 BE95 C172 C177 C l 82 PA31 TB10
MiUTARY
F4 F16 NIM
5b35 MRC F15
C130
EUROCONTROL Experimental Centre
1 - 5
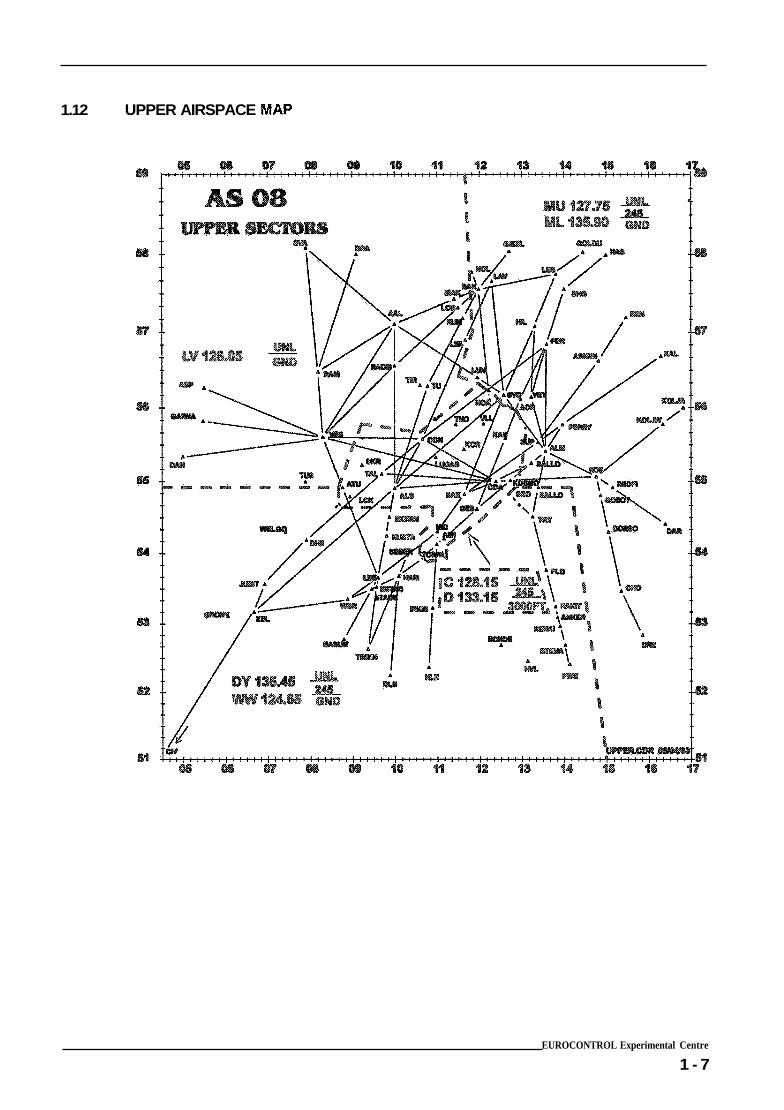
1.12 UPPER AIRSPACE MAP
EUROCONTROL Experimental Centre
1 - 7
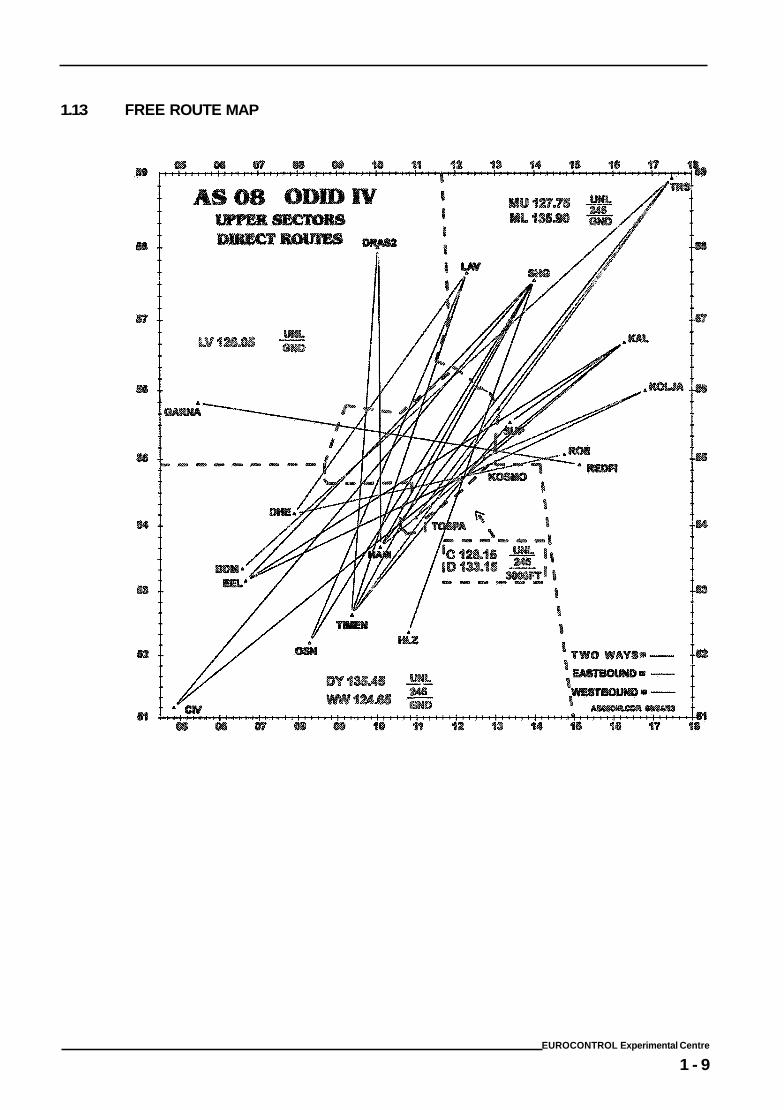
1.13 FREE ROUTE MAP
EUROCONTROL Experimental Centre
1 - 9
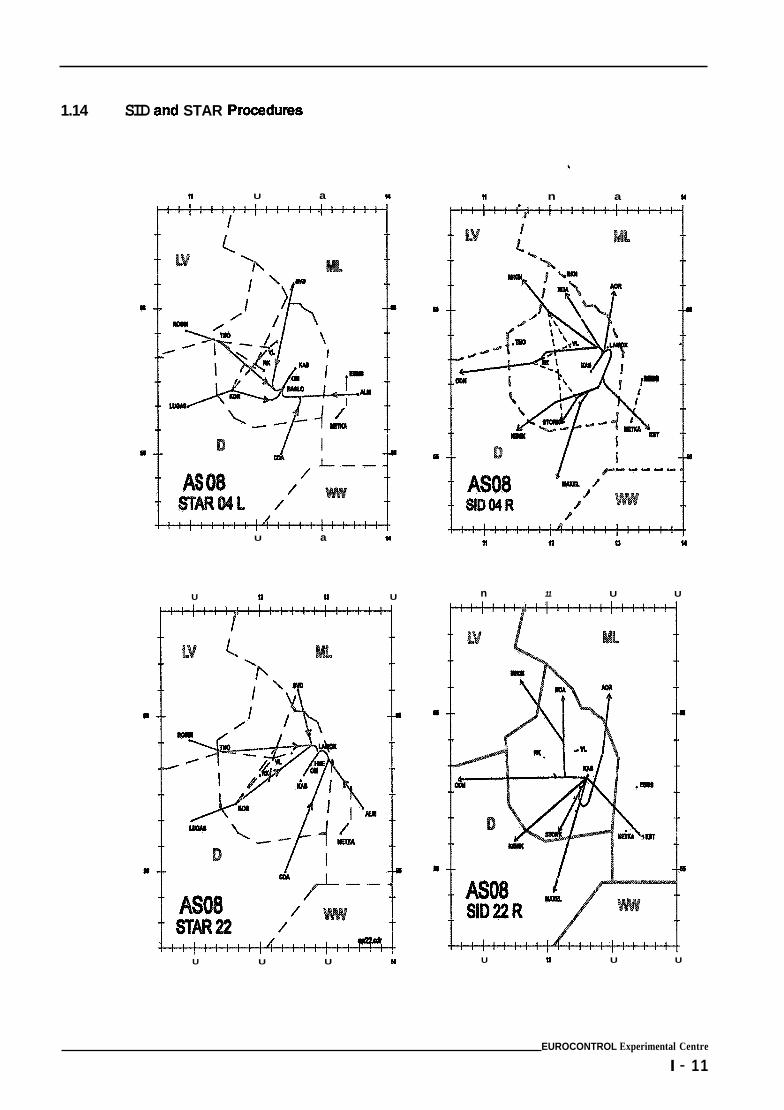
1.14 SID and STAR Procedums
n U a n
d ! /
/ L /
U a U
U 11 la U
U U U U
n n a n
n 11 U U
U U U U
EUROCONTROL Experimental Centre
I - 11
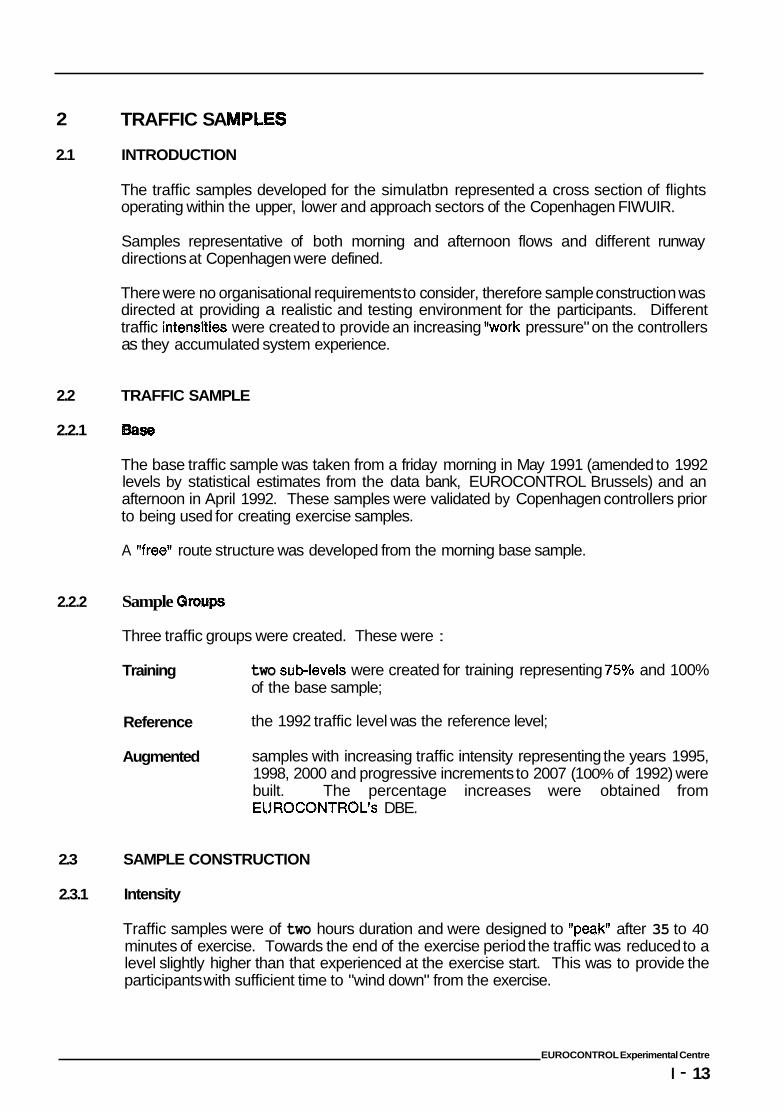
2 TRAFFIC SA
2.1 INTRODUCTION
The traffic samples developed for the simulatbn represented a cross section of flights operating within the upper, lower and approach sectors of the Copenhagen FIWUIR.
Samples representative of both morning and afternoon flows and different runway directions at Copenhagen were defined.
There were no organisational requirements to consider, therefore sample construction was directed at providing a realistic and testing environment for the participants. Different traffic intensities were created to provide an increasing "work pressure" on the controllers as they accumulated system experience.
2.2 TRAFFIC SAMPLE
2.2.1 Ba
The base traffic sample was taken from a friday morning in May 1991 (amended to 1992 levels by statistical estimates from the data bank, EUROCONTROL Brussels) and an afternoon in April 1992. These samples were validated by Copenhagen controllers prior to being used for creating exercise samples.
A "freetf route structure was developed from the morning base sample.
2.2.2 Sample Groups
Three traffic groups were created. These were :
Training two sub-levels were created for training representing '75% and 100% of the base sample;
Reference the 1992 traffic level was the reference level;
Augmented samples with increasing traffic intensity representing the years 1995, 1998, 2000 and progressive increments to 2007 (1 00% of 1992) were built. The percentage increases were obtained from EUROCONTROLIs DBE.
2.3 SAMPLE CONSTRUCTION
2.3.1 Intensity
Traffic samples were of two hours duration and were designed to "peak" after 35 to 40 minutes of exercise. Towards the end of the exercise period the traffic was reduced to a level slightly higher than that experienced at the exercise start. This was to provide the participants with sufficient time to "wind down" from the exercise.
EUROCONTROL Experimental Centre
I - 13
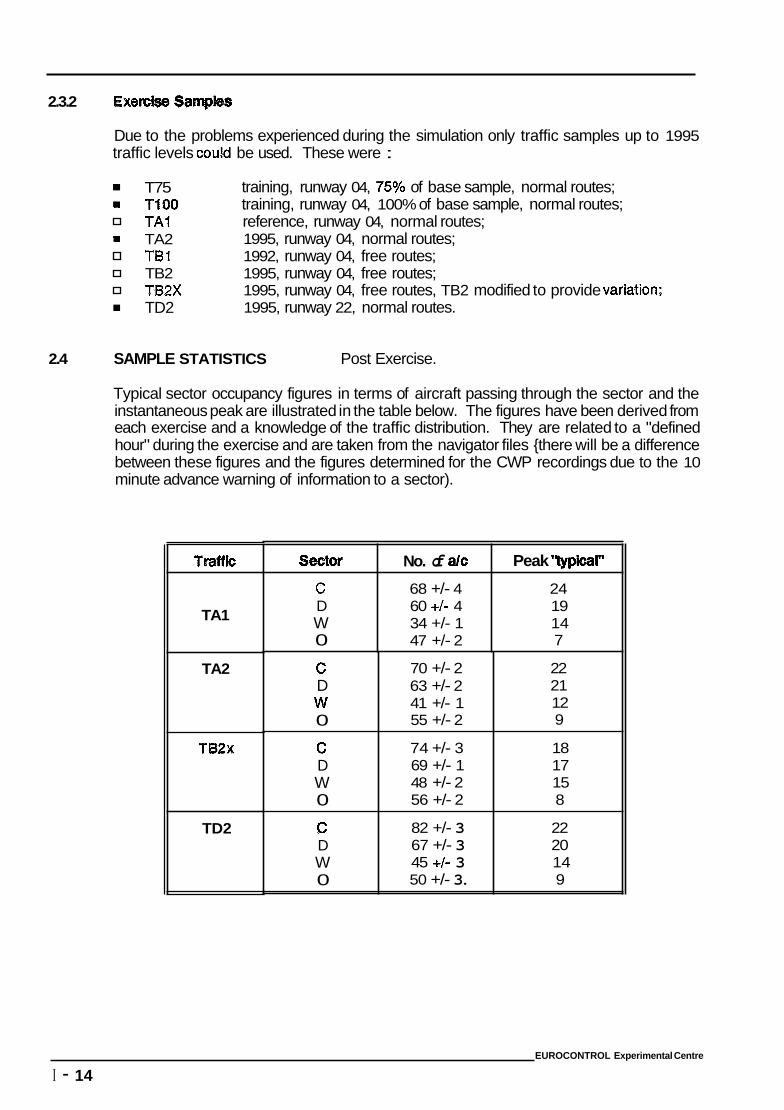
2.3.2 Exe
Sector No. of a/c
C 68 +/- 4 D 60 +I- 4 W 34 +/- 1 0 47 +/- 2
Due to the problems experienced during the simulation only traffic samples up to 1995 traffic levels could be used. These were :
Peak 'typical''
24 19 14 7
T75 T l O O TA1 TA2 TBI TB2 TB2X TD2
training, runway 04, 75% of base sample, normal routes; training, runway 04, 100% of base sample, normal routes; reference, runway 04, normal routes; 1995, runway 04, normal routes; 1992, runway 04, free routes; 1995, runway 04, free routes; 1995, runway 04, free routes, TB2 modified to provide variation; 1995, runway 22, normal routes.
2.4 SAMPLE STATISTICS Post Exercise.
Typical sector occupancy figures in terms of aircraft passing through the sector and the instantaneous peak are illustrated in the table below. The figures have been derived from each exercise and a knowledge of the traffic distribution. They are related to a "defined hour" during the exercise and are taken from the navigator files {there will be a difference between these figures and the figures determined for the CWP recordings due to the 10 minute advance warning of information to a sector).
TrafliC
TA1
TA2
TB2x
TD2
C D w 0
70 +/- 2 63 +/- 2 41 +/- 1 55 +/- 2
22 21 12 9
C D W 0
74 +/- 3 69 +/- 1 48 +/- 2 56 +/- 2
18 17 15 8
C D W 0
82 +/- 3 67 +/- 3 45 +I- 3 50 +/- 3.
22 20 14 9
EUROCONTROL Experimental Centre
I - 14
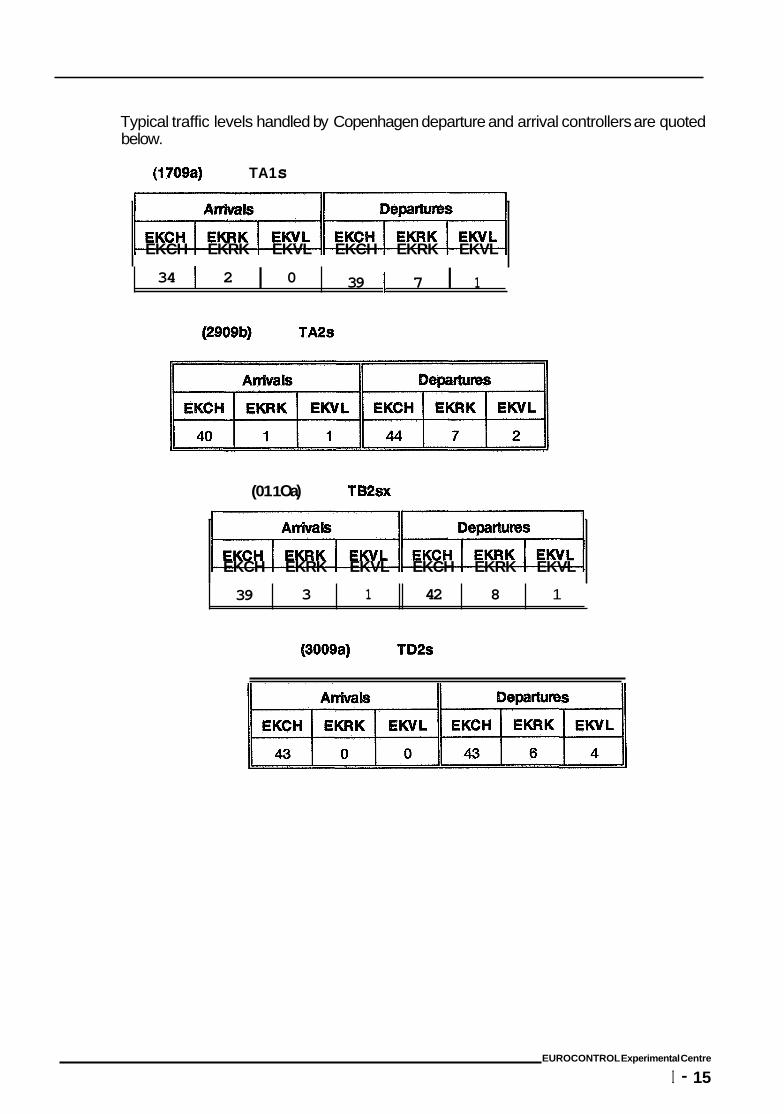
Typical traffic levels handled by Copenhagen departure and arrival controllers are quoted below.
I 34 I 2 0
(1 709a) TA1 s
7 I 1 39 I ~~ EKCH EKRK EKVL EKCH EKRK EKVL
39 3 1 42 8 1
(2009b) TA28
(01 1 Oa) TB2sx
~~ EKCH EKRK EKVL EKCH EKRK EKVL
(3009a) TD2s
EKCH EKRK EKVL EKCH EKRK EKVL 1~~~
EUROCONTROL Experimental Centre
I - 15
ANNEX II
ODlD IV
SIMULATION FACILITY
TABLE OF CONTENTS
1 INTRODUCTION ...................................... 11-1
UMTION FACILITY ............................. I I . 1
3 CWP ENVIRONMENT .................................. I I . 3
3.1 HEWLETT PACKARD WORK STATIONS ............... II . 3 3.2 METHEUS GRAPHICS CONTROLLER ................. I I . 5 3.3 SONY SCREEN .................................. 1 1 - 5 3.4 MOUSE ........................................ 11-5 3.5 LOGlClALS ..................................... 11-5
4 WINDOW ENT ............................... 11-6
5 METHODOLOGY ...................................... I I . 6
6 SOFTWARE ARCHITECTURE ............................ I I . 7
7 PRODUCTIVITY ...................................... I I . 9
7.1 PRODUCTION ................................... II . 9 7.2 SYSTEM LOAD .................................. I I - 9 7.3 VOLUME OF RECORDINGS ........................ II . 9
8 DATA PRE-PROCESSOR ............................... I I . 9
9 CONCLUSIONS ..................................... I I . 10
9.1 GENERAL ..................................... 11-10 9.2 METHODOLOGY ................................ II . 10 9.3 ADA ......................................... 11-10 9.4 PEX ......................................... 11-10 9.5 PERFORMANCE ................................ I I . 11 9.6 TRAINING ..................................... I I . 11 9.7 WINDOW MANAGEMENT ......................... I I . 11
ILLUSTRATIONS
I I . Figure 1 Simulation Facility ............................ II . 3 I I . Figure 2 CWP Composition ........................... II . 4
EUROCONTROL Experimental Centre
II . i
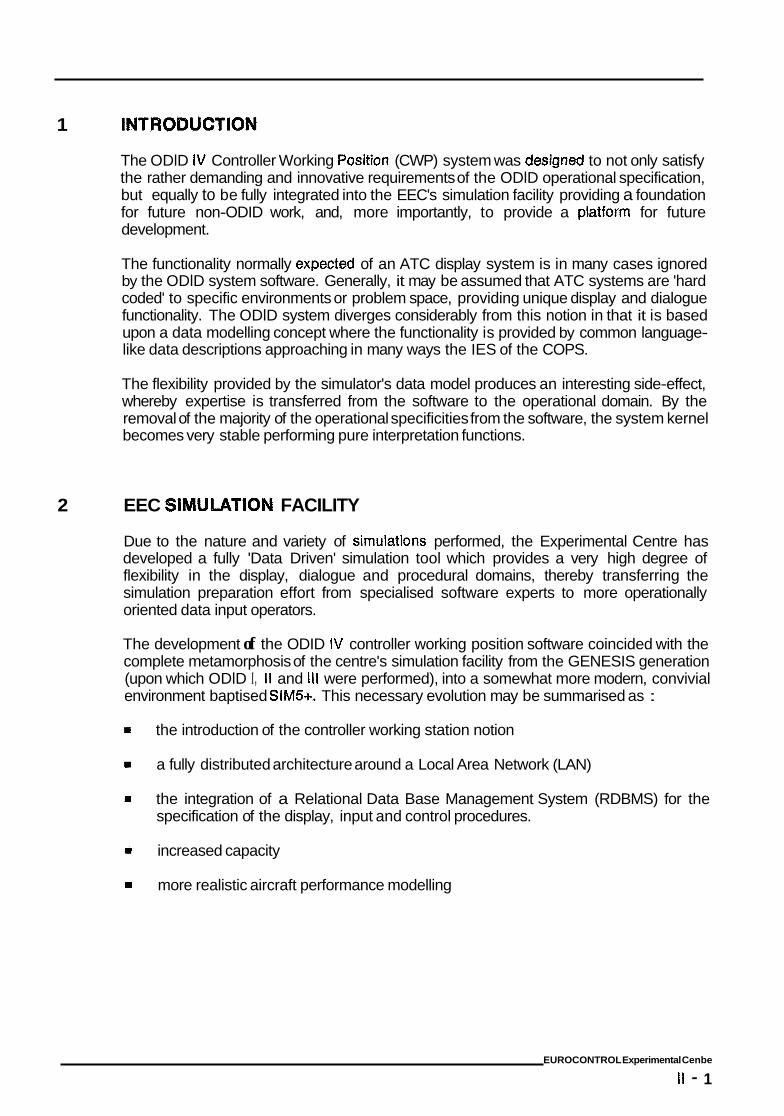
1
2
The ODlD IV Controller Working Position (CWP) system was designed to not only satisfy the rather demanding and innovative requirements of the ODlD operational specification, but equally to be fully integrated into the EEC's simulation facility providing a foundation for future non-ODID work, and, more importantly, to provide a platform for future development.
The functionality normally expected of an ATC display system is in many cases ignored by the ODlD system software. Generally, it may be assumed that ATC systems are 'hard coded' to specific environments or problem space, providing unique display and dialogue functionality. The ODlD system diverges considerably from this notion in that it is based upon a data modelling concept where the functionality is provided by common language- like data descriptions approaching in many ways the IES of the COPS.
The flexibility provided by the simulator's data model produces an interesting side-effect, whereby expertise is transferred from the software to the operational domain. By the removal of the majority of the operational specificities from the software, the system kernel becomes very stable performing pure interpretation functions.
EEC S I ~ U ~ T I O N FACILITY
Due to the nature and variety of simulations performed, the Experimental Centre has developed a fully 'Data Driven' simulation tool which provides a very high degree of flexibility in the display, dialogue and procedural domains, thereby transferring the simulation preparation effort from specialised software experts to more operationally oriented data input operators.
The development of the ODID IV controller working position software coincided with the complete metamorphosis of the centre's simulation facility from the GENESIS generation (upon which ODlD I , I I and 111 were performed), into a somewhat more modern, convivial environment baptised SIM5+. This necessary evolution may be summarised as :
the introduction of the controller working station notion
a fully distributed architecture around a Local Area Network (LAN)
the integration of a Relational Data Base Management System (RDBMS) for the specification of the display, input and control procedures.
increased capacity
more realistic aircraft performance modelling
EUROCONTROL Experimental Cenbe
II - 1
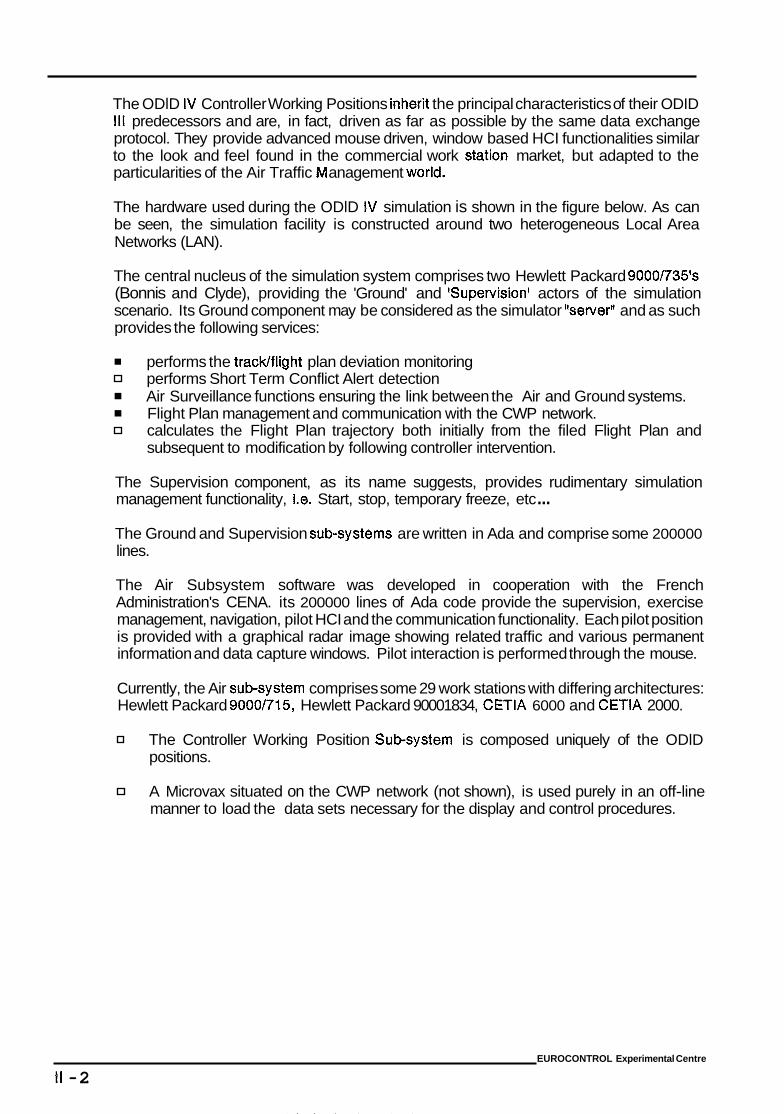
The ODlD IV Controller Working Positions inherit the principal characteristics of their ODID 111 predecessors and are, in fact, driven as far as possible by the same data exchange protocol. They provide advanced mouse driven, window based HCI functionalities similar to the look and feel found in the commercial work station market, but adapted to the particularities of the Air Traffic anagement world.
The hardware used during the ODlD IV simulation is shown in the figure below. As can be seen, the simulation facility is constructed around two heterogeneous Local Area Networks (LAN).
The central nucleus of the simulation system comprises two Hewlett Packard 9000R35's (Bonnis and Clyde), providing the 'Ground' and 'Supervision' actors of the simulation scenario. Its Ground component may be considered as the simulator 'server' and as such provides the following services:
performs the tracwflight plan deviation monitoring performs Short Term Conflict Alert detection Air Surveillance functions ensuring the link between the Air and Ground systems. Flight Plan management and communication with the CWP network. calculates the Flight Plan trajectory both initially from the filed Flight Plan and subsequent to modification by following controller intervention.
The Supervision component, as its name suggests, provides rudimentary simulation management functionality, i.e. Start, stop, temporary freeze, etc ... The Ground and Supervision subsystems are written in Ada and comprise some 200000 lines.
The Air Subsystem software was developed in cooperation with the French Administration's CENA. its 200000 lines of Ada code provide the supervision, exercise management, navigation, pilot HCI and the communication functionality. Each pilot position is provided with a graphical radar image showing related traffic and various permanent information and data capture windows. Pilot interaction is performed through the mouse.
Currently, the Air subsystem comprises some 29 work stations with differing architectures: Hewlett Packard 9000/715, Hewlett Packard 90001834, CETIA 6000 and CETIA 2000.
The Controller Working Position Subsystem is composed uniquely of the ODlD positions.
A Microvax situated on the CWP network (not shown), is used purely in an off-line manner to load the data sets necessary for the display and control procedures.
EUROCONTROL Experimental Centre
II -2
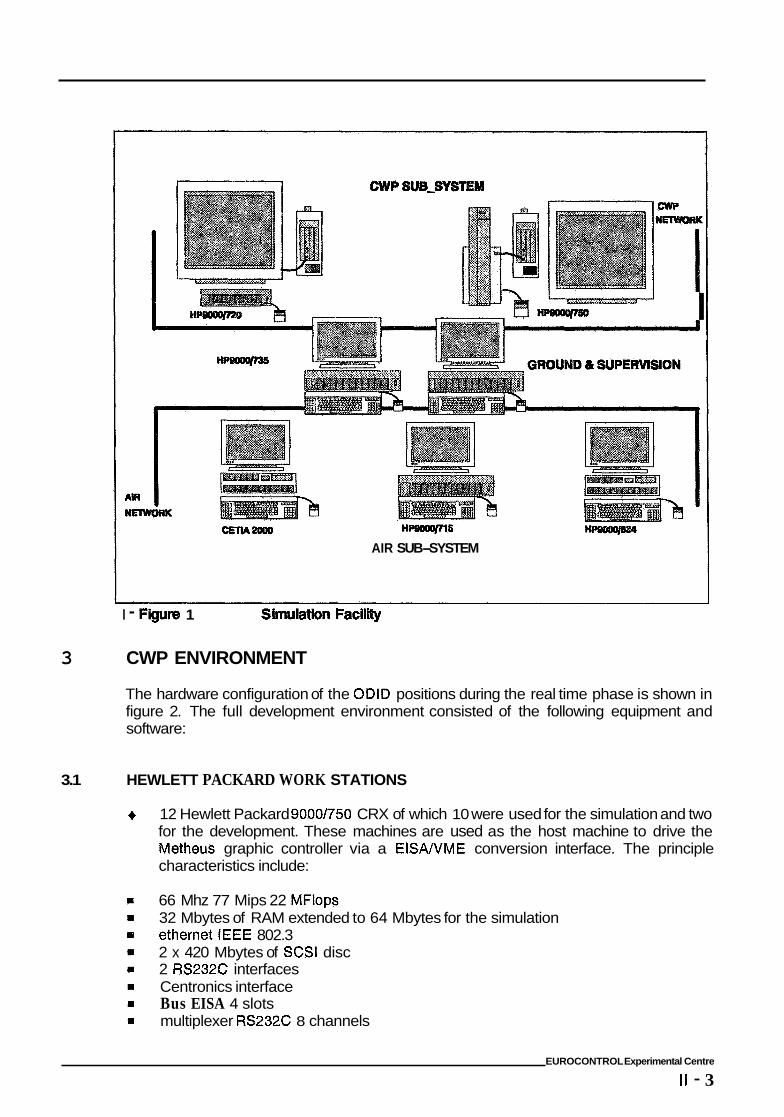
3
3.1
I
Hpwoq(nS
AIR SUB-SYSTEM n
I - F @ I ~ 1
CWP ENVIRONMENT
Simulation Faeilii
The hardware configuration of the ODlD positions during the real time phase is shown in figure 2. The full development environment consisted of the following equipment and software:
HEWLETT PACKARD WORK STATIONS
+ 12 Hewlett Packard 9000/750 CRX of which 10 were used for the simulation and two for the development. These machines are used as the host machine to drive the Metheus graphic controller via a EISANME conversion interface. The principle characteristics include:
66 Mhz 77 Mips 22 MFIops 32 Mbytes of RAM extended to 64 Mbytes for the simulation ethernet IEEE 802.3 2 x 420 Mbytes of SCSl disc 2 RS232C interfaces Centronics interface Bus EISA 4 slots multiplexer RS232C 8 channels
EUROCONTROL Experimental Centre
I I - 3
7 Hewlett Packard 9000/720 CW: of which 4 were used for the simulation and two for the development. These machines are used as the host machine to drive the Metheus graphic controller via a ElSAN E conversion interface. The principle characteristics include:
50 Mhz 57 Mips 17 MFlops 32 Mbytes of RAM extended to 64 Mbytes for the simulation ethernet IEEE 802.3 2 x 420 Mbytes of SCSl disc 2 RS232C interfaces Centronics interface Bus ElSA 1 slot
19" Monitor and HP/CRX Graphic Board
72 Hz 8 double buffered plans 1280 x 1024 frame buff er 32 bits 133 Mbytedsecond interface hardware functions include: alphanumeric functions, cursor, lnfills performance X 1 1 : 91 0 vectors/second performance Phigs: 1120k integer vectors/second, 11 50k floating point vectors/second
I II - FQUIB 2 CWP Composition
EUROCONTROL Experimental Centre
I I - 4
3.2
3.3
3.4
3.5
METHEUS GRAPHICS CONTROLLER
t Metheus Graphic Controllers type OMEGA 5700:
= 16 Mbytdsecond VME bus architecture
graphic accelerator board (GXA) - 8 Mbytes of RAM - lntel i860 processor, 33 Mips, 66 MFlops, 33 MHz
Video Frame Buffer board - 8 double buffered planes 4 double buffered overlay planes 2048 x 2048 frame buffer
- -
liaison G W F B by internal bus (IBUS) 128 Mbyteslsecond
= VME/EISA interface with host
performance: 31 Ok vectors/second (1 0 pixel), 80k characters/second
SONY SCREEN
t Sony DDM2800C
High resolution 2048 x 2048 pixels, 20" x 20" colour screen
MOUSE
t Logitech P7 opto-mechanical mice. t Hewlett Packard mice.
LOGlClALS
HP-UX 9.01 BSD X I 1 R5 OSF/Motif PEX HPVue HP Phigs 2.1 1 Soft bench (C and Ada) AIsys Ada (5.3, C compilers FrameMaker CMF (Softix) TCP/IP, NFS, NIS, Name Services NCS
EUROCONTROL Experimental Centre
II - 5
4
Following the success of the ODlD 111 implementation, the Window enhanced to provide the participants with a more comfortable system.
anag emen t was
Although built in-house, the Window Management System replicates the look and feel found on the commercial work stations, providing the follow functions :
Window R e d
owr Window
I conety window
Window Prb
ScrolVPan
zoom
Unlike ODlD 111, the Zoom and Pan/Scroll actions can be used in either a 'stepped' incremental manner or by a press and holddragging mouse action. In the latter case, the performance of the graphics controller and the facilities offered by the PEX were found sufficient to permit instantaneous on-screen redraws.
5 ETHODOLOGY
The ODlD 111 Controller Working Position system was developed using OOD methodology. Many different flavours of OOD exist (HOOD, MEYER, YOURDON etc...), the particular flavour proposed by G. BOOCH is a method whereby the architecture of the solution space corresponds to the abstractions found in the real world. This method permits a certain balancing between objects and operations, allowing the encapsulation of data and the operations which manipulate them and deals efficiently with the problems of interfaces and communications between system modules.
Following the experience of the ODlD 111 development, the system was remodelled slightly to introduce the notion of object hierarchy, thereby reducing the coupling and, in consequence, the complexity of the problem.
EUROCONTROL Experimental Centre
II - 6
6 SOFTWARE ARCHITECTURE
Basically, the controller's working position must provide the following functions :
As a network client :
I, receive data addressed either specifically to it or broadcast in general over the network,
I, transmit data via the network to other specific clients or broadcast,
I, receive data from the subsystem's designation devices following operator actions,
+ organise the display and refresh of relevant information to the operator,
I, provide the window management facilities.
To enable the flexibility required in real-time simulations, these functions are performed with the aid of preparation data, which constitute the principal support for the operator dialogue, display and control procedures.
These data are constructed off-line prior to the real-time simulation with the aid of ORACLE, a Relational Data Base Management System (RDBMS). They comprise descriptions of :
I, the geographic environment :
cartographic data, sectorisation, etc.
I, the working position configuration :
physical output device characteristics, 0 operational procedures,
etc.
By applying the initial design step prior to the execution of the BOOCH recommendations, five functionally related subsystems were identified :
subsystem which controls all transactions and operations necessary in the management of the local area network.
Controller input :
subsystem which identifies and manages the input dialogues between the controller and the machine, performed in the case of ODlD IV by the use of a mouse input device.
EUROCONTROL Experimental Centre
I 1 - 7
this subsystem is effectively the nerve centre of the entire system. Triggered by external events and depending upon the preparation data specification, this subsystem instigates all display actions, controls certain internal function logic and exports any messages pertinent to the network.
D
the visible part of the iceberg, triggered by requests from the event subsystem, this subsystem interprets data specified in the preparation phase and transforms it into P E W output commands for visualisation. PEX is used extensively for all graphic application windows and tabular messages, whilst X is used for all popup menus, gadgets and buttons.
more a collection of data than a subsystem. Effectively, comprising what BOOCH refers to as Abstract Data Types, that is to say data objects and their manipulating procedures : typically the preparation data.
These five subsystems form the baseline version for the simulators Controller Working Position package. In addition to these, two additional functions were introduced into the package for the ODlD IV simulation:
Sequencer:
a true functional block based upon the MAESTRO sequencing tool system provided by the French Administrations CENA. This software was adapted to the simulators operating environment, introducing a certain flexibility into its operating mode and airspace description. Assistance was provided by the CENA staff during the familiarisation phase of the software porting operation.
The tool is triggered by requests from the Event subsystem. It provides services to the display subsystem indicating Stack exit times, Delays, landing times, etc ... The ODlD simulation does not exploit the full functionality offered by the tool.
Conflict DetectFOn:
a Medium Term Conflict Detection functional block was developed to provide flight plan based detection as required by the ODlD specification. The detection was performed on the flight plan profiles produced by the ground subsystem, subsequently updated by controller input and track deviation monitoring. The profiles is composed of a series of 4d geodesics. Each geodesic is compared for temporal, lateral, longitudinal and vertical separation criteria suitably parameterised for different operating environments.
EUROCONTROL Experimental Centre
II - 8
7 PRODUCTIVITY
7.1 PRODUCTION
The production phase, covering the period between January 1992 to June 1993 required 85 man-months of effort.
Today, the system totalises 105730 lines of Ada source code with approximately a further 200 lines written in 'C' distributed amongst 385 compilation units. The generated object code currently runs at 3.9 Mbytes.
7.2 SYSTEM LOAD
The CWP application when running under an average load, i.e. with a hundred aircraft active, occupies approximately 24 Mbytes of memory , whilst the server requires approximately 10 Mbytes.
7.3 VOLUME OF RECORDINGS
During real time simulations, all controller interventions, display actions, internal triggers, etc. are recorded for analysis. These data are kept in an un-compressed ASCll form, enabling eventual software debugging. The volume of recordings for a typical 120 minute exercise lies in the region of :
+ 1.2 Mbytes.
8 DATA PRE-PROCESSOR
The ODlD IV application running on the Controller Working Position work stations is, as previously stated, largely parameterised by the preparation data. These data, in many ways specific to each simulation or organisation, are contained in predefined packed binary data structures, transferred to the work stations during system initialisation.
Prior to the actual system simulation, two non negligible processes have to be accomplished :
+ translation and entry of the operational specification into a Relational Data Base Management System, followed by the "Compilation" of the database into the data structures used during initialisation,
+ entry of the simulated operational environment and the corresponding traffic data.
The RDBMS employed for the entry of simulation data is that of ORACLE. It is installed on a MICROVAX II and is perfectly integrated into the host's operating system URrix Version 2.0 (Unix Digital).
Although difficult to isolate the preparation data entry effort from the total effort spent on the ODlD IV simulation, it is reasonable to assume that 6 man-months were necessary.
EUROCONTROL Experimental Centre
I I - 9
9 CONCLUSIONS
9.4 GENlERAL
The use of multiple new technologies, i.e. UNIX, Ada, PEX, etc ..., in a project where few team members have experience in any of these technologies and with no immediate support available, can cause havoc to schedules. It becomes difficult, impossible even, to anticipate problems and avoid pitfalls. There is, however, a positive aspect in that their use has a certain motivating effect upon the project team.
As previously mentioned, the flexibility provided by a data model, in our case the simulator, produces a transfer of effort from the software to the operational domain. This was demonstrated extremely well during the simulation by the rapidity at which operational modifications were implemented. Between the June and September runs, some 100 modifications were requested, of which only 30% required software intervention.
9.2 METHODOLOGY
The use of the methods advocated by G. BOOCH are sufficient for small to medium sized applications. However, the introduction of an initial operation, consisting of the regrouping into functionally dependant subsystems was greatly appreciated and simplified the design enormously.
The object paradigm is a natural and productive one for development and enhances product portability. It's use permitted parallelism during development and the rapid identification of potential Generic package candidates. However, first time users should not expect miracles. The learning curve is significant and should not be under-evaluated. The 'Design a little, Code a little, and Test a little' notion suggested by BOOCH was particularly appreciated. This was due to the fact that the developers could visually follow the state of advancement.
9.3
9.4
ADA
As is generally recognised, Ada is a very complete language that has the merit of actually relating to an internationally accepted, preestablished standard and as such is assured a long and stable future. Serious difficulties were encountered with the Ada environment due mainly the technological immaturity of the equipment employed.
PEX
As has been mentioned previously, PEX was used extensively for all graphical aspects of the application. The Gadgets, buttons and menus are coded using X. Apart from the problems encountered due to the immatur'w of the product, it may be said that "PEX is to X as Ada is to Assembler", and as such provides an ideal extension of OOD down to the graphic object. The facilities offered by the picking, structure edition, view manipulation, etc ... are powerful and relatively simple and convenient to use.
EUROCONTROL Experimental Centre
II - 10
Text manipulation was found to be a little more inconvenient, especially if one has to use the 'spidery' PEX fonts. At the current time, development is being performed to implement the tabular message data under X.
9.5 PERFORMANCE
The participating operational staff, although occasionally frustrated by the response times, were in general satisfied with the system responsiveness. It must be remembered that the ODlD positions are in fact performing the role of an interpreter and considerable gains would be achieved if the positions were hard coded to the operating environment.
9.6 TRAINING
The learning curve concerning PEX is important as no formal training is currently available. Trial and error is the rule at present.
9.7 WINDOW MANAGEMENT
The software team provided the simulated operational environment a Window Management System which replicates the look and feel of commercial work stations. Notwithstanding the ergonomic considerations, the system was greatly appreciated by all concerned and proved that modern windowing techniques may be applied to the ATM community.
EUROCONTROL Experimental Centre
ii - 11
~ . . ... ..... . . "... ... ". .... " _." ..... ~ " ~ " " . ". " " '. ",. . ., ." ...... ^ ^ .',
ODlD IV
SYSTEM DESCRIPTION
TABLE OF CONTENTS
1 ODlD IV CONTROL ENVIRON~ENT ............................ 111 . 1
1.1 INTRODUCTION ..................................... Ill . 1 1.2 OBJECTIVE ......................................... 111-1
2 ODlD IV COLOURS ........................................ 111 . 1
2.1 PLANNING COLOUR STATES ........................... 111 . 1 2.2 COORDINATION COLOUR .............................. 111 . 2 2.3 URGENCY/WARNING COLOURS ......................... 111 . 2 2.4 BACKGROUND COLOURS ............................. Ill . 3 2.5 COLOUR HIERARCHY ................................. I l l . 3 2.6 COLOUR LEVELS .................................... 111 . 3 2.7 COLOUR TABLE ..................................... Ill . 5
3 TIME PARAMETERS ....................................... 111 . 5
3.1 ADVANCE INFORMATION .............................. 111 . 5 3.2 INFORMATION REMOVAL .............................. 111 . 5
4 DATAINPUT ............................................. 111-6
4.1 REQUIREMENT ...................................... 111 . 6 4.2 GENERAL CONSIDERATIONS ........................... Ill . 6 4.3 THE MOUSE ........................................ 111-6
5 WINDOW MANAGEMENT .................................... 111 . 7
5.1 DEFINITION OF A WINDOW ............................ 111 . 7 5.2 AlTRIBUTES OF A WINDOW ........................... Ill . 7 5.3 WINDOW ACTIONS ................................... 111 . 8
6 SYSTEM ASSISTED COORDINATION AND DATA TRANSFER . . . . . . . . 111 . 9
6.1 BASIC PRINCIPLES ................................... 111 . 9 6.2 INITIAL DISPLAY OF FLIGHT DATA TO A SECTOR . . . . . . . . . . 111 . 10 6.3 NOTIFICATION OF DATA TO THE NEXT SECTOR . . . . . . . . . . . Ill . 10 6.4 MODIFICATION OF ENTRY OR EXIT CONDITIONS . . . . . . . . . . Ill . 10 6.5 DEPARTURE REQUESTS ............................. Ill . 11
7 THE ODID CWP (Controllsr Workhrg Position) ..................... 111 . 11
8 RADAR WINDOW ......................................... Ill . 12
9 THE BUTTON BAR ........................................ 111 . 13
10 CLOCK WINDOW ......................................... 111 . 24
11 COORDINATION MESSAGE WINDOW ......................... 111 . 25
EUROCONTROL Experimental Centre
111 . i
12 POP-UP VALUE WINDOWS ................................. 111 . 28
12.1 12.2 12.3 12.4 12.5 12.6 12.7 12.8
CALLSIGN MENU WINDOW ............................ 111 . 28 CFL'PEL VALUE WINDOW ............................. 111 . 31 XFL VALUE WINDOW ................................ 111 . 32 RFL VALUE WINDOW ................................ 111 . 33 XPT VALUE WINDOW ................................ I l l . 34 arc VALUE WINDOW ................................. 111 . 35 asp VALUE WINDOW ................................. 111 . 36 SEQUENCE CHANGE WINDOW ........................ 111 . 37
13 RADARLABELS .......................................... 111-38
13.1 DESCRIPTION ...................................... 111 . 38 13.2 RADAR LABEL DE-CODE ............................. 111 . 39 13.3 RADAR LABEL TYPES ................................ 111 -39 13.4 MINIMUM LABEL DISPLAY ............................ I l l . 41 13.5 CURSOR DEFAULTING ............................... I l l . 41 13.6 RADAR LABEL DIALOGUE ............................ I l l . 42
14 TABULAR INFORMATION WINDOWS .......................... 111 . 45
14.1 THE SIL (SECTOR INBOUND LIST) ...................... Ill . 45 14.2 THE LANDING LIST WINDOW .......................... I l l . 47 14.3 THE DEPARTURE LIST WINDOW ....................... 111 . 48 14.4 THE STACK WINDOW ................................ 111 . 49
15 MEDIUM TERM CONFLICT ASSISTANCE . MTCA . . . . . . . . . . . . . . . . 111 . 52
15.1 INTRODUCTION .................................... 111 . 52 15.2 PROFILE CALCULATION AND RE-CALCULATION . . . . . . . . . . . I l l . 52 15.3 CONFLICT TYPES ................................... I l l . 54 15.4 WARNING FUNCTION ................................ 111 . 55
16 MTCA WINDOWS ......................................... 111 . 56
16.1 CONFLICT AND RISK DISPLAY . CARD . . . . . . . . . . . . . . . . . . . 111 . 56 16.2 HORIZONTAL AID WINDOW . HAW ...................... I l l . 59 16.3 VERTICAL AID WINDOW . VAW ......................... 111 . 62 16.4 CONFLICT ZOOM WINDOW . CZW ...................... 111 . 65
17 ADDITIONAL FUNCTIONS .................................. 111 . 68
17.1 APPROACH MULTI INPUT DEVICE -AMID ................ I l l . 68 17.2 METERING TOOL ................................... 111 . 71 17.3 SHORT TERM CONFLICT ALERT . STCA . . . . . . . . . . . . . . . . . 111 . 72
EUROCONTROL Experimental Centre
I l l . i i
UST OF ILLUSTRATIONS
D I PLC : Full S ............................ 111- Q n Bar ........ .................................. 111-13
gram ....................................... 111-19 Dhgmm ..................................... 111 . 55
CARD .................................................. 111-57 HAW .................................................. 111-59
................................................... 111-63
................................................... 111-65 ................................ 111-69
EUROGONTROL Experimental Centre
111 . iii
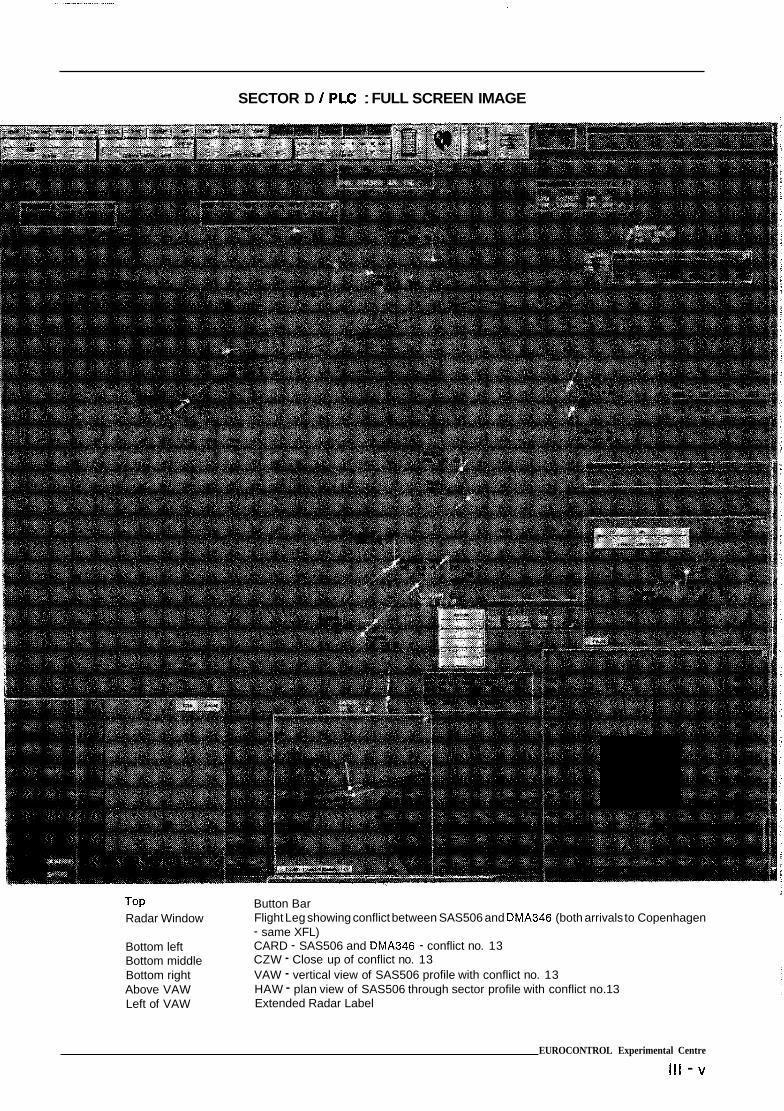
SECTOR D / PLC : FULL SCREEN IMAGE
TOP Button Bar Radar Window
Bottom left Bottom middle Bottom right Above VAW Left of VAW
Flight Leg showing conflict between SAS506 and DMA346 (both arrivals to Copenhagen - same XFL) CARD - SAS506 and DMA346 - conflict no. 13 CZW - Close up of conflict no. 13 VAW - vertical view of SAS506 profile with conflict no. 13 HAW - plan view of SAS506 through sector profile with conflict no.13 Extended Radar Label
EUROCONTROL Experimental Centre
Ill - v
1 ODlD IV CONTROL ENVIRON
1.1 INTRODUCTION
The ODlD IV simulation facility provided the air traffic controller with a multi-window working environment. Data was displayed on a priority basis (minimum information only) whilst supplementary information was available on request.
Colour was used to indicate aircraft planning status, coordination, conflict and urgency situations.
Interaction between system and controller was achieved through a three button mouse. Clicking on displayed objects input data or displayed information on a temporary or permanent basis.
The use of paper strips for advance planning information, conflict detection and noting of control instructions was replaced by tabular data displays, Medium Term Conflict Assistance tools and an interactive radar label.
An "on screen" system assisted coordination function was provided for inter Centre and inter sector coordination.
1.2 OBJECTIVE
The objective of this annex is to provide a complete description of the ODlD IV working environment including functions, tools, windows and input options.
2 ODlD IV COLOURS
The simulation employed seven main colours for use in indicating planning status, coordination, advance information and urgency/warning situations. Other colours were used in video maps and as background for windows and text.
Pastel shades were employed in background video maps and "full" colours were used for primary functions.
2.1 PLANNING COLOUR STATES
There were four label colour states used in ODlD IV. These are described below.
2.1.1 Not Concerned (or Transferred)
This colour was GREY - and the state indicated that the controller was not "working" the flight (ie. it was outside his/her sector) or that it had been transferred to another frequency. GREY labels could be filtered. (See Concerned State regarding transferred traffic still in the sector).
EUROCONTROL Experimental Centre
111 - 1
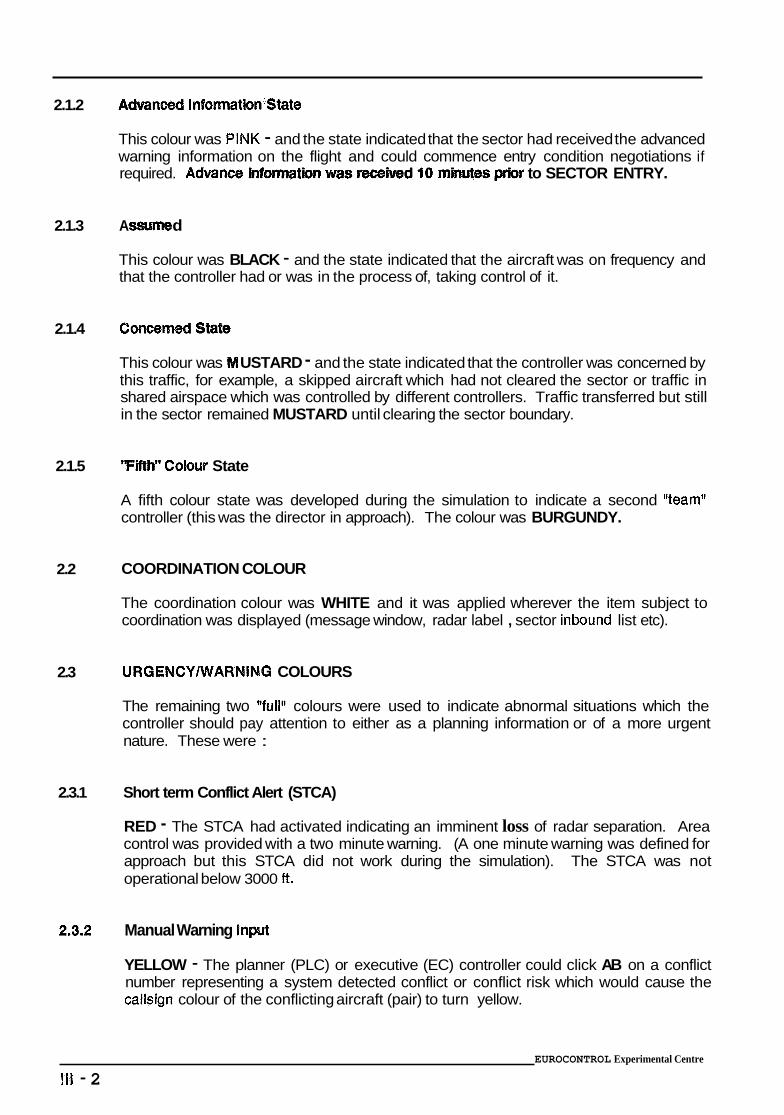
2.1.2
2.1.3
2.1.4
2.1.5
2.2
2.3
2.3.1
2.3.2
ncctd 1nfmtkM:State
This colour was PINK - and the state indicated that the sector had received the advanced warning information on the flight and could commence entry condition negotiations if required. Advance to SECTOR ENTRY.
A d
This colour was BLACK - and the state indicated that the aircraft was on frequency and that the controller had or was in the process of, taking control of it.
C m m d Stab
This colour was USTARD - and the state indicated that the controller was concerned by this traffic, for example, a skipped aircraft which had not cleared the sector or traffic in shared airspace which was controlled by different controllers. Traffic transferred but still in the sector remained MUSTARD until clearing the sector boundary.
'Fifth" Colour State
A fifth colour state was developed during the simulation to indicate a second "teamt' controller (this was the director in approach). The colour was BURGUNDY.
COORDINATION COLOUR
The coordination colour was WHITE and it was applied wherever the item subject to coordination was displayed (message window, radar label , sector inbound list etc).
URGENCYMVARNING COLOURS
The remaining two "fulP colours were used to indicate abnormal situations which the controller should pay attention to either as a planning information or of a more urgent nature. These were :
Short term Conflict Alert (STCA)
RED - The STCA had activated indicating an imminent loss of radar separation. Area control was provided with a two minute warning. (A one minute warning was defined for approach but this STCA did not work during the simulation). The STCA was not operational below 3000 ft.
Manual Warning Input
YELLOW - The planner (PLC) or executive (EC) controller could click AB on a conflict number representing a system detected conflict or conflict risk which would cause the callsign colour of the conflicting aircraft (pair) to turn yellow.
EUROCONTROL Experimental Centre
I l l - 2
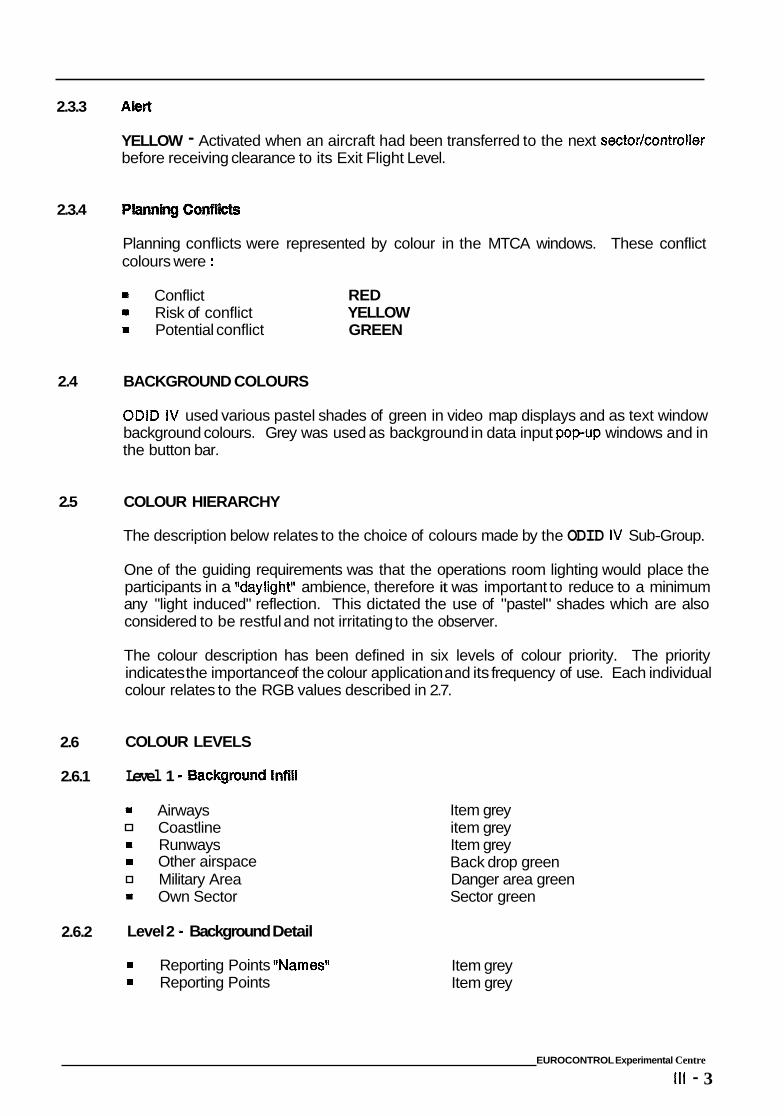
2.3.3
2.3.4
2.4
2.5
2.6
2.6.1
2.6.2
Abrt
YELLOW - Activated when an aircraft had been transferred to the next ssctor/controller before receiving clearance to its Exit Flight Level.
Planning conflicts were represented by colour in the MTCA windows. These conflict colours were :
fl Conflict RED fl Risk of conflict YELLOW fl Potential conflict GREEN
BACKGROUND COLOURS
ODID IV used various pastel shades of green in video map displays and as text window background colours. Grey was used as background in data input popup windows and in the button bar.
COLOUR HIERARCHY
The description below relates to the choice of colours made by the ODID IV Sub-Group.
One of the guiding requirements was that the operations room lighting would place the participants in a "daylight1' ambience, therefore it was important to reduce to a minimum any "light induced" reflection. This dictated the use of "pastel" shades which are also considered to be restful and not irritating to the observer.
The colour description has been defined in six levels of colour priority. The priority indicates the importance of the colour application and its frequency of use. Each individual colour relates to the RGB values described in 2.7.
COLOUR LEVELS
Level 1 - Background Infill
fl Airways Coastline
fl Runways Other airspace Military Area Own Sector
Level 2 - Background Detail
fl Reporting Points ftNamesvl fl Reporting Points
Item grey item grey Item grey Back drop green Danger area green Sector green
Item grey Item grey
EUROCONTROL Experimental Centre
111 - 3
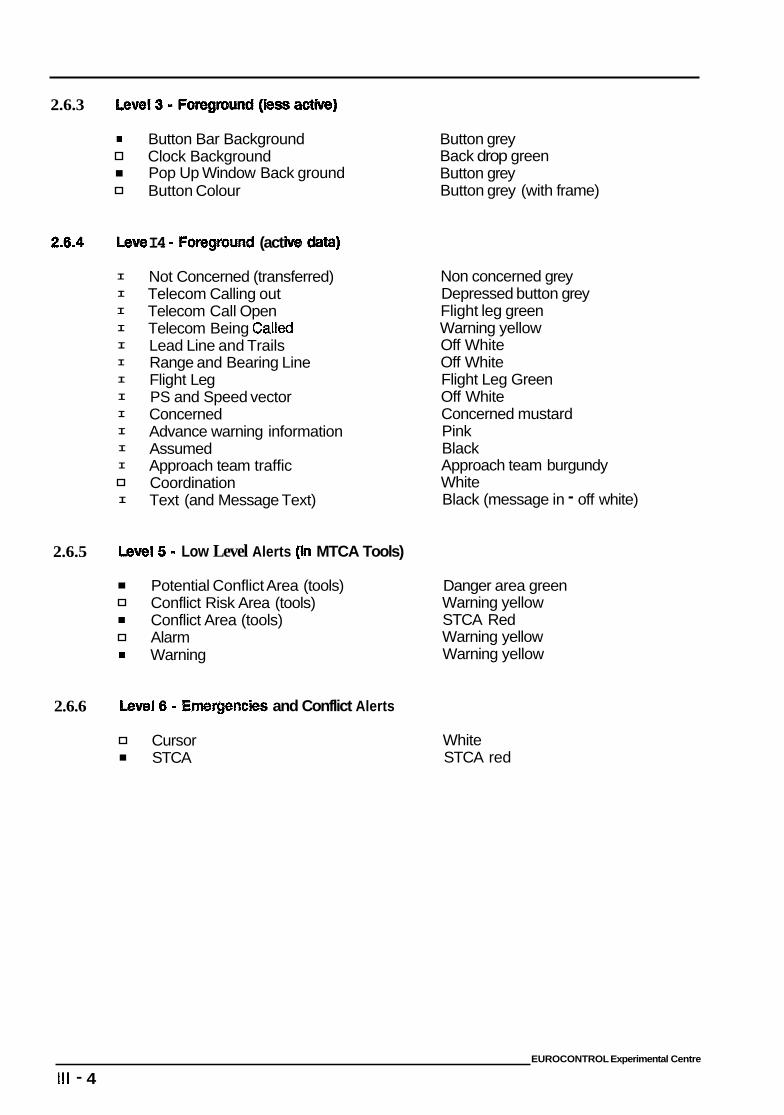
2.6.3
= Button Bar Background Button grey Clock Background Back drop green Pop Up Window Back ground Button grey Button Colour Button grey (with frame)
I4 - Fmgmnd (act
I
I
I
I
I
I
I
I
I
I
I
I
I
Not Concerned (transferred) Telecom Calling out Telecom Call Open Telecom Being Called Lead Line and Trails Range and Bearing Line Flight Leg PS and Speed vector Concerned Advance warning information Assumed Approach team traffic Coordination Text (and Message Text)
2.6.5 llsvsl5 - Low Level Alerts (in MTCA Tools)
Potential Conflict Area (tools) Conflict Risk Area (tools) Conflict Area (tools) Alarm
I Warning
2.6.6 Level6 - Emergencies and Conflict Alerts
Cursor STCA
Non concerned grey Depressed button grey Flight leg green Warning yellow Off White Off White Flight Leg Green Off White Concerned mustard Pink Black Approach team burgundy White Black (message in - off white)
Danger area green Warning yellow STCA Red Warning yellow Warning yellow
White STCA red
EUROCONTROL Experimental Centre
Ill - 4
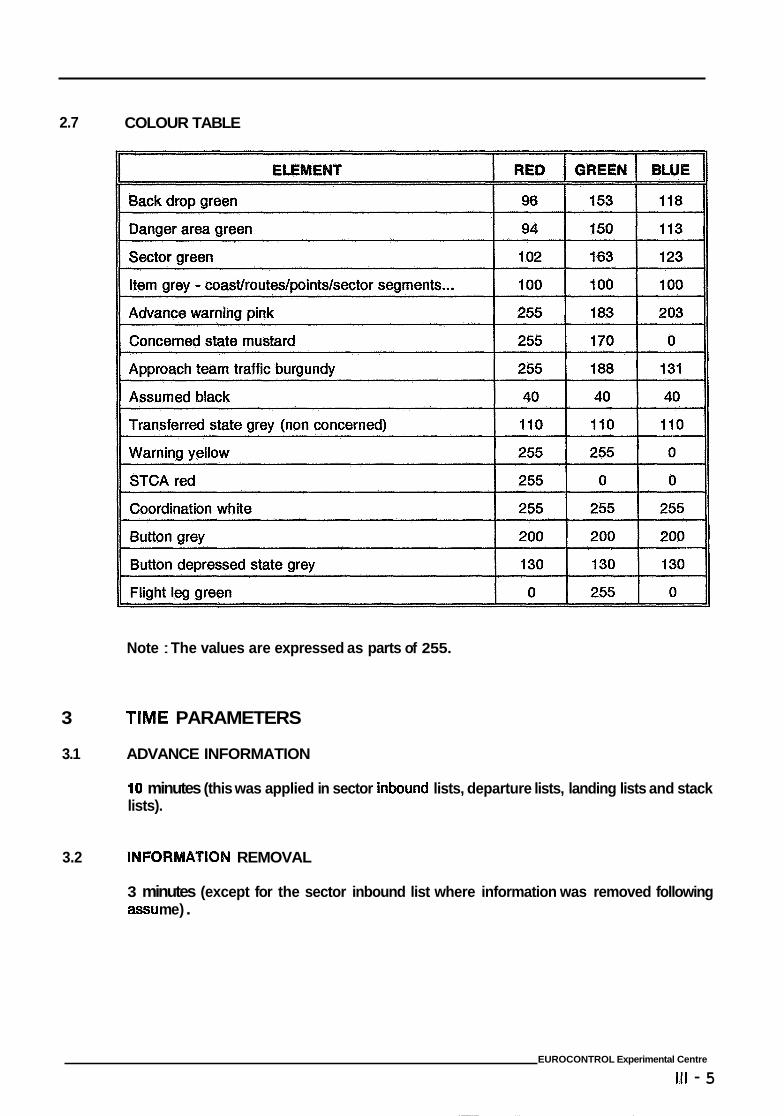
2.7
3
3.1
3.2
COLOUR TABLE
Note : The values are expressed as parts of 255.
TIME PARAMETERS
ADVANCE INFORMATION
10 minutes (this was applied in sector inbound lists, departure lists, landing lists and stack lists).
ATION REMOVAL
3 minutes (except for the sector inbound list where information was removed following assu m e) .
EUROCONTROL Experimental Centre
111 - 5
4 DATA INPUT
4.1 REQUIREMENT
Data input in ODlD IV was essential to ensure that the system was informed of the controllers tactical planning. This provided for accurate conflict prediction (reflected in the planning tools). It also ensured "on screen" system assisted coordination and permitted recording and display of controllers actions.
4.2
4.3
GENERAL CONSIDERATIONS
Inputs were made on active fields which were considered as 'objects' wherever they were located. For data input this action opened a menu, popup window or it input data directly into the system. No more than two clicks were normally required to complete an input selection.
All actions and functions initiated through the active fields were the same (object oriented design approach) whether the field was displayed in the radar window (either standard or extended label) or in other windows (for example, the HAW, VAW, CZW, SIL, Dep. List etc) . Where two controllers worked the same sector using separate CWP's (Controller Working Positions) either controller could make inputs on a flight at any time. The result of any new value input into the system was independent of the controller who initiated the action, and was re-displayed to both positions.
A request for a (call down) display of information was only displayed to the controller who requested it.
THE MOUSE
The ODlD IV mouse had three buttons which were allocated as follows :
Information Button IB (Left) Action Button, and AB (Middle) Window Management Button. WMB (Right)
Action on a given button was either a simple click or Press and Hold (P&H). The click implied a complete action, in-putting data or requesting more information whilst the P&H provided a "quick lookt1 capability with the information disappearing when the button was released.
4.3.1 Information Button - IB
The information button was used to display additional flight plan information either textually or graphically. This information display could be either permanent or temporary.
EUROCONTROL Experimental Centre
Ill - 6
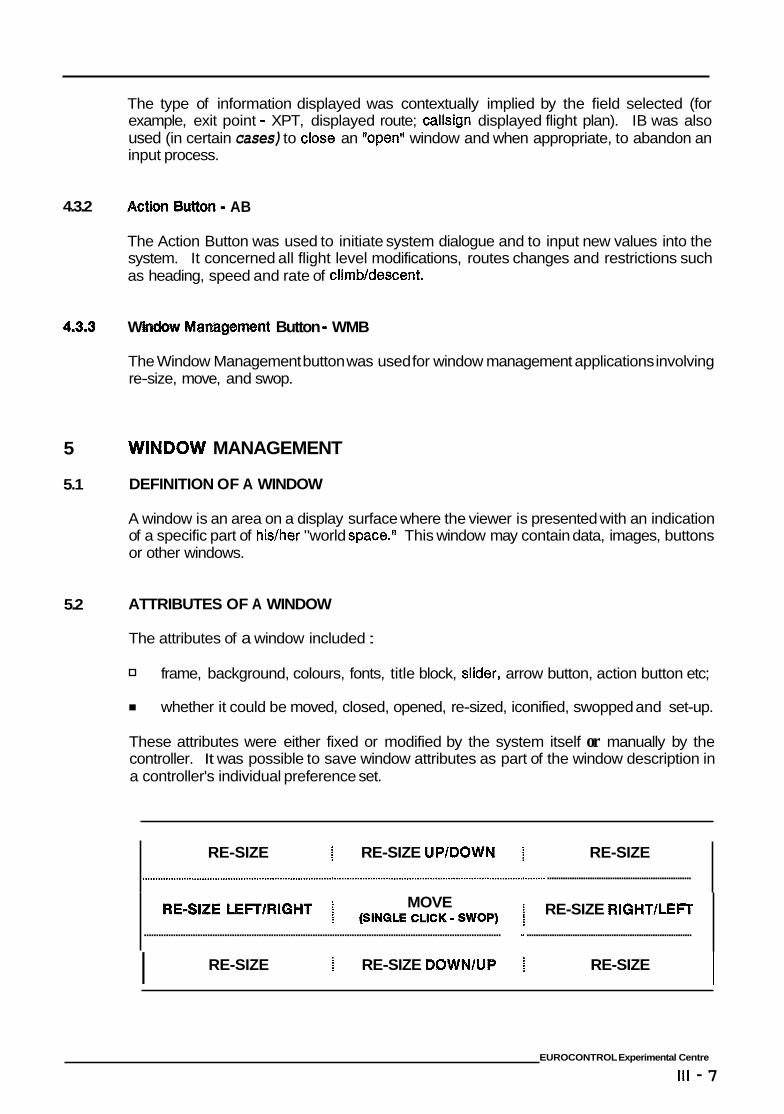
4.3.2
4.3.3
5
5.1
5.2
The type of information displayed was contextually implied by the field selected (for example, exit point - XPT, displayed route; callsign displayed flight plan). IB was also used (in certain cases) to close an "open" window and when appropriate, to abandon an input process.
EUROCONTROL Experimental Centre
Ill - 7
Action Button - AB
The Action Button was used to initiate system dialogue and to input new values into the system. It concerned all flight level modifications, routes changes and restrictions such as heading, speed and rate of climbldescent.
W Management Button - WMB
The Window Management button was used for window management applications involving re-size, move, and swop.
INDOW MANAGEMENT
DEFINITION OF A WINDOW
A window is an area on a display surface where the viewer is presented with an indication of a specific part of hidher "world space." This window may contain data, images, buttons or other windows.
ATTRIBUTES OF A WINDOW
The attributes of a window included :
frame, background, colours, fonts, title block, slider, arrow button, action button etc;
whether it could be moved, closed, opened, re-sized, iconified, swopped and set-up.
These attributes were either fixed or modified by the system itself or manually by the controller. It was possible to save window attributes as part of the window description in a controller's individual preference set.
RE-SIZE i RE-SIZE UPlDOWN RE-SIZE ............................................................................................................................................................ ................................................................
1 RE-SIZE RlGHTlLEFT MOVE j (SINQLE CLICK .. SWOP) i .................................................................................................................................................. " ........................................................................
I RE-SIZE 1 RE-SIZE DOWN/l.JP RE-SIZE I
5.3
5.3.1
5.3.2
5.3.3
5.3.4
5.3.5
WINDOW ACTIONS
Most of the windows presented in the simulation could be moved, sized, hidden (swopped) and iconified. These actions are defined as follows :
Call
To call a window made it appear. It could be called automatically as a result of internal system events or as a result of a manual action by a controller.
Move
ove a window was a manual action by the controller to place it elsewhere on the screen.
ue - Position the cursor in the centre of the window then P&H the WMB drag the displayed "ghost" outline to the new position and release the WMB. The window will move to the new position.
Re-Sbing
To Resize a window was either, a manual action by the controller to increase (or decrease) the space occupied by the window on the screen or an automatic action by the system (resulting from internal events).
Dialogue - Position the cursor on one of the corners or in the middle of one of the sides of the window. P&H the WMB and drag the "ghost" outline until it represents the required dimensions then release the button. The window will assume the new size.
For both Move and Resbe functions, the window remained in its original place during the action and a "ghost" frame followed the cursor movement. When the action was completed the window was repositioned or sized.
lconify
To ICONlFY was to modify the displayed aspect of a window from a full window display to a small pictorial representation.
- Click on the icon button (in the window) with AB and the window will iconify. To reopen the window click in the icon window with AB.
swop
To SWOP was to invert the display priority between two or more windows (ie. move one in front of the other; certain windows had a higher priority than others).
Dialogue - Place the cursor on a part of the partially covered window and click (single fast click) with the WMB. The hidden window will come to the front.
~~
EUROCONTROL Experimental Centre
I l l - 8
5.3.6 c
To CLOSE a window made it disappear. This was done manually by a controller action.
DBa - Place the cursor in the window and click (single fast click) with the IB.
5.3.7 Scroll
Where a window contained a slide bar its contents could be moved up or down, left or right.
ue - Click AB on the direction arrow (single value move) or on the space either side of the scroll bar (full page move). P&H on the scroll bar with AB then drag the scroll bar up or down to manually position data in the window.
6
6.1
SYSTEM ASSISTED COORDINATION AND DATA TRANSFER
BASIC PRINCIPLES
The basic principle of data exchange was to provide the most recent information to the adjacent control Centrehector and to reduce to a minimum the need for telephone calls.
Within the simulation it was assumed that all adjacent units were capable of exchanging AB1 and ACT messages in accordance with the OLD1 (On Line Data Interchange) standards. The simulation did not consider the failure of a message.
The data for a Centrehector was displayed at a parameter time prior to exit of the current sector. An ggACTgg message was not provided as the data was considered to be commonly available in the unit's database.
Coordination of sector entry and exit level changes, heading, direct route, speed and rate of climb/descent restrictions resulting from manual inputs, were carried out silently via a system assisted message exchange.
Coordination was also generated on the basis of :
TRANSFER Transfer of frequency; ASSUME Assume of frequency; RELEASE Release of control; SKIP Skipping control responsibility; FORCEDABI Forced advance information to the next sector, and MA Missed approach.
Each of these coordination functions was available via input action on the appropriate field displayed in the callsign menu. The result was displayed in the radar label in the form of text or a colour change.
EUROCONTROL Experimental Centre
Ill - 9
6.2 INITIAL DISPLAY OF FLIGHT DATA TO A SECTOR
Data was displayed to a sector 10 minutes prior to the estimated entry of the flight in a Sector lnbound List (SIL) associated with the aircraft sector entry point or geographical entry area. The displayed data was obtained from the information sent by the preceding sector.
Aircraft inbound to the approach area from adjacent area sectors were also displayed in SILs. This same data was displayed in a Stack window (in the lower airspace sectors).
For departures from Copenhagen and adjacent airfiefds, flight data was displayed in a Departure List Window.
On initial display of a flight's advanced warning information in a sector the system automatically proposed an XFL. This was either :
according to Letters of Agreement (LOA's) for the sector concerned, or
the Requested Flight Level (RFL) as described in the flight plan.
6.3
6.4
NOTIFICATION OF DATA TO THE NEXT SECTOR
The next downstream Centrehector received its advance warning information ten minutes before exit from the current sector. The current sector controller was advised of this data Ntransmission" by a change of sector identity in the radar label. The data made available to the next sector included the planned XFL of the current sector (as the PEL of the next sector), together with any speed, heading or rate of change inputs which had been made on the flight by the current sector.
Any subsequent changes of XFL (after transmission of the advance warning information) had to be coordinated with the next Centrehector via the system assisted coordination function.
MODIFICATION OF ENTRY OR EXIT CONDITIONS
When the flight data was displayed in both current and next sectors, a modification to the transfer conditions could be initiated by a controller of either sector.
Such amendments applied to XFUPEL conditions. Controller initiated (system assisted) requests for heading, direct route, speed and rate of climb/descent restrictions could only be generated by the accepting (downstream) controller.
No further coordination was permitted on an aircraft already subject to an outstanding coordination.
Acceptance of the coordination removed the current messages in the IN and OUT message windows and the new proposal replaced the original value in the radar label.
EUROCONTROL Experimental Centre
111 - 10
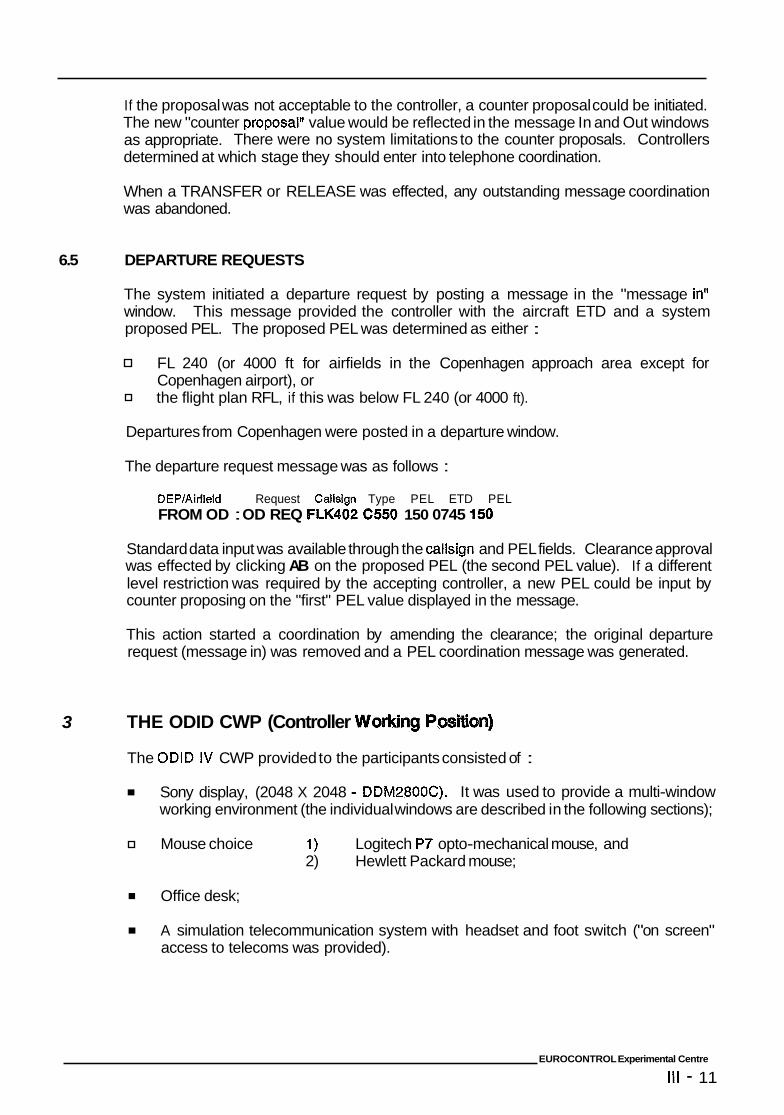
If the proposal was not acceptable to the controller, a counter proposal could be initiated. The new "counter proposalw value would be reflected in the message In and Out windows as appropriate. There were no system limitations to the counter proposals. Controllers determined at which stage they should enter into telephone coordination.
When a TRANSFER or RELEASE was effected, any outstanding message coordination was abandoned.
6.5 DEPARTURE REQUESTS
The system initiated a departure request by posting a message in the "message in" window. This message provided the controller with the aircraft ETD and a system proposed PEL. The proposed PEL was determined as either :
FL 240 (or 4000 ft for airfields in the Copenhagen approach area except for Copenhagen airport), or the flight plan RFL, if this was below FL 240 (or 4000 ft).
Departures from Copenhagen were posted in a departure window.
The departure request message was as follows :
DEP/Airfield Request Callsign Type PEL ETD PEL FROM OD : OD REQ FLK402 C550 150 0745 150
Standard data input was available through the callsign and PEL fields. Clearance approval was effected by clicking AB on the proposed PEL (the second PEL value). If a different level restriction was required by the accepting controller, a new PEL could be input by counter proposing on the "first" PEL value displayed in the message.
This action started a coordination by amending the clearance; the original departure request (message in) was removed and a PEL coordination message was generated.
3 THE ODID CWP (Controller Working Posilsion)
The ODID IV CWP provided to the participants consisted of :
Sony display, (2048 X 2048 - DDM2800C). It was used to provide a multi-window working environment (the individual windows are described in the following sections);
Mouse choice 1) Logitech Pi' opto-mechanical mouse, and 2) Hewlett Packard mouse;
Office desk;
A simulation telecommunication system with headset and foot switch ("on screen" access to telecoms was provided).
EUROCONTROL Experimental Centre
Ill - 11
8
8.1 GENERAL
The radar window presented the controller with both radar and fliiht plan information (radar labels displayed radar track, mode C and flight plan data). A specialised "button" bar provided access to the radar window set-up, supplementary call down information and access to the Medium Term Conflict Assistance (MTCA) planning tools.
Advance flight plan information was presented to the controller in tabular displays whilst planning data was presented graphically. Planning tools and information windows could be superimposed on the radar window (or behind it).
The radar tracks (labels) drawn in the radar window could contain upto five lines of data (four lines in approach) and were colour coded.
8.2
8.3
8.4
8.5
ACTIVATION
The radar window was displayed at the beginning of an exercise.
ATTRIBUTES
standard windowing management non iconifiable. non closeable. moveable and re-sizable radar label overlap detection colour coding for all components (frame, fixes, airfields, labels, R&B, speed vector, single line frame
CONTENT
background, sector limits, tracks, zones, buttons and command fields).
= slider bars at bottom and right hand side for off-centre function; a button bar for radar window management, supplementary data display in the radar label, selection of MTCA tools, telephone access and window preference set-up selection .
COLOUR
The colour used in the radar window for back ground video maps was :
Sector green Back drop green Danger area green Button grey Button depressed grey White Black
Qvnll sector. "Other" sectors. Y3pecial" use airspace - military areas. Scroll bars and Button bar back ground. "DepressedT1 button state. Window frames. Text.
EUROCONTROL Experimental Centre
Ill - 12
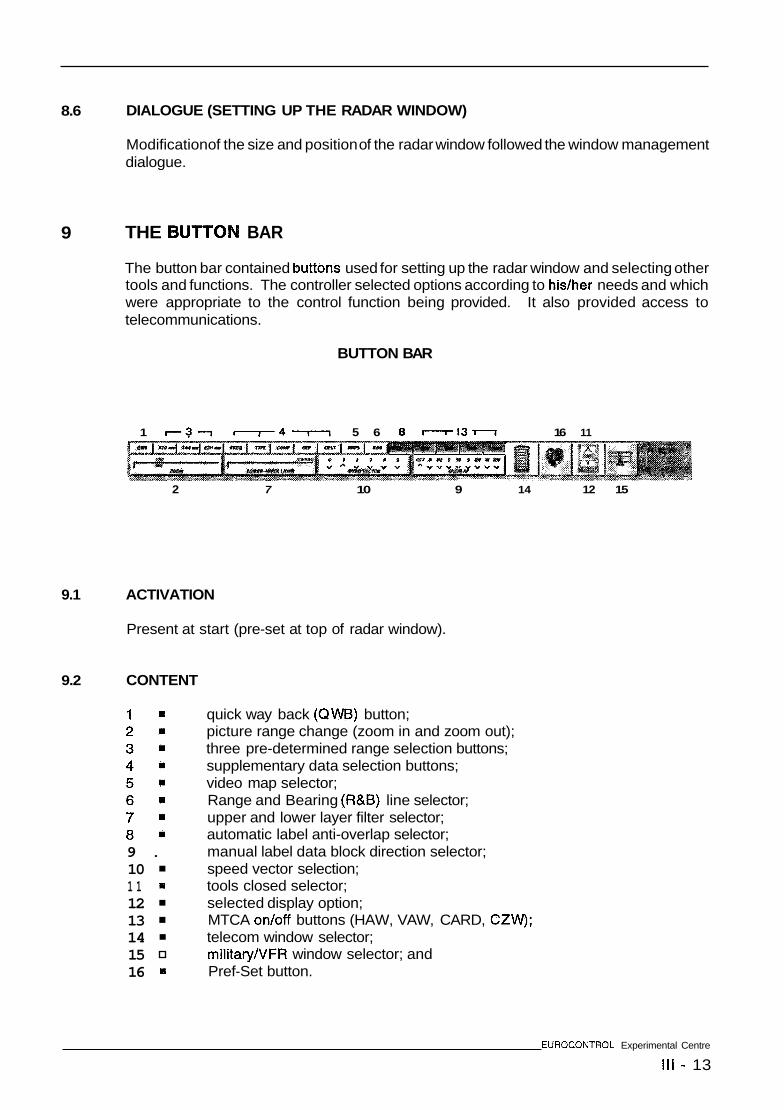
8.6 DIALOGUE (SETTING UP THE RADAR WINDOW)
Modification of the size and position of the radar window followed the window management
9
dialogue.
THE BU-ON BAR
The button bar contained ,uttons used for setting up the radar window and selecting other tools and functions. The controller selected options according to hidher needs and which were appropriate to the control function being provided. It also provided access to telecommunications.
BUTTON BAR
1 - 3 - 1 - 4 n 5 6 8 m l 3 n 16 11
2 7 10 9 14 12 15
9.1 ACTIVATION
Present at start (pre-set at top of radar window).
9.2 CONTENT
1 . 2 . 3 . 4 . 5 . 6 . 7 . a = 9 . 10 1 1 = 12 13 14 15 16 =
quick way back (QWB) button; picture range change (zoom in and zoom out); three pre-determined range selection buttons; supplementary data selection buttons; video map selector; Range and Bearing (R&B) line selector; upper and lower layer filter selector; automatic label anti-overlap selector; manual label data block direction selector; speed vector selection; tools closed selector; selected display option; MTCA on/off buttons (HAW, VAW, CARD, CZW); telecom window selector; military/VFR window selector; and Pref-Set button.
EUROCONTROL Experimental Centre
Ill - 13
9.3
9.4
9.4.1
9.4.1.1
9.4.2
9.4.2.1
9.4.3
9.4.3.1
COLOUR
8 Button grey Button bar back ground. 8 Button depressed grey "Depressed" button state. 8 Black Text.
Assorted Button bar icons
FUNCTIONS
Quick way Back
The Quick Way Back (QWB) function returned the display settings to the last saved window set-up following a period of window management experimentation.
Click AB on QWB button.
PmSet Range Selectkm (3 choices)
Each working position was provided with three pre-set radar range settings.
Diabgue
Click AB on the required pre-set position button.
Supplsmntary Radar Label Data
Supplementary data provided a display in the radar label data block (permanent or temporary - quick look) of one of the following flight plan items: DEParture airfield, DESTination airfield, aircraft TYPE, COMPany callsign and Next Sector (NS) frequency.
Dbbgue
Click AB on the chosen value (one at a time) to select the information on line 5 of the (area) radar label (line 4 in the approach label).
IB with P&H displayed the information temporarily (ie. until the button was released). This display was valid for all labels in the radar window (the information was also available through the extended label for individual targets).
EUROCONTROL Experimental Centre
111 - 15
9.4.4 Radar?/
The radar video map selector provided the controller with a selection of video maps appropriate to the control position. Video maps were denoted by a text description on a button. The full map selection was presented at the exercise start-up as the default setting. Selected values were indicated by a "depressedw button state.
9.4.4.1
Click AB on the Map button in the radar window button bar.
9.4.4.2 A
non re-sizeable non moveable closeable single font high priority single line frame
size according to content for each sector
9.4.4.3 Content
The window remained open during map selection and had to be closed when video map selections had been completed.
Map selections were described by text (written on a button) in a list format. Selected values were indicated by a depressed button state.
Video map selections available included :
own sector outline beacon names coastline CTR range rings (for approach)
I TMA outline I TIZ I airway centre lines
military airspace final approach tracks
9.4.4.4 Colour
Button grey Button bar back ground. Button depressed grey "Depressed1 button state. Black Text.
EUROCONTROL Experimental Centre
Ill - 16
9.4.4.5
Click AB on the Maps button to open the pop up window.
Click AB to select or de-select maps as required.
Click I6 in the window or on the maps button to close the popup menu.
The R&B function permitted the controller to measure the range and bearing of a selected position from a fixed point in the radar window.
9.4.5.1
9.4.5.2
9.4.5.3
9.4.5.4
Acthration
Click AB on the R&B symbol in the radar window
Function
When initiated, the cursor shape changed to a white cross. No other data inputs were possible whilst the line was selected.
Following selection of a start point, a range and bearing read out were displayed beside the cursor Moving the mouse caused the cursor (and the R&B line) to reposition (the origin remaining at the start point) with a continuous read out of range and bearing values at the extremity of the line.
Several start points could be selected (one after the other) when the R&B function was active.
colour
The range and bearing line and associated text were white.
Dbkgue
Click AB on the R&B button to activate the function.
Click AB in the radar window at the start point.
Click I6 in the radar window to cancel.
EUROCONTROL Experimental Centre
111 - 17
9.4.6
9.4.6.1
9.4.7
9.4.7.1
9.4.8
9.4.8.1
9.4.8.2
Automatk Radar La
As suggested by its name, the radar label antbverlap button selected or de-selected the system label anti-overlap detection programme.
Dla
Click AB on the anti-label overlap button selects or de-selects the function.
Manual Radar Label P&&n S0
A manual radar label position selection was available for ALL labels. Eight positions based on north and related to the aircraft radar position symbol could be selected.
A supplementary position based on the radar position symbol and the direction of flight was also provided (the system positioned the data block 135 degrees behind and to the right of the position symbol).
Dlakgue
Click AB on the direction indicator to select the appropriate direction for ALL targets (when automatic label anti-overlap had been de-selected).
Click AB on OFF to select the supplementary label position.
Radar Picture Range Change (Zoom Function)
The radar picture range change function permitted the controller to change the range of the displayed radar image. The effect of using the function was to see an image ftzoomed" in or out in a similar manner to "zooming" a camera.
Content
The function was accessed through a valuator comprising a central section with a single "slider" button. The selected range was displayed at the top of the valuator above the slider button. Range increments were in 1 nautical mile intervals.
Colour
Button grey Button bar back ground. Flight leg green Slider button Black Text.
EUROCONTROL Experimental Centre
I l l - 18
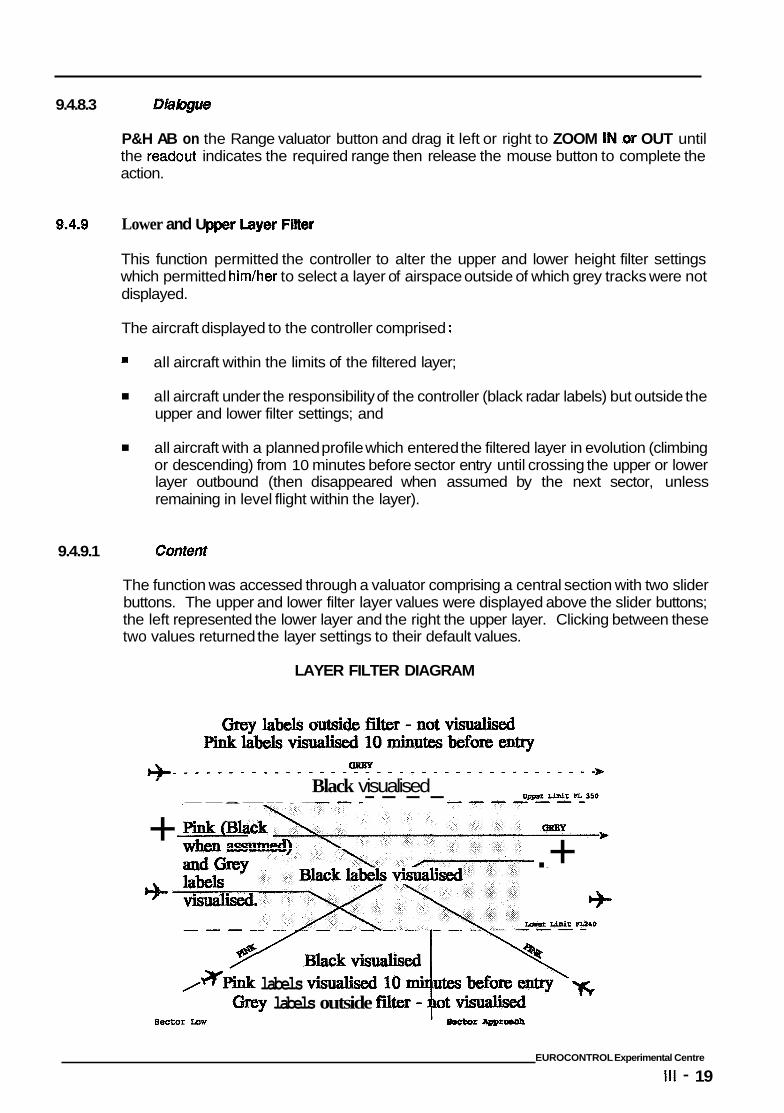
9.4.8.3 Dle,
P&H AB on the Range valuator button and drag it left or right to ZOOM IN w OUT until the readout indicates the required range then release the mouse button to complete the action.
9.4.9 Lower and U
This function permitted the controller to alter the upper and lower height filter settings which permitted him/her to select a layer of airspace outside of which grey tracks were not displayed.
The aircraft displayed to the controller comprised :
= all aircraft within the limits of the filtered layer;
all aircraft under the responsibility of the controller (black radar labels) but outside the upper and lower filter settings; and
all aircraft with a planned profile which entered the filtered layer in evolution (climbing or descending) from 10 minutes before sector entry until crossing the upper or lower layer outbound (then disappeared when assumed by the next sector, unless remaining in level flight within the layer).
9.4.9.1 Contrsnt
The function was accessed through a valuator comprising a central section with two slider buttons. The upper and lower filter layer values were displayed above the slider buttons; the left represented the lower layer and the right the upper layer. Clicking between these two values returned the layer settings to their default values.
LAYER FILTER DIAGRAM
I
+ CJ,
Black visualised --a---.- -- - -
.+ W h
,*Pink labels Grey labels outside
sector Low
EUROCONTROL Experimental Centre
I l l - 19
9.4.9.2
9.4.9.3
9.4.1 0
9.4.1 0.1
9.4.1 0.2
9.4.1 0.3
The default upper and lower layer selections were :
IJ SMorsaborsFL245 min FL 240 - max FL 450
m Sectors b b w FL 245 min FL 000 - max FL 250 (except sector D, min 2000 ft)
C
Button grey m Pink
Black
Button bar back ground. Slider buttons Text.
Aircraft were displayed in the filtered layer according to the ODID IV colour planning states. Only the Grey labels were filtered out.
Diabgue
P&H AB on the left button (lower) or right button (upper) in the Height Filter slider window. Drag on the valuator until the readout indicates the required new value then release the button. Increments will be in 100% of feet.
Click AB in between the slider buttons to return to the default values.
Speed Vector Sebction
The speed vector button selected or de-selected a forward vector attached to the radar position symbol. The vector length was determined by the aircraft's ground speed.
Content
The function was accessed through a button which displayed a choice of values (between zero and five minutes) in the form of small diamond shaped "radio" buttons.
Colour
Button grey Button depressed grey
Button bar back ground. Button depressed state (selected)
Black Text.
Click AB on the required value selects the speed vector. A click on another value de- selects the previous choice and selects the new value.
EUROGONTROL Experimental Centre
Ill - 20
9.4.1 1
9.4.1 1.1
9.4.1 2
9.4.1 2.1
9.4.1 3
9.4.1 3.1
optm (SDO)
The selected display option provided the controller with the ability to automatically close the VAW and HAW windows following a data input modification in either of these windows.
Dla
Click AB on the SDO button. When the button is depressed the function is activated. The button is a toggle ordoff switch.
The HAW, VAW, CARD and CZW were tools provided to assist the controller in planning entry, exit and "through sector" conditions.
These tools were provided to both EC (Executive) and PLC (Planning) controllers. Their selection was left to the individual controller's discretion (the tools were NOT provided in approach control).
The buttons representing these tools were toggle on/off switches.
Dbbgue
Click AB on the appropriate button to display the MTCA window on the screen. A depressed button state indicated that the tool had been selected.
Tslkacom Button
The telecom button provided the controller with "on screen" access to direct dialling telephone lines to other Centres and sectors.
Activation
Click AB on the Telecom button; or auto open following reception of an incoming call. The window opened at the top right hand corner of the screen.
9.4.1 3.2 Aftri;aufes
0 closeable (system and manual) non re-sizeable non moveable highest priority single line frame
size and layout according to each sectors requirement.
EUROCONTROL Experimental Centre
I l l - 21
9.4.1 3.3 CcW@nf
The window displayed a group of correspondents in a list format. An in-coming call opened the window automatically with the "calling correspondent" highlighted in yellow. When the call was selected the button turned to green. The window stay4 open until the last call was de-selected.
9.4.13.4 C
Button grey Button bar back ground. Button depressed grey "Depressed" button state for outgoing "unanswered"
Yellow Incoming call (unanswered). Flight leg green Call (answered) with "depressed" button state. Black Text.
calls.
9.4.13.5 Db
Click AB on the Telecom button to open the window.
Click AB on the required call text to open the line (button depressed).
Click AB on the call text to close the line (and the window unless there are outstanding calls). Only one party was required to close the line.
Click AB on the Telecom button to close the window.
9.4.14 Preference Set-Up
This feature permitted the controller to save his/her preferred window settings from one exercise to the next. The %avedtl preference set related to an individual CWP and controller.
9.4.14.1 ActbatkM
Click AB on the "Pref-Set" button in the main menu.
9.4.14.2 Att/Wt@S
non iconifiable non re-sizeable non moveable closeable high priority single line frame
fixed size according to content.
EUROCONTROL Experimental Centre
111 - 22
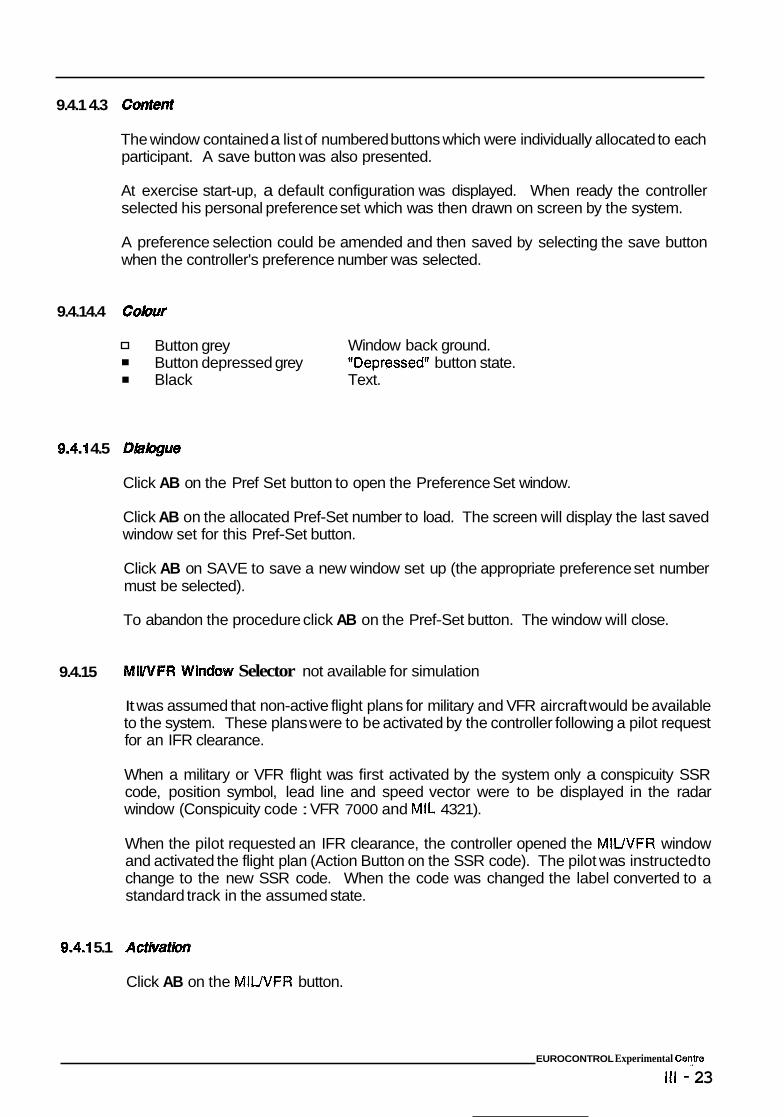
9.4.1 4.3 Cosrpsnt
The window contained a list of numbered buttons which were individually allocated to each participant. A save button was also presented.
At exercise start-up, a default configuration was displayed. When ready the controller selected his personal preference set which was then drawn on screen by the system.
A preference selection could be amended and then saved by selecting the save button when the controller's preference number was selected.
9.4.14.4 C O W
Button grey Window back ground. Button depressed grey "Depressed" button state. Black Text.
9.4.1 4.5 Dkkgue
Click AB on the Pref Set button to open the Preference Set window.
Click AB on the allocated Pref-Set number to load. The screen will display the last saved window set for this Pref-Set button.
Click AB on SAVE to save a new window set up (the appropriate preference set number must be selected).
To abandon the procedure click AB on the Pref-Set button. The window will close.
9.4.15 MiVVFR Window Selector not available for simulation
It was assumed that non-active flight plans for military and VFR aircraft would be available to the system. These plans were to be activated by the controller following a pilot request for an IFR clearance.
When a military or VFR flight was first activated by the system only a conspicuity SSR code, position symbol, lead line and speed vector were to be displayed in the radar window (Conspicuity code : VFR 7000 and MlL 4321).
When the pilot requested an IFR clearance, the controller opened the MIUVFR window and activated the flight plan (Action Button on the SSR code). The pilot was instructed to change to the new SSR code. When the code was changed the label converted to a standard track in the assumed state.
9.4.1 5.1 ActSvatbr?
Click AB on the MIWFR button.
EUROCONTROL Experimental Centre
111 - 23
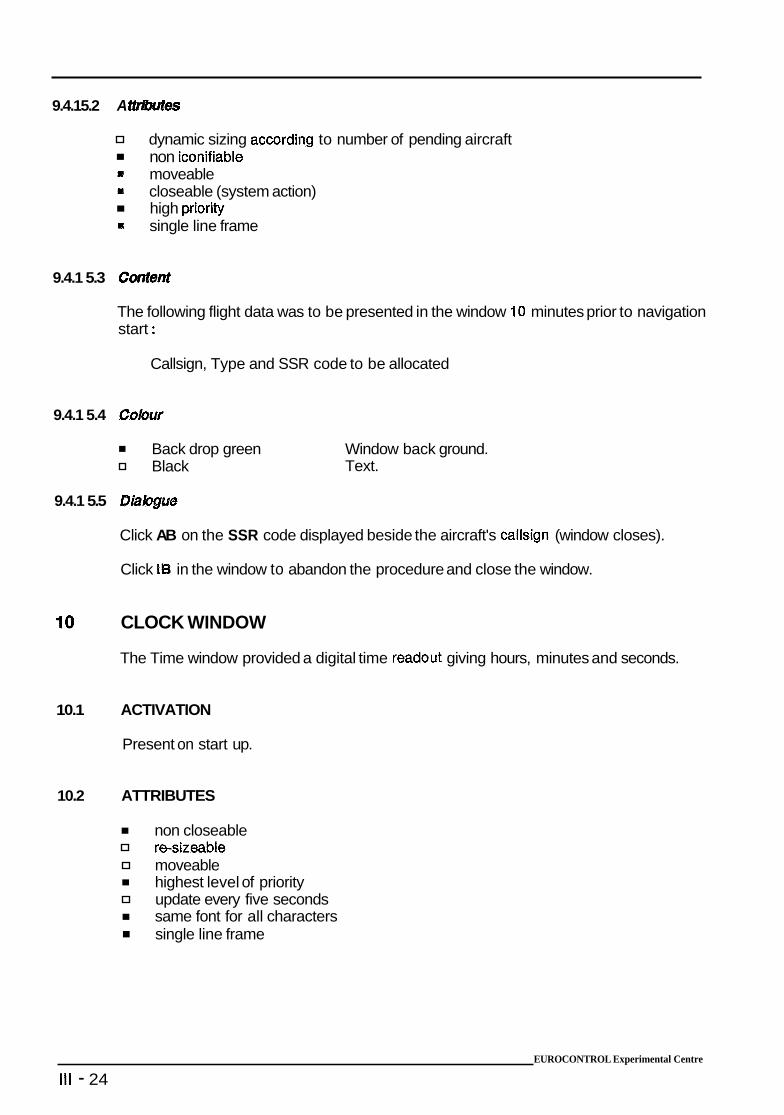
9.4.15.2 A
non iwnifiable = moveable = closeable (system action)
high priorii = single line frame
dynamic sizing according to number of pending aircraft
9.4.1 5.3 Cmf@nt
The following flight data was to be presented in the window 10 minutes prior to navigation start :
Callsign, Type and SSR code to be allocated
9.4.1 5.4 Comr
Back drop green Window back ground. Black Text.
9.4.1 5.5 DBaloslug
Click AB on the SSR code displayed beside the aircraft's callsign (window closes).
Click IB in the window to abandon the procedure and close the window.
10 CLOCK WINDOW
The Time window provided a digital time readout giving hours, minutes and seconds.
10.1 ACTIVATION
Present on start up.
10.2 ATTRIBUTES
non closeable re-sizeable moveable highest level of priority update every five seconds
single line frame same font for all characters
EUROCONTROL Experimental Centre
Ill - 24
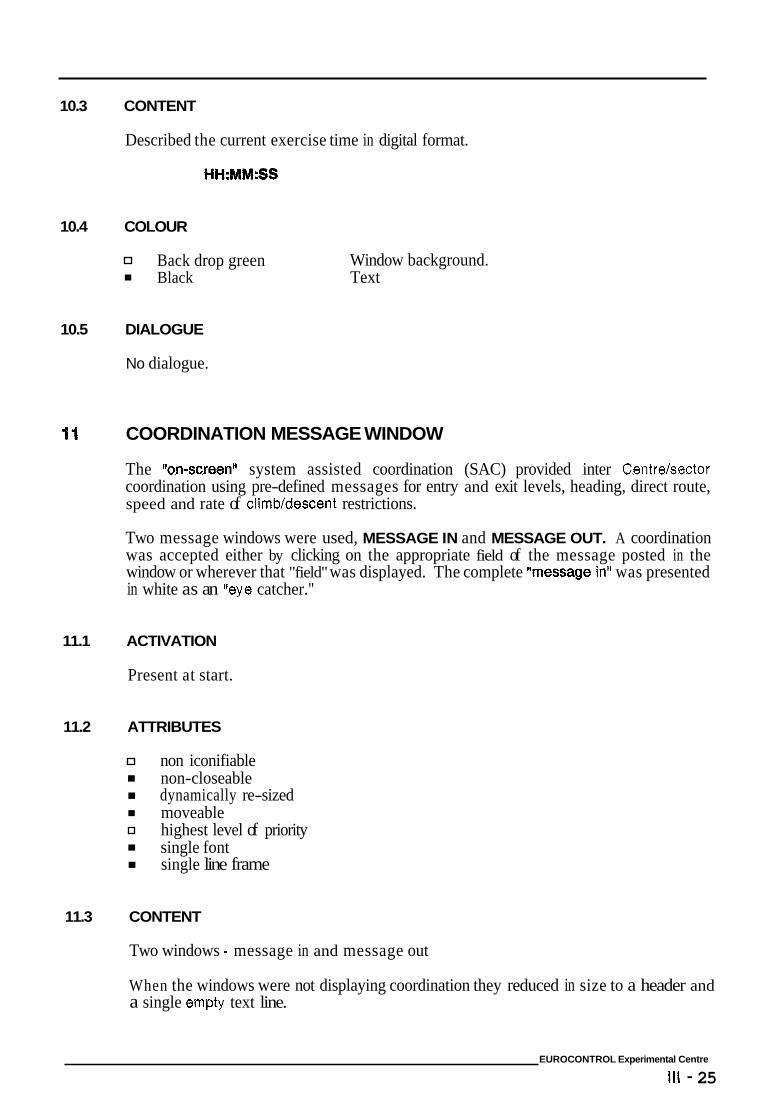
~
10.3 CONTENT
Described the current exercise time in digital format.
10.4 COLOUR
Back drop green Black
Window background. Text
10.5 DIALOGUE
No dialogue.
11 COORDINATION MESSAGE WINDOW
The ffon-screenvl system assisted coordination (SAC) provided inter Centre/sector coordination using pre-defined messages for entry and exit levels, heading, direct route, speed and rate of climb/descent restrictions.
Two message windows were used, MESSAGE IN and MESSAGE OUT. A coordination was accepted either by clicking on the appropriate field of the message posted in the window or wherever that "field" was displayed. The complete fYnessage in" was presented in white as an "eye catcher."
11.1 ACTIVATION
Present at start.
11.2 ATTRIBUTES
non iconifiable non-closeable dynamically re-sized moveable highest level of priority single font single line frame
11.3 CONTENT
Two windows - message in and message out
When the windows were not displaying coordination they reduced in size to a header and a single empty text line.
EUROCONTROL Experimental Centre
111 - 25
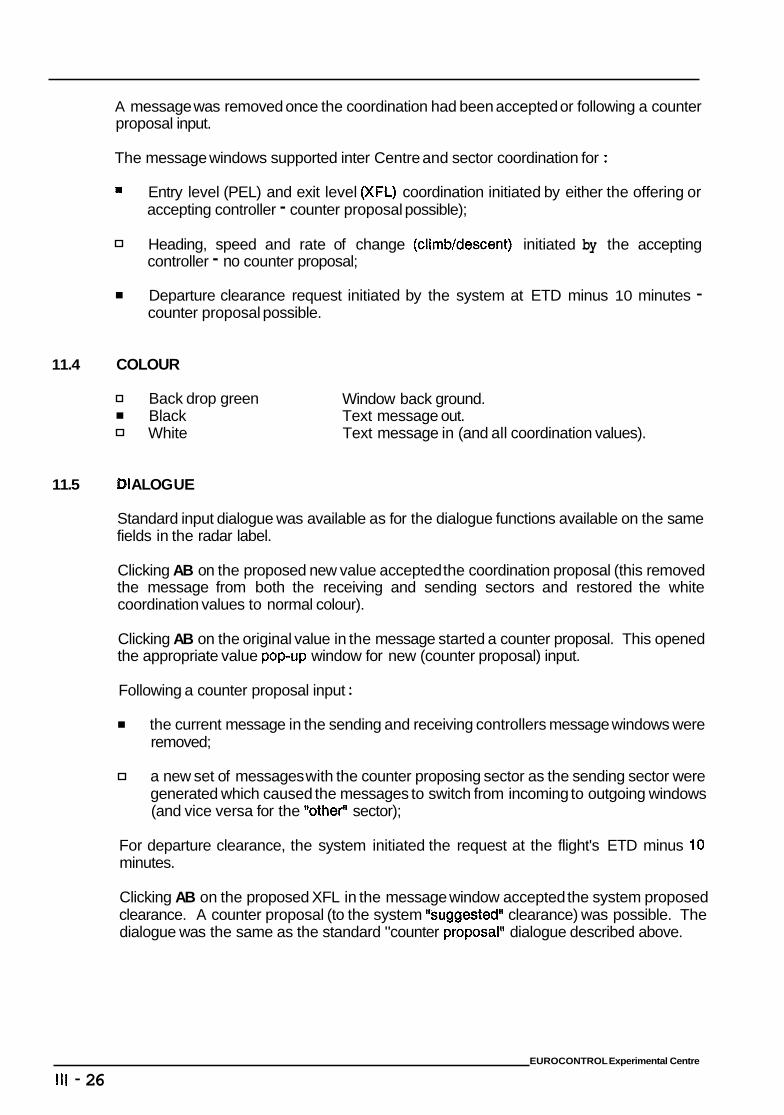
A message was removed once the coordination had been accepted or following a counter proposal input.
The message windows supported inter Centre and sector coordination for :
= Entry level (PEL) and exit level (XFL) coordination initiated by either the offering or accepting controller - counter proposal possible);
Heading, speed and rate of change (climbldescent) initiated by the accepting controller - no counter proposal;
Departure clearance request initiated by the system at ETD minus 10 minutes - counter proposal possible.
11.4 COLOUR
Back drop green Black White
Window back ground. Text message out. Text message in (and all coordination values).
11.5 Dl ALOG U E
Standard input dialogue was available as for the dialogue functions available on the same fields in the radar label.
Clicking AB on the proposed new value accepted the coordination proposal (this removed the message from both the receiving and sending sectors and restored the white coordination values to normal colour).
Clicking AB on the original value in the message started a counter proposal. This opened the appropriate value popup window for new (counter proposal) input.
Following a counter proposal input :
the current message in the sending and receiving controllers message windows were removed;
a new set of messages with the counter proposing sector as the sending sector were generated which caused the messages to switch from incoming to outgoing windows (and vice versa for the ttother't sector);
For departure clearance, the system initiated the request at the flight's ETD minus 10 minutes.
Clicking AB on the proposed XFL in the message window accepted the system proposed clearance. A counter proposal (to the system wsuggestedlf clearance) was possible. The dialogue was the same as the standard "counter proposaltt dialogue described above.
EUROCONTROL Experimental Centre
I l l - 26
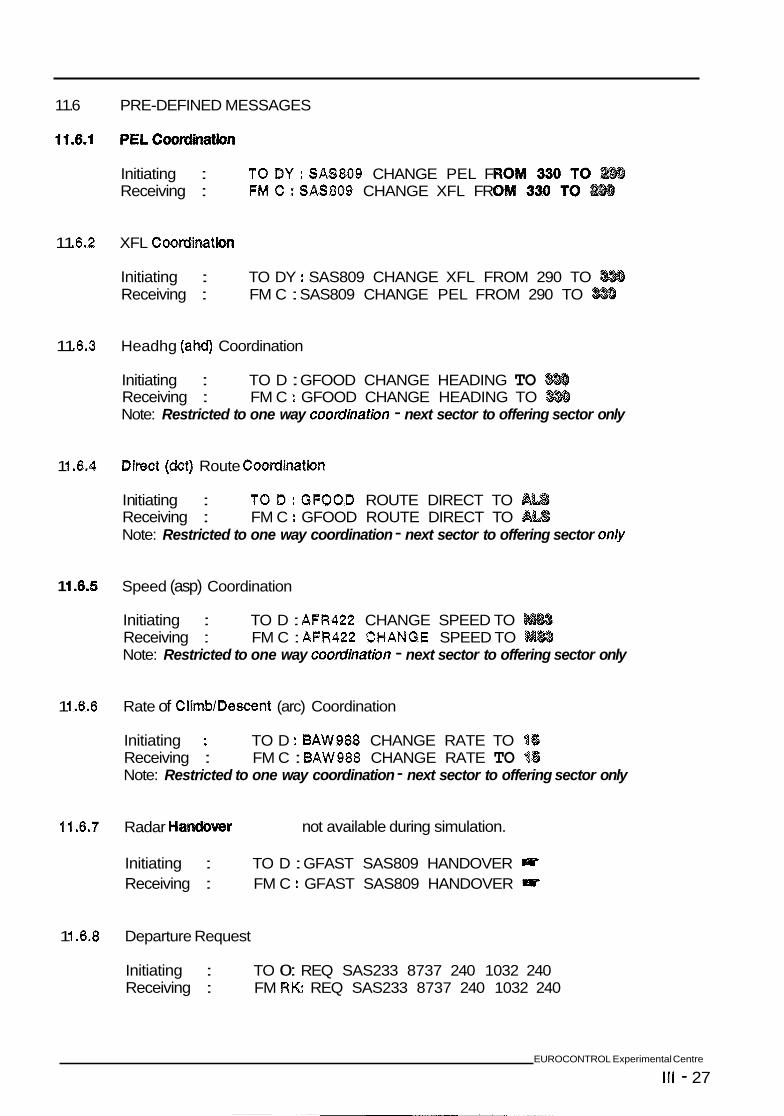
11.6
11.6.1
1 1 B.2
11 -6.3
1 1.6.4
1 1.6.5
1 1.6.6
11.6.7
1 1.6.8
PRE-DEFINED MESSAGES
Initiating : TODY:SAS809 CHANGE PEL F Receiving : FMC:SAS809 CHANGE XFL FR
XFL Coordlnat
Initiating : TO DY : SAS809 CHANGE XFL FROM 290 TO Receiving : FM C : SAS809 CHANGE PEL FROM 290 TO
Headhg (ahdl) Coordination
Initiating : TO D : GFOOD CHANGE HEADING TO Receiving : FM C : GFOOD CHANGE HEADING TO Note: Restricted to one way coordinatbn - next sector to offering sector only
D b c t (dct) Route Coordination
In it iating : T0D:GFOOD ROUTE DIRECT TO Receiving : FM C : GFOOD ROUTE DIRECT TO Note: Restricted to one way coordination - next sector to offering sector only
Speed (asp) Coordination
Initiating : TO D : AFR422 CHANGE SPEED TO Receiving : FM C : AFR422 CHANGE SPEED TO Note: Restricted to one way coordination - next sector to offering sector only
Rate of CIimb/Deseent (arc) Coordination
Initiating : TO D : BAW988 CHANGE RATE TO 1 Receiving : FM C : BAW988 CHANGE RATE TO 4 Note: Restricted to one way coordination - next sector to offering sector only
Radar Handowr not available during simulation.
Initiating : TO D : GFAST SAS809 HANDOVER Bp
Receiving : FM C : GFAST SAS809 HANDOVER Bp
Departure Request
Initiating : TO 0: REQ SAS233 8737 240 1032 240 Receiving : FM Rt<: REQ SAS233 8737 240 1032 240
EUROCONTROL Experimental Centre
111 - 27
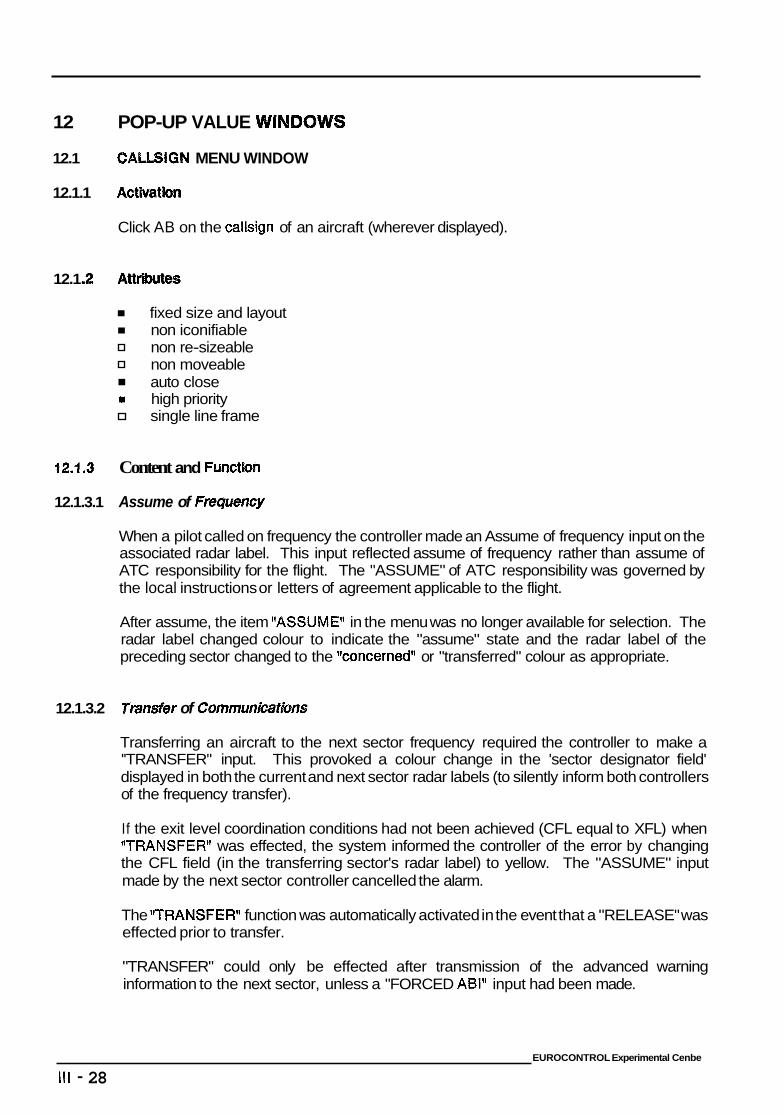
12 POP-UP VALUE W I ~ D O ~ S
12.1 CALLSIGN MENU WINDOW
12.1.1 Ac th t
Click AB on the callsign of an aircraft (wherever displayed).
12.1 -2
fixed size and layout non iconifiable non re-sizeable non moveable auto close
I high priority single line frame
12.1.3 Content and Function
12.1.3.1 Assume of Fmqwncy
When a pilot called on frequency the controller made an Assume of frequency input on the associated radar label. This input reflected assume of frequency rather than assume of ATC responsibility for the flight. The "ASSUME" of ATC responsibility was governed by the local instructions or letters of agreement applicable to the flight.
After assume, the item "ASSUME" in the menu was no longer available for selection. The radar label changed colour to indicate the "assume" state and the radar label of the preceding sector changed to the %cmcerned" or "transferred" colour as appropriate.
12.1.3.2 Transfer of Communkations
Transferring an aircraft to the next sector frequency required the controller to make a ''TRANSFER" input. This provoked a colour change in the 'sector designator field' displayed in both the current and next sector radar labels (to silently inform both controllers of the frequency transfer).
If the exit level coordination conditions had not been achieved (CFL equal to XFL) when **TRANSFER" was effected, the system informed the controller of the error by changing the CFL field (in the transferring sector's radar label) to yellow. The "ASSUME" input made by the next sector controller cancelled the alarm.
The IITRANSFERII function was automatically activated in the event that a "RELEASE" was effected prior to transfer.
"TRANSFER" could only be effected after transmission of the advanced warning information to the next sector, unless a "FORCED ABI" input had been made.
EUROCONTROL Experimental Cenbe
Ill - 28
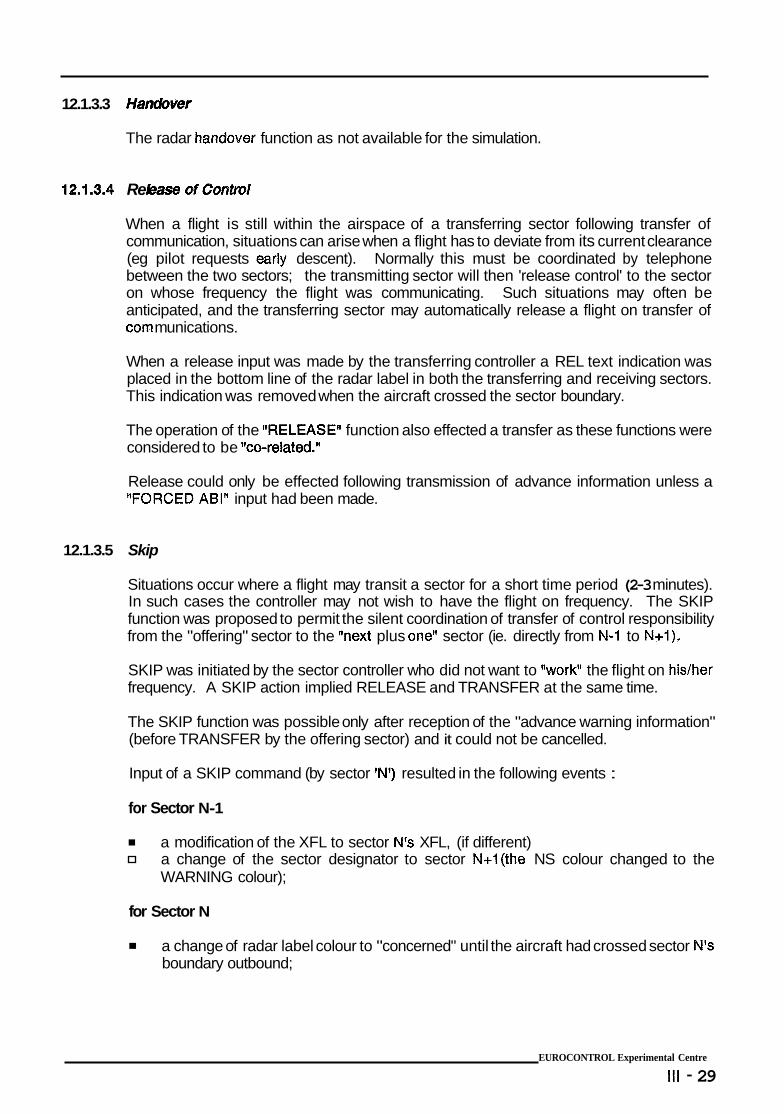
12.1.3.3 Handwer
The radar handover function as not available for the simulation.
12.1.3.4 Re OfCcwrtrol
When a flight is still within the airspace of a transferring sector following transfer of communication, situations can arise when a flight has to deviate from its current clearance (eg pilot requests early descent). Normally this must be coordinated by telephone between the two sectors; the transmitting sector will then 'release control' to the sector on whose frequency the flight was communicating. Such situations may often be anticipated, and the transferring sector may automatically release a flight on transfer of com m unications.
When a release input was made by the transferring controller a REL text indication was placed in the bottom line of the radar label in both the transferring and receiving sectors. This indication was removed when the aircraft crossed the sector boundary.
The operation of the rlRELEASE1l function also effected a transfer as these functions were considered to be tfco-related.lf
Release could only be effected following transmission of advance information unless a '!FORCED ABI" input had been made.
12.1.3.5 Skip
Situations occur where a flight may transit a sector for a short time period (2-3 minutes). In such cases the controller may not wish to have the flight on frequency. The SKIP function was proposed to permit the silent coordination of transfer of control responsibility from the "offering" sector to the wnext plus one" sector (ie. directly from N-1 to N+1).
SKIP was initiated by the sector controller who did not want to "workf1 the flight on his/her frequency. A SKIP action implied RELEASE and TRANSFER at the same time.
The SKIP function was possible only after reception of the "advance warning information" (before TRANSFER by the offering sector) and it could not be cancelled.
Input of a SKIP command (by sector 'NI) resulted in the following events :
for Sector N-1
a modification of the XFL to sector N's XFL, (if different) a change of the sector designator to sector N+l(the NS colour changed to the WARNING colour);
for Sector N
a change of radar label colour to "concerned" until the aircraft had crossed sector N's boundary outbound;
EUROCONTROL Experimental Centre
Ill - 29
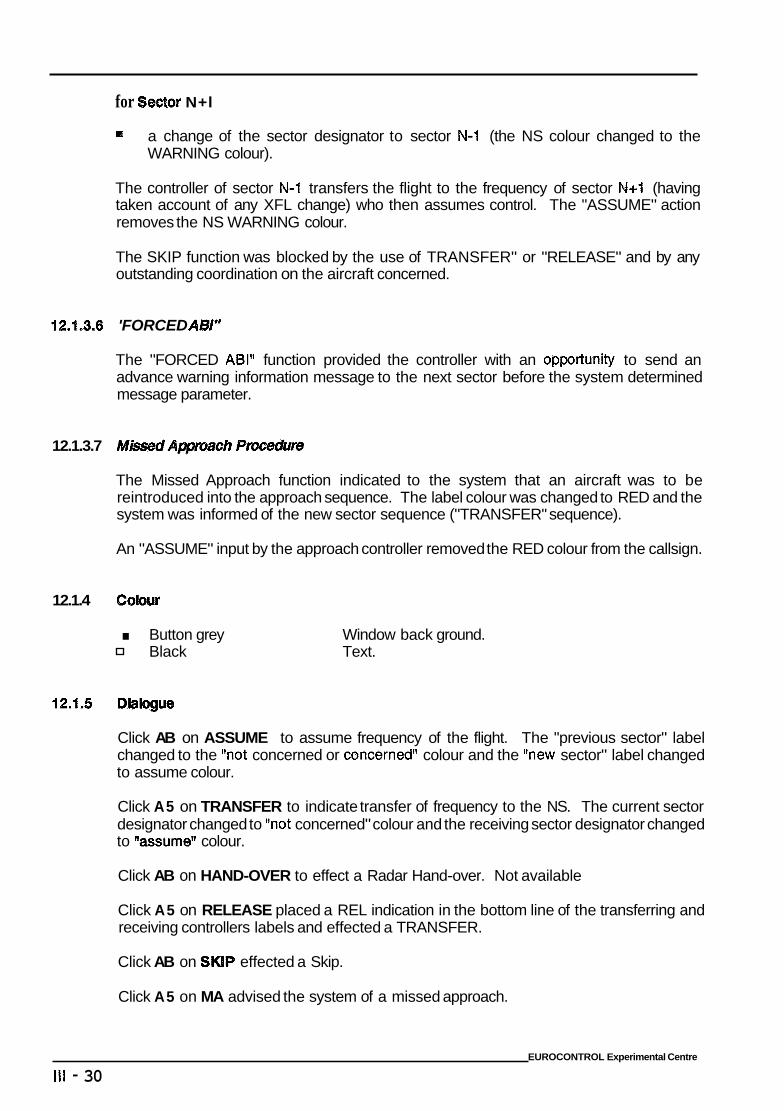
for Sector N+l
12.1.3.6
12.1.3.7
12.1.4
12.1.5
= a change of the sector designator to sector N-1 (the NS colour changed to the WARNING colour).
The controller of sector N-1 transfers the flight to the frequency of sector N+1 (having taken account of any XFL change) who then assumes control. The "ASSUME" action removes the NS WARNING colour.
The SKIP function was blocked by the use of TRANSFER" or "RELEASE" and by any outstanding coordination on the aircraft concerned.
'FORCED AB/"
The "FORCED ABP function provided the controller with an opportunity to send an advance warning information message to the next sector before the system determined message parameter.
The Missed Approach function indicated to the system that an aircraft was to be reintroduced into the approach sequence. The label colour was changed to RED and the system was informed of the new sector sequence ("TRANSFER" sequence).
An "ASSUME" input by the approach controller removed the RED colour from the callsign.
Colwr . Button grey Black
Window back ground. Text.
Click AB on ASSUME to assume frequency of the flight. The "previous sector" label changed to the "not concerned or concernedt1 colour and the "new sector" label changed to assume colour.
Click A5 on TRANSFER to indicate transfer of frequency to the NS. The current sector designator changed to "not concerned" colour and the receiving sector designator changed to ttassume*q colour.
Click AB on HAND-OVER to effect a Radar Hand-over. Not available
Click A5 on RELEASE placed a REL indication in the bottom line of the transferring and receiving controllers labels and effected a TRANSFER.
Click AB on SKIP effected a Skip.
Click A5 on MA advised the system of a missed approach.
EUROCONTROL Experimental Centre
Ill - 30
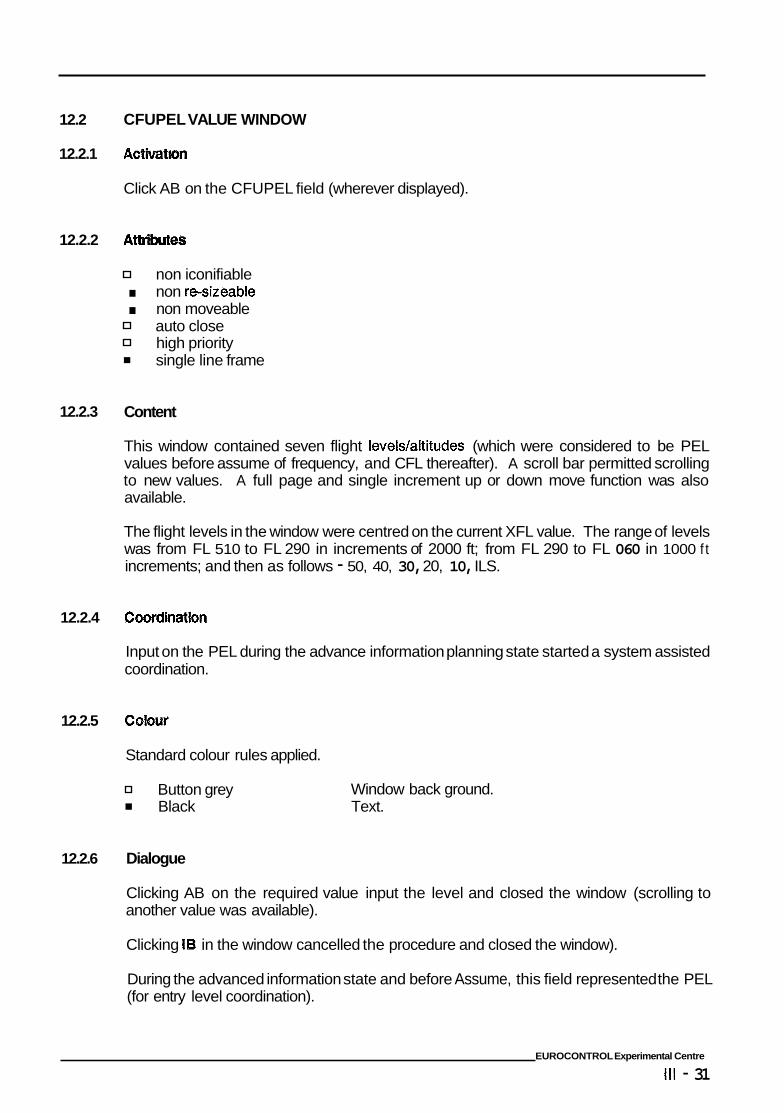
12.2
12.2.1
12.2.2
12.2.3
12.2.4
12.2.5
12.2.6
CFUPEL VALUE WINDOW
Acthrat
Click AB on the CFUPEL field (wherever displayed).
non iconifiable . non re-sizeable . non moveable auto close high priority single line frame
Content
This window contained seven flight IeveWaltitudes (which were considered to be PEL values before assume of frequency, and CFL thereafter). A scroll bar permitted scrolling to new values. A full page and single increment up or down move function was also available.
The flight levels in the window were centred on the current XFL value. The range of levels was from FL 510 to FL 290 in increments of 2000 ft; from FL 290 to FL 060 in 1000 f t increments; and then as follows - 50, 40, 30, 20, 10, ILS.
Coordination
Input on the PEL during the advance information planning state started a system assisted coordination.
Colour
Standard colour rules applied.
Button grey Black
Dialogue
Window back ground. Text.
Clicking AB on the required value input the level and closed the window (scrolling to another value was available).
Clicking 18 in the window cancelled the procedure and closed the window).
During the advanced information state and before Assume, this field represented the PEL (for entry level coordination).
EUROCONTROL Experimental Centre
I l l - 31
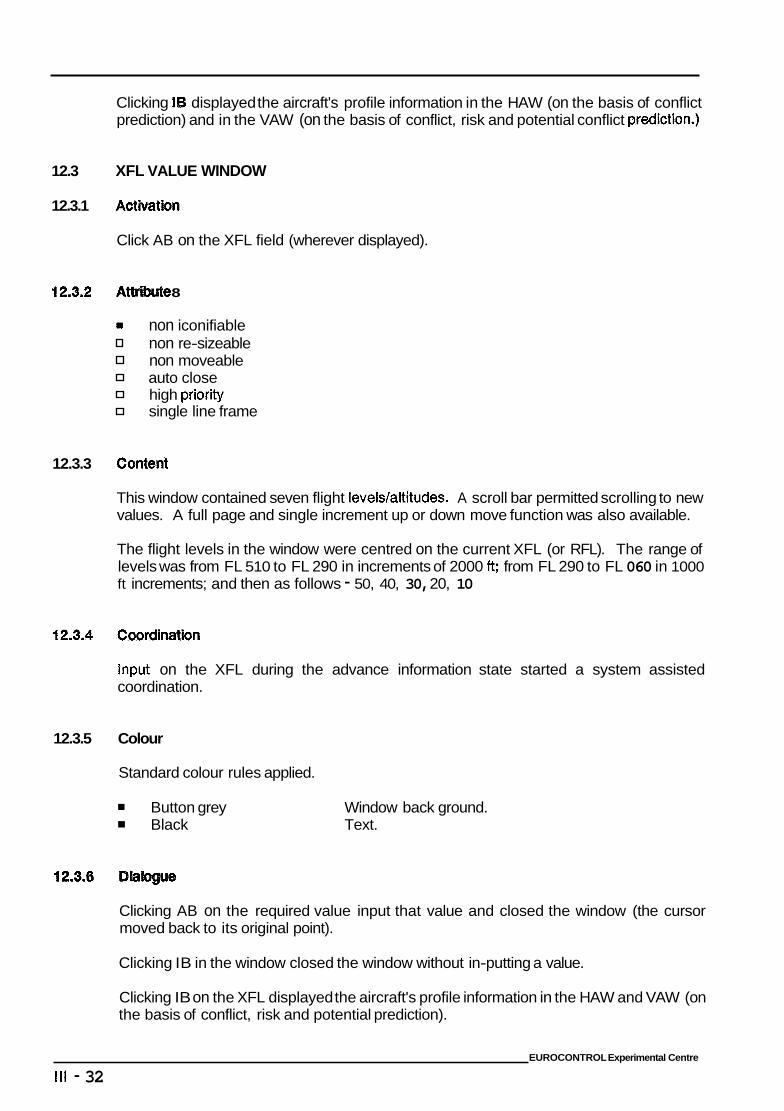
Clicking IB displayed the aircraft's profile information in the HAW (on the basis of conflict prediction) and in the VAW (on the basis of conflict, risk and potential conflict prediction.)
12.3 XFL VALUE WINDOW
12.3.1 Activation
Click AB on the XFL field (wherever displayed).
12.3.2 8
= non iconifiable non re-sizeable non moveable auto close high priority single line frame
12.3.3 Content
This window contained seven flight levels/altitudes. A scroll bar permitted scrolling to new values. A full page and single increment up or down move function was also available.
The flight levels in the window were centred on the current XFL (or RFL). The range of levels was from FL 510 to FL 290 in increments of 2000 ft; from FL 290 to FL 060 in 1000 ft increments; and then as follows - 50, 40, 30, 20, 10
12.3.4 Coordlnatbn
Input on the XFL during the advance information state started a system assisted coordination.
12.3.5 Colour
Standard colour rules applied.
Button grey Black
Window back ground. Text.
Clicking AB on the required value input that value and closed the window (the cursor moved back to its original point).
Clicking IB in the window closed the window without in-putting a value.
Clicking IB on the XFL displayed the aircraft's profile information in the HAW and VAW (on the basis of conflict, risk and potential prediction).
EUROCONTROL Experimental Centre
I l l - 32
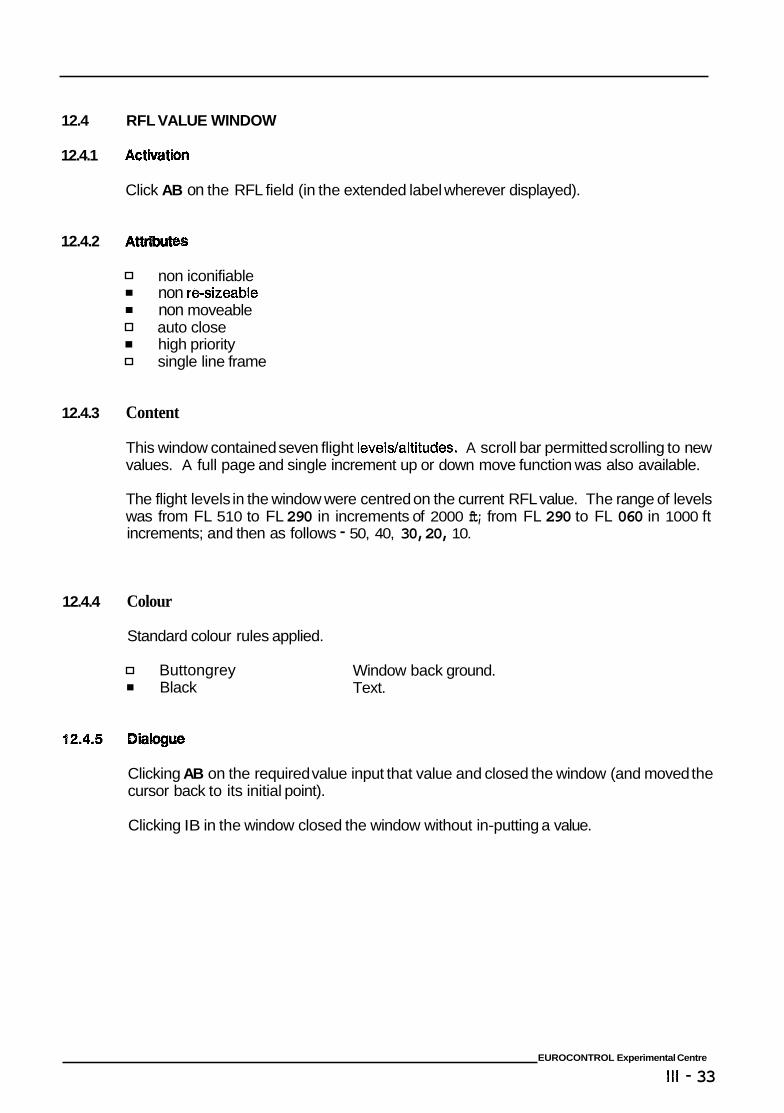
12.4 RFL VALUE WINDOW
12.4.1 Acthfatb
Click AB on the RFL field (in the extended label wherever displayed).
12.4.2 $8
non iconifiable non re-sizeable non moveable auto close high priority single line frame
12.4.3 Content
This window contained seven flight levels/altitudes. A scroll bar permitted scrolling to new values. A full page and single increment up or down move function was also available.
The flight levels in the window were centred on the current RFL value. The range of levels was from FL 510 to FL 290 in increments of 2000 ft; from FL 290 to FL 060 in 1000 ft increments; and then as follows - 50, 40, 30, 20, 10.
12.4.4 Colour
Standard colour rules applied.
Buttongrey Black
Window back ground. Text.
12.4.5 DiallogW
Clicking AB on the required value input that value and closed the window (and moved the cursor back to its initial point).
Clicking IB in the window closed the window without in-putting a value.
EUROCONTROL Experimental Centre
I l l - 33
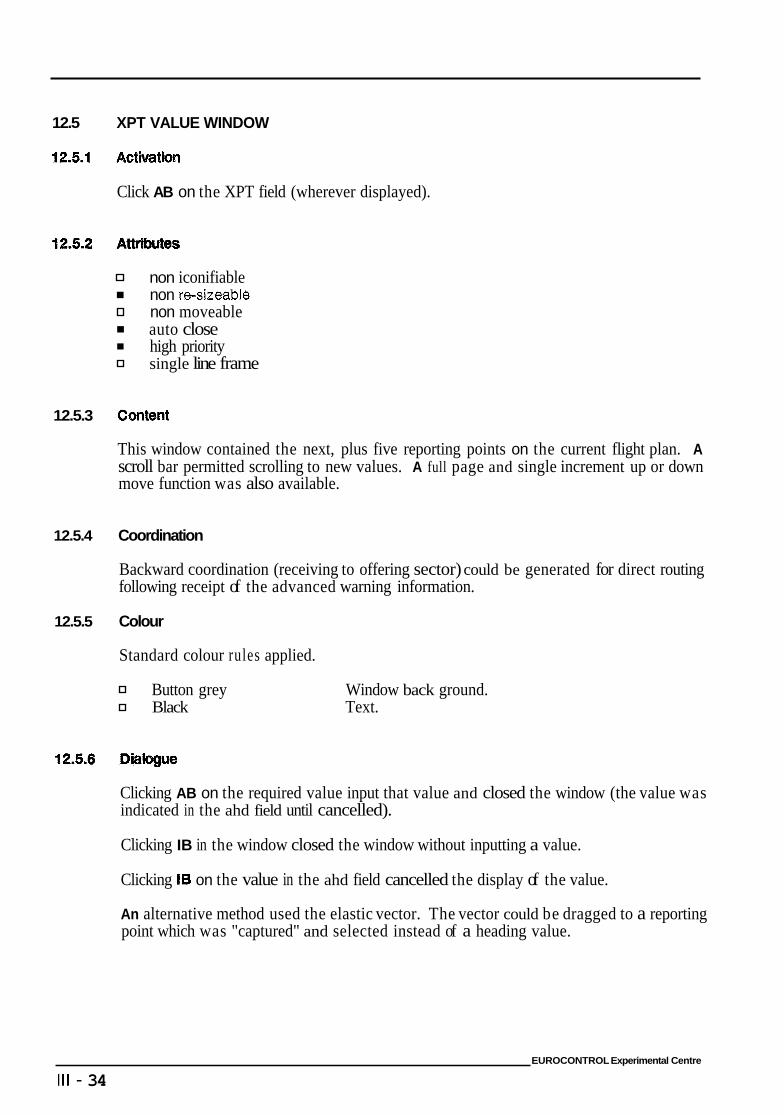
12.5 XPT VALUE WINDOW
12.5.1 Activation
Click AB on the XPT field (wherever displayed).
non iconifiable non re-sizeable non moveable auto close high priority single line frame
12.5.3 Content
This window contained the next, plus five reporting points on the current flight plan. A scroll bar permitted scrolling to new values. A full page and single increment up or down move function was also available.
12.5.4 Coordination
Backward coordination (receiving to offering sector) could be generated for direct routing following receipt of the advanced warning information.
12.5.5 Colour
Standard colour rules applied.
Button grey Black
Window back ground. Text.
Clicking AB on the required value input that value and closed the window (the value was indicated in the ahd field until cancelled).
Clicking IB in the window closed the window without inputting a value.
Clicking I6 on the value in the ahd field cancelled the display of the value.
An alternative method used the elastic vector. The vector could be dragged to a reporting point which was "captured" and selected instead of a heading value.
EUROCONTROL Experimental Centre
I l l - 34
12.5.7
12.6
12.6.1
12.6.2
12.6.3
12.6.4
12.6.5
12.6.6
The last points to be displayed in this window for arriving traffic were the approach STAR gate for the Area label and BASLO or LAMOX (as appropriate) for Approach.
arc VALUE WINDOW
Activation
Click AB on the arc field (wherever displayed).
s
non iconifiable non re-sizable non moveable auto close high priorii single line frame
contmt
The window contained seven values with 500 ft intervals (5, 10, 15, 20, 25, 30, 35).
Coordination
Backward coordination (receiving to offering sector) could be generated for assigned rate of change following receipt of the advanced warning information.
Colour
Standard colour rules applied.
Button grey Black
Window back ground. Text.
Dialogue
Clicking AB on the required value input that value and closed the window (the value was indicated in the arc field until cancelled).
Clicking IB in the window closed the window without inputting a value.
Clicking IB on the value in the arc field cancelled the display of the value.
EUROCONTROL Experimental Centre
Ill - 35
12.7 VALUE WINDOW
12.7.1 Acthratbn
Click AB on the asp field (wherever displayed).
12.7.2 es
non iconifiable non re-sizeable
= non moveable auto close high priority single line frame
12.7.3 Content
The menu supported a choice of Mach and knots (IAS) and displayed seven values in descending order, top down. A scroll bar permitted scrolling to new values. A full page and single increment up or down move function was also available.
The default applied was the actual Mach number for flights at or above FL 250 and 250 Knots for flights below FL 250. For Approach control the default value was 250 Knots.
Speed values in knots commenced at 12 (120 kts) and increased in 10 knot intervals to 40 (400 kts).
Speed values in Mach commenced at .68 and increased in increments of .01 to Mach .90.
Swopping between the Mach and Knots selection was achieved by clicking AB on the MACH/Knots text in the window.
12.7.4 Coordination
Backward coordination (receiving to offering sector) could be generated for assigned speed following receipt of the advanced warning information.
12.7.5 Colour
Standard colour rules applied.
Button grey = Black
Window back ground. Text.
EUROCONTROL Experimental Centre
I l l - 36
12.7.6
12.8
12.8.1
12.8.2
12.8.3
12.8.4
12.8.5
Click AB on Mach or Knots as required.
Clicking AB on the chosen value input and closed the window (and the cursor moved back to its initial position).
Clicking IB in the window closed the window without inputting a value.
Clicking IB on the value in the asp field cancelled the display of the value.
SEQUENCE CHANGE WINDOW not available
Activation
Click AB on the aircraft's sequence number in the appropriate list.
AttWes
non iconifiable = max size (10 values)
non moveable auto close single line frame
Content
Ten values were to be presented from 1 to 10, with 10 at the top. The window was to be used to change the sequence of a departure in the departure list or an arrival in the landing list.
Colour
Standard colour rules applied.
Button grey Window back ground. Black Text.
Dialogue
Clicking AB on the new value closed the window and amended the position of the aircraft in the corresponding list.
Clicking I6 in the window closed the window without inputting a value.
EUROCONTROL Experimental Centre
I l l - 37
13 RADAR EIS
The radar labels described below are classified according to controller function (approach control and area control). Certain fields were interactive providing the controller with the opportunity to record information and update the system.
The radar label was considered to be "dynamic" in that it changed shape as a consequence of the data input by the controller and the resulting system reaction. Planning and wordination states were indicated by colour changes in the label. These colour changes were either due to system generated events or resulting from controller input.
13.1 DESCRIPTION
The radar label consisted of :
= m
Data block (possible five lines of data); Radar Position Symbol (filled white circle); Lead Line connecting data block and radar position symbol; Speed vector of 0 to 5 minutes length; Trails (history dots/afterglow - 5 dots), and Climb and descent arrows.
Four categories of radar data block were defined for the simulation. These were :
Non Cmlated. mustard.
Military or VFR traffic squawking a conspicuity code - colour
= NQn Concernd. This category reflected traffic which had been transferred and was outside the sector or was never planned to enter the sector - colour grey.
Concerned. This category indicated traffic for which a controller was not responsible but which concerned him, for example transferred traffic still in the sector - colour mustard.
In approach the concerned category was used to differentiate traffic under the responsibility of another controller working in the same (shared) airspace; for example approach and departure controllers - colour mustard.
Standard Label. This category was the main "working label" format used by the controller. The colour planning states, coordination and system generated events were displayed in this label. It provided the main platform for data input.
Colours were - Pink (advanced warning), Black (assumed) and in approach, Burgundy (traffic transferred to director from approach - team colour).
An extended label was provided in the form of a popup window. This label presented the controller with supplementary flight plan information including system updated route point estimates. The window was available either temporarily (press and hold action on the callsign) and/or permanently displayed on screen.
The label states are described in detail in the following sections.
EUROCONTROL Experimental Centre
Ill - 38
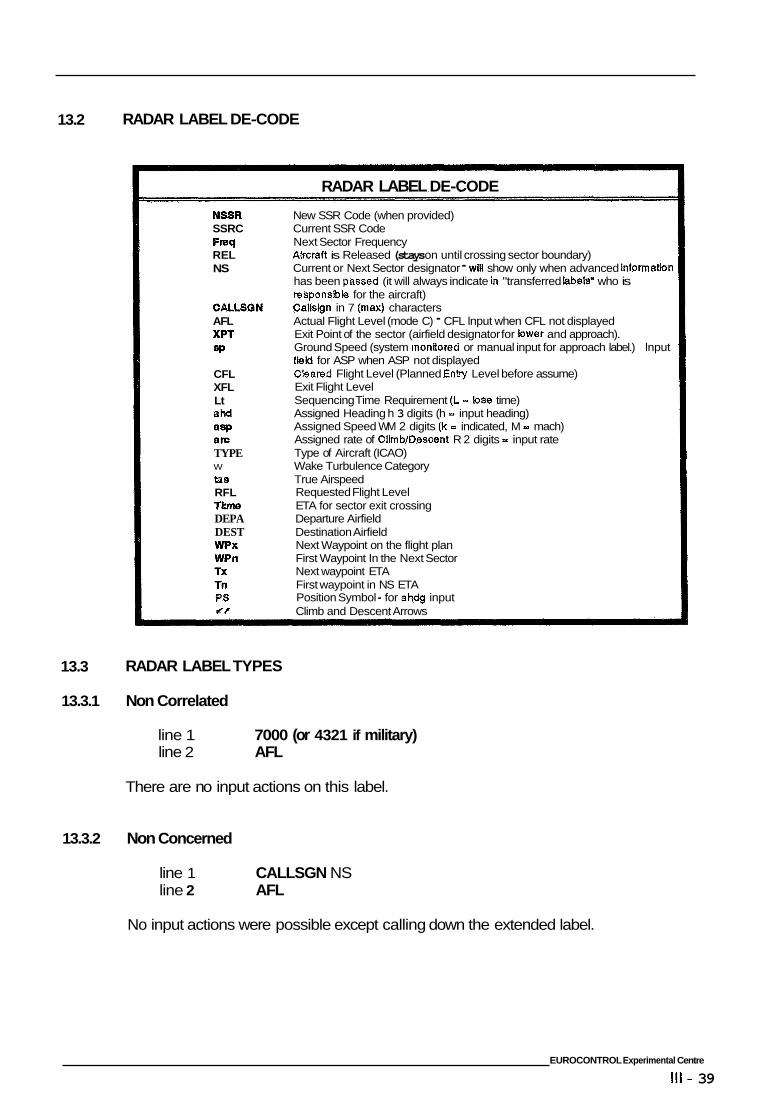
13.2
13.3
13.3.1
13.3.2
RADAR LABEL DE-CODE
RADAR LABEL DE-CODE
NSSR SSRC F w REL NS
CAUSGN AFL XPT Eq)
CFL XFL Lt ahd aw ate TYPE W
taS RFL T L m DEPA DEST WPX WPn Tx Tn PS l(r
New SSR Code (when provided) Current SSR Code Next Sector Frequency Akcraft is Released (stays on until crossing sector boundary) Current or Next Sector designator - will show only when advanced informatbn has been passed (it will always indicate in "transferred labels' who is responslble for the aircraft) CaLign in 7 (max) characters Actual Flight Level (mode C) - CFL lnput when CFL not displayed Exit Point of the sector (airfield designator for bwer and approach). Ground Speed (system monitored or manual input for approach label.) lnput field for ASP when ASP not displayed Cieared Flight Level (Planned Entry Level before assume) Exit Flight Level Sequencing Time Requirement (L = lose time) Assigned Heading h 3 digits (h = input heading) Assigned Speed WM 2 digits (k = indicated, M = mach) Assigned rate of ClimblDescent R 2 digits = input rate Type of Aircraft (ICAO) Wake Turbulence Category True Airspeed Requested Flight Level ETA for sector exit crossing Departure Airfield Destination Airfield Next Waypoint on the flight plan First Waypoint In the Next Sector Next waypoint ETA First waypoint in NS ETA Position Symbol - for ahdg input Climb and Descent Arrows
RADAR LABEL TYPES
Non Correlated
line 1 7000 (or 4321 if military) line 2 AFL
There are no input actions on this label.
Non Concerned
line 1 CALLSGN NS line 2 AFL
No input actions were possible except calling down the extended label.
EUROCONTROL Experimental Centre
Ill - 39
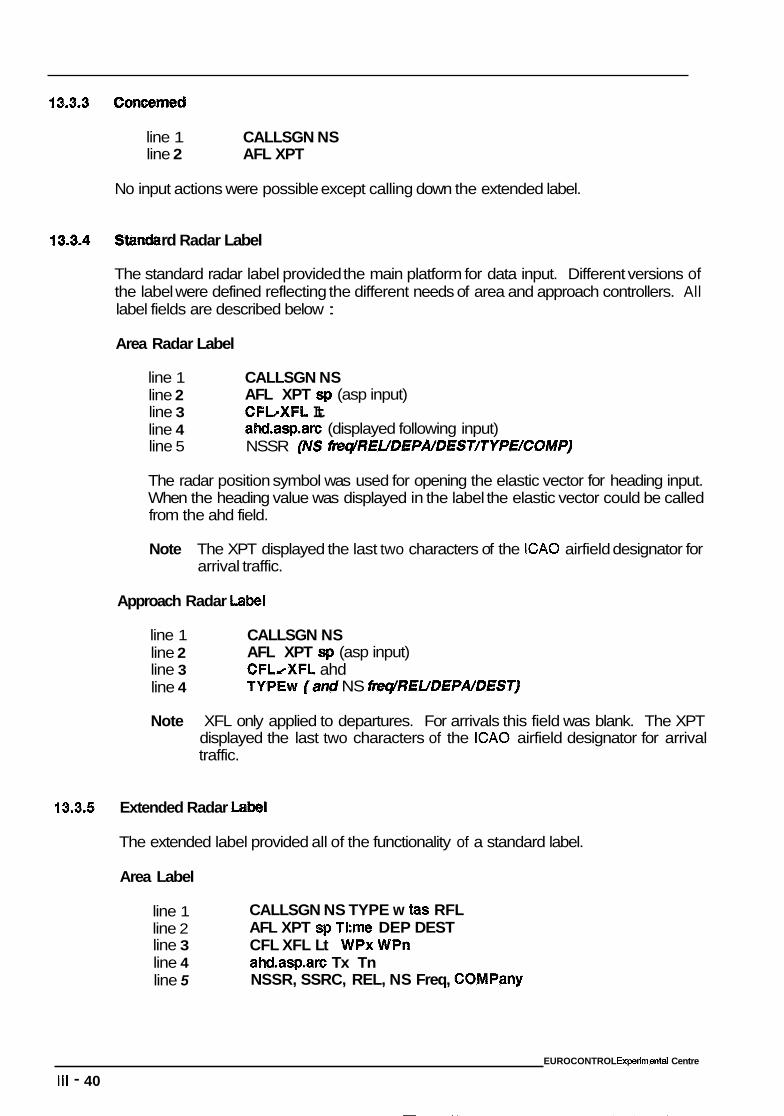
13.3.3 cam
line 1 CALLSGN NS line 2 AFL XPT
No input actions were possible except calling down the extended label.
rd Radar Label
The standard radar label provided the main platform for data input. Different versions of the label were defined reflecting the different needs of area and approach controllers. All label fields are described below :
Area Radar Label
line 1 CALLSGN NS line 2 line 3 CFLPXFL Lt line 4 line 5 NSSR (NS pltsqREUD€PA/DEST/TYPE/COMP)
AFL XPT sp (asp input)
ahd.asp.arc (displayed following input)
The radar position symbol was used for opening the elastic vector for heading input. When the heading value was displayed in the label the elastic vector could be called from the ahd field.
Note The XPT displayed the last two characters of the ICAO airfield designator for arrival traffic.
Approach Radar Label
line 1 CALLSGN NS line 2 line 3 CFLIXFL ahd line 4
AFL XPT sp (asp input)
TYPEw (and NS f&WREUDEPA/D€ST)
Note XFL only applied to departures. For arrivals this field was blank. The XPT displayed the last two characters of the ICAO airfield designator for arrival traffic.
13.3.5 Extended Radar Lab1
The extended label provided all of the functionality of a standard label.
Area Label
line 1 line 2 line 3 CFL XFL Lt WPx WPn line 4 ahd.asp.arc Tx Tn line 5
CALLSGN NS TYPE w tas RFL AFL XPT sp Tkme DEP DEST
NSSR, SSRC, REL, NS Freq, COMPany
EUROCONTROL Experimental Centre
111 - 40
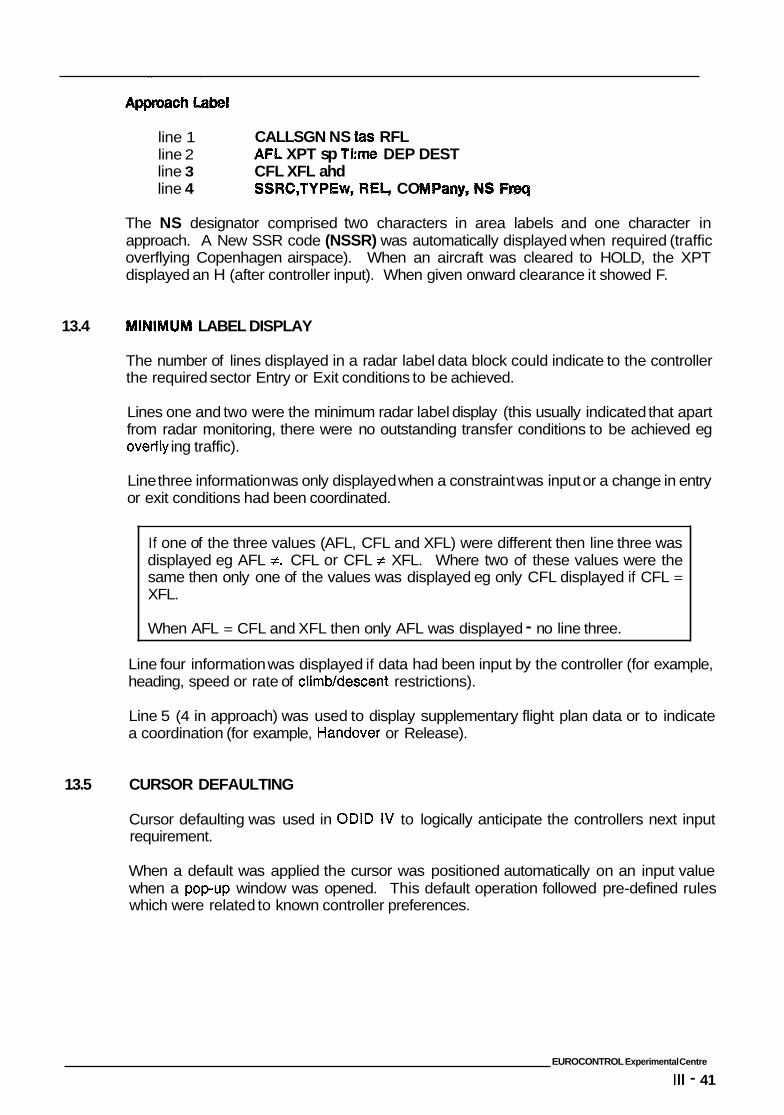
line 1 line 2 line 3 CFL XFL ahd line 4 SSRC,TYPEw, REL, CO
CALLSGN NS tas RFL A F l XPT sp T k m DEP DEST
The NS designator comprised two characters in area labels and one character in approach. A New SSR code (NSSR) was automatically displayed when required (traffic overflying Copenhagen airspace). When an aircraft was cleared to HOLD, the XPT displayed an H (after controller input). When given onward clearance it showed F.
13.4 ~ I N I ~ U ~ LABEL DISPLAY
The number of lines displayed in a radar label data block could indicate to the controller the required sector Entry or Exit conditions to be achieved.
Lines one and two were the minimum radar label display (this usually indicated that apart from radar monitoring, there were no outstanding transfer conditions to be achieved eg overfly ing traffic).
Line three information was only displayed when a constraint was input or a change in entry or exit conditions had been coordinated.
If one of the three values (AFL, CFL and XFL) were different then line three was displayed eg AFL f . CFL or CFL # XFL. Where two of these values were the same then only one of the values was displayed eg only CFL displayed if CFL = XFL.
When AFL = CFL and XFL then only AFL was displayed - no line three.
Line four information was displayed if data had been input by the controller (for example, heading, speed or rate of climb/descent restrictions).
Line 5 (4 in approach) was used to display supplementary flight plan data or to indicate a coordination (for example, Handover or Release).
13.5 CURSOR DEFAULTING
Cursor defaulting was used in ODlD IV to logically anticipate the controllers next input requirement.
When a default was applied the cursor was positioned automatically on an input value when a popup window was opened. This default operation followed pre-defined rules which were related to known controller preferences.
EUROCONTROL Experimental Centre
111 - 41
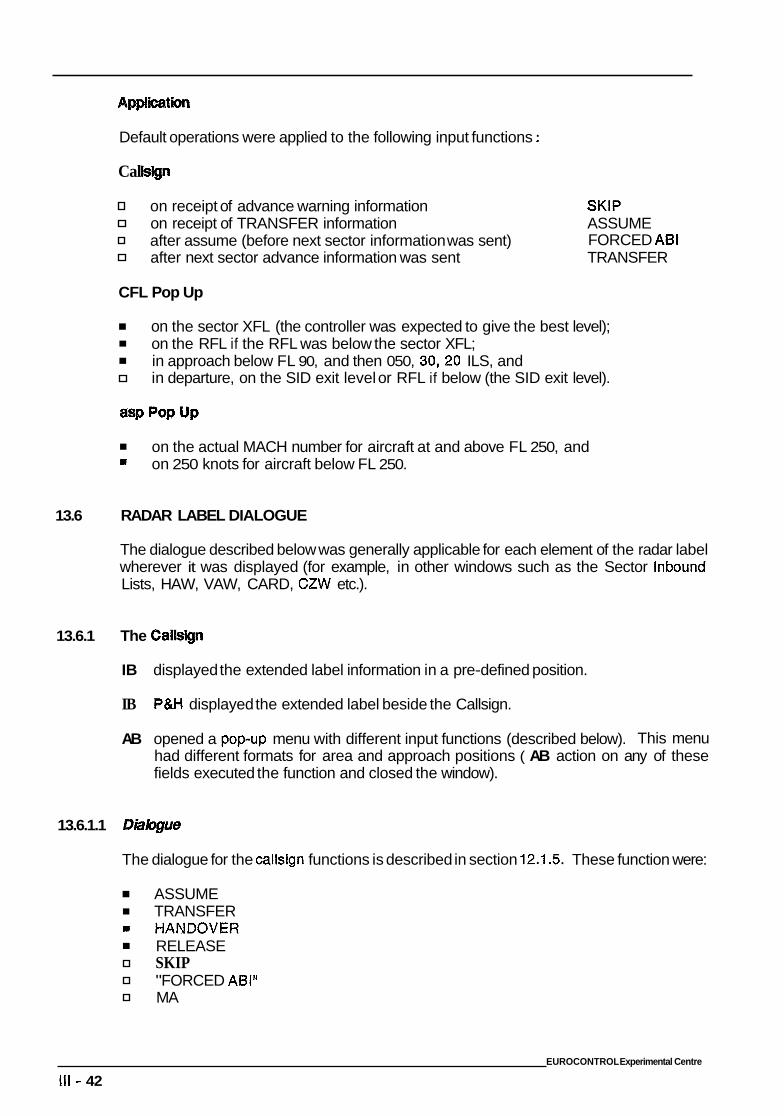
13.6
13.6.1
Default operations were applied to the following input functions :
Cal
on receipt of advance warning information SKIP on receipt of TRANSFER information ASSUME
after next sector advance information was sent TRANSFER after assume (before next sector information was sent) FORCED A61
CFL Pop Up
on the sector XFL (the controller was expected to give the best level); on the RFL if the RFL was below the sector XFL; in approach below FL 90, and then 050, 30,20 ILS, and in departure, on the SID exit level or RFL if below (the SID exit level).
I
on the actual MACH number for aircraft at and above FL 250, and on 250 knots for aircraft below FL 250.
RADAR LABEL DIALOGUE
The dialogue described below was generally applicable for each element of the radar label wherever it was displayed (for example, in other windows such as the Sector lnbound Lists, HAW, VAW, CARD, CZW etc.).
The Callsign
IB displayed the extended label information in a pre-defined position.
IB P&H displayed the extended label beside the Callsign.
AB opened a popup menu with different input functions (described below). This menu had different formats for area and approach positions ( AB action on any of these fields executed the function and closed the window).
13.6.1.1 DbkgucEs
The dialogue for the callsign functions is described in section 12.1.5. These function were:
ASSUME TRANSFER
I HANDOVER RELEASE SKIP "FORCED ABI" MA
EUROCONTROL Experimental Centre
Ill - 42
13.6.2
13.6.3
13.6.4
13.6.5
13.6.6
13.6.6.1
13.6.6.2
CFUPEL Pop Up
The dialogue for CFUPEL input is described in section 12.2.6.
XFL Pop Up
The dialogue for XFL input is described in section 12.3.6.
RFL Pop Up
The dialogue for RFL input is described in section 12.4.5.
NS - Sector Designator
AB no action
IB click or P&H, displayed the NS name and frequency.
ahd - Heading Input (elastic vector functbn)
The elastic vector function was conceived to help the controller easily find and input a heading value.
During development it transpired that the heading and range values provided by this mechanism could be used in profile re-calculation and conflict prediction. This meant that conflict prediction could more readily reflect the controllers tactical planning.
The elastic vector could also be used as a range and bearing line for mezsuring from the aircraft's position.
Activatrbn
AB on radar position symbol or ahd field.
Functbn
When initiated, the cursor shape changed to the elastic vector symbol (white cross) and the system automatically moved the cursor to the radar position symbol. No other data inputs were possible until the function was completed or abandoned.
A heading and distance read out were displayed beside the elastic vector cursor. Moving the mouse caused the cursor (and vector line) to reposition (the origin remaining at the aircraft position symbol) with a continuous display of the heading value at the extremity of the vector.
EUROCONTROL Experimental Centre
Ill - 43
13.6.6.3
13.6.6.4
13.6.7
13.6.8
13.6.9
13.6.1 0
When the required heading was indicated by the read out a second click input the value (and terminated the function).
If the elastic vector cursor was positioned to within 5 nm of a fix then the fix name was 'captured.' The heading input in this case was interpreted as a direct route input.
Cokwr
The elastic vector line and text were white.
Dh3
AB on PS (or ahd if displayed) automatically moved the cursor to the position symbol and changed its shape to the elastic vector, displaying a heading and distance read out. Moving the cursor in the radar window caused the vector to reposition (the origin remaining at the aircraft position symbol) with a continuous read out of the heading value at the extremity of the vector.
AB again, input the value (and terminated the function) when the required heading was indicated by the read out.
I6 in the radar window abandoned the procedure.
IB P&H on ahd displayed temporarily the current system monitored track (was not available for simulation.
IB on the displayed value in the label cancelled an existing input value.
arc - Climb/Descsnt Rate Restriction
The dialogue for arc input is described in section 12.6.6.
asp - Speed Restriction
The dialogue for asp input is described in section 12.7.6.
XPT - To Assign a Dbect Route
The dialogue for XPT input is described in section 12.5.6.
Dynamic Flight Leg Function
The flight leg displayed the aircraft's current flight planned route (as modified by heading and direct route input) through the sector. Conflict information was also displayed on the line. The flight leg was displayed in the radar window.
EUROCONTROL Experimental Centre
Ill - 44
13.8.1 0.1 A-tM
Click IB click on XPT (wherever displayed) or P&H for temporary display.
13.6.1 0.2 C
The flight leg was coloured green. Conflict information was displayed on the line as "road marking+* indicating the conflict area. The conflicts were coloured in accordance with the conflict type.
13.6.1 0.3 D&
IB on the XPT field displayed the Dynamic Flight Leg.
IB P&H displayed the flight leg on a "quick look" basis.
IB on the XPT deleted the flight leg (the system removed the flight leg following a transfer input).
anual change of Data B W PosZtbn
IB on the radar position symbol shifted the data block 45 degs anti-clockwise in relation to the radar position symbol.
14 TABULAR INFORMATION WINDOWS
Tabular information windows provided the controller at both approach and area positions advance warning information on inbound, landing, departing and holding aircraft. Where elements of the radar label were displayed in these window then the normal radar label input actions on these fields were available.
Colour and time parameters applicable to the radar label also applied. These windows dynamically re-sized according to the number of aircraft presented.
14.1 THE SIL (SECTOR INBOUND LIST)
The SIL windows were displayed in all area sectors and in the approach position. They provided the controller with hidher first advance warning information for planning purposes.
SlLs were geographically dispersed according to pre-defined sector entry areas.
EUROCONTROL Experimental Centre
I l l - 45
14.1.1 SIL FI
An aircraft inbound to a measured sector was allocated to a sector inbound list (SIL) (and stack windows) according to its sector boundary crossing point. Designated tracts of sector boundary were linked to selected SIL's. This allocation procedure ensured that aircraft on direct routes were displayed in a SIL which was relevant to the gmgraphical area of the sector that they crossed.
Departing traffic was allocated to a specific DEPARTURE SIL.
Feed sector traffic was allocated to a Navigation Start SIL ten minutes before commencing navigation. Traffic entering a feed sector from a measured sector was posted in a SIL according to the procedure described above.
(Aircraft advance warning information was presented in the stack window in aceordance with the posting system outlined for SlLs).
14.1.2 Activation
Information displayed
Information removed
Information updated
10 minutes prior to sector entry (or for a departure 10 minutes prior to ETD).
following assume by the receiving sector controller.
if holding, by EAT calculated by the sequencing tool.
14.1.3 Attributes
high priority I
non iconifiable non closeable moveable single line frame
dynamically re-sized by the system
14.1.4 Content
Each SIL was defined by a beacon name in the window header. The contents included:
Sector entry time;
PEL; XPT, and
callsign (maximum of ten callsigns displayed;
J (when the entry and exit conditions had been checked).
The minimum display was the window header plus one empty text line.
A scroll bar permitted scrolling to new callsigns. A full page and single increment up or down move function was also available.
EUROCONTROL Experimental Centre
Ill - 46
14.1.5 Colour
Back drop green Window back ground Pink Text
Text colour followed the colour coding rules established for labels (including coordination).
Standard data input was available as for the radar label dialogue.
14.2 THE LANDING LIST WINDOW
The Landing List was displayed in approach area positions. Flight plan details were displayed at the same time that SIL information was received. The window provided the approach controller with a system determined landing sequence for Copenhagen arrival traffic.
Access to a rate change window was provided through the landing list window. This permitted the approach controller to modify the landing rate used by the metering tool.
14.2.1 Activation
Inform at io n displayed
Information removed
information updated
at the same time as for approach SIL.
three minutes after ATA (landing).
14.2.2 Attributes
high priority
non iconifiable non closeable moveable single line frame
dynamically re-sized by the system
when a new landing sequence number was calculated by the metering tool.
EUROCONTROL Experimental Centre
I l l - 47
14.2.3
14.2.4
14.2.5
14.3
14.3.1
Content
The landing window displayed the following data :
Runway in use; Landing rate;
I
Aircraft type, and
Current airfield Met. information and QNH; Callsign (maximum of ten callsigns displayed;
Approach sequence number (incorrect during simulation).
The minimum display was the window header plus one empty text line.
A scroll bar permitted scrolling to new callsigns. A full page and single increment up or down move function was also available.
Colour
Back drop green Window back ground
Text colour followed the colour coding rules established for labels (including coordination).
Dblogura
Standard data input was available as for the radar label dialogue.
AB on rate to open the rate dialogue window. AB on the new rate (input the value and closed window).
THE DEPARTURE UST WINDOW
The Departure List window was displayed in approach area positions. Data was posted ten minutes prior to departure. The window provided the approach controller with initial flight plan information for planning departures from Copenhagen, Roskilda and Vaerlose airfields.
Activation
Information displayed Information removed
10 minutes prior to departure 3 minutes after ATD
EUROCONTROL Experimental Centre
Ill - 48
14.3.2 8
high level of priority;
non lconifiable; non closeable; moveable, and single line frame.
dynamically re-sized by the system;
14.3.3 Content
The departure list window was defined by the Copenhagen ICAO designator and runway in use, in the window header. The contents included :
ETD;
Aircraft type;
SID designator;
Callsign (maximum of ten callsigns displayed;
CFL (1 - for counter proposal action);
CFL (2 - for coordination acceptance), and Departure sequence number (incorrect during simulation).
The minimum display was the window header plus one empty text line.
A scroll bar permitted scrolling to new callsigns. A full page and single increment up or down move function was also available.
14.3.4 Colour
= Back drop green Window back ground
Text colour followed the colour coding rules established for labels (including coordination).
14.3.5 Dialogue
Standard data input was available as for the radar label dialogue.
14.4 THE STACK WINDOW not available for simulation.
The stack window was defined to help the TMA controller to manage the Copenhagen arrival holding areas. The system provided assistance in the form of EAT and stack departure information. It was displayed in sectors which fed traffic into the approach area (there were five STAR gates for Copenhagen arrivals).
The controller was required to inform the system that an aircraft was holding. At this point a sequence number and EAT were allocated (updated by the system). When the aircraft was cleared to leave the hold a further input was required.
EUROCONTROL Experimental Centre
111 - 49
Information displayed
Information removed
Information updated
at the same time as for the corresponding approach sector SIL.
ETNEAT was removed when the aircraft crossed the holding point outbound (sequence recalculated).
All information was removed three minutes after the aircraft had passed the outbound beacon.
When the EAT was re-calculated by the metering tool.
14.4.2 S
Iconifiable;
moveable; single line frame, and high level of priority.
dynamically re-sized by the system;
non closeable;
14.4.3 Content
The stack window was defined by the STAR gate name and an iconify button in the window header. The contents included :
ETA;
CFL, and AFL.
EAT (yellow when first displayed until acknowledged by a click); Callsign (maximum of ten callsigns displayed; Aircraft type; H (or sequence number when allocated or F for onward clearance);
The minimum display was the window header plus one empty text line. When not required by the controller, the window could be iconed.
A scroll bar permitted scrolling to new callsigns. A full page and single increment up or down move function was also available.
Only inbound Copenhagen traffic was presented in the stack window.
The data was sorted by CFL with the lowest at the bottom.
EUROCONTROL Experimental Centre
I l l - 50
14.4.4 cokwr
Back drop green Window back ground Yellow New EAT update
Text colour followed the colour coding rules established for labels (including coordination).
When holding was to commence the controller informed the system by clicking on the H in the window. The system then allocated a sequence number (which could not be amended by the controller). An aircraft could still be cleared to depart from the stack out of turn. EATS were allocated on a first come, first served basis.
When first presented, the EAT was coloured yellow (to attract attention). The controller was required to acknowledge the yellow EAT display (when passing the information to the pilot). Subsequent EAT updates were also presented in yellow.
When cleared to depart the stack the controller clicked on the sequence number to indicate onward clearance. Following this input an 'F' replaced the number (recording that a stack departure clearance had been passed to the aircraft).
When a flight was cleared to leave the stack (and had crossed the holding point outbound) a recalculation of the sequence numbers for the remaining flights was effected.
Standard data input was available as for the radar label dialogue.
AB on the H (indicated to the system that the aircraft had been cleared to hold.
AB on the EAT when it was passed to the pilot to indicate acknowledgment.
AB on the sequence number (indicated to the system that the aircraft had been given onward clearance).
EUROCONTROL Experimental Centre
111 - 51
15 TERM CONFLICT ASSISTANCE - 15.1 INT~O~UCTION
The MTCA tools required the provision of system determined profiles upon which conflict prediction could be calculated. These profiles were provided by a subsystem of the simulator (ground system) which calculated an initial profile for each aircraft and subsequently re-calculated profiles following controller input or track deviation alerts.
This section describes the process of trajectory calculation as applied to ODID IV, the MTCA conflict prediction rules, the conflict categories and the MTCA windows.
15.2 PROFILE CALCULATION AND RE-CALCULATION
15.2.1 General
Profile calculation was used during the simulation to create a sector sequence for data flow and to provide aircraft trajectories for MTCA conflict prediction.
This provided for :
system supported coordination.
transmission of system detected events (eg conflict information, label colour planning states etc); transmission of advance warning information between sectors, and
The flow of information was essential to the simulation as the ODID working environment is dependent on updated flight plan information and system determined planning events being displayed to the controller.
15.2.2 lnitbl Profile
The process of profile calculation commenced with an initial profile which was calculated ten minutes before an aircraft started navigation. This generated the initial advance warning information to a sector and provided the controller with hidher first planning information.
Any subsequent controller input or a system monitored longitudinal track deviation provoked a recalculation of the profile.
The profile calculation took into account the ATC operational environment which included:
the aircraft type and associated performance; the flight plan route (and any SID/STAR routings); the initial "start" flight level; the requested flight level (RFL) in the flight plan; and any predefined sector restrictions (ATC constraints eg STAR gate level, SID level restrictions and sector XFLs etc) which were explained in letters of agreement or local operating instructions.
EUROCONTROL Experimental Centre
Ill - 52
ATC constraints were described in coordination tables which defined sector exit levels in accordance with ;
letters of agreement; = sector operating instructions, and
SID/STAR constraints.
When calculating a climb profile the system attempted to attain the aircraft's RFL as quickly as possible. Attaining the RFL was only interrupted by ATC constraints which restricted the profile evolution.
When calculating a descent profile the system attempted to attain the constraint level (defined in coordination tables) as late as possible.
15.2.3 Re-CaOculation
The initial aircraft profile could be modified by system detected events (track deviation) or controller inputs. The controller inputs which resulted in a profile re-calculation included:
a heading input; a direct route input; aCFLinput;
an RFL input. a PEL or XFL input (or coordination acceptance), and
Track deviation monitoring prompted a profile re-calculation when the system detected an aircraft deviating from its longitudinal horizontal profile by more than one minute.
The re-calculation of an XFL on a vertical sector boundary was carried into the next sector as that sector's entry level or PEL. Thereafter the profile was governed by profile calculation rules relating to the RFL and ATC constraints.
During the initial profile calculation, an XFL on a horizontal sector boundary generated an XFL reference point (geographical position). This point was then used as a reference for the application of the XFL constraint on any re-calculated profile resulting from a heading or direct route input.
For ODlD IV, XFL chanaes (coordination) were not Dermitted on a horizontal boundaw between SuDerimDosed sectors.
When the system received a heading input it calculated the track from the aircraft's radar position to the point indicated by the controller input (taken from the end of the elastic vector) and then to the first reporting point in the next sector. From that position the aircraft flight plan route was maintained.
Direct route input was treated as an modification of the flight plan route. The system calculated the aircraft's track to the new point and then the track to the first reporting point in the next sector. From that position the aircraft flight plan route was maintained.
EUROCONTROL Experimental Centre
111 - 53
15.3
15.3.1
15.3.2
15.3.3
Any profile re-calculation which created a new sector sequence was artificially 'adjusted" to remove the new sector from the message sequence (ODID IV did not consider a change of sector sequence).
The ground system profile calculation was up-dated by radar determined longitudinal track deviation monitoring. Vertical and lateral deviation was not considered.
CONFLICT TYPES
Medium Term Conflict Assistance (MTCA) rules were defined to predict three levels of conflict and to provide for their display and interrogation by the controller.
This conflict information was applied in the MTCA tools provided to area control positions. Conflict detection was not provided to approach control.
The different types of conflict information provided by the MTCA rules were based upon the 4 dimension profiles calculated for every aircraft.
Hor4zontal Application
The horizontal flight path included the airspace 8 nautical miles (or 1 minute) either side of the subject aircraft's track. The flight path was considered to be either:
the flight planned route; a direct route input by the controller followed by the flight planned route; where a heading had been input by the controller, the heading from the aircraft's current position to a point indicated by the end of the elastic vector followed by a turn to the original sector exit position and then the flight planned route.
The prediction of conflicts, conflict risks and potential conflicts was applied for the whole length of the aircraft's flight path through a sector from three minutes prior to sector entry until three minutes after exit.
Vertical Application
The conflict types were determined by an (intruder) aircraft's position, detected within the subject aircraft's vertical profile. The vertical profiles considered included :
the current planned profile; CFL to XFL band, and all other levels outside of the AFL to XFL profile.
The conflict types were defined as follows :
CONFLICT A conflict was the prediction that an aircraft (or several aircraft) would be detected in the subject aircraft's profile, within its AFL to XFL level band and that their vertical profiles were calculated to cross within the 8 nm flight path.
EUROCONTROL Experimental Centre
Ill - 54
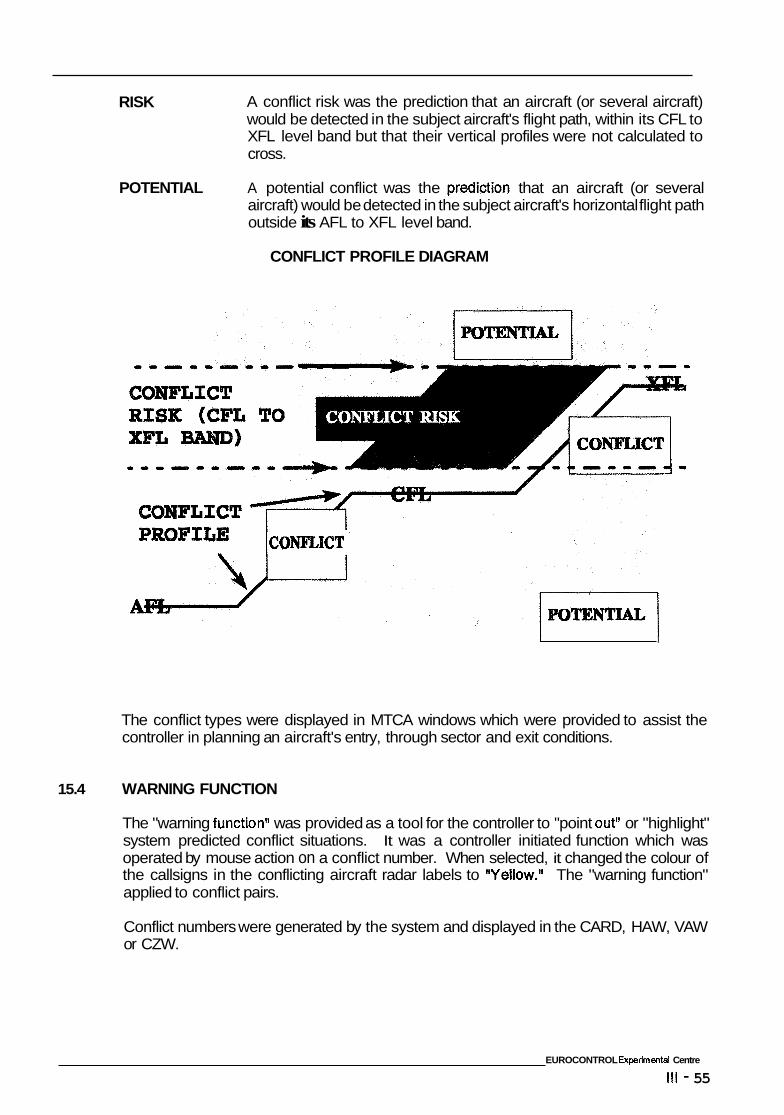
RISK A conflict risk was the prediction that an aircraft (or several aircraft) would be detected in the subject aircraft's flight path, within its CFL to XFL level band but that their vertical profiles were not calculated to cross.
POTENTIAL A potential conflict was the prsdiction that an aircraft (or several aircraft) would be detected in the subject aircraft's horizontal flight path outside its AFL to XFL level band.
CONFLICT PROFILE DIAGRAM
CCWFLICT
1 I
The conflict types were displayed in MTCA windows which were provided to assist the controller in planning an aircraft's entry, through sector and exit conditions.
15.4 WARNING FUNCTION
The "warning function" was provided as a tool for the controller to "point out" or "highlight" system predicted conflict situations. It was a controller initiated function which was operated by mouse action on a conflict number. When selected, it changed the colour of the callsigns in the conflicting aircraft radar labels to "Yellow.tg The "warning function" applied to conflict pairs.
Conflict numbers were generated by the system and displayed in the CARD, HAW, VAW or CZW.
EUROCONTROL Experimental Centre
Ill - 55
16
Warning inputs could be initiated by either PLC or EC controllers. The displayed result of these inputs was the same on the PLC and EC screens in a given sector. Either controller could delete a warning, including those selected by hidher colleague.
If a flight received several warning inputs (from different conflict pairs) they were accumulated by the system. As warnings were removed the number of outstanding warnings reduced.
When a conflict ceased to exist the warning was removed automatically.
TCA WINDOWS
The windows described below provided graphic images in plan and vertical views which were based on current flight plan data, updated by controller inputs (heading, direct route and level amendments) and system monitored track deviation. The windows displayed conflict, conflict risk and potential conflict information for planning purposes.
MTCA windows could be temporarily or permanently displayed according to the Selected Display Option choice (SDU in the button bar).
If an MTCA window was called during the ten minute advanced information state and before the aircraft was at a point three minutes from sector entry, then the resulting image would be displayed as predicted from the three minute point. Thereafter a request for MTCA display gave the actual position followed by the predicted profile.
Dialogue was standard in all MTCA windows for the designated target in accordance with the dialogue functions available on the same fields in the radar label.
Non-designated targets could be interrogated for extended label display only.
There was only a single occurrence of each window open at any given time and the windows were selectable (on/off) through the radar window button bar.
16.1 CONFUCT AND RISK DISPLAY - CARD
The CARD provided the controller with advance warning of conflict and conflict risk situations in both graphic and text formats. All area control positions were provided with a CARD window.
A conflict (or risk) was represented by a horizontal line drawn along the expected minimum distance which was indicated on the Y axis (minimum distance). The left point of the line indicated the start of the conflict (with reference to the X axis -time) and the right point its termination (therefore giving the time remaining for resolution and the predicted duration of the conflict situation).
A conflict number (surrounded by a box in the conflict colour) was presented on the line (this represented the position of predicted minimum distance with reference to time). The line moved from right to left as the aircraft concerned moved closer together.
EUROCONTROL Experimental Centre
Ill - 56
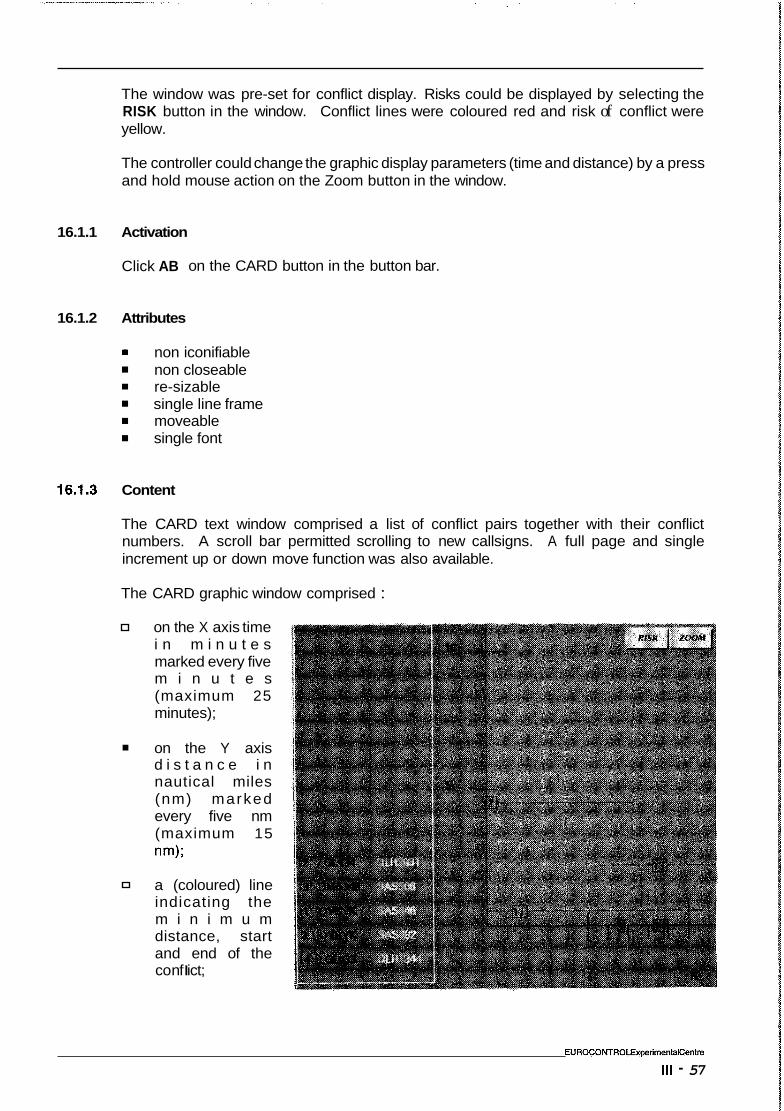
The window was pre-set for conflict display. Risks could be displayed by selecting the RISK button in the window. Conflict lines were coloured red and risk of conflict were yellow.
The controller could change the graphic display parameters (time and distance) by a press and hold mouse action on the Zoom button in the window.
16.1.1 Activation
Click AB on the CARD button in the button bar.
16.1.2 Attributes
= non iconifiable non closeable re-sizable single line frame moveable single font
16.1.3 Content
The CARD text window comprised a list of conflict pairs together with their conflict numbers. A scroll bar permitted scrolling to new callsigns. A full page and single increment up or down move function was also available.
The CARD graphic window comprised :
on the X axis time i n m i n u t e s marked every five m i n u t e s (maximum 25 minutes);
on the Y axis d i s t a n c e i n nautical miles (nm) marked every five nm (maximum 15 nm);
a (coloured) line indicating the m i n i m u m distance, start and end of the co nf I ict;
EUROCOMROLExperimentalCentre
Ill - 57
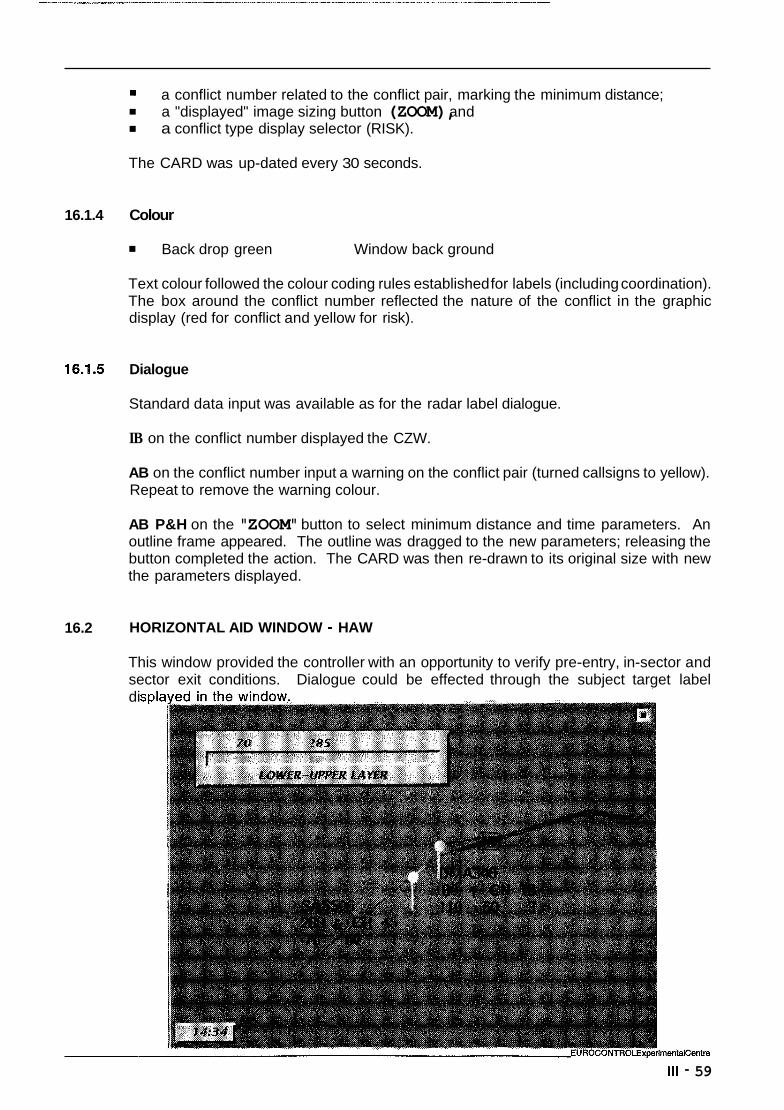
= a conflict number related to the conflict pair, marking the minimum distance; a "displayed" image sizing button (ZOOM), and a conflict type display selector (RISK).
The CARD was up-dated every 30 seconds.
16.1.4 Colour
Back drop green Window back ground
Text colour followed the colour coding rules established for labels (including coordination). The box around the conflict number reflected the nature of the conflict in the graphic display (red for conflict and yellow for risk).
16.1.5 Dialogue
Standard data input was available as for the radar label dialogue.
IB on the conflict number displayed the CZW.
AB on the conflict number input a warning on the conflict pair (turned callsigns to yellow). Repeat to remove the warning colour.
AB P&H on the "ZOOM" button to select minimum distance and time parameters. An outline frame appeared. The outline was dragged to the new parameters; releasing the button completed the action. The CARD was then re-drawn to its original size with new the parameters displayed.
16.2 HORIZONTAL AID WINDOW - HAW
This window provided the controller with an opportunity to verify pre-entry, in-sector and sector exit conditions. Dialogue could be effected through the subject target label di SP
Ill - 59
16.2.1
10.2.2
16.2.3
The HAW displayed conflict information if designated from an aircraft's CFL (or AFL) or all conflict types if designated from the XFL. When activated but not displayed (due to SDO option selected) it reopened following action on the CFUXFL fields as described above.
Acthratkm
Click AB on the HAW button in the button bar.
Information was displayed according to the conflict rules as follows :
Click IB on the CFUPEL field for display of conflicts only.
Click IB on the XFL field for display of all conflict types.
iconifiable rssizable single line frame moveable single font SDO application (selected via button bar).
Cofltsnt
The HAW displayed a plan view showing the flight plan route (as amended by heading and direct route input) through the sector.
The image was described from three minutes prior to sector entry to three minutes after sector exit. If the window was requested prior to the three minute position then the image was predicted from the three minute point. The time of requested display was positioned at the bottom left corner.
Targets were presented with a radar position symbol, standard label, trail dots and speed vector. Sector maps were displayed but reporting point names were not shown.
The flight legs of all aircraft in "conflict" with the subject target were displayed. That portion of the flight leg which was predicted to be in conflict was presented as a colour coded flight path. A conflict number was positioned at the predicted point of minimum distance.
A layer change selector indicated the subject aircraft's current vertical flight level profile. An extension of the layer could be effected by press and hold action on the upper and/or lower layer change selector buttons. New flight levels (and traffic) were displayed following this action.
EUROCONTROL Experimental Centre
I l l - 61
The standard colours displayed in the radar window were repeated in the HAW.
Text colour followed the colour coding rules established for labels.
Conflict types were presented in their pre-defined colour.
Standard data input was available as for the radar label dialogue.
IB on the conflict number displayed the CZW.
AB on the conflict number input a warning on the conflict pair. Repeat to remove the warning . AB on the iconify button iconified the window. (AB in the icon window to reopen the window.
AB P&H on one of the slider buttons (upper or lower) in the layer change valuator modified the displayed layer settings
16.3 VERTICAL AID WINDOW - VAW
This window provided the controller with an opportunity to verify preentry, in-sector and sector exit conditions. It was also possible to commence sector entry or exit level coordination through the window.
The VAW displayed all conflict information when designated from an aircraft's CFL (AFL) or XFL. When activated but not displayed (due to SDO option selected) it reopened following mouse action on the CFLIXFL fields.
16.3.1 Activation
Click AB on the VAW button in the button bar.
Information was displayed for all conflict types.
16.3.2 Attributes
iconifiable re-sizable single line frame moveable single font SDO application (selected via button bar).
EUROCONTROL Experimental Centre
Ill - 62
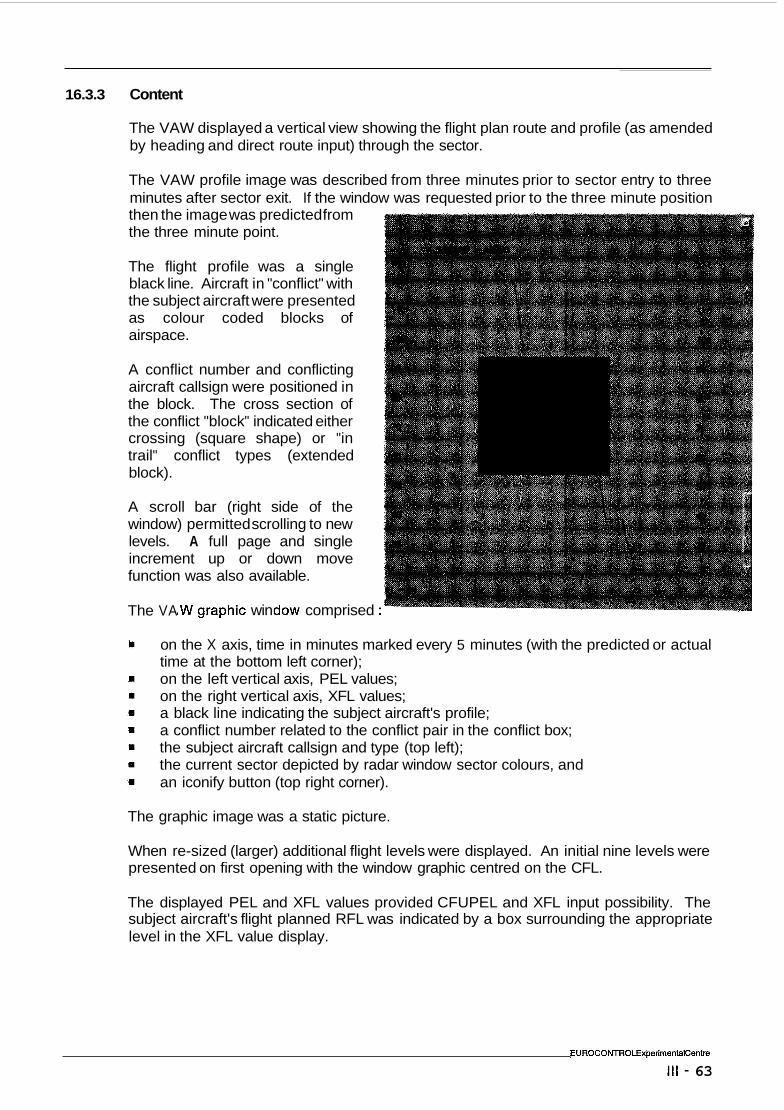
16.3.3 Content
The VAW displayed a vertical view showing the flight plan route and profile (as amended by heading and direct route input) through the sector.
The VAW profile image was described from three minutes prior to sector entry to three minutes after sector exit. If the window was requested prior to the three minute position then the image was predicted from the three minute point.
The flight profile was a single black line. Aircraft in "conflict" with the subject aircraft were presented as colour coded blocks of airspace.
A conflict number and conflicting aircraft callsign were positioned in the block. The cross section of the conflict "block" indicated either crossing (square shape) or "in trail" conflict types (extended block).
A scroll bar (right side of the window) permitted scrolling to new levels. A full page and single increment up or down move function was also available.
The VA &W gl rap lhic win comprised
on the X axis, time in minutes marked every 5 minutes (with the predicted or actual time at the bottom left corner); on the left vertical axis, PEL values; on the right vertical axis, XFL values; a black line indicating the subject aircraft's profile; a conflict number related to the conflict pair in the conflict box; the subject aircraft callsign and type (top left); the current sector depicted by radar window sector colours, and an iconify button (top right corner).
The graphic image was a static picture.
When re-sized (larger) additional flight levels were displayed. An initial nine levels were presented on first opening with the window graphic centred on the CFL.
The displayed PEL and XFL values provided CFUPEL and XFL input possibility. The subject aircraft's flight planned RFL was indicated by a box surrounding the appropriate level in the XFL value display.
EUROCONTROLExperimentalCentre
Ill - 63
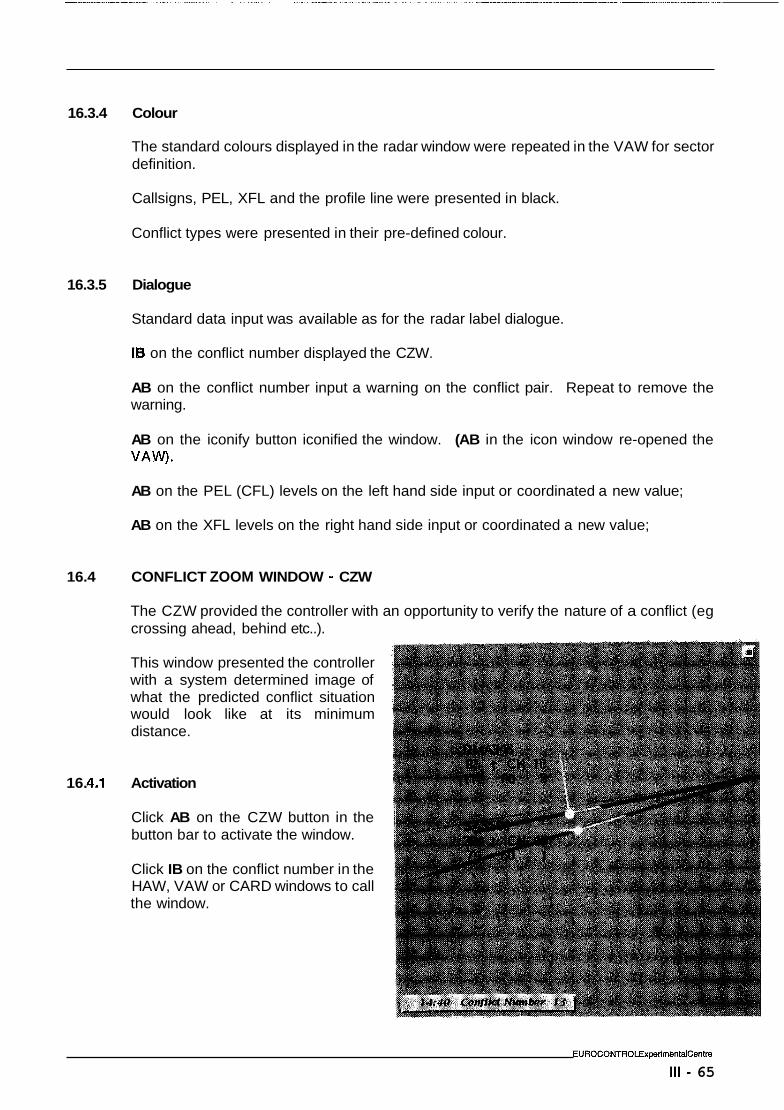
16.3.4 Colour
The standard colours displayed in the radar window were repeated in the VAW for sector definition.
Callsigns, PEL, XFL and the profile line were presented in black.
Conflict types were presented in their pre-defined colour.
16.3.5 Dialogue
Standard data input was available as for the radar label dialogue.
IB on the conflict number displayed the CZW.
AB on the conflict number input a warning on the conflict pair. Repeat to remove the warning.
AB on the iconify button iconified the window. (AB in the icon window re-opened the VAW).
AB on the PEL (CFL) levels on the left hand side input or coordinated a new value;
AB on the XFL levels on the right hand side input or coordinated a new value;
16.4 CONFLICT ZOOM WINDOW - CZW
The CZW provided the controller with an opportunity to verify the nature of a conflict (eg crossing ahead, behind etc..).
16. ,4.1
This window presented the controller with a system determined image of what the predicted conflict situation would look like at its minimum distance.
Activation
Click AB on the CZW button in the button bar to activate the window.
Click IB on the conflict number in the HAW, VAW or CARD windows to call the window.
EUROCONTROLExperimentalCentre
Ill - 65
16.4.2
16.4.3
16.4.4
16.4.5
Ati
iconifiable re-sizable single line frame moveable single font
The window displayed 20 by 20 nautical miles of airspace around the predicted minimum distance point of the conflict. Conflicting traffic were displayed at the predicted positions with standard radar label information.
The time of the predicted conflict and the conflict number were presented at the bottom left corner of the window.
An iconify button was positioned top right in the window.
Conflict information (conflict or conflict risk) was described as flight legs defining conflicting tracks. This gave the controller an indication as to whether the situation was crossing, converging or in trail.
Colour
The standard colours displayed in the radar window were repeated in the CZW for sector definition.
Text colour followed the colour coding rules established for labels (including coordination).
Conflict types were presented in their pre-defined colour.
Standard data input was available as for the radar label dialogue.
AB on the conflict number input a warning on the conflict pair. Repeat to remove the warning.
AB on the iconify button iconified the window. (AB in the icon window re-opened the Czw) .
EUROCONTROL Experimental Centre
Ill - 67
Purple
17
17.1
17.1.1
17.1.2
17.1.3
17.1.4
ADDITIONAL FUNCTIONS
ULTl INPUT DEVICE - A
The AMID provided the approach controller with an opportun*Ry to make multiple inputs for CFL, speed and heading values without having to open and close individual popup windows.
AMID could be selected on or off according to the controllers working preference.
AcZRratlon
Click AB on the AMID symbol in the button bar (approach positions only). This was a toggle on/off switch.
Thereafter, clicking AB on CFL or asp in the radar label opened the AMID for that label, with the cursor defaulted to CFL (or asp).
non iconifiable closeable single line frame
content
The AMID window was composed of :
a CFL value window (left side) with levels extending from ILS to FL 90 (scrolling available) ;
a speed value window (right side) which contained ten values with 250 kts as default at the top (scrolling available);
a heading vector (in the middle) provided heading input ( moving the cursor across the window activated the vector line).
Colour
Button grey Black
Window back ground Text Heading line and text.
EUROCONTROL Experimental Centre
I l l - 68
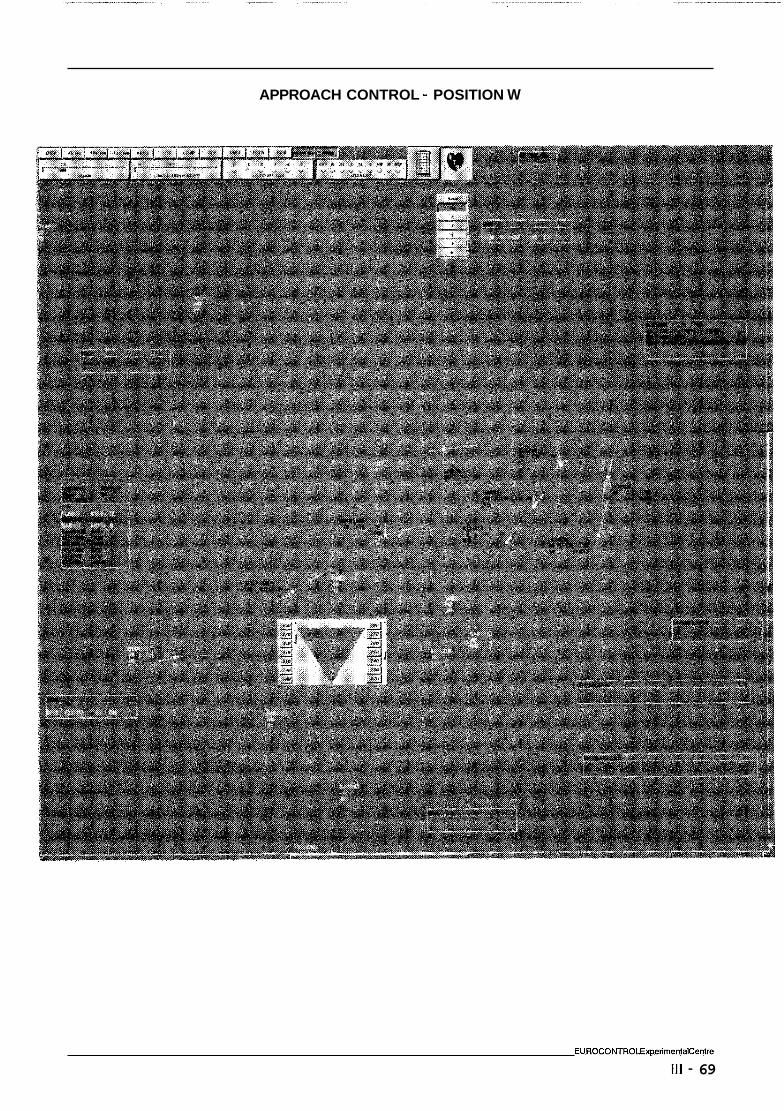
APPROACH CONTROL - POSITION W
EUROCONTROLExperirnentalCentre
I l l - 69
17.1 .S
17.2
17.2.1
17.2.2
IB in the window to close.
AB on the CFL value input a new level.
AB on the speed scale input a new assigned speed restriction.
AB when the new heading had been selected input the value.
METERING TOOL
The objective of the metering tool was to assist the controller in the optimisation and metering of traffic flows from an area control sector into an approach area.
The metering calculation was based upon :
the route structure; STAR structure;
controller inputs.
a variable Landing Rate parameter; system calculated flight plan profiles; and
The metering tool calculated an arrival sequence at the runway based on the principle of "first come, first served." This sequence was translated into a "lose time" indication which was presented to the area controller in the radar label. The lose time had to be achieved by the aircraft before the entry point into the approach area (STAR gate).
The executive controller (area sector) was required to interpret the lose time by applying appropriate control techniques (for example, speed control, vectoring, holding etc). Approach control was responsible for setting the flow rate.
The metering tool provided the controller with following information :
stack exit time (EAT); =
landing sequence order.
delay to be absorbed prior to the approach entry gate (lose time);
stack exit sequence number; and
Manual reorganisation of the arrival traffic sequence by approach was permitted. This did not effect a re-calculation of the sequence (unless a missed approach was initiated).
The metering tool had not been tested or calibrated before the simulation.
EUROCONTROL Experimental Centre
111 - 71
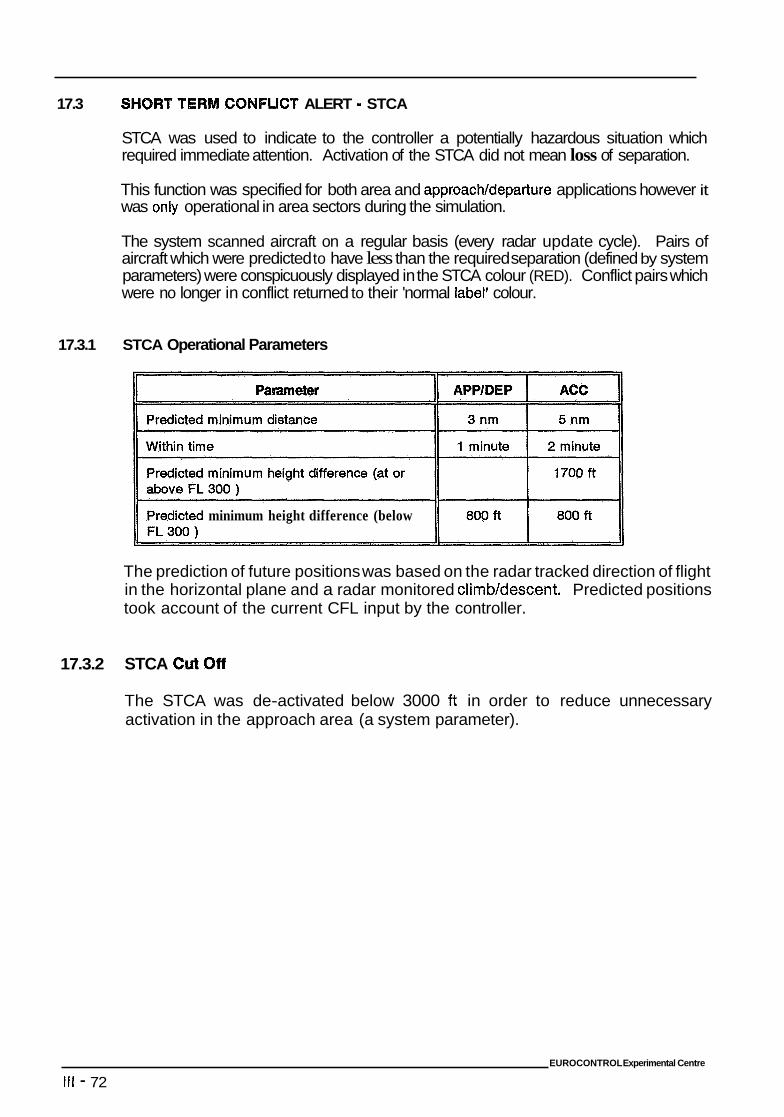
17.3 CONFUCT ALERT - STCA
STCA was used to indicate to the controller a potentially hazardous situation which required immediate attention. Activation of the STCA did not mean loss of separation.
This function was specified for both area and approacWdeparture applications however it was only operational in area sectors during the simulation.
The system scanned aircraft on a regular basis (every radar update cycle). Pairs of aircraft which were predicted to have less than the required separation (defined by system parameters) were conspicuously displayed in the STCA colour (RED). Conflict pairs which were no longer in conflict returned to their 'normal label' colour.
17.3.1 STCA Operational Parameters
minimum height difference (below
The prediction of future positions was based on the radar tracked direction of flight in the horizontal plane and a radar monitored climb/descent. Predicted positions took account of the current CFL input by the controller.
17.3.2 STCA Cutoff
The STCA was de-activated below 3000 ft in order to reduce unnecessary activation in the approach area (a system parameter).
EUROCONTROL Experimental Centre
111 - 72

ANNEX IV
ODID IV
PLETED EXERCISES
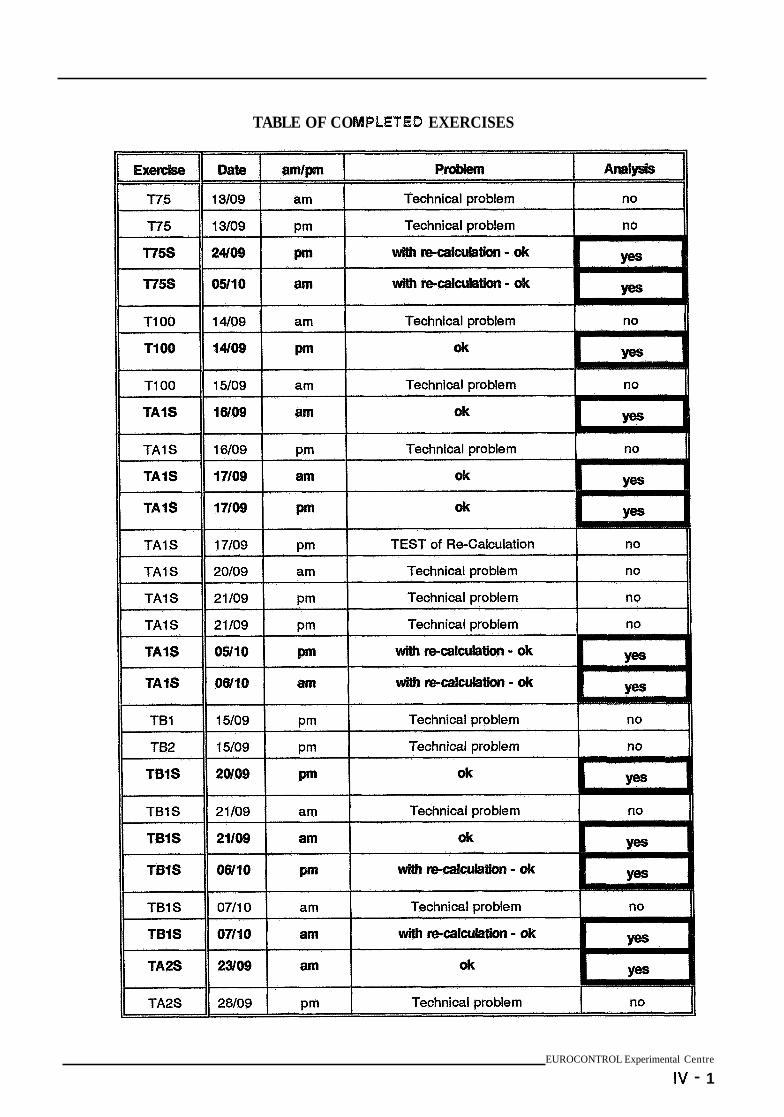
TABLE OF CO PLETED EXERCISES
EUROCONTROL Experimental Centre
IV - 1
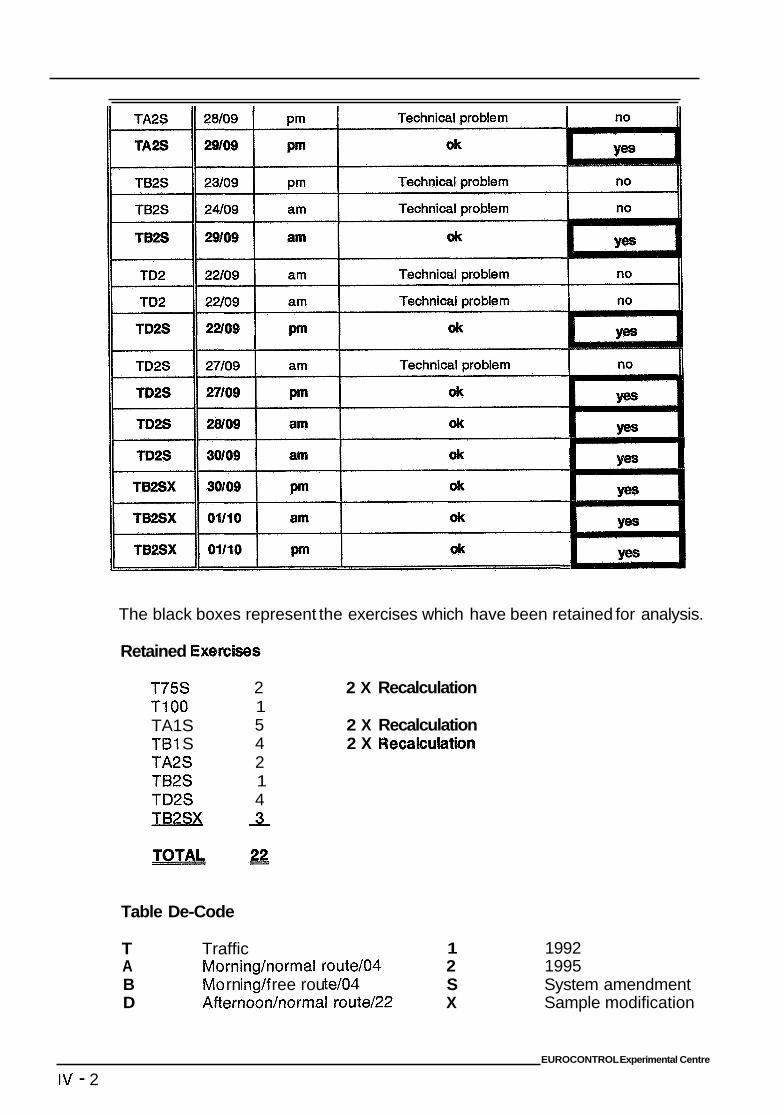
The black boxes represent the exercises which have been retained for analysis.
Retained Exercises
T75S T1OO TA1 S TB1 S TA2S TB2S TD2S TB2SX
2 2 X Recalculation 1 5 2 X Recalculation 4 2 X Recalculatbn 2 1 4 A
Table De-Code
T Traffic 1 1992
B Mo rn ing/f ree rou te/04 S System amendment D Afternoonlnormal route/22 X Sample modification
A Morning/normal route/04 2 1995
EUROCONTROL Experimental Centre
IV - 2

ANNEX W
ODlD IV
WORKLOAD ANALYSIS
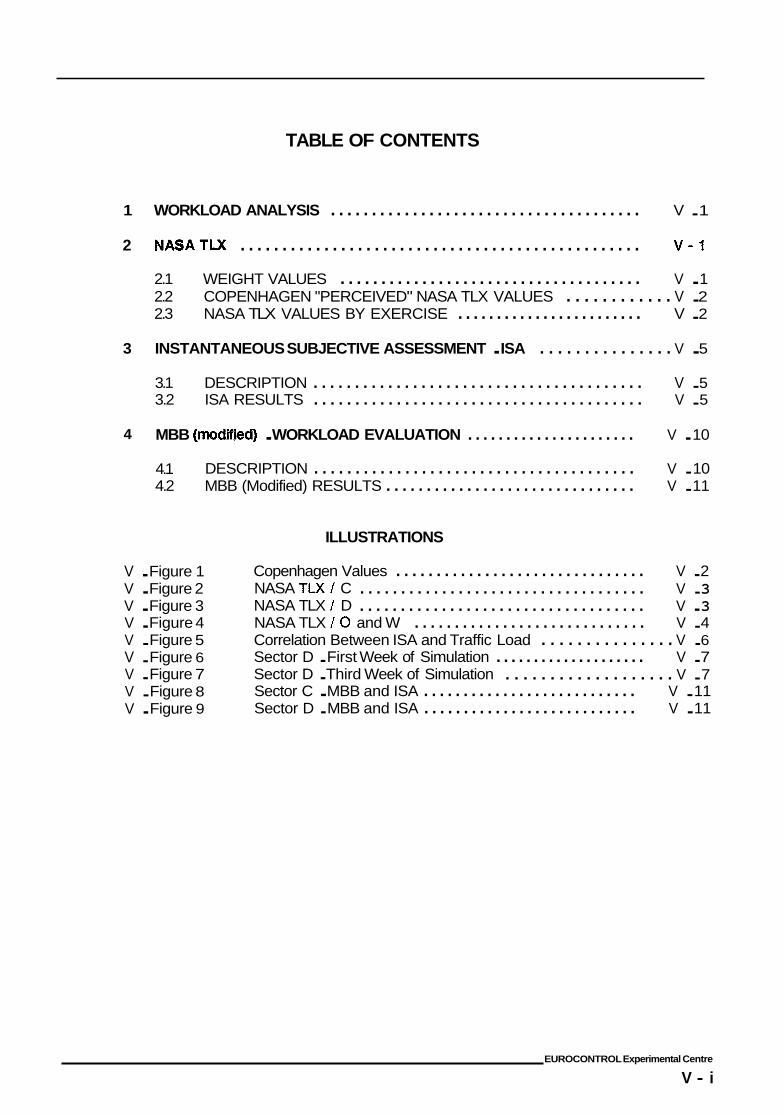
TABLE OF CONTENTS
1 WORKLOAD ANALYSIS ...................................... V . 1
2 NASATLX ................................................ V - 1
2.1 WEIGHT VALUES ..................................... V . 1 2.2 COPENHAGEN "PERCEIVED" NASA TLX VALUES . . . . . . . . . . . . V . 2 2.3 NASA TLX VALUES BY EXERCISE ........................ V . 2
3 INSTANTANEOUS SUBJECTIVE ASSESSMENT . ISA . . . . . . . . . . . . . . . V . 5
3.1 DESCRIPTION ........................................ V . 5 3.2 ISA RESULTS ........................................ V . 5
4 MBB (IIWdifiid) . WORKLOAD EVALUATION ...................... V . 10
4.1 4.2
DESCRIPTION ....................................... V . 10 MBB (Modified) RESULTS ............................... V . 11
ILLUSTRATIONS
V . Figure 1 V . Figure 2 V . Figure 3 V . Figure 4 V . Figure 5 V . Figure 6 V . Figure 7 V . Figure 8 V . Figure 9
Copenhagen Values ............................... V . 2 NASA TLX 1 C ................................... V . 3 NASA TLX I D ................................... V . 3 NASA TLX I0 and W ............................. V . 4 Correlation Between ISA and Traffic Load . . . . . . . . . . . . . . . V . 6 Sector D . First Week of Simulation .................... V . 7 Sector D . Third Week of Simulation . . . . . . . . . . . . . . . . . . . V . 7 Sector C . MBB and ISA ........................... V . 11 Sector D . MBB and ISA ........................... V . 11
EUROCONTROL Experimental Centre
V - i
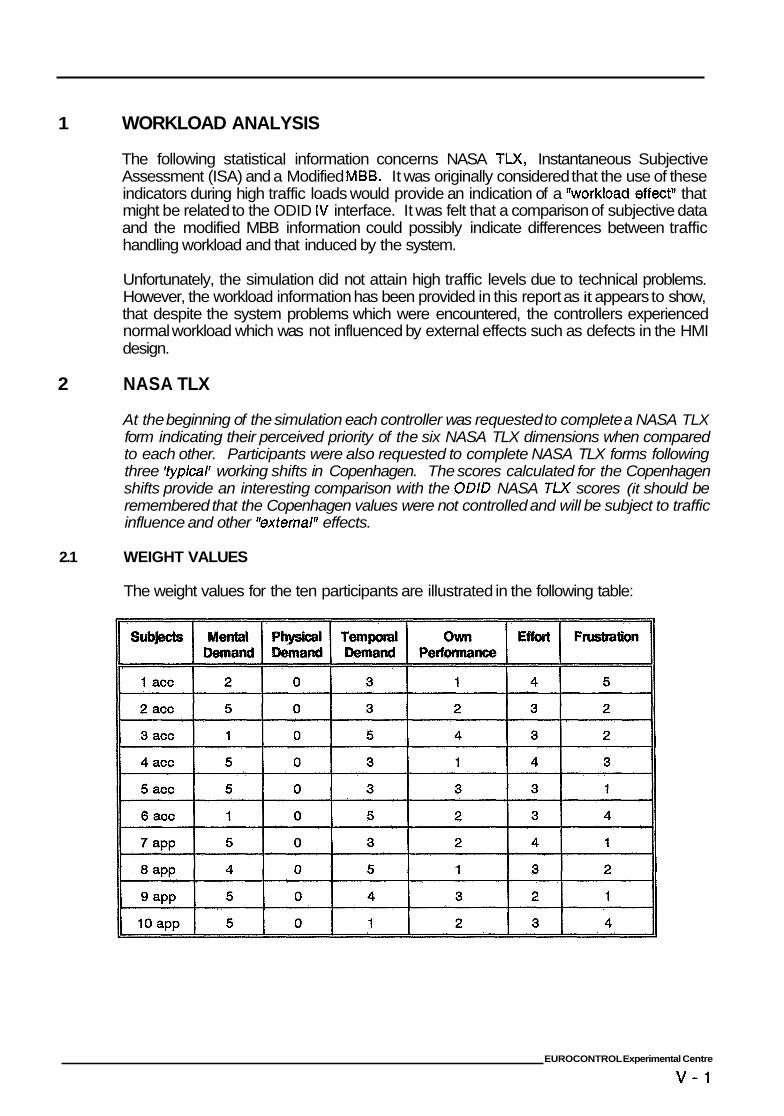
1 WORKLOAD ANALYSIS
The following statistical information concerns NASA TLX, Instantaneous Subjective Assessment (ISA) and a Modified MBB. It was originally considered that the use of these indicators during high traffic loads would provide an indication of a "workload effect' that might be related to the ODID IV interface. It was felt that a comparison of subjective data and the modified MBB information could possibly indicate differences between traffic handling workload and that induced by the system.
Unfortunately, the simulation did not attain high traffic levels due to technical problems. However, the workload information has been provided in this report as it appears to show, that despite the system problems which were encountered, the controllers experienced normal workload which was not influenced by external effects such as defects in the HMI design.
2 NASA TLX
At the beginning of the simulation each controller was requested to complete a NASA TLX form indicating their perceived priority of the six NASA TLX dimensions when compared to each other. Participants were also requested to complete NASA TLX forms following three Yypical' working shifts in Copenhagen. The scores calculated for the Copenhagen shifts provide an interesting comparison with the ODID NASA TLX scores (it should be remembered that the Copenhagen values were not controlled and will be subject to traffic influence and other "external" effects.
2.1 WEIGHT VALUES
The weight values for the ten participants are illustrated in the following table:
EUROCONTROL Experimental Centre
v - 1
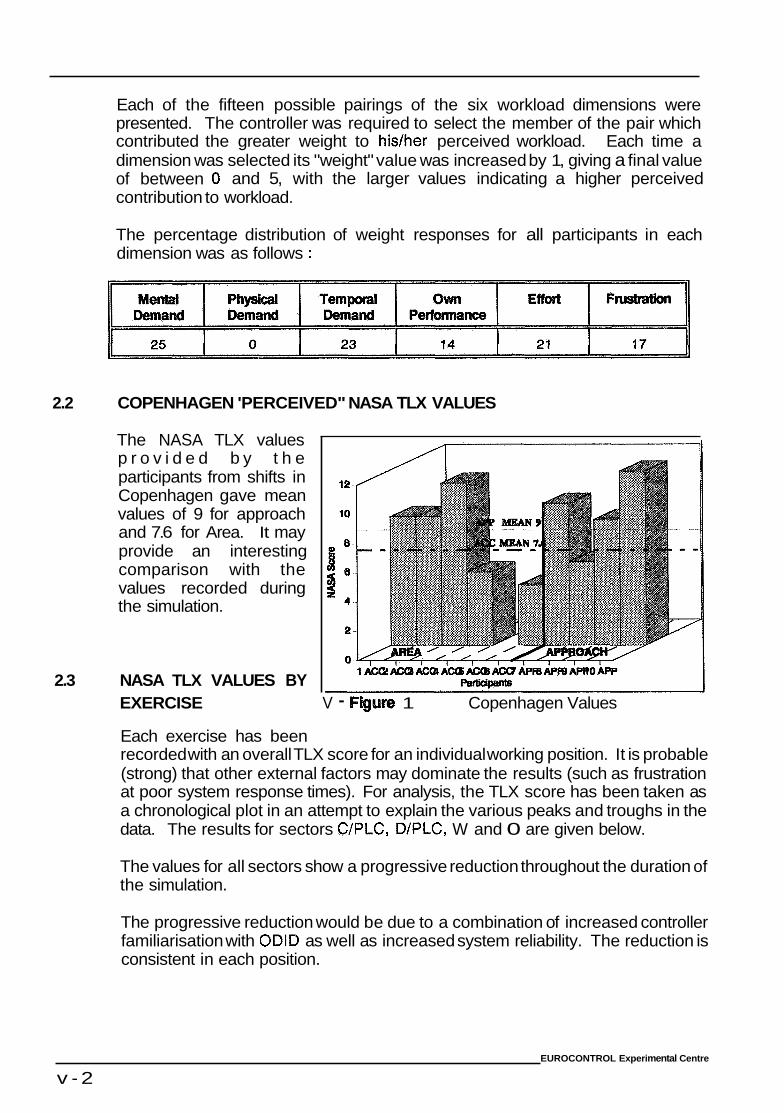
Each of the fifteen possible pairings of the six workload dimensions were presented. The controller was required to select the member of the pair which contributed the greater weight to his/her perceived workload. Each time a dimension was selected its "weight" value was increased by 1, giving a final value of between 0 and 5, with the larger values indicating a higher perceived contribution to workload.
The percentage distribution of weight responses for all participants in each dimension was as follows :
2.2 COPENHAGEN 'PERCEIVED" NASA TLX VALUES
The NASA TLX values p r o v i d e d b y t h e participants from shifts in Copenhagen gave mean values of 9 for approach and 7.6 for Area. It may provide an interesting comparison with the values recorded during the simulation.
2.3 NASA TLX VALUES BY EXERCISE V - F@JW 1 Copenhagen Values
Each exercise has been recorded with an overall TLX score for an individual working position. It is probable (strong) that other external factors may dominate the results (such as frustration at poor system response times). For analysis, the TLX score has been taken as a chronological plot in an attempt to explain the various peaks and troughs in the data. The results for sectors C/PLC, DIPLC, W and 0 are given below.
The values for all sectors show a progressive reduction throughout the duration of the simulation.
The progressive reduction would be due to a combination of increased controller familiarisation with ODlD as well as increased system reliability. The reduction is consistent in each position.
EUROCONTROL Experi mental Centre
v - 2
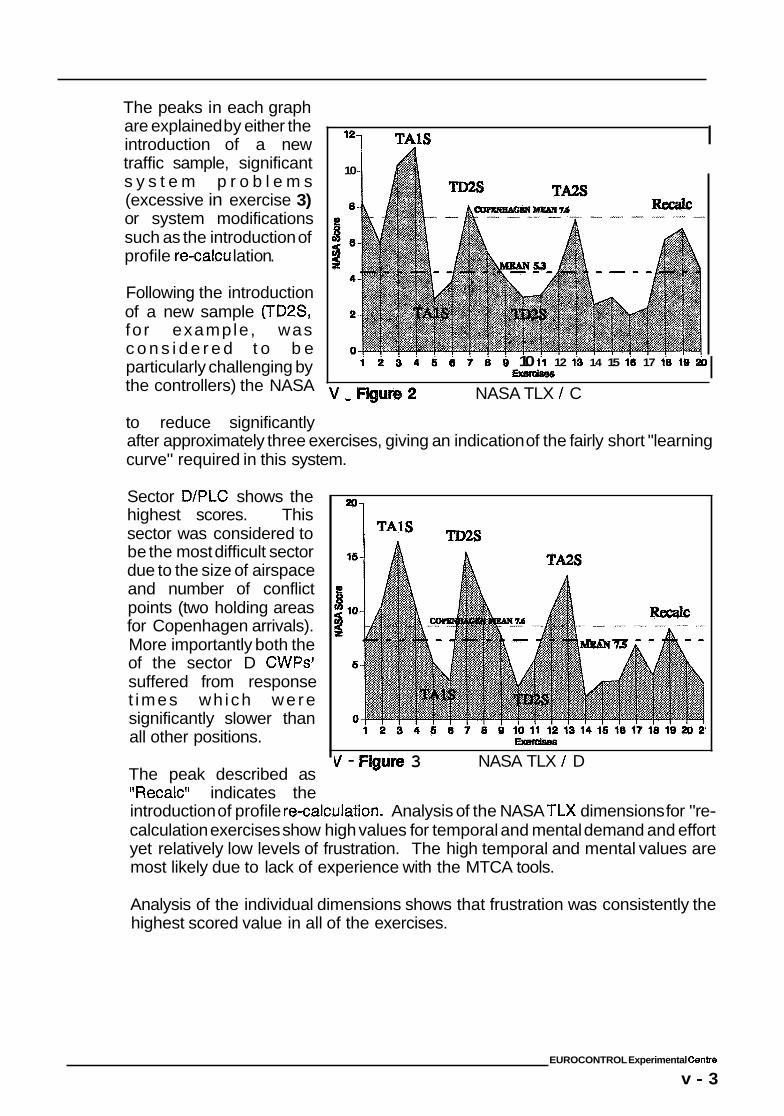
The peaks in each graph are explained by either the introduction of a new traffic sample, significant s y s t e m p r o b l e m s (excessive in exercise 3) or system modifications such as the introduction of profile re-calcu latio n.
Following the introduction of a new sample (TD2S, fo r example , was c o n s i d e r e d t o b e particularly challenging by the controllers) the NASA
121 TAlS I
-
10 i
I i i 3 i S e i B i 10 11 12 1a 14 15 16 17 18 11) rdo
NASA TLX / C
to reduce significantly after approximately three exercises, giving an indication of the fairly short "learning curve" required in this system.
Sector D/PLC shows the highest scores. This sector was considered to be the most difficult sector due to the size of airspace and number of conflict points (two holding areas for Copenhagen arrivals). More importantly both the of the sector D CWPs' suffered from response t imes wh ich we re significantly slower than all other positions.
The peak described as "Recalc" indicates the
I m2s
V - F@u~B 3 NASA TLX / D
introduction of profile re-calculation. Analysis of the NASA TLX dimensions for "re- calculation exercises show high values for temporal and mental demand and effort yet relatively low levels of frustration. The high temporal and mental values are most likely due to lack of experience with the MTCA tools.
Analysis of the individual dimensions shows that frustration was consistently the highest scored value in all of the exercises.
EUROCONTROL Experimental Cenbe
v - 3
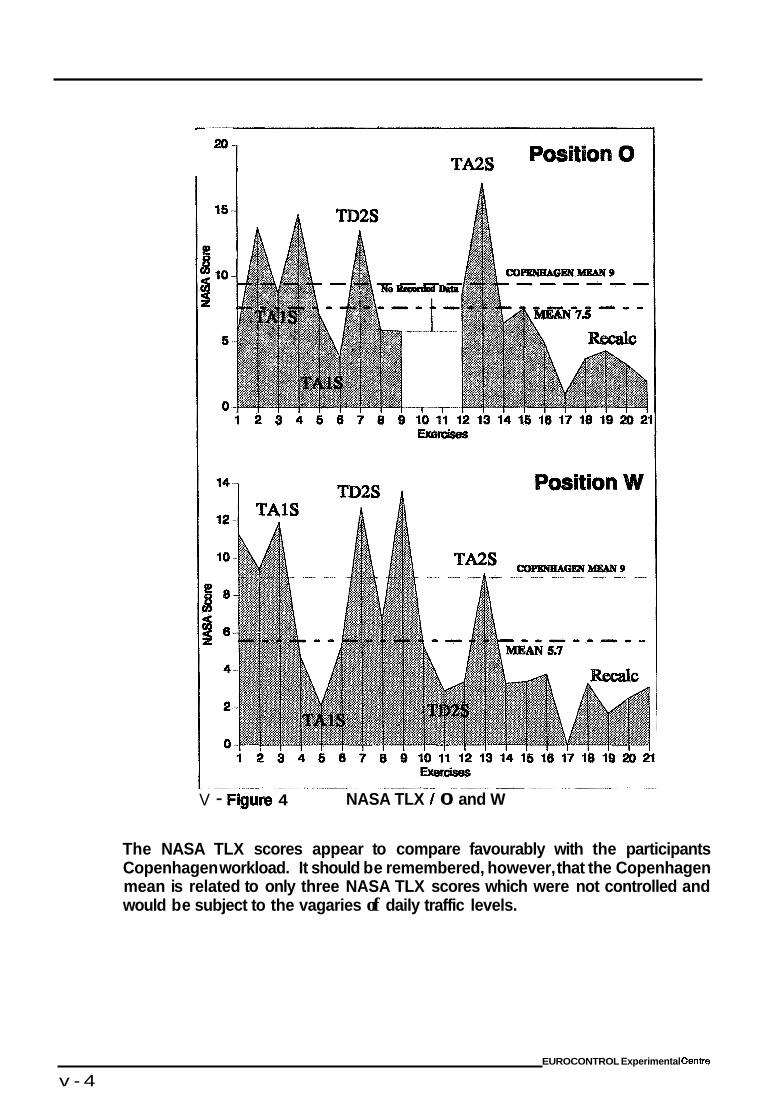
"1 TMS
V - Figure 4 NASA TLX / 0 and W
The NASA TLX scores appear to compare favourably with the participants Copenhagen workload. It should be remembered, however, that the Copenhagen mean is related to only three NASA TLX scores which were not controlled and would be subject to the vagaries of daily traffic levels.
EUROCONTROL Experimental Centre
v - 4
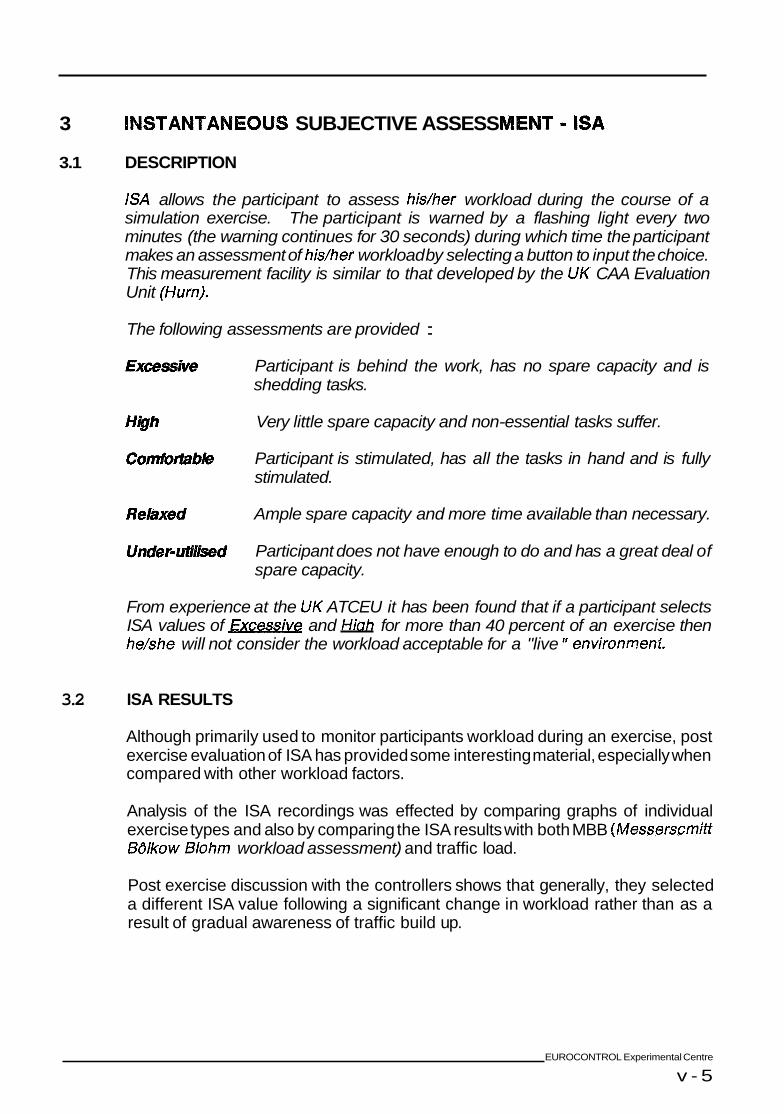
3 INSTANTA~EOUS SUBJECTIVE ASSESS
3.1 DESCRIPTION
ISA allows the participant to assess his/her workload during the course of a simulation exercise. The participant is warned by a flashing light every two minutes (the warning continues for 30 seconds) during which time the participant makes an assessment of hidher workload by selecting a button to input the choice. This measurement facility is similar to that developed by the UK CAA Evaluation Unit (Hurn).
The following assessments are provided :
Ex- Participant is behind the work, has no spare capacity and is shedding tasks.
Very little spare capacity and non-essential tasks suffer.
Comhmbb Participant is stimulated, has all the tasks in hand and is fully stimulated.
Rdaxed Ample spare capacity and more time available than necessary.
Undsr-Utl&d Participant does not have enough to do and has a great deal of spare capacity.
From experience at the UK ATCEU it has been found that if a participant selects ISA values of and Hiah for more than 40 percent of an exercise then he/she will not consider the workload acceptable for a "live I' environmenr'.
3.2 ISA RESULTS
Although primarily used to monitor participants workload during an exercise, post exercise evaluation of ISA has provided some interesting material, especially when compared with other workload factors.
Analysis of the ISA recordings was effected by comparing graphs of individual exercise types and also by comparing the ISA results with both MBB (Messerscmitt 86lkow 8lohm workload assessment) and traffic load.
Post exercise discussion with the controllers shows that generally, they selected a different ISA value following a significant change in workload rather than as a result of gradual awareness of traffic build up.
EUROCONTROL Experimental Centre
v - 5
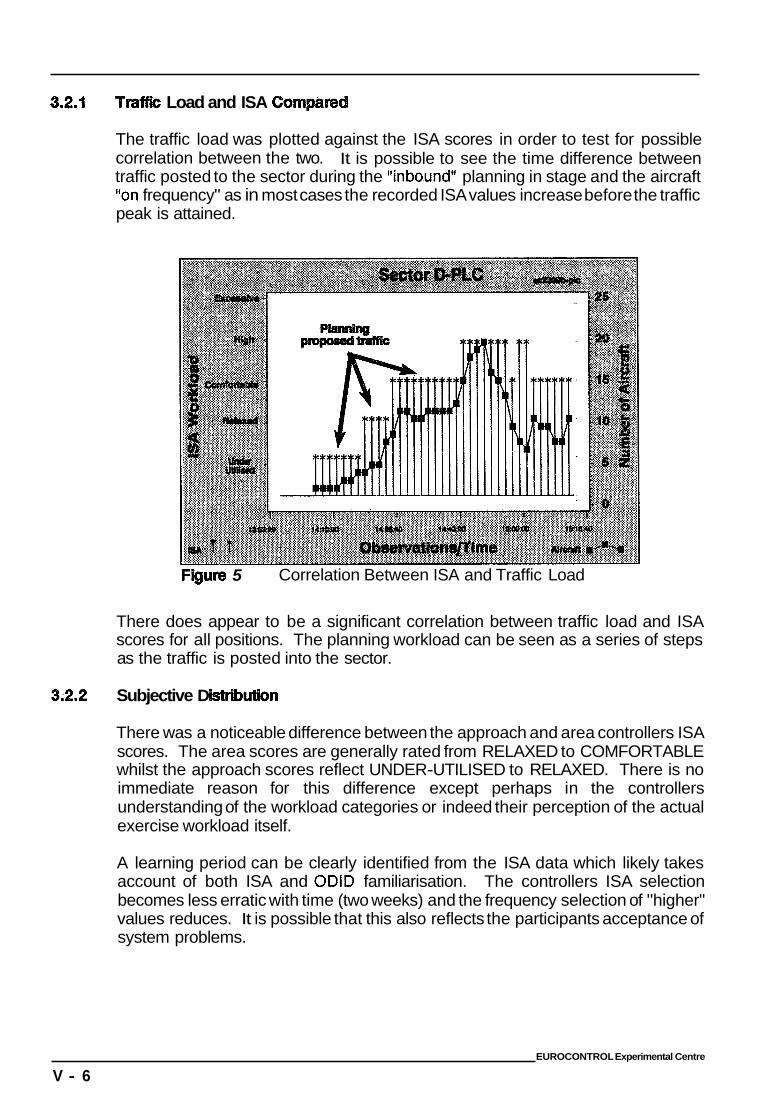
Load and ISA CO
The traffic load was plotted against the ISA scores in order to test for possible correlation between the two. It is possible to see the time difference between traffic posted to the sector during the "inbound'' planning in stage and the aircraft "on frequency" as in most cases the recorded ISA values increase before the traffic peak is attained.
Figurn 5 Correlation Between ISA and Traffic Load
There does appear to be a significant correlation between traffic load and ISA scores for all positions. The planning workload can be seen as a series of steps as the traffic is posted into the sector.
3.2.2 Subjective D
There was a noticeable difference between the approach and area controllers ISA scores. The area scores are generally rated from RELAXED to COMFORTABLE whilst the approach scores reflect UNDER-UTILISED to RELAXED. There is no immediate reason for this difference except perhaps in the controllers understanding of the workload categories or indeed their perception of the actual exercise workload itself.
A learning period can be clearly identified from the ISA data which likely takes account of both ISA and ODlD familiarisation. The controllers ISA selection becomes less erratic with time (two weeks) and the frequency selection of "higher" values reduces. It is possible that this also reflects the participants acceptance of system problems.
EUROCONTROL Experimental Centre
V - 6
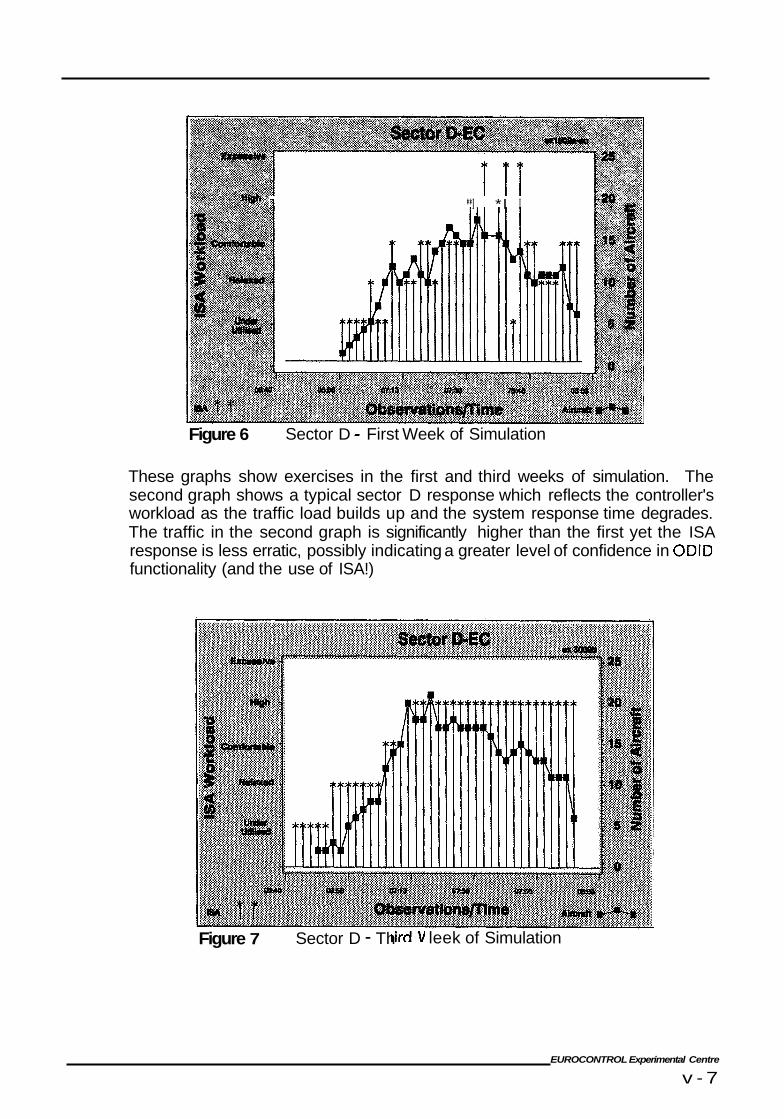
1 **I *I I
Figure 6 Sector D - First Week of Simulation
These graphs show exercises in the first and third weeks of simulation. The second graph shows a typical sector D response which reflects the controller's workload as the traffic load builds up and the system response time degrades. The traffic in the second graph is significantly higher than the first yet the ISA response is less erratic, possibly indicating a greater level of confidence in ODlD functionality (and the use of ISA!)
Figure 7 Sector D - Th leek of Simulation
EUROCONTROL Experimental Centre
v - 7
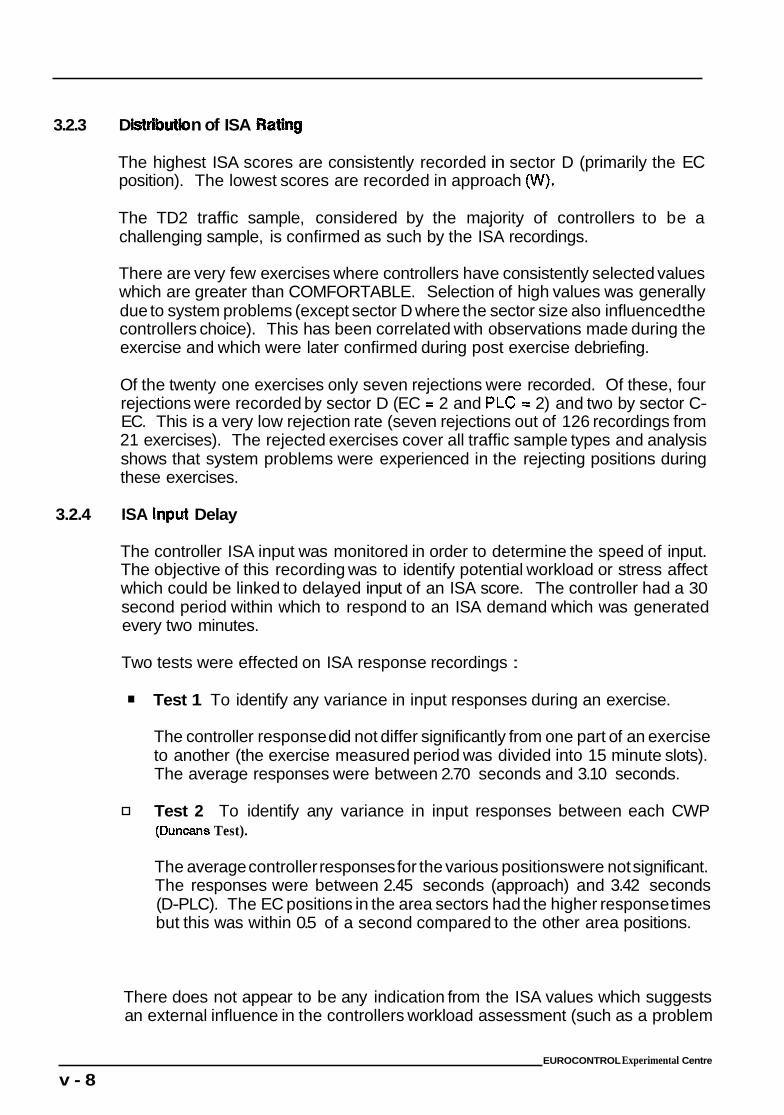
3.2.3 D n of ISA Ratlng
The highest ISA scores are consistently recorded in sector D (primarily the EC position). The lowest scores are recorded in approach (W).
The TD2 traffic sample, considered by the majority of controllers to be a challenging sample, is confirmed as such by the ISA recordings.
There are very few exercises where controllers have consistently selected values which are greater than COMFORTABLE. Selection of high values was generally due to system problems (except sector D where the sector size also influenced the controllers choice). This has been correlated with observations made during the exercise and which were later confirmed during post exercise debriefing.
Of the twenty one exercises only seven rejections were recorded. Of these, four rejections were recorded by sector D (EC = 2 and PLC = 2) and two by sector C- EC. This is a very low rejection rate (seven rejections out of 126 recordings from 21 exercises). The rejected exercises cover all traffic sample types and analysis shows that system problems were experienced in the rejecting positions during these exercises.
3.2.4 ISA Input Delay
The controller ISA input was monitored in order to determine the speed of input. The objective of this recording was to identify potential workload or stress affect which could be linked to delayed input of an ISA score. The controller had a 30 second period within which to respond to an ISA demand which was generated every two minutes.
Two tests were effected on ISA response recordings : . Test 1 To identify any variance in input responses during an exercise.
The controller response did not differ significantly from one part of an exercise to another (the exercise measured period was divided into 15 minute slots). The average responses were between 2.70 seconds and 3.10 seconds.
Test 2 To identify any variance in input responses between each CWP (Duncans Test).
The average controller responses for the various positions were not significant. The responses were between 2.45 seconds (approach) and 3.42 seconds (D-PLC). The EC positions in the area sectors had the higher response times but this was within 0.5 of a second compared to the other area positions.
There does not appear to be any indication from the ISA values which suggests an external influence in the controllers workload assessment (such as a problem
EUROCONTROL Experimental Centre
v - 8
of HMI design). System problems are clearly indicated by the ISA scores but these are excluded as there is sufficient correlation with observed system problems and post exercise debriefing.
A learning curve is discernable. Controllers ISA input becomes less erratic as the simulation progresses (this assumes that the learning curve considers both ISA and ODlD familiarisation) and fewer high values are selected in an irregular manner.
An increase in the recorded ISA values can be correlated with a corresponding increase in traffic load. This increase is considered to be "normal."
EUROCONTROL Experimental Centre
v - 9
4 - WORKLOAD EVALUATIO~
4.1 DESCRIPTION
A modified MBB workload calculation was applied to the ODlD post exercise data in order to determine a workload value for the en-route measured sectors. ?he objective was to obtain a workload value which could be compared with the subjective ISA and NASA TLX data. It was considered that comparison of these values might provide some evidence of potential capacity benefit or indicate some external effect resulting from the ODlD interface.
Unfortunately due to system problems, traffic levels were restricted to those forecast for 1995.
The MBB coefficients listed below were originally defined by MBB (Messerscmitt Bdlkow Blohm in the early 1960s) according to the R/T time spent by controllers managing flights of differing complexity. Not all of the values were applied in the equation used for ODlD IV.
In MBB, the basic unit of work is considered to be the workload involved in handling a scheduled flight at it's requested flight level. The coefficients applied in ODlD were :
Ns2 the number of military flights entering 0.20 Ns3 the number of flights changing flight level 0.24 Ns4 the number of flights transiiting between FIR and UIR 0.38 NS6 the number of radar vector inputs made by the controller 0.3 NS8 the number of inputs for conflict resolution 1.4
These coefhients were applied to the data captured during a measured hour individually for sector D and sector C.
The summation performed was as follows :
It was considered that a workload value of 80 (80 level flights) could equate to an "automated" control centre (ie a centre with flight plan processing providing the controller with printed strrps).
The MBB information is provided for interest and should be treated with care.
EUROCONTROL Experimental Centre
v-10
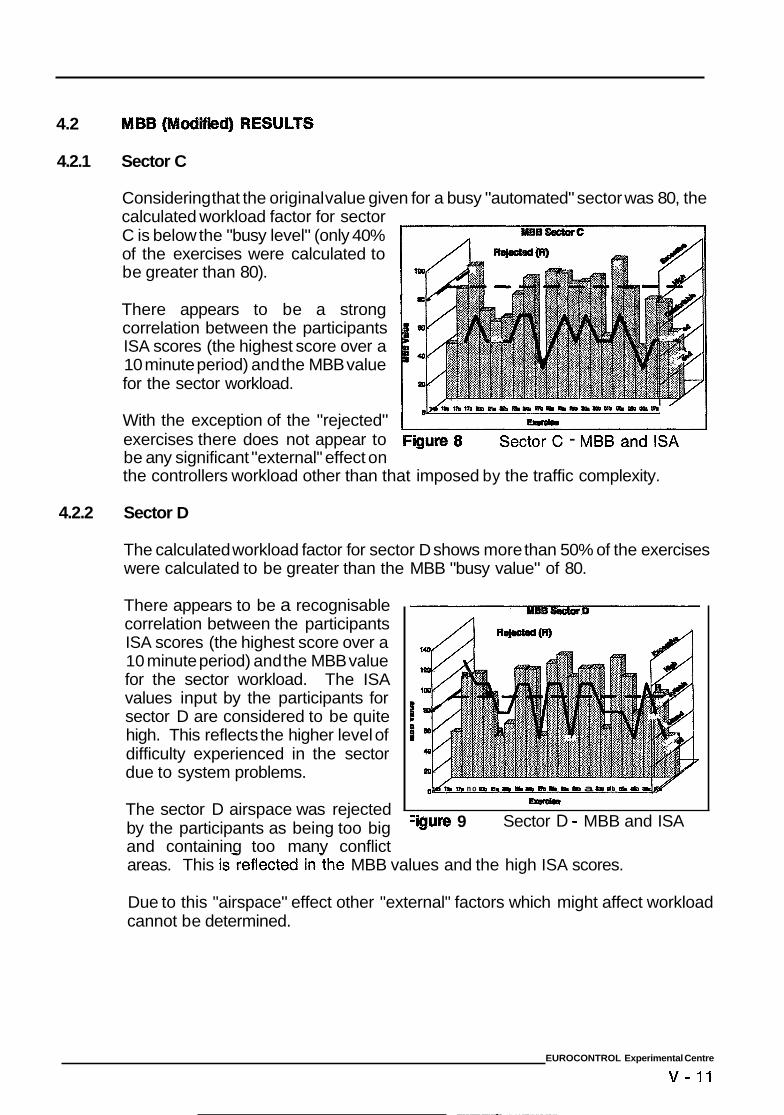
4.2
4.2.1 Sector C
Considering that the original value given for a busy "automated" sector was 80, the calculated workload factor for sector C is below the "busy level" (only 40% of the exercises were calculated to be greater than 80).
There appears to be a strong correlation between the participants ISA scores (the highest score over a 10 minute period) and the MBB value for the sector workload.
m m .D h I, La w L L m n.s ON PI m im m With the exception of the "rejected" arorr exercises there does not appear to FJguw 8 Sector C - MBB and ISA - be any significant "external" effect on the controllers workload other than that imposed by the traffic complexity.
4.2.2 Sector D
The calculated workload factor for sector D shows more than 50% of the exercises were calculated to be greater than the MBB "busy value" of 80.
There appears to be a recognisable correlation between the participants ISA scores (the highest score over a 10 minute period) and the MBB value for the sector workload. The ISA values input by the participants for sector D are considered to be quite high. This reflects the higher level of difficulty experienced in the sector due to system problems.
The sector D airspace was rejected by the participants as being too big and containing too many conflict
th n o .D s m mm w L II m a an OM im m II brrrlr
=@urn 9 Sector D - MBB and ISA
areas. This isreflected inthe MBB values and the high ISA scores.
Due to this "airspace" effect other "external" factors which might affect workload cannot be determined.
EUROCONTROL Experimental Centre
v-11
ANNEX VI
ODlD IV
NON INTRUSIVE OBSERVATIONS (NIO)
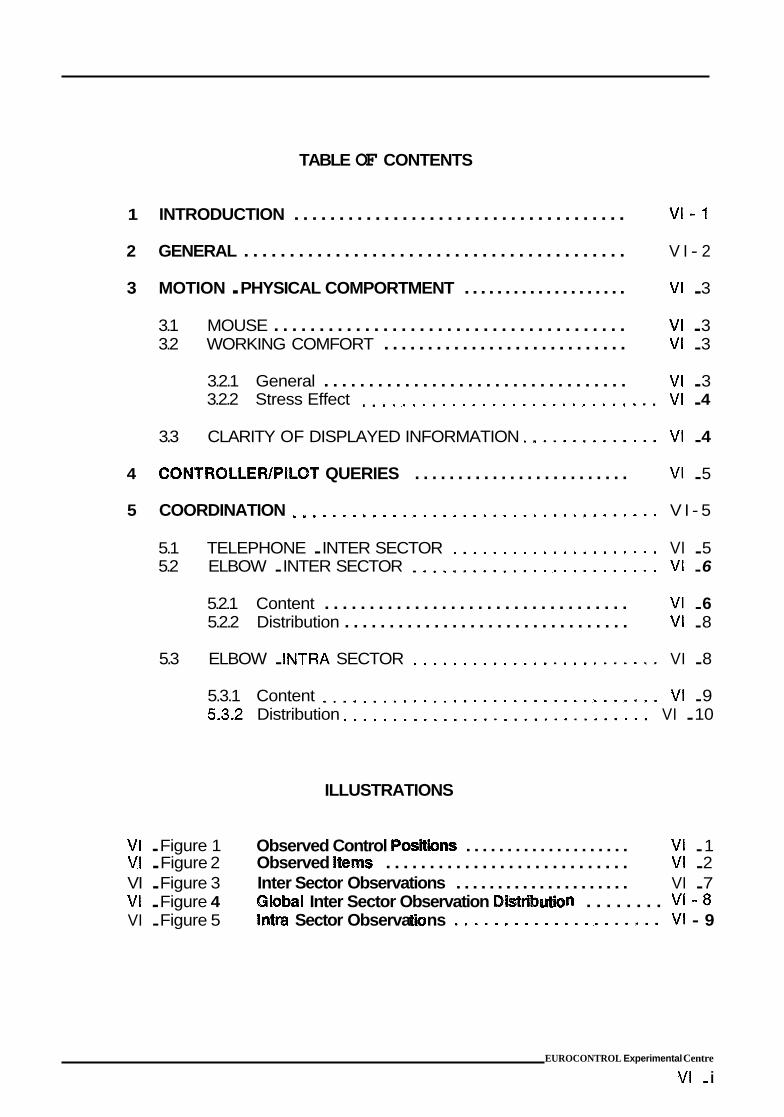
TABLE OF CONTENTS
1 INTRODUCTION ..................................... V I - I
2 GENERAL .......................................... V I - 2
3 MOTION . PHYSICAL COMPORTMENT .................... VI . 3
3.1 MOUSE ....................................... VI . 3 3.2 WORKING COMFORT ............................ VI . 3
3.2.1 General .................................. VI . 3 3.2.2 Stress Effect .............................. VI . 4
3.3 CLARITY OF DISPLAYED INFORMATION . . . . . . . . . . . . . . VI . 4
4 CONTROLLERIPILOT QUERIES ......................... VI . 5
5 COORDINATION ..................................... V I - 5
5.1 TELEPHONE . INTER SECTOR ..................... VI . 5 5.2 ELBOW . INTER SECTOR ......................... VI . 6
5.2.1 Content .................................. VI . 6 5.2.2 Distribution ................................ VI . 8
5.3 ELBOW . INTRA SECTOR ......................... VI . 8
5.3.1 Content .................................. VI . 9 5.3.2 Distribution ............................... VI . 10
ILLUSTRATIONS
VI . Figure 1 Observed Control Pos*Wns .................... VI . 1 VI . Figure 2 Observed Items ............................ VI . 2 VI . Figure 3 Inter Sector Observations ..................... VI . 7 VI . Figure 4 Gbbal Inter Sector Observation DJstrib n . . . . . . . . V I - 8 VI . Figure 5 lntra Sector Observa ns ..................... VI - 9
EUROCONTROL Experimental Centre
VI . i
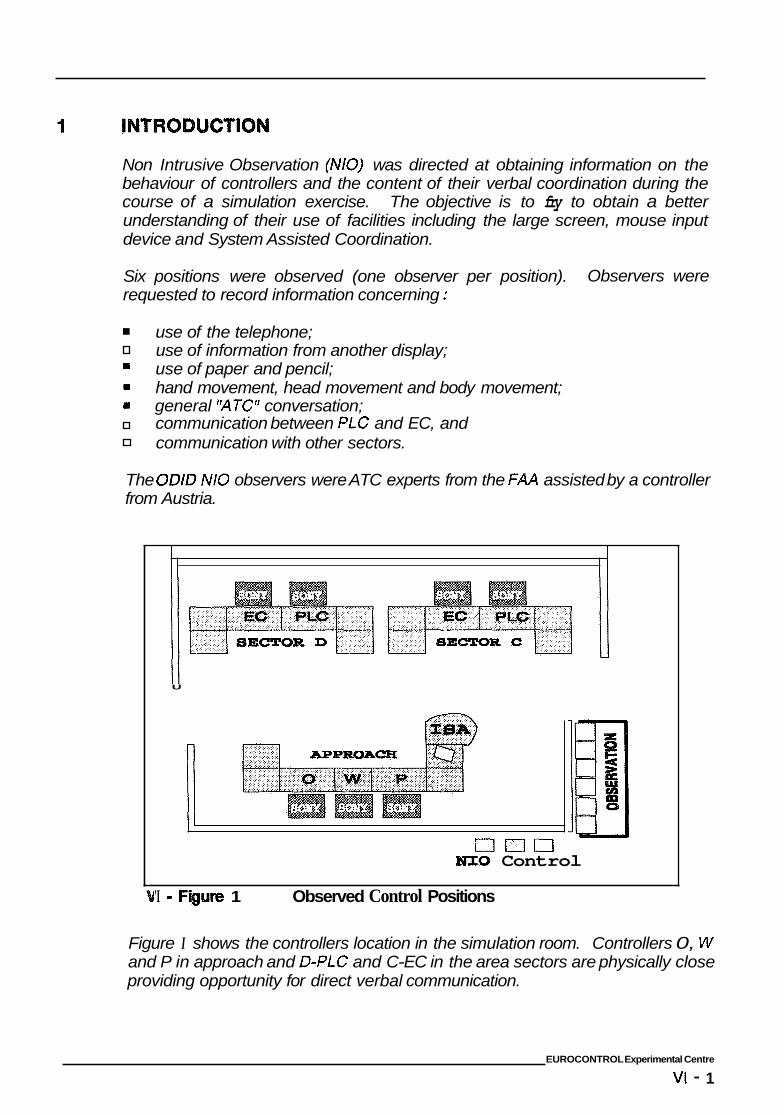
Non Intrusive Observation (NIO) was directed at obtaining information on the behaviour of controllers and the content of their verbal coordination during the course of a simulation exercise. The objective is to fry to obtain a better understanding of their use of facilities including the large screen, mouse input device and System Assisted Coordination.
Six positions were observed (one observer per position). requested to record information concerning :
Observers were
use of the telephone;
w use of information from another display; use of paper and pencil; hand movement, head movement and body movement; general "A TC" conversation; communication between PLC and EC, and communication with other sectors.
The ODD NI0 observers were ATC experts from the FAA assisted by a controller from Austria.
U
I
uuu NI0 Control
'I - Figure 1 Observed Control Positions
Figure I shows the controllers location in the simulation room. Controllers 0, W and P in approach and D-PLC and C-EC in the area sectors are physically close providing opportunity for direct verbal communication.
EUROCONTROL Experimental Centre
VI - 1
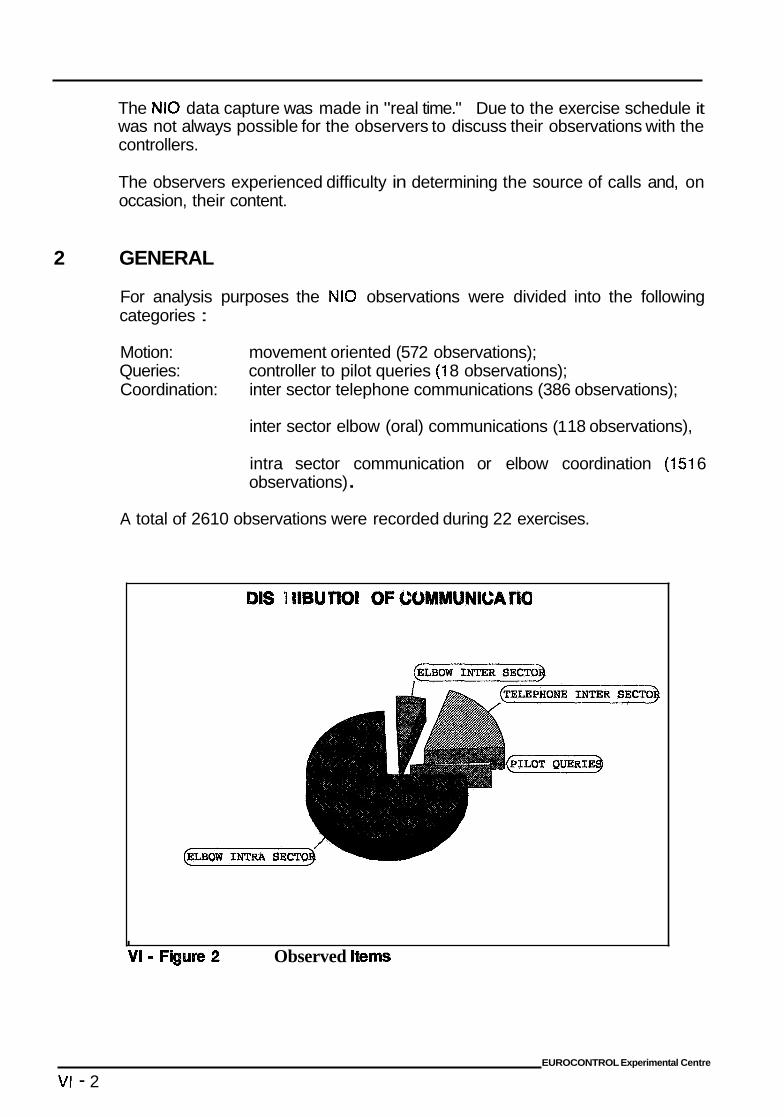
The NI0 data capture was made in "real time." Due to the exercise schedule it was not always possible for the observers to discuss their observations with the controllers.
The observers experienced difficulty in determining the source of calls and, on occasion, their content.
2 GENERAL
For analysis purposes the NI0 observations were divided into the following categories :
Motion: movement oriented (572 observations); Queries: Coordination:
controller to pilot queries (1 8 observations); inter sector telephone communications (386 observations);
inter sector elbow (oral) communications (1 18 observations),
intra sector communication or elbow coordination (151 6 observations) .
A total of 2610 observations were recorded during 22 exercises.
DISTRIBUTION OF COMMUNICATION
I
Observed Items
EUROCONTROL Experimental Centre
VI - 2
3
3.1
3.2
3.2.1
OTION - PHYSICAL CO
Observations concerning motion included the following :
m physically turning around; leaning towards own screen or another display; pointing;
looking at the mouse or unusual use of the mouse; breathing rhythm or getting annoyed, and relaxing.
MOUSE
There do not appear to be any problems with the use of the mouse, however the mouse mat provided for the simulation (standard PC mat) was too small.
A significant amount of mouse movement was observed in the area control positions, specifically in sector C. These movements required an area of movement greater than the size of the mouse mat. In sector C a significant amount of "rolling" action was observed to move the cursor from one side of the screen to the other. It was observed that 50% of the participants did not use the mOuSe mat. This observation could be due to "Observer effect" - the same observers manned the same positions; or to the size of sector and the traffic comportment - main traffic flows on a north eastlsouth west axis.
There were no observations of controllers looking at the mouse when selecting a button for inputting data.
WORKING COMFORT
General
An exercise period lasted approximately 90 minutes during which time the controller worked continuously with the large colour display. During the system validation exercise (May - June 1993) one of the participants experienced some difficulty viewing the screen due to the type of glasses that he wore. The participant was required to tilt his head in such a manner so to see clearly through the appropriate part of the bi-focal glass.
This problem was apparently resolved during the ODlD simulation as a different pair of glasses were used.
One of the participants was observed with an extremely "relaxed" posture when working in the measured "office" area (office desk). When in the "feed" sector (classic ATC type furniture) the same participant took up a more normal controller posture (angled towards the display, elbows on desk). This could have been due to difficulty reaching the transmit pedal however the posture was maintained even after the introduction of a foot rest. (The controller had skin bruising as a result of resting the forearms on the (sharp) edge of the desk.
EUROCONTROL Experimental Centre
VI - 3
3.2.2 Stress Effect
There was no significant stress effect observed in the approach area. Three out of the four approach controllers were observed effecting "relaxing movements" during exercises (this did not appear to be related to work related stress; it could have been related to physical comfort).
In the area sectors, stress was observed in terms of exaggerated breathing and controllers getting annoyed. This was pronounced in positions D-EC and D-PLC. Position D-EC displayed the highest stress effect.
3.3 CLARITY OF DISPLAYED INFORMATION
Two effects (leaning towards own screen and leaning towards adjacent screen) were observed.
In approach this was significantly more pronounced in position W than in 0. This comportment could suggest that position W had a higher density of displayed information which controllers felt they had to clarify with physical movement towards the screen (better viewing of radar label concentrations?). It also suggests periods of intense concentration.
Leaning towards adjacent screens could be explained by the need to verify information or to confirm for example, the Director's current sequencing plan or the Departure controller's separation requirements. All of this information was available on W's radar display, differentiated by the use of colour. This use of colour may have been insufficient or distracting. The approach controllers rejected the use of colour on a full radar label to distinguish the Director's traffic.
Position W was also observed turning to discuss with area controllers (directly behind the approach positions). "Turning back" observations for area controllers mostly concern sector D, suggesting that approach and sector D had a need to discuss amongst themselves outside of the system assisted coordination and telephone network. These discussions were mostly observed to be related to system problems experienced by these sectors (eg incorrect colour states).
Compared to approach there were few recorded observations in the area control positions of controllers leaning towards either their own or other controllers screens. The observations which were made primarily concerned sector D-EC who was observed leaning towards the PLC display. This is confirmed by the observations made in the Ergonomist's study of the D-PLC position.
It is possible that the D-ECs leaned towards the PLC display to see either the MTCA tools or the radar window. The EC controllers rarely displayed all of the MTCA windows and the PLC radar range was usually selected for a greater range than that selected on the ECs display.
EUROCONTROL Experimental Centre
VI - 4
4 CONTROLLER/PILOT QUERIES
5
Only a small number of controller/pilot queries were recorded during the simulation which suggests that, in general, the controllers had sufficient information available through either the radar label or the extended label.
The queries that were made concerned speed (Mach and IAS) which is considered to be normal. Provision of radar tracked speed could be introduced via a press and hold function on the radar label.
COORDINATION
The recording of coordination was separated into three distinct areas of interest;
Telephone - inter sector (inter sector representing adjacent sectors); Elbow - inter sector, and Elbow - intra sector (intra sector representing the same sector).
Observers were required to record the following :
positions involved in the exchange; subject of communication eg information transfer, query or order; the content of communication eg level coordination, conflict, release, system problem etc; whether the coordination was entry, exit or in sector (aircraft situation).
This information is related to the effectiveness of the System Assisted Coordination facility and the pre-formatted messages.
5.1 TELEPHONE - INTER SECTOR
Non intrusive Observation (NIO) has provided information on the use and distribution of telephone calls. For observation purposes this coordination was divided into the following categories :
Problems calls which concerned system problems including coordination which was available through the system assisted coordination (SAC) facility;
Additional calls which concerned functions available through the callsign menu (transfer, assume, release etc), mixed coordination (eg transfer and heading or release and heading), coordination not catered for in the system (eg sequencing information and forward coordination for heading, speed and direct route (not catered for in the system).
The majority of inter sector telephone observations (74% of the total telephone observations) were attributed to system problems such as response times, incorrect SAC messages and colour errors.
EUROCONTROL Experimental Centre
VI - 5
The SAC related telephone coordination has been traced to a small number of exercises during which an excessive number of system faults occurred. It is felt that this is not significant in that it is clarified by the subjective opinion collected during post exercise debriefings. The participants indicated that a high proportion of their calls were made to confirm that a message had been received and was correct. This occurred during the early stages of the simulation.
A large number of calls involving the callsign menu functions concerned transfer of control (this was not a feature in ODID IV, the ODID transfer function related to transfer of frequency). Although not satisfactorily explaining these calls it should be noted that a system assisted Radar Handover facility was not available during the simulation. As a result transfer of control involving radar constraints had to be effected by telephone.
There is no significant indication that controllers had a specific need for composite coordination messages concerning groupings of individual items such as level and heading or level and route. However, there are several instances of coordination concerning transfer or release of control when the controller also refers to a level value, direct route or heading constraint.
A small proportion of calls concerned forward coordination on heading, direct route and speed control. The system assisted coordination facility did not support this coordination. The participants stated during post exercise debriefings that these items should be available for both backward and forward coordination.
The majority of calls recorded in the category "Other" (new requirements) shows a significant volume of sequencing and spacing coordination between the lower airspace sector and approach control. This was not available through the system assisted coordination facility.
5.2 ELBOW - INTER SECTOR
5.2.1 Content
The recorded communication content generally concerned system problems. Specifically, communication related to transfer problems at sector entry or exit.
The nature of communications was as follows :
Information Transfer (51 %) this concerned provision of information to another sector to clarify a situation eg "1 cannot input TRANSFER for this aircraft" or "the SKIP did not work.."
Queries (29%) this concerned radar label information and planning states where the controller felt the need to clarify the situation (usually at sector entry).
EUROCONTROL Experimental Centre
VI - 6
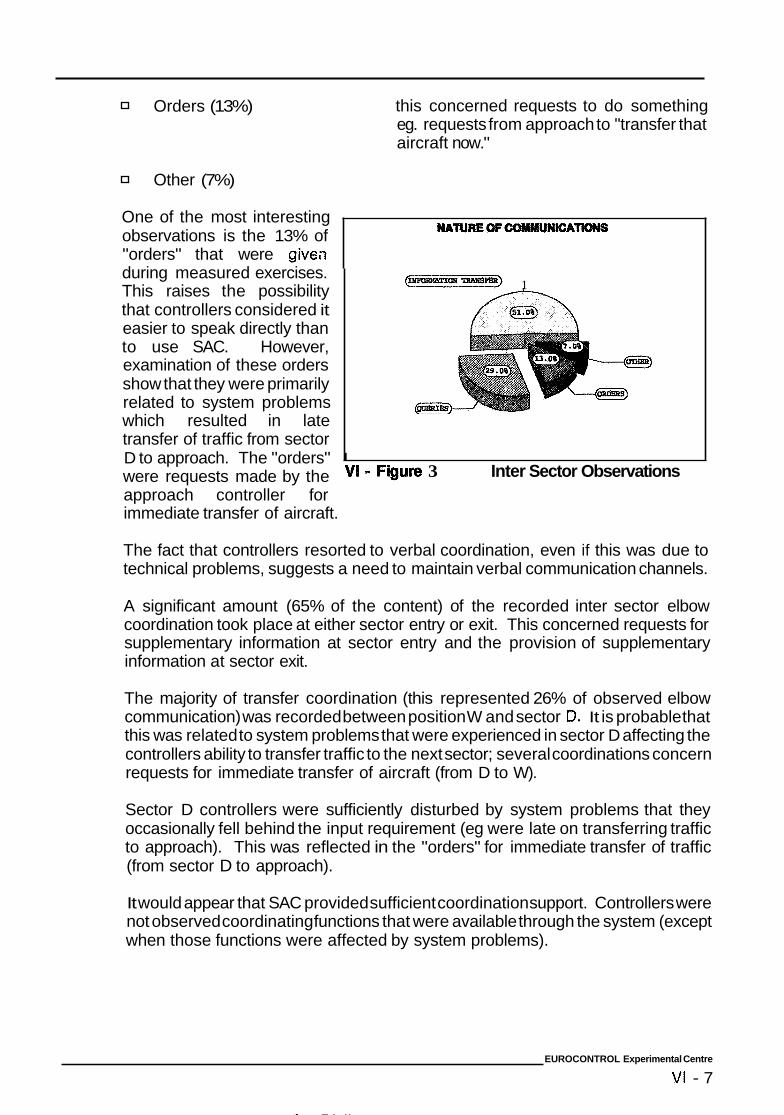
Orders (13%)
Other (7%)
One of the most interesting observations is the 13% of "orders" that were givea during measured exercises. This raises the possibility that controllers considered it easier to speak directly than to use SAC. However, examination of these orders show that they were primarily related to system problems which resulted in late transfer of traffic from sector D to approach. The "orders" were requests made by the approach controller for immediate transfer of aircraft.
this concerned requests to do something eg. requests from approach to "transfer that aircraft now."
NATURE
1
I VI - F@JW 3 Inter Sector Observations
The fact that controllers resorted to verbal coordination, even if this was due to technical problems, suggests a need to maintain verbal communication channels.
A significant amount (65% of the content) of the recorded inter sector elbow coordination took place at either sector entry or exit. This concerned requests for supplementary information at sector entry and the provision of supplementary information at sector exit.
The majority of transfer coordination (this represented 26% of observed elbow communication) was recorded between position W and sector D. It is probable that this was related to system problems that were experienced in sector D affecting the controllers ability to transfer traffic to the next sector; several coordinations concern requests for immediate transfer of aircraft (from D to W).
Sector D controllers were sufficiently disturbed by system problems that they occasionally fell behind the input requirement (eg were late on transferring traffic to approach). This was reflected in the "orders" for immediate transfer of traffic (from sector D to approach).
It would appear that SAC provided sufficient coordination support. Controllers were not observed coordinating functions that were available through the system (except when those functions were affected by system problems).
EUROCONTROL Experimental Centre
Vl - 7
.. .... . . .
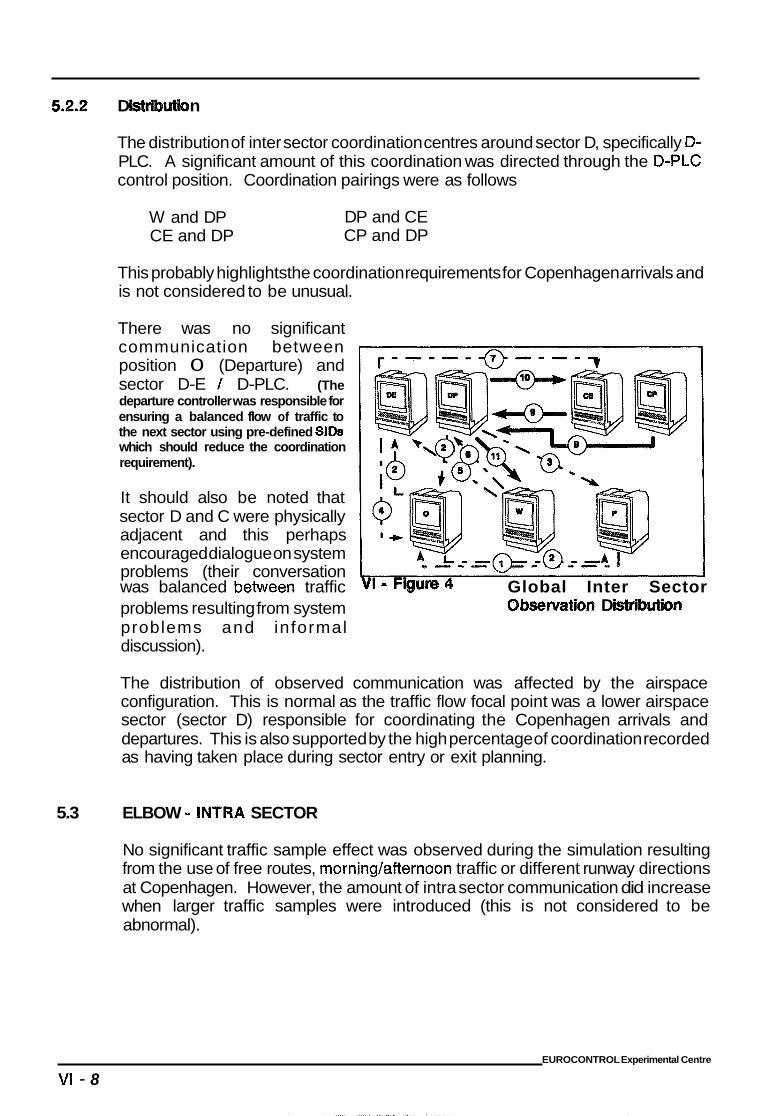
5.2.2 D n
The distribution of inter sector coordination centres around sector D, specifically D- PLC. A significant amount of this coordination was directed through the D-PLC control position. Coordination pairings were as follows
W and DP CE and DP
DP and CE CP and DP
This probably highlights the coordination requirements for Copenhagen arrivals and is not considered to be unusual.
There was no significant communication between position 0 (Departure) and sector D-E / D-PLC. (The departure controller was responsible for ensuring a balanced flow of traffic to the next sector using pre-defined SIDS which should reduce the coordination requirement).
It should also be noted that sector D and C were physically adjacent and this perhaps encouraged dialogue on system problems (their conversation was balanced between traffic VI - FbW@ 4 Global Inter Sector problems resulting from system problems and informal discussion).
Observation D
The distribution of observed communication was affected by the airspace configuration. This is normal as the traffic flow focal point was a lower airspace sector (sector D) responsible for coordinating the Copenhagen arrivals and departures. This is also supported by the high percentage of coordination recorded as having taken place during sector entry or exit planning.
5.3 ELBOW - INTRA SECTOR
No significant traffic sample effect was observed during the simulation resulting from the use of free routes, morning/afternoon traffic or different runway directions at Copenhagen. However, the amount of intra sector communication did increase when larger traffic samples were introduced (this is not considered to be abnormal).
EUROCONTROL Experimental Centre
VI - 8
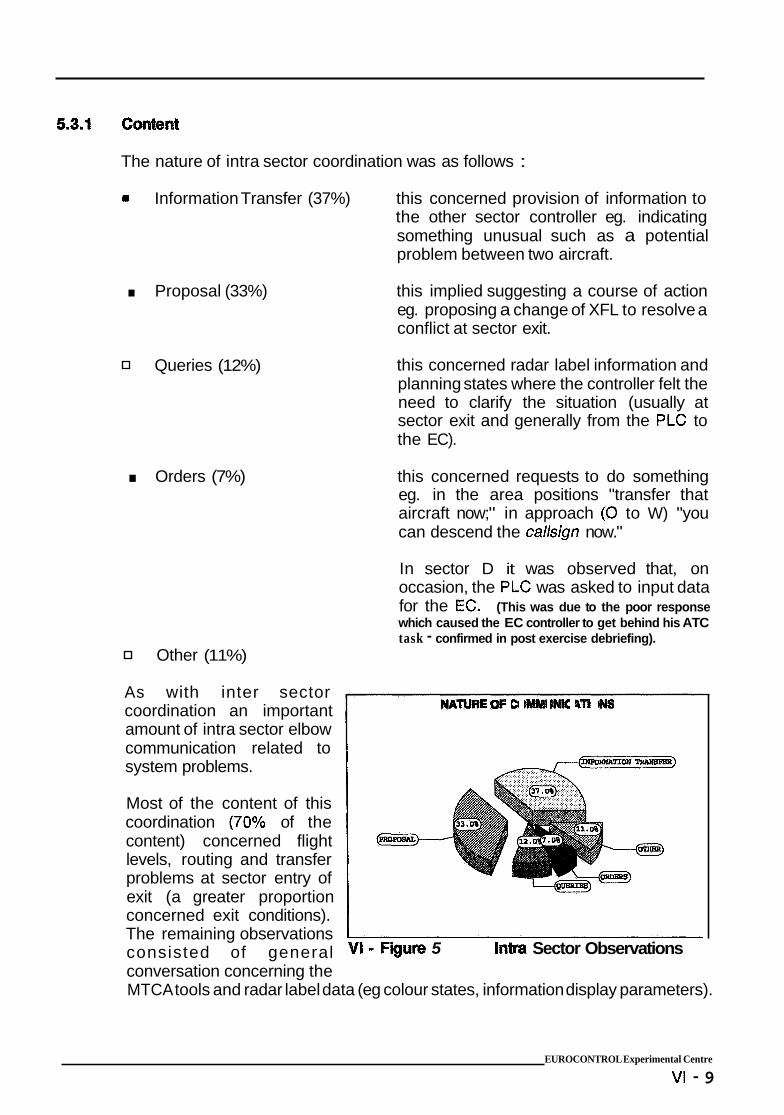
The nature of intra sector coordination was as follows :
Information Transfer (37%) this concerned provision of information to the other sector controller eg. indicating something unusual such as a potential problem between two aircraft. . Proposal (33%)
Queries (12%)
. Orders (7%)
Other (11%)
As with inter sector coordination an important amount of intra sector elbow communication related to system problems.
Most of the content of this coordination (70% of the content) concerned flight levels, routing and transfer problems at sector entry of exit (a greater proportion concerned exit conditions). The remaining observations consisted of general conversation concerning the
this implied suggesting a course of action eg. proposing a change of XFL to resolve a conflict at sector exit.
this concerned radar label information and planning states where the controller felt the need to clarify the situation (usually at sector exit and generally from the PLC to the EC).
this concerned requests to do something eg. in the area positions "transfer that aircraft now;" in approach (0 to W) "you can descend the caNsign now."
In sector D it was observed that, on occasion, the PLC was asked to input data for the EC. (This was due to the poor response which caused the EC controller to get behind his ATC task - confirmed in post exercise debriefing).
NATURE OF ColUllluNlCATlONS
VI - Figure 5 lntra Sector Observations
MTCA tools and radar label data (eg colour states, information display parameters).
EUROCONTROL Experimental Centre
VI - 9
The flight level coordination was generally related to CFL and XFL levels in the context of the PLC providing information to the EC (eg. "have you seen the conflict at FL XXX") or as a "leveltt proposition for a conflict resolution.
Significantly, a large proportion of the intra sector coordination content (40% of the 70%) concerned transfer of control or responsibility. The majority of this coordination was effected between the departure and approach controllers and specifically concerned requests for permission to climb or descend traffic in the Copenhagen approach area. (The 0 and W controllers shared airspace and they were frequently required to coordinate climb or decent as their areas of responsibility overlapped).
Within the approach area the coordination flow centred around the approach control position (W). A significant amount of this coordination was instigated by W and directed at the departure controller (32% of the total intra sector elbow observations).
The distribution of coordination among the approach positions appears to be normal considering the ATC task involved. The approach controller plays a central role and has a coordination requirement with both departure (0) and director (P).
Coordination between W and director (P) represented 10% of the total intra sector elbow observations.
In the area control positions sector D shows a significant difference in the amount of observed intra sector coordination to that recorded in sector C. 38% of the total intra sector elbow observations was attributed to communication between D-EC and D-PLC compared to 20% between C-EC and C-PLC.
The majority of coordination in sector C was instigated by the PLC whilst in D there is a slight tendency towards EC to PLC coordination.
Interestingly the volume of coordination between the controllers in sector D compared to sector C shows a significant difference, with D displaying a higher level of communication. Most of the indications suggest that this was due to system problems, however it is likely that the control task and the size of the sector also contributed to the communication requirement. (Sector D interfaces with approach and the traffic composition includes a high level of traffic in evolution requiring radar intervention and sector exit coordination).
EUROCONTROL Experimental Centre
VI - 10
ANNEX VII
ODID IV
lC STUDY (ERGO)
TABLE OF CONTENTS
1 INTRODUCTION ........................................... VII . 1
2 GENERAL DATA DISPLAY ................................... VII . 2
2.1 SCREEN LAYOUT ..................................... V11 2 2.2 WINDOW SElTING STRATEGIES ......................... VII . 4 . 2.3 QUANTITY OF INFORMATION AND DATA VALIDATION ......... VII . 6
3 RADAR WINDOW . Radar Label . SIL ........................... V11- 7
3.1 LEGIBILITY . DENSITY . CONSISTENCY .................... VII . 7 3.2 SUPPORT FOR DATA SEARCHING ........................ VII . 8 3.3 MISSING INFORMATION ................................ VII . 8
4 MTCA TOOLS . CONSULTATION ............................. VII . 10
4.1 4.2 4.3 4.4
LEGIBILITY . DENSITY ................................. VII . 10 CONSISTENCY OF DISPLAYED DATA ..................... VII . 11 CHECKING FOR CONFLICTS (CARD TO CZW) . . . . . . . . . . . . . . VII . 12 FURTHER CONFLICT DETECTION ACTION . . . . . . . . . . . . . . . . . VII . 13
4.5 CONFIDENCE IN DISPLAYED INFORMATION . . . . . . . . . . . . . . . VII . 14 4.6 CHECKING SECTOR ENTRY/EXIT CONDITIONS . . . . . . . . . . . . . VII . 14 4.7 DATA MEMORISING .................................. VII . 17
5 DATA INPUT AND DATA SELECTION .......................... VII . 18
5.1
5.3
DATA INPUT DIFFICULTIES ............................. VII . 18 5.2 INPUT PREFERENCES ................................ VII . 19
ACCESS TO DATA .................................... VII . 20 5.4 "AVOIDING" DATA INPUT (MINIMISING WORKLOAD) . . . . . . . . . VII . 20 5.5 "NEW" USE OF FUNCTIONS ............................ VII . 21
TASK SHARING ...................................... VII . 22 5.6
6 SYSTEM ASSISTED COORDINATION .......................... VII . 22
6.1 6.2 6.3
WINDOW POSITION ................................... VII . 22 "MESSAGE IN" HANDLING PROCEDURES . . . . . . . . . . . . . . . . . VII . 22 "MESSAGE OUT" HANDLING PROCEDURES . . . . . . . . . . . . . . . . VII . 24
7 SYSTEM/CONTROLLER . DIVISION OF RESPONSIBILITIES . . . . . . . . . VII . 25
8 SAC AND (ON SCREEN) TELECOM ........................... VII . 25
EUROCONTROL Experimental Centre
VII . i
ILLUSTRATIONS
VII . Figure 1 D-PLC Window Setting .............................. VII . 3 VII . Figure 2 HAWNAW Search ................................ VII . 15 VII . Figure 3 CARD Search .................................... VII . 17
EUROCONTROL Experimental Centre
VII . ii
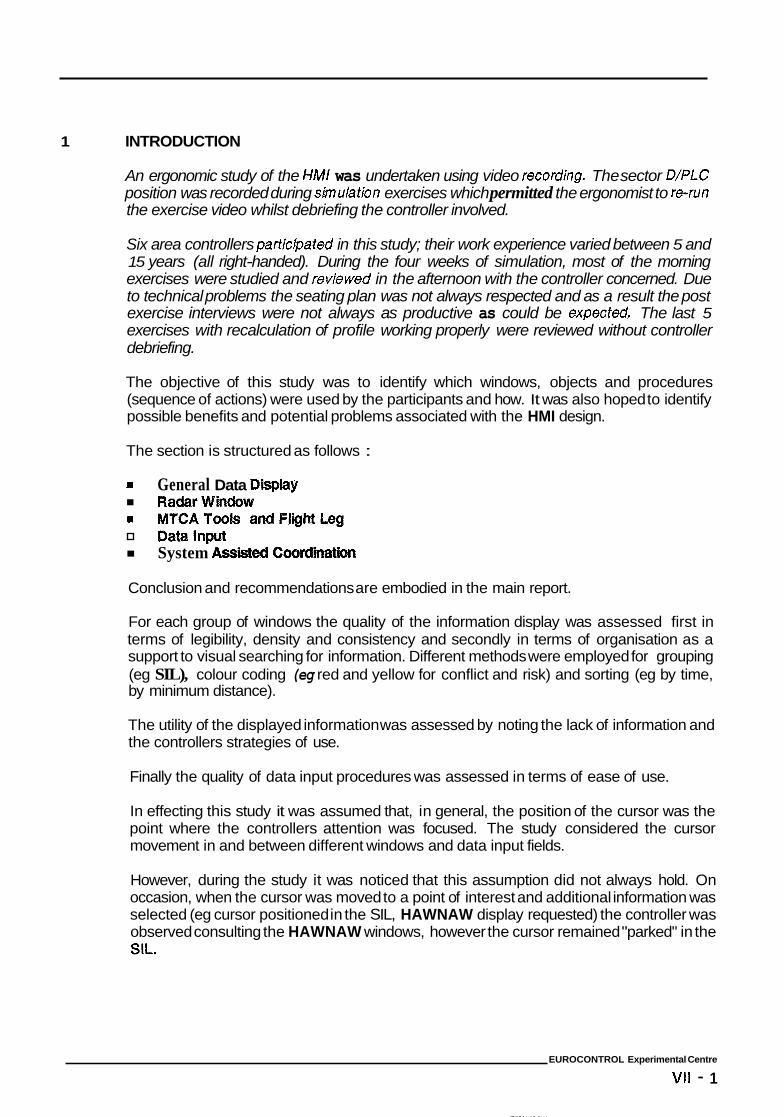
1 INTRODUCTION
An ergonomic study of the HMI was undertaken using video recoding. The sector DlPLG position was recorded during simulathn exercises which permitted the ergonomist to rerun the exercise video whilst debriefing the controller involved.
Six area controllers particbated in this study; their work experience varied between 5 and 15 years (all right-handed). During the four weeks of simulation, most of the morning exercises were studied and mviewed in the afternoon with the controller concerned. Due to technical problems the seating plan was not always respected and as a result the post exercise interviews were not always as productive as could be expwted. The last 5 exercises with recalculation of profile working properly were reviewed without controller debrie fing.
The objective of this study was to identify which windows, objects and procedures (sequence of actions) were used by the participants and how. It was also hoped to identify possible benefits and potential problems associated with the HMI design.
The section is structured as follows :
General Data Display RadarWIndow
= MTCATools andFli?ghtLeg Datalnput System Assisted Coordination
Conclusion and recommendations are embodied in the main report.
For each group of windows the quality of the information display was assessed first in terms of legibility, density and consistency and secondly in terms of organisation as a support to visual searching for information. Different methods were employed for grouping (eg SIL), colour coding (eg red and yellow for conflict and risk) and sorting (eg by time, by minimum distance).
The utility of the displayed information was assessed by noting the lack of information and the controllers strategies of use.
Finally the quality of data input procedures was assessed in terms of ease of use.
In effecting this study it was assumed that, in general, the position of the cursor was the point where the controllers attention was focused. The study considered the cursor movement in and between different windows and data input fields.
However, during the study it was noticed that this assumption did not always hold. On occasion, when the cursor was moved to a point of interest and additional information was selected (eg cursor positioned in the SIL, HAWNAW display requested) the controller was observed consulting the HAWNAW windows, however the cursor remained "parked" in the SIL.
EUROCONTROL Experimental Centre
VII - 1
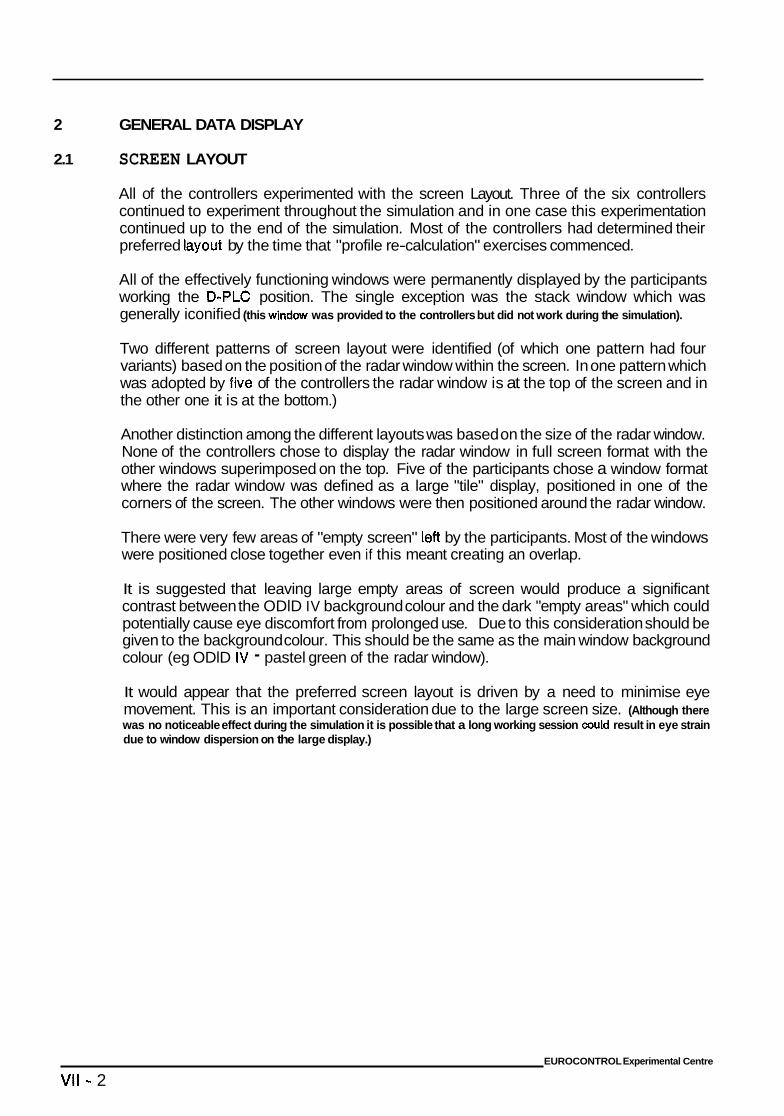
2 GENERAL DATA DISPLAY
2.1 SCREEN LAYOUT
All of the controllers experimented with the screen Layout. Three of the six controllers continued to experiment throughout the simulation and in one case this experimentation continued up to the end of the simulation. Most of the controllers had determined their preferred layout by the time that "profile re-calculation" exercises commenced.
All of the effectively functioning windows were permanently displayed by the participants working the D-PLC position. The single exception was the stack window which was generally iconified (this window was provided to the controllers but did not work during the simulation).
Two different patterns of screen layout were identified (of which one pattern had four variants) based on the position of the radar window within the screen. In one pattern which was adopted by f i e of the controllers the radar window is at the top of the screen and in the other one it is at the bottom.)
Another distinction among the different layouts was based on the size of the radar window. None of the controllers chose to display the radar window in full screen format with the other windows superimposed on the top. Five of the participants chose a window format where the radar window was defined as a large "tile" display, positioned in one of the corners of the screen. The other windows were then positioned around the radar window.
There were very few areas of "empty screen" left by the participants. Most of the windows were positioned close together even if this meant creating an overlap.
It is suggested that leaving large empty areas of screen would produce a significant contrast between the ODlD IV background colour and the dark "empty areas" which could potentially cause eye discomfort from prolonged use. Due to this consideration should be given to the background colour. This should be the same as the main window background colour (eg ODlD IV - pastel green of the radar window).
It would appear that the preferred screen layout is driven by a need to minimise eye movement. This is an important consideration due to the large screen size. (Although there was no noticeable effect during the simulation it is possible that a long working session could result in eye strain due to window dispersion on the large display.)
EUROCONTROL Experimental Centre
VII - 2
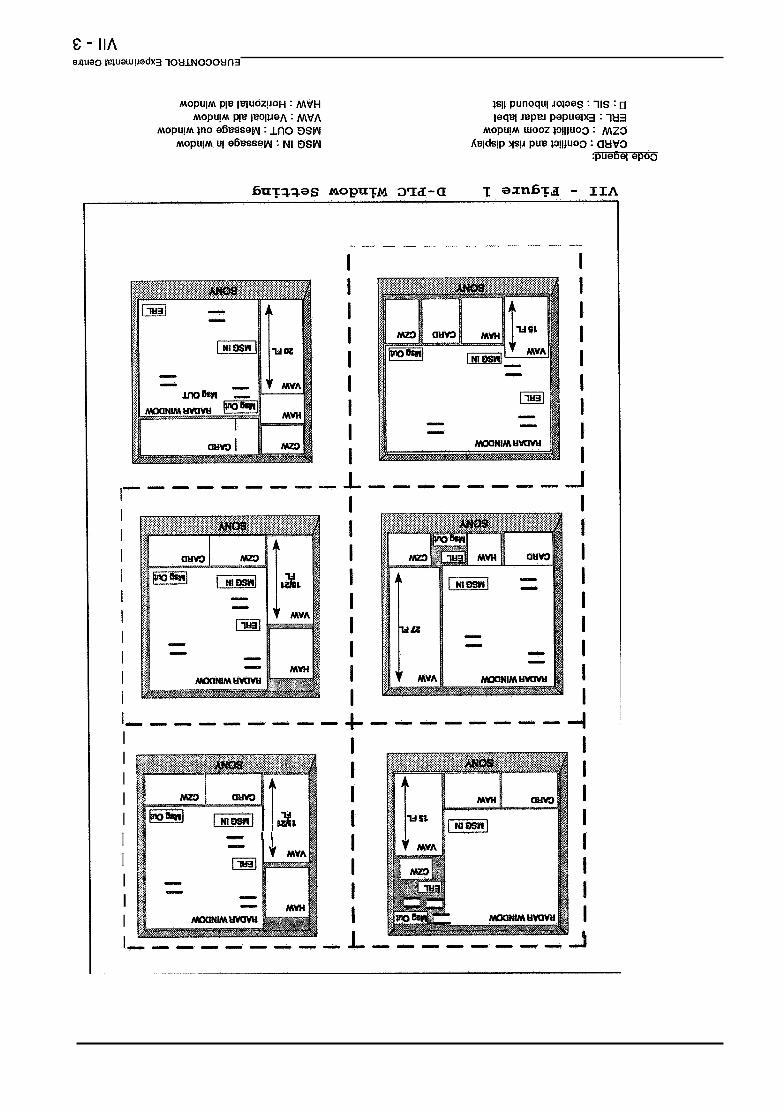
I I I I I I I I I I
L - I I
- .
I
2.2 W I ~ D O ~ SETTING STRATEGIES
Common strategies which have been observed during study of the window settings are described below :
RadatVVEndow
Five of the controllers placed the radar window at the top of the screen. The sixth controller placed it at the bottom of the screen. (this controller was quite small in size and always assumed a very relaxed posture).
Three controllers positioned the window to the right hand side with the HAW and VAW to the left. From conversation between the EC and PLC it is thought that this may have been a deliberate strategy to let the EC have sight of these windows. (The EC was positioned to the left of the PLC).
The D-PLC average radar range setting was 185 nm(160-215); D-EC's was 160 nm(145-175).
One of the participants had defined an unusual radar window setting which occupied half of the radar window. This design may have been motivated by the shape of the sector.
The simulated sector was considered to be too large by the participants. On occasion the PLC was observed pointing out traffic to the EC which was not within the EC's selected display. It is also possible that controllers experienced difficulty in detecting conflicting traffic as they were unable to easily scan the complete whole sector. (There is some evidence that a SE to NW traffic flow was occasionally neglected).
MTCAWindows
CARD Four controllers placed the CARD below the radar window and generally to the left. One controller placed the CARD at the very top of the screen as wide as the radar window.
The average graphic display scale selected in the CARD was 12 nm separation and 15 minutes warning. One controller selected 5 nm separation and a 10 minute warning period.
All participants left the "conflict risk" parameter selected.
It would appear that the CARD and radar window were considered to be closely associated by four of the (six) participants as they positioned the CARD and radar window on the same sides of the display.
EUROCONTROL Experimental Centre
VII - 4
0 VAW All controllers placed the VAW close to the HAW. Three settings show it to be below the HAW and three settings show it to be close to the CZW.
The VAW was consistently defined in an extended form (in one case it was extended to the same height as the radar window providing a large display flight levels). The average number of levels displayed in the VAW was 18 (15 -27’).
The positioning of the VAW indicates that a level of importance is attributed to the window.
0 HAW Three controllers placed the HAW below the radar window and three controllers placed the HAW to the top left corner of the radar window.
Three of the controllers positioned the HAW adjacent to the CARD. It would appear that the HAW has low priority.
0 czw Five of the controllers placed the CZW on the same level as the CARD. In four settings it is also placed to the right of the CARD. This possibly indicates the priority of use of the CARD and CZW (observe conflict then display CZW image).
SIL
The SlLs were positioned geographically by all of the controllers in accordance with the geographical entry area served by the window.
StackWindow
Two controllers positioned the Stack Window out side of the radar window; two positioned the windows geographically and two controllers consistently iconified them. (Note: this window was not operational during the simulation).
Extended Radar label
Four controllers positioned the extended radar label at the base (inside) of the radar window.
The extended label is generally positioned either close to the Message In window, close to the SIL windows or, in some cases, between the two.
EUROCONTROL Experimental Centre
VII - 5
essage In Window
2.3
All controllers placed the message in window inside the radar window T
The window is consistently placed towards the centre of the normal visual field (generally in the middle level of the display) by five of the controllers.
= Message Out W ~ ~ o w
Five of the settings show this window to the right of the message in window, possibly reflecting a left to right task -logic.
Three settings show it at the same horizontal level as the message in window while two settings show it to be above it. The last one shows it to be below it.
The message out window was never observed in a central and hence, high priority position of the display.
CIock
Three controllers placed the clock at the top of the radar window and as close as possible to the SILs.
Two controllers placed it close to the CARD. One controller put the clock in the top right corner (explaining that the clock served no purpose - yet it was positioned among the SILs).
The concept of multi-windowing is pertinent. The window management was easy and flexible enough to allow the controllers to organise the screen to reflect their preferred pattern of working .
QUANTITY OF INFORMATION AND DATA VALIDATION
Generally all of the windows were continuously displayed on the D-PLC screen by the participants. It would appear that the number of windows and amount of displayed information was not considered to be a problem. However, during debriefing controllers suggested that MTCA windows, in particular the CZW, could be displayed on a pop-up basis.
It was noted that some of the controllers moved closer to the screen in order to concentrate more on a significant area of the screen (intense traffic or perhaps due to label anti-overlap blocking) or to inspect a window more closely (eg the VAW).
Apparently no significant problem was generated by the size of the screen.
EUROCONTROL Experimental Centre
VII - 6
D-PLC controllers were often observed glancing at the EC's screen. The following possible explanations are given for this action :
the EC and PLC selected different radar display ranges; the controller was confirming that his/her understanding of the situation (traffic awareness) was the same as that of the EC; the Copenhagen PLC does not have a radar display (could be due to habit); a significant number of times it was due to system problems (PLC checking to see if the EC was experiencing the same problem).
It remains an interesting observation to note that the PLC controllers did not confine themselves to one display and that there was a need to confirm information on another display.
3 RADAR WINDOW - Radar Label - SIL
3.1 LEGIBILITY - DENSITY - CONSISTENCY
Some of the data displayed in the radar window was considered difficult to read. Certain callsigns were not clear because of the similarity of certain numbers (and certain characters) eg BOSS88B.
With a high workload and increasing data density, the ability to quickly read information can be expected to become a problem. A new font could be considered or improved spacing between individual characters. Certain characters and numbers could be specially designed to reduce confusion eg 8/6, O/O, 5/6, 5/S, 6/S, 1/1 etc.
The RED callsigns resulting from activation of the STCA function were difficult to read. The RED colour gave the callsign a "halo" effect.
Some of the controllers needed to move SlLs during an exercise as they were covering inbound traffic flows. This appeared to be linked to the selected radar display range and a difficulty in finding adequate "free" space to geographically display the SILs.
More specifically a SIL would be moved when the controller wanted to input data using the radar label in both the assumed and advanced warning state. (Following assume the aircraft information was removed from the SIL but it would have been available during the advanced warning state).
Some of the data displayed in the radar window was found to be inconsistent in format as opposed to content for example, the rate of climb was displayed in different ways in the radar label and in the extended radar label; R 1500 in the radar label and ARC 1500 in the extended label.
In the radar label and in the speed pop-up menu, speed was displayed differently; K 26 when selected in the radar label but 260 in the pop-up-menu.
EUROCONTROL Experimental Centre
VII - 7
3.2 SUPPORT FOR DATA SEARCHING
3.3
To facilitate data access some information was grouped in list form (eg SILs). However, It was observed that, as a general rule, the controllers searched for aircraft (information) in the radar window and not in the SILs. Controllers stated that the radar window was where their focus of attention would be most of the time.
For aircraft entering the sector a quicker strategy would be to scan the top lines of the SILs. However, the SIL was only used when the controller felt that there was enough time to check entry conditions by displaying the aircraft's profile in the tools (HAW and VAVV). Controllers were concerned by the slow system response times which they felt could put them behind their work if they had to wait for the system to up-date the planning tools.
Participants also said that the PLC was focused on the radar window in order to be ready to do an input for the EC. It appears that the radar window was the main data input area.
Cotourcoding
Participants found the role of colour coding in the radar window to be positive. The use of colour helped to determine task priorities, eg when an aircraft makes its first call the controller searches only the pink radar labels.
MISSING INFORMATION
Type for conflict resolution and route for planning
During the Ergonomic study controllers methods of searching for information was analysed. This study has indicated that information may be missing or not interpreted by the controller.
The first information received by a sector is the advanced information in the SIL. Some of the participants felt that the aircraft TYPE should have been displayed in the SIL. They wanted this information when resolving conflict situations (to determine speed differences). However, this was not a general conclusion as other controllers felt that, generally, they could associate an aircraft callsign with an aircraft type.
One controller suggested that the SIL data should be presented as follows :
CALLSIGN TYPE LEVEL XPT ET0
(The TYPE location is almost the same as the position in the extended radar label. In this case the type has been linked with the callsign).
EUROCONTROL Experimental Centre
VII - 8
This requirement may not have been particularly strong as none of the controllers permanently displayed the TYPE in the radar label (a button bar option). However, it must also be pointed out that none of the controllers liked having a full radar label display (up to five lines).
Extended radar label and Flight
In addition, the aircraft type was available from the extended radar label (by a press and hold action on the callsign) most of the controllers used this option. The TYPE was also written at the top of the VAW window (and could have been verified at sector entry validation). But we will see later in detail , it would appear that when checking the HAW and VAW, the controllers were only searching for colour which would indicate to them a planning conflict (red) or risk of conflict (yellow).
In order to obtain supplementary data when an aircraft is entering the sector (both before and after the assume) controllers displayed the extended radar label. (This display strategy was also a feature of the ECs control actions). During the last week of simulation when the recalculation of profiles was introduced it would appear that the controllers used the flight leg instead of the extended radar label. This suggests that the controllers needed supplementary route information (provided by the flight leg).
General observations of the controllers use of the extended radar label show that it was used as a permanent display and not on a pop-up basis. It also seems that controllers used that information for planning when aircraft were in the advanced warning state rather than when assumed. It would also appear that it was used for obtaining supplementary information rather than effecting data input eg supplementary information before responding to a message in.
During the latter part of the simulation the extended radar label was generally only used as a support for data input as a result of system problems blocking data input elsewhere and less as a support of supplementary data due to the controllers familiarisation with the traffic sample.
The flight leg was used both during the advanced warning state and after assume. It was used by controllers planning the flight through the sector and also following direct route input made by the EC.
Consideration might be given to an automatic display of the extended radar label and/or the flight leg when an aircraft in the advanced warning information state is actioned by a mouse button.
EUROCONTROL Experimental Centre
VII - 9
4 MTCA TOOLS - CONSULTATION
4.1 LEGIBILITY - DENSITY
CARD
The conflict numbers in the CARD were not always easy to read. This was most pronounced when the conflict line was positioned close to the X axis of the window frame. It was also difficult to distinguish between 3 and 9 when these numbers were inclose proximity to one another (this was due to the conflict line cutting the numbers at the level of the rounded part of the 9).
One solution which was tried to resolve this problem involved sizing the CARD as wide as the radar window and selecting a display scale of 5 nm and 10 minutes. This significantly reduced the conflict number overlap.
In addition several comments were made by participants during the video debriefings which concern the CARD. These were :
participants would like to maintain the use of red and yellow to distinguish conflict and risk of conflict information; participants would like yellow squares to represent risk of conflict. This requirement confirms the need of distinction between conflict and risk of conflict.; the width of the conflict pair text window should be fixed and not proportional to the window size, and the representation of time on the X axis should be the same as that used in the VAW.
HAW
Several of the participants commented that the information in the HAW was too concentrated in a specific area (eg around a detected conflict) and that this resulted in a lot of wasted and "empty" display area within the window.
There was also a problem of overlapping callsigns in this window.
VAIN
On occasion, controllers had difficulty in interpreting the meaning of different conflict blocks especially when they overlapped (the VAW also suffered from the problem of overlapping callsigns).
EUROCONTROL Experimental Centre
VII - 10
4.2 CONSISTENCY OF DISPLAYED DATA
The controllers were asked "What are the links between the different MTCA tools?" The majority of responses linked the CARD and the CZW, and then the HAW to the VAW.
No link was suggested between the HAWNAW and the CZW but cursor movement was observed from CZW to the HAW/VAW.
Even if the HAW/VAW and the CZW were permanently display, there does not appear to be any confusion between the CZW and the HAW. Controllers readily identified the HAW through the slider bar displayed in the window and by its extended range.
It was also suggested that the CZW should be available by press and hold action of the IB button on the conflict number as a "quick look" option.
A potentially disturbing problem concerning radar label information was observed between the HAW and CZW labels and those displayed in the radar window. The predicted conflict situations represented in the HAW and CZW used the current aircraft radar label ie the label displayed in the radar window at the time the HAW display request (the position symbols are in the "future" but the label data is in the "present") .
Different times (and visual representation of time) were displayed in the HAW, VAW, CARD, CZW, CLOCK and in the beacon estimates in the extended radar label (ETO) and tabular lists (ETO, ETA, EAT). This difference does not appear to have caused any significant problems, however controllers were concerned by the lack of accuracy of the beacon estimates. (in Copenhagen, controllers are responsible for ETA revisions so they checked, as a matter of routine, the estimates presented by the system).
Consideration should be given to different displays of static time in the HAW/ VAW and the time of the predicted conflict in the CZW. However, their position in the windows should be consistent.
It was considered that the subject aircraft was not clearly identified in the HAW and that the lack of label anti-overlap created difficulty in reading information and inputting data.
EUROCONTROL Experimental Centre
VII - 11
4.3 G FOR CONFLICTS (CARD TO CZVV)
The colour coding in the CARD was also considered to be helpful. This was evident when conflicts and risks of conflicts were both colour coded yellow for a period of time and controllers had to systematically search all of the data to identify conflicts which had a higher priority (" ... with both colours we can concentrate on red only, otherwise we have to process (study) all of the data..")
The participants could have de-selected the RISK display which would have made this conflict search easier.
Colour was a significant factor in the other MTCA tools. It would appear that the PLC only paid attention to the content of the MTCA windows (HAW and VAW) when colour was displayed in them.
When the participants were asked "what is your sorting criteria in the CARD?" they replied "the aircraft callsigns (conflict pairs) and the graphic display sorted by minimum separation then by time."
However, when traffic levels were low the controller checked the conflict and risk information as soon as it was displayed (in the order that they were displayed).
When higher traffic levels developed or when the system predicted a lot of conflicts the checking procedures were as follows :
conflicts before risks, then the closest in time (before loss of separation) for conflicts with less than 5 nm predicted minimum separation, then the closest in distance (separation) for conflicts with 5 nm or more of predicted minimum separation.
In terms of processing information the choice of the "closest conflict in time" is probably guided by a memorisation saving principle. It is less "expensive" (in terms of time) to elaborate a conflict resolution which can be realised immediately rather than to remember the solution until the moment of implementation.
When asked "what does the conflict number position mean?" some of the participants were unable to say. It would appear that the most important aspect of the conflict graphic display was the start of the conflict line which indicated the predicted time of separation loss and the expected minimum distance.
EUROCONTROL Experimental Centre
VII - 12
This may indicate that the controllers considered the part of the conflict line to the right of the conflict symbol to be of little value or indeed that the conflict line itself was unnecessary. Without displaying this line some additional "clarity" might be gained. Consideration could be given to coding the type of conflict (converging, crossing etc ) by using specific symbols.
4.4 FURTHER CONFLICT DETECTION ACTION
The most frequently observed procedure was for the controller to search the CARD information and then to call the CZW by clicking IB on the conflict number in the CARD. (This would be the quickest way to validate conflict information).
When a conflict risk was observed supplementary information was obtained from the extended radar label (perhaps to confirm estimate times). This was achieved by calling the information into the extended label by clicking IB on the callsign in the CARD callsign list.
Different strategies were used on occasion by controllers when they were checking for conflicts or if they wanted to confirm the conflict information. . CARD to CZW to HAW
One of these procedures was to search the CARD information, then to call the CZW by clicking IB on the conflict number in the CARD and then to confirm the information in the HAW. This could indicate a need to compare the different representations of the detected conflict.
It could also suggest that there was a need for additional information such as:
the position and time of the conflict (start point) together with flight plan data which would be available from the radar labels as displayed in the HAW.
flight level data corresponding to the minimum separation are not displayed in the CZW the radar label data displayed the "current" data.
CARD to CZW to FliiM leg
Another observed procedure was to search the CARD information, then to call the CZW by clicking IB on the conflict number in the CARD and then to confirm the information by reference to the flight leg.
The flight leg was considered more suitable than the HAW by most of the controllers because it was displayed in the radar window where the information is current and dynamic. This provides the controller with information on "where and whenq1 the loss of separation is predicted to occur. It would appear that the duration of the conflict was of less importance to the controller.
EUROCONTROL Experimental Centre
VII - 13
Use of the flight leg in the radar window also minimises the use of windows with different range scale (reduction of eye movement and data searching). (The HAW range was related to the subject aircraft's route through the sector from three minute8 before sector entry to three minute after sector exit; this range changed with each aircraft profile display).
The flight leg appears to provide a more consistent mental representation of the conflict situation as it relates directly to the radar display.
Attention should be given to the lack of consistency between the CZW (or the HAW) and the Fight Leg; the conflict (red line) representations does not have the same meaning. In one case (CZW) the red line codes the subject aircraft's flight path when in conflict and in the other case (Flight Leg) the red codes the object aircraft's flight path (from the aircraft's actual position to the point of minimum separation).
Consideration could be given to the provision of an automatic (time parameter to be determined) flight leg display when the CZW is consulted. Rules would have to be created to differentiate between subject and object aircraft.
There was a possibility for colour error on the flight leg. The mixing of green and red lines on the flight leg created a yellow "halo" on the leg which could indicate conflict risk instead of conflict
4.5 CONFIDENCE IN DISPLAYED INFORMATION
Controllers did not systematically check all of the displayed conflicts, they expressed the opinion during the video debriefing that they occasionally observed conflicts which were not detected by the system and also that they considered some of the system detected conflicts to be erroneous.
4.6 CHECKING SECTOR ENTRYlEXlT CONDITIONS
4.6.1 Dab searching
The most frequently observed procedure was to check flight data in the SIL and then to request profile display (HAW / VAW) by clicking IB on the PEL in the SIL.
The SlLs were positioned geographically by all controllers. With the exception of only one participant, all controllers scanned the SIL windows in a clock wise direction. It would appear that the Departure SIL was the last window to be checked in the SIL scan.
EUROCONTROL Experimental Centre
VII - 14
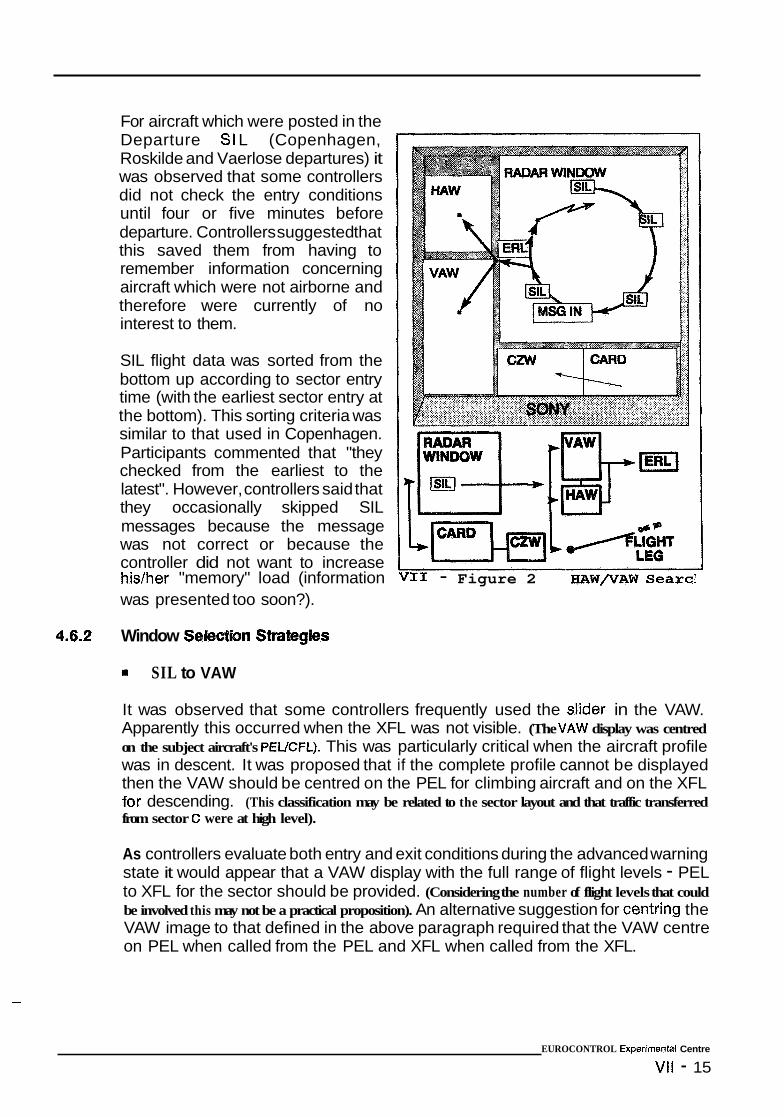
For aircraft which were posted in the Departure SI L (Copenhagen, Roskilde and Vaerlose departures) it was observed that some controllers did not check the entry conditions until four or five minutes before departure. Controllers suggested that this saved them from having to remember information concerning aircraft which were not airborne and therefore were currently of no interest to them.
SIL flight data was sorted from the bottom up according to sector entry time (with the earliest sector entry at the bottom). This sorting criteria was similar to that used in Copenhagen. Participants commented that "they checked from the earliest to the latest". However, controllers said that they occasionally skipped SIL messages because the message was not correct or because the controller did not want to increase hidher "memory" load (information VII - Figure 2 H A W P A W Searc: was presented too soon?).
4.6.2 Window Sefectbn Strategies
SIL to VAW
It was observed that some controllers frequently used the slider in the VAW. Apparently this occurred when the XFL was not visible. (The VAW display was centred on the subject aircraft's PEUCFL). This was particularly critical when the aircraft profile was in descent. It was proposed that if the complete profile cannot be displayed then the VAW should be centred on the PEL for climbing aircraft and on the XFL for descending. (This classification may be related to the sector layout and that traffic transferred from sector C were at high level).
As controllers evaluate both entry and exit conditions during the advanced warning state it would appear that a VAW display with the full range of flight levels - PEL to XFL for the sector should be provided. (Considering the number of flight levels that could be involved this may not be a practical proposition). An alternative suggestion for Centring the VAW image to that defined in the above paragraph required that the VAW centre on PEL when called from the PEL and XFL when called from the XFL.
EUROCONTROL Expenmental Centre
VII - 15
SIL to HAW
One controller was observed systematically displaying the exit conditions by clicking IB on the XFL of the subject aircraft in the HAW.
If the participants use of the HAW and VAW in the initial validation of sector entry conditions is simply to detect colour, then consideration should be given to presenting a colour coded conflict symbol in the SIL (this would require an automatic conflict probe when each aircraft is posted to the sector). Such functionality would alleviate the necessity to systematically check sector entry conditions. The conflict information in the CARD would provide a back-up in the event that the conflict symbol was not detected by the controller in the SIL.
SIL to Flight Leg
Controllers were observed hesitating between clicking on the PEL (HAWNAW display) and XPT (flight leg display). This may suggest an element of competition between the different aids.
SIL to HAW/VAW to CZW
This strategy could present potential problems of data incompatibility. The CZW is not necessarily displaying the same conflict information as that presented in the HAWNAW (different selection actions are required). When a conflict (or risk) was displayed controllers were observed moving from HAW to CZW and then to the CARD in order to re-select the CZW information. (Disp4ay of CZW from the HAWNAW did not function during the simulation).
Consideration could be given to up-dating the CZW display when the HAWIVAW are selected. (Rules would be required to determine which conflict pair to display in the CZW in the event that more than one was detected).
SIL to Extended Radar label
The extended radar label was consulted in order to determine the aircraft type and to check if an alternative flight level was reasonable with regard to destination and RFL.
It was observed that on occasion the extended radar label was consulted in preference to the HAWNAW. In this case it could be assumed that the controller may have consulted the CARD (or relied on the CARD to warn of entry conflicts) instead Of the HAW/VAW. (Some controllers said during debriefing that they used the CARD to validate entry conditions).
EUROCONTROL Experimental Centre
VII - 16
.*
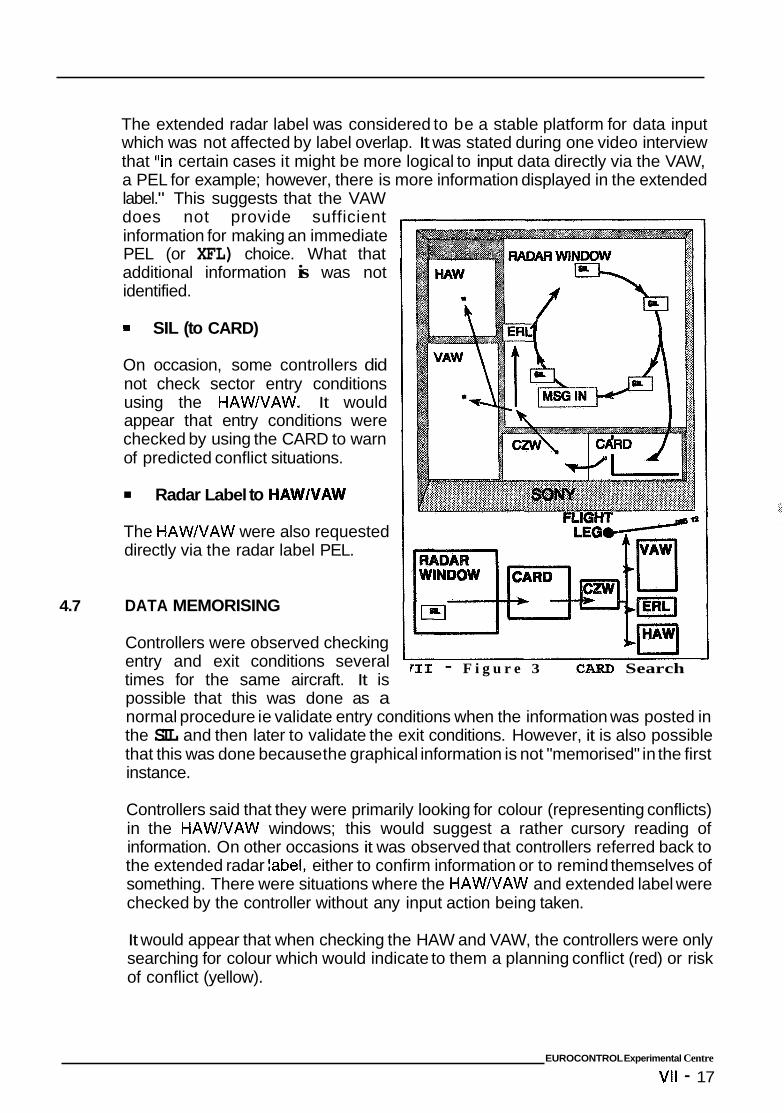
The extended radar label was considered to be a stable platform for data input which was not affected by label overlap. It was stated during one video interview that ''in certain cases it might be more logical to input data directly via the VAW, a PEL for example; however, there is more information displayed in the extended label." This suggests that the VAW does not provide sufficient information for making an immediate PEL (or XFL) choice. What that additional information is was not identified.
9 SIL (to CARD)
On occasion, some controllers did not check sector entry conditions using the HAWNAW. It would appear that entry conditions were checked by using the CARD to warn of predicted conflict situations.
Radar Label to HAWNAW
The HAW/VAW were also requested directly via the radar label PEL.
4.7 DATA MEMORISING
Controllers were observed checking entry and exit conditions several times for the same aircraft. It is possible that this was done as a
711 - F i g u r e 3 CARD Search
normal procedure ie validate entry conditions when the information was posted in the SIL and then later to validate the exit conditions. However, it is also possible that this was done because the graphical information is not "memorised" in the first instance.
Controllers said that they were primarily looking for colour (representing conflicts) in the HAWNAW windows; this would suggest a rather cursory reading of information. On other occasions it was observed that controllers referred back to the extended radar :abel, either to confirm information or to remind themselves of something. There were situations where the HAW/VAW and extended label were checked by the controller without any input action being taken.
It would appear that when checking the HAW and VAW, the controllers were only searching for colour which would indicate to them a planning conflict (red) or risk of conflict (yellow).
EUROCONTROL Experimental Centre
VII - 17
5
5.1
This is potentially a negative aspect of the use of colour. The graphical tools would have been under-utilised. Focusing only on colour suggests that the controller would miss the textual (and graphically implied) information.
DATA INPUT AND DATA SELECTION
DATA INPUT DIFFICULTIES
Participants did not display any difficulties with the use of the three button mouse. Utilisation times never exceeded 90 minutes (normal exercise period). This might be considered as quite a high level of continuous mouse use.
On occasion the EC controller was surprised by coordinated data displayed in the radar label. Such coordination would have been negotiated by the PLC and it appears that the messages were not seen by the EC eg the display of an XFL coordination in the radar label did not indicate who was the issuing controller (this had to be clarified by reference to the message windows). (There may be a requirement to identify whether a coordination is incoming or outgoing in the radar label - this could be a colour application).
The division of responsibility for acknowledging coordination was not always clear. This is could be resolved by task allocation. Controllers were left to define their own task sharing (EC and PLC) during the simulation.
Controllers were observed "clicking" on fields which did not have an associated application or which were not available at that particular moment (eg menu or pop- up not available whilst coordination was in progress). Such a situation should be clearly identified to the controller. The use of "error" pop-up messages should be considered for such a function.
During the simulation controllers exhibited difficulty in selecting data. This was not always due to system response problems but also due to the duration of the mouse click. The CWP recording confirm this as a significant number of press and hold actions were recorded on input fields which were designated for single clicks only. There was also a large number of single clicks which were recorded as being within the single click threshold yet were translated by the system as being press and hold actions.
Another system constraint which affected data input was related to cursor defaulting. The system did not recognise the cursor's new position fc!lowing a default action. This meant that the controller was required to make a minute cursor movement before selecting the defaulted item. Vhis negated the idea of two single clicks in quick succession in order to input a default item).
EUROCONTROL Experimental Centre
VII - 18
5.2 INPUT PRE~ERENCE~
Access to the as available from wherever the XPT was displayed (SIL, message in, radar label in the HAW and radar window). However, controllers generally selected the flight leg from the radar label in the radar window. This may be due to the fact that the flight leg was displayed from the radar label in the radar window and therefore its selection was only associated with the radar label itself.
The radar label was the main support for data action input. However, when the label anti-overlap was insufficient controllers used the extended radar label.
The displayed radar range.
was also used when the radar label was not within the
Few action button inputs were observed in the SIL (eg PEL and XPT amendment were possible using the SIL yet were usually selected from the radar label). The SIL inputs were essentially display inputs for the HAWNAW.
Very few input actions were observed in the windows. This may indicate a lack of confidence in the input procedures available for these tools or indeed, the tools may be perceived primarily as situation display windows, not available for flight plan up-date actions. (The controllers interest in the tools became more intense following the introduction of profile recalculation)
The primary method of data input was through pop-up windows attached to radar label data fields. Use of similar windows in the MTCA tools might enforce the awareness of data input availability by ensuring consistency of input functionality. For example, this would require that the PEL and XFL scales in the VAW would be presented in the form of open pop-up windows.
No action button inputs were observed in the CARD except selection of the Warning feature (AB on the conflict number changed the callsign of the conflict pair to yellow).
Very few data input actions were observed in the CZW. The "Warning" feature was selected from the CARD, however, since the CZW was conceived to help the controller determine the nature of a conflict it is logical that a "warning" selection should also be available from this window (it was not possible during the simulation).
In the CZW the conflict number was displayed on a separate button which also indicated the predicted time of minimum separation. This is inconsistent. The conflict number should be the same colour and shape as the conflict number displayed in the other tools. This would enforce the awareness of input availability for the "warning" feature in the CZW.
f
EUROCONTROL Experimental Centre
VII - 19
5.3 ACCESS TO DATA
It was observed that as the radar labels increased in size (number of lines - due to increased control input actions) and as a result of increasing traffic levels, the radar label anti-overlap function became overloaded. This made it difficult in certain situations to access the radar data fields for input action. Controllers reaction to this problem was to use the extended radar label for data input. However, this reaction was not immediate; some controllers continued to try to select input fields in the radar labels but following several wrong selections they eventually moved to the extended label. (One of the controllers reacted by increasing the size of the radar window to try to alleviate the overlap problem; this improved the situation slightly).
It was also observed that on the occasions when the EC CWP failed, the PLC immediately re-sized the radar window to full screen (ail EC radar window selections were sized to fuii screen). The MTCA windows were not de-selected but superimposed over the radar window or left available behind it. The controllers then input data through the radar labels (not through the extended label or the tools).
This procedure suggests that data input is potentially a "workload task" for the EC (the window re-sizing was taken to facilitate data input) and that whenever possible the preferred data input object is the radar label.
Two of the participants requested during the video debriefing that label overlap problems could be reduced if the controller was given the option of dragging the radar label data block to a "clear area" for data input.
The extended radar label was a stable platform for data input which was not affected by label overlap. It was stated during one video interview that "in certain cases it might be more logical to input data directly via the VAW, a PEL for example; however, there is more information displayed in the extended label." This suggests that the VAW does not have sufficient information on display for making an immediate PEL (or XFL) choice. What this information is, has not been identified.
In the pop-up menus the preferences for moving to non displayed values appeared to be the "page to page facility" (clicking in the slider bar either side of the slider button gave a complete page UP or down). There was no significant observed use of the slider and the arrows (single item upldown).
5.4 "AVOIDING" DATA INPUT (MINI~ISING WORKLOAD)
On a number of occasions controllers were observed giving instruction to aircraft but not recording the data in the radar label (direct route and CFL).
One of the reasons given for this was that "I know the route, it is a standard procedure and I don't like having the fourth line displayed in the label." In this case the controller also accepted the risk that the system would not conflict detect for him/her. This fqacceptance" ignored the fact that the system would not detect for the other users as well.
EUROCONTROL Experimental Centre
VII - 20
A similar effect was observed for CFL input for aircraft climbing out of Copenhagen departure airspace, traversing sector D and being quickly transferred to sector C. These aircraft were systematically given climb to flight level 240 before transfer. Controllers were frequently observed instructing the aircraft to climb without entering the data. (This occurred when the SKIP function was not operational). Controllers accepted that the CFL field would change to YELLOW (indicating incorrect transfer level) but insisted that as the receiving controllers PEL would show flight level 240 there was no loss of coordination between sectors. It was again accepted that the system would not conflict detect on the AFL to CFL profile.
This shows a temptation not to do certain inputs when the procedure is well known or when there is probability of "minimum effect and/or consequences" as a result. What is interesting is that the controllers involved have a high experience background including procedural control - they understood the consequences of their actions; they were not totally reliant on the system to help them control aircraft.
However, the temptation not to input data for the next computer literate ("NINTENDO?") generation of controllers who will rely on system events and predictions (not their procedural experience) could have severe repercussions. This could probably be protected against or at least limited at initial controller training - point of entry into the ATC system.
5.5 "NEW' USE OF FUNCTIONS
Onward Clearance for Holding Traffic
The sector D and approach controllers organized a coordination procedure for the release of Copenhagen arriving traffic from holding. This involved the transmission of a heading coordination via SAC which was interpreted as an onward clearance for the aircraft. (Sector D was responsible for "stack management" but under normal circumstances telephone coordination would be used to determine the release of traffic from holding areas).
Distance Evaluation Between Aircraft
The participants were observed selecting the elastic vector in order to measure the separation between aircraft. It was suggested that a "measuring ruler or cross" could be provided which could be "picked up" using the mouse cursor and moved around as a measuring aid.
IpOCONTROL Experimental Centre
VII - 21
5.6
6
6.1
TASK SHARING
As a general rule the controllers did not change their current (Copenhagen) working methodology. However, it was noted that when the sector became busy, the EC asked the PLC to input data, for example speed, transfer and CFL input. On occasion this input included other functions but this occurred when the EC's CWP was blocked due to a system problem.
It is probable that these EC requests were made as a result of system response times (but this has not been confirmed). When these procedures were adopted certain rules were applied :
rn rn
the EC retained the responsibility for assume, heading input and speed; the PLC input skip, transfer and CFL; when asked the PLC also input speed values.
SYSTEM ASSISTED COORDINATION
WINDOW POSITION
Irrespective of the chosen screen layout, the "message in" window was consistently placed inside the radar window within the main eye focus level. Five of the controllers placed the window almost in the centre of the screen.
The "message out" window was placed by five of the controllers to the right of the message in window. Two controllers placed it on the same horizontal level as the "message in" window and the other placed it in the less important data area.
This positioning of the two windows tends to indicate that separate message ''in'' and "out" windows are a positive design. The priority is obviously given to the "message in" window.
6.2 ESSAGE IN" HANDLING PROCEDURES
6.2.1 Detecting a Message In
There does not appear to be any problems receiving a message in when the radar label is not displayed (eg aircraft outside the selected radar display range or a departure not yet airborne or warned to the sector).
EUROCONTROL Experimental Centre
VII - 22
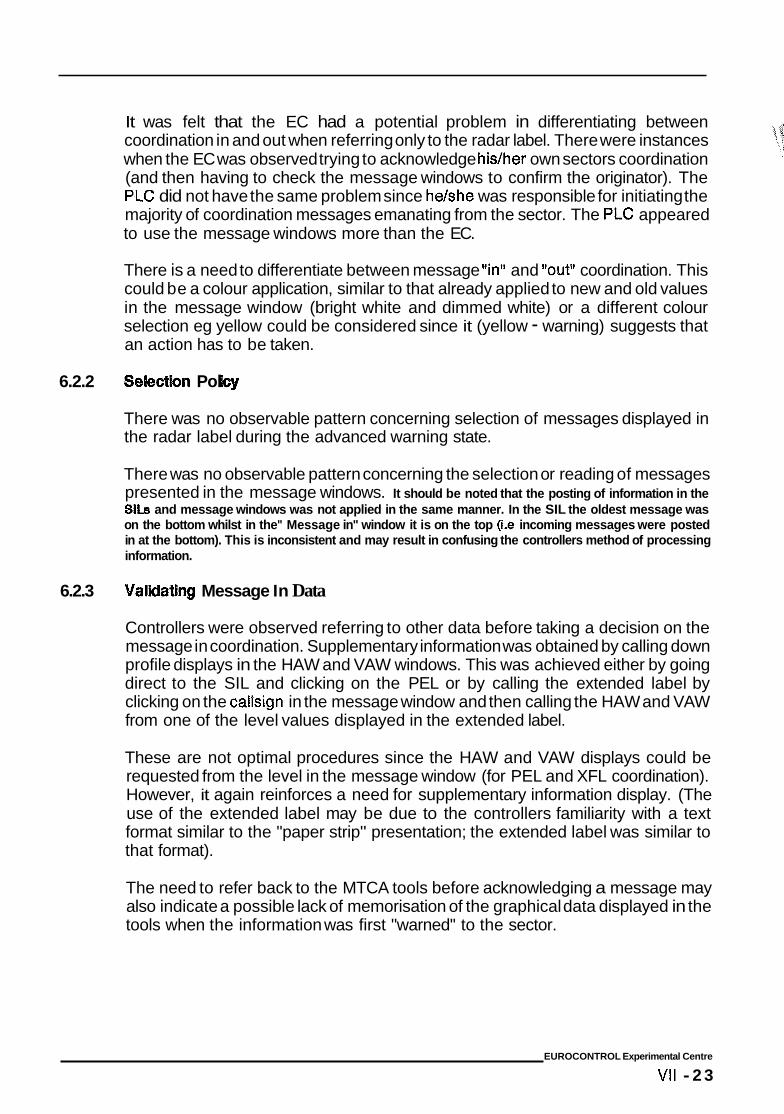
It was felt that the EC had a potential problem in differentiating between coordination in and out when referring only to the radar label. There were instances when the EC was observed trying to acknowledge his/her own sectors coordination (and then having to check the message windows to confirm the originator). The PLC did not have the same problem since he/she was responsible for initiating the majority of coordination messages emanating from the sector. The PLC appeared to use the message windows more than the EC.
There is a need to differentiate between message "in'' and "out" coordination. This could be a colour application, similar to that already applied to new and old values in the message window (bright white and dimmed white) or a different colour selection eg yellow could be considered since it (yellow - warning) suggests that an action has to be taken.
6.2.2 Selectbn Pol
There was no observable pattern concerning selection of messages displayed in the radar label during the advanced warning state.
There was no observable pattern concerning the selection or reading of messages presented in the message windows. It should be noted that the posting of information in the SlLs and message windows was not applied in the same manner. In the SIL the oldest message was on the bottom whilst in the" Message in" window it is on the top (i.e incoming messages were posted in at the bottom). This is inconsistent and may result in confusing the controllers method of processing information.
6.2.3 Valkiatlng Message In Data
Controllers were observed referring to other data before taking a decision on the message in coordination. Supplementary information was obtained by calling down profile displays in the HAW and VAW windows. This was achieved either by going direct to the SIL and clicking on the PEL or by calling the extended label by clicking on the callsign in the message window and then calling the HAW and VAW from one of the level values displayed in the extended label.
These are not optimal procedures since the HAW and VAW displays could be requested from the level in the message window (for PEL and XFL coordination). However, it again reinforces a need for supplementary information display. (The use of the extended label may be due to the controllers familiarity with a text format similar to the "paper strip" presentation; the extended label was similar to that format).
The need to refer back to the MTCA tools before acknowledging a message may also indicate a possible lack of memorisation of the graphical data displayed in the tools when the information was first "warned'' to the sector.
EUROCONTROL Experimental Centre
VII - 2 3
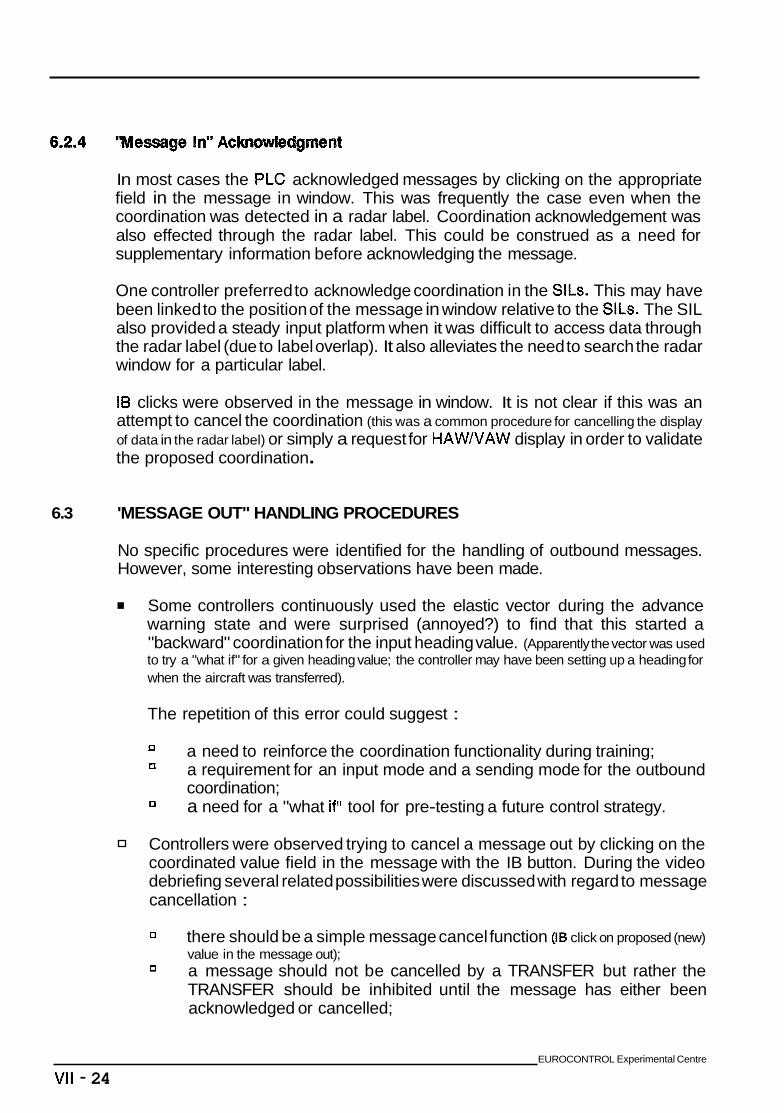
essagcb In" AG nt
In most cases the PLC acknowledged messages by clicking on the appropriate field in the message in window. This was frequently the case even when the coordination was detected in a radar label. Coordination acknowledgement was also effected through the radar label. This could be construed as a need for supplementary information before acknowledging the message.
One controller preferred to acknowledge coordination in the SILs. This may have been linked to the position of the message in window relative to the SILs. The SIL also provided a steady input platform when it was difficult to access data through the radar label (due to label overlap). It also alleviates the need to search the radar window for a particular label.
IS clicks were observed in the message in window. It is not clear if this was an attempt to cancel the coordination (this was a common procedure for cancelling the display of data in the radar label) or simply a request for HAWNAW display in order to validate the proposed coordination .
6.3 'MESSAGE OUT" HANDLING PROCEDURES
No specific procedures were identified for the handling of outbound messages. However, some interesting observations have been made.
Some controllers continuously used the elastic vector during the advance warning state and were surprised (annoyed?) to find that this started a "backward" coordination for the input heading value. (Apparently the vector was used to try a "what if" for a given heading value; the controller may have been setting up a heading for when the aircraft was transferred).
The repetition of this error could suggest :
0
0
0
a need to reinforce the coordination functionality during training; a requirement for an input mode and a sending mode for the outbound coordination; a need for a "what if" tool for pre-testing a future control strategy.
Controllers were observed trying to cancel a message out by clicking on the coordinated value field in the message with the IB button. During the video debriefing several related possibilities were discussed with regard to message cancellation :
0
0
there should be a simple message cancel function (IS click on proposed (new)
a message should not be cancelled by a TRANSFER but rather the TRANSFER should be inhibited until the message has either been acknowledged or cancelled;
value in the message out);
EUROCONTROL Experimental Centre
VII - 24
7
8
0 it is preferable to use the phone in order to cancel a coordination. This clarifies the situation and does not leave the controller wondering why the message has disappeared (eg was it due to a system problem?)
This need for a message cancellation function may also indicate a further requirement for an input mode followed by a sending mode for the outbound coordination message.
SYSTEMEONTROLLER - DIVISION OF RESPONSIBILITIES
The participants felt that, for now, they have kept the same task responsibilities that they currently use. However, they expressed concern as to how they will be affected by a transfer of task responsibilities to the system. Who will be responsible - Controller or system? They also expressed concern at the likely degradation of controller skills and their ability to revert to more traditional control techniques in the event of system malfunction. (This is a common theme among controllers but perhaps it was exacerbated in the case of the ODlD participant8 due to the system problems experienced during the simulation)
SAC AND (ON SCREEN) TELECOM
The controllers felt that they had gained time for additional work as a result of the system assisted coordination function. However, there is a strong feeling that the telephone is still a requirement for "complex" traffic coordination.
The use of the "on screen" telephone panel created certain coordination problems between sector controllers. There was no feed back to indicate that a controller was using the telephone; this resulted in controllers interrupting the other team member or starting a conversation without receiving a reply. This could be resolved by implementing a call in progress indication on the "other" controllers telephone window.
EUROGONTROL Experimental Centre
VII - 25

ANNEX VIII
ODlD IV
0 DID Q U EST ION N AI R E
TABLE OF CONTENTS
INTRODUCTION .................................... VIll 1
1 AIRSPACE AND TRAFFIC SAMPLES ..................... VIll . 2
2 EQUIPMENT ....................................... V l l l - 3
.
3 THEMOUSE ....................................... V l l l - 6
4 WINDOW MANAGEMENT TECHNIQUE ................... Vlll . 7
5 USE OF COLOUR ................................... Vlll 8
6 BUTTON BAR ...................................... V l l l - 9
7 COORDINATION MESSAGE WINDOW . . . . . . . . . . . . . . . . . . . Vlll . 12
8 RADAR WINDOW .................................. Vl l l - 14
9 RADAR LABELS ................................... Vl l l - 15
10 INFORMATION WINDOWS ........................... Vlll 21
1 1 APPROACH MULTI INPUT DEVICE ..................... Vll l . 23
12 SEQUENCING .................................... Vlll 24
13 MEDIUM TERM CONFLICT ASSISTANCE TOOLS . . . . . . . . . . Vlll . 24
14 STCA ........................................... Vlll 30
15 PROBLEMS ...................................... Vlll 31
16 FINDINGS ........................................ Vlll 31
17 TRAINING ........................................ Vlll-31
.
.
.
.
.
.
EUROCONTROL Experimental Centre
Vlll . i
INTRODUCTION
SlMULATlON QUESTIONNAIRE
During the last week of simulation the participants were requested to complete WO questionnaires; the ODlD IV simulation questionnaire and a more general questionnaire based on the SWIFT Consortium's Evaluation Instrument (see Annex ). This section summarises the responses of the ODlD IV questionnaire.
Two ODlD questionnaires were developed to cater for the special area and approach control needs. For the purposes of this section, the questionnaires have been amalgamated.
There were six area and four approach control participants. Each participant was allowed two days to complete the questionnaire.
QUESTIONNAIRE OBJECTWES
The objectives of the ODlD IV simulation questionnaire were :
a). to evaluate the operational (ATC) usefulness of the ODlD IV HMI;
b). to evaluate the operational dimensions of the system with regard to realism, validity of information and the usefulness of system proposed actions;
c). to evaluate the ergonomic dimensions including :
I the utility of the functions and information - semantic level. This overlaps with the operational dimensions (for example, were parameters convenient; were system events automatically generated at the right time and in the right operational context?)
I the dialogue and the procedures - syntactic level, and
the presentation of visual features - lexical shape, format or location of objets).
PRESENTATION OF QUESTIONS
The questions have been posed in a mixed qualitative an(
level (for example the colour,
quantitative form. Quantitative values are presented on a scale increasing from left to right (1, 2, 3, 4, 5).
Questions which were related to either area or approach control are indicated by "acc" (area) and "app'' (approach). Comments which are related to a specific ATC function are also indicated (eg app controller or acc controller).
EUROCONTROL Experimental Centre
Vlll - 1
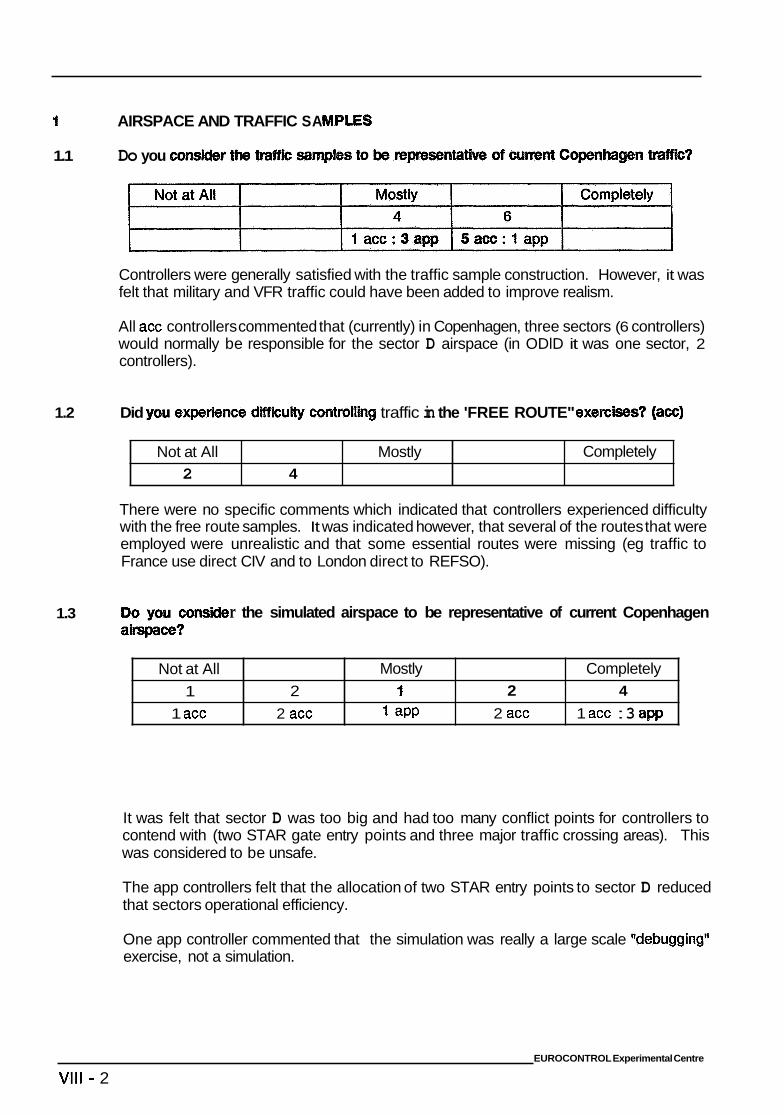
1 AIRSPACE AND TRAFFIC SA
Not at All Mostly 2 4
1.1 Do you
Completely
Controllers were generally satisfied with the traffic sample construction. However, it was felt that military and VFR traffic could have been added to improve realism.
Not at All 1 2
1 acc 2 acc
All acc controllers commented that (currently) in Copenhagen, three sectors (6 controllers) would normally be responsible for the sector D airspace (in ODlD it was one sector, 2 controllers).
Mostly Completely
1 aPP 2 acc 1 acc : 3 app 1 2 4
1.2 Did you experience difficulty eontrolihg traffic in the 'FREE ROUTE" exerc
There were no specific comments which indicated that controllers experienced difficulty with the free route samples. It was indicated however, that several of the routes that were employed were unrealistic and that some essential routes were missing (eg traffic to France use direct CIV and to London direct to REFSO).
1.3 r the simulated airspace to be representative of current Copenhagen
It was felt that sector D was too big and had too many conflict points for controllers to contend with (two STAR gate entry points and three major traffic crossing areas). This was considered to be unsafe.
The app controllers felt that the allocation of two STAR entry points to sector D reduced that sectors operational efficiency.
One app controller commented that the simulation was really a large scale lldebuggingll exercise, not a simulation.
EUROCONTROL Experimental Centre
VIll - 2
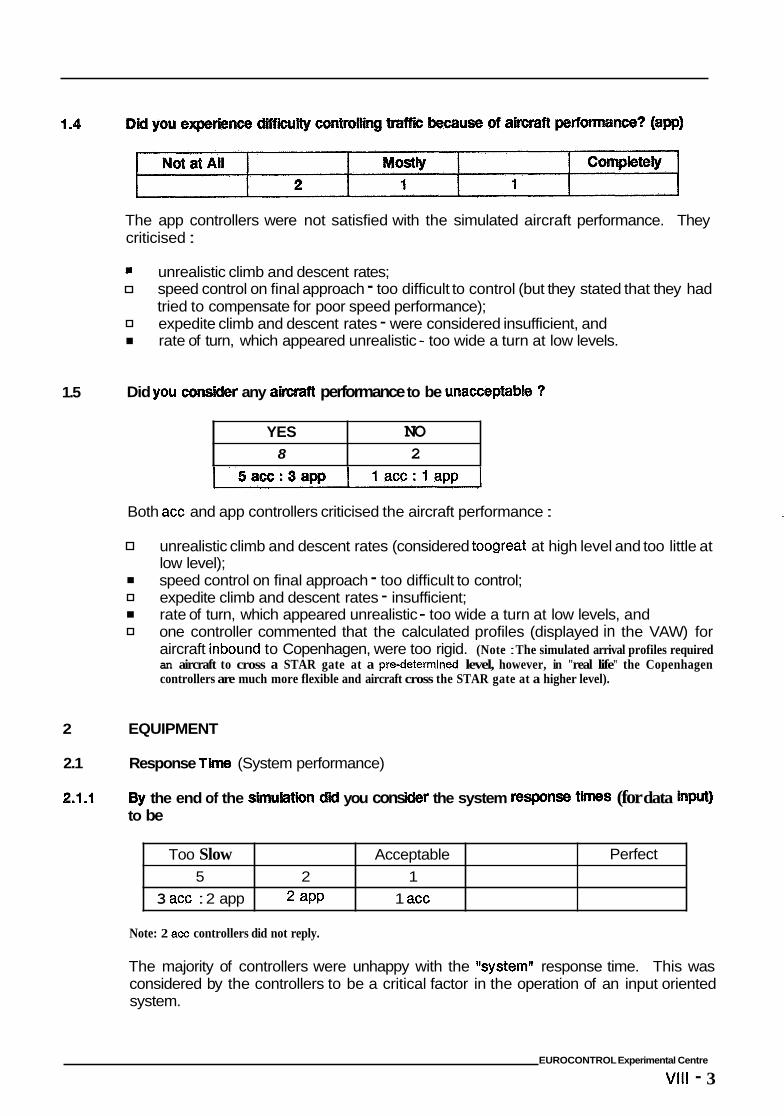
The app controllers were not satisfied with the simulated aircraft performance. They criticised :
YES 8
= unrealistic climb and descent rates; speed control on final approach - too difficult to control (but they stated that they had tried to compensate for poor speed performance); expedite climb and descent rates - were considered insufficient, and rate of turn, which appeared unrealistic - too wide a turn at low levels.
NO 2
1.5 Did yozr co1IsMctr any aircraft performance to be unacceptabk, ?
Too Slow Acceptable 5 2 1
3 acc : 2 app 2 aPP 1 acc
Perfect
Both acc and app controllers criticised the aircraft performance :
unrealistic climb and descent rates (considered toogreat at high level and too little at low level); speed control on final approach - too difficult to control; expedite climb and descent rates - insufficient; rate of turn, which appeared unrealistic - too wide a turn at low levels, and one controller commented that the calculated profiles (displayed in the VAW) for aircraft inbound to Copenhagen, were too rigid. (Note : The simulated arrival profiles required an aircraft to cross a STAR gate at a predetermined level, however, in "real life" the Copenhagen controllers are much more flexible and aircraft cross the STAR gate at a higher level).
2 EQUIPMENT
2.1 Response T h e (System performance)
2.1.1 By the end of the simulation dkl you cons to be
r the system response times (for data bnput)
Note: 2 acc controllers did not reply.
The majority of controllers were unhappy with the %ysternl' response time. This was considered by the controllers to be a critical factor in the operation of an input oriented system.
EUROCONTROL Experimental Centre
Vlll - 3

6.9 nnty you werd bar item?
Never
7
7.1
Occasionally Always 1 9
1 acc 5acc:4am
7.2
II Item
11 Laver FiRer Function
Label Overlap on/off
Speed Vector
* 1 controller did not respond.
8 1 I 2 I I
COORDINATION MESSAGE WINDOW
Do you consider system assisted coordination to be of benefit to you?
Numerous comments were made on this function. Several controllers expressed the opinion that the coordination function was one of the best features in the system because "it saves time, reduces stress and messages can be left pending." It was suggested that
message cancelation should be possible, and forward coordination for direct routes should be possible.
Were you always aware that a message had been posted in the Message In w
Several responses indicated that if a coordination message was not seen in a message window, it was noticed later during the controller's traffic scanning. (A coordination value was coloured white in the radar label).
EUROGONTROL Experimental Cenlre
Vlll - 12
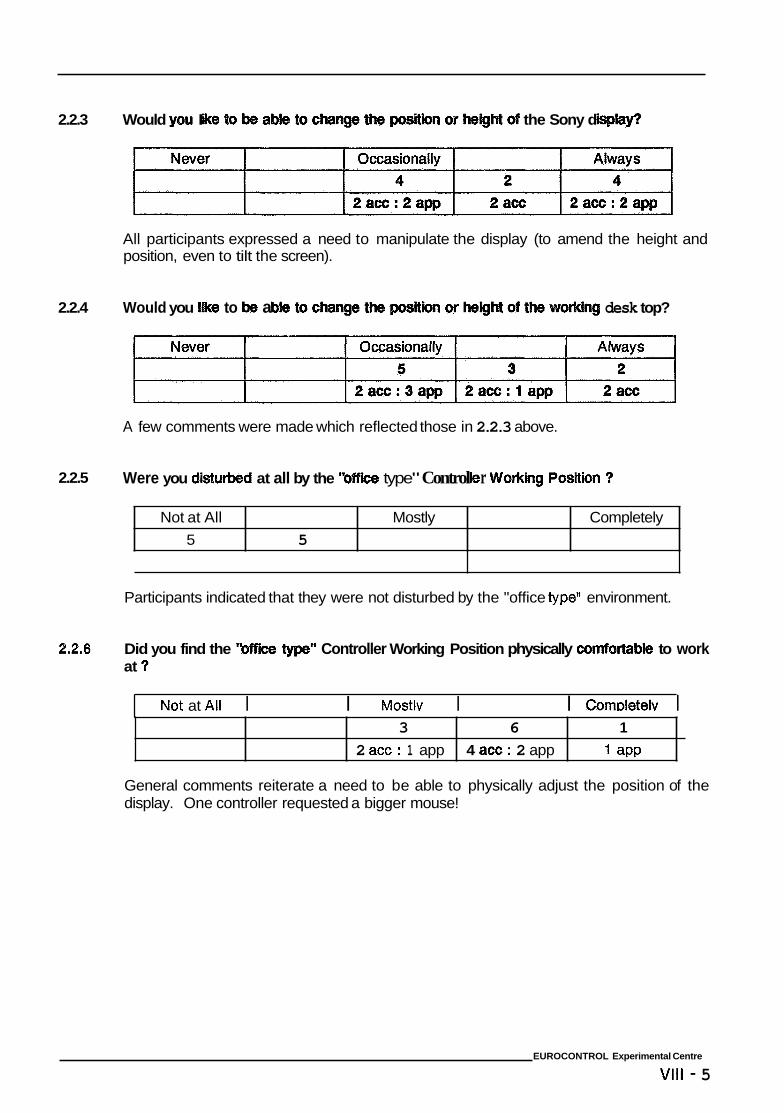
2.2.3 Would you I M d the Sony d
Not at All 5
All participants expressed a need to manipulate the display (to amend the height and position, even to tilt the screen).
Mostly Completely 5
2.2.4 Would you like to bs a desk top?
3 2 acc : 1 app
A few comments were made which reflected those in 2.2.3 above.
6 1 4 acc : 2 app 1 aPP
2.2.5 Were you dlstuwd at all by the "offb type" Control r Working Position 3
Participants indicated that they were not disturbed by the "office type" environment.
2.2.6 Did you find the "offiice type" Controller Working Position physically comfortable to work at 3
Not at AII I I Mostlv I I Comr>letelv I
General comments reiterate a need to be able to physically adjust the position of the display. One controller requested a bigger mouse!
EUROCONTROL Experimental Centre
Vlll - 5
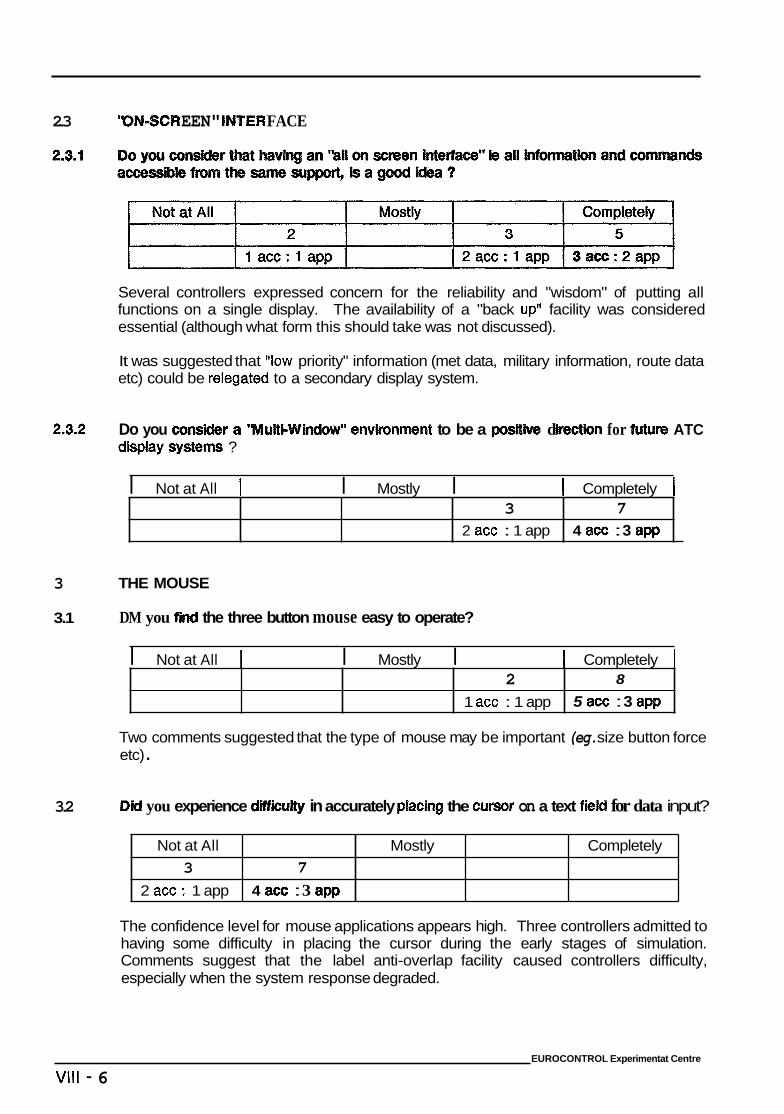
2.3 'ON-SCR EEN" INTER FACE
3 2 acc : 1 app
Several controllers expressed concern for the reliability and "wisdom" of putting all functions on a single display. The availability of a "back upw facility was considered essential (although what form this should take was not discussed).
7 4 aec : 3 app
It was suggested that "low priority" information (met data, military information, route data etc) could be relegat4 to a secondary display system.
2 1 acc : 1 app
2.3.2 Do you envhnment to be a positive d ion for puturn ATC display system ?
8
5 acc : 3 app
I Not at All I I Mostly I I Completely I
Not at All
2 acc : 1 app 3 7
4 acc : 3 app
3
3.1
Mostly Completely
3.2
THE MOUSE
DM you find the three button mouse easy to operate?
I Not at All I I Mostly I I Completely 1
Two comments suggested that the type of mouse may be important (eg. size button force etc) .
Did you experience ~~u~ in accurately placing the cursor on a text field for data input?
The confidence level for mouse applications appears high. Three controllers admitted to having some difficulty in placing the cursor during the early stages of simulation. Comments suggest that the label anti-overlap facility caused controllers difficulty, especially when the system response degraded.
EUROCONTROL Experimentat Centre
Vlll - 6
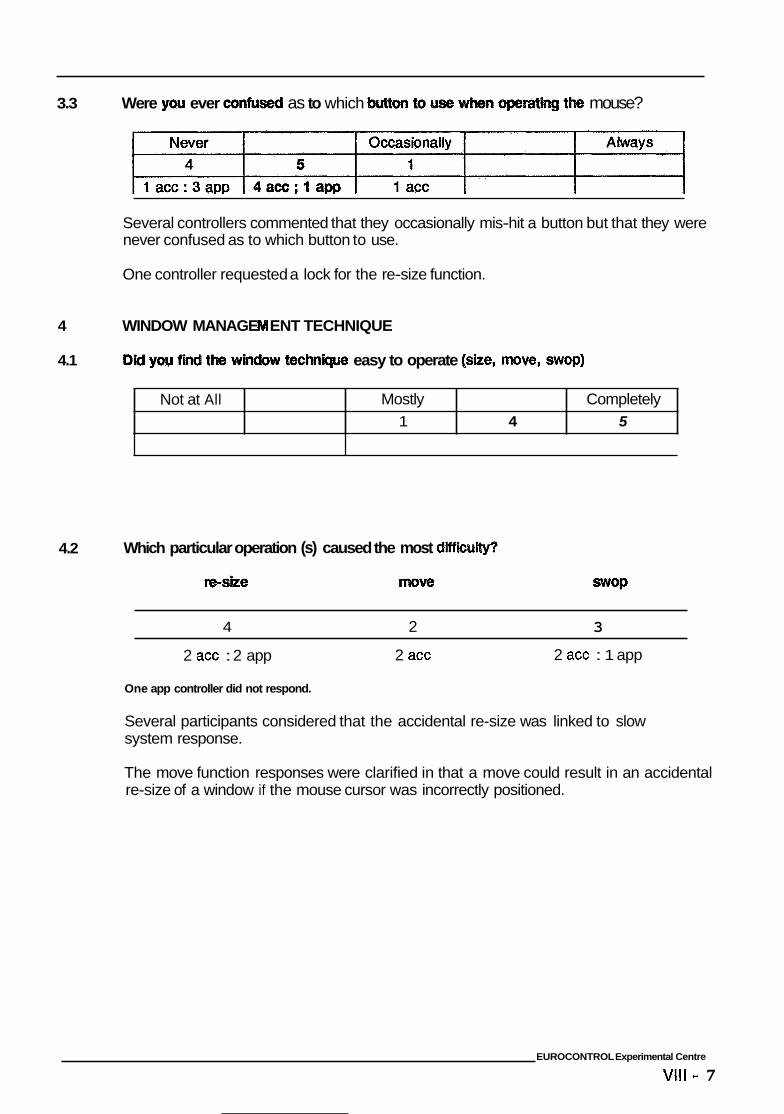
3.3 Were you ever confused as to which mouse?
Not at All
Several controllers commented that they occasionally mis-hit a button but that they were never confused as to which button to use.
Mostly Completely 1 4 5
One controller requested a lock for the re-size function.
4 WINDOW MANAGE ENT TECHNIQUE
4.1 easy to operate (size, mow, swop)
4.2 Which particular operation (s) caused the most dlifficutty?
4 2 3
2 acc 2 ace : 2 app 2 acc : 1 app
One app controller did not respond.
Several participants considered that the accidental re-size was linked to slow system response.
The move function responses were clarified in that a move could result in an accidental re-size of a window if the mouse cursor was incorrectly positioned.
EUROCONTROL Experimental Centre
Vlll - 7
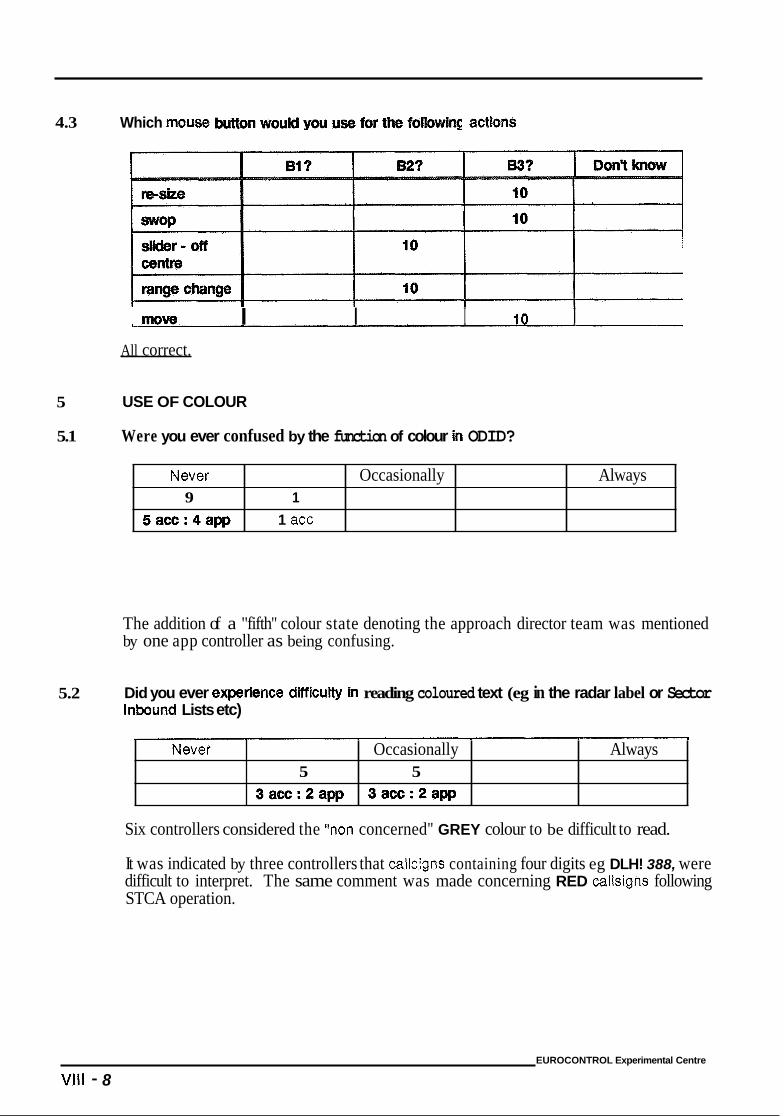
4.3 Which muse actions
Newer 9
5acc:4app
5
5.1
Occasionally Always 1
1 acc
5.2
Newer
move I I I 10 I All correct.
Occasionally Always 5 5
3acc:2app 3acc:2app
USE OF COLOUR
Were you ever confused by the function of colour in ODID?
The addition of a "fifth" colour state denoting the approach director team was mentioned by one app controller as being confusing.
Did you ever eltpe nce dlffiicuHy h reading coloured text (eg in the radar label or Sector lnbound Lists etc)
Six controllers considered the "non concerned" GREY colour to be difficult to read.
It was indicated by three controllers that callcIgns containing four digits eg DLH! 388, were difficult to interpret. The same comment was made concerning RED callsigns following STCA operation.
EUROCONTROL Experimental Centre
Vlll - 8
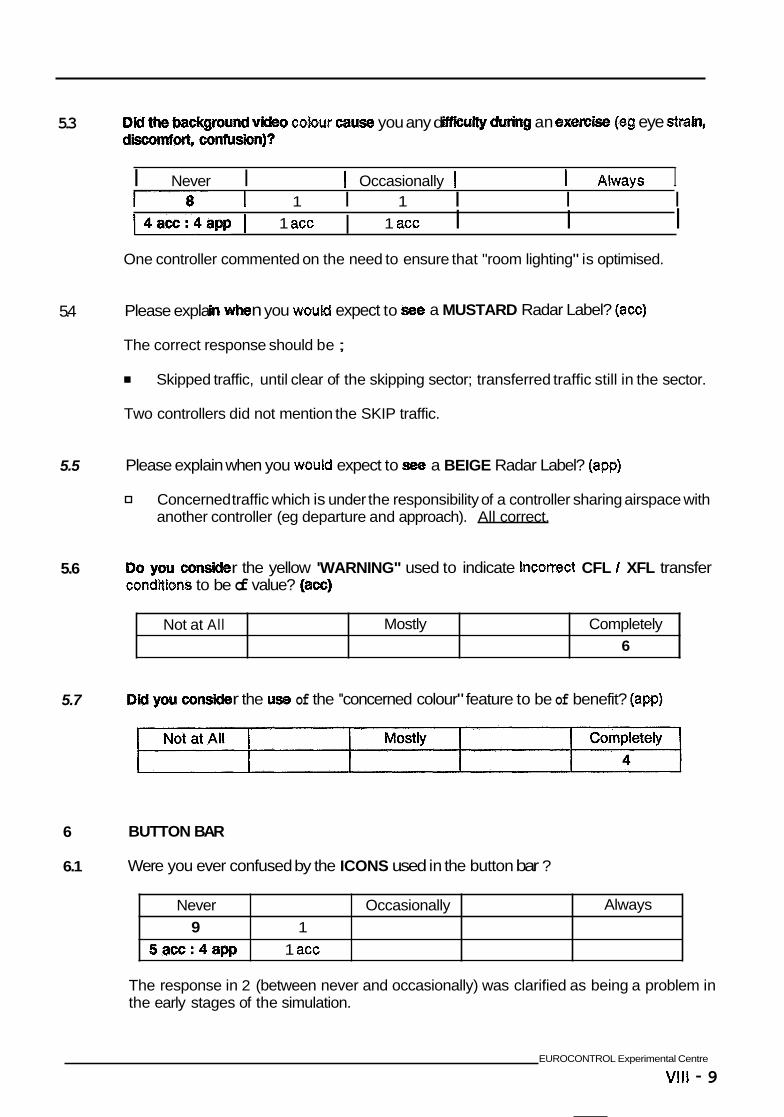
5.3 coWr cause you any d an execrckw ( e 6 ~ eye stm
Not at All
I Never I I Occasionally I I Afways I
Mostly Completely 6
5.4
Never Occasionally 9 1
5acc:4app 1 acc
5.5
Always
5.6
r - 8 - I 1 I 1 I I I 14acc:4app I 1 acc 1 acc I I I I
One controller commented on the need to ensure that "room lighting" is optimised.
Please expla n you wouM expect to a MUSTARD Radar Label? (acc)
The correct response should be ;
Skipped traffic, until clear of the skipping sector; transferred traffic still in the sector.
Two controllers did not mention the SKIP traffic.
Please explain when you wouM expect to see a BEIGE Radar Label? (app)
Concerned traffic which is under the responsibility of a controller sharing airspace with another controller (eg departure and approach). All correct.
r the yellow 'WARNING" used to indicate incomct CFL I XFL transfer conditions to be of value? (a=)
5.7 r the use of the ''concerned colour" feature to be of benefit? (app)
6
6.1
BUTTON BAR
Were you ever confused by the ICONS used in the button bar ?
The response in 2 (between never and occasionally) was clarified as being a problem in the early stages of the simulation.
EUROCONTROL Experimental Centre
Vlll - 9
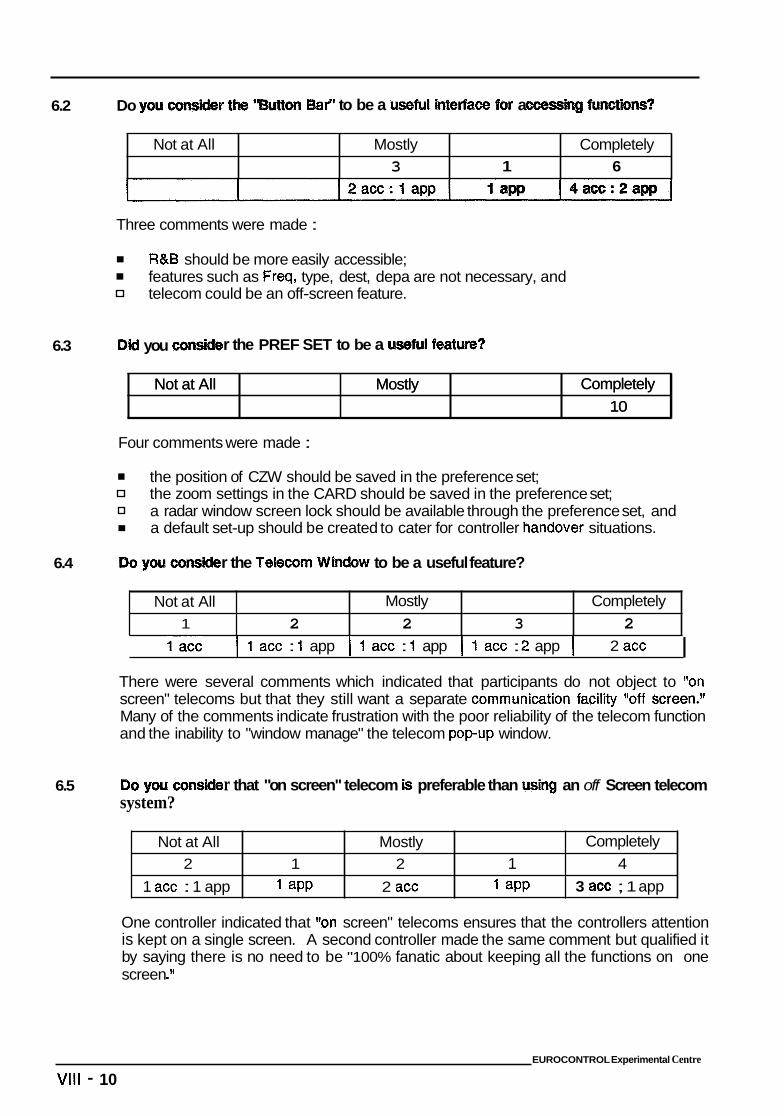
6.2 Do you Bar" to be a useful interface for a
Not at All Mostly 3 1
Completely 6
6.3
Not at All Mostly
6.4
Completely 10
Three comments were made :
Not at All Mostly
R&B should be more easily accessible; features such as Frsq, type, dest, depa are not necessary, and telecom could be an off-screen feature.
Completely 10
Did you r the PREF SET to be a ustboul feature?
Not at All 1
Mostly Completely 2 2 3 2
Not at All Mostly 2 1 2 1
1 acc : 1 app 1 aPP 2 acc 1 aPP
Four comments were made :
Completely 4
3 acc ; 1 app
the position of CZW should be saved in the preference set; the zoom settings in the CARD should be saved in the preference set; a radar window screen lock should be available through the preference set, and a default set-up should be created to cater for controller handover situations.
r the Telecom Window to be a useful feature?
1Cacc I 1 ace : 1 app I 1 acc : 1 app I 1 acc : 2 app I 2 acc I There were several comments which indicated that participants do not object to Ifon screen" telecoms but that they still want a separate communication faci1.Q "off screen.N Many of the comments indicate frustration with the poor reliability of the telecom function and the inability to "window manage" the telecom popup window.
6.5 r that "on screen" telecom is preferable than using an off Screen telecom system?
One controller indicated that Ifon screen" telecoms ensures that the controllers attention is kept on a single screen. A second controller made the same comment but qualified it by saying there is no need to be "100% fanatic about keeping all the functions on one screen .If
EUROCONTROL Experimental Centre
Vlll - 10
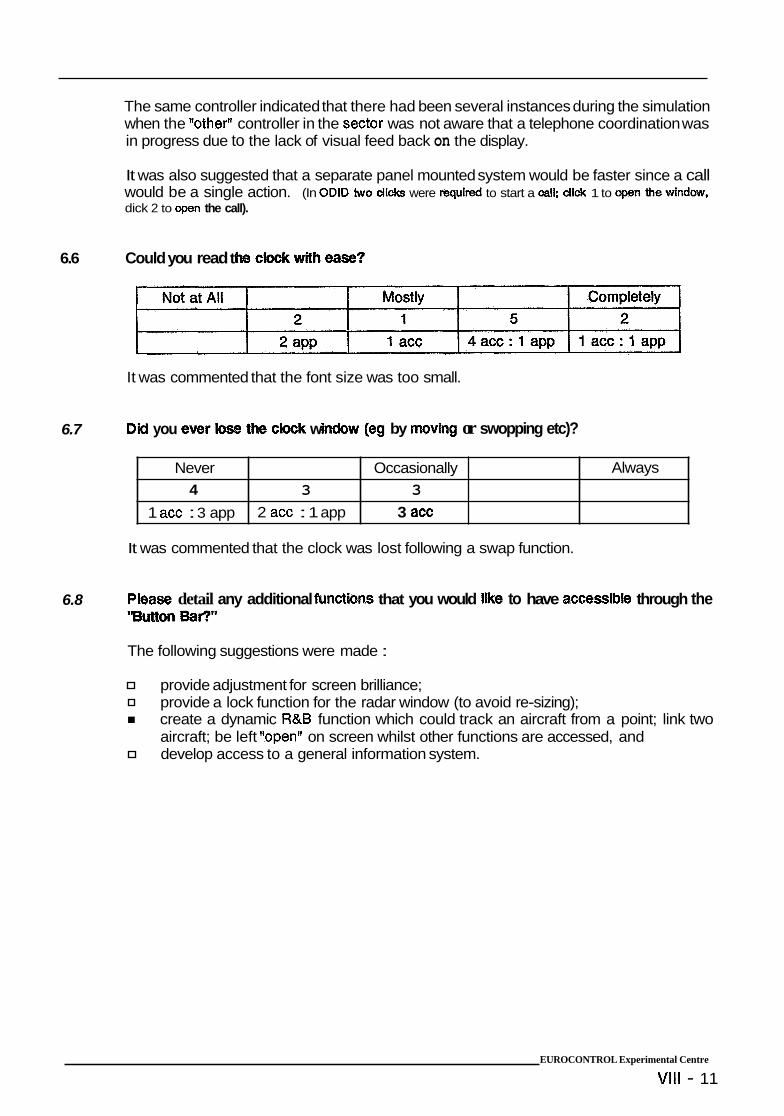
The same controller indicated that there had been several instances during the simulation when the "otheF controller in the sector was not aware that a telephone coordination was in progress due to the lack of visual feed back on the display.
Never Occasionally 4 3 3
2 acc : 1 app 1 acc : 3 app 3 acc
It was also suggested that a separate panel mounted system would be faster since a call would be a single action. (In ODlD two dicks were requid to start a all; dlck 1 to dick 2 to open the call).
Always
6.6 Could you read t
It was commented that the font size was too small.
6.7 Did you ever lose the cbck w (eg by moving or swopping etc)?
It was commented that the clock was lost following a swap function.
6.8 Please detail any additional functions that you would like to have accessible through the 'gutton Bar?"
The following suggestions were made :
provide adjustment for screen brilliance; provide a lock function for the radar window (to avoid re-sizing); create a dynamic R&B function which could track an aircraft from a point; link two aircraft; be left "open" on screen whilst other functions are accessed, and develop access to a general information system.
EUROCONTROL Experimental Centre
VIll - 11
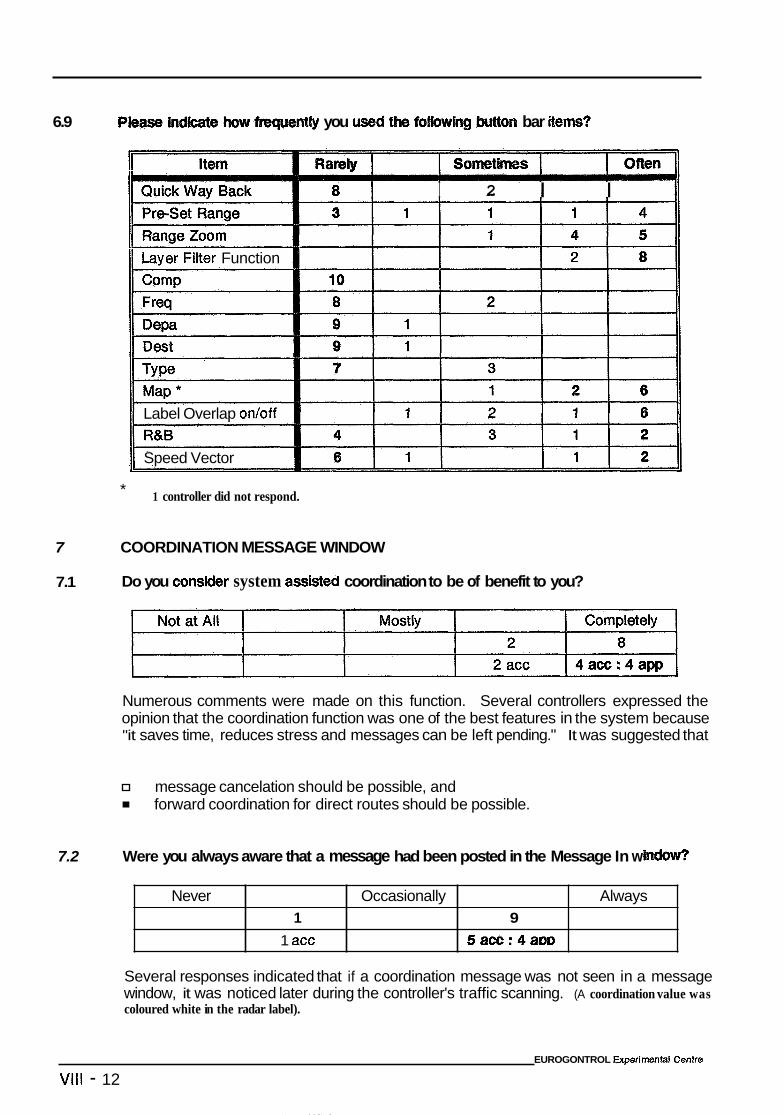
6.9 nnty you werd bar items?
Never
7
7.1
Occasionally Always 1 9
1 acc 5acc:4am
7.2
II Item
11 Laver FiRer Function
Label Overlap on/off
Speed Vector
* 1 controller did not respond.
8 1 I 2 I I
COORDINATION MESSAGE WINDOW
Do you consider system assisted coordination to be of benefit to you?
Numerous comments were made on this function. Several controllers expressed the opinion that the coordination function was one of the best features in the system because "it saves time, reduces stress and messages can be left pending." It was suggested that
message cancelation should be possible, and forward coordination for direct routes should be possible.
Were you always aware that a message had been posted in the Message In w
Several responses indicated that if a coordination message was not seen in a message window, it was noticed later during the controller's traffic scanning. (A coordination value was coloured white in the radar label).
EUROGONTROL Experimental Cenlre
Vlll - 12
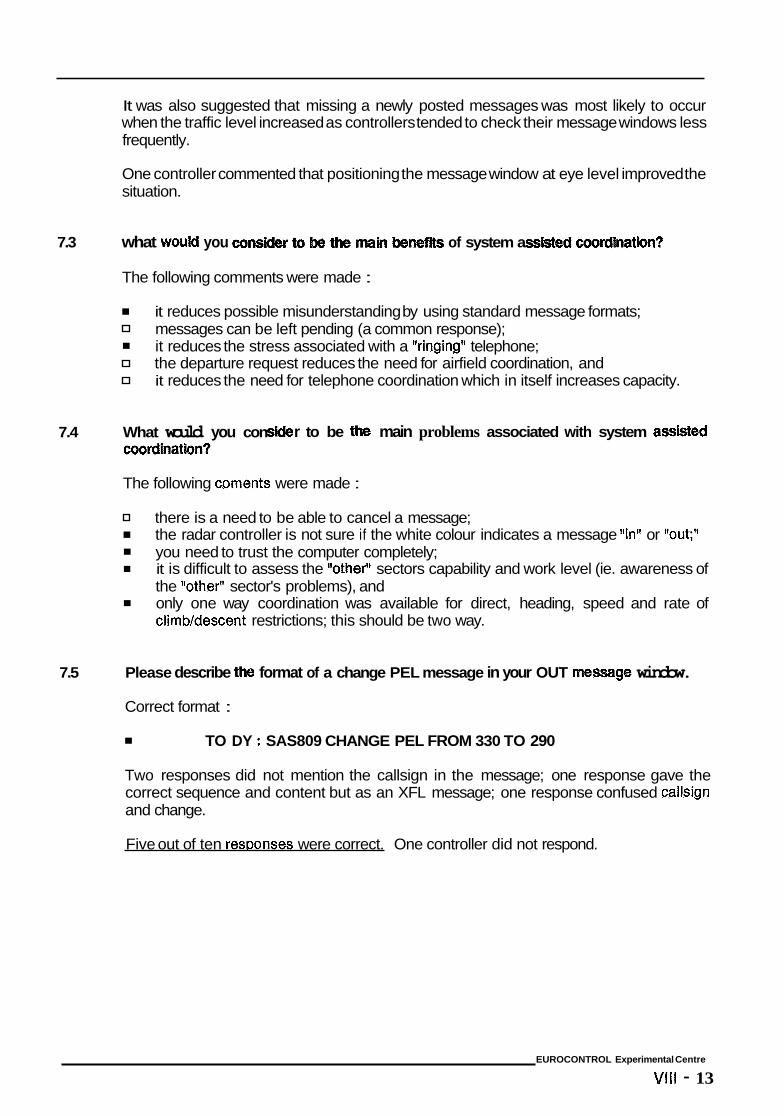
It was also suggested that missing a newly posted messages was most likely to occur when the traffic level increased as controllers tended to check their message windows less frequently.
One controller commented that positioning the message window at eye level improved the situation.
7.3 what would you of system a t h ?
The following comments were made :
it reduces possible misunderstanding by using standard message formats; messages can be left pending (a common response); it reduces the stress associated with a "ringing" telephone; the departure request reduces the need for airfield coordination, and it reduces the need for telephone coordination which in itself increases capacity.
7.4 What would you con eoordlnation?
r to be the main problems associated with system assisted
The following coments were made :
there is a need to be able to cancel a message; the radar controller is not sure if the white colour indicates a message *'in'' or "out;' you need to trust the computer completely; it is difficult to assess the tfother't sectors capability and work level (ie. awareness of the 'lother" sector's problems), and only one way coordination was available for direct, heading, speed and rate of climb/descent restrictions; this should be two way.
7.5 Please describe the format of a change PEL message in your OUT messsage window.
Correct format :
TO DY : SAS809 CHANGE PEL FROM 330 TO 290
Two responses did not mention the callsign in the message; one response gave the correct sequence and content but as an XFL message; one response confused callsign and change.
Five out of ten resmnses were correct. One controller did not respond.
EUROCONTROL Experimental Centre
Vlll - 13
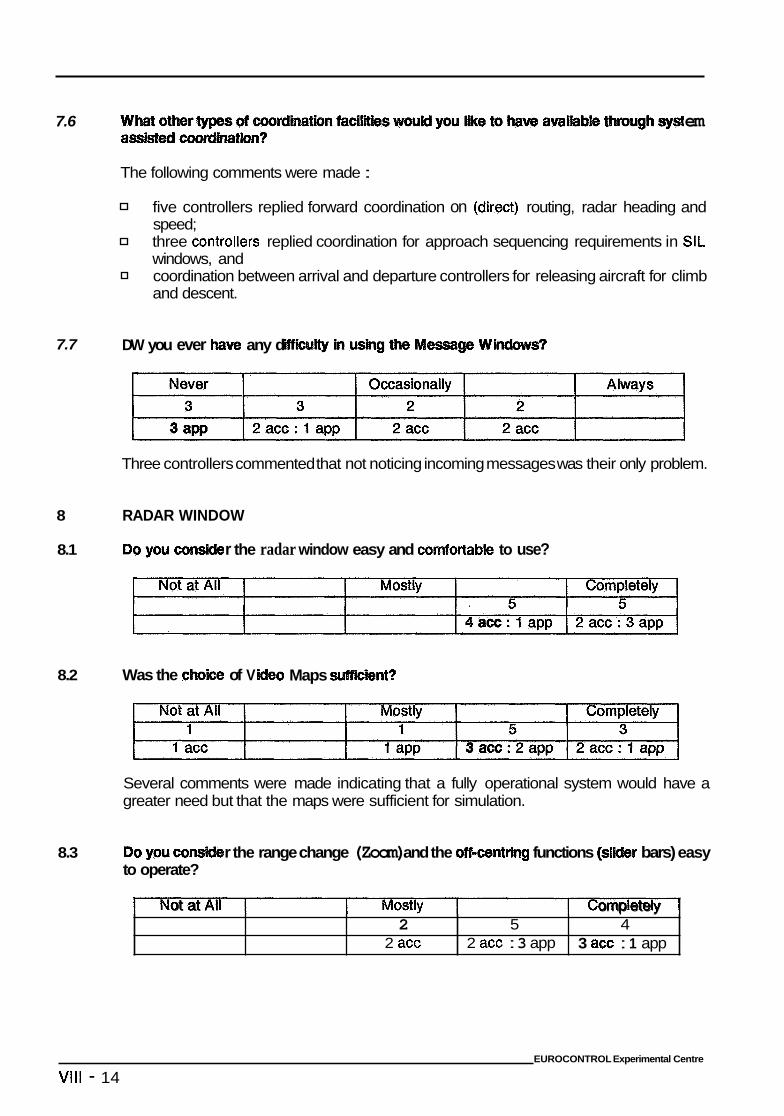
7.6 em
1 ot at AI omp ete y
2 acc 3 acc : 1 app 2 5 4
2 acc : 3 app
The following comments were made :
five controllers replied forward coordination on (direct) routing, radar heading and speed; three controllers replied coordination for approach sequencing requirements in SIL windows, and coordination between arrival and departure controllers for releasing aircraft for climb and descent.
7.7
8
8.1
8.2
8.3
DW you ever haw any d Message w
Three controllers commented that not noticing incoming messages was their only problem.
RADAR WINDOW
r the radar window easy and comfortable to use?
Was the choice of V Maps sufftisnt?
Several comments were made indicating that a fully operational system would have a greater need but that the maps were sufficient for simulation.
r the range change (Zoom) and the off-centrhg functions (slklsr bars) easy to operate?
EUROCONTROL Experimental Centre
Vlll - 14
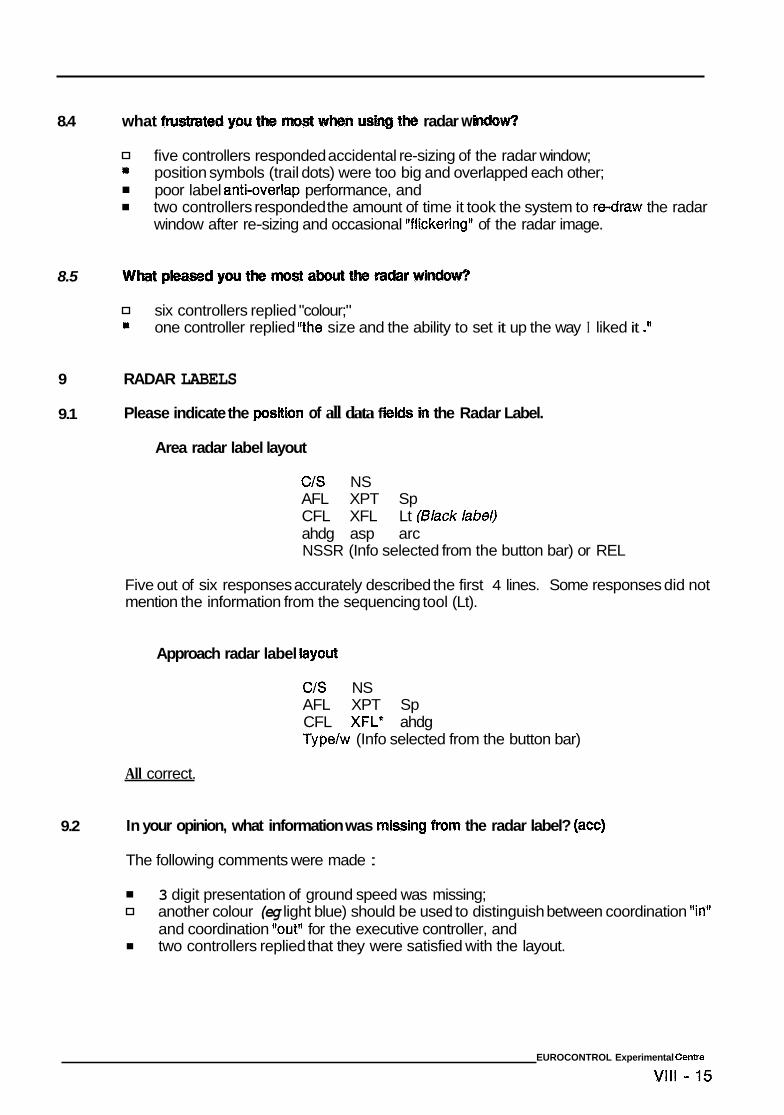
8.4 what radar w
= five controllers responded accidental re-sizing of the radar window; position symbols (trail dots) were too big and overlapped each other; poor label anttoverlap performance, and two controllers responded the amount of time it took the system to redraw the radar window after re-sizing and occasional "flickering" of the radar image.
8.5
six controllers replied "colour;" = one controller replied "the size and the ability to set it up the way I liked it .It
9 RADAR LABELS
9.1 Please indicate the postion of all data f Ids in the Radar Label.
Area radar label layout
C/S NS AFL XPT Sp CFL XFL Lt (Bhckhbel) ahdg asp arc NSSR (Info selected from the button bar) or REL
Five out of six responses accurately described the first 4 lines. Some responses did not mention the information from the sequencing tool (Lt).
Approach radar label layout
c/s NS AFL XPT Sp CFL XFL* ahdg Type/w (Info selected from the button bar)
All correct.
9.2 In your opinion, what information was missing from the radar label? (acc)
The following comments were made :
3 digit presentation of ground speed was missing; another colour (eg light blue) should be used to distinguish between coordination "in" and coordination "out" for the executive controller, and two controllers replied that they were satisfied with the layout.
EUROCONTROL Experimental CenWe
Vlll - 15
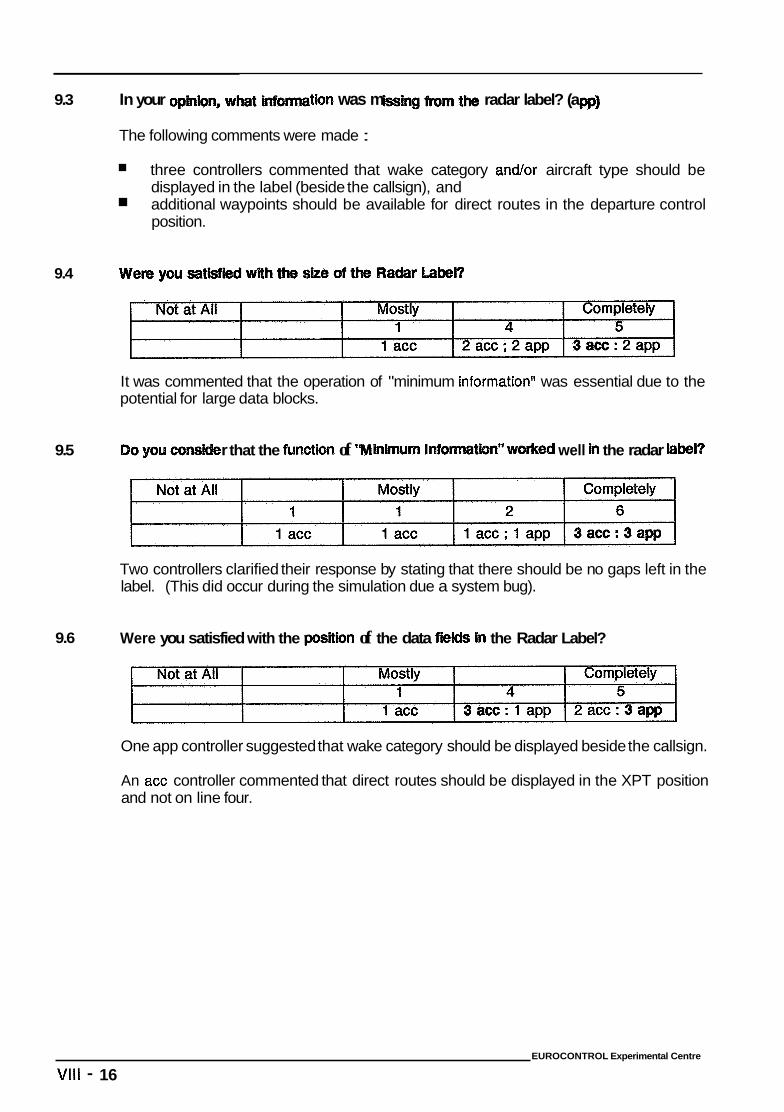
~~~
9.3 In your tbn was m radar label? (a
The following comments were made :
three controllers commented that wake category andor aircraft type should be displayed in the label (beside the callsign), and additional waypoints should be available for direct routes in the departure control position.
9.4
9.5
9.6
It was commented that the operation of "minimum information" was essential due to the potential for large data blocks.
r that the function of ' himum I ~ o ~ t ~ n ' ' ~ ~ well in the radar label?
Two controllers clarified their response by stating that there should be no gaps left in the label. (This did occur during the simulation due a system bug).
Were you satisfied with the position of the data fields Cn the Radar Label?
One app controller suggested that wake category should be displayed beside the callsign.
An acc controller commented that direct routes should be displayed in the XPT position and not on line four.
EUROCONTROL Experimental Centre
Vlll - 16
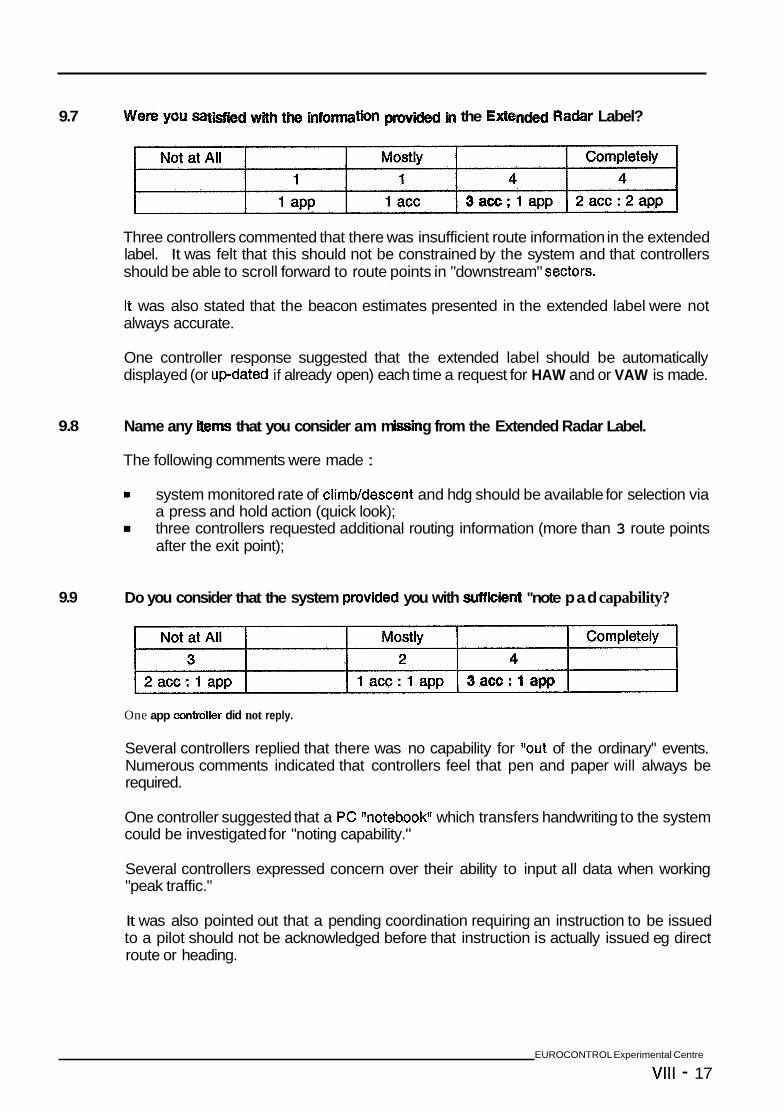
9.7 Wem y w sa t m the Exte Radar Label?
Three controllers commented that there was insufficient route information in the extended label. It was felt that this should not be constrained by the system and that controllers should be able to scroll forward to route points in "downstream" sectors.
It was also stated that the beacon estimates presented in the extended label were not always accurate.
One controller response suggested that the extended label should be automatically displayed (or updated if already open) each time a request for HAW and or VAW is made.
9.8 Name any hems that you consider am m g from the Extended Radar Label.
The following comments were made :
system monitored rate of climb/descent and hdg should be available for selection via a press and hold action (quick look); three controllers requested additional routing information (more than 3 route points after the exit point);
9.9 Do you consider that the system provided you with suffiebnt "note pad capability?
One app controller did not reply.
Several controllers replied that there was no capability for "out of the ordinary" events. Numerous comments indicated that controllers feel that pen and paper will always be required.
One controller suggested that a PC "notebookt1 which transfers handwriting to the system could be investigated for "noting capability."
Several controllers expressed concern over their ability to input all data when working "peak traffic."
It was also pointed out that a pending coordination requiring an instruction to be issued to a pilot should not be acknowledged before that instruction is actually issued eg direct route or heading.
EUROCONTROL Experimental Centre
Vlll - 17
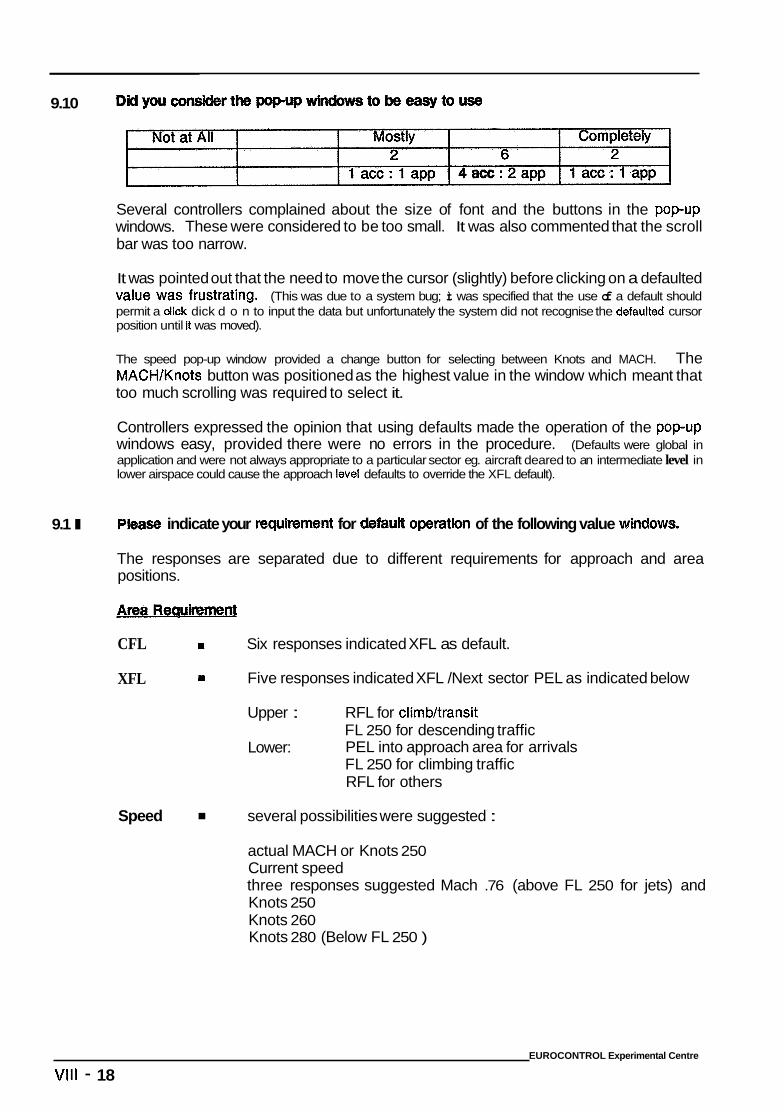
9.10 Did you P F J P
Several controllers complained about the size of font and the buttons in the popup windows. These were considered to be too small. It was also commented that the scroll bar was too narrow.
It was pointed out that the need to move the cursor (slightly) before clicking on a defaulted Value Was frustrating. (This was due to a system bug; it was specified that the use of a default should permit a dick dick d o n to input the data but unfortunately the system did not recognise the defaulted cursor position until it was moved).
The speed pop-up window provided a change button for selecting between Knots and MACH. The MACH/Knots button was positioned as the highest value in the window which meant that too much scrolling was required to select it.
Controllers expressed the opinion that using defaults made the operation of the popup windows easy, provided there were no errors in the procedure. (Defaults were global in application and were not always appropriate to a particular sector eg. aircraft deared to an intermediate level in lower airspace could cause the approach level defaults to override the XFL default).
9.1 I se indicate your mquirsmnt for dsfault operation of the following value windows.
The responses are separated due to different requirements for approach and area positions.
CFL m Six responses indicated XFL as default.
XFL rn Five responses indicated XFL /Next sector PEL as indicated below
Upper : RFL for climb/transit
Lower: FL 250 for descending traffic PEL into approach area for arrivals FL 250 for climbing traffic RFL for others
Speed several possibilities were suggested :
actual MACH or Knots 250 Current speed three responses suggested Mach .76 (above FL 250 for jets) and Knots 250 Knots 260 Knots 280 (Below FL 250 )
EUROCONTROL Experimental Centre
Vlll - 18
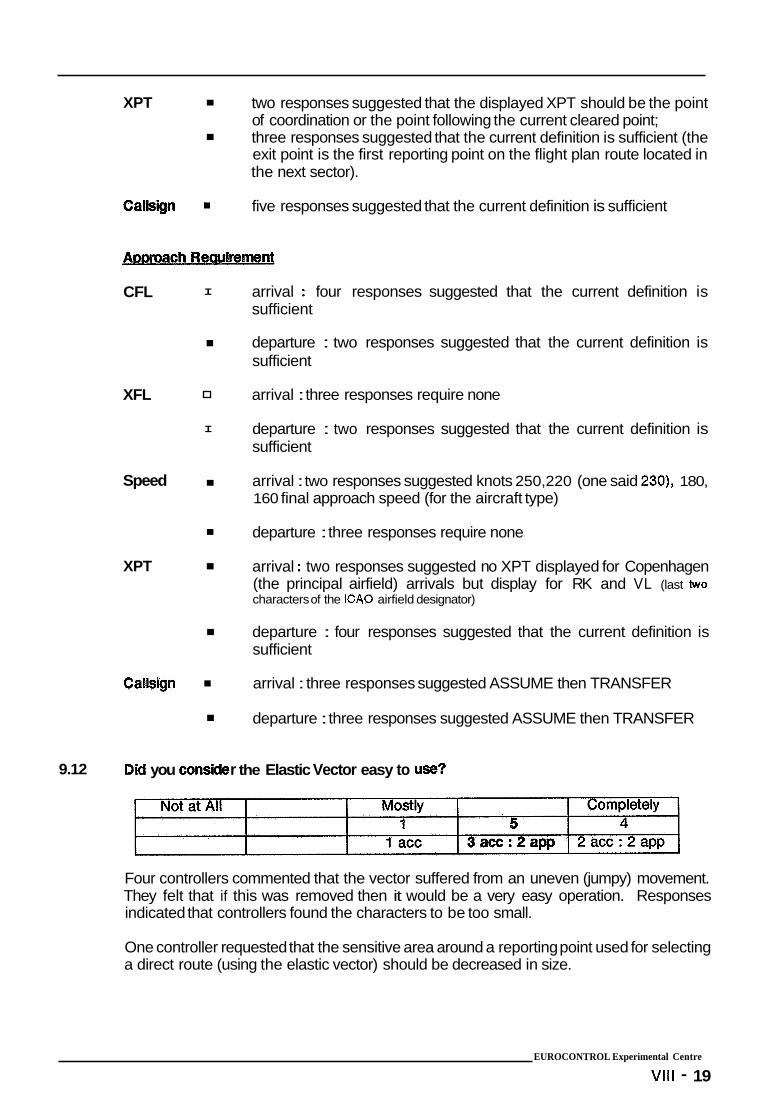
XPT I
I
two responses suggested that the displayed XPT should be the point of coordination or the point following the current cleared point; three responses suggested that the current definition is sufficient (the exit point is the first reporting point on the flight plan route located in the next sector).
five responses suggested that the current definition is sufficient
CFL I arrival : four responses suggested that the current definition is sufficient
I departure : two responses suggested that the current definition is sufficient
XFL arrival : three responses require none
I departure : two responses suggested that the current definition is sufficient
Speed I arrival : two responses suggested knots 250,220 (one said 230), 180, 160 final approach speed (for the aircraft type)
I departure : three responses require none
XPT I arrival : two responses suggested no XPT displayed for Copenhagen (the principal airfield) arrivals but display for RK and VL (last two characters of the ICAO airfield designator)
I departure : four responses suggested that the current definition is sufficient
Callsin arrival : three responses suggested ASSUME then TRANSFER
I departure : three responses suggested ASSUME then TRANSFER
9.12 Did you cons r the Elastic Vector easy to use?
Four controllers commented that the vector suffered from an uneven (jumpy) movement. They felt that if this was removed then it would be a very easy operation. Responses indicated that controllers found the characters to be too small.
One controller requested that the sensitive area around a reporting point used for selecting a direct route (using the elastic vector) should be decreased in size.
EUROCONTROL Experimental Centre
Vlll - 19
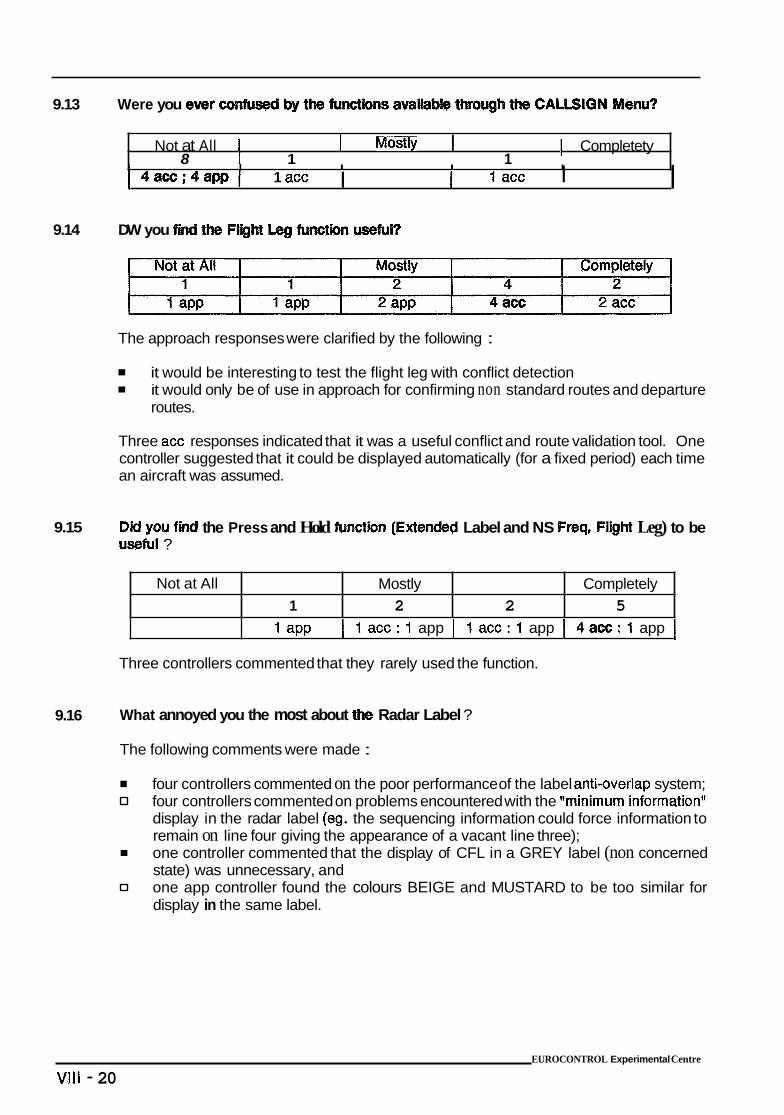
9.13 Were you fbVCar ConfIl
Not at All
Not at All I 1 Mostly I 1 Completety 8 I 1 1
Mostly Completely 1 2 2 5
I I I I
4acc;4app I 1 acc 1 ace I I 1 I 9.14 DW you
The approach responses were clarified by the following :
it would be interesting to test the flight leg with conflict detection it would only be of use in approach for confirming non standard routes and departure routes.
Three acc responses indicated that it was a useful conflict and route validation tool. One controller suggested that it could be displayed automatically (for a fixed period) each time an aircraft was assumed.
9.15 DMyouf ussful ?
the Press and Hold function (Extended Label and NS Fmq Flight Leg) to be
1 aPP I 1 acc: 1 app I 1 acc: 1 app I 4 acc: 1 app I Three controllers commented that they rarely used the function.
9.16 What annoyed you the most about the Radar Label ?
The following comments were made :
four controllers commented on the poor performance of the label anti-overlap system; four controllers commented on problems encountered with the wminimum information" display in the radar label (eg. the sequencing information could force information to remain on line four giving the appearance of a vacant line three); one controller commented that the display of CFL in a GREY label (non concerned state) was unnecessary, and one app controller found the colours BEIGE and MUSTARD to be too similar for display in the same label.
EUROCONTROL Experimental Centre
Vlll - 20
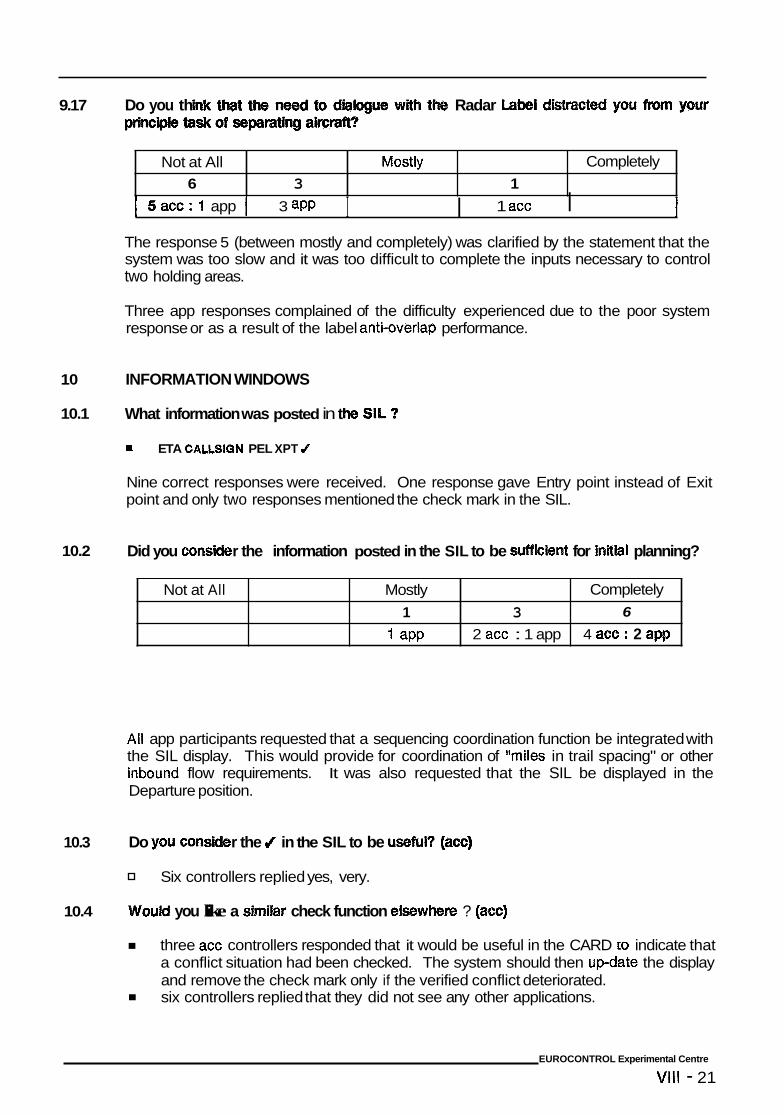
9.17 Do you th Radar Lab1 distracted ycw from your
Not at All Mostly 6 3 1
Completely
I 5 a ~ c : i app I 3 aPP 1 acc I I I 1 The response 5 (between mostly and completely) was clarified by the statement that the system was too slow and it was too difficult to complete the inputs necessary to control two holding areas.
Not at All Mostly
1 aPP
1 3 2 ace : 1 app
Three app responses complained of the difficulty experienced due to the poor system response or as a result of the label anti-overlap performance.
Completely
4 acc : 2 app 6
10 INFORMATION WINDOWS
10.1 What information was posted in t
ETA CALLSIGN PEL XPT 4
Nine correct responses were received. One response gave Entry point instead of Exit point and only two responses mentioned the check mark in the SIL.
10.2 Did you cons r the information posted in the SIL to be SUffEe i i en t for initial planning?
All app participants requested that a sequencing coordination function be integrated with the SIL display. This would provide for coordination of "miles in trail spacing" or other inbound flow requirements. It was also requested that the SIL be displayed in the Departure position.
10.3 Do youcon
Would you like a sbnibr check function elsewhere ? (acc)
r the J in the SIL to be useful? (am)
Six controllers replied yes, very.
10.4
three acc controllers responded that it would be useful in the CARD ..I indicate that a conflict situation had been checked. The system should then update the display and remove the check mark only if the verified conflict deteriorated. six controllers replied that they did not see any other applications.
EUROCONTROL Experimental Centre
Vlll - 21
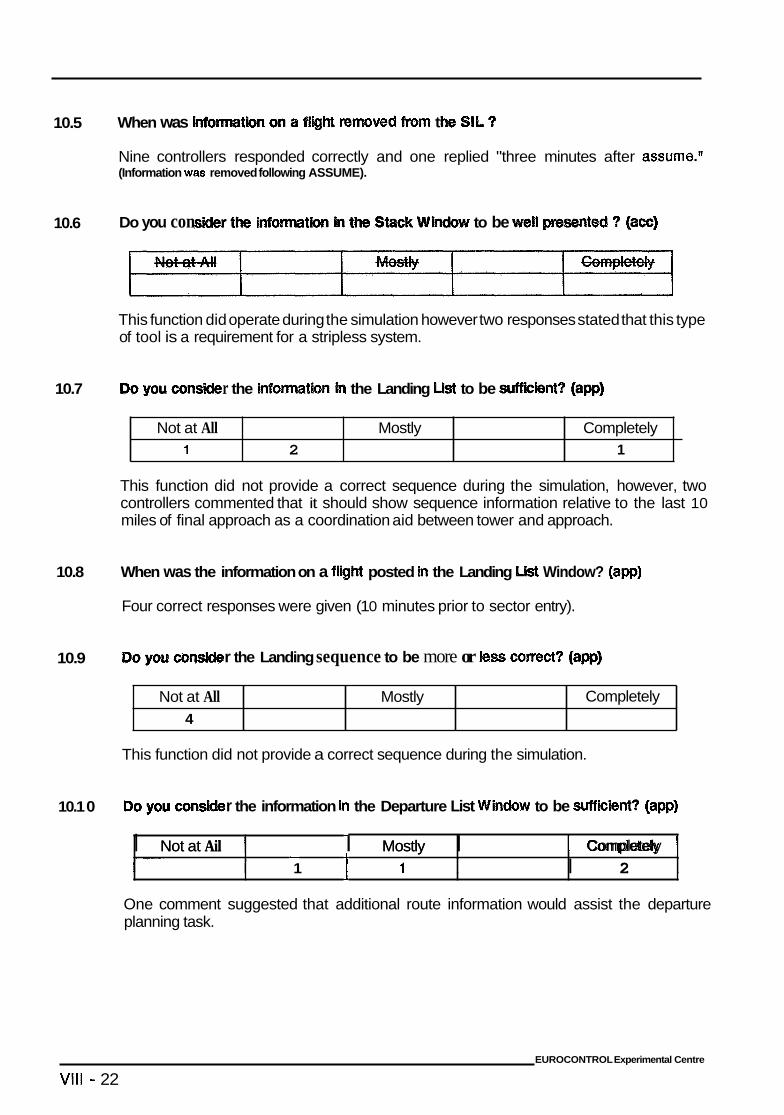
10.5
10.6
10.7
10.8
10.9
10.1 0
Not at All 1 2
When was Pnformat Qht removed hwn t
Mostly Completely 1
Nine controllers responded correctly and one replied "three minutes after assume." (Information was removed following ASSUME).
Not at All Mostly 4
Do you con to be nted ? (ace)
Completely
This function did operate during the simulation however two responses stated that this type of tool is a requirement for a stripless system.
I Not at Ail 1 I Mostly I I Completely
r the infomtion in the Landing List to be nt? (awl
I I 2
This function did not provide a correct sequence during the simulation, however, two controllers commented that it should show sequence information relative to the last 10 miles of final approach as a coordination aid between tower and approach.
I
When was the information on a flbht posted in the Landing List Window? (app)
I
Four correct responses were given (1 0 minutes prior to sector entry).
Not at Ail Mostly 1 1
r the Landing sequence to be more or less m c t ? (app)
Completely 2 1
This function did not provide a correct sequence during the simulation.
I
r the information in the Departure List Window to be suffzCDsnt? (app)
1
One comment suggested that additional route information would assist the departure planning task.
EUROCONTROL Experimental Centre
Vlll .. 22
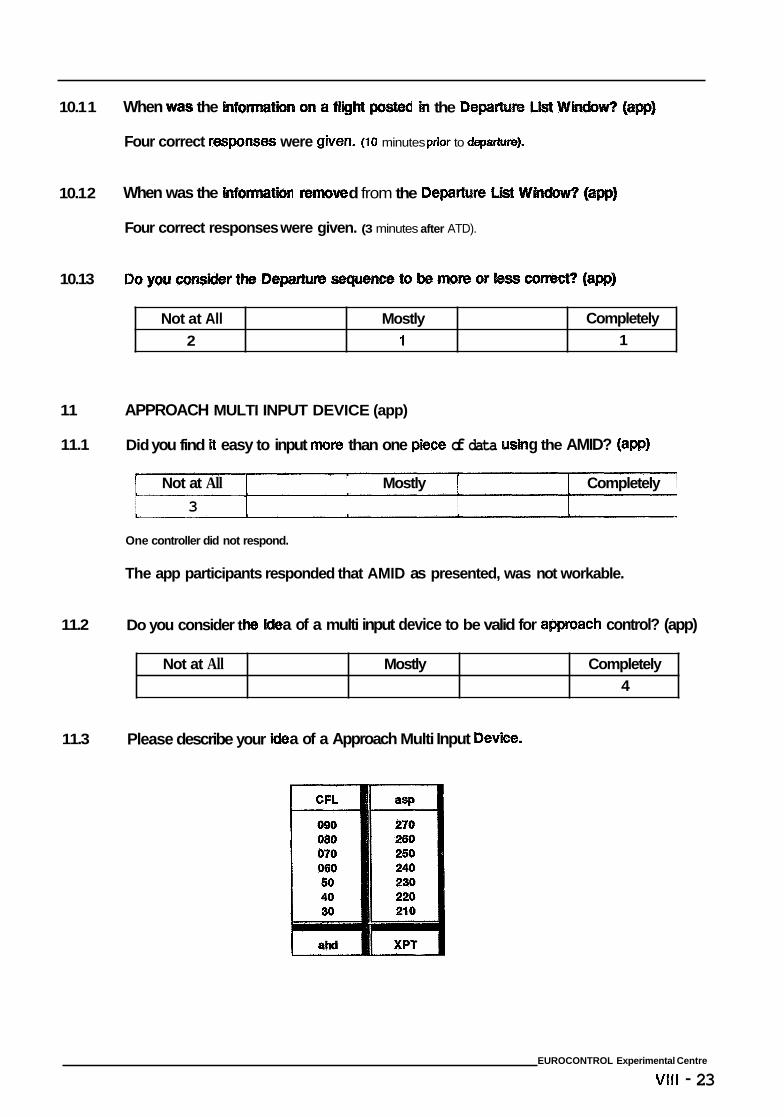
10.1 1
10.1 2
10.13
11
11.1
11.2
11.3
Not at All Mostly 2 1
When was the h the DeparREre
Completely 1
Four correct resmnses were given. (10 minutes pdor to depatture).
Not at All Mostly
When was the d from the Departure
Completely 4
Four correct responses were given. (3 minutes after ATD).
APPROACH MULTI INPUT DEVICE (app)
Did you find it easy to input more than one p W of data g the AMID? (app)
Not at All Mostly Completely 3
One controller did not respond.
The app participants responded that AMID as presented, was not workable.
Do you consider t a of a multi input device to be valid for approach control? (app)
Please describe your a of a Approach Multi Input Device.
EUROCONTROL Experimental Centre
VIIl - 23
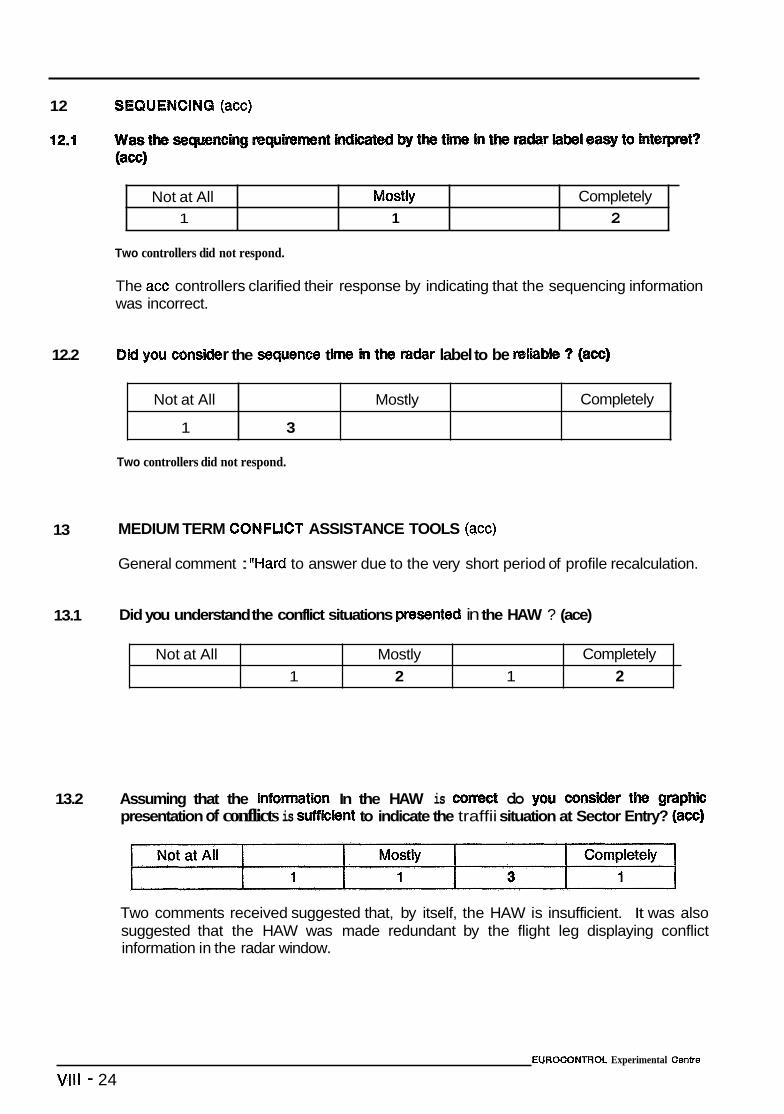
12 SEQUENCING (acc)
Not at All 1
Most& Completely 1 2
Two controllers did not respond.
Not at All Mostly
1 3
The acc controllers clarified their response by indicating that the sequencing information was incorrect.
Completely
12.2 Didyoucons r the sequence t mdar label to be relim
Not at All Mostly 1 2
Completely 1 2
Two controllers did not respond.
13 MEDIUM TERM CONFLICT ASSISTANCE TOOLS (acc)
General comment : "Hard to answer due to the very short period of profile recalculation.
13.1 Did you understand the conflict situations prssented in the HAW ? (ace)
13.2 Assuming that the information In the HAW is correct do y w presentation of conflicts is suffiebnt to indicate the traffii situation at Sector Entry? (acc)
Two comments received suggested that, by itself, the HAW is insufficient. It was also suggested that the HAW was made redundant by the flight leg displaying conflict information in the radar window.
EUROCONTROL Experimental Cenb-e
Vlll - 24
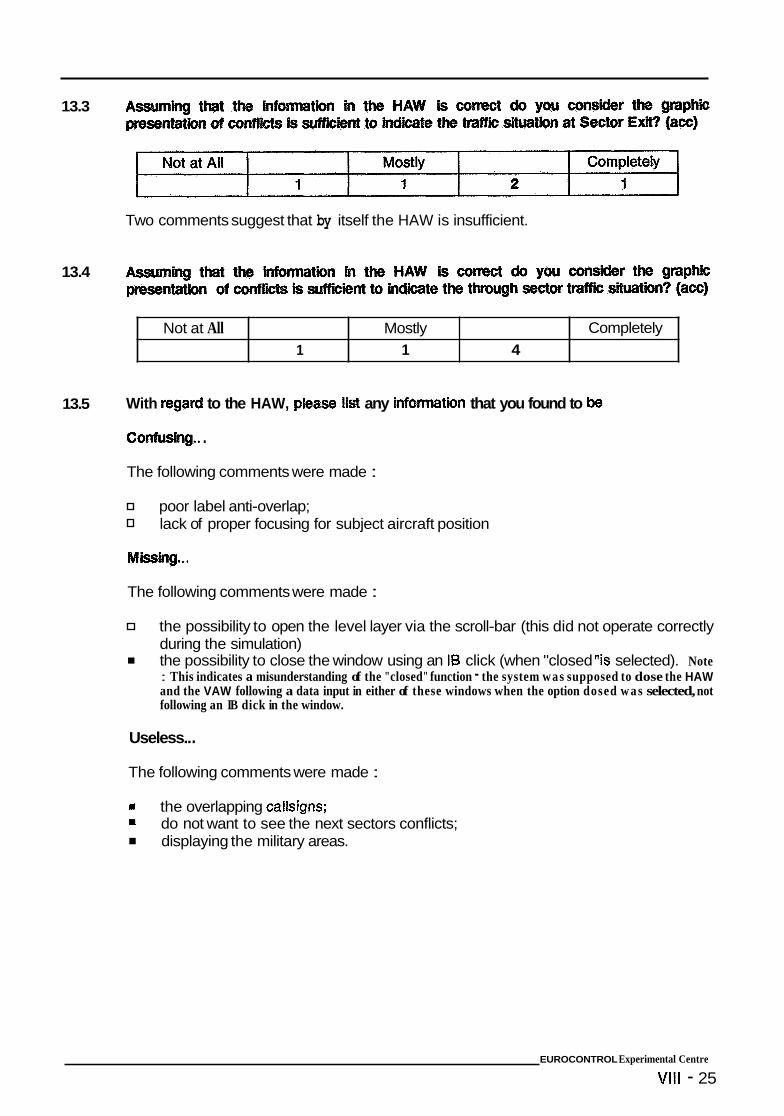
13.3
13.4
13.5
Not at All Mostly 1 1 4
Two comments suggest that by itself the HAW is insufficient.
Completely
With regard to the HAW, please llst any infomatbn that you found to be
confusing.. . The following comments were made :
poor label anti-overlap; lack of proper focusing for subject aircraft position
The following comments were made :
the possibility to open the level layer via the scroll-bar (this did not operate correctly during the simulation) the possibility to close the window using an IS click (when "closed "is selected). Note : This indicates a misunderstanding of the "closed" function - the system was supposed to dose the HAW and the VAW following a data input in either of these windows when the option dosed w a s selected, not following an IB dick in the window.
Useless.. . The following comments were made :
= the overlapping callsigns; =
displaying the military areas. do not want to see the next sectors conflicts;
EUROCONTROL Experimental Centre
Vlll - 25
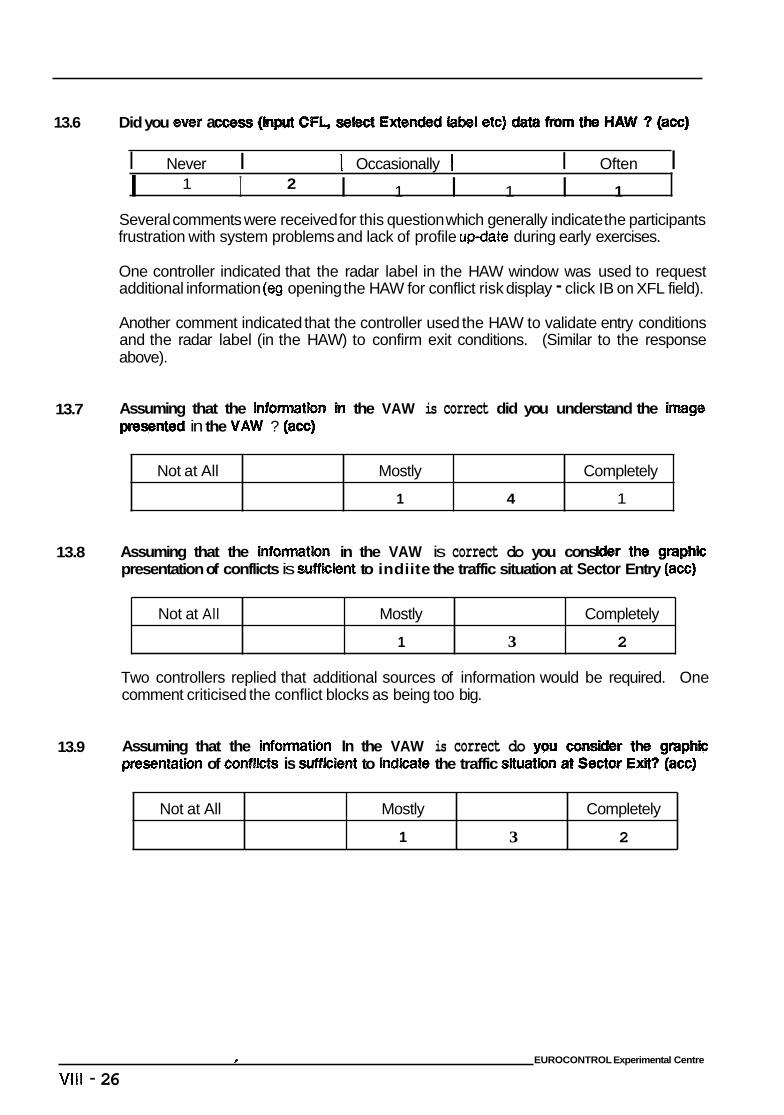
13.6 Did you ewr a ExteWd litbcal etc)
Not at All Mostly
1 4
I Never I I Occasionally I I Often I
Completely
1
I I I 1 I 1 I 1 1 2
Not at All
Several comments were received for this question which generally indicate the participants frustration with system problems and lack of profile update during early exercises.
Mostly Completely
1 3 2
One controller indicated that the radar label in the HAW window was used to request additional information (q opening the HAW for conflict risk display - click IB on XFL field).
Not at All Mostly
1
Another comment indicated that the controller used the HAW to validate entry conditions and the radar label (in the HAW) to confirm exit conditions. (Similar to the response above).
Completely
3 2
13.7 Assuming that the Infomtbn in the VAW is correct did you understand the brrage presented in the VAVV ? (am)
13.8 Assuming that the infomtion in the VAW is correct do you cons presentation of conflicts is sufficient to indiite the traffic situation at Sector Entry (ace)
Two controllers replied that additional sources of information would be required. One comment criticised the conflict blocks as being too big.
13.9 Assuming that the information In the VAW is correct do presentation of conflicts is sufficient to indkate the traffic sftua
r EUROCONTROL Experimental Centre
VIll - 26
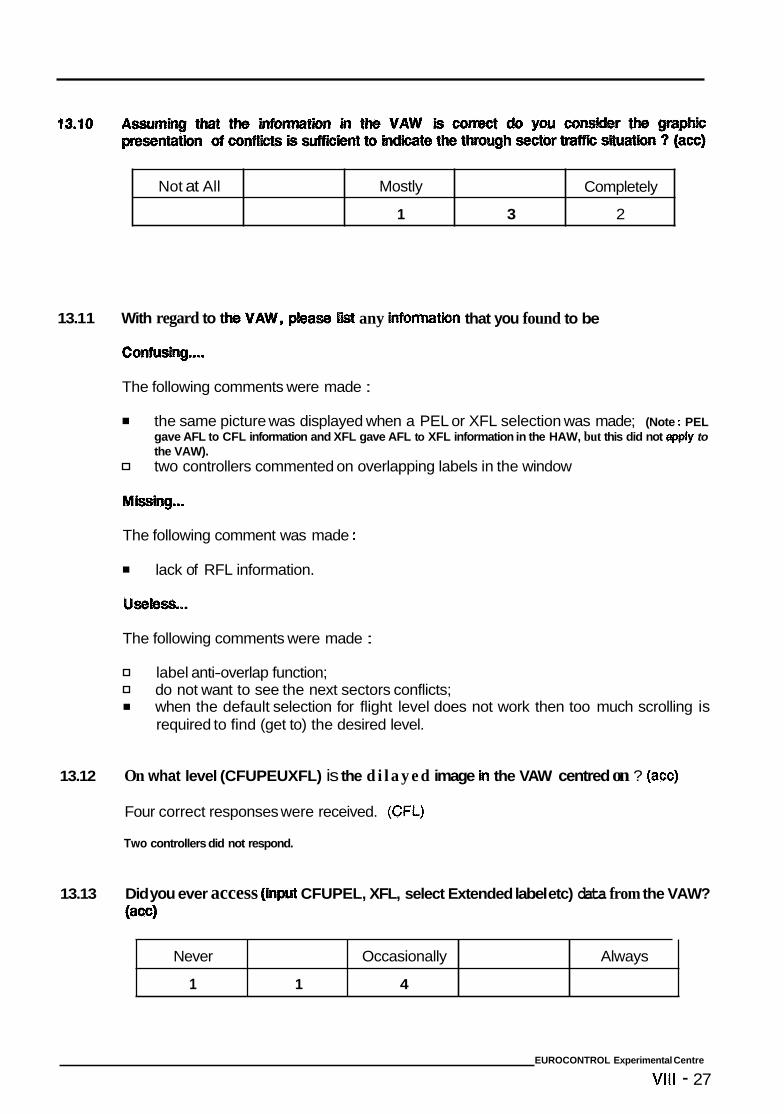
Not at All Mostly
1 3
13.1 1 With regard to t lEst any infonnath that you found to be
Completely
2
The following comments were made :
Never Occasionally
1 1 4
the same picture was displayed when a PEL or XFL selection was made; (Note : PEL gave AFL to CFL information and XFL gave AFL to XFL information in the HAW, but this did not apply to the VAW). two controllers commented on overlapping labels in the window
Always
The following comment was made :
lack of RFL information.
The following comments were made :
label anti-overlap function; do not want to see the next sectors conflicts; when the default selection for flight level does not work then too much scrolling is required to find (get to) the desired level.
13.12 On what level (CFUPEUXFL) is the d i l a y e d image h the VAW centred on ? (acc)
Four correct responses were received. (CFL)
Two controllers did not respond.
13.13 Did you ever access (input CFUPEL, XFL, select Extended label etc) data from the VAW? (am
EUROCONTROL Experimental Centre
Vlll - 27
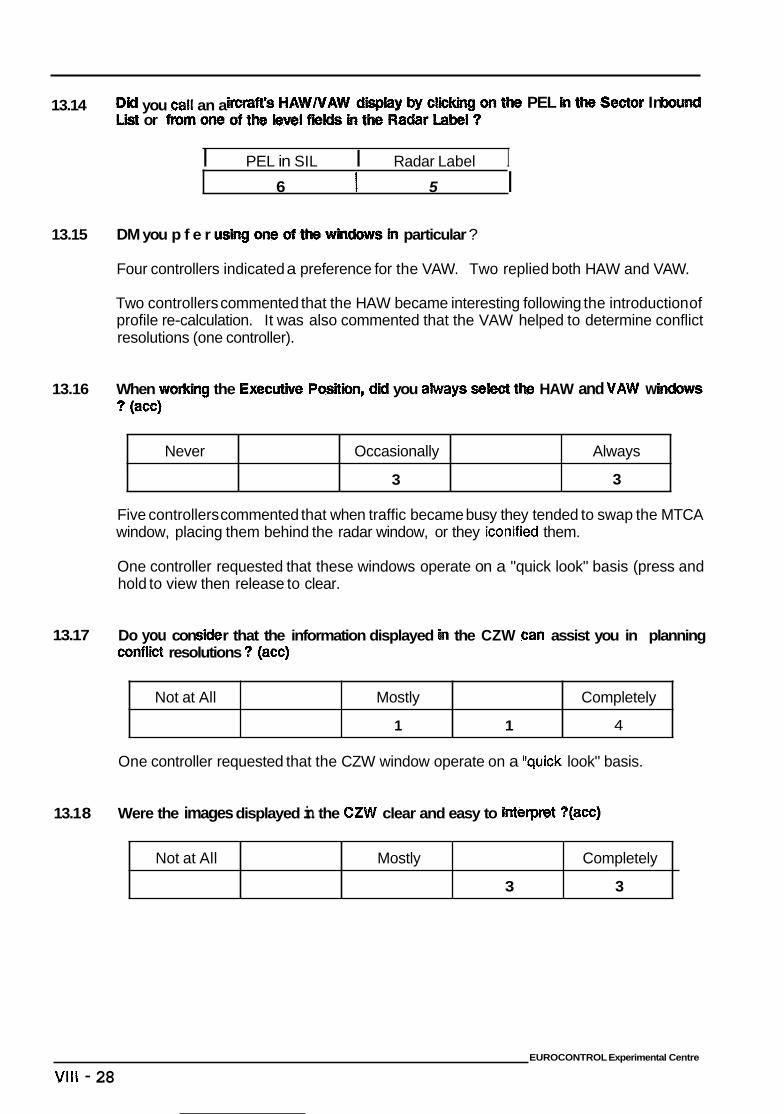
PEL Sector In 13.14 you cal an a by or h.omane da
Never Occasionally
3
I PEL in SIL I Radar Label I
Always
3
6 I 5 I
Not at All Mostly
1 1
13.15 DM you p f e r particular ?
Completely
4
Four controllers indicated a preference for the VAW. Two replied both HAW and VAW.
Not at All Mostly
3
Two controllers commented that the HAW became interesting following the introduction of profile re-calculation. It was also commented that the VAW helped to determine conflict resolutions (one controller).
Completely
3
13.16 When the Executhre Position, did you always se HAW and VAW w ? (ace)
Five controllers commented that when traffic became busy they tended to swap the MTCA window, placing them behind the radar window, or they iconified them.
One controller requested that these windows operate on a "quick look" basis (press and hold to view then release to clear.
13.17 Do you con conflict resolutions ? (ace)
r that the information displayed in the CZW can assist you in planning
One controller requested that the CZW window operate on a "quick look" basis.
13.1 8 Were the images displayed in the CZW clear and easy to hterpret ?(a=)
EUROCONTROL Experimental Centre
Vlll - 28
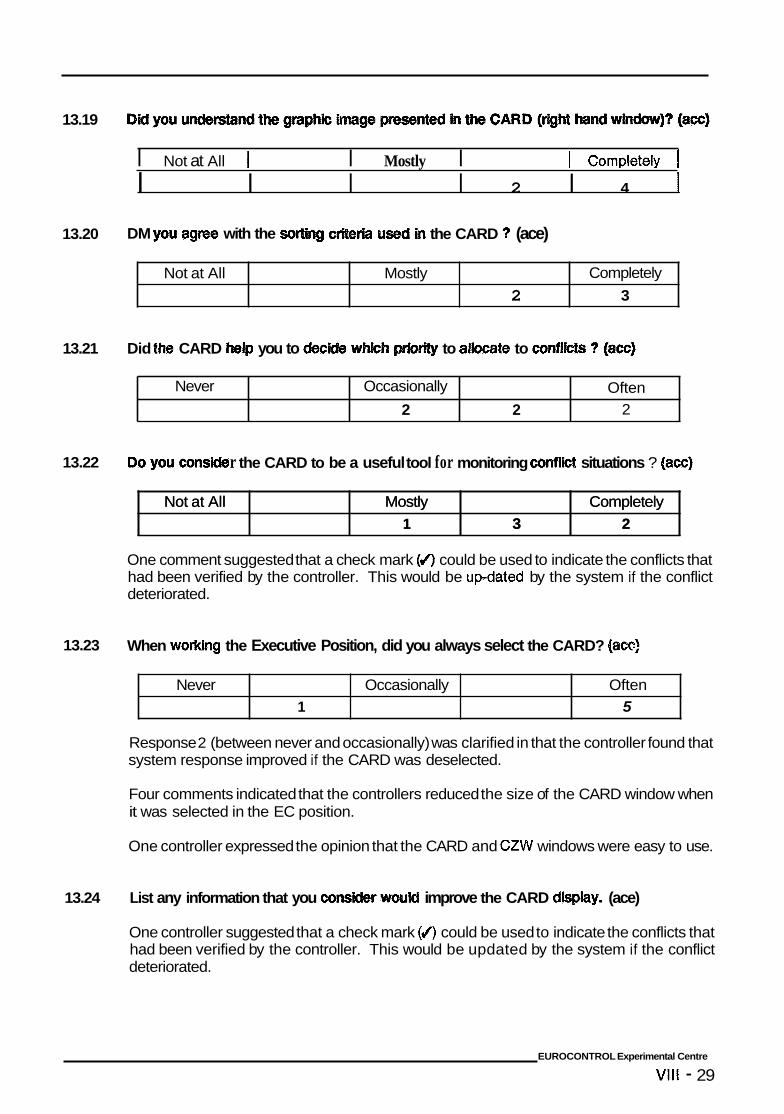
13.19
13.20
13.21
13.22
13.23
13.24
Not at All Mostly 2
I Not at All I I Mostly I 1 Completely I
Completely 3
I I I I 2 I 4 I
Never Occasionally 2 2
DM you a g m with the sort the CARD 3 (ace)
Often 2
Not at All
Did the CARD help you to dec to aflocate to CORff
Mostly Completely 1 3 2
Not at All
r the CARD to be a useful tool for monitoring conflict situations ? (ace)
Mostly Completely 1 3 2
Never Occasionally Often 1 5
One comment suggested that a check mark (0 could be used to indicate the conflicts that had been verified by the controller. This would be updated by the system if the conflict deteriorated.
When woricing the Executive Position, did you always select the CARD? (ace!
Response 2 (between never and occasionally) was clarified in that the controller found that system response improved if the CARD was deselected.
Four comments indicated that the controllers reduced the size of the CARD window when it was selected in the EC position.
One controller expressed the opinion that the CARD and CZW windows were easy to use.
List any information that you cons-kler wou improve the CARD display. (ace)
One controller suggested that a check mark (4) could be used to indicate the conflicts that had been verified by the controller. This would be updated by the system if the conflict deteriorated.
EUROCONTROL Experimental Centre
Vlll - 29
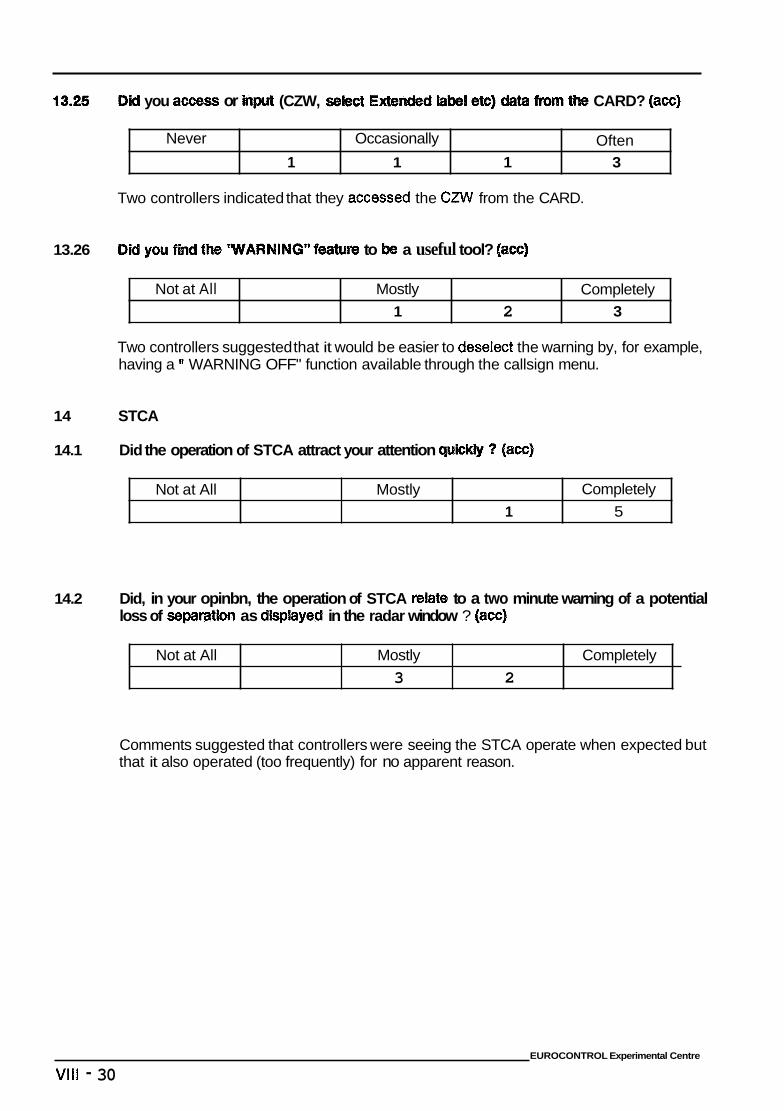
you access or input (CZW, CARD? (acc)
Never Occasionally
1 1 1 Often
3
Two controllers indicated that they access4 the CZISV from the CARD.
Not at All Mostly 1 2
13.26 Didyywf the 'WARNINWfeatum to km a useful tool? (a=)
Completely 3
Not at All Mostly 1
Two controllers suggested that it would be easier to deselect the warning by, for example, having a WARNING OFF" function available through the callsign menu.
Completely 5
14
14.1
Not at All Mostly 3
14.2
Completely 2
STCA
Did the operation of STCA attract your attention qwkkty ? (acc)
Did, in your opinbn, the operation of STCA mlate to a two minute warning of a potential loss of separatb as displayed in the radar window ? (acc)
Comments suggested that controllers were seeing the STCA operate when expected but that it also operated (too frequently) for no apparent reason.
EUROCONTROL Experimental Centre
Vlll - 30
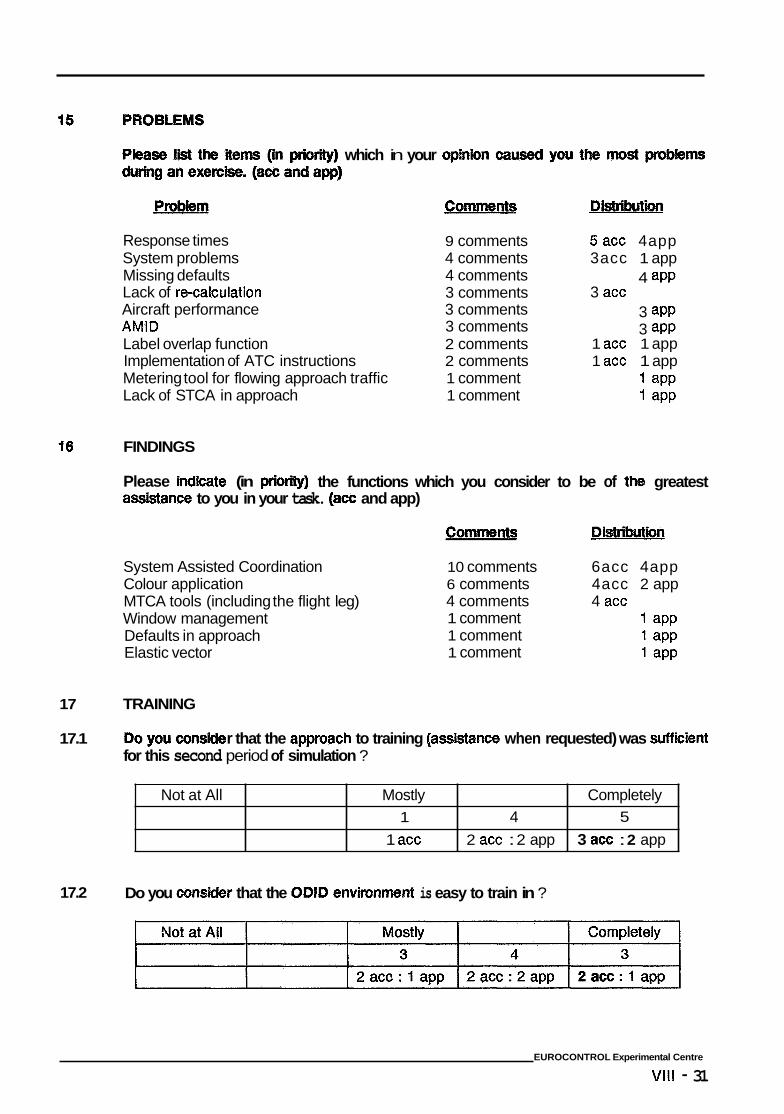
15
Not at All Mostly
1 acc 1 4
2 acc : 2 app
16
Completely 5
3 acc : 2 app
which in your
Response times System problems Missing defaults Lack of re-calculation Aircraft performance AMID Label overlap function Implementation of ATC instructions Metering tool for flowing approach traffic Lack of STCA in approach
FINDINGS
9 comments 4 comments 4 comments 3 comments 3 comments 3 comments 2 comments 2 comments 1 comment 1 comment
5acc 4app 3acc 1 app
4 aPP 3 acc
3 aPP 3 aPP
1 ace 1 app 1 acc 1 app
1 aPP 1 aPP
Please indicate (in assstance to you in your task. (ace and app)
the functions which you consider to be of the greatest
CommenQ
System Assisted Coordination Colour application MTCA tools (including the flight leg) Window management Defaults in approach Elastic vector
10 comments 6acc 4app 6 comments 4acc 2 app 4 comments 4 acc 1 comment 1 aPP 1 comment 1 aPP 1 comment 1 aPP
17 TRAINING
17.1 r that the apjmach to training (assistance when requested) was sufticient for this second period of simulation ?
17.2 Do you consMer that the ODlD envlmmnt is easy to train in ?
EUROCONTROL Experimental Centre
Vlll - 31
ANNEX IX
ODlD IV
CONTROLLER WORKING POSITION ANALYSIS
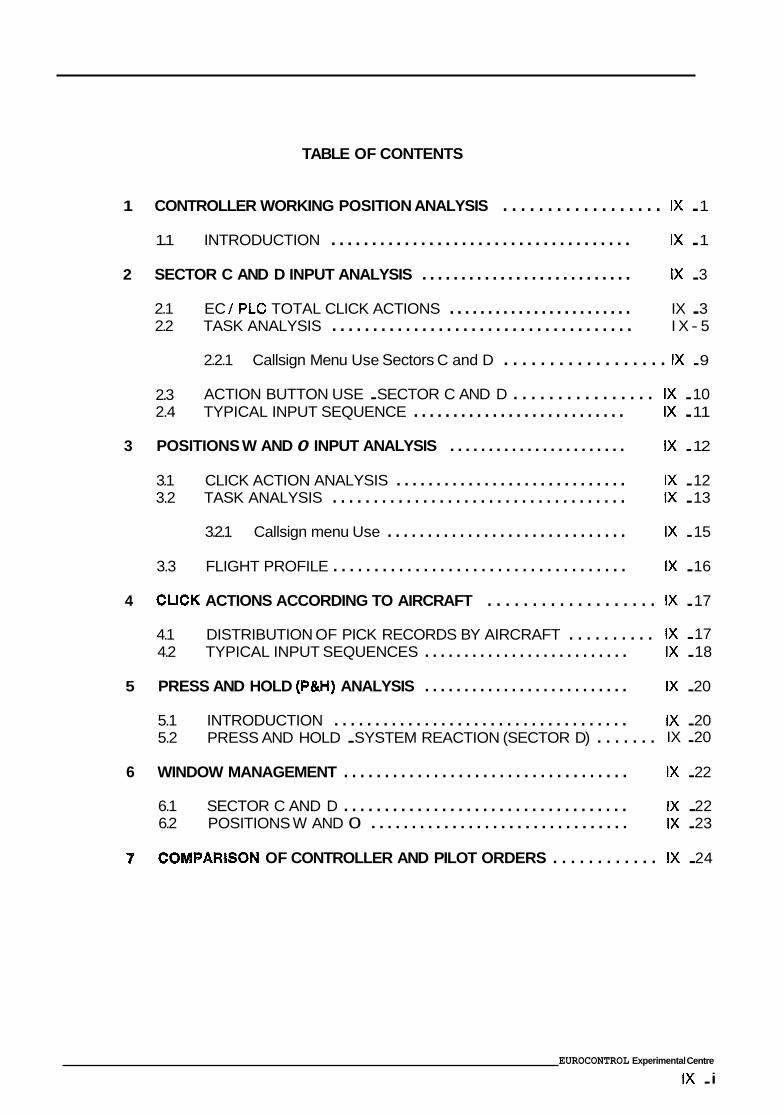
TABLE OF CONTENTS
1 CONTROLLER WORKING POSITION ANALYSIS .................. IX . 1
1.1 INTRODUCTION ..................................... IX . 1
2 SECTOR C AND D INPUT ANALYSIS ........................... IX . 3
2.1 EC / PLC TOTAL CLICK ACTIONS ........................ IX . 3 2.2 TASK ANALYSIS ..................................... I X - 5
2.2.1 Callsign Menu Use Sectors C and D . . . . . . . . . . . . . . . . . . IX . 9
2.3 ACTION BUTTON USE . SECTOR C AND D . . . . . . . . . . . . . . . . IX . 10 2.4 TYPICAL INPUT SEQUENCE ........................... IX . 11
3 POSITIONS W AND 0 INPUT ANALYSIS ....................... IX . 12
3.1 CLICK ACTION ANALYSIS ............................. IX . 12 3.2 TASK ANALYSIS .................................... IX . 13
3.2.1 Callsign menu Use .............................. IX . 15
3.3 FLIGHT PROFILE .................................... IX . 16
4 CLICK ACTIONS ACCORDING TO AIRCRAFT . . . . . . . . . . . . . . . . . . . IX . 17
4.1 DISTRIBUTION OF PICK RECORDS BY AIRCRAFT . . . . . . . . . . IX . 17 4.2 TYPICAL INPUT SEQUENCES .......................... IX . 18
5 PRESS AND HOLD (PW) ANALYSIS .......................... IX . 20
5.1 INTRODUCTION .................................... IX . 20 5.2 PRESS AND HOLD . SYSTEM REACTION (SECTOR D) . . . . . . . IX . 20
6 WINDOW MANAGEMENT ................................... IX . 22
6.1 SECTOR C AND D ................................... IX . 22 6.2 POSITIONS W AND 0 ................................ IX . 23
PARISON OF CONTROLLER AND PILOT ORDERS . . . . . . . . . . . . IX . 24
EUROCONTROL Experimental Centre
IX . i
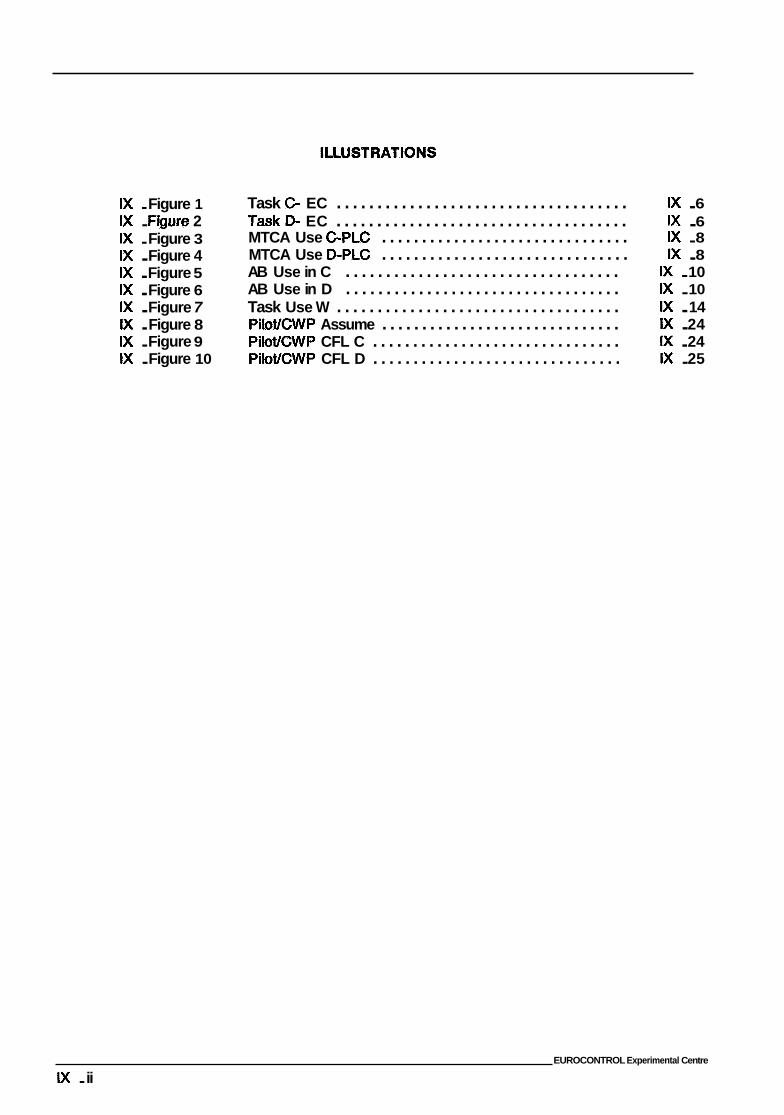
ILLUSTRATIOMS
IX . Figure 1 IX . Figure 2 IX . Figure 3 IX . Figure 4 IX . Figure 5 IX . Figure 6 IX . Figure 7 IX . Figure 8 IX . Figure 9 IX . Figure 10
Task C- EC .................................... IX . 6 T a k D- EC .................................... IX . 6 MTCA Use C-PLC ............................... IX . 8 MTCA Use D-PLC ............................... IX . 8 AB Use in C .................................. IX . 10 AB Use in D .................................. IX . 10 Task Use W ................................... IX . 14 Pilot/CWP Assume .............................. IX . 24 Pilot/CWP CFL C ............................... IX . 24 Pilot/CWP CFL D ............................... IX . 25
EUROCONTROL Experimental Centre
IX . ii
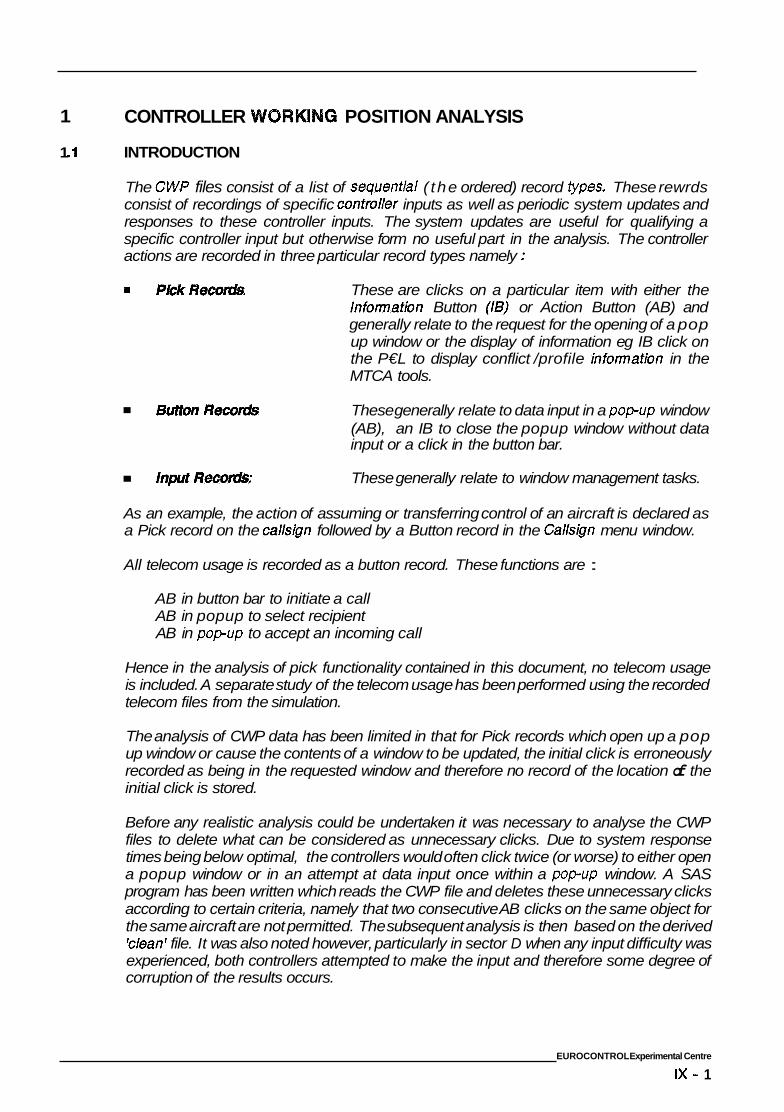
1 CONTROLLER WORKING POSITION ANALYSIS
1 .I INTRODUCTION
The CWP files consist of a list of stquential ( the ordered) record Wpes. These rewrds consist of recordings of specific controller inputs as well as periodic system updates and responses to these controller inputs. The system updates are useful for qualifying a specific controller input but otherwise form no useful part in the analysis. The controller actions are recorded in three particular record types namely :
These are clicks on a particular item with either the Infomatbn Button (IB) or Action Button (AB) and generally relate to the request for the opening of a pop up window or the display of information eg IB click on the P€L to display conflict /profile informatbn in the MTCA tools.
BuitmR These generally relate to data input in a popup window (AB), an IB to close the popup window without data input or a click in the button bar.
lnputRe&: These generally relate to window management tasks.
As an example, the action of assuming or transferring control of an aircraft is declared as a Pick record on the callsgn followed by a Button record in the Callsgn menu window.
All telecom usage is recorded as a button record. These functions are :
AB in button bar to initiate a call AB in popup to select recipient AB in popup to accept an incoming call
Hence in the analysis of pick functionality contained in this document, no telecom usage is included. A separate study of the telecom usage has been performed using the recorded telecom files from the simulation.
The analysis of CWP data has been limited in that for Pick records which open up a pop up window or cause the contents of a window to be updated, the initial click is erroneously recorded as being in the requested window and therefore no record of the location of the initial click is stored.
Before any realistic analysis could be undertaken it was necessary to analyse the CWP files to delete what can be considered as unnecessary clicks. Due to system response times being below optimal, the controllers would often click twice (or worse) to either open a popup window or in an attempt at data input once within a popup window. A SAS program has been written which reads the CWP file and deletes these unnecessary clicks according to certain criteria, namely that two consecutive AB clicks on the same object for the same aircraft are not permitted. The subsequent analysis is then based on the derived Wean' file. It was also noted however, particularly in sector D when any input difficulty was experienced, both controllers attempted to make the input and therefore some degree of corruption of the results occurs.
EUROCONTROL Experimental Centre
IX- 1
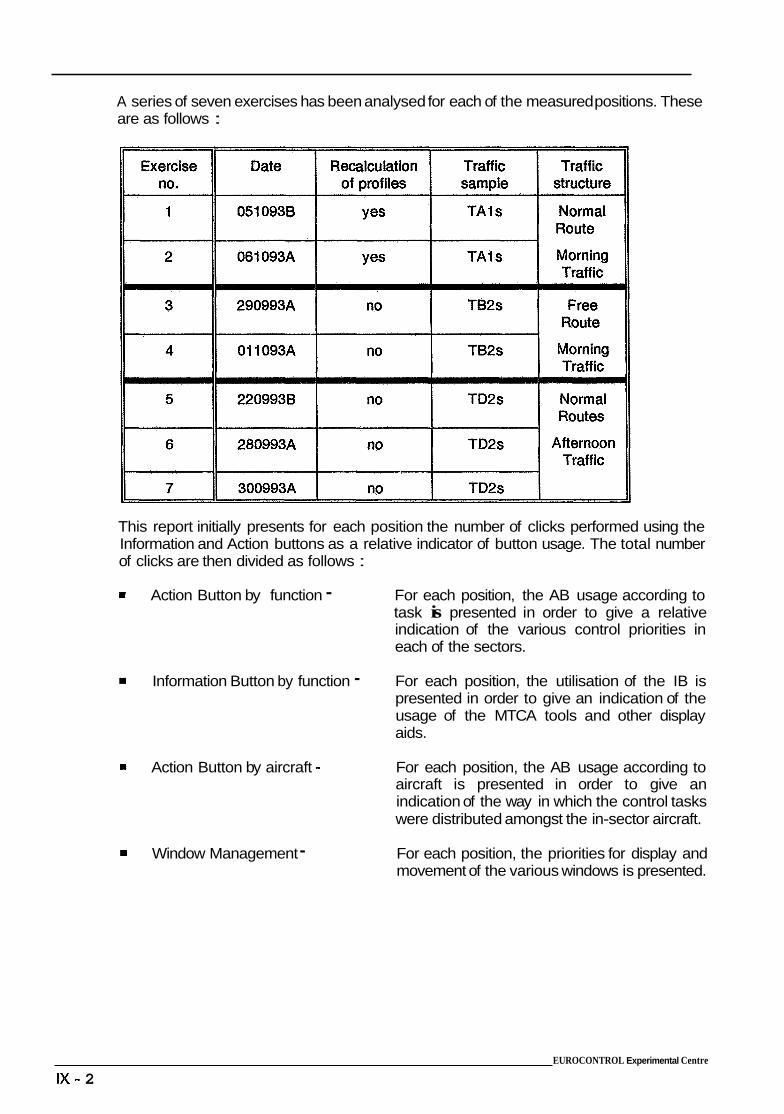
A series of seven exercises has been analysed for each of the measured positions. These are as follows :
Exercise ~1
This report initially presents for each position the number of clicks performed using the Information and Action buttons as a relative indicator of button usage. The total number of clicks are then divided as follows :
Action Button by function -
Information Button by function -
Action Button by aircraft -
Window Management -
For each position, the AB usage according to task is presented in order to give a relative indication of the various control priorities in each of the sectors.
For each position, the utilisation of the IB is presented in order to give an indication of the usage of the MTCA tools and other display aids.
For each position, the AB usage according to aircraft is presented in order to give an indication of the way in which the control tasks were distributed amongst the in-sector aircraft.
For each position, the priorities for display and movement of the various windows is presented.
EUROCONTROL Experimental Centre
IX - 2
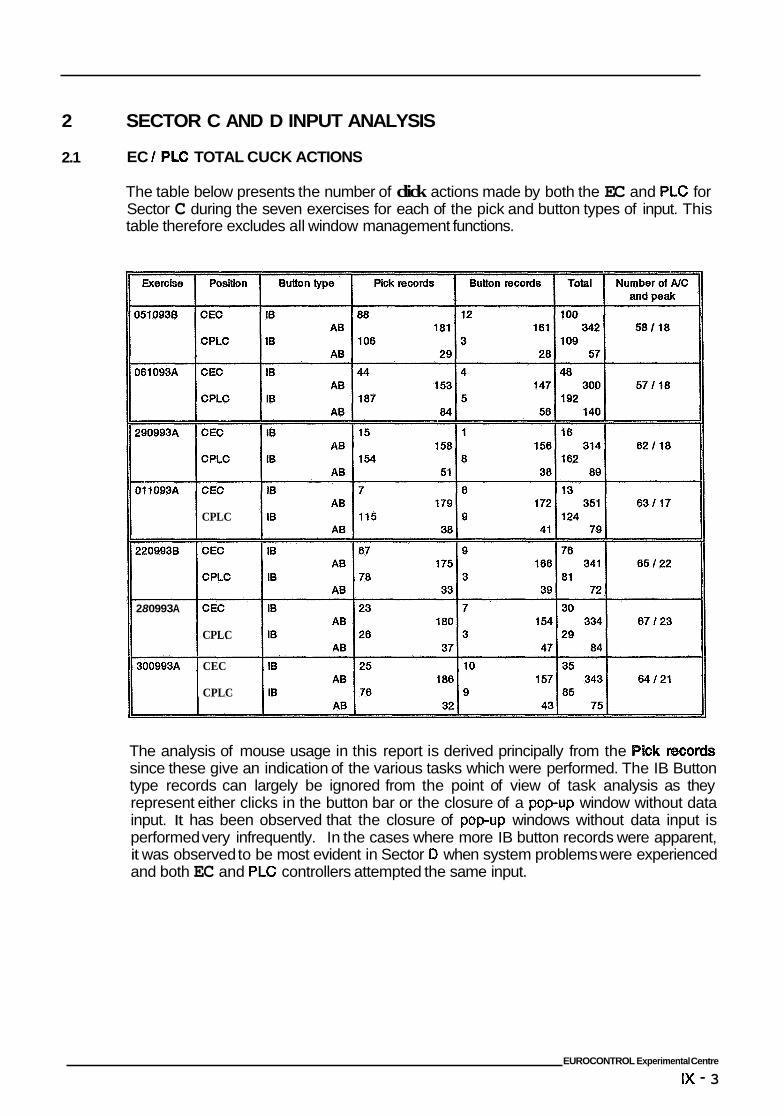
2 SECTOR C AND D INPUT ANALYSIS
2.1 EC / PLC TOTAL CUCK ACTIONS
The table below presents the number of click actions made by both the EC and PLC for Sector C during the seven exercises for each of the pick and button types of input. This table therefore excludes all window management functions.
CPLC
2 8 0 9 9 3 A
CPLC
300993A CEC
CPLC
The analysis of mouse usage in this report is derived principally from the Pick records since these give an indication of the various tasks which were performed. The IB Button type records can largely be ignored from the point of view of task analysis as they represent either clicks in the button bar or the closure of a popup window without data input. It has been observed that the closure of popup windows without data input is performed very infrequently. In the cases where more IB button records were apparent, it was observed to be most evident in Sector D when system problems were experienced and both EC and PLC controllers attempted the same input.
EUROCONTROL Experimental Centre
IX - 3
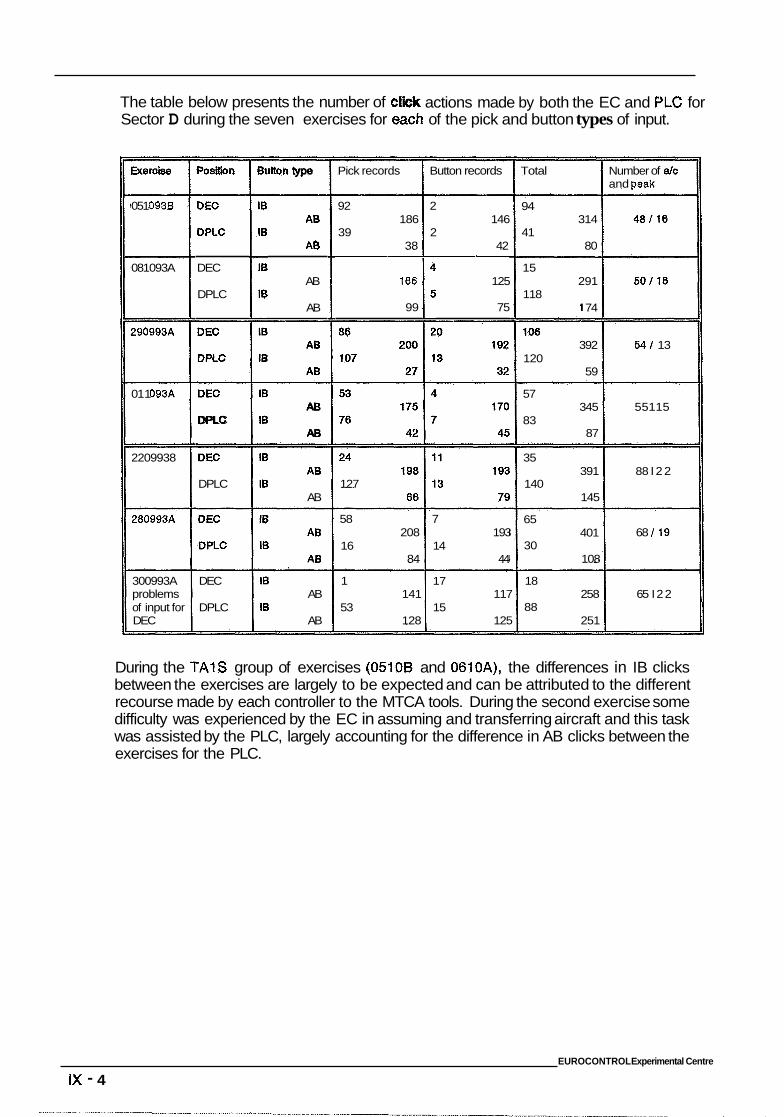
The table below presents the number of e Sector D during the seven exercises for each of the pick and button types of input.
actions made by both the EC and PLC for
Exercise
051 0938
081 093A
290993A
01 1 O93A
2209938
280993A
300993A problems of input for DEC
PosEtion Button type r %L ~I 2
~
DEC
DPLC AB
AB
AB
AB DPLC
DPLC AB
DEC
DPLC AB
AB
Pick records Button records Total
92 2
39 2 186 146
38 42
166 1; 125
99 75
127
58 7
16 14 208 193
84 44
94
41 314
80
15
118 291
1 74
108
120 392
59
57
83 345
87
35
140 391
145
65
30 401
108
Number of dc and wak
48/16
501 18
541 13
55115
88 I 22
68 I 19
1 17
53 15 141 117
128 125
18
88 258
251
65 I22
During the TAlS group of exercises (0510B and OslOA), the differences in IB clicks between the exercises are largely to be expected and can be attributed to the different recourse made by each controller to the MTCA tools. During the second exercise some difficulty was experienced by the EC in assuming and transferring aircraft and this task was assisted by the PLC, largely accounting for the difference in AB clicks between the exercises for the PLC.
EUROCONTROL Experimental Centre
IX - 4
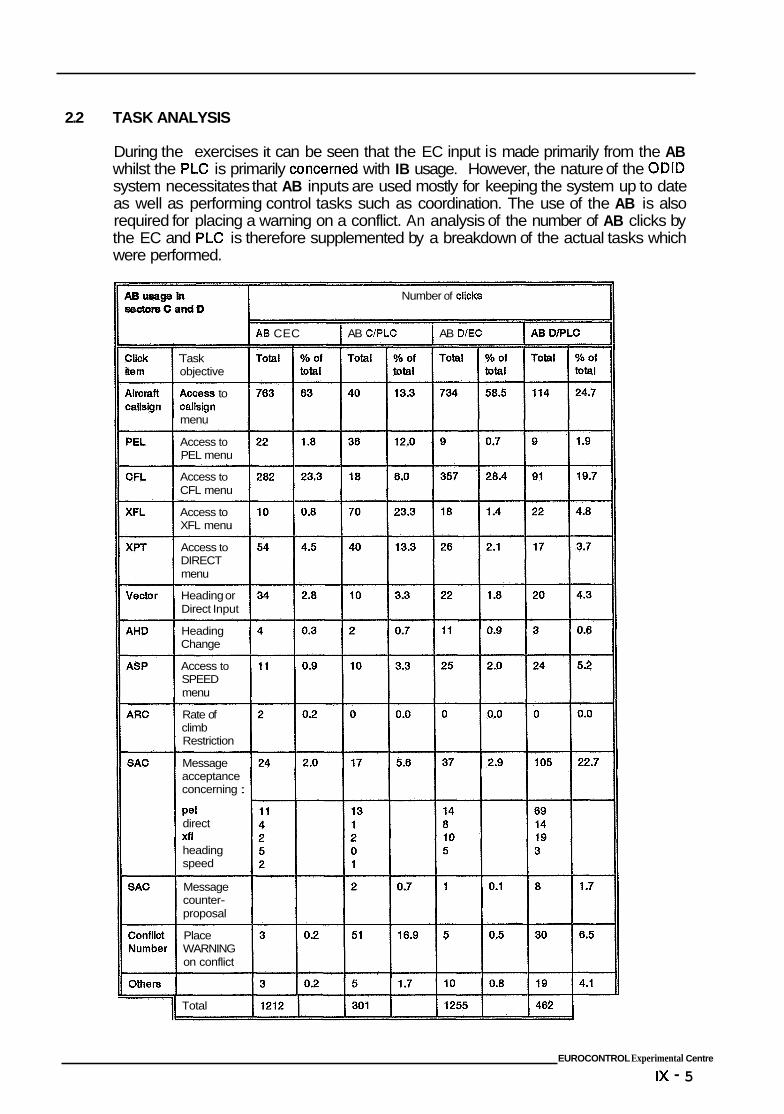
2.2 TASK ANALYSIS
During the exercises it can be seen that the EC input is made primarily from the AB whilst the PLC is primarily concerned with IB usage. However, the nature of the ODlD system necessitates that AB inputs are used mostly for keeping the system up to date as well as performing control tasks such as coordination. The use of the AB is also required for placing a warning on a conflict. An analysis of the number of AB clicks by the EC and PLC is therefore supplemented by a breakdown of the actual tasks which were performed.
Task objective
Accsss to callsign menu
Access to PEL menu
Access to CFL menu
Access to XFL menu
Access to DIRECT menu
Heading or Direct Input
Heading Change
Access to SPEED menu
Rate of climb Restriction
Message acceptance concerning :
Pel direct Xfl heading speed
Message counter- proposal
Place WARNING on conflict
Total
Number of clicha,
4B CEC I AB ClPLC I AB DEC
EUROCONTROL Experimental Centre
IX - 5
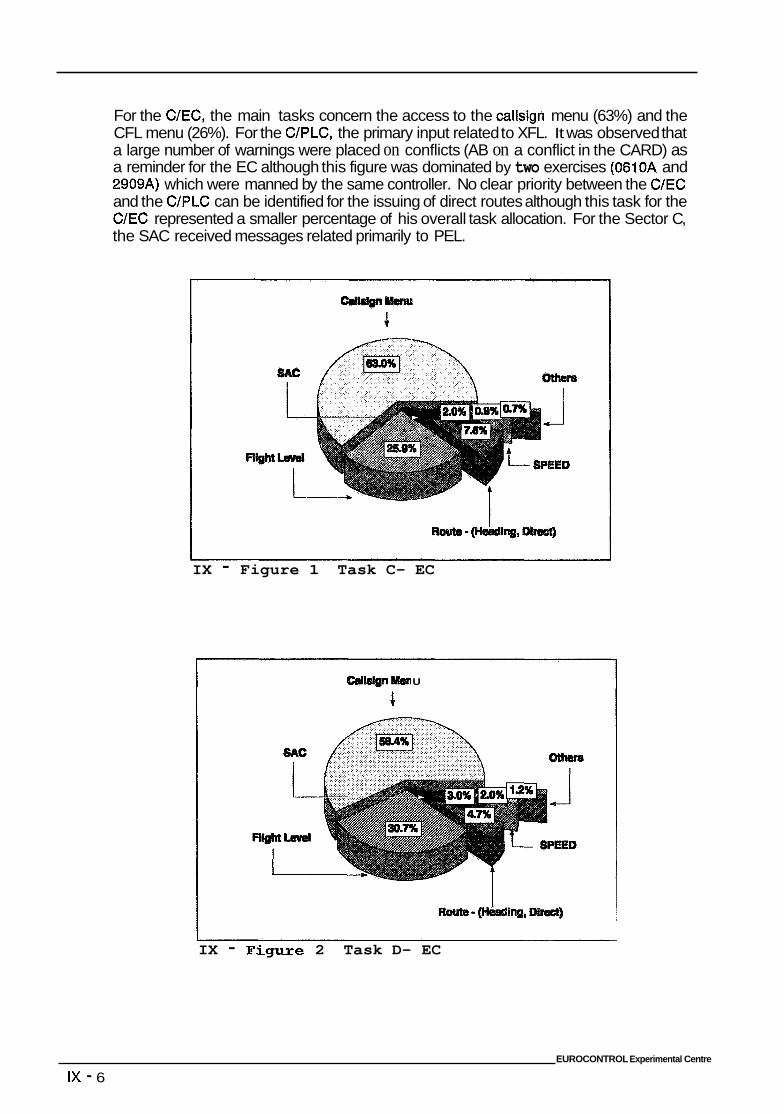
For the C/EC, the main tasks concern the access to the callsign menu (63%) and the CFL menu (26%). For the CIPLC, the primary input related to XFL. It was observed that a large number of warnings were placed on conflicts (AB on a conflict in the CARD) as a reminder for the EC although this figure was dominated by two exercises (0610A and 2909A) which were manned by the same controller. No clear priority between the C/EC and the C/PLC can be identified for the issuing of direct routes although this task for the C/EC represented a smaller percentage of his overall task allocation. For the Sector C, the SAC received messages related primarily to PEL.
IX - Figure 1 Task C- EC
U
IX - FAgure 2 Task D- EC
EUROCONTROL Experimental Centre
IX - 6
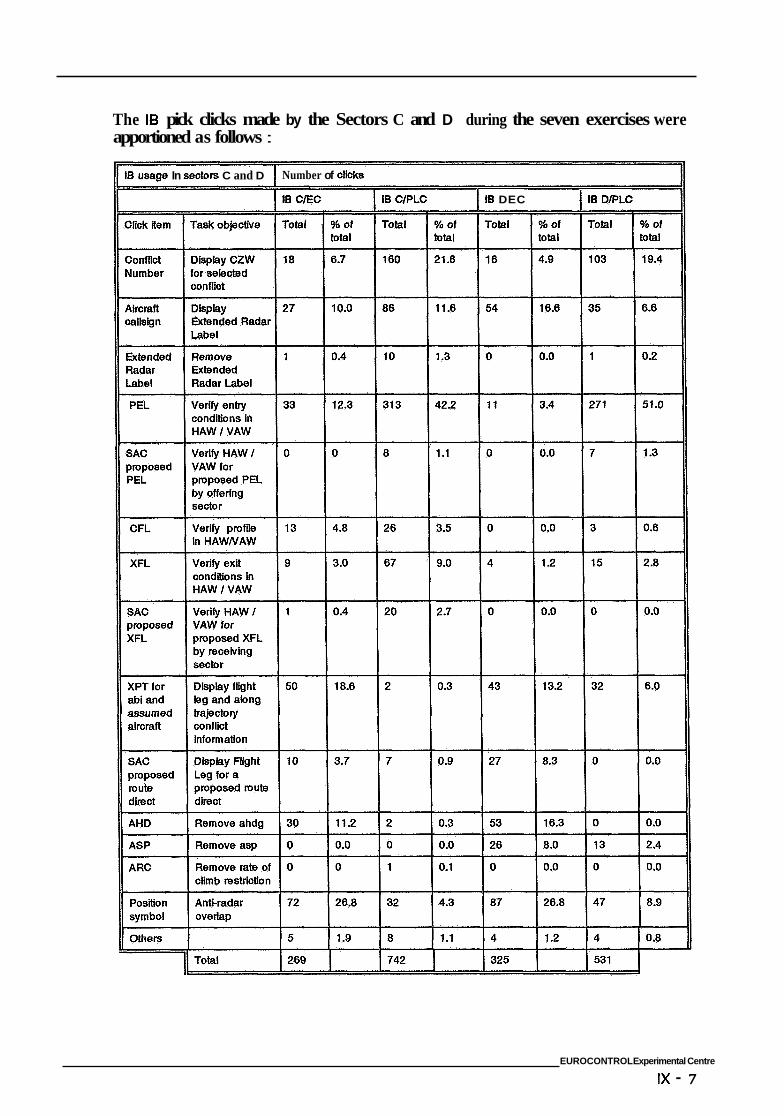
The IS pick clicks made by the Sectors C and D during the seven exercises were apportioned as follows :
iB umge In sectom C and D Number of clicks
IB CEC I IS ClPLC I IB DEC I B DPLC
EUROCONTROL Experimental Centre
IX - 7
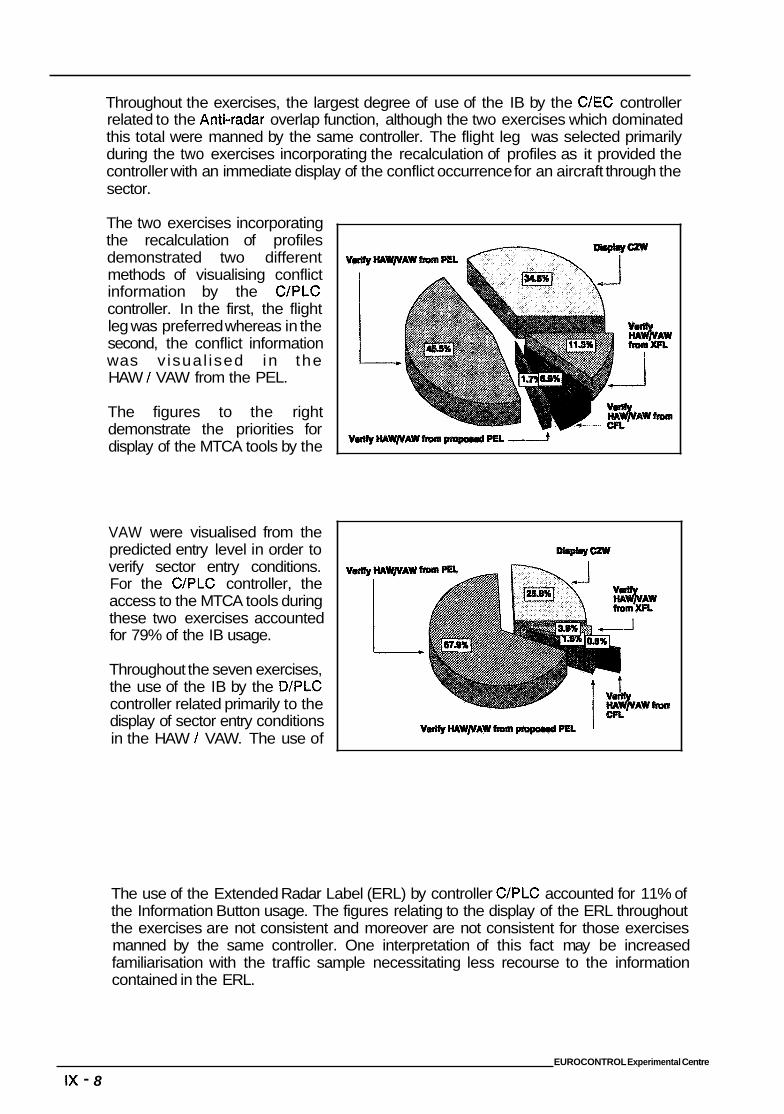
Throughout the exercises, the largest degree of use of the IB by the C/EC controller related to the Anttradar overlap function, although the two exercises which dominated this total were manned by the same controller. The flight leg was selected primarily during the two exercises incorporating the recalculation of profiles as it provided the controller with an immediate display of the conflict occurrence for an aircraft through the sector.
VAW were visualised from the predicted entry level in order to verify sector entry conditions. For the C/PLC controller, the access to the MTCA tools during these two exercises accounted for 79% of the IB usage.
Throughout the seven exercises, the use of the IB by the D/PLC controller related primarily to the
in the HAW / VAW. The use of display of sector entry conditions
The two exercises incorporating the recalculation of profiles demonstrated two different methods of visualising conflict information by the C/PLC controller. In the first, the flight leg was preferred whereas in the second, the conflict information was v isual ised in the HAW / VAW from the PEL.
V ~ H A W ~ A W
V- HAWHAW honn PFOpaud PW
The figures to the right demonstrate the priorities for display of the MTCA tools by the
The use of the Extended Radar Label (ERL) by controller C/PLC accounted for 11% of the Information Button usage. The figures relating to the display of the ERL throughout the exercises are not consistent and moreover are not consistent for those exercises manned by the same controller. One interpretation of this fact may be increased familiarisation with the traffic sample necessitating less recourse to the information contained in the ERL.
EUROCONTROL Experimental Centre
IX - 8
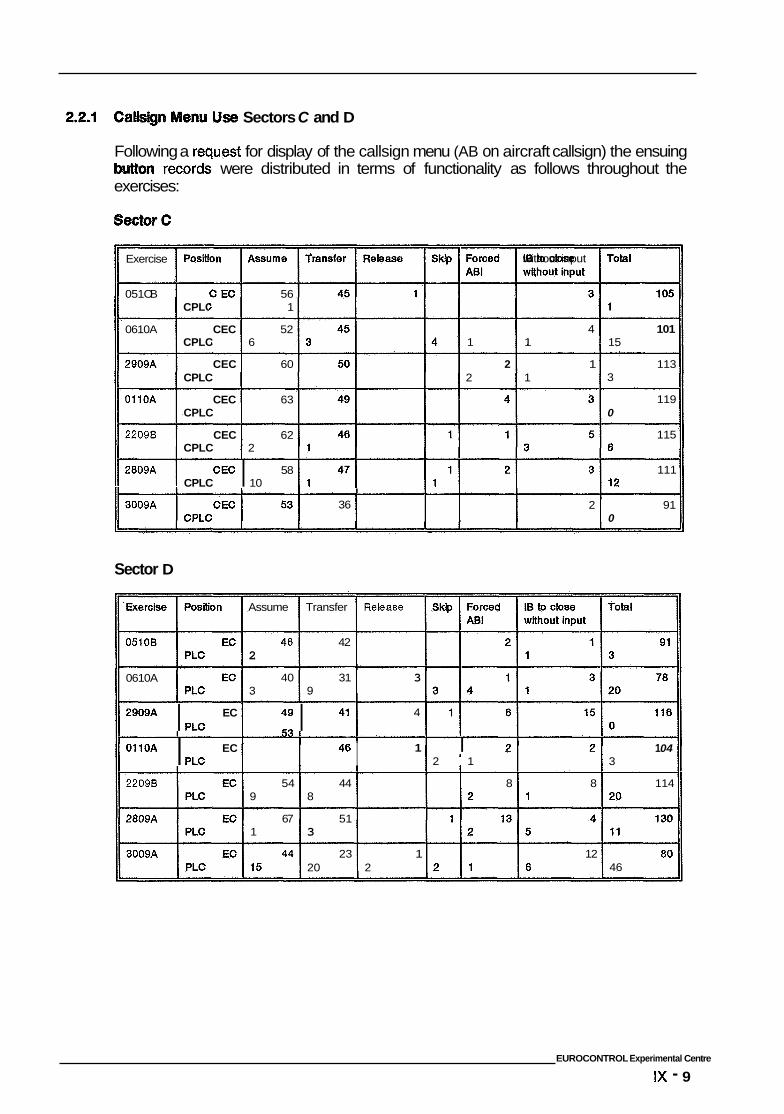
Menu Uss Sectors C and D
Following a request for display of the callsign menu (AB on aircraft callsign) the ensuing rmords were distributed in terms of functionality as follows throughout the
exercises:
sec2cwc
Position Assume I ~ without input Exercise
051 OB 56 CPLC CECl 1
CEC CPLC
52 6 1
4 1
101 15
0610A
2909A
OllOA
22098
60 2 2
1 1
113 3
CEC CPLC
CEC CPLC
63 119 0
CEC CPLC
62 2
115 6 2809A 58
CPLC cEc I 10 2 1 111 3 1 12
I I
36 3009A 2 91 0
Sector D
Assume Transfer Release
40 42 2
40 31 3 3 9
05108
0610A PLC
EC 2909A I PLC
4 49 I 41 I
EC Ol1OA I PLC
I 1 04 53 I 48 I 1 2 1 3
8 8 114 2209B
2809A
3009A PLC
54 44 9 8
67 51 1 3
44 23 1 20 2
12 80 46
EUROCONTROL Experimental Centre
IX - 9
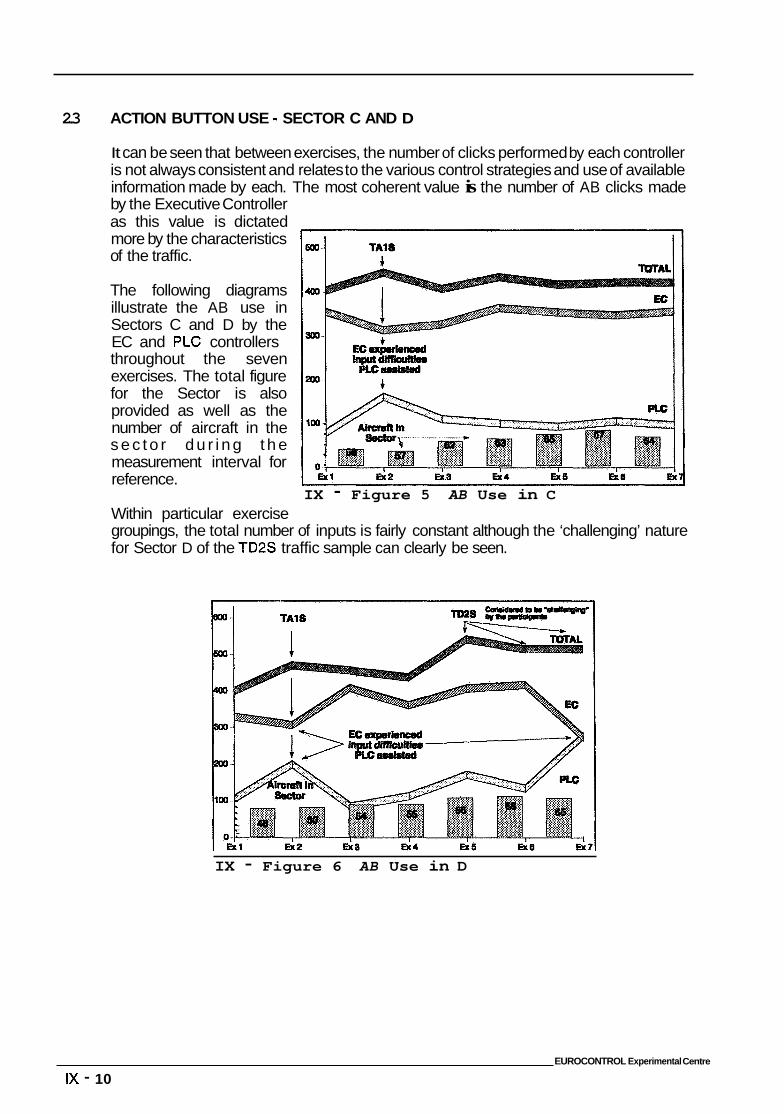
2.3 ACTION BUTTON USE - SECTOR C AND D
It can be seen that between exercises, the number of clicks performed by each controller is not always consistent and relates to the various control strategies and use of available information made by each. The most coherent value is the number of AB clicks made by the Executive Controller as this value is dictated more by the characteristics of the traffic.
The following diagrams illustrate the AB use in Sectors C and D by the EC and PLC controllers throughout the seven exercises. The total figure for the Sector is also provided as well as the number of aircraft in the s e c t o r d u r i n g t h e measurement interval for reference.
Within particular exercise groupings, the total number of inputs is fairly constant although the ‘challenging’ nature for Sector D of the TD2S traffic sample can clearly be seen.
IX - Figure 5 AB Use in C
-1 TA18
IX - Figure 6 AB Use in D
EUROCONTROL Experimental Centre
IX - 10
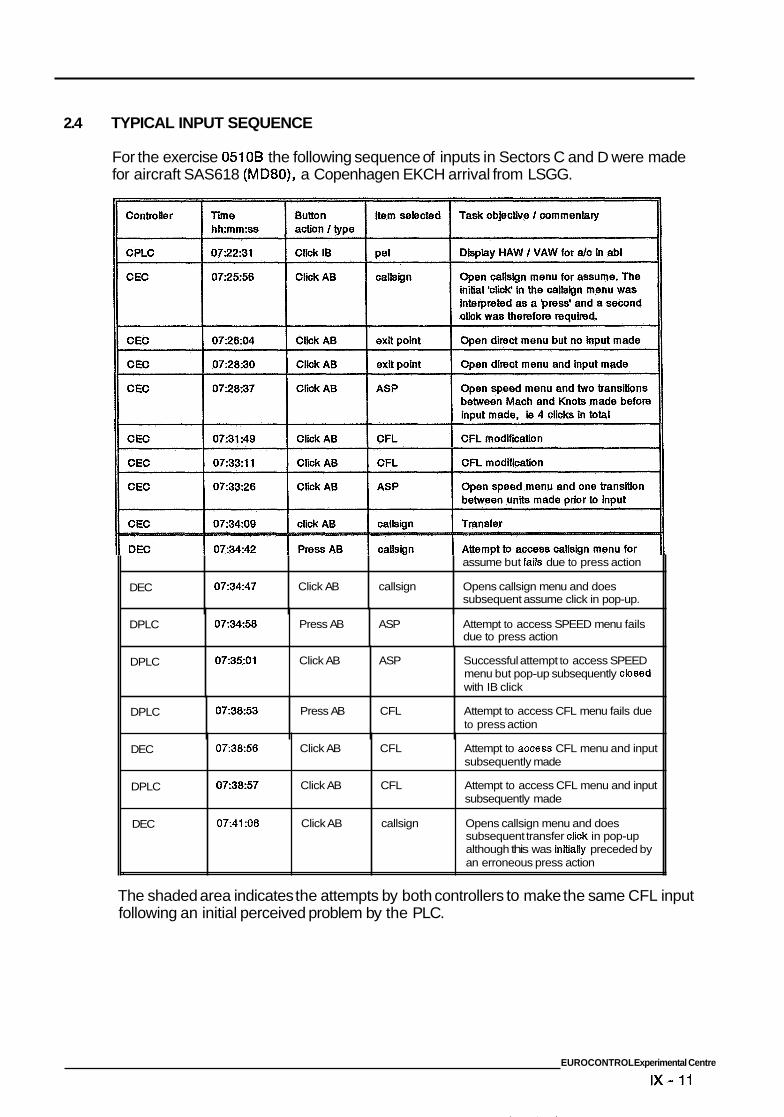
2.4 TYPICAL INPUT SEQUENCE
For the exercise 0510B the following sequence of inputs in Sectors C and D were made for aircraft SAS618 (MD80), a Copenhagen EKCH arrival from LSGG.
DEC
assume but faNs due to press action
07:34:47 Click AB callsign Opens callsign menu and does subsequent assume click in pop-up.
DPLC 07:3458 Press AB ASP Attempt to access SPEED menu fails due to press action
DPLC OR3501 Click AB ASP Successful attempt to access SPEED menu but pop-up subsequently closed with IB click
The shaded area indicates the attempts by both controllers to make the same CFL input following an initial perceived problem by the PLC.
DPLC
EUROCONTROL Experimental Centre
IX - 11
07:38:53 Press AB CFL Attempt to access CFL menu fails due to press action
DEC
DPLC
DEC
1
073858 Click AB CFL Attempt to a m s s CFL menu and input subsequently made
07:38:57 Click AB CFL Attempt to access CFL menu and input subsequently made
07:41:08 Click AB callsign Opens callsign menu and does subsequent transfer c l ik in pop-up although this was initially preceded by an erroneous press action
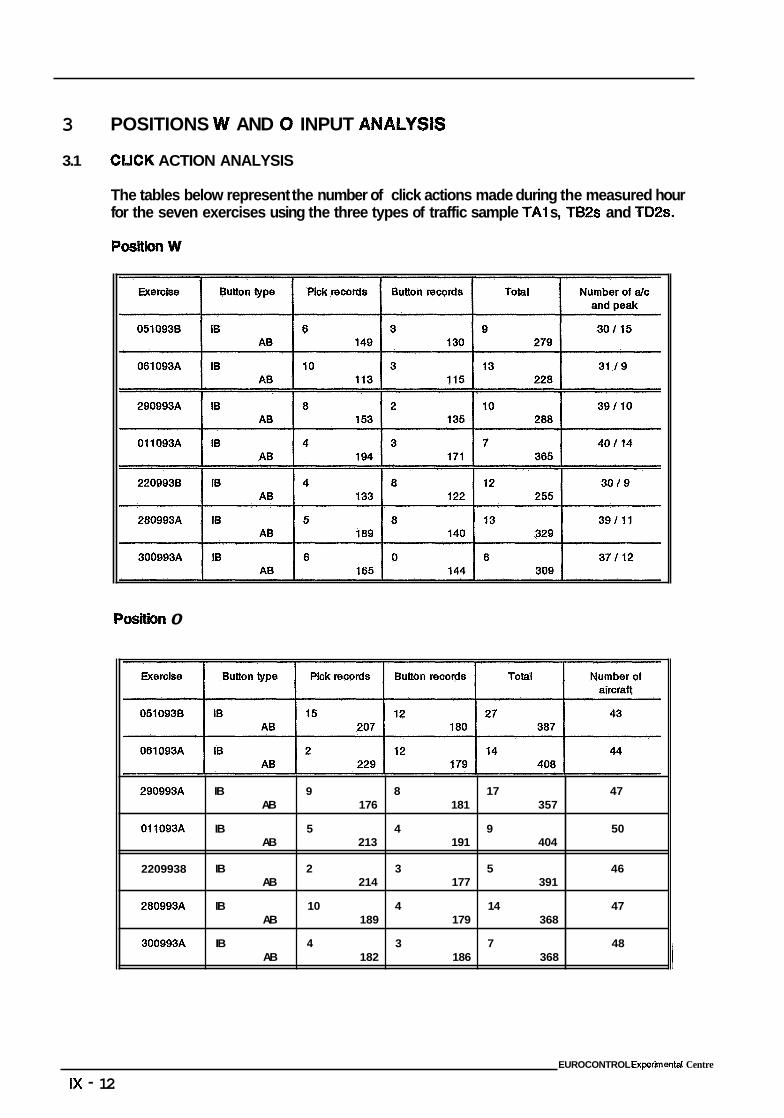
3 POSITIONS W AND 0 INPUT ANA~YS~S
290993A
011093A
2209938
280993A
300993A
3.1 CUCK ACTION ANALYSIS
IB 9 8 17 47 AB 176 181 357
IB 5 4 9 50 AB 213 191 404
IB 2 3 5 46 AB 214 177 391
IB 10 4 14 47 AB 189 179 368
IB 4 3 7 48 AB 182 186 368
The tables below represent the number of click actions made during the measured hour for the seven exercises using the three types of traffic sample TA1 s, TB2s and TD2s.
Position 0
EUROCONTROL Experimental Centre
IX - 12
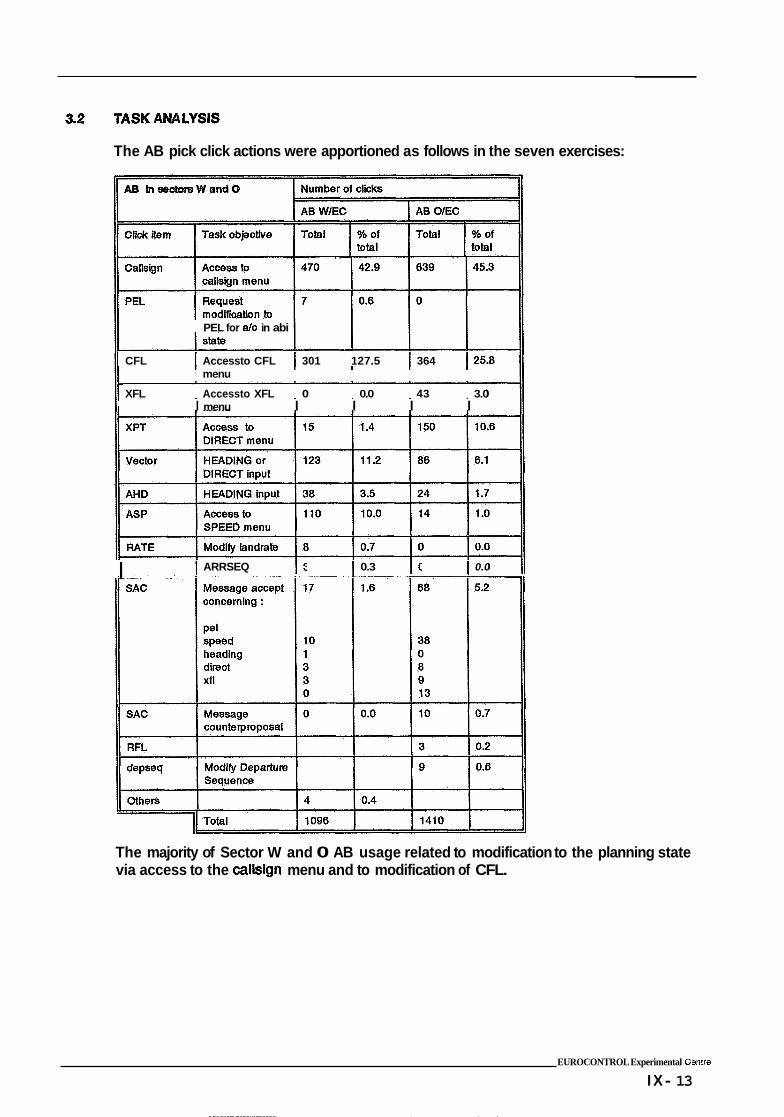
The AB pick click actions were apportioned as follows in the seven exercises:
PEL for alc in abi
CFL I Accessto CFL I 301 127.5 1 364 125.8 menu
XFL Accessto XFL 0 0.0 43 3.0 I menu I I I I
I I ARRSEQ I 0.3 I 0.0
The majority of Sector W and 0 AB usage related to modification to the planning state via access to the callsign menu and to modification of CFL.
EUROCONTROL Experimental Cenfre
IX - 13
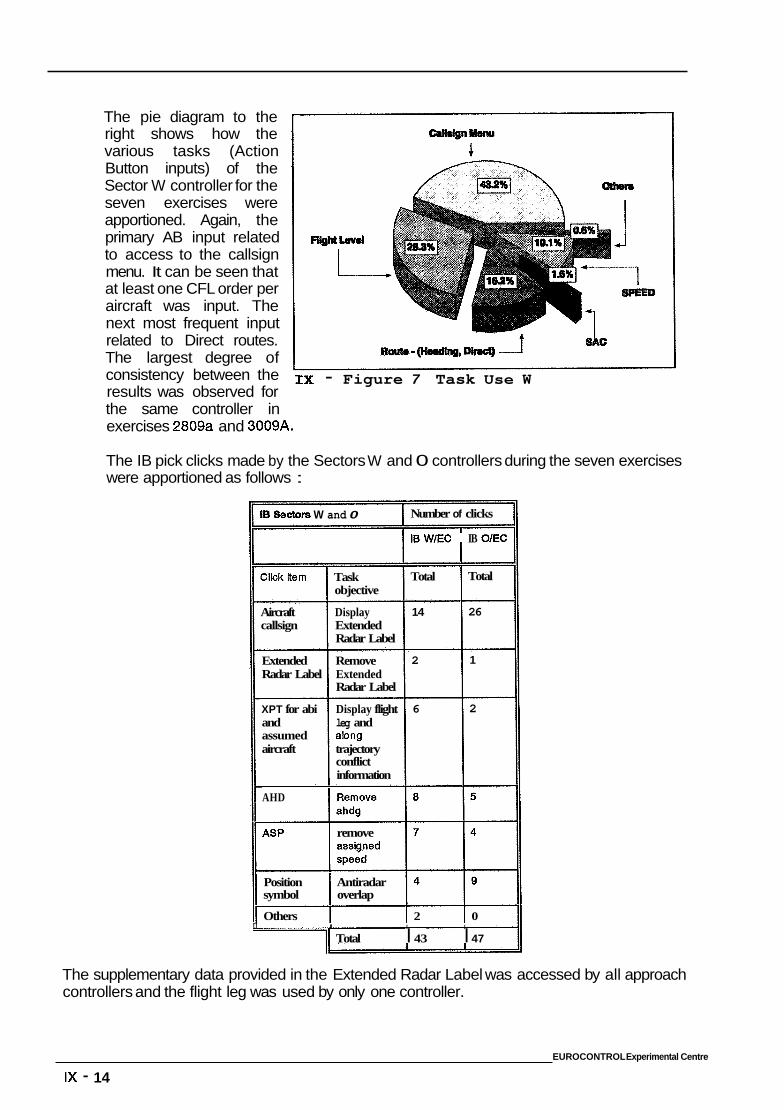
The pie diagram to the right shows how the various tasks (Action Button inputs) of the Sector W controller for the seven exercises were apportioned. Again, the primary AB input related to access to the callsign menu. It can be seen that at least one CFL order per aircraft was input. The next most frequent input related to Direct routes. The largest degree of consistency between the results was observed for the same controller in exercises 2809a and 3009A.
t CX - Figure 7 Task Use W
The IB pick clicks made by the Sectors W and 0 controllers during the seven exercises were apportioned as follows :
IS Sectow W and 0 Number of clicks
I6 WIEC IB O/EC
Clickitem Task objective
Aircraft Display callsign Extended
Extended Remove Radar Label Extended
Radar Label
XPT for abi Display flight and leg and assumed abng aircraft trajectory
Radar Label
conflict information
Total
14
2
6
= Total
26
1
2
AHD I R e o v e
remove ASP 1 aswyd
1 Position I Antiradar symbol overlap 1 Others 2 0
U I I I 1 1 Total I 43 I 47
The supplementary data provided in the Extended Radar Label was accessed by all approach controllers and the flight leg was used by only one controller.
EUROCONTROL Experimental Centre
IX - 14
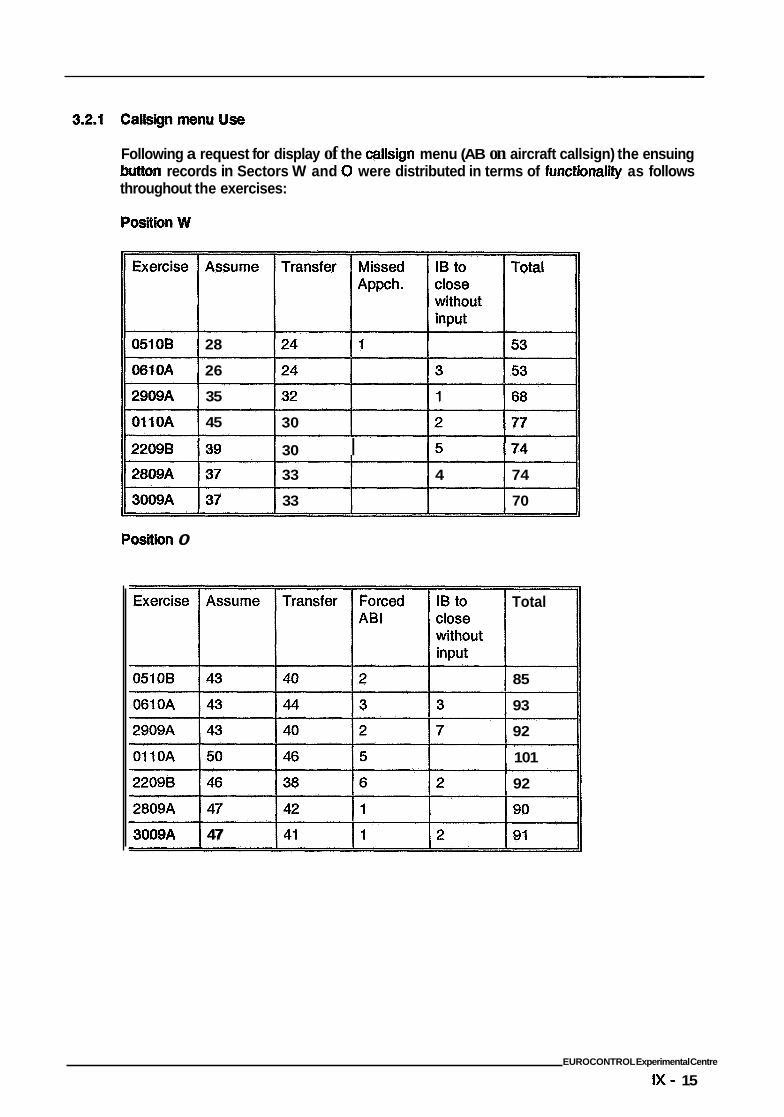
Following a request for display of the callsign menu (AB on aircraft callsign) the ensuing button records in Sectors W and 0 were distributed in terms of funct~ona l~ as follows throughout the exercises:
0510B 28
0610A 26
2909A 35
OllOA 45
22098 I39
11 2809A I37
11 3009A I37
Position 0
30 177 30 I 174 33 4 74
33 70
-~ 3009A 47
Total
85
93
92
101
92
EUROCONTROL Experimental Centre
IX - 15
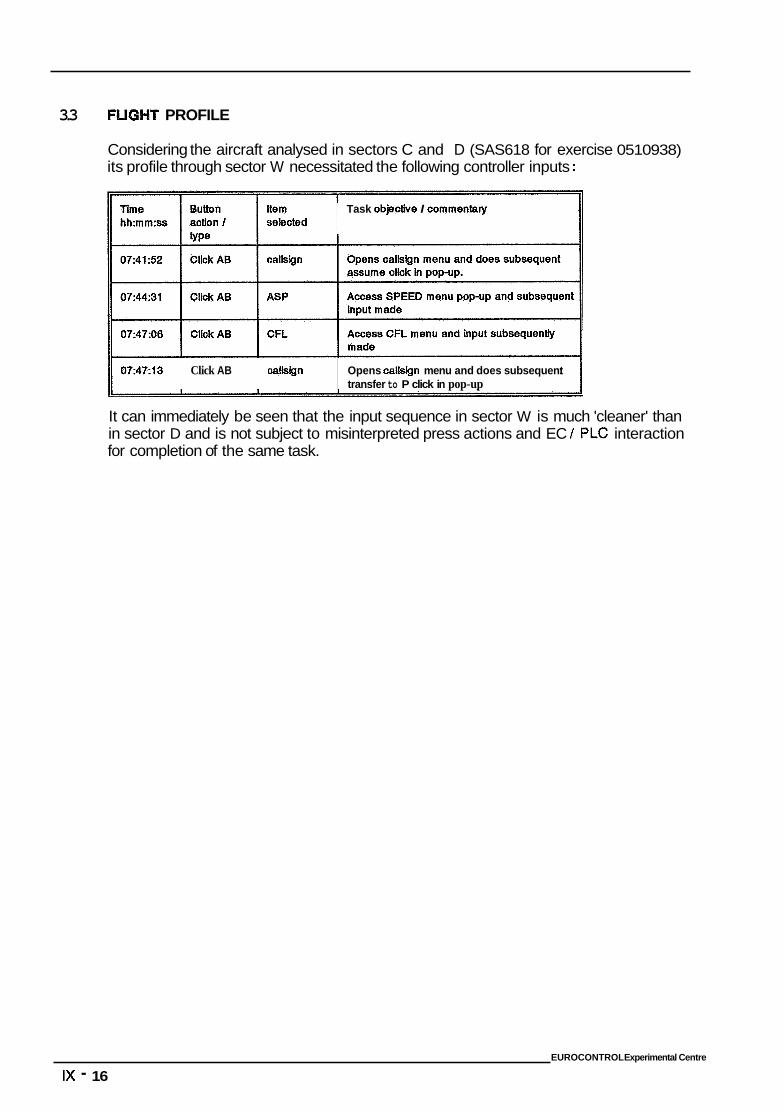
3.3 FLIGHT PROFILE
Considering the aircraft analysed in sectors C and D (SAS618 for exercise 0510938) its profile through sector W necessitated the following controller inputs :
Task objectbe I commentary
07:47:13 Click AB callsign Opens callsign menu and does subsequent transfer to P click in pop-up
It can immediately be seen that the input sequence in sector W is much 'cleaner' than in sector D and is not subject to misinterpreted press actions and EC / PLC interaction for completion of the same task.
EUROCONTROL Experimental Centre
IX - 16
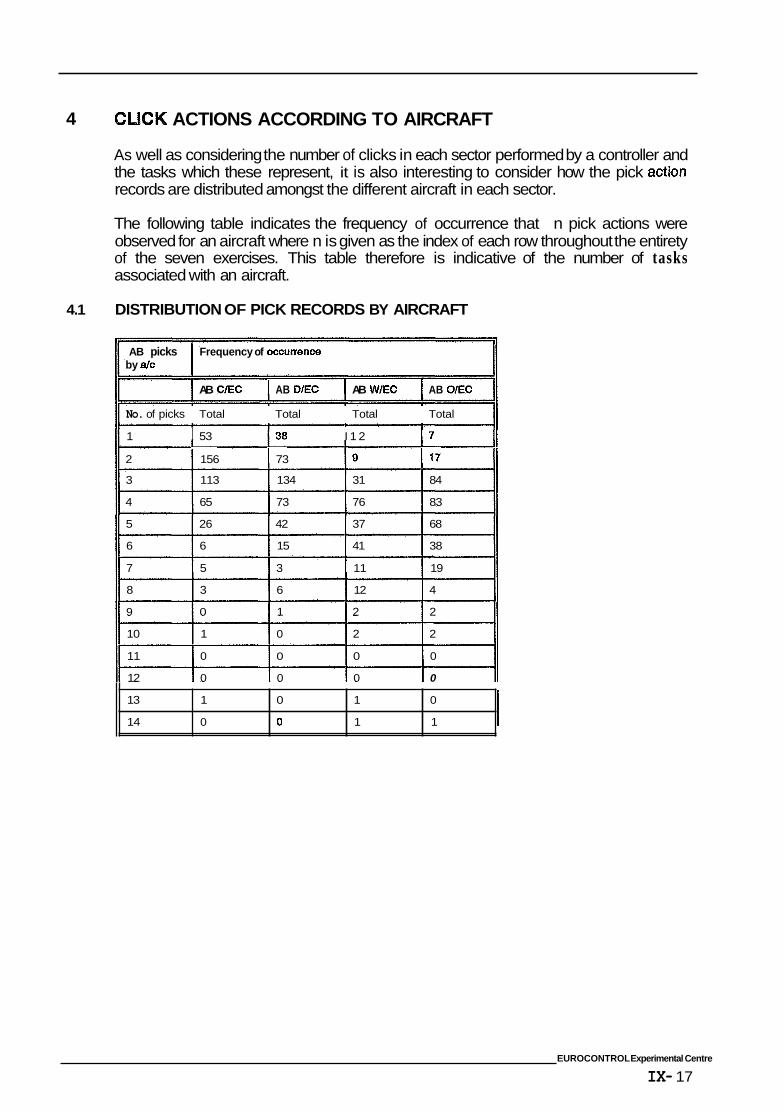
4 CLICK ACTIONS ACCORDING TO AIRCRAFT
13
14
As well as considering the number of clicks in each sector performed by a controller and the tasks which these represent, it is also interesting to consider how the pick action records are distributed amongst the different aircraft in each sector.
1 1 0 1 0
0 0 1 1
The following table indicates the frequency of occurrence that n pick actions were observed for an aircraft where n is given as the index of each row throughout the entirety of the seven exercises. This table therefore is indicative of the number of tasks associated with an aircraft.
4.1 DISTRIBUTION OF PICK RECORDS BY AIRCRAFT
AB picks Frequency of occuwence by d c
AB ClEC I AB D/EC I AB W/EC I AB OlEC
No. of picks Total Total Total Total
1 I 53 I 1 2 i1 2 I 156 I 73 I 1 7 II 3 113 134 31 84
4 65 73 76 83
5 26 42 37 68
6 6 15 41 38
7 5 3 11 19
8 3 6 12 4
9 0 1 2 2
10 1 0 2 2
11 0 0 0 0
12 0 0 0 0
EUROCONTROL Experimental Centre
IX- 17
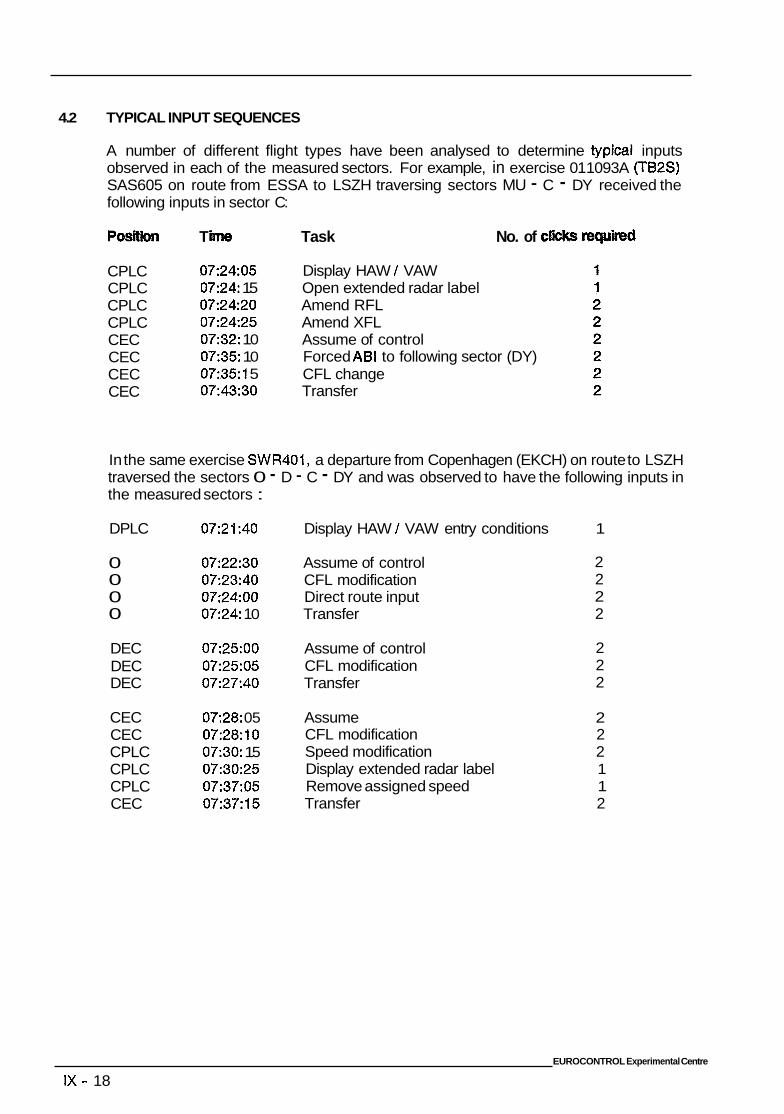
4.2 TYPICAL INPUT SEQUENCES
A number of different flight types have been analysed to determine typical inputs observed in each of the measured sectors. For example, in exercise 01 1093A (TB2S) SAS605 on route from ESSA to LSZH traversing sectors MU - C - DY received the following inputs in sector C:
POSsOn T Task No. of cl
CPLC CPLC CPLC CPLC CEC CEC CEC CEC
07:2405 07:24 1 5 07:2420 07:2425 07:32: 1 0 07:35: 1 0 0235: I 5 07:43:30
Display HAW / VAW Open extended radar label Amend RFL Amend XFL Assume of control Forced AB1 to following sector (DY) CFL change Transfer
In the same exercise SWR401, a departure from Copenhagen (EKCH) on route to LSZH traversed the sectors 0 - D - C - DY and was observed to have the following inputs in the measured sectors :
DPLC 07:21:40 Display HAW / VAW entry conditions 1
0 07:22:30 Assume of control 0 07:23:40 CFL modification 0 0724:OO Direct route input 0 07:24 1 0 Transfer
DEC 07:25:00 Assume of control DEC 07:25:05 CFL modification DEC 07:27:40 Transfer
2 2 2 2
2 2 2
CEC 07:28: 05 Assume 2 CEC 07:28:10 CFL modification 2 CPLC 07:30: 1 5 Speed modification 2 CPLC 07:30:25 Display extended radar label 1 CPLC 07:37:05 Remove assigned speed 1 CEC 07:37:15 Transfer 2
EUROCONTROL Experimental Centre
IX - 18
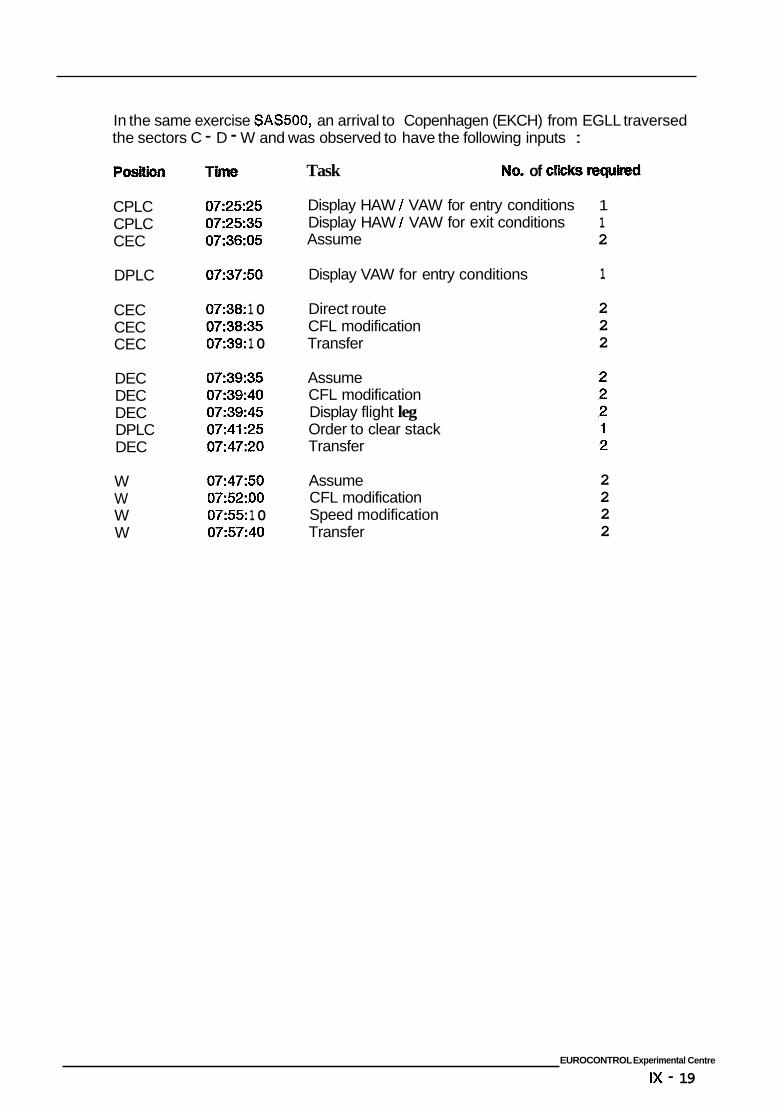
In the same exercise SAS500, an arrival to Copenhagen (EKCH) from EGLL traversed the sectors C - D - W and was observed to have the following inputs :
POSitlOn
CPLC CPLC CEC
DPLC
CEC CEC CEC
DEC DEC DEC DPLC DEC
W W W W
T
07:25:25 07:25:35 07:36:05
07~3750
07:38: 1 0 07:38:35 07:39: 1 0
07:39:35 07:39:40 07:39:45 07:41:25 07:47:20
07:47:50 07:52:00 07:55: 1 0 07:57:40
Task MO. of cl
Display HAW / VAW for entry conditions 1 Display HAW / VAW for exit conditions 1 Assume 2
Display VAW for entry conditions 1
Direct route CFL modification Transfer
Assume CFL modification Display flight leg Order to clear stack Transfer
Assume CFL modification Speed modification Transfer
2 2 2
2 2 2 2
EUROCONTROL Experimental Centre
IX - 19
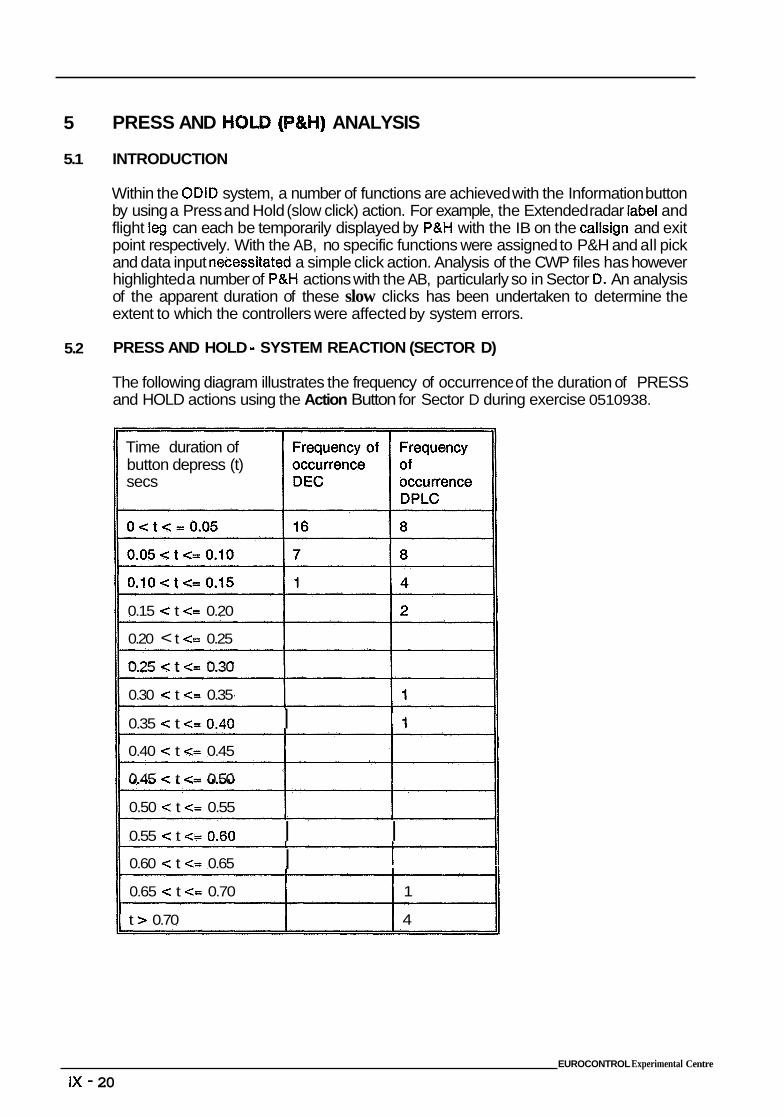
5 PRESS AND HOLD (P&H) ANALYSIS
5.1 INTRODUCTION
Within the ODlD system, a number of functions are achieved with the Information button by using a Press and Hold (slow click) action. For example, the Extended radar label and flight leg can each be temporarily displayed by P&H with the IB on the callsign and exit point respectively. With the AB, no specific functions were assigned to P&H and all pick and data input necessitated a simple click action. Analysis of the CWP files has however highlighted a number of P&H actions with the AB, particularly so in Sector D. An analysis of the apparent duration of these slow clicks has been undertaken to determine the extent to which the controllers were affected by system errors.
5.2 PRESS AND HOLD - SYSTEM REACTION (SECTOR D)
The following diagram illustrates the frequency of occurrence of the duration of PRESS and HOLD actions using the Action Button for Sector D during exercise 0510938.
Time duration of button depress (t) secs
0.15 c t <= 0.20
0.20 < t <= 0.25
0.25 C t <= 0.30
0.30 c t <= 0.35
0.35 < t <= 0.40 I I 1
0.40 < t <= 0.45
0.45 < t <= 0.50
0.50 < t <= 0.55
0.55 c t <= 0.60 I I 0.60 C t <= 0.65 I 0.65 < t <= 0.70 1
t > 0.70 4
EUROCONTROL Experimental Centre
IX - 20
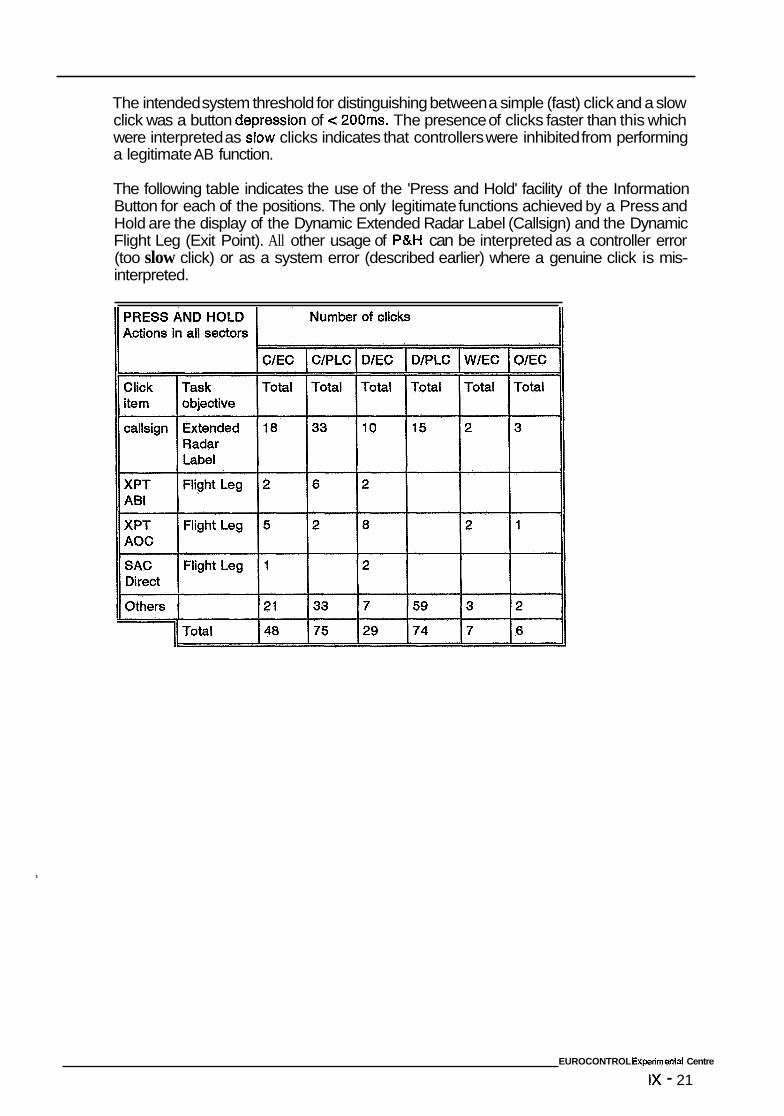
The intended system threshold for distinguishing between a simple (fast) click and a slow click was a button depression of 6 200ms. The presence of clicks faster than this which were interpreted as slow clicks indicates that controllers were inhibited from performing a legitimate AB function.
The following table indicates the use of the 'Press and Hold' facility of the Information Button for each of the positions. The only legitimate functions achieved by a Press and Hold are the display of the Dynamic Extended Radar Label (Callsign) and the Dynamic Flight Leg (Exit Point). All other usage of P&H can be interpreted as a controller error (too slow click) or as a system error (described earlier) where a genuine click is mis- interpreted.
EUROCONTROL Experimental Centre
IX - 21
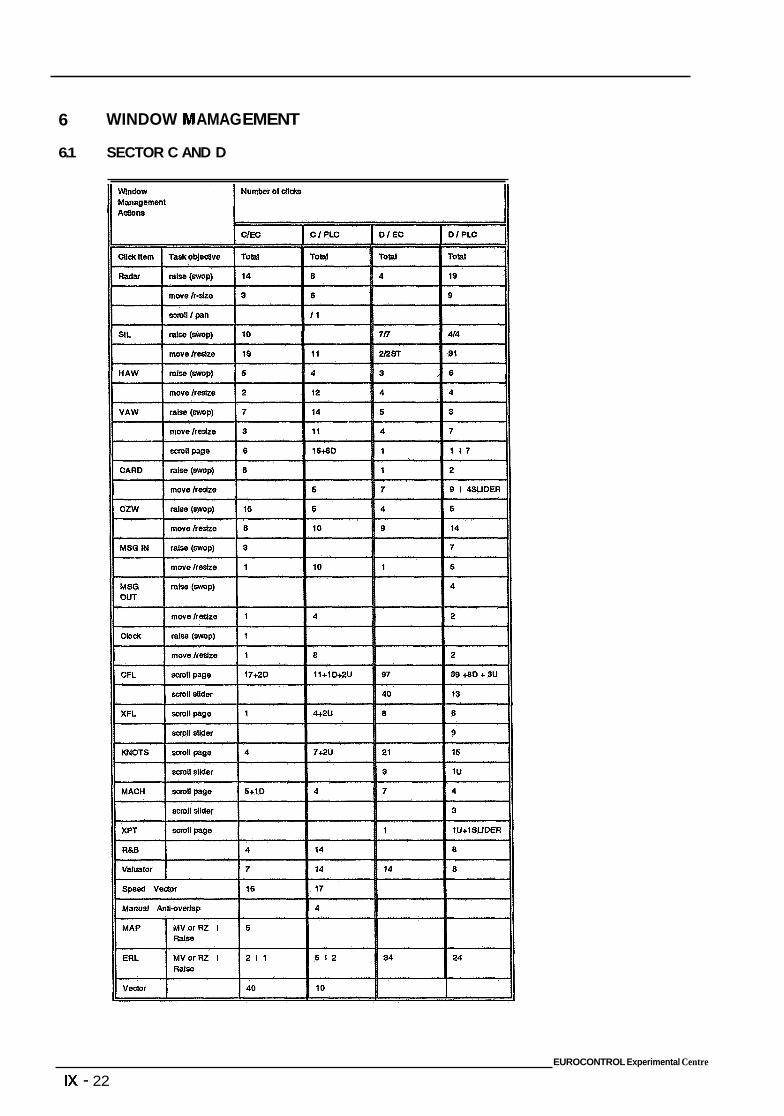
6
6.1 SECTOR C AND D
WINDOW M AMAG EM ENT
EUROCONTROL Experimental Centre
IX - 22
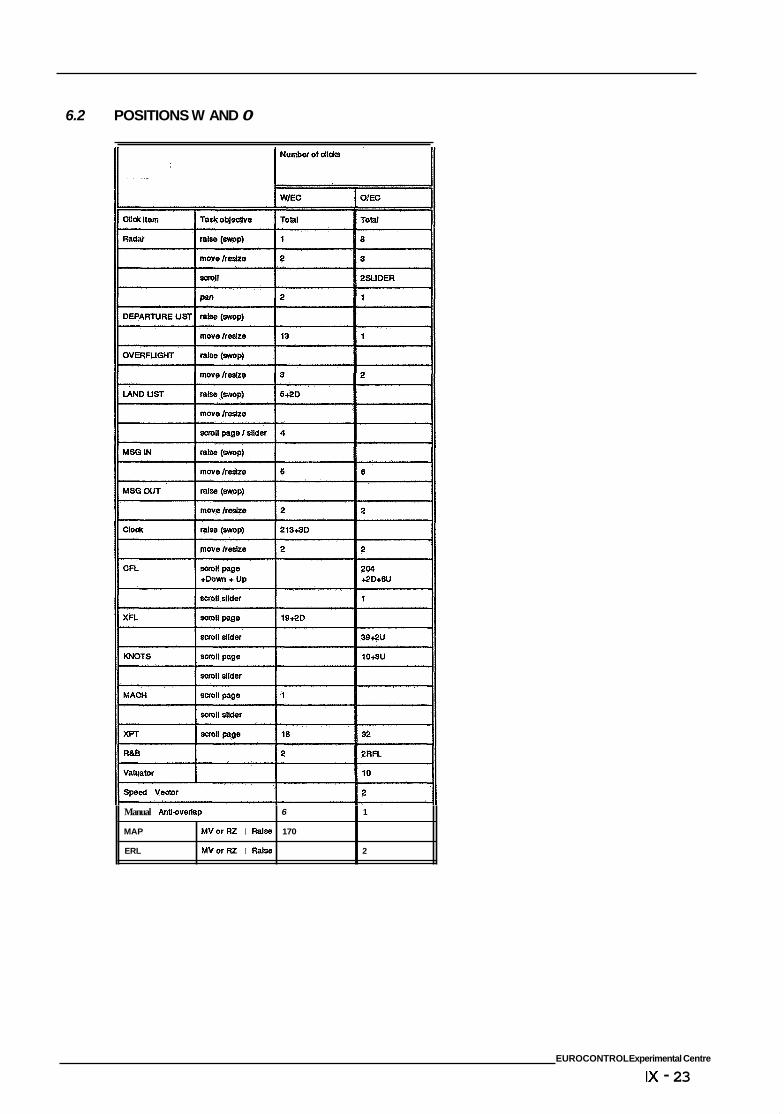
6.2 POSITIONS W AND 0
Manual Anti-ovedap
MAP MVorFE I Raise
ERL MVorRZ I Raise
6 1
170
2
EUROCONTROL Experimental Centre
IX - 23
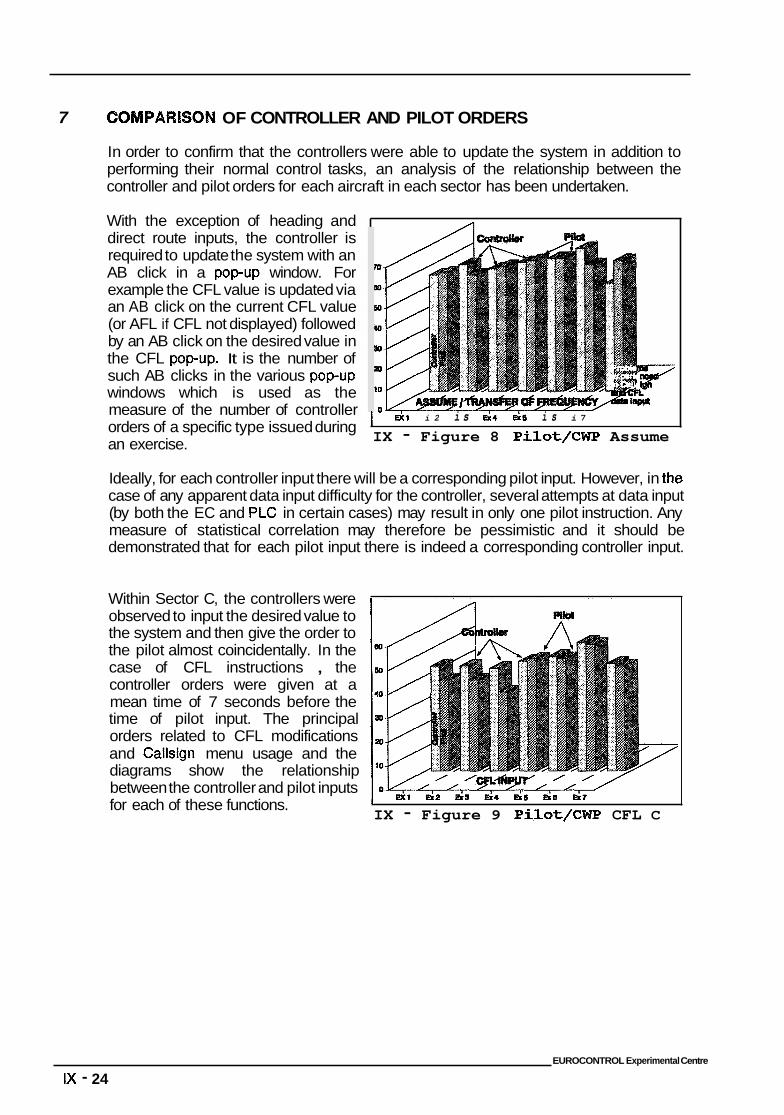
7 PARISON OF CONTROLLER AND PILOT ORDERS
In order to confirm that the controllers were able to update the system in addition to performing their normal control tasks, an analysis of the relationship between the controller and pilot orders for each aircraft in each sector has been undertaken.
With the exception of heading and direct route inputs, the controller is required to update the system with an AB click in a popup window. For example the CFL value is updated via an AB click on the current CFL value (or AFL if CFL not displayed) followed by an AB click on the desired value in the CFL popup. It is the number of such AB clicks in the various popup windows which is used as the measure of the number of controller orders of a specific type issued during an exercise.
1 - eicl i 2 i s d4 ds i s i 7
IX - Figure 8 Pilot/CWP Assume
Ideally, for each controller input there will be a corresponding pilot input. However, in the case of any apparent data input difficulty for the controller, several attempts at data input (by both the EC and PLC in certain cases) may result in only one pilot instruction. Any measure of statistical correlation may therefore be pessimistic and it should be demonstrated that for each pilot input there is indeed a corresponding controller input.
Within Sector C, the controllers were observed to input the desired value to the system and then give the order to the pilot almost coincidentally. In the case of CFL instructions , the controller orders were given at a mean time of 7 seconds before the time of pilot input. The principal orders related to CFL modifications and Callsign menu usage and the diagrams show the relationship between the controller and pilot inputs for each of these functions.
I &I &2 &a &4 &s &a 647
IX - Figure 9 Pilot/CWP CFL C
EUROCONTROL Experimental Centre
IX - 24
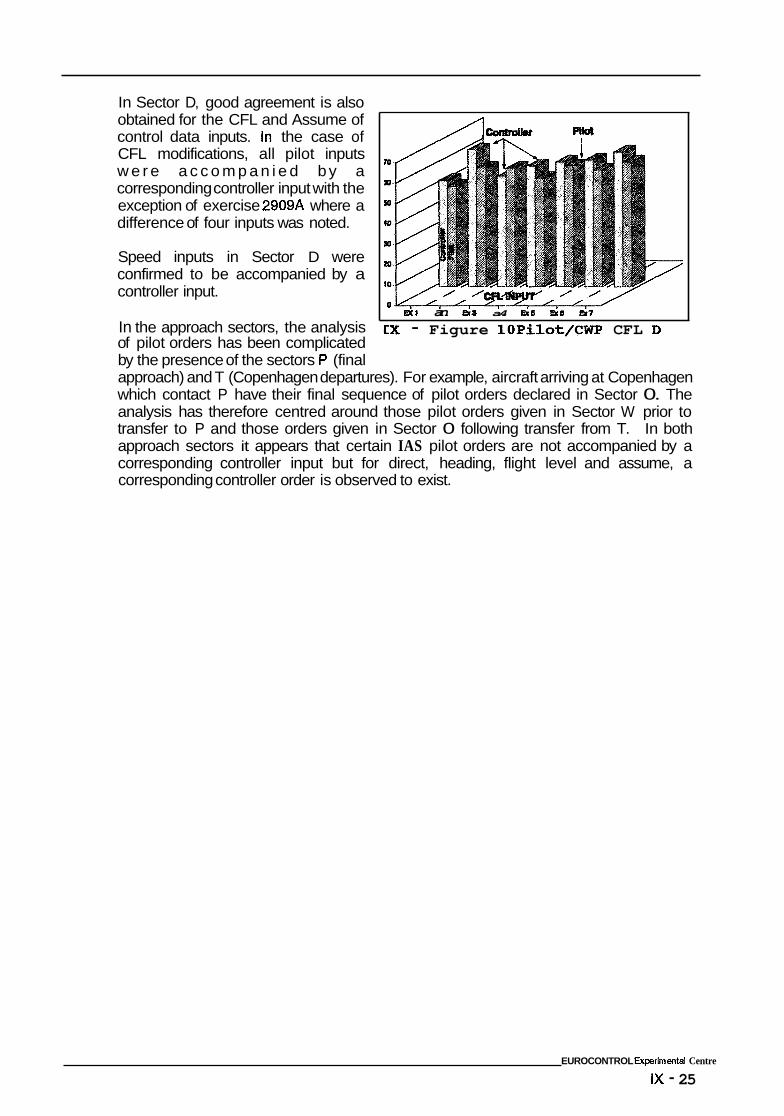
In Sector D, good agreement is also obtained for the CFL and Assume of control data inputs. In the case of CFL modifications, all pilot inputs w e r e a c c o m p a n i e d by a corresponding controller input with the exception of exercise 2909A where a difference of four inputs was noted.
Speed inputs in Sector D were confirmed to be accompanied by a controller input.
In the approach sectors, the analysis .
/l
0 P X ~ an Bra a4 ~ ~ l r i me m7
EX - Figure 10Pilot/CWP CFL D of pilot orders has been complicated by the presence of the sectors P (final approach) and T (Copenhagen departures). For example, aircraft arriving at Copenhagen which contact P have their final sequence of pilot orders declared in Sector 0. The analysis has therefore centred around those pilot orders given in Sector W prior to transfer to P and those orders given in Sector 0 following transfer from T. In both approach sectors it appears that certain IAS pilot orders are not accompanied by a corresponding controller input but for direct, heading, flight level and assume, a corresponding controller order is observed to exist.
EUROCONTROL Experimental Centre
IX - 25

ANNEX X
ODID IV
SYSTEM ASSISTED COORDINATION (SAC)
TABLE OF CONTENTS
I INTRODUCTION ...................................... X . 1
2 MESSAGE IN ANALYSIS ................................ X . 1
2.1 SECTOR C ..................................... X . 1 2.2 SECTOR D ..................................... X . 2 2.3 .......... X . 3 2.4 APPROACH (W) ................................. X . 3 2.5 DEPARTURE (0) ................................. X - 4
COMPARISON BETWEEN SECTORS C AND D
3 MESSAGE OUT ANALYSIS .............................. X . 5
3.1 SECTOR C ..................................... X - 5 3.2 SECTOR D ..................................... X . 6 3.3 .......... X . 6 3.4 APPROACH (W) ................................. X - 7 3.5 DEPARTURE (0) ................................. X . 8 3.6
COMPARISON BETWEEN SECTORS C AND D
COMPARISON BETWEEN APPROACH AND DEPARTURE . . X . 8
ILLUSTRATIONS
X . Figure 1
X . Figure 3 X . Figure 4 X . Figure 5 X . Figure 6
Response Time C ........................... X . 2 Response Time D ........................... X . 3 Response Time W ........................... X . 3 Response Time 0 ........................... X . 4 Message Out C ............................. X . 5 Message Out D ............................. X . 6 Message Out Approach ....................... X . 7
X . Figure 2
X . Figure 7
EUROCONTROL Experimental Centre
X - i
. . . . . . . . . . . . .............. ............... ......... __ ............
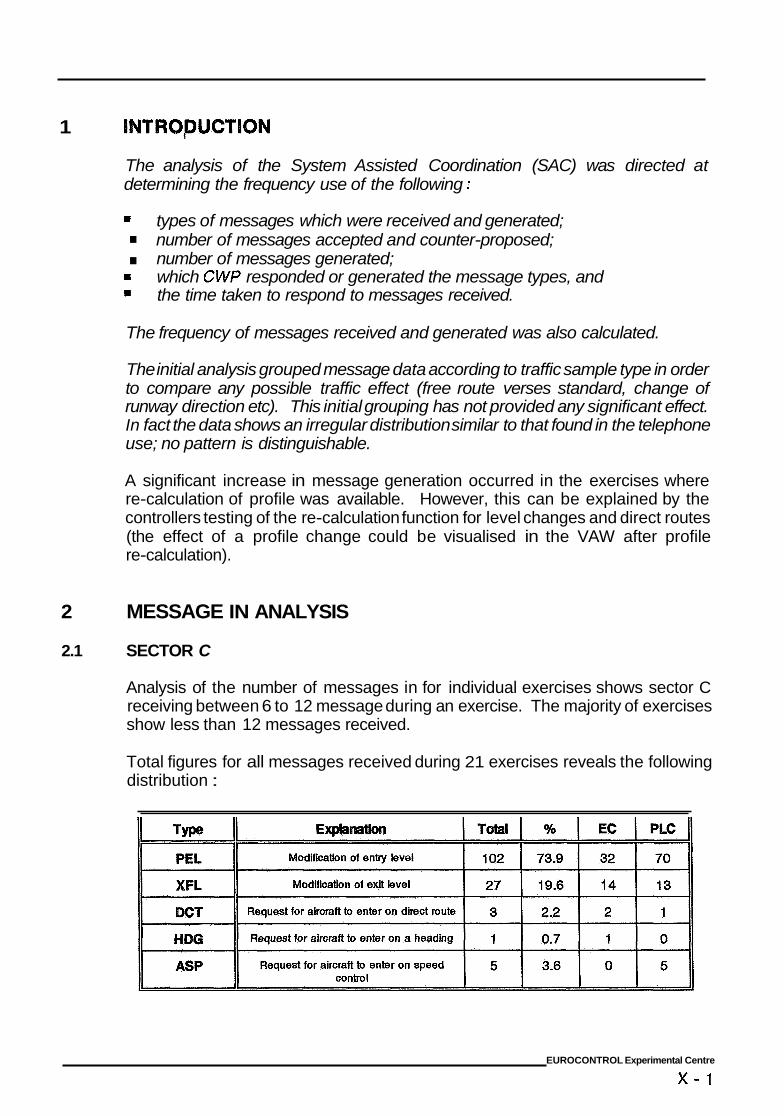
1 TROPUCTION
The analysis of the System Assisted Coordination (SAC) was directed at determining the frequency use of the following :
= . . number of messages generated;
=
types of messages which were received and generated; number of messages accepted and counter-proposed;
which CWP responded or generated the message types, and the time taken to respond to messages received.
The frequency of messages received and generated was also calculated.
The initial analysis grouped message data according to traffic sample type in order to compare any possible traffic effect (free route verses standard, change of runway direction etc). This initial grouping has not provided any significant effect. In fact the data shows an irregular distribution similar to that found in the telephone use; no pattern is distinguishable.
A significant increase in message generation occurred in the exercises where re-calculation of profile was available. However, this can be explained by the controllers testing of the re-calculation function for level changes and direct routes (the effect of a profile change could be visualised in the VAW after profile re-calculation).
2 MESSAGE IN ANALYSIS
2.1 SECTOR C
Analysis of the number of messages in for individual exercises shows sector C receiving between 6 to 12 message during an exercise. The majority of exercises show less than 12 messages received.
Total figures for all messages received during 21 exercises reveals the following distribution :
EUROCONTROL Experimental Centre
x - 1
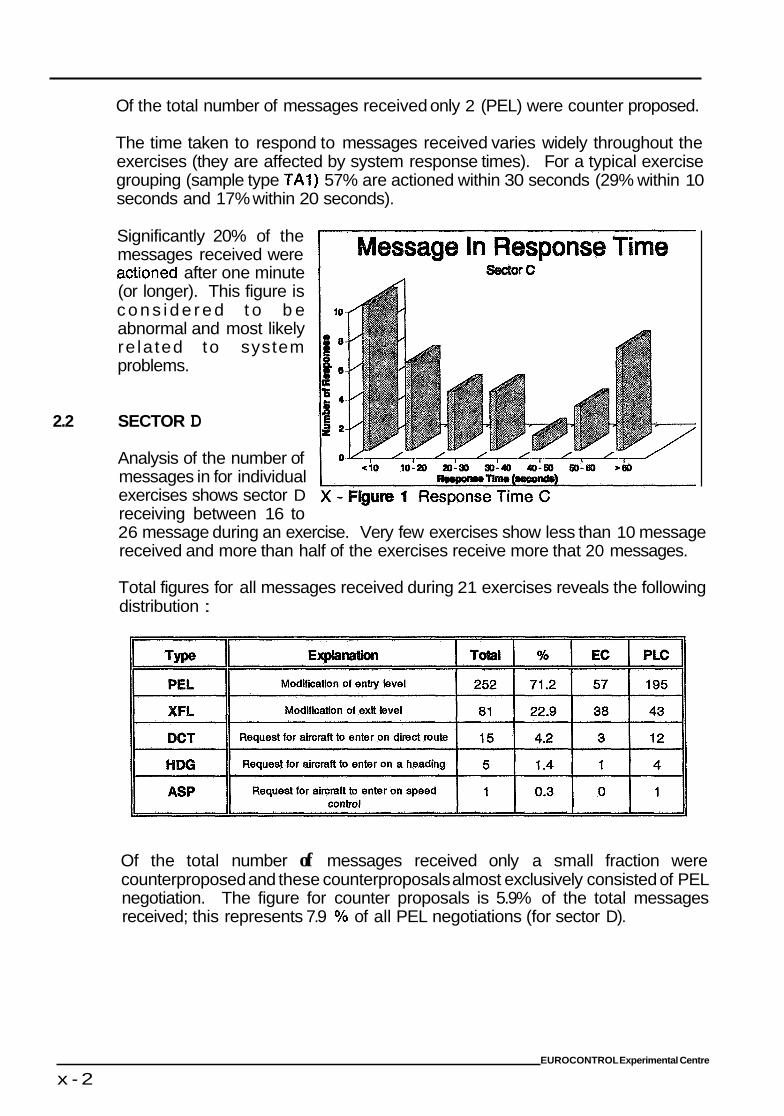
Of the total number of messages received only 2 (PEL) were counter proposed.
The time taken to respond to messages received varies widely throughout the exercises (they are affected by system response times). For a typical exercise grouping (sample type TA11 57% are actioned within 30 seconds (29% within 10 seconds and 17% within 20 seconds).
Significantly 20% of the messages received were actioned after one minute (or longer). This figure is c o n s i d e r e d t o b e abnormal and most likely re la ted to system problems.
2.2 SECTOR D
Analysis of the number of messages in for individual exercises shows sector D receiving between 16 to 26 message during an exercise. Very few exercises show less than 10 message received and more than half of the exercises receive more that 20 messages.
Total figures for all messages received during 21 exercises reveals the following distribution :
Of the total number of messages received only a small fraction were counterproposed and these counterproposals almost exclusively consisted of PEL negotiation. The figure for counter proposals is 5.9% of the total messages received; this represents 7.9 % of all PEL negotiations (for sector D).
EUROCONTROL Experimental Centre
x - 2
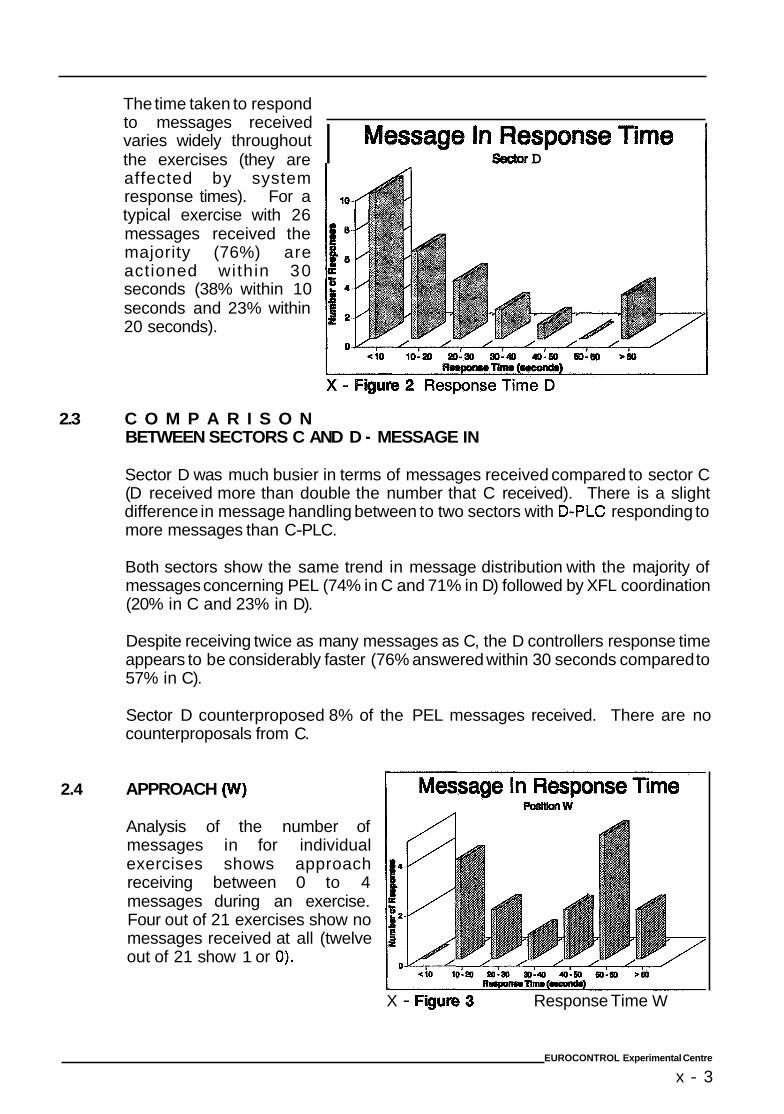
The time taken to respond to messages received varies widely throughout the exercises (they are affected by system response times). For a typical exercise with 26 messages received the majority (76%) are actioned within 30 seconds (38% within 10 seconds and 23% within 20 seconds).
I D
2.3 C O M P A R I S O N BETWEEN SECTORS C AND D - MESSAGE IN
Sector D was much busier in terms of messages received compared to sector C (D received more than double the number that C received). There is a slight difference in message handling between to two sectors with D-PLC responding to more messages than C-PLC.
Both sectors show the same trend in message distribution with the majority of messages concerning PEL (74% in C and 71% in D) followed by XFL coordination (20% in C and 23% in D).
Despite receiving twice as many messages as C, the D controllers response time appears to be considerably faster (76% answered within 30 seconds compared to 57% in C).
Sector D counterproposed 8% of the PEL messages received. There are no counterproposals from C.
2.4 APPROACH (VV)
Analysis of the number of messages in for individual exercises shows approach receiving between 0 to 4 messages during an exercise. Four out of 21 exercises show no messages received at all (twelve out of 21 show 1 or 0).
X - Figure 3 Response Time W
EUROCONTROL Experimental Centre
x - 3
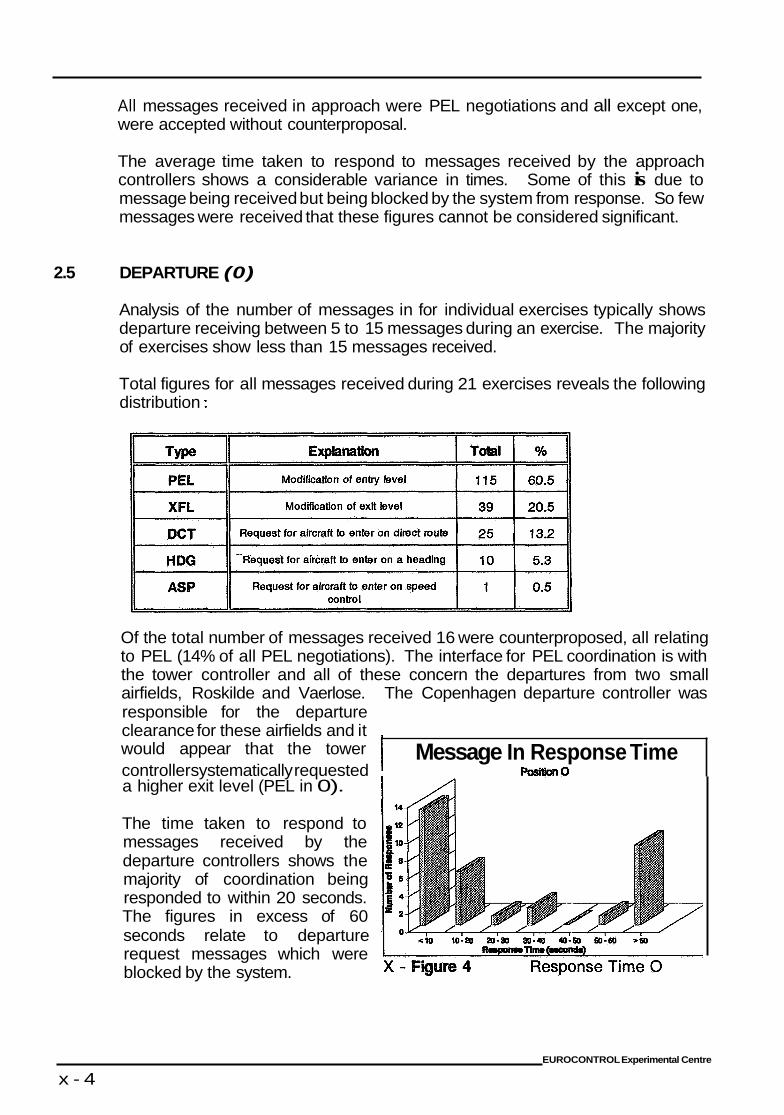
All messages received in approach were PEL negotiations and all except one, were accepted without counterproposal.
The average time taken to respond to messages received by the approach controllers shows a considerable variance in times. Some of this is due to message being received but being blocked by the system from response. So few messages were received that these figures cannot be considered significant.
2.5 DEPARTURE (0)
Analysis of the number of messages in for individual exercises typically shows departure receiving between 5 to 15 messages during an exercise. The majority of exercises show less than 15 messages received.
Total figures for all messages received during 21 exercises reveals the following distribution :
Of the total number of messages received 16 were counterproposed, all relating to PEL (14% of all PEL negotiations). The interface for PEL coordination is with the tower controller and all of these concern the departures from two small airfields, Roskilde and Vaerlose. The Copenhagen departure controller was responsible for the departure clearance for these airfields and it would appear that the tower I controller systematically requested 0
Message In Response Time a higher exit level (PEL in 0).
The time taken to respond to messages received by the departure controllers shows the majority of coordination being responded to within 20 seconds. The figures in excess of 60 seconds relate to departure request messages which were blocked by the system.
EUROCONTROL Experimental Centre
x - 4
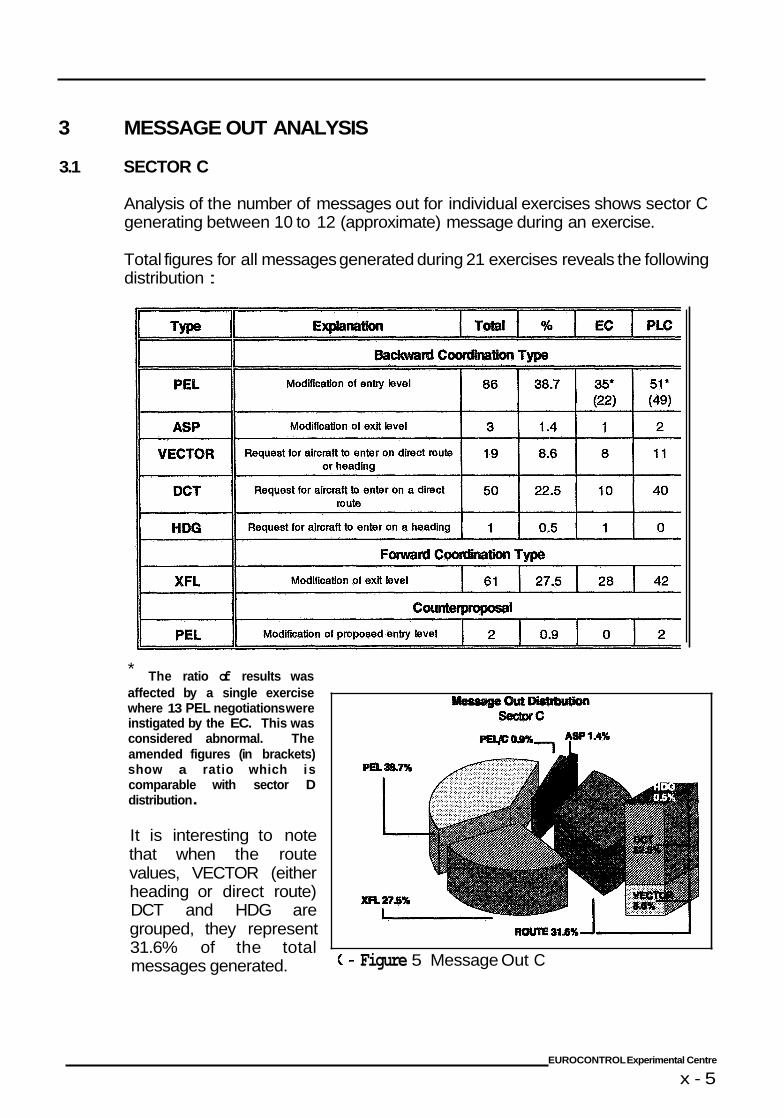
3 MESSAGE OUT ANALYSIS
3.1 SECTOR C
Analysis of the number of messages out for individual exercises shows sector C generating between 10 to 12 (approximate) message during an exercise.
Total figures for all messages generated during 21 exercises reveals the following distribution :
The ratio of results was affected by a single exercise where 13 PEL negotiations were instigated by the EC. This was considered abnormal. The amended figures (in brackets) show a ratio which is comparable with sector D distribution .
*
It is interesting to note that when the route values, VECTOR (either heading or direct route) DCT and HDG are grouped, they represent 31.6% of the total messages generated.
RourE a1sx-J-
( - Figure 5 Message Out C
EUROCONTROL Experimental Centre
x - 5
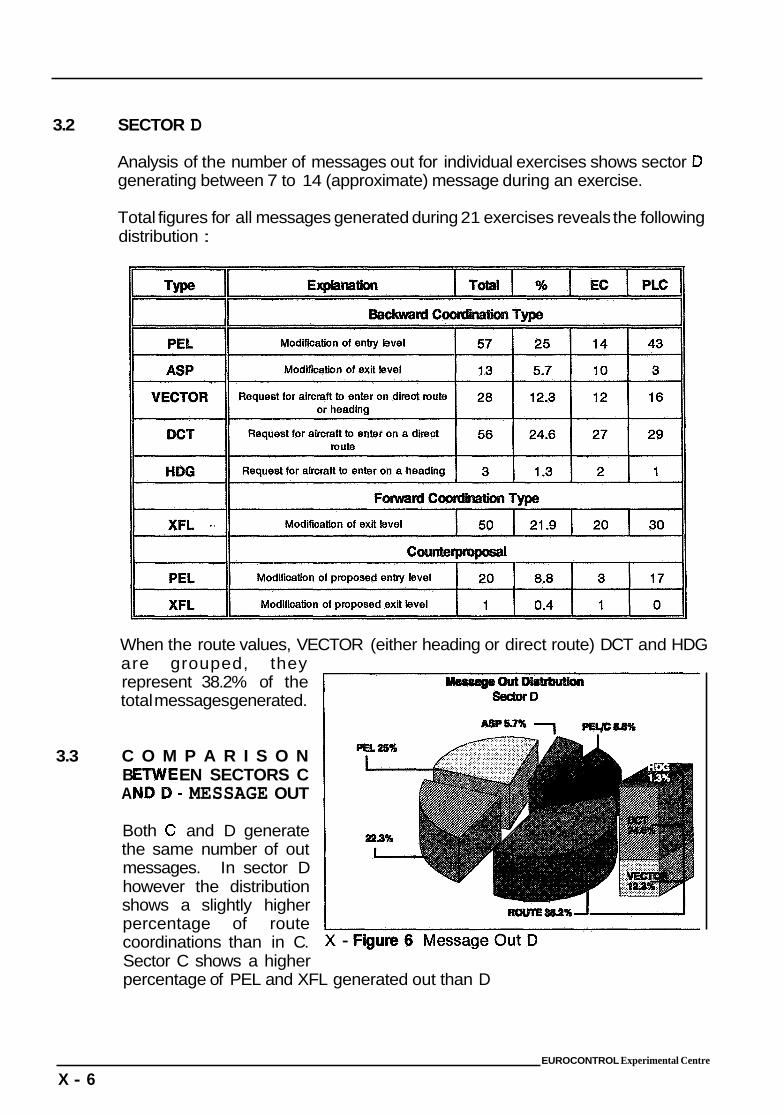
3.2 SECTOR D
Analysis of the number of messages out for individual exercises shows sector D generating between 7 to 14 (approximate) message during an exercise.
Total figures for all messages generated during 21 exercises reveals the following distribution :
When the route values, VECTOR (either heading or direct route) DCT and HDG are grouped, they represent 38.2% of the total messages generated.
3.3 C O M P A R I S O N B EN SECTORS C A - MESSAGE OUT
Both C and D generate the same number of out messages. In sector D however the distribution shows a slightly higher percentage of route coordinations than in C. X - Sector C shows a higher percentage of PEL and XFL generated out than D
EUROCONTROL Experimental Centre
X - 6
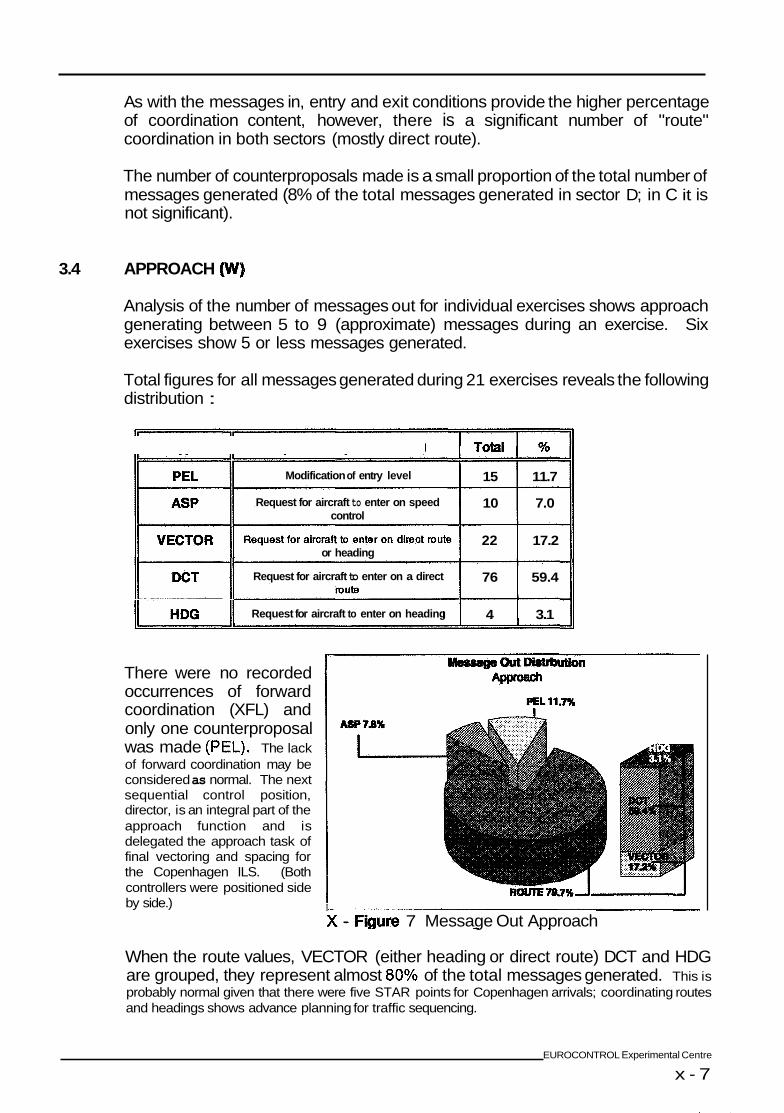
3.4
As with the messages in, entry and exit conditions provide the higher percentage of coordination content, however, there is a significant number of "route" coordination in both sectors (mostly direct route).
The number of counterproposals made is a small proportion of the total number of messages generated (8% of the total messages generated in sector D; in C it is not significant).
APPROACH (W)
Analysis of the number of messages out for individual exercises shows approach generating between 5 to 9 (approximate) messages during an exercise. Six exercises show 5 or less messages generated.
Total figures for all messages generated during 21 exercises reveals the following distribution :
Modification of entry level
Request for aircraft to enter on speed control
or heading
Request for aircraft to enter on a direct
Request for aircraft to enter on heading IHDOI There were no recorded occurrences of forward coordination (XFL) and only one counterproposal was made (PEL). The lack of forward coordination may be considered as normal. The next sequential control position, director, is an integral part of the approach function and is delegated the approach task of final vectoring and spacing for the Copenhagen ILS. (Both controllers were positioned side by side.)
15 11.7
10 7.0
22 17.2
76 59.4
4 3.1
I ure 7 Message Out Approach
When the route values, VECTOR (either heading or direct route) DCT and HDG are grouped, they represent almost 80% of the total messages generated. This is probably normal given that there were five STAR points for Copenhagen arrivals; coordinating routes and headings shows advance planning for traffic sequencing.
EUROCONTROL Experimental Centre
x - 7
3.5 DEPARTURE (0)
The number of messages out for individual exercises in departure is extremely varied. 13 exercises show a message generation of 5 or less (5 exercises have no message out generation).
The distribution of the messages generated during 21 exercises is as follows :
There are not route negotiations recorded in the departure control position. The interface (backward coordination) was with the tower and all aircraft departed on SIDS.
66.7% of the coordination was related to XFL. This does not appear to be unreasonable as one of the tasks of the departure controller (if not the main task after separation) would be the assurance of un-restricted climb for departures. This task would be assisted in certain cases by obtaining permission from the next sector to climb aircraft above the sector XFL. The figure (52 in 21 exercises) is not large however; the departure controller was departing up to 50 aircraft an hour in certain exercises.
3.6 COMPARISON BETWEEN APPROACH AND DEPARTURE - MESSAGE OUT
The different tasks of approach and departure can be clearly identified in the nature of the message out distribution. Approach is concerned primarily with route coordination, indicating pre-planning for sequencing to Copenhagen or one of the smaller airfields.
The departure position reflects the need to ensure correct sector exit conditions before aircraft are transferred.
However, in both approach and departure the amount of messages generated is significantly less than either of the area sectors.
EUROCONTROL Experimental Centre
X - 8
ANNEX XI
ODlD IV and ODlD IV Bis
SIMULATION VISITORS AND
PARTICIPANTS
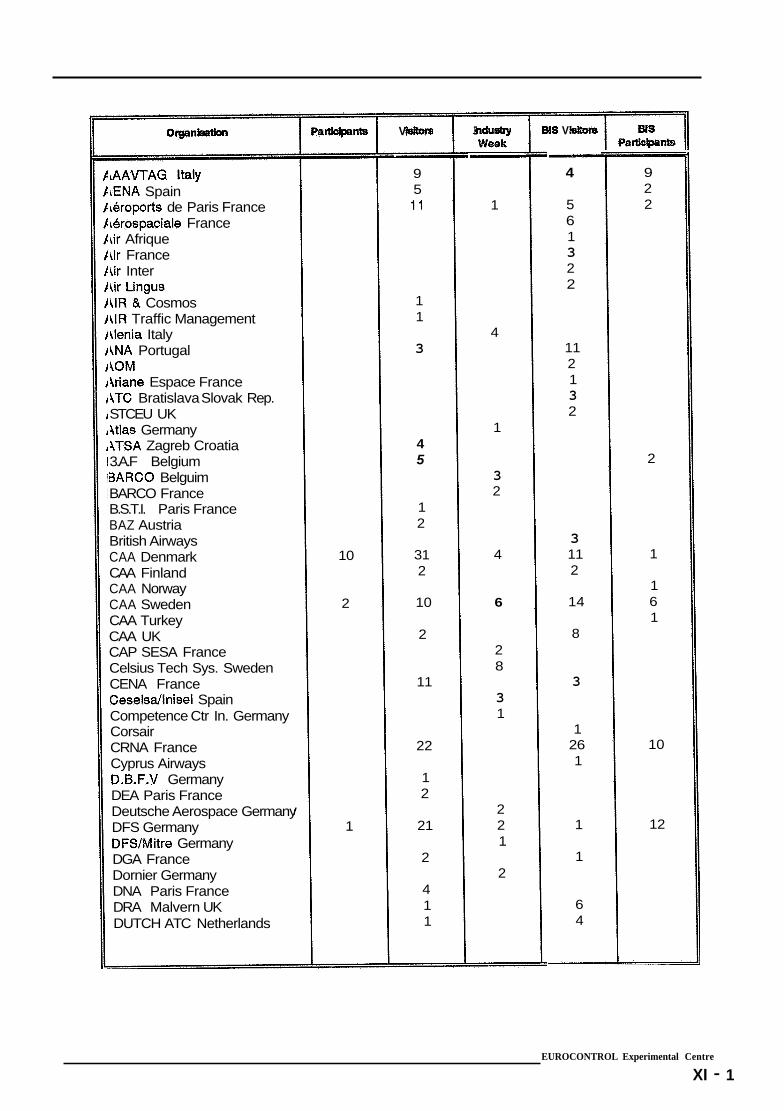
LAAWTAG Italy LENA Spain ibroports de Paris France Lbrospaciale France iir Afrique iir France Lir Inter \ir Lingus \IR L? Cosmos \IR Traffic Management Uenia Italy 4NA Portugal 4OM Mane Espace France 4TC Bratislava Slovak Rep. STCEU UK 4tlas Germany 4TSA Zagreb Croatia 3.A.F Belgium 3ARCO Belguim BARCO France B.S.T.I. Paris France BAZ Austria British Airways CAA Denmark CAA Finland CAA Norway CAA Sweden CAA Turkey CAA UK CAP SESA France Celsius Tech Sys. Sweden CENA France Ceselsdlnisel Spain Competence Ctr In. Germany Corsair CRNA France Cyprus Airways D.B.F.V Germany DEA Paris France Deutsche Aerospace Germany DFS Germany DFS/Mitre Germany DGA France Dornier Germany DNA Paris France DRA Malvern UK DUTCH ATC Netherlands
10
2
1
V - 9 5 11
1 1
3
4 5
1 2
31 2
10
2
11
22
1 2
21
2
4 1 1
E
I_
1
4
1
3 2
4
6
2 8
3 1
2 2 1
2
Eis V
7
4
5 6 1 3 2 2
11 2 1 3 2
3 11 2
14
8
3
1 26 1
1
1
6 4
9 2 2
2
1
1 6 1
10
12
EUROCONTROL Experimental Centre
XI - 1
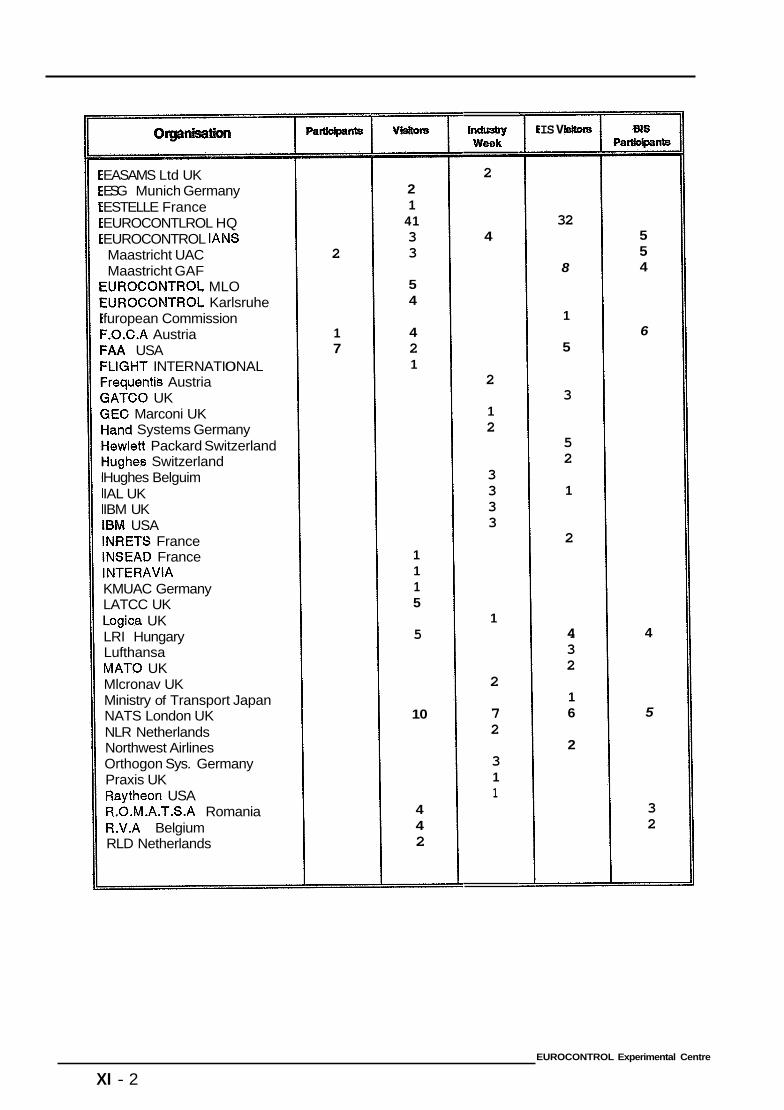
0
EASAMS Ltd UK ESG Munich Germany ESTELLE France EUROCONTLROL HQ EUROCONTROL IANS Maastricht UAC Maastricht GAF
3UROCONTROL MLO fUROCONTROL Karlsruhe furopean Commission -.O.C.A Austria -AA USA -LIGHT INTER NATI 0 NAL 7equentis Austria 3ATCO UK 3EC Marconi UK -land Systems Germany iewlett Packard Switzerland tlughes Switzerland Hughes Belguim IAL UK IBM UK ISM USA INRETS France INSEAD France INTERAVIA KMUAC Germany LATCC UK Logica UK LRI Hungary Lufthansa MAT0 UK Mlcronav UK Ministry of Transport Japan NATS London UK NLR Netherlands Northwest Airlines Orthogon Sys. Germany Praxis UK Raytheon USA R.0.M.A.T.S.A Romania R.V.A Belgium RLD Netherlands
2
1 7
2 1
41 3 3
5 4
4 2 1
1 1 1 5
5
10
4 4 2
In& Week
2 -
4
2
1 2
3 3 3 3
1
2
7 2
3 1 1
IS v
32
8
1
5
3
5 2
1
2
4 3 2
1 6
2
MS
5 5 4
6
4
5
3 2
EUROCONTROL Experimental Centre
XI - 2
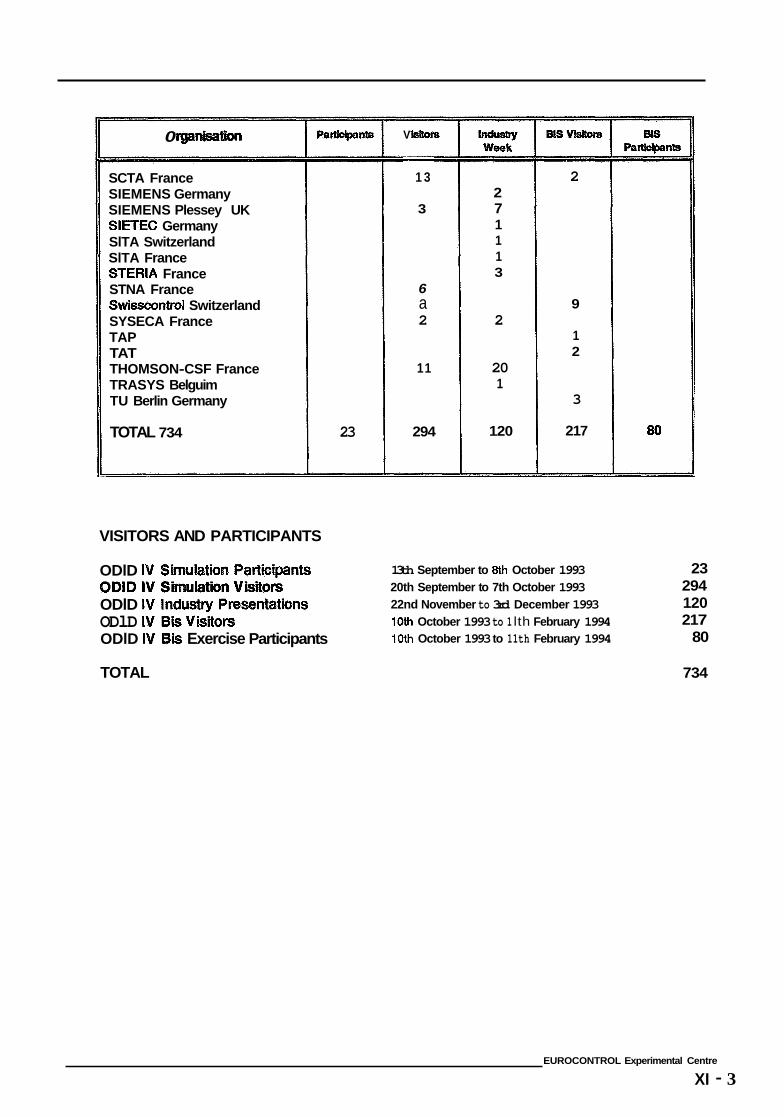
0
SCTA France SIEMENS Germany SIEMENS Plessey UK SIETEC Germany SlTA Switzerland SlTA France STERIA France STNA France Swissmntrol Switzerland SYSECA France TAP TAT THOMSON-CSF France TRASYS Belguim TU Berlin Germany
TOTAL 734 23
VISITORS AND PARTICIPANTS
ODlD IV Simulation Participants
V
1 3
3
6
2 a
11
294
2 7 1 1 1 3
2
20 1
120
2
9
1 2
3
21 7
13th September to 8th October 1993 20th September to 7th October 1993
ODlD IV Industry Presentations 22nd November to 3rd December 1993
80
23 294 120
ODlD IV BlsVlsitors ODlD IV Bis Exercise Participants
10th October 1993 to 1 lth February 1994 10th October 1993 to 11th February 1994
21 7 80
TOTAL 734
EUROCONTROL Experimental Centre
XI - 3
ANNEX XI1
ODlD IV
BIBLIOGRAPHY AND
ODlD GROUP ME
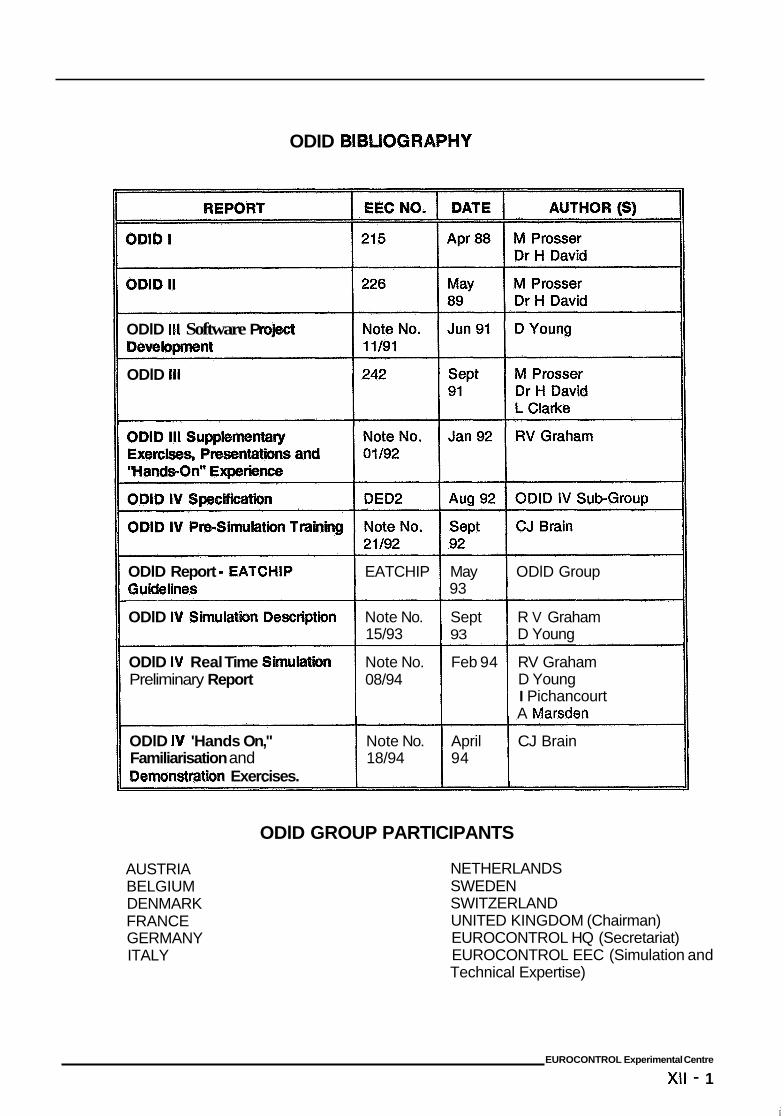
ODID BIBUOGRAPHY
ODlD 111 Software P
ODlD 111
ODlD Report - EATCHIP EATCHIP May ODlD Group GuMelJnes 93
ODlD IV SEmuhtion Description Note No. Sept R V Graham 15/93 93 D Young
ODlD IV Real Time Simulation Note No. Feb 94 RV Graham Preliminary Report 08/94 D Young
I Pichancourt A Marsden
ODlD IV 'Hands On," Note No. April CJ Brain Familiarisation and 18/94 94 Demonstration Exercises.
AUSTRIA BELGIUM DENMARK FRANCE GERMANY ITALY
ODlD GROUP PARTICIPANTS
NETHERLANDS SWEDEN SWITZERLAND UNITED KINGDOM (Chairman) EUROCONTROL HQ (Secretariat) EUROCONTROL EEC (Simulation and Technical Expertise)
EUROCONTROL Experimental Centre
XI1 - 1


