Embed Size (px)
Citation preview
Only Low Frequency Event-Related EEG Activity IsCompromised in Multiple Sclerosis: Insights from anIndependent Component Clustering AnalysisHanni Kiiski1, Richard B. Reilly1, Roisın Lonergan2, Siobhan Kelly2, Marie Claire O’Brien3, Katie Kinsella2,
Jessica Bramham3, Teresa Burke3, Sean O Donnchadha3, Hugh Nolan1, Michael Hutchinson2,
Niall Tubridy2, Robert Whelan1,4*
1 Trinity Centre for Bioengineering, Trinity College Dublin, Ireland, 2 Department of Neurology, St. Vincent’s University Hospital, Elm Park, Dublin, Ireland, 3 School of
Psychology, University College Dublin, Belfield, Dublin, Ireland, 4 Department of Psychiatry, University of Vermont, Burlington, Vermont, United States of America
Abstract
Cognitive impairment (CI), often examined with neuropsychological tests such as the Paced Auditory Serial Addition Test(PASAT), affects approximately 65% of multiple sclerosis (MS) patients. The P3b event-related potential (ERP), evoked whenan infrequent target stimulus is presented, indexes cognitive function and is typically compared across subjects’ scalpelectroencephalography (EEG) data. However, the clustering of independent components (ICs) is superior to scalp-basedEEG methods because it can accommodate the spatiotemporal overlap inherent in scalp EEG data. Event-related spectralperturbations (ERSPs; event-related mean power spectral changes) and inter-trial coherence (ITCs; event-related consistencyof spectral phase) reveal a more comprehensive overview of EEG activity. Ninety-five subjects (56 MS patients, 39 controls)completed visual and auditory two-stimulus P3b event-related potential tasks and the PASAT. MS patients were also dividedinto CI and non-CI groups (n = 18 in each) based on PASAT scores. Data were recorded from 128-scalp EEG channels and 4 ICclusters in the visual, and 5 IC clusters in the auditory, modality were identified. In general, MS patients had significantlyreduced ERSP theta power versus controls, and a similar pattern was observed for CI vs. non-CI MS patients. The ITCmeasures were also significantly different in the theta band for some clusters. The finding that MS patients had reduced P3btask-related theta power in both modalities is a reflection of compromised connectivity, likely due to demyelination, thatmay have disrupted early processes essential to P3b generation, such as orientating and signal detection. However, forposterior sources, MS patients had a greater decrease in alpha power, normally associated with enhanced cognitivefunction, which may reflect a compensatory mechanism in response to the compromised early cognitive processing.
Citation: Kiiski H, Reilly RB, Lonergan R, Kelly S, O’Brien MC, et al. (2012) Only Low Frequency Event-Related EEG Activity Is Compromised in Multiple Sclerosis:Insights from an Independent Component Clustering Analysis. PLoS ONE 7(9): e45536. doi:10.1371/journal.pone.0045536
Editor: Friedemann Paul, Charite University Medicine Berlin, Germany
Received December 30, 2011; Accepted August 23, 2012; Published September 21, 2012
Copyright: � 2012 Kiiski et al. This is an open-access article distributed under the terms of the Creative Commons Attribution License, which permitsunrestricted use, distribution, and reproduction in any medium, provided the original author and source are credited.
Funding: This study was partly funded by an Enterprise Ireland grant to R.B. Reilly (eBiomed: eHealthCare based on Biomedical Signal Processing and ICT forIntegrated Diagnosis and Treatment of Disease, http://www.enterprise-ireland.com/en/), by a Science Foundation Ireland grant to R.B. Reilly (Research FrontiersProgram, http://www.sfi.ie), and by an Irish Research Council for Science, Engineering & Technology (www.ircset.ie) grant to H. Kiiski. No additional externalfunding was received for this study. The funders had no role in study design, data collection and analysis, decision to publish, or preparation of the manuscript.
Competing Interests: The authors have declared that no competing interests exist.
* E-mail: [email protected]
Introduction
Cognitive impairment (CI) affects nearly 65% of multiple
sclerosis (MS) patients and can occur in the absence of physical
disability [1]. Dysfunctions in speed of information processing,
attention, memory and executive functions are most typically
observed in MS patients [2], which have an adverse impact on
daily life [3,4]. It is important to recognise CI as early as possible
and to monitor its course frequently [5]. Disease duration and
disability level are usually poorly correlated with CI in MS [5],
and the MRI lesions do not thoroughly explain differences in
cognition of individual MS patients [6]. Neuropsychological tests
in the MS Functional Composite [7], such as the Paced Auditory
Serial Addition Test (PASAT; a difficult test of attention and
working memory [8,9]), are generally used to measure CI in MS.
Nevertheless, the PASAT is influenced by practice effects [10],
education, anxiety and physical ability which is usually impaired in
MS [11], and therefore objective and reliable cognitive electro-
physiological measures, which are not affected by these factors,
have potential to complement the assessment of CI in MS.
Scalp-based P3b ERP studies with MS patientsPrior electroencephalography (EEG) studies have concentrated
on measuring scalp P3b event-related potential (ERP) and EEG
time-frequency domain in MS patients
[12,13,14,15,16,17,18,19,20,21,22]. The most common method
to investigate the relationship of CI and ERPs is to employ a two-
stimulus oddball task, in which occasional target stimuli have to be
detected in a train of frequent irrelevant non-target stimuli. A P3b
component is typically elicited approximately 300 ms after each
target stimulus, with maximal amplitude over the parietal scalp
area [23]. The neural generators in healthy controls of P3b have
not been comprehensively delineated, not least because they are
widespread in nature, but they include the parietal, frontal, and
medial temporal lobes, the cingulate cortex, and the temporo-
PLOS ONE | www.plosone.org 1 September 2012 | Volume 7 | Issue 9 | e45536
parietal junction [23,24]. The P3b is considered to reflect context
updating [23] and/or the categorization of task relevant events
[25].
The majority of P3b ERPs studies in MS have reported
prolonged P3b latencies and/or reduced P3b amplitudes in visual
and/or auditory modality [12,13,15,16,17,18,19], although some
studies [14,19] have failed to find differences between MS patients
and controls. The variation in the scalp-based P3b ERP results was
most likely due to the relatively small sample sizes and the use of
low-density EEG arrays. In our previous scalp-based high-density
EEG study [22], with a relatively large number of subjects
(N = 54), we showed that MS patients had reduced P3b amplitudes
over frontal and centro-parietal scalp areas in the visual task, but
there were no statistically significant differences in auditory
modality. Furthermore, in a subsequent longitudinal high-density
EEG analysis [26] we demonstrated visual modality to be more
sensitive in detecting a greater reduction of P3b amplitudes over
the centro-parietal scalp region in MS patients relative to controls
over 12-month period. Moreover, both visual and auditory P3b
amplitudes had decreased over the centro-parietal scalp area in
MS patients after 12 Months. In brief, the visual modality
appeared to be superior in detecting change in scalp-based analysis
of P3b ERPs in MS patients.
Physiologically, EEG spectral power reflects the number of
neurons that discharge synchronously (i.e. increased power implies
increased synchronous firing of a group of neurons) [27]. Theta (4–
8 Hz), alpha (8–13 Hz), and beta (14–30 Hz) EEG frequencies are
associated with cognitive processing and behaviour [23,28]. In
particular, superior working memory performance is related to an
increase in theta power and to a decrease in alpha power after an
increase in task demands, such as the presentation of less frequent
target stimuli in an oddball paradigm [27]. Theta oscillations are
also related to information processing tasks, especially those of
sustained attention and executive functions [27,29,30,31], which
are all essential for a successful oddball detection. Previous scalp-
based and low-density spectral EEG studies on MS patients related
to P3b ERP task performance have identified increased power of
only beta and gamma bands in MS patients compared to controls
over the whole scalp area, which was most prominent over frontal
electrodes [21], and over anterior right hemisphere and bilateral
posterior scalp regions [20].
Beyond scalp ERPPrevious EEG studies of cognitive functioning in MS have only
examined the differences between the mean ERPs of MS patients
and controls [12,13,14,15,16,17,18,19,22,26,32]. The informa-
tiveness of ERPs is restricted due to the fact that they are
generated by multiple, functionally distinct neural sources, which
cause EEG potentials recorded on the scalp to overlap both
temporally and spatially [33,34]. Independent component analysis
(ICA) is one of the most advanced methods to deal with the
problem of spatiotemporal overlap of EEG. Its aim is to identify
temporally independent and spatially fixed independent compo-
nents (ICs) from high-density scalp EEG activities in which they
are intermingled, yielding functionally distinct ICs which can be
mapped onto 3D head space [35,36,37]. Through this inverse
source modelling [37], the ICs reflect the origin of the EEG
activations, whereas in the traditional scalp-based ERP analysis
the recorded signals from each scalp electrode are assumed to be
comparable with the signals from equivalently placed electrodes
for all the subjects, thus not taking into account the physical
differences of the brains of different people [37]. In contrast to
other EEG source analysis methods (e.g., BESA) [38], ICA does
not require a priori assumptions on the temporal dynamics or the
spatial structure of the underlying processes. Moreover, ICA is a
useful method for isolating artifactual EEG sources (such as eye
blinks and muscle artifact), which are then removed, yielding a
more accurate representation of neural activity [35].
Average ERPs between groups only capture the portion of the
channel data that is phase-consistent at latencies relative to the
time-locking events, which may result into a potential loss of
information of the EEG activities [35,37]. The aggregation of ICs
into functionally equivalent groups provides an estimate of source
EEG activities across subjects and conditions, thus reflecting more
comprehensively the EEG activities [37]. Event-related spectral
perturbations (ERSPs) and inter-trial coherence (ITCs) are
superior methods for visualizing event-related EEG dynamics
because they reveal a more comprehensive overview of the
underlying EEG time-frequency properties than ERPs. ERSPs are
the mean latency-by-frequency images that show the frequencies
and latencies when mean changes in log power (dB) occur from a
specific mean power baseline, showing them time-locked to
experimental events [39]. ITCs measure the trial-to-trial phase
consistency at each frequency and latency relative to a set of time
locking events. If ITC is close to 0 at a given frequency and latency
(relative to time-locking events) then the measured spectral phase
is evenly distributed across trials, whereas if ITC is near 1, then the
activity is reliably phase locked to the time-locking events [40,41].
An IC clustering study of an auditory P3b task in healthy, young
volunteers showed that IC clusters reflecting P3b activations had a
decrease in alpha power post-target stimulus presentation [42]. To
our knowledge, IC clustering of EEG data has not yet been utilised
with a large sample (over 40 subjects), nor with a clinical group. IC
clustering has potential to give a more thorough insight into how
the changes in MS patients brains, due to demyelinating lesions
and cortical atrophy, affect the speed of processing of the stimulus
information.
Methods
Ethical approvalEthical approval was obtained from the St. Vincent’s University
Hospital Ethics Committee. Written informed consent was
obtained from all subjects.
HypothesesBased on earlier findings on scalp-space P3b ERP analyses in
MS [16,22,32,43] and on spectral EEG studies relating frequency
bands to cognitive functions utilised during P3b task performance,
such as sustained attention and working memory [27,29,30,31], it
was hypothesized that MS patients versus controls and cognitively
impaired MS (CI-MS) patients versus non- cognitively impaired
MS (non-CI-MS) patients would show 1) reduced theta and a
smaller decrease in alpha band after target stimuli, and 2) less
consistency in IC inter-trial coherences (ITCs), over the expected
P3b peak time period (200–400 ms). These differences were
expected to be more prominent in the IC clusters located in the
parietal brain areas which were associated with P3b activities in
prior IC clustering studies [37,42,44,45], and in visual modality
based on the previous studies of our research group [22,26].
SubjectsFifty-six MS patients (mean age = 44 years; range = 20–61 years)
satisfying the revised McDonald criteria for MS [46] were
recruited. The MS patients were age-matched with 39 healthy
volunteers (mean age = 42 years; range = 28–67 years). Exclusion
criteria included current use of benzodiazepines or neuroleptics
(minimum suspension period of 7 days), a history of alcohol or
Compromised EEG Activity in Multiple Sclerosis
PLOS ONE | www.plosone.org 2 September 2012 | Volume 7 | Issue 9 | e45536
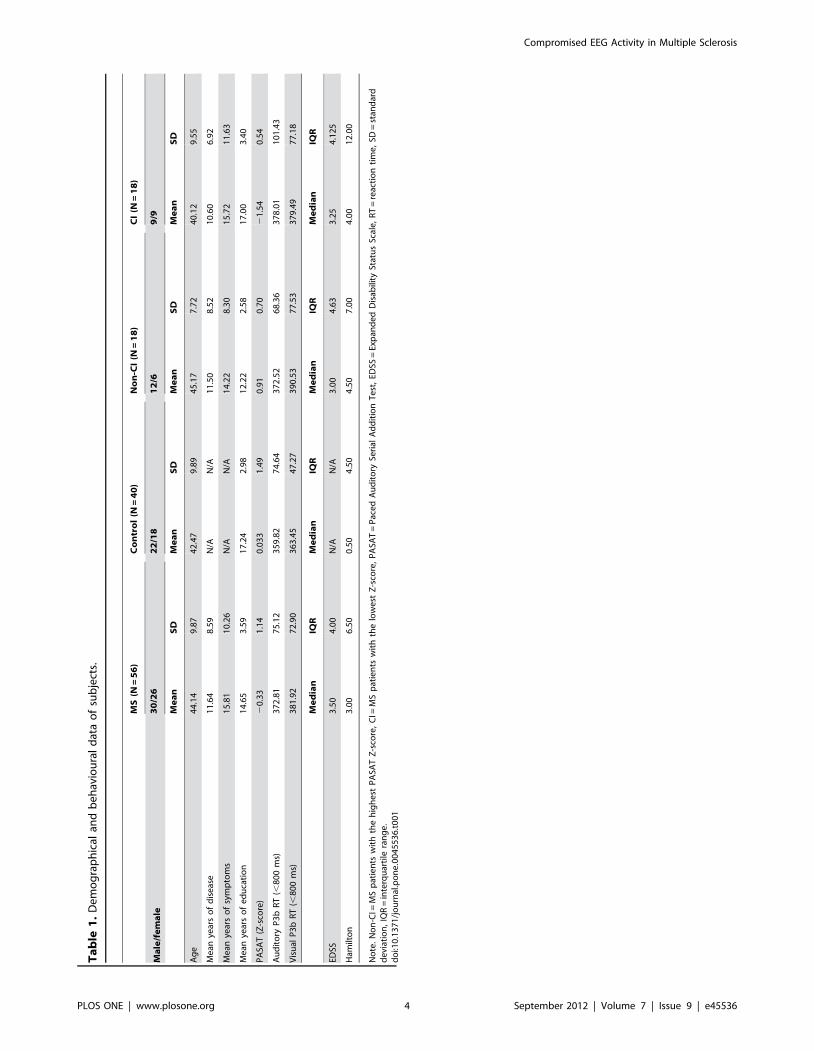
drug misuse, head injury, or stroke. Table 1 displays the
demographic and behavioural data of the subjects. Six patients
had had a relapse within the previous year. Three MS patients
were excluded from the further analysis of the PASAT perfor-
mance groups due to missing information. The effect of years of
education, age and gender on PASAT scores were controlled by
employing a regression-based approach (described in detail in
[47]) to obtain corrected PASAT Z-scores due to the differences
and correlations between MS patients and controls in the years of
education, age and gender. The MS patients were then chosen for
an extreme group analysis based on their PASAT Z-score. In this
analysis, the top third of the MS patients (N = 18) with highest
PASAT Z-scores (mean = 0.91) denoted here as the non-cogni-
tively impaired MS group (non-CI MS) were compared to the
bottom third of MS patients (N = 18) with the lowest PASAT Z-
scores (mean = 21.54) denoted here as the cognitively impaired
MS group (CI MS).
ProcedureERP data were recorded using the ActiveTwo BiosemiTM
system, from 134 electrodes (128 scalp electrodes), organized
according to the 10–5 system [48]. EEG data were digitized at
512 Hz. The vertical and horizontal electro-oculograms were
recorded bilaterally from approximately 3 cm below the eye and
from the outer canthi respectively. Participants were seated in a
soundproofed, darkened room. The visual P3b paradigm consisted
of blue circles, separated by an inter-stimulus interval of 2 s,
presented for 205 trials in a pseudorandom order. Frequent non-
target (probability = 0.8) and infrequent target (probability = 0.2)
circles were 2 cm or 4 cm in diameter, respectively. The auditory
P3b paradigm consisted of tones, separated by an inter-stimulus
interval of 2 s, presented binaurally for 205 trials in a pseudoran-
dom order. Frequent non-target (80%) and infrequent target
(20%) tones were presented at 500 Hz and 1000 Hz respectively.
Subjects were instructed to press a button as quickly as possible
following a target stimulus. Order of modality and task were
counterbalanced across subjects.
Subjects completed a neuropsychological measure of speed of
cognitive processing, the standard 3-s Paced Auditory Serial
Addition Test PASAT [8,9]. The subjects sat with the examiner in
a quiet room, and were asked to add consecutive single-digit
numbers as they were presented on a compact disk and to respond
orally with the accurate sum. Subjects were asked to perform
calculations silently, without writing or using fingers, and a
practice sequence was administered prior to the test. The standard
PASAT form, consisting of 61 single digits with a 3 s inter-stimulus
interval, was used. Raw PASAT score was based on the total
number of correct responses from a maximum of 60 correct
answers. Due to known correlations between PASAT raw scores
and and demographic variables such as age [9,49,50], education
and gender, the PASAT raw scores were corrected for
demographic variables using Parmenter’s [47] regression-based
demographic corrections for MS patients, and the demographic
corrected PASAT Z-scores were then utilised in the data analysis.
The subjects also completed the 21-item Hamilton rating scale
for depression (HRSD-21) [51], and MS patients completed a
measure of physical disability in MS, Kurtzke Expanded Disability
Status Scale (EDSS) [52].
Data analysisStatistical analyses on demographical and behavioural data
were completed using PASW Statistics 18.0 (Predictive Analytics
SoftWare; SPSS Inc., Chicago, IL, USA, www.spss.com).
Preliminary data processing employed the EEGLAB toolbox
([53]; http://sccn.ucsd.edu/eeglab) in conjunction with the
FASTER plug-in (Fully Automated Statistical Thresholding for
EEG artifact Rejection; [54]; http://sourceforge.net/projects/
faster). The EEG data were bandpass filtered between 1 and
95 Hz, notch frequencies set to 50 and 60 Hz (the monitor refresh
rate), average referenced across all scalp electrodes (appropriate
when using a high-density EEG array), epoched from 500 ms pre-
stimulus to 1000 ms post-stimulus and baseline corrected from
200 ms pre-baseline). The FASTER toolbox removed epochs with
large artefacts (e.g., muscle twitch) and interpolated channels with
poor signal quality. All pre-processing parameters for FASTER for
this study are contained in Supplemental Material.
Independent component analysis (ICA) was used to obtain
independent components (ICs) from scalp EEG activity in which
they were mixed [55,56]. This was performed using the Infomax
algorithm [55]. The ICA has the effect of spatially filtering the
data by using the information from in the EEG itself to separate
scalp data from each active cortical source. Specifically, EEG
channel recordings were arranged in a matrix of channels by time
points, which was then submitted into ICA. ICA then found an
‘unmixing’ matrix W that linearly unmixed (i.e. decomposed) the
multichannel EEG data (x) into a sum of maximally temporally
independent and spatially fixed components u (i.e., u = Wx [37]).
The rows of the resulting matrix u were the IC activations and its
columns the time points of the input data [40]. Columns of the
inverse matrix, W21, gave the relative projection weights from
each IC to each scalp electrode [37]. The auditory and visual P3
data were subjected to two separate ICAs because the tasks
involved different sensory processes activating different brain areas
at different latencies. Based on our prior experience with ICA (e.g.
developing FASTER, a fully automated method for processing
high-density EEG data; [54]) we found that applying separate
ICAs was optimal.
FASTER [54] automatically identified artifactual (i.e., non-
neural) ICs and removed them from the EEG data (note: the
standard z = 3 threshold for IC rejection was lowered to z = 2 for
the EOG channels). The remaining ICs were used in the further
analyses. Next, inverse modelling of the individual IC scalp maps
was performed to localize EEG sources related to P3b task
performance [37]. An equivalent current dipole model was
computed for each brain activity component map by using a
four-shell spherical head model in the DIPFIT2 plug-in (http://
sccn.ucsd.edu/eeglab/plugins.html), co-registered to the Biosemi
coordinates via a Talairach transformation matrix. DIPFIT2 used
automatic single dipole source localization algorithm for individual
component maps in order to test the goodness-of-fit for modelling
each IC scalp map with a single equivalent current dipole to
quantify component quality. ICs were excluded from further
analysis if 1) the best-fitting equivalent current dipole model had
more than 15% residual variance from the spherical forward-
model scalp projection (over all 128 scalp electrodes) and/or 2) the
component’s equivalent dipole was located outside of the model
brain volume.
In order to acquire comprehensive source EEG activations
related to P3b task, IC clusters were defined by means of a joint
distance measure based on three dimensional (3D) dipole source
locations and orientations, scalp maps, mean spectra (using a Fast
Fourier Transform), and ERP, ERSP and ITC activations. The
sliding windows in the frequency analysis were based on the
Morlet wavelet transform (maximum 185 ms). Computation was
performed on 100 frequencies from 3–256 Hz.
Principal components analysis was utilised for pre-clustering
with the relative weight = 1 for all of the measures, except for
dipoles which was = 10. A K-means method was employed in IC
Compromised EEG Activity in Multiple Sclerosis
PLOS ONE | www.plosone.org 3 September 2012 | Volume 7 | Issue 9 | e45536
Ta
ble
1.
De
mo
gra
ph
ical
and
be
hav
iou
ral
dat
ao
fsu
bje
cts.
MS
(N=
56
)C
on
tro
l(N
=4
0)
No
n-C
I(N
=1
8)
CI
(N=
18
)
Ma
le/f
em
ale
30
/26
22
/18
12
/69
/9
Me
an
SD
Me
an
SD
Me
an
SD
Me
an
SD
Ag
e4
4.1
49
.87
42
.47
9.8
94
5.1
77
.72
40
.12
9.5
5
Me
anye
ars
of
dis
eas
e1
1.6
48
.59
N/A
N/A
11
.50
8.5
21
0.6
06
.92
Me
anye
ars
of
sym
pto
ms
15
.81
10
.26
N/A
N/A
14
.22
8.3
01
5.7
21
1.6
3
Me
anye
ars
of
ed
uca
tio
n1
4.6
53
.59
17
.24
2.9
81
2.2
22
.58
17
.00
3.4
0
PA
SAT
(Z-s
core
)2
0.3
31
.14
0.0
33
1.4
90
.91
0.7
02
1.5
40
.54
Au
dit
ory
P3
bR
T(,
80
0m
s)3
72
.81
75
.12
35
9.8
27
4.6
43
72
.52
68
.36
37
8.0
11
01
.43
Vis
ual
P3
bR
T(,
80
0m
s)3
81
.92
72
.90
36
3.4
54
7.2
73
90
.53
77
.53
37
9.4
97
7.1
8
Me
dia
nIQ
RM
ed
ian
IQR
Me
dia
nIQ
RM
ed
ian
IQR
EDSS
3.5
04
.00
N/A
N/A
3.0
04
.63
3.2
54
.12
5
Ham
ilto
n3
.00
6.5
00
.50
4.5
04
.50
7.0
04
.00
12
.00
No
te.
No
n-C
I=M
Sp
atie
nts
wit
hth
eh
igh
est
PA
SAT
Z-s
core
,C
I=M
Sp
atie
nts
wit
hth
elo
we
stZ
-sco
re,
PA
SAT
=P
ace
dA
ud
ito
rySe
rial
Ad
dit
ion
Te
st,
EDSS
=Ex
pan
de
dD
isab
ility
Stat
us
Scal
e,
RT
=re
acti
on
tim
e,
SD=
stan
dar
dd
evi
atio
n,
IQR
=in
terq
uar
tile
ran
ge
.d
oi:1
0.1
37
1/j
ou
rnal
.po
ne
.00
45
53
6.t
00
1
Compromised EEG Activity in Multiple Sclerosis
PLOS ONE | www.plosone.org 4 September 2012 | Volume 7 | Issue 9 | e45536
clustering, and used Euclidean distances between the ICs to find
first IC cluster centroids, and then include each IC observation
into a cluster with the nearest mean. Outlier components of more
than 2 standard deviations from any of the centroid properties of
IC clusters were assigned to specific outlier IC clusters that were
excluded from further analyses. On average, 26.8% of ICs were
classified as outliers. The optimum number of final clusters was
determined by starting with a small number of clusters (the
smallest number in which activation properties were not merged
across clusters) and then increasing the number of clusters by one.
Following the addition of an extra cluster, if IC dipole groups were
divided into two but the other IC properties (and the differences
between the groups and conditions) remained approximately the
same then the maximum number of clusters was deemed to have
been exceeded. In this way, 4 distinct IC clusters were identified in
the visual condition and 5 IC clusters in the auditory condition.
Permutation statistics were applied to each cluster [57,58], in
conjunction with the false discovery rate correction for multiple
comparisons [59]. Permutation statistics were chosen as they are
non-parametric and therefore do not rely on an a priori model of
the data distribution [57,58]. In permutation-based approaches
sets of simulated sample distributions are generated by randomly
shuffling the data across trials and/or subjects. Consequently, the
shuffled distributions will have all features of the original data
except the effect to be tested [37,57,58]. The false discovery rate is
the expected proportion of erroneous rejections among all
rejections and it can be used to control the familywise error rate
(i.e. the probability of having at least one type I error among the
entire set of tests conducted) [59]. In order to correct for the
number of clusters per condition, a Bonferroni cut-off was also
applied, which involves dividing the p-value threshold by the
number of comparisons performed [57]. Thus, the corrected
significance cutoff was p = 0.0125 (i.e., .05/4) for the 4-cluster
solution in the visual condition, and p = 0.01 (i.e., .05/5) for the 5-
cluster solution in the auditory condition. The group statistic t-
values which are below the significance cutoff are displayed in red
in the ERSP and ITC subfigures showing the statistically
significant differences between the groups relative to time and
frequency.
In order to provide a comparison with the IC clustering
method, an analysis of the scalp EEG data was also performed.
The data pre-processed through FASTER were grand-averaged
and statistical analysis of ERP, ERSP and ITC conducted at Pz.
The false discovery rate correction for multiple comparisons [59]
was utilised.
Results
Behavioral resultsMS patients and controls did not differ in age or in reaction
times (p..05). MS patients had significantly higher scores in the
HRSD-21 than controls (p,.001). PASAT score did not correlate
with HRSD-21 score, but it correlated with EDSS score (p,.05).
Controls had more years of education and higher PASAT scores
than MS patients (p,0.001). As expected, the raw PASAT scores
correlated with years of education in a sample of all subjects, with
age and years of education in the MS patient sample, and with
years of education and gender in the control sample.
PASAT raw scores were converted to demographically correct-
ed scores (PASAT Z-scores: described in detail in [47]) and the MS
patients were then grouped into two extreme groups based on
their PASAT Z-score: the MS patients with the highest PASAT Z-
scores or the non-cognitively impaired MS group (non-CI MS),
and the MS patients with the lowest PASAT Z-scores or the
cognitively impaired MS group (CI MS) as detailed in Methods.
The non-CI MS and CI MS groups did not differ in age, disease
duration, reaction times, EDSS scores or HRSD-21 (p..05). The
PASAT Z-scores did not correlate with EDSS scores, with mean
years of symptoms, or with mean years of disease but the CI MS
group had more years of education than the non-CI MS group.
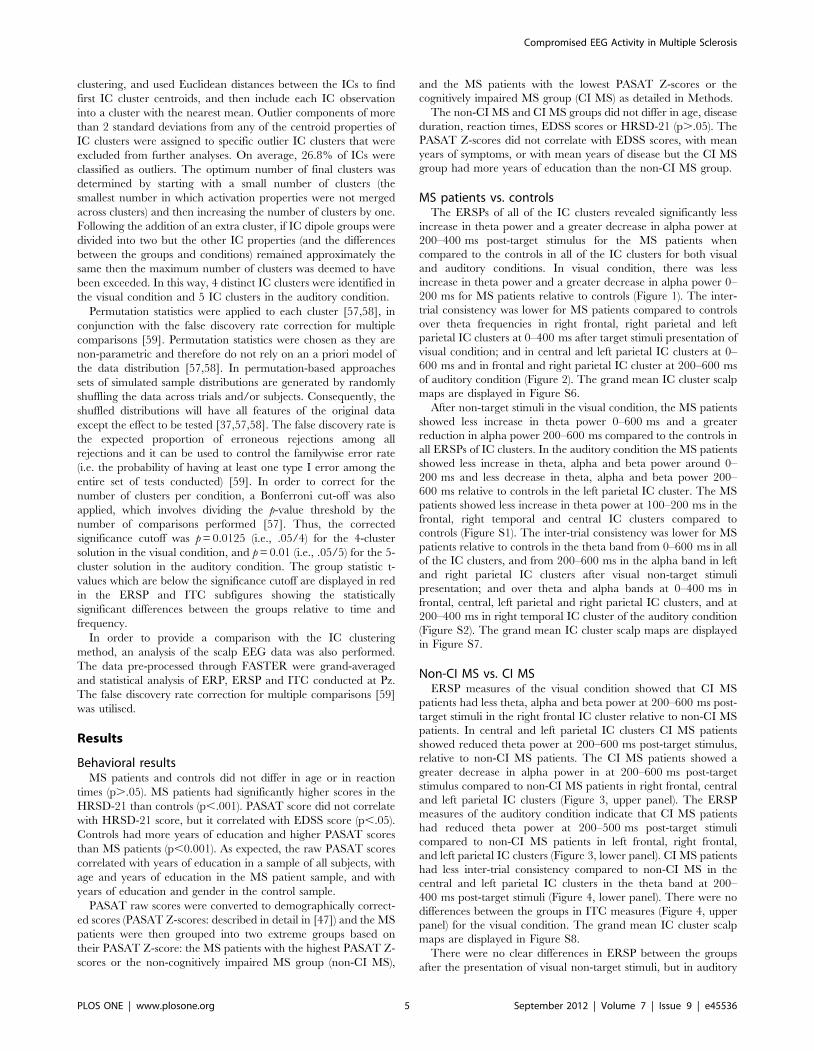
MS patients vs. controlsThe ERSPs of all of the IC clusters revealed significantly less
increase in theta power and a greater decrease in alpha power at
200–400 ms post-target stimulus for the MS patients when
compared to the controls in all of the IC clusters for both visual
and auditory conditions. In visual condition, there was less
increase in theta power and a greater decrease in alpha power 0–
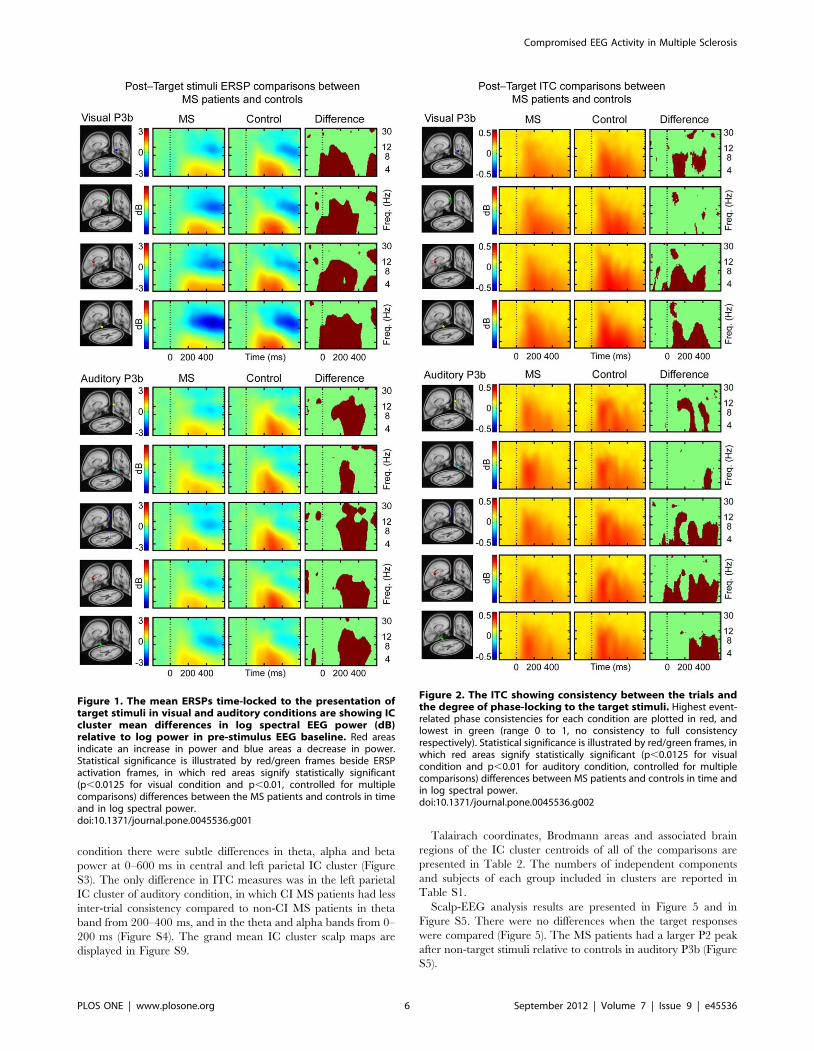
200 ms for MS patients relative to controls (Figure 1). The inter-
trial consistency was lower for MS patients compared to controls
over theta frequencies in right frontal, right parietal and left
parietal IC clusters at 0–400 ms after target stimuli presentation of
visual condition; and in central and left parietal IC clusters at 0–
600 ms and in frontal and right parietal IC cluster at 200–600 ms
of auditory condition (Figure 2). The grand mean IC cluster scalp
maps are displayed in Figure S6.
After non-target stimuli in the visual condition, the MS patients
showed less increase in theta power 0–600 ms and a greater
reduction in alpha power 200–600 ms compared to the controls in
all ERSPs of IC clusters. In the auditory condition the MS patients
showed less increase in theta, alpha and beta power around 0–
200 ms and less decrease in theta, alpha and beta power 200–
600 ms relative to controls in the left parietal IC cluster. The MS
patients showed less increase in theta power at 100–200 ms in the
frontal, right temporal and central IC clusters compared to
controls (Figure S1). The inter-trial consistency was lower for MS
patients relative to controls in the theta band from 0–600 ms in all
of the IC clusters, and from 200–600 ms in the alpha band in left
and right parietal IC clusters after visual non-target stimuli
presentation; and over theta and alpha bands at 0–400 ms in
frontal, central, left parietal and right parietal IC clusters, and at
200–400 ms in right temporal IC cluster of the auditory condition
(Figure S2). The grand mean IC cluster scalp maps are displayed
in Figure S7.
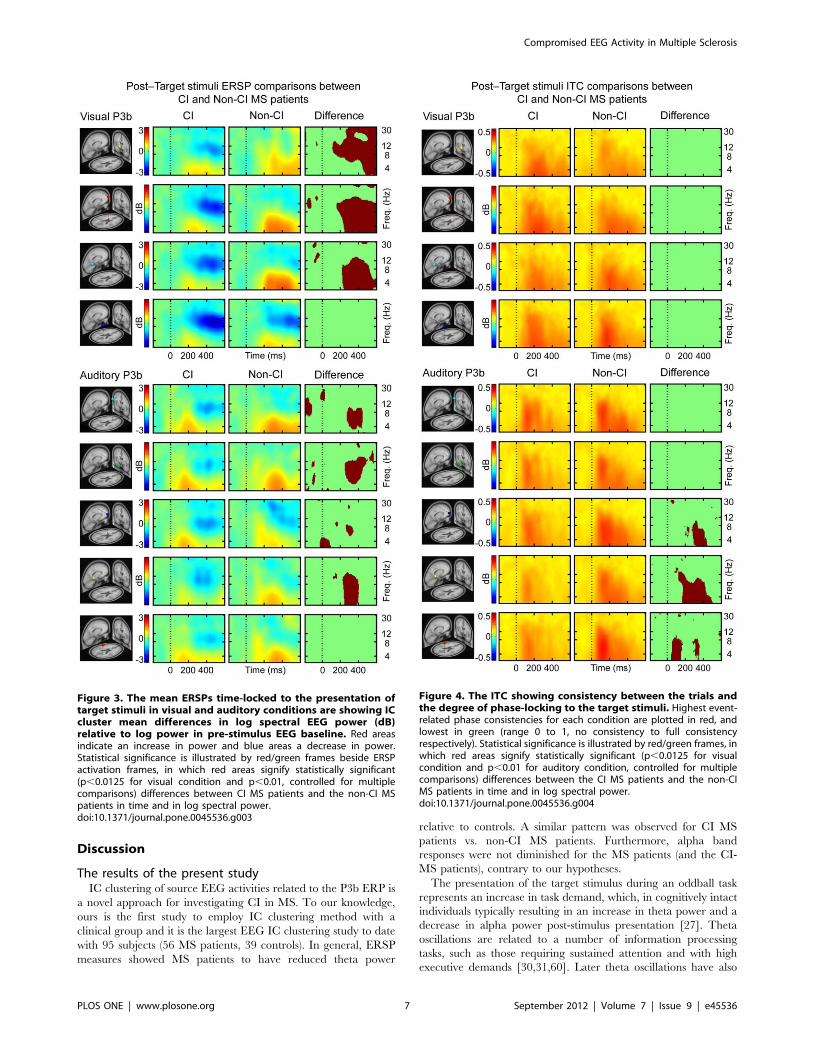
Non-CI MS vs. CI MSERSP measures of the visual condition showed that CI MS
patients had less theta, alpha and beta power at 200–600 ms post-
target stimuli in the right frontal IC cluster relative to non-CI MS
patients. In central and left parietal IC clusters CI MS patients
showed reduced theta power at 200–600 ms post-target stimulus,
relative to non-CI MS patients. The CI MS patients showed a
greater decrease in alpha power in at 200–600 ms post-target
stimulus compared to non-CI MS patients in right frontal, central
and left parietal IC clusters (Figure 3, upper panel). The ERSP
measures of the auditory condition indicate that CI MS patients
had reduced theta power at 200–500 ms post-target stimuli
compared to non-CI MS patients in left frontal, right frontal,
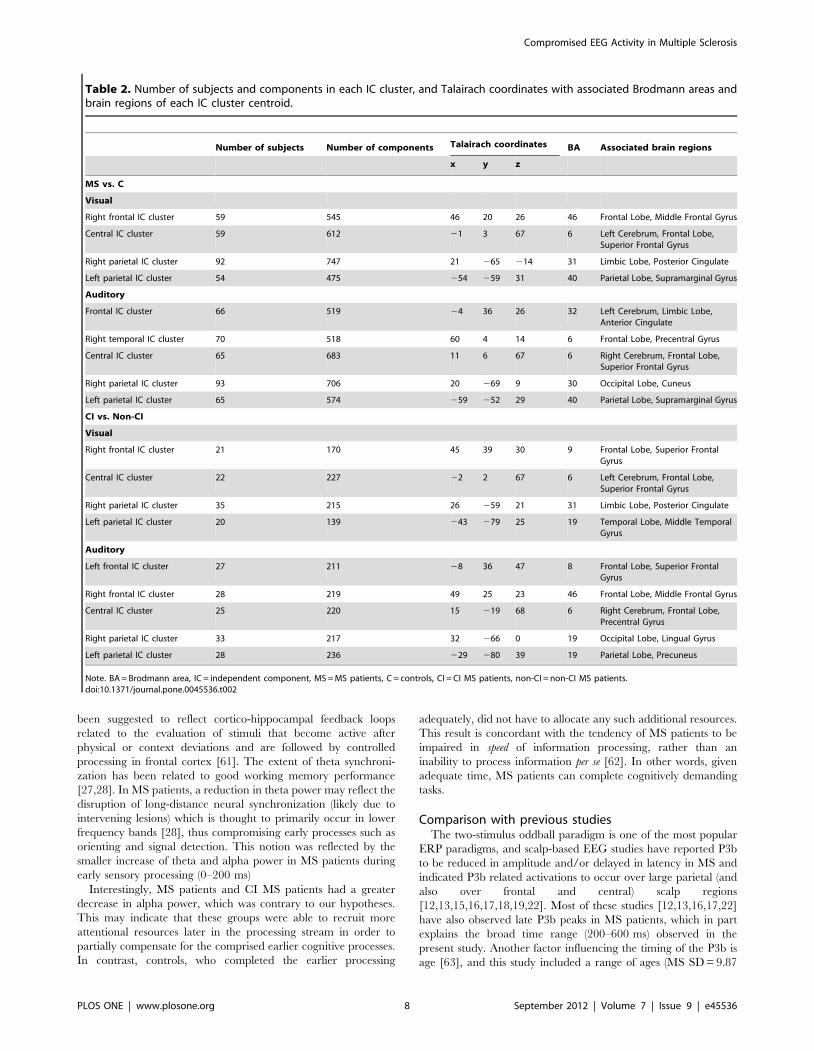
and left parietal IC clusters (Figure 3, lower panel). CI MS patients
had less inter-trial consistency compared to non-CI MS in the
central and left parietal IC clusters in the theta band at 200–
400 ms post-target stimuli (Figure 4, lower panel). There were no
differences between the groups in ITC measures (Figure 4, upper
panel) for the visual condition. The grand mean IC cluster scalp
maps are displayed in Figure S8.
There were no clear differences in ERSP between the groups
after the presentation of visual non-target stimuli, but in auditory
Compromised EEG Activity in Multiple Sclerosis
PLOS ONE | www.plosone.org 5 September 2012 | Volume 7 | Issue 9 | e45536
condition there were subtle differences in theta, alpha and beta
power at 0–600 ms in central and left parietal IC cluster (Figure
S3). The only difference in ITC measures was in the left parietal
IC cluster of auditory condition, in which CI MS patients had less
inter-trial consistency compared to non-CI MS patients in theta
band from 200–400 ms, and in the theta and alpha bands from 0–
200 ms (Figure S4). The grand mean IC cluster scalp maps are
displayed in Figure S9.
Talairach coordinates, Brodmann areas and associated brain
regions of the IC cluster centroids of all of the comparisons are
presented in Table 2. The numbers of independent components
and subjects of each group included in clusters are reported in
Table S1.
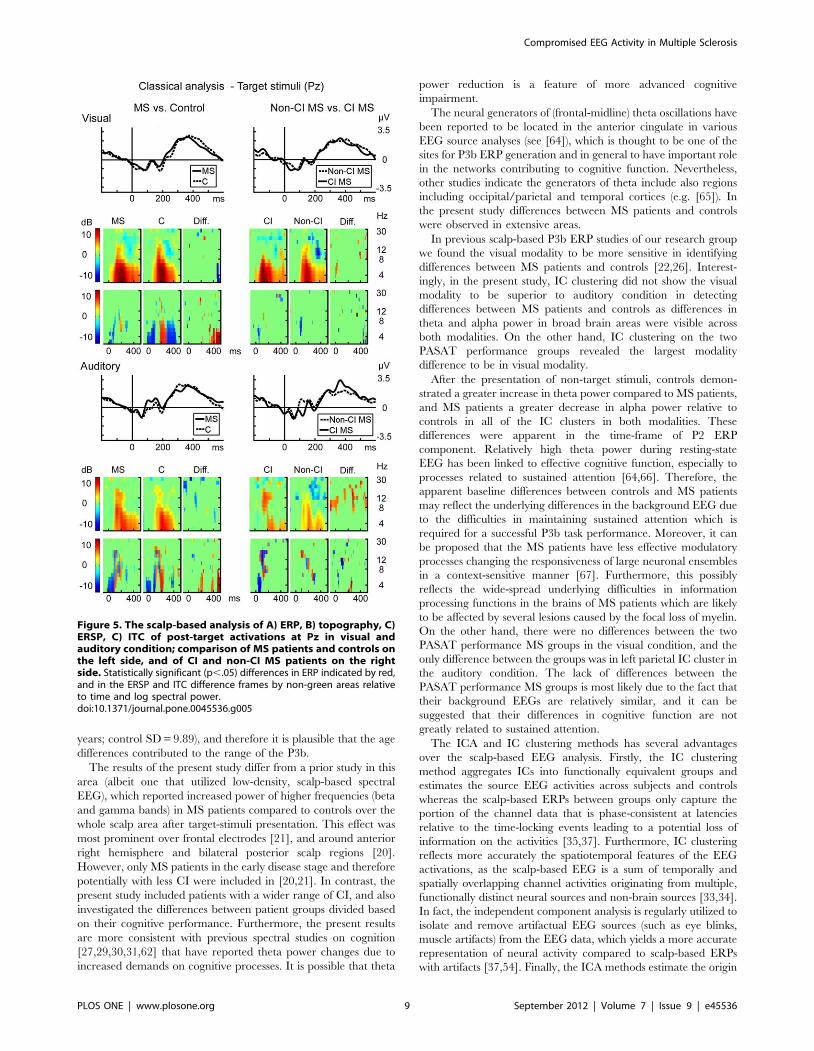
Scalp-EEG analysis results are presented in Figure 5 and in
Figure S5. There were no differences when the target responses
were compared (Figure 5). The MS patients had a larger P2 peak
after non-target stimuli relative to controls in auditory P3b (Figure
S5).
Figure 1. The mean ERSPs time-locked to the presentation oftarget stimuli in visual and auditory conditions are showing ICcluster mean differences in log spectral EEG power (dB)relative to log power in pre-stimulus EEG baseline. Red areasindicate an increase in power and blue areas a decrease in power.Statistical significance is illustrated by red/green frames beside ERSPactivation frames, in which red areas signify statistically significant(p,0.0125 for visual condition and p,0.01, controlled for multiplecomparisons) differences between the MS patients and controls in timeand in log spectral power.doi:10.1371/journal.pone.0045536.g001
Figure 2. The ITC showing consistency between the trials andthe degree of phase-locking to the target stimuli. Highest event-related phase consistencies for each condition are plotted in red, andlowest in green (range 0 to 1, no consistency to full consistencyrespectively). Statistical significance is illustrated by red/green frames, inwhich red areas signify statistically significant (p,0.0125 for visualcondition and p,0.01 for auditory condition, controlled for multiplecomparisons) differences between MS patients and controls in time andin log spectral power.doi:10.1371/journal.pone.0045536.g002
Compromised EEG Activity in Multiple Sclerosis
PLOS ONE | www.plosone.org 6 September 2012 | Volume 7 | Issue 9 | e45536
Discussion
The results of the present studyIC clustering of source EEG activities related to the P3b ERP is
a novel approach for investigating CI in MS. To our knowledge,
ours is the first study to employ IC clustering method with a
clinical group and it is the largest EEG IC clustering study to date
with 95 subjects (56 MS patients, 39 controls). In general, ERSP
measures showed MS patients to have reduced theta power
relative to controls. A similar pattern was observed for CI MS
patients vs. non-CI MS patients. Furthermore, alpha band
responses were not diminished for the MS patients (and the CI-
MS patients), contrary to our hypotheses.
The presentation of the target stimulus during an oddball task
represents an increase in task demand, which, in cognitively intact
individuals typically resulting in an increase in theta power and a
decrease in alpha power post-stimulus presentation [27]. Theta
oscillations are related to a number of information processing
tasks, such as those requiring sustained attention and with high
executive demands [30,31,60]. Later theta oscillations have also
Figure 3. The mean ERSPs time-locked to the presentation oftarget stimuli in visual and auditory conditions are showing ICcluster mean differences in log spectral EEG power (dB)relative to log power in pre-stimulus EEG baseline. Red areasindicate an increase in power and blue areas a decrease in power.Statistical significance is illustrated by red/green frames beside ERSPactivation frames, in which red areas signify statistically significant(p,0.0125 for visual condition and p,0.01, controlled for multiplecomparisons) differences between CI MS patients and the non-CI MSpatients in time and in log spectral power.doi:10.1371/journal.pone.0045536.g003
Figure 4. The ITC showing consistency between the trials andthe degree of phase-locking to the target stimuli. Highest event-related phase consistencies for each condition are plotted in red, andlowest in green (range 0 to 1, no consistency to full consistencyrespectively). Statistical significance is illustrated by red/green frames, inwhich red areas signify statistically significant (p,0.0125 for visualcondition and p,0.01 for auditory condition, controlled for multiplecomparisons) differences between the CI MS patients and the non-CIMS patients in time and in log spectral power.doi:10.1371/journal.pone.0045536.g004
Compromised EEG Activity in Multiple Sclerosis
PLOS ONE | www.plosone.org 7 September 2012 | Volume 7 | Issue 9 | e45536
been suggested to reflect cortico-hippocampal feedback loops
related to the evaluation of stimuli that become active after
physical or context deviations and are followed by controlled
processing in frontal cortex [61]. The extent of theta synchroni-
zation has been related to good working memory performance
[27,28]. In MS patients, a reduction in theta power may reflect the
disruption of long-distance neural synchronization (likely due to
intervening lesions) which is thought to primarily occur in lower
frequency bands [28], thus compromising early processes such as
orienting and signal detection. This notion was reflected by the
smaller increase of theta and alpha power in MS patients during
early sensory processing (0–200 ms)
Interestingly, MS patients and CI MS patients had a greater
decrease in alpha power, which was contrary to our hypotheses.
This may indicate that these groups were able to recruit more
attentional resources later in the processing stream in order to
partially compensate for the comprised earlier cognitive processes.
In contrast, controls, who completed the earlier processing
adequately, did not have to allocate any such additional resources.
This result is concordant with the tendency of MS patients to be
impaired in speed of information processing, rather than an
inability to process information per se [62]. In other words, given
adequate time, MS patients can complete cognitively demanding
tasks.
Comparison with previous studiesThe two-stimulus oddball paradigm is one of the most popular
ERP paradigms, and scalp-based EEG studies have reported P3b
to be reduced in amplitude and/or delayed in latency in MS and
indicated P3b related activations to occur over large parietal (and
also over frontal and central) scalp regions
[12,13,15,16,17,18,19,22]. Most of these studies [12,13,16,17,22]
have also observed late P3b peaks in MS patients, which in part
explains the broad time range (200–600 ms) observed in the
present study. Another factor influencing the timing of the P3b is
age [63], and this study included a range of ages (MS SD = 9.87
Table 2. Number of subjects and components in each IC cluster, and Talairach coordinates with associated Brodmann areas andbrain regions of each IC cluster centroid.
Number of subjects Number of components Talairach coordinates BA Associated brain regions
x y z
MS vs. C
Visual
Right frontal IC cluster 59 545 46 20 26 46 Frontal Lobe, Middle Frontal Gyrus
Central IC cluster 59 612 21 3 67 6 Left Cerebrum, Frontal Lobe,Superior Frontal Gyrus
Right parietal IC cluster 92 747 21 265 214 31 Limbic Lobe, Posterior Cingulate
Left parietal IC cluster 54 475 254 259 31 40 Parietal Lobe, Supramarginal Gyrus
Auditory
Frontal IC cluster 66 519 24 36 26 32 Left Cerebrum, Limbic Lobe,Anterior Cingulate
Right temporal IC cluster 70 518 60 4 14 6 Frontal Lobe, Precentral Gyrus
Central IC cluster 65 683 11 6 67 6 Right Cerebrum, Frontal Lobe,Superior Frontal Gyrus
Right parietal IC cluster 93 706 20 269 9 30 Occipital Lobe, Cuneus
Left parietal IC cluster 65 574 259 252 29 40 Parietal Lobe, Supramarginal Gyrus
CI vs. Non-CI
Visual
Right frontal IC cluster 21 170 45 39 30 9 Frontal Lobe, Superior FrontalGyrus
Central IC cluster 22 227 22 2 67 6 Left Cerebrum, Frontal Lobe,Superior Frontal Gyrus
Right parietal IC cluster 35 215 26 259 21 31 Limbic Lobe, Posterior Cingulate
Left parietal IC cluster 20 139 243 279 25 19 Temporal Lobe, Middle TemporalGyrus
Auditory
Left frontal IC cluster 27 211 28 36 47 8 Frontal Lobe, Superior FrontalGyrus
Right frontal IC cluster 28 219 49 25 23 46 Frontal Lobe, Middle Frontal Gyrus
Central IC cluster 25 220 15 219 68 6 Right Cerebrum, Frontal Lobe,Precentral Gyrus
Right parietal IC cluster 33 217 32 266 0 19 Occipital Lobe, Lingual Gyrus
Left parietal IC cluster 28 236 229 280 39 19 Parietal Lobe, Precuneus
Note. BA = Brodmann area, IC = independent component, MS = MS patients, C = controls, CI = CI MS patients, non-CI = non-CI MS patients.doi:10.1371/journal.pone.0045536.t002
Compromised EEG Activity in Multiple Sclerosis
PLOS ONE | www.plosone.org 8 September 2012 | Volume 7 | Issue 9 | e45536
years; control SD = 9.89), and therefore it is plausible that the age
differences contributed to the range of the P3b.
The results of the present study differ from a prior study in this
area (albeit one that utilized low-density, scalp-based spectral
EEG), which reported increased power of higher frequencies (beta
and gamma bands) in MS patients compared to controls over the
whole scalp area after target-stimuli presentation. This effect was
most prominent over frontal electrodes [21], and around anterior
right hemisphere and bilateral posterior scalp regions [20].
However, only MS patients in the early disease stage and therefore
potentially with less CI were included in [20,21]. In contrast, the
present study included patients with a wider range of CI, and also
investigated the differences between patient groups divided based
on their cognitive performance. Furthermore, the present results
are more consistent with previous spectral studies on cognition
[27,29,30,31,62] that have reported theta power changes due to
increased demands on cognitive processes. It is possible that theta
power reduction is a feature of more advanced cognitive
impairment.
The neural generators of (frontal-midline) theta oscillations have
been reported to be located in the anterior cingulate in various
EEG source analyses (see [64]), which is thought to be one of the
sites for P3b ERP generation and in general to have important role
in the networks contributing to cognitive function. Nevertheless,
other studies indicate the generators of theta include also regions
including occipital/parietal and temporal cortices (e.g. [65]). In
the present study differences between MS patients and controls
were observed in extensive areas.
In previous scalp-based P3b ERP studies of our research group
we found the visual modality to be more sensitive in identifying
differences between MS patients and controls [22,26]. Interest-
ingly, in the present study, IC clustering did not show the visual
modality to be superior to auditory condition in detecting
differences between MS patients and controls as differences in
theta and alpha power in broad brain areas were visible across
both modalities. On the other hand, IC clustering on the two
PASAT performance groups revealed the largest modality
difference to be in visual modality.
After the presentation of non-target stimuli, controls demon-
strated a greater increase in theta power compared to MS patients,
and MS patients a greater decrease in alpha power relative to
controls in all of the IC clusters in both modalities. These
differences were apparent in the time-frame of P2 ERP
component. Relatively high theta power during resting-state
EEG has been linked to effective cognitive function, especially to
processes related to sustained attention [64,66]. Therefore, the
apparent baseline differences between controls and MS patients
may reflect the underlying differences in the background EEG due
to the difficulties in maintaining sustained attention which is
required for a successful P3b task performance. Moreover, it can
be proposed that the MS patients have less effective modulatory
processes changing the responsiveness of large neuronal ensembles
in a context-sensitive manner [67]. Furthermore, this possibly
reflects the wide-spread underlying difficulties in information
processing functions in the brains of MS patients which are likely
to be affected by several lesions caused by the focal loss of myelin.
On the other hand, there were no differences between the two
PASAT performance MS groups in the visual condition, and the
only difference between the groups was in left parietal IC cluster in
the auditory condition. The lack of differences between the
PASAT performance MS groups is most likely due to the fact that
their background EEGs are relatively similar, and it can be
suggested that their differences in cognitive function are not
greatly related to sustained attention.
The ICA and IC clustering methods has several advantages
over the scalp-based EEG analysis. Firstly, the IC clustering
method aggregates ICs into functionally equivalent groups and
estimates the source EEG activities across subjects and controls
whereas the scalp-based ERPs between groups only capture the
portion of the channel data that is phase-consistent at latencies
relative to the time-locking events leading to a potential loss of
information on the activities [35,37]. Furthermore, IC clustering
reflects more accurately the spatiotemporal features of the EEG
activations, as the scalp-based EEG is a sum of temporally and
spatially overlapping channel activities originating from multiple,
functionally distinct neural sources and non-brain sources [33,34].
In fact, the independent component analysis is regularly utilized to
isolate and remove artifactual EEG sources (such as eye blinks,
muscle artifacts) from the EEG data, which yields a more accurate
representation of neural activity compared to scalp-based ERPs
with artifacts [37,54]. Finally, the ICA methods estimate the origin
Figure 5. The scalp-based analysis of A) ERP, B) topography, C)ERSP, C) ITC of post-target activations at Pz in visual andauditory condition; comparison of MS patients and controls onthe left side, and of CI and non-CI MS patients on the rightside. Statistically significant (p,.05) differences in ERP indicated by red,and in the ERSP and ITC difference frames by non-green areas relativeto time and log spectral power.doi:10.1371/journal.pone.0045536.g005
Compromised EEG Activity in Multiple Sclerosis
PLOS ONE | www.plosone.org 9 September 2012 | Volume 7 | Issue 9 | e45536
of the activation (inverse source modelling) whereas scalp-based
ERP assumes the recorded signals of the scalp electrodes to be
comparable with the signals from equivalently placed electrodes
for all the subjects, thus not taking into account the physical
differences of the brains of different people (e.g. the differences in
the orientations of cortical gyri and sulci causing different
projections of exactly equivalent cortical sources [37]. For these
reasons, the ERP P300 and ICA approach to EEG analysis are
qualitatively different, and must be interpreted differently. It is also
noteworthy that the topographies of ICs (Figures S6, S7, S8, S9)
are not as informative as 3-D locations of the equivalent dipoles as
minor differences across subjects in the orientation of equivalent
dipoles for a set of equivalent ICs can produce different scalp
maps, and as the ICs are aggregated into clusters according to
their functional similarity despite apparent scalp map differences
Therefore, the typical centro-parietal positivity typically seen with
a scalp-based ERP approach may not be seen following
summation of ICs. Moreover, ICA and IC clustering methods
do not require a priori assumptions [35,37], which is an issue in
other EEG source analysis methods such as BESA [38]. However,
ICA approaches do rest on a number of assumptions, and future
research (perhaps using simultaneous EEG and functional
magnetic resonance imaging) should attempt to quantify the
accuracy of IC spatial estimations.
On the whole, IC clustering enables a more comprehensive
understanding of the dynamic EEG source activations underlying
EEG recorded during cognitive performance which are likely to be
missed during analysis of traditional scalp-based EEG data alone
[35,37]. This notion is bolstered by the results of the scalp-based
ERP, ERSP and ITC analysis in the present study, which did not
reveal large differences among groups. The differences observed
between the results from the IC earlier). Moreover, the averaging
of the scalp-based event-related activations most likely does not
reflect all the ongoing EEG activations as it captures only the
portion of the scalp channel data that is phase-consistent at
latencies relative to the time-locking events [35,37]. Therefore
relevant information may be lost [35], and as a consequence there
are no statistically significant differences in scalp-ERPs found
between the groups. Furthermore, the IC clustering avoids (at least
in part) the vagueness of spatiotemporal overlap inherent in scalp-
based EEG recordings by aggregating the ICs with spatiotemporal
features into functionally equivalent groups and thus estimating
the source EEG activities. The group differences were not a result
from a mere selection of specific ICs, as ERP activations
recomposed of ICs in each IC cluster and back-projected to Pz
did not show similar clear group effects to IC clustering results (see
Figures S10, S11). In addition, the EEG signals recorded on the
scalp originate from multiple, functionally distinct neural and non-
neural sources leading to a considerably high level of noise (besides
spatiotemporal overlap) [35], which may mask the underlying
differences between the groups. The differences in the results may
also stem from the fact that physical characteristics and projection
orientations from the cortex to the scalp differ across individual
brains, which violates one of the main assumptions inherent in
scalp-based ERP analysis that presume the position of an electrode
to reflect the neural activities directly underneath it and the task-
related EEG activations in the same location to be similar across
different subjects. These factors may therefore have led to the lack
of statistically significant differences even though there would be a
real underlying difference or a trend between the groups.
Physiologically, EEG signals originating from the brain are
thought to be associated with near-synchronous field activities
within a connected patch of cortical pyramidal cells sharing a
common alignment near-perpendicular to the cortical surface
[68]. The maximally temporally independent component activities
with near-dipolar scalp projections may represent physiologically
distinct brain sources that can be associated with field activity
partially or fully synchronized across a cortical patch (or possibly
across and between two anatomically well-connected patch-
es).Thus, the individual ICs and IC clustering method hold
promise to estimate more accurately EEG source locations, which
in conjunction with cognitive electrophysiological experiments
such as the oddball paradigm may give insight into the source and
electrophysiological activities related to information processing
speed and cognitive performance. The development of similar
methodology is an important aim in studies with neurological
conditions as it may offer better understanding of the brain
location(s) where the changes impacting cognitive function are
occurring. In the present study, the widespread reduction in theta
and alpha power in MS patients was obvious post-target stimuli
whereas the prior scalp-based P3b ERP studies have reported
varied results of latency, amplitude and topography differences in
MS patients relative to controls.
Objective, reliable EEG methods such as IC clustering may
have potential to aid the detection and monitoring of cognitive
impairment in MS, and therefore to complement generally utilised
neuropsychological assessment. The relationship between patho-
logical changes in the brain white and grey matter, neurophys-
iological and neuropsychological cognitive function is imprecisely
defined in MS [69], and should be examined in future studies.
Inclusion of a full neuropsychological battery may help to define
better the relationships of specific cognitive domains with EEG
and/or MRI findings, as may the use of more complex oddball
paradigms [70]. Moreover, future studies could explore the
informativeness of more advanced EEG data analysis methods
such as distributed source modelling incorporating EEG activa-
tions and structural information from individual subjects’ MR
images. In addition, longitudinal studies of EEG scalp and source
activities spanning over several years are required to determine if
EEG and ERPs have utility in predicting the changes in cognitive
function in MS.
Supporting Information
Figure S1 The mean ERSPs time-locked to the presen-tation of non-target stimuli in visual and auditoryconditions are showing IC cluster mean differences inlog spectral EEG power (dB) relative to log power in pre-stimulus EEG baseline. Red areas indicate an increase in
power and blue areas a decrease in power. Statistical significance
group and condition main effects, and interaction effect, are
illustrated in red/green frames beside ERSP activation frames, in
which red areas signify statistically significant (p,0.0125 for visual
condition and p,0.01, controlled for multiple comparisons)
differences between the MS patients and controls in time and in
log spectral power.
(TIF)
Figure S2 The ITC showing consistency between thetrials and the degree of phase-locking to the non-targetstimuli. Highest event-related phase consistencies for each
condition and group are plotted in red, and lowest in green
(range 0 to 1, no consistency to full consistency respectively).
Statistical significance is illustrated by red/green frames, in which
red areas signify statistically significant (p,0.0125 for visual
condition and p,0.01 for auditory condition, controlled for
multiple comparisons) differences between MS patients and
controls in time and in log spectral power.
(TIF)
Compromised EEG Activity in Multiple Sclerosis
PLOS ONE | www.plosone.org 10 September 2012 | Volume 7 | Issue 9 | e45536
Figure S3 The mean ERSPs time-locked to the presen-tation of non-target stimuli in visual and auditoryconditions are showing IC cluster mean differences inlog spectral EEG power (dB) relative to log power in pre-stimulus EEG baseline. Red areas indicate an increase in
power and blue areas a decrease in power. Statistical significance
group and condition main effects, and interaction effect, are
illustrated in red/green frames beside ERSP activation frames, in
which red areas signify statistically significant (p,0.0125 for visual
condition and p,0.01, controlled for multiple comparisons)
differences between CI MS patients and the non-CI MS patients
in time and in log spectral power.
(TIF)
Figure S4 The ITC showing consistency between thetrials and the degree of phase-locking to the non-targetstimuli. Highest event-related phase consistencies for each
condition and group are plotted in red, and lowest in green
(range 0 to 1, no consistency to full consistency respectively).
Statistical significance is illustrated by red/green frames, in which
red areas signify statistically significant (p,0.0125 for visual
condition and p,0.01 for auditory condition, controlled for
multiple comparisons) differences between the CI MS patients and
the non-CI MS patients in time and in log spectral power.
(TIF)
Figure S5 The scalp-based analysis of A) ERP, B)topography, C) ERSP, C) ITC of post–non-target activa-tions at Pz in visual and auditory condition; comparisonof MS patients and controls on the left side, and of CIand non-CI MS patients on the right side. Statistically
significant (p,.05) differences in ERP indicated by red, and in the
ERSP and ITC difference frames by non-green areas relative to
time and log spectral power. Plots of the topographical responses
2-D circular view (looking down at the top of the head). Channel
locations below head center are shown in a ‘skirt’ outside the
cartoon head. Nose is at top of plot; left is left; right is right.
(TIF)
Figure S6 The grand mean topographies of MS patientsand controls for each IC cluster post-target in visual andauditory conditions.
(TIF)
Figure S7 The grand mean topographies of MS patientsand controls for each IC cluster post-non-target in visualand auditory conditions.(TIF)
Figure S8 The grand mean topographies of CI and non-CI MS patients for each IC cluster post-target in visualand auditory conditions.(TIF)
Figure S9 The grand mean topographies of CI and non-CI MS patients for each IC cluster post-non-target invisual and auditory conditions.(TIF)
Figure S10 The EEG-scalp analysis of recomposed ICsincluded in the IC clustering analysis. A) ERP, B) mean
topography, C) ERSP, D) ITC of post-target activations at Pz in
visual and auditory condition; comparison of MS patients and
controls on the left side, and of CI and non-CI MS patients on the
right side. Statistically significant (p,.05, FDR corrected)
differences in ERP indicated by red, and in the ERSP and ITC
difference frames by non-green areas relative to time and log
spectral power.
(TIF)
Figure S11 The EEG-scalp analysis of recomposed ICsincluded in the IC clustering analysis. A) ERP, B) mean
topography, C) ERSP, D) ITC of post-non-target activations at Pz
in visual and auditory condition; comparison of MS patients and
controls on the left side, and of CI and non-CI MS patients on the
right side. Statistically significant (p,.05, FDR corrected)
differences in ERP indicated by red, and in the ERSP and ITC
difference frames by non-green areas relative to time and log
spectral power.
(TIF)
Table S1 The number of subjects and independentcomponents from each groups in each IC cluster.(DOCX)
Author Contributions
Conceived and designed the experiments: RW HK RBR MH NT TB JB.
Performed the experiments: HK RL SK MCO KK SOD. Analyzed the
data: HK RW HN. Wrote the paper: HK RW.
References
1. Hoffmann S, Tittgemeyer M, von Cramon DY (2007) Cognitive impairment in
multiple sclerosis. Curr Opin Neurol 20: 275–280.
2. Rogers JM, Panegyres PK (2007) Cognitive impairment in multiple sclerosis:
Evidence-based analysis and recommendations. Journal of Clinical Neuroscience
14: 919–927.
3. Kalmar JH, Halper J, Gaudino EA, Moore NB, DeLuca J (2008) The
relationship between cognitive deficits and everyday functional activities in
multiple sclerosis. Neuropsychology 22: 442–449.
4. Rao SM, Leo GJ, Ellington L, Nauertz T, Bernardin L, et al. (1991) Cognitive
Dysfunction in Multiple-Sclerosis .2. Impact on Employment and Social
Functioning. Neurology 41: 692–696.
5. Amato MP, Zipoli V, Portaccio E (2006) Multiple sclerosis-related cognitive
changes: A review of cross-sectional and longitudinal studies. Journal of the
Neurological Sciences 245: 41–46.
6. Camp SJ, Stevenson VL, Thompson AJ, Miller DH, Borras C, et al. (1999)
Cognitive function in primary progressive and transitional progressive multiple
sclerosis: a controlled study with MRI correlates. Brain 122 (Pt 7): 1341–1348.
7. Cutter GR, Baier ML, Rudick RA, Cookfair DL, Fischer JS, et al. (1999)
Development of a multiple sclerosis functional composite as a clinical trial
outcome measure. Brain 122 (Pt 5): 871–882.
8. Gronwall DMA (1977) Paced Auditory Serial-Addition Task - Measure of
Recovery from Concussion. Perceptual and Motor Skills 44: 367–373.
9. Tombaugh TN (2006) A comprehensive review of the Paced Auditory Serial
Addition Test (PASAT). Arch Clin Neuropsychol 21: 53–76.
10. Barker-Collo SL (2005) Within session practice effects on the PASAT in clients
with multiple sclerosis. Archives of Clinical Neuropsychology 20: 145–152.
11. Leocani L, Locatelli T, Martinelli V, Rovaris M, Falautano M, et al. (2000)
Electroencephalographic coherence analysis in multiple sclerosis: correlation
with clinical, neuropsychological, and MRI findings. J Neurol Neurosurg
Psychiatry 69: 192–198.
12. Aminoff JC, Goodin DS (2001) Long-latency cerebral event-related potentials in
multiple sclerosis. Journal of Clinical Neurophysiology 18: 372–377.
13. Ellger T, Bethke F, Frese A, Luettmann RJ, Buchheister A, et al. (2002) Event-
related potentials in different subtypes of multiple sclerosis - a cross-sectional
study. Journal of the Neurological Sciences 205: 35–40.
14. Gerschlager W, Beisteiner R, Deecke L, Dirnberger G, Endl W, et al. (2000)
Electrophysiological, neuropsychological and clinical findings in multiple
sclerosis patients receiving interferon beta-1b: a 1-year follow-up. Eur Neurol
44: 205–209.
15. Gil R, Zai L, Neau JP, Jonveaux T, Agbo C, et al. (1993) Event-related auditory
evoked potentials and multiple sclerosis. Electroencephalogr Clin Neurophysiol
88: 182–187.
16. Magnano I, Aiello I, Piras MR (2006) Cognitive impairment and neurophys-
iological correlates in MS. J Neurol Sci 245: 117–122.
17. Piras MR, Magnano I, Canu ED, Paulus KS, Satta WM, et al. (2003)
Longitudinal study of cognitive dysfunction in multiple sclerosis: neuropsycho-
logical, neuroradiological, and neurophysiological findings. J Neurol Neurosurg
Psychiatry 74: 878–885.
Compromised EEG Activity in Multiple Sclerosis
PLOS ONE | www.plosone.org 11 September 2012 | Volume 7 | Issue 9 | e45536
18. Polich J, Romine JS, Sipe JC, Aung M, Dalessio DJ (1992) P300 in multiple
sclerosis: a preliminary report. Int J Psychophysiol 12: 155–163.19. Sailer M, Heinze HJ, Tendolkar I, Decker U, Kreye O, et al. (2001) Influence of
cerebral lesion volume and lesion distribution on event-related brain potentials
in multiple sclerosis. J Neurol 248: 1049–1055.20. Vazquez-Marrufo M, Gonzalez-Rosa JJ, Vaquero E, Duque P, Borges M, et al.
(2008) Quantitative electroencephalography reveals different physiologicalprofiles between benign and remitting-relapsing multiple sclerosis patients.
Bmc Neurology 8: -.
21. Vazquez-Marrufo M, Gonzalez-Rosa JJ, Vaquero E, Duque P, Escera C, et al.(2008) Abnormal ERPs and high frequency bands power in multiple sclerosis.
Int J Neurosci 118: 27–38.22. Whelan R, Lonergan R, Kiiski H, Nolan H, Kinsella K, et al. (2010) A high-
density ERP study reveals latency, amplitude, and topographical differences inmultiple sclerosis patients versus controls. Clin Neurophysiol. 121: 1420–1426.
23. Polich J (2007) Updating P300: an integrative theory of P3a and P3b. Clin
Neurophysiol 118: 2128–2148.24. Volpe U, Mucci A, Bucci P, Merlotti E, Galderisi S, et al. (2007) The cortical
generators of P3a and P3b: a LORETA study. Brain Research Bulletin 73: 220–230.
25. Kok A (2001) On the utility of P3 amplitude as a measure of processing capacity.
Psychophysiology 38: 557–577.26. Kiiski H, Reilly RB, Lonergan R, Kelly S, O’Brien M, et al. (2011) Change in
PASAT performance correlates with change in P3 ERP amplitude over a 12-month period in multiple sclerosis patients. J Neurol Sci 305: 45–52.
27. Klimesch W (1999) EEG alpha and theta oscillations reflect cognitive andmemory performance: a review and analysis. Brain Research Reviews 29: 169–
195.
28. Wang XJ (2010) Neurophysiological and Computational Principles of CorticalRhythms in Cognition. Physiological Reviews 90: 1195–1268.
29. Gevins A, Smith ME, McEvoy L, Yu D (1997) High-resolution EEG mapping ofcortical activation related to working memory: Effects of task difficulty, type of
processing, and practice. Cerebral Cortex 7: 374–385.
30. Mizuhara H, Wang LQ, Kobayashi K, Yamaguchi Y (2004) A long-rangecortical network emerging with theta oscillation in a mental task. Neuroreport
15: 1233–1238.31. Mizuhara H, Yamaguchi Y (2007) Human cortical circuits for central executive
function emerge by theta phase synchronization. Neuroimage 36: 232–244.32. Kiiski H, Whelan R, Lonergan R, Nolan H, Kinsella K, et al. (2010) Preliminary
evidence for correlation between PASAT performance and P3a and P3b
amplitudes in progressive multiple sclerosis. European Journal of Neurology.33. Dale AM, Liu AK, Fischl BR, Buckner RL, Belliveau JW, et al. (2000) Dynamic
statistical parametric mapping: Combining fMRI and MEG for high-resolutionimaging of cortical activity. Neuron 26: 55–67.
34. Hagoort P (2003) Interplay between syntax and semantics during sentence
comprehension: ERP effects of combining syntactic and semantic violations.Journal of Cognitive Neuroscience 15: 883–899.
35. Delorme A, Palmer J, Onton J, Oostenveld R, Makeig S (2012) IndependentEEG sources are dipolar. PLoS One 7(2):e30135. [Published online 2012
February 15. doi: 10.1371/journal.pone.0030135]36. Groppe DM, Makeig S, Kutas M (2008) Independent components analysis of
event-related potentials. Cognitive Science Online 6.1: 1–44.
37. Onton J, Westerfield M, Townsend J, Makeig S (2006) Imaging human EEGdynamics using independent component analysis. Neuroscience and Biobehav-
ioral Reviews 30: 808–822.38. Hoechstetter K, Bornfleth H, Weckesser D, Ille N, Berg P, et al. (2004) BESA
source coherence: A new method to study cortical oscillatory coupling. Brain
Topography 16: 233–238.39. Makeig S (1993) Auditory Event-Related Dynamics of the Eeg Spectrum and
Effects of Exposure to Tones. Electroencephalography and Clinical Neurophys-iology 86: 283–293.
40. Makeig S (2002) Dynamic brain sources of visual evoked responses (vol 295, pg
690, 2002). Science 295: 1466–1466.41. Tallon-Baudry C, Bertrand O, Delpuech C, Pernier J (1996) Stimulus specificity
of phase-locked and non-phase-locked 40 Hz visual responses in human.J Neurosci 16: 4240–4249.
42. Debener S, Makeig S, Delorme A, Engel AK (2005) What is novel in the noveltyoddball paradigm? Functional significance of the novelty P3 event-related
potential as revealed by independent component analysis. Brain Res Cogn Brain
Res 22: 309–321.43. Leocani L, Gonzalez-Rosa JJ, Comi G (2010) Neurophysiological correlates of
cognitive disturbances in multiple sclerosis. Neurological Sciences 31: 249–253.
44. Delorme A, Sejnowski T, Makeig S (2007) Enhanced detection of artifacts inEEG data using higher-order statistics and independent component analysis.
Neuroimage 34: 1443–1449.
45. Makeig S, Delorme A, Westerfield M, Jung TP, Townsend J, et al. (2004)
Electroencephalographic brain dynamics following manually responded visualtargets. Plos Biology 2: 747–762.
46. Polman CH, Reingold SC, Edan G, Filippi M, Hartung HP, et al. (2005)
Diagnostic criteria for multiple sclerosis: 2005 revisions to the ‘‘McDonaldCriteria’’. Ann Neurol 58: 840–846.
47. Parmenter BA, Testa SM, Schretlen DJ, Weinstock-Guttman B, Benedict RHB
(2010) The utility of regression-based norms in interpreting the minimalassessment of cognitive function in multiple sclerosis (MACFIMS). Journal of the
International Neuropsychological Society 16: 6–16.
48. Oostenveld R, Praamstra P (2001) The five percent electrode system for high-resolution EEG and ERP measurements. Clin Neurophysiol 112: 713–719.
49. Crawford JR, Allan KM (1997) Estimating premorbid WAIS-R IQ with
demographic variables: Regression equations derived from a UK sample. ClinNeuropsychol 11: 192–197.
50. Diehr MC, Cherner M, Wolfson TJ, Miller SW, Grant I, Heaton RK (2003)
The 50 and 100-item short forms of the Paced Auditory Serial Addition Task(PASAT): demographically corrected norms and comparisons with the full
PASAT in normal and clinical samples. J Clin Exp Neuropsychol 25: 571–585.
51. Vieweg BW, Hedlund JL (1979) The Hamilton rating scale for depression.Journal of Operational Psychiatry 10: 149–165.
52. Kurtzke JF (2008) Historical and clinical perspectives of the expanded disability
status scale. Neuroepidemiology 31: 1–9.
53. Delorme A, Makeig S (2004) EEGLAB: an open source toolbox for analysis ofsingle-trial EEG dynamics including independent component analysis. J Neurosci
Methods 134: 9–21.
54. Nolan H, Whelan R, Reilly RB (2010) FASTER: Fully Automated StatisticalThresholding for EEG artifact Rejection. Journal of Neuroscience Methods 192:
152–162.
55. Bell AJ, Sejnowski TJ (1995) An Information Maximization Approach to Blind
Separation and Blind Deconvolution. Neural Computation 7: 1129–1159.
56. Makeig S, Jung TP, Bell AJ, Ghahremani D, Sejnowski TJ (1997) Blind
separation of auditory event-related brain responses into independent compo-
nents. Proceedings of the National Academy of Sciences of the United States ofAmerica 94: 10979–10984.
57. Delorme A (2006) Statistical methods. Encyclopedia of Medical Device and
Instrumentation 6: 240–264.
58. Maris E (2004) Randomization tests for ERP topographies and whole
spatiotemporal data matrices. Psychophysiology 41: 142–151.
59. Benjamini Y, Yekutieli D (2001) The control of the false discovery rate in
multiple testing under dependency. Annals of Statistics 29: 1165–1188.
60. Kujala P, Portin R, Ruutiainen J (1997) The progress of cognitive decline in
multiple sclerosis - A controlled 3-year follow-up. Brain 120: 289–297.
61. Yordanova J, Kolev V, Polich J (2001) P300 and alpha event-relateddesynchronization (ERD). Psychophysiology 38: 143–152.
62. Demaree HA, DeLuca J, Gaudino E, Diamond BJ (1999) Speed of information
processing as a key deficit in multiple sclerosis. Journal of Neurology
Neurosurgery and Psychiatry 67: 661–663.
63. Polich J (2004) Clinical application of the P300 event-related brain potential.
Phys Med Rehabil Clin N Am 15(1):133–61.
64. Mitchell DJ, McNaughton N, Flanagan D, Kirk IJ (2008) Frontal-midline thetafrom the perspective of hippocampal ‘‘theta’’. Progress in Neurobiology 86: 156–
185.
65. Raghavachari S, Lisman JE, Tully M, Madsen JR, Bromfield EB, et al. (2006)
Theta oscillations in human cortex during a working-memory task: Evidence forlocal generators. Journal of Neurophysiology 95: 1630–1638.
66. Finnigan S, Robertson I (2011) Resting EEG theta power correlates with
cognitive performance in healthy older adults. Psychophysiology 48: 1083–1087.
67. David O, Kilner JM, Friston KJ (2006) Mechanisms of evoked and induced
responses in MEG/EEG. NeuroImage 31: 1580–1591.
68. Nunez P (1974) The brain wave equation: a modelfor the EEG. Mathematical
Biosciences 21: 279–297.
69. Lazeron RHC, Boringa JB, Schouten M, Uitdehaag BMJ, Bergers E, et al.
(2005) Brain atrophy and lesion load as explaining parameters for cognitive
impairment in multiple sclerosis. Multiple Sclerosis 11: 524–531.
70. Whelan R, Lonergan R, Kiiski H, Nolan H, Kinsella K, et al. (2010) Impaired
information processing speed and attention allocation in multiple sclerosis
patients versus controls: a high-density EEG study. J Neurol Sci 293: 45–50.
Compromised EEG Activity in Multiple Sclerosis
PLOS ONE | www.plosone.org 12 September 2012 | Volume 7 | Issue 9 | e45536


