Embed Size (px)
Citation preview
Overhead allocation for FrieslandCampina Domo Borculo
B. P. Kemper B.Sc. Thesis June 2017
University supervisors:
Drs. Ir. A. C. M. de Bakker
Dr. B. Roorda
Company supervisor:
Drs. J. van der Werf

i Overhead allocation for FrieslandCampina Domo, by Paul Kemper
Company FrieslandCampina Domo
A Royal FrieslandCampina N.V. Company
Address Needseweg 23
7271 AB Borculo
Tel +31 (0)545 256 789
Website www.domo.nl/en
Document title Overhead allocation for FrieslandCampina Domo Borculo
Main question What is an accurate, yet efficient way to allocate overhead costs of FrieslandCampina Domo Borculo?
Bachelor thesis for the bachelor program Industrial Engineering and Management at the University of Twente
Version Public Report; Bachelor Assignment
Date July 16th, 2017
Author Bernard Paul Kemper
S1589717
Bachelor program Industrial engineering and management
Gradation Committee Drs. Ir. A. C. M. de Bakker
University of Twente Faculty of Behavioural Management and Social sciences
Dr. B. Roorda
Faculty of Behavioural Management and Social sciences
FrieslandCampina Domo Drs. J. van der Werf
Plant Controller
ii
i. Management summary
FrieslandCampina Domo Borculo currently calculates its cost prices by use of an outdated allocation method. They are also expanding their plant with a project called Switch, where a new type of protein powder will be made. This research will evaluate the current allocation, propose a new allocation and investigate the foreseeable impact of project Switch. These three steps will lead to an answer on the main research question: “What is an accurate, yet efficient way to allocate overhead costs of FrieslandCampina Domo Borculo?”
During a first analysis of the current cost allocation, it becomes evident that the allocations substantiation is missing. Even after further analysis and inquiry with the finance department, support for it can still not be found.
In the second step, a proposed allocation gets formulated. This allocation finds its support in data driven analysis and interviews with experts on the subjects. These data analysis are set up in such a way that only the data set has to be updated in order to update the allocation. The interviews with experts which have to be done annually are kept to a minimum to keep the update process efficient, and are only conducted when data could not give accurate enough substantiation.
Together with the new allocation, a new model is designed by use of Excel VBA macros. The model can be used to set up cost allocation models for other production locations. The model is designed to be fast, user-friendly and has a lot of build in checks to prevent human errors.
Since there is still a lot of information missing about project Switch, this report contains a plan on how to gather that information. The plan contains information about who to conduct or what data to analyze in order to make an accurate costs allocation which accounts for project Switch.
The report ends with the following conclusions and recommendations:
Conclusions:
- Domo Borculo has a complex production process, where only the in- and output is measured, which makes it difficult to come up with an accurate cost allocation.
- The proposed conversion costs allocation contains an unnecessary step, in which costs get allocated to allocation keys and subsequently allocated to production cost centers.
- Some service cost centers are redundant.
- The model which we designed has been proven to be useful since it is implemented at five other locations
- More information about Switch is needed before an accurate cost allocation can be made.
Recommendations:
- It is advised for Domo Borculo to use the proposed allocation as stated in this report.
- Domo Borculo should try to get more insight in their production process. This could help solve problems and could make cost allocation using Activity Based-Costing possible.
- The service cost centers which only contain direct labor should be eliminated, as they are not in line with literary standards.
- The cost center “Productpreparation LP” and “Preparation refined LP” should be fused, since they can be seen as one production step.
- Further analysis on the impact of Switch should take place, since it is already apparent that the impact will be large.
iii Overhead allocation for FrieslandCampina Domo, by Paul Kemper
ii. Management samenvatting
FrieslandCampina Domo Borculo berekend haar kostprijzen prijzen op dit moment met een verouderde allocatie methode. Ook is ze bezig met het uitbreiden van haar fabriek met project Switch, waar een nieuw soort proteïne poeder gemaakt zal worden. Dit onderzoek zal de huidige kostenallocatie evalueren, een nieuwe allocatie voorstellen en een onderzoek doen naar de voorzienbare impact van project Switch. Deze drie stappen samen zullen antwoord geven op de hoofd onderzoeksvraag: “Wat is een accurate en efficiënte manier om de overhead kosten van FrieslandCampina Domo Boruclo te verdelen?”
Tijdens een analyse van de huidige kosten allocatie wordt het duidelijk dat er onderbouwing mist. Ook na verdere analyse en navraag bij de afdeling finance wordt er geen onderbouwing gevonden.
In de tweede stap wordt er een voorstel gedaan voor een nieuwe kosten allocatie. Deze allocatie wordt onderbouwd door data gedreven analyse en interviews met experts van het onderwerp. Deze data-analyse is zo opgezet dat alleen de data geüpdatet hoeft te worden om de allocatie te updaten. De interviews met experts die jaarlijks uitgevoerd moeten worden zijn in aantallen beperkt om ervoor te zorgen dat het updateproces van de kostenallocatie efficiënt blijft, en zijn alleen uitgevoerd wanneer data geen accurate onderbouwing kon geven.
Tijdens het opzetten van een nieuwe allocatie is er ook een model ontwikkeld met behulp van Excel VBA-macro’s. Dit model kan gebruikt worden om kostenallocatie modellen op te zetten voor andere locaties. Het model is ontworpen om snel en gebruiksvriendelijk te zijn en heeft veel checks ingebouwd om menselijk falen te voorkomen.
Omdat er nog steeds veel informatie mist omtrent project Switch bevat dit rapport een plan om deze data te verzamelen. Dit plan omvat informatie omtrent wie te raadplegen of welke data te analyseren om een accurate kostenallocatie op te zetten die rekening houdt met project Switch.
Het verslag sluit af met de volgende conclusies en aanbevelingen:
Conclusies:
- Domo Borculo heeft een complex productieproces. Alleen de in- en output wordt gemeten, wat het lastig maakt een accurate kostenallocatie op te stellen.
- De huidige allocatie methode bevat een overbodige stap waarin kosten eerst naar een verdeelsleutel worden verdeeld, en vervolgens naar een eindkostenplaats.
- Sommige hulpkostenplaatsen zijn overbodig.
- Het door ons ontworpen model heeft bewezen nuttig te zijn aangezien het door vijf andere locaties wordt gebruikt.
- Er is meer informatie omtrent Switch nodig om en accurate kostenallocatie te maken.
Aanbevelingen:
- Domo Borculo wordt geadviseerd om de voorgestelde kostenallocatie te gebruiken.
- Domo Borculo moet proberen meer inzicht te krijgen in haar productieproces. Dit kan helpen problemen op te lossen en zou het mogelijk maken om Activity Based-Costing toe te passen.
- De hulpkostenplaatsen die alleen loon bevatten zouden verwijderd moeten worden aangezien ze niet voldoen aan literaire standaarden.
- De kostenplaatsen “Productpreparation LP” en “Preparation refined LP” zouden samengevoegd moeten worden aangezien ze gezien kunnen worden als een productiestap.
- Verdere analyse omtrent de impact van project Switch zal moeten plaatsenvinden aangezien het duidelijk is dat de impact groot it.

iv
iii. Preface
This bachelor report will conclude my time as a bachelor student, and what a time has it been. I am grateful to be given the opportunity to develop myself in this way. University so far has been the greatest time of my life.
From the beginning, I got welcomed into FrieslandCampina Domo Borculo with open arms. My colleagues always made sure that not a day went by, at the end of which I did not return home with a smile. They also gave me the chance to develop myself by involving me in their work and for that I am thankful.
First, I would like to thank José, who always gave great feedforward. I would also like to thank Tommy for dragging me along and taking me to the FrieslandCampina Youngstars drink, I wouldn’t have want to miss out on that.
Secondly, I would like to thank Toon de Bakker for the tips he gave me during my research. He really kept me sharp by asking his sometimes-very challenging questions. I would also like to thank Berend Roorda in advance, for taking the time to deepen into my research.
Paul Kemper
July 2017
v Overhead allocation for FrieslandCampina Domo, by Paul Kemper
iv. Contents
i. Management summary ............................................................................................................... ii
ii. Management samenvatting ....................................................................................................... iii
iii. Preface ........................................................................................................................................ iv
iv. Contents ...................................................................................................................................... v
v. List of abbreviations .................................................................................................................. vii
vi. Glossary ..................................................................................................................................... vii
vii. List of figures ............................................................................................................................ viii
viii. List of Tables ............................................................................................................................... ix
1. Introduction ............................................................................................................................... 10
1.1. Problem description .............................................................................................................. 10
1.2. The company ......................................................................................................................... 10
1.3. Limitations............................................................................................................................. 11
1.4. Research questions ............................................................................................................... 11
1.5. Deliverables ........................................................................................................................... 12
1.6. Methodology ......................................................................................................................... 12
1.7. Report structure .................................................................................................................... 12
2. Theoretical framework .............................................................................................................. 14
2.1. Two-step allocation process ................................................................................................. 14
2.2. Traditional method ............................................................................................................... 14
2.3. Activity-based costing method ............................................................................................. 15
2.4. Variable costing method ....................................................................................................... 16
2.5. Absorption costing method .................................................................................................. 16
2.6. Cost center method .............................................................................................................. 16
3. Current situation ....................................................................................................................... 20
3.1. Conversion costs ................................................................................................................... 20
3.2. Non-manufacturing overhead .............................................................................................. 22
3.3. Total cost price ...................................................................................................................... 23
3.4. Evaluation ............................................................................................................................. 23
4. New allocation method ............................................................................................................. 25
4.1. Allocation method................................................................................................................. 25
4.2. Conversion costs ................................................................................................................... 25
4.3. Non-manufacturing overhead .............................................................................................. 29
4.4. Model .................................................................................................................................... 30
4.5. Comparison ........................................................................................................................... 34
5. Impact of Switch ........................................................................................................................ 37
vi
5.1. Defining Switch ..................................................................................................................... 37
5.2. Changes in allocation ............................................................................................................ 37
6. Conclusion & recommendations ............................................................................................... 39
6.1. Conclusions ........................................................................................................................... 39
6.2. Recommendations ................................................................................................................ 39
7. Sources ...................................................................................................................................... 40
8. Appendices ................................................................................................................................ 41
a) Cost centers ................................................................................. Error! Bookmark not defined.
b) Service cost center allocation to allocation keys ......................... Error! Bookmark not defined.
c) Allocation key allocation to production cost centers .................. Error! Bookmark not defined.
d) Total costs per production cost center ........................................ Error! Bookmark not defined.
e) Overhead rates of production cost centers ................................. Error! Bookmark not defined.
f) Service cost center allocation to product groups ........................ Error! Bookmark not defined.
g) Overhead rates of product groups ............................................... Error! Bookmark not defined.
h) Proposed cost centers .................................................................. Error! Bookmark not defined.
i) Proposed service cost allocation to production cost centers ...... Error! Bookmark not defined.
j) Allocation keys based on Ultimo data ......................................... Error! Bookmark not defined.
k) Energy tool ................................................................................... Error! Bookmark not defined.
l) Dry-matter loss tool ..................................................................... Error! Bookmark not defined.
m) Proposed total cost per production cost centers ........................ Error! Bookmark not defined.
n) Proposed overhead rates for production cost centers ................ Error! Bookmark not defined.
o) KG equivalent calculations ........................................................... Error! Bookmark not defined.
p) Proposed service cost center allocation to product groups ........ Error! Bookmark not defined.
q) Proposed overhead rates for product groups ............................. Error! Bookmark not defined.
r) Code of conversion costs model .................................................. Error! Bookmark not defined.
k) Code of non-manufacturing model .............................................. Error! Bookmark not defined.
vii Overhead allocation for FrieslandCampina Domo, by Paul Kemper
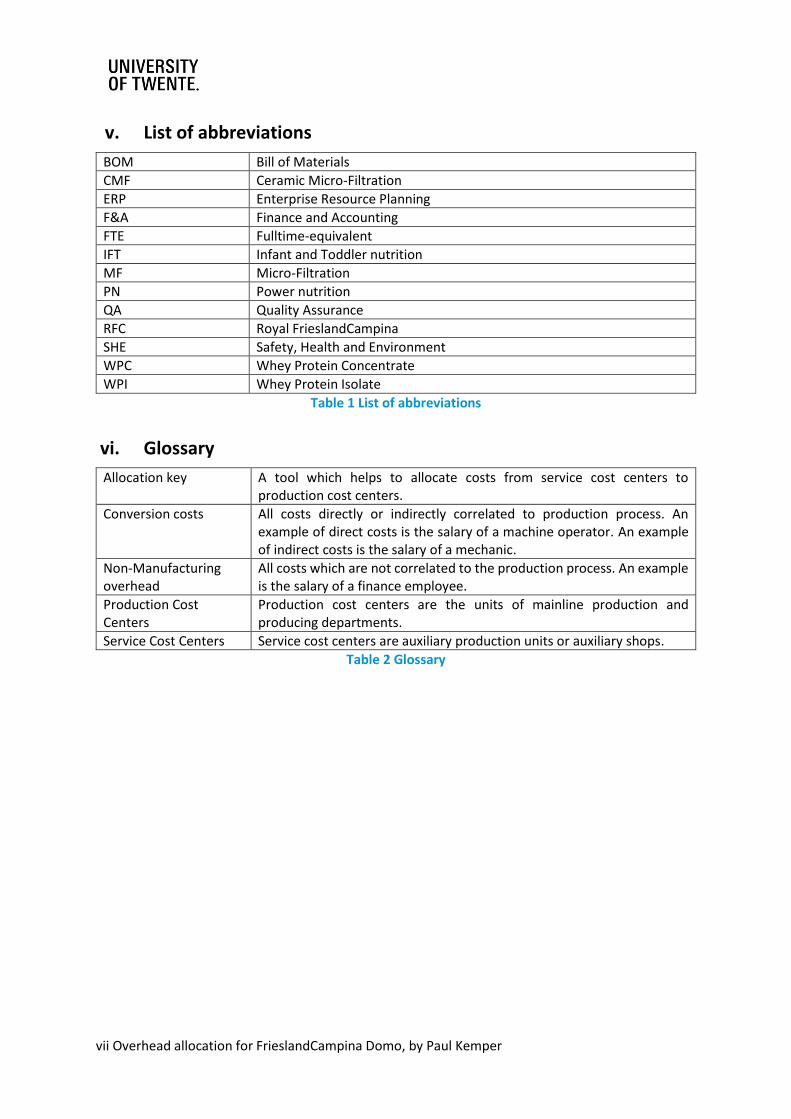
v. List of abbreviations
BOM Bill of Materials
CMF Ceramic Micro-Filtration
ERP Enterprise Resource Planning
F&A Finance and Accounting
FTE Fulltime-equivalent
IFT Infant and Toddler nutrition
MF Micro-Filtration
PN Power nutrition
QA Quality Assurance
RFC Royal FrieslandCampina
SHE Safety, Health and Environment
WPC Whey Protein Concentrate
WPI Whey Protein Isolate
Table 1 List of abbreviations
vi. Glossary
Allocation key A tool which helps to allocate costs from service cost centers to production cost centers.
Conversion costs All costs directly or indirectly correlated to production process. An example of direct costs is the salary of a machine operator. An example of indirect costs is the salary of a mechanic.
Non-Manufacturing overhead
All costs which are not correlated to the production process. An example is the salary of a finance employee.
Production Cost Centers
Production cost centers are the units of mainline production and producing departments.
Service Cost Centers Service cost centers are auxiliary production units or auxiliary shops.
Table 2 Glossary
viii
vii. List of figures
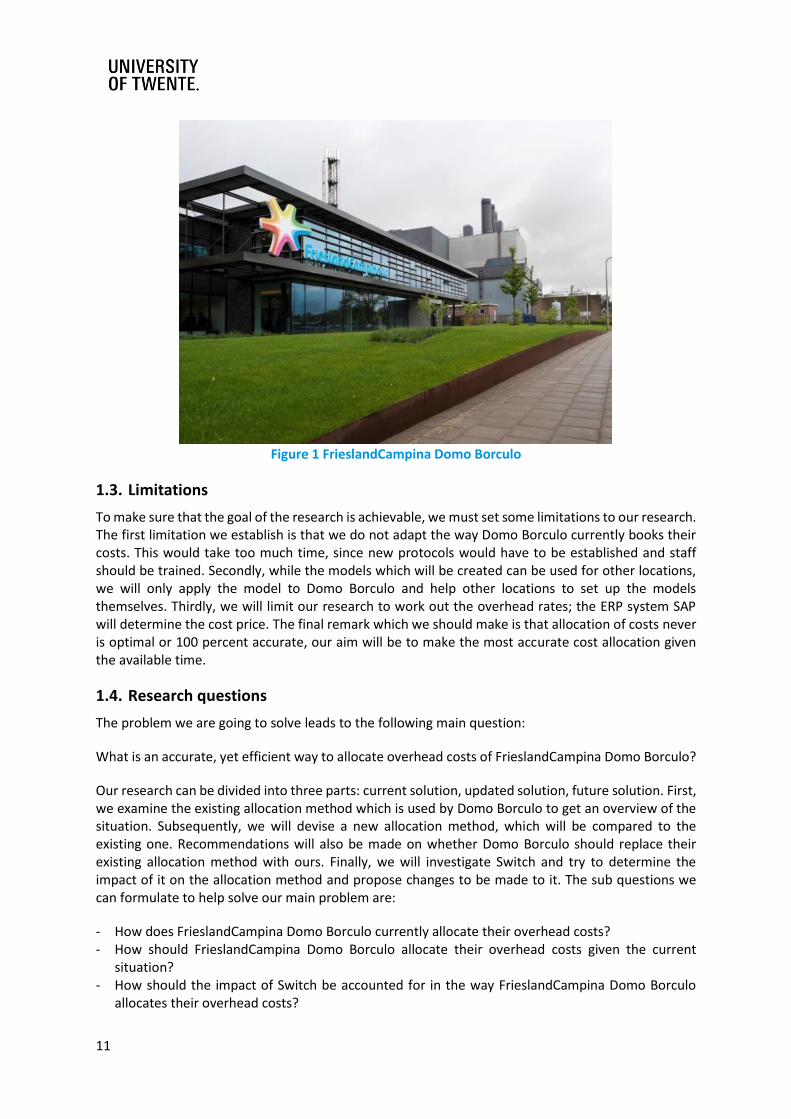
Figure 1 FrieslandCampina Domo Borculo ........................................................................................... 11
Figure 2 Traditional costing system (Drury, 2012, p. 50) ...................................................................... 14
Figure 3 Activity-based costing system (Drury, 2012, p. 50) ................................................................ 15
Figure 4 Cost allocation direct method ................................................................................................. 17
Figure 5 Cost allocation step-down method ......................................................................................... 18
Figure 6 Cost allocation reciprocal method .......................................................................................... 19
Figure 7 Allocation of conversion costs ................................................................................................ 21
Figure 8 Allocation of non-manufacturing overhead ............................................................................ 22
Figure 9 Total cost price calculation ..................................................................................................... 23
Figure 10 Proposed allocation of conversion costs .............................................................................. 26
Figure 11 Proposed allocation method for non-manufacturing overhead ........................................... 29
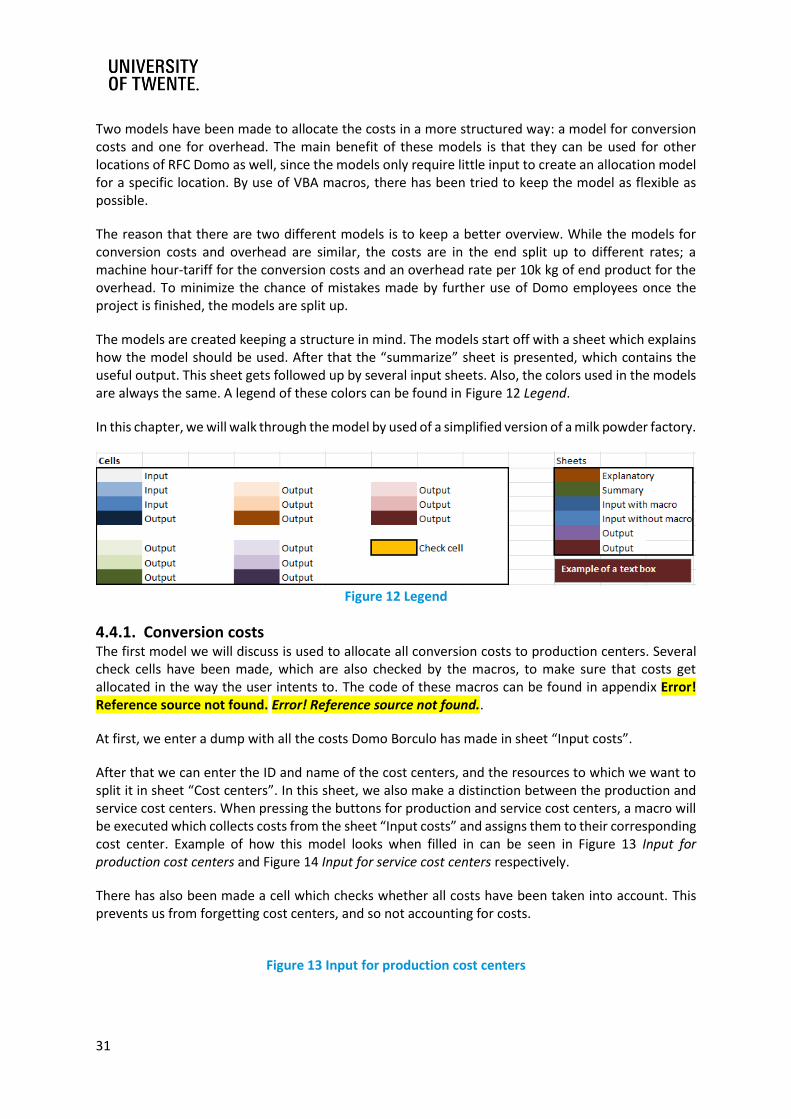
Figure 12 Legend ................................................................................................................................... 31
Figure 13 Input for production cost centers ......................................................................................... 31
Figure 14 Input for service cost centers ................................................................................................ 32
Figure 15 Allocation to cost centers ..................................................................................................... 32
Figure 16 Allocation from service to production cost centers.............................................................. 32
Figure 17 Budgeted machine hours ...................................................................................................... 32
Figure 18 Layer 1 of the summary ........................................................................................................ 32
Figure 19 Layer 2 of the summary ........................................................................................................ 32
Figure 20 A service cost center allocation in layer 3............................................................................. 32
Figure 21 Input for production cost centers & product groups ............................................................ 33
Figure 22 Budgeted production quantities ........................................................................................... 33
Figure 23 User form .............................................................................................................................. 33
Figure 24 Allocation from service cost centers to product groups ....................................................... 33
Figure 25 Layer 1 ................................................................................................................................... 33
Figure 26 Layer 2 ................................................................................................................................... 34
Figure 27 A overhead cost center allocation in layer 3 ........................................................................ 34
Figure 28 Current cost price calculation ............................................................................................... 34
Figure 29 Proposed cost price calculation ............................................................................................ 35
Figure 30 Overview of project Switch ................................................................................................... 37
Figure 31 Processes within project Switch ........................................................................................... 37
Figure 32 Energy tool from Epro Consult ................................................. Error! Bookmark not defined.
Figure 33 Dry-matter loss tool ................................................................. Error! Bookmark not defined.
ix Overhead allocation for FrieslandCampina Domo, by Paul Kemper
viii. List of Tables
Table 1 List of abbreviations ................................................................................................................. vii
Table 2 Glossary .................................................................................................................................... vii
Table 3 Mapping of allocation .............................................................................................................. 17
Table 4 Cost allocation direct method .................................................................................................. 17
Table 5 Cost allocation step-down method .......................................................................................... 18
Table 6 Cost allocation reciprocal method ........................................................................................... 19
Table 7 FTE division ............................................................................................................................... 26
Table 8 Labor costs allocation ............................................................................................................... 26
Table 9 Proposed allocation .................................................................................................................. 27
Table 10 Time-spent technology department ...................................................................................... 27
Table 11 Budgeted machine hours for the towers ............................................................................... 27
Table 12 Change in overhead rates for production cost centers.......................................................... 35
Table 13 Change in overhead rates for product group overhead rates ............................................... 36
Table 14 Cost assignment to cost centers ............................................... Error! Bookmark not defined.
Table 15 Service cost center allocation to allocation keys ...................... Error! Bookmark not defined.
Table 16 Allocation key allocation to production cost centers................ Error! Bookmark not defined.
Table 17 Total costs per production cost center ..................................... Error! Bookmark not defined.
Table 18 Overhead rates of production cost centers .............................. Error! Bookmark not defined.
Table 19 Service cost center allocation to product groups ..................... Error! Bookmark not defined.
Table 20 Overhead rates of product groups ............................................ Error! Bookmark not defined.
Table 21 Proposed cost assignment to cost centers................................ Error! Bookmark not defined.
Table 22 Proposed service cost allocation to production cost centers ... Error! Bookmark not defined.
Table 23 Allocation keys based on Ultimo data ....................................... Error! Bookmark not defined.
Table 24 Proposed total cost per production cost center ....................... Error! Bookmark not defined.
Table 25 Proposed overhead rates for production cost centers ............. Error! Bookmark not defined.
Table 26 KG equivalent calculations ........................................................ Error! Bookmark not defined.
Table 27 Proposed service cost center allocation to product groups ..... Error! Bookmark not defined.
Table 28 Proposed overhead rates for product groups ........................... Error! Bookmark not defined.
10
1. Introduction
This chapter will serve as the basis for this report as it will lay the fundamentals of it. We will begin with a problem description after which we will introduce the company. Subsequently we will set limitations, formulate the research questions, state the deliverables, explain our methodology and finally we explain the structure of our report.
1.1. Problem description
In this bachelor report a problem of Royal FrieslandCampina (RFC) Domo Borculo (see Figure 1 FrieslandCampina Domo Borculo) relating to the allocation of their overhead costs will be solved. This location of RFC currently allocates their overhead costs using a method which was created quite some time ago and which might be outdated. We will investigate the current allocation method, we will also recommend a new allocation method if necessary.
Allocating overhead costs is necessary since companies need and want to determine cost prices. They need to determine cost prices in order to comply to (inter)national accountancy laws; stocks need to be valued against the price of the products, and not against the price of only the raw materials. Furthermore, companies want to have cost prices for decision making purposes. For example: while making investment plans, it is necessary to have cost prices of products in order to calculate potential profits of different investments projects. These potential profits can then be compared to decide in which project, investments should be made. In our research, we will conduct research to these internal cost prices.
Domo Borculo is currently investing a lot in a new way of valorizing their whey; they are going to shift their main focus from producing feed related products, for cattle, to Power Nutrition (PN) for athletes and elderly. One of these investments, project Switch, will take place in Borculo and involves a new plant getting build. This investment should change the way Domo Borculo allocates their overhead costs, since costs should be allocated to the new plant also. This leads to the second objective of our research: investigating the impact of Switch on the proposed allocation method.
1.2. The company
FrieslandCampina is one of the largest dairy enterprises of the world. It consists of different companies, one of which is Domo. Domo develops and produces ingredients for producers of infant and toddler nutrition (IFT), with various kinds of whey as raw materials. Whey is a by-product which is created while producing cheese. Ten liters of milk can be transformed into 1 kilogram of cheese and 9 liters of whey. The amount of whey that is produced is therefore related to the amount of cheese that gets produced. The allocation of whey on the different whey-processing locations is done centrally in Amersfoort. This is done based on the whey needs, which are derived from the expected sales. If more whey is produced than all locations together can process the excess whey gets sold. If there is too little whey to fill demand, extra whey will be purchased. (Tijhuis, 2014)
11
Figure 1 FrieslandCampina Domo Borculo
1.3. Limitations
To make sure that the goal of the research is achievable, we must set some limitations to our research. The first limitation we establish is that we do not adapt the way Domo Borculo currently books their costs. This would take too much time, since new protocols would have to be established and staff should be trained. Secondly, while the models which will be created can be used for other locations, we will only apply the model to Domo Borculo and help other locations to set up the models themselves. Thirdly, we will limit our research to work out the overhead rates; the ERP system SAP will determine the cost price. The final remark which we should make is that allocation of costs never is optimal or 100 percent accurate, our aim will be to make the most accurate cost allocation given the available time.
1.4. Research questions
The problem we are going to solve leads to the following main question:
What is an accurate, yet efficient way to allocate overhead costs of FrieslandCampina Domo Borculo?
Our research can be divided into three parts: current solution, updated solution, future solution. First, we examine the existing allocation method which is used by Domo Borculo to get an overview of the situation. Subsequently, we will devise a new allocation method, which will be compared to the existing one. Recommendations will also be made on whether Domo Borculo should replace their existing allocation method with ours. Finally, we will investigate Switch and try to determine the impact of it on the allocation method and propose changes to be made to it. The sub questions we can formulate to help solve our main problem are:
- How does FrieslandCampina Domo Borculo currently allocate their overhead costs? - How should FrieslandCampina Domo Borculo allocate their overhead costs given the current
situation? - How should the impact of Switch be accounted for in the way FrieslandCampina Domo Borculo
allocates their overhead costs?
12
1.5. Deliverables
Our research will have the following Deliverables:
- A model that can be used throughout RFC to allocate overhead costs; - A proposed allocation method applicable in the current situation; - Proposed changes to the allocation method with project Switch in mind; - An explanatory report; - Recommendations.
1.6. Methodology
In this part, we will explain the methodology per sub question. Starting off with the first question: “How does FrieslandCampina Domo Borculo allocate their overhead costs given the current situation?”. To get an answer on this question we will begin by doing some analyses on the available data to gain an overview. Subsequently we will conduct interviews with employees of the finance department. We will then make a systematic overview of our view on the allocation method and check with the principal whether our overview is correct.
For the second question: “How should FrieslandCampina Domo Borculo allocate their overhead costs given the current situation?” literature needs to be read first. Based on this literature we will find a suitable allocation method which can be easily implied by FrieslandCampina Domo, but which also complies to the newest literary standards.
The final sub question: “How should the impact of Switch be accounted for in the way FrieslandCampina Domo Borculo allocates their overhead costs?” will be answered by first making an analysis of Switch. This will be done by means of interviewing the project managers. After this we will come up recommendations on how the impact of Switch should be accounted for.
Using the answers of these three sub questions, we will be able to come up with an answer to the main question: “What is an accurate, yet efficient way to allocate overhead costs of FrieslandCampina Domo Borculo?”.
1.7. Report structure
The current chapter serves as an introduction of the report. We introduced our research problem, gave an introduction about the company, formulated our research questions, stated our deliverables and we will conclude with a description of the reports’ structure.
The next chapter contains the theoretical framework, which will provide us with knowledge we can use throughout the rest of our research.
In the third chapter, we will describe and examine the current situation. This will be done in four parts: conversion costs, non-manufacturing overhead, total cost price and evaluation. This chapter will result in the answer on the first sub question: “How does FrieslandCampina Domo Borculo currently allocate their overhead costs?”
After that we will come up with a new suitable allocation method. This chapter will be divided into five parts: allocation method, conversion costs, non-manufacturing overhead, model and a comparison. This will result in an answer on the second sub question: “How should FrieslandCampina Domo Borculo allocate their overhead costs given the current situation?”

13
We will come up with an answer to the final sub question: “How should the impact of Switch be accounted for in the way FrieslandCampina Domo Borculo allocates their overhead costs? “In the fifth chapter, in which we will look at the impact of Switch on the allocation method. We will do this by first defining Switch and subsequently investigating the changes in allocation.
To conclude we give an answer on the main question: “What is an accurate, yet efficient way to allocate overhead costs of FrieslandCampina Domo Borculo?” We will do this in chapter six. In the same chapter, we will also make recommendations on how to implement our research, and provide suggestions for further research.
14
2. Theoretical framework
A theoretical framework will help us support the validity of our research. In this chapter, we will inquire more information about the following subjects: two-step allocation process, traditional allocation method, ABC allocation method, variable costing method, absorption costing method and cost center method.
2.1. Two-step allocation process
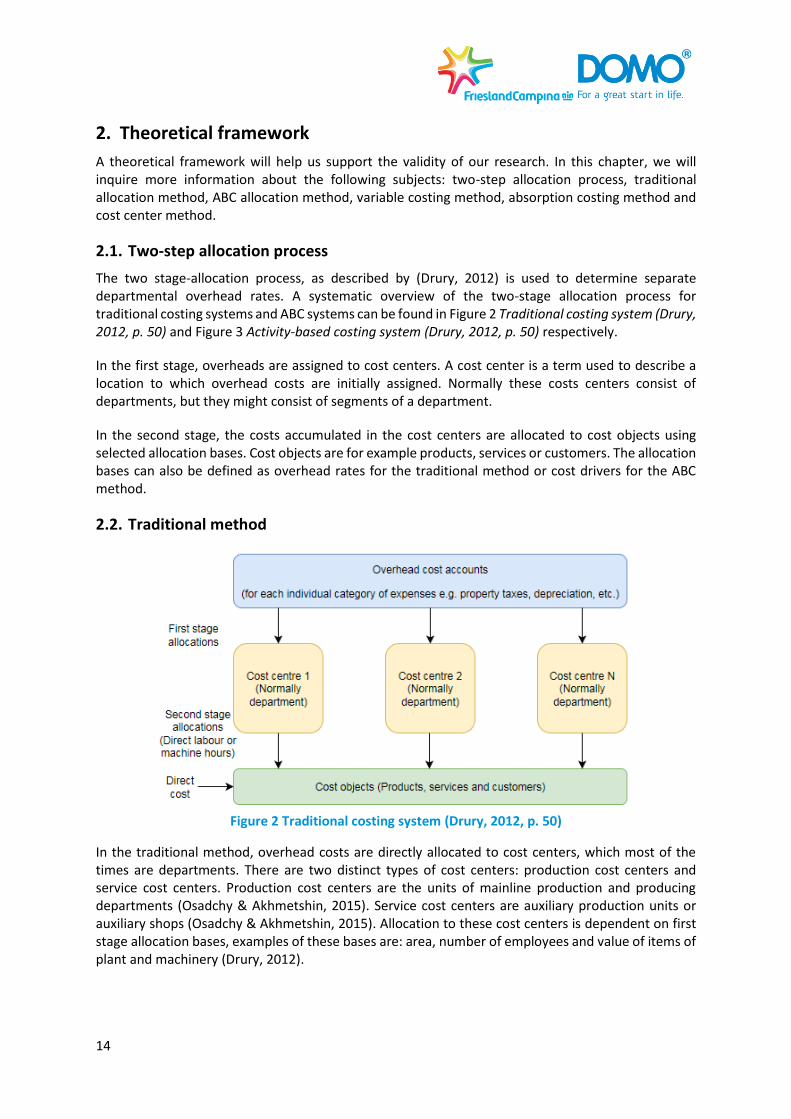
The two stage-allocation process, as described by (Drury, 2012) is used to determine separate departmental overhead rates. A systematic overview of the two-stage allocation process for traditional costing systems and ABC systems can be found in Figure 2 Traditional costing system (Drury, 2012, p. 50) and Figure 3 Activity-based costing system (Drury, 2012, p. 50) respectively.
In the first stage, overheads are assigned to cost centers. A cost center is a term used to describe a location to which overhead costs are initially assigned. Normally these costs centers consist of departments, but they might consist of segments of a department.
In the second stage, the costs accumulated in the cost centers are allocated to cost objects using selected allocation bases. Cost objects are for example products, services or customers. The allocation bases can also be defined as overhead rates for the traditional method or cost drivers for the ABC method.
2.2. Traditional method
Figure 2 Traditional costing system (Drury, 2012, p. 50)
In the traditional method, overhead costs are directly allocated to cost centers, which most of the times are departments. There are two distinct types of cost centers: production cost centers and service cost centers. Production cost centers are the units of mainline production and producing departments (Osadchy & Akhmetshin, 2015). Service cost centers are auxiliary production units or auxiliary shops (Osadchy & Akhmetshin, 2015). Allocation to these cost centers is dependent on first stage allocation bases, examples of these bases are: area, number of employees and value of items of plant and machinery (Drury, 2012).
15
After that the costs within the service cost centers are allocated to the production cost centers. The method chosen to allocate the cost to the production cost centers should be related to the benefits that the production cost centers receive from the service rendered. (Drury, 2012)
The next step is the determination of the overhead rates. This is done by dividing the costs within the production cost centers by a certain, self-chosen, allocation base. For traditional allocation methods, these are mostly based on the time a product spends in a production cost center - for example direct labor hours or machine hours. It is preferred to select the allocation bases which are most related to the overhead, for example machine hours for machine centers (Drury, 2012).
The final part we identify in the traditional allocation method assigns cost center overheads to chosen cost objects. For each cost object, it is determined how much of a certain overhead is required to produce it. By multiplying this with the overhead rate, the cost price can be established.
2.3. Activity-based costing method
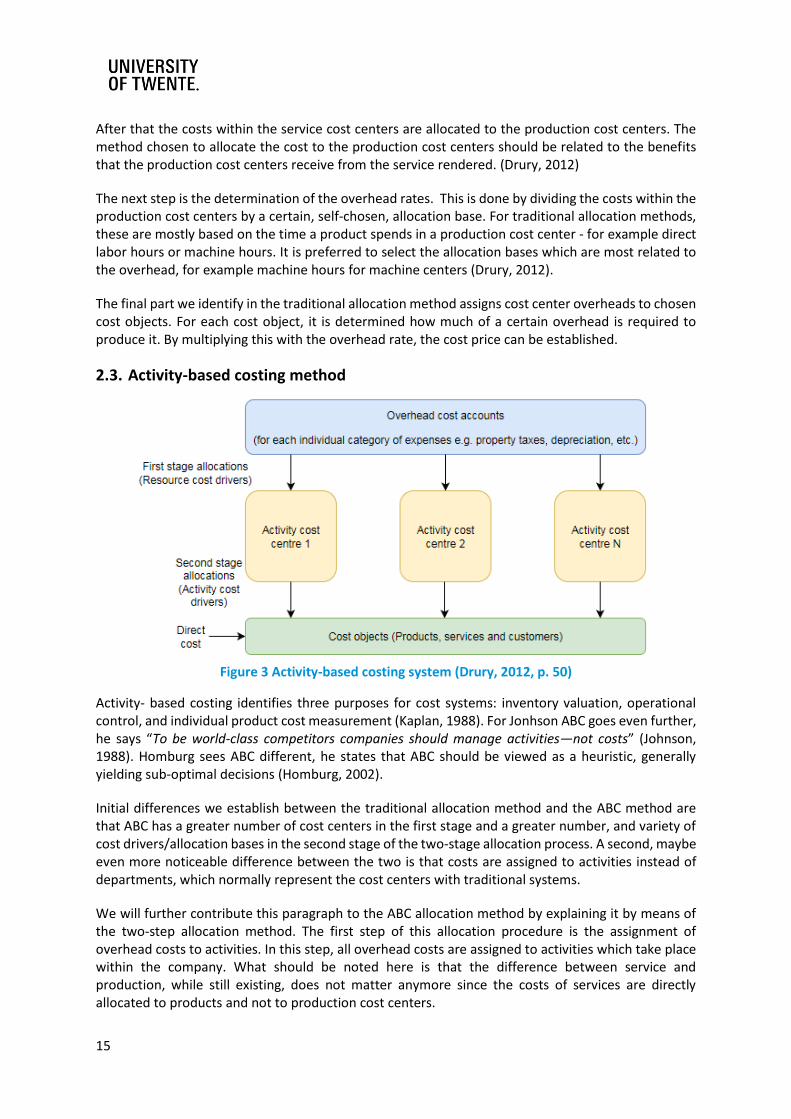
Figure 3 Activity-based costing system (Drury, 2012, p. 50)
Activity- based costing identifies three purposes for cost systems: inventory valuation, operational control, and individual product cost measurement (Kaplan, 1988). For Jonhson ABC goes even further, he says “To be world-class competitors companies should manage activities—not costs” (Johnson, 1988). Homburg sees ABC different, he states that ABC should be viewed as a heuristic, generally yielding sub-optimal decisions (Homburg, 2002).
Initial differences we establish between the traditional allocation method and the ABC method are that ABC has a greater number of cost centers in the first stage and a greater number, and variety of cost drivers/allocation bases in the second stage of the two-stage allocation process. A second, maybe even more noticeable difference between the two is that costs are assigned to activities instead of departments, which normally represent the cost centers with traditional systems.
We will further contribute this paragraph to the ABC allocation method by explaining it by means of the two-step allocation method. The first step of this allocation procedure is the assignment of overhead costs to activities. In this step, all overhead costs are assigned to activities which take place within the company. What should be noted here is that the difference between service and production, while still existing, does not matter anymore since the costs of services are directly allocated to products and not to production cost centers.
16
This brings us to the next and last step, the allocation of costs to cost objects using activity specific allocation bases. ABC is characterized by its cause-and-effect second stage allocation bases (Drury, 2012). This means that costs are allocated in a way which is more directly related to the generation of costs. For this reason, second stage allocation bases are also called cost drivers. Examples of these cost drivers are: amount of orders or number of samples taken.
A benefit of ABC is that non-accountant employees begin to appreciate cost data that was derived from operational knowledge rather than arbitrary allocations imposed by a remote accounting process. (Soin, Seal, & Cullen, 2002)
2.4. Variable costing method
The variable costing method is a primitive costing method. With variable costing, only variable costs get traced to the products. Fixed costs get treated as period expenses. This makes it difficult to determine the actual costs made to produce a single unit of output.
2.5. Absorption costing method
The absorption cost method is relatively straightforward method to calculate cost prices. Cost prices are calculated by adding a portion of the indirect costs to the direct costs per product. First, the different kind of direct and indirect costs get determined. Subsequently, the indirect costs get converted into a percentage of a specific direct cost sort, like labour, or the total direct costs. After that the fixed (indirect) costs per product can be calculated and added to the direct costs per product to determine the total cost price.
This method can be enhanced by dividing the indirect costs into diverse groups, like materials and labour costs. For each group, a distinct surcharge per product can be calculated. This increases the complexity of the allocation method; however, it does increase the causality between costs and distinct products.
2.6. Cost center method
Another commonly used allocation method is the cost center method. The cost center method does however require more insight in the costing structure. In this method, indirect costs get assigned to one of two distinct kinds of cost centers: service cost centers and production cost centers. Service cost centers are the business units which support production, like the HR department. Production cots centers are the business units where production and selling activities take place.
Once costs are assigned to cost centers, service cost centers are allocated to other service cost centers and production cost centers. Finally, the costs within the service cost centers (with possible allocated costs from other service cost centers) centers get allocated to the production cost centers. The allocation of costs from one service cost center to another can be quite complicated when costs need to be allocated in both ways. The following paragraphs will explain three different methods as described by Horgren (2012).
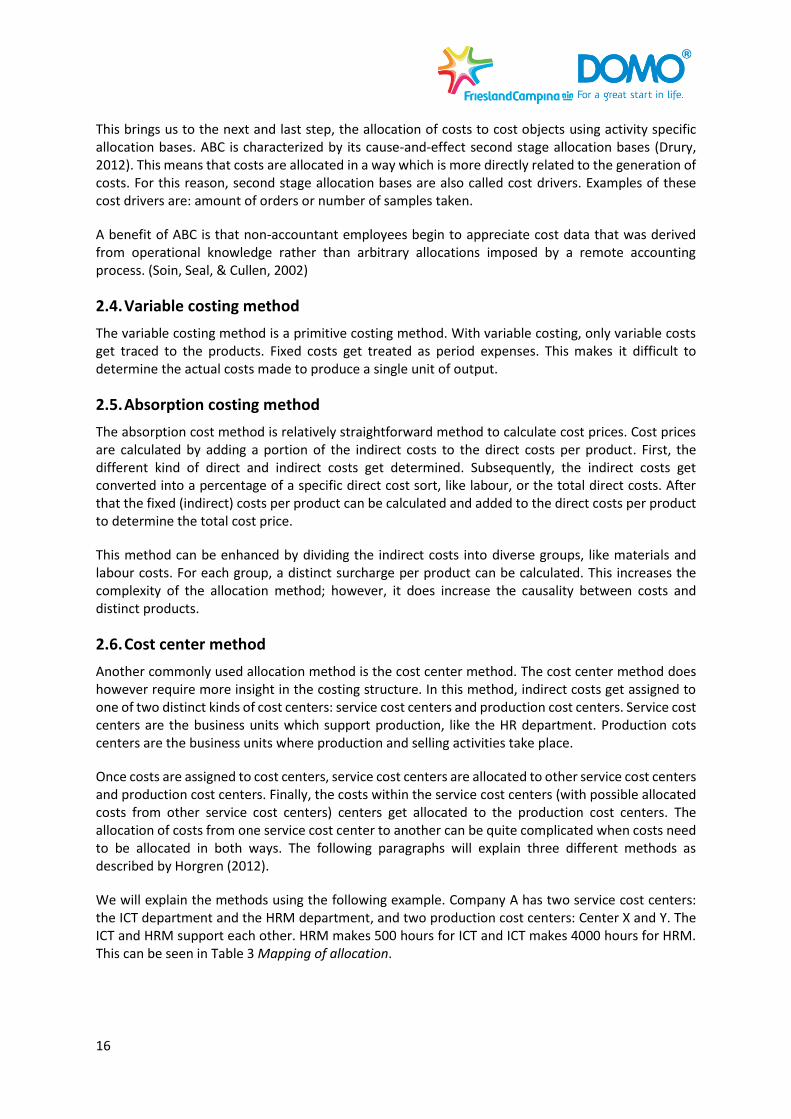
We will explain the methods using the following example. Company A has two service cost centers: the ICT department and the HRM department, and two production cost centers: Center X and Y. The ICT and HRM support each other. HRM makes 500 hours for ICT and ICT makes 4000 hours for HRM. This can be seen in Table 3 Mapping of allocation.
17
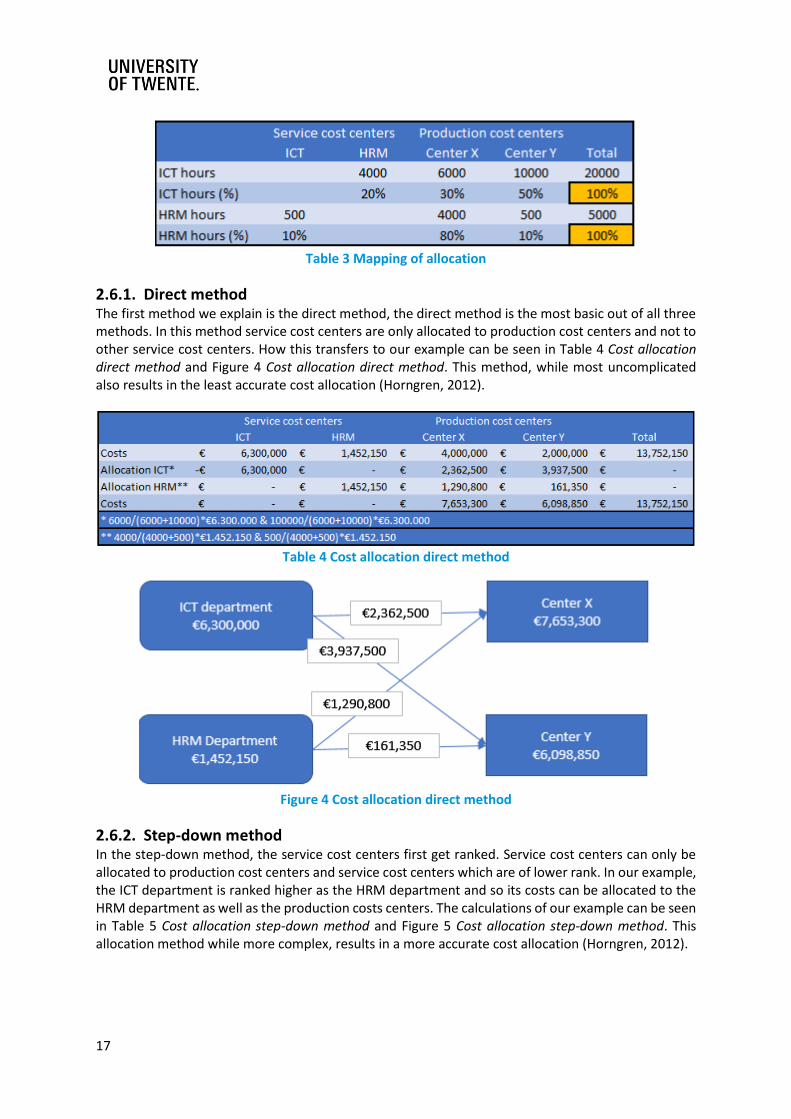
Table 3 Mapping of allocation
2.6.1. Direct method The first method we explain is the direct method, the direct method is the most basic out of all three methods. In this method service cost centers are only allocated to production cost centers and not to other service cost centers. How this transfers to our example can be seen in Table 4 Cost allocation direct method and Figure 4 Cost allocation direct method. This method, while most uncomplicated also results in the least accurate cost allocation (Horngren, 2012).
Table 4 Cost allocation direct method
Figure 4 Cost allocation direct method
2.6.2. Step-down method In the step-down method, the service cost centers first get ranked. Service cost centers can only be allocated to production cost centers and service cost centers which are of lower rank. In our example, the ICT department is ranked higher as the HRM department and so its costs can be allocated to the HRM department as well as the production costs centers. The calculations of our example can be seen in Table 5 Cost allocation step-down method and Figure 5 Cost allocation step-down method. This allocation method while more complex, results in a more accurate cost allocation (Horngren, 2012).
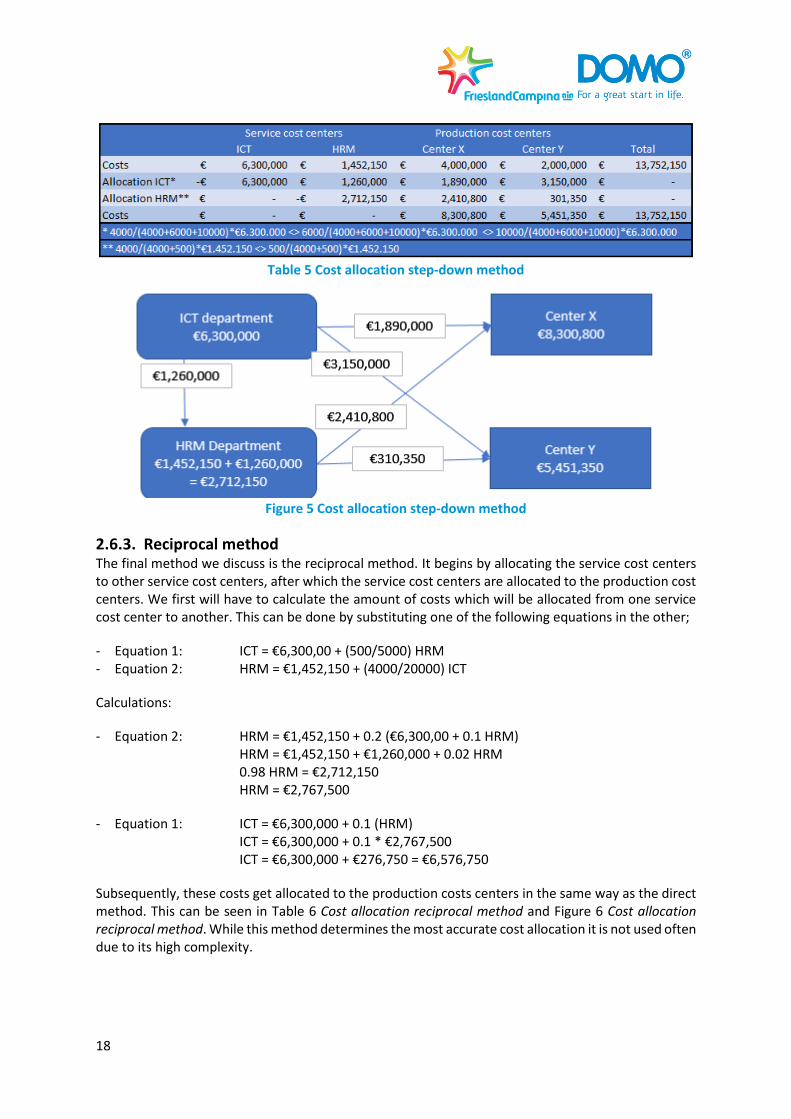
18
Table 5 Cost allocation step-down method
Figure 5 Cost allocation step-down method
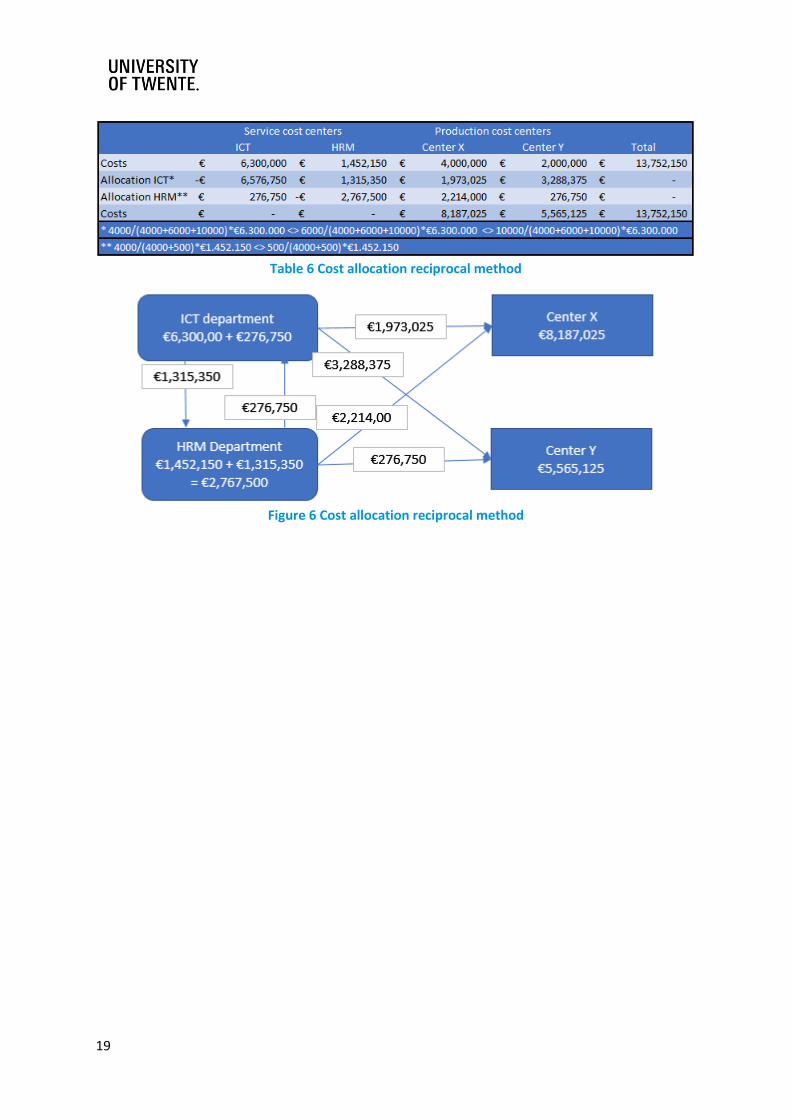
2.6.3. Reciprocal method The final method we discuss is the reciprocal method. It begins by allocating the service cost centers to other service cost centers, after which the service cost centers are allocated to the production cost centers. We first will have to calculate the amount of costs which will be allocated from one service cost center to another. This can be done by substituting one of the following equations in the other;
- Equation 1: ICT = €6,300,00 + (500/5000) HRM - Equation 2: HRM = €1,452,150 + (4000/20000) ICT
Calculations:
- Equation 2: HRM = €1,452,150 + 0.2 (€6,300,00 + 0.1 HRM) HRM = €1,452,150 + €1,260,000 + 0.02 HRM 0.98 HRM = €2,712,150 HRM = €2,767,500
- Equation 1: ICT = €6,300,000 + 0.1 (HRM) ICT = €6,300,000 + 0.1 * €2,767,500 ICT = €6,300,000 + €276,750 = €6,576,750
Subsequently, these costs get allocated to the production costs centers in the same way as the direct method. This can be seen in Table 6 Cost allocation reciprocal method and Figure 6 Cost allocation reciprocal method. While this method determines the most accurate cost allocation it is not used often due to its high complexity.
19
Table 6 Cost allocation reciprocal method
Figure 6 Cost allocation reciprocal method
20
3. Current situation
In this chapter, we will examine the current situation. Domo Borculo distinguishes two distinct kinds of overhead cost: conversion costs and non-manufacturing overhead, which is in line with the theory of (Drury, 2012). Conversion costs are the costs which are directly or indirectly connected to the production process, like machines or the maintenance department. Non-manufacturing overhead consists of departments like Human Resources. The cost assignment to these cost centers as it currently is can be found in appendix Error! Reference source not found. Error! Reference source not found.. We will begin by examining the conversion costs. Here we will look at the used allocation method, which can be seen as a general overview of the situation. Subsequently, we will go in on the details of the distinct parts. In these parts, we will describe the creation process of the allocation keys, the calculation of the overhead rates and the formulation of the cost prices.
Afterwards we will examine the non-manufacturing overhead costs. Once more, we will start by examining the allocation method; subsequently the allocation process to product groups and the overhead rates will be investigated. Finally, the formulation of the cost prices will be examined.
In the end, we will give a summary in which the complete process gets consolidated.
3.1. Conversion costs
In this paragraph, we will delve into the current process of imbedding conversion costs in the cost price.
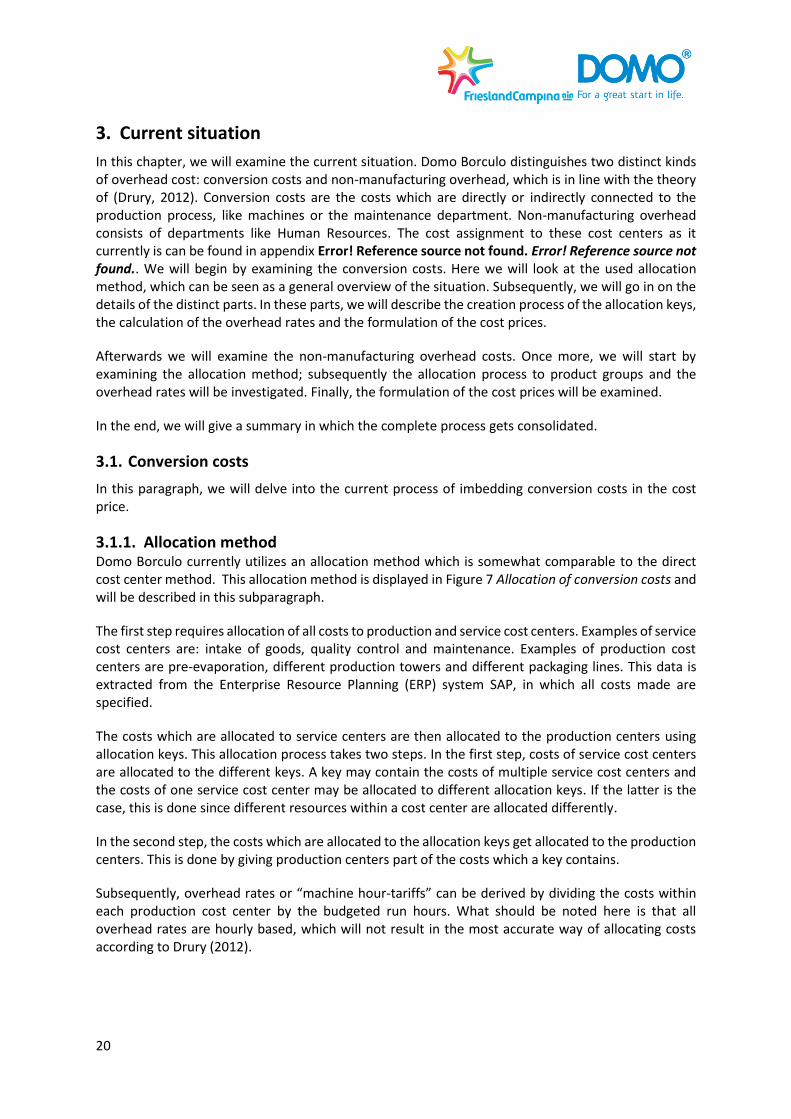
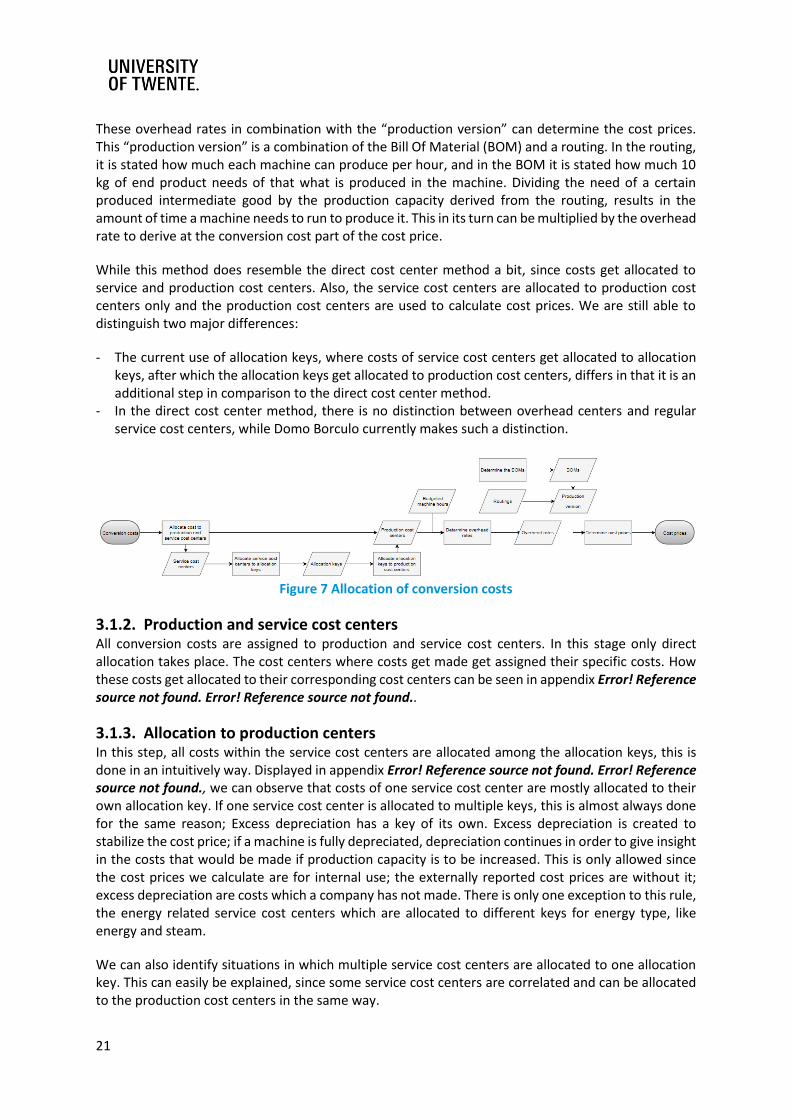
3.1.1. Allocation method Domo Borculo currently utilizes an allocation method which is somewhat comparable to the direct cost center method. This allocation method is displayed in Figure 7 Allocation of conversion costs and will be described in this subparagraph.
The first step requires allocation of all costs to production and service cost centers. Examples of service cost centers are: intake of goods, quality control and maintenance. Examples of production cost centers are pre-evaporation, different production towers and different packaging lines. This data is extracted from the Enterprise Resource Planning (ERP) system SAP, in which all costs made are specified.
The costs which are allocated to service centers are then allocated to the production centers using allocation keys. This allocation process takes two steps. In the first step, costs of service cost centers are allocated to the different keys. A key may contain the costs of multiple service cost centers and the costs of one service cost center may be allocated to different allocation keys. If the latter is the case, this is done since different resources within a cost center are allocated differently.
In the second step, the costs which are allocated to the allocation keys get allocated to the production centers. This is done by giving production centers part of the costs which a key contains.
Subsequently, overhead rates or “machine hour-tariffs” can be derived by dividing the costs within each production cost center by the budgeted run hours. What should be noted here is that all overhead rates are hourly based, which will not result in the most accurate way of allocating costs according to Drury (2012).
21
These overhead rates in combination with the “production version” can determine the cost prices. This “production version” is a combination of the Bill Of Material (BOM) and a routing. In the routing, it is stated how much each machine can produce per hour, and in the BOM it is stated how much 10 kg of end product needs of that what is produced in the machine. Dividing the need of a certain produced intermediate good by the production capacity derived from the routing, results in the amount of time a machine needs to run to produce it. This in its turn can be multiplied by the overhead rate to derive at the conversion cost part of the cost price.
While this method does resemble the direct cost center method a bit, since costs get allocated to service and production cost centers. Also, the service cost centers are allocated to production cost centers only and the production cost centers are used to calculate cost prices. We are still able to distinguish two major differences:
- The current use of allocation keys, where costs of service cost centers get allocated to allocation keys, after which the allocation keys get allocated to production cost centers, differs in that it is an additional step in comparison to the direct cost center method.
- In the direct cost center method, there is no distinction between overhead centers and regular service cost centers, while Domo Borculo currently makes such a distinction.
Figure 7 Allocation of conversion costs
3.1.2. Production and service cost centers All conversion costs are assigned to production and service cost centers. In this stage only direct allocation takes place. The cost centers where costs get made get assigned their specific costs. How these costs get allocated to their corresponding cost centers can be seen in appendix Error! Reference source not found. Error! Reference source not found..
3.1.3. Allocation to production centers In this step, all costs within the service cost centers are allocated among the allocation keys, this is done in an intuitively way. Displayed in appendix Error! Reference source not found. Error! Reference source not found., we can observe that costs of one service cost center are mostly allocated to their own allocation key. If one service cost center is allocated to multiple keys, this is almost always done for the same reason; Excess depreciation has a key of its own. Excess depreciation is created to stabilize the cost price; if a machine is fully depreciated, depreciation continues in order to give insight in the costs that would be made if production capacity is to be increased. This is only allowed since the cost prices we calculate are for internal use; the externally reported cost prices are without it; excess depreciation are costs which a company has not made. There is only one exception to this rule, the energy related service cost centers which are allocated to different keys for energy type, like energy and steam.
We can also identify situations in which multiple service cost centers are allocated to one allocation key. This can easily be explained, since some service cost centers are correlated and can be allocated to the production cost centers in the same way.
22
Next, the costs within the allocation keys are assigned to production cost centers; this is displayed in appendix Error! Reference source not found. Error! Reference source not found.. When looking at the excel sheet which is used for the allocation process we can see that percentages have been filled in as a way to allocate the costs. However, there is no explanation of these percentages. When questioned colleagues answered that they did not know how these percentages were derived either; the two persons responsible for them have left RFC.
An analysis of the data could not help us find why it is allocated in this way either.
At the end of this step we have determined to total costs per production group, this is displayed in appendix Error! Reference source not found. Error! Reference source not found..
3.1.4. Overhead rates To determine the overhead rates, we will divide the costs within the production cost centers by the budgeted machine hours. These budgeted machine hours are based on the planned production. This planned production is based on the eighteen-month plan which is made in the headquarters in Amersfoort. These results are displayed in appendix Error! Reference source not found. Error! Reference source not found..
3.2. Non-manufacturing overhead
In this paragraph, we will delve into the current process of embedding non-manufacturing overhead in the cost price.
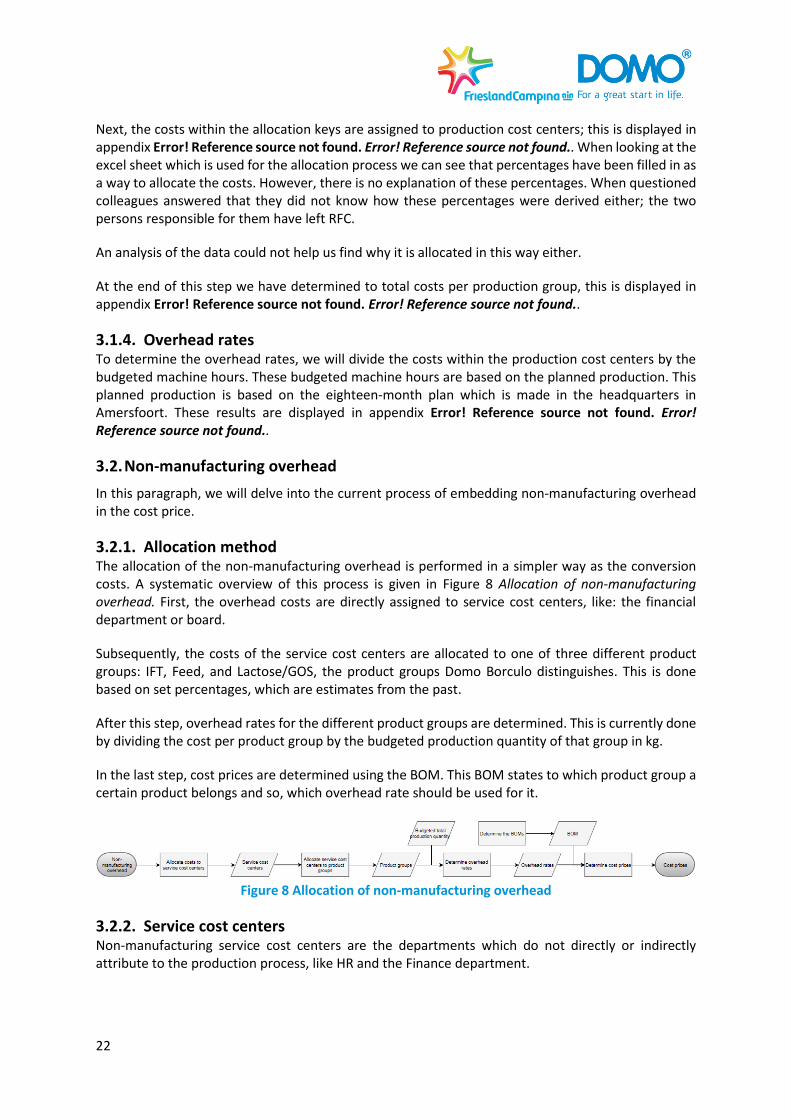
3.2.1. Allocation method The allocation of the non-manufacturing overhead is performed in a simpler way as the conversion costs. A systematic overview of this process is given in Figure 8 Allocation of non-manufacturing overhead. First, the overhead costs are directly assigned to service cost centers, like: the financial department or board.
Subsequently, the costs of the service cost centers are allocated to one of three different product groups: IFT, Feed, and Lactose/GOS, the product groups Domo Borculo distinguishes. This is done based on set percentages, which are estimates from the past.
After this step, overhead rates for the different product groups are determined. This is currently done by dividing the cost per product group by the budgeted production quantity of that group in kg.
In the last step, cost prices are determined using the BOM. This BOM states to which product group a certain product belongs and so, which overhead rate should be used for it.
Figure 8 Allocation of non-manufacturing overhead
3.2.2. Service cost centers Non-manufacturing service cost centers are the departments which do not directly or indirectly attribute to the production process, like HR and the Finance department.
23
3.2.3. Allocation to product groups After the costs have been assigned to service cost centers, the costs within these centers can be allocated to the different product groups. This is displayed in appendix Error! Reference source not found. Error! Reference source not found.. What we can see in the existing allocation is a relative small part of the costs being allocated to the product group feed. This stems from the fact that the feed product group is only responsible for a relatively small part of the revenue and the main focus of Domo Borculo does not lay on this specific product group.
3.2.4. Overhead rates Overhead rates can be determined by dividing the total costs per production group by the budgeted production quantity in kg. Since overhead rates are determined per 10k kg appendix Error! Reference source not found. Error! Reference source not found. also shows them in this way.
3.3. Total cost price
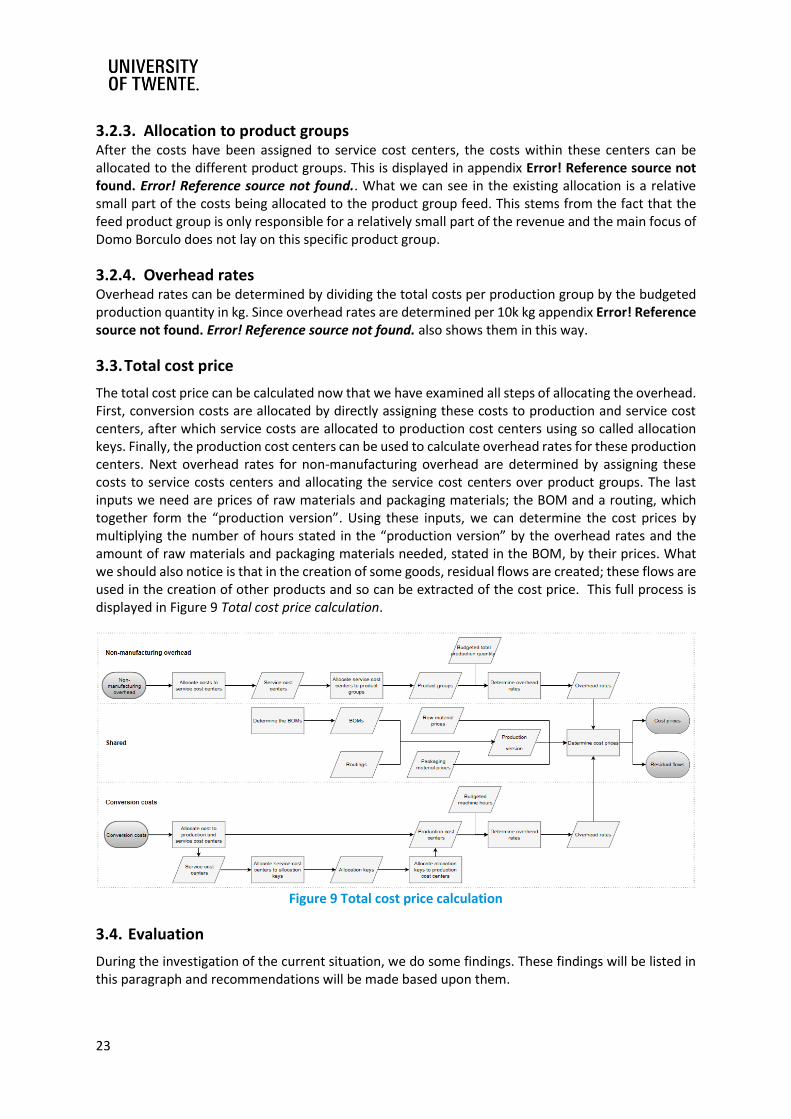
The total cost price can be calculated now that we have examined all steps of allocating the overhead. First, conversion costs are allocated by directly assigning these costs to production and service cost centers, after which service costs are allocated to production cost centers using so called allocation keys. Finally, the production cost centers can be used to calculate overhead rates for these production centers. Next overhead rates for non-manufacturing overhead are determined by assigning these costs to service costs centers and allocating the service cost centers over product groups. The last inputs we need are prices of raw materials and packaging materials; the BOM and a routing, which together form the “production version”. Using these inputs, we can determine the cost prices by multiplying the number of hours stated in the “production version” by the overhead rates and the amount of raw materials and packaging materials needed, stated in the BOM, by their prices. What we should also notice is that in the creation of some goods, residual flows are created; these flows are used in the creation of other products and so can be extracted of the cost price. This full process is displayed in Figure 9 Total cost price calculation.
Figure 9 Total cost price calculation
3.4. Evaluation
During the investigation of the current situation, we do some findings. These findings will be listed in this paragraph and recommendations will be made based upon them.
24
First, the use of allocation keys seems redundant. First, cost get assigned to a specific cost center, after that, the cost centers which can be seen as a service cost center are allocated to allocation keys. This means that costs are split, only to be combined again. The costs that these allocation keys contain are in turn allocated to the production cost centers. We advise to remove the allocation keys, and allocate the service cost centers directly to the production cost centers.
When looking at appendix Error! Reference source not found. Error! Reference source not found., we establish that some service cost centers need to be revised. Some service cost centers do contain direct production labor, while some do not, but should. Some service cost centers do contain depreciation and maintenance cost, some do not. All production cost centers lack direct production labor. We establish that the first allocation step, allocating costs to cost centers, is not done properly; in our belief, production cost centers should contain direct production labor (unless no labor is involved) and service cost centers should contain more than labor costs only, since a real department would at minimum have some other costs. This makes sure that there are no cost centers which should be directly allocated to production cost centers, like the three service cost centers which exist of only labor costs; production cost centers should add value to the product and service cost centers should deliver services to these production cost centers (Drury, 2012). We will change the cost centers; this will be further explained in the corresponding sections of this report.
The use of the traditional allocation method is not recommended for a company: 1
- Which is subjected to an elevated level of competition, - Of which non-volume related indirect costs are a high proportion of the total direct costs, - Which product portfolio is broad, - Where its products each consume organizational resources in a significantly different proportion.
We will try to make a cost-benefit analysis on whether it is worth to change the allocation method to an ABC variant.
1 See, (Drury, 2012) page 265
25
4. New allocation method
In this chapter, we will describe a method which is well suited for Domo Borculo according to our own findings and gained knowledge from the theoretical framework. We will begin this chapter with a discussion about the best allocation method. After that, we will propose a new way to allocate the conversion costs and the non-manufacturing overhead respectively. The proposed assignment can be found in appendix Error! Reference source not found. Error! Reference source not found. and will be explained in this chapter. Subsequently we will explain our model which is used to allocate costs. To conclude, we will make a comparison of our proposed allocation method and the one which is currently used.
4.1. Allocation method
When looking at Drury (2012), we see that there are two actively used allocation methods which each follow the same two-step allocation procedure. The first is the traditional method, which is somewhat comparable to the currently used one. The second is ABC. While ABC could deliver more accurate results, it also has big downside: the ABC system is significantly more expensive to operate than a direct or a traditional costing system.2 Updating the system requires more time, since less estimations are made, and more data is needed.
Something we should also notice is that we should also consider that Domo Borculo can be seen as a black box factory, meaning that it is hard to understand what happens to the input to transform it into output. Besides the black box, there are some more aspects which make it harder to allocate costs correctly. For example: while creating some products, side-products are created, which must be used in other products, since RFC is a cooperation which must turn their farmers milk into value. It might be the case that making these products out of these side products results in a loss. In that case it is hard to say whether the product that you want to produce is accountable for the loss or the product you create with the side product is.
Considering the above-mentioned reasons and the fact that Domo would like to use one standard when it comes to cost allocation, we advise to keep using the traditional method. We also suggest eliminating the usage of allocation keys in the way they are used currently (allocating service costs centers to them and subsequently allocating them to production cost centers). We do advise to allocate service cost centers directly to the production costs centers.
4.2. Conversion costs
In this section, we will propose a new allocation method for conversion costs. We will do this based on the theoretical framework which we established before. We will also keep in mind that our proposed methods should be applicable for Domo Borculo.
4.2.1. Allocation method We advise Domo Borculo to change the current way of allocation. As we stated before, the use of allocation keys seems redundant. We advise to allocate the cost of service cost centers directly to production costs centers. This is also in line with the literature of Drury (2012).
2 See, (Drury, 2012) page 265
26
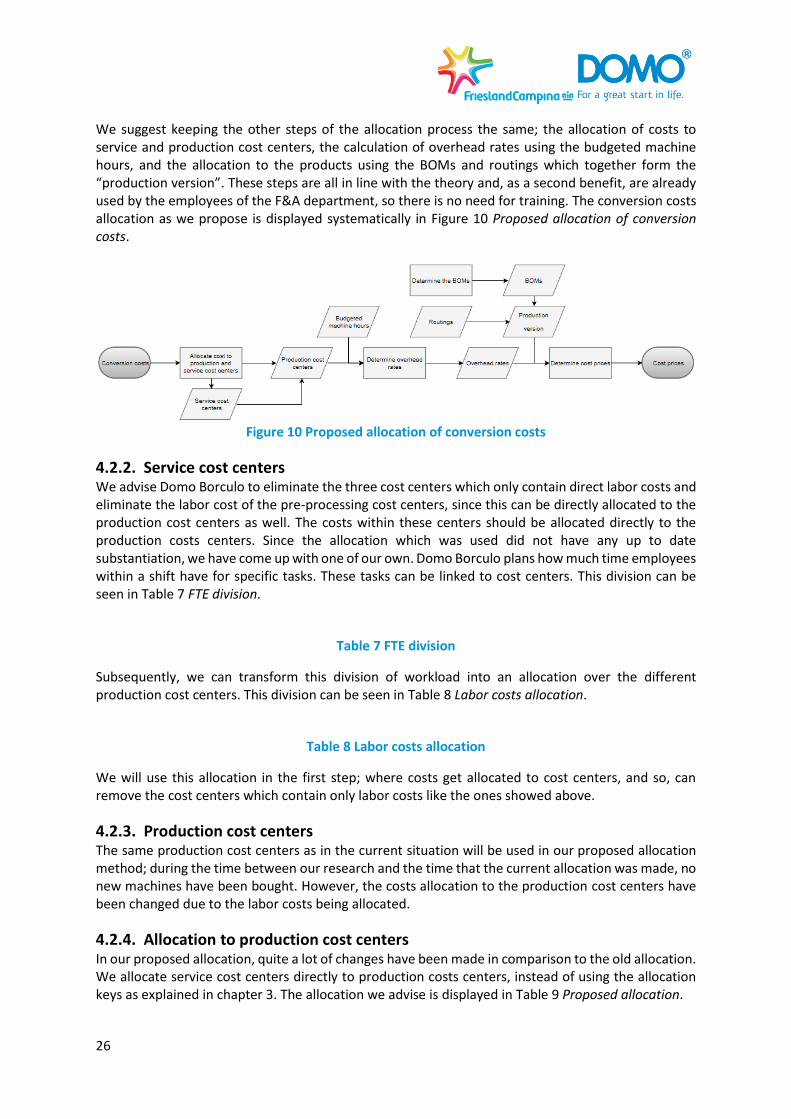
We suggest keeping the other steps of the allocation process the same; the allocation of costs to service and production cost centers, the calculation of overhead rates using the budgeted machine hours, and the allocation to the products using the BOMs and routings which together form the “production version”. These steps are all in line with the theory and, as a second benefit, are already used by the employees of the F&A department, so there is no need for training. The conversion costs allocation as we propose is displayed systematically in Figure 10 Proposed allocation of conversion costs.
Figure 10 Proposed allocation of conversion costs
4.2.2. Service cost centers We advise Domo Borculo to eliminate the three cost centers which only contain direct labor costs and eliminate the labor cost of the pre-processing cost centers, since this can be directly allocated to the production cost centers as well. The costs within these centers should be allocated directly to the production costs centers. Since the allocation which was used did not have any up to date substantiation, we have come up with one of our own. Domo Borculo plans how much time employees within a shift have for specific tasks. These tasks can be linked to cost centers. This division can be seen in Table 7 FTE division.
Table 7 FTE division
Subsequently, we can transform this division of workload into an allocation over the different production cost centers. This division can be seen in Table 8 Labor costs allocation.
Table 8 Labor costs allocation
We will use this allocation in the first step; where costs get allocated to cost centers, and so, can remove the cost centers which contain only labor costs like the ones showed above.
4.2.3. Production cost centers The same production cost centers as in the current situation will be used in our proposed allocation method; during the time between our research and the time that the current allocation was made, no new machines have been bought. However, the costs allocation to the production cost centers have been changed due to the labor costs being allocated.
4.2.4. Allocation to production cost centers In our proposed allocation, quite a lot of changes have been made in comparison to the old allocation. We allocate service cost centers directly to production costs centers, instead of using the allocation keys as explained in chapter 3. The allocation we advise is displayed in Table 9 Proposed allocation.
27
Table 9 Proposed allocation
Technology In this paragraph, we will go in on the rationale behind our proposed allocation. We will start of with the first service center: Technology. The allocation of technology is done based on a time-spent questionnaire, since the technology department main cost driver is manpower. In Table 10 Time-spent technology department, we can observe how each employee spends its time over the three different product groups. These product groups can be linked to production cost centers, since for each product group there is at least one production cost centers which needs to be passed in order to receive end-product. For Lactose & GOS these production cost centers are Crystallization and GOS Reaction. The 46.6 is divided equally over these two production cost centers since Lactose and GOS both make up around 50% of the total production within the group. IFT is split over evaporator tower 8 and 9 since all, and only, IFT products are dried at this tower. Finally, Feed is split over Tower 6 and 10 since all, and only, Feed products are dried at this tower.
The division of the key among the towers is done based on the budgeted machine hours of each tower. Which can be seen in Table 11 Budgeted machine hours for the towers.
Table 10 Time-spent technology department
Table 11 Budgeted machine hours for the towers
Whey distribution and intake These two cost centers are divided equally over the Pre-evaporation and WEC-plant. This is done in collaboration with employees from the Finance department, who advised that it was not worth it to do further investigation on them since 50% is accurate enough.
Pre-Processing and Powder-processing The costs of Pre-processing and Powder-processing are allocated in the same way as the labor costs of Pre-processing and Salary powder respectively which we discussed in 4.2.2 Service cost centers. All expenses booked onto this cost center are correlated to the use of manpower.
Production general Production general consists of costs which are made for the cost centers of powder processing, Lactose/GOS processing and the pre-evaporators of pre-processing. The costs within this cost center are generated to support for the manpower required in these production cost centers. Therefore, we recommend to allocate this cost center based on the FTE of these production cost centers.
Maintenance, Stock, Utilities general, Central workspace and Electrotechnical services These cost centers are allocated based on the actual maintenance costs of the year 2016. All costs within the cost centers are, or do highly correlate to, maintenance costs. These maintenance costs are derived from the maintenance system Domo Borculo uses, called Ultimo and can be found in appendix Error! Reference source not found. Error! Reference source not found.. (The cost within the costs centers together are higher as the total maintenance costs; this is because only jobs are registered in Ultimo and so there not accounted for general costs)
Cleaning, Compressed air supply, Chemical supply
28
These cost centers all correlate to cleaning, since compressed air and chemicals are used for cleaning. That is why we recommend to allocate these cost centers based on the total cleaning costs. Cleaning jobs are also tracked in Ultimo. The allocation for these cost centers as seen in Table 9 Proposed allocation, is derived from the Ultimo actuals as can be seen in Appendix Error! Reference source not found. Error! Reference source not found..
Buildings Costs relating to building maintenance are also tracked in Ultimo. Since allocating based on the costs in Ultimo is accurate and given the ease of gathering data from Ultimo, we recommend to allocate based on this data once more. We are, after all, looking for a pragmatic allocation, where the balance between ease and accuracy is as high as possible. The proposed allocation can be found in appendix Error! Reference source not found. Error! Reference source not found.. The key is based on the proportion of maintenance costs that a specific center has, in respect to the total maintenance costs.
Quality control, Physicochemical lab and Microbiological lab Based on an interview with an employee of the finance department, who collaborates with the manager of the quality control and labs. It is established that allocating 40% to Lactose, 20% to GOS and 40% to Tower 8 and 9 seemed like a reasonable estimation. It was not possible to get an allocation which was based on data, since such data is not available.
The 40% of Lactose is allocated to Crystallization (1), since every Lactose product has to pass this production step. The 20% of GOS is allocated to GOS reaction, since every GOS product has to pass this production step. Finally, the 40% which is allocated to Tower 8 and 9 is divided over the two based on budgeted machine hours, as can be seen in Table 11 Budgeted machine hours for the towers.
Steam, Electricity, Icewater and Water supply, Boilerhouse and Condensate water These energy related cost centers are allocated based on a tool which is developed by an external party called Epro Consult. Domo Borculo outsources the measurement of their energy usage since this is obligatory by law when reporting energy usages to the government.
This tool splits energy usage to certain production steps, which on its turn can be coupled with a production cost center. For the energy usage of the towers, we have split up the total energy consumption of them by usage of the budgeted machine hours from Table 11 Budgeted machine hours for the towers. The energy tool can be seen in appendix Error! Reference source not found. Error! Reference source not found..
We allocate the cost center steam supply based on gas usage, since Domo Borculo creates their own steam and this requires gas. The cost center Electricity supply, based on the electricity usage. The cost centers Ice water and Water supply and Condensate water, based on the water consumption. Finally, the cost center Boiler house is allocated based on all three energy usages, since it contains all three energy forms. Since not all energy forms are used equally, the allocation is based on a weighted average.
Environment We recommend to allocate the cost center Environment based on the depreciation on the machines since this cost centers mostly consists of Asset Value taxes or “WOZ-belasting” in Dutch, which companies must pay over the value of their assets, and depreciation reflects the value of assets.
29
Wastewater treatment This cost centers contains the costs which Domo Borculo make since dry matter (product) ends up in the sewage. Domo Borculo must pay the municipality fees, as a compensation for the extra cleaning costs of the water.
The allocation to cost centers takes place based on the dry-matter loss tool which Domo Borculo uses to determine their failure costs (dry-matter loss results in less end product), which can be found in appendix Error! Reference source not found. Error! Reference source not found..
Waste disposal We recommend to allocate the cost center waste disposal based on the labor cost per production cost center, since the type of waste which generates the cost in this cost center is directly linked to the amount people working there.
The total costs within the production cost centers including our proposed allocation can be found in appendix Error! Reference source not found. Error! Reference source not found..
4.2.5. Overhead rates The next step in our proposed allocation method is to determine overhead rates. These overhead rates are obtained by dividing the costs per production cost centers by the budgeted amount of production hours for that center. These overhead rates are shown in appendix Error! Reference source not found. Error! Reference source not found..
4.3. Non-manufacturing overhead
In this section, we will propose a new way to allocate the non-manufacturing overhead. We will do this based on the theoretical framework which we established before. But we will also keep in mind that our proposed methods should be applicable for Domo Borculo.
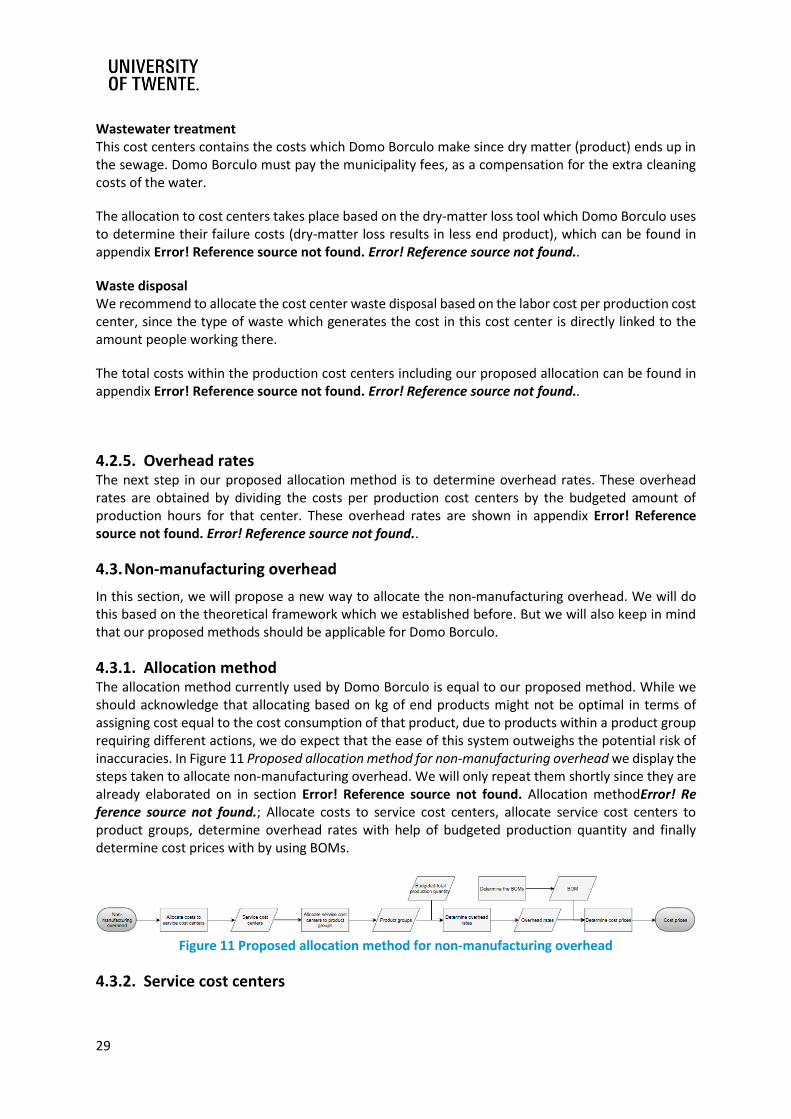
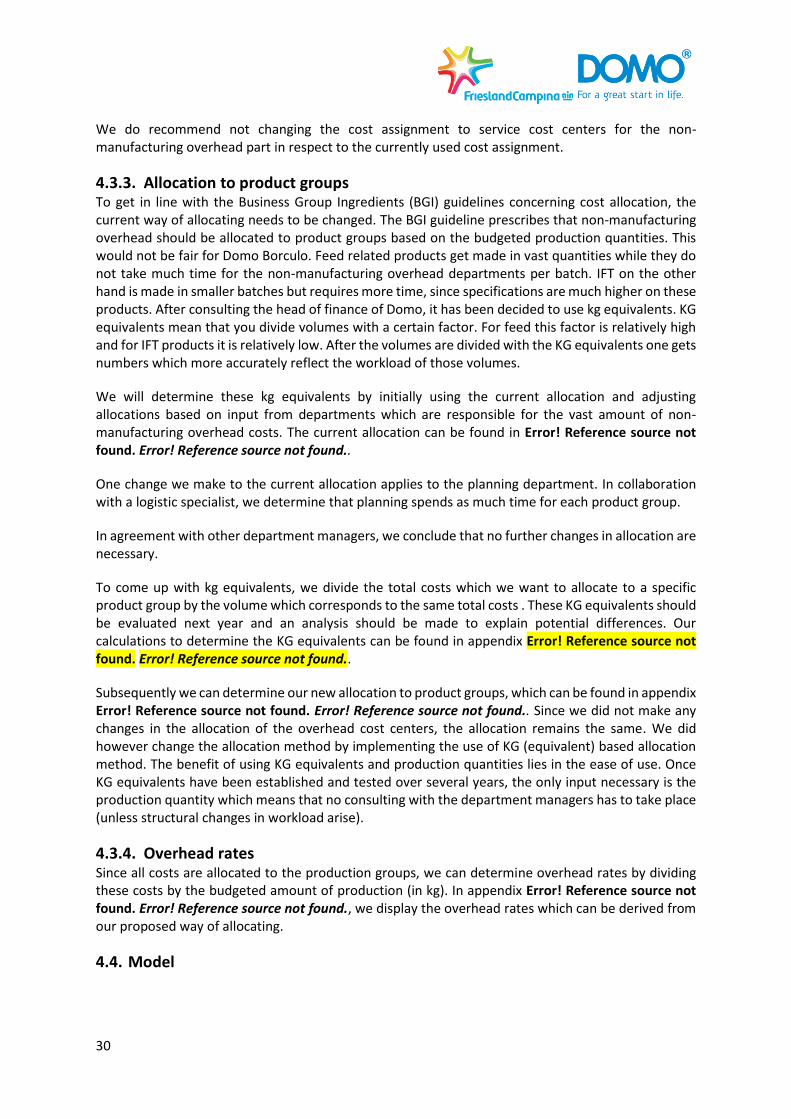
4.3.1. Allocation method The allocation method currently used by Domo Borculo is equal to our proposed method. While we should acknowledge that allocating based on kg of end products might not be optimal in terms of assigning cost equal to the cost consumption of that product, due to products within a product group requiring different actions, we do expect that the ease of this system outweighs the potential risk of inaccuracies. In Figure 11 Proposed allocation method for non-manufacturing overhead we display the steps taken to allocate non-manufacturing overhead. We will only repeat them shortly since they are already elaborated on in section Error! Reference source not found. Allocation methodError! Reference source not found.; Allocate costs to service cost centers, allocate service cost centers to product groups, determine overhead rates with help of budgeted production quantity and finally determine cost prices with by using BOMs.
Figure 11 Proposed allocation method for non-manufacturing overhead
4.3.2. Service cost centers
30
We do recommend not changing the cost assignment to service cost centers for the non-manufacturing overhead part in respect to the currently used cost assignment.
4.3.3. Allocation to product groups To get in line with the Business Group Ingredients (BGI) guidelines concerning cost allocation, the current way of allocating needs to be changed. The BGI guideline prescribes that non-manufacturing overhead should be allocated to product groups based on the budgeted production quantities. This would not be fair for Domo Borculo. Feed related products get made in vast quantities while they do not take much time for the non-manufacturing overhead departments per batch. IFT on the other hand is made in smaller batches but requires more time, since specifications are much higher on these products. After consulting the head of finance of Domo, it has been decided to use kg equivalents. KG equivalents mean that you divide volumes with a certain factor. For feed this factor is relatively high and for IFT products it is relatively low. After the volumes are divided with the KG equivalents one gets numbers which more accurately reflect the workload of those volumes.
We will determine these kg equivalents by initially using the current allocation and adjusting allocations based on input from departments which are responsible for the vast amount of non-manufacturing overhead costs. The current allocation can be found in Error! Reference source not found. Error! Reference source not found..
One change we make to the current allocation applies to the planning department. In collaboration with a logistic specialist, we determine that planning spends as much time for each product group.
In agreement with other department managers, we conclude that no further changes in allocation are necessary.
To come up with kg equivalents, we divide the total costs which we want to allocate to a specific product group by the volume which corresponds to the same total costs . These KG equivalents should be evaluated next year and an analysis should be made to explain potential differences. Our calculations to determine the KG equivalents can be found in appendix Error! Reference source not found. Error! Reference source not found..
Subsequently we can determine our new allocation to product groups, which can be found in appendix Error! Reference source not found. Error! Reference source not found.. Since we did not make any changes in the allocation of the overhead cost centers, the allocation remains the same. We did however change the allocation method by implementing the use of KG (equivalent) based allocation method. The benefit of using KG equivalents and production quantities lies in the ease of use. Once KG equivalents have been established and tested over several years, the only input necessary is the production quantity which means that no consulting with the department managers has to take place (unless structural changes in workload arise).
4.3.4. Overhead rates Since all costs are allocated to the production groups, we can determine overhead rates by dividing these costs by the budgeted amount of production (in kg). In appendix Error! Reference source not found. Error! Reference source not found., we display the overhead rates which can be derived from our proposed way of allocating.
4.4. Model
31
Two models have been made to allocate the costs in a more structured way: a model for conversion costs and one for overhead. The main benefit of these models is that they can be used for other locations of RFC Domo as well, since the models only require little input to create an allocation model for a specific location. By use of VBA macros, there has been tried to keep the model as flexible as possible.
The reason that there are two different models is to keep a better overview. While the models for conversion costs and overhead are similar, the costs are in the end split up to different rates; a machine hour-tariff for the conversion costs and an overhead rate per 10k kg of end product for the overhead. To minimize the chance of mistakes made by further use of Domo employees once the project is finished, the models are split up.
The models are created keeping a structure in mind. The models start off with a sheet which explains how the model should be used. After that the “summarize” sheet is presented, which contains the useful output. This sheet gets followed up by several input sheets. Also, the colors used in the models are always the same. A legend of these colors can be found in Figure 12 Legend.
In this chapter, we will walk through the model by used of a simplified version of a milk powder factory.
Figure 12 Legend
4.4.1. Conversion costs The first model we will discuss is used to allocate all conversion costs to production centers. Several check cells have been made, which are also checked by the macros, to make sure that costs get allocated in the way the user intents to. The code of these macros can be found in appendix Error! Reference source not found. Error! Reference source not found..
At first, we enter a dump with all the costs Domo Borculo has made in sheet “Input costs”.
After that we can enter the ID and name of the cost centers, and the resources to which we want to split it in sheet “Cost centers”. In this sheet, we also make a distinction between the production and service cost centers. When pressing the buttons for production and service cost centers, a macro will be executed which collects costs from the sheet “Input costs” and assigns them to their corresponding cost center. Example of how this model looks when filled in can be seen in Figure 13 Input for production cost centers and Figure 14 Input for service cost centers respectively.
There has also been made a cell which checks whether all costs have been taken into account. This prevents us from forgetting cost centers, and so not accounting for costs.
Figure 13 Input for production cost centers
32
Figure 14 Input for service cost centers
Since booking mistakes can be made within a company, we created sheets which have been created for both production and service cost centers which let us assign costs of a certain cost center to others. An example of this is shown in Figure 15 Allocation to cost centers. Note: these sheets are not to allocate the costs within service cost centers to production cost centers, but to allocate cost centers which should be primarily assigned to other centers.
Figure 15 Allocation to cost centers
The “extra allocation” step which we just described gets processed into the sheet “cost centers” once the buttons in this sheet gets pressed again.
During the next step, we first need to press the button; this gives us a table with all the cost centers in them. The input which is required is the percentages which form the allocation; how much percent of the service cost center should be allocated to each production center. An example of this is given in Figure 16 Allocation from service to production cost centers.
Figure 16 Allocation from service to production cost centers
The next step we need to take is entering the budgeted machine hours. By pressing the button in sheet “budgeted machine hours” a table appears, in which we can enter the budgeted machine hours. An example is given in Figure 17 Budgeted machine hours.
Figure 17 Budgeted machine hours
The last step of the model is the generation of the summary sheet. This requires no more action than a press on the button. The code behind this button creates an overview with multiple layers; layer 1, as can be seen in Figure 18 Layer 1 of the summary, only shows the total allocated costs, total costs and machine hour-tariff per production cost center. Layer 2 gives more information by showing how the total costs per service costs center are allocated to production cost centers. This layer also shows how the allocated costs, total costs and machine hour-tariff are build up; how much comes from production labor, how much from energy costs etc. This can be seen in Figure 19 Layer 2 of the summary. The third and final layer also shows the cost-build up for all allocated service cost centers. Figure 20 A service cost center allocation in layer 3 shows an example of one of these service cost center allocations.
Figure 18 Layer 1 of the summary
Figure 19 Layer 2 of the summary
Figure 20 A service cost center allocation in layer 3
4.4.2. Non-manufacturing overhead
33
The non-manufacturing models’ build up is similar to the conversion costs one. (Code can be found in appendix Error! Reference source not found. Error! Reference source not found.) The first step is to put the data containing all costs of Domo Borculo in the “Input costs” sheet.
After that the overhead costs centers’ IDs and name can be filled in, in sheet “Cost centers & product groups”. In this sheet, the distinct product groups should be filled in as well. With a press on the button, costs get collected from the “Input cost” sheet, and get placed in the sheet “Cost centers & product groups”. An example of this input can be seen in Figure 21 Input for production cost centers & product groups.
Figure 21 Input for production cost centers & product groups
Once the “Cost centers & product groups” sheet has been filled in, we can take the next step; filling in the budgeted production quantities. This can be filled in, in a table, as shown in Figure 22 Budgeted production quantities, which is created by pressing on a button.
Figure 22 Budgeted production quantities
After that, the “input allocation” sheet can be filled in. In this sheet, one must define how he wants his cost centers to be allocated over its product groups. Since Domo has set the guideline that these costs should be allocated based upon total production quantities, a user form gets displayed giving one the choice to automatically allocate based upon production quantities, once the button gets pressed which makes the allocation table. An example of this user form can be seen in Figure 23 . The size of the message automatically increases if the amount of cost centers does not fit on the user form as shown in the figure below. This is done to keep a clear overview, but offers the opportunity for bigger plants to use the model.
Figure 23 User form
The allocation table which gets created by the macro is dependent on the choice made in the above user form. The cost centers which get selected, will get a red (output) row, with the allocation keys already in place, based on the production quantities filled in before, and the cost centers which did not get selected will get a blue (input) row, where one must fill in the allocation himself. Figure 24 Allocation, shows how the table would look if we selected the cost center of: board, finance and HR.
Figure 24 Allocation from service cost centers to product groups
The final stage is the creation of the overview, which again, is simply done by pressing a button. The overview has three layers, which are identical to the ones of the conversion models. The only difference is that machine hour-tariff is replaced by overhead rate and that there is one subtotal less, since product groups only get costs allocated to them and do not have costs of their own. The layers can be seen in Figure 25 Layer 1, Figure 26 Layer 2 and Figure 27 A overhead cost center allocation in layer 3 respectively.
Figure 25 Layer 1
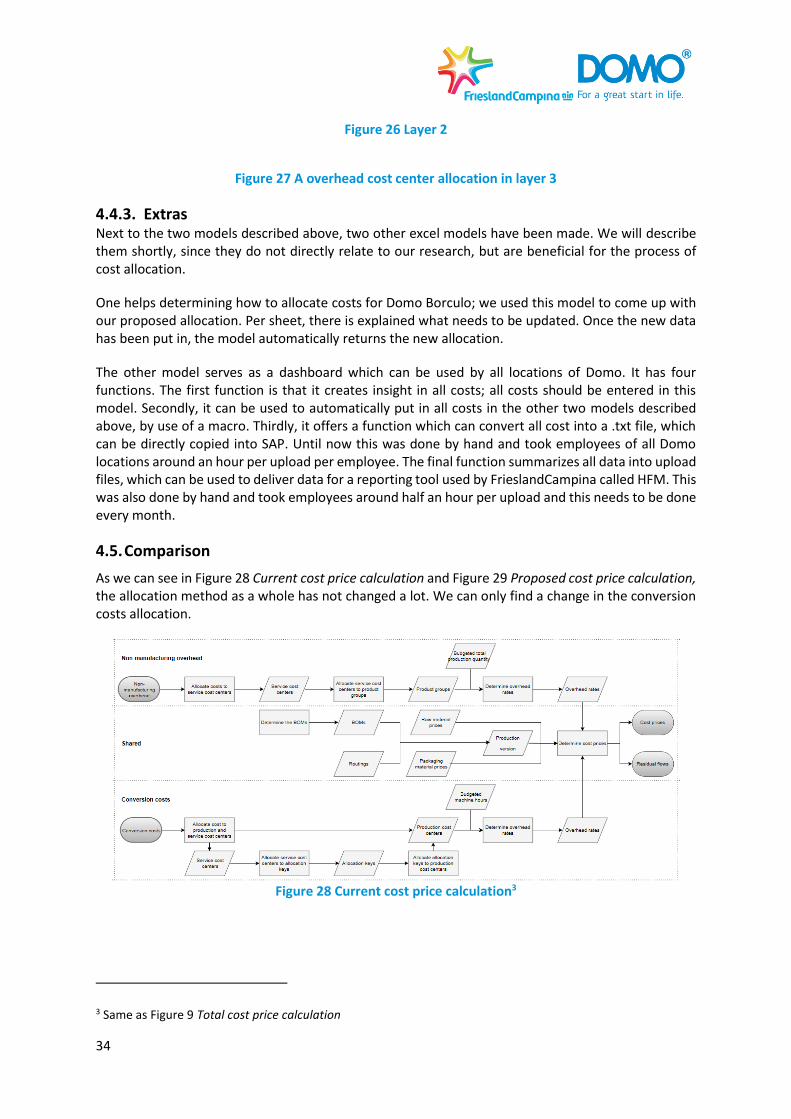
34
Figure 26 Layer 2
Figure 27 A overhead cost center allocation in layer 3
4.4.3. Extras Next to the two models described above, two other excel models have been made. We will describe them shortly, since they do not directly relate to our research, but are beneficial for the process of cost allocation.
One helps determining how to allocate costs for Domo Borculo; we used this model to come up with our proposed allocation. Per sheet, there is explained what needs to be updated. Once the new data has been put in, the model automatically returns the new allocation.
The other model serves as a dashboard which can be used by all locations of Domo. It has four functions. The first function is that it creates insight in all costs; all costs should be entered in this model. Secondly, it can be used to automatically put in all costs in the other two models described above, by use of a macro. Thirdly, it offers a function which can convert all cost into a .txt file, which can be directly copied into SAP. Until now this was done by hand and took employees of all Domo locations around an hour per upload per employee. The final function summarizes all data into upload files, which can be used to deliver data for a reporting tool used by FrieslandCampina called HFM. This was also done by hand and took employees around half an hour per upload and this needs to be done every month.
4.5. Comparison
As we can see in Figure 28 Current cost price calculation and Figure 29 Proposed cost price calculation, the allocation method as a whole has not changed a lot. We can only find a change in the conversion costs allocation.
Figure 28 Current cost price calculation3
3 Same as Figure 9 Total cost price calculation
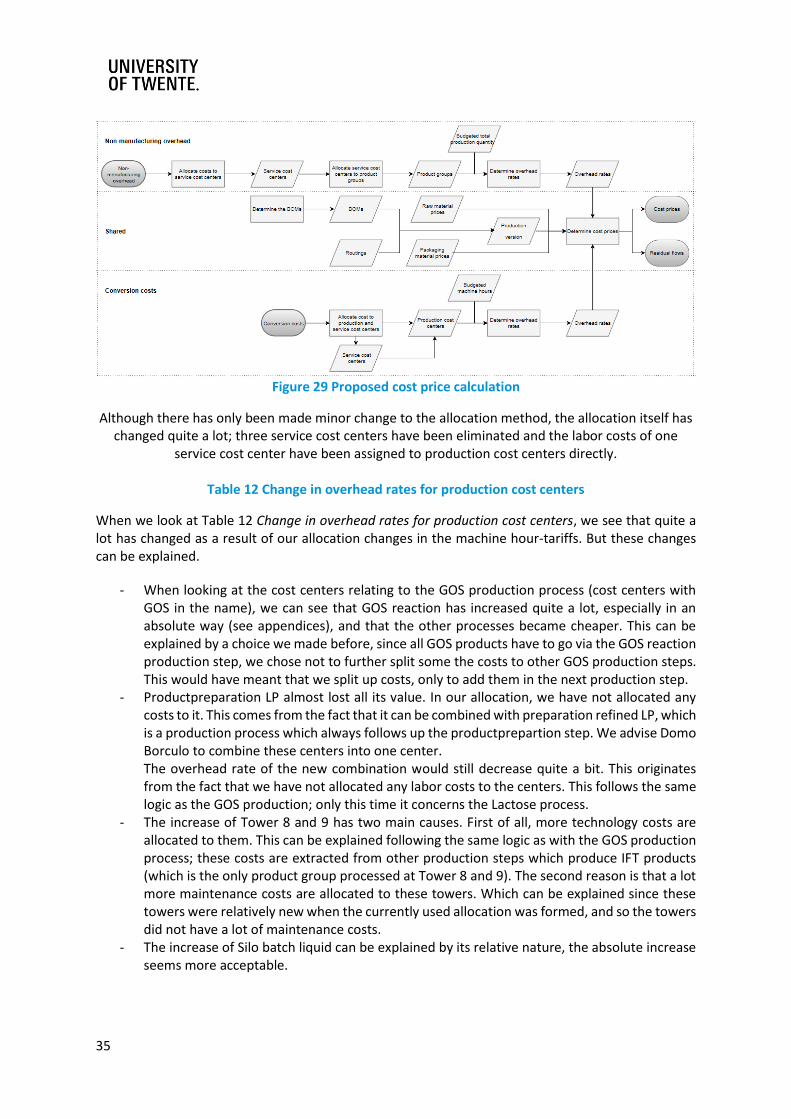
35
Figure 29 Proposed cost price calculation
Although there has only been made minor change to the allocation method, the allocation itself has changed quite a lot; three service cost centers have been eliminated and the labor costs of one
service cost center have been assigned to production cost centers directly.
Table 12 Change in overhead rates for production cost centers
When we look at Table 12 Change in overhead rates for production cost centers, we see that quite a lot has changed as a result of our allocation changes in the machine hour-tariffs. But these changes can be explained.
- When looking at the cost centers relating to the GOS production process (cost centers with GOS in the name), we can see that GOS reaction has increased quite a lot, especially in an absolute way (see appendices), and that the other processes became cheaper. This can be explained by a choice we made before, since all GOS products have to go via the GOS reaction production step, we chose not to further split some the costs to other GOS production steps. This would have meant that we split up costs, only to add them in the next production step.
- Productpreparation LP almost lost all its value. In our allocation, we have not allocated any costs to it. This comes from the fact that it can be combined with preparation refined LP, which is a production process which always follows up the productprepartion step. We advise Domo Borculo to combine these centers into one center. The overhead rate of the new combination would still decrease quite a bit. This originates from the fact that we have not allocated any labor costs to the centers. This follows the same logic as the GOS production; only this time it concerns the Lactose process.
- The increase of Tower 8 and 9 has two main causes. First of all, more technology costs are allocated to them. This can be explained following the same logic as with the GOS production process; these costs are extracted from other production steps which produce IFT products (which is the only product group processed at Tower 8 and 9). The second reason is that a lot more maintenance costs are allocated to these towers. Which can be explained since these towers were relatively new when the currently used allocation was formed, and so the towers did not have a lot of maintenance costs.
- The increase of Silo batch liquid can be explained by its relative nature, the absolute increase seems more acceptable.

36
The rest of the differences can be explained by two reasons. First, the current costs allocation is out dated and a more up to date allocation would presume changes. Second, allocation always involves some form of subjectivity;
Table 13 Change in overhead rates for product group overhead rates
In Table 13 Change in overhead rates for product group overhead rates, we see that the overhead rates of the product groups have not changed a lot. This is logical since we did not change a lot in the allocation. The main focus of the overhead allocation lays in the formulation of the KG equivalents.
37
5. Impact of Switch
In this chapter, we will investigate the impact which Switch has on the overhead allocation of Domo Borculo. We will do that in the following order: first we will try to define project Switch after which we will discuss the changes in allocation that Switch will require.
5.1. Defining Switch
We will define Switch in two steps, first we will briefly talk about Switch as an investment plan. Subsequently, we will define the new cost centers.
5.1.1. Switch as an investment plan RFC always tries to maximize their milk valorization. This is done by increasing the profit margins made on milk. RFC has noticed a business opportunity; an 8 billion euros worth market of Power nutrition (PN) with a compound annual growth rate of 9%. The margins of PN are significantly higher as the profit margins made on Feed related products. Therefore, project Switch was initiated. The team behind this project investigated the potential benefits for Domo Borculo and Domo Veghel. Their advice is to start with a plant in Borculo due to more accurate estimations and a lower time to market of the end products. The main drivers for project Switch can be seen in Figure 30 Overview of project Switch.
Figure 30 Overview of project Switch
5.1.2. Defining cost centers In order to be able to reallocate the overhead costs of Domo Borculo, after the project Switch is initiated, we need to understand the layout of project Switch. An overview of the proposed lay out can be seen in Figure 31 Processes within project Switch, where all blue rectangles, except for the storage places, can be seen as new cost centers. In collaboration with a cost price expert and a logistic specialist, we have determined that the full Switch process can be divided into two cost centers. The Ceramic Micro Filtration (CMF) step and the Micro Filtration (MF) step. The CMF center will account for all costs of the Switch project except for the MF step, which splits Whey Protein Concentrate (WPC) 80 into WPC 55 and Whey Protein Isolate (WPI) 90.
No more cost centers are necessary since incoming whey which enters the Switch plant will always undergo at least all steps in the CMF process. The MF step is optional, but will most likely be used if there is enough demand for WPI 90, since producing WPI 90 is the main goal of the Business case.
Figure 31 Processes within project Switch
5.2. Changes in allocation
At the time of writing this report, most information necessary for making a cost allocation which includes the Switch project is still not present. Still, we will devote this paragraph to set up a plan which can be used to formulate a cost allocation when all information is present.
Technology A discussion with the head of technology should be initialized, in which estimates should be made on the impact of Switch.
Whey distribution and intake
38
In first instance, this allocation should not have to change, since it only concerns production steps which take place before whey enters the Switch project. However, since the WEC plant will be turned off next year, this allocation should be revised.
Pre-Processing and Powder-processing This involves production steps which are outside of the Switch scope.
Production general The amount of FTE which will work on Switch related processes should be determined, after which a new allocation can be derived based on the new FTE distribution of all production processes.
Maintenance, Stock, Utilities general, Central workspace and Electrotechnical services One year of maintenance actuals should be tracked in order to come up with a realistic allocation. Until then, we recommend making an estimation of maintenance costs based on the total value of the Switch project.
Cleaning, Compressed air supply, Chemical supply One year of cleaning actuals should be tracked in order to come up with a realistic allocation. Until then we advise to conduct an interview with a project leader who can provide relevant information on the subject.
Buildings Assuming that no construction errors are made, we can assume that there will be no need for building maintenance, so zero percent should be allocated to the Switch processes.
Quality control, Physicochemical lab and Microbiological lab Product samples will only be taken after evaporation. This means that the WPI 90 will be analysed after it has left evaporator tower 9. Tower 9 already has got a portion of the costs of the cost centers Quality control, Physicochemical lab and Microbiological lab. It has to be revised whether this allocation should change based on an interview with a member of the quality control team
Steam, Electricity, Icewater and Water supply, Boilerhouse and Condensate water A new allocation should be developed for these cost centers based on the new energy usage. This allocation should be submitted to Epro Consult for a check on validity.
Environment Since this cost center mostly consist of Asset Value taxes or “WOZ-belasting” in Dutch, a new allocation can be made based on the deprecation of all cost centers including the deprecation of the CMF and MF cost centers.
Wastewater treatment The dry-matter loss tool should be adapted, so it can also account for the dry-matter loss in the Switch process. After this update has taken place, a new allocation can be formulated based on the outcome of the new tool.
Waste disposal A new allocation should be made for the waste disposal cost center. Since we established that the costs within this center are correlated to manpower, this allocation should be based on the new FTE allocation.
39
6. Conclusion & recommendations
In this closing chapter, we will conclude our research by presenting our findings and making recommendations.
6.1. Conclusions
- Our first conclusion is that Domo Borculo is a complex production plant. There are only two certainties in the production process, which are the input and the output. What happens to the input to transform it into the output can only be approximated. This makes it difficult to allocate costs accurately. Given the uncertainties, we have tried our best to come up with a new and more accurate cost allocation, which is also quite simple to update.
- Secondly, we conclude that current conversion costs allocation method should change. We
removed the additional step, which the current allocation keys requires, and implemented a method which resembles the traditional method as described by Drury.
- Our third conclusion is the existence of service cost centers which are redundant. There is no need
for cost centers which only contain labour costs of certain production cost centers. It woud be wise to assign these costs directly to the production cost centers. This decreases the complexity of the allocation procedure.
- Our fourth conclusion is that the model we created, can easily be implemented at other locations
due to its flexibility. This has already been done at 5 locations. - Our lasts conclusion is that a lot of more information about project Switch needs to be gathered
before accurate cost allocation can be established. This knowledge needs to be gathered before Switch goes live, and our plan could serve as a guideline to get that knowledge.
6.2. Recommendations
- First of all, we advise Domo Borculo to use our proposed allocation. Our allocation is more recent and so more up to date as the old one. It also is substantiated well by means of data driven analysis and this explanatory report to justify.
- Our second recommendation is that Domo Borculo should try to get more insight in the production
process. This would result in two benefits. One, problems can only be solved if their origination is clear. More insight in the production process would help to find the origination of problems. The second benefit is cost allocation related. When more insight is created, ABC might be applicable for the plant, which would, according to literature, result in more accurate cost prices.
- Our third recommendation is to remove the three service cost centers which only include labor
costs and allocate them directly to the production costs centers, as this is in line with literature. We advise to do the same for the labor costs of the service cost center “Pre-processing”
- Our fourth recommendation is to fuse the costs centers “Productpreparation LP” and “Preparation
refined LP” since these production steps are always followed up by one another. - Our final recommendation is to further analyse to impact of project Switch, since a lot of costs are
involved in the project and so it should have a hefty impact on the cost allocation. We advise to conduct this analysis based on the plan constructed by us.
40
7. Sources
Drury, C. (2012). Management and cost accounting 8th edition. Andover: Cengage Learning EMEA.
Homburg, C. (2002). Improving activity-based costing heuristics by higher-level cost drivers. University of Cologne, Department of Management Accounting. Amsterdam: Elsevier.
Horgren, C. T., Datar, S. M., & Rajan, M. V. (2012). Cost Accounting, 14th eddition. Pearson.
Johnson, H. T. (1988, June). Activity-based information: a blueprint for world-class management accounting. Management Accounting (US), pp. 23-30.
Kaplan, R. S. (1988, Jan-Feb). One cost system isn't enough. Harvard Business Review, pp. 61-66.
Osadchy, E. A., & Akhmetshin, E. M. (2015). Accounting and Control of Indirect Cost of Organization as a Condition of Optimizing its Financial and Economic Activities. Elabuga: Medwell Journals.
Soin, K., Seal, W., & Cullen, J. (2002, June). ABC and organizational change: An institutional perspective. Management Accounting Research, pp. 249-271.
Tijhuis, R. (2014). Onderzoek naar gebrek aan aanvoer bij de oplosstraten. Enschede: University of Twente.
*All flowcharts are created using draw.io

41
8 Appendices