Embed Size (px)
Citation preview

agronomy
Review
Smartphone Applications Targeting PrecisionAgriculture Practices—A Systematic Review
Jorge Mendes 1,2 , Tatiana M. Pinho 1 , Filipe Neves dos Santos 3 , Joaquim J. Sousa 1,2 ,Emanuel Peres 1,2 , José Boaventura-Cunha 1,2 , Mário Cunha 3 and Raul Morais 1,2,*
1 INESC TEC—Institute for Systems and Computer Engineering, Technology and Science, Pólo da UTAD,University of Trás-os-Montes e Alto Douro, 5000-801 Vila Real, Portugal; [email protected] (J.M.);[email protected] (T.M.P.); [email protected] (J.J.S.); [email protected] (E.P.); [email protected] (J.B.-C.)
2 UTAD—University of Trás-os-Montes e Alto Douro, Quinta de Prados, 5000-801 Vila Real, Portugal3 INESC TEC—Institute for Systems and Computer Engineering, Technology and Science, Pólo da FEUP,
Faculdade de Engenharia da Universidade do Porto, 4200-465 Porto, Portugal; [email protected](F.N.d.S.); [email protected] (M.C.)
* Correspondence: [email protected]
Received: 1 May 2020; Accepted: 11 June 2020; Published: 16 June 2020�����������������
Abstract: Traditionally farmers have used their perceptual sensorial systems to diagnose and monitortheir crops health and needs. However, humans possess five basic perceptual systems with accuracylevels that can change from human to human which are largely dependent on the stress, experience,health and age. To overcome this problem, in the last decade, with the help of the emergence ofsmartphone technology, new agronomic applications were developed to reach better, cost-effective,more accurate and portable diagnosis systems. Conventional smartphones are equipped with severalsensors that could be useful to support near real-time usual and advanced farming activities at avery low cost. Therefore, the development of agricultural applications based on smartphone deviceshas increased exponentially in the last years. However, the great potential offered by smartphoneapplications is still yet to be fully realized. Thus, this paper presents a literature review and ananalysis of the characteristics of several mobile applications for use in smart/precision agricultureavailable on the market or developed at research level. This will contribute to provide to farmers anoverview of the applications type that exist, what features they provide and a comparison betweenthem. Also, this paper is an important resource to help researchers and applications developers tounderstand the limitations of existing tools and where new contributions can be performed.
Keywords: precision agriculture; mobile applications; mobile computing; smartphone-based apps;machine learning; visual inspection
1. Introduction
Increasingly, farmers realize that Information and Communications Technologies (ICT), with theirpotential to transform the nature of work and the structure of the workplace, are no longer a futuristicnicety, but a current reality [1].
The smartphones powered by novel sensing technologies, artificial intelligence (AI) and machinelearning (ML) algorithms create a new intelligent intermediary layer between people and systemsto solve efficiently complex problems or, even, to address many daily problems. In fact, for the year2018, intelligent applications were identified in the top-ten (second place) strategic technology trendsglobally [2]. More and more users want to be connected to useful data and information in real-time.For this reason, the use of mobile communications has increased exponentially in the last 5 years.According to Statista [3], in 2017, 195 billion of mobile applications were downloaded by consumersand by 2021 it is expected that this number grows to about 350 billion.
Agronomy 2020, 10, 855; doi:10.3390/agronomy10060855 www.mdpi.com/journal/agronomy

Agronomy 2020, 10, 855 2 of 44
Despite the enormous potential for applied mobile technologies in agriculture, there is yet a slowadoption in the use of this technology compared to other business domains. However, the concept ofmobility has being valued and adopted due to the recognition of the mobile applications’ potential.The need for new platforms to help and facilitate the tasks of farmers is growing and becoming anindispensable tool at personal, social and professional levels [4].
The data collected in precision agriculture may appear in different formats, with specific contentand heterogeneous structures. For this reason, it is an added value to develop systems to whichthe farmer can directly and intuitively access [5]. Mobile applications allow allocating all differentinformation in one place that farmers can access. From there, the farmers can get crop maps,monitor their crops in real-time, receive alerts and perform tasks. All this in the “palm of theirhands” and even if they are miles away from the crops [6].
1.1. Role of ICT, Smartphones and Mobile Applications in Agriculture
The unavoidable importance of ICT and their application in precision agriculture has created anew concept called e-Agriculture, which focuses on improving agricultural development through theuse of various technologies [7].
E-Agriculture may involve the use of techniques such as GIS, remote sensing, and wirelessdevices that require access to PCs and/or the Internet and/or mobile devices. The use ofmobile communication technologies (MCT) brings us to another sub-concept of e-Agriculture,called m-Agriculture. MCT include all types of handheld devices, such as basic mobile phones,smartphones, or tablets. m-Agriculture may involve the collection of remote data, such as data fromautomated weather stations (AWS) or from systems and sensors used in location-based monitoring [8].This fact represents an ongoing and growing challenge to design and develop new technology strategiesthat enable farmers to access data and use it as specific information for better decision making [7].
Nowadays, farmers have a great need for information from crop planning to final productsales (Figure 1). This information varies according to the crop calendar, however, there are somecategories of information that are common to different epochs and independent of the crop type andits location [9]. These categories are divided into three main stages—know-how; contextual information;and market information.
Figure 1. Information needed from farmers through the agricultural cycle (Adapted from Reference [9]).

Agronomy 2020, 10, 855 3 of 44
There is also a number of key questions posed by farmers at each stage that must be answered forbetter production. These questions are presented in Table 1.
Table 1. Information that the farmer needs at each stage [9].
Stage Typical Information Needed
Know-how What are the new crop options?Are there higher value crops that I can grow?
Contextualinformation
When/how much should I sow?When should I harvest taking climate/soil into account?What are the best practices for my crop/soil?
Marketinformation
What are the products prices?What are the market needs?
The use of ICT can play a key role in agriculture [10] as they allow to improve the productionchains, the management and marketing of the production, as well as the management of land and itsnatural resources [1]. The role of ICT in agriculture can be summarized as follows [11]:
“[...] it may be safely stated that modern large scale farming technology [...] controlled bystate of the art information and communication technology has the potential for substantialreductions of the production costs for agricultural commodities.”
1.2. Mobile Ecosystems
Mobile ecosystems consist of a set of goods and services offered by a mobile device company,including hardware, operating system and applications store [12]. Within the hardware category canbe placed various types of mobile devices and all the physical components that constitute them. One ofthe main types of mobile devices used nowadays are smartphones.
A smartphone is a mobile phone that allows to make more than just phone calls and send textmessages. Smartphones have features that are present on personal computers allowing the user to surfthe Internet, use multimedia features (such as music, video, camera, or gaming). Also, other advancedfeatures can be added through additional software run by the operating system. These software arecommonly known as mobile applications. There are thousands of applications for various purposes,including games, productivity, entertainment, education, among others. Today’s smartphones haveseveral modems that support various wireless communications protocols (such as Wi-Fi, Bluetooth,NFC, or satellite navigation) and they are also equipped with numerous sensors (such as gyroscope,accelerometer, temperature, or pressure). A complete list and an in-depth look at these modems andsensors are provided in Section 1.3 of this paper.
There are currently two major smartphone operating systems: Android developed by Google(Mountain View, CA, USA) and iOS developed by Apple (Cupertino, CA, USA). There was also a thirdoperating system developed by Microsoft (Redmond, WA, USA) initially called Windows Phone andlater replaced by Windows 10 Mobile. However, support for this operating system ended in December2019. In this way, a brief description of the current two major mobile operating systems will be given.
Android is a mobile operating system based on a modified version of the Linux kernel andother open-source software. Since it is a cross-platform operating system, it currently equips mostsmartphones. The first version of Android appeared in September 2008 and recently (September 2019)was released the version 10.0 (Android 10). Android has an application store named Google Play thatoffers free and paid applications. According to Statista [13], in the third quarter of 2019 there wereabout 2.5 million applications in the Google Play, 96.2% free and 3.8% paid [14].
iOS is a mobile operating system designed only for Apple devices, as Apple does not allow thisoperating system to run on third party hardware. The first version of iOS appeared in June 2007 andrecently (December 2019) was released version 13.3 (iOS 13). iOS has an application store named App

Agronomy 2020, 10, 855 4 of 44
Store which offers, like Google Play, free and paid applications. According to Statista [13] in the thirdquarter of 2019 there were about 1.8 million applications on the App Store, 90.8% being free and 9.2%paid [14].
1.3. Smartphone Embedded Sensors/Modems and Their Functionalities
The connectivity modems [15] and the various built-in sensors [16] enhance the smartphone abilityto assist the user in performing numerous tasks. In particular, for tasks related to precision agriculturepractices, they can be divided into five main categories: motion sensors; image sensors; environmentsensors; position sensors and connectivity modems. The main sensors or connectivity modems thatconstitute each of these categories, as well as their functionality and applicability in agriculturalpractices, are presented in Table 2. Other sensors/modems that sometimes equip smartphones buthave no use for agricultural-related applications were left out of this table.
1.4. Smartphone Applications for Agriculture
Aiming to merge agricultural knowledge with digital technology, a variety of smartphoneapplications have been developed according to farmers’ needs which can be grouped into the followingcategories [17]: agriculture management information; agriculture information resource; agriculturecalculator; agriculture news; weather; and m-government. Besides, Reference [5] also presents thefollowing categories: learning and reference; diseases and pests; market data; conference; business;and field mapping.
In this work, the smartphone agricultural applications are categorized based on the agriculturalsub-system where they are used. That resulted in three main categories: crop operations;farm management; and information system. The crop operation category includes decision makingsupport at the crop system level, such as—crop protection and diagnosis; crop nutrition andfertilization; crop irrigation; crop growth and canopy management; and crop harvest. The farmmanagement category includes applications that help farmers to manage more efficiently andeffectively farm resources (farm system), such as: field mapping and soil information; machinerymanagement; and control of farm activities. Finally, the information system category includesapplications that provide farmers with essential information at the agricultural system level,such as: agricultural tips and knowledge; market information; relevant news; chat with experts;and climate information.
In summary, this paper reviews recent advances and developments in the field of smartphone-based agricultural technologies. It is provided a literature review and a systematic analysis of thecharacteristics and functionalities of various mobile applications that have been developed for use insmart/precision agriculture. These are available on the market or developed as part of an investigation.Several types of applications will be included, being divided into categories. These range fromsimple farm management applications to advanced decision-making applications with data processingalgorithms built on the smartphone itself or in the cloud, such as the tool/platform describedin Reference [18].
There are some published reviews of agriculturally oriented mobile applications, such asReference [19]. However, that is a limited review where only four applications are addressedand a superficial description about each of them is made. In Reference [8] several applications arepresented, being most of them web-based and not developed exclusively for mobile devices. Besides,they present only 4 applications for Android devices that were published before 2011. In Reference [5]another review is presented limited to applications developed for the Android platform and only asuperficial description of each is presented. In Reference [20], a review of smartphone-based sensorsapplications in agriculture is made by 2014. However, many of them are designed for very specifictasks, not presenting great utility to farmers in general. In this way, this paper brings a state-of-the-artupdate of this topic, presenting applications not covered in other studies and a more in-depth analysisof recently (post-2012) developed and available applications.

Agronomy 2020, 10, 855 5 of 44
Table 2. Main built-in smartphone sensors and connectivity modems.
Smartphone Sensors and Modems General Function Application in AgriculturalPractices
Motion sensors
Accelerometer Measure rotational velocity alongthe Roll, Pitch, and Yaw axes
Motion detection (shake, tilt, etc.) toassist in the agricultural machine’snavigation
Gyroscope Measure orientation and angularvelocity
Rotation detection (spin, turn, etc.)to assist in the agriculturalmachine’s navigation
Magnetometer Measure direction, strength, orrelative change of a magnetic field
Create a compass to assist in theagricultural machine’s navigation
Image sensors
Camera Record images and videos Image processing for objectscharacterization and counting
Environment sensors
Temperature Measure the ambient temperatureMeasure the ambient temperature inthe field to be used, for example, bygrowth, climate and pest models
Relative Humidity Measure the ambient relativehumidity
Measure the ambient relativehumidity in the field to be used, forexample, by growth, climate andpest models
Pressure Measure the ambient pressureMeasure the ambient pressure in thefield to calculate altitude, forexample
Light Measure ambient illuminance in luxMeasure ambient illuminance in thefield to correct image colors, forexample
Position sensors
Global Navigation SatelliteSystem (GNSS)
Provide geolocation and timeinformation
Geolocation of samples taken in thefield and agricultural machinesnavigation
Connectivity modems
Cellular network Allow connection to a cellularnetwork
Communicate with a remote serverto send data and/or receiveinformation resulting from itsprocessing
WiFi Create wireless local areanetworking (WLAN) of devices
Communicate with devices thatmay be scattered across the fieldand communicate with a remoteserver to send data and/or receiveinformation resulting from itsprocessing
Bluetooth Exchange data between fixed andmobile devices over short distances
Communicate with devices thatmay be scattered across the field
Near Field Communication (NFC) Enable wireless informationexchange between nearby devices
Read information of tags distributedacross fields
In this paper, Section 2 presents the materials and methods used in this review, namely the datasources, the application categories, the filtering criteria, and the information that will be presented foreach of the applications. Section 3 presents the research results, that is, the applications addressed inthis review, Section 4 presents a discussion and critical analysis of this research, and Section 5 presentsthe conclusions of this work, making reference to the challenges imposed during process of observingand analyzing the applications, to the limitations of the applications addressed in this research andproviding information on future advances and trends.
Agronomy 2020, 10, 855 6 of 44
2. Material and Methods
2.1. Data Sources
This systematic review collects the latest developments in smartphone-based agriculturalapplications reported from 2012, inclusive, to the present. The bibliography has been built uponsearches in the Scopus, Web of Science, ScienceDirect and IEEE Xplore Digital Library databases.Reference list of included articles/papers and relevant review articles/papers were examined toidentify every study in which the electronic search strategy may be missed. This review alsoincludes applications available in the Google Play, which offers free and paid applications developedfor the Android platform and App Store, which offers free and paid applications developed forthe Apple platform. The search queries included the following terms: (mobile OR smartphoneOR smartphone-based OR cellphone) AND (app OR application) AND (agriculture OR precisionagriculture) AND (android OR ios).
2.2. Groups of Agricultural Applications
The applications are grouped according to the three main categories and their subcategoriespresented in Section 1.4. The types of applications that fall into each of the categories are as follows:
1. Crop operations:
(a) Crop protection and diagnosis:
• Pest and diseases detection and diagnosis;• Weeds identification and treatment;• Soil and plant diagnosis.
(b) Crop nutrition and fertilization:
• Crop nutrition monitoring;• Spraying management;• Fertilization application.
(c) Crop irrigation:
• Crop hydric status and irrigation decision;• Support irrigation.
(d) Crop growth and canopy management:
• Track canopy growth;• Calculate LAI (Leaf Area Index).
(e) Crop harvest:
• Estimation of productivity;• Indicators of quality.
2. Farm management:
(a) Field mapping and soil information:
• Field location and area calculation;• Identification of sample collection points;• Soils agricultural indicators: colour, pH, NPK (N—nitrogen, P—phosphorus and
K—potassium), carbon content, etc.
(b) Machinery management:
• Machinery costs estimator;

Agronomy 2020, 10, 855 7 of 44
• Real-time field trajectories monitoring;• Machinery monitoring: activities, productivity, efficient use, stability, etc.
(c) Control of farm activities:
• Manage field tasks;• Manage farm workers’ activities.
3. Information system:
• Agricultural tips and knowledge;• Market information;• Relevant news;• Chat with experts;• Climate.
Some of the applications, due to the varied number of features, fall into more than one subcategory.In this case, they were placed in the subcategory corresponding to their main functionality/purpose.
2.3. Filtering Criteria
Five main applications’ exclusion criteria have been defined. These criteria are as follows:
• Applications not relevant to agriculture;• Applications for non-plant-based agriculture (e.g., livestock, aquaculture, poultry farming, etc.);• Applications that communicate with a remote terminal only to monitor sensors (e.g.,
weather stations);• Web-based applications that cannot be installed on mobile devices (e.g., applications that run in
the web browser);• Applications that do not provide the English language.
This systematic review includes applications published in scientific documents and applicationsavailable on Google Play and/or the App Store. Therefore, the research process related to filter resultsis very challenging, because hundreds of applications can fit in each category. For that reason, two moreexclusion criteria were defined to be applied only to the applications found through the Google Playand/or App Store:
• Applications found on Google Play and/or App Store rated less than 3.5 stars (if available in bothstores, must be less than 3.5 in both) on the date of this review (May 2020);
• Paid applications found on Google Play and/or App Store.
2.4. Information Displayed
For each of the smartphone applications covered in this paper, a brief description will be presented,clearly indicating its purpose and its main features. Also, illustrative images of their interfaces areshowed. At the end, a comparative table that summarizes the main characteristics of each of theapplications is presented. These characteristics are:
• Type of application (crop protection and diagnosis; crop nutrition and fertilization; crop irrigation;crop growth and canopy management; crop harvest; field mapping and soil information;machinery management; control of farm activities; information system);
• Processing type (without processing; local processing; cloud processing);• Operating platform (Android; iOS; Windows 10 Mobile) and source from which the application
was found (scientific database; Google Play; App Store);• Download availability;• Languages in which it is available;

Agronomy 2020, 10, 855 8 of 44
• Need for the Internet connection;• Use of internal sensors;• Need for external sensors;• Possibility to save and reuse data (export and import data);• Interface (little cared; simple; elaborated) and ease of use.
3. Results
The various applications found throughout this search are presented here. They are groupedaccording to the categories previously mentioned (crop operations; farm management; and informationsystem). For each of these applications, a brief description of it, its main features and functionalities,and an illustrative image of its interface are presented.
3.1. Crop Operation
This category includes applications that help farmers in general crop-related activities on theirfarms: crop protection and diagnosis; crop nutrition and fertilization; crop irrigation; crop growth andcanopy management and crop harvest.
3.1.1. Crop Protection and Diagnosis
Plantix [21,22], developed by PEAT GmbH (Berlin, Germany), is a diagnosis application thatdetects diseases, pests, and nutritional deficiencies using an image of the plant to be analyzed.The application uses image recognition and deep learning (DL) algorithms to detect about 400 damageoccurrences in 30 crop types. It also offers a list, divided by regions, with the most common diseases.The image is sent to the cloud where it is processed and a result is generated. Besides receiving theindividual diagnosis, the user can also view information about conventional treatments, alternativetreatment options and preventive measures. All of this information is available offline so that it can beaccessed in places without network coverage. This application also allows posting the image in thePlantix community in order to get more information from other members and qualified technicians.Besides, it also allows viewing weather forecasts (temperature, precipitation, and wind speed) for thelocation where the user is. Figure 2 presents three screenshots of the application: the main menu,the interface where the image to be analyzed is captured and the interface where the image processingresult is presented.
BioLeaf (Foliar Analysis) [23,24], developed at the Federal University of Mato Grosso do Sul(Campo Grande, Brazil), is an application that, using images captured by the smartphone or uploadedfrom the photo gallery, allows to identify automatically and in situ the regions of leaves with lesionscaused by insects. Also, it estimates the defoliation percentage in relation to the total leaf area. This isa nondestructive identification method as it does not require the leaf to be removed from the plant.This application allows to automatically estimate the lesion area if the leaves contours were not affected.If this happens, the user must manually reconstruct the contour using curves and control points. For theapplication to make a correct analysis, it is necessary to place a white surface behind the leaf to beanalyzed. The application was tested by the authors using soybean leaves, but preliminary experimentshave shown that it is also suitable for use in different crops, such as vine leaves. Figure 3 presentsthree screenshots of the application: the main menu, the interface where the captured leaf image isshown and the interface where the image segmentation and processing result (defoliation percentage)are presented.

Agronomy 2020, 10, 855 9 of 44
(a) (b) (c)
Figure 2. Plantix: (a) Main menu; (b) Capture image interface; (c) Image processing result.
(a) (b) (c)
Figure 3. Bioleaf: (a) Main menu; (b) Captured leaf image; (c) Image segmentation andprocessing result.
E-agree [25], developed at Jaywant College of Engineering & Management (Maharashtra, India),provides a variety of services to farmers. These include an image processing system to detect plantdiseases based on their leaves, a marketplace which helps farmers sell/buy products online, and amarket rate guide that helps farmers to gather information about market rates. It also provides aweather reporting system that plays a crucial role in decision making, as well as soil types informationto guide farmers in deciding which crop type is the most appropriate to their fields. Figure 4 presentsthree screenshots of the application: the main menu, the interface where images are uploaded anddiseases are checked and the interface where the weather report is presented.
ADAMA Bullseye [26], developed by ADAMA Agricultural Solutions (Tel Aviv, Israel), has adatabase that helps farmers identifying (by visual comparison) pests and diseases in rice, almonds,tomatoes, apple, watermelon and cotton crops. It also provides information on the life cycle of pestsand diseases that can be found in the application by searching for their name or symptoms and alsoallows to consult weather forecasts provided by the ADAMA Climate service. If the farmer cannotidentify the pest/disease, he/she can send photos of their crop for evaluation by qualified technicians.Figure 5 presents three screenshots of the application: the main menu, the interface where the pestsfor a particular crop (in this case apple) are presented and the interface where information about aparticular disease or pest is presented.

Agronomy 2020, 10, 855 10 of 44
(a) (b) (c)
Figure 4. E-agree: (a) Main menu; (b) Image upload and verification; (c) Weather report.
(a) (b) (c)
Figure 5. ADAMA Bullseye: (a) Main menu; (b) Pests of a particular crop; (c) Information about aparticular pest.
PMapp [27,28], developed at the University of Adelaide (Adelaide, Australia), allows users toquickly assess the powdery mildew incidence degree on grape bunches (a percentage estimate of thearea covered by powdery mildew) by visually comparing it with a computer-generated image. Using apictorial disease “key” that shows different levels of powdery mildew infection, the user can determinethe proportion of affected bunches (disease incidence) and the affected area (severity). It is possibleto store this data for further analysis or email them in XML or CSV format. The application also hasa scoring tool (this score corresponds to the incidence and severity of powdery mildew in the field)to predict the likely impact on wine quality more accurately. Figure 6 presents three screenshots ofthe application: the main menu, the interface for assessing the disease incidence degree in a bunch ofgrapes and the data export interface.

Agronomy 2020, 10, 855 11 of 44
(a) (b) (c)
Figure 6. PMapp: (a) Main menu; (b) Assessment of the disease incidence degree in a bunch of grapes;(c) Data export.
Plant Disease [29,30], developed at the Technological Educational Institute of Thessaly (Larissa,Greece), it allows to identify vines diseases through leaf photos with an accuracy greater than 90%.The technique used for disease recognition described in this work can be performed standalone,combined with remote data (cloud) or portable molecular analysis equipment. To ensure fasterimage processing time and avoid background segmentation techniques, a white surface should beplaced behind the leaf to be processed. The user initially chooses the photo that he/she wants toanalyze, and edits the Threshold, Backgroud, and Min Spot Area values to get an image with as manyvalid points as possible. Then, the user can enter the type of plant, add an estimate of how manyleaves are affected and when the first symptoms appeared. Weather forecasts can also be taken intoaccount, for which it is only necessary to associate the GPS (Global Positioning System) coordinatesof the place. In the end, the application presents the results with the three diseases most likely toexist. According to the authors, the application is easily adapted to other types of diseases and otheroperating systems. Figure 7 presents three screenshots of the application: the interface where theoriginal image is presented, the interface where the BGW1 matrix is presented and the interface wherethe color histogram of the regions affected by the disease is presented.
(a) (b) (c)
Figure 7. Plant Disease: (a) Original grape leaf photo; (b) Displaying the BGW1 matrix with Thresholdequal to 10; (c) Color histogram of the regions affected by the disease.

Agronomy 2020, 10, 855 12 of 44
ImScope [31] is an experimental tool developed by Walter J., oriented to the visualization andregistration of plant health indicators through image processing algorithms using a smartphone.The application uses a variety of filters and indices that are commonly used, some using the visible lightcaptured by the smartphone camera and others trying to take advantage of a small fraction of light thatcan pass through the NIR filter that blocks infrared on mobile devices. This application allows to getseveral images, for example, NIR (near-infrared), NRG (near-infrared, red, green), NGB (near-infrared,green, blue), NDVI (normalized difference vegetation index), GRI (relative difference between greenand red), GBI (relative difference between green and blue), among others. Figure 8 presents twoscreenshots of the application, one of them with the NDVI image and the other with the GBI image.
(a) (b)
Figure 8. ImScope: (a) Normalized difference vegetation index (NDVI) image processing result; (b) GBIimage processing result.
Agrobase [32] is an application developed by Farmis (Kaunas, Lithuania) that helps farmers toidentify weeds, diseases or pests that arise in various types of crops and check which plant protectionproduct (e.g., herbicides and fungicides) is most effective for each case. Authors claim that this toolenables us to increase the crop yield and reduce the use of pesticides, fungicides and herbicides. Weeds,pests and diseases can be found in the application by searching by their common name, Latin name,category, or type of crop where they are originated. The phytosanitary products can be found bysearching for their active material, name, category, or type of crop where it will be applied. Figure 9presents three screenshots of the application—the main menu, the catalog of weeds, pests and diseasesand the interface where the user can view a detailed description of each one of them.
(a) (b) (c)
Figure 9. Agrobase: (a) Main menu; (b) Catalog of diseases and weeds; (c) Detailed description andphotos of diseases and weeds.

Agronomy 2020, 10, 855 13 of 44
3.1.2. Crop Nutrition and Fertilization
DropLeaf [33], developed by researchers from the Federal University of Mato Grosso do Sul(Campo Grande, Brazil) and the University of São Paulo (São Paulo, Brazil), it allows the effectiveestimation of the coverage area of pesticide spraying. This application reads water-sensitive markersscattered in the cultivation area through an image/photo taken using a smartphone. This processconsists of five steps—color space conversion; image noise removal; convolutional expansion anderosion operations; water-sensitive markers contour detection; and identification of the drops in themarkers. After processing, it is possible to understand the state of pesticide coverage applied throughthree indicators—Coverage Density (CD); Volumetric Median Diameter (VMD); and Diameter RelativeSpan (DRS). Figure 10 presents three screenshots of the application: the main menu, the capturedimage visualization interface and the interface where the processing result is displayed.
Ag PhD Crop Nutrient Deficiencies [34], developed by Ag PhD (South Dakota, United States),helps farmers to identify nutrient deficiencies in their crops. The application provides a detaileddescription and photos of the various nutritional deficiencies for a wide variety of crops. The user cansearch for a nutritional deficiency of a specific crop by the missing nutrient type or visually throughphotos of crops that allow finding the image that most closely matches the fertility issue in their fields.It is, therefore, a useful tool to aid decision making in fertilization tasks. Figure 11 presents threescreenshots of the application: the crop type selection menu, the menu with the list of most commonnutritional deficiencies in a particular crop type and the interface where the image and description of aspecific nutritional deficiency are presented.
Yara TankmixIT [35], developed by Yara International ASA (Oslo, Norway), allows verifying thephysical compatibility or simulate product mixing ability in spray tanks using Yara foliar nutritionproducts with other spray materials. The information comes from an online database supplied inreal-time with laboratory test results, and it is possible to define product quantities by simulatingcombinations of herbicides, fungicides and other chemicals. Once the products to be mixed are chosen,the application generates the list of all laboratory tests performed involving these same products andthe results of them. If the required combination is not found, a tank mixing test can be requested. If thespray materials are available in Yara labs, a test can usually be done within a few hours. Figure 12presents three screenshots of the application: the main menu, the Yara product choice interface and theinterface where the mixing results are presented.
(a) (b) (c)
Figure 10. DropLeaf: (a) Main menu; (b) Captured image visualization; (c) Image processing result.

Agronomy 2020, 10, 855 14 of 44
(a) (b) (c)
Figure 11. Crop Nutrient Deficiencies: (a) Crop type selection menu; (b) List of nutritional deficiencies;(c) Image and description of a specific nutritional deficiency.
(a) (b) (c)
Figure 12. Yara TankmixIT: (a) Main menu; (b) Choose Yara product interface; (c) Mixingresult interface.
SpraySelect [36], developed by TeeJet Technologies (Springfield, IL, United States), allows toquickly and easily choose the most suitable spray nozzle taking into account some attributes of thecrop to be sprayed and the desired spray characteristics. This allows the farmers to spray their crops atthe right dose. It is only necessary to enter the speed (km/h or mph), the spacing between the spraytips (cm or in), the target rate (l/ha or gpa) and the droplet size category, and the application providesa list of recommended nozzles and useful tips. Figure 13 presents three screenshots of the application:the agricultural application type selection menu, the interface that allows setting the speed, spacing,target rate and droplet size category values, and the list of recommended nozzles.
SnapCard [37] was developed by the University of Queensland—Gatton Campus (Queensland,Australia) and the United States Department of Agriculture (USDA) Agricultural Research Service(ARS) Aerial Application Technology Research Unit in College Station (Texas, United States). It allows,like the DropLeaf application, to estimate the coverage area of pesticide spraying by readingwater-sensitive markers scattered around the crop area. This application gives farmers access toa decision support tool that can be used for three purposes: compare the spray coverage obtainedwith the expected one, based on agronomic variables, weather conditions and spray configurations;predict spray coverage based on current conditions (time of day, tractor speed, spray nozzles,

Agronomy 2020, 10, 855 15 of 44
spray volume and weather conditions) and store spray logs locally on the device and synchronize themwith the web server for later use. Figure 14 presents three screenshots of the application: the mainmenu, the interface where it is possible to adjust the area of interest for analysis and the interfacewhere the processing result is presented.
(a) (b) (c)
Figure 13. SpraySelect: (a) Application type selection menu; (b) Interface that allows to set the speed,spacing, target rate and droplet size category values; (c) List of recommended nozzles.
(a) (b) (c)
Figure 14. SnapCard: (a) Main menu; (b) Cropping tool where a scanned card is adjusted to area ofinterest for analysis; (c) Measured spray cover output.
EcoFert [38], developed at the Technical University of Cartagena (Cartagena, Spain), provides tothe farmers the ability to calculate, via an Android mobile device, the best fertilizer mixture to getthe desired nutrient solution for different crops, taking into account the current fertilizer price inthe market. In order to determine which fertilizers and quantities to use, the user needs to performthe following steps: enter the data about the water composition of their irrigation systems; enter thedata about the ideal solution of the crop of interest and select, from a list of fertilizers given by theapplication, those he/she has in stock. In case there are no fertilizers in stock, the user could select someof them from the list arbitrary or even all of them. After all data entered, the application calculates theamount (kg or L) of each selected fertilizer to be added to the tanks per liter of water. Finally, the user

Agronomy 2020, 10, 855 16 of 44
has the ability to save and/or email a record of the data entered and the results obtained. Figure 15presents three screenshots of the application: the main menu, the interface where the list of fertilizersthat the user can select is presented and the interface where the ideal solution to use is shown.
(a) (b) (c)
Figure 15. EcoFert: (a) Main menu; (b) Interface with list of fertilizers that user can choose; (c) Interfacewith the ideal solution.
Smartirrigation Cotton [39] is a mobile application for irrigation scheduling in cotton crops,developed by researchers from the University of Georgia (Georgia, United States) and the Universityof Florida (Florida, United States) and by Cotton Incorporated (North Carolina, United States).This application uses data from weather stations, soil parameters, crop phenology, crop coefficientsand irrigation applications to estimate the root zone soil water deficits (RZSWD). As input,the Smartirrigation Cotton only requires that the user indicates the GPS coordinates of the locationwhere he/she wants to schedule irrigation (if the user has the smartphone location enabled,the application will automatically get the current geographic location), soil type, irrigation system typeand the default irrigation rate. If the RZSWD exceeds 40%, phenological changes occur, or when rainis recorded at the nearest weather station, a notification is sent to the user. The model does not deliverirrigation application recommendations. However, users may utilize RZSWD information to makeappropriate irrigation decisions. Figure 16 presents three screenshots of the application: the interfacewhere the user defines the field location, the main interface of the application and an example of thenotifications presented by the application.
3.1.3. Crop Irrigation
Grapevine water stress [40–42] is an application that is being developed by researchers at theSouth Australian Research and Development Institute (Adelaide, Australia) and the University of NewSouth Wales (Sydney, Australia) and provides a portable solution to evaluate grapevine’s water status.This system uses an external thermal camera (FLIR One by FLIR, Wilsonville, OR, USA) connectedto a smartphone to collect canopy images from vines. The images are analyzed by the application,which estimates the water condition of the vine, allowing farmers to reduce costs in water use andoptimize vineyard production. The crop water stress is calculated based on the canopy temperaturerelative to canopies that are well-irrigated or under severe water stress (represented by artificialreference leaves). The application was configured to automatically synchronise measurements with aserver every time the phone was connected to Wi-Fi. Figure 17 presents a screenshot of the application,where the two artificial reference leaves are perfectly visible, one with large amounts of water (rightcircle) and the other under severe water stress (left circle).

Agronomy 2020, 10, 855 17 of 44
(a) (b) (c)
Figure 16. Smartirrigation Cotton: (a) Pin field location on map; (b) Main user-interface screen;(c) Notifications about rain and phenology change.
Figure 17. Grapevine water stress: Image of vines and respective thermal image.
pCAPS (portable Classification Application for Plants and Soil) [43], developed by researchersfrom the Autonomous University of Guerrero (Chilpancingo de los Bravo, Mexico), University ofMurcia (Murcia, Spain), Technical University of Cartagena (Cartagena, Spain) and Miguel HernándezUniversity of Elche (Elche, Spain), integrates various computer vision techniques and allows toautomate the monitoring, segmentation and analysis of agricultural images. This tool allows real-timecrop monitoring, providing information that can be used to automate and optimize the calculation ofwater needs. The processing techniques used in the application are based on the research describedin Reference [44], where a new algorithm for the selection of the ideal color space for the plant/soilsegmentation problem was proposed. Using the pCAPS application, the users can take pictures oftheir crops using the smartphone camera, automatically crop the images and perform a vegetationanalysis, obtaining the percentage of green cover (PGC), number of plants, date, time, and GPScoordinates. The system is designed for easy use by unskilled users and it allows to send informationvia email to qualified technicians to advise the appropriate decisions to make. Figure 18 presents threescreenshots of the application: the interface where the captured image is presented, the interface wherethe processing result is shown and the interface of the analyzed images history.

Agronomy 2020, 10, 855 18 of 44
(a) (b) (c)
Figure 18. pCAPS: (a) Captured image visualization interface; (b) Image processing result; (c) Historyof analyzed images.
EVAPO [45], developed at São Paulo State University (São Paulo, Brazil), it allows real-timepotential evapotranspiration (PET) estimation using data from the NASA Prediction Of WorldwideEnergy Resources (NASA–POWER) system. With the help of this application, farmers can performmore efficient irrigation, allowing to increase water conservation. This application uses weather datato calculate PET using the Penman–Monteith method. To evaluate the performance of the proposedapproach, the authors compared the estimated PET using the EVAPO application with that estimatedfrom conventional surface weather station climate data. As input, the EVAPO application only requiresthat the user indicates the GPS coordinates of the location where he/she wants to calculate PET. If theuser has the smartphone location enabled, the application will automatically get the current geographiclocation. The application also provides a “History” tab where the last 50 PET values obtained aredisplayed. Figure 19 presents three screenshots of the application: the tab that shows the PET valueobtained, the measurements history tab and the application information tab.
(a) (b) (c)
Figure 19. EVAPO: (a) “PET” tab with value obtained; (b) “History” tab with a time series of 50 pastvalues of PET; (c) “About” tab with information about application.

Agronomy 2020, 10, 855 19 of 44
3.1.4. Crop Growth and Canopy Management
VitiCanopy [46–48], is an application developed by a team of researchers from the University ofAdelaide (Adelaide, Australia) and the University of Melbourne (Melbourne, Australia), which allowswinegrowers to take crop images (using their smartphone camera) in order to characterize thearchitecture (size and density) of canopy, the leaf area index of their vines, among other parameters.These parameters allow monitoring canopy growth and porosity to assess vigor, water requirementsand sunlight transmission to the fruit zone, which are essential information for obtaining grape qualityattributes. The application also allows associating this data with a vineyard location using smartphoneGPS and GIS (Geographic Information System) techniques. Winegrowers will be able to quickly andreliably assess spatial and temporal growth and canopy architecture dynamics to manage the balancebetween vegetative growth and fruit yield. This application has the advantage that it can be appliednot only to vineyards but also to a variety of other crops and trees such as apple trees, olive trees,among others. Figure 20 presents three screenshots of the application—the main menu, the interfacewhere the image to be processed is selected and the interface where the parameters resulting from theimage processing are presented.
(a) (b) (c)
Figure 20. VitiCanopy: (a) Main menu; (b) Image setection; (c) Image processing resulting parameters.
Easy Leaf Area [49] is an open-source application [50] developed by researchers from theDepartment of Plant Sciences of the University of California (California, United States) that allowsmeasuring leaf area in digital images quickly. The application uses the RGB value of each pixel toidentify the regions that belong to the leaves and it is possible to measure multiple leaves in the sameimage. It is necessary to use a red color reference scale, with known real area, so that the applicationcan correctly calculate the area of the leaves in the image. The scale and leaves should be placed at thesame distance and parallel to the camera. Using sliders, adjustments can be made to identify the scaleand leaves correctly. Figure 21 presents two screenshots of the application: the interface that allowsadjusting the parameters to detect the scale and leaves correctly and the interface where the imageprocessing result is displayed.

Agronomy 2020, 10, 855 20 of 44
(a) (b)
Figure 21. Easy Leaf Area: (a) Image capture and slider adjusting; (b) Image processing result.
Canopy Cover Free [51], developed by researchers from the Department of Plant Sciences fromthe University of California (California, United States), allows automatically and nondestructivelymeasure and calculate the percentage of canopy coverage from the green area in images. Using sliders,adjustments can be made to identify the canopy area correctly. If the mobile device location is enabled,the latitude and longitude of the captured photo are automatically recorded. These coordinates andthe percentage of coverage can be saved in a text file. According to the authors, some attention needsto be paid to camera height and angle, lens distortion, and the incidence angle of solar radiation,as problems with these factors may result in inaccurate canopy measurements. Figure 22 presents twoscreenshots of the application: the interface that allows adjusting the parameters to detect the area ofthe canopy correctly and the interface where the image processing result is displayed.
(a) (b)
Figure 22. Canopy Cover Free: (a) Image capture and slider adjusting; (b) Image processing result.
Canopeo [52,53], developed by researchers at Oklahoma State University (Stillwater, OK, USA),is an application that allows monitoring crop growth through the green canopy size calculation.Its operation is based on colorimetry, providing faster and more accurate in situ results than visualexams using similar tools such as SamplePoint [54] or SigmaScan Pro [55]. This tool has severalutilities, including monitoring crop growth and quantifying the effect of environmental factors such

Agronomy 2020, 10, 855 21 of 44
as hail, snow, and so forth. The application offers the possibility to register users, allows saving theanalyzed images for future consultations and also allows associating them with a geolocation. One ofthe features that sets this application apart from the rest presented in this paper is that it allows videoprocessing and not just static images. Figure 23 presents three screenshots of the application—themain menu, the interface that allows visualizing the captured image and the interface where the imageprocessing result is presented.
(a) (b) (c)
Figure 23. Canopeo: (a) Main menu; (b) Captured image visualization; (c) Image processing result.
PocketLAI [56–58], developed by researchers from the University of Milan (Milan, Italy)and Tuscia University (Viterbo, Italy), is a mobile application that allows estimating leaf area indexusing a smartphone. This application uses the smartphone camera and accelerometer to acquire imagesfrom below the canopy while the user is rotating the smartphone along its main axis. When the viewangle reaches 57.5◦, the frames are automatically processed to detect sky pixels via two dedicatedsegmentation strategies, one for clear sky and the other for a cloudy sky. The segmentation algorithmis responsible for determining the opening fraction of the canopy, that is, the part of the canopy thatallows the light passing. Once processed, LAI values are stored in a table with information of date,time and GPS coordinates. The tables with LAI estimates and related metadata can be exported as CSVor SHP (allows to directly load data in a GIS application) files. Figure 24 presents two screenshots ofthe application—the image capture interface where the user must indicate if the sky is clear or cloudyand the interface where the LAI reading and its metadata can be visualized. It is also from this lastinterface that the user can import/export their data.
Sentinel-2 NDVI Maps [59], developed by Sinergise (Ljubljana, Slovenia), is a Geopedia WorldSentinel version for mobile devices and allows viewing the current NDVI map based on Sentinel-2satellite data provided by Copernicus. This NDVI map allows farmers to generally know the health ofthe plants in each region of their crops. The application provides five layers of images, namely, the OpenStreet Map layer for general navigation, two layers of vegetation index (NDVI and EVI—enhancedvegetation index) provided by Sentinel-2 and two layers with the true and false colors also provided bySentinel-2. These layers have a maximum zoom limit, allowing a maximum resolution of 15 m/pixel.The paid version of the application allows zooming four times higher than the free version. Only thelatest image data with a maximum cloud coverage of 20% is displayed. Figure 25 presents threescreenshots of the application: the Open Street Map layer view, the true color map layer view and theNDVI map layer view.

Agronomy 2020, 10, 855 22 of 44
(a) (b)
Figure 24. PocketLAI: (a) Measuring mode interface; (b) Data table with leaf area index (LAI) readingsand related metadata, as well as import/export options.
(a) (b) (c)
Figure 25. Sentinel-2 NDVI Maps: (a) Visualizing the Open Street Map layer; (b) Visualizing the truecolor map layer; (c) Visualizing the NDVI map layer.
OneSoil Scouting [60] is a mobile application developed by the startup OneSoil (Minsk, Belarus)specialized in crop monitoring using European satellite images with a resolution of 8–10 m per pixel.This application allows farmers to monitor their fields/crops continuously. For this, it is only necessaryto select in the map the area where the crop is located and the application will automatically determineits limits through an AI algorithm. Then, the application calculates the NDVI using satellite imagesand presents a colorized photographic report showing the health of the plants. Images are updatedevery 3–5 days, and a notification system can be enabled to notify the user when a new image becomesavailable. This application allows farmers to detect anomalies in crop growth and create notes of theseanomalies by associating them with a comment and a photo (if necessary). The application also allowsvisualizing weather forecasts, useful to support farmers decisions about the ideal time to spray orharvest crops. Figure 26 presents three screenshots of the application: the interface for adding andviewing fields, the interface for creating anomaly notes (represented by blue dots on the map) and theinterface for displaying weather forecasts.

Agronomy 2020, 10, 855 23 of 44
(a) (b) (c)
Figure 26. OneSoil Scouting: (a) Add and view the fields; (b) Create anomaly notes; (c) Viewweather forecasts.
Smart fLAIr (fast LAI retrieval) [61,62] is a mobile application developed by researchers at theUniversity of Osnabrück (Osnabrück, Germany). It allows the in situ and nondestructive calculationof the leaf area index (LAI) based on gap fraction analysis, a widespread indirect and nondestructivemethodology. For this, the application uses the smartphone’s internal Ambient Light Sensor (ALS).To improve the gap fraction accuracy, the authors enhance the ALS by a diffuser cap combined with anoptical band-pass filter. According to the authors, this application has good accuracy in measuringLAI, thus being a good low-cost alternative to other commercial solutions. Figure 27 presents threescreenshots of the application: the main menu, the interface where the obtained LAI value is displayedand the interface where a table with various measurements and their metadata are presented.
(a) (b) (c)
Figure 27. Smart fLAIr: (a) Main menu; (b) Measurement interface with LAI reading; (c) Measurementtable with LAI readings and metadata.
3.1.5. Crop Harvest
vitisFlower [63] allows the automated and reliable evaluation (detection and counting) of thenumber of flowers of each bunch of grapes by analyzing an image of the inflorescence (part of theplant where the flowers are located). This tool uses the OpenCV library in order to maximize thecomputational efficiency of the smartphone. For the application to make a correct analysis is necessary

Agronomy 2020, 10, 855 24 of 44
to place a black surface behind the bunch to analyze. This application was developed by Televitisgroup from the University of La Rioja (La Rioja, Spain) in collaboration with four La Rioja SMEsas part of the Vinetics research project. It was one of the first applications developed for viticulturemade available on the Google Play. Figure 28 presents three screenshots of the application: the mainmenu, the interface where the application’s use instructions are presented and the interface where theprocessing result is presented.
(a) (b) (c)
Figure 28. vitisFlower: (a) Main menu; (b) Use instructions; (c) Flower detection result.
vitisBerry [64], also developed by Televitis group from the University of La Rioja (La Rioja,Spain), is very similar to the vitisFower application, except that instead of allows the counting ofthe number of flowers, it allows the counting of the grapes when they are in their early stage ofdevelopment. The identification of grape berries is made based on their circular shape, which allowstheir differentiation from other objects present in the image. It is, therefore, a practical and efficient toolthat assists winegrowers in analyzing phenotypic information in their vineyards. Figure 29 presentsthree screenshots of the application: the main menu, the interface where the images are captured andthe interface where the processing result is presented.
(a) (b) (c)
Figure 29. vitisBerry: (a) Main menu; (b) Capture image interface; (c) Grapevine berries detection result.

Agronomy 2020, 10, 855 25 of 44
FruitSize [65] was developed by a team of researchers from Central Queensland University(Queensland, Australia) to measure fruit size using images taken from a smartphone camera. For theapplication to correctly calculate the fruit size, it is necessary to place a blue background behind itwith a yellow reference scale of known size. The user still needs to satisfy some operating restrictions,including the angle and distance between the camera and the background. The segmentation andprocessing of the fruit present in the images was performed using the OpenCV image processinglibrary. To correctly calculate the size of the fruit, the application uses some camera parameters suchas maximum resolution, focal length, and horizontal and vertical viewing angles. As an output,the application provides the size (width and length) of the processed fruit. The application also usesgeolocation data, thus allowing to map the location of all processed fruits. According to the authors,it allows measuring, on average, 240 fruits per hour. Figure 30 presents an image showing the processof acquiring a photo of the fruit to be processed and a screenshot of the application showing theprocessed fruit size.
(a) (b)
Figure 30. FruitSize: (a) Example of fruit photo capture; (b) Result of fruit size measurement.
3.2. Farm Management
This category includes applications that help farmers to achieve more efficient and effectivemanagement of farm resources and general agricultural activities: field mapping and soil information;machinery management and control of farm activities.
3.2.1. Field Mapping and Soil Information
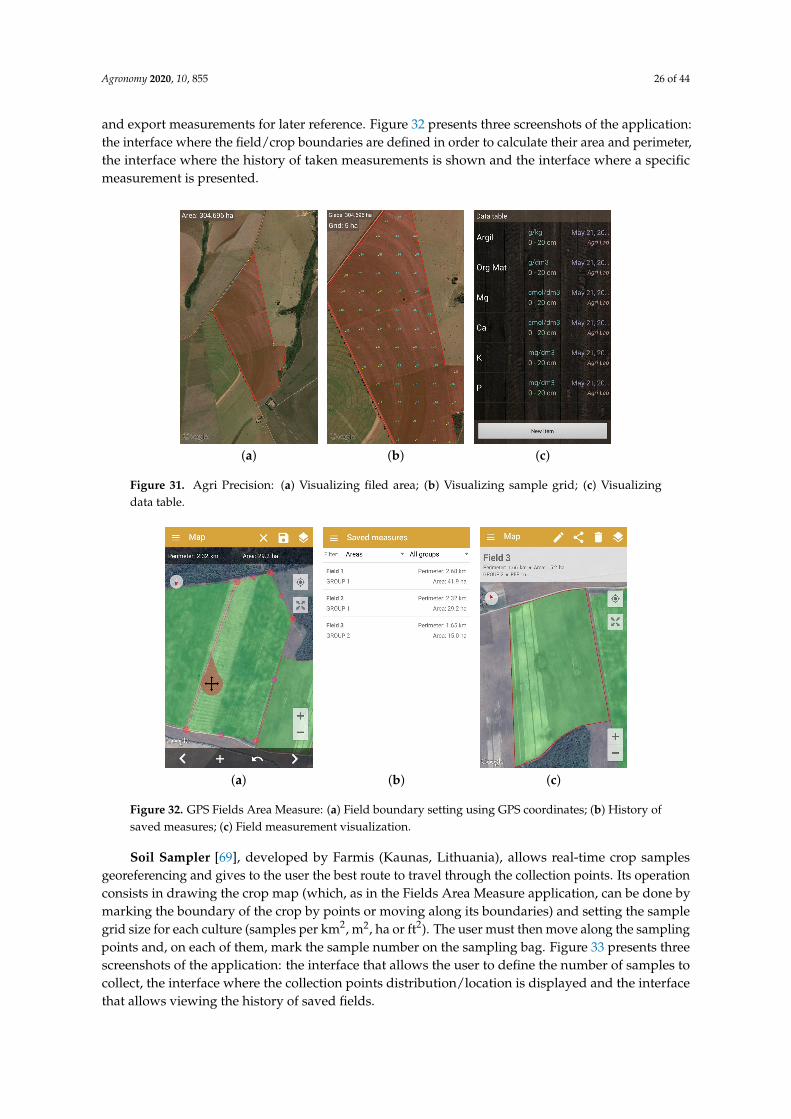
Agri Precision [66], developed by Leonardo O. Moraes (Paraná, Brazil), allows, through GPScoordinates, to generate sample grids and to identify soil nutrients (Mg, Ca, N, P, K, etc.)sample collection points. It also allows to calculate crop areas, create data tables and enter samplingresults. Data can be exported to the computer or stored on the smartphone itself for further analysis.Figure 31 presents three screenshots of the application: the interface where the field is presented,the interface that shows the sample grid with the sample collection points and the table with thecollected data.
GPS Fields Area Measure [67,68], developed by Farmis (Kaunas, Lithuania), allows measuringthe perimeter and calculate the area of a field using satellite imagery. It becomes useful for farmersto account for the area that was cultivated with each of their crops. This requires the user to locatehis/her field using GPS coordinates and mark its boundaries using points. Another measurementpossibility consists of the user moving along the field boundaries and the application automaticallymarks these points. To get higher accuracy, the developers recommend using an external GPS receiver.These measurements can be made even on pivots (round-shaped fields). The application allows import
Agronomy 2020, 10, 855 26 of 44
and export measurements for later reference. Figure 32 presents three screenshots of the application:the interface where the field/crop boundaries are defined in order to calculate their area and perimeter,the interface where the history of taken measurements is shown and the interface where a specificmeasurement is presented.
(a) (b) (c)
Figure 31. Agri Precision: (a) Visualizing filed area; (b) Visualizing sample grid; (c) Visualizingdata table.
(a) (b) (c)
Figure 32. GPS Fields Area Measure: (a) Field boundary setting using GPS coordinates; (b) History ofsaved measures; (c) Field measurement visualization.
Soil Sampler [69], developed by Farmis (Kaunas, Lithuania), allows real-time crop samplesgeoreferencing and gives to the user the best route to travel through the collection points. Its operationconsists in drawing the crop map (which, as in the Fields Area Measure application, can be done bymarking the boundary of the crop by points or moving along its boundaries) and setting the samplegrid size for each culture (samples per km2, m2, ha or ft2). The user must then move along the samplingpoints and, on each of them, mark the sample number on the sampling bag. Figure 33 presents threescreenshots of the application: the interface that allows the user to define the number of samples tocollect, the interface where the collection points distribution/location is displayed and the interfacethat allows viewing the history of saved fields.

Agronomy 2020, 10, 855 27 of 44
(a) (b) (c)
Figure 33. Soil Sampler: (a) Setting the desired number of samples; (b) Sample location visualization;(c) History of saved fields.
Nitrogen Index [70], developed at the United States Department of Agriculture (USDA)Agricultural Research Service (ARS) Soil Plant Nutrient Research Unit (New York, United States),is the first application developed for Android smartphones that allows calculating the nitrogencontent in the soil. The purpose of this tool is to help farmers increase nutrient use efficiency byimplementing best nitrogen management practices, thereby reducing their impact on the environment.This application is based on Nitrogen Index 4.4 [71] software and allows performing nitrogen leachingsimulations, which are stored in the device’s internal memory in NIN format (based on XML format).Simulations created and stored on the device can be sent via email or accessed through the device’sfile system by connecting it to a computer. Figure 34 presents two screenshots of the application: themain menu and the interface where some basic information is presented.
(a) (b)
Figure 34. Nitrogen Index: (a) Main menu; (b) Basic info page.
3.2.2. Machinery Management
AgriBus-NAVI [72], developed by Agri Info Design (Hokkaido, Japan), simulates, on thesmartphone, a GPS guidance system to assist in driving agricultural machines. With this application,farmers can drive machines in straight and evenly spaced lines since the actual position of the machine

Agronomy 2020, 10, 855 28 of 44
in relation to the baselines on which it must be driven is displayed. This application is based on“Agricultural Vehicle Navigation System” [73] software and “JP4572417B2” [74] patent, developed bythe National Agricultural Research Organization (NARO). Figure 35 presents a screenshot of theapplication, where it is possible to visualize all controls/information that the application provides.
Figure 35. AgriBus-NAVI: Main interface.
Field Navigator [75], developed by Farmis (Kaunas, Lithuania), is similar to the AgriBus-NAVIapplication as it also allows simulating, on the smartphone, a GPS guidance system to assist in drivingagricultural machines. With this application farmers can drive their machines along parallel lines,even in poor visibility and adverse weather conditions. Terrain limits, guidelines, obstacles andmarking elements can be set and saved for future use. This application prevents farmers frompassing more than once through an already treated or that he/she leaves untreated areas. For higherlocation accuracy, the application allows the connection, via Bluetooth, of various external GPS models.In future releases, the developers aim to provide some new features, such as activity logging, a 3Dmap-free driving assistant and a night mode for night work. Figure 36 presents three screenshots ofthe application: the navigation interface, the interface where the saved land history is displayed andthe interface where an external GPS receiver can be configured for higher location accuracy.
(a) (b) (c)
Figure 36. Field Navigator: (a) Navigation interface; (b) Land history for future use; (c) Connectexternal GPS receiver.
3.2.3. Control of Farm Activities
FarmManager [76] is a farm management application developed in the laboratories of theTechnological Education Institute of Serres (Katerini, Greece). FarmManager’s main features that makeit useful for agricultural tasks are—its annual structure (all information produced and recorded during
Agronomy 2020, 10, 855 29 of 44
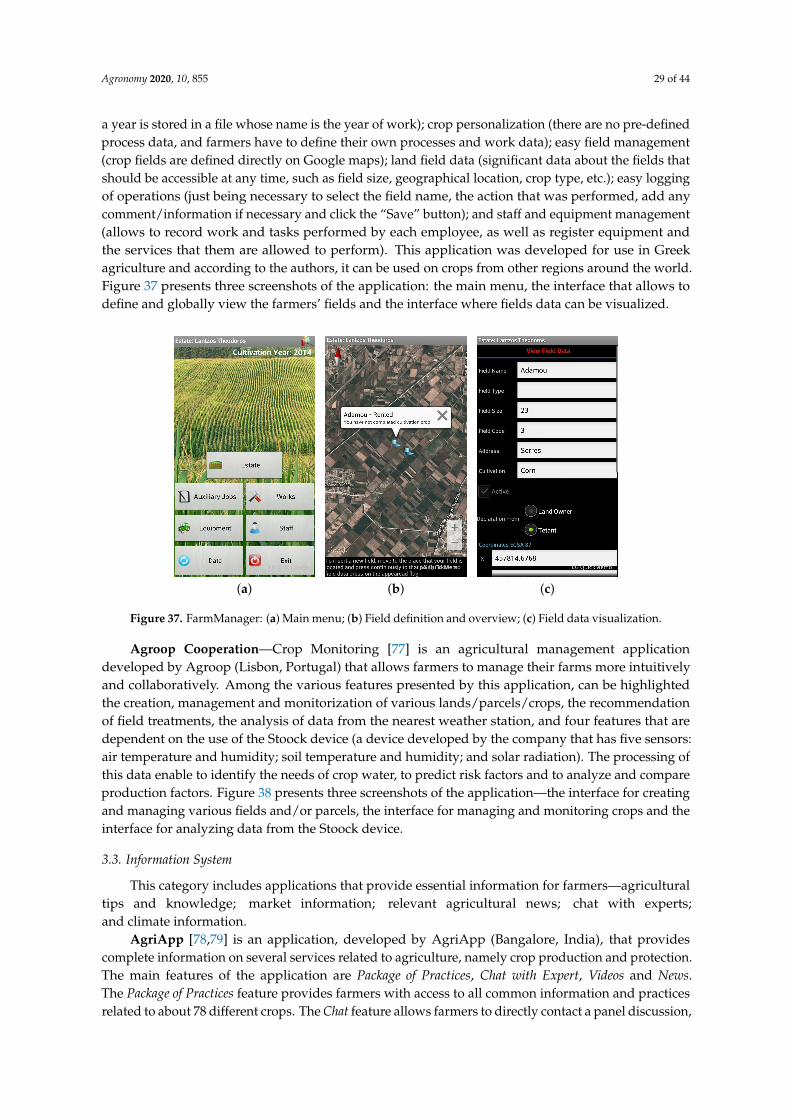
a year is stored in a file whose name is the year of work); crop personalization (there are no pre-definedprocess data, and farmers have to define their own processes and work data); easy field management(crop fields are defined directly on Google maps); land field data (significant data about the fields thatshould be accessible at any time, such as field size, geographical location, crop type, etc.); easy loggingof operations (just being necessary to select the field name, the action that was performed, add anycomment/information if necessary and click the “Save” button); and staff and equipment management(allows to record work and tasks performed by each employee, as well as register equipment andthe services that them are allowed to perform). This application was developed for use in Greekagriculture and according to the authors, it can be used on crops from other regions around the world.Figure 37 presents three screenshots of the application: the main menu, the interface that allows todefine and globally view the farmers’ fields and the interface where fields data can be visualized.
(a) (b) (c)
Figure 37. FarmManager: (a) Main menu; (b) Field definition and overview; (c) Field data visualization.
Agroop Cooperation—Crop Monitoring [77] is an agricultural management applicationdeveloped by Agroop (Lisbon, Portugal) that allows farmers to manage their farms more intuitivelyand collaboratively. Among the various features presented by this application, can be highlightedthe creation, management and monitorization of various lands/parcels/crops, the recommendationof field treatments, the analysis of data from the nearest weather station, and four features that aredependent on the use of the Stoock device (a device developed by the company that has five sensors:air temperature and humidity; soil temperature and humidity; and solar radiation). The processing ofthis data enable to identify the needs of crop water, to predict risk factors and to analyze and compareproduction factors. Figure 38 presents three screenshots of the application—the interface for creatingand managing various fields and/or parcels, the interface for managing and monitoring crops and theinterface for analyzing data from the Stoock device.
3.3. Information System
This category includes applications that provide essential information for farmers—agriculturaltips and knowledge; market information; relevant agricultural news; chat with experts;and climate information.
AgriApp [78,79] is an application, developed by AgriApp (Bangalore, India), that providescomplete information on several services related to agriculture, namely crop production and protection.The main features of the application are Package of Practices, Chat with Expert, Videos and News.The Package of Practices feature provides farmers with access to all common information and practicesrelated to about 78 different crops. The Chat feature allows farmers to directly contact a panel discussion,

Agronomy 2020, 10, 855 30 of 44
which, according to the authors, consists of highly qualified agricultural specialists. With this feature,the user can submit photos, videos, or audio to help experts identify issues so they can provide relevantrecommendations. In the Videos section, interesting agricultural information and some best practicesare shown. The News feature allows farmers to view agriculture-related news and success stories thatmotivate less experienced farmers. Figure 39 presents three screenshots of the application: the mainmenu, the interface of agricultural practices divided by crop type and the interface that allows contactwith a qualified specialist.
(a) (b) (c)
Figure 38. Agroop Cooperation: (a) Create and manage various land and/or parcels; (b) Manage andmonitor crops; (c) Analysis of data from the Stoock device.
(a) (b) (c)
Figure 39. AgriApp: (a) Main menu; (b) Package of practices; (c) Chat with expert.
4. Discussion
In this section, a comparative table (Table 3) of all the applications covered in this work ispresented and a discussion about each of the parameters used in the comparison is made. A total of38 applications were presented and the parameters considered are as follows—type of application;processing type; operating platform and source from which the application was found; downloadavailability; languages in which it is available; need for the Internet connection; use of internal sensors;need for external sensors; possibility to save and reuse data; interface and ease of use. Figure 40

Agronomy 2020, 10, 855 31 of 44
presents a treemap chart summarizing the results obtained in this comparison and then a discussion ofeach compared parameter is made.
Figure 40. A treemap chart that summarizes the results obtained in this comparison.

Agronomy 2020, 10, 855 32 of 44
Table 3. Comparison of the applications presented in this paper.
Work Name Type ProcessingType
Platform(Source)
Availablefor
DownloadLanguages Need
Internet
UseInternalSensors
NeedExternalSensors
Import orExportData
Interfaceand Ease of
Use
[21,22] Plantix CPD Cloud Android(GP) Yes EN, PT, FR,
ES, ∗1 Yes Camera No No ElaboratedEasy to use
[23,24] BioLeaf CPD Local Android(SDB) Yes EN, PT, RU,
ES No Camera No Yes SimpleEasy to use
[25] E-agree CPD Cloud Android(SDB) No EN, MR Yes Camera No No Little cared
Easy to use
[26] ADAMABullseye CPD No Android, iOS
(AS)Yes EN No No No No Elaborated
Easy to use
[27,28] PMapp CPD No Android(SDB) Yes EN No No No Yes Little cared
Easy to use
[29,30] Plant Disease CPD Local Win10Mob(SDB) No EN, EL No Camera,
GNSS No No ElaboratedEasy to use
[31] ImScope CPD Local Android(GP) Yes EN, ES No Camera No No Little cared
Easy to use
[32] Agrobase CPD No Android, iOS(AS)
YesEN, PT, FR,
ZH, AR, NL,BG, FI, #
No No No No SimpleEasy to use
[33] DropLeaf CNF Local Android(SDB) Yes EN, PT, ES,
RU No Camera No No SimpleEasy to use
[34]Crop
NutrientDeficiencies
CNF No Android, iOS(GP)
Yes EN Yes No No No ElaboratedEasy to use

Agronomy 2020, 10, 855 33 of 44
Table 3. Cont.
Work Name Type ProcessingType
Platform(Source)
Availablefor
DownloadLanguages Need
Internet
UseInternalSensors
NeedExternalSensors
Import orExport Data
Interface andEase of Use
[35] YaraTankmixIT CNF No Android, iOS
(GP)Yes EN, PT, IT, DE,
DA, ES, FR, # Yes No No Yes Little caredEasy to use
[36] SpraySelect CNF No Android, iOS(GP)
Yes EN Yes No No No ElaboratedEasy to use
[37] SnapCard CNF Local Android, iOS(SDB)
Yes EN No Camera No Yes SimpleEasy to use
[38] EcoFert CNF No Android(SDB) No EN, ES, FR, DE Yes No No Yes Little cared
Easy to use
[39] SmartirrigationCotton CNF No Android, iOS
(SDB)Yes EN Yes GNSS No Yes Elaborated
Easy to use
[40–42] GrapevineWater Stress CI Local Android
(SDB) No EN No No FLIROne —– Simple
Easy to use
[43] pCAPS CI Local Android(SDB) No EN No Camera,
GNSS No Yes Little caredEasy to use
[45] EVAPO CI No Android(SDB) Yes EN Yes GNSS No Yes Simple
Easy to use
[46–48] VitiCanopy CGCM Local Android, iOS(SDB)
Yes EN No Camera,GNSS No Yes Simple
Easy to use
[49] Easy Leaf Area CGCM Local Android(SDB) Yes EN No Camera No No Little cared
Easy to use
[51] Canopy CoverFree CGCM Local Android
(GP) Yes EN No Camera,GNSS No Yes Little cared
Easy to use

Agronomy 2020, 10, 855 34 of 44
Table 3. Cont.
Work Name Type ProcessingType
Platform(Source)
Availablefor
DownloadLanguages Need
Internet
UseInternalSensors
NeedExternalSensors
Import orExport Data
Interface andEase of Use
[52,53] Canopeo CGCM Local Android, iOS(SDB)
Yes EN No Camera,GNSS No Yes Simple
Easy to use
[56–58] PocketLAI CGCM Local Android(SDB) No EN No Camera, GNSS,
AccelerometerNo Yes Simple
Easy to use
[59] Sentinel-2NDVI Maps CGCM No Android
(GP) Yes EN Yes No No No SimpleEasy to use
[60] OneSoilScouting CGCM No Android, iOS
(AS)Yes EN, PT, FR, ES,
IT, DE, RU Yes No No No ElaboratedEasy to use
[61,62] Smart fLAIr CGCM No Android(SDB) Yes EN No Ambient
Light, GNSSNo Yes Little cared
Easy to use
[63] vitisFlower CH Local Android(SDB) Yes EN, ES No Camera No Yes Simple
Easy to use
[64] vitisBerry CH Local Android(SDB) No EN, ES No Camera No Yes Simple
Easy to use
[65] FruitSize CH Local Android(SDB) Yes EN No Camera,
GNSS No Yes Little caredEasy to use
[66] Agri Precision FMSI No Android(GP) Yes EN, PT, IT, ES,
FR No GNSS No Yes Little caredEasy to use
[67,68] GPS FieldsArea Measure FMSI No Android, iOS
(AS)Yes
EN, PT, FR, ES,ZH, AR, CS,
NL, #No GNSS No Yes Simple
Easy to use

Agronomy 2020, 10, 855 35 of 44
Table 3. Cont.
Work Name Type ProcessingType
Platform(Source)
Availablefor
DownloadLanguages Need
Internet
UseInternalSensors
NeedExternalSensors
Import orExport Data
Interface andEase of Use
[69] Soil Sampler FMSI No Android(GP) Yes EN, PT, FR,
ZH, AR, ∗2 Yes GNSS No Yes SimpleEasy to use
[70] NitrogenIndex FMSI No Android
(SDB) Yes EN, ES No No No Yes Little caredEasy to use
[72] AgriBus-NAVI MM No Android(GP) Yes EN, PT, ES, # Yes GNSS No No Simple
Easy to use
[75] FieldNavigator MM No Android
(GP) Yes EN, PT, FR,ZH, ∗3 Yes GNSS No No Simple
Easy to use
[76] FarmManager CFA No Android(SDB) No EN, EL Yes No No —– Little cared
Easy to use
[77] AgroopCooperation CFA No Android, iOS
(AS)Yes EN, PT Yes No Stoock
device No ElaboratedEasy to use
[78,79] AgriApp IS No Android(GP) Yes EN Yes No No No Elaborated
Easy to use
Legend: CPD: crop protection and diagnosis; CNF: crop nutrition and fertilization; CI: crop irrigation; CGCM: crop growth and canopy management; CH: crop harvest; FMSI:field mapping and soil information; MM: machinery management; CFA: control of farm activities; IS: information system; Win10Mob: Windows 10 Mobile; SDB: scientific database;GP: Google Play; AS: App Store; AR: Arabic; BG: Bulgarian; BN: Bengali; CS: Czech; DA: Danish; DE: German; EL: Greek; EN: English; ES: Spanish; FI: Finnish; FR: French; GU:Gujarati; HI: Hindi; HU: Hungarian; ID: Indonesian; IT: Italian; KN: Kannada; LT: Lithuanian; LV: Latvian; ML: Malayalam; MR: Marathi; NL: Dutch; OR: Oriya; PA: Punjabi;PL: Polish; PT: Portuguese; RO: Romanian; RU: Russian; SK: Slovak; SL: Slovenian; SQ: Albanian; SR: Serbian; TA: Tamil; TE: Telugu; TR: Turkish; UK: Ukrainian; UR: Urdu; VI:Vietnamese; ZH: Chinese (Mandarin); Notes: ∗1: AR, BN, GU, HI, ID, KN, ML, MR, OR, PA, TA, TE, UR and VI; ∗2: BG, DE, EL, FI, HU, LT, PL, RO, RU, SR and TR; ∗3: AR, BG, DE,EL, ES, FI, HI, HU, ID, IT, LT, LV, NL, PL, RO, RU, SK, SL, SQ, SR, TR and UK; #: Application that may be available in more languages than indicated as the language is changedaccording to the language of the mobile device’s operating system.

Agronomy 2020, 10, 855 36 of 44
The presented applications are distributed in the various categories and subcategories as follows:8 (21.1%) to crop protection and diagnosis; 7 (18.4%) to crop nutrition and fertilization; 3 (8.0%) to cropirrigation; 8 (21.1%) to crop growth and canopy management; 3 (8.0%) to crop harvest; 4 (10.5%)to field mapping and soil information; 2 (5.3%) to machinery management; 2 (5.3%) to control of farmactivities; and 1 (2.6%) to information system.
Regarding the processing type, 21 (55.3%) applications do not perform any data processing,15 (39.5%) applications perform local processing, that is, on the smartphone’s processor, and 2 (5.3%)applications perform processing on a remote server (cloud). Of the 17 applications that perform sometype of processing, 16 [23–25,29–31,33,37,40–43,46–49,51–53,56–58,63–65] use image recognition andprocessing techniques, such as color space transformation, background subtraction, segmentation,binarization, noise reduction, shape recognition, and thresholding. Other applications [21,22],besides using imaging recognition techniques, also use AI-powered algorithms that run on a remoteserver (cloud) to help farmers identify pathogens on their crops. Usually, the applications that performremote processing are more advanced and powered by DL, ML or AI algorithms.
Concerning the platforms for which the applications are available, 37 (97.4%) run on Android fromGoogle, 11 (29.0%) run on iOS from Apple, and only 1 (2.6%) is available for Windows Phone/Windows10 Mobile from Microsoft. These values were expected, since Android currently has practically all thebest-known applications. Moreover, new applications are usually first released on Android. Probablythis is due to the application’s approval process that is more straightforward in the Google Play. It wasalso expected that the percentage of applications available for Windows Phone/Windows 10 Mobilewould be the lowest, as it is a system that has never been widely adopted by the technologicalcommunity and always had limitations on its applications store. Although support for WindowsPhone/Windows 10 Mobile ended in December 2019, we consider it relevant to include the PlantDisease application as it can serve as a basis for the development of similar applications for the mobileoperating systems currently in use (Android and/or iOS).
About the availability for download, 30 (79.0%) applications are available through the GooglePlay or the App Store platforms or the developers’ pages, and 8 (21.0%) applications are not availablefor download. All applications that are not available were developed at the research level, however,some authors intend to make them available for download in the future.
Concerning the languages in which the applications are available, 19 (50.0%) applications areonly available in English and 19 (50.0%) are available in one or more languages in addition to English.Of these, Portuguese, Spanish, Chinese (Mandarin), Arabic and French stand out, being some of themost widely spoken languages in the world. Of the applications that were possible to test (available fordownload), it was found that most of them allow the user to define the language manually and only4 applications (AgriBus-NAVI, GPS FieldsArea Measure, Yara TankmixIT and Agrobase) automaticallyadapt the language according to the language of the mobile device.
Regarding the need for Internet access, 16 (42.1%) applications require this connection, and 22(57.9%) applications do not need it. This parameter depends a lot on the application type.An application that accesses data made available online, such as maps or forecasts, necessarilyrequires this connection. An application that only allows saving data locally (on the smartphoneitself), for example, location of samples taken in the field, and do not send it to any remote server, doesnot need this connection. The current trend is to provide users with cloud storage (remote servers),which provides the advantage of allowing access to information through many different smartphonesor, if the smartphone is damaged or lost, data is always safeguarded.
Concerning the use of internal sensors of the mobile device where applications run, 16 (42.1%) usethe camera, 15 (39.5%) use the GNSS, 1 (2.6%) uses the accelerometer, and 1 (2.6%) uses the ambientlight sensor. 14 (36.8%) applications do not use any internal sensor of the mobile device. It is clearthat the most used sensors are the image sensors (camera) and the GNSS sensors (GPS) followed bythe accelerometer (motion sensor) and ambient light (environmental sensor). However, none of theapplications use the other sensors presented in Section 1.3, such as the gyroscope, magnetometer,

Agronomy 2020, 10, 855 37 of 44
temperature, relative humidity, and pressure. The camera is used to collect images or videos that canbe processed locally or sent to a remote server for further processing/analysis. In the applicationspresented in this paper, the collection of images is intended for the visual inspection of crops,namely for the detection of diseases [21,22,25,29,30], plants damage detection [23,24], obtaining healthindicators [31], inspection of the coverage area of pesticide spraying [33,37], characterization of canopyarea and architecture [43,46–49,51–53,56–58], and for crop yield estimation [63–65]. The GPS is used byapplications in order to identify the location where some type of task is/was performed. These taskscan be the identification of a specific disease [29,30], watering [39,45], measuring parameters related tothe canopy [43,46–48,51–53,56–58,61,62], crop yield estimation [65], and soil sampling [66–69]. The GPScan also be used to assist in the agricultural machines navigation [72,75].
About the need for external sensors, only two (5.3%) applications need it, and the remaining36 (94.7%) do not need any external sensor. This low use of external sensors is maybe related to thefact that we are increasingly looking to develop the most practical and portable solutions possible.A system where only the smartphone is needed is a more practical solution and often the idealsolution. Another reason for this low use of external sensors is that the most common sensors(accelerometer, gyroscope, GPS, temperature, relative humidity, camera, etc.) already equip almost allcurrent smartphones. One of the applications that requires an external sensor is the Grapevine WaterStress [40–42]. This application requires the use of a thermal camera (FLIR One), however, it mayno longer be necessary since there are already smartphones with an integrated thermal camera.The other application that needs an external sensor is the Agroop Cooperation [77]. Althoughthis application works without the Stoock device (a device developed by the company that hasfive sensors: air temperature and humidity; soil temperature and humidity; and solar radiation),most of its functionalities are dependent on this device, so we considered that this application needsan external sensor. There are also two applications (GPS Fields Area Measure [67,68] and FieldNavigator [75]) that support (but do not necessarily require) the use of external GPS receivers forhigher location accuracy. Some applications require more advanced external sensors or a set of sensors,for example, weather stations or wireless sensor networks (WSNs). However, these applications areusually only responsible for downloading data from the sensors and forwarding it to a remote server.These applications were not presented in this paper since this is a defined exclusion criterion.
Concerning the possibility of saving and reuse (export and import) data, 20 (52.6%) applicationsprovide this functionality, and 16 (42.1%) do not provide it. For two (5.3%) applications, it wasnot possible to identify if they allow exporting and importing data since they are not available fordownload and the authors make no reference to it. Exporting and importing data has the advantage ofallowing to transfer it to another device or save it for future reference. It also allows importing thedata into other standalone tools, for example, GIS applications for more advanced processing.
Finally, regarding the application’s interface, 9 (23.7%) have elaborated interfaces with modernand attractive designs, 16 (42.1%) have interfaces with simple designs, and 13 (34.2%) have littlecared interfaces with old and unattractive designs. All (100.0%) applications are easy to use and donot require that users have specific technological knowledge. Any professional or non-professionalfarmer with more or fewer qualifications can use them without difficulty. Careful development ofapplication design and interface is important, as it is usually the first characteristic that a user noticeswhen downloading an application. A user is more likely to download an application with a modernand eye-catching design than an application with an untidy and old-fashioned design.
5. Conclusions and Final Remarks
The number of applications that assist farmers’ decision making is still limited and many ofthem are still in the development stage. Applications for irrigation management, disease detection,water point management, remote sensor reading, crop yields estimation and mapping, soil typemapping, among many others, have emerged.

Agronomy 2020, 10, 855 38 of 44
The bibliographic review carried out during this work provides an overview of the applicationtypes that exist, what features they provide and how they are a useful tool for farmers in general. It hasbeen found that connectivity is indeed essential and that the ability to process or execute artificialintelligence algorithms locally is an asset, this added to the fact that any modern smartphone is capableof obtaining high-quality images and having an adequate processing capacity.
These capabilities become especially useful and attractive when a mobile device such as asmartphone can indeed be of great use to get near real time agronomic indicators, for example,leaf area measuring, among others. Among all the applications analyzed, it has been concludedthat image processing is, in fact, the greatest common denominator, rather than the measurementof agrometeorological parameters. The photographic record and the interpretation or processingof images for the characterization of diseases seem to be the focus of most of the currently existingapplications.
It has been found that, given the increase in applications in this field, smartphones constitute amajor contribution to the dissemination of applications for use in precision agriculture.
5.1. Research Challenges
This systematic review includes not only applications published in scientific documents (obtainedthrough the Scopus, Web of Science, ScienceDirect and IEEE Xplore Digital Library databases)but also applications available on the Google Play and/or the App Store. This allowed for a broadercategorization of applications than if only applications published in scientific documents had been used.However, this made the search more challenging due to the difficulty in accurately understanding whatthe purpose, the functionalities and the sensors that each of them used only based on the descriptionprovided by the developers of the application, which often may not even exist. In these cases, it wasnecessary to install and test the application in order to make a more detailed description of it. Anotherproblem arises related to the filtering of results since for each category there can be hundreds ofapplications. Therefore, two criteria for exclusion of applications were defined thinking exclusivelyin the applications available on the Google Play and/or the App Store, excluding from this reviewapplications rated less than 3.5 stars and paid applications.
5.2. Limitations in Application Development
There are currently several limitations in the development of mobile applications for use inprecision agriculture. The processing capacity (operating time) of the mobile devices themselves isone of the main limitations. DL, ML or AI algorithms and even some image processing techniquesrequire considerable processing capacity, often leading to the need for transfer the data to be processedto a remote server where they are processed and from where a response will be received with theresult of the processing. Since in many places where this type of application is used, there may notbe an Internet connection, this processing ceases to be done at the moment and in situ and will haveto be performed later in a place with an Internet connection. However, when a particular action isdependent on this result, it will imply that the user moves to a location with an Internet connection andthen has to move again to the place where the action is performed, which in practice is not efficient.
Another limitation is the size of the mobile device’s screen. Ideally, farmers should be able touse the applications on their personal mobile devices instead of having to purchase a mobile devicespecifically to use them. Although most of today’s smartphones have a sizeable screen, there are stilldevices with smaller screen and, therefore, applications must be prepared to make it easy to interactwith them on screens of different dimensions. It should also be bared in mind that these applicationscan be run on tablets where it may be necessary to adapt their interface.
There is also a generational aspect to take into account when developing this type of applicationssince the farmers who currently work in the field are people of some age and are not very apt to usetechnology, implying that the applications developed are the most simple, intuitive and easy to useas possible.

Agronomy 2020, 10, 855 39 of 44
The last difficulty identified in the development of these applications is related to the differencebetween the sensors used in each mobile device. The main sensor that imposes these difficulties isthe camera, because some of the most advanced image processing algorithms are dependent on thecamera’s parameters to provide an accurate result. As there are currently a large number of deviceswith different types of cameras, from different manufacturers and with different lenses, it is difficult todevelop applications that work correctly on a large number of devices.
5.3. Future Trends
There are currently many applications that are used in the general public domain and notexclusively by professionals. In the near future it is expected that these applications will move to aprofessional domain and be considered tools for field work. Considering that the group of professionalsthat will use this type of applications, most of the time have little or practically no knowledge in thetechnological area, it is expected that the applications will maintain the level of simplicity and easeof use. However, this is a problem that tends to be resolved over time as new generations of farmersalready have proficiency to efficiently use these applications. In short, more professional applicationsare expected but which still do not require a great IT proficiency by those who use them. For that, it willbe necessary to create criteria and usability standards that applications will have to respect so thatthey can be considered a work tool and not just applications for enthusiasts and “entertainment”. It isexpected that these future work tools will be based on the entertainment applications that have beentested and improved over several years. It is also expected an increasing migration of software thatcurrently runs on computers to applications installable on mobile devices or web-based applications.
With the increase in the processing power of mobile devices, applications are also expected touse DL, ML and AI techniques on the smartphone itself, thus avoiding the impossibility of usingapplications in remote locations where there may be no Internet connection. In this way, it is expectedthat the applications can be used offline and that they can later transfer the information to a remoteserver so it can be accessed through different devices.
It is also speculated that the emergence of equipment equipped with image sensors that allowcapturing wavelengths that go beyond the visible spectrum will open new horizons for this type ofapplications. Mobile phones equipped with cameras that allow the capture of the spectrum in theinfrared and near-infrared zones will allow the implementation of vegetative vigor determinationapplications allowing the creation of, for example, NDVI maps.
Author Contributions: Conceptualization, J.M. and R.M.; methodology, T.M.P., F.N.d.S. and M.C.; validation,T.M.P., M.C. and J.B.-C.; formal analysis, E.P. and J.J.S.; investigation, J.M.; writing—original draft preparation,J.M. and T.M.P.; writing—review and editing, J.M. and R.M.; visualization, J.B.-C.; supervision, R.M. and F.N.d.S.;project administration, R.M.; funding acquisition, R.M. and F.N.d.S. All authors have read and agreed to thepublished version of the manuscript.
Funding: This research was partial funded by ERDF and North 2020—North Regional OperationalProgram, as part of project “INNOVINE&WINE—Vineyard and Wine Innovation Platform” (NORTE-01-0145-FEDER-000038), by the ERDF—European Regional Development Fund through the Operational Programmefor Competitiveness and Internationalisation—COMPETE 2020 Programme within project POCI-01-0145-FEDER-006961, by National Funds through the FCT—Fundação para a Ciência e a Tecnologia (PortugueseFoundation for Science and Technology) as part of project UID/EEA/50014/2013, and by FCT as part of thedoctoral fellowship with the reference SFRH/BD/129813/2017.
Conflicts of Interest: The authors declare no conflict of interest.
Abbreviations
The following abbreviations are used in this manuscript:

Agronomy 2020, 10, 855 40 of 44
AI Artificial IntelligenceALS Ambient Light SensorARS Agricultural Research ServiceAWS Automated Weather StationsCD Coverage DensityCSV Comma-Separated ValuesDL Deep LearningDRS Diameter Relative SpanEVI Enhanced Vegetation IndexGIS Geographic Information SystemGNSS Global Navigation Satellite SystemGPS Global Positioning SystemICT Information and Communications TechnologiesIT Information TechnologyLAI Leaf Area IndexMCT Mobile Communication TechnologiesML Machine LearningNARO National Agricultural Research OrganizationNDVI Normalized Difference Vegetation IndexNFC Near Field CommunicationNGB Near-infrared, Green, BlueNIR Near-infraredNRG Near-infrared, Red, GreenpCAPS portable Classification Application for Plants and SoilPET Potential EvapotranspirationPGC Percentage of Green CoverRZSWD Root Zone Soil Water DeficitsSHP ShapefileSS Scoring SystemUSDA United States Department of AgricultureVMD Volumetric Median DiameterWLAN wireless Local Area NetworkingWSN Wireless sensor networkXML Extensible Markup Language
References
1. Da Cruz, S.M.S.; Vieira, A.C.D.M.; Marques, M.M. Technological Management of Small Crops ThroughMobile Apps and Precision Agriculture. In Proceedings of the Annual Conference on Brazilian Symposiumon Information Systems: Information Systems: A Computer Socio-Technical Perspective (SBSI 2015), Goiania,Brazil, 26–29 May 2015; Volume 1, pp. 379–386.
2. Kasey P. Gartner Top 10 Strategic Technology Trends for 2018. Available online: https://www.gartner.com/smarterwithgartner/gartner-top-10-strategic-technology-trends-for-2018 (accessed on 4 November 2019).
3. Statista. Number of Mobile App Downloads Worldwide in 2016, 2017 and 2021, by Store. Availableonline: https://www.statista.com/statistics/276602/annual-number-of-mobile-app-downloads-by-store/(accessed on 30 October 2019).
4. Rita, I.G. A InfluêNcia das AplicaçõEs Móveis na Percepção da Imagem de Marcas Comerciai—A Perspectivados Consumidores. Master’s Thesis, Universidade Europeia—Laureate International Universities, Lisbon,Portugal, June 2016. Available online: http://hdl.handle.net/10400.26/14350 (accessed on 4 November2019).
5. Patel, H.; Patel, D. Survey of android apps for agriculture sector. Int. J. Inf. Sci. Tech. 2016, 6, 61–67.[CrossRef]

Agronomy 2020, 10, 855 41 of 44
6. Kuharic, D.; Bubalo, A.; Galic, A. Mobile applications in agriculture. In Proceedings of the 10th InternationalScientific/Professional Conference, Agriculture in Nature and Environment Protection, Vukovar, Croatia,5–7 June 2017; pp. 237–242.
7. Arroqui, M.; Mateos, C.; Machado, C.; Zunino, A. RESTful Web Services improve the efficiency of datatransfer of a whole-farm simulator accessed by Android smartphones. Comput. Electron. Agric. 2012,87, 14–18. [CrossRef]
8. Brugger, F. Mobile Applications in Agriculture; Syngenta Foundation: Basel, Switzerland, 2011; pp. 1–38.9. Mittal, S.; Gandhi, S.; Tripathi, G. Socio-Economic Impact of Mobile Phones on Indian Agriculture; Working Paper,
No. 246; Indian Council for Research on International Economic Relations (ICRIER): New Delhi, India, 2010.Available online: http://hdl.handle.net/10419/176264 (accessed on 6 November 2019).
10. Csótó, M. Mobile devices in agriculture: Attracting new audiences or serving the tech-savvy? J. Agric. Inform.2015, 6, 75–84. [CrossRef]
11. Kuhlmann, F.; Berg, E. The Farm as an Enterprise—The European Perspective. In Proceedings of the 13thInternational Farm Management Congress, Wageningen, The Netherlands, 7–12 July 2002; pp. 1–10.
12. Maréchal, N. What Do We Mean by Mobile Ecosystems? Available online: https://rankingdigitalrights.org/2016/09/15/what-are-mobile-ecosystems/ (accessed on 23 January 2020).
13. Statista. Number of Apps Available in Leading App Stores as of 3rd Quarter 2019. Available online:https://www.statista.com/statistics/276623/number-of-apps-available-in-leading-app-stores/ (accessedon 23 January 2020).
14. Statista. Distribution of Free and Paid Apps in the Apple App Store and Google Play as of December 2019.Available online: https://www.statista.com/statistics/263797/number-of-applications-for-mobile-phones/(accessed on 23 January 2020).
15. Google Developers. Connectivity Overview. Available online: https://developer.android.com/guide/topics/connectivity (accessed on 7 November 2019).
16. Google Developers. Sensors Overview. Available online: https://developer.android.com/guide/topics/sensors/sensors_overview (accessed on 7 November 2019).
17. Karetsos, S.; Costopoulou, C.; Sideridis, A. Developing a smartphone app for m-government in agriculture.J. Agric. Inform. 2014, 5, 1–8. [CrossRef]
18. Morais, R.; Silva, N.; Mendes, J.; Adão, T.; Pádua, L.; López-Riquelme, J.A.; Pavón-Pulido, N.; Sousa, J.J.;Peres, E. mySense: A comprehensive data management environment to improve precision agriculturepractices. Comput. Electron. Agric. 2019, 162, 882–894. [CrossRef]
19. Bambini, M.D.; Luchiari-Júnior, A.; Romani, L.A.S. Mercado de aplicativos móveis (apps) para uso naagricultura. In Proceedings of the Simpósio Nacional de Instrumentação Agropecuária (SIAGRO 2014),São Carlos, Brazil, 18–20 November 2014; pp. 711–714.
20. Pongnumkul, S.; Chaovalit, P.; Surasvadi, N. Applications of smartphone-based sensors in agriculture:A systematic review of research. J. Sens. 2015, 2015, 1–18. [CrossRef]
21. Plantix. The Smart Crop Assistant on Your Smartphone. Available online: https://plantix.net/ (accessed on7 October 2019).
22. International Crops Research Institute for the Semi-Arid Tropics. Mobile App to Help Farmers OvercomeCrop Damage. Available online: http://www.icrisat.org/mobile-app-to-help-farmers-overcome-crop-damage/ (accessed on 25 May 2020).
23. BioLeaf. Foliar AnalysisTM. Available online: http://bioleaf.icmc.usp.br/ (accessed on 7 October 2019).24. Machado, B.B.; Orue, J.P.; Arruda, M.S.; Santos, C.V.; Sarath, D.S.; Goncalves, W.N.; Silva, G.G.; Pistori, H.;
Roel, A.R.; Rodrigues, J.F., Jr. BioLeaf: A professional mobile application to measure foliar damage causedby insect herbivory. Comput. Electron. Agric. 2016, 129, 44–55. [CrossRef]
25. Reddy, S.; Pawar, A.; Rasane, S.; Kadam, S. A Survey on Crop Disease Detection and Prevention usingAndroid Application. Int. J. Innov. Sci. Eng. Technol. 2015, 2, 621–626.
26. ADAMA. ADAMA Bullseye. Available online: https://www.adama.com/us/en/adama-bullseye(accessed on 25 May 2020).
27. Macmillan, C. PMapp: A Mobile App for Assessing Powdery Mildew. Available online: http://www.vineyardteam.org/files/resources/PMapp.pdf (accessed on 9 October 2019).

Agronomy 2020, 10, 855 42 of 44
28. Scott, E.S.; Powell, S.; Evans, K.; Barry, K.; Petrovic, T.; Kravchuk, O.; Zanker, T.; Evans, K.J. Digital toolsto facilitate assessing powdery mildew on grape bunches. In Proceedings of the 21st Australasian PlantPathology Society Biennial Conference: Science Protecting Plant Health, Brisbane, Australia, 26–28 September2017; p. 142.
29. Petrellis, N. A smart phone image processing application for plant disease diagnosis. In Proceedings of the6th International Conference on Modern Circuits and Systems Technologies (MOCAST 2017), Thessaloniki,Greece, 4–6 May 2017; pp. 1–4.
30. Petrellis, N. Plant Disease Diagnosis for Smart Phone Applications with Extensible Set of Diseases. Appl. Sci.2019, 9, 1952. [CrossRef]
31. ImScope. Application for Android and An Experimental Tool Oriented to Visualization and Recordingof Indicators of Plant Health. Available online: https://www.idoneos.com/procesamiento_de_imagenes/imscope/imscope_(english).html (accessed on 9 October 2019).
32. Buinickaite, A. Crop Problem Identification—Quick and Easy. Available online: https://blog.farmis.lt/crop-problem-identification-quick-and-easy-3be14752fd8c (accessed on 25 May 2020).
33. Machado, B.B.; Spadon, G.; Arruda, M.S.; Goncalves, W.N.; Carvalho, A.C.; Rodrigues-Jr, J.F. A smartphoneapplication to measure the quality of pest control spraying machines via image analysis. In Proceedingsof the 33rd Annual ACM Symposium on Applied Computing (SAC’18), Pau, France, 9–13 April 2018;pp. 956–963.
34. Hefty, D.; Hefty, B. Ag PhD Crop Nutrient Deficiencies App Now Available! Available online:http://www.agphd.com/resources/ag-phd-mobile-apps/ag-phd-crop-nutrient-deficiencies/ (accessedon 12 November 2019).
35. Yara International ASA. Farmer’s Toolbox TankmixIT. Available online: https://www.yara.co.uk/crop-nutrition/farmers-toolbox/tankmixit/ (accessed on 12 November 2019).
36. TeeJet Technologies. SpraySelect. Available online: https://www.teejet.com/tools/index.aspx (accessed on25 May 2020).
37. Ferguson, J.C.; Chechetto, R.G.; O’Donnell, C.C.; Fritz, B.K.; Hoffmann, W.C.; Coleman, C.E.; Chauhan, B.S.;Adkins, S.W.; Kruger, G.R.; Hewitt, A.J. Assessing a novel smartphone application—SnapCard, compared tofive imaging systems to quantify droplet deposition on artificial collectors. Comput. Electron. Agric. 2016,128, 193–198. [CrossRef]
38. Bueno-Delgado, M.V.; Molina-Martínez, J.M.; Correoso-Campillo, R.; Pavón-Mariño, P. Ecofert: An Androidapplication for the optimization of fertilizer cost in fertigation. Comput. Electron. Agric. 2016, 121, 32–42.[CrossRef]
39. Vellidis, G.; Liakos, V.; Andreis, J.H.; Perry, C.D.; Porter, W.M.; Barnes, E.M.; Morgan, K.T.; Fraisse, C.;Migliaccio, K.W. Development and assessment of a smartphone application for irrigation scheduling incotton. Comput. Electron. Agric. 2016, 127, 249–259. [CrossRef]
40. Skewes, M.; Petrie, P.R.; Liu, S.; Whitty, M. Smartphone tools for measuring vine water status. In Proceedingsof the International Symposium on Sensing Plant Water Status—Methods and Applications in HorticulturalScience (SPWS 2016), Potsdam, Germany, 5–7 October 2016; pp. 53–58.
41. Petrie, P.R.; Wang, Y.; Liu, S.; Lam, S.; Whitty, M.A.; Skewes, M.A. The accuracy and utility of a lowcost thermal camera and smartphone-based system to assess grapevine water status. Biosyst. Eng. 2019,179, 126–139. [CrossRef]
42. American Society for Enology and Viticulture. A Thermal Camera-Based Smartphone Application to MeasureVine Water Status. Available online: http://www.asev.org/abstract/thermal-camera-based-smartphone-application-measure-vine-water-status (accessed on 16 October 2019).
43. Hernández-Hernández, J.L.; Ruiz-Hernández, J.; García-Mateos, G.; González-Esquiva, J.M.; Ruiz-Canales,A.; Molina-Martínez, J.M. A new portable application for automatic segmentation of plants in agriculture.Agric. Water. Manag. 2017, 183, 146–157. [CrossRef]
44. García-Mateos, G.; Hernández-Hernández, J.L.; Escarabajal-Henarejos, D.; Jaén-Terrones, S.;Molina-Martínez, J.M. Study and comparison of color models for automatic image analysis in irrigationmanagement applications. Agric. Water. Manag. 2015, 151, 158–166. [CrossRef]
45. Júnior, W.M.; Valeriano, T.T.B.; de Souza Rolim, G. EVAPO: A smartphone application to estimatepotential evapotranspiration using cloud gridded meteorological data from NASA-POWER system.Comput. Electron. Agric. 2019, 156, 187–192.

Agronomy 2020, 10, 855 43 of 44
46. Fuentes, S.; De Bei, R.; Pozo, C.; Tyerman, S. Development of a smartphone application to characterisetemporal and spatial canopy architecture and leaf area index for grapevines. Wine Vitic. J. 2012, 6, 56–60.
47. Fuentes, S.; Poblete-Echeverría, C.; Ortega-Farias, S.; Tyerman, S.; De Bei, R. Automated estimation of leafarea index from grapevine canopies using cover photography, video and computational analysis methods.Aust. J. Grape Wine Res. 2014, 20, 465–473. [CrossRef]
48. De Bei, R.; Fuentes, S.; Gilliham, M.; Tyerman, S.; Edwards, E.; Bianchini, N.; Smith, J.; Collins, C. VitiCanopy:A free computer App to estimate canopy vigor and porosity for grapevine. Sensors 2016, 16, 585. [CrossRef]
49. Easlon, H.M.; Bloom, A.J. Easy Leaf Area: Automated digital image analysis for rapid and accuratemeasurement of leaf area. Appl. Plant Sci. 2014, 2. [CrossRef]
50. Easlon, H.M. Easy-Leaf-Area. Available online: https://github.com/heaslon/Easy-Leaf-Area (accessed on20 December 2019).
51. Easlon, H.M. Canopy Cover Free (Version 1.0.3—2016). Available online: https://play.google.com/store/apps/details?id=com.heaslon.canopycover (accessed on 15 October 2019).
52. Patrignani, A.; Ochsner, T.E. Canopeo: A powerful new tool for measuring fractional green canopy cover.Agron. J. 2015, 107, 2312–2320. [CrossRef]
53. Canopeo. Rapid and Accurate Green Canopy Cover Measurement Tool. Available online: http://www.canopeoapp.com/ (accessed on 15 October 2019).
54. Booth, D.T.; Cox, S.E.; Berryman, R.D. Point sampling digital imagery with “SamplePoint”.Environ. Monit. Assess. 2006, 123, 97–108. [CrossRef] [PubMed]
55. Systat Software. SigmaScan Pro—Analyze Images Automatically. Available online: https://systatsoftware.com/products/sigmascan/ (accessed on 20 December 2019).
56. Confalonieri, R.; Foi, M.; Casa, R.; Aquaro, S.; Tona, E.; Peterle, M.; Boldini, A.; De Carli, G.; Ferrari, A.;Finotto, G.; et al. Development of an app for estimating leaf area index using a smartphone. Trueness andprecision determination and comparison with other indirect methods. Comput. Electron. Agric. 2013,96, 67–74. [CrossRef]
57. Confalonieri, R.; Francone, C.; Foi, M. The PocketLAI smartphone app: An alternative method for leafarea index estimation. In Proceedings of the 7th International Congress on Environmental Modelling andSoftware (iEMSs 2014), San Diego, CA, USA, 15–19 June 2014; pp. 288–293.
58. Orlando, F.; Movedi, E.; Coduto, D.; Parisi, S.; Brancadoro, L.; Pagani, V.; Guarneri, T.; Confalonieri,R. Estimating leaf area index (LAI) in vineyards using the PocketLAI smart-app. Sensors 2016, 16, 2004.[CrossRef] [PubMed]
59. Sinergise. Sentinel-2 NDVI Maps—Sentinel App for Android. Available online: http://www.sentinel-hub.com/explore/industries-and-showcases/sentinel-2-ndvi-maps (accessed on 15 October 2019).
60. OneSoil. Make Reliable Agricultural Decisions with AI. Available online: https://onesoil.ai/en/ (accessedon 12 November 2019).
61. Bauer, J.; Siegmann, B.; Jarmer, T.; Aschenbruck, N. Smart fLAIr: A smartphone application for fast LAIretrieval using ambient light sensors. In Proceedings of the 2016 IEEE Sensors Applications Symposium(SAS 2016), Catania, Italy, 20–22 April 2016; pp. 1–6.
62. Huning, L.; Bauer, J.; Aschenbruck, N. A Privacy Preserving Mobile Crowdsensing Architecture for a SmartFarming Application. In Proceedings of the First ACM Workshop on Mobile Crowdsensing Systems andApplications (CrowdSenSys’17), Delft, The Netherlands, 5 November 2017; pp. 62–67.
63. Aquino, A.; Millan, B.; Gaston, D.; Diago, M.P.; Tardaguila, J. vitisFlower R©: Development and testing ofa novel Android-smartphone application for assessing the number of grapevine flowers per inflorescenceusing artificial vision techniques. Sensors 2015, 15, 21204–21218. [CrossRef]
64. Aquino, A.; Barrio, I.; Diago, M.P.; Millan, B.; Tardaguila, J. vitisBerry: An Android-smartphone applicationto early evaluate the number of grapevine berries by means of image analysis. Comput. Electron. Agric. 2018,148, 19–28. [CrossRef]
65. Wang, Z.; Koirala, A.; Walsh, K.; Anderson, N.; Verma, B. In Field Fruit Sizing Using A Smart PhoneApplication. Sensors 2018, 18, 3331. [CrossRef]
66. Carvalho, P. As Apps NA Agricultura—Agri Precision. Abolsamia, 105, March and April 2017; p. 98.Available online: https://issuu.com/abolsamia/docs/abolsamia_105/98 (accessed on 17 October 2019).

Agronomy 2020, 10, 855 44 of 44
67. Buinickaite, A. 2,5M Farmers Are Already Measuring Their Fields for Free. Available online:https://blog.farmis.lt/2-5m-farmers-are-already-measuring-their-fields-for-free-4908bc0ee0a0 (accessedon 25 May 2020).
68. Randyte, A. Why Measuring and Tracking the Field Is So Important? Available online: https://blog.farmis.lt/why-measuring-and-tracking-the-field-is-so-important-4b949bca2acb (accessed on 25 May 2020).
69. Farmis. Soil Sampler (Version 1.0.10—2018). Available online: https://play.google.com/store/apps/details?id=com.noframe.farmissoilsamples (accessed on 17 October 2019).
70. Delgado, J.A.; Kowalski, K.; Tebbe, C. The first Nitrogen Index app for mobile devices: Using portabletechnology for smart agricultural management. Comput. Electron. Agric. 2013, 91, 121–123. [CrossRef]
71. Delgado, J.A.; Gagliardi, P.M.; Rau, E.J.; Fry, R.; Figueroa, U.; Gross, C.; Cueto-Wong, J.; Shaffer, M.J.;Kowalski, K.; Neer, D.; et al. Nitrogen Index 4.4, User Manual. 2011. Available online: https://vtechworks.lib.vt.edu/bitstream/handle/10919/69932/4975_Nitrogen_Index_4_4_User_Manual_final.pdf (accessedon 17 October 2019).
72. Agri Info Design. AgriBus-NAVI: GPS Guidance System to Mount on Agricultural Machinery. Availableonline: https://agri-info-design.com/en/agribus-navi/ (accessed on 22 October 2019).
73. Hamada, Y.; Matsuo, Y.; Yamashita, T. Agricultural Vehicle Navigation System. Jpn. Agric. Res. Q. 2009,43, 187–192. [CrossRef]
74. Yamamoto, S.; Matsuo, Y.; Hamada, Y.; Yukimoto, O. Farm Operation-Supporting Program, OperationNavigator for Agricultural Vehicle and Farm Operation-Supporting Method. Japanese Patent JP4572417B2,4 November 2010.
75. Buinickaite, A. Are Large Investments Necessary to Obtain the Benefits of Precision Farming?Available online: https://blog.farmis.lt/how-field-navigator-can-help-a-farmer-94aaadf11ae6 (accessed on25 May 2020).
76. Lantzos, T.; Koykoyris, G.; Salampasis, M. FarmManager: An Android application for the managementof small farms. In Proceedings of the 6th International Conference on Information and CommunicationTechnologies in Agriculture, Food and Environment (HAICTA 2013), Corfu Island, Greece, 19–22 September2013; pp. 587–592.
77. Agroop. Agroop Cooperation—Crop Monitoring. Available online: https://www.agroop.net/en/whatwedo#cooperation (accessed on 13 November 2019).
78. AgriApp Technologies. AgriApp—Connecting Farmers. Available online: http://agriapp.co.in/ (accessedon 24 October 2019).
79. Zargar, H. AgriApp: An App for Farmers to Help Them Improve Crop Output. Available online:https://www.livemint.com/Technology/btn0QkaCI3rBtdotyiQdfL/AgriApp-An-app-for-farmers-to-help-them-improve-crop-output.html (accessed on 25 May 2020).
c© 2020 by the authors. Licensee MDPI, Basel, Switzerland. This article is an open accessarticle distributed under the terms and conditions of the Creative Commons Attribution(CC BY) license (http://creativecommons.org/licenses/by/4.0/).