Embed Size (px)
Citation preview

T h e n e w e ng l a nd j o u r na l o f m e dic i n e
n engl j med 355;4 www.nejm.org july 27, 2006 375
special article
Pay-for-Performance Programs in Family Practices in the United Kingdom
Tim Doran, M.P.H., Catherine Fullwood, Ph.D., Hugh Gravelle, Ph.D., David Reeves, Ph.D., Evangelos Kontopantelis, Ph.D., Urara Hiroeh, Ph.D.,
and Martin Roland, D.M.
From the National Primary Care Research and Development Centre, University of Manchester, Manchester, United King-dom. Address reprint requests to Dr. Doran at the National Primary Care Re-search and Development Centre, William-son Bldg., University of Manchester, Man-chester M13 9PL, United Kingdom, or at [email protected].
N Engl J Med 2006;355:375-84.Copyright © 2006 Massachusetts Medical Society.
A bs tr ac t
Background
In 2004, after a series of national initiatives associated with marked improvements in the quality of care, the National Health Service of the United Kingdom introduced a pay-for-performance contract for family practitioners. This contract increases exist-ing income according to performance with respect to 146 quality indicators cover-ing clinical care for 10 chronic diseases, organization of care, and patient experience.
Methods
We analyzed data extracted automatically from clinical computing systems for 8105 family practices in England in the first year of the pay-for-performance program (April 2004 through March 2005), data from the U.K. Census, and data on charac-teristics of individual family practices. We examined the proportion of patients deemed eligible for a clinical quality indicator for whom the indicator was met (reported achievement) and the proportion of the total number of patients with a medical con-dition for whom a quality indicator was met (population achievement), and we used multiple regression analysis to determine the extent to which practices achieved high scores by classifying patients as ineligible for quality indicators (exception reporting).
Results
The median reported achievement in the first year of the new contract was 83.4 per-cent (interquartile range, 78.2 to 87.0 percent). Sociodemographic characteristics of the patients (age and socioeconomic features) and practices (size of practice, num-ber of patients per practitioner, age of practitioner, and whether the practi tioner was medically educated in the United Kingdom) had moderate but significant effects on performance. Exception reporting by practices was not extensive (median rate, 6 per-cent), but it was the strongest predictor of achievement: a 1 percent increase in the rate of exception reporting was associated with a 0.31 percent increase in reported achievement. Exception reporting was high in a small number of practices: 1 percent of practices excluded more than 15 percent of patients.
Conclusions
English family practices attained high levels of achievement in the first year of the new pay-for-performance contract. A small number of practices appear to have achieved high scores by excluding large numbers of patients by exception reporting. More research is needed to determine whether these practices are excluding pa-tients for sound clinical reasons or in order to increase income.
Copyright © 2006 Massachusetts Medical Society. All rights reserved. Downloaded from www.nejm.org at UC SHARED JOURNAL COLLECTION on May 7, 2009 .

T h e n e w e ng l a nd j o u r na l o f m e dic i n e
n engl j med 355;4 www.nejm.org july 27, 2006376
There is widespread variation in the quality of care in all major health care sys-tems.1,2 In the United Kingdom, where
there is a single health care system (the National Health Service), the government has introduced several quality-improvement initiatives since 1998, including national guidelines, a system of “clini-cal governance” giving clinicians and managers responsibility for delivering high-quality care, and a national inspection system.3,4 There is evidence that these initiatives have substantially improved primary care performance.5-7
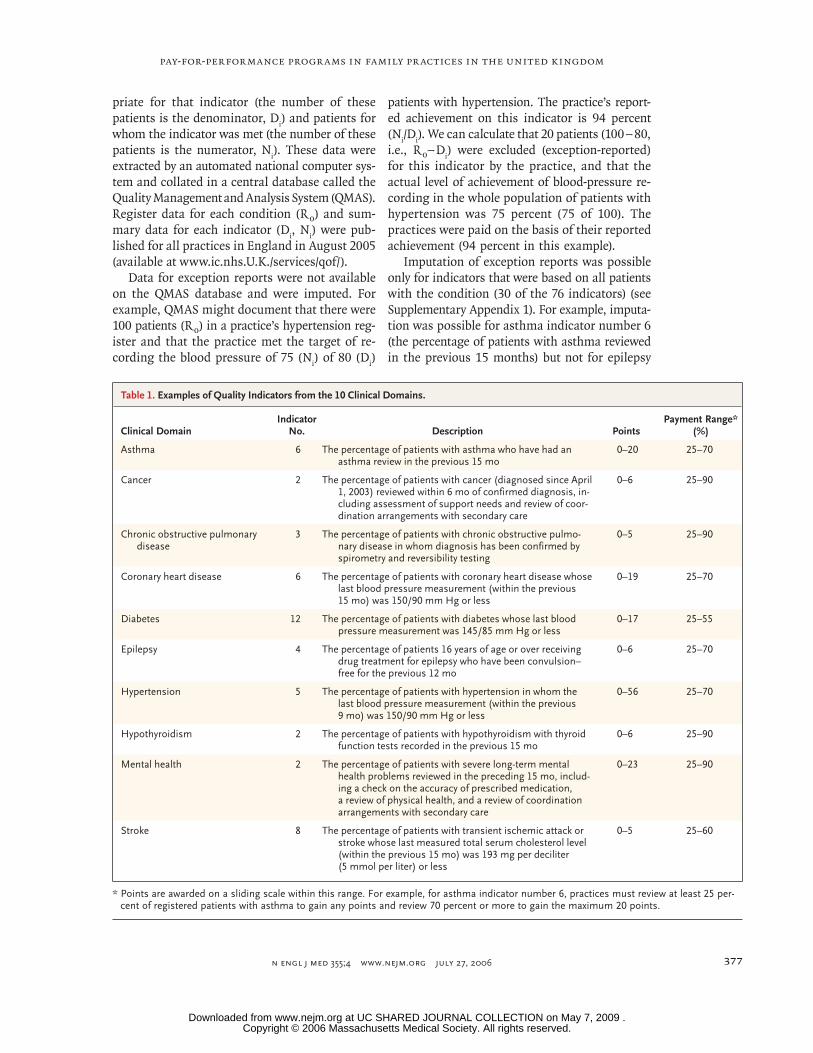
In 2004, the National Health Service commit-ted £1.8 billion ($3.2 billion) in additional fund-ing over a period of three years for a new pay-for-performance program for family practitioners (the sole type of primary care physician in the United Kingdom).8 This program was intended to in-crease family practitioners’ income by up to 25 percent, depending on their performance with respect to 146 quality indicators relating to clini-cal care for 10 chronic diseases, organization of care, and patient experience.9 For the clinical in-dicators, practices claim points that generate pay-ments according to the proportion of patients for whom they achieve each target (for examples, see Table 1; for the complete list, see Supplemen-tary Appendix 1, available with the full text of this article at www.nejm.org). Points are award-ed on a sliding scale within the payment range. For example, for asthma indicator number 6, practices gain points for clinically reviewing at least 25 percent of patients with asthma in the previous 15 months. The maximum of 20 points is gained if at least 70 percent of patients with asthma are reviewed. For 2004–2005, payment was limited to £76 ($133) per point, adjusted for the relative prevalence of the disease (payment is multiplied by the square root of the prevalence of the disease among the patients served by the practice and divided by the square root of the mean national prevalence of the disease). A maxi-mum of 1050 points was available, which was equivalent to an average of £79,800 ($139,400). From 2005–2006 onward, practices have been earning £125 ($218) per point. The payments are in addition to the practices’ core funding, which is based on the number of patients, adjusted for characteristics of the patients and the area.
Financial incentives affect physician behavior.10 A narrow national pay-for-performance program introduced in 1991 in the United Kingdom was
associated with large improvements in rates of immunization and cervical cytologic examina-tions.11,12 A more ambitious local scheme cover-ing a range of diseases, with financial incentives aligned with family practitioners’ professional values, was also successful.13 In preparation for the 2004 program, U.K. family practitioners em-ployed more nurses and administrative staff, es-tablished chronic-disease clinics,14 and increased the use of electronic medical records.
Evidence-based quality indicators should not be applied unthinkingly, since patients have co-existing conditions that affect their optimal care.15 It is inappropriate, for example, to strive to con-trol the cholesterol level of someone terminally ill with cancer. Consequently, the new U.K. pay-for-performance contract allows family practi-tioners to exclude patients from eligibility for specific indicators in the performance calcula-tions.16 The reasons for these exclusions (termed “exception reports”) are summarized in Table 2. However, exception reporting also provides an opportunity for family practitioners to increase their income by inappropriately excluding patients for whom they have missed the targets (a practice known as gaming).
We report performance on clinical quality in-dicators for 10 chronic conditions in the first year of the new pay-for-performance program. We examine whether the socioeconomic, demo-graphic, and health characteristics of practice populations and characteristics of the practices themselves affect the quality of clinical care pro-vided. We also assess exception reporting accord-ing to practice and its effect on achievement of the clinical targets.
Me thods
Analyses in this article are restricted to the 76 clinical quality indicators, which account for 550 of the 1050 potential points. The remaining 500 points were based on quality indicators assessing organizational quality and patient experience (not analyzed here). Details of data and methods are given in Supplementary Appendix 2, available with the full text of this article at www.nejm.org. The practices recorded the number of patients with each condition who were listed in their practice registers on February 14, 2005 (R
0 ). For each clin-
ical indicator (i), the practices flagged the elec-tronic medical records of patients deemed appro-
Copyright © 2006 Massachusetts Medical Society. All rights reserved. Downloaded from www.nejm.org at UC SHARED JOURNAL COLLECTION on May 7, 2009 .
pay-for-performance programs in family practices in the united kingdom
n engl j med 355;4 www.nejm.org july 27, 2006 377
priate for that indicator (the number of these patients is the denominator, D
i) and patients for
whom the indicator was met (the number of these patients is the numerator, N
i). These data were
extracted by an automated national computer sys-tem and collated in a central database called the Quality Management and Analysis System (QMAS). Register data for each condition (R
0 ) and sum-
mary data for each indicator (Di, N
i) were pub-
lished for all practices in England in August 2005 (available at www.ic.nhs.U.K./services/qof/).
Data for exception reports were not available on the QMAS database and were imputed. For example, QMAS might document that there were 100 patients (R
0 ) in a practice’s hypertension reg-
ister and that the practice met the target of re-cording the blood pressure of 75 (N
i) of 80 (D
i)
patients with hypertension. The practice’s report-ed achievement on this indicator is 94 percent (N
i/D
i). We can calculate that 20 patients (100 − 80,
i.e., R 0 − D
i) were excluded (exception-reported)
for this indicator by the practice, and that the actual level of achievement of blood-pressure re-cording in the whole population of patients with hypertension was 75 percent (75 of 100). The practices were paid on the basis of their reported achievement (94 percent in this example).
Imputation of exception reports was possible only for indicators that were based on all patients with the condition (30 of the 76 indicators) (see Supplementary Appendix 1). For example, imputa-tion was possible for asthma indicator number 6 (the percentage of patients with asthma reviewed in the previous 15 months) but not for epilepsy
Table 1. Examples of Quality Indicators from the 10 Clinical Domains.
Clinical DomainIndicator
No. Description PointsPayment Range*
(%)
Asthma 6 The percentage of patients with asthma who have had an asthma review in the previous 15 mo
0–20 25–70
Cancer 2 The percentage of patients with cancer (diagnosed since April 1, 2003) reviewed within 6 mo of confirmed diagnosis, in-cluding assessment of support needs and review of coor-dination arrangements with secondary care
0–6 25–90
Chronic obstructive pulmonary disease
3 The percentage of patients with chronic obstructive pulmo-nary disease in whom diagnosis has been confirmed by spirometry and reversibility testing
0–5 25–90
Coronary heart disease 6 The percentage of patients with coronary heart disease whose last blood pressure measurement (within the previous 15 mo) was 150/90 mm Hg or less
0–19 25–70
Diabetes 12 The percentage of patients with diabetes whose last blood pressure measurement was 145/85 mm Hg or less
0–17 25–55
Epilepsy 4 The percentage of patients 16 years of age or over receiving drug treatment for epilepsy who have been convulsion–free for the previous 12 mo
0–6 25–70
Hypertension 5 The percentage of patients with hypertension in whom the last blood pressure measurement (within the previous 9 mo) was 150/90 mm Hg or less
0–56 25–70
Hypothyroidism 2 The percentage of patients with hypothyroidism with thyroid function tests recorded in the previous 15 mo
0–6 25–90
Mental health 2 The percentage of patients with severe long-term mental health problems reviewed in the preceding 15 mo, includ-ing a check on the accuracy of prescribed medication, a review of physical health, and a review of coordination arrangements with secondary care
0–23 25–90
Stroke 8 The percentage of patients with transient ischemic attack or stroke whose last measured total serum cholesterol level (within the previous 15 mo) was 193 mg per deciliter (5 mmol per liter) or less
0–5 25–60
* Points are awarded on a sliding scale within this range. For example, for asthma indicator number 6, practices must review at least 25 per-cent of registered patients with asthma to gain any points and review 70 percent or more to gain the maximum 20 points.
Copyright © 2006 Massachusetts Medical Society. All rights reserved. Downloaded from www.nejm.org at UC SHARED JOURNAL COLLECTION on May 7, 2009 .

T h e n e w e ng l a nd j o u r na l o f m e dic i n e
n engl j med 355;4 www.nejm.org july 27, 2006378
indicator number 4 (the percentage of patients 16 years of age or older receiving drug treatment for epilepsy who were convulsion-free for the previous 12 months), because the latter indicator is based on a subgroup of patients. We therefore calculated a score that measured the overall pro-pensity of a practice to exclude patients. A com-plication of the QMAS data-collection method was that although the practices reported overall disease prevalence on February 14 (R
0 ), the nu-
merators and denominators for individual indi-cators were reported six weeks later, on March 31, and the practices could continue to add patients to their disease registers during this period. Con-sequently, the denominator for an indicator (D
i)
could be greater than the reported number of patients registered for the disease (R
0 ), and as a
result the true number of patients registered on March 31 (R
1) would be unknown. In such cas-
es, we estimated R1 by using the largest avail-
able denominator, Di, for the indicators for that
disease.We report practice outcomes with respect to
clinical indicators in three ways: the reported achievement is the proportion of patients de-clared appropriate for an indicator for whom the practice met the indicator (N
i ÷ D
i); the population
achievement is the number of patients for whom the indicator was met as a proportion of the estimated number of patients with the condition (N
i ÷ R
1); and the rate of exception reporting is
the estimated number of patients who were ex-ception-reported (excluded) for the indicator as a proportion of the estimated number of patients with the condition [(R
1 – D
i) ÷ R
1].
Summary outcome scores for each condition were constructed as weighted mean scores for the
score on each indicator, where the weights were the number of points available for each indicator. A global score was similarly constructed as a weighted mean across all conditions.
Information on practice characteristics was taken from the 2004 General Medical Statistics database maintained by the Department of Health. Socioeconomic characteristics were attributed to each practice with data from the 2001 Census and the Indices of Deprivation17 for the population of the electoral district where the practice was located. Although all practices took part in the new quality incentive framework, 42 percent were operating under an alternative Primary Medical Services contract with minor differences in the pay-for-performance scheme that diluted their fi-nancial incentives. However, the same clinical data were collected for all practices. We included an indicator for Primary Medical Services prac-tices.
The QMAS database contains data from 8576 practices with 1 or more family practitioners (with a mean of 3.2 full-time equivalents) provid-ing services for a defined population. Practices were excluded from the study if they had fewer than 1000 patients (61 practices) or if the reported register was missing (92 practices), contained no patients (272 practices), or included less than half the patients subsequently reported for individual indicators (109 practices). Our results are drawn from 8105 practices (94.5 percent; some practices had more than one of the exclusion criteria).
Linear multiple least-squares regressions with robust estimates of error variance were estimated for each outcome with the use of Stata software, version 8. The practice scores had heterogeneous variance, depending on patient numbers, and
Table 2. Reasons That Family Practitioners Can Record in Order to Exclude (Exception-Report) Patients from the Pay-for-Performance Scheme.
The patient has received at least three invitations for a review during the preceding 12 months but has not attended.
The indicator is judged inappropriate for the patient by the family practitioner because of particular circumstances, such as terminal illness, extreme frailty, or the presence of a supervening condition that makes the specified treatment of the patient’s condition clinically inappropriate.
The patient has recently received a diagnosis or has recently registered with the practice.
The patient is taking the maximal tolerated dose of a medication, but the levels remain suboptimal.
The patient has had an allergic or other adverse reaction to a specified medication or has another contraindication to the medication.
The patient does not agree to investigation or treatment.
A specified investigative service is unavailable to the family practitioner.
Copyright © 2006 Massachusetts Medical Society. All rights reserved. Downloaded from www.nejm.org at UC SHARED JOURNAL COLLECTION on May 7, 2009 .

pay-for-performance programs in family practices in the united kingdom
n engl j med 355;4 www.nejm.org july 27, 2006 379
therefore analytical weights that were approxi-mately inversely proportional to the variance at each practice were used. Each analysis used the same set of practice and population characteris-tics as explanatory variables. The regression for reported achievement also included the rate of exception reporting. Indicator variables (fixed ef-fects) were included to allow for unobserved effects of policies of the Primary Care Trust where the practice was located. Outcome variables were expressed as percentages ranging from 0 to 100. All variables were divided by their standard de-viations, and therefore the reported coefficients show the increase in the standard deviations of outcome variables for each increase of one stan-dard deviation in predictor variables. Sensitivity analyses with respect to weighting scores and calculating rates of exception reporting are re-ported in Supplementary Appendix 2.
Ethics-committee approval was not required for this study, since it was based on publicly avail-able data.
R esult s
Practice performance under the new financial incentive program
The practices scored a median of 1003 points (in-terquartile range, 948 to 1033), or 95.5 percent of those available, earning an average of £76,200 ($133,200) each. Of the 8105 practices, 230 (2.8 percent) scored the maximum of 1050 points. On the clinical indicators, the practices scored a me-dian of 532 points (interquartile range, 504 to 545), or 96.7 percent of those available, with 591 prac-tices (7.3 percent) scoring the maximum of 550.
The median reported achievement — that is, the proportion of eligible patients for whom the targets were actually achieved — was 83.4 percent overall; the reported achievement for individual diseases ranged from 80.1 percent for diabetes to 96.0 percent for hypothyroidism (Table 3).
The overall rates of exception reporting were generally low (median, 6.0 percent) but ranged widely from 0 percent to 85.8 percent (Table 3), with 91 practices (1.1 percent) excluding more than 15 percent of their patients. The median rates of exception reporting for disease domains ranged from 0.8 percent for hypothyroidism to 9.5 percent for mental health problems.
The median population achievement (the pro-portion of all patients with the condition for
whom the target was achieved, including those who were exception-reported) was estimated at 82.9 percent overall, ranging from 72.8 percent for asthma to 95.3 percent for hypothyroidism (Table 3).
Factors associated with overall performance
Characteristics of practices, patients, and local areas had significant effects on population achieve-ment (Table 4). Achievement was lower in prac-tices with a high proportion of patients who were living in single-parent or low-income households or were 65 years of age or older. Achievement was also lower in larger practices and in practices with a high proportion of family practitioners who re-ceived their medical education outside the United Kingdom or were 50 years of age or older. Achieve-ment was higher in practices with a high ratio of family practitioners to patients and lower in prac-tices that were on the Primary Medical Services contract. However, the multiple regression model explained only 20 percent of the variation between practices, and all of these effects were small. The number of patients, for example, had the effect of reducing achievement by 0.13 percent for every additional 1000 patients on the practice list.
For reported achievement (Table 4), the factor with the greatest effect was exception reporting. An increase of 1 percent in the estimated propor-tion of patients excluded was associated with an increase of 0.31 percent in reported achievement.
The rates of exception reporting were higher in Primary Medical Services practices and lower in practices with larger populations of elderly pa-tients, patients with good self-rated health, and patients without any formal educational qualifi-cations (Table 4). However, the model explained only 20 percent of the variation between practices, and the effects of individual explanatory variables were small.
Discussion
In the first year of the pay-for-performance pro-gram, English family practitioners performed ex-tremely well with respect to the quality targets, attaining a median of 96.7 percent of the avail-able points for clinical indicators. This greatly ex-ceeded the 75 percent predicted when the scheme was negotiated, and consequently the cost to the taxpayers was considerably more than expected. Before the new contract was implemented, family
Copyright © 2006 Massachusetts Medical Society. All rights reserved. Downloaded from www.nejm.org at UC SHARED JOURNAL COLLECTION on May 7, 2009 .

T h e n e w e ng l a nd j o u r na l o f m e dic i n e
n engl j med 355;4 www.nejm.org july 27, 2006380
practitioners typically earned from £70,000 to £75,000 ($122,000 to $131,000). The pay-for-per-formance program increased the gross income of the average family practitioner by £23,000 ($40,200), although the practitioners bore any ad-ditional nursing and administrative costs of meet-ing the targets. In 2005–2006, family-practitioner income will rise even more, since quality payments have been increased to £125 ($218) per point.
Exact comparisons with U.S. data on quality of care are difficult because of differences in in-dicators, dates of data collection, and samples.18 However, some limited comparisons are possible. For example, 91 percent of patients with diabetes
had their glycated hemoglobin levels measured in 2004–2005 under the new pay-for-performance program in England. In comparison, glycated hemoglobin levels were measured in 94 percent of patients with diabetes treated by the U.S. De-partment of Veterans Affairs in 1999–200019 and 93 percent of such patients in 2000–2002,20 in 83 percent of patients with diabetes treated by com-mercial managed care groups in the United States in 2000–2002,20 in 82 percent of patients with dia-betes treated by Pacific Northwest physician groups with pay-for-performance programs in 2001–2002, in 64 percent of patients with diabetes treated by California physician groups with pay-for-perfor-
Table 3. Summary Statistics for the Performance of 8105 Family Practices in England with Respect to Clinical Quality Indicators, 2004–2005.*
Clinical Domain and Summary Statistics
No. of Registered Patients per Practice
All Clinical Indicators
Subgroup of 30 Indicators for Which Data on Exception Reporting Were Available†
Reported Achievement‡
Reported Achievement‡
Estimated Exception-
Reporting Rate
Estimated Population
Achievement§
mean ±SD (range) percent
Overall
Median 83.4 88.6 6.0 82.9
IQR¶ 78.2–87.0 83.4–91.9 4.9–7.7 77.9–86.3
Range 8.2–100 10.7–100 0–85.8 10.4–97.6
Asthma 373±252 (13–2359)
Median 80.5 75.5 2.7 72.8
IQR¶ 73.9–85.7 67.7–82.8 1.3–5.5 63.7–79.5
Range 12.6–100 0–100 0–100 0–100
Cancer∥ 33±26 (1–270)
Median 91.7
IQR¶ 77.8–97.5
Range 0–100
Coronary heart disease 230±166 (2–1994)
Median 85.7 88.4 7.8 81.9
IQR¶ 80.6–89.2 84.5–91.4 5.4–10.4 78.7–84.4
Range 9.1–100 7.8–100 0–87.6 7.1–100
Chronic obstructive pulmonary disease
87±73 (1–731)
Median 88.7 87.8 8.2 78.7
IQR¶ 76.1–94.5 74.2–93.9 4.9–12.8 66.9–85.7
Range 5.4–100 8.0–100 0–100 6.6–100
Diabetes 214±133 (11–1412)
Median 80.1 89.5 4.7 84.8
IQR¶ 75.0–84.0 82.6–94.4 3.3–7.0 78.3–89.6
Range 1.7–100 3.7–100 0–83.9 3.2–99.3
Copyright © 2006 Massachusetts Medical Society. All rights reserved. Downloaded from www.nejm.org at UC SHARED JOURNAL COLLECTION on May 7, 2009 .

pay-for-performance programs in family practices in the united kingdom
n engl j med 355;4 www.nejm.org july 27, 2006 381
mance programs in 2002–2003,21 in 89 percent of Medicare patients with diabetes in 2004,22 and in 76 percent of Medicaid patients with diabetes in 2004.22 For other aspects of diabetes care, in-cluding blood lipid testing, eye examinations, microalbuminuria screening, and influenza vac-cination, performance in the first year of the new contract also placed family practitioners in En-gland on a par with their better-performing U.S. peers.
There is no baseline with which to compare performance in the first year of the U.K. program, although the quality of care was already improving
before its introduction.6 The high levels of achieve-ment might suggest that the targets were too easy to achieve.23 The scheme has been revised for 2006–2007: all minimum and some maximum payment thresholds have been raised, 30 indica-tors have been dropped or modified, and 18 new indicators have been introduced.24 The high achievement levels might also have resulted from misreporting by practices. To counter misreport-ing, Primary Care Trusts, statutory bodies respon-sible for the delivery of health care in local areas, inspect all local practices and undertake detailed audits of randomly selected practices and those
Table 3. (Continued).
Clinical Domain and Summary Statistics
No. of Registered Patients per Practice
All Clinical Indicators
Subgroup of 30 Indicators for Which Data on Exception Reporting Were Available†
Reported Achievement‡
Reported Achievement‡
Estimated Exception-
Reporting Rate
Estimated Population
Achievement§
mean ±SD (range) percentEpilepsy∥ 38±27 (1–224)
Median 84.2
IQR¶ 75.0–89.3
Range 0–100
Hypertension 727±489 (18–4166)
Median 81.0 92.6 0.9 91.6
IQR¶ 76.2–84.9 89.4–94.7 0.5–1.7 88.4–93.9
Range 16.0–100 27.1–100 0–86.1 9.9–100
Hypothyroidism 141±105 (1–1054)
Median 96.0 96.0 0.8 95.3
IQR¶ 93.2–98.2 93.2–98.2 0.0–2.0 92.3–97.7
Range 0–100 0–100 0–87.1 0–100
Mental health 35±33 (1–446)
Median 93.2 96.4 9.5 85.2
IQR¶ 86.3–97.5 91.3–100 3.1–22.7 70.0–93.3
Range 0–100 0–100 0–100 0–100
Stroke 95±80 (1–1816)
Median 84.4 91.9 6.1 85.4
IQR¶ 77.7–89.0 86.1–95.2 3.8–9.0 80.2–89.2
Range 5.7–100 10.5–100 0–90.7 8.0–100
* The reported achievement is the proportion of patients declared appropriate for an indicator for whom the practice met the indicator (Ni ÷ Di); the population achievement is the number of patients for whom the indicator was met as a proportion of the estimated number of patients with the condition (Ni ÷ R1); and the rate of exception reporting is the estimated number of patients who were exception-reported (excluded) for the indicator as a proportion of the estimated number of patients with the condition [(R1 – Di) ÷ R1].
† The results are based on indicators for which rates of exception reporting could be estimated (see Supplementary Appendix 1).‡ Exception-reported patients are excluded from the analysis.§ Exception-reported patients are included in the analysis.¶ IQR denotes interquartile range.∥ Imputation of rates of exception reporting and population achievement was not possible for indicators in this domain.
Copyright © 2006 Massachusetts Medical Society. All rights reserved. Downloaded from www.nejm.org at UC SHARED JOURNAL COLLECTION on May 7, 2009 .

T h e n e w e ng l a nd j o u r na l o f m e dic i n e
n engl j med 355;4 www.nejm.org july 27, 2006382
suspected of incorrect or fraudulent returns. The results of these audits are not, however, publicly available.
Because achievement was universally high, there was little variation between practices. It was not surprising, therefore, that socioeconomic and demographic factors, which profoundly affect pop-ulation health and the use of health care facili-
ties,25,26 had relatively little influence on achieve-ment. Although practices that served lower-income populations had worse overall population achieve-ment, the effect was small, and they were no more likely to use exception reporting to exclude pa-tients than were practices with more aff luent populations. Deprivation-related health inequali-ties therefore appear unlikely to have been great-
Table 4. Regression Analyses of the Association of Area, Patient, and Practice Characteristics with Reported Achievement, Rates of Exception Reporting, and Population Achievement in Family Practices in England, 2004–2005.*
CharacteristicOverall Reported
AchievementException-Reporting
RateOverall Population
Achievement
standardized beta coefficient
Area
Population density (persons/hectare) −0.03 0.00 −0.03
Proportion of population
Living in income-deprived household† −0.05‡ 0.02 −0.05§
No educational qualifications¶ 0.02 −0.07‡ 0.05
Long-term unemployed −0.01 0.02 −0.01
Living in social housing∥ −0.03 −0.04 −0.02
Living in 1-parent household −0.05 0.02 −0.06‡
Good self-rated health 0.03 −0.07§ 0.04
Patients
≤15 Yr of age 0.01 −0.02 0.01
≥65 Yr of age −0.04‡ −0.06§ −0.05§
Female sex 0.00 0.02 0.00
Member of racial or ethnic minority −0.02 −0.01 −0.02
Practice
Size of practice population −0.06§ −0.00 −0.07§
No. of family practitioners/10,000 patients 0.07§ −0.02 0.08§
Primary Medical Services contract −0.05§ 0.03† −0.05§
Family practitioners
≥50 Yr of age −0.04‡ 0.02 −0.03‡
Female sex 0.02 0.02 0.02
Medically educated in United Kingdom 0.08§ 0.00 0.08§
Exception reporting 0.13§
Model R2 0.19 0.20 0.20
* The reported achievement is the proportion of patients declared appropriate for an indicator for whom the practice met the indicator (Ni ÷ Di); the population achievement is the number of patients for whom the indicator was met as a pro-portion of the estimated number of patients with the condition (Ni ÷ R1); and the rate of exception reporting is the esti-mated number of patients who were exception-reported (excluded) for the indicator as a proportion of the estimated number of patients with the condition [(R1 − Di) ÷ R1].
† These households receive means-tested government benefits for low-income people.‡ The regression coefficient is significant at P<0.05.§ The regression coefficient is significant at P<0.01.¶ These persons are over the age of 18 and do not have any formal educational, vocational, or professional qualifications
on the basis of formal examination.∥ These persons do not own their housing and are not tenants in private dwellings.
Copyright © 2006 Massachusetts Medical Society. All rights reserved. Downloaded from www.nejm.org at UC SHARED JOURNAL COLLECTION on May 7, 2009 .

pay-for-performance programs in family practices in the united kingdom
n engl j med 355;4 www.nejm.org july 27, 2006 383
ly increased by the introduction of the financial incentive program. Smaller practices performed marginally better overall than large ones, although there was much greater variation in the perfor-mance of small practices, and many smaller prac-tices are believed to have merged in the face of the administrative pressures from the new con-tract.
Imputation of rates of exception reporting was possible for only 30 of the clinical indicators (39 percent), and we cannot determine how represen-tative these indicators were. There was a signifi-cant positive relationship between rates of excep-tion reporting and reported achievement for these indicators, but the effect was small. It is possible that practices that were better at identifying and treating patients with chronic conditions also tended to identify more patients for whom the targets were inappropriate. Alternatively, practices may have “gamed” the new system. The gener-ally low levels of exception reporting suggest that large-scale gaming was uncommon. However, a small minority of practices exception-reported a much larger proportion of their patients: 91 (1.1 percent) excluded over 15 percent of their patients. These practices warrant closer exami-nation to determine whether their use of excep-tion reporting was appropriate.
The rate of exception reporting varied consid-erably according to disease group. There were very low levels of exception reporting for hypo-thyroidism and relatively high levels for mental health problems, coronary heart disease, and chronic obstructive pulmonary disease. This vari-ation may reflect the nature of the indicators for each disease. For example, to meet the main hy-pothyroidism target, practices were required to record that a patient’s thyroid functions had been checked in the previous 15 months. This was a relatively easy target to meet; hence the achieve-ment level was high and there was little reason to exclude these patients. Since the indicator car-ried only a modest financial reward of 6 points (£456, or $800), there was also little incentive to game. In comparison, the main mental health indicator required a review of medication, physi-
cal health, and coordination arrangements with secondary care for patients with severe long-term mental health problems. Not only would one ex-pect legitimate exception reporting to be higher for this indicator, but the incentive to game would also be greater, since the indicator was worth 23 points (£1,748 or $3,050).
Several lessons can be drawn from the U.K. experience. First, the U.K. program was costly and was funded with substantial additional mon-ies rather than by restructuring existing payment systems. In addition to the payments for achieving quality targets, there were further costs, to both the practitioners and the government, of develop-ing and implementing the information-technol-ogy systems required to monitor the program. Budget-neutral programs would face greater resis-tance from family practitioners. Second, a clear baseline is needed to avoid paying for improve-ments that have already occurred. Third, geo-graphically staggered introduction would enable policymakers to better estimate the quality ef-fects of the program. Fourth, introducing pay-for-performance incrementally reduces risks for pro-viders and payers. Fifth, payers should allow for the possibility of higher-than-expected achieve-ment. Sixth, the risk of inappropriate treatment can be decreased with the use of mechanisms such as exception reporting, but monitoring is required to prevent abuse.
The U.K. experience suggests that greater changes in professional practice can be achieved through pay-for-performance programs than previ-ous research indicates.21 We do not know whether the size of the financial incentives made the differ-ence in the United Kingdom, and if so, how big incentives need to be. Whatever the case, financial incentives should be aligned to physicians’ profes-sional values to avoid serious distortions of care.
The National Primary Care Research and Development Centre receives core funding from the U.K. Department of Health. In 2002 and 2003, Dr. Roland was a member of a small team of academics who advised the government and professional negoti-ating teams that developed the pay-for-performance scheme. No other potential conflict of interest relevant to this article was re-ported.
The views expressed are those of the authors and not neces-sarily those of the U.K. Department of Health.
References
Schuster MA, McGlynn EA, Brook RH. How good is the quality of health care in the United States? Milbank Q 1998; 76:517-63.
Seddon ME, Marshall MN, Campbell
1.
2.
SM, Roland MO. Systematic review of quality of clinical care in general practice in the UK, Australia and New Zealand. Qual Health Care 2001;10:152-8.
Campbell S, Wilkin D, Roland M. Pri-3.
mary care groups: improving quality of care through clinical governance. BMJ 2001;322:1580-2.
Leatherman S, Sutherland K, eds. The quest for quality in the NHS. London: 4.
Copyright © 2006 Massachusetts Medical Society. All rights reserved. Downloaded from www.nejm.org at UC SHARED JOURNAL COLLECTION on May 7, 2009 .

n engl j med 355;4 www.nejm.org july 27, 2006384
pay-for-performance programs in family practices in the united kingdom
Nuffield Trust and Her Majesty’s Statio-nery Office, 2003.
Roland MO, Smith J. The role and con-tribution of primary care trusts to quality improvement. In: Leatherman S, Suther-land K, eds. The quest for quality in the NHS. London: Nuffield Trust and Her Majesty’s Stationery Office, 2003:203-24.
Campbell SM, Roland MO, Middleton E, Reeves D. Improvements in the quality of clinical care in English general practice 1998-2003: longitudinal observational study. BMJ 2005;331:1121-3.
Campbell SM, Roland MO, Shekelle PG, Cantrill JA, Buetow SA, Cragg DK. The development of review criteria for assessing the quality of management of stable angina, adult asthma, and non-insu-lin dependent diabetes mellitus in general practice. Qual Health Care 1999;8:6-15.
Shekelle P. New contract for general practitioners. BMJ 2003;326:457-8.
Roland M. Linking physician pay to quality of care — a major experiment in the United Kingdom. N Engl J Med 2004; 351:1448-54.
Chaix-Couturier C, Durand-Zaleski I, Jolly D, Durieux P. Effects of financial in-centives on medical practice: results from a systematic review of the literature and methodological issues. Int J Qual Health Care 2000;12:133-42.
Baker D, Middleton E. Cervical screen-
5.
6.
7.
8.
9.
10.
11.
ing and health inequality in England in the 1990s. J Epidemiol Community Health 2003;57:417-23.
Middleton E, Baker D. Comparison of social distribution of immunisation with measles, mumps, and rubella vaccine, En-gland, 1991-2001. BMJ 2003;326:854.
Spooner A, Chapple A, Roland M. What makes British general practitioners take part in a quality improvement scheme? J Health Serv Res Policy 2001;6:145-50.
Roland M, Campbell S, Bailey N, Whalley D, Sibbald B. Financial incentives to improve the quality of primary care in the U.K.: predicting the consequences of change. Prim Health Care Res Dev 2006;7: 18-26.
Starfield B. New paradigms for qual-ity in primary care. Br J Gen Pract 2001; 51:303-9.
British Medical Association. Focus on exception reporting. (Accessed June 28, 2006, at http://www.bma.org.uk/ap.nsf/Content/focusexcept0304.)
Office of the Deputy Prime Minister. Indices of Deprivation 2004. (Accessed June 28, 2006, at http://www.odpm.gov.uk/index.asp?id=1128440.)
McGlynn EA, Asch SM, Adams J, et al. The quality of health care delivered to adults in the United States. N Engl J Med 2003;348:2635-45.
Jha AK, Perlin JB, Steinman MA, Pea-
12.
13.
14.
15.
16.
17.
18.
19.
body JW, Ayanian JZ. Quality of ambula-tory care for women and men in the Vet-erans Affairs health care system. J Gen Intern Med 2005;20:762-5.
Kerr EA, Gerzoff RB, Krein SL, et al. Diabetes care quality in the Veterans Af-fairs health care system and commercial managed care: the TRIAD study. Ann In-tern Med 2004;141:272-81.
Rosenthal MB, Frank RG, Li Z, Epstein AM. Early experience with pay-for-perfor-mance: from concept to practice. JAMA 2005;294:1788-93.
The state of health care quality 2005. Washington, D.C.: National Committee for Quality Assurance, 2005.
Timmins N. Do GPs deserve their re-cent pay rise? BMJ 2005;331:800.
NHS Employers. The new QOF areas and indicators. (Accessed June 28, 2006, at http://www.nhsemployers.org/primary/primary-886.cfm.)
Marmot M, Davey Smith G. Socioeco-nomic differentials in health: the contri-bution of the Whitehall studies. J Health Psychol 1997;2:283-96.
Amick B, Levine S, Tarlov A, Walsh D. Community and health. In: Patrick D, Wickizer T, eds. Society and health. Ox-ford, England: Oxford University Press, 1995:46-92.Copyright © 2006 Massachusetts Medical Society.
20.
21.
22.
23.
24.
25.
26.
JOURNAL EDITORIAL FELLOW
The Journal’s editorial office invites applications for a one-year research fellowship beginning in July 2007 from individuals at any stage of training. The editorial fellow will work on Journal projects
and will participate in the day-to-day editorial activities of the Journal but is expected in addition to have his or her own independent projects. Please send curriculum vitae and research interests to the Editor-in-Chief, 10 Shattuck St., Boston, MA 02115
(fax, 617-739-9864), by October 1, 2006.
Copyright © 2006 Massachusetts Medical Society. All rights reserved. Downloaded from www.nejm.org at UC SHARED JOURNAL COLLECTION on May 7, 2009 .


