Embed Size (px)
Citation preview

Aus der Klinik und Poliklinik für Augenheilkunde
(Direktor Univ.- Prof. Dr. Stefan Clemens)
der Medizinischen Fakultät der Ernst-Moritz-Arndt-Universität Greifswald
Thema: Peripheral Dynamic Stereovision – A Novel Stereoscopic Test
Inaugural - Dissertation
zur
Erlangung des akademischen
Grades
Doktor der Naturwissenschaften in der Medizin (Dr. rer. med.)
der
Medizinischen Fakultät
der
Ernst-Moritz-Arndt-Universität
Greifswald
2009
vorgelegt von: Michael Broschart geb. am: 28.01.1976 in: Landstuhl

Dekan: Prof. Dr.rer.net. H.K. Kroemer
1. Gutachter: Prof. Dr.med. S. Clemens
2. Gutachter: Prof. Dipl.-Ing. Dr.med. H. Witte
(3. Gutachter:)
Ort, Raum: Greifswald, Konferenzraum der Kliniken für Neurologie und Neurochirurgie
Tag der Disputation: 15.02.2010

Table of Contents
1 | 97
I. Table of Contents
I. TABLE OF CONTENTS ............................................................................................................................................. 1 II. LIST OF FIGURES ................................................................................................................................................... 2 III. LIST OF TABLES ..................................................................................................................................................... 3 IV. ABSTRACT ........................................................................................................................................................... 4
PART I – INTRODUCTION .................................................................................................................................... 5
1. INTRODUCTION .......................................................................................................................................... 5
1.1 MOTIVATION ................................................................................................................................................... 5 1.2 ORGANISATION OF THE THESIS ............................................................................................................................ 7
2. THEORETICAL BACKGROUND ...................................................................................................................... 9
2.1 THE HUMAN VISION ......................................................................................................................................... 9 2.2 VISUAL FIELDS AND RETINAL ORGANIZATION ......................................................................................................... 9 2.3 PERIPHERAL VISION AND PERCEPTION OF MOTION ................................................................................................ 12 2.4 OCULAR MOTILITY .......................................................................................................................................... 14 2.5 THE OPTOKINETIC NYSTAGMUS ......................................................................................................................... 16 2.6 STEREOSCOPIC VISION ..................................................................................................................................... 20
2.6.1 Physiology of Stereopsis ........................................................................................................................ 21 2.6.2 Criteria of Stereopsis ............................................................................................................................. 23 2.6.3 Testing of stereopsis .............................................................................................................................. 26 2.6.4 Frisby Stereotest .................................................................................................................................... 32
PART II – MATERIALS AND METHODS ................................................................................................................ 35
3. MATERIALS AND METHODS ...................................................................................................................... 35
3.1 OVERVIEW OF THE EXPERIMENTAL SETUP ............................................................................................................ 35 3.2 STRUCTURAL AND ELECTROMECHANICAL HARDWARE ............................................................................................ 36 3.3 ROTATING DRUM AND STIMULUS PATTERN ......................................................................................................... 38 3.4 OPTICAL COMPONENTS ................................................................................................................................... 42 3.5 ERGONOMICS AND SETTINGS ............................................................................................................................ 44 3.6 DATA ACQUISITION AND PROCESSING ................................................................................................................. 45 3.7 PERFORMANCE AND LIMITS OF THE PROTOTYPE .................................................................................................... 48
4. EXPERIMENTAL PROCEDURE .................................................................................................................... 50
4.1 SELECTION OF SUBJECTS AND EXPERIMENTAL CONDITIONS ..................................................................................... 50 4.2 EXPERIMENTAL PROTOCOL ............................................................................................................................... 51 4.3 CONSIDERATION OF SYSTEMATIC ERRORS ............................................................................................................ 52
PART III ‐ RESULTS AND EVALUATION ............................................................................................................... 55
5. RESULTS AND EVALUATION ...................................................................................................................... 55
5.1 PRESENTATION OF THE RESULTS ........................................................................................................................ 55 5.1.1 Voluntary Feedback ............................................................................................................................... 56 5.1.2 Involuntary Feedback ............................................................................................................................ 59 5.1.3 Position of Peripheral Object Perception ............................................................................................... 64
5.2 STATISTIC CONSIDERATION ............................................................................................................................... 67 5.3 CONCLUSIONS ................................................................................................................................................ 70 5.4 IMPROVEMENT AND OPTIMIZATION OF THE TEST PROCEDURE ................................................................................. 72

Table of Contents
2 | 97
PART IV – DISCUSSION ...................................................................................................................................... 76
6. DISCUSSION ............................................................................................................................................. 76
6.1 SIGNIFICANCE OF PERIPHERAL DYNAMIC STEREOVISION ......................................................................................... 76 6.2 THE NEED OF OBJECTIVE TESTS AND CRITERIA OF ASSESSMENT ............................................................................... 79 6.3 COMPARISON OF THE RESULTS/SOLUTIONS WITH LITERATURE ................................................................................. 82 6.4 COMMERCIAL APPLICABILITY ............................................................................................................................. 85
PART V ............................................................................................................................................................. 88
7. SUMMARY ............................................................................................................................................... 88
8. REFERENCES ............................................................................................................................................. 92
ANNEX ............................................................................................................................................................. 97
MATERIAL SAFETY AND DATA SHEET OF POLYSTYRENE ........................................................................................................ 97
II. List of Figures Figure 2.1: Human visual field. .................................................................................................................................... 10 Figure 2.2: Distribution of cones and rods over the retinal surface ........................................................................... 11 Figure 2.3: Dependence of visual acuity on the position in the visual field and the lightning conditions. ................. 13 Figure 2.4: Arrangement of extraocular muscles. ....................................................................................................... 15 Figure 2.5: Synoptic overview of the basic eye movements for gaze shifting and stabilization. ................................ 16 Figure 2.6: Optokinetic Nystagmus. ............................................................................................................................ 18 Figure 2.7: Optokinetic cylinder with one quadrant removed .................................................................................... 18 Figure 2.8: Binocularity and stereopsis. ...................................................................................................................... 24 Figure 2.9: Vectograph image stereotests. ................................................................................................................. 29 Figure 2.10: Frisby Stereotest ..................................................................................................................................... 32 Figure 2.11: Geometric relations of the Frisby‐Stereotest. ........................................................................................ 33 Figure 3.1: Basic experimental setup .......................................................................................................................... 36 Figure 3.2: Control unit. .............................................................................................................................................. 37 Figure 3.3: Rotating stimulus drum. ............................................................................................................................ 39 Figure 3.4: Scheme of the sliding disparity mechanism. ............................................................................................. 40 Figure 3.5: Circumferential distribution of the differently sized circles of the stimulus pattern. ............................... 40 Figure 3.7: Aperture goggles. ...................................................................................................................................... 42 Figure 3.8: Fixation targets. ........................................................................................................................................ 43 Figure 3.9: Positioning of the subject. ......................................................................................................................... 44 Figure 3.10: Angular measurement system ................................................................................................................ 46 Figure 4.1: Flowchart of the experimental protocol. .................................................................................................. 52 Figure 4.2: Errors of edge eccentricity ........................................................................................................................ 53 Figure 5.1: Comparison of subjects with high (2) and poor (4) Performance Level. ................................................... 57 Figure 5.2: Comparative presentation of the results of 6 subjects. ............................................................................ 57 Figure 5.3: Comparison of the Confidence Ratios between the subjects of figure 5.1. .............................................. 58 Figure 5.4: The PL of two groups in comparison for the 18 experimental runs. ......................................................... 58 Figure 5.5: The CR of the two groups of figure 5.4 in comparison for the 18 experimental runs. ............................. 59 Figure 5.6: Involuntary movement pattern with hints of stereoscopic object recognition. ....................................... 62 Figure 5.7: Peripheral angles of perception (PA). ....................................................................................................... 65

Table of Contents
3 | 97
Figure 5.8: PA of the subjects averaged over their 18 runs. ....................................................................................... 65 Figure 5.9: Illustration of the mean peripheral location of conscious object. ............................................................ 66 Figure 6.1: Sequential stereo motion test................................................................................................................... 82
III. List of Tables
Table 2.1: Overview of (near) stereopsis assessment tests. ....................................................................................... 27 Table 4.1: Errors of edge eccentricity. ........................................................................................................................ 54 Table 6.1: Activities with raised demands on peripheral dynamic stereovision. ........................................................ 78

Abstract
4 | 97
IV. Abstract
This work proposes and experimentally evaluates a new method and the first prototypic design
of an apparatus for the objective assessment of peripheral dynamic stereovision.
“Peripheral dynamic stereovision” is understood as the ability to perceive, recognize and
observe moving objects in the visual periphery without sacrificing foveal fixation, i.e. shifting
the line of sight (e.g. moving the eyes or the head) and loosing attention to the scene of
interest. The presence of stereopsis on top further enhances the perceptive quality by adding
the third dimension with judgment of depth and estimation of relative spatial positions as
central cues for orientation, coordinative interaction and navigation in space.
Based on findings that moving stereoscopic contours can induce distinctive optokinetic
reactions, a panoramic stimulus pattern was rotated round subjects’ heads. Designed after the
Frisby Stereotest, solely the binocular parallax resulting from the plate thickness carries
stereoscopic information, excluding all other depth cues. A specially fitted goggle frame assured
correct binocular alignment of the subjects adding objectivity. In first experiments, voluntary
reactions (pushing a buzzer button) and involuntarily triggered ocular responses have been
registered. The performance level (PL) and confidence ratio (CR) were introduced as
benchmarks for voluntary reactions. Despite larger spreads, the PL averaged at 60 % while an
elevated CR confirmed a low error rate of 16 % and thus high overall credibility. Poor
performance of available recording hard‐ and software, in many cases, rendered the analysis of
involuntary ocular reactions less exhaustive. It was however observable, that peripherally
appearing objects triggered the onset of nystagmoid search and tracking mechanisms. Finally,
mean peripheral locations of subjects’ active reactions have been established at 30 degrees.
The outcome of this pilot study in principle confirmed basic feasibility, conceptual validity and
practical applicability of this novel method. Prospective fields of application with raised
demands on peripheral dynamic stereopsis have been identified and critically assessed. The
applicative possibilities and exclusive advantages of this test combining the assessment of
stereopsis and dynamic visual field testing have not been matched by solutions published so
far. Before however commercialization should be aimed at, design‐related issues, including the
implementation of electrophysiological ocular measurements, need to be addressed first to
lead the post‐prototype development to higher diagnostic expressiveness and reliability.

1. Introduction Motivation
5 | 97
Part I – Introduction
1. Introduction
1.1 Motivation
The presence of well‐developed stereopsis, not only within the central field of view, but also in
the periphery, and the associated early perception of moving objects outside the cone of
central vision are of prime importance for a number of activities that combine spatial
orientation, situation awareness, and quick decision making.
For certain professional activities that by their nature imply these elevated qualities of the
visual apparatus, methods of objectively assessing their presence are imperative. Especially
when decision making is based on the quick and reliable interpretation of peripherally moving
objects, while continuously focussing the actually observed scene of interest, these
considerations are important parameters of performance, being often directly safety relevant.
It is therefore reasonable to claim for medical pre‐employment tests to exclude impeding
deficits of the visual system of possible applicants. Once selected and accepted, there is also
the need to ensure the continuous fulfilment of these criteria during the active career of the
aspirants on the basis of regular tests of medical approval and confirmation. Among others,
such stringent requirements are to be met in traffic and flight‐ophthalmologic examinations,
particularly in aerospace and astronautics, public transportation and transport of dangerous
goods and so forth. For fire fighters, police and military forces, etc., similar criteria should be
considered to be defined. Also professional sports associated with good awareness and rapid,
decisive judgment of situations and coordinative interactions between team players, as it is the
case in fast ball sports such as soccer, basketball or hockey, etc., need to be mentioned, as well
as individual reactive sports ranging from tennis, martial arts to motor racing. Objective
selection of suitable candidates, since the efforts to be paid are high and costly, is of
fundamental economic and strategic interest for all parties involved.
Potential interest might as well arise in the branch of pension insurers, which is alerted by the
increasing number of claims of partial or total invalidity based on pretences and fraud. By
application of an objective and legally recognized test procedure, these cases could be easily

1. Introduction Motivation
6 | 97
debunked and settled in a very time and cost efficient way, annually saving amounts of
unjustified benefit payments.
A rather long‐term vision driving this study is a possible development of a method for early and
non‐misleading identification of symptoms of infantile amblyopia and strabismus. Especially
when dealing with younger patients conventional methods due to their more subjective nature
(on the part of patients and examiners) are either not reliable enough or simply fail due to
lacking willingness for cooperation.
Against the background of these exemplary scenarios, surely much more could be found, the
goal of this work is the pre‐development, design, prototyping and experimental verification of a
new device and method to objectively test the presence of dynamic peripheral stereopsis based
on the Frisby Stereotest. Viewing will be enabled under purely natural conditions. The
stereoscopic stimuli to be perceived are based on real physical depth and plastically exist.
Subjects are not exposed to artificialized conditions, i.e. any kind of “technical manipulation” by
means of computer‐generated patterns, polarizing filters, optic frame‐shutter systems, etc.
Consequently, they will be facing the same conditions as they will do in their daily routines
outside laboratory environments. The level of objectivity from the examiners’ and patients’
perspectives is high as by the nature of the method it should be possible to a priori exclude
manipulation from both sides.
By demonstrating the basic feasibility of this new method under simple frame conditions, the
practical experience gained and the lessons learnt so far shall motivate the further advance
towards a professional second prototype design leading towards practical applicability and
possible commercialisation within a reasonable time line.

1. Introduction Organisation of the Thesis
7 | 97
1.2 Organisation of the Thesis
The central aspects of this work are:
• Initiation of an experimental pilot study regarding dynamic peripheral stereopsis.
• Overview of the theoretical background of relevance.
• Materialization of a novel test apparatus and methodology to objectively detect the
presence of peripheral stereopsis.
• Identification of objective criterions of assessment.
• Experimental validation of this novel procedure and discussion of its diagnostic value.
• Definition of succeeding steps towards advanced prototype design overcoming
identified deficits.
• Identification of prospective fields of application.
• Evaluation of commercialization.
The work is structured into five main parts as follows:
Part I briefly introduces into the topic by presenting essential aspects of the physiology of the
human visual system and its perceptive abilities. First, the visual fields and the general retinal
organisation are outlined, chiefly focussing then on the peripheral field of view and its
particularities of interest. The basics of ocular motility and the Optokinetic Nystagmus (OKN)
are introduced. The latter is of particular interest as its underlying mechanisms will play an
important role throughout this work. The second sub‐section treats the theoretical background
concerning binocular and stereoscopic vision, outlining “stereopsis as the highest level of visual
perception”. A critical synopsis of the most common stereoscopic tests as established in
today’s clinical practise follows. Among them, the Frisby Stereo Test is brought out to be the
most appropriate one, in particular when applicative simplicity, naturalness of stimulus
presentation and objectivity of assessment are the main criterions.
The description of the experimental set‐up, its aims and methodological procedure are covered
in Part II. After a short presentation of the mechanical structure and its basic features, the
electromechanical hardware components and the control elements for operation are
described. Some emphasis is put on the construction of the transparent cylinder carrying the
stereoscopic stimuli pattern which is rotated around the subject’s head. Further, ergonomic

1. Introduction Organisation of the Thesis
8 | 97
aspects and the concept of data acquisition and processing are laid down. Finally, the attainable
performance and functional limitations of the test procedure are discussed and potential
improvements proposed. In the second sub‐section, criterions of selection of subjects are
defined and the routines of the experimental procedure described.
The results of the prototype experiments that were carried out are issued in Part III. When
exposed to the stimulus pattern, the subjects confirmed both types of possible reactions have
been expected: voluntary and involuntary ones. As common criterions for comparability, the
“performance level”, “confidence ratio”, and the “peripheral angle of perception” are defined.
The initial hypothesis that peripherally moving stereoscopic contours are perceived, with the
central field of view occluded, will trigger characteristic responses of ocular motion to be
correlated with the motion of the stimuli, could in principle be demonstrated and plausibility
checked. Additionally, the peripheral regions where object recognition was best could be
empirically found. The validity of the data and concluded results are critically assessed. Based
on the experience gained and the deficiencies identified, ways to optimize the test procedure
are finally suggested.
Part IV highlights the significance of dynamic peripheral stereopsis with special focus on
objective detectability and criterions for the optimum assessment of its presence. Motivated by
a broad field of prospective future applications, which have been shortly introduced in part I,
such as objective candidate selection for certain professional areas, aptitude tests, medical
certificates, etc., as well as a tool for the early diagnosis of visual abnormalities of binocularity
in infants, reflects justified necessity to further drive on this present pre‐development stage. A
comparison of similar test methods that have been studied and published is provided. Based
thereupon, possible commercial applicability is evaluated and argued, and a further, conclusive
plan of development is proposed.
This dissertation closes with the summary in Part V, followed by the reference list.

2. Theoretical Background The Human Vision
9 | 97
2. Theoretical Background
2.1 The Human Vision
In the process of human vision, the eyes are optically equivalent to a camera system
reproducing inverted and reversed images of the visual world onto the retina. Photosensitive
receptor cells, cones and rods, are distributed over this multi‐layered sensory surface to
generate electrical potentials via photochemical reactions [Grüsser, 1983; Guyton and Hall,
2006]. Fed into the brain through the optical nerves, along the visual pathway, these afferent
signals are pre‐processed and filtered in dedicated cortical areas [Howard and Rogers, 1995].
The actual visual impression is finally generated in the visual cortex on receptive fields that are
associated to the respective retinal areas [Grüsser, 1983; Howard and Rogers, 1995; Herzau,
2004a].
2.2 Visual Fields and Retinal Organization
The part of the environment seen without neither moving head nor the eyes is commonly
known as the visual field. In humans, with the eyes motionless, the total visual field may extend
laterally about 190 degrees [Howard and Rogers, 1995]. The field of gaze is an enlargement
thereof, an additional area opened by voluntary and multilateral movements of the eyes but
with head and body remaining motionlessly fixed. The field of gaze may cover 260
[Sachsenweger and Friedburg, 1992; Sachsenweger, 2002a] up to even 290 degrees in
horizontal extent [Howard and Rogers, 1995] strongly depending on the individual extend of
muscular contractibility. When additionally head movements, with the body remaining
stationary, came into play, the total visual field can almost cover 360 degrees [Howard and
Rogers, 1995].
Each monocular visual field is extending to about 50‐60 and 70 degrees superiorly and
inferiorly, 60 degrees nasally, and over 90 degrees temporally [Taylor, 1973; Sachsenweger and
Friedburg, 1992; Howard and Rogers, 1995; Sachsenweger, 2002a], as exemplarily portrayed in
the perimetry chart of figure 2.1a for the right eye. Resulting from the overlap of the two
monocular visual fields, the part within their spanned total visual field that can be seen with
both eyes simultaneously is called the binocular visual field. The white, central portion of figure

2. Theoretical Background Visual Fields and Retinal Organisation
10 | 97
2.1b shows a plot of a normal binocular field. It is a heart‐shaped range of about 60 degrees to
the left and to the right side of the head [Taylor, 1973; Sachsenweger and Friedburg, 1992;
Howard and Rogers, 1995; Sachsenweger, 2002a]. With the eyes aligned straight ahead, the
upper boundary extends to circa 50 degrees above, the lower boundary about 75 degrees
below the line of sight [Howard and Rogers, 1995]. Within these physiological borders, the
brain is able to merge the two individual visual impressions of the eyes enabling the perception
of spatial depth. However, the above numbers are representative standards given for healthy
subjects. Individual anatomic and physiological conditions, as well as the particular features of
the environment and the objects gazed at influence the shape and extent of the visual field.
Figure 2.1: Human visual field. Perimetric chart of the average human monocular visual field for the right eye (a) and the binocular field of view (b). The cut‐offs are shown by the black area. The eccentricity angle is the distance in degree by which a target is displaced from the fovea. The central portion of (b) represents the binocularly and the hatched portions the monocularly seen regions of space (modified from [Taylor, 1973]).
The visual environment we perceive is the synergic composition of foveal, para‐foveal, and
peripheral acquisition of information and the particularities of retinal organization. Foveal
(central) vision refers to the image formation on the fovea, the centre of the retina, which is
about 5 degrees (1.5 mm) in diameter [Lang, 1992]. With some 1.2 degrees (0.3 to 0.4 mm) in
diameter [Lang, 1992; Guyton and Hall, 2006], its central portion, the fovea centralis, contains
the highest density of cones but lacks of rods. Although scotopically blind, for the number of
optic nerve fibres almost equals to the number of innervated cones [Taylor, 1973; Guyton and

2. Theoretical Background Visual Fields and Retinal Organisation
11 | 97
Hall, 2006], rendering the fovea centralis as the region of greatest visual acuity and spatial
resolution of the entire retina. Gazing at or directing the visual attention on a target means
capturing it into the fovea centralis and then keeping it continuously fixed to extract detailed
object information. The visual line connecting the point of fixation with the central point of the
fovea centralis is called the visual axis and is not to be confused with the optic axis. The optical
axis is the line trough the centres of the optical components which are at an angle of about 5
degrees to each other [Howard and Rogers, 1995]. The para‐foveal region can centrally extend
up to 10 degrees with respect to the fovea centralis and is composed of a lower density of
cones but a steeply rising density of rods [Grüsser, 1983]. Therefore, the para‐foveal region is
operating well under both photopic and scotopic conditions. The blind spot (optic disk or
papilla) is a slightly off‐centred area measuring about 5 degrees in width and 7 degrees in
height and is located approximately 12 to 15 degrees nasally to the fovea centralis
[Sachsenweger and Friedburg, 1992; Guyton and Hall, 2006]. There, the retinal nerve fibres
merge into the optic nerve passing out of the eye through the sclera, interrupting the retina
and causing a physiological scotoma, as to say. In contrast, the retinal periphery outside the
aforementioned regions is characterized by a steep decrease of cone density at elevated rod
density peaking at about 20 degrees [Grüsser, 1983].
Figure 2.2: Distribution of cones and rods over the retinal surface (modified from [Grüsser, 1983]).

2. Theoretical Background Peripheral Vision and Perception of Motion
12 | 97
Figure 2.2 shows the density of photoreceptors distributed over the retinal surface extending
from the fovea towards the nasal and temporal periphery. Accordingly, in the visual cortex, the
topological projection of the retina is nonlinear, i.e. the fovea centralis is projected onto a far
larger cortical area compared to an equally‐sized region of the retinal periphery [Grüsser, 1983;
Howard and Rogers, 1995].
2.3 Peripheral Vision and Perception of Motion
Derived from retinal organization and measured from the fovea, the central field of view spans
a total visual angle from about 20 to 30 degrees [Sachsenweger, 2002a]. The region outside is
generally referred to as the peripheral field of view.
Figure 2.2 illustrates that the visual periphery is rod‐dominated and therefore visual acuity is
poor as figure 2.3 indicates. With increasing distance from the fovea, visual impressions
become gradually blurred and fuzzy. Nevertheless, attributable to their intrinsic properties and
the fact that an increased number of rods converges to one and the same optic nerve fibre,
summation effects trigger more intense retinal stimulation [Guyton and Hall, 2006]. This makes
the retinal periphery highly sensitive in locating light stimuli and changing contrasts. Figure 2.3
gives the typical relationship between prevailing luminance conditions of a scene and visual
acuity of the (right) eye measured with the Landolt ring. It proofs an everyday experience that
photopic vision acuity and the discrimination of contrast is best in central vision while under
scotopic conditions central vision drops to zero, constituting a central scotoma [Sachsenweger,
2002a]. Scotopic vision is dominant in the periphery where attributed to the low number of
cones the perception and discrimination of colours are considerably diminished [Grüsser, 1983;
Guyton and Hall, 2006]. Especially in dim light and transition scenarios, peripheral perception
gains importance. In the dark‐adapted state, usually, the optimum discrimination is achieved at
about 10 degrees eccentricity from the visual axis [Taylor, 1973] at the lateral margins of the
peripheral field.

2. Theoretical Background Peripheral Vision and Perception of Motion
13 | 97
Figure 2.3: Dependence of visual acuity on the position in the visual field and the lightning conditions. The red curve represents the photopic, the black one the scotopic vision (modified from [Grüsser, 1983]).
From a functional point of view, peripheral vision not only complements central vision by its
capability to detect brightness gradation. More importantly, it enables the detection of objects
and directed motion outside the narrow cone of straight‐ahead vision at a high temporal
resolution [Grüsser, 1983; Carpenter, 1988; Guyton and Hall, 2006]. Within milliseconds,
spontaneous gaze‐shifting eye movements [Carpenter, 1988] can be triggered and executed to
foveally capture and track new objects of attention. Generally, related to the structural
particularities of the peripheral retina, both the capacity and extent of peripheral vision, and
the velocity thresholds for the visual detection of movement correlate with the complexity of
objects in size, shape, and colour, and the viewing conditions such as the visual distance,
background, and luminance [Grüsser, 1983]. Under photopic1 conditions, for instance, the
lower threshold of foveal motion sensitivity is about 0.2 to 0.8 minutes of arc per second. As
cited in [Guyton and Hall, 2006], under these conditions, even a minute gnat flying across the
visual field can instantly be detected, whereas when at rest, the insect would be entirely
undetectable for the human eye. The detectability can be improved [Grüsser, 1983] once the
visual field is free of distracting stimuli or by increasing the contrast of objects relative to the 1 Photopic vision: daylight and colour, luminance > 10 cd/m²; Scotopic vision: night, luminance <0.01 cd/m² (mesopic vision: transition area, dim light) [Sachsenweger, 2002a]

2. Theoretical Background Peripheral Vision and Perception of Motion
14 | 97
global visual scene. The direction of moving objects is also well determinable, even at raised
angular velocities of up to 300 to 400 degrees per second. At further increasing velocities of up
to a threshold of approximately 600 degrees per second, directional information can no longer
be obtained and the awareness of the presence of objects is more and more reduced to appear
as light/dark stimuli only [Grüsser, 1983].
In the context of movement perception, certain habituation effects, particularly of vestibular
responses [Carpenter, 1988], following prolonged periods of exhibition to moving stimulus
patterns, may lead to phenomena such as movement aftereffects and misinterpretation of
movement velocity [Grüsser, 1983]. The latter, one might have already experienced during long
straight and monotonous sections on the highway. Against this background, the practical
meaning of peripheral vision, in particular the perception of peripherally moving objects and
their three‐dimensional relation to each other will be assessed later in part IV of this thesis.
2.4 Ocular Motility
The ocular system is continuously scanning the visual scene for new information. Particular
objects of interest are caught and kept centrally fixed, or after deviation of view shifted back
into the fovea to stabilize gaze. Our complete and sharp impression of the entire scenery, in
spite of the extremely narrow cone of acute central vision, and even more when confronted
with a moving visual panorama, is ascribed to patterns of fixation and the action of quick
saccadic jumps [Carpenter, 1988]. One is unconscious of these continuous point‐to‐point
fixations and image shifts since the brain suppresses and extrapolates the visual scene to a
coherent image [Carpenter, 1988; Guyton and Hall, 2006]. When saccades are insufficient and
larger movements are required, the head moves along with the eyes. The most common modes
of object movement to be tracked that should be of discriminative interest [Taylor, 1973] are
(a) movements across the visual field in the fronto‐parallel plane,
(b) movements in depth toward or away from an observer,
(c) combinations of both,
(d) changes of rate or direction, and
(e) rotational movements.

2. Theoretical Background Ocular Motility
15 | 97
In principle, moving objects are perceived when either the eyes remain motionless and the
image is moving across the retina, or the eyes are following the moving target object, locally
fixing thus its image on the retina [Körner and Dichgans, 1967]. For that purpose, three
antagonistic pairs of striated extraocular muscles, four rectus and two oblique muscles, enable
a six‐degree‐of‐freedom, i.e., horizontal, vertical, and diagonal, mobility of the eyeball
[Carpenter, 1988; Lang, 1992; Sachsenweger, 2002b; Kaufmann and Steffen, 2004; Recker and
Lang, 2006] which is flexibly suspended in the orbital cavity (figure 2.4).
Figure 2.4: Arrangement of extraocular muscles.Frontal view (left) and the transverse‐caudal section (right) of the extraocular muscles of the right eye [Recker and Lang, 2006].
Additionally, two intraocular muscles [Grüsser, 1983; Guyton and Hall, 2006] retain the visual
impression under varying external conditions. These, the ciliary and the iris sphincter muscle,
do not move the globe itself, but adjust the refractive power of the dioptric apparatus [Grüsser,
1983] to the fixation distance (accommodation) by modifying the curvature of the lens. Thus,
control the amount of light that is entering the eye by appropriately setting the papillary
aperture, respectively.
Under functional aspects, the different binocular eye movements [Carpenter, 1988] can be
coarsely classified as gaze shifting and gaze stabilization (gaze holding) movements, as figure

2. Theoretical Background Ocular Motility
16 | 97
2.5 schematically depicts. Furthermore, depending on whether both eyes simultaneously move
in the same or in opposite directions, versions, which are also termed “conjugate” eye
movements, are distinguished from “disconjugate” vergences [Carpenter, 1988; Kaufmann and
Steffen, 2004]. Three types of micro‐movements during the straight‐ahead fixation of an object
point can be described: microsaccades and ocular drifts which are compensating for each other,
as well as microtremor to counter retinal fatigue. General ocular anatomy and neuro‐motor
physiology are detailed in dedicated textbooks such as [Carpenter, 1988; Sachsenweger, 2002b;
Kaufmann and Steffen, 2004; Recker and Lang, 2006].
Figure 2.5: Synoptic overview of the basic eye movements for gaze shifting and stabilization.
2.5 The Optokinetic Nystagmus
Nystagmus <Greek: nystagmos ‐ drowsiness, nystazein ‐ to be sleepy> is the bilateral,
involuntary and rhythmic, reflexive jerking of the eyes. Several physiological [Carpenter, 1988;
Sachsenweger, 2002b; Kommerell, 2004a; Guyton and Hall, 2006] and pathological
[Sachsenweger, 2002b; Kommerell, 2004b; Recker and Lang, 2006] forms of nystagmus exist.
Out of the physiological ones, the optokinetic nystagmus [Carpenter, 1988] will find closer
consideration as it plays a central role in the experimental part of this work. With its
neurophysiologic particularities and characteristic responses to stimulation [Träumer and
Bührmann, 1973; Garbutt et al., 2001], besides serving as an objective criterion for the
2. Theoretical Background Optokinetic Nystagmus
17 | 97
assessment of visual acuity [Noorden and Campos, 2002], the OKS might be applicable to
objectively assess fusion and stereopsis [Fox et al., 1978; Archer et al., 1987]. The optokinetic
responses might perhaps also be indicative for early symptoms of pediatric amblyopia and
strabismus [Naegele and Held, 1982; van Hof‐van Duin and Mohn, 1986; Herzau, 2004b]. In
combination with the smooth pursuit system [Carpenter, 1988], the optokinetic and vestibular
systems form essential parts of the human gaze‐holding and visual stabilization mechanism
[Carpenter, 1988; Kommerell, 2004a], see also synopsis of figure 2.5.
The OKN originates in the cerebral cortex when structured visual stimuli move relative to the
retina while, in the ideal case, eyes and head are kept stationary fixed [Grüsser, 1983;
Carpenter, 1988; Kommerell, 2004a, 2004b] to exclude vestibular artifacts. Accomplished by
repetitive sequences of slow and quick phases, the OKN shifts the eyes in a characteristic saw‐
tooth pattern, always in a conjugate fashion, to stabilize the image of moving scenes on the
retina [Carpenter, 1988]. By convention, the quick phase defines the direction, while the slow
phase keeps the target continuously foveated, avoiding thus image degradation and blurring
effects [Carpenter, 1988; Kommerell, 2004a]. While smooth pursuit movements [Carpenter,
1988] immediately respond to sudden stimuli at moving velocities reaching 30 degrees per
second [Kommerell, 2004a], the slow phase of the OKN may however need some seconds to
establish its maximum response [Kommerell, 2004a] to stabilize the entire retinal image of
larger moving objects during locomotion or head‐turning [Carpenter, 1988]. Sometimes both
mechanisms are competing and then solely the observer’s dedicated attention decides which
mechanism will take effect and which one will be suppressed; in other words, in a complete
scene either a small object is recognized and tracked by smooth pursuit or a larger one by slow
phase OKN [Carpenter, 1988; Kommerell, 2004a]. In any case, focused attention is an essential
prerequisite for good performance of both mechanisms [Carpenter, 1988].
The diagnostic value of the OKN comes into play as it is impossible to voluntarily alter saccadic
velocity [Garbutt et al., 2001]. Significant slowing should be regarded as a pathological sign
which can reveal abnormalities in the oculo‐motor periphery [Garbutt et al., 2001] and general
disturbances in the gaze control system [Grüsser, 1983]. During neuro‐ophthalmological
examinations, patients often are asked to attend to a patterned ribbon which is uniformly
moved in front of their eyes, preferably at angular speeds of 10 and 40 degrees per second
2. Theoretical Background Optokinetic Nystagmus
18 | 97
[Kommerell, 2004a, 2004b]. Slow and smooth optokinetic shifts are co‐directional with the
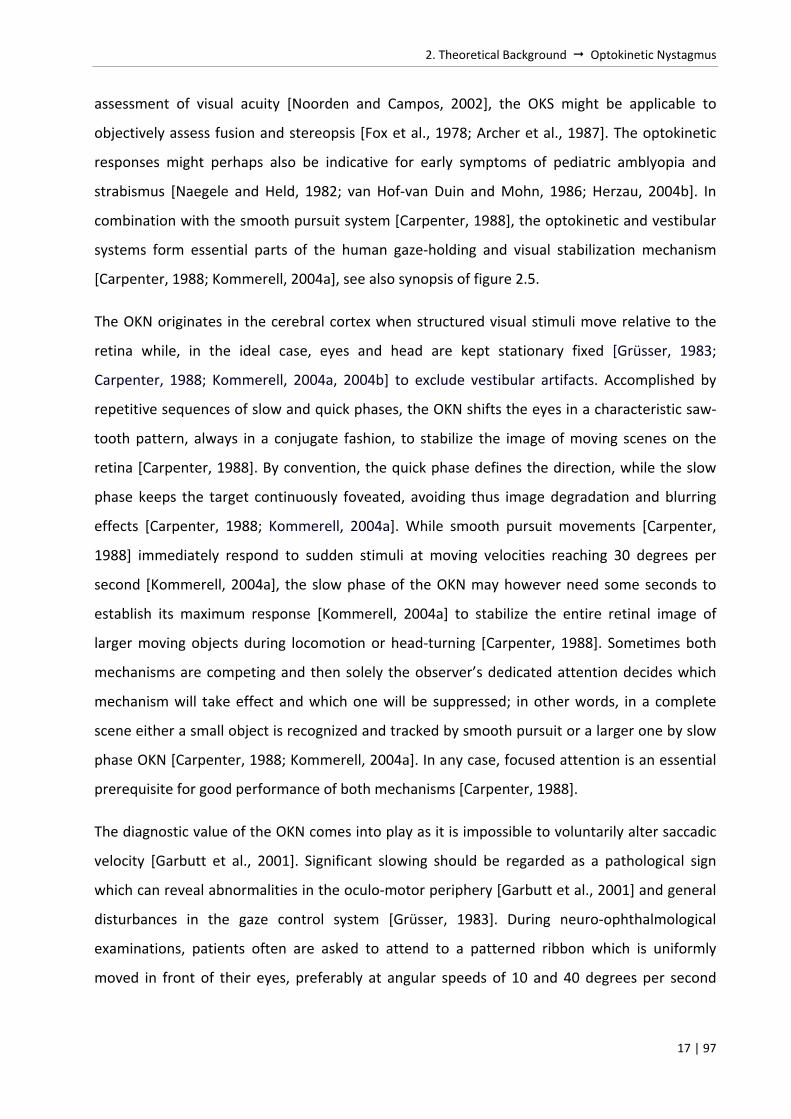
stimulus pattern and are represented as red arrows in figure 2.6. Quick saccadic jerks (black
arrows) to the opposite direction reset the eyeballs back to their central position for re‐fixation
[Grüsser, 1983] when observed objects are getting out of view. When the stimulus pattern is
moved to the side of the lesion, the OKN will be disturbed or absent [Kommerell, 2004b]. Often,
in screening situations or for infants, the Catford drum, a hand‐held cylinder covered with a
vertical pattern, is used [Suttle, 2001].
Figure 2.6: Optokinetic Nystagmus. The eyes slowly pursue the moving pattern (red arrows) and quickly jerk back to their central position (black arrows) [Sachsenweger, 2002b].
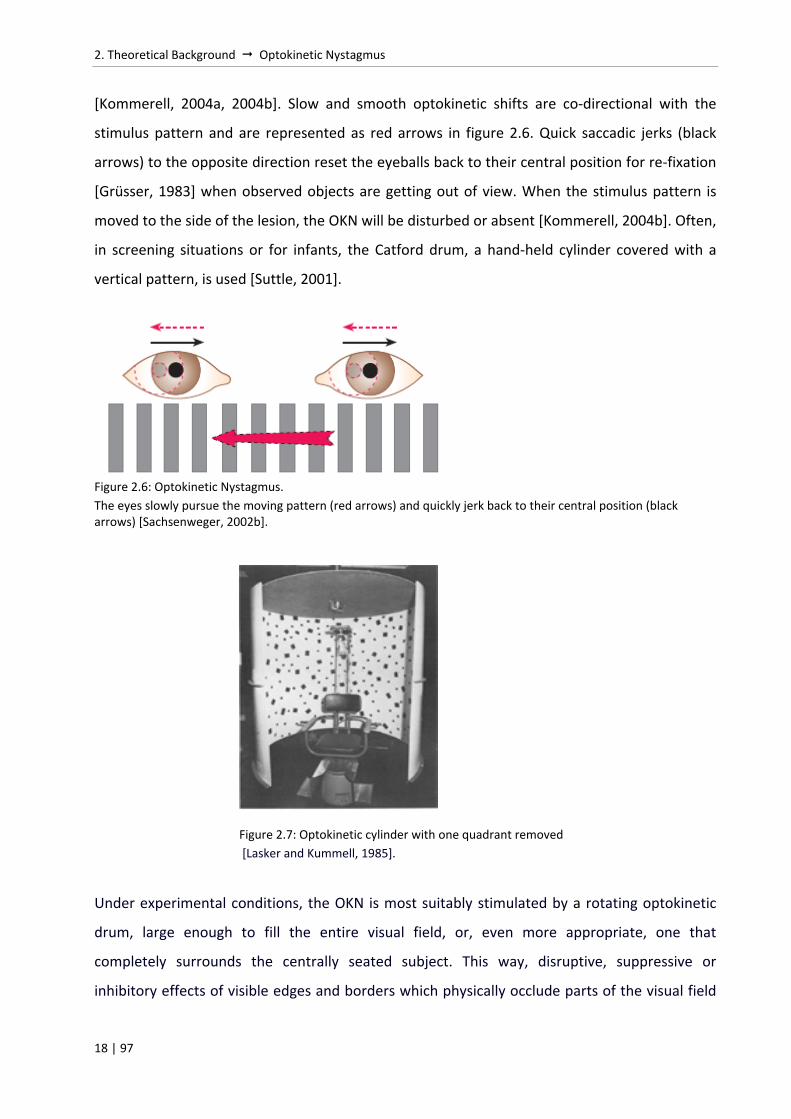
Figure 2.7: Optokinetic cylinder with one quadrant removed [Lasker and Kummell, 1985].
Under experimental conditions, the OKN is most suitably stimulated by a rotating optokinetic
drum, large enough to fill the entire visual field, or, even more appropriate, one that
completely surrounds the centrally seated subject. This way, disruptive, suppressive or
inhibitory effects of visible edges and borders which physically occlude parts of the visual field

2. Theoretical Background Optokinetic Nystagmus
19 | 97
[Murasugi et al., 1986; Pola et al., 1992] can be excluded. A possible set‐up is shown in figure
2.7 [Lasker and Kummell, 1985]. For demonstration, one part of the patterned screen is
removed.
Common criteria for optokinetic evaluation are the pace of the slow phase and whether the
OKN can be comparably well stimulated in both clockwise and counter‐clockwise directions
[Kommerell, 2004a, 2004b]. Other characteristic features for the quantitative assessment of the
OKN [Träumer and Bührmann, 1973] are the interval between successive saccades, the maximal
saccadic velocity and the power of the nystagmoid response. Usually, the relation of eye
velocity to stimulus velocity is referred to as the gain of OKN [Carpenter, 1988; Valmaggia et al.,
2001]. At moderate stimulus velocities of up to some 30 degrees per second the gain is around
unity [Carpenter, 1988] and then perfect image stabilization of the moving scene is obtained on
the retina [Murasugi et al., 1986]. Increasing the stimulus speed causes the slow phase lagging
behind, until at some 100 degrees per second the optokinetic system finally fails [Carpenter,
1988]. The elicited frequencies and amplitudes of the optokinetic beats are further influenced
by the contrast and luminance conditions [Carpenter, 1988; Wang and Sönderberg, 1995]. A
comprehensive and more detailed review on optokinetic dynamics is given in [Carpenter,
1988].
In human subjects, principally stare and look nystagmus can be discriminated [Wyatt and Pola,
1984; Carpenter, 1988; Garbutt et al., 2001]. In the stare condition (passive optokinesis),
subjects remain passive, avoiding attention to any specific feature of the moving scene. No
voluntary efforts are made to fix and track it with the eyes. It is purely reflexive and
characterized by a low gain, low amplitude, and frequent quick phases [Garbutt et al., 2001]. By
contrast in the look condition (active optokinesis), attention is to be paid to one single feature
or detail in a moving scene, i.e. it is continuously fixed and voluntarily tracked. Thus, gain is
high; amplitudes of slow phase movements are larger and interrupted by infrequent quick
phases of realignment.
However, foveal stimulation is not necessarily required to trigger optokinesis. Studies have
revealed that also a peripheral type of OKN [Dubois and Collewijn, 1979] can be shown either
by patients suffering from a central scotoma [Valmaggia et al., 2001 (and references therein)]
or by providing fixation targets that are foveally stabilized in subjects with normal binocular

2. Theoretical Background Optokinetic Nystagmus
20 | 97
vision [Dubois and Collewijn, 1979; Wyatt and Pola, 1984; Howard and Ohmi, 1984; Murasugi et
al., 1986; Carpenter, 1988]. A variety of optical and mechanical methods can serve to isolate
the peripheral OKN, some of which are reviewed e.g. in [Howard and Ohmi, 1984; Pola et al.,
1992]. Most of these methods are based on central occlusion of the retina by superposition of
stationary edges, bars, and central occluders, leaving only physically defined regions of the
retinal periphery accessible for stimulation. Also cues to be projected directly onto moving
stimulation patterns [Murasugi et al., 1986; Pola et al., 1995] have been widely considered,
likewise centrally stabilized afterimages and other artificially induced central scotomata [Dubois
and Collewijn, 1979; Wyatt and Pola, 1984], as well as intentional misconvergence of the eyes
to physical targets placed in front of the plane of the stimulus array [Howard and Ohmi, 1984;
Howard and Gonzalez, 1987]. Nevertheless, without providing a stationary fixation target, the
OKN is hardly suppressible at stimulus speeds below 5 degrees per second [Körner and
Dichgans, 1967]. Under above stated fixation conditions, it is possible defining retinal areas that
are insusceptible for optokinetic stimulation within which optokinesis can be weakened,
inhibited or even completely suppressed.
An additional feature of the OKN not mentioned so far is that also moving stereoscopic
contours are well able to induce determinable and differentiable optokinetic reactions.
However, stereoscopic nystagmus shows presence only in subjects with normal stereopsis; it
has been shown to be absent in stereo‐blind subjects [Fox et al., 1978; Archer et al., 1987].
The latter two characteristics of the OKN in tandem with a stereoscopic stimulation pattern
which is designed in the style of the Frisby Stereotest [FST] constitute the major functional
issues of the new examination method presented in this work.
2.6 Stereoscopic Vision
By inventing the stereoscope in 1838 [Wheatstone, 1838], the British physicist Charles
Wheatstone has set an important milestone in ophthalmologic history. With stereoscopy, he
showed that two in horizontal direction slightly displaced images can be fused by the brain,
implying the visual sensation of spatial depth, also referred to as stereoscopic depth or
stereoscopic vision. Under natural viewing conditions, the term stereopsis is generally used.
2. Theoretical Background Stereoscopic Vision
21 | 97
The binocularity aspect is no exclusive precondition since by assistance of certain visual and
experiential cues [Taylor, 1973; Noorden and Campos, 2002; Herzau, 2004a] depth can as well
be perceived monocularly. However, throughout this work, it is exclusively referred to binocular
stereopsis based on horizontal disparity.
2.6.1 Physiology of Stereopsis
The capability to perceive the world in three dimensions is to a great extend attributed to
binocularity and its specific senso‐motoric particularities to focus both eye on objects of
interest [Noorden and Campos, 2002]. As the eyes are located at two different head positions,
two slightly different perspectives of the visual scene are projected onto their retinas,
subtending two different visual angles. This difference is a common measure for binocular (or
retinal) disparity. The quality of normal binocular vision is distinguishable in three levels [Recker
and Lang, 2006]:
(a) Simultaneous vision – is the basic demand for binocular vision, claiming that both eyes
are simultaneously perceiving different perspectives of the foveated object.
(b) Fusion – is the brain’s capability to fuse the two different retinal inputs to one single
visual perception. Normally, fusion is initiated by a motoric process of opposite and
commensurate alignment of the lines of fixation to the object in question and keeping it
visually fixed.
(c) Stereopsis – is the highest level of binocular vision and depends on several conditions that
have to be met.
Following this gamut of binocular quality, the integration of the two‐dimensional perspectives
projected onto each retina for the final sensation of spatial depth takes place in the cortical
areas 17 and 18 in the occipital region of the brain [Carpenter, 1988; Lang, 1992; Herzau,
2004a; Likova and Tyler, 2007].
In the visual area the eyes are actually operating in, to allow for high‐quality binocular vision, in
particular good sensory fusion and finally stereopsis, retinal correspondence and some degree
of equity in image properties, such as similarity in size, brightness and sharpness, are basic
prerequisites [Noorden and Campos, 2002]. Retinal correspondence [Noorden and Campos,
2002; Rüßmann et al., 2004a] is given, when the eyes share a common visual direction. Their

2. Theoretical Background Stereoscopic Vision
22 | 97
reversed two‐dimensional perspectives can then be projected on identical retinal and finally
cortical areas yielding thus single vision. All object points that at a given fixation distance meet
this condition are connected by an imaginary, slightly curved parabolic line called horopter
[Grüsser, 1983; Howard and Rogers, 1995; Noorden and Campos, 2002; Tyler, 2004; Herzau,
2004a; Recker and Lang, 2006], a term already introduced in 1613 by Aguilonius. When an
observer changes fixation to a new point in space, also a new horopter curve through this point
will correspondingly be established.
Points of the object space located off the horopter fall on disparate or “non‐corresponding”
retinal elements eliciting double images (physiological diplopia) [Grüsser, 1983; Noorden and
Campos, 2002; Herzau, 2004a; Rüßmann et al., 2004a], which, conversely, do not a priori
exclude stereopsis [Sachsenweger and Friedburg, 1992]. Those objects located in front of (or
behind) the horopter are closer to the eyes than (or beyond) the actual fixation point and are
therefore projected on the temporal (or nasal) edge of the retina. Because the left (right) half
of the image is seen by the right (left) eye and vice‐versa, objects in front of (behind) the
horopter are referred to as seen in crossed (uncrossed) diplopia with respect to the respective
fovea [Grüsser, 1983; Howard and Rogers, 1995].
Provided these object points remain within the narrow borders of the Panum’s fusional area,
the range of which increases from the retinal centre towards the periphery [Noorden and
Campos, 2002; Herzau, 2004a] where it can even exceed 1 degree [Sachsenweger and
Friedburg, 1992; Herzau, 2004a], sensory fusion occurs and images are seen singly and
stereoscopically [Noorden and Campos, 2002; Herzau, 2004a; Rüßmann et al., 2004a; Tyler,
2004]. Outside these limits, on the other hand, sensory fusion cannot be maintained because
with increasing peripheral eccentricity images no longer fall on corresponding retinal areas and
consequently physiological diplopia results [Sachsenweger and Friedburg, 1992; Noorden and
Campos, 2002]. In that case, however, Burian experimentally verified (as cited in [Noorden and
Campos, 2002]) that adequate peripherally located disparate stimuli can elicit motor fusion (by
means of vergences) to approach objects to the horopter, allowing thus for sensory fusion in
order to avoid diplopia.

2. Theoretical Background Stereoscopic Vision
23 | 97
2.6.2 Criteria of Stereopsis
Only objects that are located within the Panum’s area can be fused by the brain to elicit
stereopsis. In complete absence of other stereoscopic cues [Taylor, 1973; Noorden and
Campos, 2002; Herzau, 2004a], exclusively disparate retinal images cause the awareness of
spatial depth. To quantify the grade of horizontal disparity, the retinal distance of the disparate
object location of one eye to that of the corresponding object location of the other eye could in
principle be simply measured. However, usually, the difference between the respective visual
angles (parallactic convergence angels) subtended by the two monocular projections is used as
a quantitative measure. This angle is termed disparity angle (δ) the particularities of which are
further defined in DIN 5340:1998‐04 (Terms for physiological optics). In general, the farther an
object is located off the horopter, the greater is the disparity angle.
That angle of disparity which corresponds to the minimum discernible binocular disparity is the
smallest perceivable difference in depth between two object planes subjects can reliably
discriminate [FST]. This so‐named stereo threshold is commonly used to express the degree of
stereoacuity, based on horizontal disparity alone. Under optimal laboratory viewing conditions,
it may range from 2 to 7 seconds of arc within the central field of view [Taylor, 1973; Noorden
and Campos, 2002; Herzau, 2004a; Tyler, 2004], whereas in clinical tests lower thresholds
between 15 and 30 seconds of arc can be considered as excellent reference values [Noorden
and Campos, 2002]. Likewise the visual acuity, with increasing retinal eccentricity, stereoacuity
diminishes with a steepening function as stimuli are moved from the fovea towards the
periphery of the visual field [Noorden and Campos, 2002; Herzau, 2004a, Tyler, 2004],
becoming very poor beyond about 20 degrees eccentricity as it is cited in [Tyler, 2004].
Regarding the perception time, in simple stereograms, and after ocular adaptation to the
prevailing ambient conditions, depth differences can in principle be distinguished within about
1 millisecond, provided sufficient luminance allows the observer to see the stimulus [Howard
and Rogers, 1995].
As illustratively schematized by the example of the three‐needle test in figure 2.8, both eyes
fixate a point F while a nearer point A and a farther point B are both located off the horopter,
but still within the Panum’s area to allow for fusion (not marked here). The incongruity in their
retinal image locations (as rear‐projected on the left margin of the figure) produces the angle of

2. Theoretical Background Stereoscopic Vision
24 | 97
binocular disparity. Here, for simplification, only the case of proximal stereopsis, point A is
located in front of the horopter, is shown.
Figure 2.8: Binocularity and stereopsis. Proximal stereopsis, i.e. when observing an object point A in front of the fixation point F is simplified (modified from [Herzau, 2004a]). In that case the corresponding retinal images are temporally shifted. Under crossed disparity conditions A appears protruding out of the fixation plane. For object point B, the situation would be analogously vice versa.
The angle of disparity varies with the distance of A and B measured from the horopter,
providing this way information how far these points are located from the plane of the fixation
point F. With (α > γ > β), for the case of crossed disparity, i.e. when point A is considered, the
angle of disparity is negative (δ/2 = γ – α), whereas it is positive for uncrossed disparity (δ/2
= γ
– β) when reference is given to point B. In the first case, as indicated in the retinal rear
projections on the left side of figure 2.8, crossed disparity causes temporal image disparity on
the retinas. This gives observers the impression that the object is stereoscopically protruding in
front of the fixation plane. The respective line of sight is presented by the red line. In the
second case, uncrossed disparity that causes nasally image shifting on the retinas gives the
impression that the object is located behind the plane of fixation (not shown here). The
respective line of sight is presented by the dotted blue line. The projection in the middle shows
fictive cyclopean eye (C) (also called binoculus or central imaginary eye [Noorden and Campos,
2002]) in which the retinas of both eyes are correspondingly matched, i.e. the respective
fixation points coincide and (Fl=Fr=F). The distance of displacement (D) between the rear

2. Theoretical Background Stereoscopic Vision
25 | 97
projections of point A to the retina of the cyclopean eye is for computational reasons projected
into the plane of fixation (red dashed line), here termed Xa. Starting from the simple geometric
relations based on the intercept theorem in equation 2.1, see also [Herzau, 2004a], the angle of
disparity (δ) can be mathematically approximated.
(2.1) a
aa
a
aa
dedPD
Xde
dPDX
−⋅
=⇒−
=
(2.2) e
X a2
2tan =⎟
⎠⎞
⎜⎝⎛ δ
As the disparity angle is given in radian measure and commonly is very small, with |δ<<1|, the
term tanδ can be approximated as δ. Applied for (2.2), with (2.1) in (2.2) and
considering ade >> it follows:
(2.3) [ ]rade
dPD a2
⋅=δ
Equation 2.3 expresses the disparity angle as a function of three variables: the observer’s
viewing distance to the fixation plane (e), the distance between the nodal points of the eyes or
simplified the interpupillary distance (PD), and the offset between two considered object
planes (da). It is to be noted that according to equation 2.3 the value of stereoacuity is defined
in radians. In degrees (seconds of arc) it is to be recalculated as:
(2.4) [ ]arcofondse
dPD a sec36001802 ⋅⋅⋅
=π
δ
Stereoscopic discrimination is finest at very close viewing distances [Herzau, 2004a]. With
increasing viewing distance to the fixation plane, the angle of disparity is reduced by the power
of two and stereopsis progressively loses its ability of unequivocal depth discrimination. The
critical far distance at which theoretically no more depth discrimination exclusively based on
binocular parallax is possible strongly depends on the parameters used for its computation
[Herzau, 2004a] as
(2.5) ( )( )2tan2 δ⋅=
PDe

2. Theoretical Background Stereoscopic Vision
26 | 97
In that case, the angle of disparity δ is to be understood as the subject’s individual stereoscopic
threshold. If in a visual scene only monocular cues are left, the reliability is not necessarily given,
as monocular cues often result from experience and knowledge, therefore they can be
deceptive or equivocal [Noorden and Campos, 2002].
In this context, one can imagine the efforts it takes estimating remote distances in an otherwise
cue‐less and monotonous widely extended environment, e.g. deserts, open sea or space
exploration [Taylor, 1973].
2.6.3 Testing of stereopsis
Today, several standard test methods for the evaluation of stereopsis are applied [Lang, 1992;
Sachsenweger and Friedburg, 1992; Noorden and Campos, 2002; Rüßmann et al., 2004a]
following a general methodology of ophthalmologic examination [Noorden and Campos, 2002;
Rüßmann et al., 2004a]. Generally, tests for stereopsis should incorporate two essential
features [Noorden and Campos, 2002]: dissociation, i.e. a separate field of view must be
presented to each eye, and retinal correspondence, i.e. each of the two targets must contain
elements that are imaged on corresponding retinal areas. This provides a frame of reference
and enables fusion of the disparately imaged elements to be seen stereoscopically. The type of
stereotest to be chosen by the examiner should depend on the particular question to be asked
[Leske et al., 2006]. Basically, as depicted in table 2.1, the commonly applied stereotests can be
coarsely classified into natural, direct methods and artificial, haploscopic ones [Lang, 1983; Lang
et al., 1991].

2. Theoretical Background Stereoscopic Vision
27 | 97
Table 2.1: Overview of (near) stereopsis assessment tests.
Natural, direct methods real depth
Artificial, haploscopic methods image separation
two‐pencil test rod alignment tests:
‐ three‐rod test of Hering ‐ Howard‐Dolman test ‐ Zagora test
falling‐bead test of Hering Frisby Stereotest
opto‐mechanical synoptophore anaglyph haploscopy polarization haploscopy phase‐difference haploscopy
anaglyphs TNO test (random dot)
light polarization Titmus stereotest Random dot stereograms a) vectograph
• Random dot butterfly
• Randot stereo smile test
• Randot test
• Random‐‘E’‐Test b) Lang I+II test
The first category of stereotests refers to natural free seeing conditions under which the same
image is binocularly presented, including some coarser tests [Noorden and Campos, 2002;
Rüßmann et al., 2004a] such as the two‐pencil test, the three‐rod and the falling‐bead test of
Hering, modifications thereof based on moveable rods to be aligned to each other, as well as
the Frisby Stereotest. A closer consideration of the Frisby Stereo Test [FST] will follow later in
this section as it is the underlying basic principle of the new examination method presented in
this work. Natural tests all have in common that they offer real spatial depth, while in contrast
haploscopic tests evoke the sensation of depth by means of two slightly disparate mappings
(stereoscopic principle, see [Rüßmann et al., 2004a]) which need to be separately offered to
each eye to be fused. In general, the presentation of such half‐frames can be achieved either
mechanically (using e.g. stereoscopes, synoptophores, or haploscopic methods) or by light
polarization and the superimposition of monocularly presented images in the frequency or
colour domain (then requiring Polaroid or red‐green glasses). Constituting another essential
difference, Lang [Lang et al., 1991] points out that at larger interpupillary distance natural
stereopsis is generally enhanced, whereas using haploscopic devices it is vice versa, i.e. smaller
interpupillary distances are then more favourable.

2. Theoretical Background Stereoscopic Vision
28 | 97
Although of great general interest, the variety of video and projection methods, or other
routines used for distance stereoacuity assessment [Rüßmann et al., 2004a] will find no
consideration here because for the time being, the method proposed in this work refers to near
stereoacuity (proximal stereopsis) testing only. Nevertheless, in further steps of development it
should also be adapted to distal stereopsis and the Frisby‐Davis distance stereotest (FD2)
should consequently be mentioned as a child‐friendly free space test of real depth [Adams et
al., 2005], in principle being quite similar to the Frisby Stereotest [FST]. Subsequently, some of
the most commonly applied stereoscopic test methods listed in table 2.1 are shortly outlined
and some relevant issues, such as applicability and diagnostic value of judgment comparatively
and critically assessed.
a) Haploscopic tests Haploscopic devices [Noorden and Campos, 2002; Rüßmann et al., 2004b] mechanically
separate images for dissociation, i.e. to individually present them to each eye. Haploscopes are
very versatile since they allow the quantification of the angle of squint, simultaneous vision, the
capacity for fusion and stereoscopic vision, depending on the type of paired test images used
[Rüßmann et al., 2004b]. In the simplest case, image separation can be accomplished by set of
blends, prisms or mirrors that present test slides at slightly different angles to each eye (e.g.
synoptophore). Alternatively, projectors that are equipped with colour or polarization filters
can be used (anaglyph or polarization haploscopy, which however require adequate
spectacles), or, as in phase‐difference haploscopy [Rüßmann et al., 2004a], alternating, phase‐
shifted image presentation can be realized by arrangements of rotating sector disks which are
synchronized with a set of special spectacles (recent alternative concepts apply liquid crystal
shutters). The latter two variations are conventionally projected on larger screens at a viewing
distance of 2 to 5 m away from the patient, covering 40‐50 degrees of the visual field [Rüßmann
et al., 2004a, 2004b].
b) Tests based on light polarization
This type includes vectograph image tests such as the Titmus stereotest, the ample group of
Random dot stereograms, and also the Lang I+II tests which are also based on random dot
pattern but due to their special design no spectacles are required to be worn.

2. Theoretical Background Stereoscopic Vision
29 | 97
Figure 2.9: Vectograph image stereotests. a) Titmus (Fly), b) Random dot, c) TNO, d) Lang Stereotest (courtesy of OCULUS Optikgeräte GmbH).
The Titmus stereotest is based on the superposition of two linearly polarized monocular images
[FST; Noorden and Campos, 2002] and consists of three parts as shown in figure 2.9a. A
housefly with disparate wings on one side of the test booklet serves to judge whether there is
gross stereopsis with a threshold of 3000 seconds of arc. It captures children’s interest when
trying to grasp the fly’s wings with their fingers. The nine sets of four grouped concentric circles
each and three series of animals on the other side of the card allow for discrimination of finer
stereopsis with disparities from 800 down to 40 seconds of arc [Noorden and Campos, 2002;
Rüßmann et al., 2004b; FST]. Subjects wear Polaroid spectacles and are asked to identify the
respective object that appears to be standing out of the booklet plane. The final reliability of
the Titmus test is doubtful since in some patients other visual cues, in particular contours and

2. Theoretical Background Stereoscopic Vision
30 | 97
daily experience (one knows that the fly’s wings should be there), might fake stereopsis
[Noorden and Campos, 2002].
A variety of tests is based on random‐dot stereograms [Noorden and Campos, 2002; Herzau,
2004a, Tyler, 2004]. Random‐dot stereograms have been developed by Julesz in the early
1960s. They consist of tangible figures or shapes composed of dots that are horizontally slightly
displaced with respect to one another. The space in between is filled by a randomly generated
dot pattern. In principle, random‐dot stereograms effect the cancellation of monocular depth
cues in such a way that when monocularly observed from a fixed and immobile perspective,
nothing more than random noise is visible and the object remains hidden. Only under binocular
observation, provided both half‐frames are binocularly correctly fused, a stereoscopic
impression is perceived, unmasking the camouflaged object. As only binocular disparity evokes
the effect of spatial depth, beside all monocular cues of depth perception, also cues based on
experience such as overlapping, differences in size of familiar objects, motion parallax,
perspective, shadings, texture, and so on [Taylor, 1973; Grüsser, 1983; Noorden and Campos,
2002], are excluded. Evidently, this approach offers a considerably higher level of stereoscopic
confidence and quality. Out of the manifold of modifications of stereotests applying the
random‐dot principle, figure 2.9b shows an exemplary test booklet. The most commonly used
modifications are briefly introduced hereafter [Noorden and Campos, 2002; Rüßmann et al.,
2004a].
The set‐up of the Random dot butterfly is very similar to the Titmus fly test, except that the
housefly is replaced by a random dot butterfly, increasing the level of trustfulness.
The Randot stereo smile test is particularly designed for infants from 6 months of age on and
complies well with non‐verbal preferential looking strategies [Noorden and Campos, 2002;
Suttle, 2001]. Several general forms of the Randot test exist for different levels of disparity
ranging from about 800 to 40(‐20) seconds of arc [Noorden and Campos, 2002]. In most cases,
patients are asked to identify known objects, animals or shapes out of a random dot
background pattern. Some test cards are adapted with cartoons such as to promote children’s
attention and medium‐acting interest. Also the Random‐‘E’‐Test is well suitable for infants and
consists of three test cards. While one is merely a motivating ”fake” model to demonstrate how
the figure looks like, subjects have to identify the one card containing that figure (in this case
the letter ‘E’ being raised) in direct comparison with another, stereo‐blank but otherwise

2. Theoretical Background Stereoscopic Vision
31 | 97
identically presented card. Performed at different viewing distances, the test offers disparities
down to 50 seconds of arc at 50 cm viewing distance.
The TNO test is a random dot test with disparate superimposed half‐images that are printed in
complementary colours. Mostly, red‐green or red‐cyan (anaglyph images) combinations are
utilized to be fused by the visual cortex. The test booklet contains 7 cards that carry figures with
retinal disparities gradually ranging from 480 to 15 seconds of arc [Noorden and Campos, 2002;
Rüßmann et al., 2004a].
Due to their nature, the random dots tests of this category require the patients wearing special
Polaroid filter or anaglyph glasses (TNO) for image separation as seen in figure 2.9a‐c. Because
most of the above tests based on dichoptic (a separate image is presented to each eye)
presentations of frames through e.g. anaglyph or polarizer goggles, shutter‐goggles combined
with CRT monitors and others are occasionally refused by infants, Lang designed a special child‐
friendly and self‐contained method which combines the utterly reliable random dot principle
with Hess’s cylindrical screens [Lang, 1983]. By a parallel arrangement of half‐cylinder gratings
that are imprinted onto the surface of the test cards, the half‐images are separated. This trick
relieves the user from wearing spectacles and, additionally, it permits the direct observation of
ocular movements by the examiner when the child discovers the typical cat, star and car stereo
pictograms with disparities ranging between 1200 and 200 seconds of arc for the Lang II test
[Lang, 1983; Rüßmann et al., 2004a]. The Lang test is depicted in figure 2.9d; the Lang II test is
a consistent further development with even reduced disparity levels. It is complemented by a
monocularly visible shape of a star which should ease the diagnosis of younger infants by
increasing their attentiveness. As a reliable means for quick visual screening, both of the Lang
tests are also useful means to differentiate between symptoms of infantile strabismus and
pseudostrabismus (epicanthus) [Lang, 1983].
In view of the above test procedures, it has to be brought to mind that measured stereoacuity,
to a large extent, depends on the test design itself. The elimination or a priori exclusion of
monocular and binocular cues is a basic prerequisite for reliable and plausible detection of true
stereopsis [Wong et al., 2002]. As further cited in [Wong et al., 2002], the levels of innervation
for accommodation and convergence have been assumed contributing to binocular depth
perception by providing extra‐retinal cues which might influence the judgement of distance and
stereoscopic processing. Gonzalez et al. (1998) on the other hand reported perceived depth

2. Theoretical Background Stereoscopic Vision
32 | 97
generated by random‐dot stereograms independent of the viewing distance, vergence, and
accommodative movements of the eyes, revealing another convincing advantage of random‐
dot stereograms.
2.6.4 Frisby Stereotest
The Frisby Stereotest is of particular interest for this study as it merges the advantages of
natural, self‐contained stereotests with the diagnostic reliability of Julesz’s random dots. The
Frisby Stereotest advantageously differs from all other stereoscopic tests that are making use of
the random dot principle or haploscopic projections because it presents the targets to the
patients in real ”plastic depth”. Consequently, no special spectacles (anaglyph or polarizing
glasses) or other technical auxiliary means are needed giving rise to free and purely natural
seeing conditions without dissociation. The patients will be facing the same or at least very
similar but realistic conditions to those they are daily confronted with outside of examination
rooms. The underlying principle of the Frisby Stereotest is astonishingly simple.
Figure 2.10: Frisby Stereotest (picture from http://www.frisbystereotest.co.uk/)
A random dot pattern of small differently sized triangles is printed on one face of a transparent
Perspex plate which is subdivided into four equally structured squares. In one of those squares,
a circular area is cut and congruently printed on the opposite face of the plate. Seen against a
featureless background, as it is shown in figure 2.10, the patient has to identify this particular

2. Theoretical Background Stereoscopic Vision
33 | 97
item out of the four possibilities. Monocularly observed, the circle remains unidentified and
hidden within the fuzzy pattern.
By combining three thicknesses of plates (6, 3 and 1.5 mm or alternatively 1 mm2) with six
viewing distances ranging between 80 and 30 cm, stereo acuities grading from 880 to 20
seconds of arc can be easily concluded with the test. This range however can be ad libitum
extended by varying the viewing distances, which can be used for calculation of the
corresponding disparities, or stereo acuities, respectively (see figure 2.11 (modified from [FST])
and equation 2.7).
Figure 2.11: Geometric relations of the Frisby‐Stereotest.
From the crossed disparity condition of figure 2.11 it follows:
(2.6a) andl
PDA
2tan =δ
(2.6b) dl
PDB += 2tanδ
Referring to section 2.6.2, for small angles in radian measure, tanδ can generally be simplified
as δ and the stereoscopic angle can be stated as:
(2.7) ( ) [ ]radl
dPDBA 22 ⋅=−⋅= δδδ
2 In the versions of the test before March 1990, the thinnest plate was 1 mm thick, today it is 1.5mm [FST].

2. Theoretical Background Stereoscopic Vision
34 | 97
In the Frisby Stereotest exclusively the binocular parallax resulting from the plate thickness (d)
and the viewing distance (l) gives the stereoscopic information; no other depth cues such as
contours, motion parallax, or personal experience come into play that could falsify the
diagnosis. Moreover, to further discourage subjects from guessing, the three test plates can be
repeatedly presented in any position, not giving the patients any hint or the possibility to learn
the correct response [FST]. These features and the simplicity of its application, provided good
instructions are given, render the Frisby Stereotest highly reliable with an increased level of
objectivity. These are reasons why it is considered well suitable for the purpose of the study
presented.

3. Materials and Methods
35 | 97
Part II – Materials and Methods
3. Materials and Methods
This part describing the prototype development of the new test apparatus shows its basic
suitability for the assessment of dynamic peripheral stereovision. To minimize evident
subjectivity and/or practical inconvenience of most of the currently applied clinical methods of
stereoscopic evaluation, in this approach real physical depth information, the underlying
principle of the established Frisby Stereotest, is used under natural binocular viewing
conditions in order to exclude all stereoscopic cues except binocular disparity. In support of this
purpose, subjects are completely surrounded by a rotating transparent cylinder carrying the
stereoscopic stimulus pattern. Subjects wear a special arrangement of goggles equipped with
adjustable blends which will be termed “aperture goggles” in this work. Through central
occlusion, the central portion of the visual field is blinded out by this artificially induced
scotoma, leaving open definable portions of the peripheral visual field only. In order to elicit a
kind of stare‐OKN (passive OKN), subjects were instructed to continuously look straight ahead,
avoiding direct focused attention to the stimulus pattern. By means of a punishment effect
based on informative deprivation that arises whenever subjects deviate from central fixation,
they note that by keeping primary fixation, the peripheral acquisition of information is most
extensive and comfortable for them.
3.1 Overview of the Experimental Setup
The experimental setup3 was established in a standard examination room which was kindly
made available by the ophthalmologic clinic of the University of Greifswald and is shown in
figure 3.1. It basically was composed of a stand carrying the patterned stimulus cylinder, a drive
and control unit, operating desk, modified chair for the subjects to comfortably have restrained
head and posture, an aperture goggle to define the respective parts of the visual field, and the
3 Most of the components have been home‐fabricated and assembled under conditions other than professional by the author himself. Consequential deficiencies and the limits of the current prototype setup are critically assessed in section 5.4.

3. Materials and Methods Experimental Setup
36 | 97
devices of general alignment, measurement and data acquisition. The drive unit and operating
desk are not visible in the picture. These and the other components will be detailed later.
The general ambient requirements for the execution of the test procedure are rather low and
only little preparatory work is needed. Basically, an unstructured, preferably white, background
(here a white wall) in an otherwise silent room free of distracting visual and audible cues is
required. The room illumination should be made adjustable, for example by a dimmer. This is to
ensure comfortable and reproducible conditions for the subjects, and above all to prevent
optical interference (such as light reflections, glare, etc.), early loss of concentration and
tiredness due to inappropriate illumination or unfavourable contrasts. The key components of
the hardware including data acquisition and the software used are subsequently specified.
Figure 3.1: Basic experimental setup (The drive unit and operating desk are not visible.)
3.2 Structural and Electromechanical Hardware
The electromechanical basic setup consisted of vertical stand, manually adjustable in height,
with a horizontal cantilever as shown in figure 3.1. A swivel was embedded into the far end of
this cantilever serving both to suspend and drive the rotating drum unit. The drum unit, which
is detailed in section 3.3, had total weight of roughly 10 kg and was mechanically balanced by

3. Materials and Methods Structural and Electromechanical Hardware
37 | 97
the construction of the stand. A small high‐speed 6 V direct current (DC) electric motor (which
was recycled from an old tape recorder) was connected through a specially tailored multiple‐
stage gear to the rotor shaft of the bearing to finally drive the drum. Compared to commercially
available low‐speed torque motors, this rather improvised assembly solution offered clear
advantages regarding size, weight, noise emission, power consumption, and price. The
transmission ratio (i≈1:150) of the gearbox was designed such as to allow with minimized
electric effort the adjustment of the desired speed range between 1 and 6 rpm (rotations per
minute) while providing sufficient torque to steadily drive the drum. The motor and its control
electronics were powered by an AC/DC universal power supply adaptor (Hama 300 mA
46590/safety, 230 V ~50 Hz AC) with selectable output voltage between 3 and 12 V DC. Figure
3.2 depicts the electronic control unit for powering, adjustment of rotation direction, velocity and
signaling with DC power supply (1), cyclocomputer (2), and push button (3) for the subjects.
Basically, the rotational direction could be selected and switched (4) by means of a double‐pole
power relay (Omron G2R‐2 5A 6V). A cascade of resistors was designed to tune the voltage
supply of the DC motor and a potentiometer (5) was used to set the rotational speed of the
drum specifically desired range. More constructive details go beyond the actual scope of this
work and can be provided upon request by the author.
Figure 3.2: Control unit.
During operation, the rotation speed of the drum was continuously measured and visualized via
a conventional digital cyclocomputer, permitting thus the experimenter to set, monitor and
readjust the speed by the potentiometer. The sensor concept was made up of a magnetic reed

3. Materials and Methods Structural and Electromechanical Hardware
38 | 97
switch and five small magnets as pulse generators. The reed switch was fixed to the static
frame close to the rotating axis of the drum bearing and wired to the input contacts of the
microprocessor. Impulse signals were provided by a circularly and equidistantly distributed set
of five small permanent magnets, mounted onto a disc which was directly fixed to the drive
axle of the drum. The rotation speed was internally calculated from the radial distance covered
against the lapsed time intervals within which the rotating magnets passed and hence triggered
the stationary reed switch to pulse the microprocessor. Calibration taking into account the gear
transmission ratio was done by relating the time needed for one drum rotation at a given
control voltage. For practical operation, the cyclocomputer was set as to digitally indicate the
rotation speed at a one‐digit precision which was considered well sufficient for the current
prototype setup.
As further detailed later in the methodological part, a push button was attached to the index
finger of the subjects. Whenever a stereoscopic figure could be observed, a push with the
thumb was to activate a piezo‐ceramic alarm buzzer which finally was recorded by a normal
microphone. Initially, it was intended to ask the subjects differentiating between the two
different sizes of the presented stimuli by choosing the respective of the two buttons. However,
preliminary tests indicated that this task might be too prone to faults and delays attributed to
the process of decision making, increasing the reaction time. So, for simplicity reasons, it was
decided to use only one button at this stage of prototyping.
3.3 Rotating Drum and Stimulus Pattern
The visual stimuli to elicit stereopsis were presented to the subjects by a rotating drum large
enough to completely surround their visual field, offering thus a number of obvious advantages
over small field stimulation [Murasugi et al., 1986; Pola et al., 1992]. A thin‐walled cylinder (50
cm of height and 100 cm of diameter), similar to the one presented in figure 2.7 of section 2.5,
was constructed by bending and connecting two transparent 2 mm thick panes of polystyrene
(PS). Practical reasons impeded the fabrication out of one single large PS pane. The adjacent
edges of the plates have been welded and sealed with dichloromethane (CH2Cl2). Attributed to
its ability to dissolve organic compounds, it is an excellent plastic welding adhesive which
normally does not notably alter transparency properties. However, cautious handling is

3. Materials and Methods Rotating Drum and Stimulus Pattern
39 | 97
recommended as dichloromethane is volatile and considered as harmful (Xn; CAS registry
number: 75‐09‐2; R:40 S:23‐24/25‐36/37).
As figure 3.3 shows, an upper and a lower supporting frame was built of aluminium rings
whereto the PS panes were screwed in order to retain their cylindrical shape. The upper ring
was radially supported by 8 struts connected by a central plate. The latter was used to couple
the cylinder unit to the swivel embedded in the horizontal cantilever of the stand. Furthermore,
both rings were used to fix an exterior set of 4 curved smaller panes and a mechanism to allow
the adjustment of their radial distance with respect to the inner cylinder. Special attention had
to be paid not to damage the plastic panes by excessive torque stress induced by the bolted
connections.
Figure 3.3: Rotating stimulus drum. The inner cylinder of the rotating drum. The outer adjustable parts to complement the stimulus pattern are not shown.
Figure 3.4 illustrates the adjustment mechanism in a simplified and schematic way. The bending
radii of each of the 4 outer PS stripes were initially fitted to that of their counter part of the
inner cylinder and then fixed to curved sledges of aluminium. Movably attached to the upper
supporting ring by means of a radially mounted linear slide guide, they could be radially
adjusted by manually operated, pivoted screw drives. The lower supporting ring carried a
second slide guide and a tension spring to force‐secure the guided stripes. With changing
disparity of the plates, i.e. radially shifting the sledge, the action of the spring forces thus
guaranteed sufficient and continuous stability in motion to avoid unbalanced force distribution,

3. Materials and Methods Rotating Drum and Stimulus Pattern
40 | 97
possible jamming and canting effects that otherwise could be induced by the total length and
weight of the moving stripes.
Figure 3.4: Scheme of the sliding disparity mechanism.
The stimulus pattern was created by sticking 5 micrometres thin, transparent and self‐adherent
plastic foil onto the outer surface of the compact inner cylinder prior to its bending and
fixation. A repetitive but randomized pattern of the triangular symbols known from the Frisby
Stereotest [FST], see figure 2.10, was designed and printed onto the non‐adhesive face of the
foil. Distributed along the mid section of the cylinder circumference, a total of seven circles
were spared leaving the foil blank at these areas. The spared circles were imprinted onto the
inner surface of the outer set of the attached transparent stripes.
Figure 3.5: Circumferential distribution of the differently sized circles of the stimulus pattern.
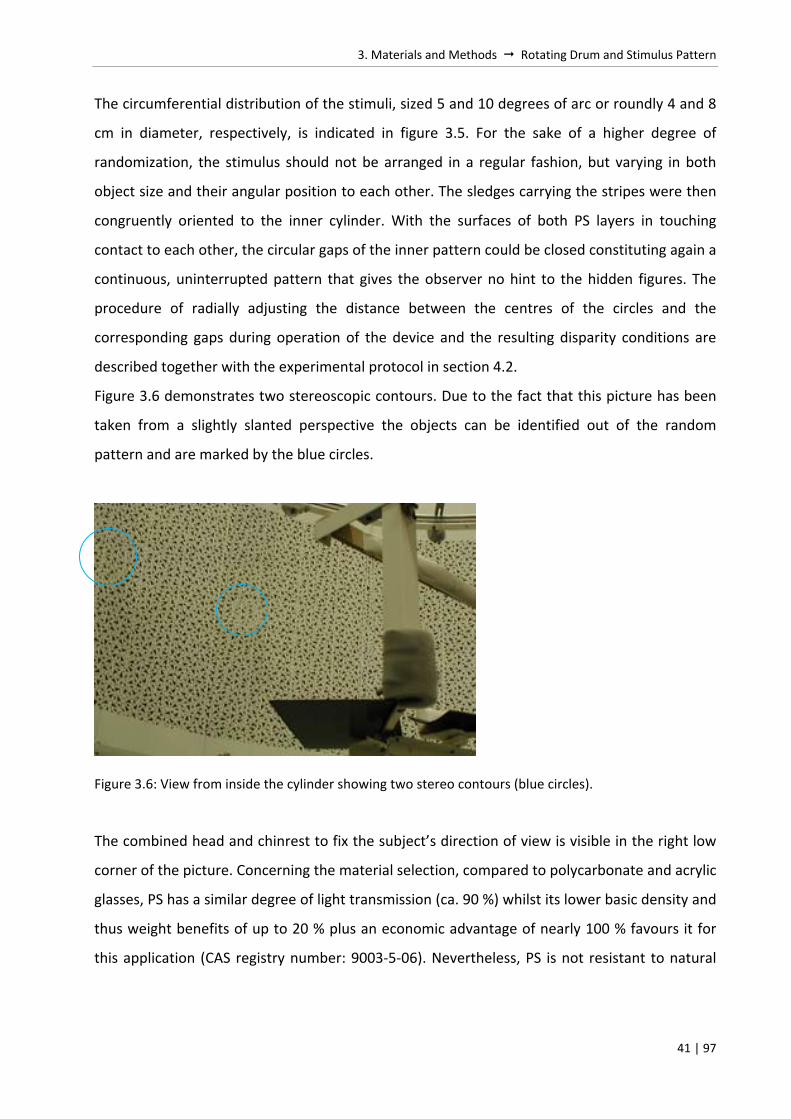
3. Materials and Methods Rotating Drum and Stimulus Pattern
41 | 97
The circumferential distribution of the stimuli, sized 5 and 10 degrees of arc or roundly 4 and 8
cm in diameter, respectively, is indicated in figure 3.5. For the sake of a higher degree of
randomization, the stimulus should not be arranged in a regular fashion, but varying in both
object size and their angular position to each other. The sledges carrying the stripes were then
congruently oriented to the inner cylinder. With the surfaces of both PS layers in touching
contact to each other, the circular gaps of the inner pattern could be closed constituting again a
continuous, uninterrupted pattern that gives the observer no hint to the hidden figures. The
procedure of radially adjusting the distance between the centres of the circles and the
corresponding gaps during operation of the device and the resulting disparity conditions are
described together with the experimental protocol in section 4.2.
Figure 3.6 demonstrates two stereoscopic contours. Due to the fact that this picture has been
taken from a slightly slanted perspective the objects can be identified out of the random
pattern and are marked by the blue circles.
Figure 3.6: View from inside the cylinder showing two stereo contours (blue circles).
The combined head and chinrest to fix the subject’s direction of view is visible in the right low
corner of the picture. Concerning the material selection, compared to polycarbonate and acrylic
glasses, PS has a similar degree of light transmission (ca. 90 %) whilst its lower basic density and
thus weight benefits of up to 20 % plus an economic advantage of nearly 100 % favours it for
this application (CAS registry number: 9003‐5‐06). Nevertheless, PS is not resistant to natural

3. Materials and Methods Rotating Drum and Stimulus Pattern
42 | 97
ultraviolet radiation and care has to be taken to avoid scratches during manufacture, handling
and operation. The data sheet is provided in the annex.
3.4 Optical Components
It was intended to exclusively assess gross stereopsis of the periphery. The central portion of
the visual field therefore needed to be excluded and the peripheral field of interest defined. As
proposed and described in various studies, foveal occlusion with physical occluders similar to
those e.g. in [Körner and Dichgans, 1967; Howard and Ohmi, 1984; Wyatt and Pola, 1984;
Murasugi et al., 1986; Howard and Gonzalez, 1987; Pola et al., 1992, 1995] has been applied. So
as to keep it as much simple and practicable as possible under given conditions, a frame of a
safety goggles was modified, as depicted in figures 3.7 and 3.8, by centrally attaching a set
black rectangular plastic stripes roughly 3 cm in front of the eyes. Laterally movable, they could
be aligned with the subjects’ pupils (direction of view) in consideration of the different
interpupillary distances (PD) of the individuals.
Figure 3.7: Aperture goggles. A goggle frame is carrying a camera and frontally and laterally adjustable aperture blends (left) to define a 45‐degree field of view (right).
By means of the aperture goggles, an adjustable frontal closure angle between 20 and 30
degrees could be achieved, occluding this way completely the central field of view. The
temporal blinders were adjusted to laterally limit the periphery to roughly 60 degrees, leaving
thus a perceptive naso‐temporal window from about 15 to 60 degrees as illustrated in figure
3.7 on the right. Black blinders against downward squinting were fixed directly at the chin rest.

3. Materials and Methods Optical Components
43 | 97
An USB webcam, in the following referred to as “cam1”, was mounted to the left side of the
goggle frame to record the eye reactions that have been expected due to stereoscopic
stimulation. The camera was hidden invisibly for the subjects behind the lateral blinder. Its
weight was counterbalanced by a weight attached to the opposite side of the frame in order to
avoid discomfort resulting from the weight force induced torque acting on the goggle frame.
The cable of the camera was fixed to the headrest and did practically play no role. On the inside
of the frontal aperture stripes, a green fixation target was printed to assist the subjects in
continuously keeping focused attention. With both visual axis correctly aligned on the targets in
primary position, these could be fused and ideally complemented to a recognizable shape as
illustrated in the middle part of figure 3.8. Subjects were instructed to keep that shape in focus
automatically preventing thus deviation from central fixation, not paying attention to the
rotating drum or other visual distraction in order to maintain stare‐OKN conditions.
Figure 3.8: Fixation targets. Targets printed on the inside of the aperture stripes are fused to a fixation cross with the eyes aligned in primary position.
Furthermore, in order to temporally limit the area of visual perception and also to prevent
intentional squinting and lateral deviation of the eyes in the search for incoming objects, on
each side of the frame, an additional black cover plate was laterally attached. This measure was
to have “automatically” ensured correct visual alignment because every deviation from the
primary fixation position towards the periphery, besides loosing the central fixation cross, was
“punished” by the perception of the laterally attached black cover plates. This abrupt
deprivation of visual information introduced certain discomfort, a negative experience subjects
consequently tried to avoid by maintaining central fixation for optimized information
acquisition. The overall design of the aperture goggles was flexible enough to permit

3. Materials and Methods Optical Components
44 | 97
continuous adjustability of the visual field for each of the subjects as specified above. The
correct alignment of the optic components was verified by verbal feedback of the subjects
reacting to the instructions given by the examiner.
3.5 Ergonomics and Settings The subjects were seated in central position inside the transparent cylinder and aligned with a
visual distance of approximately 50 cm to the rotating stimulus pattern as shown in figure 3.9.
Figure 3.9: Positioning of the subject.
The backrest of a conventional chair has been equipped with a frame combining a head‐ and
chinrest. Because the lateral struts may be perceived as disturbing objects in the peripheral
visual field and might hamper the recognition of the stereoscopic stimuli, the typical head rest
used in ophthalmologic examination was unfavourable. In view of that, an adjustable head rest
had to be designed according to the special needs, meeting the condition to fix the subjects’
heads in a defined position and the eyes stationary aligned with the stimulus patters as
comfortable as possible without superimposing disturbing interference, induced by the
vestibulo‐ocular reflex, with the visual periphery during the examination. For that purpose, the
height level of the eyes had to be aligned with the height of the geometric centres of the
stimuli. This was done by both height adjustability of the chair and the vertical stand carrying
the stimulus drum. As detailed earlier in section 3.4, the subjects wore specially designed
aperture goggles opening only a definable part of the visual field of circa 45 degrees for
stimulus perception. With the intention to provoke a kind of stare‐OKN, subjects were
instructed to continuously look straight ahead fixating on the central markers (see figure 3.8
and section 3.4) and not to visually attend to the moving drum itself or any other feature of
3. Materials and Methods Data Acquisition and Processing
45 | 97
minor order. However, in practice, most probably interference by occasional phases of look‐
OKN, mainly depending on the subject’s attentiveness and the clarity of the instructions given
[Garbutt et al., 2001], should be expected, a basic source of artefacts the avoidance of which
could be difficult to attain.
3.6 Data Acquisition and Processing
The experimental data have been registered and recorded with two conventional USB web
cameras connected to a Laptop. The cameras had a 5.0 Mega pixel CMOS colour sensor with a
maximum still frame resolution of 1280x1024 and dynamic video resolution of 640x480 with a
nominal rate of up to 30 frames per second (fps) in a well‐lit room. In practise, however, only
some 6‐7 fps could be recorded at a video resolution of 640x480. This discrepancy might be
attributable to prolonged shutter times caused by inadequate lightning conditions not sufficing
the requirements of the sensors, bad data communication, compatibility problems between
hard‐ and software, or insufficient processing power of the Laptop. The HP Pavilion 5145
Laptop, equipped with a Genuine Intel (R) CPU [email protected] GHz, 0.99 GB RAM and 120 GB
harddisk was run under the MS Windows XP SP3 operating system.
One of the cameras (cam1) was laterally fixed to the spectacle frame in a way not to attract the
patients’ attention (see figure 3.7) but to capture the behaviour of the left eye responding to
the pattern stimulation solely. The tracking of one eye only is absolutely sufficing and effort‐
saving because emmetropic eyes follow binocular stimulation in a conjugate fashion [Noorden
and Campos, 2002]. The second camera, in the following referred to as “cam2”, was mounted
on an adjustable cantilever to record from above the angular scale printed on the upper
supporting ring of the rotating cylinder. Together with an indicator arrow which was stationary
fixed to the stand carrying the camera in front of the apparatus this tracking procedure allowed
the identification and tracking of any rotational position of the cylinder.
By pushing a hand‐held buzzer‐button, subjects were asked to indicate the moment when they
got conscious of a stereoscopic object passing through their visual periphery. These sound
signals were also recorded by the integrated microphones. Relating then the angular scale to
the time the buzzer alarm was recorded and knowing the absolute positions of the stereoscopic
contours printed on the cylinder wall, at the moment of indicated appearance, the angular

3. Materials and Methods Data Acquisition and Processing
46 | 97
location of the respective stimulus in the peripheral field of view could be determined,
evaluated and plausibility‐checked according to the methodology described below. Figure 3.10
pictures how the measurement and its setup have been accomplished. In avoidance of
systematic errors of measurement such as e.g. parallax shifts, special attention had to be paid
to the correct alignment between cam2 and the indicator. The latter was fabricated of
transparent PS, hardly visible in the video frames but indicated by a well visible black arrow
pointer. Stickers on the wall served as reference marks for the alignment of the apparatus and
the subject.
Figure 3.10: Angular measurement system consisting of a stand with camera (cam2) and indicator, and an angular scale passing beneath.
The recording software (Active WebCam Version 9.9, shareware test version) allowed multi‐
channel recording, pre‐processing and pre‐filtering of the raw video files. These edited data
were initially stored on harddisk for further analysis. The video editing software MovieMaker
V5.1 was used to first synchronize the corresponding video files from the two webcams using
their audio tracks as reference markers. This step was necessary since the software
configuration did not reliably permit the simultaneous start of both camera recordings. After
synchronization, in order to finally identify the angular positions of the peripherally perceived
stereoscopic figures and providing thus a basis for the evaluation of the recorded data, the
following methodological steps have been applied:

3. Materials and Methods Data Acquisition and Processing
47 | 97
1. Determination of object position:
The angular scale passing beneath the fixed indicator arrow as recorded by cam2 has been
read out at the time the buzzer signal was registered. Using MovieMaker®, the timely
appearance of the audio track in the video file was allocated to and compared with the
clock time displayed within the video frames. This corresponding time was noted and taken
to identify the respective frame of the cam1 video file showing the zoom up of the eye.
2. Consideration of reaction time:
Reaction, in this context, shall be understood as the initiation of an action (movement) in
response to a stimulus. The subjects were not trained and in analogy with comparable
experiments involving easy tasks of eye‐hand coordination [Schiefer et al., 2001], a common
reaction time of roughly 400 ms could be assumed. The RT can be converted into angular
distance covered (xRT) as a function of the rotational speed (v) of the stimulus pattern, given
by equation 3.1.
(3.1) 310−⋅⋅= RTvxRT [degrees]
3. Plausibility check and identification:
To identify erroneous alarms and consequently avoid wrong interpretation, the criteria for
exclusion (in particular of positions that can be deemed to be physically impossible due to
the prohibitive characteristics of the spectacles) have been set as follows:
(a) During central fixation visual perception should physically only be possible within a
space defied by the window which is bilaterally extending from a position measured
from 15 degrees centrally and extending to about 60 degrees peripherally as it is
portrayed in figure 3.7 of section 3.4.
(b) The angular reaction distance calculated from equation 3.1 was subtracted from the
borders of this visual window. In other words, it had to be nasally shifted resulting from
the delay chain of “object perception awareness decision making operating the
buzzer”, induced by the RT. The explanation is lucid: considering the nasal border of the
window, at a certain RT, recognition actually took place before the object had left the
predefined field of view. Conversely, when considering the temporal margin and

3. Materials and Methods Data Acquisition and Processing
48 | 97
assuming the case of minimized RT ideally reaching 0, RTRT 0lim→
, at the time of activating
the buzzer, the object would just have temporally left the allowed window of sight.
(c) This redefined perceptive window was taken as the basis for further analysis
(d) Of those angular positions from step 1 that could be found within the range defined in
clause (c) it could be concluded that these most probably were the positions of correctly
indicated stereoscopic objects. Their respective time stamps were noted for further
consideration in step 4.
4. Correlation with eye movements:
After all, the so identified and verified objects positions had to be matched with the
corresponding elicited behaviour of the eyes. This was done by correlating their respective
frame times with the previously synchronized timeline of cam1 (the one tracking the eye).
3.7 Performance and Limits of the Prototype
The experimental setup constituted a first prototype of a new promising test procedure to
objectively assess dynamic stereoscopic vision in the peripheral field of view. However, coping
with the restrictions in financial resources and workshop availability, some limitations in
performance and constructive design had to be accepted at this initial stage of development.
The most critical aspects concerned the fabrication of the stimulus cylinder and the aperture
goggles.
The plastic cylinder and its associated mechanical parts were mainly manufactured and
assembled by the author himself in a do‐it‐yourself fashion at home, consequently being prone
to inaccuracies of a certain extend that would have been evitable by professional assembly. For
simplicity reasons, the prototype was equipped with four individually and manually operated
spindle drives to adjust the radial distance (disparity level) between the two radially coplanar
plastic layers carrying the stereoscopic stimulus pattern. Manual operation of four separate
drives implied, beside considerable effort on the part of the operator, small individual
divergences from the desired distance values. In section 4.3, a systematic consideration of such
and other design‐related fault is itemized. A computer controlled set of torque or linear motors
should be considered for a more user‐friendly and precise version. On the other hand, the
manually adjustable disparity currently ranges continuously variable from a hundred

3. Materials and Methods Performance Limits of the Prototype
49 | 97
micrometers to some 1.5 cm with an absolute disparity error depending on the dexterity of the
operator. In combination with the voltage‐dependant, bidirectional (clockwise and counter‐
clockwise) adjustable rotation speed, a variety of different configurations of stimulus
presentation could be offered to the subjects.
Another flaw necessary to mention was the aperture goggles used to constrain and redefine
the visual field of the subjects. In particular, the definability of the visual periphery was difficult
to reproduce since only manual and therefore not very precise adjustability of the cover plates
to the individual head sizes of the subjects was enabled by the present design solution.
Additionally, the verification of the extent of peripheral field of view and individual adjustment
of the cover plates are difficult to be reproduced and can only be manually checked by the
experimenter (manual perimetry), underlying his manual dexterity and subjective judgement.
As it will be detailed later, to reduce loss of concentration and fatigue to a minimum, the
experimental procedure foresaw to put down the goggles after each set of six runs while in the
meantime altered settings of the apparatus could be prepared. But, during the repetitive
putting and adjustment of the goggles, good cooperation of the subjects was a prerequisite.
This was another reason why the reproducibility was difficult to be guaranteed, surely having
some influence on the results.
Last but not least, due to the simplicity of the available recording and data processing
hardware, the low sampling rate limited the diagnostic value of the eye movements recorded
by cam1. As it can be presumed and argued later in the presentation of the results, the elicited
eye movements should then expected to be quite difficult to unmistakably being identified and
reliably interpreted.
These obvious constraints should be easy to overcome and by incorporating into the design the
practical experience gained and concluded in section 5.4, much progress can be expected in
future steps of development in professional environment.

4. Experimental Procedure Selection of Subjects and Experimental Conditions
50 | 97
4. Experimental Procedure
Subjects were seated with the eyes (ideally with the nodal points) centrally aligned in a distance
of about 50 cm from the cylinder display. All stimulus settings were viewed binocularly in
normal photopic room conditions with the subjects wearing the aperture goggles as described
in sections 3.4 and 3.5.
4.1 Selection of Subjects and Experimental Conditions
A group of nine young women aged between 16 and 24 was recruited and written consent was
obtained. All of them were students of the local school of orthoptics. In principle, for the first
evaluating experiments of this pilot study the approach with “non‐naïve” subjects was
appropriate as the girls, after a short introduction to the topic, easily understood the purpose
of the experiment. Their level of interest, motivation and cooperation was high creating thus
good basic conditions. Additionally, by filling in a questionnaire after completing the test
sessions, more objective feedback could be expected in terms of useful comments from their
clinical experience and for the improvement of the methodological and ergonomic system
design. The evaluation and conclusions derived from the questionnaires are presented in
section 5.4.
All girls underwent an ophthalmologic examination consisting of a general visual inspection,
assessment of ocular mobility and convergence behaviour. Their OKN was tested binocularly
and monocularly with each eye. No general abnormalities have been observed. Due to practical
reasons, wearers of prescription glasses were excluded a priori. With pupillary distances
ranging from 58 to 64 mm, particular accuracy was taken in the examination of binocular vision.
The prism cover/uncover test, Maddox cylinder and Worth test have been applied. Normal
visual parameters and quality of (static) stereopsis have been confirmed and cross‐checked for
all of the subjects using the Titmus test, the randot rings, TNO and the Frisby Stereotest.
All experiments were carried out during the morning and subjects did 18 runs of which each
one was executed under different settings of the apparatus as further detailed in the
subsequent section. The total duration for each subject was of roughly one hour. By means of a
dimmer switch, the level of illumination of the experimental room was set as

4. Experimental Procedure Experimental Protocol
51 | 97
(a) not to unnecessarily tire the subjects,
(b) to ensure good detection of the moving pattern and
(c) to prevent glare and reflections of the apparatus’ aluminium frame that could distract and
interfere with the stimulus perception. Once ascertained suitable illumination in some pre‐test
situations, a digital luxmeter (Mavolux 5032C/B) was used to apply the same lightning level
(1200 lux) throughout all experiment sessions.
4.2 Experimental Protocol
In the experimental protocol, the 18 runs of each subject were divided into three groups of
depth difference levels (6, 3 and 1.5 mm). At the viewing distance of 50 cm and assuming an
average PD of 64 mm, stereo acuities of roughly 320, 160 and 80 seconds of arc were thus
provided, as it can be derived from equation 2.4. This subdivision appeared useful since it
allowed the subjects a short recovery and relaxing phase lasting about two minutes to prevent
early loss of concentration due to tiredness while the experimenter could adjust the next
disparity level of the rotating cylinder. Obeying to the procedure of the Frisby Stereotest [FST],
the largest disparity level was initially set for testing of coarser stereopsis. Each of the three
ranges of rotational speeds (10, 20 and 30 degrees per second, corresponding to 1.66, 3.33 and
5 drum revolutions per minute) was run, first in clockwise (CW) and then in counter‐clockwise
(CCW) direction, starting with the slowest speed. Figure 4.1 depicts the experiment sequence in
a flowchart, showing the parameter of rotation direction, rotational velocity and disparity level.
The counter variable x represents the velocity and y the disparity levels. At the slowest speed a
timeline of two minutes was chosen as this permitted the perception of sufficient objects
(23±1) within a reasonably long time period. At the two higher speeds, only one minute was
considered satisfactory for the passage of 23±1 and 34±1 objects, respectively. Accounting for
possible influence and distraction subjects might have experienced after the onset of the
rotation and the starting signal, the first few seconds of their runs were excluded from
evaluation. It has been determined that under these conditions, the subjects’ attentiveness and
concentration appeared to be best. Resetting the stimulus cylinder each run to its initial
starting position has been intentionally avoided in order to take the subjects any possibility for
learning somehow the sequence of expected objects. Therefore, depending on the randomly

4. Experimental Procedure Experimental Protocol
52 | 97
given relative starting position of the objects on the cylinder, the total of objects passing during
one run could only stated by plus‐minus one.
Figure 4.1: Flowchart of the experimental protocol.
4.3 Consideration of Systematic Errors
Two main sources of systematic errors, both related to the amateurish, home‐made assembly
of the test apparatus, could a priori be identified. One resulted from the accuracy of speed
setting, the other from the adjustment of the disparity level, the distance between the plates
producing the depth difference. A third evident error to be expected was attributed to the
aperture goggles to be adjusted for individual subjects as already described in section 3.5.
Although incorporating possible difficulties of proper reproducibility of that part of the visual
field which should be made accessible for stereoscopic stimulation, it will not find closer
consideration here as it will be addressed to in section 5.4.
Ascribable to inaccuracies of the speed measurement system, the limitations of the digital
display of the cyclocomputer, and the lack of an accordingly tailored closed‐loop controller, a
small speed range had to be accepted instead of a fixed rotational speed. So for a rotation
speed of 10 degrees per second that was corresponding to a reading of 1.66 rpm, the actually
indicated value ranged between 1.6 and 1.8 rpm, equaling to a real rotational velocity of 9.6 ‐
10.8 degrees per second. For the second (third) set‐speed of 20 (and 30) degrees per second
and theoretically corresponding display reading of 3.33 (and 5.00) rpm, the actually indicated
values read ranged between 3.2 ‐ 3.5 (and 4.8 ‐ 5.2) rpm. This equals to actual rotational
velocities of 19.2 ‐ 21 (and 28.8 ‐ 31.2) degrees per second. However, in the overall context of
this prototypic approach, and as anyway rather ranges than exact speeds were of interest,

4. Experimental Procedure Consideration of Systematic Errors
53 | 97
these resulting relative deviation errors of roughly ±5 % did not fall into account and could be
neglected at first. The second source of errors was related to the fabrication of the apparatus
itself and the induced tolerances of the disparity settings.
The first contributing error directly resulted from the thread pitch of the screw drives (see
figure 4.2) and can be easily estimated. Using ISO metric screw threads (M6x1), one complete
rotation of the screw is translated to a linear motion of 1 mm. By either selecting adjusting
screws with metric fine pitch thread and/or appropriately designing the screw head, e.g.
choosing a large one onto which a calibrated relative angular scale could be printed, the effects
of this error would be easily ruled out. In the present case, after each process of manual
adjustment, the correct settings were verified by an adequately designed measuring body and
could therefore be neglected. An accurate and elaborate mechanical and electrical control
design would certainly relieve operators from this step.
Another error referred to the matching between the curvatures of the outer PS stripe with
respect to the inner cylinder. These led to eccentricity errors, particularly towards the edges of
the stereoscopic contours and are more difficult to encounter. Figure 4.2 shall schematically
approach this problem by consideration of two scenarios, an ideal and a worst case. For clear
illustration, the figure is not drawn to scale. Actually, the angular size of outer stripes is about
10 degrees of arc as observed from a central distance of circa 50 cm.
Figure 4.2: Errors of edge eccentricity
The ideal case shows an outer stripe (4) radially shifted from the inner cylinder (C). The
curvature of (4) has been selected and fabricated such as to radially match with the curvature
of (C) at the given displacement distance xc4. Under this condition, along the entire

4. Experimental Procedure Consideration of Systematic Errors
54 | 97
circumference the displacement will be constant, including the positions at the outer borders of
the stripe (xb4). Hence, the disparity perceived from the observer results to be equal over the
entire curved surface of the stereoscopic object, centrally (dc4) and marginally (db4), to finally
meet the condition db4=dc4. The second scenario presents the worst case in which the outer
stripe closely contacts the inner cylinder (1) creating zero‐disparity and effacing thus the
stereoscopic effect. As for this particular radial position of the stripe, xc1, the curvature in
comparatively too large and cannot match with that of the cylinder surface. Consequently, the
distance increases from the centre (here xc1=0) towards the edges of the stripes, reaching xb1
(with xb1>0), as also the perceivable disparity does. In the central part of the stereoscopic
figures, dc1 equals zero, whereas towards the edges the marginal disparity db1 changes with a
function f(x) of the varying radial displacement distance. It can be generally estimated as:
4.1 f(x)d d cibi Δ+=
For the four relevant configurations, namely the applied plate distance levels (0, 1.5, 3, and 6
mm), their numerical values of the eccentricity function ∆f(x) have been found by simulation
with CAD (computer aided design) software for the case of the larger circle (mean diameter of
10 cm). The resulting eccentricity is depicted in table 4.1, listing the values of the central (δci)
and the marginal (δbi) stereo acuities for the stereoscopic circles, to be calculated by equation
2.4 or 2.7, respectively.
Table 4.1: Errors of edge eccentricity.
i xci≡dci [mm]
∆f(x)=xbi‐xci ≡dbi‐dci [µm]
δci= δ [arc sec] δbi [arc sec]
1 0 15 0 0.8
2 1.5 13 79 0.7
3 3 9 158 0.5
4 6 0 317 0
For the determination of stereopsis at an observer’s distance of 50 cm and in the peripheral
visual field, the effects of edge eccentricity are practically not of relevance, being far below the
perceivable stereoscopic threshold (see section 2.6.2). Nevertheless, a solution to circumvent
these inaccuracies could be the design of a flexible outer sledge or carrier with an adaptive
curvature replying to radial displacement.

5. Results and Evaluation
55 | 97
Part III Results and Evaluation
5. Results and Evaluation
In this chapter, the results of the experiments are presented, evaluated and their validity
critically assessed. The smallness of the population (here the group of subjects) renders a
proper and meaningful statistic evaluation as rather impracticable and not very trustful.
Nevertheless, the methodological approach how the population should be treated is proposed.
Suggested by the positive results and based on the experience gained, it is discussed how the
test procedure could be optimized for improved diagnostic value in future steps of
development.
5.1 Presentation of the Results
The perceptibility of stereoscopic objects based on real spatial depth that move along the
horizontal meridian through the peripheral visual field was tested by the prototypic apparatus
and method as described.
As expected, subjects responded to stereoscopic excitation of voluntary and involuntary nature.
Voluntary feedback was directly given by confirmatively pushing a buzzer whenever an object
was recognized in the periphery (section 5.1.1). Concurrently, involuntary bio‐feedback was
excited through the stereoscopic moving pattern and noted by characteristic ocular reactions
(section 5.1.2), subjects under normal conditions cannot influence. Of course, in individual
cases some extend of previous training might show effects, but practically such seldom cases
can be excluded from consideration. Both types of responses have been registered and
simultaneously video‐recorded as described in section 3.6 above. In principle, it can be argued
that the two different responses should be able to serve as mutual plausibility checks, leading
to increased objectivity in the process of status assessment. Subjects claim having perceived or
not a stimulus, while a reactively triggered mechanism of ocular reaction either confirms or
rejects this statement. However, the quality of the recording equipment that was available did
not suffice for a precise evaluation of those ocular reactions. Conventionally used
electrophysiological methods of pupil tracking such as e.g. nystagmography, scleral search coils

5. Results and Evaluation Presentation of the Results
56 | 97
or infrared corneal reflection [Duchowski, 2007; Eggert T, 2007; Hoffmann, 2007], on the
contrary, irrespectively the practical inconveniences they would induce, are easily interpretable
and would remedy. But, for the sake of simple operability and cost efficiency,
electrophysiological measurements were not practicable in the scope of these preliminary
experiments.
5.1.1 Voluntary Feedback
The data obtained show that subjects in principle were able to detect peripherally moving
disparate objects. After the completion of the trials, subjects reported that they occasionally
were even able to discriminate between the two different sizes of the stimuli (a sequence of
circles of 4 and 8 cm diameter, corresponding to angular diameters of about 5 and 10 degrees,
respectively). However, when comparing the individual performance levels, large spreads
among the subjects, as seen in figures 5.1 and 5.2, have been observed. As a comparable
benchmark, here the performance level (PL) shall be defined as the ratio of objects a subject
has been correctly indicated to the total number of stereoscopic objects that have passed the
opened field of view (under the given physiological conditions and restrictions imposed by the
aperture goggles) during each trial.
In this context, the ratio between the correctly identified objects to those that have been
indicated by the subjects will be termed confidence ratio (CR) in the following. It can serve as a
benchmark for confidence and reliability, in other words, showing how often subjects
mistakenly actiated the buzzer. A low CR might point to lacking cooperative behaviour or
concentration of subjects. But it has to be noted that the fewer the total number of objects
considered for calculation of the CR, the less reliable is its expressiveness.
The PL of subject 2 (figure 5.1) ranged between 75 and 95 % throughout all 18 runs, while on
the other hand subject 4 (figure 5.1) had a low PL between 5 % in the least successful and 60 %
in the more successful runs. As comparatively presented in figure 5.2, other subjects reached
performance levels in between these extreme cases. Subjects 3, 8 and 9 are not shown; for 3
and 8 some technical difficulties with the recording appeared. Although her binocular and
visual status did not significantly differ from those of the others, subject IX did not perceive any
stimulus out of the 18 trials at all. After completion of the experiment she confirmed that she
had fully understood the procedure and her task. A possible explanation could be that her eyes

5. Results and Evaluation Presentation of the Results
57 | 97
were too strongly immobilized by the aperture goggles and thus no reactive behaviour with
respect to the moving stimuli could be triggered. Even the typical jerking movements of the
eyes to continuously stabilize and keep central fixation could hardly be seen in the video‐
recordings due to strong suppressive effects similar to those provoked by the application of
stenopaeic goggles as observed in [Körner, 1975; Körner and Hänny, 1982].
Figure 5.1: Comparison of subjects with high (2) and poor (4) Performance Level.
Figure 5.2: Comparative presentation of the results of 6 subjects.
Figure 5.3 exemplarily presents the CR for the two subjects of figure 5.1. With the exception of
run 3, the CR of subject 4 exceeded 70 % revealing a high level of cooperative willingness for all
runs, despite the low PL. Her credibility should therefore not a priori be doubted.

5. Results and Evaluation Presentation of the Results
58 | 97
Figure 5.3: Comparison of the Confidence Ratios between the subjects of figure 5.1.
Figure 5.4 displays the averaged perceptiveness of the 18 runs presented for the group of
subjects as a whole. The red graph groups seven subjects that have been considered for
evaluation. It spans a range from 50 to 65 %, arithmetically averaged as 59.1 % with a standard
deviation of 5.7. The blue group excludes subjects 3 and 4 for their low PL and the group
performance improves up to 85 %, raising the calculated average value to 66.9 % with a
standard deviation of 8.4.
Figure 5.4: The PL of two groups in comparison for the 18 experimental runs.
These differences might be attributable to both the relatively low PL of subjects 3 and 4 with
respect to the remaining ones and occasional outliers due to varying levels of attentiveness
during single examinations of all subjects. Nonetheless, for the last six runs, the difference
between the two groups lost significance.

5. Results and Evaluation Presentation of the Results
59 | 97
As all subjects were exposed to the same framework conditions, did the same sequence of trials
with well equal time parameters, they consequently should be comparable in terms of mental
stress, concentration efforts and fatigue; an assumption that seems to be supported by figure
5.5. In close relation to figure 5.4, but regardless their individual performance levels, the
confidence ratios of the two groups did not differ significantly from each other for their 18
runs. Throughout the experimental session during all of the 18 runs, the CR was established
between 68 and 94 %. For both groups, the arithmetic average over the sum all runs was at
about 84 % with a standard deviation of 6, confirming thus a certain constancy of stimulus
perception. By implication, under this aspect, the percentage of incorrectly indicated objects
(false alarms) was more or less consistently low.
Figure 5.5: The CR of the two groups of figure 5.4 in comparison for the 18 experimental runs.
A general preference for a certain configuration of settings of the experiment is presently
neither deducible from the above evaluation or the observances, nor from the interrogation of
the subjects. It might be hypothesized that, provided good concentration and willingness for
cooperation, lower levels of CR could indicate “less comfortable” settings in terms of velocity,
disparity and direction as more “phantom objects” would be alarmed.
5.1.2 Involuntary Feedback
As initially assumed and being in accordance with a number of experiments carried out using
arrangements of rotating drums such as e.g. [Howard and Ohmi, 1984; Lasker and Kummell,
1985; Howard and Gonzalez, 1987; Murasugi et al., 1989] or mostly computer‐generated

5. Results and Evaluation Presentation of the Results
60 | 97
moving stimulus patterns as applied e.g. in [Howard and Ohmi, 1984; Murasugi et al., 1986;
Pola et al., 1995], characteristic ocular reactions to those moving stereoscopic patterns could
be observed. The actually prevailing technical frame conditions and possibilities in this first
setup did not allow meaningful graphical or numerical evaluation of the ocular reactions that
have been elicited. Hence, and in contrast to the final goal of this study, namely the objective
assessment of the gross ability of the perception of peripherally moving stereoscopic objects,
here, the assessment had to be carried out in a more subjective fashion by the experimenter.
The available video‐recording equipment and freeware for video processing turned out to be
too prone to interferences and allowed only limited performance in terms of temporal
resolution (possibly suitable commercial software could not be obtained). Even trial versions of
commercial software packages could not reliably resolve the problem of overlapping effects.
Resulting from simple fixation and stabilization movements of the eyes, interleaved by
occasional blinking, they could not be adequately filtered and separated from the actual ocular
reactions towards objects recognition. Simple eye blinks or short and sudden jerky deviations of
the eyes from their central position of fixation, sufficed to render initially set marker points and
predefined tracking windows (region of interest) useless. Consequently, automated analysis,
the proper identification and interpretation of optokinesis was made difficult.
Nevertheless, a good compromise for evaluation with the given data conditions appeared to be
the commercial software WINanalyze which was designed for automatic motion analysis. A
temporally valid licence key was kindly supplied by Mr. Brinkmann of the company Mikromak
Service Brinkmann, Berlin. On the company’s homepage, WINanalyze is announced being the
first software for motion analysis able to track objects without the need of previously attached
reference markers. By using special algorithms of pattern recognition and extrapolation for
error compensation, designated parts of objects can be tracked throughout a complete digital
video sequence and the data can be graphically presented. In most cases human interaction is
not necessary.
Although eye blinks and micro‐movements during fixation such as drifts or tremor could neither
be completely compensated, in some of the trials, it was however possible to consistently track
digital marker points along an expressive distance for which also a good correlation to the
acoustically signalled perception could be done. Figure 5.6 shows a typical plot of the ocular

5. Results and Evaluation Presentation of the Results
61 | 97
movement of the left pupil which was elicited during one revolution of the test cylinder out of a
one‐minute video sequence. In this example, the cylinder rotated in clockwise direction at a
velocity of 20 degrees per second, i.e. the stereoscopic objects tempo‐nasally entered the
periphery of the left eye. The disparity level was set at 6 mm. As throughout all experiments,
the left eye was recorded due to the constructive arrangement of the aperture goggles (see
figure 3.7 and section 3.4 for details). In the plot, the horizontal co‐ordinate axis represents the
time line in seconds, the vertical one the absolute lateral deviation of the considered eye in
response to the moving pattern.
The graph was acquired by putting a digital marker at a distinctive location at the border of the
pupil and automatically tracking its horizontal position from frame to frame of the video‐
sequence considered. Here, for one rotation of the cylinder the (horizontal) deviation of the left
pupil is plotted along the timeline. The absolute values of deviation (in mm) result from the
calibration marks to be set in the video frames and the position of the identification marker
that has been tracked. With a definable sample rate, the software determined the coordinate
positions of the predefined tracking window of the eye that have been shifted from frame to
frame with respect to the marker point which remained locally fixed in each of the successive
frames. The centre of the coordinate system has been placed centrally on this marker point. By
calibration and definition, the rising components of the graph correspond to a nasal movement
of the pupil (eye globe), following the moving stimulus in clockwise direction. Conversely, the
decreasing components indicate a temporal movement of the pupil opposite the objects’
direction. As the software solution used did not allow cancelling out vertical eye shifts the plot
appears distorted. Nevertheless a clear tendency is conspicuous.
The vertical dash lines close to the peaks of the curve mark the moments when subjects
indicated the apparent recognition of a stereoscopic object by pressing the buzzer button. With
the recording method used, the exact moment of onset of the particular mechanism having the
eyes following the stimulus could not be precisely determined neither could the continuous
trembling movements of fixation that keep the eyes aligned in primary position discriminated.
However, when stereoscopic contours had left the visible space, the eyes lost stimulation and
consequently jumped back to their initial position of central fixation (which the subjects were
instructed to focus on continuously), resetting the stare OKN for newly appearing objects. This

5. Results and Evaluation Presentation of the Results
62 | 97
behaviour is clearly visible in the video recordings in the form of abrupt jerks opposite to the
stimulus direction and in the graph it is seen as a steep decline, the initiation of which is
marked by the black arrows in the upper part of figure 5.6. Then, starting from the primary
position, the eyes again involuntarily drifted to catch and follow successively appearing objects
moving into the periphery. Further in the picture, the slightly slanted dash‐dot lines mark
regions that are characterized by continuous trembling motion of the eyes. The approximated
amplitude of two mm is most probably attributable to the fixational efforts of the subjects to
keep their eyes centrally on the fixation markers that are attached onto the inner occlusion
stripes of the aperture goggles (see figure 3.8). Distortions originated by occasional blinks of the
eyes additionally interfered with the tracking algorithm of the marker. These errors however
are easy identifiable as they are directly seen in the respective video frames and thus
correlatable with the process of marker tracking.
Following this scheme of interpretation, figure 5.6 implies that all the seven stimuli along the
circumference of the cylinder have been correctly perceived and actively identified by the
subjects. Thus, it can be objectively stated and confirmed that in this case the subject was able
to detect and correctly indicate the peripherally moving stereoscopic objects.
Figure 5.6: Involuntary movement pattern with hints of stereoscopic object recognition. A typical movement pattern of the left eye as recorded during one clockwise revolution of the stimulus cylinder at 20 degrees per seconds. The horizontal axis is the timeline, the vertical the ocular deviation induced by the rotating pattern. Raising (falling) parts of the curve indicate a nasal (temporal) bulbus shift. Vertical lines mark the subject‘s direct, active identification of appearing stereoscopic objects. Arrows at the upper peaks indicate ends of perceptive phases associated with abrupt jerks returning the eyes to their primary fixation position. Other irregularities are indicated in the plot.

5. Results and Evaluation Presentation of the Results
63 | 97
An ocular behaviour like this can be observed in most cases more or less distinctively, but due
to the unfavourable conditions of the raw data (see above), meaningful and objective software‐
based evaluation was difficult. As already mentioned before, other, more precise and stable
methods based on electrophysiological measurements or infrared pupillary tracking would be
desirable. Nevertheless, the above observations support our starting hypothesis that at the
moment of perception a short nystagmus‐like mechanism is triggered to capture and pursue
the detected object until it leaves the borders of visible space. Then the eyes jerk back to their
primary position of central fixation, ready to catch and track the next stereoscopic stimulus
expected to be appearing. The exact moment when objects were first captured by the eyes
before subjects actively responded, could not be found. Nonetheless, it could be roughly
estimated by considering a coarsely averaged eye‐hand reaction time of 400 ms [Schiefer et al.,
2001] until the acoustic signal was activated. Thereafter, the velocity of the moving eyes more
or less matches the rotation speed of the stimulus pattern. When the stimulus is leaving again
the visible region, a steep decrease of the curve to a kind of base level is observed from which
again tremor like motion continuously tries keeping the eyes centrally aligned and the natural
nystagmus as the normal reaction to the passing pattern is suppressed by central occlusion as
long as no stereo‐object enters the peripheral region. In summary, the observed ocular effects
evoked by the stimulus pattern can be described as follows:
• Detection of stereoscopic contours (which for plausibility was acknowledged by the buzzer
and the consideration of the limitations of the aperture goggles) triggers a relatively fluent
and consistent ocular motion with the objects’ movement direction varying in terms of
strength and amplitude among the subjects.
• The maximum amplitudes related to object recognition were about four mm, meaning that
the eye laterally deviated roughly by 20 degrees from and back to its fixation position. Even
so, the nystagmoid movement patterns were also oscillating in an interval of coarsely 20
degrees around the point of central fixation. However, attributed once again to the limited
capabilities of the equipment, these difficulties could not be managed and the laterally
deviating amplitudes could not always be reliably registered and graphically evaluated.
• Since normal saccadic behaviour of the eyes was reduced through central fixation and
simultaneous occlusion of the central 25‐30 degrees of the visual field, the lateral deviations

5. Results and Evaluation Presentation of the Results
64 | 97
to pursue the object appear to result from added sequences of small saccade‐like
movements. A similar, albeit much smaller, effect has been observed in [Körner, 1975;
Körner and Hänny, 1982] where in contrast the eyes were immobilized by stenopaeic
goggles with a small central hole. This way, the eyes could be well stabilized reducing
saccadic jumps to a minimum. Most pronounced was the reduction of larger saccades
whereas smaller spontaneous ocular movements could only be reduced by approximately
50 % [Körner, 1975]. As proposed, the summed amplitudes could be considered as a
measure for characteristic rhythmic tremor of the eyes around the point of central fixation
in primary position when subjects intend to keep the fixation markers positioned (see the
dash‐dot‐marked tunnels in figure 5.6). But this hypothesis needs more experimental
validation and clean data evaluation.
• The onset of a nystagmus‐like mechanism was having the eyes involuntarily capturing
peripherally appearing objects in order to follow their motion, although subjects were
voluntarily fixating, i.e. focussing attention, to a central position somewhere else. With
peripheral stimuli leaving the defined periphery and giving thus no more stereoscopic
excitation, the eyes bounced back to the primary position in a sort of resetting action.
However, from literature it is known that the occlusion of the central part of the visual field, to
a certain degree depending on the individual ability of concentration, can considerably reduce
and nearly completely blot out the conventional OKN [Körner and Dichgans, 1967; Howard and
Ohmi, 1984; Wyatt and Pola, 1984; Murasugi et al., 1986; Howard and Gonzalez, 1987; Pola et
al., 1992, 1995]. Whether in the present case a reduced or a modified type of OKN is justified
cannot be doubtlessly stated. Neither can be given trustful statements concerning the steady
reproducibility of the results. For further evaluation towards this direction, both more suitable
and precise equipment of measurement and recording of signals as well as an increased
number of motivated subjects would be required.
5.1.3 Position of Peripheral Object Perception
In the following, the term peripheral angle of perception (PA) is used to express the angular
location of the stereoscopic contour a test subject (in accordance to section 5.1.1) voluntarily
reacted to. Measured from the zero‐degree line of central fixation, the PA is determined by
relating the moment the subject activated the buzzer with the corresponding position of the

5. Results and Evaluation Presentation of the Results
65 | 97
respective stimulus by means of the readings of the angular position markings on the
apparatus, being recorded as described in section 3.6.
The diagram in figure 5.7 shows that the individual PAs for the 18 runs that have been averaged
over the group of subjects range between circa 26.3 and 35.3 degrees to the peripheral field of
view. The black bold lines mark the gap beyond which the field of view was occluded by the
aperture goggles with the head fixed and the eyes kept at central fixation, i.e. in primary
position. In total, the mean PA can be established as about 30 degrees with a standard
deviation of 2.
Figure 5.7: Peripheral angles of perception (PA). The angles of peripheral stimulus perception are presented as averaged values for the 18 runs of the grouped subjects.
In contrast, when considered the summed results of all the 18 runs presented for each
individual subject, on the average, the stereoscopic objects have been similarly recognized
between 24 to 34.5 degrees as figure 5.8 reveals.
Figure 5.8: PA of the subjects averaged over their 18 runs.

5. Results and Evaluation Presentation of the Results
66 | 97
The arithmetic average of the PA in that case is also about 30 degrees, negligibly differing from
the above, but with a slightly augmented standard deviation of 3.3. In some trials, subjects
occasionally deviated from these determined ranges and single stimuli have been reported (and
their plausibility verified) even close to the outmost borders of the defined window of
peripheral perception. But these were individual exemptions without statistical relevance.
Based on the data of the preceding figures 5.7 and 5.8, figure 5.9 schematically illustrates for
the left eye where in the peripheral scene and under which conditions object perception and its
direct recognition took place. The effect of the aperture goggles (central and temporal
occlusion) is protracted by the black area, leaving open a peripheral region ranging from 15 to
60 degrees with respect to the 0‐degree line of central fixation or sight, respectively. The
individual mean PA values of each run for the subjects as a group, according to figure 5.7, are
portrayed by the red spots which are framed by blue triangles at 24 and 34.5 degrees. These
represent the two extreme values as calculated from the average PA of each of the 18 runs for
each subject, pursuant to figure 5.8. Both situations share a common average value which is
centrally portrayed at 30 degrees as a large yellow spot. Here, only the left part of the visual
field is exemplarily sketched for the clockwise stimulus rotation. The opposite part and the
option of counter‐clockwise moving direction should show the same effects and no further
dedication is necessitated.
Figure 5.9: Illustration of the mean peripheral location of conscious object.

5. Results and Evaluation Presentation of the Results
67 | 97
As a matter of fact, also the management of those results suffers from the simplicity and
technical constraints accompanying the experimental set‐up which did not allow the
measurement of the respective reaction times of the subjects. Their complete neglect, in the
worst case, would cause the actual angular ranges of peripheral object perception to be shifted
by several degrees in dependence on the rotational speed of the stimulus cylinder. Therefore,
in all the above mentioned, a mean eye‐hand reaction time of 400 ms was a priori assumed and
was particularly taken into consideration in the determination of the peripheral angles. In order
to reflect the real situation, again, appropriate procedures to record and evaluate the direct,
involuntarily elicited physiologic response of the eyes toward the stereoscopic stimulation are
deemed to be not only confirmative with respect to voluntary eye‐hand action. They might also
constitute a more objective and precise assessment criterion of the visual status in question.
5.2 Statistic Consideration
The most suitable tool for statistic analysis for the present case is the Wilcoxon Test. In
principle, the non‐parametric Wilcoxon Signed‐Rank Test is well suitable for paired samples of
unknown distribution, returning also stable results for smaller sample sizes. Unlike the similar
Sign Test, it involves not only the direction of differences (algebraic sign) between paired
samples, but also their strength (absolute value); however requiring a more or less symmetric
distribution of the calculated differences of the matched pairs. The commonly known Student t‐
test and the Chi‐square test are not applicable here as they require normally distributed
populations. For detailed description and methodological understanding of statistical tests in
general, textbooks such as [Ewens and Grant, 2005; Weiß, 2008] should be consulted. The
consecutive steps of statistic evaluation in principle are:
1. Postulation of the starting hypothesis.
The Null Hypothesis H0 assumes that a certain correlation between two or more groups or
sets of data, the experimenter is actually expecting, does not exist. Their differences are
statistically significant, meaning that it is unlikely that the results have come by chance.
Hence, events or their effects do not depend on each other, not differing in their central
tendency. The Alternative Hypothesis H1 is the contrary to H0, stating that with some

5. Results and Evaluation Statistic Consideration
68 | 97
chance variation the observations result from a real effect. Usually the aim of statistic
hypothesis testing is to support H1 as the only possibility by rejecting H0. Practically, H1
expressing the statement to be supported is formulated as a denial of H0.
2. Setting of the significance level.
The paired differences between measured values are termed significant if the probability of
their occurrence by chance is low. This probability is given by the significance level (often α=
0.05 or 0.01 is demanded). In other words, it is the maximum probability of error at which
an H0 is rejected, even though it holds true, that means H1 is wrongly favoured. The
probability c[Xa, Xb]≈1‐α (for all Xa, Xb) defines the confidence interval, in which a series of
measurements falls.
3. Rank assignation.
The core procedure of the Wilcoxon Test [Ewens and Grant, 2005; Weiß, 2008] for rank
assignation can be outlined as follows:
a. From a set of paired values (Xa and Xb) the absolute pair differences di=|xai‐xbi|,
excluding where d=0, are determined with i=1...n, n being the number of pairs.
b. The di are ranked (|dimin|==1, |dimax|==n); averaged ranks assigned at equality.
c. A “‐“sign is reattached to those rank numbers where di=(xai‐xbi)<0.
d. R(+) and R(‐) ranks are summed and correctness cross‐checked by R(+)+R(‐)=n(n+1)/2.
e. For n≥10 normal distribution could be assumed allowing for the calculation of the z‐
value, for 5<n<9 the look‐up table of critical values usually finds application.
f. The smaller of the rank sums Tmin=min(R(+),R(‐)) is compared with the critical value of the
loo‐up table Tcrit.
4. Conclusion and statement.
Following step 3f, H0 is rejected if Tmin<Tcrit, the result is significant, indicating that both
populations differ. Conversely, H0 is accepted if Tmin>Tcrit, the result is not significant and
both series should originate of the same population.
Following this scheme, the question whether the performance level (PL) and the confidence
ratio (CR) of the subjects’ voluntary feedback toward stereoscopic stimulation (detailed in

5. Results and Evaluation Statistic Consideration
69 | 97
section 5.1.1) are correlated shall statistically be considered by postulation of two test
hypothesis giving:
H0: The PL and the CR are not correlated, a good PL does not entail a high CR and vice versa.
H1: There is a correlation between the subjects’ PL and CR.
Applying the procedural steps of above to the experimental data collected, with the
significance level reasonably selected between 0.10<α<0.01, no significance can be shown,
consequently H0 is to be rejected for both experimental groups depicted in figures 5.4 and 5.5.
The rejection of H0 implies that there seems to be some relation between the PL and the CR;
however, the smallness of the population does not reasonably allow a finer discrimination. The
suggestion that a high performance (PL) also implies an elevated credibility of the subject’s
voluntary response (CR) cannot be discarded as wrong. Analogously, it can be concluded that
from a purely statistical consideration, a tendency of a notable loss of concentration (and
performance) cannot be confirmed along the time scale from the first run to the last one (1 to
18). A certain constancy of concentration could therefore be assumed over the duration of the
experimental sessions. The PL slightly drops with time while the CR remains more or less
constant.
It is evident that the sample size has large impact on the result. Being small, it is more likely
that H0 is held while a huge sample size rather tends to reject it, statistically ensuring thus an
alternative hypothesis H1. As in the present case the sample size is rather small, the confidence
interval large, and the result non‐significant, it can only be vaguely stated whether there is a
practically relevant difference or it simply cannot be proven.
Critical remark: Results of statistic considerations shall not be understood as watertight proofs.
They are only hints indicating a certain causal relationship. Statistical significance means that it
is unlikely, but does not ultimately exclude, that a difference between two observations has
been occurred by pure chance. A non‐significant test result indicates that there is either no
such relevant difference or that it cannot be confirmed due to the smallness of the sample size
or other reasons. If a priori no difference is expected, a non‐significant result can also be
confirmative while in that case a significant result, in contrast, may give hints on the
incorrectness of the statistic analysis done or content‐related mistakes.
5. Results and Evaluation Conclusions
70 | 97
5.3 Conclusions
The experimental data were evaluated in terms of voluntarily indication by pushing the buzzer
in combination with plausibility checks (section 5.1.1) and by assessment of the ocular reactions
stimulated by the moving stereoscopic patterns. The latter served as involuntary indication of
having perceived the stimuli (section 5.1.2). In addition, the angular positions in the peripheral
field of view where subjects actively reacted to the stimulation have been analysed (section
5.1.3).
a) The data gained during the experimental trials showed that within their sets of 18 runs, the
rate of correctly identified stereoscopic objects out of the pool of all possible objects
crossing the subjects’ peripheral field of view (PL), ranged between 75 and more than 95 %
for the most to 5‐60 % for the least successful subject. Considering all subjects as a group,
over the individual 18 runs a mean performance of only 50‐65 % was gained for group 1
with an arithmetic average of 59.1 % ±5.7. The group performance of group 2 was 50‐85 %
with the average raised to 66.9 %±8.4. However, taking the mean percentage of the
correctly indentified objects out of the number of objects that have been reported to be
seen (CR) as the basis of comparison for the latter situation, the common group
performance could be raised to about 84 % on the average, or conversely, the error rate of
the subjects was 16 % or less. Calculating under the same aspects the total result of the 18
runs for each individual subject separately, the values ranged from roughly 68 to 94 %,
confirming a comparably low error rate. It has to be noted that the CR depends on the size
of the population (number of subjects), the larger, the more reliable its expressiveness.
b) The analysis of the recorded ocular reactions was less expressive than initially expected. It
was idealized to properly record the eye movements in response to the stereoscopic
stimulation and having them graphically portrayed by software for analysis. However, due
to the poor performance of the recording hardware and the resulting noisy data, the
software approach was not feasible in most cases. Consequently, as initially intended,
automated data preparation in order to objectively either confirm or reject the subjects’
active responses could not be established for all cases. Nevertheless, in some cases it was
possible for a certain period of time, long enough to objectively confirm the object
perception and proving plausibility. As detailed above, the evaluation was achieved by
graphically depicting the horizontal path of ocular motion in response to the motion of the

5. Results and Evaluation Conclusions
71 | 97
stimulus pattern and relating the peaks therein with the moments, the subjects actively
reported having perceived the respective object. These basic findings do not reject the
initial idea. It appears that improvements, in first place regarding the procedure of
automated data acquisition, filtering and analysis, will be necessary to further direct the
development of this new test method and support the realisation of an improved design
solution as proposed in section 5.4 within a reasonable time line.
c) Another set of data is based on a) and is derived from the video‐analysis of the angular
location of the stereoscopic objects at the moment of perception, or of correct
identification by the subjects, respectively. It indicates where in the periphery the moving
objects have objects been identified.
Two situations have been considered and those loci where objects have been correctly
identified have been evaluated for: (i) the group of subjects as a whole by averaging the
angular positions of each of the 18 runs and (ii) relating the averaged values of all 18 runs to
each subject individually. In both cases, no clear recognizable differences between the trials
could be established. Neither when varying the disparity level of the plates nor the rotation
direction and speed of the stimulus pattern showed distinctive influence on the result. A
high percentage of the identified moving objects were located at about 25 to 35 degrees in
the peripheral field of view of the eye considered. In general, the different experimental
settings that have been applied in the diverse runs do not appear having much influence on
the peripheral position where objects have been identified. A clear statement under which
of the tested conditions object perception should be best cannot be given.
The final conclusion can be drawn as follows: Although the marginal conditions were not the
ideal ones following the intention of this pilot study, it could confirm the basic feasibility and
practical applicability of the new test method introduced here. A general point of criticism,
however, is the smallness of the group of subjects which renders a proper empirical and
statistic analysis difficult and impractical. However, the group size sufficed to show on the one
hand that the basic idea behind appears to be valid in principle. On the other hand, ways to
improve the procedure in terms of expressiveness and reliability could be identified that might
lead towards a prospective development beyond the prototyping.

5. Results and Evaluation Improvement and optimization of the Procedure
72 | 97
5.4 Improvement and Optimization of the Test Procedure
After the completion of the test sessions the subjects were ask for their subjective feedback
regarding the experimental procedure (from a patient’s perspective) and its potentials (from
their perspective as prospective orthoptists) by anonymously filling in a questionnaire. Eight
questionnaires have been returned, revealing some critical points and practical weaknesses of
the test procedure. The evaluation of the questionnaires shall give advice how to improve the
test procedure in technical (i.e. the apparatus) and methodological (concerning the practical
execution) terms, as well as the usability aspect from the potential users’ perspective. In this
context, also the operability from an examiner’s point of view is to be discussed and
improvements proposed. Finally, in order to unhide possible adverse effects, the sense of well‐
being during and after the completion of the test runs, as well as at the day after, was asked
for. All subjects confirmed that prior starting the tests they felt healthy and did not take
mentionable medication. The findings of the questionnaire can be summed up as follows:
From a procedural and methodological position, all subjects agreed that the total duration
of the entire test procedure, which in the present case encompassed 18 runs with different
settings, lasting in total about 60 to 70 minutes, was too extensive. The subjects’ active
cooperation was already required before the actual test sessions could start during the
preparation phase of the sessions. Their proper placement in the apparatus and the
associated procedures of alignment with the reference markings for the measurement and
video equipment were time‐consuming and tiresome. However, after the beginning of the
session, the duration of each run (which was between one and two minutes) and the time it
took to modify the settings (about the same) for the next run in sequence was commonly
judged as appropriate and acceptable. There was general consent that after a couple of
consecutive runs, short breaks of about five minutes would help preventing tiredness and
loss of concentration. This alleviation should be easy to be realized at an advanced stage of
apparatus maturity. But yet, at the present stage of development, it is rather impractical
since it would require repeating the same preparative efforts and readjustment of the
subjects as at the beginning of the session.
The apparatus itself, beside the ergonomic aspects that are listed later, needs some
constructive progress, in particular with respect to the design of the rotating cylinder and its

5. Results and Evaluation Improvement and optimization of the Procedure
73 | 97
stimulus pattern. The two straight vertical edges resulting from the fabrication of the
cylinder, although bonded with dichloromethane, have been recognized by seven out of
eight subjects and could be distinguished from the stereoscopic contours. Appearing and
moving edges have been noticed as artifacts but they did not disturb the subjects.
Depending on the rotation speed, most subjects, six out of eight, could recognize single
stereoscopic objects, their circular shape and even discriminate between their two sizes,
best at the medium speed of 20 degrees per second. There was a general consent that at all
tested rotation velocities the smaller circles were easier recognizable than the larger ones.
The stimulus density of the drum (seven circles per revolution) was felt as appropriate with
a slight preference towards a higher number of targets at the low and medium speed levels,
but with less at higher speed.
The usability and the general comfort for the potential patient need to be increased in
several points. From an ergonomic perspective, the posture of the subjects during the test
session was not as inconvenient as presumed. Although the seating position was tiring on
the long run, no inacceptable tension was reported in lumbar, neck or shoulder regions,
neither did the assembled headrest induce mentionable discomfort. It is evident that for
the seat better ergonomic adjustability, particularly in height, especially for smaller‐sized
subjects, should be enabled. A footrest should be provided to further reduce possible
discomfort fostering a relaxed posture. The spatial narrowness within the cylinder
practically did not play a role. Solely the total duration of the test session induced some
discomfort. Nevertheless, concentration could be maintained during the runs, although the
effort markedly differed between the subjects. Occasional background noise (e.g. buzzer
sound) did not disturb the subjects. The occasional presence of persons was noticed but it
did neither lead to mentionable distraction. The illumination conditions in the examination
room were pleasant as all subjects agreed. An extremely important issue which had
considerable influence on the general well‐being and the overall performance of the
subjects is the aperture goggles to be worn, topic of the subsequent bullet point.
The aperture goggle served to define and limit the visual field guaranteeing continuous
central fixation and in addition as supporting frame for the head‐worn camera as described
in section 3.4. It was rather uncomfortable to wear and became heavy for the duration of
the examination. All subjects claimed for a lighter version with sufficient adjustability to

5. Results and Evaluation Improvement and optimization of the Procedure
74 | 97
prevent misalignment and to reduce the felt pressure on the bridge of the nose. Therefore,
the personal efforts of maintaining central fixation as required by the nature of the test
procedure was high, but in general manageable with some effort and willingness for
cooperation. The fixation markers that should serve as fixation aids have been attached
very close, only a few centimetres in front of the eyes. All subjects noted that it was very
strenuous to keep the markers fixated. Convergence and accommodation to keep fixation
rendered the peripheral environment, i.e. the Frisby pattern, blurred and it consequently
appeared difficult to recognize and distinguish the stereoscopic objects. A tendency to
squint rather than to fixate at these markings could be provoked.
Independent of the questionnaire, two‐third of the subjects reported minor adverse side
effects such as slight headache, eyestrain and dizziness right after completion of single runs
or at the end of the session. One subject had the feeling of vertigo and nausea right at the
beginning of the first run. However, after a short rest of a few minutes and a cup of water
she could continue and complete her session without any further reported nuisance. In
general, the above symptoms disappeared within a few minutes. In one case, slight nausea
persisted for half an hour, in another case slight headache for one hour after completion.
All the other subjects did not report any continued impairment of well‐being. Accumulated
between the second half and last third of the duration of the session, subjects became tired
and more frequent blinks of the eyes were noticed. Keeping central fixation and
concentration was a more and more challenging task. By some subjects the sensation that
they would be rotating in the opposite direction, referred to as circular vection [Becker et
al., 2002], an illusion of self‐motion, has been noticed.
An evident issue from the examiners point of view is the operability of the procedure. The
rotational direction of the cylinder and its velocity can be set remotely at the control desk.
The disparity levels, on the contrary, need to be adjusted individually according to the
sequence given in the test plan of section 4.2 This brings along certain deviations in
precision while being also time‐consuming and mutually stressing for the subjects and the
examiner. Due to general character of the present apparatus, this imprecision is marginal
and can be neglected, remaining an issue for the further process of development.

5. Results and Evaluation Improvement and optimization of the Procedure
75 | 97
As conclusion, supported by the experimental results and the experience gained so far, the
above findings suggest the following (technical, methodological and ergonomic) steps to
further advance the prototype development:
The total duration of the test procedure, in particular the times of preparation, alignment
and adjustment, should be reduced by more convenient design solutions.
Regular breaks should be introduced into the test procedure to reduce symptoms of
fatigue and the related negative effects on subject concentration and motivation.
The level of comfort should be optimized by basic ergonomic considerations, especially
under view of the total duration of the test.
The aperture goggles are the most important issue for improvement. First of all, the weight
needs to be minimized and therewith the users’ comfort optimized. This should be
achieved by replacing the bulky web camera for another more suitable means of
measurement of ocular reactions. Secondly, the fixation markers should be arranged more
comfortably to reduce the physiologic loads of the patients, easing their fixation efforts.
The video‐graphic measurement of ocular reactions should be replaced by more
appropriate and precise methods in terms of spatial resolution (smallest measurable
change in eye position) and temporal resolution (sampling rate, being the number of eye
positions per second) such as scleral search coils, electro‐nystagmography, corneal
reflection, IR tracking or others [Duchowski, 2007; Eggert, 2007; Hoffmann, 2007]. Besides
enabling more reliable data analysis, these approaches would additionally go along with
the reduction in weight and imbalance of the aperture goggles as proposed before.
A generally increased level of automatic adjustability and adequate software control would
contribute not only to improved subjects’ performances; it would also increase the
usability and the acceptance of potential operators of the device. While reducing their
efforts and the time associated with manual device operation, the gains in precision of the
disparity levels and increased reproducibility should allow for more qualitative diagnosis of
the individual levels of peripheral stereoscopic perception of the patients.
Last but not least, hardware design‐related limits as in section 3.7 and systematic errors,
such as e.g. those presented in section 4.3, need to be overcome for the sake of precision,
trustability and future acceptance of the method.
6. Discussion
76 | 97
Part IV – Discussion
6. Discussion
In this pilot study, a new conceptual test method to check the presence of dynamic
stereoscopic vision in the peripheral field of view has been developed, a prototypic apparatus
fabricated and presented, and its applicability validated by preliminary, but indicatory
experiments. The method proposed is based on a random dot pattern designed according to
the Frisby Stereotest and totally surrounding the centrally placed subject. Likewise the Frisby
Stereotest and supported by the nature of the experimental setup, depth discrimination is
enabled by stereopsis only; monocular and other binocular cues of depth, as well as motion
parallax are excluded. Therefore, in difference to established current clinical methods, this new
approach is claimed to be highly objective from both, the patients and the examiners
perspective. This fact renders it a useful tool for a manifold of applications for which objective
assessment of binocular and especially stereoscopic vision is the prime requirement.
The discussion part is structured as follows. First, the practical significance of dynamic
peripheral vision is highlighted, particularly resuming the leading points from the introduction,
focused on the question of applicability. Then, a closer look, especially on the need for
objectivity, will clarify why existing and commonly used clinical methods of stereoscopic
assessment do not suffice, especially in terms of safety‐relevant issues, and hence objective
criteria of optimum assessment will be introduced. A review of exemplary and similar
approaches that are available in literature will be given before a closing discussion of
commercial applicability will conclude this work.
6.1 Significance of Peripheral Dynamic Stereovision
In the scope of this work “peripheral dynamic stereovision” shall be referred to as the ability to
perceive, recognize and observe moving targets in the peripheral field of view without
sacrificing dedicated attention to the actual visual scene of interest that is kept caught in foveal
fixation. In other words, it is the capability to peripherally gather useful information for either
planning reactive steps in anticipatory response to an action being in progress (e.g. the need of
unexpected evasive action) or just to complement the actually scene of attention by acquiring

6. Discussion Significance of Peripheral Dynamic Stereovision
77 | 97
additional information without the need of shifting the line of sight (e.g. moving the eyes or the
head) and loosing focus. On top of that, the requirement for excellent binocular vision, which is
met by the presence of stereopsis, further enhances the quality of dynamic visual perception in
the periphery by adding judgment of depth and estimation of relative spatial positions. These
are central cues for coordinative interaction and orientation in space or in a moving
environment.
The term stereopsis (as introduced in section 2.6.1) is used to express that for estimation of
distance exclusively depth binocular input and horizontal disparity shall be claimed. Monocular
cues such as perspective, texture gradients, shading, luminance or others [Taylor, 1973;
Grüsser, 1983; Noorden and Campos, 2002] might suffice, motion parallax might even create an
equally well sensation of depth [Faubert, 2001], but the particular requirements for
discriminative efficiency are not always met. For instance, monocular cues depend on
experience and knowledge and are usually useless in unstructured environments, in static
situations which elicit no retinal drifts, or in general where it is difficult for the eyes to find
appropriate points of reference.
Following up the motivating ideas presented in the introduction, occupational activities and
professional sports are the two major fields in which well‐developed dynamic peripheral
stereovision is of fundamental, even safety‐related interest. Typical tasks that set high
standards to peripheral dynamic stereovision can be exemplarily concretized as:
• Spatial (self)‐orientation and situation awareness (e.g. in space environment)
• Target recognition and debunking of optical illusions (e.g. flight maneuvers)
• Estimation of relative position and distance (e.g. in traffic situations)
• Cooperative interaction between different agents (e.g. team players)
• Remote manipulatory tasks (e.g. robotic arms)
• Machine operation (e.g. cranes)
• Accurate alignment tasks (e.g. microscopy)
• Virtual reality and tele‐robotics (e.g. surgery)

6. Discussion Significance of Peripheral Dynamic Stereovision
78 | 97
• Anticipatory reactions (e.g. object avoidance in sports)
• Complex tasks involving good hand‐eye coordination (e.g. martial arts)
Without asserting claims of completeness, some evident occupations and sports where the
above specified tasks may find compelling relevance are listed in table 6.1.
Table 6.1: Activities with raised demands on peripheral dynamic stereovision.
Occupations (Professional) Sports
Aviators • astronauts • crane and machine operators • professional drivers • air traffic controllers • mariners • etc.
Quick ball games and team sports • referees • motor racing • martial arts •
hunting • skiing • etc.
For safety and accident prevention, higher levels of visual quality should be recommended for: fire fighters, police, soldiers, private motorists, etc.
However, frequently these above specified high‐level visual tasks are often interleaved or
merged with each other sharing the same qualitative requirements on the visual apparatus, and
should therefore not separately be considered. Their interaction is quite complex as the
example of a wide receiver in typical football game might illustrate:
Being in running motion and keeping a certain general overview, he has to visually track the
moving ball he is supposed to receive while paying attention to both his quarterback and the
approaching defensive players of the opposing team. Simultaneously, when his tackling is
deemed unavoidable, quick and correct estimation of the distance to pass over the ball to the
tactically best positioned team‐mate is to assure success. In this complex scenario, the absolute
abilities of maintaining permanent attention to the events in the central field of view and
minimizing reaction time by avoiding deviant shifts of sight loosing thus central fixation, while
selectively and appropriately reacting to peripheral events, is the metrics of high performance
and success.

6. Discussion Need of Objective Tests and Criteria of Assessment
79 | 97
6.2 The Need of Objective Tests and Criteria of Assessment
As an integral part of the general strategies of examination of the sensoric [Rüßmann et al.,
2004a] and neuro‐motoric [Rüßmann et al., 2004b] components and functionalities of the
visual system, presence or absence of stereopsis is an important indicator of the state of
binocularity. It can give valuable diagnostic advice for neuromuscular anomalies and disorders
[Noorden and Campos, 2002] that conveniently could remain hidden to (less experienced)
examiners. The absence of stereopsis in amblyopes and strabismic patients does not
automatically imply stereo‐blindness. Especially if visual deficits are of early origin in life,
missing stereopsis is not felt as a real handicap as patients quickly learn making use of non‐
stereoscopic cues to depth perception [Noorden and Campos, 2002]. Against this background a
considerable quantity of clinically established tests to assess stereoscopic vision reveals two
major drawbacks: They are not really free of non‐stereoscopic cues and objectivity in both
execution and evaluation from both parts the examiner and the patient is difficult to guarantee.
For conventional diagnostic and preventive purposes, being part of a general strategy of
ophthalmologic examination [Noorden and Campos, 2002; Rüßmann et al, 2004a, 2004b], their
diagnostic value might suffice; not, however, when the above higher standards are to be
applied and perfect stereopsis (not to be confused with stereovision) is indispensable.
Occupational activities and professional sports which pose above‐average demands on the
quality of the visual system, in particular peripheral dynamic stereovision, require reliable
procedures and criteria to selectively pick the best candidates out of an often larger pool of
applicants. Once selected and in service, suitable objective test procedures are indispensible to
ensure the steady compliance with the visually criteria that have been initially defined and
applied.
Not only appropriate and satisfying hardware solutions need to be developed. The same efforts
have to be paid to the definition of objective and reliable criteria for straightforward
assessment of the data acquired. This particularly applies for patients that are either unwilling
for truthful cooperation (e.g. persons concealing or feigning deficiencies) or unable (e.g. young
infants, disabled persons, etc.).
For children, mostly electrophysiological measurements of cortical function known as visual
evoked potentials (VEP), preferential looking and the evaluation of OKN responses are used to
6. Discussion Need of Objective Tests and Criteria of Assessment
80 | 97
objectively determine visual acuity [Suttle, 2001; Noorden and Campos, 2002], or for the
unmasking of apparent blindness [Bach, 1935]. In principle, these methods are also of
relevance for the evaluation of fusion and stereovision [Fox et al., 1978; Archer et al., 1987]. By
these strategies, it has been found evidence that stereoscopic depth discrimination based on
disparity alone occurs at about the age of three months [Tyler, 2004]. The only cooperation
required is that subjects are awake and can hold the eyes open. However, for the
methodological design of the test method it has to be considered that OKN responses differ
depending on subjects’ states of attention and the clarity of the instructions given by the
examiners [Garbutt et al., 2001]. Objective estimations based on VEP, eye movements and
pupillary light reflexes are applicable to objectively determine the visual field of poorly
cooperating patients like infants or disabled persons [Gräf, 1997]. A further point deemed to
be necessary is the a priori elimination of the effects of motion parallax [Faubert, 2001] and
monocular contamination [Tyler, 2004] of the responses by an inappropriate way of stimulus
presentation.
What has not been scratched so far, are the applicative possibilities this new stereotest might
open for the purely diagnostic field, i.e. applications that are not directly related to professional
aptitude or screening tests. In line with the motivating starting points and to support the
arguments for potential commercialization, two potentially prospective categories will be
concisely exemplified: (a) debunking of fake claims of partial or total invalidity (concerning the
branch of pension insurer) and (b) early diagnosis of binocular deficiencies, particularly infantile
strabismus.
(a) Debunking fake claims of invalidity benefits
Incapacity benefit is paid to people that are below the age of pension after having satisfied
medical tests confirming incapacity to work in accordance with national regulations. In order to
claim payments from the insurer company, compulsory medical examinations are to be
scheduled for the applicant. Their final result with the respective medical advice usually is the
decisive factor and for acceptance they have to be reliable and objective. Robust estimates of
annual values of unjustified invalidity payments or overpayments insurers have to settle are
hard to be found. Usually, the number of fraud cases that can be confirmed is assumed being
small, but surely the higher is the number of undetected cases. No statement can be given
whether these cases finally result from applicants’ false pretences, wrong medical
6. Discussion Need of Objective Tests and Criteria of Assessment
81 | 97
interpretation by referees or even shortcomings of the assessment method chosen. The new
test apparatus introduced here may provide a powerful tool to support currently applied
methods of ophthalmological examination. By adding an elevated degree of objectivity it would
facilitate the debunking of possible false pretences and the associated elevated financial
expenditures the insurer would have to bear, independent of the referee’s performance and
the personal attitude of the patient towards the ordered examination.
(b) Infantile binocular deficiencies and strabismus
At about 6 months of age, the optokinetic development is more or less completed. However,
during the first three months of life, strong monocular asymmetry manifests [Naegele and Held,
1982; Suttle, 2001; Valmaggia et al., 2001]. Reactions to targets moving from the temporal to
the nasal side are innate while naso‐temporal stimulation is to be learnt [Kommerell, 2004a].
Under conditions of untreated early pediatric strabismus, this tempo‐nasal asymmetry can stay
in effect throughout all one’s life [Kommerell, 2004b], as well as other impairments that might
develop as a consequence [Herzau, 2004b]. Usually, in normal development, some minor
asymmetries keep persisting – stimuli towards the nasal side appear more effective than those
to the temporal side [Carpenter, 1988]. The symptoms of infantile strabismus may hamper the
development of binocular neurons in the visual cortex [Herzau, 2004b]. The earlier in childhood
the diagnosis and the shorter the duration of the strabismus, the more effective will be THE
therapeutic measures to re‐establish stereopsis or resuming normal binocular development,
often preventing amblyopic impairments that might develop, saving thus surgical intervention
[Noorden and Campos, 2002, Herzau, 2004b]. A good and established method of early
diagnosing possible deficits of the binocular system and the associated senso‐neurological
pathways [Kommerell, 2004a] consists in the recording of VEP as objective response to dynamic
stimulation [Noorden and Campos, 2002].
In random dot patterns, the looking behaviour of infants may indicate their recognition of
binocularly disparate objects and the presence of stereopsis can be concluded. This behaviour,
referred to as preferential looking, is based on the fact that patterned stimuli rather attract an
infant’s attention than homogeneous surfaces [Noorden and Campos, 2002]. However, this
binocular function together with the respective motor‐sensory necessities usually do not
develop until the first two to four months allowing for stereoscopic depth discrimination based

6. Discussion Need of Objective Tests and Criteria of Assessment
82 | 97
on disparity alone [Tyler, 2004]. Further, basic neuro‐anatomical immaturity and the
asymmetry of the monocular OKN during the first three months of age provide other difficulties
at that early age. But above all, the diagnostic success of ocular pursuit movements in response
to random dot pattern is strongly dependent on the attention subjects are actively paying to
the stimulus presentation [Kommerell, 2004a], a core requirement which cannot be taken for
granted for infants, consequently, limiting the applicability of the new method proposed to
those children which already can stay attentive.
6.3 Comparison of the Results/Solutions with Literature
In view of the previous section, the characteristics of the OKN in tandem with the general
presence of stereopsis should constitute the methodological basis for the novel objective test
method of dynamic peripheral stereopsis which was presented in this pilot study.
Early experimental methods that have been claimed the necessity of objective testing
procedure of dynamic stereopsis showed that an OKN response can be directly correlated with
the correct identification of stereoscopic contours [Fox et al., 1978; Archer et al., 1987]. It has
been further shown that the OKN gain can be described as a function of the binocular disparity
of the stimulus [Howard and Simpson, 1989], providing thus an objective evaluative criterion
for stereopsis. Wantanabe and colleagues (2008) recently developed a similar test for stereo
motion, however sequentially applying four types of computer‐generated anaglyphic random
dot stereograms as depicted in figure 6.1.
Figure 6.1: Sequential stereo motion test as modified from [Watanabe et al., 2008].

6. Discussion Comparison of Results with Literature
83 | 97
All stimuli were displayed on a 15 inch PC monitor at a viewing distance of 50 cm. In the first
two tests parallel planes rotating in depth around their vertical axis were presented (see figure
6.1a). In the first case, they contained combined cues of binocular disparity and inter‐ocular
velocity differences (motion parallax), excluding binocular disparity cues in the second case. In a
third test oscillation in depth was presented (see figure 6.1b). In the fourth scenario (see figure
6.1c), the random dot stereograms form a cylinder which was also presented to the subjects on
the screen. Cut into two oppositely rotating parts, the subjects had to locate the separating
border (red marking in the figure) of the cylinder. However, this procedure was intended to
investigate the motion‐in‐depth perception of strabismic patients, complementing clinical
examination with static stimuli.
The major differences to those studies were that in this work real physical depth was presented
to the subjects through a stimulus pattern which was designed in good compliance with the
Frisby Stereo Test [FST]. The evidently resulting advantage is that viewing under natural
conditions and free of dissociation is permitted. Depth information exclusively results from
binocular visual inputs, the retinal disparity of which is neuronally processed; monocular visual
cues are excluded by principle, as well as motion parallax is avoided. In general consent
therewith, tests based on real depth have been reported to be more appropriate in the de facto
verification of absence or presence of stereopsis whereas those based on Polaroid vectographs
being more suitable in determining subtle changes [Leske et al., 2006].
The planar displays onto which computer‐generated random dot patterns had been projected
in [Wantanabe et al, 2008] conveniently subtended a rather small part of the visual field. Now,
in the concept proposed here, they have been replaced by a rotating cylinder in the centre of
which subjects were seated, thus completely surrounded by the stimulus pattern. The visual
distance to the curved stimulus planes was at about 50 cm. This arrangement appeared to be
the most appropriate one because in contrast to the methods of Wantanabe and colleagues
(2008), the intention was an assessment of dynamic stereopsis in the peripheral field of view.
For this purpose, a robust spectacle frame was equipped with sets of adjustable blends that
besides occluding the central field of view served to define a more or less reproducible window
for exclusively peripheral stimulation. A detailed description is provided in section 3.4. Thereto
related was another, distinguishing aspect, contrasting previous tests, namely that the design
of these goggles assured the correct “behaviour” of the subjects. Whenever deviating from

6. Discussion Comparison of Results with Literature
84 | 97
central fixation, trying to finagle stereoscopic stimuli by intentionally squinting, a punishing
effect of visual information deprivation had the subjects to realign again to the primary
position. Temporarily lacking capabilities of data acquisition and evaluation are the only evident
deficiency that is currently limiting the persuasiveness of this prototypic solution. However, this
is by far not a show‐stopping criterion. By raising the complexity and financial efforts, this
hampering issue should be easily solved by the application of conventional electrophysiological
methods of eye position tracking [Duchowski, 2007; Eggert T, 2007; Hoffmann, 2007], which
were currently not applicable for this prototypic approach.
The test procedure presented in this work should not be considered as a stand‐alone
application. Even excellent dynamic stereopsis in the peripheral field of view does by no means
imply that the entire binocular apparatus is performing well. As already pointed out, in humans,
two different stereoscopic systems, static and dynamic stereopsis, exist independently from
each other and should be strictly differentiated [Carpenter, 1988; Mollenhauer and Haase,
2003]. By means of the coarser but quickly responding dynamic (peripheral) stereopsis,
peripherally moving stereoscopic objects are detected and brought into foveal fixation for
detailed inspection by the highly acute static (central) stereopsis. Retrospective studies
confirmed some residual dynamic stereopsis in strabismic patients without central stereopsis
[Mollenhauer and Haase, 2003] since the retinal periphery appears to be more resistant to
binocular impairment. Smaller deviations of the visual axis that already suffice cancelling
binocularity in the central field of view are peripherally compensated, most probably due to the
accepted tolerances attributable to the larger receptive fields that are associated to the retinal
periphery [Grüsser, 1983; Howard and Rogers, 1995; Herzau, 2004a]. Nevertheless, to obtain a
reliable and doubtlessly correct diagnosis of the binocular apparatus facing the dynamic
situations which are covered in this treatise, both static and dynamic stereopsis need to be
ascertained by designated test procedures.
As it is further recommended in [Tyler, 2004], for final unequivocal evidence of functioning
stereopsis, tests to differentiate the direction of depth perception, i.e. whether perceived
towards or away from the observer, should be complemented or integrated into the procedure.
The functionality, unique particularities and distinguishing features of this test with respect to
the currently applied ones can be summarized as follows:

6. Discussion Comparison of Results with Literature
85 | 97
Assessment of dynamic stereopsis in the visual periphery with central occlusion.
Real physical depth based on the Frisby Stereotest
allows testing of stereopsis under purely natural viewing conditions,
rendering viewing free of dissociation and
it excludes monocular contamination, i.e. stereoscopic viewing is free of any other cues than horizontal disparity.
Stereoscopic contours can only be detected if stereopsis is present.
By means of the test design and procedure:
Central fixation is guaranteed.
Simplicity of application: PC‐control and automation can be easily implemented, no trained medical staff needed, defined criteria for the evaluation of the results.
Objectivity by a standardized test situation: subjects respond verbally and by their involuntary ocular reactions (mutual plausibility check); examiners’ judgments are based on given characteristic and fixed criteria.
Correct answers cannot be learnt.
Adjustability of a large range of test conditions (stereoacuity, moving speed and direction of stimuli) offers diagnostic manifoldness.
Cost efficiency in terms of manpower (no specialists), little servicing and maintenance.
6.4 Commercial Applicability
The applicative possibilities of this new test method which combines the assessment of
stereopsis and dynamic visual field testing are manifold. The high degree of objectivity
guaranteed by the nature of the principle should foster above all future applications such as
medical pre‐employment testing, general aptitude and assessment tests or diagnosis. It is more
than obvious that good stereopsis attributes to quick and safe judging and the acquisition of
awareness and spatial self‐orientation in any kind of situations related to the interaction and
coordination between multiple agents. Particularly in road, air or ship traffic situations
stereopsis decisively increases the level of safety. Also in professional sport activities which

6. Discussion Commercial Applicability
86 | 97
involve quickness in coordination and reaction stereopsis is an indispensable asset. Last but not
least, there is a versatile diagnostic value, may it serve, among others, for early identification of
infantile amblyopia or strabismus, or the debunking of fake claims for invalidity benefits.
Based on the characteristics of the optokinetic mechanisms triggered by object detection in the
stimulus pattern and its tracking behaviour, one could as well consider upgrading the diagnostic
conclusiveness of this method towards a more objective type of perimetry, exclusively
depending on the alertness and the attentive state of the patient. As proposed in [Körner,
1975], by selectively stimulating definable and small receptive retinal areas, their normal
sensory function could be confirmed or deficiencies easily discovered through evaluation of the
corresponding optokinetic reactions to be usually expected.
Following these lines of reasoning, interest of specialized manufacturers of bio‐medical and
optic devices might arise. Their potential customers would cover all the above mentioned
scenarios, including clinical institutions, even authorities and military fields. As it has already
been extensively discussed in section 6.3, compared to established test methods, clear
applicative advantages are offered for this range of applications. But in spite of these unique
selling points, it is now out of the scope to show up with a possible concept for
commercialization. Before strategies can be reasonably initiated at all and a respective
marketing mix developed, it is the aim of the present feasibility study to practically define a
number of basic requirements to be met and possible showstoppers to be levered out first. The
basic ones are presented and summarized below:
• Degree of prototype maturity
Attributable to the limited resources that have been available for the fabrication of this first
prototype, significant improvements reflecting the current status of prototypic maturity are
revealed in section 5.4. Thus, it appears that a successful commercialization of the apparatus
will need to be approached trilaterally: from a procedural‐methodological, a design‐related
technical, and a practical‐operational side. Certainly, a forth, experimental side to convincingly
validate the results obtained so far, will be of strong supporting interest. In successive series of
experiments, besides the mentioned procedural optimization and design‐related upgrading,
more emphasis will have to be put on the procedures of the acquisition, evaluation and
presentation of the data obtained. With increased efforts regarding the ocular feedback of the

6. Discussion Commercial Applicability
87 | 97
subjects to the stimulation and its precise assessment, leveraging benefits could be expected in
the persuasiveness of this prototypic solution.
• Competitiveness
Commercial success and the initial motivation of daring a business venture depend on good or
even outstanding competitiveness of the new product to be introduced with respect to
comparable solutions that are already available on the market. Solving the preceding issue of
prototype maturity should promote realistic competitiveness. One strategic assessment tool
could be e.g. a SWOT Analysis which comprises an evaluation of relative strengths, weaknesses,
opportunities, and threats that are associated with the object in question.
• Certification
A certification proofing continuous compliance with national and international directives and
legal regulations is highly recommended and for certain products needed. In the European
Union, the Directive 2007/47/EC of the European Parliament which revised the Council
Directive 93/42/EEC concerning medical devices applies in this case [MDD, 2007]. Generally,
also a declaration of conformity is to be issued by manufacturers to guarantee the
authorization of medical devices. In synergy with the above directive, DIN EN ISO 13485:2007‐
10 (Medical devices ‐ Quality management systems ‐ Guidance on regulatory affairs) is to be
applied to define the manufacturers’ requirements regarding the quality management system.
Certified medical devices should be CE‐marked showing their general compliance with EC
standards. For instance in Germany, the requirements of the Medical Devices Act, which is the
national implementation of the European Directive concerning medical products, are to be met.
More information can be found in the applicable respective national and international
directives and regulations.

7. Summary
88 | 97
Part V
7. Summary
In this work a new method and a first prototypic design of an apparatus to systematically
approach the objective assessment of peripheral dynamic stereovision are proposed and
experimentally evaluated.
“Peripheral dynamic stereovision” shall be referred to as the ability to perceive, recognize and
observe moving targets in the peripheral field of view without sacrificing dedicated attention to
the actual visual scene of interest kept in foveal fixation. In other words, it is the capability to
peripherally gather useful information for either planning reactive steps in anticipatory
response to an action in progress (e.g. the need of unexpected evasive action) or just to
complement the actual scene of attention by acquiring additional information without the need
of shifting the line of sight (e.g. moving the eyes or the head) and loosing focused attention to
the scene of interest. The presence of stereopsis on top further enhances the perceptive quality
by adding the third dimension with judgment of depth and estimation of relative spatial
positions as central cues for orientation, coordinative interaction and navigation in space.
Under physiological aspects, stereopsis is regarded as the highest level of human binocular
quality. With the eyes located off‐centred at two different head positions, two perspectives of
the visual scene are projected onto the retinas and fused by the brain to generate a three‐
dimensional impression. The particular distribution of photosensitive receptor cells renders the
fovea centralis as the retinal region of greatest visual acuity and spatial resolution. Peripheral
vision complements the acute central vision by its capability to detect objects and directed
motion, as well as brightness gradation, outside the narrow cone of straight ahead central
vision at high temporal resolution. Generally, moving objects are perceived when either the
eyes remain stationary and the object image is shifting across the retina, or the eyes are
pursuing the moving target, locally capturing it in the fovea by specialized movements of gaze
shifting and stabilization. Triggered and executed within milliseconds, the sharp impression of
complete sceneries is ascribed to patterns of fixation and action of quick saccadic jumps as well
as smooth precise fine‐tuning shifts. One is unconscious of these continuous point‐to‐point
fixations and image shifts since the brain suppresses and extrapolates them to a coherent
image. The Optokinetic Nystagmus (OKN) plays a central role in this process. By repetitive and

7. Summary
89 | 97
conjugate sequences of slow and quick phases it stabilizes the image of moving repetitively
patterned scenes on the retina. Also moving stereoscopic contours can induce determinable
and differentiable optokinetic reactions. However, stereoscopic nystagmus shows presence
only in subjects with normal stereopsis; it is absent in stereo‐blind subjects. By presenting a
stationary fixation target, optokinetic responses are partly or even completely suppressible.
These characteristics of the OKN in combination with a panoramic stereoscopic stimulation
pattern which is designed according to the Frisby Stereotest and rotated around the subjects’
heads constitute the main distinguishing features of this new examination method compared to
existing ones. The Frisby Stereotest has been chosen as exclusively the binocular parallax
resulting from the plate thickness carries the stereoscopic information; other depth cues such
as contours, motion parallax, or personal experience that could falsify the diagnosis are
excluded per se. A goggle frame was equipped with sets of frontal and lateral black blends. By
this design of the “aperture goggle”, central vision was blinded out, opening a peripheral field
of view of 45 degrees to each side only. Subjects soon learned that the deviation of their eyes
from the central fixation position, i.e. squinting to the periphery, will immediately be punished
by information deprivation. Such condition is generally experienced as uncomfortable and
consequently was avoided.
The presence of gross stereopsis was tested by exposing the subjects to a total of 18
experimental runs under natural, free‐sighted conditions, each. Three different physical depth
differences (6, 3 and 1.5 mm) with corresponding stereo acuities of 320, 160 and 80 seconds of
arc have been applied for three ranges of rotational speeds (10, 20 and 30 degrees per second)
in both clockwise and counter‐clockwise rotational direction. The subjects’ voluntary reactions
(pushing a buzzer button) and their ocular responses involuntarily triggered by passing
stereoscopic objects have been recorded simultaneously and could in principle serve as mutual
plausibility checks.
For the evaluation of voluntary reactions, the performance level (the rate of correctly identified
objects to all possible objects crossing the subjects’ periphery, PL) and the confidence ratio (the
rate of the correctly indentified objects out of those that have been reported to be seen, CR)
were introduced as comparable benchmarks. Among the subjects larger spreads in the PL have
been observed ranging between 75 to 95 % for the most down to 5 to 60 % for the least

7. Summary
90 | 97
successful subject with a total average of 60 %. The mean CR of group was raised to about 84 %,
or conversely, implying an error rate of 16 %. Consequently, high overall credibility of the
subjects could be assumed and occasional low performance runs could result either from lacks
of concentration, design‐related distraction or indeed weak peripheral stereopsis. Statistical
significance, however, could not be found.
The analysis of the recorded involuntary ocular reactions was less exhaustive than initially
expected. In many cases, poor performance of the available recording hardware rendered an
automated software approach for data extraction and evaluation difficult. However, it could be
observed that upon peripheral appearance of objects, the onset of nystagmoid mechanisms
was triggered, having the eyes searching and tracking them in relatively fluent and consistent
motion.
Finally, the angular positions where in the periphery subjects actively reacted to stereoscopic
stimulation have been analysed and could be established at about 30 degrees on the average.
The extent of the different experimental settings that have been applied in the diverse runs
does yet not reason a clear statement under which of the tested conditions object perception
should be best, finding thus an optimized setting.
The basic findings gained are in line with the initial idea and it appears that consequent
technical improvements will be necessary to further direct the post‐prototype development.
Above all, the implementation of more accurate methods of electrophysiological ocular
measurements such as nystagmography or corneal reflection, etc., would represent a ground‐
breaking and substantial progress.
Although the marginal conditions were not ideal, the outcome of this pilot study could in
principle confirm the basic feasibility, conceptual validity and practical applicability of the novel
test method introduced here. Ways to improve the procedure in terms of diagnostic
expressiveness and reliability have been identified and might lead towards a prospective
development beyond the current stage of prototyping.
Prospective fields of application with raised demands on peripheral dynamic stereopsis have
been identified and critically assessed. These might include, among others, a variety of
professional activities such as piloting, management of complex traffic situations or machine

7. Summary
91 | 97
operating. More generally, such activities should be addressed which involve increased levels of
self‐orientation, quick decision making and situation awareness without deviating from a
central core attention. These may also be encountered in professional sports such as quick and
coordinative multi‐player ball games or racing, etc. Objectivity of applied test methods is of big
concern for the selection of suitable candidates and medical aptitude checks for the above
professional and sportive activities. Such tests might also serve as enhancement for
conventional diagnostic and preventive purposes, becoming part of ophthalmologic standards,
particularly for patients that are either unwilling for truthful cooperation with the examiner
(e.g. persons concealing or feigning deficiencies) or unable (e.g. infants or disabled persons).
The applicative possibilities of this new test method combining the assessment of stereopsis
and dynamic visual field testing have not been found to be matched by solutions proposed in
literature so far. Before however commercial applicability should reasonably be approached,
design‐related issues and more detailed experimental evaluation of this simple but efficient
method need to be addressed first, paving the way towards a more professional development.

8. References
92 | 97
8. References
[Adams et al., 2005] Adams, W.E., Hrisos, S., Richardson, S., Davis, H., Frisby, J.P. and Clarke, M.P. (2005). Frisby Davis distance stereoacuity values in visually normal children. Br. J. Ophthalmol. 89(11), pp. 1438‐1441.
[Archer et al., 1987] Archer, S.M., Miller, K.K. and Helveston, E.M. (1987). Stereoscopic contours and optokinetic nystagmus in normal and stereoblind subjects. Vision Res. 27(5), pp. 841‐844.
[Bach, 1935] Bach, K. (1935). Die Prüfung des Optokinetischen Nystagmus zur Entlarvung Einer Scheinblindheit. Journal of Molecular Medicine 14(42), pp. 1505‐1506.
[Becker et al., 2002] Becker, W., Raab, S. and Jürgens, R. (2002). Circular vection during voluntary suppression of optokinetic reflex. Exp. Brain Res. 144(4), pp. 554‐557.
[Carpenter, 1988] Carpenter, R.H.S. (1988). Movements of the Eyes, 2nd Ed., Pion Ltd, London.
[Dubois and Collewijn, 1979] Dubois, M.F.W. and Collewijn, H. (1979). Optokinetic reactions in man elicited by localized retinal motion stimuli. Vision Res. 19(10), pp. 1105‐1115.
[Duchowski, 2007] Duchowski, A. (2007). Eye Tracking Methodology ‐ Theory and Practice. 2nd Ed., Springer, London.
[Eggert T, 2007] Eggert, T. (2007). Eye Movement Recordings: Methods. In: Straube, A. and Büttner, U. (Volume Eds.): Neuro‐Ophthalmology. Developments in Ophthalmology. Vol. 40 Behrens‐Baumann, W. (Series Ed.), pp. 15‐34, Karger, Basel.
[Ewens and Grant, 2005]. Ewens, W.J. and Grant, G. (2004). Statistical Methods in Bioinformatics: An Introduction (Statistics for Biology and Health), 2nd Ed., Springer, New York.
[Faubert, 2001] Faubert, J. (2001). Motion parallax, stereoscopy, and the perception of depth: Practical and theoretical issues. In: Three‐dimensional video and display: Devices and systems (Eds. Bahram Javidi, Fumio Okano), Proceedings of SPIE Vol. CR76, 168‐191.
[Fox et al., 1978] Fox, R., Lehmkuhle, S. and Leguire L.E. (1978). Stereoscopic contours induce optokinetic nystagmus. Vision Res. Vol. 18, pp. 1189‐1192.
[Frisby et al., 1975] Frisby, J.P., Mein, J., Saye, A. and Stanworth, A. (1975). Use of random‐dot stereograms in the clinical assessment of strabismic patients. Brit. J. Ophthal. 59(10), pp. 545‐552.
[FST] Sasieni, L.S. (19xx). “Frisby Stereo Test – Technical Paper” (http://www.richmondproducts.com/5476%20FrisbyStereotestTechArticle.aspx) and “Instructions – The Frisby Stereotest”

8. References
93 | 97
(http://www.richmondproducts.com/PDFs/Frisby%20Plate%20Stereotest%20Instructions.pdf). Links retrieved: 25.04.2009, copies are available on request by the author of this thesis.
[Garbutt et al., 2001] Garbutt, S., Harwood, M.R. and Harris, C.M. (2001). Comparison of the main sequence of reflexive saccades and the quick phases of optokinetic nystagmus. Br J Ophthalmol 85(12), pp. 1477–1483. [Gonzalez et al., 1998] Gonzalez, F., Rivadulla, C., Perez, R. and Cadarso, C. (1998). Depth perception in random dot stereograms is not affected by changes in either vergence or accommodation. Optom Vis Sci 75(10), pp. 743–747.
[Gräf, 1997] Gräf, M. (1997). Gesichtsfeldprüfung bei eingeschränkter Kooperation (Estimating the visual field of poorly cooperative patients). Klin Monatsbl Augenheilkd 211, pp. 277‐285.
[Grüsser, 1983] Grüsser, O J. (1983). Vision and Eye Movements. In: Human Physiology (Eds. Schmidt R F and Thews G), 21st Ed., pp.234‐273, Springer, Berlin, Heidelberg, New York.
[Guyton and Hall, 2006] Guyton, A.C. and Hall, J.E. (2006). The Eye. In: Textbook of medical physiology, 11th Ed., pp.613‐650, W.B. Saunders Company.
[Herzau, 2004a] Herzau, V. (2004). Sensorik des Binokularsehens. In: Strabismus (Ed. Kaufmann, H.), 3rd Ed., pp. 97‐130, Thieme, Stuttgart.
[Herzau, 2004b] Herzau, V. (2004). Binokulare Sensorik bei Strabismus. In: Strabismus (Ed. Kaufmann, H.), 3rd Ed., pp. 319 – 329, Thieme, Stuttgart.
[Hoffmann, 2007] Hoffmann, K.P. (2007). Nystamographie. In: Medizintechnik: Verfahren ‐ Systeme – Informationsverarbeitung (Ed. Kramme, R.), 3rd. Ed., pp. 185‐192, Springer, Berlin.
[Howard and Gonzalez, 1987] Howard, I.P and Gonzalez, E. (1987). Human optokinetic nystagmus in response to moving binocularly disparate stimuli. Vision Res. 27(10), pp. 1807‐1816.
[Howard and Ohmi, 1984] Howard, I. and Ohmi, M. (1984). The efficiency of the central and peripheral retina in driving human optokinetic nystagmus. Vision Res. 24(9), pp. 969‐976.
[Howard and Rogers, 1995] Howard, I.P. and Rogers, B.J. (1995). Binocular Vision and Stereopsis. 1st Ed., Oxford University Press, New York.
[Kaufmann and Steffen, 2004] Kaufmann, H. and Steffen, H. (2004). Anatomie und Physiologie der Orbita und des Bewegungsapparates. In: Strabismus (Ed. Kaufmann, H.), 3rd Ed., pp. 26‐59, Thieme, Stuttgart.
[Kommerell, 2004a] Kommerell, G. (2004). Neurophysiologie der Augenbewegungen. In: Strabismus (Ed. Kaufmann, H.), 3rd Ed., pp. 59‐74, Thieme, Stuttgart.

8. References
94 | 97
[Kommerell, 2004b] Kommerell, G. (2004). Supranukleäre Augenbewegungsstörungen. In: Strabismus (Ed. Kaufmann, H.), 3rd Ed., pp. 465‐482, Thieme, Stuttgart.
[Körner and Dichagans, 1967] Körner, F. and Dichgans, J. (1967). Bewegungswahrnehmung, optokinetischer Nystagmus und retinale Bildwanderung. Graefe‘s Arch. klin. exp. Ophthal. 174(1), pp. 34‐48.
[Körner and Hänny, 1982] Körner, R. and Hänny, P. (1982). Möglichkeiten der Augenimmobilisierung bei vitreoretinalen Erkrankungen. Fortschr Ophthalmol 79(4), pp. 331‐335.
[Körner, 1975] Körner, F. (1975). Untersuchungen über die nicht‐visuelle Kontrolle von Augenbewegungen. Adv. Ophthal. 31, pp. 100‐158.
[Lang et al., 1991] Lang, J., Rechichi, C. and Stürmer, J. (1991). Natural versus haploscopic stereopsis. Graefe's Arch. clin. exp. Ophthal. 229(2), pp. 115‐118. [Lang, 1983] Lang, J. (1983). Ein neuer Stereotest. Klin. Mbl. Augenheilkd. 182, pp. 373‐375.
[Lang, 1992] Lang, J. (1992). Stellungsanomalien und Motilitätsstörungen. In: Lehrbuch der Augenheilkunde (Ed. Pau, H.), 13st Ed., pp.77‐150, Gustav Fischer Verlag, Stuttgart, Jena, New York.
[Lasker and Kummell, 1985] Lasker, A.G. and Kummell, J.G. (1985). A light‐weight, low‐cost optokinetic drum. Vision Res. 25(7), pp. 1001–1006.
[Leske et al., 2006] Leske, D.A., Birch, E.E. and Holmes, J.M. (2006). Real depth vs randot stereotests. American Journal of Ophthalmology 142(4), pp. 699‐701, (Abstract).
[Likova and Tyler, 2007] Likova, L.T. and Tyler, C.W. (2007). Stereomotion processing in the human occipital cortex. Neuroimage 38(2), pp. 293‐305.
[MDD, 2007] MDD (Medical Device Directive). Directive 2007/47/EC of the European Parliament and of the Council of 5 September 2007. Official Journal of the European Union L 247, pp. 21‐55.
[Mollenhauer and Haase, 2003] Mollenhauer, K.A and Haase, W. (2003). Entwicklung der dynamischen Stereopsis nach Augenmuskeloperationen bei gestörtem Binokularsehen. Ophthalmologe 100, pp. 50–54.
[Murasugi et al., 1986] Murasugi, C.M., Howard, I.P. and Ohmi, M. (1986). Optokinetic nystagmus: the effects of stationary edges, alone and in combination with central occlusion. Vision Res. 26(7), pp. 1155‐1162.
[Naegele and Held, 1982] Naegele, J.R. and Held, R. (1982). The postnatal development of monocular optokinetic nystagmus in infants. Vision Res. 22(3), pp. 341‐346.
8. References
95 | 97
[Noorden and Campos, 2002] Noorden, G.K. van and Campos, E.C. (2002). Binocular vision and ocular motility: theory and management of strabismus. 6th Ed., Mosby, St. Louis.
[Pola et al., 1992] Pola, H., Wyatt, H.J. and Lustgarten, M. (1992). Suppression of optokinesis by a stabilized target: Effects of instruction and stimulus frequency. Perception & Psychophysics 52(2), pp. 186‐200.
[Pola et al., 1995] Pola, J., Wyatt, H.J. and Lustgarten, M. (1995). Visual fixation of a target and suppression of optokinetic nystagmus: Effects of varying target feedback. Vision Res. 35(8), pp. 1079‐1087.
[Recker and Lang, 2006] Recker, D. and Lang, G.H. (2006). Ocular motility and strabismus. In: Ophthalmology (Ed. Lang, G.H.), 2nd Ed., pp. 471‐506, Thieme, Stuttgart, New York.
[Rüßmann et al., 2004a] Rüßmann, W., Fricke, J. and Neugebauer, A. (2004). Untersuchung der Sensorik. In: Strabismus (Ed. Kaufmann, H.), 3rd Ed., pp. 376 – 405, Thieme, Stuttgart.
[Rüßmann et al., 2004b] Rüßmann, W., Fricke, J. and Neugebauer, A. (2004). Untersuchung der Motorik. In: Strabismus (Ed. Kaufmann, H.), 3rd Ed., pp. 333 – 375, Thieme, Stuttgart.
[Sachsenweger and Friedburg, 1992] Sachsenweger, R. and Friedburg, D. (1992). Funktionsprüfungen und Funktionsstörungen. In: Lehrbuch der Augenheilkunde (Ed. Pau, H.), 13st Ed., pp.21‐70, Gustav Fischer Verlag, Stuttgart, Jena, New York.
[Sachsenweger, 2002a] Sachsenweger, M. (2002). Das Sehvermögen und seine Störungen. In: Augenheilkunde (Ed. Sachsenweger, M.), pp.356‐374, Thieme, Stuttgart.
[Sachsenweger, 2002b] Sachsenweger, M. (2002). Die Augenmotilität, das Binokularsehen und ihre Störungen. In: Augenheilkunde (Ed. Sachsenweger, M.), pp.375‐411, Thieme, Stuttgart.
[Schiefer et al., 2001] Schiefer, U., Strasburger, H.,Becker, S.T., Vontheim, R., Schiller, J., Traugott, J.D. and Hart, W. (2001). Reaction time in automated kinetic perimetry: effects of stimulus luminance, eccentricity, and movement direction. Vision Res. 41(16), pp. 2157‐2164.
[Suttle, 2001] Suttle, C.M. (2001). Visual acuity assessment in infants and young children. Clin. Exp. Optom. 84(6), pp. 337‐345.
[Taylor, 1973] Taylor, J.H. (1973). Vision. In: Bioastronautics Data Book (Eds. Parker, J.F. and West, V.R.), NASA SP‐3006, 2nd Ed., pp. 611‐665, NASA, Washington, D.C.
[Träumer and Bührmann] Träumer, R. and Bührmann, K. (1973). Eine neue Methode der quantitativen Auswertung des optokinetischen Nystagmus. Graefe‘s Arch. klin. exp. Ophthal. 187(4), pp. 289‐297.

8. References
96 | 97
[Tyler, 2004] Tyler, C.W. (2004). Binocular Vision. In: Duane's Foundations of Clinical Ophthalmology (Eds. Tasman W., Jaeger E.A.), Vol. 2, J.B. Lippincott Co., Philadelphia.
[Valmaggia, et al., 2001] Valmaggia, C., Charlier, J. and Gottlob, I. (2001). Optokinetic nystagmus in patients with central scotomas in age related macular degeneration. Br. J. Ophthalmol. 85(2), pp. 169‐172.
[van Hof‐van Duin and Mohn, 1986] van Hof‐van Duin, J. and Mohn, G. (1986). Monocular and binocular optokinetic nystagmus in humans with defective stereopsis. Invest Ophthalmol Vis Sci 27(4), pp. 574‐583.
[Wang and Sönderberg, 1995] Wang, L. and Söderberg, G. (1995). Frequency and amplitude in scotopically stimulated optokinetic nystagmus. Graefe’s Arch. clin. exp. Ophthalmol. 233(1), pp. 8‐12.
[Wantanabe et al., 2008] Wantanabe, Y., Kezuka, T., Harasawa, K., Usui, M., Yaguchi, H. and Shioiri, S. (2008). A new method for assessing motion‐in‐depth perception in strabismic patients. Br. J. Ophthalmol. 92(1), pp. 47‐50.
[Weiß, 2008] Weiß, C. (2008). Basiswissen Medizinische Statistik, 4th Ed., Springer Medizin Verlag, Heidelberg.
[Wheatstone, 1838] Wheatstone, C. (1838). Contributions to the physiology of vision – part the first. On some remarkable, and hitherto unobserved, phenomena of binocular vision. Philosophical Transactions of the Royal Society of London 128, pp. 371–394.
[Wong et al., 2002] Wong, B.P.H., Woods, R.L. and Peli, E. (2002). Stereoacuity at distance and near. Optometry and Vision Science, Vol. 79(12), pp. 771‐778.
[Wyatt and Pola, 1984] Wyatt, H.J. and Pola, J. (1984). A mechanism for suppression of optokinesis. Vision Res. 24(12), pp. 1931‐1945.

Annex
97 | 97
Annex
Material Safety and Data Sheet of Polystyrene

Eidesstattliche Erklärung
Hiermit erkläre ich, Michael Broschart, dass ich die vorliegende Dissertation mit dem Titel
“Peripheral Dynamic Stereovision – A Novel Stereoscopic Test”
selbständig verfasst und keine anderen als die angegebenen Hilfsmittel benutzt habe.
Die Dissertation ist bisher keiner anderen Fakultät vorgelegt worden.
Ich erkläre, dass ich bisher kein Promotionsverfahren erfolglos beendet habe und dass eine
Aberkennung eines bereits erworbenen Doktorgrades nicht vorliegt.
Schenefeld, 12.05.2009

Acknowledgements
It is difficult to express enough gratitude to Univ.‐Prof. Dr. med. Stefan Clemens. He kindly offered me this unique opportunity to realize my doctorate under his supervision at the ophthalmologic clinic of the teaching hospital of the University of Greifswald. Very enthusiastically he guided me along the way, offering all backing support and encouragement I needed with the doors always kept open for enlightening discussions. Deep gratitude I owe Dipl.‐Med. Päd. Elisabeth Brunner and her colleagues at the school of orthoptics of the University of Greifswald. Even more than that, I owe their students. Interested and highly motivated they volunteered in this pilot study with phenomenally patience. Thanks ladies for this fruitful cooperation. Also, I am indebted to Dipl.‐Phys. Rico Großjohann for many useful discussions, inspiration and advice for the practical realization of the experimental part of the work. I cordially appreciate the valuable technical assistance of Mr. Joachim Lehmann and Mr. Bodo Kuhr of the local precision mechanics machine shop. The following companies have supported my thesis by kindly providing free of charge materials, tools and software:
CZIOTEC GmbH, Greifswald Toom BauMarkt, Greifswald Mikromak Service Brinkmann, Berlin
Finally, I would like to sincerely thank all people not explicitly mentioned here who have contributed to the successful completion of this doctoral dissertation, above all my family and friends Alexey, Florian, Marcus, Stephan and Ulrike for their words of encouragement.
I will not forget your endless patience.
Galina, te iubesc.

Curriculum Vitae
Name: Michael Broschart
Day, place of birth: 28.01.1976, Landstuhl
Citizenship: German
Academic education: Apr ‘00 – Nov ‘05 Technische Universität Ilmenau Graduation as ‘Dipl.‐Ing.’ in Bio‐Mechatronics
Sep ‘04 – Feb ‘05 Universidad Politécnica de Cartagena (Spain) Centre of Electrochemistry and Smart Materials Research on intrinsically conducting polymers as artificial muscles, bio‐membranes and nerves.
Sep ‘86 – Jun ‘95 Leibniz‐Gymnasium Pirmasens Secondary school
Professional Experience:
Aug ‘08 – present Germanischer Llyod Industrial Services Expert on safety systems for wind turbines
Mai ‘06 – Apr ‘07 European Space Agency – ESA/ESTEC (Netherlands) Advanced Concepts Team – Young Graduate Trainee on Biomimetics –
Michael Broschart
Schenefeld, 12.05.2009


