Embed Size (px)
Citation preview
4.49
October 16, 2018
Shari
ah C
om
pliant
Pla
nta
tions
Mala
ysi
a
THIS REPORT HAS BEEN PREPARED BY MAYBANK INVESTMENT BANK BERHAD
SEE PAGE 9 FOR IMPORTANT DISCLOSURES AND ANALYST CERTIFICATIONS
PP16832/01/2013 (031128)
Ong Chee Ting, CA [email protected] (603) 2297 8678
IOI Corporation (IOI MK)
Postcard from Wormerveer
Immense synergies from Bunge partnership
We were privileged to visit Bunge Loders Croklaan’s Wormerveer
specialty oils & fats facility in Netherlands. Loders has targeted to
achieve USD80m p.a. in synergies by year 3 of its integration with Bunge
after the latter acquired a 70%-controlling stake from IOI in Mar 2018.
We maintain our earnings forecasts, HOLD call on IOI with an unchanged
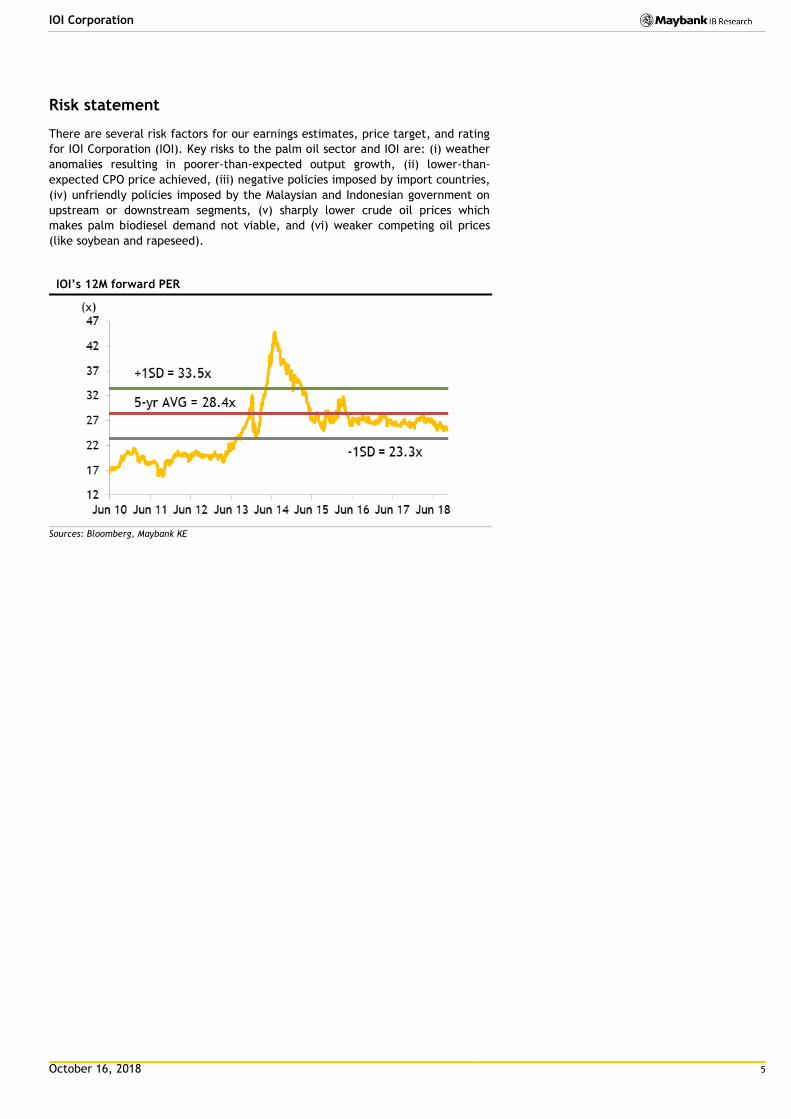
TP of MYR4.76 based on 28x FY19 PER, pegged at its 5-year mean.
Visited Loders specialty plant in Netherlands
This Loders plant is located ~20 minutes north of Amsterdam by car.
Recall that IOI still has a 30%-associate stake in Bunge Loders Croklaan
after the former sold 70% of its equity stake in Loders to Bunge (BG US,
Not Rated), a leading global agribusiness and food company in Mar 2018
for MYR3.71b in cash (~USD595m + EUR309m) and made a total disposal
gains of MYR1.68b (recognised as one-off gain in FY6/18A).
Targeting cost and revenue synergies
This Wormerveer facility has a production capacity of 0.2m tpa. We had
the opportunity to visit Loders’ Creative Studio which is the heartbeat of
this facility. At the studio, Loders jointly develop food solutions with
customers. The usual turnaround time averages around 11 months – from
concept to creation. We gather Loders targets to create a synergy of
about USD80m p.a. by year 3 of integration comprising USD45m in cost
synergies (via supply chain optimisation) and USD35m in revenue
synergies (via cross-selling and differentiated customer offering).
Downside limited by a 5-year put option
Loders is expected to benefit from Bunge’s wider global clientele and
logistic savings, amongst others. Post disposal, IOI has the right (during
the first 5 years) to require Bunge to purchase all of IOI’s remaining 30%-
stake in Loders if the integration process doesn’t go down well. This
serves as a downside support for IOI’s shareholders although we
understand IOI has no reason to exercise that option in the near term.
Share Price MYR 4.49
12m Price Target MYR 4.76 (+6%)
Previous Price Target MYR 4.76
HOLD
Company Description
Statistics
52w high/low (MYR)
3m avg turnover (USDm)
Free float (%)
Issued shares (m)
Market capitalisation
Major shareholders:
LEE SHIN CHENG FAMILY 47.6%
12.7%
7.5%
MYR28.2B
34.3
IOI Corp engages in the cultivation of oil palm and
manufacturing of oleochemicals, specialty oils and
fats, and processed palm oil.
4.87/4.34
Employees Provident Fund
Permodalan Nasional Bhd.
2.9
6,284
USD6.8B
Price Performance
90
94
98
102
106
110
114
4.30
4.40
4.50
4.60
4.70
4.80
4.90
Oct-16 Jan-17 Apr-17 Jul-17 Oct-17 Jan-18 Apr-18 Jul-18
IOI Corp - (LHS, MYR) IOI Corp / Kuala Lumpur Composite Index - (RHS, %)
-1M -3M -12M
Absolute (%) (1) (1) (1)
Relative to index (%) 3 (2) 1
Source: FactSet
FYE Jun (MYR m) FY17A FY18A FY19E FY20E FY21E
Revenue 14,127 12,111 9,895 10,373 10,720
EBITDA 1,861 1,870 1,742 1,804 1,815
Core net profit 1,008 1,081 1,068 1,149 1,168
Core EPS (sen) 16.0 17.2 17.0 18.3 18.6
Core EPS growth (%) 8.9 7.3 (1.2) 7.6 1.6
Net DPS (sen) 9.5 20.5 10.2 11.0 11.1
Core P/E (x) 27.8 26.4 26.4 24.6 24.2
P/BV (x) 3.8 3.1 2.9 2.8 2.7
Net dividend yield (%) 2.1 4.5 2.3 2.4 2.5
ROAE (%) 10.2 36.8 11.4 11.7 11.4
ROAA (%) 5.7 6.2 6.3 6.6 6.6
EV/EBITDA (x) 18.3 16.7 17.4 16.6 16.2
Net gearing (%) (incl perps) 75.4 25.6 19.1 13.5 8.1
Consensus net profit - - 1,082 1,173 1,197
MKE vs. Consensus (%) - - (1.3) (2.0) (2.5)
October 16, 2018 2
IOI Corporation
Key highlights:
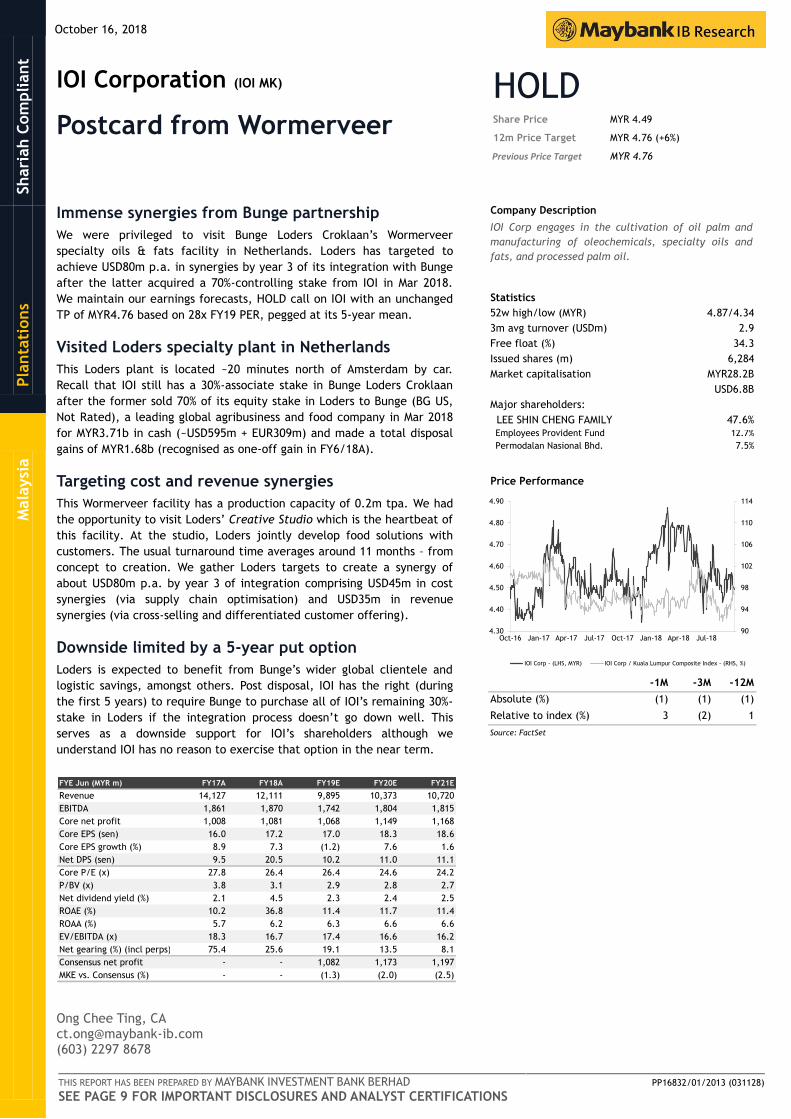
We were privileged to visit Bunge Loders Croklaan’s specialty oils & fats
operation in Wormerveer, north of Amsterdam in Netherlands with a group of
fund managers of Malaysia on 1 Oct. We also visited Loders’ Creative Studio
which has been the engine for product development in collaboration with clients.
The Wormerveer plant has a production capacity of 0.2m tpa, which is smaller
than Loders’ newer Rotterdam refinery facility of 1.2m tpa. The Rotterdam
facility, located at the mouth of the Rotterdam port, receives larger sea cargo
vessels and eventually supplies the necessary feedstocks to the Wormerveer
plant.
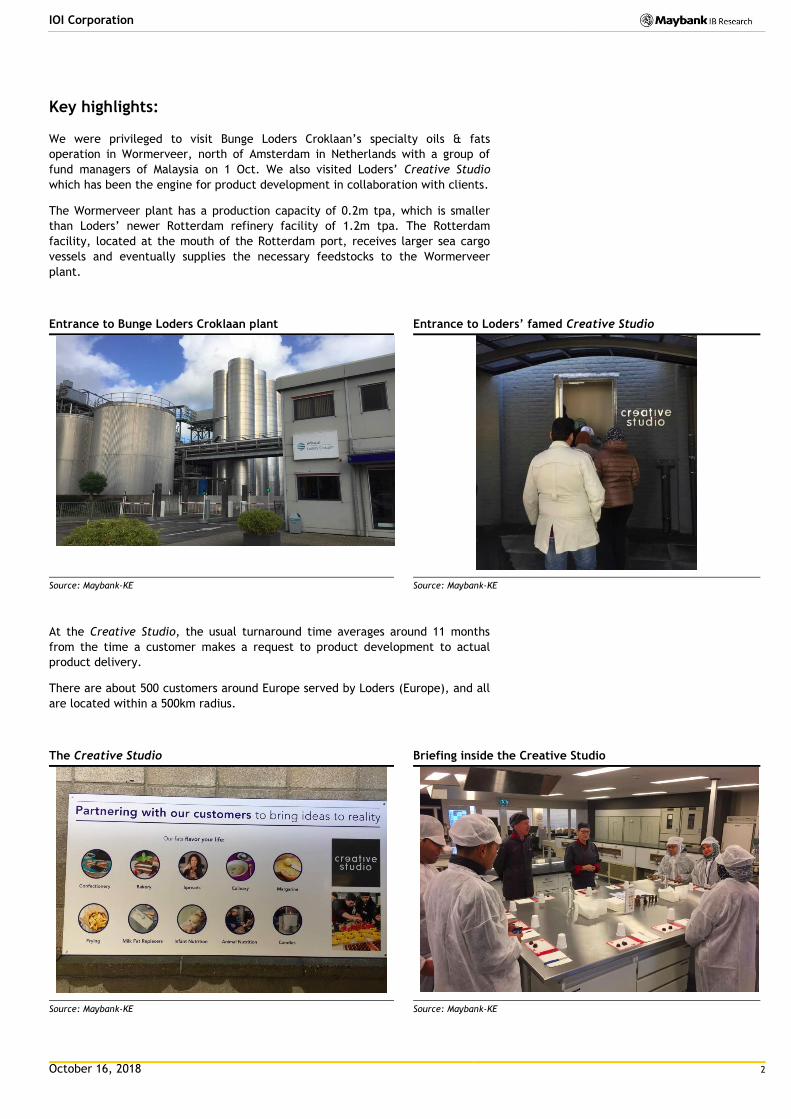
Entrance to Bunge Loders Croklaan plant Entrance to Loders’ famed Creative Studio
Source: Maybank-KE Source: Maybank-KE
At the Creative Studio, the usual turnaround time averages around 11 months
from the time a customer makes a request to product development to actual
product delivery.
There are about 500 customers around Europe served by Loders (Europe), and all
are located within a 500km radius.
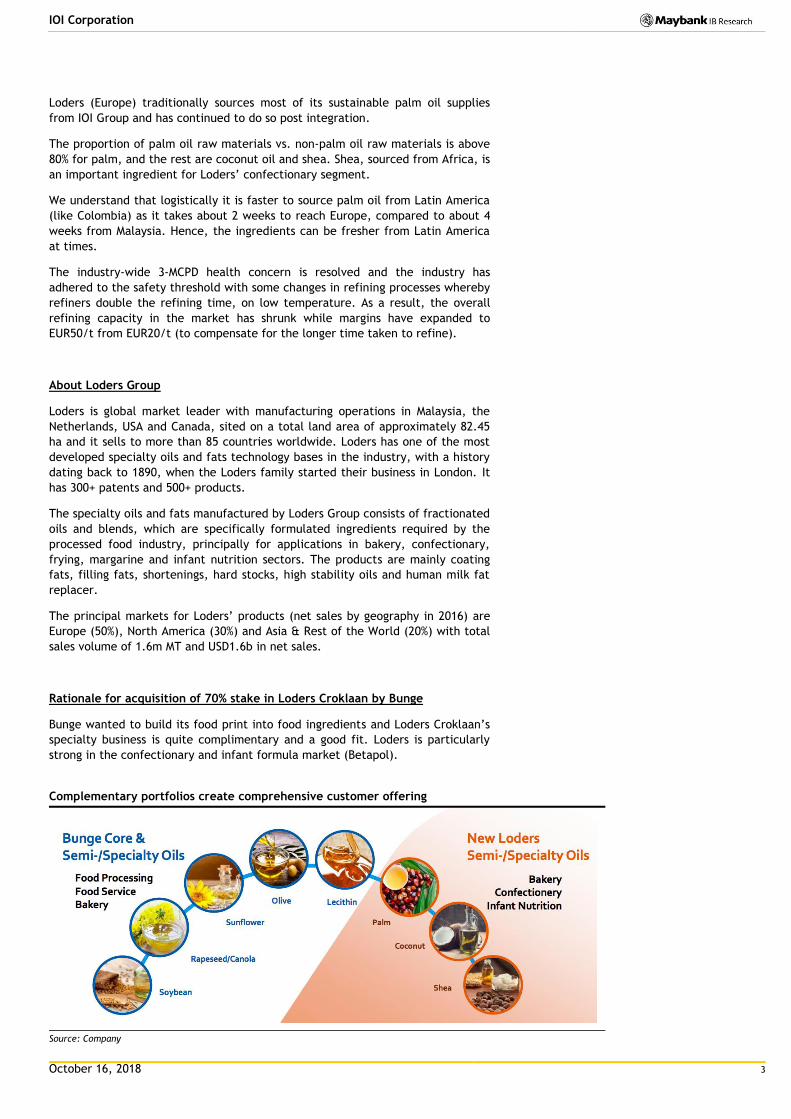
The Creative Studio Briefing inside the Creative Studio
Source: Maybank-KE Source: Maybank-KE
October 16, 2018 3
IOI Corporation
Loders (Europe) traditionally sources most of its sustainable palm oil supplies
from IOI Group and has continued to do so post integration.
The proportion of palm oil raw materials vs. non-palm oil raw materials is above
80% for palm, and the rest are coconut oil and shea. Shea, sourced from Africa, is
an important ingredient for Loders’ confectionary segment.
We understand that logistically it is faster to source palm oil from Latin America
(like Colombia) as it takes about 2 weeks to reach Europe, compared to about 4
weeks from Malaysia. Hence, the ingredients can be fresher from Latin America
at times.
The industry-wide 3-MCPD health concern is resolved and the industry has
adhered to the safety threshold with some changes in refining processes whereby
refiners double the refining time, on low temperature. As a result, the overall
refining capacity in the market has shrunk while margins have expanded to
EUR50/t from EUR20/t (to compensate for the longer time taken to refine).
About Loders Group
Loders is global market leader with manufacturing operations in Malaysia, the
Netherlands, USA and Canada, sited on a total land area of approximately 82.45
ha and it sells to more than 85 countries worldwide. Loders has one of the most
developed specialty oils and fats technology bases in the industry, with a history
dating back to 1890, when the Loders family started their business in London. It
has 300+ patents and 500+ products.
The specialty oils and fats manufactured by Loders Group consists of fractionated
oils and blends, which are specifically formulated ingredients required by the
processed food industry, principally for applications in bakery, confectionary,
frying, margarine and infant nutrition sectors. The products are mainly coating
fats, filling fats, shortenings, hard stocks, high stability oils and human milk fat
replacer.
The principal markets for Loders’ products (net sales by geography in 2016) are
Europe (50%), North America (30%) and Asia & Rest of the World (20%) with total
sales volume of 1.6m MT and USD1.6b in net sales.
Rationale for acquisition of 70% stake in Loders Croklaan by Bunge
Bunge wanted to build its food print into food ingredients and Loders Croklaan’s
specialty business is quite complimentary and a good fit. Loders is particularly
strong in the confectionary and infant formula market (Betapol).
Complementary portfolios create comprehensive customer offering
Source: Company
October 16, 2018 4
IOI Corporation
Bunge was keen to buy 100% of Loders but IOI had no interest to sell out.
Eventually, both agreed there is better value if their operations were
“integrated”, and Bunge initially offered some USD946m in cash (EUR297m +
USD595m purchase price split subject to adjustments) to buy a 70% stake in
Loders in Sept 2017 (with IOI keeping the balance 30%). The deal was eventually
completed in Mar 2018.
A winning product combination across all B2B market segments
Source: Company
Loders targets to achieve synergies worth ~USD80m p.a. by year 3 post
integration, through (i) cost synergies (~USD45m via supply chain optimization
[eg internalize supply], SG&A expenses on shared infrastructure, and industrial
know-how & best practices), and (ii) revenue synergies (~USD35m via cross-
selling, global account development, differentiated customer offering).
Over the longer term, the integrated entity will create the most comprehensive
global innovation footprint in the industry, and increase geographical reach that
is uniquely positioned to innovate with customers worldwide.
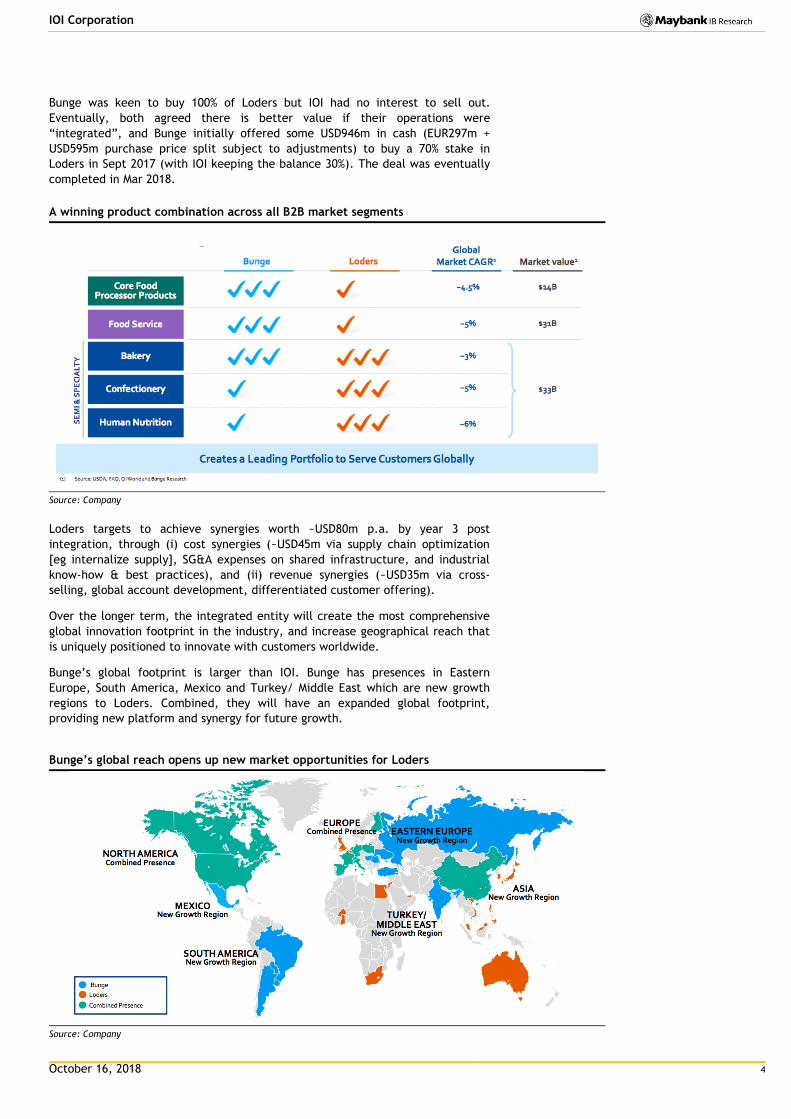
Bunge’s global footprint is larger than IOI. Bunge has presences in Eastern
Europe, South America, Mexico and Turkey/ Middle East which are new growth
regions to Loders. Combined, they will have an expanded global footprint,
providing new platform and synergy for future growth.
Bunge’s global reach opens up new market opportunities for Loders
Source: Company
October 16, 2018 5
IOI Corporation
Risk statement
There are several risk factors for our earnings estimates, price target, and rating
for IOI Corporation (IOI). Key risks to the palm oil sector and IOI are: (i) weather
anomalies resulting in poorer-than-expected output growth, (ii) lower-than-
expected CPO price achieved, (iii) negative policies imposed by import countries,
(iv) unfriendly policies imposed by the Malaysian and Indonesian government on
upstream or downstream segments, (v) sharply lower crude oil prices which
makes palm biodiesel demand not viable, and (vi) weaker competing oil prices
(like soybean and rapeseed).
IOI’s 12M forward PER
Sources: Bloomberg, Maybank KE
October 16, 2018 6
IOI Corporation
FYE 30 Jun FY17A FY18A FY19E FY20E FY21E
Key Metrics
P/E (reported) (x) 38.0 9.4 26.4 24.6 24.2
Core P/E (x) 27.8 26.4 26.4 24.6 24.2
P/BV (x) 3.8 3.1 2.9 2.8 2.7
P/NTA (x) 4.0 3.3 3.1 2.9 2.8
Net dividend yield (%) 2.1 4.5 2.3 2.4 2.5
FCF yield (%) 2.8 3.2 4.1 4.0 4.1
EV/EBITDA (x) 18.3 16.7 17.4 16.6 16.2
EV/EBIT (x) 24.6 21.3 22.9 21.7 21.3
INCOME STATEMENT (MYR m)
Revenue 14,127.3 12,110.5 9,895.0 10,373.5 10,720.0
Gross profit 2,399.1 1,831.5 1,495.8 1,591.1 1,625.2
EBITDA 1,861.0 1,870.4 1,742.2 1,803.5 1,815.5
Depreciation (474.7) (408.5) (415.3) (424.6) (433.9)
Amortisation 0.0 0.0 0.0 0.0 0.0
EBIT 1,386.3 1,461.9 1,326.9 1,378.9 1,381.6
Net interest income /(exp) (174.2) (144.4) (93.4) (78.5) (65.0)
Associates & JV 137.3 138.3 149.6 179.4 183.0
Exceptionals 10.4 1,679.7 0.0 0.0 0.0
Other pretax income (262.2) 294.4 0.0 0.0 0.0
Pretax profit 1,097.6 3,429.9 1,383.1 1,479.8 1,499.6
Income tax (331.5) (361.6) (296.0) (312.1) (316.0)
Minorities (22.9) (7.8) (18.9) (18.6) (16.0)
Discontinued operations 0.0 0.0 0.0 0.0 0.0
Reported net profit 743.2 3,060.5 1,068.1 1,149.1 1,167.5
Core net profit 1,008.2 1,080.7 1,068.1 1,149.1 1,167.5
BALANCE SHEET (MYR m)
Cash & Short Term Investments 1,522.1 2,764.6 3,213.8 3,615.2 4,045.6
Accounts receivable 1,560.6 816.2 798.8 837.4 865.4
Inventory 2,707.7 949.1 928.9 973.8 1,006.3
Property, Plant & Equip (net) 10,086.9 8,411.2 8,295.9 8,171.3 8,037.5
Intangible assets 522.1 394.9 394.9 394.9 394.9
Investment in Associates & JVs 1,188.1 2,542.7 2,617.5 2,707.2 2,798.7
Other assets 437.2 863.9 863.9 863.9 863.9
Total assets 18,024.7 16,742.6 17,113.7 17,563.7 18,012.2
ST interest bearing debt 2,076.1 894.8 894.8 894.8 894.8
Accounts payable 1,388.8 650.1 636.2 667.0 689.3
LT interest bearing debt 5,267.7 4,284.5 4,198.8 4,114.8 4,032.5
Other liabilities 1,573.0 1,498.0 1,522.0 1,547.0 1,572.0
Total Liabilities 10,306.0 7,326.9 7,251.8 7,223.6 7,189.0
Shareholders Equity 7,457.4 9,156.3 9,583.5 10,043.2 10,510.2
Minority Interest 261.3 259.4 278.3 296.9 313.0
Total shareholder equity 7,718.7 9,415.7 9,861.9 10,340.1 10,823.2
Total liabilities and equity 18,024.7 16,742.6 17,113.7 17,563.7 18,012.2
CASH FLOW (MYR m)
Pretax profit 1,097.6 3,429.9 1,383.1 1,479.8 1,499.6
Depreciation & amortisation 474.7 408.5 415.3 424.6 433.9
Adj net interest (income)/exp 174.2 144.4 93.4 78.5 65.0
Change in working capital (351.6) (160.8) 23.8 (52.8) (38.2)
Cash taxes paid (325.9) (414.3) (296.0) (312.1) (316.0)
Other operating cash flow 0.0 0.0 0.0 0.0 0.0
Cash flow from operations 1,287.7 1,351.5 1,469.9 1,438.6 1,461.3
Capex (498.6) (444.3) (300.0) (300.0) (300.0)
Free cash flow 789.1 907.2 1,169.9 1,138.6 1,161.3
Dividends paid (565.9) (1,338.1) (640.9) (689.5) (700.5)
Equity raised / (purchased) (19.7) 2.4 0.0 0.0 0.0
Change in Debt (383.8) (1,734.2) (253.8) (249.3) (244.9)
Other invest/financing cash flow (250.9) 3,366.3 173.9 201.5 214.6
Effect of exch rate changes 0.0 0.0 0.0 0.0 0.0
Net cash flow (431.2) 1,203.6 449.2 401.3 430.4
October 16, 2018 7
IOI Corporation
FYE 30 Jun FY17A FY18A FY19E FY20E FY21E
Key Ratios
Growth ratios (%)
Revenue growth 20.3 (14.3) (18.3) 4.8 3.3
EBITDA growth 2.6 0.5 (6.9) 3.5 0.7
EBIT growth 2.3 5.5 (9.2) 3.9 0.2
Pretax growth 13.6 212.5 (59.7) 7.0 1.3
Reported net profit growth 18.0 311.8 (65.1) 7.6 1.6
Core net profit growth 6.0 7.2 (1.2) 7.6 1.6
Profitability ratios (%)
EBITDA margin 13.2 15.4 17.6 17.4 16.9
EBIT margin 9.8 12.1 13.4 13.3 12.9
Pretax profit margin 7.8 28.3 14.0 14.3 14.0
Payout ratio 80.4 42.1 60.0 60.0 60.0
DuPont analysis
Net profit margin (%) 5.3 25.3 10.8 11.1 10.9
Revenue/Assets (x) 0.8 0.7 0.6 0.6 0.6
Assets/Equity (x) 2.4 1.8 1.8 1.7 1.7
ROAE (%) 10.2 36.8 11.4 11.7 11.4
ROAA (%) 5.7 6.2 6.3 6.6 6.6
Liquidity & Efficiency
Cash conversion cycle 73.0 63.7 42.1 40.7 40.9
Days receivable outstanding 35.1 35.3 29.4 28.4 28.6
Days inventory outstanding 76.6 64.0 40.2 39.0 39.2
Days payables outstanding 38.6 35.7 27.6 26.7 26.8
Dividend cover (x) 1.2 2.4 1.7 1.7 1.7
Current ratio (x) 1.7 2.9 3.1 3.3 3.6
Leverage & Expense Analysis
Asset/Liability (x) 1.7 2.3 2.4 2.4 2.5
Net gearing (%) (incl perps) 75.4 25.6 19.1 13.5 8.1
Net gearing (%) (excl. perps) 75.4 25.6 19.1 13.5 8.1
Net interest cover (x) 8.0 10.1 14.2 17.6 21.3
Debt/EBITDA (x) 3.9 2.8 2.9 2.8 2.7
Capex/revenue (%) 3.5 3.7 3.0 2.9 2.8
Net debt/ (net cash) 5,821.7 2,414.7 1,879.8 1,394.5 881.8
Source: Company; Maybank
October 16, 2018 8
IOI Corporation
Research Offices
REGIONAL
Sadiq CURRIMBHOY
Regional Head, Research & Economics (65) 6231 5836 [email protected]
WONG Chew Hann, CA
Regional Head of Institutional Research (603) 2297 8686 [email protected]
ONG Seng Yeow
Regional Head of Retail Research
(65) 6231 5839 [email protected]
ECONOMICS
Suhaimi ILIAS Chief Economist Malaysia | Philippines | China (603) 2297 8682 [email protected]
CHUA Hak Bin Regional Thematic Macroeconomist (65) 6231 5830 [email protected]
LEE Ju Ye Singapore (65) 6231 5844 [email protected]
Dr Zamros DZULKAFLI (603) 2082 6818 [email protected]
Ramesh LANKANATHAN (603) 2297 8685 [email protected]
FX
Saktiandi SUPAAT Head, FX Research (65) 6320 1379 [email protected]
Christopher WONG (65) 6320 1347 [email protected]
Leslie TANG (65) 6320 1378 [email protected]
Fiona LIM (65) 6320 1374 [email protected]
STRATEGY
Sadiq CURRIMBHOY
Global Strategist (65) 6231 5836 [email protected]
Willie CHAN
Hong Kong / Regional (852) 2268 0631 [email protected]
FIXED INCOME
Winson PHOON, ACA (65) 6231 5831 [email protected]
Se Tho Mun Yi (603) 2074 7606 [email protected]
MALAYSIA
WONG Chew Hann, CA Head of Research (603) 2297 8686 [email protected] • Strategy
Desmond CH’NG, ACA (603) 2297 8680 [email protected] • Banking & Finance
LIAW Thong Jung (603) 2297 8688 [email protected] • Oil & Gas Services- Regional
ONG Chee Ting, CA (603) 2297 8678 [email protected] • Plantations - Regional
Mohshin AZIZ (603) 2297 8692 [email protected] • Aviation - Regional • Petrochem
YIN Shao Yang, CPA (603) 2297 8916 [email protected] • Gaming – Regional • Media
TAN Chi Wei, CFA (603) 2297 8690 [email protected] • Power • Telcos
WONG Wei Sum, CFA (603) 2297 8679 [email protected] • Property
LEE Yen Ling (603) 2297 8691 [email protected] • Glove • Ports • Shipping • Healthcare
Ivan YAP (603) 2297 8612 [email protected] • Automotive • Semiconductor • Technology
Kevin WONG (603) 2082 6824 [email protected] • REITs • Consumer Discretionary
Adrian WONG
(603) 2297 8675 [email protected] • Constructions
Jade TAM
(603) 2297 8687 [email protected] • Consumer Staples
Mohd Hafiz HASSAN (603) 2082 6819 [email protected] • Building Materials • Small & Mid Caps
Amirah AZMI (603) 2082 8769 [email protected] • Media • Plantations
TEE Sze Chiah Head of Retail Research (603) 2082 6858 [email protected]
Nik Ihsan RAJA ABDULLAH, MSTA, CFTe (603) 2297 8694 [email protected]
SINGAPORE
Neel SINHA Head of Research (65) 6231 5838 [email protected] • Strategy • Industrials • SMID Caps – Regional
CHUA Su Tye (65) 6231 5842 [email protected] • REITs
Derrick HENG, CFA (65) 6231 5843 [email protected] • Property • REITs (Office)
Luis HILADO (65) 6231 5848 [email protected] • Telcos
LAI Gene Lih (65) 6231 5832 [email protected] • Technology
HONG KONG / CHINA
Mitchell KIM Head of Research (852) 2268 0634 [email protected] • Internet & Telcos
Christopher WONG (852) 2268 0652 [email protected] • HK & China Properties
Jacqueline KO, CFA (852) 2268 0633 [email protected] • Consumer Staples & Durables
Ricky NG, CFA (852) 2268 0689 [email protected] • Regional Renewables • HK & China Properties
Sonija LI, CFA, FRM (852) 2268 0641 [email protected] • Gaming
Stefan CHANG, CFA (852) 2268 0675 [email protected] • Technology – Regional
Tony REN, CFA (852) 2268 0640 [email protected] • Healthcare & Pharmaceutical
Wendy LI (852) 2268 0647 [email protected] • Consumer & Auto
INDIA
Jigar SHAH Head of Research
(91) 22 6623 2632 [email protected]
• Strategy • Oil & Gas • Automobile • Cement
Neerav DALAL
(91) 22 6623 2606 [email protected]
• Software Technology • Telcos
Vishal PERIWAL
(91) 22 6623 2605
• Infrastructure
INDONESIA
Isnaputra ISKANDAR Head of Research (62) 21 8066 8680 [email protected] • Strategy • Metals & Mining • Cement
Rahmi MARINA (62) 21 8066 8689 [email protected] • Banking & Finance
Aurellia SETIABUDI (62) 21 8066 8691 [email protected] • Property
Janni ASMAN (62) 21 8066 8687 [email protected] • Cigarette • Healthcare • Retail
PHILIPPINES
Minda OLONAN Head of Research (63) 2 849 8840 [email protected] • Strategy
Katherine TAN (63) 2 849 8843 [email protected] • Banks • Construction
Luis HILADO (65) 6231 5848 [email protected] • Telcos
Romel LIBO-ON (63) 2 849 8844 [email protected] • Property
THAILAND
Maria LAPIZ Head of Institutional Research Dir (66) 2257 0250 | (66) 2658 6300 ext 1399 [email protected] • Strategy • Consumer • Materials • Services
Ornmongkol TANTITANATORN (66) 2658 6300 ext 1395 [email protected] • Power & Utilities • Infrastructure
Surachai PRAMUALCHAROENKIT Head of Retail Research (66) 2658 5000 ext 1470 [email protected] • Auto • Conmat • Contractor • Steel
Ekachai TARAPORNTIP Deputy Head 66) 2658 5000 ext 1530 [email protected]
Sutthichai KUMWORACHAI Deputy Head (66) 2658 5000 ext 1400 [email protected] • Energy • Petrochem
Suttatip PEERASUB (66) 2658 5000 ext 1430 [email protected] • Media • Commerce
Termporn TANTIVIVAT (66) 2658 5000 ext 1520 [email protected] • Property
Jaroonpan WATTANAWONG (66) 2658 5000 ext 1404 [email protected] • Transportation • Small cap
Sorrabhol VIRAMETEEKUL Head of Digital Research (66) 2658 5000 ext 1550 [email protected] • Food, Transportation
Wijit ARAYAPISIT (66) 2658 5000 ext 1450 [email protected] • Strategist
Kritsapong PATAN (66) 2658 5000 ext 1310 [email protected] • Chartist
Apisit PATTARASAKOLKIAT (66) 2658 5000 ext 1405 [email protected] • Chartist
VIETNAM
LE Hong Lien, ACCA Head of Institutional Research (84 28) 44 555 888 x 8181 [email protected] • Strategy • Consumer • Diversified
THAI Quang Trung, CFA, Deputy Head, Institutional Research (84 28) 44 555 888 x 8180 [email protected] • Real Estate • Construction • Materials
LE Nguyen Nhat Chuyen (84 28) 44 555 888 x 8082 [email protected] • Oil & Gas
NGUYEN Thi Ngan Tuyen, Head of Retail Research (84 28) 44 555 888 x 8081 [email protected] • Food & Beverage • Oil&Gas • Banking
TRUONG Quang Binh, Deputy Head, Retail Research (84 28) 44 555 888 x 8087 [email protected] • Rubber Plantation • Tyres & Tubes • Oil & Gas
TRINH Thi Ngoc Diep (84 28) 44 555 888 x 8208 [email protected] • Technology • Utilities • Construction
NGUYEN Thi Sony Tra Mi (84 28) 44 555 888 x 8084 [email protected] • Port Operation • Pharmaceutical • Food & Beverage
NGUYEN Thanh Lam (84 28) 44 555 888 x 8086 [email protected] • Technical Analysis
October 16, 2018 9
IOI Corporation
APPENDIX I: TERMS FOR PROVISION OF REPORT, DISCLAIMERS AND DISCLOSURES DISCLAIMERS This research report is prepared for general circulation and for information purposes only and under no circumstances should it be considered or intended as an offer to sell or a solicitation of an offer to buy the securities referred to herein. Investors should note that values of such securities, if any, may fluctuate and that each security’s price or value may rise or fall. Opinions or recommendations contained herein are in form of technical ratings and fundamental ratings. Technical ratings may differ from fundamental ratings as technical valuations apply different methodologies and are purely based on price and volume-related information extracted from the relevant jurisdiction’s stock exchange in the equity analysis. Accordingly, investors’ returns may be less than the original sum invested. Past performance is not necessarily a guide to future performance. This report is not intended to provide personal investment advice and does not take into account the specific investment objectives, the financial situation and the particular needs of persons who may receive or read this report. Investors should therefore seek financial, legal and other advice regarding the appropriateness of investing in any securities or the investment strategies discussed or recommended in this report.
The information contained herein has been obtained from sources believed to be reliable but such sources have not been independently verified by Maybank Investment Bank Berhad, its subsidiary and affiliates (collectively, “MKE”) and consequently no representation is made as to the accuracy or completeness o f this report by MKE and it should not be relied upon as such. Accordingly, MKE and its officers, directors, associates, connected parties and/or employees (collectively, “Representatives”) shall not be liable for any direct, indirect or consequential losses or damages that may arise from the use or reliance of this report. Any information, opinions or recommendations contained herein are subject to change at any time, without prior notice.
This report may contain forward looking statements which are often but not always identified by the use of words such as “ant icipate”, “believe”, “estimate”, “intend”, “plan”, “expect”, “forecast”, “predict” and “project” and statements that an event or result “may”, “will”, “can”, “should”, “could” or “might” occur or be achieved and other similar expressions. Such forward looking statements are based on assumptions made and information currently available to us and are subject to certain risks and uncertainties that could cause the actual results to differ materially from those expressed in any forward looking statements. Readers are cautioned not to place undue relevance on these forward-looking statements. MKE expressly disclaims any obligation to update or revise any such forward looking statements to reflect new information, events or circumstances af ter the date of this publication or to reflect the occurrence of unanticipated events.
MKE and its officers, directors and employees, including persons involved in the preparation or issuance of this report, may, to the extent permitted by law, from time to time participate or invest in financing transactions with the issuer(s) of the securities mentioned in this report, perform services for or solicit business from such issuers, and/or have a position or holding, or other material interest, or effect transactions, in such securities or options thereon, or other investments related thereto. In addition, it may make markets in the securities mentioned in the material presented in this report. One or more directors, officers and/or employees of MKE may be a director of the issue rs of the securities mentioned in this report to the extent permitted by law.
This report is prepared for the use of MKE’s clients and may not be reproduced, altered in any way, transmitted to, copied or distributed to any other party in whole or in part in any form or manner without the prior express written consent of MKE and MKE and its Representatives accepts no liability whatsoever for the actions of third parties in this respect.
This report is not directed to or intended for distribution to or use by any person or entity who is a citizen or resident of or located in any locality, state, country or other jurisdiction where such distribution, publication, availability or use would be contrary to law or regulation. This report is for distribution only under such circumstances as may be permitted by applicable law. The securities described herein may not be eligible for sale in all jurisdictions or to certain categories of investors. Without prejudice to the foregoing, the reader is to note that additional disclaimers, warnings or qualifications may apply based on geographical location of the person or entity receiving this report.
Malaysia Opinions or recommendations contained herein are in the form of technical ratings and fundamental ratings. Technical ratings may differ from fundamental ratings as technical valuations apply different methodologies and are purely based on price and volume-related information extracted from Bursa Malaysia Securities Berhad in the equity analysis.
Singapore This report has been produced as of the date hereof and the information herein may be subject to change. Maybank Kim Eng Research Pte. Ltd. (“Maybank KERPL”) in Singapore has no obligation to update such information for any recipient. For distribution in Singapore, recipients of this report are to contact Maybank KERPL in Singapore in respect of any matters arising from, or in connection with, this report. If the recipient of this report is not an accredited investor, expert investor or institutional investor (as defined under Section 4A of the Singapore Securities and Futures Act), Maybank KERPL shall be legally liable for the contents of this report, with such liability being limited to the extent (if any) as permitted by law.
Thailand Except as specifically permitted, no part of this presentation may be reproduced or distributed in any manner without the prior written permission of Maybank Kim Eng Securities (Thailand) Public Company Limited. Maybank Kim Eng Securities (Thailand) Public Company Limited (“MBKET”) accepts no liability whatsoeve r for the actions of third parties in this respect.
Due to different characteristics, objectives and strategies of institutional and retail investors, the research reports of MBKET Institutional and Retail Research Department may differ in either recommendation or target price, or both. MBKET Retail Research is intended for retail investors (http://kelive.maybank-ke.co.th) while Maybank Kim Eng Institutional Research is intended only for institutional investors based outside Thailand only.
The disclosure of the survey result of the Thai Institute of Directors Association (“IOD”) regarding corporate governance is made pursuant to the policy of the Office of the Securities and Exchange Commission. The survey of the IOD is based on the information of a company listed on the Stock Exchange of Thailand and the market for Alternative Investment disclosed to the public and able to be accessed by a general public investor. The result, therefore, is from the perspective of a third party. It is not an evaluation of operation and is not based on inside information. The survey result is as of the date appearing in the Corporate Governance Report of Thai Listed Companies. As a result, the survey may be changed after that date. MBKET does not confirm nor certify the accuracy of such survey result.
The disclosure of the Anti-Corruption Progress Indicators of a listed company on the Stock Exchange of Thailand, which is assessed by Thaipat Institute, is made in order to comply with the policy and sustainable development plan for the listed companies of the Office of the Securities and Exchange Commission. Thaipat Institute made this assessment based on the information received from the listed company, as stipulated in the form for the assessment of Anti-corruption which refers to the Annual Registration Statement (Form 56-1), Annual Report (Form 56-2), or other relevant documents or reports of such listed company. The assessment result is therefore made from the perspective o f Thaipat Institute that is a third party. It is not an assessment of operation and is not based on any inside information. Since this assessment is only the assessment result as of the date appearing in the assessment result, it may be changed after that date or when there is any change to the relevant information. Nevertheless, MBKET does not confirm, verify, or certify the accuracy and completeness of the assessment result.
US This third-party research report is distributed in the United States (“US”) to Major US Institutional Investors (as defined in Rule 15a -6 under the Securities Exchange Act of 1934, as amended) only by Maybank Kim Eng Securities USA Inc (“Maybank KESUSA”), a broker-dealer registered in the US (registered under Section 15 of the Securities Exchange Act of 1934, as amended). All responsibility for the distribution of this report by Maybank KESUSA in the US shall be borne by Maybank KESUSA. This report is not directed at you if MKE is prohibited or restricted by any legislation or regulation in any jurisdiction from making it available to you. You should satisfy yourself before reading it that Maybank KESUSA is permitted to provide research material concerning investments to you under relevant legislation and regulations. All U.S. persons receiving and/or accessing this report and wishing to effect transactions in any security mentioned within must do so with: Maybank Kim Eng Securities USA Inc. 400 Park Avenue, 11th Floor, New York, New York 10022, 1-(212) 688-8886 and not with, the issuer of this report.
October 16, 2018 10
IOI Corporation
Disclosure of Interest
Malaysia: MKE and its Representatives may from time to time have positions or be materially interested in the securities referred to he rein and may further act as market maker or may have assumed an underwriting commitment or deal with such securities and may also perform or seek to perform investment banking services, advisory and other services for or relating to those companies. Singapore: As of 16 October 2018, Maybank KERPL and the covering analyst do not have any interest in any companies recommended in this research report. Thailand: MBKET may have a business relationship with or may possibly be an issuer of derivative warrants on the securities /companies mentioned in the research report. Therefore, Investors should exercise their own judgment before making any investment decisions. MBKET, its associates, directors, connected parties and/or employees may from time to time have interests and/or underwriting commitments in the securities mentioned in this report. Hong Kong: As of 16 October 2018, KESHK and the authoring analyst do not have any interest in any companies recommended in this research report. India: As of 16 October 2018, and at the end of the month immediately preceding the date of publication of the research report, KESI, authoring analyst o r their associate / relative does not hold any financial interest or any actual or beneficial ownership in any shares or having any conflict of interest in the subject companies except as otherwise disclosed in the research report.
In the past twelve months KESI and authoring analyst or their associate did not receive any compensation or other benefits from the subject companies or third party in connection with the research report on any account what so ever except as otherwise disclosed in the research report.
MKE may have, within the last three years, served as manager or co-manager of a public offering of securities for, or currently may make a primary market in issues of, any or all of the entities mentioned in this report or may be providing, or have provided within the previous 12 months, significant advice or investment services in relation to the investment concerned or a related investment and may receive compensation for the services provided from the companies covered in this report.
OTHERS
Analyst Certification of Independence
The views expressed in this research report accurately reflect the analyst’s personal views about any and all of the subject securities or issuers; and no part of the re search analyst’s compensation was, is or will be, directly or indirectly, related to the specific recommendations or views expressed in the report.
Reminder
Structured securities are complex instruments, typically involve a high degree of risk and are intended for sale only to soph isticated investors who are capable of understanding and assuming the risks involved. The market value of any structured security may be affected by changes in economic, financial and political factors (including, but not limited to, spot and forward interest and exchange rates), time to maturity, market conditions and volatility and the credit quality of any issuer or reference issuer. Any investor interested in purchasing a structured product should conduct its own analysis of the product and consult with its own professional advisers as to the risks involved in making such a purchase.
No part of this material may be copied, photocopied or duplicated in any form by any means or redistributed without the prior consent of MKE.
UK This document is being distributed by Maybank Kim Eng Securities (London) Ltd (“Maybank KESL”) which is authorized and regulated, by the Financial Conduct Authority and is for Informational Purposes only. This document is not intended for distribution to anyone defined as a Retail Client under the Financial Services and Markets Act 2000 within the UK. Any inclusion of a third party link is for the recipients convenience only, and that the firm does not take any responsibility fo r its comments or accuracy, and that access to such links is at the individuals own risk. Nothing in this report should be considered as constituting legal, accounting or tax advice, and that for accurate gu idance recipients should consult with their own independent tax advisers.
DISCLOSURES
Legal Entities Disclosures Malaysia: This report is issued and distributed in Malaysia by Maybank Investment Bank Berhad (15938- H) which is a Participating Organization of Bursa Malaysia Berhad and a holder of Capital Markets and Services License issued by the Securities Commission in Malaysia. Singapore: This report is distributed in Singapore by Maybank KERPL (Co. Reg No 198700034E) which is regulated by the Monetary Authority of Singapore. Indonesia: PT Maybank Kim Eng Securities (“PTMKES”) (Reg. No. KEP-251/PM/1992) is a member of the Indonesia Stock Exchange and is regulated by the Financial Services Authority (Indonesia). Thailand: MBKET (Reg. No.0107545000314) is a member of the Stock Exchange of Thailand and is regulated by the Ministry of Finance and the Securities and Exchange Commission. Philippines: Maybank ATRKES (Reg. No.01-2004-00019) is a member of the Philippines Stock Exchange and is regulated by the Securities and Exchange Commission. Vietnam: Maybank Kim Eng Securities Limited (License Number: 117/GP-UBCK) is licensed under the State Securities Commission of Vietnam. Hong Kong: KESHK (Central Entity No AAD284) is regulated by the Securities and Futures Commission. India: Kim Eng Securities India Private Limited (“KESI”) is a participant of the National Stock Exchange of India Limited and the Bombay Stock Exchange and is regulated by Securities and Exchange Board of India (“SEBI”) (Reg. No. INZ000010538). KESI is also registered with SEBI as Category 1 Merchant Banker (Reg. No. INM 000011708) and as Research Analyst (Reg No: INH000000057) US: Maybank KESUSA is a member of/ and is authorized and regulated by the FINRA – Broker ID 27861. UK: Maybank KESL (Reg No 2377538) is authorized and regulated by the Financial Conduct Authority.
October 16, 2018 11
IOI Corporation
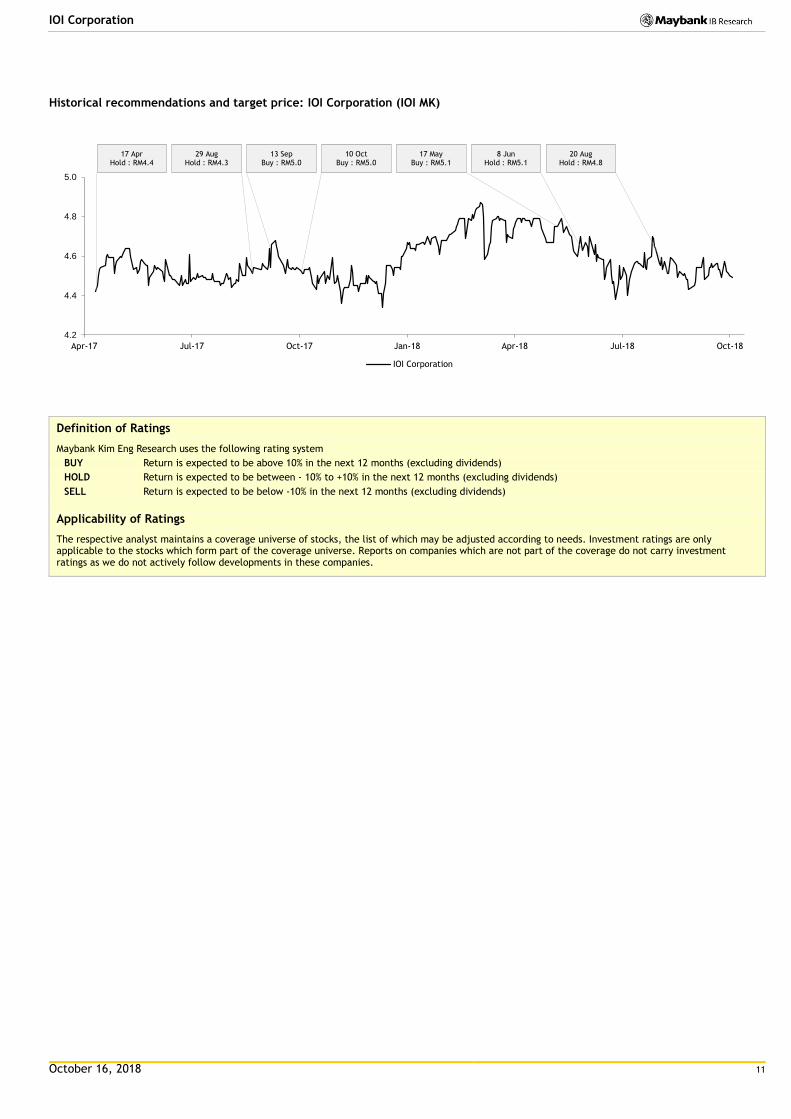
Historical recommendations and target price: IOI Corporation (IOI MK)
Definition of Ratings
Maybank Kim Eng Research uses the following rating system
BUY Return is expected to be above 10% in the next 12 months (excluding dividends)
HOLD Return is expected to be between - 10% to +10% in the next 12 months (excluding dividends)
SELL Return is expected to be below -10% in the next 12 months (excluding dividends)
Applicability of Ratings
The respective analyst maintains a coverage universe of stocks, the list of which may be adjusted according to needs. Investment ratings are only applicable to the stocks which form part of the coverage universe. Reports on companies which are not part of the coverage do not carry investment ratings as we do not actively follow developments in these companies.
4.2
4.4
4.6
4.8
5.0
Apr-17 Jul-17 Oct-17 Jan-18 Apr-18 Jul-18 Oct-18
IOI Corporation
17 Apr Hold : RM4.4
29 Aug Hold : RM4.3
13 Sep Buy : RM5.0
10 Oct Buy : RM5.0
17 May Buy : RM5.1
8 Jun Hold : RM5.1
20 Aug Hold : RM4.8
October 16, 2018 12
IOI Corporation
Malaysia Maybank Investment Bank Berhad
(A Participating Organisation of
Bursa Malaysia Securities Berhad)
33rd Floor, Menara Maybank,
100 Jalan Tun Perak,
50050 Kuala Lumpur
Tel: (603) 2059 1888;
Fax: (603) 2078 4194
Singapore Maybank Kim Eng Securities Pte Ltd
Maybank Kim Eng Research Pte Ltd
50 North Canal Road
Singapore 059304
Tel: (65) 6336 9090
London Maybank Kim Eng Securities
(London) Ltd
PNB House
77 Queen Victoria Street
London EC4V 4AY, UK
Tel: (44) 20 7332 0221
Fax: (44) 20 7332 0302
New York Maybank Kim Eng Securities USA
Inc
400 Park Avenue, 11th Floor
New York, New York 10022,
U.S.A.
Tel: (212) 688 8886
Fax: (212) 688 3500
Stockbroking Business:
Level 8, Tower C, Dataran Maybank,
No.1, Jalan Maarof
59000 Kuala Lumpur
Tel: (603) 2297 8888
Fax: (603) 2282 5136
Hong Kong Kim Eng Securities (HK) Ltd
28/F, Lee Garden Three,
1 Sunning Road, Causeway Bay,
Hong Kong
Tel: (852) 2268 0800
Fax: (852) 2877 0104
Indonesia PT Maybank Kim Eng Securities
Sentral Senayan III, 22nd Floor
Jl. Asia Afrika No. 8
Gelora Bung Karno, Senayan
Jakarta 10270, Indonesia
Tel: (62) 21 2557 1188
Fax: (62) 21 2557 1189
India Kim Eng Securities India Pvt Ltd
2nd Floor, The International,
16, Maharishi Karve Road,
Churchgate Station,
Mumbai City - 400 020, India
Tel: (91) 22 6623 2600
Fax: (91) 22 6623 2604
Philippines Maybank ATR Kim Eng Securities Inc.
17/F, Tower One & Exchange Plaza
Ayala Triangle, Ayala Avenue
Makati City, Philippines 1200
Tel: (63) 2 849 8888
Fax: (63) 2 848 5738
Thailand Maybank Kim Eng Securities
(Thailand) Public Company Limited
999/9 The Offices at Central World,
20th - 21st Floor,
Rama 1 Road Pathumwan,
Bangkok 10330, Thailand
Tel: (66) 2 658 6817 (sales)
Tel: (66) 2 658 6801 (research)
Vietnam Maybank Kim Eng Securities Limited
4A-15+16 Floor Vincom Center Dong
Khoi, 72 Le Thanh Ton St. District 1
Ho Chi Minh City, Vietnam
Tel : (84) 844 555 888
Fax : (84) 8 38 271 030
Saudi Arabia In association with
Anfaal Capital
Villa 47, Tujjar Jeddah
Prince Mohammed bin Abdulaziz
Street P.O. Box 126575
Jeddah 21352
Tel: (966) 2 6068686
Fax: (966) 26068787
South Asia Sales Trading Kevin Foy
Regional Head Sales Trading
Tel: (65) 6636-3620
US Toll Free: 1-866-406-7447
North Asia Sales Trading Andrew Lee
Tel: (852) 2268 0283
US Toll Free: 1 877 837 7635
Indonesia Harianto Liong [email protected] Tel: (62) 21 2557 1177
London Mark Howe [email protected] Tel: (44) 207-332-0221
New York James Lynch [email protected] Tel: (212) 688 8886
India Sanjay Makhija [email protected] Tel: (91)-22-6623-2629
Philippines Keith Roy [email protected] Tel: (63) 2 848-5288
www.maybank-ke.com | www.maybank-keresearch.com