Embed Size (px)
Citation preview
Page 1 of 13
INITIATING COVERAGE 23 October 2017
Tasek Corporation Berhad Between hammer and anvil: Cost rising yet price dropping
SELL Analyst Consensus: Buy 0 Hold 1 Sell 0
One of the few integrated cement plants with 53-year history
Cost rising due to raw material, diesel and maintenance
Price dropping due to overcapacity and weak demand
2Q17 earnings declined 90% yoy in tandem with revenue
Gloomy earnings outlook pending more projects from Budget
Summary
One of the few integrated cement plants with 53-year history Began operations in 1964, Tasek has an integrated manufacturing plant with clinker annual capacity of 2.3 million tonnes in Ipoh and distribution terminal in Sungai Buloh. Tasek supplies cement to some 30+ long term customers, including its Sabah associate. In 2006, Tasek ventures into ready mixed concrete and currently has 12 concrete plants in 9 locations.
Cost rising due to raw material, diesel and maintenance
Rising raw material cost driven by limited supply and rising cartage cost driven by diesel cost cause the squeeze in margin. The two operation lines are subjected to annual maintenance capex of RM 30 million in total.
Price dropping due to overcapacity and weak demand
The net price of cement has declined to RM 200-220 per tonne across industry after the rebate was given. The expansion of capacity was initiated by certain industry players 2 years ago, making them in a loss position if they were to abandon it.
The weak cement demand is mainly due to: (i) delay in construction award flow, (ii) slowdown in residential and commercial property market, and (iii) mega infrastructure projects in initial phases. The whole cement industry demand is around 18 million MT for 2017F (used to be >20 million MT) while the industry capacity is about 30 million MT excluding additional capacity coming onstream in 2017-2018.
2Q17 earnings declined 90% yoy in tandem with revenue
Tasek’s quarterly revenue saw a negative 5.4% compounded growth rate from 4Q15 to 2Q17. Earnings declined along in the same period, down to RM 1.5 million in 2Q17 that is less than 10% of RM 18 million in 2Q16.
Gloomy earnings outlook pending more projects from Budget We estimate net profit growth will be -80% for 2017 as it is dampened by the weak cement demand and overcapacity in the industry. Pending more projects such as affordable housing from Budget 2018, cement price is likely to normalise gradually. Considering the unfavourable cement price, marked increase in opex such as raw materials and decreasing dividend payment, we initiate coverage with a SELL call.
Share price RM2.30
Fundamental Score 2.35/3
Valuation Score 1.10/3
Company Description
Manufactures and sells cement and related products. It operates as an integrated cement plant. It also involved in the manufacture and trade of ready-mixed concrete; and quarry operations.
Stock Information
Industry Building materials
Sub-industry Cement & Concrete
Bursa Code 4448
Bloomberg Ticker TC MK
Listing Main
Outstanding Shares 121.1 mil
Market Cap RM 1,550.6 mil
52-week Range 12.50-14.82
Est. Free Float 22.0 %
Beta 0.21
200-day Avg Vol. 6,264
Price Performance (%)
1M 3M 12M
Stock 0.6 0.0 -9.5
FBMKLCI -1.7 -1.1 4.2
Major Shareholders
HL Cement (M) Sdn Bhd
74.28%
Aberdeen AM PLC 11.69%
Earnings Forecast 16A 17E 18E
Net Profit (RM mil) 50.3 11.2 38.5
EPS (sen) 41.5 9.3 31.8
EPS Growth (%) -45 -78 243
P/E (x) 29 136 40
DPS (sen) 70 50 70
Dividend Yield (%) 5.5 3.9 5.5
NTA/share (RM) 5.4 5.0 4.7
P/NTA (x) 2.3 2.5 2.7
Net Gearing (%) na na Na
ROA (%) 7.1 1.7 6.3
ROE (%) 7.4 1.8 6.6
Page 2 of 13
Background
Company profile
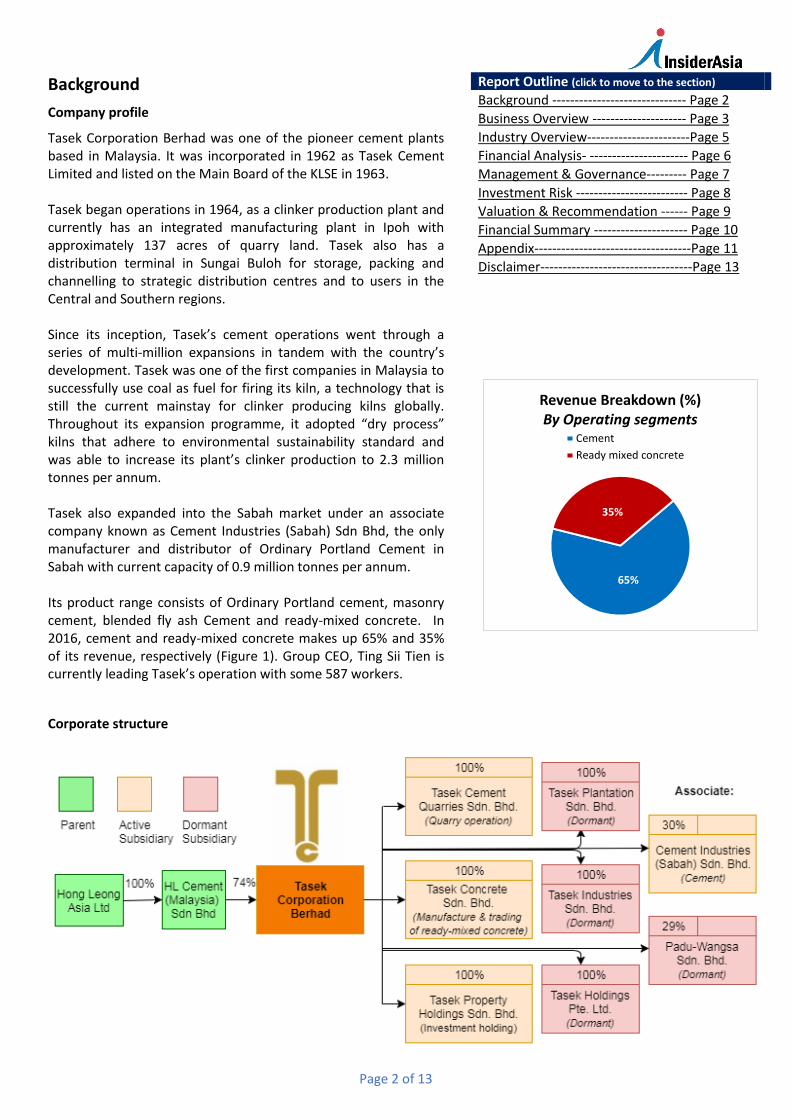
Tasek Corporation Berhad was one of the pioneer cement plants based in Malaysia. It was incorporated in 1962 as Tasek Cement Limited and listed on the Main Board of the KLSE in 1963. Tasek began operations in 1964, as a clinker production plant and currently has an integrated manufacturing plant in Ipoh with approximately 137 acres of quarry land. Tasek also has a distribution terminal in Sungai Buloh for storage, packing and channelling to strategic distribution centres and to users in the Central and Southern regions. Since its inception, Tasek’s cement operations went through a series of multi-million expansions in tandem with the country’s development. Tasek was one of the first companies in Malaysia to successfully use coal as fuel for firing its kiln, a technology that is still the current mainstay for clinker producing kilns globally. Throughout its expansion programme, it adopted “dry process” kilns that adhere to environmental sustainability standard and was able to increase its plant’s clinker production to 2.3 million tonnes per annum. Tasek also expanded into the Sabah market under an associate company known as Cement Industries (Sabah) Sdn Bhd, the only manufacturer and distributor of Ordinary Portland Cement in Sabah with current capacity of 0.9 million tonnes per annum. Its product range consists of Ordinary Portland cement, masonry cement, blended fly ash Cement and ready-mixed concrete. In 2016, cement and ready-mixed concrete makes up 65% and 35% of its revenue, respectively (Figure 1). Group CEO, Ting Sii Tien is currently leading Tasek’s operation with some 587 workers.
Report Outline (click to move to the section)
Background Page 2
Business Overview Page 3
Industry Overview-----------------------Page 5
Financial Analysis- Page 6
Management & Governance Page 7
Investment Risk Page 8
Valuation & Recommendation Page 9
Financial Summary Page 10
Appendix-----------------------------------Page 11
Disclaimer----------------------------------Page 13
65%
35%
Revenue Breakdown (%)By Operating segments
Cement
Ready mixed concrete
Corporate structure
Page 3 of 13
Business overview
Cement manufacturing process
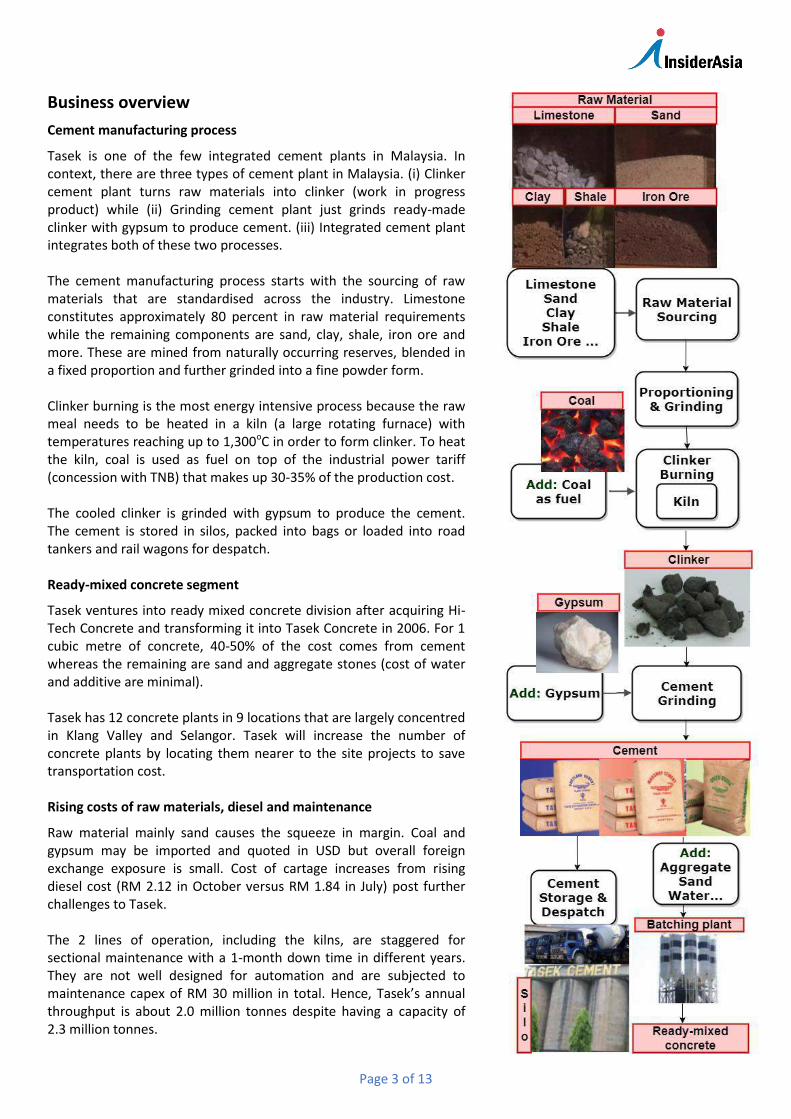
Tasek is one of the few integrated cement plants in Malaysia. In context, there are three types of cement plant in Malaysia. (i) Clinker cement plant turns raw materials into clinker (work in progress product) while (ii) Grinding cement plant just grinds ready-made clinker with gypsum to produce cement. (iii) Integrated cement plant integrates both of these two processes. The cement manufacturing process starts with the sourcing of raw materials that are standardised across the industry. Limestone constitutes approximately 80 percent in raw material requirements while the remaining components are sand, clay, shale, iron ore and more. These are mined from naturally occurring reserves, blended in a fixed proportion and further grinded into a fine powder form. Clinker burning is the most energy intensive process because the raw meal needs to be heated in a kiln (a large rotating furnace) with temperatures reaching up to 1,300oC in order to form clinker. To heat the kiln, coal is used as fuel on top of the industrial power tariff (concession with TNB) that makes up 30-35% of the production cost. The cooled clinker is grinded with gypsum to produce the cement. The cement is stored in silos, packed into bags or loaded into road tankers and rail wagons for despatch. Ready-mixed concrete segment
Tasek ventures into ready mixed concrete division after acquiring Hi-Tech Concrete and transforming it into Tasek Concrete in 2006. For 1 cubic metre of concrete, 40-50% of the cost comes from cement whereas the remaining are sand and aggregate stones (cost of water and additive are minimal). Tasek has 12 concrete plants in 9 locations that are largely concentred in Klang Valley and Selangor. Tasek will increase the number of concrete plants by locating them nearer to the site projects to save transportation cost. Rising costs of raw materials, diesel and maintenance
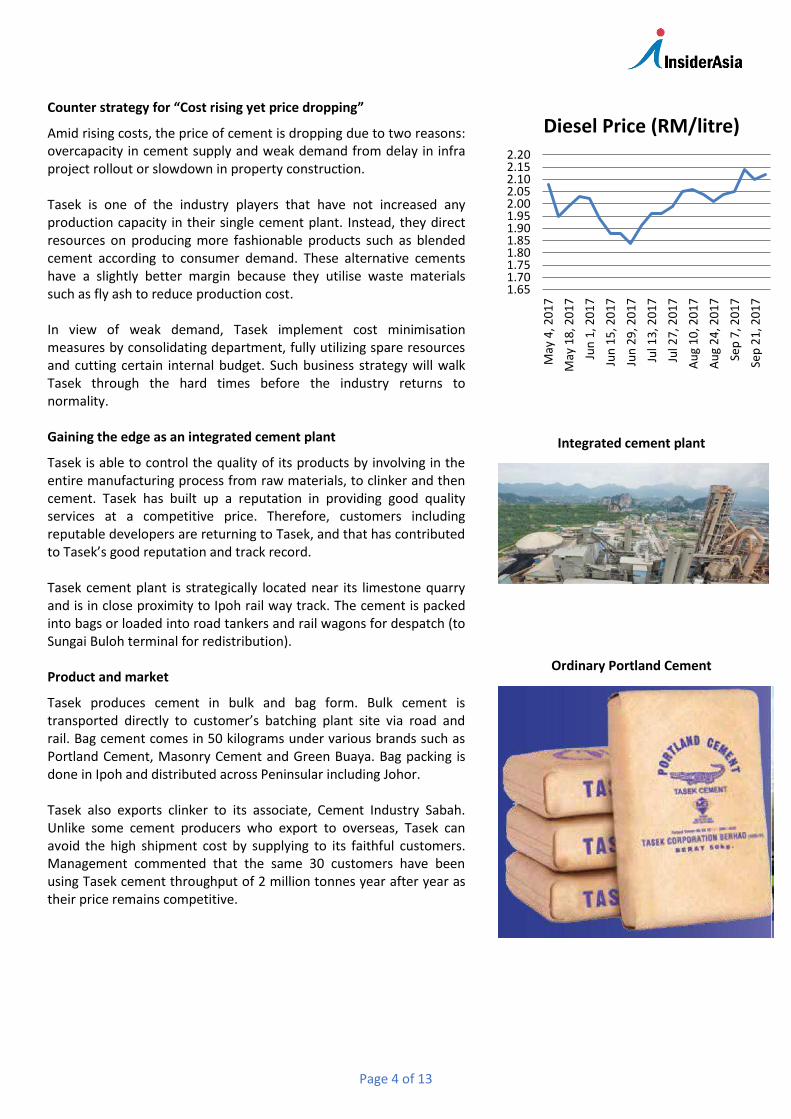
Raw material mainly sand causes the squeeze in margin. Coal and gypsum may be imported and quoted in USD but overall foreign exchange exposure is small. Cost of cartage increases from rising diesel cost (RM 2.12 in October versus RM 1.84 in July) post further challenges to Tasek. The 2 lines of operation, including the kilns, are staggered for sectional maintenance with a 1-month down time in different years. They are not well designed for automation and are subjected to maintenance capex of RM 30 million in total. Hence, Tasek’s annual throughput is about 2.0 million tonnes despite having a capacity of 2.3 million tonnes.
Page 4 of 13
Counter strategy for “Cost rising yet price dropping”
Amid rising costs, the price of cement is dropping due to two reasons: overcapacity in cement supply and weak demand from delay in infra project rollout or slowdown in property construction. Tasek is one of the industry players that have not increased any production capacity in their single cement plant. Instead, they direct resources on producing more fashionable products such as blended cement according to consumer demand. These alternative cements have a slightly better margin because they utilise waste materials such as fly ash to reduce production cost. In view of weak demand, Tasek implement cost minimisation measures by consolidating department, fully utilizing spare resources and cutting certain internal budget. Such business strategy will walk Tasek through the hard times before the industry returns to normality. Gaining the edge as an integrated cement plant
Tasek is able to control the quality of its products by involving in the entire manufacturing process from raw materials, to clinker and then cement. Tasek has built up a reputation in providing good quality services at a competitive price. Therefore, customers including reputable developers are returning to Tasek, and that has contributed to Tasek’s good reputation and track record. Tasek cement plant is strategically located near its limestone quarry and is in close proximity to Ipoh rail way track. The cement is packed into bags or loaded into road tankers and rail wagons for despatch (to Sungai Buloh terminal for redistribution). Product and market
Tasek produces cement in bulk and bag form. Bulk cement is transported directly to customer’s batching plant site via road and rail. Bag cement comes in 50 kilograms under various brands such as Portland Cement, Masonry Cement and Green Buaya. Bag packing is done in Ipoh and distributed across Peninsular including Johor. Tasek also exports clinker to its associate, Cement Industry Sabah. Unlike some cement producers who export to overseas, Tasek can avoid the high shipment cost by supplying to its faithful customers. Management commented that the same 30 customers have been using Tasek cement throughput of 2 million tonnes year after year as their price remains competitive.
1.651.701.751.801.851.901.952.002.052.102.152.20
May
4, 2
01
7
May
18
, 20
17
Jun
1, 2
01
7
Jun
15
, 20
17
Jun
29
, 20
17
Jul 1
3, 2
01
7
Jul 2
7, 2
01
7
Au
g 1
0, 2
01
7
Au
g 2
4, 2
01
7
Sep
7, 2
01
7
Sep
21
, 20
17
Diesel Price (RM/litre)
Integrated cement plant
Ordinary Portland Cement
Page 5 of 13
Industry overview
Cement Players: Group of 5
The 5 integrated players in Peninsular are Lafarge, YTL, CIMA and Hume. Lafarge has merged with Holcim in July 2015, making them the largest cement manufacturer in Malaysia and in the world. YTL has chosen to develop their concrete segment (by far the largest ready-mixed concrete player) under the flagship Buildcon Concrete by building over 50 batching plants across Peninsular. Hume just joined as the 5th member about 2 years ago. The total cement capacity is around 30 million MT after considering downtime for maintenance.
Total Cement capacity in Malaysia for 2016/17
Companies Total Cement Capacity
for 2016 (m MT) Expected Cement Capacity
for 2017 (m MT) Cement Market Share
for 2016
LafargeHolcim Malaysia 15.35 16.95 40%
YTL Cement 7.8 7.8 20%
CIMA (UEM) 5.44 7.2 14%
Hume Ind 3.65 7.3 10%
CMS Group 2.75 2.75 7%
Tasek 2.3 2.3 6%
Cement Industries Sabah 0.9 0.9 2%
Aalborg Portland Malaysia 0.21 0.21 1%
Total 38.4 45.41 100%
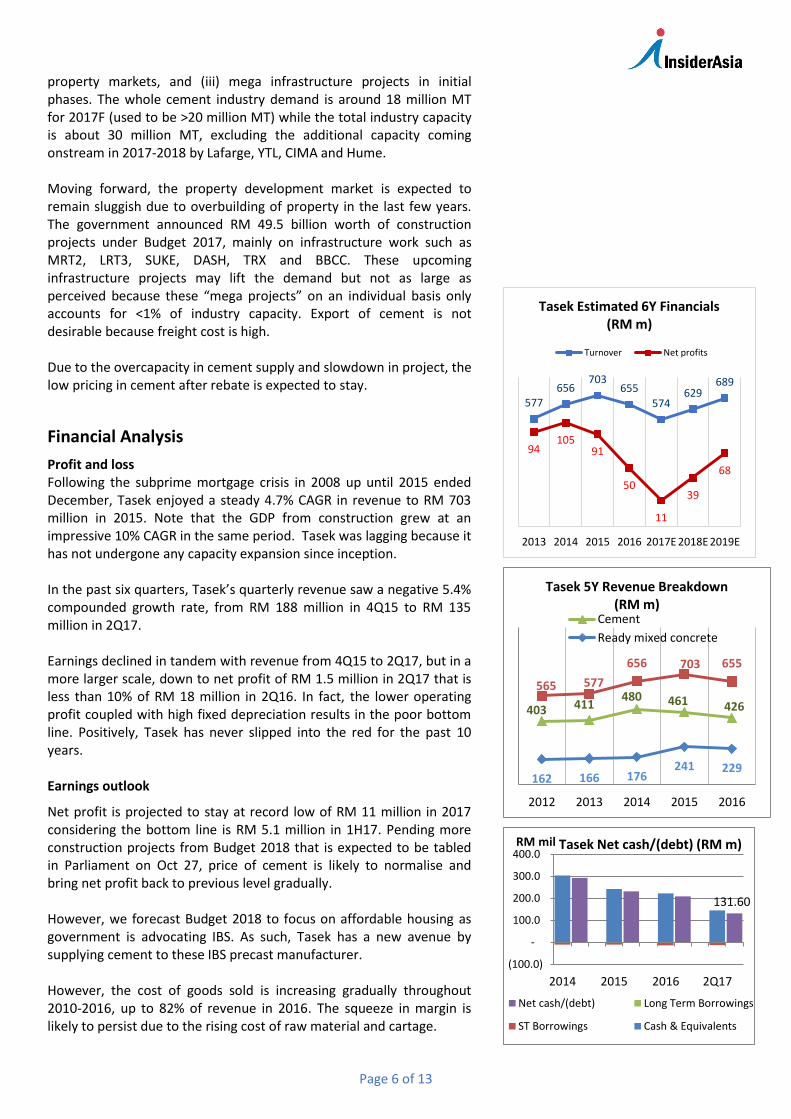
Cement capacity increasing despite lower prices
The price of cement has declined to the range of RM 370-375 per tonne among the cement players. An additional rebate is given to customer, dragging the net price down to RM 200-220 per tonne. The price of cement is dropping due to two reasons, which are overcapacity in cement supply and weak demand from delay in infra project rollout or slowdown in property construction. The cement players are still expanding today because these projects such as ordering of machinery setting up infrastructure and construction of new silos took place two years ago, making them in a loss-making position if they choose to abandon the project. Moreover, the cement manufacturers can only slow down production but not stop production. Shutting down the kiln is expensive as it takes a long time, a lot of oil and energy cost to restart the kiln. Fortunately, Tasek has not increased any production capacity but directs resources on producing alternative cement products. Weak demand from construction and property
Prior to 2016Q3, the cement demand used to grow about 3 to 5% YOY. The weak demand faced by cement players is mainly due to: (i) delay in construction award flow, (ii) slowdown in residential and commercial
-
5
10
15
20
25
30
35
40
45
50
1985 1995 2005 2015 7M15 7M17
5
13
28
39 39
45
4
12 16
24
14 11
Malaysi Cement Capacity and Demand
(in million Tonnes)
Cement Installed Capacity
Cement Demand
Page 6 of 13
property markets, and (iii) mega infrastructure projects in initial phases. The whole cement industry demand is around 18 million MT for 2017F (used to be >20 million MT) while the total industry capacity is about 30 million MT, excluding the additional capacity coming onstream in 2017-2018 by Lafarge, YTL, CIMA and Hume. Moving forward, the property development market is expected to remain sluggish due to overbuilding of property in the last few years. The government announced RM 49.5 billion worth of construction projects under Budget 2017, mainly on infrastructure work such as MRT2, LRT3, SUKE, DASH, TRX and BBCC. These upcoming infrastructure projects may lift the demand but not as large as perceived because these “mega projects” on an individual basis only accounts for <1% of industry capacity. Export of cement is not desirable because freight cost is high. Due to the overcapacity in cement supply and slowdown in project, the low pricing in cement after rebate is expected to stay.
Financial Analysis
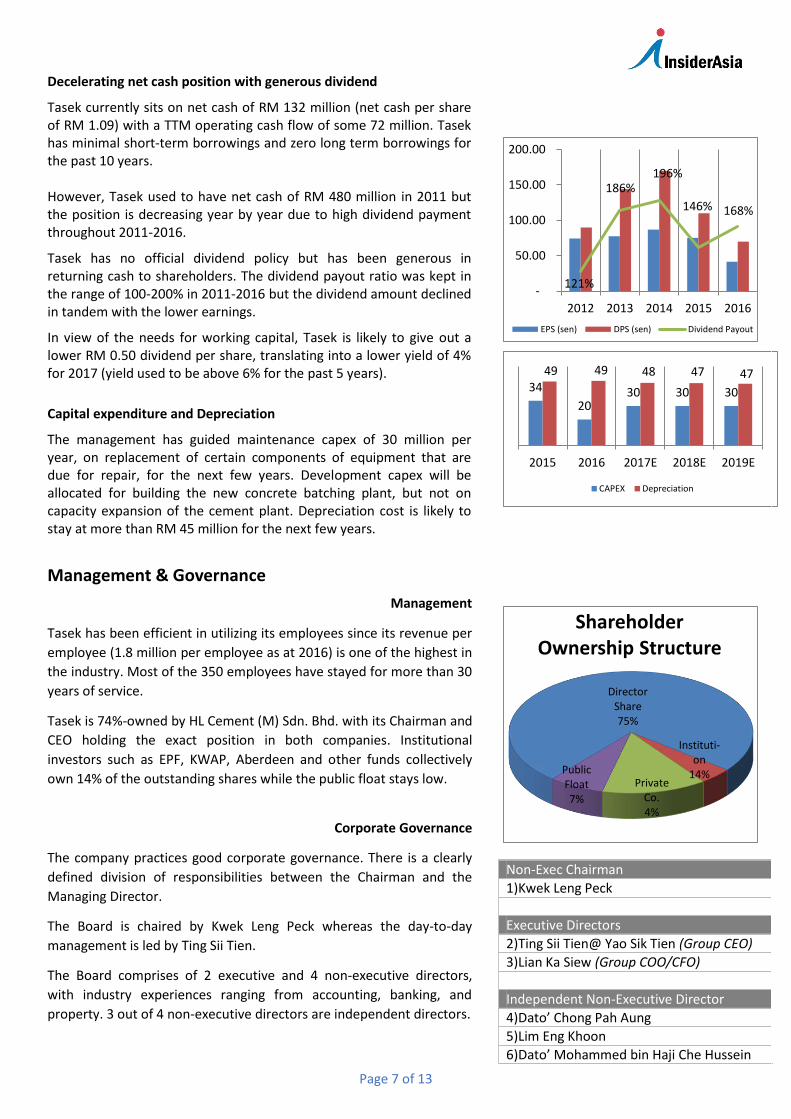
Profit and loss Following the subprime mortgage crisis in 2008 up until 2015 ended December, Tasek enjoyed a steady 4.7% CAGR in revenue to RM 703 million in 2015. Note that the GDP from construction grew at an impressive 10% CAGR in the same period. Tasek was lagging because it has not undergone any capacity expansion since inception. In the past six quarters, Tasek’s quarterly revenue saw a negative 5.4% compounded growth rate, from RM 188 million in 4Q15 to RM 135 million in 2Q17. Earnings declined in tandem with revenue from 4Q15 to 2Q17, but in a more larger scale, down to net profit of RM 1.5 million in 2Q17 that is less than 10% of RM 18 million in 2Q16. In fact, the lower operating profit coupled with high fixed depreciation results in the poor bottom line. Positively, Tasek has never slipped into the red for the past 10 years. Earnings outlook
Net profit is projected to stay at record low of RM 11 million in 2017 considering the bottom line is RM 5.1 million in 1H17. Pending more construction projects from Budget 2018 that is expected to be tabled in Parliament on Oct 27, price of cement is likely to normalise and bring net profit back to previous level gradually. However, we forecast Budget 2018 to focus on affordable housing as government is advocating IBS. As such, Tasek has a new avenue by supplying cement to these IBS precast manufacturer. However, the cost of goods sold is increasing gradually throughout 2010-2016, up to 82% of revenue in 2016. The squeeze in margin is likely to persist due to the rising cost of raw material and cartage.
577656
703655
574629
689
94105
91
50
11
39
68
2013 2014 2015 2016 2017E 2018E 2019E
Tasek Estimated 6Y Financials (RM m)
Turnover Net profits
403 411480 461 426
162 166 176241 229
565 577
656 703 655
2012 2013 2014 2015 2016
Tasek 5Y Revenue Breakdown (RM m)
Cement
Ready mixed concrete
131.60
(100.0)
-
100.0
200.0
300.0
400.0
2014 2015 2016 2Q17
RM mil Tasek Net cash/(debt) (RM m)
Net cash/(debt) Long Term Borrowings
ST Borrowings Cash & Equivalents
Page 7 of 13
Decelerating net cash position with generous dividend
Tasek currently sits on net cash of RM 132 million (net cash per share of RM 1.09) with a TTM operating cash flow of some 72 million. Tasek has minimal short-term borrowings and zero long term borrowings for the past 10 years. However, Tasek used to have net cash of RM 480 million in 2011 but the position is decreasing year by year due to high dividend payment throughout 2011-2016.
Tasek has no official dividend policy but has been generous in returning cash to shareholders. The dividend payout ratio was kept in the range of 100-200% in 2011-2016 but the dividend amount declined in tandem with the lower earnings.
In view of the needs for working capital, Tasek is likely to give out a lower RM 0.50 dividend per share, translating into a lower yield of 4% for 2017 (yield used to be above 6% for the past 5 years).
Capital expenditure and Depreciation
The management has guided maintenance capex of 30 million per year, on replacement of certain components of equipment that are due for repair, for the next few years. Development capex will be allocated for building the new concrete batching plant, but not on capacity expansion of the cement plant. Depreciation cost is likely to stay at more than RM 45 million for the next few years.
Management & Governance
Management
Tasek has been efficient in utilizing its employees since its revenue per
employee (1.8 million per employee as at 2016) is one of the highest in
the industry. Most of the 350 employees have stayed for more than 30
years of service.
Tasek is 74%-owned by HL Cement (M) Sdn. Bhd. with its Chairman and
CEO holding the exact position in both companies. Institutional
investors such as EPF, KWAP, Aberdeen and other funds collectively
own 14% of the outstanding shares while the public float stays low.
Corporate Governance
The company practices good corporate governance. There is a clearly
defined division of responsibilities between the Chairman and the
Managing Director.
The Board is chaired by Kwek Leng Peck whereas the day-to-day
management is led by Ting Sii Tien.
The Board comprises of 2 executive and 4 non-executive directors,
with industry experiences ranging from accounting, banking, and
property. 3 out of 4 non-executive directors are independent directors.
121%
186%196%
146% 168%
-
50.00
100.00
150.00
200.00
2012 2013 2014 2015 2016
EPS (sen) DPS (sen) Dividend Payout
34
2030 30 30
49 49 48 47 47
2015 2016 2017E 2018E 2019E
CAPEX Depreciation
Director Share75%
Private Co.4%
Instituti-on
14%Public Float7%
Shareholder Ownership Structure
Non-Exec Chairman
1)Kwek Leng Peck
Executive Directors
2)Ting Sii Tien@ Yao Sik Tien (Group CEO)
3)Lian Ka Siew (Group COO/CFO)
Independent Non-Executive Director
4)Dato’ Chong Pah Aung
5)Lim Eng Khoon
6)Dato’ Mohammed bin Haji Che Hussein
Page 8 of 13
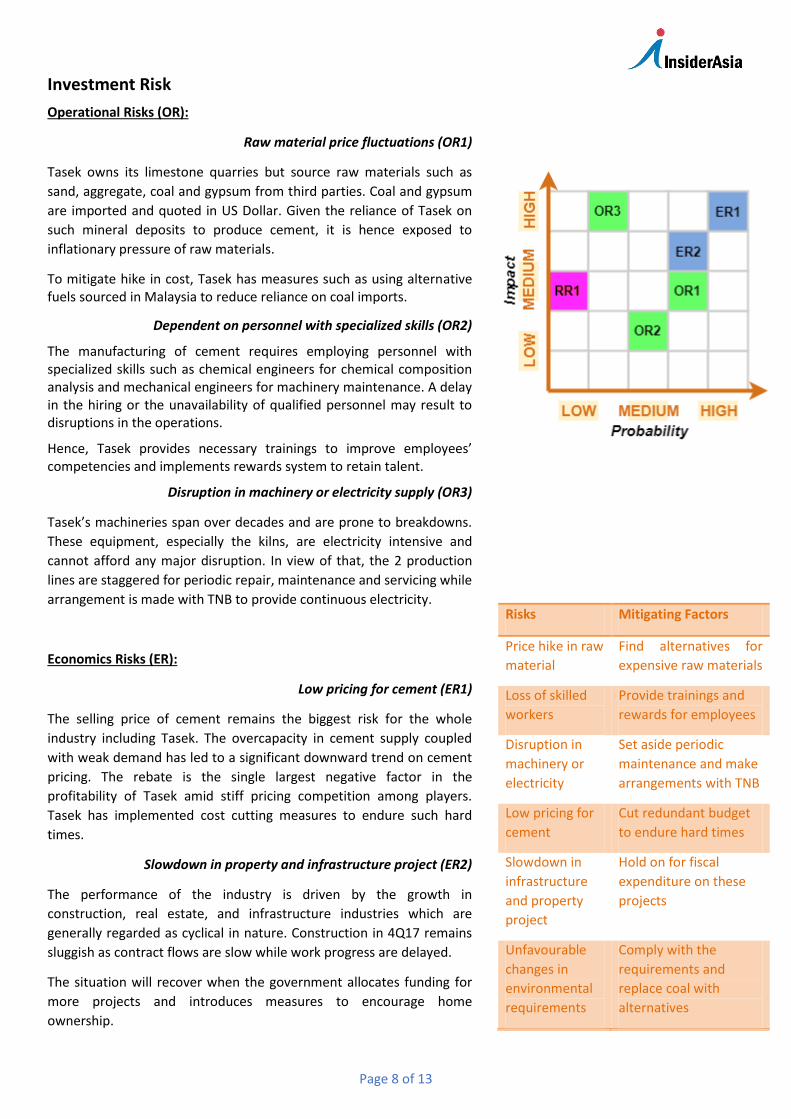
Investment Risk
Operational Risks (OR):
Raw material price fluctuations (OR1)
Tasek owns its limestone quarries but source raw materials such as
sand, aggregate, coal and gypsum from third parties. Coal and gypsum
are imported and quoted in US Dollar. Given the reliance of Tasek on
such mineral deposits to produce cement, it is hence exposed to
inflationary pressure of raw materials.
To mitigate hike in cost, Tasek has measures such as using alternative fuels sourced in Malaysia to reduce reliance on coal imports.
Dependent on personnel with specialized skills (OR2)
The manufacturing of cement requires employing personnel with specialized skills such as chemical engineers for chemical composition analysis and mechanical engineers for machinery maintenance. A delay in the hiring or the unavailability of qualified personnel may result to disruptions in the operations.
Hence, Tasek provides necessary trainings to improve employees’ competencies and implements rewards system to retain talent.
Disruption in machinery or electricity supply (OR3)
Tasek’s machineries span over decades and are prone to breakdowns.
These equipment, especially the kilns, are electricity intensive and
cannot afford any major disruption. In view of that, the 2 production
lines are staggered for periodic repair, maintenance and servicing while
arrangement is made with TNB to provide continuous electricity.
Economics Risks (ER):
Low pricing for cement (ER1)
The selling price of cement remains the biggest risk for the whole
industry including Tasek. The overcapacity in cement supply coupled
with weak demand has led to a significant downward trend on cement
pricing. The rebate is the single largest negative factor in the
profitability of Tasek amid stiff pricing competition among players.
Tasek has implemented cost cutting measures to endure such hard
times.
Slowdown in property and infrastructure project (ER2)
The performance of the industry is driven by the growth in
construction, real estate, and infrastructure industries which are
generally regarded as cyclical in nature. Construction in 4Q17 remains
sluggish as contract flows are slow while work progress are delayed.
The situation will recover when the government allocates funding for
more projects and introduces measures to encourage home
ownership.
Risks Mitigating Factors
Price hike in raw
material
Find alternatives for
expensive raw materials
Loss of skilled
workers
Provide trainings and
rewards for employees
Disruption in
machinery or
electricity
Set aside periodic
maintenance and make
arrangements with TNB
Low pricing for
cement
Cut redundant budget
to endure hard times
Slowdown in
infrastructure
and property
project
Hold on for fiscal
expenditure on these
projects
Unfavourable
changes in
environmental
requirements
Comply with the
requirements and
replace coal with
alternatives
Page 9 of 13
Regulatory Risk:
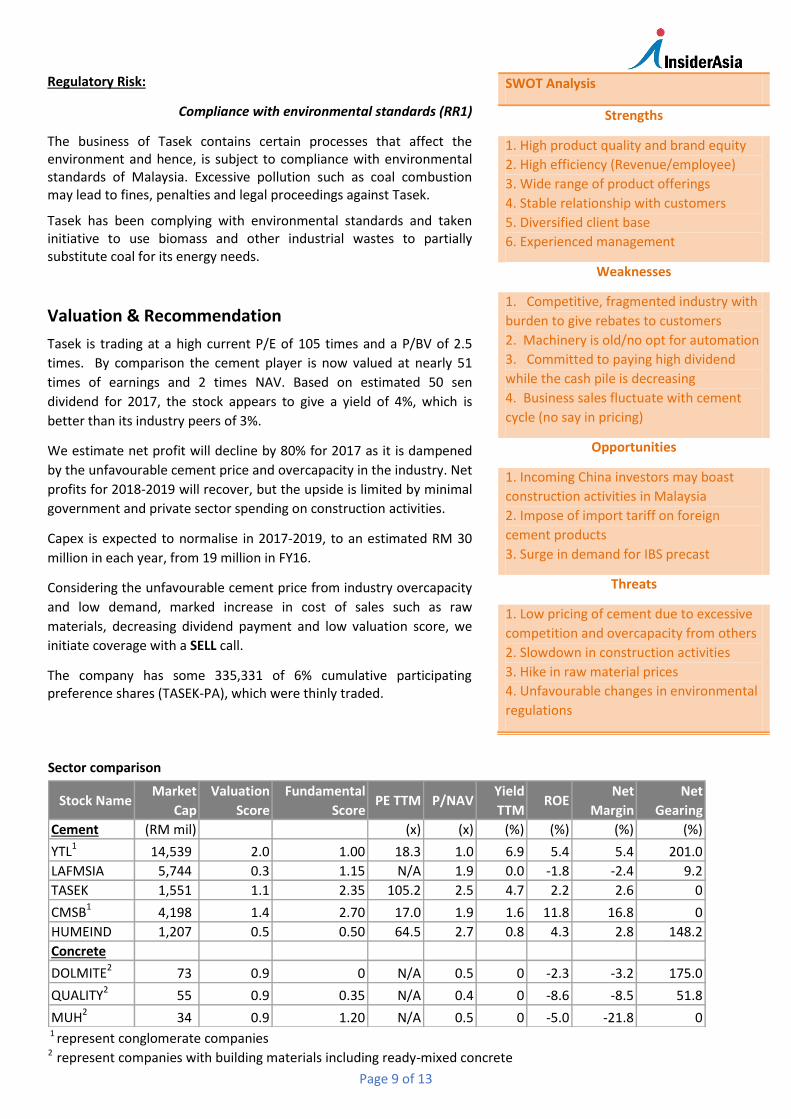
Compliance with environmental standards (RR1)
The business of Tasek contains certain processes that affect the environment and hence, is subject to compliance with environmental standards of Malaysia. Excessive pollution such as coal combustion may lead to fines, penalties and legal proceedings against Tasek.
Tasek has been complying with environmental standards and taken initiative to use biomass and other industrial wastes to partially substitute coal for its energy needs.
Valuation & Recommendation
Tasek is trading at a high current P/E of 105 times and a P/BV of 2.5
times. By comparison the cement player is now valued at nearly 51
times of earnings and 2 times NAV. Based on estimated 50 sen
dividend for 2017, the stock appears to give a yield of 4%, which is
better than its industry peers of 3%.
We estimate net profit will decline by 80% for 2017 as it is dampened
by the unfavourable cement price and overcapacity in the industry. Net
profits for 2018-2019 will recover, but the upside is limited by minimal
government and private sector spending on construction activities.
Capex is expected to normalise in 2017-2019, to an estimated RM 30
million in each year, from 19 million in FY16.
Considering the unfavourable cement price from industry overcapacity
and low demand, marked increase in cost of sales such as raw
materials, decreasing dividend payment and low valuation score, we
initiate coverage with a SELL call.
The company has some 335,331 of 6% cumulative participating preference shares (TASEK-PA), which were thinly traded.
SWOT Analysis
Strengths
1. High product quality and brand equity
2. High efficiency (Revenue/employee)
3. Wide range of product offerings
4. Stable relationship with customers
5. Diversified client base
6. Experienced management
Weaknesses
1. Competitive, fragmented industry with
burden to give rebates to customers
2. Machinery is old/no opt for automation
3. Committed to paying high dividend
while the cash pile is decreasing
4. Business sales fluctuate with cement
cycle (no say in pricing)
Opportunities
1. Incoming China investors may boast
construction activities in Malaysia
2. Impose of import tariff on foreign
cement products
3. Surge in demand for IBS precast
Threats
1. Low pricing of cement due to excessive
competition and overcapacity from others
2. Slowdown in construction activities
3. Hike in raw material prices
4. Unfavourable changes in environmental
regulations
Sector comparison
Stock NameMarket
Cap
Valuation
Score
Fundamental
ScorePE TTM P/NAV
Yield
TTMROE
Net
Margin
Net
Gearing
Cement (RM mil) (x) (x) (%) (%) (%) (%)
YTL1
14,539 2.0 1.00 18.3 1.0 6.9 5.4 5.4 201.0
LAFMSIA 5,744 0.3 1.15 N/A 1.9 0.0 -1.8 -2.4 9.2
TASEK 1,551 1.1 2.35 105.2 2.5 4.7 2.2 2.6 0
CMSB14,198 1.4 2.70 17.0 1.9 1.6 11.8 16.8 0
HUMEIND 1,207 0.5 0.50 64.5 2.7 0.8 4.3 2.8 148.2
Concrete
DOLMITE273 0.9 0 N/A 0.5 0 -2.3 -3.2 175.0
QUALITY2
55 0.9 0.35 N/A 0.4 0 -8.6 -8.5 51.8
MUH2
34 0.9 1.20 N/A 0.5 0 -5.0 -21.8 0 1 represent conglomerate companies 2 represent companies with building materials including ready-mixed concrete
Page 10 of 13
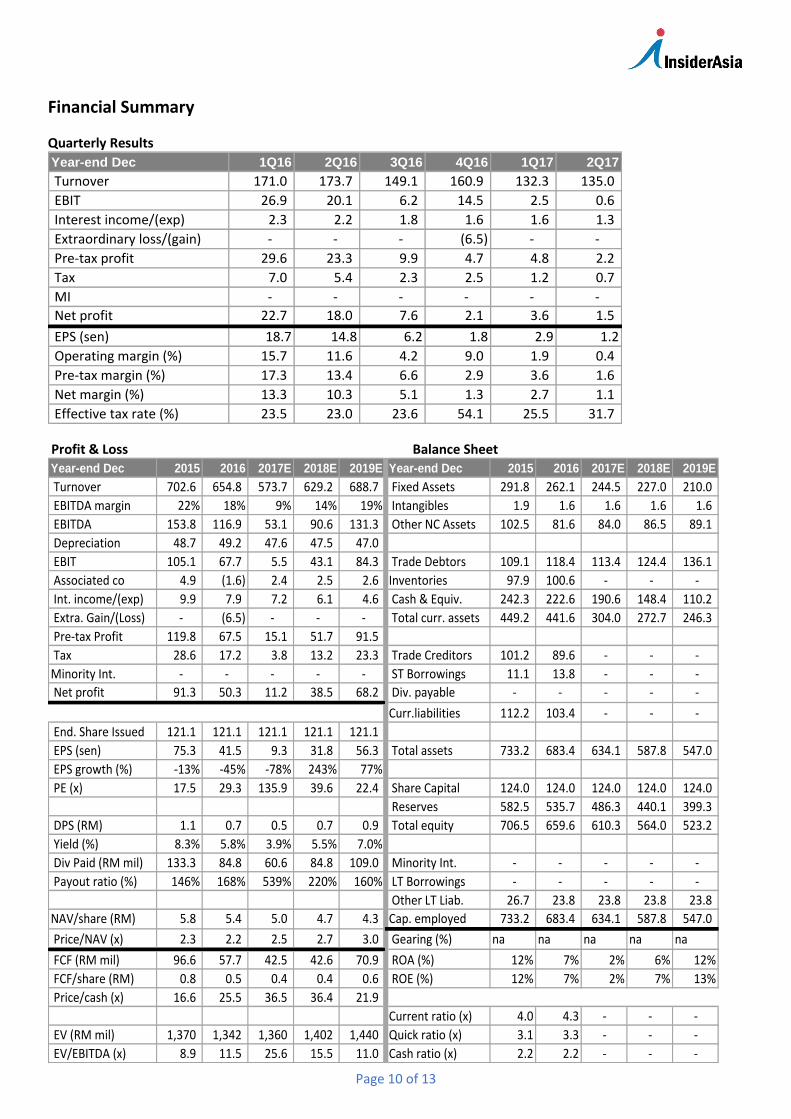
Financial Summary
Quarterly Results
Year-end Dec 1Q16 2Q16 3Q16 4Q16 1Q17 2Q17
Turnover 171.0 173.7 149.1 160.9 132.3 135.0
EBIT 26.9 20.1 6.2 14.5 2.5 0.6
Interest income/(exp) 2.3 2.2 1.8 1.6 1.6 1.3
Extraordinary loss/(gain) - - - (6.5) - -
Pre-tax profit 29.6 23.3 9.9 4.7 4.8 2.2
Tax 7.0 5.4 2.3 2.5 1.2 0.7
MI - - - - - -
Net profit 22.7 18.0 7.6 2.1 3.6 1.5
EPS (sen) 18.7 14.8 6.2 1.8 2.9 1.2
Operating margin (%) 15.7 11.6 4.2 9.0 1.9 0.4
Pre-tax margin (%) 17.3 13.4 6.6 2.9 3.6 1.6
Net margin (%) 13.3 10.3 5.1 1.3 2.7 1.1
Effective tax rate (%) 23.5 23.0 23.6 54.1 25.5 31.7
Profit & Loss Balance Sheet
Year-end Dec 2015 2016 2017E 2018E 2019E Year-end Dec 2015 2016 2017E 2018E 2019E
Turnover 702.6 654.8 573.7 629.2 688.7 Fixed Assets 291.8 262.1 244.5 227.0 210.0
EBITDA margin 22% 18% 9% 14% 19% Intangibles 1.9 1.6 1.6 1.6 1.6
EBITDA 153.8 116.9 53.1 90.6 131.3 Other NC Assets 102.5 81.6 84.0 86.5 89.1
Depreciation 48.7 49.2 47.6 47.5 47.0
EBIT 105.1 67.7 5.5 43.1 84.3 Trade Debtors 109.1 118.4 113.4 124.4 136.1
Associated co 4.9 (1.6) 2.4 2.5 2.6 Inventories 97.9 100.6 - - -
Int. income/(exp) 9.9 7.9 7.2 6.1 4.6 Cash & Equiv. 242.3 222.6 190.6 148.4 110.2
Extra. Gain/(Loss) - (6.5) - - - Total curr. assets 449.2 441.6 304.0 272.7 246.3
Pre-tax Profit 119.8 67.5 15.1 51.7 91.5
Tax 28.6 17.2 3.8 13.2 23.3 Trade Creditors 101.2 89.6 - - -
Minority Int. - - - - - ST Borrowings 11.1 13.8 - - -
Net profit 91.3 50.3 11.2 38.5 68.2 Div. payable - - - - -
Curr.liabilities 112.2 103.4 - - -
End. Share Issued 121.1 121.1 121.1 121.1 121.1
EPS (sen) 75.3 41.5 9.3 31.8 56.3 Total assets 733.2 683.4 634.1 587.8 547.0
EPS growth (%) -13% -45% -78% 243% 77%
PE (x) 17.5 29.3 135.9 39.6 22.4 Share Capital 124.0 124.0 124.0 124.0 124.0
Reserves 582.5 535.7 486.3 440.1 399.3
DPS (RM) 1.1 0.7 0.5 0.7 0.9 Total equity 706.5 659.6 610.3 564.0 523.2
Yield (%) 8.3% 5.8% 3.9% 5.5% 7.0%
Div Paid (RM mil) 133.3 84.8 60.6 84.8 109.0 Minority Int. - - - - -
Payout ratio (%) 146% 168% 539% 220% 160% LT Borrowings - - - - -
Other LT Liab. 26.7 23.8 23.8 23.8 23.8
NAV/share (RM) 5.8 5.4 5.0 4.7 4.3 Cap. employed 733.2 683.4 634.1 587.8 547.0
Price/NAV (x) 2.3 2.2 2.5 2.7 3.0 Gearing (%) na na na na na
FCF (RM mil) 96.6 57.7 42.5 42.6 70.9 ROA (%) 12% 7% 2% 6% 12%
FCF/share (RM) 0.8 0.5 0.4 0.4 0.6 ROE (%) 12% 7% 2% 7% 13%
Price/cash (x) 16.6 25.5 36.5 36.4 21.9
Current ratio (x) 4.0 4.3 - - -
EV (RM mil) 1,370 1,342 1,360 1,402 1,440 Quick ratio (x) 3.1 3.3 - - -
EV/EBITDA (x) 8.9 11.5 25.6 15.5 11.0 Cash ratio (x) 2.2 2.2 - - -
Page 11 of 13
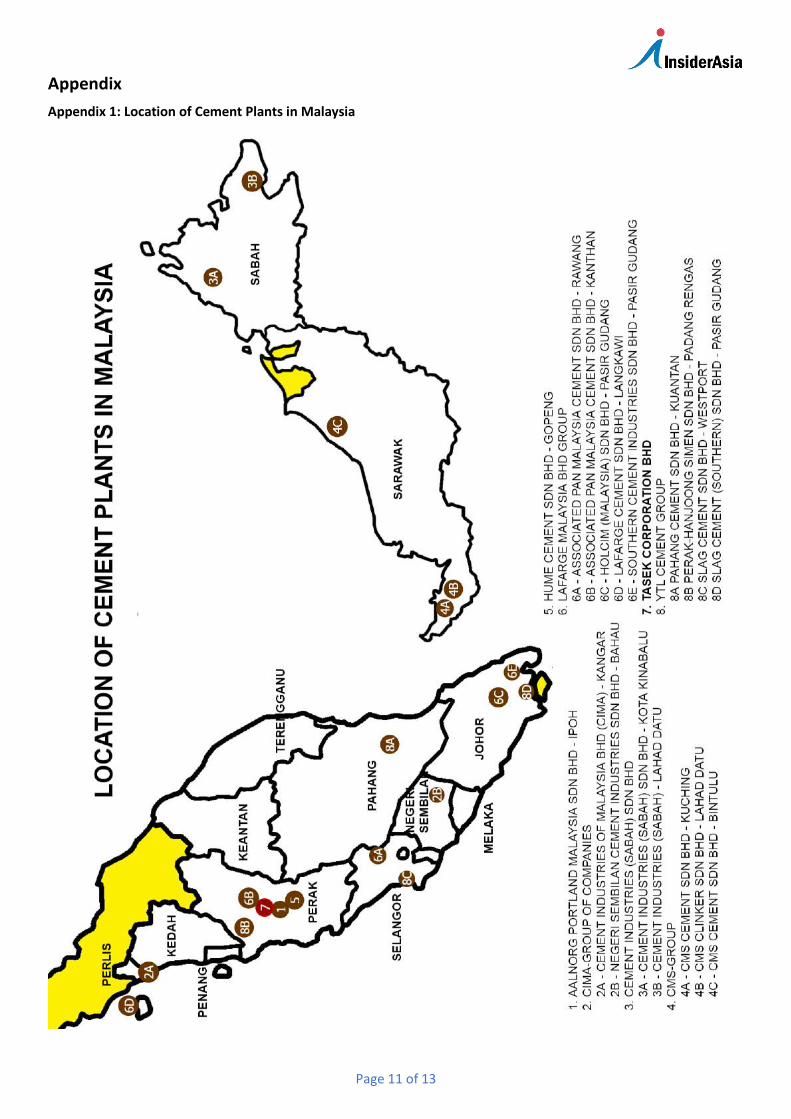
Appendix
Appendix 1: Location of Cement Plants in Malaysia
Page 12 of 13
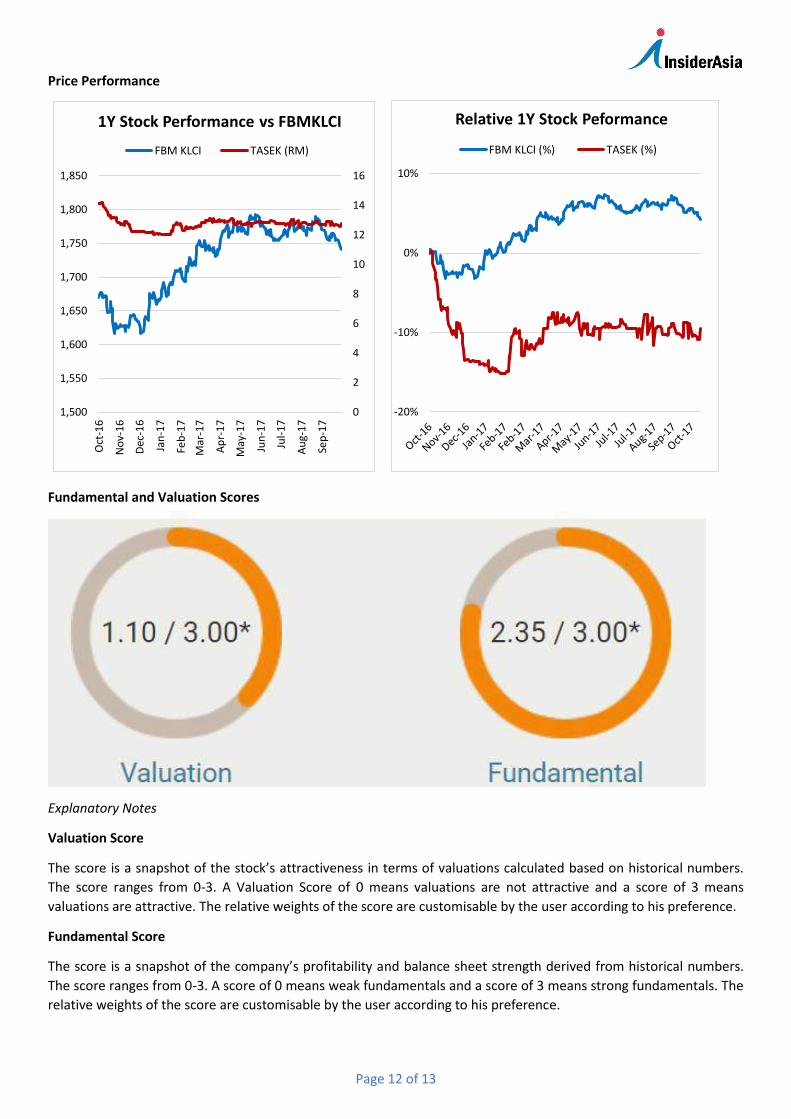
Price Performance
0
2
4
6
8
10
12
14
16
1,500
1,550
1,600
1,650
1,700
1,750
1,800
1,850
Oct
-16
No
v-1
6
Dec
-16
Jan
-17
Feb
-17
Mar
-17
Ap
r-1
7
May
-17
Jun
-17
Jul-
17
Au
g-1
7
Sep
-17
1Y Stock Performance vs FBMKLCI
FBM KLCI TASEK (RM)
-20%
-10%
0%
10%
Relative 1Y Stock Peformance
FBM KLCI (%) TASEK (%)
Fundamental and Valuation Scores
Explanatory Notes
Valuation Score
The score is a snapshot of the stock’s attractiveness in terms of valuations calculated based on historical numbers.
The score ranges from 0-3. A Valuation Score of 0 means valuations are not attractive and a score of 3 means
valuations are attractive. The relative weights of the score are customisable by the user according to his preference.
Fundamental Score
The score is a snapshot of the company’s profitability and balance sheet strength derived from historical numbers.
The score ranges from 0-3. A score of 0 means weak fundamentals and a score of 3 means strong fundamentals. The
relative weights of the score are customisable by the user according to his preference.
Page 13 of 13
Disclaimer
This report is intended for Malaysian residents only and has been prepared without regard to your specific
investment objectives, financial situation or particular needs.
Neither the information nor any opinion expressed constitutes an offer, or an invitation to make an offer, to buy or
sell any securities or related financial instruments.
The information herein is obtained from various sources and we do not guarantee its accuracy or completeness.
All views and advice are given in good faith but without legal responsibility. You should not regard the reports as a
substitute for the exercise of your own judgment and you should seek professional advice for your specific
investment needs. Any opinions expressed in this report are subject to change without notice.
Our shareholders, directors and employees may have positions in or may be materially interested in any of the
stocks. We may also have or have had dealings with or may provide or have provided content services to the
companies mentioned in the reports.
This report has been prepared by Asia Analytica Sdn Bhd pursuant to the Mid and Small Cap Research Scheme (MidS)
administered by Bursa Malaysia Berhad. This report has been produced independent of any influence from Bursa
Malaysia Berhad or the subject company. Bursa Malaysia Berhad and its group of companies disclaim any and all
liability, howsoever arising, out of or in relation to the administration of the MidS and/or this report.
For other research reports under the MidS, please visit Bursa Marketplace at http://www.bursamids.com.
Linda Koh
603-77218060
Asia Analytica Sdn Bhd
Suite 3D, Level 3, Menara KLK
1 Jalan PJU7/6 Mutiara Damansara
47810 Petaling Jaya
Selangor
Malaysia