Embed Size (px)
Citation preview

Power-law decay of the spatial correlation functionin exciton-polariton condensatesGeorgios Roumpos ∗, † Michael Lohse ∗ ‡ Wolfgang H. Nitsche ∗ Jonathan Keeling §, Marzena Hanna Szymanska¶, Peter B. Littlewood ∥, Andreas Loffler ∗∗, Sven Hofling ∗∗ , Lukas Worschech ∗∗ , Alfred Forchel ∗∗ , and YoshihisaYamamoto ∗ ††
∗E. L. Ginzton Laboratory, Stanford University, Stanford, CA, USA,‡Fakultat fur Physik, Universitat Karlsruhe, Karlsruhe, Germany,§Scottish Universities Physics Alliance,
School of Physics and Astronomy, University of St. Andrews, St Andrews, UK,¶Department of Physics, University of Warwick, Coventry, UK,∥Argonne National Laboratory,
Argonne, IL, USA,∗∗Technische Physik, Universitat Wurzburg, Physikalisches Institut and Wilhelm-Conrad-Rontgen-Research Center for Complex Material Systems, Wurzburg,
Germany,††National Institute of Informatics, Tokyo, Japan, and †Present address: JILA, University of Colorado at Boulder, Boulder, CO, USA
Submitted to Proceedings of the National Academy of Sciences of the United States of America
We create a large exciton polariton condensate and employ a Michel-son interferometer setup to characterize the short- and long-distancebehavior of the first order spatial correlation function. Our exper-imental results show distinct features of both the two-dimensionaland non-equilibrium characters of the condensate. We find thatthe gaussian short-distance decay is followed by a power law decayat longer distances, as expected for a two-dimensional condensate.The exponent of the power law is measured in the range 0.9-1.2,larger than is possible in equilibrium. We compare the experimentalresults to a theoretical model to understand the features requiredto observe a power law, and to clarify the influence of external noiseon spatial coherence in non-equilibrium phase transitions. Our re-sults indicate that Berezinskii-Kosterlitz-Thouless-like phase ordersurvives in open-dissipative systems.
IntroductionThe spatial correlation function quantifies the coherence prop-erties of a system [1]. In a three-dimensional Bose-condensedgas, long range order is observed, and the correlation func-tion decays towards a plateau at large distances [2, 3]. In thehomogeneous two-dimensional (2D) Bose gas [4], however, nolong range order can be established [5]. Instead, Berezinskii-Kosterlitz-Thouless (BKT) theory of the equilibrium interact-ing gas predicts a transition to a low-temperature superfluidphase, which shows a power law decay of the correlation func-tion [6, 7]. Unfortunately, it is frequently hard to directlymeasure this, and only very recently [8] was indication of thepower law decay of coherence seen in a two dimensional atomicgas. It has been theoretically predicted [9, 10] that power lawdecay of coherence survives in the non-equilibrium problem,and it is this prediction that the current experiment sets outto test.
Exciton polaritons are short-lived quasiparticles formedin a semiconductor quantum well strongly coupled to a pla-nar microcavity [11]. Each one is a superposition of a quan-tum well exciton and a microcavity photon, and they be-have as 2D bosons below the Mott density. Above a thresh-old particle density, condensation is observed [12]. Due tothe non-equilibrium nature of polariton condensation, under-standing its coherence properties is quite revealing regardingthe different roles of fluctuations in the equilibrium and non-equilibrium problems.
Previous measurements on polariton condensates havedemonstrated coherence at large distances, but were limitedby large experimental uncertainties [13], or highly disorderedsamples [14, 15], and the long-distance behavior could not befully extracted. Recently, the correlation function at large dis-tances was studied in one-dimensional condensates confined ina quantum wire [16], and in a valley of the disorder potential[17]. In [16], the data was energy-resolved, so that excitedstates were filtered out, while in [17] a rare area on the sam-ple was chosen in which a single mode condensate is seen. The
purpose of both those experiments was to investigate how longthe coherence length of a spectrally isolated one-dimensionalcondensate state can be. We, on the other hand, are interestedin the functional form of the correlation function in a 2D con-densate and how the excitations populated by the pumpingand decay processes can modify it.
With our setup, we can measure values of g(1)(r) as lowas 0.02, so we can reliably extract the long-distance behavior.We find that, although true thermal equilibrium is not es-tablished, an effective thermal de Broglie wavelength can stillbe defined from the short-distance gaussian decay of g(1)(r).
Furthermore, g(1)(r) at long distances r decays according toa power law, in analogy to the equilibrium BKT superfluidphase. The exponent of the power law decay is, however,higher than can be possible within the BKT theory. We ap-ply a non-equilibrium theory [9, 10] to identify the source ofthe large exponent. We argue that, although the spectrum ismodified due to dissipation, the exponent would still have theequilibrium value if the spectrum was thermally populated.If, on the other hand, a white noise source acts on the sys-tem, and induces a flat occupation of the excited states, theexponent can have a large value, proportional to the noisestrength. We therefore conclude that the pumping and decayprocesses, which introduce a non-thermal occupation of theexcited states, can be responsible for the large value of theexponent.
ResultsIn our study, we use a weak-disorder GaAs-based sample, thesame one as in our recent experiments [18]. The condensate isgenerated non-resonantly by the multimode laser, which cre-ates free electon-hole pairs at an excitation energy ∼ 100meVabove the lower polariton (LP) energy. Carriers suffer multi-ple scatterings before reaching the LP energy, so coherence isestablished spontaneously in the condensate, and cannot beinherited from the laser pump. The laser is continuously onand replaces LP’s that leak out of the microcavity at a psrate. We are interested in the limit of the homogeneous 2D
Reserved for Publication Footnotes
www.pnas.org — — PNAS Issue Date Volume Issue Number 1–7

Sample
PBS
NPBSCamera M1
M2
Laser
RR
x (µm)
y (µ
m)
−10 0 10−15
−10
−5
0
5
10
15
0
500
1000
1500
2000
2500
R R
0.5 1 1.5 20
1
2x 10
4
Phase / 2π
Inte
nsity
(a.
u.)
(a)
(b)
(c)
Fig. 1. Michelson Interferometer. (a), Schematic of the setup for measurement
of the correlation function. The laser is linearly polarized, and we record lumines-
cence of the orthogonal linear polarization through a polarizing beamsplitter (PBS).
We then employ a 50-50 non-polarizing beamsplitter (NPBS), a mirror (M1) and a
right-angle prism (M2). The latter creates the reflection of the original image along
one axis, depending on the prism orientation. A two-lens microscope setup overlaps
the two real space images of the polariton condensate on the camera. (b), Typical
interference pattern observed above the polariton condensation threshold along with
a schematic showing the orientation of the two overlapping images. (c), Blue circles:
Measured intensity on one pixel of the camera as a function of the prism (M2) position
in normalized units. Red line: Fitting to a sine function.
polariton gas. For this purpose, we employ a setup based ona refractive beam shaper, that forms a large laser excitationspot with uniform intensity. There is no confining potentialon our sample. Because of the short lifetime, however, thecondensate density follows the photon density of the excita-tion spot, so we can create circular condensates with almostflat density and diameters ranging from 14µm to 44µm (see[18] and Supplementary Information). LP luminescence in thesteady state is observed through a combination of a long-passand a band-pass interference filter, which reject scattered laserlight without distorting the LP spectrum.
We confirmed that the sample disorder potential isweak in two ways (see Supplementary Information). First,the lineshape of the luminescence at low excitation poweris Lorentzian, which is characteristic of a homogeneously-broadened line. Second, we measured a two-dimensional mapof the disorder potential with resolution ∼ 1µm, and foundthat its spatial fluctuations are indeed weaker than the homo-geneous broadening, and also much weaker than the energyshift due to polariton-polariton interactions. Therefore, wecan ignore the sample disorder in our experiment. The con-densate is still localized in space, though, following the shapeof the laser excitation spot.
The first order spatial correlation function is defined as
g(1) (r1, t1; r2, t2) =⟨ψ†
1ψ2⟩√⟨ψ†
1ψ1⟩⟨ψ†2ψ2⟩
[1]
where ψ†i and ψi are the creation and annihilation field opera-
tors at space-time point (ri, ti). To measure this function, we
0.7×Pth
x (µm)
y (µ
m)
−10 0 10
−10
0
10
×
R R2.4×P
th
x (µm)
y (µ
m)
−20 −10 0 10 20
−20
−10
0
10
20
R R×
0
π
2π
−15 −10 −5 0 5 10 1510
−3
10−2
10−1
100
x (µm)
g(1
) (x,−
x)
−15 −10 −5 0 5 10 1510
−3
10−2
10−1
100
x (µm)
g(1
) (x,−
x)
(a) (b)
(c) (d)
Fig. 2. Phase map measured for laser power (a) below and (b) above the threshold
power Pth. The prism in the Michelson interferometer is oriented horizontally. The
schematics on the top right of (a) and (b) show the orientation of the two interfer-
ing images. (c-d) Measured g(1)(x,−x) corresponding to (a) and (b) respectively,
averaged over the y-axis inside the excitation spot area of 19µm radius. Blue cir-
cles are experimental data. The continuous red and dashed yellow fitting lines are
explained in Figs. 3 and 6 respectively.
−3 −2 −1 0 1 2 310
−3
10−2
10−1
100
37.3mW
x (µm)
g(1
) (x,−
x)
0 100 200 300 4001
2
3
4
5
6
Pumping power (mW)
λ eff (
µm)
R R
RR
(a) (b)
Fig. 3. (a) Decay of g(1)(x,−x) at short distances. Blue dots are experimental
data, the red line is a gaussian fit. Data at |x| > 1µm is noise. (b) Effective de
Broglie wavelength λeff as a function of laser pumping power. λeff is extracted
from the width of the gaussian fit as shown in (a). Blue circles and red squares cor-
respond to orthogonal orientations of the prism in the Michelson interferometer (see
text). The condensation threshold is at ∼ 55mW .
built a Michelson interferometer setup. A schematic is shownin Fig. 1(a). It includes a mirror in one arm, and a right angleprism in the other. We overlap the condensate real-space im-age with its reflected version, so that fringes similar to that ofFig. 1(b) are observed on the camera. By changing the lengthof one interferometer arm, as shown in Fig. 1(a), the relativephase of the two beams is shifted. As a result, the intensitymeasured at one pixel point shows a sinusoidal modulation(Fig. 1(c)). From the data of Fig. 1(c), we extract the phasedifference of the two images at a particular pixel point, as wellas the fringe visibility. The latter is proportional to the firstorder correlation function, which is the physical quantity weare interested in in this experiment.
The prism M2 in Fig. 1(a) forms the reflection of the con-densate image along the prism axis. Therefore, point (x, y)overlaps with either (−x, y), or (x,−y) on the camera, de-pending on the orientation of the prism. This allows us to
2 www.pnas.org — — Footline Author

measure
g(1)(x,−x; τ) ≡⟨g(1) (x, y, t+ τ ;−x, y, t)
⟩t, [2]
or g(1)(y,−y; τ) ≡⟨g(1) (x, y, t+ τ ;x,−y, t)
⟩t, [3]
where ⟨⟩t denotes time average. In this experiment, we aremainly interested in interference at τ = 0, so when the timeargument is not mentioned explicitly, we imply τ = 0.
We repeat the procedure explained in Fig. 1 for everypixel, so that we measure the phase difference between thetwo interfering images in addition to the correlation functionacross the whole spot. Representative data are shown in Fig.2. Recording both these quantities allows us to identify usefulsignal from systematic or random noise. Because the prismdisplaces the beam that is incident on it, the images from themirror and the prism are focused on the camera from differentangles, so the two phase fronts are tilted with respect to eachother. As a consequence, we expect to measure a constantphase tilt. This is the case in Fig. 2(b), in which the laserpower is above threshold and a condensate has formed. Weconclude that our measurement of the correlation function inFig. 2(d) is reliable over this whole area. On the other hand,at a pump rate below threshold, only short-range correlationsexist. Fig. 2(a) shows that in this case the phase difference ismeasured correctly only over a small area around the center,(|x| ≤ 1µm). So, the measured values of g(1)(x,−x) out-side this area are not reliable, and give an estimate of ourmeasurement uncertainties. As is clear from Fig. 2(c), theexperimental error can be suppressed down to 0.01.
Phase maps such as those in Fig. 2 have been used toidentify localized phase defects, namely quantum vortices [19].The data of Fig. 2(b) show that such localized defects are notpresent in our sample. At points with large fringe visibility(near x = 0µm), fringes are perfectly parallel, whereas de-fects that appear for large |x| could be due to a numericaluncertainty in the measurement of the local phase due to thesmall fringe visibility. In any case, localized stationary phasedefects cannot influence g(1)(r), since it is their motion thatdestroys spatial correlations, and not their mere presence. Ithas been found that vortices appear in large disorder samples[19], when a direct external perturbation is introduced [20],before the condensate reaches its steady state [21], or when thecondensate moves against an obstacle [22, 23]. None of theseconditions are satisfied in our experiment. On the other hand,we have found that, under the same conditions as the currentexperiment, mobile bound vortex pairs appear spontaneouslydue to the special form of the pumping spot and the pumpingand decay noise [18]. In [18], we found that a single mobilebound vortex-antivortex pair is visible in a small condensate.In the current experiment, we probe larger condensate sizes,so it is likely that several vortex pairs are present at the sametime. Mobile bound vortex pairs are in general invisible intime-integrated phase maps, like the one in Fig. 2(b), and
they are consistent with a power law decay of g(1)(r).Fig. 3(a) shows the short-distance dependence of
g(1)(x,−x) for the same pumping power as in Figs. 2(a,c).Every dot in Fig. 3(a) corresponds to one pixel on the cam-era, and the x-axis is its distance from the axis of reflection(slightly tilted with respect to the columns of the charge-coupled device array). Data at distances |x| > 1µm is noise,since the measured phase in this area is random (Fig. 2(a)).
At shorter distances, we can measure g(1)(x,−x) reliably, andwe find that the correlation function has a gaussian form. Thisis the same functional dependence as for a thermalized Bosegas when the temperature is sufficiently high or the density
P ~0.002 Pth
t (ps)
x (µ
m)
−2 0 2 4
−4
−3
−2
−1
0
1
2
3
4 0
0.1
0.2
0.3
0.4
0.5
0.6
0.7
P ~0.004 Pth
kx (µm−1)
Wav
elen
gth
(µm
)
−4 −2 0 2 4
0.7685
0.769
0.7695
0.77
0.7705
0.771
0.7715
t (ps)
x (µ
m)
−2 0 2 4
−4
−2
0
2
4
(a)
(b)(c)
Fig. 4. (a) Measured g(1)(x,−x; t) for very low pumping power. (b) Measured
momentum-space spectrum S(kx, ~ω) for very low pumping power. As explained in
the text, g(1)(x,−x; t) is the Fourier transform of S(kx, ~ω). (c) Fourier trans-form of the experimental data shown in (b). The result indeed reproduces accurately
(a). In (b) and (c), the data is plotted in linear color scale in arbitrary units.
10−1
100
101
10−2
10−1
100
∆x (µm)
g(1
) (∆x)
R0=7µm
R0=12µm
R0=19µm
R0=22µm
Fig. 5. Measured g(1)(∆x) vs ∆x for various pumping spot radii R0. All
data is taken above threshold, and is chosen such that λeff ∼ 4.1µm. As the
condensate size increases, g(1)(∆x) converges to a power law decay.
sufficiently small [2, 4]. In that equilibrium case, the width ofthe gaussian decay is proportional to the thermal de Brogliewavelength. Although our non-equilibrium system is quitedifferent than the thermalized Bose gas, we will use this anal-ogy to define a thermal de Broglie wavelength and thereforealso a temperature. We note that the temperature measuredfrom the short distance behavior of g(1)(x,−x) is a measure ofthe occupation of the higher energy part of the spectrum, i.e.the particle-like part of the spectrum. For an insufficientlythermalized system, it is quite possible that excitations indifferent energy ranges have different effective temperatures.Therefore, the temperature measured this way will not neces-sarily agree with other measures of temperature.
In Fig. 3(b) we plot the effective wavelength λeff as afunction of pumping power. If σ is the standard deviationof the gaussian fit for g(1)(x,−x), λeff = 2
√2πσ in analogy
to the thermal de Broglie wavelength. λeff shows a smoothincrease for increasing pumping power with no obvious thresh-old, analogous to the theory of equilibrium noninteracting 2D
Footline Author PNAS Issue Date Volume Issue Number 3

10−1
100
101
10−3
10−2
10−1
100
∆x (µm)
g(1
) (∆x)
37mW 48mW 60mW 76mW 95mW118mW134mW149mW170mW190mW214mW237mW260mW283mW343mW
10−1
100
101
10−2
10−1
100
∆x (µm)
g(1
) (∆x)
134mW
x>0x<0fit
0 100 200 300 4000.9
0.95
1
1.05
1.1
1.15
1.2
1.25
Pumping power (mW)
ap
(a)
(b) (c)
Fig. 6. (a) g(1)(∆x) vs ∆x for increasing laser power. The laser pumping spot
radius isR0 = 19µm and the threshold power Pth = 55mW . (b) g(1)(∆x) vs∆x for one particular laser power and for x both positive (blue circles) and negative
(red squares). Dashed line is a power law fit. (c) Exponent ap of the power law
decay as a function of laser power.
Bose gas as the particle density is increased [4]. We per-formed the same experiment for two orthogonal prism ori-entations as shown in the legend of Fig. 3(b). In one case
we measured g(1)(x,−x), whereas in the other case we mea-
sured g(1)(y,−y). We found that λeff is shorter along the y-axis, and attribute this difference to a small asymmetry of thelaser pumping spot. The occupation of excited states (whichdetermines λeff ) depends on their spatial overlap with thelaser pumping spot, so states of equal energy are not alwaysequally populated. This asymmetry shows that λeff is notsimply related to the cryostat temperature, and depends onthe spatial and energy profiles of the high-energy states in-volved in producing this correlation length. We also note thatthe resolution limit of our imaging setup is ∼ 1µm, hence themeasurement of λeff at small pumping power is resolution-limited.
It is known that an ideal autocorrelation measurementwith a Michelson interferometer provides the same informa-tion as an ideal measurement of the spectrum. In particular,g(1)(x,−x; t) is the Fourier transform of the power spectrumin momentum space S(k, ω) [24]. However, systematic noise inmeasurement of S(k, ω) currently makes the direct measure-
ment of g(1)(x,−x; t) the only way to reliably extract λeff ofFig. 3(b), as well as the power law decay at long distancesto be explained later. The Fourier-transform relationship be-tween g(1)(x,−x; t) and S(k, ω) is illustrated in Fig. 4. The
measured g(1)(x,−x; t) at very low pumping power is shownin Fig. 4(a). At time delay t = 0, it has a gaussian form asa function of x, but for increasing t it broadens and acquiresa multi-peak structure. This unusual space-time dependenceis reproduced by the numerical Fourier transform (Fig. 4(c))of measured S(k, ω) (Fig. 4(b)). As explained in Supple-mentary Information, measurement of the time-dependenceof g(1)(x,−x; t) is limited by inhomogeneous broadening dueto time-integrated data, so it cannot provide an estimate ofthe homogeneous dephasing time.
At long distances, the behavior of the correlation functionat zero time delay t = 0 is no longer gaussian. We foundthat it is influenced by the edge of the condensate. In Fig.5, we plot the measured g(1)(∆x) = g(1) (|2x|) ≡ g(1)(x,−x)at pumping power P ∼ 3 × Pth for increasing pumping spotradius. The measured g(1) (∆x) at long distances decreases asthe spot size is increased, and eventually converges to a powerlaw decay for large condensates.
We note that the condensate size is slightly smaller thanthe pump laser spot radius (3 − 4µm smaller from each sidefor a large spot). Because of the repulsive interaction betweenpolaritons, and between polaritons and reservoir excitons, thelarge density of the condensate and reservoir creates an anti-trapping potential that pushes LP’s away from the center.This effect is stronger for a gaussian or a very small pump-ing spot and in long-lifetime samples [25, 16], whereas in thepresent experiment it only influences LP’s that are close tothe edge.
In the case of a large condensate, we should recover thelimit of (infinitely large) homogeneous polariton gas. There-fore, we consider a pumping spot radius R0 = 19µm. In Fig.6(a), we plot the correlation function g(1) (∆x) versus ∆x asthe pumping power is increased. Only short-range correlationsexist for small pumping power, whereas above the condensa-tion threshold of ∼ 55mW (4.8kW/cm2), substantial phasecoherence appears across the whole spot. The functional formof the long-distance decay is measured to be a power law overabout one decade, as can be seen in Fig. 6(b), in which weplot the data at one specific laser power. We fit the data to afunction g(1) (∆x) = (λp/∆x)
ap and plot the exponent ap asa function of pumping power in Fig. 6(c). It is found to bein the range 0.9− 1.2. λp is a parameter with units of length,and is not related to λeff , which is plotted in Fig. 3(b) 1.
It has been claimed that a criterion for polariton conden-sation is the appearance of a second threshold as the pumpingpower is increased [26, 27]. The state after the first thresholdwas called a “polariton BEC”, “polariton laser”, or “polari-ton condensate”, whereas the state after the second thresholdhas not been fully understood yet. It might be a Bardeen-Cooper-Schrieffer (BCS) crossover [28, 29], photon BEC [30],or photon laser [26]. This double threshold behavior has beenobserved in micropillar structures [26], and using a stress trap[27]. In the Supplementary Information of [18], we also re-ported the observation of double threshold using the samesample and excitation conditions as in the present experi-ment. We found that in our sample the window of intensitiesbetween the two thresholds is not very wide, and can only bewitnessed using a flat laser excitation spot. This spot createsa uniform polariton density over a large area, as opposed tothe more common gaussian spot, where the density changes alot across the pumping spot.
Finally, we repeated the same measurement of g(1)(x,−x)using an identical sample at a temperature of 200K. Becauseof the small binding energy, the GaAs excitonic effect is weakat this temperature. Also, the lasing energy was well abovethe bandgap. Therefore, only standard photon lasing waspossible. In this case, we only found exponential decay ofthe correlation function, and no power law. The details ofthis measurement are reported in the Supplementary Infor-mation. This suggests that the interactions of the stronglycoupled exciton-polaritons are essential in the observation ofthe reported phenomena
1See supplementary Information for a discussion of λp, data at different detunings, the orthogonalprism orientation, as well as for time-resolved data.
4 www.pnas.org — — Footline Author

DiscussionIn [31], it was found that excitation with a low-noise single-mode laser revealed the formation of multimode condensation,and the different condensate modes could be spectrally sepa-rated. The authors of [31] argued that, if one wants to measurethe intrinsic linewidth of polariton condensates, singelmodelaser excitation and energy-resolved data are required. In-deed, it has been shown [32] that the temporal coherence prop-erties can be understood based on the idea that laser intensitynoise introduces population fluctuations, which modulate theinteraction energy accordingly, leading to decoherence. How-ever, it is not clear how pump and decay noise influences spa-tial coherence. Under singlemode laser excitations, and whenthe lowest-energy state is spectrally isolated, long coherencelengths can be observed [15, 16, 17, 33]. In the current ex-periment, we are interested in how robust spatial correlationsare when excitations are included. We study the “worst case”scenario of multimode laser excitation, which gives broaderspectra compared to singlemode laser. However, as shown inSupplementary Information, singlemode laser excitation givessimilar results in energy-integrated data. We note that laserphase noise cannot be an issue in our experiment, as the laserenergy is ∼ 100meV above the LP energy, so the generatedquasiparticles suffer multiple scatterings before forming thecondensate.
Focussing on the multimode laser excitation case, let usnow explore the interpretation of the power law that we ob-serve, and consider what it means for the properties of thenon-equilibrium polariton condensate. In particular, we dis-cuss under what conditions a power law decay should be seen,and what may control the value, and pump power depen-dence of the observed exponent. As has been discussed pre-viously [9, 34, 10], power law decay of spatial correlations arenot an artifact of equilibrium condensates, but survive moregenerally in a non-equilibrium condensate. Since the powerlaw decay at long distances arises from the long wavelengthcollective modes, this statement is not trivial, as dissipationcan modify the spectrum at long wavelengths [9, 34, 10].
Let us first recall the results that would apply if one wereto consider an equilibrium interacting 2D Bose gas. In thiscase, the exponent is given by ap = 1/nsλ
2 ≤ 1/4, wherens is the superfluid density and λ is the thermal de Brogliewavelength λ =
√2π~2/mkBT . The restriction ap < 1/4 oc-
curs because increasing temperature has two effects: it exciteslong wavelength phase fluctuations, which are responsible forthe power law decay, and it can also excite vortex pairs. Themaximum value of ap occurs at the transition when vortex-antivortex pairs unbind, so that vortices would proliferate,and cause the BKT transition to a phase with short rangecorrelations. The observation here of a power law ap > 1/4implies that effects beyond thermal equilibrium are requiredto explain the data; i.e. there is noise which excites phase fluc-tuations without leading to vortex proliferation. In addition,since the equilibrium exponent ap ∝ 1/ns, one would expectthe exponent to decrease with pump power, as the condensatedensity increases; the absence of such a decrease again implieseffects beyond thermal equilibrium are relevant, and suggeststhat pumping noise is indeed affecting the observed exponent.
While the existence of power law decay in a non-equilibrium condensate was discussed previously, the value ofthe exponent and its pump power dependence were not givenin those previous works. Using the formalism described in[9, 10], the exponent can be found by calculating
g1(∆x) ∝ exp
[∫d2k
(2π)2(1− eik·∆x)f(k)
][4]
where f(k) =∫(dω/2π)i(DK
ϕϕ−DRϕϕ+D
Aϕϕ), andD
K,R,Aϕϕ (k, ω)
are the Keldysh, retarded and advanced Green’s functions forphase fluctuations. The advantage of writing the correlationfunction in this formal way is that it allows one to disentan-gle the effects of changes to the spectrum of long wavelengthexcitations from the effects of how this spectrum is populated.
The retarded and advanced Green’s functions are in-dependent of how the spectrum is occupied, and follow-ing quite general arguments [9, 34, 10] we can prove thatthey have poles describing the low energy spectrum ωk ≃−iγ ±
√ϵk(ϵk + 2µ)− γ2 where ϵk = ~2k2/2m is the long
wavelength polariton dispersion, µ the chemical potential (orblueshift) and γ is the linewidth 2. Despite the modificationof the equilibrium spectrum introduced by γ, it neverthelessremains the case that if this spectrum is occupied thermally(i.e. if the Keldysh Green’s function is chosen to obey theequilibrium fluctuation dissipation theorem), one finds 2:
fthermal(k) ≃1
ns
∫dω
2π
4γµkBT
|ω2 + 2iγω − 2µϵk|2≃ mkBT
ns~2k2[5]
which is independent of γ, and matches the equilibrium formof f(k). Thus, despite the modifications to the long wave-length spectrum, a sufficiently thermalised polariton conden-sate has the equilibrium exponent.
In order to explain the larger exponent observed, and theflat dependence on pump power, we consider a crude model ofa system with excess pumping noise, as an opposite extremeto the thermalised case. We thus consider a case where theoccupation of excitations is set by a Markovian noise source ofstrength ζ. Namely, we take the inverse Keldysh Green’s func-tion to be energy independent 2. This differs significantly fromthermal noise correlations, which are frequency dependent,and diverge at the chemical potential. The measured spec-tra shown in Supplementary Information are broad and theirlinewidth increases as the pumping power is increased. Thisoccupation of excited states could be induced by an energy-independent noise source whose strength increases with thepumping power. In this case, the function f(k) is given by:
fnoise(k) ≃1
ns
∫dω
2π
2ζ(µ2 + γ2)
|ω2 + 2iγω − 2µϵk|2[6]
which, despite the changed occupation spectrum, stillyields a power law decay. The exponent becomes ap =(mζ/2π~2ns)[(µ
2 + γ2)/2µγ]. Since this has the form ap ∝ζ/ns then if the noise strength and polariton density bothincrease with the pump power, then this would explain theabsence of a 1/ns decrease of the exponent, as seen on Fig.6(c).
One point not addressed so far regards the process of vor-tex proliferation in a noisy non-equilibrium condensate. Aspump noise increases, it is likely eventually to lead to pro-liferation of vortices, and a transition to a state with onlyshort range correlations, just as occurs at high temperaturesin equilibrium.
In conclusion, the measured power law decay of the corre-lation function suggests that some form of the BKT superfluidphase survives in non-equilibrium condensates, namely phaseflucutations are excited but no vortices. The large value ofthe exponent implies that, in the current experiment, this or-dered phase is more robust against external noise than wouldbe expected in equilibrium, in which equipartition holds. Weconjecture that the main noise source is pump and decay noise,which create a non-thermal occupation of excited states, and
2See Supplementary Information for further details.
Footline Author PNAS Issue Date Volume Issue Number 5
apply a non-equilibrium theory to show that a power law de-cay with a large exponent is possible in an open system withexcess noise. One may anticipate that sufficient noise couldinduce vortex proliferation and a transition to short range co-herence. This fascinating possibility remains an open questionfor future studies.
Materials and MethodsOur GaAs-based sample shows a Rabi splitting of 2~ΩRabi =14meV and LP lifetime of τLP ∼ 2− 4ps near photon-excitondetuning δ = 0, where the data presented in this paper istaken. From the curvature of the measured energy versus mo-mentum dispersion at low pumping power, the LP effectivemass was found to be m∗ = 9.5 × 10⁻⁵me at this detuning,where me is the electron rest mass. The sample is the sameas in our recent experiments [33, 18], and the experimental
setup is very similar to Ref. [18]. We pump the system with amultimode Ti-Sapphire laser operated in the continuous wavemode, combined with a chopper that creates 0.5ms pulses at100Hz repetition rate. All powers quoted in the text and Sup-plementary Information refer to the unchopped laser beam.We employ a commercial refractive beam shaper to gener-ate a flat-top pumping profile of varying size. The Michelsoninterferometer consists of a 50-50 nonpolarizing cube beam-splitter, a dielectric mirror in the first arm, and an uncoatedglass right angle prism in the second one. The position of theprism is controlled by a combination of a translation stageand a piezoelectric actuator.
ACKNOWLEDGMENTS. We acknowledge support from National Science Foun-dation ECCS-09 25549, Navy/SPAWAR Grant N66001-09-1-2024, FIRST, MEXT,Special Coordination Funds for Promoting Science and Technology, EPSRC, DOEsupport under FWP 70069, and the State of Bavaria. G.R. thanks M.D. Fraser, F.M.Marchetti, I. Carusotto, and F. Amet for helpful discussions.
1. P. M. Chaikin and T. C. Lubensky. Principles of condensed matter physics (Cambridge
University Press, 2000).
2. L. Pitaevskii and S. Stringari. Bose-Einstein Condensation (Oxford University Press,
2003).
3. I. Bloch, T. W. Hansch, and T. Esslinger (1999), Measurement of the spatial coher-
ence of a trapped Bose gas at the phase transition. Nature, 403: 166–170.
4. Z. Hadzibabic and J. Dalibard (2009), Two-dimensional bose fluids: An atomic physics
perspective. arXiv:0912.1490v2.
5. P. C. Hohenberg (1967), Existence of long-range order in one and two dimensions.
Phys. Rev., 158 : 383–386.
6. V. L. Berezinskii (1972), Destruction of long-range order in one-dimensional and two-
dimensional systems possessing a continuous symmetry group. ii. quantum systems.
Soviet Physics JETP, 34 : 1144–1156.
7. J. M. Kosterlitz and D. J. Thouless (1973), Ordering, metastability and phase transi-
tions in two-dimensional systems. J. Phys. C: Solid State Phys., 6 : 1181–1203.
8. Z. Hadzibabic, P. Kruger, M. Cheneau, B. Battelier, and J. Dalibard (2006),
Berezinskii-Kosterlitz-Thouless crossover in a trapped atomic gas. Nature, 441: 1118–
1121.
9. M. H. Szymanska, J. Keeling, and P. B. Littlewood (2006), Nonequilibrium quantum
condensation in an incoherently pumped dissipative system. Phys. Rev. Lett., 96 :
230602.
10. M. H. Szymanska, J. Keeling, and P. B. Littlewood (2007), Mean-field theory and
fluctuation spectrum of a pumped decaying Bose-Fermi system across the quantum
condensation transition. Phys. Rev. B, 75 : 195331.
11. C. Weisbuch, M. Nishioka, A. Ishikawa, and Y. Arakawa (1992), Observation of the
coupled exciton-photon mode splitting in a semiconductor quantum microcavity. Phys.
Rev. Lett., 69 : 3314–3317.
12. H. Deng, H. Haug, and Y. Yamamoto (2010), Exciton-polariton Bose–Einstein con-
densation. Rev. Mod. Phys., 82 : 1489–1537.
13. H. Deng, G. S. Solomon, R. Hey, K. H. Ploog, and Y. Yamamoto (2007), Spatial
coherence of a polariton condensate. Phys. Rev. Lett., 99: 126403.
14. J. Kasprzak, M. Richard, S. Kundermann, A. Baas, P. Jeambrun, J. M. J. Keeling,
F. M. Marchetti, M. H. Szymanska, et al. (2006), Bose–Einstein condensation of
exciton–polaritons. Nature, 443: 409–414.
15. D. N. Krizhanovskii, K. G. Lagoudakis, M. Wouters, B. Pietka, R. A. Bradley, K. Guda,
D. M. Whittaker, M. S. Skolnick, et al. (2009), Coexisting nonequilibrium condensates
with long-range spatial coherence in semiconductor microcavities. Phys. Rev. B, 80 :
045317.
16. E. Wertz, L. Ferrier, D. Solnyshkov, R. Johne, D. Sanvitto, A. Lemaıtre, I. Sagnes,
R. Grousson, et al. (2010), Spontaneous formation and optical manipulation of ex-
tended polariton condensates. Nature Phys., 6: 860–864.
17. F. Manni, K. G. Lagoudakis, B. Pietka, L. Fontanesi, M. Wouters, V. Savona,
R. Andre, and B. Deveaud-Pledran (2011), Polariton condensation in a one-
dimensional disordered potential. Phys. Rev. Lett., 106: 176401.
18. G. Roumpos, M. D. Fraser, A. Loffler, S. Hofling, A. Forchel, and Y. Yamamoto
(2011), Single vortex-antivortex pair in an exciton polariton condensate. Nature Phys.,
7: 129–133.
19. K. G. Lagoudakis, M. Wouters, M. Richard, A. Baas, I. Carusotto, R. Andre, L. S.
Dang, and B. Deveaud-Pledran (2008), Quantized vortices in an exciton–polariton
condensate. Nature Physics, 4 : 706 – 710.
20. G. Tosi, F. M. Marchetti, D. Sanvitto, C. Anton, M. H. Szymanska, A. Berceanu,
C. Tejedor, L. Marrucci, et al. (2011), Onset and dynamics of vortex-antivortex pairs
in polariton optical parametric oscillator superfluids. Phys. Rev. Lett., 107.
21. K. G. Lagoudakis, F. Manni, B. Pietka, M. Wouters, T. C. H. Liew, V. Savona, A. V.
Kavokin, R. Andre, et al. (2011), Probing the dynamics of spontaneous quantum
vortices in polariton superfluids. Phys. Rev. Lett., 106: 115301.
22. A. Amo, S. Pigeon, D. Sanvitto, V. G. Sala, R. Hivet, I. Carusotto, F. Pisanello,
G. Lemnager, et al. (2011), Polariton superfluids reveal quantum hydrodynamic soli-
tons. Science, 332 : 1167–1170.
23. G. Nardin, G. Grosso, Y. Leger, B. Pietka, F. Morier-Genoud, and B. Deveaud-Pldran
(2011), Hydrodynamic nucleation of quantized vortex pairs in a polariton quantum
fluid. Nature Phys., 7: 635–641.
24. A. M. Weiner. Ultrafast optics (John Wiley & sons, 2009).
25. M. Wouters, I. Carusotto, and C. Ciuti (2008), Spatial and spectral shape of inhomo-
geneous nonequilibrium exciton-polariton condensates. Phys. Rev. B, 77 : 115340.
26. D. Bajoni, P. Senellart, E. Wertz, I. Sagnes, A. Miard, A. Lemaıtre, and J. Bloch
(2008), Polariton laser using single micropillar GaAs-GaAlAs semiconductor cavities.
Phys. Rev. Lett., 100: 047401.
27. R. Balili, B. Nelsen, D. W. Snoke, L. Pfeiffer, and K. West (2009), Role of the stress
trap in the polariton quasiequilibrium condensation in gaas microcavities. Phys. Rev.
B, 79: 075319.
28. J. Keeling, P. R. Eastham, M. H. Szymanska, and P. B. Littlewood (2005), BCS-BEC
crossover in a system of microcavity polaritons. Phys. Rev. B, 72: 115320.
29. T. Byrnes, T. Horikiri, N. Ishida, and Y. Yamamoto (2010), BCS wave-function ap-
proach to the BEC-BCS crossover of exciton-polariton condensates. Phys. Rev. Lett.,
105: 186402.
30. J. Klaers, J. Schmitt, F. Vewinger, and M. Weitz (2010), Bose–Einstein condensation
of photons in an optical microcavity. Nature, 468: 545–548.
31. A. P. D. Love, D. N. Krizhanovskii, D. M. Whittaker, R. Bouchekioua, D. Sanvitto,
S. A. Rizeiqi, R. Bradley, M. S. Skolnick, et al. (2008), Intrinsic decoherence mecha-
nisms in the microcavity polariton condensate. Phys. Rev. Lett., 101 : 067404.
32. D. M. Whittaker and P. R. Eastham (2009), Coherence properties of the microcavity
polariton condensate. EPL, 87: 27002.
33. G. Roumpos, W. H. Nitsche, S. Hofling, A. Forchel, and Y. Yamamoto (2010), Gain-
induced trapping of microcavity exciton polariton condensates. Phys. Rev. Lett., 104
: 126403.
34. M. Wouters and I. Carusotto (2006), Absence of long-range coherence in the para-
metric emission of photonic wires. Phys. Rev. B, 74: 245316.
6 www.pnas.org — — Footline Author


Power-law decay of the spatial correlation function in exciton-polariton condensatesSupplementary Information
Georgios Roumpos1,8, Michael Lohse1,2, Wolfgang H. Nitsche1, Jonathan Keeling3, Marzena Hanna Szymanska4, Peter B.
Littlewood5, Andreas Loffler6, Sven Hofling6, Lukas Worschech6, Alfred Forchel6 and Yoshihisa Yamamoto1,7
1 E. L. Ginzton Laboratory, Stanford University, Stanford, CA, USA2 Fakultat fur Physik, Universitat Karlsruhe, Germany
3 Scottish Universities Physics Alliance, School of Physics and Astronomy, University of St. Andrews, St Andrews, UK4 Department of Physics, University of Warwick, Coventry, UK
5 Argonne National Laboratory, Argonne, IL, USA6 Technische Physik, Universitat Wurzburg, Physikalisches Institut and Wilhelm-Conrad-Rontgen-Research Center for Complex Material
Systems, Wurzburg, Germany7 National Institute of Informatics, Tokyo, Japan
8 Present address: JILA, University of Colorado at Boulder, Boulder, CO, USA
1 Experimental details
PM SMF
LaserSample
PBS Beam Shaper
Figure S1: Schematic of the laser pumping setup.
The pumping spot setup is shown in Fig. S1. The laser is first coupled to a polarization-maintaining single model fiber,
and a collimated gaussian beam is created at the other end. The beam is then coupled to a commercial refractive beam shaper,
which transforms a collimated gaussian beam of a particular size to a top-hat profile. The objective lens needs to be focused
with respect to the sample, since we image the system through it. We can use an extra lens just after the beam shaper, in order
to move the focusing point of the laser beam away from the sample surface, and have a large pumping spot on the sample.
1

x (µm)
y (µ
m)
22µm
−30 −20 −10 0 10 20 30−30
−20
−10
0
10
20
30
−30 −20 −10 0 10 20 300
2000
4000
6000
8000
10000
12000
x, y (µm)
inte
nsity
(a.
u.)
xy
x (µm)y
(µm
)
19µm
−30 −20 −10 0 10 20 30−30
−20
−10
0
10
20
30
−20 −10 0 10 200
2000
4000
6000
8000
10000
12000
x, y (µm)
inte
nsity
(a.
u.)
xy
x (µm)
y (µ
m)
12µm
−30 −20 −10 0 10 20 30−30
−20
−10
0
10
20
30
−30 −20 −10 0 10 20 300
500
1000
1500
2000
2500
3000
3500
x, y (µm)in
tens
ity (
a. u
.)
xy
x (µm)
y (µ
m)
7µm
−30 −20 −10 0 10 20 30−30
−20
−10
0
10
20
30
−30 −20 −10 0 10 20 300
0.5
1
1.5
2x 10
4
x, y (µm)
inte
nsity
(a.
u.)
xy
Figure S2: By changing the lens just after the beam shaper in Fig. S1, the pumping spot size can be varied. On the upper row,
we plot the LP luminescence images below threshold for the four different spot sizes used in this experiment. The colorscale
is linear, and the label on top of every figure is the spot radius. On the lower row, we plot the corresponding 1D profiles along
the x- and y-axes. The dashed line is an empirical fit to a Fermi-Dirac function, from which we determine the size of the
pumping spot.
The focal length of this lens determines the size of the pumping spot. In Fig. S2, we plot LP luminescence images for the four
different spot sizes used in this experiment. The pumping power is ∼ 10mW , which is below the threshold power Pth for all
four spots.
In Fig. S3, we plot the real space images of LP luminescence for various laser pumping powers, both below and above
threshold. We use a combination of two interference filters, one longpass at 750nm, and one bandpass at 770± 5nm, which
block the laser wavelength without distorting the LP luminescence spectrum. For very low pumping power, luminescence has
a top-hat shape. Close to the threshold power of 55mW , the relaxation rate increases because of enhanced bosonic scattering
into the final state. Therefore, the diffusion length shortens, and luminescence takes the shape of the laser excitation spot.
Airy-like patterns appear because of diffraction. Above threshold, the condensate progressively takes a doughnut-like shape.
We studied this effect in [1], and concluded that the reservoir has a complementary profile with a density maximum at the
center and that repulsive condensate-reservoir interactions render this distribution stable. Also, the condensate is smaller
than the original spot size because of repulsive LP-LP interactions. In particular, the large condensate density creates an
antitrapping potential that pushes LP’s away from the center. This effect only influences LP’s close to the edge for our top-hat
pumping spot.
2

0.2mW
−20 −10 0 10 20
−20
−10
0
10
20
1.2mW
−20 −10 0 10 20
−20
−10
0
10
20
3.3mW
−20 −10 0 10 20
−20
−10
0
10
20
7.0mW
−20 −10 0 10 20
−20
−10
0
10
20
12.9mW
−20 −10 0 10 20
−20
−10
0
10
20
22.5mW
−20 −10 0 10 20
−20
−10
0
10
20
37.3mW
−20 −10 0 10 20
−20
−10
0
10
20
60.0mW
−20 −10 0 10 20
−20
−10
0
10
20
76.0mW
−20 −10 0 10 20
−20
−10
0
10
20
95.0mW
−20 −10 0 10 20
−20
−10
0
10
20
x (µm)
y (µ
m)
118.0mW
−20 −10 0 10 20
−20
−10
0
10
20
149.0mW
−20 −10 0 10 20
−20
−10
0
10
20
190.0mW
−20 −10 0 10 20
−20
−10
0
10
20
237.0mW
−20 −10 0 10 20
−20
−10
0
10
20
343.0mW
−20 −10 0 10 20
−20
−10
0
10
20
0
0.25
0.5
0.75
1
Figure S3: Real space images of LP luminescence for increasing pumping power. Condensation threshold is at 55mW .
It is known that the excitation laser spot shape influences the condensation characteristics. In particular, for a small
gaussian excitation spot, the condensate ballistically expands due to repulsive polariton-polariton interactions. In this case,
condensation occurs in a state with non-zero momentum [2, 3, 4]. Our pumping spot was engineered to probe the limit of the
2D homogeneous polariton gas.
In Fig. S4, we plot momentum space (far field) spectra for a large pumping spot size (19µm diameter, same as in Fig.
S3). Just above the threshold pumping power, the condensate is formed near zero momentum, and its spectrum blue shifts and
broadens as the pumping power is increased.
To estimate up to what extent the sample disorder influences our results, we performed two measurements. In Figure S5a,
we show a luminescence spectrum measured at low polariton densities at zero momentum, namely at zero collection angle.
To characterize the lineshape, we fit both a Lorentzian and a Gaussian. The Lorentzian fits the data better, which confirms that
luminescence is homogeneously broadened. In Figure S5b, we show a map of the sample disorder potential with resolution of
∼ 1µm (see Supplementary Information in [1] for details). The fluctuations of the local disorder potential are smaller than the
3

λ (µ
m)
0.001×Pth
kx (µm−1)
−2 0 2
0.7685
0.769
0.7695
0.77
0.7705
0.771
0.68×Pth
−2 0 2
0.7685
0.769
0.7695
0.77
0.7705
0.771
1.1×Pth
−2 0 2
0.7685
0.769
0.7695
0.77
0.7705
0.771
2.7×Pth
−2 0 2
0.7685
0.769
0.7695
0.77
0.7705
0.771
Figure S4: Momentum space (far field) spectra for the 19µm diameter pumping spot at different pumping powers in linear
color scale (arbitrary units).
1.6075 1.608 1.6085 1.609 1.60950
1
2
3
4
5
E (eV)
inte
nsity
(a.
u.)
dataγ=0.23meVσ=0.22meV
y (µm)
x (µ
m)
−10 0 10
−20
−10
0
10
20−0.2
−0.1
0
0.1
0.2
∆E(m
eV)
a b
Figure S5: (a) Blue circles: Luminescence spectrum acquired at low pumping power (∼ 0.015×Pth) and at zero momentum.
Red continuous line is a fit to a Lorentzian, while green dashed line is a fit to a gaussian. (b) (from [1], Supplementary
Information) Map of the disorder potential with spatial resolution of ∼ 1µm. The sample area pictured here is approximately
where the data in the main text was taken.
4

homogeneous broadening, and much smaller than the condensate blue shift due to repulsive polariton-polariton interactions
of ∼ 1meV . Therefore, for our experiment, we can consider our sample as disorder-free.
The Michelson interferometer setup is described in the main text. Here, we note that the resolution limit of the imaging
optics is ∼ 1µm, which influences the measurement of λeff at small pumping power (see Fig. 2(b) of the main text). If the
transfer function of our imaging system is gaussian (namely, if a delta function is imaged to a gaussian) with width λres, then
the measured width of the gaussian decay is λmeas =√λ2res + λ2eff , where λeff is the real effective thermal wavelength,
and λmeas is the measured value. Therefore, if the real λeff is similar to λres, then the measured λmeas should be close
to λres. The height of the gaussian (unity for a perfect optical system) should also drop to a lower value, so that the total
surface does not change. From the measured height of the gaussian fits, namely g(1)(0, 0) ∼ 0.7 − 0.8, and the measured
λmeas ∼ 1.6− 1.7µm, we estimate a lower bound for the real λeff ≥ 1.3µm at small pumping power.
We can also vary the path length difference between the two arms of the Michelson interferometer. This way, we can mea-
sure g(1)(x,−x; t) for various time delays t and probe the temporal coherence of the system. Due to time-integrated detection,
the measured coherence time in our experimental setup is mainly influenced by inhomogeneous broadening. Namely, the con-
densate energy randomly fluctuates in time, and limits the measured fringe visibility. Below the condensation threshold, we
observe the interference pattern shown in Fig. 4a of the main text, where the measured visibility g(1)(x,−x; t) is plotted as
a function of the time delay t and the distance x from the symmetry axis. At t = 0, g(1)(x,−x; t) as a function of x has a
gaussian form, as explained in the main text. However, for increasing time delay t, it broadens and acquires an unusual peak
structure with multiple maxima and minima.
This can be explained by the fact that the first-order correlation function of a uniform, statistically stationary electromag-
netic field is given by the Fourier transform of its power spectrum in momentum space S(k, ω) [5]. Below threshold, the
observed spectrum can be approximated by
S(k, ω) = n(~ω)γ/π(
~ω − ~ω0 − ~2|k|22m∗
)2+ γ2
, (1)
where ~ω0 is the LP resonance at k = 0, m∗ is the effective mass, γ is the half width at half maximum and n(~ω) is the
particle energy distribution. It is clear that S(k, ω) cannot be written in separable form f(k)g(ω), so the temporal and spatial
correlations of g(1)(x,−x; t) are not independent of each other. Therefore the significant occupation of excited states with
finite momenta causes a broadening of g(1)(∆x) with increasing time delay due to the interference from multiple states with
different energies. The internal structure of this broadened peak with multiple local minima and maxima results from the sharp
cutoff in the far-field spectrum. The sharp cutoff is due to the fact that the polariton distribution is non-thermal because of the
short lifetime and because the polariton lifetime changes as LP’s become more and more exciton-like at larger wavevectors.
This effect is similar to the diffraction pattern of light created by sharp-edged objects like a slit.
To demonstrate this, we measured the far-field spectrum well below threshold (Fig 4(b) of the main text) and calculated its
Fourier transform (Fig 4(c) of the main text) which shows a behavior very similar to the one observed for the experimentally
measured correlation function. Although this effect makes the exact determination of the dephasing time and even its definition
impossible, one can still conclude that the correlations decay on a very fast timescale, smaller than or similar to the polariton
5

P ~1.4Pthr
t (ps)
x (µ
m)
0 1 2 3
−4
−2
0
2
4 0
0.2
0.4
0.6
−1 0 1 2 30
0.2
0.4
0.6
0.8
1
t (ps)g
(1) (0
,0;t)
4.3 Pth
2.9 Pth
1.4 Pth
(a) (b)
Figure S6: (a) Measured g(1)(x,−x; t) above threshold.
(b) g(1)(0, 0; t) for different pumping powers above thresh-
old. Dashed lines are fits using equation (2)
Table 1: Parameters of the fitting lines in Fig. S6(b) based on equation (2).
P/Pthr τr (ps) τc (ps)
1.4 0.3 1.0
2.9 1.2 1.0
4.3 2.0 1.1
lifetime of 2-4ps
Above threshold, the shape of g(1)(x,−x; t) changes significantly (Fig. S6(a)). The broadening is very weak and the
internal structure disappears completely because almost all polaritons are now in or close to the ground state in terms of energy
and momentum. This allows us to reliably obtain information about the temporal coherence properties of the condensate by
determining the first-order temporal correlation function g(1)(t) ≡ g(1)(0, 0; t) which is plotted for different pumping powers
in Fig. S6(b). The measured dephasing time is on the order of 1-2 ps, shorter than the polariton lifetime, and it seems to
become slightly shorter for higher pumping powers.
The dephasing time of the condensate in our system is most likely limited by intensity fluctuations of the pumping laser
since much longer dephasing times have been observed with the same sample [6] and in other experiments [7] when using
single-mode lasers. Fluctuations in the particle number lead to changes of the ground state energy because of repulsive
polariton-polariton interactions and therefore destroy phase coherence [8]. Assuming a Gaussian distribution of the energy
fluctuations g(1)(t) can be calculated using the Kubo stochastic line-shape theory:
g(1)(t) = exp
(−2τ2rτ2c
(e−t/τr +
t
τr− 1
))(2)
where τr describes the time scale of the fluctuations and τc the width of the energy fluctuations. The above equation can also
be derived using a quantum model of the polariton condensate [8]. The predicted form of g(1)(t) is Gaussian for t ≪ τr and
exponential for t ≫ τr. Fits of equation (2) to our experimental data (see Fig. S6(b) and Table 1) give τr ∼ 0.3 − 2.0ps and
τc ∼ 1ps. τc seems to be approximately constant, whereas τr increases with increasing pumping power.
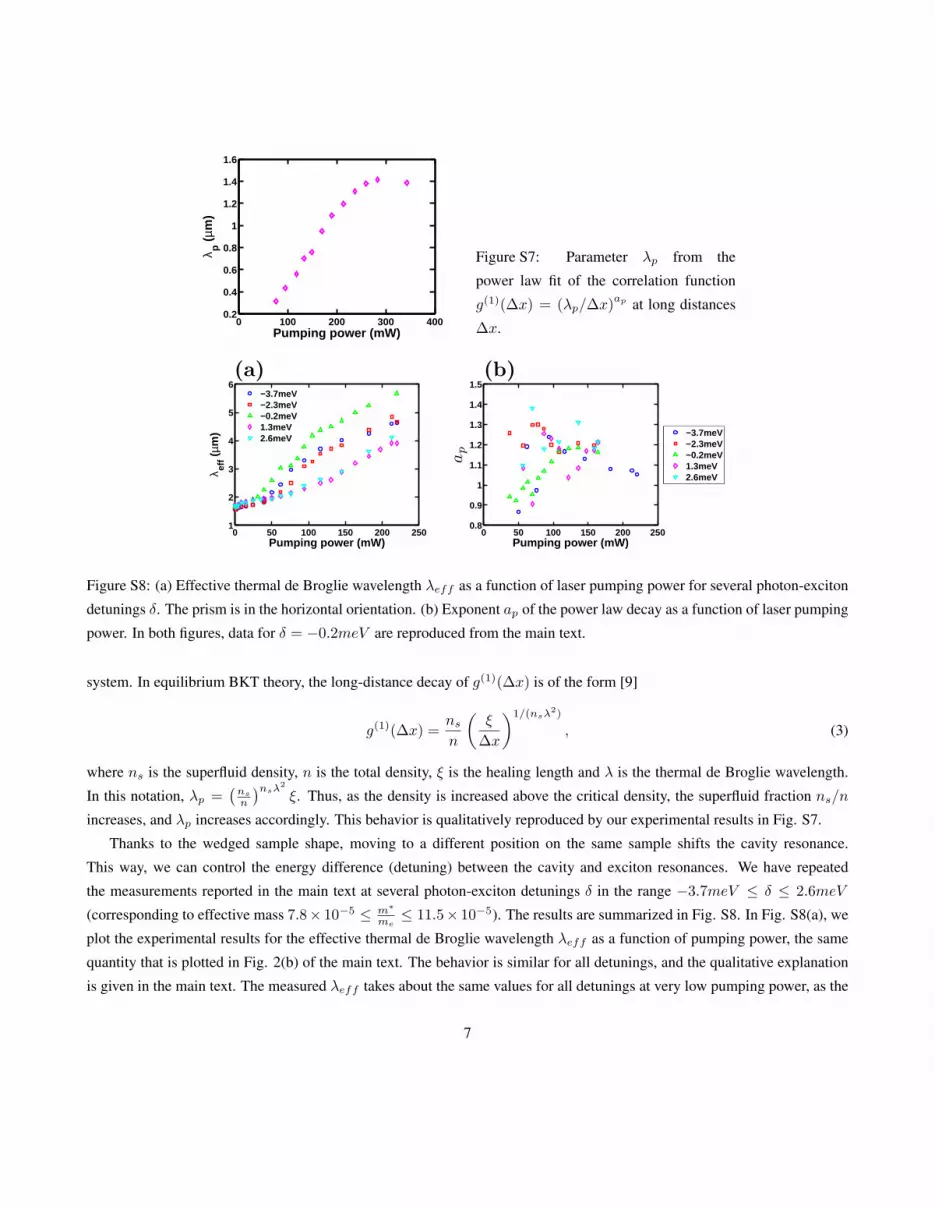
In Fig. 4(c) of the main text, we plot the exponent ap of the power law fit (λp/∆x)ap of the correlation function g(1)(∆x).
In Fig. S7, we plot the parameter λp of the same fit. Although λp has units of length, it is not a characteristic length of the
6
0 100 200 300 4000.2
0.4
0.6
0.8
1
1.2
1.4
1.6
Pumping power (mW)
λ p (
µm)
Figure S7: Parameter λp from the
power law fit of the correlation function
g(1)(∆x) = (λp/∆x)ap at long distances
∆x.
0 50 100 150 200 2501
2
3
4
5
6
Pumping power (mW)
λ eff (
µm)
−3.7meV−2.3meV−0.2meV1.3meV2.6meV
0 50 100 150 200 2500.8
0.9
1
1.1
1.2
1.3
1.4
1.5
Pumping power (mW)
ap
−3.7meV−2.3meV−0.2meV1.3meV2.6meV
(a) (b)
Figure S8: (a) Effective thermal de Broglie wavelength λeff as a function of laser pumping power for several photon-exciton
detunings δ. The prism is in the horizontal orientation. (b) Exponent ap of the power law decay as a function of laser pumping
power. In both figures, data for δ = −0.2meV are reproduced from the main text.
system. In equilibrium BKT theory, the long-distance decay of g(1)(∆x) is of the form [9]
g(1)(∆x) =nsn
(ξ
∆x
)1/(nsλ2)
, (3)
where ns is the superfluid density, n is the total density, ξ is the healing length and λ is the thermal de Broglie wavelength.
In this notation, λp =(ns
n
)nsλ2
ξ. Thus, as the density is increased above the critical density, the superfluid fraction ns/n
increases, and λp increases accordingly. This behavior is qualitatively reproduced by our experimental results in Fig. S7.
Thanks to the wedged sample shape, moving to a different position on the same sample shifts the cavity resonance.
This way, we can control the energy difference (detuning) between the cavity and exciton resonances. We have repeated
the measurements reported in the main text at several photon-exciton detunings δ in the range −3.7meV ≤ δ ≤ 2.6meV
(corresponding to effective mass 7.8× 10⁻⁵ ≤ m∗
me≤ 11.5× 10⁻⁵). The results are summarized in Fig. S8. In Fig. S8(a), we
plot the experimental results for the effective thermal de Broglie wavelength λeff as a function of pumping power, the same
quantity that is plotted in Fig. 2(b) of the main text. The behavior is similar for all detunings, and the qualitative explanation
is given in the main text. The measured λeff takes about the same values for all detunings at very low pumping power, as the
7

10−1
100
101
10−3
10−2
10−1
100
∆y (µm)
g(1
) (∆y)
23mW 48mW 76mW 95mW118mW149mW237mW306mW
10−1
100
101
10−3
10−2
10−1
100
∆y (µm)
g(1
) (∆y)
118mW
y>0y<0fit
0 100 200 300 4000.8
0.85
0.9
0.95
1
1.05
Pumping power (mW)
ap
RR
(a)
(b) (c)
Figure S9: Same as Fig. 4 of the main text, but now the
prism of the Michelson interferometer is in the vertical ori-
entation. (a) g(1)(∆y) = g(1) (|2y|) ≡ g(1)(y,−y) vs ∆y
for increasing laser power. The laser pumping spot radius
is R0 = 19µm and the threshold power Pth = 55mW .
(b) g(1)(∆y) vs ∆y for one particular laser power and for
y both positive (blue circles) and negative (red squares).
Dashed line is a power law fit. (c) Exponent ap of the
power law decay as a function of laser power.
measurement is resolution-limited in this region. In Fig. S8(b), we plot the fitting results for the exponent ap of the power
law decay of g(1)(∆x) at long distances. The same quantity is plotted in Fig. 4(c) of the main text for δ = −0.2meV . The
long-distance decay was indeed found to be a power law, with an exponent in the range 0.9 − 1.3 when including different
detunings.
In [1], it was shown that vortex-antivortex pairs are produced at the center of our condensate, and move inside it before re-
combining. Because of a small asymmetry of the pumping spot, they always sit along the horizontal axis. For an appropriately
small condensate, there is on the average only one vortex pair inside the condensate at any time, and it can be observed with
a Michelson interferometer measurement using the vertical prism orientation, for which points (x, y) interfere with (x,−y).Although the pair is mobile, so that the vortex and antivortex follow a correlated motion, a characteristic phase pattern is
present in the interferogram. In the horizontal prism orientation, points (x, y) interfere with (−x, y), so the vortex in (x, y)
overlaps with the antivortex in (−x, y) and no phase defects appear on the interferogram. The single pair is observed for
pumping spot radius of 12µm. For the 22µm spot radius that we currently use, we expect several pairs to be present, so that
no clear signature of them can be witnessed in the interferograms. Because of the vortex pair motion inside the condensate,
though, g(1)(y,−y) takes smaller values than g(1)(x,−x).In Fig. 2(b) of the main text we showed that in the vertical prism orientation the effective de Broglie wavelength is
shorter than in the horizontal prism orientation. We now compare the long-distance behavior of g(1)(r) between the two
cases. In Fig. S9, we plot the same quantities as Fig. 4 of the main text, but now the prism orientation is vertical, so we
interfere points (x, y) with (x,−y), instead of (x, y) with (−x, y). In Fig. S9(a), we plot the measured correlation function
g(1) (∆y) = g(1) (2 |y|) ≡ g(1)(y,−y) versus ∆y for several pumping powers. As in Fig. 4(a) of the main text, phase
8

10−1
100
101
10−1
100
1.5×Pth
∆x (µm)
g(1) (∆
x) Figure S10: Measured correlation function (blue
circles) under singlemode laser excitation and
energy-integrated detection. The diameter of the
pumping spot is 12µm, and the pumping power is
1.5 × Pth. The dashed line is a power law decay
with exponent of 1.05.
coherence is extended above the condensation threshold. In Fig. S9(b), we plot g(1) (∆y) as a function of ∆y for one
particular pumping power above threshold. The decay at short distances is more abrupt than in Fig. 4(a), and there is a local
minimum at ∆y ∼ 3µm. But the long-disance decay is again a power law, and the exponent ap, as shown in Fig. S9(c), is
around 1.
To investigate the effect of laser noise, we measured g(1)(∆x) under singlemode laser excitation and energy-integrated
detection. We again found a power law dependence at large distances, as shown in Fig. S10. This suggests that the power
law behavior is not influenced much by the laser intensity noise, but is rather inherent to the pump and decay processes in
the microcavity. Due to the limited power of our singlemode laser, we could not study larger condensates, but the power law
dependence is already clear at this condensate size.
Finally, we studied an identical sample at a temperature of 200K, and an area where the cavity resonance is above the
bandgap. At this temperature, excitons are dissociated, and only standard lasing is possible. We use ps pulsed excitation at a
large angle and a wavelength λ = 746.1nm. The pumping spot was gaussian with diameter ∼ 25µm. In Fig. S11, we show
the measured spectrum and total luminescence intensity as a function of pumping power. A lasing transition is observed above
70mW . We measured g(1)(x,−x) above threshold (Fig. S12), and found that it decays exponentially above threshold. This
data suggests that the interactions of the strongly coupled exciton-polaritons are essential in the observation of the reported
phenomena.
2 Theoretical model of power law decay
This section expands the discussion of correlations for a non-equilibrium polariton condensate, making use of the formalism
presented in [10, 11]. We discuss in more detail the two cases presented in the article, that of a thermalised system, where the
equilibrium exponent is recovered, and that of a noisy system, where a different exponent is recovered.
For a two-dimensional Bose gas, where long distance coherence is dominated by phase fluctuations, the asymptotic form
9

50 100 150 200764
766
768
770
772
774
776
pumping power (mW)
λ (n
m)
100
101
102
100
102
104
106
108
pumping power (mW)
inte
nsity
(a.
u.)
Figure S11: High-temperature data (200K). The mea-
sured spectrum (top) and luminescence intensity (bot-
tom) as a function of pumping power. The lasing fre-
quency is above the bandgap, so this is a standard lasing
phenomenon.
10−1
100
101
10−3
10−2
10−1
100
∆x (µm)
g(1
) (∆x)
200mW
x>0x<0σ=3.10µm
Figure S12: High-temperature data (200K). Mea-
sured g(1)(x,−x) above threshold. g(1) decays
exponentially until it hits the experimental noise
floor of ∼ 0.01. The black dashed line is a gaus-
sian fit. Compare with Fig. 6(b) of the main text.
10

of the correlation function can be written as:
g1(∆x) = nQC exp
−∫kdk
2π[1− J0(k∆x)] f(k)
(4)
where nQC is the quasi-condensate density, J0(k∆x) is a Bessel function, resulting from angular integration, and f(k) =∫(dω/2π)iD<
ϕϕ(k, ω), whereD<ϕϕ = DK
ϕϕ−DRϕϕ+D
Aϕϕ is the phase-phase component of the Green’s function corresponding
to emission.
The Green’s functions DK,R,A are the Keldysh, retarded, and advanced Green’s functions, which together define the
density of states for fluctuations, and the occupation of those states in the non-equilibrium system. In order to calculate f(k),
it is necessary to know the full form of the Green’s function, and not just the excitation spectrum. This is because it is necessary
to distinguish those excitations that correspond to phase fluctuations from those that correspond to density fluctuations.
The Keldysh Green’s function can be found by combining the retarded and advanced Green’s functions with the inverse
Keldysh Green’s function [D−1]K . The inverse Keldysh Green’s function describes the noise, due either to thermal excitations
or pumping noise, which leads to the occupation of the phase modes. The Keldysh Green’s function then has the form
DK = −DR[D−1]KDA. This can be thought of as a generalisation of the fluctuation-dissipation theorem, as the retarded
and advanced Green’s functions encode dissipation, the Keldysh Green’s function DK describes the fluctuations, and so
[D−1]K encodes the relation between these.
In the following, we first summarise previous results for the retarded and advanced Green’s functions, and then discuss the
two cases presented in the article for the Keldysh Green’s function.
2.1 Retarded and Advanced Green’s functions: Density of states
Since the long wavelength form of the Green’s function is independent of details of specific models, the retarded Green’s
function can be derived in many ways. One intuitive approach is to consider the linear response of order parameter equation
of a non-equilibrium condensate, the complex Gross-Pitaevskii Equation,
i∂tψ =
[−~2∇2
2m+ U |ψ|2 + i
(γ − Γ|ψ|2
)]ψ. (5)
Following standard methods [12], this gives a Green’s function which may be written in the ψ,ψ† basis as:
DR =1
ω2 + 2iγω − ϵk(ϵk + 2µ)
(µ+ ϵk + ω + iγ −µ+ iγ
−µ− iγ µ+ ϵk − ω − iγ
), (6)
in which ϵk = ~2k2/2m is polariton dispersion at long wavelengths. The phase-phase component can be found by changing
to the density-phase basis [11]. In terms of the ψ,ψ† basis matrix structure, the phase-phase component is thus:
iDϕϕ =i
8nS(1 − 1)D
(1
−1
). (7)
11

2.2 Thermalised case
As discussed above, for the thermalised case, the form of the inverse Keldysh Green’s is fixed by the fluctuation dissipation
relation. In the ψ,ψ† basis, the matrix structure (see [11]) requiresDψψ†(ω) = −D∗ψ†ψ(−ω) so the distribution can be written
[D−1]K = 2iγ coth
(ω
2kBT
)(1 0
0 −1
). (8)
We will focus only those terms which lead to the power law decay, and ignoring those that only affect short range correla-
tions 1. Expanding the Green’s function for low frequencies and long wavelengths (i.e. considering the terms that control the
asymptotic behaviour at large distances), one then finds:
iD<ϕϕ ≃ 4γµkBT
nS |ω2 + 2iγω − ϵk(ϵk + 2µ)|2. (9)
After integrating Eq. (9) over ω, the final expression does not depend on γ, and so the modified spectrum has no effect on the
exponent when the system is thermalised. Thus, one has:∫dω
2πiD<
ϕϕ ≃ µkBT
nSϵk(ϵk + 2µ)≃ mkBT
ns~2k2. (10)
Then, performing the integral over k in Eq. (4), there is a logarithmic divergence∫kdk/k2, which is cut off for k < 1/∆x by
the numerator 1 − J0(k∆x) → 0. Thus, one recovers the standard form g1(∆x) ∝ exp(−ap ln(∆x)) with the equilibrium
result ap = mkBT/2πns~2.
2.3 Noisy case
To model a non-thermalised system with excess noise, one may note that the inverse Keldysh Green’s function can also be
interpreted as the spectrum of noise the system experiences, arising due to pumping and decay (see e.g. [13]). Thus, taking a
flat (i.e. Markovian) noise correlation function, with strength ζ, one has:
[D−1]K = 2iζ
(1 0
0 1
). (11)
Because this corresponds to a frequency independent noise strength ζ, the matrix structure is different from Eq. (8). In the
same way as above, we may calculate the part of D<ϕϕ which dominates at long distances, which leads to the expression:
iD<ϕϕ ≃ 2ζ(µ2 + γ2)
nS |ω2 + 2iγω − ϵk(ϵk + 2µ)|2. (12)
This expression clearly has identical ω and k dependence to Eq. (9), thus the integration follows in exactly the same way.
The difference between the two expressions corresponds purely to replacing kBT → ζ µ2+γ2
2µγ , hence the modified exponent,
ap = µ2+γ2
2µγ mζ/2πns~2. Considering the model nonlinear pumping written in Eq. (5), the density, and hence blueshift, are
set by the net pumping strength µ = γU/Γ, thus the only pump power dependence of the exponent ap comes from ap ∝ ζ/ns.1In fact, it is only the contribution from DK which is responsible for the power law decay at long distances; the contribution from DR −DA is finite at
long distances, and so just provides a constant prefactor for the correlation function.
12

References
[1] G. Roumpos, M. D. Fraser, A. Loffler, S. Hofling, A. Forchel, and Y. Yamamoto (2011), Single vortex-antivortex pair in
an exciton polariton condensate. Nature Phys., 7: 129–133.
[2] M. Richard, J. Kasprzak, R. Romestain, R. Andre, and L. S. Dang (2005), Spontaneous coherent phase transition of
polaritons in CdTe microcavities. Phys. Rev. Lett., 94: 187401.
[3] M. Wouters, I. Carusotto, and C. Ciuti (2008), Spatial and spectral shape of inhomogeneous nonequilibrium exciton-
polariton condensates. Phys. Rev. B, 77 : 115340.
[4] E. Wertz, L. Ferrier, D. Solnyshkov, R. Johne, D. Sanvitto, A. Lemaıtre, I. Sagnes, R. Grousson, et al. (2010), Sponta-
neous formation and optical manipulation of extended polariton condensates. Nature Phys., 6: 860–864.
[5] A. M. Weiner. Ultrafast optics (John Wiley & sons, 2009).
[6] G. Roumpos, W. H. Nitsche, S. Hofling, A. Forchel, and Y. Yamamoto (2010), Gain-induced trapping of microcavity
exciton polariton condensates. Phys. Rev. Lett., 104 : 126403.
[7] A. P. D. Love, D. N. Krizhanovskii, D. M. Whittaker, R. Bouchekioua, D. Sanvitto, S. A. Rizeiqi, R. Bradley, M. S.
Skolnick, et al. (2008), Intrinsic decoherence mechanisms in the microcavity polariton condensate. Phys. Rev. Lett., 101
: 067404.
[8] D. M. Whittaker and P. R. Eastham (2009), Coherence properties of the microcavity polariton condensate. EPL, 87:
27002.
[9] Z. Hadzibabic and J. Dalibard (2009), Two-dimensional bose fluids: An atomic physics perspective. arXiv:0912.1490v2
[cond-mat.quant-gas].
[10] M. Szymanska, J. Keeling, and P. Littlewood (2006), Nonequilibrium quantum condensation in an incoherently pumped
dissipative system. Phys. Rev. Lett., 96 : 230602.
[11] M. Szymanska, J. Keeling, and P. Littlewood (2007), Mean-field theory and fluctuation spectrum of a pumped decaying
bose-fermi system across the quantum condensation transition. Phys. Rev. B, 75 : 195331.
[12] L. P. Pitaevskii and S. Stringari. Bose-Einstein Condensation (Clarendon Press, Oxford, 2003).
[13] A. Kamenev. Many-body theory of non-equilibrium systems. In H. Bouchiat, Y. Gefen, S. Gueron, G. Montambaux, and
J. Dalibard, editors, Nanophysics: Coherence and transport, Les Houches, volume LXXXI, p. 177 (Elsevier, Amsterdam,
2005).
13


