Embed Size (px)
Citation preview

�������� ����� ��
Power-Law Models of Signal Transduction Pathways
Julio Vera, Eva Balsa-Canto, Peter Wellstead, Julio R. Banga, Olaf Wolken-hauer
PII: S0898-6568(07)00046-0DOI: doi: 10.1016/j.cellsig.2007.01.029Reference: CLS 6380
To appear in: Cellular Signalling
Received date: 6 December 2006Accepted date: 22 January 2007
Please cite this article as: Vera Julio, Balsa-Canto Eva, Wellstead Peter, Banga JulioR., Wolkenhauer Olaf, Power-Law Models of Signal Transduction Pathways, CellularSignalling (2007), doi: 10.1016/j.cellsig.2007.01.029
This is a PDF file of an unedited manuscript that has been accepted for publication.As a service to our customers we are providing this early version of the manuscript.The manuscript will undergo copyediting, typesetting, and review of the resulting proofbefore it is published in its final form. Please note that during the production processerrors may be discovered which could affect the content, and all legal disclaimers thatapply to the journal pertain.

ACC
EPTE
D M
ANU
SCR
IPT
ACCEPTED MANUSCRIPT
1
Power-Law Models of Signal Transduction Pathways
Julio Veraa, Eva Balsa-Cantob, Peter Wellsteadc, Julio R. Bangab, Olaf Wolkenhauera, 1
aSystems Biology and Bioinformatics Group. Department of Computer Sciences.University of Rostock. Rostock, Germany
bProcess Engineering Group. Instituto de Investigaciones Marinas, Spanish Council for Scientific Research (CSIC). Vigo, Spain
cHamilton Institute. National University of Ireland, Maynooth, Ireland
16-Feb-07
Abstract
The mathematical modelling of signal transduction pathways has become a valuable aid tounderstanding the complex interactions involved in intracellular signalling mechanisms. An importantaspect of the mathematical modelling process is the selection of the model type and structure. Untilrecently, the convention has been to use a standard kinetic model, often with the Michaelis-Mentensteady state assumption. However this model form, although valuable, is only one of a number ofchoices, and the aim of this article is to consider the mathematical structure and essential features of analternative model form – the power-law model. Specifically, we analyse how power-law models canbe applied to increase our understanding of signal transduction pathways when there maybe limitedprior information. We distinguish between two kinds of power law models: a) Detailed power-lawmodels, as a tool for investigating pathways when the structure of protein-protein interactions iscompletely known, and; b) Simplified power-law models, for the analysis of systems with incompletestructural information or insufficient quantitative data for generating detailed models. If sufficient dataof high quality are available, the advantage of detailed power-law models is that they are morerealistic representations of non-homogenous or crowded cellular environments. The advantages of thesimplified power-law model formulation are illustrated using some case studies in cell signalling. Inparticular, the investigation on the effects of signal inhibition and feedback loops and the validation ofstructural hypotheses are discussed.
Keywords: Cell signalling, systems biology, power-law models, molecular crowding, inhibition ofsignal transduction, validation of hypotheses.
Introduction
The mathematical modelling of intracellular interactions is fraught with difficulties, which range fromthe challenges of measurement, to the assumptions concerning the circumstances and sequence ofreactions in a signal transduction pathway. These issues mean that the mathematical modelling ofsignal transduction pathways is always an approximation in which the art of making appropriateassumptions is of paramount importance. Mathematical models are abstract representations of anunderlying biological truth that is so complex that all models are, in a strict sense, wrong. Models are
1 Corresponding author: Olaf Wolkenhauer. Systems Biology and Bioinformatics Group. Department ofComputer Science, University of Rostock. 18051 Rostock, Germany.E-mail: [email protected] Web: www.sbi.uni-rostock.deTel.: +49 381 498 75 77 Fax: +49 381 498 75 72

ACC
EPTE
D M
ANU
SCR
IPT
ACCEPTED MANUSCRIPT
2
“reduced” and/or “phenomenological” representations of a richer reality, regardless whether thisreality is translated into equations by use of mass action principles (Heinrich and Schuster 1996),power laws (Voit 2000) or Markov processes (Van Kampen 2001). The models are “reduced”, sincefrom a practical viewpoint, models are usually simplified versions of reality because not all proteins ofinterest can be considered in experiments. More often than not, there will be interactions andinfluences that are relevant to the cell function under consideration, but which have to be ignored inthe mathematical modelling process. In the same spirit, all pathway models are “phenomenological”because the biophysical nature of molecular interactions is often not understood when modellingbiochemical reactions at the detail level of changes in protein concentrations,
The further complication in mathematical modelling is that the technologies and protocols formeasurement of biological data records are often (usually) of insufficient duration, accuracy, andspatial and temporal resolution for accurate estimation of model structure and parameters. This, (addedto the complexity of intra- and inter-cellular dynamics with the associated assumptions andsimplifications), renders all mathematical models approximate, regardless of which of the competingmethodologies they are based, be it automata (Heiner et al. 2004), process algebras or formallanguages (Errampalli et al. 2004), mass-action principles or power-law representations. Despite thedramatic simplifications of the bio-physical/chemical reality under consideration, mathematicalmodelling has proven of significant use in illuminating biological mechanisms and guidingexperimental investigations. For these reasons it is important that the validity and use of a range ofmodel structures be explored. The aim of this article is to perform such an exploration for a particularform of model - the power-law model - and compare their use with generalised mass action withrespect to their “usefulness” in cell signalling systems biology. In this connection, a “good” or“useful” model in systems biology should be:
• An intuitive means to encode hypotheses concerning a system.
• Able to reproduce (fit) experimental observations.
• Predict behaviour not directly observed in experiments.
• Useful in the design of experiments, (e.g. deciding which variables to measure and how).
The vast majority of models for signal transduction pathways are based on nonlinear ordinarydifferential equations (NODEs). Moreover, these NODEs models are mostly derived or motivated bychemical kinetics (Atkins 2002). The correspondence between the biophysical reality of the cell andits mathematical encoding is reflected in the structure of the rate equations that are used. The terms,variables, coefficients and exponents are justified or explained through the laws of mass action. The‘level’ at which a mathematical model is constructed in cell signalling systems biology is thereforerelated to a description of changes in protein concentration. Alternatively, more detailed models areprovided by the analysis of molecular dynamics (Xu 2006 and Kim 2006), and at a yet more granularlevel, the concepts of quantum chemistry (Haile 1992, Dahl 2005) would be required to include thespatial structure of molecules and details of conformational changes during reactions. Such detailedmodels and simulations are of such complexity that they are limited to relatively small systems (say asingle receptor) and could, at present, not be scaled up to entire pathways. In cell signalling systemsbiology therefore we therefore choose a higher, less precise, level of modelling where entire pathwaysand changes of protein concentrations are represented by rate equations. Despite the relative lack ofprecision, the rate equation approach has proven of great use in the study of regulatory mechanismsand the information transfer that realises cell function (apoptosis, cell differentiation, cell proliferation,cell growth etc.).
The most commonly employed conceptual framework for the construction of rate equations is basedon mass-action principles and is commonly characterized by integer-valued kinetic orders (Cornish-Bowden 2004). In this paper however, we focus on the potential advantages of these models whennon-integer kinetic orders are involved. In this spirit, the paper is laid out as follows. Section 1 dealswith the assumptions under which non-integer kinetic orders occur in signal transduction pathwaymodels. It is shown that the most popular modelling formalisms can be derived from an initialequation by making assumptions about the mathematical and biophysical nature of the systems underconsideration. In Section 2 the properties and uses of power-law models are discussed in the context ofcell signalling. In particular, the use of power-law models is presented in three practically useful cases:
ACC
EPTE
D M
ANU
SCR
IPT
ACCEPTED MANUSCRIPT
3
(i) in simplified models where reaction steps are aggregated, (ii) to represent inhibitory processes, and(iii) as a means of validating hypotheses concerning the pathway structure. The paper closes withsome brief conclusions and reflection on further work.
1. Molecular Realism and Modelling Pragmatism
Two contrasting ideas motivate the use of power-law modelling in cell signalling systems biology.The first is a need for a more realistic representation of the cellular environment, and the second is thewish to obtain an intuitive way of representing experimental data. In the first case, positive-valuednon-integer kinetic orders emerge naturally as a result of non-homogeneity and molecular crowdingwithin the cell. The second case arises in situations where there is a lack of information about the bio-physical nature of molecular interactions and their environment, and the modeller is required to makessimplifying assumptions. We will examine and give examples of both situations.
1.1. Inhomogeneity of the cellular environment
While it may be assumed that temperature, water balance, pH level, volume and temperature areconstant and at a defined level inside the cell, the assumption that molecules float freely around in awell mixed, homogenous gas-phase like environment, is in many cases an unjustified assumption.Various experimental studies support the idea that the inhomogeneity of the environment inside thecell plays an important role in biochemical processes (Kopelman 1986, Luby-Phelps et al. 1987,Elowitz et al. 1999). The existence of a significant number of molecules which do not participate inthe biochemical network, but occupy an important fraction of the space inside the cell, alters thedynamics of the system. Under these conditions, the intracellular medium becomes anisotropic andinhomogeneous. The ability to diffuse through such a medium is not the same for all molecules, andwill depend on their size and geometry. Molecules, which are small with respect to the size of theobstacles, like metabolites, would be able to percolate between the obstacles easily, while formolecules of the same size or larger than the obstacles, diffusion will be more tortuous (Minton 2001,Schnell and Turner 2004). In this situation, the effective dimension of the space available for reactionsand diffusion is fractal and smaller than the original three-dimensional space. The variable diffusionhypothesis has been supported by the work of Kopelman (1986, 1988) and Verkman (2002). In theirexperiments, they showed how chemical reactions in non-homogenous and crowded media (e.g., thecytosol) are affected by an anomalous diffusion-reaction process that influences in some cases thedynamics of the reactions.
For instance, in a simple homodimeric reaction, which scales with a kinetic order of two inconventional kinetic models, Kopelman (1986) estimated an effective value for the kinetic order ofg=3 when the reaction occurs in a channel (one-dimensional system), and g=2.46 when it occurs on asurface (two-dimensional system). The higher the restriction in the dimensionality is, the higher theorder of reaction becomes. Therefore, in the case of homodimeric reactions in a crowded intracellularthree-dimensional medium, the value for the kinetic order would be expected to vary between two(free diffusion) and 2.46 depending on how the molecular crowding constrains the space available.The higher the crowding is, the bigger the value of the kinetic order in the reaction, with themagnitude of the kinetic order depending upon the species considered and their ability to diffuse inthis specific medium.
1.2. The general form of kinetic model
When the assumptions concerning inhomogeneity of the intracellular environment are included, thedynamics of a system of intracellular reactions can be represented using a model composed by a set ofnonlinear ordinary differential equations with the following structure:
∑ ∏⋅⋅=j k
gkjij
i jkXdt
dX γσ (1)
In these equations, γj are rate constants, gjk kinetic orders, and σij the coefficients of the stoichiometricmatrix. Equation (1) can be considered as a general form, since a range different modelling formalismsfor biochemical systems emerge from this basic mathematical structure (see Figure 1). For example,

ACC
EPTE
D M
ANU
SCR
IPT
ACCEPTED MANUSCRIPT
4
what will be referred to as conventional kinetic models (in the context of cell signalling systemsbiology) are a special case of the above structure in which the kinetic orders are integers. These valueswill be usually one, but may take the value two if, for example, dimerisation is considered. Thesevalues relate directly to the molecularity of the reaction, m, i.e., the number of molecules that areassumed to participate in the reaction (as contained in the stoichiometric coefficients of the reaction).Since these values are defined a priori, they do not have to be estimated from data, thus allowing anintuitive construction of the rate equations (Cornish-Bowden 1995, Heinrich and Schuster 1996, Fell1997). The simplicity of this equations set-up and its ease of use is one reason for the success of thekinetic models in the representation of cell signalling. Thus, when in a specific reaction of a pathway acompound appears as reactant, the kinetic order assigned is equal to the stoichiometric coefficient(supposing that the stoichiometric matrix is normalised, containing only the minimum integer numberspossible for each reaction). When a compound does not appear as a reactant in a reaction, the kineticorder is zero such that we can write the conventional kinetic model form:
∑ ∏⋅⋅=j k
mkjij
i jkXdt
dX γσ , { }2,1,0∈=∀ jkjk mg (2)
Where, the kinetic order mjk of a reactant is one when it participates in the interaction, two whendimerisation takes place and zero if it is not involved.
The principal limitation of the conventional kinetic model shown in equation (2) is that the completestructure of the system must be perfectly known, which is usually not the case in signalling pathways.Nonetheless, the approach is commonly used, and special cases are derived from it. For example, apopular special case is obtained by making quasi steady-state assumptions for some components. Thisleads to Michelis-Menten type models. Similar, but more complex equations can be derived usingdifferent versions of the quasi steady-state approximation to describe more complex protein-catalyseddynamics (allosteric processes, competitive inhibition, cooperativity and so on). While the quasi-stationary approximation is generally accepted for systems operating in a preferential steady-state (e.g.metabolic pathways), in the context of signal transduction pathways, where the focus is on transientbehaviour, these assumptions can be questioned (Cox 1993 and Millat et al. 2006).
1.2. The power-law form of kinetic model
Power-law models follow the structure of Equation 1, by allowing non-integer values for kineticorders. When the complete structure of interactions is considered, this leads to detailed power-lawmodels in which kinetic orders have always real positive values and relate to the effects of molecularcrowding and inhomogeneity in intracellular compartments (Savageau 1998). When a simplifiedversion of the system is required (due to incomplete information about the network), then simplifiedpower-law models occur, in which positive real-valued kinetic orders are used. Positive valuesrepresent the activation, translocation, degradation, while negative real-valued kinetic orders are anintuitive representation for inhibition (Voit 2000). Figure 1, shows how the different modellingformalisms are related.

ACC
EPTE
D M
ANU
SCR
IPT
ACCEPTED MANUSCRIPT
5
Figure 1. Overview of rate-equation model structures for signal transductionpathways. When the molecularity of reactions is used to assign values to thekinetic orders { }( )2,1,0=jkm , we obtain a conventional kinetic model. Once weobtain this conventional kinetic model, the use of quasi steady-stateassumptions lead us to Michaelis-Menten type models. Power-law (PL) modelsemerge when non-integer kinetic orders are used. If the structure of thenetwork is well-known, detailed PL are derived with kinetic orders alwayspositive real numbers ( )+ℜ∈ijg . Lack of structural information and the need forsimplification and aggregation lead us to simplified PL models with negativereal kinetic orders for inhibition ( )−ℜ∈ijg .
This paper focuses on the use of power-law models in signal transduction pathways and will discussthe use of such models in three examples. For the purposes of these discussions it will be important todistinguish the two avenues that motivate power-law models:
1. Increased realism (accounting for molecular crowding through non-integer kinetic orders).
2. The aggregation of mechanistic detail leading to simplified, easy-to-use, representation offeedback mechanisms (with negative kinetic orders).
With the current quality of the experimental data available for the mathematical modelling ofsignalling systems, it is difficult to know whether the contribution to the non-integer kinetic orders dueto molecular crowding is relevant or not. In a power-law model the number of parameters is higherthan in a conventional kinetic model with the same structure and measured states because kineticorders must be also calculated. This complicates the process of estimating the model parameters. If thedata available is limited and noisy, then the larger the set of parameters to be estimated is, the moreprobable is the chance of finding multiple suboptimal solutions that fit the data equally well(Rodriguez-Fernandez et al. 2006a). These problems of local optimal solutions (Moles et al. 2003),and the more general problem of identifiability (Cobelli and DiStefano 1980), have to be consideredcarefully and appropriate numerical methods applied.. In the case of local optima, the use of globaloptimisation methods will increase the possibilities of exploring the parameter space in such a waythat suboptimal (i.e. local) solutions are avoided (Rodríguez-Fernández et al. 2006 and Moles et al.2003). Practical identifiability problems on the other hand can be mitigated by i) increasing thequantity and quality of experimental data available, and ii) the application of optimal experimentaldesign techniques (Balsa-Canto et al. 2006). However, it is also important to note that lack ofidentifiability can also be a structural feature of the model (Wellstead and Edmunds, 1975) in whichcase the experimental design must be changed in specific ways.
However, the quality and quantity of data is increasing with innovations in biological measurementand sensing. For example, the emergence of new methods for error reduction (Schilling et al. 2005),

ACC
EPTE
D M
ANU
SCR
IPT
ACCEPTED MANUSCRIPT
6
together with new imaging systems like near-infrared (NIR) fluorescence (Picariello et al. 2006), willpermit an increase in the quality of quantitative western blots. The generation of massive quantitativedata based on ELISA technology (Engvall and Perlman 1971), which is available for an increasingnumber of proteins, will multiply the number of time points and replicates possible, as well asimproving the time resolution and the accuracy in the measurements (Heyman 2006). Methods for thequantification of proteins, based on live cell imaging, are being currently developed and will permit abetter estimation of translocation processes and protein-protein interactions (Michalet et al. 2003).Finally, the absolute quantification of proteins and phosphoproteins using mass spectometry and liquidcromatography should be operative in the coming years (Gerber et al. 2003).
With the increasing quality of data and associated computational methods, it is probable that the datawith which to estimate the parameters of power law models will improve rapidly. . Nonetheless, as inall model parameter estimation methods, statistical significance tests (Burnham and Anderson 1998)should be used to justify the use of power-law models and to decide whether the quality of theexperimental data allows a meaningful distinction between kinetic orders of, say, 1.00 and 1.25.Moreover, it may not be necessary to allow non-integer kinetic orders for every variable if priorknowledge for some of them is available. Given these caveats on the use of power-law models, thenext section discusses situations in which they have strong potential and show tangible benefits.
2. Power-law Models of Signal Transduction Pathways
The precise structure of a signalling pathway is often less clear than for metabolic systems. Moreover,the biophysical nature of molecular interactions is complex and often poorly understood even forsimple reactions (Atkins 2002). These difficulties oblige the analyst to make simplifying assumptionsby, for example, aggregating reactions steps. This need to simplify mechanistic details makes power-law models extremely useful since they are able to accommodate aggregation within them. Thissimplifying feature of power-law models also extends to the situation where there is sparse evidenceabout the biophysical nature of interactions. Conventionally in such situations, poor information fromexperiments is complemented with information from the literature and databases to formulatehypotheses concerning the structure of a mathematical model. In this situation a conventional mass-action type model may appear “realistic”; even though the reactions that it encodes are often partiallyspeculative. However, by aggregating unknown mechanistic details within a power-law model, it ispossible to obtain a simple, intuitive mathematical model that is consistent with experimental data.
2.1. Simplification and aggregation
When there is little experimental evidence for the structure of a biochemical network, the aggregationand simplification of models describing the system is a necessity rather than an option. To illustratethis idea, let us consider a pathway integrated by a set of sub-reactions which involve several unknownintermediates states. Consider the case of the simple activation of a certain protein R with a signal S toobtain R* (Figure 2).
Figure 2. Aggregation of a protein activation process involving anintermediate non-observable state, R’.

ACC
EPTE
D M
ANU
SCR
IPT
ACCEPTED MANUSCRIPT
7
The value of the signal S can be exactly determined and the concentration of the protein either in itsnon-activated, R, or in its activated form, R*, can be measured. For the actual process, there could bean intermediate pre-activated state of protein, R', that cannot be estimated from data and may beunknown. In this case, the strategy is to estimate an empirical rate law for the reaction where, not onlythe rate constant, but also non-integer kinetic orders are estimated from experimental data:
21
*gg RS
dtdR
⋅⋅= γ (3)
To illustrate the importance and utility of this form of simplification through aggregation, we turn tothe JAK2/STAT5 signalling cascade as described in the paper by Swameye et al. (2003). This cascadeis activated through various receptors, including tyrosine kinases, G protein-coupled receptors, andhematopoietic cytokine receptors such as the erythropoietin receptor (EpoR), where EpoR exists as apreformed dimer. Upon binding of the hormone erythropoietin (Epo) the receptor-associated JAK2 isactivated through conformational changes of the receptor, transphosphorylates each other andphosphorylates various tyrosine residues in the cytoplasmic domain of EpoR. Subsequently, the latenttranscription factor STAT5 is recruited via its SH2 domain to the activated receptor becomesphosphorylated by JAK2, homodimerises and migrates to the nucleus where it initiates thetranscription of various target genes. The scheme of the proposed model is depicted in Figure 3.
Figure 3. Structure of the JAK2/STAT5 core module. S represents non-activatedSTAT5, pS is monomeric phosphorylated STAT5, 2pS cytosolic dimericphosphorylated STAT5, and 2pSNC the nuclear dimeric phosphorylated STAT5.Activated receptor-kinase complex pEpoR/pJAK2 is denoted pEpJ andconsidered as the input to the system.
A power-law representation that focuses on the core module of the JAK2/STAT5 pathway is discussedhere. This includes equations that take account of phosphorylation of STAT5 by the activated Eporeceptor, the subsequent dimerisation and translocation to the nucleus, as well as the return to thecytosol after dephosporylation and loss of dimeric conformation. A complete mechanistic model of theprocesses of STAT5 in the nucleus would include at least three states: the phosphorylated dimerisedSTAT5, the dimeric phosphorylated STAT5 bound to the regulated genes, and the monomericdephosphorylated STAT5. Unfortunately, the experimental data available (e.g. Swameye et al. 2003)does not include the information necessary to describe the system at this level of detail, andconcentrations of the species inside the nucleus are unknown. This suggests that one could aggregatethis chain of processes to a reduced expression. In this spirit, we consider only the dynamics of nuclear

ACC
EPTE
D M
ANU
SCR
IPT
ACCEPTED MANUSCRIPT
8
dimeric phosphorylated STAT5, 2pSNC, since this may be measureable in the near future asexperimental techniques develop. With these simplifications, the dynamics of STAT5 in the nucleuswill be represented by the following power-law expressions
( )[ ] '2
'1 222 '
2'1
kkNC tpScpScdtpSd τ−⋅−⋅= (4)
In the right-hand side of equation (4), the first term represents a single process – namely thetranslocation of activated dimerised STAT5 into the nucleus. In this case, and provided the effects ofanomalous diffusion can be considered imperceptible, the kinetic order '
1k could be made equal to one.In contrast, the second term represents several subsequent processes, and the single kinetic orderabsorbing all this complexity could have any non-integer value higher than zero (but usually, smallerthan two). In this case, we assume the formulation proposed by Swameye et al. (2003) where thesignal rate is depending on cytosolic dimeric phosphorylated STAT5, 2pS, and suggests the existenceof a time delay associated with this process. Moreover, we assume that phosphorylation of STAT5 inthe receptor, which seems to be a complex process involving several steps, can also be representedwith a simple power-law expression using a similar strategy of simplification and aggregation. Thedimerisation of pSTAT5 is considered to be much faster than other processes in the signallingpathway. It is therefore neglected as an independent term, and its effect is absorbed by the non-integerkinetic orders representing activation. Thus, the model proposed includes the following states: non-activated STAT5, S, cytosolic dimeric phosphorylated STAT5, 2pS, and nuclear dimericphosphorylated STAT5, 2pSNC. The activated receptor-kinase complex pEpoR/pJAK2 is considered asinput signal of the system, pEpJ. Under the assumptions stated, we arrive at the followingmathematical model for the signalling pathway:
( )[ ] 32121 222 ggg pEpJStpS
dtdS
⋅⋅⋅−−⋅⋅= γτγ (5.1)
432 2232
ggg pSpEpJSdt
pSd⋅−⋅⋅= γγ (5.2)
( )[ ] 14 22213
ggNC tpSpSdtpSd τγγ −⋅−⋅= (5.3)
The proposed model is a simplification of the one proposed in Swameye et al. (2003) because itconsiders three states for STAT5 instead of four. Translocation of 2pS to the nucleus is represented asan elementary process without any aggregation. Thus, a kinetic order different to one can only relate tothe effect of anomalous diffusion. In the present case, we suppose that this effect cannot be detectedwith the available data and make the value of g4 equal to one. We consider that cooperativity couldplay an important role in the activation of STAT5 by the receptor and allow the kinetic orders g2 andg3 to have values higher than one. In the case of the time delay, we assume that the careful estimationdone by Swameye et al. (2003) is correct and allow τ to vary only around this value. Finally,preliminary tests suggested that the value of g1 can be assumed to be one. This reduces the complexityof the model, while at the same time giving a satisfactory fit to the data (data not shown), andtherefore allowed the value of this kinetic order to be fixed. Table 1 contains the bounds assigned tothe different parameters included in the model.
Table 1. Core module of JAK2/STAT5. Bounds assigned to the parameters.Parameter g1 g2 g3 g4 γ1 γ2 γ3
Lower Bound 1.0 1.0 1.0 1.0 0.01 0.01 0.01Upper Bound 1.0 2.0 2.0 1.0 10 10 10

ACC
EPTE
D M
ANU
SCR
IPT
ACCEPTED MANUSCRIPT
9
In order to estimate the parameters in the model we used the data published in Swameye et al. (2003).These include values in arbitrary units for activated receptor complex (pEpoR), activated STAT5 inthe cytosol (pSTAT) and total amount of STAT5 in the cytosol (tSTAT5cyt). For the purposes ofcomparison between the different data sets, all data were normalised. The data for pEpoR were used asa description of the input signal, and a linear interpolation was generated from the data to describe theintensity of the input signal at any time during the experiment. Additional algebraic equations,reflecting the relation between the measured quantities and the variables, were defined for the model:
[pSTAT] = 2x2pS [tSTAT5cyt] = S + 2x2pS (6)
The variables on the left side hand represent measured quantities, while the right-hand side representthe variables considered in the model. The final step was to appropriately scale the data. The dataavailable are actually not real quantitative data, because they do not relate to the proportion of proteinin the considered state. Additional biological assumptions were used to establish the proportion ofprotein activated in the peaks of stimulation for both variables pEpJ and 2pS. The initial state of thesystem, after starvation and before stimulation, can be approximated by assuming that virtually theentire amount of STAT5 was in an inactivated state. It is then possible to assign fixed initial conditionsto the states, thus reducing the number of degrees of freedom during model calibration. Under thestated biological assumptions, in the peak of activation after stimulation 85% of the EpoR/JAK2 onthe plasma membrane was considered activated and 60% of the STAT5 was supposed to be activatedand dimerised.
In order to estimate the model parameters, two experimental data sets obtained in differentexperimental conditions were used. A multistart local optimisation method indicated the presence ofseveral suboptimal solutions, thus suggesting the use of global optimisation methods (Moles et al.2003). In this paper, we used the hybrid global optimisation approach recently proposed by Rodriguez-Fernandez et al. (2006b). Figure 4 presents the best fit for one of the experimental data sets used forcalibration.
0 20 40 600
0.2
0.4
0.6
0.8
1
time (min)
pEpJ
(nor
mal
ised
uni
ts)
0 20 40 600
0.2
0.4
0.6
0.8
1
time (min)
Obs
erva
bles
(nor
mal
ised
uni
ts)
[pSTAT5]
[tpSTAT5cyt]
[pSTAT5]
[tSTAT5cyt]
Figure 4. Example of time course data used to estimate the kinetic orders in theJAK2/STAT5 model. Left: measured values of pEpJ that were used as an inputsignal. Right: experimental data (points) and the model fit (lines) obtained withthe values estimated for parameters.
The estimated parameters obtained from the optimisation are given in Table 2. The dynamics of theactivation, which are represented by γ2 seem much faster than the other processes described in themodel. The kinetic orders g2 and g3 have values significantly different to one (respectively, 70% and30%). Moreover, the difference between g2 and g3, which are supposed to be identical and equal to onein a conventional kinetic model, is around 35%. This result supports the belief that the dynamics of the
ACC
EPTE
D M
ANU
SCR
IPT
ACCEPTED MANUSCRIPT
10
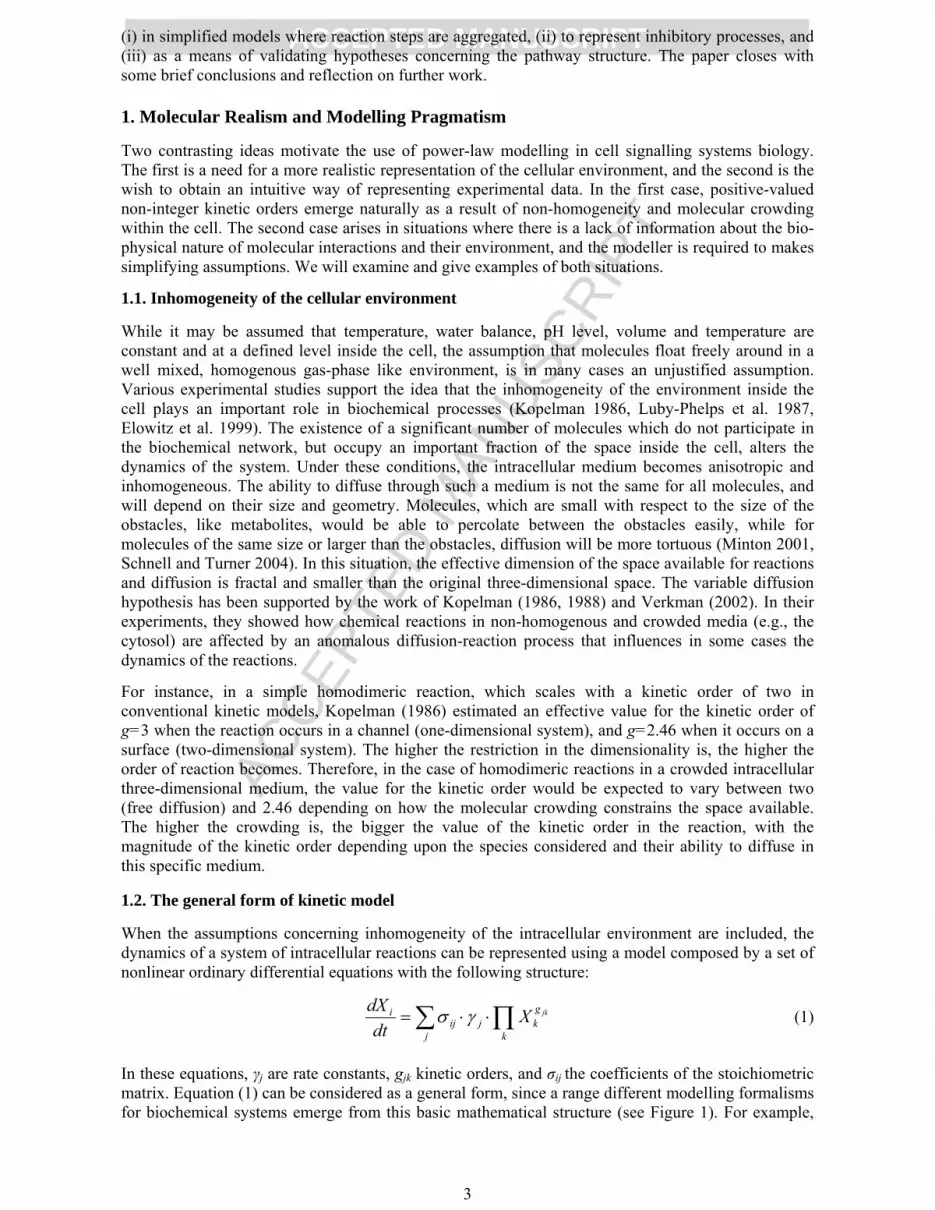
phosphorylation of STAT5 in the Epo receptor is more complex than the simple kinetic approximationwould suggest.
Table 2. Core module of the JAK2/STAT5 pathway. Values of the parameters in the selectedsolution.
Parameter g1 g2 g3 g4 γ1 γ2 γ3 τ
Value 1.00 1.73 1.28 1.00 0.49 4.69 0.15 5.00
The estimated parameters obtained can be used to further refine of the model. Specifically, if aninvestigation of the mechanisms of reaction is the aim of the model and adequate experimental dataare available, then the processes with kinetic orders different to one can be described in more detail.Alternatively some kinetic orders (g4, g1) may be fixed as in the conventional kinetic approach toimprove the identifiability properties of the model.
2.2. Modelling inhibitory processes
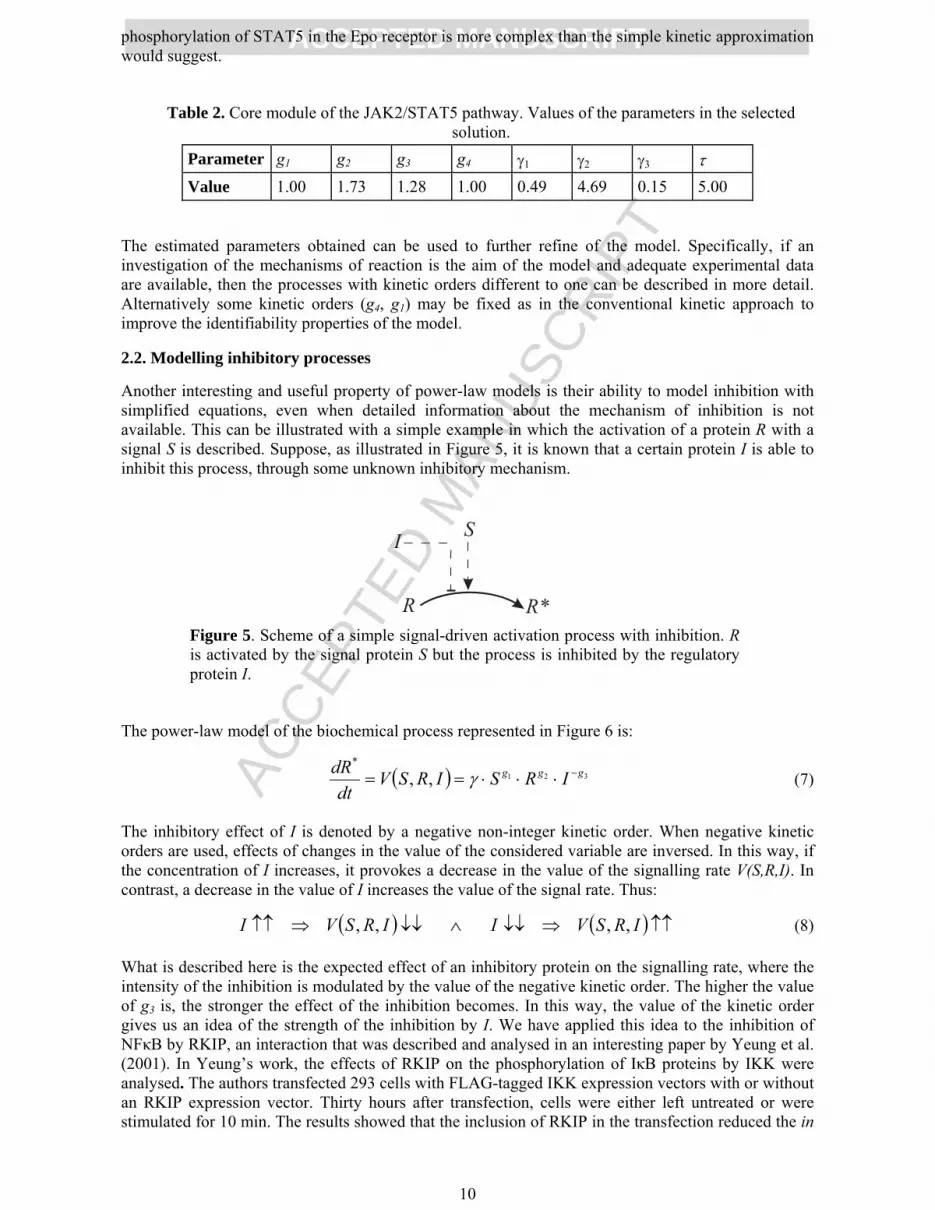
Another interesting and useful property of power-law models is their ability to model inhibition withsimplified equations, even when detailed information about the mechanism of inhibition is notavailable. This can be illustrated with a simple example in which the activation of a protein R with asignal S is described. Suppose, as illustrated in Figure 5, it is known that a certain protein I is able toinhibit this process, through some unknown inhibitory mechanism.
Figure 5. Scheme of a simple signal-driven activation process with inhibition. Ris activated by the signal protein S but the process is inhibited by the regulatoryprotein I.
The power-law model of the biochemical process represented in Figure 6 is:
( ) 321,,*
ggg IRSIRSVdt
dR −⋅⋅⋅== γ (7)
The inhibitory effect of I is denoted by a negative non-integer kinetic order. When negative kineticorders are used, effects of changes in the value of the considered variable are inversed. In this way, ifthe concentration of I increases, it provokes a decrease in the value of the signalling rate V(S,R,I). Incontrast, a decrease in the value of I increases the value of the signal rate. Thus:
( ) ( ) ↑↑⇒↓↓∧↓↓⇒↑↑ IRSVIIRSVI ,,,, (8)
What is described here is the expected effect of an inhibitory protein on the signalling rate, where theintensity of the inhibition is modulated by the value of the negative kinetic order. The higher the valueof g3 is, the stronger the effect of the inhibition becomes. In this way, the value of the kinetic ordergives us an idea of the strength of the inhibition by I. We have applied this idea to the inhibition ofNFκB by RKIP, an interaction that was described and analysed in an interesting paper by Yeung et al.(2001). In Yeung’s work, the effects of RKIP on the phosphorylation of IκB proteins by IKK wereanalysed. The authors transfected 293 cells with FLAG-tagged IKK expression vectors with or withoutan RKIP expression vector. Thirty hours after transfection, cells were either left untreated or werestimulated for 10 min. The results showed that the inclusion of RKIP in the transfection reduced the in

ACC
EPTE
D M
ANU
SCR
IPT
ACCEPTED MANUSCRIPT
11
vitro IKK activities four- to fivefold in both assays. This observation was interpretted as an inhibitionof the cited proteins by RKIP, although the exact molecular mechanism by which this occurs isunknown. Figure 6 shows a simplified model describing the activation of NFκB by IKK and theinhibitory effect of RKIP in the process.
N/I
pI
N
RKIP IKK
Figure 6. A scheme representing the phosphorylation of IkB (pI) by the Ikbkinase (IKK). In the process, the complex NFκB/IkB (N/I) is broken and NFκB(N) is free to translocate to the nucleus where it promotes activation of severalgenes.
The variables involved represent the IκB kinase, IKK, which is the input signal activating the process,the NFκB/IκB complex, N/I, phosphorylated IκB, pI, NFκB, N, and RKIP. After activation by IKK,IκB is phosphorylated and the complex NFκB/IκB is broken. NFκB can then translocate to thenucleus where it regulates the expression of several genes, such that phosphorylated IκB is degraded.These observations translate into the following equations:
( ) ( )
gRKIPIKKINdt
INd −
⎟⎠⎞
⎜⎝⎛⋅⋅⋅−=
01.0// γ (9.1)
( )gRKIPIKKIN
dtdpI −
⎟⎠⎞
⎜⎝⎛⋅⋅⋅=
01.0/γ (9.2)
( )gRKIPIKKIN
dtdN −
⎟⎠⎞
⎜⎝⎛⋅⋅⋅=
01.0/γ (9.3)
In these equations, the factor 0.01 is used to scale the inhibitory effect of RKIP, which is notsignificant at concentrations around 0.01 (normalised units). For simplicity, we have considered thecontribution of IKK and N/I to the process as linear, and then assigned to it a kinetic order equal toone. RKIP is considered an inhibitor, and initially we assign a kinetic order minus one to reflect thisfeature (g = 1). We initially take gamma equal to one (γ = 1). In Figure 7, we compare dynamicalsimulations of the system with and without RKIP, using as initial condition the switched offconfiguration of the system (N/I(0)= 1; pI(0)=N(0)=0).

ACC
EPTE
D M
ANU
SCR
IPT
ACCEPTED MANUSCRIPT
12
0 5 10 15 200
0.2
0.4
0.6
0.8
1
time (min)
norm
alis
ed u
nits
0 5 10 15 20
0
0.2
0.4
0.6
0.8
1
time (min)
norm
alis
ed u
nits
Figure 7. Comparison of a transient stimulation of the system when theinhibition of RKIP is considered. Left: System with a stable concentration ofRKIP. Right: System with suppressed RKIP. The solid black lines represent thevalue of the stimulus IKK; the dashed black lines represent N/I and solid greylines represent pI.
Figure 8 shows the effect on the model of a pulse of IKK with a normalised intensity of 1.0 betweentwo and twelve minutes (IKK(2:12)=1.00). The dynamics of the system were simulated for aconfiguration with RKIP in the left side (RKIP=1.00) and without RKIP in the right side(RKIP=0.01). It can be seen from the simulations that the activation of the system is very slow in thecase of inhibited system (left panel of Figure 8), which provokes a very weak signal for the analysedtransient signal. However, in the absence of the inhibitor (right panel of Figure 8), the system reactsrapidly and only five minutes are necessary to obtain a maximum in the activation of the system. Herewe can see how the simple power-law expansion used to describe the inhibition of RKIP is able toclearly distinguish the two possible scenarios. Moreover, different values in the kinetic order g encodedifferent intensities in the inhibitory strength of RKIP.
In Figure 8 the response of the system with sustained stimulation is studied when the value of thekinetic order g is varied from zero (meaning no inhibition by RKIP) to a value of one. In absence ofinhibition, the response of the system is fast, and it reaches the maximum activation in only fiveminutes. When the value of g is increase the reaction becomes slower, and from g= 0.70 onward, themaximum activation is not reached in the time scale represented (20 times more time than in the caseof no inhibition). Therefore, the variation on the parameter g allows the strength of the inhibitoryeffect to be modulated, and can be estimated by fitting real quantitative experimental data.
0 50 1000
0.2
0.4
0.6
0.8
1
time (min)
N/I
(nor
mal
ised
uni
ts)
g=0.0g=0.2g=0.4g=0.6g=0.8g=1.0

ACC
EPTE
D M
ANU
SCR
IPT
ACCEPTED MANUSCRIPT
13
Figure 8. Degradation of N/I for a sustained stimulus (IKK(0:100)=1.0) anddifferent strengths attributed to the inhibitory effect of RKIP, which are modelledby changing the value of the associated kinetic order (g).
2.3. Homogeneity of equations as a tool to validate hypotheses
By modifying the value of the kinetic order in the power-law equation, the properties of a function canvary from the description of an inhibitory process to the description of cooperativity. This allows theanalyst an important experimental degree of freedom in the evaluation of different hypothesesconcerning the nature of interactions. We illustrate this idea with the following simple example,involving two proteins (X1 and X2):
( ) 212121, gg XXXXV ⋅⋅= γ (10)
Suppose the value of X1 remains approximately constant and equal to one, and the associated kineticorder is also equal to one (g1= 1.00) - implying linearity of the process with respect to kinetic order.The value of γ is also established as equal to one, and we focus the analysis on the effects of differentvalues for the kinetic order g2. Depending on the values assigned, the behaviour described by thepower-law term changes completely. Negative values for the kinetic order represent inhibition, whichmeans that the value of the function decreases when the value of X2 is increased. A zero for the kineticorder indicates that the variable does not affect the described process. In the case of positive values ofkinetic order, several alternatives are possible. If the kinetic order is equal to one, the system isreproducing a perfectly conventional kinetic behaviour. With values for the kinetic order between zeroand one, the equation is representing a saturation-like behaviour in the interval of feasible values forthe variable X2. Finally, with values higher than one, the system models cooperative processes. InTable 3 we summarise the different behaviours reproduced by the function when the value of thekinetic order is modified.
Table 3. Dynamics of the system with respect to values of the kinetic order.Value g2 Behaviour represented[-2.0,0.0) Inhibition0.0 No interaction(0.0,1.0) Saturation (approx.)1.0 Perfect kinetic(1.0,2.0] Cooperativity
Figure 9 shows how the properties of the function change drastically for different values of the kineticorder included in the different intervals of Table 3.

ACC
EPTE
D M
ANU
SCR
IPT
ACCEPTED MANUSCRIPT
14
0 0.5 1 1.5 20
0.5
1
1.5
2
X2 (normalised units) V
( X1 ,
X2 )
g= -0.5g=0.0g=0.25g=1.0g=1.5
Figure 9. Dependence of the function ( ) gh XXXXV 2121 , ⋅⋅= γ on changes inthe value of X2. Different representative values for g are considered. Allequations represented have the same structure and the same values for parametersother than g (X1=1.00, g1=1.00 and γ =1.00). The exception is the case ofinhibition, where the variable X2 was adequately normalised to have values forthe function in the same range than the other cases (X2
’= X2/0.05).
All equations simulated in Figure 9 have exactly the same structure as previously described, butdifferent behaviours appear clearly in the figure. Thus inhibition (g= -0.5) provokes a significantdecrease in the values of the function while the value of X2 increases. In case of positive kinetic orders,the function describes a saturation-like curve when a value lower than one is considered for g, butincreases faster than the perfect kinetic case when higher values are considered.
To illustrate how the regularity and flexibility of power-law models helps in pathway characterisation,consider a very simple network of four interacting proteins X, Y, W and Z in which the exact structureof the interactions is unknown (Figure 10). We focus our attention on the dynamics of the protein Xthat is activated in the process, while the contributions of the other variables in the process areunknown.
Figure 10. Graphical representation of a network for which the structure isunknown. X is activated in the process, but the precise role of Z, Y and W has notbeen established.
The differential equation model describing the process is:
4321 gggg ZWYXdtdX
⋅⋅⋅⋅= α (11)
This formulation is not based on any previous information about the system, and any possible variablethat might take part in the network is included in the equation. Likewise, there is no information aboutthe possible values of the kinetic orders, which could be even zero, indicating no participation in theprocess. Using data fitting techniques, experimental data could be used to estimate preliminary values

ACC
EPTE
D M
ANU
SCR
IPT
ACCEPTED MANUSCRIPT
15
or feasible intervals for the parameter values (see Veflingstad et al. 2004). Let us suppose we obtainthe following solution:
250.0001.0450.1005.1145.0 −⋅⋅⋅⋅−= ZWYXdtdX
(12)
The solution per se provides useful structural information about the nature of an interaction that waspreviously unknown. In particular, the kinetic order associated with X is near 1, and thus represents theusual participation of a protein in its own activation. The cases of Y, W and Z are more interesting. Thekinetic order of Y is positive indicating that Y activates the process, while the kinetic order associatedto Z is negative which indicates that this protein inhibits the described process. In the case of W, thekinetic order is almost identical to zero, indicating that contrary to the original hypothesis, this proteindoes not participate in the interaction. These conclusions from Equation 12 are depicted in Figure 11.
Figure 11. Graphical representation of a network after an analysis using power-law modelling and experimental data. Y act as a signal activating X, while Zinhibits the process. After parameter estimation, the kinetic order associated to Wwas estimated to be near zero, which means that the effect of W on the activationof X can be discarded.
This “blind” investigation on the structure of an interaction, based only on the available data, wouldnot be possible without the absolute homogeneity of the power-law equations. We now illustrate thisfeature of power-law modelling for the inhibition of Ras/Raf1/MEK/ERK pathway by RKIP. The aimof the experiment is to determine whether the previously described inhibitory behaviour of RKIP inRas/Raf1/MEK/ERK (Yeung et al. 1999) appears also in MCF10A cells, a spontaneouslyimmortalised, but nontransformed human mammary epithelial cell line (Soule et al. 1990). A simplemodel describing the activation of this pathway and the potential role of RKIP is shown in Figure 12.
Figure 12. Model describing the possible inhibition of RKIP inRas/Raf1/MEK/ERK pathway. In this simple model we consider only thephosphorylation of MEK and ERK. Previous steps of the pathway are ignored.The effect of the signal used in the experiments is modelled with the variable S.
The dynamics of the system are described by the following equations:

ACC
EPTE
D M
ANU
SCR
IPT
ACCEPTED MANUSCRIPT
16
ERKpMEKRKIPEGFRMEKdt
dpMEK g ⋅−⋅⋅= −∗21
1 γγ (13.1)
pERKERKpMEKdt
dpERK32 γγ −⋅= (13.2)
pMEKKMEK −= 1 (13.3)
pERKKERK −= 2 (13.4)
The inhibitory effect of RKIP is described by the kinetic order g1, which must be estimated fromexperimental data. We estimate the values for the parameters using quantitative data produced withELISA kits that describe the dynamics of Ras/Raf1/MEK/ERK pathway in the considered cell lineafter stimulation for normal concentration of RKIP (RKIP=1.00), overexpression RKIP (RKIP=3.00),and with repression (RKIP=0.10). We focussed our attention on the value of g1, which describes thestructural property that we are considering. The interval of values allowed for g1 was between zero (nointeraction), and two (strong inhibition). The value calculated was g1= 0.00. That is, we can assumethat the inhibition by RKIP can be discarded in models describing this pathway for the considered cellline:
ERKpMEKEGFRMEKdt
dpMEK⋅−⋅= ∗
21 γγ (14.1)
Once this structural hypothesis is discarded for this cell line, the model can be refined to improve thedescription in accordance with available data.
3. Conclusions
The rationale for using non-integer kinetic orders in models of biochemical networks comes fromeither consideration of molecular crowding in inhomogeneous environments (“detailed power-lawmodels”), or where the absence of detailed mechanistic information or measured data necessitates anaggregation of details (“simplified power-law models”). Detailed power-law models are a futureperspective given the limited technologies currently available to generate quantitative, sufficiently richand accurate time series datasets. The situation for simplified power-law models is however different.The detailed structure of the interactions in the majority of the signal transduction pathways is an openquestion, and the experimental data available are usually not sufficient to estimate parameters in largemodels with an acceptable level of confidence. In this context, the need for simplification is a reality,and simplified power-law models can make an interesting contribution to the modelling workflow inwhich mathematical models are iteratively improved.
The main problem associated with the use of power-law models is particular parameter estimation ofnonlinear models. Assuming that structural identifiability is guaranteed, two types of problems mayappear: several suboptimal solutions and different but equivalent solutions. While identifiability is ageneral problem for all kind of models, it is more evident when power-law models are considered. Thequestion is then whether the apparent increase in realism justifies the additional number of parametersthat we introduce in power-law models. There is no simple answer to this question, but some clearideas exist. First, a power-law model is not necessary when a kinetic model with similar level ofdescription is able to describe the dynamics of a system with sufficient accuracy. This is evident in thecase of very detailed mechanistic models where the complete network of interactions is considered. Indetailed models the number of parameters to be estimated is much higher in the power-law versionthan in a conventional kinetic model. However, power-law models become a realistic alternative whensimplified models are proposed.
Second, the use of a power-law model does not imply that all kinetic orders in a model need to takenon-integer numbers. Using prior knowledge and constraints on the parameter values can significantlyreduce the identifiability problem. Parameter estimation in biological pathway modelling is in any casea “supervised” process and for the remaining kinetic-orders, an iterative process can be implemented.In addition, although not considered here, statistical tests on the confidence intervals of kinetic orders

ACC
EPTE
D M
ANU
SCR
IPT
ACCEPTED MANUSCRIPT
17
and other approaches based on information theory could be used to decide on the use of non-integerkinetic orders (Kuhn 2005, Liebermeister et al. 2005).
To conclude our view is that power-law models are a useful intuitive strategy for the translation ofexperimental evidence into a simplified model. The ability of these models to reproduce complexinteractions enables the modeller to study general systemic properties of the system (includingamplification, inhibition strength, feedback loops) without prior knowledge. In this sense, the initialuse of a power-law model provides a strong basis for the development of more refined mechanisticmodels.
Acknowledgements
This work was supported by the European Commission 6th Framework program and as part of theCOSBICS project under contract LSHG-CT-2004-512060 (www.sbi.uni-rostock.de)
The authors appreciate comments by Dr. Christian Fleck and Prof. Dr. Jens Timmer from theUniversity of Freiburg, Germany for discussions. PD Dr. Ursula Klingmüller, Dr. Andrea C. Pfeiferand Julie Bachmann from the German Cancer Research Centre (DKFZ Heidelberg, Germany)provided information about the JAK2/STAT5 pathway. Prof. Walter Kolch and Dr. Oliver Rath fromthe Beatson Institute of Cancer Research (Glasgow, UK) provided data and information about the roleof RKIP in the NFkB and MAPK pathways.
ReferencesAtkins, P., de Paula, J. (2004) Atkins' Physical Chemistry (7th edition). Oxford University Press.
Cobelli, C., and DiStefano, J.J. 3rd (1980) Parameter and structural identifiability concepts andambiguities: a critical review and analysis. Am. J. Physiol. 239(1):7-24.
Cornish-Bowden, A. (2004) Fundamentals of Enzyme Kinetics (3rd edition). Portland Press, London.
Cox, B.G. (1993) Modern Liquid Phase Kinetics. Oxford University Press.
Balsa-Canto, E., Rodríguez-Fernández, M., Alonso, A.A., Banga, J.R. (2006) Computational design ofoptimal dynamic experiments in systems biology: a case study in cell signaling. 1st Understandingand Exploiting Systems Biology in Bioprocesses and Biomedicine (in press).
Burnham, K.P., and Anderson, D.R. (1998) Model selection and inference: a practical information-theoretic approach. Springer-Verlag, New York.
Dahl, S.G., Sylte, I. (2005) Molecular modelling of drug targets: the past, the present and the future.Basic Clin. Pharmacol. Toxicol. 96(3):151-5.
Elowitz, M.B., Surette, M.G., Wolf, P.E., Stock, J.B., Leibler, S. (1999) Protein mobility in thecytoplasm of Escherichia coli. J. Bacteriol. 181(1):197-203.
Engvall, E. and, Perlman, P. (1971) Enzyme-linked immunosorbent assay (ELISA). Quantitative assayof immunoglobulin G. Immunochemistry 8(9):871-4.
Errampalli, D.D., Priami, C., and Quaglia, P. (2004) A Formal Language for Computational SystemsBiology. OMICS: A Journal of Integrative Biology Vol. 8(4):370 -380.
Fell, D. (1997) Understanding the Control of Metabolism. Portland Press, London.
Gerber S.A., Rush J., Stemman O., Kirschner M.W., Gygi S.P. (2003) Absolute quantification ofproteins and phosphoproteins from cell lysates by tandem MS. Proc. Natl. Acad. Sci.100(12):6940-5.
Haile, J. (1992) Molecular Dynamics Simulation: Elementary Methods. John Wiley & Sons, Inc. NewYork.
Heiner, M., Koch, I. and Will, J. (2004) Model validation of biological pathways using Petri nets -demonstrated for apoptosis. Biosystems 75, 15-28.
Heyman J. (2006) Quantification of Activated Signal Transduction Proteins Using Fast ActivatedCell-based ELISAs (FACETM). Nature Application Notes. doi:10.1038/an1562.

ACC
EPTE
D M
ANU
SCR
IPT
ACCEPTED MANUSCRIPT
18
Heinrich, R., Schuster, S. (1996) The Regulation of Cellular Systems. Chapman and Hall, New York.
Kim, S.K., Jacobson, K.A. (2006) Computational prediction of homodimerization of the A(3)adenosine receptor. J. Mol. Graph. Model. [Epub ahead of print]
Kopelman, R. (1986) Rate processes on fractals: theory, simulations and experiments. J. Stat. Phys.42:185-200.
Kopelman, R. (1988) Fractal Reaction Kinetics. Science 241:1620-1626.
Kuhn, E., Lavielle, M. (2005) Maximum likelihood estimation in nonlinear mixed effects models.Computational Statistics & Data Analysis 49:1020-1038.
Liebermeister, W., Baur, U., Klipp, E. (2005) Biochemical network models simplified by balancedtruncation. FEBS Journal 272 4034-4043.
Luby-Phelps, K., Castle, P.E., Taylor, D.L., Lanni, F. (1987) Hindered diffusion of inert tracerparticles in the cytoplasm of mouse 3T3 cells. Proc. Natl. Acad. Sci. 84(14):4910-3.
Michalet X., Kapanidis A.N., Laurence T., Pinaud F., Doose S., Pflughoefft M., Weiss S. (2003) Thepower and prospects of fluorescence microscopies and spectroscopies. Annu. Rev. Biophys.Biomol. Struct. 32:161-82.
Millat, T., Bullinger, E., Rohwer, J., Wolkenhauer, O. (2006) Approximations and their consequencesfor dynamic modelling of signal transduction pathways. Math. Biosciences (in press).
Minton, A.P. (2001) The influence of macromolecular crowding and macromolecular confinement onbiochemical reactions in physiololgical media. J. Biol. Chem. 276: 10577-10580.
Moles, C.G., Mendes, P., and Banga, J.R. (2003) Parameter estimation in biochemical pathways: acomparison of global optimization methods. Genome Research 13(11):2467-2474.
Newhouse, J.S., Kopelman, R. (1988) Steady-state chemical kinetics on surface clusters and islands:Segregation of reactants. J. Phys. Chem. 92:1538-1541.
Picariello L., Carbonell Sala S., Martineti V., Gozzini A., Aragona P., Tognarini I., Paglierani M.,Nesi G., Brandi M.L., Tonelli F. (2006) A comparison of methods for the analysis of lowabundance proteins in desmoid tumor cells. Analytical Biochemistry 354(2): 205-212.
Rodriguez-Fernandez, M., Egea. J.A. and Banga, J.R. (2006a) Novel Metaheuristic for ParameterEstimation in Nonlinear Dynamic Biological Systems. BMC Bioinformatics 7:483.
Rodriguez-Fernandez, M., Mendes, P., Banga, J.R. (2006b) A hybrid approach for efficient and robustparameter estimation in biochemical pathways. Biosystems, 83 (2-3), 248-265.
Savageau, M.A. (1998) Development of fractal kinetic theory for enzyme-catalysed reactions andimplications for the design of biochemical pathways. Biosystems 47(1-2):9-36.
Schilling M., Maiwald T., Bohl S., Kollmann M., Kreutz C., Timmer J., Klingmüller U. (2005)Computational processing and error reduction strategies for standardized quantitative data inbiological networks. FEBS J. 272:6400-6411.
Schnell, S., Turner, T.E. (2004) Reaction kinetics in intracellular environments with macromolecularcrowding: simulations and rate laws. Prog. Biophys. Mol. Biol. 85(2-3):235-60.
Soule, H.D., Maloney, T.M., Wolman, S.R., Peterson Jr., W.D., Brenz, R., McGrath, C.M., Russo, J.,Pauley, R.J., Jones, R.F., Brooks, S.C. (1990) Isolation and characterization of a spontaneouslyimmortalized human breast epithelial cell line, MCF-10. Cancer Res. 50: 6075–6086.
Swameye, I., Mueller, T.G., Timmer, J., Sandra, O., Klingmüller, U. (2003) Identification ofnucleocytoplasmic cycling as a remote sensor in cellular signalling by data-based modelling. Proc.Natl. Acad. Sci. 100:1028-1033.
Van Kampen, N.G. (2001) Stochastic Processes in Physics and Chemistry (2nd edition). Elsevier,Amsterdam.
Veflingstad, S.R., Almeida, J., Voit, E.O. (2004) Priming nonlinear searches for pathwayidentification. Theoretical Biology and Medical Modelling 1:8 doi:10.1186/1742-4682-1-8.

ACC
EPTE
D M
ANU
SCR
IPT
ACCEPTED MANUSCRIPT
19
Verkman, A.S. (2002) Solute and macromolecule diffusion in cellular aqueous compartments. TrendsBiochem. Sci. 27(1):27-33.
Voit, E.O. (2000) Computational Analysis of Biochemical Systems. A Practical Guide for Biochemistsand Molecular Biologists. Cambridge University Press,UK.
Wellstead, P.E. and Edmunds, J.M. (1975) Least Squares Identification of Closed-Loop Systems, Int.J. Control, 21: 4-15.
Xu, Y., Luo, X., Shen, J., Zhu, W., Chen, K., Jiang, H. (2006) Molecular dynamics of nicotinicacetylcholine receptor correlating biological functions. Curr. Protein Pept. Sci.7(3):195-200.
Yeung, K., Seitz, T., Li, S., Janosch, P., McFerran, B., Kaiser, C., Fee, F., Katsanakis, K.D., Rose,D.W, Mischak, H., Sedivy, J.M., Kolch, W. (2001) Raf kinase inhibitor protein interacts with NF-kappaB-inducing kinase and TAK1 and inhibits NF-kappaB activation. Mol. Cell Biol.21(21):7207-17.
Yeung K., Seitz, T., Li, S., Janosch, P., McFerran, B., Kaiser, C., Fee, F., Katsanakis, K.D., Rose,D.W., Mischak, H., Sedivy, J.M., Kolch, W. (1999) Suppression of Raf-1 kinase activity andMAP kinase signalling by RKIP. Nature 401(6749):173-7.


