Embed Size (px)
Citation preview
Electronic copy of this paper is available at: http://ssrn.com/abstract=978759
Probability of Information-Based Trading, Intraday Liquidity and Corporate
Governance in the Brazilian Stock Market
Cláudio H. S. Barbedo
Ph. D. Student of Finance, The Coppead Graduate School of Business at the Federal
University of Rio de Janeiro (UFRJ)
PO Box 68514
Rio de Janeiro, RJ 21941-972 Brazil
Tel. +55-21-2598-9800
Fax +55-21-2598-9817
E-mail [email protected]
Eduardo Camilo-Da-Silva
Ph. D. Student of Finance, The Coppead Graduate School of Business at the Federal
University of Rio de Janeiro (UFRJ)
PO Box 68514
Rio de Janeiro, RJ 21941-972 Brazil
Tel. +55-21-2598-9800
Fax +55-21-2598-9817
E-mail [email protected]
Ricardo P. C. Leal*
Professor of Finance, The Coppead Graduate School of Business at the Federal University of
Rio de Janeiro (UFRJ)
PO Box 68514
Rio de Janeiro, RJ 21941-972 Brazil
Tel. +55-21-2598-9800
Fax +55-21-2598-9817
E-mail [email protected]
* Corresponding author

Electronic copy of this paper is available at: http://ssrn.com/abstract=978759
2
Probability of Information-Based Trading, Intraday Liquidity and Corporate
Governance in the Brazilian Stock Market
Abstract
Non-traditional listing rules on stock exchanges based on corporate governance practices
criteria may ensure investors a higher level of protection and constrain expropriation of
minority shareholders. We investigate how distinct listing levels, different according to the
quality of corporate governance practices, a natural experiment provided by the Brazilian
stock exchange (Bovespa), and liquidity levels are associated to the probability of informed
trading (PIN) using the number of intraday buy and sell orders. We find that PIN is lower in
stricter corporate governance practices listing levels, after controlling for liquidity. Greater
liquidity is associated to a lower PIN particularly due to the presence of non-informed
investors.
I – Introduction
Minority shareholder protection is a key issue in any stock market around the world
these days, especially in emerging markets. Expropriation of minority shareholders can be
accomplished in many ways and apparently is more frequent than one would expect,
according to Kraakman et al. (2004). When illegal insider trading goes unpunished, as seems
to be the case in most countries in Latin America, insiders may feel at ease to use their
privileged information to profit from trading in the market. Evidence of the wealth effects of
ineffective insider trading law enforcement is provided by Bhattacharya & Daouk (2002).
Suspicion of this kind of activity by investors causes adverse selection that may lead them to
avoid the market or asset due to the fear, completely justified, of entering into bad
transactions.
In fact, conflicts of interest, and agency conflicts, occur at several levels: shareholder
vs. managers; majority vs. minority shareholders; company vs. creditors; company vs.
suppliers, etc. It is very important that companies signal to the market that they are striving to
minimize the potential occurrence and the harmful effects of agency conflicts by pledging to
certain corporate governance policies and practices.

3
For each type of relationship with the potential to generate agency conflicts and
expropriation, there are many strategies recommended by several authors, see for example
Kraakman et al (2004), and entities, such as corporate governance practices improvement
organizations and multilateral organizations. Klapper & Love (2004), La Porta et al. (2002)
and Leal & Carvalhal-da-Silva (2007) have demonstrated that markets price the quality of a
firm’s corporate governance practices. This may be the reason why firms could be interested
to incur in this costly signaling about their behavior in relation to the best corporate
governance practices.
Bovespa, the São Paulo Stock Exchange, has adopted an interesting strategy to deal
with this potential costly signaling demand by firms. In 2001, it introduced its Differentiated
Corporate Governance Practices Trading Levels, many times called “Novo Mercado” or New
Market. These are premium trading lists with specific disclosure and corporate governance
practices requirements beyond what is mandated by corporate law in Brazil. Companies
pledge to practice the premium listing requirements by privately contracting with Bovespa.
What was very clever about Bovespa`s new market, compared to similar experiences
elsewhere, was that existing companies were free to migrate between listings when they
wished. Of course, new public firms are free to choose their listing segment at the time of
their IPO. To make migration easier for existing traditional listing firms, Bovespa created
three premium listings. Bovespa’s traditional listing had no listing requirements and no
disclosure and corporate governance practices requirements other than those in the corporate
law. The three new premium listing segments are Level 1 (L1), that requires mostly additional
disclosure, Level 2 (L2), that requires everything in L1 plus an assortment of corporate
governance practices, and, finally, the “Novo Mercado” proper (NM) which is equal to L2
with the additional requirement banning companies from using non voting shares, that
dominated the Brazilian stock market until recently. Table 1 shows a compilation of the
requirements of each one of the four listings currently in use at Bovespa.
(Insert Table 1 about here)
At the beginning of 2007, Bovespa`s new market initiative was already a success.
There were no IPOs first listing at the traditional segment of the market anymore. Many
companies migrated to L1, L2 or NM and these new listings now correspond to most of the
trading, largely due to L1. The three premium listings reached 100 companies, about a fourth
of the number of companies listed. At the same time, of its approximate US$ 2.2 billion daily

4
trading volume, L1 corresponded to about 40%, NM to approximately 20%, and L2 to 5%,
leaving the traditional listing and its 300 or so firms in the 35% of total trading volume
whereabouts. On February 28, 2007 Bovespa had 399 listed firms, of which 51 were listed at
the NM, 14 at L2, 36 at L1, 298 in the traditional listing. Analysts believe that the pressure is
now on the traditional listing companies to join. The traditional listing may eventually evolve
into a segment of the market tainted by a bad reputation of not practicing good disclosure and
corporate governance practices and of showing relatively low average liquidity.
Some studies have investigated corporate governance practices in Brazil. De Carvalho
& Pennacchi (2007) studied migration to Bovespa`s new market and report positive and
significant abnormal returns on the new listing segment joining day. They also report greater
liquidity and potentially lower control premiums. Carvalhal-da-Silva & Subrahmanyan (2007)
related lower control premiums to better corporate governance practices measured by a broad
index of such practices. Leal & Carvalhal-da-Silva (2007) report on positive impact of an
improvement of corporate governance practices on the market value of Brazilian companies.
Premium listings based on corporate governance practices may foster investor
confidence when trading as well. Investors may feel that there is a lower likelihood that they
are at the other end of an insider initiated transaction in which they may end up losing money
due to information asymmetry.
Previous works on the benefits of better corporate governance in emerging markets
have concentrated on broad corporate governance practices indexes, such as the metrics found
in Klapper & Love (2004) for several emerging markets and Leal & Carvalhal-da-Silva
(2007) for Brazil, among many others. Others have concentrated on ownership and control
concentration measures and non-management blockholders, such as Lins (2003), for many
emerging markets, for example. In general, these papers favor the notion of causality from
governance practices to value. Corporate governance practices indexes are based on the
presence or absence of specific practices or rules, such as board composition and voting rights
for minority shareholders. Despite their utility as indicators of the level of protection that an
investor enjoys at the firm level, they cannot offer an objective measure of the probability of
being expropriated. In other words, corporate governance indices do not offer a measure of
prevention of investor’s wealth expropriation. Besides, although the company declares to
abide by these practices, we don’t really know objectively if its insiders do.

5
If we consider that the occurrence of agency conflicts such as the inappropriate
execution and timing of insider trading cannot be identified ex post by the metrics of those
indices and that corporate governance practices identified in those indices cannot, necessarily
prevent insiders from performing inappropriate insider trading, one can raise the question if
these governance practices effectively prevent insiders from behaving in such a manner.
Created by Easley, Kiefer, O'Hara e Paperman (1996), the Probability of Information-
based Trading (PIN) intends to measure (ex post) the probability that transactions based on
insider information occurred. Cruces and Kawamura (2007) suggest that PIN can be used to
proxy for the quality of corporate governance practices at the firm level and analyze ADR
trading from seven Latin American stock markets, including Brazil. Easley, O’Hara &
Paperman (1998) and Easley, O’Hara & Saar (2001) are examples of other applications of
PIN.
Is this work, we seize the opportunity to measure the PIN in this unique institutional
feature presented by the choice of listing Bovespa offers to all firms, listed or not to-be-listed,
to join one of its four listing requirement sets: no requirement (traditional listing); mostly
disclosure requirements (L1); L1 plus better corporate governance practices requirements
(L2); and L2 with the banning of non-voting shares (NM).
We have used PIN to compare stocks in each one of the four lists. We suppose that
lists with more demanding corporate governance and disclosure requirements will show
lower PINs than inferior demand lists. Our results, within similar liquidity levels, confirm this
hypothesis. Comparing traditional to L1 stocks, two lists with similar liquidity levels, L1
stocks show a smaller PIN. Between L2 and NM stocks, which have similar liquidity levels
amongst themselves, NM stocks present the smaller PIN. Moreover, the more liquid stock
lists (traditional and L1) boast lower PINs than the less liquid lists (L2 and NM) because these
count on less non-informed traders. If L2 and NM liquidity rises by about 25%, their PIN
would decrease to the level of the more liquid stock lists. This paper is organized as follows.
We show the PIN model used in this study in section 2. Section 3 describes the sample and
presents the results and section 4 concludes the paper.
II - Probability of informed trading (PIN)
Easley, Kiefer, O'Hara and Paperman (1996) model the probability of informed
trading (PIN) based on sequential market trading. Buy and sell trades originate from

6
potentially informed or uninformed traders. Prices are provided by a risk neutral market
maker. An information based trade, in this case, is defined as a signal that can be translated
into some degree of private knowledge about the true value of the asset. The model assumes
that this signal results from insider information.
Using Easley & alli’s (1996) notation, suppose that at the beginning of a trading day
private information reaches the market (an information event) with probability α. In this case,
the information signal can be low (bad news) with probability δ or high (good news) with
probability (1-δ). The asset is then traded between informed and uninformed traders and at the
end of they day its full information value is realized. The advent of an information event and
its good or bad nature occurs only once per day. Uninformed traders arrive to the market
according to independent Poisson processes. Uninformed traders do not monitor information
signals and trade independently of any information event, so they can participate on the buy
side or on the sell side of the market with an arrival rate of ε. The model assumes equal
proportions of uninformed buyers and sellers. Easley et alli (1996) tested for different
proportions and found no significant impact on their model. On the other hand, informed
traders orders are based on the existence and type of information event they identified. They
trade only on the days when an information event occurred and only on one side of the
market. If the information sign is low, they sell, otherwise they buy. The arrival rate of
informed traders is denoted by μ. Figure 1 provides a graphical illustration of this trading
process and is reproduced from Easley et alli (1996, p. 1409).
(insert Figure 1 about here)
The model assumes that more buy orders are expected on good event days, more sell
orders are expected on bad event days, and fewer trades are expected on no information event
days as there are no informed traders in the market. The imbalance in the buy and sell orders
arise from the arrival of informed traders who participate only on one side of the market. This
indicates information based trading. The parameters θ = (α, δ, ε, μ) are obviously not directly
observable, however, as the order arrival processes of buys and sells are, the authors proposed
a likelihood function of θ based on the daily number of buys (B) and sells (S). Buy and sell
orders follow one of three independent Poisson processes, depending on whether there is a
good, a bad, or no event day. As we do not know which process is operating on any given
day, the likelihood is computed as a weighted average of the probability of observing a

particular number of buy and sell orders on a bad, good, and no event day. These weights are
probabilities given by (1-α) for no event days, αδ for bad event days, and α(1-δ) for good
event days. The likelihood function for a specified stock is given by:
( )
[ ]
( ) [ ]
.
!S)T(e
!BT)(e1
!ST)(e
!B)T(e
!S)T(e
!B)T(e1
),,, S,B(LI
1i
i
ST
i
BT)(
i
ST)(
i
BT
i
ST
i
BT
ii
ii
ii
∏
⎪⎪⎪⎪
⎭
⎪⎪⎪⎪
⎬
⎫
⎪⎪⎪⎪
⎩
⎪⎪⎪⎪
⎨
⎧
⎥⎥⎦
⎤
⎢⎢⎣
⎡ εε+μδ−α+
⎥⎥⎦
⎤
⎢⎢⎣
⎡ ε+μεαδ+
⎥⎥⎦
⎤
⎢⎢⎣
⎡ εεα−
=μδεα=
ε−ε+μ−
ε+μ−ε−
ε−ε−
(1)
where Bi e Si represent the total number of buys and sells during a time lapse T within day i,
and θ = (α, δ, ε, μ) is the parameter vector. Assuming independence across trading days, the
authors obtained the likelihood function over i=1, …,I days by calculating the product of the
daily likelihoods. Maximization obtains estimates of the rate of informed and uninformed
trading (μ and ε) as well as the probability a particular type of information event occurring (α
and δ) for the stock. A balanced daily level of buys and sells is interpreted as uninformed
trading and is used to identify ε while an unbalanced level of buys and sells per day is used to
identify μ. The maximum likelihood estimates of the information event parameters α and δ
reflect that an information event can happen (value 1) or not (value 0). The parameters are
then used to determine the probability of a trade being information-based, given by1
ε+αμαμ
=2
PI
The equation shows that the risk of information based trading is increasing in the
frequency of information events (captured by α), increasing in the number of informed traders
(captured by μ), and decreasing in the number of uninformed traders (captured by ε). The
model is simple in its structure and a good proxy for information based trading, however
empirical evidence suggests the requirement of incorporating cross-sectional correlation of
7
1 This probability is valid only during the trading period, i.e. the period in which the market maker prices a probability of an information event.

order flows so that one can have a well-specified model of informed trading. For example, a
high number of buy orders can be explained by a bull market as the number of sell orders by a
bear market. As the stock market behaves following tendencies according to the economic
situation or structural risks, we adopted in this work a filter based on Henke (2004), that
instead of considering one constant arrival rate for liquidity traders, distinguish between two
different states of the market. In the first state there is a bear market (with probability γ) and
in the second there is a bull market (with probability 1- γ) . In a bull market, the model
assumes additional buy and sell orders and liquidity traders arrive with rate φ. We use the
daily number of buys and sells of that stock as the input variables to estimate the parameters
for the stock. To obtain estimates of γ and φ, we aggregate the daily number of buy and sell
orders of in the stock market index. The new likelihood function is given by:
( )
[ ]
( ) [ ]
( ) [ ]
( ) [ ]
.
!)(
!)(1
!)(
!)(
!)(
!)(1
!])[(
!)(1
!)(
!))((
!)]([
!)]([1
)1(
), ,(1
)(
)(
))(2(
))(2(
))(2(
∏=
−+−
+−−−−
++−
++−
+−
⎪⎪⎪⎪⎪⎪⎪⎪⎪
⎭
⎪⎪⎪⎪⎪⎪⎪⎪⎪
⎬
⎫
⎪⎪⎪⎪⎪⎪⎪⎪⎪
⎩
⎪⎪⎪⎪⎪⎪⎪⎪⎪
⎨
⎧
⎪⎭
⎪⎬⎫
⎥⎦
⎤⎢⎣
⎡ +−+
⎪⎩
⎪⎨⎧
⎥⎦
⎤⎢⎣
⎡ ++⎥
⎦
⎤⎢⎣
⎡−
+
⎪⎪⎪⎪
⎭
⎪⎪⎪⎪
⎬
⎫
⎪⎪⎪⎪
⎩
⎪⎪⎪⎪
⎨
⎧
⎥⎦
⎤⎢⎣
⎡ +++−
+⎥⎦
⎤⎢⎣
⎡ +++
+⎥⎦
⎤⎢⎣
⎡ ++−
−
=I
i
i
ST
i
BT
i
ST
i
BT
i
ST
i
BT
i
S
i
BT
i
S
i
BT
i
S
i
BT
II
STe
BTe
STe
BTe
STe
BTe
ST
BTe
ST
BTe
ST
BTe
SBL
ii
iiii
ii
ii
ii
εεμδα
εμεαδεεαγ
φεφεμδα
φεμφεαδ
φεφεα
γ
γφ
εεμ
εμεεε
μεθ
μεθ
εθ
(2)
The new probability of a trade being information-based decreases in φ and is given by:
))1((2 φγεαμαμ
−++=PI
III – Sample and Results
8

9
Buy and sell orders were obtained from Bovespa’s intraday database, which includes
the time stamp (hour, minute and second) of each trade up to the millionth of a second and an
individual code for each order. We also had a list of actual transactions containing the code
for the buy and sell offers involved. As a result, we have 100% certainty that we correctly
identified transactions as either buy or sell. Based on the trade time, we also identified each
particular trade as arising from a buyer or a seller. Thus, we created a database of the number
of buyer-initiated and seller-initiated trades during each day between January 2, 2001 and
June 30, 2006. These data are 100% reliable and not artificially estimated with standard tick
tests. Previous works in the US use the Lee & Ready (1991) technique of identifying trades as
a buy or a sell based on the price being above or below the bid-ask spread midpoint and
cannot provide 100% certainty about the correct trade classification.
We selected a sample of 48 stocks from those listed in each one of Bovespa’s listing
segments (L1, L2, NM, and Traditional), 12 per segment. Within each 12-stock group, there
are six very liquid and six less liquid stocks. The aim was to build one portfolio for each
listing segment with differentiated liquidity levels and, because of the huge size of the
intraday dataset, we had to limit the number of stocks2. Table 2 presents the sampled firms
and their liquidity index. A liquidity index of 0.10 means that the company corresponded, at
best, to 0.10% of the market’s total trading volume if it traded in every trading day.
(insert table 2 about here)
The PIN parameters are estimated by maximization of the likelihood function in
Equations 1 and 2. The parameters α and δ are restricted to [0,1] and μ and ε are restricted to
[0,∞]. The likelihood function was maximized in a program procedure of S-Plus.
The average liquidity index of the most liquid stocks (2.1851) is substantially greater
than the average of the less liquid ones (0.0369) considering all stocks together. The average
liquidity index of the 12 stocks in the traditional listing segment (2.0922) is not substantially
different from the that of L1 stocks (1.6313). Moreover, the average liquidity index of the L2
stocks (0.4033) is not substantially different from the average liquidity index of those in NM
(0.3172). However, the average liquidity index of the most liquid stocks in the traditional and
L1 in table 2 is substantially greater than liquidity of those in the NM and L2 listings.
Traditional and L1 listing stocks are similar between themselves and distinct from those in
2 For each month, we had about 1.000.000 records of buy and sell orders.

10
NM and L2, which, by their turn, are similar between themselves in terms according to the
liquidity index.
The PIN and parameters estimation are presented in Table 3. Traditional listing stocks
present the lowest probability of informed trading. Next, L1 stocks present the lower average
probability, followed by NM and L2. We used the Kruskal-Wallis non-parametric test to
verify the null hypothesis of simultaneously similar distribution functions of the parameters in
each listing segment due to non-normality of parameter distributions. The Kruskal-Wallis
non-parametric test rejects the similar distribution function hypothesis for the PIN and two of
its four parameters.
(insert table 3 about here)
Traditional listing and L1 stocks have a lower frequency of private information events
(α) while NM and L2 stocks show a higher frequency of private information events although
this parameters distribution function is not the same across the four listings.
The probability of an information event being bad news (δ) and the arrival rate of
informed investors (μ) have a similar distribution across all listing segments while the arrival
rates of uninformed traders (ε) has not. The medians for the traditional and L1 listings are
greater than those for the NM and L2 listings. Thus, the higher PIN in the L2 and NM
segments may be explained not only by the greater probability of an informed event but by
the absence of sufficient uninformed traders. It seems that L2 and NM listings are different
from the most liquid segments in terms of the PIN and its parameters. Controlling for similar
liquidity levels, the PIN for L2 and NM, the PIN is lower for NM, which has the stricter
listing requirements than L2. However, the same does not seem to be true between the
traditional and L1 listings, with L1 showing a greater PIN and probability of informed event.
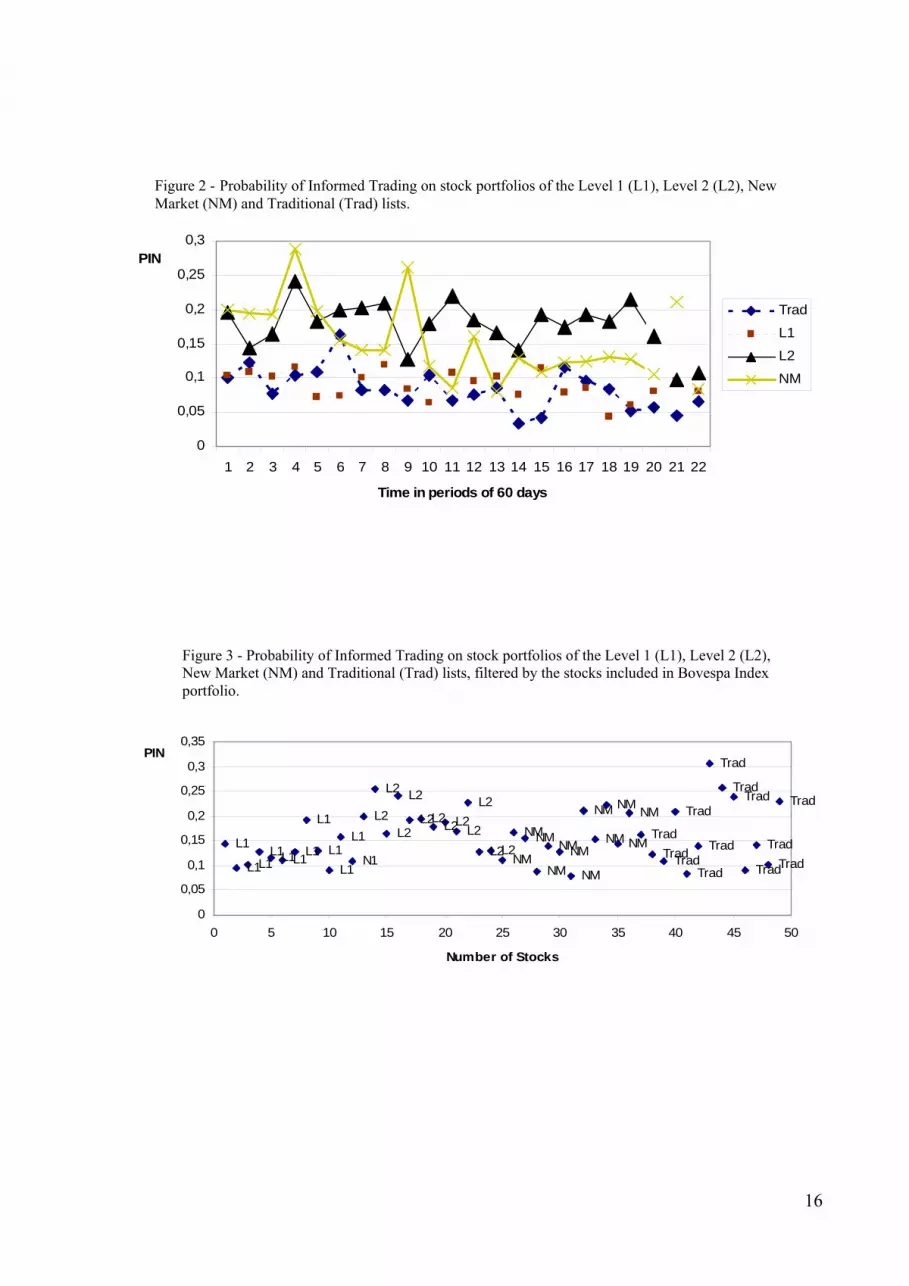
Figure 2 shows the time-varying behavior of the probability of informed trading. The
parameters were estimated for each 60 days according with Easley et al (1996). One can see
that traditional and L1 listing level portfolios present the lowest probability of informed
trading during all the studied period.
(insert Figure 2 about here)

11
We performed some simulations that show that a rise in the arrival rates of uninformed
traders from 2001 to 2006 of about 25% would be enough to match traditional and L1 PIN
levels with NM and L2 PIN. A higher PIN as a result of the relative scarcity of uninformed
traders is consistent with prior research of Easley et al (1996) and Brockman and Chung
(2000).
To take into account the potential bull and bear market bias in the number of buy and
sell orders, we estimated filtered PIN according to Equation 2, using stocks included in the
Bovespa index. The aim is to verify if the PIN of the traditional and L1 portfolio remain the
lowest. Figure 3 presents the result individually identifying each stock. A higher value in the
vertical axis means that the stock has a larger probability that buy and sell orders in the last 5
years were encouraged by private information. According with Figure 3, L1 stocks present the
lowest PIN. Table 4 presents the new PIN statistics in each listing.
(insert Figure 3 and table 4 about here)
NM stocks are more homogeneous because they present closest maximum and
minimum and the lowest standard deviation. We see the same when we look at the 6 most and
least liquid stocks. In summary, L1 stocks present the lowest PIN followed by traditional
listing stocks. As expected, traditional listing stocks present the largest difference between the
6 most and the 6 least liquid stocks and the greatest standard deviation. As in Table 3, the 12
L2 stocks present the highest PIN, however when we consider the most and least liquid
stocks, the 6 less liquid traditional listing stocks present the highest PIN.
There is an obvious relationship between market liquidity and probability of informed
trading. When the market liquidity increases, there is a lower PIN and higher arrival rates of
uninformed traders. It seems that listing level requirements have an influence after one
controls for market liquidity. According to table 4, the PIN is greater when listing
requirements are less stringent. Therefore, if we consider that the liquidity of the traditional
and L1 listings are similar, the highest average PIN is in the least stringent listing
(traditional). The same occurs if we consider that the NM and L2 liquidity is similar. Then,
NM PIN is the lowest among the two while it is the listing segment with the most demanding
requirements of all. Thus, given liquidity, better corporate governance practices means a
lower probability of informed trading.
IV – Conclusion
12
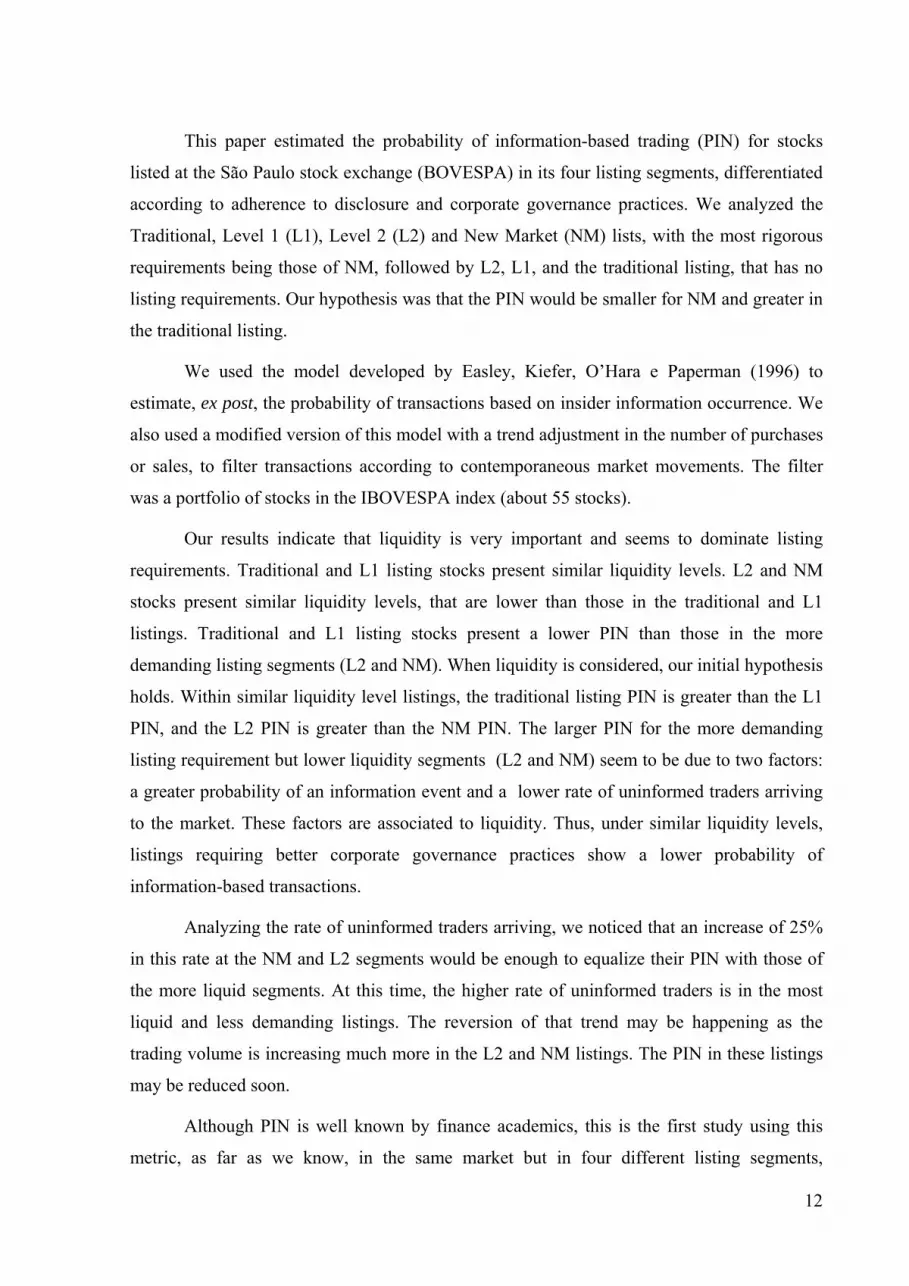
This paper estimated the probability of information-based trading (PIN) for stocks
listed at the São Paulo stock exchange (BOVESPA) in its four listing segments, differentiated
according to adherence to disclosure and corporate governance practices. We analyzed the
Traditional, Level 1 (L1), Level 2 (L2) and New Market (NM) lists, with the most rigorous
requirements being those of NM, followed by L2, L1, and the traditional listing, that has no
listing requirements. Our hypothesis was that the PIN would be smaller for NM and greater in
the traditional listing.
We used the model developed by Easley, Kiefer, O’Hara e Paperman (1996) to
estimate, ex post, the probability of transactions based on insider information occurrence. We
also used a modified version of this model with a trend adjustment in the number of purchases
or sales, to filter transactions according to contemporaneous market movements. The filter
was a portfolio of stocks in the IBOVESPA index (about 55 stocks).
Our results indicate that liquidity is very important and seems to dominate listing
requirements. Traditional and L1 listing stocks present similar liquidity levels. L2 and NM
stocks present similar liquidity levels, that are lower than those in the traditional and L1
listings. Traditional and L1 listing stocks present a lower PIN than those in the more
demanding listing segments (L2 and NM). When liquidity is considered, our initial hypothesis
holds. Within similar liquidity level listings, the traditional listing PIN is greater than the L1
PIN, and the L2 PIN is greater than the NM PIN. The larger PIN for the more demanding
listing requirement but lower liquidity segments (L2 and NM) seem to be due to two factors:
a greater probability of an information event and a lower rate of uninformed traders arriving
to the market. These factors are associated to liquidity. Thus, under similar liquidity levels,
listings requiring better corporate governance practices show a lower probability of
information-based transactions.
Analyzing the rate of uninformed traders arriving, we noticed that an increase of 25%
in this rate at the NM and L2 segments would be enough to equalize their PIN with those of
the more liquid segments. At this time, the higher rate of uninformed traders is in the most
liquid and less demanding listings. The reversion of that trend may be happening as the
trading volume is increasing much more in the L2 and NM listings. The PIN in these listings
may be reduced soon.
Although PIN is well known by finance academics, this is the first study using this
metric, as far as we know, in the same market but in four different listing segments,

13
differentiated according to disclosure and corporate governance practices. BOVESPA offers a
singular institutional feature that we took advantage of.
V - References
Bhattacharya, U., and H. Daouk. “The World Price of Insider Trading.” Journal of Finance,
57 (2002), 75-108.
Brockman, P., and D. Y. Chung. “Informed and uninformed trading in an electronic, order-
driven environment.” Financial Review, 35 (2000), 125–146.
Carvalhal-da-Silva, A. L., and A. Subrahmanyam. “Dual-Class Premium, Corporate
Governance, and the Mandatory Bid Rule: Evidence from the Brazilian Stock Market.”
Journal of Corporate Finance, forthcoming (2007).
Cruces, J., and E. Kawamura. “Insider trading and corporate governance in Latin America”,
In: Investor Protection and Corporate Governance – Firm Level Evidence Across Latin
America, F. Lopez-de-Silanes and A. Chong, eds. Palo Alto: Stanford University Press
(2007). (Also in: Research Network Working Paper R-513. Washington, DC, United
States: Inter-American Development Bank, Research Department).
De Carvalho, A. G., and G. G. Pennacchi. “Can a stock exchange improve corporate
behavior? Evidence from firm’s migration to premium listings in Brazil.” Working paper,
(2007). (Previous version available at http://ssrn.com/abstract=678282).
Easley, D., N. Kiefer, M. O’Hara, and J. Paperman. “Liquidity, information and infrequently
traded stocks.” Journal of Finance, 51 (1996), 1405–36.
Easley, D., M. O’Hara, J. Paperman. “Financial analysts and information-based trade.”
Journal of Financial Markets, 1 (1998), 175–201.
Easley, D., M. O’Hara, and G. Saar. “How stock splits affect trading: A microstructure
approach.” Journal of Financial and Quantitative Analysis, 36 (2001), 25–51.
Henke, H. “Correlation of Order Flow and the Probability of Informed Trading.” European
University Viadrina, Working Paper (2004).
Klapper, L., and I. Love. “Corporate Governance, Investor Protection and Performance in
Emerging Markets.” Journal of Corporate Finance, 10 (2004), 703-728.

14
Kraakman, R., P. Davies, H. Hansmann, G. Hertig, K. Hopt, K. Hideki, and E. Rock. The
Anatomy of Corporate Law: A comparative and functional approach. Oxford: Oxford
University Press (2004).
La Porta, R., F. Lopez-de-Silanes, A. Shleifer, R. Vishny. “Investor Protection and Corporate
Valuation.” Journal of Finance, 57 (2002), 1147-1170.
Leal, R. P. C., and A. L. Carvalhal-da-Silva. “Corporate Governance and Value in Brazil (and
Chile)”. In: Investor Protection and Corporate Governance – Firm Level Evidence Across
Latin America, F. Lopez-de-Silanes and A. Chong, eds. Palo Alto: Stanford University
Press (2007). (Also in: Research Network Working Paper R-514. Washington, DC, United
States: Inter-American Development Bank, Research Department).
Lee, C., and M. Ready. “Inferring Trade Direction from Intraday Data.” Journal of Finance,
46 (1991), 733-746.
Lins, K. V. “Equity Ownership and Firm Value in Emerging Markets.” Journal of Financial
and Quantitative Analysis, 38 (2003), 159-184.

Figure 1: The Easley et al (1996) model of private information trading
Information event
Probability = α
No Information event Probability = (1 - α)
Bad NewsProbability = δ
Good NewsProbability = (1-δ)
Buy arrival rate ε
Buy arrival rate ε + μ
Buy arrival rate ε
Sell arrival rate ε + μ
Sell arrival rate ε
Sell arrival rate ε
α is the probability of an information event occurring δ is the probability of an information event bring a bad new ε is the daily rate of uniformed tradersμ is the daily rate of informed traders
15
0
0,05
0,1
0,15
0,2
0,25
0,3
1 2 3 4 5 6 7 8 9 10 11 12 13 14 15 16 17 18 19 20 21 22
Time in periods of 60 days
PIN
Trad
L1
L2
NM
Figure 2 - Probability of Informed Trading on stock portfolios of the Level 1 (L1), Level 2 (L2), New Market (NM) and Traditional (Trad) lists.
Figure 3 - Probability of Informed Trading on stock portfolios of the Level 1 (L1), Level 2 (L2), New Market (NM) and Traditional (Trad) lists, filtered by the stocks included in Bovespa Index portfolio.
L1
L1L1L1L1L1L1
L1
L1L1
L1
N1
L2
L2
L2
L2
L2L2L2L2L2
L2
L2L2NM
NMNM
NM
NMNM
NM
NM
NM
NM
NM
NM
TradTradTrad
Trad
Trad
Trad
Trad
TradTrad
Trad
TradTrad
Trad
0
0,05
0,1
0,15
0,2
0,25
0,3
0,35
0 5 10 15 20 25 30 35 40 45 50
Number of Stocks
PIN
16

Firm Class Liquidity Firm Class LiquidityTraditional listing 6 most liquid stocks: Level 1 6 most liquid stocks:Petrobras PN 9.6071 Vale Rio Do PNA 6.7681Telemar Par PN 4.6248 Bradesco PN 3.6033Usiminas PNA 3.8601 Itaú Hold. PN 2.6651Sid Nacional ON 2.6765 Gerdau PN 2.4872Caemi PN 2.4517 Braskem PNA 2.1819Eletrobras PNB 1.8425 Cemig PN 1.7788Average 4,1771 Average 3,2507Traditional listing 6 least liquid stocks: Level 1 6 least liquid stocks:Telefônica Hold. PN 0.0078 Unibanco ON 0.0190Petroq. União PN 0.0076 Itausa ON 0.0160Tele Norte Cel. ON 0.0073 Unibanco PN 0.0133F Cataguazes PNA 0.0072 Mangels PN 0.0081M&G Poliest ON 0.0071 Aracruz ON 0.0075Tele Sudeste Cel. ON 0.0067 Braskem ON 0.0071Average 0,0073 Average 0,0118New Market 6 most liquid stocks Level 2 6 most liquid stocksCCR Rodovias ON 0.7965 Net PN 1.8680Sabesp ON 0.6432 Celesc PNB 0.6010Natura ON 0.5891 TAM PN 0.5502Light ON 0.5242 ALL A. Lati UNT 0.5145Perdigão PN 0.4963 Gol PN 0.4661Cosan ON 0.4322 Eletropaulo PN 0.3936Average 0,5803 Average 0,7322New Market 6 least liquid stocks Level 2 6 least liquid stocksPorto Seguro ON 0.1372 UOL PN 0.1545Gafisa ON 0.0822 Marcopolo PN 0.1049Copasa MG ON 0.0504 Eternit ON 0.0813Company ON 0.0238 Saraiva Livr PN 0.0507Totvs ON 0.0217 Vivax UNT 0.0426American Banknote ON 0.0095 Equatorial UNT 0.0116Average 0,0541 Average 0,0743
Table 2Sampled firms and their listing segment: Traditional, New Market, Level 1 and
Level 2 with the correponding liquidity index.
Note: (1) stock classes are either voting common shares (ON), non voting shares (PN, PNA or PNB), or units (UNT) which are a certificate that may be a combination of voting and non voting shares. (2) the liquidity index is computed for the January 2, 2001 through June 30, 2006 period as: 100 x p/P x (n/N x v/V)1/2 where p is the number of days in which there was at least one trade on the stock in the period; P is the total number of days in the period; n is the number of trades on the stock in the period; N is the total number of trades in the market in the period; v is the volume traded on the stock in the period; and V is the totalmarket trading volume in the period.
17

Statistic Trad L1 L2 NMAverage 0.3038 0.3323 0.5214 0.4932Median 0.3091 0.3421 0.5267 0.4694
Maximum 0.5810 0.4554 0.6867 10.000Minimum 0.0673 0.1117 0.3136 0.2178St. Dev. 0.1250 0.0949 0.1048 0.1974
1st Quart. 0.2136 0.2867 0.4524 0.37993rd Quart. 0.3744 0.4041 0.5890 0.5188
Kruskal-Wallis test p-value 0.0000Average 0.3919 0.3014 0.3667 0.4234Median 0.3738 0.2570 0.3563 0.4105
Maximum 0.7656 0.7347 0.5949 0.6639Minimum 0.0924 0.0214 0.1994 0.1138St. Dev. 0.1837 0.2089 0.1145 0.1534
1st Quart. 0.2786 0.1392 0.2871 0.33883rd Quart. 0.5472 0.4634 0.4592 0.5499
Kruskal-Wallis test p-value 0.1559Average 349.026 327.544 353.253 351.927Median 336.042 336.618 352.778 333.533
Maximum 577.787 479.236 477.998 496.334Minimum 218.098 200.444 100.000 193.122St. Dev. 99.422 69.770 73.643 85.292
1st Quart. 268.225 286.411 333.854 301.5863rd Quart. 421.437 354.698 373.946 426.491
Kruskal-Wallis test p-value 0.2915Average 539.899 529.977 432.398 468.655Median 544.519 521.259 436.120 485.934
Maximum 609.701 627.788 549.608 556.424Minimum 465.334 478.654 100.000 291.878St. Dev. 36.132 40.638 85.944 68.252
1st Quart. 509.670 506.631 412.723 453.2703rd Quart. 563.512 539.370 468.778 516.708
Kruskal-Wallis test p-value 0.0000Average 0.0831 0.0894 0.1763 0.1526Median 0.0827 0.0901 0.1830 0.1356
Maximum 0.1628 0.1196 0.2415 0.2890Minimum 0.0339 0.0439 0.0967 0.0800St. Dev. 0.0301 0.0196 0.0361 0.0557
1st Quart. 0.0654 0.0762 0.1622 0.11813rd Quart. 0.1025 0.1034 0.1990 0.1942
Kruskal-Wallis test p-value 0.0000
α(Probability of an information
event)
⎠ /!probability of a bad new
information⎠
⎠ /(Informed traders rate)
⎠/(Uninformed traders rate)
PIN
Table 3 Probability of Informed Trading Statistics of 12-stock portfolios in the
Level 1 (L1), Level 2 (L2), New Market (NM) and Traditional (Trad) lists. P-Values reports Kruskal-Wallis test results to verify the null hypothesis
of simultaneously similar distribution functions for the parameters in each listing segment.
18

Trad L1 L2 NM6 most liquid stocks in each listingAverage 0,1273 0,1148 0,1869 0,1402Median 0,1163 0,114 0,1969 0,1483St. Dev. 0,0352 0,0124 0,0597 0,04986 less liquid stocks in each listingAverage 0,2152 0,1361 0,1748 0,1601Median 0,2228 0,1371 0,1781 0,1474St. Dev. 0,0663 0,0368 0,0429 0,044112-stock portfolio (most and least liquid)Average 0.1626 0.1236 0.1929 0.1610Median 0.1334 0.1084 0.1842 0.1494Maximum 0.6718 0.5564 0.5987 0.2987Minimum 0.0304 0.0000 0.0412 0.0780St. Dev. 0.0985 0.0685 0.0742 0.04881st Quart. 0.0907 0.0875 0.1418 0.12803rd Quart. 0.1996 0.1374 0.2285 0.1991
Table 4Probability of Informed Trading of stock portfolios in the
Level 1 (L1), Level 2 (L2), New Market (NM) and Traditional (Trad) lists, filtered by the stocks included in
Bovespa Index portfolio.
19


