Embed Size (px)
Citation preview
Environmental solutions delivered uncommonly well
PROJECT REPORT Interfor U.S. Inc. > Perry Mill
Continuous Kiln Construction Permit Application
TRINITYCONSULTANTS3495PiedmontRoadBuilding10,Suite905Atlanta,Georgia30305
(678)441‐9977
Original:September2018Revised:January2019
Project181101.0133
Interfor U.S. Inc. – Perry Mill | Continuous Kiln Construction Permit Application Trinity Consultants i
TABLE OF CONTENTS
1. EXECUTIVE SUMMARY 1-1 1.1.ProposedProject...................................................................................................................................................1‐1 1.2.PermittingandRegulatoryRequirements....................................................................................................1‐2 1.3.BACTDetermination.............................................................................................................................................1‐4 1.4.ApplicationOrganization....................................................................................................................................1‐4
2. DESCRIPTION OF FACILITY 2-1 2.1.CurrentFacilityDescription...............................................................................................................................2‐1
2.1.1.LogPreparation/Sawmill...................................................................................................................................................2‐1 2.1.2.BatchKilns...................................................................................................................................................................................2‐1 2.1.3.PlanerMill....................................................................................................................................................................................2‐1 2.1.4.RemanMill...................................................................................................................................................................................2‐1 2.1.5.MiscellaneousSources............................................................................................................................................................2‐1
2.2.ProjectDescription...............................................................................................................................................2‐2 2.2.1.ContinuousKilnInstallation................................................................................................................................................2‐2 2.2.2.AssociatedAncillaryEmissionUnits.................................................................................................................................2‐2
3. EMISSION CALCULATION METHODOLOGY 3-1 3.1.NSRPermittingEvaluationMethodology.......................................................................................................3‐1
3.1.1.DefiningExistingversusNewEmissionUnits...............................................................................................................3‐1 3.1.2.AnnualEmissionIncreaseCalculationMethodology................................................................................................3‐2
3.2.ProposedProjectEmissionsIncreases...........................................................................................................3‐3 3.2.1.Direct‐FiredContinuousKiln(New).................................................................................................................................3‐3 3.2.2.FuelSilo(New)...........................................................................................................................................................................3‐3 3.2.3.EmergencyFirePump(New)...............................................................................................................................................3‐3 3.2.4.AncillaryEquipmentEmissionIncreases........................................................................................................................3‐4 3.2.5.ProjectEmissionsIncreases..................................................................................................................................................3‐5
4. REGULATORY REVIEW 4-1 4.1.NewSourceReviewApplicability.....................................................................................................................4‐1 4.2.FederalRegulatoryApplicability.....................................................................................................................4‐2
4.2.1.TitleVOperatingPermitProgram....................................................................................................................................4‐3 4.2.2.NewSourcePerformanceStandards................................................................................................................................4‐3 4.2.3.NationalEmissionStandardsforHazardousAirPollutants..................................................................................4‐4 4.2.4.ComplianceAssuranceMonitoringRegulations..........................................................................................................4‐6
4.3.StateRegulatoryApplicability...........................................................................................................................4‐6 4.3.1.GRAQC391‐3‐1‐.02(2)(b)–VisibleEmissions..............................................................................................................4‐6 4.3.2.GRAQC391‐3‐1‐.02(2)(c)–Incinerators........................................................................................................................4‐7 4.3.3.GRAQC391‐3‐1‐.02(2)(d)–FuelBurningEquipment..............................................................................................4‐7 4.3.4.GRAQC391‐3‐1‐.02(2)(e)–ParticulateEmissionfromManufacturingProcesses......................................4‐7 4.3.5.GRAQC391‐3‐1‐.02(2)(g)–SulfurDioxide....................................................................................................................4‐7 4.3.6.GRAQC391‐3‐1‐.02(2)(n)–FugitiveDust......................................................................................................................4‐8 4.3.7.GRAQC391‐3‐1‐.02(2)(tt)–VOCEmissionsfromMajorSources........................................................................4‐8 4.3.8.GRAQC391‐3‐1‐.02(2)(uu)–VisibilityProtection.....................................................................................................4‐8 4.3.9.GRAQC391‐3‐1‐.02(2)(yy)–EmissionsofNitrogenOxidesfromMajorSources..........................................4‐8 4.3.10.GRAQC391‐3‐1‐.02(2)(lll)–NOXEmissionsfromFuel‐burningEquipment................................................4‐8
Interfor U.S. Inc. – Perry Mill | Continuous Kiln Construction Permit Application Trinity Consultants ii
4.3.11.GRAQC391‐3‐1‐.02(2)(mmm)–NOXEmissionsfromStationaryGasTurbinesandStationaryEnginesusedtoGenerateElectricity............................................................................................................................................4‐8 4.3.12.GRAQC391‐3‐1‐.02(2)(rrr)–NOXEmissionsfromSmallFuel‐BurningEquipment.................................4‐8 4.3.13.GRAQC391‐3‐1‐.03(1)–Construction(SIP)Permitting.......................................................................................4‐9 4.3.14.GRAQC391‐3‐1‐.03(10)–TitleVOperatingPermits.............................................................................................4‐9 4.3.15.IncorporationofFederalRegulationsbyReference................................................................................................4‐9 4.3.16.Non‐ApplicabilityofOtherGRAQC..................................................................................................................................4‐9
5. BEST AVAILABLE CONTROL TECHNOLOGY ASSESSMENT 5-1 5.1.BACTDefinition......................................................................................................................................................5‐1
5.1.1.EmissionLimitation.................................................................................................................................................................5‐1 5.1.2.Case‐by‐CaseBasis....................................................................................................................................................................5‐2 5.1.3.Achievable....................................................................................................................................................................................5‐3 5.1.4.Floor................................................................................................................................................................................................5‐4
5.2.BACTRequirement................................................................................................................................................5‐4 5.3.BACTAssessmentMethodology........................................................................................................................5‐4
5.3.1.IdentificationofPotentialControlTechnologies........................................................................................................5‐4 5.3.2.EconomicFeasibilityCalculationProcess......................................................................................................................5‐5
5.4.LumberDryingKiln–VOCBACT......................................................................................................................5‐6 5.4.1.IdentificationofPotentialControlTechniques(Step1)..........................................................................................5‐6 5.4.2.EliminationofTechnicallyInfeasibleControlOptions(Step2)............................................................................5‐9 5.4.3.RankofRemainingControlTechnologies(Step3)..................................................................................................5‐10 5.4.4.EvaluationofMostStringentControls(Step4)........................................................................................................5‐11 5.4.5.SelectionofBACT(Step5)..................................................................................................................................................5‐11
5.5.EmergencyFire‐WaterPump‐VOCBACT..................................................................................................5‐11 5.5.1.IdentificationofPotentialControlTechniques(Step1).......................................................................................5‐12 5.5.2.EliminationofTechnicallyInfeasibleControlOptions(Step2).........................................................................5‐12 5.5.3.RankofRemainingControlTechnologies(Step3)..................................................................................................5‐13 5.5.4.EvaluationofMostStringentControls(Step4)........................................................................................................5‐13 5.5.5.SelectionofBACT(Step5)..................................................................................................................................................5‐13
6. CLASS I AREA ANALYSIS 6-1
7. ADDITIONAL IMPACT ANALYSIS 7-1 7.1.AirQualityAnalysis..............................................................................................................................................7‐1 7.2.MobileSources.......................................................................................................................................................7‐1 7.3.GrowthImpacts......................................................................................................................................................7‐1 7.4.SoilsandVegetation.............................................................................................................................................7‐1 7.5.VisibilityImpairment...........................................................................................................................................7‐2 7.6.OzoneImpactAnalysis.........................................................................................................................................7‐2
7.6.1.OzoneMERPsAssessment......................................................................................................................................................7‐4 7.6.2.PM2.5MERPsAssessment........................................................................................................................................................7‐4
8. TOXIC AIR POLLUTANT EMISSIONS IMPACT ASSESSMENT 8-1 8.1.ModelingAssessment...........................................................................................................................................8‐1
8.1.1.SourceParameters...................................................................................................................................................................8‐1 8.1.2.LandUseClassification...........................................................................................................................................................8‐8 8.1.3.ModelingProtocol.....................................................................................................................................................................8‐9 8.1.4.ModelingResults....................................................................................................................................................................8‐10
APPENDIX A: FACILITY DIAGRAMS A
Interfor U.S. Inc. – Perry Mill | Continuous Kiln Construction Permit Application Trinity Consultants iii
APPENDIX B: EMISSION CALCULATIONS B
APPENDIX C: SIP APPLICATION FORMS C
APPENDIX D: BACT SUPPORTING CALCULATIONS D
APPENDIX E: RACT/BACT/LAER CLEARING HOUSE DATABASE REPORT E
APPENDIX F: TOXIC MODELING DOCUMENTATION F
APPENDIX G: ELECTRONIC TOXIC MODELING FILES G
APPENDIX H: LETTERS TO FEDERAL LAND MANAGERS H
Interfor U.S. Inc. – Perry Mill | Continuous Kiln Construction Permit Application Trinity Consultants iv
LIST OF TABLES
Table1‐1.ProposedProjectNetEmissions..........................................................................................................................................1‐3
Table1‐2.ProposedBACTSummary......................................................................................................................................................1‐4
Table3‐1.ProjectEmissionsIncrease...................................................................................................................................................3‐6
Table4‐1.NetEmissionIncreasesComparedtoPSDSER............................................................................................................4‐2
Table5‐1.RemainingVOCControlTechnologies...........................................................................................................................5‐11
Table5‐2.RemainingVOCControlTechnologies..........................................................................................................................5‐13
Table6‐1.ClassIAreaswithin300kmofInterforPerryMill......................................................................................................6‐1
Table6‐2.CombinedAnnualEmissionsIncrease..............................................................................................................................6‐2
Table6‐3.Q/DAnalysis.................................................................................................................................................................................6‐2
Table7‐1.OzoneConcentrationatBibbCountyMonitor.............................................................................................................7‐2
Table7‐2.UrbanizationDataforHoustonCounty............................................................................................................................7‐3
Table7‐3.DefaultMERPValuesforGeorgiaPSDApplications...................................................................................................7‐4
Table8‐1.BatchKilnInformation............................................................................................................................................................8‐2
Table8‐2.AdjustedStackDiameterCalculationforExistingKilns...........................................................................................8‐4
Table8‐3.BoilerEmissionRates.............................................................................................................................................................8‐5
Table8‐4.PointSourceParameters........................................................................................................................................................8‐6
Table8‐5.PointSourceEmissionRates.................................................................................................................................................8‐7
Table8‐6.SummaryofLandUseAnalysis............................................................................................................................................8‐9
Table8‐7.ISCST3AirDispersionModelingResults......................................................................................................................8‐10
Interfor U.S. Inc. – Perry Mill | Continuous Kiln Construction Permit Application Trinity Consultants 1-1
1. EXECUTIVE SUMMARY
InterforU.S.Inc.(Interfor)ownsandoperatesalumbermillinPerry,HoustonCounty,Georgia(PerryMill).ThefacilitycurrentlyoperatesunderPermitNo.2421‐153‐0011‐V‐05‐0,effectiveJuly24,2018.ThefacilitymeetsthedefinitionofamajorstationarysourceundertheGeorgiaEnvironmentalProtectionDivision’s(EPD)airregulationsandisthereforerequiredtomaintainaTitleVoperatingpermit.InterforisproposingmodificationstothePerryMillthatwillincreaseitsproductioncapacityofkilndriedlumber.ThisapplicationpackagecontainsthenecessarystateairconstructionpermitapplicationandTitleVoperatingpermitmodificationelementsrelatedtotheproposedproject.Duetothetimingoftheproposedconstructionschedule(Q1/Q22019),InterforisrequestingthispermitapplicationtobeprocessedviatheGeorgiaEnvironmentalProtectionDivision(EPD)’sExpeditedPermittingProgram.Theapplicableapplicationformissubmittedinthisapplicationnotingthetypeofapplication.TheMillislocatedinHoustonCounty,whichiscurrentlydesignatedas“attainment”or“unclassifiable”forallcriteriapollutant’sNationalAmbientAirQualityStandard(NAAQS).Therefore,theproposedprojectisnotsubjecttoNonattainmentNewSourceReview(NNSR)andispotentiallysubjecttoPreventionofSignificantDeterioration(PSD)permitting,whichisdiscussedinSection4.1ofthisapplication.
Lumbermillsarenotonthelistof28namedsourcecategories.Therefore,thePSDmajorsourcethresholdis250tonperyear(tpy)ofacriteriaairpollutant.ThePerryMillisanexistingmajorPSDsource,sincepotentialemissionsofseveralcriteriaairpollutantsexceedthe250tpythreshold.Thus,thenetemissionincreasesfromtheprojectmustbecomparedtothePSDSignificantEmissionRates(SER)todetermineifPSDpermittingisrequired.InterforhasdeterminedthatnetemissionsincreasefromtheprojectwillexceedtheSERforvolatileorganiccompounds(VOC).AdditionalinformationonthenetemissionincreasecalculationscanbefoundinSection3.
AirDispersionModelingisrequiredforallpollutantsthatthenetemissionsincreasefromtheprojectexceedstheSERandthathaveaNAAQS.VOCdoesnothaveaNAAQStodetermineifthecountyisin“attainment”or“nonattainment,”therefore,modelingforcriteriapollutantswasnotcompletedforthisPSDapplication.However,astheprojectinvolvestheadditionofanewlumberdryingkiln,whichproducescertaintoxicairpollutants(TAP)regulatedbyEPD,toxicsmodelinghasbeenincludedaspartofthisapplication.VOCisaprecursortotheformationofozone.Astheprojectemissionsincreaseislessthantherelevantmodeledemissionrateforprecursors(MERPs),theprojectcanbeshowntonotcauseorcontributetoanexceedanceoftheozoneNAAQS,asdiscussedinSection7.6.
AsrequiredbyGeorgiaEnvironmentalProtectionDivision(EPD),acompletepermitapplication(ApplicationNo.278859)hasalsobeensubmittedonlineusingtheGeorgiaEPDOnlineSystem(GEOS).
1.1. PROPOSED PROJECT
Interforissubmittingthisapplicationtoinstallanewcontinuous,direct‐firedlumberkilnratedatapproximately120millionboardfeet(MMBF)peryear(MMBF/yr).Anewfiresuppressionsystemwithadiesel‐firedfirepumpwillbeinstalledtosupportthecontinuouskiln.Noneoftheexistingancillaryequipmentwillbemodifiedorshutdown;however,therewillbeanincreasedthroughputforalloftheancillaryequipmentandemissionssources,includingthesawmill,debarker,planermill,materialtransferequipment,planerhog,chipper,andtrucktrafficonthemillroads.Therefore,theseoperationswillbetreatedasassociatedemissionunitsinthePSDanalysis.
Interfor U.S. Inc. – Perry Mill | Continuous Kiln Construction Permit Application Trinity Consultants 1-2
1.2. PERMITTING AND REGULATORY REQUIREMENTS
InterforissubmittingthiscombinedconstructionpermitapplicationandTitleVsignificantmodificationapplicationtoEPDtorequestauthorizationtoinstallandoperatetheproposedcontinuouslumberdryingkilnundertheprovisionsofEPDRulesforAirQualityControl,Chapter391‐3‐1.Interforanticipatesinitiatingconstructionoftheprojectduringthefirst(1st)orsecond(2nd)quarterof2019.
ThePerryMillislocatedinHoustonCounty,whichisdesignatedas“attainment”or“unclassifiable”forallpollutants.Therefore,netemissionincreasesfromtheproposedprojectandassociatedemissionunitincreasesmustbeevaluatedandcomparedtotheSERforregulatedpollutantsforPSDpermittingapplicability.ThepollutantsevaluatedforPSDapplicabilityincludecarbonmonoxide(CO),oxidesofnitrogen(NOX),sulfurdioxide(SO2),VOC,particulatematter(PM),particulatematterlessthan10micronsindiameter(PM10),particulatematterlessthan2.5micronsindiameter(PM2.5),lead(Pb),andgreenhousegases(GHGs)intheformofcarbondioxideequivalents(CO2e)asshowninTable1‐1.1
1NotethatPSDpermittingforGHGcanonlybetriggeredifaprojectrequiresPSDpermittingforanotherPSD‐regulatedpollutant.
Interfor U.S. Inc. – Perry Mill | Continuous Kiln Construction Permit Application Trinity Consultants 1-3
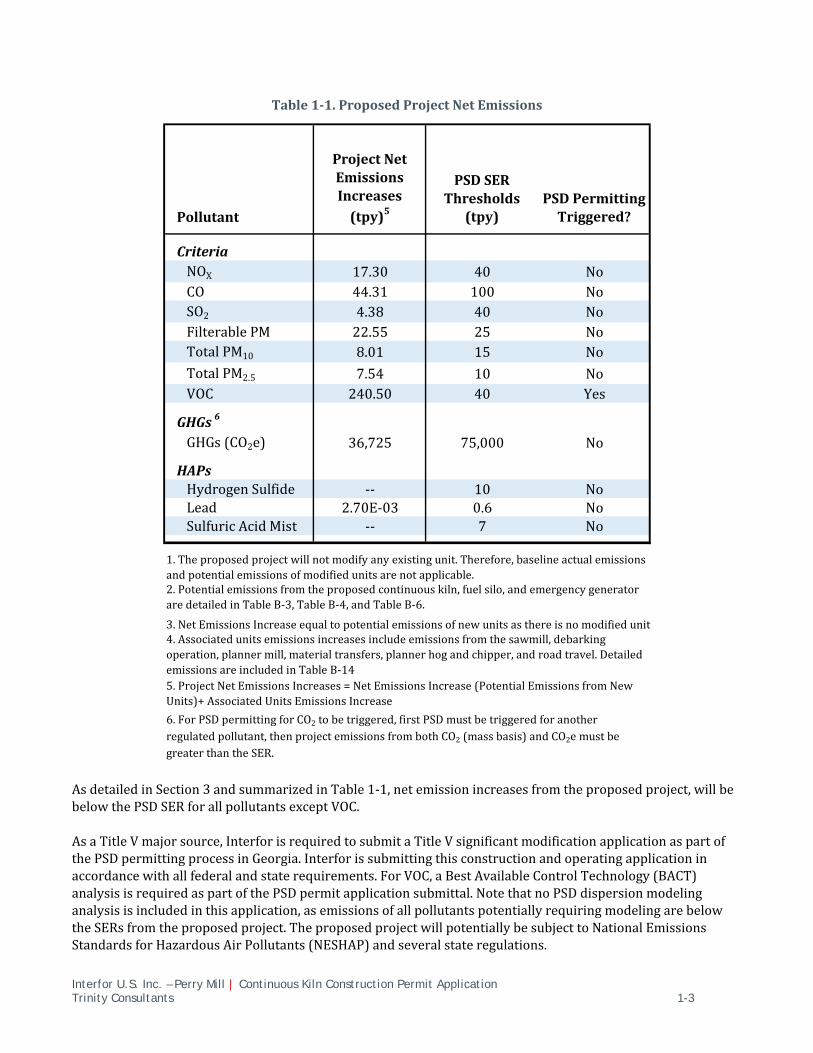
Table1‐1.ProposedProjectNetEmissions
AsdetailedinSection3andsummarizedinTable1‐1,netemissionincreasesfromtheproposedproject,willbebelowthePSDSERforallpollutantsexceptVOC.
AsaTitleVmajorsource,InterforisrequiredtosubmitaTitleVsignificantmodificationapplicationaspartofthePSDpermittingprocessinGeorgia.Interforissubmittingthisconstructionandoperatingapplicationinaccordancewithallfederalandstaterequirements.ForVOC,aBestAvailableControlTechnology(BACT)analysisisrequiredaspartofthePSDpermitapplicationsubmittal.NotethatnoPSDdispersionmodelinganalysisisincludedinthisapplication,asemissionsofallpollutantspotentiallyrequiringmodelingarebelowtheSERsfromtheproposedproject.TheproposedprojectwillpotentiallybesubjecttoNationalEmissionsStandardsforHazardousAirPollutants(NESHAP)andseveralstateregulations.
Pollutant
ProjectNetEmissionsIncreases(tpy)5
PSDSERThresholds
(tpy)PSDPermittingTriggered?
CriteriaNOX 17.30 40 NoCO 44.31 100 NoSO2 4.38 40 NoFilterablePM 22.55 25 NoTotalPM10 8.01 15 NoTotalPM2.5 7.54 10 NoVOC 240.50 40 Yes
GHGs 6
GHGs(CO2e) 36,725 75,000 No
HAPsHydrogenSulfide ‐‐ 10 NoLead 2.70E‐03 0.6 NoSulfuricAcidMist ‐‐ 7 No
3.NetEmissionsIncreaseequaltopotentialemissionsofnewunitsasthereisnomodifiedunit
6.ForPSDpermittingforCO2tobetriggered,firstPSDmustbetriggeredforanotherregulatedpollutant,thenprojectemissionsfrombothCO2(massbasis)andCO2emustbegreaterthantheSER.
4.Associatedunitsemissionsincreasesincludeemissionsfromthesawmill,debarkingoperation,plannermill,materialtransfers,plannerhogandchipper,androadtravel.DetailedemissionsareincludedinTableB‐14
1.Theproposedprojectwillnotmodifyanyexistingunit.Therefore,baselineactualemissionsandpotentialemissionsofmodifiedunitsarenotapplicable.
5.ProjectNetEmissionsIncreases=NetEmissionsIncrease(PotentialEmissionsfromNewUnits)+AssociatedUnitsEmissionsIncrease
2.Potentialemissionsfromtheproposedcontinuouskiln,fuelsilo,andemergencygeneratoraredetailedinTableB‐3,TableB‐4,andTableB‐6.
Interfor U.S. Inc. – Perry Mill | Continuous Kiln Construction Permit Application Trinity Consultants 1-4
1.3. BACT DETERMINATION
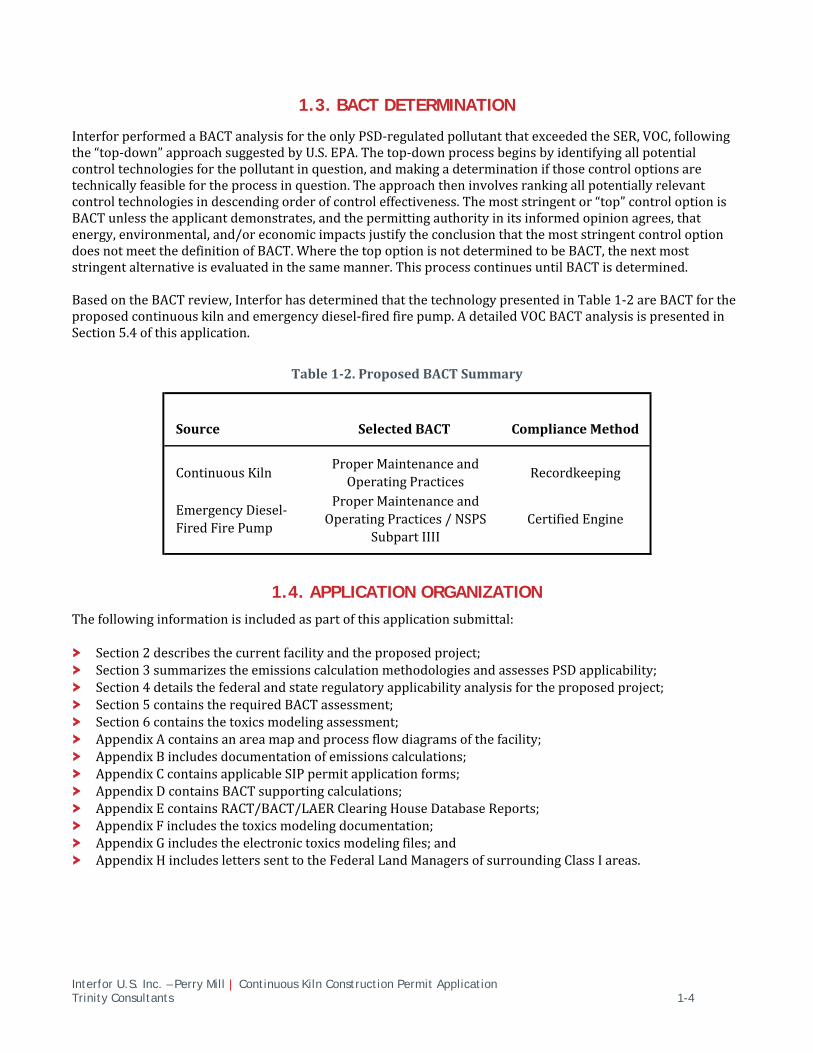
InterforperformedaBACTanalysisfortheonlyPSD‐regulatedpollutantthatexceededtheSER,VOC,followingthe“top‐down”approachsuggestedbyU.S.EPA.Thetop‐downprocessbeginsbyidentifyingallpotentialcontroltechnologiesforthepollutantinquestion,andmakingadeterminationifthosecontroloptionsaretechnicallyfeasiblefortheprocessinquestion.Theapproachtheninvolvesrankingallpotentiallyrelevantcontroltechnologiesindescendingorderofcontroleffectiveness.Themoststringentor“top”controloptionisBACTunlesstheapplicantdemonstrates,andthepermittingauthorityinitsinformedopinionagrees,thatenergy,environmental,and/oreconomicimpactsjustifytheconclusionthatthemoststringentcontroloptiondoesnotmeetthedefinitionofBACT.WherethetopoptionisnotdeterminedtobeBACT,thenextmoststringentalternativeisevaluatedinthesamemanner.ThisprocesscontinuesuntilBACTisdetermined.BasedontheBACTreview,InterforhasdeterminedthatthetechnologypresentedinTable1‐2areBACTfortheproposedcontinuouskilnandemergencydiesel‐firedfirepump.AdetailedVOCBACTanalysisispresentedinSection5.4ofthisapplication.
Table1‐2.ProposedBACTSummary
1.4. APPLICATION ORGANIZATION
Thefollowinginformationisincludedaspartofthisapplicationsubmittal:
Section2describesthecurrentfacilityandtheproposedproject; Section3summarizestheemissionscalculationmethodologiesandassessesPSDapplicability; Section4detailsthefederalandstateregulatoryapplicabilityanalysisfortheproposedproject; Section5containstherequiredBACTassessment; Section6containsthetoxicsmodelingassessment; AppendixAcontainsanareamapandprocessflowdiagramsofthefacility; AppendixBincludesdocumentationofemissionscalculations; AppendixCcontainsapplicableSIPpermitapplicationforms; AppendixDcontainsBACTsupportingcalculations; AppendixEcontainsRACT/BACT/LAERClearingHouseDatabaseReports; AppendixFincludesthetoxicsmodelingdocumentation; AppendixGincludestheelectronictoxicsmodelingfiles;and AppendixHincludesletterssenttotheFederalLandManagersofsurroundingClassIareas.
Source SelectedBACT ComplianceMethod
ContinuousKilnProperMaintenanceandOperatingPractices
Recordkeeping
EmergencyDiesel‐FiredFirePump
ProperMaintenanceandOperatingPractices/NSPS
SubpartIIIICertifiedEngine
Interfor U.S. Inc. – Perry Mill | Continuous Kiln Construction Permit Application Trinity Consultants 2-1
2. DESCRIPTION OF FACILITY
ThePerryMillproducesplanedlumberfromlogsandisclassifiedunderStandardIndustrialClassification(SIC)code2421.Therawmaterialforplanedlumber,theprincipleproduct,issouthernyellowpinelogs.Emissiongeneratingoperationsatthemillincludelogpreparation/sawmill,dryingkilns,wood‐firedboilers,planermill,andtheremanmill.AprocessflowdiagramforthePerryMillisprovidedinAppendixA.
2.1. CURRENT FACILITY DESCRIPTION
2.1.1. Log Preparation / Sawmill
Thebasicfunctionoftheinitiallogpreparationareaistopreparelogsforfurtherprocessingwithinthesawmill.Treelengthlogsaredeliveredbytrucktothemill.Logsarecuttodesiredlengthbysawsandmanuallyfedintothedebarker.Barkfromthedebarkeriscollectedasfuelinthefuelshedforthewood‐firedboilers.ThePerryMilloperatesaBarkHogtoreducethesizeofthebarkfromthedebarker.Afterthedebarkingstage,logsarecutintoroughboardsusingaseriesofsawingtechniques.Themajorityofthesawdustthatisgeneratedinthesawmillisconveyedtothefuelshedalongwithbarkfromthedebarker.Largerpiecesofwoodfromlogsaresenttoachipperandconveyedtoashakerscreen.Sawdustfromthechipperisalsosenttothefuelbin.Largerchipsarecollectedinthechipbinandsoldoff‐site.
2.1.2. Batch Kilns
Thelumbercutinthesawmillisdriedinoneofthefive(5)existingindirect‐firedbatchkilnstoreducethemoisturecontentfromapproximately50percentdowntoapproximately16percent.Thekilnshaveacapacitytoproduceapproximately162millionboardfeetperyear(MMBF/yr)driedlumber.Steamforthebatchlumberkilnsissuppliedbythewood‐firedboilersatthePerryMill.
2.1.3. Planer Mill
Driedroughlumberissentfromthelumberkilnstobefinishedintheplanermill.Eachboardispassedthroughaplanertogradethesurfaceandfinishtheboardtoitsfinalthicknessandwidth.Theendsoftheboardarethentrimmedtoachievethefinalboardlength.TrimblocksareconveyedtotheplanerhogandhoggedshavingsandotherfinesarepneumaticallyconveyedtothePlanerMillCyclone.Aftertrimming,eachboardisstampedandstackedforshipping.Thefinishedproductisthenloadedontotrucksandshippedoff‐site.
2.1.4. Reman Mill
Theremanmillreceivesaportionofthesortedandstackeddrylumberfinishedbytheplanermill.Here,thelumbercanbefurtherplanedandshaped.ShavingsproducedbytheremanmillareconveyedtotheRemanMillCyclone.
2.1.5. Miscellaneous Sources
Logs,lumber,chips,sawdust,bark,andshavingsareallshippedintooroutofthemillbytruck.Utilityvehiclessuchasforkliftsandbobcatsareusedtotransport/load/unloadmaterialsthroughoutthemill.2Fugitive
2ThePerryMillhousesdieselandgasolinedispensingstationsfortheirmobileequipment.
Interfor U.S. Inc. – Perry Mill | Continuous Kiln Construction Permit Application Trinity Consultants 2-2
emissionsfromtravelonunpavedroadsresultsinfugitiveparticulateemissions.ThePerryMilldoesnothaveanyexistingstationaryemergencygeneratorenginesorfirepumpengines.
2.2. PROJECT DESCRIPTION
Interforproposestocompletemodificationsassociatedwiththeinstallationofanewcontinuous,direct‐firedkiln(DK‐6).
2.2.1. Continuous Kiln Installation
Continuouslumberdryingkilnsareanemergingtechnologythatsignificantlyimprovesproductivity,lumbergrade,andenergyefficiencyascomparedtotheoperationofconventionalbatch‐fedkilns.Forexample,muchoftheheatthatislostbetweenbatchesinatraditionalkilnwhenthedoorsopenisretainedwithinacontinuouskiln.Sincethereisnodowntimebetweenbatches,thecontinuouskilnremainsatoperatingtemperatures,whichresultsinsignificantenergysavings.Additionalchambersareconstructedoneachendofthekilnheatingchamberandapushersystemoneachendconveysacontinuousfeedoflumberononetrackintothekilnandonasecondtrackintheoppositedirectionoutofthekiln.Theheatfromthedriedlumbercomingoutofthekilnpreheatsthegreenlumberenteringthekilnonthesecondtrack,resultinginadditionalefficiencygains.Theoperationiscontinuousanddoesnotshutdownexceptforunplannedmalfunctioneventsorplannedmaintenanceoutages.Thecontinuousoperatingfeaturesresultinimprovedenergyefficiencyandproductivityofthelumberdryingprocess.Inaddition,themoisturedrivenoffofthegreenlumberchargeconditionsthedriedlumberexitingthekilnheatingchamberresultinginimprovedproductquality.Thegasifiersystemwillhaveanabortstackwhichwillbeclosedandonlyusedduringperiodsofstartup/shutdown,whichwillhappeninfrequentlybasedoncurrentsystemdesign.Tosupporttheproposedcontinuouskiln,Interforisplanningtoinstalla300,000to350,000gallonfiresuppressionsystem,thatwillhavetwogeneratorengines,aprimaryelectricfirepumpengine,andadiesel‐firedfirepumpengineasbackup.The305horsepower(hp)diesel‐firedfirepumpsystemwillbeusedonlyforemergencysituations,andthenecessarymaintenance/readinesstesting.ThenewcontinuouskilnwillbeinstalledinthesouthwestcorneroftheexistingPerryMill.Interforisalsoplanningtoinstallanewfuelsilowithassociatedcycloneforthecontinuouskiln.Afigureoftheproposedlocationofthekiln(andemissionstacks)isincludedinAppendixF.Section3.2.1and3.2.2providesmoreinformationonemissionincreasesfromassociatedancillaryemissionunit(includingthesourcesfortheappropriateemissionfactors);AppendixBdetailstheemissioncalculationsforeachassociatedemissionunit.
2.2.2. Associated Ancillary Emission Units
TheproposedprojectwillnotincludeanyadditionalmodificationstothePerryMill,withtheexceptionoftheinstallationofthecontinuousdirect‐fireddrykilnandfuelsilo.However,therewillbeanemissionsincreasefromancillaryequipmentatthemillbecausethepotentialkilnproductionwillbeincreasing,thusmorematerialwillbeprocessedthroughassociatedunits.Theassociatedancillaryemissionunitsincludesawinganddebarking,theplanermill,materialhandling/transfersources,theplanerhog,chipper,andhaulroads.Section3.2.4providesmoreinformationonemissionincreasesfromassociatedancillaryemissionunit(includingthesourcesfortheappropriateemissionfactors);AppendixBdetailstheemissioncalculationsforeachassociatedemissionunit.
Interfor U.S. Inc. – Perry Mill | Continuous Kiln Construction Permit Application Trinity Consultants 3-1
3. EMISSION CALCULATION METHODOLOGY
ThissectionaddressesthemethodologyusedtoquantifytheemissionsfromtheproposedprojectandassessesfederalPSDpermittingapplicability.EmissionsfromtheproposedprojectwillincludeCO,NOX,SO2,VOC,PM,PM10,PM2.5,lead,andGHGsintheformofCO2e,andhazardousairpollutants(HAP).Theseemissionsoccurasaresultofcombustioninthekiln,dryingoflumber,andotherprocessoperationsatthefacility.DetailedemissioncalculationsarepresentedinAppendixB.
3.1. NSR PERMITTING EVALUATION METHODOLOGY
TheNewSourceReview(NSR)permittingprogramgenerallyrequiresthatasourceobtainapermitpriortoconstructionofanyprojectatanindustrialfacilityiftheproposedprojectresultsinthepotentialtoemitairpollutioninexcessofcertainthresholdlevels.TheNSRprogramiscomprisedoftwoelements:NNSRandPSD.TheNNSRprogrampotentiallyappliestonewconstructionormodificationsthatresultinemissionincreasesofaparticularpollutantforwhichtheareathefacilityislocatedinisclassifiedas“nonattainment”forthatpollutant.ThePSDprogramappliestoprojectincreasesofthosepollutantsforwhichtheareathefacilityislocatedinisclassifiedas“attainment”or“unclassifiable”.ThePerryMillislocatedinHoustonCounty,whichispresentlydesignatedas“attainment”or“unclassifiable”forallcriteriapollutants.3Therefore,PSDpermittingispotentiallyapplicable.AsthePerryMillisamajorPSDsource,emissionincreasesfromproposedprojectsmustbecomparedtothePSDSERtodetermineifPSDpermittingisrequired.ThefollowingsectionsdiscussthemethodologyusedintheprojectemissionsincreaseevaluationconductedtoassessPSDapplicabilityundertheNSRprogram.ForallPSD‐regulatedpollutantsotherthanCO2e,PSDpermittingisrequirediftheemissionsincreaseofaspecificpollutantexceedsthatpollutant’sPSDSER.ForCO2e,PSDpermittingisonlyrequirediftheemissionsincreaseexceedstheSERforCO2eandtheprojectisalreadyundergoingPSDpermittingforatleastoneotherPSD‐regulatedpollutant.
3.1.1. Defining Existing versus New Emission Units
Differentcalculationmethodologiesareusedforexistingandnewunits;therefore,itisimportanttoclarifywhetherasourceaffectedbytheproposedprojectisconsideredaneworexistingemissionunit. 40CFR52.21(b)(7)(i)and(ii)definenewunitandexistingunits,andareincorporatedbyreferenceintheGeorgiaRulesforAirQualityControl(GRAQC):
(i)Anewemissionsunitisanyemissionsunitthatis(orwillbe)newlyconstructedandthathasexistedforlessthan2yearsfromthedatesuchemissionsunitfirstoperated.(ii)Anexistingemissionsunitisanyunitthatdoesnotmeettherequirementsinparagraph(b)(7)(i)ofthissection.Areplacementunit,asdefinedinparagraph(b)(33)ofthissection,isanexistingemissionsunit.
Basedonthesedefinitions,theproposeddirect‐firedcontinuouswooddryingkilnandfuelsilowillbeclassifiedasnewunits.Therewillbenoexistingunitsthatarebeingphysicallymodifiedaspartoftheproject.
340CFR81.311
Interfor U.S. Inc. – Perry Mill | Continuous Kiln Construction Permit Application Trinity Consultants 3-2
3.1.2. Annual Emission Increase Calculation Methodology
AsthemillisclassifiedasamajorsourceforPSD,iftheproposedprojectwereclassifiedasamajormodification,thenthefullPSDpermittingrequirementswouldapply.ProjectincreaseswereevaluatedtodetermineiftheproposedprojectisamajormodificationusingthecurrentNSRReformmethodology.Forprojectsthatinvolveinstallingnewemissionunits,PSDapplicabilityusingtheactual‐to‐potentialapplicabilitytestisdefinedat40CFR52.21(a)(2)(iv)(d)andisincorporatedbyreferenceintoGRAQC:
(d)Actual‐to‐potentialtestforprojectsthatonlyinvolveconstructionofanewemissionsunit(s).AsignificantemissionsincreaseofaregulatedNSRpollutantisprojectedtooccurifthesumofthedifferencebetweenthepotentialtoemit…fromeachnewemissionsunit…andthebaselineactualemissions…equalsorexceedsthesignificantrateforthatpollutant….
Majormodificationisdefinedby40CFR52.21(b)(2)(i)andisincorporatedbyreferenceintoGRAQC:
“MajorModification”meansanyphysicalchangeinorchangeinthemethodofoperationofamajorstationarysourcethatwouldresultinasignificantemissionincrease…ofaregulatedNSRpollutant…andasignificantnetemissionsincreaseofthatpollutant…
Astheprojectisclassifiedasaphysicalchange,theprojectneedstobeanalyzedtodetermineifasignificantnetemissionsincreasewilloccur.Netemissionsincrease(NEI)isdefinedby40CFR52.21(b)(3)(i)andisadoptedwithchangesintoGRAQC391‐3‐1‐.02(7)(a)2).(ix):
“NetEmissionsIncrease”means,withrespecttoanyregulatedNSRpollutant…theamountbywhichthesumofthefollowingexceedszero:
(a)Theincreaseinemissions…ascalculatedpursuanttoparagraph(a)(2)(iv)[forexistingunits,calculatedbyactual‐to‐projectedactualoractual‐to‐potential;fornewunits,calculatedbyactual‐to‐potential]ofthissection;and
(b)Anyotherincreasesordecreasesinactualemissions…thatarecontemporaneouswiththeparticularchangeandareotherwisecreditable.Baselineemissionsforcalculatingincreasesanddecreases…shallbedeterminedasprovided…
Thefirststepiscommonlyreferredtoasthe“projectemissionincreases”asitaccountsonlyforemissionsrelatedtotheproposedprojectitself.Thisfirststepintheanalysisdoesnotincludetheproposedshutdownofequipmentassociatedwiththeproject.Iftheemissionincreasesestimatedperthefirstexceedthemajormodificationthresholds,thentheapplicantmaymovetothesecondstep,commonlyreferredtoasthenettinganalysis.Thenettinganalysisincludesallprojectsforwhichemissionincreasesordecreases(i.e.,equipmentshutdown)occurred.Iftheresultingnetemissionincreasesexceedthemajormodificationthreshold,thenNSRpermittingisrequired.Nettinganalysiswerenotperformedaspartofthisapplication.InterforevaluatedprojectincreasestodetermineiftheprojectisamajormodificationusingthecurrentNSRReformmethodology,whichmayincludethefollowingcomponents:
Potentialemissions(A) Baselineactualemissions(B)[Notapplicabletoproject)
Interfor U.S. Inc. – Perry Mill | Continuous Kiln Construction Permit Application Trinity Consultants 3-3
Projectedactualemissions(C)[Notapplicabletoproject) “Couldhaveaccommodated”emissionsexclusion(D)(commonlycalledthedemandgrowthexclusion)[Notapplicabletoproject)
AdditionalAssociatedEmissionUnitIncreasesAstheproposedprojectinvolvestheinstallationofnewequipmentonly,developmentofprojectemissionincreasesforcomparingtothePSDSERisrelativelystraightforward.Potentialemissionestimatesfortheproposedprojectmustbeevaluated.Astherearenomodificationstoexistingequipment,theestimateofbaselineactualemissionsisnotnecessary(i.e.,baselineemissionsfornewequipmentis0tpy).Forthisproject,Interforhasnotrelieduponprojectedactualemissionsorthe“couldhaveaccommodated”emissionsexclusionastheproposedprojectdoesnotincludeamodificationtoanexistingemissionunit.
3.2. PROPOSED PROJECT EMISSIONS INCREASES
ThefollowingsectionssummarizethemethodstoestimatetheemissionsincreasesfromtheproposedprojectforcomparisontothePSDSER.
3.2.1. Direct-Fired Continuous Kiln (New)
Potentialemissionsfromthenewdirect‐firedcontinuouskilnwereevaluatedusingthemaximumproductioncapacitiesofthekiln(MBF/yr)andtheburnerheatinputcapacities(MMBtu/yr)inconjunctionwithemissionfactorsfromdifferentliteraturesources.Forallpollutantsexceptleadandgreenhousegases,InterforrelieduponemissionfactorsfromtheEPDRecommendedEmissionFactorsforLumberKilnPermittinginGeorgiadatasheetprovidedbyGeorgiaEPD.4AnemissionfactorfromNationalCouncilforAirandStreamImprovement(NCASI)datawasusedtoestimateemissionsoflead.5CO2eemissionsfromwoodcombustionwerebasedonfactorsestablishedintheGreenhouseGasMandatoryReporting(MRR)rulein40CFR98,TableC‐1andC‐2.AppendixBprovidesadetailedlistofemissionfactorsandtheirsources.PotentialemissionsexceptSO2,leadandgreenhousegasesfromthedirect‐firedcontinuouskilnwerecalculatedbymultiplyingthemaximumproductioncapacityofdriedlumberfromthekiln(MBF/year)bytheappropriateemissionfactor(lb/MBF).PotentialemissionsofSO2,lead,andgreenhousegaseswerecalculatedbasedonthefuelfiringcapacity(MMBtu/year)multipliedbythepollutantemissionfactor(lb/MMBtu).TotalHAPemissionswereestimatedasthesumofemissionsofacetaldehyde,formaldehyde,andmethanol.
3.2.2. Fuel Silo (New)
Emissionfactorsforthenewfuelsilowerecalculatedusinguncontrolledemissionfactorsfrompubliclyavailablesources(e.g.airpermitapplicationssubmittedbylumberfacilitiestostateenvironmentalagencies).Acontrolefficiencyof95%wasappliedforthecyclone.Asthesilowillstoregreensawdust,PMemissionsareexpectedtobeminimalfromthesiloandassociatedcyclone.
3.2.3. Emergency Fire Pump (New)
EmissionfactorsforPM,non‐methanehydrocarbons(NMHC),andNOxfortheemergencyfirepumpwerederivedbasedonNSPSIIIIemissionlimits.ThePMemissionlimitwasusedtoestimateemissionsoffilterable
4ProvidedbyMr.MannyPatel(EPD)toTrinityConsultantsonAugust23,2018agencymeeting.
5AllNCASIvaluesusedintheapplicationwereobtainedfrompubliclyavailablesources(e.g.airpermitapplicationssubmittedbywoodlumberfacilitiestostateenvironmentalagencies).DetailedreferencesareprovidedinAppendixB.
Interfor U.S. Inc. – Perry Mill | Continuous Kiln Construction Permit Application Trinity Consultants 3-4
PM,TotalPM,TotalPM10,andTotalPM2.5.Thenewfirepumpenginewillbesubjecttoadieselsulfurcontentlimitof15ppmvinaccordancewith40CFR60.4207(b)asrequiredbyNSPSSubpartIIII.ThissulfurcontentwasusedtodevelopanemissionfactorforSO2.Potentialemissionsofthesepollutantswerecalculatedbyconvertingtheemissionlimitstolb/hp‐hr,thenbymultiplyingtheemissionfactorsbythemaximumpoweroutputofthedieselengine,inhp.Otherwise,emissionfactorsforremainingcriteriapollutantsandHAPemissionswerederivedfromAP‐42Section3.3,GasolineandDieselIndustrialEngines,Table3.3‐1.Emissionfactorsinlb/MMBtuwereconvertedtolb/hp‐hr,andpotentialemissionswereestimatedbymultiplyingtheseemissionfactorsbythemaximumpoweroutputofthedieselengine,inhp.
3.2.4. Ancillary Equipment Emission Increases
Inadditiontoemissionsfromtheproposednewkilnandfuelsilo,theproposedprojectwillresultinemissionsincreasesfromancillaryequipmentatthemillassociatedwiththekiln.NotethatonlyFilterablePM,FilterablePM10,andFilterablePM2.5areemittedfromtheancillaryequipmentassociatedwiththeproposedproject.DetailedemissioncalculationsforeachprocessareincludedinAppendixB.
3.2.4.1. Sawing and Debarking
IncreasesinfugitivePMemissionsfromsawinganddebarkingwerebasedontheincreasedlumberthroughputthroughthoseportionsofthefacility.Acontrolefficiencyof95percentwasappliedtoaccountfortheactivitiesbeingperformedindoors.6ThePMemissionfactorforsawingisfromtheEPAFactorInformationRetrieval(WebFIRE)database.7,Theemissionfactorforsawing(0.35poundofTotalPMpertonofwoodprocessed)wasoriginallypublishedinAP‐42witha“D”rating.ItislikelythatthisnumberismuchhigherthanappropriateandresultsininaccuratePMemissioncalculations.ThemostrecentversionofAP‐42,Section10.5,PlywoodManufacturing(publishedinJanuary2002)doesnotlistanemissionfactorforsawing.GiventhelackofamoreaccuratevalueavailableforPMemissionsfromsawing,Interforhaschosentousethe0.35lb/tonvalueforconservatism,asastartingpoint.BasedonobservationsandtestingsummarizedbytheNorthCarolinaDivisionofAirQuality(NCDAQ),itwasassumedthat1.89%ofPMisPM10andthatallPM10isconservativelyPM2.5.8Theemissionfactorsfordebarkingareobtainedfrompubliclyavailablesources(e.g.airpermitapplicationssubmittedbywoodlumberfacilitiestostateenvironmentalagencies).ThefactorsusedarebasedonmorerecentactualtestingofdebarkersasratherthanolderpublishedU.S.EPAfactors.Duetothemoisturecontentofthebark,Interforexpectsactualemissionstobemuchlessthanthehistoricemissionfactorsdeveloped.
6PerEPARegion10ParticulateMatterPotentialtoEmitEmissionFactorsforActivitiesatSawmills,ExcludingBoilers,LocatedinPacificNorthwestIndianCountry(May2014),emissionscanbereducedby100%forsawmillactivitiesbeingperformedindoorsasemissionswillstruggletoescapethroughdoorwaysandotheropenings.Forconservatism,Interforisassumingthat5%ofemissionsescapefromdoorsorotheropenings.
7CompilationofAirPollutantEmissionFactors,Volume1:StationaryPointandAreaSources,FourthEditionwithSupplementsA,B,andC,AP‐42.,pertheEPAFactorInformationRetrieval(WebFIRE)database,updated9/7/2016forSCCCode3‐07‐008‐02,LogSawing.
8Peradocumententitled"EstimatingEmissionsFromGenerationandCombustionof'Waste'Wood‐Draft"(July1998)bytheNCDAQ,thepercentageofPMemittedfromsawingoperationsthatisPM10is1.89%.Thisfactorwasdevelopedfordrywood;theamountofPMthatisPM10whensawingwetwoodismostlikelyevenlower.
Interfor U.S. Inc. – Perry Mill | Continuous Kiln Construction Permit Application Trinity Consultants 3-5
3.2.4.2. Planer Mill
IncreasesinPMemissionsfromtheplanermillwerecalculatedusinguncontrolledemissionfactorsfrompubliclyavailablesources(e.g.airpermitapplicationssubmittedbylumberfacilitiestostateenvironmentalagencies).ControlefficiencyforcycloneswerebasedonU.S.EPAairpollutioncontroltechnologyfactsheetsforsinglecyclones.9
3.2.4.3. Material Transfer Sources
IncreasesinfugitivePMemissionsfromthetruckloadingandtransferofchips,bark,sawdust,andwoodshavingswerecalculatedusingemissionfactorsbasedonEquation1ofU.S.EPA’sAP‐42,Section13.2.4,AggregateHandlingandStoragePiles.10ThisestimateisexpectedtobeahighlyconservativeassessmentofthepotentialPMemissions.
3.2.4.4. Planer Hog (Hogger) and Chipper
TheincreaseinfugitivePMemissionsfromthehoggerandchipperwerebasedontheincreasedlumberthroughputforthoseunits.Acontrolefficiencyof90percentwasappliedtoaccountfortheactivitiesbeingperformedindoors.TheemissionfactorsusedforbothprocessesarefromU.S.EPA’sFactorInformationRetrieval(WebFIRE)databasefordebarking.11Aspreviouslydiscussed,Interforbelievesthatthefactorsfordebarkersmayresultinaninaccurateoverestimateofactualemissions.However,Interforisusingthesefactorstoestimateemissionsfromthehoggerandchipperasnootherfactorsarereadilyavailableandbecausethesefactorsshouldresultinaconservativeestimationofemissions.
3.2.4.5. Roads
FugitivePMemissionsfromtheincreasedtrucktrafficonthefacilityroadwayswereestimatedbasedonthevehiclemilestravelled(VMT)bytrucksthatwilltransportadditionalmaterialstoandfromthefacility.Vehiclemilestraveledonsitewereestimatedbasedonthedistanceoftheanticipatedtruckrouteforeachmaterialandthenumberoftripsnecessarytosupportcontinuousoperationofthenewkiln.EmissioncalculationsforfugitivepavedroaddustemissionsweredevelopedbasedonAP‐42,Section13.2.1,PavedRoadsandforfugitiveunpavedroaddustfromSection13.2.2,UnpavedRoads.12,13
3.2.5. Project Emissions Increases
Table3‐1showsthetotalemissionsincreasefortheproposedprojectcomparedtothePSDSER.
9EPA‐452/F‐03‐005(https://www3.epa.gov/ttncatc1/dir1/fcyclon.pdf).
10U.S.EPAAP‐42,Section13.2.4,AggregateHandlingandStorageFiles,November2006.
11CompilationofAirPollutantEmissionFactors,Volume1:StationaryPointandAreaSources,FourthEditionwithSupplementsA,B,andC,AP‐42.,pertheEPAFactorInformationRetrieval(WebFIRE)database,updated9/7/2016forSCCCode3‐07‐008‐01,LogDebarking.
12U.S.EPAAP‐42,Section13.2.1,PavedRoads,January2011.
13U.S.EPAAP‐42,Section13.2.2,UnpavedRoads,November2006.
Interfor U.S. Inc. – Perry Mill | Continuous Kiln Construction Permit Application Trinity Consultants 3-6
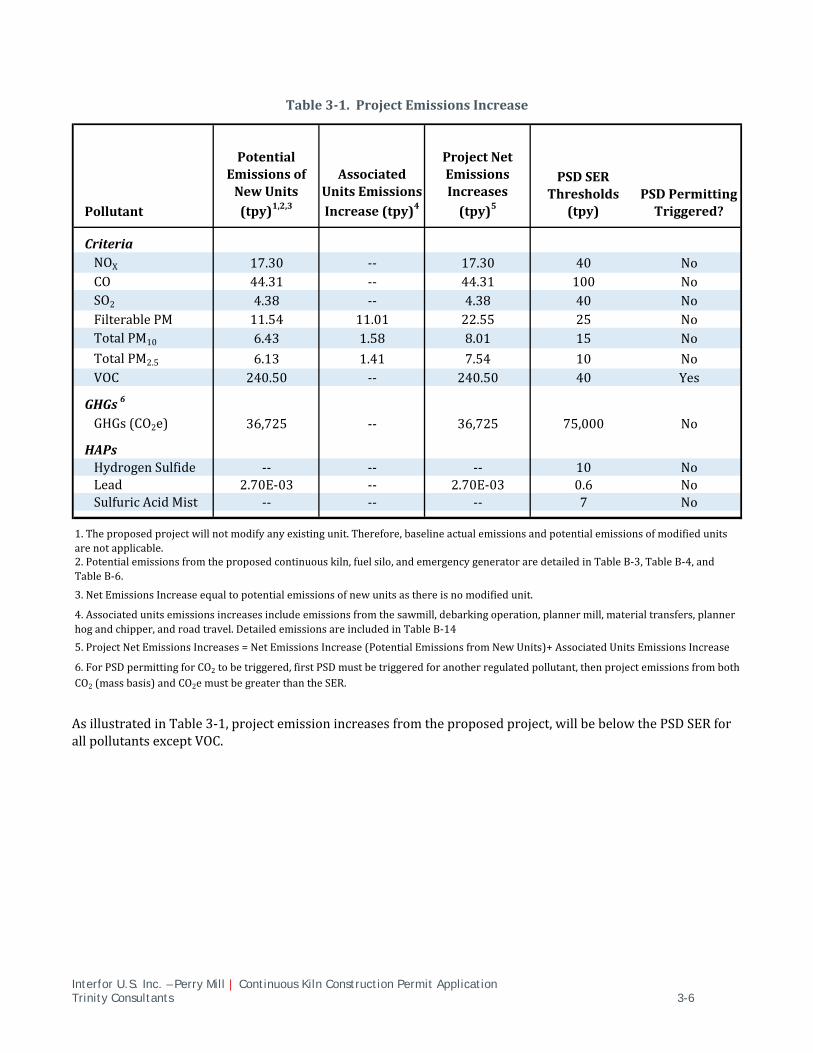
Table3‐1.ProjectEmissionsIncrease
AsillustratedinTable3‐1,projectemissionincreasesfromtheproposedproject,willbebelowthePSDSERforallpollutantsexceptVOC.
Pollutant
PotentialEmissionsofNewUnits(tpy)1,2,3
AssociatedUnitsEmissionsIncrease(tpy)4
ProjectNetEmissionsIncreases(tpy)5
PSDSERThresholds
(tpy)PSDPermittingTriggered?
CriteriaNOX 17.30 ‐‐ 17.30 40 NoCO 44.31 ‐‐ 44.31 100 NoSO2 4.38 ‐‐ 4.38 40 NoFilterablePM 11.54 11.01 22.55 25 NoTotalPM10 6.43 1.58 8.01 15 NoTotalPM2.5 6.13 1.41 7.54 10 NoVOC 240.50 ‐‐ 240.50 40 Yes
GHGs 6
GHGs(CO2e) 36,725 ‐‐ 36,725 75,000 No
HAPsHydrogenSulfide ‐‐ ‐‐ ‐‐ 10 NoLead 2.70E‐03 ‐‐ 2.70E‐03 0.6 NoSulfuricAcidMist ‐‐ ‐‐ ‐‐ 7 No
3.NetEmissionsIncreaseequaltopotentialemissionsofnewunitsasthereisnomodifiedunit.
6.ForPSDpermittingforCO2tobetriggered,firstPSDmustbetriggeredforanotherregulatedpollutant,thenprojectemissionsfrombothCO2(massbasis)andCO2emustbegreaterthantheSER.
4.Associatedunitsemissionsincreasesincludeemissionsfromthesawmill,debarkingoperation,plannermill,materialtransfers,plannerhogandchipper,androadtravel.DetailedemissionsareincludedinTableB‐14
1.Theproposedprojectwillnotmodifyanyexistingunit.Therefore,baselineactualemissionsandpotentialemissionsofmodifiedunitsarenotapplicable.
5.ProjectNetEmissionsIncreases=NetEmissionsIncrease(PotentialEmissionsfromNewUnits)+AssociatedUnitsEmissionsIncrease
2.Potentialemissionsfromtheproposedcontinuouskiln,fuelsilo,andemergencygeneratoraredetailedinTableB‐3,TableB‐4,andTableB‐6.
Interfor U.S. Inc. – Perry Mill | Continuous Kiln Construction Permit Application Trinity Consultants 4-1
4. REGULATORY REVIEW
ThePerryMillissubjecttocertainfederalandstateairregulations.Thissectionoftheapplicationsummarizestheairpermittingrequirementsandkeyairqualityregulationsthatwillapplytothefacilityunderbothfederalandstatepermittingprograms.ApplicabilitytoNSR,TitleV,NewSourcePerformanceStandards(NSPS),NESHAP,andEPDstaterulesareaddressed.
4.1. NEW SOURCE REVIEW APPLICABILITY
TheNSRpermittingprogramgenerallyrequiresasourcetoobtainapermitandundertakeotherobligationspriortoconstructionofanyprojectatanindustrialfacilityiftheproposedprojectresultsinthepotentialtoemitairpollutioninexcessofcertainthresholdlevels.TheNSRprogramiscomprisedoftwoelements:NNSRandPSD.TheNNSRprogrampotentiallyappliestonewconstructionormodificationsthatresultinemissionincreasesofaparticularpollutantforwhichareasclassifiedas“nonattainment.”ThePSDprogramappliestoprojectincreasesofthosepollutantsforwhichtheareathefacilityislocatedinisclassifiedas“attainment”or“unclassifiable.”
Aspreviouslydiscussed,thePerryMillislocatedinHoustonCounty,whichhasbeendesignatedbytheU.S.EPAas“attainment”or“unclassifiable”forallcriteriapollutants.14Therefore,thefacilityisnotsubjecttoNNSRpermittingrequirements.However,newconstructionormodificationsthatresultinemissionsincreasesarepotentiallysubjecttoPSDpermittingrequirements.
ThePSDprogramonlyregulatesemissionsfrom“major”stationarysourcesofregulatedairpollutants.AstationarysourceisconsideredPSDmajorifpotentialemissionsofanyregulatedpollutantexceedthemajorsourcethresholds.ThePSDmajorsourcethresholdis250tpyofanon‐GHGcriteriapollutantand100,000tpyofGHGsintheformofCO2e.15
AsthePerryMillisamajorPSDsource,emissionincreasesfromproposedprojectsmustbecomparedtothePSDSERtodetermineifPSDpermittingisrequired.TheemissionincreaseanalysiswaspresentedinSection3.2ofthisreport.Table4‐1presentsasummaryoftheanalysis.
1440CFR81.311.
15Woodproductmanufacturingfacilitiesarenotonthe“Listof28”sourceswhicharesubjecttoalowermajorsourcethresholdforcriteriapollutantsof100tpy.
Interfor U.S. Inc. – Perry Mill | Continuous Kiln Construction Permit Application Trinity Consultants 4-2
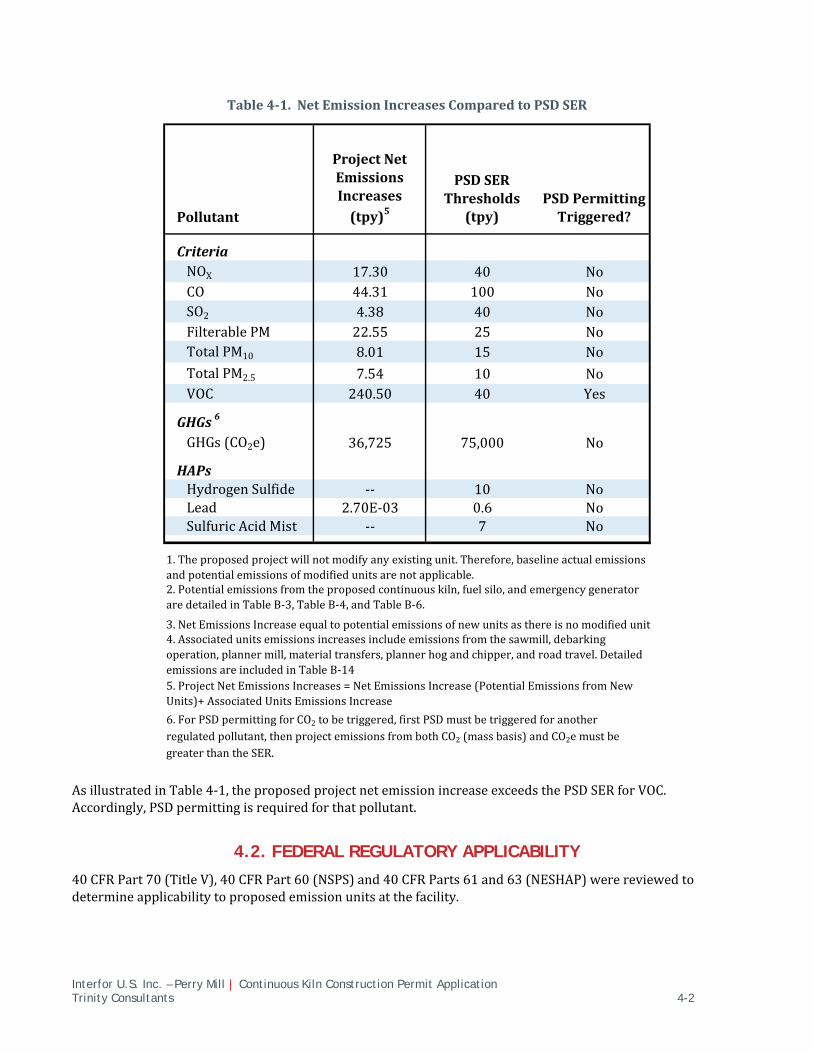
Table4‐1.NetEmissionIncreasesComparedtoPSDSER
AsillustratedinTable4‐1,theproposedprojectnetemissionincreaseexceedsthePSDSERforVOC.Accordingly,PSDpermittingisrequiredforthatpollutant.
4.2. FEDERAL REGULATORY APPLICABILITY
40CFRPart70(TitleV),40CFRPart60(NSPS)and40CFRParts61and63(NESHAP)werereviewedtodetermineapplicabilitytoproposedemissionunitsatthefacility.
Pollutant
ProjectNetEmissionsIncreases(tpy)5
PSDSERThresholds
(tpy)PSDPermittingTriggered?
CriteriaNOX 17.30 40 NoCO 44.31 100 NoSO2 4.38 40 NoFilterablePM 22.55 25 NoTotalPM10 8.01 15 NoTotalPM2.5 7.54 10 NoVOC 240.50 40 Yes
GHGs 6
GHGs(CO2e) 36,725 75,000 No
HAPsHydrogenSulfide ‐‐ 10 NoLead 2.70E‐03 0.6 NoSulfuricAcidMist ‐‐ 7 No
3.NetEmissionsIncreaseequaltopotentialemissionsofnewunitsasthereisnomodifiedunit
6.ForPSDpermittingforCO2tobetriggered,firstPSDmustbetriggeredforanotherregulatedpollutant,thenprojectemissionsfrombothCO2(massbasis)andCO2emustbegreaterthantheSER.
4.Associatedunitsemissionsincreasesincludeemissionsfromthesawmill,debarkingoperation,plannermill,materialtransfers,plannerhogandchipper,androadtravel.DetailedemissionsareincludedinTableB‐14
1.Theproposedprojectwillnotmodifyanyexistingunit.Therefore,baselineactualemissionsandpotentialemissionsofmodifiedunitsarenotapplicable.
5.ProjectNetEmissionsIncreases=NetEmissionsIncrease(PotentialEmissionsfromNewUnits)+AssociatedUnitsEmissionsIncrease
2.Potentialemissionsfromtheproposedcontinuouskiln,fuelsilo,andemergencygeneratoraredetailedinTableB‐3,TableB‐4,andTableB‐6.
Interfor U.S. Inc. – Perry Mill | Continuous Kiln Construction Permit Application Trinity Consultants 4-3
4.2.1. Title V Operating Permit Program
TheTitleVprogramwasestablishedaspartofthe1990CleanAirActAmendmentsandisinthefederalregulationsat40CFRPart70‐71.Georgiahasdevelopedtheirownprogramunder40CFRPart70,whichisprovidedinChapter391‐3‐1‐.03(10)oftheGeorgiaRulesforAirQualityControl.TitleVrequiresthatallnewandexistingmajorsourcesofairemissionsobtainfederallyapprovedstateadministeredoperatingpermits.AmajorsourceasdefinedundertheTitleVprogramisafacilitythathasthepotentialtoemiteithermorethan100tonsperyear(tpy)foranycriteriapollutant,morethan10tpyforanysinglehazardousairpollutant(HAP),andmorethan25tpyforallHAP.Additionally,40CFRPart70.2definesfacilitieswithpotentialemissionsgreaterthan100,000tpyofCO2earesubjecttoregulationundertheTitleVpermittingprogram.PotentialemissionsofmultiplepollutantsexceedtheTitleVmajorsourcethresholdandassuchthePerryMillwillcontinuetoberegulatedasaTitleVMajorSource.AstheprojectrequiresPSDpermitting,theprojectwillbeauthorizedasasignificantmodificationtothePerryMill’sTitleVpermit.
4.2.2. New Source Performance Standards
NSPS,locatedin40CFR60,requirenew,modified,orreconstructedsourcestocontrolemissionstothelevelachievablebythebest‐demonstratedtechnologyasspecifiedintheapplicableprovisions.Moreover,anysourcesubjecttoanNSPSisalsosubjecttothegeneralprovisionsofNSPSSubpartA,exceptasnoted.InterforassessedapplicabilityofNSPStothenewcontinuous,direct‐firedkilnandassociatedfuelsiloonly.
4.2.2.1. 40 CFR 60 Subpart Dc - Small Industrial-Commercial-Institutional Steam Generating Units
NSPSSubpartDc,SmallIndustrial‐Commercial‐InstitutionalSteamGeneratingUnits,appliestosteamgeneratingunitsratedbetween10and100MMBtu/hrconstructed,modified,orreconstructedafterJune9,1989.Theterm“steamgeneratingunit”isdefinedunderthisregulationasshownbelow:
“Steamgeneratingunitmeansadevicethatcombustsanyfuelandproducessteamorheatswateroranyotherheattransfermedium.Thistermincludesanyductburnerthatcombustsfuelandispartofacombinedcyclesystem.Thistermdoesnotincludeprocessheatersasdefinedinthissubpart.”16
Thenewcontinuousdirect‐firedkilnwilloperatewithagreensawdustgasifierburnerataheatinputcapacityof40MMBtu/hr,andwillbeconstructedin2018‐2019.However,thegasifierburnerswillnotgeneratesteambecausethecombustiongasesfromthefuel(greensawdust)willdirectlycontactthelumberduringthedryingprocess.Therefore,SubpartDcisnotapplicablefortheproposedproject.
4.2.2.2. 40 CFR 60 Subpart IIII - Stationary Compression Ignition Internal Combustion Engines
NSPSSubpartIIII,StandardsofPerformanceforStationaryCompressionIgnitionInternalCombustionEngines,ispotentiallyapplicabletostationaryinternalcombustionengines(ICE)basedonthedateeachenginewasconstructed,reconstructed,ormodified.Theruleprovidesperformancestandardsforbothenginemanufacturersandoperators.Engineoperatorsmustmeetthespecifiedemissionstandardsandfueltypespecifications.ThePerryMillplanstooperateonediesel‐firedemergencyfirepump(FWP1).AsFWP1willbemanufacturedafterApril1,2006,theunitissubjecttotherequirementsunderthispart.FWP1willberatedat305hp.PursuanttoCFR60.4202(d),FWP1mustbecertifiedtomeettheapplicableemissionstandardsofTable4ofNSPSSubpartIIII.AsENG1isafirepumpenginewithamaximumengine 1640CFR60.41c.
Interfor U.S. Inc. – Perry Mill | Continuous Kiln Construction Permit Application Trinity Consultants 4-4
powergreaterthan300hpandlessthan600,andwasmanufacturedafter2009,itissubjecttotheemissionlimitsdetailedinTable4toSubpartIIIIofPart60—EmissionStandardsforStationaryFirePumpEngines.Manufacturerspecificationsguaranteethecomplianceoftheenginewiththeemissionslimits.Inaddition,Interforwilloperateandmaintaintheengineaccordingtothemanufacturer’srequiredschedules,includingpartsreplacements,andtheenginewillbeequippedwithanon‐resettablehourmeterpertherequirementsof40CFR60.4209(a).
4.2.2.3. 40 CFR 60 Subpart JJJJ - Stationary Spark Ignition Internal Combustion Engines
NSPSSubpartJJJJ,StandardsofPerformanceforStationarySparkIgnitionInternalCombustionEngines,ispotentiallyapplicabletostationaryICEbasedonthedateeachenginewasconstructed,reconstructed,ormodified.TherulesetsemissionsstandardsforNOX,CO,andVOCemissionsforenginesclassifiedbysizeanddateofmanufactureorreconstruction.Theproposedfirepumpisdiesel‐firedandwillnotbesubjecttotherequirementsinthisNSPS.
4.2.2.4. Non-Applicability of All Other NSPS
NSPSstandardsaredevelopedforparticularindustrialsourcecategoriesandtheapplicabilityofaparticularNSPStoafacilitycanbereadilyascertainedbasedontheindustrialsourcecategorycovered.AllotherNSPSarecategoricallynotapplicabletotheproposedproject.
4.2.3. National Emission Standards for Hazardous Air Pollutants
NESHAP,locatedin40CFR63,havebeenpromulgatedforsourcecategoriesthatemitHAPtotheatmosphere.AfacilitythatisamajorsourceofHAPisdefinedashavingpotentialemissionsgreaterthan25tpyoftotalHAPand/or10tpyofasingleHAP.FacilitieswithapotentialtoemitHAPatanamountlessthanthemajorsourcethresholdsareotherwiseconsideredanareasource.TheNESHAPallowableemissionlimitsaremostoftenestablishedonthebasisofamaximumachievablecontroltechnology(MACT)determinationfortheparticularsource.TheNESHAPapplytosourcesinspecificallyregulatedindustrialsourcecategories(CleanAirActSection112(d))oronacase‐by‐casebasis(Section112(g))forfacilitiesnotregulatedasaspecificindustrialsourcetype.
ThePerryMillisclassifiedasamajorsourceofHAPasthemillhaspotentialHAPemissionsgreaterthanthemajorsourcethresholds.ThedeterminationofapplicabilitytoNESHAPrequirementsformajorsourcesofHAParedetailedinthefollowingsections.InterforassessedapplicabilityofNESHAPtothenewcontinuous,direct‐firedkilnandassociatedfuelsiloonly.
4.2.3.1. 40 CFR 63 Subpart A - General Provisions
NESHAPSubpartA,GeneralProvisions,containsnationalemissionstandardsforHAPdefinedinSection112(b)oftheCleanAirAct.Allaffectedsources,whicharesubjecttoanotherNESHAP,aresubjecttothegeneralprovisionsofNESHAPSubpartA,unlessspecificallyexcludedbythesource‐specificNESHAP.
4.2.3.2. 40 CFR 63 Subpart DDDD - Plywood and Composite Wood Products
NESHAPSubpartDDDDregulatesHAPemissionsfromplywoodandcompositewoodproducts(PCWP)manufacturingfacilitiesthataremajorHAPsources.ThePCWPMACTwasinitiallyfinalizedbyU.S.EPAonJuly30,2004,andwasreissuedandamendedafterreconsiderationonFebruary16,2006.TherulewaspartiallyvacatedandremandedbytheD.C.CircuitCourtofAppealsinJune2007,whichledtotherulebeingfinalizedin
Interfor U.S. Inc. – Perry Mill | Continuous Kiln Construction Permit Application Trinity Consultants 4-5
October2007.EPAisintheprocessofrequestingandcollectinginformationfromplywoodandcompositewoodproductfacilities,toevaluatefurtherruleamendments.However,atthistime,sincenorulechangeshavebeenproposed,Interforevaluatedtheruleapplicabilitybasedonthefinalrulefrom2007.Uponissuanceofaproposedorfinalamendmenttothisruleinthefuture,Interforwillevaluatepotentialmillapplicability.
Lumberkilnsareprocessunitswithintheexisting“affectedsource”underthePCWPMACT,definedin40CFR63.2232(b)as:
Thecollectionofdryers,refiners,blenders,formers,presses,boardcoolers,andotherprocessunitsassociatedwiththemanufacturingofplywoodandcompositewoodproducts.Theaffectedsourceincludes,butisnotlimitedto,greenendoperations,refining,dryingoperations(includinganycombustionunitexhauststreamroutinelyusedtodirectfireprocessunit(s)),resinpreparation,blendingandformingoperations,pressingandboardcoolingoperations,andmiscellaneousfinishingoperations(suchassanding,sawing,patching,edgesealing,andotherfinishingoperationsnotsubjecttoothernationalemissionstandardsforhazardousairpollutants(NESHAP)).Theaffectedsourcealsoincludesonsitestorageandpreparationofrawmaterialsusedinthemanufactureofplywoodand/orcompositewoodproducts,suchasresins;onsitewastewatertreatmentoperationsspecificallyassociatedwithplywoodandcompositewoodproductsmanufacturing;andmiscellaneouscoatingoperations(§63.2292).TheaffectedsourceincludeslumberkilnsatPCWPmanufacturingfacilitiesandatanyotherkindoffacility.
However,basedon§63.2252,forprocessunitsnotsubjecttothecomplianceoptionsorworkpracticerequirementsspecifiedin§63.2240(including,butnotlimitedto,lumberkilns),thePerryMillisnotrequiredtocomplywiththecomplianceoptions;workpracticerequirements;performancetesting;monitoring;startup,shutdown,andmalfunction(SSM)plans;andrecordkeepingorreportingrequirementsofNESHAPSubpartDDDD,oranyotherrequirementsinNESHAPSubpartA,GeneralProvisions,exceptfortheinitialnotificationrequirementsin§63.9(b).Althoughlumberkilnsareanaffectedsource,therearenoapplicablerequirementsforthenewdirect‐firedcontinuouskilnatthemill,exceptfortheinitialnotification.
Pursuantto40CFR63.9(b)(iii),affectedsourcesmayusetheapplicationforapprovalofconstructiontofulfilltheinitialnotificationrequirements.
4.2.3.3. 40 CFR 63 Subpart ZZZZ - Stationary Reciprocating Internal Combustion Engines
NESHAPSubpartZZZZ,NationalEmissionStandardsforHazardousAirPollutantsforStationaryReciprocatingInternalCombustionEngines,appliestostationaryreciprocatingcombustionengines(RICE)atamajororareasourceofHAPemissions.Per40CFR63.6590(a)(2)(iii),newsourcesarethosebuiltafterJune12,2006locatedatamajorsourceofHAPemissions;thereisnosizethresholdforthesubjectengines.Thenewdiesel‐firedemergencyfirepump(FWP1)isconsideredanewstationaryRICEunderNESHAPSubpartZZZZ.ThefirepumpwillsatisfytherequirementsofNESHAPSubpartZZZZbycomplyingwithNSPSSubpartIIII.17
4.2.3.4. 40 CFR 63 Subpart DDDDD - Industrial, Commercial, and Institutional Boilers and Process Heaters
NESHAPSubpartDDDDD,NationalEmissionsStandardsforHazardousAirPollutantsforMajorSources:Industrial,Commercial,andInstitutionalBoilersandProcessHeaters(MajorSourceBoilerMACT)regulates
1740CFR63.6590(c)
Interfor U.S. Inc. – Perry Mill | Continuous Kiln Construction Permit Application Trinity Consultants 4-6
boilersandprocessheatersatmajorsourcesofHAP.Thenewkilnclearlydoesnotmeetthedefinitionofaboiler.Aprocessheaterisdefinedin40CFR63.7575,as
…anencloseddeviceusingcontrolledflame,andtheunit'sprimarypurposeistotransferheatindirectlytoaprocessmaterial(liquid,gas,orsolid)ortoaheattransfermaterial(e.g.,glycoloramixtureofglycolandwater)foruseinaprocessunit,insteadofgeneratingsteam.Processheatersaredevicesinwhichthecombustiongasesdonotcomeintodirectcontactwithprocessmaterials.Adevicecombustingsolidwaste,asdefinedin§241.3ofthischapter,isnotaprocessheaterunlessthedeviceisexemptfromthedefinitionofasolidwasteincinerationunitasprovidedinsection129(g)(1)oftheCleanAirAct.Processheatersdonotincludeunitsusedforcomfortheatorspaceheat,foodpreparationforon‐siteconsumption,orautoclaves.Wasteheatprocessheatersareexcludedfromthisdefinition.
Thecontinuouslumberkilnwillbedirect‐fired,asthecombustiongasesfromthefuelwilldirectlycontactthelumberduringthedryingprocess.Therefore,thenewlumberkilnisnotconsideredaprocessheater,andBoilerMACTisnotapplicable.
4.2.3.5. Non-Applicability of All Other NESHAP
NESHAPstandardsaredevelopedforparticularindustrialsourcecategoriesforeithermajororareasourcesofHAPandtheapplicabilityofaparticularNESHAPtoafacilitycanbereadilyascertainedbasedontheindustrialsourcecategorycovered.AllotherNESHAParecategoricallynotapplicabletothemill.
4.2.4. Compliance Assurance Monitoring Regulations
Under40CFR64,theComplianceAssuranceMonitoring(CAM)Regulations,facilitiesarerequiredtoprepareandsubmitmonitoringplansforcertainemissionunitswithaTitleVapplication.TheCAMPlansprovideanongoingandreasonableassuranceofcompliancewithemissionlimits.Underthegeneralapplicabilitycriteria,thisregulationonlyappliestoemissionunitsthatuseacontroldevicetoachievecompliancewithanemissionlimitandwhosepre‐controlledemissionlevelsexceedthemajorsourcethresholdsundertheTitleVpermittingprogram.Thenewcontinuouskilnwillnotuseacontroldevice;therefore,thenewkilnwillnotbesubjecttoCAM.Thefuelsilowilluseacyclone,whichisrequiredtobeoperatedaspartofthehigh‐pressureblowersystem.Theuncontrolledemissionsforthefuelsiloresultinemissionslessthanthemajorsourcethresholds;therefore,CAMwouldnotapply.
4.3. STATE REGULATORY APPLICABILITY
Inadditiontofederalairregulations,theGeorgiaRulesforAirQualityControl(GRAQC)391‐3‐1,establishesregulationsapplicableattheemissionunitlevel(sourcespecific)andatthefacilitylevel.18Therulesalsocontainrequirementsrelatedtotheneedforconstructionand/oroperatingpermits.
4.3.1. GRAQC 391-3-1-.02(2)(b) – Visible Emissions
Thisregulationlimitsthevisibleemissionsfromallsourcesto40%opacity,providedthatthesourceisnotsubjecttosomeotheremissionlimitationunderGRAQC391‐3‐1‐.02(2).19Allequipmentassociatedwiththeproposedprojectaresubjecttothisrule.
18GRAQCeffectiveJuly23,2018
19GRAQC391‐3‐1‐.02(2)(b)1
Interfor U.S. Inc. – Perry Mill | Continuous Kiln Construction Permit Application Trinity Consultants 4-7
4.3.2. GRAQC 391-3-1-.02(2)(c) – Incinerators
ThisregulationlimitsthePMandvisibleemissionsfromincinerators.PertheGRAQC,anincineratorisdefinedasfollows:
…alldevicesintendedorusedforthereductionordestructionofsolid,liquid,orgaseouswastebyburning.20
Althoughtheproposedlumberkilnwillburngreensawdustproducedasabyproductfromthesawmill,themainpurposeofthekilnisnotthedestructionofsolidwaste.Therefore,Rule(c)willnotapplytotheproposedkiln.
4.3.3. GRAQC 391-3-1-.02(2)(d) – Fuel Burning Equipment
ThisregulationlimitsPMemissionsfromallfuel‐burningequipment.ItalsolimitsopacityandNOXemissionsfromequipmentconstructedormodifiedafterJanuary1,1972.Georgiadefinesfuel‐burningequipmentas:
…equipmenttheprimarypurposeofwhichistheproductionofthermalenergyfromthecombustionoffuel.Suchequipmentisgenerallythatusedfor,butnotlimitedto,heatingwater,generatingorsuperheatingsteam,heatingairasinwarmairfurnaces,furnishingprocessheatindirectly,throughtransferbyfluidsortransmissionsthroughprocessvesselwalls.21
Althoughthelumberdryingkilnwillcombustafuel,theprimarypurposeoftheunitsisnottoproducethermalenergyusedforindirectheating.Therefore,thekilnisnotsubjecttoRule(d).
4.3.4. GRAQC 391-3-1-.02(2)(e) – Particulate Emission from Manufacturing Processes
Thisregulation,commonlyknownastheprocessweightrule(PWR)establishesPMlimitsforallsourcesifnotspecifiedelsewhere.ThePMemissionsarelimitedbasedonthefollowingequations(forequipmentconstructedormodifiedafterJuly2,1968):
E=4.1×P0.67 forP≤30ton/hr E=55×P0.11–40 forP>30ton/hr where: E=allowablePMemissionrate[lb/hr] P=processinputweightrate[tons/hr]Thisruleappliestoallequipmentassociatedwiththeproposedproject.Thefacilitywillcontinuetobeincompliancewiththisruleafterthecompletionoftheproposedproject.
4.3.5. GRAQC 391-3-1-.02(2)(g) – Sulfur Dioxide
ThisregulationestablishesSO2emissionlimitsforfuel‐burningsources.NewfuelburningsourcesconstructedafterJanuary1,1972,capableoffiringfossilfuelatarateexceeding250MMBtu/hraresubjecttoSO2emissionlimitations.Thekilnwillexclusivelycombustwoodwaste,whichisnotafossilfuel.Thekiln,therefore,isnotsubjecttotheemissionlimitationintherule.However,therulealsospecifiesthatallfuelburningsourceswith
20GRAQC391‐3‐1‐.01(hh)21GRAQC391‐3‐1‐.01(cc)
Interfor U.S. Inc. – Perry Mill | Continuous Kiln Construction Permit Application Trinity Consultants 4-8
heatinputcapacitieslessthan100MMBtu/hrshallnotburnfuelcontainingmorethan2.5%sulfurbyweight.Thenewkilnwillcombustexclusivelywood,andtherefore,beininherentcompliancewiththisrule.
4.3.6. GRAQC 391-3-1-.02(2)(n) – Fugitive Dust
Thisregulationrequiresfacilitiestotakereasonableprecautionstopreventfugitivedustfrombecomingairborne.Allunitspartoftheproposedprojectwillbecoveredbythisgenerallyapplicablerule.Interforwilltaketheappropriateprecautionstopreventfugitivedustfrombecomingairborneandtoensurethatthepercentopacityislessthan20percent.
4.3.7. GRAQC 391-3-1-.02(2)(tt) – VOC Emissions from Major Sources
ThisregulationlimitsVOCemissionsfromfacilitiesthatarelocatedinorneartheoriginalAtlanta1‐hourozonenonattainmentarea.ThePerryMillisnotlocatedwithinthegeographicareacoveredbythisruleandis,therefore,notsubjecttothisregulation.
4.3.8. GRAQC 391-3-1-.02(2)(uu) – Visibility Protection
Rule(uu)requiresGeorgiaEPDtoprovideananalysisofaproposedmajorsourceoramajormodificationtoanexistingsource’santicipatedimpactonvisibilityinanyfederalClassIareatotheappropriateFederallandManager(FLM).Thisprojectdoesnotqualifyasamajormodificationforvisibility‐impactingpollutants(NOX,TotalPM10,SO2,andH2SO4),andthereforenovisibilityimpactmodelingwillbeperformed.
4.3.9. GRAQC 391-3-1-.02(2)(yy) – Emissions of Nitrogen Oxides from Major Sources
ThisregulationlimitsNOXemissionsfromfacilitiesthatarelocatedinorneartheoriginalAtlanta1‐hourozonenonattainmentarea.ThePerryMillisnotlocatedwithinthegeographicareacoveredbythisruleandis,therefore,notsubjecttothisregulation.
4.3.10. GRAQC 391-3-1-.02(2)(lll) – NOX Emissions from Fuel-burning Equipment
ThisregulationlimitstheNOXemissionfromfuel‐burningequipmentwithamaximumdesignheatinputcapacityequaltoorgreaterthan10MMBtu/hrandlessthanorequalto250MMBtu/hrthatarelocatedinorneartheoriginalAtlanta1‐hourozonenonattainmentarea.ThePerryMillisnotlocatedwithinthegeographicareacoveredbythisruleandis,therefore,notsubjecttothisregulation.
4.3.11. GRAQC 391-3-1-.02(2)(mmm) – NOX Emissions from Stationary Gas Turbines and Stationary Engines used to Generate Electricity
ThisregulationrestrictsNOXemissionsfromsmallcombustionturbineslocatedinorneartheAtlantanonattainmentareathatareusedtogenerateelectricity.ThePerryMillisnotlocatedwithinthegeographicareacoveredbythisruleandis,therefore,notsubjecttothisregulation.
4.3.12. GRAQC 391-3-1-.02(2)(rrr) – NOX Emissions from Small Fuel-Burning Equipment
ThisregulationlimitsNOXemissionsfromfacilitiesthatarelocatedinorneartheoriginalAtlanta1‐hourozonenonattainmentarea.ThePerryMillisnotlocatedwithinthegeographicareacoveredbythisruleandis,therefore,notsubjecttothisregulation.
Interfor U.S. Inc. – Perry Mill | Continuous Kiln Construction Permit Application Trinity Consultants 4-9
4.3.13. GRAQC 391-3-1-.03(1) – Construction (SIP) Permitting
Theproposedprojectwillrequirephysicalconstructionactivitiestoallowconstructionofthenewcontinuouslumberdryingkiln.EmissionincreasesassociatedwiththeproposedprojectareabovethedeminimisconstructionpermittingthresholdsspecifiedinGRAQC391‐3‐1‐.03(6)(i).Further,asdiscussedinSection4.1,PSDpermittingisrequiredforVOC.Therefore,aconstructionpermitapplicationisnecessary.
4.3.14. GRAQC 391-3-1-.03(10) – Title V Operating Permits
ThePerryMillisamajorstationarysource,sincethepotentialemissionofregulatedpollutantsexceedthethresholdsestablishedbyGeorgia’sTitleVOperatingPermitProgram.ThecurrentpermitissettoexpireonJuly24,2023.TheadditionofnewconditionstoallowtheprojecttoavoidPSDpermittingforcertainpollutantsandtoestablishappropriateBACTforpollutantsundergoingPSDpermittingwillberequired.AstheprojectrequiresPSDpermitting,itconstitutesamodificationunderTitleIoftheCleanAirAct,andcannotbeprocessedasaSection502(b)10operationalflexibilitychange.22Thechangealsocannotbeprocessedasaminormodificationasitrequiresacase‐by‐casedetermination(BACT).23Forthesereasons,theproposedprojectconstitutesaTitleVsignificantmodification.
4.3.15. Incorporation of Federal Regulations by Reference
ThefollowingfederalregulationsareincorporatedintheGRAQCbyreferenceandwereaddressedpreviouslyinthisapplication:
GRAQC391‐3‐1‐.02(8)–NSPS GRAQC391‐3‐1‐.02(9)–NESHAP GRAQC391‐3‐1‐.02(11)–CAM
4.3.16. Non-Applicability of Other GRAQC
AthoroughexaminationoftheGeorgiaSIPruleapplicabilitytotheprojectrevealsmanySIPregulationswillnotapplyanddonotimposeadditionalrequirementsonthenewkiln,associatedfuelsilo,andfirepump.SuchSIPrulesincludethosespecifictoaparticulartypeofunrelatedindustrialoperation.
22GRAQC391‐3‐1‐.03(10)(b)523GRAQC391‐3‐1‐.03(10)(e)5
Interfor U.S. Inc. – Perry Mill | Continuous Kiln Construction Permit Application Trinity Consultants 5-1
5. BEST AVAILABLE CONTROL TECHNOLOGY ASSESSMENT
ThissectiondiscussestheregulatorybasisforBACT,approachusedincompletingtheBACTanalyses,andtheBACTanalysesfornewandmodifiedequipmentemittingpollutantstriggeringPSDreview.SupportingdocumentationisincludedinAppendicesDandE.
5.1. BACT DEFINITION
TherequirementtoconductaBACTanalysisissetforthinthePSDregulations[40CFR52.21(j)(2)]andadoptedintotheGRAQCbyreference:
(j)ControlTechnologyReview.
(2)AnewmajorstationarysourceshallapplybestavailablecontroltechnologyforeachregulatedNSRpollutantthatitwouldhavethepotentialtoemitinsignificantamounts.
BACTisdefinedinthePSDregulations[40CFR52.21(b)(12)]andisincorporatedintotheGRAQCas:24
...anemissionslimitation(includingavisibleemissionstandard)basedonthemaximumdegreeofreductionforeachpollutantsubjecttoregulationunderActwhichwouldbeemittedfromanyproposedmajorstationarysourceormajormodificationwhichtheDirector,onacase‐by‐casebasis,takingintoaccountenergy,environmental,andeconomicimpactsandothercosts,determinesisachievableforsuchsourceormodificationthroughapplicationofproductionprocessesoravailablemethods,systems,andtechniques,includingfuelcleaningortreatmentorinnovativefuelcombustiontechniquesforcontrolofsuchpollutant.Innoeventshallapplicationofbestavailablecontroltechnologyresultinemissionsofanypollutantwhichwouldexceedtheemissionsallowedbyanyapplicablestandardunder40CFRparts60and61.[primaryBACTdefinition]IftheDirectordeterminesthattechnologicaloreconomiclimitationsontheapplicationofmeasurementmethodologytoaparticularemissionsunitwouldmaketheimpositionofanemissionsstandardinfeasible,adesign,equipment,workpractice,operationalstandard,orcombinationthereof,maybeprescribedinsteadtosatisfytherequirementfortheapplicationofbestavailablecontroltechnology.Suchstandardshall,tothedegreepossible,setforththeemissionsreductionachievablebyimplementationofsuchdesign,equipment,workpracticeoroperation,andshallprovideforcompliancebymeanswhichachieveequivalentresults.[allowanceforsecondaryBACTstandardundercertainconditions]
TheprimaryBACTdefinitioncanbebestunderstoodbybreakingitapartintoitsseparatecomponents.
5.1.1. Emission Limitation
anemissionslimitationFirstandforemost,BACTisanemissionlimit.WhileBACTisprefacedupontheapplicationoftechnologiestoachievethatlimit,thefinalresultofBACTisalimit.Ingeneral,thislimitwouldbeanemissionratelimitofa
24TheGRAQCsubstitutetheword“Director”fortheword“Administrator”.
Interfor U.S. Inc. – Perry Mill | Continuous Kiln Construction Permit Application Trinity Consultants 5-2
pollutant(i.e.,lb/hr).25Ifanemissionsmeasurementisinfeasible,thendesign,equipment,workpractice,operationalstandard,orcombinationthereofmaybeestablished.
5.1.2. Case-by-Case Basis
acase‐by‐casebasis,takingintoaccountenergy,environmentalandeconomicimpactsandothercost
UnlikemanyoftheCleanAirActprograms,thePSDprogram’sBACTevaluationiscase‐by‐case.AsnotedbyU.S.EPA,
Thecase‐by‐caseanalysisisfarmorecomplexthanmerelypointingtoaloweremissionslimitorhighercontrolefficiencyelsewhereinapermitorapermitapplication.TheBACTdeterminationmusttakeintoaccountallofthefactorsaffectingthefacility,suchasthechoiceof[fuel]…TheBACTanalysis,therefore,involvesjudgmentandbalancing.26
Toassistapplicantsandregulatorswiththecase‐by‐caseprocess,in1987U.S.EPAissuedamemorandumthatimplementedcertainprograminitiativestoimprovetheeffectivenessofthePSDprogramwithintheconfinesofexistingregulationsandstateimplementationplans.27Amongtheinitiativeswasa“top‐down”approachfordeterminingBACT.Inbrief,thetop‐downprocesssuggeststhatallavailablecontroltechnologiesberankedindescendingorderofcontroleffectiveness.Themoststringentor“top”controloptionisthedefaultBACTemissionlimitunlesstheapplicantdemonstrates,andthepermittingauthorityinitsinformedopinionagrees,thatenergy,environmental,and/oreconomicimpactsjustifytheconclusionthatthemoststringentcontroloptionisnotachievableinthatcase.Uponeliminationofthemoststringentcontroloptionbaseduponenergy,environmental,and/oreconomicconsiderations,thenextmoststringentalternativeisevaluatedinthesamemanner.ThisprocesscontinuesuntilBACTisselected.
Thefivestepsinatop‐downBACTevaluationcanbesummarizedasfollows:
Step1.Identifyallpossiblecontroltechnologies;Step2.Eliminatetechnicallyinfeasibleoptions;Step3.Rankthetechnicallyfeasiblecontroltechnologiesbaseduponemissionreductionpotential;Step4.Evaluaterankedcontrolsbasedonenergy,environmental,and/oreconomicconsiderations;andStep5.SelectBACT.
Whilethetop‐downBACTanalysisisaproceduralapproachsuggestedbyU.S.EPApolicy,thisapproachisnotspecificallymandatedasastatutoryrequirementoftheBACTdetermination.AsdiscussedinSection5.1.1,theBACTlimitisanemissionslimitationanddoesnotrequiretheinstallationofanyspecificcontroldevice.
25Emissionlimitscanbebroadlydifferentiatedas“rate‐based”or“mass‐based.”Forakiln,arate‐basedlimitwouldtypicallybeinunitsoflb/ton(massemissionspertonmaterialinput).Incontrast,atypicalmass‐basedlimitwouldbeinunitsoflb/hr(massemissionspertime).
26U.S.EPAResponsestoPublicCommentsontheProposedPSDPermitfortheDesertRockEnergyFacility,July31,2008,p.41‐42.
27MemodatedDecember1,1987,fromJ.CraigPotter(EPAHeadquarters)toEPARegionalAdministrators,titled“ImprovingNewSourceReviewImplementation.”
Interfor U.S. Inc. – Perry Mill | Continuous Kiln Construction Permit Application Trinity Consultants 5-3
5.1.3. Achievable
“basedonthemaximumdegreeofreduction…whichtheDirector…determinesisachievable…throughapplicationofproductionprocessesoravailablemethods,systemsandtechniques,includingfuelcleaningortreatmentorinnovativefuelcombustiontechniques”
BACTistobesetatthelowestvaluethatisachievable.However,thereisanimportantdistinctionbetweenemissionratesachievedataspecifictimeonaspecificunit,andanemissionlimitationthataunitmustbeabletomeetcontinuouslyoveritsoperatinglife.
AsdiscussedbytheD.C.CircuitCourtofAppeals,
InNationalLimeAss'nv.EPA,627F.2d416,431n.46(D.C.Cir.1980),wesaidthatwhereastatuterequiresthatastandardbe“achievable,”itmustbeachievable“undermostadversecircumstanceswhichcanreasonablybeexpectedtorecur.”28
U.S.EPAhasreachedsimilarconclusionsinpriordeterminationsforPSDpermits.
Agencyguidanceandourpriordecisionsrecognizeadistinctionbetween,ontheonehand,measured‘emissionsrates,’whicharenecessarilydataobtainedfromaparticularfacilityataspecifictime,andontheotherhand,the‘emissionslimitation’determinedtobeBACTandsetforthinthepermit,whichthefacilityisrequiredtocontinuouslymeetthroughoutthefacility’slife.Statedsimply,ifthereisuncontrollablefluctuationorvariabilityinthemeasuredemissionrate,thenthelowestmeasuredemissionratewillnecessarilybemorestringentthanthe“emissionslimitation”thatis“achievable”forthatpollutioncontrolmethodoverthelifeofthefacility.Accordingly,becausethe“emissionslimitation”isapplicableforthefacility’slife,itiswhollyappropriateforthepermitissuertoconsider,aspartoftheBACTanalysis,theextenttowhichtheavailabledatademonstratewhethertheemissionsrateatissuehasbeenachievedbyotherfacilitiesoveralongterm.29
Thus,BACTmustbesetatthelowestfeasibleemissionraterecognizingthattheemissionunitmustbeincompliancewiththatlimitforthelifetimeoftheunitonacontinuousbasis.Thus,whileviewingindividualunitperformancecanbeinstructiveinevaluatingwhatBACTmightbe,anyactualperformancedatamustbeviewedcarefully,asrarelywillthedatabeadequatetotrulyassesstheperformancethataunitwillachieveduringitsentireoperatinglife.Whilestatisticalvariabilityofactualperformancecanbeusedtoinferwhatis“achievable,”suchtestingrequiresadetailedtestplanakintowhatteamsinU.S.EPAusetodevelopMACTstandardsoveraseveralyearperiod,andisfarbeyondwhatisreasonabletoexpectofanindividualsource.Incontrasttolimitedsnapshotsofactualperformancedata,emissionlimitsfromsimilarsourcescanreasonablybeusedtoinferwhatis“achievable”foragivenunit.30
ToassistinmeetingtheBACTlimit,thesourcemustconsiderproductionprocessesoravailablemethods,systemsortechniques,aslongasthoseconsiderationsdonotredefinethesource.Aspreviouslystated,ifan
28AsquotedinSierraClubv.EPA(97‐1686).
29U.S.EPAEnvironmentalAppealsBoarddecision,Inre:NewmontNevadaEnergyInvestmentL.L.C.PSDAppealNo.05‐04,decidedDecember21,2005.EnvironmentalAdministrativeDecisions,Volume12,Page442.
30Emissionlimitsmustbeusedwithcareinassessingwhatis“achievable.”Limitsestablishedforfacilitieswhichwereneverbuiltmustbeviewedwithcare,astheyhaveneverbeendemonstratedandthatcompanynevertookasignificantliabilityinhavingtomeetthatlimit.Likewise,permittedunitswhichhavenotyetcommencedconstructionmustalsobeviewedwithspecialcareforsimilarreasons.
Interfor U.S. Inc. – Perry Mill | Continuous Kiln Construction Permit Application Trinity Consultants 5-4
emissionsmeasurementisinfeasible,thendesign,equipment,workpractice,operationalstandard,orcombinationthereofmaybeestablished.
5.1.4. Floor
Emissions[shallnot]exceed…40CFRParts60and61
TheleaststringentemissionrateallowableforBACTisanyapplicablelimitundereitherNewSourcePerformanceStandards(NSPS–Part60)orNationalEmissionStandardsforHazardousAirPollutants(NESHAP–Parts61and63).StateSIPlimitationsmustalsobeconsideredwhendeterminingtheemissionsfloor.
5.2. BACT REQUIREMENT
TheBACTrequirementappliestoeachnewormodifiedemissionunitfromwhichthereareemissionsincreasesofpollutantssubjecttoPSDreview.TheproposedprojectissubjecttoPSDpermittingforVOC,andthus,subjecttoBACTforthispollutant.31Theproposedcontinuouskilnandemergencyfire‐waterpumparesubjecttoBACTforVOC.ThefuelsiloisnotsubjecttoBACTasitisnotasourceofVOC.Therewillbenoothernewormodifiedemissionsourcesatthefacility.
5.3. BACT ASSESSMENT METHODOLOGY
ThefollowingsectionsprovidedetailsontheassessmentmethodologyutilizedinpreparingtheBACTanalysesfortheproposedfacility.Aspreviouslynoted,theminimumcontrolefficiencytobeconsideredinaBACTassessmentmustresultinanemissionratelessthanorequaltoanyapplicableNSPSorNESHAPemissionrateforthesource.ThecontinuouskilnundergoingBACTisnotsubjecttoanyNSPSorNESHAPemissionlimitsforVOC.WhileaNESHAPexiststhatregulatesHAPemissionsfromPCWPsources,lumberkilnsarenotsubjecttoanynumericalHAPlimitationsorworkpracticestandardsthatcouldbeconsideredBACTforVOC.32Theemergencyfire‐waterpumpwillbesubjecttoanon‐methanehydrocarbon(NMHC)emissionlimitof4g/kW‐hr,pursuanttoNSPSSubpartIIII.
5.3.1. Identification of Potential Control Technologies
PotentiallyapplicableemissioncontroltechnologieswereidentifiedforthecontinuouslumberkilnbyresearchingtheU.S.EPAcontroltechnologydatabase,technicalliterature,controlequipmentvendorinformation,statepermittingauthorityfiles,andbyusingprocessknowledgeandengineeringexperience.TheReasonablyAvailableControlTechnology(RACT)/BACT/LowestAchievableEmissionRate(LAER)Clearinghouse(RBLC),adatabasemadeavailabletothepublicthroughtheU.S.EPA’sOfficeofAirQualityPlanningandStandards(OAQPS)TechnologyTransferNetwork(TTN),liststechnologiesandcorrespondingemissionlimitsthathavebeenapprovedbyregulatoryagenciesinpermitactions.Thesetechnologiesaregroupedintocategoriesbyindustryandcanbereferencedindeterminingwhatemissionslevelswereproposedforsimilartypesofemissionunits.
31Aspreviouslymentioned,thisapplicationusesthetwoterms“VOC”and“TotalVOC”interchangeably.Inallinstances,thebasis,forthepurposeofthisPSDapplicationandBACTAnalysis,isasterpenes(accountingformethanolandformaldehydeasappropriate).
3240CFR63.2230and63.2252,
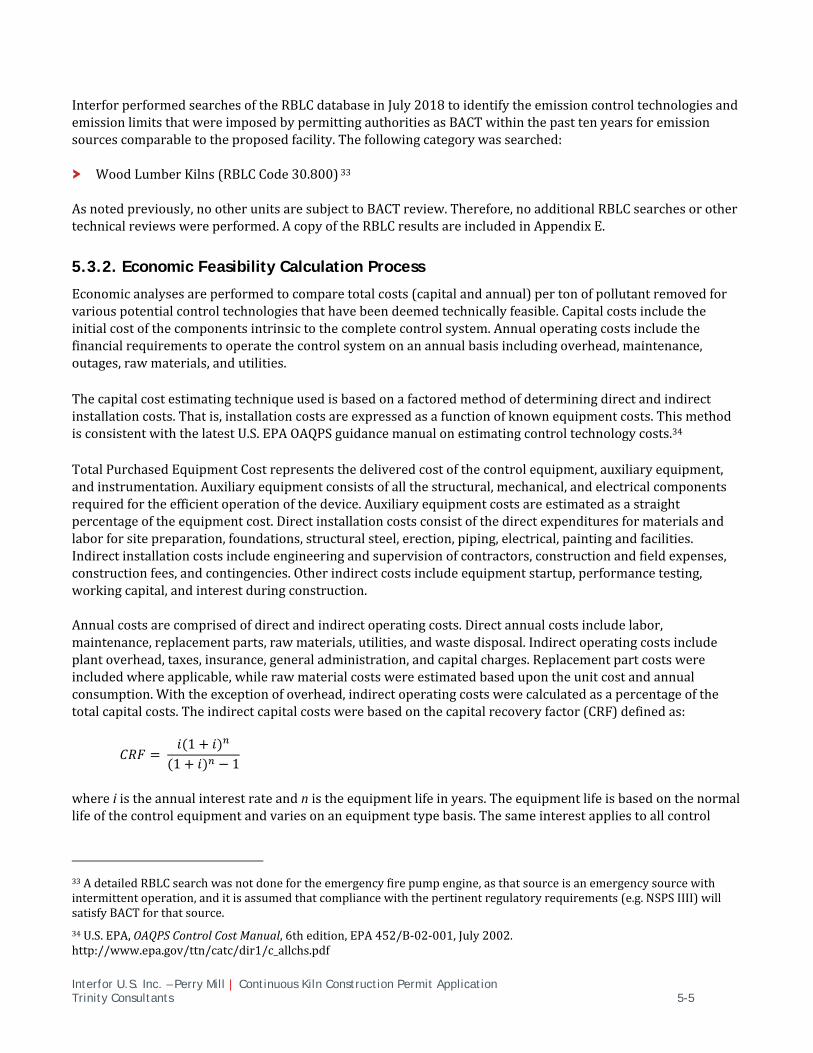
Interfor U.S. Inc. – Perry Mill | Continuous Kiln Construction Permit Application Trinity Consultants 5-5
InterforperformedsearchesoftheRBLCdatabaseinJuly2018toidentifytheemissioncontroltechnologiesandemissionlimitsthatwereimposedbypermittingauthoritiesasBACTwithinthepasttenyearsforemissionsourcescomparabletotheproposedfacility.Thefollowingcategorywassearched:
WoodLumberKilns(RBLCCode30.800)33Asnotedpreviously,nootherunitsaresubjecttoBACTreview.Therefore,noadditionalRBLCsearchesorothertechnicalreviewswereperformed.AcopyoftheRBLCresultsareincludedinAppendixE.
5.3.2. Economic Feasibility Calculation Process
Economicanalysesareperformedtocomparetotalcosts(capitalandannual)pertonofpollutantremovedforvariouspotentialcontroltechnologiesthathavebeendeemedtechnicallyfeasible.Capitalcostsincludetheinitialcostofthecomponentsintrinsictothecompletecontrolsystem.Annualoperatingcostsincludethefinancialrequirementstooperatethecontrolsystemonanannualbasisincludingoverhead,maintenance,outages,rawmaterials,andutilities.Thecapitalcostestimatingtechniqueusedisbasedonafactoredmethodofdeterminingdirectandindirectinstallationcosts.Thatis,installationcostsareexpressedasafunctionofknownequipmentcosts.ThismethodisconsistentwiththelatestU.S.EPAOAQPSguidancemanualonestimatingcontroltechnologycosts.34TotalPurchasedEquipmentCostrepresentsthedeliveredcostofthecontrolequipment,auxiliaryequipment,andinstrumentation.Auxiliaryequipmentconsistsofallthestructural,mechanical,andelectricalcomponentsrequiredfortheefficientoperationofthedevice.Auxiliaryequipmentcostsareestimatedasastraightpercentageoftheequipmentcost.Directinstallationcostsconsistofthedirectexpendituresformaterialsandlaborforsitepreparation,foundations,structuralsteel,erection,piping,electrical,paintingandfacilities.Indirectinstallationcostsincludeengineeringandsupervisionofcontractors,constructionandfieldexpenses,constructionfees,andcontingencies.Otherindirectcostsincludeequipmentstartup,performancetesting,workingcapital,andinterestduringconstruction.Annualcostsarecomprisedofdirectandindirectoperatingcosts.Directannualcostsincludelabor,maintenance,replacementparts,rawmaterials,utilities,andwastedisposal.Indirectoperatingcostsincludeplantoverhead,taxes,insurance,generaladministration,andcapitalcharges.Replacementpartcostswereincludedwhereapplicable,whilerawmaterialcostswereestimatedbasedupontheunitcostandannualconsumption.Withtheexceptionofoverhead,indirectoperatingcostswerecalculatedasapercentageofthetotalcapitalcosts.Theindirectcapitalcostswerebasedonthecapitalrecoveryfactor(CRF)definedas:
1
1 1
whereiistheannualinterestrateandnistheequipmentlifeinyears.Theequipmentlifeisbasedonthenormallifeofthecontrolequipmentandvariesonanequipmenttypebasis.Thesameinterestappliestoallcontrol
33AdetailedRBLCsearchwasnotdonefortheemergencyfirepumpengine,asthatsourceisanemergencysourcewithintermittentoperation,anditisassumedthatcompliancewiththepertinentregulatoryrequirements(e.g.NSPSIIII)willsatisfyBACTforthatsource.
34U.S.EPA,OAQPSControlCostManual,6thedition,EPA452/B‐02‐001,July2002.http://www.epa.gov/ttn/catc/dir1/c_allchs.pdf
Interfor U.S. Inc. – Perry Mill | Continuous Kiln Construction Permit Application Trinity Consultants 5-6
equipmentcostcalculations.Forthisanalysis,aninterestrateof7%wasusedbasedoninformationprovidedinthemostrecentOAQPSControlCostManual.35NotethatalleconomiccalculationsarebasedonJune2018dollars.DetailedcostcalculationsforeconomicanalysesprovidedwithinthisBACTanalysisarepresentedinAppendixD.
5.4. LUMBER DRYING KILN – VOC BACT
5.4.1. Identification of Potential Control Techniques (Step 1)
CandidatecontroloptionsidentifiedfromtheRBLCsearchandtheliteraturereviewincludethoseclassifiedaspollutionreductiontechniques.VOCreductionoptionsinclude:
Adsorption Biofiltration Condensation ThermalOxidation WetScrubbing ProperMaintenanceandOperatingPractices
Thesecontroltechnologiesarebrieflydescribedinthefollowingsections.
5.4.1.1. Adsorption
Regenerativeadsorptionsystemsaretypicallyabatchoperationinvolvingtwoormorefixedadsorptionbeds.Oneormoreofthebedsoperatesinadsorptionmodewhiletheothersoperateinregenerationmode.Severaladsorbentmaterialswithsubstantialsurfaceareaperunitvolumecanbeusedinadsorbersincludingactivatedcarbon,organicresinpolymers,andinorganicmaterialssuchaszeolite.AninduceddraftfanistypicallyusedtoforcetheVOC‐ladengasthroughtheadsorptionbedwheretheVOCmoleculesarephysicallyboundtotheporespaceintheadsorbentbyVanderWaalsnuclearattractionforces.Therearemanytypesofcarbon,polymer,andzeoliteadsorbentsavailablewithdifferentaffinitiesforadsorbingvariousVOC.AkeyselectioncriterionfordeterminingtheappropriateadsorbentistherangeofporesizesrelativetothelargestmolecularsizeoftheVOCtobeadsorbed.ThebatchnatureoftheadsorptionprocessconcludeswhentheadsorbentbedbecomessaturatedwithVOCandmustberegenerated.Thegas‐solidinterfacewithinthebedatwhichadsorptionisoccurringisreferredtoasthemasstransferzone(MTZ),andthelocationofthisMTZwithinthebeddeterminesitslevelofbedsaturationandthetimeatwhichitmustberegenerated.WhentheMTZnearstheendofthebed,theVOCconcentrationoftheexhaustgaswillincreaseproducingaphenomenonreferredtoas“breakthrough.”Afterbreakthroughhasoccurredinanadsorbentbed,itmustberegeneratedusingathermalswingorvacuumprocess.ThermalswingregenerationusessteamtoraisethetemperatureoftheloadedadsorbentbedtotheboilingpointoftheVOCatwhichpointtheVOCisdesorbedandisdischargedfromthebedwiththesteam.TheVOC‐ladensteamisthenroutedtoacondensertoproducealiquidwater‐VOCmixture.TheVOCisthenseparatedfromthewaterusingadecantationordistillationprocessandcanberecycledbacktotheprocessfromwhichitwasgeneratedorroutedtoanappropriatedisposalsite.
35U.S.EPA,OAQPSControlCostManual,6thedition,Section2,Chapter1,page1‐52.http://www.epa.gov/ttn/catc/dir1/c_allchs.pdf
Interfor U.S. Inc. – Perry Mill | Continuous Kiln Construction Permit Application Trinity Consultants 5-7
VacuumregenerationlowersthepressureoftheadsorbentbedbelowthevaporpressureoftheadsorbedVOCattheambienttemperatureofthebed.Atthisreducedpressure,theVOCboilsoffoftheadsorbentandcanbecollectedinacondenserorroutedtoanoxidizer.Essentially,adsorberscaptureVOCfromrelativelydiluteconcentrationstreamsandreleasetheseVOCintoahigherconcentrationstreamthatcanbereadilycontrolledusinganotherVOCdestructionorrecoverytechnology.Oncetheregenerationcycleiscomplete,thefreshadsorbentbedisreadytobegincapturingadditionalVOCinanotheradsorptioncycle.36ThetypicalVOCinletconcentrationrequiredforeffectiveadsorptionfallsintherangeof400to2,000ppmv,andadsorbersandtheirassociatedfollow‐upcontroldevices(i.e.,condenserordecanter)aretypicallycapableofachievingVOCcontrolefficienciesgreaterthan95percent.37
5.4.1.2. Biofiltration
Inbiofiltration,off‐gasescontainingbiodegradableorganiccompoundsarevented,undercontrolledtemperatureandhumidity,throughabiologicallyactivematerial.Theprocessusesabiofilmcontainingapopulationofmicroorganismsimmobilizedonaporoussubstratesuchaspeat,soil,sand,wood,compost,ornumeroussyntheticmedia.Asanairstreampassesthroughthebiofilter,thecontaminantsintheairstreampartitionfromthegaseousphasetotheliquidphaseofthebiofilm.Oncecontaminantspassintotheliquidphase,theybecomeavailableforthecomplexoxidativeprocessbythemicroorganismsinhabitingthebiofilm.
5.4.1.3. Condensation
CondensersoperatebyloweringthetemperatureoftheexhaustgasstreamscontainingcondensableVOCtoatemperatureatwhichthetargetVOC’svaporpressureislowerthanitsenteringpartialpressure.Thisconditioniscommonlyreferredtoasthesaturationpoint.BeforetheVOCcancondense,anysensibleheatpresentintheexhaustgasabovethesaturationpointmustberemoved.CoolingtheexhauststreamtoatemperaturebelowthesaturationpointremovesthelatentheatfromtheexhaustandallowstheVOCtocondenseonthesurfaceofthecondensertubesforcollectionandrecycletotheprocessordisposaltoanappropriatelocation.Thetubeslocatedwithinthecondensercontainre‐circulatingcoolingliquidthatprovidesaheatsinkforrejectingbothsensibleandlatentheatfromthehotexhaustgasstream.Availablecoolingfluids(dependingonthenecessaryoutlettemperatureoftheexhauststreamtoachievehighlevelsofrecoveryforthecondensableVOC)includechilledwater,brine,orrefrigerants.Oncethecoolingliquidispassedthroughthecondenser,itischilledtotherequiredcondenserinlettemperatureandrecycledbacktothecoolingliquidinletofthecondenser.38 TheVOCefficiencyachievedbyacondenser,asasoleadd‐oncontroldevice,isafunctionof:1)theheatcapacityandtemperatureoftheinletexhauststream,2)theheattransfercharacteristicsofthecondenser(includingtheheattransferareaandtheheattransfercoefficient),and3)theoutlettemperatureoftheexhaustgasexitingthecondenser.CondensersaremosteffectiveinsinglecomponentsystemsinvolvingemissionstreamswithahighpercentageofacondensableVOC,becauselessheatmustberemovedfromtheexhaustgastoreducethesensibleheatofnon‐condensablegasesandtherequiredcondensertemperaturetoachievehighlevelsofrecovery.UnlikeotherVOCcontroldevicesforwhichquantifyingcontrolefficiencycanrequireemissionstesting,onlytheoutletexhaustgastemperatureisrequiredtoestimatetheVOCcontrolefficiencyofacondenserifthetemperature,VOCconcentration,andflowrateofthenon‐condensablesintheinletexhauststreamareall 36U.S.EPA,CleanAirTechnologyCenter,TechnicalBulletinChoosinganAdsorptionSystemforVOC:Carbon,Zeolite,orPolymer?,EPA456/F‐99‐004,May1999.
37Ibid.
38U.S.EPA,OfficeofAirQualityPlanningandStandards,ControlofVolatileOrganiccompoundEmissionsfromBatchProcesses–AlternativeControlTechniqueInformationDocument,EPA‐450/R‐94‐020,February1994.
Interfor U.S. Inc. – Perry Mill | Continuous Kiln Construction Permit Application Trinity Consultants 5-8
known.SincethecontrolefficiencyofacondenserisdynamicbasedontheoutlettemperatureandinletconcentrationofVOCintheexhauststream,condensersexhibitawiderangeofVOCcontrolefficiencyfromaslowas50percenttoashighas99percent.39,40
5.4.1.4. Thermal Oxidation
AthermaloxidizersuppliessufficientcombustionairandsupplementalfuelatasuitabletemperaturetoallowforoxidationofVOCandothercombustiblecompoundspresentintheexhauststreamwithinthecombustionchamber.Oxidizersarecategorizedbyeitherathermalorcatalyticdesignandcanbefurthersubdividedintounitswithandwithoutexhaustgasheatrecovery.Straightthermaloxidizerswithoutheatrecoveryarereservedforapplicationswheretheheatingvalueoftheexhauststreamsroutedtotheoxidizerishighenoughthatlargeamountsofsupplementalfuelcombustionorhighlevelsofheatrecoveryarenotnecessarytobringtheexhaustgasestooxidationreactiontemperatures.InordertoprovideVOCcontrolinapracticalandefficientmanner,straightthermaloxidizersrequireaVOCinletconcentrationofgreaterthan1,500ppmv,becauseatthisconcentration,theheatofcombustionproducedfromoxidizingVOCpresentintheexhaustgasissufficienttosustainadequateoperatingtemperatureswithouttheadditionoflargequantitiesofexpensiveauxiliaryfuel.41Oxidizerswithheatrecoveryareeitherconsideredrecuperativeorregenerativedependingonthedesignoftheincomingprocessgastoexhaustgasheatexchangesystem.Recuperativeoxidizers(labeledhereinasaTO)useplate‐to‐plateorshell‐and‐tubegasheatexchangerstorecoverupto70percentofthesensibleheatpresentinthehotexhausttotransferittotheincomingprocessgas.U.S.EPAexpectsthataTOcanachieveadestruction/removalefficiency(DRE)ofgreaterthan98percentdependingonthesystemrequirementsoftheaircontaminantstream.42Aregenerativethermaloxidizer(RTO)usesahigh‐densitypackedheattransfermedia,typicallyceramicrandomsaddlepackingorhoneycombmonolithstructures,topreheatincomingwastegasstreamsandtoachieve85to95percentheatrecovery.TheRTOconsistsofatleasttwomodulesthatarecycledbetweeninletandoutletservicetomaintainappropriateoperatingtemperaturesandtoconserveasmuchthermalenergyaspossible.ThehighlevelofheatintegrationofferedbyRTOsisparticularlysuitedforhighflowrateandlowVOCconcentrationwastegasstreamsthatdonotvaryincompositionorflowrateovertime.Whennecessary,thefeedgasstreaminanRTOcanalsobefurtherheatedtotheoxidizer’soperatingtemperatures(1,400to2,000°F)throughsupplementalfuelcombustion.RTOshavebeenusedeffectivelyinapplicationswheretheinletVOCconcentrationisaslowas100ppmv,and,therefore,theyarethepreferredoxidizerdesignforlowVOCconcentrationexhauststreams.43U.S.EPAexpectsthatanRTOcanachieveadestruction/removalefficiencyofgreaterthan95percentdependingonthesystem’srequirementsandthecharacteristicsofthecontaminatedstream.44Thermaloxidationsystemsdesignedtopassthegasstreamoveracatalystbed(usuallyanoblemetalsuchaspalladiumorplatinum),wherecombustiblecompoundscanbeoxidizedatafasterrateandatalowertemperaturethanispossiblewithaTOorRTO,arecalledcatalyticoxidationsystems(CatOx).Theprocess
39Ibid.
40U.S.EPA,CleanAirTechnologyCenter,TechnicalBulletinRefrigeratedCondensersforControlofOrganicAirEmissions,EPA456/R‐01‐004,December2001.
41U.S.EPA,AirPollutionControlTechnologyFactSheet–RecuperativeIncinerator.EPA‐452/F‐03‐020.
42U.S.EPA,AirPollutionControlTechnologyFactSheet–RecuperativeIncinerator.EPA‐452/F‐03‐020.
43U.S.EPA,AirPollutionControlTechnologyFactSheet–RegenerativeIncinerator.EPA‐452/F‐03‐021.
44Ibid.
Interfor U.S. Inc. – Perry Mill | Continuous Kiln Construction Permit Application Trinity Consultants 5-9
requirestemperaturesof600to1,000°FtoachievehighdestructionefficienciesforVOC.45Belowthisrange,thereactionratedropssharplyandeffectiveoxidationofVOCisnolongerfeasible.
5.4.1.5. Wet Scrubbing
Wetscrubbingofgasorvaporpollutantsinagasstream,liketheexhaustthatwillexitthecontinuouskiln,isapotentialmethodforreducingVOCemissions.Wetscrubbingistypicallyconductedusingapackedcolumnwherepollutantsareabsorbedbyacounter‐currentflowofscrubbingliquid.WetscrubbingalsorequiresthattheVOCsthatareintheexhaustgasstreamarehighlysolubleinwater.
5.4.1.6. Proper Maintenance and Operating Practices
VOCemissionscanbereducedthroughpropermaintenanceandoperatingpracticesoftheproposedlumberdryingkiln.Themanufacturer’srecommendationsshouldbeusedwhendeterminingtheappropriateoperatingspecificationsanddevelopingascheduleforroutinemaintenanceofthekiln.
5.4.2. Elimination of Technically Infeasible Control Options (Step 2)
Aftertheidentificationofcontroloptions,thesecondstepintheBACTassessmentistoeliminateanytechnicallyinfeasibleoptions.Acontroloptioniseliminatedfromconsiderationifthereareprocess‐specificconditionsthatwouldprohibittheimplementationofthecontrolorifthehighestcontrolefficiencyoftheoptionwouldresultinanemissionlevelthatishigherthananyapplicableregulatorylimits.ThefollowingsectionsevaluatethefeasibilityoftheabovementionedcontroltechnologiesforreducingVOCemissionsfromtheproposedcontinuouskiln.Notethat,basedonareviewofbothbatchandcontinuouslumberdryingkilnsintheU.S.EPA’sRBLCdatabase,acontroldevicehasneverbeenappliedtoalumberdryingkiln.
5.4.2.1. Adsorption
Thekilnexhaustcontainsthewatervaporthathasevaporatedfromthelumberasitisdriedandwillhavearelativehumidityover100%.Athighmoisturecontents,thewatermoleculesandhydrocarbonsintheexhauststreamwillcompetewitheachotherforactiveadsorptionsite,reducingtheefficiencyoftheadsorptionsystem.Thiscontroldeviceis,therefore,deemedtechnicallyinfeasible.
5.4.2.2. Biofiltration
Themicroorganismsusedinbiofiltrationcannotsurviveattemperaturesexceeding105°F;however,thetemperatureoftheexhauststreamfromthekilnwillbeapproximately120°F.Furthermore,theprimaryconstituentoftheVOCintheexhauststreamisterpenes,whicharehighlyviscousandwouldcausethebiofiltertoeasilyfoul.Becauseofthenatureofthelong‐chainedhydrocarbonsintheexhauststream,abiofilterwithareasonablefootprint/retentiontime,willhaveareducedcontrolefficiencyrelativetoaunittreatingstreamswithlargeconcentrationsofmethanolorformaldehyde.Themicroorganismsrequireamuchlongerretentiontime/sizeofaunitinordertoprovideanincreasedefficiency.Forexample,engineeringfirmshavepreviouslynotedthattoincreasethecontrolefficiencyanadditional5%attheseremovallevelswouldessentiallyrequireabiofiltertwiceaslarge.Thiscontroldeviceisthereforedeemedtechnicallyinfeasible.
5.4.2.3. Condensation
CondensationrequiresthattheexhauststreambecooledtoalowenoughtemperatureforthevaporpressuretobelowerthantheVOCconcentration.TheprimaryconstituentoftheVOCintheexhauststreamfromthelumber
45U.S.EPA,AirPollutionControlTechnologyFactSheet–CatalyticIncinerator.EPA‐452/F‐03‐018.
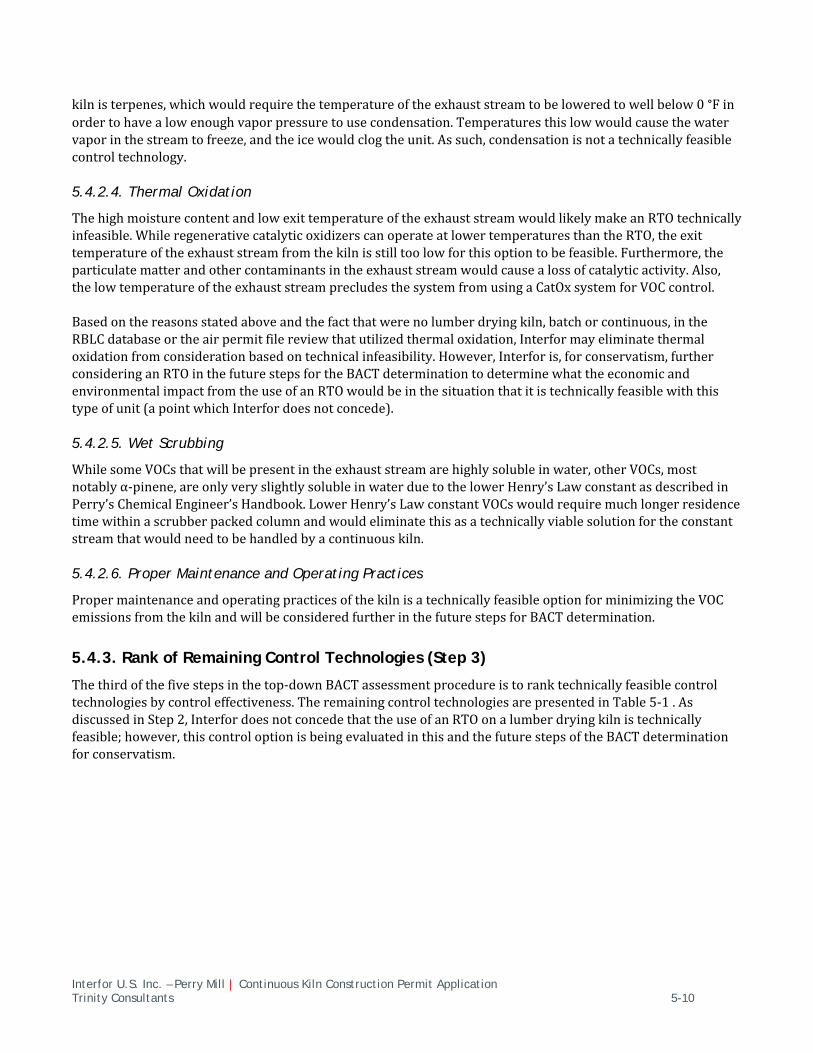
Interfor U.S. Inc. – Perry Mill | Continuous Kiln Construction Permit Application Trinity Consultants 5-10
kilnisterpenes,whichwouldrequirethetemperatureoftheexhauststreamtobeloweredtowellbelow0°Finordertohavealowenoughvaporpressuretousecondensation.Temperaturesthislowwouldcausethewatervaporinthestreamtofreeze,andtheicewouldclogtheunit.Assuch,condensationisnotatechnicallyfeasiblecontroltechnology.
5.4.2.4. Thermal Oxidation
ThehighmoisturecontentandlowexittemperatureoftheexhauststreamwouldlikelymakeanRTOtechnicallyinfeasible.WhileregenerativecatalyticoxidizerscanoperateatlowertemperaturesthantheRTO,theexittemperatureoftheexhauststreamfromthekilnisstilltoolowforthisoptiontobefeasible.Furthermore,theparticulatematterandothercontaminantsintheexhauststreamwouldcausealossofcatalyticactivity.Also,thelowtemperatureoftheexhauststreamprecludesthesystemfromusingaCatOxsystemforVOCcontrol.Basedonthereasonsstatedaboveandthefactthatwerenolumberdryingkiln,batchorcontinuous,intheRBLCdatabaseortheairpermitfilereviewthatutilizedthermaloxidation,Interformayeliminatethermaloxidationfromconsiderationbasedontechnicalinfeasibility.However,Interforis,forconservatism,furtherconsideringanRTOinthefuturestepsfortheBACTdeterminationtodeterminewhattheeconomicandenvironmentalimpactfromtheuseofanRTOwouldbeinthesituationthatitistechnicallyfeasiblewiththistypeofunit(apointwhichInterfordoesnotconcede).
5.4.2.5. Wet Scrubbing
WhilesomeVOCsthatwillbepresentintheexhauststreamarehighlysolubleinwater,otherVOCs,mostnotablyα‐pinene,areonlyveryslightlysolubleinwaterduetothelowerHenry’sLawconstantasdescribedinPerry’sChemicalEngineer’sHandbook.LowerHenry’sLawconstantVOCswouldrequiremuchlongerresidencetimewithinascrubberpackedcolumnandwouldeliminatethisasatechnicallyviablesolutionfortheconstantstreamthatwouldneedtobehandledbyacontinuouskiln.
5.4.2.6. Proper Maintenance and Operating Practices
PropermaintenanceandoperatingpracticesofthekilnisatechnicallyfeasibleoptionforminimizingtheVOCemissionsfromthekilnandwillbeconsideredfurtherinthefuturestepsforBACTdetermination.
5.4.3. Rank of Remaining Control Technologies (Step 3)
Thethirdofthefivestepsinthetop‐downBACTassessmentprocedureistoranktechnicallyfeasiblecontroltechnologiesbycontroleffectiveness.TheremainingcontroltechnologiesarepresentedinTable5‐1.AsdiscussedinStep2,InterfordoesnotconcedethattheuseofanRTOonalumberdryingkilnistechnicallyfeasible;however,thiscontroloptionisbeingevaluatedinthisandthefuturestepsoftheBACTdeterminationforconservatism.
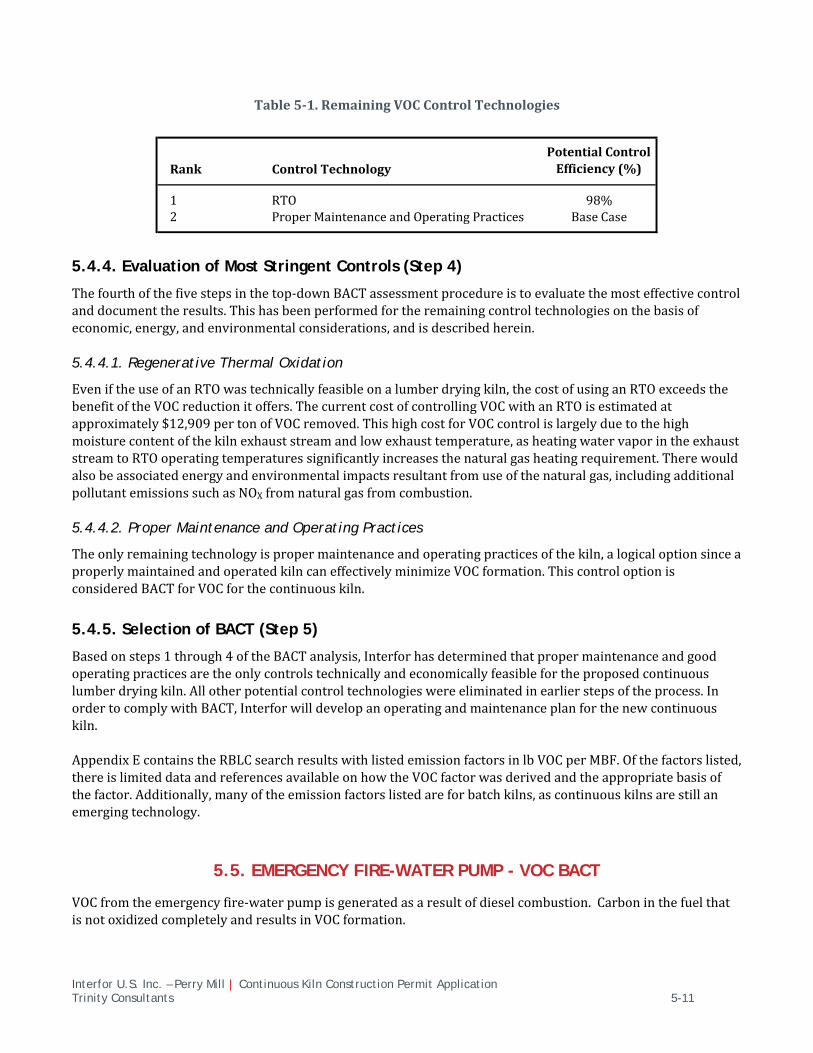
Interfor U.S. Inc. – Perry Mill | Continuous Kiln Construction Permit Application Trinity Consultants 5-11
Table5‐1.RemainingVOCControlTechnologies
5.4.4. Evaluation of Most Stringent Controls (Step 4)
Thefourthofthefivestepsinthetop‐downBACTassessmentprocedureistoevaluatethemosteffectivecontrolanddocumenttheresults.Thishasbeenperformedfortheremainingcontroltechnologiesonthebasisofeconomic,energy,andenvironmentalconsiderations,andisdescribedherein.
5.4.4.1. Regenerative Thermal Oxidation
EveniftheuseofanRTOwastechnicallyfeasibleonalumberdryingkiln,thecostofusinganRTOexceedsthebenefitoftheVOCreductionitoffers.ThecurrentcostofcontrollingVOCwithanRTOisestimatedatapproximately$12,909pertonofVOCremoved.ThishighcostforVOCcontrolislargelyduetothehighmoisturecontentofthekilnexhauststreamandlowexhausttemperature,asheatingwatervaporintheexhauststreamtoRTOoperatingtemperaturessignificantlyincreasesthenaturalgasheatingrequirement.Therewouldalsobeassociatedenergyandenvironmentalimpactsresultantfromuseofthenaturalgas,includingadditionalpollutantemissionssuchasNOXfromnaturalgasfromcombustion.
5.4.4.2. Proper Maintenance and Operating Practices
Theonlyremainingtechnologyispropermaintenanceandoperatingpracticesofthekiln,alogicaloptionsinceaproperlymaintainedandoperatedkilncaneffectivelyminimizeVOCformation.ThiscontroloptionisconsideredBACTforVOCforthecontinuouskiln.
5.4.5. Selection of BACT (Step 5)
Basedonsteps1through4oftheBACTanalysis,Interforhasdeterminedthatpropermaintenanceandgoodoperatingpracticesaretheonlycontrolstechnicallyandeconomicallyfeasiblefortheproposedcontinuouslumberdryingkiln.Allotherpotentialcontroltechnologieswereeliminatedinearlierstepsoftheprocess.InordertocomplywithBACT,Interforwilldevelopanoperatingandmaintenanceplanforthenewcontinuouskiln.AppendixEcontainstheRBLCsearchresultswithlistedemissionfactorsinlbVOCperMBF.Ofthefactorslisted,thereislimiteddataandreferencesavailableonhowtheVOCfactorwasderivedandtheappropriatebasisofthefactor.Additionally,manyoftheemissionfactorslistedareforbatchkilns,ascontinuouskilnsarestillanemergingtechnology.
5.5. EMERGENCY FIRE-WATER PUMP - VOC BACT
VOCfromtheemergencyfire‐waterpumpisgeneratedasaresultofdieselcombustion.CarboninthefuelthatisnotoxidizedcompletelyandresultsinVOCformation.
Rank ControlTechnologyPotentialControlEfficiency(%)
1 RTO 98%2 ProperMaintenanceandOperatingPractices BaseCase
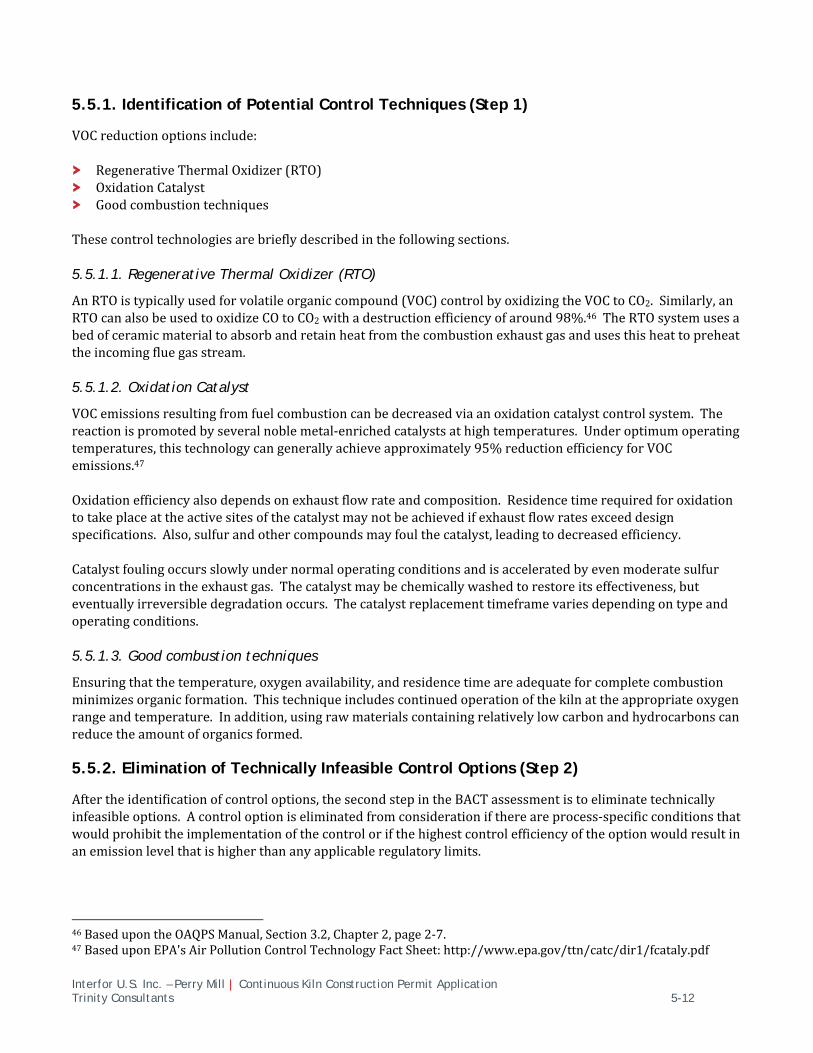
Interfor U.S. Inc. – Perry Mill | Continuous Kiln Construction Permit Application Trinity Consultants 5-12
5.5.1. Identification of Potential Control Techniques (Step 1)
VOCreductionoptionsinclude:
RegenerativeThermalOxidizer(RTO) OxidationCatalyst Goodcombustiontechniques
Thesecontroltechnologiesarebrieflydescribedinthefollowingsections.
5.5.1.1. Regenerative Thermal Oxidizer (RTO)
AnRTOistypicallyusedforvolatileorganiccompound(VOC)controlbyoxidizingtheVOCtoCO2.Similarly,anRTOcanalsobeusedtooxidizeCOtoCO2withadestructionefficiencyofaround98%.46TheRTOsystemusesabedofceramicmaterialtoabsorbandretainheatfromthecombustionexhaustgasandusesthisheattopreheattheincomingfluegasstream.
5.5.1.2. Oxidation Catalyst
VOCemissionsresultingfromfuelcombustioncanbedecreasedviaanoxidationcatalystcontrolsystem.Thereactionispromotedbyseveralnoblemetal‐enrichedcatalystsathightemperatures.Underoptimumoperatingtemperatures,thistechnologycangenerallyachieveapproximately95%reductionefficiencyforVOCemissions.47
Oxidationefficiencyalsodependsonexhaustflowrateandcomposition.Residencetimerequiredforoxidationtotakeplaceattheactivesitesofthecatalystmaynotbeachievedifexhaustflowratesexceeddesignspecifications.Also,sulfurandothercompoundsmayfoulthecatalyst,leadingtodecreasedefficiency.
Catalystfoulingoccursslowlyundernormaloperatingconditionsandisacceleratedbyevenmoderatesulfurconcentrationsintheexhaustgas.Thecatalystmaybechemicallywashedtorestoreitseffectiveness,buteventuallyirreversibledegradationoccurs.Thecatalystreplacementtimeframevariesdependingontypeandoperatingconditions.
5.5.1.3. Good combustion techniques
Ensuringthatthetemperature,oxygenavailability,andresidencetimeareadequateforcompletecombustionminimizesorganicformation.Thistechniqueincludescontinuedoperationofthekilnattheappropriateoxygenrangeandtemperature.Inaddition,usingrawmaterialscontainingrelativelylowcarbonandhydrocarbonscanreducetheamountoforganicsformed.
5.5.2. Elimination of Technically Infeasible Control Options (Step 2)
Aftertheidentificationofcontroloptions,thesecondstepintheBACTassessmentistoeliminatetechnicallyinfeasibleoptions.Acontroloptioniseliminatedfromconsiderationifthereareprocess‐specificconditionsthatwouldprohibittheimplementationofthecontrolorifthehighestcontrolefficiencyoftheoptionwouldresultinanemissionlevelthatishigherthananyapplicableregulatorylimits.
46BasedupontheOAQPSManual,Section3.2,Chapter2,page2‐7.47BaseduponEPA'sAirPollutionControlTechnologyFactSheet:http://www.epa.gov/ttn/catc/dir1/fcataly.pdf
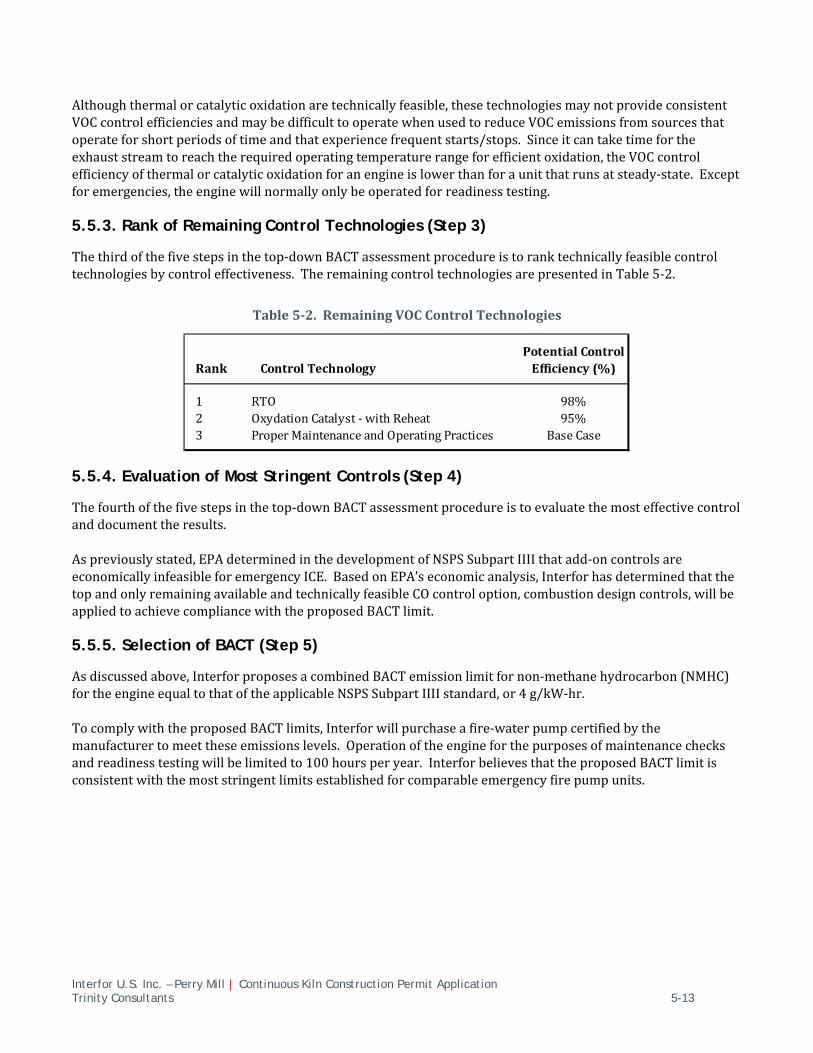
Interfor U.S. Inc. – Perry Mill | Continuous Kiln Construction Permit Application Trinity Consultants 5-13
Althoughthermalorcatalyticoxidationaretechnicallyfeasible,thesetechnologiesmaynotprovideconsistentVOCcontrolefficienciesandmaybedifficulttooperatewhenusedtoreduceVOCemissionsfromsourcesthatoperateforshortperiodsoftimeandthatexperiencefrequentstarts/stops.Sinceitcantaketimefortheexhauststreamtoreachtherequiredoperatingtemperaturerangeforefficientoxidation,theVOCcontrolefficiencyofthermalorcatalyticoxidationforanengineislowerthanforaunitthatrunsatsteady‐state.Exceptforemergencies,theenginewillnormallyonlybeoperatedforreadinesstesting.
5.5.3. Rank of Remaining Control Technologies (Step 3)
Thethirdofthefivestepsinthetop‐downBACTassessmentprocedureistoranktechnicallyfeasiblecontroltechnologiesbycontroleffectiveness.TheremainingcontroltechnologiesarepresentedinTable5‐2.
Table5‐2.RemainingVOCControlTechnologies
5.5.4. Evaluation of Most Stringent Controls (Step 4)
Thefourthofthefivestepsinthetop‐downBACTassessmentprocedureistoevaluatethemosteffectivecontrolanddocumenttheresults.
Aspreviouslystated,EPAdeterminedinthedevelopmentofNSPSSubpartIIIIthatadd‐oncontrolsareeconomicallyinfeasibleforemergencyICE.BasedonEPA’seconomicanalysis,InterforhasdeterminedthatthetopandonlyremainingavailableandtechnicallyfeasibleCOcontroloption,combustiondesigncontrols,willbeappliedtoachievecompliancewiththeproposedBACTlimit.
5.5.5. Selection of BACT (Step 5)
Asdiscussedabove,InterforproposesacombinedBACTemissionlimitfornon‐methanehydrocarbon(NMHC)fortheengineequaltothatoftheapplicableNSPSSubpartIIIIstandard,or4g/kW‐hr.
TocomplywiththeproposedBACTlimits,Interforwillpurchaseafire‐waterpumpcertifiedbythemanufacturertomeettheseemissionslevels.Operationoftheengineforthepurposesofmaintenancechecksandreadinesstestingwillbelimitedto100hoursperyear.InterforbelievesthattheproposedBACTlimitisconsistentwiththemoststringentlimitsestablishedforcomparableemergencyfirepumpunits.
Rank ControlTechnologyPotentialControlEfficiency(%)
1 RTO 98%2 OxydationCatalyst‐withReheat 95%3 ProperMaintenanceandOperatingPractices BaseCase
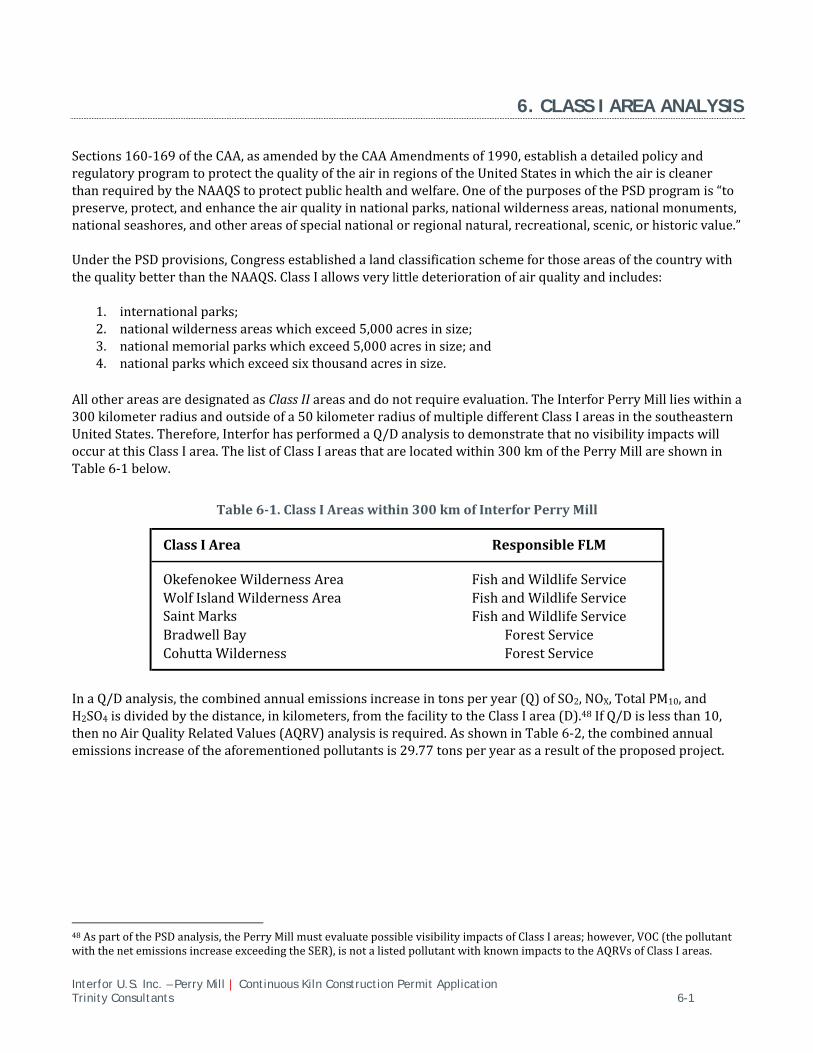
Interfor U.S. Inc. – Perry Mill | Continuous Kiln Construction Permit Application Trinity Consultants 6-1
6. CLASS I AREA ANALYSIS
Sections160‐169oftheCAA,asamendedbytheCAAAmendmentsof1990,establishadetailedpolicyandregulatoryprogramtoprotectthequalityoftheairinregionsoftheUnitedStatesinwhichtheairiscleanerthanrequiredbytheNAAQStoprotectpublichealthandwelfare.OneofthepurposesofthePSDprogramis“topreserve,protect,andenhancetheairqualityinnationalparks,nationalwildernessareas,nationalmonuments,nationalseashores,andotherareasofspecialnationalorregionalnatural,recreational,scenic,orhistoricvalue.”UnderthePSDprovisions,CongressestablishedalandclassificationschemeforthoseareasofthecountrywiththequalitybetterthantheNAAQS.ClassIallowsverylittledeteriorationofairqualityandincludes:
1. internationalparks;2. nationalwildernessareaswhichexceed5,000acresinsize;3. nationalmemorialparkswhichexceed5,000acresinsize;and4. nationalparkswhichexceedsixthousandacresinsize.
AllotherareasaredesignatedasClassIIareasanddonotrequireevaluation.TheInterforPerryMilllieswithina300kilometerradiusandoutsideofa50kilometerradiusofmultipledifferentClassIareasinthesoutheasternUnitedStates.Therefore,InterforhasperformedaQ/DanalysistodemonstratethatnovisibilityimpactswilloccuratthisClassIarea.ThelistofClassIareasthatarelocatedwithin300kmofthePerryMillareshowninTable6‐1below.
Table6‐1.ClassIAreaswithin300kmofInterforPerryMill
InaQ/Danalysis,thecombinedannualemissionsincreaseintonsperyear(Q)ofSO2,NOX,TotalPM10,andH2SO4isdividedbythedistance,inkilometers,fromthefacilitytotheClassIarea(D).48IfQ/Dislessthan10,thennoAirQualityRelatedValues(AQRV)analysisisrequired.AsshowninTable6‐2,thecombinedannualemissionsincreaseoftheaforementionedpollutantsis29.77tonsperyearasaresultoftheproposedproject.
48AspartofthePSDanalysis,thePerryMillmustevaluatepossiblevisibilityimpactsofClassIareas;however,VOC(thepollutantwiththenetemissionsincreaseexceedingtheSER),isnotalistedpollutantwithknownimpactstotheAQRVsofClassIareas.
ClassIArea ResponsibleFLM
OkefenokeeWildernessArea FishandWildlifeServiceWolfIslandWildernessArea FishandWildlifeServiceSaintMarks FishandWildlifeServiceBradwellBay ForestServiceCohuttaWilderness ForestService
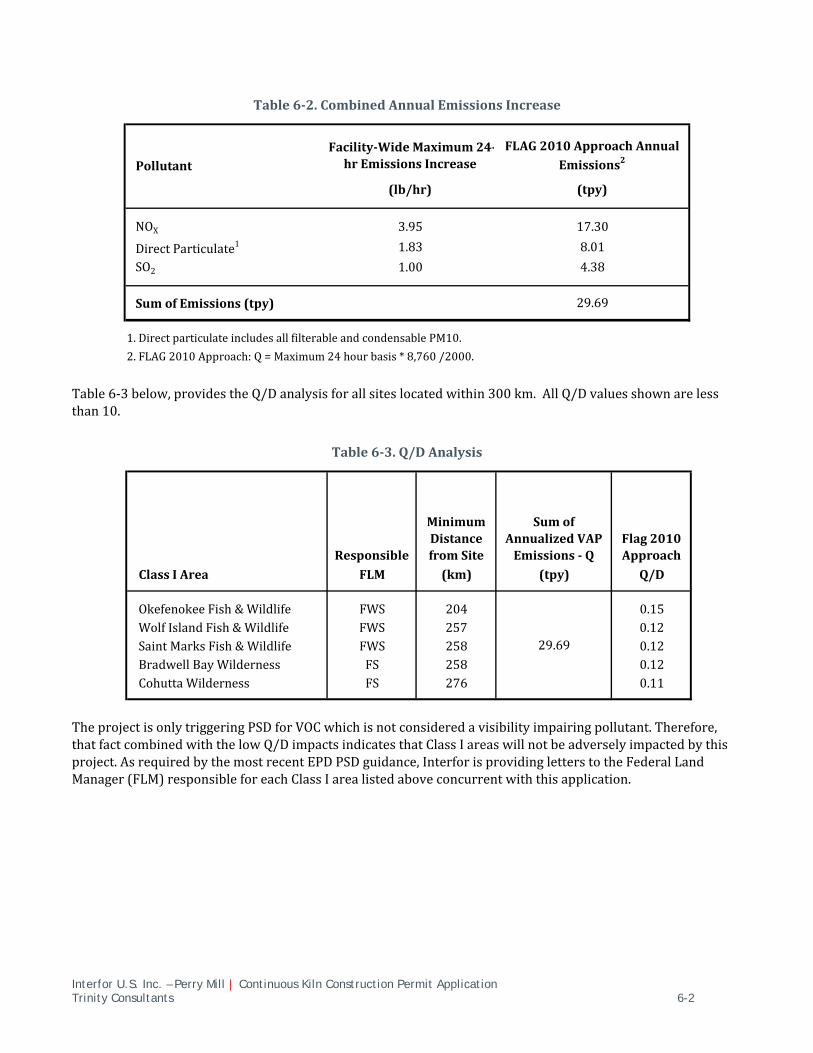
Interfor U.S. Inc. – Perry Mill | Continuous Kiln Construction Permit Application Trinity Consultants 6-2
Table6‐2.CombinedAnnualEmissionsIncrease
Table6‐3below,providestheQ/Danalysisforallsiteslocatedwithin300km.AllQ/Dvaluesshownarelessthan10.
Table6‐3.Q/DAnalysis
TheprojectisonlytriggeringPSDforVOCwhichisnotconsideredavisibilityimpairingpollutant.Therefore,thatfactcombinedwiththelowQ/DimpactsindicatesthatClassIareaswillnotbeadverselyimpactedbythisproject.AsrequiredbythemostrecentEPDPSDguidance,InterforisprovidingletterstotheFederalLandManager(FLM)responsibleforeachClassIarealistedaboveconcurrentwiththisapplication.
NOX
DirectParticulate1
SO2
SumofEmissions(tpy)
1.DirectparticulateincludesallfilterableandcondensablePM10.
2.FLAG2010Approach:Q=Maximum24hourbasis*8,760/2000.
PollutantFacility‐WideMaximum24‐hrEmissionsIncrease
(lb/hr)
3.95
1.83
1.00
FLAG2010ApproachAnnualEmissions2
(tpy)
17.30
8.01
4.38
29.69
Responsible
MinimumDistancefromSite
SumofAnnualizedVAPEmissions‐Q
Flag2010Approach
ClassIArea FLM (km) (tpy) Q/D
OkefenokeeFish&Wildlife FWS 204 0.15WolfIslandFish&Wildlife FWS 257 0.12SaintMarksFish&Wildlife FWS 258 0.12BradwellBayWilderness FS 258 0.12CohuttaWilderness FS 276 0.11
29.69
Interfor U.S. Inc. – Perry Mill | Continuous Kiln Construction Permit Application Trinity Consultants 7-1
7. ADDITIONAL IMPACT ANALYSIS
7.1. AIR QUALITY ANALYSIS
AnambientairimpactsanalysiswillnotbeperformedfortheprojectbecauseVOCarenotmodeledforNAAQSorPSDIncrementcompliancepurposes.Additionally,becausetheprojectisexclusivelyrelatedtoVOC,aClassIIvisibilityanalysisisalsonotrequired.
7.2. MOBILE SOURCES
AsshownindetailinAppendixB,Interforprojectsthattrucktrafficonunpavedroadswillincreasebyapproximately5,741vehiclemilestraveled(VMT)peryear.TheincreaseinTotalPM/PM10/PM2.5emissionshasbeenaccountedforintheapplicationandsupportingcalculations.
7.3. GROWTH IMPACTS
Agrowthanalysisisintendedtoquantifytheamountofnewgrowththatislikelytooccurinsupportofthefacilityandtoestimateemissionsresultingfromthatassociatedgrowth.Associatedgrowthincludesresidentialandcommercial/industrialgrowthresultingfromthenewfacility.Residentialgrowthdependsonthenumberofnewemployeesandtheavailabilityofhousinginthearea,whileassociatedcommercialandindustrialgrowthconsistsofnewsourcesprovidingservicestothenewemployeesandthefacility.Interforanticipatesthatfewadditionalpersonnelwillbeemployedtoaidtheoperationofthecontinuouskiln.Therefore,additionalgrowthfromthisprojectisexpectedtobeminimal.
7.4. SOILS AND VEGETATION
Thefollowingdiscussionwillreviewtheproject’spotentialtoimpactitsagriculturalsurroundingsbasedonthefacility’sallowableemissionratesandresultinggroundlevelconcentrationsofVOC.Theeffectsofgaseousairpollutantsonvegetationmaybeclassifiedintothreeratherbroadcategories:acute,chronic,andlong‐term.Acuteeffectsarethosethatresultfromrelativelyshort(lessthan1month)exposurestohighconcentrationsofpollutants.Chroniceffectsoccurwhenorganismsareexposedformonthsorevenyearstocertainthresholdlevelsofpollutants.Long‐termeffectsincludeabnormalchangesinecosystemsandsubtlephysiologicalalterationsinorganisms.Acuteandchroniceffectsarecausedbythegaseouspollutantactingdirectlyontheorganism,whereaslong‐termeffectsmaybeindirectlycausedbysecondaryagentssuchaschangesinsoilpH. VOCareregulatedbytheU.S.EPAasprecursorstotroposphericozone.Elevatedground‐levelozoneconcentrationscandamageplantlifeandreducecropproduction.VOCinterferewiththeabilityofplantstoproduceandstorefood,makingthemmoresusceptibletodisease,insects,otherpollutants,andharshweather.OzoneisformedbytheinteractionofNOX,VOC,andsunlightintheatmosphere.ThePerryMillislocatedinHoustonCounty,whichisdesignatedasattainment,orunclassifiableforNO2andozone.Also,thePerryMillemitshigherquantitiesofVOCthanNOX,andtherefore,ozoneformationisprimarilydependentuponNOXemissionsandproperatmosphericconditions.SinceNOXemissionsareonlyincreasingslightlyasaresultofthisproject,aminimalincreaseinozoneproductionisexpected.ThusInterfordoesnotpredicttherewillbeanysignificantnegativeimpactonsoilorvegetationasaresultofthisproject.
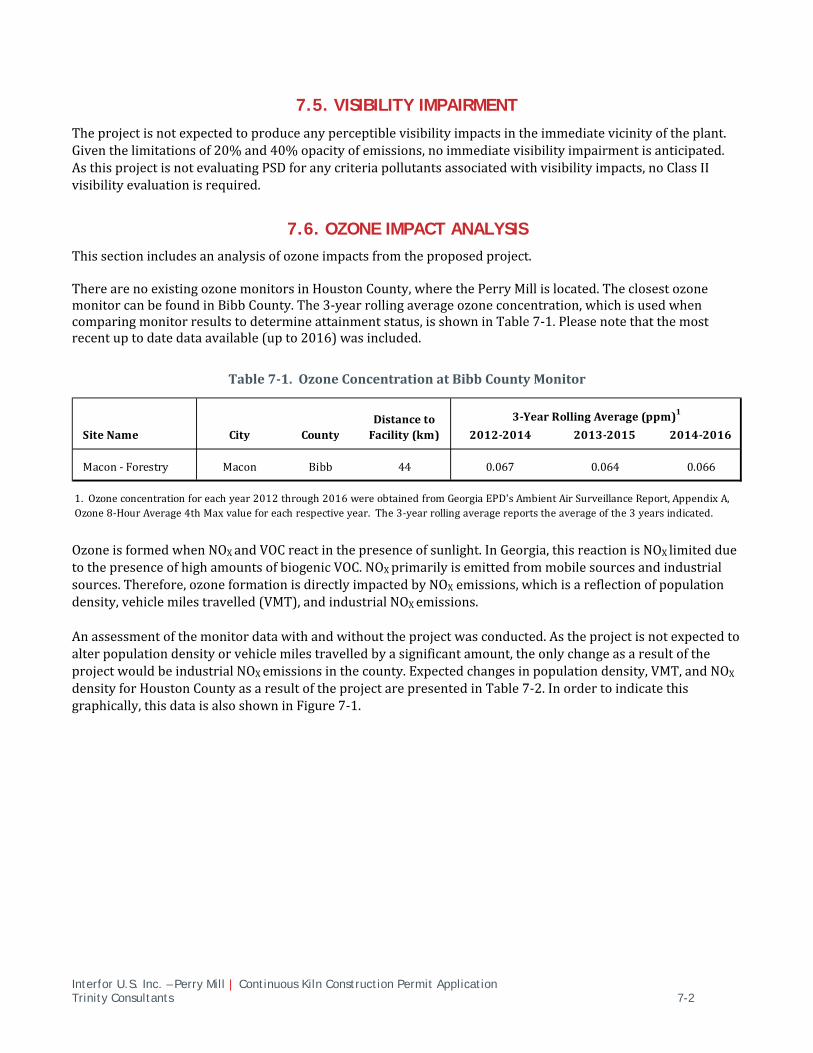
Interfor U.S. Inc. – Perry Mill | Continuous Kiln Construction Permit Application Trinity Consultants 7-2
7.5. VISIBILITY IMPAIRMENT
Theprojectisnotexpectedtoproduceanyperceptiblevisibilityimpactsintheimmediatevicinityoftheplant.Giventhelimitationsof20%and40%opacityofemissions,noimmediatevisibilityimpairmentisanticipated.AsthisprojectisnotevaluatingPSDforanycriteriapollutantsassociatedwithvisibilityimpacts,noClassIIvisibilityevaluationisrequired.
7.6. OZONE IMPACT ANALYSIS
Thissectionincludesananalysisofozoneimpactsfromtheproposedproject.TherearenoexistingozonemonitorsinHoustonCounty,wherethePerryMillislocated.TheclosestozonemonitorcanbefoundinBibbCounty.The3‐yearrollingaverageozoneconcentration,whichisusedwhencomparingmonitorresultstodetermineattainmentstatus,isshowninTable7‐1.Pleasenotethatthemostrecentuptodatedataavailable(upto2016)wasincluded.
Table7‐1.OzoneConcentrationatBibbCountyMonitor
OzoneisformedwhenNOXandVOCreactinthepresenceofsunlight.InGeorgia,thisreactionisNOXlimitedduetothepresenceofhighamountsofbiogenicVOC.NOXprimarilyisemittedfrommobilesourcesandindustrialsources.Therefore,ozoneformationisdirectlyimpactedbyNOXemissions,whichisareflectionofpopulationdensity,vehiclemilestravelled(VMT),andindustrialNOXemissions.
Anassessmentofthemonitordatawithandwithouttheprojectwasconducted.Astheprojectisnotexpectedtoalterpopulationdensityorvehiclemilestravelledbyasignificantamount,theonlychangeasaresultoftheprojectwouldbeindustrialNOXemissionsinthecounty.Expectedchangesinpopulationdensity,VMT,andNOXdensityforHoustonCountyasaresultoftheprojectarepresentedinTable7‐2.Inordertoindicatethisgraphically,thisdataisalsoshowninFigure7‐1.
2012‐2014 2013‐2015 2014‐2016
Macon‐Forestry Macon Bibb 44 0.067 0.064 0.066
3‐YearRollingAverage(ppm)1
1.Ozoneconcentrationforeachyear2012through2016wereobtainedfromGeorgiaEPD'sAmbientAirSurveillanceReport,AppendixA,Ozone8‐HourAverage4thMaxvalueforeachrespectiveyear.The3‐yearrollingaveragereportstheaverageofthe3yearsindicated.
DistancetoFacility(km)SiteName City County
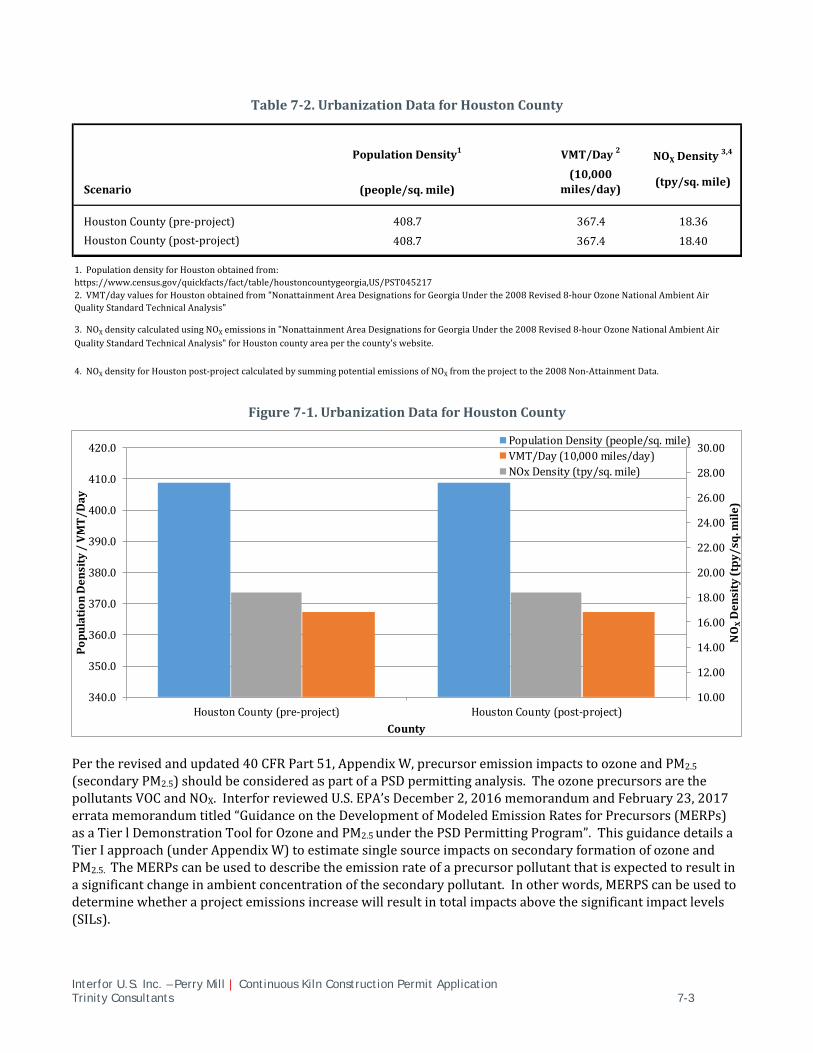
Interfor U.S. Inc. – Perry Mill | Continuous Kiln Construction Permit Application Trinity Consultants 7-3
Table7‐2.UrbanizationDataforHoustonCounty
Figure7‐1.UrbanizationDataforHoustonCounty
Pertherevisedandupdated40CFRPart51,AppendixW,precursoremissionimpactstoozoneandPM2.5
(secondaryPM2.5)shouldbeconsideredaspartofaPSDpermittinganalysis.TheozoneprecursorsarethepollutantsVOCandNOX.InterforreviewedU.S.EPA’sDecember2,2016memorandumandFebruary23,2017erratamemorandumtitled“GuidanceontheDevelopmentofModeledEmissionRatesforPrecursors(MERPs)asaTierlDemonstrationToolforOzoneandPM2.5underthePSDPermittingProgram”.ThisguidancedetailsaTierIapproach(underAppendixW)toestimatesinglesourceimpactsonsecondaryformationofozoneandPM2.5.TheMERPscanbeusedtodescribetheemissionrateofaprecursorpollutantthatisexpectedtoresultinasignificantchangeinambientconcentrationofthesecondarypollutant.Inotherwords,MERPScanbeusedtodeterminewhetheraprojectemissionsincreasewillresultintotalimpactsabovethesignificantimpactlevels(SILs).
PopulationDensity1 VMT/Day2 NOXDensity3,4
(people/sq.mile)(10,000
miles/day)(tpy/sq.mile)
HoustonCounty(pre‐project) 408.7 367.4 18.36
HoustonCounty(post‐project) 408.7 367.4 18.40
3.NOXdensitycalculatedusingNOXemissionsin"NonattainmentAreaDesignationsforGeorgiaUnderthe2008Revised8‐hourOzoneNationalAmbientAirQualityStandardTechnicalAnalysis"forHoustoncountyareaperthecounty'swebsite.
4.NOXdensityforHoustonpost‐projectcalculatedbysummingpotentialemissionsofNOXfromtheprojecttothe2008Non‐AttainmentData.
Scenario
1.PopulationdensityforHoustonobtainedfrom:https://www.census.gov/quickfacts/fact/table/houstoncountygeorgia,US/PST0452172.VMT/dayvaluesforHoustonobtainedfrom"NonattainmentAreaDesignationsforGeorgiaUnderthe2008Revised8‐hourOzoneNationalAmbientAirQualityStandardTechnicalAnalysis"
10.00
12.00
14.00
16.00
18.00
20.00
22.00
24.00
26.00
28.00
30.00
340.0
350.0
360.0
370.0
380.0
390.0
400.0
410.0
420.0
HoustonCounty(pre‐project) HoustonCounty(post‐project)
NOXDensity(tpy/sq.mile)
PopulationDensity/VMT/Day
County
PopulationDensity(people/sq.mile)VMT/Day(10,000miles/day)NOxDensity(tpy/sq.mile)
Interfor U.S. Inc. – Perry Mill | Continuous Kiln Construction Permit Application Trinity Consultants 7-4
Aspartofconsiderationofmodelinganalyses,pertherevisedandupdated40CFRPart51,AppendixW,precursoremissionimpactstoozoneandPM2.5(secondaryPM2.5)shouldbeconsidered.TheozoneprecursorsarethepollutantsVOCandNOX,whereastheprecursoremissionsofinterestforsecondaryPM2.5areNOXandSO2.ThefollowingTable7‐3istakenfromTable2oftheJuly11,2018GuidanceontheUseofEPA’sMERPstoAccountforSecondaryFormationofOzoneandPM2.5inGeorgia.
Table7‐3.DefaultMERPValuesforGeorgiaPSDApplications
7.6.1. Ozone MERPs Assessment
UtilizingtheproposedprojectemissionincreasesofVOC(240.50tpy)andNOX(17.30tpy)fromTable3‐1andtheMERPvalues(156tpyNOX,and3,980tpyVOC)providedinTable7‐3(fromtheJuly11,2018GuidanceontheUseofEPA’sMERPstoAccountforSecondaryFormationofOzoneandPM2.5inGeorgia),demonstratesthatthereshouldbenoconcernsregardingadverseozoneambientimpactsfromthisproposedproject,perthefollowingcalculationasoutlinedintheguidancedocument:(17.30tpyNOXfromproject/156tpyNOX8‐hrdailymaximumO3MERP)+(240.50tpyVOCfromproject/3,980tpyVOC8‐hrdailymaximumO3MERP)=0.111+0.060=0.171*100=17%Sincethereisnodirectcomponentofozonewhichcanbemodeled,asitsformationisdependentontheprecursoremissionsofVOCandNOX,thentheresultsoftheTier1analysisforozone(17%)canbecompareddirectlytothethresholdlevelofconcernof100%.Inotherwords,solongastheanalysisabovedoesnotshowresultsgreaterthan100%,therecanbeapresumptionofnoadverseimpactassociatedwithozone.Therefore,thereshouldbenoadverseimpactassociatedwithprecursoremissionsforozoneaspartofthisproject.
7.6.2. PM2.5 MERPs Assessment
ForPM2.5,sincetheprojectdoesnotexceedthePSDSERsfordirectPM2.5,orSO2orNOX,anevaluationofPM2.5
associatedimpactsisnotrequired.AnynumericevaluationofprojectemissionsincreaseforthesepollutantswouldundoubtedlybelessthantheassociatedMERPssincetheyarelessthanthePSDSERs.Therefore,thereisnopresumedconcernoradverseimpactassociatedwithsecondaryPM2.5onanannualbasis.
Interfor U.S. Inc. – Perry Mill | Continuous Kiln Construction Permit Application Trinity Consultants 8-1
8. TOXIC AIR POLLUTANT EMISSIONS IMPACT ASSESSMENT
EPDregulatestheemissionsoftoxicairpollutants(TAPs)throughaprogramapprovedundertheprovisionsofGRAQCRule391‐3‐1‐.02(2)(a)3(ii).ATAPisdefinedasanysubstancethatmayhaveanadverseeffectonpublichealth,excludinganyspecificsubstancethatiscoveredbyaStateorFederalambientairqualitystandard.ProceduresgoverningtheEPD’sreviewoftoxicairpollutantemissionsaspartofairpermitreviewsarecontainedinEPD’sGuidelineforAmbientImpactAssessmentofToxicAirPollutantEmissions(theGuideline).49
TheGuidelinehasestablishedtheAllowableAmbientConcentration(AAC)foreachTAP,whichareincludedinAppendixAoftheGuideline.ThereareseveralTAPsemittedfromthefacility.PerdiscussionwithEPD50,onlyacetaldehyde,formaldehydeandmethanolweremodeledaspartofthisapplicationastheyarethepollutantsofconcernforthesetypeofprocesses.Astheemergencydiesel‐firedfirepumphaslimitedoperation(emergencysituations,andmaintenance/readinesstesting),thisunitwasexcludedfromthetoxicsevaluation.
8.1. MODELING ASSESSMENT
Duetothenumberofstacksandvariablestackparameters,refinedmodelingtechniqueswereselectedforthiscomplianceassessmentandSCREEN3wasnotutilizedforthismodelingassessment.Thefollowingsectiondescribesthemodelingprotocolandsourceparametersusedintherefineddispersionmodelingassessmentforthefacility.ThisassessmentwasperformedinaccordancewiththeGuideline.
Section6oftheGuidelinerequirestheuseoftheIndustrialSourceComplex(ISCST3)dispersionmodelortheAmericanMeteorologicalSociety/EnvironmentalProtectionAgencyRegulatoryModel(AERMOD)todeterminethemaximumgroundlevelconcentration(MGLC)foraTAPundertherefinedmodelingprocedures.ISCST3wasselectedforthisassessment.ISCST3isacomputersolutiontotheGaussianplumedispersionmodelandisusedtodeterminepollutantconcentrationsattheplumecenterlineandatthegroundleveldownwindofthereleasepoints.RefinedmodelingwasconductedinaccordancewiththeISCST3User’sGuides.
8.1.1. Source Parameters
TAPemissionsweremodeledaspointsourcesforthisrefinedassessment.Forpointsources,ISCST3requiresthestackheight(m),insidestackexitdiameter(m),temperature(K),andvolumetricexhaustgasflowrate(acfm)orexitgasvelocity(m/s)tobespecified.Table8‐4providesasummaryofthelocation,baseelevation,andstackparametersusedinthedispersionmodelforthepointsources.Table8‐5providesasummaryoftheemissionratesforthepointsourcesevaluatedinthisassessment.Abriefdiscussionofthedesigncapacityanddescriptionofthereleasepointsforeachsourceisdiscussedinthefollowingsections.
8.1.1.1. New Continuous Kiln
ModeledsourceparametersareconsistentwiththeGuidelineforthecontinuouskilnsource.Thekilnwillberatedatapproximately120MMBF/yr,haveaburnercapacityofapproximately40MMBtu/hr,andhavetwopoweredvents,oneoneachendofthekiln.Thekilnwillalsohavetwoexitopenings,oneoneachendofthekiln.Potentialemissionsfromthenewcontinuouskilnwerediscussedinprevioussections.Forthenewcontinuouskiln,itisassumedthat80%oftheemissionswillbethroughthetwopoweredvents,and20%ofthe
49GuidelineforAmbientImpactAssessmentofToxicAirPollutantEmissions.GeorgiaDepartmentofNaturalResources,EnvironmentalProtectionDivision,AirProtectionBranch,Revised,May2017.50InputsfromMr.MannyPatelonAugust23,2018.BasedoninputfromMannyPatel,onlythesepollutantsweremodeled,andnoevaluationincomparisontotheMERswasconducted.
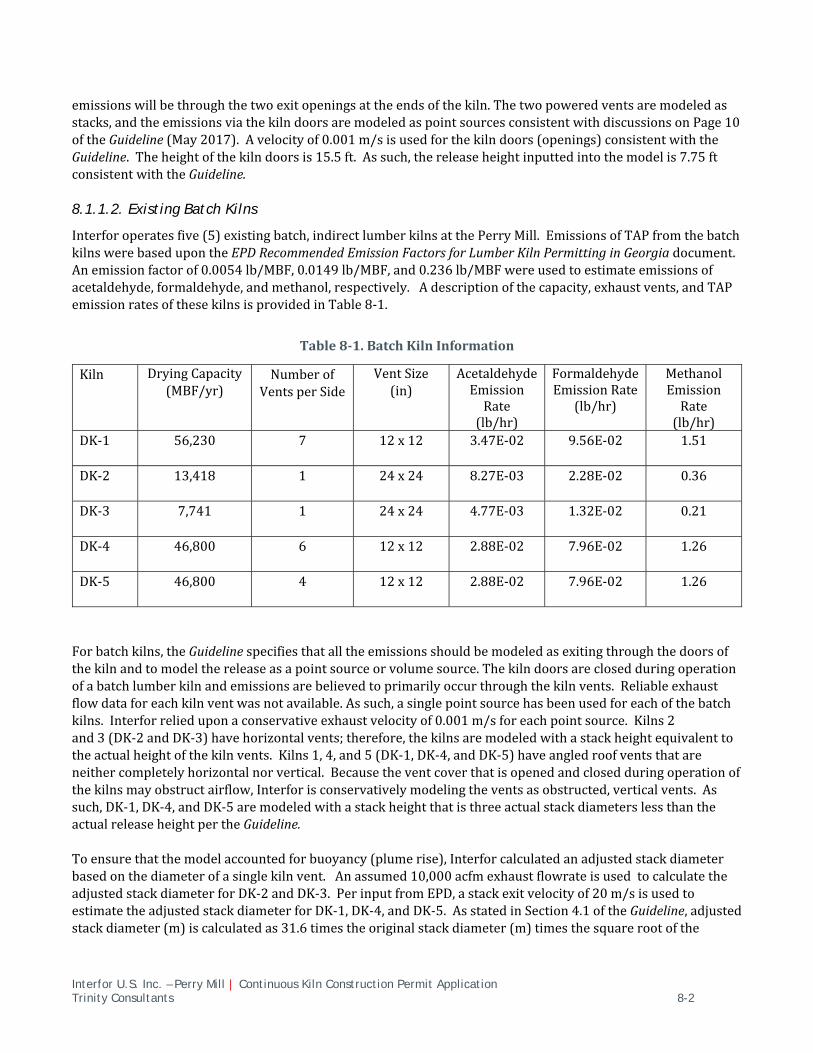
Interfor U.S. Inc. – Perry Mill | Continuous Kiln Construction Permit Application Trinity Consultants 8-2
emissionswillbethroughthetwoexitopeningsattheendsofthekiln.Thetwopoweredventsaremodeledasstacks,andtheemissionsviathekilndoorsaremodeledaspointsourcesconsistentwithdiscussionsonPage10oftheGuideline(May2017).Avelocityof0.001m/sisusedforthekilndoors(openings)consistentwiththeGuideline.Theheightofthekilndoorsis15.5ft.Assuch,thereleaseheightinputtedintothemodelis7.75ftconsistentwiththeGuideline.
8.1.1.2. Existing Batch Kilns
Interforoperatesfive(5)existingbatch,indirectlumberkilnsatthePerryMill.EmissionsofTAPfromthebatchkilnswerebasedupontheEPDRecommendedEmissionFactorsforLumberKilnPermittinginGeorgiadocument.Anemissionfactorof0.0054lb/MBF,0.0149lb/MBF,and0.236lb/MBFwereusedtoestimateemissionsofacetaldehyde,formaldehyde,andmethanol,respectively.Adescriptionofthecapacity,exhaustvents,andTAPemissionratesofthesekilnsisprovidedinTable8‐1.
Table8‐1.BatchKilnInformation
Kiln DryingCapacity(MBF/yr)
NumberofVentsperSide
VentSize(in)
AcetaldehydeEmissionRate(lb/hr)
FormaldehydeEmissionRate
(lb/hr)
MethanolEmissionRate(lb/hr)
DK‐1 56,230 7 12x12 3.47E‐02 9.56E‐02 1.51
DK‐2 13,418 1 24x24 8.27E‐03 2.28E‐02 0.36
DK‐3 7,741 1 24x24 4.77E‐03 1.32E‐02 0.21
DK‐4 46,800 6 12x12 2.88E‐02 7.96E‐02 1.26
DK‐5 46,800 4 12x12 2.88E‐02 7.96E‐02 1.26
Forbatchkilns,theGuidelinespecifiesthatalltheemissionsshouldbemodeledasexitingthroughthedoorsofthekilnandtomodelthereleaseasapointsourceorvolumesource.Thekilndoorsareclosedduringoperationofabatchlumberkilnandemissionsarebelievedtoprimarilyoccurthroughthekilnvents.Reliableexhaustflowdataforeachkilnventwasnotavailable.Assuch,asinglepointsourcehasbeenusedforeachofthebatchkilns.Interforrelieduponaconservativeexhaustvelocityof0.001m/sforeachpointsource.Kilns2and3(DK‐2andDK‐3)havehorizontalvents;therefore,thekilnsaremodeledwithastackheightequivalenttotheactualheightofthekilnvents.Kilns1,4,and5(DK‐1,DK‐4,andDK‐5)haveangledroofventsthatareneithercompletelyhorizontalnorvertical.Becausetheventcoverthatisopenedandclosedduringoperationofthekilnsmayobstructairflow,Interforisconservativelymodelingtheventsasobstructed,verticalvents.Assuch,DK‐1,DK‐4,andDK‐5aremodeledwithastackheightthatisthreeactualstackdiameterslessthantheactualreleaseheightpertheGuideline.
Toensurethatthemodelaccountedforbuoyancy(plumerise),Interforcalculatedanadjustedstackdiameterbasedonthediameterofasinglekilnvent.Anassumed10,000acfmexhaustflowrateisusedtocalculatetheadjustedstackdiameterforDK‐2andDK‐3.PerinputfromEPD,astackexitvelocityof20m/sisusedtoestimatetheadjustedstackdiameterforDK‐1,DK‐4,andDK‐5.AsstatedinSection4.1oftheGuideline,adjustedstackdiameter(m)iscalculatedas31.6timestheoriginalstackdiameter(m)timesthesquarerootofthe
Interfor U.S. Inc. – Perry Mill | Continuous Kiln Construction Permit Application Trinity Consultants 8-3
originalstackexitvelocity(m/s).ThecalculationoftheadjustedstackdiametercalculationfortheexistingkilnsisshowninTable8‐2.
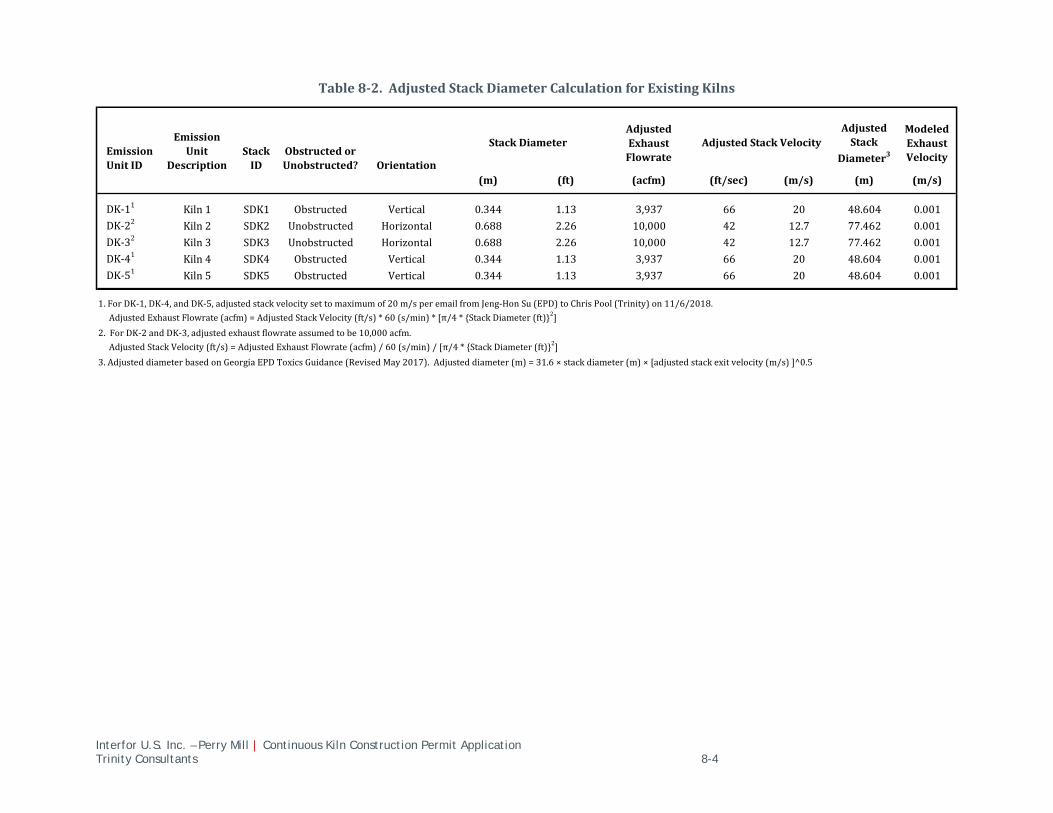
Interfor U.S. Inc. – Perry Mill | Continuous Kiln Construction Permit Application Trinity Consultants 8-4
Table8‐2.AdjustedStackDiameterCalculationforExistingKilns
EmissionUnitID
EmissionUnit
DescriptionStackID
ObstructedorUnobstructed? Orientation
AdjustedExhaustFlowrate
AdjustedStack
Diameter3
ModeledExhaustVelocity
(m) (ft) (acfm) (ft/sec) (m/s) (m) (m/s)
DK‐11 Kiln1 SDK1 Obstructed Vertical 0.344 1.13 3,937 66 20 48.604 0.001DK‐22 Kiln2 SDK2 Unobstructed Horizontal 0.688 2.26 10,000 42 12.7 77.462 0.001
DK‐32 Kiln3 SDK3 Unobstructed Horizontal 0.688 2.26 10,000 42 12.7 77.462 0.001DK‐41 Kiln4 SDK4 Obstructed Vertical 0.344 1.13 3,937 66 20 48.604 0.001DK‐51 Kiln5 SDK5 Obstructed Vertical 0.344 1.13 3,937 66 20 48.604 0.001
1.ForDK‐1,DK‐4,andDK‐5,adjustedstackvelocitysettomaximumof20m/speremailfromJeng‐HonSu(EPD)toChrisPool(Trinity)on11/6/2018.
AdjustedExhaustFlowrate(acfm)=AdjustedStackVelocity(ft/s)*60(s/min)*[π/4*{StackDiameter(ft)}2]
2.ForDK‐2andDK‐3,adjustedexhaustflowrateassumedtobe10,000acfm.
AdjustedStackVelocity(ft/s)=AdjustedExhaustFlowrate(acfm)/60(s/min)/[π/4*{StackDiameter(ft)}2]
3.AdjusteddiameterbasedonGeorgiaEPDToxicsGuidance(RevisedMay2017).Adjusteddiameter(m)=31.6×stackdiameter(m)×[adjustedstackexitvelocity(m/s)]^0.5
StackDiameter AdjustedStackVelocity
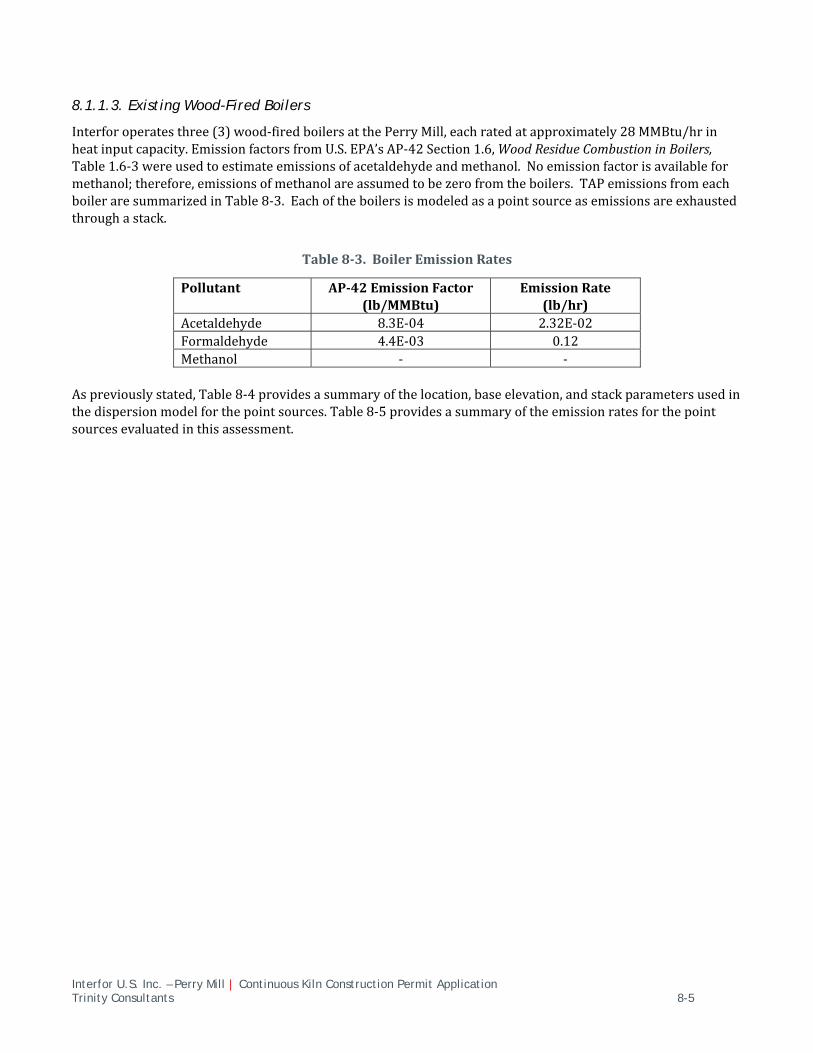
Interfor U.S. Inc. – Perry Mill | Continuous Kiln Construction Permit Application Trinity Consultants 8-5
8.1.1.3. Existing Wood-Fired Boilers
Interforoperatesthree(3)wood‐firedboilersatthePerryMill,eachratedatapproximately28MMBtu/hrinheatinputcapacity.EmissionfactorsfromU.S.EPA’sAP‐42Section1.6,WoodResidueCombustioninBoilers,Table1.6‐3wereusedtoestimateemissionsofacetaldehydeandmethanol.Noemissionfactorisavailableformethanol;therefore,emissionsofmethanolareassumedtobezerofromtheboilers.TAPemissionsfromeachboileraresummarizedinTable8‐3.Eachoftheboilersismodeledasapointsourceasemissionsareexhaustedthroughastack.
Table8‐3.BoilerEmissionRates
Pollutant AP‐42EmissionFactor(lb/MMBtu)
EmissionRate(lb/hr)
Acetaldehyde 8.3E‐04 2.32E‐02Formaldehyde 4.4E‐03 0.12Methanol ‐ ‐
Aspreviouslystated,Table8‐4providesasummaryofthelocation,baseelevation,andstackparametersusedinthedispersionmodelforthepointsources.Table8‐5providesasummaryoftheemissionratesforthepointsourcesevaluatedinthisassessment.
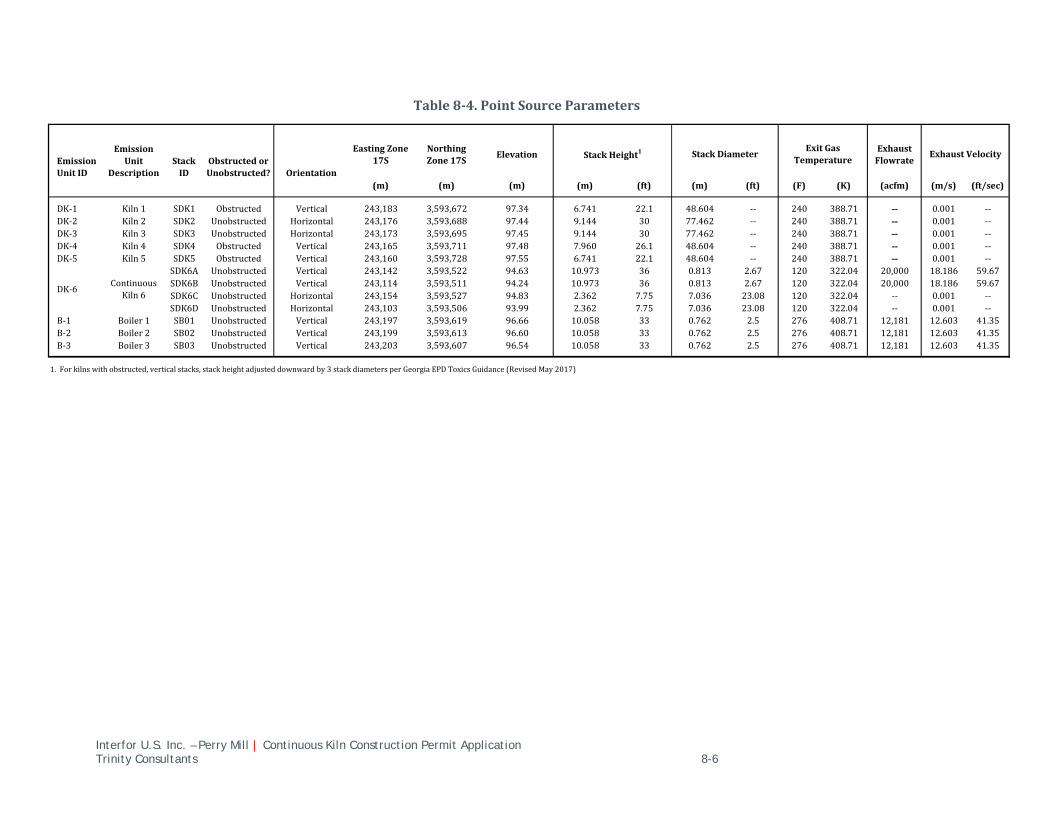
Interfor U.S. Inc. – Perry Mill | Continuous Kiln Construction Permit Application Trinity Consultants 8-6
Table8‐4.PointSourceParameters
EmissionUnitID
EmissionUnit
DescriptionStackID
ObstructedorUnobstructed? Orientation
EastingZone17S
NorthingZone17S
ElevationExhaustFlowrate
(m) (m) (m) (m) (ft) (m) (ft) (F) (K) (acfm) (m/s) (ft/sec)
DK‐1 Kiln1 SDK1 Obstructed Vertical 243,183 3,593,672 97.34 6.741 22.1 48.604 ‐‐ 240 388.71 ‐‐ 0.001 ‐‐DK‐2 Kiln2 SDK2 Unobstructed Horizontal 243,176 3,593,688 97.44 9.144 30 77.462 ‐‐ 240 388.71 ‐‐ 0.001 ‐‐DK‐3 Kiln3 SDK3 Unobstructed Horizontal 243,173 3,593,695 97.45 9.144 30 77.462 ‐‐ 240 388.71 ‐‐ 0.001 ‐‐DK‐4 Kiln4 SDK4 Obstructed Vertical 243,165 3,593,711 97.48 7.960 26.1 48.604 ‐‐ 240 388.71 ‐‐ 0.001 ‐‐DK‐5 Kiln5 SDK5 Obstructed Vertical 243,160 3,593,728 97.55 6.741 22.1 48.604 ‐‐ 240 388.71 ‐‐ 0.001 ‐‐
SDK6A Unobstructed Vertical 243,142 3,593,522 94.63 10.973 36 0.813 2.67 120 322.04 20,000 18.186 59.67SDK6B Unobstructed Vertical 243,114 3,593,511 94.24 10.973 36 0.813 2.67 120 322.04 20,000 18.186 59.67SDK6C Unobstructed Horizontal 243,154 3,593,527 94.83 2.362 7.75 7.036 23.08 120 322.04 ‐‐ 0.001 ‐‐SDK6D Unobstructed Horizontal 243,103 3,593,506 93.99 2.362 7.75 7.036 23.08 120 322.04 ‐‐ 0.001 ‐‐
B‐1 Boiler1 SB01 Unobstructed Vertical 243,197 3,593,619 96.66 10.058 33 0.762 2.5 276 408.71 12,181 12.603 41.35B‐2 Boiler2 SB02 Unobstructed Vertical 243,199 3,593,613 96.60 10.058 33 0.762 2.5 276 408.71 12,181 12.603 41.35B‐3 Boiler3 SB03 Unobstructed Vertical 243,203 3,593,607 96.54 10.058 33 0.762 2.5 276 408.71 12,181 12.603 41.35
1.Forkilnswithobstructed,verticalstacks,stackheightadjusteddownwardby3stackdiametersperGeorgiaEPDToxicsGuidance(RevisedMay2017)
DK‐6ContinuousKiln6
ExhaustVelocityStackHeight1 StackDiameterExitGas
Temperature
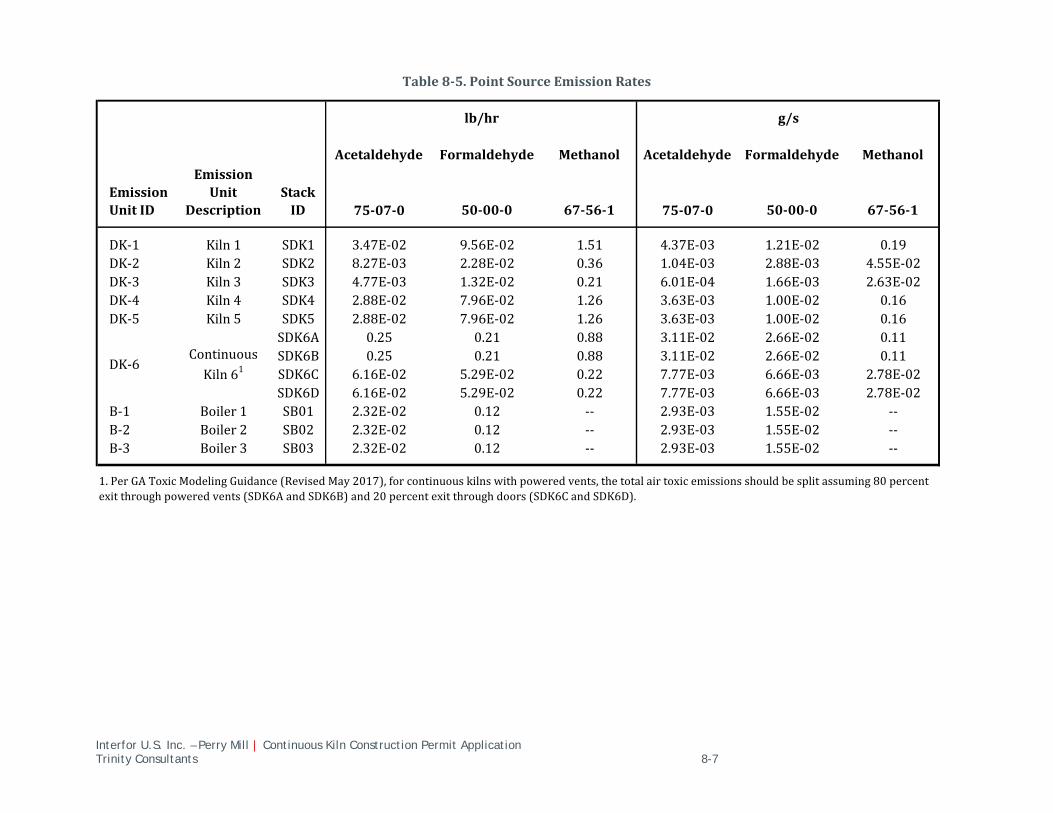
Interfor U.S. Inc. – Perry Mill | Continuous Kiln Construction Permit Application Trinity Consultants 8-7
Table8‐5.PointSourceEmissionRates
Acetaldehyde Formaldehyde Methanol Acetaldehyde Formaldehyde Methanol
EmissionUnitID
EmissionUnit
DescriptionStackID 75‐07‐0 50‐00‐0 67‐56‐1 75‐07‐0 50‐00‐0 67‐56‐1
DK‐1 Kiln1 SDK1 3.47E‐02 9.56E‐02 1.51 4.37E‐03 1.21E‐02 0.19DK‐2 Kiln2 SDK2 8.27E‐03 2.28E‐02 0.36 1.04E‐03 2.88E‐03 4.55E‐02DK‐3 Kiln3 SDK3 4.77E‐03 1.32E‐02 0.21 6.01E‐04 1.66E‐03 2.63E‐02DK‐4 Kiln4 SDK4 2.88E‐02 7.96E‐02 1.26 3.63E‐03 1.00E‐02 0.16DK‐5 Kiln5 SDK5 2.88E‐02 7.96E‐02 1.26 3.63E‐03 1.00E‐02 0.16
SDK6A 0.25 0.21 0.88 3.11E‐02 2.66E‐02 0.11SDK6B 0.25 0.21 0.88 3.11E‐02 2.66E‐02 0.11SDK6C 6.16E‐02 5.29E‐02 0.22 7.77E‐03 6.66E‐03 2.78E‐02SDK6D 6.16E‐02 5.29E‐02 0.22 7.77E‐03 6.66E‐03 2.78E‐02
B‐1 Boiler1 SB01 2.32E‐02 0.12 ‐‐ 2.93E‐03 1.55E‐02 ‐‐B‐2 Boiler2 SB02 2.32E‐02 0.12 ‐‐ 2.93E‐03 1.55E‐02 ‐‐B‐3 Boiler3 SB03 2.32E‐02 0.12 ‐‐ 2.93E‐03 1.55E‐02 ‐‐
1.PerGAToxicModelingGuidance(RevisedMay2017),forcontinuouskilnswithpoweredvents,thetotalairtoxicemissionsshouldbesplitassuming80percentexitthroughpoweredvents(SDK6AandSDK6B)and20percentexitthroughdoors(SDK6CandSDK6D).
DK‐6ContinuousKiln61
lb/hr g/s
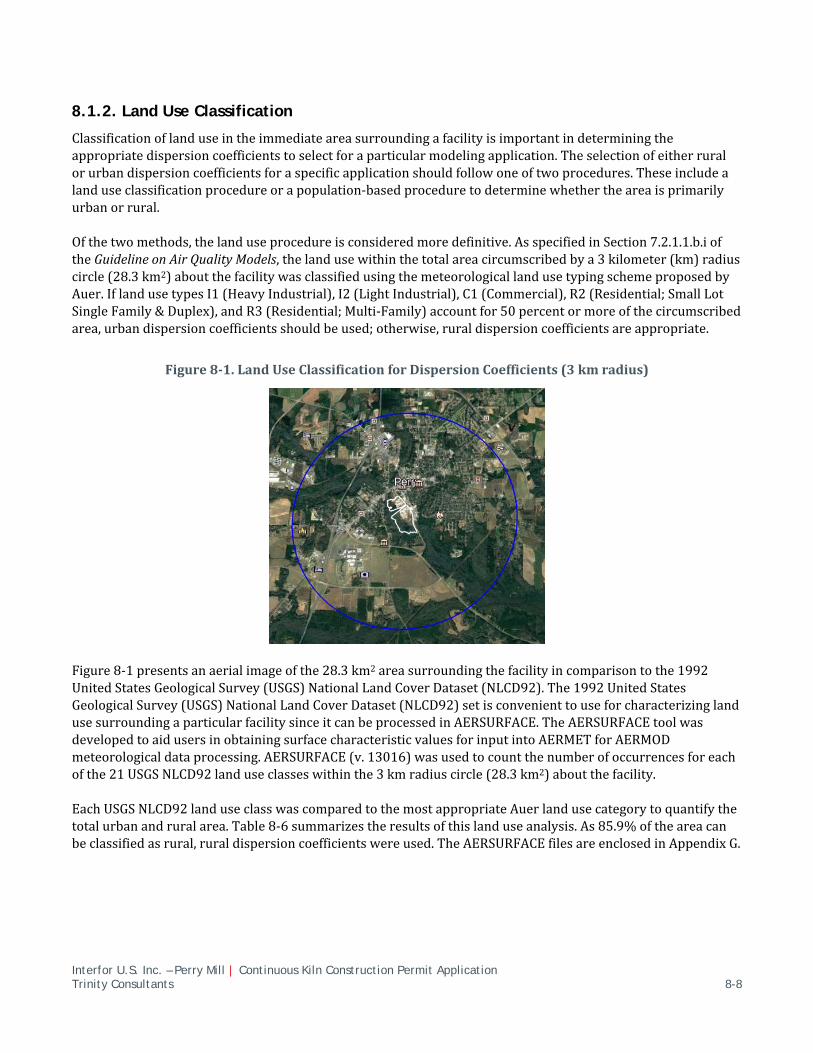
Interfor U.S. Inc. – Perry Mill | Continuous Kiln Construction Permit Application Trinity Consultants 8-8
8.1.2. Land Use Classification
Classificationoflanduseintheimmediateareasurroundingafacilityisimportantindeterminingtheappropriatedispersioncoefficientstoselectforaparticularmodelingapplication.Theselectionofeitherruralorurbandispersioncoefficientsforaspecificapplicationshouldfollowoneoftwoprocedures.Theseincludealanduseclassificationprocedureorapopulation‐basedproceduretodeterminewhethertheareaisprimarilyurbanorrural.Ofthetwomethods,thelanduseprocedureisconsideredmoredefinitive.AsspecifiedinSection7.2.1.1.b.ioftheGuidelineonAirQualityModels,thelandusewithinthetotalareacircumscribedbya3kilometer(km)radiuscircle(28.3km2)aboutthefacilitywasclassifiedusingthemeteorologicallandusetypingschemeproposedbyAuer.IflandusetypesI1(HeavyIndustrial),I2(LightIndustrial),C1(Commercial),R2(Residential;SmallLotSingleFamily&Duplex),andR3(Residential;Multi‐Family)accountfor50percentormoreofthecircumscribedarea,urbandispersioncoefficientsshouldbeused;otherwise,ruraldispersioncoefficientsareappropriate.
Figure8‐1.LandUseClassificationforDispersionCoefficients(3kmradius)
Figure8‐1presentsanaerialimageofthe28.3km2areasurroundingthefacilityincomparisontothe1992UnitedStatesGeologicalSurvey(USGS)NationalLandCoverDataset(NLCD92).The1992UnitedStatesGeologicalSurvey(USGS)NationalLandCoverDataset(NLCD92)setisconvenienttouseforcharacterizinglandusesurroundingaparticularfacilitysinceitcanbeprocessedinAERSURFACE.TheAERSURFACEtoolwasdevelopedtoaidusersinobtainingsurfacecharacteristicvaluesforinputintoAERMETforAERMODmeteorologicaldataprocessing.AERSURFACE(v.13016)wasusedtocountthenumberofoccurrencesforeachofthe21USGSNLCD92landuseclasseswithinthe3kmradiuscircle(28.3km2)aboutthefacility.
EachUSGSNLCD92landuseclasswascomparedtothemostappropriateAuerlandusecategorytoquantifythetotalurbanandruralarea.Table8‐6summarizestheresultsofthislanduseanalysis.As85.9%oftheareacanbeclassifiedasrural,ruraldispersioncoefficientswereused.TheAERSURFACEfilesareenclosedinAppendixG.
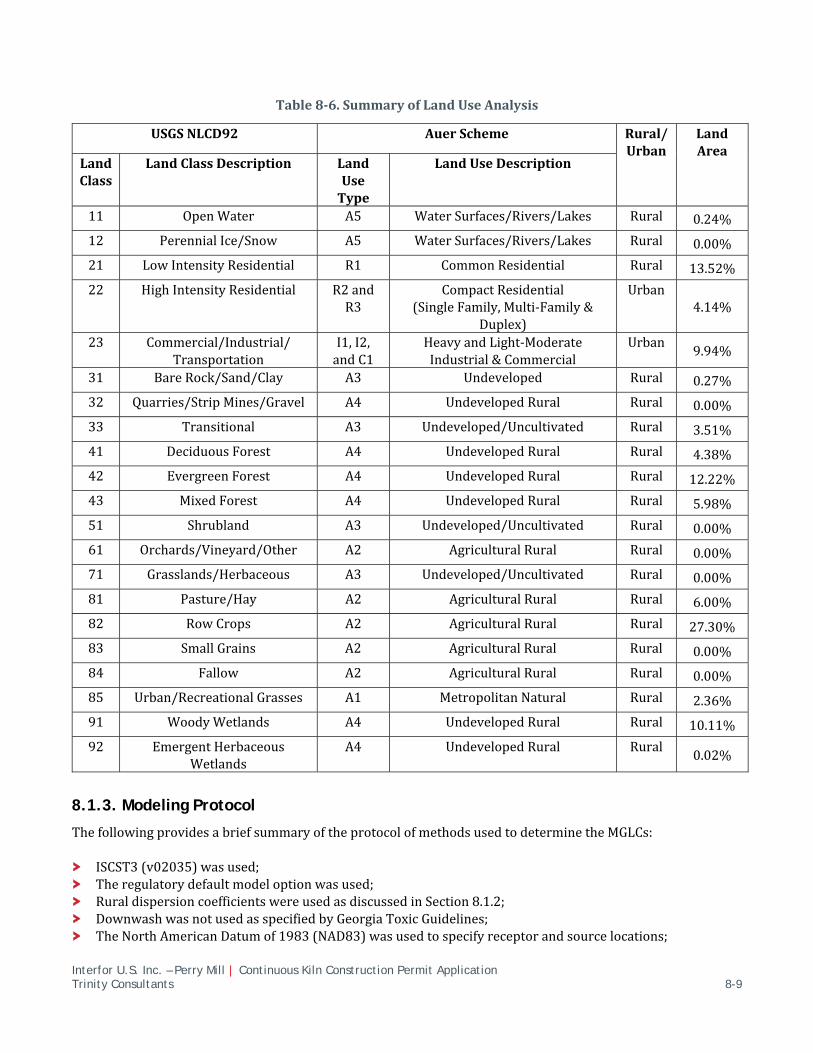
Interfor U.S. Inc. – Perry Mill | Continuous Kiln Construction Permit Application Trinity Consultants 8-9
Table8‐6.SummaryofLandUseAnalysis
USGSNLCD92 AuerScheme Rural/Urban
LandArea
LandClass
LandClassDescription LandUseType
LandUseDescription
11 OpenWater A5 WaterSurfaces/Rivers/Lakes Rural 0.24%
12 PerennialIce/Snow A5 WaterSurfaces/Rivers/Lakes Rural 0.00%
21 LowIntensityResidential R1 CommonResidential Rural 13.52%
22 HighIntensityResidential R2andR3
CompactResidential(SingleFamily,Multi‐Family&
Duplex)
Urban4.14%
23 Commercial/Industrial/Transportation
I1,I2,andC1
HeavyandLight‐ModerateIndustrial&Commercial
Urban9.94%
31 BareRock/Sand/Clay A3 Undeveloped Rural 0.27%
32 Quarries/StripMines/Gravel A4 UndevelopedRural Rural 0.00%
33 Transitional A3 Undeveloped/Uncultivated Rural 3.51%
41 DeciduousForest A4 UndevelopedRural Rural 4.38%
42 EvergreenForest A4 UndevelopedRural Rural 12.22%
43 MixedForest A4 UndevelopedRural Rural 5.98%
51 Shrubland A3 Undeveloped/Uncultivated Rural 0.00%
61 Orchards/Vineyard/Other A2 AgriculturalRural Rural 0.00%
71 Grasslands/Herbaceous A3 Undeveloped/Uncultivated Rural 0.00%
81 Pasture/Hay A2 AgriculturalRural Rural 6.00%
82 RowCrops A2 AgriculturalRural Rural 27.30%
83 SmallGrains A2 AgriculturalRural Rural 0.00%
84 Fallow A2 AgriculturalRural Rural 0.00%
85 Urban/RecreationalGrasses A1 MetropolitanNatural Rural 2.36%
91 WoodyWetlands A4 UndevelopedRural Rural 10.11%
92 EmergentHerbaceousWetlands
A4 UndevelopedRural Rural0.02%
8.1.3. Modeling Protocol
ThefollowingprovidesabriefsummaryoftheprotocolofmethodsusedtodeterminetheMGLCs:
ISCST3(v02035)wasused; Theregulatorydefaultmodeloptionwasused; RuraldispersioncoefficientswereusedasdiscussedinSection8.1.2; DownwashwasnotusedasspecifiedbyGeorgiaToxicGuidelines; TheNorthAmericanDatumof1983(NAD83)wasusedtospecifyreceptorandsourcelocations;
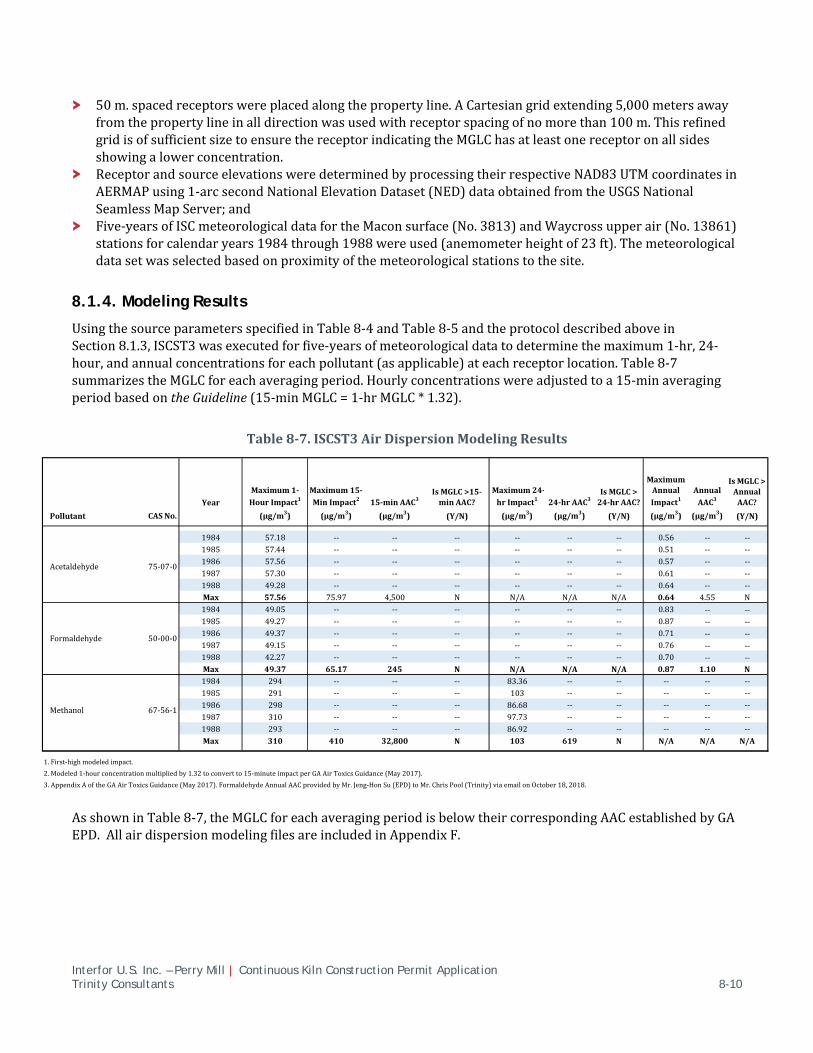
Interfor U.S. Inc. – Perry Mill | Continuous Kiln Construction Permit Application Trinity Consultants 8-10
50m.spacedreceptorswereplacedalongthepropertyline.ACartesiangridextending5,000metersawayfromthepropertylineinalldirectionwasusedwithreceptorspacingofnomorethan100m.ThisrefinedgridisofsufficientsizetoensurethereceptorindicatingtheMGLChasatleastonereceptoronallsidesshowingalowerconcentration.
ReceptorandsourceelevationsweredeterminedbyprocessingtheirrespectiveNAD83UTMcoordinatesinAERMAPusing1‐arcsecondNationalElevationDataset(NED)dataobtainedfromtheUSGSNationalSeamlessMapServer;and
Five‐yearsofISCmeteorologicaldatafortheMaconsurface(No.3813)andWaycrossupperair(No.13861)stationsforcalendaryears1984through1988wereused(anemometerheightof23ft).Themeteorologicaldatasetwasselectedbasedonproximityofthemeteorologicalstationstothesite.
8.1.4. Modeling Results
UsingthesourceparametersspecifiedinTable8‐4andTable8‐5andtheprotocoldescribedaboveinSection8.1.3,ISCST3wasexecutedforfive‐yearsofmeteorologicaldatatodeterminethemaximum1‐hr,24‐hour,andannualconcentrationsforeachpollutant(asapplicable)ateachreceptorlocation.Table8‐7summarizestheMGLCforeachaveragingperiod.Hourlyconcentrationswereadjustedtoa15‐minaveragingperiodbasedontheGuideline(15‐minMGLC=1‐hrMGLC*1.32).
Table8‐7.ISCST3AirDispersionModelingResults
AsshowninTable8‐7,theMGLCforeachaveragingperiodisbelowtheircorrespondingAACestablishedbyGAEPD.AllairdispersionmodelingfilesareincludedinAppendixF.
Year
Maximum1‐HourImpact1
Maximum15‐MinImpact2 15‐minAAC3
IsMGLC>15‐minAAC?
Maximum24‐hrImpact1 24‐hrAAC3
IsMGLC>24‐hrAAC?
MaximumAnnualImpact1
AnnualAAC3
IsMGLC>AnnualAAC?
Pollutant CASNo. (µg/m3) (µg/m3) (µg/m3) (Y/N) (µg/m3) (µg/m3) (Y/N) (µg/m3) (µg/m3) (Y/N)
1984 57.18 ‐‐ ‐‐ ‐‐ ‐‐ ‐‐ ‐‐ 0.56 ‐‐ ‐‐1985 57.44 ‐‐ ‐‐ ‐‐ ‐‐ ‐‐ ‐‐ 0.51 ‐‐ ‐‐1986 57.56 ‐‐ ‐‐ ‐‐ ‐‐ ‐‐ ‐‐ 0.57 ‐‐ ‐‐1987 57.30 ‐‐ ‐‐ ‐‐ ‐‐ ‐‐ ‐‐ 0.61 ‐‐ ‐‐1988 49.28 ‐‐ ‐‐ ‐‐ ‐‐ ‐‐ ‐‐ 0.64 ‐‐ ‐‐Max 57.56 75.97 4,500 N N/A N/A N/A 0.64 4.55 N1984 49.05 ‐‐ ‐‐ ‐‐ ‐‐ ‐‐ ‐‐ 0.83 -- --
1985 49.27 ‐‐ ‐‐ ‐‐ ‐‐ ‐‐ ‐‐ 0.87 -- --
1986 49.37 ‐‐ ‐‐ ‐‐ ‐‐ ‐‐ ‐‐ 0.71 -- --
1987 49.15 ‐‐ ‐‐ ‐‐ ‐‐ ‐‐ ‐‐ 0.76 -- --
1988 42.27 ‐‐ ‐‐ ‐‐ ‐‐ ‐‐ ‐‐ 0.70 -- --
Max 49.37 65.17 245 N N/A N/A N/A 0.87 1.10 N1984 294 ‐‐ ‐‐ ‐‐ 83.36 ‐‐ ‐‐ ‐‐ ‐‐ ‐‐1985 291 ‐‐ ‐‐ ‐‐ 103 ‐‐ ‐‐ ‐‐ ‐‐ ‐‐1986 298 ‐‐ ‐‐ ‐‐ 86.68 ‐‐ ‐‐ ‐‐ ‐‐ ‐‐1987 310 ‐‐ ‐‐ ‐‐ 97.73 ‐‐ ‐‐ ‐‐ ‐‐ ‐‐1988 293 ‐‐ ‐‐ ‐‐ 86.92 ‐‐ ‐‐ ‐‐ ‐‐ ‐‐Max 310 410 32,800 N 103 619 N N/A N/A N/A
1.First‐highmodeledimpact.
2.Modeled1‐hourconcentrationmultipliedby1.32toconvertto15‐minuteimpactperGAAirToxicsGuidance(May2017).
3.AppendixAoftheGAAirToxicsGuidance(May2017).FormaldehydeAnnualAACprovidedbyMr.Jeng‐HonSu(EPD)toMr.ChrisPool(Trinity)viaemailonOctober18,2018.
50‐00‐0Formaldehyde
Acetaldehyde 75‐07‐0
Methanol 67‐56‐1

Interfor U.S. Inc. – Perry Mill | Continuous Kiln Construction Permit Application Trinity Consultants A
APPENDIX A: FACILITY DIAGRAMS
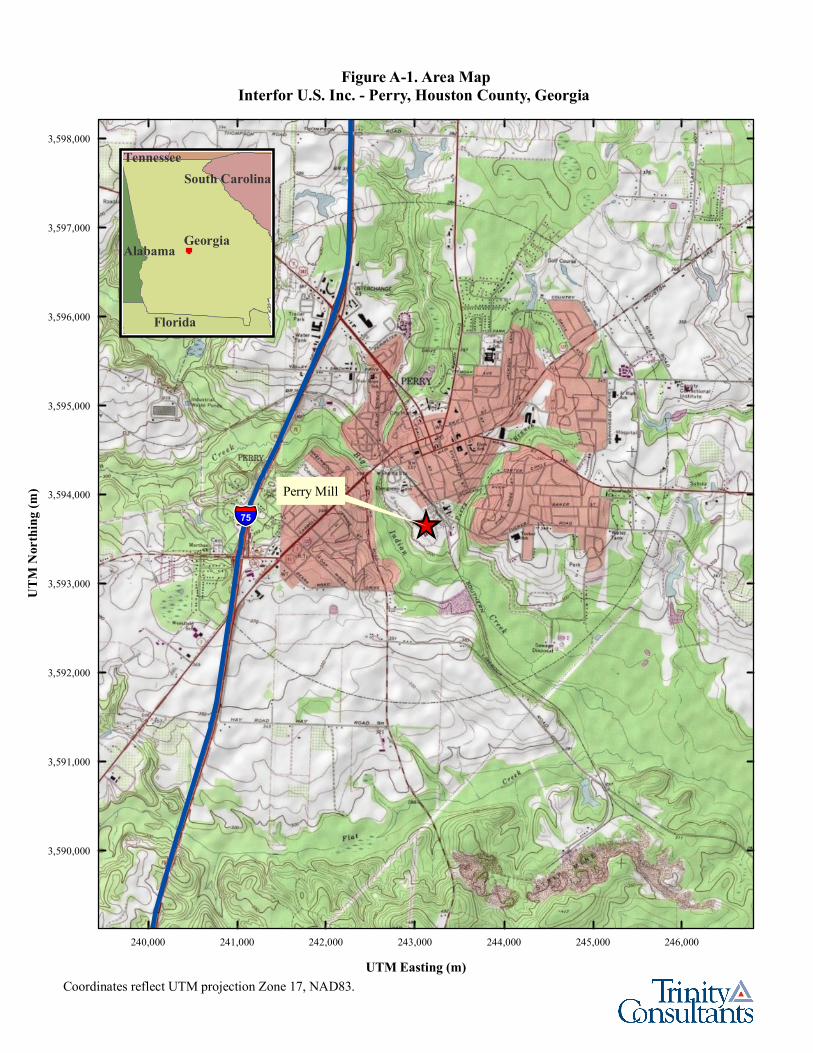
75
240,000 241,000 242,000 243,000 244,000 245,000 246,000
3,590,000
3,591,000
3,592,000
3,593,000
3,594,000
3,595,000
3,596,000
3,597,000
3,598,000
Georgia
Florida
South Carolina
Alabama
Tennessee
Perry Mill
Figure A-1. Area MapInterfor U.S. Inc. - Perry, Houston County, Georgia
UTM Easting (m)
UTM
Nor
thing
(m)
Coordinates reflect UTM projection Zone 17, NAD83.
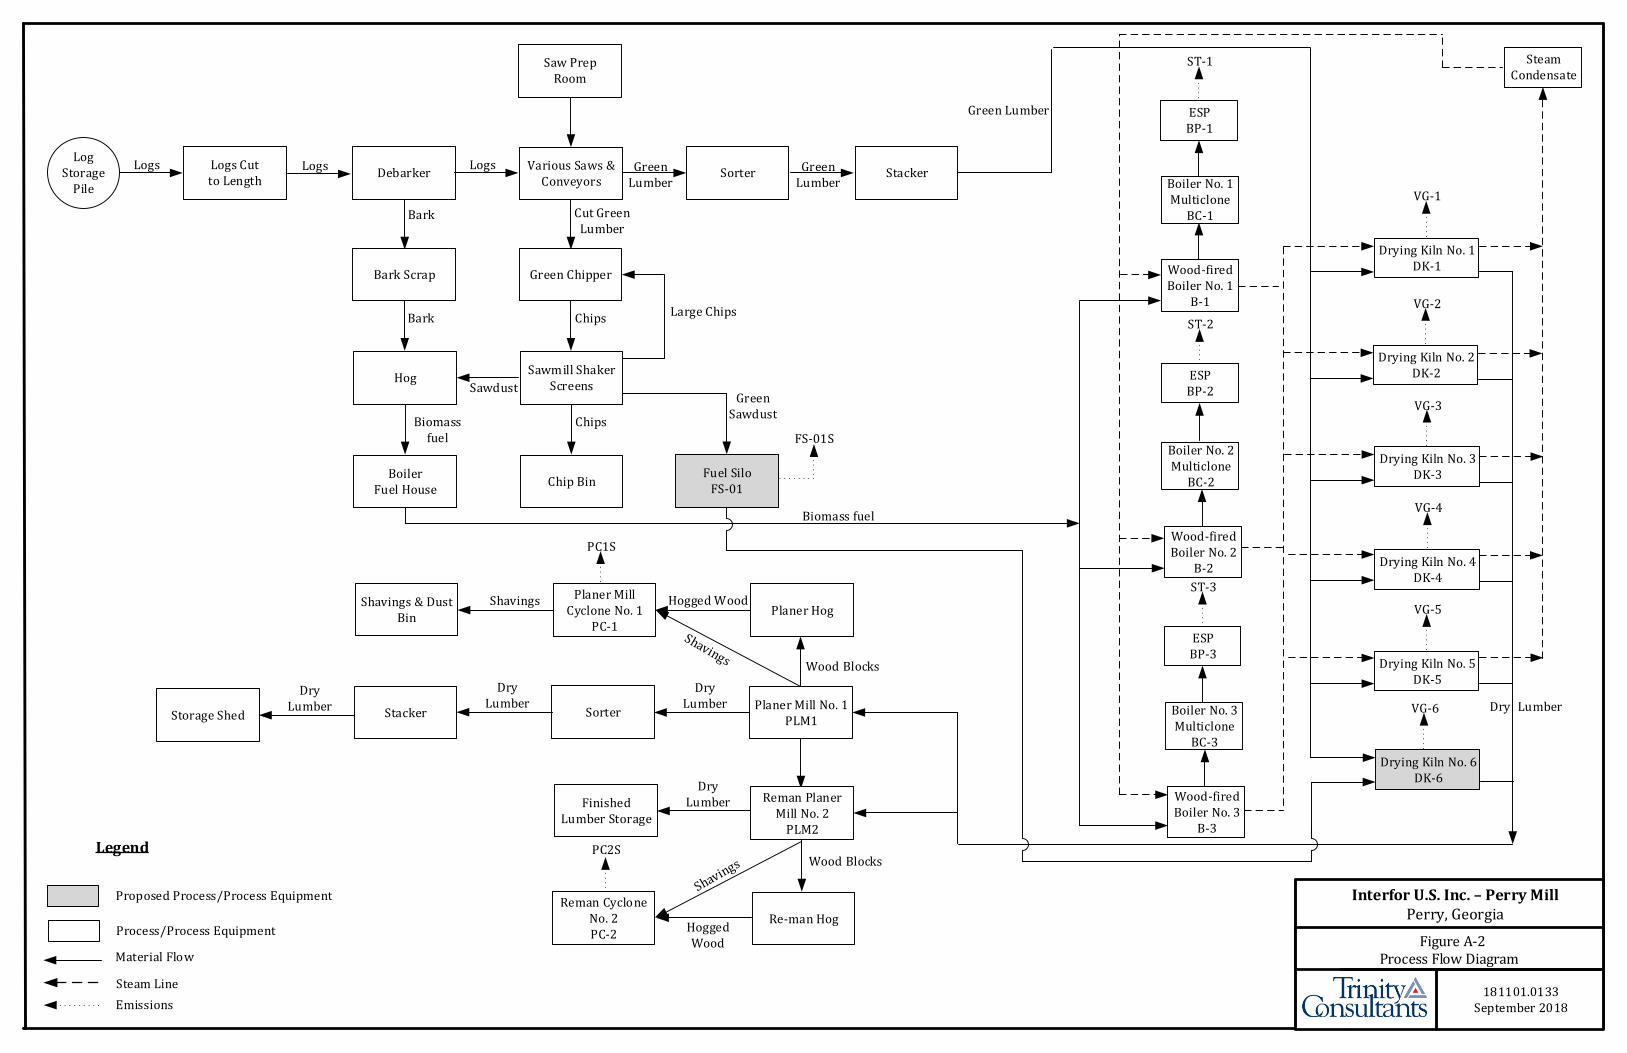
181101.0133September 2018
Interfor U.S. Inc. – Perry MillPerry, Georgia
Figure A-2Process Flow Diagram
Legend
Material Flow
Steam Line
Process/Process Equipment
Log Storage
Pile
Logs Logs Cut to Length
LogsDebarker
Logs Various Saws & Conveyors
Green Lumber
Sorter Green Lumber
Stacker
Saw Prep Room
Cut Green Lumber
Green Chipper
Chips
Sawmill Shaker Screens
Chips
Chip Bin
Bark
Bark Scrap
Bark
Hog
Biomass fuel
Boiler Fuel House
ESPBP-1
ST-1
ESPBP-2
ST-2
ESPBP-3
ST-3
Boiler No. 3 Multiclone
BC-3
Wood-fired Boiler No. 3
B-3
Drying Kiln No. 1 DK-1
VG-1
VG-2
VG-3
Shavings & Dust Bin
Planer Mill Cyclone No. 1
PC-1
Shavings
Wood Blocks
Hogged Wood
PC1S
Planer Hog
Planer Mill No. 1PLM1
Sorter
Dry Lumber
Wood Blocks
Reman Planer Mill No. 2
PLM2
Hogged Wood
Reman Cyclone No. 2PC-2
PC2S
Dry Lumber
Stacker
Dry Lumber
Storage Shed
Finished Lumber Storage
Dry Lumber
Re-man Hog
Steam Condensate
Biomass fuel
Green Lumber
Large Chips
Sawdust
Emissions
Boiler No. 2 Multiclone
BC-2
Wood-fired Boiler No. 2
B-2
Boiler No. 1 Multiclone
BC-1
Wood-fired Boiler No. 1
B-1
Dry Lumber
Drying Kiln No. 2 DK-2
Drying Kiln No. 3 DK-3
Drying Kiln No. 4 DK-4
VG-4
Drying Kiln No. 5 DK-5
VG-5
Fuel SiloFS-01
Green Sawdust
Drying Kiln No. 6 DK-6
VG-6
Proposed Process/Process Equipment
FS-01S
Interfor U.S. Inc. – Perry Mill | Continuous Kiln Construction Permit Application Trinity Consultants B
APPENDIX B: EMISSION CALCULATIONS
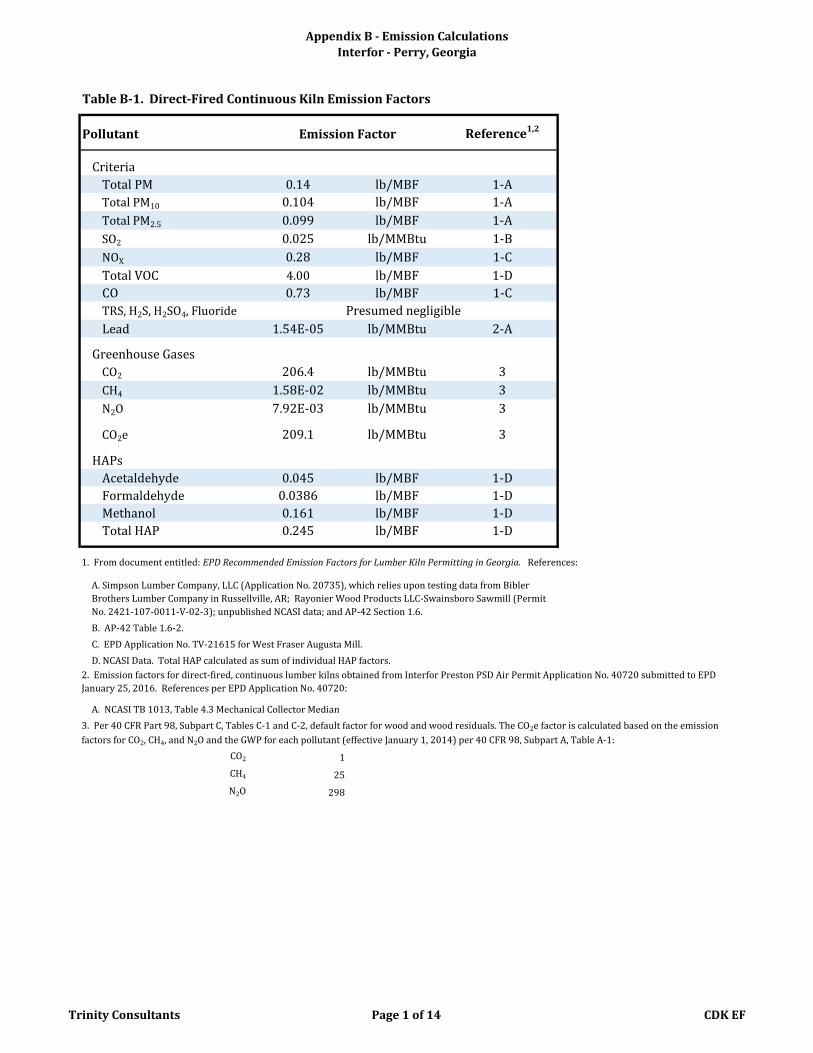
Appendix B - Emission Calculations
Interfor - Perry, Georgia
Table B-1. Direct-Fired Continuous Kiln Emission Factors
Pollutant Reference1,2
Criteria
Total PM 0.14 lb/MBF 1-A
Total PM10 0.104 lb/MBF 1-A
Total PM2.5 0.099 lb/MBF 1-A
SO2 0.025 lb/MMBtu 1-B
NOX 0.28 lb/MBF 1-C
Total VOC 4.00 lb/MBF 1-D
CO 0.73 lb/MBF 1-C
TRS, H2S, H2SO4, Fluoride
Lead 1.54E-05 lb/MMBtu 2-A
Greenhouse Gases
CO2 206.4 lb/MMBtu 3
CH4 1.58E-02 lb/MMBtu 3
N2O 7.92E-03 lb/MMBtu 3
CO2e 209.1 lb/MMBtu 3
HAPs
Acetaldehyde 0.045 lb/MBF 1-D
Formaldehyde 0.0386 lb/MBF 1-D
Methanol 0.161 lb/MBF 1-D
Total HAP 0.245 lb/MBF 1-D
1. From document entitled: EPD Recommended Emission Factors for Lumber Kiln Permitting in Georgia. References:
B. AP-42 Table 1.6-2.
C. EPD Application No. TV-21615 for West Fraser Augusta Mill.
D. NCASI Data. Total HAP calculated as sum of individual HAP factors.
A. NCASI TB 1013, Table 4.3 Mechanical Collector Median
CO2 1
CH4 25
N2O 298
3. Per 40 CFR Part 98, Subpart C, Tables C-1 and C-2, default factor for wood and wood residuals. The CO2e factor is calculated based on the emission
factors for CO2, CH4, and N2O and the GWP for each pollutant (effective January 1, 2014) per 40 CFR 98, Subpart A, Table A-1:
Emission Factor
Presumed negligible
2. Emission factors for direct-fired, continuous lumber kilns obtained from Interfor Preston PSD Air Permit Application No. 40720 submitted to EPD
January 25, 2016. References per EPD Application No. 40720:
A. Simpson Lumber Company, LLC (Application No. 20735), which relies upon testing data from Bibler
Brothers Lumber Company in Russellville, AR; Rayonier Wood Products LLC-Swainsboro Sawmill (Permit
No. 2421-107-0011-V-02-3); unpublished NCASI data; and AP-42 Section 1.6.
Trinity Consultants Page 1 of 14 CDK EF
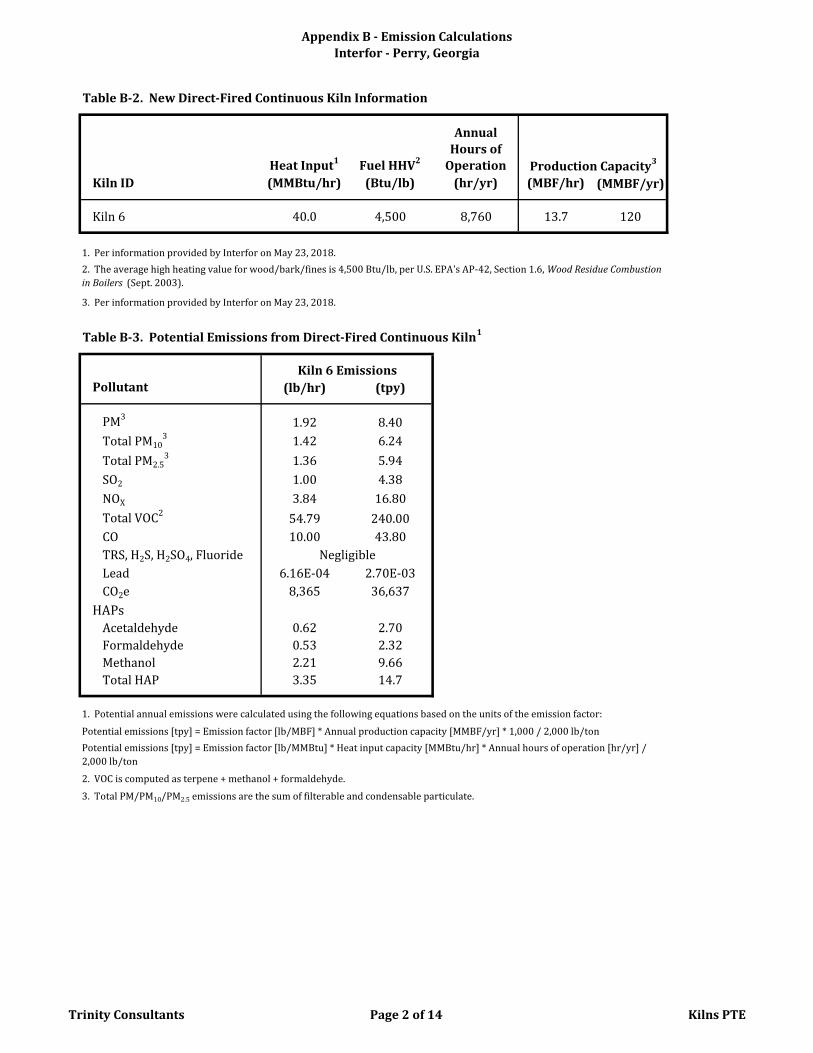
Appendix B - Emission Calculations
Interfor - Perry, Georgia
Table B-2. New Direct-Fired Continuous Kiln Information
Heat Input1 Fuel HHV2
Annual
Hours of
Operation
Kiln ID (MMBtu/hr) (Btu/lb) (hr/yr) (MBF/hr) (MMBF/yr)
Kiln 6 40.0 4,500 8,760 13.7 120
1. Per information provided by Interfor on May 23, 2018.
3. Per information provided by Interfor on May 23, 2018.
Table B-3. Potential Emissions from Direct-Fired Continuous Kiln1
Pollutant (lb/hr) (tpy)
PM31.92 8.40
Total PM103 1.42 6.24
Total PM2.53 1.36 5.94
SO2 1.00 4.38
NOX 3.84 16.80
Total VOC254.79 240.00
CO 10.00 43.80
TRS, H2S, H2SO4, Fluoride
Lead 6.16E-04 2.70E-03
CO2e 8,365 36,637
HAPs
Acetaldehyde 0.62 2.70
Formaldehyde 0.53 2.32
Methanol 2.21 9.66
Total HAP 3.35 14.7
1. Potential annual emissions were calculated using the following equations based on the units of the emission factor:
Potential emissions [tpy] = Emission factor [lb/MBF] * Annual production capacity [MMBF/yr] * 1,000 / 2,000 lb/ton
2. VOC is computed as terpene + methanol + formaldehyde.
3. Total PM/PM10/PM2.5 emissions are the sum of filterable and condensable particulate.
Potential emissions [tpy] = Emission factor [lb/MMBtu] * Heat input capacity [MMBtu/hr] * Annual hours of operation [hr/yr] /
2,000 lb/ton
Negligible
Production Capacity3
Kiln 6 Emissions
2. The average high heating value for wood/bark/fines is 4,500 Btu/lb, per U.S. EPA's AP-42, Section 1.6, Wood Residue Combustion
in Boilers (Sept. 2003).
Trinity Consultants Page 2 of 14 Kilns PTE
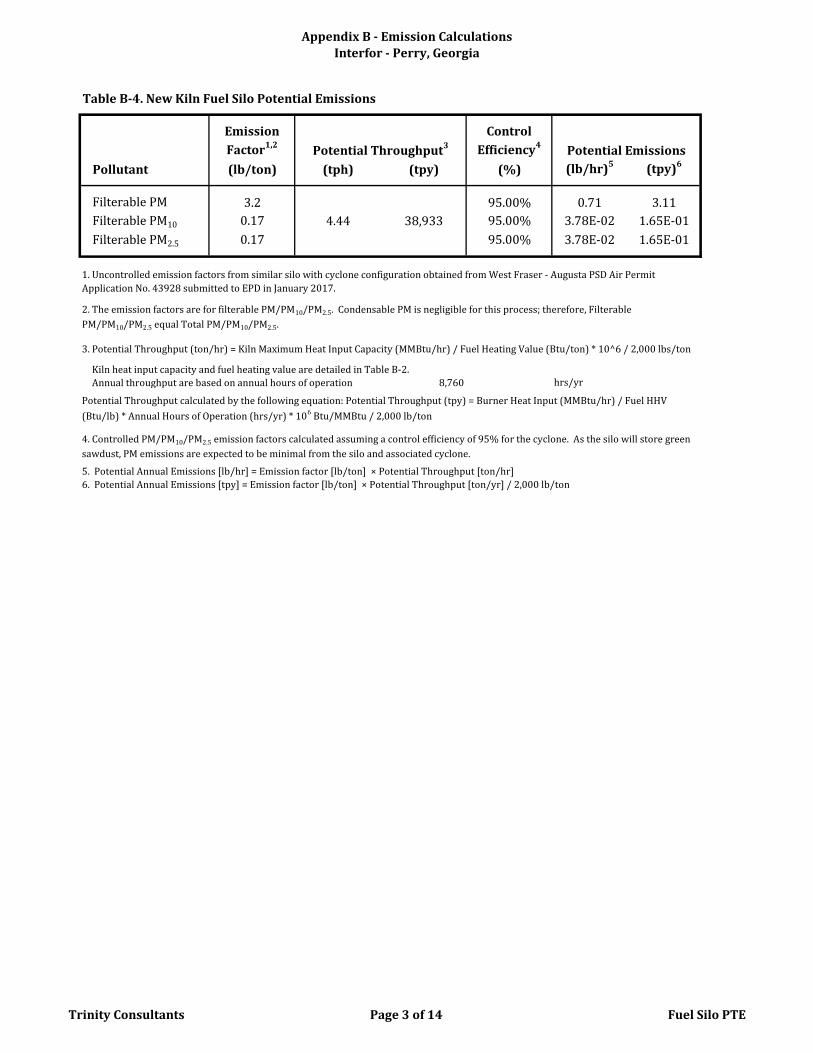
Appendix B - Emission Calculations
Interfor - Perry, Georgia
Table B-4. New Kiln Fuel Silo Potential Emissions
Emission
Factor1,2
Control
Efficiency4
(lb/ton) (tph) (tpy) (%) (lb/hr)5 (tpy)6
Filterable PM 3.2 95.00% 0.71 3.11
Filterable PM10 0.17 95.00% 3.78E-02 1.65E-01
Filterable PM2.5 0.17 95.00% 3.78E-02 1.65E-01
Kiln heat input capacity and fuel heating value are detailed in Table B-2.
Annual throughput are based on annual hours of operation 8,760 hrs/yr
6. Potential Annual Emissions [tpy] = Emission factor [lb/ton] × Potential Throughput [ton/yr] / 2,000 lb/ton
Potential Throughput calculated by the following equation: Potential Throughput (tpy) = Burner Heat Input (MMBtu/hr) / Fuel HHV
(Btu/lb) * Annual Hours of Operation (hrs/yr) * 106 Btu/MMBtu / 2,000 lb/ton
4.44 38,933
3. Potential Throughput (ton/hr) = Kiln Maximum Heat Input Capacity (MMBtu/hr) / Fuel Heating Value (Btu/ton) * 10^6 / 2,000 lbs/ton
1. Uncontrolled emission factors from similar silo with cyclone configuration obtained from West Fraser - Augusta PSD Air Permit
Application No. 43928 submitted to EPD in January 2017.
4. Controlled PM/PM10/PM2.5 emission factors calculated assuming a control efficiency of 95% for the cyclone. As the silo will store green
sawdust, PM emissions are expected to be minimal from the silo and associated cyclone.
2. The emission factors are for filterable PM/PM10/PM2.5. Condensable PM is negligible for this process; therefore, Filterable
PM/PM10/PM2.5 equal Total PM/PM10/PM2.5.
5. Potential Annual Emissions [lb/hr] = Emission factor [lb/ton] × Potential Throughput [ton/hr]
Pollutant
Potential EmissionsPotential Throughput3
Trinity Consultants Page 3 of 14 Fuel Silo PTE
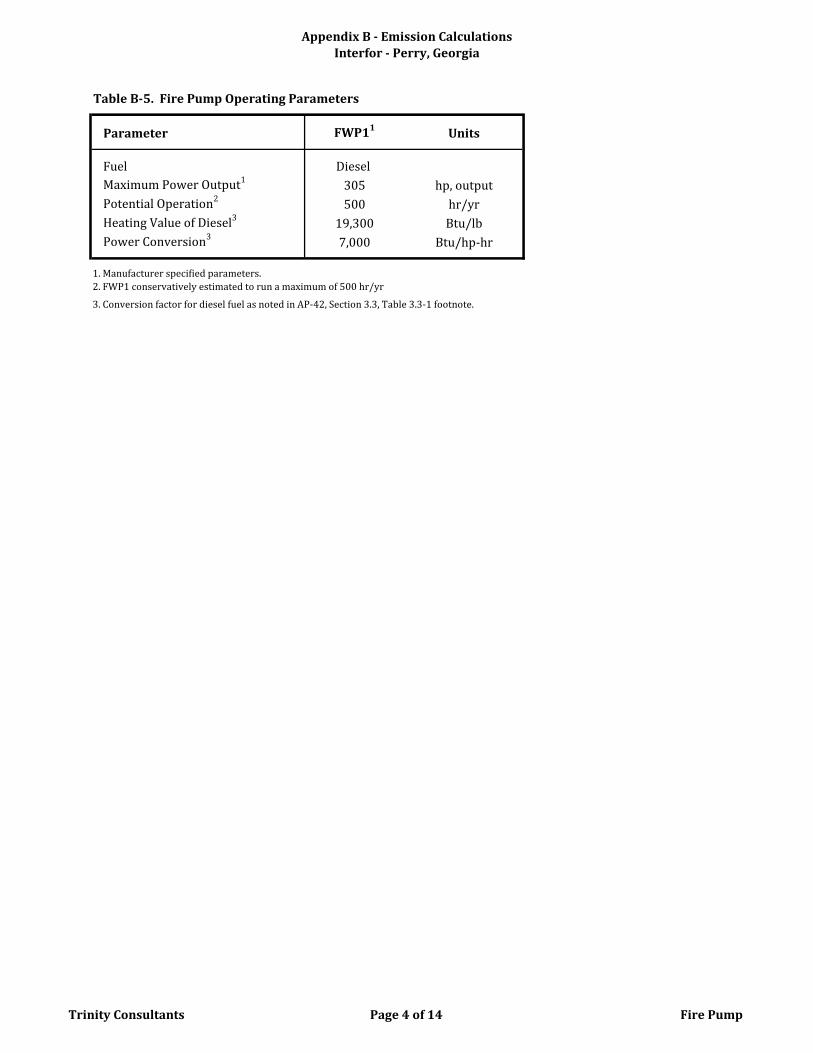
Appendix B - Emission Calculations
Interfor - Perry, Georgia
Table B-5. Fire Pump Operating Parameters
Parameter FWP11Units
Fuel Diesel
Maximum Power Output1
305 hp, output
Potential Operation2500 hr/yr
Heating Value of Diesel3
19,300 Btu/lb
Power Conversion37,000 Btu/hp-hr
1. Manufacturer specified parameters.
2. FWP1 conservatively estimated to run a maximum of 500 hr/yr
3. Conversion factor for diesel fuel as noted in AP-42, Section 3.3, Table 3.3-1 footnote.
Trinity Consultants Page 4 of 14 Fire Pump
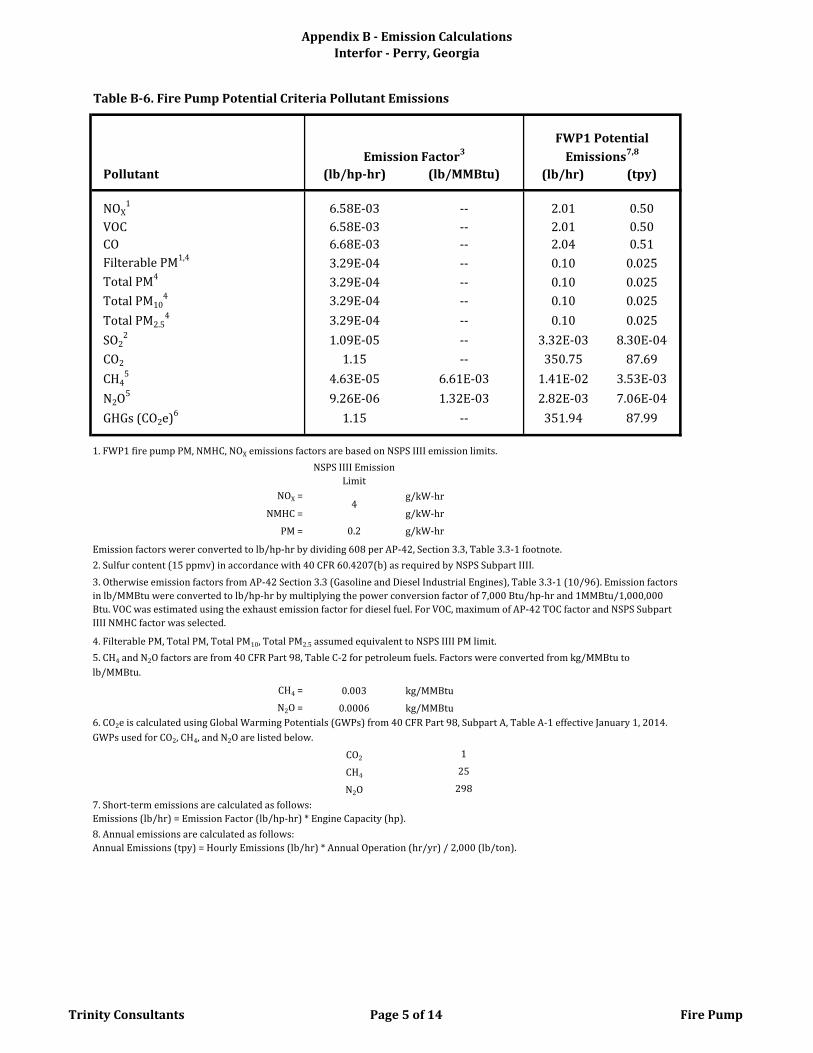
Appendix B - Emission Calculations
Interfor - Perry, Georgia
Table B-6. Fire Pump Potential Criteria Pollutant Emissions
Pollutant (lb/hp-hr) (lb/MMBtu) (lb/hr) (tpy)
NOX1 6.58E-03 -- 2.01 0.50
VOC 6.58E-03 -- 2.01 0.50
CO 6.68E-03 -- 2.04 0.51
Filterable PM1,4
3.29E-04 -- 0.10 0.025
Total PM43.29E-04 -- 0.10 0.025
Total PM104 3.29E-04 -- 0.10 0.025
Total PM2.54
3.29E-04 -- 0.10 0.025
SO22 1.09E-05 -- 3.32E-03 8.30E-04
CO2 1.15 -- 350.75 87.69
CH45 4.63E-05 6.61E-03 1.41E-02 3.53E-03
N2O5 9.26E-06 1.32E-03 2.82E-03 7.06E-04
GHGs (CO2e)6 1.15 -- 351.94 87.99
NSPS IIII Emission
Limit
NOX = g/kW-hr
NMHC = g/kW-hr
PM = 0.2 g/kW-hr
Emission factors werer converted to lb/hp-hr by dividing 608 per AP-42, Section 3.3, Table 3.3-1 footnote.
CH4 = 0.003 kg/MMBtu
N2O = 0.0006 kg/MMBtu
CO2 1
CH4 25
N2O 298
5. CH4 and N2O factors are from 40 CFR Part 98, Table C-2 for petroleum fuels. Factors were converted from kg/MMBtu to
lb/MMBtu.
7. Short-term emissions are calculated as follows:
Emissions (lb/hr) = Emission Factor (lb/hp-hr) * Engine Capacity (hp).
8. Annual emissions are calculated as follows:
Annual Emissions (tpy) = Hourly Emissions (lb/hr) * Annual Operation (hr/yr) / 2,000 (lb/ton).
6. CO2e is calculated using Global Warming Potentials (GWPs) from 40 CFR Part 98, Subpart A, Table A-1 effective January 1, 2014.
GWPs used for CO2, CH4, and N2O are listed below.
4
2. Sulfur content (15 ppmv) in accordance with 40 CFR 60.4207(b) as required by NSPS Subpart IIII.
3. Otherwise emission factors from AP-42 Section 3.3 (Gasoline and Diesel Industrial Engines), Table 3.3-1 (10/96). Emission factors
in lb/MMBtu were converted to lb/hp-hr by multiplying the power conversion factor of 7,000 Btu/hp-hr and 1MMBtu/1,000,000
Btu. VOC was estimated using the exhaust emission factor for diesel fuel. For VOC, maximum of AP-42 TOC factor and NSPS Subpart
IIII NMHC factor was selected.
4. Filterable PM, Total PM, Total PM10, Total PM2.5 assumed equivalent to NSPS IIII PM limit.
Emission Factor3
FWP1 Potential
Emissions7,8
1. FWP1 fire pump PM, NMHC, NOX emissions factors are based on NSPS IIII emission limits.
Trinity Consultants Page 5 of 14 Fire Pump
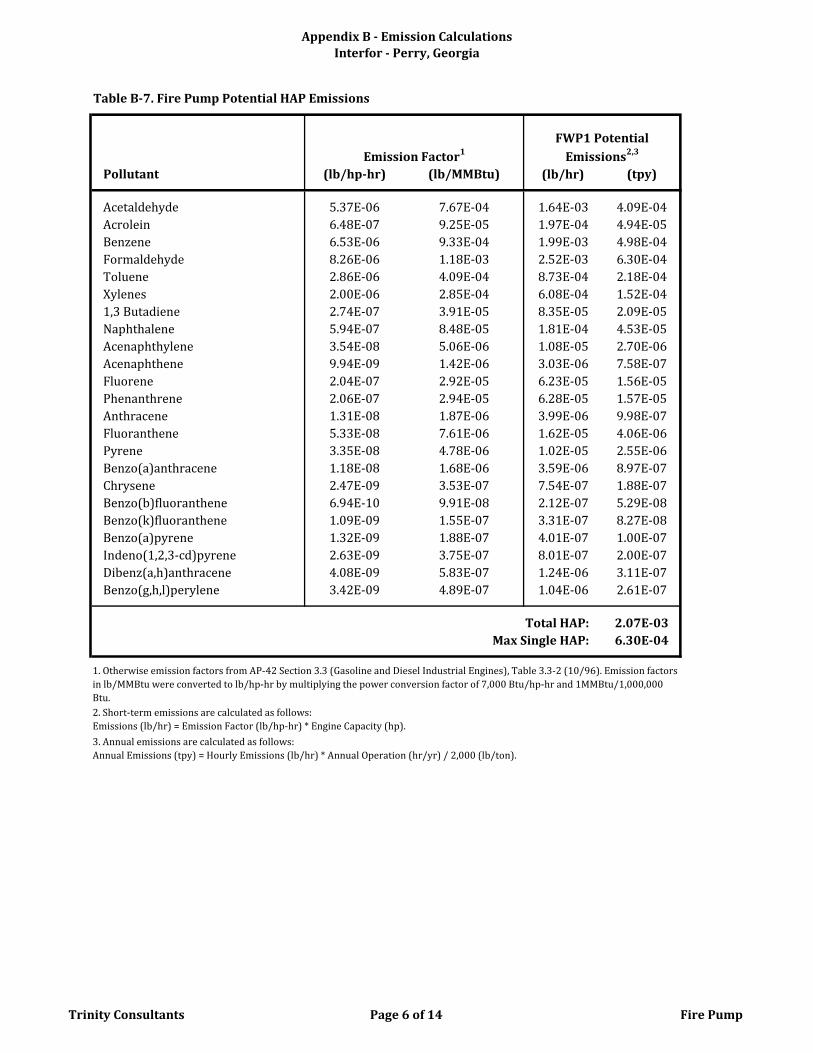
Appendix B - Emission Calculations
Interfor - Perry, Georgia
Table B-7. Fire Pump Potential HAP Emissions
Pollutant (lb/hp-hr) (lb/MMBtu) (lb/hr) (tpy)
Acetaldehyde 5.37E-06 7.67E-04 1.64E-03 4.09E-04
Acrolein 6.48E-07 9.25E-05 1.97E-04 4.94E-05
Benzene 6.53E-06 9.33E-04 1.99E-03 4.98E-04
Formaldehyde 8.26E-06 1.18E-03 2.52E-03 6.30E-04
Toluene 2.86E-06 4.09E-04 8.73E-04 2.18E-04
Xylenes 2.00E-06 2.85E-04 6.08E-04 1.52E-04
1,3 Butadiene 2.74E-07 3.91E-05 8.35E-05 2.09E-05
Naphthalene 5.94E-07 8.48E-05 1.81E-04 4.53E-05
Acenaphthylene 3.54E-08 5.06E-06 1.08E-05 2.70E-06
Acenaphthene 9.94E-09 1.42E-06 3.03E-06 7.58E-07
Fluorene 2.04E-07 2.92E-05 6.23E-05 1.56E-05
Phenanthrene 2.06E-07 2.94E-05 6.28E-05 1.57E-05
Anthracene 1.31E-08 1.87E-06 3.99E-06 9.98E-07
Fluoranthene 5.33E-08 7.61E-06 1.62E-05 4.06E-06
Pyrene 3.35E-08 4.78E-06 1.02E-05 2.55E-06
Benzo(a)anthracene 1.18E-08 1.68E-06 3.59E-06 8.97E-07
Chrysene 2.47E-09 3.53E-07 7.54E-07 1.88E-07
Benzo(b)fluoranthene 6.94E-10 9.91E-08 2.12E-07 5.29E-08
Benzo(k)fluoranthene 1.09E-09 1.55E-07 3.31E-07 8.27E-08
Benzo(a)pyrene 1.32E-09 1.88E-07 4.01E-07 1.00E-07
Indeno(1,2,3-cd)pyrene 2.63E-09 3.75E-07 8.01E-07 2.00E-07
Dibenz(a,h)anthracene 4.08E-09 5.83E-07 1.24E-06 3.11E-07
Benzo(g,h,l)perylene 3.42E-09 4.89E-07 1.04E-06 2.61E-07
Total HAP: 2.07E-03
Max Single HAP: 6.30E-04
2. Short-term emissions are calculated as follows:
Emissions (lb/hr) = Emission Factor (lb/hp-hr) * Engine Capacity (hp).
3. Annual emissions are calculated as follows:
Annual Emissions (tpy) = Hourly Emissions (lb/hr) * Annual Operation (hr/yr) / 2,000 (lb/ton).
Emission Factor1
FWP1 Potential
Emissions2,3
1. Otherwise emission factors from AP-42 Section 3.3 (Gasoline and Diesel Industrial Engines), Table 3.3-2 (10/96). Emission factors
in lb/MMBtu were converted to lb/hp-hr by multiplying the power conversion factor of 7,000 Btu/hp-hr and 1MMBtu/1,000,000
Btu.
Trinity Consultants Page 6 of 14 Fire Pump
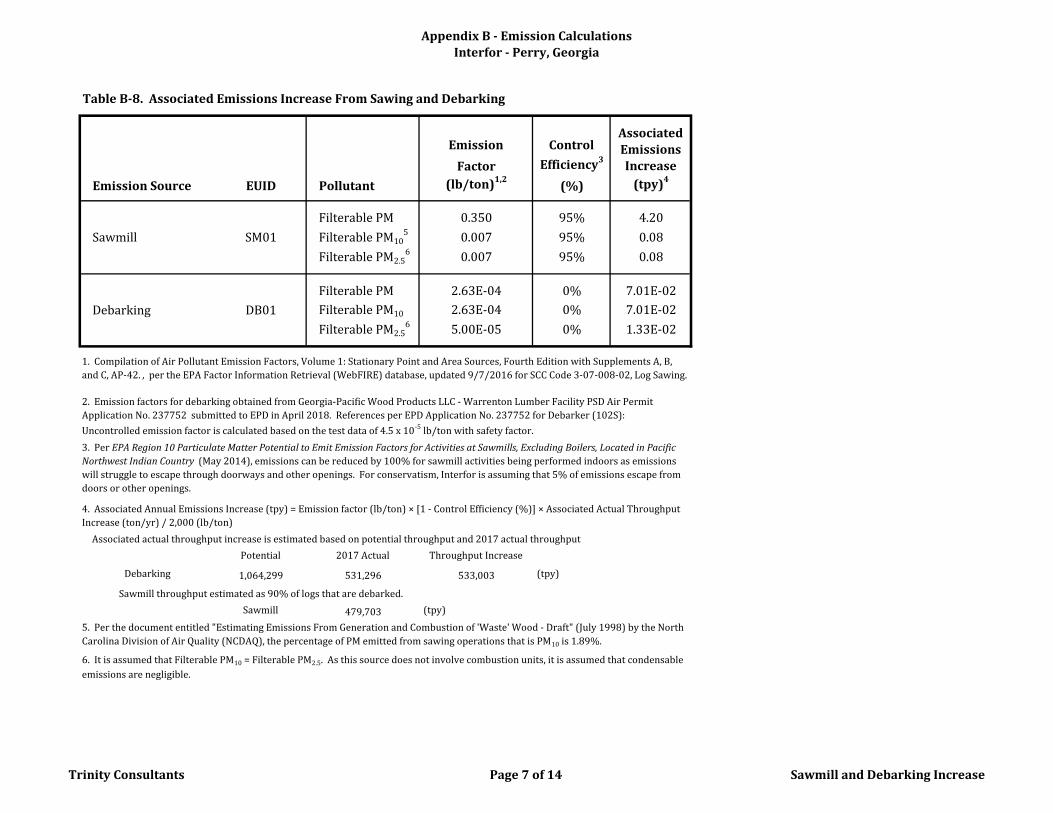
Appendix B - Emission Calculations
Interfor - Perry, Georgia
Table B-8. Associated Emissions Increase From Sawing and Debarking
Emission Control
Factor Efficiency3
Emission Source Pollutant (lb/ton)1,2(%) (tpy)4
Filterable PM 0.350 95% 4.20
Filterable PM105 0.007 95% 0.08
Filterable PM2.56 0.007 95% 0.08
Filterable PM 2.63E-04 0% 7.01E-02
Filterable PM10 2.63E-04 0% 7.01E-02
Filterable PM2.56
5.00E-05 0% 1.33E-02
Associated actual throughput increase is estimated based on potential throughput and 2017 actual throughput
Potential 2017 Actual Throughput Increase
Debarking 1,064,299 531,296 533,003 (tpy)
Sawmill throughput estimated as 90% of logs that are debarked.
Sawmill 479,703 (tpy)
4. Associated Annual Emissions Increase (tpy) = Emission factor (lb/ton) × [1 - Control Efficiency (%)] × Associated Actual Throughput
Increase (ton/yr) / 2,000 (lb/ton)
5. Per the document entitled "Estimating Emissions From Generation and Combustion of 'Waste' Wood ‐ Draft" (July 1998) by the North
Carolina Division of Air Quality (NCDAQ), the percentage of PM emitted from sawing operations that is PM10 is 1.89%.
6. It is assumed that Filterable PM10 = Filterable PM2.5. As this source does not involve combustion units, it is assumed that condensable
emissions are negligible.
3. Per EPA Region 10 Particulate Matter Potential to Emit Emission Factors for Activities at Sawmills, Excluding Boilers, Located in Pacific
Northwest Indian Country (May 2014), emissions can be reduced by 100% for sawmill activities being performed indoors as emissions
will struggle to escape through doorways and other openings. For conservatism, Interfor is assuming that 5% of emissions escape from
doors or other openings.
EUID
Sawmill SM01
Debarking DB01
Associated
Emissions
Increase
1. Compilation of Air Pollutant Emission Factors, Volume 1: Stationary Point and Area Sources, Fourth Edition with Supplements A, B,
and C, AP-42. , per the EPA Factor Information Retrieval (WebFIRE) database, updated 9/7/2016 for SCC Code 3-07-008-02, Log Sawing.
2. Emission factors for debarking obtained from Georgia-Pacific Wood Products LLC - Warrenton Lumber Facility PSD Air Permit
Application No. 237752 submitted to EPD in April 2018. References per EPD Application No. 237752 for Debarker (102S):
Uncontrolled emission factor is calculated based on the test data of 4.5 x 10⁻⁵ lb/ton with safety factor.
Trinity Consultants Page 7 of 14 Sawmill and Debarking Increase
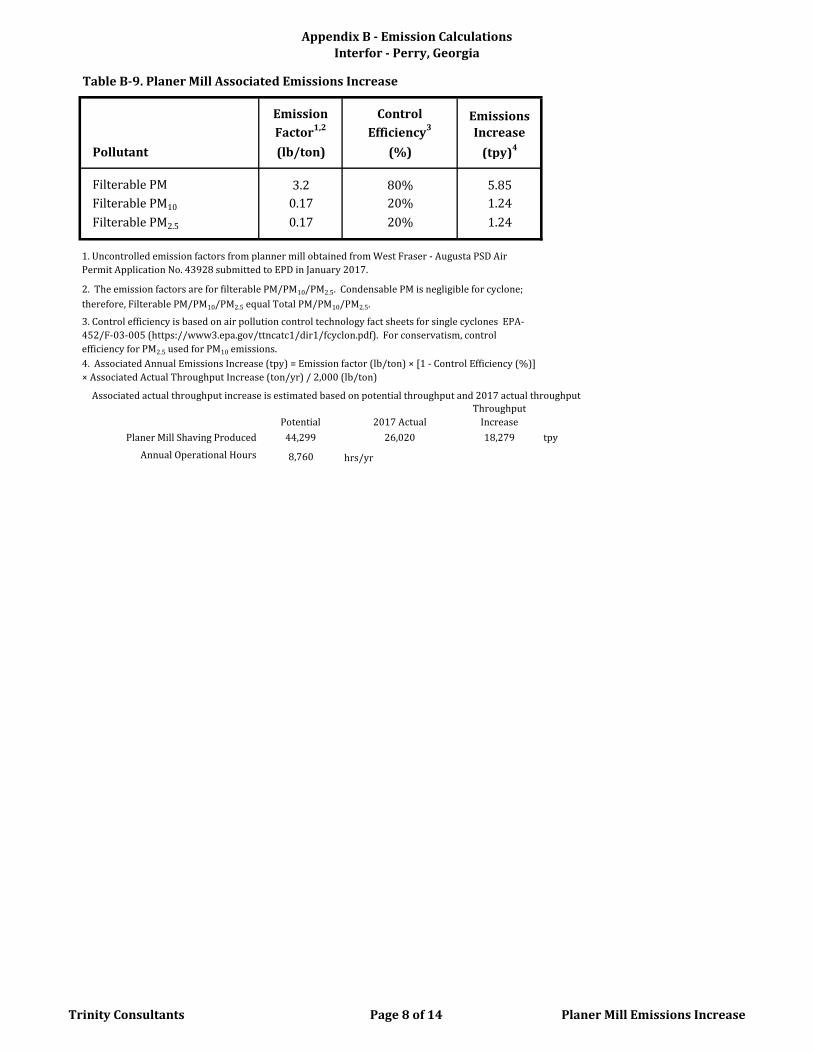
Appendix B - Emission Calculations
Interfor - Perry, Georgia
Table B-9. Planer Mill Associated Emissions Increase
Emission
Factor1,2
Control
Efficiency3
Associated
Emissions
Increase
(lb/ton) (%) (tpy)4
Filterable PM 3.2 80% 5.85
Filterable PM10 0.17 20% 1.24
Filterable PM2.5 0.17 20% 1.24
Associated actual throughput increase is estimated based on potential throughput and 2017 actual throughput
Potential 2017 Actual
Throughput
Increase
Planer Mill Shaving Produced 44,299 26,020 18,279 tpy
Annual Operational Hours 8,760 hrs/yr
Pollutant
1. Uncontrolled emission factors from planner mill obtained from West Fraser - Augusta PSD Air
Permit Application No. 43928 submitted to EPD in January 2017.
2. The emission factors are for filterable PM/PM10/PM2.5. Condensable PM is negligible for cyclone;
therefore, Filterable PM/PM10/PM2.5 equal Total PM/PM10/PM2.5.
4. Associated Annual Emissions Increase (tpy) = Emission factor (lb/ton) × [1 - Control Efficiency (%)]
× Associated Actual Throughput Increase (ton/yr) / 2,000 (lb/ton)
3. Control efficiency is based on air pollution control technology fact sheets for single cyclones EPA-
452/F-03-005 (https://www3.epa.gov/ttncatc1/dir1/fcyclon.pdf). For conservatism, control
efficiency for PM2.5 used for PM10 emissions.
Trinity Consultants Page 8 of 14 Planer Mill Emissions Increase
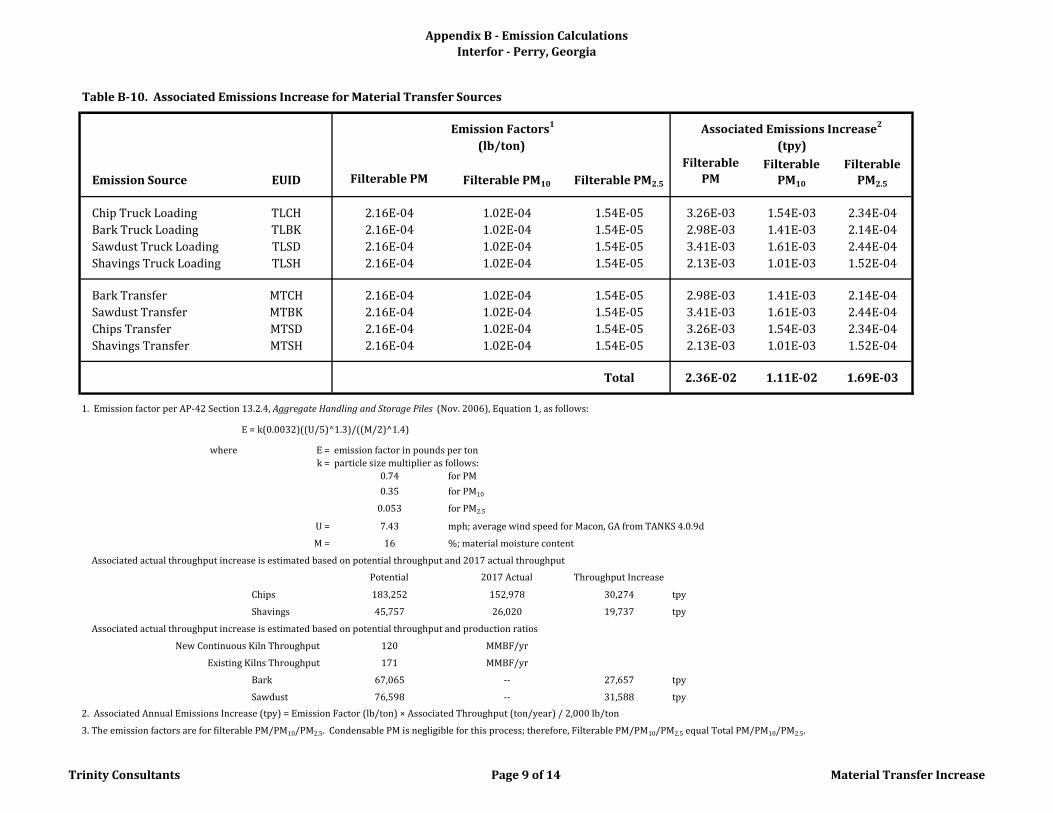
Appendix B - Emission Calculations
Interfor - Perry, Georgia
Table B-10. Associated Emissions Increase for Material Transfer Sources
Emission Source EUID Filterable PM Filterable PM10 Filterable PM2.5
Filterable
PMFilterable
PM10
Filterable
PM2.5
Chip Truck Loading TLCH 2.16E-04 1.02E-04 1.54E-05 3.26E-03 1.54E-03 2.34E-04
Bark Truck Loading TLBK 2.16E-04 1.02E-04 1.54E-05 2.98E-03 1.41E-03 2.14E-04
Sawdust Truck Loading TLSD 2.16E-04 1.02E-04 1.54E-05 3.41E-03 1.61E-03 2.44E-04
Shavings Truck Loading TLSH 2.16E-04 1.02E-04 1.54E-05 2.13E-03 1.01E-03 1.52E-04
Bark Transfer MTCH 2.16E-04 1.02E-04 1.54E-05 2.98E-03 1.41E-03 2.14E-04
Sawdust Transfer MTBK 2.16E-04 1.02E-04 1.54E-05 3.41E-03 1.61E-03 2.44E-04
Chips Transfer MTSD 2.16E-04 1.02E-04 1.54E-05 3.26E-03 1.54E-03 2.34E-04
Shavings Transfer MTSH 2.16E-04 1.02E-04 1.54E-05 2.13E-03 1.01E-03 1.52E-04
Total 2.36E-02 1.11E-02 1.69E-03
1. Emission factor per AP-42 Section 13.2.4, Aggregate Handling and Storage Piles (Nov. 2006), Equation 1, as follows:
E = k(0.0032)((U/5)^1.3)/((M/2)^1.4)
where E = emission factor in pounds per ton
k = particle size multiplier as follows:
0.74 for PM
0.35 for PM10
0.053 for PM2.5
U = 7.43 mph; average wind speed for Macon, GA from TANKS 4.0.9d
M = 16 %; material moisture content
Associated actual throughput increase is estimated based on potential throughput and 2017 actual throughput
Potential 2017 Actual Throughput Increase
Chips 183,252 152,978 30,274 tpy
Shavings 45,757 26,020 19,737 tpy
Associated actual throughput increase is estimated based on potential throughput and production ratios
New Continuous Kiln Throughput 120 MMBF/yr
Existing Kilns Throughput 171 MMBF/yr
Bark 67,065 -- 27,657 tpy
Sawdust 76,598 -- 31,588 tpy
2. Associated Annual Emissions Increase (tpy) = Emission Factor (lb/ton) × Associated Throughput (ton/year) / 2,000 lb/ton
3. The emission factors are for filterable PM/PM10/PM2.5. Condensable PM is negligible for this process; therefore, Filterable PM/PM10/PM2.5 equal Total PM/PM10/PM2.5.
Emission Factors1 Associated Emissions Increase2
(lb/ton) (tpy)
Trinity Consultants Page 9 of 14 Material Transfer Increase
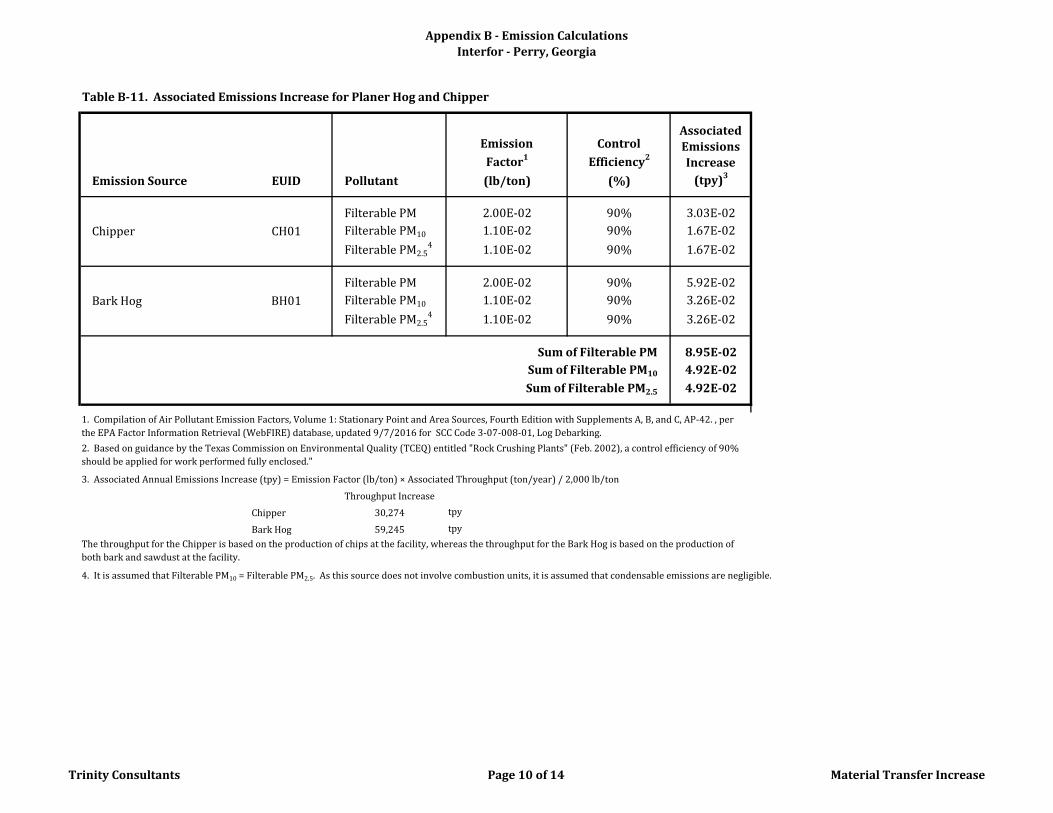
Appendix B - Emission Calculations
Interfor - Perry, Georgia
Table B-11. Associated Emissions Increase for Planer Hog and Chipper
Emission Control
Factor1 Efficiency2
Emission Source EUID Pollutant (lb/ton) (%) (tpy)3
Filterable PM 2.00E-02 90% 3.03E-02
Filterable PM10 1.10E-02 90% 1.67E-02
Filterable PM2.54 1.10E-02 90% 1.67E-02
Filterable PM 2.00E-02 90% 5.92E-02
Filterable PM10 1.10E-02 90% 3.26E-02
Filterable PM2.54 1.10E-02 90% 3.26E-02
Sum of Filterable PM 8.95E-02
Sum of Filterable PM10 4.92E-02
Sum of Filterable PM2.5 4.92E-02
3. Associated Annual Emissions Increase (tpy) = Emission Factor (lb/ton) × Associated Throughput (ton/year) / 2,000 lb/ton
Throughput Increase
Chipper 30,274 tpy
Bark Hog 59,245 tpy
4. It is assumed that Filterable PM10 = Filterable PM2.5. As this source does not involve combustion units, it is assumed that condensable emissions are negligible.
The throughput for the Chipper is based on the production of chips at the facility, whereas the throughput for the Bark Hog is based on the production of
both bark and sawdust at the facility.
Associated
Emissions
Increase
Bark Hog BH01
1. Compilation of Air Pollutant Emission Factors, Volume 1: Stationary Point and Area Sources, Fourth Edition with Supplements A, B, and C, AP-42. , per
the EPA Factor Information Retrieval (WebFIRE) database, updated 9/7/2016 for SCC Code 3-07-008-01, Log Debarking.
2. Based on guidance by the Texas Commission on Environmental Quality (TCEQ) entitled "Rock Crushing Plants" (Feb. 2002), a control efficiency of 90%
should be applied for work performed fully enclosed."
Chipper CH01
Trinity Consultants Page 10 of 14 Material Transfer Increase
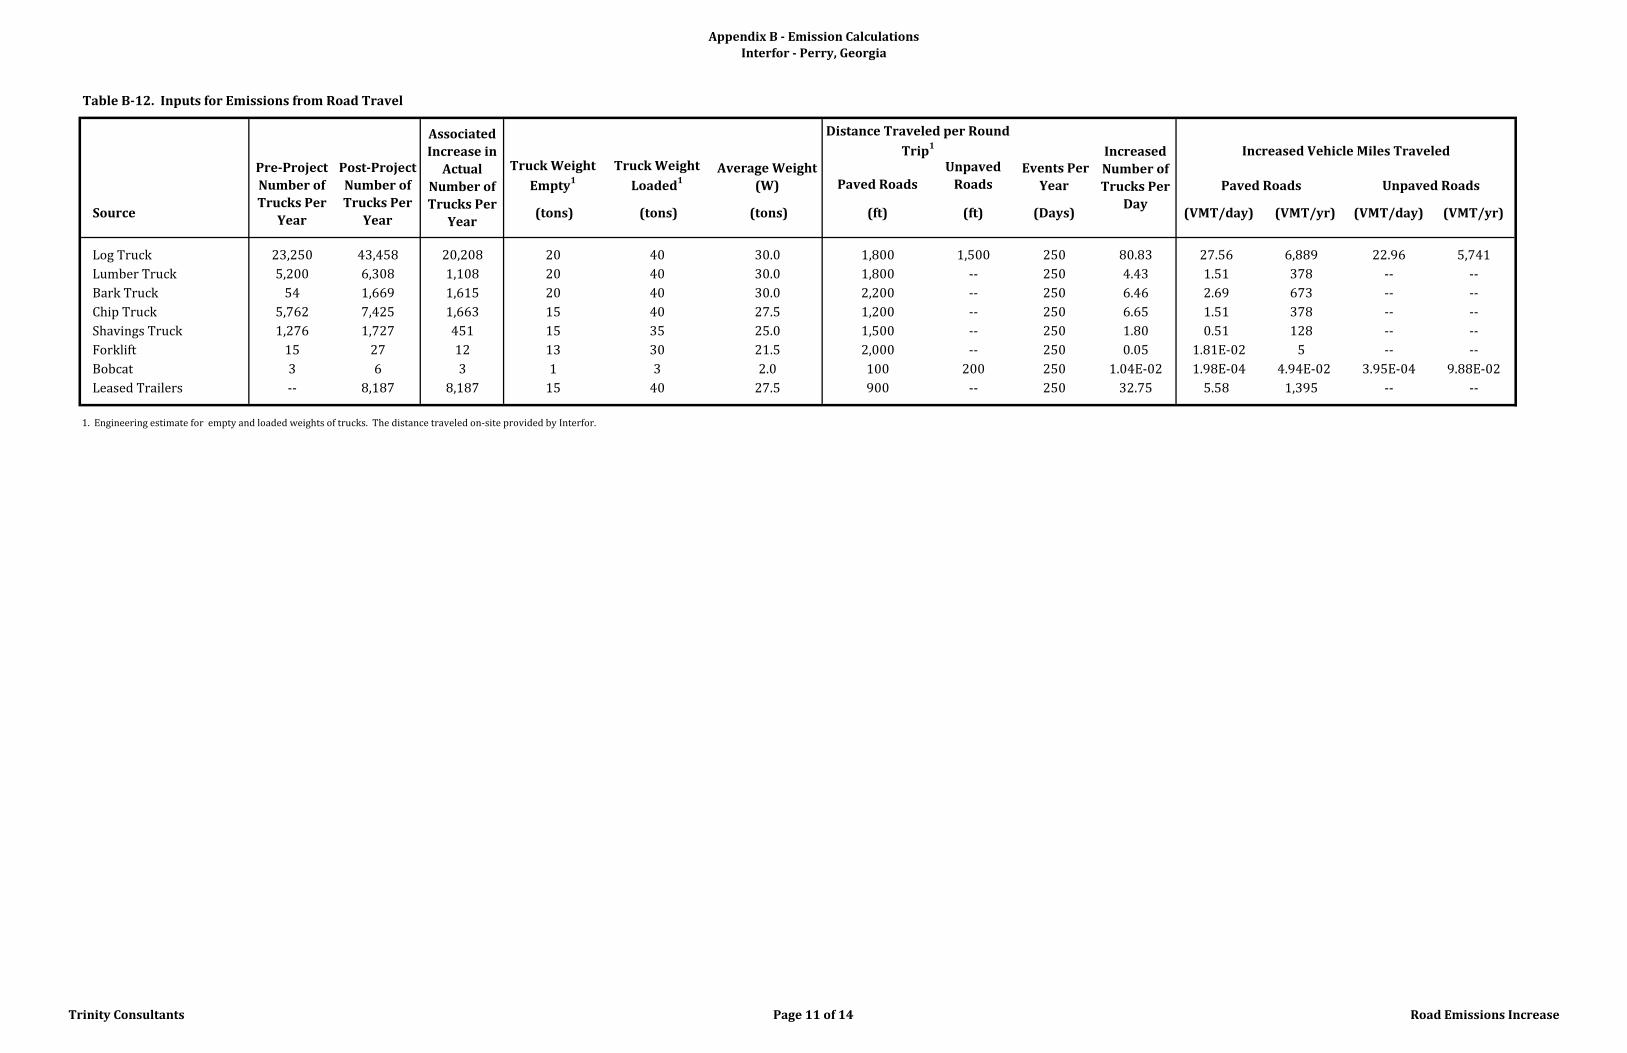
Appendix B - Emission Calculations
Interfor - Perry, Georgia
Table B-12. Inputs for Emissions from Road Travel
Paved Roads
Unpaved
Roads
Source (tons) (tons) (tons) (ft) (ft) (Days) (VMT/day) (VMT/yr) (VMT/day) (VMT/yr)
Log Truck 23,250 43,458 20,208 20 40 30.0 1,800 1,500 250 80.83 27.56 6,889 22.96 5,741
Lumber Truck 5,200 6,308 1,108 20 40 30.0 1,800 -- 250 4.43 1.51 378 -- --
Bark Truck 54 1,669 1,615 20 40 30.0 2,200 -- 250 6.46 2.69 673 -- --
Chip Truck 5,762 7,425 1,663 15 40 27.5 1,200 -- 250 6.65 1.51 378 -- --
Shavings Truck 1,276 1,727 451 15 35 25.0 1,500 -- 250 1.80 0.51 128 -- --
Forklift 15 27 12 13 30 21.5 2,000 -- 250 0.05 1.81E-02 5 -- --
Bobcat 3 6 3 1 3 2.0 100 200 250 1.04E-02 1.98E-04 4.94E-02 3.95E-04 9.88E-02
Leased Trailers -- 8,187 8,187 15 40 27.5 900 -- 250 32.75 5.58 1,395 -- --
1. Engineering estimate for empty and loaded weights of trucks. The distance traveled on-site provided by Interfor.
Increased
Number of
Trucks Per
Day
Increased Vehicle Miles Traveled
Paved Roads Unpaved Roads
Associated
Increase in
Actual
Number of
Trucks Per
Year
Truck Weight
Empty1
Truck Weight
Loaded1
Average Weight
(W)
Distance Traveled per Round
Trip1
Events Per
Year
Pre-Project
Number of
Trucks Per
Year
Post-Project
Number of
Trucks Per
Year
Trinity Consultants Page 11 of 14 Road Emissions Increase
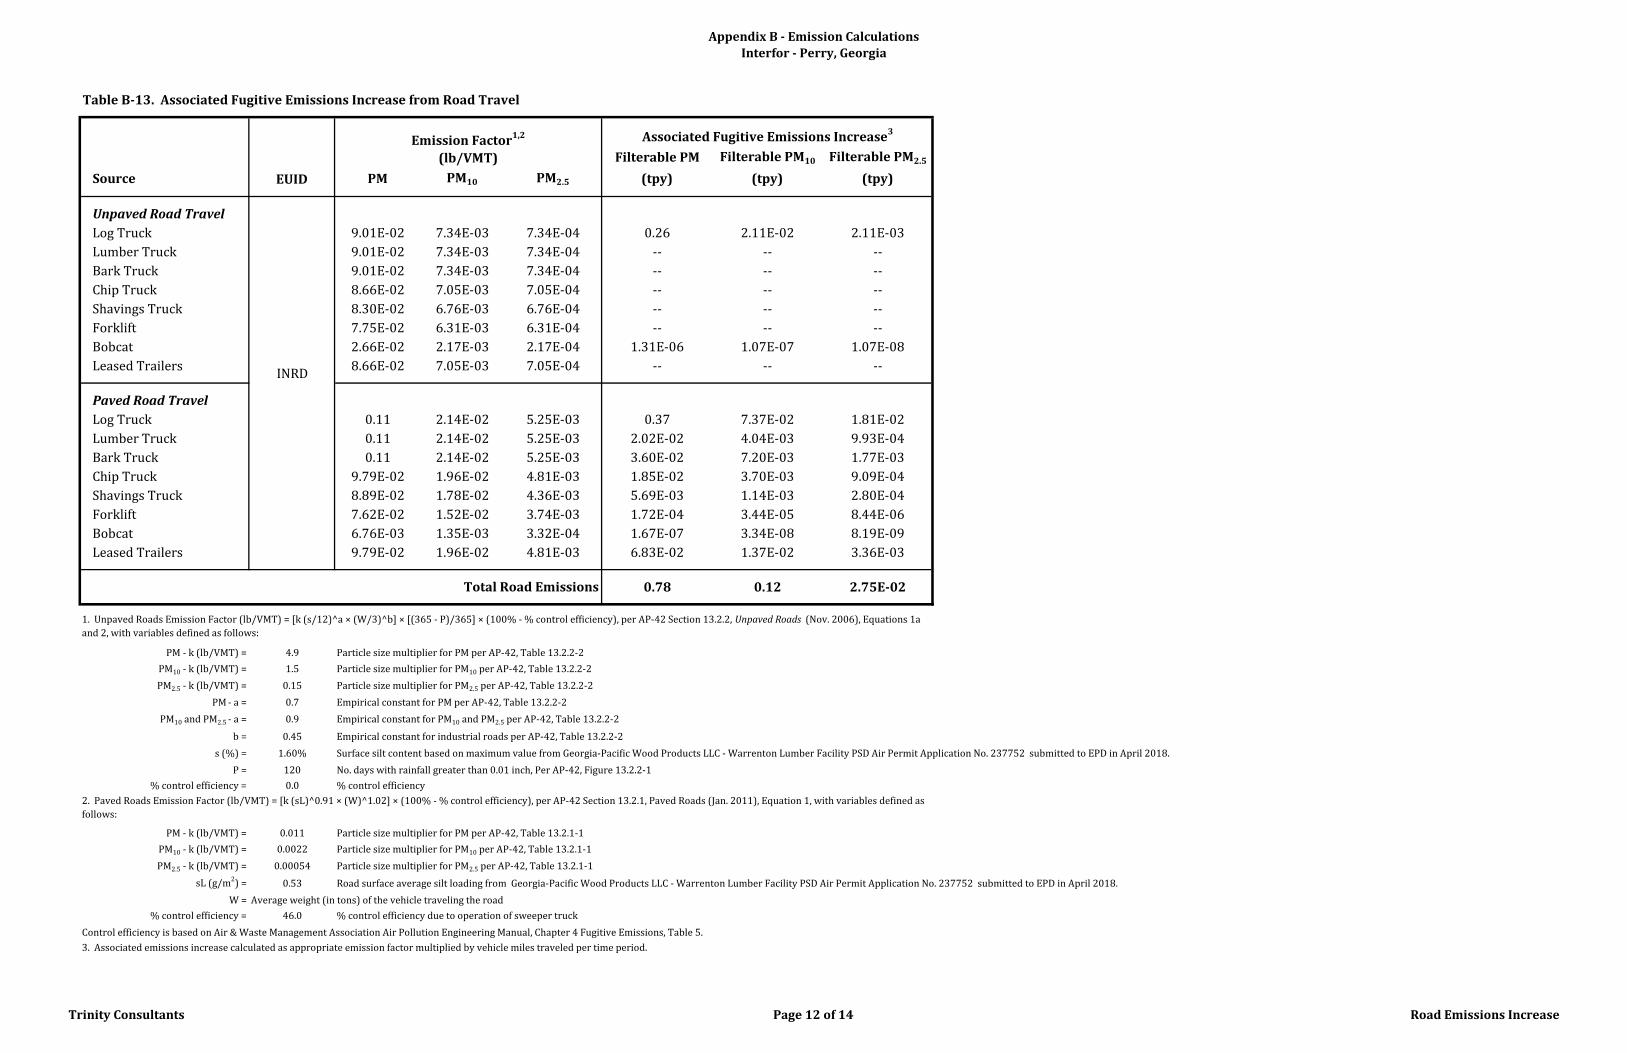
Appendix B - Emission Calculations
Interfor - Perry, Georgia
Table B-13. Associated Fugitive Emissions Increase from Road Travel
Filterable PM Filterable PM10 Filterable PM2.5
Source PM PM10 PM2.5 (tpy) (tpy) (tpy)
Unpaved Road Travel
Log Truck 9.01E-02 7.34E-03 7.34E-04 0.26 2.11E-02 2.11E-03
Lumber Truck 9.01E-02 7.34E-03 7.34E-04 -- -- --
Bark Truck 9.01E-02 7.34E-03 7.34E-04 -- -- --
Chip Truck 8.66E-02 7.05E-03 7.05E-04 -- -- --
Shavings Truck 8.30E-02 6.76E-03 6.76E-04 -- -- --
Forklift 7.75E-02 6.31E-03 6.31E-04 -- -- --
Bobcat 2.66E-02 2.17E-03 2.17E-04 1.31E-06 1.07E-07 1.07E-08
Leased Trailers 8.66E-02 7.05E-03 7.05E-04 -- -- --
Paved Road Travel
Log Truck 0.11 2.14E-02 5.25E-03 0.37 7.37E-02 1.81E-02
Lumber Truck 0.11 2.14E-02 5.25E-03 2.02E-02 4.04E-03 9.93E-04
Bark Truck 0.11 2.14E-02 5.25E-03 3.60E-02 7.20E-03 1.77E-03
Chip Truck 9.79E-02 1.96E-02 4.81E-03 1.85E-02 3.70E-03 9.09E-04
Shavings Truck 8.89E-02 1.78E-02 4.36E-03 5.69E-03 1.14E-03 2.80E-04
Forklift 7.62E-02 1.52E-02 3.74E-03 1.72E-04 3.44E-05 8.44E-06
Bobcat 6.76E-03 1.35E-03 3.32E-04 1.67E-07 3.34E-08 8.19E-09
Leased Trailers 9.79E-02 1.96E-02 4.81E-03 6.83E-02 1.37E-02 3.36E-03
0.78 0.12 2.75E-02
PM - k (lb/VMT) = 4.9 Particle size multiplier for PM per AP-42, Table 13.2.2-2
PM10 - k (lb/VMT) = 1.5 Particle size multiplier for PM10 per AP-42, Table 13.2.2-2
PM2.5 - k (lb/VMT) = 0.15 Particle size multiplier for PM2.5 per AP-42, Table 13.2.2-2
PM - a = 0.7 Empirical constant for PM per AP-42, Table 13.2.2-2
PM10 and PM2.5 - a = 0.9 Empirical constant for PM10 and PM2.5 per AP-42, Table 13.2.2-2
b = 0.45 Empirical constant for industrial roads per AP-42, Table 13.2.2-2
s (%) = 1.60% Surface silt content based on maximum value from Georgia-Pacific Wood Products LLC - Warrenton Lumber Facility PSD Air Permit Application No. 237752 submitted to EPD in April 2018.
P = 120 No. days with rainfall greater than 0.01 inch, Per AP-42, Figure 13.2.2-1
% control efficiency = 0.0 % control efficiency
PM - k (lb/VMT) = 0.011 Particle size multiplier for PM per AP-42, Table 13.2.1-1
PM10 - k (lb/VMT) = 0.0022 Particle size multiplier for PM10 per AP-42, Table 13.2.1-1
PM2.5 - k (lb/VMT) = 0.00054 Particle size multiplier for PM2.5 per AP-42, Table 13.2.1-1
sL (g/m2) = 0.53 Road surface average silt loading from Georgia-Pacific Wood Products LLC - Warrenton Lumber Facility PSD Air Permit Application No. 237752 submitted to EPD in April 2018.
W = Average weight (in tons) of the vehicle traveling the road
% control efficiency = 46.0 % control efficiency due to operation of sweeper truck
Control efficiency is based on Air & Waste Management Association Air Pollution Engineering Manual, Chapter 4 Fugitive Emissions, Table 5.
1. Unpaved Roads Emission Factor (lb/VMT) = [k (s/12)^a × (W/3)^b] × [(365 - P)/365] × (100% - % control efficiency), per AP-42 Section 13.2.2, Unpaved Roads (Nov. 2006), Equations 1a
and 2, with variables defined as follows:
2. Paved Roads Emission Factor (lb/VMT) = [k (sL)^0.91 × (W)^1.02] × (100% - % control efficiency), per AP-42 Section 13.2.1, Paved Roads (Jan. 2011), Equation 1, with variables defined as
follows:
3. Associated emissions increase calculated as appropriate emission factor multiplied by vehicle miles traveled per time period.
INRD
Total Road Emissions
EUID
Emission Factor1,2
(lb/VMT)
Associated Fugitive Emissions Increase3
Trinity Consultants Page 12 of 14 Road Emissions Increase
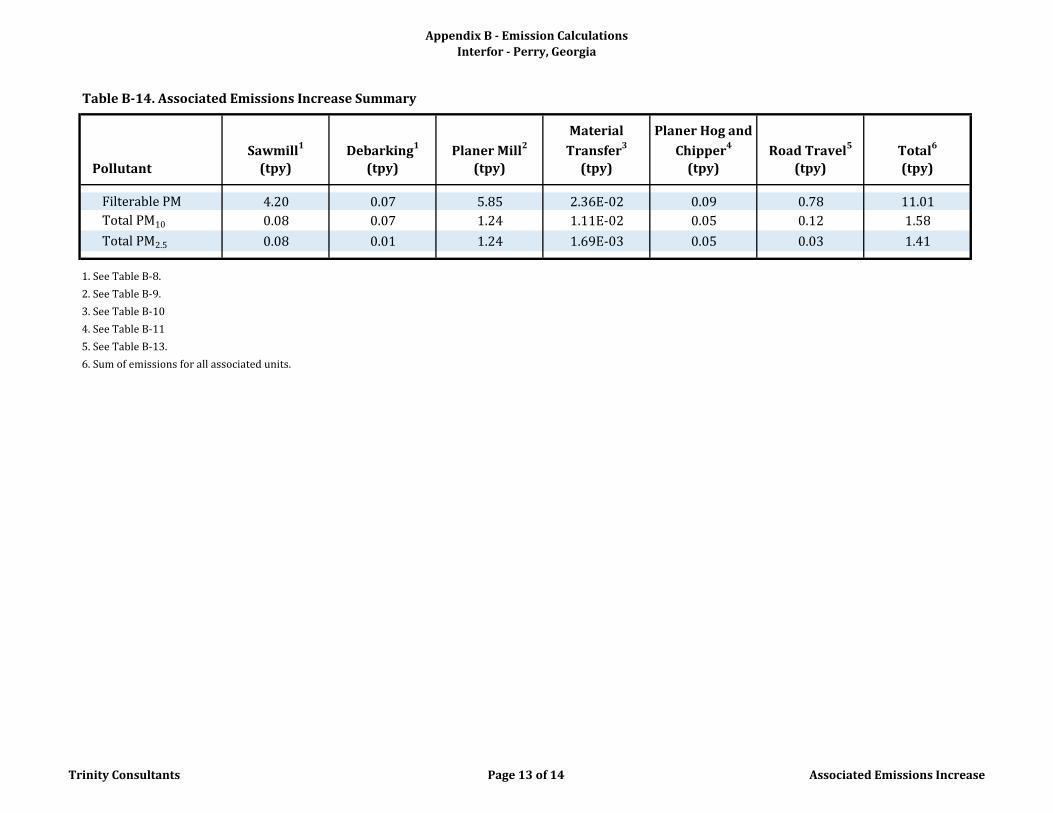
Appendix B - Emission Calculations
Interfor - Perry, Georgia
Table B-14. Associated Emissions Increase Summary
Sawmill1 Debarking1 Planer Mill2
Material
Transfer3
Planer Hog and
Chipper4 Road Travel5 Total6
Pollutant (tpy) (tpy) (tpy) (tpy) (tpy) (tpy) (tpy)
Filterable PM 4.20 0.07 5.85 2.36E-02 0.09 0.78 11.01
Total PM10 0.08 0.07 1.24 1.11E-02 0.05 0.12 1.58
Total PM2.5 0.08 0.01 1.24 1.69E-03 0.05 0.03 1.41
1. See Table B-8.
2. See Table B-9.
3. See Table B-10
4. See Table B-11
5. See Table B-13.
6. Sum of emissions for all associated units.
Trinity Consultants Page 13 of 14 Associated Emissions Increase
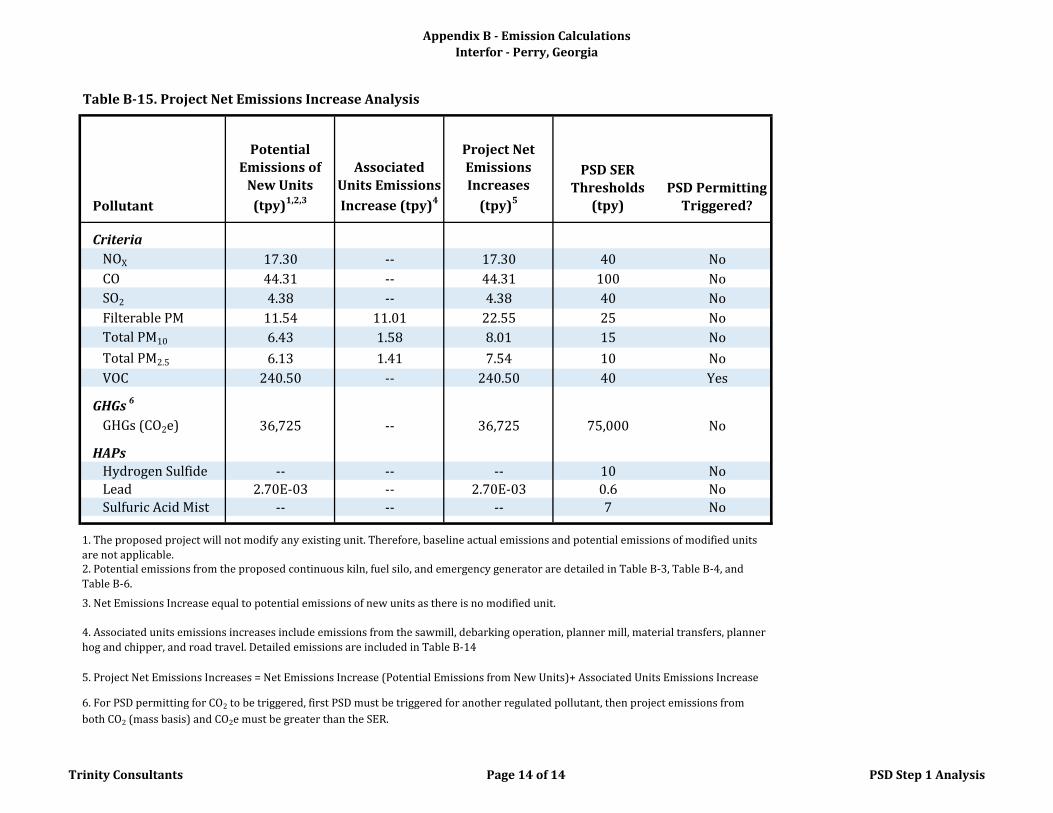
Appendix B - Emission Calculations
Interfor - Perry, Georgia
Table B-15. Project Net Emissions Increase Analysis
Pollutant
Potential
Emissions of
New Units
(tpy)1,2,3
Associated
Units Emissions
Increase (tpy)4
Project Net
Emissions
Increases
(tpy)5
PSD SER
Thresholds
(tpy)
PSD Permitting
Triggered?
Criteria
NOX 17.30 -- 17.30 40 No
CO 44.31 -- 44.31 100 No
SO2 4.38 -- 4.38 40 No
Filterable PM 11.54 11.01 22.55 25 No
Total PM10 6.43 1.58 8.01 15 No
Total PM2.5 6.13 1.41 7.54 10 No
VOC 240.50 -- 240.50 40 Yes
GHGs 6
GHGs (CO2e) 36,725 -- 36,725 75,000 No
HAPs
Hydrogen Sulfide -- -- -- 10 No
Lead 2.70E-03 -- 2.70E-03 0.6 No
Sulfuric Acid Mist -- -- -- 7 No
3. Net Emissions Increase equal to potential emissions of new units as there is no modified unit.
6. For PSD permitting for CO2 to be triggered, first PSD must be triggered for another regulated pollutant, then project emissions from
both CO2 (mass basis) and CO2e must be greater than the SER.
4. Associated units emissions increases include emissions from the sawmill, debarking operation, planner mill, material transfers, planner
hog and chipper, and road travel. Detailed emissions are included in Table B-14
1. The proposed project will not modify any existing unit. Therefore, baseline actual emissions and potential emissions of modified units
are not applicable.
5. Project Net Emissions Increases = Net Emissions Increase (Potential Emissions from New Units)+ Associated Units Emissions Increase
2. Potential emissions from the proposed continuous kiln, fuel silo, and emergency generator are detailed in Table B-3, Table B-4, and
Table B-6.
Trinity Consultants Page 14 of 14 PSD Step 1 Analysis
Interfor U.S. Inc. – Perry Mill | Continuous Kiln Construction Permit Application Trinity Consultants C
APPENDIX C: SIP APPLICATION FORMS
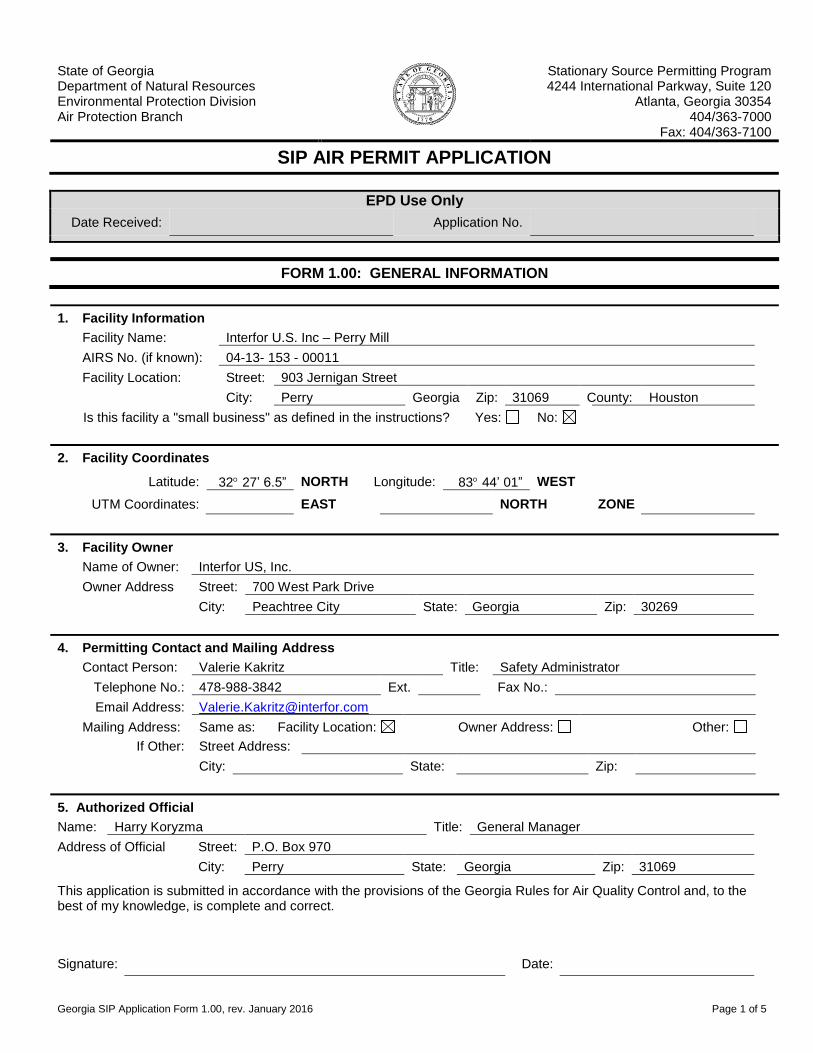
Georgia SIP Application Form 1.00, rev. January 2016 Page 1 of 5
State of Georgia Department of Natural Resources Environmental Protection Division Air Protection Branch
Stationary Source Permitting Program 4244 International Parkway, Suite 120
Atlanta, Georgia 30354 404/363-7000
Fax: 404/363-7100
SIP AIR PERMIT APPLICATION
EPD Use Only
Date Received: Application No.
FORM 1.00: GENERAL INFORMATION
1. Facility Information
Facility Name: Interfor U.S. Inc – Perry Mill
AIRS No. (if known): 04-13- 153 - 00011
Facility Location: Street: 903 Jernigan Street
City: Perry Georgia Zip: 31069 County: Houston
Is this facility a "small business" as defined in the instructions? Yes: No:
2. Facility Coordinates
Latitude: 32 27’ 6.5” NORTH Longitude: 83 44’ 01” WEST
UTM Coordinates: EAST NORTH ZONE
3. Facility Owner
Name of Owner: Interfor US, Inc.
Owner Address Street: 700 West Park Drive
City: Peachtree City State: Georgia Zip: 30269
4. Permitting Contact and Mailing Address
Contact Person: Valerie Kakritz Title: Safety Administrator
Telephone No.: 478-988-3842 Ext. Fax No.:
Email Address: [email protected]
Mailing Address: Same as: Facility Location: Owner Address: Other:
If Other: Street Address:
City: State: Zip:
5. Authorized Official
Name: Harry Koryzma Title: General Manager
Address of Official Street: P.O. Box 970
City: Perry State: Georgia Zip: 31069
This application is submitted in accordance with the provisions of the Georgia Rules for Air Quality Control and, to the best of my knowledge, is complete and correct.
Signature:
Date:
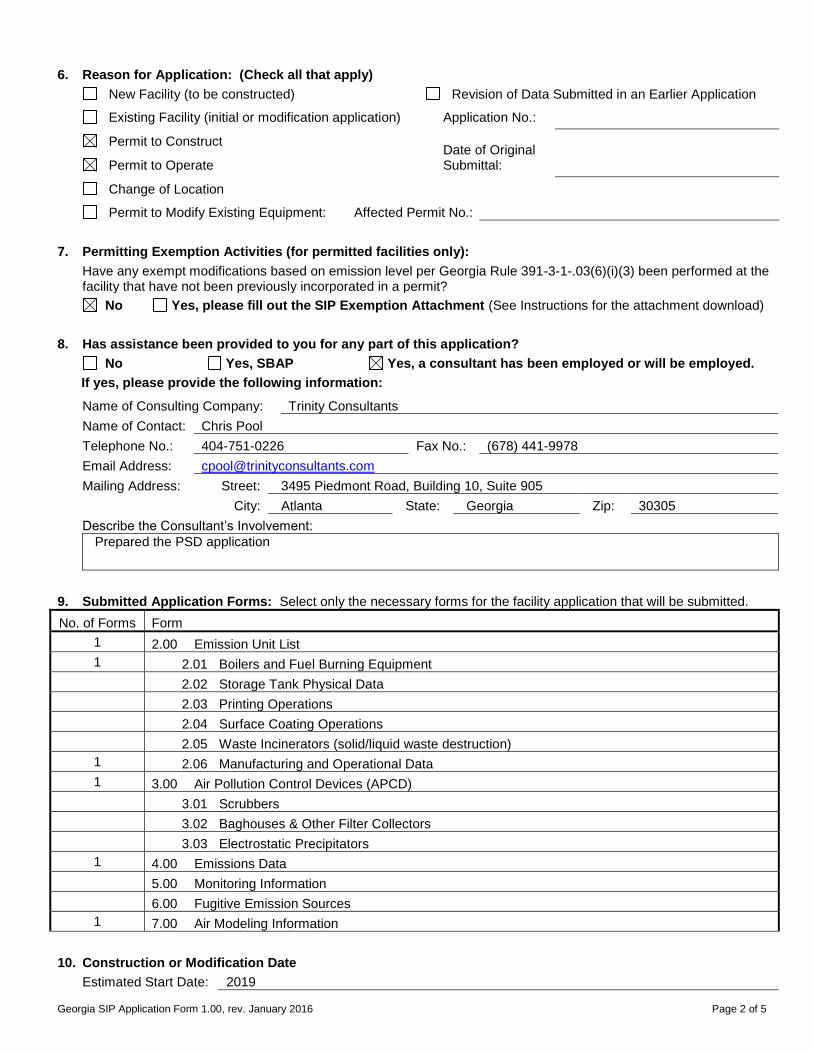
Georgia SIP Application Form 1.00, rev. January 2016 Page 2 of 5
6. Reason for Application: (Check all that apply)
New Facility (to be constructed) Revision of Data Submitted in an Earlier Application
Existing Facility (initial or modification application) Application No.:
Permit to Construct Date of Original Submittal: Permit to Operate
Change of Location
Permit to Modify Existing Equipment: Affected Permit No.:
7. Permitting Exemption Activities (for permitted facilities only):
Have any exempt modifications based on emission level per Georgia Rule 391-3-1-.03(6)(i)(3) been performed at the facility that have not been previously incorporated in a permit?
No Yes, please fill out the SIP Exemption Attachment (See Instructions for the attachment download)
8. Has assistance been provided to you for any part of this application?
No Yes, SBAP Yes, a consultant has been employed or will be employed.
If yes, please provide the following information:
Name of Consulting Company: Trinity Consultants
Name of Contact: Chris Pool
Telephone No.: 404-751-0226 Fax No.: (678) 441-9978
Email Address: [email protected]
Mailing Address: Street: 3495 Piedmont Road, Building 10, Suite 905
City: Atlanta State: Georgia Zip: 30305
Describe the Consultant’s Involvement:
Prepared the PSD application
9. Submitted Application Forms: Select only the necessary forms for the facility application that will be submitted.
No. of Forms Form
1 2.00 Emission Unit List 1 2.01 Boilers and Fuel Burning Equipment
2.02 Storage Tank Physical Data 2.03 Printing Operations 2.04 Surface Coating Operations 2.05 Waste Incinerators (solid/liquid waste destruction)
1 2.06 Manufacturing and Operational Data 1 3.00 Air Pollution Control Devices (APCD)
3.01 Scrubbers 3.02 Baghouses & Other Filter Collectors 3.03 Electrostatic Precipitators
1 4.00 Emissions Data 5.00 Monitoring Information
6.00 Fugitive Emission Sources 1 7.00 Air Modeling Information
10. Construction or Modification Date
Estimated Start Date: 2019
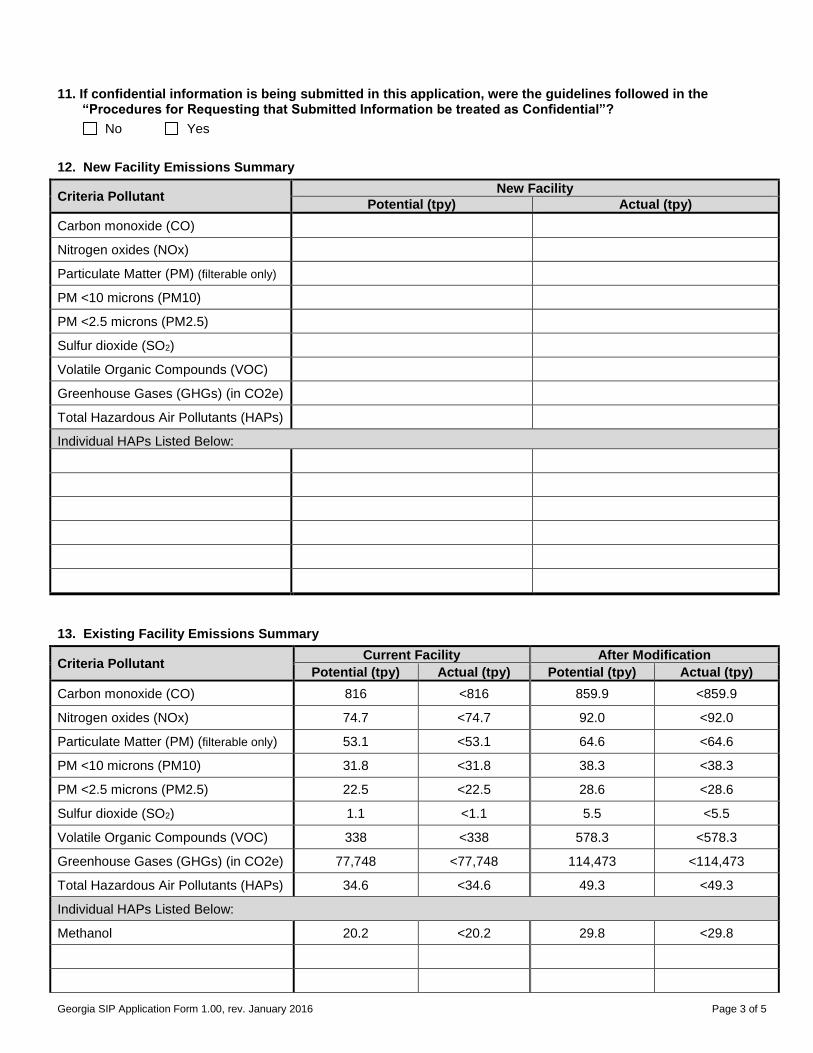
Georgia SIP Application Form 1.00, rev. January 2016 Page 3 of 5
11. If confidential information is being submitted in this application, were the guidelines followed in the “Procedures for Requesting that Submitted Information be treated as Confidential”?
No Yes
12. New Facility Emissions Summary
Criteria Pollutant New Facility
Potential (tpy) Actual (tpy)
Carbon monoxide (CO)
Nitrogen oxides (NOx)
Particulate Matter (PM) (filterable only)
PM <10 microns (PM10)
PM <2.5 microns (PM2.5)
Sulfur dioxide (SO2)
Volatile Organic Compounds (VOC)
Greenhouse Gases (GHGs) (in CO2e)
Total Hazardous Air Pollutants (HAPs)
Individual HAPs Listed Below:
13. Existing Facility Emissions Summary
Criteria Pollutant Current Facility After Modification
Potential (tpy) Actual (tpy) Potential (tpy) Actual (tpy)
Carbon monoxide (CO) 816 <816 859.9 <859.9
Nitrogen oxides (NOx) 74.7 <74.7 92.0 <92.0
Particulate Matter (PM) (filterable only) 53.1 <53.1 64.6 <64.6
PM <10 microns (PM10) 31.8 <31.8 38.3 <38.3
PM <2.5 microns (PM2.5) 22.5 <22.5 28.6 <28.6
Sulfur dioxide (SO2) 1.1 <1.1 5.5 <5.5
Volatile Organic Compounds (VOC) 338 <338 578.3 <578.3
Greenhouse Gases (GHGs) (in CO2e) 77,748 <77,748 114,473 <114,473
Total Hazardous Air Pollutants (HAPs) 34.6 <34.6 49.3 <49.3
Individual HAPs Listed Below:
Methanol 20.2 <20.2 29.8 <29.8
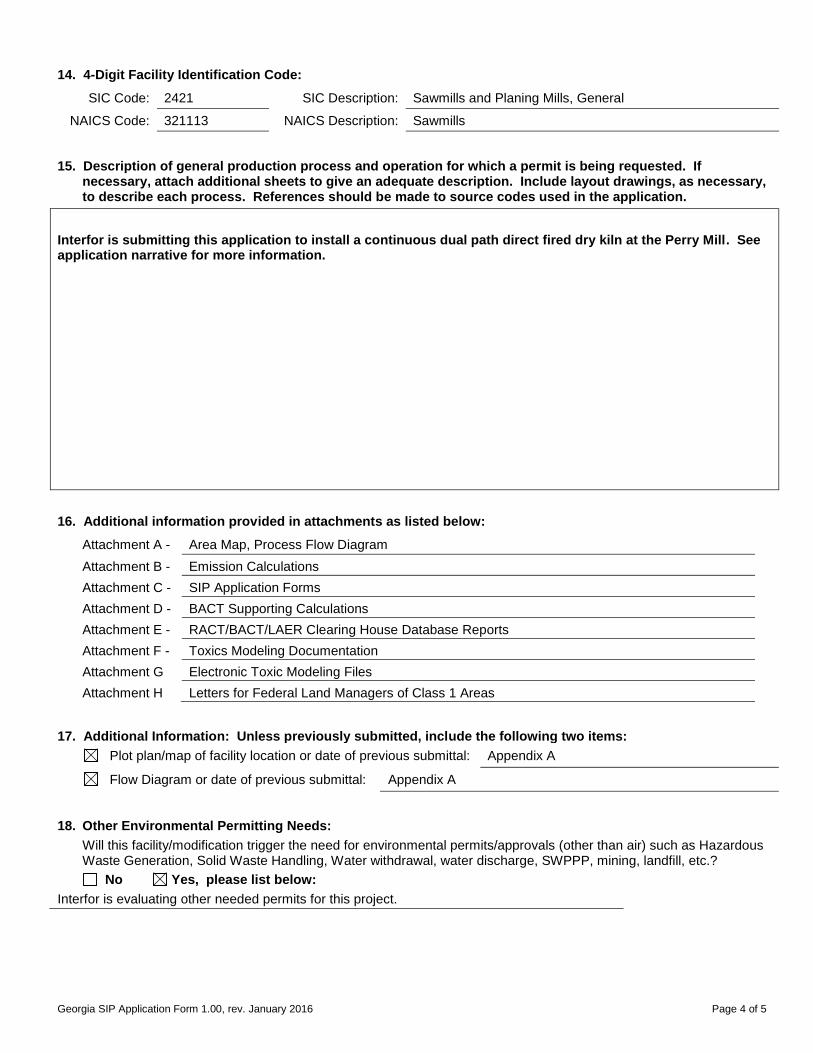
Georgia SIP Application Form 1.00, rev. January 2016 Page 4 of 5
14. 4-Digit Facility Identification Code:
SIC Code: 2421 SIC Description: Sawmills and Planing Mills, General
NAICS Code: 321113 NAICS Description: Sawmills
15. Description of general production process and operation for which a permit is being requested. If necessary, attach additional sheets to give an adequate description. Include layout drawings, as necessary, to describe each process. References should be made to source codes used in the application.
Interfor is submitting this application to install a continuous dual path direct fired dry kiln at the Perry Mill. See application narrative for more information.
16. Additional information provided in attachments as listed below:
Attachment A - Area Map, Process Flow Diagram
Attachment B - Emission Calculations
Attachment C - SIP Application Forms
Attachment D - BACT Supporting Calculations
Attachment E - RACT/BACT/LAER Clearing House Database Reports
Attachment F - Toxics Modeling Documentation
Attachment G Electronic Toxic Modeling Files
Attachment H Letters for Federal Land Managers of Class 1 Areas
17. Additional Information: Unless previously submitted, include the following two items:
Plot plan/map of facility location or date of previous submittal: Appendix A
Flow Diagram or date of previous submittal: Appendix A
18. Other Environmental Permitting Needs:
Will this facility/modification trigger the need for environmental permits/approvals (other than air) such as Hazardous Waste Generation, Solid Waste Handling, Water withdrawal, water discharge, SWPPP, mining, landfill, etc.?
No Yes, please list below:
Interfor is evaluating other needed permits for this project.

Georgia SIP Application Form 1.00, rev. January 2016 Page 5 of 5
19. List requested permit limits including synthetic minor (SM) limits.
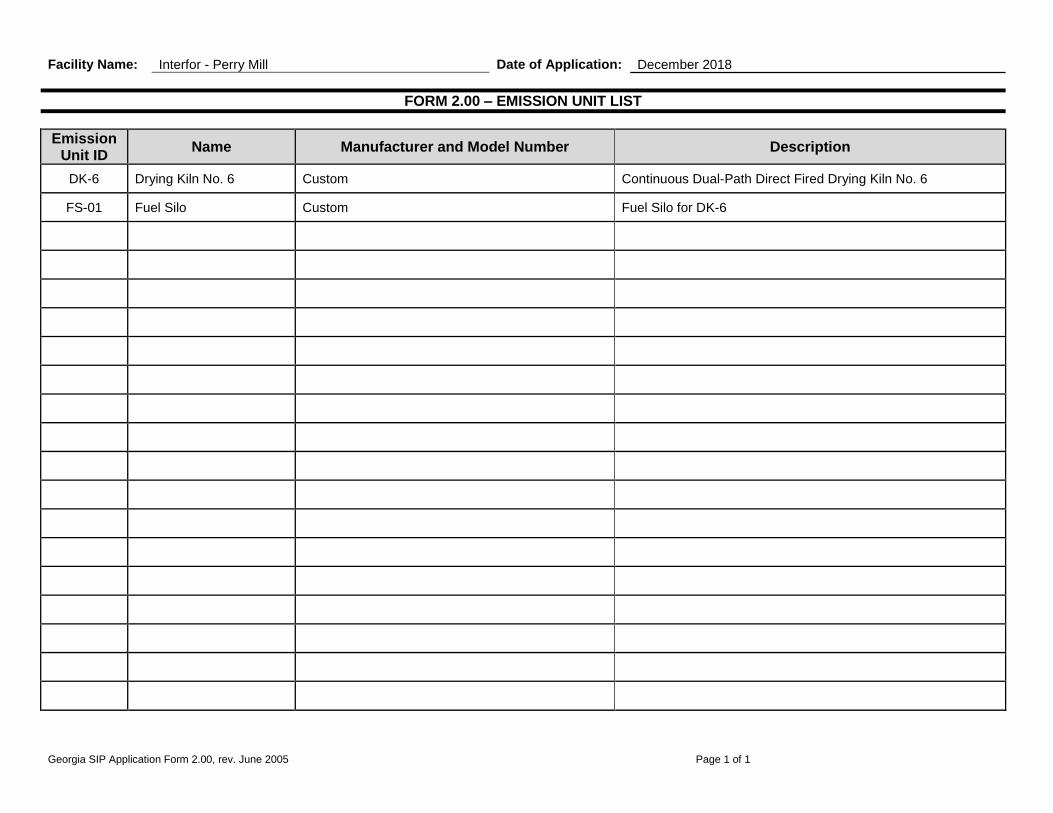
Georgia SIP Application Form 2.00, rev. June 2005 Page 1 of 1
Facility Name: Interfor - Perry Mill Date of Application: December 2018
FORM 2.00 – EMISSION UNIT LIST
Emission
Unit ID Name Manufacturer and Model Number Description
DK-6 Drying Kiln No. 6 Custom Continuous Dual-Path Direct Fired Drying Kiln No. 6
FS-01 Fuel Silo Custom Fuel Silo for DK-6
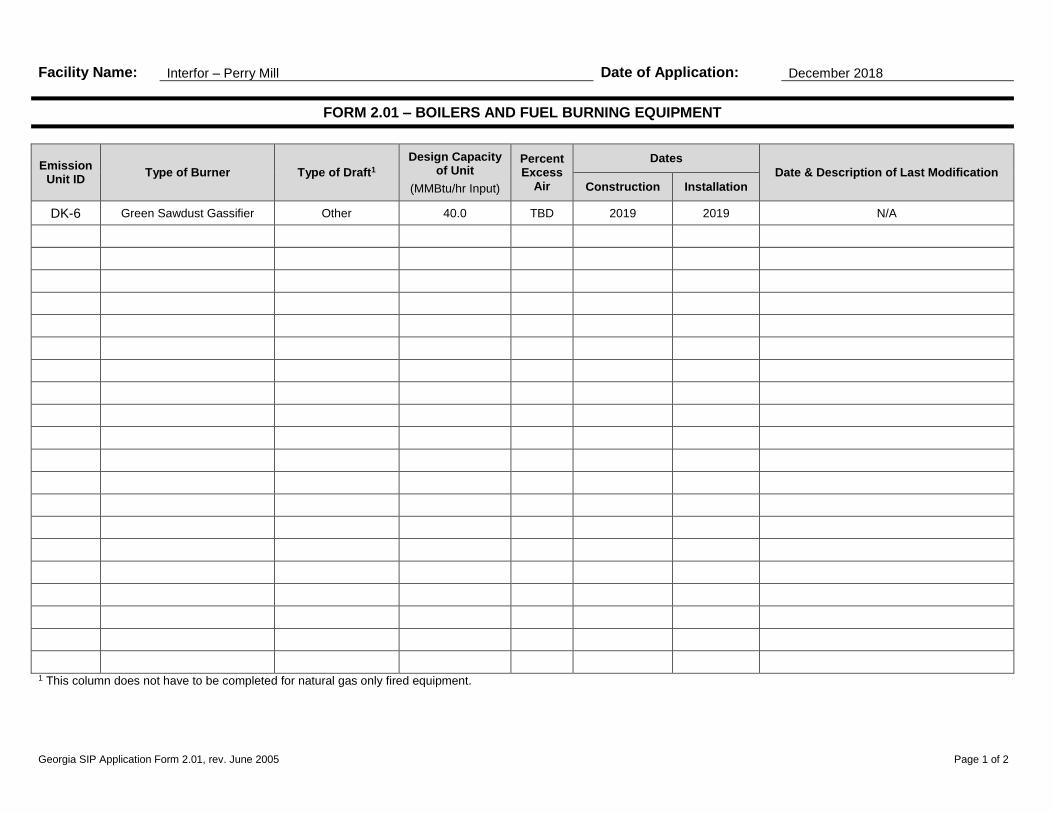
Georgia SIP Application Form 2.01, rev. June 2005 Page 1 of 2
Facility Name: Interfor – Perry Mill Date of Application: December 2018
FORM 2.01 – BOILERS AND FUEL BURNING EQUIPMENT
Emission Unit ID Type of Burner Type of Draft1
Design Capacity of Unit
(MMBtu/hr Input)
Percent Excess
Air
Dates Date & Description of Last Modification
Construction Installation
DK-6 Green Sawdust Gassifier Other 40.0 TBD 2019 2019 N/A
1 This column does not have to be completed for natural gas only fired equipment.
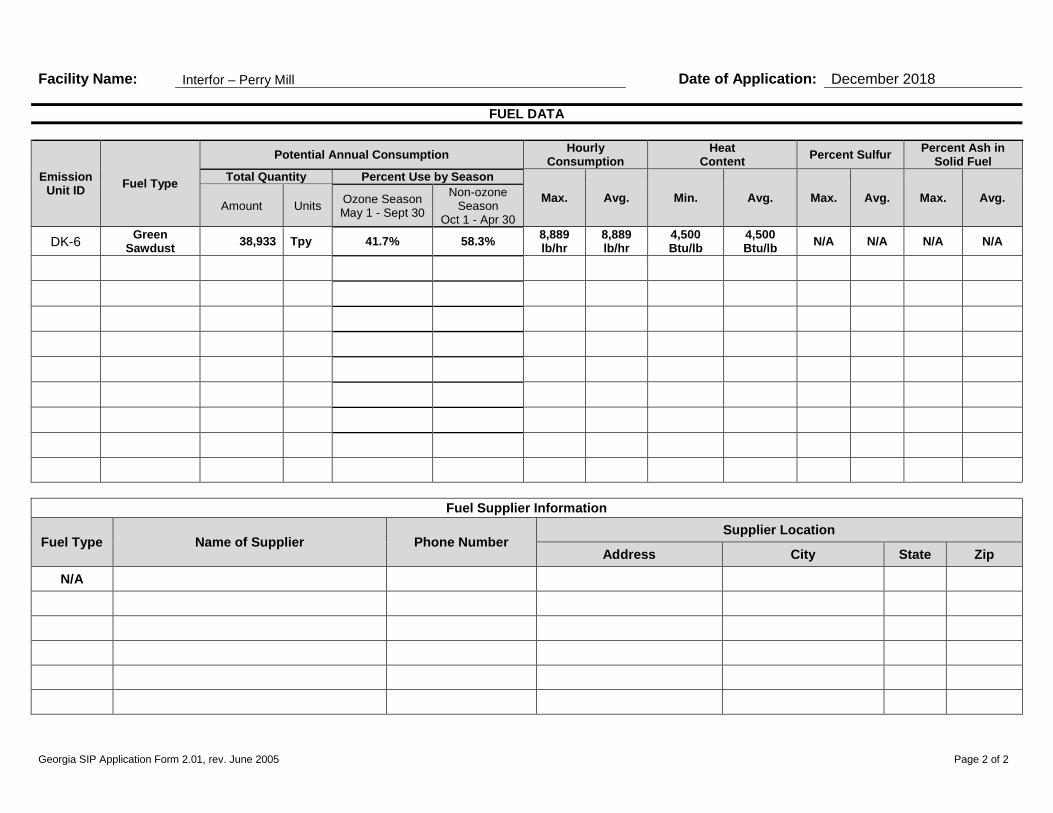
Georgia SIP Application Form 2.01, rev. June 2005 Page 2 of 2
Facility Name: Interfor – Perry Mill Date of Application: December 2018
FUEL DATA
Emission Unit ID
Fuel Type
Potential Annual Consumption Hourly
Consumption Heat
Content Percent Sulfur
Percent Ash in Solid Fuel
Total Quantity Percent Use by Season
Max. Avg. Min. Avg. Max. Avg. Max. Avg. Amount Units
Ozone Season May 1 - Sept 30
Non-ozone Season
Oct 1 - Apr 30
DK-6 Green
Sawdust 38,933 Tpy 41.7% 58.3%
8,889 lb/hr
8,889 lb/hr
4,500 Btu/lb
4,500 Btu/lb
N/A N/A N/A N/A
Fuel Supplier Information
Fuel Type Name of Supplier Phone Number Supplier Location
Address City State Zip
N/A
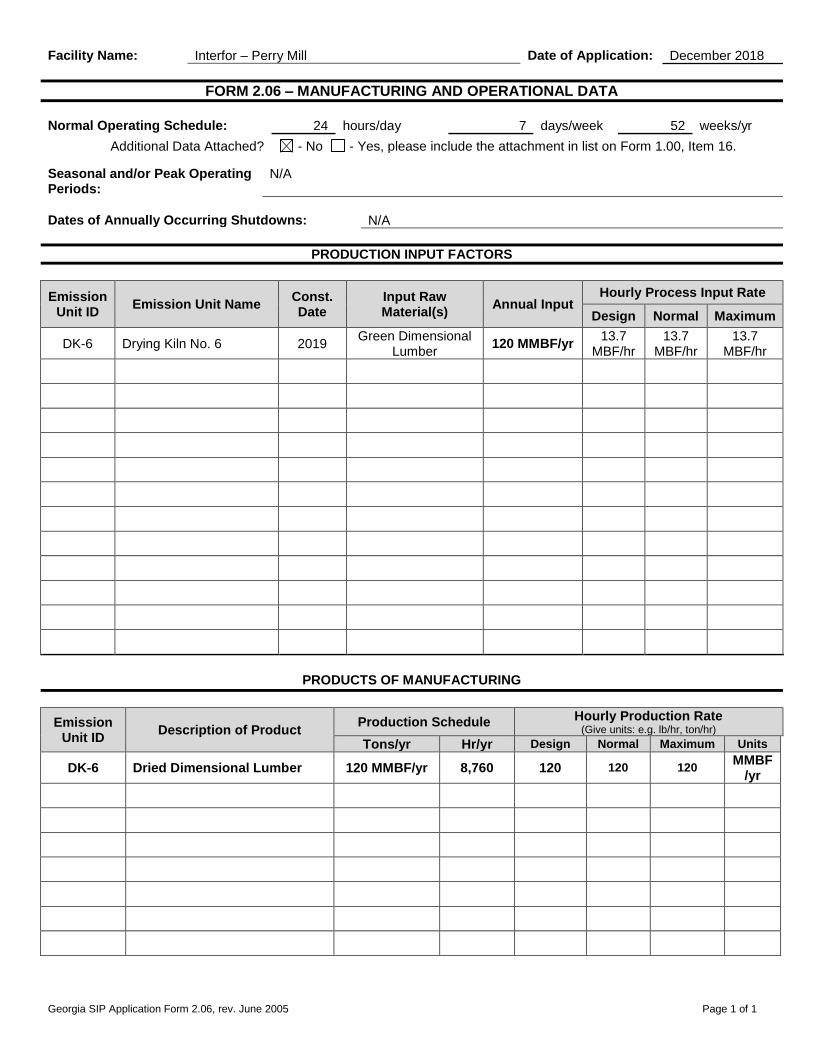
Georgia SIP Application Form 2.06, rev. June 2005 Page 1 of 1
Facility Name: Interfor – Perry Mill Date of Application: December 2018
FORM 2.06 – MANUFACTURING AND OPERATIONAL DATA
Normal Operating Schedule: 24 hours/day 7 days/week 52 weeks/yr
Additional Data Attached? - No - Yes, please include the attachment in list on Form 1.00, Item 16. Seasonal and/or Peak Operating Periods:
N/A
Dates of Annually Occurring Shutdowns: N/A
PRODUCTION INPUT FACTORS
Emission Unit ID
Emission Unit Name Const. Date
Input Raw Material(s)
Annual Input Hourly Process Input Rate
Design Normal Maximum
DK-6 Drying Kiln No. 6 2019 Green Dimensional
Lumber 120 MMBF/yr
13.7 MBF/hr
13.7 MBF/hr
13.7 MBF/hr
PRODUCTS OF MANUFACTURING
Emission Unit ID
Description of Product Production Schedule Hourly Production Rate
(Give units: e.g. lb/hr, ton/hr) Tons/yr Hr/yr Design Normal Maximum Units
DK-6 Dried Dimensional Lumber 120 MMBF/yr 8,760 120 120 120 MMBF
/yr
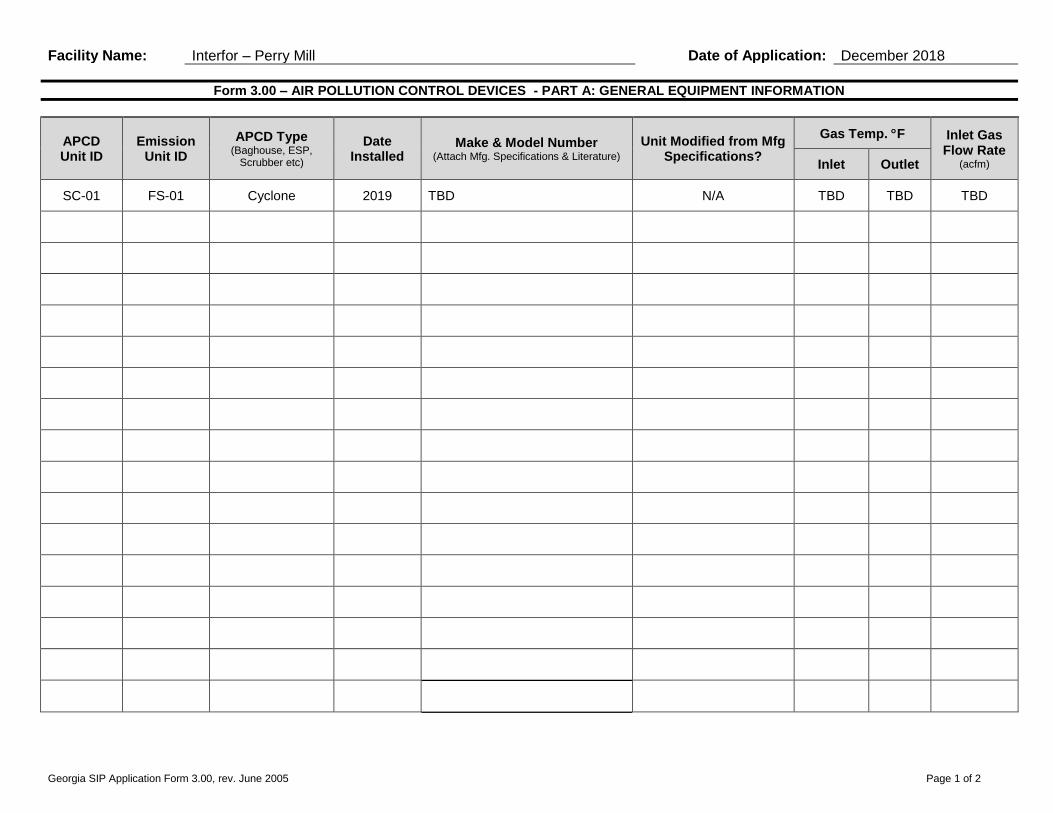
Georgia SIP Application Form 3.00, rev. June 2005 Page 1 of 2
Facility Name: Interfor – Perry Mill Date of Application: December 2018
Form 3.00 – AIR POLLUTION CONTROL DEVICES - PART A: GENERAL EQUIPMENT INFORMATION
APCD Unit ID
Emission Unit ID
APCD Type (Baghouse, ESP,
Scrubber etc)
Date Installed
Make & Model Number (Attach Mfg. Specifications & Literature)
Unit Modified from Mfg Specifications?
Gas Temp. F Inlet Gas Flow Rate
(acfm) Inlet Outlet
SC-01 FS-01 Cyclone 2019 TBD N/A TBD TBD TBD
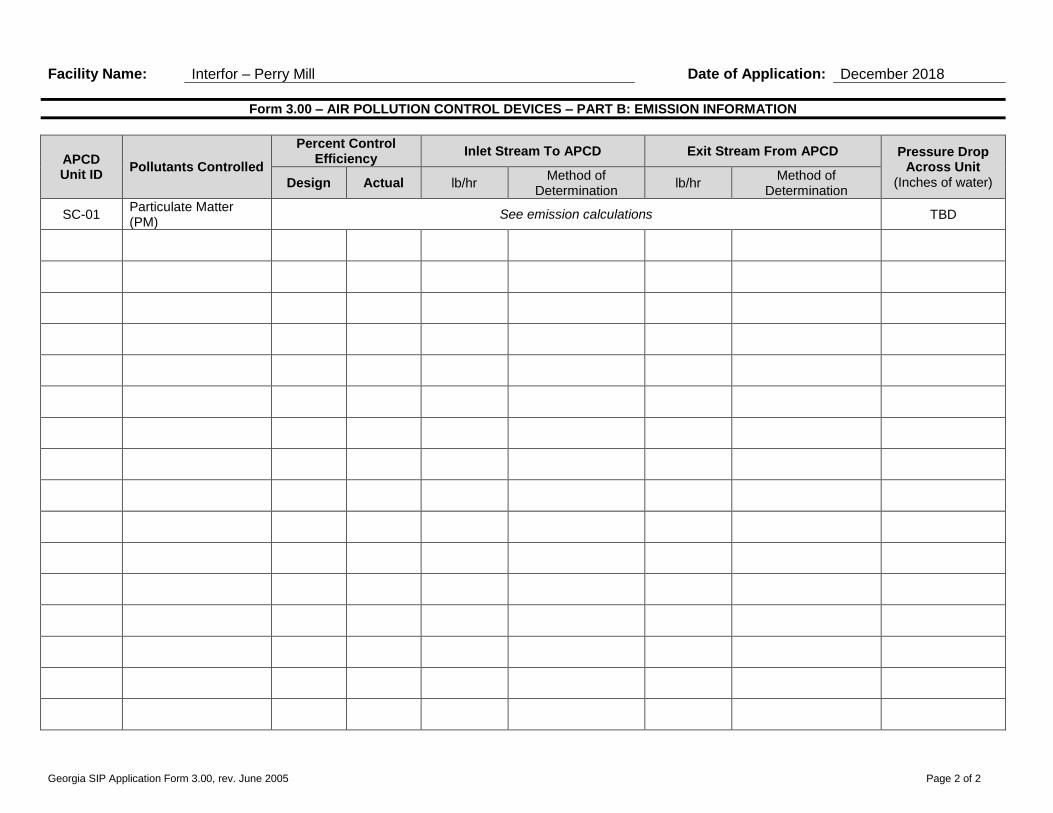
Georgia SIP Application Form 3.00, rev. June 2005 Page 2 of 2
Facility Name: Interfor – Perry Mill Date of Application: December 2018
Form 3.00 – AIR POLLUTION CONTROL DEVICES – PART B: EMISSION INFORMATION
APCD Unit ID
Pollutants Controlled
Percent Control Efficiency
Inlet Stream To APCD Exit Stream From APCD Pressure Drop Across Unit
(Inches of water) Design Actual lb/hr Method of
Determination lb/hr
Method of Determination
SC-01 Particulate Matter (PM)
See emission calculations TBD
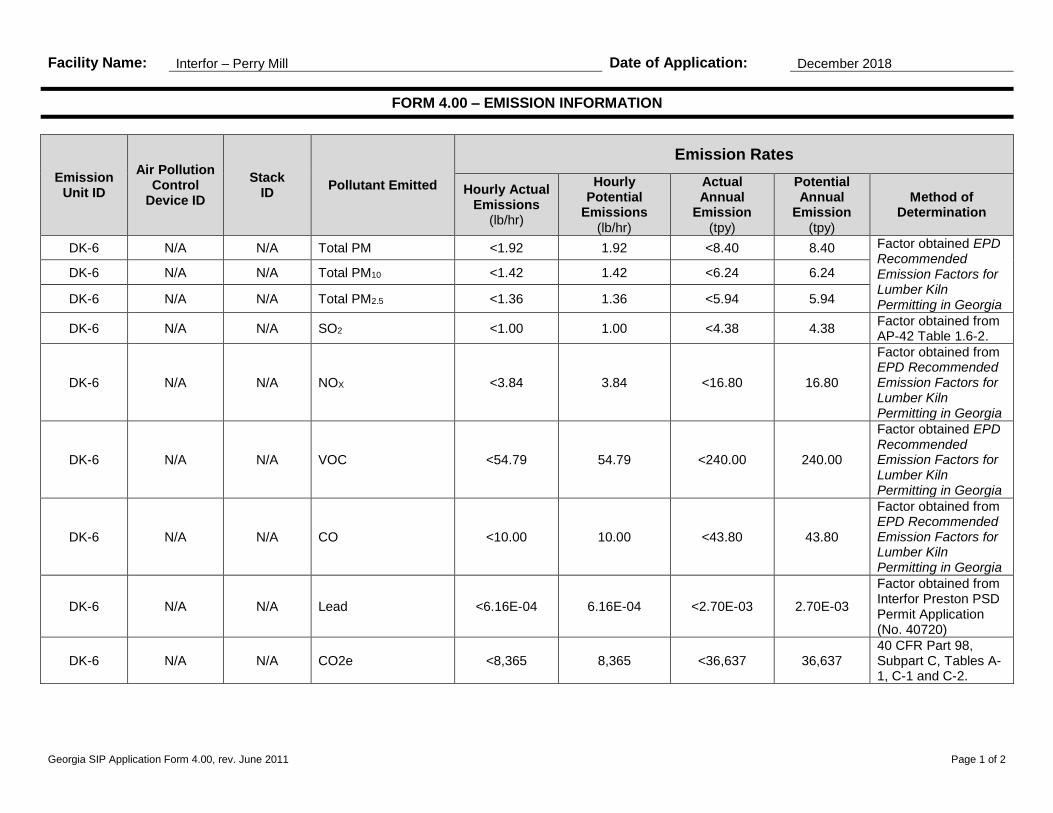
Georgia SIP Application Form 4.00, rev. June 2011 Page 1 of 2
Facility Name: Interfor – Perry Mill Date of Application: December 2018
FORM 4.00 – EMISSION INFORMATION
Emission Unit ID
Air Pollution Control
Device ID
Stack ID
Pollutant Emitted
Emission Rates
Hourly Actual Emissions
(lb/hr)
Hourly Potential
Emissions (lb/hr)
Actual Annual
Emission (tpy)
Potential Annual
Emission (tpy)
Method of Determination
DK-6 N/A N/A Total PM <1.92 1.92 <8.40 8.40 Factor obtained EPD Recommended Emission Factors for Lumber Kiln Permitting in Georgia
DK-6 N/A N/A Total PM10 <1.42 1.42 <6.24 6.24
DK-6 N/A N/A Total PM2.5 <1.36 1.36 <5.94 5.94
DK-6 N/A N/A SO2 <1.00 1.00 <4.38 4.38 Factor obtained from AP-42 Table 1.6-2.
DK-6 N/A N/A NOX <3.84 3.84 <16.80 16.80
Factor obtained from EPD Recommended Emission Factors for Lumber Kiln Permitting in Georgia
DK-6 N/A N/A VOC <54.79 54.79 <240.00 240.00
Factor obtained EPD Recommended Emission Factors for Lumber Kiln Permitting in Georgia
DK-6 N/A N/A CO <10.00 10.00 <43.80 43.80
Factor obtained from EPD Recommended Emission Factors for Lumber Kiln Permitting in Georgia
DK-6 N/A N/A Lead <6.16E-04 6.16E-04 <2.70E-03 2.70E-03
Factor obtained from Interfor Preston PSD Permit Application (No. 40720)
DK-6 N/A N/A CO2e <8,365 8,365 <36,637 36,637 40 CFR Part 98, Subpart C, Tables A-1, C-1 and C-2.
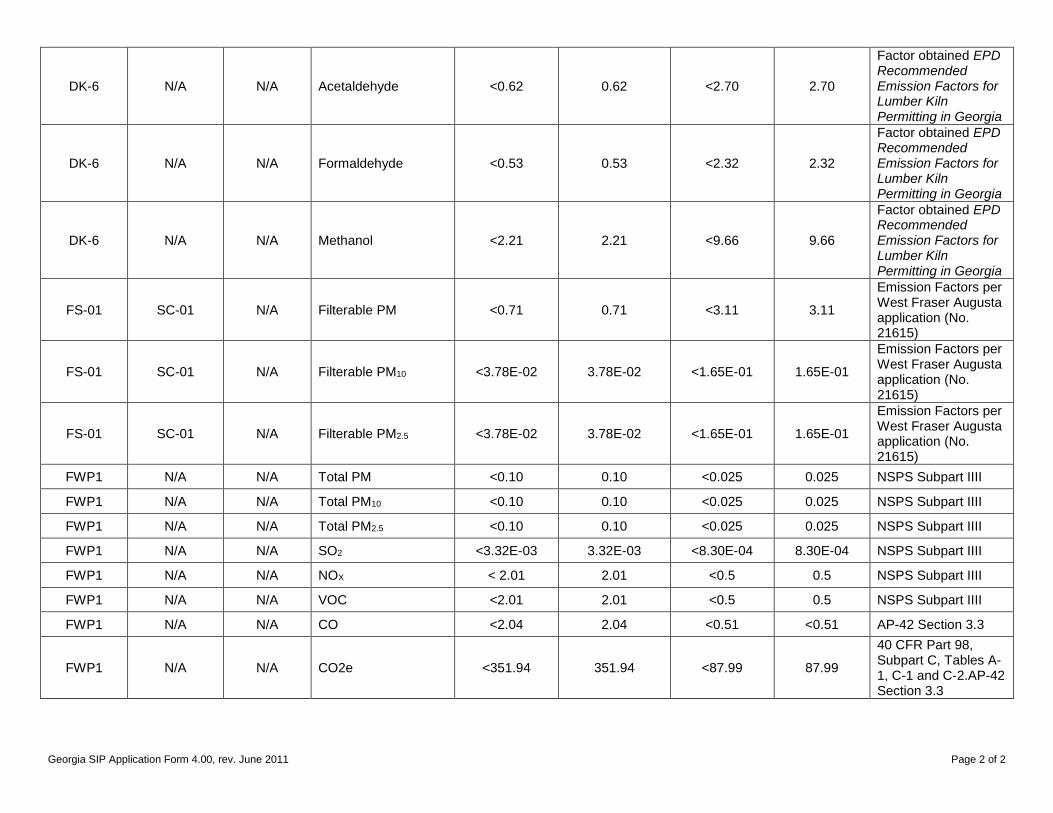
Georgia SIP Application Form 4.00, rev. June 2011 Page 2 of 2
DK-6 N/A N/A Acetaldehyde <0.62 0.62 <2.70 2.70
Factor obtained EPD Recommended Emission Factors for Lumber Kiln Permitting in Georgia
DK-6 N/A N/A Formaldehyde <0.53 0.53 <2.32 2.32
Factor obtained EPD Recommended Emission Factors for Lumber Kiln Permitting in Georgia
DK-6 N/A N/A Methanol <2.21 2.21 <9.66 9.66
Factor obtained EPD Recommended Emission Factors for Lumber Kiln Permitting in Georgia
FS-01 SC-01 N/A Filterable PM <0.71 0.71 <3.11 3.11
Emission Factors per West Fraser Augusta application (No. 21615)
FS-01 SC-01 N/A Filterable PM10 <3.78E-02 3.78E-02 <1.65E-01 1.65E-01
Emission Factors per West Fraser Augusta application (No. 21615)
FS-01 SC-01 N/A Filterable PM2.5 <3.78E-02 3.78E-02 <1.65E-01 1.65E-01
Emission Factors per West Fraser Augusta application (No. 21615)
FWP1 N/A N/A Total PM <0.10 0.10 <0.025 0.025 NSPS Subpart IIII
FWP1 N/A N/A Total PM10 <0.10 0.10 <0.025 0.025 NSPS Subpart IIII
FWP1 N/A N/A Total PM2.5 <0.10 0.10 <0.025 0.025 NSPS Subpart IIII
FWP1 N/A N/A SO2 <3.32E-03 3.32E-03 <8.30E-04 8.30E-04 NSPS Subpart IIII
FWP1 N/A N/A NOX < 2.01 2.01 <0.5 0.5 NSPS Subpart IIII
FWP1 N/A N/A VOC <2.01 2.01 <0.5 0.5 NSPS Subpart IIII
FWP1 N/A N/A CO <2.04 2.04 <0.51 <0.51 AP-42 Section 3.3
FWP1 N/A N/A CO2e <351.94 351.94 <87.99 87.99
40 CFR Part 98, Subpart C, Tables A-1, C-1 and C-2.AP-42 Section 3.3
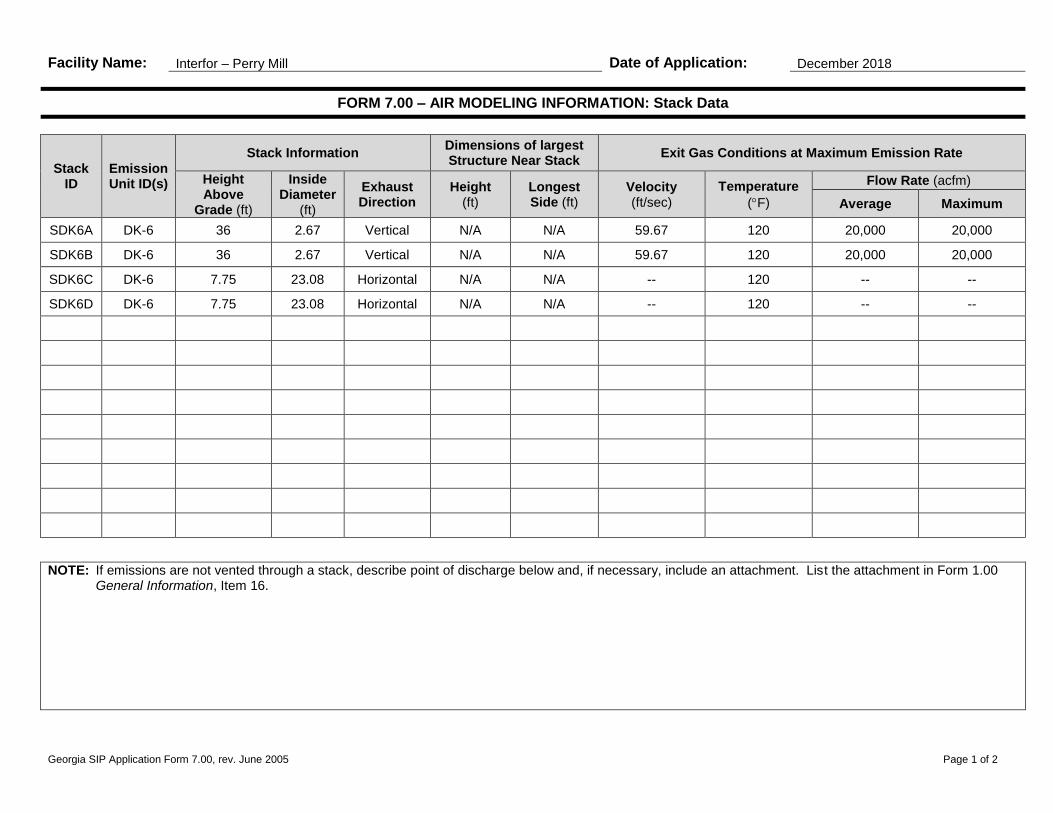
Georgia SIP Application Form 7.00, rev. June 2005 Page 1 of 2
Facility Name: Interfor – Perry Mill Date of Application: December 2018
FORM 7.00 – AIR MODELING INFORMATION: Stack Data
Stack ID
Emission Unit ID(s)
Stack Information Dimensions of largest Structure Near Stack
Exit Gas Conditions at Maximum Emission Rate
Height Above
Grade (ft)
Inside Diameter
(ft)
Exhaust Direction
Height (ft)
Longest Side (ft)
Velocity (ft/sec)
Temperature (F)
Flow Rate (acfm)
Average Maximum
SDK6A DK-6 36 2.67 Vertical N/A N/A 59.67 120 20,000 20,000
SDK6B DK-6 36 2.67 Vertical N/A N/A 59.67 120 20,000 20,000
SDK6C DK-6 7.75 23.08 Horizontal N/A N/A -- 120 -- --
SDK6D DK-6 7.75 23.08 Horizontal N/A N/A -- 120 -- --
NOTE: If emissions are not vented through a stack, describe point of discharge below and, if necessary, include an attachment. List the attachment in Form 1.00 General Information, Item 16.
Georgia SIP Application Form 7.00, rev. June 2005 Page 2 of 2
Facility Name: Interfor – Perry Mill Date of Application: December 2018
FORM 7.00 AIR MODELING INFORMATION: Chemicals Data
Chemical Potential
Emission Rate (lb/hr)
Toxicity Reference MSDS
Attached
See application with additional information about modeling
Interfor U.S. Inc. – Perry Mill | Continuous Kiln Construction Permit Application Trinity Consultants D
APPENDIX D: BACT SUPPORTING CALCULATIONS
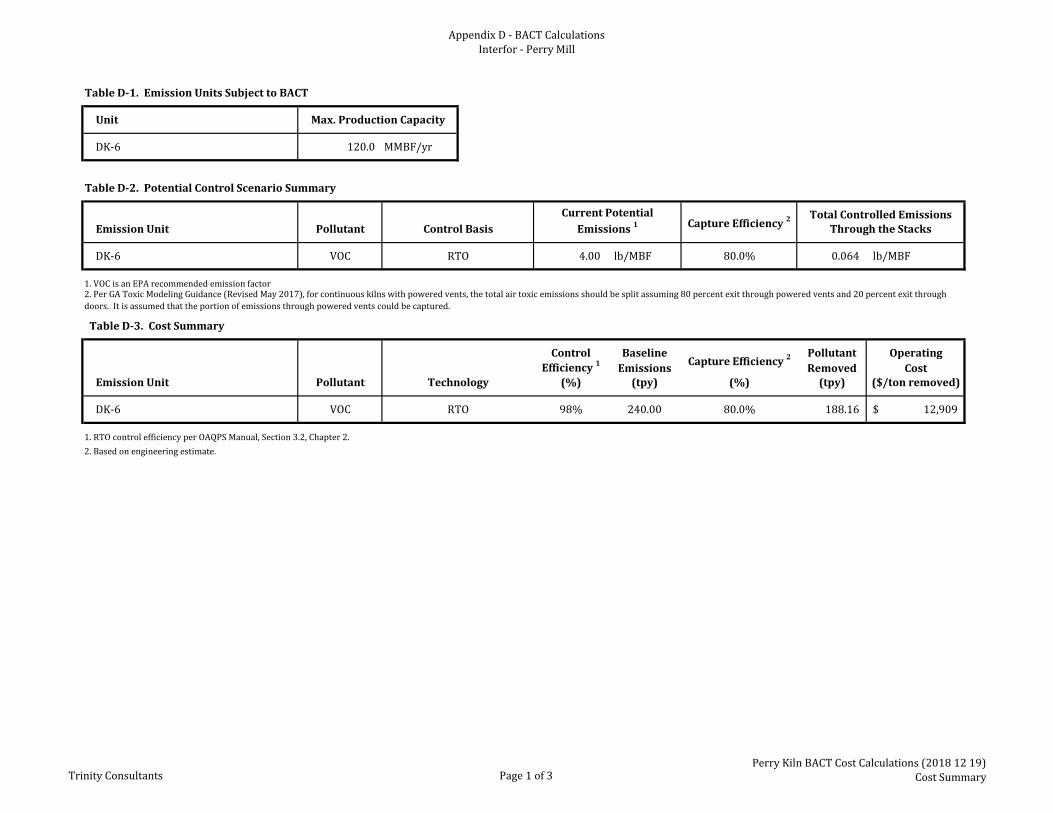
Appendix D - BACT CalculationsInterfor - Perry Mill
Table D-1. Emission Units Subject to BACT
Unit
DK-6 120.0 MMBF/yr
Table D-2. Potential Control Scenario Summary
Emission Unit Pollutant Capture Efficiency 2
DK-6 VOC 4.00 lb/MBF 80.0% 0.064 lb/MBF
1. VOC is an EPA recommended emission factor
Table D-3. Cost Summary
Control Baseline Pollutant Operating
Efficiency 1 Emissions Removed CostEmission Unit Pollutant (%) (tpy) (%) (tpy) ($/ton removed)
DK-6 VOC 98% 240.00 80.0% 188.16 12,909$
1. RTO control efficiency per OAQPS Manual, Section 3.2, Chapter 2.
2. Based on engineering estimate.
Capture Efficiency 2
Technology
RTO
Max. Production Capacity
Control Basis
RTO
2. Per GA Toxic Modeling Guidance (Revised May 2017), for continuous kilns with powered vents, the total air toxic emissions should be split assuming 80 percent exit through powered vents and 20 percent exit through
doors. It is assumed that the portion of emissions through powered vents could be captured.
Total Controlled Emissions
Through the Stacks
Current Potential
Emissions 1
Trinity Consultants Page 1 of 3Perry Kiln BACT Cost Calculations (2018 12 19)
Cost Summary
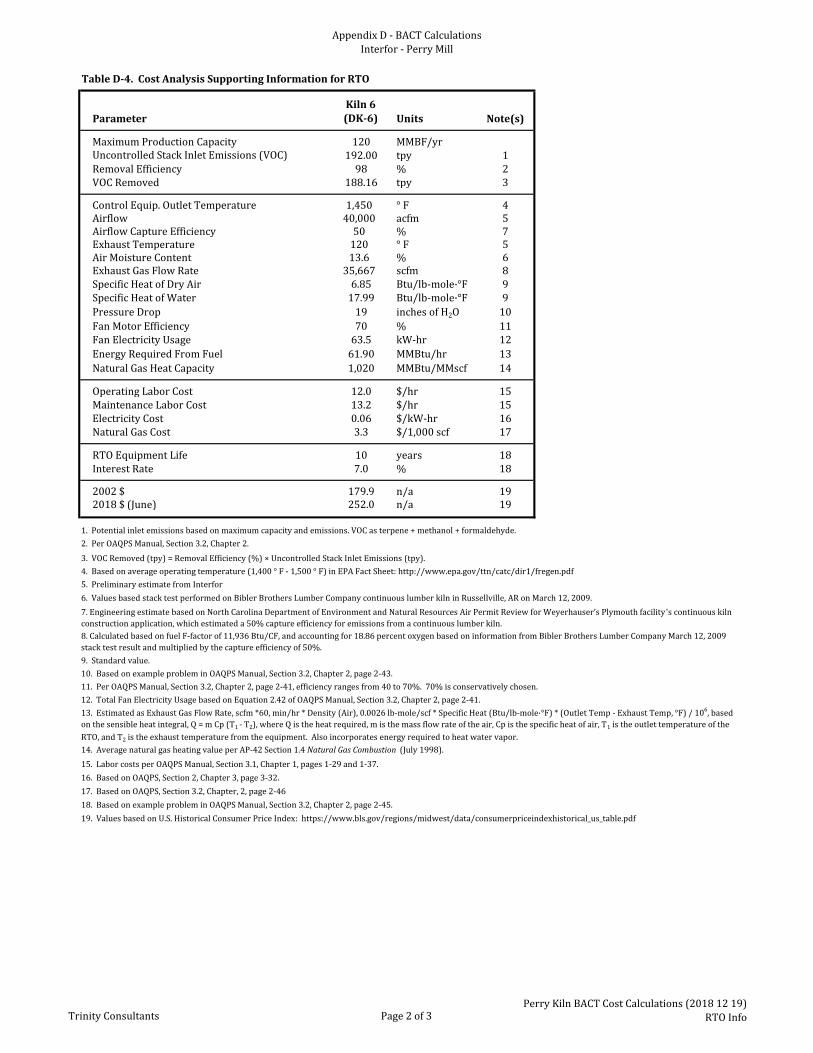
Appendix D - BACT Calculations
Interfor - Perry Mill
Table D-4. Cost Analysis Supporting Information for RTO
Parameter
Kiln 6
(DK-6) Units Note(s)
Maximum Production Capacity 120 MMBF/yrUncontrolled Stack Inlet Emissions (VOC) 192.00 tpy 1Removal Efficiency 98 % 2VOC Removed 188.16 tpy 3
Control Equip. Outlet Temperature 1,450 ° F 4Airflow 40,000 acfm 5Airflow Capture Efficiency 50 % 7Exhaust Temperature 120 ° F 5Air Moisture Content 13.6 % 6Exhaust Gas Flow Rate 35,667 scfm 8Specific Heat of Dry Air 6.85 Btu/lb-mole·°F 9Specific Heat of Water 17.99 Btu/lb-mole·°F 9
Pressure Drop 19 inches of H2O 10
Fan Motor Efficiency 70 % 11Fan Electricity Usage 63.5 kW-hr 12
Energy Required From Fuel 61.90 MMBtu/hr 13
Natural Gas Heat Capacity 1,020 MMBtu/MMscf 14
Operating Labor Cost 12.0 $/hr 15Maintenance Labor Cost 13.2 $/hr 15Electricity Cost 0.06 $/kW-hr 16Natural Gas Cost 3.3 $/1,000 scf 17
RTO Equipment Life 10 years 18Interest Rate 7.0 % 18
2002 $ 179.9 n/a 192018 $ (June) 252.0 n/a 19
1. Potential inlet emissions based on maximum capacity and emissions. VOC as terpene + methanol + formaldehyde.
2. Per OAQPS Manual, Section 3.2, Chapter 2.
3. VOC Removed (tpy) = Removal Efficiency (%) × Uncontrolled Stack Inlet Emissions (tpy).
4. Based on average operating temperature (1,400 ° F - 1,500 ° F) in EPA Fact Sheet: http://www.epa.gov/ttn/catc/dir1/fregen.pdf
5. Preliminary estimate from Interfor
6. Values based stack test performed on Bibler Brothers Lumber Company continuous lumber kiln in Russellville, AR on March 12, 2009.
9. Standard value.
10. Based on example problem in OAQPS Manual, Section 3.2, Chapter 2, page 2-43.
11. Per OAQPS Manual, Section 3.2, Chapter 2, page 2-41, efficiency ranges from 40 to 70%. 70% is conservatively chosen.
12. Total Fan Electricity Usage based on Equation 2.42 of OAQPS Manual, Section 3.2, Chapter 2, page 2-41.
14. Average natural gas heating value per AP-42 Section 1.4 Natural Gas Combustion (July 1998).
15. Labor costs per OAQPS Manual, Section 3.1, Chapter 1, pages 1-29 and 1-37.
16. Based on OAQPS, Section 2, Chapter 3, page 3-32.
17. Based on OAQPS, Section 3.2, Chapter, 2, page 2-46
18. Based on example problem in OAQPS Manual, Section 3.2, Chapter 2, page 2-45.
19. Values based on U.S. Historical Consumer Price Index: https://www.bls.gov/regions/midwest/data/consumerpriceindexhistorical_us_table.pdf
13. Estimated as Exhaust Gas Flow Rate, scfm *60, min/hr * Density (Air), 0.0026 lb-mole/scf * Specific Heat (Btu/lb-mole·°F) * (Outlet Temp - Exhaust Temp, °F) / 106, based
on the sensible heat integral, Q = m Cp (T1 - T2), where Q is the heat required, m is the mass flow rate of the air, Cp is the specific heat of air, T1 is the outlet temperature of the
RTO, and T2 is the exhaust temperature from the equipment. Also incorporates energy required to heat water vapor.
8. Calculated based on fuel F-factor of 11,936 Btu/CF, and accounting for 18.86 percent oxygen based on information from Bibler Brothers Lumber Company March 12, 2009
stack test result and multiplied by the capture efficiency of 50%.
7. Engineering estimate based on North Carolina Department of Environment and Natural Resources Air Permit Review for Weyerhauser’s Plymouth facility 's continuous kiln
construction application, which estimated a 50% capture efficiency for emissions from a continuous lumber kiln.
Trinity Consultants Page 2 of 3Perry Kiln BACT Cost Calculations (2018 12 19)
RTO Info
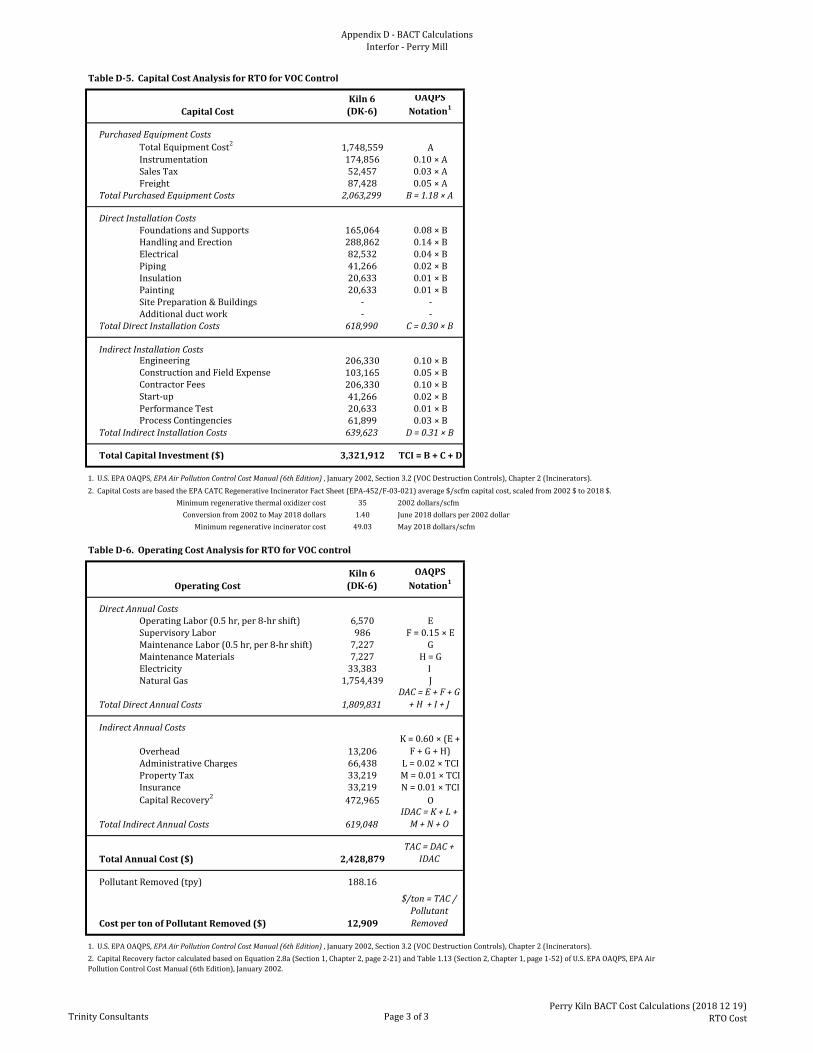
Appendix D - BACT Calculations
Interfor - Perry Mill
Table D-5. Capital Cost Analysis for RTO for VOC Control
Kiln 6
(DK-6)
OAQPS
Notation1
Purchased Equipment Costs
Total Equipment Cost21,748,559 A
Instrumentation 174,856 0.10 × ASales Tax 52,457 0.03 × AFreight 87,428 0.05 × A
Total Purchased Equipment Costs 2,063,299 B = 1.18 × A
Direct Installation CostsFoundations and Supports 165,064 0.08 × BHandling and Erection 288,862 0.14 × BElectrical 82,532 0.04 × BPiping 41,266 0.02 × BInsulation 20,633 0.01 × BPainting 20,633 0.01 × BSite Preparation & Buildings - -Additional duct work - -
Total Direct Installation Costs 618,990 C = 0.30 × B
Indirect Installation CostsEngineering 206,330 0.10 × BConstruction and Field Expense 103,165 0.05 × BContractor Fees 206,330 0.10 × BStart-up 41,266 0.02 × BPerformance Test 20,633 0.01 × BProcess Contingencies 61,899 0.03 × B
Total Indirect Installation Costs 639,623 D = 0.31 × B
Total Capital Investment ($) 3,321,912 TCI = B + C + D
1. U.S. EPA OAQPS, EPA Air Pollution Control Cost Manual (6th Edition) , January 2002, Section 3.2 (VOC Destruction Controls), Chapter 2 (Incinerators).
Minimum regenerative thermal oxidizer cost 35 2002 dollars/scfm
Conversion from 2002 to May 2018 dollars 1.40 June 2018 dollars per 2002 dollar
Minimum regenerative incinerator cost 49.03 May 2018 dollars/scfm
Table D-6. Operating Cost Analysis for RTO for VOC control
Kiln 6
(DK-6)
OAQPS
Notation1
Direct Annual CostsOperating Labor (0.5 hr, per 8-hr shift) 6,570 ESupervisory Labor 986 F = 0.15 × EMaintenance Labor (0.5 hr, per 8-hr shift) 7,227 GMaintenance Materials 7,227 H = GElectricity 33,383 I Natural Gas 1,754,439 J
Total Direct Annual Costs 1,809,831
DAC = E + F + G
+ H + I + J
Indirect Annual Costs
Overhead 13,206
K = 0.60 × (E +
F + G + H)
Administrative Charges 66,438 L = 0.02 × TCIProperty Tax 33,219 M = 0.01 × TCIInsurance 33,219 N = 0.01 × TCI
Capital Recovery2472,965 O
Total Indirect Annual Costs 619,048
IDAC = K + L +
M + N + O
Total Annual Cost ($) 2,428,879
TAC = DAC +
IDAC
Pollutant Removed (tpy) 188.16
Cost per ton of Pollutant Removed ($) 12,909
$/ton = TAC /
Pollutant
Removed
1. U.S. EPA OAQPS, EPA Air Pollution Control Cost Manual (6th Edition) , January 2002, Section 3.2 (VOC Destruction Controls), Chapter 2 (Incinerators).
Operating Cost
Capital Cost
2. Capital Recovery factor calculated based on Equation 2.8a (Section 1, Chapter 2, page 2-21) and Table 1.13 (Section 2, Chapter 1, page 1-52) of U.S. EPA OAQPS, EPA Air
Pollution Control Cost Manual (6th Edition), January 2002.
2. Capital Costs are based the EPA CATC Regenerative Incinerator Fact Sheet (EPA-452/F-03-021) average $/scfm capital cost, scaled from 2002 $ to 2018 $.
Trinity Consultants Page 3 of 3Perry Kiln BACT Cost Calculations (2018 12 19)
RTO Cost
Interfor U.S. Inc. – Perry Mill | Continuous Kiln Construction Permit Application Trinity Consultants E
APPENDIX E: RACT/BACT/LAER CLEARING HOUSE DATABASE REPORT
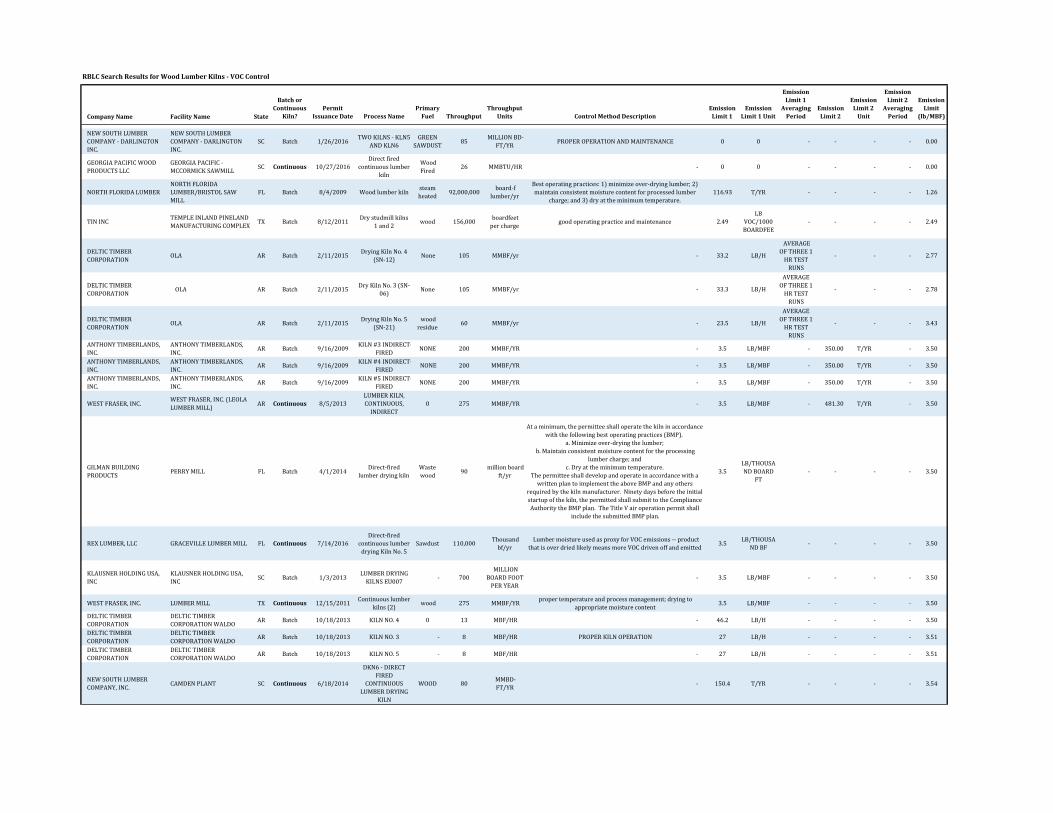
RBLCSearchResultsforWoodLumberKilns‐VOCControl
CompanyName FacilityName State
BatchorContinuous
Kiln?Permit
IssuanceDate ProcessNamePrimaryFuel Throughput
ThroughputUnits ControlMethodDescription
EmissionLimit1
EmissionLimit1Unit
EmissionLimit1
AveragingPeriod
EmissionLimit2
EmissionLimit2Unit
EmissionLimit2
AveragingPeriod
EmissionLimit
(lb/MBF)
NEWSOUTHLUMBERCOMPANY‐DARLINGTONINC.
NEWSOUTHLUMBERCOMPANY‐DARLINGTONINC.
SC Batch 1/26/2016TWOKILNS‐KLN5
ANDKLN6GREEN
SAWDUST85
MILLIONBD‐FT/YR
PROPEROPERATIONANDMAINTENANCE 0 0 ‐ ‐ ‐ ‐ 0.00
GEORGIAPACIFICWOODPRODUCTSLLC
GEORGIAPACIFIC‐MCCORMICKSAWMILL
SC Continuous 10/27/2016Directfired
continuouslumberkiln
WoodFired
26 MMBTU/HR ‐ 0 0 ‐ ‐ ‐ ‐ 0.00
NORTHFLORIDALUMBERNORTHFLORIDALUMBER/BRISTOLSAWMILL
FL Batch 8/4/2009 Woodlumberkilnsteamheated
92,000,000board‐flumber/yr
Bestoperatingpractices:1)minimizeover‐dryinglumber;2)maintainconsistentmoisturecontentforprocessedlumber
charge;and3)dryattheminimumtemperature.116.93 T/YR ‐ ‐ ‐ ‐ 1.26
TININCTEMPLEINLANDPINELANDMANUFACTURINGCOMPLEX
TX Batch 8/12/2011Drystudmillkilns
1and2wood 156,000
boardfeetpercharge
goodoperatingpracticeandmaintenance 2.49LB
VOC/1000BOARDFEE
‐ ‐ ‐ ‐ 2.49
DELTICTIMBERCORPORATION
OLA AR Batch 2/11/2015DryingKilnNo.4
(SN‐12)None 105 MMBF/yr ‐ 33.2 LB/H
AVERAGEOFTHREE1‐HRTESTRUNS
‐ ‐ ‐ 2.77
DELTICTIMBERCORPORATION
OLA AR Batch 2/11/2015DryKilnNo.3(SN‐
06)None 105 MMBF/yr ‐ 33.3 LB/H
AVERAGEOFTHREE1‐HRTESTRUNS
‐ ‐ ‐ 2.78
DELTICTIMBERCORPORATION
OLA AR Batch 2/11/2015DryingKilnNo.5
(SN‐21)woodresidue
60 MMBF/yr ‐ 23.5 LB/H
AVERAGEOFTHREE1‐HRTESTRUNS
‐ ‐ ‐ 3.43
ANTHONYTIMBERLANDS,INC.
ANTHONYTIMBERLANDS,INC.
AR Batch 9/16/2009KILN#3INDIRECT‐
FIREDNONE 200 MMBF/YR ‐ 3.5 LB/MBF ‐ 350.00 T/YR ‐ 3.50
ANTHONYTIMBERLANDS,INC.
ANTHONYTIMBERLANDS,INC.
AR Batch 9/16/2009KILN#4INDIRECT‐
FIREDNONE 200 MMBF/YR ‐ 3.5 LB/MBF ‐ 350.00 T/YR ‐ 3.50
ANTHONYTIMBERLANDS,INC.
ANTHONYTIMBERLANDS,INC.
AR Batch 9/16/2009KILN#5INDIRECT‐
FIREDNONE 200 MMBF/YR ‐ 3.5 LB/MBF ‐ 350.00 T/YR ‐ 3.50
WESTFRASER,INC.WESTFRASER,INC.(LEOLALUMBERMILL)
AR Continuous 8/5/2013LUMBERKILN,CONTINUOUS,INDIRECT
0 275 MMBF/YR ‐ 3.5 LB/MBF ‐ 481.30 T/YR ‐ 3.50
GILMANBUILDINGPRODUCTS
PERRYMILL FL Batch 4/1/2014Direct‐fired
lumberdryingkilnWastewood
90millionboard
ft/yr
Ataminimum,thepermitteeshalloperatethekilninaccordancewiththefollowingbestoperatingpractices(BMP).
a.Minimizeover‐dryingthelumber;b.Maintainconsistentmoisturecontentfortheprocessing
lumbercharge;andc.Dryattheminimumtemperature.
ThepermitteeshalldevelopandoperateinaccordancewithawrittenplantoimplementtheaboveBMPandanyothers
requiredbythekilnmanufacturer.Ninetydaysbeforetheinitialstartupofthekiln,thepermittedshallsubmittotheComplianceAuthoritytheBMPplan.TheTitleVairoperationpermitshall
includethesubmittedBMPplan.
3.5LB/THOUSANDBOARD
FT‐ ‐ ‐ ‐ 3.50
REXLUMBER,LLC GRACEVILLELUMBERMILL FL Continuous 7/14/2016Direct‐fired
continuouslumberdryingKilnNo.5
Sawdust 110,000Thousandbf/yr
LumbermoistureusedasproxyforVOCemissions‐‐productthatisoverdriedlikelymeansmoreVOCdrivenoffandemitted
3.5LB/THOUSA
NDBF‐ ‐ ‐ ‐ 3.50
KLAUSNERHOLDINGUSA,INC
KLAUSNERHOLDINGUSA,INC
SC Batch 1/3/2013LUMBERDRYINGKILNSEU007
‐ 700MILLION
BOARDFOOTPERYEAR
‐ 3.5 LB/MBF ‐ ‐ ‐ ‐ 3.50
WESTFRASER,INC. LUMBERMILL TX Continuous 12/15/2011Continuouslumber
kilns(2)wood 275 MMBF/YR
propertemperatureandprocessmanagement;dryingtoappropriatemoisturecontent
3.5 LB/MBF ‐ ‐ ‐ ‐ 3.50
DELTICTIMBERCORPORATION
DELTICTIMBERCORPORATIONWALDO
AR Batch 10/18/2013 KILNNO.4 0 13 MBF/HR ‐ 46.2 LB/H ‐ ‐ ‐ ‐ 3.50
DELTICTIMBERCORPORATION
DELTICTIMBERCORPORATIONWALDO
AR Batch 10/18/2013 KILNNO.3 ‐ 8 MBF/HR PROPERKILNOPERATION 27 LB/H ‐ ‐ ‐ ‐ 3.51
DELTICTIMBERCORPORATION
DELTICTIMBERCORPORATIONWALDO
AR Batch 10/18/2013 KILNNO.5 ‐ 8 MBF/HR ‐ 27 LB/H ‐ ‐ ‐ ‐ 3.51
NEWSOUTHLUMBERCOMPANY,INC.
CAMDENPLANT SC Continuous 6/18/2014
DKN6‐DIRECTFIRED
CONTINUOUSLUMBERDRYING
KILN
WOOD 80MMBD‐FT/YR
‐ 150.4 T/YR ‐ ‐ ‐ ‐ 3.54
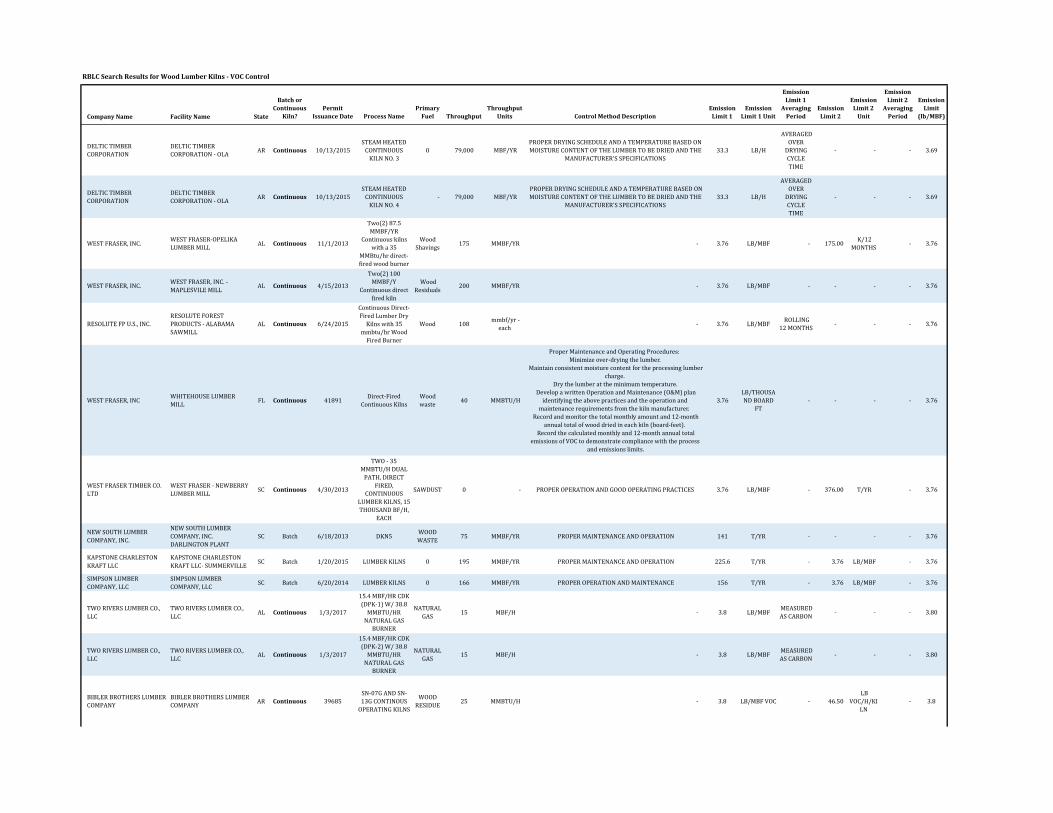
RBLCSearchResultsforWoodLumberKilns‐VOCControl
CompanyName FacilityName State
BatchorContinuous
Kiln?Permit
IssuanceDate ProcessNamePrimaryFuel Throughput
ThroughputUnits ControlMethodDescription
EmissionLimit1
EmissionLimit1Unit
EmissionLimit1
AveragingPeriod
EmissionLimit2
EmissionLimit2Unit
EmissionLimit2
AveragingPeriod
EmissionLimit
(lb/MBF)
DELTICTIMBERCORPORATION
DELTICTIMBERCORPORATION‐OLA
AR Continuous 10/13/2015STEAMHEATEDCONTINUOUSKILNNO.3
0 79,000 MBF/YRPROPERDRYINGSCHEDULEANDATEMPERATUREBASEDONMOISTURECONTENTOFTHELUMBERTOBEDRIEDANDTHE
MANUFACTURER'SSPECIFICATIONS33.3 LB/H
AVERAGEDOVERDRYINGCYCLETIME
‐ ‐ ‐ 3.69
DELTICTIMBERCORPORATION
DELTICTIMBERCORPORATION‐OLA
AR Continuous 10/13/2015STEAMHEATEDCONTINUOUSKILNNO.4
‐ 79,000 MBF/YRPROPERDRYINGSCHEDULEANDATEMPERATUREBASEDONMOISTURECONTENTOFTHELUMBERTOBEDRIEDANDTHE
MANUFACTURER'SSPECIFICATIONS33.3 LB/H
AVERAGEDOVERDRYINGCYCLETIME
‐ ‐ ‐ 3.69
WESTFRASER,INC.WESTFRASER‐OPELIKALUMBERMILL
AL Continuous 11/1/2013
Two(2)87.5MMBF/YR
Continuouskilnswitha35
MMBtu/hrdirect‐firedwoodburner
WoodShavings
175 MMBF/YR ‐ 3.76 LB/MBF ‐ 175.00K/12
MONTHS‐ 3.76
WESTFRASER,INC.WESTFRASER,INC.‐MAPLESVILEMILL
AL Continuous 4/15/2013
Two(2)100MMBF/Y
Continuousdirectfiredkiln
WoodResiduals
200 MMBF/YR ‐ 3.76 LB/MBF ‐ ‐ ‐ ‐ 3.76
RESOLUTEFPU.S.,INC.RESOLUTEFORESTPRODUCTS‐ALABAMASAWMILL
AL Continuous 6/24/2015
ContinuousDirect‐FiredLumberDryKilnswith35
mmbtu/hrWoodFiredBurner
Wood 108mmbf/yr‐
each‐ 3.76 LB/MBF
ROLLING12MONTHS
‐ ‐ ‐ 3.76
WESTFRASER,INCWHITEHOUSELUMBERMILL
FL Continuous 41891Direct‐Fired
ContinuousKilnsWoodwaste
40 MMBTU/H
ProperMaintenanceandOperatingProcedures:Minimizeover‐dryingthelumber.
Maintainconsistentmoisturecontentfortheprocessinglumbercharge.
Drythelumberattheminimumtemperature.DevelopawrittenOperationandMaintenance(O&M)planidentifyingtheabovepracticesandtheoperationandmaintenancerequirementsfromthekilnmanufacturer.
Recordandmonitorthetotalmonthlyamountand12‐monthannualtotalofwooddriedineachkiln(board‐feet).
Recordthecalculatedmonthlyand12‐monthannualtotalemissionsofVOCtodemonstratecompliancewiththeprocess
andemissionslimits.
3.76LB/THOUSANDBOARD
FT‐ ‐ ‐ ‐ 3.76
WESTFRASERTIMBERCO.LTD
WESTFRASER‐NEWBERRYLUMBERMILL
SC Continuous 4/30/2013
TWO‐35MMBTU/HDUALPATH,DIRECT
FIRED,CONTINUOUS
LUMBERKILNS,15THOUSANDBF/H,
EACH
SAWDUST 0 ‐ PROPEROPERATIONANDGOODOPERATINGPRACTICES 3.76 LB/MBF ‐ 376.00 T/YR ‐ 3.76
NEWSOUTHLUMBERCOMPANY,INC.
NEWSOUTHLUMBERCOMPANY,INC.DARLINGTONPLANT
SC Batch 6/18/2013 DKN5WOODWASTE
75 MMBF/YR PROPERMAINTENANCEANDOPERATION 141 T/YR ‐ ‐ ‐ ‐ 3.76
KAPSTONECHARLESTONKRAFTLLC
KAPSTONECHARLESTONKRAFTLLC‐SUMMERVILLE
SC Batch 1/20/2015 LUMBERKILNS 0 195 MMBF/YR PROPERMAINTENANCEANDOPERATION 225.6 T/YR ‐ 3.76 LB/MBF ‐ 3.76
SIMPSONLUMBERCOMPANY,LLC
SIMPSONLUMBERCOMPANY,LLC
SC Batch 6/20/2014 LUMBERKILNS 0 166 MMBF/YR PROPEROPERATIONANDMAINTENANCE 156 T/YR ‐ 3.76 LB/MBF ‐ 3.76
TWORIVERSLUMBERCO.,LLC
TWORIVERSLUMBERCO.,LLC
AL Continuous 1/3/2017
15.4MBF/HRCDK(DPK‐1)W/38.8MMBTU/HRNATURALGAS
BURNER
NATURALGAS
15 MBF/H ‐ 3.8 LB/MBFMEASUREDASCARBON
‐ ‐ ‐ 3.80
TWORIVERSLUMBERCO.,LLC
TWORIVERSLUMBERCO.,LLC
AL Continuous 1/3/2017
15.4MBF/HRCDK(DPK‐2)W/38.8MMBTU/HRNATURALGAS
BURNER
NATURALGAS
15 MBF/H ‐ 3.8 LB/MBFMEASUREDASCARBON
‐ ‐ ‐ 3.80
BIBLERBROTHERSLUMBERCOMPANY
BIBLERBROTHERSLUMBERCOMPANY
AR Continuous 39685SN‐07GANDSN‐13GCONTINOUSOPERATINGKILNS
WOODRESIDUE
25 MMBTU/H ‐ 3.8 LB/MBFVOC ‐ 46.50LB
VOC/H/KILN
‐ 3.8
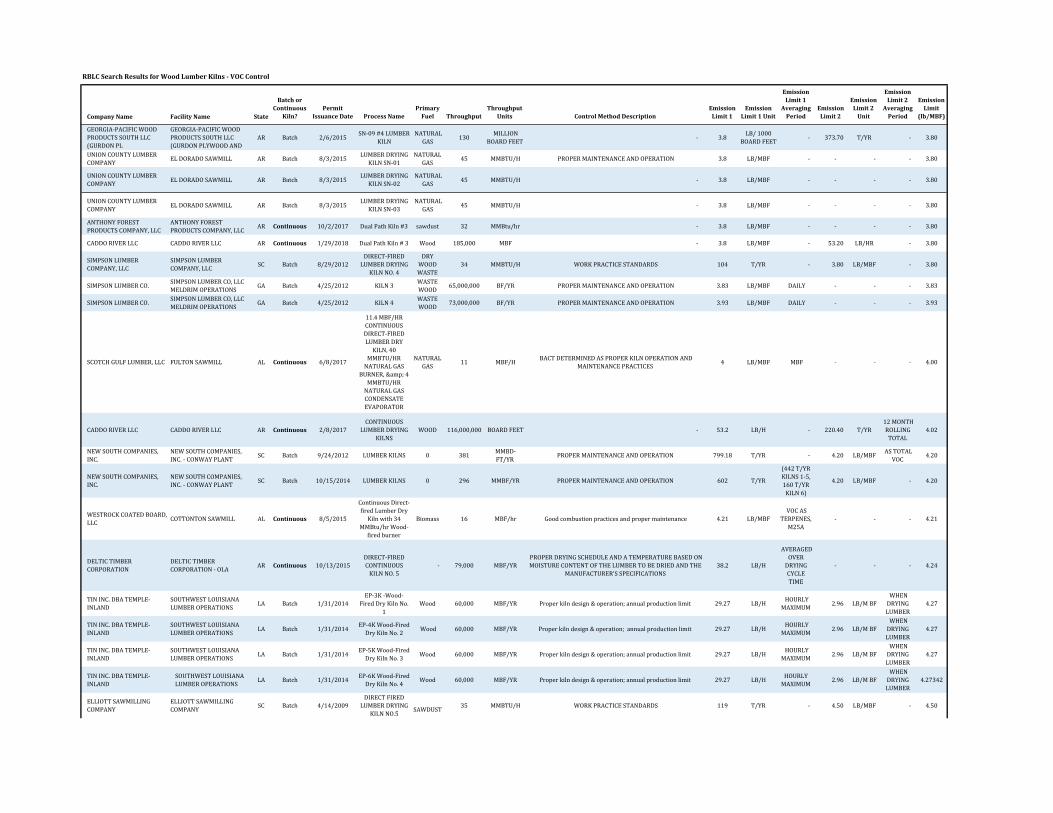
RBLCSearchResultsforWoodLumberKilns‐VOCControl
CompanyName FacilityName State
BatchorContinuous
Kiln?Permit
IssuanceDate ProcessNamePrimaryFuel Throughput
ThroughputUnits ControlMethodDescription
EmissionLimit1
EmissionLimit1Unit
EmissionLimit1
AveragingPeriod
EmissionLimit2
EmissionLimit2Unit
EmissionLimit2
AveragingPeriod
EmissionLimit
(lb/MBF)
GEORGIA‐PACIFICWOODPRODUCTSSOUTHLLC(GURDONPL
GEORGIA‐PACIFICWOODPRODUCTSSOUTHLLC(GURDONPLYWOODAND
AR Batch 2/6/2015SN‐09#4LUMBER
KILNNATURALGAS
130MILLION
BOARDFEET‐ 3.8
LB/1000BOARDFEET
‐ 373.70 T/YR ‐ 3.80
UNIONCOUNTYLUMBERCOMPANY
ELDORADOSAWMILL AR Batch 8/3/2015LUMBERDRYING
KILNSN‐01NATURAL
GAS45 MMBTU/H PROPERMAINTENANCEANDOPERATION 3.8 LB/MBF ‐ ‐ ‐ ‐ 3.80
UNIONCOUNTYLUMBERCOMPANY
ELDORADOSAWMILL AR Batch 8/3/2015LUMBERDRYING
KILNSN‐02NATURALGAS
45 MMBTU/H ‐ 3.8 LB/MBF ‐ ‐ ‐ ‐ 3.80
UNIONCOUNTYLUMBERCOMPANY
ELDORADOSAWMILL AR Batch 8/3/2015LUMBERDRYING
KILNSN‐03NATURALGAS
45 MMBTU/H ‐ 3.8 LB/MBF ‐ ‐ ‐ ‐ 3.80
ANTHONYFORESTPRODUCTSCOMPANY,LLC
ANTHONYFORESTPRODUCTSCOMPANY,LLC
AR Continuous 10/2/2017 DualPathKiln#3 sawdust 32 MMBtu/hr ‐ 3.8 LB/MBF ‐ ‐ ‐ ‐ 3.80
CADDORIVERLLC CADDORIVERLLC AR Continuous 1/29/2018 DualPathKiln#3 Wood 185,000 MBF ‐ 3.8 LB/MBF ‐ 53.20 LB/HR ‐ 3.80
SIMPSONLUMBERCOMPANY,LLC
SIMPSONLUMBERCOMPANY,LLC
SC Batch 8/29/2012DIRECT‐FIREDLUMBERDRYING
KILNNO.4
DRYWOODWASTE
34 MMBTU/H WORKPRACTICESTANDARDS 104 T/YR ‐ 3.80 LB/MBF ‐ 3.80
SIMPSONLUMBERCO.SIMPSONLUMBERCO,LLCMELDRIMOPERATIONS
GA Batch 4/25/2012 KILN3WASTEWOOD
65,000,000 BF/YR PROPERMAINTENANCEANDOPERATION 3.83 LB/MBF DAILY ‐ ‐ ‐ 3.83
SIMPSONLUMBERCO.SIMPSONLUMBERCO,LLCMELDRIMOPERATIONS
GA Batch 4/25/2012 KILN4WASTEWOOD
73,000,000 BF/YR PROPERMAINTENANCEANDOPERATION 3.93 LB/MBF DAILY ‐ ‐ ‐ 3.93
SCOTCHGULFLUMBER,LLC FULTONSAWMILL AL Continuous 6/8/2017
11.4MBF/HRCONTINUOUSDIRECT‐FIREDLUMBERDRYKILN,40
MMBTU/HRNATURALGAS
BURNER,&4MMBTU/HRNATURALGASCONDENSATEEVAPORATOR
NATURALGAS
11 MBF/HBACTDETERMINEDASPROPERKILNOPERATIONAND
MAINTENANCEPRACTICES4 LB/MBF MBF ‐ ‐ ‐ 4.00
CADDORIVERLLC CADDORIVERLLC AR Continuous 2/8/2017CONTINUOUS
LUMBERDRYINGKILNS
WOOD 116,000,000 BOARDFEET ‐ 53.2 LB/H ‐ 220.40 T/YR12MONTHROLLINGTOTAL
4.02
NEWSOUTHCOMPANIES,INC.
NEWSOUTHCOMPANIES,INC.‐CONWAYPLANT
SC Batch 9/24/2012 LUMBERKILNS 0 381MMBD‐FT/YR
PROPERMAINTENANCEANDOPERATION 799.18 T/YR ‐ 4.20 LB/MBFASTOTAL
VOC4.20
NEWSOUTHCOMPANIES,INC.
NEWSOUTHCOMPANIES,INC.‐CONWAYPLANT
SC Batch 10/15/2014 LUMBERKILNS 0 296 MMBF/YR PROPERMAINTENANCEANDOPERATION 602 T/YR
(442T/YRKILNS1‐5,160T/YRKILN6)
4.20 LB/MBF ‐ 4.20
WESTROCKCOATEDBOARD,LLC
COTTONTONSAWMILL AL Continuous 8/5/2015
ContinuousDirect‐firedLumberDryKilnwith34
MMBtu/hrWood‐firedburner
Biomass 16 MBF/hr Goodcombustionpracticesandpropermaintenance 4.21 LB/MBFVOCAS
TERPENES,M25A
‐ ‐ ‐ 4.21
DELTICTIMBERCORPORATION
DELTICTIMBERCORPORATION‐OLA
AR Continuous 10/13/2015DIRECT‐FIREDCONTINUOUSKILNNO.5
‐ 79,000 MBF/YRPROPERDRYINGSCHEDULEANDATEMPERATUREBASEDONMOISTURECONTENTOFTHELUMBERTOBEDRIEDANDTHE
MANUFACTURER'SSPECIFICATIONS38.2 LB/H
AVERAGEDOVERDRYINGCYCLETIME
‐ ‐ ‐ 4.24
TININC.DBATEMPLE‐INLAND
SOUTHWESTLOUISIANALUMBEROPERATIONS
LA Batch 1/31/2014EP‐3K‐Wood‐
FiredDryKilnNo.1
Wood 60,000 MBF/YR Properkilndesign&operation;annualproductionlimit 29.27 LB/HHOURLYMAXIMUM
2.96 LB/MBFWHENDRYINGLUMBER
4.27
TININC.DBATEMPLE‐INLAND
SOUTHWESTLOUISIANALUMBEROPERATIONS
LA Batch 1/31/2014EP‐4KWood‐FiredDryKilnNo.2
Wood 60,000 MBF/YR Properkilndesign&operation;annualproductionlimit 29.27 LB/HHOURLYMAXIMUM
2.96 LB/MBFWHENDRYINGLUMBER
4.27
TININC.DBATEMPLE‐INLAND
SOUTHWESTLOUISIANALUMBEROPERATIONS
LA Batch 1/31/2014EP‐5KWood‐FiredDryKilnNo.3
Wood 60,000 MBF/YR Properkilndesign&operation;annualproductionlimit 29.27 LB/HHOURLYMAXIMUM
2.96 LB/MBFWHENDRYINGLUMBER
4.27
TININC.DBATEMPLE‐INLAND
SOUTHWESTLOUISIANALUMBEROPERATIONS
LA Batch 1/31/2014EP‐6KWood‐FiredDryKilnNo.4
Wood 60,000 MBF/YR Properkilndesign&operation;annualproductionlimit 29.27 LB/HHOURLYMAXIMUM
2.96 LB/MBFWHENDRYINGLUMBER
4.27342
ELLIOTTSAWMILLINGCOMPANY
ELLIOTTSAWMILLINGCOMPANY
SC Batch 4/14/2009DIRECTFIREDLUMBERDRYING
KILNNO.5
SAWDUST
35 MMBTU/H WORKPRACTICESTANDARDS 119 T/YR ‐ 4.50 LB/MBF ‐ 4.50
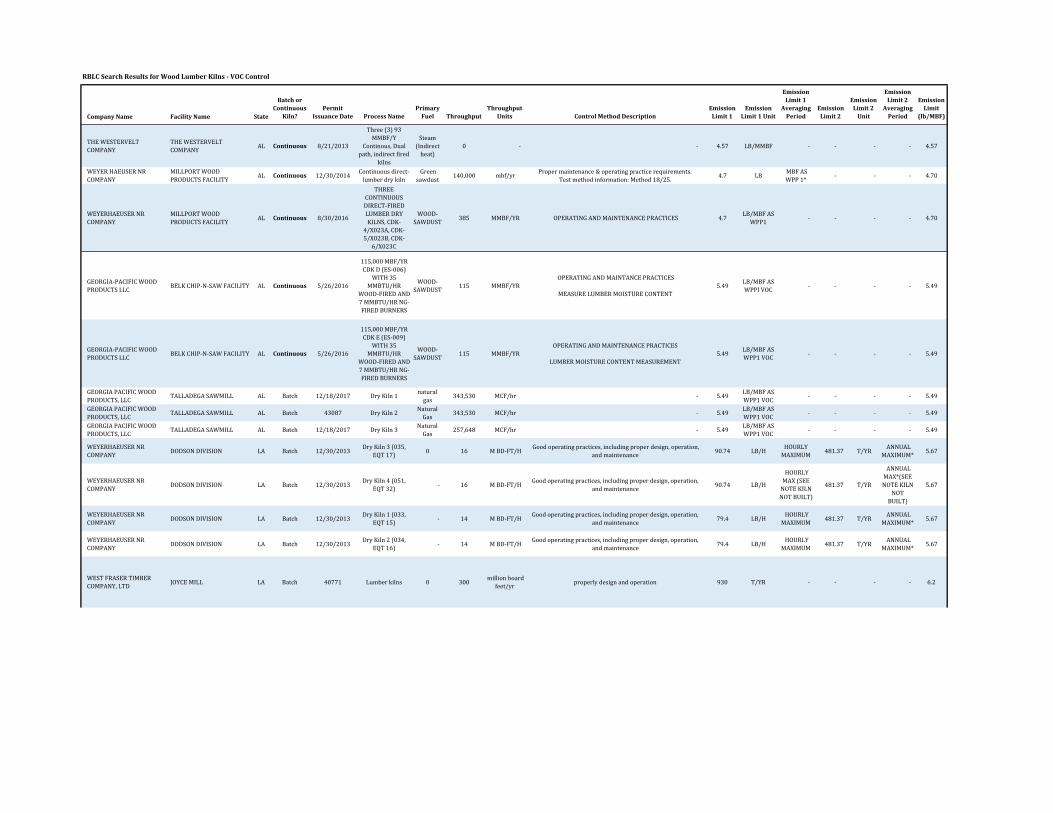
RBLCSearchResultsforWoodLumberKilns‐VOCControl
CompanyName FacilityName State
BatchorContinuous
Kiln?Permit
IssuanceDate ProcessNamePrimaryFuel Throughput
ThroughputUnits ControlMethodDescription
EmissionLimit1
EmissionLimit1Unit
EmissionLimit1
AveragingPeriod
EmissionLimit2
EmissionLimit2Unit
EmissionLimit2
AveragingPeriod
EmissionLimit
(lb/MBF)
THEWESTERVELTCOMPANY
THEWESTERVELTCOMPANY
AL Continuous 8/21/2013
Three(3)93MMBF/Y
Continous,Dualpath,indirectfired
kilns
Steam(Indirectheat)
0 ‐ ‐ 4.57 LB/MMBF ‐ ‐ ‐ ‐ 4.57
WEYERHAEUSERNRCOMPANY
MILLPORTWOODPRODUCTSFACILITY
AL Continuous 12/30/2014Continuousdirect‐lumberdrykiln
Greensawdust
140,000 mbf/yrPropermaintenance&operatingpracticerequirements.
Testmethodinformation:Method18/25.4.7 LB
MBFASWPP1*
‐ ‐ ‐ 4.70
WEYERHAEUSERNRCOMPANY
MILLPORTWOODPRODUCTSFACILITY
AL Continuous 8/30/2016
THREECONTINUOUSDIRECT‐FIREDLUMBERDRYKILNS,CDK‐
4/X023A,CDK‐5/X023B,CDK‐
6/X023C
WOOD‐SAWDUST
385 MMBF/YR OPERATINGANDMAINTENANCEPRACTICES 4.7LB/MBFASWPP1
‐ ‐ ‐ ‐ 4.70
GEORGIA‐PACIFICWOODPRODUCTSLLC
BELKCHIP‐N‐SAWFACILITY AL Continuous 5/26/2016
115,000MBF/YRCDKD(ES‐006)
WITH35MMBTU/HR
WOOD‐FIREDAND7MMBTU/HRNG‐FIREDBURNERS
WOOD‐SAWDUST
115 MMBF/YROPERATINGANDMAINTANCEPRACTICES
MEASURELUMBERMOISTURECONTENT5.49
LB/MBFASWPPIVOC
‐ ‐ ‐ ‐ 5.49
GEORGIA‐PACIFICWOODPRODUCTSLLC
BELKCHIP‐N‐SAWFACILITY AL Continuous 5/26/2016
115,000MBF/YRCDKE(ES‐009)
WITH35MMBTU/HR
WOOD‐FIREDAND7MMBTU/HRNG‐FIREDBURNERS
WOOD‐SAWDUST
115 MMBF/YROPERATINGANDMAINTENANCEPRACTICES
LUMBERMOISTURECONTENTMEASUREMENT5.49
LB/MBFASWPP1VOC
‐ ‐ ‐ ‐ 5.49
GEORGIAPACIFICWOODPRODUCTS,LLC
TALLADEGASAWMILL AL Batch 12/18/2017 DryKiln1naturalgas
343,530 MCF/hr ‐ 5.49LB/MBFASWPP1VOC
‐ ‐ ‐ ‐ 5.49
GEORGIAPACIFICWOODPRODUCTS,LLC
TALLADEGASAWMILL AL Batch 43087 DryKiln2NaturalGas
343,530 MCF/hr ‐ 5.49LB/MBFASWPP1VOC
‐ ‐ ‐ ‐ 5.49
GEORGIAPACIFICWOODPRODUCTS,LLC
TALLADEGASAWMILL AL Batch 12/18/2017 DryKiln3NaturalGas
257,648 MCF/hr ‐ 5.49LB/MBFASWPP1VOC
‐ ‐ ‐ ‐ 5.49
WEYERHAEUSERNRCOMPANY
DODSONDIVISION LA Batch 12/30/2013DryKiln3(035,
EQT17)0 16 MBD‐FT/H
Goodoperatingpractices,includingproperdesign,operation,andmaintenance
90.74 LB/HHOURLYMAXIMUM
481.37 T/YRANNUALMAXIMUM*
5.67
WEYERHAEUSERNRCOMPANY
DODSONDIVISION LA Batch 12/30/2013DryKiln4(051,
EQT32)‐ 16 MBD‐FT/H
Goodoperatingpractices,includingproperdesign,operation,andmaintenance
90.74 LB/H
HOURLYMAX(SEENOTEKILNNOTBUILT)
481.37 T/YR
ANNUALMAX*(SEENOTEKILN
NOTBUILT)
5.67
WEYERHAEUSERNRCOMPANY
DODSONDIVISION LA Batch 12/30/2013DryKiln1(033,
EQT15)‐ 14 MBD‐FT/H
Goodoperatingpractices,includingproperdesign,operation,andmaintenance
79.4 LB/HHOURLYMAXIMUM
481.37 T/YRANNUALMAXIMUM*
5.67
WEYERHAEUSERNRCOMPANY
DODSONDIVISION LA Batch 12/30/2013DryKiln2(034,
EQT16)‐ 14 MBD‐FT/H
Goodoperatingpractices,includingproperdesign,operation,andmaintenance
79.4 LB/HHOURLYMAXIMUM
481.37 T/YRANNUALMAXIMUM*
5.67
WESTFRASERTIMBERCOMPANY,LTD
JOYCEMILL LA Batch 40771 Lumberkilns 0 300millionboard
feet/yrproperlydesignandoperation 930 T/YR ‐ ‐ ‐ ‐ 6.2
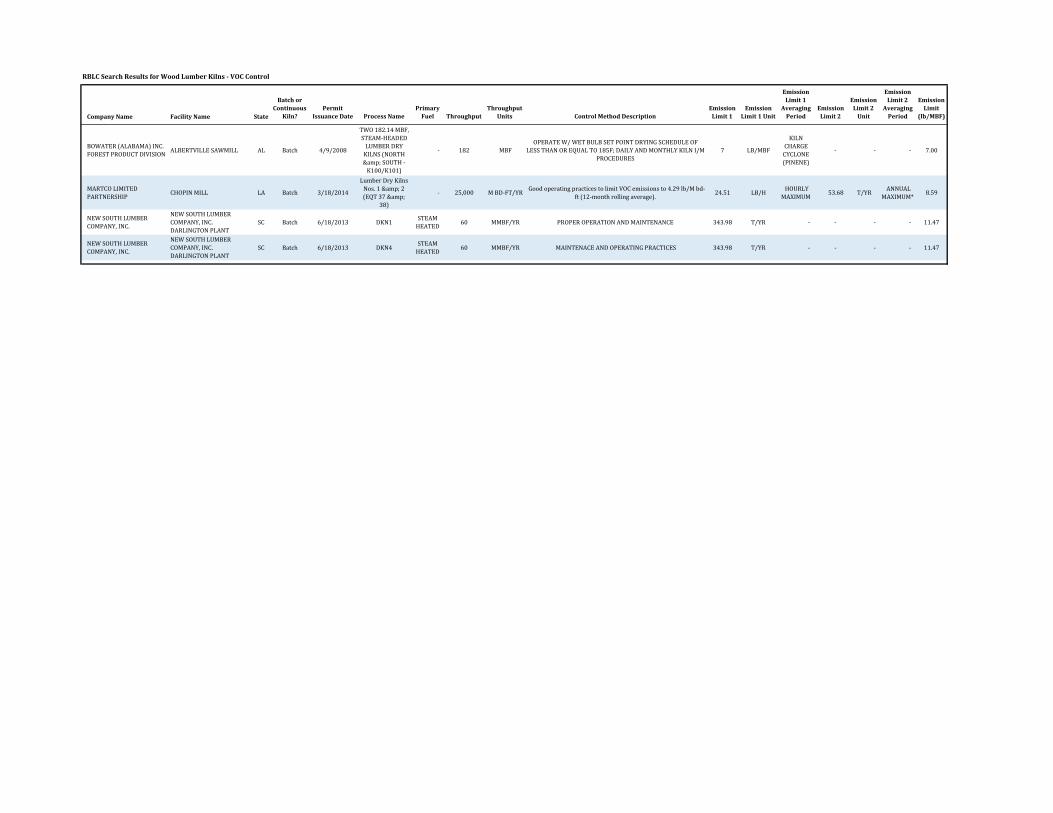
RBLCSearchResultsforWoodLumberKilns‐VOCControl
CompanyName FacilityName State
BatchorContinuous
Kiln?Permit
IssuanceDate ProcessNamePrimaryFuel Throughput
ThroughputUnits ControlMethodDescription
EmissionLimit1
EmissionLimit1Unit
EmissionLimit1
AveragingPeriod
EmissionLimit2
EmissionLimit2Unit
EmissionLimit2
AveragingPeriod
EmissionLimit
(lb/MBF)
BOWATER(ALABAMA)INC.FORESTPRODUCTDIVISION
ALBERTVILLESAWMILL AL Batch 4/9/2008
TWO182.14MBF,STEAM‐HEADEDLUMBERDRYKILNS(NORTH&SOUTH‐K100/K101)
‐ 182 MBFOPERATEW/WETBULBSETPOINTDRYINGSCHEDULEOF
LESSTHANOREQUALTO185F;DAILYANDMONTHLYKILNI/MPROCEDURES
7 LB/MBF
KILNCHARGECYCLONE(PINENE)
‐ ‐ ‐ 7.00
MARTCOLIMITEDPARTNERSHIP
CHOPINMILL LA Batch 3/18/2014
LumberDryKilnsNos.1&2(EQT37&
38)
‐ 25,000 MBD‐FT/YRGoodoperatingpracticestolimitVOCemissionsto4.29lb/Mbd‐
ft(12‐monthrollingaverage).24.51 LB/H
HOURLYMAXIMUM
53.68 T/YRANNUALMAXIMUM*
8.59
NEWSOUTHLUMBERCOMPANY,INC.
NEWSOUTHLUMBERCOMPANY,INC.DARLINGTONPLANT
SC Batch 6/18/2013 DKN1STEAMHEATED
60 MMBF/YR PROPEROPERATIONANDMAINTENANCE 343.98 T/YR ‐ ‐ ‐ ‐ 11.47
NEWSOUTHLUMBERCOMPANY,INC.
NEWSOUTHLUMBERCOMPANY,INC.DARLINGTONPLANT
SC Batch 6/18/2013 DKN4STEAMHEATED
60 MMBF/YR MAINTENACEANDOPERATINGPRACTICES 343.98 T/YR ‐ ‐ ‐ ‐ 11.47
Interfor U.S. Inc. – Perry Mill | Continuous Kiln Construction Permit Application Trinity Consultants F
APPENDIX F: TOXIC MODELING DOCUMENTATION
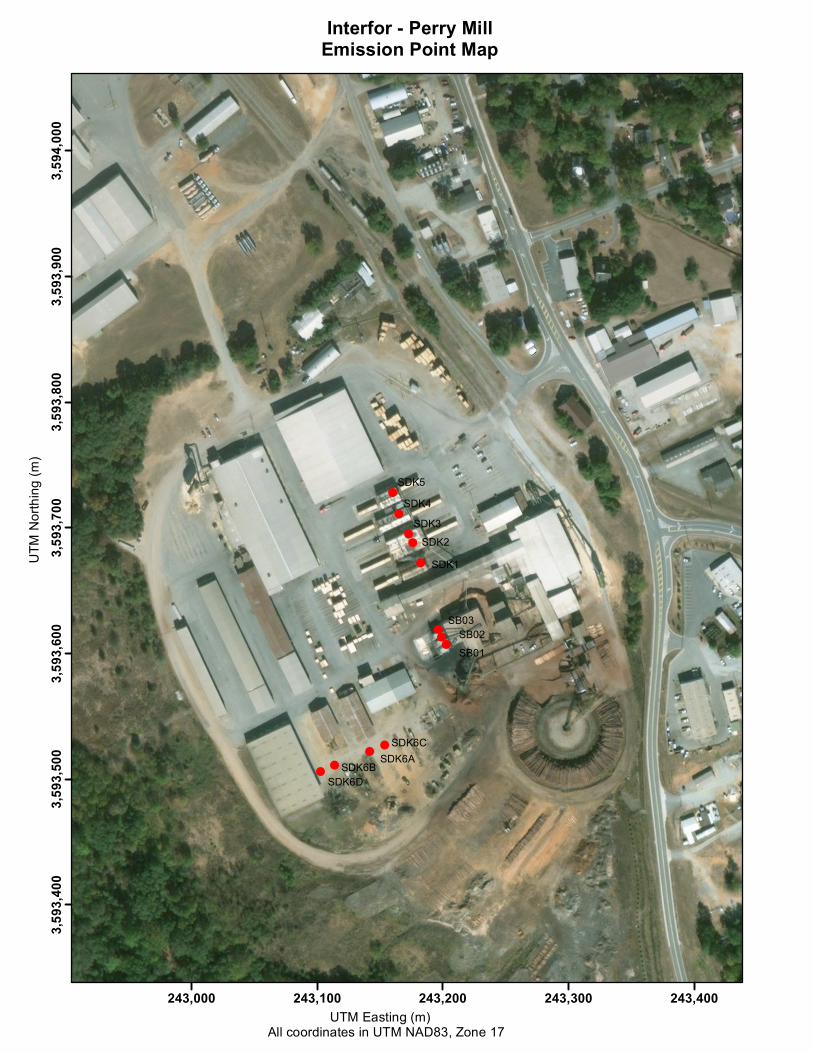
SB03SB02SB01
SDK5SDK4
SDK3SDK2
SDK1
SDK6D
SDK6CSDK6B SDK6A
243,000 243,100 243,200 243,300 243,400
3,593
,400
3,593
,500
3,593
,600
3,593
,700
3,593
,800
3,593
,900
3,594
,000
Interfor - Perry MillEmission Point Map
UTM Easting (m)
UTM
North
ing (m
)
All coordinates in UTM NAD83, Zone 17
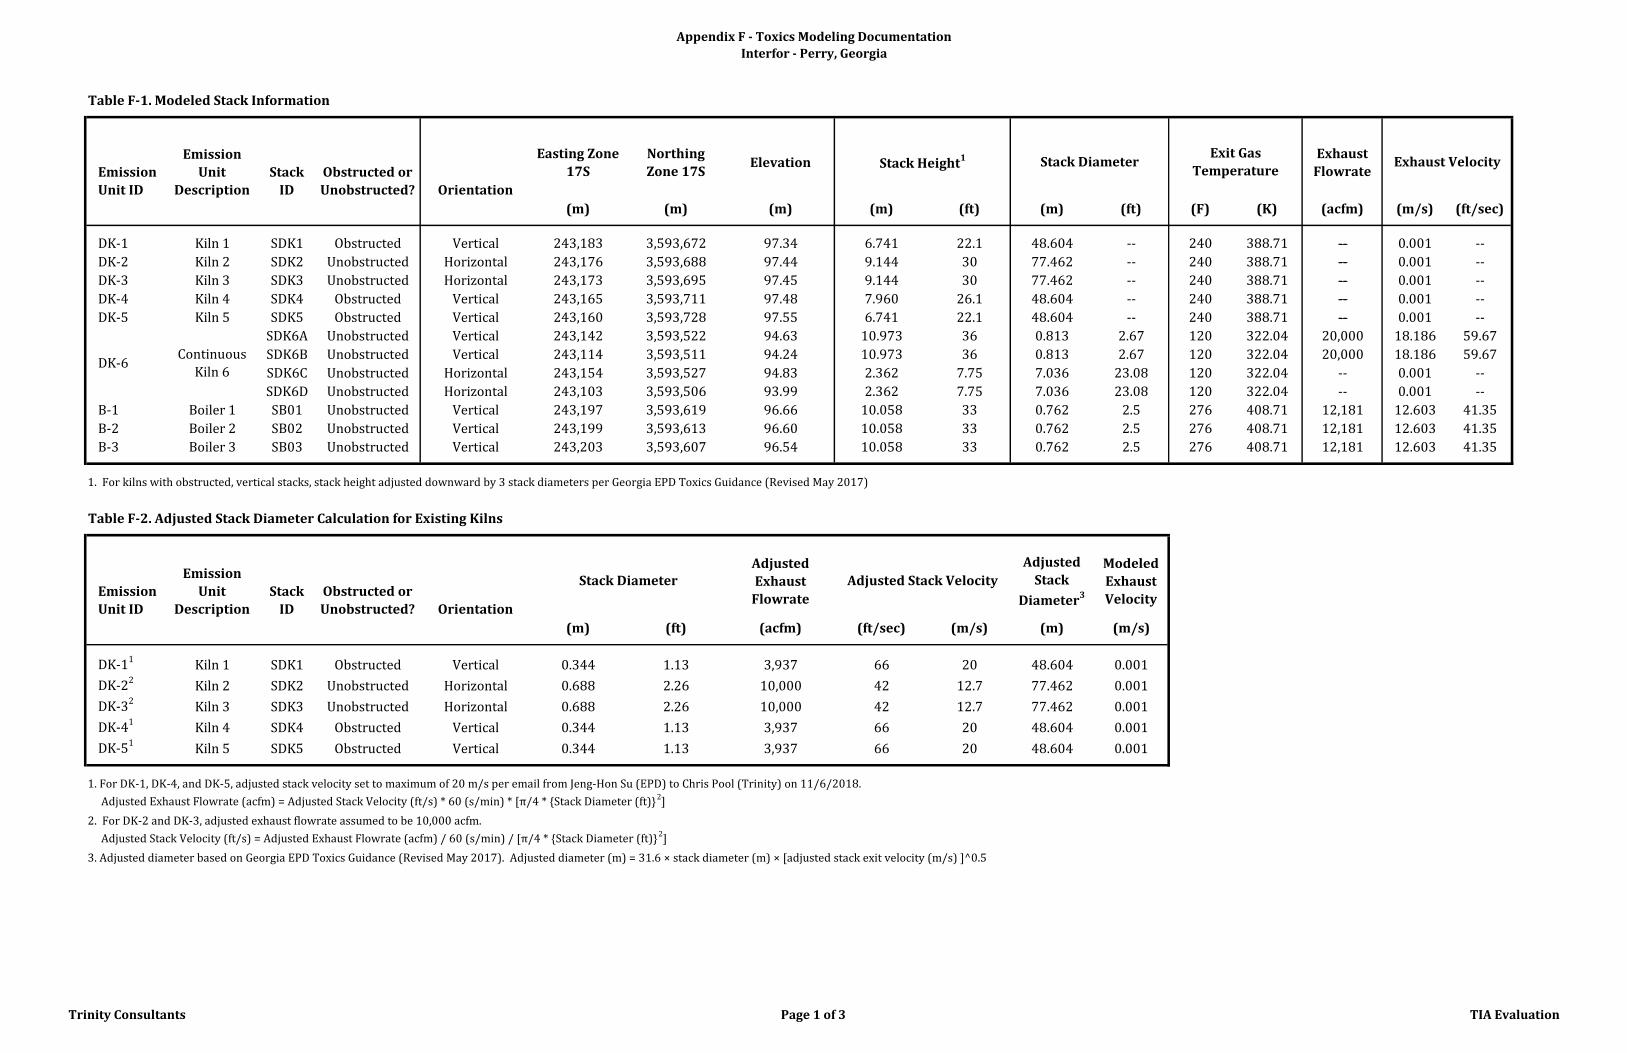
Appendix F - Toxics Modeling Documentation
Interfor - Perry, Georgia
Table F-1. Modeled Stack Information
Emission
Unit ID
Emission
Unit
Description
Stack
ID
Obstructed or
Unobstructed? Orientation
Easting Zone
17S
Northing
Zone 17SElevation
Exhaust
Flowrate
(m) (m) (m) (m) (ft) (m) (ft) (F) (K) (acfm) (m/s) (ft/sec)
DK-1 Kiln 1 SDK1 Obstructed Vertical 243,183 3,593,672 97.34 6.741 22.1 48.604 -- 240 388.71 -- 0.001 --
DK-2 Kiln 2 SDK2 Unobstructed Horizontal 243,176 3,593,688 97.44 9.144 30 77.462 -- 240 388.71 -- 0.001 --
DK-3 Kiln 3 SDK3 Unobstructed Horizontal 243,173 3,593,695 97.45 9.144 30 77.462 -- 240 388.71 -- 0.001 --
DK-4 Kiln 4 SDK4 Obstructed Vertical 243,165 3,593,711 97.48 7.960 26.1 48.604 -- 240 388.71 -- 0.001 --
DK-5 Kiln 5 SDK5 Obstructed Vertical 243,160 3,593,728 97.55 6.741 22.1 48.604 -- 240 388.71 -- 0.001 --
SDK6A Unobstructed Vertical 243,142 3,593,522 94.63 10.973 36 0.813 2.67 120 322.04 20,000 18.186 59.67
SDK6B Unobstructed Vertical 243,114 3,593,511 94.24 10.973 36 0.813 2.67 120 322.04 20,000 18.186 59.67
SDK6C Unobstructed Horizontal 243,154 3,593,527 94.83 2.362 7.75 7.036 23.08 120 322.04 -- 0.001 --
SDK6D Unobstructed Horizontal 243,103 3,593,506 93.99 2.362 7.75 7.036 23.08 120 322.04 -- 0.001 --
B-1 Boiler 1 SB01 Unobstructed Vertical 243,197 3,593,619 96.66 10.058 33 0.762 2.5 276 408.71 12,181 12.603 41.35
B-2 Boiler 2 SB02 Unobstructed Vertical 243,199 3,593,613 96.60 10.058 33 0.762 2.5 276 408.71 12,181 12.603 41.35
B-3 Boiler 3 SB03 Unobstructed Vertical 243,203 3,593,607 96.54 10.058 33 0.762 2.5 276 408.71 12,181 12.603 41.35
1. For kilns with obstructed, vertical stacks, stack height adjusted downward by 3 stack diameters per Georgia EPD Toxics Guidance (Revised May 2017)
Table F-2. Adjusted Stack Diameter Calculation for Existing Kilns
Emission
Unit ID
Emission
Unit
Description
Stack
ID
Obstructed or
Unobstructed? Orientation
Adjusted
Exhaust
Flowrate
Adjusted
Stack
Diameter3
Modeled
Exhaust
Velocity
(m) (ft) (acfm) (ft/sec) (m/s) (m) (m/s)
DK-11Kiln 1 SDK1 Obstructed Vertical 0.344 1.13 3,937 66 20 48.604 0.001
DK-22Kiln 2 SDK2 Unobstructed Horizontal 0.688 2.26 10,000 42 12.7 77.462 0.001
DK-32Kiln 3 SDK3 Unobstructed Horizontal 0.688 2.26 10,000 42 12.7 77.462 0.001
DK-41Kiln 4 SDK4 Obstructed Vertical 0.344 1.13 3,937 66 20 48.604 0.001
DK-51Kiln 5 SDK5 Obstructed Vertical 0.344 1.13 3,937 66 20 48.604 0.001
1. For DK-1, DK-4, and DK-5, adjusted stack velocity set to maximum of 20 m/s per email from Jeng-Hon Su (EPD) to Chris Pool (Trinity) on 11/6/2018.
Adjusted Exhaust Flowrate (acfm) = Adjusted Stack Velocity (ft/s) * 60 (s/min) * [π/4 * {Stack Diameter (ft)}2]
2. For DK-2 and DK-3, adjusted exhaust flowrate assumed to be 10,000 acfm.
Adjusted Stack Velocity (ft/s) = Adjusted Exhaust Flowrate (acfm) / 60 (s/min) / [π/4 * {Stack Diameter (ft)}2]
3. Adjusted diameter based on Georgia EPD Toxics Guidance (Revised May 2017). Adjusted diameter (m) = 31.6 × stack diameter (m) × [adjusted stack exit velocity (m/s) ]^0.5
DK-6Continuous
Kiln 6
Stack Diameter
Exhaust VelocityStack Height1 Stack DiameterExit Gas
Temperature
Adjusted Stack Velocity
Trinity Consultants Page 1 of 3 TIA Evaluation
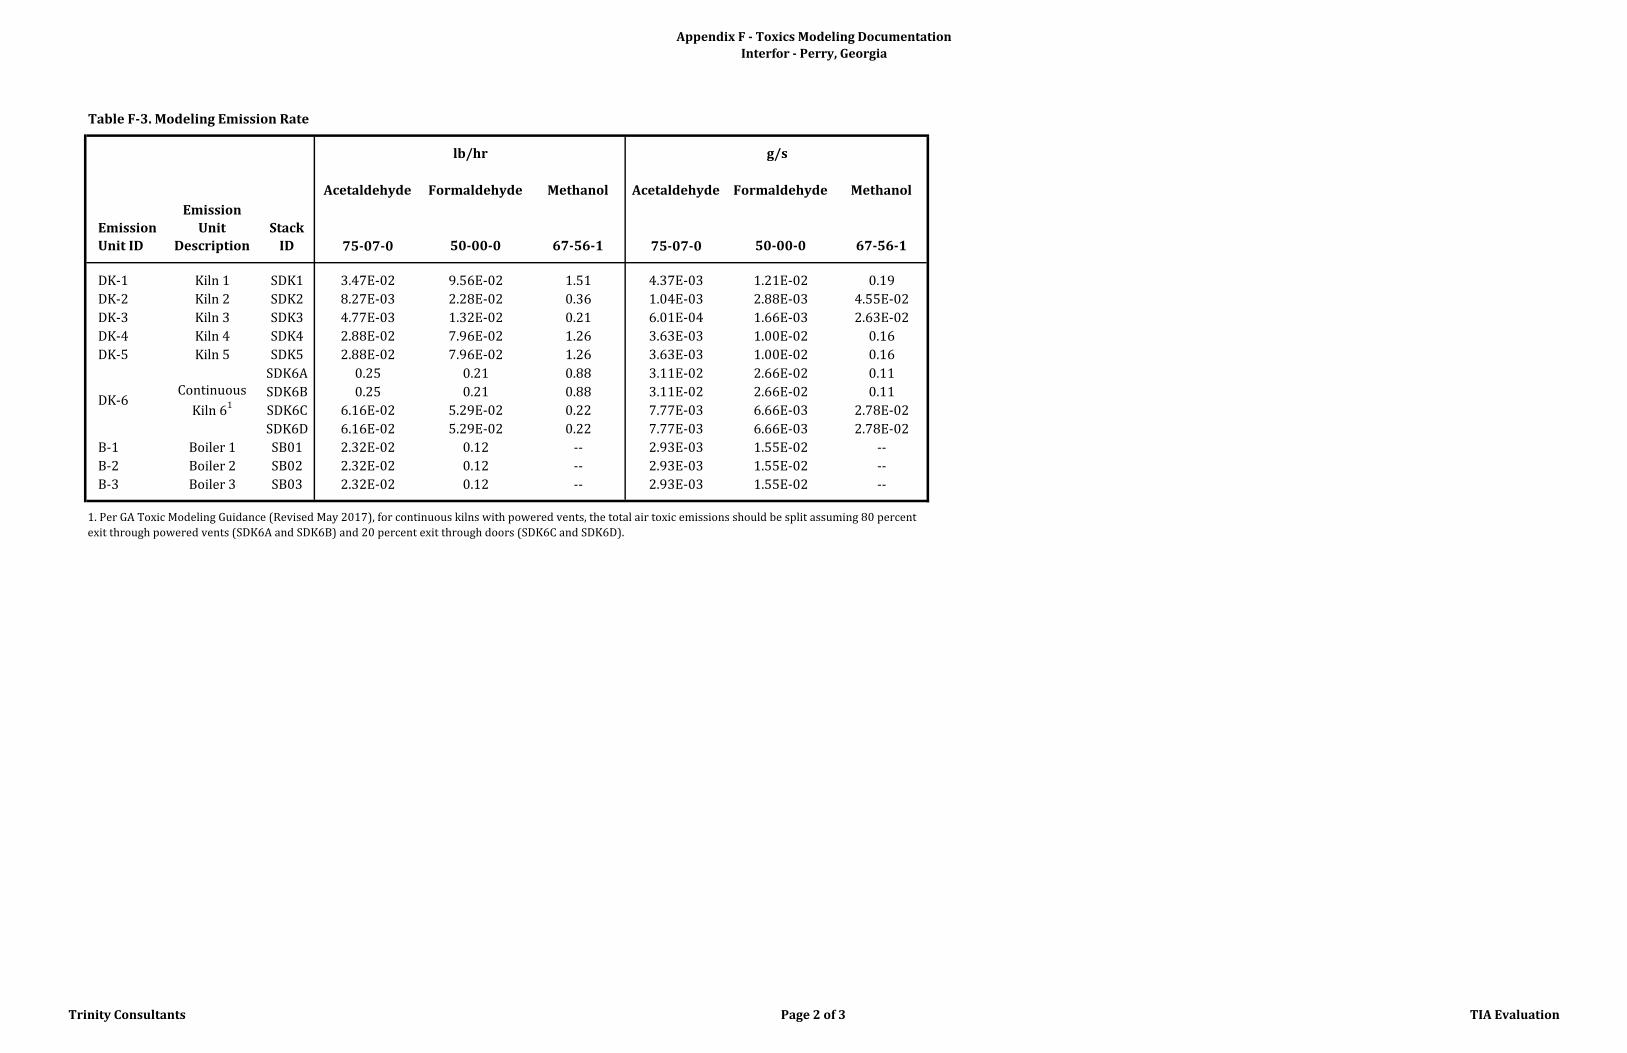
Appendix F - Toxics Modeling Documentation
Interfor - Perry, Georgia
Table F-3. Modeling Emission Rate
Acetaldehyde Formaldehyde Methanol Acetaldehyde Formaldehyde Methanol
Emission
Unit ID
Emission
Unit
Description
Stack
ID 75-07-0 50-00-0 67-56-1 75-07-0 50-00-0 67-56-1
DK-1 Kiln 1 SDK1 3.47E-02 9.56E-02 1.51 4.37E-03 1.21E-02 0.19
DK-2 Kiln 2 SDK2 8.27E-03 2.28E-02 0.36 1.04E-03 2.88E-03 4.55E-02
DK-3 Kiln 3 SDK3 4.77E-03 1.32E-02 0.21 6.01E-04 1.66E-03 2.63E-02
DK-4 Kiln 4 SDK4 2.88E-02 7.96E-02 1.26 3.63E-03 1.00E-02 0.16
DK-5 Kiln 5 SDK5 2.88E-02 7.96E-02 1.26 3.63E-03 1.00E-02 0.16
SDK6A 0.25 0.21 0.88 3.11E-02 2.66E-02 0.11
SDK6B 0.25 0.21 0.88 3.11E-02 2.66E-02 0.11
SDK6C 6.16E-02 5.29E-02 0.22 7.77E-03 6.66E-03 2.78E-02
SDK6D 6.16E-02 5.29E-02 0.22 7.77E-03 6.66E-03 2.78E-02
B-1 Boiler 1 SB01 2.32E-02 0.12 -- 2.93E-03 1.55E-02 --
B-2 Boiler 2 SB02 2.32E-02 0.12 -- 2.93E-03 1.55E-02 --
B-3 Boiler 3 SB03 2.32E-02 0.12 -- 2.93E-03 1.55E-02 --
1. Per GA Toxic Modeling Guidance (Revised May 2017), for continuous kilns with powered vents, the total air toxic emissions should be split assuming 80 percent
exit through powered vents (SDK6A and SDK6B) and 20 percent exit through doors (SDK6C and SDK6D).
DK-6Continuous
Kiln 61
lb/hr g/s
Trinity Consultants Page 2 of 3 TIA Evaluation
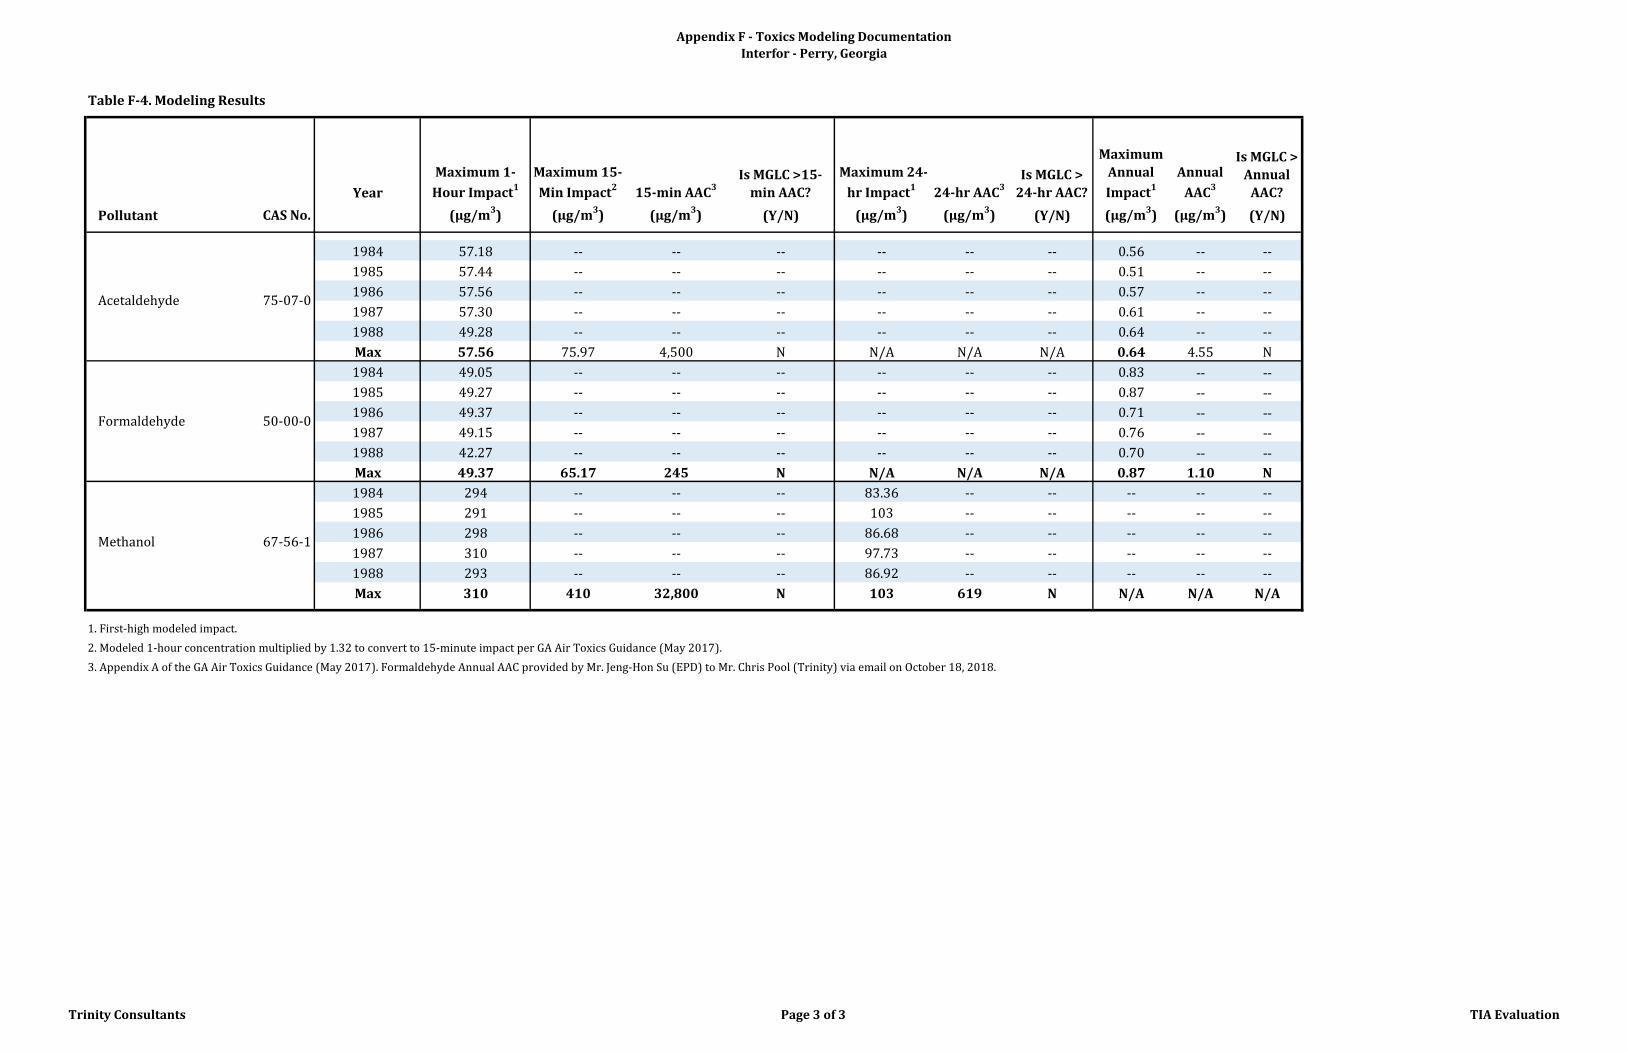
Appendix F - Toxics Modeling Documentation
Interfor - Perry, Georgia
Table F-4. Modeling Results
Year
Maximum 1-
Hour Impact1
Maximum 15-
Min Impact2
15-min AAC3
Is MGLC >15-
min AAC?
Maximum 24-
hr Impact1
24-hr AAC3
Is MGLC >
24-hr AAC?
Maximum
Annual
Impact1
Annual
AAC3
Is MGLC >
Annual
AAC?
Pollutant CAS No. (µg/m3) (µg/m
3) (µg/m
3) (Y/N) (µg/m
3) (µg/m
3) (Y/N) (µg/m
3) (µg/m
3) (Y/N)
1984 57.18 -- -- -- -- -- -- 0.56 -- --
1985 57.44 -- -- -- -- -- -- 0.51 -- --
1986 57.56 -- -- -- -- -- -- 0.57 -- --
1987 57.30 -- -- -- -- -- -- 0.61 -- --
1988 49.28 -- -- -- -- -- -- 0.64 -- --
Max 57.56 75.97 4,500 N N/A N/A N/A 0.64 4.55 N
1984 49.05 -- -- -- -- -- -- 0.83 -- --
1985 49.27 -- -- -- -- -- -- 0.87 -- --
1986 49.37 -- -- -- -- -- -- 0.71 -- --
1987 49.15 -- -- -- -- -- -- 0.76 -- --
1988 42.27 -- -- -- -- -- -- 0.70 -- --
Max 49.37 65.17 245 N N/A N/A N/A 0.87 1.10 N
1984 294 -- -- -- 83.36 -- -- -- -- --
1985 291 -- -- -- 103 -- -- -- -- --
1986 298 -- -- -- 86.68 -- -- -- -- --
1987 310 -- -- -- 97.73 -- -- -- -- --
1988 293 -- -- -- 86.92 -- -- -- -- --
Max 310 410 32,800 N 103 619 N N/A N/A N/A
1. First-high modeled impact.
2. Modeled 1-hour concentration multiplied by 1.32 to convert to 15-minute impact per GA Air Toxics Guidance (May 2017).
3. Appendix A of the GA Air Toxics Guidance (May 2017). Formaldehyde Annual AAC provided by Mr. Jeng-Hon Su (EPD) to Mr. Chris Pool (Trinity) via email on October 18, 2018.
50-00-0Formaldehyde
Acetaldehyde 75-07-0
Methanol 67-56-1
Trinity Consultants Page 3 of 3 TIA Evaluation

Interfor U.S. Inc. – Perry Mill | Continuous Kiln Construction Permit Application Trinity Consultants G
APPENDIX G: ELECTRONIC TOXIC MODELING FILES
Interfor U.S. Inc. – Perry Mill | Continuous Kiln Construction Permit Application Trinity Consultants H
APPENDIX H: LETTERS TO FEDERAL LAND MANAGERS
September19,2018Mr.BillJacksonAirProgramStaffUSDAForestService(FS)NationalForestsinNorthCarolinaP.O.Box2750Ashville,[email protected]: InterforU.S.,Inc.–Perry,GA
NotificationofPSDProjectinReferencetoFSClassIAreasDearMr.Jackson,TrinityConsultants(Trinity)issubmittingthislettertoyourattentiononbehalfofourclientInterforU.S.,Inc.(Interfor)foraproposedmodificationattheirfacilitylocatedinPerry,Georgia(HoustonCounty).InterforintendstoinstallanewcontinuousdualpathdirectfiredlumberdryingkilnatthePerryMill.TheproposedprojectwillrequireaPreventionofSignificantDeterioration(PSD)permitasamajormodificationtoanexistingmajorsource.1Expectedemissionsfromtheproposedprojectincludeoxidesofnitrogen(NOX),volatileorganiccompounds(VOC),greenhousegases(GHG)intheformofcarbondioxideequivalents(CO2e)2,particulatematterwithanaerodynamicdiameterlessthan10microns(PM10),particulatematterwithanaerodynamicdiameterlessthan2.5microns(PM2.5),particulatematter(PM),sulfurdioxide(SO2),carbonmonoxide(CO),hazardousairpollutants(HAP),andallothercombustionemissionsassociatedwithnaturalgas.TheproposedprojectwillrequireaPreventionofSignificantDeterioration(PSD)permitaspotentialemissionincreasesfromtheproposedprojectareanticipatedtoexceedPSDsignificantemissionrate(SER)thresholdsforVOC.AspartofthePSDapplicationprocess,Interforhasqualitativelyevaluateditsimpactsonfederally‐protectedClassIareas.ThepurposeofthisletteristoprovidetheFederalLandManager(FLM)withpreliminaryinformationontheproposedprojectandtorequestconcurrencefromtheFLMonthefindingspresented.
Q/D SCREENING ANALYSIS
AQ/DscreeninganalysiswasperformedinamannerconsistentwiththeapproachdiscussedinthemostrecentFederalLandManagers’AirQualityRelatedValuesWorkGroup(FLAG)guidancedocument(FLAG2010),whichcomparestheratioofvisibilityaffectingpollutantemissionstothedistancefromtheClassIarea(i.e.,referenced
1 The Perry Mill is an existing PSD major source as potential facility-wide emissions of volatile organic compounds (VOC) are greater than the major source threshold of 250 tons per year (tpy).
2 CO2eiscarbondioxideequivalentscalculatedasthesumofthesixwell‐mixedGHGs(CO2,CH4,N2O,HFCs,PFCs,andSF6)withapplicableglobalwarmingpotentialsper40CFR98applied.
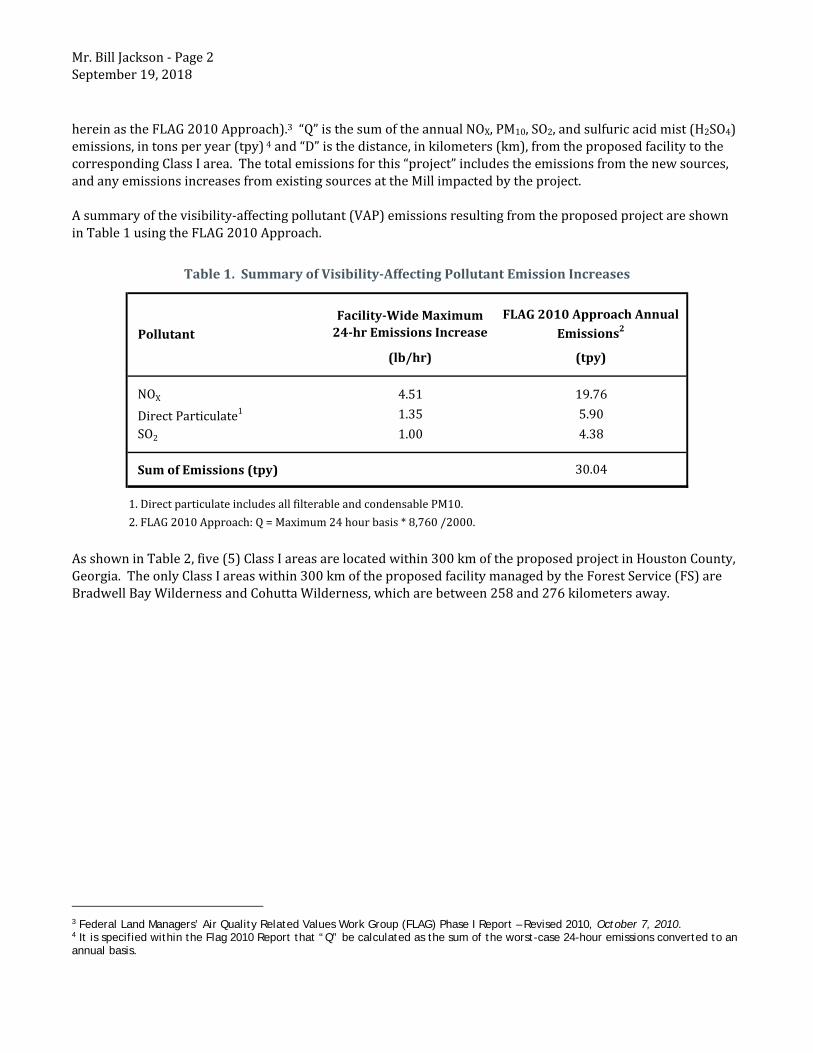
Mr.BillJackson‐Page2September19,2018
hereinastheFLAG2010Approach).3“Q”isthesumoftheannualNOX,PM10,SO2,andsulfuricacidmist(H2SO4)emissions,intonsperyear(tpy)4and“D”isthedistance,inkilometers(km),fromtheproposedfacilitytothecorrespondingClassIarea.Thetotalemissionsforthis“project”includestheemissionsfromthenewsources,andanyemissionsincreasesfromexistingsourcesattheMillimpactedbytheproject.Asummaryofthevisibility‐affectingpollutant(VAP)emissionsresultingfromtheproposedprojectareshowninTable1usingtheFLAG2010Approach.
Table1.SummaryofVisibility‐AffectingPollutantEmissionIncreases
AsshowninTable2,five(5)ClassIareasarelocatedwithin300kmoftheproposedprojectinHoustonCounty,Georgia.TheonlyClassIareaswithin300kmoftheproposedfacilitymanagedbytheForestService(FS)areBradwellBayWildernessandCohuttaWilderness,whicharebetween258and276kilometersaway.
3 Federal Land Managers’ Air Quality Related Values Work Group (FLAG) Phase I Report – Revised 2010, October 7, 2010. 4 It is specified within the Flag 2010 Report that “Q” be calculated as the sum of the worst-case 24-hour emissions converted to an annual basis.
NOXDirectParticulate1
SO2
SumofEmissions(tpy)
1.DirectparticulateincludesallfilterableandcondensablePM10.
2.FLAG2010Approach:Q=Maximum24hourbasis*8,760/2000.
PollutantFacility‐WideMaximum24‐hrEmissionsIncrease
(lb/hr)
4.51
1.35
1.00
FLAG2010ApproachAnnualEmissions2
(tpy)
19.76
5.90
4.38
30.04
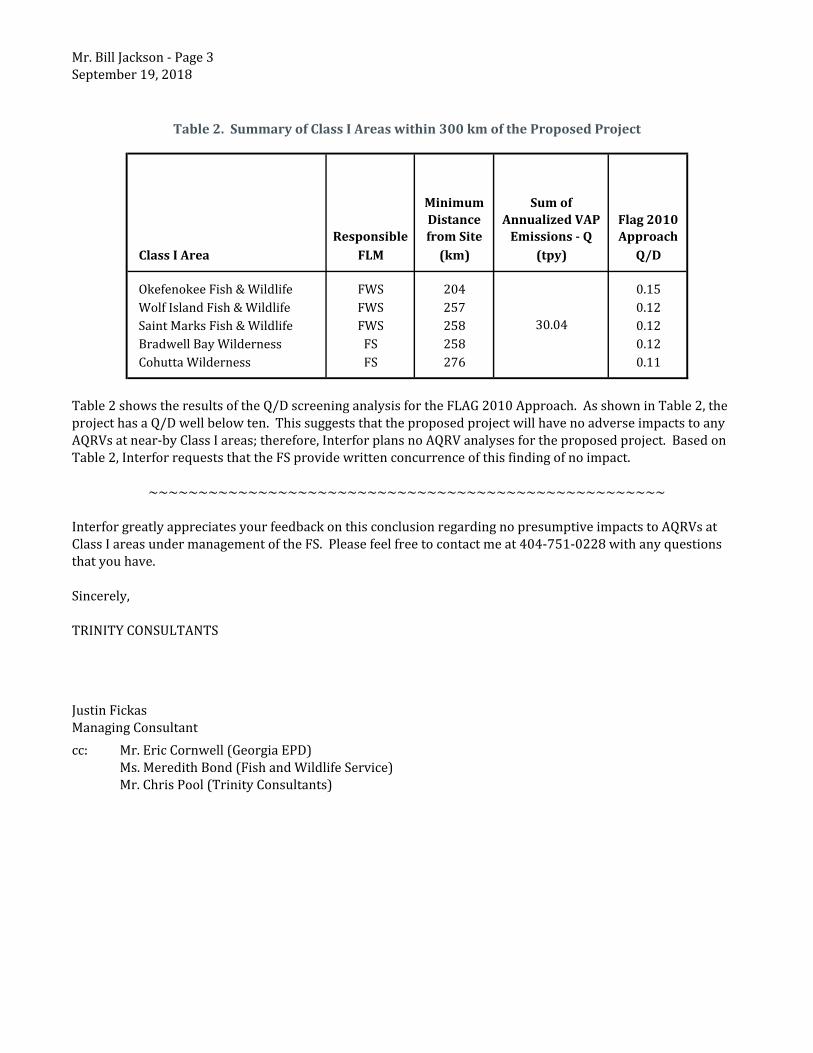
Mr.BillJackson‐Page3September19,2018
Table2.SummaryofClassIAreaswithin300kmoftheProposedProject
Table2showstheresultsoftheQ/DscreeninganalysisfortheFLAG2010Approach.AsshowninTable2,theprojecthasaQ/Dwellbelowten.ThissuggeststhattheproposedprojectwillhavenoadverseimpactstoanyAQRVsatnear‐byClassIareas;therefore,InterforplansnoAQRVanalysesfortheproposedproject.BasedonTable2,InterforrequeststhattheFSprovidewrittenconcurrenceofthisfindingofnoimpact.
~~~~~~~~~~~~~~~~~~~~~~~~~~~~~~~~~~~~~~~~~~~~~~~~~~~~InterforgreatlyappreciatesyourfeedbackonthisconclusionregardingnopresumptiveimpactstoAQRVsatClassIareasundermanagementoftheFS.Pleasefeelfreetocontactmeat404‐751‐0228withanyquestionsthatyouhave.Sincerely,TRINITYCONSULTANTS
JustinFickasManagingConsultantcc: Mr.EricCornwell(GeorgiaEPD)
Ms.MeredithBond(FishandWildlifeService)Mr.ChrisPool(TrinityConsultants)
Responsible
MinimumDistancefromSite
SumofAnnualizedVAPEmissions‐Q
Flag2010Approach
ClassIArea FLM (km) (tpy) Q/D
OkefenokeeFish&Wildlife FWS 204 0.15WolfIslandFish&Wildlife FWS 257 0.12SaintMarksFish&Wildlife FWS 258 0.12BradwellBayWilderness FS 258 0.12CohuttaWilderness FS 276 0.11
30.04
September19,2018Ms.MeredithBondUnitedStatesDepartmentoftheInteriorU.S.FishandWildlifeServiceNationalWildlifeRefugeSystemBranchofAirQuality7333W.JeffersonAve.,Suite375Lakewood,CO80235‐2017RE: InterforU.S.,Inc.–Perry,GA
NotificationofPSDProjectinReferencetoFWSClassIAreasDearMs.Bond,TrinityConsultants(Trinity)issubmittingthislettertoyourattentiononbehalfofourclientInterforU.S.,Inc.(Interfor)foraproposedmodificationattheirfacilitylocatedinPerry,Georgia(HoustonCounty).InterforintendstoinstallanewcontinuousdualpathdirectfiredlumberdryingkilnatthePerryMill.TheproposedprojectwillrequireaPreventionofSignificantDeterioration(PSD)permitasamajormodificationtoanexistingmajorsource.1Expectedemissionsfromtheproposedprojectincludeoxidesofnitrogen(NOX),volatileorganiccompounds(VOC),greenhousegases(GHG)intheformofcarbondioxideequivalents(CO2e)2,particulatematterwithanaerodynamicdiameterlessthan10microns(PM10),particulatematterwithanaerodynamicdiameterlessthan2.5microns(PM2.5),particulatematter(PM),sulfurdioxide(SO2),carbonmonoxide(CO),hazardousairpollutants(HAP),andallothercombustionemissionsassociatedwithnaturalgas.TheproposedprojectwillrequireaPreventionofSignificantDeterioration(PSD)permitaspotentialemissionincreasesfromtheproposedprojectareanticipatedtoexceedPSDsignificantemissionrate(SER)thresholdsforVOC.AspartofthePSDapplicationprocess,Interforhasqualitativelyevaluateditsimpactsonfederally‐protectedClassIareas.ThepurposeofthisletteristoprovidetheFederalLandManager(FLM)withpreliminaryinformationontheproposedprojectandtorequestconcurrencefromtheFLMonthefindingspresented.
Q/D SCREENING ANALYSIS
Q/DscreeninganalysiswasperformedinamannerconsistentwiththeapproachdiscussedinthemostrecentFederalLandManagers’AirQualityRelatedValuesWorkGroup(FLAG)guidancedocument(FLAG2010),whichcomparestheratioofvisibilityaffectingpollutantemissionstothedistancefromtheClassIarea(i.e.,referencedhereinastheFLAG2010Approach).3“Q”isthesumoftheannualNOX,PM10,SO2,andsulfuricacidmist(H2SO4)
1 The Perry Mill is an existing PSD major source as potential facility-wide emissions of volatile organic compounds (VOC) are greater than the major source threshold of 250 tons per year (tpy).
2 CO2eiscarbondioxideequivalentscalculatedasthesumofthesixwell‐mixedGHGs(CO2,CH4,N2O,HFCs,PFCs,andSF6)withapplicableglobalwarmingpotentialsper40CFR98applied.
3 Federal Land Managers’ Air Quality Related Values Work Group (FLAG) Phase I Report – Revised 2010, October 7, 2010.
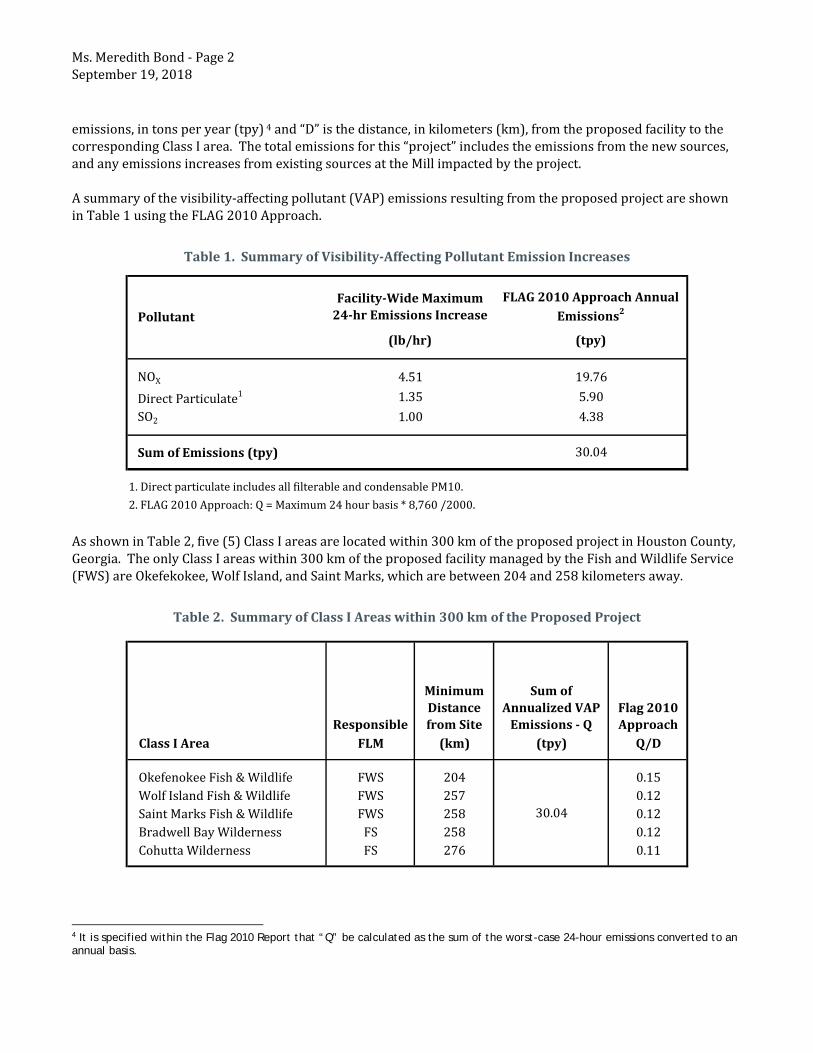
Ms.MeredithBond‐Page2September19,2018
emissions,intonsperyear(tpy)4and“D”isthedistance,inkilometers(km),fromtheproposedfacilitytothecorrespondingClassIarea.Thetotalemissionsforthis“project”includestheemissionsfromthenewsources,andanyemissionsincreasesfromexistingsourcesattheMillimpactedbytheproject.Asummaryofthevisibility‐affectingpollutant(VAP)emissionsresultingfromtheproposedprojectareshowninTable1usingtheFLAG2010Approach.
Table1.SummaryofVisibility‐AffectingPollutantEmissionIncreases
AsshowninTable2,five(5)ClassIareasarelocatedwithin300kmoftheproposedprojectinHoustonCounty,Georgia.TheonlyClassIareaswithin300kmoftheproposedfacilitymanagedbytheFishandWildlifeService(FWS)areOkefekokee,WolfIsland,andSaintMarks,whicharebetween204and258kilometersaway.
Table2.SummaryofClassIAreaswithin300kmoftheProposedProject
4 It is specified within the Flag 2010 Report that “Q” be calculated as the sum of the worst-case 24-hour emissions converted to an annual basis.
NOXDirectParticulate1
SO2
SumofEmissions(tpy)
1.DirectparticulateincludesallfilterableandcondensablePM10.
2.FLAG2010Approach:Q=Maximum24hourbasis*8,760/2000.
PollutantFacility‐WideMaximum24‐hrEmissionsIncrease
(lb/hr)
4.51
1.35
1.00
FLAG2010ApproachAnnualEmissions2
(tpy)
19.76
5.90
4.38
30.04
Responsible
MinimumDistancefromSite
SumofAnnualizedVAPEmissions‐Q
Flag2010Approach
ClassIArea FLM (km) (tpy) Q/D
OkefenokeeFish&Wildlife FWS 204 0.15WolfIslandFish&Wildlife FWS 257 0.12SaintMarksFish&Wildlife FWS 258 0.12BradwellBayWilderness FS 258 0.12CohuttaWilderness FS 276 0.11
30.04
Ms.MeredithBond‐Page3September19,2018
Table2showstheresultsoftheQ/DscreeninganalysisfortheFLAG2010Approach.AsshowninTable2,theprojecthasaQ/Dwellbelowten.ThissuggeststhattheproposedprojectwillhavenoadverseimpactstoanyAQRVsatnear‐byClassIareas;therefore,InterforplansnoAQRVanalysesfortheproposedproject.BasedonTable2,InterforrequeststhattheFSprovidewrittenconcurrenceofthisfindingofnoimpact.
~~~~~~~~~~~~~~~~~~~~~~~~~~~~~~~~~~~~~~~~~~~~~~~~~~~~InterforgreatlyappreciatesyourfeedbackonthisconclusionregardingnopresumptiveimpactstoAQRVsatClassIareasundermanagementoftheFWS.Pleasefeelfreetocontactmeat404‐751‐0228withanyquestionsthatyouhave.Sincerely,TRINITYCONSULTANTS
JustinFickasManagingConsultantcc: Mr.EricCornwell(GeorgiaEPD)
Mr.BillJackson(ForestService)Mr.ChrisPool(TrinityConsultants)