Embed Size (px)
Citation preview
CITY OF LOVEJOY, GEORGIA
Comprehensive Plan 2004-2025
June 2004

CONTENTS I PUBLIC PARTICIPATION II POPULATION III ECONOMIC DEVELOPMENT IV NATURAL AND HISTORIC RESOURCES V COMMUNITY FACILITIES AND SERVICES VI HOUSING VII LAND USE Existing Land Use Map Future Land Use Map VIII TRANSPORTATION IIX INTERGOVERNMENTAL AGREEMENT APPENDIX I SHORT TERM WORK PLAN APPENDIX II 1998 CLAYTON COUNTY COMPREHENSIVE SOLID WASTE MANAGEMENT
PLAN APPENDIX III EXISTING LAND USE PLAN APPENDIX IV FUTURE LAND USE MAP
Introduction Lovejoy is a small city located at the southern extreme of Clayton County, northeast of what is known as Clayton’s "panhandle." The city limits abut Henry County on the south, thus "landlocking" Lovejoy and hindering further growth. Clayton County Water and Sewer Authority property adjoins the city limits to the north, also impacting Lovejoy's ability to expand its corporate limits. Clayton County’s Landfill and Clayton Regional Youth Detention Center define the eastern boundary. U.S. Census recorded Lovejoy's population as 2,495 residents in 2000. The City estimates that as many as 2,781 residents have been added since the 2000 Census count. Clayton County is one of the 13 Atlanta Regional Commission counties. Lovejoy is also within the ARC area. Transportation systems have tremendous impacts on all cities, including Lovejoy. U.S. Highway 19/41 and the Norfolk Southern Railroad line form critical components of the Lovejoy’s transportation system. Commuter rail service utilizing the N/S rail line is proposed from Atlanta to Macon, with a station in Lovejoy. This proposed service will link Lovejoy to these urban centers and 12 other cities. Lovejoy has not experienced dynamic development to-date, and a primary factor has been isolation from downtown Atlanta and the region. Commuter rail service would eliminate such isolation and could spell explosive growth. Such growth is not unrealistic as cities like Hampton and Locust Grove in Henry County also lie along the 19/41 corridor and are even further removed from the core of the Atlanta region. Traffic congestion, exorbitant land and housing and perceptions of "overdevelopment" on Atlanta's northside are driving this growth. Highway 19/41 is a well-traveled artery which carries 25,843 (January 2000 data) vehicles per day through Lovejoy between Atlanta and Griffin. This four-lane route, and the growing market represented by new residential development in Clayton and north Henry County, will bring significant retail development to Lovejoy. This, is turn, will attract additional residents to Lovejoy and the surrounding area as people seek locations convenient to shopping and employment. Lovejoy, a quiet town of 351 in 1980, promises to become a populated anchor in south Clayton County. This Plan conveys additional information about the city of Lovejoy, and describes how the Lovejoy community may accommodate and respond to growth. The Plan also portrays the community’s anticipated future.
Public Participation Page 1
PUBLIC PARTICIPATION The City of Lovejoy held two public hearings and prepared a citizen survey to solicit public input into the comprehensive plan. The City conducted a 100 percent survey in an attempt to collect feedback from citizens concerning future directions for Lovejoy. The survey addresses all elements of the comprehensive plan and solicits residents feedback. Survey Results The City of Lovejoy sought resident input concerning the future of Lovejoy and an assessment of living conditions and public services. A survey questionnaire containing 35 questions was mailed to all residential addresses, for a total of 390 surveys. Some 50 surveys were completed and returned; 69 were undeliverable. Each question provided an opportunity for resident comments concerning the individual topic as well as an opportunity to voice an opinion about the future of Lovejoy or any other topic. Significant, written comments are reported here. Responses were solicited based on a five point scale of “Strongly Agree,” “Agree,” Undecided,” Disagree” and “Strongly Disagree.” “No Answer” was also among the possible responses. While a detailed breakdown of all responses is reported, the general themes reflected in the responses are based on an aggregation of the two categories of “Agree” or “Disagree.” Responses are organized below in six topical areas, Growth and Development, Economic Development, Residential Development, Public Services and Facilities, Greenspace and Access. General community sentiments are noted in a Summary. Growth and Development Inquiries that sought input about growth and development were found in questions 1, 2, 3, 10, 20, 33 and 35. These questions solicited input concerning residential, commercial and industrial development. Responses regarding desire for growth showed 50 percent negative responses, while 32 percent had positive responses. The desire for commercial development within the city was relatively split, as 36 percent opposed growth while vs 42 percent in favor. More than half of respondent favor expansion fo public sanitary sewer which would accommodate further development. More than 60 percent of respondents felt that housing options were satisfactory. A minority of respondents favored future industrial development. Nearly 80 percent of respondents endorsed preservation of rural portions of Lovejoy.
Public Participation Page 2
Economic Development Most residents favor commercial development and most also favor industrial development; however, more than one-quarter of respondents registered “Undecided” about industrial growth. A strong majority, 70 percent, indicated a preference for locating commercial development on Tara Boulevard (Highway 19/41). Perhaps, a preference for limiting such development to that corridor is indicated in respondent opposition to commercial development along Hastings Bridge Road, an arterial comprising a commercial node at its intersection with Tara Boulevard. Little disagreement was evidenced in responses to the question as to whether local employment is important, 80 percent responded affirmatively. Residential Development Responses indicate that most people (half of those responding to this question) did not favor population growth. A majority of respondents believed Lovejoy homes were well-maintained. A strong majority opposed multifamily development, but fewer would exclude future townhouse development. A strong majority felt that single family detached homes should be the dominant housing type in Lovejoy; 56 percent supported such housing on large lots. Most residents held the opinion that housing options in Lovejoy were satisfactory, somewhat fewer thought housing values were satisfactory. Public Services and Facilities Lovejoy residents expressed satisfaction with a range of public services, including garbage collection, fire and police protection, street maintenance, storm water management, sign regulation and code enforcement, although 40 percent were “Undecided” as to whether code enforcement was satisfactory. More than 80 percent of respondents indicated that they would use local library services if they were available. Residents were evenly split (Agree, Undecided or Disagree) about whether job training opportunities in Clayton County were satisfactory. A similar response rate was recorded concerning community services and facilities, generally. Greenspace Rural character and greenspace was an expected emphasis in a semi-rural community at the fringe of a growing metropolitan region. Ninety percent of respondents, among the strongest majority recorded on any question, indicated that natural areas should be reserved when new subdivisions are built and 76 percent, more than 3 of every 4 respondents, stated that rural portions of Lovejoy should be preserved. Of course, an
Public Participation Page 3
inherent conflict may exist with a preference for greenspace preservation and “large lot” development. While 80 percent supported preservation of open space as the city develops, this support fell to only 54 percent concerning the possibility of purchasing land for such preservation. Importantly, 62 percent of residents responding believed that Lovejoy needs more parks and 66 percent felt more recreation areas are needed. Ninety percent of respondents rated trees and other streetscape greenery as important. Access More than 3 of 4 residents believe that motorists are able to travel around Lovejoy easily, although 58 percent support widening of major roads. Eight-two percent, more than 8 people in 10, think that more sidewalks are needed. At 60 percent, fewer believe more bike paths are needed; however, this ratio remains significant as concerns new transportation facilities and perhaps, development standards. Summary In general, Lovejoy residents would like to limit future development to single family “for sale” units on large lots, but do indicate a preference for preservation of greenspace and rural character. Half of all respondents actually favored a “no growth” posture. Commercial and, to a lesser extent, industrial development, is favored. Tara Boulevard is the preferred location for commercial growth. Respondents expressed satisfaction with community services, but had concerns about job training opportunities. A clear indication of support in a local library was registered. A preference for more sidewalks, bike paths and street right-of-way landscaping suggests that Lovejoy residents are interested in pedestrian character and is consistent with a preference for preservation of rural character.
Lovejoy Population Page 1
POPULATION ELEMENT Introduction Reliable estimates of future population are essential to anticipating the employment, housing and public service needs of Lovejoy residents. The Population Element examines population trends over the past 20 years and projects the future population through the next 20 years. This Element also examines population characteristics, known as demographics, for the purpose of tailoring public services, shaping private development, particularly housing development, and matching employment to the needs and abilities of Lovejoy residents. The City of Lovejoy plays a critical role in the provision of public services such as roads, water and sanitary sewer. Private development controls many aspects of residential, commercial and industrial development. However, the City can have a substantial impact on private development. Sound demographic analyses also enable the City to plan public services such as recreation and social services and influence decisions concerning public schools. Importantly, information about such population characteristics as family size, resident age and household income can be helpful in guiding private market housing development. The Population Element provides important information to local decision makers by building a demographic profile of Lovejoy's past, present and future population. Information about Lovejoy’s future population may also be used to identify desirable population growth rates, densities and development patterns consistent with goals and policies established in the Plan. Population growth and the jobs, services, public infrastructure, and housing needed to support that growth impacts land and natural resources. The Population Element is, therefore, linked to the Economic Development, Community Facilities and Services, Transportation, Housing and Land Use Elements. The Natural and Cultural Resources Element is also linked to population and identifies environmental constraints affecting future development.
Lovejoy Population Page 2
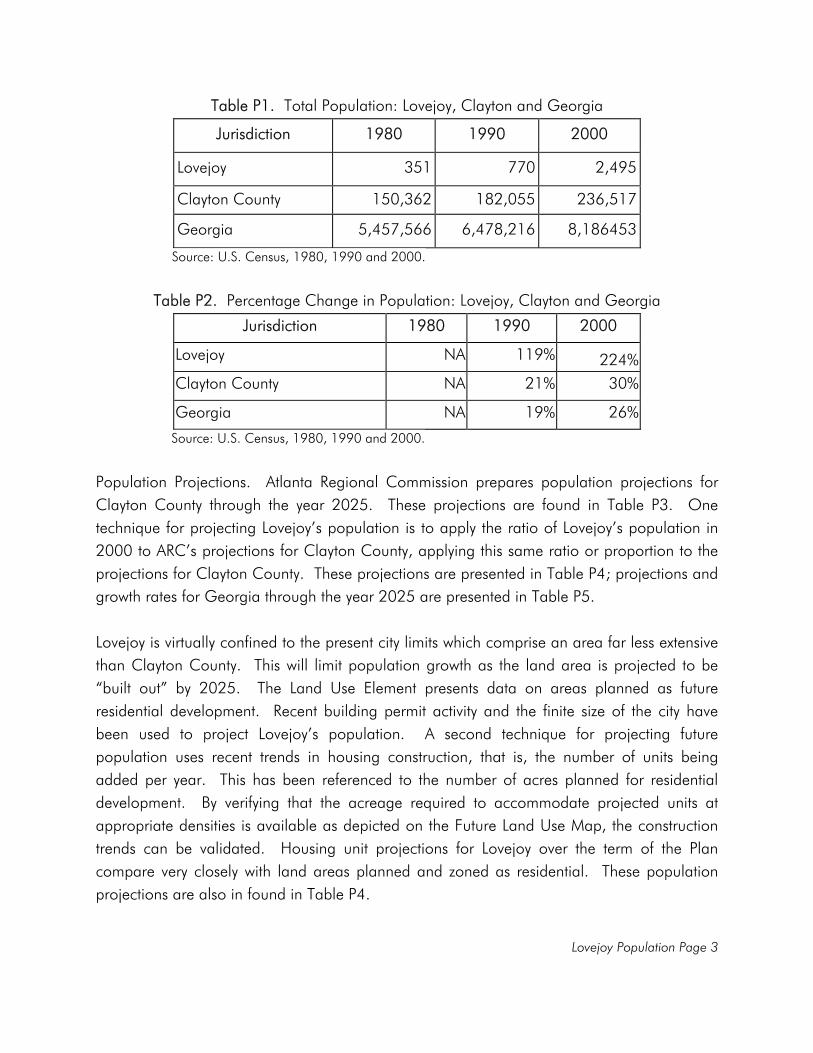
Population The Georgia Department of Community Affairs establishes minimum standards for preparation of a Comprehensive Plan. The standards involve a three-step process: (1) inventory of current conditions, (2) assessment of current and future conditions and (3) formulation of a community vision, including goals and implementation strategies. These three steps are described below: Inventory of Current Conditions Various demographic characteristics of Lovejoy's population have been collected. These characteristics include historic data, referring to the past 20 years, at five-year intervals, 2000 Census data and data through the year 2025, also at five-year intervals. Specific demographic characteristics found in this Plan are presented below: Total Population. Lovejoy’s past, present and future population totals as well as respective growth rates are compared to those for Clayton County and Georgia. Annual projections are provided for 2004-2010. In 1980, Lovejoy was home to 351 people. By 1990, the population had more than doubled and, by the 2000 Census, more than tripled. This rate of increase is huge, some 119 percent from 1980 to 1990, and 224 percent between 1990 and 2000. Clayton County, an urban county in the Atlanta metropolitan region, also logged significant gains, growing some 21 percent between 1980 and 1990, and 30 percent more by 2000. Georgia recorded slightly lower population growth for the two decades, 19 and 26 percent, respectively. Population totals and percentage change in population are recorded in Tables P1 and P2. Obviously, Lovejoy's growth far outstripped that of the county and the state. This dramatic contrast can be explained in part by the small size of Lovejoy's base population. It must also be noted that the inmate population of the Lovejoy Detention Center, built in 1986, is reflected in the 2000 Census. The inmate population was recorded as 1,174. This indicates that the actual “resident” population increased by 74 percent, independent of the inmate population. Such an increase remains impressive. This growth is particularly significant given the amount of undeveloped land in and around Lovejoy, and the recent development focus on south metro counties.
Lovejoy Population Page 3
Table P1. Total Population: Lovejoy, Clayton and Georgia
Jurisdiction 1980 1990 2000
Lovejoy 351 770 2,495
Clayton County 150,362 182,055 236,517
Georgia 5,457,566 6,478,216 8,186453
Source: U.S. Census, 1980, 1990 and 2000.
Table P2. Percentage Change in Population: Lovejoy, Clayton and Georgia
Jurisdiction 1980 1990 2000
Lovejoy NA 119% 224% Clayton County NA 21% 30%
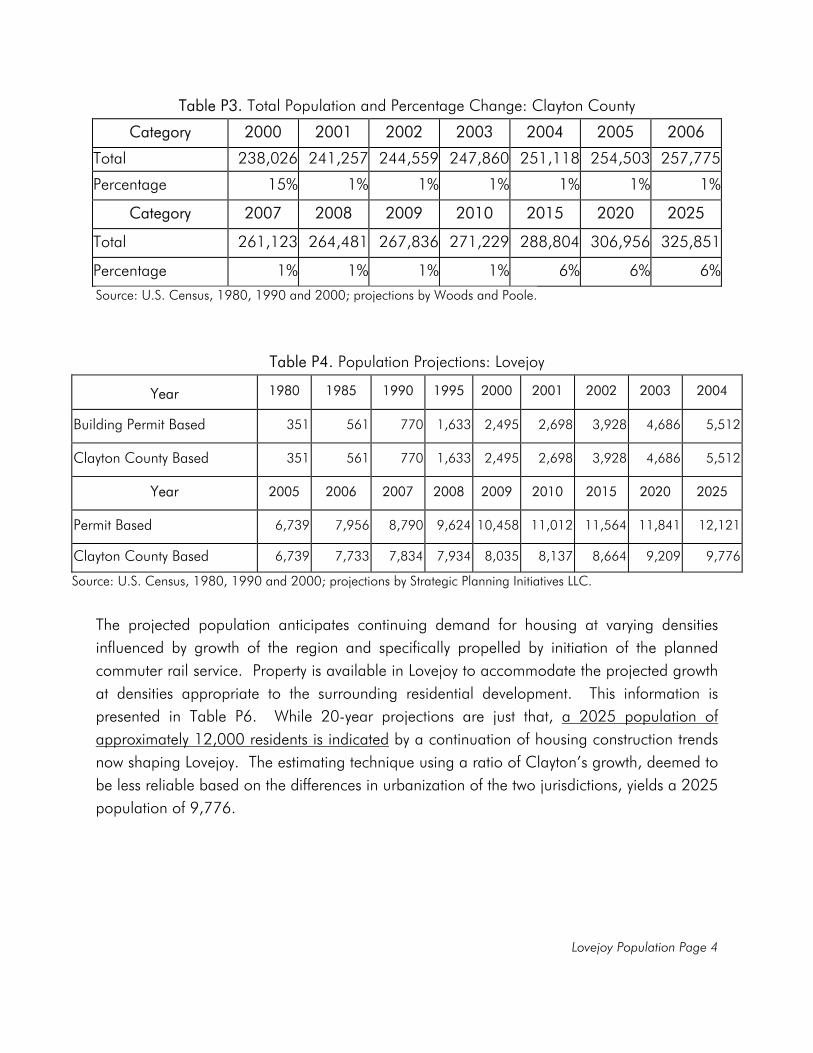
Georgia NA 19% 26% Source: U.S. Census, 1980, 1990 and 2000. Population Projections. Atlanta Regional Commission prepares population projections for Clayton County through the year 2025. These projections are found in Table P3. One technique for projecting Lovejoy’s population is to apply the ratio of Lovejoy’s population in 2000 to ARC’s projections for Clayton County, applying this same ratio or proportion to the projections for Clayton County. These projections are presented in Table P4; projections and growth rates for Georgia through the year 2025 are presented in Table P5. Lovejoy is virtually confined to the present city limits which comprise an area far less extensive than Clayton County. This will limit population growth as the land area is projected to be “built out” by 2025. The Land Use Element presents data on areas planned as future residential development. Recent building permit activity and the finite size of the city have been used to project Lovejoy’s population. A second technique for projecting future population uses recent trends in housing construction, that is, the number of units being added per year. This has been referenced to the number of acres planned for residential development. By verifying that the acreage required to accommodate projected units at appropriate densities is available as depicted on the Future Land Use Map, the construction trends can be validated. Housing unit projections for Lovejoy over the term of the Plan compare very closely with land areas planned and zoned as residential. These population projections are also in found in Table P4.
Lovejoy Population Page 4
Table P3. Total Population and Percentage Change: Clayton County
Category 2000 2001 2002 2003 2004 2005 2006
Total 238,026 241,257 244,559 247,860 251,118 254,503 257,775
Percentage 15% 1% 1% 1% 1% 1% 1%
Category 2007 2008 2009 2010 2015 2020 2025
Total 261,123 264,481 267,836 271,229 288,804 306,956 325,851
Percentage 1% 1% 1% 1% 6% 6% 6%Source: U.S. Census, 1980, 1990 and 2000; projections by Woods and Poole.
Table P4. Population Projections: Lovejoy
Year 1980 1985 1990 1995 2000 2001 2002 2003 2004
Building Permit Based 351 561 770 1,633 2,495 2,698 3,928 4,686 5,512
Clayton County Based 351 561 770 1,633 2,495 2,698 3,928 4,686 5,512
Year 2005 2006 2007 2008 2009 2010 2015 2020 2025
Permit Based 6,739 7,956 8,790 9,624 10,458 11,012 11,564 11,841 12,121
Clayton County Based 6,739 7,733 7,834 7,934 8,035 8,137 8,664 9,209 9,776
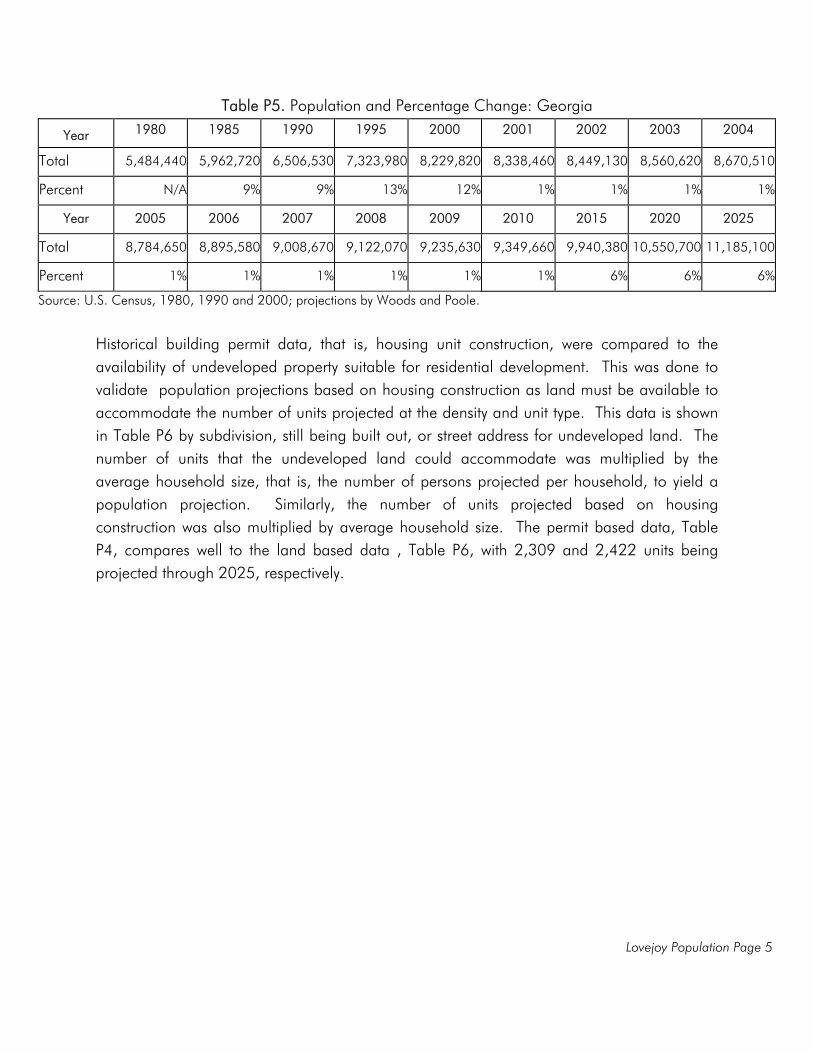
Source: U.S. Census, 1980, 1990 and 2000; projections by Strategic Planning Initiatives LLC. The projected population anticipates continuing demand for housing at varying densities influenced by growth of the region and specifically propelled by initiation of the planned commuter rail service. Property is available in Lovejoy to accommodate the projected growth at densities appropriate to the surrounding residential development. This information is presented in Table P6. While 20-year projections are just that, a 2025 population of approximately 12,000 residents is indicated by a continuation of housing construction trends now shaping Lovejoy. The estimating technique using a ratio of Clayton’s growth, deemed to be less reliable based on the differences in urbanization of the two jurisdictions, yields a 2025 population of 9,776.
Lovejoy Population Page 5
Table P5. Population and Percentage Change: Georgia
Year 1980 1985 1990 1995 2000 2001 2002 2003 2004
Total 5,484,440 5,962,720 6,506,530 7,323,980 8,229,820 8,338,460 8,449,130 8,560,620 8,670,510
Percent N/A 9% 9% 13% 12% 1% 1% 1% 1%
Year 2005 2006 2007 2008 2009 2010 2015 2020 2025
Total 8,784,650 8,895,580 9,008,670 9,122,070 9,235,630 9,349,660 9,940,380 10,550,700 11,185,100
Percent 1% 1% 1% 1% 1% 1% 6% 6% 6%
Source: U.S. Census, 1980, 1990 and 2000; projections by Woods and Poole.
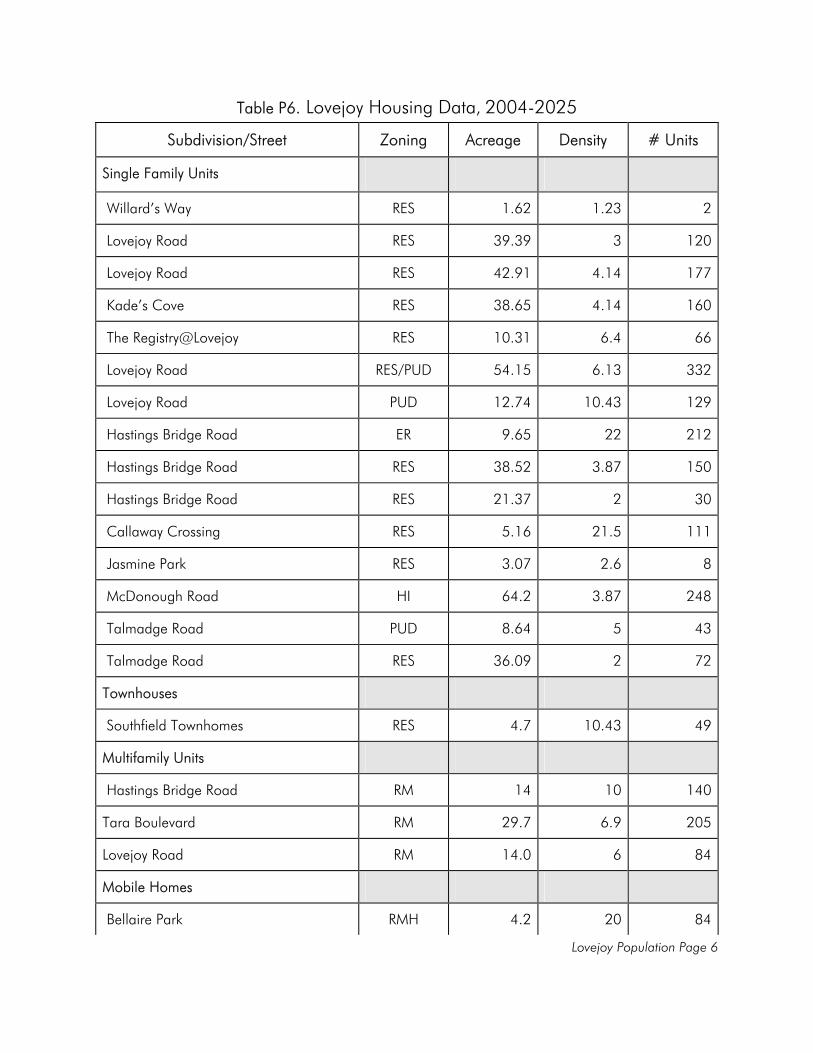
Historical building permit data, that is, housing unit construction, were compared to the availability of undeveloped property suitable for residential development. This was done to validate population projections based on housing construction as land must be available to accommodate the number of units projected at the density and unit type. This data is shown in Table P6 by subdivision, still being built out, or street address for undeveloped land. The number of units that the undeveloped land could accommodate was multiplied by the average household size, that is, the number of persons projected per household, to yield a population projection. Similarly, the number of units projected based on housing construction was also multiplied by average household size. The permit based data, Table P4, compares well to the land based data , Table P6, with 2,309 and 2,422 units being projected through 2025, respectively.
Lovejoy Population Page 6
Table P6. Lovejoy Housing Data, 2004-2025
Subdivision/Street Zoning Acreage Density # Units
Single Family Units
Willard’s Way RES 1.62 1.23 2
Lovejoy Road RES 39.39 3 120
Lovejoy Road RES 42.91 4.14 177
Kade’s Cove RES 38.65 4.14 160
The Registry@Lovejoy RES 10.31 6.4 66
Lovejoy Road RES/PUD 54.15 6.13 332
Lovejoy Road PUD 12.74 10.43 129
Hastings Bridge Road ER 9.65 22 212
Hastings Bridge Road RES 38.52 3.87 150
Hastings Bridge Road RES 21.37 2 30
Callaway Crossing RES 5.16 21.5 111
Jasmine Park RES 3.07 2.6 8
McDonough Road HI 64.2 3.87 248
Talmadge Road PUD 8.64 5 43
Talmadge Road RES 36.09 2 72
Townhouses
Southfield Townhomes RES 4.7 10.43 49
Multifamily Units
Hastings Bridge Road RM 14 10 140
Tara Boulevard RM 29.7 6.9 205
Lovejoy Road RM 14.0 6 84
Mobile Homes
Bellaire Park RMH 4.2 20 84
Lovejoy Population Page 7
TOTAL 453.07 2,422
Source: Strategic Planning Initiatives LLC, 2004.
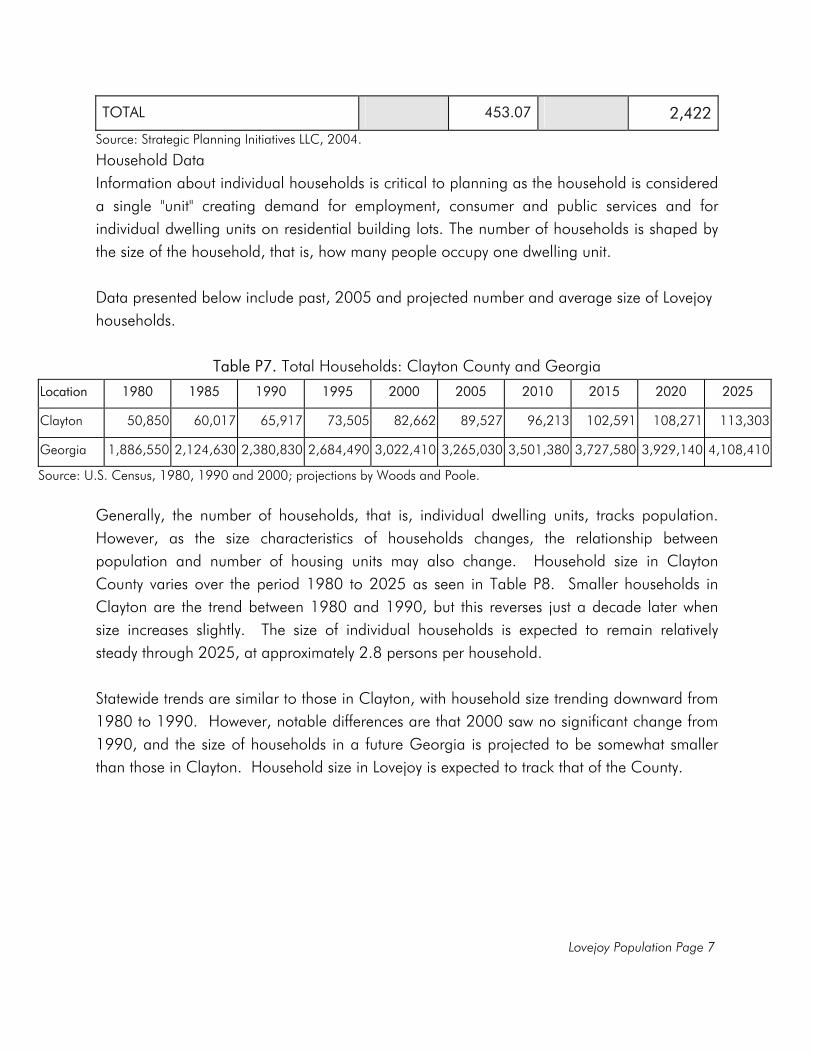
Household Data Information about individual households is critical to planning as the household is considered a single "unit" creating demand for employment, consumer and public services and for individual dwelling units on residential building lots. The number of households is shaped by the size of the household, that is, how many people occupy one dwelling unit. Data presented below include past, 2005 and projected number and average size of Lovejoy households.
Table P7. Total Households: Clayton County and Georgia
Location 1980 1985 1990 1995 2000 2005 2010 2015 2020 2025
Clayton 50,850 60,017 65,917 73,505 82,662 89,527 96,213 102,591 108,271 113,303
Georgia 1,886,550 2,124,630 2,380,830 2,684,490 3,022,410 3,265,030 3,501,380 3,727,580 3,929,140 4,108,410
Source: U.S. Census, 1980, 1990 and 2000; projections by Woods and Poole.
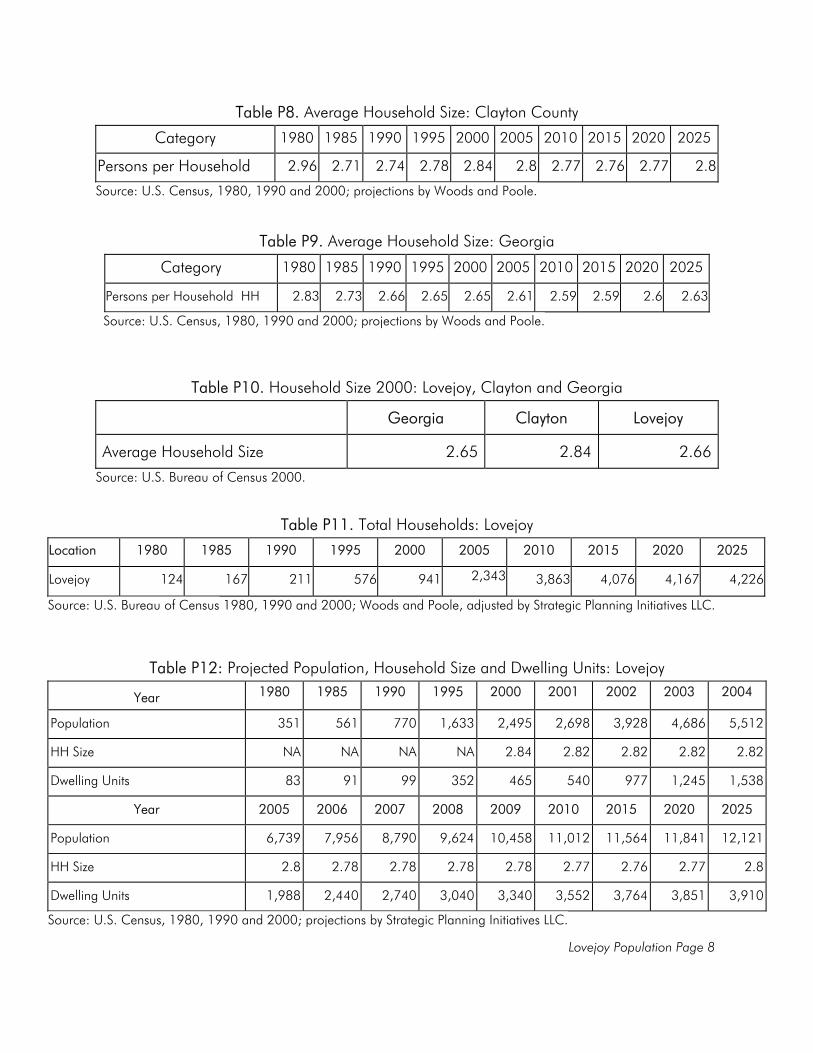
Generally, the number of households, that is, individual dwelling units, tracks population. However, as the size characteristics of households changes, the relationship between population and number of housing units may also change. Household size in Clayton County varies over the period 1980 to 2025 as seen in Table P8. Smaller households in Clayton are the trend between 1980 and 1990, but this reverses just a decade later when size increases slightly. The size of individual households is expected to remain relatively steady through 2025, at approximately 2.8 persons per household. Statewide trends are similar to those in Clayton, with household size trending downward from 1980 to 1990. However, notable differences are that 2000 saw no significant change from 1990, and the size of households in a future Georgia is projected to be somewhat smaller than those in Clayton. Household size in Lovejoy is expected to track that of the County.
Lovejoy Population Page 8
Table P8. Average Household Size: Clayton County
Category 1980 1985 1990 1995 2000 2005 2010 2015 2020 2025
Persons per Household 2.96 2.71 2.74 2.78 2.84 2.8 2.77 2.76 2.77 2.8
Source: U.S. Census, 1980, 1990 and 2000; projections by Woods and Poole.
Table P9. Average Household Size: Georgia
Category 1980 1985 1990 1995 2000 2005 2010 2015 2020 2025
Persons per Household HH 2.83 2.73 2.66 2.65 2.65 2.61 2.59 2.59 2.6 2.63
Source: U.S. Census, 1980, 1990 and 2000; projections by Woods and Poole.
Table P10. Household Size 2000: Lovejoy, Clayton and Georgia
Georgia Clayton Lovejoy
Average Household Size 2.65 2.84 2.66
Source: U.S. Bureau of Census 2000.
Table P11. Total Households: Lovejoy
Location 1980 1985 1990 1995 2000 2005 2010 2015 2020 2025
Lovejoy 124 167 211 576 941 2,343 3,863 4,076 4,167 4,226
Source: U.S. Bureau of Census 1980, 1990 and 2000; Woods and Poole, adjusted by Strategic Planning Initiatives LLC.
Table P12: Projected Population, Household Size and Dwelling Units: Lovejoy
Year 1980 1985 1990 1995 2000 2001 2002 2003 2004
Population 351 561 770 1,633 2,495 2,698 3,928 4,686 5,512
HH Size NA NA NA NA 2.84 2.82 2.82 2.82 2.82
Dwelling Units 83 91 99 352 465 540 977 1,245 1,538
Year 2005 2006 2007 2008 2009 2010 2015 2020 2025
Population 6,739 7,956 8,790 9,624 10,458 11,012 11,564 11,841 12,121
HH Size 2.8 2.78 2.78 2.78 2.78 2.77 2.76 2.77 2.8
Dwelling Units 1,988 2,440 2,740 3,040 3,340 3,552 3,764 3,851 3,910
Source: U.S. Census, 1980, 1990 and 2000; projections by Strategic Planning Initiatives LLC.
Lovejoy Population Page 9
Households, Population and Dwelling Units Findings of the Population Element, including projected total population and household size must bear a relationship to the total number of dwelling units in Lovejoy projected in the Housing Element. Each “household” must have a corresponding dwelling unit to become residents of Lovejoy. In other words, families and other households must a have a place to live. Table P12 displays Lovejoy’s population through 2025 as well as household size and the number of dwelling units. The number of dwelling units projected in 2025, for example, can be multiplied by the average household size projected for 2025 to yield the projected occupants, that is, residents. This total is 12,121 residents to occupy the number of dwelling units which were projected based on residential construction trends evident in Lovejoy. This number does not compare favorably to the population projected for 2025. However, the inmate population housed in group quarters at the Lovejoy Detention Center must be removed from the population occupying dwelling units in Lovejoy. When the 1,174 inmates are subtracted from the population total of 12,121, the resulting 10,947 residents compares very well with the population that is expected to occupy the 3,910 dwelling units projected in the Housing Element. Age Distribution The number of people in each age range, that is, age distribution, is important to assessing demand for various housing types and public services. This is particularly important over time as such data is an indication of the direction in which the population is heading, such as aging or entering family-forming age ranges. Data concerning the past, present and future distribution by age groups is presented here.
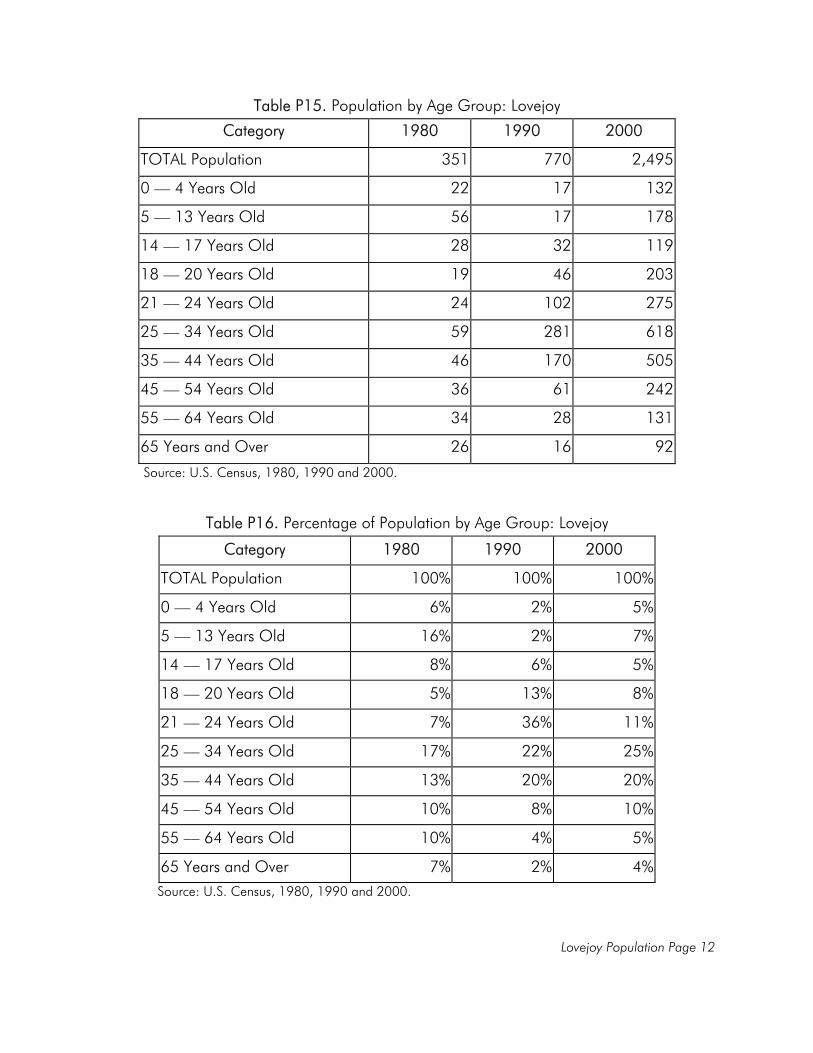
In 1980, 33 percent of Clayton County residents were under the age of 18, fully one person in three. This ratio slipped marginally in 1990 and stabilized at 29 percent by 2000. Lovejoy, by contrast, dropped from 30 percent in 1980 to 18 percent in 1990 and 17 percent by 2000. Lovejoy experienced a significant increase in population in the 25 - 34 and 35 - 44 age ranges which would normally signal an increase in children. This increase is very likely generated by the inmate population in the Lovejoy Detention Center which is male and would be in these age ranges. Clayton's population was more stable across the age ranges for the three decades which is expected in a larger population.
The Detention Center being located in a city with a small population base present an interesting dynamic. The Center opened in Lovejoy in 1986, occurring between the 1980 and 1990 census of population. Despite stability in average household size, which is a figure
Lovejoy Population Page 10
based on Clayton data only, the city saw a precipitous decline in the number of children as a percentage of total population. As household size changed very little, the composition had to have changed. This would normally suggest that several adults occupied the same household as one unit. However, the inmate population explains this, and as this population would not impact the number of children, this also explains how the number of persons in child-bearing age ranges could increase as the percentage of children decreased.
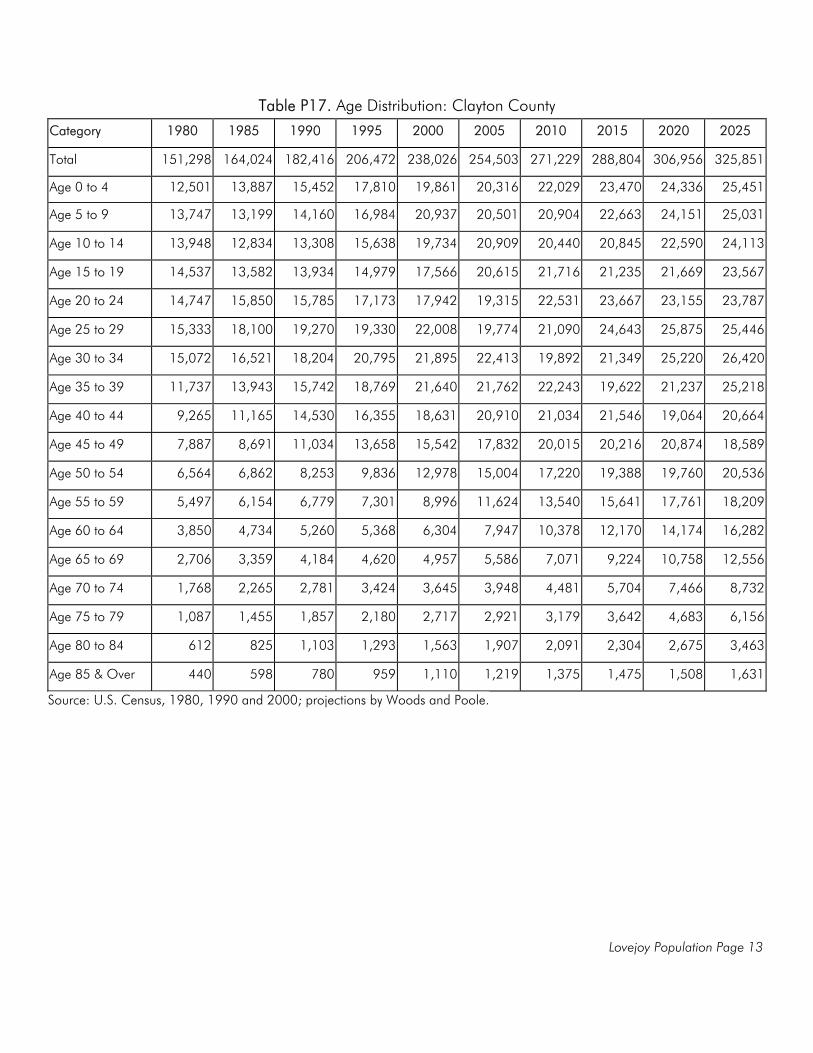
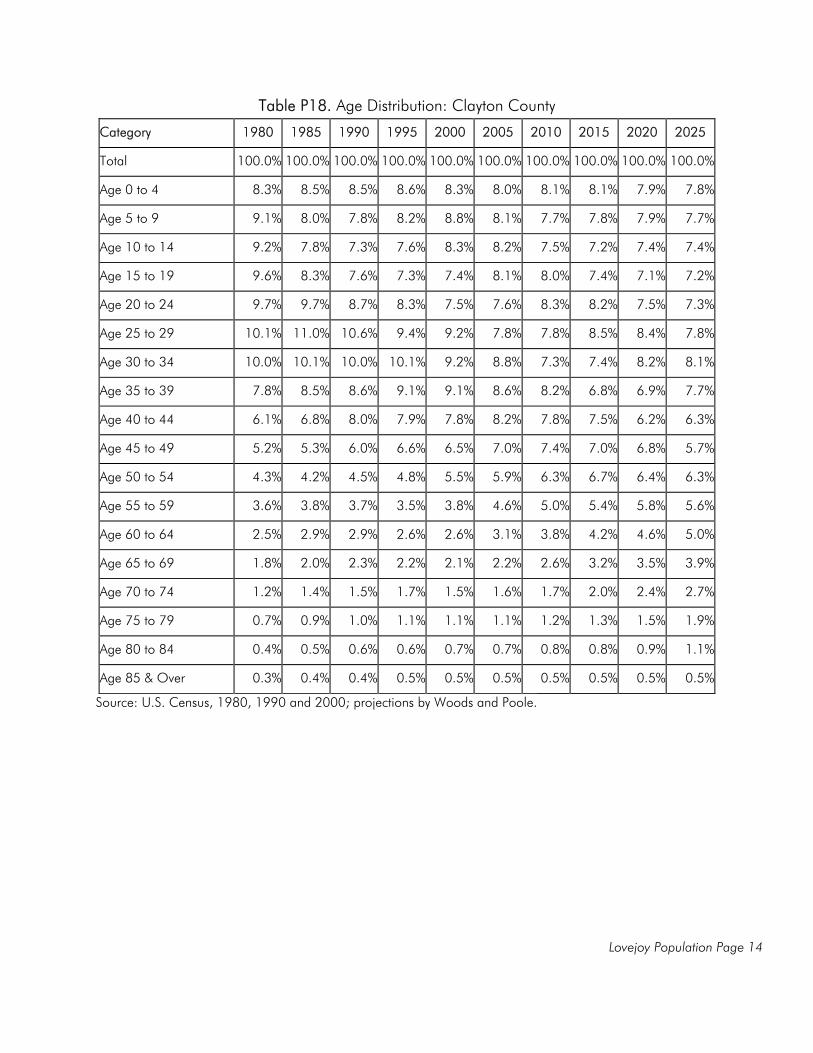
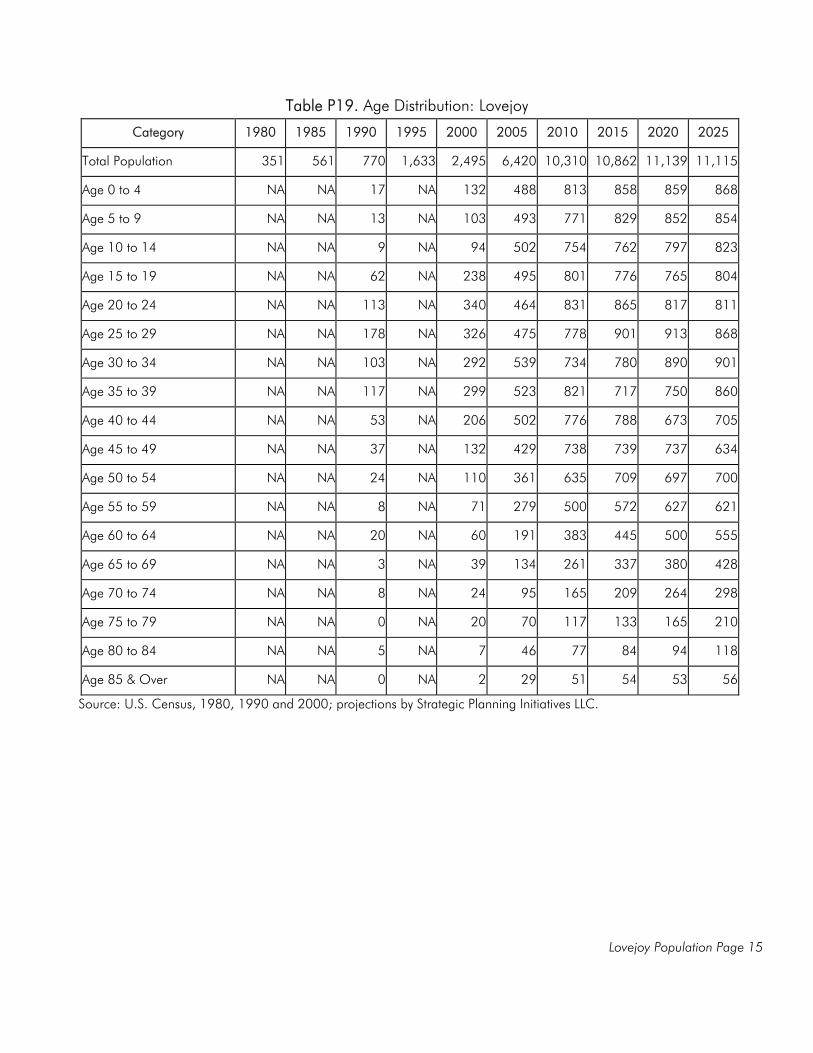
Projections as to age range are not readily available for Lovejoy. Surprisingly, projections for Clayton County demonstrate the continuing dominance of the post-World War II "baby boomers." This age cohort, born between 1947 and 1964, will be in the 55 - 64 and 65 plus age ranges by 2025. These ranges are projected to expand slightly, some four (4) percentage points individually, with a commensurate contraction in all other age ranges, with the exception of the 0 - 4 years old. Importantly, as Lovejoy continues to develop, an expectation that the age distribution will more closely track that of Clayton County is reasonable. Approximately 21 percent of the population of Clayton County, an increase of eight (8) percent over the year 2000, will be age 55 and over by 2025. Information concerning age distribution for Clayton County is presented in Tables P13 and P14. This data is applied to Lovejoy’s population totals to derive age group distribution through the year 2025 and is presented in Table P4.
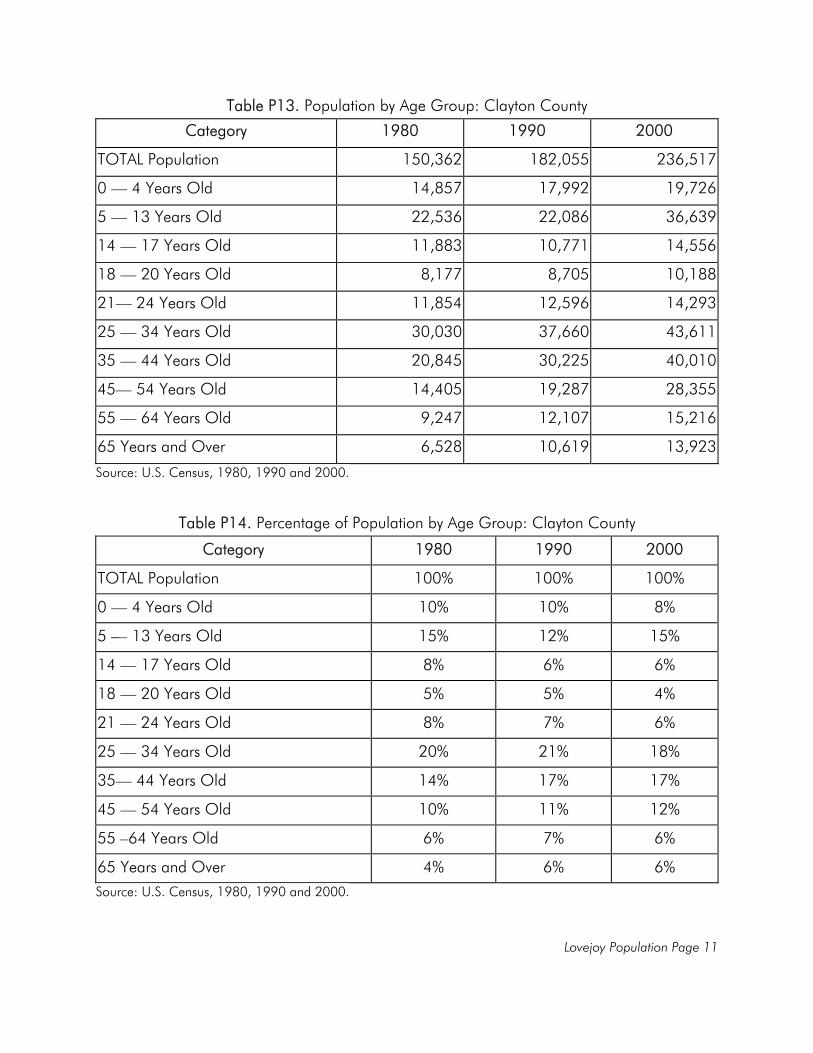
Lovejoy Population Page 11
Table P13. Population by Age Group: Clayton County
Category 1980 1990 2000
TOTAL Population 150,362 182,055 236,517
0 –– 4 Years Old 14,857 17,992 19,726
5 –– 13 Years Old 22,536 22,086 36,639
14 –– 17 Years Old 11,883 10,771 14,556
18 –– 20 Years Old 8,177 8,705 10,188
21–– 24 Years Old 11,854 12,596 14,293
25 –– 34 Years Old 30,030 37,660 43,611
35 –– 44 Years Old 20,845 30,225 40,010
45–– 54 Years Old 14,405 19,287 28,355
55 –– 64 Years Old 9,247 12,107 15,216
65 Years and Over 6,528 10,619 13,923
Source: U.S. Census, 1980, 1990 and 2000.
Table P14. Percentage of Population by Age Group: Clayton County
Category 1980 1990 2000
TOTAL Population 100% 100% 100%
0 –– 4 Years Old 10% 10% 8%
5 –– 13 Years Old 15% 12% 15%
14 –– 17 Years Old 8% 6% 6%
18 –– 20 Years Old 5% 5% 4%
21 –– 24 Years Old 8% 7% 6%
25 –– 34 Years Old 20% 21% 18%
35–– 44 Years Old 14% 17% 17%
45 –– 54 Years Old 10% 11% 12%
55 –64 Years Old 6% 7% 6%
65 Years and Over 4% 6% 6% Source: U.S. Census, 1980, 1990 and 2000.
Lovejoy Population Page 12
Table P15. Population by Age Group: Lovejoy
Category 1980 1990 2000
TOTAL Population 351 770 2,495
0 –– 4 Years Old 22 17 132
5 –– 13 Years Old 56 17 178
14 –– 17 Years Old 28 32 119
18 –– 20 Years Old 19 46 203
21 –– 24 Years Old 24 102 275
25 –– 34 Years Old 59 281 618
35 –– 44 Years Old 46 170 505
45 –– 54 Years Old 36 61 242
55 –– 64 Years Old 34 28 131
65 Years and Over 26 16 92
Source: U.S. Census, 1980, 1990 and 2000.
Table P16. Percentage of Population by Age Group: Lovejoy
Category 1980 1990 2000
TOTAL Population 100% 100% 100%
0 –– 4 Years Old 6% 2% 5%
5 –– 13 Years Old 16% 2% 7%
14 –– 17 Years Old 8% 6% 5%
18 –– 20 Years Old 5% 13% 8%
21 –– 24 Years Old 7% 36% 11%
25 –– 34 Years Old 17% 22% 25%
35 –– 44 Years Old 13% 20% 20%
45 –– 54 Years Old 10% 8% 10%
55 –– 64 Years Old 10% 4% 5%
65 Years and Over 7% 2% 4% Source: U.S. Census, 1980, 1990 and 2000.
Lovejoy Population Page 13
Table P17. Age Distribution: Clayton County
Category 1980 1985 1990 1995 2000 2005 2010 2015 2020 2025
Total 151,298 164,024 182,416 206,472 238,026 254,503 271,229 288,804 306,956 325,851
Age 0 to 4 12,501 13,887 15,452 17,810 19,861 20,316 22,029 23,470 24,336 25,451
Age 5 to 9 13,747 13,199 14,160 16,984 20,937 20,501 20,904 22,663 24,151 25,031
Age 10 to 14 13,948 12,834 13,308 15,638 19,734 20,909 20,440 20,845 22,590 24,113
Age 15 to 19 14,537 13,582 13,934 14,979 17,566 20,615 21,716 21,235 21,669 23,567
Age 20 to 24 14,747 15,850 15,785 17,173 17,942 19,315 22,531 23,667 23,155 23,787
Age 25 to 29 15,333 18,100 19,270 19,330 22,008 19,774 21,090 24,643 25,875 25,446
Age 30 to 34 15,072 16,521 18,204 20,795 21,895 22,413 19,892 21,349 25,220 26,420
Age 35 to 39 11,737 13,943 15,742 18,769 21,640 21,762 22,243 19,622 21,237 25,218
Age 40 to 44 9,265 11,165 14,530 16,355 18,631 20,910 21,034 21,546 19,064 20,664
Age 45 to 49 7,887 8,691 11,034 13,658 15,542 17,832 20,015 20,216 20,874 18,589
Age 50 to 54 6,564 6,862 8,253 9,836 12,978 15,004 17,220 19,388 19,760 20,536
Age 55 to 59 5,497 6,154 6,779 7,301 8,996 11,624 13,540 15,641 17,761 18,209
Age 60 to 64 3,850 4,734 5,260 5,368 6,304 7,947 10,378 12,170 14,174 16,282
Age 65 to 69 2,706 3,359 4,184 4,620 4,957 5,586 7,071 9,224 10,758 12,556
Age 70 to 74 1,768 2,265 2,781 3,424 3,645 3,948 4,481 5,704 7,466 8,732
Age 75 to 79 1,087 1,455 1,857 2,180 2,717 2,921 3,179 3,642 4,683 6,156
Age 80 to 84 612 825 1,103 1,293 1,563 1,907 2,091 2,304 2,675 3,463
Age 85 & Over 440 598 780 959 1,110 1,219 1,375 1,475 1,508 1,631
Source: U.S. Census, 1980, 1990 and 2000; projections by Woods and Poole.
Lovejoy Population Page 14
Table P18. Age Distribution: Clayton County
Category 1980 1985 1990 1995 2000 2005 2010 2015 2020 2025
Total 100.0% 100.0% 100.0% 100.0% 100.0% 100.0% 100.0% 100.0% 100.0% 100.0%
Age 0 to 4 8.3% 8.5% 8.5% 8.6% 8.3% 8.0% 8.1% 8.1% 7.9% 7.8%
Age 5 to 9 9.1% 8.0% 7.8% 8.2% 8.8% 8.1% 7.7% 7.8% 7.9% 7.7%
Age 10 to 14 9.2% 7.8% 7.3% 7.6% 8.3% 8.2% 7.5% 7.2% 7.4% 7.4%
Age 15 to 19 9.6% 8.3% 7.6% 7.3% 7.4% 8.1% 8.0% 7.4% 7.1% 7.2%
Age 20 to 24 9.7% 9.7% 8.7% 8.3% 7.5% 7.6% 8.3% 8.2% 7.5% 7.3%
Age 25 to 29 10.1% 11.0% 10.6% 9.4% 9.2% 7.8% 7.8% 8.5% 8.4% 7.8%
Age 30 to 34 10.0% 10.1% 10.0% 10.1% 9.2% 8.8% 7.3% 7.4% 8.2% 8.1%
Age 35 to 39 7.8% 8.5% 8.6% 9.1% 9.1% 8.6% 8.2% 6.8% 6.9% 7.7%
Age 40 to 44 6.1% 6.8% 8.0% 7.9% 7.8% 8.2% 7.8% 7.5% 6.2% 6.3%
Age 45 to 49 5.2% 5.3% 6.0% 6.6% 6.5% 7.0% 7.4% 7.0% 6.8% 5.7%
Age 50 to 54 4.3% 4.2% 4.5% 4.8% 5.5% 5.9% 6.3% 6.7% 6.4% 6.3%
Age 55 to 59 3.6% 3.8% 3.7% 3.5% 3.8% 4.6% 5.0% 5.4% 5.8% 5.6%
Age 60 to 64 2.5% 2.9% 2.9% 2.6% 2.6% 3.1% 3.8% 4.2% 4.6% 5.0%
Age 65 to 69 1.8% 2.0% 2.3% 2.2% 2.1% 2.2% 2.6% 3.2% 3.5% 3.9%
Age 70 to 74 1.2% 1.4% 1.5% 1.7% 1.5% 1.6% 1.7% 2.0% 2.4% 2.7%
Age 75 to 79 0.7% 0.9% 1.0% 1.1% 1.1% 1.1% 1.2% 1.3% 1.5% 1.9%
Age 80 to 84 0.4% 0.5% 0.6% 0.6% 0.7% 0.7% 0.8% 0.8% 0.9% 1.1%
Age 85 & Over 0.3% 0.4% 0.4% 0.5% 0.5% 0.5% 0.5% 0.5% 0.5% 0.5%
Source: U.S. Census, 1980, 1990 and 2000; projections by Woods and Poole.
Lovejoy Population Page 15
Table P19. Age Distribution: Lovejoy
Category 1980 1985 1990 1995 2000 2005 2010 2015 2020 2025
Total Population 351 561 770 1,633 2,495 6,420 10,310 10,862 11,139 11,115
Age 0 to 4 NA NA 17 NA 132 488 813 858 859 868
Age 5 to 9 NA NA 13 NA 103 493 771 829 852 854
Age 10 to 14 NA NA 9 NA 94 502 754 762 797 823
Age 15 to 19 NA NA 62 NA 238 495 801 776 765 804
Age 20 to 24 NA NA 113 NA 340 464 831 865 817 811
Age 25 to 29 NA NA 178 NA 326 475 778 901 913 868
Age 30 to 34 NA NA 103 NA 292 539 734 780 890 901
Age 35 to 39 NA NA 117 NA 299 523 821 717 750 860
Age 40 to 44 NA NA 53 NA 206 502 776 788 673 705
Age 45 to 49 NA NA 37 NA 132 429 738 739 737 634
Age 50 to 54 NA NA 24 NA 110 361 635 709 697 700
Age 55 to 59 NA NA 8 NA 71 279 500 572 627 621
Age 60 to 64 NA NA 20 NA 60 191 383 445 500 555
Age 65 to 69 NA NA 3 NA 39 134 261 337 380 428
Age 70 to 74 NA NA 8 NA 24 95 165 209 264 298
Age 75 to 79 NA NA 0 NA 20 70 117 133 165 210
Age 80 to 84 NA NA 5 NA 7 46 77 84 94 118
Age 85 & Over NA NA 0 NA 2 29 51 54 53 56
Source: U.S. Census, 1980, 1990 and 2000; projections by Strategic Planning Initiatives LLC.
Lovejoy Population Page 16
Table P20. Age Distribution: Lovejoy Percentage
Category 1980 1985 1990 1995 2000 2005 2010 2015 2020 2025
Lovejoy 351 561 770 1,633 2,495 6,116 10,006 10 006
10,558 10 558
10,835 11,115
Age 0 to 4 NA NA 2% NA 5.3% 8.1% 7.7% 7.8% 7.9% 7.7%
Age 5 to 9 NA NA 2% NA 4.1% 8.2% 7.5% 7.2% 7.4% 7.4%
Age 10 to 14 NA NA 1% NA 3.8% 8.1% 8.0% 7.4% 7.1% 7.2%
Age 15 to 19 NA NA 8% NA 9.5% 7.6% 8.3% 8.2% 7.5% 7.3%
Age 20 to 24 NA NA 15% NA 13.6% 7.8% 7.8% 8.5% 8.4% 7.8%
Age 25 to 29 NA NA 23% NA 13.1% 8.8% 7.3% 7.4% 8.2% 8.1%
Age 30 to 34 NA NA 13% NA 11.7% 8.6% 8.2% 6.8% 6.9% 7.7%
Age 35 to 39 NA NA 15% NA 12.0% 8.2% 7.8% 7.5% 6.2% 6.3%
Age 40 to 44 NA NA 7% NA 8.3% 7.0% 7.4% 7.0% 6.8% 5.7%
Age 45 to 49 NA NA 5% NA 5.3% 5.9% 6.3% 6.7% 6.4% 6.3%
Age 50 to 54 NA NA 3% NA 4.4% 4.6% 5.0% 5.4% 5.8% 5.6%
Age 55 to 59 NA NA 1% NA 2.8% 3.1% 3.8% 4.2% 4.6% 5.0%
Age 60 to 64 NA NA 2% NA 2.4% 2.2% 2.6% 3.2% 3.5% 3.9%
Age 65 to 69 NA NA 0% NA 1.6% 1.6% 1.7% 2.0% 2.4% 2.7%
Age 70 to 74 NA NA 8% NA 1.0% 1.1% 1.2% 1.3% 1.5% 1.9%
Age 75 to 79 NA NA 0% NA 0.8% 0.7% 0.8% 0.8% 0.9% 1.1%
Age 80 to 84 NA NA 5% NA 0.3% 0.5% 0.5% 0.5% 0.5% 0.5%
Age 85 & Over NA NA 0% NA 100.0% 100.0% 100.0% 100.0% 100.0% 100.0%
Source: U.S. Census, 1980, 1990 and 2000; projections by Strategic Planning Initiatives LLC.
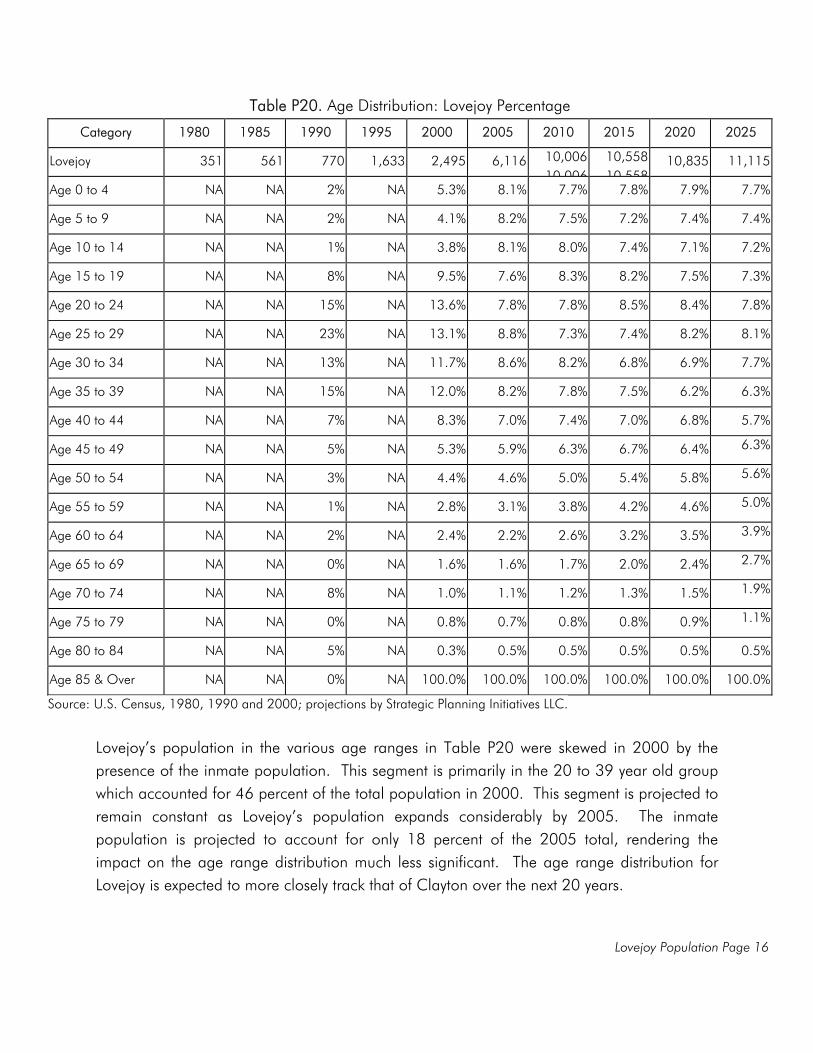
Lovejoy’s population in the various age ranges in Table P20 were skewed in 2000 by the presence of the inmate population. This segment is primarily in the 20 to 39 year old group which accounted for 46 percent of the total population in 2000. This segment is projected to remain constant as Lovejoy’s population expands considerably by 2005. The inmate population is projected to account for only 18 percent of the 2005 total, rendering the impact on the age range distribution much less significant. The age range distribution for Lovejoy is expected to more closely track that of Clayton over the next 20 years.
Lovejoy Population Page 17
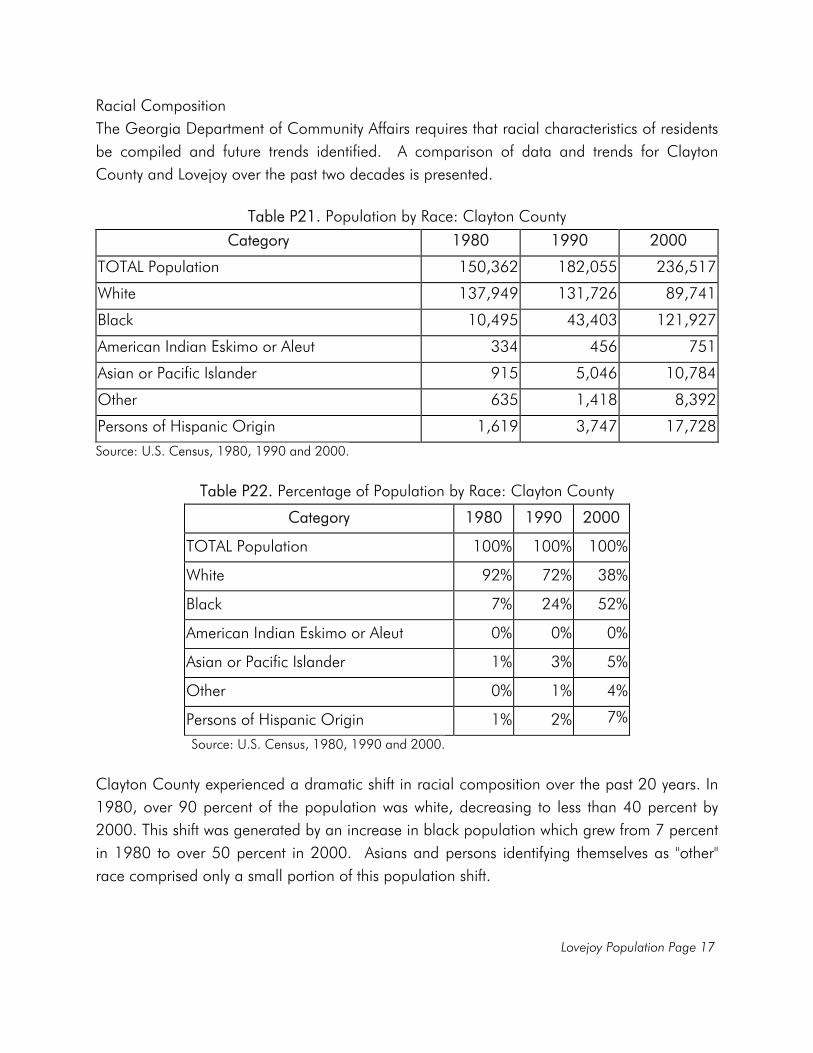
Racial Composition The Georgia Department of Community Affairs requires that racial characteristics of residents be compiled and future trends identified. A comparison of data and trends for Clayton County and Lovejoy over the past two decades is presented.
Table P21. Population by Race: Clayton County
Category 1980 1990 2000
TOTAL Population 150,362 182,055 236,517
White 137,949 131,726 89,741
Black 10,495 43,403 121,927
American Indian Eskimo or Aleut 334 456 751
Asian or Pacific Islander 915 5,046 10,784
Other 635 1,418 8,392
Persons of Hispanic Origin 1,619 3,747 17,728
Source: U.S. Census, 1980, 1990 and 2000.
Table P22. Percentage of Population by Race: Clayton County
Category 1980 1990 2000
TOTAL Population 100% 100% 100%
White 92% 72% 38%
Black 7% 24% 52%
American Indian Eskimo or Aleut 0% 0% 0%
Asian or Pacific Islander 1% 3% 5%
Other 0% 1% 4%
Persons of Hispanic Origin 1% 2% 7%
Source: U.S. Census, 1980, 1990 and 2000.
Clayton County experienced a dramatic shift in racial composition over the past 20 years. In 1980, over 90 percent of the population was white, decreasing to less than 40 percent by 2000. This shift was generated by an increase in black population which grew from 7 percent in 1980 to over 50 percent in 2000. Asians and persons identifying themselves as "other" race comprised only a small portion of this population shift.
Lovejoy Population Page 18
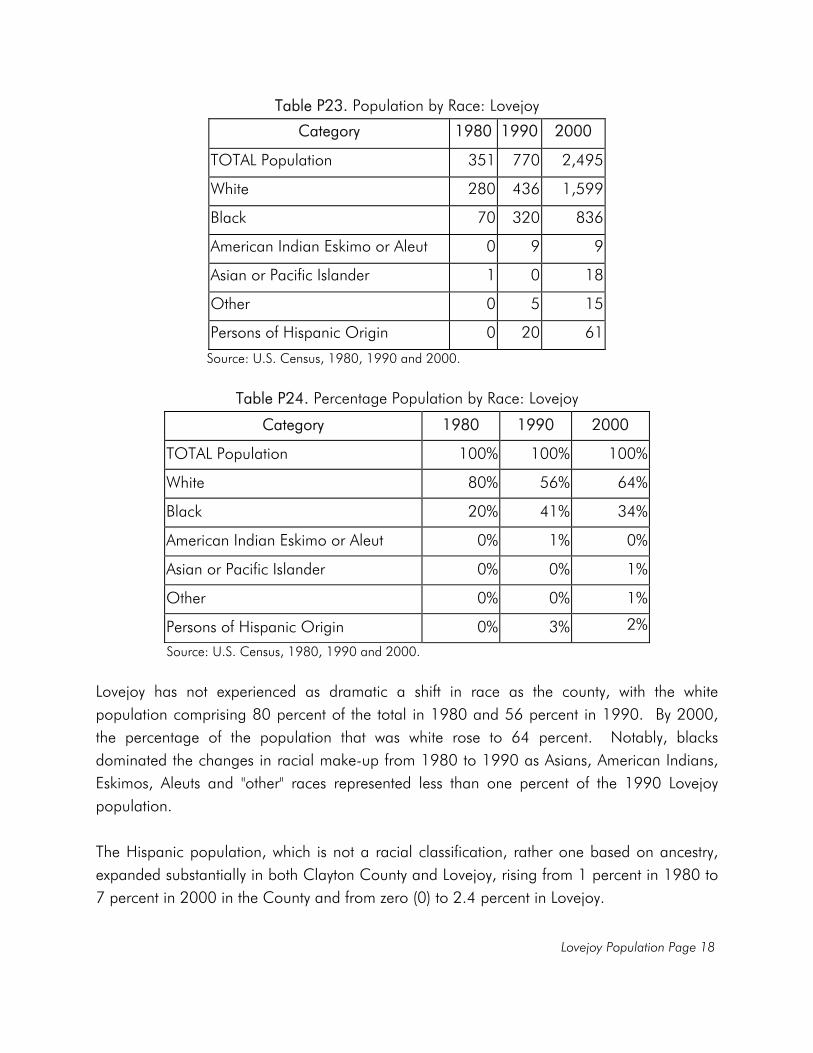
Table P23. Population by Race: Lovejoy
Category 1980 1990 2000
TOTAL Population 351 770 2,495
White 280 436 1,599
Black 70 320 836
American Indian Eskimo or Aleut 0 9 9
Asian or Pacific Islander 1 0 18
Other 0 5 15
Persons of Hispanic Origin 0 20 61 Source: U.S. Census, 1980, 1990 and 2000.
Table P24. Percentage Population by Race: Lovejoy
Category 1980 1990 2000
TOTAL Population 100% 100% 100%
White 80% 56% 64%
Black 20% 41% 34%
American Indian Eskimo or Aleut 0% 1% 0%
Asian or Pacific Islander 0% 0% 1%
Other 0% 0% 1%
Persons of Hispanic Origin 0% 3% 2%
Source: U.S. Census, 1980, 1990 and 2000.
Lovejoy has not experienced as dramatic a shift in race as the county, with the white population comprising 80 percent of the total in 1980 and 56 percent in 1990. By 2000, the percentage of the population that was white rose to 64 percent. Notably, blacks dominated the changes in racial make-up from 1980 to 1990 as Asians, American Indians, Eskimos, Aleuts and "other" races represented less than one percent of the 1990 Lovejoy population. The Hispanic population, which is not a racial classification, rather one based on ancestry, expanded substantially in both Clayton County and Lovejoy, rising from 1 percent in 1980 to 7 percent in 2000 in the County and from zero (0) to 2.4 percent in Lovejoy.
Lovejoy Population Page 19
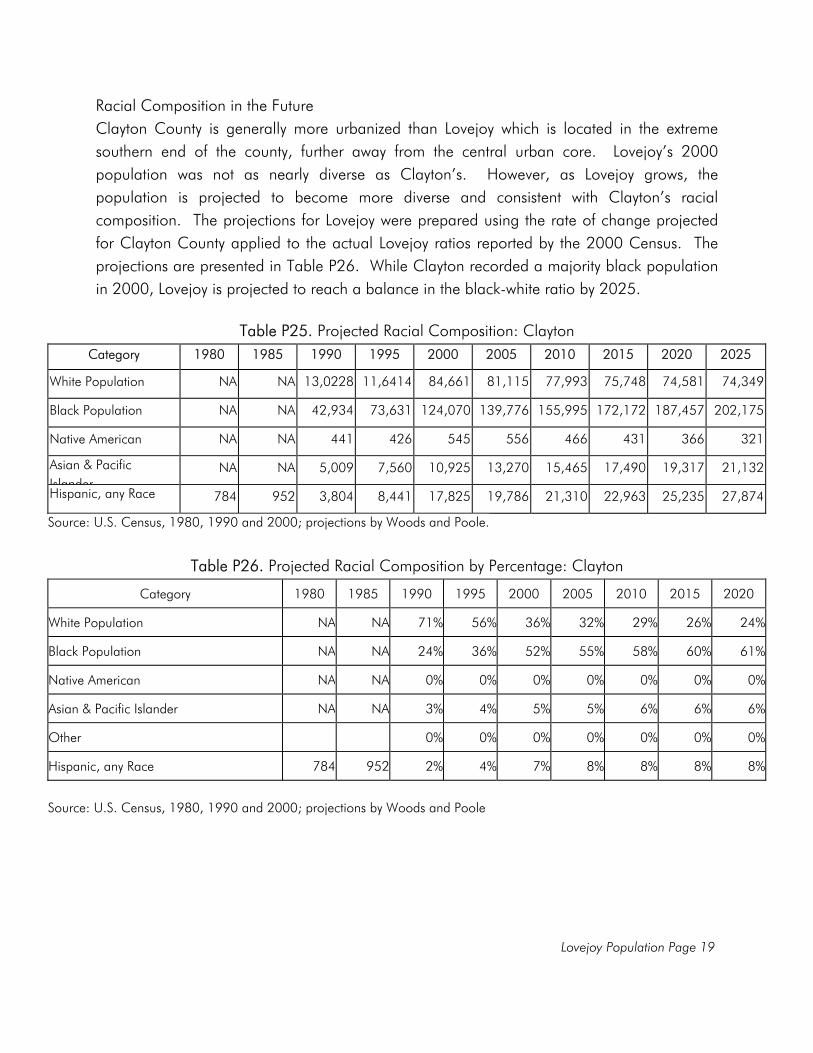
Racial Composition in the Future Clayton County is generally more urbanized than Lovejoy which is located in the extreme southern end of the county, further away from the central urban core. Lovejoy’s 2000 population was not as nearly diverse as Clayton’s. However, as Lovejoy grows, the population is projected to become more diverse and consistent with Clayton’s racial composition. The projections for Lovejoy were prepared using the rate of change projected for Clayton County applied to the actual Lovejoy ratios reported by the 2000 Census. The projections are presented in Table P26. While Clayton recorded a majority black population in 2000, Lovejoy is projected to reach a balance in the black-white ratio by 2025.
Table P25. Projected Racial Composition: Clayton
Category 1980 1985 1990 1995 2000 2005 2010 2015 2020 2025
White Population NA NA 13,0228 11,6414 84,661 81,115 77,993 75,748 74,581 74,349
Black Population NA NA 42,934 73,631 124,070 139,776 155,995 172,172 187,457 202,175
Native American NA NA 441 426 545 556 466 431 366 321
Asian & Pacific Islander
NA NA 5,009 7,560 10,925 13,270 15,465 17,490 19,317 21,132
Hispanic, any Race 784 952 3,804 8,441 17,825 19,786 21,310 22,963 25,235 27,874
Source: U.S. Census, 1980, 1990 and 2000; projections by Woods and Poole.
Table P26. Projected Racial Composition by Percentage: Clayton
Category 1980 1985 1990 1995 2000 2005 2010 2015 2020
White Population NA NA 71% 56% 36% 32% 29% 26% 24%
Black Population NA NA 24% 36% 52% 55% 58% 60% 61%
Native American NA NA 0% 0% 0% 0% 0% 0% 0%
Asian & Pacific Islander NA NA 3% 4% 5% 5% 6% 6% 6%
Other 0% 0% 0% 0% 0% 0% 0%
Hispanic, any Race 784 952 2% 4% 7% 8% 8% 8% 8%
Source: U.S. Census, 1980, 1990 and 2000; projections by Woods and Poole
Lovejoy Population Page 20
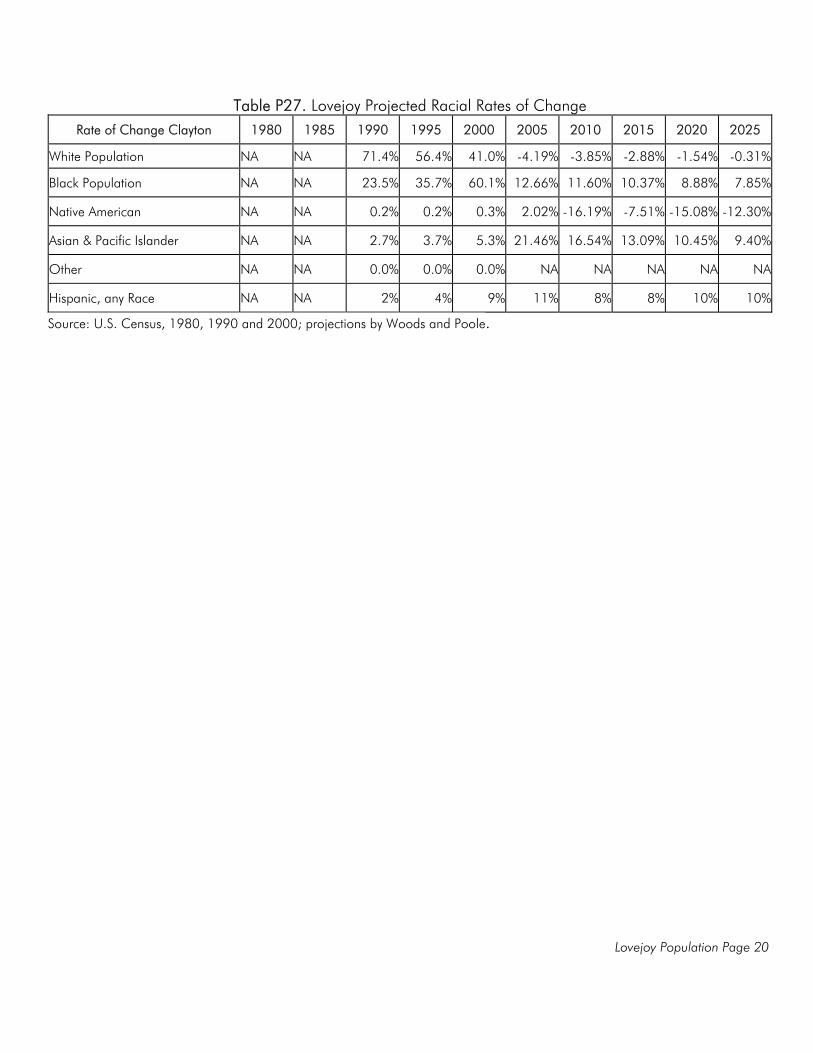
Table P27. Lovejoy Projected Racial Rates of Change
Rate of Change Clayton 1980 1985 1990 1995 2000 2005 2010 2015 2020 2025
White Population NA NA 71.4% 56.4% 41.0% -4.19% -3.85% -2.88% -1.54% -0.31%
Black Population NA NA 23.5% 35.7% 60.1% 12.66% 11.60% 10.37% 8.88% 7.85%
Native American NA NA 0.2% 0.2% 0.3% 2.02% -16.19% -7.51% -15.08% -12.30%
Asian & Pacific Islander NA NA 2.7% 3.7% 5.3% 21.46% 16.54% 13.09% 10.45% 9.40%
Other NA NA 0.0% 0.0% 0.0% NA NA NA NA NA
Hispanic, any Race NA NA 2% 4% 9% 11% 8% 8% 10% 10%
Source: U.S. Census, 1980, 1990 and 2000; projections by Woods and Poole.
Lovejoy Population Page 21
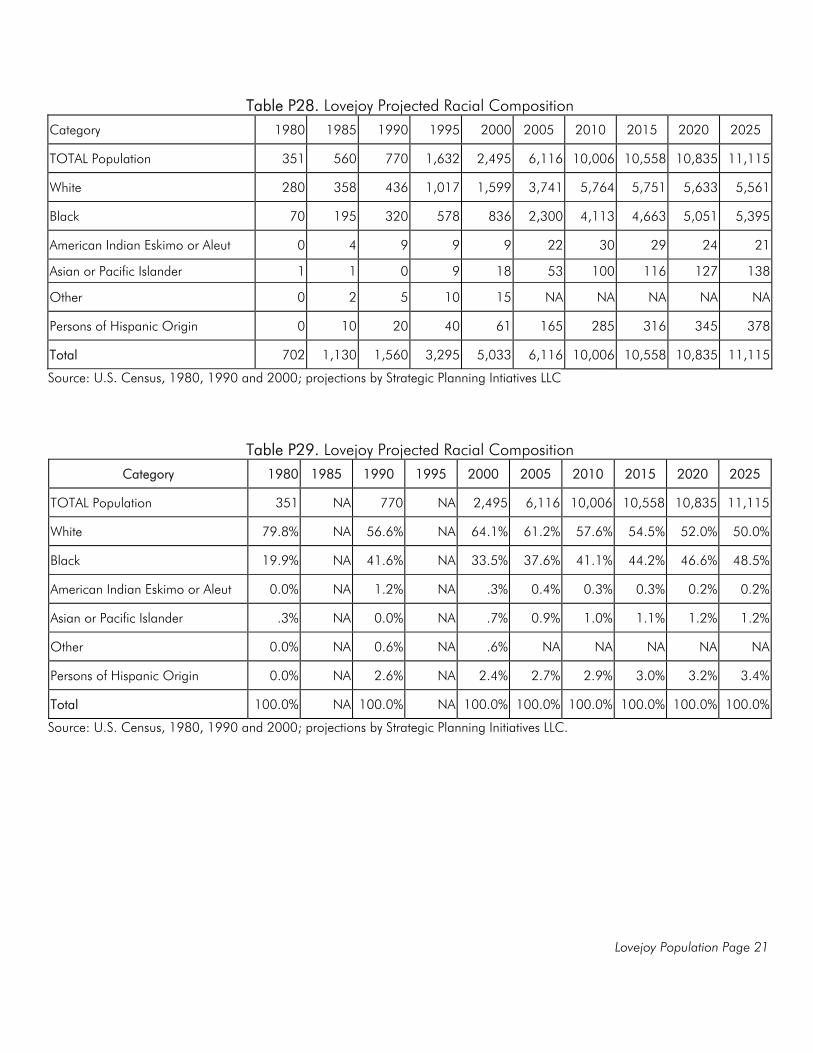
Table P28. Lovejoy Projected Racial Composition Category 1980 1985 1990 1995 2000 2005 2010 2015 2020 2025
TOTAL Population 351 560 770 1,632 2,495 6,116 10,006 10,558 10,835 11,115
White 280 358 436 1,017 1,599 3,741 5,764 5,751 5,633 5,561
Black 70 195 320 578 836 2,300 4,113 4,663 5,051 5,395
American Indian Eskimo or Aleut 0 4 9 9 9 22 30 29 24 21
Asian or Pacific Islander 1 1 0 9 18 53 100 116 127 138
Other 0 2 5 10 15 NA NA NA NA NA
Persons of Hispanic Origin 0 10 20 40 61 165 285 316 345 378
Total 702 1,130 1,560 3,295 5,033 6,116 10,006 10,558 10,835 11,115
Source: U.S. Census, 1980, 1990 and 2000; projections by Strategic Planning Intiatives LLC
Table P29. Lovejoy Projected Racial Composition Category 1980 1985 1990 1995 2000 2005 2010 2015 2020 2025
TOTAL Population 351 NA 770 NA 2,495 6,116 10,006 10,558 10,835 11,115
White 79.8% NA 56.6% NA 64.1% 61.2% 57.6% 54.5% 52.0% 50.0%
Black 19.9% NA 41.6% NA 33.5% 37.6% 41.1% 44.2% 46.6% 48.5%
American Indian Eskimo or Aleut 0.0% NA 1.2% NA .3% 0.4% 0.3% 0.3% 0.2% 0.2%
Asian or Pacific Islander .3% NA 0.0% NA .7% 0.9% 1.0% 1.1% 1.2% 1.2%
Other 0.0% NA 0.6% NA .6% NA NA NA NA NA
Persons of Hispanic Origin 0.0% NA 2.6% NA 2.4% 2.7% 2.9% 3.0% 3.2% 3.4%
Total 100.0% NA 100.0% NA 100.0% 100.0% 100.0% 100.0% 100.0% 100.0%
Source: U.S. Census, 1980, 1990 and 2000; projections by Strategic Planning Initiatives LLC.
Lovejoy Population Page 22
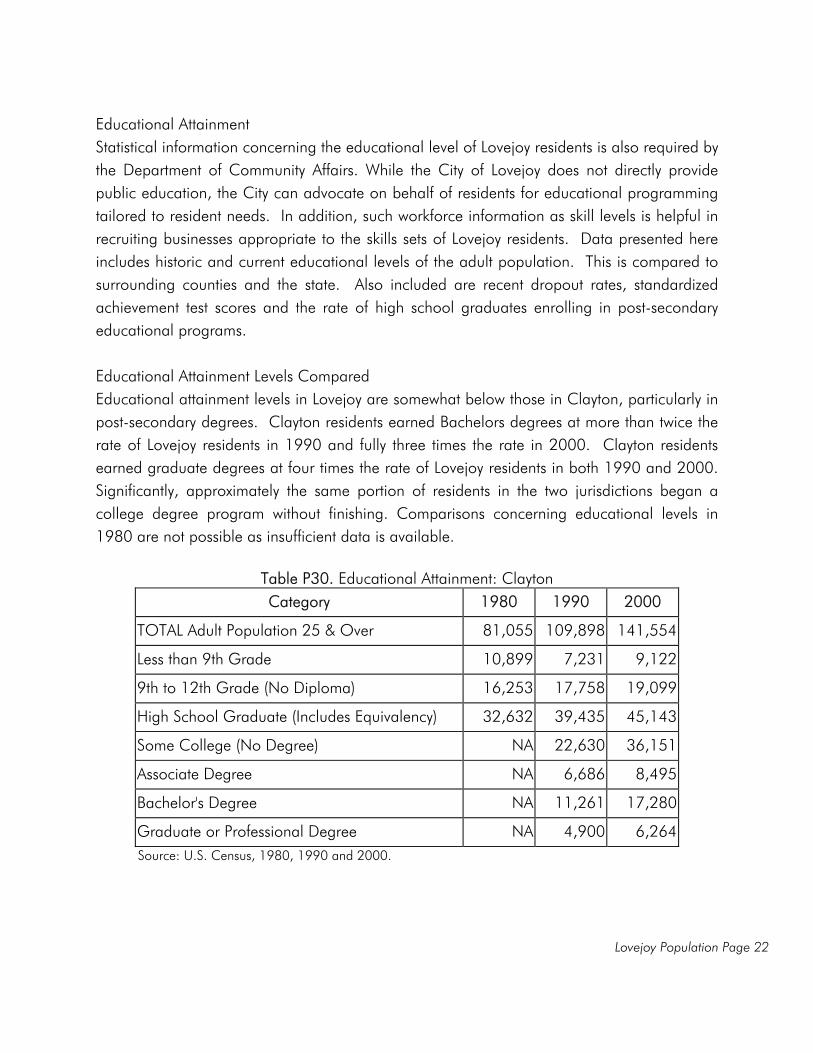
Educational Attainment Statistical information concerning the educational level of Lovejoy residents is also required by the Department of Community Affairs. While the City of Lovejoy does not directly provide public education, the City can advocate on behalf of residents for educational programming tailored to resident needs. In addition, such workforce information as skill levels is helpful in recruiting businesses appropriate to the skills sets of Lovejoy residents. Data presented here includes historic and current educational levels of the adult population. This is compared to surrounding counties and the state. Also included are recent dropout rates, standardized achievement test scores and the rate of high school graduates enrolling in post-secondary educational programs. Educational Attainment Levels Compared Educational attainment levels in Lovejoy are somewhat below those in Clayton, particularly in post-secondary degrees. Clayton residents earned Bachelors degrees at more than twice the rate of Lovejoy residents in 1990 and fully three times the rate in 2000. Clayton residents earned graduate degrees at four times the rate of Lovejoy residents in both 1990 and 2000. Significantly, approximately the same portion of residents in the two jurisdictions began a college degree program without finishing. Comparisons concerning educational levels in 1980 are not possible as insufficient data is available.
Table P30. Educational Attainment: Clayton
Category 1980 1990 2000
TOTAL Adult Population 25 & Over 81,055 109,898 141,554
Less than 9th Grade 10,899 7,231 9,122
9th to 12th Grade (No Diploma) 16,253 17,758 19,099
High School Graduate (Includes Equivalency) 32,632 39,435 45,143
Some College (No Degree) NA 22,630 36,151
Associate Degree NA 6,686 8,495
Bachelor's Degree NA 11,261 17,280
Graduate or Professional Degree NA 4,900 6,264 Source: U.S. Census, 1980, 1990 and 2000.
Lovejoy Population Page 23
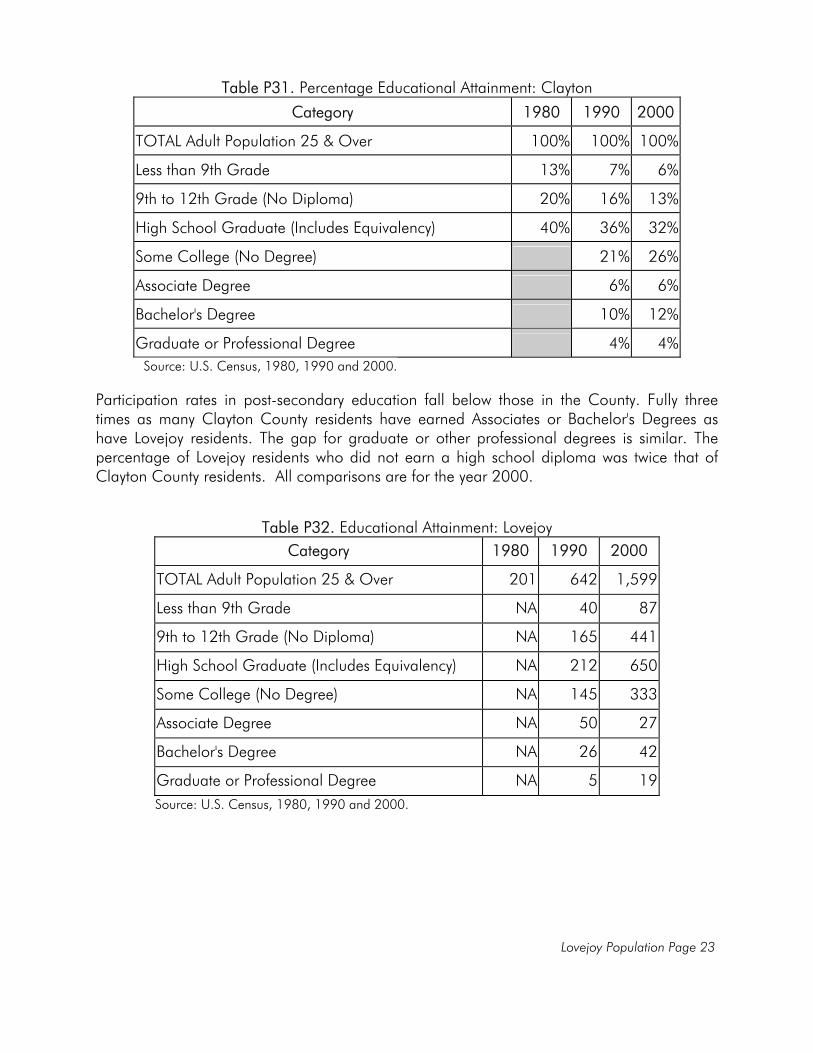
Table P31. Percentage Educational Attainment: Clayton
Category 1980 1990 2000
TOTAL Adult Population 25 & Over 100% 100% 100%
Less than 9th Grade 13% 7% 6%
9th to 12th Grade (No Diploma) 20% 16% 13%
High School Graduate (Includes Equivalency) 40% 36% 32%
Some College (No Degree) 21% 26%
Associate Degree 6% 6%
Bachelor's Degree 10% 12%
Graduate or Professional Degree 4% 4% Source: U.S. Census, 1980, 1990 and 2000. Participation rates in post-secondary education fall below those in the County. Fully three times as many Clayton County residents have earned Associates or Bachelor's Degrees as have Lovejoy residents. The gap for graduate or other professional degrees is similar. The percentage of Lovejoy residents who did not earn a high school diploma was twice that of Clayton County residents. All comparisons are for the year 2000.
Table P32. Educational Attainment: Lovejoy
Category 1980 1990 2000
TOTAL Adult Population 25 & Over 201 642 1,599
Less than 9th Grade NA 40 87
9th to 12th Grade (No Diploma) NA 165 441
High School Graduate (Includes Equivalency) NA 212 650
Some College (No Degree) NA 145 333
Associate Degree NA 50 27
Bachelor's Degree NA 26 42
Graduate or Professional Degree NA 5 19 Source: U.S. Census, 1980, 1990 and 2000.
Lovejoy Population Page 24
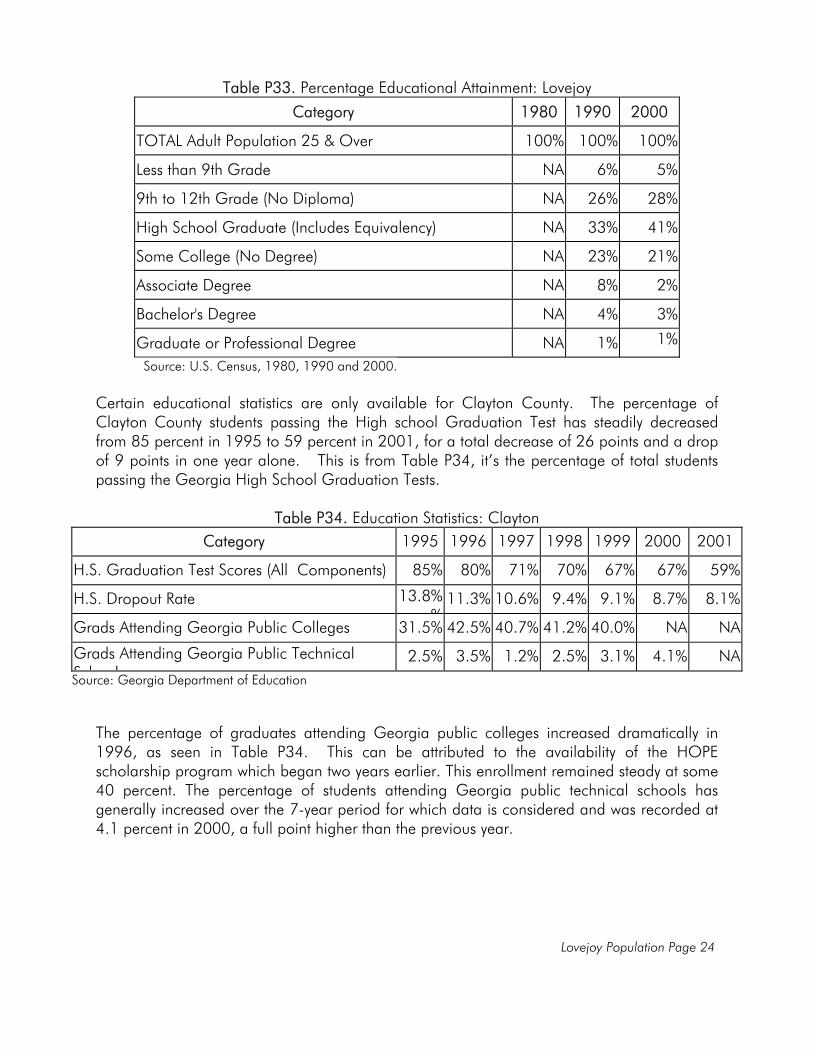
Table P33. Percentage Educational Attainment: Lovejoy
Category 1980 1990 2000
TOTAL Adult Population 25 & Over 100% 100% 100%
Less than 9th Grade NA 6% 5%
9th to 12th Grade (No Diploma) NA 26% 28%
High School Graduate (Includes Equivalency) NA 33% 41%
Some College (No Degree) NA 23% 21%
Associate Degree NA 8% 2%
Bachelor's Degree NA 4% 3%
Graduate or Professional Degree NA 1% 1%
Source: U.S. Census, 1980, 1990 and 2000.
Certain educational statistics are only available for Clayton County. The percentage of Clayton County students passing the High school Graduation Test has steadily decreased from 85 percent in 1995 to 59 percent in 2001, for a total decrease of 26 points and a drop of 9 points in one year alone. This is from Table P34, it’s the percentage of total students passing the Georgia High School Graduation Tests.
Table P34. Education Statistics: Clayton
Category 1995 1996 1997 1998 1999 2000 2001
H.S. Graduation Test Scores (All Components) 85% 80% 71% 70% 67% 67% 59%
H.S. Dropout Rate 13.8%%
11.3% 10.6% 9.4% 9.1% 8.7% 8.1%
Grads Attending Georgia Public Colleges 31.5% 42.5% 40.7% 41.2% 40.0% NA NA
Grads Attending Georgia Public Technical S h ls
2.5% 3.5% 1.2% 2.5% 3.1% 4.1% NASource: Georgia Department of Education
The percentage of graduates attending Georgia public colleges increased dramatically in 1996, as seen in Table P34. This can be attributed to the availability of the HOPE scholarship program which began two years earlier. This enrollment remained steady at some 40 percent. The percentage of students attending Georgia public technical schools has generally increased over the 7-year period for which data is considered and was recorded at 4.1 percent in 2000, a full point higher than the previous year.
Lovejoy Population Page 25
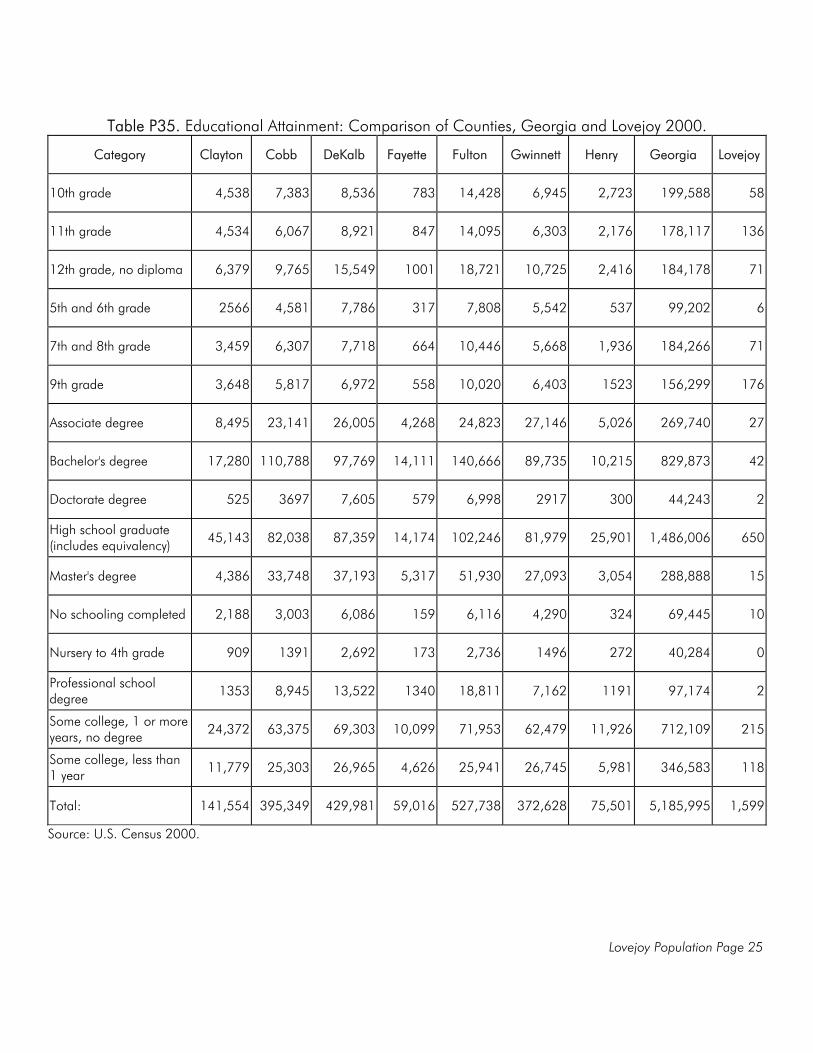
Table P35. Educational Attainment: Comparison of Counties, Georgia and Lovejoy 2000.
Category Clayton Cobb DeKalb Fayette Fulton Gwinnett Henry Georgia Lovejoy
10th grade 4,538 7,383 8,536 783 14,428 6,945 2,723 199,588 58
11th grade 4,534 6,067 8,921 847 14,095 6,303 2,176 178,117 136
12th grade, no diploma 6,379 9,765 15,549 1001 18,721 10,725 2,416 184,178 71
5th and 6th grade 2566 4,581 7,786 317 7,808 5,542 537 99,202 6
7th and 8th grade 3,459 6,307 7,718 664 10,446 5,668 1,936 184,266 71
9th grade 3,648 5,817 6,972 558 10,020 6,403 1523 156,299 176
Associate degree 8,495 23,141 26,005 4,268 24,823 27,146 5,026 269,740 27
Bachelor's degree 17,280 110,788 97,769 14,111 140,666 89,735 10,215 829,873 42
Doctorate degree 525 3697 7,605 579 6,998 2917 300 44,243 2
High school graduate (includes equivalency) 45,143 82,038 87,359 14,174 102,246 81,979 25,901 1,486,006 650
Master's degree 4,386 33,748 37,193 5,317 51,930 27,093 3,054 288,888 15
No schooling completed 2,188 3,003 6,086 159 6,116 4,290 324 69,445 10
Nursery to 4th grade 909 1391 2,692 173 2,736 1496 272 40,284 0
Professional school degree 1353 8,945 13,522 1340 18,811 7,162 1191 97,174 2
Some college, 1 or more years, no degree 24,372 63,375 69,303 10,099 71,953 62,479 11,926 712,109 215
Some college, less than 1 year 11,779 25,303 26,965 4,626 25,941 26,745 5,981 346,583 118
Total: 141,554 395,349 429,981 59,016 527,738 372,628 75,501 5,185,995 1,599
Source: U.S. Census 2000.
Lovejoy Population Page 26
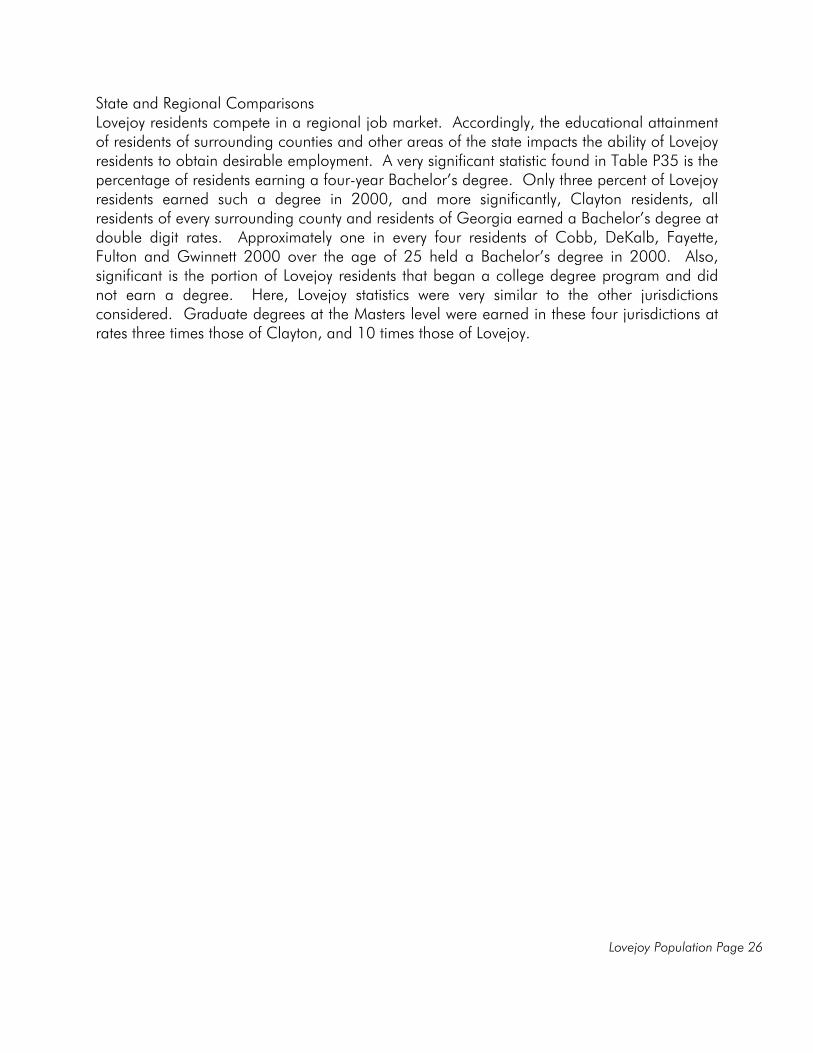
State and Regional Comparisons Lovejoy residents compete in a regional job market. Accordingly, the educational attainment of residents of surrounding counties and other areas of the state impacts the ability of Lovejoy residents to obtain desirable employment. A very significant statistic found in Table P35 is the percentage of residents earning a four-year Bachelor’s degree. Only three percent of Lovejoy residents earned such a degree in 2000, and more significantly, Clayton residents, all residents of every surrounding county and residents of Georgia earned a Bachelor’s degree at double digit rates. Approximately one in every four residents of Cobb, DeKalb, Fayette, Fulton and Gwinnett 2000 over the age of 25 held a Bachelor’s degree in 2000. Also, significant is the portion of Lovejoy residents that began a college degree program and did not earn a degree. Here, Lovejoy statistics were very similar to the other jurisdictions considered. Graduate degrees at the Masters level were earned in these four jurisdictions at rates three times those of Clayton, and 10 times those of Lovejoy.
Lovejoy Population Page 27
Table P36. Educational Attainment: Comparison Counties, Georgia and Lovejoy 2000.
Category Clayton Cobb DeKalb Fayette Fulton Gwinnett Henry Georgia Lovejoy
10th grade 3% 2% 2% 1% 3% 2% 4% 2% 4%
11th grade 3% 2% 2% 1% 3% 2% 3% 3% 9%
12th grade, no diploma 5% 2% 4% 2% 4% 3% 3% 4% 4%
5th and 6th grade 2% 1% 2% 1% 1% 1% 1% 2% 0%
7th and 8th grade 2% 2% 2% 1% 2% 2% 3% 4% 4%
9th grade 3% 1% 2% 1% 2% 2% 2% 3% 11%
Associate degree 6% 6% 6% 7% 5% 7% 7% 5% 2%
Bachelor's degree 12% 28% 23% 24% 27% 24% 14% 16% 3%
Doctorate degree 0% 1% 2% 1% 1% 1% 0% 1% 0%
High school graduate (includes equivalency) 32% 21% 20% 24% 19% 22% 34% 29% 41%
Master's degree 3% 9% 9% 9% 10% 7% 4% 6% 1%
No schooling completed 2% 1% 1% 0% 1% 1% 0% 1% 1%
Nursery to 4th grade 1% 0% 1% 0% 1% 0% 0% 1% 0%
Professional school degree 1% 2% 3% 2% 4% 2% 2% 2% 0%
Some college, 1 or more years, no degree 17% 16% 16% 17% 14% 17% 16% 14% 13%
Some college, less than 1 year 8% 6% 6% 8% 5% 7% 8% 7% 7%
Total: 100% 100% 100% 100% 100% 100% 100% 100% 100%
Source: U.S. Census 2000.
Lovejoy Population Page 28
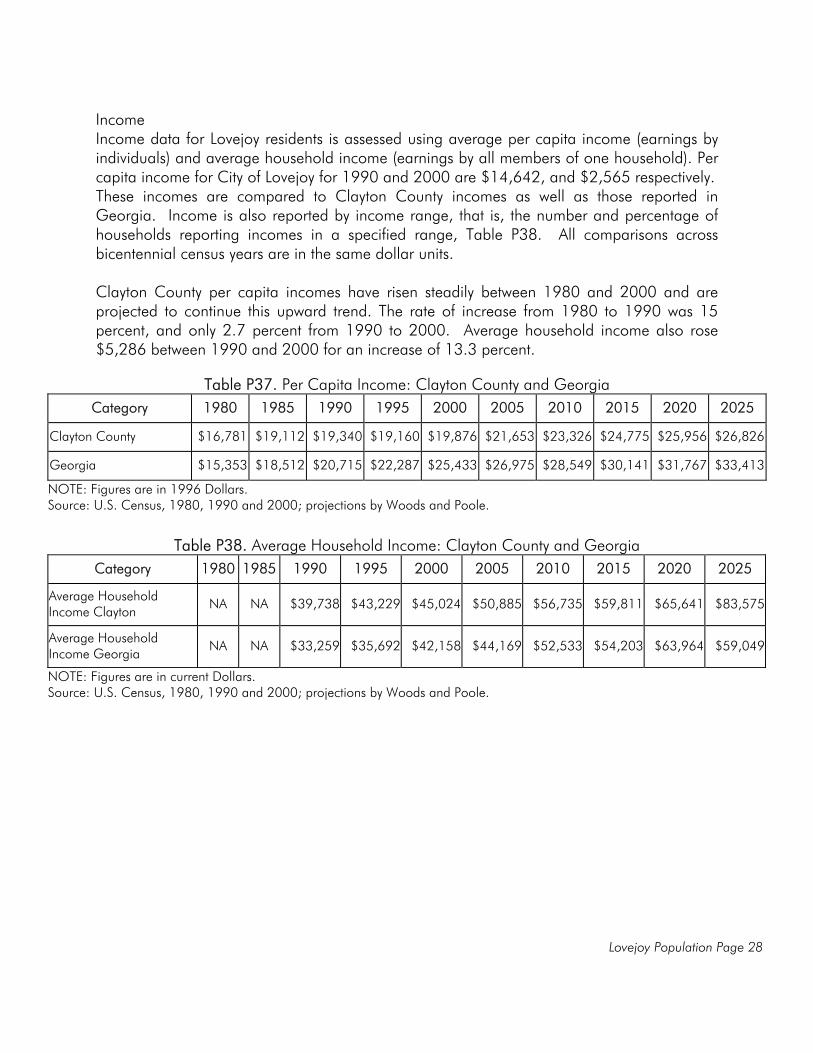
Income Income data for Lovejoy residents is assessed using average per capita income (earnings by individuals) and average household income (earnings by all members of one household). Per capita income for City of Lovejoy for 1990 and 2000 are $14,642, and $2,565 respectively. These incomes are compared to Clayton County incomes as well as those reported in Georgia. Income is also reported by income range, that is, the number and percentage of households reporting incomes in a specified range, Table P38. All comparisons across bicentennial census years are in the same dollar units.
Clayton County per capita incomes have risen steadily between 1980 and 2000 and are projected to continue this upward trend. The rate of increase from 1980 to 1990 was 15 percent, and only 2.7 percent from 1990 to 2000. Average household income also rose $5,286 between 1990 and 2000 for an increase of 13.3 percent.
Table P37. Per Capita Income: Clayton County and Georgia
Category 1980 1985 1990 1995 2000 2005 2010 2015 2020 2025
Clayton County $16,781 $19,112 $19,340 $19,160 $19,876 $21,653 $23,326 $24,775 $25,956 $26,826
Georgia $15,353 $18,512 $20,715 $22,287 $25,433 $26,975 $28,549 $30,141 $31,767 $33,413
NOTE: Figures are in 1996 Dollars. Source: U.S. Census, 1980, 1990 and 2000; projections by Woods and Poole.
Table P38. Average Household Income: Clayton County and Georgia
Category 1980 1985 1990 1995 2000 2005 2010 2015 2020 2025
Average Household Income Clayton NA NA $39,738 $43,229 $45,024 $50,885 $56,735 $59,811 $65,641 $83,575
Average Household Income Georgia NA NA $33,259 $35,692 $42,158 $44,169 $52,533 $54,203 $63,964 $59,049
NOTE: Figures are in current Dollars. Source: U.S. Census, 1980, 1990 and 2000; projections by Woods and Poole.
Lovejoy Population Page 29
Table P39. Household Income Distribution: Clayton County
Category 1980 1990 2000
TOTAL Households 50,448 65,522 82,272
Income less than $5,000 3,711 2,540 NA
Income $5,000 - $9,999 5,551 3,512 5,031
Income $10,000 - $14,999 7,322 4,434 3,286
Income $15,000 - $19,999 8,350 5,353 4,934
Income $20,000 - $29,999 7,938 12,039 12,147
Income $30,000 - $34,999 6,435 6,563 6,335
Income $35,000 - $39,999 4,585 5,383 5,781
Income $40,000 - $49,999 2,460 10,109 10,843
Income $50,000 - $59,999 1,358 6,299 9,444
Income $60,000 - $74,999 876 5,290 9,934
Income $75,000 - $99,999 1,271 2,703 8,566
Income $100,000 or more 593 1,273 5,971
Source: U.S. Census, 1980, 1990 and 2000.
Table P40. Household Income Distribution: Lovejoy
Category 1980 1990 2000
TOTAL Households 114 184 472
Income less than $5,000 15 1 NA
Income $5,000 - $9,999 13 1 18
Income $10,000 - $14,999 7 5 18
Income $15,000 - $19,999 12 13 33
Income $20,000 - $29,999 11 9 67
Income $30,000 - $34,999 18 21 50
Income $35,000 - $39,999 22 9 48
Income $40,000 - $49,999 14 51 75
Income $50,000 - $59,999 1 37 52
Income $60,000 - $74,999 1 32 61
Income $75,000 - $99,999 0 1 25
Income $100,000 or more 0 5 25
Source: U.S. Census, 1980, 1990 and 2000.
Lovejoy Population Page 30
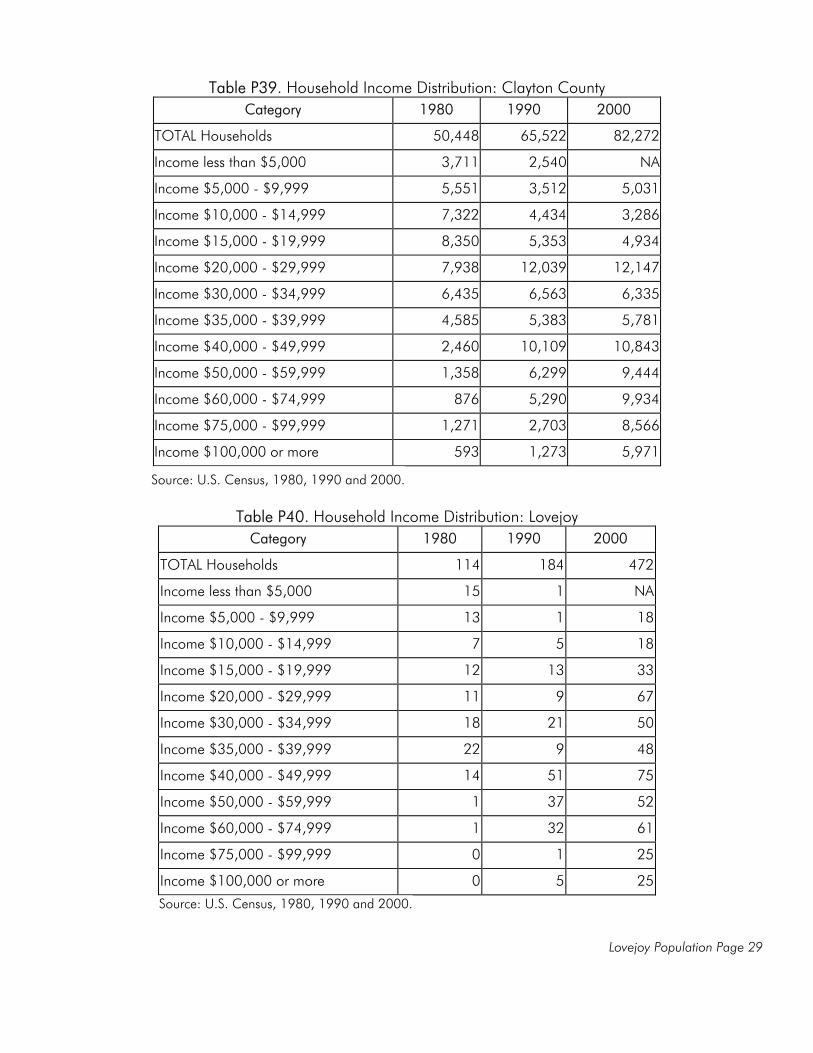
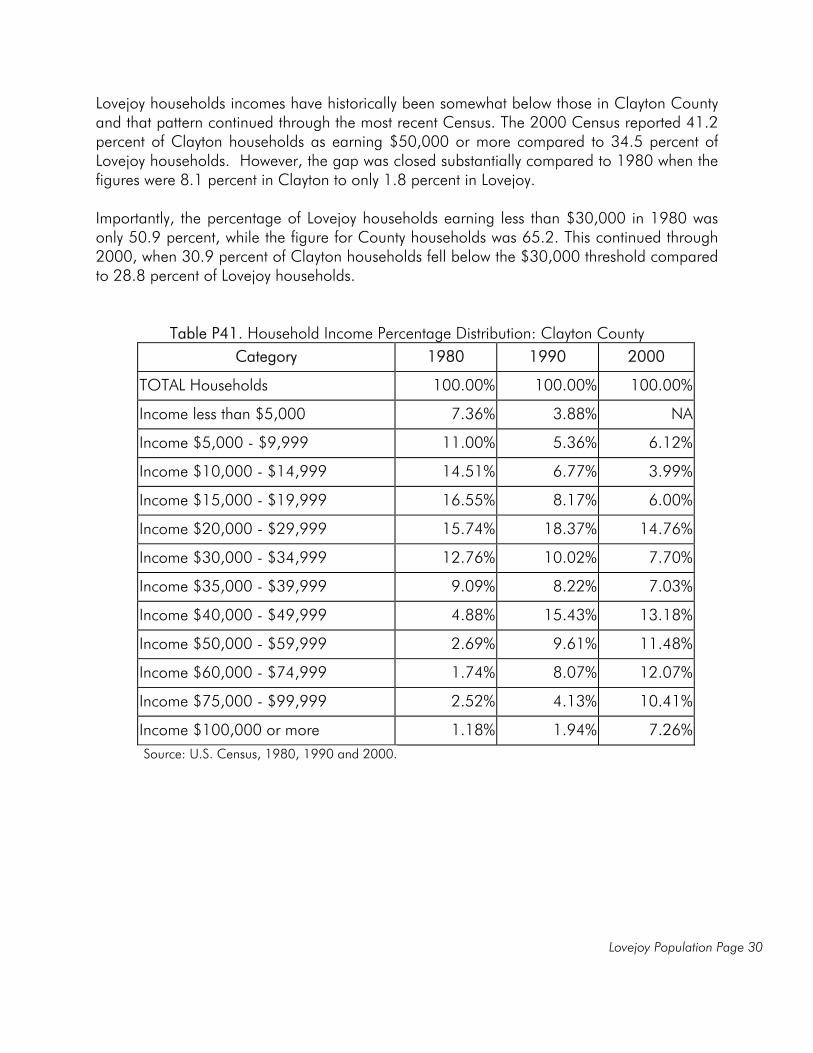
Lovejoy households incomes have historically been somewhat below those in Clayton County and that pattern continued through the most recent Census. The 2000 Census reported 41.2 percent of Clayton households as earning $50,000 or more compared to 34.5 percent of Lovejoy households. However, the gap was closed substantially compared to 1980 when the figures were 8.1 percent in Clayton to only 1.8 percent in Lovejoy. Importantly, the percentage of Lovejoy households earning less than $30,000 in 1980 was only 50.9 percent, while the figure for County households was 65.2. This continued through 2000, when 30.9 percent of Clayton households fell below the $30,000 threshold compared to 28.8 percent of Lovejoy households.
Table P41. Household Income Percentage Distribution: Clayton County
Category 1980 1990 2000
TOTAL Households 100.00% 100.00% 100.00%
Income less than $5,000 7.36% 3.88% NA
Income $5,000 - $9,999 11.00% 5.36% 6.12%
Income $10,000 - $14,999 14.51% 6.77% 3.99%
Income $15,000 - $19,999 16.55% 8.17% 6.00%
Income $20,000 - $29,999 15.74% 18.37% 14.76%
Income $30,000 - $34,999 12.76% 10.02% 7.70%
Income $35,000 - $39,999 9.09% 8.22% 7.03%
Income $40,000 - $49,999 4.88% 15.43% 13.18%
Income $50,000 - $59,999 2.69% 9.61% 11.48%
Income $60,000 - $74,999 1.74% 8.07% 12.07%
Income $75,000 - $99,999 2.52% 4.13% 10.41%
Income $100,000 or more 1.18% 1.94% 7.26% Source: U.S. Census, 1980, 1990 and 2000.
Lovejoy Population Page 31
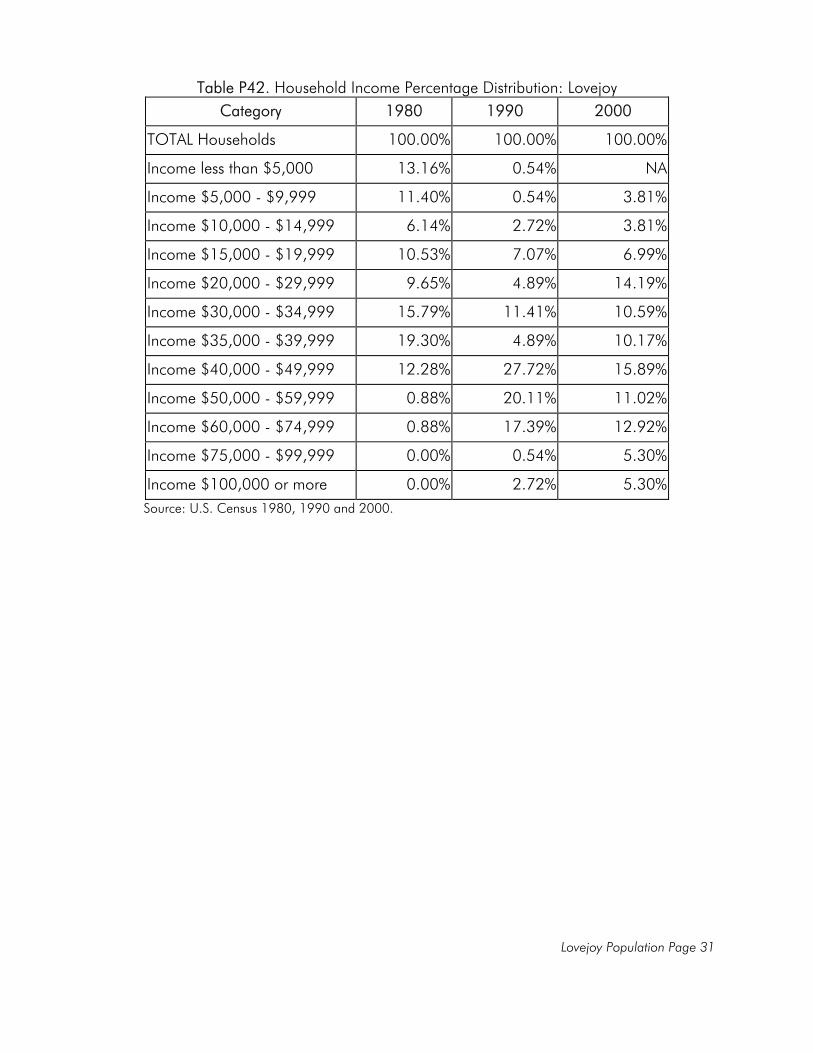
Table P42. Household Income Percentage Distribution: Lovejoy
Category 1980 1990 2000
TOTAL Households 100.00% 100.00% 100.00%
Income less than $5,000 13.16% 0.54% NA
Income $5,000 - $9,999 11.40% 0.54% 3.81%
Income $10,000 - $14,999 6.14% 2.72% 3.81%
Income $15,000 - $19,999 10.53% 7.07% 6.99%
Income $20,000 - $29,999 9.65% 4.89% 14.19%
Income $30,000 - $34,999 15.79% 11.41% 10.59%
Income $35,000 - $39,999 19.30% 4.89% 10.17%
Income $40,000 - $49,999 12.28% 27.72% 15.89%
Income $50,000 - $59,999 0.88% 20.11% 11.02%
Income $60,000 - $74,999 0.88% 17.39% 12.92%
Income $75,000 - $99,999 0.00% 0.54% 5.30%
Income $100,000 or more 0.00% 2.72% 5.30% Source: U.S. Census 1980, 1990 and 2000.
Lovejoy Population Page 32
POPULATION ASSESSMENT Lovejoy's 2000 population was recorded as 2,495 persons, up substantially from 351 in 1980. The rate of increase over the two decades was far higher than either Clayton County or Georgia. Even accounting for the influx of 1,154 inmates at the Clayton County Detention Center, the traditional resident population more than doubled between 1990 and 2000. Housing units added since the 2000 Census are believed to have brought an additional 2,183 residents. Lovejoy is poised to become the most populated municipality in Clayton County, driven by planned commuter rail and an openness to medium and high density development. Projections of the number of households, essential to housing projections, are derived from total population divided by average household size. Lovejoy household size is expected to track Clayton County since as the city grows, it is expected to better reflect the housing characteristics of the larger population of the county. Lovejoy’s households is expected to grow from 941 in 2000 to 3,863 in 2010 and 4,226 by 2025. The size of these households is expected to hover around 2.8 persons per household. Age Distribution The distribution of population in uniform age ranges such as 0 to 4 year olds, 5 to 13 year olds, etc. over time is an essential predictor of housing market demand as well as public and consumer services. Lovejoy's 2000 population distribution was skewed in 2000 as incarcerated males in the 21 to 24 year, 25 to 34 and 35 to 44 age ranges somewhat artificially inflated these age ranges. This population did not contribute to the number of school age children that males in these ranges typically would, nor did they impact employment or demand for consumer services. As Lovejoy's resident population expands over the next 20 years, the age distribution is expected to become more consistent with Clayton County since the ratio of inmates relative to that population will decline. Racial Composition The ratio of Black, White, American Indian Eskimo or Aleut, Asian or Pacific Islander and other races in Lovejoy is expected to mirror ratios in Clayton County. The county experienced a dramatic shift in racial composition over the past 20 years. In 1980, over 90 percent of the population was white, decreasing to less than 40 percent by 2000. This shift was generated by an increase in black population which grew from 7 percent in 1980 to over 50 percent in 2000. Lovejoy's past, including the 2000, population differs from the more urbanized county. In predicting future racial make-up, the rate of change projected for Clayton is a sound reference. However, the base ratios for Lovejoy, that is, having higher White and lower Black percentages, means that anticipated changes in those ratios in Lovejoy will occur over a longer period. Educational Attainment Educational statistics for Lovejoy residents do indicate causes for concern, and possible intervention should consider not only school aged children, but working age residents who
Lovejoy Population Page 33
may be at a disadvantage compared to their regional counterparts. Lovejoy participation rates in post-secondary education fall below those in the County. The gap for graduate or other professional degrees is similar. The percentage of Lovejoy residents who did not earn a high school diploma was twice that of Clayton County residents. State and Regional Comparisons Lovejoy residents compete in a regional job market and the educational level of residents of surrounding counties and other areas of the state impacts the ability of Lovejoy residents to obtain desirable employment. Only three percent of Lovejoy residents earned a four-year Bachelor's degree in 2000, and more significantly, Clayton residents, all residents of every surrounding county and residents of Georgia earned a Bachelor's degree at double digit rates. Approximately one in every four residents of Cobb, DeKalb, Fayette, Fulton and Gwinnett 2000 over the age of 25 held a Bachelor's degree in 2000. Graduate degrees at the Masters level were earned in these four jurisdictions at rates three times those for Clayton, and 10 times those of Lovejoy. Income The most telling statistic about Lovejoy households compared to the county is under-representation in both the "less than $30,000 per year" and the "$50,000 or more" income ranges. This means that poverty is less of a problem in Lovejoy, but affluence is less prominent as well. This circumstance can diminish the availability of goods and housing in upscale markets as demand is deemed to be absent. This can be addressed somewhat through housing strategies designed to expand middle and upper income households.

Lovejoy Economic Page 1
ECONOMIC DEVELOPMENT Introduction Local economies are comprised of businesses and the people they employ. These economic assets are supported by the public infrastructure and services, including roads, water supply, sanitary sewers and police and fire protection. Local economies are also supported by marketing and public funding programs. Sound economies are built on an appropriate balance of commercial and retail centers, industrial districts and housing developments. This Economic Development Element assesses the vitality of the Lovejoy economy by reviewing economic data and trends. Such assessments can inform the community and elected officials about those segments of the local economy requiring reinvestment or other public intervention. In addition to highlighting appropriate data comparisons designed to enhance the assessment, the Georgia Department of Community Affairs has established Minimum Standards for Local Government Comprehensive Planning that encompass the following state Economic Development goals: • An Economy that is growing and balanced • An Economy consistent with prudent management of state resources • An Economy that equitably benefits all segments of the population Lovejoy's development goals expressed in this Economic Development Element must be consistent with these state goals. "Quality Community Objectives" associated with these and other state goals must be considered in developing the goals, objectives, policies and strategies of the Lovejoy Comprehensive Plan, including the following: Regional Identity Objective: Regions should promote and preserve an “identity,” defined in terms of traditional regional architecture, common economic linkages that bind the region together or other shared characteristics.

Lovejoy Economic Page 2
Growth Preparedness Objective: Each community should identify and put in place the prerequisites for the type of growth it seeks to achieve. These may include housing and infrastructure (roads, water, sewer and telecommunications) to support new growth, appropriate training of the workforce, ordinances to direct growth as desired or leadership capable of responding to growth opportunities. Appropriate Businesses Objective: The businesses and industries encouraged to develop or expand in a community should be suitable for the community in terms of job skills required, linkages to other economic activities in the region, impact on the resources of the area, and future prospects for expansion and creation of higher-skill job opportunities. Educational Opportunities Objective: Educational and training opportunities should be readily available in each community to permit community residents to improve their job skills, adapt to technological advances, or to pursue entrepreneurial ambitions. Employment Options Objective: A range of job types should be provided in each community to meet the diverse needs of the local workforce. Lovejoy's Economic Development Element is responsive to these state goals and objectives and is presented below:

Lovejoy Economic Page 3
Economic Development Element The Economic Development Element is an inventory and assessment of Lovejoy's economic base, labor force and economic development resources. The purpose of the inventory and assessment is to evaluate the local economy and job market. Economic development and educational and job training programs can be shaped by such information. Information about Lovejoy's economy is presented below: Economic Base Economic base data and information has been compiled for each economic sector comprising the Lovejoy community. These sectors are agriculture, forestry and fishing; mining; construction; manufacturing; transportation, communications and utilities; wholesale trade; retail trade; financial, insurance and real estate; services and government. In addition, past, present and projected employment and earnings figures have been reviewed and compared with state figures. Much of the economic data is available only at the county level. These comparisons are valid in many instances. Where such comparisons are not particularly valid due to differences in Lovejoy's economic base relative to Clayton County's, such differences are noted. The data and comparisons are presented below: Weekly Wages, Earnings and Employment by Sector These three data sets are interrelated as the earnings of a specified number of employees determines actual spending power in any locale. Weekly wage data represents vital information in characterizing Lovejoy’s resident employment. The data is most useful when compared to wage data throughout the state. As seen in Table E1, average weekly wages paid to Clayton residents in 1999 were highest in the Transportation, Communication and Utilities sector at $943. This can be explained by relatively high wage jobs at Hartsfield-Jackson International Airport. Wholesale Trade ranked next highest in weekly wages at $736, followed by Manufacturing at $698 and the Construction sector with workers in the County earning $658 per week in 1999. The average weekly wage for all industries in Clayton County in 1999 was $663. Comparisons using Clayton places of work are presented in Table E11as nearly half of all workers living in Lovejoy worked within Clayton County.
Lovejoy Economic Page 4
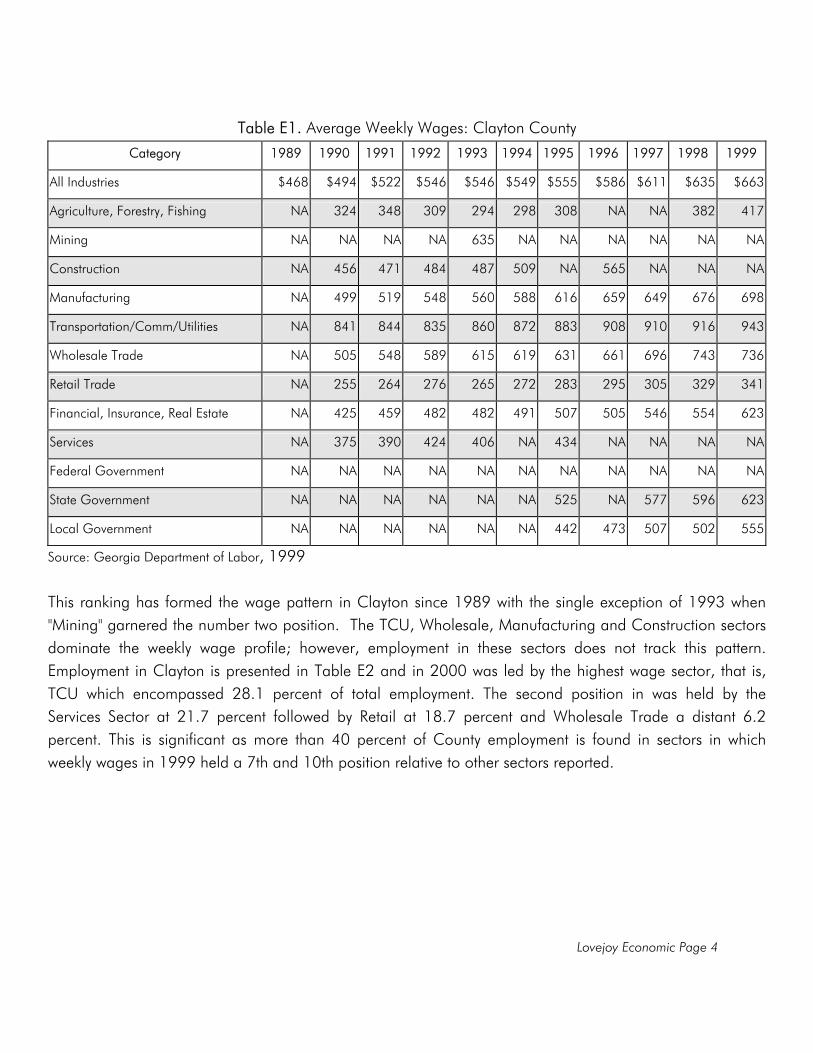
Table E1. Average Weekly Wages: Clayton County
Category 1989 1990 1991 1992 1993 1994 1995 1996 1997 1998 1999
All Industries $468 $494 $522 $546 $546 $549 $555 $586 $611 $635 $663
Agriculture, Forestry, Fishing NA 324 348 309 294 298 308 NA NA 382 417
Mining NA NA NA NA 635 NA NA NA NA NA NA
Construction NA 456 471 484 487 509 NA 565 NA NA NA
Manufacturing NA 499 519 548 560 588 616 659 649 676 698
Transportation/Comm/Utilities NA 841 844 835 860 872 883 908 910 916 943
Wholesale Trade NA 505 548 589 615 619 631 661 696 743 736
Retail Trade NA 255 264 276 265 272 283 295 305 329 341
Financial, Insurance, Real Estate NA 425 459 482 482 491 507 505 546 554 623
Services NA 375 390 424 406 NA 434 NA NA NA NA
Federal Government NA NA NA NA NA NA NA NA NA NA NA
State Government NA NA NA NA NA NA 525 NA 577 596 623
Local Government NA NA NA NA NA NA 442 473 507 502 555
Source: Georgia Department of Labor, 1999 This ranking has formed the wage pattern in Clayton since 1989 with the single exception of 1993 when "Mining" garnered the number two position. The TCU, Wholesale, Manufacturing and Construction sectors dominate the weekly wage profile; however, employment in these sectors does not track this pattern. Employment in Clayton is presented in Table E2 and in 2000 was led by the highest wage sector, that is, TCU which encompassed 28.1 percent of total employment. The second position in was held by the Services Sector at 21.7 percent followed by Retail at 18.7 percent and Wholesale Trade a distant 6.2 percent. This is significant as more than 40 percent of County employment is found in sectors in which weekly wages in 1999 held a 7th and 10th position relative to other sectors reported.
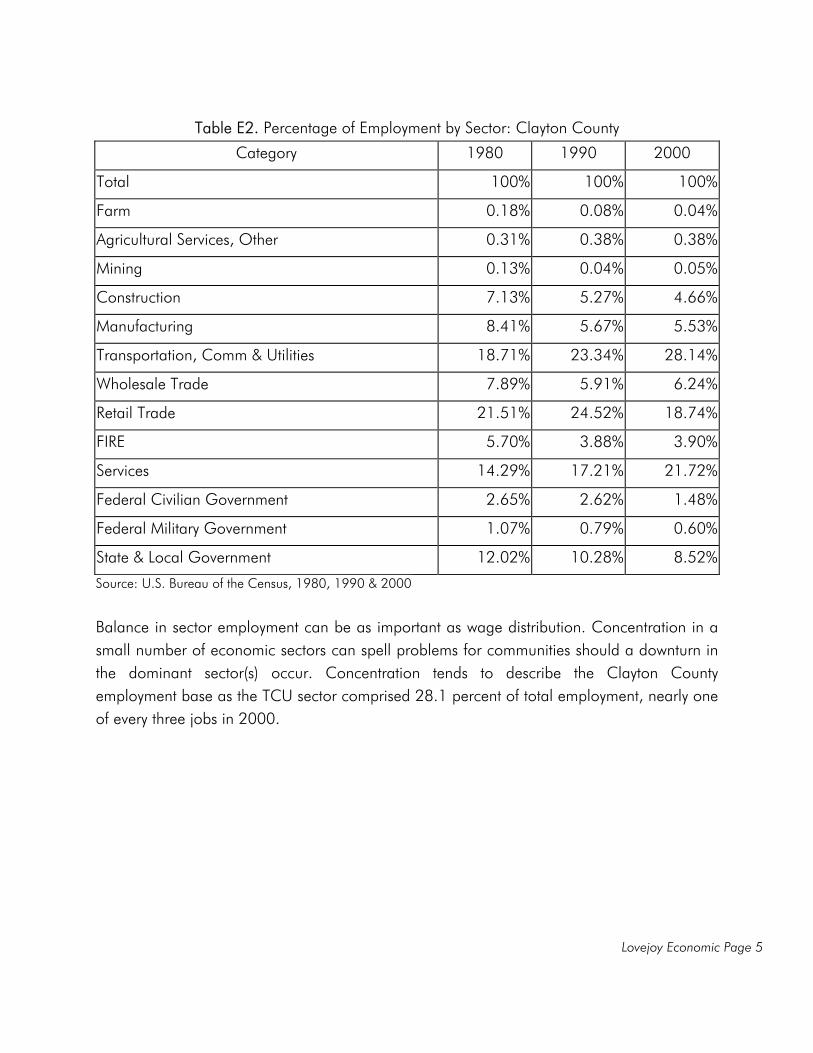
Lovejoy Economic Page 5
Table E2. Percentage of Employment by Sector: Clayton County
Category 1980 1990 2000
Total 100% 100% 100%
Farm 0.18% 0.08% 0.04%
Agricultural Services, Other 0.31% 0.38% 0.38%
Mining 0.13% 0.04% 0.05%
Construction 7.13% 5.27% 4.66%
Manufacturing 8.41% 5.67% 5.53%
Transportation, Comm & Utilities 18.71% 23.34% 28.14%
Wholesale Trade 7.89% 5.91% 6.24%
Retail Trade 21.51% 24.52% 18.74%
FIRE 5.70% 3.88% 3.90%
Services 14.29% 17.21% 21.72%
Federal Civilian Government 2.65% 2.62% 1.48%
Federal Military Government 1.07% 0.79% 0.60%
State & Local Government 12.02% 10.28% 8.52%
Source: U.S. Bureau of the Census, 1980, 1990 & 2000
Balance in sector employment can be as important as wage distribution. Concentration in a small number of economic sectors can spell problems for communities should a downturn in the dominant sector(s) occur. Concentration tends to describe the Clayton County employment base as the TCU sector comprised 28.1 percent of total employment, nearly one of every three jobs in 2000.
Lovejoy Economic Page 6
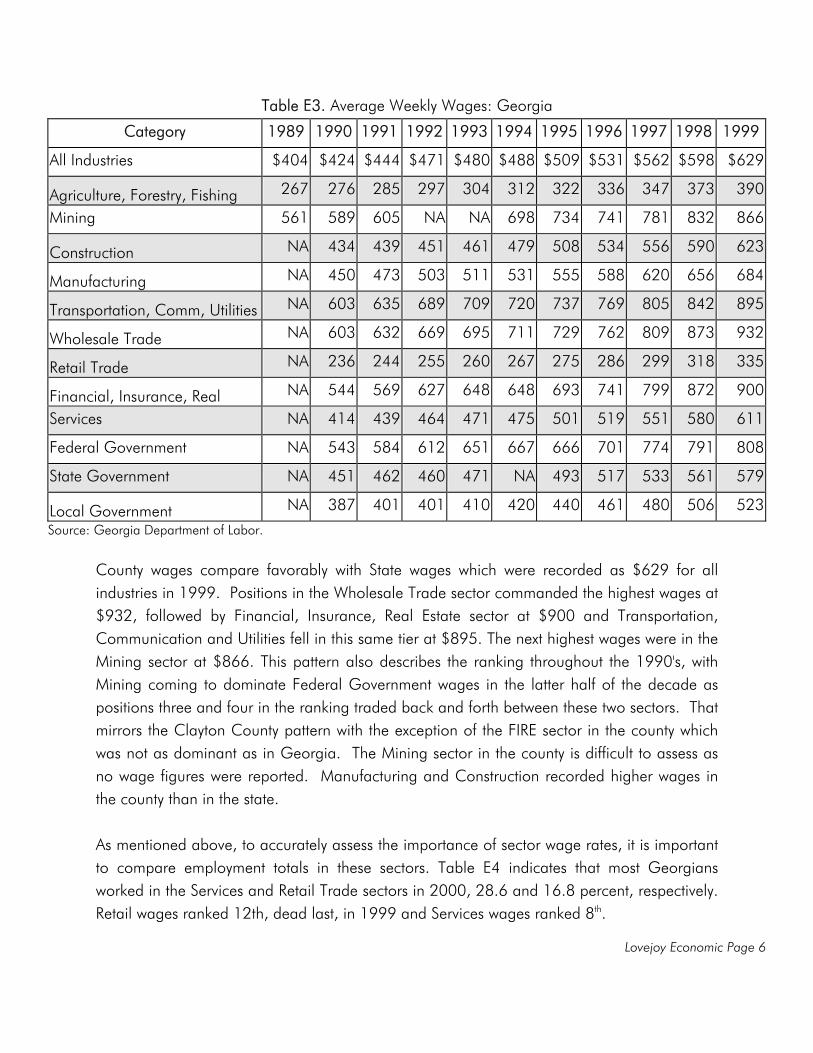
Table E3. Average Weekly Wages: Georgia
Category 1989 1990 1991 1992 1993 1994 1995 1996 1997 1998 1999
All Industries $404 $424 $444 $471 $480 $488 $509 $531 $562 $598 $629
Agriculture, Forestry, Fishing 267 276 285 297 304 312 322 336 347 373 390
Mining 561 589 605 NA NA 698 734 741 781 832 866
Construction NA 434 439 451 461 479 508 534 556 590 623
Manufacturing NA 450 473 503 511 531 555 588 620 656 684
Transportation, Comm, Utilities NA 603 635 689 709 720 737 769 805 842 895
Wholesale Trade NA 603 632 669 695 711 729 762 809 873 932
Retail Trade NA 236 244 255 260 267 275 286 299 318 335
Financial, Insurance, Real NA 544 569 627 648 648 693 741 799 872 900
Services NA 414 439 464 471 475 501 519 551 580 611
Federal Government NA 543 584 612 651 667 666 701 774 791 808
State Government NA 451 462 460 471 NA 493 517 533 561 579
Local Government NA 387 401 401 410 420 440 461 480 506 523
Source: Georgia Department of Labor.
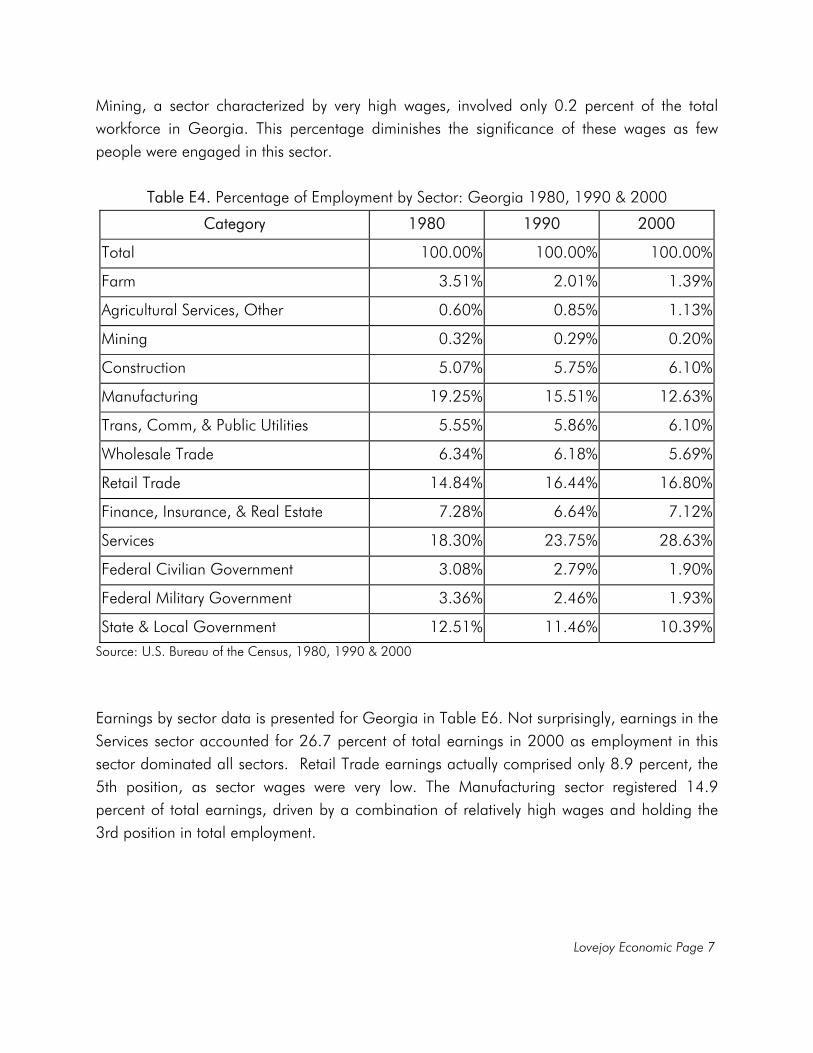
County wages compare favorably with State wages which were recorded as $629 for all industries in 1999. Positions in the Wholesale Trade sector commanded the highest wages at $932, followed by Financial, Insurance, Real Estate sector at $900 and Transportation, Communication and Utilities fell in this same tier at $895. The next highest wages were in the Mining sector at $866. This pattern also describes the ranking throughout the 1990's, with Mining coming to dominate Federal Government wages in the latter half of the decade as positions three and four in the ranking traded back and forth between these two sectors. That mirrors the Clayton County pattern with the exception of the FIRE sector in the county which was not as dominant as in Georgia. The Mining sector in the county is difficult to assess as no wage figures were reported. Manufacturing and Construction recorded higher wages in the county than in the state. As mentioned above, to accurately assess the importance of sector wage rates, it is important to compare employment totals in these sectors. Table E4 indicates that most Georgians worked in the Services and Retail Trade sectors in 2000, 28.6 and 16.8 percent, respectively. Retail wages ranked 12th, dead last, in 1999 and Services wages ranked 8th.
Lovejoy Economic Page 7
Mining, a sector characterized by very high wages, involved only 0.2 percent of the total workforce in Georgia. This percentage diminishes the significance of these wages as few people were engaged in this sector.
Table E4. Percentage of Employment by Sector: Georgia 1980, 1990 & 2000
Category 1980 1990 2000
Total 100.00% 100.00% 100.00%
Farm 3.51% 2.01% 1.39%
Agricultural Services, Other 0.60% 0.85% 1.13%
Mining 0.32% 0.29% 0.20%
Construction 5.07% 5.75% 6.10%
Manufacturing 19.25% 15.51% 12.63%
Trans, Comm, & Public Utilities 5.55% 5.86% 6.10%
Wholesale Trade 6.34% 6.18% 5.69%
Retail Trade 14.84% 16.44% 16.80%
Finance, Insurance, & Real Estate 7.28% 6.64% 7.12%
Services 18.30% 23.75% 28.63%
Federal Civilian Government 3.08% 2.79% 1.90%
Federal Military Government 3.36% 2.46% 1.93%
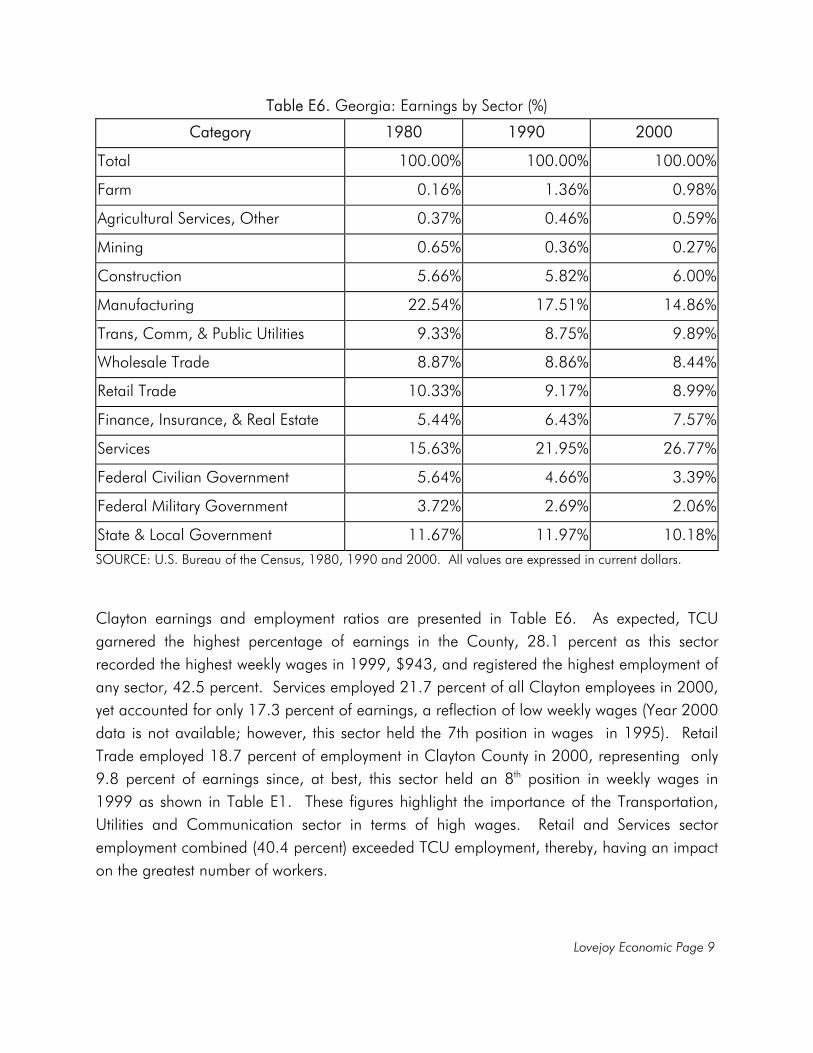
State & Local Government 12.51% 11.46% 10.39%Source: U.S. Bureau of the Census, 1980, 1990 & 2000 Earnings by sector data is presented for Georgia in Table E6. Not surprisingly, earnings in the Services sector accounted for 26.7 percent of total earnings in 2000 as employment in this sector dominated all sectors. Retail Trade earnings actually comprised only 8.9 percent, the 5th position, as sector wages were very low. The Manufacturing sector registered 14.9 percent of total earnings, driven by a combination of relatively high wages and holding the 3rd position in total employment.
Lovejoy Economic Page 8
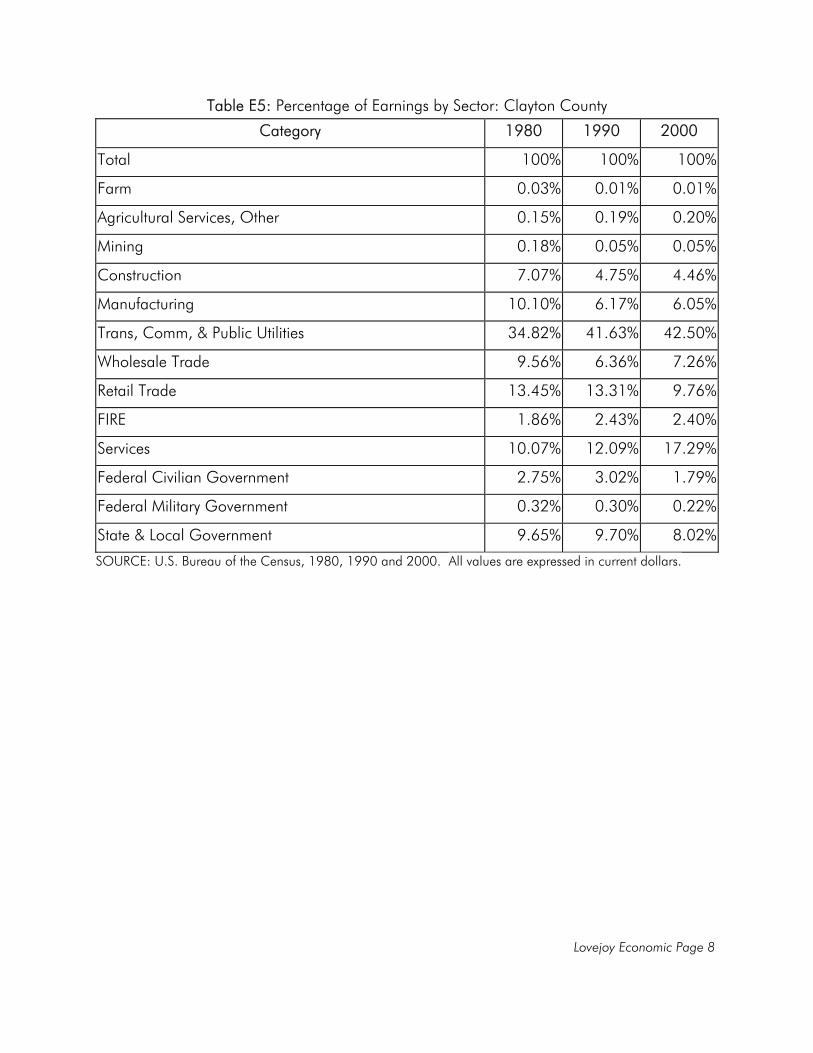
Table E5: Percentage of Earnings by Sector: Clayton County
Category 1980 1990 2000
Total 100% 100% 100%
Farm 0.03% 0.01% 0.01%
Agricultural Services, Other 0.15% 0.19% 0.20%
Mining 0.18% 0.05% 0.05%
Construction 7.07% 4.75% 4.46%
Manufacturing 10.10% 6.17% 6.05%
Trans, Comm, & Public Utilities 34.82% 41.63% 42.50%
Wholesale Trade 9.56% 6.36% 7.26%
Retail Trade 13.45% 13.31% 9.76%
FIRE 1.86% 2.43% 2.40%
Services 10.07% 12.09% 17.29%
Federal Civilian Government 2.75% 3.02% 1.79%
Federal Military Government 0.32% 0.30% 0.22%
State & Local Government 9.65% 9.70% 8.02%
SOURCE: U.S. Bureau of the Census, 1980, 1990 and 2000. All values are expressed in current dollars.
Lovejoy Economic Page 9
Table E6. Georgia: Earnings by Sector (%)
Category 1980 1990 2000
Total 100.00% 100.00% 100.00%
Farm 0.16% 1.36% 0.98%
Agricultural Services, Other 0.37% 0.46% 0.59%
Mining 0.65% 0.36% 0.27%
Construction 5.66% 5.82% 6.00%
Manufacturing 22.54% 17.51% 14.86%
Trans, Comm, & Public Utilities 9.33% 8.75% 9.89%
Wholesale Trade 8.87% 8.86% 8.44%
Retail Trade 10.33% 9.17% 8.99%
Finance, Insurance, & Real Estate 5.44% 6.43% 7.57%
Services 15.63% 21.95% 26.77%
Federal Civilian Government 5.64% 4.66% 3.39%
Federal Military Government 3.72% 2.69% 2.06%
State & Local Government 11.67% 11.97% 10.18%SOURCE: U.S. Bureau of the Census, 1980, 1990 and 2000. All values are expressed in current dollars.
Clayton earnings and employment ratios are presented in Table E6. As expected, TCU garnered the highest percentage of earnings in the County, 28.1 percent as this sector recorded the highest weekly wages in 1999, $943, and registered the highest employment of any sector, 42.5 percent. Services employed 21.7 percent of all Clayton employees in 2000, yet accounted for only 17.3 percent of earnings, a reflection of low weekly wages (Year 2000 data is not available; however, this sector held the 7th position in wages in 1995). Retail Trade employed 18.7 percent of employment in Clayton County in 2000, representing only 9.8 percent of earnings since, at best, this sector held an 8th position in weekly wages in 1999 as shown in Table E1. These figures highlight the importance of the Transportation, Utilities and Communication sector in terms of high wages. Retail and Services sector employment combined (40.4 percent) exceeded TCU employment, thereby, having an impact on the greatest number of workers.
Lovejoy Economic Page 10
Personal Income by Type
Personal Income by Type is only available for Clayton County and Georgia and not at Lovejoy level. The source of personal income is also an important determinant of economic vitality. Census records data in five income categories: (1) wages and salaries; (2) other labor income; (3) proprietor's income; (4) dividends, interest and rent; and (5) transfer payments to persons (such as retirement pensions or social security payments). As seen in Table E7, data for Georgia in 2000 indicate that wages and salaries accounted for 61.2 percent of all personal income. Dividends, interest and rents accounted for 16.8 percent, and transfer payments (retirements, social security benefits, etc.) comprising 11.1 percent. This compares to a distribution in Clayton County that favored wages and salaries which accounted for a whopping 89.86 percent of personal income in 2000. When coupled with only 3.95 percent of personal income represented by proprietor's income, the income of small business owners, it is evident that entrepreneurial opportunities in Clayton lag behind opportunities, or at least propensity for business ownership, in Georgia. This figure is less than half the 8.7 percent recorded for the state. Income generated by "Other labor" is substantially higher in Clayton relative to the state; however, remaining sources of personal income generally track state ratios.
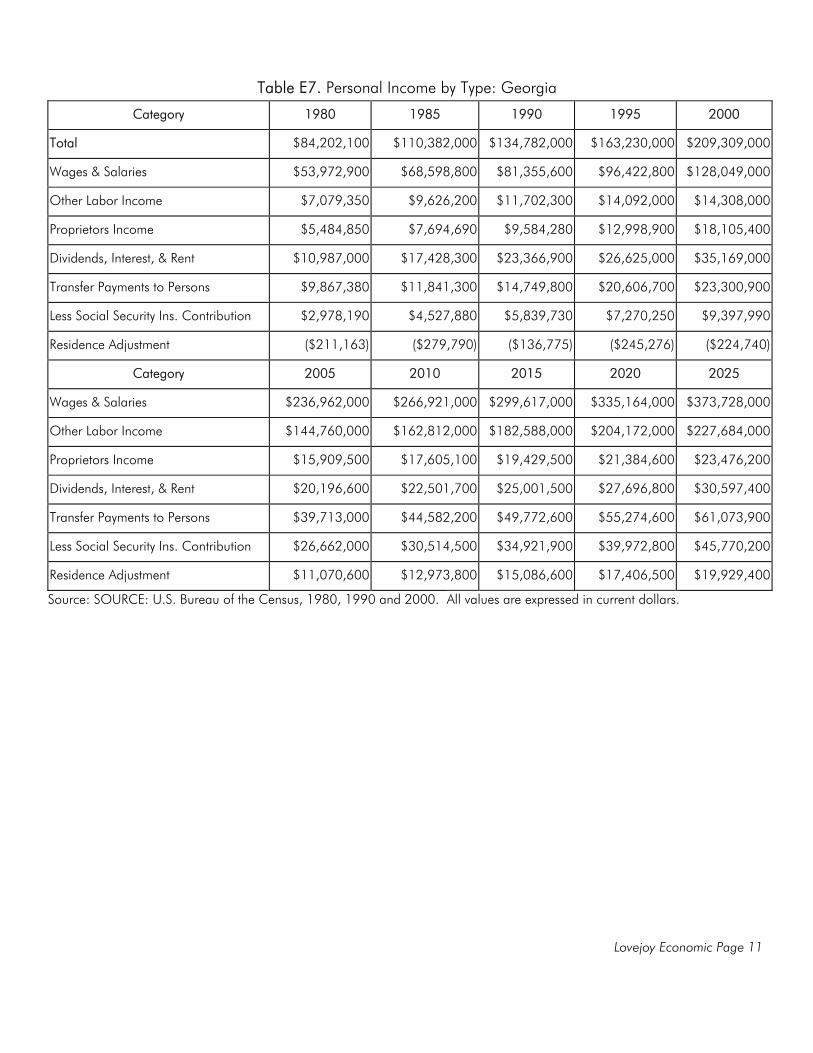
Lovejoy Economic Page 11
Table E7. Personal Income by Type: Georgia
Category 1980 1985 1990 1995 2000
Total $84,202,100 $110,382,000 $134,782,000 $163,230,000 $209,309,000
Wages & Salaries $53,972,900 $68,598,800 $81,355,600 $96,422,800 $128,049,000
Other Labor Income $7,079,350 $9,626,200 $11,702,300 $14,092,000 $14,308,000
Proprietors Income $5,484,850 $7,694,690 $9,584,280 $12,998,900 $18,105,400
Dividends, Interest, & Rent $10,987,000 $17,428,300 $23,366,900 $26,625,000 $35,169,000
Transfer Payments to Persons $9,867,380 $11,841,300 $14,749,800 $20,606,700 $23,300,900
Less Social Security Ins. Contribution $2,978,190 $4,527,880 $5,839,730 $7,270,250 $9,397,990
Residence Adjustment ($211,163) ($279,790) ($136,775) ($245,276) ($224,740)
Category 2005 2010 2015 2020 2025
Wages & Salaries $236,962,000 $266,921,000 $299,617,000 $335,164,000 $373,728,000
Other Labor Income $144,760,000 $162,812,000 $182,588,000 $204,172,000 $227,684,000
Proprietors Income $15,909,500 $17,605,100 $19,429,500 $21,384,600 $23,476,200
Dividends, Interest, & Rent $20,196,600 $22,501,700 $25,001,500 $27,696,800 $30,597,400
Transfer Payments to Persons $39,713,000 $44,582,200 $49,772,600 $55,274,600 $61,073,900
Less Social Security Ins. Contribution $26,662,000 $30,514,500 $34,921,900 $39,972,800 $45,770,200
Residence Adjustment $11,070,600 $12,973,800 $15,086,600 $17,406,500 $19,929,400
Source: SOURCE: U.S. Bureau of the Census, 1980, 1990 and 2000. All values are expressed in current dollars.
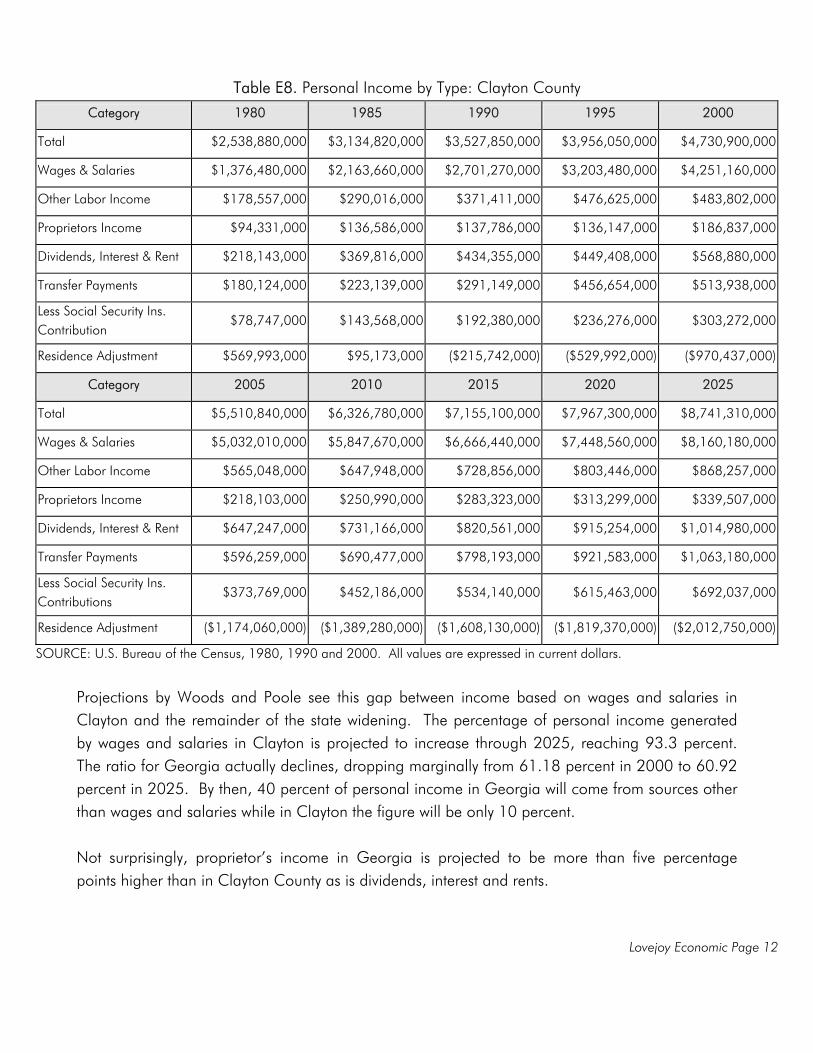
Lovejoy Economic Page 12
Table E8. Personal Income by Type: Clayton County
Category 1980 1985 1990 1995 2000
Total $2,538,880,000 $3,134,820,000 $3,527,850,000 $3,956,050,000 $4,730,900,000
Wages & Salaries $1,376,480,000 $2,163,660,000 $2,701,270,000 $3,203,480,000 $4,251,160,000
Other Labor Income $178,557,000 $290,016,000 $371,411,000 $476,625,000 $483,802,000
Proprietors Income $94,331,000 $136,586,000 $137,786,000 $136,147,000 $186,837,000
Dividends, Interest & Rent $218,143,000 $369,816,000 $434,355,000 $449,408,000 $568,880,000
Transfer Payments $180,124,000 $223,139,000 $291,149,000 $456,654,000 $513,938,000
Less Social Security Ins. Contribution
$78,747,000 $143,568,000 $192,380,000 $236,276,000 $303,272,000
Residence Adjustment $569,993,000 $95,173,000 ($215,742,000) ($529,992,000) ($970,437,000)
Category 2005 2010 2015 2020 2025
Total $5,510,840,000 $6,326,780,000 $7,155,100,000 $7,967,300,000 $8,741,310,000
Wages & Salaries $5,032,010,000 $5,847,670,000 $6,666,440,000 $7,448,560,000 $8,160,180,000
Other Labor Income $565,048,000 $647,948,000 $728,856,000 $803,446,000 $868,257,000
Proprietors Income $218,103,000 $250,990,000 $283,323,000 $313,299,000 $339,507,000
Dividends, Interest & Rent $647,247,000 $731,166,000 $820,561,000 $915,254,000 $1,014,980,000
Transfer Payments $596,259,000 $690,477,000 $798,193,000 $921,583,000 $1,063,180,000
Less Social Security Ins. Contributions
$373,769,000 $452,186,000 $534,140,000 $615,463,000 $692,037,000
Residence Adjustment ($1,174,060,000) ($1,389,280,000) ($1,608,130,000) ($1,819,370,000) ($2,012,750,000)
SOURCE: U.S. Bureau of the Census, 1980, 1990 and 2000. All values are expressed in current dollars.
Projections by Woods and Poole see this gap between income based on wages and salaries in Clayton and the remainder of the state widening. The percentage of personal income generated by wages and salaries in Clayton is projected to increase through 2025, reaching 93.3 percent. The ratio for Georgia actually declines, dropping marginally from 61.18 percent in 2000 to 60.92 percent in 2025. By then, 40 percent of personal income in Georgia will come from sources other than wages and salaries while in Clayton the figure will be only 10 percent. Not surprisingly, proprietor’s income in Georgia is projected to be more than five percentage points higher than in Clayton County as is dividends, interest and rents.
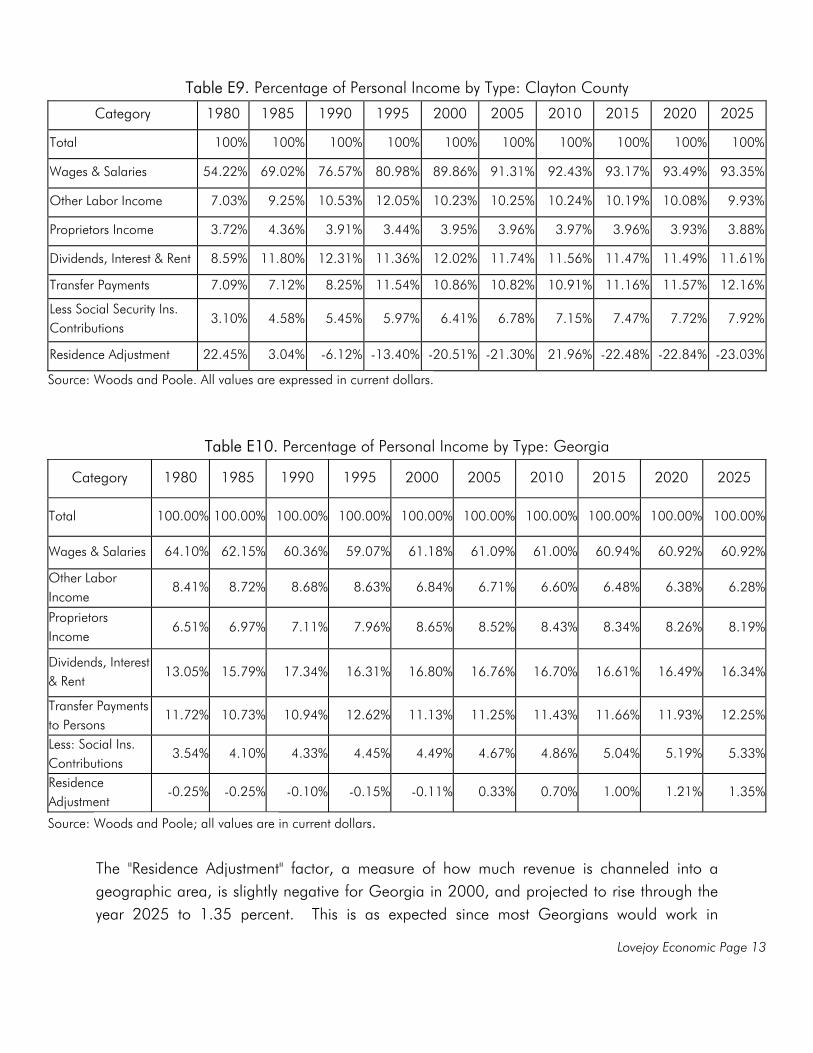
Lovejoy Economic Page 13
Table E9. Percentage of Personal Income by Type: Clayton County
Category 1980 1985 1990 1995 2000 2005 2010 2015 2020 2025
Total 100% 100% 100% 100% 100% 100% 100% 100% 100% 100%
Wages & Salaries 54.22% 69.02% 76.57% 80.98% 89.86% 91.31% 92.43% 93.17% 93.49% 93.35%
Other Labor Income 7.03% 9.25% 10.53% 12.05% 10.23% 10.25% 10.24% 10.19% 10.08% 9.93%
Proprietors Income 3.72% 4.36% 3.91% 3.44% 3.95% 3.96% 3.97% 3.96% 3.93% 3.88%
Dividends, Interest & Rent 8.59% 11.80% 12.31% 11.36% 12.02% 11.74% 11.56% 11.47% 11.49% 11.61%
Transfer Payments 7.09% 7.12% 8.25% 11.54% 10.86% 10.82% 10.91% 11.16% 11.57% 12.16%
Less Social Security Ins. Contributions
3.10% 4.58% 5.45% 5.97% 6.41% 6.78% 7.15% 7.47% 7.72% 7.92%
Residence Adjustment 22.45% 3.04% -6.12% -13.40% -20.51% -21.30% 21.96% -22.48% -22.84% -23.03%
Source: Woods and Poole. All values are expressed in current dollars.
Table E10. Percentage of Personal Income by Type: Georgia
Category 1980 1985 1990 1995 2000 2005 2010 2015 2020 2025
Total 100.00% 100.00% 100.00% 100.00% 100.00% 100.00% 100.00% 100.00% 100.00% 100.00%
Wages & Salaries 64.10% 62.15% 60.36% 59.07% 61.18% 61.09% 61.00% 60.94% 60.92% 60.92%
Other Labor Income
8.41% 8.72% 8.68% 8.63% 6.84% 6.71% 6.60% 6.48% 6.38% 6.28%
Proprietors Income
6.51% 6.97% 7.11% 7.96% 8.65% 8.52% 8.43% 8.34% 8.26% 8.19%
Dividends, Interest & Rent
13.05% 15.79% 17.34% 16.31% 16.80% 16.76% 16.70% 16.61% 16.49% 16.34%
Transfer Payments to Persons
11.72% 10.73% 10.94% 12.62% 11.13% 11.25% 11.43% 11.66% 11.93% 12.25%
Less: Social Ins. Contributions
3.54% 4.10% 4.33% 4.45% 4.49% 4.67% 4.86% 5.04% 5.19% 5.33%
Residence Adjustment
-0.25% -0.25% -0.10% -0.15% -0.11% 0.33% 0.70% 1.00% 1.21% 1.35%
Source: Woods and Poole; all values are in current dollars.
The "Residence Adjustment" factor, a measure of how much revenue is channeled into a geographic area, is slightly negative for Georgia in 2000, and projected to rise through the year 2025 to 1.35 percent. This is as expected since most Georgians would work in
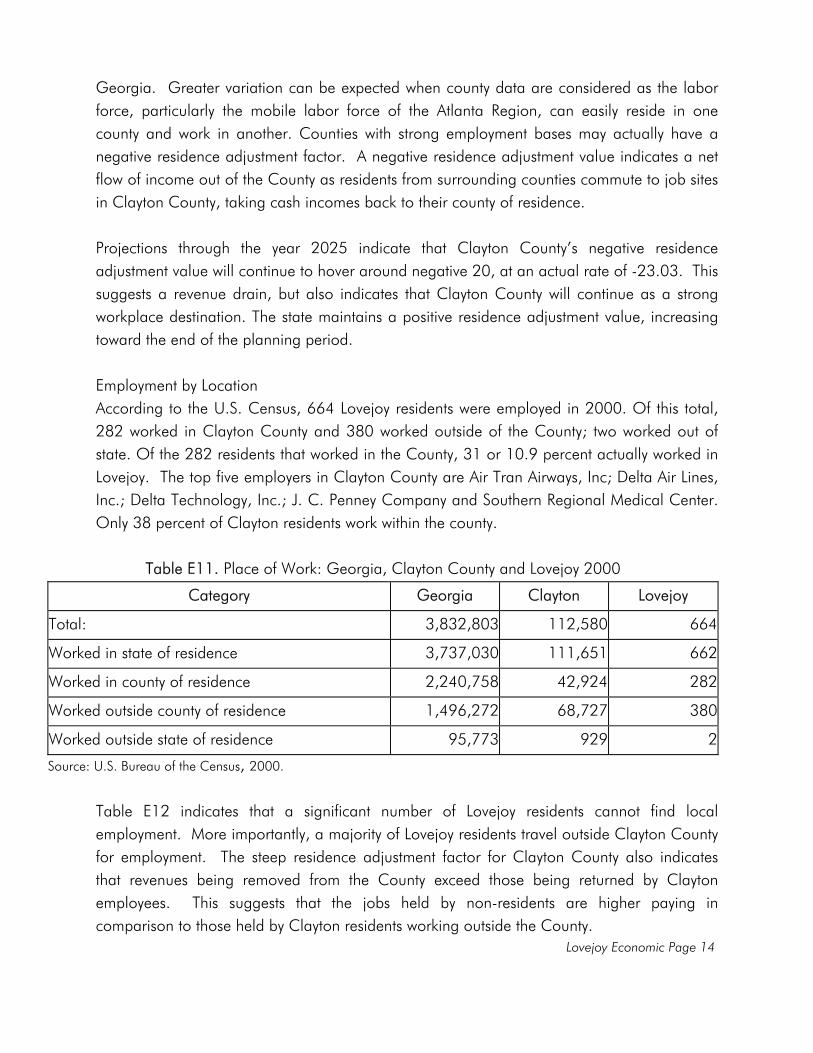
Lovejoy Economic Page 14
Georgia. Greater variation can be expected when county data are considered as the labor force, particularly the mobile labor force of the Atlanta Region, can easily reside in one county and work in another. Counties with strong employment bases may actually have a negative residence adjustment factor. A negative residence adjustment value indicates a net flow of income out of the County as residents from surrounding counties commute to job sites in Clayton County, taking cash incomes back to their county of residence. Projections through the year 2025 indicate that Clayton County’s negative residence adjustment value will continue to hover around negative 20, at an actual rate of -23.03. This suggests a revenue drain, but also indicates that Clayton County will continue as a strong workplace destination. The state maintains a positive residence adjustment value, increasing toward the end of the planning period. Employment by Location According to the U.S. Census, 664 Lovejoy residents were employed in 2000. Of this total, 282 worked in Clayton County and 380 worked outside of the County; two worked out of state. Of the 282 residents that worked in the County, 31 or 10.9 percent actually worked in Lovejoy. The top five employers in Clayton County are Air Tran Airways, Inc; Delta Air Lines, Inc.; Delta Technology, Inc.; J. C. Penney Company and Southern Regional Medical Center. Only 38 percent of Clayton residents work within the county.
Table E11. Place of Work: Georgia, Clayton County and Lovejoy 2000
Category Georgia Clayton Lovejoy
Total: 3,832,803 112,580 664
Worked in state of residence 3,737,030 111,651 662
Worked in county of residence 2,240,758 42,924 282
Worked outside county of residence 1,496,272 68,727 380
Worked outside state of residence 95,773 929 2
Source: U.S. Bureau of the Census, 2000.
Table E12 indicates that a significant number of Lovejoy residents cannot find local employment. More importantly, a majority of Lovejoy residents travel outside Clayton County for employment. The steep residence adjustment factor for Clayton County also indicates that revenues being removed from the County exceed those being returned by Clayton employees. This suggests that the jobs held by non-residents are higher paying in comparison to those held by Clayton residents working outside the County.
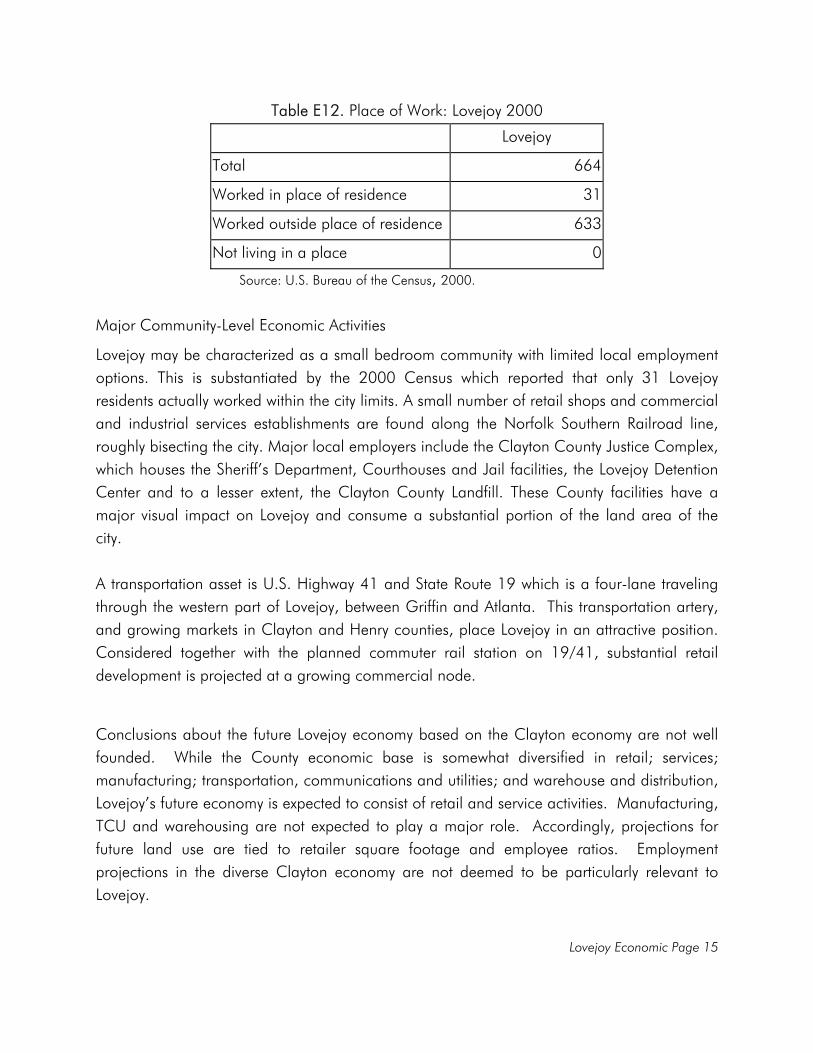
Lovejoy Economic Page 15
Table E12. Place of Work: Lovejoy 2000
Lovejoy
Total 664
Worked in place of residence 31
Worked outside place of residence 633
Not living in a place 0
Source: U.S. Bureau of the Census, 2000. Major Community-Level Economic Activities
Lovejoy may be characterized as a small bedroom community with limited local employment options. This is substantiated by the 2000 Census which reported that only 31 Lovejoy residents actually worked within the city limits. A small number of retail shops and commercial and industrial services establishments are found along the Norfolk Southern Railroad line, roughly bisecting the city. Major local employers include the Clayton County Justice Complex, which houses the Sheriff’s Department, Courthouses and Jail facilities, the Lovejoy Detention Center and to a lesser extent, the Clayton County Landfill. These County facilities have a major visual impact on Lovejoy and consume a substantial portion of the land area of the city. A transportation asset is U.S. Highway 41 and State Route 19 which is a four-lane traveling through the western part of Lovejoy, between Griffin and Atlanta. This transportation artery, and growing markets in Clayton and Henry counties, place Lovejoy in an attractive position. Considered together with the planned commuter rail station on 19/41, substantial retail development is projected at a growing commercial node.
Conclusions about the future Lovejoy economy based on the Clayton economy are not well founded. While the County economic base is somewhat diversified in retail; services; manufacturing; transportation, communications and utilities; and warehouse and distribution, Lovejoy’s future economy is expected to consist of retail and service activities. Manufacturing, TCU and warehousing are not expected to play a major role. Accordingly, projections for future land use are tied to retailer square footage and employee ratios. Employment projections in the diverse Clayton economy are not deemed to be particularly relevant to Lovejoy.
Lovejoy Economic Page 16
Major Residential Development Major residential development in Lovejoy since the 2000 Census includes 216 single family detached units, 258 single family attached (townhouse) units and 250 multifamily dwelling units. This construction has diversified the housing stock in Lovejoy. Unique Economic Activities Among Lovejoy's unique economic activities are the Clayton County Justice Complex and the Clayton County Landfill. Agricultural operations are found nearby, in Henry County. No other unique economic activities are present.
Lovejoy Economic Page 17
Labor Force Labor force statistics represent employment of Lovejoy residents, not necessarily employment in Lovejoy as residents may or may not be employed locally. In fact, Census indicates that of the total number of jobs held by Lovejoy residents, a mere 31, or 5 percent actually work in Lovejoy. This data also indicates that the majority of Lovejoy residents, 57.2 percent, do not work in Clayton County. Employment of residents can be important data as the characteristics of the labor force is useful to employers and to such public programs as adult education, workforce training and job placement.
Lovejoy Resident Occupations Employment by occupation is also an important indicator of the economic health and stability of the community based on the range and wage characteristics of jobs held by local residents. Such data is reported for Lovejoy for 1990 and 2000. Substantial increases in employment were expected given the jump in population between these years. However, nearly half of the population surge in Lovejoy between 1990 and 2000 was accounted for by an influx of inmates at the Clayton Detention Center. New residents bring varying skill sets and this is reflected in the change in distribution of occupations. For example, the largest number of positions held by Lovejoy residents in 1990 was in "clerical and administrative support," some 30 percent of all employment was in this occupational category. "Clerical and administrative support" remained the number one occupation in 2000; however, the percentage of all employees dropped to 18.7 percent. Offsetting gains were seen in "machine operators, assemblers and inspectors" occupations which represented 6.4 percent of the total in 1990, expanding to 16.4 percent by 2000. Participation in "transportation and material moving" occupations expanded significantly from 9.7 percent in 1990 to 14.7 percent in 2000. "Sales" occupations rose marginally from 10.1 percent in 1990 to 11.8 percent. The respective ranking of employment by occupation changed somewhat dramatically through the decade of the 90's, suggesting that new residents were engaged in occupations different from longer term residents. By far, the most significant change in the Lovejoy labor force was in "machine operators, assemblers and inspectors which increased by more than 600 percent. The number of employees in "transportation and material moving" quadrupled as did employees in "service occupations." The number of employees in "professional and technical specialty occupations" tripled in the 90's along with "sales." "Clerical and administrative support" employment gained only 160 percent, but remained the largest employment occupation. Finally, participation in "precision production, crafts and repair" rose only slightly.
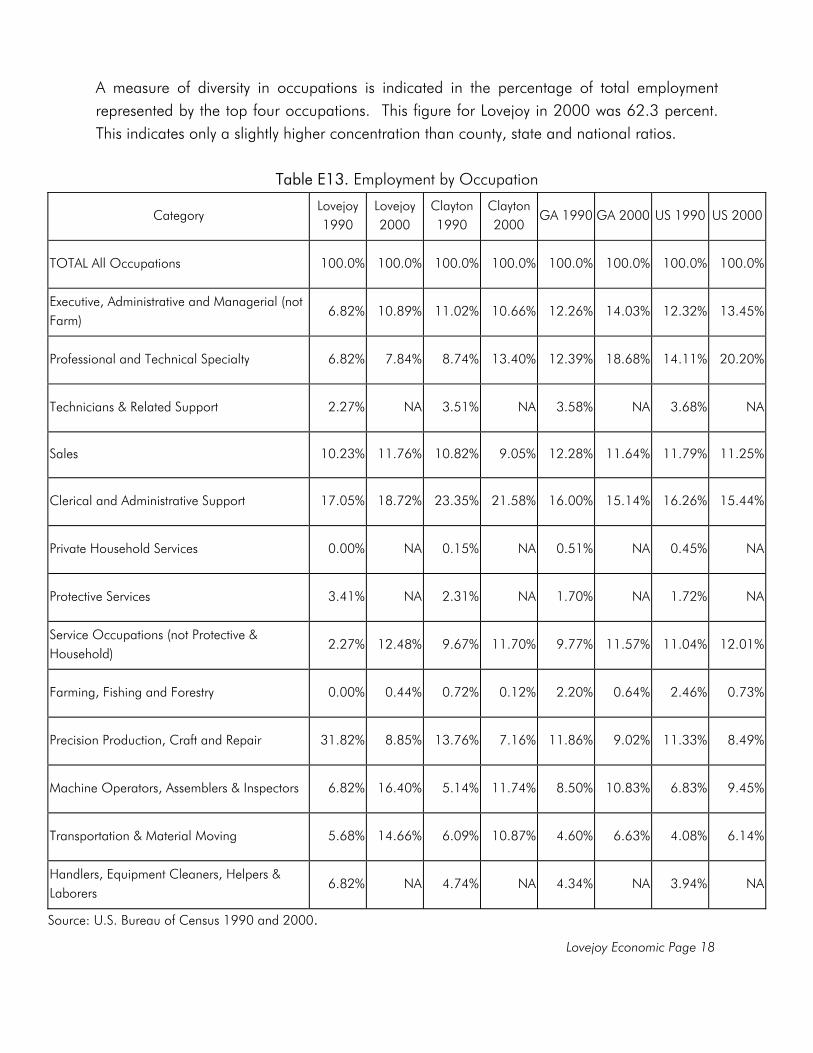
Lovejoy Economic Page 18
A measure of diversity in occupations is indicated in the percentage of total employment represented by the top four occupations. This figure for Lovejoy in 2000 was 62.3 percent. This indicates only a slightly higher concentration than county, state and national ratios.
Table E13. Employment by Occupation
Category Lovejoy 1990
Lovejoy 2000
Clayton 1990
Clayton 2000
GA 1990 GA 2000 US 1990 US 2000
TOTAL All Occupations 100.0% 100.0% 100.0% 100.0% 100.0% 100.0% 100.0% 100.0%
Executive, Administrative and Managerial (not Farm)
6.82% 10.89% 11.02% 10.66% 12.26% 14.03% 12.32% 13.45%
Professional and Technical Specialty 6.82% 7.84% 8.74% 13.40% 12.39% 18.68% 14.11% 20.20%
Technicians & Related Support 2.27% NA 3.51% NA 3.58% NA 3.68% NA
Sales 10.23% 11.76% 10.82% 9.05% 12.28% 11.64% 11.79% 11.25%
Clerical and Administrative Support 17.05% 18.72% 23.35% 21.58% 16.00% 15.14% 16.26% 15.44%
Private Household Services 0.00% NA 0.15% NA 0.51% NA 0.45% NA
Protective Services 3.41% NA 2.31% NA 1.70% NA 1.72% NA
Service Occupations (not Protective & Household)
2.27% 12.48% 9.67% 11.70% 9.77% 11.57% 11.04% 12.01%
Farming, Fishing and Forestry 0.00% 0.44% 0.72% 0.12% 2.20% 0.64% 2.46% 0.73%
Precision Production, Craft and Repair 31.82% 8.85% 13.76% 7.16% 11.86% 9.02% 11.33% 8.49%
Machine Operators, Assemblers & Inspectors 6.82% 16.40% 5.14% 11.74% 8.50% 10.83% 6.83% 9.45%
Transportation & Material Moving 5.68% 14.66% 6.09% 10.87% 4.60% 6.63% 4.08% 6.14%
Handlers, Equipment Cleaners, Helpers & Laborers
6.82% NA 4.74% NA 4.34% NA 3.94% NA
Source: U.S. Bureau of Census 1990 and 2000.
Lovejoy Economic Page 19
Clayton Resident Occupations As seen in Table E13, "clerical and administrative support" comprised 23.4 percent of the jobs, nearly one in four positions, held by Clayton County residents in 1990. This ratio fell to 21.6 percent in 2000, but as seen in Lovejoy, this occupational category remained atop as the largest employment category. "Professional and technical specialty occupations;" "machine operators, assemblers and inspectors;" "service occupations" and "executive, administrative and managerial" occupations comprised the next four categories in rank order in terms of number of residents employed in such occupations. Employment in these five categories garnered similar ratios in 1990 and 2000, with the exception of "professional and technical specialty occupations" which rose nearly 5 percent and "precision production, crafts and repair" which was cut in half. Clerical and administrative support positions continued to dominate employment for Clayton residents in 2000; however, the ordering of the dominant occupations changed dramatically. Professional and technical specialty occupations replaced “precision production, crafts and repair” in the number two spot and “machine operators, assemblers and inspectors” moved up to number three. Neither of these occupations were in the top five just a decade earlier. A substantial decline in the number of residents engaged in “precision production, crafts and repair,” a loss of over 5,000 jobs, was offset by large increases in “professional and technical specialty occupations,” 6,858 positions, and in “machine operators, assemblers and inspectors” where 8,497 positions were added or a 172 percent expansion. The top four occupations in Clayton in 2000 comprised 58.4 percent of all occupations. Georgia Resident Occupations Table E13 indicates that “professional and technical specialty,” occupations led all other employment at 18.68 percent. "Clerical and administrative support" comprised 15.14 percent of all jobs, and 11.64 percent of state workers were employed in “sales” occupations. The distribution of occupations in Georgia was broader with less concentrations in a few occupations. This structure is more desirable as downturns in one or two occupational categories in Clayton would impact a higher percentage of the working population compared to Georgians. The top four occupations in Georgia in 2000 comprised 59.4 percent of all occupations. U.S. Resident Occupations “Professional and technical specialty” occupations not only represented the largest category in the nation, this group also rose the largest number of percentage points from 1990 to 2000, gaining over 6 percent. Clerical and administrative support” occupations represented 15.44 percent of the total in 2000, while non-farm “executive, administrative and managerial” occupations accounted for 13.45 percent of employment. The top four occupations comprised 61.1 percent of all occupations at the national level.
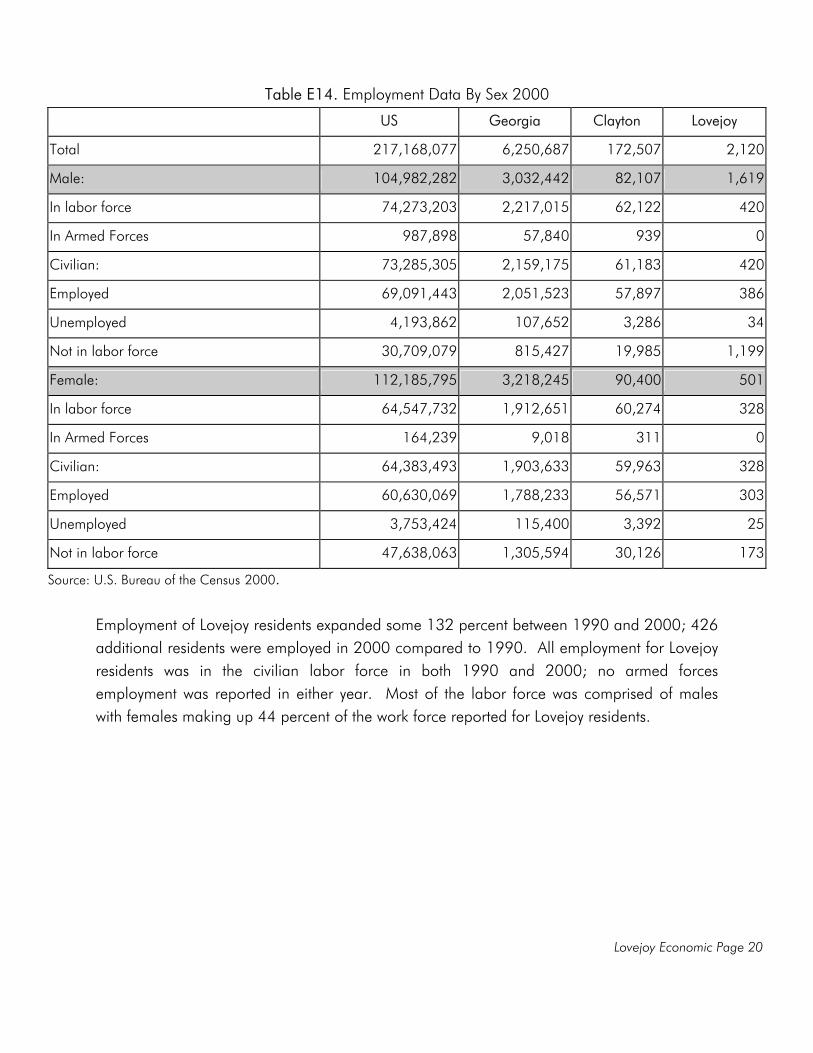
Lovejoy Economic Page 20
Table E14. Employment Data By Sex 2000
US Georgia Clayton Lovejoy
Total 217,168,077 6,250,687 172,507 2,120
Male: 104,982,282 3,032,442 82,107 1,619
In labor force 74,273,203 2,217,015 62,122 420
In Armed Forces 987,898 57,840 939 0
Civilian: 73,285,305 2,159,175 61,183 420
Employed 69,091,443 2,051,523 57,897 386
Unemployed 4,193,862 107,652 3,286 34
Not in labor force 30,709,079 815,427 19,985 1,199
Female: 112,185,795 3,218,245 90,400 501
In labor force 64,547,732 1,912,651 60,274 328
In Armed Forces 164,239 9,018 311 0
Civilian: 64,383,493 1,903,633 59,963 328
Employed 60,630,069 1,788,233 56,571 303
Unemployed 3,753,424 115,400 3,392 25
Not in labor force 47,638,063 1,305,594 30,126 173
Source: U.S. Bureau of the Census 2000.
Employment of Lovejoy residents expanded some 132 percent between 1990 and 2000; 426 additional residents were employed in 2000 compared to 1990. All employment for Lovejoy residents was in the civilian labor force in both 1990 and 2000; no armed forces employment was reported in either year. Most of the labor force was comprised of males with females making up 44 percent of the work force reported for Lovejoy residents.
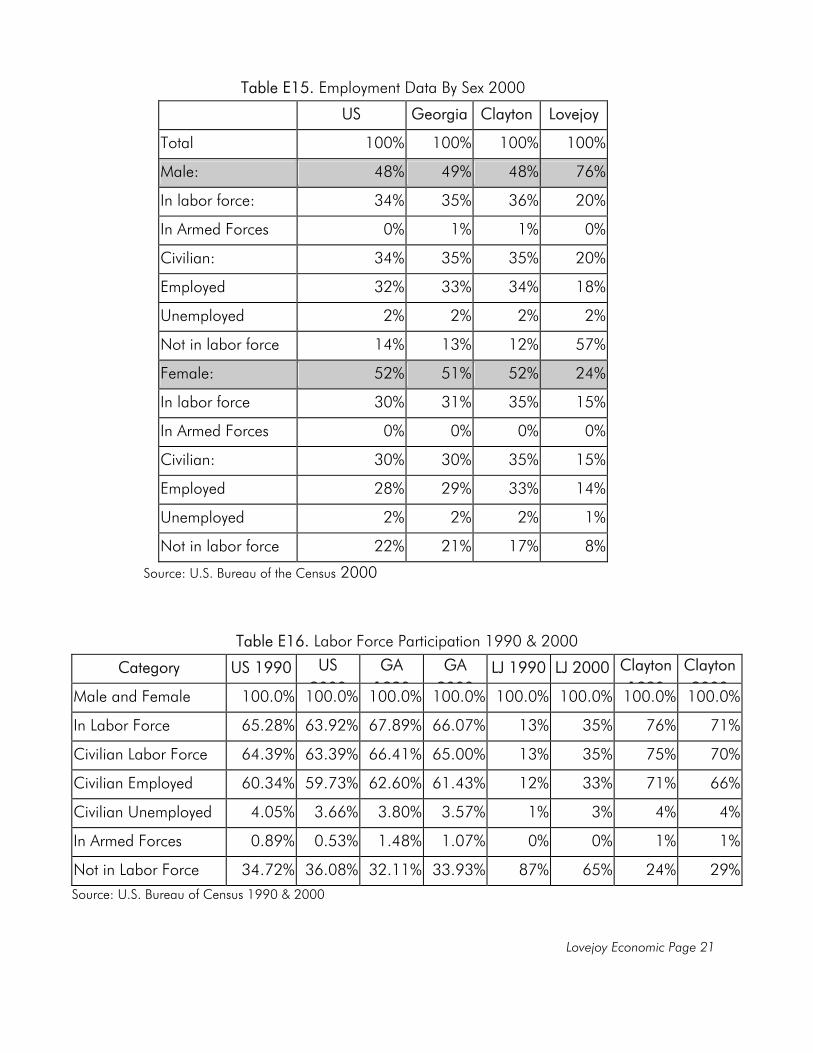
Lovejoy Economic Page 21
Table E15. Employment Data By Sex 2000
US Georgia Clayton Lovejoy
Total 100% 100% 100% 100%
Male: 48% 49% 48% 76%
In labor force: 34% 35% 36% 20%
In Armed Forces 0% 1% 1% 0%
Civilian: 34% 35% 35% 20%
Employed 32% 33% 34% 18%
Unemployed 2% 2% 2% 2%
Not in labor force 14% 13% 12% 57%
Female: 52% 51% 52% 24%
In labor force 30% 31% 35% 15%
In Armed Forces 0% 0% 0% 0%
Civilian: 30% 30% 35% 15%
Employed 28% 29% 33% 14%
Unemployed 2% 2% 2% 1%
Not in labor force 22% 21% 17% 8%
Source: U.S. Bureau of the Census 2000
Table E16. Labor Force Participation 1990 & 2000
Category US 1990 US 2000
GA 1990
GA 2000
LJ 1990 LJ 2000 Clayton 1990
Clayton 2000Male and Female 100.0% 100.0% 100.0% 100.0% 100.0% 100.0% 100.0% 100.0%
In Labor Force 65.28% 63.92% 67.89% 66.07% 13% 35% 76% 71%
Civilian Labor Force 64.39% 63.39% 66.41% 65.00% 13% 35% 75% 70%
Civilian Employed 60.34% 59.73% 62.60% 61.43% 12% 33% 71% 66%
Civilian Unemployed 4.05% 3.66% 3.80% 3.57% 1% 3% 4% 4%
In Armed Forces 0.89% 0.53% 1.48% 1.07% 0% 0% 1% 1%
Not in Labor Force 34.72% 36.08% 32.11% 33.93% 87% 65% 24% 29%Source: U.S. Bureau of Census 1990 & 2000
Lovejoy Economic Page 22
The presence of inmates in Lovejoy influences employment statistics greater than any other demographic indicator. The 1,154 men incarcerated are all in the employable age ranges. These individuals comprise more than half (54.4%) of the total working age population in Lovejoy of 2,120 persons. In 2000, the percentage of the working population which were not in the labor force, absent the inmates, would fall to 22 percent, significantly below all other jurisdictions. This skewing of the statistics also explains the low percentage of participation by women in the labor force. When the inmate population is removed, the percentage of females in the labor force rises from 24 percent to 51.8 percent, very comparable to Clayton, Georgia and U.S. levels. Similarly, the relatively high rate of males in the working age group of 76 percent falls to 48.1 percent when the inmate population is removed. Figures for both males and females are very comparable to the figures of the other geographic areas. Labor force participation by sex in Georgia tracks national figures more closely than either Lovejoy or Clayton County. The circumstances in Lovejoy have been described above. Clayton representation in the labor force is higher than that for Georgia and the nation. Approximately two-thirds of all individuals in an employable age range were active in the labor force in 1990 and 2000 in Georgia and the U.S.
Unemployment Rate Unemployment rates by county have tended to demonstrate the strength of Atlanta’s northern counties over the past decade and beyond. With the exception of DeKalb in certain years, Clayton and Spalding, both southside counties, have recorded higher unemployment rates. Clayton and Spalding unemployment spiked in 2002 and again in 2003. However, so did Fulton and DeKalb. In 2003, Clayton and Spalding were the only counties with an unemployment rate above 5 percent.
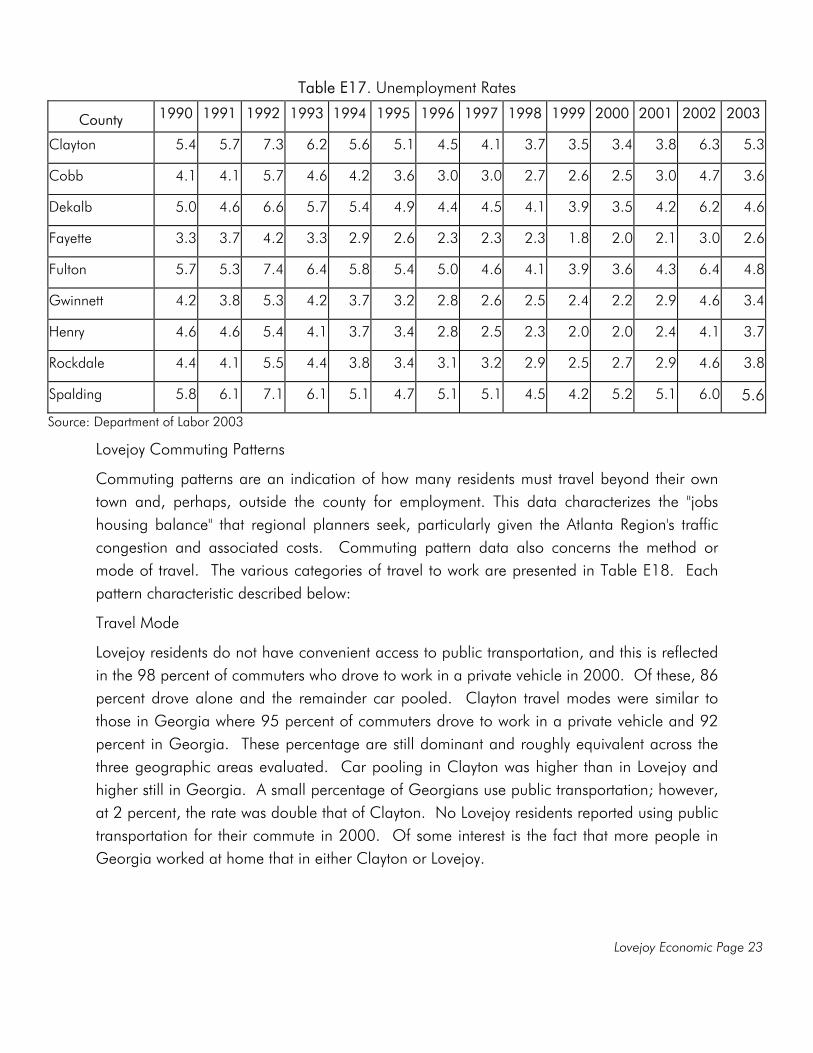
Lovejoy Economic Page 23
Table E17. Unemployment Rates
County 1990 1991 1992 1993 1994 1995 1996 1997 1998 1999 2000 2001 2002 2003
Clayton 5.4 5.7 7.3 6.2 5.6 5.1 4.5 4.1 3.7 3.5 3.4 3.8 6.3 5.3
Cobb 4.1 4.1 5.7 4.6 4.2 3.6 3.0 3.0 2.7 2.6 2.5 3.0 4.7 3.6
Dekalb 5.0 4.6 6.6 5.7 5.4 4.9 4.4 4.5 4.1 3.9 3.5 4.2 6.2 4.6
Fayette 3.3 3.7 4.2 3.3 2.9 2.6 2.3 2.3 2.3 1.8 2.0 2.1 3.0 2.6
Fulton 5.7 5.3 7.4 6.4 5.8 5.4 5.0 4.6 4.1 3.9 3.6 4.3 6.4 4.8
Gwinnett 4.2 3.8 5.3 4.2 3.7 3.2 2.8 2.6 2.5 2.4 2.2 2.9 4.6 3.4
Henry 4.6 4.6 5.4 4.1 3.7 3.4 2.8 2.5 2.3 2.0 2.0 2.4 4.1 3.7
Rockdale 4.4 4.1 5.5 4.4 3.8 3.4 3.1 3.2 2.9 2.5 2.7 2.9 4.6 3.8
Spalding 5.8 6.1 7.1 6.1 5.1 4.7 5.1 5.1 4.5 4.2 5.2 5.1 6.0 5.6
Source: Department of Labor 2003
Lovejoy Commuting Patterns
Commuting patterns are an indication of how many residents must travel beyond their own town and, perhaps, outside the county for employment. This data characterizes the "jobs housing balance" that regional planners seek, particularly given the Atlanta Region's traffic congestion and associated costs. Commuting pattern data also concerns the method or mode of travel. The various categories of travel to work are presented in Table E18. Each pattern characteristic described below:
Travel Mode
Lovejoy residents do not have convenient access to public transportation, and this is reflected in the 98 percent of commuters who drove to work in a private vehicle in 2000. Of these, 86 percent drove alone and the remainder car pooled. Clayton travel modes were similar to those in Georgia where 95 percent of commuters drove to work in a private vehicle and 92 percent in Georgia. These percentage are still dominant and roughly equivalent across the three geographic areas evaluated. Car pooling in Clayton was higher than in Lovejoy and higher still in Georgia. A small percentage of Georgians use public transportation; however, at 2 percent, the rate was double that of Clayton. No Lovejoy residents reported using public transportation for their commute in 2000. Of some interest is the fact that more people in Georgia worked at home that in either Clayton or Lovejoy.
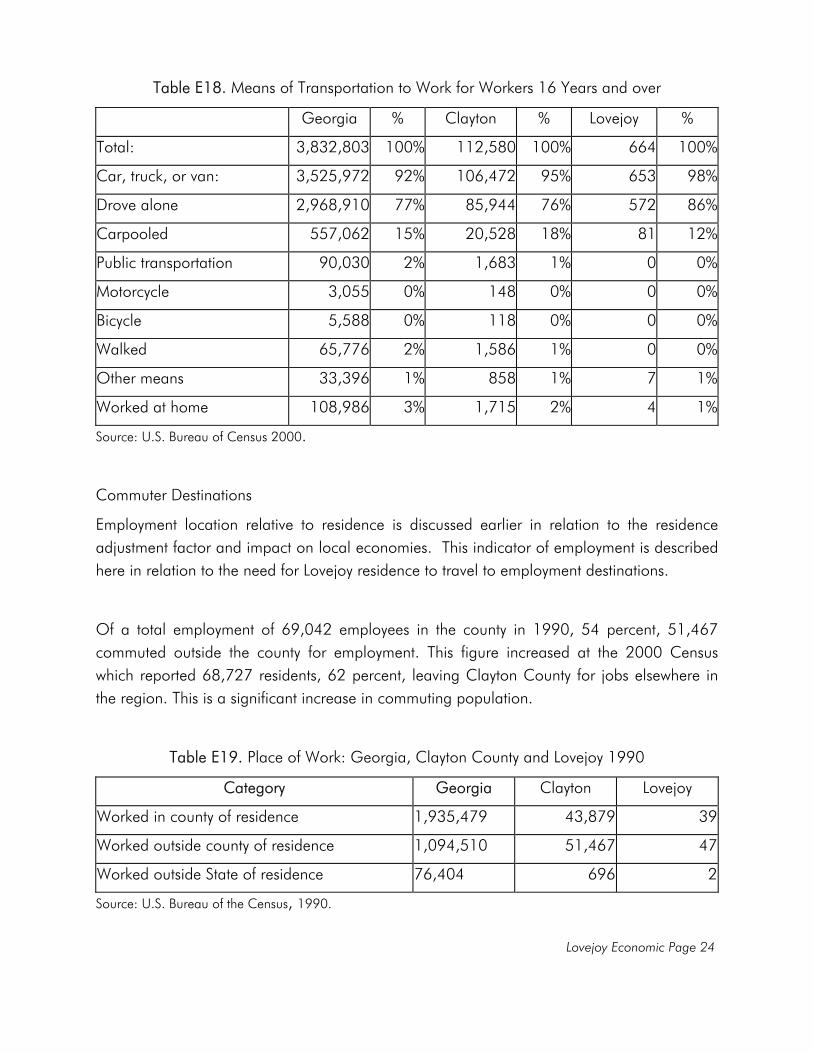
Lovejoy Economic Page 24
Table E18. Means of Transportation to Work for Workers 16 Years and over
Georgia % Clayton % Lovejoy %
Total: 3,832,803 100% 112,580 100% 664 100%
Car, truck, or van: 3,525,972 92% 106,472 95% 653 98%
Drove alone 2,968,910 77% 85,944 76% 572 86%
Carpooled 557,062 15% 20,528 18% 81 12%
Public transportation 90,030 2% 1,683 1% 0 0%
Motorcycle 3,055 0% 148 0% 0 0%
Bicycle 5,588 0% 118 0% 0 0%
Walked 65,776 2% 1,586 1% 0 0%
Other means 33,396 1% 858 1% 7 1%
Worked at home 108,986 3% 1,715 2% 4 1%
Source: U.S. Bureau of Census 2000.
Commuter Destinations
Employment location relative to residence is discussed earlier in relation to the residence adjustment factor and impact on local economies. This indicator of employment is described here in relation to the need for Lovejoy residence to travel to employment destinations.
Of a total employment of 69,042 employees in the county in 1990, 54 percent, 51,467 commuted outside the county for employment. This figure increased at the 2000 Census which reported 68,727 residents, 62 percent, leaving Clayton County for jobs elsewhere in the region. This is a significant increase in commuting population.
Table E19. Place of Work: Georgia, Clayton County and Lovejoy 1990
Category Georgia Clayton Lovejoy
Worked in county of residence 1,935,479 43,879 39
Worked outside county of residence 1,094,510 51,467 47
Worked outside State of residence 76,404 696 2
Source: U.S. Bureau of the Census, 1990.
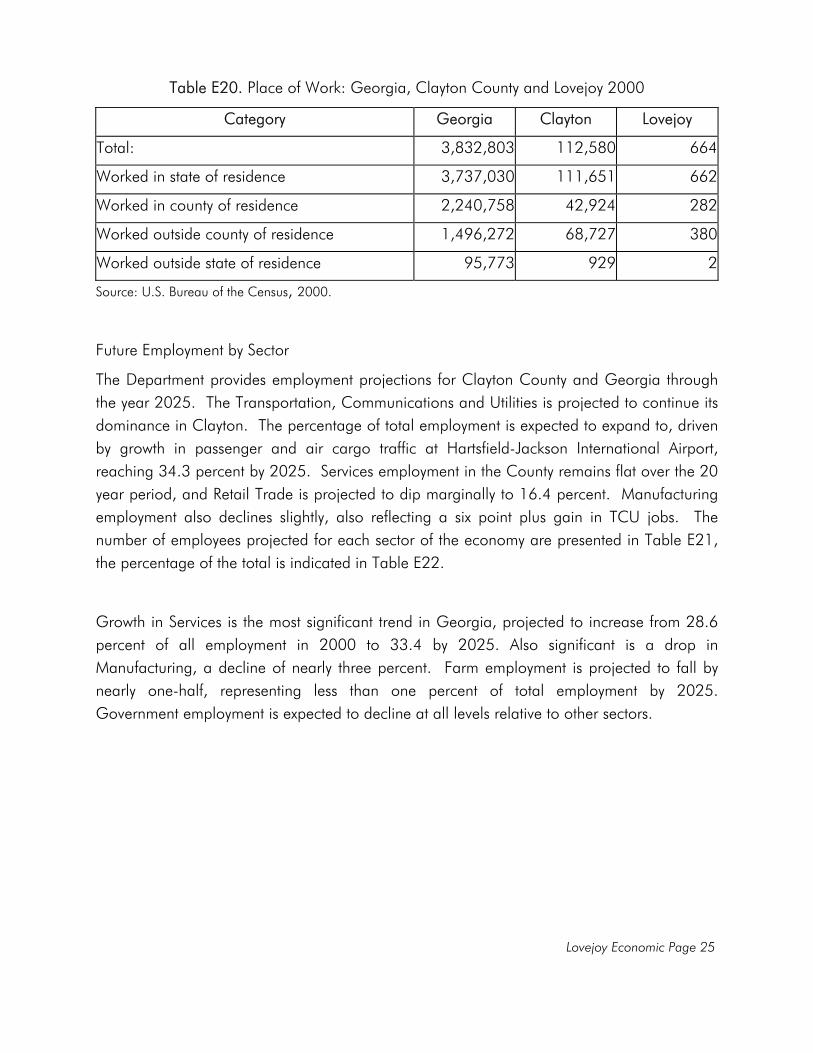
Lovejoy Economic Page 25
Table E20. Place of Work: Georgia, Clayton County and Lovejoy 2000
Category Georgia Clayton Lovejoy
Total: 3,832,803 112,580 664
Worked in state of residence 3,737,030 111,651 662
Worked in county of residence 2,240,758 42,924 282
Worked outside county of residence 1,496,272 68,727 380
Worked outside state of residence 95,773 929 2
Source: U.S. Bureau of the Census, 2000.
Future Employment by Sector
The Department provides employment projections for Clayton County and Georgia through the year 2025. The Transportation, Communications and Utilities is projected to continue its dominance in Clayton. The percentage of total employment is expected to expand to, driven by growth in passenger and air cargo traffic at Hartsfield-Jackson International Airport, reaching 34.3 percent by 2025. Services employment in the County remains flat over the 20 year period, and Retail Trade is projected to dip marginally to 16.4 percent. Manufacturing employment also declines slightly, also reflecting a six point plus gain in TCU jobs. The number of employees projected for each sector of the economy are presented in Table E21, the percentage of the total is indicated in Table E22.
Growth in Services is the most significant trend in Georgia, projected to increase from 28.6 percent of all employment in 2000 to 33.4 by 2025. Also significant is a drop in Manufacturing, a decline of nearly three percent. Farm employment is projected to fall by nearly one-half, representing less than one percent of total employment by 2025. Government employment is expected to decline at all levels relative to other sectors.
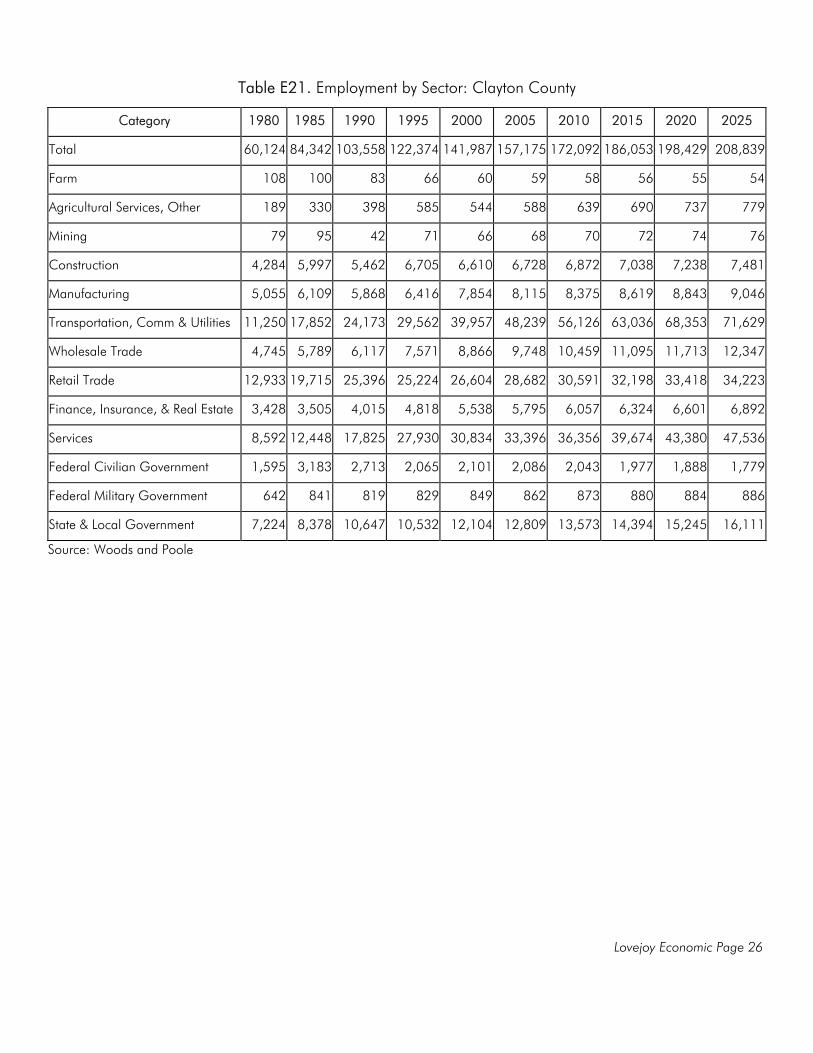
Lovejoy Economic Page 26
Table E21. Employment by Sector: Clayton County
Category 1980 1985 1990 1995 2000 2005 2010 2015 2020 2025
Total 60,124 84,342 103,558 122,374 141,987 157,175 172,092 186,053 198,429 208,839
Farm 108 100 83 66 60 59 58 56 55 54
Agricultural Services, Other 189 330 398 585 544 588 639 690 737 779
Mining 79 95 42 71 66 68 70 72 74 76
Construction 4,284 5,997 5,462 6,705 6,610 6,728 6,872 7,038 7,238 7,481
Manufacturing 5,055 6,109 5,868 6,416 7,854 8,115 8,375 8,619 8,843 9,046
Transportation, Comm & Utilities 11,250 17,852 24,173 29,562 39,957 48,239 56,126 63,036 68,353 71,629
Wholesale Trade 4,745 5,789 6,117 7,571 8,866 9,748 10,459 11,095 11,713 12,347
Retail Trade 12,933 19,715 25,396 25,224 26,604 28,682 30,591 32,198 33,418 34,223
Finance, Insurance, & Real Estate 3,428 3,505 4,015 4,818 5,538 5,795 6,057 6,324 6,601 6,892
Services 8,592 12,448 17,825 27,930 30,834 33,396 36,356 39,674 43,380 47,536
Federal Civilian Government 1,595 3,183 2,713 2,065 2,101 2,086 2,043 1,977 1,888 1,779
Federal Military Government 642 841 819 829 849 862 873 880 884 886
State & Local Government 7,224 8,378 10,647 10,532 12,104 12,809 13,573 14,394 15,245 16,111
Source: Woods and Poole
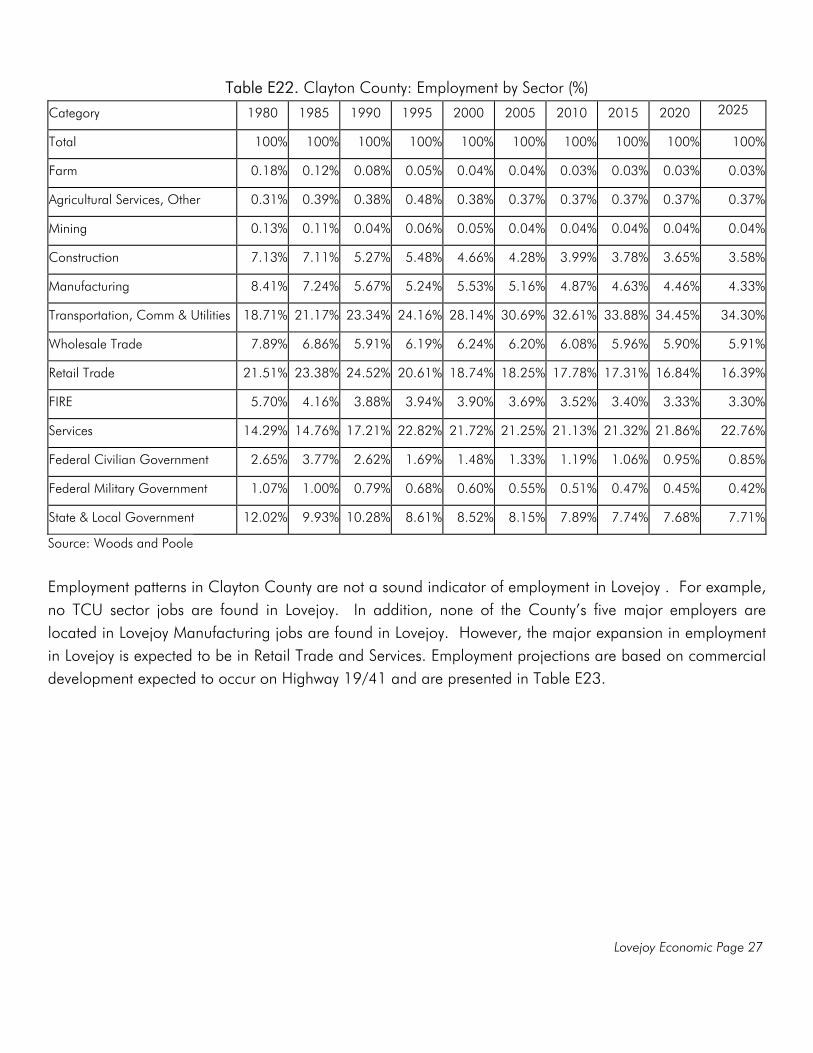
Lovejoy Economic Page 27
Table E22. Clayton County: Employment by Sector (%)
Category 1980 1985 1990 1995 2000 2005 2010 2015 2020 2025
Total 100% 100% 100% 100% 100% 100% 100% 100% 100% 100%
Farm 0.18% 0.12% 0.08% 0.05% 0.04% 0.04% 0.03% 0.03% 0.03% 0.03%
Agricultural Services, Other 0.31% 0.39% 0.38% 0.48% 0.38% 0.37% 0.37% 0.37% 0.37% 0.37%
Mining 0.13% 0.11% 0.04% 0.06% 0.05% 0.04% 0.04% 0.04% 0.04% 0.04%
Construction 7.13% 7.11% 5.27% 5.48% 4.66% 4.28% 3.99% 3.78% 3.65% 3.58%
Manufacturing 8.41% 7.24% 5.67% 5.24% 5.53% 5.16% 4.87% 4.63% 4.46% 4.33%
Transportation, Comm & Utilities 18.71% 21.17% 23.34% 24.16% 28.14% 30.69% 32.61% 33.88% 34.45% 34.30%
Wholesale Trade 7.89% 6.86% 5.91% 6.19% 6.24% 6.20% 6.08% 5.96% 5.90% 5.91%
Retail Trade 21.51% 23.38% 24.52% 20.61% 18.74% 18.25% 17.78% 17.31% 16.84% 16.39%
FIRE 5.70% 4.16% 3.88% 3.94% 3.90% 3.69% 3.52% 3.40% 3.33% 3.30%
Services 14.29% 14.76% 17.21% 22.82% 21.72% 21.25% 21.13% 21.32% 21.86% 22.76%
Federal Civilian Government 2.65% 3.77% 2.62% 1.69% 1.48% 1.33% 1.19% 1.06% 0.95% 0.85%
Federal Military Government 1.07% 1.00% 0.79% 0.68% 0.60% 0.55% 0.51% 0.47% 0.45% 0.42%
State & Local Government 12.02% 9.93% 10.28% 8.61% 8.52% 8.15% 7.89% 7.74% 7.68% 7.71%
Source: Woods and Poole Employment patterns in Clayton County are not a sound indicator of employment in Lovejoy . For example, no TCU sector jobs are found in Lovejoy. In addition, none of the County’s five major employers are located in Lovejoy Manufacturing jobs are found in Lovejoy. However, the major expansion in employment in Lovejoy is expected to be in Retail Trade and Services. Employment projections are based on commercial development expected to occur on Highway 19/41 and are presented in Table E23.
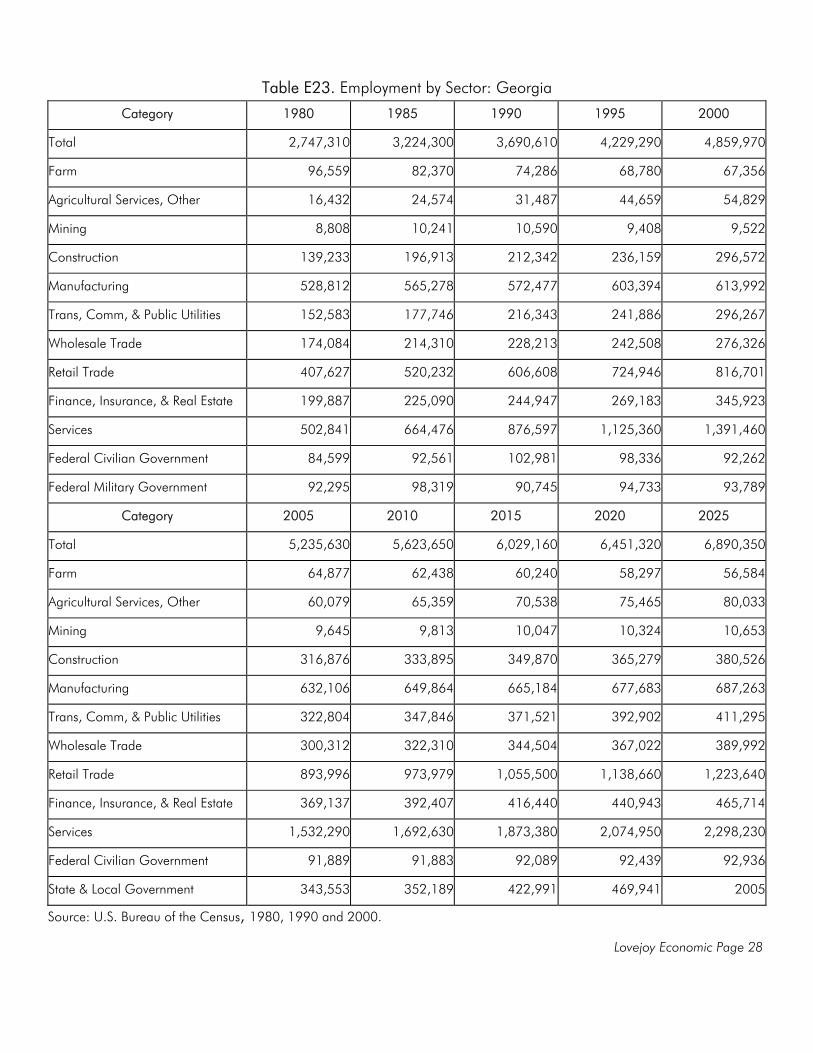
Lovejoy Economic Page 28
Table E23. Employment by Sector: Georgia
Category 1980 1985 1990 1995 2000
Total 2,747,310 3,224,300 3,690,610 4,229,290 4,859,970
Farm 96,559 82,370 74,286 68,780 67,356
Agricultural Services, Other 16,432 24,574 31,487 44,659 54,829
Mining 8,808 10,241 10,590 9,408 9,522
Construction 139,233 196,913 212,342 236,159 296,572
Manufacturing 528,812 565,278 572,477 603,394 613,992
Trans, Comm, & Public Utilities 152,583 177,746 216,343 241,886 296,267
Wholesale Trade 174,084 214,310 228,213 242,508 276,326
Retail Trade 407,627 520,232 606,608 724,946 816,701
Finance, Insurance, & Real Estate 199,887 225,090 244,947 269,183 345,923
Services 502,841 664,476 876,597 1,125,360 1,391,460
Federal Civilian Government 84,599 92,561 102,981 98,336 92,262
Federal Military Government 92,295 98,319 90,745 94,733 93,789
Category 2005 2010 2015 2020 2025
Total 5,235,630 5,623,650 6,029,160 6,451,320 6,890,350
Farm 64,877 62,438 60,240 58,297 56,584
Agricultural Services, Other 60,079 65,359 70,538 75,465 80,033
Mining 9,645 9,813 10,047 10,324 10,653
Construction 316,876 333,895 349,870 365,279 380,526
Manufacturing 632,106 649,864 665,184 677,683 687,263
Trans, Comm, & Public Utilities 322,804 347,846 371,521 392,902 411,295
Wholesale Trade 300,312 322,310 344,504 367,022 389,992
Retail Trade 893,996 973,979 1,055,500 1,138,660 1,223,640
Finance, Insurance, & Real Estate 369,137 392,407 416,440 440,943 465,714
Services 1,532,290 1,692,630 1,873,380 2,074,950 2,298,230
Federal Civilian Government 91,889 91,883 92,089 92,439 92,936
State & Local Government 343,553 352,189 422,991 469,941 2005
Source: U.S. Bureau of the Census, 1980, 1990 and 2000.
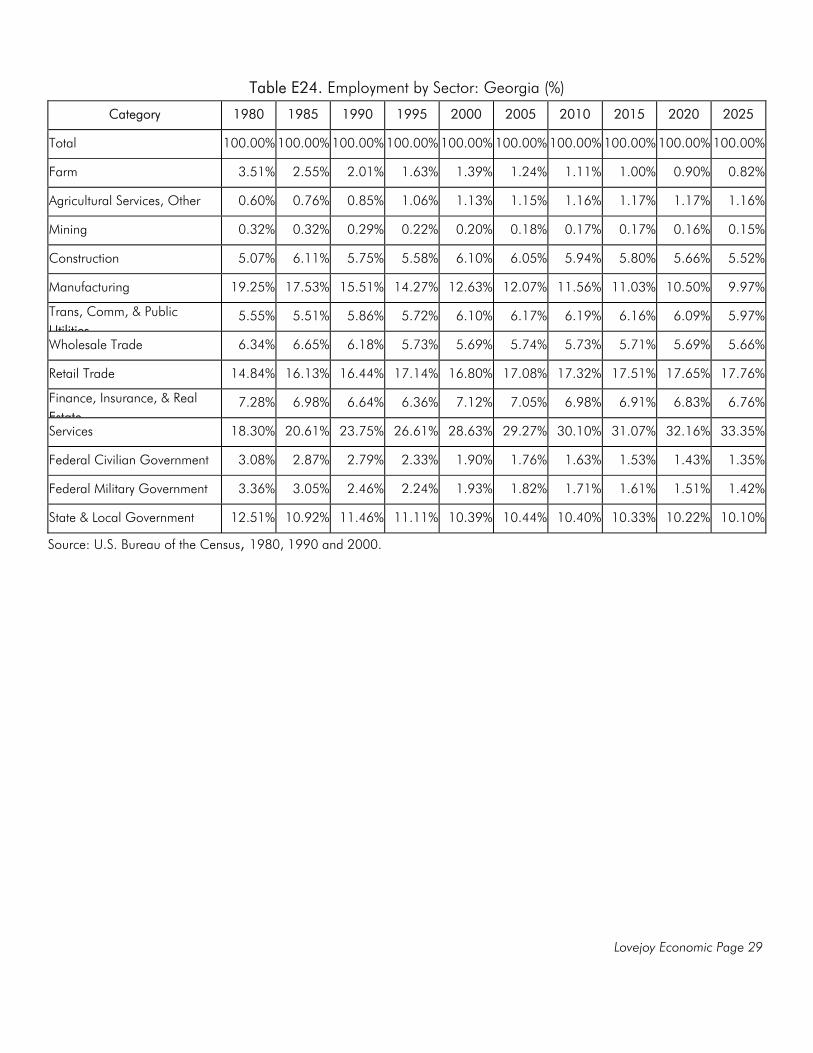
Lovejoy Economic Page 29
Table E24. Employment by Sector: Georgia (%)
Category 1980 1985 1990 1995 2000 2005 2010 2015 2020 2025
Total 100.00% 100.00% 100.00% 100.00% 100.00% 100.00% 100.00% 100.00% 100.00% 100.00%
Farm 3.51% 2.55% 2.01% 1.63% 1.39% 1.24% 1.11% 1.00% 0.90% 0.82%
Agricultural Services, Other 0.60% 0.76% 0.85% 1.06% 1.13% 1.15% 1.16% 1.17% 1.17% 1.16%
Mining 0.32% 0.32% 0.29% 0.22% 0.20% 0.18% 0.17% 0.17% 0.16% 0.15%
Construction 5.07% 6.11% 5.75% 5.58% 6.10% 6.05% 5.94% 5.80% 5.66% 5.52%
Manufacturing 19.25% 17.53% 15.51% 14.27% 12.63% 12.07% 11.56% 11.03% 10.50% 9.97%
Trans, Comm, & Public Utilities
5.55% 5.51% 5.86% 5.72% 6.10% 6.17% 6.19% 6.16% 6.09% 5.97%
Wholesale Trade 6.34% 6.65% 6.18% 5.73% 5.69% 5.74% 5.73% 5.71% 5.69% 5.66%
Retail Trade 14.84% 16.13% 16.44% 17.14% 16.80% 17.08% 17.32% 17.51% 17.65% 17.76%
Finance, Insurance, & Real Estate
7.28% 6.98% 6.64% 6.36% 7.12% 7.05% 6.98% 6.91% 6.83% 6.76%
Services 18.30% 20.61% 23.75% 26.61% 28.63% 29.27% 30.10% 31.07% 32.16% 33.35%
Federal Civilian Government 3.08% 2.87% 2.79% 2.33% 1.90% 1.76% 1.63% 1.53% 1.43% 1.35%
Federal Military Government 3.36% 3.05% 2.46% 2.24% 1.93% 1.82% 1.71% 1.61% 1.51% 1.42%
State & Local Government 12.51% 10.92% 11.46% 11.11% 10.39% 10.44% 10.40% 10.33% 10.22% 10.10%
Source: U.S. Bureau of the Census, 1980, 1990 and 2000.
Lovejoy Economic Page 30
Local Economic Development Resources The Georgia Department of Community Affairs requires that local economic development resources be identified and assessed as to their effectiveness and adequacy. Such resources include economic development agencies such as chambers of commerce, economic development authorities, development arms of electrical utilities and small business assistance programs. Those impacting Lovejoy are described below: Economic Development Agencies The Clayton County Chamber of Commerce is the primary economic development agency in Clayton County. Its role is to provide suitable environments for new businesses wishing to relocate in the county. The Chamber facilitates provision of property tax incentives, venture capital programs, and tax abatement through such mechanisms as enterprise zones. The Development Authority of Clayton County has the ability to issue tax exempt or taxable bonds to business wishing to relocate to Clayton County. The Authority also has the power to acquire and sell property, construct buildings and to perform some of the same duties as the Chamber of Commerce. Clayton College and State University, the largest continuing education program in Georgia, is recognized as the business development center of the county. The College provides several developmental opportunities that assist businesses in expansion purposes as well as job training. Clayton County Development Authority is empowered to carry out the duties of the development authority. The redevelopment authority has been authorized by the Georgia Redevelopment Powers Act of 1985, to create special districts on approved urban redevelopment issues. Economic Development Programs According to the Clayton County Comprehensive Plan, the county has a large number of programs to foster economic development. The programs the county has in place include industrial recruitment opportunities, business incubators, special tax districts and industrial parks. These programs are not being utilized by Lovejoy as much of the development expected to occur will be market driven.

Lovejoy Economic Page 31
Education and Training Opportunities A number of programs are available, primarily through Clayton County. These are described below: Adult Education The adult education programs in Clayton County provide instruction in basic education, GED (General Education Diploma) preparation and English as a Second Language. Day and evening classes are offered at no cost on a space available basis. GED testing is scheduled each month. Class schedules, GED testing dates and registration information are available from the Clayton County Adult Education Office. English as a Second Language ESL for adults is offered at a variety of locations through day and evening classes. Instruction is designed for four levels of proficiency. Schedules are available upon request from the Department of Education. Technology/ Career Education Technology/Career Education is an essential component of the educational program available to youth enrolled in Clayton County Public Schools (CCPS). By integrating problem solving, hands-on activities, and contextual learning, the Technology/Career Education curriculum provides opportunities for career exploration, guided practice and application of academic and technical skills. Students who graduate from high school after successfully completing a Technology/Career Education program of study are prepared for immediate employment, future education and life-long learning. The Georgia Department of Education has adopted the term Technology/Career Education as a title to more accurately represent the area of study commonly known as Vocational Education. The term Technology/Career Education as used by CCPS is synonymous with other terms such as vocational education, technical education, career education, etc. Technology/Career Education Work-Based Learning Clayton County offers Technological and Career education titled work-based learning. This program is offered to high school students as an opportunity for integration of academic and occupational curriculum to connect school to work. Students are given every opportunity to receive academic and occupational preparation that equips them with the necessary skills for obtaining employment and/or entering post secondary education.

Lovejoy Economic Page 32
Technology/ Career Education Youth Apprenticeship Programs Youth Apprenticeships are unique opportunities for Clayton juniors and seniors to begin preparing for a career path while in high school. The apprenticeships combine school-based learning, occupational activities, and work-based learning with an employer. Students work one to three periods per day depending on their schedule. Apprenticeships include business, health services, teacher/child care, automotive and construction.
Lovejoy Economic Page 33
ECONOMIC DEVELOPMENT ASSESSMENT Weekly Wages, Earnings and Employment average weekly wages paid to Clayton residents in 1999 were highest in the Transportation, Communication and Utilities sector at $943. This can be explained by relatively high wage jobs at Hartsfield-Jackson International Airport. Wholesale Trade ranked next highest in weekly wages at $736, followed by Manufacturing at $698 and the Construction sector with workers in the County earning $658 per week in 1999. The Clayton County employment base, and by reference the Lovejoy employment base as nearly half of all Lovejoy residents who work are employed in the county, is oriented toward the Transportation, Communication and Utilities sector. This a high wage sector, and in fact, was more than $200 higher than the next largest employment sector in Clayton. Fortunately for Lovejoy, TCU was also the largest employment sector, representing 28.1 percent of total employment. The second position in was held by the Services Sector at 21.7 percent followed by Retail at 18.7 percent and Wholesale Trade a distant 6.2 percent. This is significant as more than 40 percent of County employment is found in sectors in which weekly wages in 1999 held a 7th and 10th position relative to other sectors reported. The concentration of employment in TCU, nearly one job in three, could be a problem during downturns in that sector. Concentration also characterizes the state labor force where 28.6 percent of Georgia employees work in services. Clayton and Lovejoy workers should be in a better position as wages in TCU far exceed those in services. Personal Income by Type Personal income in Clayton relies heavily on wage and other labor income compared to Georgia. Concurrently, income derived from dividends and interest income as well as proprietor income is higher in Georgia than in the county. The gap is considerable with wages and salaries accounting for 89.9 percent of personal income in 2000 while those in Georgia accounted for only 61.2 percent. Projections indicate a widening gap between income based on wages and salaries in Clayton and those in the state. The percentage of personal income generated by wages and salaries in Clayton is projected to increase through 2025, reaching 93.3 percent. The ratio for Georgia is expected to drop to 60.92 percent. By then, 40 percent of personal income in
Lovejoy Economic Page 34
Georgia will come from sources other than wages and salaries while in Clayton the figure will be only 10 percent. The data suggests that entrepreneurial opportunities in Clayton lag behind opportunities, or interest in business ownership, in Georgia. This may indicate a need for Chamber of Commerce campaigns to stimulate new investment by existing businesses and start-up businesses. This data is bolstered by projections through the year 2025 for Clayton County's residence adjustment factor. Clayton will remain a strong employment destination; however, incomes appear to be draining to counties outside Clayton. Lovejoy’s economy is centered on retail services with a limited number of light industrial establishments located in the old town center, along Lovejoy Road. Introduction on commuter rail service is expected to generate a substantial amount of retail development. Tara Boulevard, a regional arterial, has already created a retail node at McDonough Road. This is also the location planned for the commuter rail station and this transportation resource will propel commercial development along this four-lane.
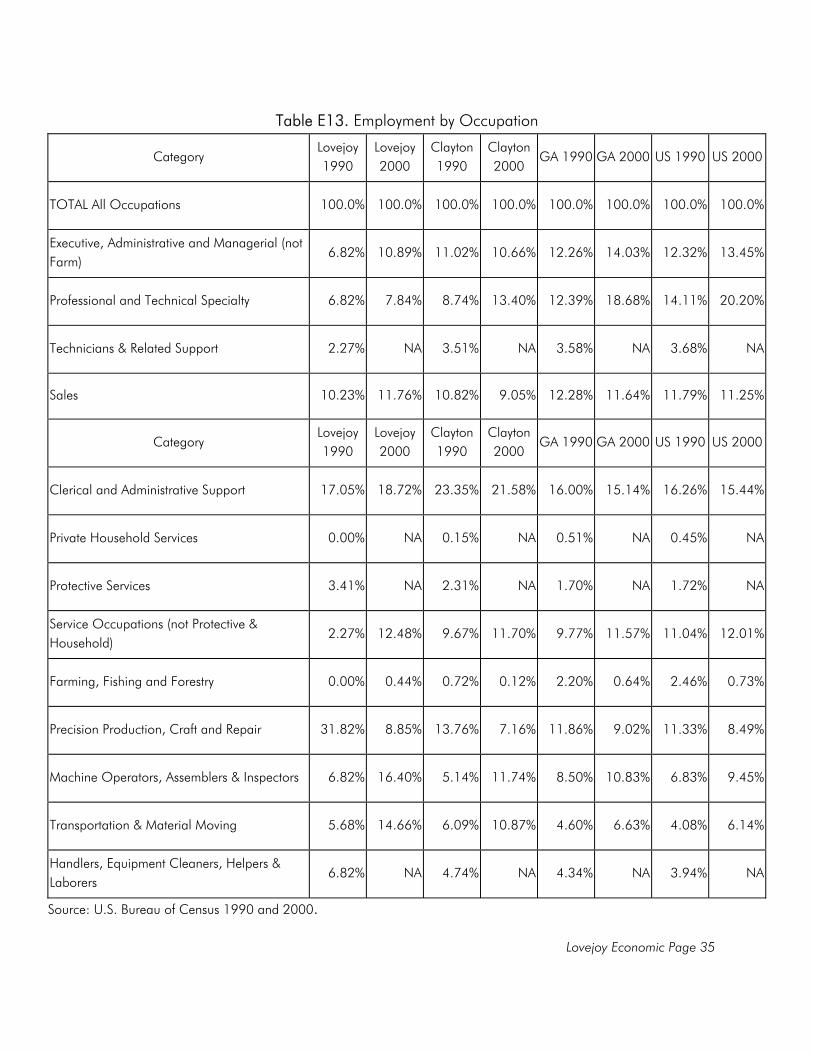
Lovejoy Economic Page 35
Table E13. Employment by Occupation
Category Lovejoy 1990
Lovejoy 2000
Clayton 1990
Clayton 2000
GA 1990 GA 2000 US 1990 US 2000
TOTAL All Occupations 100.0% 100.0% 100.0% 100.0% 100.0% 100.0% 100.0% 100.0%
Executive, Administrative and Managerial (not Farm)
6.82% 10.89% 11.02% 10.66% 12.26% 14.03% 12.32% 13.45%
Professional and Technical Specialty 6.82% 7.84% 8.74% 13.40% 12.39% 18.68% 14.11% 20.20%
Technicians & Related Support 2.27% NA 3.51% NA 3.58% NA 3.68% NA
Sales 10.23% 11.76% 10.82% 9.05% 12.28% 11.64% 11.79% 11.25%
Category Lovejoy 1990
Lovejoy 2000
Clayton 1990
Clayton 2000
GA 1990 GA 2000 US 1990 US 2000
Clerical and Administrative Support 17.05% 18.72% 23.35% 21.58% 16.00% 15.14% 16.26% 15.44%
Private Household Services 0.00% NA 0.15% NA 0.51% NA 0.45% NA
Protective Services 3.41% NA 2.31% NA 1.70% NA 1.72% NA
Service Occupations (not Protective & Household)
2.27% 12.48% 9.67% 11.70% 9.77% 11.57% 11.04% 12.01%
Farming, Fishing and Forestry 0.00% 0.44% 0.72% 0.12% 2.20% 0.64% 2.46% 0.73%
Precision Production, Craft and Repair 31.82% 8.85% 13.76% 7.16% 11.86% 9.02% 11.33% 8.49%
Machine Operators, Assemblers & Inspectors 6.82% 16.40% 5.14% 11.74% 8.50% 10.83% 6.83% 9.45%
Transportation & Material Moving 5.68% 14.66% 6.09% 10.87% 4.60% 6.63% 4.08% 6.14%
Handlers, Equipment Cleaners, Helpers & Laborers
6.82% NA 4.74% NA 4.34% NA 3.94% NA
Source: U.S. Bureau of Census 1990 and 2000.
Lovejoy Economic Page 36
Labor Force Data The ratio of Lovejoy residents engaged in “Executive, Administrative and Managerial” occupations in 2000 compares favorably to Clayton County, Georgia and the nation. However, residents are employed in “Professional and Technical Specialty” occupations at rates substantially below rates in these larger jurisdictions. These occupations tend to be high salaries and wages. Remaining occupations are similar in terms of participation by Lovejoy residents. These findings suggest that employment training of continuing education may be appropriate to enhance resident marketability in professional and technical specialty occupations. Unemployment Rate Clayton, along with nearby Spalding consistently record unemployment rates among the highest in the region. Access could be driving these rates; however, employee education, skill levels or readiness could also influence these rates. Lovejoy recognizes that planned commuter rail, expanded C-Tran service and education and training programs have the potential to remedy continuing high unemployment. Travel to Work Mode Public transportation is not available in Lovejoy, and accordingly, 98 percent of commuters drove to work in a private vehicle in 2000. Of these, 86 percent drove alone. Commuter rail planned for Lovejoy should address accessibility problems, although given ridership rates in the region, an emphasis should be placed on car pooling and other alternatives to the single occupancy vehicle. Of the 664 Lovejoy residents employed in 2000, 382 worked outside Clayton County. Enhanced access could improve unemployment rates as many jobs secured by Clayton residents lie some distance for home. Projections by Woods and Poole indicate that employment in TCU and the services sector will comprise some 57 percent of all employment in 2025. Enhanced access to these jobs, many of which will be near Hartsfield, should enable Lovejoy residents to obtain jobs within the county. Service employment will grow in Lovejoy, improving the poor jobs-housing balance that now characterizes this outlying community. By comparison, Georgia will see more than half of all employment in the retail and services
Lovejoy Economic Page 37
sectors. This bodes well for Lovejoy residents who enjoy proximity to many TCU sector jobs in this region. Economic Development Agencies Given the occupational profiles of Lovejoy residents, and the retail nature of projected employment within the city limits, Lovejoy could benefit more active participation with the Clayton County Development Authority and the Clayton County Chamber of Commerce. Greater emphasis on job training and job creation could benefit Lovejoy if industry cooperation were enhanced. Specifically, relationships such as those promoted by Clayton College and State University for their students were promoted by the City for Lovejoy residents. The College itself represents a tremendous resource for continuing education, particularly given the linkages that planned commuter rail will deliver. Economic and housing development in Lovejoy appears to be market driven. The energies of the City may be better spent in developing employment options throughout the County through job training, access and entry promoted by relationships established through cooperative efforts among Lovejoy and its economic development partners, the Clayton County Development Authority, the Clayton County Chamber of Commerce and Clayton College and State University.
Lovejoy Economic Page 38
IMPLEMENTATION STRATEGIES ECONOMIC DEVELOPMENT In addition to highlighting appropriate data comparisons designed to enhance the assessment, the Georgia Department of Community Affairs has established Minimum Standards for Local Government Comprehensive Planning that encompass the following state Economic Development objectives: ! Regional Identity Objective ! Growth Preparedness Objective ! Appropriate Businesses Objective ! Educational Opportunities Objective ! Employment Options Objective Lovejoy Economic Development goals and objectives focus on the following State objectives:
Growth Preparedness Objective: Each community should identify and put in place the prerequisites for the type of growth it seeks to achieve. These may include housing and infrastructure (roads, water, sewer and telecommunications) to support new growth, appropriate training of the workforce, ordinances to direct growth as desired or leadership capable of responding to growth opportunities.
Educational Opportunities Objective: Educational and training opportunities should be readily available in each community to permit community residents to improve their job skills, adapt to technological advances, or to pursue entrepreneurial ambitions.
Policy responses to these objectives form the Lovejoy Economic Development Goals and Objectives. Achievement of the other state objectives, “Regional Identity Objective,” “Appropriate Businesses Objective” and “Employment Options Objective” are beyond the control of the City of Lovejoy and depend on market opportunities that are simply not present in Lovejoy and not expected to be present over the period of the Plan.
Lovejoy Economic Page 39
Goal: Position Lovejoy to capitalize on economic development opportunities represented by
planned commuter rail and Highway 19/41. Objective A: Establish a mix of housing alternatives in close proximity to the planned
commuter rail station. Objective B: Ensure that road, water and sanitary sewer networks are available in the
locations and capacity necessary to accommodate projected demand in the 19/41 growth corridor.
Objective C: Adopt ordinances that foster development in this corridor characterized
by attractive settings and a broad range of consumer services. Goal: Create an environment in Lovejoy that promotes education and training, encourages
entrepreneurship and yields professional employment options. Objective D: Promote use of Clayton College & State University by Lovejoy residents
to take advantage of the linkage provided by the Lovejoy and CCSU commuter rail stations, including marketing of programs to residents and tailored coursework at the school.
Objective E: Investigate opportunities for Lovejoy business owners through the
Clayton County Development Authority; solicit input from owners to gauge interest in Development Authority assistance.
Objective F: Consider permitting and development incentives as techniques for
leveraging employment for Lovejoy residents in new commercial enterprises being established in the city.
Objective G: Broaden the range of employment options in Lovejoy to encompass
professional and managerial positions. Objective H: Improve the rate at which Lovejoy residents graduate from high
school graduation, pursue post secondary education and earn graduate or other professional degrees.
Lovejoy Economic Page 40
Associated Implementation Strategies include the following: Strategy A: Ensure that the Future Land Use Map and Zoning Ordinance accommodate
a broad selection of residential developments that will enable Lovejoy to capitalize on the transportation resources of Highway 19/41 and the planned commuter rail station at densities sufficient to feed market demand within this commercial node and the station itself.
Strategy B: Cooperate with Clayton County and Clayton County Water and Sewer
Authority in scheduling road, water and sanitary sewer improvements commensurate with projected demand in the 19/41 growth corridor.
Strategy C: Adopt ordinances such as overlay districts that establish architectural
standards, pedestrian amenity provisions, reduced parking requirements, sign controls, and mixed use incentives for the 19/41 growth corridor.
Strategy D: Cultivate a relationship with Clayton College & State University, perhaps
with the assistance of the Clayton County Chamber of Commerce, aimed at establishing coursework tailored to the education and training needs of Lovejoy residents and also establish relationships with GRTA in marketing rail access to the school.
Strategy E: Cooperate with the Clayton County Development Authority in identifying
business assistance programs available to Lovejoy businesses and convene forums with area merchants and developers to match such programs with the project financing demands of the local market.
Strategy F: Foster professional office development in collaboration with the Clayton
County Chamber of Commerce as a means of enhancing earnings and employment opportunities in Lovejoy. Proximity to the planned commuter rail station should be aggressively marketed to potential office developers and tenants.
Strategy G: Develop a package of incentives in conjunction with such agencies as the
Clayton County Development Authority, Clayton County, Clayton County

Lovejoy Economic Page 41
Water and Sewer Authority and Georgia Power Company, including infrastructure improvements, reduced fees, expedited plan review, density bonuses, lower parking ratios and other development incentives to leverage employment for Lovejoy residents.
Strategy H: Investigate such programs as mentoring to improve high school graduation
rates and achievement and work with Clayton College & State University officials to promote higher education for Lovejoy residents.

Lovejoy Natural and Cultural Resources
NATURAL AND CULTURAL RESOURCES ELEMENT
The Georgia Department of Community Affairs has established the following Natural and
Historic Resources Goal:
"To conserve and protect the environmental, natural and historic resources of
Georgia’s communities, regions and the state."
Various State objectives are associated with this goal, among these are the following:
Environmental Protection Objective
"Air quality and environmentally sensitive areas should be protected from
negative impacts of development. Environmentally sensitive areas deserve
special protection, particularly when they are important for maintaining
traditional character or quality of life of the community or region. Whenever
possible, the natural terrain, drainage and vegetation of an area should be
preserved."
Open Space Preservation Objective
"New development should be designed to minimize the amount of land
consumed, open space should be set aside from development for use as public
parks or as greenbelts or wildlife corridors."
Heritage Preservation Objective
"The traditional character of the community should be maintained through
preserving and revitalizing historic areas of the community, encouraging new
development compatible with traditional features of the community, and
protecting other scenic or natural features important to defining community
character."
Lovejoy Natural and Cultural Resources
Regional Cooperation Objective
"Regional cooperation should be encouraged in setting priorities, identifying
shared needs, and finding collaborative solutions, particularly where it is critical
to success of a venture, such as protection of shared natural resources."
Goals and objectives adopted under this Element of the Lovejoy Comprehensive Plan must be
consistent with these State objectives.
Natural environment and cultural resources are considered invaluable Georgia assets. The
Georgia Department of Natural Resources defines "natural resources" as the air, soil and
water; all species of animals, birds, and fish; all plants, whether common, endangered or
protected; and every cultural, historic or recreational resource within the state.
Structures, places, institutions and a variety of resources are considered cultural resources.
Such features define a community and contribute to community heritage, economy and
neighborhoods. Historical and archaeological resources define the unique way of life of a
community. Cultural resources inform the public about the past. Protection of such resources
is critical to understanding local history and culture, appreciating architecture and the
landscape and learning about community institutions.
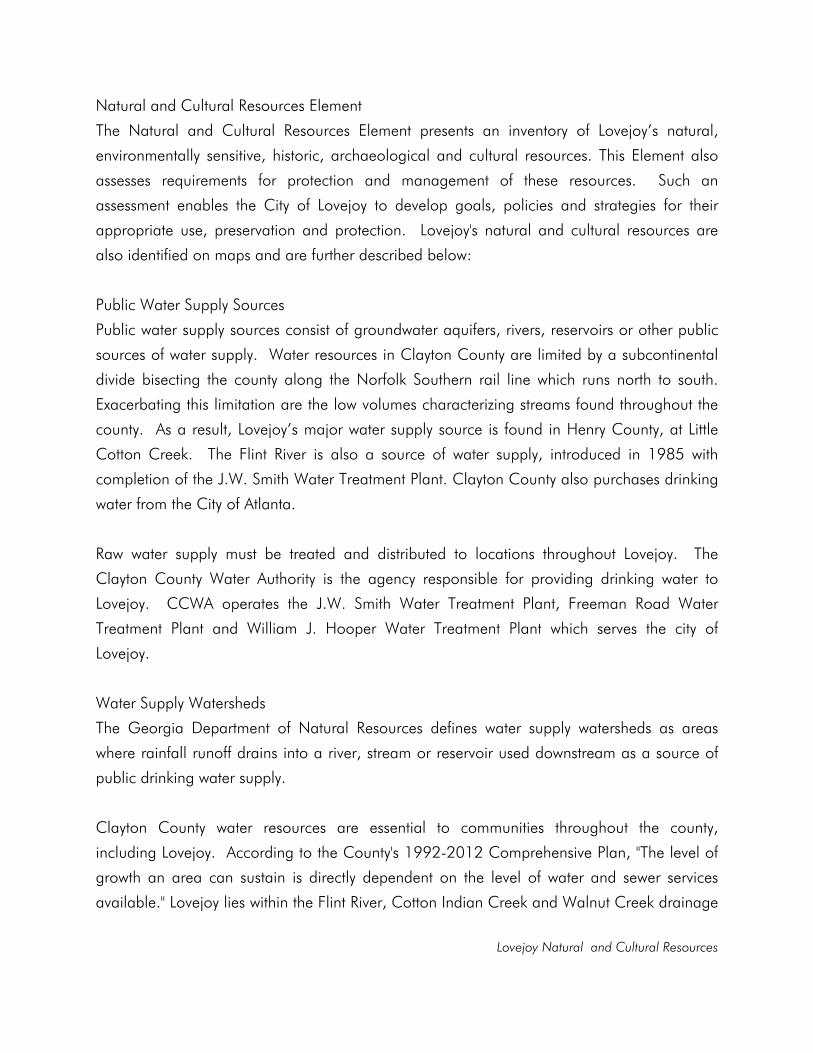
Lovejoy Natural and Cultural Resources
Natural and Cultural Resources Element
The Natural and Cultural Resources Element presents an inventory of Lovejoy’s natural,
environmentally sensitive, historic, archaeological and cultural resources. This Element also
assesses requirements for protection and management of these resources. Such an
assessment enables the City of Lovejoy to develop goals, policies and strategies for their
appropriate use, preservation and protection. Lovejoy's natural and cultural resources are
also identified on maps and are further described below:
Public Water Supply Sources
Public water supply sources consist of groundwater aquifers, rivers, reservoirs or other public
sources of water supply. Water resources in Clayton County are limited by a subcontinental
divide bisecting the county along the Norfolk Southern rail line which runs north to south.
Exacerbating this limitation are the low volumes characterizing streams found throughout the
county. As a result, Lovejoy’s major water supply source is found in Henry County, at Little
Cotton Creek. The Flint River is also a source of water supply, introduced in 1985 with
completion of the J.W. Smith Water Treatment Plant. Clayton County also purchases drinking
water from the City of Atlanta.
Raw water supply must be treated and distributed to locations throughout Lovejoy. The
Clayton County Water Authority is the agency responsible for providing drinking water to
Lovejoy. CCWA operates the J.W. Smith Water Treatment Plant, Freeman Road Water
Treatment Plant and William J. Hooper Water Treatment Plant which serves the city of
Lovejoy.
Water Supply Watersheds
The Georgia Department of Natural Resources defines water supply watersheds as areas
where rainfall runoff drains into a river, stream or reservoir used downstream as a source of
public drinking water supply.
Clayton County water resources are essential to communities throughout the county,
including Lovejoy. According to the County's 1992-2012 Comprehensive Plan, "The level of
growth an area can sustain is directly dependent on the level of water and sewer services
available." Lovejoy lies within the Flint River, Cotton Indian Creek and Walnut Creek drainage

Lovejoy Natural and Cultural Resources
basins. The two major basins, Flint River and Cotton Indian Creek, are divided by the Norfolk
Southern Railroad line, a ridgeline that bisects the city.
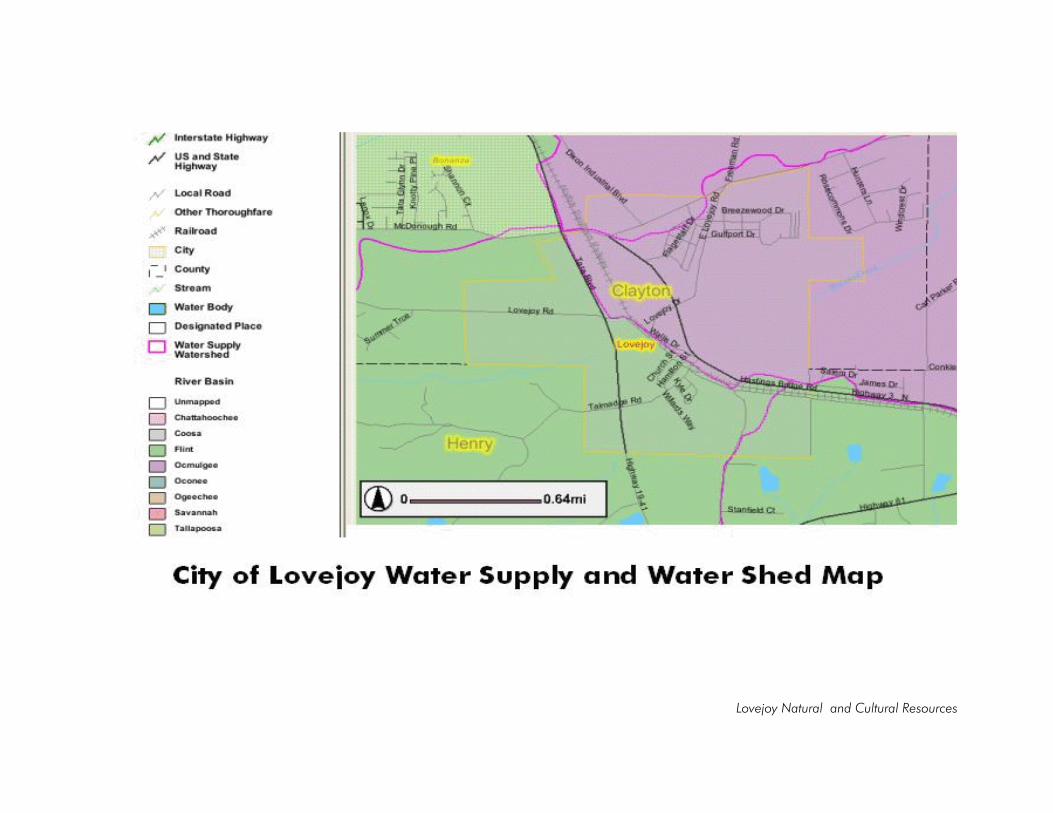
Lovejoy Natural and Cultural Resources

Lovejoy Natural and Cultural Resources
Lovejoy Natural and Cultural Resources
Groundwater Recharge Areas
"Recharge Area" means any portion of the earth's surface where water seeps into the ground
to replenish an aquifer. Aquifers are water-bearing rock strata or layers that can be used to
produce well water. Groundwater is water found in aquifers, underground streams, channels,
artesian basins, reservoirs, lakes, and other water under the earth’s surface. A related term is
"Pollution Susceptibility" which is the relative vulnerability of an aquifer to pollution caused by
spills, discharges, leaks, impoundments, applications of chemicals such as fertilizers,
injections and other activities in the recharge area. Pollution susceptibility in Lovejoy is
regarded as low.
Three ground water recharge areas are located within Clayton County. The largest of these is
found in northwestern Clayton. The two smaller recharge areas are found within the city limits
of Lovejoy. The Lovejoy recharge area, the larger of the two, extends into Henry County, and
is located in the eastern portion of the city. Recharge areas represent a constraint to
development as creation of impervious surfaces within such recharge areas diminishes the
productivity of the aquifer. Fortunately, only limited development has occurred in that eastern
portion.
Lovejoy Natural and Cultural Resources
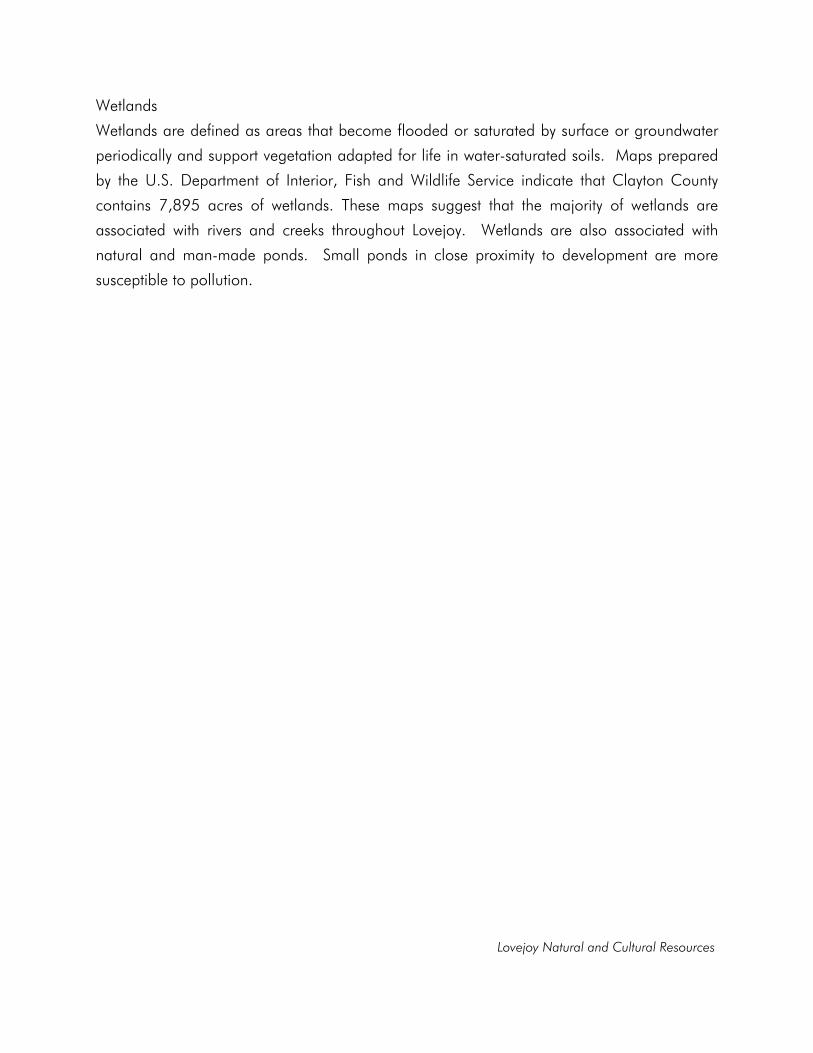
Lovejoy Natural and Cultural Resources
Wetlands
Wetlands are defined as areas that become flooded or saturated by surface or groundwater
periodically and support vegetation adapted for life in water-saturated soils. Maps prepared
by the U.S. Department of Interior, Fish and Wildlife Service indicate that Clayton County
contains 7,895 acres of wetlands. These maps suggest that the majority of wetlands are
associated with rivers and creeks throughout Lovejoy. Wetlands are also associated with
natural and man-made ponds. Small ponds in close proximity to development are more
susceptible to pollution.
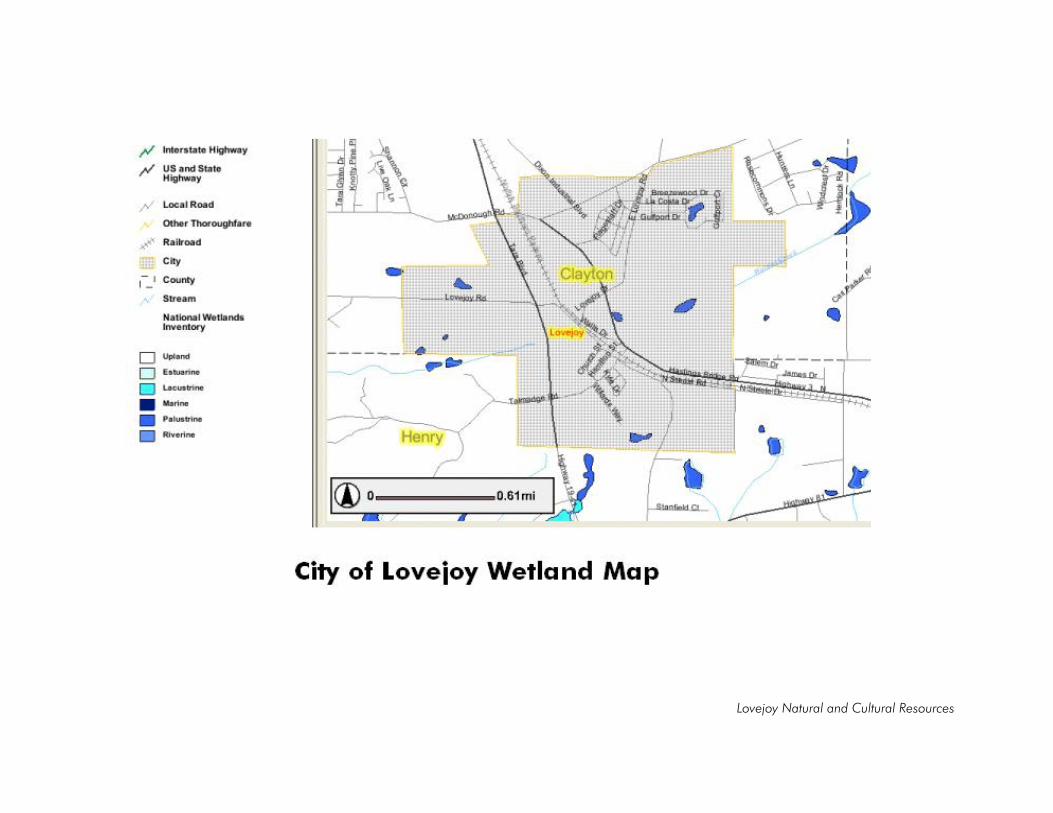
Lovejoy Natural and Cultural Resources
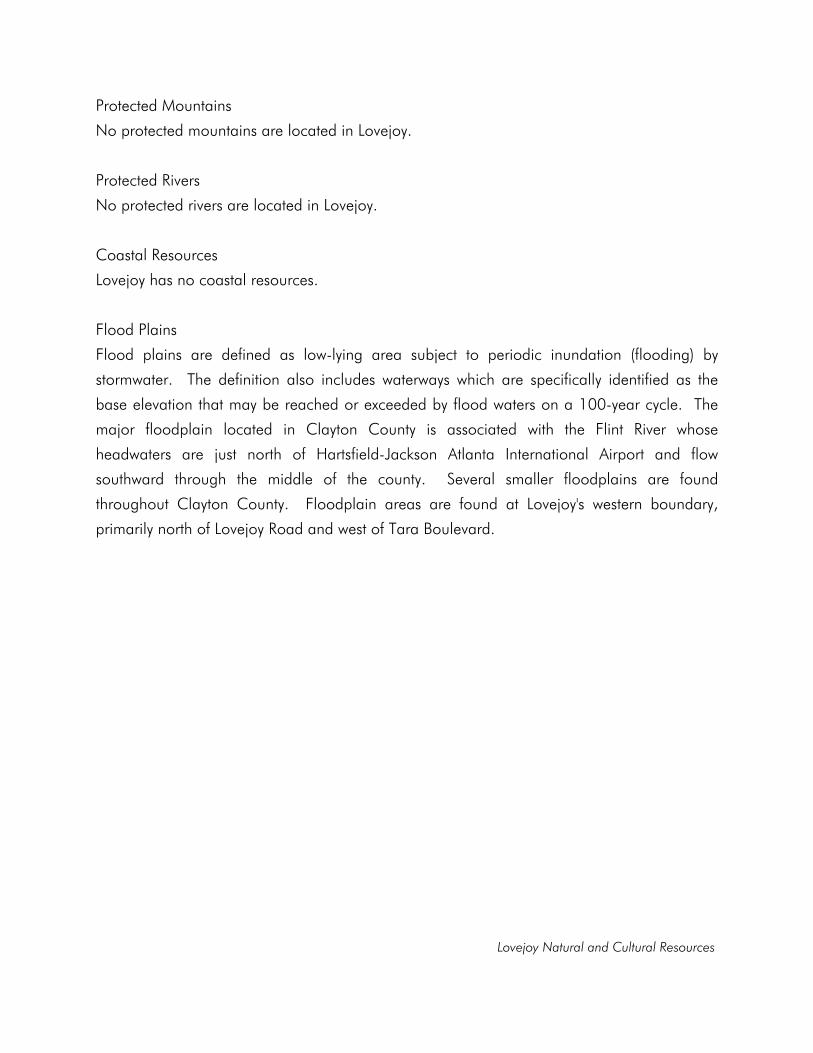
Lovejoy Natural and Cultural Resources
Protected Mountains
No protected mountains are located in Lovejoy.
Protected Rivers
No protected rivers are located in Lovejoy.
Coastal Resources
Lovejoy has no coastal resources.
Flood Plains
Flood plains are defined as low-lying area subject to periodic inundation (flooding) by
stormwater. The definition also includes waterways which are specifically identified as the
base elevation that may be reached or exceeded by flood waters on a 100-year cycle. The
major floodplain located in Clayton County is associated with the Flint River whose
headwaters are just north of Hartsfield-Jackson Atlanta International Airport and flow
southward through the middle of the county. Several smaller floodplains are found
throughout Clayton County. Floodplain areas are found at Lovejoy's western boundary,
primarily north of Lovejoy Road and west of Tara Boulevard.
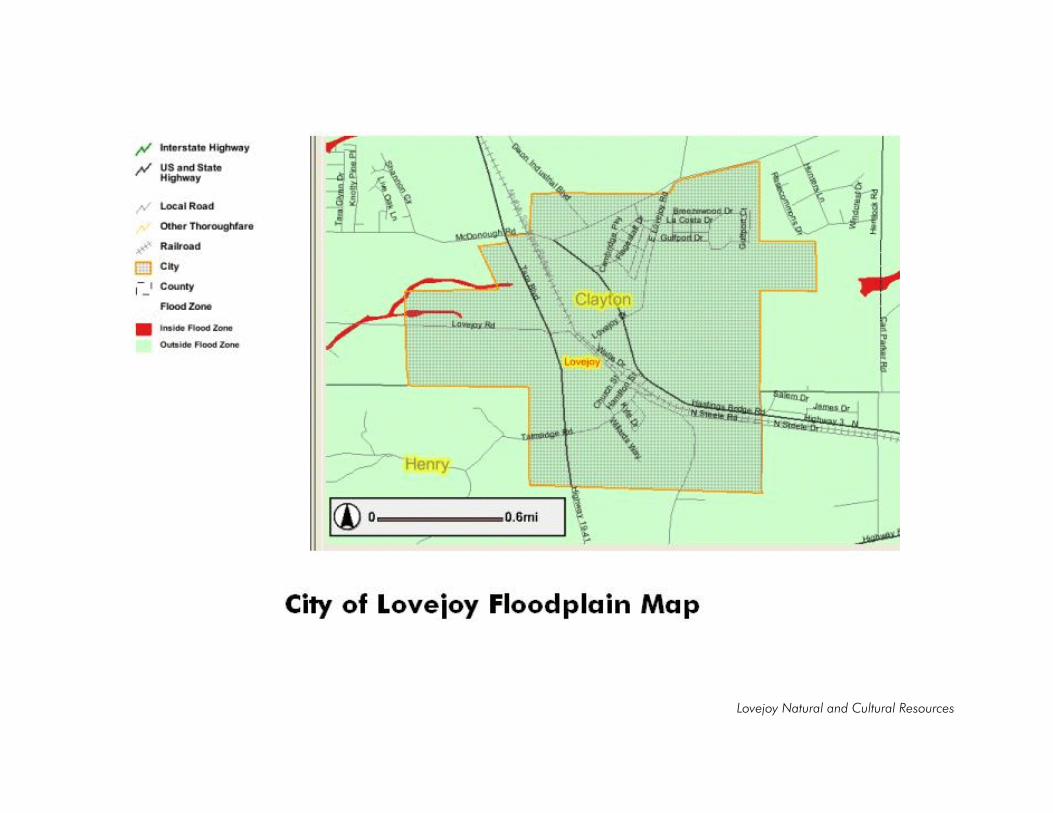
Lovejoy Natural and Cultural Resources
Lovejoy Natural and Cultural Resources
Soils
The U.S. Soil Conservation Service classifies Clayton County soils within six soil associations.
These consist of sandy loam surface soils and red clay subsoils. The Soil Conservation Survey
produces a General Soils Map used to evaluate development constraints related to the
properties and characteristics of each soil association. Soils classified as Cartecay-Wehadkee
soils are prone to flooding and are not well suited for urban development. These soils
comprise approximately 12 percent of the land area of Clayton County.
Steep Slopes
No slopes having a grade characterized as sufficiently steep so as to warrant special
management practices are found in Lovejoy.
Prime Agricultural and Forest Land
Lovejoy contains very limited agricultural and forested lands. These areas do not comprise a
major economic asset and are not valued for agricultural or forestry production that may
warrant special management practices.
Plant and Animal Habitats
No plant or animal habitats that support rare or endangered plants or animals are found in
Lovejoy.
Major Park, Recreation and Conservation Areas
No major park, recreation or conservation areas are found within the Lovejoy city limits.
Lovejoy Regional Park, owned and operated by Clayton County, is located just west of the city
and features such amenities such as eight (8) soccer fields, eight (8) tennis courts, nine (9)
athletic fields, two (2) walking tracks and playground equipment. The Clayton County Parks
and Recreation Department classifies Lovejoy Regional Park as a community park.
Scenic Views and Sites
No scenic views, sites, significant visual landmarks or vistas that require special management
practices are found in Lovejoy.
Lovejoy Natural and Cultural Resources
Cultural Resources
Cultural resources encompass residential, commercial, industrial, institutional and
transportation resources. Lovejoy cultural resources are described below:
Residential Resources
Most dwellings in Lovejoy are suburban-styled ranches. Newer homes have tended to be
two-story single family construction reflecting recent market preferences. Development of two
townhouse subdivisions and one apartment community has also occurred. These new
dwellings are a reflection of Lovejoy’s continuing growth and development.
Commercial Resources
The State defines commercial districts as crossroads, downtowns, marketplaces and individual
buildings such as general stores or offices. Lovejoy’s commercial districts are found along
Highway 19/41 and also in a small, older town center featuring limited commercial services
and wholesale and industrial establishments.
Industrial Resources
No significant industrial resources are found in Lovejoy.
Institutional Resources
Lovejoy has no schools or military complexes within the city limits. The nearest library is the
Jonesboro Library operated by the Clayton County Library System. One place of worship is
established within the city limits and is located on Talmadge Road.
Transportation Resources
Lovejoy is served by a variety of streets, roadways and highways as described in the
Transportation Element. The Norfolk Southern Railroad operates a national rail line through
the community. Sidewalks are present primarily in newly-developed subdivisions and a few
streets in the town center have sidewalks. No other transportation resources are found in
Lovejoy.
Lovejoy Natural and Cultural Resources
Natural Resources
Rural Resources
No significant rural resources such as farmsteads, crop production or crossroads communities
are found in Lovejoy.
Other Historic, Archaeological and Cultural Resources
The following historical sketch conveys a sense of early Lovejoy:
The city of Lovejoy was named after Mr. Frank Lovejoy, who is buried in the
Lutheran Church Cemetery on Lovejoy Road. Lovejoy has a population of over
4,000 and is located just across the Clayton County line from West Henry
County.
First known as “Lovejoy Station” during the Civil War, an act creating and
incorporating the Town of Lovejoy, in the County of Clayton, was approved
September 16, 1891. This act was amended several times, including August
24, 1905, August 17, 1929 and April 2, 1963.
Many of the buildings in Lovejoy are more than 100 years old. One of the old
brick buildings on the west side of the railroad was once the post office. The
new post office is located on Talmadge Road and was built in 1989.
The Lovejoy community once had six stores. Some of these old stores have
been abandoned and are decaying. The community currently has
approximately 35 thriving businesses.
One of the best known citizens of the community was the late Dr. J. K. Willis.
He began his practice of medicine in Lovejoy in 1904 and continued until his
death in 1956. The Wallis house located on Wallis Drive, has been restored
and is now called Lovejoy Manor. Lovejoy was also home to former Senator
Herman Talmadge and Talmadge Hams.
Lovejoy Natural and Cultural Resources
The city of Lovejoy is growing by leaps and bounds. Hopefully, in the future, it
can maintain the small neighborhood atmosphere that has drawn so many
newcomers with their families.
Source: Taken from the historical notes produced by City of Lovejoy.
No significant community landmarks, that is, battlegrounds, gardens, parks, views,
cemeteries, burial grounds, festival locations or gathering places have been identified.
Several dwellings on Talmadge Road and East Lovejoy Road may qualify for listing on the
National Register of Historic Places. The two primary historic dwellings are Lovejoy Manor on
Talmadge Road and the Thomas Crawford home on Wallis Drive.
Lovejoy Manor was the home of the late Dr. J.K. Willis and over the years has been restored
to preserve its original beauty and historic architecture. Lovejoy has many homes that boast a
rich history. The Thomas Crawford home, built in 1835, was purchased by the late Governor
Eugene Talmadge in 1942 and is still occupied today by his son. The Talmadge home sits
on 1,200 acres and features six fluted columns which support a second floor porch.
Lovejoy Natural and Cultural Resources
NATURAL AND CULTURAL RESOURCES ASSESSMENT
The natural and cultural resources of Lovejoy are somewhat limited. Their circumstances
and bearing on use and development are assessed below:
Water Supply
The Lovejoy water supply lies outside the city in Clayton County. Drinking water is provided
to the city through the Clayton County Water Authority and thus, no special provisions to
protect or manage the water supply is necessary.
Water Supply Watersheds
Even though the city lies in two watersheds, Flint River and Cotton Indian Creek no major
protection or management of watersheds is needed. Enforcement of Best Management
Practices can ensure protection of watershed resources.
Groundwater Recharge Areas
Lovejoy’s city limits contain two of three groundwater recharge areas located in the County.
The larger of the two extends into Henry County and is situated in the eastern portion of the
city. Only limited development has occurred in this area. Protection and management
measures should be employed in this portion of the city to protect groundwater resources.
Wetlands
Wetland areas are found throughout the City. These wetlands are associated with rivers and
creeks that run throughout the city. These wetlands must be protected and managed to
maintain the vital function such wetlands achieve.
Protected Mountains
Since no protected mountains are located in Lovejoy, specific management measures are not
necessary.
Protected Rivers
No protected rivers are located in Lovejoy and specific management measures are not
needed.

Lovejoy Natural and Cultural Resources
Coastal Resources
Lovejoy has no coastal resources thus, and management of this resource is not needed.
Flood Plains
Floodplain areas are found at Lovejoy's western boundary, primarily north of Lovejoy Road
and west of Tara Boulevard.
Soils
Soils classified as Cartecay-Wehadkee soils which are prone to flooding occur in limited
portions of Lovejoy and only then in association with floodplains. Restrictions on
development and building within the floodplain are considered adequate to protect these
sensitive soils.
Steep Slopes
No slopes having a grade characterized as sufficiently steep so as to warrant special
management practices are found in Lovejoy.
Prime Agricultural and Forest Land
Lovejoy contains very limited agricultural and forested lands. These areas do not comprise a
major economic asset and are not sufficiently valued for agricultural or forestry production
such that special management practices are warranted.
Plant and Animal Habitats
No plant or animal habitats that support rare or endangered plants or animals are found in
Lovejoy. Hence, special protection or management is not needed for the plants and animals
of Lovejoy.
Major Park, Recreation and Conservation Areas
No major park, recreation or conservation areas are found within the Lovejoy. Lovejoy
Regional Park adjoins the city limits on the west. This park is operated by the Clayton County
Parks and Recreation Department which performs all management and maintenance
functions.
Lovejoy Natural and Cultural Resources
Scenic Views and Sites
No scenic views, sites, significant visual landmarks or vistas requiring special management
practices are found in Lovejoy.
Cultural Resources
Lovejoy’s cultural resources are assessed below:
Residential Resources
Residential development following the 2000 Census has shown a trend toward more diversity
in housing choice. This is characterized by an increase in single family detached dwellings
and townhouse developments that have recently occurred within the city. These new
residential developments are new and do not require special management practices or
protection.
Commercial Resources
Commercial resources within the “old town” center are limited. New commercial
development is located primarily along U.S. Highway 19/41. The latter commercial
resources will be expanding in response to market demand driven by residential development
in Lovejoy and beyond.
Industrial Resources
No significant industrial resources are located in Lovejoy. Local ordinances state
environmental laws will ensure proper management of any further development on industrial
sites.
Institutional Resources
The limited institutional resources in the city are established and require no additional
management.
Transportation Resources
The transportation network in the city consists of Highway 19/41, a number of two lane
streets and the Norfolk Southern Railroad. The city will be the location of the terminus of

Lovejoy Natural and Cultural Resources
planned, commuter rail service. This resource will introduce a new positive, dimension into
Lovejoy’s transportation network and is further described in the Transportation Element.
Rural Resources
No significant rural resources such as farmsteads, crop production or crossroads communities
are found in Lovejoy and no preservation practices are planned.
Other Historic, Archaeological and Cultural Resources
Lovejoy contains a limited number of historic resources that may be eligible for placement on
the National Register of Historic Places. Research would be needed to determine which
structures within the city such as Lovejoy Manor and Thomas Crawford Home may be eligible.
Lovejoy Natural and Cultural Resources
NATURAL AND HISTORIC RESOURCES GOALS AND OBJECTIVES
In considering Lovejoy’s Natural and Historic Resources Goals and Objectives, it is important
to restate and emphasize State objectives:
Environmental Protection Objective
"Air quality and environmentally sensitive areas should be protected from
negative impacts of development. Environmentally sensitive areas deserve
special protection, particularly when they are important for maintaining
traditional character or quality of life of the community or region. Whenever
possible, the natural terrain, drainage and vegetation of an area should be
preserved."
Open Space Preservation Objective
"New development should be designed to minimize the amount of land
consumed, open space should be set aside from development for use as public
parks or as greenbelts or wildlife corridors."
Heritage Preservation Objective
"The traditional character of the community should be maintained through
preserving and revitalizing historic areas of the community, encouraging new
development compatible with traditional features of the community, and
protecting other scenic or natural features important to defining community
character."
Regional Cooperation Objective
"Regional cooperation should be encouraged in setting priorities, identifying
shared needs, and finding collaborative solutions, particularly where it is critical
to success of a venture, such as protection of shared natural resources."
Lovejoy Natural and Cultural Resources
Lovejoy is a developing semi-rural area linked to Griffin and Atlanta by Highway 19/41, a
regional arterial, and will soon be linked more directly by commuter rail. As the city is
completely sewered and served by water mains, this urbanization is expected to proceed
rapidly. While Lovejoy has a small number of farms and limited natural areas, the transition
to an urban setting cannot be characterized as severe. However, loss of these areas and the
sprinkling of historic homes can erode the established sense of place and the City seeks to
preserve each through adoption of the following goals and objectives:
Lovejoy has a history as documented in a wonderful text, History of Lovejoy. This history is
remembered first hand by many living residents. The following goals and objectives are
intended to address these resource concerns:
Goal: Recognize and protect critical natural and historic resources as a means of preserving
Lovejoy’s natural and cultural heritage.
Objective A: Identify and protect all environmentally sensitive natural areas.
Objective B: Preserve Lovejoy’s natural features, site hydrology and landforms to the
maximum practical extent.
Objective C: Protect Lovejoy’s tree canopy to ensue development minimizes removal
of this community resource.
Objective D: Preserve Lovejoy’s rural heritage through greenspace preservation.
Objective E: Recognize and preserve Lovejoy’s historic structures.
Objective F: Preserve Lovejoy’s sense of history and create a sense of place.

Lovejoy Natural and Cultural Resources
Strategy A:
Map all environmentally sensitive natural areas and incorporate this
information into the development plan review process as a means of ensuring
protection of natural resources. Adopt and enforce “Best Management
Practices” endorsed by Atlanta Regional Commission and promulgated under
State environmental law.
Strategy B: Ensure that site grading is minimized during the construction plan review
process
Strategy C: Draft, adopt and enforce a tree ordinance to better protect Lovejoy’s natural
environment.
Strategy D: Encourage new development designed to minimize the amount of land
consumed and preserve open space for use as public parks or greenbelts or
wildlife corridors during the zoning and platting process.
Strategy E: Incorporate preservation of sensitive environmental resources into the property
zoning and platting process by mandating “permanent protection” language
into deed restrictions.
Strategy F: Identify and inventory all public and private structures, properties and facilities
having the potential for recognition and preservation, and pursue National and
State Register nomination where appropriate. Solicit volunteer resources in
Lovejoy or the resources of County historical groups in performing the
inventory and cooperating with the State Office of Historic Preservation in the
nomination process.
Strategy G: Solicit input from residents, community groups and homeowners associations
aimed at involving residents in community affairs, including sponsoring cultural
festival events designed to preserve a sense of history and create a sense of
place. Involve merchants and area employers and the Clayton County Parks
and Recreation Department in such sponsorship.

Lovejoy Natural and Cultural Resources
Strategy H: Compile, publish and maintain all available documentation concerning
Lovejoy’s history in the planned Lovejoy Library. Involve Lovejoy Middle School
and Lovejoy High School classes in a research project designed to collect oral
and photographic histories from the Lovejoy community.

Lovejoy Community Facilities
COMMUNITY FACILITIES AND SERVICES Introduction This element provides local governments the opportunity to inventory a wide range of community facilities and services. It also give communities to assess their adequacy for serving present and future population and economic needs, and to articulate community goals and an associated implementation program for providing the desired level of public facilities and services throughout the planning period. The purpose of this element is to assist local governments in coordinating the planning of public facilities and services in order to make most efficient use of existing infrastructure as well as future investments and expenditures for capital improvements and long-term operation and maintenance costs. Each local government must address in this element those facilities that provide service within its jurisdiction. Local governments that provide facilities to serve areas within other local government jurisdictions must also address those facilities, using data from the comprehensive plan(s) of other jurisdictions as needed for the purpose of projecting facility needs. For shared facilities, each local government must indicate the proportional capacity of the systems allocated to serve its jurisdiction. The Community Facilities and Services Element is an inventory public facilities and services established to met the needs of Lovejoy residents, property owners and business operators. An assessment of the adequacy of these facilities and services to meet current and future demand is presented. The Element identifies community goals and objectives concerning public facilities and services. Finally, implementation programs necessary to provide the community with a desirable level of facilities and services throughout the planning period are also presented. Such an inventory and assessment assists the city of Lovejoy in coordinating the planning of public facilities and services planning and programming to ensure that capital improvements and long-term operation and maintenance costs. This element will inventory the entity having operational responsibility for the facilities, the service area of the facility and the predominant types of land uses served by the facility, the design capacity of the facility, the current demand on the facility capacity, and the level of service provided by the facility.
Lovejoy Community Facilities
Inventory of Existing Conditions. Transportation Network The transportation system consist of roads, highways, sidewalks, signalization and signs, bridges, public transportation, railroads, port facilities, airports, etc. See the Transportation Element for further information on Lovejoy’s transportation system. Water and Sanitary Sewer Service The Clayton County Water Authority is expressly authorized and empowered to contract for a period not to exceed 50 years with any public agency, public corporation, city, town, county or authority for water, sewer or other services. The construction, operation and maintenance of all sanitary sewer lines under the County’s jurisdiction are the responsibility of the Clayton County Water Authority. All existing and future sanitary sewer lines laid in the County and all areas served by the sanitary sewer lines are within the jurisdiction of CCWA, including locations within the City of Lovejoy limits unless prior agreements or ordinances have been adopted. The Clayton County Water Authority Manager supervises all resources of CCWA in building, operating and maintaining the sanitary sewer system. Water Supply and Treatment Clayton County Water Authority manages the three plants that provide drinking water to the city of Lovejoy. These plants are the J.W. Smith Water Treatment Plant, Freeman Road Water Treatment Plant and William J. Hooper Water Treatment Plant. All three plants ultimately supply water to the entire city and the county. The combined plant capacity is 42 million gallons per day (mgd). Total county demand is 27 mgd. Some 74,319 linear feet of water mains have been installed to serve private properties within the city limits. The useful life of the treatment plants and distribution mains is 100 years. Sewerage System and Wastewater Treatment The Shoal Creek Wastewater Treatment Plant located on Shoal Creek serves the city of Lovejoy. This facility is operated by the Clayton County Water Authority. The service area for the plant is 12,000 acres and the design capacity is 4.4 mgd. Current demand on the facility is 1.53 mgd. The sanitary sewer collection system serving the city of Lovejoy is comprised of approximately 43,694 linear feet of sewer main. The useful life of the collection mains and treatment plants is 100 years.
Lovejoy Community Facilities
Solid Waste Management The City of Lovejoy cooperates with Clayton County in preparation of a comprehensive solid waste management plan. The 1998 Clayton County Comprehensive Solid Waste Management Plan is enclosed as an appendix. Lovejoy’s solid waste needs are met by private contractors who dispose of solid wastes at the Clayton County Municipal Solid Waste Landfill, owned and operated by Clayton County. Residents and property owners may contract with over 20 private waste haulers to dispose of household and commercial waste. Clayton County regulates the private contractors, and assists in removal of refuse throughout the city. The waste is hauled to then Clayton County Municipal Solid Waste Landfill, off Hastings Bridge Road (Georgia Hwy 3), within the Lovejoy city limits. The Lovejoy Landfill accepts and disposes of waste from Clayton County and surrounding areas according to Georgia Environmental Protection Divisions standards and procedures. Lovejoy’s recycling needs are met by the Landfill which is responsible for funding and operating the Clayton County Recycling Drop Off Center located at 1430 Highway 138, Jonesboro and the Processing Center at 11650 SLR Parkway Lovejoy. The Clayton County Landfill receives no public funding; the operation is funded by recycling revenues. Table AM-7 of the SWMP indicates a remaining capacity at the Clayton County Municipal Landfill for 2003 of 3,156,962.72 cubic yards. A waste stream of 256,413.31 cubic yards per year is indicated as the waste stream generated in Clayton County. An assumption that 40 percent of that waste stream will be delivered to Clayton County Landfill is used in Table AM-7 and indicates a useful life of over 12 years. This exceeds the minimum 10-year capacity requirement. The Clayton County Short Term Work Program of the SWMP indicates that Lovejoy will continue to support Clayton Clean and Beautiful as an avenue of public education and involvement in the waste handling process. Public Works Clayton County Public Works Department performs all road resurfacing and pot hole repair in Lovejoy. The Department also installs and repairs roadway drainage systems on County and Lovejoy right-of-ways; mows right-of-ways and removes debris from ditches in the County
Lovejoy Community Facilities
and Lovejoy right-of-ways. Public Works also performs roadway widening and construction. General Government City administration functions are performed at City Hall located at 2601 Steele Road. This building contains the offices of the Mayor and Council, City Clerk and administrative staff. City Hall is also the location of public hearings and serves the all the public administration needs of the entire city of Lovejoy. Financial reporting functions are performed by the City Auditor, who prepares the annual budget and audit. Legal matters associated with a range of City responsibilities are handled by the City Attorney. Code enforcement tasks are provided by Clayton County Code Enforcement Officers through an Intergovernmental Agreement with Clayton County. Public Safety Public safety services encompass police and fire protection and emergency medical service. Each is described below: Police Services Lovejoy’s public safety needs, including traffic patrols, are met by the Clayton County Police Department. Lovejoy is located in the Department’s Zone 4. The Clayton County Sheriff’s Department also provides services within the city limits, such as serving arrest warrants and other documents. The Sheriff’s Department is also responsible for overseeing the Lovejoy Detention Center. Fire Services Fire protection is provided by the Clayton County Fire Department. The Department’s primary responsibility is to respond to medical emergencies, vehicle crashes, natural gas leaks, building fires, vehicle fires, woods/grass fires and natural disasters. CCFD has an ISO Class rating of three. Station 10, located in Hampton, is the CCFD station serving Lovejoy. The following services are provided to Lovejoy residents and property owners: • Fire Code Enforcement • Fire Cause Investigation • Safety Education for Children & Adults • Emergency Medical Services (EMS)
Lovejoy Community Facilities
• Lead Agency of Safe Kids of Georgia • Fire Evacuation Planning for Commercial Buildings • Youthful Fire Setter Intervention Program • Fire Station Tours • Day Care Provider Workshops • Hydrant Maintenance • Fire Suppression • Crash Victim Extrication Recreation Facilities Lovejoy Regional Park, owned and operated by Clayton County, adjoins the city limits on the west, and features such amenities such as eight (8) soccer fields, eight (8) tennis courts, nine (9) athletic fields, two (2) walking tracks and playground equipment. The Clayton County Parks and Recreation Department classifies Lovejoy Regional Park as a community park. No major park, recreation or conservation areas are found within the Lovejoy city limits. Hospitals and Other Public Health Facilities Southern Regional Medical Health Center serves Lovejoy. Southern Regional was established in 1971 as a community-based healthcare provider and grew into a health care system in the early 1990's. In 1996, Southern Regional became a member of the PROMINA Health Care System, Georgia's largest non-profit hospital alliance. Southern Regional Health System provides comprehensive health services, including Southern Regional Medical Center, a 406-bed, full service hospital in Riverdale featuring a state-of-the-art outpatient surgery center, one of the busiest emergency departments in the state and a Community Care Center. In 2001, Southern Regional opened the Women's Life Center, a 107,000-square foot, state-of-the-art facility which offers complete obstetrical, gynecological, diagnostic and educational services to women. Educational Facilities Lovejoy students attend Lovejoy Middle School and Lovejoy High School. Neither school is located within the Lovejoy city limits. Both the middle and high schools are operated by the Clayton County Board of Education. These schools are located nearby in unincorporated Clayton County. The Board of Education provides after school programs, adult and vocational programs.
Lovejoy Community Facilities
The Clayton County Public Schools After School Enrichment Program offers students in Pre-Kindergarten through Grade 8 a safe, warm and caring environment. Students are offered a variety of learning experiences. Children are given opportunities to explore technology, arts & crafts, performing arts and outdoor recreation. Students are also provided with a variety of other activities including homework time; math, science, and language arts activities; karate and cooking classes. The Board also provides adult Education/GED Preparation, GED Testing, literacy programs that provide instruction in basic reading, math and language skills. Vocational training or Technology/Career Education is provided as an essential component of the educational program available to the youth enrolled in Clayton County Public Schools. The schools integrate problem solving, hands-on activities, and contextual learning. The Technology/Career Education curriculum provides opportunities for career exploration, guided practice and application of academic and technical skills. Libraries and Other Cultural Facilities Lovejoy residents may access the Jonesboro Public Library as no library is located in Lovejoy. Plans are to establish a Lovejoy Public Library in City Hall. The first public library in Clayton County began in January 1941 with a collection of 200 books. A room was rented above the old Jones Brothers Department Store on South Main Street, across from the Jonesboro train depot. In 1964, ground breaking for a new Jonesboro Library began. In 1966, the library opened on the corner of Smith and Lee Streets in downtown Jonesboro, where it is operated today. The Jonesboro Library, the closest library to Lovejoy, has 55,000 books and offers six (6) computers with internet access.
Lovejoy Community Facilities
COMMUNITY FACILITIES AND SERVICES ASSESSMENT Lovejoy’s population has increased dramatically and further growth is projected. Commercial growth is being propelled by growth of the region and such the transportation improvements as Highway 19/41and planned commuter rail. This growth spells significant increases in demand for community facilities and services. Much of this demand will be met through continuing contracts with such service providers as Clayton County Water Authority. Other service demand such as greenspace and recreation needs will be met by facilities provided by private developers. Lovejoy is well-served by the water plants and distribution mains as well as the wastewater treatment facilities and collection lines maintained by Clayton County Water Authority. Public services are solid as evidenced, for example, by the excellent ISO rating of the Clayton County Fire Department which protects Lovejoy properties. The City intends to maintain public facilities and services as development proceeds and has established the following goals and objectives: Goal: Provide public infrastructure, facilities and services sufficient to meet future demand in
a manner that will attract quality development, tenants and residents. Water Supply Clayton County Water Authority serves the drinking water and fire suppression needs of Lovejoy. The City seeks to maintain this arrangement. Objective A: Ensure that water supply and fire flow keep pace with projected growth. Sanitary Sewer Clayton County Water Authority has built an excellent wastewater collection and treatment system throughout Clayton County, including Lovejoy. The City seeks to maintain this service relationship. Objective B: Ensure that wastewater treatment capacity and facilities are available to
accommodate projected growth. Storm Sewer Flooding is not perceived as a problem in Lovejoy. However, as development intensifies,

Lovejoy Community Facilities
precautions must be taken to ensure storm water management is adequate and wetlands and waterways are protected. Objective C: Ensure that the storm water drainage system is capable of handling
increasing levels of storm water runoff. In a survey conducted for the purpose of soliciting input for this comprehensive plan, Lovejoy residents expressed satisfaction with a range of public services, including garbage collection, fire and police protection, street maintenance, storm water management, sign regulation and code enforcement. Significantly, 40 percent were “Undecided” as to whether code enforcement services were satisfactory.
Solid Waste Lovejoy’s Solid Waste Management Plan (SWMP) establishes programs and schedules for achieving the state-mandated solid waste reduction goals. The SWMP identifies the following plan elements: Continue to allow citizens and businesses to contract individually for collection services.
Target reduction of all yard trimmings including emphasis on composting at home.
Encourage the expansion of drop-off programs for the collection of paper, steel cans, glass containers, aluminum cans, plastic soft drink and milk bottles.
Divert ties, wood pallets, white goods, etc. by educational programs, special collection programs and ordinances.
Lovejoy’s “Rally Day” will be expanded to include educational materials and recycling and composting.
Hold town hall meetings to discuss solid waste and recycling issues.
Continue financial contributions to “Keep Clayton County Beautiful.”
Comply with state requirements concerning “Full Cost Accounting” and disclosure to the public.
Lovejoy Community Facilities
An inherent solid waste management objective is adopted as Objective D, below: Objective D: Effectively address the solid waste collection and disposal needs of the
city and fully comply with the Georgia Solid Waste Management Act. Police Services
Police services provided by the Clayton County Police Department are deemed to be satisfactory. The City plans to ensure these essential services continue to meet Lovejoy’s public safety needs as the city further develops. Objective E: Maintain the current level of services as the demand for services
expands. Fire and Emergency Medical Services (EMS) Fire and EMS services provided by the Clayton County Fire Department are deemed to be satisfactory. The City plans to ensure these essential services continue to meet Lovejoy’s public fire protection and emergency medical needs. Objective F: Maintain the current ISO rating as the demand for services expands.
Hospitals and Public Health Facilities The City will continue to depend on Southern Regional Hospital to meet public health care needs. Objective G: Ensure that residents, employees and visitors are provided an excellent
level of health care.
Recreation The Clayton County Parks and Recreation Department provides recreational services for the city of Lovejoy. Their mission is “Living naturally and providing quality recreation on Atlanta’s southside.” The City intends that new developments will contain facilities to meet the needs of residents within these developments.
Lovejoy Community Facilities
Objective H: Develop parks and recreation facilities within the city as needed to address the demand for facilities and conform to the national park and recreation standards.
Public Works Clayton County Public Works Department performs all road resurfacing in Lovejoy. The City plans to continue to have this Department maintain all local and county streets in the city. Objective I: Ensure that Lovejoy’s streets are adequate to handle traffic flow and right-of-
ways are well maintained. Code Enforcement Clayton County Community Development Department provides code enforcement services to Lovejoy, including inspections during construction and in enforcement of property and building maintenance codes. According to residents responding to a city survey, a need for improved enforcement may exist. Objective J: Ensure all properties in Lovejoy are maintained in a safe and sanitary condition
and that new construction conforms to all building and health safety codes.
General Government City Hall is deemed adequate throughout the five-year period of the Short Term Work Program. The City would like to more fully utilize City Hall to meet resident needs. Objective K: Enhance the service capacity of City Hall.
Educational Facilities The city of Lovejoy has no educational facilities within the city limits. However, the City has established the following educational objective for Lovejoy Middle School and Lovejoy High School: Objective L: Ensure quality, public education to Lovejoy residents.
Lovejoy Community Facilities
Libraries and Cultural Facilities More than 80 percent of respondents to a city survey indicated they would use local library services if they were available. The City plans to establish a local library within City Hall. Residents may also access any branch of the county-wide library program operated by Clayton County. The main Library headquarters branch is located on Battlecreek Road, north of the city limits. Objective M: Ensure residents have convenient access to library and cultural
facilities. Associated Implementation Strategies include the following: Strategy A: Cooperate with Clayton Water Authority in projecting future demand for
potable water supply to ensure that supply allocations are sufficient to meet projected water volume and fire protection requirements.
Strategy B: Cooperate with Clayton County Water Authority in projecting future demand
for sanitary sewer service to ensure that sewer capacity is available to accommodate projected wastewater volumes.
Strategy C: Mandate that “Best Management Practices” are employed during construction
of new developments to ensure that flood potential and erosion are minimized. Strategy D: Implement and update the 1998 Clayton County Comprehensive Solid Waste
Management Plan. Strategy E: Continue the relationship with Clayton County Police Department to ensure
excellent police services throughout Lovejoy. Strategy F: Continue the relationship with Clayton County Fire Department to ensure
excellent levels of service throughout Lovejoy. Strategy G: Continue to depend on Southern Regional Hospital to meet public health care
needs.

Lovejoy Community Facilities
Strategy H: Continue to depend on Clayton County Parks and Recreation Department to
meet the majority of park and recreation needs, and foster creation of greenspace and recreation facilities within new developments.
Strategy I: Continue the relationship with Clayton County Public Works Department to
ensure excellent street and right-of-way maintenance. Strategy J: Continue the relationship with Clayton County Community Development
ensures high levels of property maintenance and new construction standards. Supplement code enforcement efforts through implementation of stepped up property inspections.
Strategy K: Establish a Lovejoy Library Branch at City Hall as a means to enhance
communications with residents. Strategy L: Explore such supplemental programs as mentoring to enhance the educational
experience at Lovejoy Middle School and Lovejoy High School. Strategy M: Establish a Lovejoy Library Branch at City Hall to enhance student and resident
access to educational materials and facilities. Post notices of cultural events held in Clayton County such as performances at Spivey Hall on the Clayton College and State University in City Hall.
Lovejoy Housing Page 1
HOUSING ELEMENT Introduction "Housing, and the land it is sited on, constitutes the biggest single land use in most cities and towns; in many places it occupies more land than all other land uses combined. There are few if any planning issues that touch more people than the condition of their immediate neighborhoods, because that is where they spend most of their time." Levy, 1997. The above quote is provided by the Department of Community Affairs to highlight the importance of housing in comprehensive planning. The Department also provides the following state housing goal and objective that are central to understanding topics and policies presented in the Housing Element of the Comprehensive Plan:
Housing Goal: To ensure that residents of the state have access to adequate and
affordable housing.
Housing Objective: Quality housing and a range of housing size, cost, and density should be provided in each community, to make it possible for all who work in the community to also live in the community. Central to this objective is a desire to shorten commutes and enhance the quality of people's lives by increasing convenience.
Lovejoy’s pattern of housing development, particularly recent construction, but historic development as well, is entirely consistent with this Housing Goal. As the data compiled here will indicate, a wide range of housing is becoming available in Lovejoy and housing types are as diverse as any in the region. Density increases that are projected will foster consistency with housing policies contained ion the Regional Development Plan prepared by the Atlanta Regional Commission. The planned commuter rail service will serve a growing Lovejoy population that will enjoy improved access to regional employment destinations.
Lovejoy Housing Page 2
Housing Element The Housing Element characterizes Lovejoy's housing over the past two decades as well as future housing demand over the next 20 years. This Element also assesses the suitability of Lovejoy’s housing in meeting resident needs and compares housing demand to growth projections of the Population Element. Given state affordability objectives, the Housing Element also formulates strategies for providing appropriate housing for all segments of Lovejoy's population. Finally, as the market demands variety in dwelling unit size, style, cost, setting and ownership, the available range of Lovejoy housing options is evaluated as well. The housing inventory considers housing unit type, unit age and condition, owner/renter ratios and housing cost. The source of this data is the U.S. Census, particularly the 2000 Census. Future housing trends are forecasted over a 20-year planning period and are based on local records and the designations of the Future Land Use Map contained in the Land Use Element. Specific housing topics addressed in this Element are as follows: Unit Totals. In 1980, only 83 housing units were found in Lovejoy (Table H1). In 1990, the number of units rose to 99, a 19 percent increase. The 2000 Census signaled tremendous growth, as the number of units rose by 511 percent in 10 years to a total of 605. Clayton County also experienced growth in housing units between 1990 and 2000. The total number of units in the county increased from 71,926 units in 1990 to 86,461 units in 2000, a 20 percent increase. The number of housing units in the Region rose from 1,052,430 in 1990 to 1,331,264, an increase of 26 percent. This compares to housing growth in Georgia which registered a 24 percent growth rate between 1990 and 2000, expanding from 2,638,418 to 3,281,737 units. Housing growth in Lovejoy greatly exceeded county regional and state growth rates between 1900 and 2000. Unit Type. A range of housing unit types are present in Lovejoy. The1990 total included 73 detached single family units and 26 mobile homes, that is, manufactured homes. Two units were classified by Census as being "20 to 49 units;" however, neither the numbers nor field surveys support that classification. By 2000, 605 dwelling units were found in Lovejoy, of which 552, some 91 percent, were manufactured homes. The number of detached units declined to 51. Absent from the housing mix in 2000, were duplexes, triplexes, quadruplexes, single family attached units (either townhouse or condominium) and multifamily units (apartments).
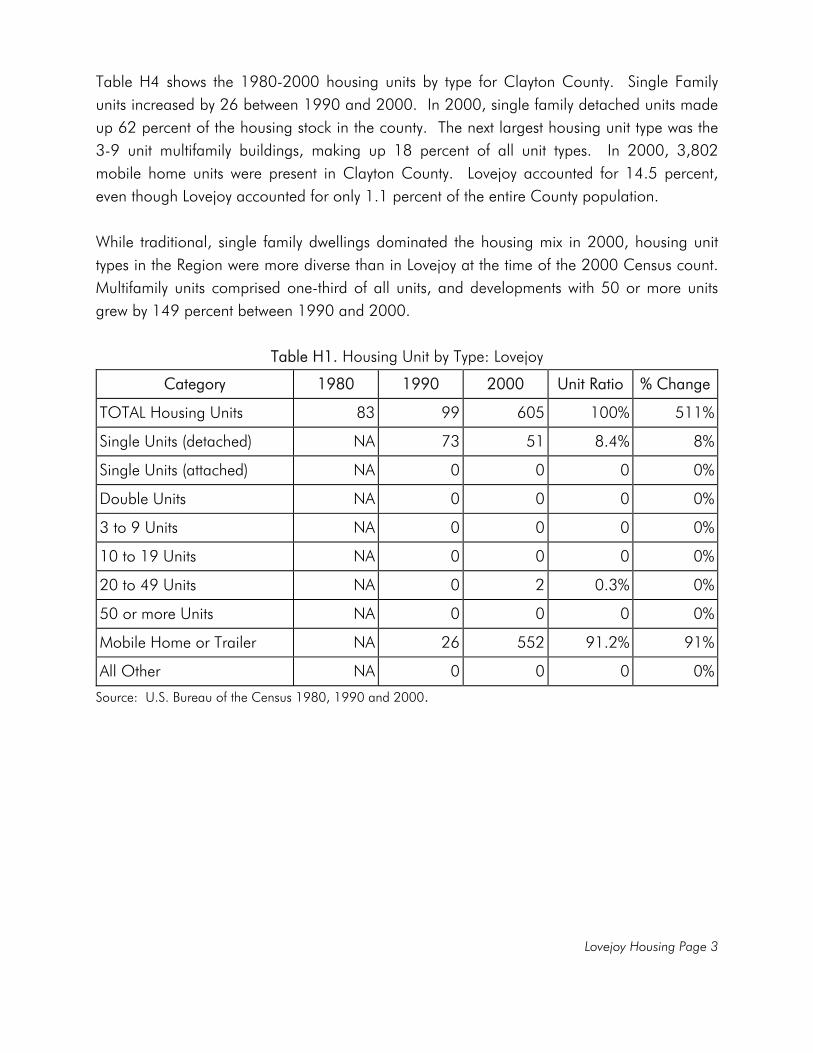
Lovejoy Housing Page 3
Table H4 shows the 1980-2000 housing units by type for Clayton County. Single Family units increased by 26 between 1990 and 2000. In 2000, single family detached units made up 62 percent of the housing stock in the county. The next largest housing unit type was the 3-9 unit multifamily buildings, making up 18 percent of all unit types. In 2000, 3,802 mobile home units were present in Clayton County. Lovejoy accounted for 14.5 percent, even though Lovejoy accounted for only 1.1 percent of the entire County population. While traditional, single family dwellings dominated the housing mix in 2000, housing unit types in the Region were more diverse than in Lovejoy at the time of the 2000 Census count. Multifamily units comprised one-third of all units, and developments with 50 or more units grew by 149 percent between 1990 and 2000.
Table H1. Housing Unit by Type: Lovejoy
Category 1980 1990 2000 Unit Ratio % Change
TOTAL Housing Units 83 99 605 100% 511%
Single Units (detached) NA 73 51 8.4% 8%
Single Units (attached) NA 0 0 0 0%
Double Units NA 0 0 0 0%
3 to 9 Units NA 0 0 0 0%
10 to 19 Units NA 0 0 0 0%
20 to 49 Units NA 0 2 0.3% 0%
50 or more Units NA 0 0 0 0%
Mobile Home or Trailer NA 26 552 91.2% 91%
All Other NA 0 0 0 0%
Source: U.S. Bureau of the Census 1980, 1990 and 2000.
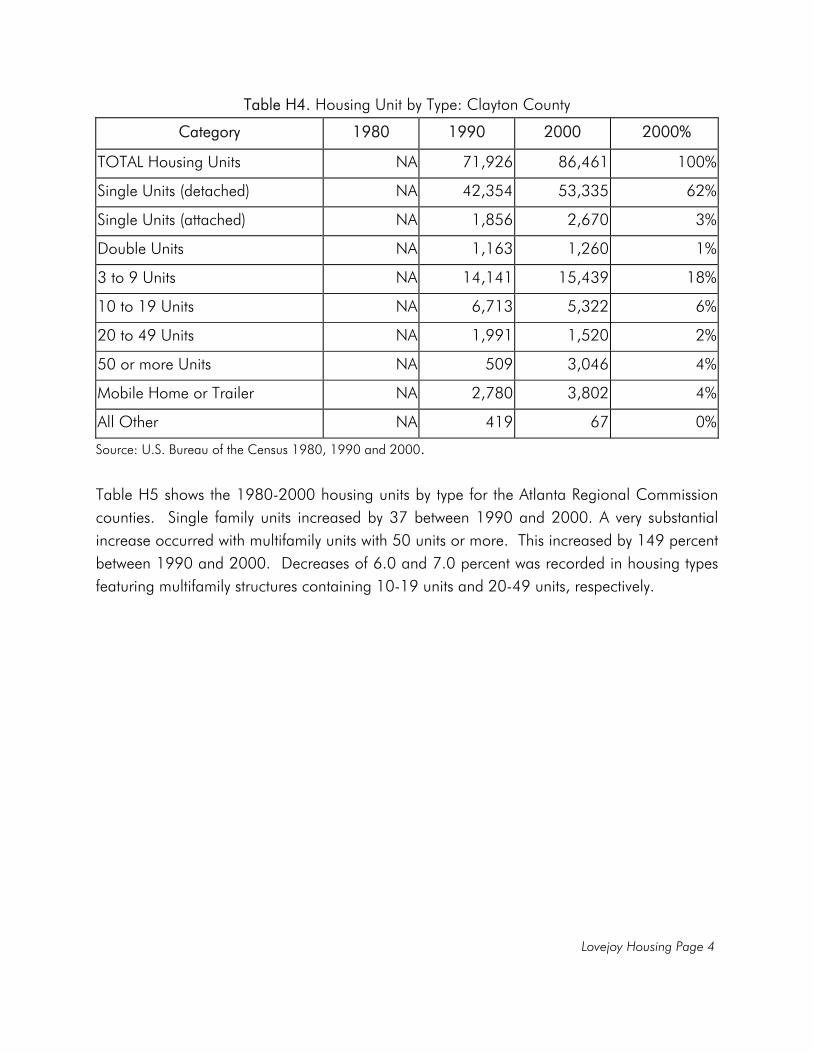
Lovejoy Housing Page 4
Table H4. Housing Unit by Type: Clayton County
Category 1980 1990 2000 2000%
TOTAL Housing Units NA 71,926 86,461 100%
Single Units (detached) NA 42,354 53,335 62%
Single Units (attached) NA 1,856 2,670 3%
Double Units NA 1,163 1,260 1%
3 to 9 Units NA 14,141 15,439 18%
10 to 19 Units NA 6,713 5,322 6%
20 to 49 Units NA 1,991 1,520 2%
50 or more Units NA 509 3,046 4%
Mobile Home or Trailer NA 2,780 3,802 4%
All Other NA 419 67 0%
Source: U.S. Bureau of the Census 1980, 1990 and 2000. Table H5 shows the 1980-2000 housing units by type for the Atlanta Regional Commission counties. Single family units increased by 37 between 1990 and 2000. A very substantial increase occurred with multifamily units with 50 units or more. This increased by 149 percent between 1990 and 2000. Decreases of 6.0 and 7.0 percent was recorded in housing types featuring multifamily structures containing 10-19 units and 20-49 units, respectively.
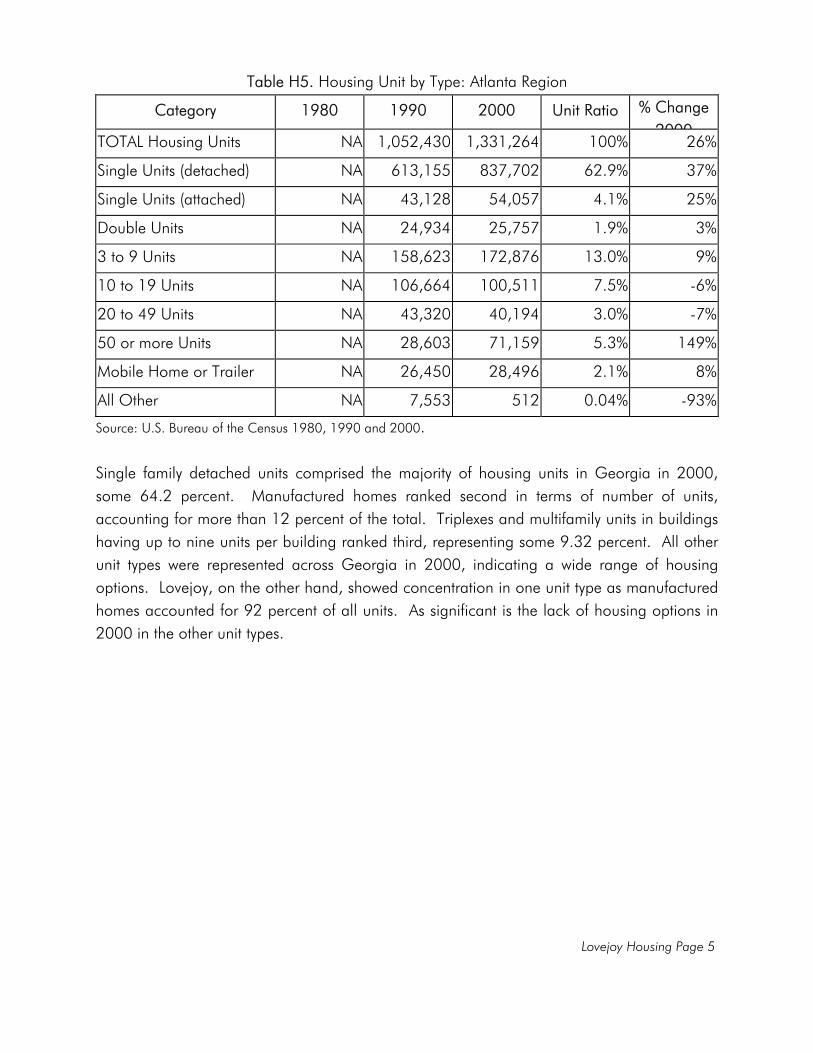
Lovejoy Housing Page 5
Table H5. Housing Unit by Type: Atlanta Region
Category 1980 1990 2000 Unit Ratio % Change 2000
TOTAL Housing Units NA 1,052,430 1,331,264 100% 26%
Single Units (detached) NA 613,155 837,702 62.9% 37%
Single Units (attached) NA 43,128 54,057 4.1% 25%
Double Units NA 24,934 25,757 1.9% 3%
3 to 9 Units NA 158,623 172,876 13.0% 9%
10 to 19 Units NA 106,664 100,511 7.5% -6%
20 to 49 Units NA 43,320 40,194 3.0% -7%
50 or more Units NA 28,603 71,159 5.3% 149%
Mobile Home or Trailer NA 26,450 28,496 2.1% 8%
All Other NA 7,553 512 0.04% -93%
Source: U.S. Bureau of the Census 1980, 1990 and 2000. Single family detached units comprised the majority of housing units in Georgia in 2000, some 64.2 percent. Manufactured homes ranked second in terms of number of units, accounting for more than 12 percent of the total. Triplexes and multifamily units in buildings having up to nine units per building ranked third, representing some 9.32 percent. All other unit types were represented across Georgia in 2000, indicating a wide range of housing options. Lovejoy, on the other hand, showed concentration in one unit type as manufactured homes accounted for 92 percent of all units. As significant is the lack of housing options in 2000 in the other unit types.
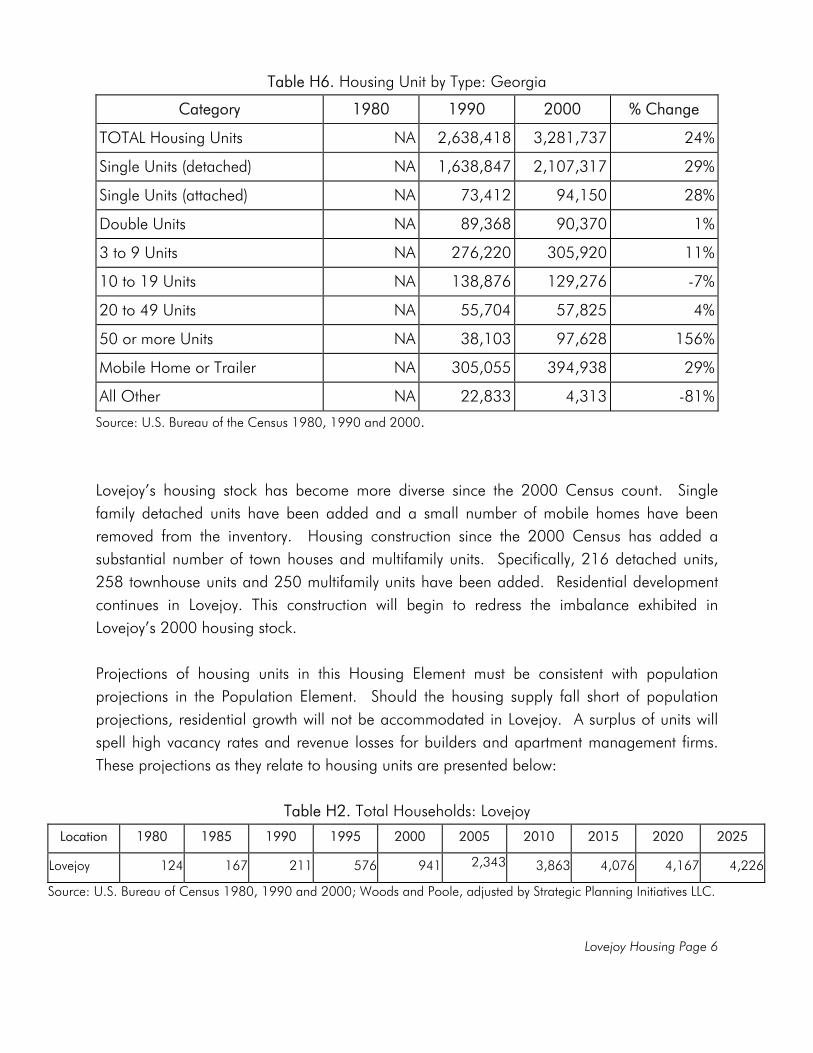
Lovejoy Housing Page 6
Table H6. Housing Unit by Type: Georgia
Category 1980 1990 2000 % Change
TOTAL Housing Units NA 2,638,418 3,281,737 24%
Single Units (detached) NA 1,638,847 2,107,317 29%
Single Units (attached) NA 73,412 94,150 28%
Double Units NA 89,368 90,370 1%
3 to 9 Units NA 276,220 305,920 11%
10 to 19 Units NA 138,876 129,276 -7%
20 to 49 Units NA 55,704 57,825 4%
50 or more Units NA 38,103 97,628 156%
Mobile Home or Trailer NA 305,055 394,938 29%
All Other NA 22,833 4,313 -81%
Source: U.S. Bureau of the Census 1980, 1990 and 2000.
Lovejoy’s housing stock has become more diverse since the 2000 Census count. Single family detached units have been added and a small number of mobile homes have been removed from the inventory. Housing construction since the 2000 Census has added a substantial number of town houses and multifamily units. Specifically, 216 detached units, 258 townhouse units and 250 multifamily units have been added. Residential development continues in Lovejoy. This construction will begin to redress the imbalance exhibited in Lovejoy’s 2000 housing stock. Projections of housing units in this Housing Element must be consistent with population projections in the Population Element. Should the housing supply fall short of population projections, residential growth will not be accommodated in Lovejoy. A surplus of units will spell high vacancy rates and revenue losses for builders and apartment management firms. These projections as they relate to housing units are presented below:
Table H2. Total Households: Lovejoy
Location 1980 1985 1990 1995 2000 2005 2010 2015 2020 2025
Lovejoy 124 167 211 576 941 2,343 3,863 4,076 4,167 4,226
Source: U.S. Bureau of Census 1980, 1990 and 2000; Woods and Poole, adjusted by Strategic Planning Initiatives LLC.
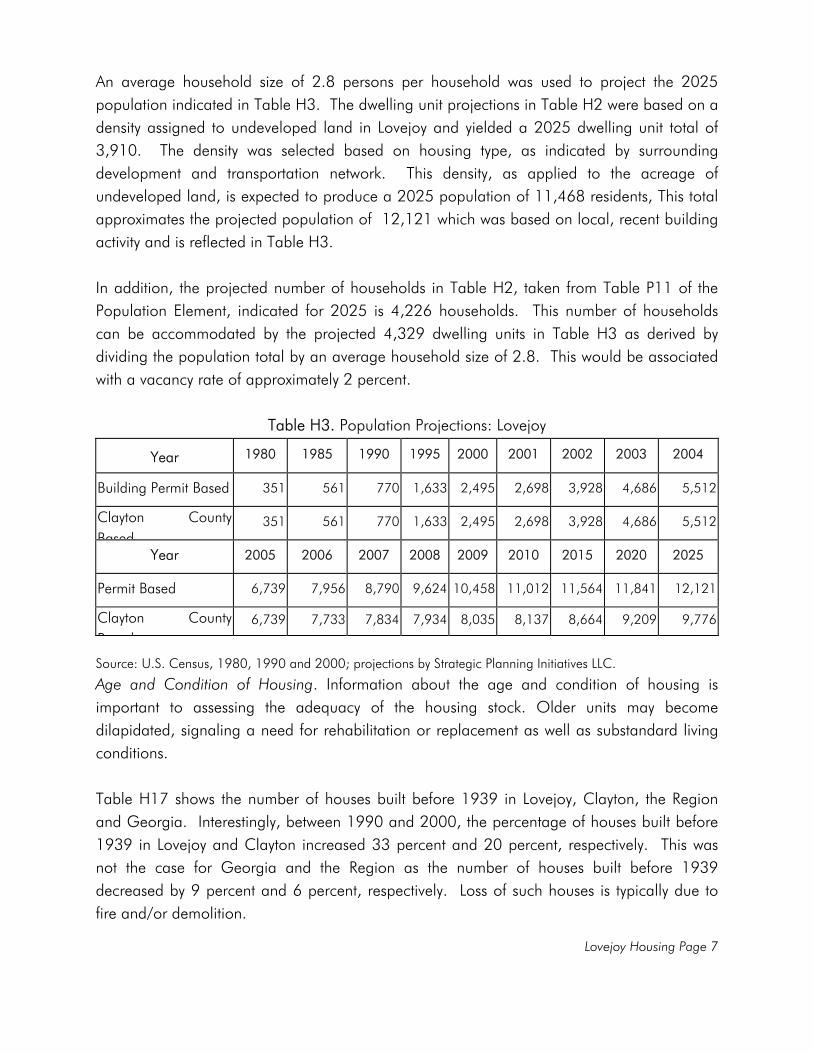
Lovejoy Housing Page 7
An average household size of 2.8 persons per household was used to project the 2025 population indicated in Table H3. The dwelling unit projections in Table H2 were based on a density assigned to undeveloped land in Lovejoy and yielded a 2025 dwelling unit total of 3,910. The density was selected based on housing type, as indicated by surrounding development and transportation network. This density, as applied to the acreage of undeveloped land, is expected to produce a 2025 population of 11,468 residents, This total approximates the projected population of 12,121 which was based on local, recent building activity and is reflected in Table H3. In addition, the projected number of households in Table H2, taken from Table P11 of the Population Element, indicated for 2025 is 4,226 households. This number of households can be accommodated by the projected 4,329 dwelling units in Table H3 as derived by dividing the population total by an average household size of 2.8. This would be associated with a vacancy rate of approximately 2 percent.
Table H3. Population Projections: Lovejoy
Year 1980 1985 1990 1995 2000 2001 2002 2003 2004
Building Permit Based 351 561 770 1,633 2,495 2,698 3,928 4,686 5,512
Clayton County Based
351 561 770 1,633 2,495 2,698 3,928 4,686 5,512
Year 2005 2006 2007 2008 2009 2010 2015 2020 2025
Permit Based 6,739 7,956 8,790 9,624 10,458 11,012 11,564 11,841 12,121
Clayton County B d
6,739 7,733 7,834 7,934 8,035 8,137 8,664 9,209 9,776
Source: U.S. Census, 1980, 1990 and 2000; projections by Strategic Planning Initiatives LLC.
Age and Condition of Housing. Information about the age and condition of housing is important to assessing the adequacy of the housing stock. Older units may become dilapidated, signaling a need for rehabilitation or replacement as well as substandard living conditions. Table H17 shows the number of houses built before 1939 in Lovejoy, Clayton, the Region and Georgia. Interestingly, between 1990 and 2000, the percentage of houses built before 1939 in Lovejoy and Clayton increased 33 percent and 20 percent, respectively. This was not the case for Georgia and the Region as the number of houses built before 1939 decreased by 9 percent and 6 percent, respectively. Loss of such houses is typically due to fire and/or demolition.
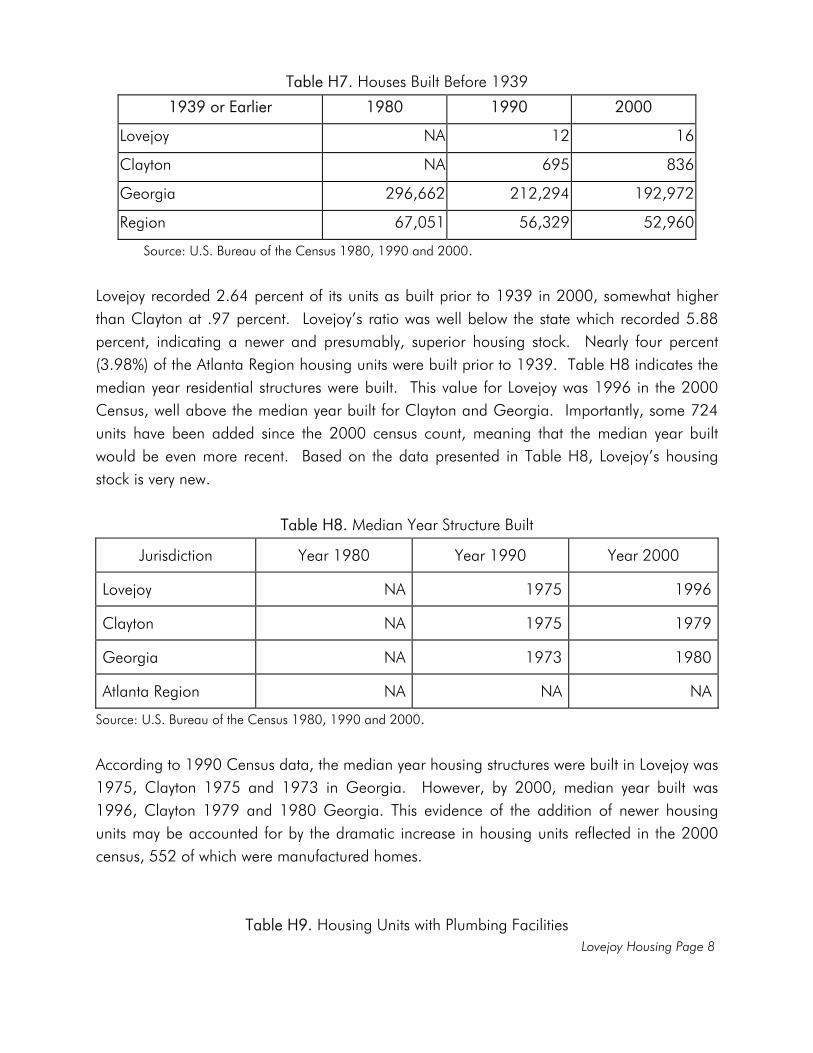
Lovejoy Housing Page 8
Table H7. Houses Built Before 1939
1939 or Earlier 1980 1990 2000
Lovejoy NA 12 16
Clayton NA 695 836
Georgia 296,662 212,294 192,972
Region 67,051 56,329 52,960
Source: U.S. Bureau of the Census 1980, 1990 and 2000.
Lovejoy recorded 2.64 percent of its units as built prior to 1939 in 2000, somewhat higher than Clayton at .97 percent. Lovejoy’s ratio was well below the state which recorded 5.88 percent, indicating a newer and presumably, superior housing stock. Nearly four percent (3.98%) of the Atlanta Region housing units were built prior to 1939. Table H8 indicates the median year residential structures were built. This value for Lovejoy was 1996 in the 2000 Census, well above the median year built for Clayton and Georgia. Importantly, some 724 units have been added since the 2000 census count, meaning that the median year built would be even more recent. Based on the data presented in Table H8, Lovejoy’s housing stock is very new.
Table H8. Median Year Structure Built
Jurisdiction Year 1980 Year 1990 Year 2000
Lovejoy NA 1975 1996
Clayton NA 1975 1979
Georgia NA 1973 1980
Atlanta Region NA NA NA
Source: U.S. Bureau of the Census 1980, 1990 and 2000. According to 1990 Census data, the median year housing structures were built in Lovejoy was 1975, Clayton 1975 and 1973 in Georgia. However, by 2000, median year built was 1996, Clayton 1979 and 1980 Georgia. This evidence of the addition of newer housing units may be accounted for by the dramatic increase in housing units reflected in the 2000 census, 552 of which were manufactured homes.
Table H9. Housing Units with Plumbing Facilities
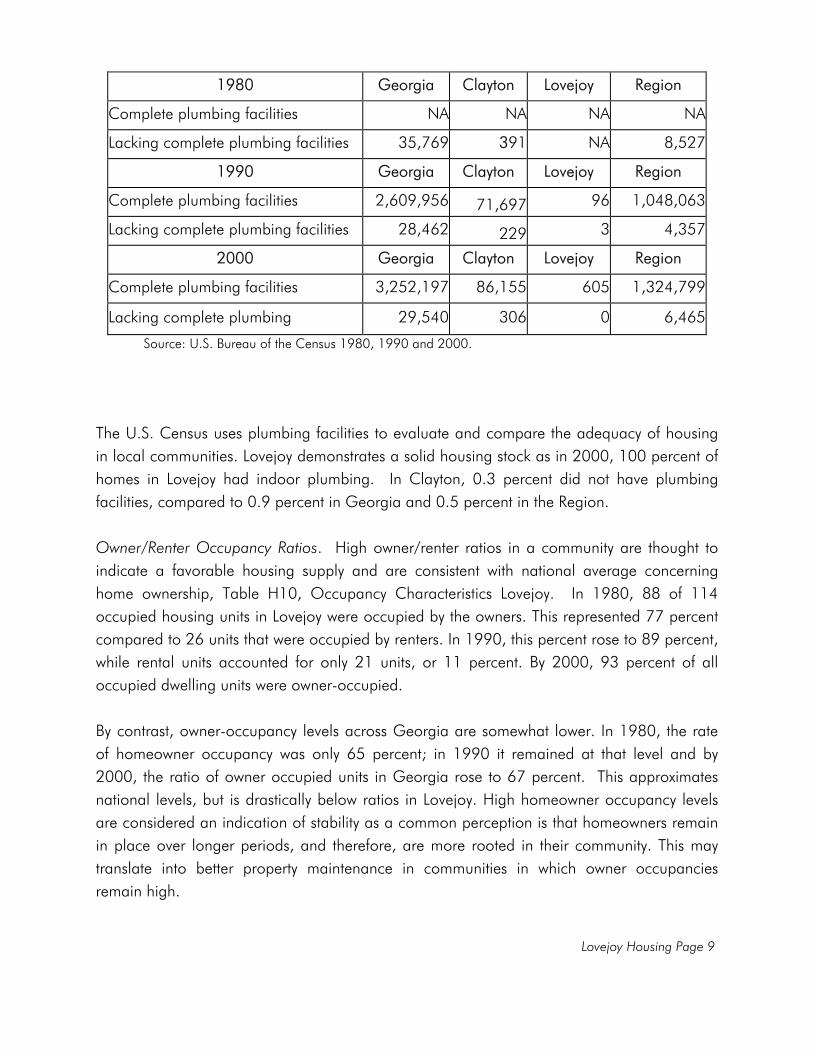
Lovejoy Housing Page 9
1980 Georgia Clayton Lovejoy Region
Complete plumbing facilities NA NA NA NA
Lacking complete plumbing facilities 35,769 391 NA 8,527
1990 Georgia Clayton Lovejoy Region
Complete plumbing facilities 2,609,956 71,697 96 1,048,063
Lacking complete plumbing facilities 28,462 229 3 4,357
2000 Georgia Clayton Lovejoy Region
Complete plumbing facilities 3,252,197 86,155 605 1,324,799
Lacking complete plumbing 29,540 306 0 6,465
Source: U.S. Bureau of the Census 1980, 1990 and 2000.
The U.S. Census uses plumbing facilities to evaluate and compare the adequacy of housing in local communities. Lovejoy demonstrates a solid housing stock as in 2000, 100 percent of homes in Lovejoy had indoor plumbing. In Clayton, 0.3 percent did not have plumbing facilities, compared to 0.9 percent in Georgia and 0.5 percent in the Region. Owner/Renter Occupancy Ratios. High owner/renter ratios in a community are thought to indicate a favorable housing supply and are consistent with national average concerning home ownership, Table H10, Occupancy Characteristics Lovejoy. In 1980, 88 of 114 occupied housing units in Lovejoy were occupied by the owners. This represented 77 percent compared to 26 units that were occupied by renters. In 1990, this percent rose to 89 percent, while rental units accounted for only 21 units, or 11 percent. By 2000, 93 percent of all occupied dwelling units were owner-occupied. By contrast, owner-occupancy levels across Georgia are somewhat lower. In 1980, the rate of homeowner occupancy was only 65 percent; in 1990 it remained at that level and by 2000, the ratio of owner occupied units in Georgia rose to 67 percent. This approximates national levels, but is drastically below ratios in Lovejoy. High homeowner occupancy levels are considered an indication of stability as a common perception is that homeowners remain in place over longer periods, and therefore, are more rooted in their community. This may translate into better property maintenance in communities in which owner occupancies remain high.
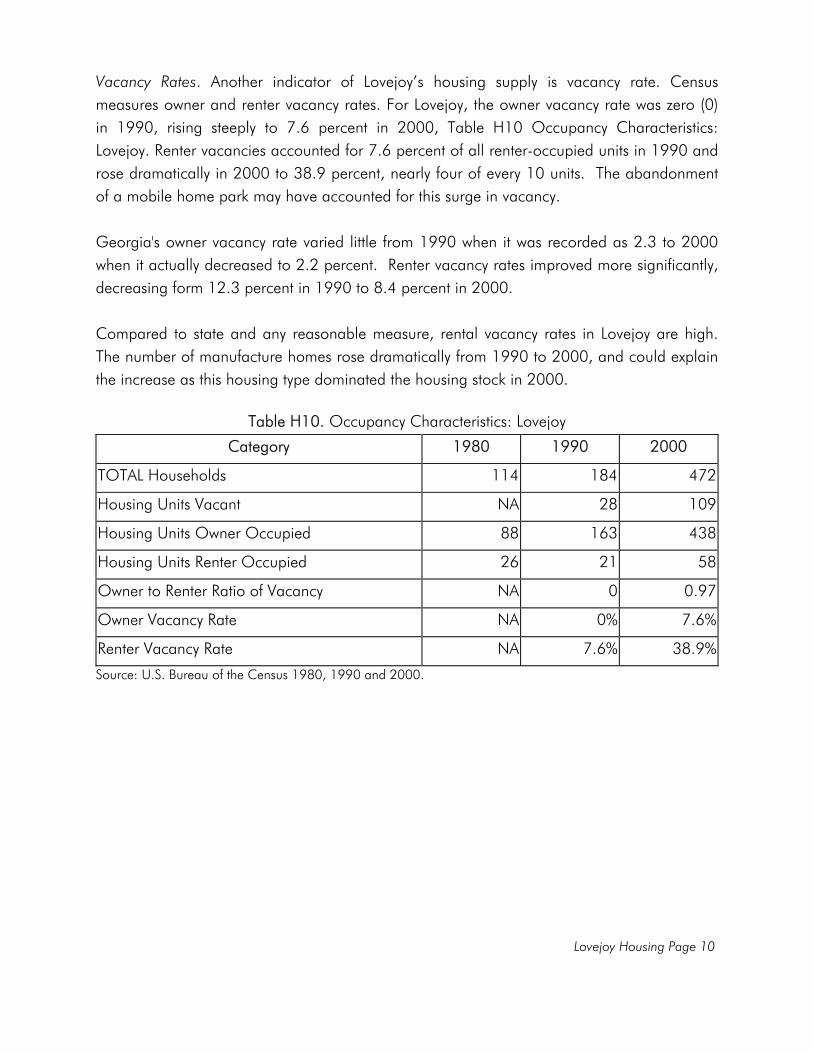
Lovejoy Housing Page 10
Vacancy Rates. Another indicator of Lovejoy’s housing supply is vacancy rate. Census measures owner and renter vacancy rates. For Lovejoy, the owner vacancy rate was zero (0) in 1990, rising steeply to 7.6 percent in 2000, Table H10 Occupancy Characteristics: Lovejoy. Renter vacancies accounted for 7.6 percent of all renter-occupied units in 1990 and rose dramatically in 2000 to 38.9 percent, nearly four of every 10 units. The abandonment of a mobile home park may have accounted for this surge in vacancy. Georgia's owner vacancy rate varied little from 1990 when it was recorded as 2.3 to 2000 when it actually decreased to 2.2 percent. Renter vacancy rates improved more significantly, decreasing form 12.3 percent in 1990 to 8.4 percent in 2000. Compared to state and any reasonable measure, rental vacancy rates in Lovejoy are high. The number of manufacture homes rose dramatically from 1990 to 2000, and could explain the increase as this housing type dominated the housing stock in 2000.
Table H10. Occupancy Characteristics: Lovejoy
Category 1980 1990 2000
TOTAL Households 114 184 472
Housing Units Vacant NA 28 109
Housing Units Owner Occupied 88 163 438
Housing Units Renter Occupied 26 21 58
Owner to Renter Ratio of Vacancy NA 0 0.97
Owner Vacancy Rate NA 0% 7.6%
Renter Vacancy Rate NA 7.6% 38.9%
Source: U.S. Bureau of the Census 1980, 1990 and 2000.
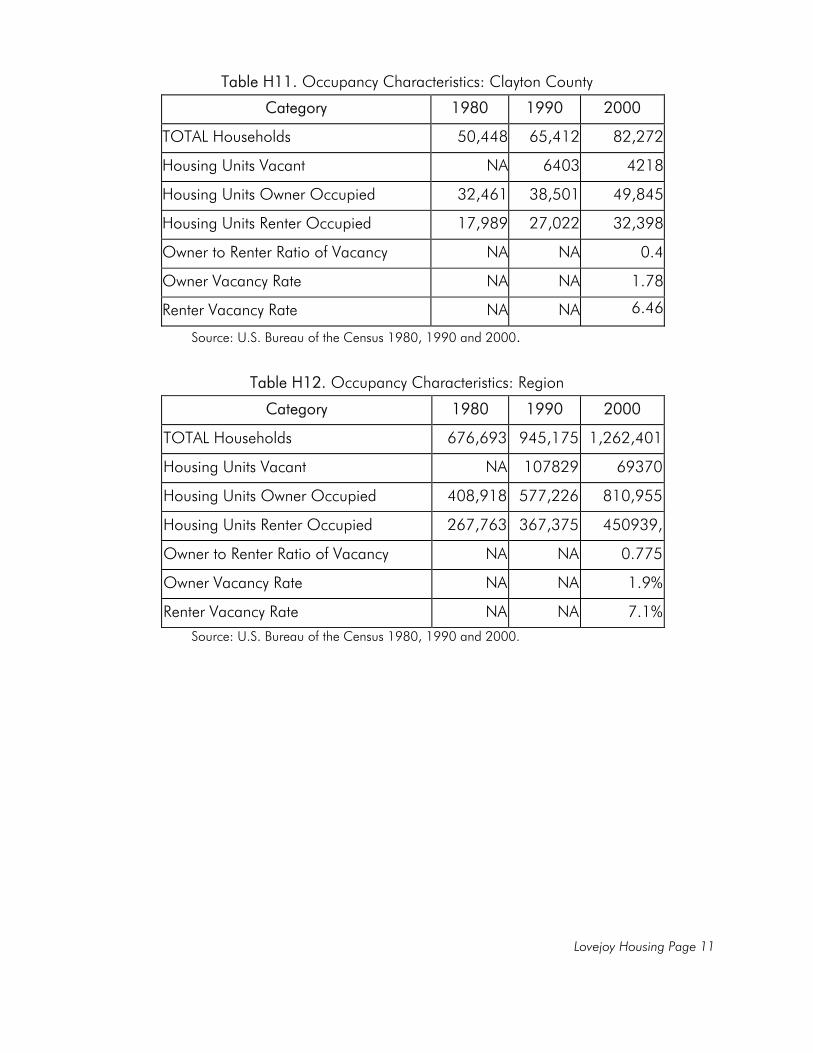
Lovejoy Housing Page 11
Table H11. Occupancy Characteristics: Clayton County
Category 1980 1990 2000
TOTAL Households 50,448 65,412 82,272
Housing Units Vacant NA 6403 4218
Housing Units Owner Occupied 32,461 38,501 49,845
Housing Units Renter Occupied 17,989 27,022 32,398
Owner to Renter Ratio of Vacancy NA NA 0.4
Owner Vacancy Rate NA NA 1.78
Renter Vacancy Rate NA NA 6.46
Source: U.S. Bureau of the Census 1980, 1990 and 2000.
Table H12. Occupancy Characteristics: Region
Category 1980 1990 2000
TOTAL Households 676,693 945,175 1,262,401
Housing Units Vacant NA 107829 69370
Housing Units Owner Occupied 408,918 577,226 810,955
Housing Units Renter Occupied 267,763 367,375 450939,
Owner to Renter Ratio of Vacancy NA NA 0.775
Owner Vacancy Rate NA NA 1.9%
Renter Vacancy Rate NA NA 7.1% Source: U.S. Bureau of the Census 1980, 1990 and 2000.
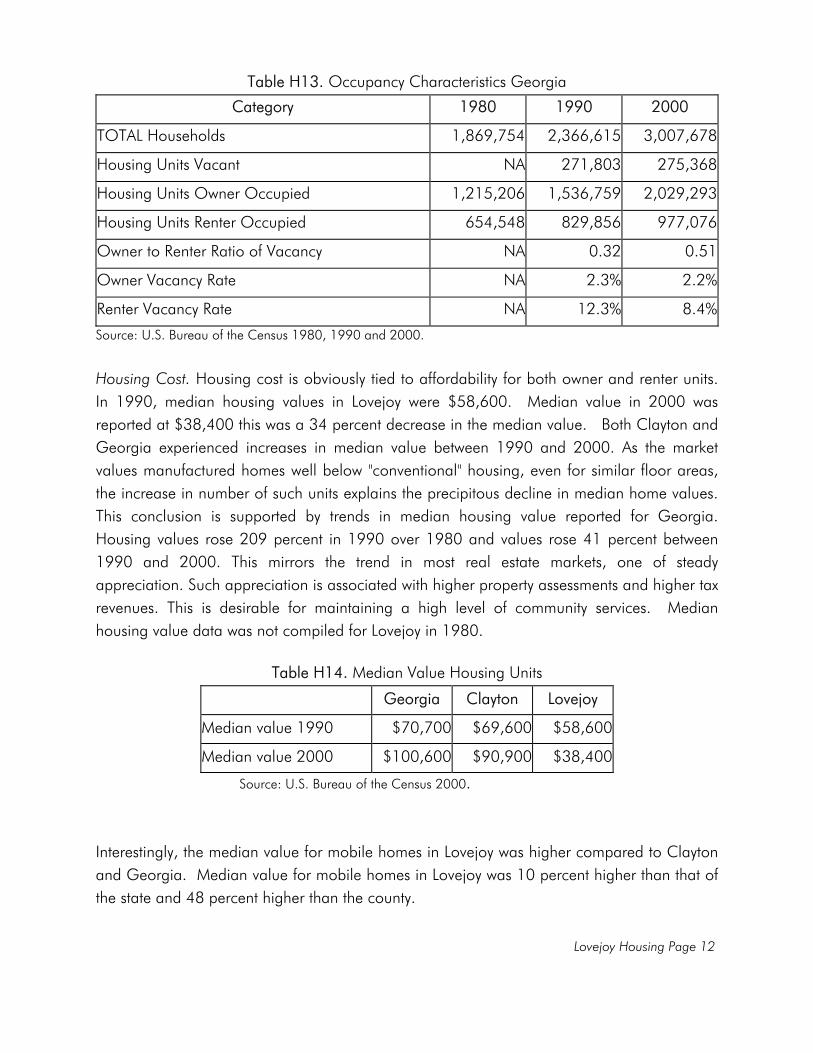
Lovejoy Housing Page 12
Table H13. Occupancy Characteristics Georgia
Category 1980 1990 2000
TOTAL Households 1,869,754 2,366,615 3,007,678
Housing Units Vacant NA 271,803 275,368
Housing Units Owner Occupied 1,215,206 1,536,759 2,029,293
Housing Units Renter Occupied 654,548 829,856 977,076
Owner to Renter Ratio of Vacancy NA 0.32 0.51
Owner Vacancy Rate NA 2.3% 2.2%
Renter Vacancy Rate NA 12.3% 8.4%
Source: U.S. Bureau of the Census 1980, 1990 and 2000. Housing Cost. Housing cost is obviously tied to affordability for both owner and renter units. In 1990, median housing values in Lovejoy were $58,600. Median value in 2000 was reported at $38,400 this was a 34 percent decrease in the median value. Both Clayton and Georgia experienced increases in median value between 1990 and 2000. As the market values manufactured homes well below "conventional" housing, even for similar floor areas, the increase in number of such units explains the precipitous decline in median home values. This conclusion is supported by trends in median housing value reported for Georgia. Housing values rose 209 percent in 1990 over 1980 and values rose 41 percent between 1990 and 2000. This mirrors the trend in most real estate markets, one of steady appreciation. Such appreciation is associated with higher property assessments and higher tax revenues. This is desirable for maintaining a high level of community services. Median housing value data was not compiled for Lovejoy in 1980.
Table H14. Median Value Housing Units
Georgia Clayton Lovejoy
Median value 1990 $70,700 $69,600 $58,600
Median value 2000 $100,600 $90,900 $38,400
Source: U.S. Bureau of the Census 2000. Interestingly, the median value for mobile homes in Lovejoy was higher compared to Clayton and Georgia. Median value for mobile homes in Lovejoy was 10 percent higher than that of the state and 48 percent higher than the county.
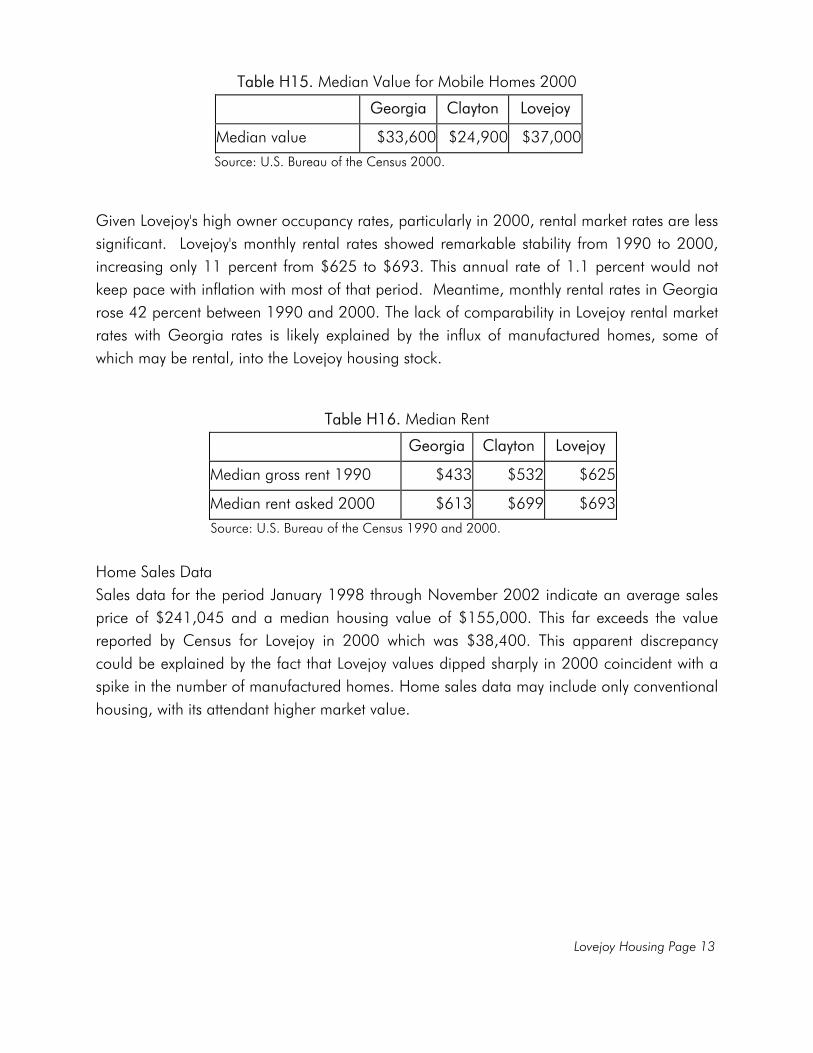
Lovejoy Housing Page 13
Table H15. Median Value for Mobile Homes 2000
Georgia Clayton Lovejoy
Median value $33,600 $24,900 $37,000
Source: U.S. Bureau of the Census 2000.
Given Lovejoy's high owner occupancy rates, particularly in 2000, rental market rates are less significant. Lovejoy's monthly rental rates showed remarkable stability from 1990 to 2000, increasing only 11 percent from $625 to $693. This annual rate of 1.1 percent would not keep pace with inflation with most of that period. Meantime, monthly rental rates in Georgia rose 42 percent between 1990 and 2000. The lack of comparability in Lovejoy rental market rates with Georgia rates is likely explained by the influx of manufactured homes, some of which may be rental, into the Lovejoy housing stock.
Table H16. Median Rent
Georgia Clayton Lovejoy
Median gross rent 1990 $433 $532 $625
Median rent asked 2000 $613 $699 $693
Source: U.S. Bureau of the Census 1990 and 2000.
Home Sales Data Sales data for the period January 1998 through November 2002 indicate an average sales price of $241,045 and a median housing value of $155,000. This far exceeds the value reported by Census for Lovejoy in 2000 which was $38,400. This apparent discrepancy could be explained by the fact that Lovejoy values dipped sharply in 2000 coincident with a spike in the number of manufactured homes. Home sales data may include only conventional housing, with its attendant higher market value.
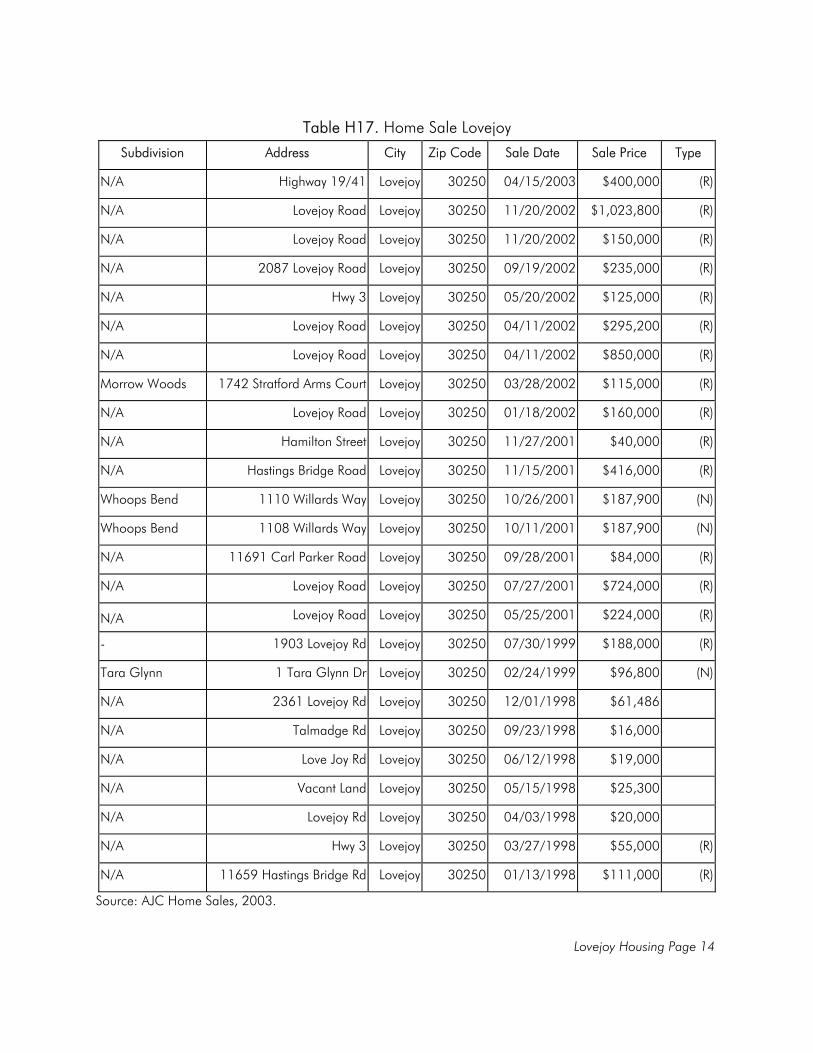
Lovejoy Housing Page 14
Table H17. Home Sale Lovejoy
Subdivision Address City Zip Code Sale Date Sale Price Type
N/A Highway 19/41 Lovejoy 30250 04/15/2003 $400,000 (R)
N/A Lovejoy Road Lovejoy 30250 11/20/2002 $1,023,800 (R)
N/A Lovejoy Road Lovejoy 30250 11/20/2002 $150,000 (R)
N/A 2087 Lovejoy Road Lovejoy 30250 09/19/2002 $235,000 (R)
N/A Hwy 3 Lovejoy 30250 05/20/2002 $125,000 (R)
N/A Lovejoy Road Lovejoy 30250 04/11/2002 $295,200 (R)
N/A Lovejoy Road Lovejoy 30250 04/11/2002 $850,000 (R)
Morrow Woods 1742 Stratford Arms Court Lovejoy 30250 03/28/2002 $115,000 (R)
N/A Lovejoy Road Lovejoy 30250 01/18/2002 $160,000 (R)
N/A Hamilton Street Lovejoy 30250 11/27/2001 $40,000 (R)
N/A Hastings Bridge Road Lovejoy 30250 11/15/2001 $416,000 (R)
Whoops Bend 1110 Willards Way Lovejoy 30250 10/26/2001 $187,900 (N)
Whoops Bend 1108 Willards Way Lovejoy 30250 10/11/2001 $187,900 (N)
N/A 11691 Carl Parker Road Lovejoy 30250 09/28/2001 $84,000 (R)
N/A Lovejoy Road Lovejoy 30250 07/27/2001 $724,000 (R)
N/A Lovejoy Road Lovejoy 30250 05/25/2001 $224,000 (R)
- 1903 Lovejoy Rd Lovejoy 30250 07/30/1999 $188,000 (R)
Tara Glynn 1 Tara Glynn Dr Lovejoy 30250 02/24/1999 $96,800 (N)
N/A 2361 Lovejoy Rd Lovejoy 30250 12/01/1998 $61,486
N/A Talmadge Rd Lovejoy 30250 09/23/1998 $16,000
N/A Love Joy Rd Lovejoy 30250 06/12/1998 $19,000
N/A Vacant Land Lovejoy 30250 05/15/1998 $25,300
N/A Lovejoy Rd Lovejoy 30250 04/03/1998 $20,000
N/A Hwy 3 Lovejoy 30250 03/27/1998 $55,000 (R)
N/A 11659 Hastings Bridge Rd Lovejoy 30250 01/13/1998 $111,000 (R)
Source: AJC Home Sales, 2003.
Lovejoy Housing Page 15
Post 2000 Census Construction Activity Based on building permits and field surveys, dramatic change have occurred and continue to occur in Lovejoy’s housing supply. Not only have approximately 216 single family detached units been added throughout Lovejoy, several townhouse developments, some 258 units, and a multifamily community, comprised of 250 units, have been added since the 2000 Census. The detached product is primarily moderately-prices, but a small number of upscale homes have been built as well. The attached product is more upscale, particularly units in the developing west section of Lovejoy, near the Highway 19/41 commercial corridor.
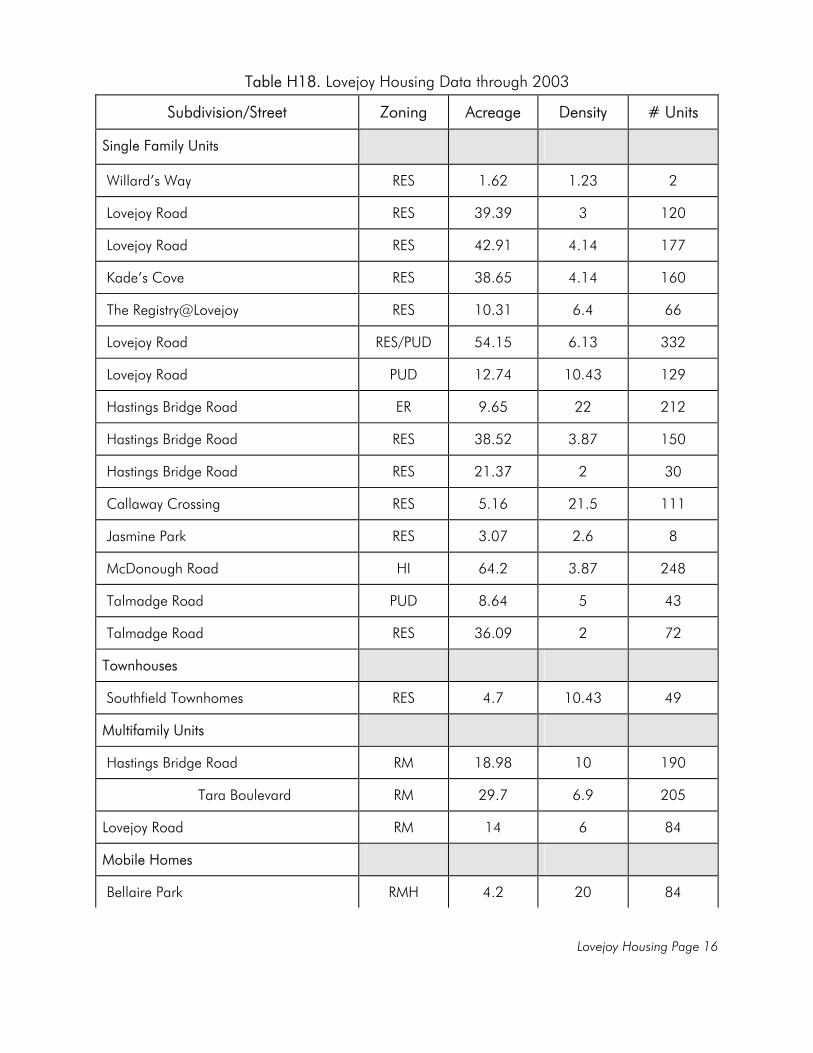
Lovejoy Housing Page 16
Table H18. Lovejoy Housing Data through 2003
Subdivision/Street Zoning Acreage Density # Units
Single Family Units
Willard’s Way RES 1.62 1.23 2
Lovejoy Road RES 39.39 3 120
Lovejoy Road RES 42.91 4.14 177
Kade’s Cove RES 38.65 4.14 160
The Registry@Lovejoy RES 10.31 6.4 66
Lovejoy Road RES/PUD 54.15 6.13 332
Lovejoy Road PUD 12.74 10.43 129
Hastings Bridge Road ER 9.65 22 212
Hastings Bridge Road RES 38.52 3.87 150
Hastings Bridge Road RES 21.37 2 30
Callaway Crossing RES 5.16 21.5 111
Jasmine Park RES 3.07 2.6 8
McDonough Road HI 64.2 3.87 248
Talmadge Road PUD 8.64 5 43
Talmadge Road RES 36.09 2 72
Townhouses
Southfield Townhomes RES 4.7 10.43 49
Multifamily Units
Hastings Bridge Road RM 18.98 10 190
Tara Boulevard RM 29.7 6.9 205
Lovejoy Road RM 14 6 84
Mobile Homes
Bellaire Park RMH 4.2 20 84
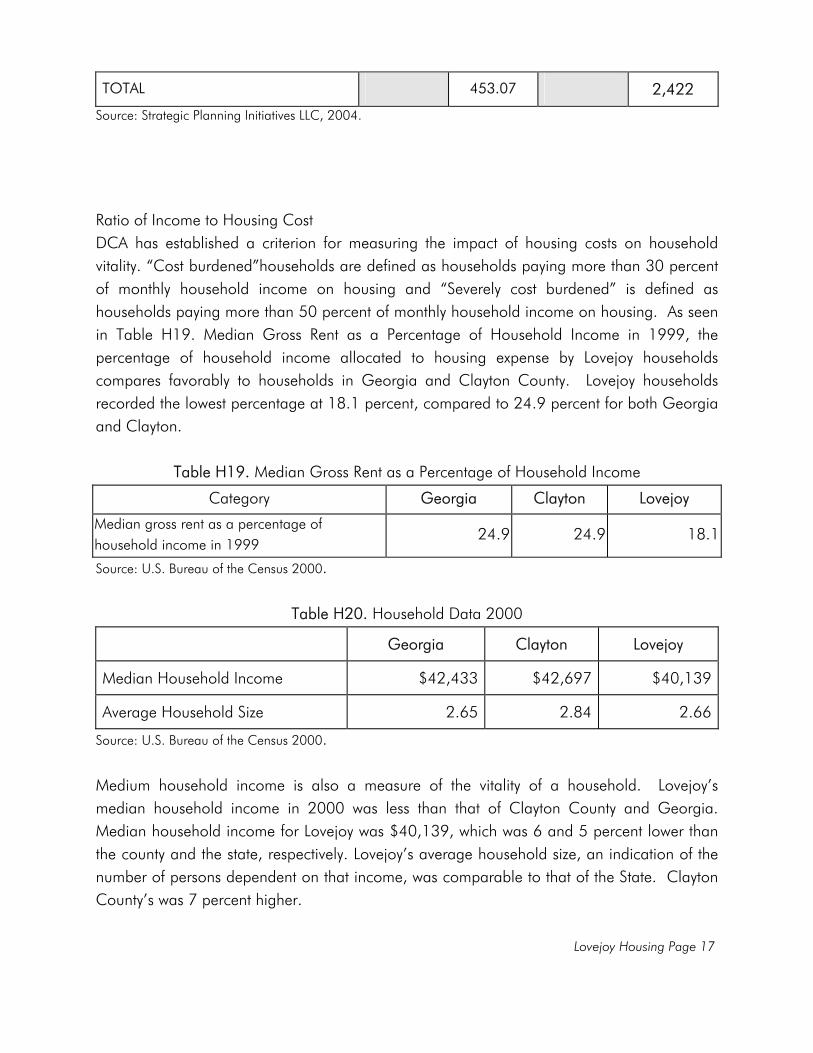
Lovejoy Housing Page 17
TOTAL 453.07 2,422
Source: Strategic Planning Initiatives LLC, 2004.
Ratio of Income to Housing Cost DCA has established a criterion for measuring the impact of housing costs on household vitality. “Cost burdened”households are defined as households paying more than 30 percent of monthly household income on housing and “Severely cost burdened” is defined as households paying more than 50 percent of monthly household income on housing. As seen in Table H19. Median Gross Rent as a Percentage of Household Income in 1999, the percentage of household income allocated to housing expense by Lovejoy households compares favorably to households in Georgia and Clayton County. Lovejoy households recorded the lowest percentage at 18.1 percent, compared to 24.9 percent for both Georgia and Clayton.
Table H19. Median Gross Rent as a Percentage of Household Income
Category Georgia Clayton Lovejoy
Median gross rent as a percentage of household income in 1999
24.9 24.9 18.1
Source: U.S. Bureau of the Census 2000.
Table H20. Household Data 2000
Georgia Clayton Lovejoy
Median Household Income $42,433 $42,697 $40,139
Average Household Size 2.65 2.84 2.66
Source: U.S. Bureau of the Census 2000. Medium household income is also a measure of the vitality of a household. Lovejoy’s median household income in 2000 was less than that of Clayton County and Georgia. Median household income for Lovejoy was $40,139, which was 6 and 5 percent lower than the county and the state, respectively. Lovejoy’s average household size, an indication of the number of persons dependent on that income, was comparable to that of the State. Clayton County’s was 7 percent higher.
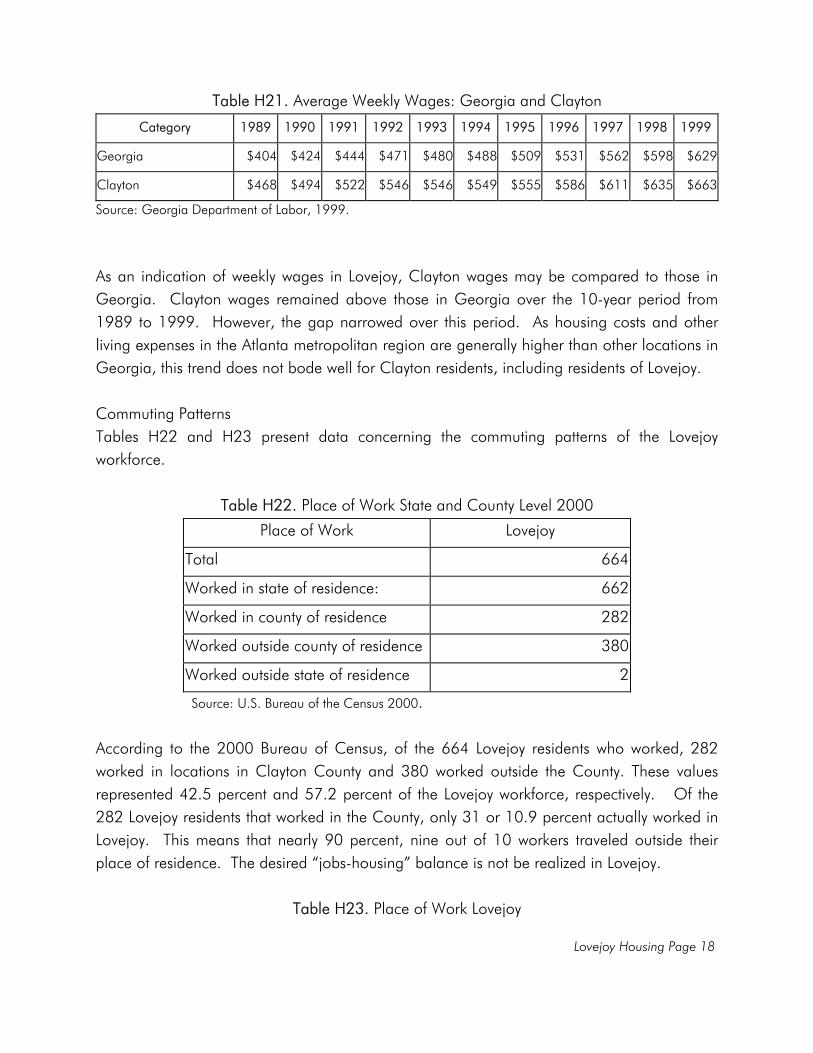
Lovejoy Housing Page 18
Table H21. Average Weekly Wages: Georgia and Clayton
Category 1989 1990 1991 1992 1993 1994 1995 1996 1997 1998 1999
Georgia $404 $424 $444 $471 $480 $488 $509 $531 $562 $598 $629
Clayton $468 $494 $522 $546 $546 $549 $555 $586 $611 $635 $663
Source: Georgia Department of Labor, 1999. As an indication of weekly wages in Lovejoy, Clayton wages may be compared to those in Georgia. Clayton wages remained above those in Georgia over the 10-year period from 1989 to 1999. However, the gap narrowed over this period. As housing costs and other living expenses in the Atlanta metropolitan region are generally higher than other locations in Georgia, this trend does not bode well for Clayton residents, including residents of Lovejoy. Commuting Patterns Tables H22 and H23 present data concerning the commuting patterns of the Lovejoy workforce.
Table H22. Place of Work State and County Level 2000
Place of Work Lovejoy
Total 664
Worked in state of residence: 662
Worked in county of residence 282
Worked outside county of residence 380
Worked outside state of residence 2
Source: U.S. Bureau of the Census 2000. According to the 2000 Bureau of Census, of the 664 Lovejoy residents who worked, 282 worked in locations in Clayton County and 380 worked outside the County. These values represented 42.5 percent and 57.2 percent of the Lovejoy workforce, respectively. Of the 282 Lovejoy residents that worked in the County, only 31 or 10.9 percent actually worked in Lovejoy. This means that nearly 90 percent, nine out of 10 workers traveled outside their place of residence. The desired “jobs-housing” balance is not be realized in Lovejoy.
Table H23. Place of Work Lovejoy
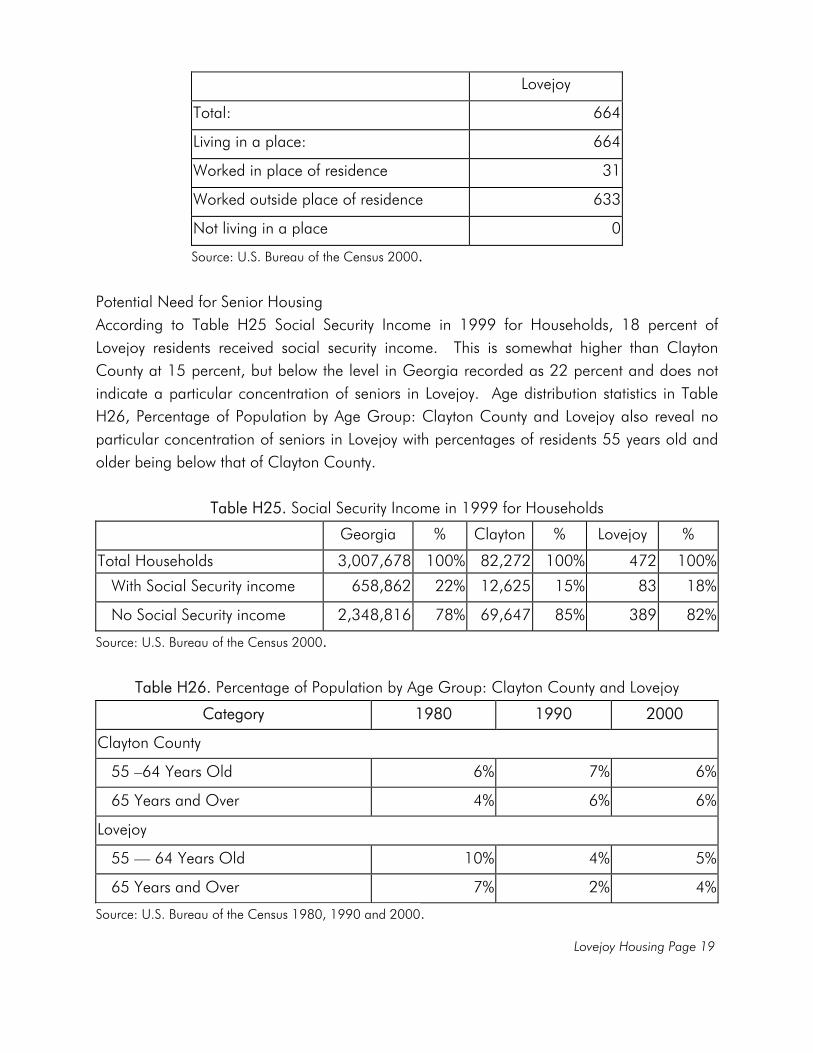
Lovejoy Housing Page 19
Lovejoy
Total: 664
Living in a place: 664
Worked in place of residence 31
Worked outside place of residence 633
Not living in a place 0
Source: U.S. Bureau of the Census 2000. Potential Need for Senior Housing According to Table H25 Social Security Income in 1999 for Households, 18 percent of Lovejoy residents received social security income. This is somewhat higher than Clayton County at 15 percent, but below the level in Georgia recorded as 22 percent and does not indicate a particular concentration of seniors in Lovejoy. Age distribution statistics in Table H26, Percentage of Population by Age Group: Clayton County and Lovejoy also reveal no particular concentration of seniors in Lovejoy with percentages of residents 55 years old and older being below that of Clayton County.
Table H25. Social Security Income in 1999 for Households
Georgia % Clayton % Lovejoy %
Total Households 3,007,678 100% 82,272 100% 472 100%
With Social Security income 658,862 22% 12,625 15% 83 18%
No Social Security income 2,348,816 78% 69,647 85% 389 82%
Source: U.S. Bureau of the Census 2000.
Table H26. Percentage of Population by Age Group: Clayton County and Lovejoy
Category 1980 1990 2000
Clayton County
55 –64 Years Old 6% 7% 6%
65 Years and Over 4% 6% 6%
Lovejoy
55 –– 64 Years Old 10% 4% 5%
65 Years and Over 7% 2% 4%
Source: U.S. Bureau of the Census 1980, 1990 and 2000.
Lovejoy Housing Page 20
Persons with Special Housing Needs The Georgia Department of Human Resources does not collect data on such groups as the homeless; victims of domestic violence; migrant farm workers; persons with mental, physical, or developmental disabilities; persons with HIV/AIDS or persons recovering from substance abuse at the city level. Lovejoy residents obtain special needs services from Clayton County. No information is available at the state level and only limited data at the county level. In Clayton County, 522 aids cases were reported between January1981 and March 2003. This number can be compared to 17, 610 reported in the Atlanta Metropolitan Statistical Area (MSA) and amounts to less than three percent of the total number of cases in the MSA. Clayton households represents 6.6 percent of the regions’s households. Census data presented in Table H27. Public Assistance Income in 1999 indicates the percentage of persons receiving public assistance as a measure of special housing needs, among other services. That ratio in Lovejoy is four percent, marginally above Georgia and Clayton, but not sufficiently high enough to require public programs at the local level.
Table H27. Public Assistance Income in 1999
Category Georgia % Clayton % Lovejoy %
Total Households 3,007,678 100% 82,272 100% 472 100%
With public assistance income 87,403 3% 2,409 3% 17 4%
No public assistance income 2,920,275 97% 79,863 97% 455 96%Source: U.S. Bureau of the Census 2000
Lovejoy Housing Page 21
Table H28. Medicaid Recipients and Expenditures by County - FY 2002
County Number of
Unique Recipients
Net Payments Payment per
Recipient
Estimated 20002
population
% Population Receiving Medicaid
% State Recipient
Population Living in County
Clayton 50,319 $112,108,836 $2,227.96 246,779 20.39% 3.67%
Cobb 11,037 $32,241,778 $2,882.92 631,767 8.57% 3.95%
Dekalb 100,280 $274,983,242 $2,742.15 665,133 15.08% 7.32%
Fayette 4,716 $14,616,483 $3,099.34 95,542 4.94% .34%
Fulton 153,517 $406,600 ,402 $2,648.57 816,638 18.80% 11.21%
Gwinnett 55,519 $140,200,825 $2,525.28 621,528 8.93% 4.05%
Henry 12,212 $31,205,178 $2,555.29 132,581 9.21% 0.89%
Rockdale 9,320 $25,866,799 $2,775.41 71,798 12.98% 0.68%
Spalding 13,163 $39,579,106 $3,006.77 59,066 22.29% 0.96%
Source: Georgia Department of Community Health State Fiscal Year 2002 Annual Report. Clayton and Spalding recorded the highest ratios of residents receiving Medicaid among counties in the region. This exceeded even Fulton and DeKalb which, as core urban counties, could have been expected to have recorded the highest levels. This suggests soe lelvel of economic stress in the Lovejoy and Clayton County community that is not revealed in other demographics. Housing Demand Based on Family and Household Size Census data reporting the number of children per household or per family would be instructive as to projections of the need for housing by number of bedrooms and, perhaps, housing type. Unfortunately, such data are not reported. Only data concerning the percentage of families or households with children under 18 years of age is reported. Inferences may be made based on such data. For example, Lovejoy reported 31 percent of married couple families having children under the age of 18 compared to 25 percent in Georgia and Clayton County. Clayton reported a higher percentage of female households with children under the age of 18 than either Lovejoy or Georgia. These statistics indicate that Lovejoy may have households slightly larger than those in Clayton and Georgia, suggesting that market demand for 3- and 4-bedroom dwelling units may be present in Lovejoy.
Lovejoy Housing Page 22
Table H29. Household Size by Household Type by Presence of Own Children under 18
Indicator Georgia % Clayton % Lovejoy %
Total: 3,007,678 100% 82,272 100% 472 100%1-person household: 710,098 24% 17,980 22% 75 16%
Male householder 298,689 10% 7,962 10% 42 9%
Female householder 411,409 14% 10,018 12% 33 7%
2-or-more-person household: 2,297,580 76% 64,292 78% 397 84%
Family households: 2,126,360 71% 59,478 72% 374 79%
Married-couple family: 1,579,407 53% 38,179 46% 258 55%
With own children under 18 years 759,345 25% 20,679 25% 146 31%
No own children under 18 years 820,062 27% 17,500 21% 112 24%
Other family: 546,953 18% 21,299 26% 116 25%
Male householder, no wife present: 124,524 4% 4,988 6% 26 6%
With own children under 18 years 60,757 2% 2,454 3% 14 3%
No own children under 18 years 63,767 2% 2,534 3% 12 3%
Female householder, no husband 422,429 14% 16,311 20% 90 19%
With own children under 18 years 250,562 8% 10,901 13% 45 10%
No own children under 18 years 171,867 6% 5,410 7% 45 10%
Nonfamily households: 171,220 6% 4,814 6% 23 5%
Male householder 101,496 3% 2,710 3% 7 1%
Female householder 69,724 2% 2,104 3% 16 3%
Source: U.S. Bureau of the Census 2000.

Lovejoy Housing Page 23
HOUSING ASSESSMENT Units by Type The number of dwelling units in Lovejoy rose by 511 percent between 1990 and 2000. Of the 605 dwelling units found in Lovejoy in 2000, 552, some 91 percent, were manufactured homes. A flurry of residential development since the 2000 Census has produced a more balanced housing stock, with considerable increases in the number of single family detached, attached and multifamily dwellings. The rate of housing growth in Lovejoy greatly exceeded county, regional and state growth rates between 1900 and 2000. Age and Condition of Housing Lovejoy’s housing stock is very new compared to Clayton County, the Atlanta Region and Georgia based on median year built. This is consistent with the recent residential growth. The vast majority of dwellings in Georgia have plumbing facilities and this indicator is less of a predictor of relative housing condition than may have been the case in the past. Housing condition is not a problem in Lovejoy. Owner/Renter Occupancy Ratios Lovejoy has a history of exceptionally high owner occupancy, 77 percent in 1980, 89 percent in 1990 and 93 percent by 2000. These are well above the state which hover around 65 percent. These levels suggest that Lovejoy is a stable community, and the good housing conditions seemed to confirm this assessment. Vacancy Rates Residential vacancy rates are not deemed a concern in Lovejoy despite rates moving dramatically higher in 2000, particularly in the rental market. A vacancy rate of 7.6 percent was recorded in 2000 for owner-occupied units and, 38.9 percent for rental units. This is higher than those found in Georgia which were in the two percent range for owner-occupied units; however, this figure was zero as recently as 1990. Abandonment of a mobile home park is believed to have accounted for the surge in rental unit vacancy. Housing Cost The drop in median housing value from 1990 to 2000 is believed to be related to the substantial increase in manufactured homes. Market values for manufactured homes are well below "conventional" housing, even for similar floor areas. Clayton and Georgia experienced increases in median value between 1990 and 2000, consistent with traditional real estate market appreciation that has characterized the Atlanta region. However, these figures
Lovejoy Housing Page 24
evidence an atypical housing mix in Lovejoy, and coupled with considerably higher values for manufactured homes compared to Clayton and Georgia and development since the 2000 Census, the low cost of housing is somewhat less alarming. That development has tended to be more upscale with some exceptions and further development of housing, both in diverse unit types, but also in the middle, and especially the upper end, market segments, is justified. Lovejoy’s rental rate escalation did not keep pace with Georgia rising at an annual rate of 1.1 percent compared with 4.2 percent. This is not perceived as a concern given Lovejoy's high owner occupancy rates. Ratio of Income to Housing Cost Lovejoy households recorded the lowest percentage of household income allocated to housing expense at 18.1 percent, compared to 24.9 percent for both Georgia and Clayton. "Cost burdened" households are defined as households paying more than 30 percent of monthly household income on housing and "severely cost burdened" is defined as households paying more than 50 percent of monthly household income on housing. Thus, housing costs are very reasonable, and this statistic suggests that higher value homes could actually improve household wealth through increased equity appreciation associated with larger household income percentages tied to housing expenses. Commuting Patterns Of the 282 Lovejoy residents that worked in the County, only 31 or 10.9 percent actually worked in Lovejoy. This means that nearly 90 percent, nine out of 10 workers traveled outside their place of residence. The desired "jobs-housing" balance is not being realized in Lovejoy. Potential Need for Senior Housing Some 18 percent of Lovejoy residents received social security income in 1999. This is somewhat higher than Clayton County at 15 percent, but below the level in Georgia recorded as 22 percent and does not indicate a particular concentration of seniors in Lovejoy. Age distribution statistics in Clayton County and Lovejoy also reveal no particular concentration of seniors in Lovejoy with percentages of residents 55 years old and older being below that of Clayton County. Persons with Special Housing Needs No information concerning special needs services to individuals is available at the city level and only limited data at the county level. One potential indicator is the number of aids
Lovejoy Housing Page 25
cases, reported as 522 in Clayton County between January 1981 and March 2003. This number represents less than three percent of the total number of cases in the Atlanta Metropolitan Statistical Area. Clayton households represents 6.6 percent of the region's households. Census data indicates that four percent of Lovejoy’s population received public assistance in 1999. That ratio is marginally above Georgia and Clayton, but not sufficiently high enough to require local public programs. Clayton and Spalding recorded the highest ratios of residents receiving Medicaid in the region, exceeded even Fulton and DeKalb which, as core urban counties, could have been expected to have recorded the highest levels. This suggests some level of economic stress in Lovejoy and Clayton County not revealed in other demographics. Housing Demand Based on Family and Household Size Only data concerning the percentage of families or households with children under 18 years of age are reported by Census. Lovejoy reported 31 percent of married couple families having children under the age of 18 compared to 25 percent in Georgia and Clayton County. Clayton reported a higher percentage of female households with children under the age of 18 than either Lovejoy or Georgia. These statistics indicate that Lovejoy may have households slightly larger than those in Clayton and Georgia, suggesting market demand for 3- and 4-bedroom dwellings.
Lovejoy Housing Page 26
HOUSING GOALS AND OBJECTIVES The State has established a housing goal and objective to guide local housing policy; these are reprinted below: Housing Goal: To ensure that residents of the state have access to adequate and
affordable housing.
Housing Objective: Quality housing and a range of housing size, cost, and density should be provided in each community, to make it possible for all who work in the community to also live in the community.
Lovejoy seeks to address the State housing goal and objective as well as housing goals and objectives indicated in the housing inventory and assessment by establishing the following housing goals and objectives: Goal: Ensure access to quality housing across the broadest range of housing types, unit
sizes, price points and densities the market will bear. Objective A: Adopt a future land use map and official zoning map that promotes a
more diverse housing supply and redresses the imbalance in mobile home units relative to the full range of housing alternatives.
Objective B: Promote a rational distribution and selection of housing densities to
offer desirable housing options to the full spectrum of the market. Objective C: Ensure that housing density capitalizes on the region’s public investment
in transportation by permitting the fullest range of densities and housing types the market will support.
Objective D: Foster horizontal and vertical mixed-use development in proximity to the
planned commuter rail station. Objective E: Ensure that locations are available for, and zoning regulations permit,
life cycle housing options, particularly senior housing.
Lovejoy Housing Page 27
Goal: Preserve Lovejoy’s historic homes and promote quality neighborhoods throughout the city.
Objective F: Preserve the heritage of Lovejoy rooted in the city’s historic homes. Objective G: Investigate architectural standards that will encourage development of
mid-range and upscale housing and devise incentives that will foster construction of such options.
Objective H: Foster home ownership in neighborhoods intended for owner
occupancy to promote stability. Objective I: Protect residential property values by ensuring that all common open
space and private properties are well maintained. The following housing strategies are associated with these goals and objectives: Strategy A: Discourage future development of mobile home communities beyond those in
existence and ensure that the Future Land Use Map and Official Zoning Map offer locations for single family detached, single family attached and multifamily dwellings.
Strategy B: Designate land on the Future Land Use Map at densities appropriate to the
context, infrastructure, including street network, and ensure that zoning decisions are guided by these designations.
Strategy C: Designate land within close proximity to the planned commuter rail station as
mid and high density on the Future Land Use Map and devise incentives packages, including regulatory incentives, that promote such densities.
Strategy D: Revise the Zoning Ordinance to ensure that mixed use is permitted within
individual zoning districts as well as within individual structures. Strategy E: Maintain an abundance of land designated in various residential densities on
the Future Land Use Map, and ensure that zoning districts accommodate housing options across the full range of the market.

Lovejoy Housing Page 28
Strategy F: Pursue an inventory of historic homes aimed at creation of an historic district and seek funding for restoration of historic structures.
Strategy G: Consider adoption of architectural design standards that mandate high quality
construction and preservation of greenspace in exchange for small lot development.
Strategy H: Consider adoption of ordinances capping the ratio of single family attached
units in future townhouse developments that may be rented and require that such caps be incorporated into the covenants.
Strategy I: Mandate homeowners associations for all new residential development.

Lovejoy Land Use Page 1
LAND USE ELEMENT
Introduction
Land use is simply what activities take place on the “land.” Land use focuses on how such
activities as residential, commercial and industrial uses are distributed around Lovejoy. The
arrangement of land uses depends on a number of factors, most associated with public
improvements such as roads and water and sewer service. These improvements generate
demand for development as only low density uses such as agriculture, forestry and low
density, large lot residential uses can be developed in areas sparsely served by such
infrastructure. As access improvements and sanitary sewer services arrive, more intense land
uses can occur. Market demand generates the necessity of the improvements and can also
fund these public investments. Urbanized centers demand the most from public facilities and
services and the level of services can be used to determine the appropriate intensity of
development.
Land use is about the type, intensity and distribution of development and the pattern of
development of a community is determined by these development characteristics. The pattern
of development which formed Lovejoy will be examined as well as future patterns that can be
supported by public policy, infrastructure, capacity of the land and market demand.
Lovejoy Land Use Page 2
Land Use Element
The Land Use Element presents information about development patterns in Lovejoy. The
location and extent of various land uses are described and mapped. The Element also relates
the current pattern to growth in the economic and housing sectors as future growth must be
accommodated on the ground. An assessment of that future growth is included to ensure
that projected growth can be accommodated.
Lovejoy’s historical development pattern consisted of limited residential development on
surprisingly small lots in close proximity to a small town center which offered few retail
services. Local employment was based there in conjunction with commercial and industrial
establishments along the rail line. The rural nature of the community meant that other
residential uses in relatively close proximity were established on larger lots, and those
supporting agricultural uses, on very substantial lots. Small farmsteads were interspersed
among these uses.
Subsequent to this historic pattern has been more dense residential development both in and
just outside the city limits consisting of very extensive manufactured home communities.
Limited traditional subdivision activity has also occurred. More recently, new subdivisions
have been developed in the eastern and western, across Highway 19/41, portions of Lovejoy.
Both townhouse and multifamily development has also occurred in these locations. This
development has triggered sales by long term residents on adjacent properties which were
originally developed on very large lots. It is reasonable to expect further density increases as
such properties are acquired, assembled and re-platted in smaller lot subdivisions or other
residential use.
More recent commercial development has occurred along Highway 19/41, both in Lovejoy
and immediately north of the city, rather than expansion of the traditional town center.
Market demand is heightened on this regional arterial which conveys substantial traffic
volumes between Atlanta and Griffin. Both residential and commercial development will be
spurred by initiation of commuter rail service. Lovejoy will be the southern terminus of this
service, and in conjunction with the arterial access provided by U.S. 19/41 and strengthening
residential and commercial demand along this corridor, the rail station is expected to become
the focus of substantial growth.
Lovejoy Land Use Page 3
Industrial development in Lovejoy has remained in the town center, and while this use has not
expanded significantly, industrial activities occur on a substantial amount of land within the
traditional town center.
Development Density, Intensity and Acreage in Each Use
One characteristic that distinguishes single family neighborhoods from multifamily
neighborhoods is density, a measure of the number of units on a given area of land, usually
expressed as units per acre. Residential density in single family detached developments in
Lovejoy is approximately 1.2 units per acre established on 220.7 acres. This density is
skewed by the presence of individual dwellings on very large lots, including one 36-acre tract
and one 21-acre tract; recent development densities are in the range of 5-6 dwelling units
per acre. Single family attached developments have been established at an approximate
density of 12 units per acre on approximately 27.9 acres. The density for multifamily
communities is 10 units per acre, and density in the mobile home neighborhoods is
approximately 4.3 units per acre. Multifamily development occupies 23.45 acres and mobile
home development 97.39acres.
Development intensity in Lovejoy’s commercial and industrial properties has been low. No
multistory construction is present, and while a number of industrial uses are established on
parcels that could accommodate added construction, substantial partially developed tracts
are the exception in this use category.
Land Use Categories
In addition to the three land uses mentioned above, residential, commercial and industrial,
several other categories are used to differentiate among land uses. These are
Public/Institutional, Transportation/Communication/Utilities, Park/Recreation/Conservation,
Agriculture, Forestry and Undeveloped. Residential land use in Lovejoy is further
characterized as Single Family Detached, Single Family Attached, Multifamily and
Lovejoy Land Use Page 4
Manufactured (also referred to as mobile) Homes. Similarly, the industrial land uses consist
of Light Industrial and Heavy Industrial categories. These land use categories will be adopted
and reflected on the Future Land Use Map; each is defined below:
Residential. Residential land uses are defined by housing type which also bears a relationship
to density. Single Family Detached uses represent the lowest density and are established on
building lots ranging from one-fifth of an acre to more than one acre. Single Family Attached
and Multifamily uses record approximately the same density although multifamily projects
tend to be developed at a higher density. Services such as street networks, utilities and transit
are more heavily used in higher density areas. As a result, planning and developing such
services in multifamily areas must account for the greater system loads associated with higher
density. Manufactured Home developments are single story and reach a density between the
detached and attached dwelling types, with individual units generally established on 2,400 to
3,200-square foot lots. Dwellings dominate land use in the residential category although
customary uses in these districts include places of worship, schools and parks. The Future
Land Use Map differentiates between single family detached, townhouse, manufactured and
multifamily units.
Commercial. Commercial uses consist of non-industrial business uses, including retail sales,
office, service and entertainment facilities. Hotels, restaurants, shopping centers, offices,
banks, automotive repair shops and dry cleaners are examples of commercial land uses. In
Lovejoy, the commercial uses are located in single story structures. Development intensity
depends on the size of individual structures, although surface parking needs tend to limit the
building coverage of commercial sites.
Light Industrial. The light industrial category consists of land dedicated to warehousing and
wholesale trade facilities and “clean” manufacturing facilities. The category is differentiated
from Heavy Industrial not by lot coverage and size of structures, rather by the limited impacts
of activities conducted on the site compared to heavy industrial uses.
Heavy Industrial. This category includes processing plants, factories, mining or mineral
extraction activities, landfills and similar uses. Potential impacts of these uses normally
Lovejoy Land Use Page 5
excludes their establishment near residential uses in particular, but a range of other uses as
well.
Public/Institutional. The public/institutional land use category includes state, federal and
local government uses and institutional land uses. Government uses include city halls, police
and fire stations, libraries, prisons, post offices, schools and military installations. Institutional
land uses also include colleges, churches, cemeteries and hospitals.
Transportation/Communication/Utilities. This “TCU” category includes such uses as major
transportation routes, public transit stations, electrical power plants and substations, railroad
facilities, radio towers, water and sewer plants and facilities, airports, port facilities and
similar uses.
Park/Recreation/Conservation. Park/Recreation/Conservation land uses include “active”
recreation, that is, ball fields, courts and swimming, among others, and “passive” recreation,
including trails, picnic areas and natural habitats. PRC lands may be either publicly or
privately owned and also include playgrounds, public parks, nature preserves, wildlife
management areas, national forests, golf courses and recreation centers.
Agriculture. Agricultural land is dedicated to farming, for example, crop fields, feed lots,
pastures, farmsteads, specialty farms and livestock production or similar rural uses.
Forestry. This land use category encompasses commercial timber or pulpwood production
and similar rural uses such as woodlands.
Undeveloped. This category represents uses on land that has never been developed and land
that has been developed, but has since been abandoned. The category also includes vacant
portions of residential subdivisions or industrial parks and water bodies.
Existing Land Use Map The Existing Land Use Map provides information about activities that now exist on various properties throughout Lovejoy. This Map is a graphic depiction of the location and extent of the above land uses and is a "current conditions" document. The Existing Land Use Map defines the development pattern in the city and the amount of land occupied by each land
Lovejoy Land Use Page 6
use. Such information is vital to projecting future land use patterns and the need for land in various use categories to accommodate projected development. For example, should market analyses indicate that retailing, "commercial land uses," represent future development, land designated for commercial development must be available. The Existing Land Use Map also conveys information about the geographic relationship of individual land uses to surrounding land uses and to transportation networks. Surrounding land uses and transportation networks influence the character of future development. An important aspect of the Existing Land Use Map is identification of undeveloped property
which is expected to be developed. Land must be available in parcel sizes and at locations
that meet the needs of the market. The Map facilitates understanding by the City of Lovejoy
of the amount of land developed in each use category. This information is presented below
and is essential in anticipating the capacity of Lovejoy’s land resource to accommodate
projected development. This information also enables the City to appropriately plan the
location of future growth.
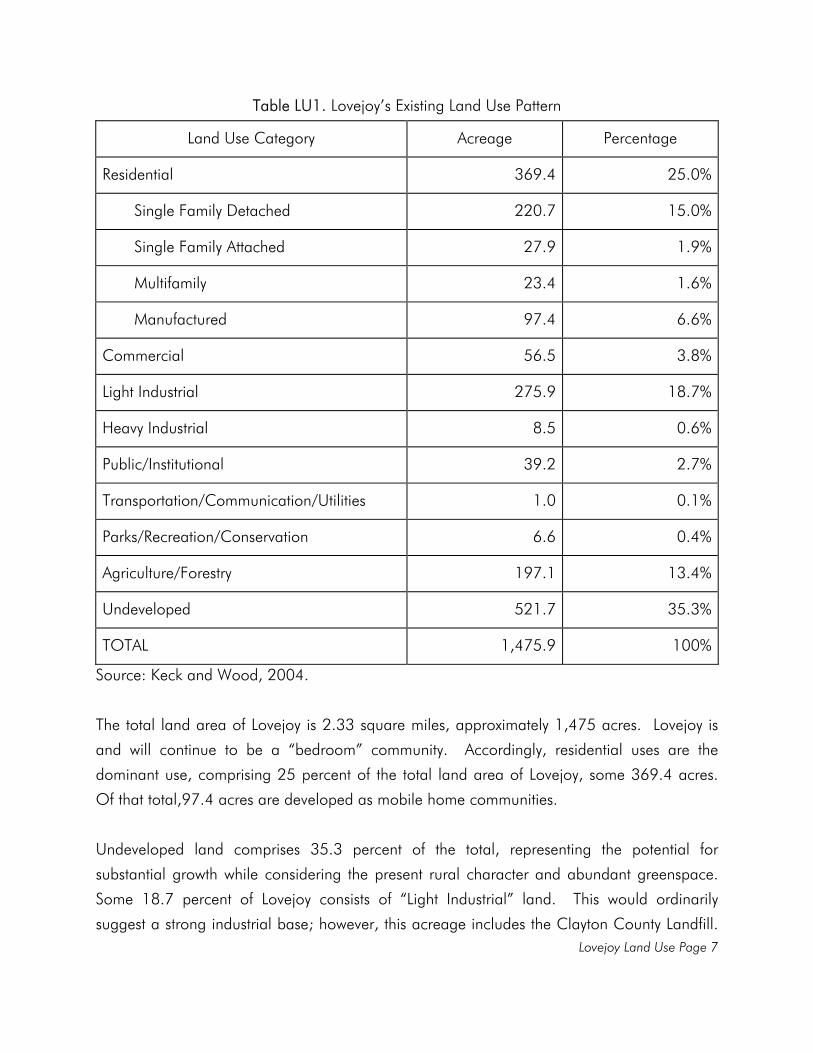
Lovejoy Land Use Page 7
Table LU1. Lovejoy’s Existing Land Use Pattern
Land Use Category Acreage Percentage
Residential 369.4 25.0%
Single Family Detached 220.7 15.0%
Single Family Attached 27.9 1.9%
Multifamily 23.4 1.6%
Manufactured 97.4 6.6%
Commercial 56.5 3.8%
Light Industrial 275.9 18.7%
Heavy Industrial 8.5 0.6%
Public/Institutional 39.2 2.7%
Transportation/Communication/Utilities 1.0 0.1%
Parks/Recreation/Conservation 6.6 0.4%
Agriculture/Forestry 197.1 13.4%
Undeveloped 521.7 35.3%
TOTAL 1,475.9 100%
Source: Keck and Wood, 2004.
The total land area of Lovejoy is 2.33 square miles, approximately 1,475 acres. Lovejoy is
and will continue to be a “bedroom” community. Accordingly, residential uses are the
dominant use, comprising 25 percent of the total land area of Lovejoy, some 369.4 acres.
Of that total,97.4 acres are developed as mobile home communities.
Undeveloped land comprises 35.3 percent of the total, representing the potential for
substantial growth while considering the present rural character and abundant greenspace.
Some 18.7 percent of Lovejoy consists of “Light Industrial” land. This would ordinarily
suggest a strong industrial base; however, this acreage includes the Clayton County Landfill.
Lovejoy Land Use Page 8
Relatively few jobs are provided by this use and little capital investment is represented by the
Landfill. A sizeable amount of land is recorded as “Agriculture/Forestry.” In this urbanizing
setting, much of this 197.05 acres comprising 13.4 percent of the total is expected to be
developed in variety of uses, primarily residential. Parks, Recreation and Conservation areas
comprise 6.64 acres in Lovejoy.
Existing Land Use Assessment
The Georgia Department of Community Affairs has established standards for an assessment
of existing land use. These standards (shown in italics), and their application to Lovejoy, are
presented below to facilitate review of the Plan by Atlanta Regional Commission and the
Georgia Department of Community Affairs.
Historical factors that have led to current development patterns, to the extent they can be
identified such as the construction of major public transportation facilities, water and sewer
facilities, and other community facilities; annexations; large-scale private land developments,
and purchases of land for open space, parks and recreation purposes.
Most notable in the development of Lovejoy beyond the early settlement of a core area and
surrounding agricultural land uses is construction of Highway 19/41, a regional arterial
linking Atlanta to Griffin and passing through Lovejoy. This has propelled housing
construction as residents may access regional employment and shopping destinations, and
promises substantial commercial growth based on the market this arterial supplies. In
addition, provision of water and sanitary sewer capacity by the Clayton County Water and
Sewer Authority, and the ownership of land by CCWA, has led to recent subdivision
development and will foster development of additional vacant tracts.
Land use patterns and densities as they relate to the provision of infrastructure improvements,
including identification of any areas where rapid development threatens to outpace
infrastructure capacity; or areas where existing infrastructure capacity exists.
Residential densities being achieved in Lovejoy would not be possible in the absence of public
Lovejoy Land Use Page 9
sanitary sewer service, particularly the capacity generated by a regional system such as
CCWA affords. Market demand for housing is also influenced by proximity to Highway
19/41, without which the service upgrades to the water and sewer system would not be
required. Both public services are available throughout Lovejoy given its compact size. The
land use pattern has tended to locate lower density housing within the “older” section of the
city, that is, east of Highway 19/41. However, housing of a higher density as defined in
Lovejoy is found in the older section as well. Recent residential development west of 19/41
has tended to be higher density. Individual owner objectives appear to dictate density more
than factors such as transportation network and public sewer.
Blighted areas, areas in need of redevelopment, and transitional areas undergoing shifts in
predominant land use; including: (1) business districts that are experiencing loss of retail,
office, and related residential activity; (2) residential areas where dwelling units are in a
marked state of deterioration or dilapidation; and (3) industrial areas where plants and
facilities are abandoned, idled, or underused and the sites themselves are environmentally
contaminated and must be remediated before they can be reused.
Blighted residential areas are not found in Lovejoy with the single exception of an abandoned
manufactured home community which is planned for redevelopment. This judgment is based
on the “median year built” information contained in the Housing Element and field surveys.
This approximately 10-acre property is expected to be redeveloped by the private market in
low density residential use.
Limited industrial areas are found in Lovejoy. A number of properties may be considered
underutilized. The location of these within the town center and separated from Highway
19/41 by residential districts, coupled with the limited acreage involved and the lack of rail
sidings to effect economies on individual sites, appears to diminish the importance of
addressing such underutilization.

Lovejoy Land Use Page 10
The town center commercial core does not appear to have been adequate to support more
than Lovejoy’s 1980 population, and rather than being blighted, has simply never developed
at a level appropriate to recent population totals. Market forces and transportation
infrastructure, in combination with the lack of a substantial historic business district, preclude
characterization of the early business district as experiencing a loss of retail.
Environmentally sensitive or locally valued land and resources identified in the natural and
cultural resources element as being unsuitable for development or in need of special
protection or management practices.
No significant environmentally sensitive or locally valued land and resources has been
identified in the Natural and Cultural Resources Element. Sites having such areas in need of
special protection or management practices can be developed with such areas preserved as
greenspace.
Problems with existing development patterns, reflected in extensive single-use districts, strip
commercial development, and “leap-frog” development remote from urban centers and public
infrastructure (or other common indicators of inefficient use of land and community facilities)
that may be addressed through changes in local policy on location of land uses, provision of
infrastructure, etc.
“Problems” identified in the Plan requirements, that is, extensive single-use districts, strip
commercial development, and “leap-frog” development remote from urban centers, can
each be used to characterize Lovejoy. However, these characteristics describe urban centers
throughout the region. While Lovejoy is not a free-standing center, few centers in the region
can claim such status, and public infrastructure is available throughout the city.
Solutions indicated such as “changes in local policy on location of land uses or provision of
infrastructure” do not actually pertain to Lovejoy. The city is a compact 2.33 square miles.
Commercial development is being actively sought along a regional arterial. This action will
reduce the city’s dependence on remote consumer services and will provide local
employment. Residential development on undeveloped tracts will increase the efficiency of
local services and infrastructure provision. The limited size of the city limits indicates that
Lovejoy Land Use Page 11
future development will be within this compact center, as opposed to along distant utility runs
characterizing larger or more remote jurisdictions.
From the City’s point of view, the characteristics of this urban center, though not free-
standing, are not problems. These characteristics simply describe a community with a set of
preferences and challenges different from the perspective of approaches that emphasize
mixed use districts, compact commercial settings focused on a traditional town center and
urban development concentrated within one urban center.
Evaluation of the community’s opportunities for encouraging infill development in areas where
infrastructure and services are available versus expanding infrastructure and services into new
areas, including consideration of Traditional Neighborhood Development (TND) and other
compact forms of urban development.
Lovejoy has significant opportunities for encouraging infill development in areas where
infrastructure and services are available. The existing compact nature of the city, both a lack
of interest in annexation and legislative prohibitions on such expansion, and the universal
availability of infrastructure and services indicate that Lovejoy’s future development pattern
will be infill development. As the city experiences a conversion of former rural land to urban
use, albeit at moderate densities and intensities, such growth will be geographically confined
to the historic city limits.
The Traditional Neighborhood Development pattern is not a “cure all” for every community.
Many suburban residents continue to demonstrate a preference for single use districts,
particularly residential districts, and more spacious development settings. The oldest section
of the city are focused on a very limited town center. Given the market opportunities
represented along a regional arterial, that is, Highway 19/41, the potential for enlarging the
old town center on which pedestrian models and other concepts of the TND model depends
are unlikely. The market reflects consumer preferences which may be at odds with such
planning models, but represents a reality addressed by the current development model being
driven by market demand.
Local development policies that could affect future land use patterns, such as zoning, land
Lovejoy Land Use Page 12
development regulations, and locational policies applicable to various types, densities and
intensities of land uses.
Lovejoy maintains a zoning ordinance and promotes public policy that facilitates
establishment of a range of housing options atypical of many urban centers in the Region.
Low density residential, moderate density detached residential, townhouse development,
multifamily development and extensive mobile home communities found throughout Lovejoy
are not typical of these centers. Rather, many are characterized as exclusive enclaves of
single family detached dwelling districts, with very limited options for alternate dwelling types.
Mobile or manufactured homes are effectively excluded from many jurisdictions in the Region.
Locational policies in Lovejoy, many of which are in reality responses to market demand and
owner objectives, have tended to place higher density residential development in appropriate
proximity to regional transportation networks. Most, though not all, moderate density
housing has direct access to collector streets feeding conveniently to Highway 19/41.
Future commercial development which is scheduled to occur primarily on raw land rather
than an intensification of existing centers is appropriately located on that regional arterial.
This is very likely to be “strip” commercial development although an argument can be made
that the new commercial center established along 19/41, including development at the city
limits in Clayton County, represents “nodal” development. This is particularly plausible as
land in northern Henry County is either not developing or is not supported by an urban center
that could spur development along the “four lane.” The intensity will be consistent with one-
story shopping center development as the market for multistory structures, given the current
availability of land and the distance from any significant urban center, must be characterized
as weak.
Lovejoy Land Use Page 13
Assessment of Current and Future Needs
The Future Land Use Map portrays land use patterns and configurations thought to best
reflect future market demand for various land uses. These land use patterns and
configurations must also present an efficient utilization of Lovejoy's land resource, conform to
plans for infrastructure improvements, and be consistent with goals and objectives of the
Comprehensive Plan.
Projection of Future Land Use Needs
A projection of future land use needs, by land use category, must include an analysis of the
amount of land needed to accommodate the projected population and economic growth of
the community and the continuing need for protection of natural and cultural resource uses,
including the estimated gross acreage needed for each land use category. An analysis of
land use follows:
Residential. Future demand for residential land uses are estimated on the basis of the
population projections developed within the Population Element. The residential land use
projections include information about the assumptions of net densities that have been
applied.
Fully one-quarter of all land in Lovejoy is developed in residential use. Considering that
nearly one-third of all land is undeveloped, and over 13 percent is held in agricultural or
forestry use, the potential for further residential growth is substantial. Of course, a sizeable
portion of the undeveloped land is found along Highway 19/41 and can be expected to be
developed in commercial use.
The Population Element projects a 2025 population of 12,121. The Future Land Use Map
indicates that 386.47 acres will be developed in single family detached uses. The Map
indicates 57.7acres in multifamily use (includes single family attached “for sale” and
multifamily “for rent”). Manufactured housing units are estimated at 84 units encompassing
20 acres. The total number of dwelling units, associated density and household size has
been used to project Lovejoy’s population through 2025. Projections by subdivision or street
location are reflected in Table LU2.
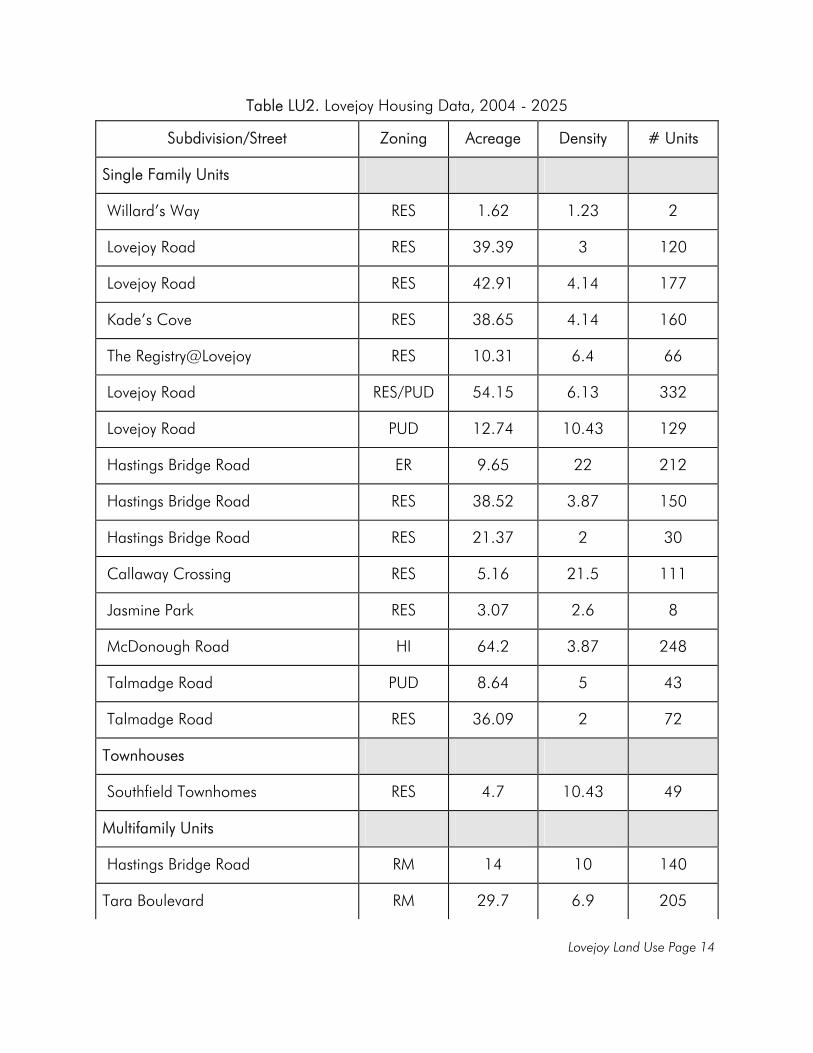
Lovejoy Land Use Page 14
Table LU2. Lovejoy Housing Data, 2004 - 2025
Subdivision/Street Zoning Acreage Density # Units
Single Family Units
Willard’s Way RES 1.62 1.23 2
Lovejoy Road RES 39.39 3 120
Lovejoy Road RES 42.91 4.14 177
Kade’s Cove RES 38.65 4.14 160
The Registry@Lovejoy RES 10.31 6.4 66
Lovejoy Road RES/PUD 54.15 6.13 332
Lovejoy Road PUD 12.74 10.43 129
Hastings Bridge Road ER 9.65 22 212
Hastings Bridge Road RES 38.52 3.87 150
Hastings Bridge Road RES 21.37 2 30
Callaway Crossing RES 5.16 21.5 111
Jasmine Park RES 3.07 2.6 8
McDonough Road HI 64.2 3.87 248
Talmadge Road PUD 8.64 5 43
Talmadge Road RES 36.09 2 72
Townhouses
Southfield Townhomes RES 4.7 10.43 49
Multifamily Units
Hastings Bridge Road RM 14 10 140
Tara Boulevard RM 29.7 6.9 205
Lovejoy Land Use Page 15
Lovejoy Road RM 14.0 6 84
Mobile Homes
Bellaire Park RMH 4.2 20 84
TOTAL 453.07 2,422
Source: Strategic Planning Initiatives LLC, 2004.
Commercial and Industrial. Future needs for commercial and industrial land uses must be
estimated on the basis of projections of economic activity developed within the Economic
Development Element.
Undeveloped land designated on the Future Land Use Map as commercial totals some 130
acres. This is found primarily along Highway 19/41. A floor area ratio of 0.25 is
appropriate for the Lovejoy setting. Application of employee ratios indicates employment in
the retail sector of 5,663, over several shifts, associated with new commercial development.
Initiation of commuter rail is expected to drive most of this construction over the next five to
seven years.
Industrial uses are expected to undergo a mild expansion, primarily through a more extensive
utilization of properties already in active industrial use. Accordingly, the Future Land Use
Map will not reflect a substantial gain in land designated as industrial relative to the Existing
Land Use Map. The future economic base of Lovejoy lies in commercial development.
Approximately 100 acres of the Clayton County Landfill is closed, having reached capacity. A
200-foot buffer is maintained on the perimeter, and further acreage is absorbed in cover dirt
and debris storage, as well as areas required to accept waste hauled to the Landfill daily.
Clayton County operators conservatively estimate the useful life of the Landfill as 20 years.
Lovejoy Land Use Page 16
Land Uses Other than Residential, Commercial, and Industrial
Parks/Recreation/Conservation. Lovejoy has no public parks within the city limits, although a
6.64-acre greenspace adjoins Lovejoy Regional Park. Lovejoy residents enjoy convenient
access to this Regional Park, owned and operated by Clayton County. This 33-acre park is
located just west of the city limits at McDonough Road and features such amenities such as
eight (8) soccer fields, eight (8) tennis courts, nine (9) athletic fields, two (2) walking tracks
and playground equipment. This combination of active recreation facilities and the park
acreage supplemented by 6.64 acres of greenspace within Lovejoy allocated at a ratio of 5
acres per 1,000 residents is expected to satisfy Lovejoy’s parkland needs through 2006.
Lovejoy will identify suitable land based on wetland and floodplain acreage to supplement
Lovejoy Regional Park, thereafter.
Articulation of Community Goals and an Associated Implementation Program
The City of Lovejoy Community Vision is based on the aspirations of the community as
shaped by elected officials and as conveyed informally by their constituents. Such
communications are typical of small towns in which many encounters are face to face.
Lovejoy supplemented this communication with a survey that sought feedback on a number of
policy matters concerning future growth. Survey results are presented in the appendix section
of this Plan.
The Community Vision embraces aggressive growth in the residential and commercial sectors.
This growth has been accommodated by public investment in transportation and water and
sewer facilities and is directed primarily by the property zoning process which will implement
the Future Land Use Map. Further, site specific infrastructure improvements will be
accomplished by private developers as the needs and impacts of individual projects become
apparent.
Future Land Use Map
The Future Land Use Map identifies the location, distribution and characteristics of proposed
land uses, including an indication of development density and intensity. Density pertains to
residential development and is indicated by the number of units per acre as influenced by the
character or type of units being proposed; development intensity refers to commercial and
Lovejoy Land Use Page 17
industrial development and is also indicated by the character of development proposed. For
example, Light Industrial uses are often less intense than Heavy Industrial uses.
The Future Land Use Map depicts the distribution of the eight land uses throughout Lovejoy.
This Map represents the anticipated future pattern of land use based on historical land use,
trends identified in this Plan and a projection of land use in the future. The Map is a
indispensable tool in controlling future land use, particularly through zoning, as it guides the
decisions of Lovejoy officials in infrastructure and utility provision as well as zoning decisions.
The Future Land Use Map appears in the Map section of this Plan.
A comparison of acreage totals for existing land use and future land use confirms a trend
toward commercial conversion of residential land, and suggests a number of policy directions
endorsed in this Plan. The comparison is also evidence of Lovejoy's semi-rural past as well as
the dynamic development environment characterizing future Lovejoy.
Lovejoy Land Use Page 18
Table LU3. Lovejoy’s Future Land Use Pattern
Land Use Category Acreage Percentage
Residential 551.9 37.4%
Single Family Detached 416.0 28.2%
Single Family Attached 67.8 4.6%
Multifamily 116.6 7.9%
Manufactured 117.4 7.9%
Commercial 226.2 15.3%
Light Industrial 18.8 1.3%
Heavy Industrial 383.8 26.0%
Public/Institutional 39.2 2.6%
Transportation/Communication/Utilities 11.5 0.8%
Parks/Recreation/Conservation 6.6 0.5%
Agriculture/Forestry 6.3 0.4%
Undeveloped 63.6 4.3%
TOTAL 1,473.7 100%
Source: Keck and Wood, 2004.
Residential land use is projected to increase from 25 percent of the total to 37.4 percent, with
significant expansions in each dwelling type except manufactured dwellings. Commercial
development gains nearly 170 acres and comprises 15.3 percent of the total acreage on the
Future Land Use Map. Light industrial appears to decrease tremendously; however, the
Clayton County Landfill was designated as Light Industrial on the Existing Land Use Map and
is designated as Heavy Industrial on the Future Land Use Map. This reclassification also
explains the Heavy Industrial acreage expansion. Very significantly, undeveloped land
declines from 521.7 acres, 35.4 percent of the total, to 63.6, just 4.3 percent. Agricultural
land falls to the lowest portion of the total, at 6.3 acres or 0.4 percent.
Lovejoy Land Use Page 19
Future Land Use Narrative
The Georgia Department of Community Affairs establishes standards for preparation of a
Future Land Use Narrative. This narrative describes the policies driving land use patterns
indicated on the Future Land Use Map. Many of these policies are incorporated into the
purposes of the Zoning Ordinance, the primary tool used to implement the Plan and Future
Land Use Map. These DCA standards (shown in italics), and their application to Lovejoy, are
presented below to facilitate review of the Plan by Atlanta Regional Commission and the
Department.
Geographic areas within the community proposed to receive particular types of growth.
As stated, the majority of commercial development is expected to locate along the frontages
of Highway 19/41. This is consistent with the transportation infrastructure, traffic volumes
supporting the market such new development is expected to serve, established commercial
uses adjoining Lovejoy in unincorporated Clayton County and relatively higher density
residential developments being established to the rear of Highway 19/41 commercial uses.
The latter will supplement retail demand. This development focus is expected to sharpen with
initiation of regional commuter rail service at the station proposed on 19/41 at McDonough
Road.
Lovejoy is expected to experience only a moderate expansion of industrial uses as no
“industrial park” development is planned and few sites are available that would be isolated
from residential uses. Such expansion is expected within the confines of existing industrial
sites. The size of the industrial component in total acreage is misleading as the Clayton
County Landfill, is located within the Lovejoy city limits and is included in this total. While
designated as industrial, this use is not an economic generator in the sense that similar
acreages might be in other industrial categories such as manufacturing. In addition, the
impact on services and employment moving forward is flat since only a certain percentage of
the landfill is active at any given time. Accordingly, the impact of future industrial
development on the Lovejoy economy and community is considered slight. Only 27.3
industrial acres are found outside the Landfill.
Lovejoy Land Use Page 20
Planned commuter rail featuring a station at Highway 19/41 and Hastings Bridge Road is
expected to significantly impact the density and intensity of development in Lovejoy. Higher
density residential development, including a mixed-use development on adjacent, vacant land
east of the station site is projected. Commercial development is expected to accelerate and
achieve a higher intensity as a result of the initiation of commuter rail service.
Although a considerable amount of land will be absorbed by surface parking for 400
vehicles, the pedestrian character of development adjoining the station will distinguish the
“transit-oriented development” from development occurring in nearby portions of Lovejoy and
Clayton County.
Areas likely to be annexed by the local government within the planning period.
While property has been annexed in recent years, this has been limited. Lovejoy faces
significant obstacles to growth through annexation of territory. The Clayton County Landfill
confines municipal expansion to the east. Henry County effectively limits expansion to the
south, and properties owned and planned for regional waste water facilities northeast of
Lovejoy and owned by CCWA also preclude expansion. Importantly, commercial districts to
the north along Highway 19/41 in unincorporated Clayton have already developed. As an
urban County, Clayton County and the Water and Sewer Authority provide a sophisticated
level of public services. Not only are business owners reluctant to annex into municipalities
once development has occurred, counties typically guard against any loss of control or
revenues. Lovejoy will depend on the County for provision of many public services,
significantly police and fire services, to accommodate the commercial development projected
within the city limits. Local development strategies accordingly, rely on densification and
intensification of development largely through infill on scattered undeveloped tracts within the
current city limits.
The timing or sequencing of any infrastructure improvements needed to support desired
growth patterns.
As noted, water and sewer capacity have been made available throughout Lovejoy by CCWA.

Lovejoy Land Use Page 21
Further main extensions, and capacity enhancements such as at lift stations, are normally
accomplished by private developers and this will be the case in Lovejoy. These improvements
will come on line as properties develop.
A substantial residential development is proposed for Lovejoy Road from the Henry County
line northward. Sewer capacity upgrades will be accomplished by the developer. In addition,
Lovejoy Road will be widened to a three-lane section to link the new development with
19/41. No other infrastructure improvements are planned within the 5-year period of the
Short Term Work Program.
Areas identified by the local government as critical and sensitive areas and areas subject to
natural hazards, such as flooding, high winds, unstable soils or wildfires etc.
No significant environmentally sensitive areas have been identified in Lovejoy. Minor
floodplains may restrict the density and location of development. These areas will be
identified on the Future Land Use Map.
The land use element must consider any designated or nominated Regionally Important
Resource wholly or partially within the local government jurisdiction.
No Regionally Important Resources are found in Lovejoy.
Areas containing sites, buildings or areas of local architectural, cultural, historic, or
archaeological interest.
No sites, buildings or areas of local architectural, cultural, historic or archaeological interest
have been identified in Lovejoy.
Alternative land use patterns considered to provide for the community’s future needs, including
Traditional Neighborhood Development (TND), or other forms of compact urban
development.
Lovejoy is a suburban community in which lifestyle choices reflected in recent construction
Lovejoy Land Use Page 22
continue this suburban pattern featuring relatively large lots and a segregation of land uses.
Aside from a very small historic core of housing, no desire for TND patterns which may be
appropriate for other urban centers is evident.
Areas where significant transitions from one land use to another are expected or planned to
occur.
Lovejoy is characterized by a developing commercial corridor along Highway 19/41 with the
majority of the remaining land devoted to residential use. Land west of 19/41 is
redeveloping at substantially greater densities than the limited residential development that
historically occurred. Accordingly, most of the construction is new and is developing within
sight of the commercial corridor. Land east of 19/41 is situated nearer the historic town
center.
Areas proposed for redevelopment or designated for the future preparation of area plans or
master plans, such as central business districts, neighborhoods or transportation corridors.
No areas are proposed for redevelopment as most development is expected to occur on
undeveloped tracts. Lovejoy’s leaders expect remaining undeveloped tracts in Lovejoy’s
eastern and western residential districts to be developed in single family and multifamily
densities. The Zoning Ordinance and conditions assigned to rezoning approvals will be
employed to shape new development in these districts as well as commercial development
along Highway 19/41.
Other factors expected to influence growth patterns within the local jurisdiction, including
significant developments within or in close proximity to the jurisdiction; private sector
initiatives; and land ownership patterns.
Significant retail development has been proposed on large tracts within the Lovejoy city limits.
“Big box” retail is anticipated on the west frontage of Highway 19/41 at Lovejoy Road. This
development will generate spin off retail on both frontages of 19/41, perhaps, along the
entire stretch of Lovejoy city limits on this commercial artery. New commercial development
and the location of the Lovejoy Commuter Rail Station will reinforce the development node
Lovejoy Land Use Page 23
at Hastings Bridge Road and 19/41, and growing retail and commercial services will also
generate and accelerate residential development throughout Lovejoy.
Land ownership patterns are expected to move from long-held, sizeable tracts, ranging from
6-39 acres, to individual building lots as new residential subdivisions are platted. A number
of tracts will continue in single ownership, although the principals involved could change.
The latter circumstance describes the process of future multifamily development. This
evolving ownership has characterized Lovejoy’s development pattern over the past several
years.
The type, location and quality of rural, agricultural or forest lands.
As a formerly rural community, scattered pockets of agricultural and forested properties are
found throughout Lovejoy. A limited number of farmsteads and timber lands are expected to
remain throughout the period of the Plan. However, development has encroached upon
owners of such properties, impacting traditional lifestyles. Whether such change or market
forces have displaced these owners cannot be ascertained. These forces have yielded
opportunities for relatively explosive residential development that is projected to continue.
Local development policies to be adopted or amended to allow or promote alternative
development patterns including flexible street standards, zoning to allow a variety of housing
options, mixed land uses, etc.
Traditional development patterns dominate Lovejoy’s recent development, indicating that the
market for alternate development patterns is apparently absent. Perhaps, households seeking
locations in Lovejoy prefer such patterns which continue to characterize the overwhelming
majority of communities in rural and suburban locales.
Analysis of Plans of Adjoining Jurisdictions
Given Lovejoy’s adjacency to Henry County in particular, plans of surrounding jurisdictions
can significantly impact Lovejoy. Clayton County forms the remaining boundary with Lovejoy.
The plans of each county are summarized below:
Clayton County
Lovejoy Land Use Page 24
Clayton County utilizes 16 land use classifications, including low density residential, medium
density residential, high density residential, mobile homes, office/professional, commercial,
light industrial, manufacturing/distribution, heavy industrial, public buildings/schools, quasi-
public buildings, cemeteries, public/private parks, agricultural,
transportation/communication/ utility and vacant land. The Clayton County Existing Land Use
Map identifies land west of Lovejoy as undeveloped. According to the County’s FLUM, low
density residential development is planned for land west and northeast of the Lovejoy city
limits. Low density residential uses are compatible with the residential uses being developed
in Lovejoy. Property northeast of Lovejoy has actually developed in commercial use,
compatible with the City’s FLUM and Official Zoning Map.
Henry County
Property in Henry County on Lovejoy’s southern and southeastern border is characterized on
the County’s Existing Land Use Map as low density residential and industrial land uses. The
Henry County Future Land Use Map indicates that property southeast of the city will develop
in a mix of low density residential as well as industrial and wholesale land uses. The planned
industrial land uses abut the Clayton County Landfill in Lovejoy. Low density residential and
commercial development is projected along US 19/41 and to the south of Lovejoy. These
residential and commercial uses abut similar planned development in Lovejoy.
Lovejoy Land Use Page 25
LAND USE GOALS AND OBJECTIVES
Lovejoy is a compact community that contains a town center and a developing activity center.
Land uses surrounding the town center are seen as more traditional, that is, characteristic of a
small town in a semi-rural setting. Market demand for redevelopment of the town center is
not apparent. Rather, a new activity center that may come to be characterized as a “sense of
place” featuring attractive, mixed-use, pedestrian-friendly destinations where people choose
to gather for shopping, dining, socializing, and entertainment is developing at the periphery
of town center. This new activity center is not characteristic of greenfield development as
even the periphery is contained within a compact radius and is well served by public
infrastructure and planned transportation improvements, including commuter rail. Given the
respective scale of the traditional town center and the new activity center, it is conceivable
that Lovejoy’s town center may well shift to the activity center over time.
Amid this dynamic, Lovejoy seeks to maintain the small town character of the traditional town
center and accommodate growth of the activity center by fostering a land use pattern that is
consistent with public policy described in this Plan, consumer preferences, market demand,
natural and cultural resources limitations, public infrastructure capacity and sound planning
principles. The following goals and objectives are established to achieve this pattern.
Goal: Create a land use strategy that will successfully accommodate the explosive growth in
population and commercial development projected over the period of the Plan.
Objective A: Foster higher density residential and higher intensity commercial
development in proximity to Town Center, Highway 19/41 and the
commuter rail station, reserving alternate locations for residential
development consistent with suburban models.
Objective B: Protect stable, single family detached neighborhoods from encroachment
by incompatible land uses or densities.
Lovejoy Land Use Page 26
Objective C: Translate the land use plan into a zoning scheme that as accurately as
possible reflects the City’s desire for future uses and adopt, by action of
Mayor and Council, such zoning map amendments as are appropriate.
Objective D: Establish land uses appropriate to the transportation network and guard
against location of uses in neighborhoods that will introduce unacceptable
traffic types or volumes.
Objective E: Mandate pedestrian connectivity in new residential and commercial
development within ½ mile of the planned, commuter rail station as a
means of reducing the need for expansive parking facilities.
Objective F: Preserve Lovejoy’s greenspace, particularly wetlands, floodplains and other
common open space.
Objective G: Implement favorable density bonuses approaches geared toward
preservation of greenspace through “cluster” and “conservation”
subdivisions.
Objective H: Require landscaped buffers adequate to protect less intensive land uses
from new more intense development.
Objective I: Preserve Lovejoy’s semi-rural character by protecting the tree canopy.
Objective J: Institutionalize desirable development practices in ordinance form rather
than enforce such practices on a case by case basis.
Objective K: Ensure that land use and zoning decisions are consistent with the Future
Land Use Map.
Objective L: Ensure that development at the city’s borders is compatible with Lovejoy’s
land uses and land use plans.
Lovejoy Land Use Page 27
Objective M: Use public infrastructure provision as a strategic means of shaping
development patterns in the city.
Objective N: Foster a close working relationship among zoning administration and
inspections and code enforcement functions to ensure realistic and
responsive codes as well as field compliance with the zoning ordinance and
conditions of zoning approval.
Objective O: Position the City at the cutting edge of land use and zoning practice and
protect the City from excessive litigation.
Objective P: Maintain consistency of the official zoning map and desirable land uses.
Objective Q: Present zoning regulations that are easily used by the development
community and understood by the public.
Objective R: Foster quality development of the Tara Boulevard commercial corridor to
ensure establishment of an attractive commercial district.
Objective S: Ensure that the goals and objectives of the Comprehensive Plan are
safeguarded by Lovejoy’s package of ordinances.
Objective T: Facilitate effective and responsive administration of Lovejoy’s land use
regulations and development codes.
Associated Implementation Strategies include the following:
Strategy A: Adopt a Future Land Use Map that focuses higher density residential and higher
intensity commercial development in proximity to Town Center, Highway 19/41
and the commuter rail station, reserving alternate locations for suburban
densities and use the Map as the primary guide in zoning decisions.
Lovejoy Land Use Page 28
Strategy B: Ensure appropriate transitions in land use featuring a “step down” from single
family detached neighborhoods to medium density attached residential
developments and similar transitions in land use.
Strategy C: Provide for districts in the Zoning Ordinance that correspond to land use
classifications of the Future Land Use Map and strive to zone property
consistent with the land use designation of the Map.
Strategy D: Strongly consider the impact of traffic generated by a proposed development
on the street network and approve projects appropriate to that network and
surrounding uses, particularly where neighborhoods may be impacted.
Strategy E: Incorporate a site plan review process and development standards using such
approaches as a special district overlay to achieve pedestrian connectivity in
new residential and commercial development within ½ mile of the planned,
commuter rail station.
Strategy F: Introduce a mechanism in the zoning ordinance and the subdivision regulations
that will mandate preservation of Lovejoy’s greenspace through adoption of
deed restrictions “permanently protecting” such resources as wetlands,
floodplains and other common open space as conditions of zoning and plat
approval.
Strategy G: Consider structuring a system of density bonuses that encourage preservation
of greenspace through creation of a “cluster” or “conservation” subdivision
within the zoning ordinance which incorporates such incentives.
Strategy H: Adopt a landscaped buffers schedule as an amendment to the Zoning
Ordinance that specifies the character, size and applicability of such buffers.
Strategy I: Adopt a tree ordinance based on regional models as a means of preserving
Lovejoy’s semi-rural character.
Lovejoy Land Use Page 29
Strategy J: Consider incorporation of desirable development practices such as architectural
materials standards, building siting and open space reservation ratios into the
zoning ordinance.
Strategy K: Consider adoption of regulations that mandate that zoning be accomplished in
conformance with the Future Land Use Map.
Strategy L: Monitor the land use plans and policies of Clayton County, Clayton County Water
and Sewer Authority and Henry County and actively participate in the regional
review processes sponsored by Atlanta Regional Commission as a means of
fending off undesirable development at the city’s borders.
Strategy M: Measure all infrastructure improvement proposals against the City’s
Comprehensive Plan and the surrounding context to ensure compatibility prior
to approval of improvements associated with development proposals.
Strategy N: Establish a routine schedule of coordination meetings among zoning
administration and inspections and code enforcement staff to identify problem
areas and formulate solutions for incorporation into City ordinances,
procedures and policies.
Strategy O: Modernize the zoning ordinance to ensure compliance with federal and state
law; rely on model ordinances to minimize costs.
Strategy P: Revise the official zoning map to ensure conformity with actual uses and
development intensity on the ground, as appropriate, bearing in mind
amortization of non-conforming uses.
Strategy Q: Simplify the zoning classifications, particularly residential classifications, as a
means of streamlining land use regulation in Lovejoy.
Strategy R: Consider such mechanisms as an overlay for the Tara Boulevard commercial
Lovejoy Land Use Page 30
corridor to ensure development of an attractive commercial district in
collaboration with Clayton County, property owners, developers and new
business owners.
Strategy S: Revise and update the Zoning Ordinance, and any other ordinances dealing with
the regulation of land use, development and protection, as appropriate, to
ensure that the goals and objectives of the Comprehensive Plan are
safeguarded by Lovejoy’s package of ordinances.
Strategy T: Maximize training opportunities for Planning and Zoning staff and boards to
ensure effective and responsive administration of land use regulations and
development codes.
Lovejoy Transportation Page 1
TRANSPORTATION ELEMENT Introduction Lovejoy's transportation system is comprised of local streets and highways, sidewalks and the Norfolk Southern Railroad line. The transportation system in Clayton County encompasses interstate routes, public transit via "C-Tran" bus service, an airport, parking lots and parking decks walking trails, bike paths and sidewalks. Both systems are also comprised of traffic signs and signals. Transportation systems are essential public improvements linking commercial centers, industrial and office parks, neighborhoods and institutional uses. Transportation systems must accommodate development that depends on access to properties and locations throughout Lovejoy and the region. The Transportation Element considers the diverse needs of the community in planning and programming a variety of transportation improvements. Transportation Element The Transportation Element presents an inventory of the transportation network serving Lovejoy. This Element also assesses the adequacy of that system to serve current and future demand generated by commercial traffic, personal vehicles, cyclists and pedestrians. Community goals related to transportation infrastructure are also presented. Finally, strategies for achieving these goals and delivering the desired level of transportation facilities and services throughout the 20-year period of the Comprehensive Plan are formulated. Transportation and Land Use Roads and highway construction impact land use more than any other single public investment. Little development can occur in the absence of vehicular access. The nature of that access depends on population density, commercial and industrial employment demand and other development characteristics. Land use patterns shape demand for transportation infrastructure and the character of the transportation network. This network is comprised of local streets, which feed neighborhood traffic onto collector streets; arterials, which move traffic through communities, and commercial and industrial districts; and interstate and other limited access highways, which move traffic throughout the region and across the nation. Characteristics of the Transportation System The Transportation System accommodates a variety of transportation modes: Vehicular and Truck, Rail, Aviation, Public Transportation, Cycling and Pedestrian. These modes are described below:
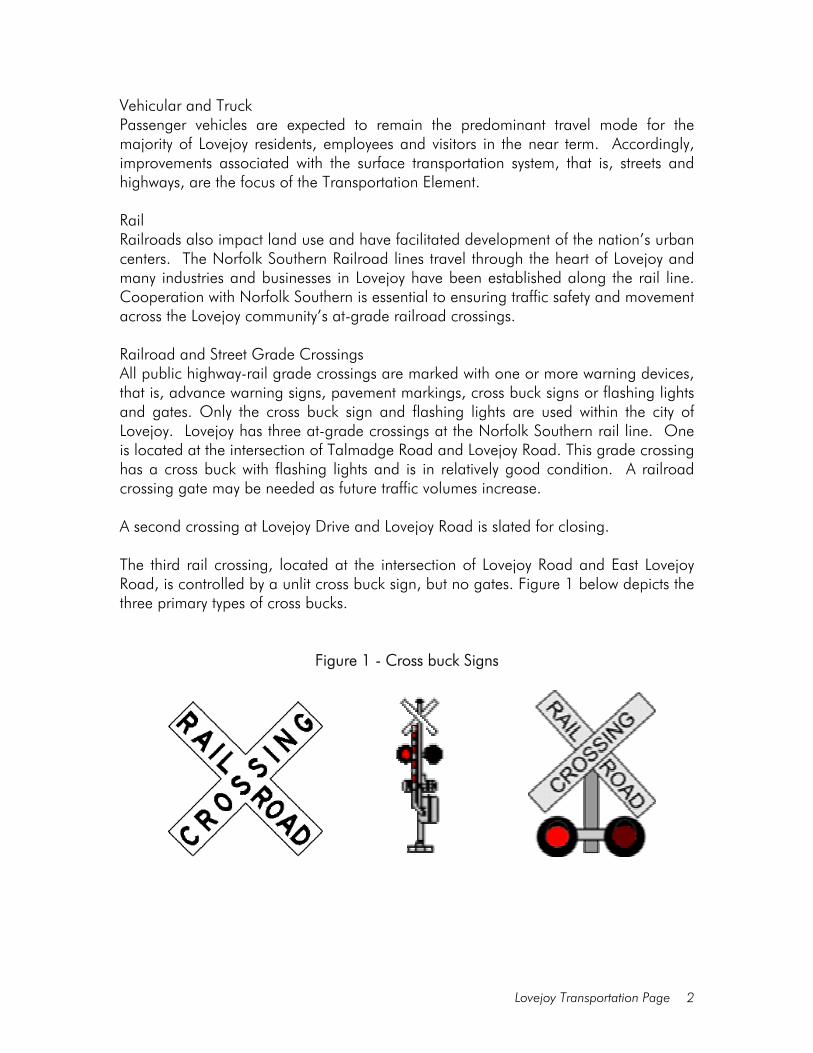
Lovejoy Transportation Page 2
Vehicular and Truck Passenger vehicles are expected to remain the predominant travel mode for the majority of Lovejoy residents, employees and visitors in the near term. Accordingly, improvements associated with the surface transportation system, that is, streets and highways, are the focus of the Transportation Element. Rail Railroads also impact land use and have facilitated development of the nation’s urban centers. The Norfolk Southern Railroad lines travel through the heart of Lovejoy and many industries and businesses in Lovejoy have been established along the rail line. Cooperation with Norfolk Southern is essential to ensuring traffic safety and movement across the Lovejoy community’s at-grade railroad crossings. Railroad and Street Grade Crossings All public highway-rail grade crossings are marked with one or more warning devices, that is, advance warning signs, pavement markings, cross buck signs or flashing lights and gates. Only the cross buck sign and flashing lights are used within the city of Lovejoy. Lovejoy has three at-grade crossings at the Norfolk Southern rail line. One is located at the intersection of Talmadge Road and Lovejoy Road. This grade crossing has a cross buck with flashing lights and is in relatively good condition. A railroad crossing gate may be needed as future traffic volumes increase. A second crossing at Lovejoy Drive and Lovejoy Road is slated for closing. The third rail crossing, located at the intersection of Lovejoy Road and East Lovejoy Road, is controlled by a unlit cross buck sign, but no gates. Figure 1 below depicts the three primary types of cross bucks.
Figure 1 - Cross buck Signs
Lovejoy Transportation Page 3
Freight and Passenger Railroads Norfolk Southern Railroad, a freight carrier, travels through the Lovejoy community. However, rail service is not available in Lovejoy and the demand for shipments via rail is very limited. This demand is expected to remain so as development opportunities in the city are oriented toward surface transportation rather than rail. Aviation Aviation facilities are not present within Lovejoy city limits and none are planned. Many residents and business owners rely on Hartsfield Jackson Atlanta International Airport for passenger and air freight services offered some 30 miles north of the city. Others utilize the Clayton County Airport, Tara Field, situated approximately four miles south of Lovejoy in Henry County. Tara Field, located at 474 Mt. Pleasant Road in Hampton, offers a 4,503-foot paved runway and averages 82 aircraft operations daily.
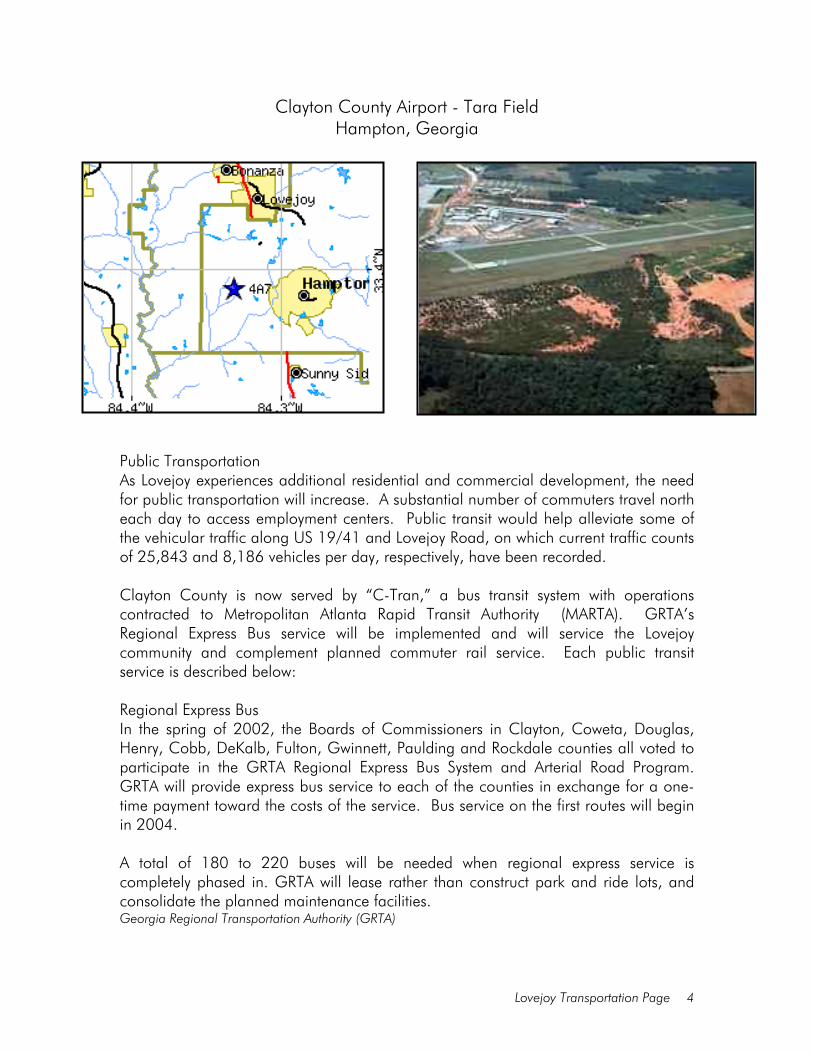
Lovejoy Transportation Page 4
Clayton County Airport - Tara Field Hampton, Georgia
Public Transportation As Lovejoy experiences additional residential and commercial development, the need for public transportation will increase. A substantial number of commuters travel north each day to access employment centers. Public transit would help alleviate some of the vehicular traffic along US 19/41 and Lovejoy Road, on which current traffic counts of 25,843 and 8,186 vehicles per day, respectively, have been recorded. Clayton County is now served by “C-Tran,” a bus transit system with operations contracted to Metropolitan Atlanta Rapid Transit Authority (MARTA). GRTA’s Regional Express Bus service will be implemented and will service the Lovejoy community and complement planned commuter rail service. Each public transit service is described below: Regional Express Bus In the spring of 2002, the Boards of Commissioners in Clayton, Coweta, Douglas, Henry, Cobb, DeKalb, Fulton, Gwinnett, Paulding and Rockdale counties all voted to participate in the GRTA Regional Express Bus System and Arterial Road Program. GRTA will provide express bus service to each of the counties in exchange for a one-time payment toward the costs of the service. Bus service on the first routes will begin in 2004. A total of 180 to 220 buses will be needed when regional express service is completely phased in. GRTA will lease rather than construct park and ride lots, and consolidate the planned maintenance facilities. Georgia Regional Transportation Authority (GRTA)
Lovejoy Transportation Page 5
Commuter Rail Service City of Lovejoy was recently announced as the temporary, southern terminus of a planned “Commuter Rail” Line that will eventually provide service from Atlanta to Macon. The proposed location of the “Lovejoy Rail/Bus Station” straddles the boundary between the city of Lovejoy and unincorporated Clayton County. This undeveloped site is situated along the Norfolk Southern railroad line and Tara Boulevard (US 19/41), just south of McDonough Road. This location is approximately one mile northwest of the geographic center of Lovejoy.1 1 Macon-Atlanta Corridor Draft EIS, August 30, 2001, Georgia Rail Consultants.
The project will develop commuter rail service between Lovejoy and Atlanta using the existing Norfolk Southern S-Line railroad corridor. The rail will support express bus service from Henry County to Atlanta within the I-75 Corridor. The project includes rehabilitation of existing railroad tracks, construction of passing siding tracks and other support facilities. The first phase of the project will terminate in Lovejoy and will encourage commuters from Clayton, Henry and Spalding County to travel to Lovejoy. The 2000 Census recorded 94,500 persons living within the corridor study area; of this total, 18,152 persons live within one-half mile of a proposed rail and bus station. Georgia Rail Consultants determined that development of the Commuter Rail service would contribute positively to quality of life and social interaction between communities and businesses, by strengthening access to facilities and services throughout the region. The rail service is expected to accelerate commercial development along Tara Boulevard as well as residential development. The latter will be at densities above those of traditional suburban development. The proposed 26-mile commuter rail line to downtown Atlanta is expected to generate a daily ridership of 1,800 commuters when service is initiated in 2006. The $106 million commuter rail line will serve six stops between Atlanta and Lovejoy. An estimated $87 million in federal funds and $19 million in state money will be allocated for upgrades to the train track, building the park-and-ride lots and station platforms with canopies, and refurbishment of rail cars. The Lovejoy Station is proposed just south of the intersection of McDonough Road and Tara Boulevard. The passenger platform will front the rail line. The station parking facility will accommodate approximately 840 vehicles and will contain substantial landscaping. As much of the immediately surrounding uses are commercial, industrial, and warehouse facilities, few unacceptable visual impacts are anticipated from introduction of the passenger platform and parking facility.
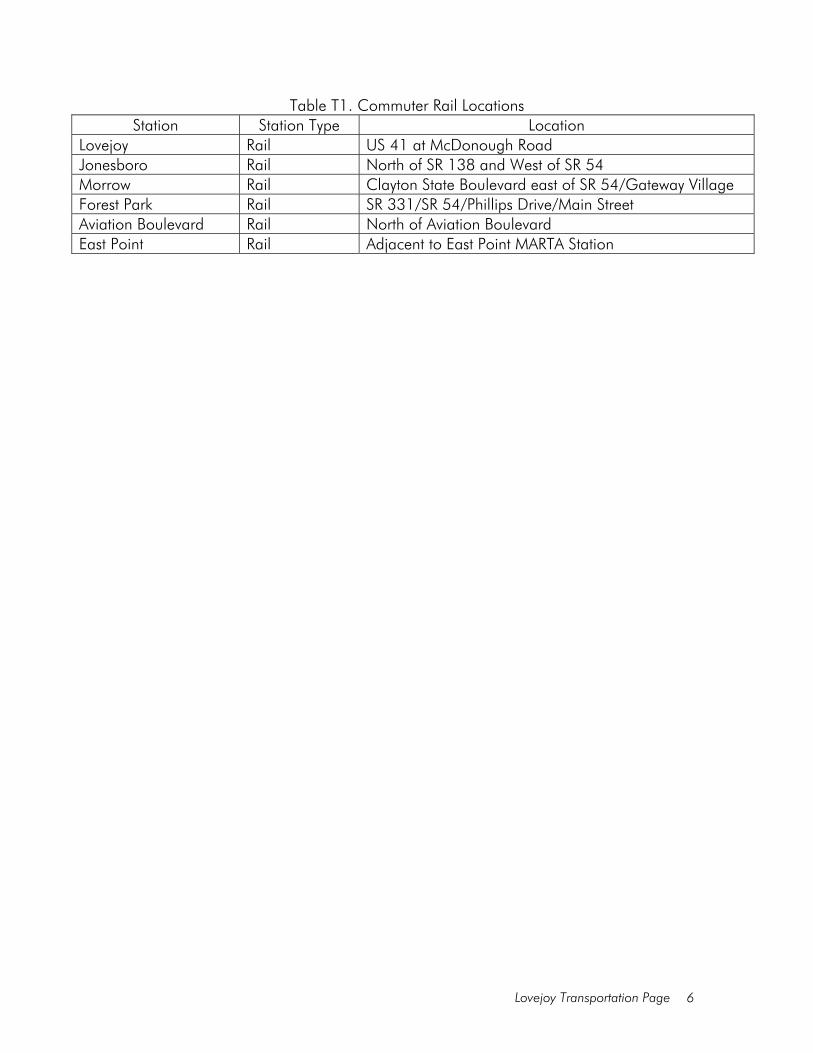
Lovejoy Transportation Page 6
Table T1. Commuter Rail Locations Station Station Type Location
Lovejoy Rail US 41 at McDonough Road Jonesboro Rail North of SR 138 and West of SR 54 Morrow Rail Clayton State Boulevard east of SR 54/Gateway Village Forest Park Rail SR 331/SR 54/Phillips Drive/Main Street Aviation Boulevard Rail North of Aviation Boulevard East Point Rail Adjacent to East Point MARTA Station
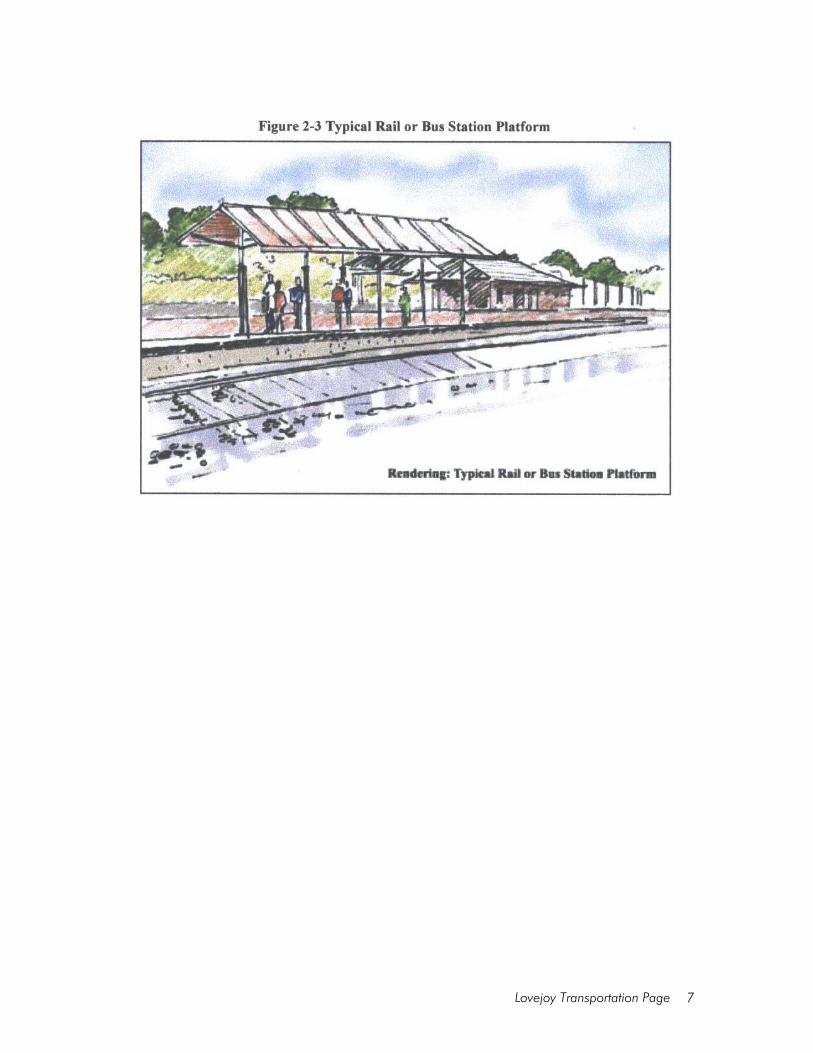
Lovejoy Transportation Page 7
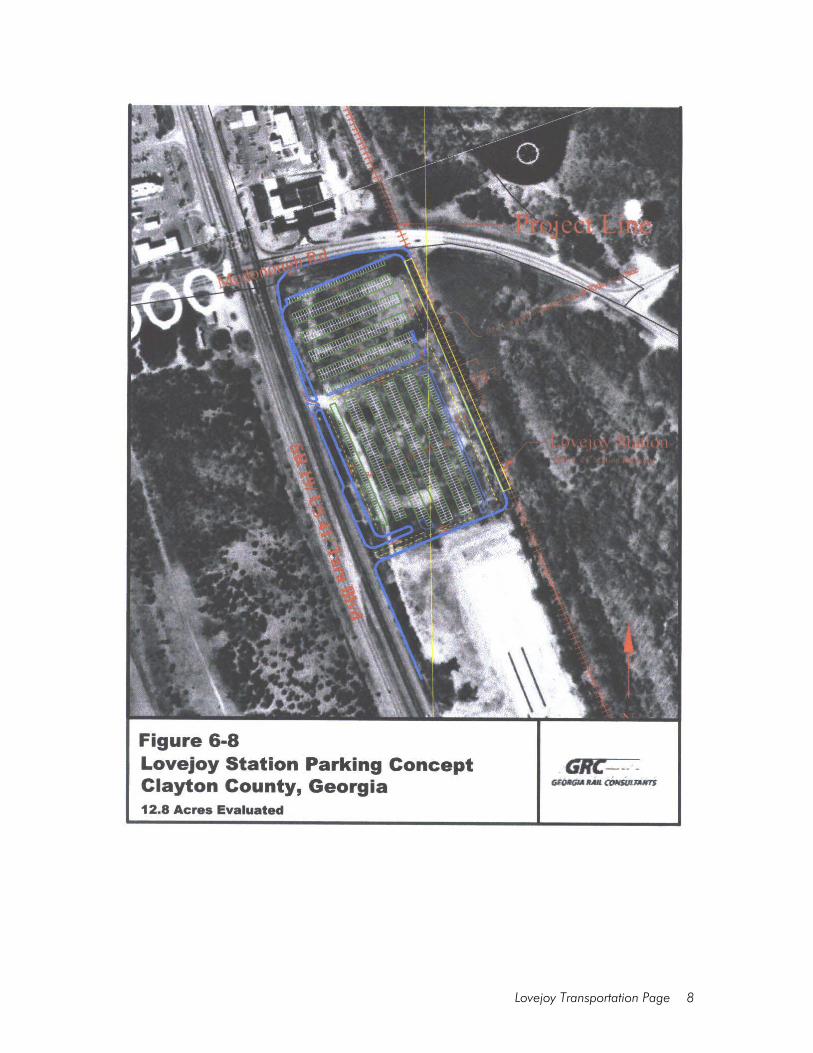
Lovejoy Transportation Page 8
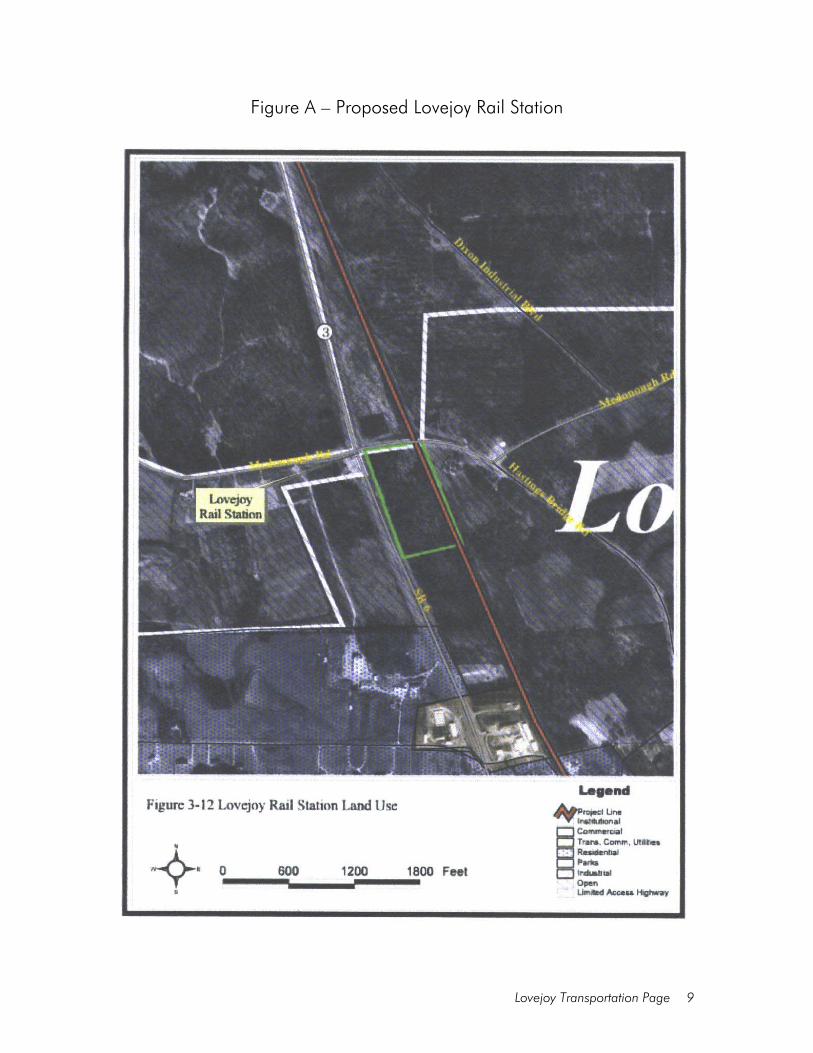
Lovejoy Transportation Page 9
Figure A – Proposed Lovejoy Rail Station
Lovejoy Transportation Page 10
Cycling and Pedestrian Pedestrian travel and cycling can and should be accommodated within the street and highway network. Other transportation modes are important, particularly commuter rail and bus service, and are addressed in this Element. Pedestrian travel and safety is increasingly important in more densely populated areas of the city. Significant Bicycle and Pedestrian Ways Sidewalks are present along limited portions of the town center. New subdivisions, including Panhandle Corners Subdivision, provide sidewalks. The City's development standards enforce a minimum sidewalk width of four feet. Sidewalks must be installed along both right-of-ways at the sole expense of the developer. Bikeways, exercise and hiking trails and such pedestrian paths as greenway trails are not found in Lovejoy. Lovejoy's Road and Street Transportation System Lovejoy's transportation system is comprised primarily of two lane streets classified as collectors and local streets. Four main arterials, including Hastings Bridge Road (Georgia Highway 3), McDonough Road, East Lovejoy Road and Lovejoy Road also serve Lovejoy. A regional arterial, U.S. 19/41, also serves the city and offers access to the region. Lovejoy’s street network is classified below: Road System and Street Classification The City of Lovejoy maintains a road network of Regional and Primary Arterials, Collectors and Local Streets. Table T2 classifies each route serving Lovejoy. Regional Arterials The U.S. Highway 19/41 (Tara Boulevard) Expressway was built west of Lovejoy in the mid-1960's as a divided four lane, limited access road from Atlanta to Griffin. This road served as the main transportation corridor for several years prior to construction of I-75. Highway 19/41 functions as a high volume, north-south limited access thoroughfare. This route provides a direct link into Clayton, Henry and Spaulding County and carries a traffic volume of 25,843 vehicles per day. Primary Arterials Roads classified as Arterials handle moderate to high traffic volumes throughout the county. Such arterials include Hastings Bridge Road, McDonough Road, East Lovejoy Road and Lovejoy Road. East Lovejoy Road and Lovejoy Road are major two-lane, north-south arterial roads, while Hastings Bridge Road and McDonough Road serve as two-lane, east-west arterial roads.
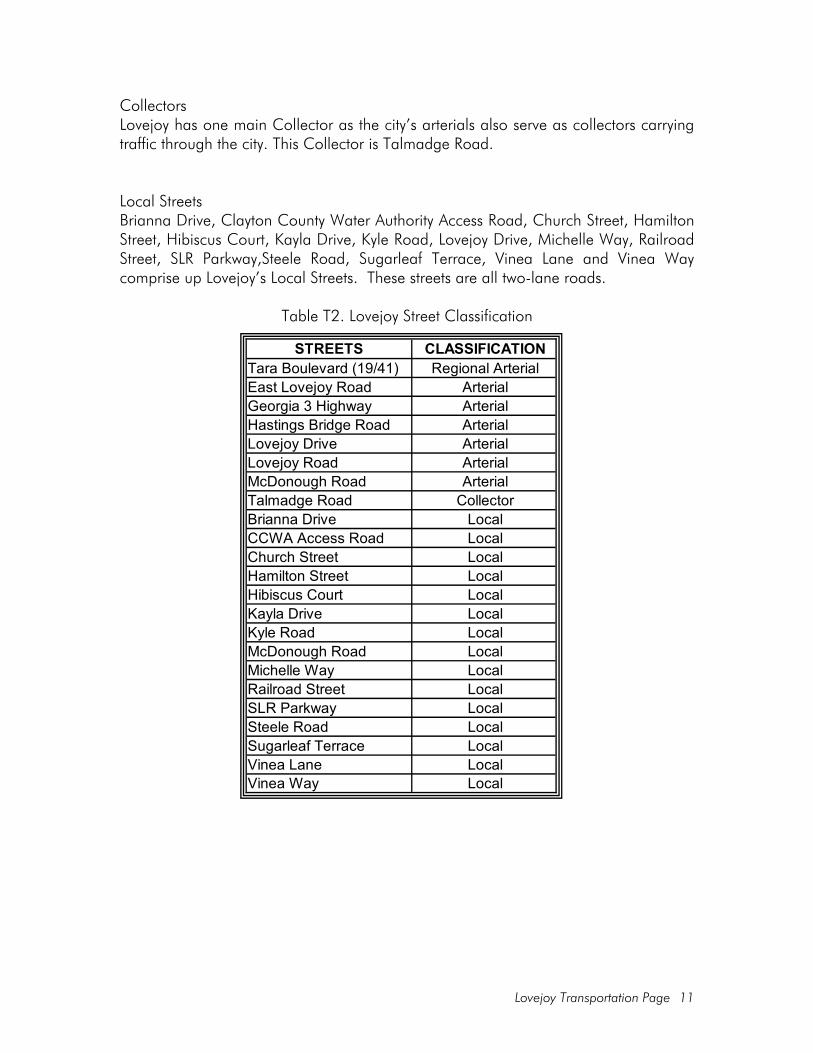
Lovejoy Transportation Page 11
STREETS CLASSIFICATIONTara Boulevard (19/41) Regional ArterialEast Lovejoy Road ArterialGeorgia 3 Highway ArterialHastings Bridge Road ArterialLovejoy Drive ArterialLovejoy Road ArterialMcDonough Road ArterialTalmadge Road CollectorBrianna Drive LocalCCWA Access Road LocalChurch Street LocalHamilton Street LocalHibiscus Court LocalKayla Drive LocalKyle Road LocalMcDonough Road LocalMichelle Way LocalRailroad Street LocalSLR Parkway LocalSteele Road LocalSugarleaf Terrace LocalVinea Lane LocalVinea Way Local
Collectors Lovejoy has one main Collector as the city’s arterials also serve as collectors carrying traffic through the city. This Collector is Talmadge Road. Local Streets Brianna Drive, Clayton County Water Authority Access Road, Church Street, Hamilton Street, Hibiscus Court, Kayla Drive, Kyle Road, Lovejoy Drive, Michelle Way, Railroad Street, SLR Parkway,Steele Road, Sugarleaf Terrace, Vinea Lane and Vinea Way comprise up Lovejoy’s Local Streets. These streets are all two-lane roads.
Table T2. Lovejoy Street Classification
Lovejoy Transportation Page 12
Street Signs and Signalization The intersections of Church Street and Lovejoy Road, East Lovejoy Road and McDonough Road, Lovejoy Road and 19/41, Hwy 81 and Lovejoy Road, Tara Boulevard and Talmadge Road are controlled by stop signs. Signalization may be needed in the future as traffic volumes increase with the growth and development within the city. Lovejoy’s signalized intersections are Tara Boulevard at Hastings Bridge Road and Hastings Bridge at Talmadge Road. A signal is also provided on Tara Boulevard between Hastings Bridge Road and Lovejoy Road. This signal will be relocated to the south to serve proposed retail development. Road Condition Lovejoy’s arterials, collectors and local streets are all in good condition and are sufficient for the low density traffic volume they handle. City Road Improvements Among the most significant road improvements has been the Hastings Bridge Road project. This project was completed in March 2000 and provides an important grade-separated crossing of the Norfolk Southern rail line. The improvement also facilitated the addition of turning lanes at this intersection. A second important road improvement anticipated by the City of Lovejoy is the widening of Lovejoy Road to a three-lane section. This improvement is necessary to accommodate planned, residential development feeding onto this road, which conveys local traffic to the regional network at Highway 19/41. A number of local streets are substandard as to lane width. The widening of these streets is not considered critical given the low density nature of development along them, their limited length and the presence of alternate routes in the immediate vicinity. Wallis Drive, a very short road segment at the terminus of Talmadge Road, will be widened to a four-lane as part of a rail crossing improvement by Norfolk Southern. Bridges A single bridge is found in Lovejoy at Hastings Bridge Road, just east of 19/41. This four-lane bridge was built in 1976 and provides vehicular access over the Norfolk Southern rail line. The bridge could provide an evacuation route in the event of a rail incident that might impact the three at-grade crossings linking Lovejoy to the region via 19/41. However, numerous alternate routes are available and the bridge is not considered critical as a single bridge to coastal communities or mountain locations
Lovejoy Transportation Page 13
might be. All other intersections in Lovejoy, including other rail crossings, are at-grade. Traffic Safety With the exception of the 19/41 Arterial highway, which adequately serves the current projected traffic volumes, Lovejoy has no traffic safety issues. Traffic volumes in the older section of the city are safely handled by the current transportation network. Lovejoy Road will be widened from a two (2) to a three (3) lane section to accommodate proposed residential development. Significant Parking Facilities No significant parking facilities are present in Lovejoy. Given the low intensity of development throughout most of Lovejoy, parking demand is minimal. Projected development, particularly commercial development along Highway 19/41, will require significant parking facilities and capacities. Usage patterns, as well as architectural and design standards, will be described in future Plan Updates. The Lovejoy Station is proposed just south of the intersection of McDonough Road and Tara Boulevard. The passenger platform will front the rail line. The station parking facility will accommodate approximately 840 vehicles introduction of the passenger platform and parking facility. Port City and Port Facilities Lovejoy is not a port city and port facilities do not comprise any portion of the transportation system.
Lovejoy Transportation Page 14
TRANSPORTATION GOALS AND OBJECTIVES
Lovejoy’s future transportation improvements focus on commuter rail as an efficient network of local streets and regional arterials is in place. The following transportation goal and objectives are established: Goal: Link residential, employment and service destinations through a variety of travel
modes. Objective A: Develop the Commuter Rail Station and implement an efficient bus
service. Objective B: Ensure that road improvements are funded as development generating
demand for such improvements are approved. Objective C: Foster a broad spectrum of travel modes, including walking, cycling, car
pooling and public transit. The following strategies are associated with these objectives: Strategy A: Cooperate with Georgia Regional Transportation Authority in ensuring
that the Commuter Rail Station is established in Lovejoy and that bus service is available to serve Lovejoy and supplement station ridership.
Strategy B: Cooperate with developers in appropriately funding road improvements necessitated by private development. Strategy C: Mandate pedestrian connectivity in new residential and commercial
development within ½ mile of the commuter rail station as a means of reducing the need for expansive parking facilities.
Strategy D: Enhance circulation by locating medium and higher density residential development in close proximity to transportation investments, particularly rail investment. Strategy E: Promote walking and cycling by requiring sidewalks and bicycle facilities in all new development.
Lovejoy Intergovernmental Coo
INTERGOVERNMENTAL COORDINATION Introduction The Georgia Department of Community Affairs encourages greater cooperation among governments in Georgia. DCA hopes to facilitate this by requiring that such cooperation among public agencies, that is, “Intergovernmental Coordination,” be considered in local comprehensive plans. The State reasons that since planning and land use are primarily local decisions, and these decisions may impact neighboring jurisdictions, formal mechanisms should be established to provide for intergovernmental coordination among local governments. An example of such coordination is the review of local comprehensive plans by the Regional Development Center. The RDC for Lovejoy is the Atlanta Regional Commission. The purpose of the regional review is to identify potential conflicts in the plans of neighboring jurisdictions. A second coordination mechanism is established in Georgia's Growth Strategies program. This mechanism is referred to as the DRI process, a regional review of Developments of Regional Impact (DRI's). The review focuses on large developments that have the potential to impact jurisdictions beyond the borders of the locality experiencing such development.
Lovejoy Intergovernmental Coo
Intergovernmental Coordination Element Inventory and Assessment The Intergovernmental Coordination Element is an inventory of the mechanisms and processes employed by the City of Lovejoy to facilitate intergovernmental coordination. This Element assesses the ability of these mechanisms to serve the needs of the Lovejoy community. The Coordination Element also establishes goals and formulates strategies for effective implementation of community goals, objectives and policies that may involve several governments or public agencies. For the Lovejoy community, these government agencies are Clayton County, the Clayton County Water Authority, Clayton County Sheriff’s Department, Clayton County Justice Center, Clayton County Board of Education, Clayton County Development Authority, Clayton County Housing Authority and Henry County. Coordination with Local Agencies The inventory must describe the relationship of such agencies to Lovejoy, and any intergovernmental agreements, joint planning and service agreements, special legislation and joint meetings or work groups for the purpose of coordination. The inventory must also identify the local government offices having primary responsibility for such coordination. These agencies and their respective roles are described below: Clayton County The City of Lovejoy and Clayton County entered into an Intergovernmental Agreement for the purpose of defining and formalizing certain understandings concerning public services delivery as well as land use. These Agreements are associated with House Bill 489, this Bill is commonly known as the Services Delivery Strategy and the Agreement specifies the contractual arrangements associated with public services provision. Land use disputes arising from rezoning decisions and annexation of land are also addressed in the Agreement which establishes the process for resolving such disputes. These services and agreements are described below: Code Enforcement and Building Inspections An Intergovernmental Agreement concerning code enforcement was executed by Clayton County and the City of Lovejoy in August of 2003. This "Code Enforcement Agreement" provides for County staffing sufficient to reasonably enforce the Code Enforcement provisions of the Code of Ordinances of the City. Code Enforcement Officers perform enforcement functions within the city limits as part of their regular inspection routine. Lovejoy receives one-
Lovejoy Intergovernmental Coo
half of the fines collected for code violations. Clayton County Water Authority Clayton County Water Authority provides potable water and sanitary sewer services to the City of Lovejoy. CCWA also owns and maintains all treatment capacity and distribution and collection mains. No written agreement exists between CCWA and the City of Lovejoy. Information concerning water and sewer services is provided in the Community Facility Element Clayton County Police Department The Clayton County Police Department provides policing within the city limits of Lovejoy. No written agreement exist between the City of Lovejoy and the Clayton County Police Department. The Clayton County Police Department is a full service law enforcement agency, handling all calls for service in unincorporated Clayton County. The City of Lovejoy is located in Zone 4 of the County’s police zones. CCPD also provides Alcohol Permits, Records, Criminal History, Vehicle Impounds and Neighborhood Watch services. The Alcohol Permits Unit works under the direction of the Criminal Investigations Division. This unit accepts applications for individuals in Clayton County seeking employment in establishments which sell alcoholic beverages. The Clayton County Police Department's Records Unit is responsible for processing and maintaining approximately 50,000 case files, annually. The Unit also completes criminal background investigations for employment verification and personal reasons. The Neighborhood Watch Program is supported by CCPD and helps neighborhoods establish the Program that creates a communications network between themselves and the Police Department for the purpose of reporting suspicious or illegal activity in their respective areas. Clayton County Board of Education Lovejoy students attend Lovejoy Middle School and Lovejoy High School. Neither school is located within the Lovejoy city limits. Both the middle and high schools are operated by the Clayton County Board of Education. Since these schools are not within the city limits, no intergovernmental agreement is necessary.
Lovejoy Intergovernmental Coo
Clayton County Development Authority The Development Authority of Clayton County (correct name) has the jurisdiction to perform the following redevelopment powers: 1. Contract preparation of redevelopment plans, and implement the provisions of the
plans; 2. Create within redevelopment areas tax allocation; 3. Define the boundaries of a redevelopment area for implementation of redevelopment
plans; 4. Issue tax allocation bonds; 5. Deposit and disburse funds from the special revenues of any tax allocation district; 6. Execute any contracts, leases, mortgages, or other agreements, including agreements
with bondholders or lenders, determined by the local legislative body to be necessary to implement the provisions redevelopment plans. The contracts or agreements may include conditions, restrictions, or covenants which either run with the land or otherwise regulate the use of land;
7. Acquire and retain or dispose of property for redevelopment purposes; and any
disposition of such property may be by public or private sale or lease; and The Development Authority also performs some of the same economic development functions as the Chamber of Commerce. The City of Lovejoy has not established a local development authority, rather the City relies on the cooperation of the Clayton Authority which can assist the City in promoting economic development in Lovejoy and utilizing all the powers of the Authority. No intergovernmental agreement exists. Clayton County Housing Authority The Clayton County Housing Authority administers housing rehabilitation programs throughout the county, including Lovejoy. These programs benefit homeowners by providing funding for residential rehabilitation. Such housing programs provided by the Authority are
Lovejoy Intergovernmental Coo
limited to unincorporated Clayton County. Only the Jonesboro Housing Authority provides such services within a municipality. The Jonesboro Housing Authority provides more traditional services for which housing authorities are known, including Housing Assistance, Housing Choice Voucher programs (Section 8), down payment assistance, homeowners assistance, family self-sufficiency programs and low rent housing programs. Henry County No intergovernmental agreements currently exist between Henry County and the City of Lovejoy. Those regional review processes described above, the DRI process and Comprehensive Plan review conducted by ARC, represent controls available to the two jurisdictions. Coordination with State Agencies Georgia Department of Community Affairs planning standards also mandate that Lovejoy inventory state programs impacting the comprehensive plan. This inventory identifies agreements, policies and initiatives that may affect Lovejoy's ability to implement strategies proposed in the comprehensive plan. Such programs include the Service Delivery Strategy Law, known as House Bill 489; the Governor’s Greenspace Program and regional Water Supply and Water Quality protection plans. House Bill 489 House Bill 489 is referred to as the Service Delivery Strategy. The strategy is an intergovernmental agreement formalizing certain understandings concerning such topics as annexation and land use. Lovejoy has not executed an agreement concerning annexation. Governor’s Greenspace Program Clayton County has adopted a Community Greenspace Plan. However, the City of Lovejoy is not a participant in the Community Greenspace Program. The City plans to prepare and adopt a Community Greenspace Program and become a participant in the Clayton County Community Greenspace Program, thus making the City eligible for greenspace funds.
Lovejoy Intergovernmental Coo
Coordination with other Entities The City of Lovejoy must also inventory coordination mechanisms and agreements with government agencies exercising authority within the city limits which may be unrelated to land use. Examples of such agencies are constitutional officers, that is, the Sheriff's Office, Tax Assessor and the Courts; and utility companies such as Georgia Power Company that provide services in Lovejoy and exercise condemnation powers. Clayton County Sheriff’s Department The Clayton County Sheriff’s Department manages the Lovejoy Detention Center which is located within the Lovejoy city limits. The facility houses an average of 150 work release inmates. These inmates sleep at the facility and are released to work in area businesses. The Detention Center serves to reduce overcrowding at the new Clayton County Jail, located north of Lovejoy on Tara Boulevard. Services provided by the Center are not restricted to Lovejoy, rather the Center is simply located in Lovejoy. Accordingly, no intergovernmental agreement exists between the Clayton County Sherif Department and the City of Lovejoy as concerns the Detention Center. Clayton County Tax Assessor The County Assessor’s Office performs property assessments and collects taxes on behalf of the County and Lovejoy. The Tax Assessors' Office is responsible for preparation of the annual real and personal property tax digest in compliance with the taxation laws of the State. No formal written intergovernmental agreement exists. Georgia Power Company Under the Georgia Territorial Electric Service Act of 1973, Georgia Power serves the elect power needs of the Lovejoy Community. The territorial act was designed to ensure the most economical, efficient, and orderly provision of electric service; to prevent duplication of facilities; and to foster a competitive spirit in Georgia. Adequacy of Intergovernmental Agreements Lovejoy must consider the utility and function of agreements and coordination mechanisms and devise approaches for resolving any problems. For example, Henry County adjoins Lovejoy's city limits; however, as no portion of the city lies within Henry County, mechanisms for dispute resolution, particularly over land use, may be weak. This relationship and any concerns about agreements with Henry County, among other agencies, are described below:

Lovejoy Intergovernmental Coo
Henry County Unincorporated Henry County at the Lovejoy city limits is sparsely developed and semi-rural. Low density residential development and agricultural uses are present. While these land uses do not conflict with land uses in Lovejoy, new development could pose problems for Lovejoy. As noted, no intergovernmental agreement exists between the two agencies, and in the event of a dispute, any appeal would only be available at Atlanta Regional Commission. In fact, unless the conflict is caused by a development exceeding the Development of Regional Impact DRI thresholds, no relief would be available at ARC. The lack of a dispute resolution mechanism as to land use could prove to be a major concern. Atlanta Regional Commission provides a forum for review of draft comprehensive plans of nearby jurisdictions. Henry County is in the process of updating their plan. Lovejoy will participate in the review of the draft plan, and will examine the impacts of land uses and intensities proposed near the City’s common border. This regional review, along with the DRI review process, is deemed adequate to protect Lovejoy from adverse impacts of land use decisions by Henry County, should any occur. Public infrastructure and services decisions are not subject to the above reviews, and in the absence of intergovernmental agreements, Henry County could adversely impact service provision in Lovejoy. The lack of such agreements could pose problems to the City. Similarly, annexation into Clayton County accomplished through agreements between the two counties could adversely impact Lovejoy. State annexation law virtually precludes such action; however, creation of an incorporated area in Clayton County could conceivably result in annexation across the Clayton County line, given their permission. Securing an agreement with Henry County prohibiting such annexation and such language added to the Intergovernmental Agreement with Clayton may be indicated. Clayton County Water Authority The Authority controls land use via fee-simple ownership of considerable acreage at Lovejoy's northern border. Given the mission and function of the Authority, the potential for land use impacts on residential development in Lovejoy is substantial. However, these impacts are diminished by State agency controls on waste water treatment technologies. Significantly, the actual use of land is also controlled by the Clayton County Comprehensive Plan and Future Land Use Map as well as the County Zoning Map and Zoning Ordinance. Agreements with both the County and CCWSA serve to ensure that such impacts are not generated, or if unavoidable, are mitigated through the use of appropriate technologies, facility siting and
Lovejoy Intergovernmental Coo
buffering. Clayton Board of Education The City of Lovejoy has no schools within the city limits. The schools that Lovejoy students attend are Lovejoy Middle School and Lovejoy High School. Both schools are administered by the Clayton County Board of Education. Since no schools are within the city limits, no intergovernmental agreement is needed. The Georgia Board of Education and the State Superintendent of Schools provides the statewide leadership necessary to ensure appropriate opportunities for each public school student. Enhanced Coordination Opportunities Common practice among governments as well as departments within governments is the generation of independent population projections in the calculation of service demand. Three entities in particular with interrelated, if not overlapping, responsibility for services provision are City of Lovejoy, Clayton County and the Clayton County Water Authority. While the functions and service area of each agency are well-defined and the basis of appropriate intergovernmental agreements, consistency of population and economic development projections can create disparities in infrastructure and services provision. For example, if the land use plans, specifically density and intensity of development, rezoning and platting activity of Lovejoy are not well known by plant capacity and distribution system planners at CCWSA, shortfalls in water supply could result. Similarly, the range of services provided to Lovejoy by Clayton County, including police, fire, EMS and inspections services trigger short term staff shortages. The close working relationships of these three agencies, based on common practice and written agreements, minimizes these outcomes. However, continued emphasis must be placed on coordinating the growth projections of the County and Lovejoy. School boards also represent agencies that often generate their own population projections in evaluating future demand for services. This disconnect in predicting future demand can have severe impacts on residents such as use of temporary trailers, a common occurrence in the Region. Lovejoy has no such agreements with the Clayton County Board of Education. Establishment of a working relationship with the Board is critical given the growth projections in the city. Coastal Management. The City of Lovejoy is not located along the coast, therefore, Georgia’’s Coastal Management Program is not applicable.
Lovejoy Intergovernmental Coo
Appalachian Regional Commission. Clayton County is not encompassed within the geography of the thirty-five county area defining Georgia’’s Appalachian Regional Commission, rather the County is south of this territory. Coordination concerns appropriate to the Appalachian Region are not applicable to the City of Lovejoy. Water Planning Districts . The Metropolitan North Georgia Water Planning District and Coastal Georgia Groundwater Planning/Management Districts are two examples of state initiatives focused on maintaining a reliable supply of water and ensuring the quality of this water to the regions served by these state initiatives. Local governments, through their land use, economic development and environmental management practices, will also play an important role in the success in achieving these goals. To better coordinate these state/local activities, local governments located in any state designated water planning district must, within their comprehensive plans, identify relevant state water supply and water quality protection policies and goals and ensure consistency of local comprehensive plans with the water planning district policies and goals.
Lovejoy Intergovernmental Coo
INTERGOVERNMENTAL COORDINATION ASSESSMENT The City of Lovejoy considers the existing agreements and understandings that form the system of public service provision and regulations to be adequate. For example, Lovejoy and Clayton County have executed “Intergovernmental Agreement” for the purpose of defining and formalizing certain understandings concerning public services delivery as well as land use. The Agreement specifies the contractual arrangements associated with public services provision. Land use disputes arising from rezoning decisions and annexation of land and the process for resolving such disputes are also addressed. One area of intergovernmental coordination that Lovejoy is interested in amending is the “Community Greenspace Program. The City realizes that as development proceeds, the greenspace that much of the public now takes for granted could disappear. Accordingly, Lovejoy plans to consider participating in the Clayton County program as a means of permanently protecting greenspace through acquisition and by other more economical means.
Lovejoy Intergovernmental Coo
GOALS AND OBJECTIVES Goal: Provide quality public infrastructure, facilities and services sufficient to meet future
demand at minimal cost to residents and business owners. Objective A: Ensure that public services, facilities and infrastructure are commensurate with
future demand. Strategy A: Continue the intergovernmental agreements and relationships now in place to
provide a high level of services and accommodate projected growth. Strategy B: Identify preparation of a Community Greenspace Plan as a Short Term Work
Program task for 2005 and participate in the Clayton County Community Greenspace Program.
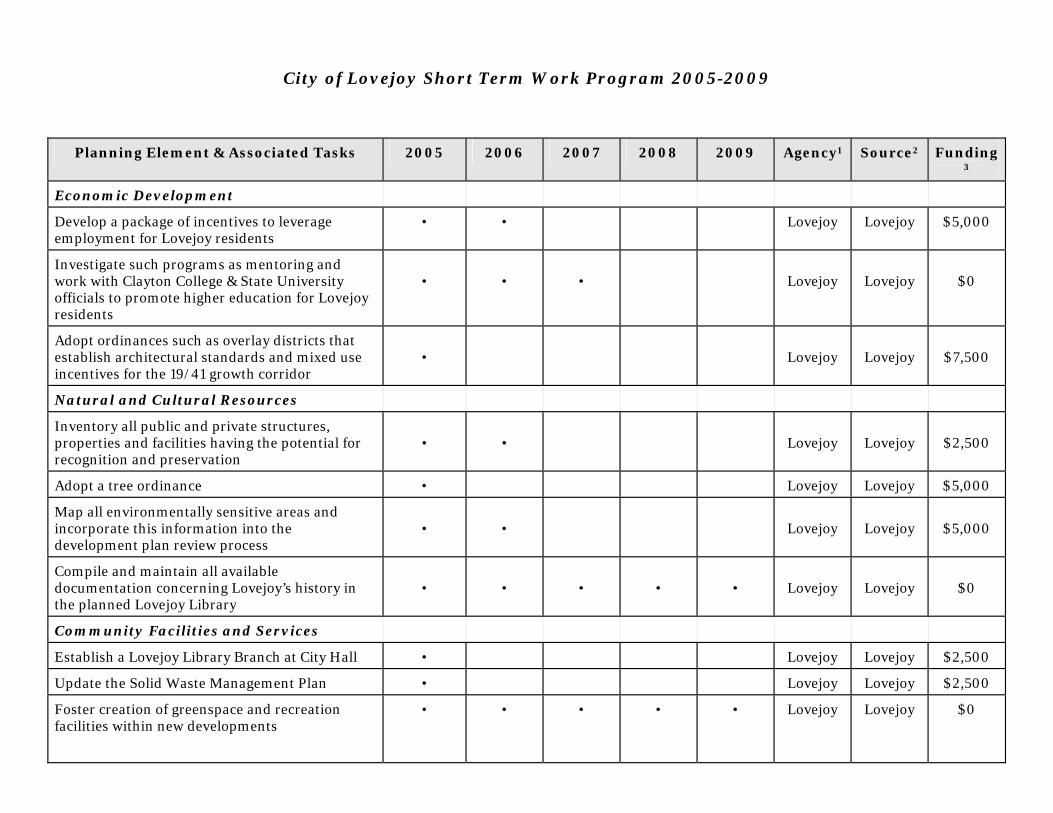
City of Lovejoy Short Term Work Program 2005-2009
Planning Element & Associated Tasks 2005 2006 2007 2008 2009 Agency1 Source2 Funding3
Economic Development
Develop a package of incentives to leverage employment for Lovejoy residents
• • Lovejoy Lovejoy $5,000
Investigate such programs as mentoring and work with Clayton College & State University officials to promote higher education for Lovejoy residents
•
•
•
Lovejoy
Lovejoy
$0
Adopt ordinances such as overlay districts that establish architectural standards and mixed use incentives for the 19/41 growth corridor
•
Lovejoy
Lovejoy
$7,500
Natural and Cultural Resources
Inventory all public and private structures, properties and facilities having the potential for recognition and preservation
•
•
Lovejoy
Lovejoy
$2,500
Adopt a tree ordinance • Lovejoy Lovejoy $5,000
Map all environmentally sensitive areas and incorporate this information into the development plan review process
•
•
Lovejoy
Lovejoy
$5,000
Compile and maintain all available documentation concerning Lovejoy’s history in the planned Lovejoy Library
•
•
•
•
•
Lovejoy
Lovejoy
$0
Community Facilities and Services
Establish a Lovejoy Library Branch at City Hall • Lovejoy Lovejoy $2,500
Update the Solid Waste Management Plan • Lovejoy Lovejoy $2,500
Foster creation of greenspace and recreation facilities within new developments
• • • • • Lovejoy Lovejoy $0
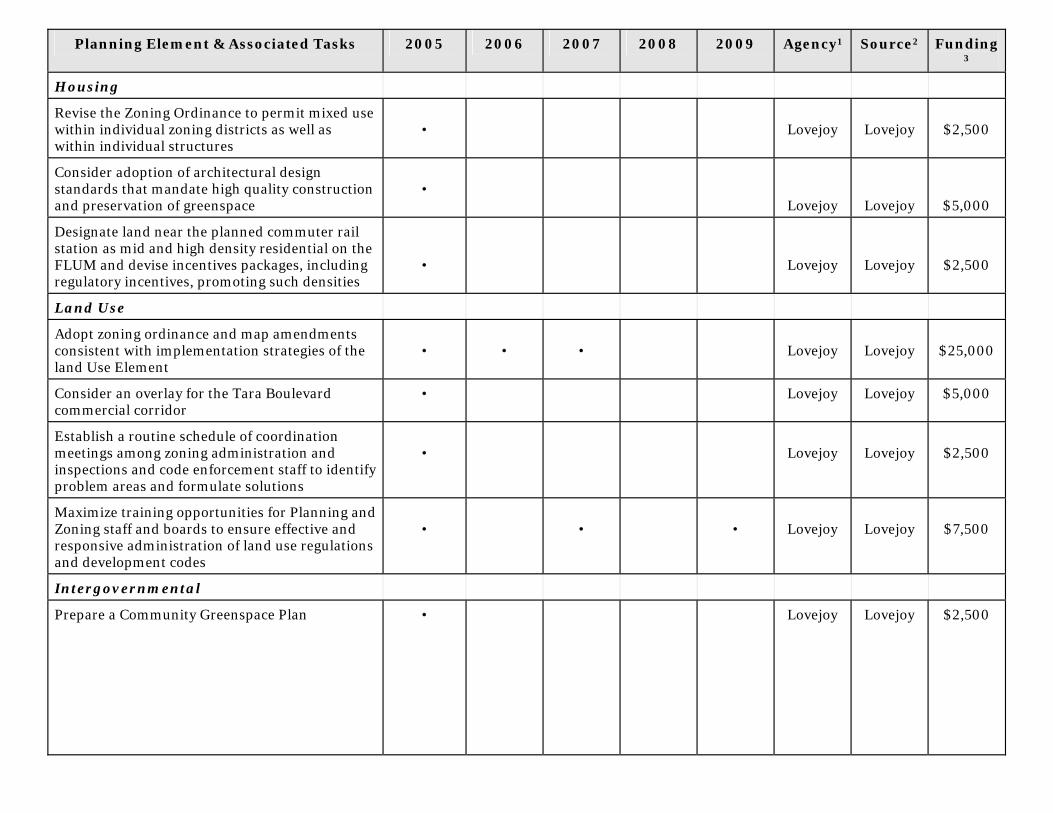
Planning Element & Associated Tasks 2005 2006 2007 2008 2009 Agency1 Source2 Funding3
Housing
Revise the Zoning Ordinance to permit mixed use within individual zoning districts as well as within individual structures
•
Lovejoy
Lovejoy
$2,500
Consider adoption of architectural design standards that mandate high quality construction and preservation of greenspace
•
Lovejoy
Lovejoy
$5,000
Designate land near the planned commuter rail station as mid and high density residential on the FLUM and devise incentives packages, including regulatory incentives, promoting such densities
•
Lovejoy
Lovejoy
$2,500
Land Use
Adopt zoning ordinance and map amendments consistent with implementation strategies of the land Use Element
•
•
•
Lovejoy
Lovejoy
$25,000
Consider an overlay for the Tara Boulevard commercial corridor
• Lovejoy Lovejoy $5,000
Establish a routine schedule of coordination meetings among zoning administration and inspections and code enforcement staff to identify problem areas and formulate solutions
•
Lovejoy
Lovejoy
$2,500
Maximize training opportunities for Planning and Zoning staff and boards to ensure effective and responsive administration of land use regulations and development codes
•
•
•
Lovejoy
Lovejoy
$7,500
Intergovernmental
Prepare a Community Greenspace Plan
• Lovejoy Lovejoy $2,500
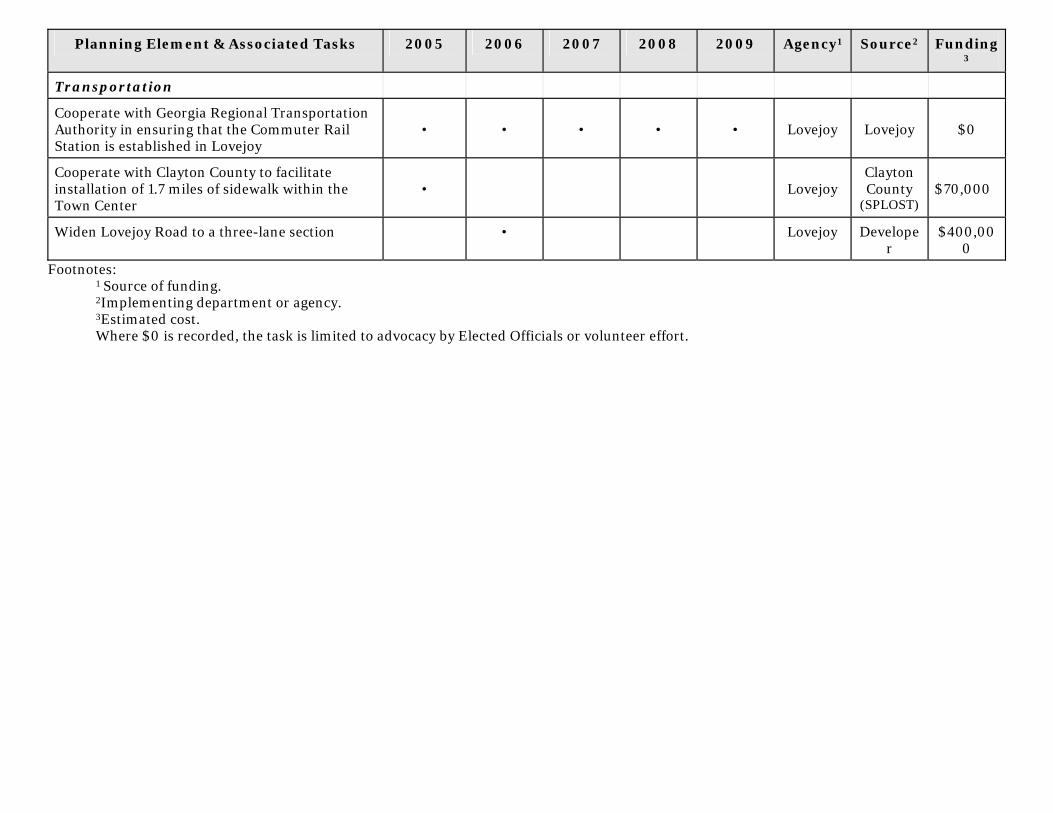
Planning Element & Associated Tasks 2005 2006 2007 2008 2009 Agency1 Source2 Funding3
Transportation
Cooperate with Georgia Regional Transportation Authority in ensuring that the Commuter Rail Station is established in Lovejoy
•
•
•
•
•
Lovejoy
Lovejoy
$0
Cooperate with Clayton County to facilitate installation of 1.7 miles of sidewalk within the Town Center
•
Lovejoy
Clayton County
(SPLOST)
$70,000
Widen Lovejoy Road to a three-lane section • Lovejoy Developer
$400,000
Footnotes: 1 Source of funding.
2Implementing department or agency. 3Estimated cost. Where $0 is recorded, the task is limited to advocacy by Elected Officials or volunteer effort.
NOTE: This is digital signature. Original on file.
DATE: 10/19/2004 ARC REVIEW CODE: P410191 TO: Mayor William Morris ATTN TO: Cheryl Murphy, City Clerk FROM: Charles Krautler, Director
The Atlanta Regional Commission (ARC) has received the following proposal and is initiating a regional review to seek comments from potentially impacted jurisdictions and agencies. The ARC requests your comments regarding related to the proposal not addressed by the Commission’s regional plans and policies.
Name of Proposal: City of Lovejoy Full Comprehensive Plan Update 2004-2025 Review Type: Local Comprehensive Plan Description: Full comprehensive plan update for the City of Lovejoy 2004-2005.
Submitting Local Government: City of Lovejoy Action Under Consideration: Approval Date Opened: 10/19/2004 Deadline for Comments: 11/2/2004 Earliest the Regional Review can be Completed: 12/8/2004
THE FOLLOWING LOCAL GOVERNMENTS AND AGENCIES ARE RECEIVING NOTICE OF THIS REVIEW:
ARC LAND USE PLANNING ARC TRANSPORTATION PLANNING ARC ENVIRONMENTAL PLANNING ARC DATA RESEARCH ARC AGING DIVISION GEORGIA DEPARTMENT OF COMMUNITY AFFAIRS GEORGIA DEPARTMENT OF NATURAL RESOURCES GEORGIA DEPARTMENT OF TRANSPORTATION GEORGIA REGIONAL TRANSPORTATION AUTHORITY CLAYTON COUNTY CLAYTON COUNTY SCHOOLS HENRY COUNTY CITY OF JONESBORO CITY OF HAMPTON FAYETTE COUNTY CITY OF RIVERDALE CITY OF MORROW CITY OF LAKE CITY CITY OF FOREST PARK CITY OF STOCKBRIDGE CITY OF MCDONOUGH CITY OF FAYETTEVILLE CITY OF WOOLSEY
Attached is information concerning this review. If you have any questions regarding this review, Please call Mike Alexander, Review Coordinator, at (404) 463-3302. If the ARC staff does not receive comments from you by 11/2/2004, we will assume that your agency has no additional comments and we will close the review. Comments by email are strongly encouraged.
The ARC review website is located at: http://www.atlantaregional.com/qualitygrowth/reviews.html .
NOTICE OF LOCAL PLAN SUBMITTAL AND HEARING/COMMENT OPPORTUNITY Submitting Local Government:
City of Lovejoy
Date Received:
10/19/2004
Local Contact:
Cheryl Murphy, City Clerk City of Lovejoy
Public Hearing Date and Time:
11/2/2004 8:30am
Phone: 770-471-2304 E-Mail: [email protected]
Fax: 770-471-6499 Website: Street PO Box 220 City
State, Zip:
Lovejoy, Georgia 30250
Department of Community Affairs Review Required
Review Title: City of Lovejoy Full Comprehensive Plan Update 2004-2025
Description:
Full comprehensive plan update for the City of Lovejoy 2004-2005. Document can be viewed on the ARC website at: http://www.atlantaregional.com/qualitygrowth/compplanreviews.html Click on the Regional Review Notice for the City of Lovejoy.
The submitted documents are available for review at the City and at ARC.
Reviewing Regional Development Center:
Atlanta Regional Commission 40 Courtland Street, NE Atlanta, GA. 30303 Phone 404.463.3302 FAX 404.463.3254 Contact Person:
Mike Alexander, Review Coordinator
E-Mail [email protected]
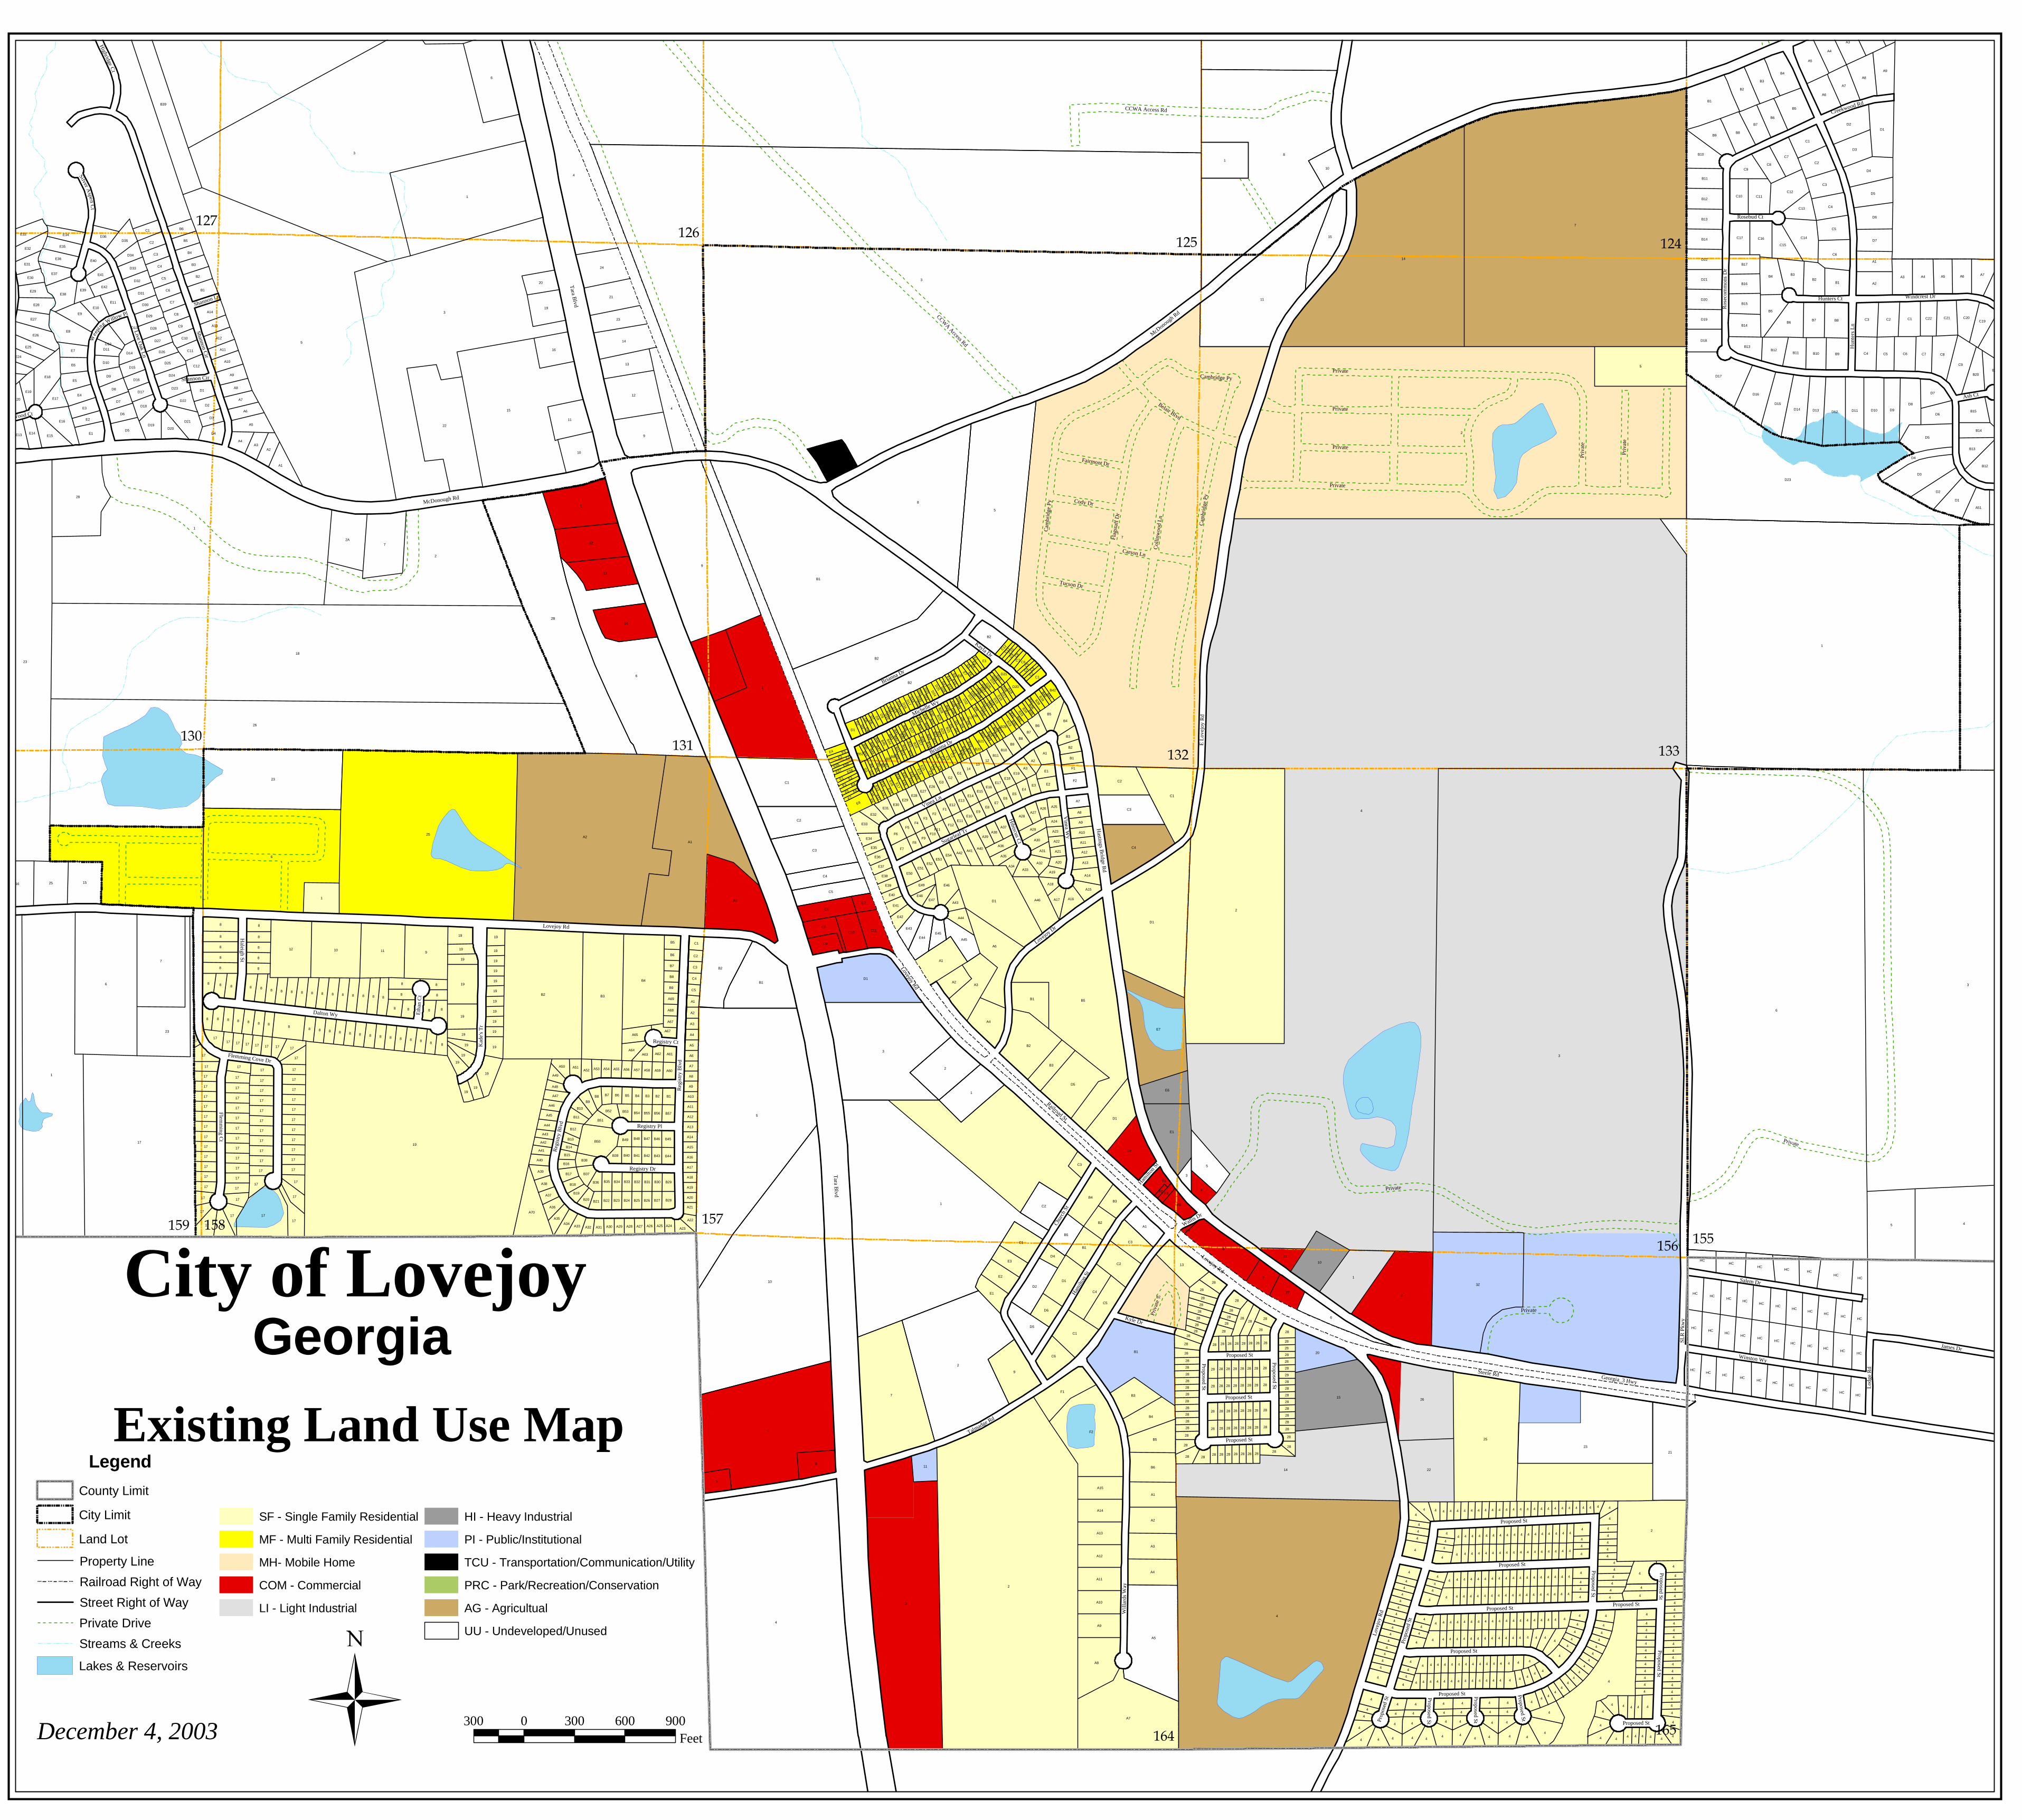
Tara B
lvd
E L
ovej
oy R
d
Private
Hastings B
ridge Rd
Talmadge Rd
Steele Rd Georgia_3 Hwy
Railroad St
Hun
ters
Ln
Ros
ecom
mon
s D
r
Shannon Cir
Chu
rch
St
Wil
lard
s W
ay
Windcrest Dr
Lovejoy D
r
Ham
ilton
St
Live O
ak Ln
SLR
Pkw
y Kyle Dr
Wee
ping W
illow Pl
Silver Aspen C
t
Highridge C
t
Hunters Ct
Ash Ct
Creekwood Rd
Rosebud Ct
Cotton Wood Ct
Shannon Ln
Private
Hamilt
on S
t Pr
ivat
e
Private
Private
Private
Private
Private
Belair Blvd
Tara B
lvd
McD
onough Rd
Lovejoy Rd
CCWA Access Rd
Priv
ate
Priv
ate
Shannon Cir
Vinea Ln
Sugarleaf Tr
Vinea W
y
Hibiscus C
t
Brianna Dr
Brianna Dr
Kayla Dr
Michelle Wy
CCWA Access Rd
Lod
ge R
d
James Dr
Salem Dr
Winston Wy
Lovejoy Rd
Registry Pl
Registry Dr
Reg
istr
y B
lvd
Kad
e's
Tr
Registry Ct
Col
linw
ood
Ln
Cam
brid
ge P
y
Cambridge Py
Fairmont Dr
Cody Dr
Cam
brid
ge P
y
Carson Ln
Tucson Dr
Flag
staf
f D
r
McDonough Rd
Wallis Dr
Reg
istr
y B
lvd
Haleigh S
t
Eth
an C
t
Dalton Wy
Flemm
ing Ct
Flemming Cove Dr
Proposed St
Proposed St
Proposed St
Proposed St
Proposed St
Proposed St
Proposed St
Proposed St
Proposed St
Proposed St
Proposed StProp
osed
St Proposed St
Proposed St
Proposed St
Prop
osed
St
Proposed StProposed St
Proposed StProposed St
Lov
ejoy
Rd
Lovejoy Rd
130131
165
132 133
127
159156
158
125
164
155
124126
157
4
3
3
3
6
7
2
1
7
4
2
3
1
5
1
2
3
18
5
19
8
26
1
3
9
25
6
14
6
2
5
8
1
10
A2
2
B1
6
23
17
3
6
1
7
23
4
D23
15
2B
14
B5
2
4
A1
B2
7
4
17
3Z
11
23
25
B2
5
D1
5
6
22
A7
1
15
2
1
7
A5
26
B3
E7
9
B1
2
F2
28
9
8
A1 D1
9
1
B4
1
4
C1
D1
21
22
23
B1
B2
10 11
B2
C3
2
C4
C1
5
B39
B2
12
12
1
B2
12
E1
6
A6
D5
A8
8
10
C2
15
14
2A
B1
13
20
24
16
D1
25
C3
14
15
D3
21
F1
D2
D17
A3
7
11
B6
19
10
A1
5
A4
B1
A3
A2
C2
E6
D1
13
C4
A4
B4
A1
16
C2
B5
D5
13
19
C5
B4
C1
23
D2
B3
D2
D4
C2
D8
A9
A70
D1
D9
B5
D12
C9
4
B6
A5
C4
A9
D16
D5
D5
A8
C5
HC
B9
B3
E8
C1
B4
C6
D14
10
C6
D10
B3
A3
C3
D3
B2
D6
B8
A46
A2
D1
C6
D11
D2
19
D15
C8
B1
B1
11
A6
B8
B4
A4
D7
D13
C14
B7
A4
20
A7
C12
B50
B5
A3
27
A7
B5
C3 C1
B9
C2
C6
A1
C4
C3
B3
A15
C2
A1
A14
B2
A10
A11
A13
C1
A12
C4
C5
B2
19
B7
E18
A5
C7
A6
B1
E2
B6
E9
B10
HC
C8
A5
C8
HC
D6
D4
11
D7
C11
E1
A2
C9
B2
B3
HC
C5
D5
A1 B12
C7
HC
3
E3
D6
HC
HC
C10
B12
D18
F6
C16
E16
HC
E1
A45
HC
C11
HC
HC
B14
HC
B11
HC
HC
B14
HC
HC
C9
B13
A51
HC
D21
E33
HC
HC
B5
D22
HC
HC
HC
HC
HC
HC
D21
HC
HC
C21
D20
HC
HC
C15
E26
19
HC
E38
HCHC
HC
HC
C17
C20
B15
HC
D19
HC
E5
B13
B15
E46
HC
E44
HC
B10B12
B11
C10
B1
HC
E4
B20
D4
B13
E6
B16
C19
A2
HC
B17
E25
A9
E15
19
F1
B14
A6
B19
A7
E32
D35
C22
C13
E3
E7
D1
A4
A8
B4
D6
A3
E8
19
F2
D8
D19
E36
E28
D9
B2
E24
19
B3
E27
E37
B4
19
B5
B6
E43
C1
C7
E35
D2
A1
C2
19
C3
E17
A14
D4
C4
19
C5
D25
D7
C6
C8
F6
E2
19
C7
C3
E34
F7
C9
D20
E13
E29
A7
A10
D23
E33
E10
E19
E11
D13
A16
D24
D36
E14
19
D3
E31
A14
A40
A65
A12
D28
E2
19
D22
E45
D33
E40
B6
B3
A13
E20
A15
D31
E41
D27
B2
B1
D34
A44
D29
E1
E42
A64
B9
A9
B5
E30
F113
D32
A8
A41
C12
19
D14
D12
A11
A17
E50
D26
D18
D10
A30
B9
E39
E42
D11
A2
B1
A36
A28
A3
E49
D15
14
D30
A33
B7
C11
D16
19
C10
19
D17
19
A34
19
19
19
19
19
B8
A13
F1F2
12
E3
F4
B51
A42
A35
A29
19
C1
B8
F5
F3
E4
E32
A35
B7
B37
A32
G1
E5
G3
A36
E54
B6
B6
A50
E7
G2
B5
E8
B7
B4
E6
B3 B2
F9
A33
B8
A43E41
E9
F8
E31
B52
B9
A11
A39
A18
A25
A10
A52
B28
D1
A37
A47
B29
A12
A67
C2
B57
C1
E34
A60
B38
A63
B12
C3
B17
E51E52
E53
B11
A1
A38
A19
E4
A40
C4
B44
A27
B11
A37
A5
A7
A9
B45
A6
A4
E48
A31
A2
A8
E47
A3
A38A39
C5
B18
B53
E29
E35
E36
B36
E37
A61
B49
B10
E38
E19
A46
E28
E1
A51
A49
B39
E30
F3
E39
B35
A59
A23
E26
B10
E14
B34
E27
A44
A45
E40
B33
B21
B32
A32
B22
B31
A34
B23
B19
B24
E13
B30
B25
A20
B26B20
A56
A26
B27
E15
A57A53 A58A54
E12
E17E18
A55
B54 B55
A31
B56
E16
A62
E10
B43B42B41B40
A22
A48
D20
F12
B46B47B48
A30
C6
F11
A29
A24E11
A28
F10
A69
A27
A41
A68
A26 A25
A67
B42
A22
A21
A43
A42
A23
A24
A21
B16
B13
B15
A13
A12
A11
A14
A10
A15
A16
B8
A17
A18
B9
A19
C3
C2
A20
C7
D8
B28
B21
E7
D7
D21E8
B14
B20
D8
D9
E1
E2
C9
E3
E2
B29
B25
E3
D24
B52
C12
D31D
32
G1
B39B38
C1
F2
C9
C3C4
C8
C2
C5
B16
E24
B33
E17
E25
E16E4
B34
B17
E58
E7
D15
B24
D9
E1
B7
B6
D25
D16
B5
B4
B44
B3
C7
C5 C
4C
6
C8
D3
D2
D4D1
D5
D6
B37
E2
B28
B36
B29
B45
E5 E6
D24
E5
D5
D25
E6E9
E4E3
D17D
16
D6
D7
D2
G2
D3
E57E55
C10D
19
G1
D17
D18
B13
E9
E14
E19
E22
B36
B30C11
E12
B27B22
B26
B17
B19
B18
B16
D4
B15
B32
B15
B23B25
B14
E15
E20
E23
B35
B24
B12
B18
B11
B19
B20
B40
B21
B31
B22
B41
B23
B30
E56
D11
D12D
13
E21
E18
E13
B37
E12
D10
B10
D14
D20
B43
D13
B35
B51B50
B38
B26B
27
B49
B48 B
47
B42
E10
B33
B34
B32
B40
B39
D22
D26
D23
D30 D29
D34
D35
D36
D28
B46
D27D
26
D19
D18D
15D
14
D22
D11
D23
D10
E11
D27
D33
D12
E11
B41
D21
B31
E10
28
28
28
28
17
28
28
28
28
2828
28
28
28
28
28
28
28
28
28
28
28
28
28
28
28 28 28 28 28 28 28 2828
28
28
28
28
28
28
28
28
28
28
28
28
28
28
28
28
28
28 28 28 28 28 28
28
28
28
28
4
8
28
28
28
28
28
28
28
28
28
28
28
2828
28
28
28
28
28
28
28
28
28
28
28
28
28
28
28
28 28
28 28
28
28
28
28
28
2828
28
4
4
4
4
4
4 4 4 4 4 4 4 4 4 4 4
4
4 4 4 4 4
4
4
4 4
4
4
4
4
4
4
4
4
4
4
4
4
4
4
4
4
4
4
4
4
4
4
4
4
4
4
4
4
4
4
4
4
4
4 4
4 4 4 4 4 4 4 4
4
4
4
4
4 4
4
4
4
4
4
4
4
4
4
4 4
4
4
4
4
4
4
4
4
4
4
4
4
4
4
4
4
4
4
4
4
444444
4
4
4
4 4 4 4 4
4
4
4
4
4
4
4
4
4
4
4
4
4
4
4
4
4
4
4
4
4
4
4
4
44
4
44
44
4
4
4
4
4
4
4
4
4
4
44
44
44
4
4
4
44
44
44
4
4
4
4
4
4
4
4
4 44
4
444
4
4
4
4
4
4
4
4
4
4
4
4
4
4
4
4
4
4
4
4
4
4
4
4
4
4
4
4
4
4
4
4
4
4
4
4
4
4
4
4
4
4
4 4
4
4
4
444
4
4
44
44
444
4
4
4
4
4444
4
4
4
4
4
4
4
4
4
4
4
4
4
4
4
4
4
4
4
4
4 4
4 4
4
4
4
44
44
44
4
4
4
4
4
4
4
4
4
44
4
4
4
4
4
4
4
4
4
4
4
4
4
4
4
4
4
4
4 4
4 4
4
4
4
4
4
4
4
4
4
4
4
17
17
17
17
17
17
17
17
17
17
17
17
17
17
17
17
17
17
17
17
17 17
17
17
17
17
17
17
17
17
17
17
17
17
17
17 17 17 17 17
17
17
17
17
17
17
17
17
17
1717
17
17
17
17
17
17
17
17
17
17
17
17
17
17
17
17
17
8 888
88
8
8 8
8 8
8 8
8 8 8 8 8 8 8 8 8 8
8 8
8
8 8
8
8 8
88888888888888
8 8 8 88
8 8
8 8
8 8
300 0 300 600 900Feet
City of LovejoyGeorgia
Existing Land Use Map
December 4, 2003
Legend
County Limit
City Limit
Land Lot
Property Line
Railroad Right of Way
Street Right of Way
Private Drive
Streams & Creeks
Lakes & Reservoirs
SF - Single Family Residential
MF - Multi Family Residential
MH- Mobile Home
COM - Commercial
LI - Light Industrial
HI - Heavy Industrial
PI - Public/Institutional
TCU - Transportation/Communication/Utility
PRC - Park/Recreation/Conservation
AG - Agricultual
UU - Undeveloped/Unused
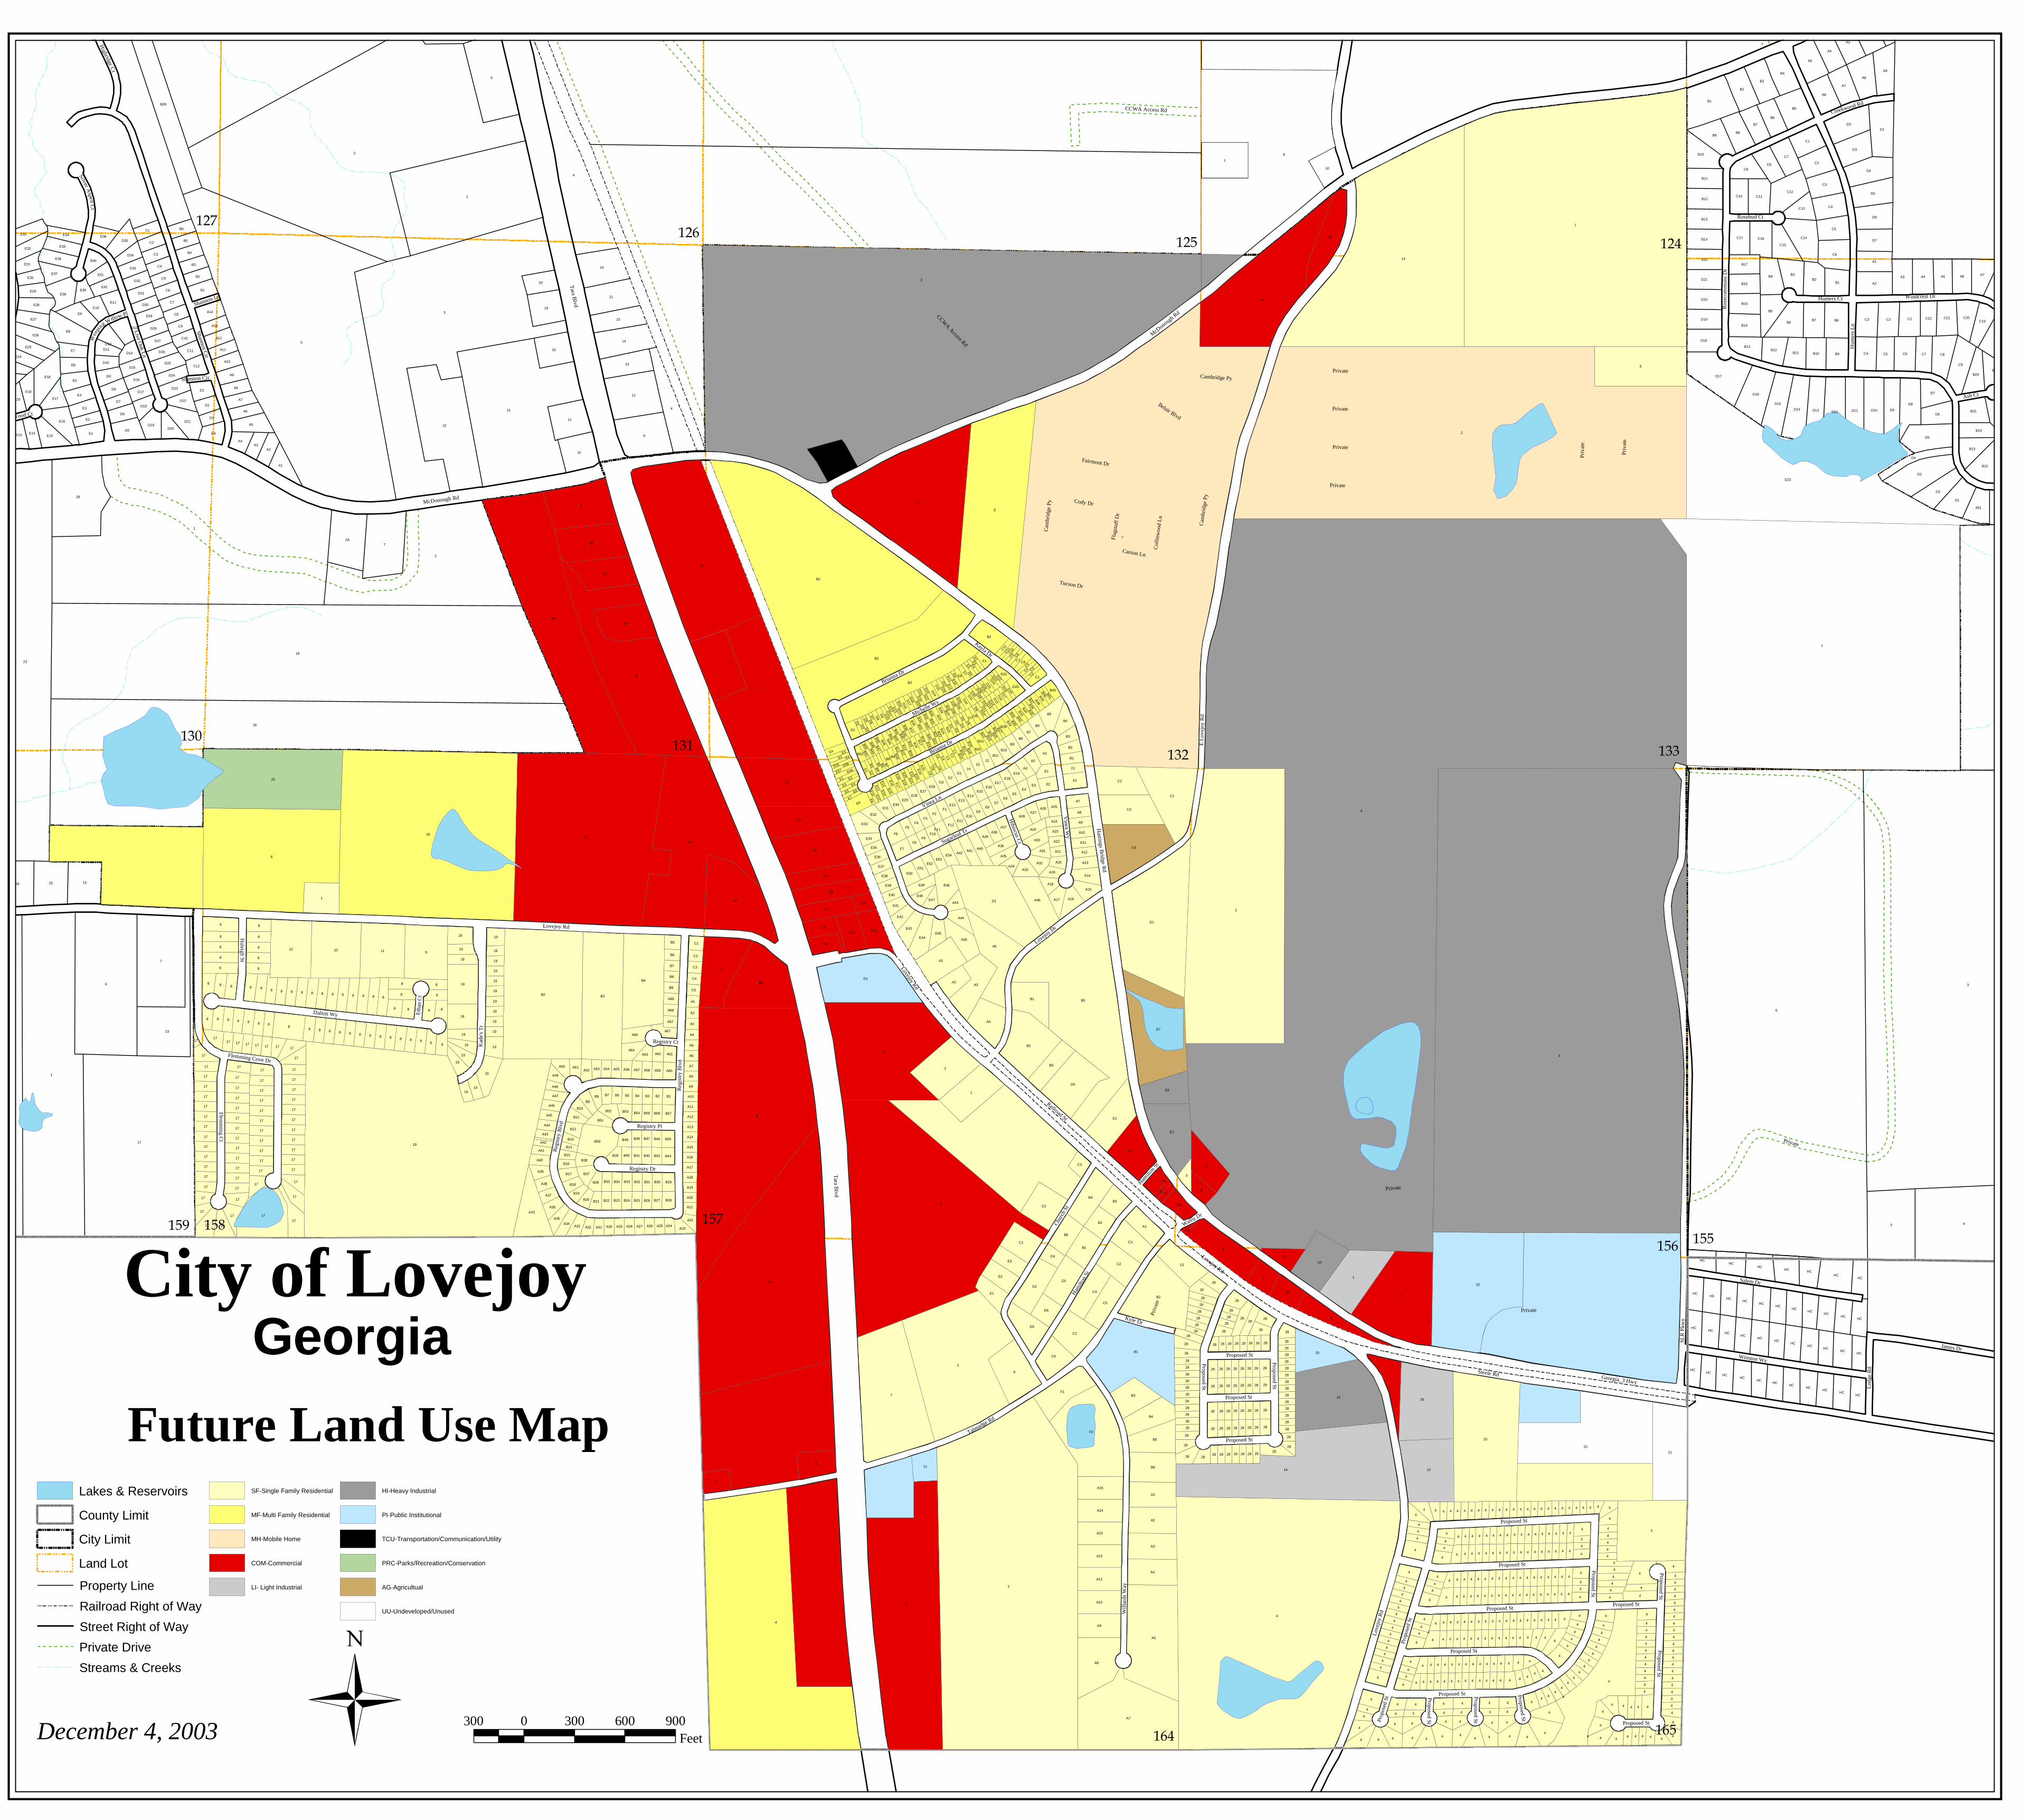
Tara B
lvd
E L
ovej
oy R
d
Private
Hastings B
ridge Rd
Talmadge Rd
Steele Rd Georgia_3 Hwy
Railroad St
Hun
ters
Ln
Ros
ecom
mon
s D
r
Shannon Cir
Chu
rch
St
Wil
lard
s W
ay
Windcrest Dr
Lovejoy D
r
Ham
ilton
St
Live O
ak Ln
SLR
Pkw
y Kyle Dr
Wee
ping W
illow Pl
Silver Aspen C
t
Highridge C
t
Hunters Ct
Ash Ct
Creekwood Rd
Rosebud Ct
Cotton Wood Ct
Shannon Ln
Private
Hamilt
on S
t Pr
ivat
e
Private
Private
Private
Private
Private
Belair Blvd
Tara B
lvd
McD
onough Rd
Lovejoy Rd
CCWA Access Rd
Priv
ate
Priv
ate
Shannon Cir
Vinea Ln
Sugarleaf Tr
Vinea W
y
Hibiscus C
t
Brianna Dr
Brianna Dr
Kayla Dr
Michelle Wy
CCWA Access Rd
Lod
ge R
d
James Dr
Salem Dr
Winston Wy
Lovejoy Rd
Registry Pl
Registry Dr
Reg
istr
y B
lvd
Kad
e's
Tr
Registry Ct
Col
linw
ood
Ln
Cam
brid
ge P
y
Cambridge Py
Fairmont Dr
Cody Dr
Cam
brid
ge P
y
Carson Ln
Tucson Dr
Flag
staf
f D
r
McDonough Rd
Wallis Dr
Reg
istr
y B
lvd
Haleigh S
t
Eth
an C
t
Dalton Wy
Flemm
ing Ct
Flemming Cove Dr
Proposed St
Proposed St
Proposed St
Proposed St
Proposed St
Proposed St
Proposed St
Proposed St
Proposed St
Proposed St
Proposed StProp
osed
St Proposed St
Proposed St
Proposed St
Prop
osed
St
Proposed StProposed St
Proposed StProposed St
Lov
ejoy
Rd
Lovejoy Rd
130131
165
132 133
127
159156
158
125
164
155
124126
157
4
3
3
3
6
7
2
1
7
4
2
3
1
5
1
2
3
18
5
19
8
26
1
3
9
25
6
14
6
2
5
8
1
10
A2
2
B1
6
23
17
3
6
1
7
23
4
D23
15
2B
14
B5
2
4
A1
B2
7
4
17
3Z
11
23
25
B2
5
D1
5
6
22
A7
1
15
2
1
7
A5
26
B3
E7
9
B1
2
F2
28
9
8
A1 D1
9
1
B4
1
4
C1
D1
21
22
23
B1
B2
10 11
B2
C3
2
C4
C1
5
B39
B2
12
12
1
B2
12
E1
6
A6
D5
A8
8
10
C2
15
14
2A
B1
13
20
24
16
D1
25
C3
14
15
D3
21
F1
D2
D17
A3
7
11
B6
19
10
A1
5
A4
B1
A3
A2
C2
E6
D1
13
C4
A4
B4
A1
16
C2
B5
D5
13
19
C5
B4
C1
23
D2
B3
D2
D4
C2
D8
A9
A70
D1
D9
B5
D12
C9
4
B6
A5
C4
A9
D16
D5
D5
A8
C5
HC
B9
B3
E8
C1
B4
C6
D14
10
C6
D10
B3
A3
C3
D3
B2
D6
B8
A46
A2
D1
C6
D11
D2
19
D15
C8
B1
B1
11
A6
B8
B4
A4
D7
D13
C14
B7
A4
20
A7
C12
B50
B5
A3
27
A7
B5
C3 C1
B9
C2
C6
A1
C4
C3
B3
A15
C2
A1
A14
B2
A10
A11
A13
C1
A12
C4
C5
B2
19
B7
E18
A5
C7
A6
B1
E2
B6
E9
B10
HC
C8
A5
C8
HC
D6
D4
11
D7
C11
E1
A2
C9
B2
B3
HC
C5
D5
A1 B12
C7
HC
3
E3
D6
HC
HC
C10
B12
D18
F6
C16
E16
HC
E1
A45
HC
C11
HC
HC
B14
HC
B11
HC
HC
B14
HC
HC
C9
B13
A51
HC
D21
E33
HC
HC
B5
D22
HC
HC
HC
HC
HC
HC
D21
HC
HC
C21
D20
HC
HC
C15
E26
19
HC
E38
HCHC
HC
HC
C17
C20
B15
HC
D19
HC
E5
B13
B15
E46
HC
E44
HC
B10B12
B11
C10
B1
HC
E4
B20
D4
B13
E6
B16
C19
A2
HC
B17
E25
A9
E15
19
F1
B14
A6
B19
A7
E32
D35
C22
C13
E3
E7
D1
A4
A8
B4
D6
A3
E8
19
F2
D8
D19
E36
E28
D9
B2
E24
19
B3
E27
E37
B4
19
B5
B6
E43
C1
C7
E35
D2
A1
C2
19
C3
E17
A14
D4
C4
19
C5
D25
D7
C6
C8
F6
E2
19
C7
C3
E34
F7
C9
D20
E13
E29
A7
A10
D23
E33
E10
E19
E11
D13
A16
D24
D36
E14
19
D3
E31
A14
A40
A65
A12
D28
E2
19
D22
E45
D33
E40
B6
B3
A13
E20
A15
D31
E41
D27
B2
B1
D34
A44
D29
E1
E42
A64
B9
A9
B5
E30
F113
D32
A8
A41
C12
19
D14
D12
A11
A17
E50
D26
D18
D10
A30
B9
E39
E42
D11
A2
B1
A36
A28
A3
E49
D15
14
D30
A33
B7
C11
D16
19
C10
19
D17
19
A34
19
19
19
19
19
B8
A13
F1F2
12
E3
F4
B51
A42
A35
A29
19
C1
B8
F5
F3
E4
E32
A35
B7
B37
A32
G1
E5
G3
A36
E54
B6
B6
A50
E7
G2
B5
E8
B7
B4
E6
B3 B2
F9
A33
B8
A43E41
E9
F8
E31
B52
B9
A11
A39
A18
A25
A10
A52
B28
D1
A37
A47
B29
A12
A67
C2
B57
C1
E34
A60
B38
A63
B12
C3
B17
E51E52
E53
B11
A1
A38
A19
E4
A40
C4
B44
A27
B11
A37
A5
A7
A9
B45
A6
A4
E48
A31
A2
A8
E47
A3
A38A39
C5
B18
B53
E29
E35
E36
B36
E37
A61
B49
B10
E38
E19
A46
E28
E1
A51
A49
B39
E30
F3
E39
B35
A59
A23
E26
B10
E14
B34
E27
A44
A45
E40
B33
B21
B32
A32
B22
B31
A34
B23
B19
B24
E13
B30
B25
A20
B26B20
A56
A26
B27
E15
A57A53 A58A54
E12
E17E18
A55
B54 B55
A31
B56
E16
A62
E10
B43B42B41B40
A22
A48
D20
F12
B46B47B48
A30
C6
F11
A29
A24E11
A28
F10
A69
A27
A41
A68
A26 A25
A67
B42
A22
A21
A43
A42
A23
A24
A21
B16
B13
B15
A13
A12
A11
A14
A10
A15
A16
B8
A17
A18
B9
A19
C3
C2
A20
C7
D8
B28
B21
E7
D7
D21E8
B14
B20
D8
D9
E1
E2
C9
E3
E2
B29
B25
E3
D24
B52
C12
D31D
32
G1
B39B38
C1
F2
C9
C3C4
C8
C2
C5
B16
E24
B33
E17
E25
E16E4
B34
B17
E58
E7
D15
B24
D9
E1
B7
B6
D25
D16
B5
B4
B44
B3
C7
C5 C
4C
6
C8
D3
D2
D4D1
D5
D6
B37
E2
B28
B36
B29
B45
E5 E6
D24
E5
D5
D25
E6E9
E4E3
D17D
16
D6
D7
D2
G2
D3
E57E55
C10D
19
G1
D17
D18
B13
E9
E14
E19
E22
B36
B30C11
E12
B27B22
B26
B17
B19
B18
B16
D4
B15
B32
B15
B23B25
B14
E15
E20
E23
B35
B24
B12
B18
B11
B19
B20
B40
B21
B31
B22
B41
B23
B30
E56
D11
D12D
13
E21
E18
E13
B37
E12
D10
B10
D14
D20
B43
D13
B35
B51B50
B38
B26B
27
B49
B48 B
47
B42
E10
B33
B34
B32
B40
B39
D22
D26
D23
D30 D29
D34
D35
D36
D28
B46
D27D
26
D19
D18D
15D
14
D22
D11
D23
D10
E11
D27
D33
D12
E11
B41
D21
B31
E10
28
28
28
28
17
28
28
28
28
2828
28
28
28
28
28
28
28
28
28
28
28
28
28
28
28 28 28 28 28 28 28 2828
28
28
28
28
28
28
28
28
28
28
28
28
28
28
28
28
28
28 28 28 28 28 28
28
28
28
28
4
8
28
28
28
28
28
28
28
28
28
28
28
2828
28
28
28
28
28
28
28
28
28
28
28
28
28
28
28
28 28
28 28
28
28
28
28
28
2828
28
4
4
4
4
4
4 4 4 4 4 4 4 4 4 4 4
4
4 4 4 4 4
4
4
4 4
4
4
4
4
4
4
4
4
4
4
4
4
4
4
4
4
4
4
4
4
4
4
4
4
4
4
4
4
4
4
4
4
4
4 4
4 4 4 4 4 4 4 4
4
4
4
4
4 4
4
4
4
4
4
4
4
4
4
4 4
4
4
4
4
4
4
4
4
4
4
4
4
4
4
4
4
4
4
4
4
444444
4
4
4
4 4 4 4 4
4
4
4
4
4
4
4
4
4
4
4
4
4
4
4
4
4
4
4
4
4
4
4
4
44
4
44
44
4
4
4
4
4
4
4
4
4
4
44
44
44
4
4
4
44
44
44
4
4
4
4
4
4
4
4
4 44
4
444
4
4
4
4
4
4
4
4
4
4
4
4
4
4
4
4
4
4
4
4
4
4
4
4
4
4
4
4
4
4
4
4
4
4
4
4
4
4
4
4
4
4
4 4
4
4
4
444
4
4
44
44
444
4
4
4
4
4444
4
4
4
4
4
4
4
4
4
4
4
4
4
4
4
4
4
4
4
4
4 4
4 4
4
4
4
44
44
44
4
4
4
4
4
4
4
4
4
44
4
4
4
4
4
4
4
4
4
4
4
4
4
4
4
4
4
4
4 4
4 4
4
4
4
4
4
4
4
4
4
4
4
17
17
17
17
17
17
17
17
17
17
17
17
17
17
17
17
17
17
17
17
17 17
17
17
17
17
17
17
17
17
17
17
17
17
17
17 17 17 17 17
17
17
17
17
17
17
17
17
17
1717
17
17
17
17
17
17
17
17
17
17
17
17
17
17
17
17
17
8 888
88
8
8 8
8 8
8 8
8 8 8 8 8 8 8 8 8 8
8 8
8
8 8
8
8 8
88888888888888
8 8 8 88
8 8
8 8
8 8
300 0 300 600 900Feet
City of LovejoyGeorgia
Future Land Use Map
December 4, 2003
Lakes & Reservoirs
County Limit
City Limit
Land Lot
Property Line
Railroad Right of Way
Street Right of Way
Private Drive
Streams & Creeks
SF-Single Family Residential
MF-Multi Family Residential
MH-Mobile Home
COM-Commercial
LI- Light Industrial
HI-Heavy Industrial
PI-Public Institutional
TCU-Transportation/Communication/Utility
PRC-Parks/Recreation/Conservation
AG-Agricultual
UU-Undeveloped/Unused