Embed Size (px)
Citation preview

XML Template (2010) [19.7.2010–5:10pm] [143–166]K:/tandf/TAOL/TAOL_I_1_01/TAOL_A_483336.3d (TAOL) [PRINTER STAGE]
Advances in Oceanography and LimnologyVol. 1, No. 1, June 2010, 143–166
Prokaryotic abundance and heterotrophic metabolism in the deep
Mediterranean Sea
Rosabruna La Ferlaa*, Maurizio Azzaroa, Gabriella Carusoa,Luis Salvador Monticellia, Giovanna Maimonea, Renata Zacconea and
Theodore T. Packardb
aCNR-IAMC, Institute for Marine Coastal Environment Section of Messina,Spianata S. Raineri 86, c.a.p. 98122 Messina, Italy; bFacultad de Ciencias del Mar ULPGC,
Campus Universitario de Tafira, 35017 Las Palmas Gran Canaria, Spain
(Received 10 January 2010; final version received 12 March 2010)
A synthesis of field data carried out in the Mediterranean Sea are presented,aimed at contributing to the knowledge of three prokaryotic-mediated processesand their implications on the Carbon cycle. The distribution of exoenzymaticactivities, secondary production and respiration rates was studied together withthe prokaryotic abundances. Particular attention was paid to the meso- andbathypelagic layers which play an important role in the Mediterranean carboncycle. The study is noteworthy because of its large spatial scale spanning the entireMediterranean Sea over 4 years. In addition, two Atlantic stations in front of theGibraltar Strait were investigated. The longitudinal distribution of prokaryoticactivities and abundance along the MED showed different trends along the depth-layers. In particular, higher exoenzymatic rates were detected in the Eastern basincompared to the Western one; carbon respiration rate showed patterns variablewith the sampling periods in the epipelagic and bathypelagic layers, while aconsistent Westwards decreasing trend at the mesopelagic layers occurred.Specific enzyme activities per cell showed high values in the deepest layers forleucine aminopeptidase. Comparison with Carbon respiration rate data collectedbefore the 2000s showed changing patterns of microbial heterotrophic processesin the Mediterranean Sea.
Keywords: carbon cycle; beta-glucosidase; leucine-aminopeptidase; heterotrophicproduction; respiration; prokaryotic abundances; Mediterranean Sea
1. Introduction
The biogeochemical cycle of carbon in the sea contributes to the equilibrium of thebiosphere, by means of the solubility, carbonate and biological pumps [1,2] that assumegreat importance in mitigating the effects of the increasing atmospheric CO2 by itssequestration in the marine depths. The major actors in the biological pump, by means oftheir anabolic and catabolic activities, are the dark ocean microbial communities [3].
The deep-sea microbes change the chemistry and productivity of the oceanic watercolumn by performing complex transformations on both organic and inorganic molecules.In spite of the several studies concerning the biogeochemical fluxes of elements and therole of microbial assemblage within them [4–6], the mechanisms by which these reactions
*Corresponding author. Email: [email protected]
ISSN 1947–5721 print/ISSN 1947–573X online
� 2010 Taylor & Francis
DOI: 10.1080/19475721.2010.483336
http://www.informaworld.com

XML Template (2010) [19.7.2010–5:10pm] [143–166]K:/tandf/TAOL/TAOL_I_1_01/TAOL_A_483336.3d (TAOL) [PRINTER STAGE]
proceed, their in situ transformation rates, their quantitative significance to elementcycling are still poorly understood [3,7].
For a long time, the twilight and dark ocean were considered to be sites of negligiblebiological activity compared to the photic layers. On the contrary, they represent key sitesfor remineralization of organic matter and long-term carbon storage and burial inthe biosphere. They contain the largest pool of microbes in aquatic systems, harbouringnearly 75 and 50% of the prokaryotic biomass and production, respectively, of the globalocean [3].
Most of the organic carbon, produced by photosynthesis in the epipelagic zone, istransported into the twilight and dark ocean, respired there by prokaryotes, and returnedback to the atmosphere as CO2 within months to years [3].
Despite emerging evidence pointing to the deep ocean as a site of active biogeochem-istry, until now few studies have recognised the importance of meso- and bathypelagictrophic processes [8–12]. Recent attempts to derive estimates of carbon cycling in theglobal ocean conclude that about one-third of biological CO2 production in the oceanoccurs in the deep pelagic layers [13,14], where relatively intense microbial activity takeplace driven by prokaryotes (both Bacteria and Archaea) in a complex communityfeaturing virus, protist, zooplankton, and nekton interactions [15–18]. In theMediterranean Sea this biological complexity is compounded even more by dynamichydrographic and atmospheric processes [19–24]. In simplified terms, three main waterlayers can be distinguished: a surface layer, an intermediate layer, and a deep layer thatsinks to the bottom. A separate bottom layer is absent [25]. Fragmentary studies onmicrobial processes in the Mediterranean Sea have been carried out within the frameworkof different multidisciplinary cruises and projects (i.e. MEDGOOS, FIRB, CIESM-SUB,DYFAMED, VECTOR). Moreover, the Mediterranean basin has recently attractedscientific attention because it is a sensitive ecosystem to climate changes [26–28].
Deep water formation, exchange rates, and the processes of heat and water exchangemake the Mediterranean an excellent model for studying the global climatic change. Infact, it represents a natural ‘laboratory’ for mesoscale studies on oceanic processes due toits small size and the brief residence time and higher turnover rates of its deep waters.These deep waters in the western Mediterranean have been warming and becoming moresaline since the 1950s. This tendency has accelerated after the climate event called EasternMediterranean Transient (EMT) [29–31]. In addition, there is evidence of changingbiogeochemical dynamics in the Eastern MED [32,33], evolving microbial assemblages,increasing deep-respiration in the Levantine and Ionian Seas, and reduced remineraliza-tion in the South Adriatic Sea. All these changes seem to be caused by enhanced deep-water renewal and organic matter injection following the EMT [9]. Furthermore,superimposed on these changes related to the EMT there are newly discovered associationsof heterotrophic processes other than respiration, such as bacterial production andexoenzymatic activities that appear associated with the main Mediterranean watermasses [11].
After 2000, the propagation of EMT from eastern to western Mediterranean basinoccurred again [29,34]. The Eastern Mediterranean basin appears to be a nutrient sourcefor the Western one while renewing the old resident western deep water [35]. This results inchanging chemical signatures and DOC pool distribution in the Western Mediterraneanbasin [36,37].
Adding to this knowledge base, this work presents a study of three key-processescontrolled by the marine microbial assemblage. These are the carbon respiration rate, the
144 R. La Ferla et al.

XML Template (2010) [19.7.2010–5:10pm] [143–166]K:/tandf/TAOL/TAOL_I_1_01/TAOL_A_483336.3d (TAOL) [PRINTER STAGE]
activities of two exoenzymes involved in Carbon cycle (Leucine aminopeptidase and beta
glucosidase), and the rate of heterotrophic prokaryotic production. Moreover, the
prokaryotic (Archaea and Bacteria) standing stock in several provinces of the MED is
presented for 2004, 2005 and 2007. A major contribution of this study lies in the large
spatial scale covered by the investigations. As the microbial variables are recognised to be
strictly related to both physical and chemical parameters, three main questions are
addressed in this paper: (1) the distribution of three prokaryotic heterotrophic activities in
the Mediterranean Sea, (2) the contribution of the microbial assemblage to carbon flux in
the meso- and bathypelagic layers of different Mediterranean provinces, and (3) the
identification of unique biogeochemical properties of the Mediterranean deep-water.
2. Materials and methods
The data here derive from five multidisciplinary field studies carried out in the
Mediterranean Sea in 2004, 2005, and 2007 on the R/Vs Urania of the Italian National
Research Council (CNR) and Universitatis of the National Interuniversity Consortium
For Marine Sciences (CoNISMa). The surveys had similar scientific objectives, research
approaches, sampling strategies and methods. As a matter of fact, in the different sampling
sites and cruises, the same depths were collected (2, 10, 25, 50, 75, 100, 200, 500, 750, 1000,
1500, 2000, 2500, 3000, 3500 and 3700m) according to the bathymetry. In Table 1 the
names of cruises and projects, sampling periods, studied provinces, depths, parameters,
sampling size, and bibliographic references are reported [22,38–41]. A CTD probe 911plus
SeaBird was used to record conductivity, temperature, pressure and oxygen content at all
the stations. Salinity values were also checked in comparison with the measurements on
discrete samples made with an induction salinometer AutoSal Guildline Model 8004B. The
water samples were collected at different depths from surface to bottom, using a rosette
sampler equipped with 10-L acid rinsed Niskin bottles. The samples were either
Table 1. Names of cruises or projects, sampling periods and provinces, depths, parameters andsampling size together with references.
Projects, cruises Periods ProvincesMax
depth (m) Parameters
Sample sizefor eachparameter References
MedGOOS October 04 ATL, ALB,APR, TYR
3000 CR, PA 130 [38]
MedBIO November 04 ION 3300 CR, HPP,EEA, PA
99 [39]
CIESM July 05 TYR 3600 CR, PA 93 [40]CIESM December 05 TYR 3600 CR, PA 87 [40]FIRB-MIUR July 05 TYR 3400 HPP, EEA, PA 50 [22]TRANSMED May 07 ATL, ALB,
APR, TYR3700 CR, HPP,
EEA, PA60 [41]
TRANSMED June 07 ION, EB 3700 CR, HPP,EEA, PA
67 [41]
CR, Community respiration; HPP, heterotrophic prokaryotic production; EEA exoenzymaticactivities (LAP, b-GLU); PA, prokaryotic abundance.
Advances in Oceanography and Limnology 145

XML Template (2010) [19.7.2010–5:10pm] [143–166]K:/tandf/TAOL/TAOL_I_1_01/TAOL_A_483336.3d (TAOL) [PRINTER STAGE]
immediately processed for specific measurements aboard the R/Vs or stored forsubsequent analyses in laboratory.
Simultaneous measurements of prokaryotic abundances and metabolism were carriedout. In particular, the data set covered the distribution of the following parameters:exoenzymatic hydrolysis (EEA) by leucine aminopeptidase (LAP) and �-glucosidase(�-Glu) activities by using fluorogenic substrates [42,43], heterotrophic prokaryoticproduction (HPP) by [3H]-leucine uptake [44,45], potential respiration rates measured viaETS assay, converted into Carbon Respiration (CR) which represents the Carbon DioxideProduction Rates [10,46], as well as prokaryotic abundances (PA) by image analysis[47,48].
2.1. Study areas
The study area was divided into 6 provinces: Atlantic (ATL), Alboran-Almerian (ALB),Algero-Provencal (APR), Southern Tyrrhenian Sea (TYR), Ionian (ION), EasternMediterranean (EM) sub-basins (Figure 1). The ATL province lies near to the west ofthe Strait of Gibraltair which connects to the Alboran Sea, the first Mediterranean province(ALB). ALB is a transition zone between ATL and the Mediterranean (MED) Sea. Here,surface currents flows eastward, bringing water from the ATL into the MED. Deepersubsurface currents flow westward, carring saltier Mediterranean Water into AtlanticOcean. There is often a gyre as a result of this exchange of water. The APR is located east ofALB Basin and west of Sardinia and Corsica, extending from the Algerian littoral to theFrench littoral. The TYR is about 760 km long and from 97 to 483 km wide, between theLigurian Sea, the Italian peninsula, Sicily, Sardinia, and Corsica. The ION represents acrossing point between theWestern and the LevantineMED Sea; it is a site where the majorwater masses of the Eastern MED are transformed as they spread from their sites of
Figure 1. Map of the Mediterranean Sea with locations of the studied provinces: Atlantic (ATL),Alboran (ALB), Algero-Provencal (APR), Tyrrhenian (TYR), Ionian (ION) and Eastern Basin (EB)provinces.
146 R. La Ferla et al.

XML Template (2010) [19.7.2010–5:10pm] [143–166]K:/tandf/TAOL/TAOL_I_1_01/TAOL_A_483336.3d (TAOL) [PRINTER STAGE]
formation [25] and it is directly influenced by Adriatic outflow [49]. Finally, the EM basin,in particular the Levantine Sea, is the most important site of the Intermediate Water (LIW)formation, which spreads throughout the entire MED. Moreover, from the Aegean Sea theclimatic event called EMT is formed.
During MEDGOOS cruise 2, 3, 5 and 4 stations in the ATL, ALB, APR and TYRprovinces, respectively, were collected; during MEDBIO cruise 7 stations in ION; duringCIESM and FIRB-MIUR cruises 14 and 4 stations, respectively, in TYR; duringTRANSMED cruise a single water column was sampled for each province with theexception of ION and EB, where 3 and 2 stations for provinces, respectively, wereconsidered.
2.2. Data processing
Data were integrated with depth according to the trapezoidal method and normalized tothe depth: from 2 to 200m for the epipelagic layer; from 200 to 1000m for the mesopelagiclayer; and from 1000 to the bottom depth for the bathypelagic layer. Normalized valuesare reported throughout the paper.
Specific cell activity was determined by dividing the activities by cell numbers in eachwater sample and then averaging them.
CR power functions were obtained by fitting the data with the following powerfunction:
Ri¼ yZX, where y is the CR in mgCm�3 h�1, Z is the depth below the surface in metresand x is the exponent of depth [2]. The depth-integrated rate (
RRdz in mgCm�2 d�1) in
the water column was calculated within the depth interval between Z1 and Z2 using thefollowing formula [9]: Z
Rdz ¼ y Zðxþ1Þ2 � Z
ðxþ1Þ1
� �=ðxþ 1Þ:
Analysis of variance (ANOVA) was applied to log-transformed data to assess thestatistical differences between sampling periods.
From each parameter, significant differences between two or more groups wereanalyzed applying the non-parametric multivariate analysis of variance NPMANOVA test(known also as PERMANOVA) [50]. The test was performed using Bray–Curtis distancemeasure on untransformed data; P values were calculated from 4999 random permuta-tions. Analysis were done using PAST Statistics V 1.97 software (Ø. Hammer, Universityof Oslo).
3. Results
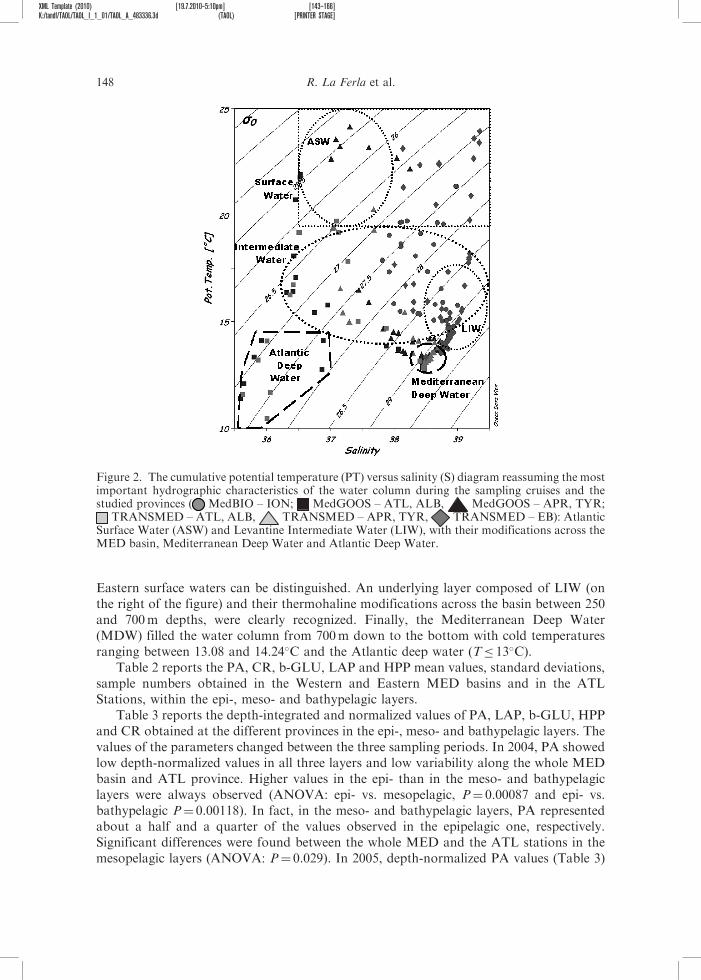
The hydrological signatures of the water samples such as the cumulative potentialtemperature (PT) versus salinity (S) are shown in Figure 2. It allowed us tohydrographically identify the most important water masses and their thermohalinemodifications across the studied provinces. On the left of the figure, a layer of relativelylow salinity waters of Atlantic origin are recognizable – the Atlantic Surface Water (ASW)characterized by temperature and salinity around to 13.04 and 36.32�C – followed by theirthermohaline modifications of the surface waters (Modified Atlantic Water, MAW) acrossthe ALB, APR and TYR provinces. On the right, the warmer and saltier Ionian and
Advances in Oceanography and Limnology 147
XML Template (2010) [19.7.2010–5:10pm] [143–166]K:/tandf/TAOL/TAOL_I_1_01/TAOL_A_483336.3d (TAOL) [PRINTER STAGE]
Eastern surface waters can be distinguished. An underlying layer composed of LIW (onthe right of the figure) and their thermohaline modifications across the basin between 250and 700m depths, were clearly recognized. Finally, the Mediterranean Deep Water(MDW) filled the water column from 700m down to the bottom with cold temperaturesranging between 13.08 and 14.24�C and the Atlantic deep water (T� 13�C).
Table 2 reports the PA, CR, b-GLU, LAP and HPP mean values, standard deviations,sample numbers obtained in the Western and Eastern MED basins and in the ATLStations, within the epi-, meso- and bathypelagic layers.
Table 3 reports the depth-integrated and normalized values of PA, LAP, b-GLU, HPPand CR obtained at the different provinces in the epi-, meso- and bathypelagic layers. Thevalues of the parameters changed between the three sampling periods. In 2004, PA showedlow depth-normalized values in all three layers and low variability along the whole MEDbasin and ATL province. Higher values in the epi- than in the meso- and bathypelagiclayers were always observed (ANOVA: epi- vs. mesopelagic, P¼ 0.00087 and epi- vs.bathypelagic P¼ 0.00118). In fact, in the meso- and bathypelagic layers, PA representedabout a half and a quarter of the values observed in the epipelagic one, respectively.Significant differences were found between the whole MED and the ATL stations in themesopelagic layers (ANOVA: P¼ 0.029). In 2005, depth-normalized PA values (Table 3)
Figure 2. The cumulative potential temperature (PT) versus salinity (S) diagram reassuming the mostimportant hydrographic characteristics of the water column during the sampling cruises and thestudied provinces ( MedBIO – ION; MedGOOS – ATL, ALB, MedGOOS – APR, TYR;
TRANSMED – ATL, ALB, TRANSMED – APR, TYR, TRANSMED – EB): AtlanticSurface Water (ASW) and Levantine Intermediate Water (LIW), with their modifications across theMED basin, Mediterranean Deep Water and Atlantic Deep Water.
148 R. La Ferla et al.

XML Template (2010) [19.7.2010–5:10pm] [143–166]K:/tandf/TAOL/TAOL_I_1_01/TAOL_A_483336.3d (TAOL) [PRINTER STAGE]
Table
2.Meanvalues
andstandard
deviationsofthePA,CR,b-G
LU,LAPandHPPin
theWestern
andEasternMED
basinsandin
theAtlantic
Stations,in
theepi-,meso-andbathypelagic
layers.
Western
MEDIT
ERRANEAN
EasternMEDIT
ERRANEAN
Cruise
Parameter
Units
Layer
nMean�SD
Cruise
Parameter
Units
Layer
nMean�SD
MEDGOOS2004
PA
�105cellsml�
1EPI
34
2.86�1.27
MEDBIO
2004
PA
�105cellsml�
1EPI
30
2.348�1.303
MESO
19
0.98�0.22
MESO
14
1.224�1.442
BATHY
25
1.36�1.60
BATHY
29
1.803�2.539
CR
mgCl�
1h�1
EPI
35
0.2849�0.2021
CR
mgCl�
1h�1
EPI
300.1992�0.1084
MESO
21
0.0028�0.0014
MESO
140.0055�0.0020
BATHY
25
0.0046�0.0020
BATHY
290.0035�0.0012
CIE
SM
2005
PA
�105cellsml�
1EPI
67
3.88�1.56
HPP
mgCl�
1h�1
EPI
180.0151�0.0097
MESO
56
1.32�0.66
MESO
70.0012�0.0013
BATHY
56
0.82�0.31
BATHY
150.0011�0.0009
CR
mgCl�
1h�1
EPI
66
0.0709�0.059
LAP
nM
leuh�1
EPI
24
4.594�5.119
MESO
57
0.00315�0.00169
MESO
10
3.269�3.283
BATHY
56
0.00219�0.0010
BATHY
28
3.183�2.673
FIR
B2005
bGLU
nM
h�1
EPI
28
0.623�0.580
bGLU
nM
h�1
EPI
25
2.909�6.955
MESO
10
0.794�0.792
MESO
91.309�2.618
BATHY
17
0.399�0.549
BATHY
27
0.880�0.972
LAP
nM
leuh�1
EPI
17
5.249�2.799
TRANSMED
2007
PA
�105cellsml�
1EPI
3510.374�3.934
MESO
66.933�4.943
MESO
12
2.190�0.906
BATHY
10
7.447�4.754
BATHY
20
1.117�0.302
TRANSMED
2007
PA
�105cellsml�
1EPI
33
16.01�6.98
CR
mgCl�
1h�1
EPI
350.0905�0.0363
MESO
13
3.28�1.19
MESO
200.0128�0.0202
BATHY
22
1.84�0.59
BATHY
220.0021�0.0004
CR
mgCl�
1h�1
EPI
21
0.0937�0.0411
HPP
mgCl�
1h�1
EPI
350.0242�0.0163
MESO
11
0.0046�0.0078
MESO
150.0009�0.0011
BATHY
13
0.0645�0.1216
BATHY
260.0025�0.0017
HPP
mgCl�
1h�1
EPI
21
0.02558�0.0282
LAP
nM
leuh�1
EPI
35
1.533�1.286
MESO
100.000139�0.00016
MESO
15
0.663�5710
BATHY
16
0.00114�0.00158
BATHY
26
1.222�0.949
LAP
nM
leuh�1
EPI
19
0.2477�0.1735
bGLU
nM
h�1
EPI
35
0.500�0.556
MESO
90.2855�0.1209
MESO
15
0.519�0.490
BATHY
14
0.3613�0.3268
BATHY
26
0.579�0.448
bGLU
nM
h�1
EPI
21
0.2012�0.1818
MESO
90.3079�0.1927
BATHY
14
0.2430�0.2315
(continued
)
Advances in Oceanography and Limnology 149

XML Template (2010) [19.7.2010–5:10pm] [143–166]K:/tandf/TAOL/TAOL_I_1_01/TAOL_A_483336.3d (TAOL) [PRINTER STAGE]
Table
2.Continued.
Atlanticstations
Cruise
Parameter
Units
Layer
nMean�SD
Cruise
Parameter
Units
Layer
nMean�SD
MEDGOOS2004
PA
�105cellsml�
1EPI
52.08�1.01
TRANSMED
2007
PA
�105cellsml�
1EPI
78.96�3.12
MESO
51.50�0.55
MESO
40.37�0.10
CR
mgCl�
1h�1
EPI
50.1396�0.1304
BATHY
50.09�0.12
MESO
50.0015�0.0009
CR
mgCl�
1h�1
EPI
80.167�0.072
TRANSMED
2007
LAP
nM
leuh�1
EPI
60.375�0.256
MESO
30.0031�0.0008
MESO
40.735�0.403
BATHY
50.0012�0.0003
BATHY
40.566�0.158
bGLU
nM
h�1
EPI
60.274�0.271
HPP
mgCl�
1h�1
EPI
70.0293�0.0192
MESO
40.131�0.125
MESO
40.00057�0.00013
BATHY
40.252�0.107
BATHY
50.0004�0.0002
150 R. La Ferla et al.

XML Template (2010) [19.7.2010–5:10pm] [143–166]K:/tandf/TAOL/TAOL_I_1_01/TAOL_A_483336.3d (TAOL) [PRINTER STAGE]
Table
3.ProkaryoticAbundance
(PA),
Leucine-aminopeptidase
(LAP),
beta-G
lucosidase
(b-G
LU),
Heterotrophic
ProkaryoticProduction(H
PP)
andCarbonRespiration(C
R)depth-integratedandnorm
alizedvalues
intheepi-,meso-andbathypelagic
zones
ofthedifferentMED
provinces.
PA
LAP
b-G
LU
HPP
CR
(cell�
1011m�3)
(mgCm�3d�1)
(mgCm�3d�1)
(mgCm�3d�1)
(mgCm�3d�1)
Epi
Meso
Bathy
Epi
Meso
Bathy
Epi
Meso
Bathy
Epi
Meso
Bathy
Epi
Meso
Bathy
2004
ATL
2.5
1.5
nd
nd
nd
nd
nd
nd
Nd
nd
nd
nd
3.550
0.071
nd
ALB
2.6
1.4
0.9
nd
nd
nd
nd
nd
Nd
nd
nd
nd
4.469
0.081
0.157
APR
2.5
1.0
0.9
nd
nd
nd
nd
nd
Nd
nd
nd
nd
7.588
0.124
0.105
TYR
2.4
1.0
0.8
nd
nd
nd
nd
nd
nd
nd
nd
nd
9.895
0.128
0.098
ION
2.3
1.2
1.6
9.50
6.28
9.98
5.43
1.74
1.64
0.244
0.032
0.032
5.825
0.146
0.073
2005
TYR
3.9
1.3
0.8
8.86
11.28
13.48
1.31
1.46
0.65
0.323
0.034
0.085
1.107
0.073
0.055
2007
ATL
7.4
1.8
0.9
0.77
1.33
0.78
0.24
0.24
0.35
0.444
0.014
0.009
2.227
0.099
0.030
ALB
15.6
3.8
2.8
0.33
0.31
0.67
0.16
0.49
0.28
0.478
0.005
0.006
2.220
0.164
0.064
APR
14.1
4.0
2.0
0.18
0.44
0.22
0.25
0.52
0.25
0.397
0.007
0.010
1.144
0.133
0.046
TYR
12.0
3.4
1.1
0.33
0.59
0.97
0.45
0.62
0.90
0.141
0.006
0.007
2.264
0.219
0.048
ION
9.4
2.0
1.0
2.51
1.57
1.56
0.95
0.83
0.72
0.405
0.010
0.024
1.695
0.228
0.039
EB
10.1
3.5
1.4
1.64
1.24
1.37
0.48
0.62
1.08
0.627
0.037
0.050
2.013
0.244
0.049
Advances in Oceanography and Limnology 151

XML Template (2010) [19.7.2010–5:10pm] [143–166]K:/tandf/TAOL/TAOL_I_1_01/TAOL_A_483336.3d (TAOL) [PRINTER STAGE]
showed higher values than those in the TYR during 2004 in the epi- and meso-pelagiclayers (ANOVA: P5 0.01) but not in the bathypelagic. Again a decreasing trend along thewater column from surface toward the bottom was observed. Finally, in 2007, the depth-normalized PA values were higher than in 2004 and 2005, especially in the epipelagic layerwhere the cell counts were one order of magnitude higher. In this upper layer, a significantdecreasing west-to-east trend was observed (ANOVA: P¼ 0.0001) and the same appearedin the meso- and bathypelagic layers, also if to a lesser extent. Higher values in MED basinthan in ATL stations were observed (ANOVA: P¼ 0.013 in the epipelagic;PERMANOVA: P¼ 0.002 in the mesopelagic).
From 2004 to 2007 PA significantly increased by about 7 and 2 times in the epi- andmesopelagic layers, respectively (ANOVA: epi2004 vs. epi2007, P5 0.0001; meso2004 vs.meso2007, P5 0.0001). In the bathypelagic layer, the differences were significant withPERMANOVA (P5 0.0001). Finally, also in ATL province higher values in 2007 than2004 were observed in the epipelagic layer (ANOVA: P¼ 0.0018) but lower in themesopelagic one. In Figure 3, the distribution of the depth-normalized PA values withinthe three layers and along the MED provinces in 2004 and 2007 are reported.
Regarding the EEA activities, during November 2004 only the ION province wasstudied. Depth-normalized LAP values were low (Table 2), prevailing at the epi- andbathypelagic layers, where it was about 150% of the mesopelagic value. b-GLU activitywas 3 times higher in the epipelagic layer than in deeper ones.
During 2005, depth-normalized LAP values increased progressively over depth alongthe water column. b-GLU values showed the highest activity at the mesopelagic layer.
Figure 3. Distribution of the depth-normalized PA values in the different provinces along the MEDin the epi- meso- and bathypelagic layers in 2004 and 2007. The values are expressed ascells� 1011m�3.
152 R. La Ferla et al.

XML Template (2010) [19.7.2010–5:10pm] [143–166]K:/tandf/TAOL/TAOL_I_1_01/TAOL_A_483336.3d (TAOL) [PRINTER STAGE]
Comparing the b-GLU and the LAP data from 2004 (ION) and 2005 (TYR) to the2007 data, a reduction of enzyme levels was observed for both the enzyme activities.However, no statistically significant differences were found for b-GLU values. In 2007,LAP values at epi- and mesopelagic layers were significantly lower than in 2004 in the IONprovince (ANOVA: P5 0.05; P5 0.01, respectively) and lower than in 2005 in the TYRone (ANOVA: P5 0.05).
In 2007, in the ATL province, LAP activity in the mesopelagic layer exceeded thatobserved in the epi- and bathypelagic ones; this behaviour was also observed in the APRbasin (Figure 4). LAP was higher in the bathypelagic layer compared to the other onesonly at the ALB and TYR provinces. b-GLU activity showed lower absolute values thanLAP, except in the APR and TYR where it exceeded LAP activity in the surface layer.b-GLU generally exhibits greater importance in the meso- and bathypelagic areas (Table 3).Both activities increased from Western to Eastern provinces at all depths (Figure 4).
In 2004 in the ION province, the depth-normalized HPP rate was 8 times higher in theepi- than in the meso- and bathypelagic layers, reaching 0.244mgCm�3 d�1. In 2005, HPPshowed the highest values in the epipelagic layer (0.323mgCm�3 d�1) and the lowest in themesopelagic layer; values in the bathypelagic layer fell in between. In 2007, high valueswere always observed in the epipelagic (Table 3), where they were over0.397mgCm�3 d�1, with the only exception of the TYR province (Figure 5). Themaximum value occurred in the EB with rates exceeding 0.627mgCm�3 d�1. In the meso-and bathypelagic layers, low values were found although several high HPP rates werefrequently detected in the deeper layers. At the sub-basin scale, higher HPP activities in themesopelagic layer were observed in the Eastern MED as compared to the Western one.
Figure 4. EEA distribution along the MED in 2007: depth-normalized LAP and b-GLU values(expressed as mgCm�3 d�1) in the different provinces at the epi- meso- and bathypelagic layers.
Advances in Oceanography and Limnology 153

XML Template (2010) [19.7.2010–5:10pm] [143–166]K:/tandf/TAOL/TAOL_I_1_01/TAOL_A_483336.3d (TAOL) [PRINTER STAGE]
In 2004, CR showed higher depth-normalized values in MED basin with respect to theATL station, with significant differences at epipelagic layers (PERMANOVA:P5 0.0001). In the MED basin, at the epipelagic layer an eastward increasing trendwas observed reaching the maximum value in the TYR. At the mesopelagic layer, low CRvalues were observed, reflecting a trend similar to the upper layer. In the bathypelagiclayer, the CR rates decreased again, with the only exception in the ALB, where the highestdata was detected. The CR values were not statistically different between the Western andEastern MED in the epi- and mesopelagic layers, whilst significant decreases wereobserved in the bathypelagic layers (PERMANOVA P5 0.0001).
In 2005, depth-normalized values of CR were lower than in 2004, with the valuesdecreasing by about a factor of 6 and 2 in the epi- and bathypelagic-layers, respectively,but only the decrease in the epipelagic layer was significant (ANOVA: P5 0.01).
In 2007, CR rates showed significantly lower depth-normalized values than in 2004(Table 3) in both the epi- and bathypelagic layers (PERMANOVA: both P5 0.0001). Onthe contrary, in the mesopelagic layer the CR values significantly increased (ANOVA:P¼ 0.00035). Moreover significant differences were found between Western MED basinand ATL province (ANOVA P5 0.0001). In Figure 6, the variability of CR along a West-East transect in 2004 and 2007 is reported. In 2004, positive W-E trends in both the epi-and mesopelagic layers were observed, whilst a negative W-E tendency in the bathypelagiclayer was found. In fact, the highest respiratory rates were observed in the ALB provinceand the lowest in the ION. In 2007, lower CR values were detected in the epi- andbathypelagic layers where no evident longitudinal variations were observed, while in themesopelagic layer, the eastwards increasing distribution of CR values was confirmed.
In Table 4, the power functions of the CR distribution in the water column, thecoefficients of the power functions, and the depth-integrated CR values for 2004 and2007 in the six provinces are shown. In 2004, APR and ION depth-integrated rateswere comparable and higher than those in the TYR. In 2007 the rates in the ALT,APR and ION provinces were again similar to each other but lower than those inthe ALB, TYR and EB provinces. Steep slopes of the CR distribution within the
Figure 5. Distribution along the MED of the HPP depth-normalized values (mgCm�3 d�1) in thedifferent provinces at the epi- meso- and bathypelagic layers in 2007.
154 R. La Ferla et al.

XML Template (2010) [19.7.2010–5:10pm] [143–166]K:/tandf/TAOL/TAOL_I_1_01/TAOL_A_483336.3d (TAOL) [PRINTER STAGE]
deep-water were computed at all the MED provinces. Decreasing rates were recordedin the water column below 200m, so that the exponents (x) of the CR power functionswere negative. Only the ATL exponent (x) in November 2004 was positive. In adifferent way, in 2004, the exponents (x) of the ALB function were the lowest followedby the exponents (x) of the ION, indicating a slower decrease of the respiration alongthe entire water column. It is important to remember that at low x, the exponentscorrespond to steep slopes. In 2007, the power functions changed for all the provinces,with the exception of the slope calculated for the ION equation (Table 4). Table 5reports the ‘shallow’ CR (depth integrated from 200 to 1200m), the ‘deep’ CR (depthintegrated from 1500 to 2500m) as mgCm�2 d�1 as well as the deep/shallow ratios (aspercentages) estimated in the studied areas. These ratios have been calculated using theCR integrated data derived from each equation reported in Table 4. Such a ratio wassuggested to quantify the relative importance of deep vs. shallow layer respiration asa percentage of the deepest C respiration (1500–2500m) with respect to the remainingupper aphotic layers (200–1200) [51]. The deep C respiration was stronger in November2004 than in June 2007. In particular, in 2004 the APR, TYR, ION rates, calculated atthe same depth range, were 1.76, 1.18 and 1.92 times higher than in 2007, respectively.
Assuming that the activities we measured were mainly due to the prokaryotic fractionand that all the cells have similar activity levels, cell specific activity was calculated tocompare surface-water with deep sea cell activity (from the whole data set). In Figure 7,
Figure 6. Distribution of the depth-normalized CR values in the different provinces along the MEDin the epi- meso- and bathypelagic layers in 2004 and 2007. The values are expressed asmgCm�3 d�1.
Advances in Oceanography and Limnology 155

XML Template (2010) [19.7.2010–5:10pm] [143–166]K:/tandf/TAOL/TAOL_I_1_01/TAOL_A_483336.3d (TAOL) [PRINTER STAGE]
Table
4.CR
power
functionsandCR
depth-integratedvalues
in2004and2007in
thestudiedprovinces.
2004
2007
yx
R2
mgCm�2d�1
Depth
range(m
)y
xR2
mgCm�2d�1
Depth
range(m
)
ATL
0.0001
0.9382
11.0
200–600
5.4355
�0.6747
0.8212
119.3
200–2500
ALB
3.1243
�0.6578
0.4054
67.1
200–2000
0.246
�0.1854
0.5255
154.4
200–2500
APR
0.2081
�0.1167
0.0347
211.0
200–2500
0.2382
�0.2171
0.6606
119.9
200–2500
TYR
0.3773
�0.2314
0.1947
171.9
200–3000
0.1521
�0.1241
0.0755
146.4
200–2500
ION
0.911
�0.3194
0.367
225.7
200–2500
0.4796
�0.3206
0.5843
117.8
200–2500
EB
0.2701
�0.2069
0.4401
145.9
200–2500
156 R. La Ferla et al.

XML Template (2010) [19.7.2010–5:10pm] [143–166]K:/tandf/TAOL/TAOL_I_1_01/TAOL_A_483336.3d (TAOL) [PRINTER STAGE]
CR, LAP, b-GLU and HPP cell specific activities are presented. CR rates per celldecreased with increasing depth, whilst LAP and b-GLU cell specific rates generallyshowed an opposite behavior and increased with depth. For HPP, the trend of cell specificactivity was: epi4 bathy4meso-pelagic layers.
4. Discussion
4.1. Uncertainties in the estimation of the prokaryotic activities
This study contributes to the knowledge of three microbial heterotrophic key-processesthat rule the cycle of the carbon in the sea. To our knowledge, there are few synoptic
Figure 7. Cell-specific activities (mgC cell�1 d�1) obtained dividing the CR, LAP, b-GLU, HPPvalues by the cell abundances in the different depth layers. The bars represent the standarddeviations of measurements.
Table 5. Shallow respiratory rates (depth integrated from 200 to 1200m), deep respiratory rates(depth integrated from 1500 to 2500m) and deep/shallow ratios (as percentages) estimated in thestudied Mediterranean provinces.
November 2004 June 2007
200–1200m 1500–2500m % 200–1200m 1500–2500m %
ATL – – 74.1 32.6 44ALB – – 74.7 60.2 81APR 98.2 85.8 87 59.1 45.9 78TYR 85.4 65.2 76 68.4 59.3 87ION 117.6 80.7 69 61.4 42.1 69EB – – 71.5 56.2 79
The integrated data of CR are expressed in mgCm�2 d�1.
Advances in Oceanography and Limnology 157

XML Template (2010) [19.7.2010–5:10pm] [143–166]K:/tandf/TAOL/TAOL_I_1_01/TAOL_A_483336.3d (TAOL) [PRINTER STAGE]
reports available on these activities across the whole MED basin particularly in its darkwater column. We know that some uncertainties exist with the adopted analyticalprocedures as already discussed [12,52]. The determination of respiration from ETS relieson some empirically determined factors to convert the ETS Vmax into actual rates of O2
consumption and CO2 production [53]. However, the ETS data interpretation ‘facesproblems, but no more so than those of other commonly used rate process techniques(14C and 3H-tymidine) [54] or extrapolations of remotely sensed ocean colour data to seasurface (Chl and primary production estimates)’ [55]. Currently, the ETS assay has gainedacceptance due to the ubiquity of the ETS and its role as an universal tracer of lifeand metabolism. Furthermore the ETS assay offers sensitivity and resolution levels as wellas data acquisition rates that are not attainable with incubation-based methods. It isa sensitive biochemical assay especially suited for estimating the community respirationof organisms in the meso- and bathypelagic waters [12,14,56–59]. Moreover, it facilitatesthe collection of large temporal and spatial data sets rendering it suitable foroceanographic surveys.
With regard to all enzyme assays, it is likely that pressure affects the expression ofmicrobial enzymes; consequently the true HPP and EEA in situ activities could be higherthan that estimated in atmospheric pressure. A threefold to fivefold decrease in thebacterial uptake rates of glucose and aminoacids, when deep water samples were analyzedat sea surface pressure, was found [60], while in other study [61] a 50% underestimation ofEEA values in decompressed water samples was found. The effect of in situ pressure onprokaryotic production and enzyme activities is still a matter of debate; nevertheless theyare potential rates and they indicate the capability of the prokaryotic community todecompose organic polymers and incorporate DOC into the microbial food chain.
Despite the uncertainties concerning the microbial activity levels measured here, it isnoteworthy that the information reported in this study covering a wide spatial scale is notfrequently available in the pertinent literature, excepting for a few other studies [7,62,63].
4.2. Experimental observations in 2004, 2005 and 2007
The synthesis of the observations from 2004, 2005 and 2007 showed high variability ingeneral, both with time and space of the microbial processes in the water column. Withtime, the prokaryotic abundances increased while the bacterial activities decreased from2004 (ION) or 2005 (TYR) to 2007. The time-changes of b-GLU at TYR in thebathypelagic layer were the only exception. In the context of the global warming, previousinvestigations recognized that seasonal variability could increase remineralization in warmperiods. Consequently strong heterotrophy was predicted [10]. In our case, the microbialparameters were not impacted by temperature changes, although prokaryotic activities diddecrease from November–October 2004 to June 2007.
The PA, EEA and CR in the water column showed linear decreasing trends with depthin all provinces with the exceptions of LAP at ION (2004) and TYR (2005) and CR atALB in 2004, when an increase between meso- and bathypelagic layers occurred.Altogether these findings confirmed the negative relationship between respiration anddepth. Respiration decreases by about 53% over the mesopelagic layer have been observed[13] but, at the same time, enhanced respiratory activity at 1000–2000m depth often occursand seems to be a consistent feature in various seas and oceans. In our study case, in 2004,CR declined by 57% from the epi- to meso-pelagic, but in 2005 and 2007 by only 15 and
158 R. La Ferla et al.

XML Template (2010) [19.7.2010–5:10pm] [143–166]K:/tandf/TAOL/TAOL_I_1_01/TAOL_A_483336.3d (TAOL) [PRINTER STAGE]
10%, respectively. The declines from epi- to bathypelagic were 58, 20, and 42% in 2004,
2005 and 2007, respectively.With regards to the cell specific activities, increases of exoenzymatic and respiratory
activities with depth but not for HPP were reported in the meso- and bathypelagic layers of
the sub-tropical Atlantic [12]. Decreasing cell-specific HPP values with depth, as observed
in this study, were also noted in a synthesis on microbial activity in the dark ocean [3]. This
behavior means that DOC uptake per cell is reduced, especially in the mesopelagic layer
where the lowest single-cell HPP was observed, thus suggesting a low cell metabolism in
these dark waters. The meaning of the EEA per cell increases was probably related to
availability of labile polymeric OM (both dissolved and particulate), so the cells produced
more enzyme to degrade OM, however as HPP per cell decreased, the monomers released
cannot be taken up by prokaryotes for new biomass production, causing an uncoupling of
degradation and production processes. This phenomenon was reported for bacteria living
in aggregates in euphotic zones [44] but never in the aphotic zones. Biomass production
decreases with the increasing expression of extracellular enzymes was observed only in the
sub tropical Atlantic Ocean [12].
4.3. Longitudinal patterns of cell abundances and activities
More interesting findings were the occurrences of the longitudinal patterns of the
prokaryotic activities and cell abundance along the MED basin and their variability
among the years. In 2004, PA were homogeneously distributed throughout the whole
MED basin in the three layers. The cell abundances were in agreement with a previous
study carried out in 2004 [18] and showed a similar increase at meso- and bathypelagic
layers in the Eastern stations. Instead, in two MED transects done during 1999, similar
abundance but different longitudinal distribution were observed in the epipelagic layer
[63]. In 2007, the situation changed with increasing prokaryotic abundances and
statistically different distribution in each layers compared to 2004. Significant differences
were observed between Western and Eastern basin at all layers.Enzyme levels showed a high occurrence of LAP activity during summer 2005 in the
TYR province, confirming the availability of greater amounts of labile, proteinaceous
matter prone to microbial decomposition. Conversely, high levels of b-GLU activity
measured during autumn 2004 in the ION province suggested with the presence of high
concentrations of refractory compounds, especially at the epipelagic layers. In 2007, LAP
distribution was in the same order of magnitude as that found in a previous study [63]. The
prevalence of LAP at the bathypelagic layer observed at the ALB and TYR basins
indicated an active microbial community metabolizing proteinaceous substrates still
present even in the deepest waters. High cell-specific activities in the meso- and
bathypelagic layers are a common feature of the deep-sea prokaryotes [7,12,61]. Thus,
they might express more enzymes than epipelagic cells to cleave the same amount of
monomers, due probably to the more recalcitrant nature of organic matter at depth [12].
Moreover, our hypothesis is that the renewal of the deep water in the MED probably
introduces new un-degraded organic matter [32].HPP rates were in agreement with those previously reported in the MED Sea [63],
moreover along a longitudinal transect the Western distribution was similar as well as in
the Easternmost regions an increase occurred.
Advances in Oceanography and Limnology 159

XML Template (2010) [19.7.2010–5:10pm] [143–166]K:/tandf/TAOL/TAOL_I_1_01/TAOL_A_483336.3d (TAOL) [PRINTER STAGE]
The distribution of the respiratory rates showed trends in relation with isobaths. In2004, a general W-E increasing pattern was observed in the epipelagic layer in the westernMED basin and, more clearly, in the mesopelagic layers; an opposite decreasing trend inthe bathypelagic layer also occurred. In 2007, lower values were detected in the epi- andbathypelagic layers compared to 2004, while the mesopelagic layer showed the sameEastward increasing slope. For comparison, the data of CR referred by several authorsbefore 1998 in the MED were reported and assigned within the different main MED watermasses [64] (Figure 8). The analysis of the time evolution of CR along MED transect, bycomparison with Figures 6 and 8, has shown the occurrence of variable scenarios in the Crespiration. In fact, before 1998 the CR values appeared associated to the circulatorypatterns of the main water masses such as Atlantic Surface Water (ASW), LIW andMediterranean Deep Water (MDW) roughly and partially superimposed on the epi-,meso- and bathypelagic layers, respectively, and with the preformed organic load injectedfrom the new dense water formation sites (both deep and intermediate layers) (see [64]). Infact, in the epipelagic layer the CR values decreased Eastward, in mesopelagic layer thevalues decreased Westward and in bathypelagic layer the values decreased from the deepwater formation sites toward the Western and Eastern deep MED basins [25]. Moreover,in the MDW of the EB basin, the enhanced oxidative processes depended on the newlyentrapped organic matter in the younger outflowing Aegean water and served as a firstsignal of the EMT event. After 1998, the EMT has spread into the rest of the MED.
In 2004 throughout the MED, the CR levels fell consistently, in comparison to earlierstudies and the organic matter transported by the EMT spread along the western part ofthe MED basin. In the surface layer, the enhanced respiration rates in the Easternprovinces evidenced that the close relationship between CR and the ASW circulatorypathway was missing. In the mesopelagic layers the scenario observed before 2000occurred again, although to a lower extent. In the bathypelagic the EMT, spreading
Figure 8. Distribution of CR mean values (mgCm�3 d�1) in the ALB, ION and EB provinces withinthe Atlantic Surface Water (ASW, 0–200m), Levantine Intermediate Water (LIW, 200–600m) andMediterranean Deep Water (MDW, 600m – bottom depth) before 1998 (modified from [64]).
160 R. La Ferla et al.
XML Template (2010) [19.7.2010–5:10pm] [143–166]K:/tandf/TAOL/TAOL_I_1_01/TAOL_A_483336.3d (TAOL) [PRINTER STAGE]
towards the Western basin, probably sustained the increase of CR values in the Westernprovinces while, in the Eastern provinces, the pre-2000 situation tended to be restored. In2007, at the epi- and bathypelagic layers the CR values decreased about 5 and 3 times,respectively, with respect to 2004. In the mesopelagic layer the CR values kept the sametrend already observed in 2004 and the pre-1998 years. Briefly, considering the westwarddiffusion of the EMT within the whole MED, implying, among other things, the spreadingof waters mass with peculiar physical and chemical characteristics (more saltier and rich-in-organic-carbon waters), a speculative synoptic picture could indicate the tight couplingbetween microbial respiration and the hydrological and circulatory patterns in the upperand deep layers. Nevertheless, the LIW contribution to the mesopelagic water renewalcontinues to be the prevailing engine of the MED circulatory patterns and the deepbiological activity, even though at different levels, the CR distribution suggests that themesopelagic layer was less affected by climatic changes.
4.4. Evidence of the unique biogeochemical peculiarities of the Mediterranean Sea
ATL prokaryotic activities and abundances were different from those of the MEDprovinces. These findings need to be confirmed by more data, nevertheless, the data wehave support the hypothesis that the deep-metabolism of the MED is different from otherseas. However, comparing the ‘deep’-integrated CR and the ‘shallow’-integrated CRthroughout the MED, the deep aphotic zone metabolism contributes more than 76% ofthe shallow C respiration. This argues for the occurrence of important mechanisms otherthan sinking and export production. For example, it is known that the lateral advection ofnew-formed water masses (both intermediate and deep) from convective regions as well asthe lateral injection in the winter of organic matter from the canyons and shelves ofthe northern MED enhanced C respiration in deep layers [65].
Hence, the export of biogenic carbon from the surface layers to deeper waters –normally driven by the vertically oriented biological pump – is enhanced by a considerableamount of ‘preformed’ organic products conveyed and respired within laterally movingwater masses [56].
Previous studies showed that the ratio of oceanic ‘deep’-integrated CR to the ‘shallow’-integrated CR ratios were always below 21%. The only exception was the ratio of 44%calculated in 2007 in the ATL province, in this study. This occurrence was probablystrongly connected with the outflowing of dense LIW waters from the MED to theAtlantic and, presumably, the pool of respired carbon is transported along the isopycnalsurfaces in this outflowing LIW [66]. Hence, notwithstanding climate events thattemporarily changed the MED hydrological patterns, the uniqueness of the MEDcirculation is still associated with its intermediate waters and their important physical andbiological contributions to the Atlantic waters.
5. Conclusions
In conclusion, our field studies have confirmed a great variability in the different steps inthe C cycle, in contrast to the old view of a steady-state system of MED. The occurrenceof diverse patterns in microbial metabolism has emphasized the MED’s sensitivity toclimate changes. They suggest that the export of biogenic carbon depends not only onthe biological pump but also on lateral advection of organic matter associated with
Advances in Oceanography and Limnology 161

XML Template (2010) [19.7.2010–5:10pm] [143–166]K:/tandf/TAOL/TAOL_I_1_01/TAOL_A_483336.3d (TAOL) [PRINTER STAGE]
winter cooling, deep-mixing, and off-shelf canyon flows. In this context, both CR andPA seem to be suitable markers to describe the variability in the dark deep waters of theMediterranean Sea. Despite the few data available on enzyme activities, the temporaldecrease in their activity levels argues that hydrological changes could have affectednegatively the deep-sea microbial decomposition processes. Future investigations arenecessary to verify these hypotheses and describe the temporal evolution of these trends.The increases with depth of specific enzyme activities suggest comparable behaviour ofthe MED with open ocean tropical environments. On the contrary, respiratory rates andtheir variability indicate that the MED shows biogeochemical peculiarities different fromother oceanic systems. Microbial activities in the deep layers of the MED provincesappear to be modulated by the deep circulatory patterns. Here, two pathways seemed torule the MED biogeochemical arrangement: the EMT spreading across the entire basinmainly at deep levels, and the ‘classical’ LIW circulation route in the mesopelagic layer.In fact, notwithstanding the EMT climate event that temporarily changed the MEDhydrological patterns, the intermediate waters maintain their unique and peculiarcharacteristics within the MED circulation.
Acknowledgments
We want to thank M. Dibitetto (CNR – DCSPI), M. Astraldi (CNR – ISMAR, La Spezia), L.Giuliano (CIESM), E. De Domenico (CONISMA – University of Messina) for allowing us toparticipate in MedGOOS, CIESM SUB 1/SUB 2, MedBio, FIRB-MIUR Cruises. The research wasfunded by: FIRB-MIUR Project ‘Biodiversity and organization of the communities in differentenvironmental context’ and partially by University of Messina (PRA 2003 and 2004); by MedGOOS(Global Ocean Observing System for the Mediterranean), by VECTOR Project (VulnErabilita delleCoste e degli ecosistemi marini italiani ai cambiamenti climaTici e loro ruolO nei cicli del caRboniomediterraneo) in the frame of the CARPEL – TRANSMED cruises. Again many thanks to thefollowing colleagues of IAMC-UOS.ME: F. Soraci, F. Raffa and A. Cosenza for their valuabletechnical assistance and F. Genovese, P. De Francesco, M. Furnari for their prompt and friendlyhelp in logistic support.
References
[1] J.A. Raven and P.G. Falkowski, Ocean sink for atmospheric CO2, Plant Cell Environ. 22 (1999),
pp. 741–755.[2] T.T. Packard, M. Denis, M. Rodier, and P. Garfield, Deep-ocean metabolic CO2 production:
calculations from ETS activity, Deep-Sea Res. 35 (1988), pp. 371–382.[3] J. Arıstegui, G.M. Gasol, C.M. Duarte, and G.J. Herndl, Microbial oceanography of the dark
ocean’s pelagic realm, Limnol. Oceanogr. 54 (5) (2009), pp. 1501–1529.[4] C.R. Benitez-Nelson, The biogeochemical cycling of phosphorus in marine systems, Earth-Sci. Rev.
51 (2000), pp. 109–135.
[5] F.M.M. Morel and N.M. Price, The biogeochemical cycles of trace metals in the oceans, Science
300 (5621) (2003), pp. 944–947.[6] D.A. Hansell and C. A. Carlson (eds), Biogeochemistry of Marine Dissolved Organic Matter,
Academic Press, San Diego, CA (2002), pp 1–774.[7] H.G. Hoppe, K. Gocke, R. Koppe, and C. Begler, Bacterial growth and primary production along
a north-south transect of the Atlantic Ocean, Nature 416 (2002), pp. 168–171.
[8] J.K. Andersson, J.W.M. Wijsman, P.M.J. Herman, J.J. Middelburg, K. Soetaert, and C. Heip,
Respiration patterns in the deep ocean, Geoph. Res. Lett. 31 (2004), L03304, doi: 10.1029/
2003GL018756,2004.
162 R. La Ferla et al.

XML Template (2010) [19.7.2010–5:10pm] [143–166]K:/tandf/TAOL/TAOL_I_1_01/TAOL_A_483336.3d (TAOL) [PRINTER STAGE]
[9] R. La Ferla, M. Azzaro, G. Civitarese, and M. Ribera D’Alcala, Distribution patterns of carbon
oxidation in the Eastern Mediterranean Sea: evidence of changes in remineralization processes, J.
Geophys. Res. 108 (C9) (2003), p. 8111.[10] R. La Ferla, F. Azzaro, M. Azzaro, G. Caruso, F. Decembrini, M. Leonardi, G. Maimone,
L.S. Monticelli, F. Raffa, C. Santinelli, R. Zaccone, and M. Ribera d’Alcala, Microbial
processes contribution to carbon biogeochemistry in the Mediterranean sea: spatial and temporal
scale variability of activities and biomass, J. Mar. Sys. 57 (2005), pp. 146–166.[11] R. Zaccone, L.S. Monticelli, A. Seritti, C. Santinelli, M. Azzaro, A. Boldrin, R. La Ferla, and
M. Ribera d’Alcala, Bacterial processes in the intermediate and deep layers of the Ionian Sea in
winter 1999: vertical profiles and their relationship to the different water masses, J. Geophys. Res.
108 (C9) (2003) 8117, doi: 10.1029/2002JC001625, PBE 18.[12] F. Baltar, J. Arıstegui, E. Sintes, H.M. van Haken, J.M. Gasol, and G.J. Herndl, Prokariotic
extracellular enzyme activity in relation to biomass production and respiration in the meso- and
bathypelagic waters of the (sub)tropical Atlantic, Environ. Microbiol. 11 (8) (2009),
pp. 1998–2014.
[13] P.A. del Giorgio and C.M. Duarte, Respiration in the open ocean, Nature 420 (2002),
pp. 379–384.[14] J. Arıstegui, S. Agustı, J.J. Middelburg, and C.M. Duarte, Respiration in the mesopelagic and
bathypelagic zones of the oceans, in Respiration in Aquatic Systems, P.A. del Giorgio and P.J. le
B. Williams, eds., Ofxord University Press, New York, 2005, pp. 181–205.[15] R. Koppelmann and H. Weikert, Full-depth zooplankton profiles over the deep bathyal of the NE
Atlantic, Mar. Ecol. Prog. Ser. 86 (1992), pp. 263–272.[16] P.D. Countway, R.J. Gast, M.R. Denett, P. Savai, J.M. Rose, and D.A. Caron,
Distinct protistan assemblages characterize the euphotic zone and deep sea (2500m) of the
western North Atlantic (Sargasso Sea and Gulf Stream), Environ. Microbiol. 9 (2007),
pp. 1219–1232.[17] H. Fukuda, R. Sohrin, T. Nagata, and I. Koike, Size distribution and biomass of nanoflagellates
in meso- and bathypelagic layers of the subarctic Pacific, Aquat. Microb. Ecol. 46 (2007),
pp. 203–207.[18] M. Magagnini, C. Corinaldesi, L.S. Monticelli, E. De Domenico, and R. Danovaro, Viral
abundance and distribution in mesopelagic and bathypelagic waters of the Mediterranean Sea,
Deep-Sea Res. I. 54 (2007), pp. 1209–1220.[19] C. Pedros-Alio, J.I. Calderon-Paz, N. Guixa-Boixereu, M. Estrada, and J.M. Gasol,
Bacterioplankton and phytoplankton biomass and production during summer stratification in the
northwestern Mediterranean sea, Deep-Sea Res. I. 46 (1999), pp. 985–1019.[20] F. Van Wambeke, S. Heussner, F. Diaz, P. Raimbault, and P. Conan, Small-scale variability in
the coupling/uncoupling of bacteria, phytoplankton and organic carbon fluxes along the continental
margin of the Gulf of Lions, Northwestern Mediterranean Sea, J. Mar. Syst. 33–34 (2002),
pp. 411–429.[21] T. Tanaka and F. Rassoulzadegan, Full-depth profile (0–2000m) of bacteria, heterotrophic
nanoflagellates and ciliates in the NW Mediterranean Sea: vertical partitioning of microbial
trophic structures, Deep-Sea Res. II. 49 (2002), pp. 2093–2107.
[22] G. Caruso, L.S. Monticelli, R. La Ferla, G. Maimone, M. Azzaro, F. Azzaro, F. Decembrini,
M. Leonardi, and E. De Domenico, Microbial distribution and activity within the epi-, meso- and
bathypelagic layers of the southern Tyrrhenian Sea, 3rd International Conference ‘Enzymes in the
Environment: activity, ecology, applications’, Viterbo, 2007.[23] R. Danovaro, A. Dell’Anno, C. Corinaldesi, M. Magagnini, R. Noble, C. Tamburini, and
M. Weinbauer, Major viral impact on the functioning of benthic deep-sea ecosystems, Nature. 454
(2008), pp. 1084–1087.
[24] C. Tamburini, M. Garel, B. Al Ali, B. Merigot, P. Kriwy, B. Charriere, and G. Budillon,
Distribution and activity of prokaryotes in the water column of the Tyrrhenian Sea, Deep-Sea Res.
II. 56 (2008), pp. 1533–1546.
Advances in Oceanography and Limnology 163

XML Template (2010) [19.7.2010–5:10pm] [143–166]K:/tandf/TAOL/TAOL_I_1_01/TAOL_A_483336.3d (TAOL) [PRINTER STAGE]
[25] P. Malanotte-Rizzoli, B.B. Manca, M. Ribera d’Alcala, A. Theocharis, A. Bergamasco,
D. Bregant, G. Budillon, G. Civitarese, D. Georgopoulos, G. Korres, A. Lascaratos,
A. Michelato, E. Sansone, P. Scarazzato, and E. Souvermezoglou, A synthesis of the Ionian
Sea hydrography. Circulation and water mass pathways during POEM phase I, Progr. Oceanogr.
39 (3) (1997), pp. 153–204.[26] C.M. Turley, The changing Mediterranean Sea – a sensitive ecosystem?, Progr. Oceanogr. 44
(1999), pp. 387–400.[27] A.R. Robinson, W.G. Leslie, A. Theocharis, and A. Lascaratos, Mediterranean Sea circulation,
in Ocean Currents. Academic Press, London, 2001, Doi:10.1006/rwos.2001.0376.
[28] Briand F. (ed.), Climate warming and related changes in Mediterranean marine biota, in
CIESM Workshop Monographs, Monaco, 35, (2008), 152 pp.
[29] K. Schroeder, A. Ribotti, M. Borghini, R. Sorgente, A. Perilli, and G.P. Gasparini, An extensive
Western Mediterranean Deep Water Renewal between 2004 and 2006. Geophys. Res. Lett. 35
(2008), L18605, doi: 10.1029/2008GL035146.
[30] B.B. Manca, G. Budillon, P. Scarazzato, and L. Ursella, Evolution of dynamics in the eastern
Mediterranean affecting water mass structures and properties in the Ionian and Adriatic Sea, J.
Geophys. Res. 108 (2003), p. 8102.
[31] W. Roether, B. Klein, B.B. Manca, A. Theocharis, and S. Kioroglou, Transient Eastern
Mediterranean deep waters in response to the massive dense-water output of the Aegean Sea in the
1990s, Progr. Oceanogr. 74 (4) (2007), pp. 540–571.
[32] A. Seritti, B.B Manca., C. Santinelli, E. Murru, A. Boldrin, and L. Nannicini, Relationships
between dissolved organic carbon (DOC) and water mass structure in the Ionian Sea (winter
1999). J. Geophys. Res. 108 (C9) (2003), 8112, PBE13.1–13.
[33] R. Delfanti, B. Klein, and C. Papucci, Distribution of 137Cs and other radioactive tracers in the
eastern Mediterranean: Relationship to the deepwater transient: Physical and Biochemical
Evolution of the Eastern Mediterranean in the ’90s (PBE), J. Geoph. Res. 108 (C9) (2003),
pp. PBE9.1–PBE9.10.[34] G.P. Gasparini, A. Ortona, G. Budillon, M. Astraldi, and E. Sansone, The effect of the Eastern
Mediterranean Transient on the hydrographic characteristics in the Strait of Sicily and in the
Tyrrhenian Sea, Deep-Sea Res. I. 52 (2005), pp. 915–935.[35] K. Schroeder, G.P. Gasparini, M. Borghini, and A. Ribotti, Experimental evidences of the
recent abrupt changes in the deep Western Mediterranean Sea, in Dynamics of
Mediterranean Deep Waters, CIESM Workshop Monographs, Briand F. (ed.), Monaco, 38
(2009) pp. 51–56.[36] C. Santinelli, G.P. Gasparini, L. Nannicini, and A. Seritti, Vertical distribution of dissolved
organic carbon (DOC) in the Western Mediterranean Sea in relation to the hydrological
characteristics, Deep-Sea Res. I. 49 (2002), pp. 2203–2219.[37] M. Astraldi, F. Conversano, G. Civitarese, G.P. Gasparini, M. Ribera d’Alcala, and
A. Vetrano, Water mass properties and chemical signatures in the central Mediterranean
region, J. Mar. Sys. 33–34 (2002), pp. 155–177.[38] R. La Ferla, M. Azzaro, G. Maimone, and M. Ribera d’Alcala, Microbial biomass and
respiration in the Western Mediterranean Sea, XVII AIOL Congress, Napoli, 2006.[39] L.S. Monticelli, G. Caruso, E. De Domenico, F. Azzaro, M. Azzaro, R. La Ferla, M. Leonardi,
G. Maimone, and F. Decembrini, Attivita e biomasse microbiche nelle acque superficiali del Mar
Ionio, Proc. Italian Assoc Oceanol. Limnol. 19 (II) (2008), pp. 349–359.[40] R. La Ferla, M. Azzaro, G. Budillon, C. Caroppo, F. Decembrini, and G. Maimone, Variability
of microbial biomass and activities in the water masses of the South Tyrrhenian Sea
(Mediterranean), Aq. Microb. Ecol. (submitted).[41] R. Zaccone, G. Boldrin, G. Caruso, R. La Ferla, G. Maimone, G.P. Irrera, C. Santinelli, and
M. Turchetto, Attivita sulla sostanza organica ed abbondanza microbica nel Mediterraneo durante
la campagna Transmed, XIX AIOL Congress, Venezia, 2009.
164 R. La Ferla et al.

XML Template (2010) [19.7.2010–5:10pm] [143–166]K:/tandf/TAOL/TAOL_I_1_01/TAOL_A_483336.3d (TAOL) [PRINTER STAGE]
[42] H.G. Hoppe, Significance of exoenzymatic activities in the ecology of brackish water:
measurements by means of methylumbelliferyl-substrates, Mar. Ecol. Prog. Ser. 11 (1983),
pp. 299–308.[43] H.G. Hoppe, Use of fluorogenic model substrates for extracellular enzyme activity (EEA)
measurement of bacteria, in Handbook of Methods in Aquatic Microbial Ecology, P.F. Kemp,
B.F. Sherr, E.B. Sherr, and J.J. Cole, eds., Lewis Publisher, Boca Raton, FL, 1993, pp. 423–432.[44] D.C. Smith and F. Azam, A simple, economical method for measuring bacterial protein synthesis
rates in seawater using 3H leucine, Mar. Microb. Food Webs. 6 (1992), pp. 107–114.[45] D.L. Kirchman, Leucine incorporation as a measure of biomass production by heterotrophic
bacteria, in Current Methods in Aquatic Microbial Ecology, P.F. Kemp, B.F. Sherr, E.B. Sherr,
and J.J. Cole, eds., Lewis Publisher, Boca Raton, FL, 1993, pp. 509–512.
[46] T.T. Packard, The measurement of respiratory electron transport activity in marine phytoplank-
ton, J. Mar. Res. 29 (1971), pp. 235–244.[47] K.G. Porter and Y.S. Feig, The use of DAPI for identifying and counting aquatic microflora,
Limnol. Oceanogr. 25 (1980), pp. 943–948.[48] R. La Ferla, A. Lo Giudice, and G. Maimone,Morphology and LPS content for the estimation of
marine bacterioplankton biomass in the Ionian Sea, Sci. Mar. 68 (2004), pp. 23–31.
[49] B.B. Manca, L. Ursella, and P. Scarazzato, New development of Eastern Mediterranean
circulation from thermohaline properties and marine current measurements, P.S.Z.N. Mar. Ecol.
23 (1) (2002), pp. 237–257.[50] M.J. Anderson, A new method for non-parametric multivariate analysis of variance, Austral Ecol.
26 (2001), pp. 32–46.[51] J.P. Christensen, T.T. Packard, F.Q. Dortch, H.J. Minas, J.C. Gascard, C. Richez, and
P.C. Garfield, Carbon oxidation in the deep Mediterranean Sea: evidence for dissolved organic
carbon source, Global Biogeochem. Cycles. 3 (1989), pp. 315–335.
[52] T.T. Packard and J.P. Christensen, Respiration and vertical carbon flux in the Gulf of Maine
water column, J. Mar. Res. 62, (2004), pp. 93–115.[53] J. Arıstegui and M.F. Montero, The relationship between community respiration and ETS activity
in the ocean, J. Plankton Res. 17 (1) (1995), pp. 563–571.[54] P.A. del Giorgio, The relationship between ETS (electron transport system) activity and oxygen
consumption in lake plankton: A cross-system calibration, J. Plankton Res. 14 (1992),
pp. 1723–1741.[55] C. Robinson and P.J. le B. Williams, Respiration and its measurements in surface marine waters,
in Respiration in Aquatic Systems, P.A. del Giorgio and P.J. le B. Williams, eds., Ofxord
University Press, New York, 2005, pp. 147–180.
[56] R. La Ferla, M. Azzaro, and G. Chiodo, Microplankton respiratory activity and CO2 production
rates in the Otranto Strait (Mediterranean Sea), Aquat. Ecol. 33 (1999), pp. 157–165.[57] R. Koppelmenn, H. Weikert, and C. Halsband-Lenk, Mesozooplankton community respiration
and its relation to particle flux in the oligotrophic eastern Mediterranean, Glob. Biogeochem.
Cycles. 18 (2004), p. 1039.[58] M. Azzaro, R. La Ferla, and F. Azzaro, Microbial respiration in the aphotic zone of the Ross Sea
(Antarctica), Mar. Chem. 99 (1–4) (2006), pp. 199–209.
[59] T.T. Packard and L.A. Codispoti, Respiration, mineralization, and biochemical properties of the
particulate matter in the southern Nansen Basin water column in April 1981, Deep Sea Res. I,. 54
(2007), pp. 403–414.[60] O. Tholosan, J. Garcin, and A. Bianchi, Effects of hydrostatic pressure on microbial activity
through a 2000m deep water column in the NW Mediterranean Sea, Aquat. Microb. Ecol. 32
(1999), pp. 209–218.[61] C. Tamburini, J. Garcin, and A. Bianchi, Role of deep-sea bacteria in organic matter
mineralization and adaptation to hydrostatic pressure conditions in the NW Mediterranean Sea,
Aquat. Microb. Ecol. 32 (2002), pp. 209–218.
Advances in Oceanography and Limnology 165

XML Template (2010) [19.7.2010–5:10pm] [143–166]K:/tandf/TAOL/TAOL_I_1_01/TAOL_A_483336.3d (TAOL) [PRINTER STAGE]
[62] C. Misic, M. Castellano, M. Fabiano, N. Ruggieri, V. Saggiomo, and P. Povero, Ectoenzymaticactivity in surface waters: A transect from the Mediterranean Sea across the Indian Ocean toAustralia, Deep-Sea Res. I. 53 (2006), pp. 1517–1532.
[63] F. Van Wambeke, U. Christaki, A. Giannakourou, T. Moutin, and K. Souvemerzoglou,
longitudinal and vertical trends of bacterial limitation by phosphorus and carbon in theMediterranean Sea, Microbial Ecol. 43 (2002), pp. 119–133.
[64] R. La Ferla and M. Azzaro, Microbial respiration in the Levantine Sea: evolution of the oxidative
processes in relation to the main Mediterranean water masses, Deep-Sea Res. I. 48 (10) (2001),pp. 2147–2159.
[65] T.T. Packard, M. Gomez, and J. Christensen, Fueling Western Mediterranean deep metabolism
by deep water formation and shelf-slope cascading; evidence from 1981, in Dynamics ofMediterranean Deep Waters, CIESM Workshop Monographs, F. Briand, ed., Monaco, 2008,132pp.
[66] C. Savenkoff, D. Lefevre, M. Denis, and C.E. Lambert, How do microbial communities keepliving in the M editerranean outflow within northeast Atlantic Intermediate Waters?, Deep-SeaRes. II. 40 (1–2) (1993), pp. 627–641.
166 R. La Ferla et al.


