Embed Size (px)
Citation preview
Rapid and Efficient Filtration-Based Procedure forSeparation and Safe Analysis of CBRN Mixed SamplesMostafa Bentahir1, Frederic Laduron3, Leonid Irenge1, Jerome Ambroise2, Jean-Luc Gala1,2*
1 Biothreats Unit, Defense Laboratories Department (DLD), Belgian Armed Forces, Brussels, Belgium, 2Centre de Technologies Moleculaires Appliquees, Institut de
Recherche Experimentale et Clinique, Universite catholique de Louvain, Brussels, Belgium, 3Chemical Analysis Laboratory, Defense Laboratories Department (DLD),
Belgian Armed Forces, Brussels, Belgium
Abstract
Separating CBRN mixed samples that contain both chemical and biological warfare agents (CB mixed sample) in liquid andsolid matrices remains a very challenging issue. Parameters were set up to assess the performance of a simple filtration-based method first optimized on separate C- and B-agents, and then assessed on a model of CB mixed sample. In thismodel, MS2 bacteriophage, Autographa californica nuclear polyhedrosis baculovirus (AcNPV), Bacillus atrophaeus andBacillus subtilis spores were used as biological agent simulants whereas ethyl methylphosphonic acid (EMPA) and pinacolylmethylphophonic acid (PMPA) were used as VX and soman (GD) nerve agent surrogates, respectively. Nanoseparationcentrifugal devices with various pore size cut-off (30 kD up to 0.45 mm) and three RNA extraction methods (Invisorb, EZ1and Nuclisens) were compared. RNA (MS2) and DNA (AcNPV) quantification was carried out by means of specific andsensitive quantitative real-time PCRs (qPCR). Liquid chromatography coupled to time-of-flight mass spectrometry (LC/TOFMS) methods was used for quantifying EMPA and PMPA. Culture methods and qPCR demonstrated that membraneswith a 30 kD cut-off retain more than 99.99% of biological agents (MS2, AcNPV, Bacillus Atrophaeus and Bacillus subtilisspores) tested separately. A rapid and reliable separation of CB mixed sample models (MS2/PEG-400 and MS2/EMPA/PMPA)contained in simple liquid or complex matrices such as sand and soil was also successfully achieved on a 30 kD filter withmore than 99.99% retention of MS2 on the filter membrane, and up to 99% of PEG-400, EMPA and PMPA recovery in thefiltrate. The whole separation process turnaround-time (TAT) was less than 10 minutes. The filtration method appears to berapid, versatile and extremely efficient. The separation method developed in this work constitutes therefore a useful modelfor further evaluating and comparing additional separation alternative procedures for a safe handling and preparation of CBmixed samples.
Citation: Bentahir M, Laduron F, Irenge L, Ambroise J, Gala J-L (2014) Rapid and Efficient Filtration-Based Procedure for Separation and Safe Analysis of CBRNMixed Samples. PLoS ONE 9(2): e88055. doi:10.1371/journal.pone.0088055
Editor: Bruno Verhasselt, Ghent University, Belgium
Received March 1, 2013; Accepted January 5, 2014; Published February 5, 2014
Copyright: � 2014 Bentahir et al. This is an open-access article distributed under the terms of the Creative Commons Attribution License, which permitsunrestricted use, distribution, and reproduction in any medium, provided the original author and source are credited.
Funding: This project was funded by the Department Management of Scientific and Technological Research of Defence (IRSD-RSTD, Royal High Institute forDefence) supporting research and development (grant LAND-06). The funders had no role in study design, data collection and analysis, decision to publish, orpreparation of the manuscript.
Competing Interests: The authors have declared that no competing interests exist.
* E-mail: [email protected]
Introduction
The accidental release or deliberate use of chemical, biological,
radiological and/or nuclear agents (CBRN) as weapons in warfare
and terrorism threatens indistinctly the health of civilian and
military personnel and may cause societal disruption. In recent
years, several cases of chemical and biological terrorism have been
recorded worldwide [1]. These incidents included the release of
sarin nerve gas (Japanese cult Aum Shinrikyo 1995), the use of
ricin [2], HIV-contaminated blood [3], Salmonella species and
Shigella food contaminants [4] and the release of a powdery form of
B. anthracis spores through the US post in 2001 [5]. Whereas these
incidents were perpetrated using a single category of C- or B-
agent, there is a growing concern that samples containing mixtures
of hazardous biological, chemical and radioactive substances
(CBRN mixed samples) might be used in the future.
For samples possibly contaminated with radio-elements, field
analysis is preferred because existing screening methods are fast
and reliable. However, samples suspected to contain both
chemical and biological agents (CB mixed samples) pose a serious
challenge as they need appropriate handling and preparation to
allow subsequent safe analysis of the B- and C-components of the
sample. When such samples are shipped to specialized laborato-
ries, they require a first risk-assessment to prevent subsequent
harmful exposure of personnel and contamination of the
laboratory working space. The major issue for chemists is to
remove and/or inactivate hazardous B-agents potentially contam-
inating the sample before performing subsequent chemical
analysis. While inactivation can notably be achieved by high
irradiation, this method is known to hinder the detection of
irradiation-sensitive chemical agents [6]. Alternatively, inactiva-
tion may be achieved using chemical compounds or through
removal of all B-agents by filtration. Conversely, biologists are
concerned about the best way to decrease, or eventually to
suppress specific chemical hazards in subsamples undergoing
biological analysis. These issues are further complicated when the
CB mixed sample is contained in a complex matrix such as
powder or soil. On the top of that, it should be worth noting that
the concomitant presence of C- and B-agents within the same
PLOS ONE | www.plosone.org 1 February 2014 | Volume 9 | Issue 2 | e88055
sample could affect DNA-based identification methods through
inhibition of DNA recovery [7].
In 2004, the Centers for Disease Control and Prevention (CDC)
assessed the methods for safe handling, processing and analysis of
mixed-threat environmental samples used in several laboratories in
the US. It was concluded that there was an important deficiency
on these matters (CBIAC report 2004: Assessment of protocols
involving unknown samples). Besides the CDC, many other
military organizations and civilian laboratories have drawn similar
conclusions and pointed out the crucial need for reliable methods
for safe handling and preparation of CBRN mixed samples (2007
and 2011 reports of 1st and 2nd NATO mixed sample laboratory
exercises).
However, the development of innovative new procedures for
separating CBRN mixed samples depends also on the availability
of adequate simulants structurally and biologically mimicking
genuine chemical and biological hazardous agents, respectively. In
the current model, the bacteriophage MS2 [8], the Autographa
californica nuclear polyhedrosis baculovirus (AcNPV) [9], B.
atrophaeus and B. subtilis spores were used as biological simulants
[10]. Ethyl methylphosphnic acid (EMPA) and pinacolyl methyl-
phophonic acid (PMPA) are the products of the spontaneous
hydrolysis of the chemical warfare agents (CWA) VX and GD
(soman), respectively. They were used as surrogates for the
corresponding chemical warfare agents [11–13].
The adequate pore-size for the filtration-based method was first
selected on separate C- and B-agents. Further assessment was
carried out on a model of CB mixed sample (RNA virus [MS2])
and chemical compounds [PEG-400, EMPA and PMPA]) in
complex matrices such as sand and soil. To assess accurately the
ultrafiltration efficiency, this study developed performance indica-
tors allowing a precise quantification of the biological and
chemical simulants in the filtrate and filter-retained fractions.
Materials and Methods
Biological Simulants ProductionA seed stock of bacteriophage MS2 and E. coli F+ MC-4100/
pOX38 host strain were obtained from Dr. Majdalani (Bethesda,
USA). The E. coli host was a transformed strain with the pOX38
plasmid encoding for proteins involved in pilus formation which is
an important structure required for MS2 virus infection. To
propagate MS2, E. coli host strain was grown in liquid Luria broth
at 37uC with shaking to an optical density of 0.2 at 600 nm. MS2
viruses were then added at a multiplicity of infection (MOI) of
approximately 5 and the culture was incubated under kanamycin
selection for 2 to 4 h until complete lysis of the bacterial host
strain. Cell debris were removed by centrifugation. The resulting
supernatant was subsequently filtrated through a 0.45 mm filter
and the viral stock stored at 4uC. The MS2 viral titer of the cell
lysate was determined by culture method using the double agar
overlay phage assay (DAL) [14]. Briefly, a tenfold serial dilution
containing initially 100 mL of the MS2 virus and 100 mL of an
exponential culture of the host strain were rapidly mixed with
2.5 mL of a molten Luria broth top agar (0.5% agar). The
mixtures were poured onto 20 mL of solid Luria broth plates
containing 1.5% agar. After an overnight incubation at 37uC, theresulting plaques were counted and the virus titer was calculated
taking into account the volume of virus inoculation and the
dilution factor.
The recombinant Autographa californica nuclearpolyhedrosis virus
(AcNPV) expressing Aequorea victoria green-fluorescent gene (Gen-
Bank: L29345.1) was purchased from AB vector (San Diego,
California, USA). Spodoptera frigiperda (SF9) host cell line was
purchased from Life Technologies (Carlsbad, California, USA)
and maintained in TC100 medium containing 10% fetal calf
serum at 28uC. For AcNPV production, a seed fraction of the viral
stock was diluted in 15 ml of TC100 medium supplemented with
10% fetal calf serum to an MOI of 0.2. This mixture was
subsequently added to a semiconfluent culture of SF9 monolayer
cells grown in a T75 flask. An uninfected control culture was set in
parallel to follow SF9 monolayer growth. The virus propagation
was followed by monitoring GFP fluorescence by microscopy. Five
days post-transduction, produced virus in the conditioned media
was harvested, centrifuged to remove cellular debris and the
resulting AcNPV was stored at 4uC. Bacillus subtilis and Bacillus
atrophaeus (ATCC 9372) spores were purchased from ArTechno
(Liege, Belgium) and Liofilchem (Roseto degli Abruzzi, Italy),
respectively.
PCR Assay Design and ConditionsTwo specific qPCR assays were developed to detect and
quantify the number of MS2 and AcNPV genomes in various test
samples. Primers were designed using Primer 3 algorithm [15].
For the amplification of MS2 bacteriophage, the extracted phage
RNA was first retro-transcribed into cDNA using 1411-MS2-R
primer (59-AAGTTGCTTGGAGCGACAGT) and VersoTM
cDNA synthesis kit (Thermo Scientific, Surrey, UK) according
to the manufacturer’s instructions. A specific pair of primers 430-
MS2-F: 59-TGCTACAGCCTCTTCCCTGT and 681-MS2-R:
59-ATCTTCGTTTAGGGCGAGGT was then used to amplify a
250 bp DNA fragment within the gene coding for MS2
bacteriophage assembly protein. Similarly, a pair of primers
(452-Bac-F: 59-ACATCATGGCAGACAAACCA and 696-Bac-
R: 59-GCCATGTGTAATCCCAGCAG) specific to the GFP
encoding gene, generated a DNA fragment of 245 bp from GFP-
recombinant AcNPV genomic DNA used as template for
amplification.
The qPCR assay was carried out in 25 mL reaction volume
containing 12.5 mL of 2x power SYBR Green master mix (Life
technologies, Carlsbad, California, USA), 1.5 mL of each primer
(300 nM) and 2 mL of AcNPV DNA or 2 mL of MS2 bacterio-
phage cDNA. The reaction was initiated at 50uC for 2 min, and
95uC for 10 min followed by 40 cycles of denaturation at 95uC for
15 s and annealing at 60uC for 1 min and extension for 30 seconds
at 72uC. Each sample was tested in triplicate and data were
recorded as Cycle threshold (Ct) on a TaqMan 7900HT Sequence
Detection System (Life Technologies, Carlsbad, California, USA),
using the analytical software from the same manufacturer.
To quantify the copy number of MS2 phage and AcNPV
genomes by the qPCR assays, DNA fragments obtained after PCR
amplification of MS2 and AcNPV nucleic acids were cloned into a
pCR4 vector (Life Technologies, Carlsbad, California, USA) and
transformed into a One-Shot TOP10 electro-competent E. coli
according to the manufacturer’s instructions. The resulting
recombinant plasmids (pCR4-MS2 and pCR4-AcNPV) were
isolated from positive clones using the plasmid Midi Kit (Roche,
Basel Switzerland) and inserts were verified by sequencing. The
MS2 phage and AcNPV standard curves were created from 10-
fold diluted recombinant plasmids pCR4-MS2 and pCR4-AcNPV
assaying 26105 down to 26101 copies per PCR reaction as
calculated from plasmid concentration (OD 260 nm). Each serial
dilution was tested in triplicate and in three independent
experiments. Plotting the cycle threshold values (Ct) against the
log10 of the copy number generated a standard curve from each
plasmid and allowed the accurate quantification of MS2 phage
and AcNPV in various samples.
CBRN Mixed Sample Separation and Safe Analysis
PLOS ONE | www.plosone.org 2 February 2014 | Volume 9 | Issue 2 | e88055
FiltrationVarious nanoseparation centrifugal devices bearing polyether-
sulfone membranes and displaying a pore size cut-off of 30, 100,
300 kD and 0.2 or 0.45 mm were purchased from Pall life science
(Ann Arbor, MI, USA). The ability of various filters to retain
bacteriophage MS2, AcNPV, B. atrophaeus or B. subtilis spores after
filtration was assessed. Briefly, each biological simulant was
prepared in 400 mL of Tris-Mg-Ca buffer (10 mM tris-HCl
pH 7.4, 5 mM CaCl2 and 10 mM MgCl2), applied to various
filter devices and centrifuged up to 5 min at 12000 g at room
temperature. In these conditions, the totality of the test sample
passed through the filtration membrane. Subsequently, culture-
based assays were used to measure first the amount of each
biological simulant in 100 mL of the filtrate and in an equal
volume of an original non-filtrated sample containing approxi-
mately 106, 107 and 108/ml of bacteriophage MS2, B. atrophaeus
and B. subtilis spores. Next, q-PCR assays were used to assess
filtration of bacteriophage MS2 and AcNPV through various
filters in a second step. Following filtration of 400 mL containing
approximately 108 genome copies of MS2 or AcNPV, 200 mL of
each test sample was used for nucleic acid extraction. The log10reduction capacity of each filter for each biological simulant was
calculated by subtracting the log10 number value measured in the
filtrate from that measured in the original non-filtered sample.
Recovery of MS2 Bacteriophage and AcNPV from Sandand Soil MatricesThree various extraction kits were evaluated for the reproduc-
ible and efficient extraction of nucleic acid and the optimal
recovery of MS2 bacteriophage and AcNPV from liquid, sand or
soil matrices. The kits tested included Invisorb (Startec, Berlin,
Germany), the NucliSensH miniMag semi-automated apparatus
(Biomerieux Inc., Boxtel, The Netherlands) and the fully
automated system EZ1 (Qiagen, The Netherlands) according to
the manufacturer’s instructions. Briefly, 50 mL of the viral stock
was diluted in 950 mL of Tris-Mg-Ca buffer or directly spiked in
0.25 g of sand or soil. Samples spiked with the viral simulant were
allowed to dry for 1 h. Tris-Mg-Ca buffer (950 mL) was used to
recover viruses from solid matrices by vortexing and insoluble
material was removed by filtration through a 5 mm cut-off filters.
Subsequently, 200 mL of each test sample was used for nucleic acid
extraction. Elution was carried out in 60 mL of nuclease-free
buffer. MS2 virus RNA was reverse transcribed into cDNA prior
to PCR amplification. Data were compared for identifying the best
extraction method. Virus recovery and nucleic acid extraction
from soil matrix was optimized according to a method using
glycine buffer (0.25 M, pH 9). For further optimization, this buffer
was supplemented either with 1% BSA, 0.15, 0.5 M NaCl or a
combination of BSA and salt.
The soil matrix used for spiking biological and chemical
simulants originated from Namibia. This matrix had a dry mass of
97.4% at 105uC and contained 19.4, 61 and 19.6% of clay, silt and
sand, respectively. The sand matrix contained 98.8, 0.71 and
0.49% of sand texture particles, silt and clay, respectively.
Chemical SimulantsPolyethylene glycol 400 (PEG-400), ethyl methylphosphonic
acid (EMPA) and pinacolyl methylphophonic acid (PMPA) were
purchased from Sigma-Aldrich (St-Louis, USA). The water soluble
EMPA and PMPA compounds arise from the spontaneous
hydrolysis of chemical warfare agents (CWA) VX and GD
(soman), respectively. For the quantification of PEG-400, EMPA
and PMPA chemical compounds, detection methods based on
liquid chromatography separation coupled to LC/TOFMS were
developed. Briefly, serial dilutions of each chemical compound
were prepared in water and injected into a C18 column (3615
mm). The chromatographic separation of PEG-400 dilutions was
performed at 25uC and at a flow rate of 0.2 mL/min using a
gradient of 60 to 40% of solvent A (10 mM formic acid in water)
while solvent B contained 10 mM formic acid prepared in
acetonitrile. The ESI positive mode was selected and peak area
was calculated based on the base peak chromatogram (BPC). The
chromatographic separation of EMPA and PMPA compounds was
performed at 40uC using a gradient 80–50–80% of solvent A. The
ESI negative ion mode was selected. The peak area was calculated
based on the EIC (extracted ion chromatogram) at
123.0160.05 m/z for EMPA and 179.0860.05 m/z for PMPA.
CB Mixed Sample ModelsTo mimic CB mixed samples, bacteriophage MS2 simulant and
chemical warfare agent surrogates were mixed and spiked either in
a liquid, sand or soil matrix. In the first model (CB mixed sample
nu1), 20 mL of MS2 viral stock containing 56108 genome copies
were mixed together with 0.125, 0.25, 0.5 or 1% of PEG-400 in a
1 mL final volume of Tris-Mg-Ca buffer (liquid matrix). The
second CB mixed sample model (CB mixed sample nu2) was
prepared by mixing 20 mL of a 10-fold dilution of MS2 viral stock
with 25 mg/mL of EMPA and PMPA. Mixed samples were diluted
directly in 980 mL of glycine buffer (liquid matrix) or spiked either
in a 0.25 g of sand or soil matrix. The recovery from sand or soil
matrices was carried out by adding 980 mL of glycine buffer and
subsequent prefiltration through a 5 mm cut-off filter. Separation
was carried out by filtration through a 30 kD cut-off filter. The
amount of biological and chemical simulants was then measured in
the filtrate and the filter-retained fractions, respectively and
compared with the total amounts of biological and chemical
surrogates in a control sample analyzed before filtration.
Statistical AnalysisStatistical analyses were performed using R software for
statistical computing. Intra- and inter-assay coefficient of varia-
tions (CV) was calculated for qPCR and LC/TOF quantitative
assays over the whole range of concentrations. For qPCR assays,
CV were computed from corresponding copy numbers, as
recommended in the MIQE Guidelines [16].
Percentages of recoveries were compared between types of
matrix (i.e. liquid, sand and soil) and between extraction methods
by using the non-parametric one-tailed Wilcoxon test.
Statistical tolerance intervals (95%/95%), which correspond to
intervals containing the value of 95% of all units with a probability
of 95%, were also used to characterize the filtrate and retained
fractions of CB mixed samples.
Results
Quantification of Biological and Chemical SimulantsApproximately 100 mL of bacteriophage MS2 and recombi-
nant AcNPV were produced at a titer of 1011 and 108 viral
particles/mL, respectively, as assessed by double layer agar culture
method and qPCR. For detecting and quantifying MS2 and
AcNPV, two specific qPCR assays using SYBR Green were
developed. The specificity was confirmed on a panel of irrelevant
DNA and RNA templates extracted from various unrelated viruses
and bacteria (data not shown). The pCR4-MS2 and pCR4-
AcNPV recombinant plasmids containing a MS2- and AcNPV-
specific insert, respectively, were used to construct calibration
curves. These were used to determine the absolute number of
CBRN Mixed Sample Separation and Safe Analysis
PLOS ONE | www.plosone.org 3 February 2014 | Volume 9 | Issue 2 | e88055
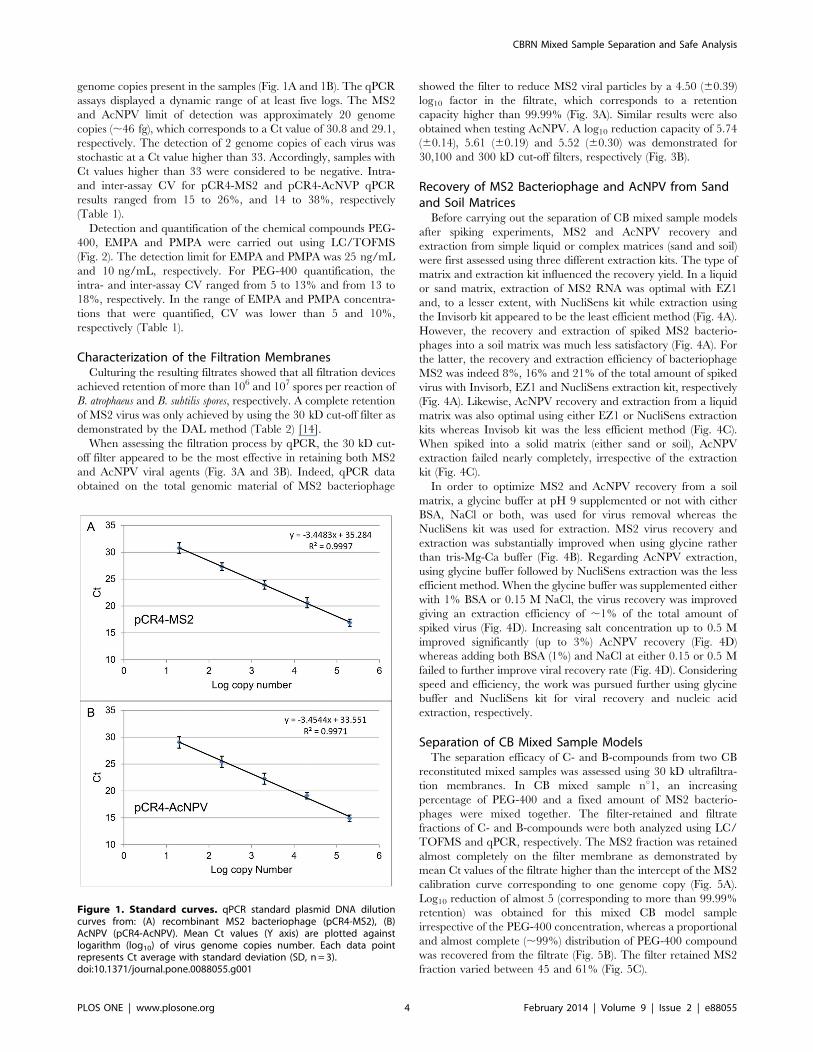
genome copies present in the samples (Fig. 1A and 1B). The qPCR
assays displayed a dynamic range of at least five logs. The MS2
and AcNPV limit of detection was approximately 20 genome
copies (,46 fg), which corresponds to a Ct value of 30.8 and 29.1,
respectively. The detection of 2 genome copies of each virus was
stochastic at a Ct value higher than 33. Accordingly, samples with
Ct values higher than 33 were considered to be negative. Intra-
and inter-assay CV for pCR4-MS2 and pCR4-AcNVP qPCR
results ranged from 15 to 26%, and 14 to 38%, respectively
(Table 1).
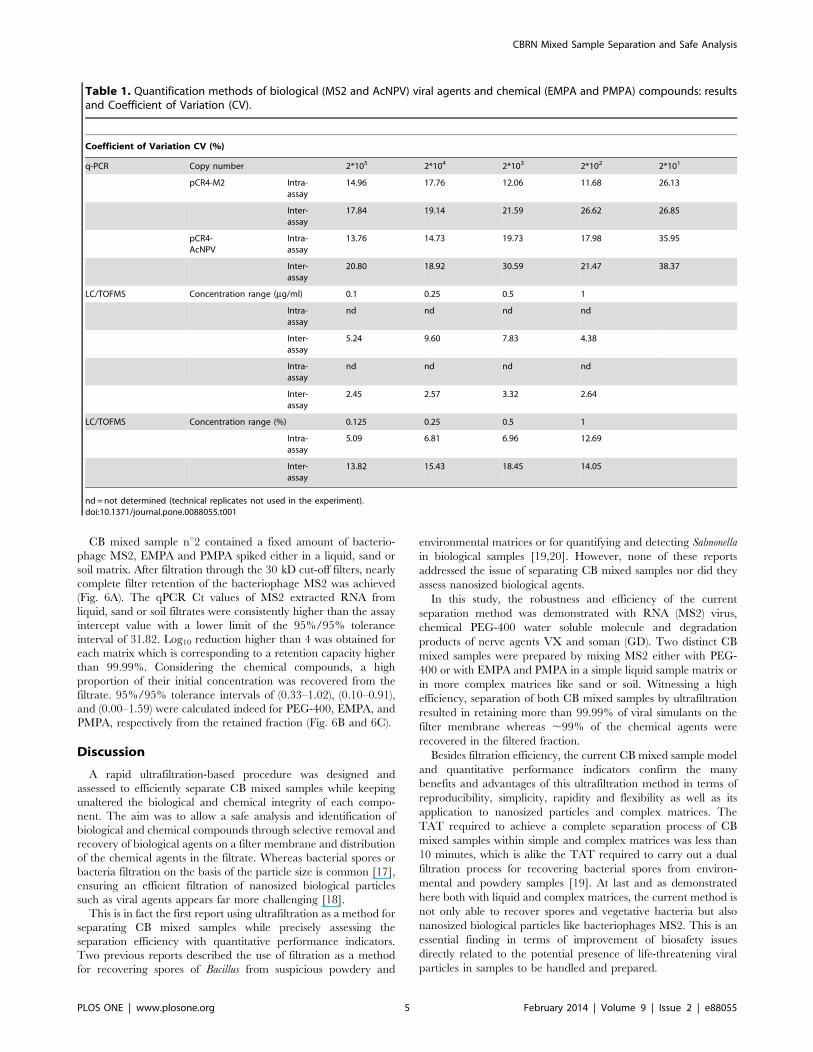
Detection and quantification of the chemical compounds PEG-
400, EMPA and PMPA were carried out using LC/TOFMS
(Fig. 2). The detection limit for EMPA and PMPA was 25 ng/mL
and 10 ng/mL, respectively. For PEG-400 quantification, the
intra- and inter-assay CV ranged from 5 to 13% and from 13 to
18%, respectively. In the range of EMPA and PMPA concentra-
tions that were quantified, CV was lower than 5 and 10%,
respectively (Table 1).
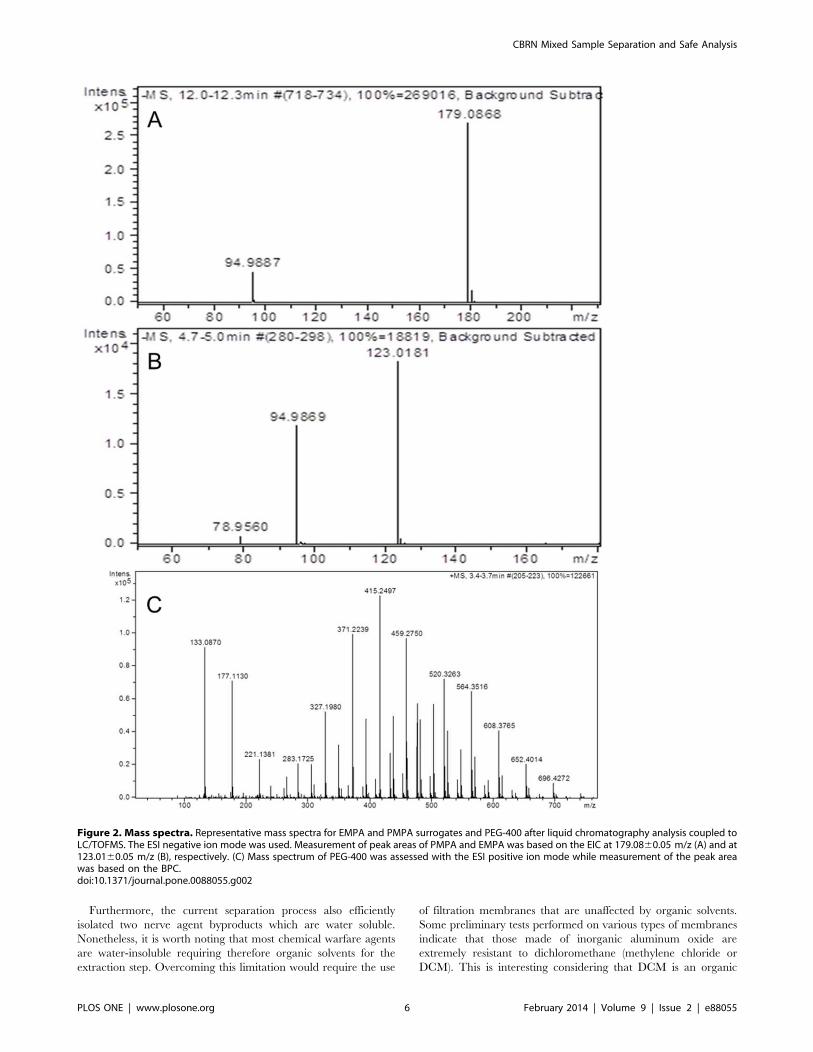
Characterization of the Filtration MembranesCulturing the resulting filtrates showed that all filtration devices
achieved retention of more than 106 and 107 spores per reaction of
B. atrophaeus and B. subtilis spores, respectively. A complete retention
of MS2 virus was only achieved by using the 30 kD cut-off filter as
demonstrated by the DAL method (Table 2) [14].
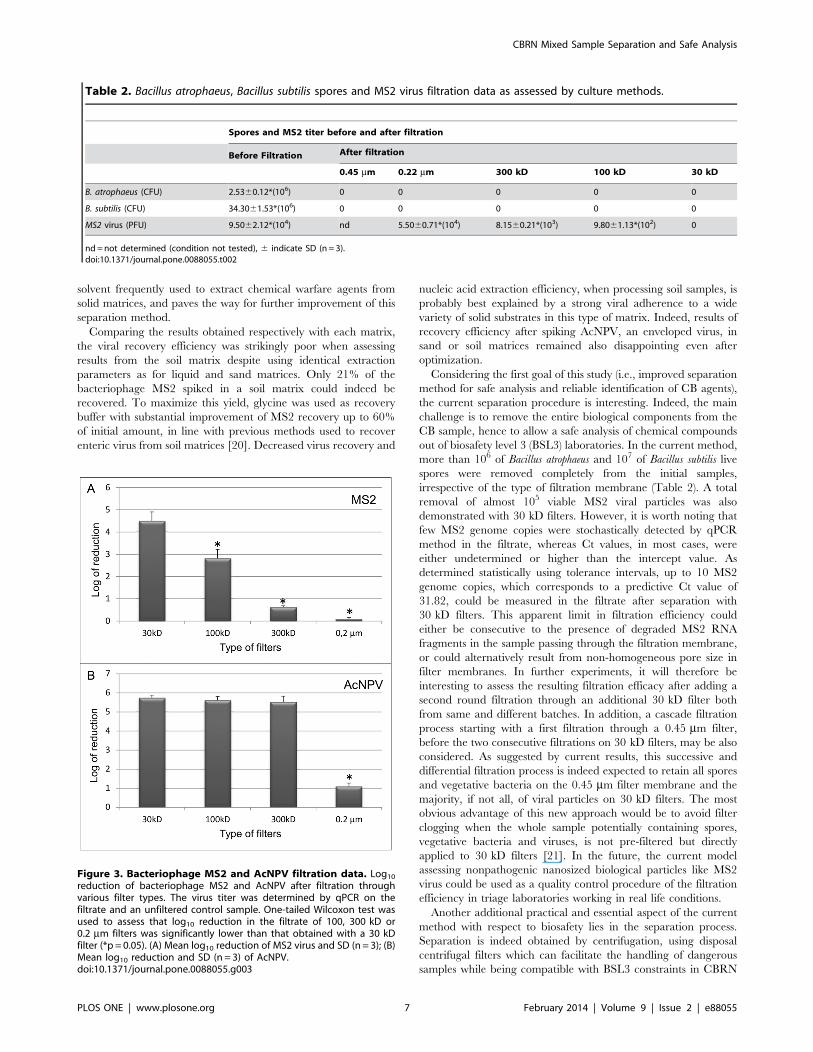
When assessing the filtration process by qPCR, the 30 kD cut-
off filter appeared to be the most effective in retaining both MS2
and AcNPV viral agents (Fig. 3A and 3B). Indeed, qPCR data
obtained on the total genomic material of MS2 bacteriophage
showed the filter to reduce MS2 viral particles by a 4.50 (60.39)
log10 factor in the filtrate, which corresponds to a retention
capacity higher than 99.99% (Fig. 3A). Similar results were also
obtained when testing AcNPV. A log10 reduction capacity of 5.74
(60.14), 5.61 (60.19) and 5.52 (60.30) was demonstrated for
30,100 and 300 kD cut-off filters, respectively (Fig. 3B).
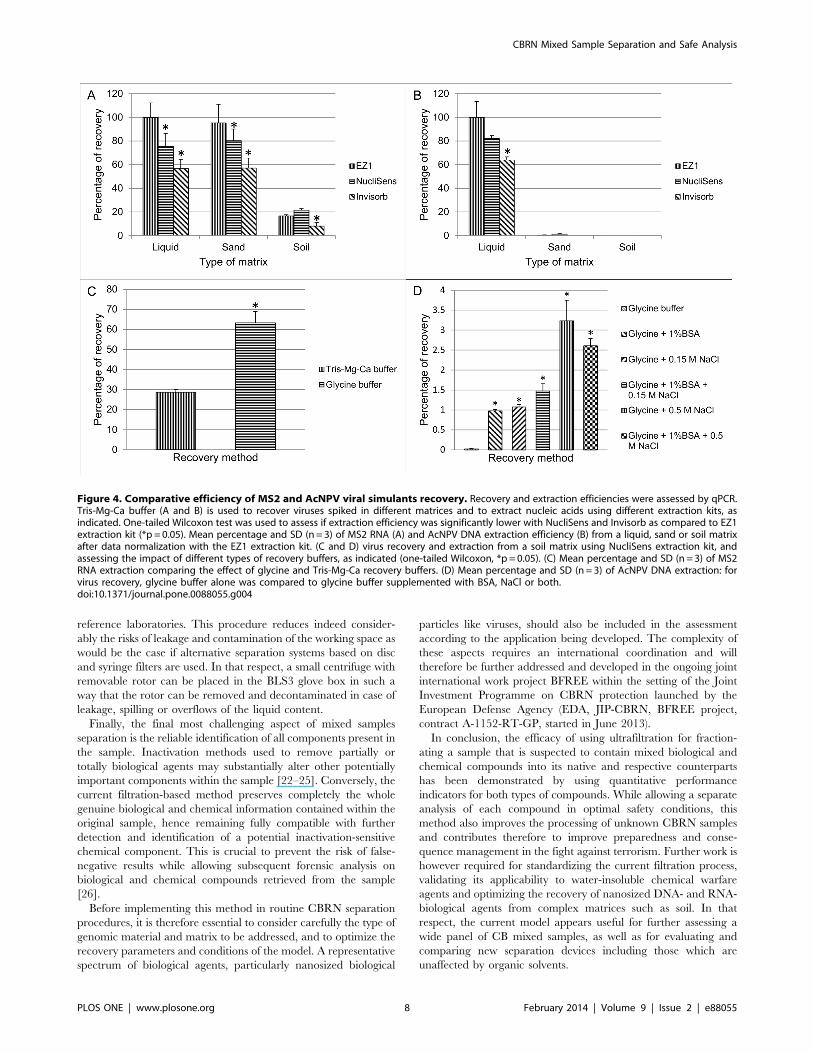
Recovery of MS2 Bacteriophage and AcNPV from Sandand Soil MatricesBefore carrying out the separation of CB mixed sample models
after spiking experiments, MS2 and AcNPV recovery and
extraction from simple liquid or complex matrices (sand and soil)
were first assessed using three different extraction kits. The type of
matrix and extraction kit influenced the recovery yield. In a liquid
or sand matrix, extraction of MS2 RNA was optimal with EZ1
and, to a lesser extent, with NucliSens kit while extraction using
the Invisorb kit appeared to be the least efficient method (Fig. 4A).
However, the recovery and extraction of spiked MS2 bacterio-
phages into a soil matrix was much less satisfactory (Fig. 4A). For
the latter, the recovery and extraction efficiency of bacteriophage
MS2 was indeed 8%, 16% and 21% of the total amount of spiked
virus with Invisorb, EZ1 and NucliSens extraction kit, respectively
(Fig. 4A). Likewise, AcNPV recovery and extraction from a liquid
matrix was also optimal using either EZ1 or NucliSens extraction
kits whereas Invisob kit was the less efficient method (Fig. 4C).
When spiked into a solid matrix (either sand or soil), AcNPV
extraction failed nearly completely, irrespective of the extraction
kit (Fig. 4C).
In order to optimize MS2 and AcNPV recovery from a soil
matrix, a glycine buffer at pH 9 supplemented or not with either
BSA, NaCl or both, was used for virus removal whereas the
NucliSens kit was used for extraction. MS2 virus recovery and
extraction was substantially improved when using glycine rather
than tris-Mg-Ca buffer (Fig. 4B). Regarding AcNPV extraction,
using glycine buffer followed by NucliSens extraction was the less
efficient method. When the glycine buffer was supplemented either
with 1% BSA or 0.15 M NaCl, the virus recovery was improved
giving an extraction efficiency of ,1% of the total amount of
spiked virus (Fig. 4D). Increasing salt concentration up to 0.5 M
improved significantly (up to 3%) AcNPV recovery (Fig. 4D)
whereas adding both BSA (1%) and NaCl at either 0.15 or 0.5 M
failed to further improve viral recovery rate (Fig. 4D). Considering
speed and efficiency, the work was pursued further using glycine
buffer and NucliSens kit for viral recovery and nucleic acid
extraction, respectively.
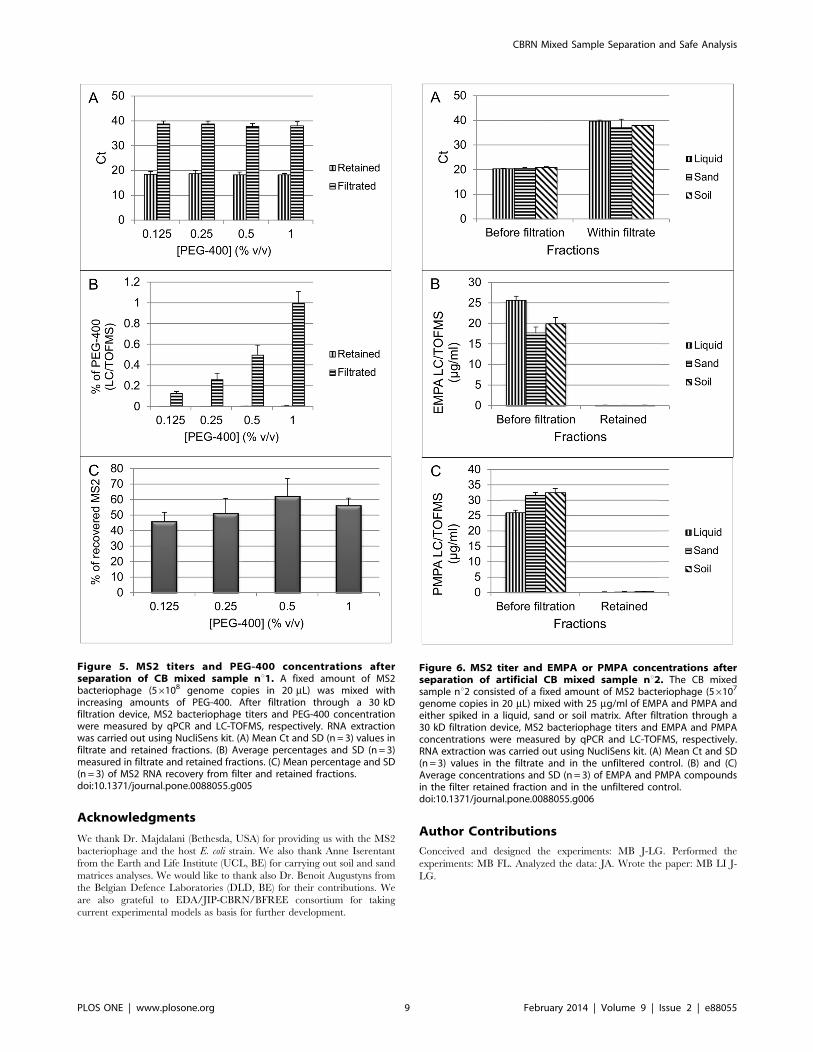
Separation of CB Mixed Sample ModelsThe separation efficacy of C- and B-compounds from two CB
reconstituted mixed samples was assessed using 30 kD ultrafiltra-
tion membranes. In CB mixed sample nu1, an increasing
percentage of PEG-400 and a fixed amount of MS2 bacterio-
phages were mixed together. The filter-retained and filtrate
fractions of C- and B-compounds were both analyzed using LC/
TOFMS and qPCR, respectively. The MS2 fraction was retained
almost completely on the filter membrane as demonstrated by
mean Ct values of the filtrate higher than the intercept of the MS2
calibration curve corresponding to one genome copy (Fig. 5A).
Log10 reduction of almost 5 (corresponding to more than 99.99%
retention) was obtained for this mixed CB model sample
irrespective of the PEG-400 concentration, whereas a proportional
and almost complete (,99%) distribution of PEG-400 compound
was recovered from the filtrate (Fig. 5B). The filter retained MS2
fraction varied between 45 and 61% (Fig. 5C).
Figure 1. Standard curves. qPCR standard plasmid DNA dilutioncurves from: (A) recombinant MS2 bacteriophage (pCR4-MS2), (B)AcNPV (pCR4-AcNPV). Mean Ct values (Y axis) are plotted againstlogarithm (log10) of virus genome copies number. Each data pointrepresents Ct average with standard deviation (SD, n = 3).doi:10.1371/journal.pone.0088055.g001
CBRN Mixed Sample Separation and Safe Analysis
PLOS ONE | www.plosone.org 4 February 2014 | Volume 9 | Issue 2 | e88055
CB mixed sample nu2 contained a fixed amount of bacterio-
phage MS2, EMPA and PMPA spiked either in a liquid, sand or
soil matrix. After filtration through the 30 kD cut-off filters, nearly
complete filter retention of the bacteriophage MS2 was achieved
(Fig. 6A). The qPCR Ct values of MS2 extracted RNA from
liquid, sand or soil filtrates were consistently higher than the assay
intercept value with a lower limit of the 95%/95% tolerance
interval of 31.82. Log10 reduction higher than 4 was obtained for
each matrix which is corresponding to a retention capacity higher
than 99.99%. Considering the chemical compounds, a high
proportion of their initial concentration was recovered from the
filtrate. 95%/95% tolerance intervals of (0.33–1.02), (0.10–0.91),
and (0.00–1.59) were calculated indeed for PEG-400, EMPA, and
PMPA, respectively from the retained fraction (Fig. 6B and 6C).
Discussion
A rapid ultrafiltration-based procedure was designed and
assessed to efficiently separate CB mixed samples while keeping
unaltered the biological and chemical integrity of each compo-
nent. The aim was to allow a safe analysis and identification of
biological and chemical compounds through selective removal and
recovery of biological agents on a filter membrane and distribution
of the chemical agents in the filtrate. Whereas bacterial spores or
bacteria filtration on the basis of the particle size is common [17],
ensuring an efficient filtration of nanosized biological particles
such as viral agents appears far more challenging [18].
This is in fact the first report using ultrafiltration as a method for
separating CB mixed samples while precisely assessing the
separation efficiency with quantitative performance indicators.
Two previous reports described the use of filtration as a method
for recovering spores of Bacillus from suspicious powdery and
environmental matrices or for quantifying and detecting Salmonella
in biological samples [19,20]. However, none of these reports
addressed the issue of separating CB mixed samples nor did they
assess nanosized biological agents.
In this study, the robustness and efficiency of the current
separation method was demonstrated with RNA (MS2) virus,
chemical PEG-400 water soluble molecule and degradation
products of nerve agents VX and soman (GD). Two distinct CB
mixed samples were prepared by mixing MS2 either with PEG-
400 or with EMPA and PMPA in a simple liquid sample matrix or
in more complex matrices like sand or soil. Witnessing a high
efficiency, separation of both CB mixed samples by ultrafiltration
resulted in retaining more than 99.99% of viral simulants on the
filter membrane whereas ,99% of the chemical agents were
recovered in the filtered fraction.
Besides filtration efficiency, the current CB mixed sample model
and quantitative performance indicators confirm the many
benefits and advantages of this ultrafiltration method in terms of
reproducibility, simplicity, rapidity and flexibility as well as its
application to nanosized particles and complex matrices. The
TAT required to achieve a complete separation process of CB
mixed samples within simple and complex matrices was less than
10 minutes, which is alike the TAT required to carry out a dual
filtration process for recovering bacterial spores from environ-
mental and powdery samples [19]. At last and as demonstrated
here both with liquid and complex matrices, the current method is
not only able to recover spores and vegetative bacteria but also
nanosized biological particles like bacteriophages MS2. This is an
essential finding in terms of improvement of biosafety issues
directly related to the potential presence of life-threatening viral
particles in samples to be handled and prepared.
Table 1. Quantification methods of biological (MS2 and AcNPV) viral agents and chemical (EMPA and PMPA) compounds: resultsand Coefficient of Variation (CV).
Coefficient of Variation CV (%)
q-PCR Copy number 2*105 2*104 2*103 2*102 2*101
pCR4-M2 Intra-assay
14.96 17.76 12.06 11.68 26.13
Inter-assay
17.84 19.14 21.59 26.62 26.85
pCR4-AcNPV
Intra-assay
13.76 14.73 19.73 17.98 35.95
Inter-assay
20.80 18.92 30.59 21.47 38.37
LC/TOFMS Concentration range (mg/ml) 0.1 0.25 0.5 1
Intra-assay
nd nd nd nd
Inter-assay
5.24 9.60 7.83 4.38
Intra-assay
nd nd nd nd
Inter-assay
2.45 2.57 3.32 2.64
LC/TOFMS Concentration range (%) 0.125 0.25 0.5 1
Intra-assay
5.09 6.81 6.96 12.69
Inter-assay
13.82 15.43 18.45 14.05
nd =not determined (technical replicates not used in the experiment).doi:10.1371/journal.pone.0088055.t001
CBRN Mixed Sample Separation and Safe Analysis
PLOS ONE | www.plosone.org 5 February 2014 | Volume 9 | Issue 2 | e88055
Furthermore, the current separation process also efficiently
isolated two nerve agent byproducts which are water soluble.
Nonetheless, it is worth noting that most chemical warfare agents
are water-insoluble requiring therefore organic solvents for the
extraction step. Overcoming this limitation would require the use
of filtration membranes that are unaffected by organic solvents.
Some preliminary tests performed on various types of membranes
indicate that those made of inorganic aluminum oxide are
extremely resistant to dichloromethane (methylene chloride or
DCM). This is interesting considering that DCM is an organic
Figure 2. Mass spectra. Representative mass spectra for EMPA and PMPA surrogates and PEG-400 after liquid chromatography analysis coupled toLC/TOFMS. The ESI negative ion mode was used. Measurement of peak areas of PMPA and EMPA was based on the EIC at 179.0860.05 m/z (A) and at123.0160.05 m/z (B), respectively. (C) Mass spectrum of PEG-400 was assessed with the ESI positive ion mode while measurement of the peak areawas based on the BPC.doi:10.1371/journal.pone.0088055.g002
CBRN Mixed Sample Separation and Safe Analysis
PLOS ONE | www.plosone.org 6 February 2014 | Volume 9 | Issue 2 | e88055
solvent frequently used to extract chemical warfare agents from
solid matrices, and paves the way for further improvement of this
separation method.
Comparing the results obtained respectively with each matrix,
the viral recovery efficiency was strikingly poor when assessing
results from the soil matrix despite using identical extraction
parameters as for liquid and sand matrices. Only 21% of the
bacteriophage MS2 spiked in a soil matrix could indeed be
recovered. To maximize this yield, glycine was used as recovery
buffer with substantial improvement of MS2 recovery up to 60%
of initial amount, in line with previous methods used to recover
enteric virus from soil matrices [20]. Decreased virus recovery and
nucleic acid extraction efficiency, when processing soil samples, is
probably best explained by a strong viral adherence to a wide
variety of solid substrates in this type of matrix. Indeed, results of
recovery efficiency after spiking AcNPV, an enveloped virus, in
sand or soil matrices remained also disappointing even after
optimization.
Considering the first goal of this study (i.e., improved separation
method for safe analysis and reliable identification of CB agents),
the current separation procedure is interesting. Indeed, the main
challenge is to remove the entire biological components from the
CB sample, hence to allow a safe analysis of chemical compounds
out of biosafety level 3 (BSL3) laboratories. In the current method,
more than 106 of Bacillus atrophaeus and 107 of Bacillus subtilis live
spores were removed completely from the initial samples,
irrespective of the type of filtration membrane (Table 2). A total
removal of almost 105 viable MS2 viral particles was also
demonstrated with 30 kD filters. However, it is worth noting that
few MS2 genome copies were stochastically detected by qPCR
method in the filtrate, whereas Ct values, in most cases, were
either undetermined or higher than the intercept value. As
determined statistically using tolerance intervals, up to 10 MS2
genome copies, which corresponds to a predictive Ct value of
31.82, could be measured in the filtrate after separation with
30 kD filters. This apparent limit in filtration efficiency could
either be consecutive to the presence of degraded MS2 RNA
fragments in the sample passing through the filtration membrane,
or could alternatively result from non-homogeneous pore size in
filter membranes. In further experiments, it will therefore be
interesting to assess the resulting filtration efficacy after adding a
second round filtration through an additional 30 kD filter both
from same and different batches. In addition, a cascade filtration
process starting with a first filtration through a 0.45 mm filter,
before the two consecutive filtrations on 30 kD filters, may be also
considered. As suggested by current results, this successive and
differential filtration process is indeed expected to retain all spores
and vegetative bacteria on the 0.45 mm filter membrane and the
majority, if not all, of viral particles on 30 kD filters. The most
obvious advantage of this new approach would be to avoid filter
clogging when the whole sample potentially containing spores,
vegetative bacteria and viruses, is not pre-filtered but directly
applied to 30 kD filters [21]. In the future, the current model
assessing nonpathogenic nanosized biological particles like MS2
virus could be used as a quality control procedure of the filtration
efficiency in triage laboratories working in real life conditions.
Another additional practical and essential aspect of the current
method with respect to biosafety lies in the separation process.
Separation is indeed obtained by centrifugation, using disposal
centrifugal filters which can facilitate the handling of dangerous
samples while being compatible with BSL3 constraints in CBRN
Table 2. Bacillus atrophaeus, Bacillus subtilis spores and MS2 virus filtration data as assessed by culture methods.
Spores and MS2 titer before and after filtration
Before Filtration After filtration
0.45 mm 0.22 mm 300 kD 100 kD 30 kD
B. atrophaeus (CFU) 2.5360.12*(106) 0 0 0 0 0
B. subtilis (CFU) 34.3061.53*(106) 0 0 0 0 0
MS2 virus (PFU) 9.5062.12*(104) nd 5.5060.71*(104) 8.1560.21*(103) 9.8061.13*(102) 0
nd =not determined (condition not tested), 6 indicate SD (n = 3).doi:10.1371/journal.pone.0088055.t002
Figure 3. Bacteriophage MS2 and AcNPV filtration data. Log10reduction of bacteriophage MS2 and AcNPV after filtration throughvarious filter types. The virus titer was determined by qPCR on thefiltrate and an unfiltered control sample. One-tailed Wilcoxon test wasused to assess that log10 reduction in the filtrate of 100, 300 kD or0.2 mm filters was significantly lower than that obtained with a 30 kDfilter (*p = 0.05). (A) Mean log10 reduction of MS2 virus and SD (n= 3); (B)Mean log10 reduction and SD (n= 3) of AcNPV.doi:10.1371/journal.pone.0088055.g003
CBRN Mixed Sample Separation and Safe Analysis
PLOS ONE | www.plosone.org 7 February 2014 | Volume 9 | Issue 2 | e88055
reference laboratories. This procedure reduces indeed consider-
ably the risks of leakage and contamination of the working space as
would be the case if alternative separation systems based on disc
and syringe filters are used. In that respect, a small centrifuge with
removable rotor can be placed in the BLS3 glove box in such a
way that the rotor can be removed and decontaminated in case of
leakage, spilling or overflows of the liquid content.
Finally, the final most challenging aspect of mixed samples
separation is the reliable identification of all components present in
the sample. Inactivation methods used to remove partially or
totally biological agents may substantially alter other potentially
important components within the sample [22–25]. Conversely, the
current filtration-based method preserves completely the whole
genuine biological and chemical information contained within the
original sample, hence remaining fully compatible with further
detection and identification of a potential inactivation-sensitive
chemical component. This is crucial to prevent the risk of false-
negative results while allowing subsequent forensic analysis on
biological and chemical compounds retrieved from the sample
[26].
Before implementing this method in routine CBRN separation
procedures, it is therefore essential to consider carefully the type of
genomic material and matrix to be addressed, and to optimize the
recovery parameters and conditions of the model. A representative
spectrum of biological agents, particularly nanosized biological
particles like viruses, should also be included in the assessment
according to the application being developed. The complexity of
these aspects requires an international coordination and will
therefore be further addressed and developed in the ongoing joint
international work project BFREE within the setting of the Joint
Investment Programme on CBRN protection launched by the
European Defense Agency (EDA, JIP-CBRN, BFREE project,
contract A-1152-RT-GP, started in June 2013).
In conclusion, the efficacy of using ultrafiltration for fraction-
ating a sample that is suspected to contain mixed biological and
chemical compounds into its native and respective counterparts
has been demonstrated by using quantitative performance
indicators for both types of compounds. While allowing a separate
analysis of each compound in optimal safety conditions, this
method also improves the processing of unknown CBRN samples
and contributes therefore to improve preparedness and conse-
quence management in the fight against terrorism. Further work is
however required for standardizing the current filtration process,
validating its applicability to water-insoluble chemical warfare
agents and optimizing the recovery of nanosized DNA- and RNA-
biological agents from complex matrices such as soil. In that
respect, the current model appears useful for further assessing a
wide panel of CB mixed samples, as well as for evaluating and
comparing new separation devices including those which are
unaffected by organic solvents.
Figure 4. Comparative efficiency of MS2 and AcNPV viral simulants recovery. Recovery and extraction efficiencies were assessed by qPCR.Tris-Mg-Ca buffer (A and B) is used to recover viruses spiked in different matrices and to extract nucleic acids using different extraction kits, asindicated. One-tailed Wilcoxon test was used to assess if extraction efficiency was significantly lower with NucliSens and Invisorb as compared to EZ1extraction kit (*p = 0.05). Mean percentage and SD (n= 3) of MS2 RNA (A) and AcNPV DNA extraction efficiency (B) from a liquid, sand or soil matrixafter data normalization with the EZ1 extraction kit. (C and D) virus recovery and extraction from a soil matrix using NucliSens extraction kit, andassessing the impact of different types of recovery buffers, as indicated (one-tailed Wilcoxon, *p = 0.05). (C) Mean percentage and SD (n = 3) of MS2RNA extraction comparing the effect of glycine and Tris-Mg-Ca recovery buffers. (D) Mean percentage and SD (n= 3) of AcNPV DNA extraction: forvirus recovery, glycine buffer alone was compared to glycine buffer supplemented with BSA, NaCl or both.doi:10.1371/journal.pone.0088055.g004
CBRN Mixed Sample Separation and Safe Analysis
PLOS ONE | www.plosone.org 8 February 2014 | Volume 9 | Issue 2 | e88055
Acknowledgments
We thank Dr. Majdalani (Bethesda, USA) for providing us with the MS2
bacteriophage and the host E. coli strain. We also thank Anne Iserentant
from the Earth and Life Institute (UCL, BE) for carrying out soil and sand
matrices analyses. We would like to thank also Dr. Benoit Augustyns from
the Belgian Defence Laboratories (DLD, BE) for their contributions. We
are also grateful to EDA/JIP-CBRN/BFREE consortium for taking
current experimental models as basis for further development.
Author Contributions
Conceived and designed the experiments: MB J-LG. Performed the
experiments: MB FL. Analyzed the data: JA. Wrote the paper: MB LI J-
LG.
Figure 5. MS2 titers and PEG-400 concentrations afterseparation of CB mixed sample nu1. A fixed amount of MS2bacteriophage (56108 genome copies in 20 mL) was mixed withincreasing amounts of PEG-400. After filtration through a 30 kDfiltration device, MS2 bacteriophage titers and PEG-400 concentrationwere measured by qPCR and LC-TOFMS, respectively. RNA extractionwas carried out using NucliSens kit. (A) Mean Ct and SD (n= 3) values infiltrate and retained fractions. (B) Average percentages and SD (n= 3)measured in filtrate and retained fractions. (C) Mean percentage and SD(n = 3) of MS2 RNA recovery from filter and retained fractions.doi:10.1371/journal.pone.0088055.g005
Figure 6. MS2 titer and EMPA or PMPA concentrations afterseparation of artificial CB mixed sample nu2. The CB mixedsample nu2 consisted of a fixed amount of MS2 bacteriophage (56107
genome copies in 20 mL) mixed with 25 mg/ml of EMPA and PMPA andeither spiked in a liquid, sand or soil matrix. After filtration through a30 kD filtration device, MS2 bacteriophage titers and EMPA and PMPAconcentrations were measured by qPCR and LC-TOFMS, respectively.RNA extraction was carried out using NucliSens kit. (A) Mean Ct and SD(n= 3) values in the filtrate and in the unfiltered control. (B) and (C)Average concentrations and SD (n= 3) of EMPA and PMPA compoundsin the filter retained fraction and in the unfiltered control.doi:10.1371/journal.pone.0088055.g006
CBRN Mixed Sample Separation and Safe Analysis
PLOS ONE | www.plosone.org 9 February 2014 | Volume 9 | Issue 2 | e88055
References
1. Tucker JB (1999) Historical trends related to bioterrorism: An empirical analysis.
Emerg Infect Dis 5: 498–504.
2. Schep LJ, Temple WA, Butt GA, Beasley MD (2009) Ricin as a weapon of mass
terror–separating fact from fiction. Environ Int 35: 1267–1271.
3. Hannay T (1995) Tokyo HIV-contaminated blood product hearing. Nat Med 1:
396.
4. Torok TJ, Tauxe RV, Wise RP, Livengood JR, Sokolow R, et al. (1997) A large
community outbreak of salmonellosis caused by intentional contamination of
restaurant salad bars. JAMA 278: 389–395.
5. Rasko DA, Worsham PL, Abshire TG, Stanley ST, Bannan JD, et al. (2011)
Bacillus anthracis comparative genome analysis in support of the Amerithrax
investigation. Proc Natl Acad Sci U S A 108: 5027–5032.
6. Petrick LM, Sabach S, Dubowski Y (2013) Degradation of VX Surrogate
Profenofos on Surfaces via in Situ Photo-oxidation. Environ Sci Technol 47:
8751–8758.
7. Wilkinson DA, Hulst AG, de Reuver LP, van Krimpen SH, van Baar BM (2007)
The fate of the chemical warfare agent during DNA extraction. J Forensic Sci
52: 1272–1283.
8. O’Connell KP, Bucher JR, Anderson PE, Cao CJ, Khan AS, et al. (2006) Real-
time fluorogenic reverse transcription-PCR assays for detection of bacteriophage
MS2. Appl Environ Microbiol 72: 478–483.
9. Garnier L, Gaudin JC, Bensadoun P, Rebillat I, Morel Y (2009) Real-time PCR
assay for detection of a new simulant for poxvirus biothreat agents. Appl Environ
Microbiol 75: 1614–1620.
10. Raju D, Waters M, Setlow P, Sarker MR (2006) Investigating the role of small,
acid-soluble spore proteins (SASPs) in the resistance of Clostridium perfringens
spores to heat. BMC Microbiol 6: 50.
11. Heleg-Shabtai V, Gratziany N, Liron Z (2006) Separation and detection of VX
and its methylphosphonic acid degradation products on a microchip using
indirect laser-induced fluorescence. Electrophoresis 27: 1996–2001.
12. Liu Q, Hu X, Xie J (2004) Determination of nerve agent degradation products
in environmental samples by liquid chromatography-time-of-flight mass
spectrometry with electrospray ionization. Analytica Chimica Acta 512: 93–101.
13. Smith JN, Noll RJ, Cooks RG (2011) Facility monitoring of chemical warfare
agent simulants in air using an automated, field-deployable, miniature mass
spectrometer. Rapid Commun Mass Spectrom 25: 1437–1444.
14. Kropinski AM, Mazzocco A, Waddell TE, Lingohr E, Johnson RP (2009)
Enumeration of bacteriophages by double agar overlay plaque assay. MethodsMol Biol 501: 69–76.
15. You FM, Huo N, Gu YQ, Luo MC, Ma Y, et al. (2008) BatchPrimer3: a highthroughput web application for PCR and sequencing primer design. BMC
Bioinformatics 9: 253.
16. Bustin SA, Benes V, Garson JA, Hellemans J, Huggett J, et al. (2009) The MIQEguidelines: minimum information for publication of quantitative real-time PCR
experiments. Clin Chem 55: 611–622.17. Carrera M, Zandomeni RO, Fitzgibbon J, Sagripanti JL (2007) Difference
between the spore sizes of Bacillus anthracis and other Bacillus species. J Appl
Microbiol 102: 303–312.18. Pei L, Rieger M, Lengger S, Ott S, Zawadsky C, et al. (2012) Combination of
crossflow ultrafiltration, monolithic affinity filtration, and quantitative reversetranscriptase PCR for rapid concentration and quantification of model viruses in
water. Environ Sci Technol 46: 10073–10080.19. Isabel S, Boissinot M, Charlebois I, Fauvel CM, Shi LE, et al. (2012) Rapid
filtration separation-based sample preparation method for Bacillus spores in
powdery and environmental matrices. Appl Environ Microbiol 78: 1505–1512.20. Bitton G, Charles MJ, Farrah SR (1979) Virus detection in soils: a comparison of
four recovery methods. Can J Microbiol 25: 874–880.21. Abdelzaher AM, Solo-Gabriele HM, Palmer CJ, Scott TM (2009) Simultaneous
concentration of Enterococci and coliphage from marine waters using a dual
layer filtration system. J Environ Qual 38: 2468–2473.22. Powell BS, Lazarev AV, Carlson G, Ivanov AR, Rozak DA (2012) Pressure
cycling technology in systems biology. Methods Mol Biol 881: 27–62.23. Rose LJ, O’Connell H (2009) UV light inactivation of bacterial biothreat agents.
Appl Environ Microbiol 75: 2987–2990.24. Sagripanti JL, Hulseweh B, Grote G, Voss L, Bohling K, et al. (2011) Microbial
inactivation for safe and rapid diagnostics of infectious samples. Appl Environ
Microbiol 77: 7289–7295.25. Talbot SR, Russmann H, Kohne S, Niederwohrmeier B, Grote G, et al. (2010)
Effects of inactivation methodson the analysis of Bacillus atrophaeus endosporesusing real-time PCR and MALDI-TOF-MS. Eng Life Sci 10: 109–120.
26. Reutter D, Schutzer SE, Craft CM, Fletcher J, Fricke FL, et al. (2010) Planning
for exercises of chemical, biological, radiological, and nuclear (CBRN) forensiccapabilities. Biosecur Bioterror 8: 343–355.
CBRN Mixed Sample Separation and Safe Analysis
PLOS ONE | www.plosone.org 10 February 2014 | Volume 9 | Issue 2 | e88055