Embed Size (px)
Citation preview

ELSEVIER Surface Science 365 (1996) 53-68
i i i i 1 | |
surface science
Reaction of 8 2 with X/Mo(l l0) (X= Fe, Pt or A1) surfaces: admetal-promoted sulfidation of Mo and the behavior of
hydrodesulfurization catalysts
Markus Kuhn, Jos6 A. Rodriguez *, Jan Hrbek Department of Chemistry, Brookhaven National Laboratory, 11973 Upton, NY11973, USA
Received 7 November 1995; accepted for publication 8 March 1996
Abstract
Exposure of a clean Mo(110) surface to $2 at room temperature or at 700 K results in a chemisorbed layer of sulfur only, without any evidence for the formation of molybdenum sulfides. The effects of Fe, Pt, and A1 on the reactivity of Mo(110) toward sulfur have been studied using thermal desorption spectroscopy (TDS), X-ray photoelectron spectroscopy (XPS) and X-ray excited Auger electron spectroscopy (XAES). It is found that at room temperature, the reactivity of $2 with muitilayers of the admetal follows the order Fe > AI >> Pt. While most of the Fe becomes sulfidized, only a few layers of the A1 become sulfidized before passivation, and the least reactive Pt surface is covered by a chemisorbed layer of sulfur. Upon exposure of the Fe/Mo(ll0) (0Fe <2 ML) surfaces to S 2 at elevated temperatures (700 K) or annealing of FeSy/Mo(110) surfaces (700--1000 K), the formation of MOSx compounds is observed, with FeSy remaining on the surface. High-temperature $2 exposure of the Pt/Mo(110) system leads to the formation of a small amount of MoSx only in the case where Opt < 1, with only a chemisorbed layer of sulfur observed on top the Pt surface in all other cases. There is no evidence for PtSx formation. High-temperature $2 exposure of A1/Mo(ll0) or annealing of the A1SJA1/Mo(ll0) system does not lead to formation of molybdenum sulfides. The thin layer A1Sx fi l l remains stable to further $2 exposure.
The effects of Fe, Pt, and AI on the rate of sulfidation of Mo are rationalized by examining the relative stabilities of the metal sulfides, the cohesive energies of the metals involved and electronic interactions in bimetallic bonding. The trends in our results are compared with trends in the activity of Mo-based bimetallic catalysts in hydrodesulfurization processes.
Keywords: Aluminum; Catalysis; Iron; Molybdenum; Platinum; Sulfides; Surface chemical reaction; Thermal desorption spectroscopy; X-ray photoelectron spectroscopy
1. Introduction
Molybdenum-based bimetallic catalysts are fre- quent ly used for hydrodesulfur izat ion (HDS) pro-
cesses in oil refineries [1,2-1. A fundamenta l knowledge of the factors that control the inter- act ion between sulfur and a bimetallic system can
* Corresponding author. Fax: + 1 516 344 5815; e-mail: [email protected]
Published by Elsevier Science B.V. PH S0039-6028 (96) 00693-0
have a significant impact in the design of new materials with superior catalytic properties. This fact has mot ivated several studies of the adsorpt ion of sulfur on well-defined bimetall ic surfaces pre- pared by the deposi t ion of a metal (Co, Ni, Cu, Ag, Au, or Zn) on to a single-crystal face of Mo [3-7-1. These studies have allowed for a clear identif ication of several p h e n o m e n a that can occur when sulfur interacts with a bimetallic surface.
Recently, we have discovered that some admetals

54 M. Kuhn et al./Surface Science 365 (1996) 53-68
promote S-Mo interactions, forming molybdenum sulfide films several layers thick [5-7]. The exact cause behind this promotional effect is unclear at present. To explore what type of metals can induce the sulfidation of molybdenum, we here examine the interaction of sulfur with Fe/Mo(ll0), Pt/Mo(110), and A1/Mo(110) surfaces. The admet- als form sulfides with a large range of thermal stabilities [8]. Aluminum forms very stable com- pounds with sulfur (A12S3, A H f = - 1 7 3 kcal mol-1). In contrast, sulfides that contain Fe (FeS2, A H f = - 4 2 kcal mo1-1) or Pt (PtS2, AHf = - 26 kcal mol- 1) are less stable than molyb- denum sulfides (MoSz, A H f = - 5 6 kcal mol-1; Mo2S3, AHf= -87 kcal mol-1).
The interaction between Mo(110) and S [9-12], Fe [13,14], Pt [15] or A1 [16] has been studied in detail in previous works. The two-dimensional phase diagram for the S/Mo(ll0) system shows several ordered structures [9,10]. At sulfur cover- ages (0s) of 0.25 and 0.50 ML, p(2 x 2) and c(2 x 2) LEED patterns are observed, respectively. The exposure of Mo(ll0) to large amounts of $2 gas produces only a chemisorbed layer of sulfur (0s g0.9 ML), without forming molybdenum sul- fides [5]. This adlayer does not desorb at temper- atures below 1200 K [10]. Auger electron spectroscopy (AES), LEED, work-function meas- urements and thermal desorption spectroscopy (TDS) have been used to study the deposition of Fe on Mo(ll0) [13,14]. At 300 K, the first mono- layer of Fe forms a structure that is pseudomorphic with respect to the Mo(ll0) lattice [13]. Alloying of Fe and Mo is observed at temperatures above 700 K [13]. For 0Fe_< 1 ML, Fe desorbs from the surface at temperatures between 1200 and 1400 K [13]. The growth and stability of Pt layers on Mo(ll0) have been examined using AES, LEED and TDS [15]. At 300 K, Pt grows in a layer-by- layer fashion on top of the molybdenum substrate. At coverages of Pt below 1 ML, LEED measure- ments show a diffuse ( 1 x 1) structure characteristic of pseudomorphic growth. No desorption of Pt is observed at temperatures below 1500 K. Finally, the interaction of A1 with Mo(ll0) has been studied using LEED, AES, work-function measure- ments and electron energy-loss spectroscopy (EELS) [16]. At low coverages (up to ,-~2 ML)
AI grows in a layer-by-layer fashion at room temperature. Desorption of the admetal occurs in the temperature range 1200-1600 K.
In this work, the reaction of $2 with various X/Mo(110) (X = Fe, Pt or AI) surfaces was investi- gated using XPS and X-ray excited Auger electron spectroscopy (XAES). The thermal stability of the resulting metal sulfides was examined using TDS.
2. Experimental
The experiments were performed in an ultra- high vacuum chamber with a base pressure of
1 x 10-xo Torr. The XPS and XAES data were acquired using a Mg K~ X-ray source and a hemispherical electron-energy analyzer with multi- channel detection. The sample was positioned such that the takeoff angle for electron detection was 30 ° off normal, in order to enhance surface sensitiv- ity. The binding-energy scales for the photoemis- sion spectra were calibrated setting the A1 2p [ 17,18], Fe 2p3/2 , Pt 4f7/2, and Mo 3d5/2 core levels of the pure metals to binding energies of 72.6, 706.8, 71.2, and 227.9 eV, respectively [18]. TDS measurements were performed using a quadrupole mass spectrometer.
The Mo(110) crystal was mounted on a manipu- lator capable of resistive heating to 1550 K. Temperatures were monitored with a W-5%Re/ W-26%Re thermocouple spot-welded to the upper edge of the sample. An electron-beam assembly provided the capability for heating to 2500 K. The Mo(l l0) surface was cleaned according to standard procedures [19]. The typical cleaning procedure involved successive cycles of oxida- tion (02 background pressure of 5 x 10 -7 Torr) at high temperature (1000-1300 K), followed by flashing to 2500 K. Cleanliness of the surface was verified by XPS.
A1, Fe and Pt deposition was performed by resistively heating a tungsten filament wrapped with a high-purity wire of the respective metal. The Fe coverages were determined by TDS area analysis following the procedure described in Ref. [13], while the A1 and Pt coverages were determined by calibrating the atomic flux of the dosers with an XPS core-level intensity analysis

M. Kuhn et al./Surface Science 365 (1996) 53-68 55
following Refs. [15,16]. S 2 gas was generated in situ by decomposing Ag2S in a solid-state electro- chemical cell: Pt/Ag/AgI/Ag2S/Pt [20]. By apply- ing a voltage across the cell, sulfur is evolved primarily as $2 with a minor component of S, clusters [20]. For small doses of $2, the coverage of sulfur on the sample was determined by measur- ing the area under the S 2p peaks, which was scaled to absolute units by comparing to the corresponding area for the saturation coverage of sulfur on Mo(ll0), known to be 0.91 ML [9,10]. In this work, coverages are reported with respect to the number of Mo(ll0) surface atoms (1.43 x 10¹⁵ atoms per cm2). One adatom (S, Fe, Pt or A1) per substrate surface atom corresponds to 0= 1 ML.
3. Results
3.1. Interaction of S 2 with Fe/Mo(110)
Fig. 1 shows the Fe 2P3/2 XPS and L 3VV Auger results obtained after exposing an Fe multilayer (0Fe>5 ML) to gaseous $2 at 320 and 500 K. Upon $2 exposure, there is a reduction in both the Fe 2p3/2 core level and L 3VV Auger intensities, with a large change in the lineshape of the photo- emission peaks. The Fe 2p3/2 peak maximum shifts slightly to higher binding energy with exposures at 320 K and has a more pronounced shift (0.3-0.4 eV) towards higher binding energy after exposure to $2 at 500 K. The Auger maximum shifts to lower binding energy (by 0.6 and 0.9 eV) at 320 and 500 K, respectively.
Fig. 2 shows the corresponding valence band and S 2p core-level XPS results for the system described above. Focussing on the upper panel, there are notable differences in the valence band spectra of the sulfur-exposed Fe multilayers as compared to that of clean Fe. The feature at the Fermi level, which is associated with emission from the Fe 3d band, is attenuated and shifts slightly towards the Fermi level, upon exposure to $2 at 320 and 500 K. Also, two new emission bands appear at ~ 5 and ~ 14 eV below the Fermi level (as indicated by the arrows in Fig. 2A). These emission features compare quite well with XPS
Fe 2p3/.2:S/Fe/Mo(110) (~)
I ' I I ' I I [ ' I
714 712 710 708 706 704 702 700
Binding Energy (eV)
E
Fe L3W Auger: S/Fe/Mo(110) (~)
I I I I I I I I L I
560 558 556 554 552 550 548 546 544 542
Binding Energy (eV)
Fig. 1. Fe 2p3/2 XPS (top) and Fe L 3VV Auger (bottom) spectra of a multilayer of Fe on Mo(110) exposed to gaseous $2 at 320 and 500 K.
valence band spectra previously reported for FeS 2
[21] and are attributed to emission from the S 3p and 3s bands, respectively. The lower panel shows the XPS results for the S 2p region of the sulfur- exposed Fe multilayer and, for comparison, a satu- ration coverage of sulfur on Mo(ll0) (0s=0.91 ML) [5,10]. It is clear that a significant uptake of sulfur on Fe occurs upon $2 exposure (greater than a chemisorbed layer) and that higher-temperature exposure increases the amount of sulfur uptake. For the sample prepared at 320 K, the S 2p3/2 peak is located at 162.0 eV. After sulfur exposure at 500 K, new emission features occur which cause the

56 M. Kuhn et aL /Surface Science 365 (1996) 53-68
v
Valence: S/Fe/Mo(110) (~)
I I " "1 I I I I ~ l l K 14 12 10 8 6 4 2 0 -2 -4
Binding Energy (eV)
S 2p: S/Fe/Mo(110) . , . Z ~ (~)
j .... \
" i + S, 500 K
0=0.91 I I I I I
168 166 164 162 160
Binding Energy (eV)
Fig. 2. Valence band (top) and S 2p (bottom) XPS spectra of a multilayer of Fe on Mo(110) exposed to gaseous S 2 at 320 and 500 K. The arrows in the valence band spectra indicate the position of the S 3s and S 3p bands at ~ 14 and ~ 5 eV, respec- tively. The dotted spectrum at the bot tom of the figure corres- ponds to 0.91 M L of S on M o( l l 0 ) .
peak to lose its typical doublet character. This indicates the presence of at least two distinct sulfur species. The bulk S 2p3/2 binding energy position for a FeS2(100) crystal has been reported to occur at 162.4 eV r22], a value somewhat higher than noted here for the sulfur-exposed Fe multilayers.
The valence band features and the significant uptake of sulfur indicate the formation of bulk- like iron sulfides throughout most of the iron film. Shifts of the Fe core levels and Auger features are
less clear to the presence of bulk-like Fe sulfides, yet the shapes for both the Fe core levels and Auger feature are distinctly different from that of the pure Fe multilayer. The core level shift for the system exposed to $2 at 500 K is ~ 0.4 eV towards higher binding energy, while the literature states values of ~ - 0 . 4 and ~3.4 eV as the shifts for FeS2 [23] and FeS [24], respectively, relative to pure Fe. Given these shifts for the compounds, it is clear that this system does not exhibit a homo- geneous phase of either FeS2 or FeS. We conclude that an FeSx non-stoichiometric compound is formed.
Fig. 3 shows the S 2p and the Mo 3d results for a system in which a monolayer film of Fe (0re=l.1 ML) is exposed to S 2 at 310 K and subsequently annealed to 700 and 1000 K. Focussing on the top panel, a broad unresolved S 2p feature is observed upon exposure to Sz at room temperature. Again, it is clear, by comparing with the area measured for the sulfur layer chemi- sorbed on a clean Mo(ll0) surface, that there is significantly higher uptake than would be expected for a chemisorbed layer, indicating the formation of an iron sulfide (FeSx) thin film. Upon annealing to 700 and 1000 K, the S 2p features resolve into a doublet. The bottom panel shows the correspond- ing results for the Mo 3d core levels. Upon expo- sure of $2 at 310 K, the Mo 3d core levels exhibit a well-resolved doublet very similar to that observed for clean Mo. Upon annealing to 700 K, a distinct second feature emerges at ~ 1.0 eV higher binding energy and increases in intensity with a further shift of ,-,0.2 eV after annealing to 1000 K. This is indicative of the formation of MoSx com- pounds [5,25,26]
The corresponding Fe 2p3/2 core level spectra (Fig. 4, top panel) shows the distinctive broad features associated with formation of iron sulfide after $2 exposure at 310 K. Upon annealing, there is a decrease in the core-level intensity and a sharpening of the features more closely resembling those of an Fe multilayer. The attenuation of the Fe core-level signal upon annealing does not indi- cate a loss of Fe adatoms from the system, rather it suggests a change in the morphology of the system (i.e. clustering) as has been previously reported for similar systems [5], or interdiffusion

M. Kuhn et aL/Surface Science 365 (1996) 5 3 ~ 8 57
S 2p: S/Fe/Mo(110) (~)
0Fe=1 .1
0=0.91,700 K
I I I I I
168 166 164 162 160
Binding Energy (eV)
Mo 3d: S/Fe/Mo(110)
0 F e = 1.1 / l
i
v \
I I I I I
234 232 230 228 226
Binding Energy (eV)
Fig. 3. S 2p (top) and Mo 3d (bottom) XPS spectra for a 1.1 ML coverage of Fe on Mo(ll0) exposed to gaseous $2 at 310 K and then annealed to 700 and 1000 K. For comparison, a saturated coverage of sulfur on Mo(ll0) is indicated by the dotted spectrum in the upper panel.
between the admetal and substrate, as has been observed before for Fe/Mo(ll0) surfaces at tem- peratures above 700 K [13]. We propose that a decomposition of the iron sulfide film occurs, allowing sulfur to migrate to the molybdenum sample to form molybdenum sulfides:
FeSx + Mo--*FeSx_y + MoSr.
The bottom panel of Fig. 4 shows the sulfur dimer desorption from the FeS=/MoSy/Mo(ll0) system described above. A single desorption feature
v # m
Fe 2p~: S/Fe/Mo(11 O) 1~)
] ' I I I I ' I I I ' I
714 712 710 708 706 704 702 700
Binding Energy (eV)
v
tO
m
S2-TDS: S/Fe/Mo(110)
OFe=1 .1
®
/ 11100 12100 1000 1300 1400 1500
Temperature (K)
Fig. 4. Fe 2p3/2 XPS results (top) for a 1.1 ML coverage of Fe on Mo(l l0) exposed to gaseous $2 at 310 K and then annealed to 700 and 1000 K. The bottom panel shows the corresponding $2 thermal desorption results of this system as it is annealed to 1500 K.
is seen, with the peak maximum at ~ 1180 K. This is somewhat less than the value reported for the decomposition of MoS=/Mo(ll0) systems (peak maximum at ~ 1260 K [5]).
In another set of experiments, we investigated the interaction of $2 with Fe/Mo(ll0) surfaces (0r¢=0.4-1.8 ML) at 700 K. The XPS results provided clear evidence for the formation of sig- nificant amounts of molybdenum sulfides in these systems. This is in contrast to the results found for the reaction of $2 with Mo(ll0) [5], where only a chemisorbed layer of sulfur is observed. Thus, it
58 M. Kuhn et al.ISurface Science 365 (1996) 53-68
appears that iron promotes the sulfidation of the Mo(110) surface.
In general, the TDS results for the FeSx/ MoSr/Mo(ll0 ) surfaces showed desorption of $2 from 1100 to 1250 K, with Fe evolving into the gas phase at temperatures between 1250 and 1350 K. At 1400 K, only chemisorbed sulfur was left on top of the Mo(ll0) substrate. Complete desorption of this sulfur adlayer occurred at tem- peratures above 2000 K [ 10].
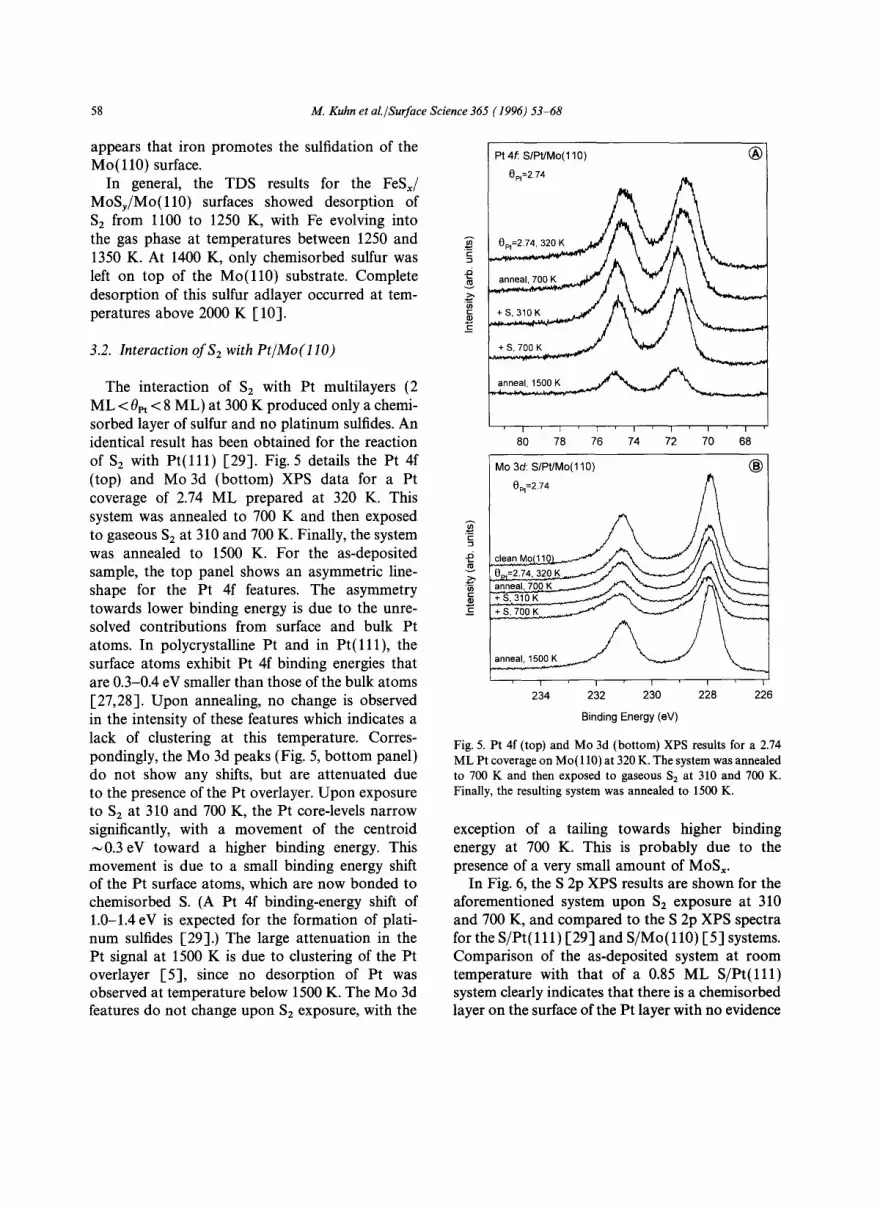
3.2. Interaction of Sz with Pt/Mo(110)
The interaction of S 2 with Pt multilayers (2 ML < Opt < 8 ML) at 300 K produced only a chemi- sorbed layer of sulfur and no platinum sulfides. An identical result has been obtained for the reaction of $2 with P t ( l l l ) [29]. Fig. 5 details the Pt 4f (top) and Mo 3d (bottom) XPS data for a Pt coverage of 2.74 ML prepared at 320 K. This system was annealed to 700 K and then exposed to gaseous $2 at 310 and 700 K. Finally, the system was annealed to 1500 K. For the as-deposited sample, the top panel shows an asymmetric line- shape for the Pt 4f features. The asymmetry towards lower binding energy is due to the unre- solved contributions from surface and bulk Pt atoms. In polycrystalline Pt and in P t ( l l l ) , the surface atoms exhibit Pt 4f binding energies that are 0.3-0.4 eV smaller than those of the bulk atoms [27,28]. Upon annealing, no change is observed in the intensity of these features which indicates a lack of clustering at this temperature. Corres- pondingly, the Mo 3d peaks (Fig. 5, bottom panel) do not show any shifts, but are attenuated due to the presence of the Pt overlayer. Upon exposure to $2 at 310 and 700 K, the Pt core-levels narrow significantly, with a movement of the centroid ~0.3eV toward a higher binding energy. This movement is due to a small binding energy shift of the Pt surface atoms, which are now bonded to chemisorbed S. ( A P t 4f binding-energy shift of 1.0-1.4 eV is expected for the formation of plati- num sulfides [29].) The large attenuation in the Pt signal at 1500 K is due to clustering of the Pt overlayer [5], since no desorption of Pt was observed at temperature below 1500 K. The Mo 3d features do not change upon $2 exposure, with the
E
PI 4£ S/Pt/Mo(110) (~)
0p1=2.74
,,Ls..?.I°.K..,W / t ~ " ! X\
I o I I I I I I
8 78 76 74 72 70 6
MO 3d: S/Pt/Mo(110) • ~ 0pi=274 ~ /~ . . ~
clean M ~ je/,.%~%,. ~ _/ / / , ,~ \ \ .
• == ~ f . i \ ' - . - - - . - ~ l / A \ \ "
I I I I I
234 232 230 228 226
Binding Energy (eV)
Fig. 5. Pt 4f (top) and Mo 3d (bottom) XPS results for a 2.74 ML Pt coverage on Mo(110) at 320 K. The system was annealed to 700 K and then exposed to gaseous $2 at 310 and 700 K. Finally, the resulting system was annealed to 1500 K.
exception of a tailing towards higher binding energy at 700 K. This is probably due to the presence of a very small amount of MoSx.
In Fig. 6, the S 2p XPS results are shown for the aforementioned system upon $2 exposure at 310 and 700 K, and compared to the S 2p XPS spectra for the S/Pt ( l l l ) [29] and S/Mo(ll0) [5] systems. Comparison of the as-deposited system at room temperature with that of a 0.85 ML S/Pt ( l l l ) system clearly indicates that there is a chemisorbed layer on the surface of the Pt layer with no evidence

M. Kuhn et al./Surface Science 365 (1996) 53-68 59
E
v
"E
S 2p: S/Pt/Mo(110) (~)
_ ~ 0p'=274 I
+s 7oo ~ . . , . , . ~ ~
I I I I I
168 166 164 162 160
Binding Energy (eV)
® S 2 TDS: S/Pt/Mo(110)
~ =.
0 E
1000 11;0 12;0 1300 14'00 1500
Temperature (K)
Fig. 6. S 2p XPS results (top) for a 2.74 ML coverage of Pt on Mo(ll0) exposed to $2. The as-deposited Pt /Mo(l l0) system was first annealed to 700 K and then exposed to gaseous $2 at 310 and 700 K (solid traces). Finally, the resulting system was annealed to 1500 K. The dotted traces correspond to S 2p spectra for a S ovedayer on P t ( l l l ) [29] and Mo(l l0) [5]. The bottom panel shows the corresponding $2 thermal desorp- tion results for the PtSJMoSy/Mo(110) system as it is annealed from 1000 to 1500 K.
of bulk platinum sulfide formation. After further $2 exposure at 700 K, the S 2p features shift to a lower binding energy and resemble a simple doublet. Even though these features appear to resemble that of the S/Mo(l l0) system, they may actually indicate a rearrangement (change of adsorption site) of the S atoms on the Pt surface [29]. (A similar change in the lineshape of the S 2p spectrum is observed when annealing
S /P t ( l l l ) surfaces from 300 to 700 K [29]). In Fig. 6A, after annealing to 1500 K, part of the S has desorbed. The remaining S is chemisorbed on the Mo substrate, as indicated by the binding energy positions of a simple S 2p doublet and also by the fact that all the S will have desorbed from Pt by 1400 K [20]. At 1500 K, the surface of the system probably consists of islands of Mo-bonded sulfur and three-dimensional (3D) clusters of Pt (see above). During the experiments of Fig. 5 and Fig. 6, very little bulk-like MoS= is produced (as shown by the photoemission results), essentially indicating that the surface of the Pt overlayer becomes passivated towards further adsorption of S, preventing the formation of significant amounts of bulk-like platinum and molybdenum sulfides. The bottom panel of Fig. 6 shows the $2 TDS results of the above system. There is a sharp desorption feature centered at ~ 1210 K, close to the desorption maximum observed for MoSx/Mo(ll0) (~1260 K [5]) and that of the previously discussed S/Fe/Mo(110) system (~ 1180 K, Fig. 4B). For comparison, an Sz desorption feature is seen for S /P t ( l l l ) at a much lower temperature of ~720 K [29].
Figs. 7 and 8 summarize the corresponding XPS and TDS results for a smaller coverage of Pt (~ 0.9 ML) on Mo(110). Essentially the behavior is quite similar to that of the larger Pt coverage with the exception that there is clearly more MoS= formed, as shown by the arrows in the Mo 3d XPS results in the bottom of Fig. 7. The inset on the top panel of Fig. 7 shows a shift of ~ 0.5 eV towards a higher binding energy in the Pt 4f core-levels after exposing the Pt /Mo(l l0) system to $2 at room temperature. The shift is larger than that seen for the higher coverage system, presumably due to the fact that within this system there is a lack of a bulk Pt signal (which obscures the results for Pt /Mo(l l0) , Opt =2.74 ML). This is also shown by the narrowness of the initial Pt 4f peak in Fig. 7A. Annealing to 1500 K induces clustering of the Pt overlayer (as evidenced by a decrease of the area under the Pt 4f features) due to the presence of the chemisorbed S adatoms on Mo(ll0). Clustering is not seen in submonolayer coverages of Pt alone on Mo( l l0) [15]. In the top panel of Fig. 8, the S 2p XPS spectra for the as-deposited system at

60 M. Kuhn et aL/Surface Science 365 (1996) 53-68
,11Pt onll Pt 4f. S/Pt/Mo(110) (~) = ,
.>,
80 78 76 74 72 70 68
Mo 3d: S/Pt/Mo(110) /¢~
Opt=09 / A I
I
234 232 230 228 226
Binding Energy (eV)
Fig. 7. Pt 4f (top) and Mo 3d (bottom) XPS results of a 0.9 ML coverage of Pt on Mo(ll0) exposed to gaseous $2 at 320 and 700 K, and subsequently annealed to 1500 K. The inset in the top panel gives a close-up comparison of the Pt 4f emission of the as-deposited system with that of the system exposed to sulfur. The arrows in the bottom panel indicate the positions for emissions due to MoSx.
310 K show features associated with S chemisorbed on P t ( l l l ) and Mo(l l0) . After high-temperature exposure to $2, the integrated S area increases significantly, and along with the Mo 3d XPS results (Fig. 7B), this again shows the formation of MoSx. The $2 TDS results shown in the bottom of Fig. 8 are again similar to those previously described for the FeSx/MoSy/Mo(110) system, with
8 e
8 E
S 2p: S/Pt/Mo(110) (~)
Opt=O. 9
anneal, 1500 K
I I I I I
168 166 164 162 160
Binding Energy (eV)
"E
v
IIJ E
¢.D
S 2 TDS: S/Pt/Mo(110)
0pt=0.9
_J 11100 1000 1200 1 00 1400
®
1500
Temperature (K)
Fig. 8. S 2p XPS results (top) for a 0.9 ML coverage of Pt on Mo(ll0) exposed to gaseous $2 at 310 and 700 K. The resulting system was annealed to 1500 K. For comparison, the results for a 0.85 ML sulfur coverage on P t ( l l l ) [29] and a 0.91 ML sulfur coverage on Mo(l l0) I-5] have been included (dotted traces). The bottom panel shows the corresponding $2 thermal desorption results of this system as it is annealed from 1000 to 1500 K.
a peak maximum located at ,-, 1250 K. No desorp- tion of Pt was seen at temperatures below 1500 K.
3.3. Interaction of S 2 with Al/Mo(110)
AI and Mo form bulk alloys [30,31] . Previous studies have shown the formation of alloys upon deposition of aluminum on the surfaces of early or late transition metals [ 32 -36 ] . In Fig. 9 we exam- ine the A1 2p and Mo 3d results for an A1 overlayer

M. Kuhn et aL/Surface Science 365 (1996) 53-68 61
~2
E
AI 2p: AI/Mo(110)
OAt~3
®
I I 60 ;, ,6 ;4 ,2 ;6 68
Binding Energy (eV)
Mo 3d: AI/Mo(110) /~ (~)
1 0AI-3 f f
,
:lean Mo(110) (x05)
~ Ldm~c~jm, _~.... / , ~ . . . ~ j ~ l ~ . , ~ _ a n n e a l , 1000 K a ~ " / / " ~ - ~ m ~ ' j ./, \ ~.
pure Mo alloy
I I 1 ] I
234 232 230 228 226 Binding Energy (eV)
Fig. 9. AI 2p (top) and Mo 3d (bottom) XPS results for a 3 ML coverage of A1 on Mo(ll0) as-deposited and annealed to 1000 K. The dashed plots in the bottom panel show the curve fit results for the AI/Mo(ll0) system after annealing to 1000 K.
(0A, ~ 3 ML) on Mo(110) which has been annealed to 1000 K (there was no desorption of AI during the heating of the sample). A small shift of ~ 0.2 eV toward lower binding is seen in the A1 2p core levels and in the Mo 3d core levels. However, the Mo 3d5/2 core-level broadening from a full width at half maximum of ,~0.8eV in Mo( l l0 ) to
1.2 eV in the annealed A1/Mo(II0) surface sug- gests the presence of a second Mo species in the bimetallic system. The use of a curve fit employing a Doniach-~unji6 lineshape [37] deafly reveals the presence of new Mo features shifted ,-,0.5 eV
below that of the Mo 3d bulk peak. These observa- tions, coupled with previous results obtained for A1 alloyed to early transition metals, clearly indi- cate the formation of an A1-Mo alloy. When A1 is bonded to an early transition metal such as Ti, both core levels experience shifts toward lower binding energy (0.3 eV for the Ti 2p core levels and 0.7 eV for the A1 2p core levels [38]). For binary alloys of aluminum, it is not uncommon to see core-level binding-energy shifts in the same direction for both metals [32,38].
Fig. 10 shows the A1 2p and 2s XPS results for
AI 2p: S/AI/Mo(110)
0AI~10
~ A I 320 K
annea
®
I I 80 ,8 ;8 , , ;0 6,
Binding Energy (eV)
AI 2s: S/AI/Mo(110) (~)
OAt1° . ~
I I I I 122 120 118 116 114
Binding Energy (eV)
Fig. 10. A12p (top panel) and 2s (bottom panel) XPS results for a 10 ML coverage of AI on Mo(ll0). The system was exposed to gaseous $2 at 310 K, annealed to 700 K, and subse- quently exposed to sulfur at 700 and 900 K.

62 M. Kuhn et aL/Surface Science 365 (1996) 53-68
an A1 multilayer (,~ 10 ML) supported on Mo(110) and exposed to S 2 at various substrate temper- atures. The as-deposited AI/Mo(110) system shows an unresolved doublet for the A1 2p and a single peak for the A1 2s core level. With exposure to $2 at room temperature, a new peak emerges in the spectra of both core levels at ,-,2.1 eV higher binding energy. This is similar to the ~2.4 eV binding energy shift (relative to pure A1) reported for A12Sa [39]. Annealing or higher-temperature exposure at 700 K does not cause any further change to the core-level spectra. Exposure at 900 K causes a small shift towards lower binding energy, with a corresponding small decrease in the A1/A1Sx intensity ratio.
Fig. 11 summarizes the Mo 3d and S 2p XPS results for the system described above. Exposure of the multilayer A1 film to $2 at room temperature leads to an attenuation of the Mo 3d features with no discernible binding-energy shifts. The S 2p region shows a significant uptake, higher than that which would be expected for a chemisorbed layer. These S 2p features do not resemble those of sulfur interacting with a Mo(110) surface. These observa- tions support the conclusion that only a thin film of A1Sx is formed. Annealing of this system to 700 K and subsequent exposure at this temperature further attenuates the Mo 3d features and causes the emergence of a new feature at a lower binding energy. The S 2p features do not show any signifi- cant changes. After exposure at 900 K, the Mo 3d signal increases and broadens significantly with the centroid shifting by ~ 0.4 eV towards a lower binding energy. The S 2p spectra show a small increase in area with no significant change in the appearance of the emission features. These observa- tions, coupled with the small decrease in the A1/A1Sx intensity ratio, indicate alloy formation between A1 and the Mo substrate at these elevated temperatures. There is no evidence of MoS~ forma- tion in either the Mo 3d or S 2p spectra. Thus, for the dosing of $2 to a thick A1 overlayer at 900 K, one sees evidence for the reaction of sulfur with the A1 atoms at the top of the film, while the A1 atoms that are at the metal-metal interface, and cannot reach the sulfur, alloy with the Mo sub- strate. The net result is a A1SJMoA1 r system.
Fig. 12 shows A1 2p and Mo 3d spectra acquired
Me 3d: S/AI/Mo(110) (~)
0AI~10
clean Mo(110) ~ / ~ 3 k { X ~ 0"25
I I I I
234 232 230 228 226
Binding Energy (eV)
v
E
S 2p: S/AI/Mo(110) (~)
OAC I 0 . ~ ~ .
S/Mo 110) 0=0.91
I I I I I 168 166 164 162 160
Binding Energy (eV)
Fig. 11. Mo 3d (top) and S 2p (bottom) XPS results for a 10 ML coverage of AI on Mo(ll0). The system was exposed to gaseous $2 at 310 K, annealed to 700 K, and subsequently exposed to sulfur at 700 and 900 K. For comparison, the bottom panel includes a spectrum showing the results for a 0.91 ML sulfur coverage on Mo(110).
after dosing S 2 to an A1-Mo alloy. This alloy was formed by dosing ,-~3 ML of A1 to Mo( l l0) at 320 K with subsequent annealing of the system to 1000 K. The A1 2p spectra show no significant changes (the binding-energy shift is less than 0.2 eV), however, the Mo 3d features show a shift of the centroid to a lower binding energy and an asymmetric lineshape which must be fitted by two components (see Fig. 9). As previously stated, this indicates the formation of an A1-Mo alloy.

M. Kuhn et al.tSurface Science 365 (1996) 53-68 63
E
AI 2p: S/AI/Mo(110) (~)
0A1~3
' ' 7'8 76 ' ' '0 82 80 74 72 7 68
Binding Energy (eV)
Mo 3d: S/AI/Mo(110) (~)] I
"- clean Mo(11.0)~,_,~,,,.~ .. f \ ~ ,/ / ~k~.tx05fl
234 232 230 228 226
Binding Energy (eV)
Fig. 12. A1 2p (top) and Mo 3d (bottom) XPS results for an A1-Mo alloy exposed to gaseous S 2. ~ 3 M L of AI were depos- ited on M o ( l l 0 ) at 320 K and the system was annealed to 1000 K and then exposed to gaseous $2 at 320 K. Finally, it was annealed to 700 K and exposed to $2 at 700 K.
Exposure of this system to S 2 at 320 K leads to the formation of AlSo, as indicated by the large feature observed in the A1 2p spectra at ~2.1 eV higher binding energy. Annealing to 700 K or further exposure to $2 at 700 K leads only to a small shift and increase in the signal due to AlSo. The Mo 3d features reveal a small narrowing upon sulfur exposure (probably due to decomposition of some of the A1-Mo alloy to form A1Sx), but no other changes after annealing and high-temper-
ature exposure. No evidence for MoS~ formation is observed in these spectra.
4. Discussion
4.1. Admetal-promoted sulfidation of Mo( l l O)
Exposure of $2 gas to a Mo(ll0) substrate does not lead to formation of bulk-like M o S 2 , but only to a chemisorbed layer of sulfur even though this process is thermochemically favorable (AG=-73 kcal mo1-1) [40]. The large cohesive energy of Mo provides a barrier for S penetration into the bulk and thus prevents MoSx formation. In addi- tion, the large difference between the surface free energies of S (0.08 J m -2 [41]) and Mo (2.88 J m -2 [41]) forces sulfur to remain on the surface of the system. As previously described [5,7], the addition of a second metal can promote the sulfi- dation of the Mo substrate by overcoming the barrier for S penetration into the bulk.
By studying the effects of the addition of Fe, Pt and A1 to Mo(ll0), a large range of cohesive energies (78.1, 98.7, 134.7 and 157.2 kcal tool -1 for A1, Fe, Pt and Mo, respectively [42]) and metal sulfide stabilities (see Table 1) have been examined. In principle, the extent of promoted MoSx forma- tion depends upon the stability of the admetal sulfide and the cohesive energy of the admetal. The larger the cohesive energy of the metal overlayer, the more difficult the diffusion of sulfur toward the Mo substrate. In order for the process of MoSx formation to be kinetically fast, the admetal sulfide must be less stable than MoSx, to allow for the rapid migration of sulfur from the admetal to Mo.
Of the three admetals examined here, Fe induces the highest production of MoSx. The Fe adlayers readily react with sulfur to form FeS~. Since the iron sulfide is less stable than molybdenum sulfide (see Table 1), upon annealing or exposure to $2 at elevated temperatures a solid-state reaction occurs, transferring sulfur from the admetal to Mo. This process continues until a few layers of MoS~ are formed, and the stable molybdenum sulfide passi- vates the remaining Mo from further sulfidation.
Pt induces a small amount of MoS~ formation (relative to Fe), and only in the case where the Pt

64 M. Kuhn et al./Surface Science 365 (1996) 53-68
Table 1
Hea t s of fo rmat ion and sulf idat ion of X/P t (111) and X /Mo(110) surfaces
Admeta l sulfide dHf ° (kcal m o l - 1 ) a P r o m o t e d fo rmat ion of Subst ra te sulfide
PtS~ MoSx
AHf ° (kca l t o o l - l ) ~'
Silver Ag2S - 7.8 Yes Yes
C o p p e r Cu2S - 19.0 Yes Yes CuS - 12.7
I ron FeS - 23.9 ? Yes
FeS2 (pyri te) - 4 2 . 9 Zinc ZnS (wurtzite) - 46.0 N o Yes
Coba l t CoS - 19.8 ? Yes
Co2S 3 - 35.2 Nicke l NiS - 19.6 ? Yes
NiaS 2 - 48.5 ? Yes
A l u m i n u m AI2S 3 - 173.0 N o N o
P l a t i n u m PtS - 19.5
PtS2 - 26.0
M o l y b d e n u m Mo2S 3 - 87.0
MoS 2 - 56.2
a F r o m Ref. [81.
coverage is below 1 MU This is a consequence of the fact that sulfur cannot penetrate through thick Pt adlayers to the Mo interface due to the high cohesive energy of Pt and the large difference in surface free energies between sulfur and Pt [41]. (A similar behavior has been seen for S on P t ( l l l ) [29].) At submonolayer coverages of Pt there are sites available for sulfur adsorption in the presence of Pt atoms which then allow sulfur to enter into the Mo lattice and form bulk-like MoSx. The very small amount of MoS~ that is formed in the case of the 2.74 ML Pt coverage is probably due to the inhomogeneity of the thin film, allowing some sulfur to reach the Mo interface through defects in the adlayer.
The cohesive energy of A1 is relatively low and it reacts readily with Sz to form aluminum sulfide on Mo(110). However, the thermal stability of the aluminum sulfide is much higher than that of the molybdenum sulfide (see Table 1), and therefore there is no decomposition of the aluminum sulfide film and subsequent migration of the sulfur to form molybdenum sulfide. Instead, there is a decomposition of A1-Mo alloys to form alumi- num sulfides.
It is of interest to compare admetal-induced sulfide formation in Pt(111) and Mo(110) systems.
In Fig. 13 a series of admetal-sulfide systems are shown for P t ( l l l ) and Mo(l l0) surfaces. In the left panel of Fig. 13, the Pt 4f core levels are shown for X/Pt ( l l l ) systems and clean P t ( l l l ) exposed to $2 at 550 K. The right panel shows the Mo 3d core levels for X/Mo(ll0) systems and clean Mo(ll0) exposed to $2 at 700 K. Table 1 summa- rizes the heats of formation for the admetal-sulfides and the corresponding heats of formation for the substrate sulfides. Also indicated in Table 1 are the results for admetal-promoted sulfidation of the P t ( l l l ) or Mo(ll0) substrates. Focussing on the P t ( l l l ) substrate, both Ag [29] and Cu [43] induce the formation of platinum sulfides, while neither Zn [43], AI [44] nor clean Pt [29] exhibit any PtSx formation. As indicated in Table 1, both Zn and A1 form more stable sulfides than Pt. This makes a transfer of S to Pt and the formation of PtSx difficult. In the case of the Mo(110) substrate, MoS2 is more stable than ZnS and therefore bulk sulfidation of Mo is observed in the S2/Zn/Mo (110) system [7]. Similarly, it is observed that aluminum sulfide is much more stable than molyb- denum sulfides, and therefore no bulk sulfidation is observed for S2/A1/Mo(ll0). It can be stated, therefore, that the relative stabilities of the admetal sulfides have a direct impact on whether or not

M. Kuhn et aL/Surface Science 365 (1996) 53-68 65
I Pt 4~ $2 at 550 K PiSx (~ [ Mo 3d: S~ at 700 K / ° (~)
, sulfide
I I I I
82 80 78 76 74 72 70 68 234 232 230 228 228
Binding Energy (eV) Binding Energy (eV)
Fig. 13. Pt 4f (left) XPS results comparing the effect of $2 exposure at 550 K to clean Pt(111) with a series of X/Pt(111) systems (X-- Ag [29], Cu [43], Zn [43] and A1 [44]). Corresponding Mo 3d (right) XPS results comparing the effect of $2 exposure at 700 K to clean Mo(l l0) with a series of X/Mo(ll0) systems (X=Ag [5], Cu [5], Fe, Zn [7] and A1). The heat of formation for the sulfides of the admetals increases (more exothermic) when going from the top to the bottom of the figure.
sulfidation of the metal substrate will occur. In bimetallic systems, in which the admetals form sulfides of higher stability than those formed by the substrate, the adsorption of sulfur stops once the admetal is saturated with sulfur.
From the results discussed above, it is clear that only in bimetallic systems in which the admetal forms sulfides that are less stable than those formed by the substrate can one see an admetal-promoted sulfidation of the metal substrate. Once that this condition is satisfied, the magnitude of the "promo- tional effect" depends on several factors. For exam- ple, Fe and Ni form sulfides that exhibit similar stabilities [8], but Ni shows a much larger ability to promote the sulfidation of Mo(110) (see Fig. 14). Thus, the relative stability of the admetal sulfides is not the only factor that controls the amount of MoSx formed. An admetal can promote the forma- tion of molybdenum sulfides by changing the struc- ture of the surface (making it easier for the penetration of S into the bulk of the sample), and
by modifying the electronic structure of Mo (favor- ing in this way the bonding of S to Mo).
4.2. The behavior of Mo-based hydrodesulfurization catalysts
Molybdenum-based catalysts are frequently used for hydrodesulfurization (HDS) processes in the petrochemical industry [1,2]. This fact has moti- vated many works investigating the interaction of S-containing molecules with Mo surfaces [45-50]. Previous studies have shown that Fe promotes the catalytic activity of MoS 2 in HDS processes [51,52]. The exact role of Fe and the nature of its ability to enhance HDS processes is not well understood. The data discussed above for the Sz/Fe/Mo(ll0) systems indicate quite clearly that Fe enhances the Mo-S interactions.
Fig. 14 compares trends seen in the HDS activity of a series of XSr/MoS 2 catalysts (X =Zn, Cu, Fe, Co or Ni) [5] with trends found for the sulfidation

66 M. Kuhn et aL/Surface Science 365 (1996) 53-68
E
¢o
~oo_ X
X >
" r -5 0
0
2
1
Mo o
o.oo
Ni
/
Cu
I r I I
0.25 0.50 0.75 1.00
MOSy/Mo 3d5:2 XPS Area Ratio in S/X/Mo(110)
1.25
Fig. 14. X axis: relative amount of MoSy formed after exposing Xl.s/Mo(ll0) surfaces ( X = Z n [7], Cu [5], Fe, Co 16] and Ni [6]; with 0x = 1.5 ML) to $2 at 700 K. We report the ratio of the MoSy and Mo peaks in the Mo 3ds/2 XPS spectrum. Yaxis: activity of MoS2 and XSy/MoS2 catalysts for the desulfurization of dibenxothiophene (DBT) 1,51].
of Mo in X/Mo(l l0) surfaces (0x=l.5 ML). In general, a good correlation is observed between the changes in the two properties. The presence of Ni leads to a significant enhancement in the Mo-S interactions and a very large HDS activity. In contrast, the effects of Fe on the Mo-S interactions and HDS activity are less pronounced.
For some authors, the difference between the HDS activity of FeMoS and NiMoS catalysts is a consequence of a change in the electronic inter- action between the metals, with Ni being more effective than Fe at increasing the electron density and reactivity of Mo toward S-containing mole- cules [51]. This model can also explain the diff- erences in the reactivity of Fe/Mo(l l0) and Ni/Mo(l l0) toward $2. Table 2 lists the results of ab initio SCF calculations [6,53] for F e / M o 9 and Ni/Mo9 clusters that model the bonding of a Fe or Ni atom to a hollow site of Mo(l l0) , and Fe4Mo4 and Ni4Mo4 cubic clusters that model 1:1 alloys of the metals. A positive charge indicates a depletion of electrons at the metal center. One can see that Ni is a much better electron donor than Fe. In Ni /Mo(l l0) the electron density on the Mo atoms should be larger than in Fe/Mo(ll0), making an S electrophilic attack on Mo and the formation of Mo-S dative bonds easier.
Table 2 Charge in Fe-Mo and Ni-Mo clusters (electrons)
Fe or Ni
Electron populations
3d 4s 4p
Atomic charge
Fe/Mo9 a 6.89 0.75 0.23 +0.13 Ni/Mo9 b 8.77 0.74 0.28 + 0.21 FeMo4 a'c 6.91 0.79 0.21 +0.09 Ni4Mo4 b'c 8.80 0.82 0.22 +0.16
a From Ref. [53]. b From Ref. [6 ]? The Listed values are for one of the Fe or Ni atoms in the cluster. In the cubic Fe4Mo4 and Ni4Mo4 dusters, all the Fe and Ni atoms are equivalent 16,53].
5. Conclusions
For X/Mo(l l0) (X=Fe, Pt or A1) surfaces, it was found that the reactivity of the admetal towards $2 at room temperature follows the order Fe > AI >> Pt. After annealing (or high-temperature exposure to $2) only Fe or submonolayer coverages of Pt were found to promote the sulfidation of Mo( l l0) in an effective way. These systems illustrate the delicate interplay that occurs between
M. Kuhn et al./Surface Science 365 (1996) 53-68 67
the thermal stability of the sulfides and the cohesive energy of the admetals and substrate.
Two conditions must be met in order for admetal-promoted sulfidation of Mo( l l0 ) to occur: (i) the thermochemical stability of the admetal sulfide (or admetal-sulfur bond) must be smaller than that of molybdenum sulfide in order to allow for decomposition of the admetal sulfide and subsequent migration of the sulfur into the substrate, (ii) the cohesive energy of the admetal overlayer of sulfide should be low enough to allow for the penetration of sulfur toward the Mo substrate.
A good correlation exists between the trends seen in the HDS activity of XSy/MoS2 catalysts (X=Zn,Cu,Fe,Co or Ni) and the trends found for the sulfidation of Mo in X/Mo( l l0 ) surfaces. The promotional effects of Fe on the Mo-S interactions and HDS activity are moderate, and smaller than those exhibited by the best promoter (Ni). For the S2Fe/Mo(110) and S2/Ni/Mo(110) systems, there is a direct relation between the electronic inter- actions in the bimetallic bond and the enhancement in the reactivity of Mo toward sulfur.
Acknowledgements
This work was carried out at Brookhaven National Laboratory and supported by the US Department of Energy (DE-AC02-76CH00016), Office of Basic Energy Sciences, Chemical Science Division.
References
[1] R. Prins, V.H.J. de Beer and G.A. Somorjai, Catal. Rev. Sci. Eng. 31 (1989) 1.
[2] R.R. Chianelli, M. Daage and N.J. Ledoux, Adv. Catal. 40 (1994) 177.
[3] C.C. Knight and G.A. Somorjai, Surf. Sci. 240 (1990) 101. [4] J.C. Dunphy, C. Chapelier, D.F. Ogletree and M.B. Salm-
eron, J. Vac. Sci. Technol. B 12, (1994) 1742; J.A. Rodri- guez, M. Kuhn and J. Hrbek, J. Phys. Chem. 100 (1996) 3799.
[5] J.A. Rodriguez and M. Kuhn, J. Phys. Chem. 99 (1995) 9567.
[6] M. Kuhn and J.A. Rodriguez, Surf. Sci. 355 (1996) 85. [7] M. Kuhn and J.A. Rodriguez, Surf. Sci. 336 (1995) 1.
[ 8] CRC Handbook of Chemistry and Physics, 67th ed. (CRC Press, Boca Raton, 1986) Section D.
[9] L. Peralta, Y. Berthier and J. Oudar, Surf. Sci. 55 (1976) 199.
[10] A. Sanchez, J.J. De Miguel, E. Martinez and R. Miranda, Surf. Sci. 171 (1986) 157.
[11] J. Toofan, G.R. Tinseth and P.R. Watson, J. Vac. Sci. Tech- nol. A 12 (1994) 2246.
[12] J.T. Roberts and C.M. Friend, J. Chem. Phys. 88 (1988) 7172.
[13] M. Tikhov and E. Bauer, Surf. Sci. 232 (1990) 73. [14] J.-W. He, W.L. Shea, X. Jiang and D.W. Goodman, J. Vac.
Sci. Technol. A 8 (1990) 2435. [15] A. Linsebigler, G. Lu and J.T. Yates, Surf. Sci. 294
(1993) 284. [16] J. Kotaczkiewicz, M. Hochrt and S. Zuber, Surf. Sci. 247
(1990) 284. [17] The A12P3/2 and 2pt/2 positions are given in Ref. [18] as
72.5 and 72.9 eV, respectively. Since we are unable to resolve the doublet in our spectra, we have opted for a weighted average, based on the theoretical 3/2 to 1/2 inten- sity ratio of 2:1, for the binding energy position.
[18] G.P. Williams, Electron Binding Energies of the Elements, Version II, (National Synchrotron Light Source, Brookha- yen National Laboratory, 1992).
[19] J.A. Rodriguez, R.A. Campbell and D.W. Goodman, J. Phys. Chem. 95 (1991) 5716; R.A. Campbell, J.A. Rodri- guez and D.W. Goodman, Surf. Sci. 256 (1991) 272.
[20] W. Heegemann, K.H. Meister, E. Betchtold and K. Hayek, Surf. Sci. 256 (1975) 161; G.Q. Xu and J. Hrbek, Catal. Lett. 2 (1989) 35.
[21] A. Ohsawa, H. Yamamoto and H. Watanabe, J. Phys. Soc. Jpn. 37 (1974) 568.
[22] M. Bronold, Y. Tomm and W. Jaegermann, Surf. Sci. 314 (1994) L931.
[23] H. Binder, Z. Nattirforsch. B 28 (5) (1973) 256. [24] J.C. Carver, G.K. Schweitzer and T.A. Carlson, J. Chem.
Phys. 57 (1972) 980. [25] C.D. Wagner, W.M. Riggs, L.E. Davis, J.F. Moulder, and
G.E. Muilenberg, Handbook of X-ray Photoelectron Spectroscopy, (PerkinElmer, Eden Prairie, 1978) p. 104.
[26] W. Jaegermann and D. Schmeisser, Surf. Sci. 165 (1986) 143.
[27] G. Apai, R.C. Baetzold, P.J. Jupiter. A.J. Jupiter, A.J. Viescas and I. Lindau, Surf. Sci. 134 (1983) 122.
[28] W.F. Egelhoff, Surf. Sci. Rep. 6 (1987) 253. [29] M. Kuhn and J.A. Rodriguez, J. Catal. 154 (1995) 355.
J.A. Rodriguez, M. Kuhn and J. Hrbek, Chem. Phys. Lett. 251 (1996) 13.
[30] R.P. Elliot, Constitution of Binary Alloys, First Supple- ment, (McGrawHill, New York, 1965) p 45.
[31] F.A. Shunk, Constitution of Binary Alloys, Second Supple- ment, (McGraw-Hill, New York, 1969) p. 29.
[32] J.A. Rodriguez and M. Kuhn, Chem. Phys. Lett. 240 (1995) 435.
[33] Y. Wu, HS. Tao, E. Garfunkel, T.E. Madey and N. Shinn, Surf. Sci. 336 (1995) 123.

68 M. Kuhn et al./Surface Science 365 (1996) 5348
[34] C.T. Campbell and D.W. Goodman, J. Phys. Chem. 92 (1988) 2569.
[35] L.Q. Jiang, M.W. Ruckman and M. Strongin, Phys. Rev. B 39 (1989) 1564.
[36] W.J. Wytenburg, R.M. Ormerod and R.M. Lambert, Surf. Sci. 282 (1993) 205.
[37] S. Doniach and M. ~unji6, J. Phys. C 3 (1970) 285. [38] N.R. Gleason and D.R. Strongin, Surf. Sci. 295 (1993) 306. [39] G.E. McGuire, G.K. Schweitzer and T.A. Carlson, Inorg.
Chem. 12 (1973) 2450. [40] Lange's Handbook of Chemistry, 13th Ed. (McGraw-Hill,
New York, 1985) Table 9-1. 1-41] L.Z. Mezey and J. Giber, Jpn. J. Appl. Phys. 21 (1982)
1569. [42] C. Kittel, Introduction to Solid State Physics, 6th ed.
(John Wiley, New York, 1986). [43] M. Kuhn and J.A. Rodriguez, Catal. Lett. 32 (1995) 345. [44] M. Kuhn and J.A. Rodriguez, to be published.
[45] F. Zaera, E.B. Kollin and J.L. Gland, Surf. Sci. 184 (1987) 75.
[46] C.M. Friend and J.T. Roberts, Ace. Chem. Res. 21 (1988) 394.
[47] J.P. Fulmer, F. Zaera and W.T. Tysoe, J. Phys. Chem. 92 (1988) 4147.
[48] J.A. Rodriguez, Surf. Sci. 278 (1992) 326. [49] J. StOhr and D.A. Outka, Phys. Rev. B 36 (1987) 7891. [50] J.L. Gland, E.B. Kollin and F. Zaera, Langmuir 4 (1988)
118. [51] S. Harris and R.R. Chianelli, J. Catal. 98 (1986) 17. [52] D.S. Thakur, P. Grange and B. Delmon, J. Less Common
Met. 64 (1979) 201; M. Karroua, J. Ladriere, H. Matralis, P. Grange and B. Delmon, J. Catal. 138 (1992) 640; J.P.R. Vissers, C.K. Groot, E.M. van Oers, V.H.J. De Beer and R. Prins, Bull. Soc. Chim. Belg. 93 (1984) 707.
[53] J.A. Rodriguez and M. Kuhn, J. Vac. Sci. Technol., to be published.


