Embed Size (px)
Citation preview

Ultrasound in Med. & Biol., Vol. 23, No. 3, pp. 39 l-403, 1997 Copyright 0 1997 World Federation for Ultrasound in Medicine & Biology
Printed in the USA. All rights reserved 0301-5629I97 $17.00 + .O+l
ELSEVIER PI1 SO301-5629(%)00208-6
l Origina1 Contribution
RECURSIVE AUTOREGRESSIVE SPECTRAL MAPS FOR OCULAR PATHOLOGY DETECTION
ADA FORT,* CLAUDIA MANFREDI* and SANTINA ROCCHI? *Electronic Engineering Department, University of Florence, Florence, Italy;
‘Information Engineering Department, University of Siena, Siena, Italy
(Received 23 February 1996; in final form 13 March 1996)
Abstract-This article presents a new approach to the problem of obtaining topological maps for tissue characterization, based on spectral parameters extracted from radio frequency (RF) backscattered ultra- sonic signals. The spectral parameter we deal with is the power spectral density centroid, since it is an eflicient indicator of the tissue microstructure characteristics as far as the particle dimensions are concerned. The spectral analysis of RF ultrasonic echoes is performed using a recursive least-squares scheme with a variable forgetting factor, based on low-order autoregressive models. The proposed technique is particularly tailored to the differentiation of ocular pathologies; moreover, it is capable of tracking the spatkl high- varying signal characteristics. The proposed approach was tested on simulated signals and on a gel suspen- sion of calibrated latex spheres; finally, it was applied to signals scattered by in vitro eye specimens, giving satisfactory results in terms of frequency resolution and computational efficiency. The reduced computational burden allows an on-line implementation of the procedure. Topological spectral maps, com- bined with the conventional B-mode display, may offer a complete and integrated diagnostic tool, able to locally characterize the investigated tissue region in terms of amplitude and frequency shift of the corre- sponding echoes. 0 1997 World Federation for Ultrasound in Medicine & Biology.
Key Words: Ultrasonic signal, Spectral analysis, Power spectral density, Autoregressive models, Recursive least squares, Ocular pathology Detection.
INTRODUCTION
The interest in evaluating histological features of uveal lesions by noninvasive techniques arises mainly from two issues. First, there is an obvious interest in obtaining a differential diagnosis for intraocular pathologies. Moreover, due to the constant therapeu- tic progress achieved by conservative treatments, ophthalmologists use such treatments more fre- quently. Nevertheless, this kind of therapy cannot be supported by histological analysis on pathology sam- ples. Therefore, a noninvasive evaluation of the histo- logical features of intraocular pathologies, during and after conservative treatments, becomes of utmost im- portance. In this context, ultrasonic techniques play a major role.
It is well known that a pathological tissue often looks like a distribution of scatterers of different shapes and sizes suspended in a homogeneous fluid,
Address correspondence to: Dr. Ada Fort, Department of Elec- tronic Engineering, University of Florence, via di Santa Marta 3, 50 139 Florence, Italy.
whose dimensions are well below the ultrasonic wavelength. Such a distribution gives rise to interfer- ing echoes, with a stochastic and very complex inter- ference pattern. Thus, a single scatterer cannot be isolated and studied by means of ultrasonic investiga- tion. Nevertheless, ultrasonic echoes backscattered by the tissue convey extensive information on the tu- moral tissue; this information is embedded in random components due to the stochastic nature of the micro- structure. Thus, the radio frequency (RF) backscat- tered echo must be studied as a stochastic process. In ophthalmology, intraocular pathologies, such as various kinds of melanomas, carcinomas and retino- blastomas, are adequately described by the spherical particle model (Lizzi et al. 1986; Ueda and Ichikawa 1981). Usually, melanoma is characterized by a fine homogeneous microstructure containing spherical particles with a diameter of few tens of micrometers, while retinoblastoma is structurally coarse, because small particles somewhere form aggregates that can be approximately considered as larger spherical parti- cles (diameters up to 100 pm). Moreover, the investi-
391

392 Ultrasound in Medicine and Biology Volume 23, Number 3, 1997
gated pathological region is usually inhomogeneous, due to the possible presence of necrosis and vessels. Finally, note that an inflamed tissue, which often sur- rounds such pathologies, has a different and more regular structure with respect to the pathology itself. Such aspects indicate that a local tissue characteriza- tion is required. The spectral analysis proposed in the present article aims at performing this task, by means of a recursive technique with better tracking capabiii- ties compared to traditional approaches.
The aim of the present work is to provide a diag- nostic tool able to distinguish among various uveal pathological tissues, mainly when the region investi- gated is of small size, thus making conventional spec- tral estimators of poor applicability.
The power spectral density (PSD) estimate of the backscattered echo is commonly used for ultrasonic tissue characterization, since it is an efficient indicator of many relevant tissue properties, such as the mean scatterer density, size, shape and strength. In particu- lar, the value of the PSD centroid depends on the scatterer mean size (Insana et al. 1990; Ueda and Ichikawa 198 1) .
For ophthalmological diagnosis, the differentia- tion is required among tissues made up of particles whose mean dimension (diameter) ranges from lo- 100 pm. To this end, the RF backscattered signals are processed in terms of spectral analysis, to obtain a local centroid evaluation. Spectral maps are proposed, based on a local PSD centroid evaluation, to highlight the local value of the mean particle size. Such spectral maps thus provide complementary information with respect to conventional A-B-mode displays.
The ultrasonic transducer used in this work is characterized by a large bandwidth (7 MHz at -6 dB > and a central frequency of 10 MHz, which implies a wavelength of 150 pm, well above the mean particle diameters. This choice is determined by the tradeoff between good resolution and low attenuation of the ultrasonic waves in tissues. The large bandwidth used is required because the frequency range of the back- scattered signal, affected by the scatterer size, goes from 6 to 10 MHz for particles of 100 to 10 pm of diameter, respectively. This will be explained in detail in the next section.
Commonly, the power spectrum of the backscat- tered signals is estimated via an averaging process based on the periodogram technique (Lizzi et al. 1983, 1986), but results are often degraded by the residual randomness, especially when the investigated region is spatially limited, as in the present application. To overcome this problem, an autoregressive (AR) mod- eling technique is proposed for PSD estimation (Kay and Marple 1981; Marple 1987) and for the spectral
centroid shift evaluation. In particular, low-order AR models are used, as they smooth the random peaks and pits of the backscattered signal spectrum while being sensitive to the spectral shift trend. Moreover, this technique is intrinsically insensitive to the windowing side-lobe effects; as a consequence, the centroid fre- quency estimate is meaningful for local tissue charac- terization.
Due to the high space signal variability, a re- cursive least-squares (RLS) algorithm with variable forgetting factor was implemented, which allows tracking the local characteristics of the investigated inhomogeneous medium (Kulhavy 1987). Finally, it is to be pointed out that the use of low-order AR mod- els has the additional advantage of requiring low pro- cessing time as far as the centroid evaluation is con- cerned (Wang et al. 1991).
The above-mentioned aspects make the proposed recursive technique particularly suitable for a real-time production of pathology maps based on spectral param- eters, To evaluate the performance of the proposed approach, it was tested on simulated signals, on a gel suspension of calibrated latex spheres and, finally, ap- plied to signals scattered by in vitro eye specimens, giving satisfactory results.
THEORETICAL BACKGROUND
The ultrasonic signal coming from a random parti- cle distribution can be described by the superposition of scatterer contributions, provided the particle concen- tration is weak enough to neglect multiple scattering effects. Moreover, a one-dimensional model is adopted for isotropic media when the ultrasonic beam is narrow and a plane-wave propagation is assumed. This is often the case in medical analysis, when a weakly focused ultrasonic transducer is used and the region of interest lies in the focal zone.
Applying the Born approximation, the backscat- tered signal is expressed in the frequency domain by (Insana et al. 1990; Romijn and Thijssen 1989):
E(f) = c E,(f) Ei (f) = T2(f,Zi )A2(.fvzO)Bi (f).
In eqn ( 1 ), f is the frequency; z. is the investigated region depth; zi and Bi (f ) are the axial position and the frequency response of the ith scatterer, respectively; T(f,z) is the transducer response; and A(f,z) is the attenuation of the biological medium. T(f,z) is squared because the transducer is used both as transmitter and receiver. Since attenuation is a causal process, velocity dispersion has to be accounted for (O’Donnell et al.
Recursive autoregressive spectral maps for ocular pathology 0 A. FORT ef al. 393
198 1) . Thus, A (f,z) can be expressed by the following approximate formula (Gurumurthy and Arthur 1982) :
A(f,z) = e-““e -2*j(r,fi - cx~[ln(2a.f)lal) (2)
where (Y is the attenuation coefficient, and ~~ is the minimum phase delay factor (7, = 1 /c + 20al7r’, where c is the speed of sound). The square of A (f,;:) in eqn ( 1) represents the attenuation along the direct and reflected path.
Assuming the validity of the Rayleigh-Born ap- proximation, Bj (f) can be obtained as follows. The velocity potential ascan of the acoustic field at point r scattered by an object placed at point 5 is (Ying an; True11 1956) :
where ajnc is the velocity potential of the incident field; Fi is a form factor: K is the propagation vector of the impinging field; andK’ is the propagation vector of the scattered field. Thsackscattered field, B(f), can be found by setting K’ = - K in the expression of F: - -
B(f) = F(KK’)(KI=mK. --‘- (4) -
In the present work, a model made up by spherical fluid particles was considered. Therefore, B(f) is a function of frequency as follows (Cheung et al. 1989: Gubematis et al. 1977):
Wf) = F(K, - &I (5)
sin ( 2Ku ) = P _ ~cos(2Ka)
8K 4 1 where y is a parameter related to the scatterer acoustic impedance, and a is the particle radius.
From eqn (5), it is evident that B(f) in eqn ( 1) is a term depending on the scatterer size. Moreover, in the tumoral region, the attenuation is also given by particle scattering and depends on scatterer diameter (Romijn et al. 1989).
For a uniform random distribution of identical scatterers, the PSD of the backscattered echo coincides with the squared spectrum of the single scatterer re- sponse, Hence, it can be seen that different scatterer dimensions yield to different frequency shapes for the PSD. The average size of the scatterers can be obtained by evaluating the power spectrum centroid, having eliminated the signal randomness due to random phase
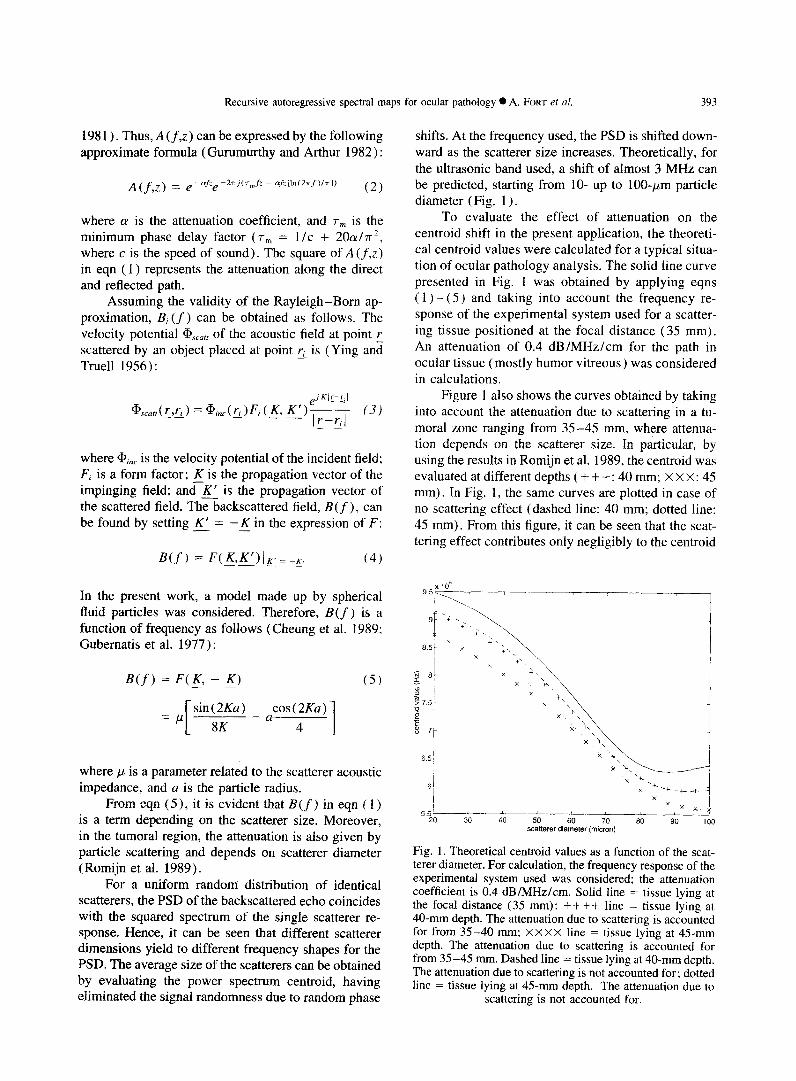
shifts. At the frequency used, the PSD is shifted down- ward as the scatterer size increases. Theoretically, for the ultrasonic band used, a shift of almost 3 MHz can be predicted, starting from lo- up to lOO+m particle diameter (Fig. 1).
To evaluate the effect of attenuation on the centroid shift in the present application, the theoreti- cal centroid values were calculated for a typical situa- tion of ocular pathology analysis. The solid line curve presented in Fig. 1 was obtained by applying eqns ( 1) - (5) and taking into account the frequency re- sponse of the experimental system used for a scatter- ing tissue positioned at the focal distance (35 mm). An attenuation of 0.4 dB/MHz/cm for the path in ocular tissue (mostly humor vitreous) was considered in calculations.
Figure 1 also shows the curves obtained by taking into account the attenuation due to scattering in a tu- moral zone ranging from 35-45 mm, where attenua- tion depends on the scatterer size. In particular, by using the results in Romijn et al. 1989, the centroid was evaluated at different depths ( + + f : 40 mm; X X X: 45 mm). In Fig. 1, the same curves are plotted in case of no scattering effect (dashed line: 40 mm; dotted line: 45 mm). From this figure, it can be seen that the scat- tering effect contributes only negligibly to the centroid
:
5 50 60 70
scatterer diameter (micron)
Fig. 1. Theoretical centroid values as a function of the scat- terer diameter. For calculation, the frequency response of the experimental system used was considered; the attenuation coefficient is 0.4 dB/MHz/cm. Solid line = tissue lying at the focal distance (35 mm): + + ++ line = tissue lying at 40-mm depth. The attenuation due to scattering is accounted for from 3.5-40 mm; XXXX line = tissue lying at 45-mm depth. The attenuation due to scattering is accounted for from 35-45 mm. Dashed line = tissue lying at 40-mm depth. The attenuation due to scattering is not accounted for; dotted line = tissue lying at 45-mm depth. The attenuation due to
scattering is not accounted for.

394 Ultrasound in Medicine and Biology Volume 23, Number 3, 1997
shift, due to the small dimension of the tumoral region, and thus it can be disregarded.
However, since the centroid value shifts down- ward with depth, due to the attenuation, a compensa- tion should be performed based on the results pre- sented in Fig. 1. This issue will be addressed in the last section.
SPECTRUM ESTIMATION BY AUTOREGRESSIVE MODELS
In this section, after a brief review of the main characteristics of the periodogram method, the AR sig- nal modeling approach will be outlined. The character- istics of the recursive algorithm used in this work will be described in the next section, showing its suitability for the analysis of the signals under consideration as far as the diagnosis of ocular pathologies is concerned.
The estimation of the PSD of a finite discrete data sequence is commonly performed via the fast Fourier transform ( FFT) -based periodogram technique. De- spite the wide range of its possible applications, the periodogram approach has two main limitations: (1) an increase of the estimation quality obtained by in- creasing the data segment length decreases the fre- quency resolution; and (2) the windowing of data, implicit in the method, causes the leakage effect in the spectral domain, which may obscure and distort weak signal spectral responses.
On the other hand, the use of a priori information or assumptions based on some knowledge about the process under consideration may permit the selection of a model that is a good approximation of the actual underlying process; it is then possible to obtain better spectral estimates. Thus, spectrum analysis, in the context of parametric modeling, becomes a three-step procedure: ( 1) Selection of a time series model describing the
process, i.e., the measured data y(t) ; (2) Estimation of the parameters of the assumed
model; and (3) Substitution of the above parameters into the theo-
retical PSD implied by the model. In the present article, an AR model of order p,
AR(p), is selected to describe the sampled backscat- tered ultrasonic signal y(t) (Ljung 1987):
y(t) = -i aky(t - k) + u(t) (7) k=l
These limitations are particularly troublesome where y(t) represents the measured data, ffk, k = 1, when analyzing short data records, as in the present . . ., p are the unknown model parameters (to be esti- application for local tissue characterization. Therefore, mated), and u(t) is the unknown input sequence (as- over the last two decades, alternative spectral estima- sumed to be a zero-mean white noise process with tion procedures, based on fitting of the measured data variance a’,). When the p + 1 unknowns, I& and to an assumed model, have been proposed (Kay and a:, have been estimated, the power spectral density Marple 1981; Marple 1987). (AR PSD) can be evaluated as follows (Marple 1987) :
It is well known that, for a discrete signal y ( t) , the PSD, P (f ) , can be estimated using the periodogram method, when the measured process can be considered stationary and ergodic.
PAR(f) = ( (8) ?
When applying the periodogram method, the PSD is evaluated by splitting the data sequence y(t) into M subsegments of length L, weighted by the window sequence w(r), and computing the average of the squared DFT coefficients of each segment. The seg- ments can be adjacent or partially overlapping. Hence:
I 1 + C ake-j2rfkT
k=l I
where T is the signal sampling period, and ak and S’, are the estimated AR model parameters and input vari- ance, respectively.
In general, the best performance of parametric methods could be achieved if a variable order is esti- mated over subsequent data windows, to follow the varying signal dynamic. Several methods that imple- ment such an approach exist, and successful results have been obtained with a modification of the singular value decomposition technique applied to Doppler sig- nals (Fort et al. 1995). However, this approach usually requires a large computational burden. Hence, the pres-
B,(k) = t i P,(k) r= 1
P,(k) = 3
L-l
T c y&)w(t)e-‘?” 2
t=o
wherey,(t) is the rth subsequence of y(t), r = 1, . . . ,
M, and T is the sampling interval. As mentioned above, many of the limitations of the periodogram approach are caused by the implicit hypothesis that data outside the window w(t) are equal to zero. However, such a hypothesis is usually not verified. Therefore, the over- all transform is the convolution of the desired signal transform and the window transform.

Recursive autoregressive spectral maps for ocular pathology 0 A. FORT et al.
0.8. 0.8.
0.6 -
0.8
0.6
freq. (Hz)
0 5 10 15 freq. (Hz) x IO6
1
0.8
0.6
0.4
0.2
freq. (Hz)
10 freq. (Hz)
Fig. 2. Effect of an increased AU model order on the estimation of the PSD. (upper left) Simulated signal squared FFI (dashed line) compared to the theoretical PSD (solid line); (upper right) simulated signal squared FFI (dashed line) compared to the PSD estimated by AR( 3) (solid line); (lower left) simulated signal squared FFT (dashed line) compared to the PSD estimated by AR( 12) (solid line); (lower right) simulated signal squared
FFT (dashed line) compared to the PSD estimated by an AR(40) (solid line).
ent article deals with recursive estimation methods ap- plied to AR models of fixed (low) order.
Since the AR model order p is usually unknown, it is often necessary to postulate several model orders. Too large a model order produces spurious peaks in the AR PSD estimate, while a low order does not allow reproducing the signal spectral details. Thus, the selec- tion of the AR model order represents a tradeoff be- tween increased resolution and decreased variance of the prediction error e(t) . The prediction error e(t), which depends on the estimated parameters at time f - 1, @(t-,) = [al u2.. . a,]‘, can be expressed as:
e(t) = y(t) + f: a&t - k). (9) k=l
mation methods have been developed. These tech- niques can roughly be divided into batch and recursive methods. Batch techniques minimize different func- tionals, related to the energy of the error over a data block. In previous works (Fort et al. 1992; Rocchi et al. 1993), the AR PSD centroid evaluation was ob- tained by analyzing subsequent data windows of fixed length and by using a batch algorithm for the estima- tion of the model coefficients. In particular, the modi- fied covariance method (MCM) (Marple 1987) was used, which minimizes the average of the forward and backward linear prediction squared errors over N avail- able data. The results were found to be satisfactory, due to the higher frequency resolution of the AR method with respect to traditional techniques, which has allowed the use of data windows of reduced length.
To evaluate the AR coefficients, a variety of esti- Other significant work has been done with batch

396 Ultrasound in Medicine and Biology Volume 23, Number 3, 1997
estimation methods, both as far as estimation algo- rithms and model order selection methods are con- cerned (Wear et al. 1994, 1995). However, the batch estimation approach has the drawback of requiring a computational effort that makes an on-line implemen- tation difficult; moreover, the estimated centroids were found to heavily oscillate around the theoretical values, thus producing nonuniformly varying spectral maps.
In the present article, as in Fort et al. (1992) and Rocchi et al. (1993), a fixed low p value was chosen for the AR model (p = 3 ) , the main interest being in emphasizing the frequency range of highest energy, regardless of spectrum details.
Moreover, a model order greater than three in- creases the prediction error variance due to high signal variability, which does not allow the use of a long sample memory in the estimation procedure. Experi- mental results have shown that such memory length has to be lower than 32 samples.
In Fig. 2, the effect of increasing the model order on the AR PSD estimate is shown. It is clearly seen that a higher order AR model introduces additional details in the spectrum, due to the random delays of interfering echoes, which are not informative as far as the frequency shift is concerned. Moreover, it requires higher computational time. The AR(3) choice was also found convenient as far as the PSD centroid eval- uation (6- to IO-MHz frequency range) is concerned, which can be approximated by the maximum ampli- tude frequency, given by the analytical formula (Wang et al. 1991):
1 1 + --(a$23 + u*y- pz*u3 + u*u; + u$z3 - 34) II
(10)
where Ui, i = 1,2,3, are the AR(3) model estimated coefficients. This avoids using eqn (8) with an evident computational saving.
The discussion above leads to the fast recursive AR PSD centroid evaluation that will be described in the next section.
RECURSIVE LEAST SQUARES WITH VARIABLE FORGETTING FACTOR
The need for identification of time-varying sys- tems arises in many practical problems, although no explicit knowledge of the system time variations is available a priori. This is commonly handled by means
of recursive identification schemes, which allow tracking the system time-varying characteristics for different purposes (regulation, control, etc.).
In the present work, data exhibit high “time”- (i.e., space) varying characteristics, depending on the spatial distribution of tissue particles. According to the discussion in previous sections, the aim is to evaluate almost “continuous” parametric centroid values over the analyzed tissue by means of a new estimate each time sample. This approach allows smooth spectral map production, capable of describing, and hence dis- tinguishing, the fine structure of ocular pathologies, possibly in an on-line framework. This justifies the use of recursive identification schemes, as will be de- scribed below.
The most popular class of recursive parameter estimation techniques is the RLS one. The best known modification of the standard RLS is based on data weighting, which consists of assigning less weight to older measurements that are no longer representative for the system, by means of the so-called “forgetting factor” X(t) . Basically, each member of the RLS class of algorithms is described by two updating equations: one for the parameter estimates f!)(t) and the other for the “covariance matrix” P (Goodwin and Payne 1977; Ljung 1987) :
e(t) = l?(t - 1) + P(t - 1)&t)
Y(f) - cpTWW - 1)
x cut) + cp’wfYt - l)cp(t))
P(t _ 1) _ P(t - lMwwPu - 1)
P(t) = h(t) + cpTww - l)cp(O
h(t)
(11)
where, for time series, as in the present work, e(t) is the (column) vector of the AR model estimated parameters, e(t) = [a, u2 . . . a,]=, p is the model order (p = 3 in our work), P(t) is the inverse of the data covariance matrix, cp(t) = [-y(t - l), - y(t -
21, . . ., -y( t - p)]= is the regressor vector and A(t) is the forgetting factor.
For a system that changes gradually and in a “sta- tionary manner,” one of the most popular techniques that ensures adaptivity of identification in such a case is based on exponential data weighting and is known as exponential forgetting: the assumption made is that the older the data item is, the less reliable is the infor- mation contained in it. The most common choice for A(t) is to assign it a constant value:
x(t) = A < 1. (12)

Recursive autoregressive spectral maps for ocular pathology 0 A. FORT et al. 391
Typical choices of X are in the range between 0.99 and 0.995. It can be shown that the measurements that are older than To = l/( 1 - h) samples are included in the criterion with a weight that is about 36% of that of the most recent measurement. To is called the “memory time constant” of the criterion. If the system remains approximately constant over To samples, a suitable choice of X can be made from eqn ( 12).
However, the cited assumption is justified only if information carried by measured data is distributed sufficiently uniformly over the whole parameter space and over the whole time horizon. If this condition is not fulfilled, i.e., if the measured data do not carry sufficient information about all unknown parameters for a rather long time period, the application of the exponential forgetting results in the loss of a piece of accumulated information that is not compensated by the gain of new information. This case arises often in practice, with severe consequences: any change of the character of system excitation may result in a sudden increase of the prediction error due to a poor descrip- tion of the external system behavior by the hitherto satisfactory model.
For a system that undergoes abrupt and sudden changes, rather than steady and slow ones, an adaptive choice of A could be conceived. When an abrupt system change has been detected, it is suitable to decrease h(t) to a small value for one or a few samples, thereby “cutting off ” past measurements from the criterion, and then to increase it to a value close to 1 again.
As already mentioned, in the present applica- tion, the investigated pathological region is usually nonhomogeneous, due to the possible presence of necrosis and vessels, thus causing sudden changes in the signal behavior. Such aspects justify the im- plementation of a variable forgetting factor for a local tissue characterization.
Different modifications of the standard exponen- tial forgetting have been suggested in the literature (Fortesque et al. 1981; Goodwin and Sin 1984; Hag- glund 1983; Salgado et al. 1988). A general insight into the problem of parameter tracking is given by the family of approaches named “directional forgetting,” the prime idea being that of keeping P well conditioned by forgetting information only in the “direction” where the new one is obtained.
Perhaps the most general approach is that pro- posed by Kulhavy (1987), named “restricted expo- nential forgetting” (REF), which, instead of purely heuristic constructions of suppressing obsolete infor- mation, builds, in a Bayesian framework, an explicit model of updating the probability density of unknown parameters in time: just the piece of posterior informa- tion innovated by the current data is taken as obsolete.
This defines the “direction” mentioned above, the main REF procedure feature being that of modifying only that piece of information so-far accumulated, which is innovated by the currently measured data, making it possible to respect partial prior knowledge about the location and/or the evolution of parameters in a unified manner. The method ensures a high numer- ical reliability of parameter tracking, even for poorly excited systems.
With the same notations as in eqn ( 11) , the REF algorithm is described by the following equations. I]p( t)]] = Jvr( t)cp( t) is the Euclidean norm of the regressor ; then, for IIv(r)]] > 0 and cpT(t)P(t - l)cp(f) > 0:
(a) e(t) = y(t) - cpT(t)B(r - 1)
(b) 8(t) = 13(t - 1) + P(t - l)YJ(tk(t) 1 + cpT(wYt - l)cp(t)
(c) c2(t - 1) = e*(t) g2(l + pT(t)PO - l)cp(t))
(d)I = ut>
1 +(I +P) r
X In (1 + cpT(t)P(t - I)cp(t)) 1
(e) y(t - 1) = A(t) - 1 - A(t)
cpTww - 1 b&t)
(f) P(t) = P(t - 1)
P(t - l)cp(t)cpT(t)fYt - 1) - y-‘(t - 1) + cp’(t)P(t - l)q(t)
(13)
For
IIp(t)ll = 0: f?(t) = e(t - 1) P(t) = P(t - 1)
where 0’ is the input noise variance, and the scalar p, supposed prespecified, represents the steady-state ratio of the expected amount of “forgotten” information to the expected amount of information contained in the latest data (p = 0.3 in the present work). The initial conditions are 0(O) = 0 and P(0) = I.
Eqn ( 13a) represents the prediction error [see eqn (9)]. Eqns ( 13b) and ( 13f) are the parameter updating equations [on analogy to eqn ( 1 1 )] . The novel feature of this approach concerns eqns ( 13~) - ( 13e), which update the variable forgetting factor [lly( t)] . In par- ticular, eqn ( 13~) is the normalized square of the pre-

398 Ultrasound in Medicine and Biology Volume 23, Number 3, 1997
-0.6’ I 0.5 1 1.5 2 2.5 3
time (s) x 1o-5
Fig. 3. Signal simulated according to eqns ( 1) - (5)) repre- sented in the time domain. The simulated tissue is made up of three adjacent zones, characterized by mean scatterer
diameters of 20, 50 and 100 pm. respectively.
diction error; the denominator of the left-hand term is a gain factor depending on the uncertainty of the regression coefficients f!?(t) through cpr( t)P(t - l)cp(t). This allows a high degree of adaptability of the forgetting factor, which decreases when the uncer- tainty of the estimation increases, due to a sudden vari- ation of the signal characteristics. In fact, it can be shown (Kulhavy 1987) that eqn (13d) implies a roughly exponential increase of A(t) in the initial phase of estimation, as well as in retuning after important parameter changes.
Notice that the “weight” y(t) can also be nega- tive [ eqn ( 13e)] ; hence, the covariance updating equa- tion does not imply a simple data weighting.
Finally, the computational demands are shown to be comparable with the RLS using the standard expo- nential forgetting ( Kulhavy 1987 ) .
In the present work, the REF algorithm was com- pleted with eqn ( 10) for the centroid evaluation, thus giving rise to a procedure capable of tracking the fast centroid spatial evolution. The method was applied to simulated as well as to in vitro eye specimen data. In the next section, the results obtained are presented and discussed.
EXPERIMENTAL RESULTS
The spectral maps based on the processing tech- nique presented in previous sections are produced by considering a set of RF backscattered signals obtained by linear or sector scan. Each echo line is processed by the REF procedure [ eqn ( 13)] applied to a third- order AR model, AR( 3). The PSD centroid is esti-
mated by means of eqn ( 10). The estimated centroid value is corrected for the attenuation effect by means of a look-up table that relates depth and centroid values according to the curves shown in Fig. 1. Each row of the table corresponds to a different value of the esti- mated centroid (at steps of 200 kHz), while columns are related to different depths (in the interval 25-50 mm with steps of 1 mm). The entries of the look-up table are the corrected centroid values as derived from calculations.
Finally, a two-dimensional spectral image is pro- duced by associating the estimated centroid value to a gray level or to a color-coded legend.
The proposed spectral imaging technique was previously tested on signals provided by the simula- tion model of the scattering tissue derived from eqns (l)-(5).
The simulated signal was generated in the fre- quency domain by superimposing the single scatterer contributions. Each term of the summation is obtained by multiplying the single scatterer frequency response with the ultrasonic transducer response and the attenua- tion term, according to eqns ( 1) and (2).
The transducer response was measured as the echo caused by a perfect plane mirror positioned in the focal plane. The attenuation effect was accounted for by considering the attenuation coefficient values reported by Chivers (1984) for ocular tissues. More- over, a uniform random distribution of the scatterer size was assumed.
Randomness of the backscattered signal was taken into account by a random phase and a random ampli-
1
0.5
2 0
m -0.5
-1 I 'Y 1 -1.51 I
0 0.5 1 1.5 2 2.5 3 time (5) X IO-'
0.21, I
‘J\ 0.2 '-I--<
._,--.
5O.W '.,-__ -.
2 -._._ '.--._
O.l& -_
-_--,-
0.171 I 0 0.5 1 1.5 2 2.5 3
time (s) xlod
Fig. 4. (Upper plot) Comparison of backscattered ultrasonic signal [simulated by eqns ( 1) - (5)] with the predicted AR( 3) model output. The model parameters are recursively estimated by means of the REF procedure. (Lower plot)
RMS prediction error as a function of time.

Recursive autoregressive spectral maps for ocular pathology 0 A. FORT et al. 399
1.5 2 2.5 3 time (s) x 1o-5
Fig. 5. Time behavior of the PSD centroid values. The figure shows the simulated signal backscattered by a fictitious tissue made up of three zones containing scatterers with diameters of 20, 50 and 100 pm, respectively. Continuous line = Centroid evaluated by the REF procedure; dotted line = theoretical centroid values; dashed line = centroid estimated by AR performed on blocks of fixed length. Blocks are partially overlapped (75%) and
their length is 64 samples ( 1.28 ys) .
tude for each term of the summation in eqn ( 1). In particular, phases were determined by the random posi- tions of scatterers in the pathological tissue. In the simulated tissue, the scatterer position (i.e., the phase delay) was assumed to be uniformly distributed and varying between zero and the maximum assumed dis- tance, which corresponds to the investigated depth.
As far as the amplitude is concerned, the choice of a random distribution accounts for fluctuations in the scatterer strengths. In the present model, a Rayleigh distribution was assumed.
In Fig. 3, a simulated signal is shown in the time domain. The simulated tissue was made up of three adjacent zones, characterized by three different scat- terer diameters. In particular, the mean scatterer size was 20 pm from O-10 ps, 50 ym from lo-20 ps and 100 ym from 20-30 ps. This signal, characterized
by abrupt changes, was used for testing the recursive technique described in the previous section.
As far as the AR( 3) model identification is con- cerned, the performance of the REF was tested in terms of the root-mean-square (RMS) prediction error PE( 13( t)), defined as:
PE(lqf)) = J---
i,i e(i)’ (14) !=I
where e(t) is the prediction error [ eqn ( 13a)]. Figure 4 (upper panel) compares the simulated
signal with the one obtained by applying the REF iden- tification procedure. In spite of the low p value se- lected, the good performance of the method in follow- ing spatial data variations is clearly shown, when the REF forgetting factor is used.

Ultrasound in Medicine and Biology
2 4 6 mm
2 4 6 mm
2 4 6 2 4 6 mm mm
2 4 6 mm
2 4 6 mm
6 7 8 9 10 centroid (MHz)
Fig. 6. (Left maps) Spectral maps obtained by analyzing signals coming from three different test objects consisting of a gel suspension of latex spheres of 20 (lower map), 50 (middle map) and 100 pm (upper map), respectively.
(Right maps) B-mode images of the test objects.
Figure 4 (lower panel) shows the RMS prediction error values as obtained from eqn ( 14) for the signal in Fig. 4a. In spite of the low AR model order, the PE(@(t)) values decrease and reach values below the 10% of the signal amplitude.
In Fig. 5, the behavior of the estimated PSD centroid is reported. The figure compares the centroid values ob- tained by applying the REEF procedure [along with eqn ( 10) for the centroid evaluation] (solid line) and the batch estimator (dashed line) to the theoretical ones (dot- ted line) for a simulated signal. The batch estimator was based on partially overlapped (75%) blocks with a fixed length of 64 samples ( 1.28 11s). An AR(3) model was estimated on each block, and the centroid value was evaluated as the first-order moment of the corresponding PSD [ eqn (S)] . The simulated tissue was made up of three homogeneous regions characterized by scatterers of diameter 20, 50 and 100 pm, respectively. The attenua- tion was set to 0.4 dB/MHz/cm. The two methods give comparable results in terms of capability to distinguish
among scatterers of different size. However, as can be seen in Fig. 5, the centroid values estimated by REF are less oscillating around the theoretical values with respect to those obtained by the batch estimator.
On the other hand, a larger bias was obtained with the recursive method: this result could be due to the fact that eqn (10) actually gives the maxima positions of the amplitude frequency, which are, in general, higher than the corresponding PSD centroid values when an AR (3) model is selected. This, in fact, usually exhibits a non- symmetric PSD shape, as can be observed in Fig. 2 (upper right). Consequently, the spectrum maximum is shifted upwards with respect to the theoretical centroid. However, from the particle classification point of view, this fact is of little importance, the main interest being that of distinguishing among various particle sizes in an on-line framework. Moreover, the centroid approxima- tion given by the maximum calculation leads to a notice- able reduction in the computational burden.
Simulation results were also compared with those

- 6 6.5 7 7.5 8 8.5 9 9.5 10 centmkl (MHz)
2 4 6 8 10 12 14 mm
Fig. 7. Real data analysis: in vitro specimen of a retinoblastoma. (Upper image) Spectral map based on the frequency centroid evaluation obtained by applying the REF procedure. (Lower image) B-mode image.
obtained by applying the standard RLS method with an a priori fixed value for the forgetting factor A. In this case, results were sometimes comparable with those obtained with the REF procedure, on condition that an accurate choice of A could be made. This is, in fact, the main drawback of the fixed forgetting factor, as discussed in the previous section: too low a value im- plies heavily oscihating estimates, while too large a value produces too much smoothed estimates, which fail to follow the signal variations. For the present application, a reasonable choice of A was found to be between 0.97 and 0.98, corresponding to a memory time constant To of 32 and 64 points, respectively; such values were, in any case, a posteriori deduced from mean values of the variable forgetting factor. Moreover, note that the variable h oscillates in a wider range of values (0.7-0.99)) i.e., for T,, varying approx- imately between 3 and 100 samples, thus pointing out sudden and strong spatial signal variations. Finally, it was found that a fixed value for the forgetting factor gives, in most cases, a worse performance as far as
the RMS prediction error is concerned. Hence, results for fixed A are not reported.
For experimental validation of the proposed tech- nique, a set of test objects was built. They consisted of gel suspensions of calibrated latex spheres (with diameters of 20, 50, 80 and 100 pm).
A linear scanning was performed on the test ob- jects to gather the RF echo signals that were sampled at 50 MHz, digitized with a quantization error of -48 dI3 and stored in a computer memory for subsequent processing. A wide-band focused transducer (Paname- tries V3 11) was used, whose main characteristics were: bandwidth of 7 MHz at -6 dB, central frequency of 9.9 MHz and - 12 dB focal spot of 0.8 mm at a distance of 35 mm. Both the pulser and the receiver (Paname- tries PR5601A) were characterized by a large band- width ( 150 MHz), and signals were sampled with 50- MHz frequency by a digital scope (TDS540,500-MHz bandwidth). The experimental results obtained by the test object investigation are characterized by an error comparable to that obtained with simulated signals
402
7.5 8 8.5 9 9.5 10 centroid (MHz)
2 4 6 8 10 12 14 mm
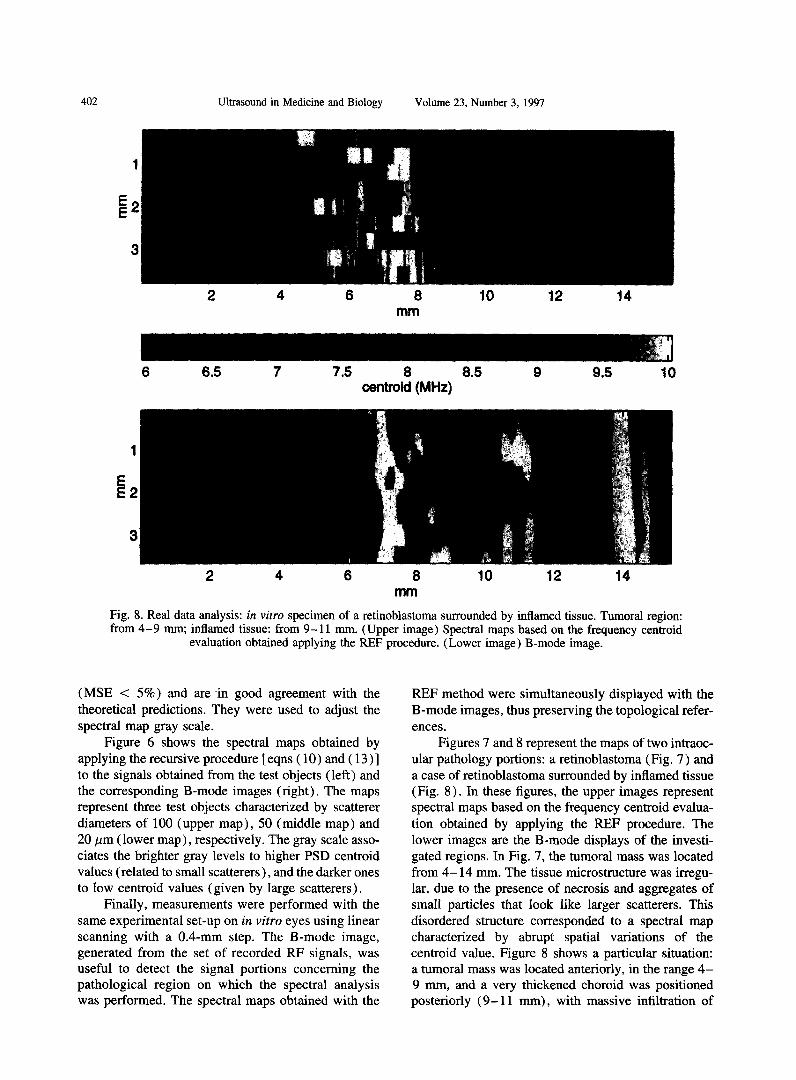
Fig. 8. Real data analysis: in vitro specimen of a retinoblastoma surrounded by inflamed tissue. Tumoral region: from 4-9 mm; inflamed tissue: from 9-11 mm. (Upper image) Spectral maps based on the frequency centroid
evaluation obtained applying the REF procedure. (Lower image) B-mode image.
(MSE < 5%) and are -in good agreement with the REF method were simultaneously displayed with the theoretical predictions. They were used to adjust the B-mode images, thus preserving the topological refer- spectral map gray scale. ences.
Figure 6 shows the spectral maps obtained by applying the recursive procedure [eqns (10) and (13)] to the signals obtained from the test objects (left) and the corresponding B-mode images (right). The maps represent three test objects characterized by scatterer diameters of 100 (upper map), 50 (middle map) and 20 pm (lower map), respectively. The gray scale asso- ciates the brighter gray levels to higher PSD centroid values (related to small scatterers), and the darker ones to low centroid values (given by large scatterers).
Finally, measurements were performed with the same experimental set-up on in vitro eyes using linear scanning with a 0.4-mm step. The B-mode image, generated from the set of recorded RF signals, was useful to detect the signal portions concerning the pathological region on which the spectral analysis was performed. The spectral maps obtained with the
Figures 7 and 8 represent the maps of two intraoc- ular pathology portions: a retinoblastoma (Fig. 7) and a case of retinoblastoma surrounded by inflamed tissue (Fig. 8). In these figures, the upper images represent spectral maps based on the frequency centroid evalua- tion obtained by applying the REF procedure. The lower images are the B-mode displays of the investi- gated regions. In Fig. 7, the tumoral mass was located from 4- 14 mm. The tissue microstructure was irregu- lar, due to the presence of necrosis and aggregates of small particles that look like larger scatterers. This disordered structure corresponded to a spectral map characterized by abrupt spatial variations of the centroid value. Figure 8 shows a particular situation: a tumoral mass was located anteriorly, in the range 4- 9 mm, and a very thickened choroid was positioned posteriorly (9-l 1 mm), with massive infiltration of

Recursive autoregressive spectral maps for ocular pathology l A. FORT et al. 403
inflamed cells. The inflamed tissue had a more regular structure with respect to that of the tumoral zone itself. The distinction between the two tissue structures was not evidenced by the B-mode image, due to their simi- lar backscattering strengths, while the spectral map was capable distinguishing between the two tissues.
These results show that the application of REF to spectral maps production gives enhanced results with respect to the conventional approaches, since it allows different centroid value estimations even on very small tissue regions, due to its tracking capability.
A fast and complete diagnostic tool is thus ob- tained, since the B-mode image exploits the informa- tion related to the echo amplitude, while the spectral maps outline the frequency dependence of the back- scattered echoes.
CONCLUSIONS
A signature detection for the ultrasonic spectral characterization of pathological tissues is very difficult, due to the complex nature of biological media. Hence, in the present article, a spectral imaging technique is proposed that can effectively lead to extraction of pathol- ogy features when the displayed information is filtered and interpreted using the physician’s experience. The spectral images are based on the AR PSD centroid fre- quency estimate, which is related to the average scatterer size. An RLS algorithm with variable forgetting factor is implemented, to track the spatially high signal varying characteristics. The use of low-order AR models has al- lowed a fast evaluation of the centroid values [ eqns ( 10) and ( 13)] and smooth map production suitable for local characterization of the investigated inhomogeneous me- dium. O(p) operations are required for a fast implemen- tation of the proposed approach (Ljung 1987). Hence, spectral maps can be obtained in real time for tissue regions scanned with 20 echo lines up to 1 cm in depth. In fact, an echographic equipment with a DSP board reaches a 50-Hz frame rate. The spectral maps, obtained from simulated signals, test objects and real data, empha- size both the average value of the scatterer sizes and the degree of local inhomogeneity of the investigated pathology, thus providing easy and effective diagnosis that may offer a complete diagnostic tool when combined with the conventional B-mode display.
Acknowledgemenrs-The authors acknowledge the contribution of Prof. R. Frezzotti and Dr. A. Bartolomei, Clinica Oculistica, Univer- sity of Siena, Siena, Italy, for their support in the clinical field.
REFERENCES
Cheung AT, Buchen PW, Macaskill C, Robinson DE. Backscatter spectrum of a random perturbed regular array of discrete scatter- ers. .I Acoust Sot Am 1989;86:407-413.
Chivers RC, Round WH, Zienuk D. Investigation of ultrasound axi-
ally traversing the human eye. Ultrasound Med Biol 1984; 10:173-188.
Fort A, Manfredi C, Masotti L, Rocchi S. Spectral maps by ARMA modelling for ultrasonic tissue characterization: Application in ophthalmology. In: Alippi A, ed. 4th Int. School of Phys. Acoust. Acoustic sensing and probing. Singapore: World Sci. Pub. Co.. 1992;405-417.
Fort A, Manfredi C, Rocchi S. Adaptive SVD-based AR model order determination for time frequency analysis of Doppler ultrasound signals. Ultrasound Med Biol 1995; 2 1:793 -805.
Fortesque TR, Kershenbaum LS, Ydstie BE. Implementation of self- tuning regulators with variable forgetting factors. Automatica 1981; 17:831-835.
Goodwin GC, Payne RL. Dynamic system identification: Experiment design and data analysis. New York: Academic Press, 1977.
Goodwin GC, Sin KS. Adaptive filtering prediction and control. Englewood Cliffs, NJ: Prentice Hall, 1984.
Gubernatis JE, Domany E, Krumhansi JA, Huberman M. The Born approximation in the theory of the scattering of elastic waves by flaws. J Appl Phys 1977;48:2812-2819.
Gurumurthy KV, Arthur RM. A dispersive model for the propagation of ultrasound in soft tissue. Ultrason Imaging 1982;4:355-377.
Hagglund T. The problem of forgetting old data in recursive estima- tion. In: Proc. IFAC Workshop on Adaptive Systems in Control and Signal Processing, San Francisco. CA. 1983.
Insana MF, Wagner RF, Brown DG, Hall TJ. Describing small-scale structure in random media using pulse-echo ultrasound. J Acoust Sot Am 1990;87:179-191.
Kay SM. Marple SL. Spectrum analysis-A modem perspective. IEEE Proc 1981;69:1380-1419.
Kulhavy R. Restricted exponential forgetting in real-time identifica- tion. Automatica 1987;23:589-600.
Lizzi FL, Greenbaum M. Feleppa EJ, Elbaum M. Theoretical frame- work for spectrum analysis in ultrasonic tissue characterization, J Acoust Sot Am 1983;73:1366-1373.
Lizzi FL, Ostromogilisky M, Feleppa EJ, Rorke M, Yaremko MM. Relationship ofultrasonic spectral parameters to features of tissue microstructure. IEEE Trans UFFC 1986:33:319-328.
Ljung L. System identification: Theory for the user. Englewood Cliffs, NJ: Prentice Hall, 1987.
Marple SL. Digital spectral analysis with applications. Englewood Cliffs. NJ: Prentice Hall, 1987.
O’Donnell M, Jaynes ET, Miller JG. Kramers-Kronig relationship between ultrasonic attenuation and phase velocity. J Acoust Sot Am 1981;69:696-701.
Rocchi S, Fort A. Manfredi C. Masotti L. A new spectrum-amplitude combined imaging technique for intraocular tumor characteriza- tion. Proc Acoust Imaging Conf Nanjing, China. 1993;20:441- 447.
Romijn RL, Thijssen JM, Beuningen WJ. Estimation of scatterer size from backscattered ultrasound: A simulation study. IEEE Trans UFFC 1989;36:593-606.
Salgado ME, Goodwin GC, Middleton RH. Modified least squares algorithm incorporating exponential resetting and forgetting. Int J Control 1988;47:477-491.
Ueda M, Ichikawa H. Analysis of an echo signal reflected from a weakly scattering volume by a discrete model of the medium. J Acoust Sot Am 1981;70:1768-1775.
Wang T. Saniie J, Jin X. Analysis of low-order autoregressive mod- els for ultrasonic grain signal characterization. IEEE Tram UFFC 1991;38:116-124.
Wear KA, Wagner RF, Garra BS. High resolution ultrasonic back- scatter coefficient estimation based on autoregressive spectral estimation using Burg’s algorithm. IEEE Trans Med Imaging 1994; 13:500-507.
Wear KA, Wagner RF. Garra BS. A comparison of autoregressive spectral estimation algorithms and order determination methods in ultrasonic tissue characterization. IEEE Trans UFFC 1995;42:709-716.
Ying CF, True11 R. Scattering of a plane longitudinal wave by a spherical obstacle in an isotropically elastic solid. J Appl Phys 1956:27:1086-1097.


