Embed Size (px)
Citation preview
Tourism and Hospitality Enterprise Survey of Employment and Skills in Lao PDR, 2021: Research Findings and Employment Projections, 2021-2026
Tourism and Hospitality Enterprise Survey of Employment and Skills in Lao PDR, 2021:
Research Findings and Employment Projections, 2021-2026September 2021
2
Published by:Ministry of Education and Sports Lane Xang Avenue, Ban Xieng Yuen Chanthabouly District Vientiane Capital, Lao PDRP. O. Box: 67T +856 21 216004 F +856 21 216004
Supported by the Skills for Tourism Project (LAO/029) receiving financial support from the Governments of Lao PDR, the Grand Duchy of Luxembourg and Switzerland.
Skills for Tourism Project (LAO/029)Khounboulom Road, Ban Watchan Chanthabouly DistrictVientiane, Lao PDRP. O. Box: 2098T +856 21 253 156F +856 21 253 157
Prepared by: PJ Hagan Consulting Fieldwork conducted by Enterprise Development Consultants Co., Ltd.
3
Tourism and Hospitality Enterprise Survey of Employment and Skills in Lao PDR, 2021:
Research Findings and Employment Projections, 2021-2026
September 2021

Intro
duct
ion
4
5
Fore
word
Before the onset of the COVID-19 pandemic, tourism was growing rapidly in Lao PDR. In 2019, international tourist arrivals increased by 14.4%, reaching an all-time high of 4.79 million, with international tourism receipts of $934 million. The downturn in tourism from early 2020 caused by the COVID-19 pandemic has resulted in the closure of many tourism businesses in Lao PDR with heavy job losses reported.
The 2021 Tourism and Hospitality Enterprise Employment and Skills Survey was conducted during May and June 2021 to measure change in the sector since the last survey was conducted in 2018. Furthermore, the report assesses the impact of COVID-19 on employment and the longer-term viability of tourism enterprises. This survey is the most comprehensive of its type to be conducted in tourism and hospitality and provides a representative picture of the sector across 17 provinces and Vientiane Capital.
Historically, tourism has shown a strong capacity to recover from adversity returning to being a source of revenue for public and private stakeholders, and an important source of job creation. With the expectation that tourists will resume travelling to Laos, it is essential to ensure the preparedness of the workforce with updated skillsets, such as appropriate health and hygiene skills, for when international travel restrictions ease.
An increased investment in training, together with ongoing collaboration between training providers, employers and government, will ensure further improvement in the alignment of supply and demand for skilled workers in the tourism and hospitality sector, improving international competitiveness and the ability to attract more visitors.
This report has been produced through close collaboration of the Government of the Lao PDR and the Skills for Tourism Project (LAO/029). It is our intention that the findings of this survey will contribute to interventions and efforts aimed at supporting the recovery of the tourism sector in Lao PDR. We look forward to continued partnership and collaboration toward sustainable and inclusive growth and poverty reduction.
Nouphanh OutsaDirector GeneralTechnical Vocational Education DepartmentMinistry of Education and Sports
Foreword

Intro
duct
ion
6
7
Selected Acronyms and Abbreviations
ADB Asian Development BankASEAN Association of South East Asian NationsCAG Compound Average GrowthDICT Department of Information, Culture and TourismEDC Enterprise and Development Consultants Co., Ltd.EMIS Education Management Information SystemESS Tourism and Hospitality Enterprise Survey of Employment and Skills in Lao PDRGDP Gross Domestic ProductHR Human ResourcesILO International Labour OrganizationISCO International Standard Classification of OccupationsISIC International Standard Industry ClassificationIVET Integrated Vocational Education and TrainingLao PDR Lao People’s Democratic RepublicMICT Ministry of Information, Culture and TourismMoES Ministry of Education and SportsMoLSW Ministry of Labour and Social WelfareMRA (ASEAN) Mutual Recognition ArrangementNEC Not Elsewhere ClassifiedPPE Personal Protective EquipmentSD Skills DevelopmentSDC Skills Development CentersT/H Tourism and Hospitality Sector (Industry)TCO Tourism Characteristic OccupationsTVET Technical Vocational Education and TrainingWB World Bank
Sele
cted
Acr
onym
s and
Abb
revi
atio
ns
8
Glo
ssar
y
Glossary
This glossary provides operational definitions of key terms used in this report:
Business longevity Business longevity relates to the existence of an establishment since commence-ment of its operations. Tourism establishments in this study are categorised as ‘start-up’ (in operation for two years or less), ‘new (three to eight years), ‘estab-lished’ (nine to 20 years), and ‘long term’ (21 years or longer).
Constant prices Constant prices (also referred to as ‘real’) are used to measure the true growth of a series, i.e. adjusting for the effects of price inflation. Usually expressed in terms of a base year (e.g., 2012 prices are the base year for GDP and visitor expenditure cited in this report).
Current prices Also referred to as ‘nominal’ prices. Current prices make no adjustment for inflation.
Disadvantaged Disadvantaged workers were defined, for this study, as meeting one (or more) of the following criteria:• poor/from a poor family background/from a poor household;• living in a rural and/or remote area;• did not complete basic education;• from an ethnic minority;• other (e.g. orphaned, abandoned, a survivor of human trafficking, sexual crime or
violence, living with a disability or chronic illness, or recovering from addiction).
Employed in temporarily closed business
Staff not actively engaged in any productive capacity, nor being adequately remunerated. Such workers could be considered as ‘stood down’, ‘furloughed’ or ‘marginally attached’ since they do not meet the activity test requirements to be classified as employed according to International Labor Organization (ILO) definitions.
Enterprise Any business, company, organisation, or firm which may operate at one or multiple business locations.
Establishment A single business location of an organisation with people working at it (also referred to as workplace, business, firm, and employer).
Firm size Firm size relates to the number of employees in an establishment. Tourism establishments in this study are categorised as ‘micro-businesses’ (employing fewer than six workers), ‘small’ (employing six to 20 persons), ‘medium’ (21 to 100 staff), ‘large’ (101 to 200 staff), and ‘very large’ (over 200 staff).
Handicrafts Handicrafts is a subsector included in this study comprising businesses engaged primarily in the production and distribution of locally made handicraft goods and souvenirs popular with the tourist market. The subsector includes small own account businesses and retail outlets (employing three or more staff) through to large handicraft cooperatives and factories.
Hard-to-fill vacancies
Vacancies which are proving difficult to fill, whether this be the result of poor supply (e.g., insufficient qualified or experienced candidates) or demand reasons (e.g., uncompetitive wages).

9
Glo
ssar
y
In-scope Refers to sampled businesses to be included in the survey. To be in-scope for this study a firm needed to employ three or more persons in the hotel, resort, restau-rant, and entertainment subsectors, or three or more persons in the guesthouse, travel services, attraction, and handicraft subsectors.
Labour demand Total employment plus unfilled vacancies.
Labour supply Total employment plus unemployment.
Net replacement rate The number of jobs arising from individuals leaving an occupation net of jobs taken by persons re-entering the occupation, expressed as a percentage of total employ-ment in that occupation.
Occupations Definitions of occupations used in this report are derived from the International Standard Classification of Occupations (ISCO).
Out-of-scope Refers to firms omitted from the survey because they were either found not to be tourism related businesses or they employed too few persons.
Real gross domestic product
The total value of output, adjusted for inflation, produced within the geographical boundaries of the country regardless of the nationality of the entities producing the output.
Real per capita GDP An approximation of the value of goods produced per person in the country, equal to the country’s constant GDP divided by the total number of people in the country.
Region Four geographic regions used in this report are amalgamations of provinces: ‘North’ includes Bokeo, Houaphan, Luang Namtha, Luang Prabang, Oudomxay, Phong-saly, Xayabouly, and Xiengkhuang. ‘Central’ includes Bolikhamxay, Khammouane, Savannakhet, Vientiane Province, and Xaysomboun. ‘South’ includes Attapeu, Champasak, Saravan, and Sekong. Vientiane Capital comprises the fourth region.
Skills deepening An increase in the level of knowledge and skills required to perform a task or job role due to advances in technology and related factors which impact the complex-ity of the role.
Skills gaps A “skills gap” is where an employee is not fully proficient, i.e., is not able to do their job to the required level.
Skill level An indicator of both the complexity of tasks to be performed and the qualifications and knowledge required for competent performance in a defined occupation.
Staff turnover rate The number of job leavers over the past year expressed as a percentage of year- average total employment.
10
Subsector Tourism subsectors defined in this report are: Hotels, Resorts and Guesthouses (Accommodation); Restaurants; Entertainment; Travel Services; Attractions; and Handicrafts.
Tourism characteristic occupations
Occupations in which most workers will be employed by tourism establishments.
Vacancy rate The number of current vacancies expressed as a percentage of total employment.
Glo
ssar
y
11
Con
tent
s
Table of ContentsForeword 5Selected Acronyms and Abbreviations 7Glossary 8Table of Contents 11List of Figures 12List of Tables 13Executive Summary 151 Introduction 19
1.1 Context 191.2 Objectives 201.3 Structure of this report 20
2 Economic Outlook 213 Survey Methodology 23
3.1 Scope of the survey 233.2 Survey frame 233.3 Sample design and selection 243.4 Response and consent rates 243.5 Post-enumeration procedures 25
4 Findings 274.1 Total employment 27
4.1.1 Employment change, 2018 to 2021 284.1.2 Impact of COVID-19 on employment 30
4.2 Impact of COVID-19 on turnover and business operations 314.3 Characteristics of firms 354.4 Employment composition 40
4.4.1 Workforce composition 434.4.2 Occupational composition 46
4.5 Qualifications, skills and training 484.6 Turnover, vacancies, and recruitment 52
4.6.1 Recruitment practices 544.6.2 Hard-to-fill vacancies 554.6.3 Graduate supply data 56
5 Sectoral Snapshots 595.1 Hotels 595.2 Resorts 605.3 Guesthouses 615.4 Restaurants 625.5 Entertainment 635.6 Travel services 645.7 Attractions 655.8 Handicrafts 66
6 Employment Projections and Future Skills Demand 687 Conclusions 71
Annex A: Sample Stratification and Weights 72 Annex B: Occupational Coding and Skill Level 73 Annex C: Occupation Employment, 4-digit ISCO 75 Annex D: Provincial Employment 77 Annex E: Tourism and Hospitality Graduate Data 78 Annex F: Survey Questionnaire 80
12
List
of F
igur
es
List of Figures
Figure 1: GDP and GDP per capita growth, 2010 to 2022 21Figure 2: International visitors and expenditure: 2010 to 2020 22Figure 3: Comparison of sample frame by sector, 2018 and 2021 26Figure 4: Total employment by sector and business trading status 28Figure 5: Employment change since 2018: Matched sample by sector and trading status 29Figure 6: Employment growth/decline since 2018 by firm: Matched sample 30Figure 7: Total employment in 2020 by month and business trading status 30Figure 8: COVID-19 impact on turnover and employment by sector 32Figure 9: Measures taken to mitigate COVID-19 impacts 32Figure 10: Employer assistance to staff laid off by sector 33Figure 11: Types of assistance provided to displaced workers 33Figure 12: Safety measures introduced in response to COVID-19 34Figure 13: Proportion of T/H employers not undertaking safety measures by sector 34Figure 14: Long-term viability of T/H enterprises 35Figure 15: Firm size and share of employment 37Figure 16: Business longevity by region 37Figure 17: Business ownership by sector 37Figure 18: Foreign business ownership by region and trading status 38Figure 19: Capacity utilisation, 2017 and 2020 39Figure 20: Capacity utilisation by sector 39Figure 21: Enterprise trading status by reliance on international tourists 40Figure 22: Employment by sector and region 40Figure 23: Employment by province and sector 43Figure 24: Female and disadvantaged workers by sector 45Figure 25: Seasonal/temporary and foreign workers by sector 45Figure 26: Employment by tourism characteristic occupation 46Figure 27: TCO employment share by sector 47Figure 28: Occupational employment by skill level and sector 47Figure 29: Qualifications of staff by sector 48Figure 30: Staff training rates by sector 50Figure 31: Tourism establishments who provided no staff training in 2020 50Figure 32: Staff training days by sector and provider type 51Figure 33: Staff training rate* and training days per employee 51Figure 34: Staff turnover and vacancy rates by sector 52Figure 35: Vacancies open to foreigners by sector 54Figure 36: Vacancies open to foreigners by skill level 55Figure 37: Occupational vacancies by skill level and education required 55Figure 38: Recruitment strategies of employers with hard-to-fill vacancies 56Figure 39: Supply of tourism and hospitality graduates by programme, 2015 to 2020 57Figure 40: Supply of tourism and hospitality graduates by qualification, 2015 to 2020 57Figure 41: T/H turnover and training graduates in 2020 by province 58Figure 42: Hotel workforce characteristics 59Figure 43: Resort workforce characteristics 60
Figure 15: Firm size and share of employment
13
List
of T
able
s
List of Tables Table 1: Sample allocation 24Table 2: Consent and response rates 25Table 3: Post-enumeration population counts and sample frame 25Table 4: Weighted estimates of total employment in currently trading enterprises by sector 27Table 5: Employment by sector, 2018 and 2021 28Table 6: Employment by sector, 2018 and 2021: Matched sample 29Table 7: Impact of COVID-19 on turnover, employment, and business operations 31Table 8: Characteristics of tourism enterprises 36Table 9: Characteristics of accommodation enterprises 38Table 10: Employment by sector, region, and firm characteristics 41Table 11: Average number of employees per establishment by sector, region and firm characteristics 42Table 12: Workforce composition 44Table 13: Qualification and training rates 49Table 14: Staff turnover, vacancies, and recruitment 53Table 15: Top ten occupational vacancies 54Table 16: Hard-to-fill vacancies 56Table 17: Hotels, top ten occupations 60Table 18: Resort, top ten occupations 61Table 19: Guesthouse, top ten occupations 62Table 20: Restaurant, top ten occupations 63Table 21: Entertainment, top ten occupations 64Table 22: Travel services, top ten occupations 65Table 23: Attractions, top ten occupations 66Table 24: Handicrafts, top ten occupations 67Table 25: Estimates of annual training demand 70Table A1: Post-enumeration Revised Sample Frame and Population Weights 72Table B1: Tourism characteristic occupations 73Table B2: Mapping of ISCO major groups to skill levels 74Table C1: Employment, qualifications, vacancies and future recruitment by 4-digit ISCO 75Table D1: Characteristics of T/H employment by province 77Table E1: Providers of T/H related education and training programmes in 2020 78Table E2: Tourism and hospitality graduates by programme and province: 2015 to 2020 79
Figure 44: Guesthouse workforce characteristics 61Figure 45 Restaurant workforce characteristics 62Figure 46: Entertainment workforce characteristics 63Figure 47: Travel services workforce characteristics 64Figure 48: Attraction workforce characteristics 65Figure 49: Handicraft workforce characteristics 66Figure 50: Historic and projected T/H employment, 2009 to 2026 69Figure B1: Tourism job classifications 73

15
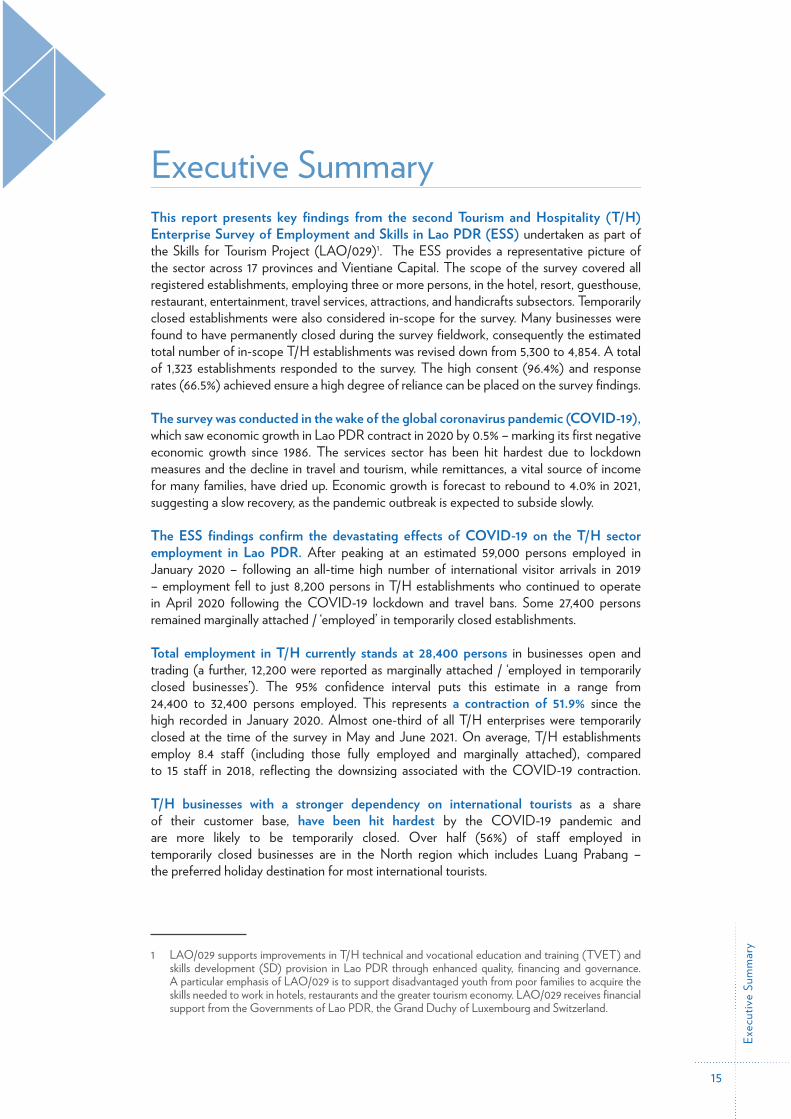
Executive SummaryThis report presents key findings from the second Tourism and Hospitality (T/H) Enterprise Survey of Employment and Skills in Lao PDR (ESS) undertaken as part of the Skills for Tourism Project (LAO/029)1. The ESS provides a representative picture of the sector across 17 provinces and Vientiane Capital. The scope of the survey covered all registered establishments, employing three or more persons, in the hotel, resort, guesthouse, restaurant, entertainment, travel services, attractions, and handicrafts subsectors. Temporarily closed establishments were also considered in-scope for the survey. Many businesses were found to have permanently closed during the survey fieldwork, consequently the estimated total number of in-scope T/H establishments was revised down from 5,300 to 4,854. A total of 1,323 establishments responded to the survey. The high consent (96.4%) and response rates (66.5%) achieved ensure a high degree of reliance can be placed on the survey findings.
The survey was conducted in the wake of the global coronavirus pandemic (COVID-19), which saw economic growth in Lao PDR contract in 2020 by 0.5% – marking its first negative economic growth since 1986. The services sector has been hit hardest due to lockdown measures and the decline in travel and tourism, while remittances, a vital source of income for many families, have dried up. Economic growth is forecast to rebound to 4.0% in 2021, suggesting a slow recovery, as the pandemic outbreak is expected to subside slowly.
The ESS findings confirm the devastating effects of COVID-19 on the T/H sector employment in Lao PDR. After peaking at an estimated 59,000 persons employed in January 2020 – following an all-time high number of international visitor arrivals in 2019 – employment fell to just 8,200 persons in T/H establishments who continued to operate in April 2020 following the COVID-19 lockdown and travel bans. Some 27,400 persons remained marginally attached / ‘employed’ in temporarily closed establishments.
Total employment in T/H currently stands at 28,400 persons in businesses open and trading (a further, 12,200 were reported as marginally attached / ‘employed in temporarily closed businesses’). The 95% confidence interval puts this estimate in a range from 24,400 to 32,400 persons employed. This represents a contraction of 51.9% since the high recorded in January 2020. Almost one-third of all T/H enterprises were temporarily closed at the time of the survey in May and June 2021. On average, T/H establishments employ 8.4 staff (including those fully employed and marginally attached), compared to 15 staff in 2018, reflecting the downsizing associated with the COVID-19 contraction.
T/H businesses with a stronger dependency on international tourists as a share of their customer base, have been hit hardest by the COVID-19 pandemic and are more likely to be temporarily closed. Over half (56%) of staff employed in temporarily closed businesses are in the North region which includes Luang Prabang – the preferred holiday destination for most international tourists.
1 LAO/029 supports improvements in T/H technical and vocational education and training (TVET) and skills development (SD) provision in Lao PDR through enhanced quality, financing and governance. A particular emphasis of LAO/029 is to support disadvantaged youth from poor families to acquire the skills needed to work in hotels, restaurants and the greater tourism economy. LAO/029 receives financial support from the Governments of Lao PDR, the Grand Duchy of Luxembourg and Switzerland.
Exec
utiv
e Su
mm
ary
16
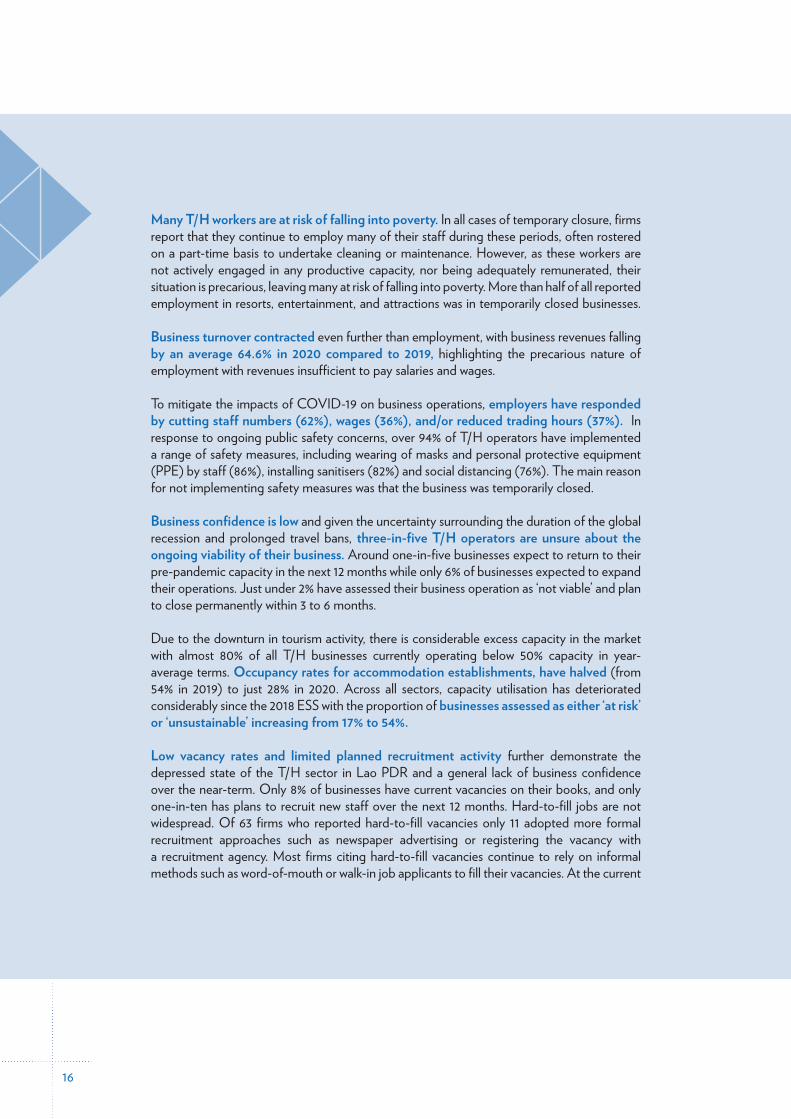
Many T/H workers are at risk of falling into poverty. In all cases of temporary closure, firms report that they continue to employ many of their staff during these periods, often rostered on a part-time basis to undertake cleaning or maintenance. However, as these workers are not actively engaged in any productive capacity, nor being adequately remunerated, their situation is precarious, leaving many at risk of falling into poverty. More than half of all reported employment in resorts, entertainment, and attractions was in temporarily closed businesses.
Business turnover contracted even further than employment, with business revenues falling by an average 64.6% in 2020 compared to 2019, highlighting the precarious nature of employment with revenues insufficient to pay salaries and wages.
To mitigate the impacts of COVID-19 on business operations, employers have responded by cutting staff numbers (62%), wages (36%), and/or reduced trading hours (37%). In response to ongoing public safety concerns, over 94% of T/H operators have implemented a range of safety measures, including wearing of masks and personal protective equipment (PPE) by staff (86%), installing sanitisers (82%) and social distancing (76%). The main reason for not implementing safety measures was that the business was temporarily closed.
Business confidence is low and given the uncertainty surrounding the duration of the global recession and prolonged travel bans, three-in-five T/H operators are unsure about the ongoing viability of their business. Around one-in-five businesses expect to return to their pre-pandemic capacity in the next 12 months while only 6% of businesses expected to expand their operations. Just under 2% have assessed their business operation as ‘not viable’ and plan to close permanently within 3 to 6 months.
Due to the downturn in tourism activity, there is considerable excess capacity in the market with almost 80% of all T/H businesses currently operating below 50% capacity in year-average terms. Occupancy rates for accommodation establishments, have halved (from 54% in 2019) to just 28% in 2020. Across all sectors, capacity utilisation has deteriorated considerably since the 2018 ESS with the proportion of businesses assessed as either ‘at risk’ or ‘unsustainable’ increasing from 17% to 54%.
Low vacancy rates and limited planned recruitment activity further demonstrate the depressed state of the T/H sector in Lao PDR and a general lack of business confidence over the near-term. Only 8% of businesses have current vacancies on their books, and only one-in-ten has plans to recruit new staff over the next 12 months. Hard-to-fill jobs are not widespread. Of 63 firms who reported hard-to-fill vacancies only 11 adopted more formal recruitment approaches such as newspaper advertising or registering the vacancy with a recruitment agency. Most firms citing hard-to-fill vacancies continue to rely on informal methods such as word-of-mouth or walk-in job applicants to fill their vacancies. At the current
17
levels of staff turnover and planned recruitment, it could take over five years for the total T/H employment to return to pre-COVID-19 levels.
Notwithstanding the current turmoil and disruption to T/H services caused by the global pandemic, the T/H sector in Lao PDR has undergone significant skill deepening since the first ESS in 2018.
Encouraging trends in T/H graduate supply data demonstrate significantly improved alignment between T/H training providers and the labour demands of employers in the industry. Consequently, the industry has recorded a 20%-point increase in the qualification profile, with 51% of employed workers holding formal qualifications (up from 30% in 2018). Of these, 6.7% hold T/H related qualifications (compared to just 3.1% in 2018). The illiteracy rate has fallen by 7% points from 49.3% to 42% over the same period.
Despite the severe contraction caused by the global pandemic tourism is seen as one of the sectors with significant long-term potential to create income for people from disadvantaged backgrounds in Lao PDR. New sets of skills, such as infection prevention and control, as well as health and safety practices, will be required to safely operate in the post COVID-19 workplace.
Projections of T/H employment demand to 2026 in this report have been modelled under a range of scenarios reflecting the underlying uncertainty going forward. The most likely scenario incorporates the impact of the current economic contraction and consensus forecasts of future economic growth. Under this scenario aggregate T/H employment is forecast to rebound to pre-COVID levels of 57,000 by 2023 – during which time many displaced workers could be re-employed – reaching 67,600 persons by 2026. Implicit in this forecast is a return to ‘normal’ international travel levels within the timeframe of 2021-22 with the growth trajectory moderating from 2023. To achieve this, a concerted and effective effort will be required to ensure a sustained rate of recovery in visitor arrivals and spending across the economy.
With ongoing uncertainty surrounding global travel, as precautionary behaviour and travel continue to negatively affect international tourism related services and transportation, promoting and developing domestic tourism could be a key component of the T/H sector medium term recovery strategy for Lao PDR. Increased investment in vocational training, together with ongoing collaboration between training providers, employers and government, will ensure further improvement in the alignment of supply and demand for skilled T/H workers in Lao PDR, underpinning international competitiveness and an ability to attract a more lucrative visitor portfolio.
Exec
utiv
e Su
mm
ary
18
Surv
ey M
etho
dolo
gy
19 19
Intro
duct
ion
1 Introduction
1.1 ContextThe Lao People’s Democratic Republic (Lao PDR) remains one of the 48 nations on the United Nations’ list of least developed countries. About 7.3 million people live in its 17 provinces and capital city. Most people are still living in rural areas, although urbanisation is occurring at a rate of approximately 5% per year, primarily to Vientiane Capital. The population is relatively young with 58% under the age of 25. Having one of the youngest pop-ulations in the region, Lao PDR is projected to benefit from a ‘demographic dividend’ to the economy in the medium-term, but only if young women and men are better equipped with appropriate skills and knowledge, and job creation keeps pace with the growth of the working-age population.
Despite the severe contraction caused by the global corona-virus pandemic (COVID-19), tourism is seen as one of the sectors with significant long-term potential to create income for people from disadvantaged backgrounds in Lao PDR. The main income from tourism (with pro-poor potential) is generated in hotels and restaurants (through salaries paid to employees and sale of agricultural products for meals), as well as the sale of handicrafts and community-based services (such as guiding and homestays). However, at present, people from disadvantaged backgrounds profit only marginally from tourism. There is potential to increase their share of tourism-related income, directly through greater participation in the tourism labour force, and indirectly through participation in tourism-related supply chains such as handicrafts. The challenge is to provide them with the skills and knowledge to move up the value chain by providing higher quality services and goods, resulting in higher economic yields that make a greater contribution to poverty alleviation.
In 2018 the Skills for Tourism Project (LAO/029)2, support-ed the conduct of the first Tourism and Hospitality (T/H) En-terprise Employment and Skills Survey (ESS) in 17 provinces and Vientiane Capital in Lao PDR. The survey identified the specific and evolving human resource needs of the T/H industry in Lao PDR. The findings of the survey informed T/H skills devel-opment helping training providers to match capacity to demand and supporting their efforts to develop a market-oriented offer.
2 LAO/029 (hereinafter refered to as the Project) supports improvements in T/H technical and vocational education and training (TVET) and skills development (SD) provision in Lao PDR through enhanced quality, financing and governance. A particular emphasis of LAO/029 is to support disadvantaged youth from poor families to acquire the skills needed to work in hotels, restaurants and the greater tourism economy. LAO/029 receives financial support from the Governments of Lao PDR, the Grand Duchy of Luxembourg and Switzerland.
20
Intro
duct
ion
The 2020 downturn in tourism caused by the COVID-19 pandemic has resulted in closure of many tourism businesses in Lao PDR with job losses reported. It is anticipated that once international travel restrictions ease, most tourism businesses plan to re-open. When this happens the demand for additional and appropriately skilled staff will increase. New sets of skills, such as infection prevention and control, as well as health and safety practices, will be required to safely operate in the post COVID-19 workplace.
The second ESS for Lao PDR was conducted during May and June 2021 as a re-run of the 2018 ESS, to provide directly comparable results to measure change – growth/decline – in employment in the sector over the past three years. Additional questions have been incorporated to assess the impact of COVID-19 on employment and the longer-term viability of tourism enterprises.
1.2 ObjectivesThis survey is the most comprehensive of its type to be conducted in the T/H sector and provides a representative picture of the sector across 17 provinces and Vientiane Capital. The specific objectives of the survey were to:
• Ascertain the size of the labour market in each T/H subsector by occupation, location, and skill level, • Assess the impact of COVID-19 on employment and T/H skills development,• Quantify the number of vacancies and recruitment issues, and• Identify priority occupations and skills challenges.
The survey data gathered will be used, in conjunction with training supply data and other data sources, to develop a quantitative model of labour demand and skills requirement in the T/H sector in Lao PDR. The find-ings will inform an assessment of the projected skills needs for the T/H sector in Lao PDR from 2022 – 2026.
The findings of this report will further inform relevant stakeholders of T/H Technical Vocational Education and Training (TVET) and skills development (SD) in terms of policy, planning, provision and evaluation.
1.3 Structure of this reportA brief economic outlook, for the Lao PDR economy in general and prospects for the tourism sector more specifically, is presented in section 2. Section 3 outlines the survey methodology including sample selection and stratification for the ESS. The results of the analysis are presented in section 4, focusing primarily on the implications at national and sectoral level. Section 5 presents additional sectoral snapshots as an aid to focus skill needs and training development at the subsector level. The growth prospects for the T/H sector are considered in section 6. The final section concludes with recommendations to support recovery following the COVID-19 contraction and sustainable and inclusive growth as the sector transitions to a higher-skilled workforce and improved international competitiveness.
21
Econ
omic
Out
look
2 Economic Outlook
While Lao PDR has made good development progress over the past twenty years, halving poverty, reducing malnutrition, and improving education and health outcomes, the effects of COVID-19 on the Lao economy are placing at risk some of the significant gains made.
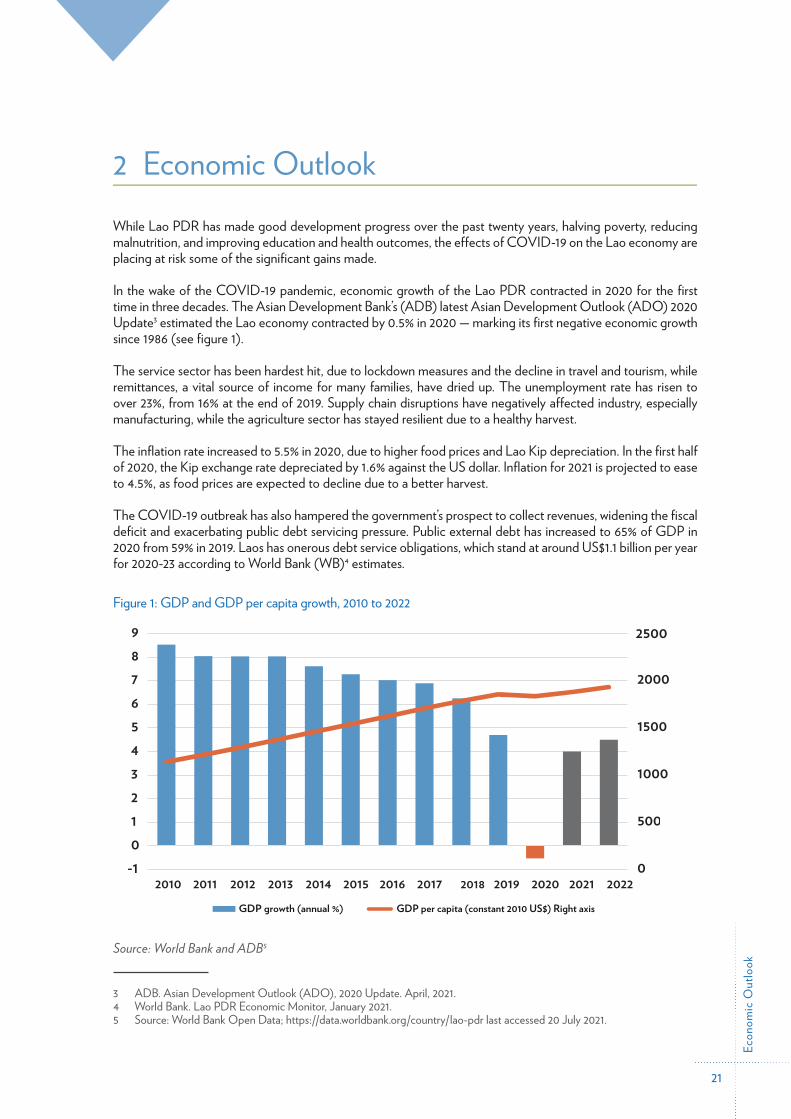
In the wake of the COVID-19 pandemic, economic growth of the Lao PDR contracted in 2020 for the first time in three decades. The Asian Development Bank’s (ADB) latest Asian Development Outlook (ADO) 2020 Update3 estimated the Lao economy contracted by 0.5% in 2020 — marking its first negative economic growth since 1986 (see figure 1).
The service sector has been hardest hit, due to lockdown measures and the decline in travel and tourism, while remittances, a vital source of income for many families, have dried up. The unemployment rate has risen to over 23%, from 16% at the end of 2019. Supply chain disruptions have negatively affected industry, especially manufacturing, while the agriculture sector has stayed resilient due to a healthy harvest.
The inflation rate increased to 5.5% in 2020, due to higher food prices and Lao Kip depreciation. In the first half of 2020, the Kip exchange rate depreciated by 1.6% against the US dollar. Inflation for 2021 is projected to ease to 4.5%, as food prices are expected to decline due to a better harvest.
The COVID-19 outbreak has also hampered the government’s prospect to collect revenues, widening the fiscal deficit and exacerbating public debt servicing pressure. Public external debt has increased to 65% of GDP in 2020 from 59% in 2019. Laos has onerous debt service obligations, which stand at around US$1.1 billion per year for 2020-23 according to World Bank (WB)4 estimates.
Figure 1: GDP and GDP per capita growth, 2010 to 2022
Figure-1
has increased to 65% of GDP in 2020 from 59% in 2019. Laos has onerous debt service obligations, which stand at around US$1.1 billion per year for 2020-23 according to World Bank (WB)4 estimates.
Figure 1: GDP and GDP per capita growth, 2010 to 2022
Source: World Bank and ADB5
0
500
1000
1500
2500
-10123456789
2010 2011 2012 2013 2014 2015 2016 2017 2018 2019 2020 2021 2022
2000
GDP growth (annual %) GDP per capita (constant 2010 US$) Right axis
Source: World Bank and ADB5
3 ADB. Asian Development Outlook (ADO), 2020 Update. April, 2021.4 World Bank. Lao PDR Economic Monitor, January 2021.5 Source: World Bank Open Data; https://data.worldbank.org/country/lao-pdr last accessed 20 July 2021.
22
Econ
omic
Out
look
Economic growth is forecast to rebound to 4.0% in 2021,6 suggesting a slow recovery, as the pandemic outbreak is expected to subside slowly. Risks to the outlook, however, are mainly on the downside and include a prolonged COVID-19 outbreak, delays in rolling out the vaccines, a more sluggish recovery in Lao PDR’s key trading partners, heightened difficulties in meeting external public debt-service obligations, and potential adverse weather-related events. Rising food prices and job uncertainty for the poor and vulnerable are also major risks.
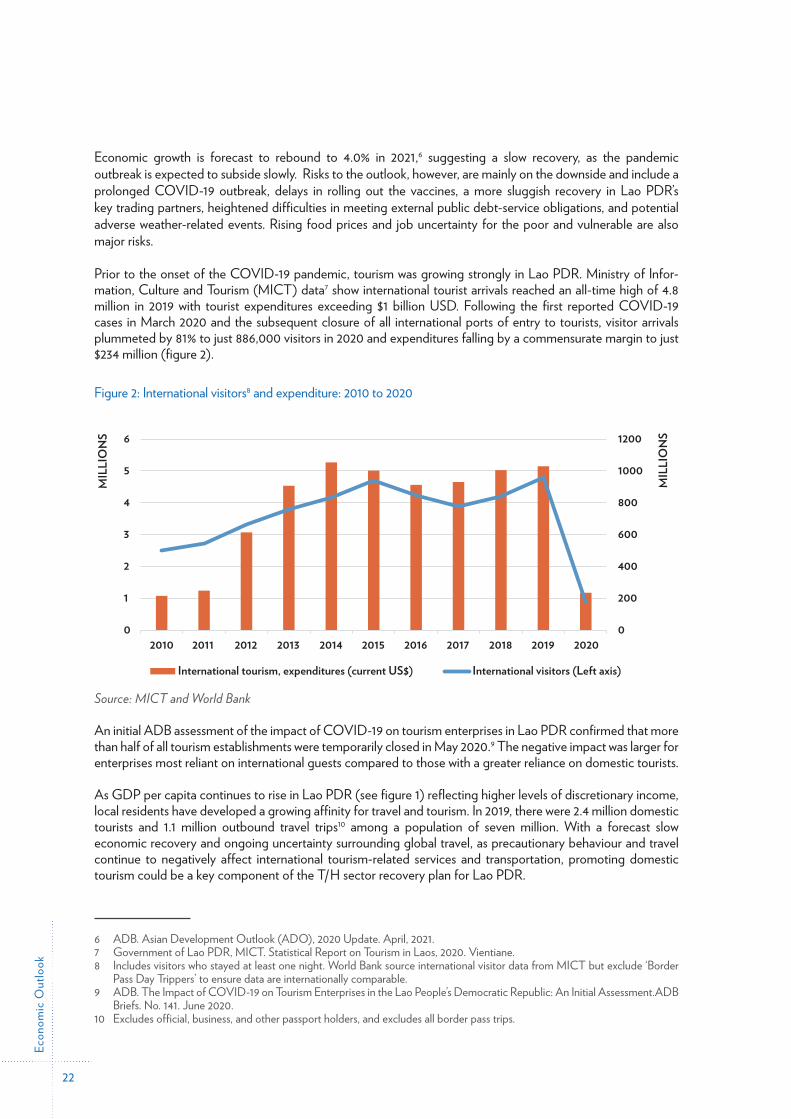
Prior to the onset of the COVID-19 pandemic, tourism was growing strongly in Lao PDR. Ministry of Infor-mation, Culture and Tourism (MICT) data7 show international tourist arrivals reached an all-time high of 4.8 million in 2019 with tourist expenditures exceeding $1 billion USD. Following the first reported COVID-19 cases in March 2020 and the subsequent closure of all international ports of entry to tourists, visitor arrivals plummeted by 81% to just 886,000 visitors in 2020 and expenditures falling by a commensurate margin to just $234 million (figure 2).
Figure 2: International visitors8 and expenditure: 2010 to 2020
Figure-2
of entry to tourists, visitor arrivals plummeted by 81% to just 886,000 visitors in 2020 and expenditures falling by a commensurate margin to just $234 million (figure 2).
Figure 2: International visitors8 and expenditure: 2010 to 2020
Source: MICT and World Bank
An initial ADB assessment of the impact of COVID-19 on tourism enterprises in Lao PDR confirmed that more than half of all tourism establishments were temporarily closed in May 2020.9 The
0
200
400
600
800
1000
1200
0
1
2
3
4
5
6
2010 2011 2012 2013 2014 2015 2016 2017 2018 2019 2020M
ILLI
ON
S
MIL
LIO
NS
International tourism, expenditures (current US$)
Lorem ipsum
International visitors (Left axis)
employment in actively trading enterprises, or a 31.4% contraction when taking into account‘employed in temporarily closed businesses’ since the high of 59,200 recorded in January 2020
4.2 Impact of COVID-19 on turnover and business operations
The survey results also confirm that COVID-19 has had a devastating impact on the revenues of tourism enterprises with average turnover falling by almost 65% between 2019 and 2020As can be seen in figure 8, the reported fall in turnover revenues is considerably higher in
Source: MICT and World Bank
An initial ADB assessment of the impact of COVID-19 on tourism enterprises in Lao PDR confirmed that more than half of all tourism establishments were temporarily closed in May 2020.9 The negative impact was larger for enterprises most reliant on international guests compared to those with a greater reliance on domestic tourists.
As GDP per capita continues to rise in Lao PDR (see figure 1) reflecting higher levels of discretionary income, local residents have developed a growing affinity for travel and tourism. In 2019, there were 2.4 million domestic tourists and 1.1 million outbound travel trips10 among a population of seven million. With a forecast slow economic recovery and ongoing uncertainty surrounding global travel, as precautionary behaviour and travel continue to negatively affect international tourism-related services and transportation, promoting domestic tourism could be a key component of the T/H sector recovery plan for Lao PDR.
6 ADB. Asian Development Outlook (ADO), 2020 Update. April, 2021.7 Government of Lao PDR, MICT. Statistical Report on Tourism in Laos, 2020. Vientiane.8 Includes visitors who stayed at least one night. World Bank source international visitor data from MICT but exclude ‘Border
Pass Day Trippers’ to ensure data are internationally comparable.9 ADB. The Impact of COVID-19 on Tourism Enterprises in the Lao People’s Democratic Republic: An Initial Assessment.ADB
Briefs. No. 141. June 2020.10 Excludes official, business, and other passport holders, and excludes all border pass trips.
Surv
ey M
etho
dolo
gy
23
3 Survey Methodology A total sample of 1,323 responding T/H enterprises operating across 17 provinces plus Vientiane Capital made up the survey. Of the total responses, 430 firms also responded to the 2018 ESS, providing a longitudinal subset of directly matched results.
The survey was conducted by face-to-face and telephone interviews with data captured electronically using tablets. The fieldwork, undertaken by Enterprise and Development Consultants Co., Ltd. (EDC), took place between 24 May and 30 June 2021, across all 17 provinces and Vientiane Capital. Follow-up interviews and data validation were completed by 20 July 2021.
Enumerator and supervisor training was conducted over five days in Vientiane in March 2021 and included the involvement of staff from MICT and the Ministry of Labour and Social Welfare (MoSLW) to be trained as enumerators as part of a capacity development initiative for the Project partners. The initial survey schedule was disrupted due to a secondary outbreak of COVID-19 in late April 2021 necessitating a suspension of travel of the survey field teams from province to province. Consequently, online training was conducted for a further two weeks (from 10 to 21 May 2021) recruiting additional local enumerators from each province including staff from the provincial offices of the Department of Information, Culture and Tourism (DICT). In total, a team of 80 enumerators (including 46 women) were recruited for the duration of the survey.
3.1 Scope of the surveyThe scope of the survey covered all registered establishments employing three or more persons, in each subsector whose business operations offer services to tourists (either international or domestic).
It should be noted that the employment threshold for hotels, resorts, and restaurants in the 2018 ESS was six or more persons. This change in scope was deemed necessary to ensure that firms who have temporarily scaled down due to the impact of COVID-19 would still be captured in the survey results. Similarly, temporarily closed establishments – who would meet the selection criteria under normal operating circumstances – were also con-sidered in-scope for this survey.
3.2 Survey frameThe primary source of information used to determine the total population of each subsector, and the in-scope component within each from which the sample would be drawn, was the MICT Department of Tourism Promo-tion’s central database containing lists of registered tourism businesses across all provinces by subsector.
This database contains reasonably comprehensive information, such as the number of employees, number of rooms, investment capital, etc., and was used to categorise (out-of-scope) micro-businesses where possible. Information was available to varying degrees across the subsectors, providing full coverage for hotels, resorts, guesthouses, restaurants and partial information on entertainment and travel services. From the list of attrac-tions, it was possible to identify, and exclude, natural attractions which do not employ staff. Natural attractions were only considered in-scope where the MICT database indicated the site also had a gift shop and/or a restau-rant/cafeteria attached. The handicraft sector sample frame was compiled from three official lists identifying handicrafts groups and cooperatives, handicraft factories, and family-based handicraft factories.
Overall, the quality of the sample frame has increased considerably since the 2018 ESS (at which time no central list of attractions and handicraft businesses were available). There are, however, considerable time lags associated with business registrations received in provincial offices and the updating of the central database in MICT. Consequently, the frame was supplemented with additional business names from the DICT where available during the fieldwork phase of the survey.
Surv
ey M
etho
dolo
gy
24
3.3 Sample design and selectionThe sample size for each sub-sector was calculated to achieve a 7.5% accuracy rate at the 95% confidence level for the required geographic level of analysis. For hotels and resorts, geography has been set at the provincial level, while the sample size for handicrafts was determined to provide national level results only. For the remain-ing sub-sectors, sample size was based on four regions: North, Central, South and Vientiane Capital.
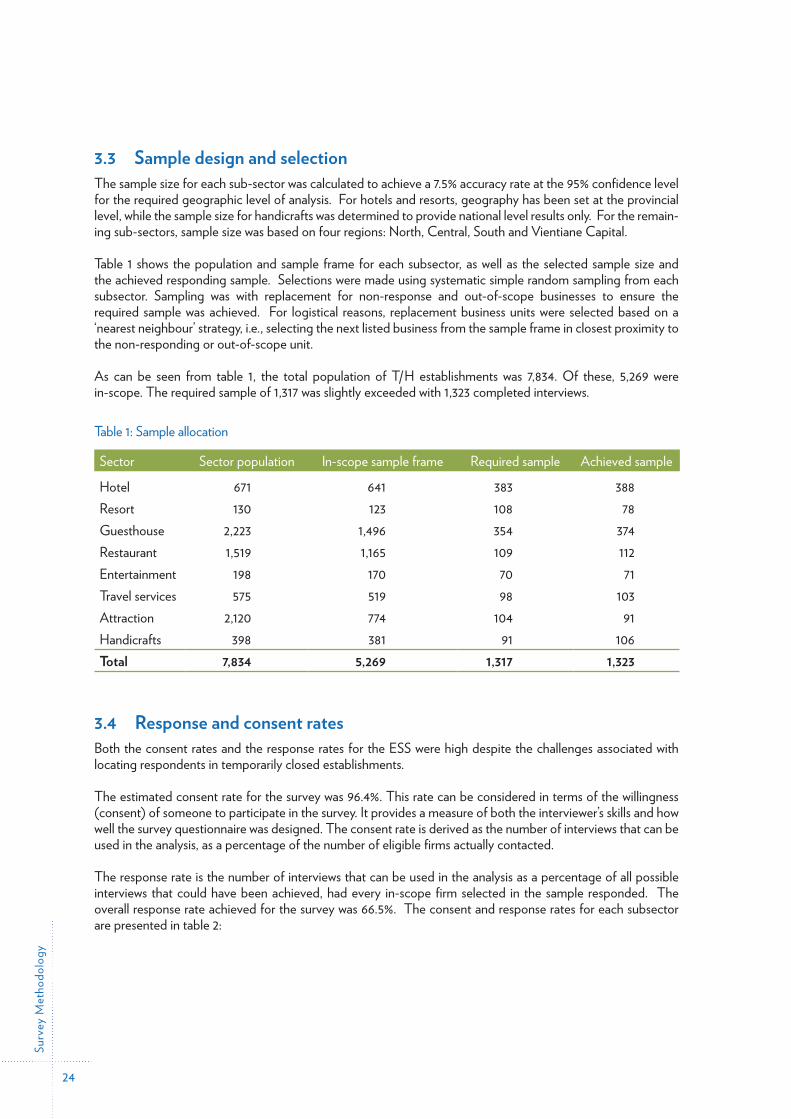
Table 1 shows the population and sample frame for each subsector, as well as the selected sample size and the achieved responding sample. Selections were made using systematic simple random sampling from each subsector. Sampling was with replacement for non-response and out-of-scope businesses to ensure the required sample was achieved. For logistical reasons, replacement business units were selected based on a ‘nearest neighbour’ strategy, i.e., selecting the next listed business from the sample frame in closest proximity to the non-responding or out-of-scope unit.
As can be seen from table 1, the total population of T/H establishments was 7,834. Of these, 5,269 were in-scope. The required sample of 1,317 was slightly exceeded with 1,323 completed interviews.
Table 1: Sample allocation
Sector Sector population In-scope sample frame Required sample Achieved sample
Hotel 671 641 383 388Resort 130 123 108 78Guesthouse 2,223 1,496 354 374Restaurant 1,519 1,165 109 112Entertainment 198 170 70 71Travel services 575 519 98 103Attraction 2,120 774 104 91Handicrafts 398 381 91 106Total 7,834 5,269 1,317 1,323
3.4 Response and consent ratesBoth the consent rates and the response rates for the ESS were high despite the challenges associated with locating respondents in temporarily closed establishments.
The estimated consent rate for the survey was 96.4%. This rate can be considered in terms of the willingness (consent) of someone to participate in the survey. It provides a measure of both the interviewer’s skills and how well the survey questionnaire was designed. The consent rate is derived as the number of interviews that can be used in the analysis, as a percentage of the number of eligible firms actually contacted.
The response rate is the number of interviews that can be used in the analysis as a percentage of all possible interviews that could have been achieved, had every in-scope firm selected in the sample responded. The overall response rate achieved for the survey was 66.5%. The consent and response rates for each subsector are presented in table 2:
Surv
ey M
etho
dolo
gy
25
Table 2: Consent and response rates
Sector Consent rate Response rate Sample replacement rateHotel 95.8% 76.7% 37.9%Resort 94.0% 54.2% 34.3%Guesthouse 94.7% 65.3% 66.9%Restaurant 97.4% 59.7% 82.1%Entertainment 98.6% 60.2% 71.0%Travel services 98.1% 59.2% 84.7%Attraction 100.0% 70.0% 84.6%Handicrafts 99.1% 67.5% 80.2%Total 96.4% 66.5% 60.9%
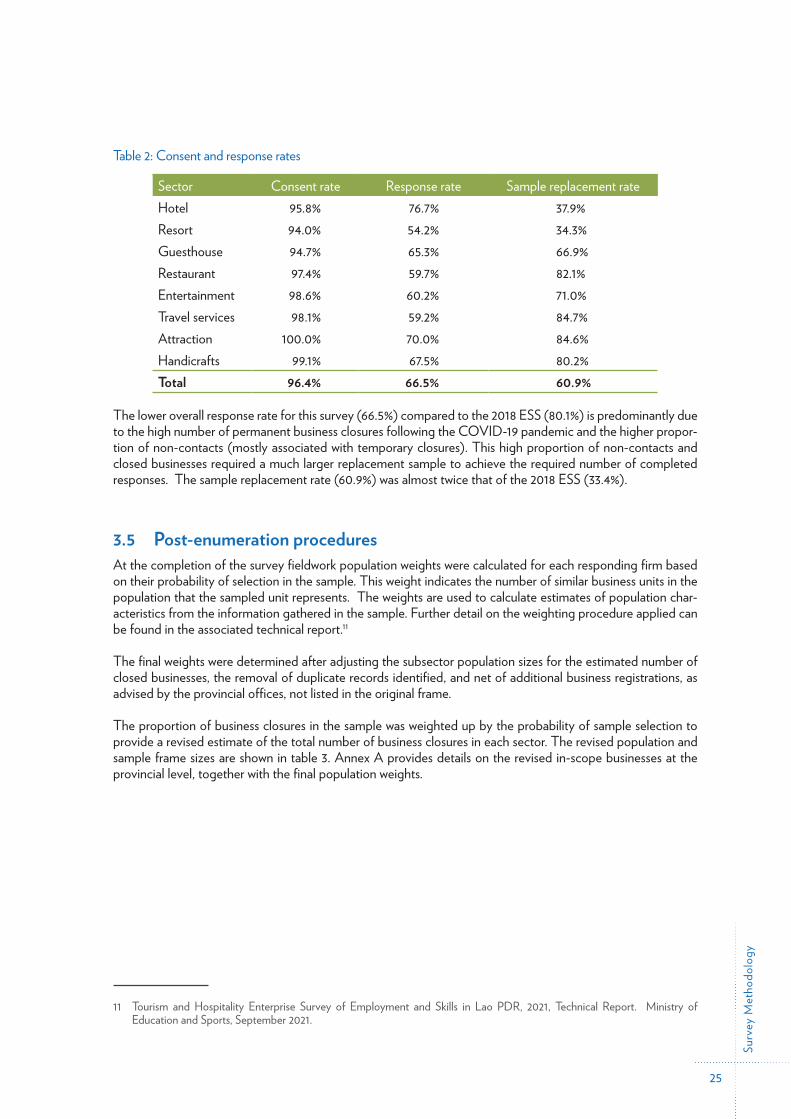
The lower overall response rate for this survey (66.5%) compared to the 2018 ESS (80.1%) is predominantly due to the high number of permanent business closures following the COVID-19 pandemic and the higher propor-tion of non-contacts (mostly associated with temporary closures). This high proportion of non-contacts and closed businesses required a much larger replacement sample to achieve the required number of completed responses. The sample replacement rate (60.9%) was almost twice that of the 2018 ESS (33.4%).
3.5 Post-enumeration proceduresAt the completion of the survey fieldwork population weights were calculated for each responding firm based on their probability of selection in the sample. This weight indicates the number of similar business units in the population that the sampled unit represents. The weights are used to calculate estimates of population char-acteristics from the information gathered in the sample. Further detail on the weighting procedure applied can be found in the associated technical report.11
The final weights were determined after adjusting the subsector population sizes for the estimated number of closed businesses, the removal of duplicate records identified, and net of additional business registrations, as advised by the provincial offices, not listed in the original frame.
The proportion of business closures in the sample was weighted up by the probability of sample selection to provide a revised estimate of the total number of business closures in each sector. The revised population and sample frame sizes are shown in table 3. Annex A provides details on the revised in-scope businesses at the provincial level, together with the final population weights.
11 Tourism and Hospitality Enterprise Survey of Employment and Skills in Lao PDR, 2021, Technical Report. Ministry of Education and Sports, September 2021.
Surv
ey M
etho
dolo
gy
26
Table 3: Post-enumeration population counts and sample frame
Sector Additional business registrations
Closures Out-of-scope micro-businesses
Adjusted sample frame
Revised subsector population
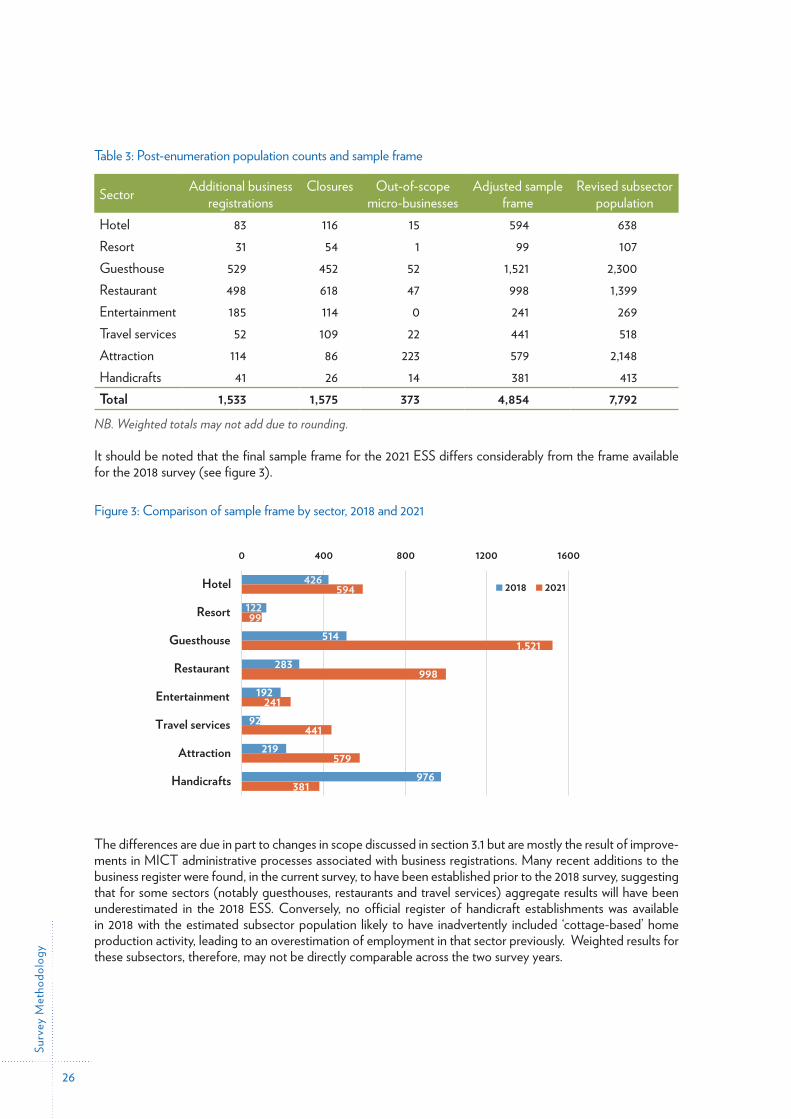
Hotel 83 116 15 594 638Resort 31 54 1 99 107Guesthouse 529 452 52 1,521 2,300Restaurant 498 618 47 998 1,399Entertainment 185 114 0 241 269Travel services 52 109 22 441 518Attraction 114 86 223 579 2,148Handicrafts 41 26 14 381 413Total 1,533 1,575 373 4,854 7,792
NB. Weighted totals may not add due to rounding.
It should be noted that the final sample frame for the 2021 ESS differs considerably from the frame available for the 2018 survey (see figure 3).
Figure 3: Comparison of sample frame by sector, 2018 and 2021
Figure-3
It should be noted that the final sample frame for the 2021 ESS differs considerably from the frame available for the 2018 survey (see figure 3).
Figure 3: Comparison of sample frame by sector, 2018 and 2021
The differences are due in part to changes in scope discussed in section 3.1 but are mostly the result of improvements in MICT administrative processes associated with business registrations.
426
514
283
192
92
219
976
594
99122
1,521
998
241
441
579
381
0 400 800 1200 1600
Hotel
Resort
Guesthouse
Restaurant
Entertainment
Travel services
Attraction
Handicrafts
2018 2021
The differences are due in part to changes in scope discussed in section 3.1 but are mostly the result of improve-ments in MICT administrative processes associated with business registrations. Many recent additions to the business register were found, in the current survey, to have been established prior to the 2018 survey, suggesting that for some sectors (notably guesthouses, restaurants and travel services) aggregate results will have been underestimated in the 2018 ESS. Conversely, no official register of handicraft establishments was available in 2018 with the estimated subsector population likely to have inadvertently included ‘cottage-based’ home production activity, leading to an overestimation of employment in that sector previously. Weighted results for these subsectors, therefore, may not be directly comparable across the two survey years.
Find
ings
27
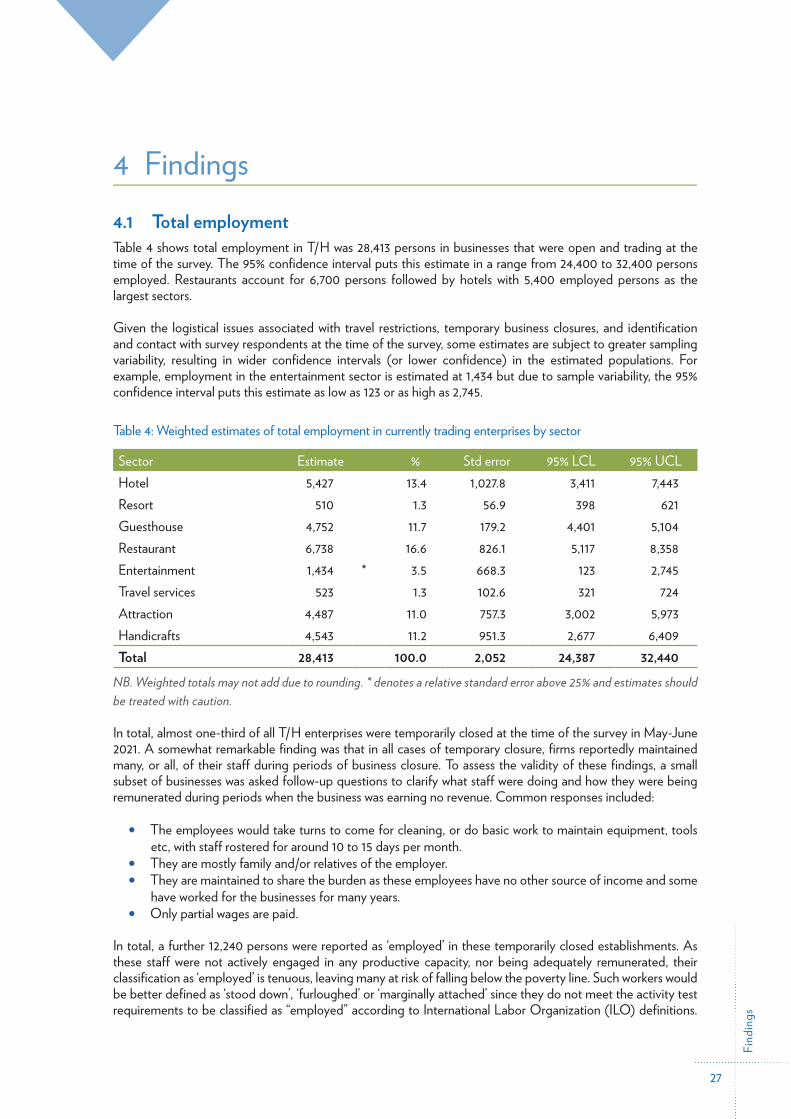
4 Findings4.1 Total employmentTable 4 shows total employment in T/H was 28,413 persons in businesses that were open and trading at the time of the survey. The 95% confidence interval puts this estimate in a range from 24,400 to 32,400 persons employed. Restaurants account for 6,700 persons followed by hotels with 5,400 employed persons as the largest sectors.
Given the logistical issues associated with travel restrictions, temporary business closures, and identification and contact with survey respondents at the time of the survey, some estimates are subject to greater sampling variability, resulting in wider confidence intervals (or lower confidence) in the estimated populations. For example, employment in the entertainment sector is estimated at 1,434 but due to sample variability, the 95% confidence interval puts this estimate as low as 123 or as high as 2,745.
Table 4: Weighted estimates of total employment in currently trading enterprises by sector
Sector Estimate % Std error 95% LCL 95% UCLHotel 5,427 13.4 1,027.8 3,411 7,443Resort 510 1.3 56.9 398 621Guesthouse 4,752 11.7 179.2 4,401 5,104Restaurant 6,738 16.6 826.1 5,117 8,358Entertainment 1,434 * 3.5 668.3 123 2,745Travel services 523 1.3 102.6 321 724Attraction 4,487 11.0 757.3 3,002 5,973Handicrafts 4,543 11.2 951.3 2,677 6,409Total 28,413 100.0 2,052 24,387 32,440
NB. Weighted totals may not add due to rounding. * denotes a relative standard error above 25% and estimates should be treated with caution.
In total, almost one-third of all T/H enterprises were temporarily closed at the time of the survey in May-June 2021. A somewhat remarkable finding was that in all cases of temporary closure, firms reportedly maintained many, or all, of their staff during periods of business closure. To assess the validity of these findings, a small subset of businesses was asked follow-up questions to clarify what staff were doing and how they were being remunerated during periods when the business was earning no revenue. Common responses included:
• The employees would take turns to come for cleaning, or do basic work to maintain equipment, tools etc, with staff rostered for around 10 to 15 days per month.
• They are mostly family and/or relatives of the employer.• They are maintained to share the burden as these employees have no other source of income and some
have worked for the businesses for many years.• Only partial wages are paid.
In total, a further 12,240 persons were reported as ‘employed’ in these temporarily closed establishments. As these staff were not actively engaged in any productive capacity, nor being adequately remunerated, their classification as ‘employed’ is tenuous, leaving many at risk of falling below the poverty line. Such workers would be better defined as ‘stood down’, ‘furloughed’ or ‘marginally attached’ since they do not meet the activity test requirements to be classified as “employed” according to International Labor Organization (ILO) definitions.
Find
ings
28
However, in order to present the full survey results, subsequent tables and figures distinguish these persons as ‘employed in temporarily closed businesses’.
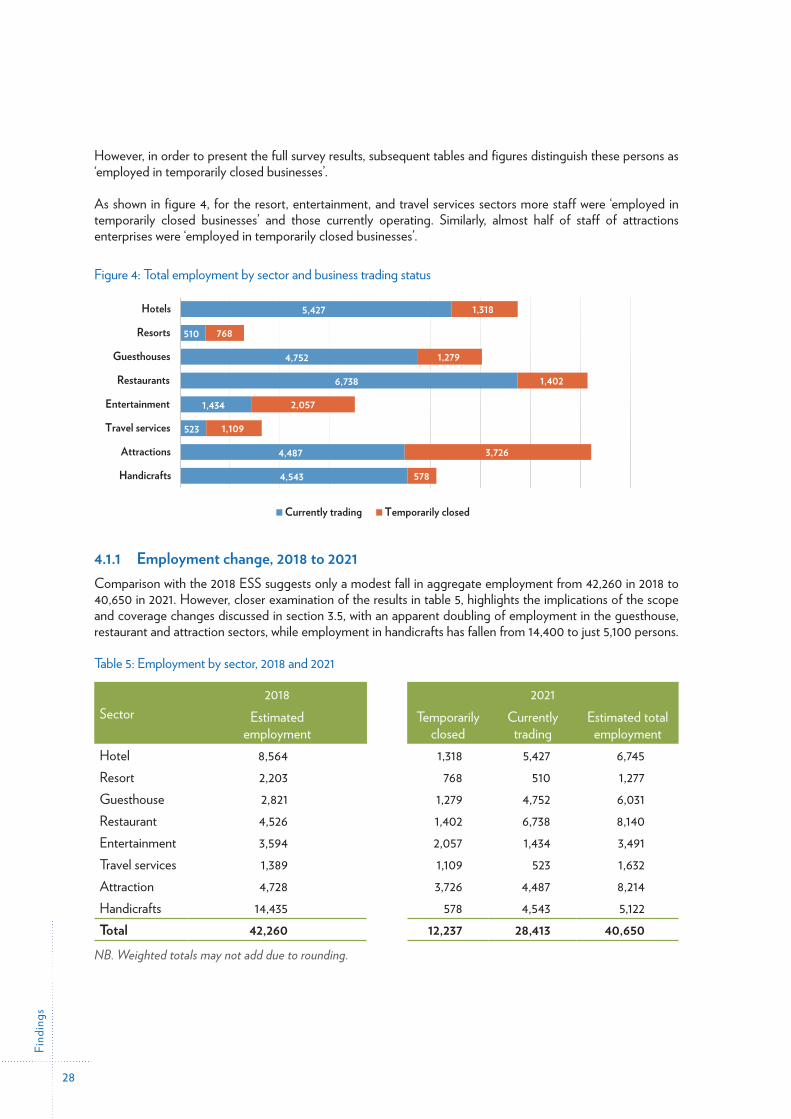
As shown in figure 4, for the resort, entertainment, and travel services sectors more staff were ‘employed in temporarily closed businesses’ and those currently operating. Similarly, almost half of staff of attractions enterprises were ‘employed in temporarily closed businesses’.
Figure 4: Total employment by sector and business trading status
4.1.1 Employment change, 2018 to 2021 Comparison with the 2018 ESS suggests only a modest fall in aggregate employment from 42,260 in 2018 to 40,650 in 2021. However, closer examination of the results in table 5, highlights the implications of the scope and coverage changes discussed in section 3.5, with an apparent doubling of employment in the guesthouse, restaurant and attraction sectors, while employment in handicrafts has fallen from 14,400 to just 5,100 persons.
Table 5: Employment by sector, 2018 and 2021
Sector2018 2021
Estimated employment
Temporarily closed
Currently trading
Estimated total employment
Hotel 8,564 1,318 5,427 6,745Resort 2,203 768 510 1,277Guesthouse 2,821 1,279 4,752 6,031Restaurant 4,526 1,402 6,738 8,140Entertainment 3,594 2,057 1,434 3,491Travel services 1,389 1,109 523 1,632Attraction 4,728 3,726 4,487 8,214Handicrafts 14,435 578 4,543 5,122Total 42,260 12,237 28,413 40,650
NB. Weighted totals may not add due to rounding.
Figure-4
As shown in figure 4, for the resort, entertainment, and travel services sectors more staff were ‘employed in temporarily closed businesses’ and those currently operating. Similarly, almost half of staff of attractions enterprises were ‘employed in temporarily closed businesses’.
Figure 4: Total employment by sector and business trading status
4.1.1 Employment change, 2018 to 2021 Comparison with the 2018 ESS suggests only a modest fall in aggregate employment from 42,260 in 2018 to 40,650 in 2021. However, closer examination of the results in table 5, highlights the
5,427
510
4,752
6,738
1,434
523
4,487
4,543
1,318
768
1,279
1,402
2,057
1,109
3,726
578
Hotels
Resorts
Guesthouses
Restaurants
Entertainment
Travel services
Attractions
Handicrafts
Currently trading Temporarily closed
Figure 6: Employment growth/decline since 2018 by firm: Matched sample
Find
ings
29
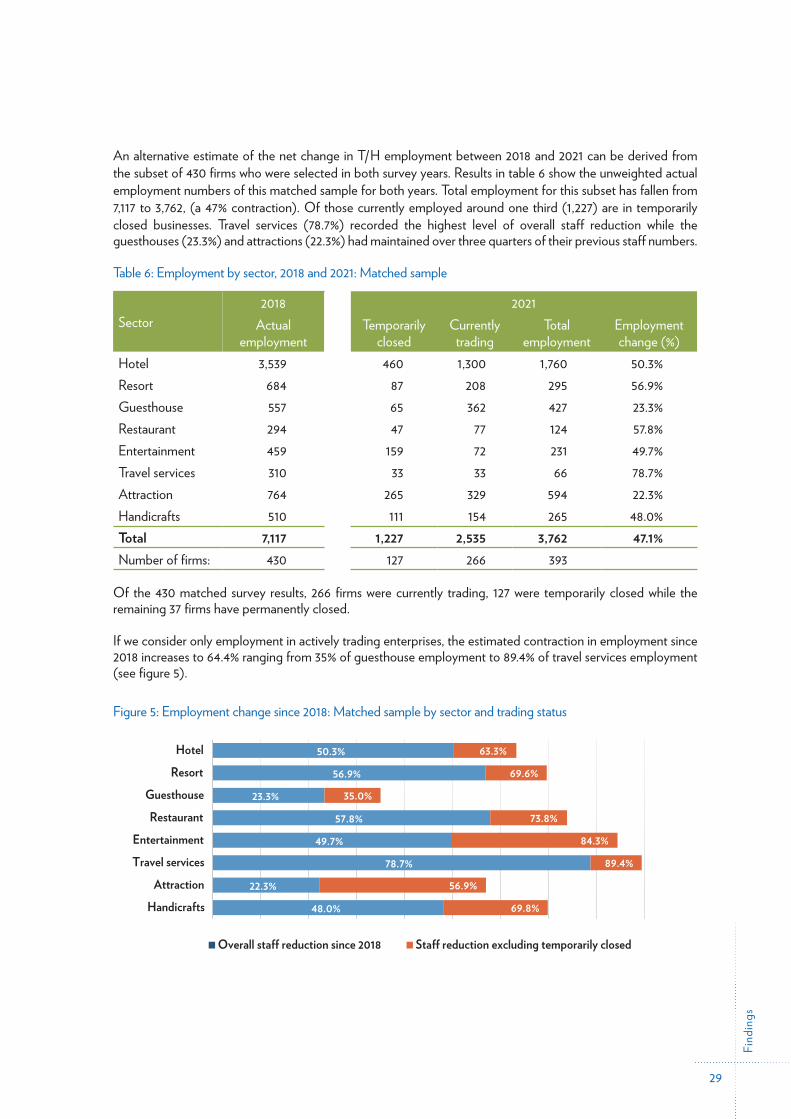
An alternative estimate of the net change in T/H employment between 2018 and 2021 can be derived from the subset of 430 firms who were selected in both survey years. Results in table 6 show the unweighted actual employment numbers of this matched sample for both years. Total employment for this subset has fallen from 7,117 to 3,762, (a 47% contraction). Of those currently employed around one third (1,227) are in temporarily closed businesses. Travel services (78.7%) recorded the highest level of overall staff reduction while the guesthouses (23.3%) and attractions (22.3%) had maintained over three quarters of their previous staff numbers.
Table 6: Employment by sector, 2018 and 2021: Matched sample
Sector2018 2021
Actual employment
Temporarily closed
Currently trading
Total employment
Employment change (%)
Hotel 3,539 460 1,300 1,760 50.3%Resort 684 87 208 295 56.9%Guesthouse 557 65 362 427 23.3%Restaurant 294 47 77 124 57.8%Entertainment 459 159 72 231 49.7%Travel services 310 33 33 66 78.7%Attraction 764 265 329 594 22.3%Handicrafts 510 111 154 265 48.0%Total 7,117 1,227 2,535 3,762 47.1%Number of firms: 430 127 266 393
Of the 430 matched survey results, 266 firms were currently trading, 127 were temporarily closed while the remaining 37 firms have permanently closed.
If we consider only employment in actively trading enterprises, the estimated contraction in employment since 2018 increases to 64.4% ranging from 35% of guesthouse employment to 89.4% of travel services employment (see figure 5).
Figure 5: Employment change since 2018: Matched sample by sector and trading status
Figure-5
15
discretionary income, local residents have developed a growing affinity for travel and tourism. In 2019, there were 2.4 million domestic tourists and 1.1 million outbound travel trips10 among a population of seven million. With a forecast slow economic recovery and ongoing uncertainty surrounding global travel, as precautionary behaviour and travel continue to negatively affect international tourism-related services and transportation, promoting domestic tourism could be a key component of the T/H sector recovery plan for Lao PDR.
6 ADB. Asian Development Outlook (ADO), 2020 Update. April, 2021. 7 Government of Lao PDR, MICT. Statistical Report on Tourism in Laos, 2020. Vientiane. 8 Includes visitors who stayed at least one night. World Bank source international visitor data from MICT but exclude ‘Border Pass
Day Trippers’ to ensure data are internationally comparable. 9 ADB. The Impact of COVID-19 on Tourism Enterprises in the Lao People’s Democratic Republic: An Initial Assessment. ADB
Briefs. No. 141. June 2020. 10 Excludes official, business, and other passport holders, and excludes all border pass trips.
employment since 2018 increases to 64.4% ranging from 35% of guesthouse employment to 89.4% of travel services employment (see figure 5).
Figure 5: Employment change since 2018: Matched sample by sector and trading status
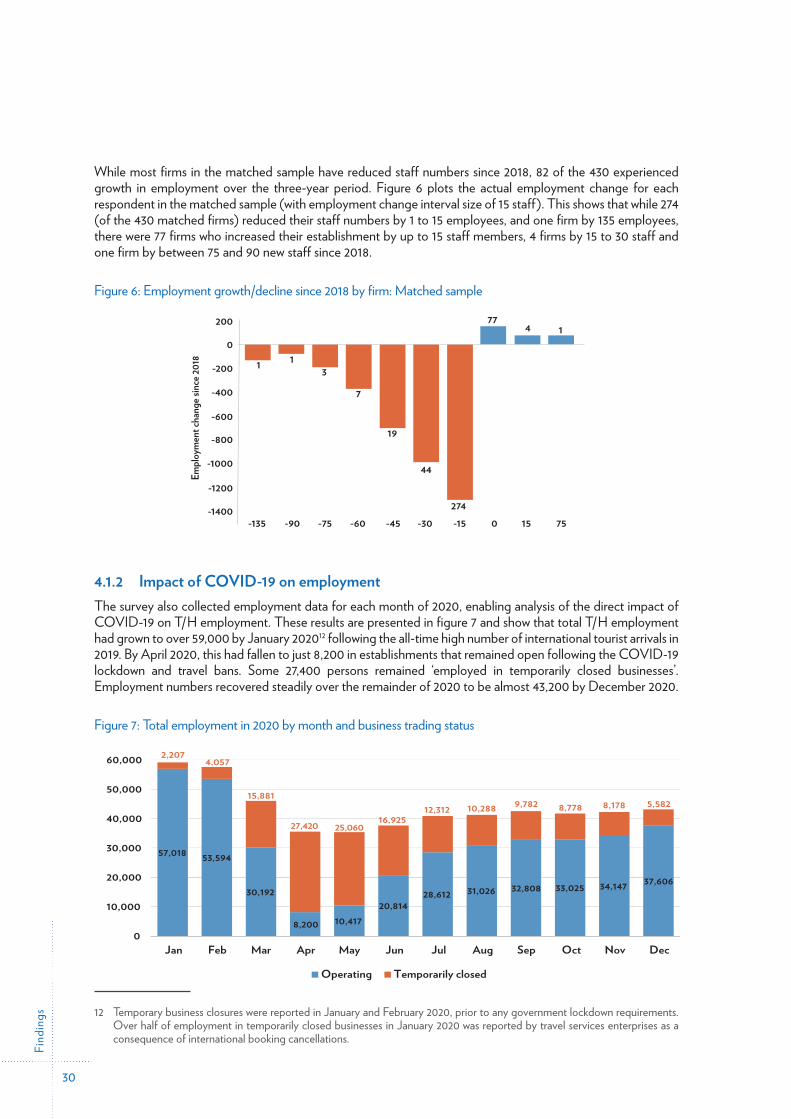
While most firms in the matched sample have reduced staff numbers since 2018, 82 of the 430 experienced growth in employment over the three-year period. Figure 6 plots the actual employment change for each respondent in the matched sample (with employment change interval size of 15 staff). This shows that while 274 (of the 430 matched firms) reduced their staff numbers
50.3%
56.9%
23.3%
57.8%
49.7%
78.7%
22.3%
48.0%
63.3%
69.6%
35.0%
73.8%
84.3%
89.4%
56.9%
69.8%
HotelResort
GuesthouseRestaurant
EntertainmentTravel services
AttractionHandicrafts
Overall sta� reduction since 2018 Sta� reduction excluding temporarily closed
Table 7: Impact of COVID-19 on turnover, employment, and business operations
Find
ings
30
While most firms in the matched sample have reduced staff numbers since 2018, 82 of the 430 experienced growth in employment over the three-year period. Figure 6 plots the actual employment change for each respondent in the matched sample (with employment change interval size of 15 staff). This shows that while 274 (of the 430 matched firms) reduced their staff numbers by 1 to 15 employees, and one firm by 135 employees, there were 77 firms who increased their establishment by up to 15 staff members, 4 firms by 15 to 30 staff and one firm by between 75 and 90 new staff since 2018.
Figure 6: Employment growth/decline since 2018 by firm: Matched sample
Figure-6
-1200
-1000
Empl
oym
ent c
hang
e sinc
e 201
8
-800
-600
-400
-200
0
200
-1400-135 -90 -75 -60 -45 -30 -15
274
19
44
7
31
774 1
1
0 15 75
Conversely, no official register of handicraft establishments was available in 2018 with the estimated subsector population likely to have inadvertently included ‘cottage-based’ home production activity, leading to an overestimation of employment in that sector previously. Weighted results for these subsectors, therefore, may not be directly comparable across the two survey years.
Geographically, the COVID-19 impact – while still devastating – was least severe in the south region, comprising Champasak, Attapeu, Saravan and Sekong provinces. This region, which 4.1.2 Impact of COVID-19 on employment
The survey also collected employment data for each month of 2020, enabling analysis of the direct impact of COVID-19 on T/H employment. These results are presented in figure 7 and show that total T/H employment had grown to over 59,000 by January 202012 following the all-time high number of international tourist arrivals in 2019. By April 2020, this had fallen to just 8,200 in establishments that remained open following the COVID-19 lockdown and travel bans. Some 27,400 persons remained ‘employed in temporarily closed businesses’. Employment numbers recovered steadily over the remainder of 2020 to be almost 43,200 by December 2020.
Figure 7: Total employment in 2020 by month and business trading status
Figure-7
21
Sector
Es�mated employment
Temporarily closed
Currently trading
Es�mated total
employment Hotel 8,564 1,318 5,427 6,745 Resort 2,203 768 510 1,277 Guesthouse 2,821 1,279 4,752 6,031 Restaurant 4,526 1,402 6,738 8,140 Entertainment 3,594 2,057 1,434 3,491 Travel services 1,389 1,109 523 1,632 A�rac�on 4,728 3,726 4,487 8,214 Handicra�s 14,435 578 4,543 5,122
Total 42,260 12,237 28,413 40,650 NB. Weighted totals may not add due to rounding.
An alternative e�imate of the net change in T/H employment between 2018 and 2021 can be derived from the subset of 430 firms who were selected in both survey years. Results in table 6 show the unweighted actual employment numbers of this matched sample for both years. Total
27, 4 00 persons remained ‘employed in temporarily closed businesses ’. Employment numbers
recovered �eadily o ver the remainder of 2020 to be almo� 43, 2 00 by December 2020.
Figure 7: Total employment in 2020 by month and business trading status
Following a secondary outbreak of COVID -19 in late April 2021, ju� prior to data collection for this
survey, total em ployment ha d dropped to 40,650 persons with almo� one -third (12,237)
associated with temporarily closed businesses. This represents a 50.2% contraction in
57,018 53,594
30,192
8,200 10,41720,814
28,612 31,026 32,808 33,025 34,147 37,606
2,2074,057
15,881
27,420 25,06016,925
12,312 10,288 9,782 8,778 8,178 5,582
0
10,000
20,000
30,000
40,000
50,000
60,000
70,000
Jan Feb Mar Apr May Jun Jul Aug Sep Oct Nov Dec
Operating Temporarily closed
The mo� common actions taken to mitigate the impacts of COVID -19 on business operations wto cut �a� numbers (62%) , wages (36%) and/or to reduce trading hours (37%). Around one quarter of all businesses scaled down their operations or discontinued some service o�erings. one-in-twenty firms found it necessary to increased borrowings (4.7%).
Figure 9: Measures taken to mitigate COVID-19 impacts
24.4%
61.6%
36.3%
36.6%
8.5%
4.7%
0.0% 10.0% 20.0% 30.0% 40.0% 50.0% 60.0% 70.0%
Scaled down or discon�nued services
Cut staff numbers
Cut staff wages
Reduced trading hours
Restructured opera�ons
Increased borrowings12 Temporary business closures were reported in January and February 2020, prior to any government lockdown requirements. Over half of employment in temporarily closed businesses in January 2020 was reported by travel services enterprises as a consequence of international booking cancellations.
Find
ings
31
Following a secondary outbreak of COVID-19 in late April 2021, just prior to data collection for this survey, total employment had dropped to 40,650 persons with almost one-third (12,237) associated with temporarily closed businesses. This represents a 50.2% contraction in employment in actively trading enterprises, or a 31.4% contraction when taking into account those ‘employed in temporarily closed businesses’ since the high of 59,200 recorded in January 2020.
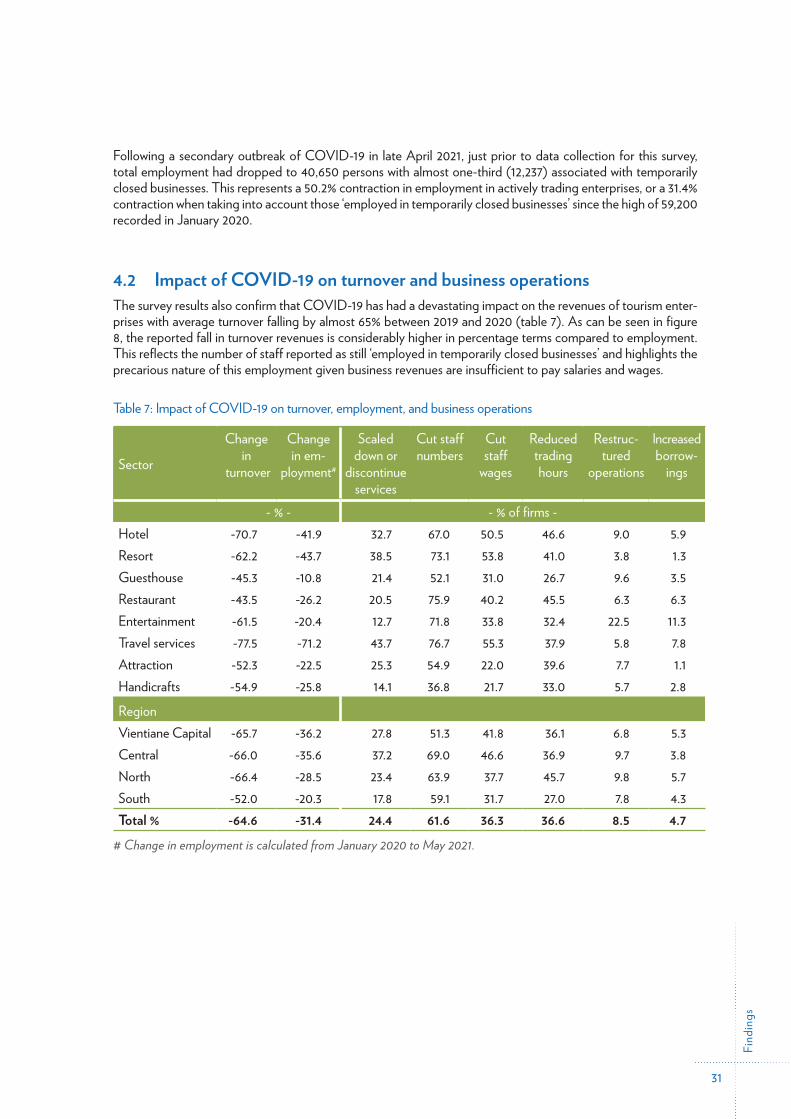
4.2 Impact of COVID-19 on turnover and business operationsThe survey results also confirm that COVID-19 has had a devastating impact on the revenues of tourism enter-prises with average turnover falling by almost 65% between 2019 and 2020 (table 7). As can be seen in figure 8, the reported fall in turnover revenues is considerably higher in percentage terms compared to employment. This reflects the number of staff reported as still ‘employed in temporarily closed businesses’ and highlights the precarious nature of this employment given business revenues are insufficient to pay salaries and wages.
Table 7: Impact of COVID-19 on turnover, employment, and business operations
Sector
Change in
turnover
Change in em-
ployment#
Scaled down or
discontinue services
Cut staff numbers
Cut staff
wages
Reduced trading hours
Restruc-tured
operations
Increased borrow-
ings
- % - - % of firms -Hotel -70.7 -41.9 32.7 67.0 50.5 46.6 9.0 5.9Resort -62.2 -43.7 38.5 73.1 53.8 41.0 3.8 1.3Guesthouse -45.3 -10.8 21.4 52.1 31.0 26.7 9.6 3.5Restaurant -43.5 -26.2 20.5 75.9 40.2 45.5 6.3 6.3Entertainment -61.5 -20.4 12.7 71.8 33.8 32.4 22.5 11.3Travel services -77.5 -71.2 43.7 76.7 55.3 37.9 5.8 7.8Attraction -52.3 -22.5 25.3 54.9 22.0 39.6 7.7 1.1Handicrafts -54.9 -25.8 14.1 36.8 21.7 33.0 5.7 2.8
Region Vientiane Capital -65.7 -36.2 27.8 51.3 41.8 36.1 6.8 5.3Central -66.0 -35.6 37.2 69.0 46.6 36.9 9.7 3.8North -66.4 -28.5 23.4 63.9 37.7 45.7 9.8 5.7South -52.0 -20.3 17.8 59.1 31.7 27.0 7.8 4.3Total % -64.6 -31.4 24.4 61.6 36.3 36.6 8.5 4.7
# Change in employment is calculated from January 2020 to May 2021.
Find
ings
32
Figure 8: COVID-19 impact on turnover and employment by sector
Figure-8
# Change in employment is calculated from January 2020 to May 2021.
Figure 8: COVID-19 impact on turnover and employment by sector
-80.0% -70.0% -60.0% -50.0% -40.0% -30.0% -20.0% -10.0% 0.0%
HotelResort
GuesthouseRestaurant
EntertainmentTravel services
AttractionHandicrafts
Turnover Emploment
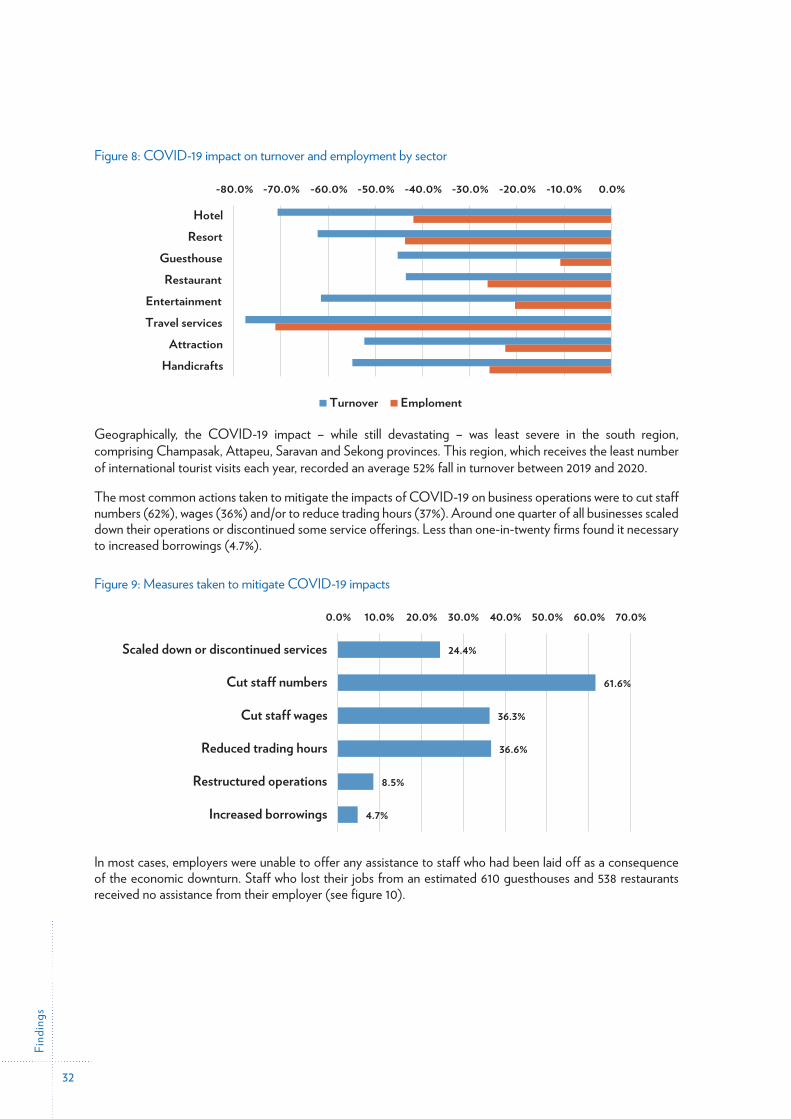
Geographically, the COVID-19 impact – while still devastating – was least severe in the south region, comprising Champasak, Attapeu, Saravan and Sekong provinces. This region, which receives the least number of international tourist visits each year, recorded an average 52% fall in turnover between 2019 and 2020.
The most common actions taken to mitigate the impacts of COVID-19 on business operations were to cut staff numbers (62%), wages (36%) and/or to reduce trading hours (37%). Around one quarter of all businesses scaled down their operations or discontinued some service offerings. Less than one-in-twenty firms found it necessary to increased borrowings (4.7%).
Figure 9: Measures taken to mitigate COVID-19 impacts
Figure-9
of all businesses scaled down their operations or discontinued some service offerings. Less than one-in-twenty firms found it necessary to increased borrowings (4.7%).
Figure 9: Measures taken to mitigate COVID-19 impacts
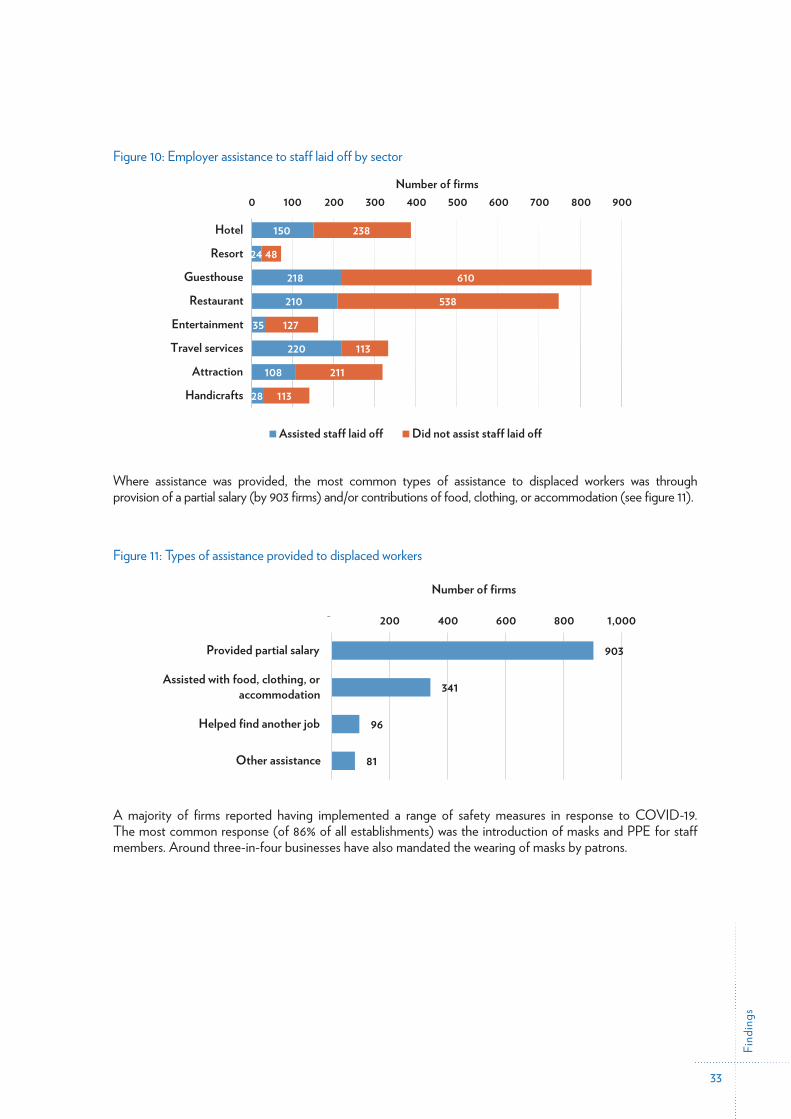
In most cases, employers were unable to offer any assistance to staff who had been laid off as a consequence of the economic downturn. Staff who lost their jobs from an estimated 610 guesthouses and 538 restaurants received no assistance from their employer (see figure 10).
24.4%
61.6%
36.3%
36.6%
8.5%
4.7%
0.0% 10.0% 20.0% 30.0% 40.0% 50.0% 60.0% 70.0%
Scaled down or discontinued services
Cut sta� numbers
Cut staff wages
Reduced trading hours
Restructured operations
Increased borrowings
Figure 11: Types of assistance provided to displaced workers
903
341
96
- 200 400 600 800 1,000
Provided par�al salary
Assisted with food, clothing, oraccommoda�on
Helped find another job
Number of firms
In most cases, employers were unable to offer any assistance to staff who had been laid off as a consequence of the economic downturn. Staff who lost their jobs from an estimated 610 guesthouses and 538 restaurants received no assistance from their employer (see figure 10).
Find
ings
33
Figure 10: Employer assistance to staff laid off by sector
Figure-10
Figure 10: Employer assistance to staff laid off by sector
150
24
218
210
35
220
108
28
238
48
610
538
127
113
211
113
0 100 200 300 400 500 600 700 800 900
Hotel
Resort
Guesthouse
Restaurant
Entertainment
Travel services
Attraction
Handicrafts
Number of firms
Assisted staff laid o� Did not assist staff laid o�
Where assistance was provided, the most common types of assistance to displaced workers was through provision of a partial salary (by 903 firms) and/or contributions of food, clothing, or accommodation (see figure 11).
Figure 11: Types of assistance provided to displaced workers
Figure-11
Figure 11: Types of assi�ance provided to displaced workers
A majority of firms reported having implemented a range of safety measures in response to COVID
903
341
96
81
- 200 400 600 800 1,000
Provided partial salary
Assisted with food, clothing, oraccommodation
Helped find another job
Other assistance
Number of firms
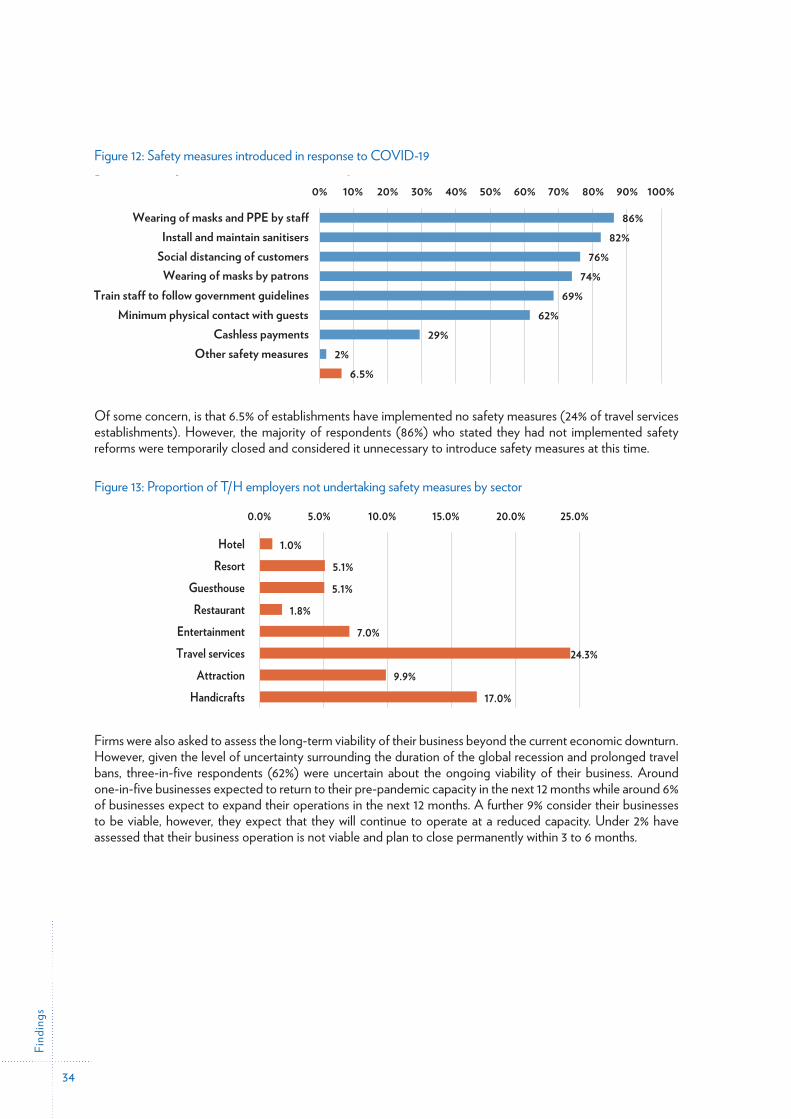
A majority of firms reported having implemented a range of safety measures in response to COVID-19. The most common response (of 86% of all establishments) was the introduction of masks and PPE for staff members. Around three-in-four businesses have also mandated the wearing of masks by patrons.
Find
ings
34
Figure 12: Safety measures introduced in response to COVID-19
Figure-12
19. The most common response (of 86% of all establishments) was the introduction of masks and PPE for staff members. Around three-in-four businesses have also mandated the wearing of masks by patrons.
Figure 12: Safety measures introduced in response to COVID-19
86%82%
76%74%
69%62%
29%2%
6.5%
0% 10% 20% 30% 40% 50% 60% 70% 80% 90% 100%
Wearing of masks and PPE by sta�Install and maintain sanitisers
Social distancing of customersWearing of masks by patrons
Train sta� to follow government guidelinesMinimum physical contact with guests
Cashless paymentsOther safety measures
No safety measures undertakenOf some concern, is that 6.5% of establishments have implemented no safety measures (24% of travel services establishments). However, the majority of respondents (86%) who stated they had not implemented safety reforms were temporarily closed and considered it unnecessary to introduce safety measures at this time.
Figure 13: Proportion of T/H employers not undertaking safety measures by sector
1.0%5.1%5.1%
1.8%7.0%
24.3%9.9%
17.0%
0.0% 5.0% 10.0% 15.0% 20.0% 25.0%
HotelResort
GuesthouseRestaurant
EntertainmentTravel services
AttractionHandicrafts
Figure-13
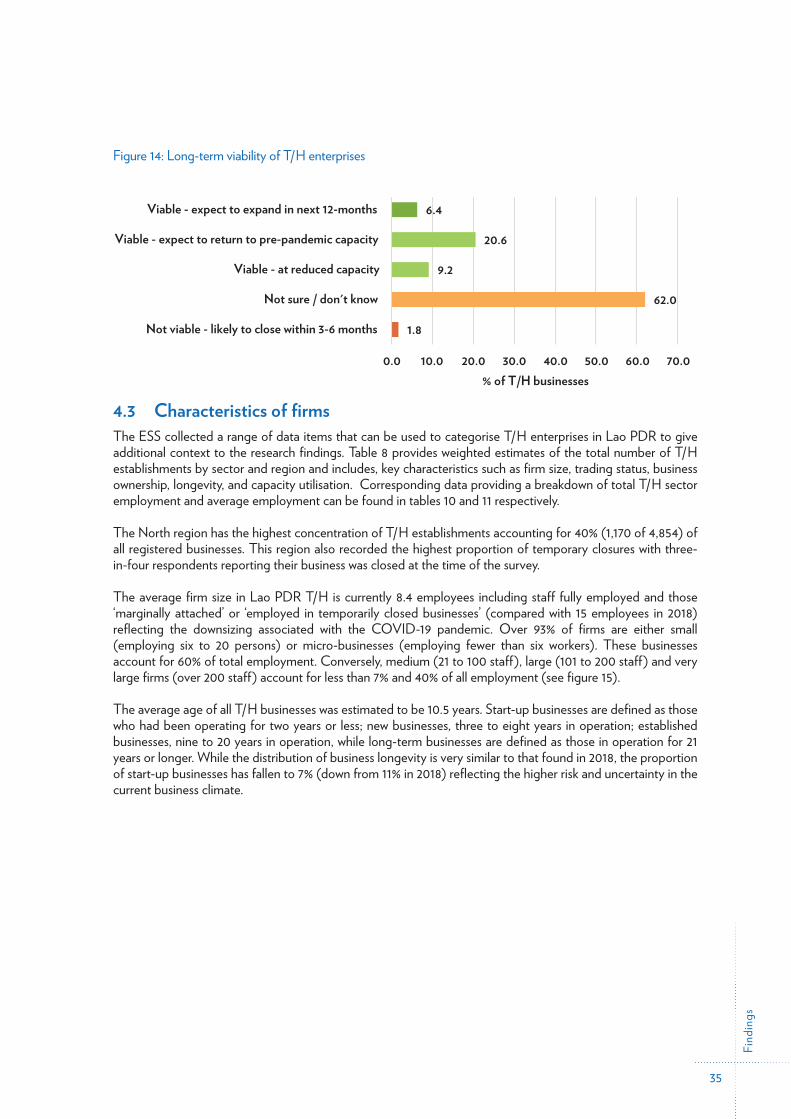
Firms were also asked to assess the long-term viability of their business beyond the current economic downturn. However, given the level of uncertainty surrounding the duration of the global recession and prolonged travel bans, three-in-five respondents (62%) were uncertain about the ongoing viability of their business. Around one-in-five businesses expected to return to their pre-pandemic capacity in the next 12 months while around 6% of businesses expect to expand their operations in the next 12 months. A further 9% consider their businesses to be viable, however, they expect that they will continue to operate at a reduced capacity. Under 2% have assessed that their business operation is not viable and plan to close permanently within 3 to 6 months.
Find
ings
35
Figure 14: Long-term viability of T/H enterprises
Figure-14
their business operation is not viable and plan to close permanently within 3 to 6 months.
Figure 14: Long-term viability of T/H enterprises
4.3 Characteristics of firms
The ESS collected a range of data items that can be used to categorise T/H enterprises in Lao PDR to give additional context to the research findings. Table 8 provides weighted estimates of
1.8
62.0
9.2
20.6
6.4
0.0 10.0 20.0 30.0 40.0 50.0 60.0 70.0
Not viable - likely to close within 3-6 months
Not sure / don't know
Viable - at reduced capacity
Viable - expect to return to pre-pandemic capacity
Viable - expect to expand in next 12-months
% of T/H businesses
Figure 16: Business longevity by region
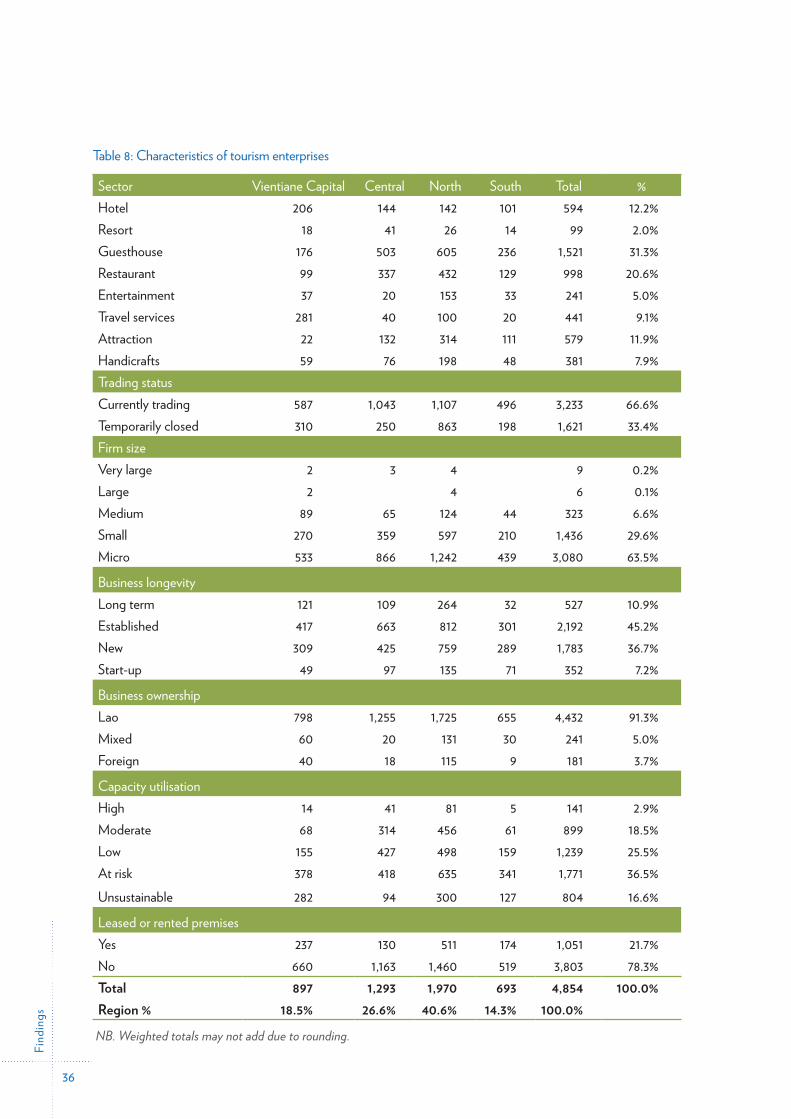
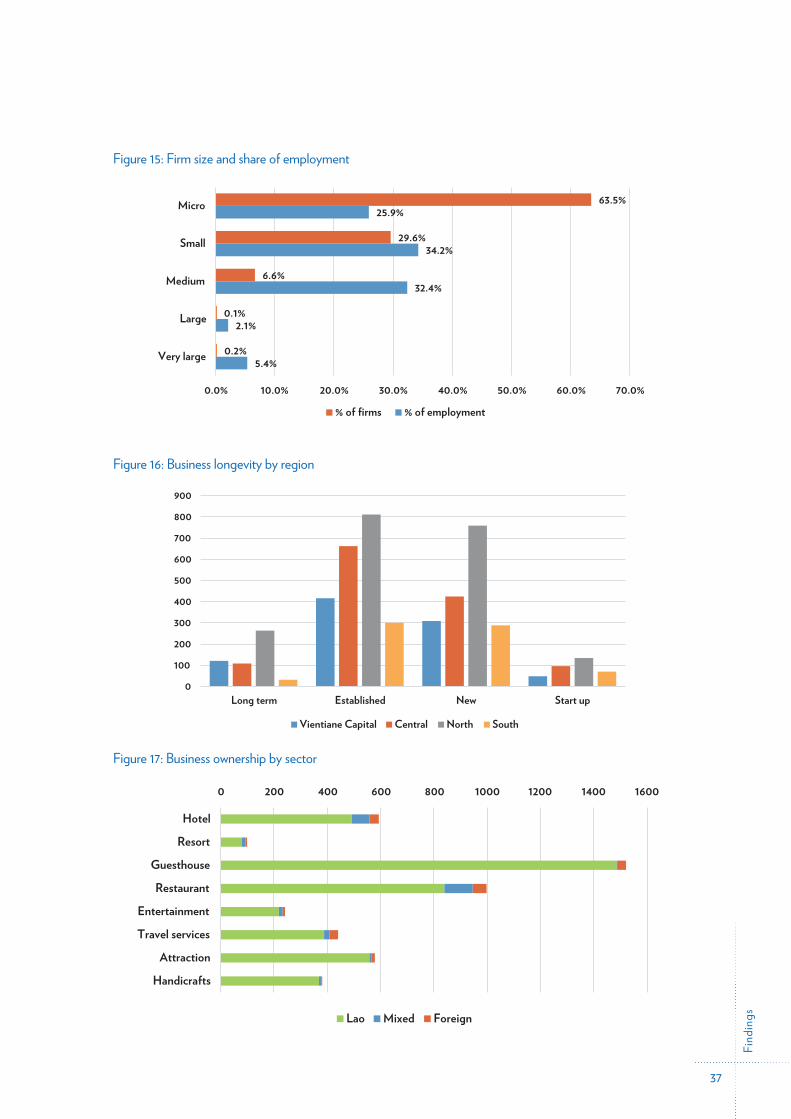
4.3 Characteristics of firmsThe ESS collected a range of data items that can be used to categorise T/H enterprises in Lao PDR to give additional context to the research findings. Table 8 provides weighted estimates of the total number of T/H establishments by sector and region and includes, key characteristics such as firm size, trading status, business ownership, longevity, and capacity utilisation. Corresponding data providing a breakdown of total T/H sector employment and average employment can be found in tables 10 and 11 respectively.
The North region has the highest concentration of T/H establishments accounting for 40% (1,170 of 4,854) of all registered businesses. This region also recorded the highest proportion of temporary closures with three- in-four respondents reporting their business was closed at the time of the survey.
The average firm size in Lao PDR T/H is currently 8.4 employees including staff fully employed and those ‘marginally attached’ or ‘employed in temporarily closed businesses’ (compared with 15 employees in 2018) reflecting the downsizing associated with the COVID-19 pandemic. Over 93% of firms are either small (employing six to 20 persons) or micro-businesses (employing fewer than six workers). These businesses account for 60% of total employment. Conversely, medium (21 to 100 staff), large (101 to 200 staff) and very large firms (over 200 staff) account for less than 7% and 40% of all employment (see figure 15).
The average age of all T/H businesses was estimated to be 10.5 years. Start-up businesses are defined as those who had been operating for two years or less; new businesses, three to eight years in operation; established businesses, nine to 20 years in operation, while long-term businesses are defined as those in operation for 21 years or longer. While the distribution of business longevity is very similar to that found in 2018, the proportion of start-up businesses has fallen to 7% (down from 11% in 2018) reflecting the higher risk and uncertainty in the current business climate.
Find
ings
36
Table 8: Characteristics of tourism enterprises
Sector Vientiane Capital Central North South Total %Hotel 206 144 142 101 594 12.2%Resort 18 41 26 14 99 2.0%Guesthouse 176 503 605 236 1,521 31.3%Restaurant 99 337 432 129 998 20.6%Entertainment 37 20 153 33 241 5.0%Travel services 281 40 100 20 441 9.1%Attraction 22 132 314 111 579 11.9%Handicrafts 59 76 198 48 381 7.9%Trading status Currently trading 587 1,043 1,107 496 3,233 66.6%Temporarily closed 310 250 863 198 1,621 33.4%Firm size Very large 2 3 4 9 0.2%Large 2 4 6 0.1%Medium 89 65 124 44 323 6.6%Small 270 359 597 210 1,436 29.6%Micro 533 866 1,242 439 3,080 63.5%
Business longevity Long term 121 109 264 32 527 10.9%Established 417 663 812 301 2,192 45.2%New 309 425 759 289 1,783 36.7%Start-up 49 97 135 71 352 7.2%
Business ownership Lao 798 1,255 1,725 655 4,432 91.3%Mixed 60 20 131 30 241 5.0%Foreign 40 18 115 9 181 3.7%
Capacity utilisation High 14 41 81 5 141 2.9%Moderate 68 314 456 61 899 18.5%Low 155 427 498 159 1,239 25.5%At risk 378 418 635 341 1,771 36.5%Unsustainable 282 94 300 127 804 16.6%
Leased or rented premises Yes 237 130 511 174 1,051 21.7%No 660 1,163 1,460 519 3,803 78.3%Total 897 1,293 1,970 693 4,854 100.0%Region % 18.5% 26.6% 40.6% 14.3% 100.0%
NB. Weighted totals may not add due to rounding.
Find
ings
37
Figure 15: Firm size and share of employment
Figure-15
Figure 16: Business longevity by region
5.4%
2.1%
32.4%
34.2%
25.9%
0.2%
0.1%
6.6%
29.6%
63.5%
0.0% 10.0% 20.0% 30.0% 40.0% 50.0% 60.0% 70.0%
Very large
Large
Medium
Small
Micro
% of firms % of employment
Figure 16: Business longevity by region
Figure-16
0
100
200
300
400
500
600
700
800
900
Long term Established New Start up
Vientiane Capital Central North South
the average percentage of business customers who are international tourists by current trading status and sector. Figure 17: Business ownership by sector
Figure-17
The North region has the highest concentration of T/H establishments accounting for 40% (1,170 of 4,854) of all registered businesses. This region also recorded the highest proportion of temporary closures with three-in-four respondents reporting their business was closed at the time of the survey.
The average firm size in Lao PDR T/H is currently 8.4 employees including staff fully employed and those ‘marginally attached’ or ‘employed in temporarily closed businesses’ (compared with employees in 2018) reflecting the downsizing associated with the COVID-19 pandemic. Over 93% of firms are either small (employing six to 20 persons) or micro-businesses (employing fewer thansix workers). These businesses account for 60% of total employment. Conversely, medium (21 to 100 staff), large (101 to 200 staff) and very large firms (over 200 staff) account for less than 7%and 40% of all employment (see figure 15).
The average age of all T/H businesses was estimated to be 10.5 years. Start-up businesses defined as those who had been operating for two years or less; new businesses, three to years in operation; established businesses, nine to 20 years in operation, while long-businesses are defined as those in operation for 21 years or longer. While the distribution of business longevity is very similar to that found in 2018, the proportion of start-up businesses has fallen to 7% (down from 11% in 2018) reflecting the higher risk and uncertainty in the current business climate.
29
Figure 17: Business ownership by sector
0 200 400 600 800 1000 1200 1400 1600
Hotel
Resort
Guesthouse
Restaurant
Entertainment
Travel services
Attraction
Handicrafts
Lao Mixed Foreign
On average, the accommodation enterprises had 30 rooms and employed 17 staff, of which 58% were female. International tourists make up 40% of total guests in accommodation establishments ranging from one-third of guesthouse patrons to over half of resort guests (51%). Reported occupancy rates averaged just 28% for 2020 which is almost half the official published occupancy rate for 2019 of 54%15.
Figure 19: Capacity utilisation, 2017 and 2020 0.0% 5.0% 10.0% 15.0% 20.0% 25.0% 30.0% 35.0% 40.0% 45.0%
High
Moderate
Low
At risk
Unsustainable
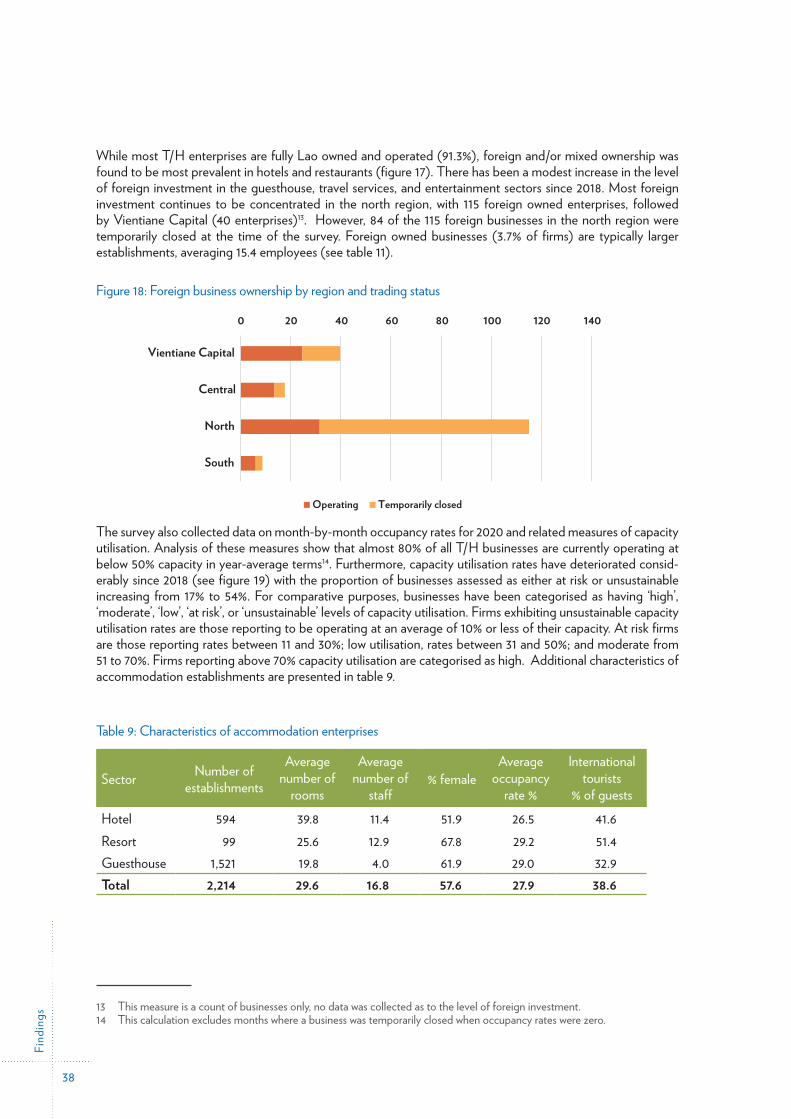
Find
ings
38
While most T/H enterprises are fully Lao owned and operated (91.3%), foreign and/or mixed ownership was found to be most prevalent in hotels and restaurants (figure 17). There has been a modest increase in the level of foreign investment in the guesthouse, travel services, and entertainment sectors since 2018. Most foreign investment continues to be concentrated in the north region, with 115 foreign owned enterprises, followed by Vientiane Capital (40 enterprises)13. However, 84 of the 115 foreign businesses in the north region were temporarily closed at the time of the survey. Foreign owned businesses (3.7% of firms) are typically larger establishments, averaging 15.4 employees (see table 11).
Figure 18: Foreign business ownership by region and trading status
Figure-18
0 20 40 60 80 100 120 140
Vientiane Capital
Central
North
South
Operating Temporarily closed
Figure 17: Business ownership by sector
The survey also collected data on month-by-month occupancy rates for 2020 and related measures of capacity utilisation. Analysis of these measures show that almost 80% of all T/H businesses are currently operating at below 50% capacity in year-average terms14. Furthermore, capacity utilisation rates have deteriorated consid-erably since 2018 (see figure 19) with the proportion of businesses assessed as either at risk or unsustainable increasing from 17% to 54%. For comparative purposes, businesses have been categorised as having ‘high’, ‘moderate’, ‘low’, ‘at risk’, or ‘unsustainable’ levels of capacity utilisation. Firms exhibiting unsustainable capacity utilisation rates are those reporting to be operating at an average of 10% or less of their capacity. At risk firms are those reporting rates between 11 and 30%; low utilisation, rates between 31 and 50%; and moderate from 51 to 70%. Firms reporting above 70% capacity utilisation are categorised as high. Additional characteristics of accommodation establishments are presented in table 9.
Table 9: Characteristics of accommodation enterprises
Sector Number of establishments
Average number of
rooms
Average number of
staff% female
Average occupancy
rate %
International tourists
% of guestsHotel 594 39.8 11.4 51.9 26.5 41.6Resort 99 25.6 12.9 67.8 29.2 51.4Guesthouse 1,521 19.8 4.0 61.9 29.0 32.9Total 2,214 29.6 16.8 57.6 27.9 38.6
13 This measure is a count of businesses only, no data was collected as to the level of foreign investment.14 This calculation excludes months where a business was temporarily closed when occupancy rates were zero.
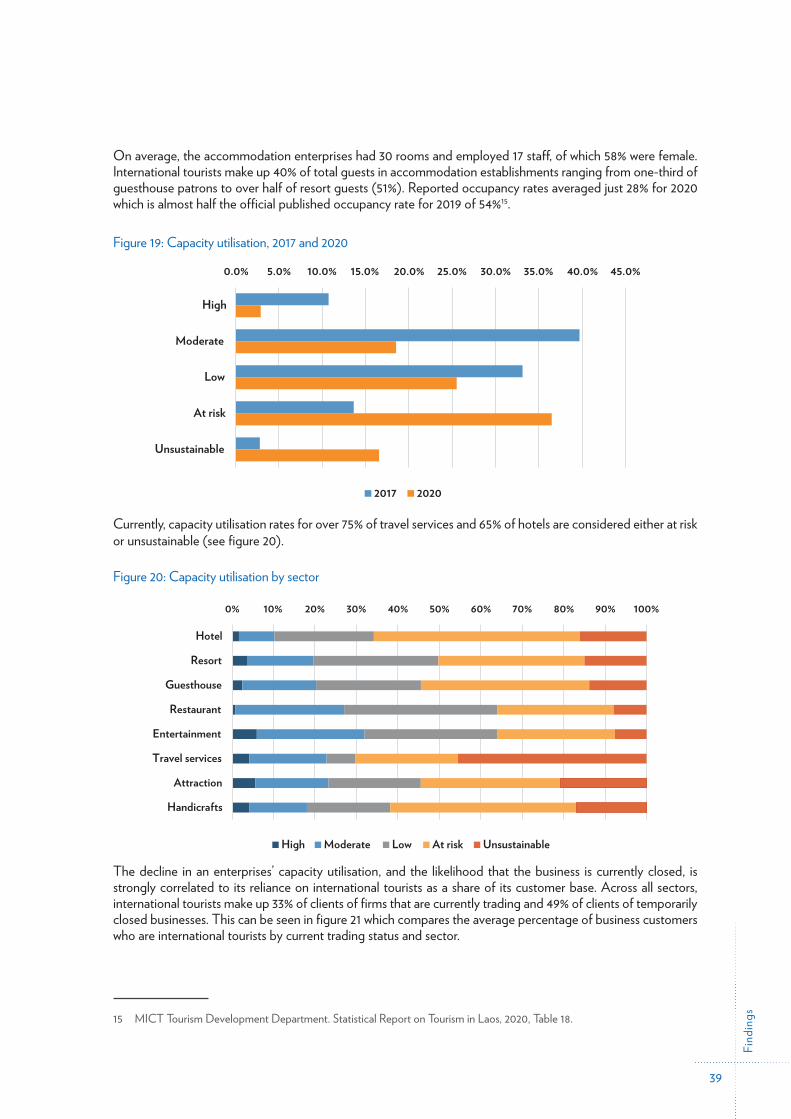
Find
ings
39
On average, the accommodation enterprises had 30 rooms and employed 17 staff, of which 58% were female. International tourists make up 40% of total guests in accommodation establishments ranging from one-third of guesthouse patrons to over half of resort guests (51%). Reported occupancy rates averaged just 28% for 2020 which is almost half the official published occupancy rate for 2019 of 54%15.
Figure 19: Capacity utilisation, 2017 and 2020
Figure-19
occupancy rates averaged just 28% for 2020 which is almost half the official published rate for 2019 of 54%15.
Figure 19: Capacity utilisation, 2017 and 2020
Currently, capacity utilisation rates for over 75% of travel services and 65% of hotels are considered either at risk or unsustainable (see figure 20).
0.0% 5.0% 10.0% 15.0% 20.0% 25.0% 30.0% 35.0% 40.0% 45.0%
High
Moderate
Low
At risk
Unsustainable
2017 2020
4.4 Employment composition
Just over 40% of all T/H employment – fully employed and ‘marginally attached’ / ‘employed by temporarily closed businesses’ – (16,400 jobs) occurs in the Northern provinces with the largest sectors being attractions, restaurants, and handicrafts (3,900, 3,400 and 3,200 jobs respectively). Over half (56%) of employed staff in temporarily closed businesses are in the north region which includes Luang Prabang – the preferred holiday destination for a majority of international tourists.
29.7
23.7
16.8
67.9
39.2
22.3
33.2
44.9
38.0
25.1
58.9
54.9
64.6
48.8
Guesthouse
Restaurant
Entertainment
Travel services
A�rac�on
Handicra�s
All sectors
Currently trading Temporarily closed
Currently, capacity utilisation rates for over 75% of travel services and 65% of hotels are considered either at risk or unsustainable (see figure 20).
Figure 20: Capacity utilisation by sector
Figure-20
considered either at risk or unsustainable (see figure 20).
Figure 20: Capacity utilisation by sector
The decline in an enterprises’ capacity utilisation, and the likelihood that the business is currently closed, is strongly correlated to its reliance on international tourists as a share of its customer base.
0% 10% 20% 30% 40% 50% 60% 70% 80% 90% 100%
Hotel
Resort
Guesthouse
Restaurant
Entertainment
Travel services
Attraction
Handicrafts
High Moderate Low At risk Unsustainable
The decline in an enterprises’ capacity utilisation, and the likelihood that the business is currently closed, is strongly correlated to its reliance on international tourists as a share of its customer base. Across all sectors, international tourists make up 33% of clients of firms that are currently trading and 49% of clients of temporarily closed businesses. This can be seen in figure 21 which compares the average percentage of business customers who are international tourists by current trading status and sector.
15 MICT Tourism Development Department. Statistical Report on Tourism in Laos, 2020, Table 18.
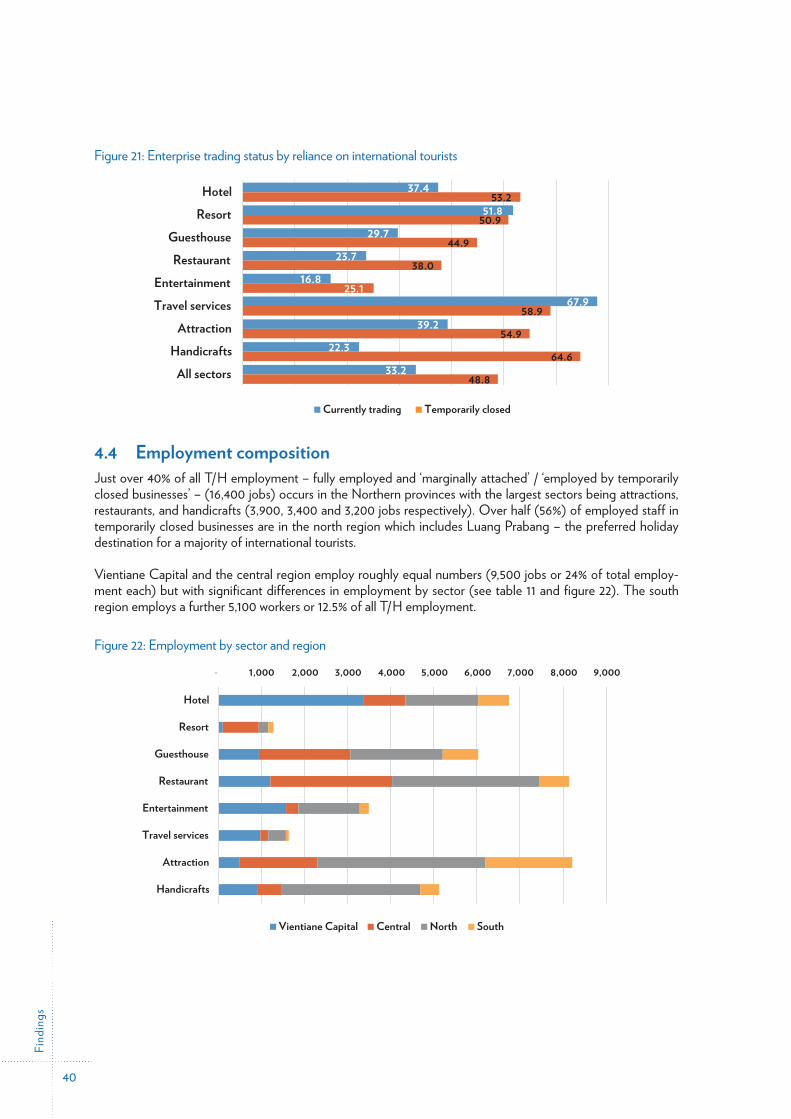
Find
ings
40
Figure 21: Enterprise trading status by reliance on international tourists
Figure-21
the average percentage of business customers who are international tourists by current trading status and sector.
Figure 21: Enterprise trading status by reliance on international tourists
4.4 Employment composition
37.451.8
29.723.7
16.867.9
39.222.3
33.2
53.2
50.9
44.9
38.0
25.1
58.9
54.9
64.6
48.8
HotelResort
GuesthouseRestaurant
EntertainmentTravel services
AttractionHandicrafts
All sectors
Currently trading Temporarily closed
4.4 Employment compositionJust over 40% of all T/H employment – fully employed and ‘marginally attached’ / ‘employed by temporarily closed businesses’ – (16,400 jobs) occurs in the Northern provinces with the largest sectors being attractions, restaurants, and handicrafts (3,900, 3,400 and 3,200 jobs respectively). Over half (56%) of employed staff in temporarily closed businesses are in the north region which includes Luang Prabang – the preferred holiday destination for a majority of international tourists.
Vientiane Capital and the central region employ roughly equal numbers (9,500 jobs or 24% of total employ-ment each) but with significant differences in employment by sector (see table 11 and figure 22). The south region employs a further 5,100 workers or 12.5% of all T/H employment.
Figure 22: Employment by sector and region
Figure-22
The decline in an enterprises’ capacity utilisation, and the likelihood that the business is currently closed, is strongly correlated to its reliance on international tourists as a share of its customer base. Across all sectors, international tourists make up 33% of clients of firms that are currently trading and 49% of clients of temporarily closed businesses. This can be seen in figure 21 which
Hotel
Resort
Guesthouse
Restaurant
Entertainment
Travel services
A�rac�on
Handicra�s
High Moderate Low At risk Unsustainable
Figure 22: Employment by sector and region
- 1,000 2,000 3,000 4,000 5,000 6,000 7,000 8,000 9,000
Hotel
Resort
Guesthouse
Restaurant
Entertainment
Travel services
Attraction
Handicrafts
Vientiane Capital Central North South
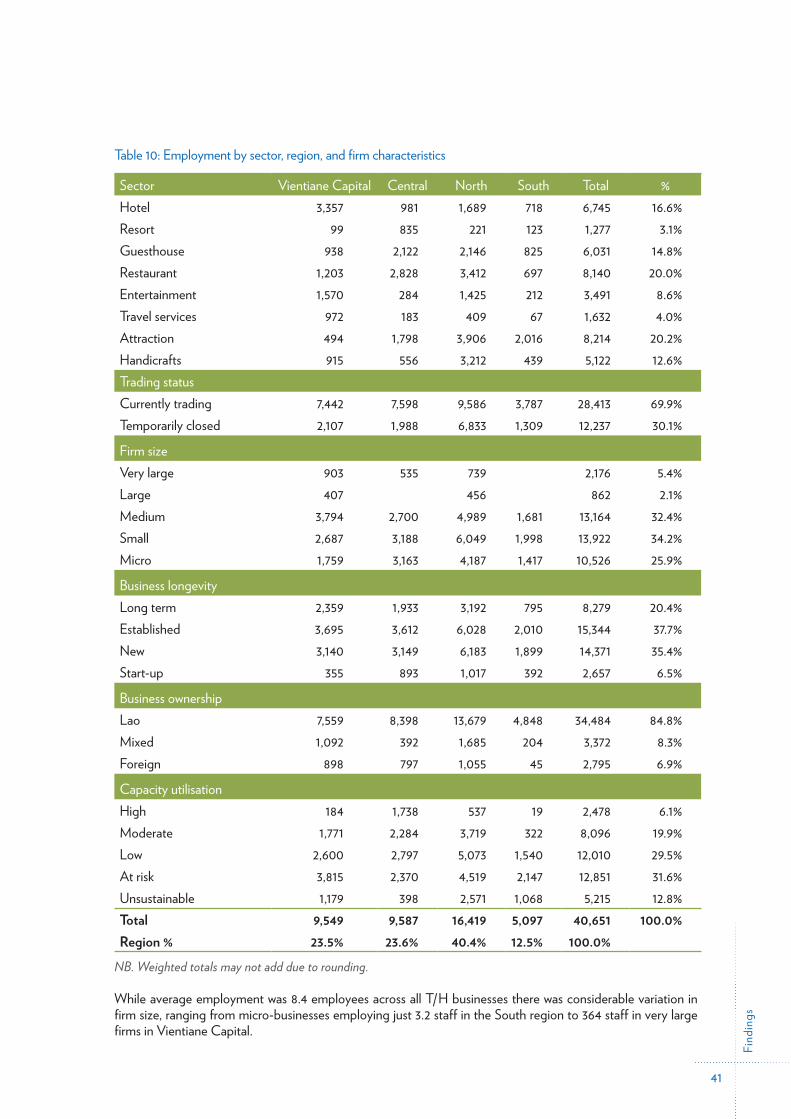
Find
ings
41
Table 10: Employment by sector, region, and firm characteristics
Sector Vientiane Capital Central North South Total %Hotel 3,357 981 1,689 718 6,745 16.6%Resort 99 835 221 123 1,277 3.1%Guesthouse 938 2,122 2,146 825 6,031 14.8%Restaurant 1,203 2,828 3,412 697 8,140 20.0%Entertainment 1,570 284 1,425 212 3,491 8.6%Travel services 972 183 409 67 1,632 4.0%Attraction 494 1,798 3,906 2,016 8,214 20.2%Handicrafts 915 556 3,212 439 5,122 12.6%Trading status Currently trading 7,442 7,598 9,586 3,787 28,413 69.9%Temporarily closed 2,107 1,988 6,833 1,309 12,237 30.1%
Firm size Very large 903 535 739 2,176 5.4%Large 407 456 862 2.1%Medium 3,794 2,700 4,989 1,681 13,164 32.4%Small 2,687 3,188 6,049 1,998 13,922 34.2%Micro 1,759 3,163 4,187 1,417 10,526 25.9%
Business longevity Long term 2,359 1,933 3,192 795 8,279 20.4%Established 3,695 3,612 6,028 2,010 15,344 37.7%New 3,140 3,149 6,183 1,899 14,371 35.4%Start-up 355 893 1,017 392 2,657 6.5%
Business ownership Lao 7,559 8,398 13,679 4,848 34,484 84.8%Mixed 1,092 392 1,685 204 3,372 8.3%Foreign 898 797 1,055 45 2,795 6.9%
Capacity utilisation High 184 1,738 537 19 2,478 6.1%Moderate 1,771 2,284 3,719 322 8,096 19.9%Low 2,600 2,797 5,073 1,540 12,010 29.5%At risk 3,815 2,370 4,519 2,147 12,851 31.6%Unsustainable 1,179 398 2,571 1,068 5,215 12.8%Total 9,549 9,587 16,419 5,097 40,651 100.0%Region % 23.5% 23.6% 40.4% 12.5% 100.0%
NB. Weighted totals may not add due to rounding.
While average employment was 8.4 employees across all T/H businesses there was considerable variation in firm size, ranging from micro-businesses employing just 3.2 staff in the South region to 364 staff in very large firms in Vientiane Capital.
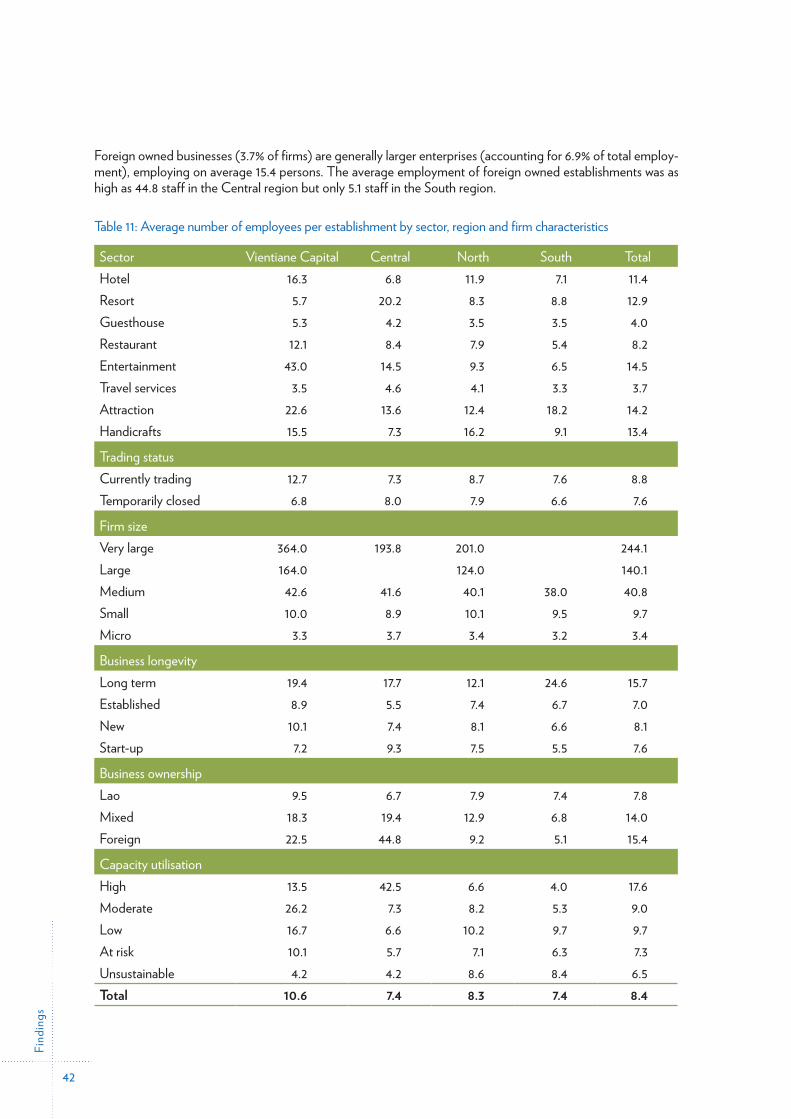
Find
ings
42
Foreign owned businesses (3.7% of firms) are generally larger enterprises (accounting for 6.9% of total employ-ment), employing on average 15.4 persons. The average employment of foreign owned establishments was as high as 44.8 staff in the Central region but only 5.1 staff in the South region.
Table 11: Average number of employees per establishment by sector, region and firm characteristics
Sector Vientiane Capital Central North South TotalHotel 16.3 6.8 11.9 7.1 11.4Resort 5.7 20.2 8.3 8.8 12.9Guesthouse 5.3 4.2 3.5 3.5 4.0Restaurant 12.1 8.4 7.9 5.4 8.2Entertainment 43.0 14.5 9.3 6.5 14.5Travel services 3.5 4.6 4.1 3.3 3.7Attraction 22.6 13.6 12.4 18.2 14.2Handicrafts 15.5 7.3 16.2 9.1 13.4
Trading statusCurrently trading 12.7 7.3 8.7 7.6 8.8Temporarily closed 6.8 8.0 7.9 6.6 7.6
Firm sizeVery large 364.0 193.8 201.0 244.1Large 164.0 124.0 140.1Medium 42.6 41.6 40.1 38.0 40.8Small 10.0 8.9 10.1 9.5 9.7Micro 3.3 3.7 3.4 3.2 3.4
Business longevityLong term 19.4 17.7 12.1 24.6 15.7Established 8.9 5.5 7.4 6.7 7.0New 10.1 7.4 8.1 6.6 8.1Start-up 7.2 9.3 7.5 5.5 7.6
Business ownershipLao 9.5 6.7 7.9 7.4 7.8Mixed 18.3 19.4 12.9 6.8 14.0Foreign 22.5 44.8 9.2 5.1 15.4
Capacity utilisationHigh 13.5 42.5 6.6 4.0 17.6Moderate 26.2 7.3 8.2 5.3 9.0Low 16.7 6.6 10.2 9.7 9.7At risk 10.1 5.7 7.1 6.3 7.3Unsustainable 4.2 4.2 8.6 8.4 6.5Total 10.6 7.4 8.3 7.4 8.4
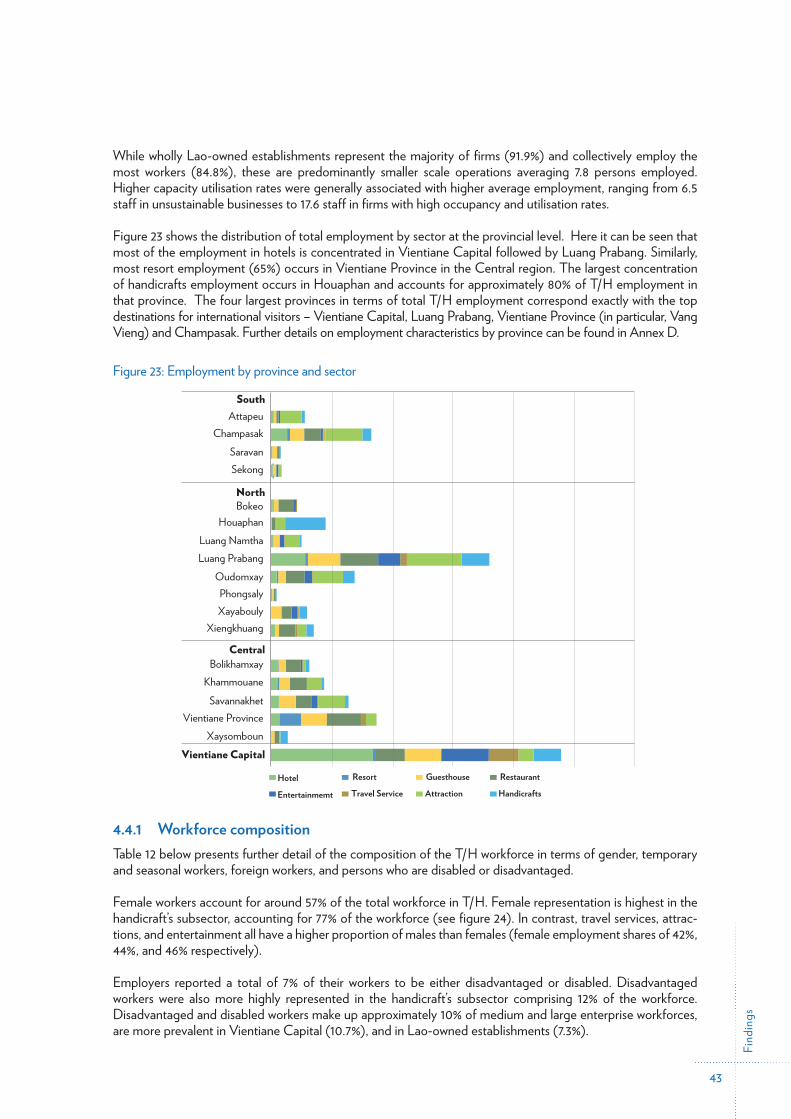
Find
ings
43
While wholly Lao-owned establishments represent the majority of firms (91.9%) and collectively employ the most workers (84.8%), these are predominantly smaller scale operations averaging 7.8 persons employed. Higher capacity utilisation rates were generally associated with higher average employment, ranging from 6.5 staff in unsustainable businesses to 17.6 staff in firms with high occupancy and utilisation rates.
Figure 23 shows the distribution of total employment by sector at the provincial level. Here it can be seen that most of the employment in hotels is concentrated in Vientiane Capital followed by Luang Prabang. Similarly, most resort employment (65%) occurs in Vientiane Province in the Central region. The largest concentration of handicrafts employment occurs in Houaphan and accounts for approximately 80% of T/H employment in that province. The four largest provinces in terms of total T/H employment correspond exactly with the top destinations for international visitors – Vientiane Capital, Luang Prabang, Vientiane Province (in particular, Vang Vieng) and Champasak. Further details on employment characteristics by province can be found in Annex D.
Figure 23: Employment by province and sector
Figure-23
15 MICT Tourism Development Department. Stati ical Report on Tourism in Laos, 2020, Table 18.
0
AttapeuChampasak
SaravanSekong
BokeoHouaphan
Luang NamthaLuang Prabang
OudomxayPhongsalyXayabouly
Xiengkhuang
BolikhamxayKhammouane
SavannakhetVientiane Province
Xaysomboun
Hotel Resort
Travel Service
Guesthouse
Attraction
Restaurant
HandicraftsEntertainmemt
2000 4000 6000 8000 10000 12000
Vientiane Capital
Central
North
South
4.4.1 Workforce compositionTable 12 below presents further detail of the composition of the T/H workforce in terms of gender, temporary and seasonal workers, foreign workers, and persons who are disabled or disadvantaged.
Female workers account for around 57% of the total workforce in T/H. Female representation is highest in the handicraft’s subsector, accounting for 77% of the workforce (see figure 24). In contrast, travel services, attrac-tions, and entertainment all have a higher proportion of males than females (female employment shares of 42%, 44%, and 46% respectively).
Employers reported a total of 7% of their workers to be either disadvantaged or disabled. Disadvantaged workers were also more highly represented in the handicraft’s subsector comprising 12% of the workforce. Disadvantaged and disabled workers make up approximately 10% of medium and large enterprise workforces, are more prevalent in Vientiane Capital (10.7%), and in Lao-owned establishments (7.3%).
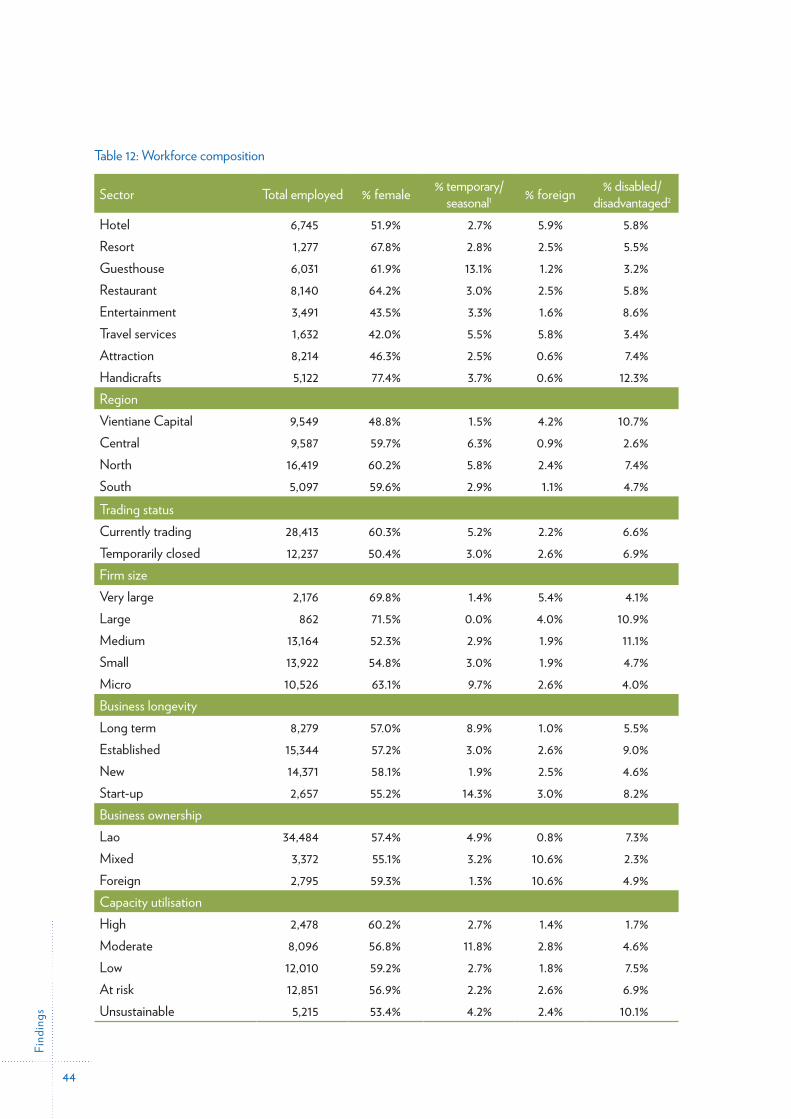
Find
ings
44
Table 12: Workforce composition
Sector Total employed % female % temporary/ seasonal1 % foreign % disabled/
disadvantaged2
Hotel 6,745 51.9% 2.7% 5.9% 5.8%Resort 1,277 67.8% 2.8% 2.5% 5.5%Guesthouse 6,031 61.9% 13.1% 1.2% 3.2%Restaurant 8,140 64.2% 3.0% 2.5% 5.8%Entertainment 3,491 43.5% 3.3% 1.6% 8.6%Travel services 1,632 42.0% 5.5% 5.8% 3.4%Attraction 8,214 46.3% 2.5% 0.6% 7.4%Handicrafts 5,122 77.4% 3.7% 0.6% 12.3%RegionVientiane Capital 9,549 48.8% 1.5% 4.2% 10.7%Central 9,587 59.7% 6.3% 0.9% 2.6%North 16,419 60.2% 5.8% 2.4% 7.4%South 5,097 59.6% 2.9% 1.1% 4.7%Trading statusCurrently trading 28,413 60.3% 5.2% 2.2% 6.6%Temporarily closed 12,237 50.4% 3.0% 2.6% 6.9%Firm sizeVery large 2,176 69.8% 1.4% 5.4% 4.1%Large 862 71.5% 0.0% 4.0% 10.9%Medium 13,164 52.3% 2.9% 1.9% 11.1%Small 13,922 54.8% 3.0% 1.9% 4.7%Micro 10,526 63.1% 9.7% 2.6% 4.0%Business longevityLong term 8,279 57.0% 8.9% 1.0% 5.5%Established 15,344 57.2% 3.0% 2.6% 9.0%New 14,371 58.1% 1.9% 2.5% 4.6%Start-up 2,657 55.2% 14.3% 3.0% 8.2%Business ownershipLao 34,484 57.4% 4.9% 0.8% 7.3%Mixed 3,372 55.1% 3.2% 10.6% 2.3%Foreign 2,795 59.3% 1.3% 10.6% 4.9%Capacity utilisationHigh 2,478 60.2% 2.7% 1.4% 1.7%Moderate 8,096 56.8% 11.8% 2.8% 4.6%Low 12,010 59.2% 2.7% 1.8% 7.5%At risk 12,851 56.9% 2.2% 2.6% 6.9%Unsustainable 5,215 53.4% 4.2% 2.4% 10.1%
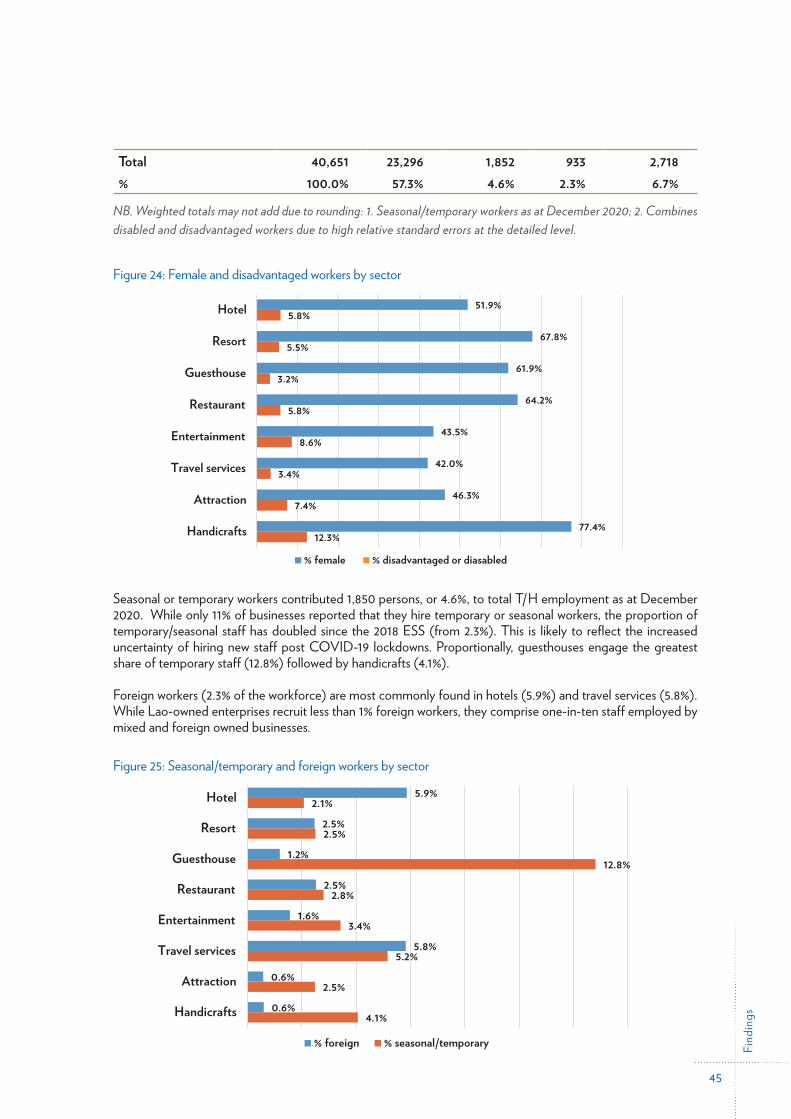
Find
ings
45
Total 40,651 23,296 1,852 933 2,718% 100.0% 57.3% 4.6% 2.3% 6.7%
NB. Weighted totals may not add due to rounding: 1. Seasonal/temporary workers as at December 2020; 2. Combines disabled and disadvantaged workers due to high relative standard errors at the detailed level. Figure 24: Female and disadvantaged workers by sector
Figure-24
includes Luang Prabang – the preferred holiday de�ination for a majority of international touri�s.
Vientiane Capital and the central region employ roughly equal numbers (9,500 jobs or 24% of total employment each) but with significant di�erences in employment by sector (see table 11 and figure 22). The south region employs a further 5,100 workers or 12.5% of all T/H employment.
Figure 22: Employment by sector and region
- 1,000 2,000 3,000 4,000 5,000 6,000 7,000 8,000 9,000
Hotel
Resort
Guesthouse
Restaurant
Entertainment
Travel services
A�rac�on
Handicra�s
Figure 24: Female and disadvantaged workers by sector
51.9%
67.8%
61.9%
64.2%
43.5%
42.0%
46.3%
77.4%
5.8%
5.5%
3.2%
5.8%
8.6%
3.4%
7.4%
12.3%
Hotel
Resort
Guesthouse
Restaurant
Entertainment
Travel services
Attraction
Handicrafts
% female % disadvantaged or diasabled
Seasonal or temporary workers contributed 1,850 persons, or 4.6%, to total T/H employment as at December 2020. While only 11% of businesses reported that they hire temporary or seasonal workers, the proportion of temporary/seasonal staff has doubled since the 2018 ESS (from 2.3%). This is likely to reflect the increased uncertainty of hiring new staff post COVID-19 lockdowns. Proportionally, guesthouses engage the greatest share of temporary staff (12.8%) followed by handicrafts (4.1%).
Foreign workers (2.3% of the workforce) are most commonly found in hotels (5.9%) and travel services (5.8%). While Lao-owned enterprises recruit less than 1% foreign workers, they comprise one-in-ten staff employed by mixed and foreign owned businesses.
Figure 25: Seasonal/temporary and foreign workers by sector
Figure-25
Figure 25: Seasonal/temporary and foreign workers by sector
5.9%
2.5%
1.2%
2.5%
1.6%
5.8%
0.6%
0.6%
2.1%
2.5%
12.8%
2.8%
3.4%
5.2%
2.5%
4.1%
Hotel
Resort
Guesthouse
Restaurant
Entertainment
Travel services
Attraction
Handicrafts
% foreign % seasonal/temporary
ISCO occupations are also classified by skill level. While the mo� important determinant of skill level is the nature of the tasks performed in a particular occupation, formal education and training requirements are feature in determining skill level. Skill level 1 occupations involve routine tasks and require low levels of educational attainment, e.g., cleaners; skill level 2 occupations machinery operators, maintenance and repair, and clerical functions; skill level 3 occupations involve advanced technical knowledge and skills and include hotel managers and associate professionals; skill level 4 occupations typically require complex problem solving and decision making, these include general managers and professionals. Analysis of occupational demand by skill level is an important aid to T/H skill supply planning to help align graduates trainingappropriately targeted by field of � udy and qualification level. The four ISCO skill levels are
79.7%
68.2%
18.9%
51.0%
0.6%
57.3%
Restaurant
Entertainment
Travel services
A�rac�on
Handicra�s
Total
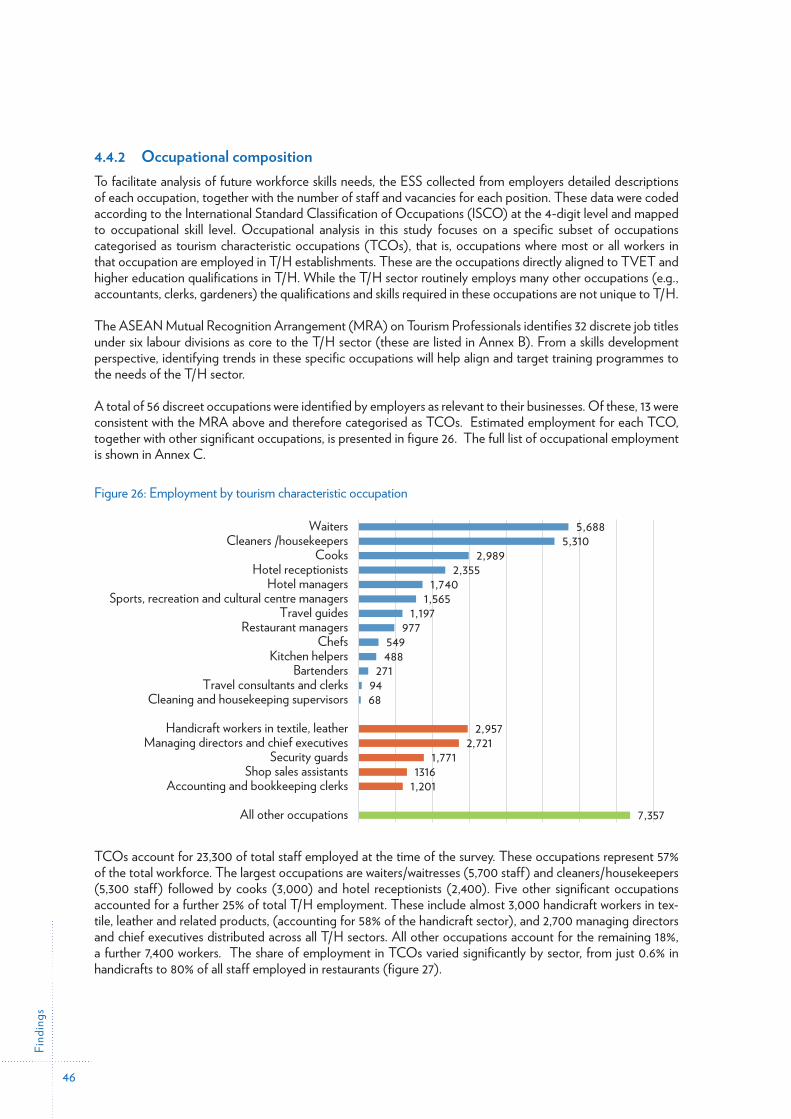
Find
ings
46
4.4.2 Occupational compositionTo facilitate analysis of future workforce skills needs, the ESS collected from employers detailed descriptions of each occupation, together with the number of staff and vacancies for each position. These data were coded according to the International Standard Classification of Occupations (ISCO) at the 4-digit level and mapped to occupational skill level. Occupational analysis in this study focuses on a specific subset of occupations categorised as tourism characteristic occupations (TCOs), that is, occupations where most or all workers in that occupation are employed in T/H establishments. These are the occupations directly aligned to TVET and higher education qualifications in T/H. While the T/H sector routinely employs many other occupations (e.g., accountants, clerks, gardeners) the qualifications and skills required in these occupations are not unique to T/H.
The ASEAN Mutual Recognition Arrangement (MRA) on Tourism Professionals identifies 32 discrete job titles under six labour divisions as core to the T/H sector (these are listed in Annex B). From a skills development perspective, identifying trends in these specific occupations will help align and target training programmes to the needs of the T/H sector.
A total of 56 discreet occupations were identified by employers as relevant to their businesses. Of these, 13 were consistent with the MRA above and therefore categorised as TCOs. Estimated employment for each TCO, together with other significant occupations, is presented in figure 26. The full list of occupational employment is shown in Annex C.
Figure 26: Employment by tourism characteristic occupation
Figure-26
5,6885,310
2,9892,355
1,7401,565
1,197977
549488
2719468
2,9572,721
1,7711316
1,201
7,357
WaitersCleaners /housekeepers
CooksHotel receptionists
Hotel managersSports, recreation and cultural centre managers
Travel guidesRestaurant managers
ChefsKitchen helpers
BartendersTravel consultants and clerks
Cleaning and housekeeping supervisors
Handicraft workers in textile, leatherManaging directors and chief executives
Security guardsShop sales assistants
Accounting and bookkeeping clerks
All other occupations
TCOs account for 23,300 of total staff employed at the time of the survey. These occupations represent 57% of the total workforce. The largest occupations are waiters/waitresses (5,700 staff) and cleaners/housekeepers (5,300 staff) followed by cooks (3,000) and hotel receptionists (2,400). Five other significant occupations accounted for a further 25% of total T/H employment. These include almost 3,000 handicraft workers in tex-tile, leather and related products, (accounting for 58% of the handicraft sector), and 2,700 managing directors and chief executives distributed across all T/H sectors. All other occupations account for the remaining 18%, a further 7,400 workers. The share of employment in TCOs varied significantly by sector, from just 0.6% in handicrafts to 80% of all staff employed in restaurants (figure 27).
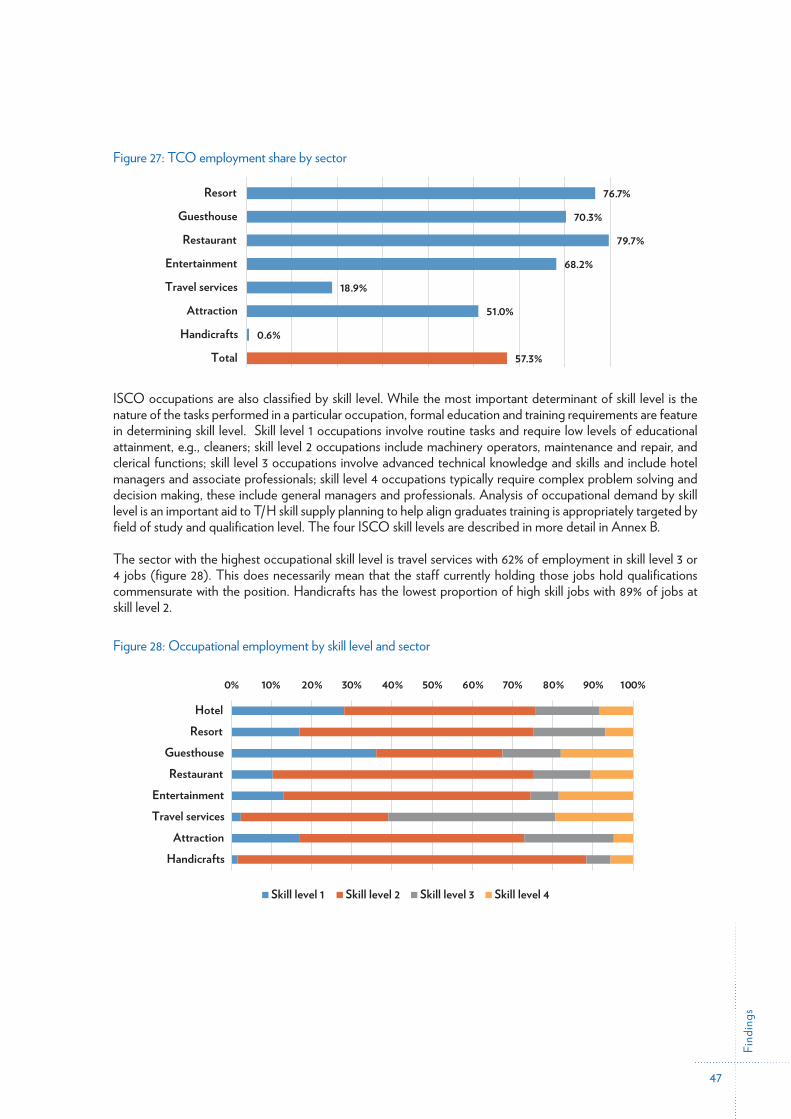
Find
ings
47
Figure 27: TCO employment share by sector
handicrafts to 8 0% of all af f employed in re aurants (figure 27).
Figure 27: TCO employment share by sector
ISCO occupations are also classified by skill level. While the mo important determinant of skill level is the nature of the tasks performed in a particular occupation, for mal education and trainrequirements are feature in determining skill level. Skill level 1 occupations involve routine ta
69.5%
76.7%
70.3%
79.7%
68.2%
18.9%
51.0%
0.6%
57.3%
Hotel
Resort
Guesthouse
Restaurant
Entertainment
Travel services
Attraction
Handicrafts
TotalMore were trained in Vientiane Capital (31.7%) compared to other regions. Similarly, were more likely to receive training if they were employed in foreign owned enterprises (49.8%and/or large businesses (47.2%). Of intere also is that training rates were repoin temporarily closed businesses (28.8%) compared to those currently trading (17.3%).
ISCO occupations are also classified by skill level. While the most important determinant of skill level is the nature of the tasks performed in a particular occupation, formal education and training requirements are feature in determining skill level. Skill level 1 occupations involve routine tasks and require low levels of educational attainment, e.g., cleaners; skill level 2 occupations include machinery operators, maintenance and repair, and clerical functions; skill level 3 occupations involve advanced technical knowledge and skills and include hotel managers and associate professionals; skill level 4 occupations typically require complex problem solving and decision making, these include general managers and professionals. Analysis of occupational demand by skill level is an important aid to T/H skill supply planning to help align graduates training is appropriately targeted by field of study and qualification level. The four ISCO skill levels are described in more detail in Annex B.
The sector with the highest occupational skill level is travel services with 62% of employment in skill level 3 or 4 jobs (figure 28). This does necessarily mean that the staff currently holding those jobs hold qualifications commensurate with the position. Handicrafts has the lowest proportion of high skill jobs with 89% of jobs at skill level 2.
Figure 28: Occupational employment by skill level and sector
jobs hold qualifications commensurate with the position. Handicrafts has the lowe proportion of high skill jobs with 89% of jobs at skill level 2.
Figure 28: Occupatio nal employment by skill level and sector
0% 10% 20% 30% 40% 50% 60% 70% 80% 90% 100%
HotelResort
GuesthouseRestaurant
EntertainmentTravel services
AttractionHandicrafts
Skill level 1 Skill level 2 Skill level 3 Skill level 4
tables or perform in the evening. 16
Figure 30 ing rates by sector
St training rates have fallen by around 8% points compared to the 2018 ESS with ju 28%
0.0%
10.0%
20.0%
30.0%
40.0%
50.0%
60.0%
% sta trained in 2020 % sta currently studying
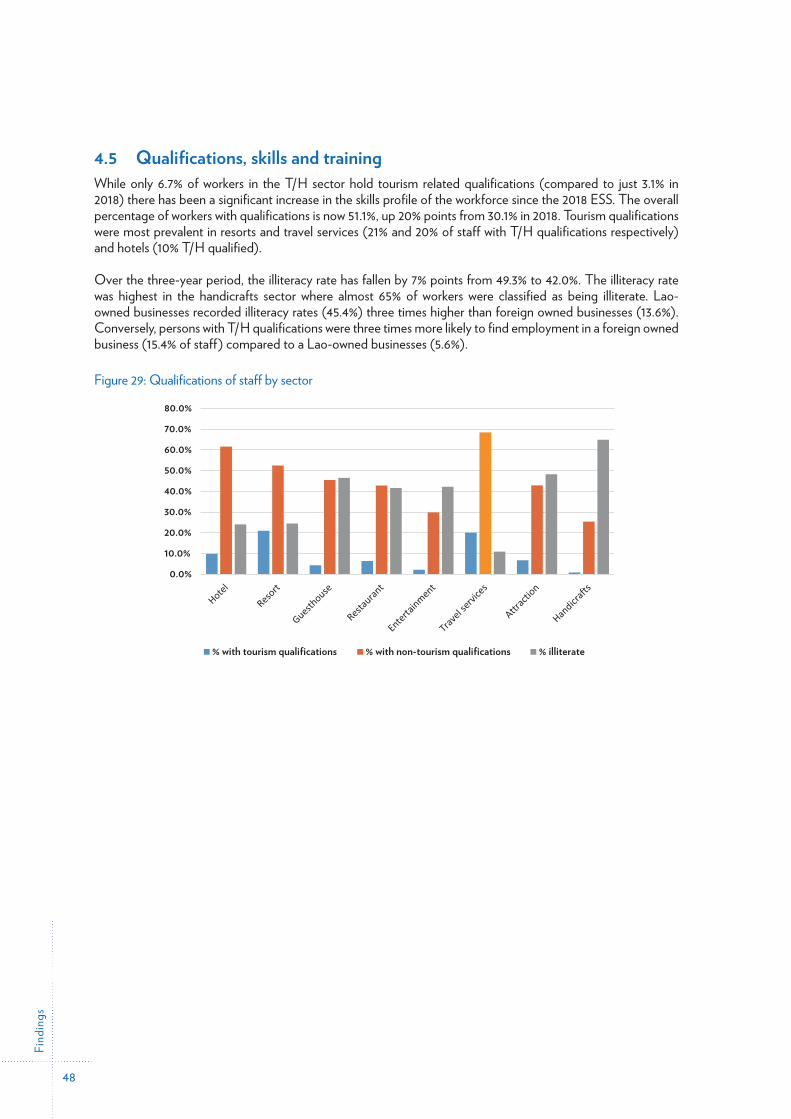
Find
ings
48
4.5 Qualifications, skills and trainingWhile only 6.7% of workers in the T/H sector hold tourism related qualifications (compared to just 3.1% in 2018) there has been a significant increase in the skills profile of the workforce since the 2018 ESS. The overall percentage of workers with qualifications is now 51.1%, up 20% points from 30.1% in 2018. Tourism qualifications were most prevalent in resorts and travel services (21% and 20% of staff with T/H qualifications respectively) and hotels (10% T/H qualified).
Over the three-year period, the illiteracy rate has fallen by 7% points from 49.3% to 42.0%. The illiteracy rate was highest in the handicrafts sector where almost 65% of workers were classified as being illiterate. Lao-owned businesses recorded illiteracy rates (45.4%) three times higher than foreign owned businesses (13.6%). Conversely, persons with T/H qualifications were three times more likely to find employment in a foreign owned business (15.4% of staff) compared to a Lao-owned businesses (5.6%).
Figure 29: Qualifications of staff by sector
Figure-29
0.0%
10.0%
20.0%
30.0%
40.0%
50.0%
60.0%
70.0%
80.0%
% with tourism qualifications % with non-tourism qualifications % illiterateMore staff were trained in Vientiane Capital (31.7%) compared to other regions. Similarly, staff were more likely to receive training if they were employed in foreign owned enterprises (49.8%) and/or large businesses (47.2%). Of interest also is that staff training rates were reportedly higher in temporarily closed businesses (28.8%) compared to those currently trading (17.3%). Table 15: Top ten occupational vacancies
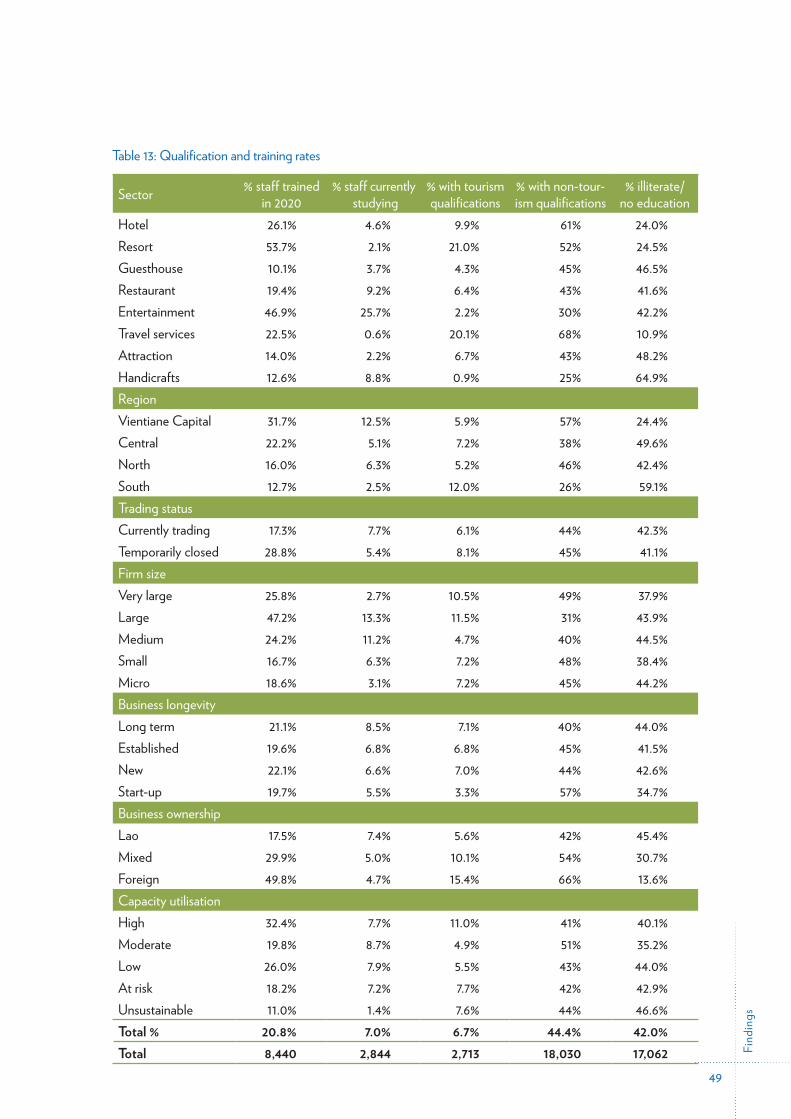
Find
ings
49
Table 13: Qualification and training rates
Sector % staff trained in 2020
% staff currently studying
% with tourism qualifications
% with non-tour-ism qualifications
% illiterate/ no education
Hotel 26.1% 4.6% 9.9% 61% 24.0%Resort 53.7% 2.1% 21.0% 52% 24.5%Guesthouse 10.1% 3.7% 4.3% 45% 46.5%Restaurant 19.4% 9.2% 6.4% 43% 41.6%Entertainment 46.9% 25.7% 2.2% 30% 42.2%Travel services 22.5% 0.6% 20.1% 68% 10.9%Attraction 14.0% 2.2% 6.7% 43% 48.2%Handicrafts 12.6% 8.8% 0.9% 25% 64.9%Region Vientiane Capital 31.7% 12.5% 5.9% 57% 24.4%Central 22.2% 5.1% 7.2% 38% 49.6%North 16.0% 6.3% 5.2% 46% 42.4%South 12.7% 2.5% 12.0% 26% 59.1%Trading status Currently trading 17.3% 7.7% 6.1% 44% 42.3%Temporarily closed 28.8% 5.4% 8.1% 45% 41.1%Firm size Very large 25.8% 2.7% 10.5% 49% 37.9%Large 47.2% 13.3% 11.5% 31% 43.9%Medium 24.2% 11.2% 4.7% 40% 44.5%Small 16.7% 6.3% 7.2% 48% 38.4%Micro 18.6% 3.1% 7.2% 45% 44.2%Business longevity Long term 21.1% 8.5% 7.1% 40% 44.0%Established 19.6% 6.8% 6.8% 45% 41.5%New 22.1% 6.6% 7.0% 44% 42.6%Start-up 19.7% 5.5% 3.3% 57% 34.7%Business ownership Lao 17.5% 7.4% 5.6% 42% 45.4%Mixed 29.9% 5.0% 10.1% 54% 30.7%Foreign 49.8% 4.7% 15.4% 66% 13.6%Capacity utilisation High 32.4% 7.7% 11.0% 41% 40.1%Moderate 19.8% 8.7% 4.9% 51% 35.2%Low 26.0% 7.9% 5.5% 43% 44.0%At risk 18.2% 7.2% 7.7% 42% 42.9%Unsustainable 11.0% 1.4% 7.6% 44% 46.6%Total % 20.8% 7.0% 6.7% 44.4% 42.0%Total 8,440 2,844 2,713 18,030 17,062
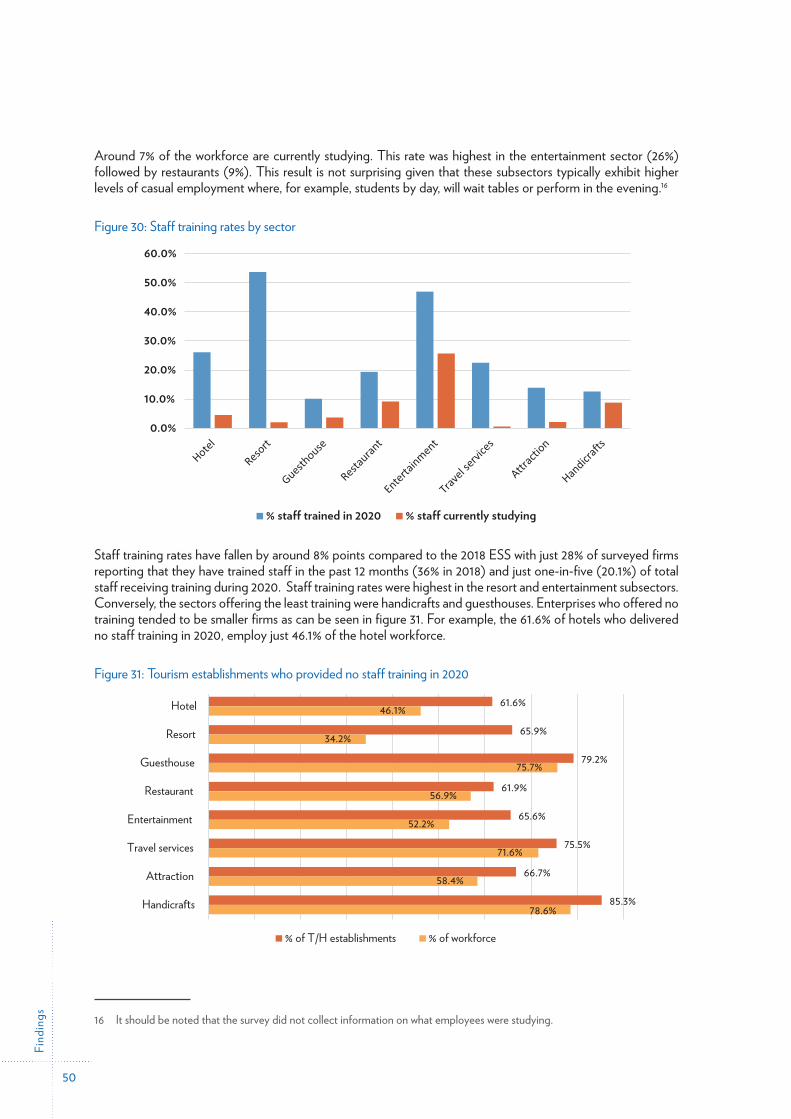
Find
ings
50
Around 7% of the workforce are currently studying. This rate was highest in the entertainment sector (26%) followed by restaurants (9%). This result is not surprising given that these subsectors typically exhibit higher levels of casual employment where, for example, students by day, will wait tables or perform in the evening.16
Figure 30: Staff training rates by sector
Figure-30
professionals; skill level 4 occupations typically require complex problem solving and decision making, these include general managers and professionals. Analysis of occupational demand by skill level is an important aid to T/H skill supply planning to help align graduates trainingappropriately targeted by field of study and qualification level. The four ISCO skill levels are described in more detail in Annex B.
The sector with the highest occupational skill level is travel services with 62% of employment in skill level 3 or 4 jobs (figure 28). This does necessarily mean that the staff currently holding those jobs hold qualifications commensurate with the position. Handicrafts has the lowest proportion of high skill jobs with 89% of jobs at skill level 2.
Figure 28: Occupational employment by skill level and sector 0% 10% 20% 30% 40% 50% 60% 70% 80% 90% 100%
Hotel
Resort
Guesthouse
Restaurant
Entertainment
Travel services
tables or perform in the evening.
Figure 30: Staff training rates by sector
Staff training rates have fallen by around 8% points compared to the 2018 ESS with just 28%
0.0%
10.0%
20.0%
30.0%
40.0%
50.0%
60.0%
% sta� trained in 2020 % sta� currently studying
absolute terms (2,100 days). However, this equates to approximately one-half a day per year for each employee (figure 33). This estimate excludes all firms who did not offer training.
Figure 32: Staff training days by sector and provider type
Entertainment establishments who did deliver training, reportedly provided training to 98% of their
0 500 1000 1500 2000 2500
Hotel
Resort
Guesthouse
Restaurant
Entertainment
Travel services
A�rac�on
Handicra�s
In-house, own team In-house, external provider Othe provider
Staff training rates have fallen by around 8% points compared to the 2018 ESS with just 28% of surveyed firms reporting that they have trained staff in the past 12 months (36% in 2018) and just one-in-five (20.1%) of total staff receiving training during 2020. Staff training rates were highest in the resort and entertainment subsectors. Conversely, the sectors offering the least training were handicrafts and guesthouses. Enterprises who offered no training tended to be smaller firms as can be seen in figure 31. For example, the 61.6% of hotels who delivered no staff training in 2020, employ just 46.1% of the hotel workforce.
Figure 31: Tourism establishments who provided no staff training in 2020
can be seen in figur e 3 1 . For example, the 61.6% of hotels who delivered no �a� training in 2020, employ ju� 46.1% of the hotel workforce.
Figure 3 1 : Tourism establishments who provided no �a� training in 2020
61.6%
65.9%
79.2%
61.9%
65.6%
75.5%
66.7%
85.3%
46.1%
34.2%
75.7%
56.9%
52.2%
71.6%
58.4%
78.6%
Hotel
Resort
Guesthouse
Restaurant
Entertainment
Travel services
Attraction
Handicrafts
% of T/H establishments % of workforce
4.6 Turnover , vacancies, and recruitment
Table 1 4 presents �a� t urnover , va cancy , and planned recruitment activity for T/H e�ablishments by sector, region, and firm characteri�ics.
Despite the COVID -19 lockdowns and temporary business closures, over a third of businesses (36%) reported no �a� turnover at all during 2020. Total �a� tur nover at 6.8% (2,752) is considered low compared to indu�ry averages. Turnover rates were highe� for travel services and re�aurants, and much higher in Vientiane Capital compared to the other regions. businesses also recorded a high turnover ra te.
Low vacancy rates and limited planned recruitment activity demon�rates the depressed �ate of
16 It should be noted that the survey did not collect information on what employees were studying.
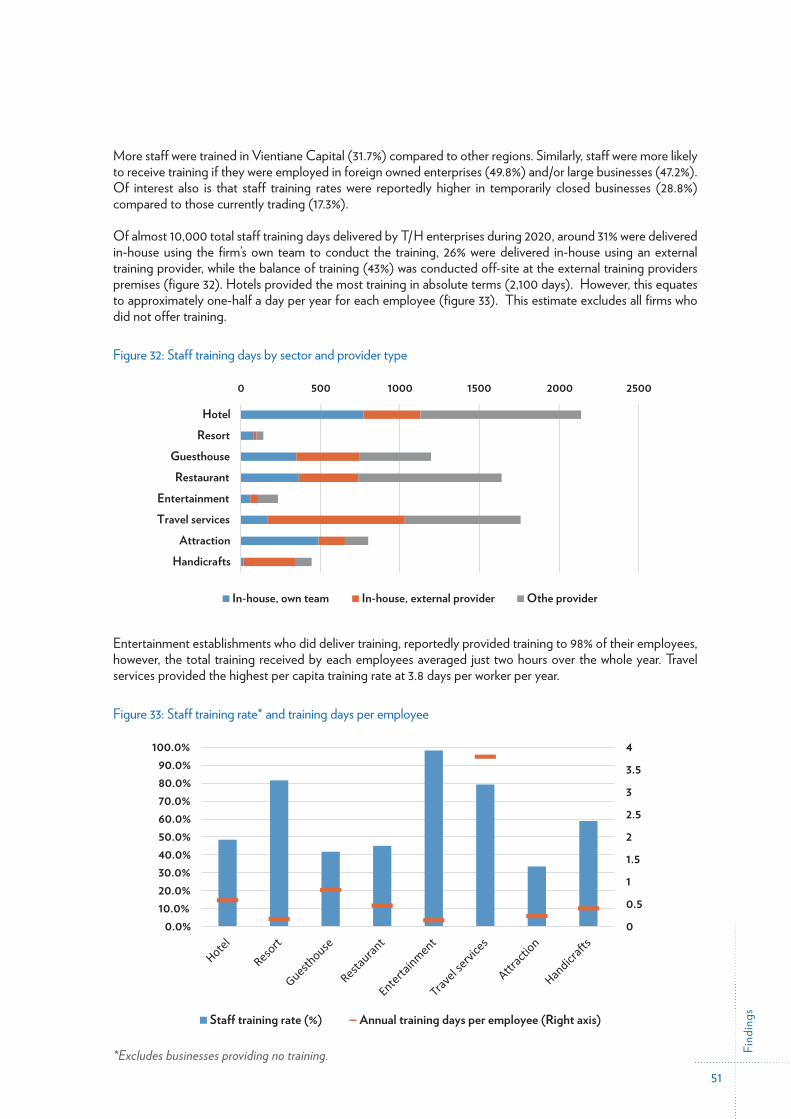
Find
ings
51
More staff were trained in Vientiane Capital (31.7%) compared to other regions. Similarly, staff were more likely to receive training if they were employed in foreign owned enterprises (49.8%) and/or large businesses (47.2%). Of interest also is that staff training rates were reportedly higher in temporarily closed businesses (28.8%) compared to those currently trading (17.3%).
Of almost 10,000 total staff training days delivered by T/H enterprises during 2020, around 31% were delivered in-house using the firm’s own team to conduct the training, 26% were delivered in-house using an external training provider, while the balance of training (43%) was conducted off-site at the external training providers premises (figure 32). Hotels provided the most training in absolute terms (2,100 days). However, this equates to approximately one-half a day per year for each employee (figure 33). This estimate excludes all firms who did not offer training.
Figure 32: Staff training days by sector and provider type
Figure-32
absolute terms (2,100 days). However, this equates to approximately one-half a day per year for each employee (figure 33). This estimate excludes all firms who did not offer training.
Figure 32: Staff training days by sector and provider type
Entertainment establishments who did deliver training, reportedly provided training to 98% of their employees, however, the total training received by each employees averaged just two hours over the whole year. Travel services provided the highest per capita training rate at 3.8 days per worker
0 500 1000 1500 2000 2500
HotelResort
GuesthouseRestaurant
EntertainmentTravel services
AttractionHandicrafts
In-house, own team In-house, external provider Othe provider 4.6.1 Recruitment practices While all vacancies identified were open to Lao residents, 21% of vacancies were also open to foreigners. Handicrafts (at 50%) and hotels (at 39%) were far more receptive of foreign applicants
Entertainment establishments who did deliver training, reportedly provided training to 98% of their employees, however, the total training received by each employees averaged just two hours over the whole year. Travel services provided the highest per capita training rate at 3.8 days per worker per year.
Figure 33: Staff training rate* and training days per employee
Figure-33
can be seen in figure 31. For example, the 61.6% of hotels who delivered no staff training in 2020, employ just 46.1% of the hotel workforce.
Figure 31: Tourism establishments who provided no staff training in 2020
61.6%
65.9%
79.2%
61.9%
65.6%
75.5%
66.7%
85.3%
46.1%
34.2%
75.7%
56.9%
52.2%
71.6%
58.4%
78.6%
Hotel
Resort
Guesthouse
Restaurant
Entertainment
Travel services
A�rac�on
Handicra�s
% of T/H establishments % of workforce
Figure 33: Staff training rate* and training days per employee
00.511.522.533.54
0.0%10.0%20.0%30.0%40.0%50.0%60.0%70.0%80.0%90.0%
100.0%
Sta� training rate (%) Annual training days per employee (Right axis)While all vacancies identified were open to Lao residents, 21% of vacancies were also open to
otels (at 39%) were far more receptive of foreign applicants *Excludes businesses providing no training.
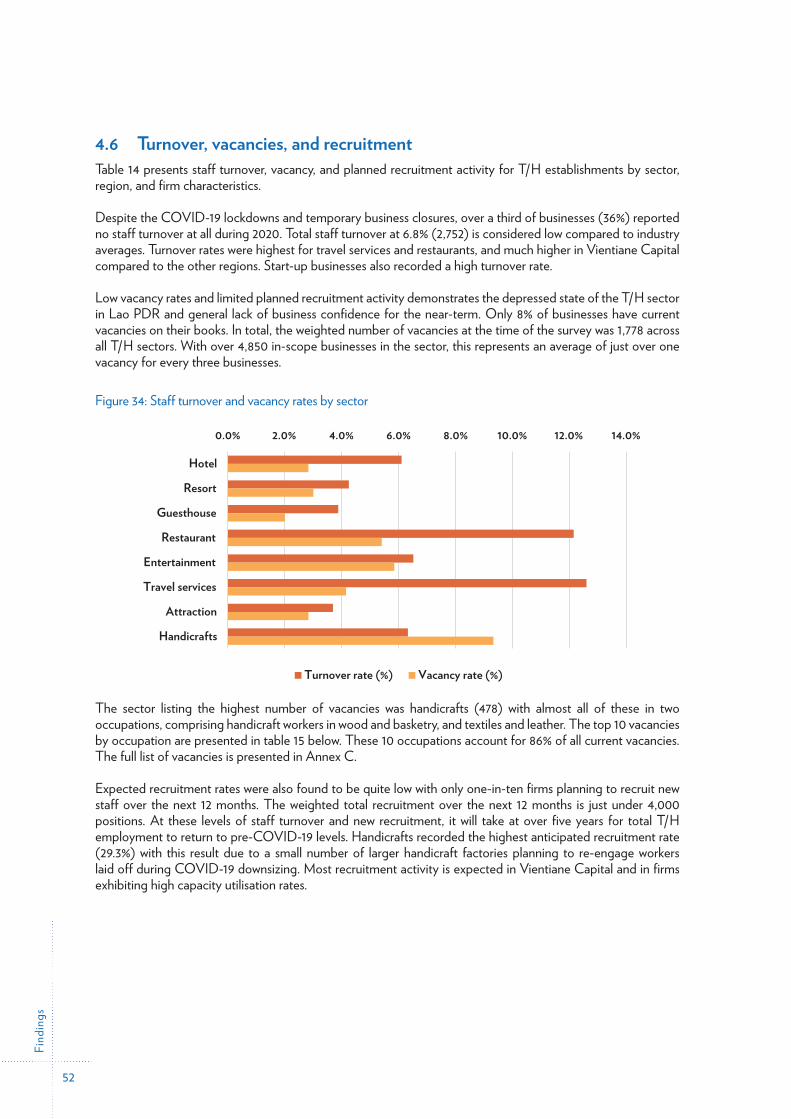
Find
ings
52
4.6 Turnover, vacancies, and recruitmentTable 14 presents staff turnover, vacancy, and planned recruitment activity for T/H establishments by sector, region, and firm characteristics.
Despite the COVID-19 lockdowns and temporary business closures, over a third of businesses (36%) reported no staff turnover at all during 2020. Total staff turnover at 6.8% (2,752) is considered low compared to industry averages. Turnover rates were highest for travel services and restaurants, and much higher in Vientiane Capital compared to the other regions. Start-up businesses also recorded a high turnover rate.
Low vacancy rates and limited planned recruitment activity demonstrates the depressed state of the T/H sector in Lao PDR and general lack of business confidence for the near-term. Only 8% of businesses have current vacancies on their books. In total, the weighted number of vacancies at the time of the survey was 1,778 across all T/H sectors. With over 4,850 in-scope businesses in the sector, this represents an average of just over one vacancy for every three businesses.
Figure 34: Staff turnover and vacancy rates by sector
Figure-34
the sector, this represents an average of just over one vacancy for every three businesses.
Figure 34: Staff turnover and vacancy rates by sector 0.0% 2.0% 4.0% 6.0% 8.0% 10.0% 12.0% 14.0%
Hotel
Resort
Guesthouse
Restaurant
Entertainment
Travel services
Attraction
Handicrafts
Turnover rate (%) Vacancy rate (%)
The sector listing the highest number of vacancies was handicrafts (478) with almost all of these in two occupations, comprising handicraft workers in wood and basketry, and textiles and leather. The top 10 vacancies by occupation are presented in table 15 below. These 10 occupations account for 86% of all current vacancies. The full list of vacancies is presented in Annex C.
Expected recruitment rates were also found to be quite low with only one-in-ten firms planning to recruit new staff over the next 12 months. The weighted total recruitment over the next 12 months is just under 4,000 positions. At these levels of staff turnover and new recruitment, it will take at over five years for total T/H employment to return to pre-COVID-19 levels. Handicrafts recorded the highest anticipated recruitment rate (29.3%) with this result due to a small number of larger handicraft factories planning to re-engage workers laid off during COVID-19 downsizing. Most recruitment activity is expected in Vientiane Capital and in firms exhibiting high capacity utilisation rates.
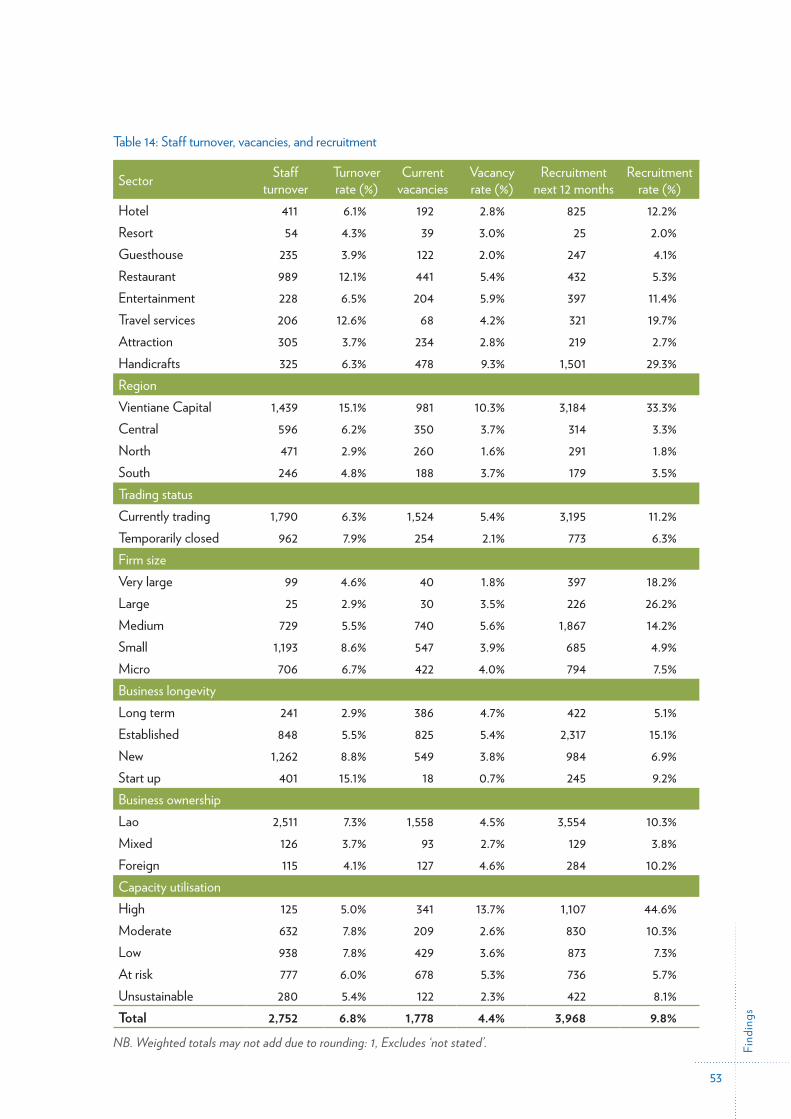
Find
ings
53
Table 14: Staff turnover, vacancies, and recruitment
Sector Staff turnover
Turnover rate (%)
Current vacancies
Vacancy rate (%)
Recruitment next 12 months
Recruitment rate (%)
Hotel 411 6.1% 192 2.8% 825 12.2%Resort 54 4.3% 39 3.0% 25 2.0%Guesthouse 235 3.9% 122 2.0% 247 4.1%Restaurant 989 12.1% 441 5.4% 432 5.3%Entertainment 228 6.5% 204 5.9% 397 11.4%Travel services 206 12.6% 68 4.2% 321 19.7%Attraction 305 3.7% 234 2.8% 219 2.7%Handicrafts 325 6.3% 478 9.3% 1,501 29.3%RegionVientiane Capital 1,439 15.1% 981 10.3% 3,184 33.3%Central 596 6.2% 350 3.7% 314 3.3%North 471 2.9% 260 1.6% 291 1.8%South 246 4.8% 188 3.7% 179 3.5%Trading statusCurrently trading 1,790 6.3% 1,524 5.4% 3,195 11.2%Temporarily closed 962 7.9% 254 2.1% 773 6.3%Firm sizeVery large 99 4.6% 40 1.8% 397 18.2%Large 25 2.9% 30 3.5% 226 26.2%Medium 729 5.5% 740 5.6% 1,867 14.2%Small 1,193 8.6% 547 3.9% 685 4.9%Micro 706 6.7% 422 4.0% 794 7.5%Business longevityLong term 241 2.9% 386 4.7% 422 5.1%Established 848 5.5% 825 5.4% 2,317 15.1%New 1,262 8.8% 549 3.8% 984 6.9%Start up 401 15.1% 18 0.7% 245 9.2%Business ownershipLao 2,511 7.3% 1,558 4.5% 3,554 10.3%Mixed 126 3.7% 93 2.7% 129 3.8%Foreign 115 4.1% 127 4.6% 284 10.2%Capacity utilisationHigh 125 5.0% 341 13.7% 1,107 44.6%Moderate 632 7.8% 209 2.6% 830 10.3%Low 938 7.8% 429 3.6% 873 7.3%At risk 777 6.0% 678 5.3% 736 5.7%Unsustainable 280 5.4% 122 2.3% 422 8.1%Total 2,752 6.8% 1,778 4.4% 3,968 9.8%
NB. Weighted totals may not add due to rounding: 1, Excludes ‘not stated’.
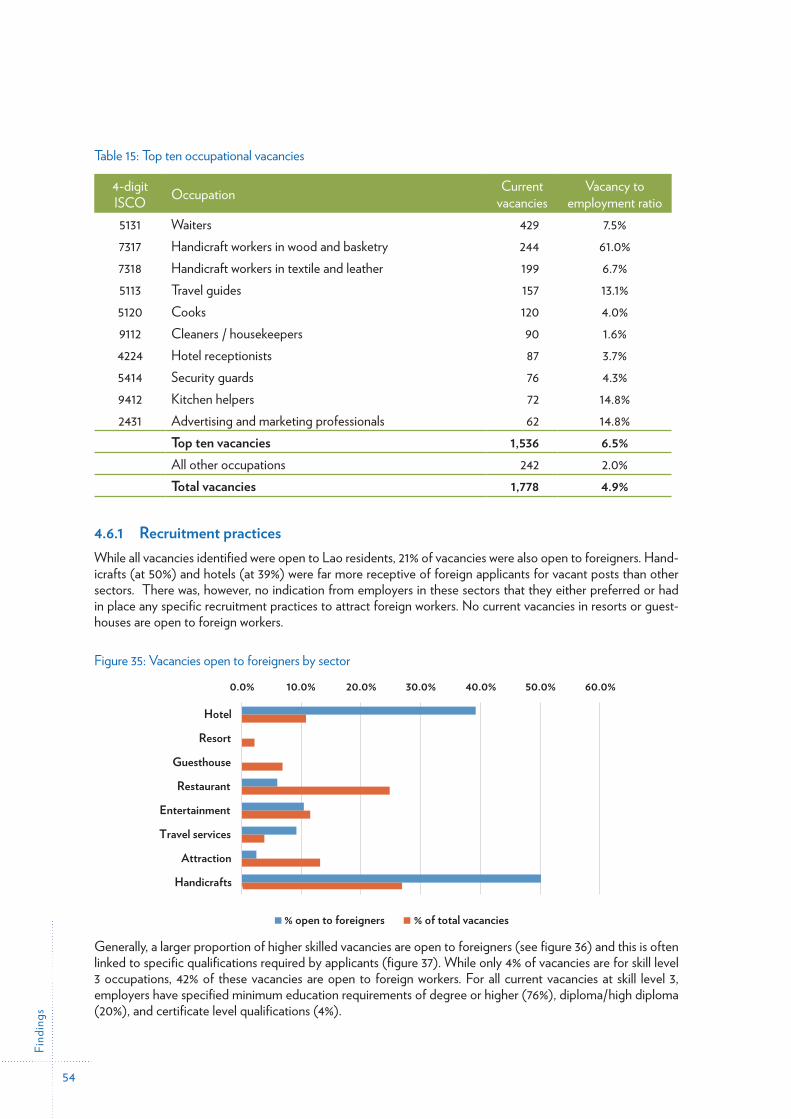
Find
ings
54
Table 15: Top ten occupational vacancies
4-digit ISCO Occupation Current
vacanciesVacancy to
employment ratio5131 Waiters 429 7.5%7317 Handicraft workers in wood and basketry 244 61.0%7318 Handicraft workers in textile and leather 199 6.7%5113 Travel guides 157 13.1%5120 Cooks 120 4.0%9112 Cleaners / housekeepers 90 1.6%4224 Hotel receptionists 87 3.7%5414 Security guards 76 4.3%9412 Kitchen helpers 72 14.8%2431 Advertising and marketing professionals 62 14.8%
Top ten vacancies 1,536 6.5%All other occupations 242 2.0%
Total vacancies 1,778 4.9%
4.6.1 Recruitment practicesWhile all vacancies identified were open to Lao residents, 21% of vacancies were also open to foreigners. Hand-icrafts (at 50%) and hotels (at 39%) were far more receptive of foreign applicants for vacant posts than other sectors. There was, however, no indication from employers in these sectors that they either preferred or had in place any specific recruitment practices to attract foreign workers. No current vacancies in resorts or guest-houses are open to foreign workers.
Figure 35: Vacancies open to foreigners by sector
Figure-35
*Excludes businesses providing no training.
0
0.5
1
1.5
2
2.5
3
3.5
4
0.0%10.0%20.0%30.0%40.0%50.0%60.0%70.0%80.0%90.0%
100.0%
Staff training rate (%) Annual training days per employee (Right axis)
Figure 35: Vacancies open to foreigners by sector
0.0% 10.0% 20.0% 30.0% 40.0% 50.0% 60.0%
Hotel
Resort
Guesthouse
Restaurant
Entertainment
Travel services
Attraction
Handicrafts
% open to foreigners % of total vacancies
Generally, a larger proportion of higher skilled vacancies are open to foreigners (see figure 36) and this is often linked to specific qualifications required by applicants (figure 37). While only 4% of vacancies are for skill level 3 occupations, 42% of these vacancies are open to foreign workers. For all current vacancies at skill level 3, employers have specified minimum education requirements of degree or higher (76%), diploma/high diploma (20%), and certificate level qualifications (4%).
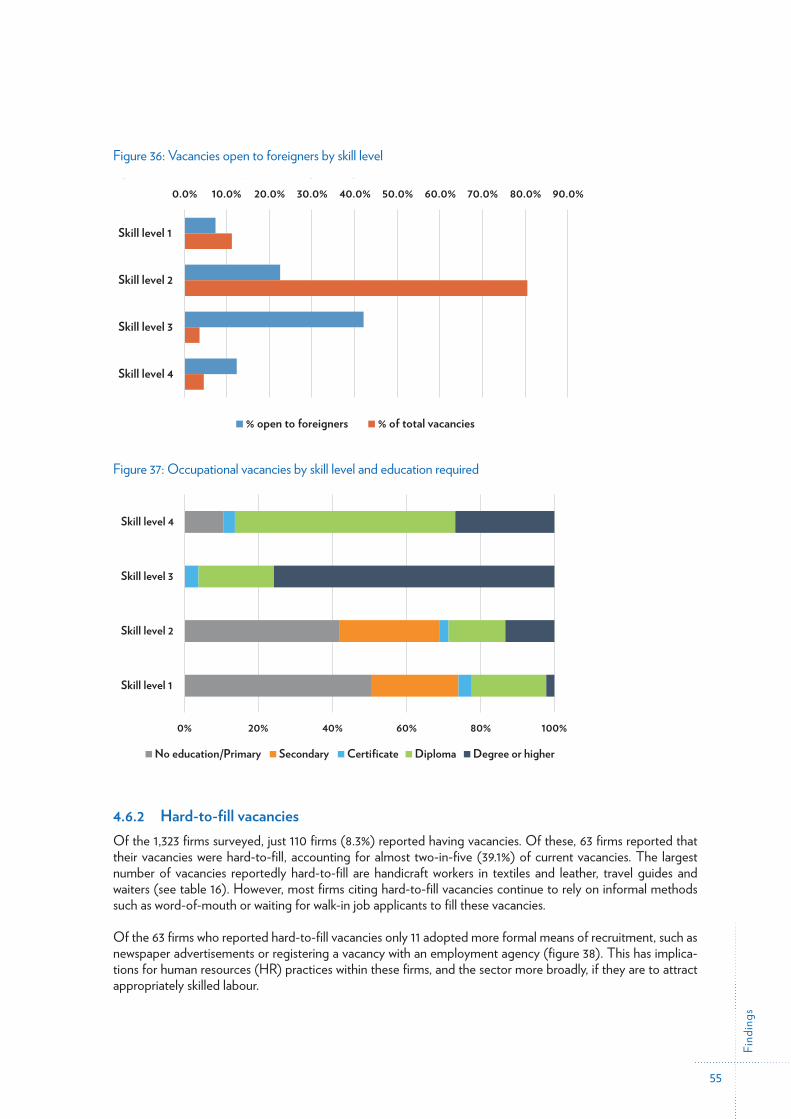
Find
ings
55
Figure 36: Vacancies open to foreigners by skill level
Figure-36
Figure 36: Vacancies open to foreigners by skill level
0.0% 10.0% 20.0% 30.0% 40.0% 50.0% 60.0% 70.0% 80.0% 90.0%
Skill level 1
Skill level 2
Skill level 3
Skill level 4
% open to foreigners % of total vacancies
Figure 37: Occupational vacancies by skill level and education required
Figure-37
Figure 37: Occupational vacancies by skill level and education required
4.6.2 Hard-to-fill vacancies
0% 20% 40% 60% 80% 100%
Skill level 1
Skill level 2
Skill level 3
Skill level 4
No education/Primary Secondary Certificate Diploma Degree or higher
The trend increase in total qualifications is driven entirely by an increase in diploma graduates which is an appropriate qualification for competent performance of most skill level 2 and 3 vacancies in the T/H sector.
Figure 39: Supply of tourism and hospitality graduates by programme, 2015 to 2020
419
659
995 1015
1274
1593
621 648
907671 642 613
1040
1307
19021686
1916
2206
2015 2016 2017 2018 2019 2020
4.6.2 Hard-to-fill vacanciesOf the 1,323 firms surveyed, just 110 firms (8.3%) reported having vacancies. Of these, 63 firms reported that their vacancies were hard-to-fill, accounting for almost two-in-five (39.1%) of current vacancies. The largest number of vacancies reportedly hard-to-fill are handicraft workers in textiles and leather, travel guides and waiters (see table 16). However, most firms citing hard-to-fill vacancies continue to rely on informal methods such as word-of-mouth or waiting for walk-in job applicants to fill these vacancies.
Of the 63 firms who reported hard-to-fill vacancies only 11 adopted more formal means of recruitment, such as newspaper advertisements or registering a vacancy with an employment agency (figure 38). This has implica-tions for human resources (HR) practices within these firms, and the sector more broadly, if they are to attract appropriately skilled labour.
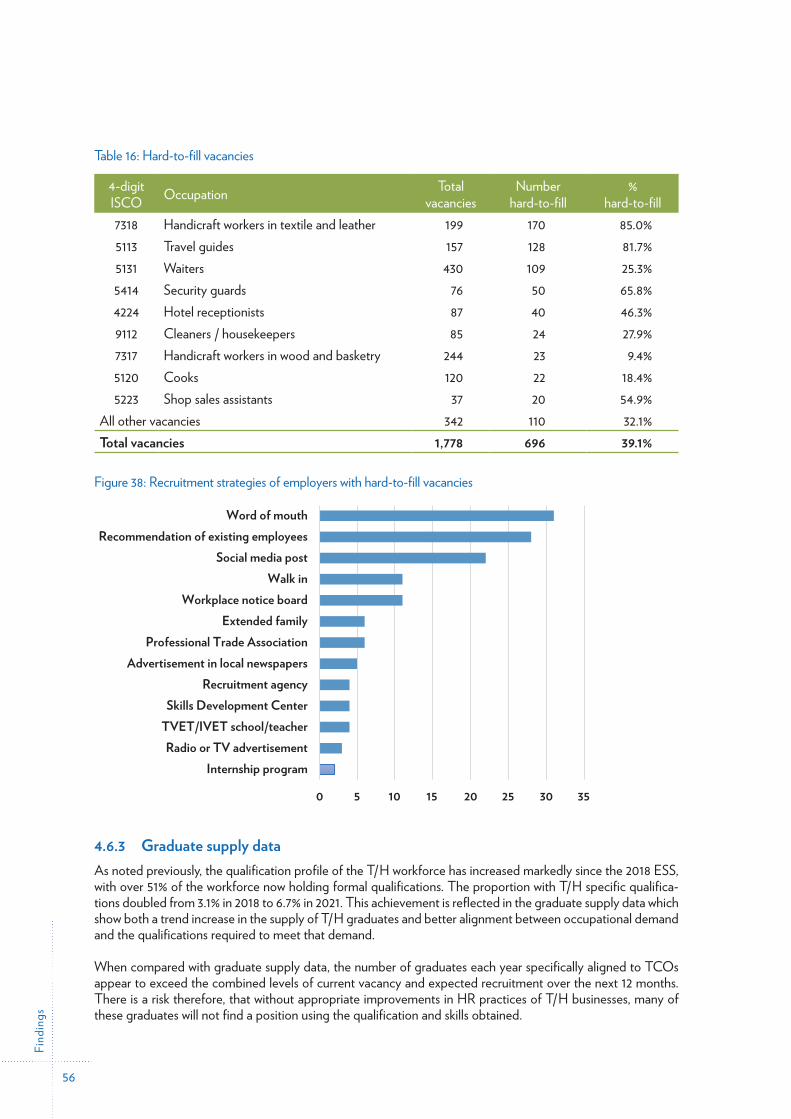
Find
ings
56
Table 16: Hard-to-fill vacancies
4-digit ISCO Occupation Total
vacanciesNumber
hard-to-fill%
hard-to-fill7318 Handicraft workers in textile and leather 199 170 85.0%5113 Travel guides 157 128 81.7%5131 Waiters 430 109 25.3%5414 Security guards 76 50 65.8%4224 Hotel receptionists 87 40 46.3%9112 Cleaners / housekeepers 85 24 27.9%7317 Handicraft workers in wood and basketry 244 23 9.4%5120 Cooks 120 22 18.4%5223 Shop sales assistants 37 20 54.9%
All other vacancies 342 110 32.1%Total vacancies 1,778 696 39.1%
Figure 38: Recruitment strategies of employers with hard-to-fill vacancies
Figure-38
0 5 10 15 20 25 30 35
Internship programRadio or TV advertisement
TVET/IVET school/teacherSkills Development Center
Recruitment agencyAdvertisement in local newspapers
Professional Trade AssociationExtended family
Workplace notice boardWalk in
Social media postRecommendation of existing employees
Word of mouth
4.6.3 Graduate supply dataAs noted previously, the qualification profile of the T/H workforce has increased markedly since the 2018 ESS, with over 51% of the workforce now holding formal qualifications. The proportion with T/H specific qualifica-tions doubled from 3.1% in 2018 to 6.7% in 2021. This achievement is reflected in the graduate supply data which show both a trend increase in the supply of T/H graduates and better alignment between occupational demand and the qualifications required to meet that demand.
When compared with graduate supply data, the number of graduates each year specifically aligned to TCOs appear to exceed the combined levels of current vacancy and expected recruitment over the next 12 months. There is a risk therefore, that without appropriate improvements in HR practices of T/H businesses, many of these graduates will not find a position using the qualification and skills obtained.
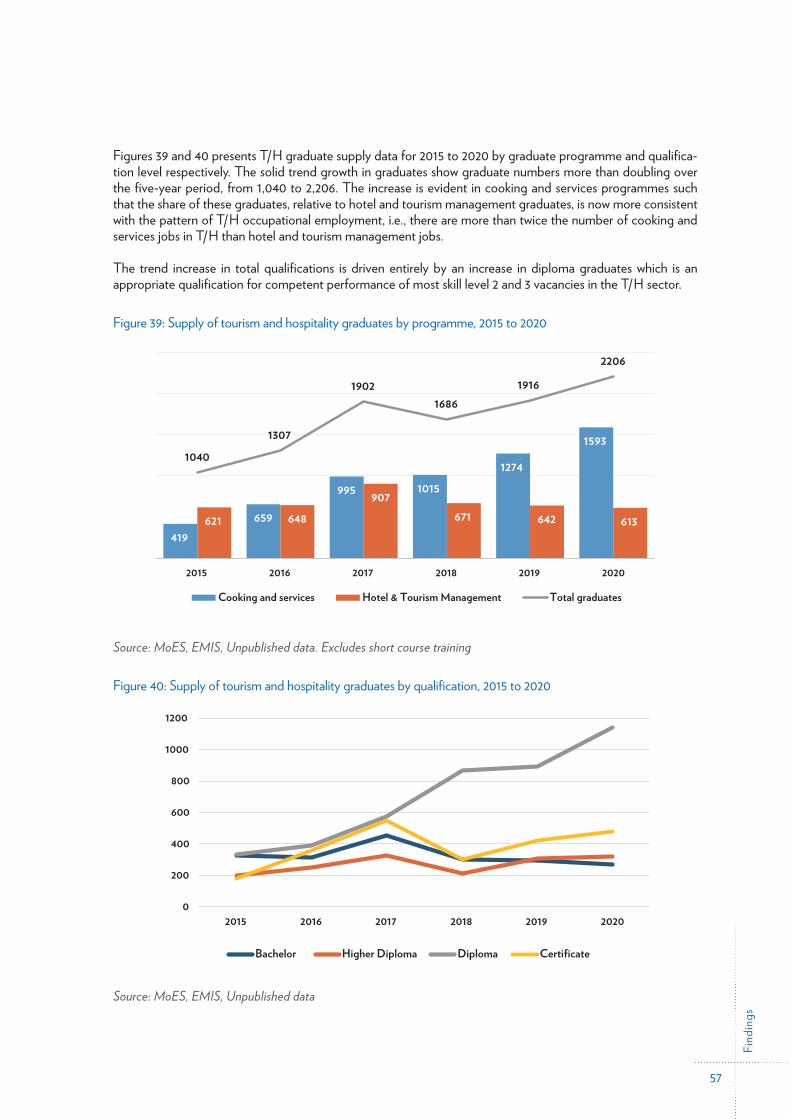
Find
ings
57
Figures 39 and 40 presents T/H graduate supply data for 2015 to 2020 by graduate programme and qualifica-tion level respectively. The solid trend growth in graduates show graduate numbers more than doubling over the five-year period, from 1,040 to 2,206. The increase is evident in cooking and services programmes such that the share of these graduates, relative to hotel and tourism management graduates, is now more consistent with the pattern of T/H occupational employment, i.e., there are more than twice the number of cooking and services jobs in T/H than hotel and tourism management jobs.
The trend increase in total qualifications is driven entirely by an increase in diploma graduates which is an appropriate qualification for competent performance of most skill level 2 and 3 vacancies in the T/H sector.
Figure 39: Supply of tourism and hospitality graduates by programme, 2015 to 2020
Figure-39
Figure 39: Supply of tourism and hospitality graduates by programme, 2015 to 2020
Source: MoES, EMIS, Unpublished data. Excludes short course training
419659
995 10151274
1593
621 648907
671 642 613
10401307
19021686
1916
2206
2015 2016 2017 2018 2019 2020
Cooking and services Hotel & Tourism Management Total graduates
5.1 Hotels
Hotels currently employ 6,745 persons, the 3rd largest T/H sector, representing
17% of total T/H employment, whileSource: MoES, EMIS, Unpublished data. Excludes short course training
Figure 40: Supply of tourism and hospitality graduates by qualification, 2015 to 2020
Figure-40
vacancies continue to rely on informal methods such as word-of-mouth or waiting for walkapplicants to fill these vacancies.
Of the 63 firms who reported hard-to-fill vacancies only 11 adopted more formal means of recruitment, such as newspaper advertisements or regi�ering a vacancy with an employment agency (figure 38). This has implications for human resources (HR) practices within these firmsand the sector more broadly, if they are to attract appropriately skilled labour.
Source: MoES, EMIS, Unpublished data
0
200
400
600
800
1000
1200
2015 2016 2017 2018 2019 2020
5.2 Resorts
Resorts currently employ 1,277 persons, the smallest T/H sector, represen�ng
3%
60%
of total T/H employment, while
are in temporarily closed establishments;
Bachelor Higher Diploma Diploma Certificate
Source: MoES, EMIS, Unpublished data
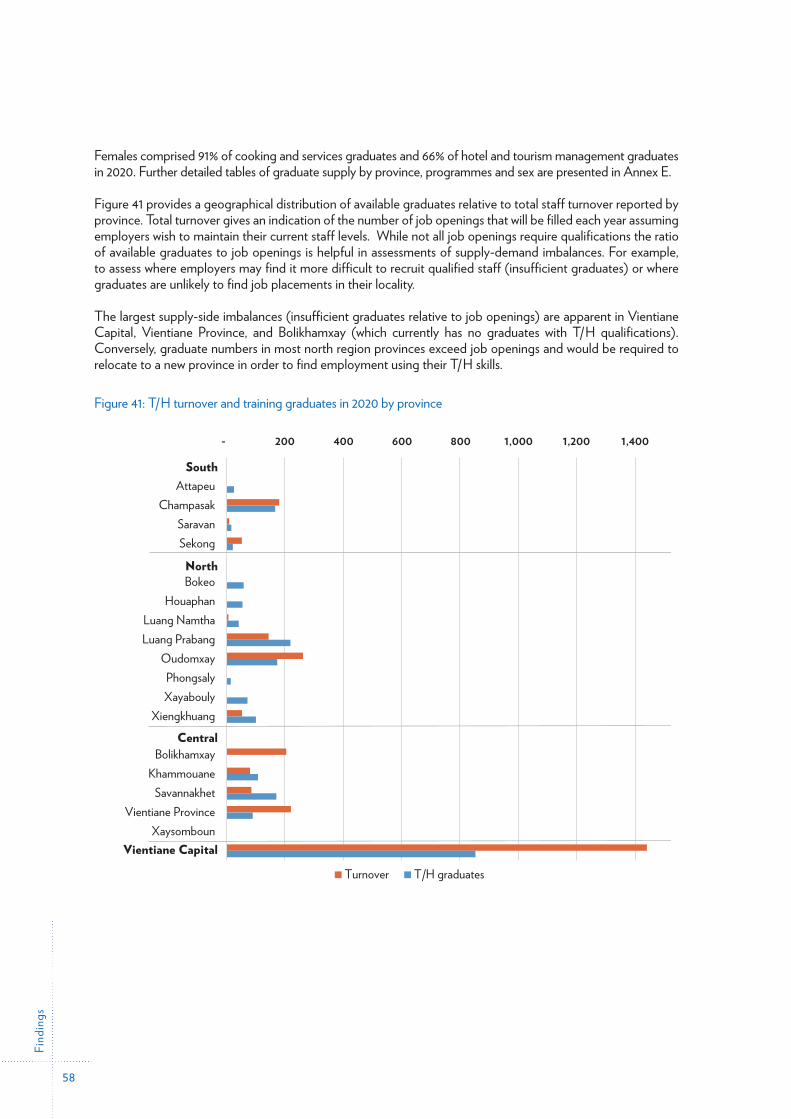
Find
ings
58
Females comprised 91% of cooking and services graduates and 66% of hotel and tourism management graduates in 2020. Further detailed tables of graduate supply by province, programmes and sex are presented in Annex E.
Figure 41 provides a geographical distribution of available graduates relative to total staff turnover reported by province. Total turnover gives an indication of the number of job openings that will be filled each year assuming employers wish to maintain their current staff levels. While not all job openings require qualifications the ratio of available graduates to job openings is helpful in assessments of supply-demand imbalances. For example, to assess where employers may find it more difficult to recruit qualified staff (insufficient graduates) or where graduates are unlikely to find job placements in their locality.
The largest supply-side imbalances (insufficient graduates relative to job openings) are apparent in Vientiane Capital, Vientiane Province, and Bolikhamxay (which currently has no graduates with T/H qualifications). Conversely, graduate numbers in most north region provinces exceed job openings and would be required to relocate to a new province in order to find employment using their T/H skills.
Figure 41: T/H turnover and training graduates in 2020 by province
Figure-41
- 200 400 600 800 1,000 1,200 1,400 1,600
SouthAttapeu
ChampasakSaravanSekong
NorthBokeo
HouaphanLuang NamthaLuang Prabang
OudomxayPhongsalyXayabouly
XiengkhuangCentral
BolikhamxayKhammouane
SavannakhetVientiane Province
XaysombounVien�ane Capital
Turnover T/H graduates
Vientiane Capital
North
Central
South
5.3 Guesthouses
Guesthouses currently employ 6,033 persons, the 4th largest T/H sector, represen�ng
17% of total T/H employment, while
Sect
oral
Sna
psho
ts
59
5 Sectoral Snapshots
The figures and tables provided in this section provide a snapshot of key characteristics regarding employment composition and the top ten occupations for each T/H sector.
Each snapshot provides a visual representation of the relative contribution of the sector to total T/H employ-ment in Lao PDR; the share employment in temporarily closed businesses; a measure of concentration of employment within the top ten occupations in the sector; and an indicator of the relative skill level of employ-ment in the sector. Workforce composition characteristics are displayed, relative to total T/H employment. These include: relative shares of female; disabled and disadvantaged; and illiterate workers; and the proportion of qualified workers employed with tourism and non-tourism related qualifications.
The top ten employing occupations within each sector have been tabulated together with vacancy rates and proposed recruitment intentions over the next 12 months.
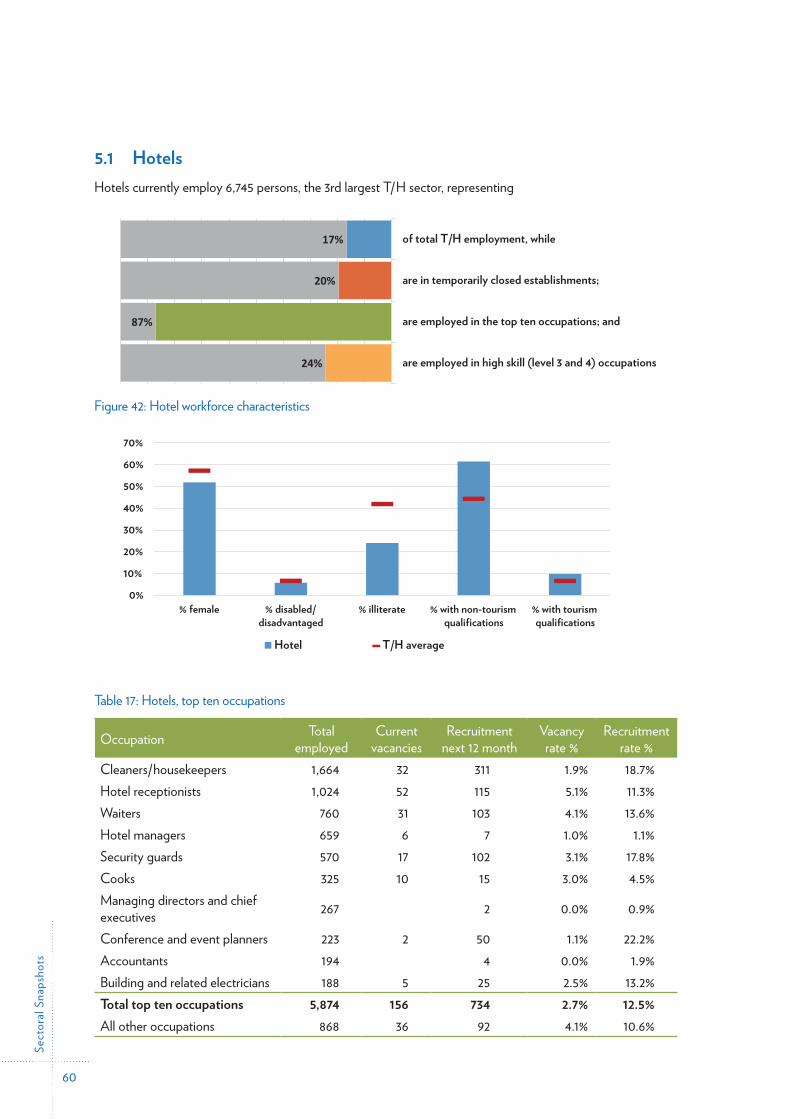
Sect
oral
Sna
psho
ts
60
5.1 HotelsHotels currently employ 6,745 persons, the 3rd largest T/H sector, representing
17%
20%
87%
24%
of total T/H employment, while
are in temporarily closed establishments;
are employed in the top ten occupations; and
are employed in high skill (level 3 and 4) occupations
Figure 42: Hotel workforce characteristics
Figure-42
Source: MoES, EMIS, Unpublished data
0
200
400
600
800
1000
2015 2016 2017 2018 2019 2020
Figure 42: Hotel workforce characteri ics,
Table 17: Hotels, top ten occupations
Occupa on Total
employed Current
vacancies Recruitment
next 12 month Vacancy
rate % Recruitment
rate % Cleaners/housekeepers 1,664 32 311 1.9% 18.7%
24% are employed in high skill (level 3 and 4) occupa ons
0%
10%
20%
30%
40%
50%
60%
70%
% female % disabled/disadvantaged
% illiterate % with non-tourismqualifications
% with tourismqualifications5.4 Restaurants
Restaurants currently employ 8,140 persons, the 2nd largest T/H sector, represen ng
20% of total T/H employment, while
Hotel T/H average
Table 17: Hotels, top ten occupations
Occupation Total employed
Current vacancies
Recruitment next 12 month
Vacancy rate %
Recruitment rate %
Cleaners/housekeepers 1,664 32 311 1.9% 18.7%Hotel receptionists 1,024 52 115 5.1% 11.3%Waiters 760 31 103 4.1% 13.6%Hotel managers 659 6 7 1.0% 1.1%Security guards 570 17 102 3.1% 17.8%Cooks 325 10 15 3.0% 4.5%Managing directors and chief executives 267 2 0.0% 0.9%
Conference and event planners 223 2 50 1.1% 22.2%Accountants 194 4 0.0% 1.9%Building and related electricians 188 5 25 2.5% 13.2%Total top ten occupations 5,874 156 734 2.7% 12.5%All other occupations 868 36 92 4.1% 10.6%
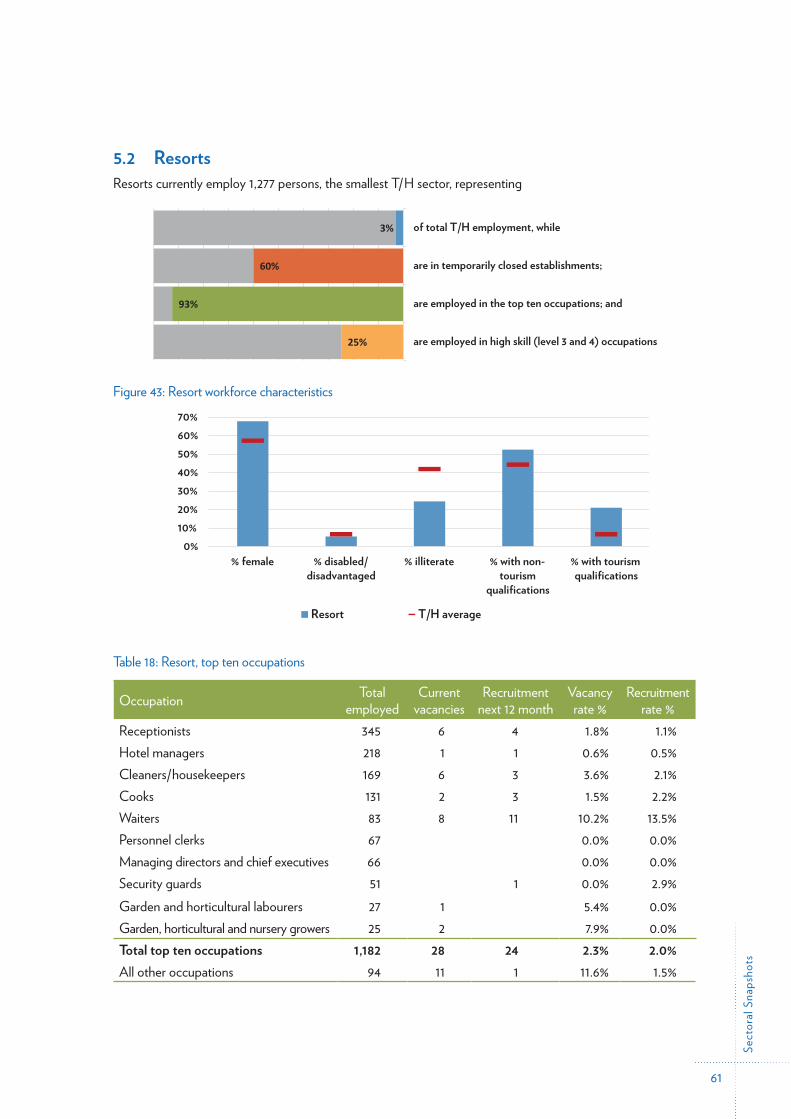
Sect
oral
Sna
psho
ts
61
5.2 ResortsResorts currently employ 1,277 persons, the smallest T/H sector, representing
3%
60%
93%
25%
of total T/H employment, while
are in temporarily closed establishments;
are employed in the top ten occupations; and
are employed in high skill (level 3 and 4) occupations
Figure 43: Resort workforce characteristics
Figure-43
Figure 43: Resort workforce characteri�ics
Table 18: Resort, top ten occupations
Occupa�on Total
employed Current
vacancies Recruitment
next 12 month Vacancy
rate % Recruitment
rate %
0%10%20%30%40%50%60%70%80%
% female % disabled/disadvantaged
% illiterate % with non-tourism
qualifications
% with tourismqualifications
5.5 Entertainment
Entertainment establishments currently employ 3,491 persons, the 6th largest T/H sector, represen�ng
9%
59%
of total T/H employment, while
are in temporarily closed establishments;
Resort T/H average
Table 18: Resort, top ten occupations
Occupation Total employed
Current vacancies
Recruitment next 12 month
Vacancy rate %
Recruitment rate %
Receptionists 345 6 4 1.8% 1.1%Hotel managers 218 1 1 0.6% 0.5%Cleaners/housekeepers 169 6 3 3.6% 2.1%Cooks 131 2 3 1.5% 2.2%Waiters 83 8 11 10.2% 13.5%Personnel clerks 67 0.0% 0.0%Managing directors and chief executives 66 0.0% 0.0%Security guards 51 1 0.0% 2.9%Garden and horticultural labourers 27 1 5.4% 0.0%Garden, horticultural and nursery growers 25 2 7.9% 0.0%Total top ten occupations 1,182 28 24 2.3% 2.0%All other occupations 94 11 1 11.6% 1.5%
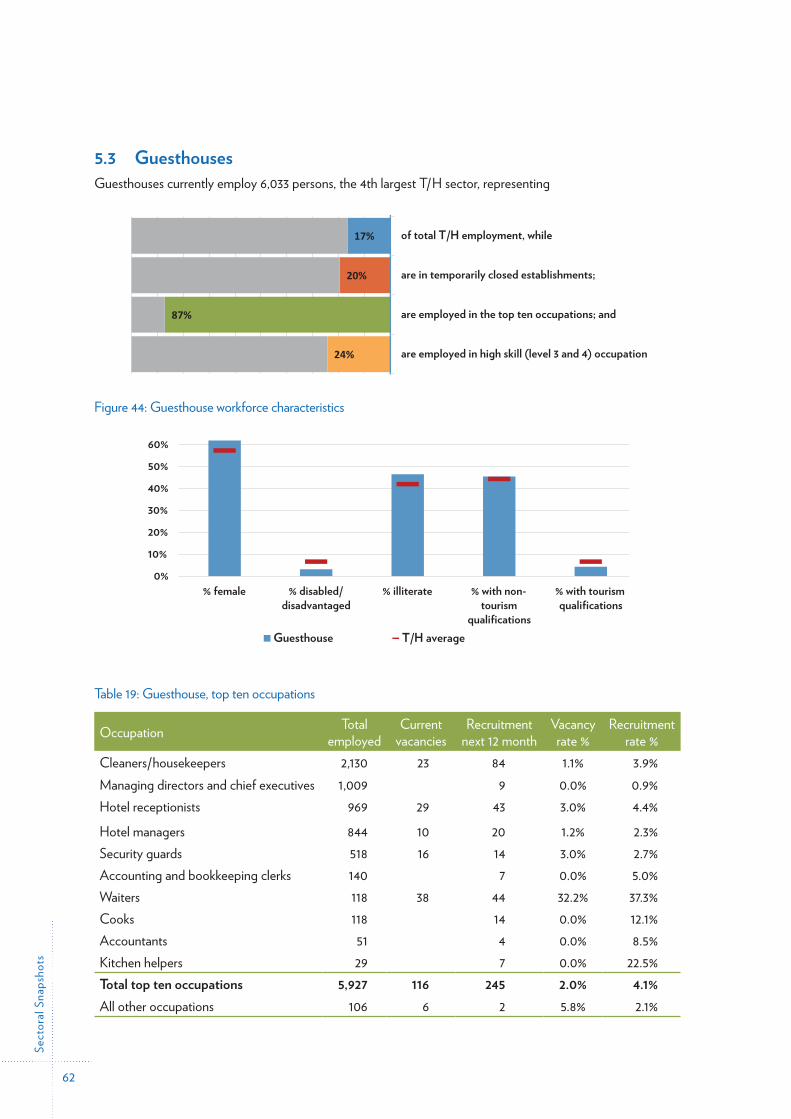
Sect
oral
Sna
psho
ts
62
5.3 GuesthousesGuesthouses currently employ 6,033 persons, the 4th largest T/H sector, representing
17%
20%
87%
24%
of total T/H employment, while
are in temporarily closed establishments;
are employed in the top ten occupations; and
are employed in high skill (level 3 and 4) occupations
Figure 44: Guesthouse workforce characteristics
Figure-44
Figure 44: Gue�house workforce characteri�ics
Table 19: Gue�house , top ten occupations
Occupa�on Total
employed Current
vacancies Recruitment
next 12 month Vacancy
rate % Recruitment
rate %
24% are employed in high skill (level 3 and 4) occupa�ons
0%
10%
20%
30%
40%
50%
60%
70%
% female % disabled/disadvantaged
% illiterate % with non-tourism
qualifications
% with tourismqualifications
5.6 Travel services
Travel services currently employ 1,632 persons, the 2nd smallest T/H sector, represen�ng
4%
68%
of total T/H employment, while
are in temporarily closed establishments;
Guesthouse T/H average
Table 19: Guesthouse, top ten occupations
Occupation Total employed
Current vacancies
Recruitment next 12 month
Vacancy rate %
Recruitment rate %
Cleaners/housekeepers 2,130 23 84 1.1% 3.9%Managing directors and chief executives 1,009 9 0.0% 0.9%Hotel receptionists 969 29 43 3.0% 4.4%
Hotel managers 844 10 20 1.2% 2.3%Security guards 518 16 14 3.0% 2.7%Accounting and bookkeeping clerks 140 7 0.0% 5.0%Waiters 118 38 44 32.2% 37.3%Cooks 118 14 0.0% 12.1%Accountants 51 4 0.0% 8.5%Kitchen helpers 29 7 0.0% 22.5%Total top ten occupations 5,927 116 245 2.0% 4.1%All other occupations 106 6 2 5.8% 2.1%
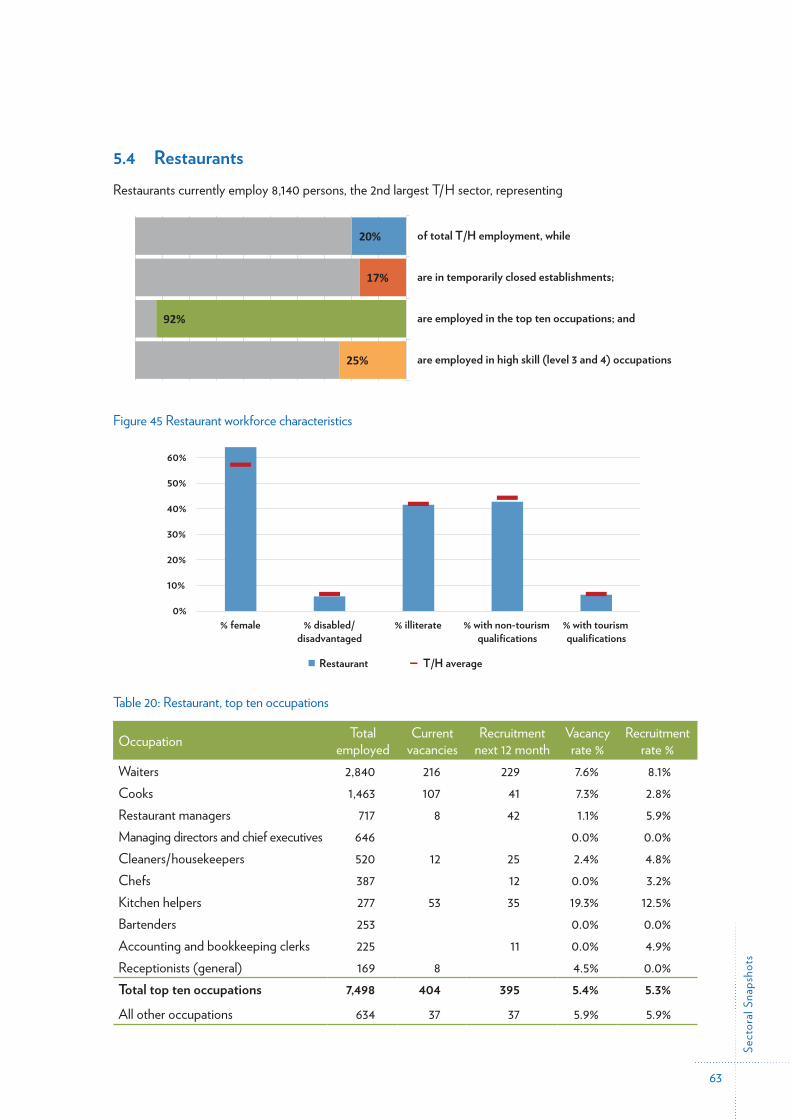
Sect
oral
Sna
psho
ts
63
5.4 RestaurantsRestaurants currently employ 8,140 persons, the 2nd largest T/H sector, representing
20%
17%
92%
25%
of total T/H employment, while
are in temporarily closed establishments;
are employed in the top ten occupations; and
are employed in high skill (level 3 and 4) occupations
Figure 45 Restaurant workforce characteristics
Figure-45
52
Conference and event planners 223 2 50 1.1% 22.2% Accountants 194 4 0.0% 1.9% Building and related electricians 188 5 25 2.5% 13.2% Total top ten occupa�ons 5,874 156 734 2.7% 12.5% All other occupa�ons 868 36 92 4.1% 10.6%
Figure 45 Re�aurant workforce characteri�ics
Table 20: Re�aurant , top ten occupations
Occupa�on Total
employed Current
vacancies Recruitment
next 12 month Vacancy
rate % Recruitment
rate % Waiters 2,840 216 229 7.6% 8.1%
0%
10%
20%
30%
40%
50%
60%
70%
% female % disabled/disadvantaged
% illiterate % with non-tourismqualifications
% with tourismqualifications
5.7 Attractions
A�rac�ons currently employ 8,214 persons, the largest T/H sector, represen�ng
20%
45%
of total T/H employment, while
are in temporarily closed establishments;
Restaurant T/H average
Table 20: Restaurant, top ten occupations
Occupation Total employed
Current vacancies
Recruitment next 12 month
Vacancy rate %
Recruitment rate %
Waiters 2,840 216 229 7.6% 8.1%Cooks 1,463 107 41 7.3% 2.8%Restaurant managers 717 8 42 1.1% 5.9%Managing directors and chief executives 646 0.0% 0.0%Cleaners/housekeepers 520 12 25 2.4% 4.8%Chefs 387 12 0.0% 3.2%Kitchen helpers 277 53 35 19.3% 12.5%Bartenders 253 0.0% 0.0%Accounting and bookkeeping clerks 225 11 0.0% 4.9%Receptionists (general) 169 8 4.5% 0.0%Total top ten occupations 7,498 404 395 5.4% 5.3%All other occupations 634 37 37 5.9% 5.9%
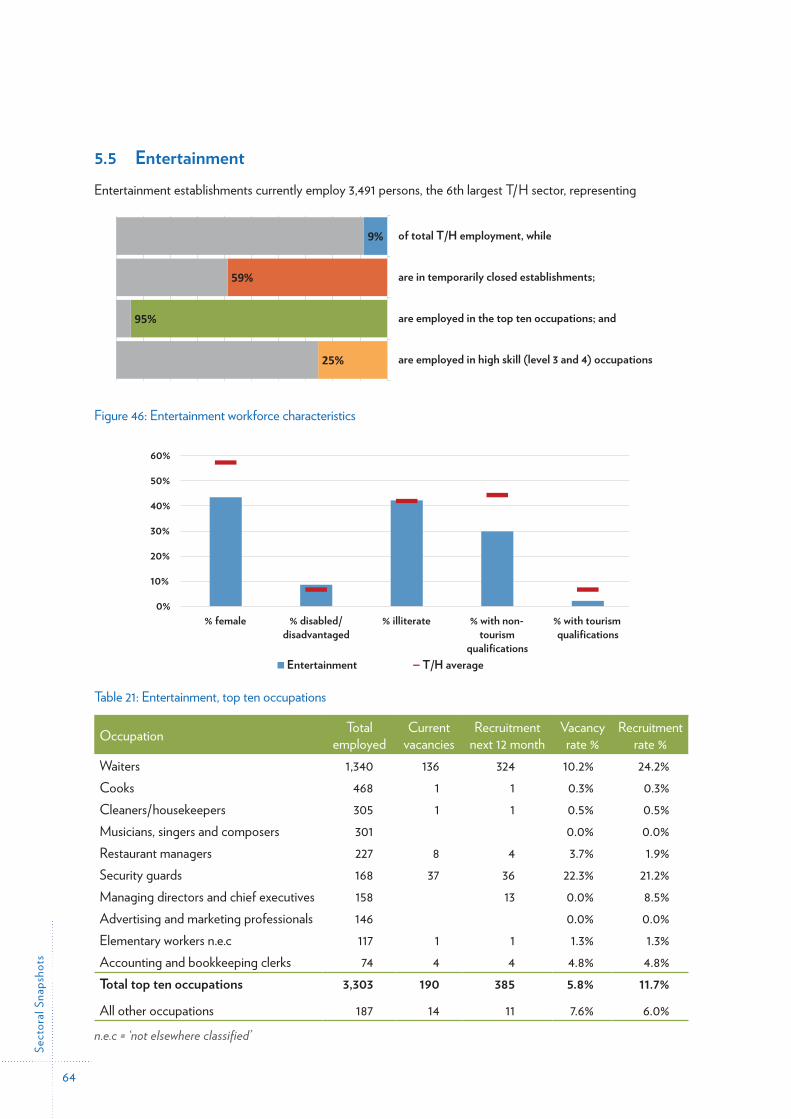
Sect
oral
Sna
psho
ts
64
5.5 EntertainmentEntertainment establishments currently employ 3,491 persons, the 6th largest T/H sector, representing
9%
59%
95%
25%
of total T/H employment, while
are in temporarily closed establishments;
are employed in the top ten occupations; and
are employed in high skill (level 3 and 4) occupations
Figure 46: Entertainment workforce characteristics
Figure-46 53
Waiters 83 8 11 10.2% 13.5%Personnel clerks 67 0.0% 0.0%Managing directors and chief execu�ves 66 0.0% 0.0%Security guards 51 1 0.0% 2.9%Garden and hor�cultural labourers 27 1 5.4% 0.0%Garden, horticultural and nursery growers 25 2 7.9% 0.0%Total top ten occupa�ons 1,182 28 24 2.3% 2.0%All other occupa�ons 94 11 1 11.6% 1.5%
Figure 46: Entertainment workforce characteri�ics
0%
10%
20%
30%
40%
50%
60%
70%
% female % disabled/disadvantaged
% illiterate % with non-tourism
qualifications
% with tourismqualifications
Entertainment T/H average
Table 21: Entertainment, top ten occupations
Occupation Total employed
Current vacancies
Recruitment next 12 month
Vacancy rate %
Recruitment rate %
Waiters 1,340 136 324 10.2% 24.2%Cooks 468 1 1 0.3% 0.3%Cleaners/housekeepers 305 1 1 0.5% 0.5%Musicians, singers and composers 301 0.0% 0.0%Restaurant managers 227 8 4 3.7% 1.9%Security guards 168 37 36 22.3% 21.2%Managing directors and chief executives 158 13 0.0% 8.5%Advertising and marketing professionals 146 0.0% 0.0%Elementary workers n.e.c 117 1 1 1.3% 1.3%Accounting and bookkeeping clerks 74 4 4 4.8% 4.8%Total top ten occupations 3,303 190 385 5.8% 11.7%
All other occupations 187 14 11 7.6% 6.0%
n.e.c = ‘not elsewhere classified’
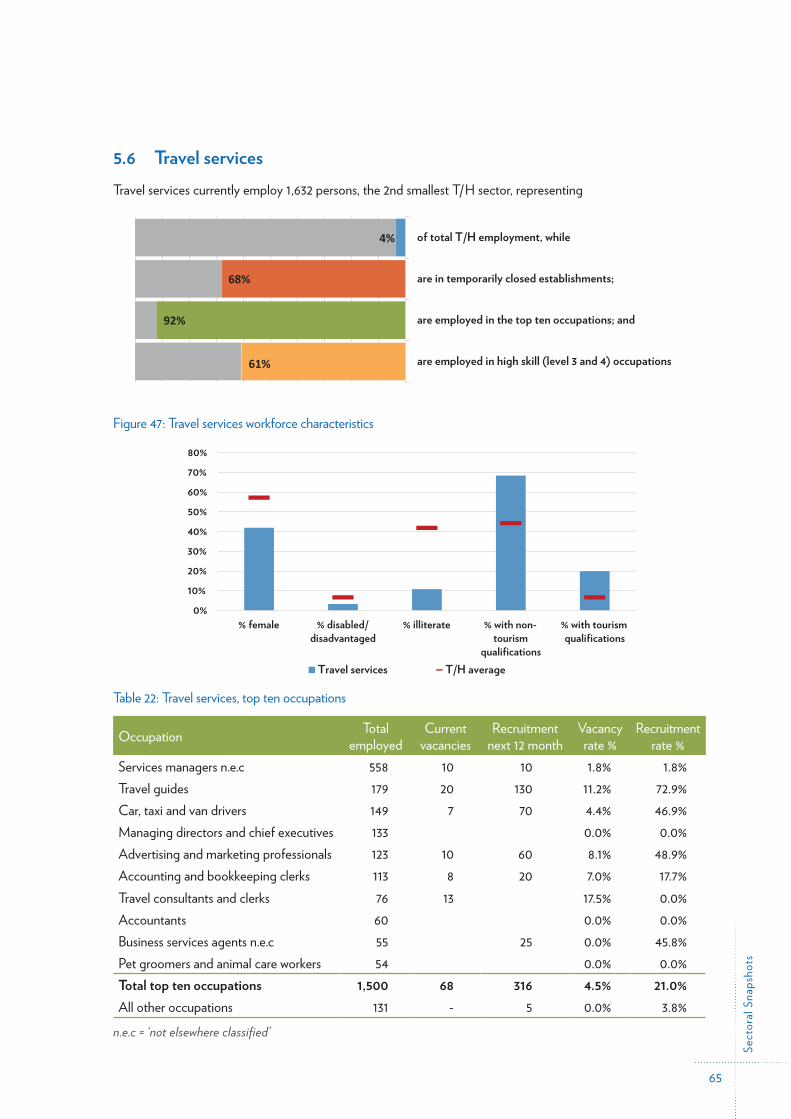
Sect
oral
Sna
psho
ts
65
5.6 Travel servicesTravel services currently employ 1,632 persons, the 2nd smallest T/H sector, representing
4%
68%
92%
61%
of total T/H employment, while
are in temporarily closed establishments;
are employed in the top ten occupations; and
are employed in high skill (level 3 and 4) occupations
Figure 47: Travel services workforce characteristics
Figure-4754
Security guards 518 16 14 3.0% 2.7% Accoun�ng and bookkeeping clerks 140 7 0.0% 5.0% Waiters 118 38 44 32.2% 37.3% Cooks 118 14 0.0% 12.1% Accountants 51 4 0.0% 8.5% Kitchen helpers 29 7 0.0% 22.5% Total top ten occupa�ons 5,927 116 245 2.0% 4.1% All other occupa�ons 106 6 2 5.8% 2.1%
Figure 47: Travel services workforce characteri�ics
Table 22: Travel services, top ten occupations
0%10%20%30%40%50%60%70%80%
% female % disabled/disadvantaged
% illiterate % with non-tourism
qualifications
% with tourismqualifications
Travel services T/H average
Table 22: Travel services, top ten occupations
Occupation Total employed
Current vacancies
Recruitment next 12 month
Vacancy rate %
Recruitment rate %
Services managers n.e.c 558 10 10 1.8% 1.8%Travel guides 179 20 130 11.2% 72.9%Car, taxi and van drivers 149 7 70 4.4% 46.9%Managing directors and chief executives 133 0.0% 0.0%Advertising and marketing professionals 123 10 60 8.1% 48.9%Accounting and bookkeeping clerks 113 8 20 7.0% 17.7%Travel consultants and clerks 76 13 17.5% 0.0%Accountants 60 0.0% 0.0%Business services agents n.e.c 55 25 0.0% 45.8%Pet groomers and animal care workers 54 0.0% 0.0%Total top ten occupations 1,500 68 316 4.5% 21.0%All other occupations 131 - 5 0.0% 3.8%
n.e.c = ‘not elsewhere classified’
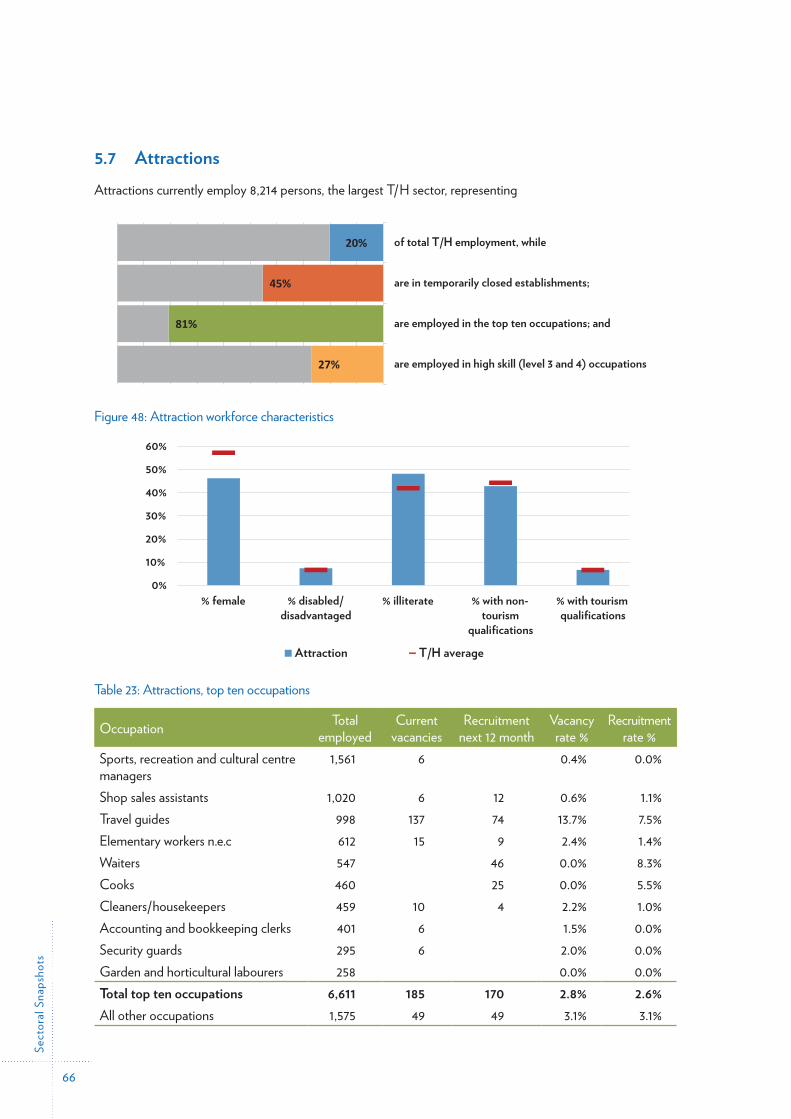
Sect
oral
Sna
psho
ts
66
5.7 AttractionsAttractions currently employ 8,214 persons, the largest T/H sector, representing
45%
20%
45%
81%
27%
of total T/H employment, while
are in temporarily closed establishments;
are employed in the top ten occupations; and
are employed in high skill (level 3 and 4) occupations
Figure 48: Attraction workforce characteristics
Figure-4855
Kitchen helpers 277 53 35 19.3% 12.5% Bartenders 253 0.0% 0.0% Accoun�ng and bookkeeping clerks 225 11 0.0% 4.9% Recep�onists (general) 169 8 4.5% 0.0% Total top ten occupa�ons 7,498 404 395 5.4% 5.3% All other occupa�ons 634 37 37 5.9% 5.9%
Figure 48: Attraction workforce characteri�ics
Table 25: Attractions, top ten occupations Total Current Recruitment Vacancy Recruitment
0%
10%
20%
30%
40%
50%
60%
70%
% female % disabled/disadvantaged
% illiterate % with non-tourism
qualifications
% with tourismqualifications
Attraction T/H average
Table 23: Attractions, top ten occupations
Occupation Total employed
Current vacancies
Recruitment next 12 month
Vacancy rate %
Recruitment rate %
Sports, recreation and cultural centre managers
1,561 6 0.4% 0.0%
Shop sales assistants 1,020 6 12 0.6% 1.1%Travel guides 998 137 74 13.7% 7.5%Elementary workers n.e.c 612 15 9 2.4% 1.4%Waiters 547 46 0.0% 8.3%Cooks 460 25 0.0% 5.5%Cleaners/housekeepers 459 10 4 2.2% 1.0%Accounting and bookkeeping clerks 401 6 1.5% 0.0%Security guards 295 6 2.0% 0.0%Garden and horticultural labourers 258 0.0% 0.0%Total top ten occupations 6,611 185 170 2.8% 2.6%All other occupations 1,575 49 49 3.1% 3.1%
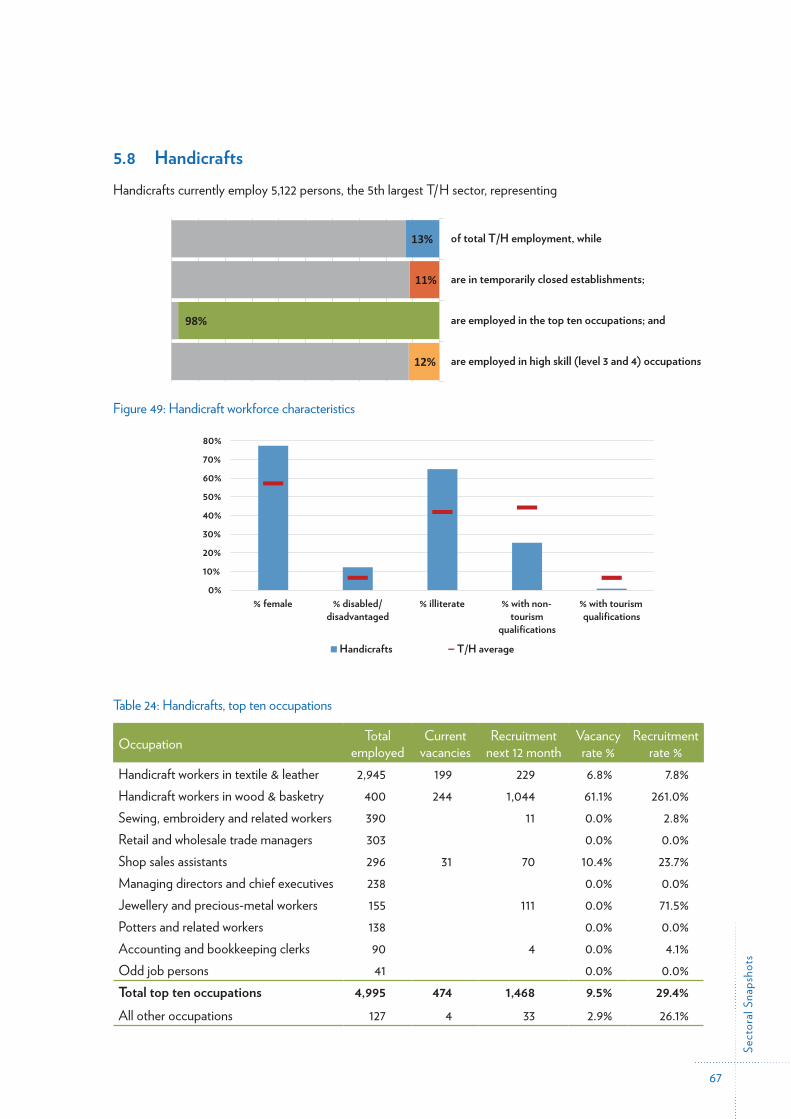
Sect
oral
Sna
psho
ts
67
5.8 HandicraftsHandicrafts currently employ 5,122 persons, the 5th largest T/H sector, representing
59
Retail and wholesale trade managers 303 0.0% 0.0% Shop sales assistants 296 31 70 10.4% 23.7% Managing directors and chief execu�ves 238 0.0% 0.0% Jewellery and precious-metal workers 155 111 0.0% 71.5% Po�ers and related workers 138 0.0% 0.0% Accoun�ng and bookkeeping clerks 90 4 0.0% 4.1% Odd job persons 41 0.0% 0.0% Total top ten occupa�ons 4,995 474 1,468 9.5% 29.4% All other occupa�ons 127 4 33 2.9% 26.1%
13%
11%
98%
12%
of total T/H employment, while
are in temporarily closed establishments;
are employed in the top ten occupations; and
are employed in high skill (level 3 and 4) occupations
Figure 49: Handicraft workforce characteristics
Figure-49
Figure 49: Handicraft workforce characteri�ics
Table 26: Handicrafts, top ten occupations
Occupa�on Total
employed Current
vacancies Recruitment
next 12 month Vacancy
rate % Recruitment
rate %
0%10%20%30%40%50%60%70%80%90%
% female % disabled/disadvantaged
% illiterate % with non-tourism
qualifications
% with tourismqualifications
Handicrafts T/H average
Table 24: Handicrafts, top ten occupations
Occupation Total employed
Current vacancies
Recruitment next 12 month
Vacancy rate %
Recruitment rate %
Handicraft workers in textile & leather 2,945 199 229 6.8% 7.8%Handicraft workers in wood & basketry 400 244 1,044 61.1% 261.0%Sewing, embroidery and related workers 390 11 0.0% 2.8%Retail and wholesale trade managers 303 0.0% 0.0%Shop sales assistants 296 31 70 10.4% 23.7%Managing directors and chief executives 238 0.0% 0.0%Jewellery and precious-metal workers 155 111 0.0% 71.5%Potters and related workers 138 0.0% 0.0%Accounting and bookkeeping clerks 90 4 0.0% 4.1%Odd job persons 41 0.0% 0.0%Total top ten occupations 4,995 474 1,468 9.5% 29.4%All other occupations 127 4 33 2.9% 26.1%
68
Empl
oym
ent P
roje
ctio
ns a
nd F
utur
e Sk
ills D
eman
d
6 Employment Projections and Future Skills Demand
A key challenge for policy makers and training providers is to ensure appropriately qualified and skilled workers are available to meet projected future demand. And while there is a considerable lead-time associated with the production of new graduates on the supply-side, demand for skills in the T/H sector can be extremely volatile as evidenced by the current turmoil induced by the COVID-19 pandemic. Detailed occupational employment demand projections in the Lao-context are even more problematic given the lack of historic time series data. This section presents a simplified model of projected labour demand for the T/H sector and models the implications of an approach to increase the skills profile of the sector. As there are no consistent time series data for T/H employment, detailed projections at the occupational level are not possible17. Aggregate T/H employment projections to 2026, have been developed using a simplified econometric model of gross domes-tic product (GDP) and GDP per capita as the primary determinants of employment growth18. The modelling approach is an update of the model developed for the 2018 ESS projections19. In essence, this modelling uses a ‘top-down’ approach to ensure internally consistent estimates; firstly, of total employment in Lao PDR which in turn impacts employment in services of which employment in T/H is a subset. The model directly incorporates differential equations to take account of structural adjustment, e.g., services sector’s increased share of total employment through time.
T/H employment is likewise increasing its share of service sector employment over time. To obtain a measure of the rate of change over time reliance has been placed on a 2009 study by the former Lao National Tourism Administration (LNTA) which estimated that the T/H sector accounted for 17,000 direct jobs20. This was considered to be the most comparable historical estimate of T/H employment available.
Figure 50 shows the regression model projection for T/H employment to 2026 incorporating alternative growth scenarios. The compound average growth (CAG) line incorporates all the point-in-time sample estimates of T/H employment available from the 2009 LNTA study and both the 2018 and 2021 ESS. The point estimates for 2019 and 2020 are derived from the month-by-month data for 2020 collected in during the current survey and therefore exhibits the volatility associated with the COVID-19 pandemic. The CAG scenario assumes future growth will occur at the compound average rate of growth between 2009 and 2021. Under this scenario, aggregate T/H employment will reach 65,400 persons by 2026.
The GDP regression line directly incorporates the impact of the current economic contraction and consensus forecasts of future economic growth from ADB and WB and is considered the most likely trajectory for T/H employment. Under this scenario aggregate T/H employment will rebound to pre-COVID levels of 57,000 by 2023 – during which time many displaced workers could be re-employed – reaching 67,600 persons by 2026. Implicit in this forecast is a return to ‘normal’ international travel levels in 2021-22 with the growth trajectory moderating from 2023. The mid-point scenario is derived using a simple ‘naive’ linear trend (59,500 by 2026). The non-linear trend presents a lower bound and is included as a plausible outcome (just 49,200 persons employed by 2026) should international travel bans be extended, further impacting business confidence and investment in the sector.
17 The prime objective of occupational level forecasts is to assess changes in skill needs as the occupational mix adjusts to structural change. Without historic data on employment by occupation there are no determinants to include in a modelling approach to capture structural change.
18 A necessary qualifying assumption of projected tourism employment presented here is that the current underlying occupation structure will remain stable over the projection horizon.
19 For a detailed description of the model methodology and assumptions see MoES, 2018. Tourism and Hospitality Enterprise Survey of Employment and Skills in Lao PDR: Research Findings and Employment Projections 2018-2023. Skills for Tourism Project (LAO/029). July. Vientiane.
20 Tourism Employment and Education in Lao PDR, Summary of Research 2009. Lao National Tourism Administration (LNTA).
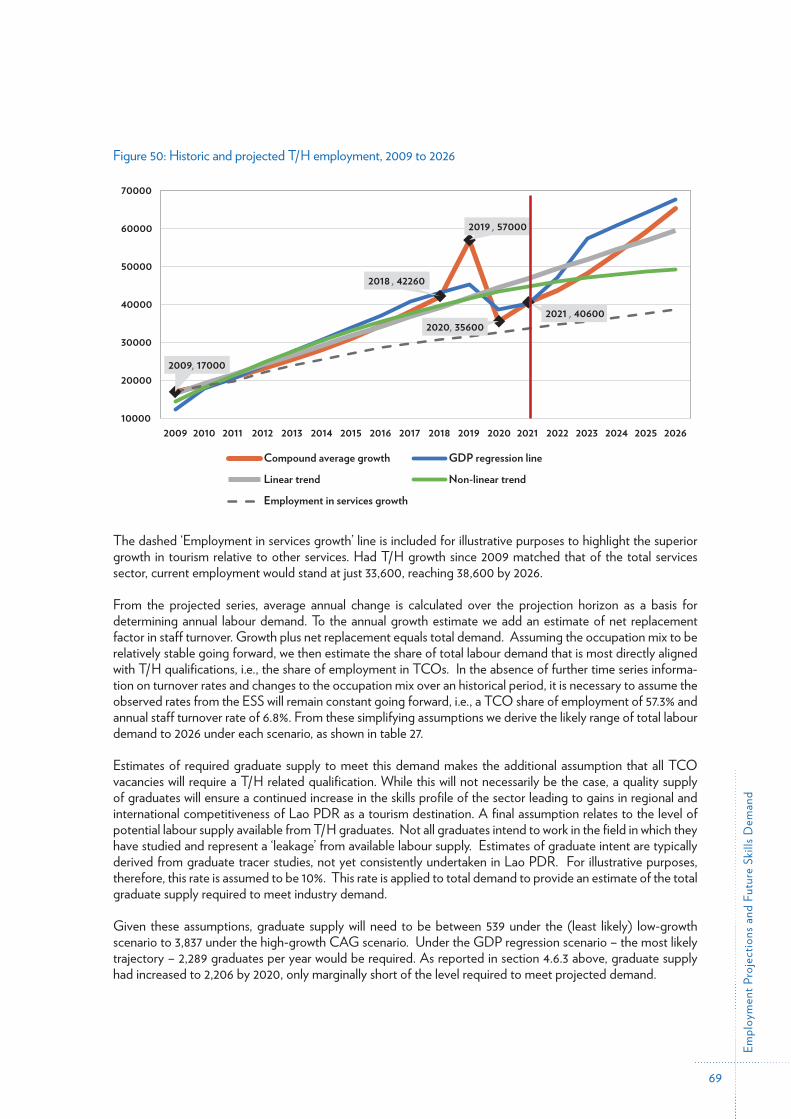
69
Empl
oym
ent P
roje
ctio
ns a
nd F
utur
e Sk
ills D
eman
d
Figure 50: Historic and projected T/H employment, 2009 to 2026
Figure-502009, 17000
2018 , 42260
2019 , 57000
2020, 356002021 , 40600
10000
20000
30000
40000
50000
60000
70000
2009 2010 2011 2012 2013 2014 2015 2016 2017 2018 2019 2020 2021 2022 2023 2024 2025 2026
Compound average growth GDP regression line
Linear trend Non-linear trend
Employment in services growth
The dashed ‘Employment in services growth’ line is included for illustrative purposes to highlight the superior growth in tourism relative to other services. Had T/H growth since 2009 matched that of the total services sector, current employment would stand at just 33,600, reaching 38,600 by 2026.
From the projected series, average annual change is calculated over the projection horizon as a basis for determining annual labour demand. To the annual growth estimate we add an estimate of net replacement factor in staff turnover. Growth plus net replacement equals total demand. Assuming the occupation mix to be relatively stable going forward, we then estimate the share of total labour demand that is most directly aligned with T/H qualifications, i.e., the share of employment in TCOs. In the absence of further time series informa-tion on turnover rates and changes to the occupation mix over an historical period, it is necessary to assume the observed rates from the ESS will remain constant going forward, i.e., a TCO share of employment of 57.3% and annual staff turnover rate of 6.8%. From these simplifying assumptions we derive the likely range of total labour demand to 2026 under each scenario, as shown in table 27.
Estimates of required graduate supply to meet this demand makes the additional assumption that all TCO vacancies will require a T/H related qualification. While this will not necessarily be the case, a quality supply of graduates will ensure a continued increase in the skills profile of the sector leading to gains in regional and international competitiveness of Lao PDR as a tourism destination. A final assumption relates to the level of potential labour supply available from T/H graduates. Not all graduates intend to work in the field in which they have studied and represent a ‘leakage’ from available labour supply. Estimates of graduate intent are typically derived from graduate tracer studies, not yet consistently undertaken in Lao PDR. For illustrative purposes, therefore, this rate is assumed to be 10%. This rate is applied to total demand to provide an estimate of the total graduate supply required to meet industry demand.
Given these assumptions, graduate supply will need to be between 539 under the (least likely) low-growth scenario to 3,837 under the high-growth CAG scenario. Under the GDP regression scenario – the most likely trajectory – 2,289 graduates per year would be required. As reported in section 4.6.3 above, graduate supply had increased to 2,206 by 2020, only marginally short of the level required to meet projected demand.
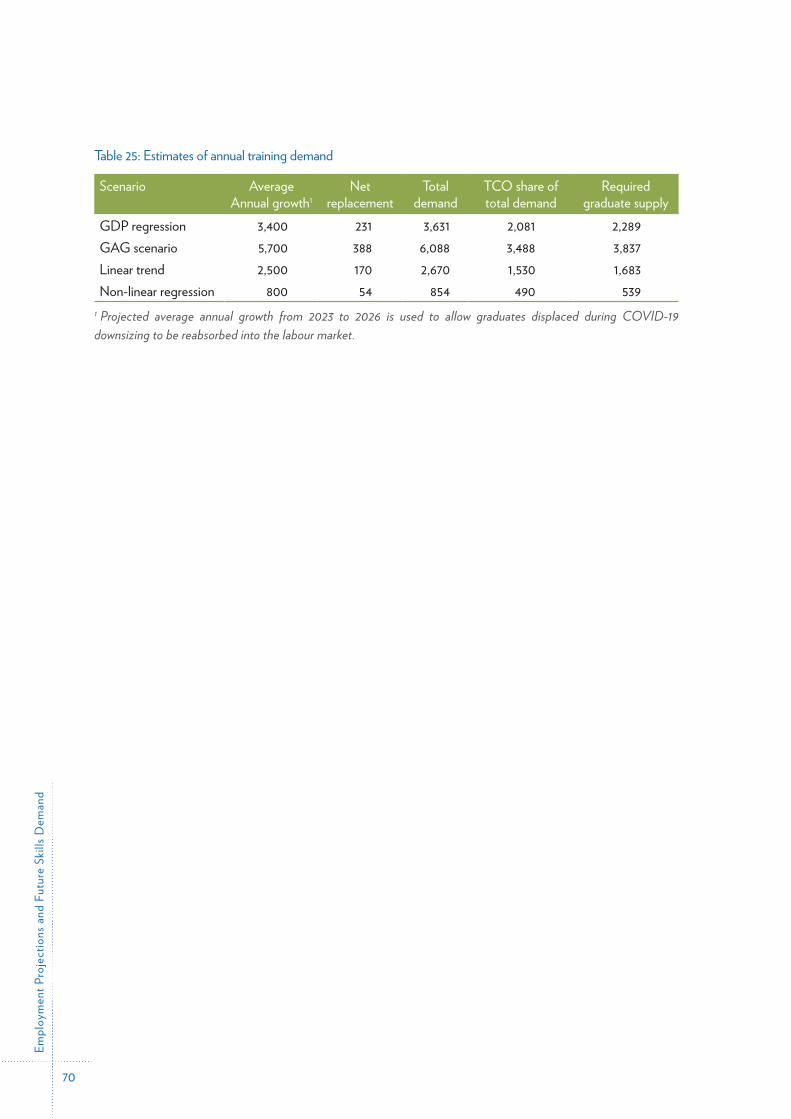
70
Table 25: Estimates of annual training demand
Scenario Average Annual growth1
Net replacement
Total demand
TCO share of total demand
Required graduate supply
GDP regression 3,400 231 3,631 2,081 2,289GAG scenario 5,700 388 6,088 3,488 3,837Linear trend 2,500 170 2,670 1,530 1,683Non-linear regression 800 54 854 490 539
1 Projected average annual growth from 2023 to 2026 is used to allow graduates displaced during COVID-19 downsizing to be reabsorbed into the labour market.
Empl
oym
ent P
roje
ctio
ns a
nd F
utur
e Sk
ills D
eman
d
71
Con
clus
ions
7 Conclusions
The second ESS was conducted in the wake of the COVID-19 pandemic which has presented some unique problems in both data collection and in the comparability of the results with the 2018 survey. The survey firm, who undertook the field work, is to be commended on the excellent job they have done in tracking down and eliciting responses from firms who were temporarily closed.
Necessary changes to scope and coverage, e.g., to incorporate temporarily closed businesses, limit, in some respects, direct comparability of results across the two survey years. It should be noted, however, this is limited only to weighted measures, e.g., total employment, total vacancies, etc. Proportional comparisons between the survey groups across the two years are not impacted by the changes in scope and coverage, e.g., the percent-age of firms with job vacancies, average occupancy rates, averaged size of business, etc.
The sample frame used for the study shows considerable variation in the underlying populations in some subsectors compared to 2018. These changes are generally attributed to better administrative records being available through MICT. Consequently, many existing businesses in 2018 in the guesthouse, restaurant, and attractions subsectors were ‘invisible’ to the survey weighting process, leading to an underestimation of the weighted results. While the converse was true for the handicraft sector, (i.e., it was overestimated previously) the net effect of the sample frame adjustments suggests total employment in T/H reported in the 2018 ESS will have been underestimated.
While sample variability (and therefore standard errors) has increased in the current sample due to the inclu-sion of temporarily closed businesses, overall, the sample results are robust and provide a reliable and accurate estimate of total T/H employment in Lao PDR as at June 2021. Furthermore, the employment-by-month data, collected for 2020, provides a valid basis for measuring the direct impact of COVID-19 on employment numbers during this period.
Detailed information collected by occupation show that the occupational mix within each subsector has remained relatively stable over the three-year period. In the absence of more accurate time series estimates of employment by occupation in Lao PDR, the stability in these results can be relied upon as an aid to future workforce planning.
The survey results confirm clear evidence of skill deepening across all T/H sectors since 2018. Overall, the proportion of workers in T/H has increased by 21 percentage points to be 51% of all workers in the sector. Those with T/H related qualifications has doubled from 3.4% to 6.7%. The illiteracy rate has fallen by 7% and the number of disadvantaged/disabled workers has fallen commensurately by 2%.
This finding is substantiated by growth trends in the graduate supply data for students completing T/H related qualifications. Combined, these results demonstrate a much closer alignment between skill supply and skills demand compared with three years ago.
In the current economic climate, the employment projections presented are subject to greater variability. On balance, however, the modelled scenario based on GDP and GDP per capita growth presents the most likely growth trajectory for employment demand. Should the trend in T/H graduate numbers continue, the training supply system is already on track to meet future demand. Ongoing collaboration, however, between training providers and employers, is essential to ensure the right mix of graduates in terms of field of study and level of qualification.
To improve training and skills development planning further, it is recommended that the ESS, if repeated, also include a separate questionnaire – to be completed by staff members of selected enterprises – to provide an additional perspective on skill needs and their utilisation within the workplace. Additionally, the use of tracer studies of T/H graduates to monitor their transitions into employment would also provide valuable assistance in the planning and delivery of vocational training.
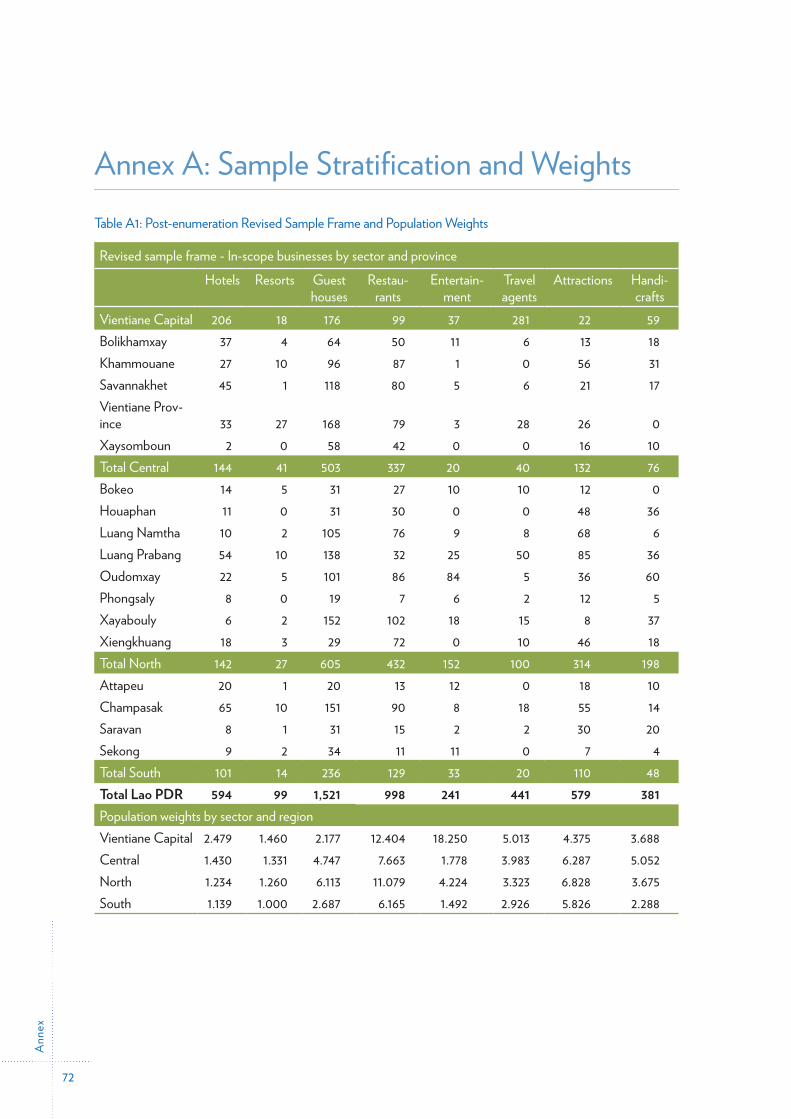
Ann
ex
72
Annex A: Sample Stratification and Weights Table A1: Post-enumeration Revised Sample Frame and Population Weights
Revised sample frame - In-scope businesses by sector and province
Hotels Resorts Guest
housesRestau-
rantsEntertain-
mentTravel agents
Attractions Handi-crafts
Vientiane Capital 206 18 176 99 37 281 22 59Bolikhamxay 37 4 64 50 11 6 13 18Khammouane 27 10 96 87 1 0 56 31Savannakhet 45 1 118 80 5 6 21 17Vientiane Prov-ince 33 27 168 79 3 28 26 0Xaysomboun 2 0 58 42 0 0 16 10Total Central 144 41 503 337 20 40 132 76Bokeo 14 5 31 27 10 10 12 0Houaphan 11 0 31 30 0 0 48 36Luang Namtha 10 2 105 76 9 8 68 6Luang Prabang 54 10 138 32 25 50 85 36Oudomxay 22 5 101 86 84 5 36 60Phongsaly 8 0 19 7 6 2 12 5Xayabouly 6 2 152 102 18 15 8 37Xiengkhuang 18 3 29 72 0 10 46 18Total North 142 27 605 432 152 100 314 198Attapeu 20 1 20 13 12 0 18 10Champasak 65 10 151 90 8 18 55 14Saravan 8 1 31 15 2 2 30 20Sekong 9 2 34 11 11 0 7 4Total South 101 14 236 129 33 20 110 48Total Lao PDR 594 99 1,521 998 241 441 579 381Population weights by sector and region Vientiane Capital 2.479 1.460 2.177 12.404 18.250 5.013 4.375 3.688Central 1.430 1.331 4.747 7.663 1.778 3.983 6.287 5.052North 1.234 1.260 6.113 11.079 4.224 3.323 6.828 3.675South 1.139 1.000 2.687 6.165 1.492 2.926 5.826 2.288
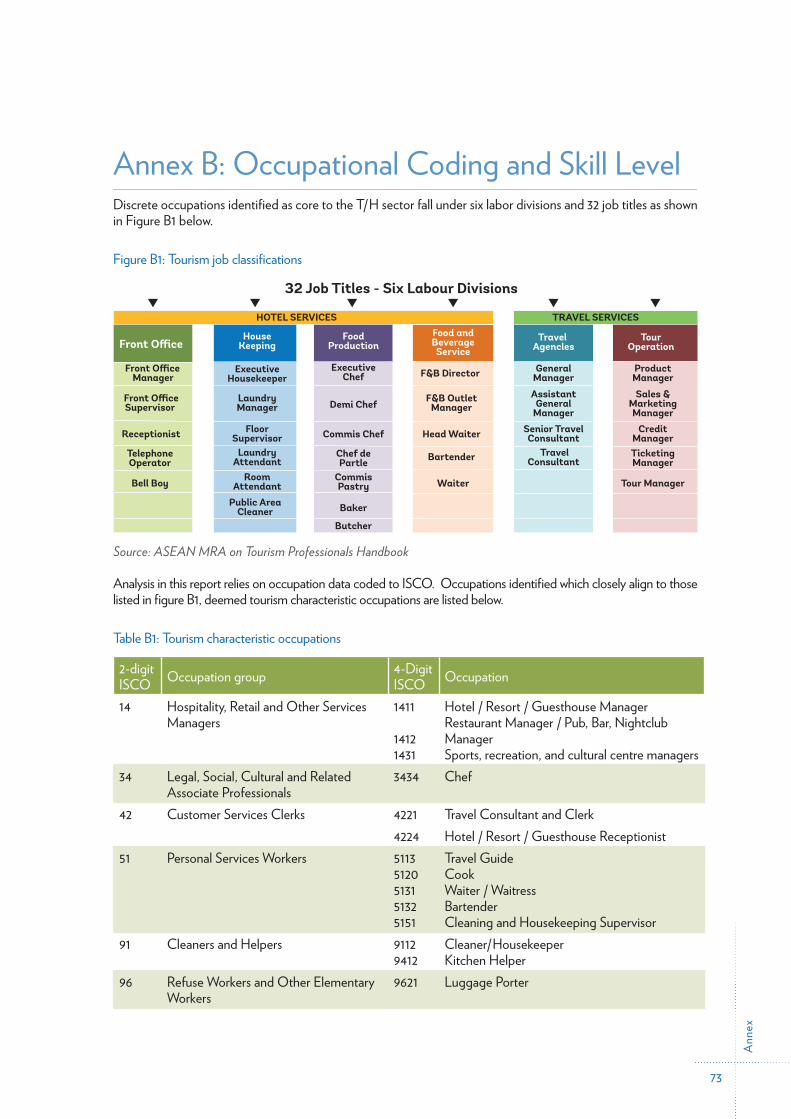
Ann
ex
73
Annex B: Occupational Coding and Skill LevelDiscrete occupations identified as core to the T/H sector fall under six labor divisions and 32 job titles as shown in Figure B1 below.
Figure B1: Tourism job classifications
B1
FoodProduction
Commis
Tour
Product
TRAVEL SERVICESHOTEL SERVICES
Floor
Room
Source: ASEAN MRA on Tourism Professionals Handbook
Analysis in this report relies on occupation data coded to ISCO. Occupations identified which closely align to those listed in figure B1, deemed tourism characteristic occupations are listed below.
Table B1: Tourism characteristic occupations
2-digit ISCO Occupation group 4-Digit
ISCO Occupation
14
Hospitality, Retail and Other Services Managers
1411 14121431
Hotel / Resort / Guesthouse ManagerRestaurant Manager / Pub, Bar, Nightclub ManagerSports, recreation, and cultural centre managers
34 Legal, Social, Cultural and Related Associate Professionals
3434 Chef
42 Customer Services Clerks 4221 Travel Consultant and Clerk 4224 Hotel / Resort / Guesthouse Receptionist51
Personal Services Workers 51135120513151325151
Travel GuideCookWaiter / WaitressBartenderCleaning and Housekeeping Supervisor
91
Cleaners and Helpers 91129412
Cleaner/HousekeeperKitchen Helper
96 Refuse Workers and Other Elementary Workers
9621 Luggage Porter
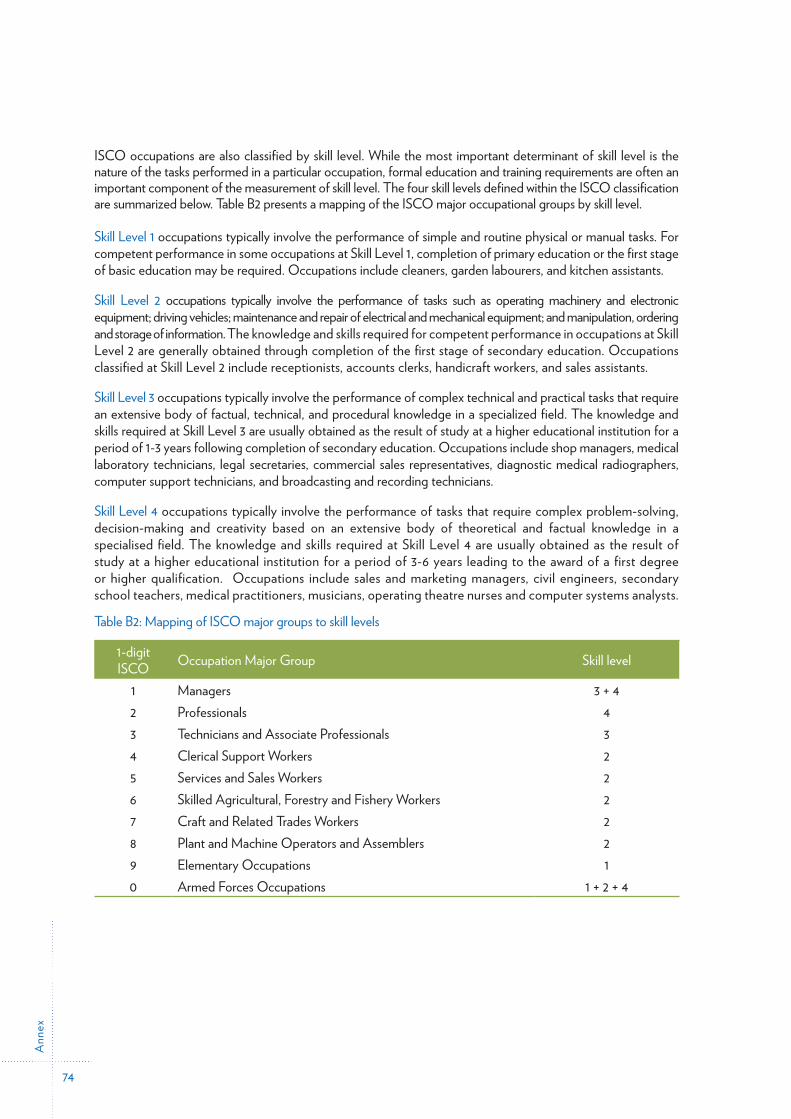
Ann
ex
74
ISCO occupations are also classified by skill level. While the most important determinant of skill level is the nature of the tasks performed in a particular occupation, formal education and training requirements are often an important component of the measurement of skill level. The four skill levels defined within the ISCO classification are summarized below. Table B2 presents a mapping of the ISCO major occupational groups by skill level.
Skill Level 1 occupations typically involve the performance of simple and routine physical or manual tasks. For competent performance in some occupations at Skill Level 1, completion of primary education or the first stage of basic education may be required. Occupations include cleaners, garden labourers, and kitchen assistants.
Skill Level 2 occupations typically involve the performance of tasks such as operating machinery and electronic equipment; driving vehicles; maintenance and repair of electrical and mechanical equipment; and manipulation, ordering and storage of information. The knowledge and skills required for competent performance in occupations at Skill Level 2 are generally obtained through completion of the first stage of secondary education. Occupations classified at Skill Level 2 include receptionists, accounts clerks, handicraft workers, and sales assistants.
Skill Level 3 occupations typically involve the performance of complex technical and practical tasks that require an extensive body of factual, technical, and procedural knowledge in a specialized field. The knowledge and skills required at Skill Level 3 are usually obtained as the result of study at a higher educational institution for a period of 1-3 years following completion of secondary education. Occupations include shop managers, medical laboratory technicians, legal secretaries, commercial sales representatives, diagnostic medical radiographers, computer support technicians, and broadcasting and recording technicians.
Skill Level 4 occupations typically involve the performance of tasks that require complex problem-solving, decision-making and creativity based on an extensive body of theoretical and factual knowledge in a specialised field. The knowledge and skills required at Skill Level 4 are usually obtained as the result of study at a higher educational institution for a period of 3-6 years leading to the award of a first degree or higher qualification. Occupations include sales and marketing managers, civil engineers, secondary school teachers, medical practitioners, musicians, operating theatre nurses and computer systems analysts.
Table B2: Mapping of ISCO major groups to skill levels
1-digit ISCO Occupation Major Group Skill level
1 Managers 3 + 42 Professionals 43 Technicians and Associate Professionals 34 Clerical Support Workers 25 Services and Sales Workers 26 Skilled Agricultural, Forestry and Fishery Workers 27 Craft and Related Trades Workers 28 Plant and Machine Operators and Assemblers 29 Elementary Occupations 10 Armed Forces Occupations 1 + 2 + 4
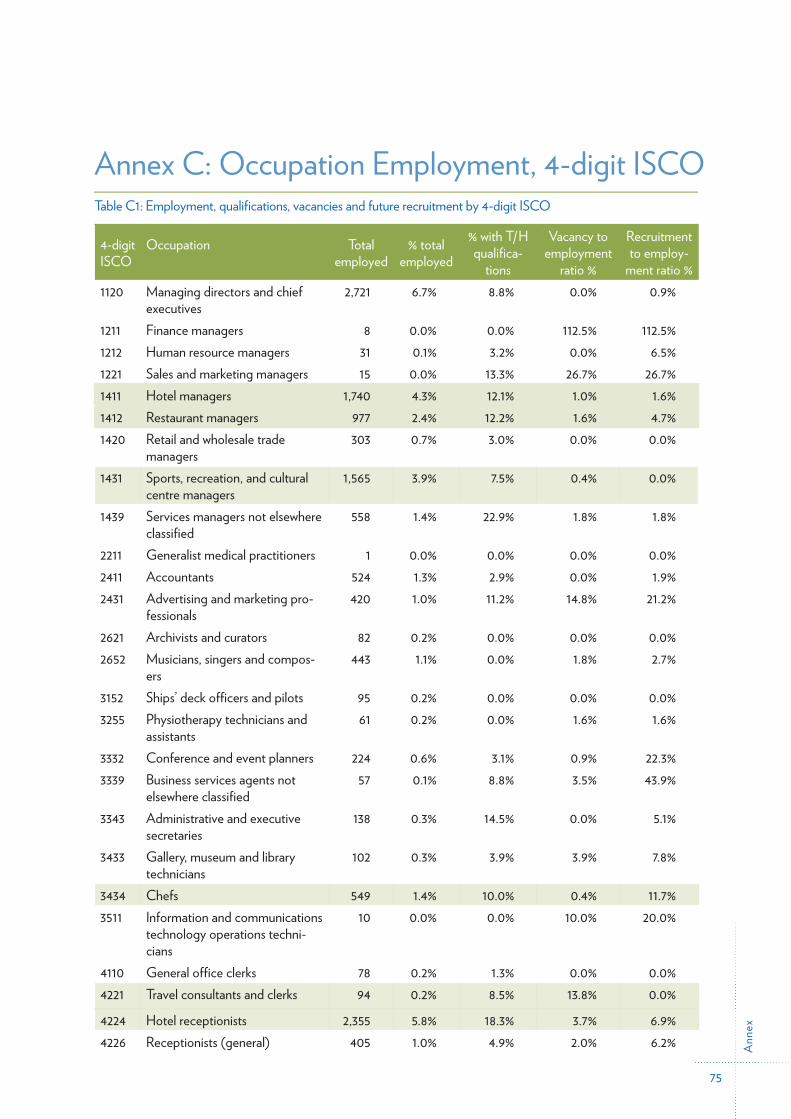
Ann
ex
75
Annex C: Occupation Employment, 4-digit ISCO Table C1: Employment, qualifications, vacancies and future recruitment by 4-digit ISCO
4-digit ISCO
Occupation Total employed
% total employed
% with T/H qualifica-
tions
Vacancy to employment
ratio %
Recruitment to employ-
ment ratio %1120 Managing directors and chief
executives2,721 6.7% 8.8% 0.0% 0.9%
1211 Finance managers 8 0.0% 0.0% 112.5% 112.5%1212 Human resource managers 31 0.1% 3.2% 0.0% 6.5%1221 Sales and marketing managers 15 0.0% 13.3% 26.7% 26.7%1411 Hotel managers 1,740 4.3% 12.1% 1.0% 1.6%1412 Restaurant managers 977 2.4% 12.2% 1.6% 4.7%1420 Retail and wholesale trade
managers303 0.7% 3.0% 0.0% 0.0%
1431 Sports, recreation, and cultural centre managers
1,565 3.9% 7.5% 0.4% 0.0%
1439 Services managers not elsewhere classified
558 1.4% 22.9% 1.8% 1.8%
2211 Generalist medical practitioners 1 0.0% 0.0% 0.0% 0.0%2411 Accountants 524 1.3% 2.9% 0.0% 1.9%2431 Advertising and marketing pro-
fessionals420 1.0% 11.2% 14.8% 21.2%
2621 Archivists and curators 82 0.2% 0.0% 0.0% 0.0%2652 Musicians, singers and compos-
ers443 1.1% 0.0% 1.8% 2.7%
3152 Ships’ deck officers and pilots 95 0.2% 0.0% 0.0% 0.0%3255 Physiotherapy technicians and
assistants61 0.2% 0.0% 1.6% 1.6%
3332 Conference and event planners 224 0.6% 3.1% 0.9% 22.3%3339 Business services agents not
elsewhere classified57 0.1% 8.8% 3.5% 43.9%
3343 Administrative and executive secretaries
138 0.3% 14.5% 0.0% 5.1%
3433 Gallery, museum and library technicians
102 0.3% 3.9% 3.9% 7.8%
3434 Chefs 549 1.4% 10.0% 0.4% 11.7%3511 Information and communications
technology operations techni-cians
10 0.0% 0.0% 10.0% 20.0%
4110 General office clerks 78 0.2% 1.3% 0.0% 0.0%4221 Travel consultants and clerks 94 0.2% 8.5% 13.8% 0.0%
4224 Hotel receptionists 2,355 5.8% 18.3% 3.7% 6.9%4226 Receptionists (general) 405 1.0% 4.9% 2.0% 6.2%
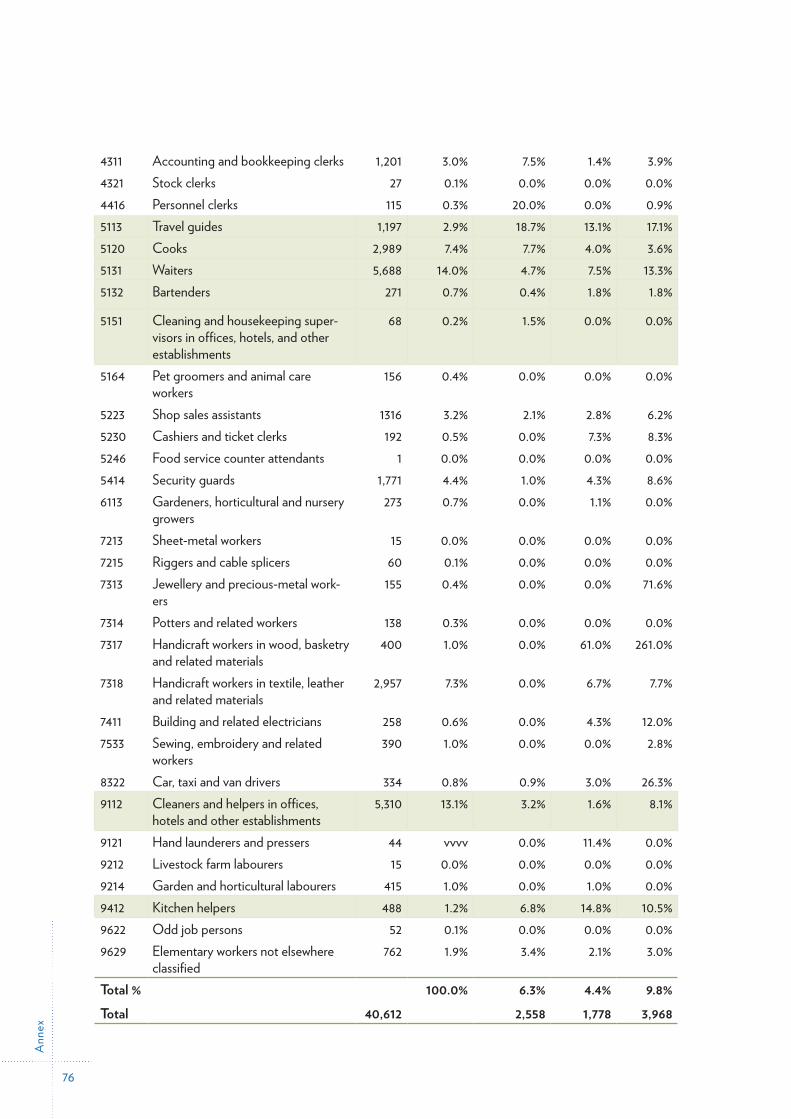
Ann
ex
76
4311 Accounting and bookkeeping clerks 1,201 3.0% 7.5% 1.4% 3.9%4321 Stock clerks 27 0.1% 0.0% 0.0% 0.0%4416 Personnel clerks 115 0.3% 20.0% 0.0% 0.9%5113 Travel guides 1,197 2.9% 18.7% 13.1% 17.1%5120 Cooks 2,989 7.4% 7.7% 4.0% 3.6%5131 Waiters 5,688 14.0% 4.7% 7.5% 13.3%5132 Bartenders 271 0.7% 0.4% 1.8% 1.8%
5151 Cleaning and housekeeping super-visors in offices, hotels, and other establishments
68 0.2% 1.5% 0.0% 0.0%
5164 Pet groomers and animal care workers
156 0.4% 0.0% 0.0% 0.0%
5223 Shop sales assistants 1316 3.2% 2.1% 2.8% 6.2%5230 Cashiers and ticket clerks 192 0.5% 0.0% 7.3% 8.3%5246 Food service counter attendants 1 0.0% 0.0% 0.0% 0.0%5414 Security guards 1,771 4.4% 1.0% 4.3% 8.6%6113 Gardeners, horticultural and nursery
growers273 0.7% 0.0% 1.1% 0.0%
7213 Sheet-metal workers 15 0.0% 0.0% 0.0% 0.0%7215 Riggers and cable splicers 60 0.1% 0.0% 0.0% 0.0%7313 Jewellery and precious-metal work-
ers155 0.4% 0.0% 0.0% 71.6%
7314 Potters and related workers 138 0.3% 0.0% 0.0% 0.0%7317 Handicraft workers in wood, basketry
and related materials400 1.0% 0.0% 61.0% 261.0%
7318 Handicraft workers in textile, leather and related materials
2,957 7.3% 0.0% 6.7% 7.7%
7411 Building and related electricians 258 0.6% 0.0% 4.3% 12.0%7533 Sewing, embroidery and related
workers390 1.0% 0.0% 0.0% 2.8%
8322 Car, taxi and van drivers 334 0.8% 0.9% 3.0% 26.3%9112 Cleaners and helpers in offices,
hotels and other establishments5,310 13.1% 3.2% 1.6% 8.1%
9121 Hand launderers and pressers 44 vvvv 0.0% 11.4% 0.0%9212 Livestock farm labourers 15 0.0% 0.0% 0.0% 0.0%9214 Garden and horticultural labourers 415 1.0% 0.0% 1.0% 0.0%9412 Kitchen helpers 488 1.2% 6.8% 14.8% 10.5%9622 Odd job persons 52 0.1% 0.0% 0.0% 0.0%9629 Elementary workers not elsewhere
classified762 1.9% 3.4% 2.1% 3.0%
Total % 100.0% 6.3% 4.4% 9.8%Total 40,612 2,558 1,778 3,968
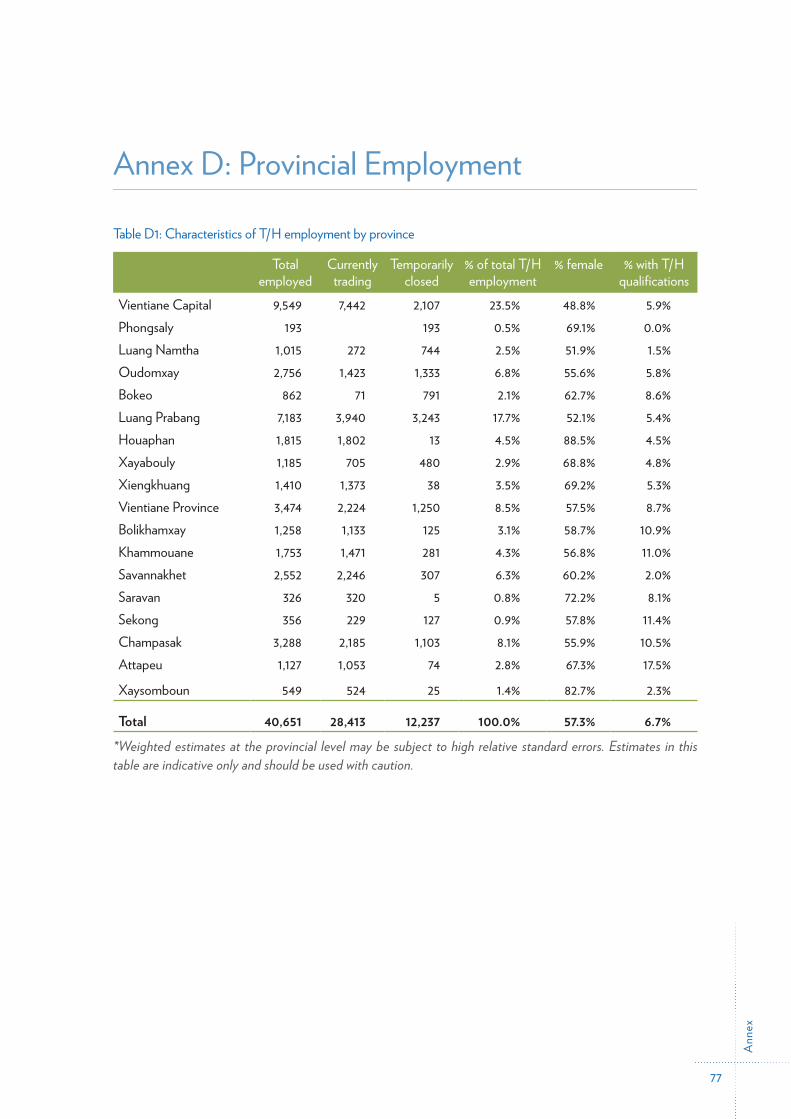
Ann
ex
77
Annex D: Provincial Employment
Table D1: Characteristics of T/H employment by province
Total employed
Currently trading
Temporarily closed
% of total T/H employment
% female % with T/H qualifications
Vientiane Capital 9,549 7,442 2,107 23.5% 48.8% 5.9%Phongsaly 193 193 0.5% 69.1% 0.0%Luang Namtha 1,015 272 744 2.5% 51.9% 1.5%Oudomxay 2,756 1,423 1,333 6.8% 55.6% 5.8%Bokeo 862 71 791 2.1% 62.7% 8.6%Luang Prabang 7,183 3,940 3,243 17.7% 52.1% 5.4%Houaphan 1,815 1,802 13 4.5% 88.5% 4.5%Xayabouly 1,185 705 480 2.9% 68.8% 4.8%Xiengkhuang 1,410 1,373 38 3.5% 69.2% 5.3%Vientiane Province 3,474 2,224 1,250 8.5% 57.5% 8.7%Bolikhamxay 1,258 1,133 125 3.1% 58.7% 10.9%Khammouane 1,753 1,471 281 4.3% 56.8% 11.0%Savannakhet 2,552 2,246 307 6.3% 60.2% 2.0%Saravan 326 320 5 0.8% 72.2% 8.1%Sekong 356 229 127 0.9% 57.8% 11.4%Champasak 3,288 2,185 1,103 8.1% 55.9% 10.5%Attapeu 1,127 1,053 74 2.8% 67.3% 17.5%
Xaysomboun 549 524 25 1.4% 82.7% 2.3%
Total 40,651 28,413 12,237 100.0% 57.3% 6.7%*Weighted estimates at the provincial level may be subject to high relative standard errors. Estimates in this table are indicative only and should be used with caution.
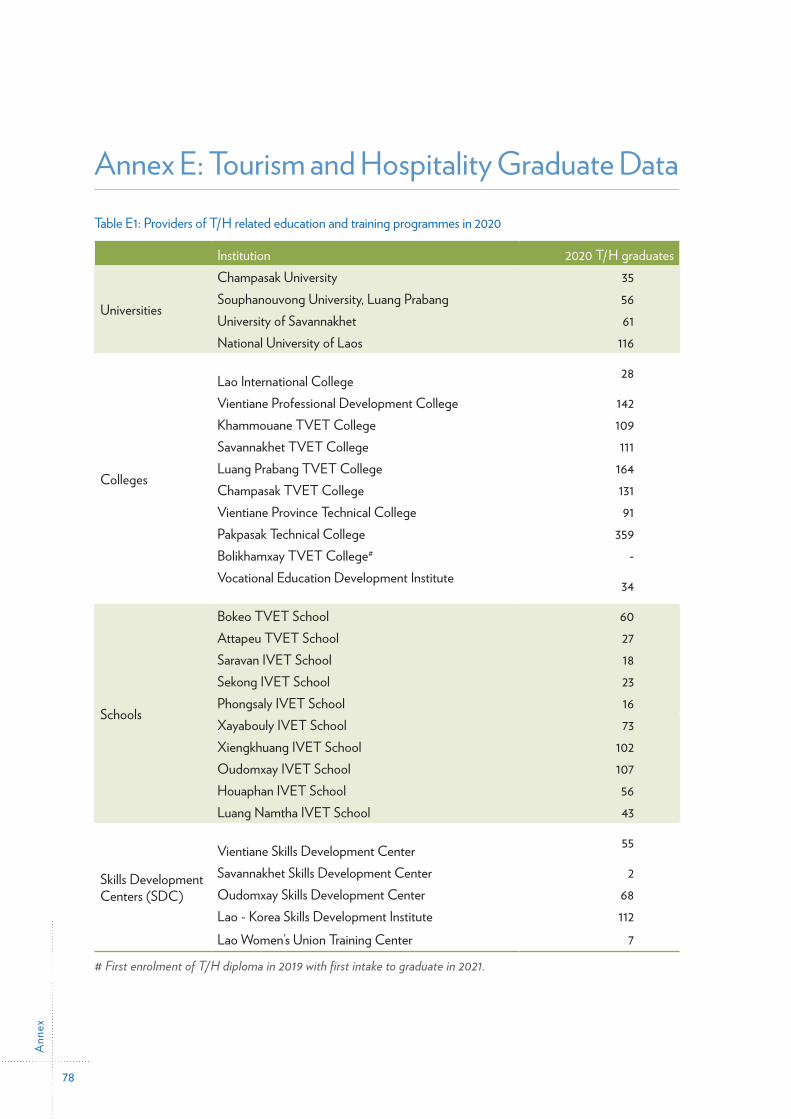
Ann
ex
78
Annex E: Tourism and Hospitality Graduate Data Table E1: Providers of T/H related education and training programmes in 2020
Institution 2020 T/H graduates
Universities
Champasak University 35Souphanouvong University, Luang Prabang 56University of Savannakhet 61National University of Laos 116
Colleges
Lao International College 28
Vientiane Professional Development College 142Khammouane TVET College 109Savannakhet TVET College 111Luang Prabang TVET College 164Champasak TVET College 131Vientiane Province Technical College 91Pakpasak Technical College 359Bolikhamxay TVET College# -Vocational Education Development Institute 34
Schools
Bokeo TVET School 60Attapeu TVET School 27Saravan IVET School 18Sekong IVET School 23Phongsaly IVET School 16Xayabouly IVET School 73Xiengkhuang IVET School 102Oudomxay IVET School 107Houaphan IVET School 56Luang Namtha IVET School 43
Skills Development Centers (SDC)
Vientiane Skills Development Center 55
Savannakhet Skills Development Center 2Oudomxay Skills Development Center 68Lao - Korea Skills Development Institute 112Lao Women’s Union Training Center 7
# First enrolment of T/H diploma in 2019 with first intake to graduate in 2021.
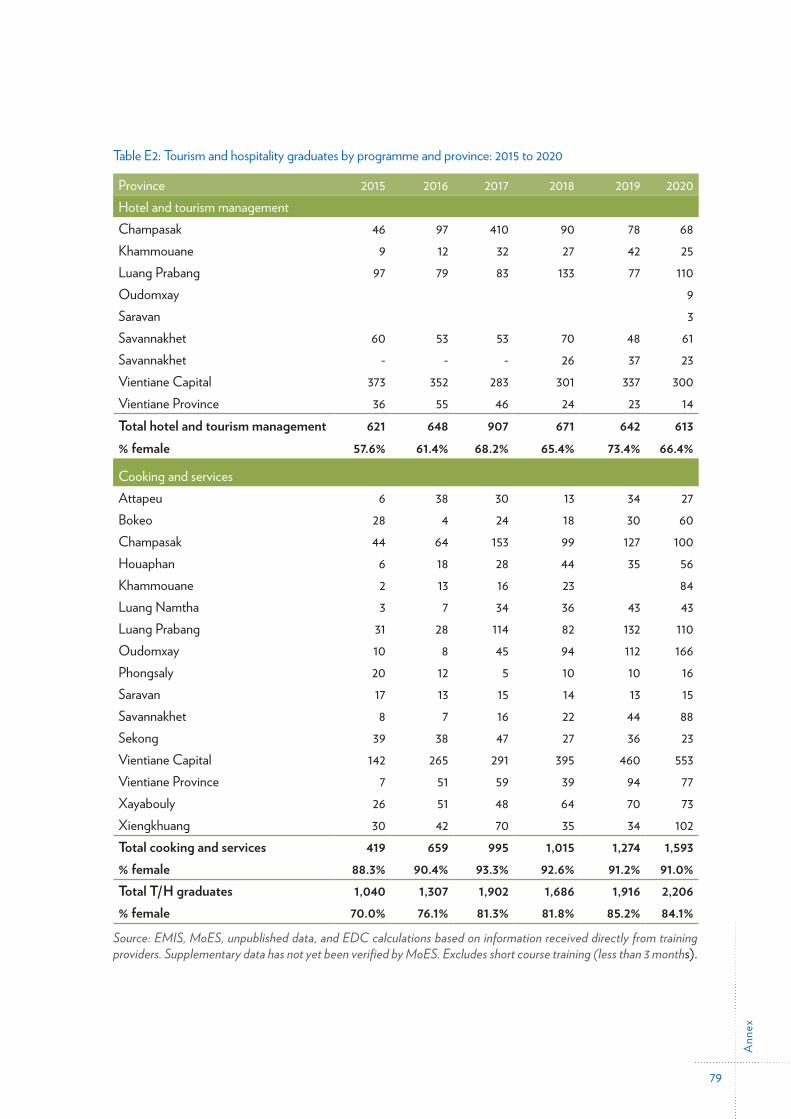
Ann
ex
79
Table E2: Tourism and hospitality graduates by programme and province: 2015 to 2020
Province 2015 2016 2017 2018 2019 2020Hotel and tourism managementChampasak 46 97 410 90 78 68Khammouane 9 12 32 27 42 25Luang Prabang 97 79 83 133 77 110Oudomxay 9Saravan 3Savannakhet 60 53 53 70 48 61Savannakhet - - - 26 37 23Vientiane Capital 373 352 283 301 337 300Vientiane Province 36 55 46 24 23 14Total hotel and tourism management 621 648 907 671 642 613% female 57.6% 61.4% 68.2% 65.4% 73.4% 66.4%
Cooking and servicesAttapeu 6 38 30 13 34 27Bokeo 28 4 24 18 30 60Champasak 44 64 153 99 127 100Houaphan 6 18 28 44 35 56Khammouane 2 13 16 23 84Luang Namtha 3 7 34 36 43 43Luang Prabang 31 28 114 82 132 110Oudomxay 10 8 45 94 112 166Phongsaly 20 12 5 10 10 16Saravan 17 13 15 14 13 15Savannakhet 8 7 16 22 44 88Sekong 39 38 47 27 36 23Vientiane Capital 142 265 291 395 460 553Vientiane Province 7 51 59 39 94 77Xayabouly 26 51 48 64 70 73Xiengkhuang 30 42 70 35 34 102Total cooking and services 419 659 995 1,015 1,274 1,593% female 88.3% 90.4% 93.3% 92.6% 91.2% 91.0%Total T/H graduates 1,040 1,307 1,902 1,686 1,916 2,206% female 70.0% 76.1% 81.3% 81.8% 85.2% 84.1%
Source: EMIS, MoES, unpublished data, and EDC calculations based on information received directly from training providers. Supplementary data has not yet been verified by MoES. Excludes short course training (less than 3 months).
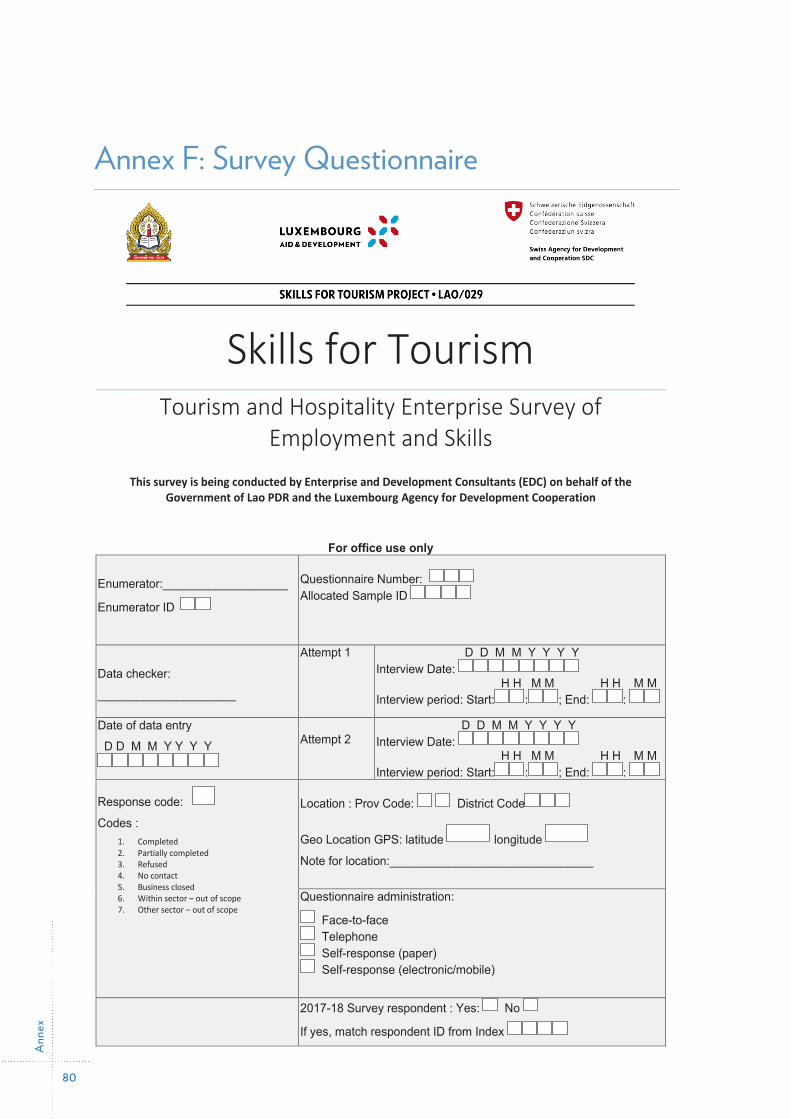
Ann
ex
80
Annex F: Survey Questionnaire
Skills for Tourism Tourism and Hospitality Enterprise Survey of
Employment and Skills
This survey is being conducted by Enterprise and Development Consultants (EDC) on behalf of the Government of Lao PDR and the Luxembourg Agency for Development Cooperation
For office use only
Enumerator:___________________
Enumerator ID
Questionnaire Number: Allocated Sample ID
Data checker:
_____________________
Attempt 1 D D M M Y Y Y Y Interview Date: H H M M H H M M Interview period: Start: : ; End: :
Date of data entry
D D M M Y Y Y Y
Attempt 2
D D M M Y Y Y Y Interview Date: H H M M H H M M Interview period: Start: : ; End: :
Response code:
Codes : 1. Completed 2. Partially completed 3. Refused 4. No contact 5. Business closed 6. Within sector – out of scope 7. Other sector – out of scope
Location : Prov Code: District Code
Geo Location GPS: latitude longitude
Note for location:_______________________________
Questionnaire administration:
Face-to-face Telephone Self-response (paper) Self-response (electronic/mobile)
2017-18 Survey respondent : Yes: No
If yes, match respondent ID from Index
Ann
ex
81
Tourism and Hospitality Enterprise Survey of Employment and Skills
The LAO/029 Skills for Tourism Project: The Skills for Tourism Project receives financial support from the Governments of Lao PDR, Switzerland and the Grand Duchy of Luxembourg. The Project allows for improvements in Tourism and Hospitality related vocational education and skills development in Lao PDR through enhanced quality, financing and governance. A particular emphasis of this Project is to support disadvantaged youth from poor families to acquire the skills needed to work in hotels, restaurants and the greater tourism economy in Lao PDR. The overall project objective is the promotion of the sustainable and inclusive growth of the Lao PDR Tourism and Hospitality sector thereby contributing to poverty reduction.
Survey Objectives: The 2021 Tourism and Hospitality Enterprise Survey is the second survey commissioned under the Skills for Tourism Project. The survey results will provide a timely update on the growth in the sector since the 2017-18 survey and will quantify the impacts of the COVID-19 pandemic on tourism and hospitality businesses in Lao PDR. This Survey aims to: (a) ascertain the numbers employed in the Tourism and Hospitality sector by occupation, skill level, gender and province; (b) quantify the number of vacancies that currently exist by occupation, skills level and province; (c) identify priority occupations associated with shortage of supply by skill level and province; and (d) these data will be used to assess the future skills requirements of the Tourism and Hospitality sector in Lao PDR from 2021 to 2026 by occupation, skill level and province. Confidentiality: All information collected as part of this survey is confidential. Under no circumstances will data be shared in public or for other purposes besides the completion of the survey objectives. The respondents' anonymity and privacy will be protected and will not appear in any Project LAO/029 reports or documentation. Your cooperation will be valuable to the Tourism and Hospitality sector, the providers of vocational education and skills development in Lao PDR and your enterprise.
Screening questions by enumerator:
S1. What is the core business activity of this enterprise? (See below for Enterprise codes 1 through 9)
If code = 9, business is out of scope, end survey)
S2. Does this business provide services to tourists (domestic and/or international)?
Yes No (if no, business is out of scope, end survey)
S3 Including you, does this business usually employ 3 or more staff? Yes No (if no, business is out of scope, end survey)
S4. Is this business currently trading (i.e. open for business)? Yes No (if no, S5) S5. Is this business temporarily closed? Yes No closed down (business is
out of scope, end survey) Enterprise codes: 1 = Hotel ; 2 = Resort; 3= Guesthouse; 4= Restaurant; 5= Entertainment; 6= Travel Agency; 7= Attraction; 8= Handicraft/Souvenir retail; 9= Other non-Tourism related business
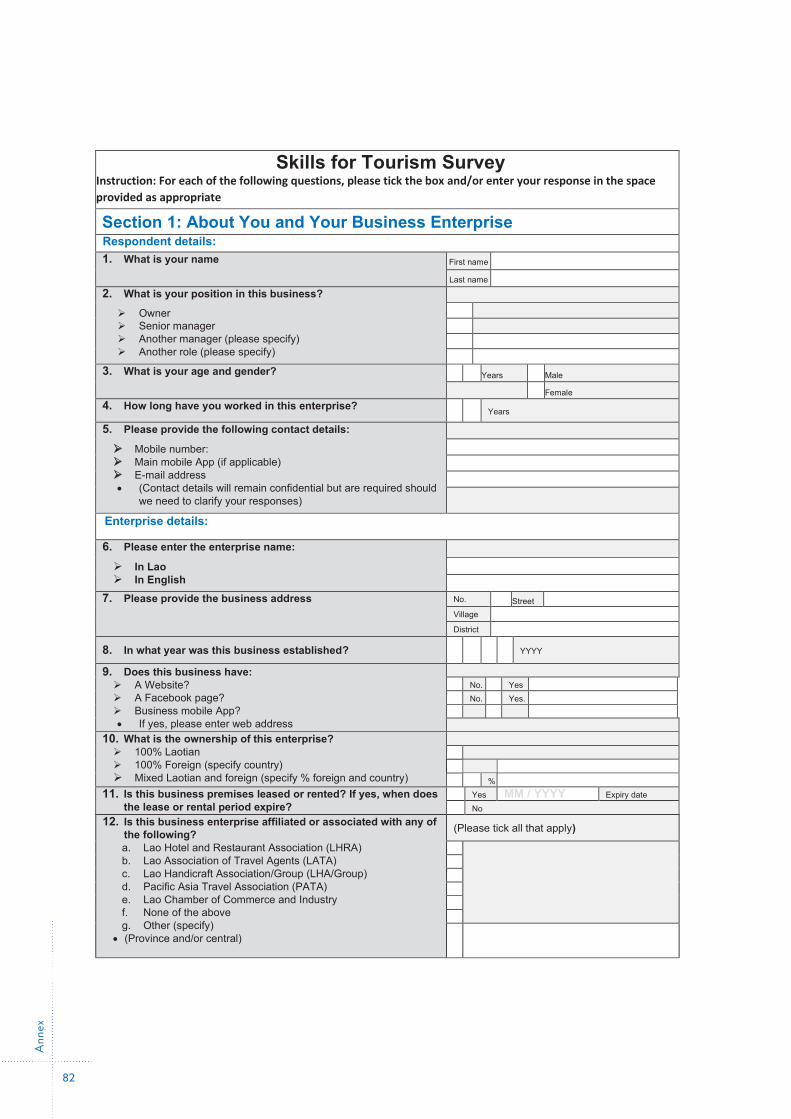
Ann
ex
82
2 | P a g e
Skills for Tourism Survey Instruction: For each of the following questions, please tick the box and/or enter your response in the space provided as appropriate
Section 1: About You and Your Business Enterprise Respondent details: 1. What is your name First name
Last name
2. What is your position in this business?
➢ Owner ➢ Senior manager ➢ Another manager (please specify) ➢ Another role (please specify)
3. What is your age and gender? Years Male
Female
4. How long have you worked in this enterprise? Years
5. Please provide the following contact details:
➢ Mobile number: ➢ Main mobile App (if applicable) ➢ E-mail address • (Contact details will remain confidential but are required should
we need to clarify your responses)
Enterprise details:
6. Please enter the enterprise name:
➢ In Lao ➢ In English
7. Please provide the business address No. Street Village District
8. In what year was this business established? YYYY
9. Does this business have: ➢ A Website? ➢ A Facebook page? ➢ Business mobile App? • If yes, please enter web address
No. Yes No. Yes.
10. What is the ownership of this enterprise? ➢ 100% Laotian ➢ 100% Foreign (specify country) ➢ Mixed Laotian and foreign (specify % foreign and country)
% 11. Is this business premises leased or rented? If yes, when does
the lease or rental period expire? Yes MM / YYYY Expiry date
No 12. Is this business enterprise affiliated or associated with any of
the following? a. Lao Hotel and Restaurant Association (LHRA) b. Lao Association of Travel Agents (LATA) c. Lao Handicraft Association/Group (LHA/Group) d. Pacific Asia Travel Association (PATA) e. Lao Chamber of Commerce and Industry f. None of the above g. Other (specify)
• (Province and/or central)
(Please tick all that apply)
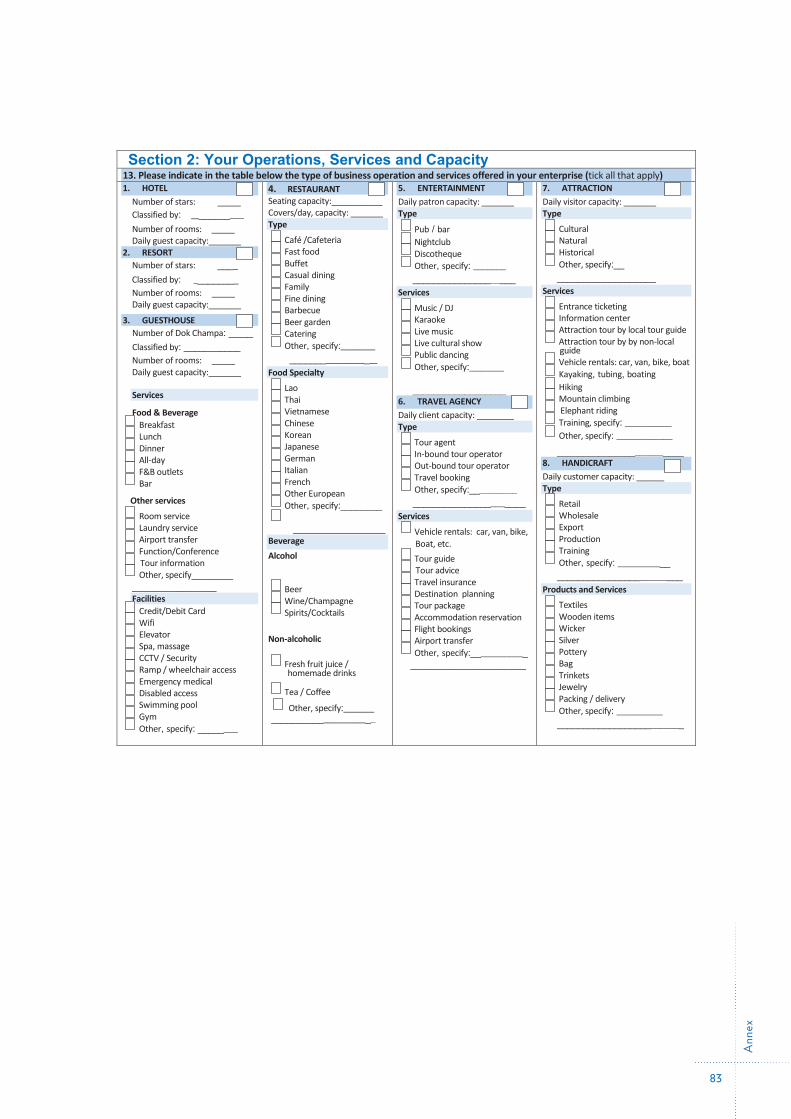
Ann
ex
83
3 | P a g e
Section 2: Your Operations, Services and Capacity 13. Please indicate in the table below the type of business operation and services offered in your enterprise (tick all that apply) 1. HOTEL
Number of stars: _____ Classified by: ___________ Number of rooms: ______ Daily guest capacity:_______
2. RESORT Number of stars: ____ Classified by: _________ Number of rooms: _____ Daily guest capacity:_______
3. GUESTHOUSE Number of Dok Champa: _____ Classified by: ___________ Number of rooms: _____ Daily guest capacity:_______
Services
Food & Beverage
Breakfast Lunch Dinner All-day F&B outlets Bar
Other services
Room service Laundry service Airport transfer Function/Conference Tour information Other, specify_________
______________________ Facilities
Credit/Debit Card Wifi Elevator Spa, massage CCTV / Security Ramp / wheelchair access Emergency medical Disabled access Swimming pool Gym Other, specify: ________
4. RESTAURANT Seating capacity:___________ Covers/day, capacity: _______ Type
Café /Cafeteria Fast food Buffet Casual dining Family Fine dining Barbecue Beer garden Catering Other, specify:_________
____________________ Food Specialty
Lao Thai Vietnamese Chinese Korean Japanese German Italian French Other European Other, specify:________
____________________ Beverage Alcohol
Beer Wine/Champagne Spirits/Cocktails
Non-alcoholic
Fresh fruit juice / homemade drinks
Tea / Coffee
Other, specify:________ _______________________
5. ENTERTAINMENT Daily patron capacity: _______ Type
Pub / bar Nightclub Discotheque Other, specify: _______ ____________________
Services Music / DJ Karaoke Live music Live cultural show Public dancing Other, specify:_________
__________________
6. TRAVEL AGENCY Daily client capacity: ________ Type
Tour agent In-bound tour operator Out-bound tour operator Travel booking Other, specify:__________ ______________________
Services Vehicle rentals: car, van, bike,
Boat, etc. Tour guide Tour advice Travel insurance Destination planning Tour package Accommodation reservation Flight bookings Airport transfer Other, specify:____________
_________________________
7. ATTRACTION Daily visitor capacity: _______ Type
Cultural Natural Historical Other, specify:__ ___________________
Services Entrance ticketing Information center Attraction tour by local tour guide Attraction tour by by non-local
guide Vehicle rentals: car, van, bike, boat Kayaking, tubing, boating Hiking Mountain climbing Elephant riding Training, specify: __________ Other, specify: ____________
_________________________ 8. HANDICRAFT Daily customer capacity: ______ Type
Retail Wholesale Export Production Training Other, specify: _____________ __________________________
Products and Services Textiles Wooden items Wicker Silver Pottery Bag Trinkets Jewelry Packing / delivery Other, specify: ____________ _________________________
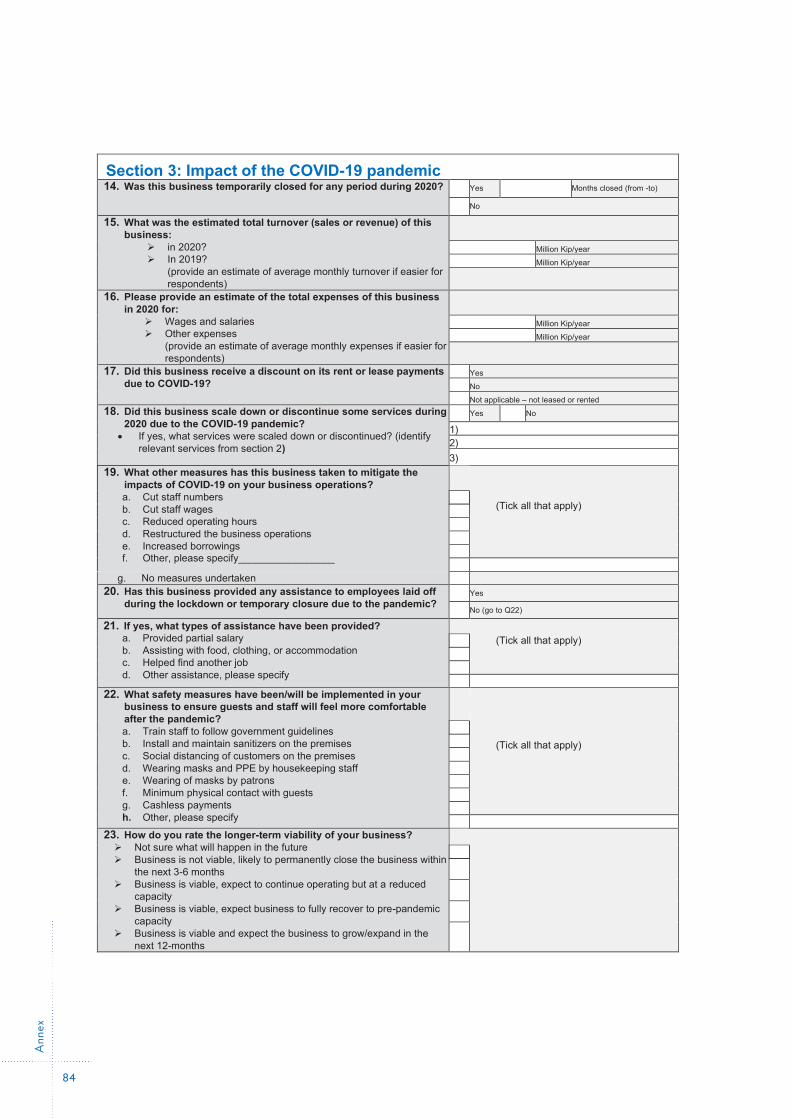
Ann
ex
84
4 | P a g e
Section 3: Impact of the COVID-19 pandemic
14. Was this business temporarily closed for any period during 2020?
Yes Months closed (from -to)
No
15. What was the estimated total turnover (sales or revenue) of this business:
➢ in 2020? ➢ In 2019?
(provide an estimate of average monthly turnover if easier for respondents)
Million Kip/year
Million Kip/year
16. Please provide an estimate of the total expenses of this business in 2020 for:
➢ Wages and salaries ➢ Other expenses
(provide an estimate of average monthly expenses if easier for respondents)
Million Kip/year
Million Kip/year
17. Did this business receive a discount on its rent or lease payments due to COVID-19?
Yes
No
Not applicable – not leased or rented 18. Did this business scale down or discontinue some services during
2020 due to the COVID-19 pandemic? • If yes, what services were scaled down or discontinued? (identify
relevant services from section 2)
Yes No
1) 2) 3)
19. What other measures has this business taken to mitigate the impacts of COVID-19 on your business operations? a. Cut staff numbers b. Cut staff wages c. Reduced operating hours d. Restructured the business operations e. Increased borrowings f. Other, please specify_________________
(Tick all that apply)
g. No measures undertaken
20. Has this business provided any assistance to employees laid off during the lockdown or temporary closure due to the pandemic?
Yes
No (go to Q22)
21. If yes, what types of assistance have been provided? a. Provided partial salary b. Assisting with food, clothing, or accommodation c. Helped find another job d. Other assistance, please specify
(Tick all that apply)
22. What safety measures have been/will be implemented in your business to ensure guests and staff will feel more comfortable after the pandemic? a. Train staff to follow government guidelines b. Install and maintain sanitizers on the premises c. Social distancing of customers on the premises d. Wearing masks and PPE by housekeeping staff e. Wearing of masks by patrons f. Minimum physical contact with guests g. Cashless payments h. Other, please specify
(Tick all that apply)
23. How do you rate the longer-term viability of your business? ➢ Not sure what will happen in the future ➢ Business is not viable, likely to permanently close the business within
the next 3-6 months ➢ Business is viable, expect to continue operating but at a reduced
capacity ➢ Business is viable, expect business to fully recover to pre-pandemic
capacity ➢ Business is viable and expect the business to grow/expand in the
next 12-months
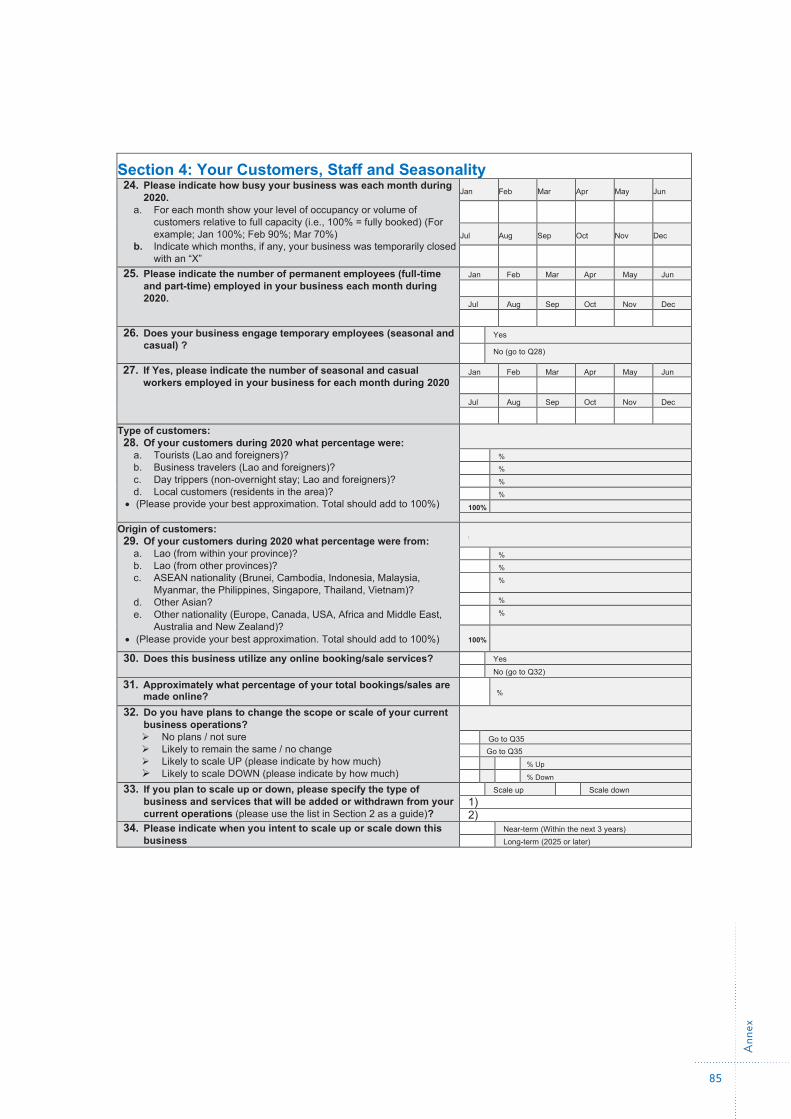
Ann
ex
85
5 | P a g e
Section 4: Your Customers, Staff and Seasonality
24. Please indicate how busy your business was each month during 2020.
a. For each month show your level of occupancy or volume of customers relative to full capacity (i.e., 100% = fully booked) (For example; Jan 100%; Feb 90%; Mar 70%)
b. Indicate which months, if any, your business was temporarily closed with an “X”
Jan Feb Mar Apr May Jun
Jul Aug Sep Oct Nov Dec
25. Please indicate the number of permanent employees (full-time and part-time) employed in your business each month during 2020.
Jan Feb Mar Apr May Jun
Jul Aug Sep Oct Nov Dec
26. Does your business engage temporary employees (seasonal and casual) ?
Yes
No (go to Q28)
27. If Yes, please indicate the number of seasonal and casual workers employed in your business for each month during 2020
Jan Feb Mar Apr May Jun
Jul Aug Sep Oct Nov Dec
Type of customers: 28. Of your customers during 2020 what percentage were:
a. Tourists (Lao and foreigners)? b. Business travelers (Lao and foreigners)? c. Day trippers (non-overnight stay; Lao and foreigners)? d. Local customers (residents in the area)?
• (Please provide your best approximation. Total should add to 100%)
%
%
%
%
100%
Origin of customers: 29. Of your customers during 2020 what percentage were from:
a. Lao (from within your province)? b. Lao (from other provinces)? c. ASEAN nationality (Brunei, Cambodia, Indonesia, Malaysia,
Myanmar, the Philippines, Singapore, Thailand, Vietnam)? d. Other Asian? e. Other nationality (Europe, Canada, USA, Africa and Middle East,
Australia and New Zealand)? • (Please provide your best approximation. Total should add to 100%)
(
%
%
%
%
%
100%
30. Does this business utilize any online booking/sale services?
Yes
No (go to Q32)
31. Approximately what percentage of your total bookings/sales are made online? %
32. Do you have plans to change the scope or scale of your current business operations? ➢ No plans / not sure ➢ Likely to remain the same / no change ➢ Likely to scale UP (please indicate by how much) ➢ Likely to scale DOWN (please indicate by how much)
Go to Q35 Go to Q35 % Up % Down
33. If you plan to scale up or down, please specify the type of business and services that will be added or withdrawn from your current operations (please use the list in Section 2 as a guide)?
Scale up Scale down
1) 2)
34. Please indicate when you intent to scale up or scale down this business
Near-term (Within the next 3 years)
Long-term (2025 or later)
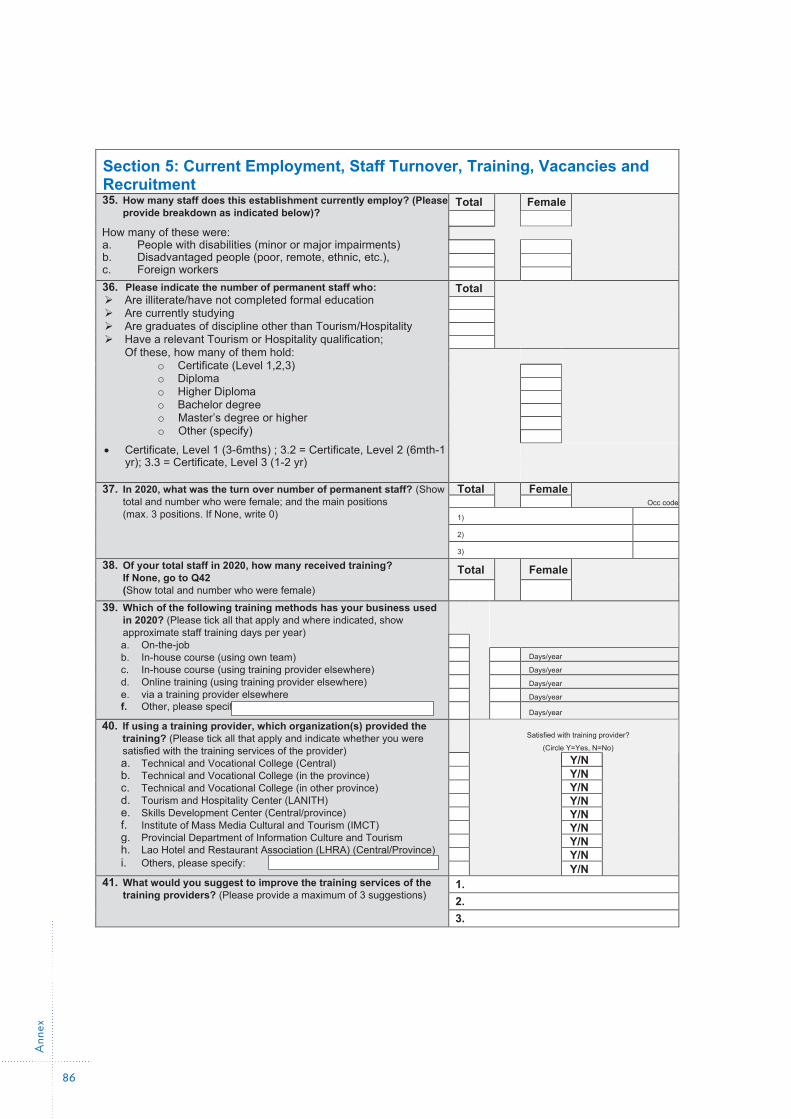
Ann
ex
86
6 | P a g e
Section 5: Current Employment, Staff Turnover, Training, Vacancies and Recruitment 35. How many staff does this establishment currently employ? (Please
provide breakdown as indicated below)?
How many of these were: a. People with disabilities (minor or major impairments) b. Disadvantaged people (poor, remote, ethnic, etc.), c. Foreign workers
Total
Female
36. Please indicate the number of permanent staff who: ➢ Are illiterate/have not completed formal education ➢ Are currently studying ➢ Are graduates of discipline other than Tourism/Hospitality ➢ Have a relevant Tourism or Hospitality qualification;
Of these, how many of them hold: o Certificate (Level 1,2,3) o Diploma o Higher Diploma o Bachelor degree o Master’s degree or higher o Other (specify)
• Certificate, Level 1 (3-6mths) ; 3.2 = Certificate, Level 2 (6mth-1 yr); 3.3 = Certificate, Level 3 (1-2 yr)
Total
37. In 2020, what was the turn over number of permanent staff? (Show total and number who were female; and the main positions (max. 3 positions. If None, write 0)
Total
Female
Occ code
1)
2)
3)
38. Of your total staff in 2020, how many received training? If None, go to Q42 (Show total and number who were female)
Total
Female
39. Which of the following training methods has your business used in 2020? (Please tick all that apply and where indicated, show approximate staff training days per year) a. On-the-job b. In-house course (using own team) c. In-house course (using training provider elsewhere) d. Online training (using training provider elsewhere) e. via a training provider elsewhere f. Other, please specify:
Days/year
Days/year
Days/year
Days/year
Days/year
40. If using a training provider, which organization(s) provided the training? (Please tick all that apply and indicate whether you were satisfied with the training services of the provider) a. Technical and Vocational College (Central) b. Technical and Vocational College (in the province) c. Technical and Vocational College (in other province) d. Tourism and Hospitality Center (LANITH) e. Skills Development Center (Central/province) f. Institute of Mass Media Cultural and Tourism (IMCT) g. Provincial Department of Information Culture and Tourism h. Lao Hotel and Restaurant Association (LHRA) (Central/Province) i. Others, please specify:
Satisfied with training provider?
(Circle Y=Yes, N=No)
Y/N
Y/N
Y/N
Y/N
Y/N
Y/N
Y/N
Y/N
Y/N
41. What would you suggest to improve the training services of the training providers? (Please provide a maximum of 3 suggestions)
1. 2. 3.
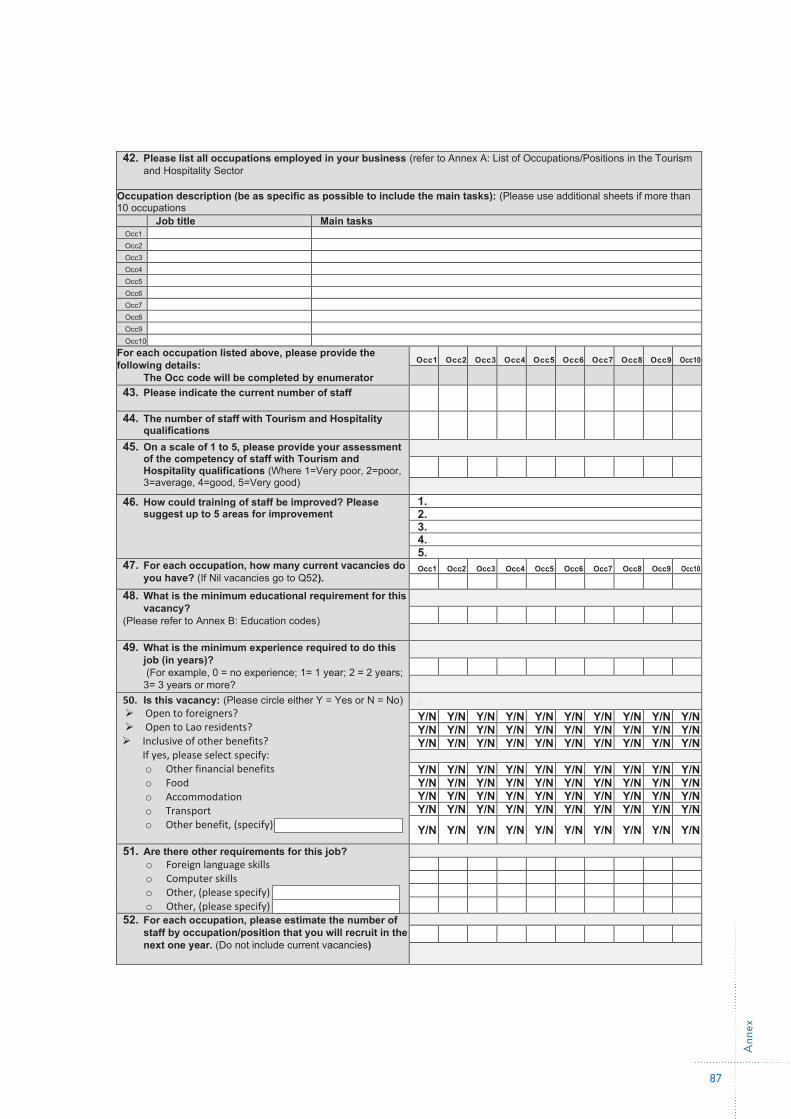
Ann
ex
87
7 | P a g e
42. Please list all occupations employed in your business (refer to Annex A: List of Occupations/Positions in the Tourism and Hospitality Sector
Occupation description (be as specific as possible to include the main tasks): (Please use additional sheets if more than 10 occupations
Job title Main tasks
Occ1
Occ2
Occ3
Occ4
Occ5
Occ6
Occ7
Occ8
Occ9
Occ10
For each occupation listed above, please provide the following details:
The Occ code will be completed by enumerator
Occ1 Occ2 Occ3 Occ4 Occ5 Occ6 Occ7 Occ8 Occ9 Occ10
43. Please indicate the current number of staff
44. The number of staff with Tourism and Hospitality qualifications
45. On a scale of 1 to 5, please provide your assessment of the competency of staff with Tourism and Hospitality qualifications (Where 1=Very poor, 2=poor, 3=average, 4=good, 5=Very good)
46. How could training of staff be improved? Please suggest up to 5 areas for improvement
1.
2.
3.
4.
5.
47. For each occupation, how many current vacancies do you have? (If Nil vacancies go to Q52).
Occ1 Occ2 Occ3 Occ4 Occ5 Occ6 Occ7 Occ8 Occ9 Occ10
48. What is the minimum educational requirement for this vacancy?
(Please refer to Annex B: Education codes)
49. What is the minimum experience required to do this job (in years)? (For example, 0 = no experience; 1= 1 year; 2 = 2 years; 3= 3 years or more?
50. Is this vacancy: (Please circle either Y = Yes or N = No) ➢ Open to foreigners? ➢ Open to Lao residents? ➢ Inclusive of other benefits?
If yes, please select specify: o Other financial benefits o Food o Accommodation o Transport o Other benefit, (specify)
(
Y/N Y/N Y/N Y/N Y/N Y/N Y/N Y/N Y/N Y/N
Y/N Y/N Y/N Y/N Y/N Y/N Y/N Y/N Y/N Y/N
Y/N Y/N Y/N Y/N Y/N Y/N Y/N Y/N Y/N Y/N
Y/N Y/N Y/N Y/N Y/N Y/N Y/N Y/N Y/N Y/N
Y/N Y/N Y/N Y/N Y/N Y/N Y/N Y/N Y/N Y/N
Y/N Y/N Y/N Y/N Y/N Y/N Y/N Y/N Y/N Y/N
Y/N Y/N Y/N Y/N Y/N Y/N Y/N Y/N Y/N Y/N
Y/N Y/N Y/N Y/N Y/N Y/N Y/N Y/N Y/N Y/N
51. Are there other requirements for this job? o Foreign language skills o Computer skills o Other, (please specify) o Other, (please specify)
52. For each occupation, please estimate the number of staff by occupation/position that you will recruit in the next one year. (Do not include current vacancies)
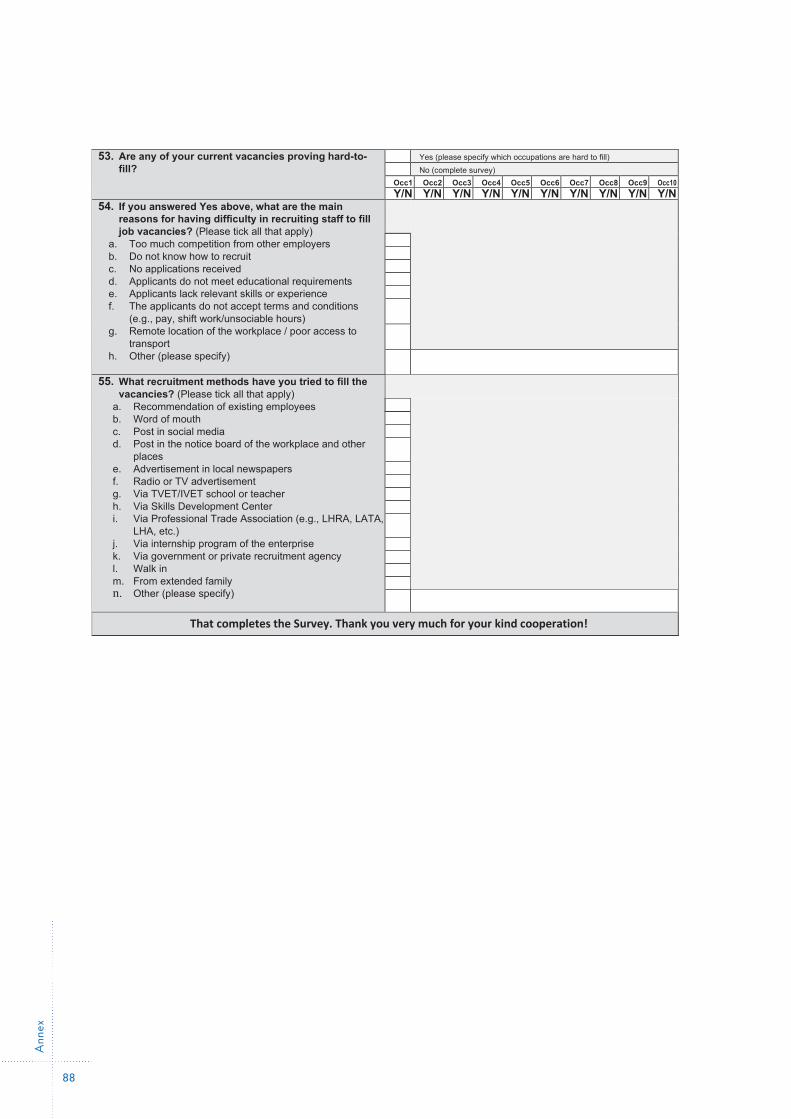
Ann
ex
88
8 | P a g e
53. Are any of your current vacancies proving hard-to-fill?
Yes (please specify which occupations are hard to fill)
No (complete survey)
Occ1 Occ2 Occ3 Occ4 Occ5 Occ6 Occ7 Occ8 Occ9 Occ10 Y/N Y/N Y/N Y/N Y/N Y/N Y/N Y/N Y/N Y/N
54. If you answered Yes above, what are the main reasons for having difficulty in recruiting staff to fill job vacancies? (Please tick all that apply)
a. Too much competition from other employers b. Do not know how to recruit c. No applications received d. Applicants do not meet educational requirements e. Applicants lack relevant skills or experience f. The applicants do not accept terms and conditions
(e.g., pay, shift work/unsociable hours) g. Remote location of the workplace / poor access to
transport h. Other (please specify)
55. What recruitment methods have you tried to fill the vacancies? (Please tick all that apply)
a. Recommendation of existing employees b. Word of mouth c. Post in social media d. Post in the notice board of the workplace and other
places e. Advertisement in local newspapers f. Radio or TV advertisement g. Via TVET/IVET school or teacher h. Via Skills Development Center i. Via Professional Trade Association (e.g., LHRA, LATA,
LHA, etc.) j. Via internship program of the enterprise k. Via government or private recruitment agency l. Walk in m. From extended family n. Other (please specify)
That completes the Survey. Thank you very much for your kind cooperation!
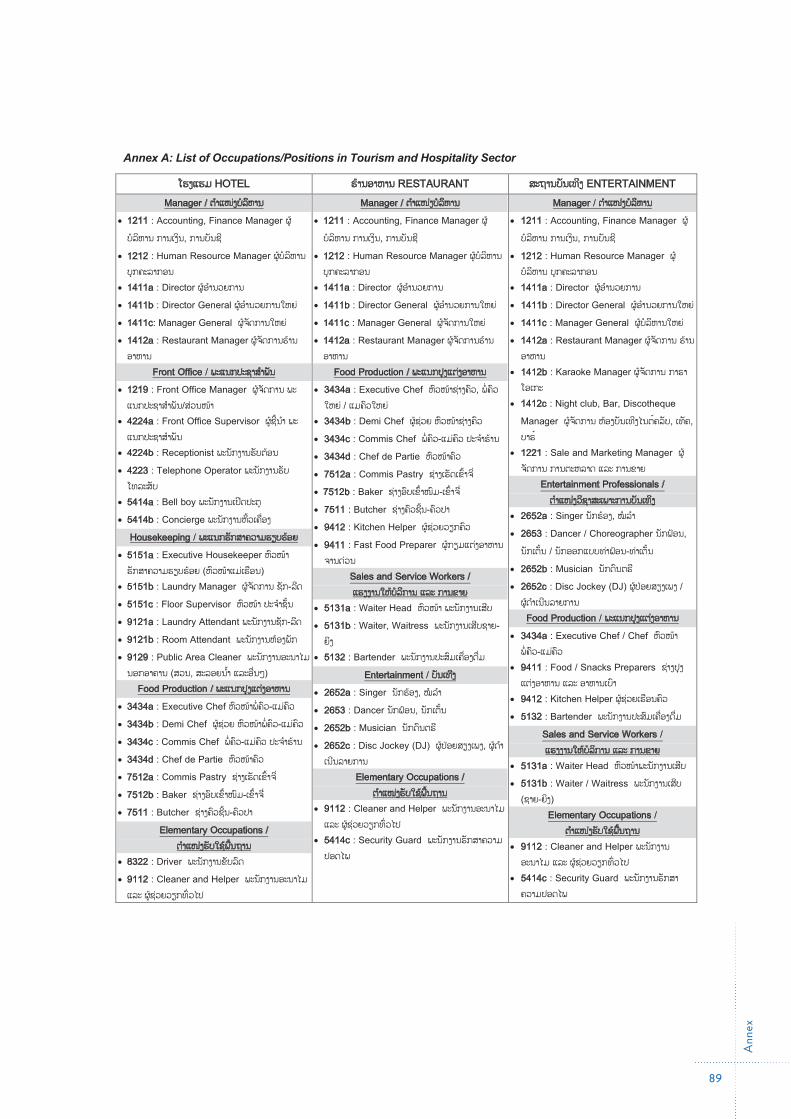
Ann
ex
89
9 | P a g e
Annex A: List of Occupations/Positions in Tourism and Hospitality Sector
ໂຮງແຮມ HOTEL ຮ້ານອາຫານ RESTAURANT ສະຖານບນັເທີງ ENTERTAINMENT Manager / ຕໍາແໜງ່ບລໍຫິານ
• 1211 : Accounting, Finance Manager ຜ ້ບໍລິຫານ ການເງິນ, ການບັນຊີ
• 1212 : Human Resource Manager ຜ ້ບໍລິຫານ ບຸກຄະລາກອນ
• 1411a : Director ຜ ້ອໍານວຍການ • 1411b : Director General ຜ ້ອໍານວຍການໃຫຍ່ • 1411c: Manager General ຜ ້ຈັດການໃຫຍ່ • 1412a : Restaurant Manager ຜ ້ຈັດການຮ້ານອາຫານ
Front Office / ພະແນກປະຊາສາໍພນັ • 1219 : Front Office Manager ຜ ້ຈັດການ ພະແນກປະຊາສໍາພັນ/ສ່ວນໜ້າ
• 4224a : Front Office Supervisor ຜ ້ຊີີ້ນໍາ ພະແນກປະຊາສໍາພັນ
• 4224b : Receptionist ພະນັກງານຮັບຕ້ອນ • 4223 : Telephone Operator ພະນັກງານຮັບໂທລະສັບ
• 5414a : Bell boy ພະນັກງານເປີດປະຕ • 5414b : Concierge ພະນັກງານຫິີ້ວເຄ ື່ອງ
Housekeeping / ພະແນກຮກັສາຄວາມຮຽບຮອ້ຍ • 5151a : Executive Housekeeper ຫົວໜ້າ ຮັກສາຄວາມຮຽບຮ້ອຍ (ຫົວໜ້າແມ່ເຮ ອນ)
• 5151b : Laundry Manager ຜ ້ຈັດການ ຊັກ-ລີດ • 5151c : Floor Supervisor ຫົວໜ້າ ປະຈໍາຊັີ້ນ • 9121a : Laundry Attendant ພະນັກງານຊັກ-ລີດ • 9121b : Room Attendant ພະນັກງານຫ້ອງພັກ • 9129 : Public Area Cleaner ພະນັກງານອະນາໄມນອກອາຄານ (ສວນ, ສະລອຍນໍໍ້າ ແລະອ ື່ນໆ)
Food Production / ພະແນກປງຸແຕງ່ອາຫານ • 3434a : Executive Chef ຫົວໜ້າພໍໍ່ຄົວ-ແມ່ຄົວ • 3434b : Demi Chef ຜ ້ຊ່ວຍ ຫົວໜ້າພໍໍ່ຄົວ-ແມ່ຄົວ • 3434c : Commis Chef ພໍໍ່ຄົວ-ແມ່ຄົວ ປະຈໍາຮ້ານ • 3434d : Chef de Partie ຫົວໜ້າຄົວ • 7512a : Commis Pastry ຊ່າງເຮັດເຂົີ້າຈີື່ • 7512b : Baker ຊ່າງອົບເຂົີ້າໜົມ-ເຂົີ້າຈີື່ • 7511 : Butcher ຊ່າງຄົວຊີີ້ນ-ຄົວປາ
Elementary Occupations / ຕໍາແໜງ່ຮບັໃຊພ້ ີ້ນຖານ
• 8322 : Driver ພະນັກງານຂັບລົດ • 9112 : Cleaner and Helper ພະນັກງານອະນາໄມ ແລະ ຜ ້ຊ່ວຍວຽກທົົ່ວໄປ
Manager / ຕໍາແໜງ່ບລໍຫິານ • 1211 : Accounting, Finance Manager ຜ ້ບໍລິຫານ ການເງິນ, ການບັນຊີ
• 1212 : Human Resource Manager ຜ ້ບໍລິຫານ ບຸກຄະລາກອນ
• 1411a : Director ຜ ້ອໍານວຍການ • 1411b : Director General ຜ ້ອໍານວຍການໃຫຍ່ • 1411c : Manager General ຜ ້ຈັດການໃຫຍ່ • 1412a : Restaurant Manager ຜ ້ຈັດການຮ້ານອາຫານ
Food Production / ພະແນກປງຸແຕງ່ອາຫານ • 3434a : Executive Chef ຫົວໜ້າຊ່າງຄົວ, ພໍໍ່ຄົວໃຫຍ່ / ແມຄົວໃຫຍ່
• 3434b : Demi Chef ຜ ້ຊ່ວຍ ຫົວໜ້າຊ່າງຄົວ • 3434c : Commis Chef ພໍໍ່ຄົວ-ແມ່ຄົວ ປະຈໍາຮ້ານ • 3434d : Chef de Partie ຫົວໜ້າຄົວ • 7512a : Commis Pastry ຊ່າງເຮັດເຂົີ້າຈີື່ • 7512b : Baker ຊ່າງອົບເຂົີ້າໜົມ-ເຂົີ້າຈີື່ • 7511 : Butcher ຊ່າງຄົວຊີີ້ນ-ຄົວປາ • 9412 : Kitchen Helper ຜ ້ຊ່ວຍວຽກຄົວ • 9411 : Fast Food Preparer ຜ ້ກຽມແຕ່ງອາຫານຈານດ່ວນ
Sales and Service Workers / ແຮງງານໃຫບ້ລໍກິານ ແລະ ການຂາຍ
• 5131a : Waiter Head ຫົວໜ້າ ພະນັກງານເສີບ • 5131b : Waiter, Waitress ພະນັກງານເສີບຊາຍ-ຍິງ
• 5132 : Bartender ພະນັກງານປະສມົເຄ ື່ອງດ ື່ມ Entertainment / ບນັເທງີ
• 2652a : Singer ນັກຮ້ອງ, ໝໍລໍາ • 2653 : Dancer ນັກຟ້ອນ, ນັກເຕັີ້ນ • 2652b : Musician ນັກດົນຕຣີ • 2652c : Disc Jockey (DJ) ຜ ້ປ່ອຍສຽງເພງ, ຜ ້ດໍາເນີນລາຍການ
Elementary Occupations / ຕໍາແໜງ່ຮບັໃຊພ້ ີ້ນຖານ
• 9112 : Cleaner and Helper ພະນັກງານອະນາໄມ ແລະ ຜ ້ຊ່ວຍວຽກທົົ່ວໄປ
• 5414c : Security Guard ພະນັກງານຮັກສາຄວາມປອດໄພ
Manager / ຕໍາແໜງ່ບລໍຫິານ • 1211 : Accounting, Finance Manager ຜ ້
ບໍລິຫານ ການເງິນ, ການບັນຊີ • 1212 : Human Resource Manager ຜ ້
ບໍລິຫານ ບຸກຄະລາກອນ • 1411a : Director ຜ ້ອໍານວຍການ • 1411b : Director General ຜ ້ອໍານວຍການໃຫຍ່ • 1411c : Manager General ຜ ້ບໍລິຫານໃຫຍ່ • 1412a : Restaurant Manager ຜ ້ຈັດການ ຮ້ານ
ອາຫານ • 1412b : Karaoke Manager ຜ ້ຈັດການ ກາຣາ
ໂອເກະ • 1412c : Night club, Bar, Discotheque
Manager ຜ ້ຈັດການ ຫ້ອງບັນເທີງໄນຕ໌ຄລັບ, ເທັຄ, ບາຣ໌
• 1221 : Sale and Marketing Manager ຜ ້ຈັດການ ການຕະຫລາດ ແລະ ການຂາຍ
Entertainment Professionals / ຕໍາແໜງ່ວຊິາສະເພາະການບນັເທງິ
• 2652a : Singer ນັກຮ້ອງ, ໝໍລໍາ • 2653 : Dancer / Choreographer ນັກຟ້ອນ,
ນັກເຕັີ້ນ / ນັກອອກແບບທ່າຟ້ອນ-ທ່າເຕັີ້ນ • 2652b : Musician ນັກດົນຕຣີ • 2652c : Disc Jockey (DJ) ຜ ້ປ່ອຍສຽງເພງ /
ຜ ້ດໍາເນີນລາຍການ Food Production / ພະແນກປງຸແຕງ່ອາຫານ
• 3434a : Executive Chef / Chef ຫົວໜ້າພໍໍ່ຄົວ-ແມ່ຄົວ
• 9411 : Food / Snacks Preparers ຊ່າງປຸງແຕ່ງອາຫານ ແລະ ອາຫານເບົາ
• 9412 : Kitchen Helper ຜ ້ຊ່ວຍເຮ ອນຄົວ • 5132 : Bartender ພະນັກງານປະສມົເຄ ື່ອງດ ື່ມ
Sales and Service Workers / ແຮງງານໃຫບ້ລໍກິານ ແລະ ການຂາຍ
• 5131a : Waiter Head ຫົວໜ້າພະນັກງານເສີບ • 5131b : Waiter / Waitress ພະນກັງານເສີບ
(ຊາຍ-ຍິງ) Elementary Occupations /
ຕໍາແໜງ່ຮບັໃຊພ້ ີ້ນຖານ • 9112 : Cleaner and Helper ພະນັກງານ
ອະນາໄມ ແລະ ຜ ້ຊ່ວຍວຽກທົົ່ວໄປ • 5414c : Security Guard ພະນັກງານຮັກສາ
ຄວາມປອດໄພ
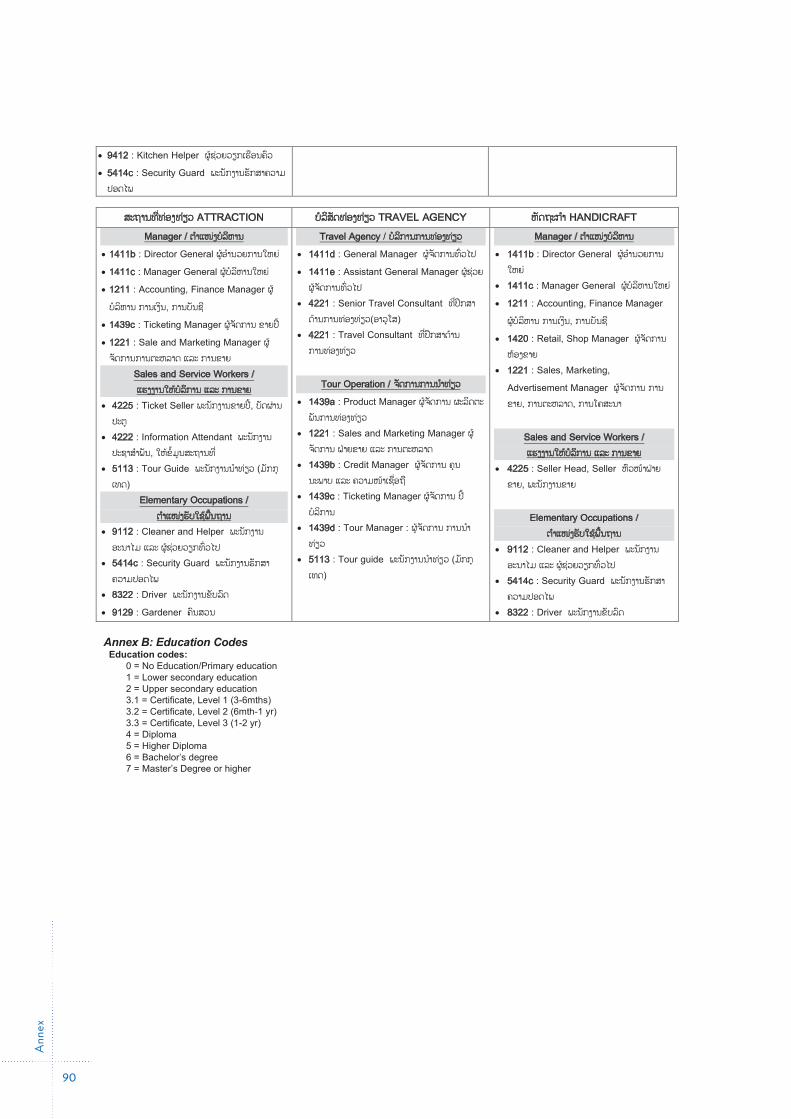
Ann
ex
90
10 | P a g e
• 9412 : Kitchen Helper ຜ ້ຊ່ວຍວຽກເຮ ອນຄົວ • 5414c : Security Guard ພະນັກງານຮັກສາຄວາມປອດໄພ
ສະຖານທີື່ທອ່ງທຽ່ວ ATTRACTION ບລໍິສດັທອ່ງທຽ່ວ TRAVEL AGENCY ຫັດຖະກາໍ HANDICRAFT Manager / ຕໍາແໜງ່ບລໍຫິານ
• 1411b : Director General ຜ ້ອໍານວຍການໃຫຍ່ • 1411c : Manager General ຜ ້ບໍລຫິານໃຫຍ່ • 1211 : Accounting, Finance Manager ຜ ້ບໍລິຫານ ການເງິນ, ການບັນຊີ
• 1439c : Ticketing Manager ຜ ້ຈັດການ ຂາຍປີີ້ • 1221 : Sale and Marketing Manager ຜ ້ຈັດການການຕະຫລາດ ແລະ ການຂາຍ
Sales and Service Workers / ແຮງງານໃຫບ້ລໍກິານ ແລະ ການຂາຍ
• 4225 : Ticket Seller ພະນັກງານຂາຍປີີ້, ບັດຜ່ານປະຕ
• 4222 : Information Attendant ພະນັກງານ ປະຊາສໍາພັນ, ໃຫ້ຂໍໍ້ມ ນສະຖານທີື່
• 5113 : Tour Guide ພະນັກງານນໍາທ່ຽວ (ມັກກຸເທດ)
Elementary Occupations / ຕໍາແໜງ່ຮບັໃຊພ້ ີ້ນຖານ
• 9112 : Cleaner and Helper ພະນັກງານອະນາໄມ ແລະ ຜ ້ຊ່ວຍວຽກທົົ່ວໄປ
• 5414c : Security Guard ພະນັກງານຮັກສາຄວາມປອດໄພ
• 8322 : Driver ພະນັກງານຂັບລົດ • 9129 : Gardener ຄົນສວນ
Travel Agency / ບລໍກິານການທອ່ງທຽ່ວ • 1411d : General Manager ຜ ້ຈັດການທົົ່ວໄປ • 1411e : Assistant General Manager ຜ ້ຊ່ວຍ
ຜ ້ຈັດການທົົ່ວໄປ • 4221 : Senior Travel Consultant ທີື່ປຶກສາ
ດ້ານການທ່ອງທ່ຽວ(ອາວຸໂສ) • 4221 : Travel Consultant ທີື່ປຶກສາດ້ານ
ການທ່ອງທ່ຽວ
Tour Operation / ຈດັການການນາໍທຽ່ວ • 1439a : Product Manager ຜ ້ຈັດການ ຜະລິດຕະ
ພັນການທ່ອງທ່ຽວ • 1221 : Sales and Marketing Manager ຜ ້
ຈັດການ ຝ່າຍຂາຍ ແລະ ການຕະຫລາດ • 1439b : Credit Manager ຜ ້ຈັດການ ຄຸນ
ນະພາບ ແລະ ຄວາມໜ້າເຊ ື່ອຖ • 1439c : Ticketing Manager ຜ ້ຈັດການ ປີີ້
ບໍລິການ • 1439d : Tour Manager : ຜ ້ຈັດການ ການນໍາ
ທ່ຽວ • 5113 : Tour guide ພະນັກງານນໍາທ່ຽວ (ມັກກຸ
ເທດ)
Manager / ຕໍາແໜງ່ບລໍຫິານ • 1411b : Director General ຜ ້ອໍານວຍການ
ໃຫຍ່ • 1411c : Manager General ຜ ້ບໍລິຫານໃຫຍ່ • 1211 : Accounting, Finance Manager
ຜ ້ບໍລິຫານ ການເງິນ, ການບັນຊີ • 1420 : Retail, Shop Manager ຜ ້ຈັດການ
ຫ້ອງຂາຍ • 1221 : Sales, Marketing,
Advertisement Manager ຜ ້ຈັດການ ການຂາຍ, ການຕະຫລາດ, ການໂຄສະນາ
Sales and Service Workers / ແຮງງານໃຫບ້ລໍກິານ ແລະ ການຂາຍ
• 4225 : Seller Head, Seller ຫົວໜ້າຝ່າຍຂາຍ, ພະນັກງານຂາຍ
Elementary Occupations /
ຕໍາແໜງ່ຮບັໃຊພ້ ີ້ນຖານ • 9112 : Cleaner and Helper ພະນັກງານ
ອະນາໄມ ແລະ ຜ ້ຊ່ວຍວຽກທົົ່ວໄປ • 5414c : Security Guard ພະນັກງານຮັກສາ
ຄວາມປອດໄພ
• 8322 : Driver ພະນັກງານຂັບລົດ Annex B: Education Codes
Education codes: 0 = No Education/Primary education 1 = Lower secondary education 2 = Upper secondary education 3.1 = Certificate, Level 1 (3-6mths) 3.2 = Certificate, Level 2 (6mth-1 yr) 3.3 = Certificate, Level 3 (1-2 yr) 4 = Diploma 5 = Higher Diploma 6 = Bachelor’s degree 7 = Master’s Degree or higher

Tourism and Hospitality Enterprise Survey of Employment and Skills in Lao PDR, 2021: Research Findings and Employment Projections, 2021-2026
Skills for Tourism Project (LAO/029) Co-financed by the Governments of Lao PDR, the Grand Duchy of Luxembourg and Switzerland, and implemented by the Ministry of Education and Sports of Lao PDR and LuxDev, the Luxembourg Development Cooperation Agency.


