Embed Size (px)
Citation preview

Applied Geochemistry 24 (2009) 16–31
Contents lists available at ScienceDirect
Applied Geochemistry
journal homepage: www.elsevier .com/locate /apgeochem
Salinization processes in the unconfined aquifer of Bou-Areg (NE Morocco):A geostatistical, geochemical, and tomographic study
F. El Yaouti a,*, A. El Mandour b, D. Khattach a, J. Benavente c, O. Kaufmann d
a Laboratory of LGA, Faculty of Sciences, University Mohammed I, Oriental Center of Water Science and Technology (COSTE), P.B. 524, Oujda, Moroccob Laboratory of Hydrogeology, Faculty of Sciences Semlalia, University Cadi Ayyad, P.B. 2390, Marrakech, Moroccoc Water Research Institute, University of Granada, Ramon y Cajal, 4, 18071 Granada, Spaind Polytechnic Faculty of Mons, Service of Fundamental and Applied Geology, Mons, Belgium
a r t i c l e i n f o
Article history:Received 11 January 2008Accepted 23 October 2008Available online 5 November 2008
Editorial handling by R. Fuge
0883-2927/$ - see front matter � 2008 Elsevier Ltd. Adoi:10.1016/j.apgeochem.2008.10.005
* Corresponding author.E-mail addresses: [email protected] (F. El Yaout
(A. El Mandour), [email protected] (D. Khattach), jb
a b s t r a c t
Hydrogeological and geochemical data, in conjunction with the results of an electrical imaging tomo-graphic survey, were examined to determine the main factors and mechanisms controlling the ground-water chemistry and salinity of the unconfined aquifer of Bou-Areg, on the Mediterranean coast of NEMorocco. In addition, statistical and geochemical interpretation methods were used to identify the distri-bution of the salinity. Multivariate statistical analysis (cluster and principal component factors) revealedthe main sources of contamination. Groups A, B, and C in the cluster analysis and Factors 1–3 (Factor 1:CE, Cl�, K+, SO2�
4 , and Mg2+; Factor 2: Ca2+, HCO�3 , and pH; Factor 3: NO�3 ) represent the ‘signature’ of sea-water intrusion in the coastal zone, the influence of marly-gypsum outcrops in the upstream zone, andanthropogenic sources, respectively. The ionic delta, the ionic ratio, the saturation index, and Stuyfzand’smethod were applied to evaluate geochemical processes. The results obtained indicate, on the one hand,the phenomenon of salinization in both the coastal and the upstream zones, and on the other, the dilutionof groundwater by recharge. Cation exchange is shown to modify the concentration of ions in groundwa-ter. Locally, with respect to salinization processes in the coastal zone, the results of electrical imagingtomography show that salinity increases both with depth and laterally inland from the coastline, dueto seawater intrusion.
� 2008 Elsevier Ltd. All rights reserved.
1. Introduction
Groundwater in coastal areas is vulnerable to salinization byseawater, which can make it unfit for drinking or agriculturaluse; moreover, groundwater salinization can be increased by nat-ural processes and anthropogenic factors. The latter is a commonphenomenon affecting Mediterranean groundwater (Capaccioniaet al., 2005; Custodio, 1987; Dörfliger, 2003; El Baruni, 1995; ElMandour et al., 2006, 2008; Ferrara and Pappalardo, 2004; Grassiand Netti, 2000; Lambrakis et al., 1997; Petalas and Diamantis,1999; Vincenzo and Giovanna, 2003). Generally, fresh groundwaterthat is not affected by pollution is characterized by low values ofEC and Ca–Mg–HCO3 water type. The latter represents freshwaterthat has recently infiltrated into the zone of recharge, while theEC shows a gradual increase from the uplands recharge areastowards the lowlands discharge areas. Along the coastline, highvalues of EC are usually attributed to salinization by seawaterintrusion (Stamatis and Voudouris, 2003). However, there are
ll rights reserved.
i), [email protected]@ugr.es (J. Benavente).
cases where salinization is due to the presence of connate fossilwaters (Worden et al., 2006). According to Appelo and Postma(1996), some water types characterise salt groundwater: Na–Cldominant type, Ca–Cl, indicating the seawater intrusion process,and Na–Mg–Cl–SO4, representing a mixed water type. Water–rockinteraction can alter groundwater; high-SO2�
4 concentrations canbe associated with the dissolution of gypsum, which occurs in wes-tern Greece (Diamantopoulou, 1999). In addition, groundwater isaffected by anthropogenic factors; NO�3 pollution can be attributedto different sources, the most important of which are the uncon-trolled application of fertilizers, untreated domestic effluent intoabandoned wells, and the disposal of domestic and industrialwastewater.
Cation exchange is another factor modifying groundwater qual-ity and is one of the most important geochemical processes takingplace in aquifers. In coastal aquifers, where the relationship be-tween seawater and fresh water is complex, cation exchange con-tributes significantly to the final composition of the groundwater.In detrital sedimentary aquifers, cation exchange is one of the mostimportant geochemical processes of seawater intrusion (Cardonaet al., 2004). The characteristic cation-exchange process that takesplace when seawater intrudes a coastal fresh water aquifer (Appeloand Postma, 1996) is

F. El Yaouti et al. / Applied Geochemistry 24 (2009) 16–31 17
2Naþ ðCa1�xMgxÞ � X! ð1� xÞCaþ xMgþ Na2 � Xð0 6 x P 1Þð1Þ
where X indicates the exchanging solid surface.The reverse process takes place with freshening, i.e., when fresh
water intrudes a salt water aquifer:
ð1� xÞCaþ xMgþ Na2 � X! ðCa1�xMgxÞ � Xþ 2Nað0 6 x 6 1Þð2Þ
The freshwater resources of the Bou-Areg plain, located on theMediterranean coast of NE Morocco (Fig. 1), are mainly composedof groundwater and the Selouane River. The groundwater is af-fected by the above-described phenomenon of salinization (ElMandour et al., 2006, 2007) and the Selouane River, which crossesthe central plain of Bou-Areg and ends in the Bou-Areg lagoon, ischaracterized by very high salinity, with an average electrical con-ductivity of 9060 lS/cm in December 2006. The study area is bor-dered in the lowlands by the lagoon of Nador; the water of thislagoon is very saline, with an average salt content that has rangedbetween 37 g/L and 42 g/L over the last 30 a (Dakki et al., 2000).The study area has long been used for agriculture, and both riverwater and groundwater are exploited for irrigation. However, sincethe groundwater is severely affected by salinization, most waterextracted for agriculture depends on the river water irrigation sys-tem. Nevertheless, the groundwater salinization may have beencaused by natural processes rather then excessive pumping. Otherimportant factors such as cation exchange and agricultural fertiliz-ers, however, should also be considered. The population of the re-gion has increased significantly, following remarkable economicdevelopment in sectors such as agro-food, textiles, chemistry,parachemistry, and steel (the last being based upon nearby ironmines in Sghanghan and Ouksan). In addition, various projects re-lated to aquaculture (fish, oysters, shrimp, clams) have been set upin the Nador lagoon since 1982. Taking into account this economicdevelopment and demographic extension, a study of the ground-water quality is essential for future management and to preventthe deterioration.
Different methods have been used to study groundwater salini-zation and pollution. The evaluation of seawater intrusion has beendealt with through different approaches. Some authors (i.e., Hidalgo
Fig. 1. Location map and geologic framework
and Gruz-Sanjuhan, 2001; Jalali, 2007) have employed only geo-chemical methods based on variations of salinity and cation and an-ion concentrations, while others have introduced both geophysicaland geochemical approaches to obtain a more comprehensive pic-ture of this phenomenon (Cimino et al., 2008; Lee et al., 2001).Other authors have used multivariate statistical techniques, suchas factor analysis (FA) and cluster analysis (CA) (i.e., Liu et al.,2003; Kim et al., 2003), to discuss geochemical evolution, mineral-ization, and groundwater contamination.
A research project was undertaken with the objectives of deter-mining the hydrodynamic behavior of the groundwater and identi-fying and evaluating the main factors affecting groundwaterquality. To accomplish these goals, statistical methods were usedto classify and characterize groundwater quality. Stuyfzand’smethod, ionic ratios, ionic deltas, saturation indexes, and othergeochemical methods of analysis were used to evaluate the sourcesof salinization. In order to test the reliability of the electrical imag-ing tomography method to characterize subsurface geological for-mations and to detect possible saline water intrusion, geophysicalsurveys were carried out in an area for which lithological boreholedata were already available.
2. Geological and hydrogeological setting
The coastal plain of Bou-Areg covers a surface area of 190 km2
(Fig. 1), bounded to the NW and W by the Gourougou and Ibn-Bou-Ifrour massifs and to the E by the Kebdana range. The northernpart of the plain coincides with the arched shape of the Bou-Areglagoon, also termed the Nador lagoon. To the S, it is bounded bythe Selouane passage that connects it to the Gareb plain. The cli-mate of the region is semi-arid, typically Mediterranean, withirregular annual rainfall; the average annual precipitation isaround 346 mm.
North-Eastern Morocco, which includes the Bou-Areg basin,experienced the most recent marine transgression during the low-er Pliocene. This transgression is characterized by marly deposits.After the retreat of the sea in the Villafranchien period, an exten-sive tectonic regime dominated by strong E–W extension (Morel,1989) caused subsidence of the Bou-Areg basin. Thus, a laguno-lacustrine regime and continental sedimentation characterizes
of the coastal Bou-Areg plain of Morocco.

18 F. El Yaouti et al. / Applied Geochemistry 24 (2009) 16–31
the region. The sedimentation exceeded a depth of 80 m, and con-sists of clay, marls, silts, lacustrine limestone, and is associatedwith coarse elements of varied lithologies. Given that the Quater-nary deposits were accompanied by tectonics, the sedimentationhas been disturbed in this zone. In fact, some 30 boreholes havebeen drilled, revealing various sedimentary features, including lay-ers and lenses. In terms of hydrogeological properties, these depos-its are characterized by different degrees of permeability, inaccordance with the grain size. It is possible to distinguish threeprincipal formations. Formation 1 forms the upper layer, madeup of fine materials with low permeability, including silts, clayeysilts, encrusted limestones and marly-calcareous tufa that maycontain gravels. Formation 2 is the bottom of the aquifer reservoir,grouping coarser elements with high permeability, such as peb-bles, gravels of volcanic or sedimentary origin, and sands. Forma-tion 3, which is reached by some boreholes, contains gypsiferousmarls of Pliocene age. This formation represents the imperviousbed to the upper Quaternary aquifer, dipping towards the lagoon.Thus, the Plio-Quaternary formations of Bou-Areg basin form anunconfined aquifer limited on the bottom by the Pliocene substra-tum of gypsiferous marls.
The Selwane formation (Fig. 1), attributed to the upperMessinian, consists of marls and intercalations of marly-limestone.The series is completed by marly-limestone with occasional inter-calations of lagoon sediments. The Bou-Areg depression forms partof the Melilla-Nador Basin, one of the Mediterranean areas affectedduring the Late Miocene by the rapid and dramatic palaeoenviron-mental change known as the Messinian Salinity Crisis (Hsü et al.,1973). This event was characterized by the deposition of thickevaporite materials in both peripheral and deep basins. It startedat about 5.96 Ma (Lourens et al., 1996; Krijgsman et al., 1999), asa result of the closure of marine gateways between the Atlanticand the Mediterranean (Benson et al., 1991). This episode explainsthe existence of gypsiferous marls in Formation 3.
The plain is surrounded by geological formations with variousfacies (El Mandour et al., 2007) (Fig. 1). The Gourougou massif, bor-dering the plain to the NE and reaching a height of 887 m a.s.l., is astrato-volcano formed by three types of volcanic eruptions: (1)calc-alkaline (potassic trend); (2) intermediate (shoshonites,
Fig. 2. Potentiometric map of the Bou-Areg
trachytes, and latites); and (3) alkali (basalt–sodium trend)(Barathon, 1989; Gill et al., 2004; Hernandez and Bellon, 1985).These volcanic events took place between the Messinian and thePlio-Quaternary (Morel, 1985). Although the primary porosity ofthe volcanic rocks is very low, tectonic activity has resulted in sec-ondary porosity (fissured igneous rocks), which gives rise to a sig-nificant increase in permeability. Therefore, the volcanic rocksprovide a suitable context for recharging and storing groundwater,and a sufficient quantity of water is obtained from the Bou-Aregplain, especially the Sghanghan region to the south of Gourougou.South of the Gourougou massif, the plain is bordered by the Ibn-bou-Ifrour complex (699 m a.s.l.), which is mainly composed ofJurassic deposits (limestone, limestone–sandstone and marls) andCretaceous deposits (schisto-sandstone and volcano-sedimentaryrocks). All of these are covered by the Miocene molasses. Part ofthe massif is crossed by micro-granodiorite veins, associated withhydrothermal mineralization (El Bakkali, 1995), resulting in thepresence of Fe ore (Jbel Ouchxane).
The eastern boundary is defined by the Kebdana heights (937 ma.s.l.), where the deposits consist of Jurassic formations (marls andmarly-limestones, sandstone, limestone–sandstone, limestone anddolomite-limestone) overlain locally by Miocene formations (lime-stone and marls) (Bloundi, 2005). Towards the Bou-Areg plain, theKebdana range (Fig. 1) is made up of Villafranchian and recentQuaternary rocks (limestone, conglomerates, gravels, and silts).The Neogene post-nappe unit (Fig. 1) is comprised of marls, bedsof sand and conglomerate levels.
Generally, the aquifer has good hydrodynamic characteristics(El Mandour et al., 2006, 2007). The highest permeability values,reaching 7 � 10�4 m/s, are found in the vicinity of the lagoon andin the western zone. Lower values are found at the borders of theKebdana massif. Transmissivity varies continuously from upstreamto the coastal zone, ranging from 9 � 10�4 to 2 � 10�2 m2/s. Thehighest values are found in the west (north of the plain), whereasthe lowest are measured at the borders of the Kebdana massif,probably due to the accumulation of marls. All along the coast,the transmissivity varies around 2 � 10�2 m2/s. The potentiometricmap obtained in December 2006 (Fig. 2) shows a general SW–NEgroundwater flow, toward the lagoon, which forms the main outlet
unconfined aquifer (December 2006).

F. El Yaouti et al. / Applied Geochemistry 24 (2009) 16–31 19
of the aquifer. Except for the upstream part of the aquifer, thehydraulic gradients are generally low (2–5‰).
3. Materials and methods
3.1. Sampling and analysis
Hydrogeological information was gathered from a samplingnetwork set up in December 2006. As access to the wells is not en-tirely allowed by the population due to rite and private customs,only 41 wells were sampled. A sample of sea water was alsoanalyzed.
The temperature, pH, and electrical conductivity (EC) weremeasured in the field. Chemical analyses of Na+, Mg2+, HCO�3 , Cl�,SO2�
4 , K+ and NO�3 were carried out in the laboratory of theMoulouya Water Basin Agency Oujda, using standard analyticalprocedures. Chloride, Ca2+, CO2�
3 , HCO�3 and Mg2+ were determinedby titrimetric methods. Atomic absorption spectrophotometry wasused to measure the concentrations of Na+, K+, NO�3 and sO2�
4 . Thequality of the chemical analyses was carefully inspected by check-ing ion balances. The chemical analyses were tested for chargebalance error according to (Freeze and Cherry, 1979):
%Charge Balance Error ¼P
z �mc �P
z �maPz �mc þ
Pz �ma
� 100 ð3Þ
where z is the absolute value of the ionic valence, mc is the molalityof cationic species, and ma is the molality of the anionic species.
Table 1Physico-chemical results (ionic contents in mg/L) of the water sample analysis of Bou-Aregconductivity (in ls/cm).
Wells Depth of samples (m) T (�C) pH CE Cl
V2 18.7 21.0 7.6 21000.0 7797.6V3 18 21.0 7.4 9560.0 3039.1V4 7.9 21.7 7.3 9260.0 2779.1V5 12 21.5 7.6 13550.0 4318.7V6 16 19.8 7.5 3400.0 529.8V7 4.5 18.5 8.1 7620.0 1989.4V8 6 19.8 7.9 4900.0 899.7V9 12 20.3 7.8 4000.0 587.8V10 4 4.8 7.9 5430.0 1055.7V11 20.2 22.1 7.5 4180.0 601.8V12 8.7 19.8 7.6 3320.0 497.9V13 6.2 21.4 8.1 2550.0 463.9V14 8.3 18.4 7.7 8390.0 2539.2V15 10 20.5 7.4 6120.0 1624.5V16 11 19.7 8.0 5370.0 949.7V17 22.2 18.9 7.8 13140.0 4878.5V18 22.8 18.2 8.2 3950.0 831.7V19 17.5 20.2 8.3 4180.0 683.8V20 14.7 19.6 7.7 4910.0 969.7V21 6.2 20.5 8.2 3190.0 609.8V23 15.4 20.2 8.0 4520.0 927.7V24 5.4 19.3 8.0 6850.0 1879.4V25 12.4 20.3 7.6 7550.0 2179.3V26 15.3 20.7 8.0 6870.0 1749.5V27 15 18.4 7.7 4640.0 891.7V28 12.9 20.5 7.4 9650.0 3049.1V29 12.3 26.6 7.7 7370.0 2289.3V30 19.6 20.0 8.0 3630.0 507.8V31 32.1 21.4 8.0 6200.0 1599.5V33 35 19.5 8.5 2610.0 445.9V34 29 21.2 8.2 6210.0 1549.5V35 2.5 22.0 7.4 16080.0 5358.3V36 3.6 20.5 8.1 5470.0 1199.6V37 6 18.0 8.3 5100.0 999.7V38 4.5 20.8 7.8 6420.0 1639.5V39 3.3 19.7 7.7 7080.0 1789.5V40 9.5 18.3 8.1 6170.0 1579.5V41 8.2 17.9 7.5 7730.0 2189.3Lagoon – 16.2 8.3 53700.0 20993.5
Calculated charge balance errors are less than or equal to ±10%,which is an acceptable error for the purpose of this study.
3.2. Statistical analysis
Ten hydrochemical variables (including EC, Cl�, Na+, Mg2+,HCO�3 , SO2�
4 , K+, Ca2+, HCO�3 and pH), and 41 samples were analyzedusing multivariate statistical techniques. The values of the differ-ent variables (Table 1) were standardized prior to the multivariateanalyses. The standardization step tends to minimize the influenceof the difference of variance in variables, eliminates the influenceof different units of measurement, and makes the data dimension-less (Liu et al., 2003). P variables were denoted x1; x2 . . . xp in Table1, each with N observations. The jth observation of the ith variableis Xi,j and indicates the original value of the measured parameter,where i = 1. . ..P and j = 1. . .N.. The standardized value Zij is com-puted from the N observations of the ith variable and the meanand standard xm and Si, respectively:
Zij ¼Xij � xm
Sið4Þ
where the mean and variance of Zij are zero and one, respectively,for all values of i.
Hierarchical Cluster Analysis (HCA) and Principal ComponentsAnalysis (PCA) were used for the multivariate analysis.
HCA is a powerful tool for analyzing water chemistry data(Reeve et al., 1996). In this method, samples are grouped into dis-
groundwater (December 2006), and depth of samples for each samples. EC: electrical
NO3 HCO3 SO4 Na K Mg Ca
2.3 347.7 1473.9 3000.0 83.3 797.0 416.812.5 390.4 576.3 1580.0 19.7 293.5 355.944.9 463.6 805.8 1660.0 13.0 198.3 413.668.8 408.7 1173.0 2080.0 18.0 337.8 248.520.1 524.6 616.1 840.0 9.7 63.2 32.175.8 585.6 642.6 1480.0 28.0 116.6 121.831.7 725.9 814.0 1060.0 24.7 90.4 115.480.0 542.9 891.5 900.0 19.7 56.4 58.589.9 542.9 948.6 1080.0 27.0 50.5 208.4
8.0 695.4 514.1 860.0 15.3 48.6 112.2172.4 494.1 667.1 400.0 7.3 34.0 423.2
18.8 298.9 461.0 440.0 18.7 20.9 125.132.3 359.9 856.8 1440.0 22.0 217.7 256.528.9 469.7 561.0 1040.0 19.0 134.1 230.983.4 732.0 963.9 1300.0 17.3 46.7 102.613.1 256.2 1387.2 2400.0 21.3 165.2 649.374.3 366.0 605.9 960.0 8.7 50.5 64.169.0 610.0 750.7 1100.0 11.3 22.4 41.749.2 585.6 969.0 1140.0 8.7 80.7 115.420.3 549.0 795.6 900.0 8.7 34.0 32.171.1 707.6 642.6 980.0 18.0 49.6 51.340.5 457.5 770.1 1180.0 22.0 153.6 221.243.3 366.0 260.1 1180.0 20.7 184.7 218.055.5 732.0 1086.3 1420.0 18.0 83.6 70.5
133.4 854.0 567.1 960.0 19.3 25.3 160.333.3 573.4 984.3 1480.0 18.0 200.2 304.650.4 591.7 714.0 1260.0 18.7 155.5 243.718.2 768.6 750.7 700.0 23.0 93.3 89.822.8 488.0 861.9 1200.0 17.3 116.6 96.225.1 579.5 605.9 740.0 11.3 30.1 48.128.9 579.5 963.9 1360.0 17.7 75.8 51.319.2 549.0 1086.3 2280.0 33.0 393.7 352.745.8 610.0 943.5 1020.0 83.3 165.2 96.260.4 671.0 1076.1 1080.0 20.3 116.6 96.231.2 677.1 1045.5 1220.0 83.3 165.2 125.123.8 683.2 76.5 1160.0 250.0 165.2 144.318.8 433.1 714.0 1220.0 27.3 153.6 131.5
160.4 427.0 612.0 1260.0 29.0 210.0 246.99.9 170.8 3468.0 9800.0 368.0 1234.4 741.5

Table 3Loading of the components obtained from principal component analysis, with twofactors: Eigenvalue derived by factor analysis, and cumulative% explained by factors.
F1 F2 F3
pH 0.007 0.761 0.057CE 0.396 0.022 0.064Cl� 0.397 0.017 0.046NO3
� �0.120 �0.145 0.942HCO3
� �0.235 0.336 0.245SO4
2� 0.353 0.197 0.138Na+ 0.389 0.116 0.086K+ 0.310 0.234 0.065Ca2+ 0.313 �0.421 0.106Mg2+ 0.382 �0.040 �0.023Eigen value 6.270 1.385 0.955% Cumulative 62.700 76.546 86.094
Table 4Hydrochemical classification (Stuyfzand, 1986).
Classification Units Limits Code
<150 F: freshMain type Cl (mg/L) 150–300 Fb: fresh-
brackish300–1000 B: brackish1000–10,000
Bs: brackish-salt
0–½ *
½–1 01–2 12–4 24–8 3
Type (total hardness) Ca + Mg (meq/L)
8–16 4
16–32 532–64 664–128 7128–256 8> 256 9
Class meq/L 0 (balance) 0((Na++K++Mg2+)corrected�
p(½Cl�) >0 (excess) +
Cation exchange situation <0 (deficit) �
* Very low.
20 F. El Yaouti et al. / Applied Geochemistry 24 (2009) 16–31
tinct populations according to their geological and hydrogeologicalcontexts. The hierarchical (tree clustering) method is used to pro-duce a graphical representation of individual groups using dendro-grams. To perform CA, an agglomerative hierarchical clusteringwas developed using a combination of the Ward’s linkage method(Word, 1963) and squared Euclidean distances as a measure of dis-similarity. To examine the chemical variation according to thegroups, box plots (also called box-and-whisker plots) of individualvariables are plotted. The line across the box represents the med-ium, whereas the bottom and top of the box show the locationsof the first and third quartiles (Q1 and Q3), respectively. The whis-kers are the lines that extend from the bottom and the top of thebox to the lowest and highest observations inside the region de-fined by Q1 � 1.5 (Q3 � Q1) and Q3 + 1.5 (Q3 � Q1). Individualpoints with values outside these limits are plotted with asterisks.
PCA and Factor Analysis attempt by similar means to explainrelationships between variables and thus infer the processes thatcontrol water chemistry (Helina et al., 2000). Factor analysis takesdata contained in a correlation matrix and rearranges them in amanner that better explains the structure of the underlying systemthat produced the data. Therefore, the correlation coefficient ma-trix measures how well the variance of each constituent can be ex-plained by relationships with each of the others. Then, thevariances–co-variances and correlation coefficients of the variablesare computed, and the correlation coefficient is
rXi;j ;Yi;j¼
PðXi;j � xmÞðYi;j � ymÞffiffiffiffiffiffiffiffiffiffiffiffiffiffiffiffiffiffiffiffiffiffiffiffiffiffiffiffiffiffiffiffiffiffiffiffiffiffiffiffiffiffiffiffiffiffiffiffiffiffiffiffi
½ðXi;j � xmÞ�2½ðYi;j � ymÞ�2
q ð5Þ
In this expression, the correlation coefficient (rXi;j ;Yi;j) is simply
the sum (over all samples) of the products of the deviations ofthe Xi,j-measurements and the Yi,j-measurements on each sample,from the mean values xm and ym, respectively, for the completeset of samples. (Table 2) presents the matrix of correlation coeffi-cients for the hydrochemical data in Bou-Areg. Eigenvalues andeigenvectors were calculated for the covariance matrix. Then thedata were transformed into factors. (Table 3) presents the eigen-values and the cumulative percentages of variance associated witheach factor. Factor extraction was done with a minimum accept-able eigenvalue as 1 (Kaiser, 1958; Harman, 1960). Orthogonalrotation of these initial factors to terminal factor solutions (Table2) was done with Kaiser’s varimax scheme (Kaiser, 1958). Factorscore coefficients are derived from the factor loadings. Factorscores are computed for each sample by a matrix multiplicationof the factor score coefficient with the standardized data. The valueof each factor score (Table 5) represents the importance of a givenfactor at the sample site. A factor score >+1 indicates intense influ-ence by the process. Very negative values (<�1) reflect areas virtu-ally unaffected by the process while near-zero scores reflect areaswith only a moderate effect of the process. The spatial distributionof the factors (and hence the hydrochemical process representedby them) can be assessed by a contour of the factor scores repre-senting each factor.
Table 2Correlation matrix of 10 variables computed from chemical data for December 2006.
Variables pH CE Cl� NO�3 H
pH 1CE 0.017 1Cl� 0.024 0.999 1NO�3 �0.051 �0.252 �0.264 1HCO�3 0.108 �0.518 �0.541 0.217SO2�
4 0.239 0.888 0.886 �0.199 �Na+ 0.125 0.984 0.983 �0.243 �K+ 0.147 0.771 0.765 �0.234 �Ca2+ �0.355 0.751 0.761 �0.075 �Mg2+ �0.069 0.957 0.956 �0.300 �
3.3. Hydrochemical methods
Stuyfzand’s method (1986) is used to identify the evolution ofchemical processes in groundwater. The Stuyfzand’s classificationsubdivides the most important chemical water characteristics atfour levels: the main type, type, subtype, and class of a water sam-ple. Each of the four levels of subdivision contributes to the totalcode (and name) of the water type.
The main type is determined based on the Cl� content (in mg/L)(Table 4). The type is determined on the basis of an index for totalhardness (TH) of the sample of water (Table 4); the total hardnessis the sum of Ca and Mg (in meq/L) and is expressed by: TH (meq/
CO�3 SO2�4 Na+ K+ Ca2+ Mg2+
10.382 10.482 0.910 10.234 0.606 0.787 10.627 0.612 0.690 0.450 10.534 0.811 0.911 0.733 0.717 1

Table 5Factor Scores and ionic ratios of chemical data (in meq/L) of Bou-Areg groundwater (December 2006).
Wells Factor Scores Ionic ratios
F1 F2 F3 Na+/Cl� Ca2+/Cl� Mg2+/Cl� SO2�4 /Cl� Na+/Ca2+ (Ca2+ + Mg2+)/Na+ Ca2+/SO2�
4
V2 F1 F2 F3 0.59 0.09 0.30 0.14 6.27 0.66 0.68V3 7.44 1.50 2.21 0.80 0.21 0.28 0.14 3.87 0.61 1.48V4 0.23 7.28 3.70 0.92 0.26 0.21 0.21 3.50 0.51 1.23V5 0.14 9.18 0.09 0.74 0.10 0.23 0.20 7.29 0.44 0.51V6 0.71 2.13 0.49 2.44 0.11 0.35 0.86 22.83 0.19 0.12V7 0.70 0.75 3.03 1.15 0.11 0.17 0.24 10.58 0.24 0.45V8 0.17 0.85 1.21 1.82 0.23 0.29 0.67 8.00 0.29 0.34V9 0.46 0.83 0.14 2.36 0.18 0.28 1.12 13.40 0.19 0.16V10 0.57 0.06 0.98 1.58 0.35 0.14 0.66 4.52 0.31 0.53V11 0.19 0.00 2.74 2.20 0.33 0.24 0.63 6.68 0.26 0.52V12 0.81 0.15 2.82 1.24 1.50 0.20 0.99 0.82 1.38 1.52V13 0.52 6.99 22.01 1.46 0.48 0.13 0.73 3.07 0.42 0.65V14 0.46 0.00 4.92 0.87 0.18 0.25 0.25 4.89 0.49 0.72V15 0.09 1.88 1.27 0.99 0.25 0.24 0.26 3.93 0.50 0.99V16 0.08 3.93 1.65 2.11 0.19 0.14 0.75 11.04 0.16 0.25V17 0.55 1.21 3.27 0.76 0.24 0.10 0.21 3.22 0.44 1.12V18 2.57 4.91 1.60 1.78 0.14 0.18 0.54 13.04 0.18 0.25V19 0.49 0.44 0.07 2.48 0.11 0.10 0.81 22.99 0.08 0.13V20 0.80 3.59 0.63 1.81 0.21 0.24 0.74 8.61 0.25 0.29V21 0.30 0.03 0.00 2.27 0.09 0.16 0.96 24.46 0.11 0.10V23 0.63 3.63 1.80 1.63 0.10 0.16 0.51 16.64 0.16 0.19V24 0.96 1.35 1.05 0.97 0.21 0.24 0.30 4.65 0.46 0.69V25 0.01 0.00 0.33 0.83 0.18 0.25 0.09 4.72 0.51 2.01V26 0.03 3.85 1.12 1.25 0.07 0.14 0.46 17.54 0.17 0.16V27 0.25 2.80 0.62 1.66 0.32 0.08 0.47 5.22 0.24 0.68V28 1.39 0.00 15.28 0.75 0.18 0.19 0.24 4.23 0.49 0.74V29 0.07 2.37 0.20 0.85 0.19 0.20 0.23 4.51 0.46 0.82V30 0.04 0.56 0.01 2.12 0.31 0.54 1.09 6.79 0.40 0.29V31 0.78 2.50 0.76 1.16 0.11 0.21 0.40 10.87 0.28 0.27V33 0.09 0.72 1.65 2.56 0.20 0.20 1.00 12.97 0.15 0.20V34 0.91 7.21 1.17 1.35 0.06 0.14 0.46 23.10 0.15 0.13V35 0.19 3.15 0.54 0.65 0.12 0.21 0.15 7 0.37 0.78V36 1.25 2.83 0.67 1.31 0.14 0.40 0.58 9.24 0.41 0.24V37 0.07 3.34 0.01 1.67 0.17 0.34 0.79 9.78 0.31 0.21V38 0.30 4.82 0.71 1.15 0.13 0.29 0.47 8.50 0.37 0.29V39 0.02 0.70 0.09 0.66 0.14 0.27 0.03 5.63 0.50 4.52V40 0.00 0.49 0.57 1.19 0.15 0.28 0.33 8.09 0.36 0.44V41 0.03 0.65 2.51 0.89 0.20 0.28 0.21 4.45 0.54 0.97Lagoon – – – 0.72 0.06 0.17 0.12 11.49 0.33 0.51
F. El Yaouti et al. / Applied Geochemistry 24 (2009) 16–31 21
L) = ([Ca] + [Mg]) � 5; thus, the level attributed to this type de-pends on the total hardness value (Table 4). The classification intosubtypes is determined based on the dominant cations and anions(in meq/L) in the triangle (Fig. 3). Finally, the class is determined onthe basis of the sum of Na, K and Mg in meq/L, corrected for a seasalt contribution:
ðNaþ KþMgÞcorrected ¼ ðNaþ KþMgÞmeasured � 1:0716Cl ð6Þ
The factor 1.0716 is equal to [(Na + K + Mg)/Cl] in meq/L formean ocean water. It is assumed that all the Cl ions are of marineorigin (Eriksson, 1952). The value of the corrected sum valueswould be compared to the error margin (0.5. Cl)1/2 depending on(table 4), which shows the method by which groundwater qualityis classified. The deficit in the cation exchange represented by anegative sign results from salinization, and a positive sign indicatesan excess in the cation exchange produced by the presence of freshwater; the cation exchange equilibrium shown by a zero describesa state of chemical balance.
The ionic ratio and the ionic delta are calculated in order to bet-ter understand the hydrochemical processes that take place in theaquifer. The ionic delta is derived from the relation between the ac-tual concentration of each constituent and its theoretical concen-tration for a freshwater–seawater mix calculated for the Cl�
concentration of the sample. The saturation index (SI) of a mineralin solution is obtained using the method described by Appelo andPostma (1996), and is useful for evaluating the extent to whichwater chemistry is controlled by equilibrium with solid phases.
PHREEQC software (Appelo and Postma, 1996) was used to calcu-late the SI for common evaporite minerals and the distribution ofmajor aqueous species.
3.4. Electrical tomography
The concept of electrical imaging has been amply discussed inthe geophysical literature (e.g., Loke and Barker, 1996; Tsourlosand Ogilvy, 1999; Zhang et al., 1995). Resistivity measurementsare made for a large number of sets of four electrodes. Resistivityis determined by factors such as lithology, salinity of the pore fluid,water content, composition (mineral clay and metal content),porosity, grain size distribution and temperature (Berthold et al.,2004; Lashkaripour and Nakhaei, 2005; Löwner et al., 2005). Resis-tivity methods are routinely used to locate air filled voids. If thevoid is filled by water instead of air, its resistivity contrast withthat of the host rocks may be quite small, and may even providea resistivity low, depending on the salinity of the water.
For this study, the dipole–dipole electrode configuration illus-trated in Fig. 4 was used and the apparent resistivity calculatedby the formula shown.
The survey was conducted in the coastal zone of Bou-Areg(Fig. 5). Resistivity measurements were acquired along three pro-files, termed L1, L2, and L3 (Fig. 5). For these profiles, the electrodeswere oriented orthogonal to the coastline, and each had a totallength of 475 m, with a maximum penetration depth of nearly50 m. The data were collected using a multi-electrode Syscal-Pro
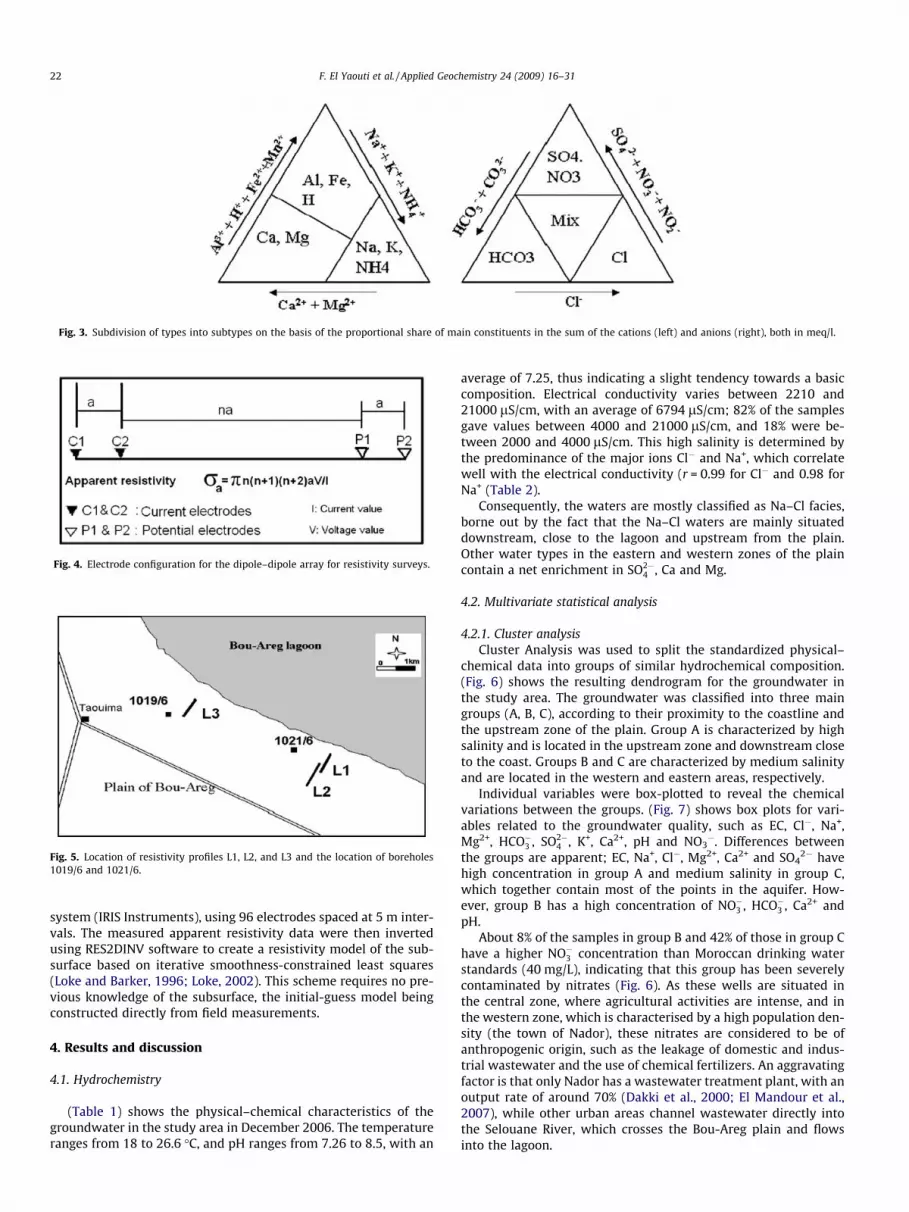
Fig. 3. Subdivision of types into subtypes on the basis of the proportional share of main constituents in the sum of the cations (left) and anions (right), both in meq/l.
Fig. 4. Electrode configuration for the dipole–dipole array for resistivity surveys.
Fig. 5. Location of resistivity profiles L1, L2, and L3 and the location of boreholes1019/6 and 1021/6.
22 F. El Yaouti et al. / Applied Geochemistry 24 (2009) 16–31
system (IRIS Instruments), using 96 electrodes spaced at 5 m inter-vals. The measured apparent resistivity data were then invertedusing RES2DINV software to create a resistivity model of the sub-surface based on iterative smoothness-constrained least squares(Loke and Barker, 1996; Loke, 2002). This scheme requires no pre-vious knowledge of the subsurface, the initial-guess model beingconstructed directly from field measurements.
4. Results and discussion
4.1. Hydrochemistry
(Table 1) shows the physical–chemical characteristics of thegroundwater in the study area in December 2006. The temperatureranges from 18 to 26.6 �C, and pH ranges from 7.26 to 8.5, with an
average of 7.25, thus indicating a slight tendency towards a basiccomposition. Electrical conductivity varies between 2210 and21000 lS/cm, with an average of 6794 lS/cm; 82% of the samplesgave values between 4000 and 21000 lS/cm, and 18% were be-tween 2000 and 4000 lS/cm. This high salinity is determined bythe predominance of the major ions Cl� and Na+, which correlatewell with the electrical conductivity (r = 0.99 for Cl� and 0.98 forNa+ (Table 2).
Consequently, the waters are mostly classified as Na–Cl facies,borne out by the fact that the Na–Cl waters are mainly situateddownstream, close to the lagoon and upstream from the plain.Other water types in the eastern and western zones of the plaincontain a net enrichment in SO2�
4 , Ca and Mg.
4.2. Multivariate statistical analysis
4.2.1. Cluster analysisCluster Analysis was used to split the standardized physical–
chemical data into groups of similar hydrochemical composition.(Fig. 6) shows the resulting dendrogram for the groundwater inthe study area. The groundwater was classified into three maingroups (A, B, C), according to their proximity to the coastline andthe upstream zone of the plain. Group A is characterized by highsalinity and is located in the upstream zone and downstream closeto the coast. Groups B and C are characterized by medium salinityand are located in the western and eastern areas, respectively.
Individual variables were box-plotted to reveal the chemicalvariations between the groups. (Fig. 7) shows box plots for vari-ables related to the groundwater quality, such as EC, Cl�, Na+,Mg2+, HCO�3 , SO2�
4 , K+, Ca2+, pH and NO3�. Differences between
the groups are apparent; EC, Na+, Cl�, Mg2+, Ca2+ and SO42� have
high concentration in group A and medium salinity in group C,which together contain most of the points in the aquifer. How-ever, group B has a high concentration of NO�3 , HCO�3 , Ca2+ andpH.
About 8% of the samples in group B and 42% of those in group Chave a higher NO�3 concentration than Moroccan drinking waterstandards (40 mg/L), indicating that this group has been severelycontaminated by nitrates (Fig. 6). As these wells are situated inthe central zone, where agricultural activities are intense, and inthe western zone, which is characterised by a high population den-sity (the town of Nador), these nitrates are considered to be ofanthropogenic origin, such as the leakage of domestic and indus-trial wastewater and the use of chemical fertilizers. An aggravatingfactor is that only Nador has a wastewater treatment plant, with anoutput rate of around 70% (Dakki et al., 2000; El Mandour et al.,2007), while other urban areas channel wastewater directly intothe Selouane River, which crosses the Bou-Areg plain and flowsinto the lagoon.

Fig. 6. Results of cluster analysis shown by a dendrogram (December 2006).
Fig. 7. Box plots of EC, Cl�, Na+, Mg2+, HCO�3 , SO2�4 , Ca2+, pH and NO�3 for groundwater groups A, B and C (December 2006).
F. El Yaouti et al. / Applied Geochemistry 24 (2009) 16–31 23
The groundwater in group A is mainly located in the upstreamzone and downstream close to the lagoon (Fig. 6). This group hashigh salinity (EC, Cl�, Na+, Mg2+, K+ and SO2�
4 ); this may be dueto the seawater in the coastal area and to the influence of marly-gypsum outcrops in the upstream zone (more details on this willbe discussed below). However, group C, located in the central, east-ern and western zones, is characterized by low concentrations ofthese parameters.
4.2.2. Factor analysis(Table 3) presents the eignvalues of the first 3 factors (F1, F2,
and F3), their percentage of variance, and cumulative of variance.The eignvalues of the 3 factors, which exceeded one, explain86.09% of the total variance. A factor score associated with eachmonitoring well was determined, and the scores are plotted toillustrate the spatial characteristics of groundwater quality of theBou-Areg aquifer (Figs. 8–10).
Factor 1 has a high loading of EC, Cl�, Na+, Mg2+, Ca2+, K+ andSO2�
4 and accounts for 62.7% of the total variance (Table 3). Thehydrochemical items are the dominant solutes in seawater, espe-cially Cl� and Na+ (r = 0.98 for raw data in Table 3), and in the re-
gion where the weathering of evaporites occurred. Therefore,factor 1 describes the salinization factor. The components of thesalinization factor are similar to the ‘seawater salinization factor’in Yun-Lin, Taiwan (Liu et al., 2003) and to ‘processes of the evap-orite dissolution rocks’ in Alto Guadalentín, SE Spain (Ceron et al.,2000). The spatial distribution of the scores of factor 1 (Fig. 8)shows two areas with high values, one towards the upstream(V1, V3, V4) and the other towards the downstream (V35, V36,V37). These high scores could be due to seawater in the area closeto the Bou-Areg lagoon. One zone in the upstream plain with highscores could be related to the influence of marly-gypsum outcropsin the upstream zone and to the processes of dissolution of theevaporite rocks (Messinian formation (Fig. 1) enriched in evaporateand gypsiferous materials), furthermore, the zone could be influ-enced by run-off and hence infiltration of superficial salty watersinto the aquifer, which contribute significantly to the groundwatersalinization.
Factor 2 explains 13.84% of the total variance (Table 3), withstrong loadings of HCO�3 , Ca2+ and pH, comparable with group Cin the Cluster Analysis. This factor describes factor dilution ofgroundwater by water recharge and/or mineralization by water–

Fig. 8. Spatial distribution of F1 Factor scores (December 2006).
Fig. 9. Spatial distribution of F2 Factor scores (December 2006).
24 F. El Yaouti et al. / Applied Geochemistry 24 (2009) 16–31
soil/rock interaction. The opposite evolution of Ca2+ and HCO�3 infactor 2 indicates another source in addition to carbonate weather-ing, such as dissolution of gypsum and cation exchange that in-creases the Ca content. (Fig. 9), which shows the spatialdistribution of factor 2, shows that high concentrations of Ca2+
and HCO�3 occur in the zones bounding the aquifer (Ibn-Bou-Ifrourand Kebdana massifs). This excess may be related to the effect ofthe geological formations; the entry of fresh water due to rainfallinto the aquifer dissolves carbonate rocks. Locally, in the centralzone and urban zone of Nador, the high scores can be related towater infiltration from irrigation recharge and leakage of domesticwaters into the aquifer during the sampling period. In addition, thepresence of carbonate rocks such as calcite and dolomite in the
sediments causes the high HCO�3 concentrations throughout theaquifer, which range between 256.20 mg/L and 854 mg/L. Thisinterpretation is corroborated by the secondary loadings of Ca2+
and HCO�3 in Factor 3, as discussed below.Factor 3 explains 9.55% of the total variance and is associated
with groundwater with high concentrations of NO�3 , and moderateconcentrations of HCO�3 , Ca2+ and SO2�
4 , such as group B in the clus-ter analysis. The NO�3 pollution is serious in the Bou-Areg plain, andthe NO�3 concentrations in the monitoring wells exceed the stan-dard of drinking water (40 mg/L.) because of extensive agriculturalactivities in the region, superficial N sources such as fertilizer,and domestic wastewaters, all of which significantly influencethe groundwater quality through soil infiltration. The spatial

Fig. 10. Spatial distribution of F3 Factor scores (December 2006).
F. El Yaouti et al. / Applied Geochemistry 24 (2009) 16–31 25
distribution of the factor scores of F3 (Fig. 10) shows 3 areas of highNO�3 contamination. Two zones are in the central plain and onezone is in the urban region near Nador city. The potential sourcesof the NO�3 pollution in the study area could be linked to wastewa-ter leakage from industrial activities and urbanization. However,part of the NO�3 contamination is from natural N in the soil, re-leased to the unsaturated zone due to intense cultivation. Throughnitrification processes by microbial oxidation in the presence of O2,NHþ4 is transformed into NO�3 in the unsaturated zone (Stumm andMorgan, 1996) and can be described by the following equation:NHþ4 + 2O2 = NO�3 + 2H+ + H2O. Association of high concentrationof NO�3 with low Ca2+ and SO2�
4 concentrations to factor 3 providesevidence for the use of fertilizers with SO2�
4 , Ca2+ and NHþ4 .
4.3. Geochemical processes
Based on Stuyfzand’s classification (1986), the chemicalgroundwater types of the study area were distinguished and dis-tributed spatially, as shown in Fig. 11. The results show threetrends: in the upstream, central and downstream zones of theaquifer, the water types are mainly BS4NaCl, BS5NaCl, and BS6NaCl,indicating that the waters are brackish and enriched with Cl� andNa+; the hardness of the water increases from 4 to 6 downgradienttowards the Bou-Areg lagoon and upgradient towards the up-stream zone. The water types in these two regions are negative,which explains that the salt waters intrude the groundwater. Thesalinization could be due to seawater intrusion in the zone closethe lagoon, and it could also be linked to interactions betweengroundwater and marly substratum in the upstream zone. A posi-tive sign of water types in the central zone indicates the dilution ofgroundwater with fresh water; the infiltration of irrigation waterin this zone is thought to be the source of groundwater dilution.The eastern and western zones are also brackish, with the predom-inant water types in the eastern zone being B0Na–Cl–SO4–HCO3,B1Na–Cl–SO4–HCO3, B2Na–Cl–SO4–HCO3, and B3Na–Cl–SO4–HCO3. In the western zone, however, the water type changes fromB4NaMix to B4CaMix towards the Gourougou massif. Somewhatless brackish water quality, with a positive sign, was identified inthese areas, and may be explained by recharge from the Gourou-gou, Ibn-Bou-Ifrour, and Kebdana massifs, which refreshes theaquifer and restricts the mixing of fresh and salt water, conse-
quently limiting the degree of salinization. This latter effect is as-signed by the dominance of Cl� rather than HCO�3 ions in the saltwater. The results of this method corroborate the results of thecluster and factor analysis.
The dominant groundwater type is NaCl, which explains thatthe waters are brackish in the study area. If the salt water intrudesthe aquifer, the Na+ is adsorbed on the clay fraction, and Ca2+ is re-leased, and, consequently, the CaCl water type should be developedas according to Appelo and Postma (1996). However, in the study,the salinization phenomenon occurred in the upstream and down-stream zones, but the CaCl water type has not been developed. Thisfact suggests that these zones are in the first state of salinization;the Stuyfzand’s method indicates that the salinization phenome-non influences only the water type sign that is negative in the up-stream and downstream zones; thus, the development of type NaClto CaCl has not been achieved. Otherwise, the positive sign gener-alizes all waters types of Bou-Areg aquifer (Stuyfzand’s classifica-tion) and supports the idea of groundwater dilution byinfiltration of irrigation water and recharge from the massifsbounding the aquifer.
The chemical composition of the salts in the groundwater isslightly different from that of seawater, due to differences in thehydrochemical processes taking place, i.e., rock–water interactionin the former case and water recharge in the latter. In fact, the rela-tionship between Cl� and Na+ (Fig. 12) shows that all samples plotabove the fresh–seawater mixing line, except samples V2 and V35.This enrichment in Na+ relative to Cl�, with the Na+/Cl� ratio (Table5) greater than the sample from the lagoon (0.72), and the corre-sponding depletion in Ca2+ and Mg2+ over Na+ at some points, sug-gests a strong water–aquifer interaction related to dilution ofhalite and direct cation-exchange reactions between groundwaterand the clay fraction of the aquifer material. This reaction takesplace during the refreshening stage when freshwater flushes sea-water in a coastal aquifer, displacing the freshwater/saltwaterinterface towards the lagoon. During refreshening, Na+ is releasedto the groundwater because, where seawater saturates the aquifer,the Na/Ca ratio at the clay surface is higher than in the freshwateraquifer. The relationships between Cl� and Na+, and Ca2+ and Mg2+,(Fig. 12) indicate that there are cases where samples (i.e., V17, V15,V36, V41, V3, V5, V28, V10, V12) plot above the fresh-seawatermixing line. This suggests other sources for the enrichment in

Fig. 11. Spatial distribution of the types of waters based on the Stuyfzand’s classification (December 2006).
Fig. 12. Relationship between Cl content (meq/l) and 4 cations analyzed (December 2006).
26 F. El Yaouti et al. / Applied Geochemistry 24 (2009) 16–31
these cations; the dissolution of gypsum and carbonates in theunsaturated zone is the probable factor increasing the Ca2+ andMg2+ in groundwater. The water point (V35), located in the down-stream zone of the aquifer, shows a Na+/Cl� ratio lower than the la-goon sample (0.72) and an increase of Ca2+ and Mg2+ concentrationwith respect to the mixing line (Fig. 12), which shows that thewater chemistry is determined by reverse cation-exchange reac-tions between groundwater and the clay fraction of the aquifermaterial. Generally, reverse cation-exchange results during seawa-ter intrusion, when the seawater wedge moves inland (Appelo andPostma, 1996). In this condition, the Na/Ca ratio on the surface ofthe exchanger in the freshwater portion of the aquifer is lower thanthat of the seawater front moving inland (Table 5). In addition, the
water point (V2), located in the upstream zone of the aquifer,shows a Na+/Cl� ratio lower than the lagoon sample (0.72) andan increase of Ca2+ and Mg2+ concentration with respect to themixing line (Fig. 12), showing that the salinization phenomenonhas modified the water chemistry in this area. Water–rock interac-tion is thus thought to be the main factor of salinization.
The SO2�4 vs Cl� graph (Fig. 12) shows that some water points
(located in the central and western zones) are located well abovethe theoretical mixing line between freshwater and saltwater. Also,(Table 4) shows that the SO2�
4 /Cl� ratio of the majority of the sam-ples is greater than that of the lagoon sample (0.12). The enrich-ment of these points with SO2�
4 suggests other sources, includingthe dissolution of gypsum and agricultural pollution (where some

Table 6Ionic delta and saturation index of groundwater samples of Bou-Areg, December 2006.
Wells Ionic delta Saturation index (SI)
DNa + DK DCa + DCVg DHCO3 DSO4 Calcite Dolomite Gypsum Halite
V2 �29.06 26.55 3.47 �1.29 0.63 1.92 �0.64 �3.42V3 6.56 11.01 4.38 �5.44 0.61 1.50 �0.85 �4.05V4 15.28 7.63 5.59 0.13 0.65 1.34 �0.63 �4.07V5 1.64 1.51 4.62 3.08 0.62 1.73 �0.77 �3.80V6 26.33 �8.84 6.68 3.06 �0.06 0.51 �1.55 �5.02V7 24.27 �8.84 7.62 �0.85 1.06 2.46 �1.13 �4.24V8 28.59 �4.69 9.97 6.05 0.95 2.14 �0.99 �4.71V9 27.99 �8.44 6.98 8.62 0.52 1.37 �1.20 �4.96V10 26.27 �4.28 6.96 8.38 1.11 1.95 �0.70 �4.64V11 25.85 �6.48 9.48 0.71 0.66 1.31 �1.10 �4.96V12 7.81 8.47 6.19 4.22 1.15 1.55 �0.49 �5.38V13 10.55 �7.28 2.99 0.03 0.91 1.38 �1.00 �5.34V14 10.94 2.85 3.90 1.93 0.73 1.75 �0.77 �4.16V15 12.50 0.26 5.74 �1.44 0.62 1.36 �0.89 �4.47V16 37.80 �9.24 10.07 9.02 0.96 1.93 �0.99 �4.61V17 3.99 3.90 2.10 5.83 0.99 1.75 �0.31 �3.69V18 25.25 �10.12 4.07 1.92 0.76 1.76 �1.29 �4.77V19 34.48 �12.66 8.08 5.39 0.83 1.74 �1.41 �4.81V20 30.20 �5.92 7.67 9.06 0.68 1.54 �0.93 �4.65V21 27.25 �11.73 7.08 6.55 0.66 1.70 �1.47 �4.94V23 24.36 �11.42 9.67 2.39 0.73 1.80 �1.38 �4.72V24 13.36 �0.17 5.53 2.14 1.10 2.40 �0.82 �4.36V25 7.08 0.40 4.01 �9.40 0.65 1.58 �1.27 �4.30V26 26.39 �12.66 10.03 9.12 0.84 2.10 �1.16 �4.32V27 24.27 �7.77 12.07 0.93 1.07 1.69 �0.96 �4.75V28 1.97 0.71 7.38 3.03 0.78 1.73 �0.67 �4.08V29 8.22 �1.39 7.71 �0.28 0.97 2.09 �0.83 �4.26V30 21.05 �3.35 10.69 5.93 1.03 2.42 �1.08 �5.12V31 19.93 �7.75 6.04 4.91 0.84 2.10 �1.08 �4.42V33 23.78 �10.25 7.59 3.10 1.13 2.42 �1.37 �5.14V34 27.94 �13.05 7.54 7.19 0.75 2.01 �1.31 �4.38V35 �26.56 4.98 6.88 �1.91 0.73 1.87 �0.69 �3.75V36 22.11 �1.32 8.06 7.83 1.04 2.66 �1.06 �4.61V37 27.27 �4.10 9.06 11.20 1.19 2.82 �1.00 �4.67V38 21.66 �2.55 9.14 8.61 0.82 2.11 �0.94 �4.41V39 21.93 �2.51 9.23 �12.04 0.86 2.14 �1.95 �4.37V40 21.47 �2.83 5.14 1.89 1.00 2.43 �1.04 �4.42V41 10.57 3.86 5.01 �2.10 0.65 1.59 �0.91 �4.28
F. El Yaouti et al. / Applied Geochemistry 24 (2009) 16–31 27
of these water points recorded high NO�3 content). The SO2�4 /Ca2+
ratio for the majority of the samples is greater than 1 (Table 5).The excess of SO2�
4 over Ca2+ reflects extra sources of SO2�4 and/or
a deficit of Ca2+; cation exchange and calcite precipitation are sug-
Fig. 13. Diagram of ionic delta (December 2006). L is the lago
gested as the factors that remove the Ca from groundwater and de-crease its content.
In order to more thoroughly determine the behavior of thesecations and to identify the processes that modify the theoretical
on sample and F is the freshwater sample from the canal.

Fig. 14. Plots of Saturated Index (SI) with respect to some carbonate and evaporiteminerals.
28 F. El Yaouti et al. / Applied Geochemistry 24 (2009) 16–31
content, the ionic delta (Table 6) were calculated for each of thecations in question. Fig. 13 illustrates the various geochemical pro-cesses that occur in the groundwater. The opposite evolution ofDNa+ + DK+ and DCa2+ + DMg2+ shows that a deficit (or excess) ofNa+ + K+ is compensated for by a corresponding excess (or deficit)in Ca2+ + Mg2+. This could explain the different types of exchangethat can occur between groundwater and the clay matrix. Thereis absorption of Na+ and a release of Ca2+ (and Mg2+) from the clayminerals in the case of salinization in samples V2 and V35, whilethe reverse occurs in the case of dilution (desalinization) in someaquifer samples. Cation exchangers take up Ca2+ from the waterand release Na+ if the Ca2+ concentration in the groundwater ishigh with respect to the concentration of Na+ in the exchange posi-tion of clay minerals (Robertson, 1991). The similar evolution ofDNa+ + DK+ and DCa2+ + DMg2+ in some samples located in thecentral zone shows that the excess in these cations is due to othersources of contamination, such as the use of agricultural fertilizers.This is especially so in the case of water points V3, V4, V5, V12, V14V17, V25 and V29 (Table 1), which have a high content of NO�3 and/or SO2�
4 . (Fig. 13) shows that the ionic delta of DHCO�3 is positive forall water points of aquifer and also the positive ionic delta of DSO2�
4
for the majority of the water points. This fact suggests that the dis-
Fig. 15. Cross-section of resistivity
solution of gypsum and carbonate minerals found in the aquiferdeposits are the sources of these elements.
(Fig. 14) shows the plots of SI against TDS for all the investi-gated waters. All the groundwater samples are supersaturatedwith respect to calcite and dolomite (Fig. 14), suggesting that thesecarbonate mineral phases are present in the corresponding hostrock. In fact, the presence of limestone through the aquifer depositsand the presence of calcite and dolomite detected by X-ray diffrac-tion analysis (Bloundi, 2005; Mahjoubi et al., 2003) leads to an in-crease of Ca2+, Mg2+ and HCO�3 in the aquifer. All of thegroundwater samples are undersaturated with respect to gypsumand halite (Table 6 and Fig. 14), suggesting that evaporate mineralphases are minor or absent in the host rocks. The enrichment ofgroundwater in Ca2+ as a result of both Na+ – Ca2+ cation exchangeand dissolution of calcite in the unsaturated zone (caused by nitri-fication and an increase in CO2 concentration) created favorableconditions for calcite precipitation.
4.4. Electrical tomography
(Figs. 15–17) show sections of the inverted resistivity model forL1, L2 and L3. In general, the site is characterized by a relativelylow background resistivity (0.5–9 X/m). This variability of resistiv-ity is observed with depth as well as laterally. The variation oflithology is quite different and each profile can be subdivided intothree electrolayers, each with a specific resistivity value. Low resis-tivity is explained by the pores of sediments having been filled bysalty water.
The resistivity profile L1 (Fig. 15) (10.1% total average RMS er-ror) is calibrated with borehole 1021/6, taking into account thehydraulic conductivity of the water points (V35, V36, V37 andV38). The high resistivity anomaly (6.03–9.58 X/m) in the SW to-wards the inland zone corresponds well with the interpretedoccurrence of gravel and minor silt. The area of very high resistivityvalues (>9.58 X/m) corresponds to coherent sediments (debris –conglomerate). Laterally and towards the NE coastline, resistivitydecreases to values of 2.39–3.79 X/m, reflecting the transfer ofsalty water from the lagoon into the groundwater. These resistivityvalues extend 8.27–41.5 m below the surface. The lowermost elec-trolayer in the resistivity image has a low resistivity (0.375–0.94 /m), which is interpreted as corresponding to a clay layer, indicatingthat the aquifer bedrock is not far below this level.
inversion results of profile L1.

Fig. 16. Cross-section of resistivity inversion results of profile L2.
Fig. 17. Cross-section of resistivity inversion results of profile L3.
F. El Yaouti et al. / Applied Geochemistry 24 (2009) 16–31 29
The resistivity profile L2 (Fig. 16) (9.4% total average RMS error)is a continuation of profile L1. In the NE of this section, resistivityvalues are low, indicating the clay layer of the bedrock, which isa continuation of the corresponding layer in profile L1. The sectionindicates moderate resistivity values (4.76–9.82 X/m), as the sed-iments are infiltrated by freshwater that tends to raise resistivity.The high resistivity anomaly (>9.82 X/m) corresponds to rigid sed-iments (debris – conglomerate) as in profile L1. The area of lowresistivity at a depth of 14.5 m may be due to pollution by agricul-tural fertilizers, a conclusion supported by the observed high val-ues of NO�3 at V36 and V37 (Table 2).
The resistivity profile L3 (Fig. 17) (5.5% total average RMS error)is calibrated with borehole 1019/6 and with hydraulic conductivityof water points located near this profile. This section shows threedistinct electrolayers. A thin layer of moderate resistivity values(4.34–6.6 X/m), corresponding to gravel and some silt, is visiblealong the top of the resistivity image and indicates the infiltrationof freshwater as a result of irrigation. The pore sediments are filledby freshwater, and, consequently, the resistivity of the layer is in-creased. The second electrolayer comprises clayey silt with a littlegravel and has low resistivity values (3.09–4.34 X/m). The resistiv-ity varies laterally from the coastline inland, reflecting the incur-sion of seawater into the aquifer. The very low resistivity values(0.563–0.92 X/m) of the third electrolayer show it to be relativelyimpermeable.
The results of the electrical tomography surveys provide furtherinformation about the water quality of the various formations.These results also show that the zone at a depth of 8.27–41.5 m be-low the surface has low resistivity values, which indicates highsalinity that may be due to the recent intrusion of saltwater fromthe lagoon into the aquifer, or to the existence of connate fossilwater from ancient seawater incursion that occurred in the past(Carlier, 1964). The top layer is affected by water infiltration, whichincreases the resistivity. Finally, the groundwater bedrock is at adepth of 48 m.
5. Conclusions
Statistical and geochemical analyses were applied to the hydro-chemical data set, and electrical tomography was used to provideinsight into the regional factors and processes controlling thechemical composition and degree of salinity of groundwater inthe study area.
Multivariate statistical analyses are powerful tools due to theirability to assist in making an objective interpretation. Cluster andfactor analysis, applied to groundwater samples of the study area,are an effective means of manipulating, interpreting, and represent-ing data concerning groundwater pollutants. The results of the clus-ter analysis showed 3 groups (A, B and C), and factor analysisshowed 3 factors (F1, F2 and F3), that explained 84.09% of the total

30 F. El Yaouti et al. / Applied Geochemistry 24 (2009) 16–31
variance in the groundwater quality. Group A and factor F1 (de-scribed as the salinization factor) included EC, Cl�, SO2�
4 , Na+, K+
and Mg2+, group B and factor F2 (the dilution processes) includedCa2+, Mg2+, HCO�3 and pH, and group C and factor 3 included NO�3and represented agricultural and other anthropogenic sources.
The spatial distribution of the factor scores at individual wellsdelineated boundaries that define the areas of high salinizationand pollution. Areas of high scores of factor 1 close to the coastallagoon are due to seawater, and, at the upstream zone, the salini-zation is linked to the influence of marly-gypsum outcrops. Highscores of factor 2 are located in the zone bounding the plain, wherethe recharge from the Gourougou, Ibn-Bou-Ifrour, and Kebdanamassifs refreshes the groundwater and enriches the area inHCO�3 . The anthropogenic pollutants are also detected in this studyarea; the high scores of factor 3 are identified in the central andeastern zones of the plain. Agricultural practices involving syn-thetic fertilizers have been identified as the main source of NO�3contamination of groundwater in the central zone, but, in the east-ern zone (city of Nador), the source of NO�3 may be linked to theleakage of domestic and industrial wastewater.
The geochemical results (Stuyfzand’s method, ionic ratios andionic deltas) showed different processes that modify the chemicalcomposition in the Bou-Areg groundwater. Stuyfzand’s method ap-pears to be appropriate for this kind of study, and it constrains theresults obtained from the statistical analysis and spatial distribu-tion, showing two phenomena: the dilution phenomenon that oc-curred in the groundwater during the sampling period and thesalinization phenomenon in the coastal zone by seawater intrusionand in the upstream zone caused by processes related to the disso-lution of evaporite rocks from the Miocene substratum. Cation ex-change also takes place and modifies the concentration of ions inthe groundwater. When seawater intrudes the aquifer, Na+ ionsare released into the groundwater, and Ca2+ and/or Mg2+ are ab-sorbed by the clay-matrix, and vice versa in the case of refreshinggroundwater. The saturation index showed the precipitation anddissolution mechanism that occurred in the aquifer system. Thedissolution of gypsum increased the concentrations of SO2�
4 andCa2+, and the dissolution of halite increased the Na+ concentrationsin the groundwater. Conversely, the Ca2+ and Mg2+ were decreasedby the precipitation of calcite and dolomite.
The results of the electrical tomography surveys corroborate thegeostatistical and geochemical results and provide further infor-mation about the water quality of the various formations. These re-sults also show that the zone 8.27–41.5 m below the surface haslow resistivity values, which indicates high salinity that may bedue to the recent intrusion of saltwater from the lagoon into theaquifer or to the existence of connate fossil water from ancient sea-water incursion that occurred in the past. The top layer is affectedby water infiltration, which increases resistivity. The groundwaterbedrock is close to a depth of 48 m.
This study shows that the multivariate statistical and geochem-ical methods and electrical tomography are excellent exploratorytools for interpreting complex water quality data and the originof groundwater pollution. The obtained information represents abase for future hydrogeological work that will help in the planning,protection and decision-making regarding the groundwater man-agement of the Bou-Areg plain. However, for additional corrobora-tion of the interpretations of the origin of the salinity, isotopicanalysis will be performed in the study area.
Acknowledgments
We are grateful for the support from COSTE (Oriental Center ofWater Science and Technology, Oujda, Morocco), and the Mou-louya Water Basin Agency. We also acknowledge Dr. I. Vadillo,from the University of Malaga, Spain, and Prof. Ph. Renard, from
the University of Neuchatel, Switzerland, for their early commentsabout this paper. We thank Dr. A. Herczeg for handling this paperand the reviewers for their comments that improved the originalpaper.
Appendix A. Supplementary material
Supplementary data associated with this article can be found, inthe online version, at doi:10.1016/j.apgeochem.2008.10.005.
References
Appelo, C.A.J., Postma, D., 1996. Geochemistry, Groundwater and Pollution. A.A.Balkema, USA.
Barathon, J.J., 1989. Bassins et littoraux du Rif oriental (Maroc): évolutionmorphoclimatique et tectonique depuis le Néogène superieur. InteruniversityCenter of Mediterranean study. Ph.D., Univ. Poitiers, France.
Benson, R.H., Rakic-El Bied, K., Bonaduce, G., 1991. An important current reversal(influx) in the Rifian Corridor (Morocco) at the Tortonian-Messinian boundary:the end of the Tethys Ocean. Paleoceanog 6, 164–192.
Berthold, S., Bentley, L.R., Hayashi, M., 2004. Integrated hydrogeological andgeophysical study of depressionfocused groundwater recharge in theCanadian prairies. Water Resour. Res. 40, W06505.1–W06505.14.
Bloundi, M.K., 2005. Etude geochimique de la lagune de Nador (Maroc oriental):impacts des facteurs anthropiques. Ph.D., Univ. Mohamed V. Agdal. Faculté desSciences Rabat. Maroc.
Capaccionia, B., Diderob, M., Palettab, C., Didero, L., 2005. Saline intrusion andrefreshening in a multilayer coastal aquifer in the Catania Plain (Sicily, SouthernItaly): dynamics of degradation processes according to the hydrochemicalcharacteristics of groundwaters. J. Hydrol. 307, 1–16.
Cardona, A., Carrillo-Rivera, J.J., Huizar-Alvarez, R., Graniel-Castro, E., 2004.Salinization in coastal aquifers of arid zones: an example from SantoDomingo, Baja California Sur, Mexico. Environ. Geol. 45, 350–366.
Carlier, P.H. 1964. Plaines de Gareb et Bou-Areg (Plains of Gareb and Bou-Areg).Note and Service Memory, Geology, Morocco.
Ceron, J.C., Jimenez-Espinosa, R., Pulido-Bosch, A., 2000. Numerical analysis ofhydrogeochemical data: a case study (Alto Guadalentõan, southeast Spain).Appl. Geochem. 15, 1053–1067.
Cimino, A., Cosentino, C., Oieni, A., Tranchina, L., 2008. A geophysical andgeochemical approach for seawater intrusion assessment in the Acquedolcicoastal aquifer (Northern Sicily). Environ. Geol. 55 (7), 1473–1482.
Custodio, E., 1987. Hydrogeochemistry and tracers. In: Custodio, E. (Ed.),Groundwater Problems in Coastal Areas Studies and Reports in Hydrology,vol. 45. UNESCO, Paris, pp. 213–269.
Dakki, M., El Fallah, B., Fkhaoui, M., 2000. Diagnostic sur les zones humides (Humidezones diagnostic). MedWet Coast Project, Preliminary Report, pp. 5–15.
Diamantopoulou, P., 1999. Hydrogeological conditions of the island of Zakynthos,Ionian sea. Ph.D., Univ. Patras, Greece (in Greek).
Dörfliger, N. 2003. The state of the French Mediterranean coastal aquifers. In:López-Geta, J.A., Orden, J.A., Gómez, J.D., Ramos, G., Mejías, M., Rodríguez, L.(Eds) Coastal Aquifers Intrusion Technology: Mediterranean Countries. Publs.Inst. Geol. Min. de España. Serie: Hidrogeologia y Aguas Subterraneas No 8.Madrid, Spain, Tome II, pp. 187–206.
El Bakkali, S., 1995. Volcanologie et Magmatologie du système du Gourougou (RifOriental, Maroc). Ph.D., Univ. Blaise Pascal Clermont-Ferrand II, France.
El Baruni, S., 1995. Deterioration of the quality of groundwater from Suani wellfield,Tripoli, Libya. Hydrogeol. J. 3, 58–64.
El Mandour, A., Fakir, Y., Aqil, H., Boughriba, M., Zarhloule, Y., Ghomari, Y., 2008.Salinisation des eaux souterraines de la plaine de Saïdia, côte méditerranéenneorientale Maroc Centre d’hydrogéologie, Université de Neuchâtel, Edition PeterLang. Bulletin d’Hydrogéologie 22, 43–57.
El Mandour, A., El Yaouti, F., Fakir, Y., Zarhloule, Y., Benavente, J., 2007. Evolution ofgroundwater salinity in the unconfined aquifer of Bou-Areg, NortheasternMediterranean coast, Morocco. Environ. Geol. 54, 491–503.
El Mandour, A., El Yaouti, F., Fakir, Y., Zarhloule, Y., Bourhriba, M., El Haouadi, B.,2006. Origin and distribution of groundwater salinization in the unconfinedcoastal aquifer of Bou-Areg, Northeastern Mediterranean Coast, Morocco. Lasaguas subterraneas en los paises mediterraneos. Publs. Inst. Geol. Min. deEspaña. Serie: hidrogeologia y Aguas Subterraneas No 17. Madrid, Spain, pp.287–294.
Eriksson, E., 1952. Composition of atmospheric precipitation; II Sulfur, chloride,iodine compounds. Tellus 4, 280–303. Bibliography.
Ferrara, V., Pappalardo, G., 2004. Intensive exploitation effects on alluvial aquiferof the Catania plain, eastern Sicily, Italy. Geofísica Internacional 43, 671–681.
Freeze, R.A., Cherry, J.A., 1979. Groundwater. Prentice Hall, Englewood Cliffs, N.J.Gill, R.C.O., Aparicio, A., El Azzouzi, M., Hernandez, J., Thirlwall, M.F., Bourgois, J.,
Marriner, G.F., 2004. Depleted arc volcanism in the Alboran sea and shoshoniticvolcanism in Morocco: geochemical and isotopic constraints on Neogenetectonic processes. Lithos 78, 363–388.
Grassi, S., Netti, R., 2000. Sea water intrusion and mercury pollution of some coastalaquifers in the province of Grosseto (Southern Tuscany, Italy). J. Hydrol. 237,98–211.

F. El Yaouti et al. / Applied Geochemistry 24 (2009) 16–31 31
Harman, H.H., 1960. Modern Factor Analysis. University of Chicago Press.Helina, B., Pardo, R., Vega, M., Barrado, E., Fernandez, J.M., Fernandez, L., 2000.
Temporal evolution of groundwater composition in an alluvial aquifer (PisuergaRiver, Spain) by principal component analysis. Water Res. 34, 807–816.
Hernandez, J., Bellon, H., 1985. Chronologie K-Ar du volcanisme miocène du Riforiental (Maroc): implications tectoniques et magmatiques. Rev. Geol. Dyn.Geog. Phys. 26, 85–94.
Hidalgo, M.C., Gruz-Sanjuhan, J., 2001. Groundwater composition, hydrochemicalevolution and mass transfer in a regional detrital aquifer, Baza basin, southernSpain. Appl. Geochem. 16, 745–758.
Hsü, K.J., Ryan, W.B.F., Cita, M.B., 1973. Late Miocene desiccation of theMediterranean. Nature 242, 240–244.
Jalali, M., 2007. Salinization of groundwater in arid and semi arid zone an examplefrom Tajarak, Western Iran. Environ. Geol. 52, 1133–1149.
Kaiser, H.F., 1958. The varimax criteria for analytical rotation in factor analysis.Psychometrika 23, 187–200.
Kim, J.H., Yum, B.W., Kim, R.H., Koh, D.C., Cheong, T.J., Lee, J., Chang, H.W., 2003.Application of cluster analysis for the hydrogeological factors of salinegroundwater in Kinjé, Korea. Geosci. J. 7, 313–322.
Krijgsman, W., Langereis, C.G., Zachariasse, W.J., Boccaletti, M., Moratti, G., Gelati, R.,Iaccarino, S., Papani, G., Villa, G., 1999. Late Neogene evolution of the Taza-Guercif basin (Riftian Corridor, Morocco) and implications for the Messiniansalinity crisis. Mar. Geol. 153, 147–160.
Lambrakis, N.J., Voudouris, K.S., Tiniakos, L.N., Kallergis, G., 1997. Impact ofsimultaneous action of drought and overpumping on quaternary aquifers ofGlafkos basin (Patras region, western Greece). Environ. Geol. 29, 209–215.
Lashkaripour, G.R., Nakhaei, M., 2005. Geoelectrical investigation for the assessmentof groundwater conditions: a case study. Annals Geophys. 48, 937–944.
Lee, S.H., Kim, K.G., Ko, I., Lee, S.G., Hwang, H.S., 2001. Geochemical and geophysicalmonitoring of saline water intrusion in Korean paddy fields. Environ. Geochem.Health 24, 277–291.
Liu, C.W., Lin, K.H., Kuo, Y.M., 2003. Application of factor analysis in the assessmentof groundwater quality in a blackfoot disease area in Taiwan. Sci. Total Environ.313, 77–89.
Loke, M.H., 2002. Rapid 3D resistivity and IP inversion using the least-squaresmethod. Geoelectrical imaging 2D & 3D, Geotomo software.
Loke, M.H., Barker, R.D., 1996. Practical techniques for 3D resistivity surveys anddata inversion. Geophys. Prospect. 44, 499–523.
Lourens, L.J., Hilgen, F.J., Zachariasse, W.J., Van Hoof, A.A.M., Antonrakou, A.,Vergnaud-Grazzini, C., 1996. Evaluation of the Pliocene to early Pleistoceneastronomical timescale. Paleoceanog 11, 391–413.
Löwner, M.O., Preston, N.J., Dikau, R., 2005. Reconstruction of a colluvial body usinggeoelectrical resistivity. Z. Geomorph. N. F. 49, 225–238.
Mahjoubi, R., Kamel, S., El Moumni, B., Noack, Y., Parron, C., 2003. Nature, origine etrépartition de la phase argileuse de la lagune de Nador (Maroc Nord Oriental).Geologica Belgica 6, 31–42.
Morel, J.L., 1985. Les événements tectoniques et volcaniques responsable de larégression messinienne dans le Maroc septentrional: exemple du bassind’Iddouyine (Segangane – Rif oriental – Maroc). Inst. Sci. Bull. 9, 97–106.
Morel, J.L., 1989. Evolution paléogéographique et tectonique du rif (Maroc) duTortonien à l’actuel. C. R. Acad. Sci. Paris 309, 2053–2059.
Petalas, C.P., Diamantis, I.B., 1999. Origin and distribution of saline groundwaters inthe upper Miocene aquifer system, coastal Rhodope area, Northeastern Greece.Hydrogeol. J. 7, 305–316.
Reeve, A.S., Siegel, D.I., Glaser, P.H., 1996. Geostatistical analysis of peat pore-waterchemistry: Hudson Bay Lowlands, Ontario, Canada. J. Hydrol. 181, 285–304.
Robertson, F.N. 1991. Geochemistry of groundwater in alluvial basins of Arizonaand adjacent parts of Nevada, New Mexico and California. U. S.Geol. Surv. Prof.Paper 1406–C.
Stamatis, G., Voudouris, K., 2003. Marine and human activity influences on thegroundwater quality of southern Korinthos area (Greece). Hydrol. Process. 17,2327–2345.
Stumm, W., Morgan, J.J., 1996. Aquatic chemistry—chemical equilibria and rates innatural waters. John Wiley and Sons, New York, USA.
Stuyfzand, P.J., 1986. A new hydrochemical classification of water types: principlesand application to the coastal dunes aquifer system of the Netherlands. SWIM9th Delft.
Tsourlos, P.I., Ogilvy, R.D., 1999. An algorithm for the 3D inversion of tomographicresistivity and induced polarization data: preliminary results. J. BalkanGeophys. Soc. 2 (2), 30–45.
Vincenzo, F., Giovanna, P., 2003. Salinization of coastal aquifers in the southwesternhyblean plateau (SE Sicily, Italy). In: López-Geta, J.A., Orden, J.A., Gómez, J.D.,Ramos, G., Mejías, M., Rodríguez, L., (Eds.), Publs. Inst. Geol. Min. de España.Serie: Hidrogeologia y Aguas Subterraneas No 8. Madrid, Spain, Tome I, pp. 103–112.
Word, J.H., 1963. Hierarchical grouping to optimize an objective function. J. Am.Stat. Assoc. 58, 236–244.
Worden, R.H., Manning, D.A.C., Bottrell, S.H., 2006. Multiple generations of highsalinity formation water in the Triassic Sherwood Sandstone: Wytch Farmoilfield, onshore UK. Appl. Geochem. 21, 455–475.
Zhang, J., Mackie, R.L., Madden, T.R., 1995. 3D resistivity forward modeling andinversion using conjugate gradients. Geophysics 60, 1313–1325.


