Embed Size (px)
Citation preview
wellhead protection program
Salmon Creek Wellhead Protection Program
Prepared for Clark Public Utilities
by Economic and Engineering Services, Inc.
Pacific Groundwater Group
I I I I I I I I I I I I I I I I I I I
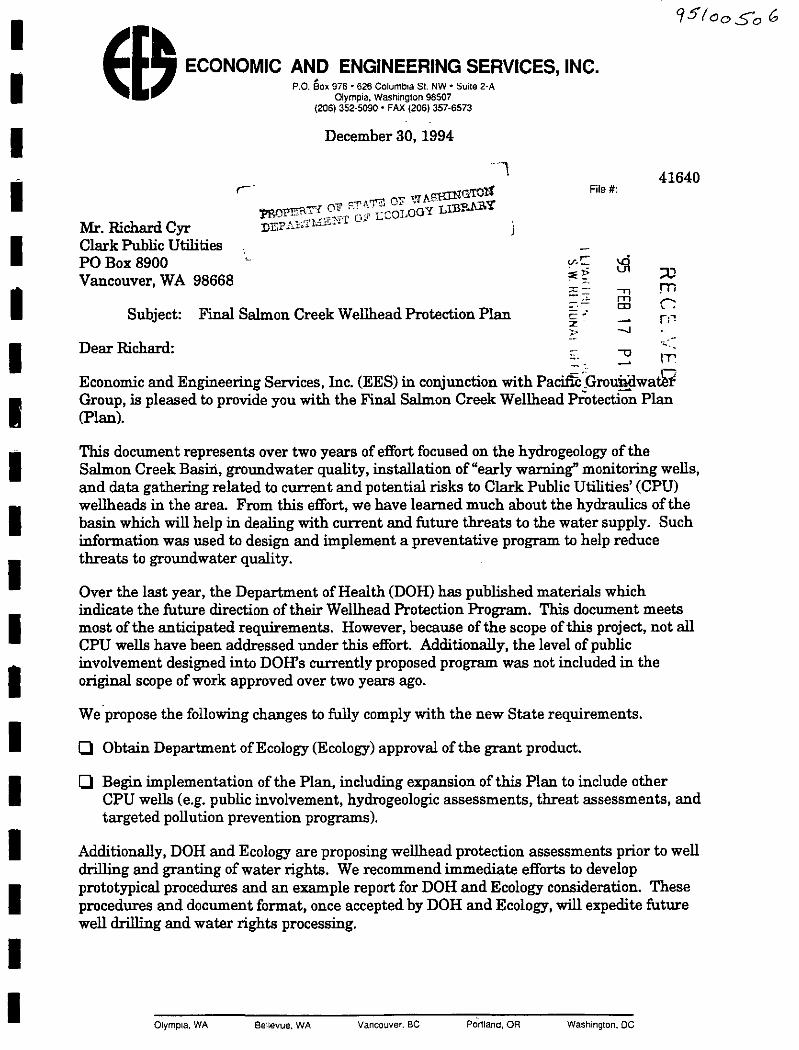
El~ ECONOMIC AND ENGINEERING SERVICES, INC.
Mr. Richard Cyr Clark Public Utilities POBox8900 Vancouver, WA 98668
' P.O. Box 976 • 626 Columbia St. NW • Suite 2-A Olympia, Washington 98507
(206) 352-5090 • FAX (206) 357-6573
December 30, 1994
Subject: Final Salmon Creek Wellhead Protection Plan
Dear Richard:
File#:
v.C ~ ~~ :::::-- -rt
=-·:..:: fT"1 CD c .. ~ ~ z
> -.I
41640
:::0 rn r. n: '!t.,:_
-o -· __. {T'
Economic and Engineering Services, Inc. (EES) in conjunction with Paci&~Gro~wa~ Group, is pleased to provide you with the Final Salmon Creek Wellhead Protection Plan (Plan).
This document represents over two years of effort focused on the hydrogeology of the Salmon Creek Basin, groundwater quality, installation of"early warning" monitoring wells, and data gathering related to current and potential risks to Clark Public Utilities' (CPU) wellheads in the area From this effort, we have learned much about the hydraulics of the basin which will help in dealing with current and future threats to the water supply. Such information was used to design and implement a preventative program to help reduce threats to groundwater quality.
Over the last year, the Department of Health (DOH) has published materials which indicate the future direction of their Wellhead Protection Program. This document meets most of the anticipated requirements. However, because of the scope of this project, not all CPU wells have been addressed under this effort. Additionally, the level of public involvement designed into DOH's currently proposed program was not included in the original scope of work approved over two years ago.
We ·propose the following changes to fully comply with the new State requirements.
0 Obtain Department of Ecology (Ecology) approval ofthe grant product.
0 Begin implementation of the Plan, including expansion of this Plan to include other CPU wells (e.g. public involvement, hydrogeologic assessments, threat assessments, and targeted pollution prevention programs).
Additionally, DOH and Ecology are proposing wellhead protection assessments prior to well drilling and granting of water rights. We recommend immediate efforts to develop prototypical procedures and an example report for DOH and Ecology consideration. These procedures and document format, once accepted by DOH and Ecology, will expedite future well drilling and water rights processing.
Olympia, WA Bellevue. WA Vancouver. BC Portland, OR Washington. DC
I I I I I I I I I I I I I I I I I I I
Mr. Richard Cyr December 30, 1994 Page2
We look forward to assisting you in pursuing the activities outlined above and in securing the necessary agency approvals.
It has been a pleasure working with you and your staff on this project.
RLW:da:w
Enclosure
I I I I I I I I I I I I I I I I I I I
CLARK PUBLIC UTILITIES
SALMON CREEK WELLHEAD
PROTECTION PLAN
December 1994
Presented By
Economic and Engineering Services, Inc. and
Pacific Ground Water Group
Olympia, WA • Bellevue, WA • Portland, OR • Vancouver B.C. • Washington, DC
I I I I I I I I I I I I I I I I I I I
Certificate of Engineer
DECEMBER 30, 1994
The technical material and data contained in the Clark Public Utilities' Salmon Creek Wellhead Protection Plan were prepared under the supervision and direction of the undersigned, whose seal as a professional engineer licensed to practice as such, is affixed below.
Economic and Engineering Services, Inc.
Certificate of Engineer
I I I I I I I I I I I I I I I I I I
1.
2.
3.
4.
5.
6.
December 30, 1994
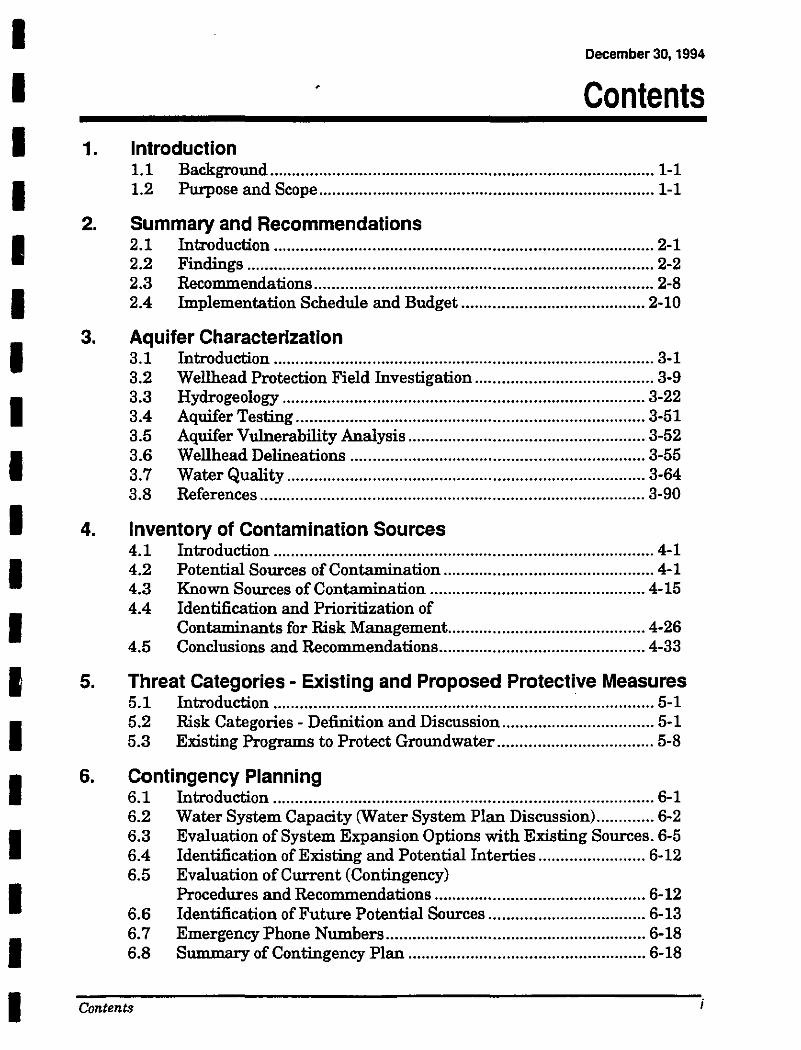
, Contents Introduction 1.1 Background ...................................................................................... 1-1 1.2 Purpose and Scope ........................................................................... 1-1
Summary and Recommendations 2.1 Introduction ..................................................................................... 2-1 2.2 Findings ........................................................................................... 2-2 2.3 Recommendations ............................................................................ 2-8 2.4 Implementation Schedule and Budget ......................................... 2-10
Aquifer Characterization 3.1 Introduction ..................................................................................... 3-1 3.2 Wellhead Protection Field Investigation ........................................ 3-9 3.3 Hydrogeology ................................................................................. 3-22 3.4 Aquifer Testing .............................................................................. 3-51 3.5 Aquifer Vulnerability Analysis ..................................................... 3-52 3.6 Wellhead Delineations .................................................................. 3-55 3.7 Water Quality ................................................................................ 3-64 3.8 References ...................................................................................... 3-90
Inventory of Contamination Sources 4.1 Introduction ..................................................................................... 4-1 4.2 Potential Sources of Contamination ............................................... 4-1 4.3 Known Sources of Contamination ................................................ 4-15 4.4 Identification and Prioritization of
Contaminants for Risk Management ............................................ 4-26 4.5 Conclusions and Recommendations .............................................. 4-33
Threat Categories - Existing and Proposed Protective Measures 5.1 Introduction ..................................................................................... 5-1 5.2 Risk Categories - Definition and Discussion .................................. 5-1 5.3 Existing Programs to Protect Groundwater ................................... 5-8
Contingency Planning 6.1 Introduction ..................................................................................... 6-1 6.2 Water System Capacity (Water System Plan Discussion) ............. 6-2 6.3 Evaluation of System Expansion Options with Existing Sources. 6-5 6.4 Identification of Existing and Potential Internes ........................ 6-12 6.5 Evaluation of Current (Contingency)
Procedures and Recommendations ............................................... 6-12 6.6 Identification of Future Potential Sources ................................... 6-13 6. 7 Emergency Phone Numbers .......................................................... 6-18 6.8 Summary of Contingency Plan ..................................................... 6-18
I Contents
December 30, 1994
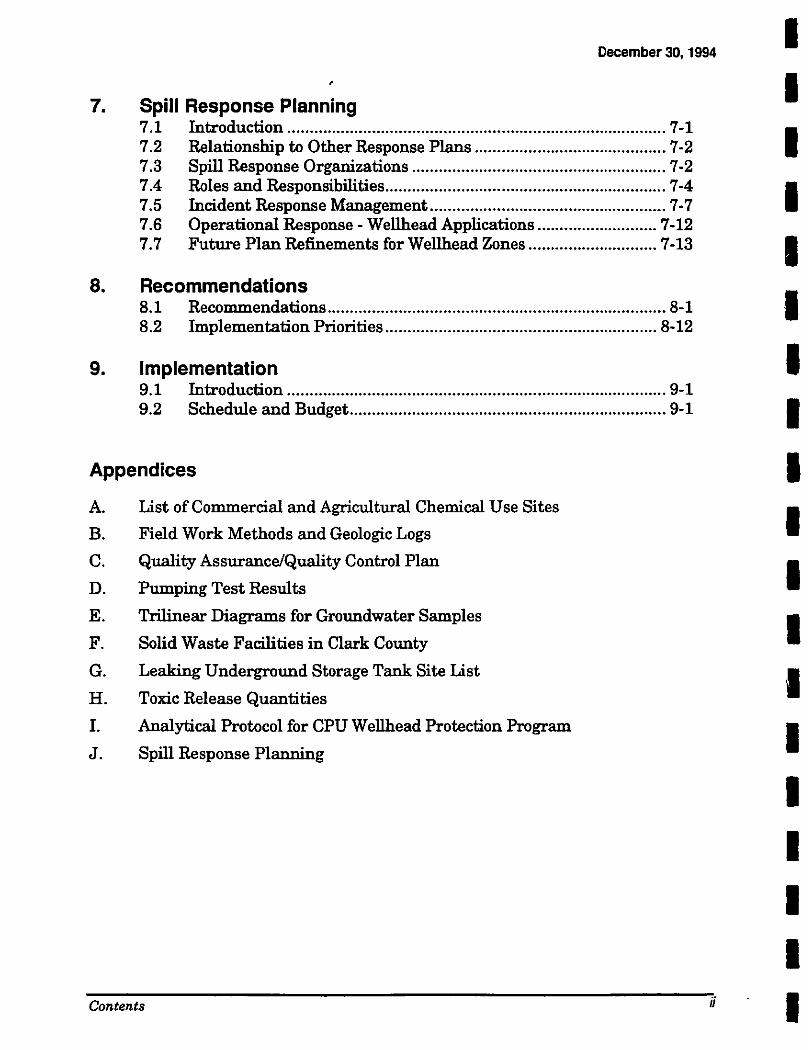
7. Spill Response Planning 7.1 Introduction ..................................................................................... 7-1 7.2 Relationship to Other Response Plans ........................................... 7-2 7.3 Spill Response Organizations ......................................................... 7-2 7.4 Roles and Responsibilities ............................................................... 7-4 7.5 Incident Response Management ..................................................... 7-7 7.6 Operational Response- Wellhead Applications ........................... 7-12 7. 7 Future Plan Refinements for Wellhead Zones ............................. 7-13
8. Recommendations 8.1 Recommendations ............................................................................ 8-1 8.2 Implementation Priorities ............................................................. 8-12
9. Implementation 9.1 Introduction ..................................................................................... 9-1 9.2 Schedule and Budget ....................................................................... 9-1
Appendices
A. B. c. D. E. F.
G. H. I.
J.
List of Commercial and Agricultural Chemical Use Sites
Field Work Methods and Geologic Logs
Quality Assurance/Quality Control Plan
Pumping Test Results
Trilinear Diagrams for Groundwater Samples
Solid Waste Facilities in Clark County
Leaking Underground Storage Tank Site List
Toxic Release Quantities
Analytical Protocol for CPU Wellhead Protection Program
Spill Response Planning
Contents ii
I I I I I I I I I I I I I I I I I I I
I I I I I I I I I I I I I I I I I I I
December 30, 1994
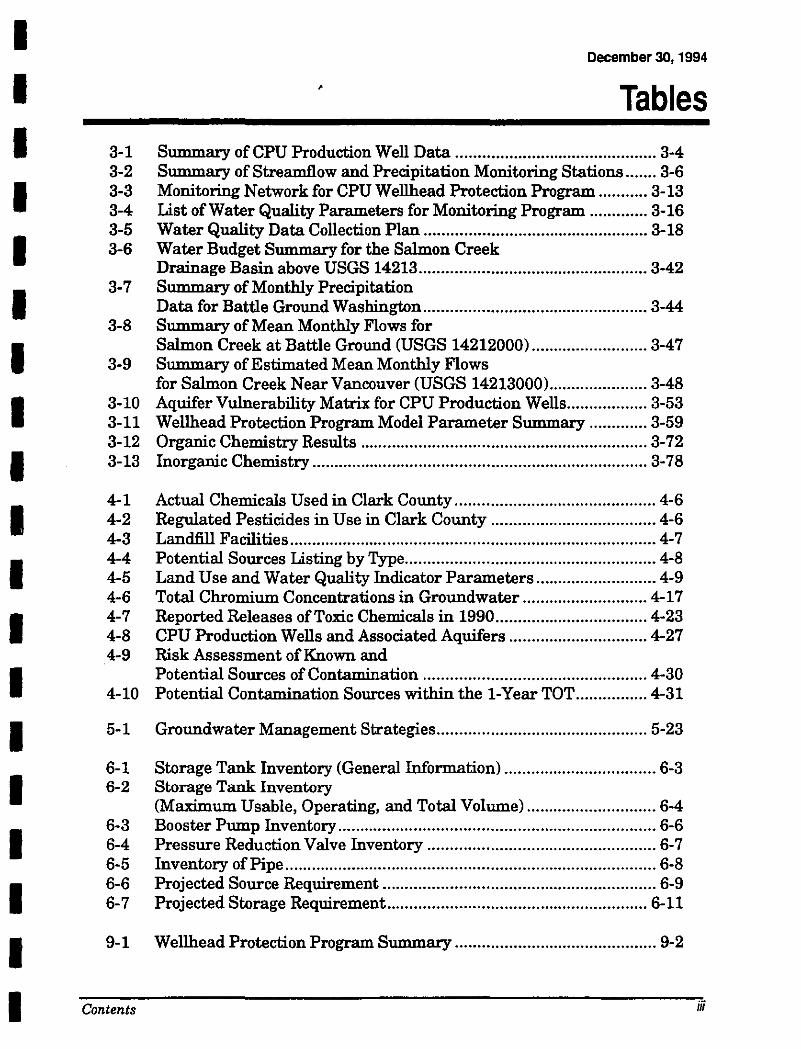
Tables 3-1 Summary of CPU Production Well Data ............................................. 3-4 3-2 Summary of Streamflow and Precipitation Monitoring Stations ....... 3-6 3-3 Monitoring Network for CPU Wellhead Protection Program ........... 3-13 3-4 List of Water Quality Parameters for Monitoring Program ............. 3-16 3-5 Water Quality Data Collection Plan .................................................. 3-18 3-6 Water Budget Summary for the Salmon Creek
Drainage Basin above USGS 14213 ................................................... 3-42 3-7 Summary of Monthly Precipitation
Data for Battle Ground Washington .................................................. 3-44 3-8 Summary of Mean Monthly Flows for
Salmon Creek at Battle Ground (USGS 14212000) .......................... 3-47 3-9 Summary of Estimated Mean Monthly Flows
for Salmon Creek Near Vancouver (USGS 14213000) ...................... 3-48 3-10 Aquifer Vulnerability Matrix for CPU Production Wells .................. 3-53 3-11 Wellhead Protection Program Model Parameter Summary ............. 3-59 3-12 Organic Chemistry Results ................................................................ 3-72 3-13 Inorganic Chemistry ........................................................................... 3-78
4-1 Actual Chemicals Used in Clark County ............................................. 4-6 4-2 Regulated Pesticides in Use in Clark County ..................................... 4-6 4-3 Landfill Facilities .................................................................................. 4-7 4-4 Potential Sources Listing by Type ........................................................ 4-8 4-5 Land Use and Water Quality Indicator Parameters ........................... 4-9 4-6 Total Chromium Concentrations in Groundwater ............................ 4-17 4-7 Reported Releases of Toxic Chemicals in 1990 .................................. 4-23 4-8 CPU Production Wells and Associated Aquifers ............................... 4-27 4-9 Risk Assessment of Known and
Potential Sources of Contamination .................................................. 4-30 4-10 Potential Contamination Sources within the 1-Year TOT ................ 4-31
5-1 Groundwater Management Strategies ............................................... 5-23
6-1 Storage Tank Inventory (General Information) .................................. 6-3 6-2 Storage Tank Inventory
(Maximum Usable, Operating, and Total Volume) ............................. 6-4 6-3 Booster Pump Inventory ....................................................................... 6-6 6-4 Pressure Reduction Valve Inventory ................................................... 6-7 6-5 Inventory of Pipe ................................................................................... 6-8 6-6 Projected Source Requirement ............................................................. 6-9 6-7 Projected Storage Requirement .......................................................... 6-11
9-1 Wellhead Protection Program Summary ............................................. 9-2
Contents iii
3-1 3-2 3-3 3-4 3-5 3-6 3-7 3-8 3-9
3-10 3-11 3-12 3-13
3-14
3-15
3-16 3-17 3-18 3-19
4-1 4-2 4-3 4-4
4-5 4-6
4-7
4-8 4-9 4-10
Contents
December 30, 1994
,
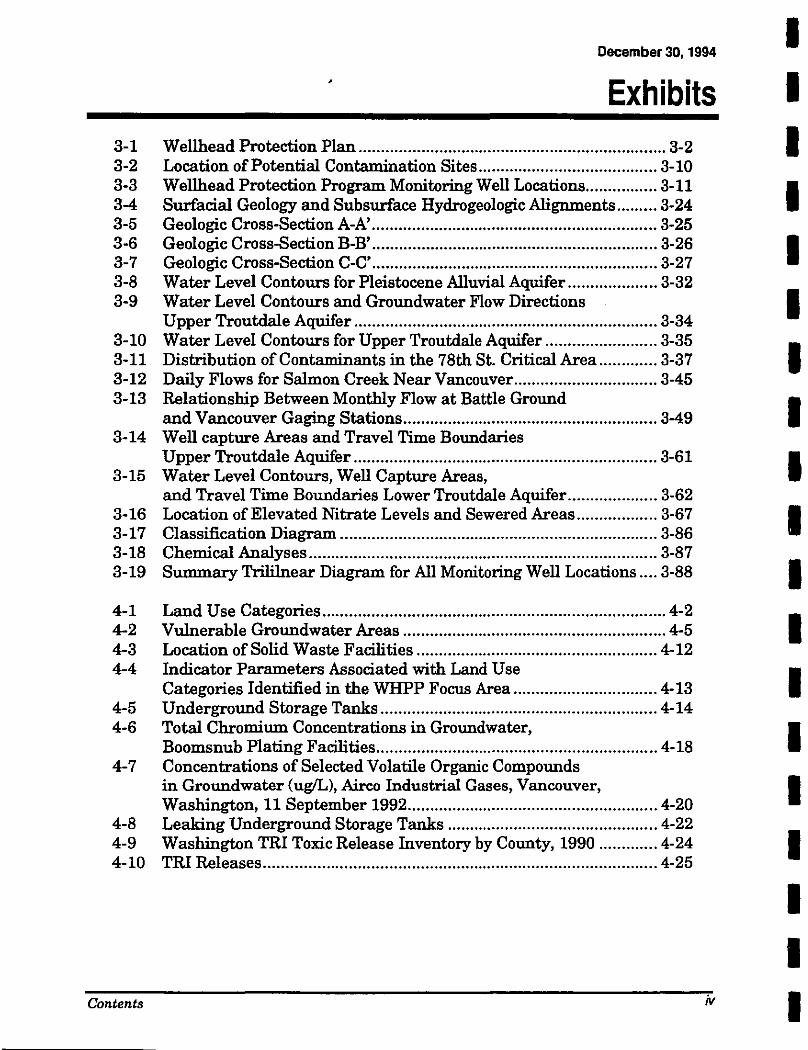
Exhibits Wellhead Protection Plan ..................................................................... 3-2 Location of Potential Contamination Sites ........................................ 3-10 Wellhead Protection Program Monitoring Well Locations ................ 3-11 Surfacial Geology and Subsurface Hydrogeologic Alignments ......... 3-24 Geologic Cross-Section A-A' ................................................................ 3-25 Geologic Cross-Section B-B' ................................................................ 3-26 Geologic Cross-Section C-C' ................................................................ 3-27 Water Level Contours for Pleistocene Alluvial Aquifer .................... 3-32 Water Level Contours and Groundwater Flow Directions Upper Troutdale Aquifer .................................................................... 3-34 Water Level Contours for Upper Troutdale Aquifer ......................... 3-35 Distribution of Contaminants in the 78th St. Critical Area ............. 3-37 Daily Flows for Salmon Creek Near Vancouver ................................ 3-45 Relationship Between Monthly Flow at Battle Ground and Vancouver Gaging Stations ......................................................... 3-49 Well capture Areas and Travel Time Boundaries Upper Troutdale Aquifer .................................................................... 3-61 Water Level Contours, Well Capture Areas, and Travel Time Boundaries Lower Troutdale Aquifer .................... 3-62 Location of Elevated Nitrate Levels and Sewered Areas .................. 3-67 Classification Diagram ....................................................................... 3-86 Chemical Analyses .............................................................................. 3-87 Summary Trililnear Diagram for All Monitoring Well Locations .... 3-88
Land Use Categories ............................................................................. 4-2 Vulnerable Groundwater Areas ........................................................... 4-5 Location of Solid Waste Facilities ...................................................... 4-12 Indicator Parameters Associated with Land Use Categories Identified in the WHPP Focus Area ................................ 4-13 Underground Storage Tanks .............................................................. 4-14 Total Chromium Concentrations in Groundwater, Boomsnub Plating Facilities ............................................................... 4-18 Concentrations of Selected Volatile Organic Compounds in Groundwater (ug/L), Airco Industrial Gases, Vancouver, Washington, 11 September 1992 ........................................................ 4-20 Leaking Underground Storage Tanks ............................................... 4-22 Washington TRI Toxic Release Inventory by County, 1990 ............. 4-24 TRI Releases ........................................................................................ 4-25
iv
I I I I I I I I I I I I I I I I I I I
I I I I I I I I I I I I I I I I I I I
December 30, 1994
6-1 Hazel Dell Water System Existing Distribution and Transmission Network ................................................................ 6-20
6-2 Hockinson Water System Existing Distribution and Transmission Network ................................................................ 6-21
6-3 Hockinson Pressure Zone Schematic ................................................. 6-22 6-4 Projected Source Requirement ........................................................... 6-23
Contents v
I I I I I I ·Section 1
I I I I I I I I I I I I I
I I I I I I I I I I I I I I I I I I I
'
1.1 Background
December 30, 1994
Section I Introduction
In October 1990, Clark Public Utilities (CPU) received a Centennial Clean Water Fund grant (Tax 91064) from the Washington State Department of Ecology (Ecology) to establish a Wellhead Protection Program (WHPP) for wells in its Hazel Dell well field, which lies within the Salmon Creek Drainage Basin. CPU depends totally on local groundwater resources to meet the demands of approximately 13,500 municipal, residential, and industrial customers in Hazel Dell and adjacent communities (in 1991). This represents a total population served of about 35,500. The average day water consumption of CPU's total water system in 1991 was 5:33 million gallons per day (MGD), with an estimated peak day usage of 13.3 MGD.
The Hazel Dell well field includes sixteen operating (on-line) wells, with a peak production rate of approximately 9,200 gpm or about 13.3 MGD.
Based on land use practices, and on the location of major water supply sources, a Focus Area encompassing about 55 square miles in the Hazel Dell area has been designated for this WHPP investigation.
The WHPP was initiated as a result of Section 1428 of the 1986 Amendments to the Federal Safe Drinking Water Act (SDWA) which mandates that every state develop a WHPP. In Washington, the Governor designated the State Department of Health (DOH) as lead agency for wellhead protection program development and administration. DOH in June of 1993, published its 'Washington State Proposed Wellhead Protection Program," with expectations for the program to be adopted by the State Board of Health through amendment of Chapter 246-290 WAC in the spring of 1994.
CPU and its consultants have kept informed on the development of the State program; this program conforms with the proposed State requirements and also satisfies contract commitments with Ecology.
1.2 Purpose and Scope
The purpose of this project is to establish a WHPP for CPU's Hazel Dell well field that will do the following:
Introduction J.J
December 30, 1994
CJ Reduce the likelihood that potential contaminant sources will pollute the drinking water supply provided by CPU's Hazel Dell wells;
CJ Include a contingency plan for preparedness and provide alternate sources of drinking water in the event that, notwithstanding reasonable protective measures, contamination does occur; and
CJ Include a monitoring program to provide an "early warning" of contaminant entry into the wellhead protection areas to allow timely implementation of the contingency plan.
In brief, the project has included construction of monitoring wells, field investigations and analyses, aquifer characterization leading to delineation of the one-, five-, and ten-year time of travel boundaries for each of CPU's Hazel Dell production wells, water quality analyses, identification of existing and potential sources of contamination, and prioritization of threat categories. This prioritization of threats led to an evaluation of existing protective measures for the high threat categories, recommendations for needed actions, development of a contingency plan and spill response strategy, and a monitoring program.
Throughout this project, it has been recognized that an effective implementation of a WHPP for CPU's Hazel Dell wells is contingent to a large degree on actions by other governmental entities, as well as the general public. For example, CPU can not mandate land use conditions; that is a responsibility of the Clark County (County) and cities. Additionally, there are many ongoing activities in the County that directly or indirectly relate to groundwater protection (e.g. the Ground Water Management Plan for Clark County is being finalized).
Therefore, the approach on this project has been to utilize other work and regional programs whenever possible to avoid duplication of efforts and keep abreast of related activities. Actions which CPU can do on its own (relative to those actions they can only support or recommend to other entities) are clearly identified.
Introduction 1-2
I I I I I I I I I I I I I I I I I I I

I I I I I I I I I I I I I I I I I I I
Section 2
I I I I I I I I I I I I I I I I I I I
December 30, 1994
Section 2 Summary and Recommendations
2.1 Introduction
Clark Public Utilities (CPU) is a major water purveyor which supplies water to much of Clark County. CPU is wholly reliant on groundwater resources and manages an extensive well field in the Hazel Dell vicinity to satisfy local water demands. The Hazel Dell area is rapidly urbanizing. Aa water demands increase, so do potentially polluting land use practices. These practices include septic drain fields, underground storage tanks, concentration of urban runoff into dry wells, light industry, and (small quantity) hazardous waste generating businesses. Groundwater in the area is shallow, and in some places the principal regional aquifer is exposed at the land surface, creating a direct route for contaminant migration. This aquifer system has been identified as a major component in fulfilling the future public water supply needs of Clark County (County) (see Chapter 173-592 WAC, Reservation of Future Water Supply for Clark County).
The goal of this planning effort is to establish a Wellhead Protection Program (WHPP) for the Hazel Dell - Salmon Creek Basin aquifer system which provides a large proportion of the total water supply to CPU. The components of this WHPP have been patterned generally on the criteria as authorized in the 1986 Amendments to the Safe Drinking Water Act (SDWA). Further adjustments have been made to reflect the recent State Department of Health (DOH) Guidelines for Wellhead Protection (June 1993).
This project was partially funded by a grant to CPU through the Department of Ecology (Ecology) Centennial Clean Water Fund. Funding was approved in 1991, and planning efforts have been underway since that time.
The overall planning effort has consisted of:
CJ Evaluation and characterization of the level and sensitivity to contamination of the various groundwater supply sources within the Salmon Creek Basin area based on hydrogeologic, land use, and water quality factors; and,
CJ The design and early implementation of management strategies which serve to protect long-term groundwater quality in the source areas.
Summary and Recommendations 2-1
December 30, 1994
Hydrogeologic and land use factors which may impact groundwater quality have been identified. Water supply sources at greatest risk to water quality degradation have been delineated. New data has been generated to further identify water quality concerns by the installation of monitoring wells and monitoring equipment. Capture areas and travel time contours for supply sources have been identified and have been used to establish wellhead protection areas. Based on this information, management strategies have been developed and some early implementation has begun.
The planning area lies within the Clark County Ground Water Management Area (GWMA), defined in 1987, which encompasses all of Clark County. CPU has been an active participant in the ongoing Clark County Ground Water Management Plan (GWMP) planning effort. This project is complementary to that effort and will facilitate early implementation of the GWMP.
Although this effort was primarily directed to the Hazel Dell - Salmon Creek area, the elements of this program, with some modification and tailoring, can be utilized as part of a WHPP for CPU's wells outside of this Focus Area.
2.2 Findings
The following are the major findings of this study and planning effort. Further information on these summaries can be found in the corresponding section of this report.
2.2.1 Aquifer Characterization
Wellhead Delineation
The modeled capture zones for one-, five-, and ten-year time-of-travel analyses for CPU wells are presented in Exhibits 3-14 and 3-15. The areas within the shaded boundaries shown on the figures represent the estimated zone of groundwater contribution to the well sources for each period of analysis. Capture zone areas expand as a function of larger travel times. The capture areas extend mostly upgradient of the well source. The downgradient limit of the capture area is defined by the location of a stagnation point. Water particles upgradient of the stagnation point travel toward the well. Water particles downgradient of the stagnation point travel in the direction of the regional hydraulic gradient and are carried away from the well.
Exhibit 3-14 shows the ten-year travel time boundary and capture areas for all of the shallow water supply wells, as well as the recharge area that
Summary and Recommendations 2-2
I I I I I I I I I I I I I I I I I I I
I I I I I I I I I I I I I I I I I I I
December 30, 1994
' contributes upgradient of shallow wells in the Salmon Creek Basin. The ten-year capture area for the well sources represents the most critical area in which to focus additional field investigations, land use surveys, and long-term monitoring. The recharge area upstream of the shallow wells in the Salmon Creek Basin represents a secondary area for future investigations.
Water Quality
A wide variety of data have been collected to date, providing a profile of water quality conditions in both the Pleistocene Alluvial and Upper Troutdale aquifers. The data have been reviewed and evaluated according to standards applied to drinking water under the SDWA. These standards were used as guidelines since one goal of the WHPP is to identify the presence of compounds posing a threat to water supply wells before they are impacted by contamination. Excessive levels of compounds or trends in contaminant concentration may provide an advance warning that drinking water quality may be impacted in the future.
In general, the data collected during the first three monitoring rounds (samples from the supply aquifers) indicate that: 1) water quality has not been significantly impacted by inorganic chemical contamination; and 2) Volatile Organic Chemical (VOC) contamination, particularly in the vicinity of 78th and St. Johns Road (see Section 3), is a significant issue which should continue to be addressed in future monitoring efforts. Inorganic and organic contamination has been documented in the marsurface aquifer overlying the regional supply aquifer in the area of 78th and St. Johns Road.
A probable source of VOC contamination (AIRCO) and the source of chromium contamination (Boomsnub) have been identified, and investigations to characterize the plumes associated with each site are ongoing. Although chromium was detected at MW-lShallow (MW-1, Exhibit 3-3), levels were well below the established MCL of 0.1 mg/L. Of primary concern is the VOC contaminant plume because it lies hydraulically upgradient of CPU Zone 2 Production Well Nos. 5, 7.1, and 23. A Work Plan is currently in progress to address these concerns. One or more monitoring wells will be constructed and screened in the Upper Troutdale area, and will be located between the AIRCO-Boomsnub contaminated sites and CPU Well MW-1. Additional sampling of such wells should be beneficial for tracking the extent of contamination and to determine the threat to CPU production wells. Additional information
Summary and Recommendations 2-3
December 30, 1994
' regarding contamination at the AIRCO-Boomsnub contaminated sites is provided in Section 4.
2.2.2 Potential Sources of Contamination
High Risk Sources
As a result of an evaluation of existing data on aquifer contamination, land use, and site contamination, the following are considered high risk source categories and should be the focus of further evaluation and protective measures:
Underground Storage Tanks - The risk of a contaminant released in the subsurface environment reaching the water table is also increased by the difficulty of discovering that the release has occurred. Often, leaking underground storage tanks are not identified until the contaminant is detected in a potable water source, or, until such a large quantity of the product has been released that the change in tank volume is readily measurable.
Transportation and H02ardous Material Spills - Contamination from a spill during chemical transport. could pose a serious threat to water quality in the shallow aquifer. Although a larger volume of potential contaminants is most likely transported on a more frequent basis via Interstate 5, the proximity of Highways 99 and 205 to many of CPU's production wells places these corridors in a higher risk category. Spill events cannot be predicted, and therefore, preventative measures are limited.
Existing Contaminated Sites - Groundwater contamination from the AIRCO-Boomsnub contaminated sites (78th and St. Johns Road) present the largest and most probable threat to groundwater quality. Close monitoring of the contaminant plumes and maintaining an open working relationship with both Ecology and the two facilities is crucial to protecting CPU's water quality and quantity requirements. A continued monitoring program is outlined in this report..
Lower Risk Sources
The lower risk source categories and/or activities identified in this study include septic tanks, commercial and industrial hazardous material management, stormwater runoff, pesticides and fertilizers (including
Summary and Recommendations 2-4
I I I I I I I I I I I I I I I I I I I
I I I I I I I I I I I I I I I I I I I
December 30, 1994
• animal waste disposal), and either poorly constructed or improperly decommissioned wells.
It is emphasized that '1ower risk" does not mean "no risk." Existing regulatory programs that provide measures for the protection of groundwater quality, particularly in wellhead protection areas, need to be fully implemented and enhanced where practical and economically feasible.
2.2.3 Existing Protective Measures
Federal, State, or local protective programs exist in the County for most sources posing a risk to groundwater. However, these programs are geographically broad in focus. Generally, wellhead protection could be enhanced by a more focused application of these programs. An evaluation of existing programs has led to the following findings:
Underground Storage Tanks - Regulatory programs exist under federal law to cover most fuel storage, and complementary State programs have also been developed. . Inventories exist for all regulated tanks and the tanks of concern are those which are exempt under State or federal rules. These include farm fuel tanks and home heating tanks.
Hazardous Materials - Hazardous material regulatory programs exist under State, federal, and local law. Federal and State regulation focus on transportation and storage of hazardous commodities, and the transport, storage, treatment, and disposal of hazardous wastes. Groundwater risk continues from small quantity storage of hazardous material and generation and disposal of hazardous wastes. Similarly, household hazardous waste disposal continues to be a threat. Local programs have been initiated to help minimize the threat from these sources.
Existing Contaminated Sites - Many contaminated sites in the County have been identified. Further, programs are underway to reduce the risk to groundwater from these sites, or to clean-up existing groundwater contamination. Further work needs to be done to fully characterize contaminated sites, to fully identify the source and extent of contamination, and to fully evaluate clean-up options.
Septic Tanks - Local programs exist to control the density and to promote maintenance of on-site septic systems. With wellhead areas defined, new consideration needs to be given to allowable density of these systems in
Summary and Recommendations 2·5
December 30, 1994
• various wellhead zones. In addition, septic maintenance program efforts can be focused to specific wellhead areas.
Stormwater Runoff - State programs exist to regulate stormwater runoff from cities and large industrial sources. In addition, local programs are now being implemented which will greatly strengthen the protection of groundwater from urbanization activity.
Animal Waste Disposal - Educational and regulatory programs exist at the federal and State level. Some siting control exists for locating new facilities under local regulations. Federal programs of the United States Department of Agriculture are primarily educational while some controls exist under the Environmental Protection Agency for animal waste disposal. At the State level, Ecology can regulate waste disposal under either surface water regulations or the more recent groundwater regulations. Again, however, these programs are broad in their geographic focus, and wellhead protection would benefit from a more narrow focus.
Pesticides and Fertilizers - Although some regulation of pesticide applicators is in place, there is little control and few education programs covering the use of pesticides or fertilizers. With the designation of wellhead zones, the opportunity exists for focused education efforts, and possibly some focused regulatory control.
New and Abandoned Wells - There are currently no controls over the installation of new private domestic wells, with the exception of well driller licensing programs, to help control construction standards. Larger wells are permitted and regulated by Ecology. Further, there are no programs to find and properly decommission wells which are no longer in use (abandoned). Both the proliferation of private domestic wells, and the existence of abandoned wells represent a threat to proper management and protection of the groundwater resources.
2.2.4 Contingency Planning - Evaluation of Existing Approach
Because of the geographic and hydrologic separation of sources and the strategic location of storage in the CPU system, loss of any particular source can be accommodated. The existing contingency plan calls for strategic pumping of various wells in the system, storage management, and continued new source development.
Summary and RecommendatiOns 2-6
I I I I I I I I I I I I I I I I I I I
I I I I I I I I I I I I I I I I I I I
December 30, 1994
• 2.2.5 Spill Response Planning - Existing Plans
A review of existing spill response planning reveals an elaborate federal, State and local system designed to handle all types of spills and on any level of magnitude. Planning for the large, almost unimaginable size of a spill is part of spill contingency planning and preparedness. However, on a more "routine"level, most spills are small and require close coordination with a group known as "first responders." These first responders are generally local fire departments or districts, local law enforcement, or the State Patrol.
While the response capabilities for the extremely large spills is not tested often, experience in Washington with large oil spills in particular, has shown that the system is capable of providing necessary response in an efficient manner.
At the local level, the response capability is tested often and this experience has demonstrated that response is generally efficient and effective.
The following are key findings concerning this critical local capability:
Local Fire Districts
Local operational response to hazardous material spills generally rests with local fire departments or districts. For this plan, this translates to the local fire districts of the County. All districts are trained in the Incident Command System and are pre-designated as Incident Command Agencies for events in their districts (with the exception of State highways).
Vancouver Fire Department (Including Former Fire District Five)
One district in particular, is a key to the area's spill response. Vancouver Fire Department (former Fire District Five) is the area's hazardous materials response agency (HAZMAT), and is well trained and equipped. Operationally, the district has pre-arranged contracts with the other fire districts to respond for HAZMAT incidents. The only exception, and one of concern for Salmon Creek wellheads, is that no agreement exists with the State Patrol for incidents on State Highways.
Summary and Recommendations 2-7
December 30, 1994
State Patrol
The Washington State Patrol is the pre-designated Incident Command Agency for all incidents occurring on State highways. Without a prearranged agreement with the Vancouver Fire Department for HAZMAT incidents, the State Patrol must contact an agency with jurisdiction and a contract with Vancouver Fire Department in order to secure a HAZMAT Team response. This situation may represent an unnecessary risk to the waterways and wellheads particularly along Interstate 5.
2.3 Recommendations
The following actions are recommended as protective measures for CPU's groundwater supply. Because CPU does not have land use or regulatory power, CPU's activities are focused in cooperative, voluntary, and public involvement/education areas. CPU will serve in a support role for all action items for which it does not have lead responsibility. Further description of these items can be found in the body of the report. CPU has lead responsibility for all items in 2.3.3 below.
2.3.1 Land Use
Action Lead Responsibility
Establish Protective Zoning Regulations for Clark County Wellbead Areas
Establish Protective Regulations Governing Clark County Activities within Wellbead Zones
2.3.2 Regulatory
Action Lead Responsibility
Expanded Underground and Clark County or Southwest Washington Aboveground Tank Regulation Health District
Implement a Septic Maintenance Southwest Washington Health District Program
Implement Mandatory Sewer Hook-up Southwest Washington Health District
Implement Increased Storm water Clark County Management Regulation
Implement a drywell inventory and Clark County control program
Restrict Pesticide and Fertilizer Use in Clark County
Summary and Recommendations 2·8
I I I I I I I I I I I I I I I I I I I
I I I I I I I I I I I I I I I I I I I
• Wellhead Areas
2.3.3 Cooperative I Voluntary
Action
Continue Streambank Stabilization Efforts
Establish a Well Location I Status Program
Decommission All Abandoned Wells
Establish a Low Cost or Free Septic Maintenance Service
Continue Ground Water Monitoring Efforts
Research Groundwater Recharge Methods
Implement Water Conservation
Develop Wellhead Spill Response Planning
Inventory Land Use within Wellhead Zones
Increase the Availability of Hazardous Material "Audits" to Small Businesses
Continue Source Development Determination of Availability
Complete and Implement the Salmon Creek Water Resources Management Plan
December 30, 1994
Lead Responsibility
CPU
CPU
CPU
CPU
CPU
CPU
CPU
CPU
CPU
CPU Southwest Washington Health District
CPU
CPU
2.3.4 Public Involvement /Information and Education
Action Inform All Residents within Wellhead Zones of Boundaries Develop a Comprehensive Wellhead Education Program Continue Environmental Education Pro ams
2.3.5 Data Gathering
Action Continue Collection ofWell Pumping Data Continue Depth to Water Monitoring Well and Groundwater Water Quality Monitoring
Summary and Recommendations
Lead Responsibility CPU
CPU
CPU
Lead Responsibility CPU CPU CPU
2-9
December 30, 1994
' 2.4 Implementation Schedule and Budget
The majority of this WHPP can be implemented by CPU. However, CPU does not have land use or regulatory authority. Consequently, the focus of CPU activity will be voluntary, cooperative, and educational.
Specifically, CPU will be pursuing wellhead protection with a general approach that encourages wellhead protection by making property ownership and living in a wellhead zone desirable. CPU believes that this can most effectively be accomplished through incentive programs and by providing wellhead protection services to the public.
There is a time and place for controls and regulation. CPU fully supports a well rounded program which is supported and enforced, if necessary, through regulation.
An element by element estimate of the cost of this program indicates that the cost could be between $200,000 and $600,000 in the first year, and about $600,000, annually (Table 9-1). However, many of the activities covered under this WHPP are budgeted or otherwise covered by other programs planned or implemented by CPU. The impact of this program, therefore, will be significant, but not as large as indicated by this summary of the costs of individual elements.
This WHPP will be incorporated in CPU's planning for 1994 and beyond. At that time, the incremental impact due to the incremental increase in activity due to this effort and its effect on rates, if any, will be more apparent.
Summary and Recommendations 2-10
I I I I I I I I I I I I I I I I I I I

I I I I I I Section 3
I I I I I I I I I I I I I
I I I
#
December 30, 1994
Section 3 Aquifer Characterization
1 3.1 Introduction
I I I I I I I I I I I I I I I
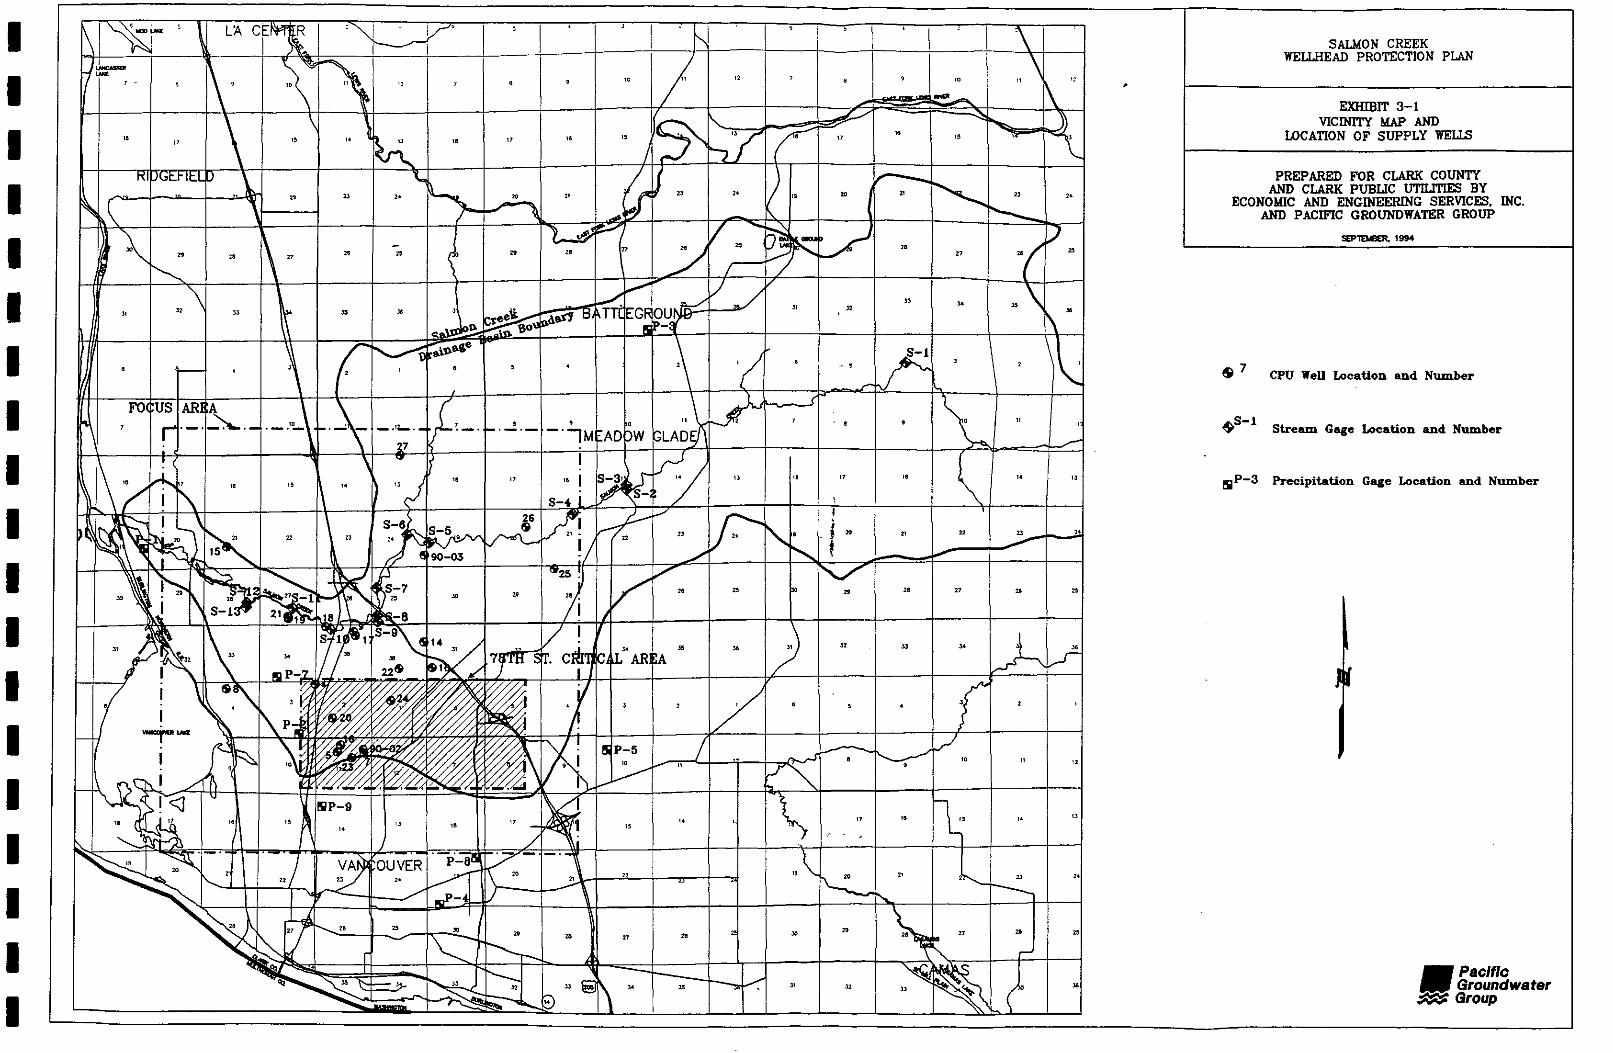
A preliminary data assessment was conducted by Pacific Groundwater Group (PGG) and Economic and Engineering Services (EES) in 1991 to facilitate investigations for Clark Public Utilities' (CPU) Wellhead Protection Program (WHPP). A Focus Area encompassing about 55 square miles in the Hazel Dell area was designated for this investigation based on land use practices and on the location of major water supply sources. Locations of the WHPP Focus Area and CPU production wells are shown on Exhibit 3-1. The approach used for the preliminary assessment included:
CJ Characterizing hydrogeologic conditions in the Focus Area using existing data;
CJ Characterizing land use practices in the Focus Area;
CJ Evaluating aquifer vulnerability in the vicinity of each production well;
CJ Computing capture zones and travel times for each production well using the US Environmental Protection Agency (EPA) Wellhead Protection Model;
CJ IdentifYing water supply sources which are at greatest risk to water quality impacts;
CJ IdentifYing areas where existing hydrogeologic data are. insufficient for assessing aquifer vulnerability, and designing a work plan for additional data collection;
CJ Analyzing available stream flow data for Salmon Creek to assess the interaction between groundwater and surface water systems; and
CJ Developing a work plan to monitor groundwater and surface water quality and quantity in high-risk areas.
Based on the results of the assessment, a work plan was designed to evaluate the vulnerability and sensitivity of CPU's water supply sources with respect to potential and confirmed contaminant sources. In accordance with the 1991 Work Plan, fourteen monitoring wells were installed at eight sites, and a groundwater/surface water monitoring network was established for the Focus Area. This report presents the findings of the WHPP investigation and incorporates the results of installation and testing of the new monitoring wells and other work proposed in the Work Plan, such as water level monitoring, water quality sampling,
Aquifer Characterization 3-1
I I I I I I I I I I I I I I I I I I I
·it.LD -\. u
,lf----1
-
-"
.. '6""
\ '( . . . ~"
\ "
" -
"
,
\.:
' --"
"
,.
"
SALMON CREEK WElLHEAD PROTECTION PLAN
EXHIBIT 3-1 VICINITY MAP AND
LOCATION OF SUPPLY WELLS
PREPARED FOR CLARK COUNTY AND CLARK PUBIJC UTIIJTIES BY
ECONOMIC AND ENGINEERING SERVICES, INC.
s7
+S-1
sP-3
AND PACIFIC GROUNDWATER GROUP
SEP1B<BER. , ...
CPU Well Location and Number
Streazn Gage Location and Number
Precipitation Gage Location and Number
•Pacific Groundwater
:1# Group
I I I I I I I I I I I I I I I I I I I
December 30, 1994
stream flow gaging, and continued precipitation monitoring. The results of this additional work have provided a better understanding of hydrostratigraphy, aquifer properties, hydraulic gradients, groundwater/surface water relations, and water quality in the Focus Area.
Additional hydrogeologic investigations were initiated by CPU in the fall of 1993 to further evaluate the extent of groundwater contamination in vicinity of the Boomsnub and Airco facilities near NE 78th Street and St. Johns Road. The studies included installation of seven additional monitoring wells to better define the extent of chromium and Volatile Organic Chemicals (VOC) contaminant plumes and a refined assessment of the potential threats that the plumes pose to CPU's water supply sources. The results of these investigations are presented in a separate report (PGG, 1994).
3.1.1 Production Wells
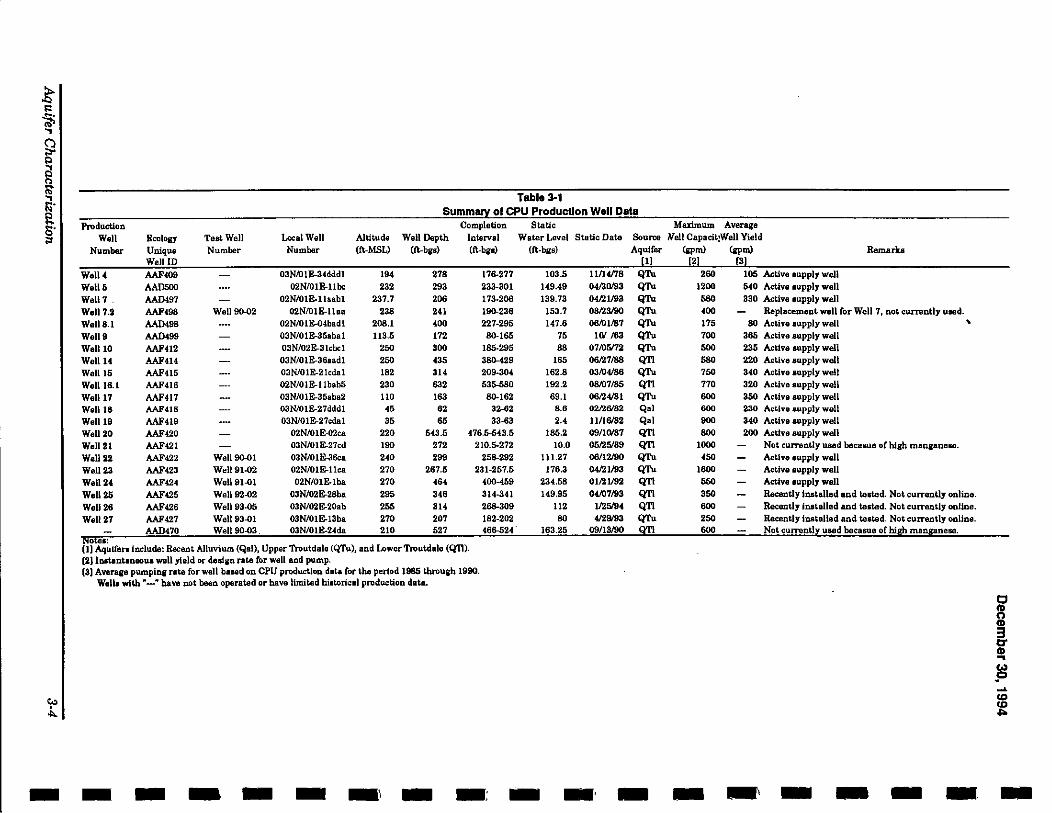
The Hazel Dell well field comprises nineteen active production wells. Locations of these production wells are shown on Exhibit 3-1. Construction details and other pertinent data for the wells is presented on Table 3-1. The well field lies entirely within the Salmon Creek Drainage Basin. CPU Production Well Nos. 9, 17, 18, and 19 are shallow wells located along the Salmon Creek corridor and are herein designated "Zone 1" wells. CPU Production Well Nos. 4, 5, 7, 8, 10, 15, 22, 23, and 27 are shallow wells located outside the Salmon Creek corridor, and are designated "Zone 2" Wells. Well Nos. 14, 16, 20, 24, 25 and 26 are "deep wells" which do not fall into either designation. The wells are pumped at rates which range from 250 to 1,600 gpm. CPU Well Nos. 22, 24, and 23 are former exploration wells which are now used as supply wells. These wells were identified in previous reports as Well Nos. 90-01, 91-01, and 91-02, respectively. CPU Well Nos. 25, 26, and 27 were just recently completed. These sources will be placed online during the summer of 1994.
In addition to the production wells, CPU has also installed several non-active production wells and exploration wells in the Hazel Dell vicinity. Table 3-1 summarizes construction details and other pertinent data for these wells. CPU Well No. 7.2 (formerly designated as Well No. 90-02) is a replacement well for existing Well No. 7. CPU Production Well Nos. 21 and 90-03 have elevated manganese levels and will not be used until cost-effective treatment can be developed.
The production and exploration wells yield water from one of three aquifer systems, which include: 1) the lower Salmon Creek alluvial system; 2) the Upper Troutdale system; and 3) the Lower Troutdale system. The Salmon Creek alluvial aquifer is a shallow shoestring aquifer which occurs within the lower Salmon Creek valley and yields moderate to large amounts of
Aquifer Characterization 3-3
~ I: -:;; ., ., 9 ., g lil" ., t;· a s· ;:r
-
Table 3-1 Summary ol CPU Production Well Data
Prodw:tion
Well EcoloBY Number Unique
WelliD
Well4 AAF409
Well5 AAil500 Well7. AAD497 Well7.2 AAF498 Well8.1 AAD498
WellB AAD499 WelllO AAF412
Well14 AAF414
Welll5 AAF415
Welll6.1 AAF416
Well17 AAF417 Well IS AAF41B
Well19 AAF419
Well20 AAF420
Wsll21 AAF421
Well22 AAF422
Well23 AAF423
WellU AAF424
Well26 AAF425
WeU26 AAF426
Well27 AAF427 AAD470
o a:
Teat Well
Number
Well90-02
Well 90-01
Well91-02 Well91-0l
Well92-02
Well93-05 Well93-01 Well90-03
Local Well Number
03NAHE-34dddl
02N/01E-llbc
02N/01E-lhabl 02N/01E-llaa
02N/01E-04badl
03N/01E-35abal 03N/02E-31cbcl
03N/OIE-36aadl 03N/01E-21cdal
02N/01E-llbab5 03N/01E-35aba2 03N/01E-27ddd1 03N/01E-27cdal
02N/OIE-02ca 03N/01E-27cd
03N/01E-36c:a 02N/01E-llca
02N/01E-1ba
03N/02E-28ba 03N/02E-20ab
03N/01E-13ba 03N/01E-24da
Completion
AJtitude Well Depth Interval (fi.MSLJ (ft..bgs) (f\..bgll)
194 278 176-277
232 293 233-301
237.7 206 173-206
238 241 190-236 208.1 400 227-295 113.5 172 80-165
250 300 185-295
250 435 380-429 182 314 209-304 230 632 535-580
llO 183 80-162 45 62 32-62 35 85 33-83
220 543.5 476.6-543.5
190 272 210.5-272
240 299 258-292
270 267.5 231-257.5
270 464 400-459
295 346 314-341
255 314 268-309
270 207 182-202 210 627 466-524.
(I] Aqutfera include: Recent Alluvium (Qal), Upper Troutdale (QTu), and Lower Troutdale (Q'Il). (2)1oattntaneoua well yield or desia:n rate for well and pump. (3) Averaje pumpiDj' rate far well based on CPU production data for the period 1985 throul(h 1990.
Walla with •-• have not been operated or have limited historical production data.
Static Water Level
(ft-bga)
103.5 149.49 139.73
153.7 147.6
75
88 165
162.8
192.2
69.1 8.6
2.4 185.2
10.0 111.27
176.3 234.58
149.95
ll2 80
163.25
- - - - - - -
Muimum Averago
Static Date Source Nell Capacit~Well Yield Aquifer {opm) {opm) Remarb
1 2 3
11114178 Q'lU 260 105 Active supply well
04/30193 Q'lU 1200 640 Active supply well 04121193 Q'lU 580 330 Active supply well
08tl3/90 Q'lU 400 Replacement well for Well 7, not currently used. 06101187 Q'lU 175 80 Active supply well '
101 /63 Q'lU 700 365 Active supply well
07/05172 Q'lU 500 235 Active supply well 06121188 Q'n 580 220 Active supply well 03/04/86 Q'lU 750 340 Active supply well 08107/85 Q'n 770 320 Active supply well
06/l4/81 Q'lU 600 350 Active supply well 02t.l<V82 Qa1 600 230 Act.ive au.pply well
11/16182 Qal 900 340 Active supply well 09/10187 Q'n 800 200 Active supply well 05125189 Q'n 1000 Not currently used becas.ue of high m8Jl&'ana&e.
06/12190 Q'lU 450 Active supply well
04121193 Q'lU 1600 Active supply well 01121192 Q'n 650 Aettve supply well
04JU7/93 Q'n 350 Recently installed and tested. Not currently online.
1125194 Q'n 600 Recently installed and tested. Not currently online. 4129193 Q'lU 250 Recently installed and tested. Not currently online.
09/13/90 600 Not current! used becasue of hi
- - - - - - -
I I I I I I I I I I I I I I I I I I I
December 30, 1994
water to wells. The Upper Troutdale is the Regional Supply Aquifer, a shallow aquifer system characterized by a series of interconnected unconfined and semi-confined aquifers which yield moderate to large quantities of water. The Lower Troutdale is a deeper, confined aquifer system which occurs at depths of several hundred feet below ground surface (bgs) and yields less water to wells than the shallow system which overlies it. All three aquifers are described in detail in Section 3.3.
3.1.2 Previous Studies
1991 Work Plan
Existing information for wells, hydrogeology, water quality, and land use in the WHPP Focus Area was most recently compiled and reviewed for the Salmon Creek Wellhead Protection Program Preliminary Data Assessment and Work Plan (PGG & EES, 1991). The data sources included regional and local technical reports, and well, hydrogeologic, and water quality data. The report provides a comprehensive summary of hydrogeologic data available for the WHPP Focus Area, and summarizes results of a preliminary aquifer vulnerability assessment and wellhead capture zone analysis. The report also contained recommendations for additional data collection and analyses.
Other Hydrogeologic Investigations
The regional hydrogeology was characterized by Mundorff (1964) in Geology and Ground-Water Resources of Clark County Washington, with a Description of a Major Alluvial Aquifer Along the Columbia River. The regional hydrogeology was further characterized by the U. S. Geological Survey (USGS) in Portland, Oregon, in conjunction with the Intergovernmental Resource Center (IRC) of Vancouver, Washington. The joint effort facilitated development of a regional-scale groundwater flow model, as well as characterization of regional geology, groundwater hydraulics, groundwater recharge, water quality, and water use. These issues, as well as recently compiled hydrologic data, are addressed in a series of reports published by the USGS (McCarthy and Anderson, 1990; McFarland and Morgan, 1991; Morgan and McFarland, 1991; Orzol, 1991; Swanson and others, 1989; Swanson and others, 1991, and Swanson, 1991). Swanson (1992) prepared wellhead delineations for approximately 40 public water supply wells in Clark County using various modeling approaches. Water supply management on a regional scale is addressed in the Coordinated Water System Plan (CWSP) and the CPU Water System Plan (WSP), issued every five years (EES, 1981; EES, 1985). The current CWSP was completed by the IRC in 1991 (IRC, 1991). The current WSP was completed by Economic and Engineering Services in 1993 (EES, 1993).
Afiuifer Characterization 3-5
December 30, 1994
Technical reports addressing the local-scale hydrologic systems are available mostly in the form of groundwater management and well construction reports submitted by consultants to various clients. Well construction reports generally include geologic information, aquifer test results, and well as-builts. Hydrogeologic investigations have been conducted for CPU to address groundwater management issues in the Hazel Dell area, and include a groundwater management plan prepared by Carr & Associates (1985); an Aquifer Protection Strategy prepared by EES and PGG (1989); and a (Draft) Hazel Dell Wellfield Optimization Analysis by PGG (1991a). CPU, in conjunction with the Washington Department of Ecology (Ecology) and Clark County (County) are currently developing a Water Resource Management Plan for the Salmon Creek Basin. The study was scheduled to be completed in early 1994, and to address water supply and water rights allocation issues.
Precipitation, Stream Flow, and Water Level Data
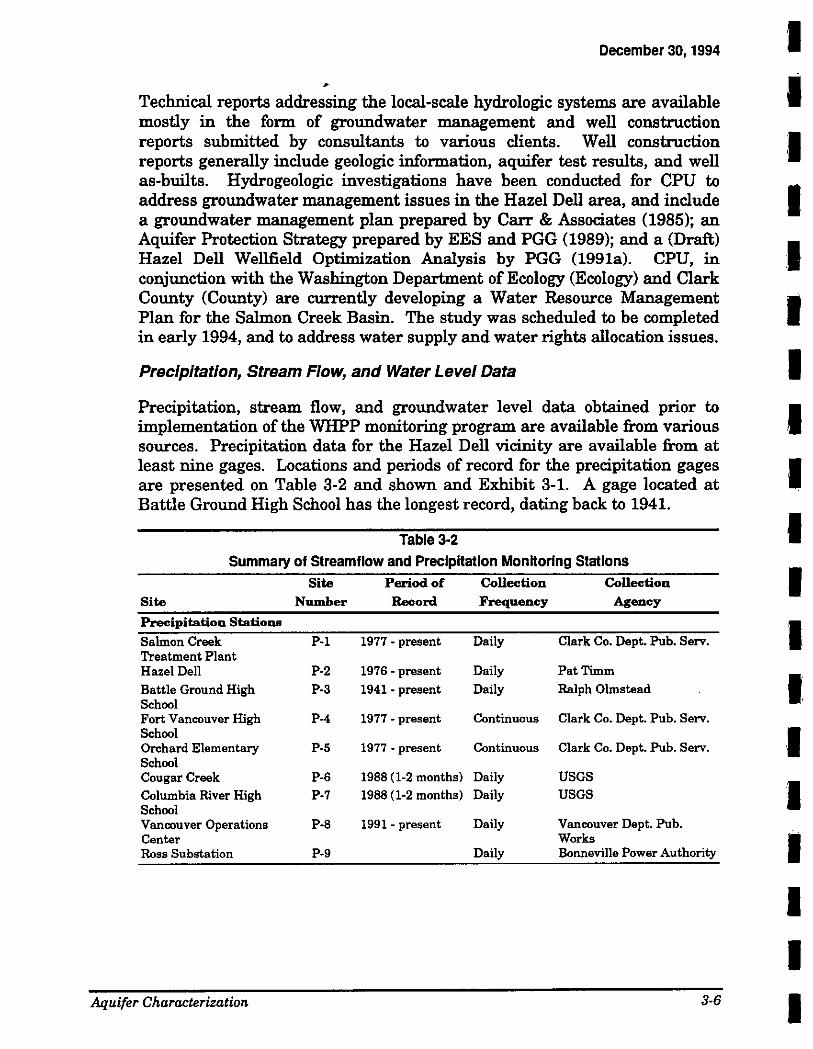
Precipitation, stream flow, and groundwater level data obtained prior to implementation of the WHPP monitoring program are available from various sources. Precipitation data for the Hazel Dell vicinity are available from at least nine gages. Locations and periods of record for the precipitation gages are presented on Table 3-2 and shown and Exhibit 3-1. A gage located at Battle Ground High School has the longest record, dating back to 1941.
Table 3-2
Summary of Streamflow and Precipitation Monitoring Stations
Site Period of Collection Collection
Site Number Record Frequency Agency
Precipitation Stations
Salmon Creek P-1 1977 • present Daily Clark Co. Dept. Pub. Serv. Treatment Plant Hazel Dell P-2 1976 · present Daily PatTimm
Battle Ground High P-3 1941 ·present Daily Ralph Olmstead School Fort Vancouver High P-4 1977 • present Continuous Clark Co. Dept. Pub. Serv. School Orchard Elementary P-5 1977 • present Continuous Clark Co. Dept. Pub. Serv. School Cougar Creek P-6 1988 (1-2 months) Daily USGS Columbia River High P-7 1988 (1-2 months) Daily USGS School Vancouver Operations P-8 1991 · present Daily Vancouver Dept. Pub. Center Works Ross Substation P-9 Daily Bonneville Power Authority
AL/.uifer Characterization 3-6
I I
•• I I I I I I I I I I. I I I I I I
I I I I I I I I I I I I I I I I I I I
December 30, 1994
,
Table 3-2 (cont) Site Period of Collection Collection
Site Number Record Frequency Agency
Streamflow Stations
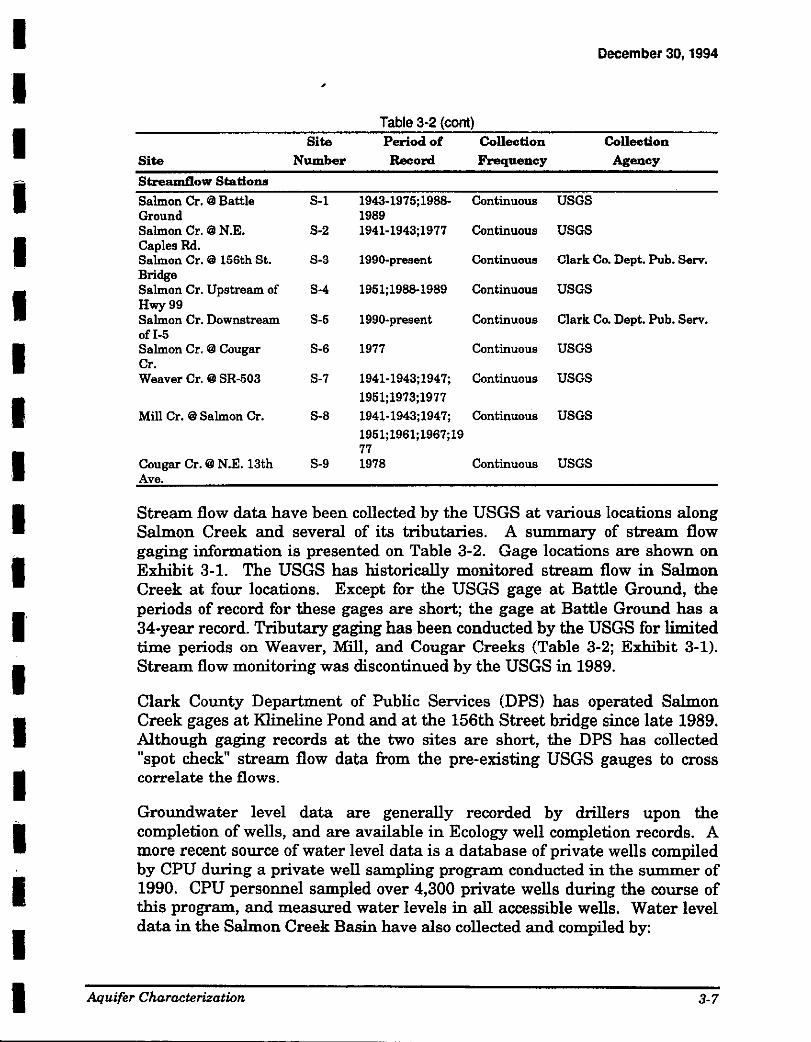
Salmon Cr. @ Battle S-1 1943-1975;1988- Continuous USGS Ground 1989 Salmon Cr. @ N.E. S-2 1941-1943;1977 Continuous USGS Caples Rd. Salmon Cr. @ 156th St. S-3 1990-present Continuous Clark Co. Dept. Pub. Serv. Bridge Salmon Cr. Upstream of S-4 1951;1988-1989 Continuous USGS Hwy99 Salmon Cr. Downstream S-5 1990-present Continuous Clark Co. Dept. Pub. Serv. ofl-5 Salmon Cr. @ Cougar S-6 1977 Continuous USGS Cr. Weaver Cr. @ SR-503 S-7 1941-1943;1947; Continuous USGS
1951;1973;1977 Mill Cr. @Salmon Cr. S-8 1941-1943;1947; Continuous USGS
1951;1961;1967;19 77
Cougar Cr. @ N.E. 13th S-9 1978 Continuous USGS Ave.
Stream flow data have been collected by the USGS at various locations along Salmon Creek and several of its tributaries. A summary of stream flow gaging information is presented on Table 3-2. Gage locations are shown on Exhibit 3-1. The USGS has historically monitored stream flow in Salmon Creek at four locations. Except for the USGS gage at Battle Ground, the periods of record for these gages are short; the gage at Battle Ground has a 34-year record. Tributary gaging has been conducted by the USGS for limited time periods on Weaver, Mill, and Cougar Creeks (Table 3-2; Exhibit 3-1). Stream flow monitoring was discontinued by the USGS in 1989.
Clark County Department of Public Services (DPS) has operated Salmon Creek gages at Klineline Pond and at the 156th Street bridge since late 1989. Although gaging records at the two sites are short, the DPS has collected "spot check" stream flow data from the pre-existing USGS gauges to cross correlate the flows.
Groundwater level data are generally recorded by drillers upon the completion of wells, and are available in Ecology well completion records. A more recent source of water level data is a database of private wells compiled by CPU during a private well sampling program conducted in the summer of 1990. CPU personnel sampled over 4,300 private wells during the course of this program, and measured water levels in all accessible wells. Water level data in the Salmon Creek Basin have also collected and compiled by:
Aquifer Characterization 3-7
December 30, 1994
0 The USGS, during the period from 1987 to 1989, for characterizing water level trends and the regional groundwater flow system;
0 Ecology, for over 60 wells historically, and for the twelve wells which currently comprise their monitoring well network (Eylar, Anderson, and Blair, 1990);
0 CPU, for their production wells, and for wells which comprised their monitoring network, prior to initiation of the WHPP;
0 Other local water purveyors such as the city of Vancouver.
Water Quality Data
Limited water quality data for the County are published in Mundorff (1964). CPU maintains water quality records for the production wells, which are sampled annually for Washington State drinking water analyses. Water quality sampling is required for all public water systems under Washington Administrative Code (WAC) 248-54. Water quality data may therefore be available from other purveyors within the County. CPU analyzed samples collected from over 4,300 private wells for several key water quality parameters (nitrate, bacteria, iron, manganese, specific conductance) during their 1989 private well sampling program (PGG, 1991b). Water quality data are also available for studies in progress addressing groundwater contamination problems at the Leichner Brothers Landfill, Boomsnub-Pacific Northwest Plating, Airco Gases, and the Bonneville Power Administration Ross Complex.
CPU Database System
Basic well data for the County and the WHPP Focus Area has been compiled into a database management system. The database includes well location, construction, water level, water quality, and geologic data. The database is the basis for much of the technical analysis contained in this report and in the 1991 Work Plan, as well as for other studies that were conducted by the USGS and the IRC. A summary of groundwater data for the Focus Area is presented in the 1991 Work Plan. A summary of database information can also be found in USGS Open-File Report 90-126 (McCarthy and Anderson, 1990).
Land Use Information
Information related to existing land use practices was available from current zoning data for Clark County and an initial survey of chemical use sites for the Hazel Dell - Salmon Creek Drainage Basin. This survey was performed as part of an Aquifer Protection Strategy for CPU and the Hazel Dell Sewer
Aquifer Characterization 3-8
I I I I I I I I I I I I I I I I I I I
I I I I I I I I I I I I I I I I I I I
3.2
December 30, 1994
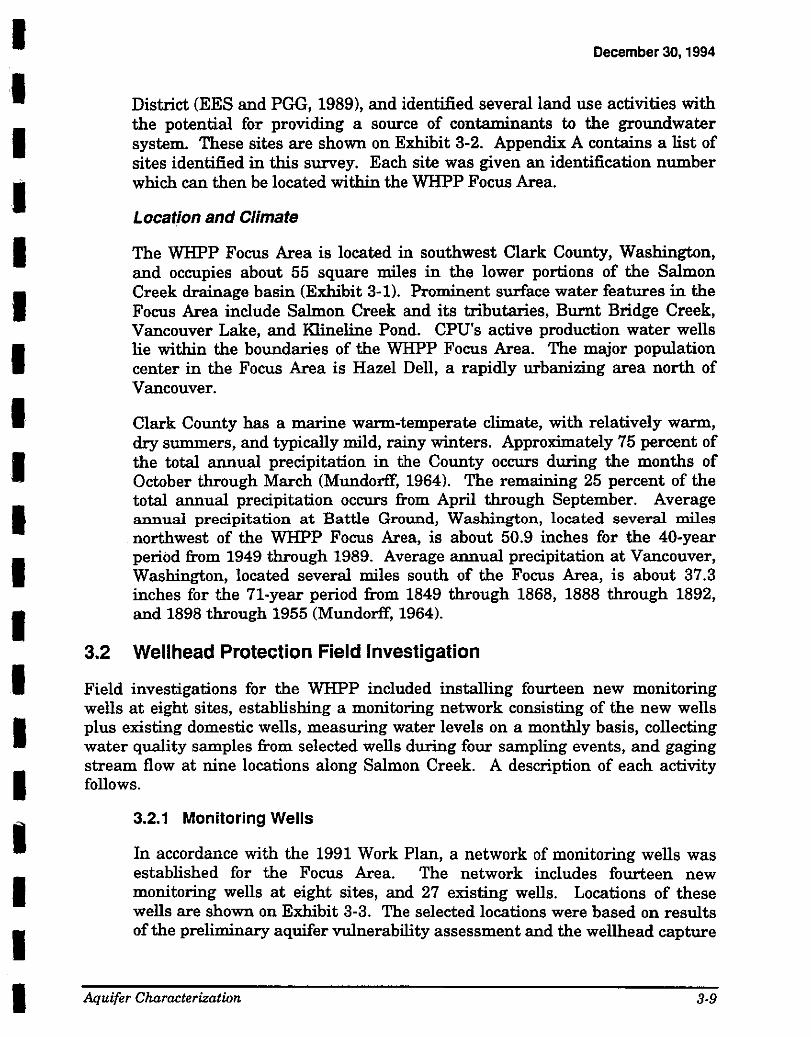
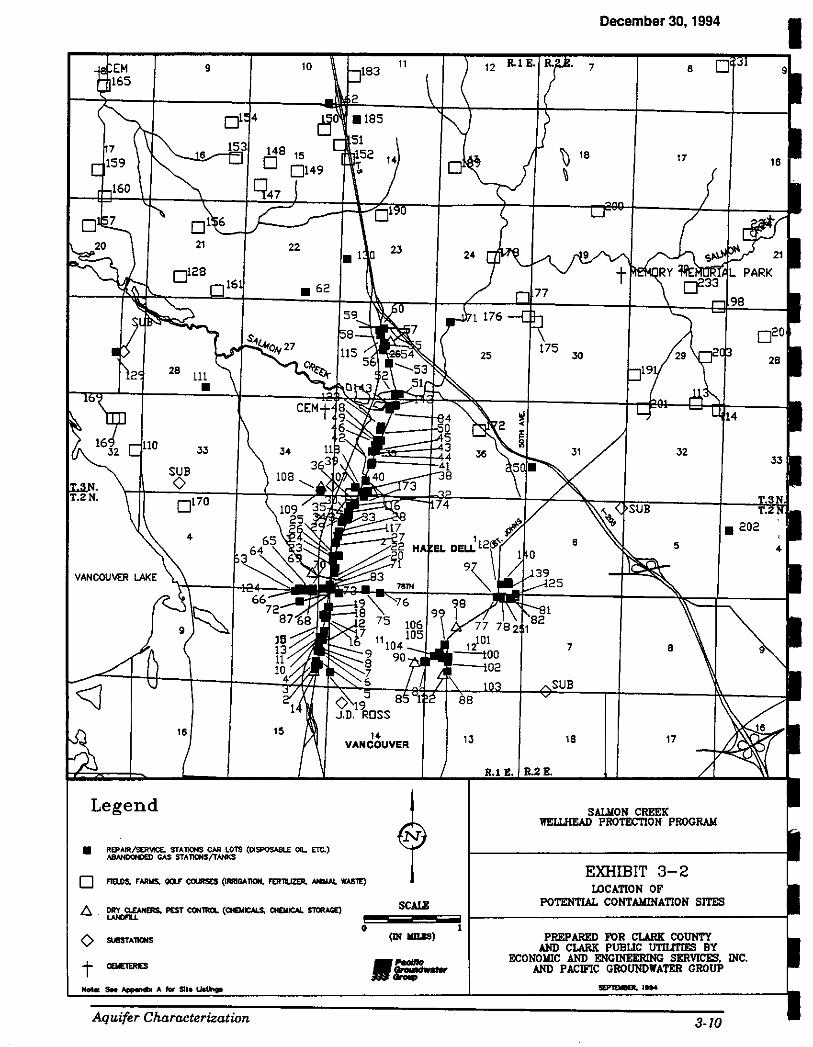
District (EES and PGG, 1989), and identified several land use activities with the potential for providing a source of contaminants to the groundwater system. These sites are shown on Exhibit 3-2. Appendix A contains a list of sites identified in this survey. Each site was given an identification number which can then be located within the WHPP Focus Area.
Location and Climate
The WHPP Focus Area is located in southwest Clark County, Washington, and occupies about 55 square miles in the lower portions of the Salmon Creek drainage basin (Exhibit 3-1). Prominent surface water features in the Focus Area include Salmon Creek and its tributaries, Burnt Bridge Creek, Vancouver Lake, and Klineline Pond. CPU's active production water wells lie within the boundaries of the WHPP Focus Area. The major population center in the Focus Area is Hazel Dell, a rapidly urbanizing area north of Vancouver.
Clark County has a marine warm-temperate climate, with relatively warm, dry summers, and typically mild, rainy winters. Approximately 75 percent of the total annual precipitation in the County occurs during the months of October through March (Mundorff, 1964). The remaining 25 percent of the total annual precipitation occurs from April through September. Average annual precipitation at Battle Ground, Washington, located several miles northwest of the WHPP Focus Area, is about 50.9 inches for the 40-year period from 1949 through 1989. Average annual precipitation at Vancouver, Washington, located several miles south of the Focus Area, is about 37.3 inches for the 71-year period from 1849 through 1868, 1888 through 1892, and 1898 through 1955 (Mundorff, 1964).
Wellhead Protection Field Investigation
Field investigations for the WHPP included installing fourteen new monitoring wells at eight sites, establishing a monitoring network consisting of the new wells plus existing domestic wells, measuring water levels on a monthly basis, collecting water quality samples from selected wells during four sampling events, and gaging stream flow at nine locations along Salmon Creek. A description of each activity follows.
3.2.1 Monitoring Wells
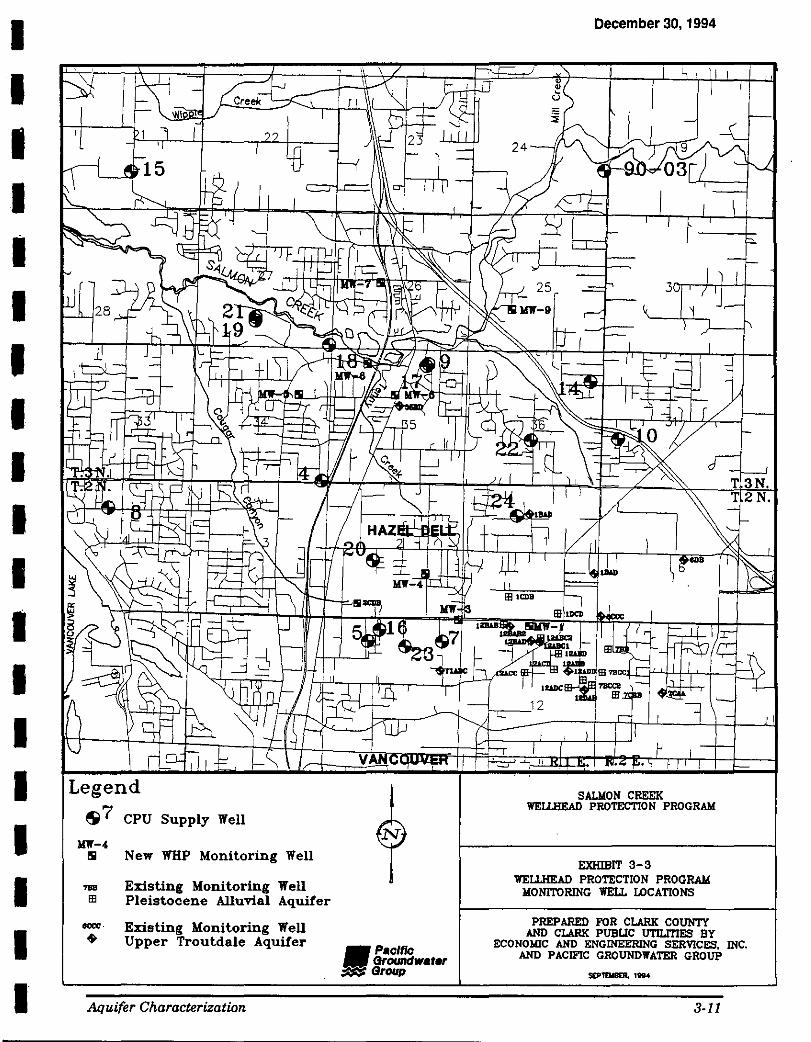
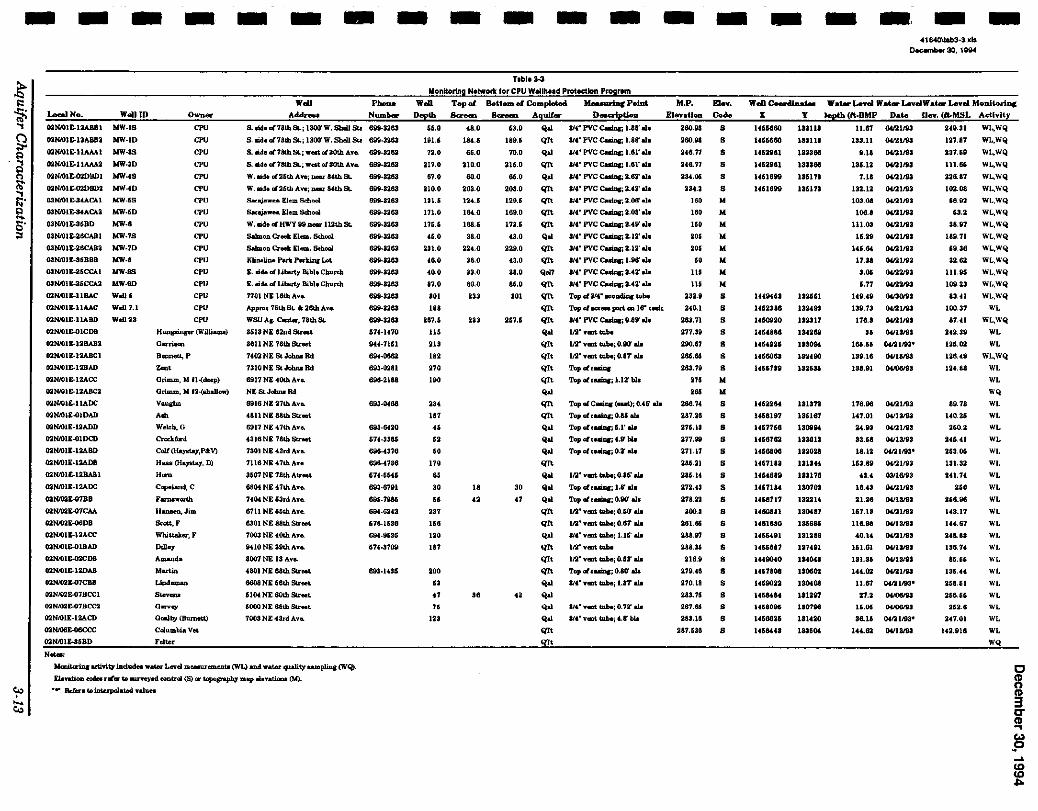
In accordance with the 1991 Work Plan, a network of monitoring wells was established for the Focus Area. The network includes fourteen new monitoring wells at eight sites, and 27 existing wells. Locations of these wells are shown on Exhibit 3-3. The selected locations were based on results of the preliminary aquifer vulnerability assessment and the wellhead capture
AiJuifer Characterization 3-9
•
9 10
16 15
Legend
REPAIR/SER'o1CE. STATIONS CAR LOTS (DISPOSABt.E Oil. ETC.) A8AHDOICIED GAS STA110NS/TN«S
14 VANCOUVER
N
0 FIELDS, F'ARMS, QOLF COURSES (IRRIGA110N, FER1LIZER. ANIW~ WAS1E)
0 SliiSTATlQNS
t CEIIE1ERES --Aquifer Characterization
SC.w!
0 1 (IN IIIUIS)
·==·*'·
December 30, 1994
7 8
7 8
18 17
SALIIONCREEK WEWIEAD PROTECTION PROGRAiol
EXHIBIT 3-2 LOCATION OF
POTENTIAL CONTAlliNATION SITES
PREPARED FOR CLARK COUNTY AND CLARK PUBUC UTILITlES BY
ECONOIIIC AND ENGINEERING SERVICES, INC. AND PACIFIC GROUNDWATER GROUP
3-10
I I I I I I I I I I I I I I I I I I I
Legend
S 7 CPU Supply Well
... IE
New WHP Monitoring Well
Existing Monitoring Well Pleistocene Alluvial Aquifer
Existing Monitoring Well Upper Troutdale Aquifer
Aquifer Characterization
N
•Pac/tlc GrOUIIdwater
~Group
December 30, 1994
SALIION CREEK WEWiEAD PROTECTION PROGRAM
EXHIBIT 3-3 WEU.HEAD PROTECTION PROGRAM
MONITORING WEU. LOCATIONS
PREPARED FOR CLARK COUNTY AND CLARK PUBUC UTILITIES BY
ECONOJ.IIC AND ENGINEERING SERVICES, INC. AND PACIFIC GROUNDWATER GROUP
3-11
December 30, 1994
zone analysis completed for the 1991 Work Plan. These results indicated that the most vulnerable areas for the Regional Water Supply aquifer were: 1) the area west of the intersection of 78th Street and St. John's Road, where Boomsnub, Airco, and other industrial facilities are located; and 2) the area west of the Highway 99 corridor, which is the center of the commercial district in Hazel Dell. Of the 35 wells included in the monitoring network, 28 occur within a one mile radius of the Boomsnub and Airco facilities. This area (herein designated the "78th Street Critical Area") is of particular concern because chromium contamination has been found in the upper aquifer. The location of the Critical Area is shown on Exhibit 3-1. VOC contamination has also been recently detected in samples from several wells which are completed in the regional water supply aquifer. The area has been under investigation by Ecology since 1987.
New Monitoring Wells
Results of preliminary hydrogeologic investigations to characterize the subsurface geology and hydrologic flow system in the WHPP Focus Area indicated several critical areas where additional data were necessary. In order to facilitate this additional data collection, 14 monitoring wells were installed at eight sites. The well sites are MW-1, MW-3, MW-4, MW-5, MW-6, MW-7, MW-8, and MW-9. Two wells were installed at each site except for MW-6 and MW-8. A summary of well construction data is presented in Table 3-3. The monitoring wells were installed to provide further characterization of hydrostratigraphy, aquifer properties, water levels, groundwater flow directions, and water quality.
The monitoring wells lie along groundwater flow paths of interest in the WHPP Focus Area. Well locations were selected in areas of relatively high aquifer vulnerability based upon the results of vulnerability matrix and capture zone/travel time analyses presented in the 1991 Work Plan (PGG & EES, 1991). The wells were drilled a sufficient depth to penetrate the regional water supply aquifer. In order to provide additional data regarding vertical hydraulic gradients and water quality distribution, double completion well designs were used where saturation occurs in the regional aquifer and in the overlying upper aquifer
All wells were designed and installed according to Ecology's criteria as outlined in Chapter 173-160 WAC, Minimum Standards for Construction and Maintenance of Wells. Appendix B contains a detailed description of field procedures related to the drilling and installation of each well. Appendix B also contains Exhibits B-1 through B-8, which present a geologic log and an as-built diagram showing the construction of each well. Table 3-3 summarizes construction details for the wells. The wells were drilled using the cable-tool method. Well depths ranged from 46 to 87 feet
Aquifer Characterization 3-12
I I I I I I I I I I I I I I I I I I I
- - - - - - - - - - - - -Local No. Well JD
CtUVOIE-lv.BBI MW-15
03NIOIE-l3ABBll MW·ID
o:nwtE-llAMt MW-18
O'ltool£.11..-..v.3 MW-30
O'lNIOI£.020801 NW-'S
O'lNIOIE-02DIIDll MW-40
03NIOii!-a.tACA.I MW-IiS
03NIOIE.SfA.Cf..3 MW-60
03NIOIE-36BD MW-6
03NIOit-26CAIU MW-75
03NIOIE-26CAB3 NW-70
OINIOl~liBBD NW-8
03NIOIE-26CCAI NW-98
Gar«l1E-26CC.U MW.SD
O'lNIOIE-llBit.C
O'lNIOIE-llAAC
O'lNIOlJ:-llABD
O'lN/011:-0lCDB
03NIOIE-13BAB2
O'lNIOIE-lUBCl
02NIOIE-12BAD
02NIOIE-12ACC
OliN/01 E-l:u.BC3
O'lNIOIE-llADC
O'lNIOIJ:.OlDAD
O'lNIOIE-13ADD
O'lNIOIE-OIDCD
02NIOII-1U.BD
O'lNIOIE·l2ADB
02NIOIE-l2B.ABI
02NIOIE-12A.OC
O:lN/02£..0788
OliiN/OliiE-07C.U
O'lN.'02E-0608
O'lNIOIE-I:iiACC
O'lNIOIE-OlBAD
O'lNIOIE.o2CDB
O'lNIOlE-IWAB
O'lNI02E-07CBB
02NI02E-07BCCI
02NXIIIE-07BCCII:
02N..VIE-12ACD
02W06&<>6CCC
O'lNIOll-31180 ·-
Wolll
Woll7.1
w.nu
CPU
CPU
CPU
CPU
CPU
CPU
CPU
CPU
CPU
CPU
CPU
CPU
CPU
CPU
CPU CPU CPU
HJll1811in&er (Willi.--) a......, Bem~ett,P .... Grimm, M ll.(de$p)
Grimm, M 124hallow)
Vaua:bo ... Welc:h, 0
C.<Xktacd
Co!! (Haysta,y,P.tV)
HUll (Ha}'8ta1, D)
H~
Capellllld, C
·~H&D&eD,Jim
&ott,,.
Whiualtel', F
om., .......... Morlio ...... _ ... _ a~~
0.-lb;i (BlUJiett)
C<ihllllhiaVet
Felter
Woll
Ad"-
S. .We ~78tbSt.; 1300'W. SbeU Stl 699-8263
S.lide of 78th St.; 1300'W. Shell SU 6$.3W
s. llide of 78th St.; wert~aOtb Ave. 699-3~83
S.lide of 78th St.; wt:lltol30th An. 699-n83
W.llide ~26thAwo; ue. Uth.SL 699-8363
W.llida~26thAve;-Mthst. SW-3:183
s....-.~a ....... n ..... Soh""" 699-aa63 s • ..;.- Dem. Scboolo 699-3363
W .llide <;~ HWY 99 Delli' I 12th St. 699-3383
SalmOD. Cr•lr. Elem. &hool 699-3263
SalaiOD. Croell Elem. Schoail 899-3363
KliBdine Perk Plll'kinc Lot 699-3363
E. oi.de o( Uberll' Bible Clw.nb 699-3363
E. lli.de o1 Ubortl' Bi.ble Churdl 899-8363
7101 NE 16th Ave.
Appro.t76tbS!. &26th Ave.
WSU AI- Coater-, 78th St.
3613NE82ndSU.t
3611NE78thStreet.
7402NEStJom.Rd.
7310NE St .Jobne Rd.
6917 NE 40th Ave.
NESt.Jobno:Rd
6916 Nl27thAve.
4811NE88thStreet.
6911NE47thAve.
43l6NE 78th Street
7:10INE-f.3rd.An.
7116NE47th.Ave
8507 NE 78th Atr"eet
6804NE47tbAve.
740f, NE 63rd Ave.
6111N£66tbAve.
6301 NE 88th Street
7003 NE .fOOl Ave.
9-f.IO NE 39th Ave.
8007 NE ta Ave.
.f&OI NE 63th Sti'Mt
6GOa NE 66th Street
6000 NE 68th &r..t
7003 NE 43rd Ave.
699-3~63
899-3363
899-3383
67-f.-1470
9«-7161 ........ 693-0281
696-2188
693-6420
674.-3385
696-4376
696--1736
67.f.-66-f.6
693-6791
695-7$86
69-f.-6241
676-1686
694-9636
674-3709
Mm:lit<riDC lldirit)' ind.Gdee water L~el m....uementll (WL) aDd. water qll&lit)' u..m.plina (W~
Ele...ti011. codee ntl• tA ~ contz-cl (S) 01' topoaraph.y map •nati- (M).
Tabl• 3-3
Monltortna N1twork tor CPU W .. lhtld Protection Proarem
Well Topol Bottomol Completed. M~Polnt
Depth 8c:reeo B-. Aquifer D-=rfpdoo
66.0
191.6
72.0
at7.0
&1.0
210.0
Ul.J5
111.0
116.6
46.0
an.o
••o ... 17.0
101
188
267.6
116 ... 182
'" 190
, .. 181 .. " ..
170 .. .. " "' 116
120
181
200
" " 11
"'
43.0
18-U
... o 210.0
60.0
203.0
124.6
164.0
168.6
38.0
2:U.O
a8.o
83.0
80.0
"' ...
l8
"
..
63.0
189.6
70.0
216.0
... o 208.0
129.5
169.0
173.5
(3.0
229.0
43.0
aa.o ... o 101
267.&
30
"
Qal at-f..• PVC e-m,; 1.88' U.
Q1't 81-f.." PVC CuiDa; 1.88' el1
Qel 8/.f" PVC c..i11G 1.61' el.
QTt 31-f." PVC CaiD(; 1.61' all
Qel 81-f.." PVC Ca1iDat 2.67 els
QTt 814" PVC CMiDc; a.-f..:l' lla
QTt ll/4" PVC c..iDtr; 2.06' at.
QTt at4" PVC eam.: 2.oa· •
Q1't 814" PVC Cuizlr, U9' elt:
Qal 3i-f." PVC Cuizlr, 2.12' elt:
QTt 31-f."PVCC~U2'elt:
QTt at4" PVc Calhw: ue· e1e
Qal't 81-f.." PVC CulniJ; 11.42' ele
Q'l\ 81--f.." PVC Cuizlr. 2..f.2' elt:
.....
.....
..... Qd
.....
.....
.....
..... Qd
.....
..... Qd Qd Qd
"" ... Qd
Qd
.....
..... Qd
"" "" "" Qd Qd Qd Qd
"" ""
Top ofa/4" ~tube
Top o1--port m ur c..U: 31-f." PVC Cuizla:; 0.89' elt:
lf.l"ymtiube
lt.l" vt:DI. tube; 0.90' ele
lt.l" not. tube; 0.87 ele
Topofc..U.
Top ofc..W.; l.l:lhll
Top olC..U. (...t); 0.46' all
Top of·~ 0.86 ele
Top ofoaiUJc'; 6.1' ele
Top of o.-u.; -f...9' bll
Top oloa~U~c'; 0.2' ....
lt.l" vmt td>e; 0,16' ....
Top of c.-u.; 1.8' ..._.
Top of c...,.; 0.90' a!•
lt.l" vd tube; 0.60' elt:
lf.l" Yllllt tube; 0.61 ail
814" v ..... tllbe; l-16' ele
lfr'vmt tilt.
1f.il" Vllllt tllbe; 0.13' ele
Top of caam,-; o.8a 1111
814" yf:lll. tllbe; 1.17 allo
S/.f." ·- tu.t.; 0. '72' e1e
314" Ymt tu.be; -f...8' biJI
M.P. Elevation
260.98
aeo.98
2-f..6.71
U6.77 ....... uu
160
160
110 ... ... .. Ill
Ill
23U
2-li0.1
261.71
271.fi
290.&7
261.66
263.79
211 ... 268.74.
287.18
27&.13
277.118
211.17
241.31
246.14.
272.4J
27Ull
300.3
261.6&
288.97
288.3i
UG.i
279.4.8
270.18
283.11
2B7.6&
283.18
287.638
-..... Codo
s B
B
B
s B
M .. M .. M .. M
M
B
B
B
B
B
B
B .. M
B
B
B
B
B
B
B
s s s s s s B
s s s s B
s
-WoO eo...thWoo
• 1466660
l-f..IH60
l-f..J5D61
l-f..J52S61
l-f..ll6i9
l-f..616i9
1«9UJ
14.62386
}.f.J50920
}(6(886
l-f..6-f..i21
l-f..l6061
1-f..U?Ji
146226-f..
1(18197
)(67168
H667G
1466806
l.f.J57U2
l.f.U.6!9
UJ51184
l.f.68717
l.f.608U
1461880
146M91
1-f..H887
1((90-f..O
l-f..&7808
l-f..l9022
l-f..li8-f.N
1468096
1466821
1-f..I8UI
y
181111
111111
128368
131168
116171
136111
132111
13U90
132317
13-f..2651
11309-f.
lH-f..90
taa&u
131872
136161
UOSIIH 133612
132028
1311-U
181178
110101
13221-f..
130f.87
186696
131288
U't-f..ll1
II<OU
"""" 130408
18129'1
110186
131(20
IUUW.
- - -41&40\lab3-3.)Cb
~30.11MM
W at.r Level W Mer Levei.W at.r Level Mooitorinc teeth (ft-BMP Data llev. (ft.MSL Activity
11-67 0-f..r.Uf92 249.31 WL,WQ
133.11 0-f..f.Uf92 121.87 WL.WQ
11.18 ov.t1/91
13U2 ov.t1192
7.18 ov.l1192
ut.ta ooa 1192
103.08 0&/'ll/93
108.8 0Vll/9a
111.03 0-f..f.ill/113
16.29 0-f..l'll/91
l-f..&.64 O-f..f.il1193
17.38 04fl1193
1.06 0-f..fl2193
&.77 04122193
1(9.-f..&
139.73
176.3
16 0-f..IU/93
16&.16 Off.il1193•
13U6 0-f..l'll/93
138.91 0-f..106193
176.96 0Vl1192
147.01 0-f../13193
2-f...eJ 04f.il1/93
32.&8 O-f..ll3193
18.12 0-f../21193°
1&3.89 01.1'21193
-fo.U 03/HI/93
18.-f..S Off.ill/98
21.26 0013193
167.11 0Vl1/93
116.98 O-f..I1319J
40.14 0Vl119S
161.61 O-f..l13193
131.31 0-f..l'lattl
14-f...oa O&l'l1192
U.61 Of.nll93•
21.2 O-f..I06I93
16.01 0«161113
36. u 0Vl119a•
l.f.4.G IWI319a
237.69 WL,WQ
111.66 WL,WQ
:i26.17 WL.WQ
102.08 WL.WQ
~-92 WI.,WQ
63.a WL,WQ
38.97 WL,WQ
189.71 WL,WQ
59.36 WL,WQ
32.6a WL,WQ
111.96 WL,WQ
109.23 WL,WQ
83.41
100.37
87.41
WL,WQ
WL WL,WQ
342.39 WL
126.02 WL
l26.-f..9 WL,WQ
J:j.f..l8 WL
WL WQ
89.78 WL
14.0.26 WL
2&0.2
2-f.6 . .fl
263.06
131.32
2.f.l.74
'" , ... ,. 14.3.11
144.67
248.83
136.7.f.
86.66
Ul . .f..f.
268.61
266.66
21102.6
2(7.01
1.fa.916
WL WL WL WL WL
WL WL WL WL WL WL WL WL WL WL WL WL
WL WQ
December 30, 1994
within the Salmon Creek corridor (MW-8 and MW-9), from 171 to 231 feet at the three sites that lie upgradient of the Salmon Creek corridor (MW-5 through MW-7), and from 191.5 to 217 feet in the areas upgradient of CPU Well Nos. 5, 7, 7.2, and 23 (MW-1 through MW-4). In all cases, a borehole diameter of 8 inches was used. Well Nos. MW-1, MW-2, MW-3, MW-4, MW-5, MW-7, and MW-9 were completed with two 2-inch PVC wells. Well Nos. MW-6 and MW-8 were completed as single wells. The two-inch PVC monitoring wells each had 5 feet of slotted screen set within an appropriate filter pack. Centering guides were used to center the monitoring wells within the boreholes. Single completions were installed where saturation was not encountered in the upper aquifer. In double completion wells, a bentonite seal was installed between filter packs to prevent flow between the two completion zones.
Monitoring well site MW-1 is located in the 78th Street Critical Area, approximately 500 to 1,500 feet west and downgradient of Boomsnub. The site lies within the five year travel time boundary for CPU Well Nos. 5, 7, 7.2, and 23. The site was chosen to obtain water level and water quality data to assess local groundwater flow directions and chromium and migration from the Boomsnub facility. In addition, VOC samples could be collected to assess organic contamination in the area.
Monitoring well site MW-3 is located on N. E. 78th Street near N. E. 30th Avenue. The site is situated approximately 500 to 800 feet upgradient of CPU Well Nos. 7 and 23, within the one-year travel time boundary.
Monitoring well site MW-4 is located on N. E. 25th Avenue near N. E. 83rd Street. The site is situated approximately 3,000 feet upgradient of CPU Well Nos. 5 and 91-02 and within the five-year travel time boundary.
Monitoring well site MW-5 is located at the Sacajawea Elementary School near N. E. 112th Street and N. E. 6th Avenue. The site lies approximately 2,000 feet south of Salmon Creek and upgradient of CPU Well Nos. 18 and 19. The site lies within the five-year travel time boundary and downgradient of the Interstate 5 and Highway 99 commercial corridor.
Monitoring well MW-6 is located on the south side of Salmon Creek near Highway 99 and N. E. llOth Street. The site is situated in the vicinity of the Interstate 5 and Highway 99 commercial corridor and upgradient of CPU Well Nos. 9, 17, 18 and 19. The site lies within the five-year travel time boundary of the Salmon Creek Zone 1 wells.
Monitoring well MW-7 is located on the north side of Salmon Creek downgradient of the Highway 99 and Interstate 5 commercial corridor. The site is situated upgradient of CPU Well Nos. 18 and 19. The site lies within the five-year travel time boundary.
Aquifer Characterization 3-14
I I I I I I I I I I I I I I I I I I I
I I I I I I I I I I I I I I I I I I I
December 30, 1994
Monitoring well MW-8 is located on the south side of Salmon Creek approximately 300 feet upgradient of Well No. 18. The site was chosen to provide an upgradient sampling point for Well No. 18 and water level data to facilitate analysis of stream-aquifer continuity and local groundwater flow directions.
Monitoring well MW-9 is located adjacent to Salmon Creek near Salmon Creek Avenue and N. E. 127th Street. The site was chosen to provide water level data for assessing stream-aquifer continuity, as well as local groundwater flow directions and general upstream water quality conditions.
Existing Wells
Based on review of geologic logs and well construction data, 27 private domestic wells were selected to monitor water levels in the Focus Area. Four of these wells were also selected to monitor groundwater quality. The locations of the private domestic wells are shown on Exhibit 3-3 and listed on Table 3-3. Table 3-3 also presents construction information for these wells. The wells used for water level monitoring are located primarily within the 78th Street Critical Area and yield water from either the Regional Supply Aquifer (Upper Troutdale) or the upper alluvial aquifer. Three of the wells used for water quality monitoring (the Bennett well and two Grimm wells) and are located within one mile of the Boomsnub and Airco facilities; the remaining well (the Felter well) is located along the Highway 99 corridor. All of these wells except one of the Grimm wells yields water from the Regional Supply Aquifer.
3.2.2 Water Quality Sampling
A water quality monitoring program was developed in order to: 1) further assess the water quality of the Focus Area; 2) refine the understanding of potential land use impacts on the groundwater system; 3) provide advance warning of potential water quality threats to CPU production wells; 4) evaluate the extent of surface water influence on CPU's Zone 1 Wells; and 5) assess compliance with drinking water regulations.
Water Quality Parameters
The 1991 Work Plan recommended the following categories of contaminants for further study based on the types of activities in the Focus Area, the proximity of potential contaminants to CPU supply wells, and their health and aesthetic implications:
0 Contaminants derived from sanitary sewage, because of the major areas ofunsewered land served by on-site septic systems.
Aquifer Characterization 3-15
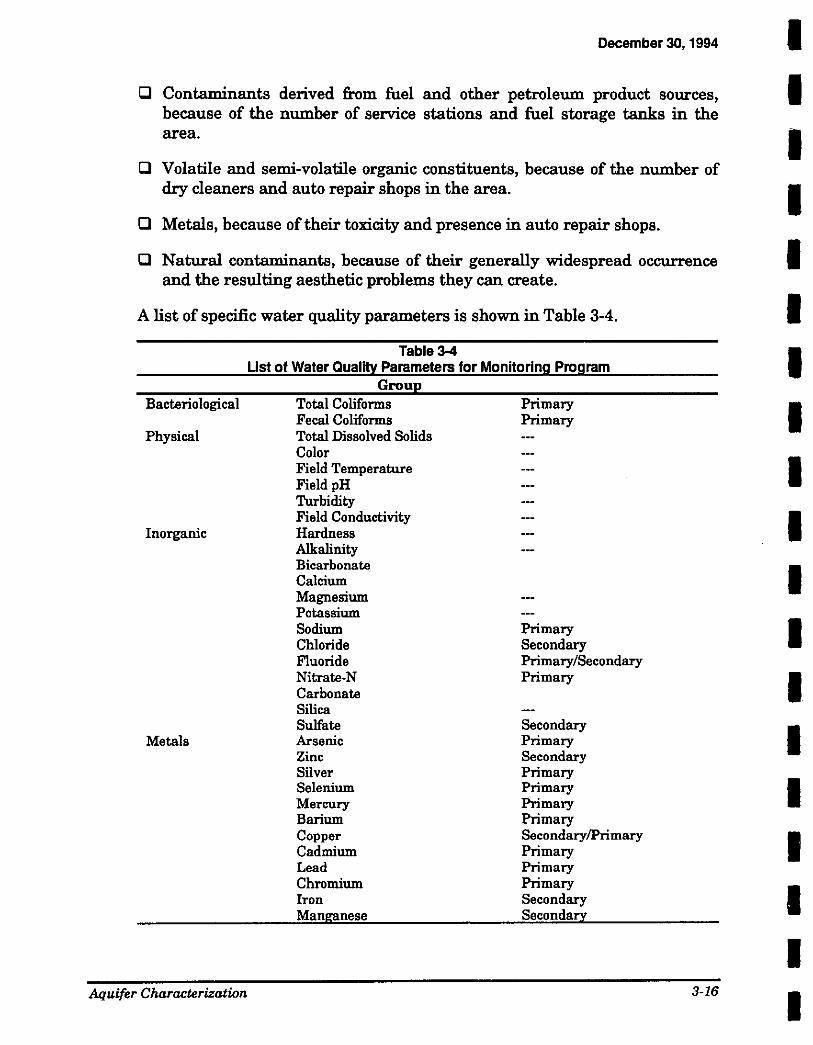
December 30, 1994
CJ Contaminants derived from fuel and other petroleum product sources, because of the number of service stations and fuel storage tanks in the area.
CJ Volatile and semi-volatile organic constituents, because of the number of dry cleaners and auto repair shops in the area.
CJ Metals, because of their toxicity and presence in auto repair shops.
CJ Natural contaminants, because of their generally widespread occurrence and the resulting aesthetic problems they can create.
A list of specific water quality parameters is shown in Table 3-4.
Bacteriological
Physical
Inorganic
Metals
Aquifer Characterization
Table3-4 Ust of Water Quality Parameters for Monitoring Program
Grou Total Coliforms Fecal Coliforms Total Dissolved Solids Color Field Temperature Field pH Turbidity Field Conductivity Hardness Alkalinity Bicarbonate Calcium Magnesium Potassium Sodium Chloride Fluoride Nitrate-N Carbonate Silica Sulfate Arsenic Zinc Silver Selenium Mercury Barium Copper Cadmium Lead Chromium Iron Manganese
Primary Primary
Primary Secondary Primary/Secondary Primary
Secondary Primary Secondary Primary Primary Primary Primary Secondary/Primary Primary Primary Primary Secondary Secondary
3-16
I I I I I I I I I I I I I I I I I I I
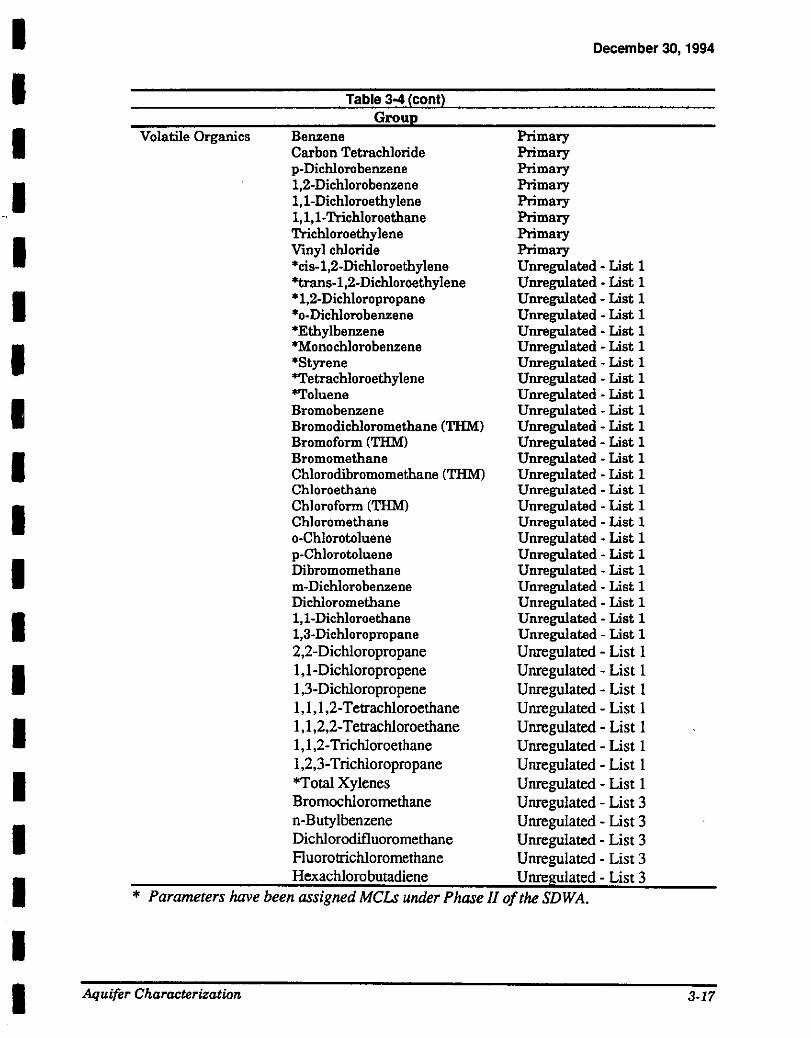
I I I I I I I I I I I I I I I I I I I
December 30, 1994
Table 3-4 (cont) Grou
Volatile Organics Benzene Primary Carbon Tetrachloride Primary p-Dichlorobenzene Primary 1,2-Dichlorobenzene Primary 1,1-Dichloroethylene Primary 1,1,1-Trichloroethane Primary Trichloroethylene Primary Vinyl chloride Primary *cis-1,2-Dichloroethylene Unregulated- List 1 *trans-1,2-Dichloroethylene Unregulated- List 1 *1,2-Dichloropropane Unregulated- List 1 *o-Dichlorobenzene Unregulated - List 1 *Ethylbenzene Unregulated - List 1 *Monochlorobenzene Unregulated - List 1 *Styrene Unregulated - List 1 *Tetrachloroethylene Unregulated - List 1 *Toluene Unregulated - List 1 Bromobenzene Unregulated - List 1 Bromodichloromethane (THM) Unregulated - List 1 Bromoform (THM) Unregulated - List 1 Bromomethane Unregulated - List 1 Chlorodibromomethane (THM) Unregulated- List 1 Chloroethane Unregulated -List 1 Chloroform (THM) Unregulated - List 1 Chloromethane Unregulated - List 1 o-Chlorotoluene Unregulated - List 1 p-Chlorotoluene Unregulated- List 1 Dibromomethane Unregulated- List 1 m-Dichlorobenzene Unregulated- List 1 Dichloromethane Unregulated - List 1 1,1-Dichloroethane Unregulated- List 1 1,3-Dichloropropane Unregulated - List 1 2,2-Dichloropropane Unregulated - List I 1,1-Dichloropropene Unregulated- List 1 1,3-Dichloropropene Unregulated - List 1 1,1,1,2-Tetrachloroethane Unregulated- List I I, 1 ,2,2-Tetrachloroethane Unregulated - List 1 1,1,2-Trichloroethane Unregulated- List 1 1,2,3-Trichloropropane Unregulated- List 1 *Total Xylenes Unregulated- List 1 Bromochloromethane Unregulated- List 3 n-Butylbenzene Unregulated- List 3 Dichlorodifluoromethane Unregulated- List 3 Fluorotrichloromethane Unregulated- List 3 Hexachlorobutadiene Unregulated- List 3
* Parameters have been assigned MCLs under Phase II of the SDWA.
Aquifer Characterization 3-17
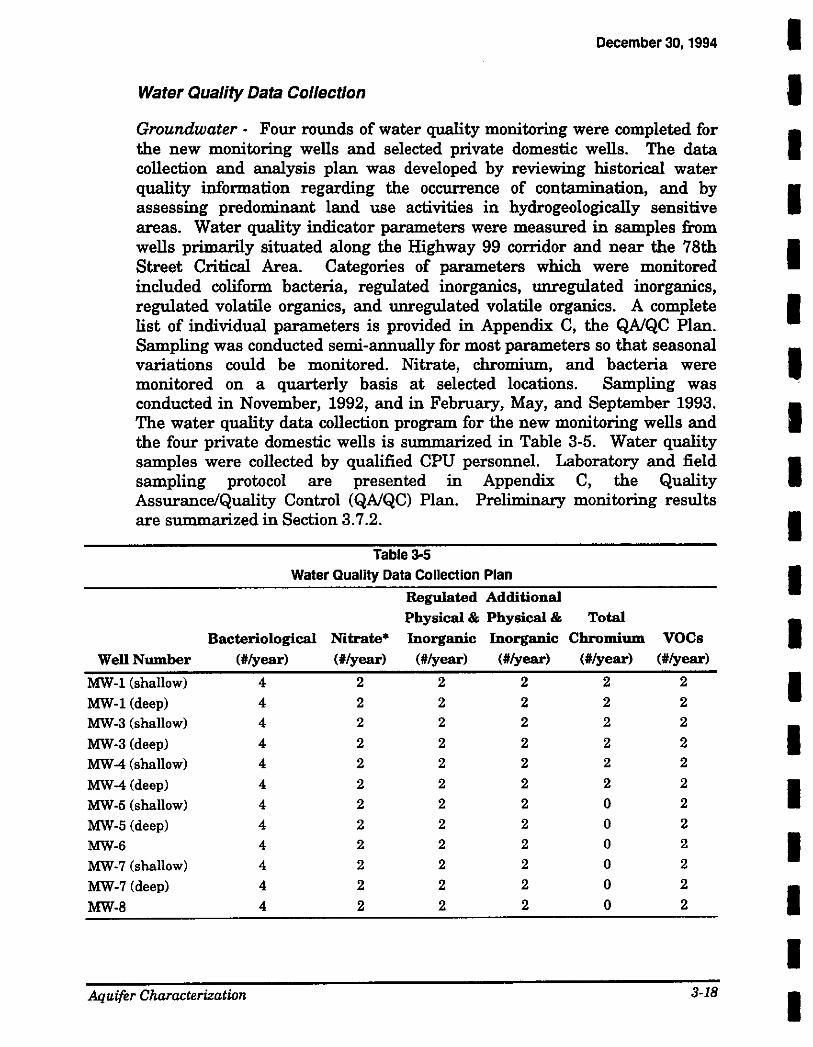
December 30, 1994
Water Quality Data Collection
Groundwater · Four rounds of water quality monitoring were completed for the new monitoring wells and selected private domestic wells. The data collection and analysis plan was developed by reviewing historical water quality information regarding the occurrence of contamination, and by assessing predominant land use activities in hydrogeologically sensitive areas. Water quality indicator parameters were measured in samples from wells primarily situated along the Highway 99 corridor and near the 78th Street Critical Area. Categories of parameters which were monitored included coliform bacteria, regulated inorganics, unregulated inorganics, regulated volatile organics, and unregulated volatile organics. A complete list of individual parameters is provided in Appendix C, the QA/QC Plan. Sampling was conducted semi-annually for most parameters so that seasonal variations could be monitored. Nitrate, chromium, and bacteria were monitored on a quarterly basis at selected locations. Sampling was conducted in November, 1992, and in February, May, and September 1993. The water quality data collection program for the new monitoring wells and the four private domestic wells is summarized in Table 3-5. Water quality samples were collected by qualified CPU personnel. Laboratory and field sampling protocol are presented in Appendix C, the Quality Assurance/Quality Control (QNQC) Plan. Preliminary monitoring results are summarized in Section 3.7.2.
Table 3-5 Water Quality Data Collection Plan
Regulated Additional Physical & Physical & Total
Bacteriological Nitrate* Inorganic Inorganic Chromium VOCs
WeD Number (#/year) (#/year) (#/year) (#/year) (#/year) (#/year)
MW-1 (shallow) 4 2 2 2 2 2
MW-1 (deep) 4 2 2 2 2 2
MW-3 (shallow) 4 2 2 2 2 2
MW-3 (deep) 4 2 2 2 2 2
MW-4 (shallow) 4 2 2 2 2 2
MW-4(deep) 4 2 2 2 2 2
MW-5 (shallow) 4 2 2 2 0 2
MW-5 (deep) 4 2 2 2 0 2
MW-6 4 2 2 2 0 2
MW-7 (shallow) 4 2 2 2 0 2
MW-7 (deep) 4 2 2 2 0 2
MW-8 4 2 2 2 0 2
Ai[uifer Characterization 3-18
I I I I I I I I I I I I I I I I I I I
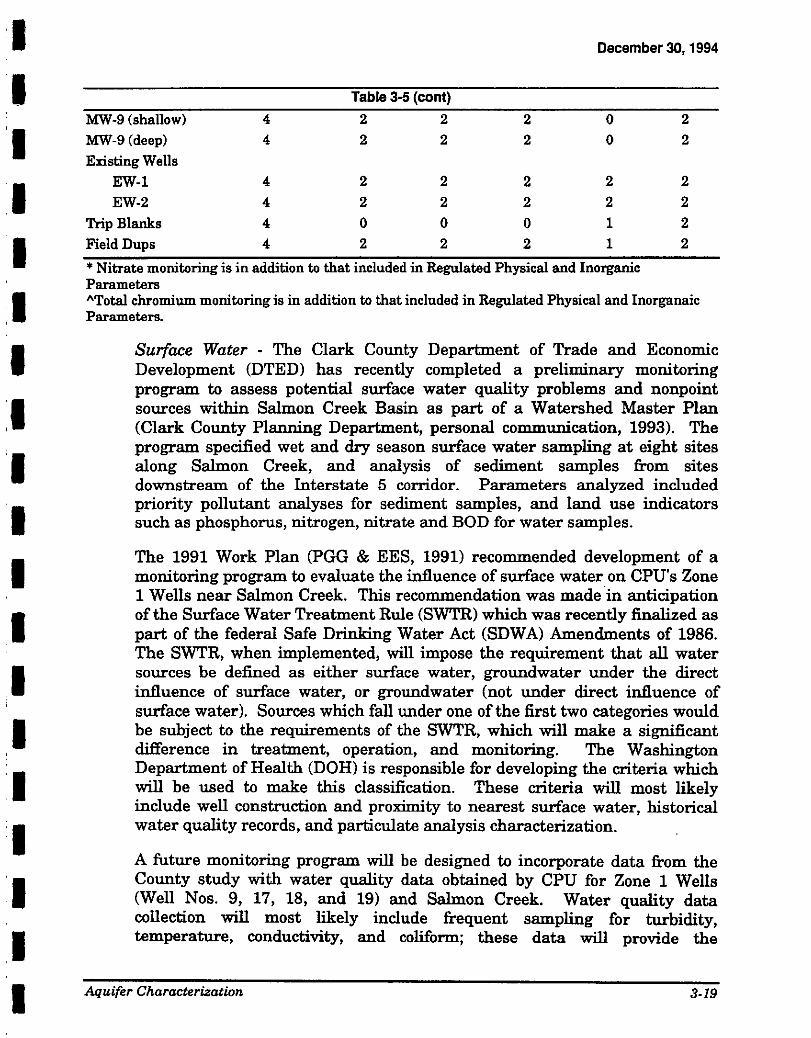
I I I I I .I I :I I I I I I I I I I I I
December 30, 1994
Table 3-5 (cont)
MW-9 (shallow) 4 2 2 2 0
MW-9 (deep) 4 2 2 2 0
Existing Wells
EW-1 4 2 2 2 2
EW-2 4 2 2 2 2
Trip Blanks 4 0 0 0 1
Field Dups 4 2 2 2 1
* Nitrate monitoring is in addition to that included in Regulated Physical and Inorganic Parameters
2 2
2 2
2 2
"Total chromium monitoring is in addition to that included in Regulated Physical and lnorganaic Parameters.
Surface Water - The Clark County Department of Trade and Economic Development (DTED) has recently completed a preliminary monitoring program to assess potential surface water quality problems and nonpoint sources within Salmon Creek Basin as part of a Watershed Master Plan (Clark County Planning Department, personal communication, 1993). The program specified wet and dry season surface water sampling at eight sites along Salmon Creek, and analysis of sediment samples from sites downstream of the Interstate 5 corridor. Parameters analyzed included priority pollutant analyses for sediment samples, and land use indicators such as phosphorus, nitrogen, nitrate and BOD for water samples.
The 1991 Work Plan (PGG & EES, 1991) recommended development of a monitoring program to evaluate the influence of surface water on CPU's Zone 1 Wells near Salmon Creek. This recommendation was made in anticipation of the Surface Water Treatment Rule (SWTR) which was recently finalized as part of the federal Safe Drinking Water Act (SDWA) Amendments of 1986. The SWTR, when implemented, will impose the requirement that all water sources be defined as either surface water, groundwater under the direct influence of surface water, or groundwater (not under direct influence of surface water). Sources which fall under one of the first two categories would be subject to the requirements of the SWTR, which will make a significant difference in treatment, operation, and monitoring. The Washington Department of Health (DOH) is responsible for developing the criteria which will be used to make this classification. These criteria will most likely include well construction and proximity to nearest surface water, historical water quality records, and particulate analysis characterization.
A future monitoring program will be designed to incorporate data from the County study with water quality data obtained by CPU for Zone 1 Wells (Well Nos. 9, 17, 18, and 19) and Salmon Creek. Water quality data collection will most likely include frequent sampling for turbidity, temperature, conductivity, and coliform; these data will provide the
Aquifer Characterization 3-19
December 30, 1994
background necessary for determining whether the Zone 1 wells are under the direct influence of surface water. Historical water quality records will be reviewed and will likely include raw water total and fecal coliform data, raw water turbidity data, and data for temperature and turbidity from the well and nearby surface water. Particulate analysis is intended to identify organisms which occur only in surface water as opposed to groundwater, and whose presence in a groundwater would clearly indicate that at least some surface water has been mixed with it. Particulate analyses of well water may . be the most critical assessment used to determine direct surface water influence; however, the EPA has not yet refined the evaluation technique.
3.2.3 Water Level Measurements
Water levels were measured in the newly-installed monitoring wells, in CPU production wells, and in selected private domestic wells. A map showing the water level monitoring sites is presented in Exhibit 3-3. Table 3-3 contains information related to the location, ownership, and construction of wells included in the water level monitoring network.
Private domestic wells were selected for the water level monitoring network based on criteria such as location, accessibility, aquifer completion interval, etc. Wherever possible, geologic logs and well construction data were obtained and reviewed for prospective monitoring wells. In addition, a field survey was conducted in order to verify the location and accessibility of each well. Wells were selected primarily on the basis of the field inventory results. All of the wells that were selected are completed within either the Regional Supply Aquifer or the overlying shallow alluvial aquifers where wellhead protection issues are of greatest concern.
Qualified CPU personnel measured water levels in the wells using an electric well sounder (or a pressure transducer where equipped) to an accuracy of 0.01 foot. The monitoring program has been completed for the first year. Water levels were measured monthly in the fourteen new monitoring wells, and during wet season and dry season in all other wells to facilitate development of groundwater level contour maps. Measuring points were established and water level data were recorded on standard Ecology well data forms.
In March 1992, Ecology, the County, and CPU entered into a Memorandum of Understanding (MOU) designed to define a long-term partnership for management of water resources in the Salmon Creek Basin. The MOU resulted in the development of the Salmon Creek Water Resources Management Plan. In accordance with this plan, CPU is currently measuring, and will continue to measure, water levels in WHPP monitoring wells and other wells. This extended monitoring will provide data for long-
Aquifer Characterization 3-20
I I I I I I I I I I I I I I I I I I I
I I I I I I I I I I I I I I I I I I I
December 30, 1994
term analysis of water level trends. A total of approximately 60 wells in the Salmon Creek Basin have been selected for long-term water level monitoring.
3.2.4 Wellhead Survey
Water level measuring point elevations and well locations for WHPP monitoring wells located outside the 78th Street Critical Area were determined using a USGS 7.5 minute topographic quadrangle. These wellhead elevations are accurate to only within± 5 feet. In order to provide a basis for accurate assessment of groundwater flow patterns within the 78th Street Critical Area, however, wellhead elevation and location surveys were required. The surveys were conducted by Hagedorn, Inc., of Vancouver, Washington. The surveyed measuring point elevations are accurate to within ± 0.01 feet. The surveyed well locations are accurate to within 0.1 foot, and were reported in the State plane coordinate system. Wellhead elevations and locations for all monitoring wells are included in Table 3-3.
3.2.5 Streamflow Monitoring
Gaging streamflow in Salmon Creek is necessary for understanding the system water balance and the relationship between groundwater and surface water, and for evaluating water quality in the WHPP Focus Area. Mundorff (1964) and Carr (1985) established that influent (losing water to the subsurface) conditions exist in the lower portions of the Salmon Creek. Thus, surface water quality could ultimately affect the quality of water from shallow wells that occur in this area.
Nine stream gaging stations have been established in the Focus Area on Salmon Creek and its tributaries by CPU and the Clark County DPS. The stations include:
Cl Staff gage on lower Salmon Creek near CPU Well No. 19 (CPU).
Cl Staff gage on Canyon Creek near CPU Well No. 19 (CPU).
Cl Data logger/staff gage on Salmon Creek at Klineline Pond (DPS).
Cl Staff gage on 119th Street tributary to Salmon Creek (CPU).
Cl Data logger/staff gage on Salmon Creek at near USGS 14213000 station site (CPU).
Cl Staff gage on Salmon Creek just downstream of the 50th Avenue bridge (CPU).
Cl Data logger/staff gage on Salmon Creek at 156th Street Bridge (DPS).
Cl Staff gage on Woodin Creek (CPU).
Cl Data logger/staff gage on Salmon Creek at USGS 14212000 station site (CPU).
Aquifer Characterization 3-21
December 30, 1994
Gaging station information is summarized in Table 3-2 and gage locations are shown on Exhibit 3-1.
The USGS has gaged Salmon Creek in the past at four different locations; these locations are shown on Exhibit 3-1 and are described on Table 3-2. The Battle Ground gage has the longest period of record (34 years); however, this gage is located downstream of the bedrock portion of the drainage basin, and is too far from the Focus Area to assess stream/aquifer interaction. Although the remaining three gages are closer to the Focus Area, their records are short and sporadic. The USGS has also conducted several base flow (seepage) stream surveys along the Salmon Creek corridor as part of the Ground Water Management Area field studies program. The results of these studies were summarized by McFarland and Morgan (1991).
Gaging is presently conducted by the DPS at two sites within the WHPP Focus Area. These sites are located in Hazel Dell at Klineline Pond, and in Brush Prairie at the !56th Street bridge. Both gages have operated from late 1989 to the present.
The 1991 Work Plan recommended that CPU conduct long-term continuous gaging of Salmon Creek to provide baseflow data for: 1) assessing trends related to changes in recharge associated with urbanization/runoff management and natural variation of precipitation; and 2) increasing our understanding of groundwater and surface water interaction by further defining gaining and losing reaches of Salmon Creek. In order to fill this data gap, two of the old USGS gaging stations were equipped with pressure transducers and data loggers to provide a continuous record of streamflow. The streamflow data are stored digitally within field computers. The continuously-gaged stations maintained by CPU are located near Battle Ground and near the where the Interstate 205 bridge crosses Salmon Creek (Northcutt residence). CPU also maintains staff gages at several other stations (see above list). Stage readings are collected approximately every two weeks from the staff gages or when stream surveys are performed. Stream surveys are performed periodically to establish relationships between stage height and discharge (i.e. rating curves). A Swoffer current meter is used to measure streamflow velocities and determine flow rates during these surveys. Unfortunately, the streamflow at several of the gaging stations cannot be safely measured when the flows exceed about 250 cubic feet per second (cfs).
3.3 Hydrogeology
3.3.1 Hydrogeologic Units
The WHPP Focus Area lies within the physiographic trough between the Cascade and Coast Ranges in southwest Washington, along the channel of
Ailuifer Characterization 3·22
I I I I I I I I I I I I I I I I I I I
I I I I I I I I I I I I I I I I I I I
December 30, 1994
the ancestral Columbia River. Four principal hydrogeologic units are known to occur in the Focus Area within the interval from land surface to a depth of about 1,000 feet. These units range from Pliocene to Recent in age, and include: 1) Recent Floodplain Alluvium, 2) Pleistocene Alluvial Deposits, 3) the upper member of the Troutdale formation, and 4) the lower member of the Troutdale formation. Exhibit 3-4 is a map which shows surface outcrop patterns for the units as well as locations of cross section alignments. Exhibits 3-5, 3-6, and 3-7 are cross sections which show subsurface relationships for the hydrogeologic units.
Of these four units, only the upper and lower members of the Troutdale formation comprise the principal water supply sources in the WHPP Focus Area. The Upper Troutdale forms what has been referred to in preceding sections of this report as the ''Regional Supply Aquifer" in the WHPP Focus Area. The Pleistocene Alluvial Deposits form what has been referred to in preceding sections as the "upper aquifer." Because the permeability of this aquifer is low, the unit is not used for public water supply. The Alluvial Deposits are used to some extent to provide small amounts of water for domestic supplies. The Recent Floodplain Alluvium is not regionally extensive; and therefore, serves as an important aquifer only in localized areas along the Salmon Creek corridor.
The characteristics of surface and near-surface soils associated with these hydrogeologic units have a significant effect on the vulnerability of each aquifer to water quality impacts which occur as a result of contaminant releases at the surface. In general, aquifer vulnerability decreases with the occurrence of fine-grained, impermeable, or poorly permeable units at the surface, and increases with the occurrence of coarser-grained material such as sand and gravel. Therefore, water quality in shallow, highly permeable units such as the Recent Floodplain Alluvium is generally at a relatively high risk.
Recent Floodplain Alluvium
The Recent Floodplain Alluvium crops out in the floodplain and low terraces along Salmon Creek and other surface water drainages in the WHPP Focus Area (Exhibit 3-4). The unit consists chiefly of unconsolidated coarse sand and gravel, and is penetrated by CPU production Well Nos. 18 and 19, and exploration Well Nos. C-2, A-2.75, and 21. Thickness of the Recent Floodplain Alluvium at these well sites is estimated to range from about 50 to 100 feet.
AIJuifer Characterization 3-23
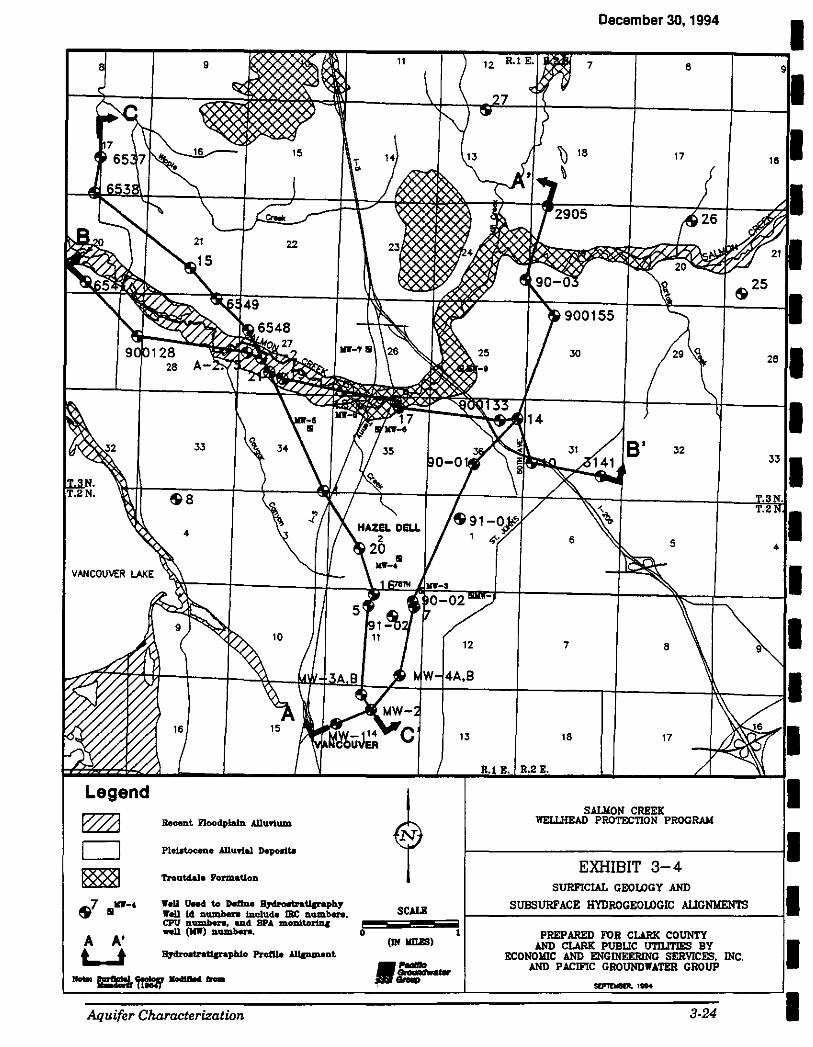
Legend
~ D ~ ~i A t.
.... _, !II
A' t
Recent Floodplain AllUYium
Plet.tocene Allu'rial Depo.tta:
Traut4ale FormaUon
YoU UH<I to DetlDe __ ,
w.u td o.um.ben tnclud.• me a.UIIlben. CPU namben, and SPA m.ODit.orinl ...U (1111) nambon.
~phlo Proft1o .lllpmont
Aquifer Characterization
13
SCALE
0 1 (Ill IOLI!S) •ee ..
December 30, 1994
7 6
18 17
7 8
16 17
SALILON CREEK WELLHEAD PROTECTION PROGRAM
EXHIBIT 3-4 SURFICIAL GEOLOGY AND
SUBSURFACE HYDROGEOLOGIC AUGNliENTS
PREPARED FOR CL.U!K COUNTY AND CL.U!K PUBUC UTILITIES BY
ECONOWIC AND ENGINEERING SERVICES. INC. AND PACIFIC GROUNDWATER GROUP
3-24
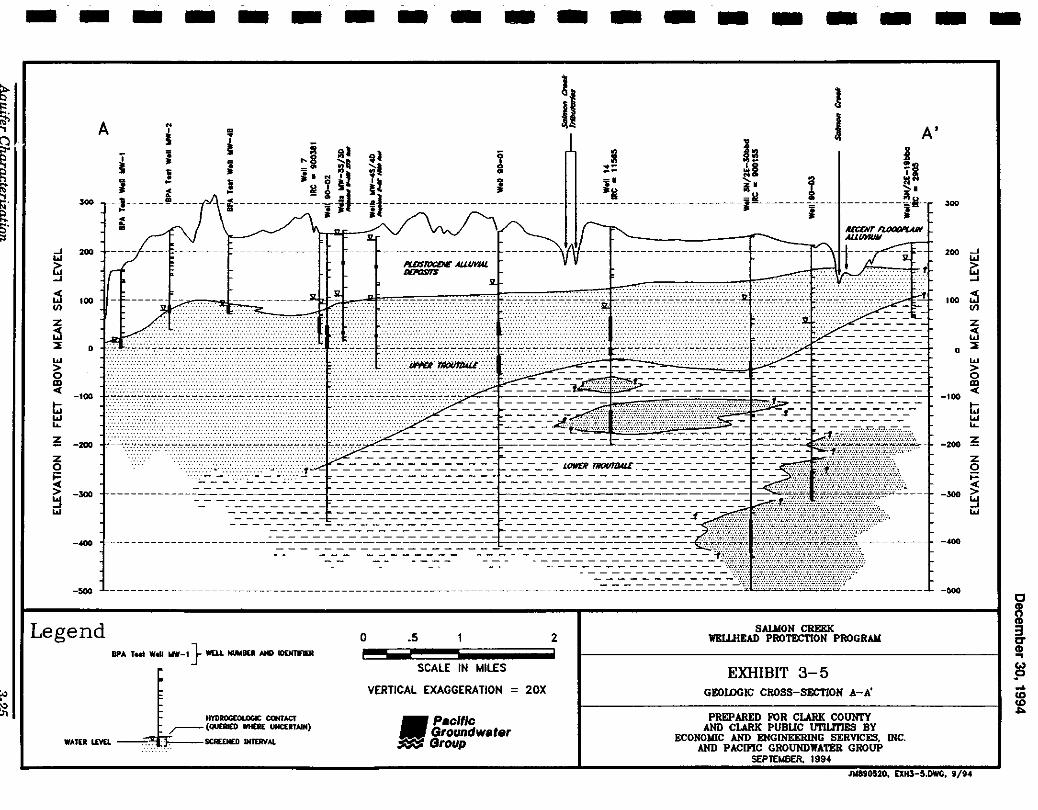
~ F:: S; "' .,
r ~ ., r;;· a s· ~
-
..... .., i':i .....
i:l Ill
z i:l :I .., > 0 m <(
1-.., .., ... a; z 0
~ > ~ ..,
-A
"j
I i
300
200
100
0
-100
-300
--
-- - - - -- ----- - -- -N I
I J l
I ~~ ' -~ ..... !i• l i = :Jll ...... Gl
! ~~ p! h ~ --,1"4.- ,_ ___________ :-_ I -tl--i}----------------------
l A' J
5! i!! I I S! "I'l-l ~~ :: ~·. = i 1 ~ 9
"'ll =i! * ~· t- ·-- -·--:. ------------------,----·-- -·-;;---i---------- ~-~~- ... I
200 ..... .., ~
0 :I ... 15 m
=l=o.::c--fc---·----------+ -1oo <(
t;; ... ... -zoo ~
z 0
~ -300 ~ ...
---~ ------------------------------------------------------------------------------------------- -ODD
Legend 0 ~ 2 SALMON CREEK
1iEWIEAil PROTECTION PROGRAII BP.\ T..t Wtll WW-1} WD.L NUWBER AND IO£N11flER
~ ==-WAJ£R LIYD. --.kSCREDI£0 INTERVAL
----SCALE IN ~ILES
VERTICAL EXAGGERATION = 20X
•Pacific Groundwater
~ Broup
EXHIBIT 3-5 GEOIDGIC CROSS-SECTION A-A'
PREPARED FOR CLARK COUNTY AND CLARK PUBUC I1I'ILITIES BY
ECONOIIIC AND ENGINEERING SERVICES, INC. AND PACIFIC GROUNDWATER GROUP
SEPTEMBER, 1994 JWit0520, EXH3-5.DWG, t/94
-
c § 3 a' CD .. ~ ... "' ~
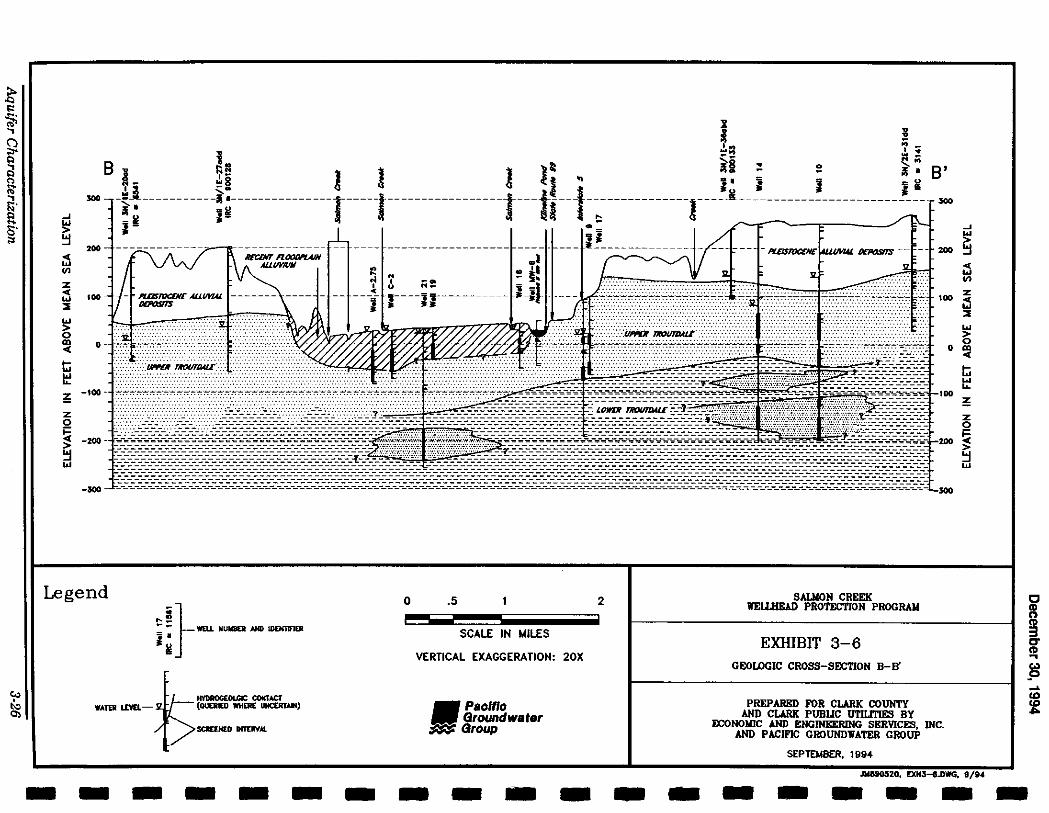
t "' -:;; "' ., () .,. "' § ~ ., !:;•
"' ...J - w ~. > c .. ~
~ VI
z "" ... "' w > 0 ID
"" ti w ... ~ z 0
~ > ~ w
Legend
~=t : :: WEU. NUMBOt AND IDDrnnDI:
~~
t HYDIIOG£0LGIC OOI<IACT WATP LI'm.- (OUERIEO WHERE I.IICUT.liM)
SCII££HEO INTtRYAt.
- - -- - --
0 ~ 2 ----SCALE IN MILES
VERTICAL EXAGGERATION: 20X
•Paolno Groundwater
fffl:r::: Group
-- - - - -
SALilON CREEK 11EWIEAD PROTECTION PROGRAII
EXHIBIT 3-6 GEOLOGIC CROSS-SilCTION B-11"
PREPARED FOR CLARK COUNTY AND CLARK PUBLIC UTILITIES BY
llCONO)I]C AND ENGINEERING SERVICES. INC. AND PACIFIC GROUNDWATER GROuP
SEPTEMBER. 1994
JW890320, EXH3-«S.DWG, 9/94 - - - - - -
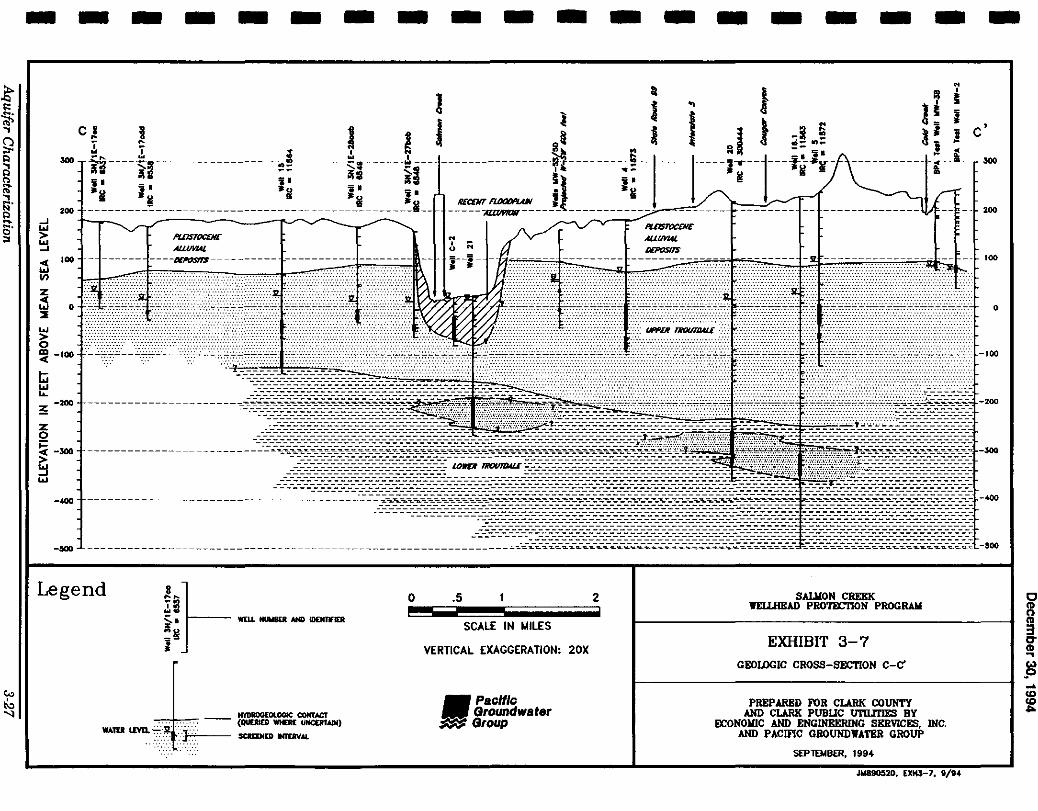
$ 1:: -:5; "' ., ~ ., a " 1il' ., !<" ., -~. 0 ;:1
- - - - -- - - - - -
-' ... > ... -' <( ... "' z ~ :::E
t:i ~
c~ ~ J ~ ~..... .!, : .!, I
~ ~----~------------------~~-------~-----~-#111 iU :- i!i:U ,s i I _ 'WI _ l:i •II ~~ •~;~ ~~ I'
200 ---------~------------------------------~-------~~
ALI.I/Yl<l -+---·---+----~--------
0
~ -200
~ ;:: <( -300 +-----·-------------------
~ ... --
l J
-~ -----------------------------------------------------------
Legend 0 ~ 2 ----SCALE IN lotiLES
VERTICAL EXAGGERATION: 20X
, Pacific Groundwater Group
- -- - - - -
SALioiON CREKK liELLIIEAD PROTilCTION PROGRAM
EXHIBIT 3-7
GEOLOGIC CROSS-SECTION C-C"
PREPARED FOR CLARK COUNTY AND CLARK PUBilC 1lTlLmES BY
fJCONOIIIC AND ENGINBERIIfG SERVICES. INC. AND PACIFIC GROUNDWATER GROUP
SEPTEMBER. 1994
~ 0
~
I l
JW890$20, EXH.J-7. 1/114
-co
300
200
000
0
c g 3 0" .. ... ~ ... "' ~
December 30, 1994
In localized areas, the Recent Floodplain Alluvium is highly permeable and yields moderate to large amounts of water (up to 1,000 gpm) to wells. The transmissivity of the Recent Floodplain Alluvium has been determined for the production and exploration wells using results of pumping tests. The transmissivity of the unit ranges from about 13,000 gpdlft (gallons per day per foot) at exploration Well No. A-2.75 (Carr & Associates, 1988) to about 730,000 gpdlft at CPU Well No. 19. Based on analyses of lithologic logs, the long-term storage coefficient of the Recent Floodplain Alluvium is estimated to be in the range from about 0.15 to 0.25. The depth to water in the Recent Floodplain Alluvium is typically less than 10 feet below land surface. Groundwater in the Recent Floodplain Alluvium is generally unconfined.
Results of the preliminary aquifer vulnerability assessment and wellhead capture zone analyses (PGG & EES, 1991) indicate that the sensitivity of the Recent Floodplain Alluvium aquifer to water quality impacts is greater than for other aquifers in the WHPP Focus Area as a result of the following factors: 1) the transmissivity of the unit is high, 2) fine-grained or confining units are typically not present, and 3) wells completed in the unit are shallow.
Pleistocene Alluvial Deposits
The Pleistocene Alluvial Deposits occur within the WHPP Focus Area as broad plains and terraces (Exhibit 3-4). The sediments were deposited by the ancestral Columbia River as a great delta or deltaic fan emanating from the Columbia River Gorge. The deposits are generally coarse along the Columbia River but grade to textures of fine sand, silt, and clay along the outer edges of the delta. Although the deposits approach 350 feet in thickness along the Columbia River, they generally range from 100 to 150 feet thick in the surrounding broad plains. Within the WHPP Focus Area, the Pleistocene Alluvial Deposits consist chiefly of fine sand, silt, and clay, and range from about 100 to 200 feet in thickness.
The fine-grained portions of the Pleistocene Alluvial Deposits, such as those encountered within the Focus Area, generally do not serve as regional aquifers, but may include shallow perched aquifers utilized for domestic supplies. Yields to wells completed in the Pleistocene Alluvial Deposits vary from small to moderate in the WHPP Focus Area, depending on local lithologic characteristics and saturation of the unit. Average capacity for wells completed in the Pleistocene Alluvial Deposits within the WHPP Focus Area is about 40 gpm; average specific capacity is about five gpm/ft. Average depth to water in the Focus Area is about 13 feet below land surface. Groundwater in the Pleistocene Alluvial Deposits is believed to occur under semi-confined to unconfined conditions.
Aquifer Characterization 3-28
I I I I I I I I I I I I I I I I I I I
I I I I I I I I I I I I I I I I I I I
December 30, 1994
The geology of Pleistocene Alluvial Deposits has been investigated extensively in the 78th Street Critical Area in order to characterize pathways for chromium and VOC contamination. A total of 47 monitoring wells have been installed within a 0.5 mile radius of the Boomsnub-Airco facilities. Analysis of lithologic logs indicates that the Pleistocene Deposits typically consist of silty sands with some interbedded silt and coarser sand layers in this area. The lower portion of this unit is very fine grained (silt, clay, or silty clay). The Pleistocene Alluvial Deposits range from about 65 to 120 feet in thickness in the 78th Street Critical Area. The geology of this area will continue to be investigated in the future. A Work Plan is currently being developed which specifies procedures for drilling and sampling as many as four new monitoring wells to be completed in the upper aquifer. These wells will be located to the south of the existing Boomsnub monitoring wells.
Results of the preliminary aquifer vulnerability assessment and wellhead capture zone analyses (PGG & EES, 1991) indicate that the sensitivity of the Pleistocene Alluvial Deposits aquifer to water quality impacts in the WHPP Focus Area is moderately high, primarily due to the fact that water levels and wells completed in the unit are shallow and aerially extensive finegrained or confining units may not be present. There are no CPU production wells which yield water from this unit.
Troutdale Formation
The Troutdale formation underlies the Pleistocene Alluvial Deposits. The formation is Pliocene in age, and crops out north of Salmon Creek in the WHPP Focus Area (Exhibit 3-4). Mundorff (1964) informally divided the Troutdale formation into upper and lower members. The upper and lower units differ substantially in hydrogeologic characteristics as discussed below.
Upper Troutdale - The upper member of the Troutdale formation consists of semi-consolidated to unconsolidated gravel and cobbles in a sand or silty sand matrix. Thickness of the unit generally ranges from about 100 to 300 feet in the WHPP Focus Area.
The Upper Troutdale serves as southwestern Clark County's regional aquifer and supplies water to CPU Well Nos. 4, 5, 7, 7.2, 8, 9, 10, 15, 17, 22, 23, and 27. The Upper Troutdale may also supply a component of water (along with the Recent Alluvial Deposits) to Well Nos. 18 and 19, which are located along the Salmon Creek corridor. The unit typically yields between 400 and 1,000 gpm to supply wells in the WHPP Focus Area. However, where silt content and cementation in the Upper Troutdale are high, production potential may be poor. Average well capacity for wells completed in the Upper Troutdale within the WHPP Focus Area is about 70 gpm; average specific capacity is about seven gpm/ft. Transmissivity of the Upper Troutdale has been
Aquifer Charact£ri2ation 3-29
December 30, 1994
computed from results of pumping tests for most CPU production wells. Where pumping test data were not available, transmissivity for the CPU wells was estimated by applying a factor of 2,000 to the specific capacity for each well. Transmissivity estimates for the Upper Troutdale range from about 8,000 gpd/ft at CPU Well No. 8 to as high as 200,000 gpdlft at CPU Well No. 5 (PGG & EES, 1991). Long-term storage coefficient of the unit is estimated from lithologic logs to be in the range from about 0.05 to 0.2. Average depth to water in the Upper Troutdale is about 90 feet below land surface. Groundwater in the Upper Troutdale occurs chiefly under semiconfined and unconfined conditions.
The geology of the Upper Troutdale was investigated in the 78th Street Critical Area during the drilling of Well Nos. MW-lD, MW-3D, and MW-4D. The unit will be further characterized in this area as additional wells are constructed to provide geologic and water quality data for assessing contaminant transport pathways for chromium and VOCs.
Results of the preliminary aquifer vulnerability assessment and wellhead capture zone analyses (PGG & EES, 1991) indicate that the sensitivity of the Upper Troutdale aquifer to water quality impacts in the WHPP Focus Area is considered to be moderate. Where transmissivity is high and water levels are shallow, aquifer vulnerability may be higher. Where significant thicknesses of silt or clay overlie the Upper Troutdale, aquifer vulnerability may be lower.
Lower Troutdale - Below the Upper Troutdale sands and gravels lies a thick sequence of clay and silt. Interbedded with these fine-grained deposits are non-continuous lenses of sand which range from several feet to 60 or more feet in thickness. The Lower Troutdale is penetrated by CPU production Well Nos. 14, 16, 20, 21, 24, 25, 26, and 90-03 (Exhibits 3-5, 3-6, and 3-7; Table 3-1). Analysis of lithologic and driller's logs for wells which penetrate the Lower Troutdale indicates that the unit slopes to the southwest (Mundorff, 1964; Exhibits 3-5 and 3-7). This structural feature may be a result of down warping which occurred contemporaneously with deposition.
The Lower Troutdale generally does not yield groundwater to wells except where sand lenses of substantial thickness and aerial extent occur. At these locations, yields to water wells range from about 600 to 800 gpm. Average specific capacity for wells screened in the Lower Troutdale sands is about 6 gpm/ft. Transmissivity for the Lower Troutdale sands has been determined using results of pumping tests at CPU Well Nos. 16, 20, 24, 25, 26 and 90-03; representative transmissivity of the unit is estimated to range from about 9,500 at CPU Well No. 25 to about 95,000 gpdlft at CPU Well No. 90-03. Transmissivity values typically vary in proportion with the aquifer thickness. Hydraulic conductivity values for Lower Troutdale wells average
Aquifer Characterization 3-30
I I I I I I I I I I I I I I I I I I I
I I I I I I I I I I I I I I I I I I I
December 30, 1994
approximately 87 ftlday. Long-term storage coefficient is estimated to be on the order of about 10-4. The depth to water in the Lower Troutdale is typically about 180 to 200 feet below land surface. Groundwater in the Lower Troutdale occurs under confined conditions.
Results of the preliminary aquifer vulnerability assessment and wellhead capture zone analyses (PGG & EES, 1991) indicate that the sensitivity of the Lower Troutdale aquifers to water quality impacts is less than for other aquifers in the WHPP Focus Area primarily because the water-producing zones occur at depths ·of 400 feet or more, and are overlain by several hundred feet of fine-grained sediments.
3.3.2 Groundwater Occurrence and Flow
Lower Salmon Creek Basin
Groundwater in the WHPP Focus Area occurs under unconfined, semiconfined, and confined conditions. Groundwater is typically unconfined to semi-confined in unconsolidated sediments such as the Pleistocene Alluvial Deposits, the Recent Floodplain Alluvium, and portions of the Upper Troutdale. Confined conditions occur in the Lower Troutdale.
Water level data from studies conducted by the USGS and the IRC prior to initiation of the WHPP program (McFarland and Morgan, 1991; Swanson, 1991) were evaluated to assess regional groundwater flow patterns in the Pleistocene Deposits and the Upper Troutdale. Groundwater level data obtained during the WHPP program were evaluated for the Pleistocene Deposits and the Upper and Lower Troutdale regional aquifer systems within the Focus Area. In addition, the local hydrologic flow regime in the 78th Street Critical Area has been investigated extensively by Ecology in an effort to define flow paths for chromium and VOC contamination. Nearly all of the hydrologic characterization in the Critical Area has focused on the upper aquifer system (the Pleistocene Deposits); Ecology has done a limited amount of work in the Upper Troutdale.
Pleistocene Deposits Aquifer - Regional groundwater flow patterns in the Pleistocene Deposits aquifer in the Portland Basin were evaluated by the USGS (McFarland and Morgan, 1991). The results of the study indicate that the direction of groundwater flow in the Pleistocene Deposits is to the westnorthwest in the area corresponding to the WHPP Focus Area; these results are based on groundwater levels measured in the spring of 1988.
Exhibit 3-8 is a map showing water level contours for the Pleistocene Alluvial Deposits aquifer based on water level monitoring data obtained in April 1993. The water level data were obtained from private domestic wells and CPU monitoring wells included in the WHPP monitoring network. The water
Aquifer Characterization 3-31
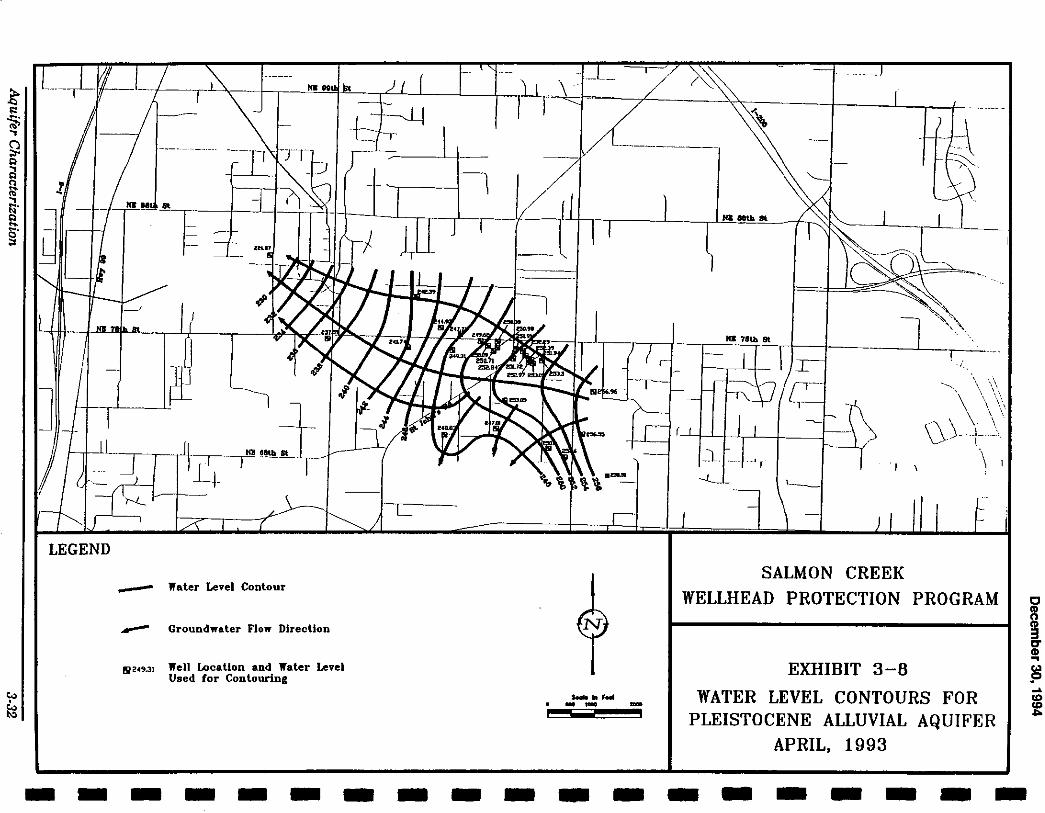
LEGEND
--Water Level Contour
Groundwater Flo1f Direction
Well location and Water Level Used for Contouring
N
S..lltF ... . .. - -
SALMON CREEK
WELLHEAD PROTECTION PROGRAM
EXHIBIT 3-8
WATER LEVEL CONTOURS FOR PLEISTOCENE ALLUVIAL AQUIFER
APRIL, 1993
-------------------
I I I I I I I I I I I I I I I I I I I
December 30, 1994
level contours shown on Exhibit 3-8 indicate that the direction of groundwater flow in the upper aquifer is generally to the northwest. Water level contours south of the intersection of St. John's Road and N. E. 78th Street indicate a component of flow to the south; these contours may illustrate the influence of surface water flow in Cold Creek.
In the 78th Street Critical Area, depth to water in the upper aquifer typically ranges from about 5 to 30 feet below ground surface. The direction of the horizontal component of groundwater flow in the Pleistocene Alluvial Deposits within the Boomsnub-Airco study area is generally to the west or northwest (SAIC, 1993; EA, 1993). The hydraulic gradient is estimated to be about 3.6 X 10⁻³. The average vertical hydraulic gradient is 5.3 X 10⁻³, and is downward (SAIC, 1993). The rate of transport in the Pleistocene Alluvial Deposits for dissolved constituents is estimated to range from about 0.6 feet per day to 1.4 feet per day (personal communication, Ecology, 1993).
Upper Troutdale Aquifer - Regional groundwater elevations in the Upper Troutdale aquifer were evaluated by the IRC as part of the Ground Water Management Program. Exhibit 3-9 shows groundwater level elevation contours prepared by the IRC (Swanson, 1991). Water level elevations range from almost 200 feet above mean sea level in the eastern part of the WHPP Focus Area to near sea level in the southern and western parts of the Focus Area. Results of this preliminary investigation indicated that groundwater flow direction in the Upper Troutdale aquifer is generally to the westsouthwest in the WHPP Focus Area, and that horizontal gradients range from 0.004 to 0.01. Groundwater flow patterns are influenced locally by production wells and streams.
Exhibit 3-10 is a map showing water level contours for the Upper Troutdale Aquifer based on water level monitoring data obtained for the WHPP in April 1993. The data were obtained from CPU production wells, and from private domestic wells and CPU monitoring wells included in the WHPP monitoring network. The water level contours shown on Exhibit 3-10 indicates that the direction of groundwater flow in the regional aquifer is to the west-southwest and that horizontal gradients range from about 0.004 to 0.01. Water level data for CPU monitoring wells with completions in both the Pleistocene Deposits aquifer and the Upper Troutdale aquifer (MW-1S, MW-1D, MW-3S, MW-3D, MW-4S, MW-4D, MW-7S, and MW-7D) indicate an average downward vertical gradient of 0.83 between the two units. CPU monitoring wells MW-5S and MW-5D are completed in shallow and deep zones, respectively, of the Upper Troutdale; water level data for these wells indicates that the vertical hydraulic gradient in the aquifer at this location is 0.13 and is downward.
Aquifer Characterization 3-33
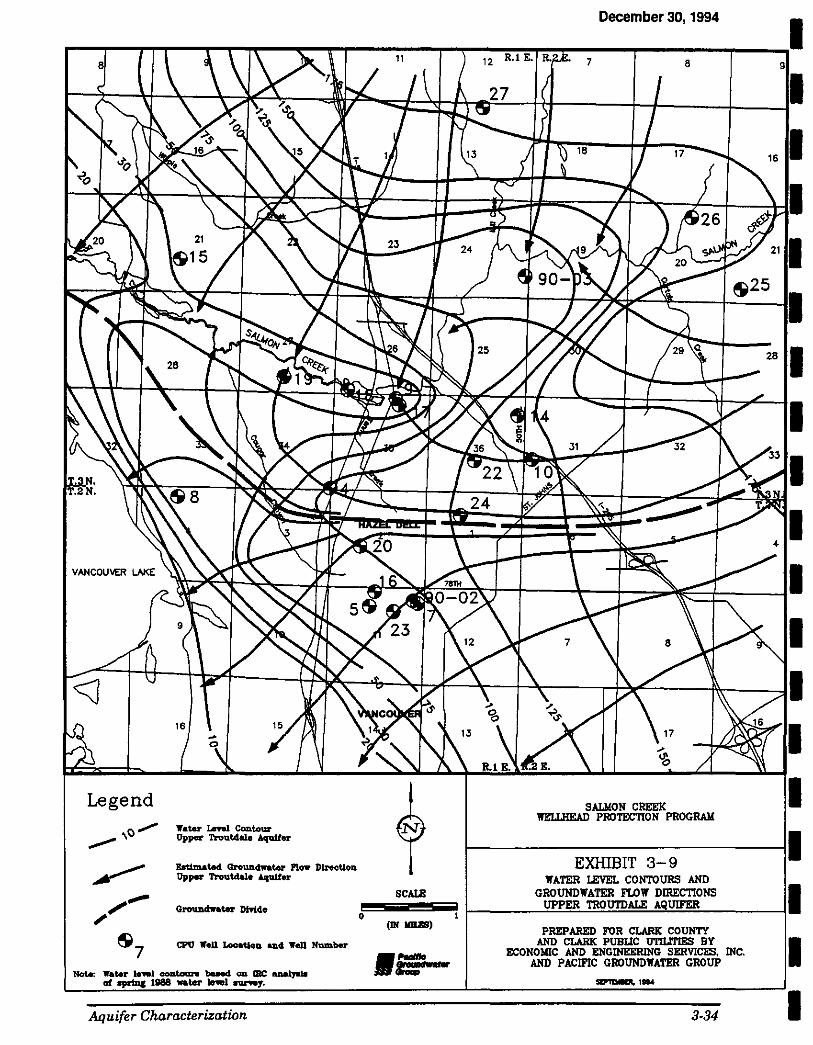
December 30, 1994
11~11~~~~-r~~~~--~~1 12 R.l E.
8 8 9
~~\Y~~~~~~~--~· 16 I
~~~~~~~~~~~~ I
~~~~qp~~~~~~~~.
Legend ••ter Lnel Contour Upper Troutdale Aqtaifer
BsUmated. Groun4water P1.o1r DlrecUon Upper Trvuldale ........
CPO Well LoollUon an4 'l'eU Number
SALIION CREEK WELLliEAil PROTECTION PROGRAII
I
I I
r--------------11 EXHIBIT 3-9
WATER LEVEL CONTOURS AND SCALE GROUNDWATER FLOW DIRECTIONS I
.~~~~~ ~------~UP~PER~~TIW~mD~~~~A~Q~U~Th~ER~------~ (IN IIWIS)
PREPARED FOR CLARK COUNTY AND CLARK PUBUC UTILITIES BY
ECONOIIIC AND ENGINEERING SERVICES, INC. AND PACIFIC GROUNDWATER GROUP
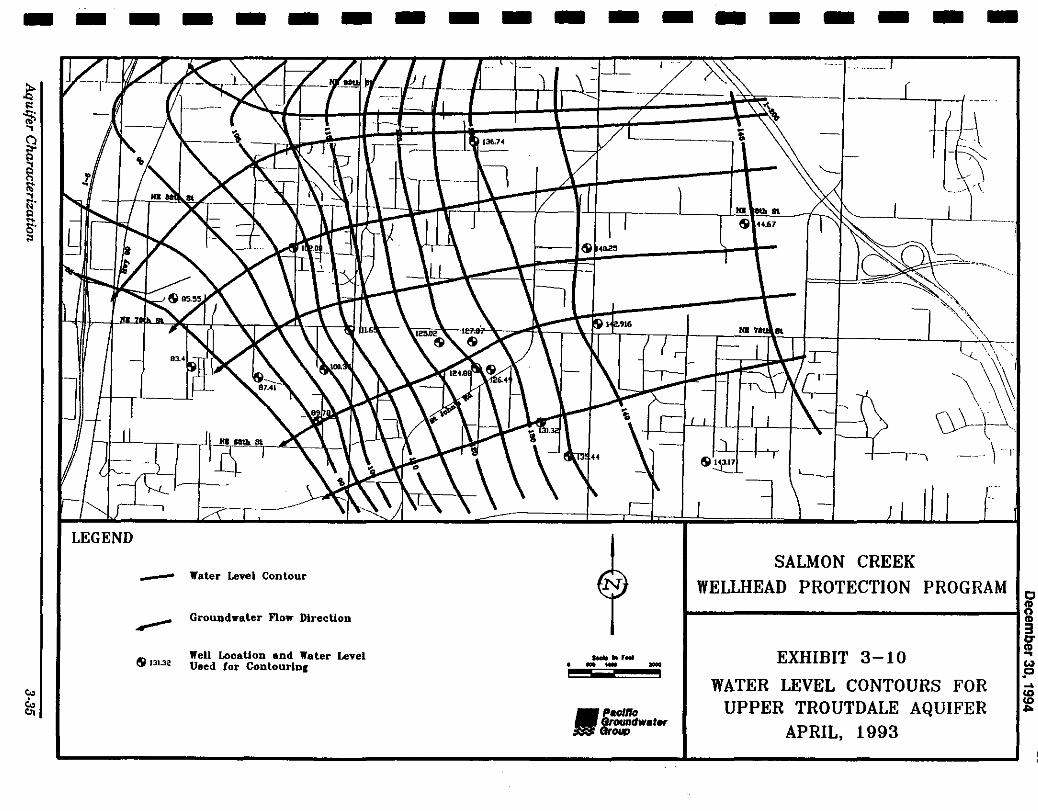
-------------------
J
LEGEND
---s 131.32
Water Level Contour
Groundwater Flow Direction
Well LocaUon and Water Level Ueed for Contourlnr
I .
N
........ , ... . -.... -•
Paotno
~··'·
-- ..
SALMON CREEK WELLHEAD PROTECTION PROGRAM
~--------------------------~§ EXHIBIT 3-10
WATER LEVEL CONTOURS FOR UPPER TROUTDALE AQUIFER
APRIL, 1993
3 g .. .., p .... (l)
~
December 30, 1994
Several privately-owned domestic wells within the 78th Street Critical Area are completed in this unit. In addition, Well MW-1D, which was constructed as part of CPU's Wellhead Protection program, is screened in this Upper Troutdale (185 to 190 feet). Approximately 110 feet of Upper Troutdale sediments were penetrated by this well.
Lower Troutdale AQuifer - Insufficient data are available for the Lower Troutdale sands to determine groundwater flow and gradient. Preliminary analyses of water level data by the IRC for Well Nos. 14, 16, and 20 (Swanson, 1993), indicate that the direction of groundwater flow in the Lower Troutdale is approximately west, and that the horizontal hydraulic gradient is very small (0.001). Hydraulic communication between the Upper and Lower Troutdale aquifers is likely to be low because the clay and silt which occur between the two aquifers has a low permeability and a thickness of approximately 200 feet. The vertical hydraulic gradient between the Upper and Lower Troutdale aquifers is generally downward, and is estimated to be about 0.5.
Contaminant Flow Paths - 78th Street Critical Area
Geologic data for local monitoring wells suggest that vertical hydraulic communication between the upper and regional aquifer systems in the 78th Street Critical Area would be limited by the silt/clay unit that occurs within the Pleistocene Alluvial Deposits. Exhibit 3-11 illustrates the relationship between these two units in plan view and cross section, respectively. The plan view in Exhibit 3-11 shows the location of capture zones for wells completed in the regional supply aquifer, and horizontal groundwater flow directions in both aquifers; it also shows the orientation of the chromiumNOC plume in the upper aquifer and the VOC plume in the regional aquifer. The chromium plume boundary is approximate and includes the areas within which the concentration of chromium exceeds 1.0 mg/L. Further characterization will be necessary to define the plume boundaries beyond the 1.0 mg/L designation. Likewise, the VOC plume boundary includes areas within which VOC concentrations exceed 1.0 J.lg/L. The schematic hydrogeologic cross section in Exhibit 3-11 shows the subsurface relationship of the upper and regional aquifers, the confining (silt/clay) unit, and the approximate extent and orientation of the chromium and VOC plumes. The flow path for chromium is to the northwest and then to the west through the upper aquifer. Results of previous investigations indicate that the chromium moves preferentially through the upper aquifer in sandy, more permeable layers (personal communication, Ecology, 1993). The vertical distribution of chromium contamination in the upper aquifer monitoring wells suggests a significant vertical component of flow through this aquifer. Chromium has not been detected in regional supply aquifer monitoring wells (MW-1, MW-3, MW-4, and private domestic wells).
AiJuifer Characterization 3-36
I I I I I I I I I I I I I I I I I I I
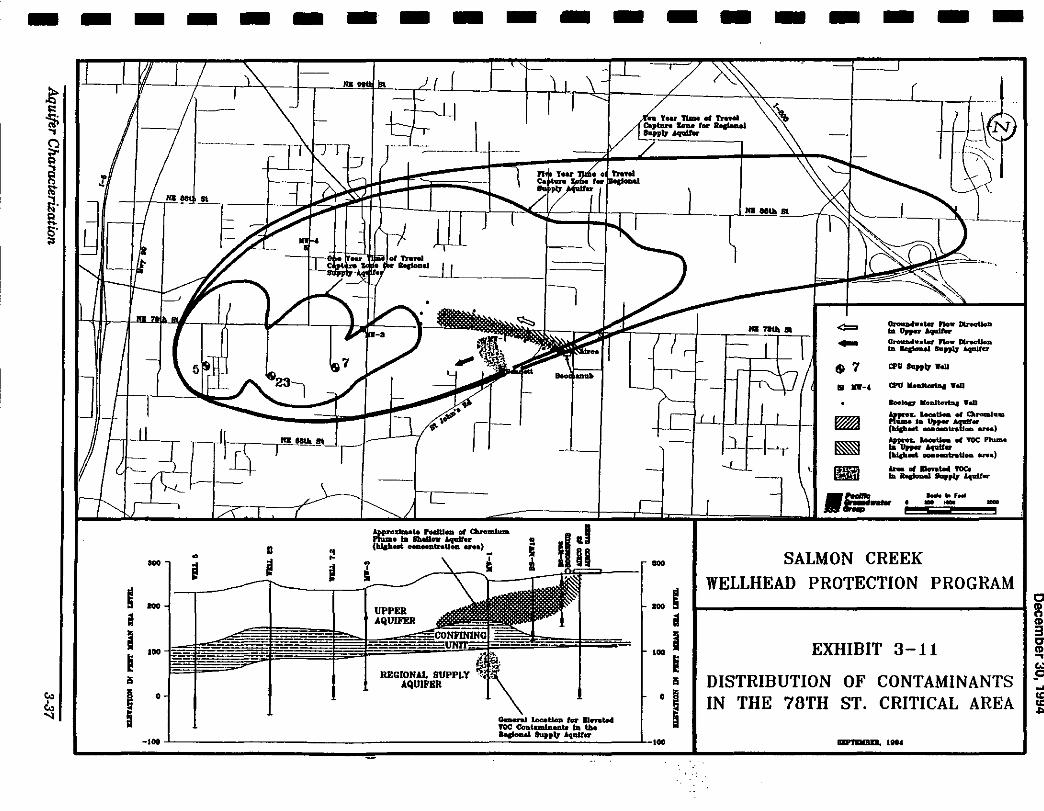
-------------------
G ~ ... s s •
• ~ ... a I I
100
! REGIONAL suPPLY AQUIPBR
"" I 0 • "" "'
-100
... -~ a 100 I
I !
0 I 5
~·- ,.. btreaUoll .. ._._ OI'OIIIO<h•'- n.. lltndlno Ill. lloepnW aa..., ~ CPU ..,., W.U
8ooloc7 lloaltodJtc ••
#J::._ t-U.a .t G..-hua
~--~.:c:.-_, ...... c. --.u.. .t 1QC Phame bi .,.,.. Ata«• (wp...t --enuoa. ..,.., -- ., lkq_\af toe. bt. ...._.. ...,,., , • .,..
SALMON CREEK
..... , ... -- -
WELLHEAD PROTECTION PROGRAM
EXHIBIT 3-11
DISTRIBUTION OF CONTAMINANTS IN THE 78TH ST. CRITICAL AREA
Ba'TDI8D. •••
c .. n .. 3 c:r .. .. ... p .... "' "' ""
December 30, 1994
Therefore, the silt/clay confining unit is presumed to be an effective barrier to chromium transport. The chromium is likely to continue moving along the top of the low permeability silt/clay unit.
Because very little off-site work has been done with respect to VOC contamination, the critical flow paths for these compounds are less well known. VOCs appear to have followed roughly the same flow path as chromium in the upper aquifer. However, VOCs (trichloroethylene, in particular) have also been detected at low levels in the regional aquifer in MW-lD and the Bennett domestic well. This suggests that VOCs have migrated into the regional aquifer upgradient of these wells or that an additional source of VOCs exists in the regional aquifer. Downward migration may occur via: 1) a discontinuity in the silt/clay unit that usually occurs in the lower portion of the Pleistocene Deposits; or 2) the annulus of an improperly sealed well. In addition, migration of VOCs such as trichloroethylene either in the dissolved phase or as a dense, non-aqueous phase liquid (DNAPL) may occur within low permeability sediments such as those in the lower portion of the Pleistocene Deposits. Such migration would likely be very slow and would depend largely on the hydraulic conductivity and organic content of the fine-grained unit, as well as on the vertical hydraulic gradient between the aquifers. Water level data indicate a strong downward gradient from the upper shallow alluvial aquifer to the Upper Troutdale. Since no quantitative data are available for conductivity or organic content within the silt/clay unit in the lower portion of the Pleistocene Deposits, downward migration cannot be ruled out. Further hydrogeologic characterization in the 78th Street Critical Area may resolve these issues. Contaminant transport through the Upper Troutdale is assumed to occur chiefly in higher permeability (clean) sand and gravel layers.
3.3.3 Surface Water Features
Salmon Creek is the principal surface water drainage in the WHPP Focus Area. The creek drains approximately 90 square miles and has its headwaters in the eastern foothills of Clark County. Salmon Creek discharges into the Lake River which in turn discharges to the Columbia River near Ridgefield.
The water level contours shown on Exhibit 3-9 indicate that shallow aquifers in the WHPP Focus Area discharge to Salmon Creek. Because the transmissivity of the Recent Alluvial Deposits is significantly higher than the transmissivity of other shallow aquifers in the WHPP Focus Area, the largest component of groundwater flow and recharge from the shallow aquifer system to Salmon Creek is assumed to be from the Recent Alluvial Deposits. Although Salmon Creek is predominantly a gaining stream in the
Aquifer Characterization 3-38
I I I I I I I I I I I I I I I I I I I
I I I I I I I I I I I I I I I I I I I
December 30, 1994
Focus Area, a losing reach between Corbin Road and Klineline Pond has been identified by Mundorff (1964) and Carr (1985). Average discharge of Salmon Creek at the Battle Ground, Washington, gaging station Oocated about six miles upstream from the WHPP Focus Area boundary) is about 63 cubic feet per second (cfs) for the 33-year period from 1944 through 1975 and 1989; minimum flow during this period was about 1.2 cfs (Miles and others, 1990).
The water level elevation contours shown on Exhibit 3-9 indicate that shallow aquifers in the WHPP Focus Area discharge to a number of other surface water features including Vancouver Lake, Shillapoo Lake, and the Columbia River. The shallow aquifers also discharge to springs which occur predominantly along surface water drainages in the Focus Area.
Hydraulic communication between Salmon Creek and the shallow aquifers, particularly the Recent Alluvial Deposits, is high. This conclusion is supported by: 1) Discharge/recharge relationships between the shallow aquifers and Salmon Creek; and 2) Results of analyses comparing stream flow in Salmon Creek to water level trends in nearby shallow wells (Mundorff, 1964). Hydraulic communication between the deeper aquifers of the Lower Troutdale and Salmon Creek is assumed to be very small because these aquifers are separated from the stream bed by several hundred feet of silt and clay.
3.3.4 Water Budget and Groundwater Recharge
The water budget approximates volumes of water for each major component of the hydrologic cycle flowing into and out of a region's hydrologic system through precipitation, evapotranspiration, runoff, groundwater recharge, human consumption, and natural discharge.
The water budget serves as the basis for initial planning of groundwater use. A general understanding of the water budget helps in the management of groundwater resources by indicating the relative magnitude (importance) of each component of the flow system.
The water budget is based on the mass-balance principle: water going into the system is equal to the water flowing out of the system plus or minus the change in storage of the water within the system. This situation is true at all points of the system at all times based on the principle of the conservation of mass. In the natural system, groundwater storage changes seasonally and with dry/wet year cycles. Pumping of groundwater also changes the amount of storage in the system. Over a long-term period changes in storage can be assumed to be negligible and the water budget can be represented as an "average" year.
Ai[uifer Characterization 3-39
December 30, 1994
With the assumption that change in storage is zero (equilibrium conditions) the mass balance equation becomes (modified from Freeze and Cherry, 1979):
Inflow = Outflow
The water budget equations can be expressed in greater detail by the following expression:
P =ET+SR +BF+WU+GD and, RO =SR+BF and, R = P - ET - SR = BF + WU + GD where:
Precipitation Evapotranspiration Runoff Storm Runoff Baseflow Consumptive Water Use Groundwater Discharge
p = ET = RO = SR = BF = wu = GD = R = recharge)
Groundwater Recharge (herein referred to as basin
USGS Deep Percolation Model Water Budget Assessment
Recharge and other components of the water balance for the Salmon Creek basin were evaluated in detail by the USGS as part of the Portland Basin hydrogeologic studies (Snyder and others, 1990). The USGS study made use of a deep percolation model developed by Bauer and Vaccaro (1990) to determine recharge from precipitation. The modeling process simulates, on a daily basis, the major factors controlling recharge from precipitation such as changes in soil moisture, evapotranspiration, surface water runoff, snow cover, and intercepted precipitation. Data input requirements include climatic factors such as precipitation, temperature, and percentage sunshine; land surface attributes such as altitude, slope and aspect; soil properties such as soil depth available water capacity, and texture; and land use information (i.e. grass, orchard/deciduous forest, residential, industrial, etc.). The model calculates recharge over discrete areal blocks (cell spacing of 1,640 feet) and provides long-term annual average recharge estimates.
Because the USGS deep percolation model analysis considers a large number of variables and analyzes precipitation recharge and other water balance factors over small time intervals and geographic areas, the results are considered to be relatively reliable. In a general sense, the USGS analysis represents a detailed climatic balance and an assessment of the recharge input to the system. However, the analysis does not provide an evaluation of
Ar/uifer Characterization 3-40
I I I I I I I I I I I I I I I I I I I
I' I I I I I I I I I I I I I I I I I I
December 30, 1994
other components of the water budget related to the surface water system (runoff, baseflow, storm runoft) or the groundwater system (consumptive water use, groundwater discharge). Many of these other components of the water budget were evaluated through other related studies by the USGS.
There are may different methods that can be used to evaluate each component of the water budget. In order to evaluate the possible range of values for each component, several of the components were evaluated based on calculations which were different from those used by the USGS. Results of these independent calculations were compared to the USGS results.
Water Budget Data
The data used in the water budget assessment were compiled from a number of different sources. The data and data sources are described below.
Climatic data are available for a number of regional reporting stations through the National Atmospheric and Oceanic Administration (NOAA). Long-term precipitation and temperature data stations in the vicinity of Salmon Creek include Battle Ground and Vancouver (S-1 on Exhibit 3-1). Precipitation data are also available for other local stations that are operated by Bonneville Power Administration, the County and other local agencies. Long-term data for the Battle Ground station were compiled and review for this investigation.
Long-term streamflow data for the Salmon Creek basin are relatively limited. The only long-term streamflow record is for a gaging station located near Battle Ground, Washington. This station was operated by the USGS from October 1943 through September 1975, and then again from February 1988 to September 1989. All streamflow monitoring was discontinued by the USGS in 1989 at the conclusion of the Ground Water Management Program field studies. Short-term streamflow records were also generated by the USGS at several other sites along Salmon Creek and several of its tributaries. Carr (1985) also performed limited gaging studies in the lower portion of the basin. More recently, CPU and Clark County initiated gaging studies at several sites. Several of these sites correspond to the same control points that were previously gaged by the USGS and Carr. A few new sites were established in other areas to better delineate the runoff characteristics of the basin. A summary of past and current streamflow gaging sites is presented on Table 3-2. Gage locations are shown on Exhibit 3-1. The streamflow data collected at the USGS stations (14212000, Battle Ground and 14213000, Vancouver) were the basis for the water budget analysis include in this investigation.
Aquifer Characterization 3·41
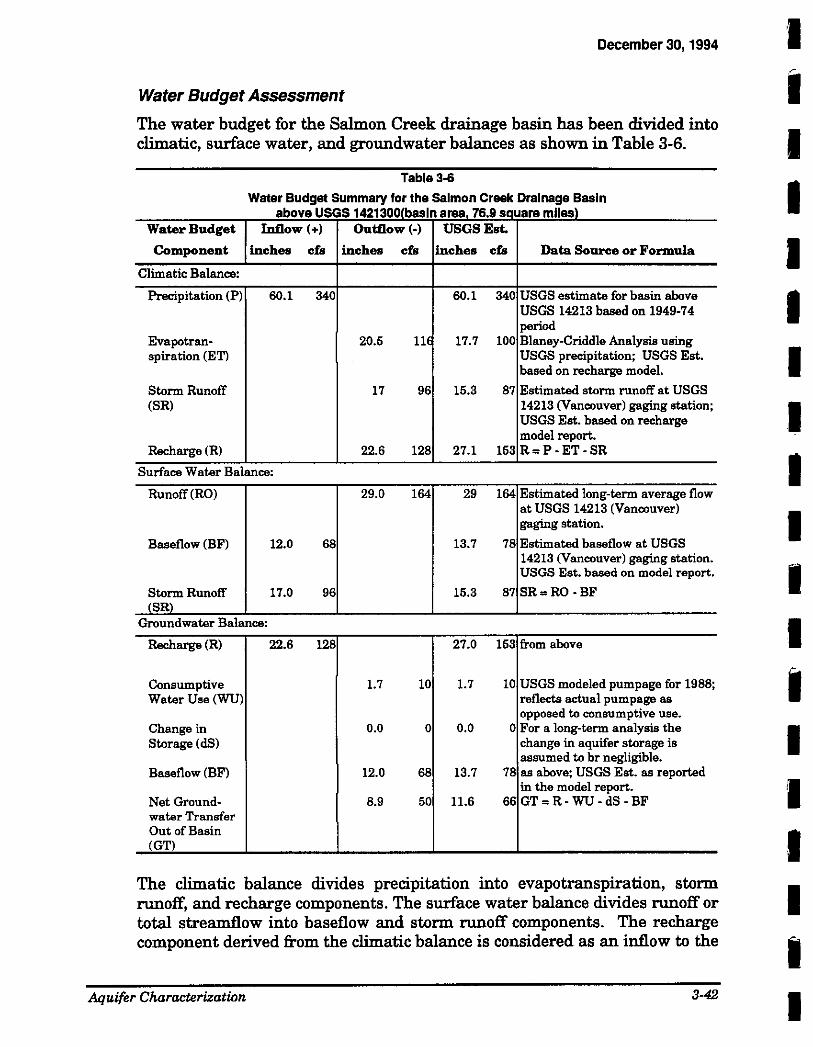
December 30, 1994
Water Budget Assessment
The water budget for the Salmon Creek drainage basin has been divided into climatic, surface water, and groundwater balances as shown in Table 3-6.
Table3-6
Water Budget Summary for the Salmon Creek Drainage Basin above USGS 1421300(basln area 76.9 square miles)
Water Budget Inflow(+) Outflow(·) USGS Est.
Component inches cfs inches cfs inches cfs Data Source or Formula
Climatic Balance:
Precipitation (P) 60.1 340 60.1 340 USGS estimate for basin above USGS 14213 based on 1949-74 period
Evapotran· 20.5 11 17.7 100 Blaney-Criddle Analysis using spiration (ET) USGS precipitation; USGS Est.
based on recharge model.
Storm Runoff 17 96 15.3 87 Estimated storm runoff at USGS (SR) 14213 (Vancouver) gaging station;
USGS Est. based on recharge model report.
Recharge (R) 22.6 128 27.1 153 R=P-ET-SR
Surface Water Balance:
Runoff(RO) 29.0 164 29 164 Estimated long-term averaga flow at USGS 14213 (Vancouver) gaging station.
Baseflow (BF) 12.0 68 13.7 78 Estimated baseflow at USGS 14213 (Vancouver) gaging station. USGS Est. based on model report.
Storm Runoff 17.0 96 15.3 87 SR=RO-BF (SRl
Groundwater Balance:
Recharge (R) 22.6 128 27.0 153 from above
Consumptive 1.7 10 1.7 10 USGS modeled pumpage for 1988; Water Use (WU) reflects actual pumpage as
opposed to consumptive use. Change in 0.0 0 0.0 0 For a long-term analysis the Storage ( dS) change in aquifer storage is
assumed to br negligible. Baseflow (BF) 12.0 68 13.7 78 as above; USGS Est. aa reported
in the model report. Net Ground· 8.9 50 11.6 66 GT=R· WU -dS -BF water Transfer Out of Basin (GT)
The climatic balance divides precipitation into evapotranspiration, storm runoff, and recharge components. The surface water balance divides runoff or total streamflow into baseflow and storm runoff components. The recharge component derived from the climatic balance is considered as an inflow to the
Aquifer Characterization 3-42
'I I I I I I I I I I I I I I 'I I I I I
I I I I I I I I I I I I I I I, I I I I
December 30, 1994
groundwater balance while consumptive use, baseflow to streams, and groundwater discharge out of the basin are considered as outflow from the groundwater balance. The water budget assessment for Salmon Creek was based on the drainage basin upstream of USGS gage 14213000. The total drainage area of the basin upstream from this control point is 76.9 square miles. The water budget components presented in Table 3-6 are expressed in both inches over the basin as well as cubic feet per second (cfs). The following provides a discussion of each of the water budget components.
Precipitation · Precipitation (P) is the source of groundwater recharge to the Salmon Creek Basin. Average monthly precipitation totals for the Battle Ground station are summarized in Table 3-7.
Average maximum precipitation generally occurs in December and average minimum precipitation occurs in July. The long-term average annual precipitation at Battle Ground is 51 inches/year.
As part of their deep percolation modeling effort, the USGS evaluated longterm average annual precipitation for the basin using Vancouver and Battle Ground data for the period 1949 to 1974. The long-term total annual precipitation to the basin upstream of USGS 14213000 is 60.1 inches/year. The long-term total precipitation inflow to the basin assuming a drainage area of 76.9 square miles is 340 cfs.
Evapotranspiration - Evapotranspiration (ET) is the water that is evaporated from soil and transpired by plants. ET was estimated using the BlaneyCriddle method (USSCS, 1970) and then compared to the results obtained from the USGS deep percolation model.
The average calculated ET rate based on the Blaney-Criddle method is 20.5 inches/year. Based on a total basin drainage area of 76.9 square miles, the total ET outflow from the system is 116 cfs. By comparison, the USGS deep percolation model estimates 17.7 inches/year or 100 cfs of ET from the basin.
Storm Runoff - Runoff that reaches the stream channel within a few days of a rainfall event is considered to be storm runoff (SR). Storm runoff represents overland flow from steep slopes and impervious areas as well as shallow subsurface stormflow (sometimes referred to as interflow) and direct precipitation onto saturated areas.
Storm runoff was estimated from the gaged flow data for USGS 14213000 that was collected during the 1988 water year. The data are presented in Exhibit 3-12. The storm runoff portion of the hydrograph was derived through visual inspection and hydrograph separation. Because the total annual precipitation for the 1988 water year was 88 percent of normal, the estimated storm water runoff for water year 1988 was adjusted (normalized) to reflect long-term average conditions.
AiJuifer Characterization 3-43
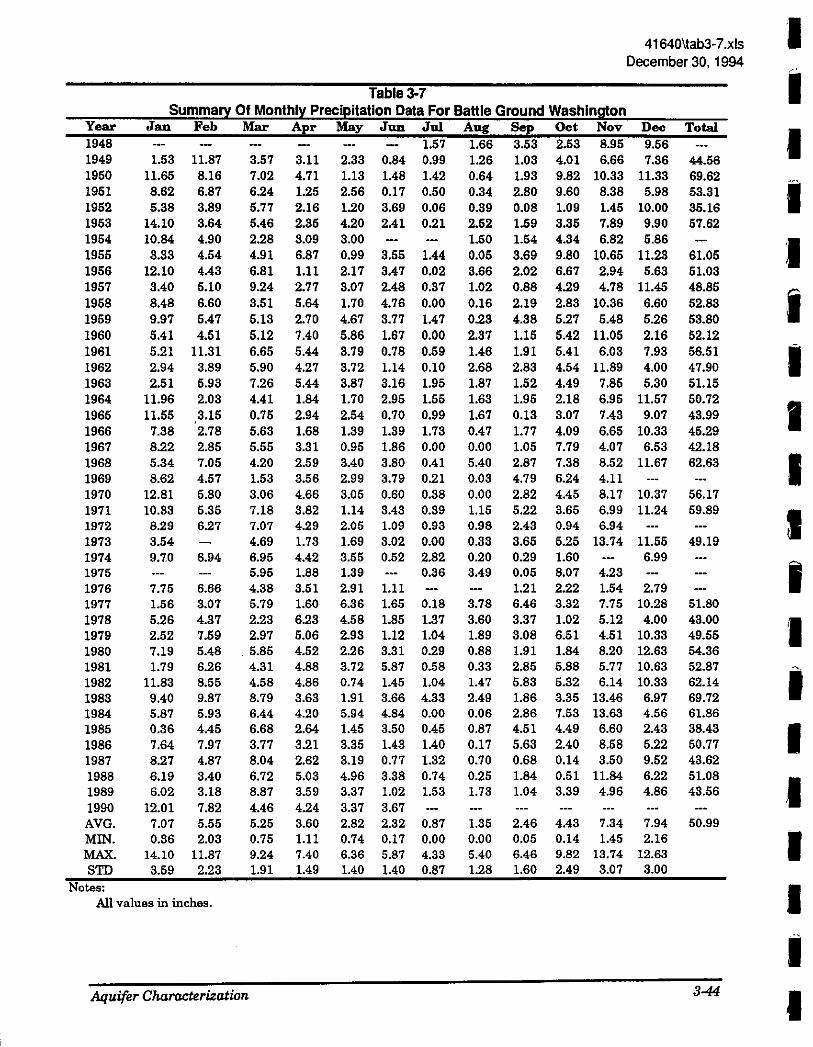
Year 1948 1949 1950 1951 1952 1963 1954 1955 1956 1957 1958 1959 1960 1961 1962 1963 1964 1965 1966 1967 1968 1969 1970 1971 1972 1973 1974 1975 1976 1977 1978 1979 1980 1981 1982 1983 1964 1985 1986 1987 1988 1989 1990 AVG. MIN. MAX. STD
Notes:
Table3-7
41640\lab3-7 .xis December 30, 1994
Summary Of Monthly Precipitation Data For Battle Ground Washington Jan Feb Mar Apr May Jun Jul Aug Sep Oct Nov Dec Total
1.57 1.66 3.63 2.63 8.95 9.56 1.53 11.87 3.57 3.11 2.33 0.84 0.99 1.26 1.03 4.01 6.66 7.36 44.56
11.65 8.16 7.02 4.71 1.13 1.48 1.42 0.64 1.93 9.82 10.33 11.33 69.62 8.62 6.87 6.24 1.25 2.56 0.17 0.50 0.34 2.80 9.60 8.38 5.98 53.31 5.38 3.89 5.77 2.16 1.20 3.69 0.06 0.39 0.08 1.09 1.45 10.00 35.16
14.10 3.64 5.46 2.35 4.20 2.41 0.21 2.52 1.59 3.36 7.89 9.90 57.62 10.64 4.90 2.28 3.09 3.00 1.50 1.54 4.34 6.82 5.86 3.33 4.54 4.91 6.87 0.99 3.55 1.44 0.05 3.69 9.80 10.65 11.23 61.05
12.10 4.43 6.81 1.11 2.17 3.47 0.02 3.66 2.02 6.67 2.94 5.63 51.03 3.40 5.10 9.24 2.77 3.07 2.48 0.37 1.02 0.88 4.29 4.78 11.45 48.85 8.48 6.60 3.51 5.64 1.70 4.76 0.00 0.16 2.19 2.83 10.36 6.60 52.33 9.97 5.47 5.41 4.51 5.21 11.31 2.94 3.89 2.51 5.93
11.96 2.03 11.55 .3.15
7.38 2.78 8.22 2.85 5.34 7.05 8.62 4.57
12.81 5.80 10.33 5.35 8.29 6.27 3.54 9.7.0 6.94
7.75 6.66 1.56 3.07 5.26 4.37 2.52 7.59 7.19 5.48 1.79 6.26
11.83 8.55 9.40 9.87 5.87 5.93 0.36 4.45 7.64 7.97 8.27 4.87 6.19 3.40 6.02 3.18
12.01 7.82 7.07 5.55 0.36 2.03
14.10 11.87 3.59 2.23
5.13 5.12 6.65 5.90 7.26 4.41 0.75 5.63 5.55 4.20 1.53 3.06 7.18 7.07 4.69 6.95 5.95 4.38 5.79 2.23 2.97
. 5.85 4.31 4.58 8.79 6.44 6.68 3.77 8.04 6.72 8.87 4.46
2.70 7.40 5.44 4.27 5.44 1.84 2.94 1.68 3.31 2.59 3.56 4.66 3.82 4.29 1.73 4.42 1.88 3.51 1.60 6.23 5.06 4.52 4.88 4.86 3.63 4.20 2.64 3.21 2.62 5.03 3.59 4.24
4.67 3. 77 1.4 7 5.86 1.67 0.00 3. 79 0. 78 0.59 3.72 1.14 0.10 3.87 3.16 1.95 1. 70 2.95 1.55 2.54 0. 70 0.99 1.39 1.39 1.73 0.95 1.86 0.00 3.40 3.80 0.41 2.99 3.79 0.21 3.05 0.60 0.38 1.14 3.43 0.39 2.05 1.09 0.93 1.69 3.02 0.00 3.55 0.52 2.82 1.39 0.36 2.91 1.11 6.36 1.65 0.18 4.58 1.85 1.37 2.93 1.12 1.04 2.26 3.31 0.29 3.72 5.87 0.58 0. 7 4 1.45 1.04 1.91 3.66 4.33 5.94 4.84 0.00 1.45 3.50 0.45 3.35 1.43 1.40 3.19 0.77 1.32 4.96 3.38 0.74 3.37 1.02 1.53 3.37 3.67
0.23 2.37 1.46 2.68 1.87 1.63 1.67 0.47 0.00 5.40 0.03 0.00 1.15 0.98 0.33 0.20 3.49
3.78 3.60 1.89 0.88 0.33 1.47 2.49 0.06 0.87 0.17 0.70 0.25 1.73
4.38 1.15 1.91 2.83 1.52 1.95 0.13 1.77 1.05 2.87 4.79 2.82 5.22 2.43 3.65 0.29 0.05 1.21 6.46 3.37 3.08 1.91 2.85 5.83 1.86 2.86 4.51 5.63 0.68 1.84 1.04
5.27 5.48 5.26 5.42 11.05 2.16 5.41 6.03 7.93 4.54 11.89 4.00 4.49 7.85 5.30 2.18 6.95 11.57 3.07 7.43 9.07 4.09 6.65 10.33 7.79 4.07 6.53 7.38 8.52 11.67 6.24 4.11 4.45 8.17 10.37 3.65 6.99 11.24 0.94 6.94 5.25 13.74 11.55 1.60 6.99 8.07 4.23 2.22 1.54 2. 79 3.32 7.75 10.28 1.02 5.12 4.00 6.51 4.51 10.33 1.84 8.20 12.63 5.88 5. 77 10.63 5.32 6.14 10.33 3.35 13.46 6.97 7.53 13.63 4.56 4.49 6.60 2.43 2.40 8.58 5.22 0.14 3.50 9.52 0.51 11.84 6.22 3.39 4.96 4.86
53.80 52.12 56.51 47.90 51.15 50.72 43.99 45.29 42.18 62.63
56.17 59.89
49.19
51.80 43.00 49.55 54.36 52.87 62.14 69.72 61.86 38.43 50.77 43.62 51.08 43.56
5.25 3.60 2.82 2.32 0.87 1.35 2.46 4.43 7.34 7.94 50.99 0.75 1.11 0.74 0.17 0.00 0.00 0.05 0.14 1.45 2.16 9.24 7.40 6.36 5.87 4.33 5.40 6.46 9.82 13.74 12.63 1.91 1.49 1.40 1.40 0.87 1.28 1.60 2.49 3.07 3.00
All values in inches.
Aquifer Characterization 3-44
I I I I I I I I I I I I I I I I I I I
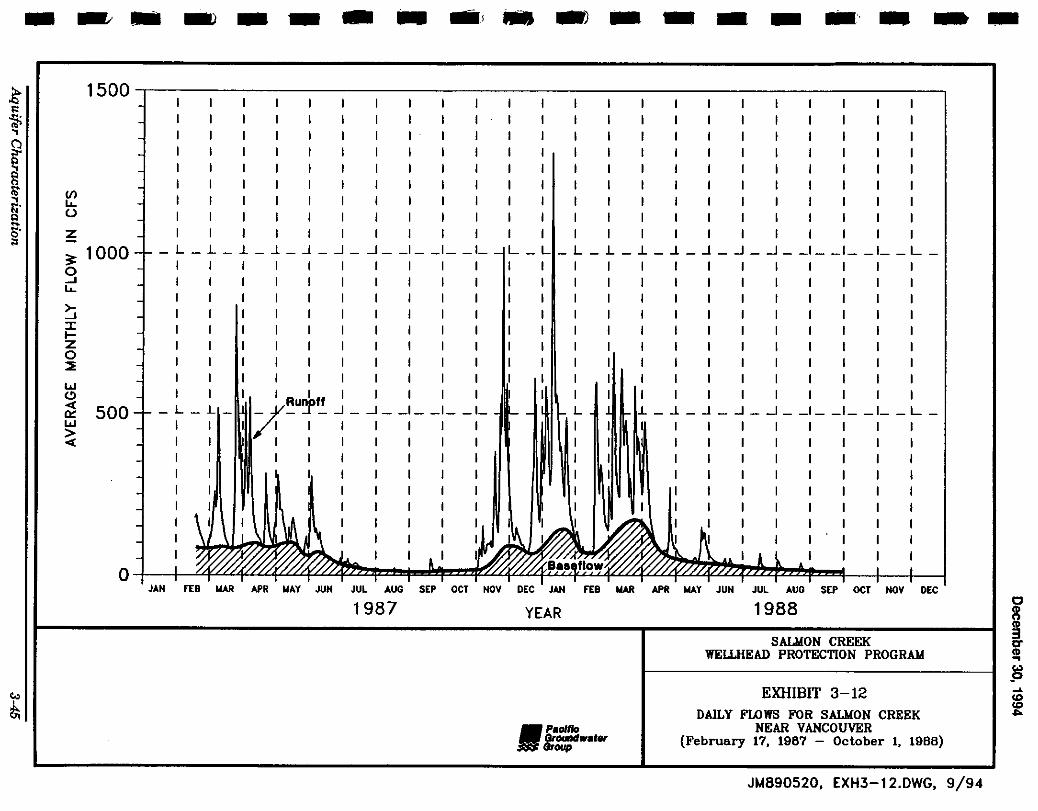
-~-~----~--------~-
(/) I.... ()
z
31: 0 .....1 I....
~ :I: 1-z 0 ::E
w (!)
< 0:: w > <
1500.-------------------------------------------------------------,
1000
500
I .
I I
I I I I I I I I I I
I I I I I I I I I I _L_L_.l _ _l _ _j _ _j _ _j __ I __ I __ L L_ _ L _ L _ .l _ .1 _ _j _ _j _ _j __ I __ I_ _I __ L _
I I I I
- _j- -'-_I __ I __ L
I I I I I I I I
1987
I I I I I
YEAR
L I
-Paoltlo
-~····
- .1- _l- _j- _I __ I __ I __ I __ L _
I I I I I I I I I I
1988
SALioiON CREEK WEWIEAD PROTECTION PROGRAM
EXHIBIT 3-12 DAILY FLOWS FOR SALioiON CREEK
NEAR VANCOUVER {February 17, 1967 - October 1, 1966)
JM890520, EXH3-12.DWG, 9/94
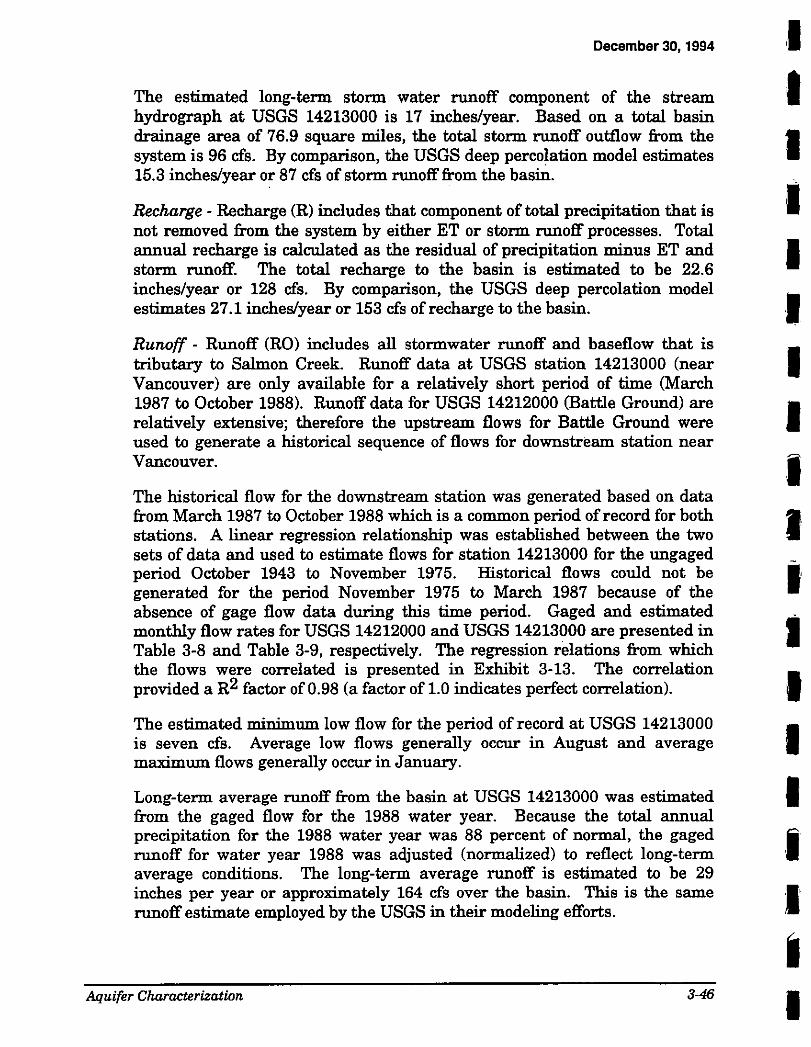
December 30, 1994
The estimated long-term storm water runoff component of the stream hydrograph at USGS 14213000 is 17 inches/year. Based on a total basin drainage area of 76.9 square miles, the total storm runoff outflow from the system is 96 cfs. By comparison, the USGS deep percolation model estimates 15.3 inches/year or 87 cfs of storm runoff from the basin.
Recharge - Recharge (R) includes that component of total precipitation that is not removed from the system by either ET or storm runoff processes. Total annual recharge is calculated as the residual of precipitation minus ET and storm runoff. The total recharge to the basin is estimated to be 22.6 inches/year or 128 cfs. By comparison, the USGS deep percolation model estimates 27.1 inches/year or 153 cfs of recharge to the basin.
Runoff- Runoff (RO) includes all stormwater runoff and baseflow that is tributary to Salmon Creek. Runoff data at USGS station 14213000 (near Vancouver) are only available for a relatively short period of time (March 1987 to October 1988). Runoff data for USGS 14212000 (Battle Ground) are relatively extensive; therefore the upstream flows for Battle Ground were used to generate a historical sequence of flows for downstream station near Vancouver.
The historical flow for the downstream station was generated based on data from March 1987 to October 1988 which is a common period of record for both stations. A linear regression relationship was established between the two sets of data and used to estimate flows for station 14213000 for the ungaged period October 1943 to November 1975. Historical flows could not be generated for the period November 1975 to March 1987 because of the absence of gage flow data during this time period. Gaged and estimated monthly flow rates for USGS 14212000 and USGS 14213000 are presented in Table 3-8 and Table 3-9, respectively. The regression relations from which the flows were correlated is presented in Exhibit 3-13. The correlation provided a R2 factor of 0.98 (a factor of LO indicates perfect correlation).
The estimated minimum low flow for the period of record at USGS 14213000 is seven cfs. Average low flows generally occur in August and average maximum flows generally occur in January.
Long-term average runoff from the basin at USGS 14213000 was estimated from the gaged flow for the 1988 water year. Because the total annual precipitation for the 1988 water year was 88 percent of normal, the gaged runoff for water year 1988 was adjusted (normalized) to reflect long-term average conditions. The long-term average runoff is estimated to be 29 inches per year or approximately 164 cfs over the basin. This is the same runoff estimate employed by the USGS in their modeling efforts.
Af!.uifer Characterization 3-46
,I I I I I ~I
I I I I I I I I I I I I I
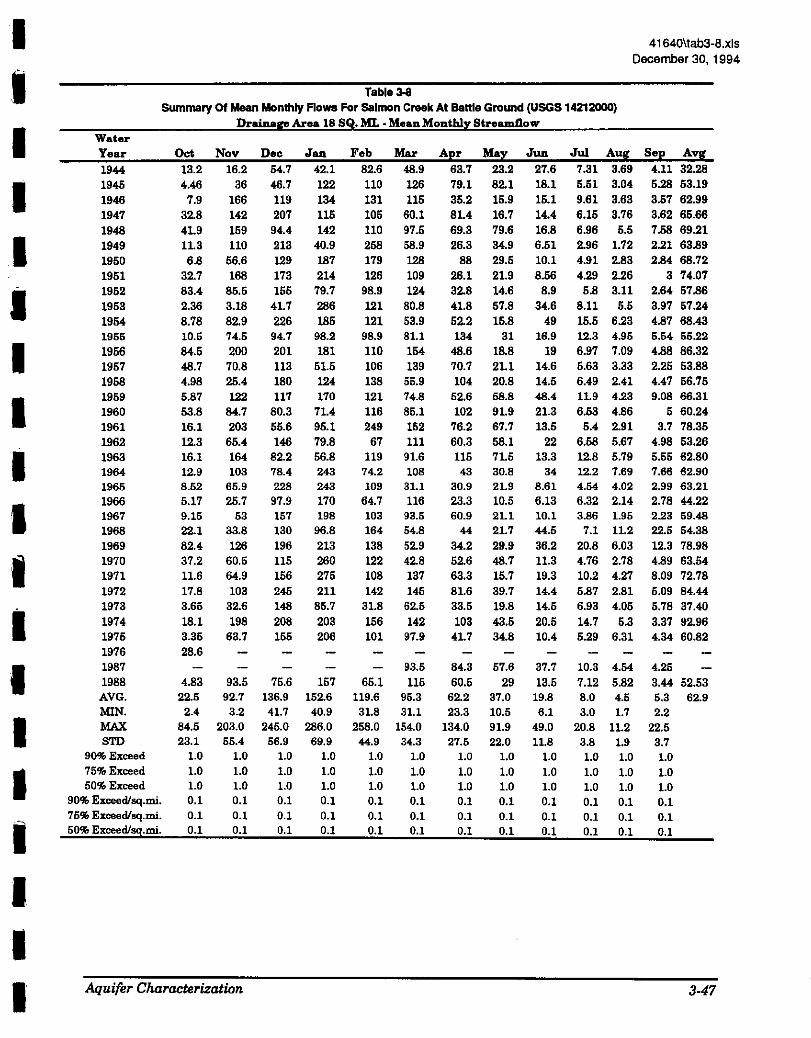
I I I I I I I I I I I I I I I I I I I
Table 3-8
41 640itab3-8.xls December 30, 1 994
SUmmary Of Mean Monlhly Flo- For Salmon Creek At Battle Ground (USGS 14212000) Drainap Area 18 SQ. ML - Mean Monthly Streamflow
Water Year
1944 1945 1946 1947 1946 1949 1950 1951 1952 1953 1954 1955 1956 1957 1958 1959 1960 1961 1962 1963 1964 1965 1966 1967 1968 1969 1970 1971 1972 1973 1974 1975 1976 1987
13.2 4.46
7.9 32.8 41.9 11.3 6.8
32.7 83.4 2.36 8.78 10.5 84.5 46.7 4.98 5.87 53.8 16.1 12.3 16.1 12.9 8.52 5.17 9.15 22.1 82.4 37.2 11.6 17.8 3.65 18.1 3.35 28.6
Nov 16.2
36 166 142 159 110
56.6 168
85.5 3.18 82.9 74.5 200 70.8 25.4 122
84.7 203 65.4 164 103
65.9 25.7
53 33.8 126
60.5 64.9 103
32.6 198
63.7
Dec 54.7 46.7 119 207 94.4 213 129 173 155
41.7 226 94.7 201 113 180 117
80.3 55.6 146
82.2 78.4 228 97.9 157 130 196 115 156 245 146 208 155
Jan 42.1 122 134 115 142
40.9 187 214 79.7 286 185
98.2 181
51.5 124 170
71.4 95.1 79.8 56.8 243 243 170 198
96.8 213 260 275 211 85.7 203 206
1968 4.83 93.5 75.6 157 AVG. 22.5 92.7 136.9 152.6 MIN. 2.4 3.2 41.7 40.9 MAX 84.5 203.0 245.0 286.0 STD 23.1 55.4 56.9 69.9
90% Exceed 1.0 1.0 1.0 1.0 75% Exceed 1.0 1.0 1.0 1.0 50% Exceed 1.0 1.0 1.0 1.0
90% Exceedlsq.mi. 0.1 0.1 0.1 0.1 75% Exceedlsq.mi. 0.1 0.1 0.1 0.1 50% Exceedlsq.mi. 0.1 0.1 0.1 0.1
Aquifer Characterization
Feb 82.6 110 131 105 110 258 179 126
98.9 121 121
98.9 110 106 138 121 116 249
67 119
74.2 109
64.7 103 164 138 122 108 142
31.8 156 101
Mar 46.9 126 115
60.1 97.5 58.9 128 109 124
80.8 53.9 81.1 154 139
55.9 74.8 85.1 152 111
91.6 108
31.1 116
93.5 54.8 52.9 42.8 137 145
62.5 142
97.9
93.5 65.1 115
119.6 95.3 31.8 31.1
258.0 154.0 44.9 34.3
1.0 1.0 1.0 1.0 1.0 1.0 0.1 0.1 0.1 0.1 0.1 0.1
Apr 63.7 79.1 35.2 au 69.3 26.3
88 26.1 32.8 41.8 52.2 134
48.6 70.7 104
52.6 102
76.2 60.3 115 43
30.9 23.3 60.9
44 34.2 52.6 63.3 81.6 33.5 103 4L7
84.3 60.5
62.2 23.3
134.0 27.5
1.0 1.0 1.0 0.1 0.1 0.1
May
23.2 82.1 15.9 16.7 79.6 34.9 29.5 21.9 14.6 57.8 15.8
31 18.8 21.1 20.8 58.8 91.9 67.7 58.1 71.5 30.8 21.9 10.5 21.1 21.7 29.9 48.7 15.7 39.7 19.8 43.5 34.8
57.6 29
37.0 10.5 91.9 22.0
1.0 1.0 1.0 0.1 0.1 0.1
Jun 27.6 18.1 15.1 14.4 16.8 6.51 10.1 8.56
8.9 34.6
49 16.9
19 14.6 14.5 48.4 21.3 13.5
22 13.3
34 8.61 6.13 10.1 44.5 36.2 11.3 19.3 14.4 14.5 20.5 10.4
37.7 13.5
19.8 6.1
49.0 11.8
1.0 1.0 1.0 0.1 0.1 0.1
Jul Aug 7.31 3.69 5.51 3.04 9.61 3.63 6.15 3.76 6.96 5.5 2.96 1.72 4.91 2.83 4.29 2.26
5.8 3.11 8.11 5.5 15.5 6.23 12.3 4.95 6.97 7.09 5.63 3.33 6.49 2.41 11.9 4.23 6.53 4.86
5.4 2.91 6.58 5.67 12.8 5.79 12.2 7.69 4.54 4.02 6.32 2.14 3.86 1.95
7.1 11.2 20.8 6.03 4.76 2.78 10.2 4.27 5.87 2.81 6.93 4.05 14.7 5.3 5.29 6.31
Sep AVJ 4.11 32.28 5.28 53.19 3.57 62.99 3.62 65.66 7.58 69.21 2.21 63.89 2.84 68.72
3 74.07 2.64 57.86 3.97 57.24 4.87 68.43 5.54 55.22 4.88 86.32 2.25 53.88 4.47 56.75 9.08 68.31
5 60.24 3.7 78.35
4.98 53.26 5.55 62.80 7.66 62.90 2.99 63.21 2.78 44.22 2.23 59.48 22.5 54.38 12.3 78.98 4.89 63.54 8.09 72.78 5.09 84.44 5.78 37.40 3.37 92.96 4.34 60.82
10.3 4.54 4.25 7.12 5.82 3.44 52.53 8.0 4.5 5.3 62.9 3.0 1.7 2.2
20.8 11.2 22.5 3.8 1.9 3.7 1.0 1.0 1.0 1.0 1.0 1.0 1.0 1.0 1.0 0.1 0.1 0.1 0.1 0.1 0.1 0.1 0.1 0.1
3-47
December 30, 1994 I I
Table3-9 Summary Of Estimatad Mean Monthly Flows For Salmon Creek Near Vancouver (USGS 14213000) I Drainage Araa 76.9 SQ. MI. • Mean MonthiJt Streamflow
Water Year Oct Nov Dec Jan Feb Mar A;er Mal: Jun Jul Aus See A vi[ 1944 49 58 172 135 255 155 199 79 92 32 21 22 105.55 I 1945 23 117 148 372 336 383 244 253 64 26 19 26 167.56 1946 33 502 363 407 398 351 114 57 55 38 21 20 196.62 1947 107 431 624 351 321 188 261 59 53 28 21 21 204.53
I 1948 134 481 290 431 336 299 215 246 60 31 26 32 215.05 1949 43 336 641 131 775 184 88 113 29 19 15 16 199.28 1950 30 178 392 564 541 389 271 97 40 24 18 18 213.58 1951 107 508 523 644 383 333 87 75 35 23 17 19 229.45
I 1952 257 263 469 246 303 377 107 53 36 27 19 18 181.41 1953 17 19 133 858 369 249 134 181 112 34 26 22 179.55 1954 36 266 880 558 369 170 165 57 155 56 28 24 212.74 1955 41 231 291 301 303 260 407 102 60 46 26 26 173.56 I 1956 260 603 606 546 336 466 154 66 88 31 31 24 265.77 1957 154 220 345 163 324 422 219 72 53 27 20 17 169.61 1958 26 85 543 377 419 176 318 72 53 29 17 23 178.10 1959 27 372 357 514 369 232 188 184 153 45 22 37 206.44 I 1960 169 261 248 222 354 262 312 282 73 29 24 26 188.46 1961 58 612 175 292 748 460 236 211 50 26 18 21 242.15 1962 46 204 443 246 208 339 189 162 75 29 27 26 167.77 1963 58 496 254 178 363 281 351 222 49 46 27 26 196.06 I 1964 48 315 242 730 230 330 137 101 111 46 33 33 196.35 1965 35 205 686 730 333 102 101 75 35 23 22 19 197.26 1966 26 86 300 514 202 354 79 41 28 29 16 18 140.96
I 1967 37 167 475 597 315 287 190 72 40 21 16 16 186.21 1968 75 110 395 287 496 172 140 74 142 31 43 77 171.07 1969 254 383 591 641 419 187 111 99 117 72 28 46 244.01 1970 120 189 351 781 372 137 186 154 43 24 18 24 196.25
I 1971 44 202 472 826 330 416 198 56 67 40 23 34 225.63 1972 63 315 736 635 431 440 262 128 53 27 18 26 260.20 1973 21 107 449 264 104 195 109 69 53 30 22 27 120.75 1974 64 597 627 612 472 431 315 139 71 53 26 20 285.45
I 1975 20 199 469 621 309 300 133 113 41 26 29 23 190.16 1976 95 1987 287 260 181 122 40 23 22 1988 24 287 234 475 203 351 189 96 50 31 27 20 165.61 I AVG. 76 285 416 462 364 292 194 119 69 34 23 25 197 MIN. 17 19 133 131 104 102 79 41 28 19 15 16 MAX 260 612 736 858 775 466 407 282 155 72 43 77 STD 88 164 169 207 133 102 82 65 35 11 6 11 I 90% Exceed 21.6 83.6 203.4 201.5 208.6 160.3 101.7 54.3 34.7 22.5 16.8 17.8
75% Exceed 31.7 154.0 234.0 296.0 272.2 213.6 133.1 72.0 43.9 26.7 19.0 19.2 50% Exceed 51.7 264.6 395.5 432.5 354.6 283.8 178.9 101.1 59.1 30.8 22.0 22.1
I 90'9& Exceedlsq.mi 0.3 1.1 2.6 2.6 2.7 2.1 1.3 0.7 0.5 0.3 0.2 0.2 75% Exceedlsq.mi 0.4 2.0 3.7 3.8 3.5 2.8 1.7 0.9 0.6 0.3 0.2 0.2 50% Exceedls9.mi 0.7 3.4 5.1 5.6 4.6 3.7 2.3 1.3 0.8 0.4 0.3 0.3 Notes:
I Data fur period 1944 - 1976 was generated through regression analysis with Battle Ground Station (USGS 14212) using the relationship USGS14213 = 2.96261* USGS14212 + 26.2546
All values are in cfa.
'I I
Al:[uifer Characterization 3-48
I
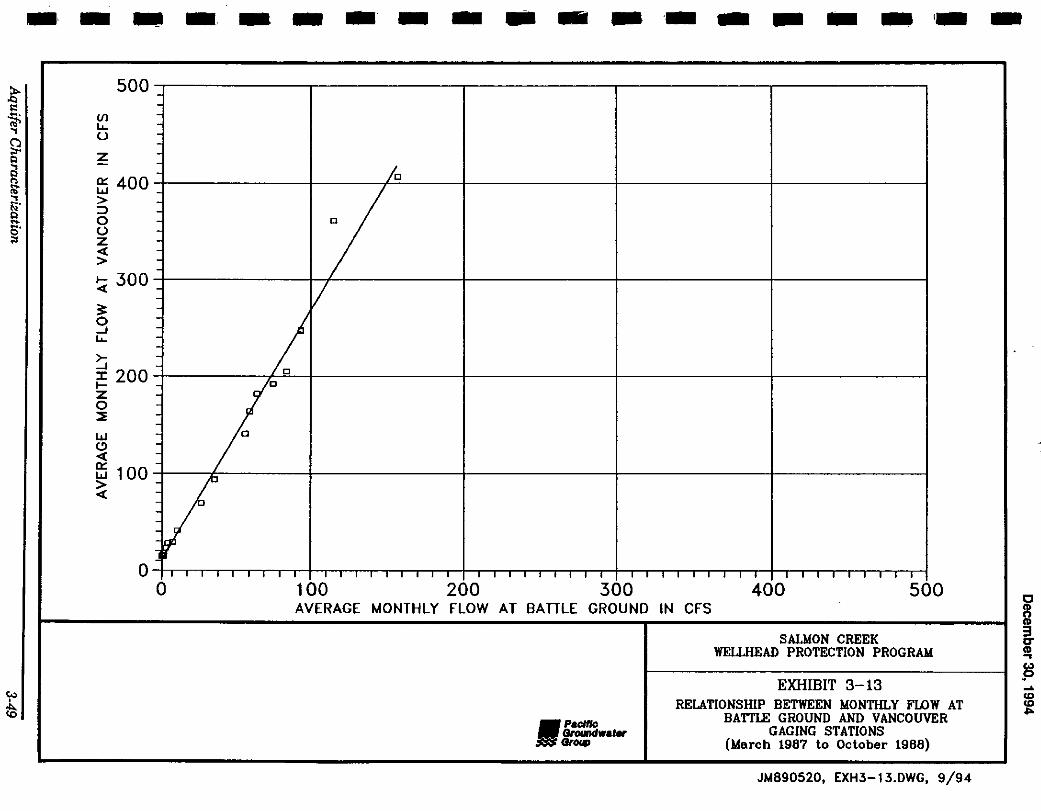
-------------------500-
Ul :
Lo.. -u z -
/c 0:: 400 w > -:::l 0 : c u z -<C( :
> -~ 300- v ~ -0
! _J Lo..
>-_J
::t: 200 c 1-z 0 :::IE : w : c C> <C( -0:: 100 w > <C(
0 ' ' ' ' ' ' ' ' ' ' ' ' ' ' ' ' ' ' ' ' ' ' ' ' ' ' ' ' ' ' ' ' ' ' ' ' ' 0 100 200 300 400 500
AVERAGE MONTHLY FLOW AT BATILE GROUND IN CFS
SAIJ,fON CREEK WEUJIEAD PROTECTION PROGRAM
EXHIBIT 3-13 RELATIONSffiP BETWEEN MONTHLY FLOW AT
• Pacific BATTLE GROUND AND VANCOUVER - ... ,... GAGING STATIONS
Gr- (March 1987 to October 1988)
JM890520, EXH3-13.DWG, 9/94
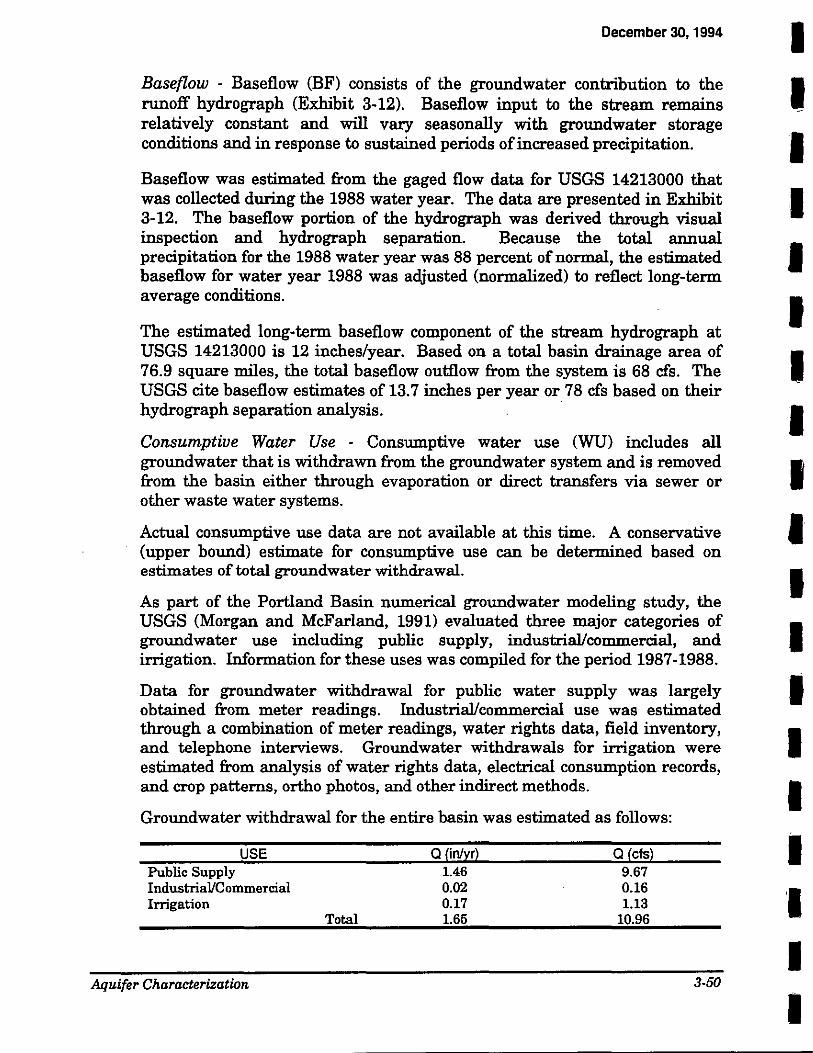
December 30,1994
Baseflow - Baseflow (BF) consists of the groundwater contribution to the runoff hydrograph (Exhibit 3-12). Baseflow input to the stream remains relatively constant and will vary seasonally with groundwater storage conditions and in response to sustained periods of increased precipitation.
Baseflow was estimated from the gaged flow data for USGS 14213000 that was collected during the 1988 water year. The data are presented in Exhibit 3-12. The baseflow portion of the hydrograph was derived through visual inspection and hydrograph separation. Because the total annual precipitation for the 1988 water year was 88 percent of normal, the estimated baseflow for water year 1988 was adjusted (normalized) to reflect long-term average conditions.
The estimated long-term baseflow component of the stream hydrograph at USGS 14213000 is 12 inches/year. Based on a total basin drainage area of 76.9 square miles, the total baseflow outflow from the system is 68 cfs. The USGS cite baseflow estimates of 13.7 inches per year or 78 cfs based on their hydrograph separation analysis. ·
Consumptive Water Use - Consumptive water use (WU) includes all groundwater that is withdrawn from the groundwater system and is removed from the basin either through evaporation or direct transfers via sewer or other waste water systems.
Actual consumptive use data are not available at this time. A conservative (upper bound) estimate for consumptive use can be determined based on estimates of total groundwater withdrawal.
As part of the Portland Basin numerical groundwater modeling study, the USGS (Morgan and McFarland, 1991) evaluated three major categories of groundwater use including public supply, industrial/commercial, and irrigation. Information for these uses was compiled for the period 1987-1988.
Data for groundwater withdrawal for public water supply was largely obtained from meter readings. Industrial/commercial use was estimated through a combination of meter readings, water rights data, field inventory, and telephone interviews. Groundwater withdrawals for irrigation were estimated from analysis of water rights data, electrical consumption records, and crop patterns, ortho photos, and other indirect methods.
Groundwater withdrawal for the entire basin was estimated as follows:
USE Public Supply Industrial/Commercial Irrigation
A4ui{er Characterization
Total
a {intvrl 1.46 0.02 0.17 1.65
a {cfs) 9.67 0.16 1.13
10.96
3-50
I I I I I I I I I I I I I I I I I I I
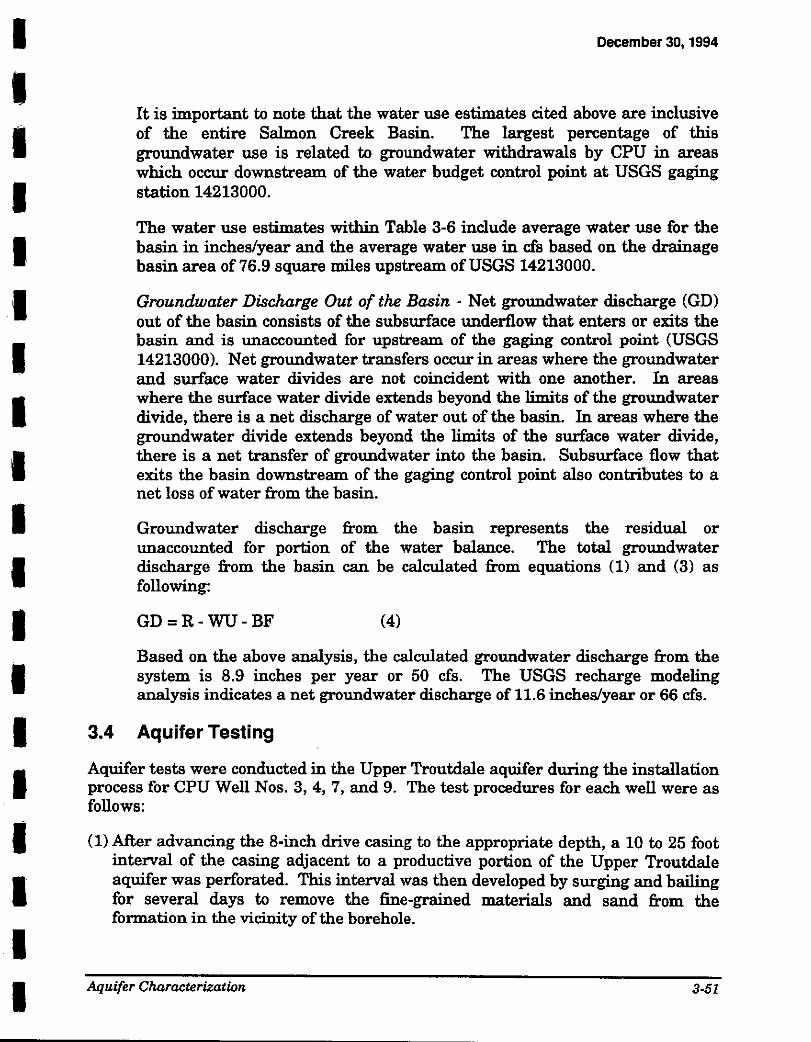
I I I I I, I I I I I I I I I I I I I I
December 30, 1994
It is important to note that the water use estimates cited above are inclusive of the entire Salmon Creek Basin. The largest percentage of this groundwater use is related to groundwater withdrawals by CPU in areas which occur downstream of the water budget control point at USGS gaging station 14213000.
The water use estimates within Table 3-6 include average water use for the basin in inches/year and the average water use in cfs based on the drainage basin area of 76.9 square miles upstream of USGS 14213000.
Groundwater Discharge Out of the Basin - Net groundwater discharge (GD) out of the basin consists of the subsurface underflow that enters or exits the basin and is unaccounted for upstream of the gaging control point (USGS 14213000). Net groundwater transfers occur in areas where the groundwater and surface water divides are not coincident with one another. In areas where the surface water divide extends beyond the limits of the groundwater divide, there is a net discharge of water out of the basin. In areas where the groundwater divide extends beyond the limits of the surface water divide, there is a net transfer of groundwater into the basin. Subsurface flow that exits the basin downstream of the gaging control point also contributes to a net loss of water from the basin.
Groundwater discharge from the basin represents the residual or unaccounted for portion of the water balance. The total groundwater discharge from the basin can be calculated from equations (1) and (3) as following:
GD=R- WU -BF (4)
Based on the above analysis, the calculated groundwater discharge from the system is 8.9 inches per year or 50 cfs. The USGS recharge modeling analysis indicates a net groundwater discharge of 11.6 inches/year or 66 cfs.
3.4 Aquifer Testing
Aquifer tests were conducted in the Upper Troutdale aquifer during the installation process for CPU Well Nos. 3, 4, 7, and 9. The test procedures for each well were as follows:
(1) After advancing the 8-inch drive casing to the appropriate depth, a 10 to 25 foot interval of the casing adjacent to a productive portion of the Upper Troutdale aquifer was perforated. This interval was then developed by surging and bailing for several days to remove the fine-grained materials and sand from the formation in the vicinity of the borehole.
Aquifer Characterization 3-51
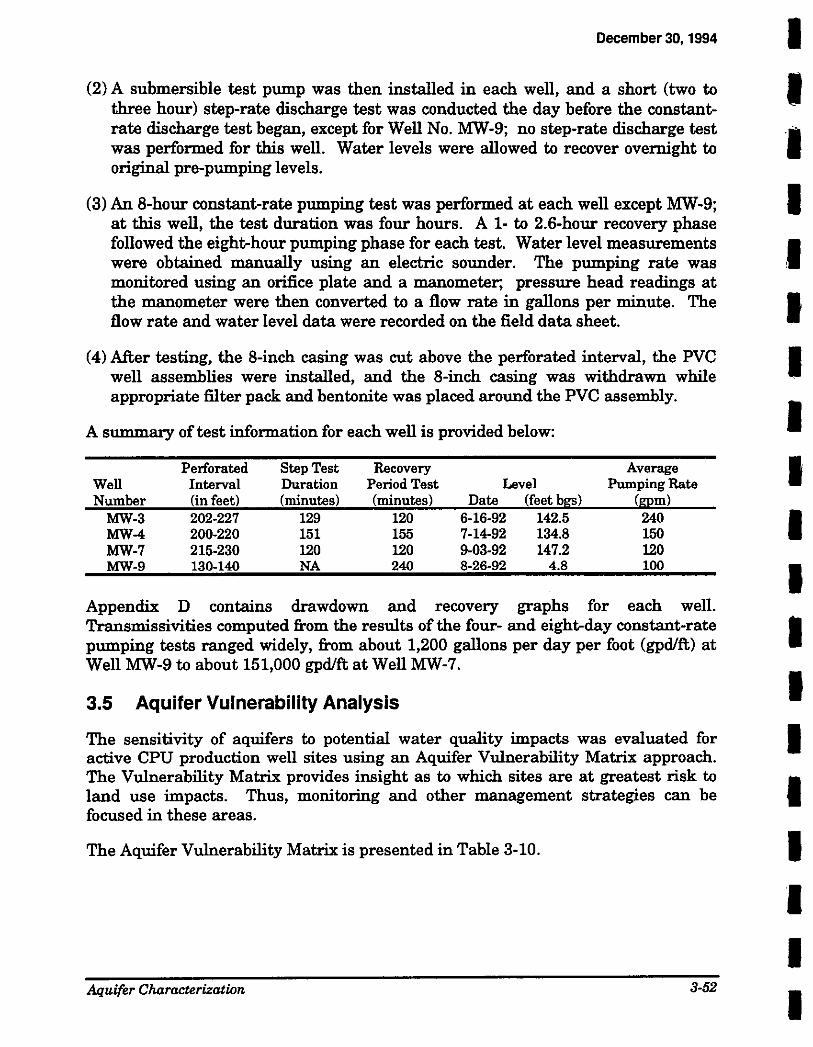
December 30, 1994
(2) A submersible test pump was then installed in each well, and a short (two to three hour) step-rate discharge test was conducted the day before the constantrate discharge test began, except for Well No. MW-9; no step-rate discharge test was performed for this well. Water levels were allowed to recover overnight to original pre-pumping levels.
(3) An 8-hour constant-rate pumping test was performed at each well except MW-9; at this well, the test duration was four hours. A 1- to 2.6-hour recovery phase followed the eight-hour pumping phase for each test. Water level measurements were obtained manually using an electric sounder. The pumping rate was monitored using an orifice plate and a manometer; pressure head readings at the manometer were then converted to a flow rate in gallons per minute. The flow rate and water level data were recorded on the field data sheet.
(4) After testing, the 8-inch casing was cut above the perforated interval, the PVC well assemblies were installed, and the 8-inch casing was withdrawn while appropriate filter pack and bentonite was placed around the PVC assembly.
A summary of test information for each well is provided below:
Perforated Step Test Recovery Average Well Interval Duration Period Test Level Pumping Rate Number (in feet) (minutes) (minutes) Date (feet bgs) (gpml
MW-3 202-227 129 120 6-16-92 142.5 240 MW-4 200-220 151 155 7-14-92 134.8 150 MW-7 215-230 120 120 9-03-92 147.2 120 MW-9 130-140 NA 240 8-26-92 4.8 100
Appendix D contains drawdown and recovery graphs for each well. Transmissivities computed from the results of the four- and eight-day constant-rate pumping tests ranged widely, from about 1,200 gallons per day per foot (gpdlft) at Well MW-9 to about 151,000 gpdlft at Well MW-7.
3.5 Aquifer Vulnerability Analysis
The sensitivity of aquifers to potential water quality impacts was evaluated for active CPU production well sites using an Aquifer Vulnerability Matrix approach. The Vulnerability Matrix provides insight as to which sites are at greatest risk to land use impacts. Thus, monitoring and other management strategies can be focused in these areas.
The Aquifer Vulnerability Matrix is presented in Table 3-10.
Ai[uifer Characterization 3-52
I I ·a I .I I I I I I I I I I I I I I I
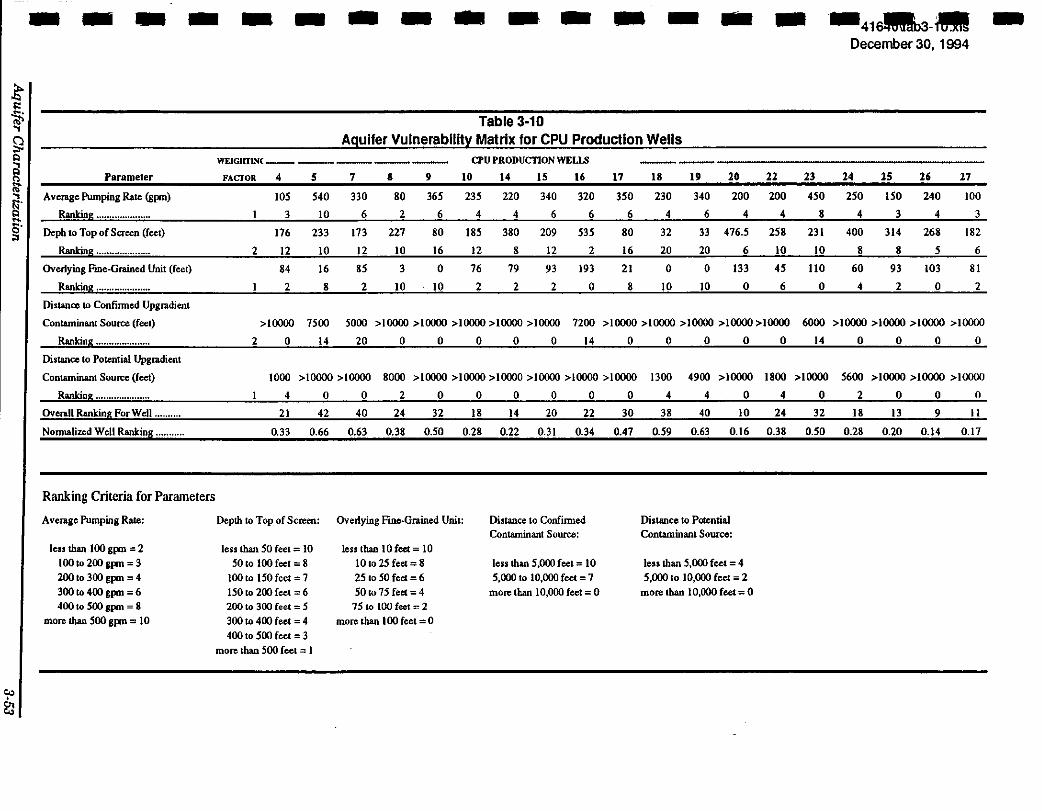
- - - - - - - - - - - - - - - •41sa3-•
Parameter
Average Pumping Rate (gpm)
Ranking .................. ...
Depb 10 Top of Screen (feet)
Ranking .................... .
Overlying FineMGrained Unit (feet)
Ronlcins .................... .
Distance to Confinned Upgradient
Contaminant Source (feet)
Ranking ................... ..
Distance to Potential Upgradient
Contaminant Source (feet)
Ranking .................... .
Overall Ranking For Well ......... .
Nonnalized Well Ranking ......... ..
Ranking Criteria for Parameters
Avenge Pumping Rate:
less than 100 gp:n = 2 10010 200 gpm = 3 20010 300 gpm = 4 300 to 400 gpm = 6 400 to soo spn = 8
more than SOO gJ:m = 10
December 30, 1994
Table 3-10 Aquifer Vulnerability Matrix for CPU Production Wells
WEIGKflNC-----------
FACIOR. 4
2
105
3
176
12
84
2
5
540
10
233
10
16
8
7
330
6
173
12
85
2
8
80
2
227
10
3
10
9
365
6
80
16
0
10
CPU PRODUCTION WELLS
10 14 15 16
235
4
185
12
76
2
220
4
380
8
79
2
340
6
209
12
93
2
320
6
535
2
193
0
17
350
6
80
16
21
8
18
230
4
32
20
0
10
340
6
33
20
0
10
20
200
4
476.5
6
133
0
22
200
4
258
10
45
6
23
450
8
231
10
liO
0
24
250
4
400
8
60
4
15
!50
3
314
8
93
2
26
240
4
268
5
!03
0
27
100
3
182
6
81
2
>10000 7500 5000 >10000 >10000 >10000 >10000 >10000 7200 >10000 >10000 >10000 >10000 >10000 6000 >10000 >10000 >10000 >10000
2 0 14 20 0 0 0 0 0 14 0
1000 >I 0000 >I 0000 8000 >I 0000 >I 0000 >I 0000 >I 0000 >I 0000 >I 0000
4 0 0 2 0 0 0 0 0
21 42 40 24 32 18 14 20 22
0.33 0.66 0.63 0.38 0.50 0.28 0.22 0.31 0.34
Depth to Top of Screen: Overlying Fine·Grained Unit: Distance to Confirmed Contaminant Source:
less than 50 feet= 10 50 to 100 feet= 8
100 to !50 feet= 7 !50 to 200 feet= 6 200 to 300 feet = S 300 10 400 feet = 4 400 to 500 feet = 3
more than 500 feet = 1
less than tO feet= 10 10 IO 25 feet= 8 25 to 50 feet =6 50 to 75feet = 4
15 to 100 feet= 2 more than 100 feet= 0
less than 5,000 feet= 10 5,000 to 10,000 feet= 7
more than I 0,000 feet= 0
0
30
0.47
0 0 0 0 14 0 0 0 0
1300
4
4900 >10000 1800 >10000 5600 >10000 >10000 >10000
4 0 4 0 2 0 0 0
38 40 10 24 32 18 13 9 II
0.59 0.63 0.16 0.38 0.50 0.28 0.20 0.14 0.17
Distance to Potential Contaminant Source:
less than 5,000 feet = 4 5,000 to 10,000 feet= 2
more than 10,000 feet= 0
-
December 30, 1994
The following parameters were considered for this evaluation: 1) average pumping rate; 2) depth to top of the screen or perforations; 3) occurrence and thickness of an overlying fine-grained or confining unit; and 4) distance from the well to known and/or potential sources of contamination.
0 Pumping rate was considered in the analysis because the extent of the capture zone for each well, and contaminant transport velocity to the well both increase as pumping rate increases. Higher pumping rates also have a greater influence on groundwater flow directions, and in some cases may change natural groundwater flow patterns.
0 Depth to top of screen was considered because wells which produce water from shallow zones will be more susceptible to water quality degradation from overlying contaminant sources than wells which produce water from deeper zones. Contaminants have a longer vertical migration path before reaching deeper production zones. In addition, the deeper production zones may be protected from potential water quality impacts by the occUrr-ence of fine-grained strata as discussed below.
0 Occurrence and thickness of an overlying fine-grained or confining unit was considered because such units limit the extent of hydraulic communication between overlying sources of contamination and the production zone. Contaminant transport through fine grained media (such as the silt/clay sequences which comprise most of the Lower Troutdale) will be inhibited because: 1) groundwater flow velocities may be several orders of magnitude slower through these media than through coarse-grained media; 2) the finegrained soils have greater capacity to adsorb metals and other mobile constituents before they reach the production zone; and, 3) denser fluid phases associated with contaminants may be unable to penetrate the fine-grained media.
0 Distance to known I potential sources of contamination was considered because the risk of water quality degradation is substantially higher for wells located near documented sources of contamination.
Other factors which may influence aquifer vulnerability include the capture zone for each well, travel time for contaminants to the well, and transmissivity. A detailed summary of well capture zone and travel time analyses is presented in the following section of this report. Results of capture zone/travel time analyses were used in conjunction with the aquifer vulnerability matrix to assess overall aquifer vulnerability for each well site. Transmissivity was not considered in the aquifer vulnerability matrix because the bulk transmissivity of the Upper Troutdale is considered to be relatively uniform over the WHPP Focus Area. Transmissivity of the Recent Floodplain Alluvium is higher than for other units; however, the aerial extent of the Recent Floodplain Alluvium is small, and recharge areas for wells
AiJuifer Characterization 3-54
I I I I I I I I I I I I I I I I I I I
I I I I I I I I I I I I I I I I I I I
December 30, 1994
which yield water from this unit extend into the Upper Troutdale. Therefore, although differences in transmissivity may be significant on a local scale, these differences are not likely to be significant on a regional scale.
For each CPU production well, a ranking of one to ten was assigned for the four parameters, where a score of ten indicates highest vulnerability and a score of one indicates lowest vulnerability. Ranking criteria for each parameter are presented in Table 3-10. A weighting factor of one was assigned to all the parameters except for depth to top of the screened or perforated interval and distance to confirmed downgradient source of contamination; these parameters were assigned a weighting factor of two. A total "score" of 64 points was possible for each well. The well rankings were normalized by dividing the score for each well by the total possible score.
Results of the analysis indicate that the normalized scores range from 0.16 to 0.66. The wells have been divided into three groups based on relative vulnerability, as determined from the aquifer vulnerability matrix, as follows:
Low Vulnerability
Well Nos. 10, 20, 14, 24, 25 27
Moderate Vulnerability
Well Nos. 4, 8, and 15
High Vulnerability
Well Nos. 18, 19, 5, 7, 17 23 and 27 and 9
CPU Well Nos. 21 and 90-03 were not included in this analysis because these wells will not be used for production until a cost-effective treatment for manganese levels is developed. Well No. 7.2 was likewise not included since it is a replacement well for Well No.7 and is assumed to have the same parameters as Well No.7.
3.6 Wellhead Delineations
3.6.1 Well Capture Zone and Travel Time Analysis
Time-related capture zones were estimated for each of the production well sources. A capture zone is defined as the zone surrounding a pumping well that will supply groundwater recharge to the well. A time-related capture zone is the surface or subsurface areas surrounding a pumping well that will supply groundwater recharge to the well within some specified period of time. An understanding of the time-related capture zones in conjunction with the aquifer vulnerability assessment provides a basis for identifying effective areas in which to direct future monitoring, land use inventories, and data collection.
Wells were assigned to three different groups for this analysis. The first group of wells included the "Zone 1" wells that are located along the Salmon Creek corridor. These wells are completed in both the Recent Floodplain Alluvium and the Upper Troutdale aquifers. The second group of wells
Aquifer Characterization 3-55
December 30, 1994
include the "Zone 2" wells that are located outside the Salmon Creek corridor and are completed in the Upper Troutdale aquifer. The third group of wells are the "deep" wells that are completed in the Lower Troutdale aquifer.
Capture zones for one, five and ten year times-of-travel were predicted using either; 1) a analytical modeling approach and a computer program (WHPA) developed by the EPA; or 2) hydrologic mapping approach coupled to a Darcian travel time analysis. A sensitivity analysis was also performed to assess the effects of analytical modeling input parameter errors on capture zone areas.
Modeling Approach
Zone 1 Wells - The "Zone 1" wells comprise existing production wells located along Salmon Creek (CPU Well Nos. 9, 17, 18, and 19). All of these wells are interpreted to be completed in both the Recent Floodplain Alluvium and the Upper Troutdale (Table 3-1). These sources are all relatively shallow and likely receive recharge from underflow from the upland areas and possibly stream leakage from Salmon Creek.
The WHP A code could not be used to assess capture zones and travel times in vicinity of these sources given the complex nature of the flow system (the model assumes a uniform flow field whereas the actual flow system in this area consists of convergent flow from the surrounding upland areas). Therefore, the capture zones for the Zone 1 wells were delineated using a hydrologic mapping (flow net) approach. In addition, travel times were delineated using a one-dimensional Darcy velocity analysis along capture area stream lines.
The capture zone or upland recharge area for the Zone 1 wells was estimated from the flow lines shown in Exhibit 3-9. The capture area for the wells is bounded by the two sets of flow lines that are depicted north and south of the creek (the downstream flow lines that terminate at Well No. 19 and the upstream flow line that terminates just upstream of Well Nos. 9 and 17).
The wells may also be locally recharged by natural stream leakage and induced recharge from Salmon Creek associated with groundwater pumpage. Stream gaging data (Carr, 1985) indicate significant leakage losses to the groundwater system in the reach of the stream between Corbin Road and Klineline Pond. The stream leakage is most significant during the winter runoff season and is relatively small to nonexistent during the summer base flow season.
Because Salmon Creek stream flow may provide a portion of the recharge that is supplied to Well Nos. 9, 17, 18, and 19, the recharge area that contributes to the creek upstream of the wells needs to be considered in the
AiJuifer Characterization 3-56
I I I I I I I I I I I I I I I I I I I
I I I I I I I I I I I I I I I I I I I
December 30, 1994
capture zone analysis. Land use activity that adversely effects groundwater and surface water quality upstream of the Salmon Creek wells could potentially impact water quality in the downstream sources. The upstream recharge area for the stream is depicted by the flow lines shown in Exhibit 3-9.
Groundwater travel time boundaries for the Zone 1 wells were calculated using a Darcy velocity approach. Groundwater velocities were estimated using the following equation:
v = IG/~where: v = Darcy velocity K = Hydraulic conductivity i = Hydraulic gradient ~ = Aquifer porosity
Travel time distances were then calculated using the following equation:
d=vdt where: d = the distance traveled by a conservative groundwater tracer particle
dt = Travel time
A hydraulic conductivity of 80 ftlday was used in the analysis. The hydraulic conductivity corresponds to a transmissivity of 30,000 gpd/ft and effective aquifer thickness of 50 feet. A hydraulic gradient of 0.01 was estimated from the water level contours shown on Exhibit 3-10. An aquifer porosity of 0.20 was assumed.
Zone 2 Wells- An analytical flow model developed by the EPA was used to assess shallow aquifer capture areas in the vicinity of active CPU production wells located outside the Salmon Creek corridor. These sites comprise the "Zone 2" wells, and include Well Nos. 4, 5, 7, 8, 10, 15, 22, 23, and 27.
The WHP A computer model is described in a document entitled "A Modular Semi-Analytical Model for the Delineation of Wellhead Protection Areas" (Blandford and Huyakom, 1991). The model provides semi-analytical capture zone solutions for homogenous aquifers that exhibit two dimensional, steady-state groundwater flow in an aerial plane. Multiple pumping wells can be assessed. The model includes four separate modules for capture zone and travel time analysis. The RESSQC module was used for the analysis of the CPU well system.
Input to the model included the following parameters:
0 Welllocations 0 Pumping rates 0 Aquifer transmissivity
Aquifer Characterization 3-57
1:1 Aquifer thickness 1:1 Hydraulic gradient and direction for ambient flow 1:1 Aquifer porosity
December 30, 1994
A summary of the input parameters used in the modeling analysis are presented in Table 3-11.
Pumping rates for the wells were estimated from historical and projected patterns of pumpage. Maximum and estimated average pumping rates for each of the well sources is summarized in Table 3-11. Average rates for each source were computed as a percent of the total system capacity normalized by the anticipated water demand for the year 2000. Average rates of pumping were modeled because the analysis considers groundwater flow over a period of one to ten years.
Aquifer transmissivity values were generally estimated from pumping test data. In cases where test data were not available (Well Nos. 4 and 15), transmissivity values were estimated from specific capacity data by multiplying the specific capacity in gpm/ft by an empirical factor of 2,000. The transmissivity values obtained from pumping test generally reflect conditions in the immediate vicinity of the well. The bulk transmissivity of the aquifer, that is, the transmissivity averaged over relatively large areas, would be generally lower. Thus, the model transmissivity estimates were grouped by three values: 8,000 gpdlft; 30,000 gpdlft; and 40,000 gpdlft.
Aquifer thickness values were estimated from drillers and/or lithologic logs. The estimates generally include all significant water bearing material that was encountered in the well while drilling through the Upper Troutdale aquifer. Hydraulic gradients and groundwater flow directions were estimated from the water level contours presented in Exhibit 3-10. A constant aquifer porosity of 0.20 was used for the entire modeling analysis.
Separate model runs were performed for Well Nos. 4, 8, 15, and 27 because they lie at sufficient distances from the other pumping centers that interference effects can be ignored. The remaining wells were combined into two other model runs. Well Nos. 5, 7, and 23 lie in proximity to one another and have approximately the same ambient gradient and flow direction. Therefore, these wells were combined into a single model run using the average estimated aquifer properties and thicknesses (Table 3-11). In a similar manner, Well Nos. 10 and 22 were combined into a single model run. Since Well No. 7.2 is a backup well for CPU Well No. 7 and is expected to replace that well within the next few years, it was not incorporated into the analysis.
Aquifer Characterization 3-58
I I I I I I I I I I I I I I I I I I I
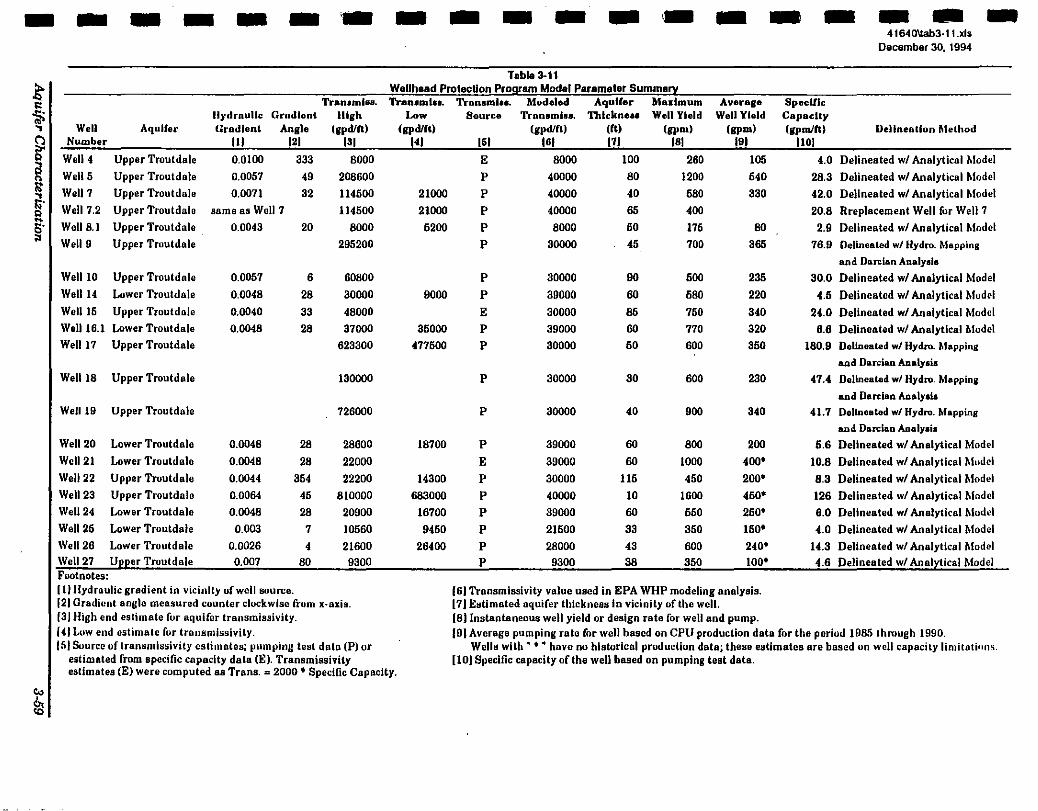
- - - - - - ·- - - - - - - - - - - -Tabla 3-11
41640\lab3-11.xls December 30, 1994
WeUhaad Protection Program Model Parameter Summary Tran1mlsa. 'll-on•n•l••· Tranemlu. Modeled Aquirer Maximum Average
Well Yield (gpm)
IBI
Specific Capacity (gpm/11) Well AquJter
Number
Well 4 Upper Troutdale
WellS Upper Troutdale
Well 7 Upper Troutdale
llydrnullc Gradient
Ill 0.0100
0.0057
0.0071
Grndlent lllgh Angle (gpd/lt)
121 131
333
49
32
Well 7.2 Upper Troutdale
Well8.1 Upper Troutdale
Well 9 Upper Troutdale
same as Well?
8000
208600
114600
114500
Well 10 Upper Troutdale
Well14 Lower Troutdale
Well 16 Upper Troutdalo
Welll6.1 Lower Troutdale Well 17 Upper Troutdale
Well 18 Upper Troutdale
Well 19 Upper Troutdale
Well 20 Lower Troutdale
Well21 Lower Troutdalo
Well22 Upper Troutdale
Well23
Well24
Well25
Well26
Upper Troutdale
Lower Troutdale
Lower Troutdale Lower Troutdale
Well 27 UpPer Troutdale Footnotes:
0.0043
0.0057
0.0048
0.0040
0.0048
0.0048
0.0048
0.0044
0.0064
0.0048
0.003
0.0026 0.007
(11 Hydraulic gradient in vicinity of well source.
20
6
28
33
28
28
28
364
45
28
7
4 80
8000
295200
60800
30000
48000
37000
623300
130000
726000
28600
22000
22200
810000
20900
10560
21600 9300
(21 Gradient anglo measured counter clockwise from x·axis. {31 High end estimate fur aquifer transmissivity. 141 Low end estimate for transmissivity. 151 Source of transmissivity estimates; pumping lest data (P) or
estimated from specific capacity data (E). Transmissivity estimates (E) were computed as Trans. = 2000 • Specific Capacity.
Low Source Tron1mlu. Thlcknea• Well Yield (gpd/11) (gpd/11) (II) (gpm)
~ w w rn w
21000
21000
6200
9000
36000
477600
18700
14300
683000
16700
9460
26400
E p p
p
p p
p
p
E p
p
p
p
p
E p
p p p
p p
8000
40000
40000
40000
8000
30000
30000
39000
30000
39000
30000
30000
30000
39000
39000
30000
40000
39000
21600
28000 9300
100
80
40
65
60
45
90
60
86
80
60
30
40
60
60
116
10
60
33
43 38
260
1200
680
400
176 700
600
680
760
770 600
600
900
800
1000
460
1600
650 350
800
350
105 640
330
80
365
235
220
340
320
350
230
340
200
400'
200'
460'
260'
160'
240' 100'
(61 Transmissivity value used in EPA WHP modeling analysis. [7) Estimated aquifer thickness in vicinity of the well. (8) Instantaneous well yield or design rate for well and pump.
Delineation Method IJOI
4.0 Delineated w/ Analytical Model
28.3 Delineated w/ Analytical Model
42.0 Delineated w/ Analytical Model
20.8 Rreplacement Well for Well7
2.9 Delineated w/ Analytical Model
76.9 Delineated w/ Hydro. Mapping
and Oe.rcie.n Analysis
30.0 Delineated w/ Analytical Model
4.6 Delineated w/ Analytical Model
24.0 Delineated w/ Analytical Model
8.6 Delineated w/ Analytical Model
180.9 Delineated w/ Hydro. Mapping
and Darcian Analysis
47.4 Dellneated w/ Hydro. Mapping
and Darcian Analysis
41.7 Delineated w/ Hydro. Mapping
and Darcian Analysis
6.6 Delineated w/ Analytical Model
10.8 Delineated w/ Analytical Model
8.3 Delineated w/ Analytical Model
126 Delineated w/ Analytical Model
6.0 Delineated w/ Analytical Mudd
4.0 Delineated w/ Analytical Model
14.3 Delineated w/ Analytical Model
4.6 Delineated w/ Analytical Model
191 Average pumping rate for well based on CPU production data for the period 1985 through 1990. Wells with" •" have no historical production data; these estimates are based on well capacity limitatinns.
[10) Specific capacity of the well based on pumping test data.
December 30, 1994
Deep Wells · Existing production wells at sites 14, 16, 20, 24, 25, and 26 are completed within the Lower Troutdale aquifer and are currently used for production (Table 3-1). Other deep supply wells that are currently not used due to excessive manganese levels include Wells 21 and 90-03.
Reliable water level data for assessing groundwater flow direction and gradient in the Lower Troutdale are limited. Water level contour maps for the Lower Troutdale aquifer have not been developed. However, water levels, groundwater flow directions and hydraulic gradients for the deeper aquifer systems have been delineated by the USGS (Morgan and McFarland, 1991) as part of the Portland Basin numerical groundwater flow modeling study (Exhibit 3-15). The water level contours are for layer 4 of the USGS model. The model contours were obtained from a steady-state model simulation of the 1988 water level conditions.
The EPA analytical capture zone model was used in conjunction with the water level contours defined by the USGS numerical modeling study to assess capture zones· for the deep supply wells. The USGS model contours provide a definition of the hydraulic gradients and flow directions for the Lower Troutdale. An average hydraulic conductivity value of 87 ft/day was used for modeling the capture zones. Aquifer transmissivity was varied in proportion to the thickness of the aquifer at each site. An aquifer porosity of 0.20 was assumed for all wells. A summary of the input parameters used in the modeling analysis are presented in Table 3-11.
-Pumping rates for the wells were estimated from historical and projected patterns of pumpage. Maximum and estimated average pumping rates for each of the well sources is snmmarized in Table 3-11. Average rates for each source were computed as a percent of the total system capacity normalized by the anticipated water demand for the year 2000. Average rates of pumping were modeled because the analysis considers groundwater flow over a period of one to ten years.
Separate model runs were performed for Well Nos. 21, 25, 26, and 90-03 because they lie at sufficient distances from the other pumping centers that interference effects can be ignored. The remaining wells (14, 16, 20, and 24) were modeled collectively because they lie in proximity to one another and have approximately the same ambient gradient and flow direction. These wells were combined into a single model run using the average estimated aquifer properties and thicknesses that are presented in Table 3-11.
Results
The modeled capture zone for one, five, and ten year time-of-travel analyses for Zone 1, Zone 2, and deep wells are presented in Exhibits 3-14 and 3-15. The areas within the shaded boundaries shown on the figures represent the
Aquifer Characterization 3-60
I I I I I I I I I I I I I I I I I I I
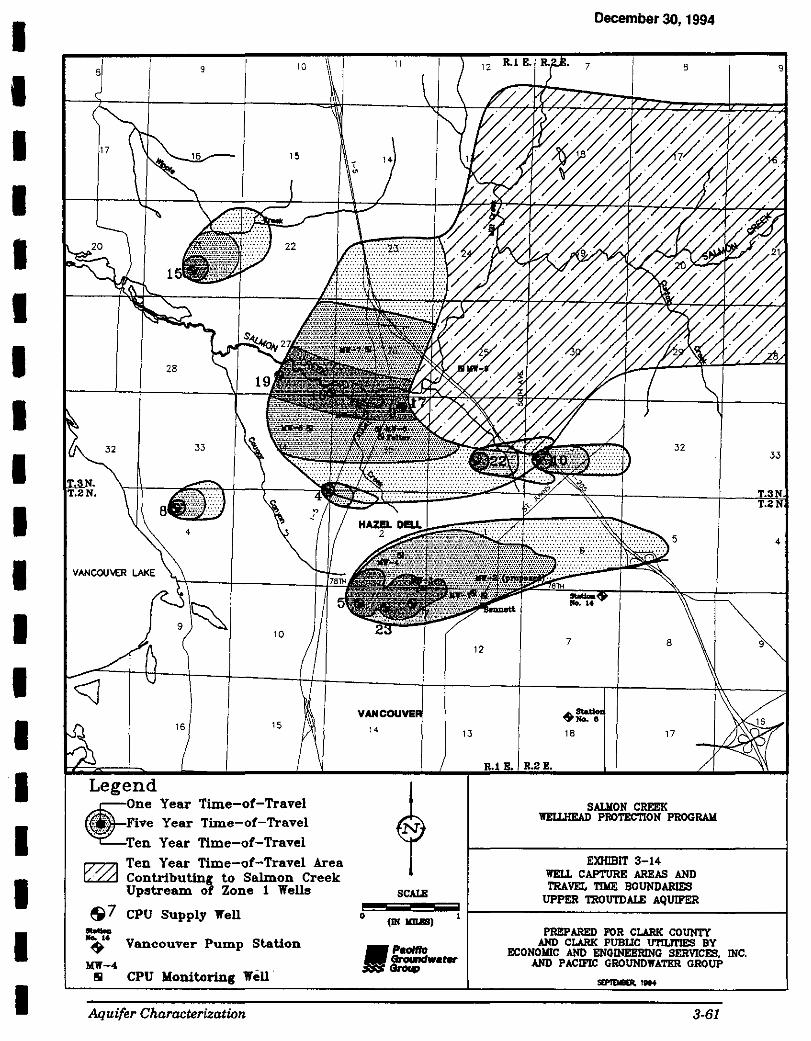
I I I I I I I I I I I I I I I I I I I
9 10
15
28
32 33
10
16 15
Legend One Year Time-of-Travel Five Year Time-of-Travel
Ten Year Time-of-Travel
17771 Ten Year Time-of-Travel Area r.:LLJ Contributing to Salmon Creek
Upstream of Zone 1 Wells
S 7 CPU Supply Well -~· Vancouver Pump Station
Mll'-4 !II CPU Monitoring Well.
Aquifer Characterization
II
14
N
SCALI!
0 (Ill IIIUIII)
•Paolffo ::::'_,.,.
12
13
December 30, 1994
7 8
32
7 8
18 17
SALIION CREEK WEU.IIEAD PROTECTION PROGR.UI
EXHIBIT 3-14 WELL CAPTURE AREAS AND TRAVEL TillE BOUNDARIES
UPPER TROUTDALE AQUIFER
PREPARED FOR CLARK COUNTY AND CLARK PUBIJC UTILITIES BY
ECONOIIIC AND ENGINEERlNG SERVICES, INC. AND PACIFIC GROUNDWATER GROUP
.......... .... 3-61
33
4
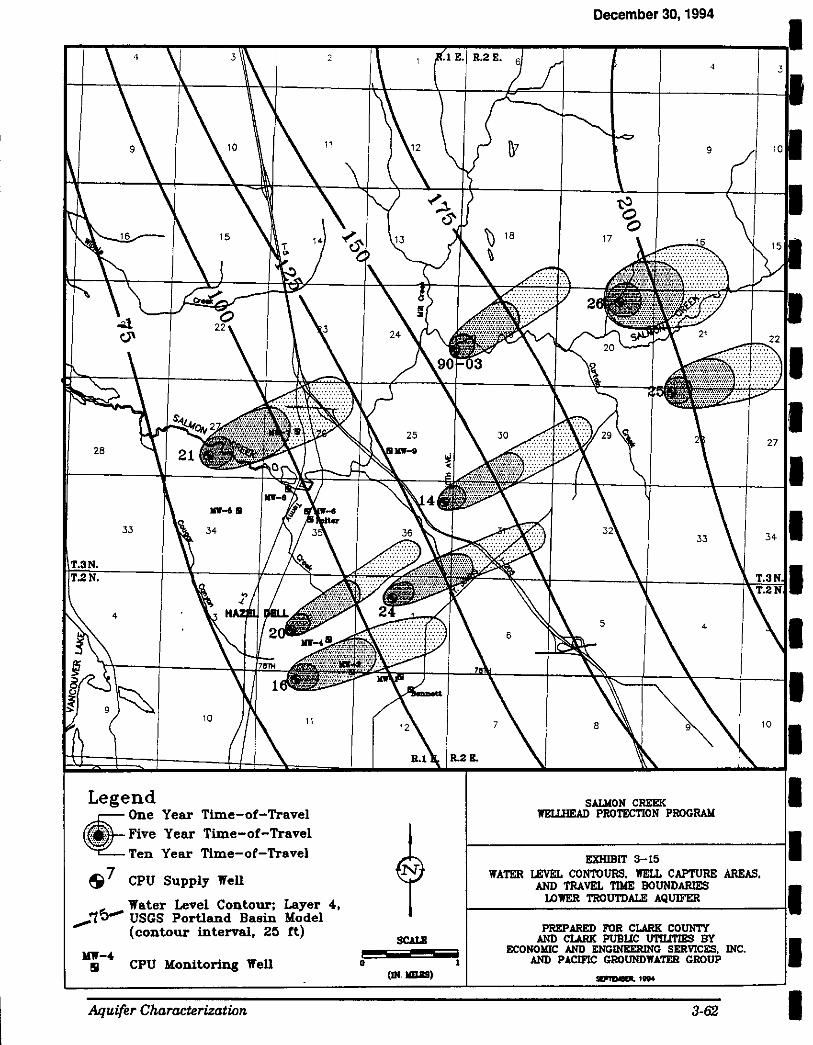
28
33
10 11
Legend One Year Time-of-Travel Five Year Time-of-Travel Ten Year Time-of-Travel
S] CPU Supply Well
Water Level Contour; Layer 4, _1<0- USGS Portland Basin Model
(contour interval, 25 ft)
I(W-4 !II CPU Monitoring Well o
Aquifer Characterization
SCALII
1 (IN. liiUIII)
18
December 30, 1994
4
17
8
SALllON CREEK 1IELLHEAD PROTECTION PROGRAII
EXIDBIT 3-15 WATER LEVEL CONTOURS, liEU. CAPTURE AREAS.
AND TRAVEL TIIoiE BOUNDARIES LOWER TROUTDALE AQUIFER
PREPARED FOR CLARK COUNTY AND CLARK PUBUC UTILITIES BY
ECONOIIIC AND ENG!NEERING SERVICES, INC. AND PACIFIC GROUNDWATER GROUP ....
3-62 I
I I I I I I I I I I I I I I I I I I I
December 30, 1994
estimated zone of groundwater contribution to the well sources for each period of analysis. Capture zone areas expand as a function of larger travel times. The capture areas extend mostly upgradient of the well source. The downgradient limit of the capture area is defined by the location of a stagnation point. Water particles upgradient of the stagnation point travel toward the well. Water particles downgradient of the stagnation point travel in the direction of the regional hydraulic gradient and are carried away from the well.
Theoretically, well capture areas should not extend beyond a groundwater divide. However, the RESSQC option of the WHPA model has an inherent limitation, which is that it assumes a uniform flow field or only one ambient groundwater flow direction. Consequently, the modeled capture areas for CPU Well Nos. 4, 5, 7, and 23 would have extended beyond the groundwater divide if no corrections were made to the model output. If the model could assess a variable two dimensional flow field, then capture areas would tend to align with variations in the natural flow field and would extend subparallel to the divide boundary. In order to correct for this limitation, the model output for Well Nos. 4, 5, 7, and 23 was graphically modified to reflect non-uniform flow field conditions resulting from the groundwater divide which occurs to the north of these wells.
Exhibit 3-14 shows the ten year travel time boundary and capture areas for the all of the shallow water supply wells as well as the recharge area that contributes upgradient of the Zone 1 wells. The ten year capture area for the well sources represents the most critical area in which to focus additional field investigations, land use surveys, and long-term monitoring. The recharge area upstream of the Zone 1 wells represents a secondary area for future investigations.
3.6.2 Sensitivity Analysis
A parameter sensitivity analysis was performed using the WHPA program. The objective of the sensitivity analysis was to illustrate the effects of parameter uncertainty on capture areas for wells. Because of the parameter uncertainty, the capture areas presented above should be considered as only an approximation of actual conditions. The confidence limits of the model and its resultant output can be improved through additional data collection efforts.
The sensitivity analysis was performed by establishing a base case timerelated capture zone for a representative set of input parameters and then comparing changes in the capture zone configuration that results from changes in the model input.
AiJuifer Characterization 3-63
December 30, 1994
The base case input parameters can be summarized as follows:
Transmissivity (T) Pumping rate (Q) Hydraulic gradient (I) Aquifer thickness (b) Aguifer porosity (0)
40,000 gpdlft 500gpm 0.005 50ft 0.02
For each subsequent sensitivity model run, a single parameter was changed and the results evaluated. The parameters were both increased (high end) and decreased (low end) by a factor of two. The results of the sensitivity analysis are presented in the 1991 Work Plan (PGG & EES, 1991). The following is a summary of the results of this analysis:
l:l Increasing the pumping rate (high Q) tends to increase the width of the capture zone whereas decreasing the pumping rate (low Q) has the opposite effect.
l:l Increasing the transmissivity (high T) tends to both increase the length of the capture area (for a specified travel time) as well as decrease its width. Decreasing the transmissivity (low T) has . the opposite effect on the capture zone.
l:l The effects of hydraulic gradient errors are very similar to the effects introduced by transmissivity errors.
l:l Larger aquifer thickness (high b) tends to reduce the length of the capture area for any specified travel time. Smaller aquifer thickness has the opposite effect on the capture zone.
The effects of aquifer porosity errors are very similar to the effects introduced by aquifer thickness errors.
3. 7 Water Quality
A wide range of historical and current water quality data was reviewed and summarized in order to characterize conditions in the Focus Area and to evaluate the susceptibility of groundwater supplies to contamination from land use activities. Data from past monitoring efforts were analyzed and new monitoring wells were sampled to provide additional water quality information and to fill data gaps.
3.7.1 Existing Data
Historical water quality data from the following sources were reviewed as part of the 1991 Work Plan (PGG & EES, 1991):
Aquifer Characterization 3-64
I I I I I I I I I I I I I I I I I I I
I I I I I I I I I I I I I I I I I I I
CJ CPU production wells;
CJ private wells monitored by CPU;
CJ USGS/IRC monitoring; and
December 30, 1994
CJ Department of Health monitoring wells located downgradient of Pacific Northwest Plating, Leichner Landfill, and Ross Complex.
Results from this data are summarized below.
CPU Production Wells
CPU monitors their production wells for primary and secondary contaminants in accordance with State drinking water regulations. Water quality data for CPU production wells in 1990 are summarized in the 1991 Work Plan (PGG & EES, 1991). These data indicate that the water quality is generally good. Inorganic constituents are all within primary and secondary drinking water standards with the exception of elevated iron and manganese in Well Nos. 12 and 15. VOCs have also been monitored in CPU production wells. Well No. 17 was temporarily taken out of production when low levels of tetrachloroethylene, trichloroethylene, and other VOCs were detected in 1989. The levels measured for these parameters were well below maximum contaminant levels proposed by EPA. The well was put back into service after subsequent testing.
Manganese concentrations in Well Nos. 21 and 90-03 have exceeded drinking water standards since the wells were installed in 1990. Consequently, these wells are not used for water supply.
Private Wells
CPU initiated a water quality sampling program for approximately 4,200 private domestic wells in the spring of 1990. The objectives of this program were to:
CJ Assess general water quality conditions in Clark County,
CJ Create a database of private wells in Clark County, and
CJ Provide a service to private well owners by malcing water quality results available.
Field parameters included pH, temperature, and conductivity; in addition, samples were collected for coliform bacteria, nitrate, iron, and manganese and were submitted to a chemical laboratory for analysis. Results were summarized in the 1991 Work Plan (PGG & EES, 1991). The percentage of
Aquifer Characterization 3·65
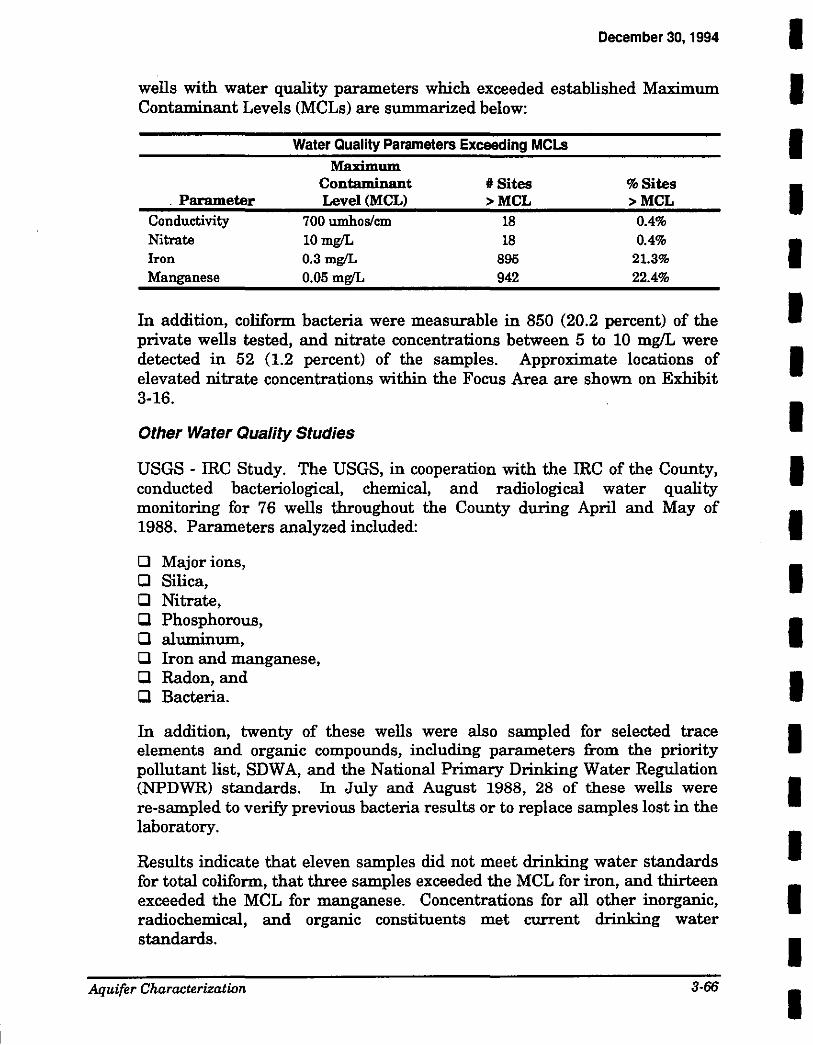
December 30, 1994 I wells with water quality parameters which exceeded established Maximum I Contaminant Levels (MCLs) are summarized below:
Water Quality Parameters Exceeding MCL.s
Maximum Contaminant #Sites %Sites
. Parameter Level(MCL) >MCL >MCL Conductivity 700 umhos/cm 18 0.4% Nitrate 10mg/L 18 0.4% Iron 0.3mg/L 895 21.3% Manganese 0.05mg/L 942 22.4%
In addition, coliform bacteria were measurable in 850 (20.2 percent) of the private wells tested, and nitrate concentrations between 5 to 10 mg/L were detected in 52 (1.2 percent) of the samples. Approximate locations of elevated nitrate concentrations within the Focus Area are shown on Exhibit 3-16.
Other Water Quality Studies
USGS - IRC Study. The USGS, in cooperation with the IRC of the County, conducted bacteriological, chemical, and radiological water quality monitoring for 76 wells throughout the County during April and May of 1988. Parameters analyzed included:
0 Major ions, 0 Silica, 0 Nitrate, 0 Phosphorous, 0 aluminum, 0 Iron and manganese, 0 Radon, and 0 Bacteria.
In addition, twenty of these wells were also sampled for selected trace elements and organic compounds, including parameters from the priority pollutant list, SDWA, and the National Primary Drinking Water Regulation (NPDWR) standards. In July and August 1988, 28 of these wells were re-sampled to verifY previous bacteria results or to replace samples lost in the laboratory.
Results indicate that eleven samples did not meet drinking water standards for total coliform, that three samples exceeded the MCL for iron, and thirteen exceeded the MCL for manganese. Concentrations for all other inorganic, radiochemical, and organic constituents met current drinking water standards.
AJiuifer Characterization 3·66
I I I I I I I I I I I I I I I I I
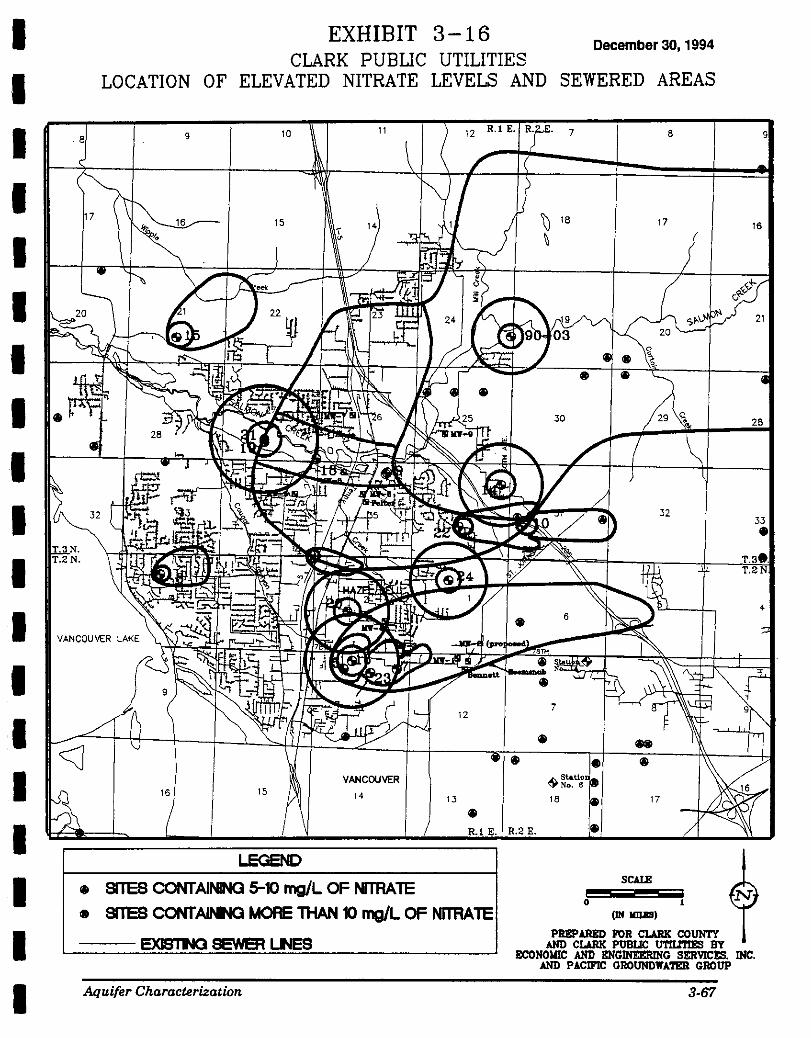
I I I I I I I I I I I I I I I I I I I
EXHIBIT 3-16 December 30, 1994
CLARK PUBUC UTILITIES LOCATION OF ELEVATED NITRATE LEVELS AND SEWERED AREAS
9
16 15
10
15
11
VANCOUVER
14
• SITES CONTAINING 5-10 mg/L OF NITRATE
• 911 ES CONTAN«l MORE 1liAN 10 mg/L OF NITRATE
EXISTINQ SEWER LIES
Aquifer Characterization
7 8
17 16
32
17
SCAlE
0 1
PREPARED FOR CLARK COUNTY AND CL.IRK PUBIJC UTIU'l'IES BY
ECONOIIIC AND ENGINEERING SERVICES. INC. AND PACIFIC GROUNDWATER GROUP
3-67
December 30, 1994
VOCs (tetrachloroethene, 1,1,1-trichloroethane, and other solvents) were present in three wells located in the Vancouver urban area. Trace amounts of VOCs were detected in several other wells, but levels were too small to assess the validity of the results. Atrazine (a pesticide) was detected in one of the Vancouver area wells, and 2,4-D (another pesticide) was detected in two rural wells. These wells were re-sampled at a later date however, and the compounds were not detected. Nitrate nitrogen concentrations exceeded 1.0 mgiL throughout the Vancouver urban area, and were as high as 6.7 mg!L.
Pacific Northwest Plating - The Boomsnub-Pacific Northwest Plating facility lies just southeast of the intersection ofN. E. 78th Street and St. John's Road (Exhibits 3-2 and 3-11). Ecology is currently conducting interim remedial activities associated with cleanup of chromium contamination in groundwater at and downgradient from the Boomsnub site. Boomsnub is currently under an enforcement order requiring extraction of contaminated groundwater and treatment to remove chromium. The contaminated groundwater from the on-site extraction well contains hexavalent chromium levels in excess of 300 ppm. The source of chromium contamination in the groundwater appears to be contaminated soil beneath the facility. It is believed that the site soils may have been contaminated as a result of a chromic acid spill due to failure of an above-ground tank 20 years ago. In addition, discharges of spent plating solution directly to the soil have also been reported.
Soil and groundwater contamination was first documented at the site in 1987. Quarterly monitoring data through 1989 indicated a relatively stable and low concentration of hexavalent chromium. In late 1989, data obtained during the installation of and sampling of a downgradient well indicated that the plume was migrating. In March 1990, the Boomsnub Corporation reported to Ecology a 4.5 order of magnitude increase in hexavalent chromium at one of the downgradient monitoring wells. The increase in chromium was attributed to a leak (300,000 gallons) in a fresh water supply line that lies beneath the facility.
To-date, Ecology has installed a total of 43 monitoring wells in order to characterize the local hydrogeology and assess the horizontal and vertical extent of the chromium plume. The extent of the chromium plume has not yet been fully defined. Exhibit 3-11 shows the approximate location of the chromium plume based on June 1993 monitoring data. The plume boundary has been arbitrarily defined as the area within which chromium concentrations exceed 1.0 mg/L. The western and southern extents of the portion of the plume in the upper aquifer are still unknown. In addition, chromium is likely present beyond the boundaries shown on Exhibit 3- 11 in concentrations less than 1.0 mg/L. Chromium does not appear to have
, Afiuifer Characterization 3-68
I I I I I I I I I I I I I I I I I I I
I I I I I I I I I I I I I I I I I I I
December 30, 1994
migrated below the upper (Pleistocene Deposits) aquifer. Chromium concentrations exceeding 1.0 mg/L have been detected as far as 2,000 feet downgradient of the Boomsnub site. In order to restrict further plume migration, groundwater is being pumped at a rate of about 27 gallons per minute from nine wells which comprise the existing extraction system. CPU and Ecology are currently working together to expand this system, which does not extend north of 78th Street. The primary objective of the expansion will be to contain the portion of the plume containing total chromium concentrations greater than 1.0 mg/L. Further investigation will be required in the future to characterize the full extent of the plume and to determine the feasibility and approach to cleanup.
Airco - The Airco plant is located at 4715 N. E. 78th Street in Vancouver, Washington (Exhibits 3-2 and 3-11). VOCs were first identified in samples collected downgradient of the site in January and May, 1991. Concentrations of VOCs as high as 12,000 pg/L have been detected in Boomsnub's monitoring wells. Airco has just completed an Interim Action under Agreed Order Number DE93TC-S153. This Interim Action consisted of on-site investigations and source characterization for VOC contamination. A total of seventeen monitoring wells have been installed on site. No off-site work has been done by Airco to-date; however, Airco has recently negotiated an Agreed Order with Ecology which would include off-site hydrogeologic and hydrochemical characterization. The horizontal and vertical extents of the VOC plume have been poorly defined. Preliminary data indicate that the plume may extend as far west as CPU Well MW-1, and nearly as far south as St. John's Road (Exhibit 3-11). Available data also indicate that VOCs may have migrated below the upper (Pleistocene Alluvial Deposits) aquifer.
Leichner Landfill - Thirteen wells in the Leichner Landfill area have been monitored by WDOH for VOCs. The landfill is located near the intersection of N. E. 94th Street and N. E. 94th Avenue (Exhibit 3-2). Five of the wells had detectable levels of VOCs ranging from 0.5 to 2.4 pg!L. All levels were below current drinking water standards.
BPA - Ross Complex - Ross Complex is a control center for electrical generation and transmission which is owned and operated by the Bonneville Power Administration (BPA). The facility is located just south of Cold Creek and east of Interstate 5 and Highway 99 (Exhibit 3-2). Activities at the Ross Complex include handling transformer oils containing polychlorinated biphenyls (PCBs), organic and inorganic compounds for preserving wood, paints, solvents, waste oils, and heavy metals; using organic and inorganic compounds in the laboratory; and operating a disposal site and sanitary drainfield. A preliminary assessment and site investigation which involved sampling several on-site wells has been completed for this site. In addition, five supply wells in the City of Vancouver's Well Field 3 were sampled for
Aquifer Characterization 3-69
December 30, 1994
VOCs, base-neutral-acid compounds (BNAs), pesticides, PCBs, and polynuclear aromatic hydrocarbons (PAHs) because the wells are located one half mile downgradient of Ross Complex. Of the five wells tested, three showed levels of 1,1,1-trichlorethane ranging from 1.65 to 4.08 J.lg/L, and 1,1-dichlorethylene was detected at concentrations ranging from 0.58 to 0. 70 J.lg/L. Although both parameters are found in concentrations below current drinking water standards, the results suggest a source of contamination to the aquifer. These wells are located to the south of Ross Complex, and lie outside of the Focus Area.
Data Gaps
The 1991 Work Plan identified several areas where water quality data were insufficient to characterize groundwater quality in the WHPP Focus Area. Specifically, the Work Plan identified the following data gaps which are critical to wellhead protection:
Cl Additional monitoring data for land use indicator parameters. This data should be from CPU production wells and from monitoring wells located upgradient from production zones. Parameters should include indicators of increasing urbanization, commercial and industrial activity, and agricultural land use impacts.
Cl Additional geochemical and physical water quality data to further characterize the hydrogeology of the Focus Area.
Cl Monitoring to determine the extent of surface water influence to Zone 1 Wells. Data collection would involve sampling groundwater from Zone 1 Wells and surface water from nearby reaches of Salmon Creek.
3.7.2 Data Analysis
Six of the eight monitoring wells were installed with double completions so that water quality could be analyzed from both the upper (Pleistocene Alluvial Deposits) aquifer and the regional (Upper Troutdale) aquifer.
A data collection and analysis plan was developed by reviewing historical water quality information regarding the occurrence of contamination, and by assessing predominant land use activities in hydrogeologically sensitive areas. Water quality indicator parameters were measured from wells primarily situated along the Highway 99 corridor and in the vicinity of the Boomsnub and Airco sites along N. E. 78th Street. Categories of parameters which were monitored included: 1) Coliform bacteria; 2) Regulated
Ai[uifer Characterization 3-70
I I I I I I I I I I I I I I I I I I I
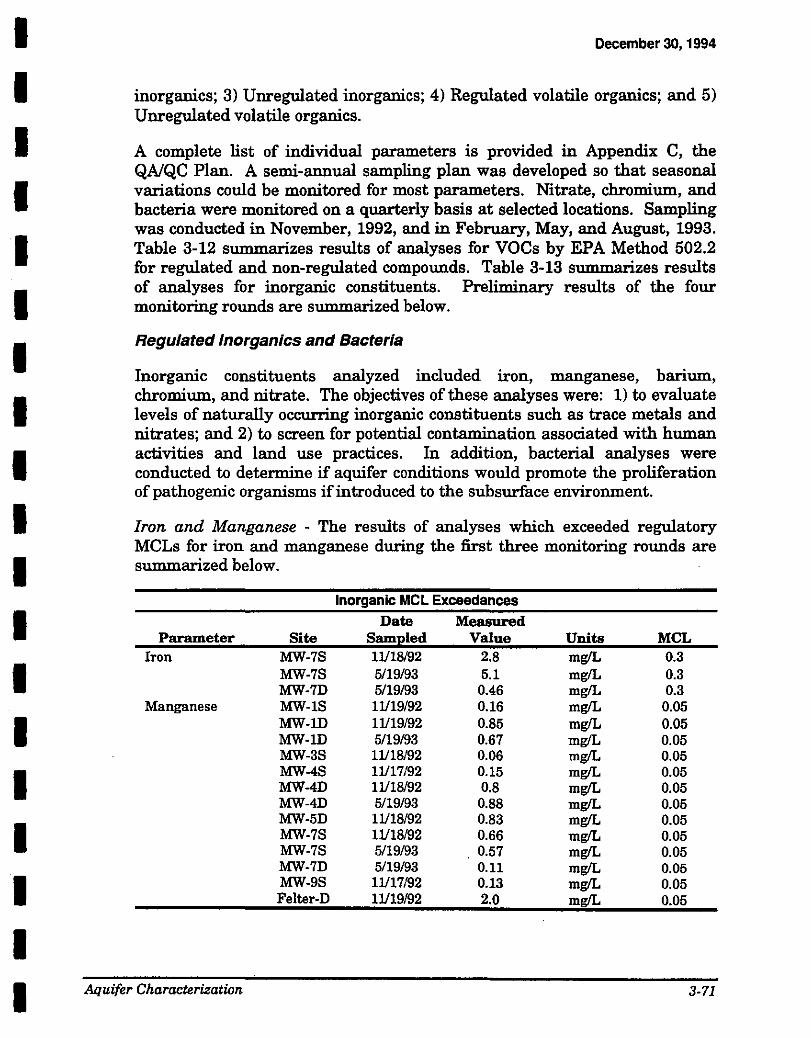
I I I I I I I I I I I I I I I I I I I
December 30,1994
inorganics; 3) Unregulated inorganics; 4) Regulated volatile organics; and 5) Unregulated volatile organics.
A complete list of individual parameters is provided in Appendix C, the QA/QC Plan. A semi-annual sampling plan was developed so that seasonal variations could be monitored for most parameters. Nitrate, chromium, and bacteria were monitored on a quarterly basis at selected locations. Sampling was conducted in November, 1992, and in February, May, and August, 1993. Table 3-12 summarizes results of analyses for VOCs by EPA Method 502.2 for regulated and non-regulated compounds. Table 3-13 summarizes results of analyses for inorganic constituents. Preliminary results of the four monitoring rounds are summarized below.
Regulated lnorganics and Bacteria
Inorganic constituents analyzed included iron, manganese, barium, chromium, and nitrate. The objectives of these analyses were: 1) to evaluate levels of naturally occurring inorganic constituents such as trace metals and nitrates; and 2) to screen for potential contamination associated with human activities and land use practices. In addition, bacterial analyses were conducted to determine if aquifer conditions would promote the proliferation of pathogenic organisms ifintroduced to the subsurface environment.
Iron and Manganese - The results of analyses which exceeded regulatory MCLs for iron and manganese during the first three monitoring rounds are summarized below.
Inorganic MCL Exceedances
Date Measured Parameter Site Sampled Value Units MCL
Iron MW-7S 1ll18/92 2.8 mg/L 0.3 MW-78 5/19/93 5.1 mg/L 0.3 MW-70 5/19/93 0.46 mg/L 0.3
Manganese MW-18 1]}19/92 0.16 mg/L 0.05 MW-lD 1]}19/92 0.85 mg/L 0.05 MW-lD 5/19/93 0.67 mg/L 0.05 MW-38 lll18/92 0.06 mg/L 0.05 MW-48 1ll17/92 0.15 mg/L 0.05 MW-4D lll18/92 0.8 mg/L 0.05 MW-4D 5/19/93 0.88 mg/L 0.05 MW-5D lll18/92 0.83 mg/L 0.05 MW-78 1]}18192 0.66 mg/L 0.05 MW-78 5/19/93 0.57 mg/L 0.05 MW-7D 5/19/93 0.11 mg/L 0.05 MW-9S lll17/92 0.13 mg/L 0.05 Felter-D lll19/92 2.0 mg/L 0.05
Aquifer Characterization 3-71
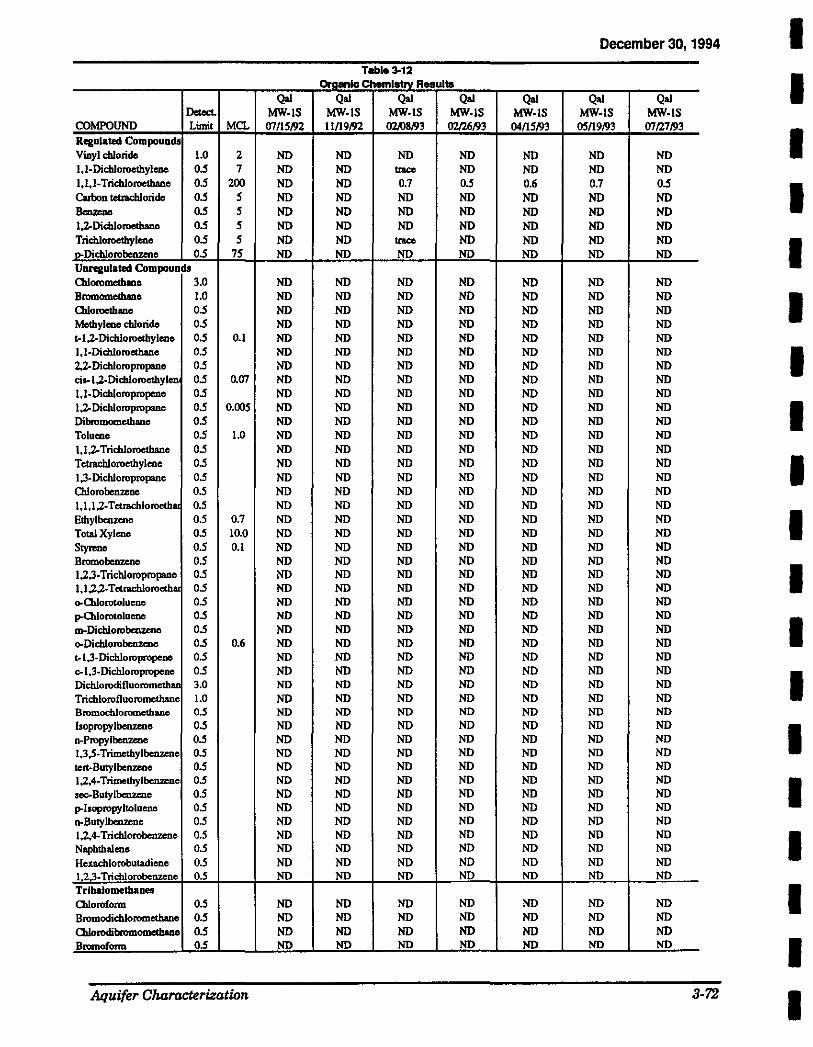
Qal Delect. MW-IS
COMPOUND Limit MCL (JT/151'12 Regulated Compounds Vinyl cblorids 1.0 2 ND 1,1-Dicbloroethylcnc o.s 1 ND 1.1.1-Tricbloroetbane o.s 200 ND Oubon tetru:bloridc o.s 5 ND 1leu7.cDo o.s 5 ND 1,2-Dicbloroetbane o.s 5 ND Tricbloroethylonc o.s 5 ND P:Dicblorobenzene o.s 15 ND Unregulated Compounds Cllloromethano 3.0 ND Bromom.ethano 1.0 ND Ollorocthanc o.s ND Methylene cbloridc o.s ND t-1 ;J.-Di.chloroetbyleno 0.5 0.1 ND 1,1-Di.ch.loroethanc 0.5 ND 2,2-Dicbloropropane o.s ND cis-! ,Z..Dicbloroethylen o.s 0.07 ND 1,1-Dicbloropropane o.s ND 1;2-0icbloropropanc o.s 0.005 ND Dibromomcthanc o.s ND Toluene o.s 1.0 ND 1,1,2-Tricbloroethane o.s ND Tetrachloroethylene o.s ND 1,3-Dicbloropropane o.s ND Odorobenzenc 0.5 ND 1,1,1,2-Tetrachloroeth., 0.5 ND Ethyl benzene o.s 0.1 ND Total Xylene o.s 10.0 ND Styrene o.s 0.1 ND Bromobenzenc o.s ND I ,2,3-Tricbloropropane o.s ND 1,1,2,2-T etrachloroeth., o.s ND ~>Otlorotoluenc o.s ND p-Ollorotolucnc o.s ND m-Dichlorobenzeno o.s ND o-Dicblorobcnzc:nc o.s 0.6 ND t-1,3-Dichloropropanc 0.5 ND c-1,3-Dichloropropene 0.5 ND Dicblorodifluorometh~~~: 3.0 ND Tri.cb.lorofluoromethane 1.0 ND Bromochlorometbanc 0.5 ND lsopropy !benzene o.s ND n-Propylbcnzcoe o.s ND 1,3,5-Trimethylbenzene o.s ND tert-Butylbenzcnc o.s ND I ,2.4-Trimcthylbenzene o.s ND scc:-Butylbenzcnc o.s ND p-lsopropyltolueno o.s ND n-Butylbeozene 0.5 ND 1,2.4-Tricblorobenzene o.s ND Naphthalene 0.5 ND Hexachlorobutad.iene o.s ND 1 2.3-Trichlorobenzene 0.5 ND Tribalometbaoes Oalorofoma 0.5 ND Brom.odichloromethano o.s ND Chlorodibromomethanc 0.5 ND Bromoform o.s ND
All.uifer Charar:Urization
Table 3-12 Organic Chemistry Results
Qal Qal Qal Qal MW-IS MW-IS MW-IS MW-IS lln91'12 02108193 fJ2/26/93 04!15l'J3
ND ND ND ND ND II1I<C ND ND ND 0.1 o.s 0.6 ND ND ND ND ND ND ND ND ND ND ND ND ND II1I<C ND ND ND ND ND ND
ND ND ND ND ND ND ND ND ND ND ND ND ND ND ND ND ND ND ND ND ND ND ND ND ND ND ND ND ND ND ND ND ND ND ND ND ND ND ND ND ND ND ND ND ND ND ND ND ND ND ND ND ND ND ND ND ND ND ND ND ND ND ND ND ND ND ND ND ND ND ND ND ND ND ND ND ND ND ND ND ND ND ND ND ND ND ND ND ND ND ND ND ND ND ND ND ND ND ND ND ND ND ND ND ND ND ND ND ND ND ND ND ND ND ND ND ND ND ND ND ND ND ND ND ND ND ND ND ND ND ND ND ND ND ND ND ND ND ND ND ND ND ND ND ND ND ND ND ND ND ND ND ND ND ND ND ND ND ND ND ND ND ND ND ND ND ND ND ND ND ND ND ND ND ND ND
ND ND ND ND ND ND ND ND ND ND ND ND ND ND ND ND
December 30, 1994
Qal Qal MW-IS MW-IS 05/19/93 07{27/93
ND ND ND ND 0.1 o.s ND ND ND ND ND ND ND ND ND ND
ND ND ND ND ND ND ND ND ND ND ND ND ND ND ND ND ND ND ND ND ND ND ND ND ND ND ND ND ND ND ND ND ND ND ND ND ND ND ND ND ND ND ND ND ND ND ND ND ND ND ND ND ND ND ND ND ND ND ND ND ND ND ND ND ND ND ND ND ND ND ND ND ND ND ND ND ND ND ND ND ND ND ND ND ND ND ND ND
ND ND ND ND ND ND ND ND
3-72
I I I I I I I I I I I I I I I I I I I
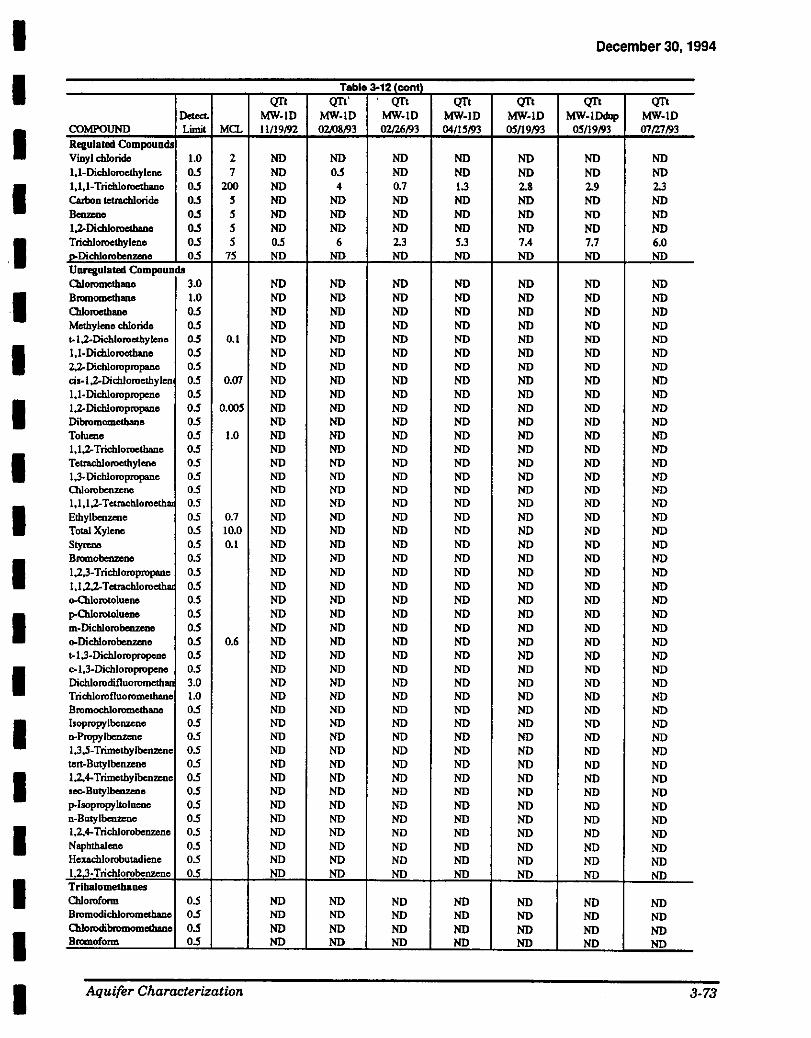
I I I I I I I I I I I I I I I I I I I
Detect. COMPOUND Limit MCL Rqulated Compounds Vinyl cbloridc 1.0 2 1.1-Dicbloroelhylonc 0.5 7 1,1,1-Trichloroethane 0.5 200 Carb>n tetmcbloridc 0.5 5 Boazcuo 0.5 5 1.2-Dicblorootbano 0.5 5 Tricbloroothylooo 0.5 5 _p-J)ichlorobenzenc 0.5 75 Unregulated Compouodl Cblorometbaoo 3.0 Bromometbano 1.0 Qlloroetbaoo 0.5 Methylene chloride 0.5 t-l~Dichloroethyleno 0.5 0.1 1,1-Dicbloroctbano 0.5 2.2-Oicbloropropanc 0.5 cis-1,2-Dichloroethylen 0.5 0.07 1,1-Dichloropropeno 0.5 1.,2-Dichloropropanc 0.5 0.005 Dibromometbane 0.5 Toluene 0.5 1.0 1,1,2-Trichloroethane 0.5 Tctrachloroethyleoo 0.5 1,3--Dichloropropane 0.5 Ollorobeo.zenc 0.5 1,1,1.2-Totnu:bloroeth" 0.5 Ethylboozme 0.5 0.7 Total Xylene 0.5 10.0 Sty...,. 0.5 0.1 Bromobenz.cno 0.5 1,2,3-Tricbloropropano 0.5 1,1,2.2-Totnu:bloroeth" 0.5 o-Ollorotolueno 0.5 p-(lllorotoluene 0.5 m-Dichlorobenzeno 0.5 ~Dichlorobenzene 0.5 0.6 t-1.3-0ichloropropcoc 0.5 c--1,3-Dichloropropenc 0.5 Dichlorodifluorometh811 3.0 T ricblorofluoromethane 1.0 Bromochlorometbano 0.5 l:sopropylbcnz.cno 0.5 o--Propylbenzene 0.5 1,3.5-Trimolbylbenzeno 0.5 ten-Butyl benzene 0.5 1.2.4-Trimothylben=o 0.5 sec-ButylbeDzeao 0.5 p-lsopropyltoluooo 0.5 n-Butylbenzeno 0.5 1,2.4-Trichlorobeozene 0.5 Naphthalene 0.5 Hexachlorobutadiene 0.5 I 2.3· Tricblorobenzono 0.5 Trlbalometbaoes Qllorofonn 0.5 Bromodichloromcthano 0.5 Oliorodibromnm......,. 0.5 Bromoform 0.5
Aquifer Characterization
QTt MW-ID 11119m
ND ND ND ND ND ND 0.5 ND
ND ND ND ND ND ND ND ND ND ND ND ND ND ND ND ND ND ND ND ND ND ND ND ND ND ND ND ND ND ND ND ND ND ND ND ND ND ND ND ND ND ND ND ND
ND ND ND ND
December 30, 1994
Tabla 3-12 (coot) QTt' QTt QTt QTt QTt QTt
MW-ID MW-ID MW-ID MW-10 MW-1Ddup MW-10 02108.93 fYZ/26.93 04/15193 05/19193 05/19193 07(rl,93
ND ND ND ND ND ND 0.5 ND ND ND ND ND
4 0.7 1.3 2.8 2.9 2.3 ND ND ND ND ND ND ND ND ND ND ND ND ND ND ND ND ND ND
6 2.3 5.3 7.4 7.7 6.0 ND ND ND ND ND ND
ND ND ND ND ND ND ND ND ND ND ND ND ND ND ND ND ND ND ND ND ND ND ND ND ND ND ND ND ND ND ND ND ND ND ND ND ND ND ND ND ND ND ND ND ND ND ND ND ND ND ND ND ND ND ND ND ND ND ND ND ND ND ND ND ND ND ND ND ND ND ND ND ND ND ND ND ND ND ND ND ND ND ND ND ND ND ND ND ND ND ND ND ND ND ND ND ND ND ND ND ND ND ND ND ND ND ND ND ND ND ND ND ND ND ND ND ND ND ND ND ND ND ND ND ND ND ND ND ND ND ND ND ND ND ND ND ND ND ND ND ND ND ND ND ND ND ND ND ND ND ND ND ND ND ND ND ND ND ND ND ND ND ND ND ND ND ND ND ND ND ND ND ND ND ND ND ND ND ND ND ND ND ND ND ND ND ND ND ND ND ND ND ND ND ND ND ND ND ND ND ND ND ND ND ND ND ND ND ND ND ND ND ND ND ND ND ND ND ND ND ND ND ND ND ND ND ND ND ND ND ND ND ND ND ND ND ND ND ND ND ND ND ND ND ND ND ND ND ND ND ND ND ND ND ND ND ND ND ND ND ND ND ND ND
ND ND ND ND ND ND ND ND ND ND ND ND ND ND ND ND ND ND ND ND ND ND ND ND
3-73
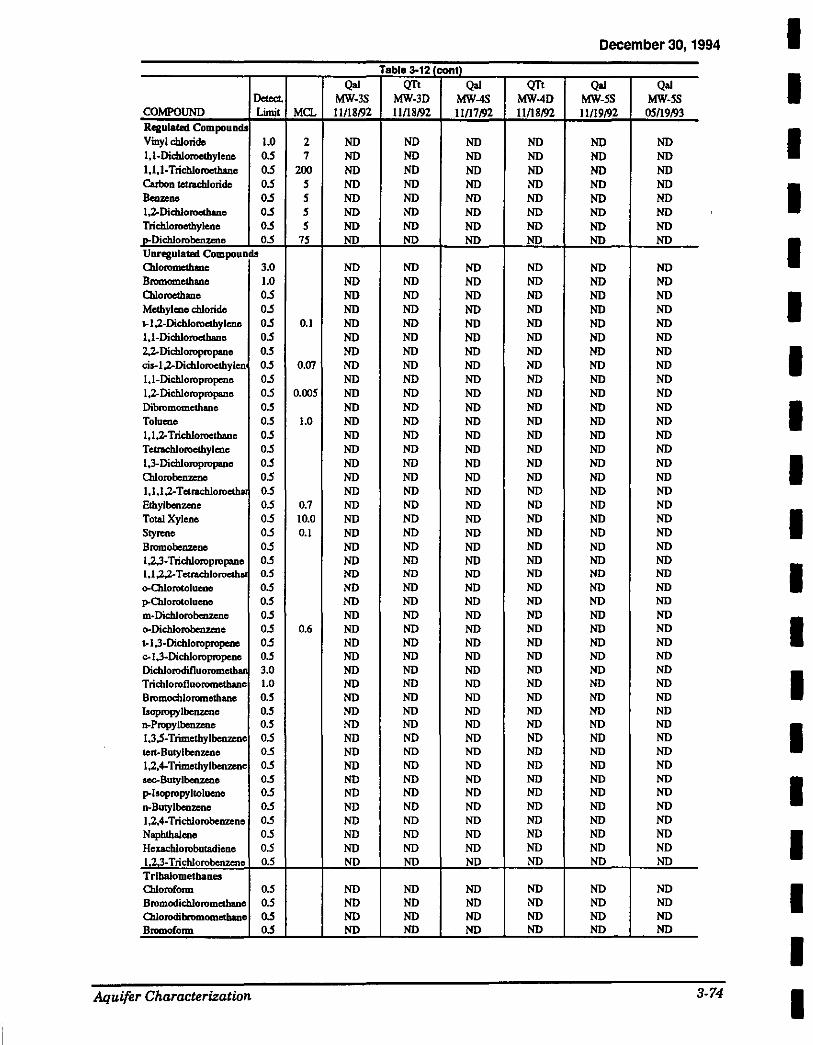
Detect. COMPOUND Limit MCL Regulated Compounds Vinyl chloride 1.0 2 1,1-Dicbloroctbylenc 0.5 7 1,1,1-Tricbloroethano 0.5 200 Cartxm tetrachloride 0.5 5 Benz.enc 0.5 5 1,2.-Dicbloroetbaoo 0.5 5 Trichloroethylene 0.5 5 p-Dichlorobenzcno o.s 1S Unregulated Compounds Chloromethane 3.0 Bromomctb.ano 1.0 Olloroelhaoe 0.5 Metbylc:ne chloride 0.5 ,.1,2-Dicbloroctbylcoo 0.5 0.1 1,1-Dicblorocthano 0.5 2,2-Dicbloropropano 0.5 cis-1.2-Dichlorocthylen 0.5 0.01 1,1-Dicbloropropcoo 0.5 1,2-Dichloropropano 0.5 0.005 Dibromomethanc o.s Toluene o.s 1.0 l,l,Z.. Trichloroctbaoc 0.5 Tetrachloroethylene 0.5 1,3-Dicbloropropanc o.s adorobenzeno 0.5 1,1,1,2-Tctrochlorootb~ 0.5 Ethylbenzcnc 0.5 0.1 Total Xylene o.s 10.0 S~y~<nc o.s 0.1 Bromobenzeoc 0.5 1~-Trichloropropanc 0.5 1,1,2,2-Tctnlchlorootb., o.s <Hlllorotolucno o.s p-Otlorotoluenc 0.5 m-Dichlorobmzcne 0.5 o-Dichlorobe.nzenc 0.5 0.6 t-1.3-Dicbloropropcoo 0.5 c- 1,3-Dichloropropene 0.5 Dichlorodifluorometball 3.0 Trichlorofluorometbane 1.0 Bromochloromethane o.s 1sopropylbenzono o.s n-Propylbenzene o.s 1,3,5-Trimetbylbenzeno o.s tert-Butylbenzcne o.s 1,2,4-Trimetbylbenzeno o.s sec-Butylbenzcno 0.5 p-1sopropyltolucoo 0.5 n-Butylbenzono o.s 1,2,4-Trichlorobeozc:ne o.s Naphthalene 0.5 Hexachlorobutadiene 0.5 1 2,3-Trichlorobenzeno o.s TrlbaJometbaoet Clloroform. 0.5 Bromodic:hloromethanc 0.5 Cltlorodibrom.ometbano 0.5 Bromoform 0.5
AL/uifer Characterization
Table 3-12 tcon1) Qal QTt Qal QTt
MW-3S MW-30 MW-4S MW-40 11/181'}2 11/18192 11/171'}2 11/18/92
ND ND ND ND ND ND ND ND ND ND ND ND ND ND ND ND ND ND ND ND ND ND ND ND ND ND ND ND ND ND ND ND
ND ND ND ND ND ND ND ND ND ND ND ND ND ND ND ND ND ND ND ND ND ND ND ND ND ND ND ND ND ND ND ND NO ND ND ND ND ND ND ND ND ND ND ND ND ND ND ND ND ND ND ND ND ND ND ND ND ND ND ND ND ND ND ND ND ND ND ND ND ND ND ND ND ND ND ND ND ND ND ND ND ND ND ND ND ND ND ND ND ND ND ND ND ND ND ND ND ND ND ND ND ND ND ND ND ND ND ND ND ND ND ND ND ND ND ND ND ND ND ND ND ND ND ND ND ND ND ND ND ND ND ND ND ND ND ND NO ND ND ND ND ND ND ND ND ND ND ND ND ND ND ND ND ND ND ND NO ND ND ND ND ND ND ND NO ND NO NO ND ND ND ND NO ND NO NO
ND ND ND ND ND ND ND ND ND ND ND ND ND ND ND ND
December 30, 1994
Qal Qal MW-5S MW-SS 11/191'}2 05/19/93
ND ND ND ND ND ND ND ND ND ND ND ND ND ND ND ND
ND ND ND ND ND ND ND ND ND ND ND ND ND ND ND ND ND ND ND ND ND ND ND ND ND ND ND ND ND ND ND ND ND ND ND ND ND NO ND ND ND ND ND NO ND ND ND ND ND ND ND ND ND ND ND ND ND ND ND ND ND NO ND ND ND ND ND ND ND ND ND ND ND ND ND ND ND ND ND ND ND ND ND ND ND NO ND ND
ND ND ND ND ND ND ND ND
3-74
I I I I I I I I I I I I I I I I I I I
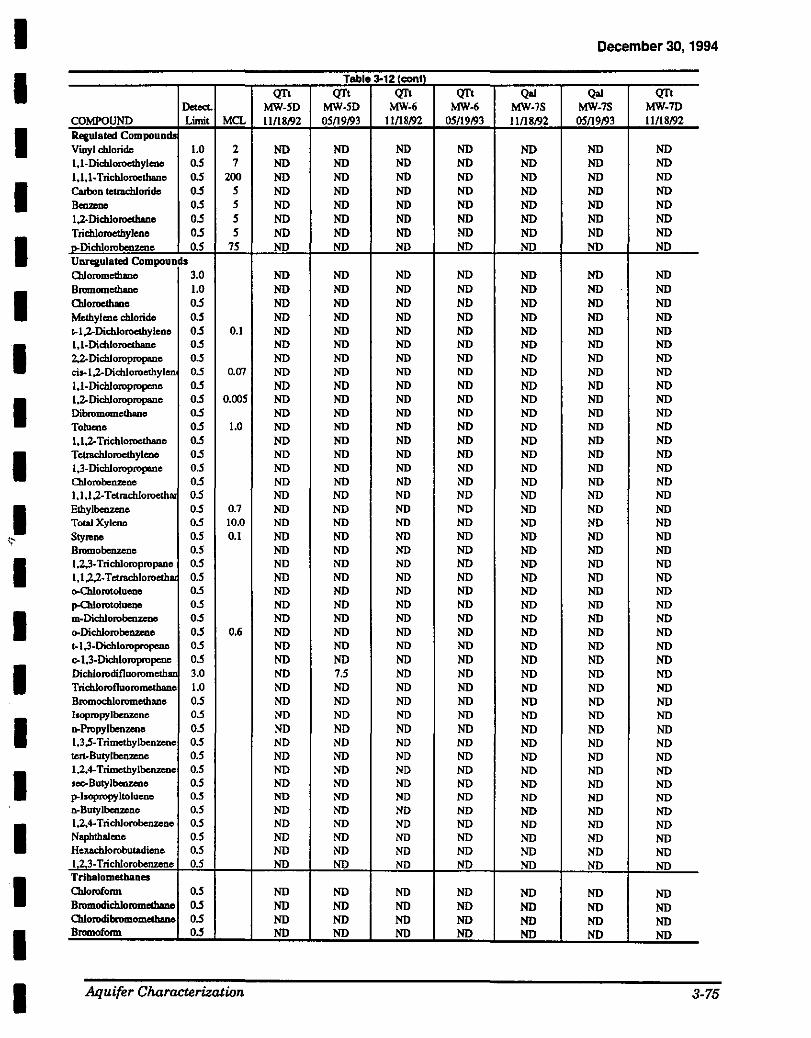
I I I I I I I I I I
<;-
I I I I I I I I I
Detect. COMPOUND Limit MCL Regulated Compounds Vinyl chloride 1.0 2 1,1-Dicbloroethylene 0.5 7 1.1,1· Trichloroethane 0.5 200 Carbon tctmchloridc 0.5 5
Bcozcoe 0.5 5 1,2-Dic:hloroetbanc 0.5 5 Trichloroethylcoe 0.5 5 p..Oicblorobenzene 0.5 75 Unregulated Compounds Olloromcthaoo 3.0 Bromomelbanc 1.0 OJ.Ioroethanc 0.5 Methylene cbloridc 0.5 t..l ;1.-Dichloroetbyleno 0.5 0.1 1,1-Dichloroethanc 0.5 2.2-Dichloropropanc 0.5 ci,..l.2-Dichloroethylen 0.5 0,07 1.1-Dichloropropcnc 0.5 I :z-Dichloropropanc 0.5 0.005 Dibromomctbano 0.5 Toluene 0.5 1.0 l,l.Z.. Trichloroethane 0.5 Tctnchloroctbyleoc 0.5 1,3-Dichloropropanc 0.5 Chlorobenzenc 0.5 1,1,1,2-Tetnu:hloroeth~ 0.5 Elhylbcozcnc 0.5 0.7 Total Xylcno 0.5 10.0 Styrene 0.5 0.1 Bromo benzene 0.5 1,2.3-Trichloropropanc 0.5 1,1,2,2-Tetnu:hloroeth~ 0.5 o--Chlorotolucnc 0.5 p-Ollorotoluene 0.5 m-Dichlorobc:nzcno 0.5 o-Dichlorobenzeo.c 0.5 0.6 t-1,3-Dichloropropcuc 0.5 c-1,3-Dichloropropcno 0.5 Dicblorodifluoromcthan 3.0 Trichlorofluoromethanc 1.0 Bromocb.loromelhane 0.5 Isopropylbenzenc 0.5 n-Propylbenzenc 0.5 1,3.5-Trimethylbenzene 0.5 ten-Botylbon=e 0.5 1,2,4-Trimethylbenzene 0.5 sec-Butylbc:nzeno 0.5 p-Isopropyltoluene 0.5 n-Butylbc:nzcnc 0.5 1,2.+ Trichlorobenzcno 0.5 Naphthalene 0.5 Hexach.lorobuladicnc 0.5 l 2 :3-Trichlorobenzcnc 0.5 Trlbalometbaaes Chlorofo1m 0.5 Bromodichlorometbano 0.5 <lllorodibromomdhanc 0.5 Bromoform 0.5
AL/uifer Characterization
December 30, 1994
Table 3-12 (cont) QTt QTt QTt QTt Qal Qal QTt
MW-5D MW-SD MW-6 MW-6 MW-75 MW-75 MW-7D 11/18192 05M/93 11/18/92 05/19193 11/18/92 05/19193 11/18/92
ND ND ND ND ND ND ND ND ND ND ND ND ND ND ND ND ND ND ND ND ND ND ND ND ND ND ND ND ND ND ND ND ND ND ND ND ND ND ND ND ND ND ND ND ND ND ND ND ND ND ND ND ND ND ND ND
ND ND ND ND ND ND ND ND ND ND ND ND ND ND ND ND ND ND ND ND ND ND ND ND ND ND ND ND ND ND ND ND ND ND ND ND ND ND ND ND ND ND ND ND ND ND ND ND ND ND ND ND ND ND ND ND ND ND ND ND ND ND ND ND ND ND ND ND ND ND ND ND ND ND ND ND ND ND ND ND ND ND ND ND ND ND ND ND ND ND ND ND ND ND ND ND ND ND ND ND ND ND ND ND ND ND ND ND ND ND ND ND ND ND ND ND ND ND ND ND ND ND ND ND ND ND ND ND ND ND ND ND ND ND ND ND ND ND ND ND ND ND ND ND ND ND ND ND ND ND ND ND ND ND ND ND ND ND ND ND ND ND ND ND ND ND ND ND ND ND ND ND ND ND ND ND ND ND ND ND ND ND ND ND ND ND ND ND ND ND ND ND ND ND ND ND ND ND ND ND ND ND ND ND 7.5 ND ND ND ND ND ND ND ND ND ND ND ND ND ND ND ND ND ND ND ND ND ND ND ND ND ND ND ND ND ND ND ND ND ND ND ND ND ND ND ND ND ND ND ND ND ND ND ND ND ND ND ND ND ND ND ND ND ND ND ND ND ND ND ND ND ND ND ND ND ND ND ND ND ND ND ND ND ND ND ND ND ND ND ND ND ND ND ND ND ND ND ND ND ND ND ND ND ND ND ND ND ND ND
ND ND ND ND ND ND ND ND ND ND ND ND ND ND ND ND ND ND ND ND ND ND ND ND ND ND ND ND
3-75
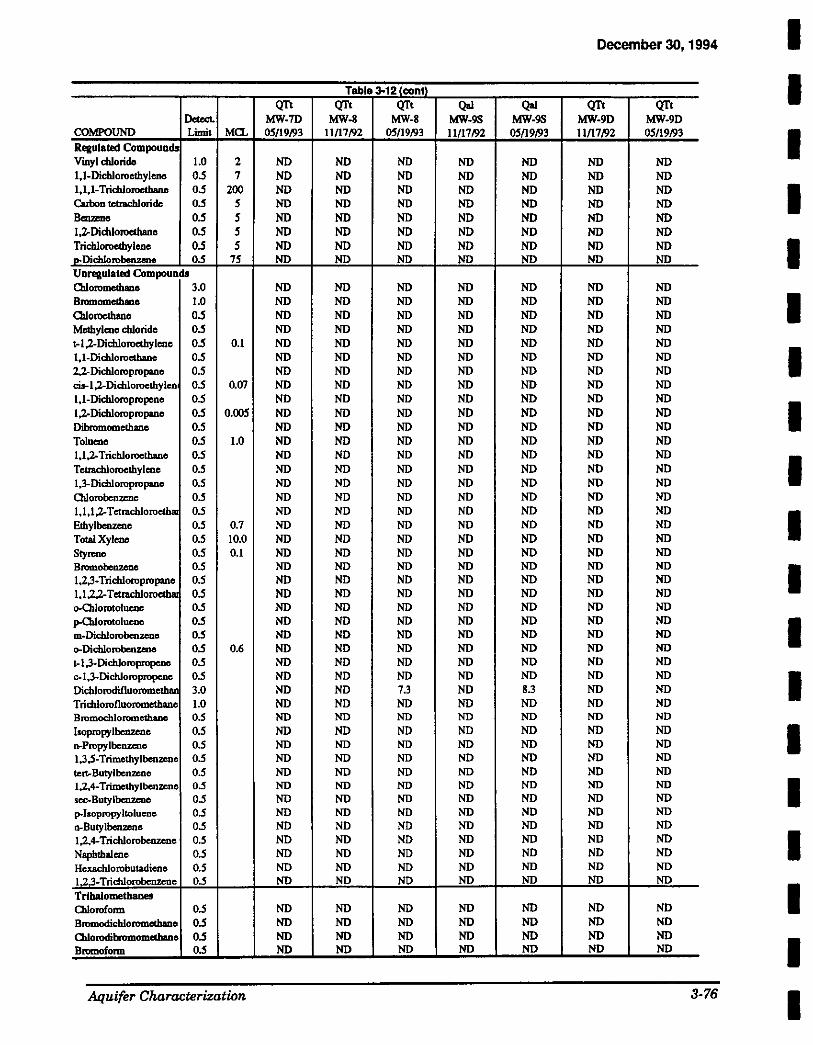
QTt Delect. MW-70
COMPOUND Limit MCL 05/19193 Regulated Compounds Vinyl cblorids 1.0 2 NO 1,1-Dicbloroelhyleoe 0.5 7 NO 1,1,1-Trichloroetbano 0.5 200 NO Carbon tctracbloridc 0.5 5 NO B<ozeoo 0.5 5 NO 1,2.-Dicbloroelhaoe 0.5 5 NO Trichloroethylene 0.5 5 NO o-Dicblorobenzene 0.5 75 NO Unregulated Compounds Cllloromethane 3.0 NO Bromomethane 1.0 NO a.Joroelhaoe 0.5 NO Melhyleoe cbloride 0.5 NO t-1,2.-Dicbloroelhy leoe 0.5 0.1 NO 1,1-Dicbloroethane 0.5 NO 2.2-Dichloropropanc 0.5 NO cis-1 ,2-Dicbloroethylen 0.5 0.07 NO 1, 1-Dichloropropcne 0.5 NO 1,2.-Dichloropropanc 0.5 0.005 NO Dibromomelhane 0.5 NO Toluene 0.5 1.0 NO 1,1_2.. Trichloroethane 0.5 NO Tetracbloroclhylenc 0.5 NO 1,3-Dichloropropanc 0.5 NO Chlorobenzenc 0.5 ND 1,1,1_2.. T etrachloroelhm 0.5 NO Elhylbeozeoe 0.5 0.7 NO Tota!Xyleoe 0.5 !0.0 ND Styronc 0.5 0.1 NO Bromobenzene 0.5 NO 1,2,3-Trichloropropane 0.5 NO 1.1.2.2-Tetrachloroelhm 0.5 NO o--Ollorotolucnc 0.5 NO p-Ollorotolucoc 0.5 NO m-Dicblorobenzeno 0.5 NO o-Dicbloroben.zene 0.5 0.6 NO t-1,3-Dichloropropeoe 0.5 NO c-1,3-Dichloropropcnc 0.5 NO Oichlorodifluoromcth81l 3.0 NO Tricblorofluoromethane 1.0 NO Bromochloromethane o.s NO lsopropylbenzenc 0.5 NO n--Propy lbenzene 0.5 NO 1,3 .S-Trimcthylbenzenc 0.5 NO tert-Butyl benzene 0.5 NO 1.2,4-Trimcthylbenzcnc 0.5 ND sec.Butylbenzenc 0.5 NO p-laopropyltoluenc 0.5 NO o-Butylbenzenc 0.5 NO 1,2.4-Tricblorobenzenc 0.5 NO Napblhalenc 0.5 NO Hcxachlorobutadienc 0.5 NO 1.2.3-Trichlorobcnzcne 0.5 NO Tribalometha~
Chloroform 0.5 NO Bromodichloromethanc 0.5 NO a.Jorodibromomelhaoc 0.5 NO Bromofonn 0.5 NO
Aquifer Characterization
Table 3-121contl QTt QTt Qal
MW-8 MW-8 MW-9S 11/17/92 05/19/93 11/17/92
NO NO NO NO NO NO NO NO NO NO NO NO NO NO NO NO NO NO NO NO NO NO NO NO
NO NO NO NO NO NO NO NO NO NO NO NO NO NO NO NO NO NO NO NO NO NO NO NO NO NO NO NO NO NO NO NO NO NO NO NO NO NO NO NO NO NO NO NO NO NO NO NO NO NO NO NO NO NO NO NO NO NO NO NO NO NO NO NO NO NO NO ND NO NO NO NO NO NO NO NO NO NO ND NO NO ND NO NO ND NO NO ND 7.3 ND ND NO NO ND ND ND NO NO ND ND ND NO NO ND NO NO NO ND ND ND ND ND NO NO NO ND NO NO NO NO NO NO NO NO ND ND NO NO NO ND NO NO
NO NO NO NO NO NO NO NO NO NO NO NO
Qal MW-9S 05/19/93
NO NO NO NO NO NO NO NO
NO NO NO NO NO NO NO NO NO NO NO NO NO NO NO NO NO NO NO NO NO NO NO NO NO NO NO NO NO 8.3 NO ND NO NO NO NO ND ND ND NO NO NO ND ND
NO NO NO NO
December 30, 1994
QTt QTt MW-90 MW-90 11/17/92 05/19/93
NO NO NO NO NO NO NO NO NO NO NO NO NO NO NO NO
NO NO NO NO NO NO NO NO NO NO NO NO NO NO NO NO NO NO NO NO NO NO NO NO NO NO NO NO NO ND NO NO NO NO NO NO NO NO NO NO NO NO NO NO NO NO NO NO NO NO NO NO NO NO NO NO NO NO NO NO NO NO ND ND NO NO ND NO NO NO NO ND ND ND ND NO NO NO NO NO ND NO NO NO ND NO NO ND
NO NO NO NO NO NO NO NO
3-76
I I I I I I I I I I I I I I I I I I I
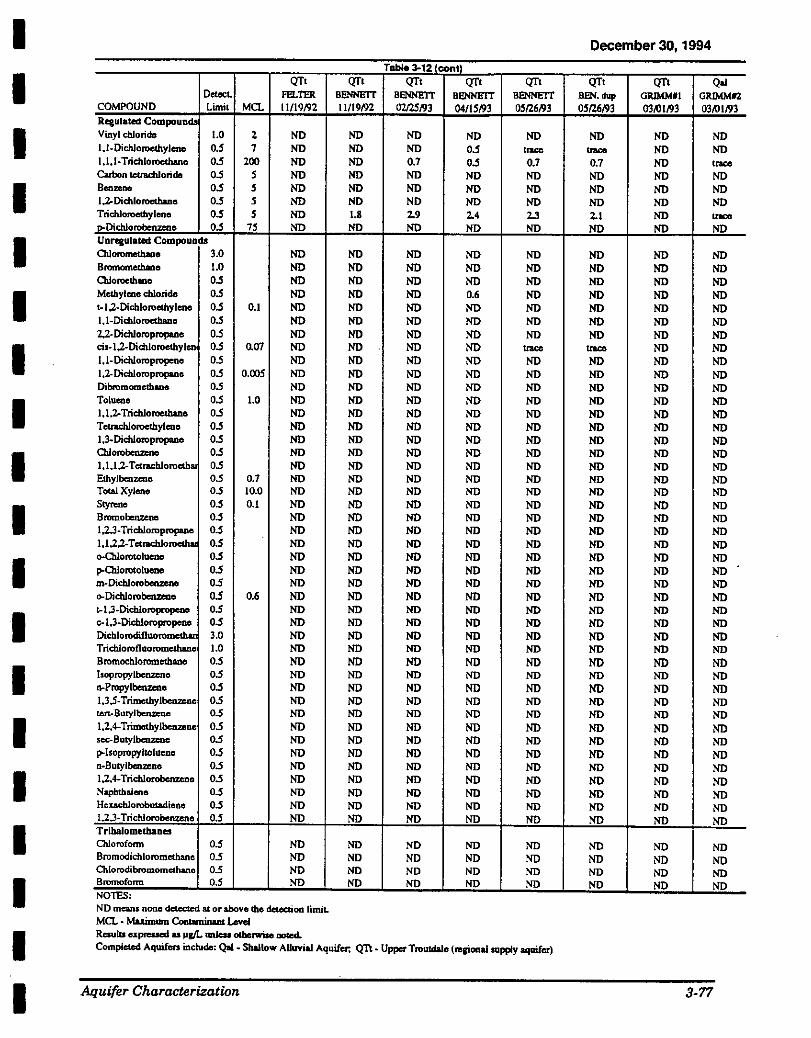
I I I I I I I I I I I I I I I I I I I
QTt Dote<t. FEL'I1lR
COMPOUND Limit MCL 11/19/92 Regulated Compounds Vinyl chloride 1.0 2 NO 1,1-Dichloroelhyleno o.s 7 NO 1,1,1-Trichloroethane o.s 200 NO Catbon tctracb.lorido o.s s NO Benzene o.s s NO 1.2--Dichloroethano o.s s NO Trichloroetby leno o.s s NO n.Dichlorobcnzc:nc o.s 7S NO Unregulated Compounds Ollorometbaoo 3.0 NO BromomethaDe 1.0 NO Ollorocthaoo o.s NO Methylene chloride o.s NO t-1,2-Dichlorocthylcno o.s 0.1 NO 1,1-Dicbloroethanc o.s NO u-Dichloropropano o.s NO cis-1.2-Dicbloroetby len o.s O.o7 NO 1,1-Dichloropropeno o.s NO 1,2-Dichloropropano o.s o.oos NO Dibromomcthano o.s NO Toluene o.s 1.0 NO 1,1.2-Tricb.lorocthane o.s NO T ctrachlorocthylcoo o.s NO 1 ,J. Dichloropropaoo o.s NO Odorobenzcnc o.s NO 1.1.1.2-Tcttachloroc<ba o.s NO Ethylbenzeno o.s 0.7 NO Total Xylene o.s 10.0 NO Styrene o.s 0.1 NO Bromo benzene o.s NO 1.2.3-T richloropropane o.s NO 1.1.2.2-Totnodllo~ o.s NO o--Ctlorotolueno o.s NO p-Ollorotolueno o.s NO m-Dicblorobeozcno o.s NO o-Dichlorobenzeoo o.s 0.6 NO t-1.3-Dichloropropeoo o.s NO ~ 1,3-Dicb.loropropcno o.s NO Oich1otodilluotoDtelb~< 3.0 NO Trichlorofluoromclhanc 1.0 NO Bromochlorometbaoe o.s NO Isopropylbenzcno o.s NO n-Propy1betw:oo o.s NO 1.3 .5-TrimethylbellZCile o.s NO tert-Butylbcnzcnc o.s NO 1,2,4-Trimctbylbenzene o.s NO sec-Butylbc:nzcnc o.s NO p-.lsopropyltolueno o.s NO n-Butylbenzcno o.s NO 1,2,4-Trichlorobenzcno o.s NO Naphthalene o.s NO Hcxacblorobutadieoc o.s NO 1.2.3-Trichlorobenzene o.s NO Tribalomethanes Otloroform o.s NO Bromodichloromethane o.s NO Chlorodibroatomc:thanc o.s NO Bromoform 0.5 NO NOTES. NO means none detected at or above the dctoctioa. limiL MCL • Moaimum Contominaal Lovol Rcsulu: expressed as JIIIL unlcsa otherwise DOted.
Tablo 3-12 cont) QTt QTt QTt QTt
BENNETI' BINII!rr BENNETI' BENNEIT 11/19192 omsm 04/IS/93 OS/26193
NO NO NO NO NO NO o.s .... NO 0.7 o.s 0.7 NO NO NO NO NO NO NO NO NO NO NO NO 1.8 2.9 2.4 2.3 NO NO NO NO
NO NO NO NO NO NO NO NO NO NO NO NO NO NO 0.6 NO NO NO NO NO NO NO NO NO NO NO NO NO NO NO NO .... NO NO NO NO NO NO NO NO NO NO NO NO NO NO NO NO NO NO NO NO NO NO NO NO NO NO NO NO NO NO NO NO NO NO NO NO NO NO NO NO NO NO NO NO NO NO NO NO NO NO NO NO NO NO NO NO NO NO NO NO NO NO NO NO NO NO NO NO NO NO NO NO NO NO NO NO NO NO NO NO NO NO NO NO NO NO NO NO NO NO NO NO NO NO NO NO NO NO NO NO NO NO NO NO NO NO NO NO NO NO NO NO NO NO NO NO NO NO NO NO NO NO NO NO NO NO NO NO NO NO NO NO NO NO NO NO NO NO NO NO NO NO NO NO
NO NO NO NO NO NO NO NO NO NO NO NO NO NO NO NO
Completed Aquifers include: Qal· Shallow AUuvial Aquifer, Qn • Upper Troutdale (regional supply aquifer)
Aquifer Characterization
December 30, 1994
QTt QTt Qal BEN.dup GRIMM II GR!MMI2 OS/26193 03,01,<)3 03,()1/93
NO NO NO ..... NO NO 0.7 NO lni<C
NO NO NO NO NO NO NO NO NO 2.1 NO !lOCO
NO NO NO
NO NO NO NO NO NO NO NO NO NO NO NO NO NO NO NO NO NO NO NO NO .... NO NO NO NO NO NO NO NO NO NO NO NO NO NO NO NO NO NO NO NO NO NO NO NO NO NO NO NO NO NO NO NO NO NO NO NO NO NO NO NO NO NO NO NO NO NO NO NO NO NO NO NO NO NO NO NO NO NO NO NO NO NO NO NO NO NO NO NO NO NO NO NO NO NO NO NO NO NO NO NO NO NO NO NO NO NO NO NO NO NO NO NO NO NO NO NO NO NO NO NO NO NO NO NO NO NO NO NO NO NO
NO NO NO NO NO NO NO NO NO NO NO NO
3-77
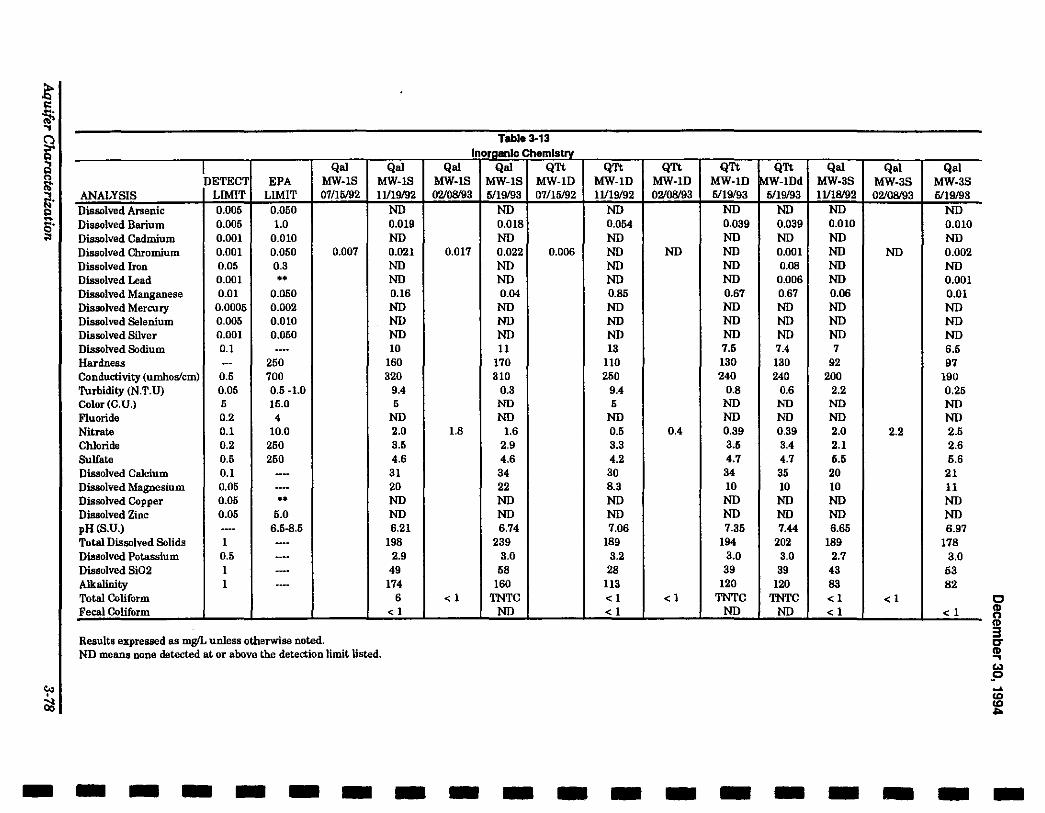
Table 3-13 lnoraanlc Chemlstrv
!DETECT Qal Qal Qal Qal QTt QTt QTt QTt QTt Qal Qal Qal
EPA MW-1S MW-1S MW-1S MW-1S MW-lD MW-lD MW-lD MW-lD MW-lDd MW-3S MW-3S MW-3S ANALYSIS LIMIT LIMIT 07/16192 1!119/92 02/08/93 6119/93 07/16192 1!119/92 02/08193 6119/93 6119/93 1!118192 02/08/93 6119/93 Dissolved Arsenic 0.005 0.050 ND ND ND ND ND ND ND Dissolved Barium 0.005 1.0 0.019 0.018 0.054 0.039 0.039 0.010 0.010 Dissolved Cadmium 0.001 0.010 ND ND ND ND ND ND ND Dissolved Chromium 0.001 0.050 0.007 0.021 0.017 0.022 0.006 ND ND ND 0.001 ND ND 0.002 Dissolved Iron 0.05 0.3 ND ND ND ND 0.08 ND ND Dissolved Lead 0.001 •• ND ND ND ND 0.006 ND 0.001 Dissolved Manganese 0.01 0.050 0.16 0.04 0.85 0.67 0.67 0.06 0.01 Dissolved Mercury 0.0005 0.002 ND ND ND ND ND ND ND Dissolved Selenium 0.005 0.010 ND ND ND ND ND ND ND Dissolved Silver 0.001 0.050 ND ND ND ND ND ND ND Dissolved Sodium 0.1 ~--· 10 11 13 7.5 7.4 7 6.5 Hardness --- 250 160 170 110 130 130 92 97 Conductivity (umhoslcm) 0.5 700 320 310 250 240 240 200 190 Turbidity (N.T.U) 0.05 0.5-1.0 9.4 0.3 9.4 0.8 0.6 2.2 0.25 Color (C.U.) 5 15.0 5 ND 5 ND ND ND ND Fluoride 0.2 4 ND ND ND ND ND ND ND Nitrate 0.1 10.0 2.0 1.8 1.6 0.5 0.4 0.39 0.39 2.0 2.2 2.5 Chloride 0.2 250 3.5 2.9 3.3 3.5 3.4 2.1 2.6 Sulfate 0.5 250 4.6 4.6 4.2 4.7 4.7 5.5 5.6 Dissolved Calcium 0.1 --- 31 34 30 34 35 20 21 Dissolved Magnesium 0.05 -- 20 22 8.3 10 10 10 11 Dissolved Copper 0.05 •• ND ND ND ND ND ND ND Dissolved Zinc 0.05 5.0 ND ND ND ND ND ND ND pH(S.U.) --- 6.5-8.5 6.21 6.74 7.06 7.35 7.44 6.65 6.97 Total Dissolved Solids 1 ---- 198 239 189 194 202 189 178 Dissolved Potassium 0.5 --- 2.9 3.0 3.2 3.0 3.0 2.7 3.0 Dissolved Si02 1 --- 49 58 28 39 39 43 53 Alkolinity 1 --- 174 160 113 120 120 83 82 Total Coliform 6 <1 TNTC <1 <1 TNTC TNTC <1 <1 Fecal Coliform <1 ND < 1 ND ND <1 < 1
Results expressed as mgiL unless otherwise noted. ND means none detected at or above the detection limit listed.
- - - - - -- - - - - - - - - - - - -
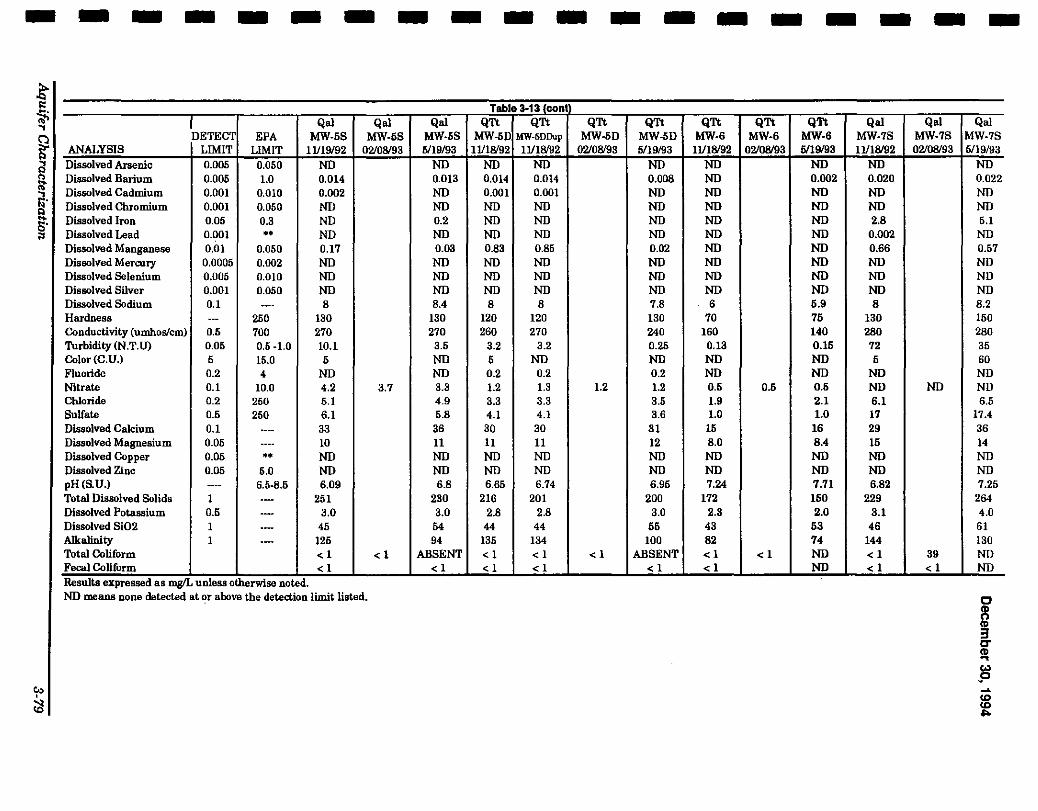
-- - - -- - - - - - - -- - - - - -Table 3-13 (coni
~ETECT Qal Qal Qal QTt QTt QTt QTt QTt QTt QTt Qal Qal Qal EPA MW-5S MW-5S MW-5S MW-5D MW-5DDup MW-5D MW-5D MW-6 MW-6 MW-6 MW-7S MW-7S MW-7S
ANALYSIS LIMIT LIMIT 11/19192 02/08193 5/19/93 11/18192 11/18192 02108193 5/19/93 11/18192 02/08193 5/19/93 11/18192 02/08193 5/19/93 Dissolved Arsenic 0.005 0.050 ND ND ND ND ND ND ND ND ND Dissolved Barium 0.005 1.0 0.014 0.013 0.014 0.014 0.006 ND 0.002 0.020 0.022 Dissolved Cadmium 0.001 0.010 0.002 ND 0.001 0.001 ND ND ND ND ND Dissolved Chromium 0.001 0.050 ND ND ND ND ND ND ND ND ND Dissolved Iron 0.05 0.3 ND 0.2 ND ND ND ND ND 2.8 5.1 Dissolved Lead 0.001 •• ND ND ND ND ND ND ND 0.002 ND Dissolved Manganese 0,01 0.050 0.17 0.03 0.83 0.85 0.02 ND ND 0.66 0.57 Dissolved Mercury 0.0005 0.002 ND ND ND ND ND ND ND ND ND Dissolved Selenium 0.005 0.010 ND ND ND ND ND ND ND ND ND Dissolved Silver 0.001 0.050 ND ND ND ND ND ND ND ND ND Dissolved Sodium 0.1 ·-· 8 8.4 8 8 7.8 6 5.9 8 8.2 Hardness --- 250 130 130 120 120 130 70 75 130 150 Conductivity (umhos/cm) 0.5 700 270 270 260 270 240 160 140 280 280 Turbidity(N.T.U) 0.05 0.5-1.0 10.1 3.5 3.2 3.2 0.25 0.13 0.15 72 35 Color(C.U.) 5 15.0 5 ND 5 ND ND ND ND 5 60 Fluoride 0.2 4 ND ND 0.2 0.2 0.2 ND ND ND ND Nitrate 0.1 10.0 4.2 3.7 3.3 1.2 1.3 1.2 1.2 0.5 0.5 0.5 ND ND ND Chloride 0.2 250 5.1 4.9 3.3 3.3 3.5 1.9 2.1 6.1 6.5 Sulfate 0.5 250 6.1 5.8 4.1 4.1 3.6 1.0 1.0 17 17.4 Dissolved Calcium 0.1 ·--- 33 36 30 30 31 15 16 29 36 Dissolved Magnesium 0.05 ---- 10 11 11 11 12 8.0 8.4 15 14 Dissolved Copper 0.05 •• ND ND ND ND ND ND ND ND ND Dissolved Zinc 0.05 5.0 ND ND ND ND ND ND ND ND ND pH(S.U.) --- 6.5-8.5 6.09 6.8 6.65 6.74 6.95 7.24 7.71 6.82 7.25 Total Dissolved Solids 1 ---- 251 230 216 201 200 172 150 229 264 Dissolved Potassium 0.5 ---· 3.0 3.0 2.8 2.8 3.0 2.3 2.0 3.1 4.0 Dissolved Si02 1 .... 45 54 44 44 55 43 53 46 61 Alkalinity 1 ---- 125 94 135 134 100 82 74 144 130 Total Coliform <1 <1 ABSENT <1 <I <1 ABSENT <1 <1 ND <1 39 ND Fecal Coliform <1 <1 <1 <1 <1 <1 ND <I <1 ND Results expressed as mgiL unless otherWise noted. ND means none detected at or above the detection limit listed.
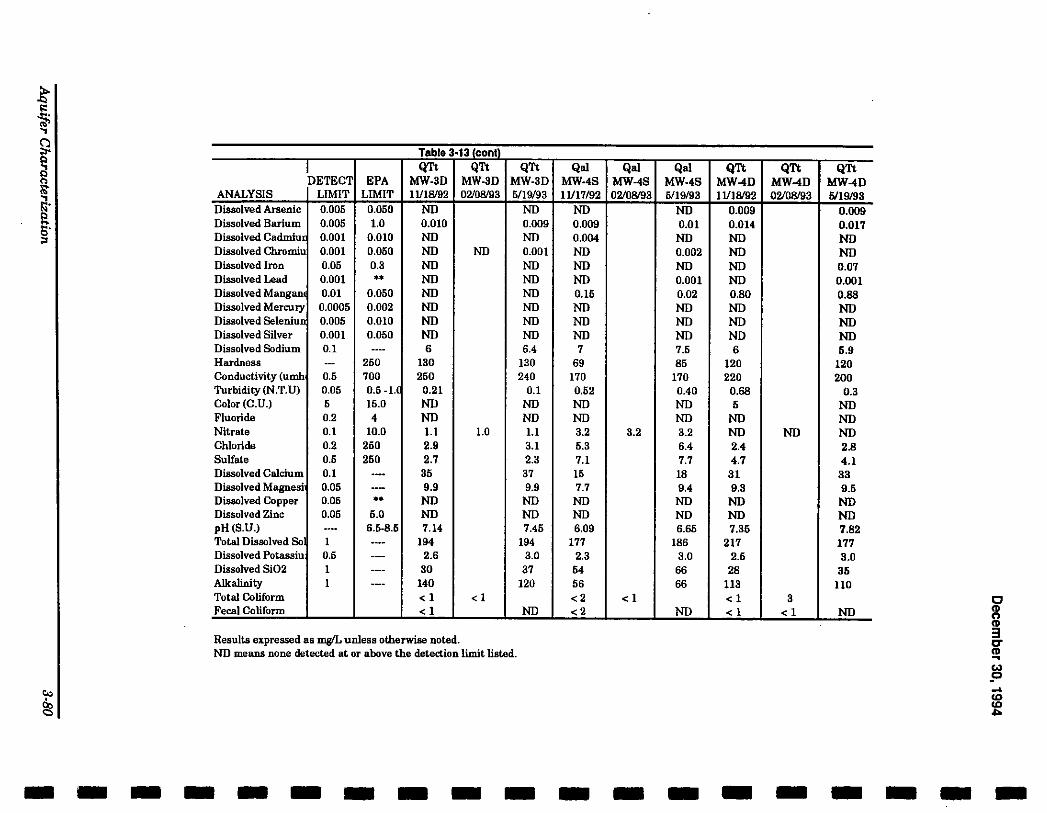
Table 3·13 (cont)
~ETECT QTt QTt QTt Qol Qol Qol QTt QTt QTt EPA MW-3D MW-3D MW-3D MW-48 MW-48 MW-48 MW-4D MW-4D MW-4D
ANALYSIS LIMIT LIMIT 11118/92 02/08193 5/19/93 11117/92 02/08193 5/19/93 11118/92 02/08193 5/18193 Dissolved Arsenic 0.005 0.050 ND ND ND ND 0.009 0.009 Dissolved Barium 0.005 1.0 0.010 0.009 0.009 0.01 0.014 0.017 Dissolved Cadmiu 0.001 0.010 ND ND 0.004 ND ND ND Dissolved Chromiu 0.001 0.050 ND ND 0.001 ND 0.002 ND ND Dissolved Iron 0.05 0.3 ND ND ND ND ND O.D7 Dissolved Lead 0.001 •• ND ND ND 0.001 ND 0.001 Dissolved Mangan 0.01 0.050 ND ND 0.15 0.02 0.80 0.88 Dissolved Mercury 0.0005 0.002 ND ND ND ND ND ND Dissolved Seleniuo 0.005 0.010 ND ND ND ND ND ND Dissolved Silver 0.001 0.050 ND ND ND ND ND ND Dissolved Sodium 0.1 ---- 6 6.4 7 7.5 6 5.9 Hardness --- 250 130 130 69 85 120 120 Conductivity (umh 0.5 700 260 240 170 170 220 200 Turbidity(N.T.U) 0.06 0.6 -1. 0.21 0.1 0.62 0.40 0.88 0.3 Color (C.U.) 5 15.0 ND ND ND ND 6 ND Fluoride 0.2 4 ND ND ND ND ND ND Nitrate 0.1 10.0 1.1 1.0 1.1 3.2 3.2 3.2 ND ND ND Chloride 0.2 260 2.9 3.1 5.3 6.4 2.4 2.8 Sulfate 0.5 260 2.7 2.3 7.1 7.7 4.7 4.1 Dissolved Calcium 0.1 --- 35 37 15 18 31 33 Dissolved Magnesi 0.05 -- 9.9 9.9 7.7 9.4 9.3 9.6 Dissolved Copper 0.06 •• ND ND ND ND ND ND Dissolved Zinc 0.05 6.0 ND ND ND ND ND ND pH(S.U.) ---- 6.5-8.6 7.14 7.45 6.09 6.66 7.35 7.82 Total Dissolved So I ---- 194 194 177 186 217 177 Dissolved Potassiu 0.6 -- 2.6 3.0 2.3 3.0 2.6 3.0 Dissolved Si02 1 ---- 30 37 54 66 28 35 Alkalinity I ---- 140 120 56 66 113 110 Total Coliform <1 <1 <2 <1 <1 3 Fecal Coliform <1 ND <2 ND < 1 <1 ND
Results expressed as mgiL unless otherwise noted. ND means none detected at or above the detection limit listed.
- - - - - - - - - - - - - - - - - - -
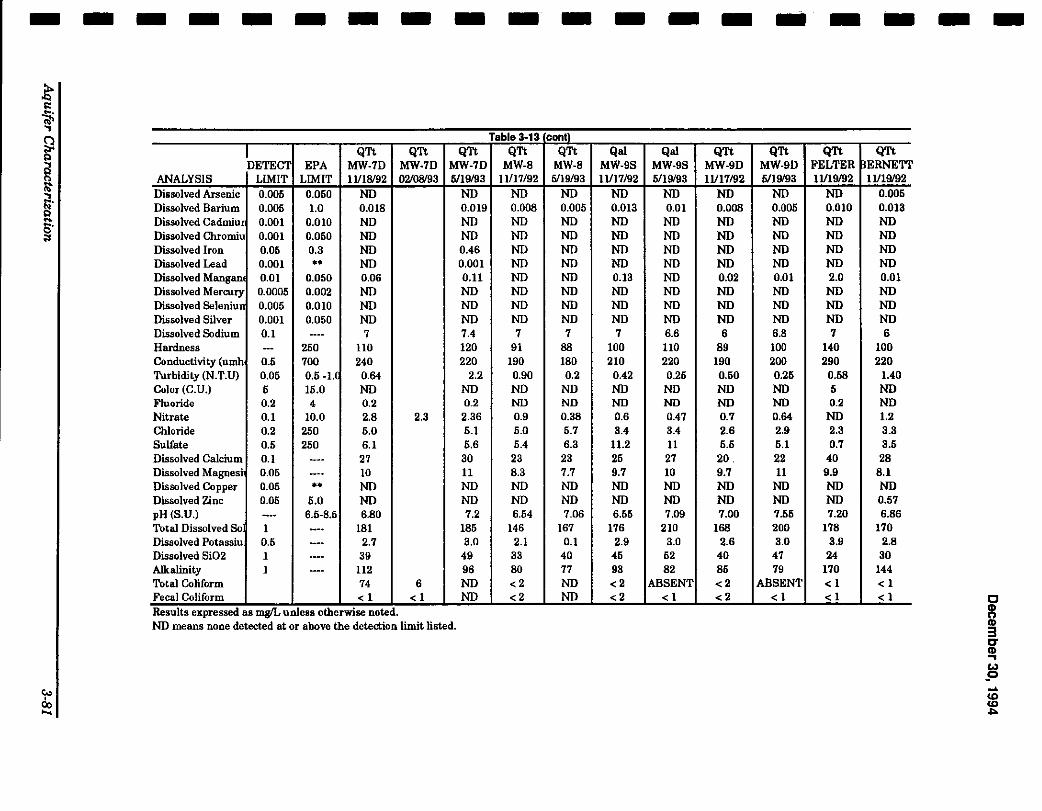
- - - - - -- - - -·-Table 3-13 contl
IDETECT QTt QTt QTt QTt QTt
EPA MW-7D MW-7D MW-7D MW-8 MW-8 ANALYSIS LIMIT LIMIT IJI1B/92 02/0B/93 6/19193 11/17/92 5/19/93 Dissolved Arsenic 0.005 0.050 ND ND ND ND Dissolved Barium 0.005 1.0 O.ot8 0.019 0.008 0.005 Dissolved Cadmiu 0.001 0.010 ND ND ND ND Dissolved Chromiu 0.001 0.050 ND ND ND ND Dissolved Iron 0.05 0.3 ND 0.46 ND ND Dissolved Lead 0.001 •• ND 0.001 ND ND Dissolved Mangan O.Gl 0.050 0.06 0.11 ND ND Dissolved Mercury 0.0005 0.002 ND ND ND ND Dissolved Seleniun 0.005 0.010 ND ND ND ND Dissolved Silver 0.001 0.050 ND ND ND ND Dissolved Sodium 0.1 --- 7 7.4 7 7 Hardness -- 250 110 120 91 88 Conductivity (umh 0.5 700 240 220 190 180 Turbidity (N.T.U) 0.05 0.5 -1. 0.64 2.2 0.90 0.2 Color (C.U.) 5 15.0 ND ND ND ND Fluoride 0.2 4 0.2 0.2 ND ND Nitrate 0.1 10.0 2.8 2.3 2.36 0.9 0.38 Chloride 0.2 250 5.0 5.1 5.0 5.7 Sulfate 0.5 250 6.1 5.6 5.4 6.3 Dissolved Calcium 0.1 ---- 27 30 23 23 Dissolved Magnesi 0.05 ---- 10 11 8.3 7.7 Dissolved Copper 0.05 •• ND ND ND ND Dissolved Zinc 0.05 5.0 ND ND ND ND pH (S.U.) ---- 6.5-8.5 6.80 7.2 6.54 7.06 Total Dissolved So 1 ---- 181 185 146 167 Dissolved Potassiu 0.5 ---- 2.7 3.0 2.1 0.1 Dissolved Si02 1 ---- 39 49 33 40 Alkalinity 1 ---- 112 96 80 77 Total Coliform 74 6 ND <2 ND Fecal Coliform <1 <1 ND <2 ND Results expressed as mWL unless otherWise noted. ND means none detected at or above the detection limit listed.
- --Qal Qal QTt
MW-9S MW-9S MW-9D lll17/92 5/19/93 11117/92
ND ND ND 0.013 O.ot 0.008 ND ND ND ND ND ND ND ND ND ND ND ND 0.13 ND 0.02 ND ND ND ND ND ND ND ND ND 7 6.6 6
100 110 89 210 220 190
0.42 0.25 0.50 ND ND ND ND ND ND 0.6 0.47 0.7 3.4 3.4 2.6
11.2 11 5.5 25 27 20. 9.7 10 9.7 ND ND ND ND ND ND 6.55 7.09 7.00
176 210 168 2.9 3.0 2.6
45 52 40 93 82 85 <2 ABSENT <2 <2 <1 <2
- -QTt QTt
MW-9D FELTER 6/19/93 11119/92
ND ND 0.005 0.010 ND ND ND ND ND ND ND ND O.Dl 2.0 ND ND ND ND ND ND 6.8 7 100 140 200 290 0.25 0.58 ND 5 ND 0.2 0.64 ND 2.9 2.3 5.1 0.7 22 40 11 9.9
ND ND ND ND 7.55 7.20 200 178 3.0 3.9
47 24 79 170
ABSENT <1 <1 <1
-QTt
~ERNETT 11119192
0.005 0.013 ND ND ND ND 0.01 ND ND ND 6
100 220
1.40 ND ND 1.2 3.3 3.5 28
8.1 ND 0.57 6.86
170 2.8
30 144 <1 <1
- -
c g 3 17 CD ....
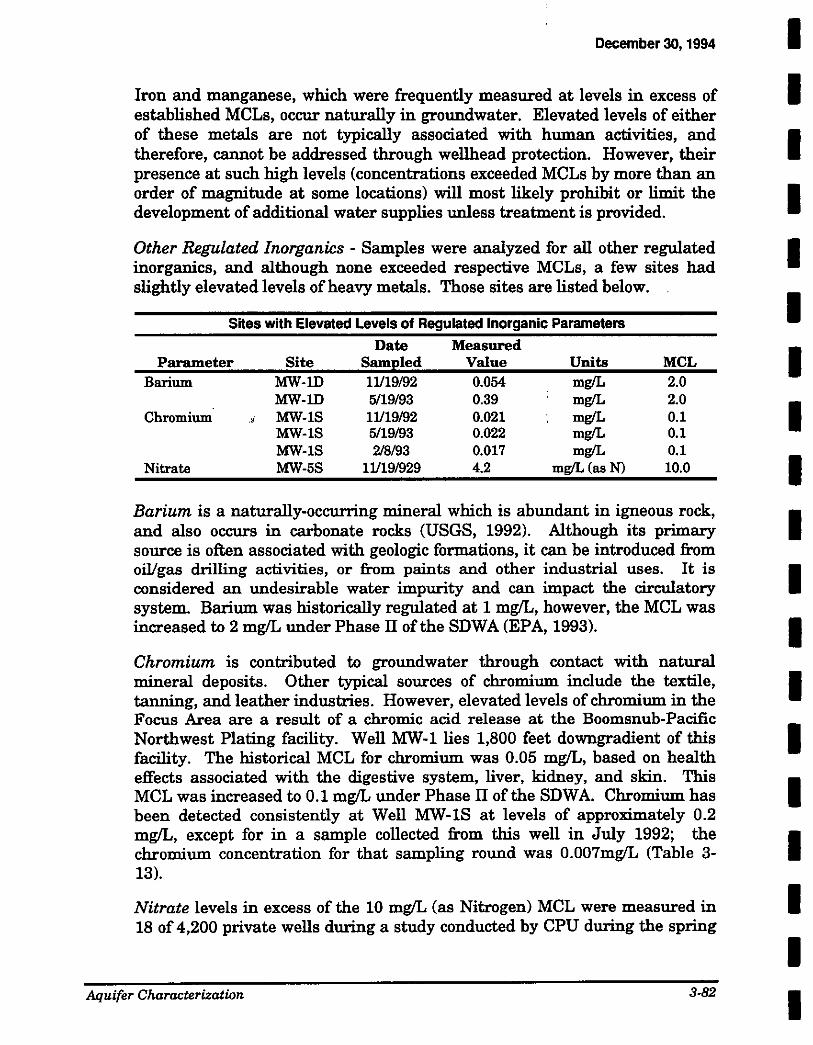
December 30, 1994
Iron and manganese, which were frequently measured at levels in excess of established MCLs, occur naturally in groundwater. Elevated levels of either of these metals are not typically associated with human activities, and therefore, cannot be addressed through wellhead protection. However, their presence at such high levels (concentrations exceeded MCLs by more than an order of magnitude at some locations) will most likely prohibit or limit the development of additional water supplies unless treatment is provided.
Other Regulated Inorganics - Samples were analyzed for all other regulated inorganics, and although none exceeded respective MCLs, a few sites had slightly elevated levels of heavy metals. Those sites are listed below.
Sites with Elevated Levels of Regulated Inorganic Parameters
Date Measured Parameter Site Sampled Value Units MCL
Barium MW-lD 11/19/92 0.054 mg/L 2.0 MW-lD 5119/93 0.39 mg/L 2.0
Chromium .i MW-18 11/19/92 0.021 mg/L 0.1 MW-18 5/19/93 0.022 mg/L 0.1 MW-18 218193 0.017 mg/L 0.1
Nitrate MW-58 11/19/929 4.2 mg/L(as N) 10.0
Barium is a naturally-occurring mineral which is abundant in igneous rock, and also occurs in carbonate rocks (USGS, 1992). Although its primary source is often associated with geologic formations, it can be introduced from oil/gas drilling activities, or from paints and other industrial uses. It is considered an undesirable water impurity and can impact the circulatory system. Barium was historically regulated at 1 mg/L, however, the MCL was increased to 2 mg/L under Phase II of the SDWA (EPA, 1993).
Chromium is contributed to groundwater through contact with natural mineral deposits. Other typical sources of chromium include the textile, tanning, and leather industries. However, elevated levels of chromium in the Focus Area are a result of a chromic acid release at the Boomsnub-Pacific Northwest Plating facility. Well MW-1lies 1,800 feet downgradient of this facility. The historical MCL for chromium was 0.05 mg/L, based on health effects associated with the digestive system, liver, kidney, and skin. This MCL was increased to 0.1 mg/L under Phase II of the SDWA. Chromium has been detected consistently at Well MW-1S at levels of approximately 0.2 mg/L, except for in a sample collected from this well in July 1992; the chromium concentration for that sampling round was 0.007mg/L (Table 3-13).
Nitrate levels in excess of the 10 mg/L (as Nitrogen) MCL were measured in 18 of 4,200 private wells during a study conducted by CPU during the spring
Aquifer Characterization 3-82
I I I I I I I I I I I I I I I I I I I
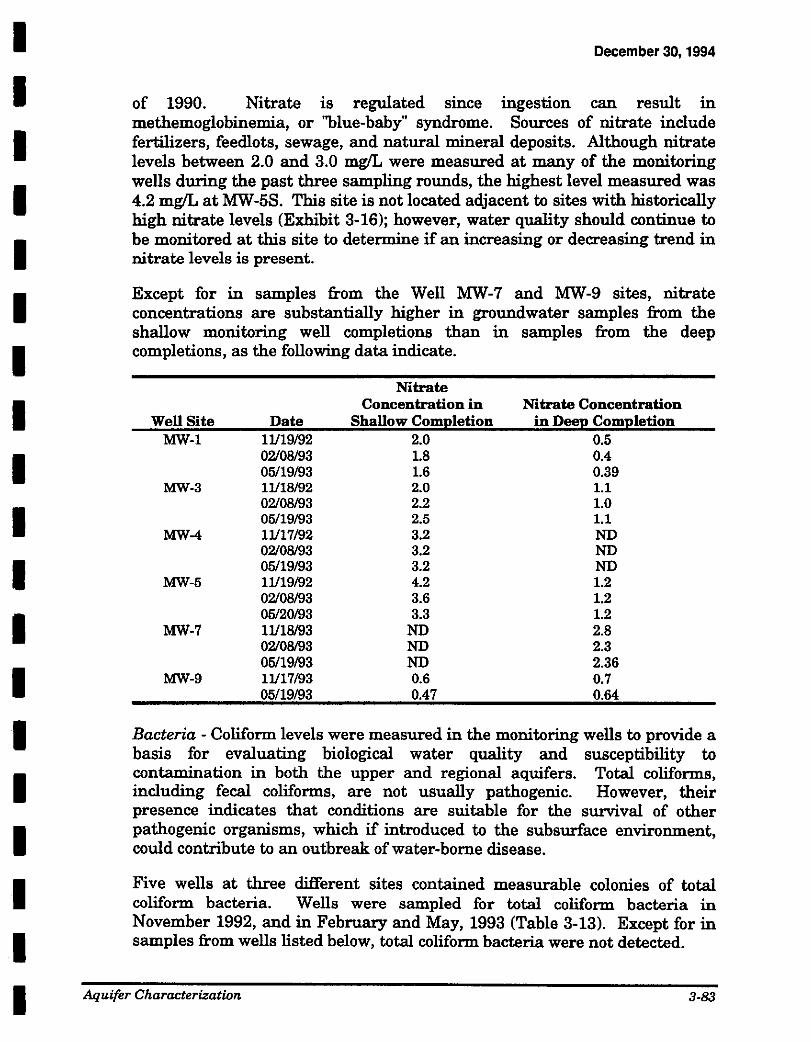
I I I I I I I I I I I I I I I I I I I
December 30, 1994
of 1990. Nitrate is regulated since ingestion can result in methemoglobinemia, or 'blue-baby" syndrome. Sources of nitrate include fertilizers, feedlots, sewage, and natural mineral deposits. Although nitrate levels between 2.0 and 3.0 mg/L were measured at many of the monitoring wells during the past three sampling rounds, the highest level measured was 4.2 mg/L at MW-58. This site is not located adjacent to sites with historically high nitrate levels (Exhibit 3-16); however, water quality should continue to be monitored at this site to determine if an increasing or decreasing trend in nitrate levels is present.
Except for in samples from the Well MW-7 and MW-9 sites, nitrate concentrations are substantially higher in groundwater samples from the shallow monitoring well completions than in samples from the deep completions, as the following data indicate.
Nitrate Concentration in Nitrate Concentration
Well Site Date Shallow Completion in Deep Completion MW-1 1l/19/92 2.0 0.5
02/08/93 1.8 0.4 05/19/93 1.6 0.39
MW-3 1l/18/92 2.0 1.1 02/08/93 2.2 1.0 05/19/93 2.5 1.1
MW-4 1l/17/92 3.2 ND 02/08/93 3.2 ND 05/19/93 3.2 ND
MW-5 1l/19/92 4.2 1.2 02/08/93 3.6 1.2 05/20/93 3.3 1.2
MW-7 ll/18/93 ND 2.8 02/08193 ND 2.3 05/19/93 ND 2.36
MW-9 1l/17/93 0.6 0.7 05/19/93 0.47 0.64
Bacteria- Coliform levels were measured in the monitoring wells to provide a basis for evaluating biological water quality and susceptibility to contamination in both the upper and regional aquifers. Total coliforms, including fecal coliforms, are not usually pathogenic. However, their presence indicates that conditions are suitable for the survival of other pathogenic organisms, which if introduced to the subsurface environment, could contribute to an outbreak of water-borne disease.
Five wells at three different sites contained measurable colonies of total coliform bacteria. Wells were sampled for total coliform bacteria in November 1992, and in February and May, 1993 (Table 3-13). Except for in samples from wells listed below, total coliform bacteria were not detected.
Aquifer Characterization 3-83
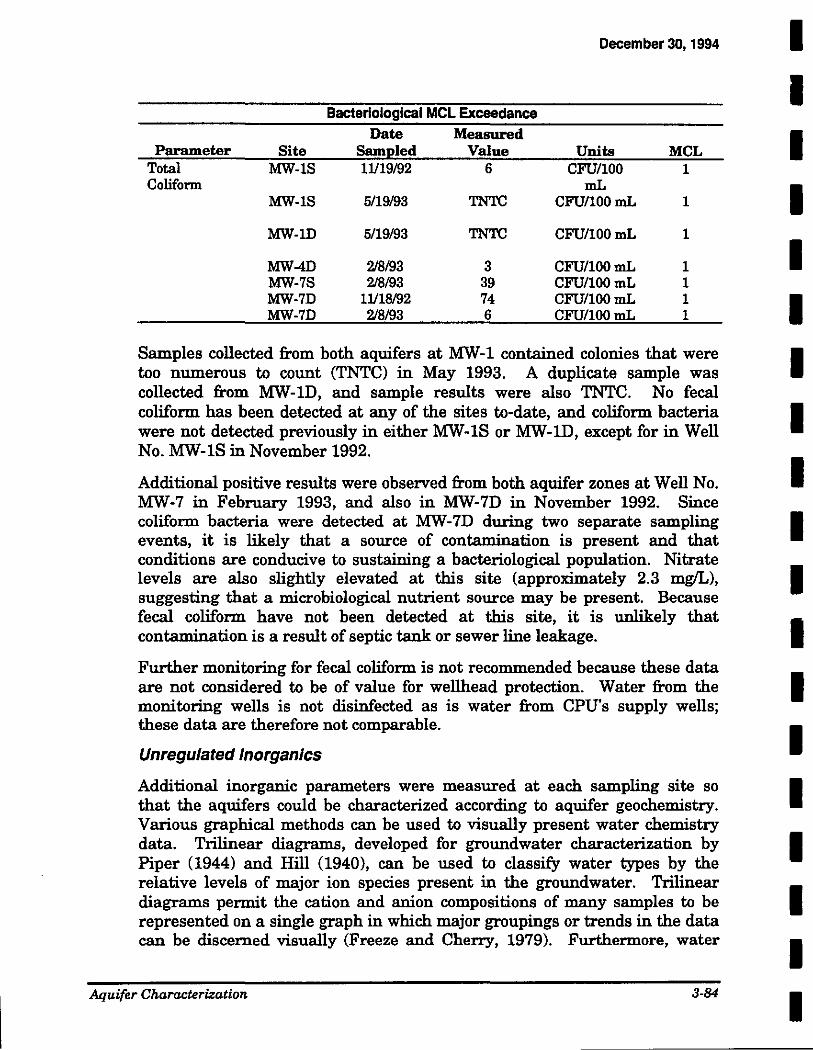
December 30, 1994
Bacteriological MCL Exceedance
Date Measured Parameter Site Sampled Value Units MCL
Total MW-18 11119/92 6 CFU/100 1 Coliform mL
MW-18 5/19/93 TNTC CFU/100mL 1
MW-lD 5/19/93 TNTC CFU/100mL 1
MW-4D 2/8/93 3 CFU/100mL 1 MW-78 2/8/93 39 CFU/100mL 1 MW-7D 11118/92 74 CFU/100mL 1 MW-7D 2/8/93 6 CFU/100mL 1
Samples collected from both aquifers at MW-1 contained colonies that were too numerous to count (TNTC) in May 1993. A duplicate sample was collected from MW-1D, and sample results were also TNTC. No fecal coliform has been detected at any of the sites to-date, and coliform bacteria were not detected previously in either MW-1S or MW-1D, except for in Well No. MW-1S in November 1992.
Additional positive results were observed from both aquifer zones at Well No. MW-7 in February 1993, and also in MW-7D in November 1992. Since coliform bacteria were detected at MW-7D during two separate sampling events, it is likely that a source of contamination is present and that conditions are conducive to sustaining a bacteriological population. Nitrate levels are also slightly elevated at this site (approximately 2.3 mg/L), suggesting that a microbiological nutrient source may be present. Because fecal coliform have not been detected at this site, it is unlikely that contamination is a result of septic tank or sewer line leakage.
Further monitoring for fecal coliform is not recommended because these data are not considered to be of value for wellhead protection. Water from the monitoring wells is not disinfected as is water from CPU's supply wells; these data are therefore not comparable.
Unregulated lnorganics
Additional inorganic parameters were measured at each sampling site so that the aquifers could be characterized according to aquifer geochemistry. Various graphical methods can be used to visually present water chemistry data. Trilinear diagrams, developed for groundwater characterization by Piper (1944) and Hill (1940), can be used to classify water types by the relative levels of major ion species present in the groundwater. Trilinear diagrams permit the cation and anion compositions of many samples to be represented on a single graph in which major groupings or trends in the data can be discerned visually (Freeze and Cherry, 1979). Furthermore, water
Aquifer Characterization 3·84
I I I I I I I I I I I I I I I I I I I
I I I I I I I
•• I I I I I I I I I I I
December 30, 1994
types can be distinguish~d on the basis of ion percentages and can be easily interpreted from trilinear diagrams. Exhibit 3-17 shows the relationship between water type designations and major ion percentages.
Exhibit 3-18 shows the cation and anion composition (by percentage) for each sampling location. The diagram suggests that the two aquifers are similar in chemical composition and no major trends exist between the upper (Pleistocene Deposits) and regional (Upper Troutdale) aquifers. All of the water samples would be classified as having no singularly dominant cation species, although calcium and magnesium levels are present at high enough levels to impart a moderate degree of hardness to the water. The bicarbonate domain strongly dominates the anions present in the water, resulting in a moderate to high level of alkalinity.
Although the parameters monitored for aquifer characterization are not typically associated with anthropogenic impacts on water quality, trilinear diagrams can be used to map regional water quality characteristics, and can be especially useful for documenting trends or for predicting the result of mixing two waters. Consistency of water chemistry can be observed over time, with natural changes in water levels, or as a result of human activities.
Regulated and Unregulated VOCs
VOCs are regulated under the SDW A. Long-term monitoring for VOCs may provide an early warning that contaminants are migrating toward a production well. Investigations to define contaminant plumes located downgradient of the Airco facility on N. E. 78th Street are currently underway.
VOC samples were collected from each monitoring well and from three existing private wells to assess current water quality conditions. Trichloroethane and trichlorethylene were most frequently detected, and trichloroethylene concentrations exceeded the established MCL of 5.0 p!L at site MW-1D during repeated sampling events. Exhibit 3-19 shows the locations of sites with detectable levels ofVOCs.
Most of the documented VOC contamination has occurred at Well MW-1 (in both the shallow and deep installations) and the Bennett domestic well. These wells are located within one-half mile (downgradient) of the Airco facility. Results of analyses for trichloroethylene indicate that contamination from human activities has rendered the groundwater in the vicinity of these wells unfit for human consumption. Although other contaminants have been detected, levels were below their respective MCLs. CPU supply Wells 5, 7, 16, and 23 are located hydraulically down-gradient of MW-1 and the Airco facility.
Af[uifer Characterization 3-85
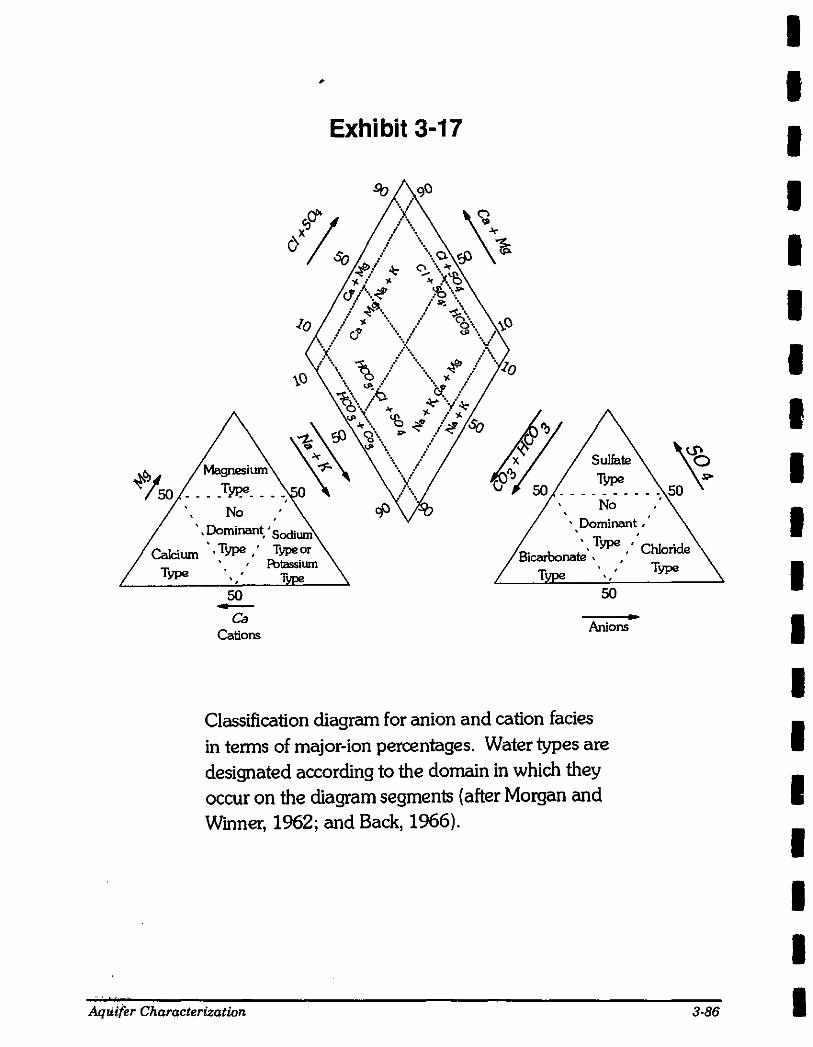
Exhibit 3-17
50 50 -Ca Cations
Anions
Classification diagram for anion and cation facies in terms of major-ion percentages. Water types are designated according to the domain in which they occur on the diagram segments (after Morgan and Wmner, 1962; and Back, 1966).
Aquif'er Characterization 3-86
I I I I I I I I I I I I I I I I I I I
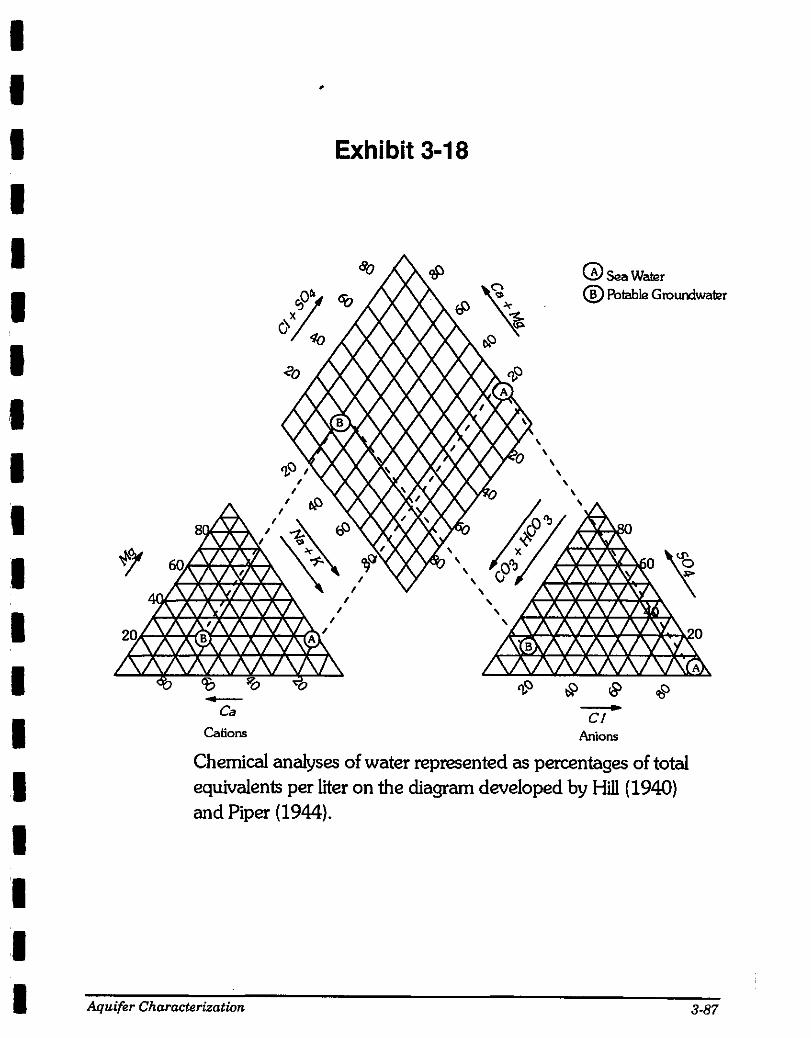
I I I I I I I I I I I I I I I I I I I
•
Exhibit 3-18
0seaWater @ Potable Grourxiwatl!r
-Ca
Cations
q_(;) ~ rS> O:Jc -CJ Anions
Chemical analyses of water represented as percentages of total equivalents per liter on the diagram developed by Hill (1940) and Piper (1944).
Aquifer Characterization 3-87
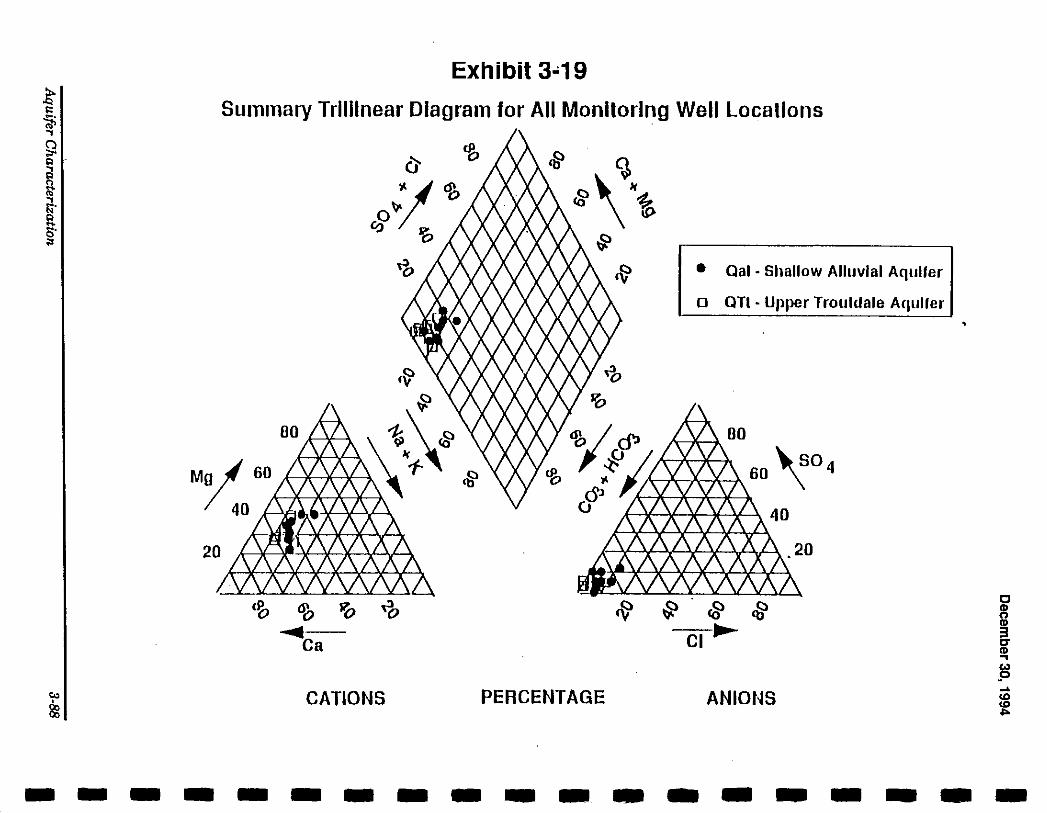
Exhibit 3•19
Summary Trllllnear Diagram for All Monitoring Well locallons
CATIONS PERCENTAGE
• Qal • Shallow Alluvial Aquifer
o QTI • Upper Trouldale Aquifer
J'r-j't-J,. 8 0
,...,..-A--k--A 60 '\0 4
ANIONS
-------------------
I I I I I I I I I I I I I I I I I I I
December 30, 1994
At both MW-18 and MW-1D, as well as at the Bennett Well 1,1,1-Trichloroethane was detected. At the Bennett Well1,1-Dichloroethylene was detected, but only on one sampling occasion. Both of these contaminants were also found during the investigation of the Airco facility. All three contaminants have MCLs, indicating that they have adverse health effects.
Methylene chloride was detected at the Bennett Well during two sampling events. This compound is widely used as an organic extractant and in plastics manufacturing. Methylene chloride was not detected in samples collected as part of the Airco investigation, and additional monitoring should be conducted to determine if the source of the contamination is persistent. Analysis ofQA/QC data indicates that methylene chloride contamination was not present in the laboratory during analysis.
Dichlorodifluoromethane was detected at two wells, MW-5D and MW-98. This compound was not analyzed for in previous investigations. Dichlordifluoromethane has many synonyms, including Freon 12. It is commonly used as a refrigerant, aerosol propellant, solvent, and as a leakdetection agent (Montgomery and Welkom, 1991). It is unlikely that detection in both monitoring wells is related to a sole source of contamination since the wells are not completed in the same aquifer, and data does not indicate a hydraulic connection between the two wells. Although the contamination was detected in samples collected on the same day, QA/QC results indicate that laboratory contamination did not occur. The contamination detected in these Wells MW-5D and MW-98 may, therefore, be related to sampling equipment used in the field. Future monitoring at these sites will provide additional information regarding the likelihood of actual aquifer contamination.
Conclusions
A wide variety of data has been collected to-date, providing a profile of water quality conditions in both the Pleistocene Alluvial and Upper Troutdale Aquifers. The data have been reviewed and evaluated according to standards applied to drinking water under the 8DWA. These standards were used as guidelines, since one goal of the WHPP is to identify the presence of compounds posing a threat to water supply wells before they are impacted by contamination. Excessive levels of compounds or trends in contaminant concentration may provide an advance warning that drinking water quality may be impacted in the future.
In general, the data collected during the first three monitoring rounds indicate that: 1) water quality has not been significantly impacted by inorganics; and 2) VOC contamination, particularly in the vicinity of the Boomsnub-Airco sites, is a significant issue which should be continue to be addressed in future monitoring efforts.
Aquifer Characterization 3·89
December 30, 1994
The probable source of VOC contamination (Airco) and the source of chromium contamination (Boomsnub) have been identified, and investigations to characterize the plumes associated with each site are ongoing. Although chromium was detected at MW-1S, levels were well below the established MCL of 0.1 mg/L. Of primary concern is the VOC contaminant plume because it lies hydraulically upgradient of CPU Zone 2 production Well Nos. 5, 7, and 23. A Work Plan is currently in progress to address these concerns. One or more monitoring wells will be constructed and screened in the Upper Troutdale, and will be located between the Boomsnub-Airco sites and CPU MW-1. Additional sampling of such wells should be beneficial for tracking the extent of contamination and to determine the threat to CPU production wells. Additional information regarding contamination at the Boomsnub and Airco sites is provided in Section 4.
Water quality data collected during the past three sampling rounds suggests that additional sources of known and potential groundwater contamination are not currently impacting water quality. An in-depth discussion of cont.amination sources is provided in the following section.
3.8 References
Bauer, H. H., and Vaccaro, J. J., 1987. Documentation of a Deep Percolation Model for Estimating Ground-Water Recharge. U.S. Geological Survey Open-File Report 86-536.
Blandford, T. N., and Huyakorn, P. S., 1991. A Modular Semi-Analytical Model for the Delineation of Wellhead Protection Areas. Prepared for the U. S. Environmental Protection Agency Office of Groundwater Protection.
Carr, J.R. and Associates, 1985. Ground Water Management and Development Plan. Report prepared for Clark Public Utility District, August 1985.
Carr, J. R. and Associates, 1988. Salmon Creek 1988 Test Drilling. Report prepared for Clark Public Utility District, June 1988.
Clark County Planning Department, 1993. Personal communication with Ms. Monica Tubberville on November 1, 1993.
EA Engineering, Science, and Technology, 1993. Phase II Soil and Groundwater Investigation, Airco Gases, 4715 N. E. 78th Street, Vancouver, Washington. Report prepared for Airco Gases in July 1993.
Economic and Engineering Services, Inc., 1981. Water System Plan. Report prepared for Public Utility District of Clark County, November 1981.
Aquifer Characterization 3-90
I i I I I I I I I I I I I I I I I I I
I I I I I I I I I I I I I I I I I I I
December 30, 1994
Economic and Engineering Services, Inc., 1985. Clark County Coordinated Water System Plan Regional Supplement. Report prepared for Clark County Public Utility District, March 1985.
Economic and Engineering Services, Inc., 1993. Clark Public Utilities Water System Plan. Report prepared for Clark Public Utilities, June 1993.
Economic and Engineering Services, Inc., and Pacific Groundwater Group, 1989. Hazel Dell Area - Salmon Creek Basin Aquifer Protection Strategy for Clark Public Utilities and Hazel Dell Sewer District. Report prepared for Clark Public Utility District, November 1989.
Eylar, T., Anderson, C., and Blair, M., 1990. Streamflow and Ground Water Level Records for Southwest Washington, 1976 to 1989. Washington Department of Ecology 90-57, October 1990.
Freeze, R. A., and Cherry, J. A., 1979. Groundwater. Englewood Cliffs, New Jersey: Pentice-Hall, Inc.
Hem, J. D., 1992. Study and Interpretation of the Chemical Characteristics of Natural Water. U. S. Geological Survey Water-Supply Paper 2254.
Hill, R. A. 1940. Geochemical Patterns in the Coachella Valley, California. Trans. Amer. Geophys. Union, 21.
McCarthy, K A., and Anderson, D. B., 1990. Ground-Water Data for the Portland Basin, Oregon and Washington. U.S. Geological Survey Open-File Report 90-126.
McFarland, W. D., and Morgan, D. S., 1991. Description of the Ground-Water Flow System in the Portland Basin, Oregon and Washington. Draft U. S. Geological Survey Water-Resources Investigations Report 91-XXX, prepared in cooperation with the City of Portland Bureau of Water Works, the Intergovernmental Resources Center, and the Oregon Water Resources Department.
Miles, M. B., Wiggins, W. D., Ruppet, G. P., Blazs, R. L., Reed, L. L., and Hubbard, L. E., 1990. Water Resources Data, Washington, Water Year 1989. U.S. Geological Survey Water-Data Report WA-89-1.
Montgomery, J. H., and Welkom, L. M., 1991. Groundwater Chemicals Desk Reference. Chelsea, Michigan: Lewis Publishers.
Morgan, D. S., and McFarland, W. D., 1991. A Regional Ground-Water Flow Model ofthe Portland Basin, Oregon and Washington. U. S. Geological Survey WaterResources Investigations Report 91-XXX.
Aquifer Characterization 3-91
December 30, 1994
Mundorff, M. J., 1964. Geology and Groundwater Conditions of Clark County Washington, with a Description of a Major Alluvial Aquifer along the Columbia River. U.S. Geological Survey Water-Supply Paper 1600.
Orzol, L. L., 1991. Documentation of a Software Interface Between a Modular, Finite-Difference, Ground-Water Flow Model and a Geographic Information System Data Base. U. S. Geological Survey Water-Resources Investigations Report 91-XXX.
Pacific Groundwater Group, 1991a. Hazel Dell Well Field Optimization Analysis (Draft). Report prepared for Clark Public Utilities, February 1991.
Pacific Groundwater Group, 1991b. Clark County Private Well Sampling Program Interim Status Report. Report prepared for Clark Public Utilities, March 1991.
Pacific Groundwater Group and Economic and Engineering Services, 1991. Salmon Creek Wellhead Protection Program Preliminary Data Assessment and Proposed Work Plan. Report prepared for Clark Public Utilities, dated September 3, 1991.
Pacific Groundwater Group, 1994. Results of Hydrogeologic Investigations near Boomsnub I Airco Facilities for Clark Public Utilities, Clark County, Washington, Report prepared for Clark Public Utilities, dated August 31, 1994.
Piper, A. M., 1944. A Graphic Procedure in the Geochemical Interpretation of Water Analyses. Trans. Amer. Geophys. Union, 25, pp. 914-923.
Public Utility District of Clark County (presently CPU), 1984. Hockinson Water System Plan Update, January 1984.
Science Applications International Corporation, 1993. April1993 Monitoring at the Boomsnub Pacific Northwest Plating Facility, Vancouver, Washington. Report submitted to Washington Department of Ecology June 9, 1993.
Snyder, D. T., Morgan, D. S., and McGrath, T. S., 1990. Estimation of GroundWater Recharge from Precipitation, Runoff into Drywells, and On-Site Waste Disposal Systems within the Portland Basin. Unpublished report subject to revision.
Swanson, R.D., 1992. Methods to Determine Wellhead Protection Areas for Public Supply Wells in Clark County, Washington. Intergovernmental Resource Center.
Swanson, R. D., 1991. Unpublished water level map for Clark County. Intergovernmental Resource Center.
AiJuifer Characterization 3-92
I I ·I I I I
•• I I I I I I I I I I I I
I I I I I I I I I I I I I I I I I I I
December 30, 1994
Swanson, R.D., 1993. U. S. Geological Survey Wellhead Protection Area Delineation Reports for CPU Wells 14, 16, and 20. Personal communication transmitted to Mr. Dan Matlock dated April 26, 1993.
Swanson, R. D., Gonthier, J. B., and Wilkenson, J. M., 1989. Geologic Framework for the Ground-Water System in the Portland Basin, Oregon and Washington. U.S. Geological Survey Water-Resource Investigations Report 90-:XXX, unpublished report subject to revision, July 1989.
Swanson, R. D., McFarland, W. D., and Gonthier, J. B., 1991. A Description of Hydrogeologic Units in the Portland Basin, Oregon and Washington. U. S. Geological Survey Water-Resources Investigations Report 90-4196.
U. S. Environmental Protection Agency, 1987. Guidelines for Delineation of Wellhead Protection Areas, June 1987.
U. S. Soil Conservation Service, 1970. Irrigation Water Requirements. U. S. Department of Agriculture Technical Release No. 21.
Washington Department of Ecology, 1986. Quality Assurance Interim Guidelines for Water Quality Sampling and Analysis: Ground Water Management Areas Program, Water Investigations Section, December 1986.
Washington Department of Ecology, 1988a. Quality Assurance Interim Guidelines for Groundwater Resource Characterization, Water Investigations Section, Reprinted February, 1988.
Washington Department of Ecology, 1988b. Data Reporting Manual for the Ground Water Management Program, 1988.
Washington Department of Ecology, 1989. Guidelines for Data Collection from Wells used in the Ground Water Management Area Program, May, 1989.
Washington Department of Ecology, 1993. Personal communication with Mr. Dan Alexanian on July 28, 1993.
Aquifer Characterization 3·93
I I I I I I Section 4
I I I I I I I I I I I I I
I I I I I I I I I I I I I I I I I I I
December 30, 1994
Section 4 Inventory of Contamination Sources
4.1 Introduction
An integral part of establishing an effective Well Head Protection Plan (WHPP) is the assessment of existing land use data. Land use and zoning in the Focus Area are under the jurisdiction of the Clark County (County) Planning Department. Currently, there are large areas zoned as single family residential throughout the Well Head Plan (WHP) Focus Area, with multi-family residential units found primarily along major transportation routes (Exhibit 4-1). The majority of commercial land use activity is found along the Interstate 5, and the Highway 99 corridor in the Hazel Dell area. The northeastern portion of the service area is rural in nature and is comprised of agricultural land uses such as dairy and cattle farms.
Data concerning potential and known sources of contamination based on land use activities in the WHPP Focus Area were evaluated to determine their completeness, accuracy, and accessibility. Agencies and organizations that maintain information useful to the project were contacted. The purpose of the data review was to evaluate results from the various sources, combine results into one report, and develop an overall assessment of risk resulting from potential and known contamination sources.
4.2 Potential Sources of Contamination
Potential groundwater contamination sources associated with the various land use categories found in the WHP focus area include solid waste facilities, surface runoff and storm drainage, commercial and industrial activity, underground storage tanks, septic systems, and pesticide use. The occurrence of each of these land use activities and a discussion of their potential impact on groundwater quality is discussed below.
4.2.1 Data Sources
Several contaminant databases were obtained in order to determine the risk of aquifer contamination, in the event that a chemical release should occur. Data pertaining to the location of underground storage tanks (USTs); sewer lines; and facilities which use, generate, or store waste have been included in this review. Databases regarding potential sources of contamination were obtained from existing files on the County's GIS service center, as well as directly from Washington State Department of Ecology (Ecology). Additionally, a "windshield survey" was previously performed as part of an
Inventory of Contamination Sources 4-1
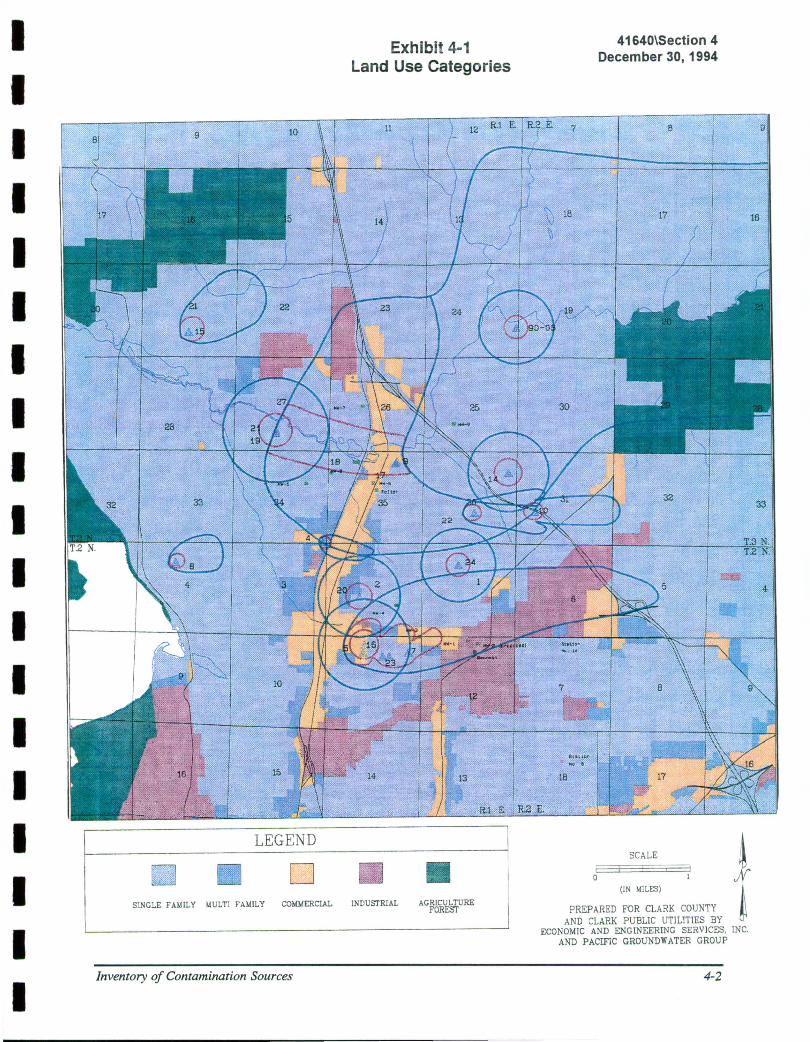
I I I I I I I I I I I I I I I I I I I
Exhibit 4-1 Land Use Categories
LEGEND
SiNGLE FAMILY MULTI FAMILY COMMERCIAL INDUSTRJAL AGRICULTURE FOREST
Inventory of Contamination Sources
41640\Section 4 December 30, 1994
SCALE ~
PREP:RED (;0:1~:~RK COUNTY 1~ AND CLARK PUBLIC UTILlTIES BY
ECONOMIC AND ENGINEERING SERVICES, INC. AND PACIFIC GROUNDWATER GROUP
4-2
I I I I I I I I I I I I I I I I I I I
December 30, 1994
Aquifer Protection Strategy for Clark Public Utilities (CPU) and the Hazel Dell Sewer District (Economic and Engineering Services, Inc. (EES) and Pacific Groundwater Group (PGG), 1989). A summary of all County and Ecology databases which were reviewed are summarized below.
Washington State Department of Ecology
Listing of Underground Storage Tanks. This listing includes the age, volume, status, and contents of underground storage tanks reported in Washington State.
U.S. Environmental Protection Agency (EPA)
Superfund Amendments and Re-authorization Act of 1986 (SARA) Title III Facilities, Tier Two Reporters. This list contains the name, address, and facility identification number of owner/operators who have submitted a Tier Two form. The owner/operator of a facility where chemicals are present in quantities greater than threshold levels is required to submit a completed Tier I Emergency and Hazardous Chemical Inventory Form (Tier One) annually. Under certain conditions, the Tier Two form may be submitted in lieu of Tier One. The Tier Two form requires more specific information about chemicals and their location within the facility, including the types and conditions of storage. Submittal of a Tier Two form does not imply that an unauthorized release of hazardous material has occurred at the site.
"Windshield Survey," EES and PGG, 1989.
Over 200 sites were identified within the Focus Area which could potentially release contaminants to the groundwater system. Sites were identified which most likely used, stored, or transported chemicals or wastes.
Washington State Department of Ecology
State of Washington Solid Waste Facility Handbook, 1993. A comprehensive list of solid waste handling facilities that require permitting. There are 459 regulated facilities classified by type of waste received.
U.S. Environmental Protection Agency Region 10
Survey of Pesticides Used in Selected Areas Having Vulnerable Groundwaters in Washington State, 1987. This study evaluates the potential for groundwater contamination from normal, commercial agricultural use of leachable pesticides.
Clark Public Utility Sewer Lines.
This database was provided by the County for use in WHPP study. It contains the location of sewer lines within CPU's service area.
Inuentory of Contamination Sources 4-3
December 30, 1994
Databases a - d are rosters of sites located within the Focus Area which have tanks or handle chemicals and/or hazardous materials on-site. The listing of a particular site in any of these databases does not necessarily imply that a spill has occurred or that there exists an immediate threat to human health or the environment. These databases should serve only as references for potential sources of contamination, not as site identifiers where any intentional or unintentional contamination has occurred.
4.2.2 Potential Contaminant Sources
Pesticides and Fertilizers
Both agricultural lands and residential areas can serve as sources of chemical contamination to groundwater. Fertilizers are a source of nitrates, and pesticides and herbicides may be toxic and may have a tendency to bioaccumulate. In addition, their general persistence in the environment causes these compounds to be of particular importance when addressing wellhead protection issues.
Various studies have been conducted by the United States Environmental Protection Agency (EPA) to determine the impact of pesticide use on groundwater quality. These studies include: "Survey of Pesticides Used in Selected Areas Having Vulnerable Groundwaters in Washington State" (EPA 910/9-87-169) and the "National Pesticide Survey - Phases I and II" (EPA 579/09-91-020). The intent of these reports was to evaluate the potential for groundwater contamination from the commercial or agricultural use of pesticides, and to determine the frequency and concentration of pesticides in drinking water wells.
Groundwater contamination from pesticides and fertilizers is a function of interacting chemical, physical, and biological processes including:
CJ Sensitivity of groundwater to contamination, CJ Use of fertilizers and pesticides, CJ Precipitation and irrigation, CJ Chemical characteristics of pesticides, CJ Age, depth, and construction of drinking water wells, and CJ Location of drinking water wells.
The complexity of these interactions may limit the effectiveness of predictive models, however, in the absence of detailed pesticide application data and monitoring results, the information obtained from other studies can serve as a first step toward assessing the potential for contamination in Clark County.
Pesticide use in the County was quantified according to vulnerable groundwater areas. The WHPP Focus Area is encompassed in what was designated as Area A in the Pesticide Survey (Exhibit 4-2). Acreage of crops and associated pesticides in Area A are listed in Table 4-1.
Inventory of Contamination Sources 4-4
I I I I I I I I I I I I I I I I I I I
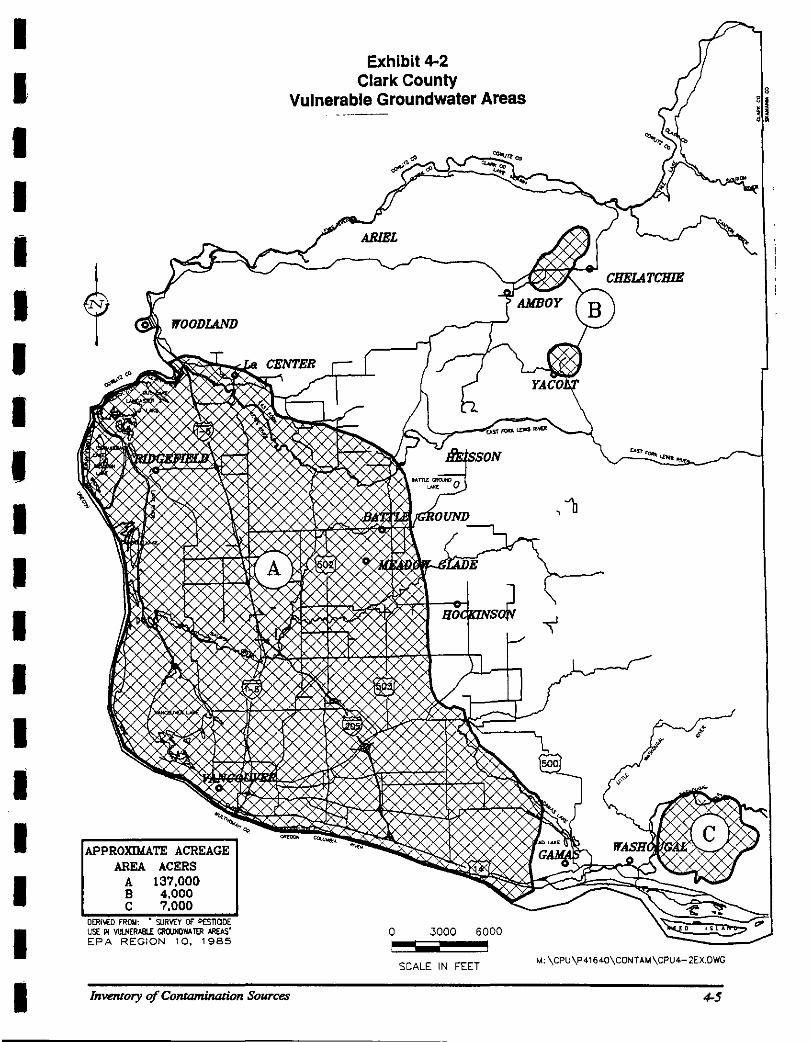
I I I I I I I I I I I I I I I I I I I
APPROXIMATE ACREAGE AREA ACERS
A 137,000 B 4,000 c 7,000
OERI\€0 FROtot. " SURY!Y or P£STIODE USE IN WLNERABLE GRWNDWA TER AREAS" EPA REGION 10, 1 985
Exhibit 4-2 Clark County
Vulnerable Groundwater Areas
0 3000 6000
SCALE IN FEET
Inventory of Contamination Sources
M: \CPU\P41640\CONTAM\CPU4-2EX.DWG
4-5
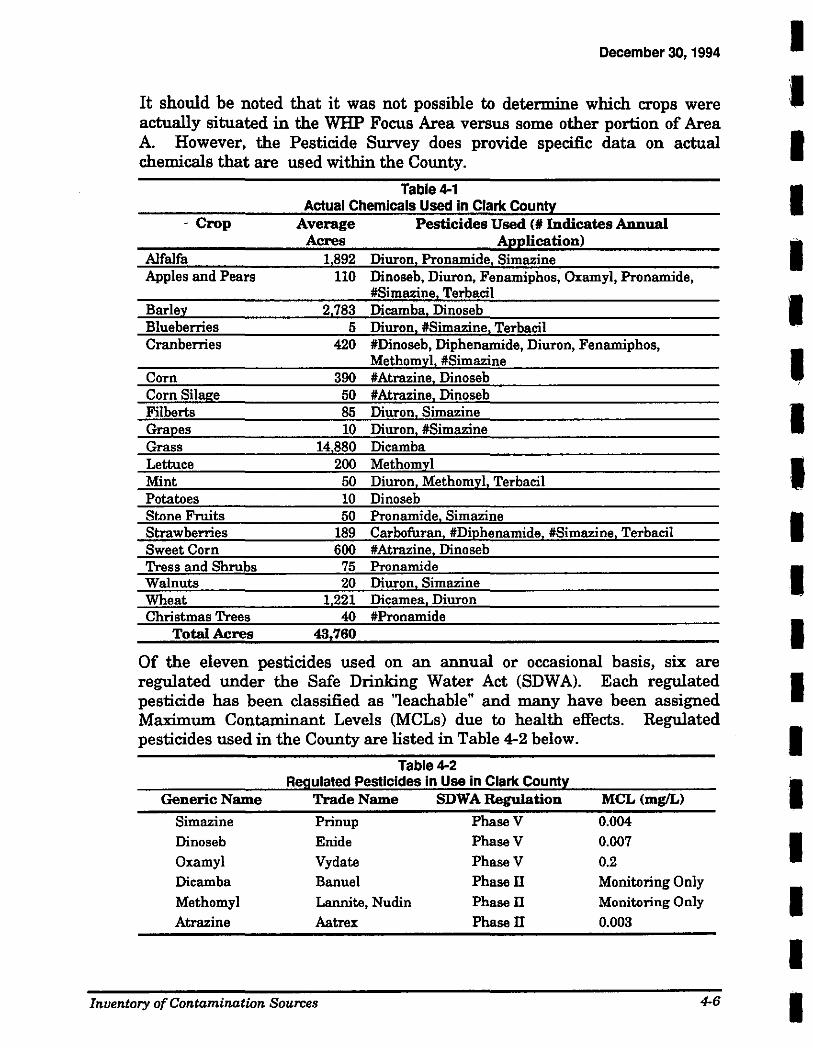
December 30, 1994
It should be noted that it was not possible to determine which crops were actually situated in the WHP Focus Area versus some other portion of Area A. However, the Pesticide Survey does provide specific data on actual chemicals that are used within the County.
-Crop
Alfalfa Apples and Pears
Barley Blueberries Cranberries
Corn Corn Silage Filberts Grapes Grass Lettuce Mint Potatoes Stone Fruits Strawberries Sweet Corn Tress and Shrubs Walnuts Wheat Christmas Trees
Total Acres
Generic Name
Simazine Dinoseb Oxamyl Dicamba Methomyl Atrazine
Table 4-1 Actual Chemicals Used In Clark County
Average Pesticides Used (I# Indicates Annual Acres Application)
1,892 Diuron, Pronamide, Simazine 110 Dinoseb, Diuron, Fenamiphos, Oxamyl, Pronamide,
#Simazine Terbacil 2,783 Dicamba, Dinoseb
5 Diuron, #Simazine, Terbacil 420 #Dinoseb, Diphenamide, Diuron, Fenamiphos,
Methomyl, #Simazine 390 #Atrazine Dinoseb 50 #Atrazine, Dinoseb 85 Diuron Simazine 10 Diuron, #Simazine
14 880 Dicamba 200 Methomyl 50 Diuron, Methomyl, Terbacil 10 Dinoseb 50 Pronamide Simazine
189 Carbofuran, #Diphenamide, #Simazine, Terbacil 600 #Atrazine Dinoseb
75 Pronamide 20 Diuron Simazine
1 221 Dicamea Diuron 40 #Pronamide
43760
Table4-2 Regulated Pesticides in Use in Clark County
Trade Name SDWA Regulation MCL(mg/L)
Prinup PhaseV 0.004 Enide PhaseV 0.007 Vydate PhaseV 0.2 Banuel Phase II Monitoring Only Lannite, Nudin Phase II Monitoring Only
Aatrex Phase II 0.003
Inventory of Contamination Sources 4-6
I I I I I I
' I I I I I
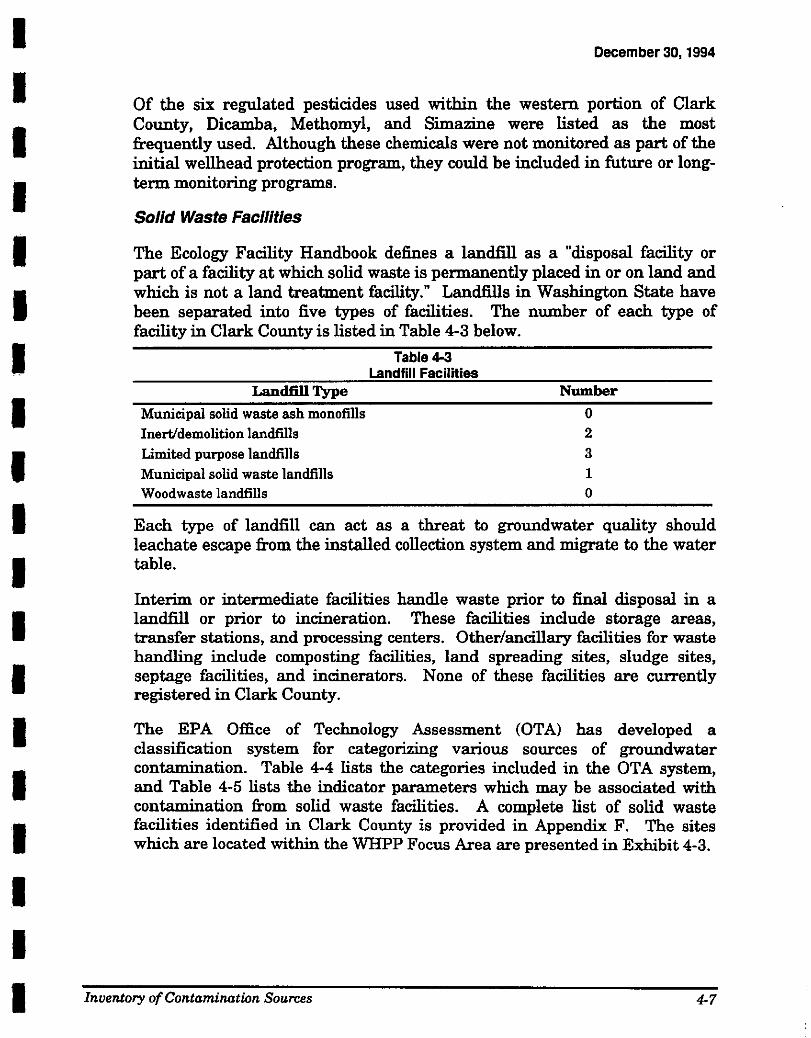
I I I I I I I I I I I I I I I I I I I
December 30, 1994
Of the six regulated pesticides used within the western portion of Clark County, Dicamba, Methomyl, and Simazine were listed as the most frequently used. Although these chemicals were not monitored as part of the initial wellhead protection program, they could be included in future or longterm monitoring programs.
Solid Waste Facilities
The Ecology Facility Handbook defines a landfill as a "disposal facility or part of a facility at which solid waste is permanently placed in or on land and which is not a land treatment facility." Landfills in Washington State have been separated into five types of facilities. The number of each type of facility in Clark County is listed in Table 4-3 below.
Landfill Type
Municipal solid waste ash monofills Inert/demolition landfills Limited purpose landfills
Municipal solid waste landfills Woodwaste landfills
Table 4-3 Landfill Facilities
Number
0 2 3 1
0
Each type of landfill can act as a threat to groundwater quality should leachate escape from the installed collection system and migrate to the water table.
Interim or intermediate facilities handle waste prior to final disposal in a landfill or prior to incineration. These facilities include storage areas, transfer stations, and processing centers. Other/ancillary facilities for waste handling include composting facilities, land spreading sites, sludge sites, septage facilities, and incinerators. None of these facilities are currently registered in Clark County.
The EPA Office of Technology Assessment (OTA) has developed a classification system for categorizing various sources of groundwater contamination. Table 4-4 lists the categories included in the OTA system, and Table 4-5 lists the indicator parameters which may be associated with contamination from solid waste facilities. A complete list of solid waste facilities identified in Clark County is provided in Appendix F. The sites which are located within the WHPP Focus Area are presented in Exhibit 4-3.
Inventory of Contamination Sources 4-7
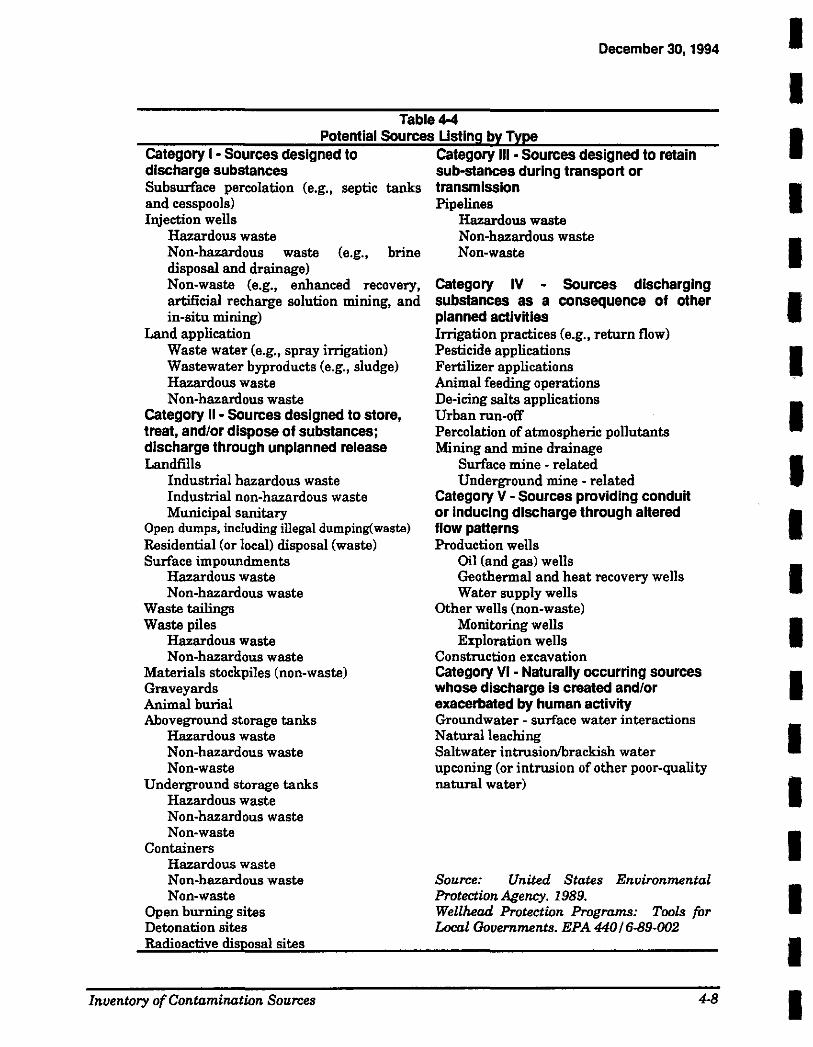
December 30, 1994
Table 4-4 Potential Sources Usting by Type
category I· Sources designed to category Ill • Sources designed to retain discharge substances sub-stances during transport or Subsurface percolation (e.g., septic tanks transmission and cesspools) Pipelines Injection wells Hazardous waste
Hazardous waste Non-hazardous waste Non-hazardous waste (e.g., brine Non-waste disposal and drainage) Non-waste (e.g., enhanced recovery, artificial recharge solution mining, and in-situ mining)
Land application Waste water (e.g., spray irrigation) Wastewater byproducts (e.g., sludge) Hazardous waste Non-hazardous waste
category II • Sources designed to store, treat, and/or dispose of substances; discharge through unplanned release Landfills
Industrial hazardous waste Industrial non-hazardous waste Municipal sanitary
Open dumps, including illegal dumping( waste) Residential (or local) disposal (waste) Surface impoundments
Hazardous waste Non-hazardous waste
Waste tailings Waste piles
Hazardous waste Non-hazardous waste
Materials stockpiles (non-waste) Graveyards Animal burial Aboveground storage tanks
Hazardous waste Non-hazardous waste Non-waste
Underground storage tanks Hazardous waste Non-hazardous waste Non-waste
Containers Hazardous waste Non-hazardous waste Non-waste
Open burning sites Detonation sites Radioactive disposal sites
Inventory of Contamination Sources
category IV substances as a planned activities
Sources discharging consequence of other
Irrigation practices (e.g., return flow) Pesticide applications Fertilizer applications Animal feeding operations De-icing salts applications Urban run-off Percolation of atmospheric pollutants Mining and mine drainage
Surface mine - related Underground mine - related
category V - Sources providing conduit or inducing discharge through altered flow patterns Production wells
Oil (and gas) wells Geothermal and heat recovery wells Water supply wells
Other wells (non-waste) Monitoring wells Exploration wells
Construction excavation category VI - Naturally occurring sources whose discharge is created and/or exacerbated by human activity Groundwater - surface water interactions Natural leaching Saltwater intrusion/brackish water upconing (or intrusion of other poor-quality natural water)
Source: United States Environmental Protection Agency. 1989. Wellhead Protection Programs: Tools for Local Governments. EPA 440 I 6-89-002
4-8
I I I I I I I I I I I I I I I I I I I
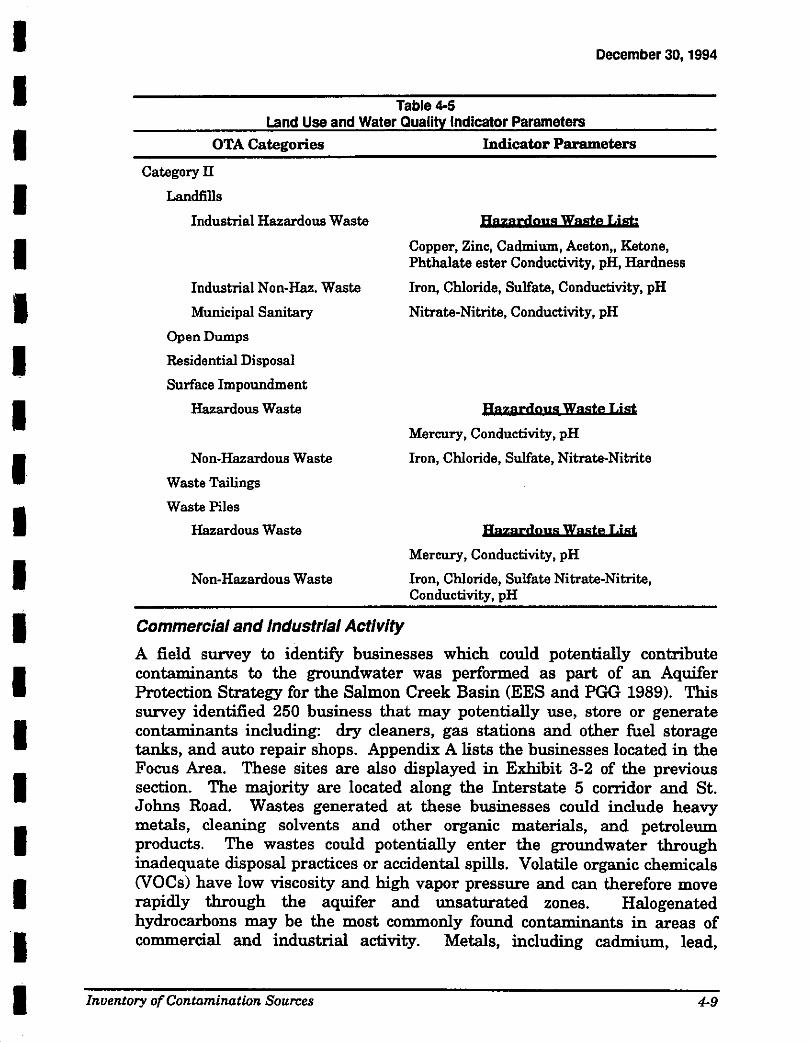
I I I I I I I I I I I I I I I I I I I
December 30, 1994
Table4-5 Land Use and Water Quality Indicator Parameters
OTA Categories
Category II
Landfills
Industrial Hazardous Waste
Industrial Non-Haz. Waste
Municipal Sanitary
Open Dumps
Residential Disposal
Surface Impoundment
Hazardous Waste
Non-Hazardous Waste
Waste Tailings
Waste Piles
Hazardous Waste
Non-Hazardous Waste
Commercial and Industrial Activity
Indicator Parameters
Hgzardous Wasfe IJst;
Copper, Zinc, Cadmium, Aceton, Ketone, Phthalate ester Conductivity, pH, Hardness
Iron, Chloride, Sulfate, Conductivity, pH
Nitrate-Nitrite, Conductivity, pH
Hazardous Waste I.jsf
Mercury, Conductivity, pH
Iron, Chloride, Sulfate, Nitrate-Nitrite
Hazardous Waste I.jst
Mercury, Conductivity, pH
Iron, Chloride, Sulfate Nitrate-Nitrite, Conductivity, pH
A field survey to identify businesses which could potentially contribute contaminants to the groundwater was performed as part of an Aquifer Protection Strategy for the Salmon Creek Basin (EES and PGG 1989). This survey identified 250 business that may potentially use, store or generate contaminants including: dry cleaners, gas stations and other fuel storage tanks, and auto repair shops. Appendix A lists the businesses located in the Focus Area. These sites are also displayed in Exhibit 3-2 of the previous section. The majority are located along the Interstate 5 corridor and St. Johns Road. Wastes generated at these businesses could include heavy metals, cleaning solvents and other organic materials, and petroleum products. The wastes could potentially enter the groundwater through inadequate disposal practices or accidental spills. Volatile organic chemicals (VOCs) have low viscosity and high vapor pressure and can therefore move rapidly through the aquifer and unsaturated zones. Halogenated hydrocarbons may be the most commonly found contaminants in areas of commercial and industrial activity. Metals, including cadmium, lead,
Inuentory of Contamiootion Sources 4-9
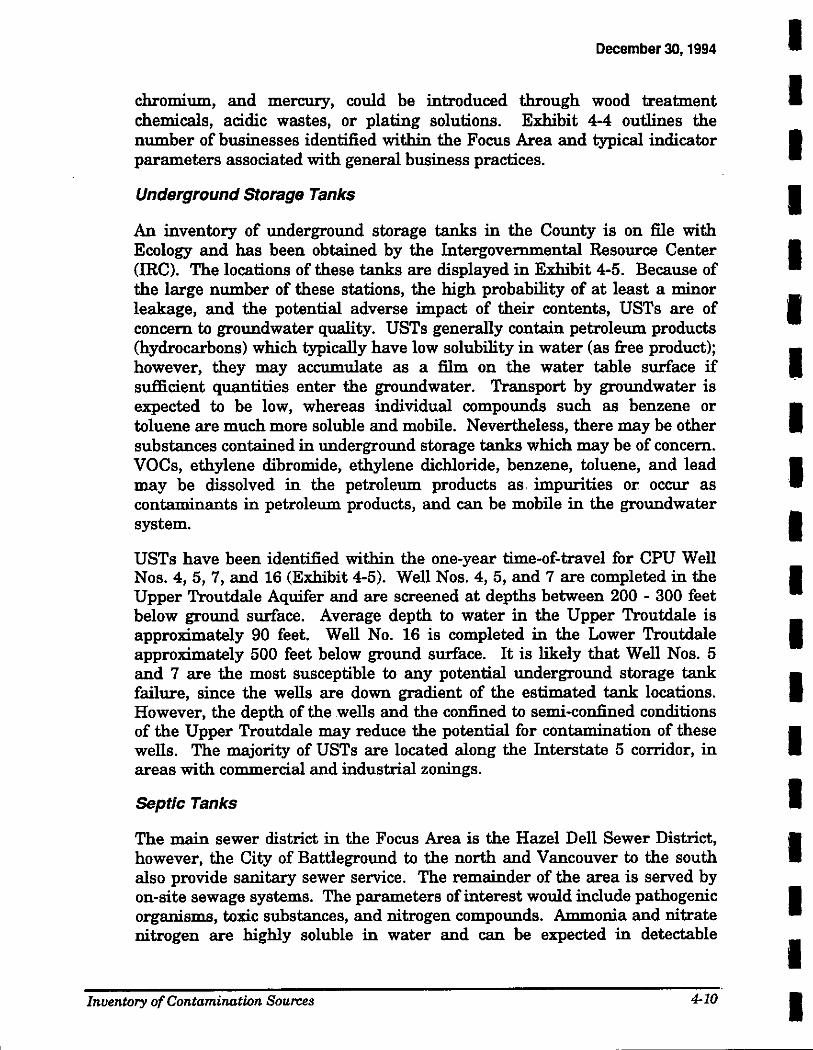
December 30, 1994
chromium, and mercury, could be introduced through wood treatment chemicals, acidic wastes, or plating solutions. Exhibit 4-4 outlines the number of businesses identified within the Focus Area and typical indicator parameters associated with general business practices.
Underground Storage Tanks
An inventory of underground storage tanks in the County is on file with Ecology and has been obtained by the Intergovernmental Resource Center (IRC). The locations of these tanks are displayed in Exhibit 4-5. Because of the large number of these stations, the high probability of at least a minor leakage, and the potential adverse impact of their contents, USTs are of concern to groundwater quality. USTs generally contain petroleum products (hydrocarbons) which typically have low solubility in water (as free product); however, they may accumulate as a film on the water table surface if sufficient quantities enter the groundwater. Transport by groundwater is expected to be low, whereas individual compounds such as benzene or toluene are much more soluble and mobile. Nevertheless, there may be other substances contained in underground storage tanks which may be of concern. VOCs, ethylene dibromide, ethylene dichloride, benzene, toluene, and lead may be dissolved in the petroleum products as. impurities or occur as contaminants in petroleum products, and can be mobile in the groundwater system.
USTs have been identified within the one-year time-of-travel for CPU Well Nos. 4, 5, 7, and 16 (Exhibit 4-5). Well Nos. 4, 5, and 7 are completed in the Upper Troutdale Aquifer and are screened at depths between 200 - 300 feet below ground surface. Average depth to water in the Upper Troutdale is approximately 90 feet. Well No. 16 is completed in the Lower Troutdale approximately 500 feet below ground surface. It is likely that Well Nos. 5 and 7 are the most susceptible to any potential underground storage tank failure, since the wells are down gradient of the estimated tank locations. However, the depth of the wells and the confined to semi-confined conditions of the Upper Troutdale may reduce the potential for contamination of these wells. The majority of USTs are located along the Interstate 5 corridor, in areas with commercial and industrial zonings.
Septic Tanks
The main sewer district in the Focus Area is the Hazel Dell Sewer District, however, the City of Battleground to the north and Vancouver to the south also provide sanitary sewer service. The remainder of the area is served by on-site sewage systems. The parameters of interest would include pathogenic organisms, toxic substances, and nitrogen compounds. Ammonia and nitrate nitrogen are highly soluble in water and can be expected in detectable
Inventory of Contamination Sources 4-10
I I I I I I I I I I I I I I I I I I I
I I I I I I I I I I I I I I I I I I I
December 30, 1994
quantities wherever portions of the aquifer are affected by septic system discharges. Suspended solids in sewage, including coliform bacteria, are easily filtered by soil and would not be transported significant distances from the drain field. However, improperly abandoned wells may provide direct entrance of sewage into the aquifer.
Historical nitrate data collected by CPU (1988) was reviewed and sites where nitrate levels exceeded 5 mg/L (as N) were plotted in conjunction with existing sewer lines in the Focus Area (Exhibit 3-16 from the previous section). This figure clearly demonstrates that elevated nitrate levels do not typically occur in sewered areas. All locations where levels exceeded the nitrate MCL of 10 mg/L (as N) were situated in non-sewered areas, or areas primarily relying on septic systems.
Nitrate levels measured during the first three monitoring rounds of the WHPP were below 5 mg/L (as N) in all samples. The location of the monitoring wells versus historically high nitrate levels can be seen in Exhibit 3-16. This figure also shows that all of the monitoring wells are located in sewered areas. Most of CPU's production wells are located in sewered areas, minimizing the risk of nitrate contamination of the public water supply. Review of water quality data collected by CPU in 1990 for compliance with the SDWA indicates that nitrate levels were typically below 2.5 mg/L, with the exception of an elevated level (6.1 mg/L) at CPU Well No. 8 (Table 3-5). This well is located in a sewered area which is zoned as residential, and additional sampling would be required to determine if nitrate contamination is persistent in this vicinity.
Surface Runoff. Stormwater runoff can contain heavy metals, hydrocarbons, petroleum products, pesticides, and animal wastes. Stormwater can enter the groundwater system through infiltration over the land, surface, or drainage ditches, or be discharged directly to the subsurface through infiltration basins and dry wells. Clark County is charged with controlling stormwater runoff in the Focus Area. The County has recently received a Centennial Clean Water Fund Grant from Ecology to inventory and map existing dry wells in the area. In addition, the Salmon Creek Watershed Management Plan is currently addressing the issues of potential pollution from this source in more detail.
The major transportation corridors in the Focus Area include Highway 99, and Interstate 5 and 205. There are also many miles of surface streets throughout the Focus Area. Contaminants associated with transportation routes include petroleum products, lead and other exhaust emission products, plus any other material transported through the area that could be a potential source of contamination to the aquifer.
Inventory of Contamination Sources 4-11
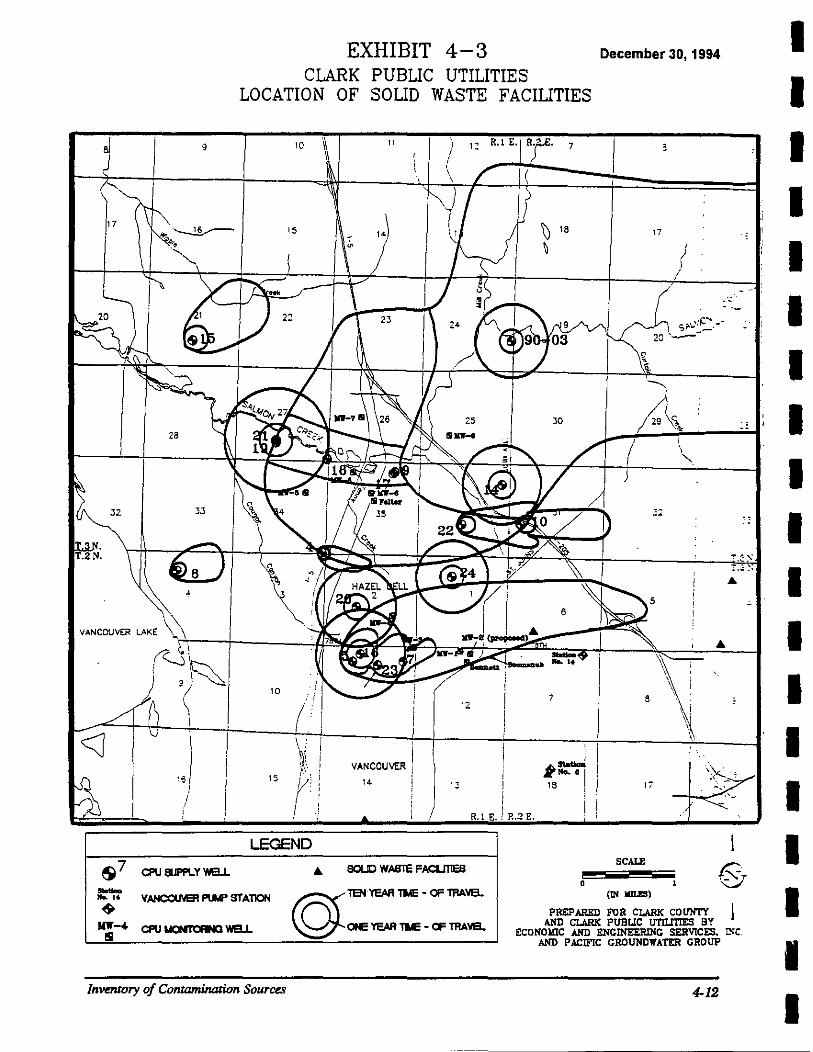
8 g
EXHIBIT 4-3 CLARK PUBLIC UTILITIES
LOCATION OF SOLID WASTE FACILITIES
11 ~ ) 1'"' R.l E. Rr· 7
\, \ / I(
10
December 30, 1994
17
1---~ I I I \.
"-- ~ \ 1,
~i VA~N4COUVER J 1.- k18:0:u~.!~. !I 15 li
/ 15 r,,: .
·} R.l E. R.2 E.
LEGEND
S 7 CPU SUPI'LY WBJ.. 4 BOliO WASTE FACLITlES
r;=::;:::: Tel YEAA TIME - OF TRA'IB..
~OlE YEAA liE- OF TRA'IB..
Inventory of Contamination Sources
SCALE
0 l (IN IIILI!S)
PREPARED FOR CLARK COUNTY I AND CLARK PUBUC UTILITIES BY
ECONOiliC AND ENGIIIEERlNG SERVICES, ~C AND PACIFIC GROUNDWATER GROUP
4-12
' I
I I I I I I I I I I I I I I I I I I I
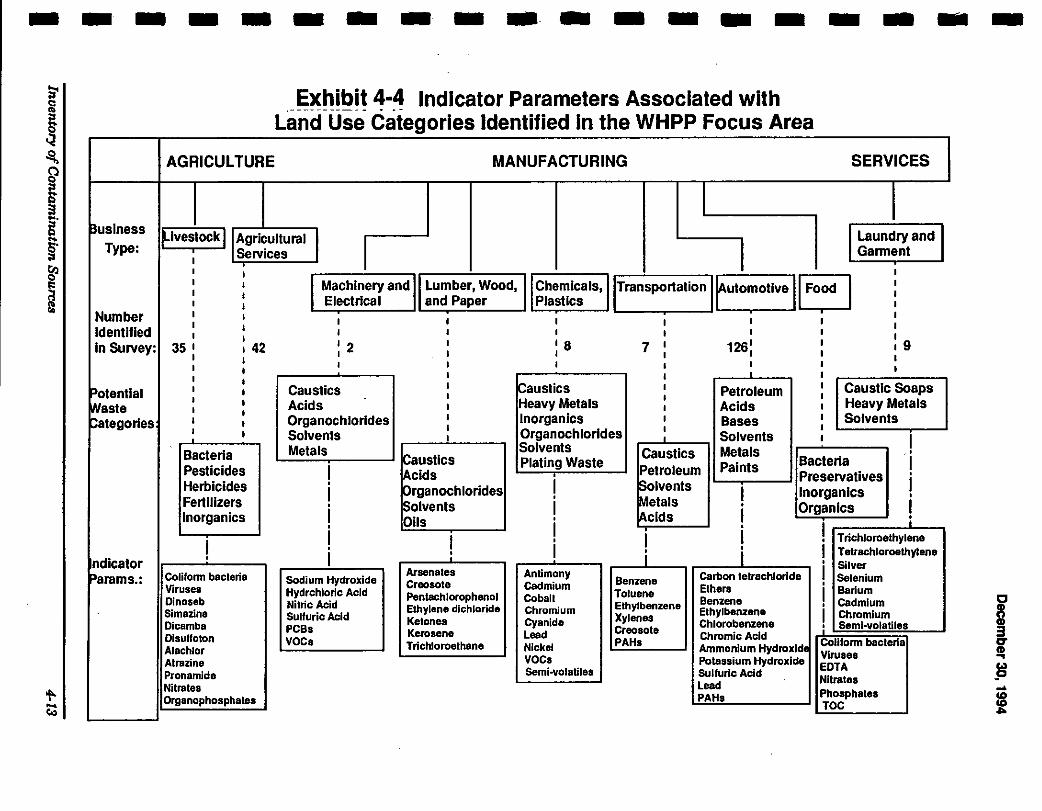
-------------------Exhibit 4·4 Indicator Parameters Associated with .----------- . ~-
Land Use Categories Identified In the WHPP Focus Area
AGRICULTURE MANUFACTURING SERVICES
I Business
flvestock 11 Agricultural I Laundry and Type: I I Services Gannent
I I
I Machinery and II Lumber, Wood, II fhemlcals, Transportation !Automotive IFo~ I I
I I
I Electrical and Paper Plastics I
Number I I I I I I I
Identified I I I I I I I I I
In Survey: 35 I 42 12 I 18 7 I 1261 19 I I I I I I I I I I I I
I I I
I I I I Caustics I Caustic Soaps Potential I Caustics I I Petroleum
Waste I Acids I Heavy Metals I Acids Heavy Metals I
Organochlorldes I lnorganics Solvents Categories I Bases I I Solvents Organochlorides I
I I I Solvents I Bacteria Metals
Caustics Solvents Caustics Metals • 0
Pesticides ! Plating Waste Petroleum Paints Bacteria I
Acids Preservatives 0
Herbicides I Organochlorides ! ~lvents I lnorganics I Fertilizers Metals '
i Solvents I 0 Organics I lnorganics Oils 0 Acids I : 0 I 0 I
! I I ' I I 0 Trichloroethylene 0 I i I Tetrachloroethylene I
0 i ndicator 0 Silver Params.: Coliform bacteria Sodium Hydroxide
Arsena tea Antimony Cerbon lelrachlorido I Selenium Viruses Creosote cadmium Benzene
Elhers 0
Hydrchloric Acid I Barium Oinoseb Penlachlorophanol Co ball Toluene
Benzene Nitric Acid Ethylene dichloride Ethylbenzene 0 Cedmlum Simazine Sulfuric Acid
Chromium Xylenes
Ethylbenzene I Chromium Ketones Cyanide Chlorobenzene Oicamba PCBs Creosote j Semi-volatiles Kerosene Lead Chromic Acid Disulfoton VOCa PAHs Coliform bacleria
Alachlor Trichloroethane Nickel Ammonium Hydroxldo Viruses
Atrazine VOCs Polassium Hydroxide EDTA Pronamlde Semi-volatiles Sulfuric Acid Nitrates Nitrates Lead
Phosphalea Organophosphales PAHs
TOC
I g ...
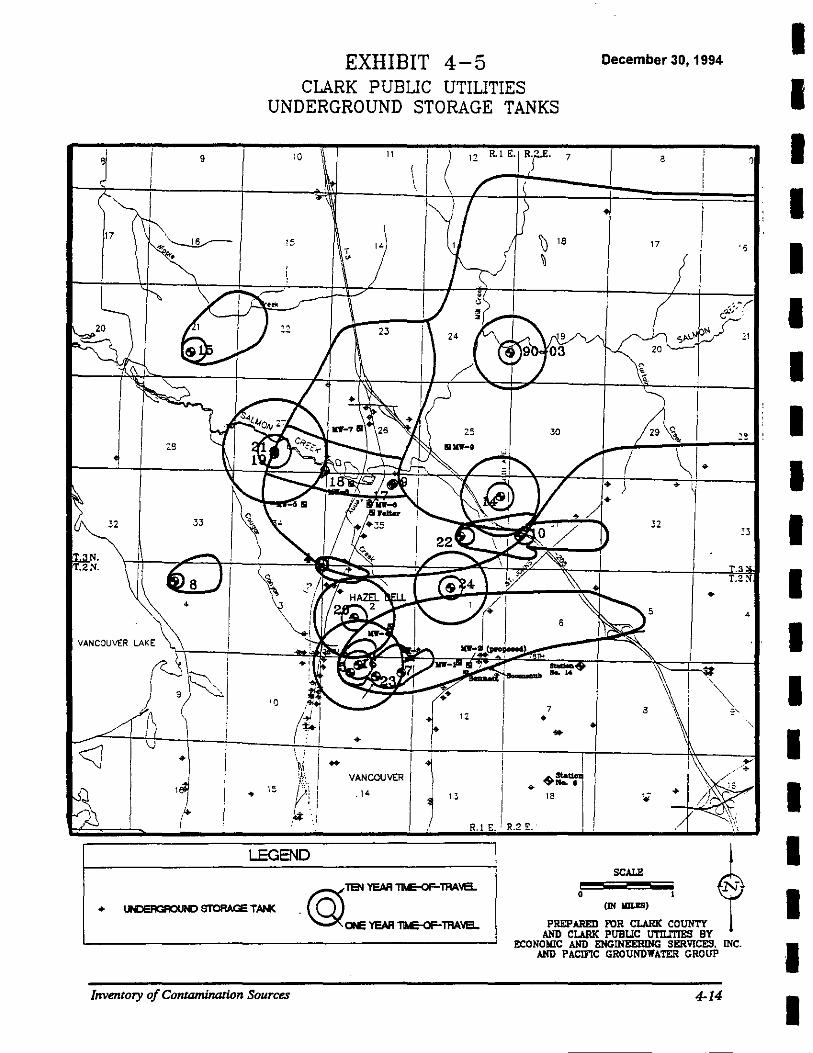
9
EXHIBIT 4-5 CLARK PUBUC UTIUTIES
UNDERGROUND STORAGE TANKS
:o II
December 30, 1994
a ' \ 12 R.l E. I Rr. 7
~-+----1-~\~4\ ~~~~/ d 17 15 T ,.\ '() 18 17 I
• I ~ I
:: 28 ( \I~
32 33 32 53
.3 T.2.
VANCOUVER LAK~ 4
~rt--r,---'4'A~
) ,~1 ~~,, +' .. u . •
3
• .. I 113 VANCOUVER
. 14
I '
... 15
LEGEND
Inventory of Contamination Sources
~ +~~ " I
R.l E. R.2 E.
SCALE
0 (IN !IlLES)
PREP AREll FOR CLARK COUNTY AND CLARK PUBUC llTIUTIES BY
ECONOIIIC AND ENGINEERING SERVICES. INC. AND PACIFIC GROUNDWATER GROUP
4-14
I I I I I I I I I I I I I I I I I I I
I I I I I I I I I I I I I I I I I I I
December 30, 1994
Improperly Abandoned Wells
Little information exists on the location of abandoned wells due to insufficient reporting in the past. Current water well construction standards require that well abandonments be recorded with Ecology, however, this practice was rarely done in the past. Of the more than 6,000 water well construction records compiled by the IRC, there were only five records which recorded an abandonment (EES and PGG 1989). Improperly abandoned wells are a concern to groundwater quality because they provide a direct path for entrance of contaminants from the surface, and these contaminants may be transported from one aquifer to another within the well.
4.3 Known Sources Of Contamination
4.3.1 Data Sources
Contaminant databases were obtained from Ecology. Data files contained lists of sites within the County with contaminated soil, groundwater, or where chemicals had been released to the air. Additionally, the most recent reports regarding the chromium release at the Boomsnub Pacific Northwest Plating Facility and the VOC release at Airco Industrial Gases have been reviewed and summarized. Data and reports involving known sources of contamination reviewed for this study are summarized below.
Washington State Department of Ecology
Washington State Toxic Release Inventory Summary Report, 1990. This report is an annual summary of toxic chemical release report forms submitted by manufacturing facilities in the State. It was prepared by Ecology Community Right-to-Know (CRTK) Unit to enhance access to data, along with citizen awareness.
Washington State Department of Ecology
Toxics Cleanup Program, Leaking Underground Storage Tank (LUST) Site List. This list contains the names and addresses of sites located by County where an underground storage tank has reportedly leaked, the date of notification, the affected media, and status of the incident.
Washington Department of Ecology
SARA Title III CRTK Toxic Release Quantities. This database contains facility names, addresses, chemical quantities, and affected media for toxic releases that have been reported. The most recent list available for Clark County contains releases that occurred in 1991.
Inuentory of Contamination Sources 4-15
December 30, 1994
Sciences Applications International Corporation (SA/C)
Groundwater Monitoring Report, May 1993. This report summarizes analytical results of groundwater monitoring at the Boomsnub Pacific Northwest Plating Facility.
Sciences Applications International Corporation (SA/C)
Project Work Plan, 1992. This report presents the work plan for installation of groundwater monitoring wells at the Boomsnub Plating Facility.
EA Engineering, Science and Technology
Phase III Investigation Airco Industrial Gases, 1993. investigations conducted at the Airco plant are presented.
4.3.2 Contaminated Sites
Results of
Two chemical releases have recently occurred upgradient of CPU's Zone 2 wells. A hexavalent chromium plume has been identified as originating from the Boomsnub Pacific Northwest Plating Facility, and.VOC contamination of groundwater has been traced to the Airco Industrial facility. Extensive groundwater monitoring has been completed to-date, and results are summarized below.
Boomsnub Plating Facility
SAIC has been operating under an Ecology contract monitoring water quality, water level data, and groundwater flow conditions at a network of wells located around the Boomsnub facility. The facility is located in Vancouver, Washington at 7608 NE 47th Avenue. Groundwater contamination has been measured since 1987, and is apparently due to several episodic releases of chromic acid and discharges of spent plating solution (SAIC, 1992). Chromium migration was greatly enhanced in March of 1990 when approximately 300,000 gallons of potable water was released due to a leak in the water service line (SAIC, 1992).
A total of 43 monitoring wells have been installed in the vicinity of the site. In addition, CPU has installed MW-1S and MW-1D downgradient of the site as part of the WHPP. MW-2 is scheduled for construction during October of 1993. Chromium results from the most recent sampling round (conducted May 25-26, 1993) are provided in Table 4-6. The highest measurements (1,500 mg/L) were measured at wells along the apparent centerline of the plume as it extends downgradient from the facility (SAIC, 1993). Monitoring well locations are shown in Exhibit 4-6.
Inventory of Contamination Sources 4-16
I I I I I I I I I I I I I I I I I I I
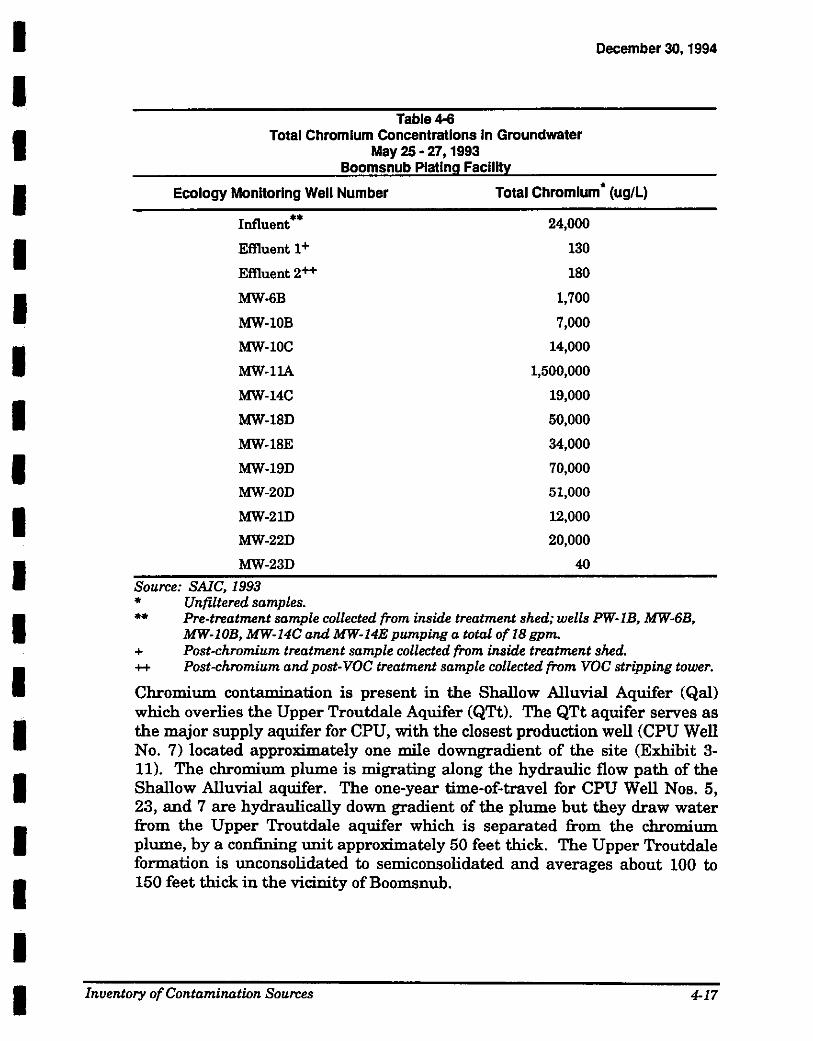
I I I I I I I I I I I I I I I I I I I
December 30, 1994
Table 4-6 Total Chromium Concentrations In Groundwater
May 25 • ZT, 1993 Boomsnub Plating Facility
• Ecology Monitoring Well Number Total Chromium (ug/L)
Influent ** 24,000
Effiuent 1+ 130
Effiuent 2++ 180
MW-6B 1,700
MW-10B 7,000
MW-lOC 14,000
MW-llA 1,500,000
MW-14C 19,000
MW-18D 50,000
MW-18E 34,000
MW-19D 70,000
MW-20D 51,000
MW-21D 12,000
MW-22D 20,000
MW-23D 40
Source: SAIC, 1993 * Unfiltered samples. ** Pre-treatment sample collected from inside treatment shed; wells PW-1B, MW-6B,
MW-10B, MW-14C and MW-14E pumping a total of 18 gpm. + Post-chromium treatment sample collected from inside treatment shed. ++ Post-chromium and post-VOC treatment sample collected from VOC stripping tower.
Chromium contamination is present in the Shallow Alluvial Aquifer (Qal) which overlies the Upper Troutdale Aquifer (QTt). The QTt aquifer serves as the major supply aquifer for CPU, with the closest production well (CPU Well No. 7) located approximately one mile downgradient of the site (Exhibit 3-11). The chromium plume is migrating along the hydraulic flow path of the Shallow Alluvial aquifer. The one-year time-of-travel for CPU Well Nos. 5, 23, and 7 are hydraulically down gradient of the plume but they draw water from the Upper Troutdale aquifer which is separated from the chromium plume, by a confining unit approximately 50 feet thick. The Upper Troutdale formation is unconsolidated to semiconsolidated and averages about 100 to 150 feet thick in the vicinity ofBoomsnub.
Inventory of Contamination Sources 4-17
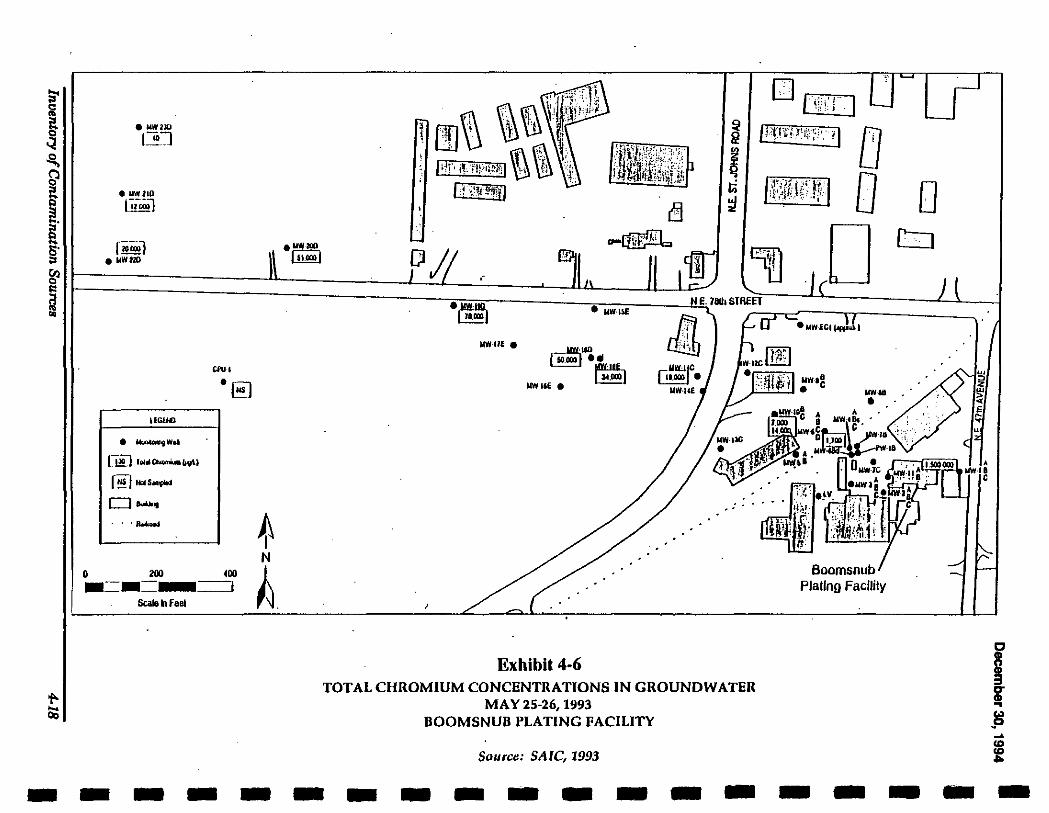
• WW2JO
1-iO::J
e WW21D
1''""1 fi~l
e WW2l0
• ~Wet
I:Ji:l '""""""""lo9'l f!!D .... ~ ... o ..... . ........
0 200 ~00 -=-=-=:J Scalo~feet
' \
WW·Ilf e
• UW·IU:
........-'"';''" ~··· r!~l
WW·Iii •
Exhibit 4-6 TOTAL CHROMIUM CONCENTRATIONS IN GROUNDWATER
MAY 25-26, 1993 BOOMSNUB PLATING FACILITY
Source: SAIC, 1993
Boomsnub Plallng Facllily
0 0
-------------------
I I I I I I I I I I I I I I I I I I I
December 30, 1994
Ecology has been operating a groundwater extraction treatment system (ion exchange) capable of treating a minimum of 10 gpm. During the month of May 1993, over 600,000 gallons of water were treated and approximately 125 pounds of chromium were removed. Since 1990, approximately 7,000 pounds of chromium have been removed from the subsurface environment (SAIC, 1993).
Chromium levels have been measured at each monitoring well as part of the WHPP. Quarterly samples have been collected at sites located in the vicinity of the contamination plume. Elevated chromium levels were detected in MW-1S during the February and May 1993 sampling events, however, levels were below the regulatory MCL of 0.1 mg/L determined by the USEPA. Continued monitoring of the contaminant plume is essential for protecting CPU's Zone 2 production wells.
VOCs including trichloroethane (TCA), trichlorothene (TCE), tetrachloroethane (PCE), Freon 11, and 1,1-dichloroethene (DCE) have also been measured at wells on and off the Boomsnub site. The source was determined to be upgradient of the facility and additional investigations were conducted by Ecology.
Airco Industrial Gases
Airco Industrial Gases is located at 4715 NE 78th St., Vancouver, Washington. The plant manufactures compressed gases for use by industry and distributes other specialty gases (EA Engineers, 1992).
In 1991, Ecology measured TCE, TCA, PCE, trichlorofluoromethane (Freon 11), acetone, and other compounds during investigations at the Boomsnub site. Airco was identified as a source of the VOC contamination and a site investigation was initiated in January of 1992. None of the VOCs detected in groundwater were detected in soil samples, as determined by analysis of six soil borings. Eight monitoring wells were installed, and water quality samples were collected in addition to samples collected from the cooling water supply wells. Results of monitoring conducted in September of 1992 are presented in Exhibit 4-7.
As part of the CPU WHPP, VOCs have been sampled at each monitoring and private well included in the study. VOCs have been detected consistently at MW-1S and MW-lD and in the Bennett well. Only TCE was present at levels that exceeded the regulatory MCL of 5 ug/L at MW-lD. Correlation between VOCs measured at MW-1D and the Bennett well versus the releases at the Airco Facility have not been clearly defined.
Inventory of Contamination Sources 4-19
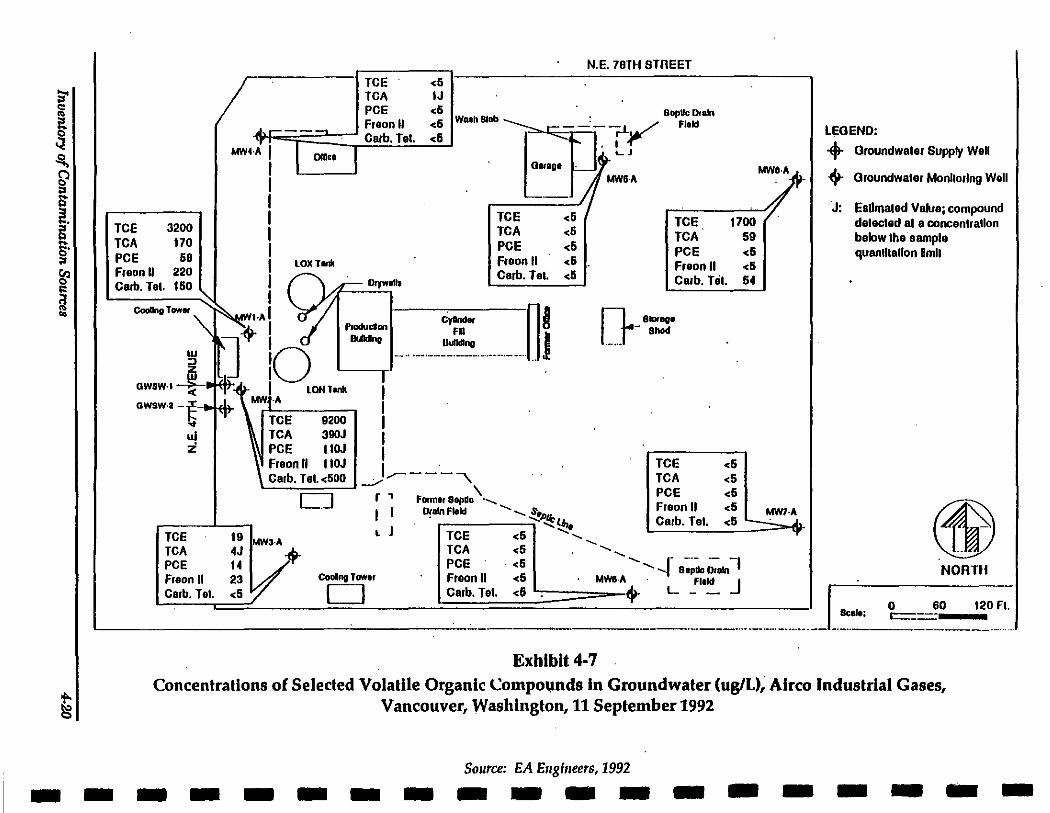
TCE 3200 TCA 170 PCE 68 Freon II 220 Cam. Tat. 160
Cooang Towet
GWSW·2 -t... uJ z
TCE TCA PCE Freon II
LOXTonlo
LCNlonk
TCE 9200 TCA 390J PCE IIOJ freon II IIOJ Garb. Tal.<500
19 MW3·A 4J fr
N.E. 70TH STREET
TCE <6 TCA IJ PCE <6 . SopUc Drain Freon II <6 waoh Blob
Garb. Tat. <6 ----~~ Flold
. I
r I I I I I 1;---·-"
_/ '
TCE <6 TCA <6 PCE <5 Freon II <6 Carb. Tat. <5
\ r ; Formlf Sepdo •-.. 1 I Dfaln Field ..._ -.... .!'0PI.l-
,-----...::;' .... (flo L J TCE <6 ""-...
L..J
....
TCE. 1700 TCA 59 PCE <6 Freon II <6 Carb. Tlit. 64
TCE TCA PCE Freon II <6 Carb. Tel. <5
14 23 Cooing Tower
~~~ :: ..._' '..._ --~- s~~d. Draln-1
MW7·A . ~-.,
LEGEND:
-+- Groundwater Supply Wall
• Groundwater Monitoring Well
J: Esdmalad Value; compound dalaclad al a concantrallon below the a ample quentllallon lmll
NOR Ttl Freon II <6 MWo.A · Flold J
Carb. Tat. <6 ~---~-·~-=-··----·-·-·---~-.~~ole: __ L __ 60 120Ft. Garb. Tat. <5 D
Exblblt4-7 Concentrations of Selected Volatile Organic Compo1,1nds In Groundwater (ug!L), Alrco Industrial Gases,
Vancouver, Washington, 11 September 1992
Source: EA Engineers, 1992 -------------------
I I I I I I I I I I I I I I I I I I I
December 30, 1994
Investigations at the Airco facility have been conducted exclusively on the Qal aquifer, and MW -lD and the Bennett Well are completed in the QTt aquifer. The path of migration of TCE has not been determined at this point, and the likelihood of contaminant transport from the Qal aquifer to the QTt aquifer has not been clearly established. However, hydraulic gradients would suggest that the contaminant source to both MW-lD and the Bennett Well is northeast of the wells, since the predominant direction of flow in the QTt aquifer is southwest.
Recent monitoring under Phase III of the Airco Facility Investigation revealed that high levels ofVOC contamination were present in the south dry well, also shown in Exhibit 4-7. The presence of these contaminants further implicates Airco as a source ofVOCs measured regionally in the Qal aquifer. Additionally, high levels of VOCs measured in Airco MW 8-A, on the northeastern border of the facility, appear to be a result of some source of contamination other than the Airco Facility, based on the west-northwest groundwater flow direction of the Qal aquifer. Additional monitoring is planned under Ecology supervision to clearly define the extent and source of the VOC phase.
General Service Administration (GSA)
Contamination from an automotive repair facility at the GSA Fleet Management Center has recently been investigated by Ecology. The site is located at 9226 N.E. Highway 99, and is listed as site No. 29 in Exhibit 3-2 (Potential Contamination Sites). Six dry wells have been contaminated with petroleum hydrocarbons and metals, resulting from washwater discharge used for vehicle steam cleaning. Contamination has primarily occurred in sediments in the drywells. Groundwater contamination has not been confirmed to-date.
The GSA site lies on the northwest comer of the ten-year time-of-travel for CPU production Well No. 20, and just south of the ten-year time-of-travel for CPU production Well No.4. Regional flow patterns indicate that if contamination did reach the water table, groundwater quality at CPU Well No. 4 could be impacted. Well No. 4 draws from the Upper Troutdale Aquifer which occurs approximately 300 feet below ground surface at this location. Depth to water is approximately 100 feet below ground surface and the Upper Troutdale is unconfined in this region.
Leaking Underground Storage Tanks
Contaminants are rarely generated underground, however, they are often stored in underground tanks. Typically, chemicals that may be explosive or pose a fire hazard have been stored in the subsurface environment. According to Ecology's database on LUSTs there are currently 27 known groundwater contamination sites in Clark County which have resulted from LUSTs (Appendix G). Four are within the WHPP Focus Area and are located along the Interstate 5 corridor (Exhibit 4-8).
Inuentory of Contamination Sources 4-21
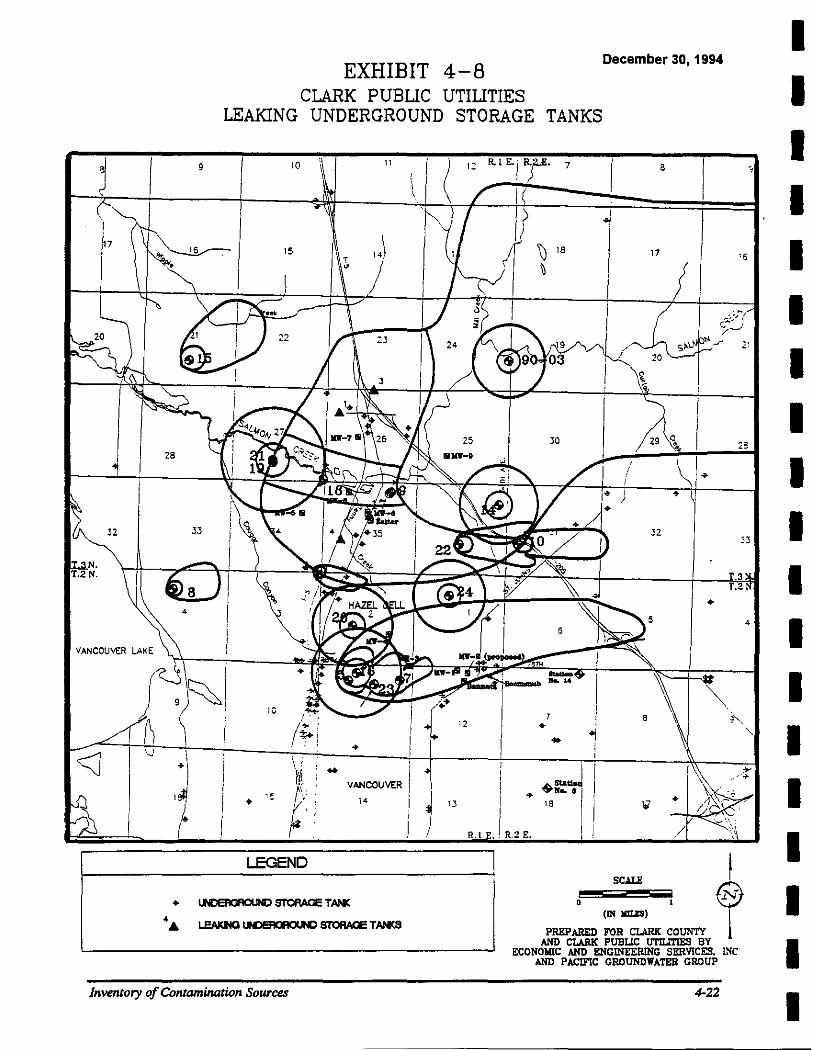
9
EXHIBIT 4-8 December 30, 1994
CLARK PUBUC UTIUTIES LEAKING UNDERGROUND STORAGE TANKS
10 \
LEGEND
B
'5
,. \
33
T,3,. T,2 :l
+
sc=: ~ o (IN IIILES) l e
PREPARED FOR CLARK COUNTY I AND CLARK PUBUC UTILlTIES BY
ECONOIIIC AND ENGINEERING SERVICES, L~C AND PACIFIC GROUNDWATER GROUP
4
Inventory of Contaminalion Sources 4-22
I I I I I I I I I I I I I I I I I I I
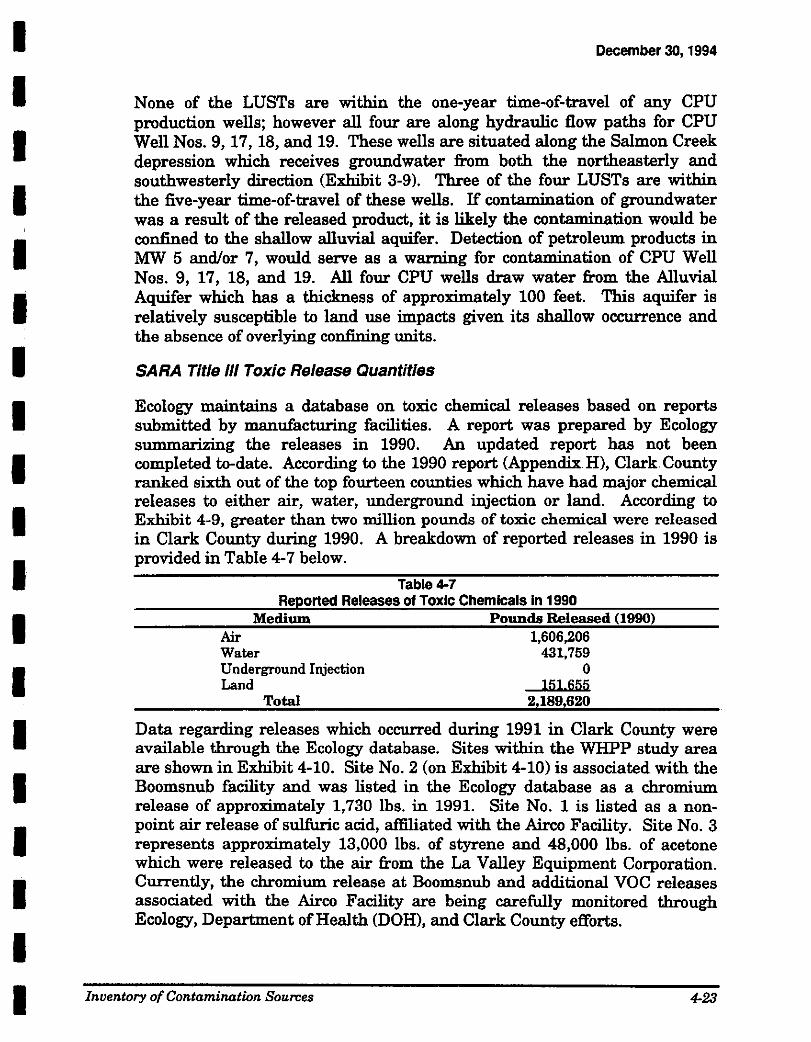
I I I I
'
I I I I I I I I I I I I I I I
December 30, 1994
None of the LUSTs are within the one-year time-of-travel of any CPU production wells; however all four are along hydraulic flow paths for CPU Well Nos. 9, 17, 18, and 19. These wells are situated along the Salmon Creek depression which receives groundwater from both the northeasterly and southwesterly direction (Exhibit 3-9). Three of the four LUSTs are within the five-year time-of-travel of these wells. If contamination of groundwater was a result of the released product, it is likely the contamination would be confined to the shallow alluvial aquifer. Detection of petroleum products in MW 5 and/or 7, would serve as a warning for contamination of CPU Well Nos. 9, 17, 18, and 19. All four CPU wells draw water from the Alluvial Aquifer which has a thickness of approximately 100 feet. This aquifer is relatively susceptible to land use impacts given its shallow occurrence and the absence of overlying confining units.
SARA Title Ill Toxic Release Quantities
Ecology maintains a database on toxic chemical releases based on reports submitted by manufacturing facilities. A report was prepared by Ecology summarizing the releases in 1990. An updated report has not been completed to-date. According to the 1990 report (Appendix. H), Clark County ranked sixth out of the top fourteen counties which have had major chemical releases to either air, water, underground injection or land. According to Exhibit 4-9, greater than two million pounds of toxic chemical were released in Clark County during 1990. A breakdown of reported releases in 1990 is provided in Table 4-7 below.
Table 4-7 Reported Releases of Toxic Chemicals In 1990
Medium Pounds Released (1990) Air Water Underground Injection Land
Total
1,606,206 431,759
0 151 655
2189620
Data regarding releases which occurred during 1991 in Clark County were available through the Ecology database. Sites within the WHPP study area are shown in Exhibit 4-10. Site No.2 (on Exhibit 4-10) is associated with the Boomsnub facility and was listed in the Ecology database as a chromium release of approximately 1,730 lbs. in 1991. Site No. 1 is listed as a nonpoint air release of sulfuric acid, affiliated with the Airco Facility. Site No. 3 represents approximately 13,000 lbs. of styrene and 48,000 lbs. of acetone which were released to the air from the La Valley Equipment Corporation. Currently, the chromium release at Boomsnub and additional VOC releases associated with the Airco Facility are being carefully monitored through Ecology, Department of Health (DOH), and Clark County efforts.
Inventory of Contamination Sources 4-23
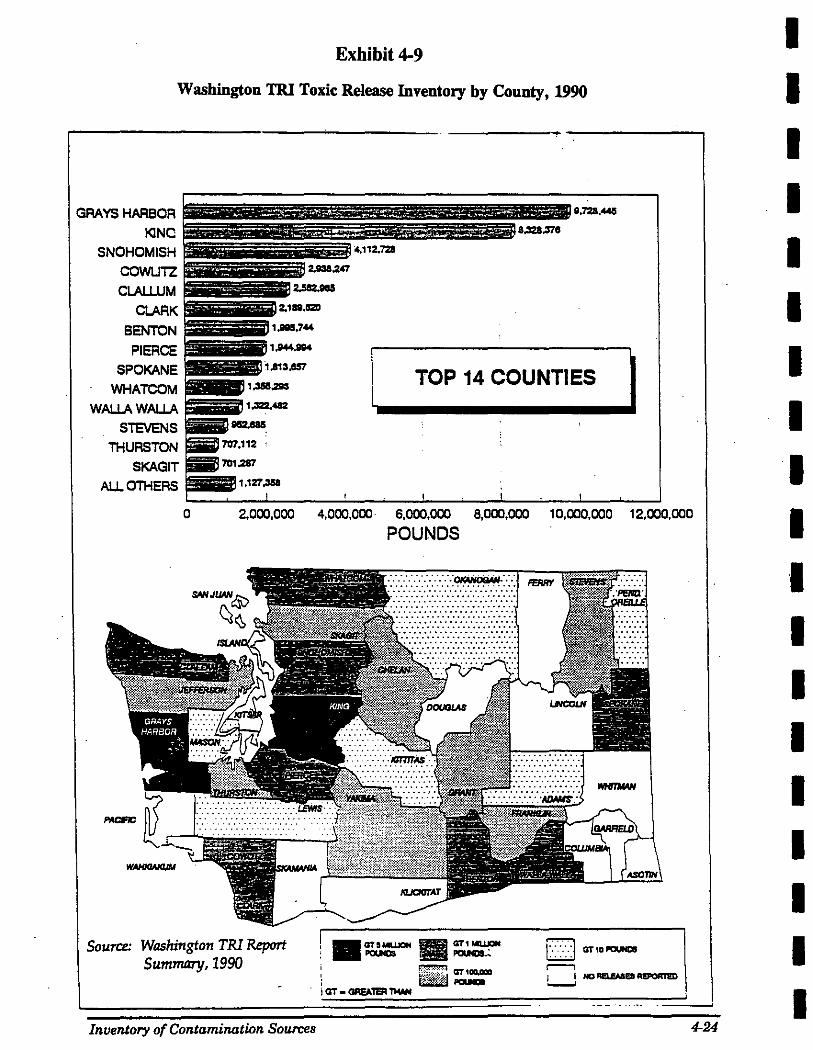
Exhibit 4-9
Washington TRI Toxic Release Inventory by County, 1990
GRAYS HARBOR KINC
SNOHOMISH COWUTZ CLALLUM
CLARK
BENTON
PIERCE SPOKANE
WHATCOM WAUJ\WAUJ\ l TOP 14 COUNTIES
STEVENS THURSTON
SKAGIT ALL OTHERS 1,127,358
0 2.000,000 4,000,000 6,000,000 8,000,000 10,000,000 12,000,000
Source: Washington TRI Report Summary, 1990
Inventory of Contamination Sources
POUNDS
:-::-:-:-:-:-:-::·:~:-
, • GT !lloii..IJON iJIII GT 1 MUJON : POUNDS fBI ~ I f:·:~:'·''·:···\ QT 1oa.aaD
i tJ:'!iliil -I GT • OAI!A'IER "-
4-24
I I I I I I I I I I I I I I I I I I I
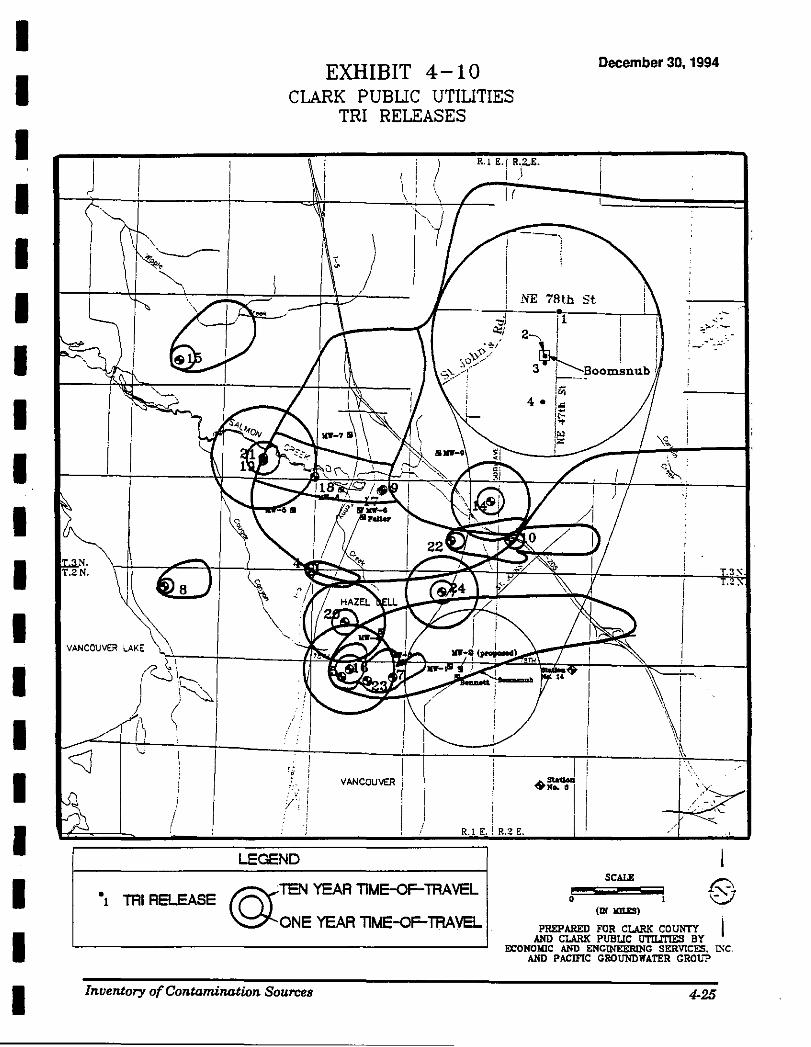
I I I
'
I I I I I I I I I I I I I I I I
EXHIBIT 4-10 CLARK PUBUC UTIUTIES
TRI RELEASES
I I ) R.l E.f R .. :U. I )
I ' ' \ I ~, II
~ ) N"E 7flth St.
December 30, 1994
-.,-j ·--rr--~~.L..,\
:-,,,;_~~~ 2'), i ! ·-· --"J-'o·}·?--·· 3 ~!loomsnub
.... ;;
LEGEND
@ TEN YEAR TIME-QF-TRAVEL "1 TRI RELEASE
ONE YEAR TIME-oF-TRAVEL
Inventory of Contamination Sources
4.
SCALE
• (1!1 IIILBS)
' 'i
T.3~ T.2.
PREPARED FOR CLARK COUNTY I AND CLARK PUBUC UTILITIES BY
ECONOMIC AND ENGINEERING SERVICES. eoc. AND PACIFIC GROUNDWATER GROUP
4-25
December 30, 1994 I 4.4 Identification And Prioritization Of Contaminants For Risk I
Management
Contamination of the subsurface environment is controlled by numerous processes. Chemical interaction with the soil, movement with hydraulic gradients, and transformation by chemical, physical, and biological processes are all governed by a complex network of contaminant and aquifer characteristics.
Contaminant properties that will determine the degree of water quality degradation include:
t:l Quantity of contaminant, t:l Concentration in the aqueous, soil, and vapor phases of the aquifer, t:l Contaminant solubility, t:l Contaminant mobility, t:l Contaminant reactivity, t:l Available treatment techniques, t:l Spatial and vertical location of contamination, t:l Persistence of contaminant source (i.e., spill or leakage), t:l Contaminant/aqueous phase contact time, and t:l Other characteristics.
Aquifer properties that govern the degree of groundwater contamination include:
t:l Hydraulic conductivity and transmisitivity, t:l Soil pore space size, t:l Soil type, t:l Natural organic matter content, t:l Hydraulic gradient in relation to source of contamination, t:l Sorptive, advective, and dilution capabilities, t:l Degree of water level fluctuation, t:l Degree of groundwater recharge, and t:l Other physical, chemical, and biological characteristics.
Both the physical properties of the Shallow Alluvial (Qal) aquifer and the relatively high number of potential contamination sources along the Highway 99 corridor within the WHPP study area increase the risk of groundwater quality degradation in the Qal. Known contamination sources to the east of NE St. John St. have been documented and the degree of water quality degradation in the Qal and potentially in the Upper Troutdale is currently being monitored. The Qal aquifer is believed to occur under "unconfined" conditions, meaning that the water table itself forms the upper boundary of the aquifer. However, the portions of the Qal in the WHPP Focus Area are primarily comprised affine-grained deposits, which generally do not serve as regional aquifers. Localized perched aquifers are utilized for domestic supplies and the unit serves as an important aquifer only in localized areas along the Salmon Creek corridor.
Inventory of Contamination Sources 4-26
I I I I I I I I I I I I I I I I I
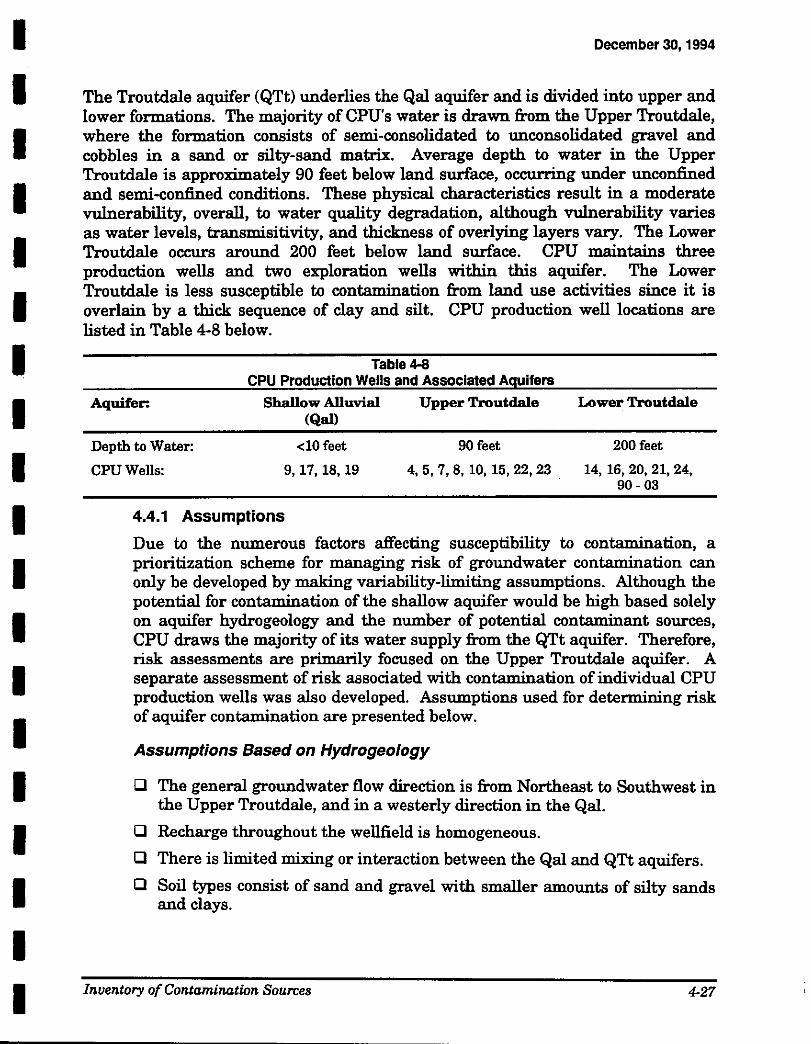
I I I I I I I I I I I I I I I I I I I
December 30, 1994
The Troutdale aquifer (QTt) underlies the Qal aquifer and is divided into upper and lower formations. The majority of CPU's water is drawn from the Upper Troutdale, where the formation consists of semi-consolidated to unconsolidated gravel and cobbles in a sand or silty-sand matrix. Average depth to water in the Upper Troutdale is approximately 90 feet below land surface, occurring under unconfined and semi-confined conditions. These physical characteristics result in a moderate vulnerability, overall, to water quality degradation, although vulnerability varies as water levels, transmisitivity, and thickness of overlying layers vary. The Lower Troutdale occurs around 200 feet below land surface. CPU maintains three production wells and two exploration wells within this aquifer. The Lower Troutdale is less susceptible to contamination from land use activities since it is overlain by a thick sequence of clay and silt. CPU production well locations are listed in Table 4-8 below.
Table 4-8 CPU Production Wells and Associated Aquifers
Aquifer: Shallow Alluvial (Qal)
Depth to Water: <10 feet
CPU Wells: 9, 17, 18, 19
4.4.1 Assumptions
Upper Troutdale
90 feet
4,5,7,8, 10,15,22,23
Lower Troutdale
200feet
14, 16, 20, 21, 24, 90-03
Due to the numerous factors affecting susceptibility to contamination, a prioritization scheme for managing risk of groundwater contamination can only be developed by making variability-limiting assumptions. Although the potential for contamination of the shallow aquifer would be high based solely on aquifer hydrogeology and the number of potential contaminant sources, CPU draws the majority of its water supply from the QTt aquifer. Therefore, risk assessments are primarily focused on the Upper Troutdale aquifer. A separate assessment of risk associated with contamination of individual CPU production wells was also developed. Assumptions used for determining risk of aquifer contamination are presented below.
Assumptions Based on Hydrogeology
1:1 The general groundwater flow direction is from Northeast to Southwest in the Upper Troutdale, and in a westerly direction in the Qal.
1:1 Recharge throughout the wellfield is homogeneous.
1:1 There is limited mixing or interaction between the Qal and QTt aquifers.
1:1 Soil types consist of sand and gravel with smaller amounts of silty sands and clays.
Inuentory of Contamination Sources 4·27
December 30, 1994
Assumptions Based on Types of Contaminants
Cl VOC's fate and transport will be considered as a group and generally regarded as either petroleum products or solvents.
Cl Coliform bacteria will serve as an indicator of potential water-borne disease outbreak.
Cl Chromium contamination will not serve as an indicator of metals contamination since a point-source of chromium contamination has been identified.
Assumptions Based on Contaminant Location
Cl All theoretical contamination events will occur within the one-year time of travel for all production wells.
Cl Existing or known contamination events will be evaluated separately from potential contamination events.
4.4.2 Risk Assessment from Potential Sources of Contamination Based on Business Types
The major contaminant categories associated with business types in the WHPP study area identified in Exhibit 4-4 were separated based on the likelihood of contaminant use and their likely storage on the surface or in the subsurface environment. It is important to emphasize that use or storage of contaminants have not been verified at the businesses identified; and therefore, the risks of contamination from these businesses may be overrated. For the purpose of assessing risk, a conservative approach would be to assume that representative contaminant categories Oisted in Appendix A for the potential contamination sites) are present at the sites and the potential for water quality degradation exists. Additional field searches and windshield surveys would need to be conducted to ensure that all potential sources of contamination were previously identified and to update the existing database. The number of businesses potentially serving as sources of contamination which were identified during the windshield survey is by no means conclusive since the data were generated in 1989 and businesses may have opened, closed, or changed location. However, the data does serve as an initial inventory for assessing the risk of groundwater contamination, especially in the Qal aquifer.
Land uses and zoning in the WHPP study area consist primarily of commercial and urban residential activities. Some agricultural and industrial activities are also present, and estimates of pesticide use were evaluated previously. Potential sources of contamination associated with typicallanduse activities in the County are:
lnuentory of Contamination Sources 4-28
I I I I I I I I I I I I I I I I I I I
I I I I I I I I I I I I I I I I I I I
0 Storm drainage, 0 Chemical spills, 0 Pesticide and fertilizer application, 0 Wastes from commercial and industrial operations, and 0 Transportation spills and runoff.
December 30, 1994
Also, activities such as above ground storage, chemical delivery, contaminant transport, as well as intentional and unintentional spills and leaks are common as part of daily surface activities. The actual potential for contaminant migration to the subsurface environment is lower for all surface activities than for contamination caused by events occurring below the ground surface. This is especially true for contamination of the QTt aquifer.
Potential waste categories were ranked according to their hazardous nature, ease of locating contamination sources, nearness of businesses to wells, contaminant mobility, and the potential quantity of contaminant types based on the number of businesses identified. A matrix of potential contamination risk is provided in Table 4-9.
Petroleum hydrocarbons and solvents were given a higher ranking based on the following criteria:
0 They are widely used throughout the WHPP Focus Area, and therefore, any release may be near a production well;
0 They include compounds such as halogenated organics and volatile organics that are known carcinogens;
0 They are comprised of compounds which are generally more mobile and soluble than most metals and pesticides;
0 Underground storage of these products is widespread, and therefore, a release could occur near a production well;
0 Releases in the subsurface environment are typically more difficult to locate, and the widespread use of underground tanks would further complicate the source identification process;
0 Petroleum products and solvents can exist in the vapor or liquid phase, increasing the likelihood of groundwater contamination upon contact with the liquid product or from contact with unsaturated soils containing contaminant vapors; and,
0 Of the five businesses creating a potential for water quality degradation located within the one-year time-of-travel for a well, all probably use, store, or generate petroleum products and solvents.
Inventory of Contamination Sources 4-29
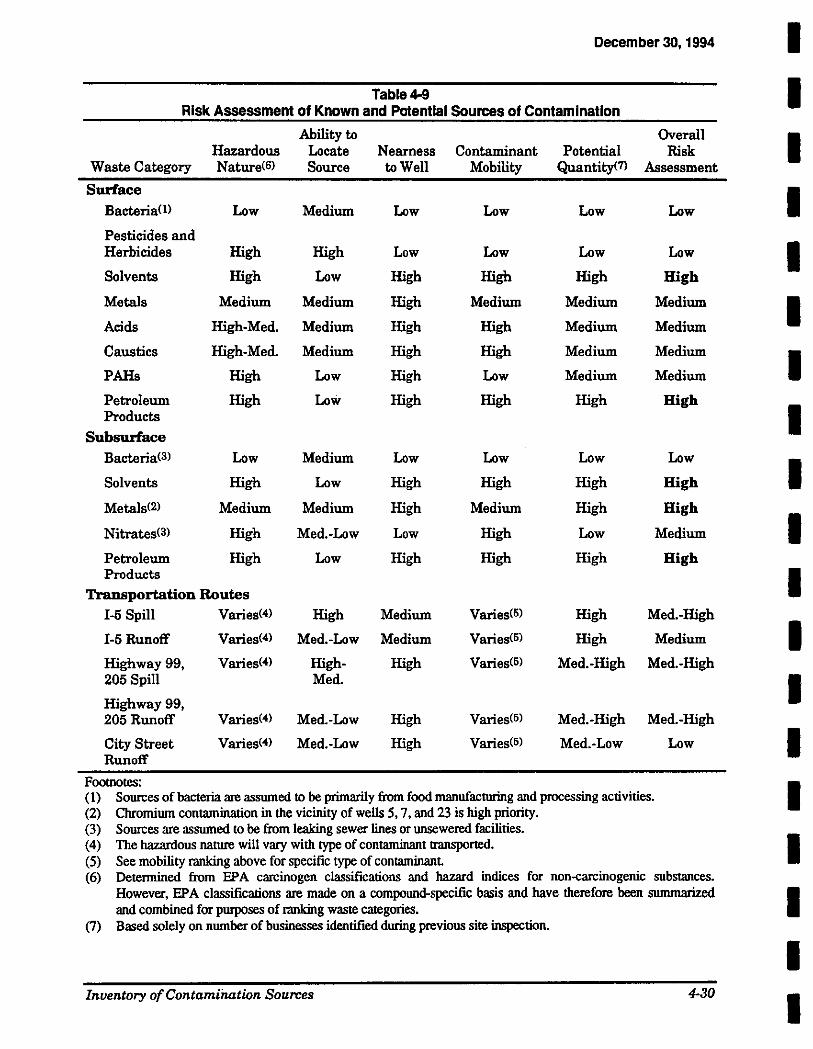
December 30, 1994 I I Table4-9
Risk Assessment of Known and Potential Sources of Contamination
Ability to Overall I Hazardous Locate Nearness Contaminant Potential Risk Waste Category Nature( G) Source to Well Mobility Quantity(7l Assessment
Surface I Bacteria(!) Low Medium Low Low Low Low
Pesticides and Herbicides High High Low Low Low Low I Solvents High Low High High High High
Metals Medium Medium High Medium Medium Medium I Acids High-Med. Medium High High Medium Medium
Caustics High-Med. Medium High High Medium Medium
I PAHs High Low High Low Medium Medium
Petroleum High Low High High High High
I Products
Subsurface Bacteria(3) Low Medium Low Low Low Low
I Solvents High Low High High High High
Metals(2) Medium Medium High Medium High High
Nitrates< a> High Med.-Low Low High Low Medium I Petroleum High Low High High High High Products I Transportation Routes 1-5 Spill Varies(4) High Medium Varies<5J High Med.-High
1-5 Runoff Varies(4) Med.-Low Medium Varies(5) High Medium I Highway99, Varies<4> High- High Varies<5l Med.-High Med.-High 205 Spill Me d. I Highway99, 205 Runoff Varies(4) Med.-Low High Varies<5l Med.-High Med.-High
City Street Varies<4> Med.-Low High Varies(5) Med.-Low Low I Runoff
Foomotes:
I (1} Sources of bacteria are assumed m be primarily from food manufacturing and processing activities. (2) Chromium contamination in the vicinity of wells 5, 7, and 23 is bigh priority. (3) Sources are assumed to be from leaking sewer lines or unsewered facilities.
I (4) The hazardous nature will vary with type of contaminant transported. (5) See mobility ranking above for specific type of contaminant (6) Determined from EPA carcinogen classifications and bazard indices for non-<:arcinogenic substances.
However, EPA classifications are made on a compound-specific basis and have therefore been summarized I and combined for purposes of ranking waste categories. (7) Based solely on number of businesses identified during previous site inspection.
I Inventory of Contamination Sources 4-30
I
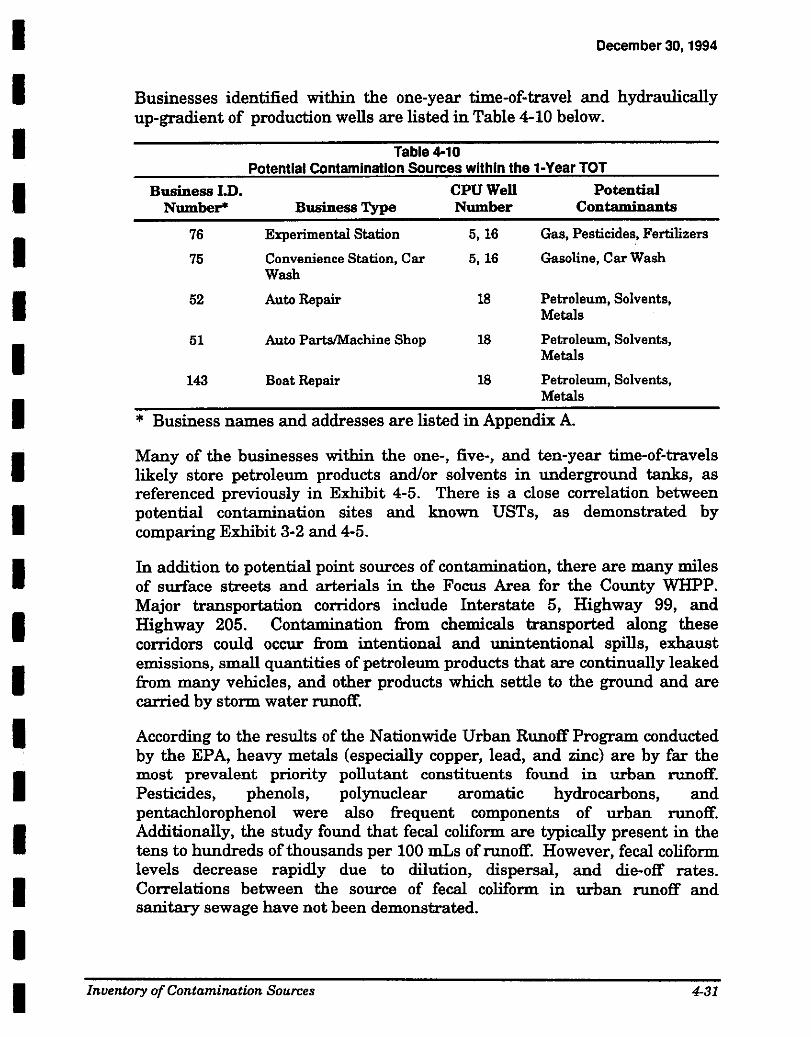
I I I I I I I I I I I I I I I I I I I
December 30, 1994
Businesses identified within the one-year time-of-travel and hydraulically up-gradient of production wells are listed in Table 4-10 below.
Table 4-10 Potential Contamination Sources within the 1-Year TOT
Business I.D. CPU Well Potential Number* Business Type Number Contamjnants
76
75
Experimental Station 5, 16 Gas, Pesticides, Fertilizers
Convenience Station, Car 5, 16 Gasoline, Car Wash Wash
52 Auto Repair 18 Petroleum, Solvents, Metals
51 Auto Parts/Machine Shop 18 Petroleum, Solvents, Metals
143 Boat Repair 18 Petroleum, Solvents, Metals
* Business names and addresses are listed in Appendix A.
Many of the businesses within the one-, five-, and ten-year time-of-travels likely store petroleum products and/or solvents in underground tanks, as referenced previously in Exhibit 4-5. There is a close correlation between potential contamination sites and known USTs, as demonstrated by comparing Exhibit 3-2 and 4-5.
In addition to potential point sources of contamination, there are many miles of surface streets and arterials in the Focus Area for the County WHPP. Major transportation corridors include Interstate 5, Highway 99, and Highway 205. Contamination from chemicals transported along these corridors could occur from intentional and unintentional spills, exhaust emissions, small quantities of petroleum products that are continually leaked from many vehicles, and other products which settle to the ground and are carried by storm water runoff.
According to the results of the Nationwide Urban Runoff Program conducted by the EPA, heavy metals (especially copper, lead, and zinc) are by far the most prevalent priority pollutant constituents found in urban runoff. Pesticides, phenols, polynuclear aromatic hydrocarbons, and pentachlorophenol were also frequent components of urban runoff. Additionally, the study found that fecal coliform are typically present in the tens to hundreds of thousands per 100 mLs of runoff. However, fecal coliform levels decrease rapidly due to dilution, dispersal, and die-off rates. Correlations between the source of fecal coliform in urban runoff and sanitary sewage have not been demonstrated.
Inventory of Contamination Sources 4-31
December 30, 1994
The risk of groundwater contamination from spills or runoff originating from the major transportation routes has been summarized in Table 4-9. Runoff from Highway 99 and 205 were given the highest priority based on the location of the corridors which run through both the one- and ten-year timeof-travels for many wells. All of the major priority pollutants measured in the national study could be expected to be found in runoff from both of these roads. Therefore, a contaminant spill on either road could have a severe impact on drinking water quality; however, it is not possible to predict the likelihood of a spill or determine what type of contaminant may be involved should a spill occur.
Runoff from Interstate 5 would also be expected to contain many priority pollutants. However, Interstate 5 passes through fewer critical well areas than do Highways 99 and 205. Furthermore, Interstate 5 lies primarily down gradient of many of CPU's wells. A large spill of a mobile product such as petroleum or solvents could pose a greater threat to groundwater quality in the shallow aquifer, as well as impact water quality in CPU Well No.4.
4.4.3 Risk Assessment Based on Known Contaminant Sources
Known sources of groundwater contamination within the Focus Area include:
Cl Leaking underground storage tanks, Cl Toxic release inventory sites, and Cl Boomsnub and Airco Facilities.
Although four LUSTs have been identified in the County's WHPP Focus Area, none are located within the one-year time-of-travel of any CPU production wells and evidence of groundwater contamination has not been verified to-date, based on water quality data gathered at MWs 6, 7, and 8, and the Felter Well (Exhibit 4-8). Every attempt should be made to identify the extent of soil contamination resulting from these LUSTs and whether or not groundwater contamination is evident. Ecology maintains a quarterly data base on LUSTs and can provide information regarding the status of individual sites. Future monitoring as part of the WHPP will help to determine if water quality degradation has occurred down gradient of these sites.
Of primary importance to maintaining CPU's production well water quality is the delineation and remediation of the chromium plume apparently migrating toward CPU Well Nos. 7, 5, and 23, and VOC contamination presently measured in the Upper Troutdale Aquifer. Although chromium contamination is confined to the Shallow Alluvial Aquifer, an improperly abandoned well or poorly constructed active well could serve as a path of contaminant migration into the Upper Troutdale Aquifer. Results of recent monitoring under the WHPP indicate that 1,1,1-trichloroethane (TCA),
Inventory of Contamination Sources 4-32
I I I I I I I I I I I I I I I I I I I
I I I I I I I I I I I I I I I I I I I
December 30, 1994
trichloroethylene (TC), dichloroethylene, and methylene chloride have been detected on more than one sampling occasion from MW-1 and the Bennett Well. TCA was also detected from the Shallow Alluvial Aquifer at MW-1 (see Section 3).
Currently, remediation practices are on-going at both the Airco-Boomsnub contaminated sites, however, the extent of the chromium contamination has not yet been clearly defined along the south end of the plume. Additional monitoring is imperative to ensuring that water quality associated with CPU wells is not impacted from these known contamination sites.
4.5 Conclusions and Recommendations
Although there are many potential sources of contamination stored, transported, and generated in the WHPP Focus Area, not all contaminant types pose the same risk for degrading water quality. Issues having the greatest impact on risk of contamination include:
CJ Vertical location of spill or leak (i.e., occurring on the land surface or in the subsurface environment),
CJ Contaminant mobility, and
CJ Quantity (or concentration) of the contaminant released.
The overall risk assessment for surface activities, subsurface storage, and contamination resulting from transportation routes is provided in Table 4-9. Although the frequency of contaminant use and storage associated with surface activities is typically greater than in the subsurface environment, a relatively small release in the subsurface environment can pose the most immediate threat to groundwater quality.
4.5.1 Above and Below Ground Storage Tanks
The risk of a contaminant released in the subsurface environment reaching the water table is also increased by the difficulty of discovering that the release has occurred. Often, leaking underground storage tanks are not identified until the contaminant is detected in a potable water source, or, until such a large quantity of the product has been released that the change in tank volume is readily measurable.
Recommendations:
CJ Implement a program of focused, local regulation of underground tanks which might include tanks which are not regulated by the State or federal government.
Inventory of Contamination Sources 4-33
December 30, 1994
1:1 Ensure that all businesses storing contaminants in underground tanks are permitted. Maintain a database so that underground storage tank locations can be readily identified.
1:1 Determine tank age, size, and type at all locations within the ten year time-of-travel.
1:1 Develop a tank inspection program beginning with oldest tanks and those constructed of steel. The typical life of a steel tank storing petroleum products is 40 years. However, tanks storing more corrosive products may have shorter lives.
4.5.2 Transportation Routes
Contamination from a spill during hazardous material transport could pose a serious threat to water quality in the shallow aquifer. Although a larger volume of potential contaminants is most likely transported on a more frequent basis via Interstate 5, the proximity of Highways 99 and 205 to many of CPU's production wells places these corridors in a higher risk category. Spill events cannot be predicted; and therefore, preventative measures are limited. ·
Recommendations:
1:1 Ensure that fire departments and emergency response teams are familiar with production well locations and boundaries of the shallow aquifer zone.
1:1 Coordinate training with spill response teams to minimize environmental impact of clean-up procedures.
1:1 Determine the frequency and schedule of contaminant transport along major transportation routes.
1:1 Investigate a prioritized program of storm drain upgrade, such that strategic drains and systems are capable of not only treatment of stormwater, but can serve as a temporary detention facility for hazardous spills.
4.5.3 Known Contamination Sites
Groundwater contamination from the Airco-Boomsnub contaminated sites present the largest and most probable threat to groundwater quality. Close monitoring of the contaminant plumes and maintenance of an open working relationship with both Ecology and the two facilities is crucial to protecting CPUs water quality and quantity requirements. A continued monitoring program is outlined in Section 5.
Inventory of Contamination Sources 4-34
I I I I I I I I I I I I I I I I I I I
I I I I I "
I I I I I I I I I I I I I I
Section 5
I I I I I I I I I I I I I I I I I I I
December 30, 1994
Section 5 Threat Categories - Existing And
Proposed Protective Measures 5.1 Introduction
In the last section, various sources of groundwater contamination were reviewed, existing data were analyzed, and sources or categories of sources presenting a high risk of contamination of aquifers were discussed. In this section, potential contamination sources will first be classified into general threat categories (note: For completeness within this Section, it has been necessary to reiterate some discussion from previous sections). Existing programs to control and clean-up contamination from those categories of sources will be reviewed. Subsequent sections will deal specifically with spill response planning and contingency planning (Sections 6 and 7). In Section 8, the Wellhead Protection Program (WHPP) recommendations are described based on the programs outlined in this and the following two sections.
5.2 Risk Categories - Definition and Discussion
5.2.1 High Risk Categories
Above and Below Ground Storage Tanks
Underground storage tanks (USTs) usually contain flammable motor fuels or heating oil, but may contain other compounds used by industry, government, or businesses. Contamination of soil and groundwater by leaks from USTs and associated piping has become an increasingly prominent environmental, legal, and regulatory issue. The U.S. Environmental Protection Agency (USEP A) estimates that 35 percent of all USTs could be leaking. The most common causes of leaks are structural failure, corrosion, improper fittings, improper installation, and natural phenomena.
Leakage from USTs and associated piping often occurs without detection. Even relatively small amounts of certain compounds can have serious adverse impacts on groundwater quality. For instance, one gallon of gasoline can render a million gallons of groundwater unpalatable for as long as several decades. A one-quarter inch hole in UST can release up to
Threat Categories • Existing and Proposed Protection Measures 5·1
December 30, 1994
930 gallons of gasoline in a single day. Once released from a UST, some volatile organic compounds and petroleum products can rapidly migrate through the soil profile to groundwater. This problem is especially serious in areas with excessively permeable soils such as coarse sands and gravels.
Studies show that the mean age of leaking tanks in California, Oregon, and Washington is eighteen years. Of the many materials stored in USTs, solvents are considered the most toxic. However, petroleum products may pose a greater risk to groundwater because of the large number of tanks containing such products. In addition, petroleum products contain many potential pollutants, including three USEPA priority pollutants: benzene, toluene, and ethylbenzene. Benzene is a known human carcinogen.
Location of USTs tends to follow the transportation and population pattern of Clark County (County), as do the public water well locations. This, of course, increases the public health risk associated with leaking USTs.
According to the Department of Ecology's (Ecology) database on leaking underground storage tanks (LUSTs) there are currently 27 known groundwater contamination sites in the County which have resulted from LUSTs. Four are within the WHPP Focus Area and all four are located along the Interstate 5 corridor (Exhibit 4-8). None of the LUSTs are within the one-year time of travel of any Clark Public Utility (CPU) production wells; however, all four are along hydraulic flow paths for CPU Well Nos. 9, 17, 18, and 19. These wells are situated along the Salmon Creek depression which receives groundwater from both the northeasterly and southwesterly direction (Exhibit 3-9). Three of the four LUSTs are within the five-year time of travel of these wells. If contamination of groundwater was a result of the released product, it is likely the contamination would be confined to the shallow alluvial aquifer. Detection of petroleum products in MWs 5 and/or 7, would serve as a warning for contamination of CPU Well Nos. 9, 17, 18, and 19. This aquifer is relatively susceptible to land use impacts given its shallow occurrence and the absence of overlying confining units.
Aboveground storage tanks are generally not the threat that underground tanks represent. This is because leaks can generally be detected before large quantities of material are released. However, storage of some materials, such as bulk petroleum, can represent a large threat simply because of their size. Other types of aboveground storage which are
Threat Categories - Existing and Proposed Protection Measures 5-2
I I I I I I I I I I I I i I I I I I I
I I I I I J,
I I I I I I ,I I I I I I I
December 30, 1994
vulnerable to vandalism, such as those on construction sites, or those tanks which are not easily and visually monitored should be a focus of attention.
Hazardous Materials Transportation
The risk of spilling hazardous materials resulting from a traffic accident is inherent in the existence of traffic corridors. A wide variety of materials are transported by rail and road every day. Fortunately, the corridors themselves (roads and rail) are controlling elements and provide a very good target for risk reduction measures.
Existing Hazardous Material Contamination
Ecology has indicated that there are over 900 contaminated (with hazardous materials) sites in Washington. If these sites exist in an aquifer recharge area, then a risk exists. The significance of the risk depends on the susceptibility of the aquifer to contamination. Susceptibility is determined by the nature of the chemical contaminant and the hydro-geologic characteristics of the area.
Of primary importance to maintaining CPU's production well water quality is the delineation and remediation of the chromium plume apparently migrating toward CPU Well Nos. 5, 7, and 23, and volatile organic chemicals (VOC) contamination presently measured in the Upper Troutdale aquifer. Although chromium contamination is confined to the shallow alluvial aquifer (Pleistocene alluvial deposits), an improperly abandoned well or poorly constructed active well could serve as a path of contaminant migration into the Upper Troutdale Aquifer. Results of recent monitoring under the WHPP indicate that 1,1,1-trichlorethane (TCA), trichloroethylene (TC), dichloroethylene, and methylene chloride have been detected on more than one sampling occasion at MW-1 and the Bennett Well. TCA was also detected from the Shallow Alluvial Aquifer at MW-1 (see Section 3).
VOC contamination has been measured in the Upper Troutdale Aquifer. Results of recent monitoring under the WHPP indicate that 1,1,1-TCA, TC, dichloroethylene, and methylene chloride have been detected on more than one sampling occasion from MW-1 and the Bennett Well. TCA was also detected from the Shallow Alluvial Aquifer at MW-1 (see Section 3). Recently, a suspected source for this VOC contamination is the Airco Industrial Gas production facility.
Threat Categories • Existing and Proposed Protection Measures 5·3
December 30, 1994
Currently, remediation practices are on-going at both the Airco-Boomsnub contaminated sites. However, the extent of the chromium contamination has not yet been clearly defined along the south end of the plume; and, similarly, the chromium plume is not fully defined. On-site characterization needs to be more fully completed at both suspected sources.
5.2.2 Lower Risk Categories
Septic Tanks
The main sewer district in the Focus Area is the Hazel Dell Sewer District, however the City of Battle Ground to the north and Vancouver to the south also provide sanitary sewer service. The remainder of the area is served by on-site sewage systems. Potential contaminants from septic tanks and drain fields would include pathogenic organisms, toxic substances, and nitrogen compounds.
Ammonia and nitrate nitrogen are highly soluble in water, and can be expected in detectable quantities wherever portions of the aquifer are affected by septic system discharges. Suspended solids in sewage, including coliform bacteria, are easily filtered by soil and would not be transported significant distances from the drain field. However, improperly abandoned wells may provide direct entrance of sewage into the aquifer.
Hazardous chemical contamination of groundwater from septic tanks is also a threat. The spectrum of chemicals used inside the home is great, but the volumes are small. The pathway to groundwater usually involves a septic system. Cleaners, polishes, waxes, and paints, are the primary materials of concern. Some of these products contain toxic and long lasting chemicals, which when coupled with a high density of septic fields, can cause low level aquifer contamination, and raise health risks. Proper handling of these materials should result in little or no waste, and therefore, little or no contamination. However, lack of knowledge of the potential threat, or chemical content, often leads to improper application or disposal.
The historical nitrate data collected by CPU (1988) has been reviewed in Section 4. Data demonstrated that elevated nitrate levels do not typically occur in sewered areas. All locations where levels exceeded the nitrate MCL of 10 mg/L (as N) were situated in non-sewered areas, or areas primarily relying on septic systems.
Threat Categories - Existing and Proposed Protection Measures 5-4
I I I ,I I I 'I I I I I I I I I I I I I
I I I I I I I I I I' I I I I ,. I I I I
December 30, 1994
Nitrate levels measured during the first three monitoring rounds from newly installed monitoring wells were below 5 mgiL (as N) in all samples. All of the monitoring wells are located in sewered areas. Most of CPU's production wells are located in sewered areas, minimizing the risk of nitrate contamination ofthe public water supply. Review of water quality data collected by CPU in 1990 for compliance with the Safe Drinking Water Act (SDWA) indicates that nitrate levels were typically below 2.5 mg/L, with the exception of an elevated level (6.1 mg/L) at CPU Well No.8 (Exhibit 3-16). This well is located in a sewered area which is zoned as residential. Additional sampling would be required to determine if nitrate contamination is persistent in this vicinity.
In some areas, business and commercial facilities still utilize on-site septic for sewage disposal. Routine processing of chemicals, as has been the case with some dry cleaners and photo processors, can lead to serious problems. Business, commercial, and industrial operations that rely on on-site systems need to take special precautions to avoid contamination of their waste water.
Commercial and Industrial Hazardous Material Management
Commercial use of chemicals can present significant risk to groundwater. While there are always inherent releases of chemicals to the environment with most chemical handling and use, most significant releases of liquids occur in one of two ways.
The most obvious release pathway is through accidental spills. Handling materials always presents a risk of spills, but the method of handling, spill prevention measures, and spill response preparedness can reduce some of the risk.
Improper disposal is the second pathway. Most waste materials which could be construed to be hazardous are regulated, with the exception of "small quantities" which will be described later. For the regulated materials, disposal decisions must be documented and reported, and the disposal facility must be licensed. For small quantities of regulated hazardous materials, and for other materials not regulated, disposal can occur virtually anywhere and cause environmental problems. Small quantity generators, therefore, should receive attention under any risk reduction program.
There are still many businesses that do not follow proper waste handling procedures for a variety of their waste products. For many, the waste
Threat Categories - Existing and Proposed Protection Measures 5-5
December 30, 1994
material is sent to local landfills along with other solid wastes. Others still dispose of material on-site, unaware of the potential hazard the materials can represent. For nearly all, the issue is one of education (or lack of it). Because the potential liabilities are very high, and regardless of the regulatory classification of the material, few businesses would knowingly subject themselves to such financial risk.
If materials are disposed through the solid waste stream, they may not be much of a threat. Landfill disposal generally is becoming less of a threat to groundwater because of new landfill construction standards. Most landfills now have liners, leachate collection and treatment with little or no contamination of groundwater. Also, as the "non-conforming" landfills are closed and covered, the threat of past dumping practices is being reduced.
The pathways of concern, therefore, are the result of on-site handling and disposal of material. Risk reduction strategies should focus on these onsite management practices, but particularly with the non-regulated business use of chemicals.
Stormwater Runoff
Stormwater is a not only a source of groundwater recharge, but is also a potential source of contamination. Stormwater can directly dissolve many pollutants and serve as a carrier or transport for many which are not soluble. Runoff from streets, parking lots, and other relatively impervious land cover often contains a variety of inorganic, organic, and bacterial contamination. Everything from petroleum, to metals, to coliform bacteria can be easily swept away, and, depending on the disposal mechanism, be transported to groundwater. Stormwater runoff in highly permeable soils such as those surrounding CPU's wells, can also serve as a driving force to push pollutants into aquifers. The pressure from stormwater can push septic wastes or surface contaminants downward in these soils, the rate depending on the quantity of water, the solubility of the contaminants, and the permeability of the soils. Specific contaminants of concern and typical sources for CPU's groundwater include the following.
Bacteria - Sources of bacterial contamination from stormwater in the County are likely to be typical of other urban, suburban, and rural areas. They might include livestock operations, small farms, stream bank and soil erosion from many causes, and urban runoff, in general.
Threat Categories - Existing and Proposed Protection Measures 5-6
I I I I I I I I I 'I I I I I I I I I I
I I I I I I I I I I I I I I I I I I I
December 30, 1994
Metals - Metals can come from a variety of sources, but the most common source is automobiles. Lead, for example, is a typical byproduct of combustion of leaded vehicle fuels. Other metals come from vehicle and tire wear.
Nutrients - Nutrients commonly come from fertilizer application, animal waste, or septic systems.
Toxics (Organics) - Many toxic organic contaminants, like metals, come from vehicle combustion and use. Others, however, have their origin in household application (or over application), spills, or existing contaminated sites.
Pesticides and Fertilizers (Animal Waste Disposal)
The groundwater contamination potential from pesticides and fertilizers has been well documented throughout the Country. Pesticides are of concern because some of these chemicals are not only toxic to their target species, but also are toxic or carcinogenic to humans. Nitrogen fertilizers are of concern because of their potential effect on small children if ingested at a high enough concentration. The beneficial effects of these chemicals are well known, but they also represent a significant threat to groundwater and wellheads.
Pathways to groundwater have their origin in over application, high porosity soils and geology, and accidental releases. Additionally, improper disposal, transport through improperly abandoned wells, stormwater and natural drainage systems can contribute to widespread contamination from these materials. Much of the County and the areas surrounding CPU wells have the soils and geology to make the underlying aquifers susceptible to contmnination from pesticides and fertilizers.
Dry Wells (Injection Wells)
Class V injection wells (dry wells) are used throughout the County. These are used for stormwater, septic waste, or other wastewater disposal at commercial, industrial, and multifamily residential sites. They are likely sources of contamination due to inappropriate waste disposal, spills, and in some cases, normal use.
Wells (Poor Construction or Improperly Abandoned)
Wells are a conduit between the aquifer(s) and the ground surface. In most cases with active wells, this conduit is used to transport water
Threat Categories · Existing and Proposed Protection Measures 5-7
December 30, 1994
upward for application to some beneficial use. However, wells which are improperly constructed or abandoned can be a conduit for water, and surface contaminants, to contaminate the aquifer.
Wells which are no longer in service can also pose a risk when they are unknowingly damaged during construction on the property. Any of these possibilities can pose a risk to groundwater through the opening of a conduit for pesticides, metals, petroleum products, fertilizers, etc.
Decommissioning generally consists of appropriate filling of the well with a variety of materials including a concrete or impervious seal near the surface.
Clark County, like many rapidly developing rural areas, has significant numbers of private domestic wells. CPU estimates that about 100 to 200 per year are abandoned in favor of the utility's water supply. Since many of these were constructed before well drilling standards and because of lack of Ecology oversight, the likelihood of improperly constructed wells is high. Similarly, without a program encouraging or enforcing proper abandonment, these wells may present a significant conduit for aquifer contamination. There is currently no inventory, either of the number or location of private domestic wells. Such a system might be a first step in developing a program for proper abandonment. A WHPP should contain an element which, at least in a focused manner, deals with this issue.
5.3 Existing Programs to Protect Groundwater
The threats from the categories listed above are to some degree reduced by existing programs. These efforts can take the form of land use controls, regulatory programs, voluntary or cooperative efforts of public or private organizations, and involve elements or specific programs in public education. Existing programs are described below.
5.3.1 Land Use
Land use is controlled by the existing Clark County Comprehensive Plan. This plan was last updated in 1990. This plan and associated implementing ordinances control basic land use and a variety of associated activities which impact the environment, specifically groundwater quality. Implementing ordinances are:
0 Land Use - Title 18 - Zoning: The basic implementation ordinance for Clark County's Comprehensive Plan.
Threat Categories - Existing and Proposed Protection Measures 5-8
I I I I I I I I I I I I I I I I I I I
I I I I ·t I I I I I I I I I I I I I I
December 30, 1994
Q Drainage and Erosion Control - Chapter 13.26 - Establishes policies and processes to protect water resources.
Q Sewage Disposal - Chapter 24.04 - Basic health related wellhead protection prohibiting sewage disposal close to wellheads, and controlling other methods ofland disposal.
Q Industrial Waste Disposal- Chapter 24.05- Requires compliance with Southwest Washington Health District guidelines.
Q Solid Waste Management - Chapter 24.12 - Provides for a comprehensive solid waste plan and also requires leachate control.
Cl Critical Areas Ordinance - Requires special environmental review for activities in "Critical Areas" as defined by the Growth Management Act (GMA) and Clark County Policy.
5.3.2 Regulatory
Regulatory programs cover many hazardous materials. These regulated materials represent a subset of materials which because of quantity or type might be considered hazardous to groundwater. Hazardous Materials (regulated) are generally those materials which are hazardous to humans or the environment through characteristics of toxicity, ignitability, reactivity, or corrosivity. In other words, ingestion, inhalation, or contact with these materials would be hazardous to human health or other life forms and biological systems.
Listed below are descriptions of regulatory programs under specific statutes or regulations:
The Federal Resource Conservation and Recovery Act (RCRA)!Solidl Dangerous Wastes Regulations
The Federal Resource Conservation and Recovery Act (RCRA) of 1976 (40CFR 260) - as amended in 1984 - is a comprehensive piece of legislation created in reaction to improper handling of waste materials. The legislation contains provisions for handling a variety of ''hazardous" and other waste streams. Discussed below are programs developed under RCRA or complementary programs developed at the State or local level. The three major waste categories of interest are: 1) Hazardous Wastes, 2) Solid Wastes, and 3) Underground Tanks.
Threat CategorU.s • Existing and Proposed Protection Measures 5-9
December 30, 1994
Hazardous Waste - The hazardous waste stream has had the highest priority for USEP A during the years following passage of RCRA. Consequently, this section of the law has had the most attention and notoriety and the term "RCRA" became synonymous with hazardous waste regulation. ''RCRA" was termed the "Cradle to Grave" legislation regulating hazardous wastes because the legislation required controls on hazardous wastes from the time of their creation to their ultimate disposal.
Washington was one of the first states to pass legislation and create regulations severe enough to warrant partial "authorization" by the USEPA to administer the hazardous waste portions of RCRA. Actually, Washington has more stringent regulations than the federal program and has been regulating hazardous wastes since 1984.
Under the State's "Dangerous Waste Regulations" (Chapter 173-303 WAC), waste materials thought to be hazardous must be "designated" through a process of determining the characteristics of the material.
Like the federal regulation, hazardous waste generation of small quantities is exempt from most provisions of the State rules. The regulatory threshold amounts, however, are ten times lower under the State rules than those of the USEPA. While larger "generators" must meet strict requirements for record keeping, storage, and disposal, "small quantity generators" are relatively uncontrolled and free from requirements. Small quantities can be amounts of dangerous waste up to 220 pounds per month.
Waste Reduction Planning has recently been required of Washington Businesses (Hazardous Waste Reduction Act of 1990). Under the terms of this legislation, large (regulated) generators of hazardous waste must develop plans for the reduction of hazardous wastes. The overall goal of the legislation is for a 50 percent reduction by 1995.
Given a set of circumstances involving a toxic material, mishandling of it, spill(s), and proximity to an aquifer, significant damage could occur. This is an area where local programs can help. Other than the fire code, there are currently no programs which regulate hazardous wastes at the local level in the County.
Above and Below Ground Storage Tanks - Federal regulations (Technical Standards and Corrective Action Requirements for Owners and Operators ofUSTs, 40 CFR 290 Part 280) have been developed by the USEPA under
Threat Categories - Existing and Proposed Protection Measures 5-10
I I I I I I I I I I I I I I I I I I I
I I I I I I I I I I
•• I I I I I I I I
December 30, 1994
Subtitle "i" of the RCRA. The USEPA regulations contain requirements for proper underground storage tank (UST) design, leak detection, overfill protection, tank inventory monitoring, financial responsibility, leak reporting, remedial action, and removal. However, the USEPA does not possess the necessary resources to directly enforce their regulations.
In 1989, Washington enacted legislation, creating a comprehensive program for the regulation of USTs and a reinsurance program to assist owners and operators in demonstrating financial assurance under the USEPA's financial responsibility requirements. The State legislation, Engrossed Substitute House Bill (ESHB) No. 1086, now codified as Chapter 90.76 RCW, required Ecology to develop and adopt UST rules as stringent as the USEP A regulations. The rules, Chapter 173-360 WAC, were filed by Ecology on November 28, 1990.
Unlike the USEPA UST program, a funding mechanism has been established for the Ecology program. RCW 90.76 requires UST owners to pay an annual fee of $75 per tank each year. ·
Under RCW 90.76, Ecology is encouraged to delegate part or all of the State UST programs to a city, town, or county upon request from the local jurisdiction. Ecology must be satisfied that the city, town, or county requesting delegation can adequately enforce the regulations and has sufficient resources to implement the program. The delegation agreement will also include an identification of fee distribution ratio between Ecology and the city, town, or county assuming responsibility for the program.
Local UST requirements more stringent than State rules can be implemented in Environmentally Sensitive Areas (ESAs) designated by Ecology (after being proposed by local jurisdictions). A supplementary local fee, not to exceed 50 percent of the State fee, may be imposed in ESAs with more stringent rules, if such fees are necessary for enhanced program administration and/or enforcement. The supplementary local fee must be authorized by Ecology.
ESAs are portions of the State that possess physical characteristics that make them especially vulnerable to releases from USTs. A city, town, or county can petition Ecology to have an area within its jurisdiction designated as an ESA. If a single ESA is located in more than one jurisdiction, such as two different cities or one city and a county, the jurisdictions can jointly request that Ecology designate the area as sensitive.
Threat Categories • Existing and Proposed Protection Measures 5-11
December 30, 1994
An ESA designation under Chapter 90.76 RCW is not synonymous with an ESA designation under WAC 197-11-908 of the State Environmental Policy Act (SEPA), although the same single area could be designated as an ESA under both Chapter 90.76 RCW and SEPA. Designation under Chapter 90.76 RCW affects only the construction and operation ofUSTs, while designation under SEPA can affect a much broader range of landuse activities.
The rules (WAC 173-360-510 through -530) for establishing ESAs under Chapter 90.76 RCW are somewhat unclear. The implication under WAC 173-360-510(3)(d) is that the Clark County Ground Water Management Area (GWMA) could, in total, automatically qualify as an ESA; yet, WAC 173-360-510(4) requires compliance with WAC 173-360-530 which includes a very rigorous set of criteria for establishing an ESA. The tone of WAC 173-360-530 seems to require that the need for more stringent UST requirements must be well documented.
The existing Ecology program for USTs is comprehensive linder Chapter 173-360 WAC. Among other things, the regulations require examination and licensing for firms and persons involved in UST-related activities. Some of the activities that must be done in the presence of licensed personnel are:
l:l Installing tank and associated piping (all facets);
l:l Retrofitting existing tanks to meet new requirements;
l:l Installing and testing cathodic protection systems and release detection equipment;
l:l Testing of tank and piping tightness;
l:l Decommissioning including excavating around the tank, tank purging, removal of sludge and vapors, and removal ofthe tank.
Owners of all tanks covered by the regulations must apply for and obtain an annual permit in order to operate. Permit requirements include: (1) a properly completed installation checklist filled out by an Ecology-licensed installation supervisor; and, (2) certification of compliance with corrosion protection of tanks and piping, financial responsibility requirements, and release detection requirements.
Owners or operators of existing tanks must notify Ecology of the tank(s), and along with owners and operators of new tanks, must annually certify
Threat Categories • Existing and Proposed Protection Measures 5-12
I I I I I I I I I I I I I I I I I I I
I I I I I I I I I I I I I I I I I I I
--------
December 30, 1994
compliance with the requirements of the regulations in order to obtain the subsequent year's operating permit. Permits may be revoked for noncompliance and penalties may also be levied against persons who violate regulations. It is illegal for suppliers to deliver a product to a tank unless a valid permit is displayed. It is also illegal to deliver a product to a tank known to be leaking.
Authorized representatives of the State may gain access to the premises for inspection of records, to sample, or otherwise monitor operation.
Performance standards are provided for new tanks. Existing tanks must upgrade according to a schedule.
In addition to the above, there are programs in existence at both a federal and State level intended to assure cleanup of releases of contaminants from USTs. Section 205 of the Superfund Amendments and Reauthorization Act of 1986 created an Underground Storage Tank Trust Fund intended to pay for the cleanup of releases of hazardous substances, including petroleum products, from USTs. The fund, administered by the USEPA Office of Underground Storage Tanks (OUST), made a total of $500 million available over a five-year period which ended in 1992. The life of this fund was recently extended by Congress for an additional five years.
The fund is intended to support cleanup of LUSTs in cases where no financially solvent owner/operator can be identified, where the owner/operator refuses or is unable to promptly respond to the problem, or where an imminent hazard to public health or the environment exists. The fund also provides financial assistance to State governments for development of State LUST response programs.
Ecology received assistance from the fund to develop this State's LUST Program, which was finalized in September of 1989. Ecology currently uses money from the fund to offset salaries and related expenses for the State LUST Program.
Releases of hazardous substances from USTs in this State are currently addressed by Ecology through oversight of voluntary cleanup actions by tank owners or through enforcement actions under the Washington Model Toxics Control Act passed by the voters as Initiative 97 in 1988. One of the main purposes of this act was to raise sufficient funds to clean up all hazardous waste sites in the State. The bulk of the revenue is generated through a tax on industry. The act creates the Toxics Control Account
Threat Categories · Existing and Proposed Protection Measures 5-13
December 30, 1994
and describes the many possible uses of revenues, one of which is funding for the Ecology LUST Program cleanup activities. In cases where a financially solvent owner/operator cannot be identified or is unwilling to undertake appropriate cleanup actions, Ecology will directly undertake the cleanup of a site under this Act. If a financially solvent responsible party can be identified, Ecology will seek to recover costs incurred in any cleanup action.
It is important to note that the above State and federal UST regulatory programs do not cover all USTs. Notable exceptions are:
CJ Farm or residential UST systems of 1,100 gallons or less capacity used for storing motor fuel for non-commercial purposes.
CJ UST systems used for storing heating oil for consumptive use on the premises where stored, except that systems with a capacity of more than 1,100 gallons have a reporting requirement.
CJ USTs with a capacity of 10,000 gallons or less are exempted from environmental review under SEP A.
However, the first two exceptions noted above are subject to local regulatory authority under Article 79 of the Uniform Fire Code (UFC) which has been adopted by Clark County Ordinance.
Additionally, Ecology has developed a six-page informational document on Unused Underground Residential Heating Oil Tanks including considerations for operational home heating oil tanks.
Installation and removal of abandoned home heating oil tanks is regulated by the Clark County Fire Marshal's Office, local fire districts, and cities under Article 79 of the UFC. The UFC requires that tanks which have been unused longer than a year be properly closed in a manner approved by the appropriate fire official. The Clark County Fire Marshal's Office is a part of the County's Department of Community Development. The public is generally unaware of home heating oil UST regulations, and general enforcement of Article 79 relating to these tanks is not rigorous; and inspections of operational tanks is minimal.
For aboveground storage tanks, existing controls consist oflocal and State fire regulations, and State and federal contingency planning requirements for large bulk petroleum storage.
Threat Categories - Existing and Proposed Protection Measures 5-14
I I I I I I I I I I I I I I I I I I I
I I I I I I I I I I I I I I I I I I I
December 30, 1994
Landfills - A portion of the RCRA statute covered the more traditional solid waste stream. Activity under that portion of the statute, however, has lagged behind the actions of Ecology under the State's solid waste legislation (Chapter 70.95 RCW). Ecology has developed ''Minimal Functional Standards" (Chapter 173-304 WAC) which require lined landfills, leachate collection, and a variety of measures which Federal rules have only recently required. Consequently, Washington is generally ahead of many parts of the nation in environmental protection from landfill operation.
The result has been a decrease in the risk these operations pose to groundwater. Once past operations are properly closed, the risk will be even further reduced. Actually, all non-conforming landfills should have been closed or in the process of closing by October 1989.
Under the State Solid Waste Laws, local governments are charged with administration of the Solid Waste Regulations as they apply to landfills and transfer stations. This function has been handled by local health districts and departments throughout Washington.
Currently in Clark County, site compliance is good. All operating landfills are in compliance with standards or are operating under compliance schedules issued by the Health District or Ecology.
Comprehensive Environmental Response, Compensation and Liability Act- CERCLA (Superfund)/Model Taxies Control Act (MTCA)
The Federal "Superfund" legislation of 1980, CERCLA, was created to assure that the nation's worst contaminated sites were cleaned-up. It has received considerable attention because of the large, highly toxic contamination it has addressed (e.g. Times Beach and the Love Canal). It has also received considerable criticism with reports of lack of progress despite the considerable "fund" which was available and being spent.
Regardless of the criticism, it was clear from the inception of the Superfund program that there were more contaminated sites than the fund, and USEP A, could reasonably manage. Many would simply not get attention because of their size and consequent lower priority. Washington, for example, had over 500 contaminated sites listed by the middle of the 1980s. In response to the need, Washington began a State clean-up effort in the early 1980s. This effort was largely funded by general tax revenue, and because of the limited funding was targeted to only a few sites. The Legislature subsequently responded by providing a
Threat Categories - Existing and Proposed Protection Measures 5-15
December 30, 1994
"State Superfund" legislation which was followed within two years (1988) by the Model Toxics Control Act - an initiative from the people (Initiative 97).
While the procedural details of these State programs have differed, the thrust has been to make progress on what has become a list of over 900 sites in Washington. In theory, the RCRA and Dangerous Waste programs would prevent any new sites from being developed, and the clean-up programs would reduce the past practice threat.
Two factors have caused the number of sites to increase from nearly 500 in the late-1980s to over 900 currently. First, there has been a continual "discovery" of sites which were previously unknown to the regulators. Second, there have been incidences of spills, fires, and chemical applications which have increased the number of sites.
The Federal process is limited. Only sites which rank high in the Hazard Ranking process can be nominated for the National Priority List (NPL). That process alone is lengthy. Further, USEPA expenditure of Superfund money is largely limited to these ''NPL sites." The State has instituted a similar, but less lengthy process to prioritize its sites, and can generally take action more quickly. Nevertheless, progress is relatively slow.
Many sites are receiving "independent" and voluntary attention by the owners or "responsible parties" as a matter of necessity to make fairly immediate use of the land, or as a mechanism to limit further liability. Ecology's involvement has been limited due to their need to focus on the higher priority sites.
Both the State and federal processes can, and have, become bogged down in legal maneuvering. The stakes, in terms of clean-up costs and liability, are generally high and each action is considered from legal and technical angles before action. From the perspective of the involved parties, this is prudent. From the viewpoint of concerned citizens and interest groups, the process is painfully slow.
LUSTs are handled in a separate (from the USTs or non-leaking tanks) regulatory approach by the federal and State Governments. Both USEP A and Ecology have programs for cleaning up LUSTs (described above). For USEP A, this has largely been a funding program to states to implement clean-up programs. For Ecology, the program has involved regulation development, reporting requirements, and clean-up standards.
Threat Categories - E:x;isting and Proposed Protection Measures 5-16
I I I I I I I I I I I I I I I I I I I
I I I I I I I I I I I I I I I I I I I
December 30, 1994
At the local level, there are no programs that deal with contaminated sites with the exception of underground tank programs in some areas of the State. Jurisdiction for LUSTs continues to rest with Ecology for tanks in Clark County. The Southwest Washington Health District, however, is involved in location and oversight of the treatment of petroleum contaminated soils.
Superfund Amendments andRe authorization Act of 1986 (SARA) Title Ill
The Superfund Amendments and Reauthorization Act of 1986 (SARA) contained numerous sections or titles. One section contained, as indicated, the basic amendments to the Superfund program. Another section, Title III, contained provisions for "Community Right to Know" and Emergency Response.
Community Right to Know · Under the terms of this section, entities handling hazardous materials come under varying levels of reporting requirements in an attempt to let the community (especially emergency response groups and agencies) know the types and amounts of chemicals on hand. ''Reportable Quantities" vary from chemical to chemical and can go as low as one pound. In addition, these businesses or companies must report annually on any releases, accidental or process related, of these chemicals to the environment. Reporting thresholds here are much lower. USEP A keeps a data base of releases.
Clark County has created a Local Emergency Response Committee and has an Emergency Response Coordinator on staff. Part of this committee's function is to assimilate information on chemical use and release in the County and make this information available to the public.
Emergency Response - In an attempt to improve emergency response, an emergency response organization was required for each State. In Washington, the ground level of this structure is a County or local emergency response committee.
Through the Local Emergency Planning Committee, topics such as training, chemical storage, and incident response are discussed. In this manner, close coordination in the event of a release or spill is enhanced.
Clark County does have well trained first responders in their local fire departments and districts. Locally, Fire District Five is recognized as the local hazardous materials response organization and responds on request
Threat Categories - Existing and Proposed Protection Measures 5-17
December 30, 1994
to virtually all areas of the County. The Incident Command Agency for hazardous material spills, however, depends on where the spill occurs. In all cases, except State highways, the local fire district is the Incident Command Agency. For State highways, the State Patrol serves this role.
Under Section I of SARA, there were provisions for worker protection relating to emergency response. These provisions are mentioned here because of the connection between worker safety, training, and contingency planning. Federal and State rules require any business which handles hazardous materials to provide training for their workers in emergency response. The training is required at differing levels depending on the level of emergency response expected from the worker.
Many businesses are unaware of these recent requirements. With guidance, businesses could easily develop a coordinated program to meet standards for worker protection, worker right to know, and contingency planning. Most of all, these efforts will greatly reduce the risk to workers and the environment - including groundwater.
Transportation • Labeling, Placarding, Shipping Papers
U.S. Department of Transportation (DOT) regulation of the transportation of hazardous materials is focused on three areas: labeling, placarding, and shipping papers (Manifests). DOT has very specific requirements for labeling of hazardous materials. Further, vehicles carrying these materials must be placarded with the appropriate DOT signage. Recent changes to DOT regulations require emergency information to be placed on shipping papers (such as a phone number where 24-hour emergency response information is available) and that emergency response information be maintained in the vehicle. (Generally a copy of the DOT publication Emergency Response Guidebook).
Hazardous wastes (under RCRA) utilize a specific manifest form which was developed to track waste material from point of origin to disposal.
There are no programs to provide notification to local government of special hazards related to transport of materials. The question is: Is it practical to have such a notification system? Perhaps not. However, an inventory of the types of materials typically traveling along the highways of Clark County could provide guidance as to the level of concern certain materials might represent.
Threat Categories - Existing and Proposed Protection Measures 5-18
I I I I I I I I I I I I I I I I I I I
I I I I I I I I I I I I I I I I I I I
December 30, 1994
Fire Regulations
State and local fire regulations can help regulate amount and type of hazardous materials stored at any location. For example, above ground storage of gasoline is generally prohibited in most counties. Under the Uniform Fire Code (Articles 79 and 80), heating oil tanks which are not in use must be closed, and spill prevention measures need to be taken for storage of materials above ground. Instances of chemical fires, injuries, evacuations, and environmental contamination have led to regulations covering the manner in which specific types and amounts of chemicals, such as pesticides and fertilizers, are stored.
5.3.3 CooperatlveNoluntary
A powerful adjunct to regulatory programs are the endless variety of creative educational, informational, preventive, and response oriented programs which have been, and continue to be, developed at all levels of government. Implementation funds have been, and are, the limiting factor. But despite the scarcity of funds, several programs are directly reducing risk to groundwater and are described in the following paragraphs:
Ecology Help/Education
Ecology has provided a variety of educational materials pertaining to hazardous materials management and compliance with hazardous waste regulations, underground tank rules, and general environmental protection. In addition, they have offered help to business in recycling efforts. Recently, they have offered a pilot program to help several businesses' model Waste Reduction Plans required under the Hazardous Waste Reduction Act (1990).
Spill Response
The effectiveness of spill response is often tied to the cooperative efforts, capability, and training of the "First Responders." Depending on the event timing and location, this is usually the local fire department, the local police, or the State Patrol. Their primary mission is human safety, but closely related is environmental protection.
These responders often have the task of taking immediate action to protect the environment from chemical contamination. Further, their immediate action can effectively reduce risk or increase risk to
Threat Categories - Existing and Proposed Protection Measures 5-19
December 30, 1994
groundwater depending on their initial decisions. For this reason, response training is critical.
The level of environmental protection training offered to these first responders has varied from place to place in the State. The more rural areas generally have more difficulty with these preparedness issues than the urban areas. Volunteer emergency and fire responders are used more than the professionals. Consequently, a preparedness gap may exist.
Generally, environmental protective measures and clean-up is left to specialty contractors or secondary responders. Ecology has spill response staff in their four regional offices, but their capability is limited. If they respond, they have a dual role of regulatory enforcement and emergency response. When they respond, Ecology generally relies on specialty contractors to take mitigative action, especially in large spills.
More detail on spill response can be found in Section 7.
Water Supply Contingency Planning
During the development of Water System Plans, some contingency planning is required to determine the adequacy of source and storage. The requirements are those of the Department of Health (DOH) and basically call for enough supply to meet demand with the loss of the largest source in the system. This level of contingency planning has the weakness of not preparing for the loss of multiple sources and dealing with both short and long term scenarios.
Emergency Planning and Response
Many large and small businesses have recognized that emergency preparedness is in their best interest. In many cases it is required. Many small businesses have undertaken ''Worker Right to Know" programs which include emergency response elements. Efforts to educate small businesses would benefit from more focus, money, and government outreach efforts.
Household Waste Disposal
Many local governments have developed programs for handling "household hazardous wastes" recognizing the need to prevent these materials from entering the environment. Some communities have had special "Hazardous Waste Days" while others provide routine handling at their local landfill. This is especially true in Clark County.
Threat Categories • Existing and Proposed Protection Measures 5-20
I I I I I I I I I I I I I I I I I I I
I I I I I I I I I I I I I I I I I I I
December 30, 1994
Southwest Washington Health District, the County, and waste disposal companies sponsor ''Household Hazardous Waste Collection Days" throughout the year at specified locations. The Health District also undertakes special events for small quantity generators as part of their ''Moderate Risk Waste Program" which has been partially funded by grant dollars from Ecology.
Streambank Stabilization Efforts
During 1992 and 1993, CPU initiated a program to help with streambank stabilization within the Salmon Creek Basin. This effort also focused on stream fencing where livestock threatened the stability of the bank and also contributed to nutrient levels in the stream. Working cooperatively with the Soil Conservation Service, the local Conservation District, and Fish and Wildlife agencies, CPU achieved fencing or other stabilization measures on over 5,000 feet of stream channel.
5.3.4 Public Involvement/Information and Education/Planning
Moderate Risk Hazardous Waste Programs
The Southwest Washington Health District has undertaken an information program targeting small business. Under a grant from Ecology, this Coordinated Prevention Program offers information and business "audits" on request. In addition, efforts are being made to work with other Ecology information and outreach programs, and provide curriculum materials for schools. This program could easily be expanded with additional money and staff to become a very complementary program, and alternative to, regulation.
Environmental Education
CPU has been working with area schools to provide tools, information, and assistance in environmental education. These efforts have included providing water quality test kits, fish rearing equipment, and field assistance. The efforts have been well received and there appears to be opportunity for expansion of efforts and development of on-going programs. Salmon Creek has been recognized and targeted by the Northwest Watershed Alliance for possible funding and program development.
Threat Categories • Existing and Proposed Protection Measures 5-21
December 30, 1994
Groundwater Management- Clark County Ground Water Management Plan
In 1986, Clark County petitioned Ecology to become a Ground Water Management Area and thus become eligible for funds to help create a Ground Water Management Plan (GWMP). The County was granted the designation and awarded funding. Since 1987, the GWMP has been under development. It is currently in its final draft form and undergoing review for approval and certification by Ecology.
The effort to create this plan reflects a significantly cooperative effort by virtually all government, interest groups, and the public. The draft document contains issue papers on all key groundwater threat areas and institutional issues. The plan calls for programs or action in twelve areas outlined below and further delineated in Table 5-1:
0 Commercial and Industrial Hazardous Material Management 0 Management of Groundwater Water Resources 0 Groundwater Availability and Water Rights 0 Septic Systems 0 Municipal Sludge 0 Stormwater Runoff 0 Landfills 0 Animal Waste Disposal 0 Pesticides and Fertilizers Cl USTs 0 Improperly Constructed and Abandoned Wells 0 Groundwater Education and Outreach
5.3.5 Data Gathering
Salmon Creek Memorandum of Understanding
CPU, the County, DOH, and Ecology have been cooperatively working to improve the collective knowledge of groundwater and surface water resources in Clark County. Since 1992, under the auspices of a Memorandum of Understanding, data activities have been accelerated, coordinated, and focused on the Salmon Creek Drainage. In conjunction with Wellhead Protection Planning by CPU, additional monitoring wells have been drilled, groundwater monitoring has expanded, and geohydraulic testing has been undertaken.
Threat Categories - Existing and Proposed Protection Measures 5-22
I I I I I I I I I I I I I I I I I I I
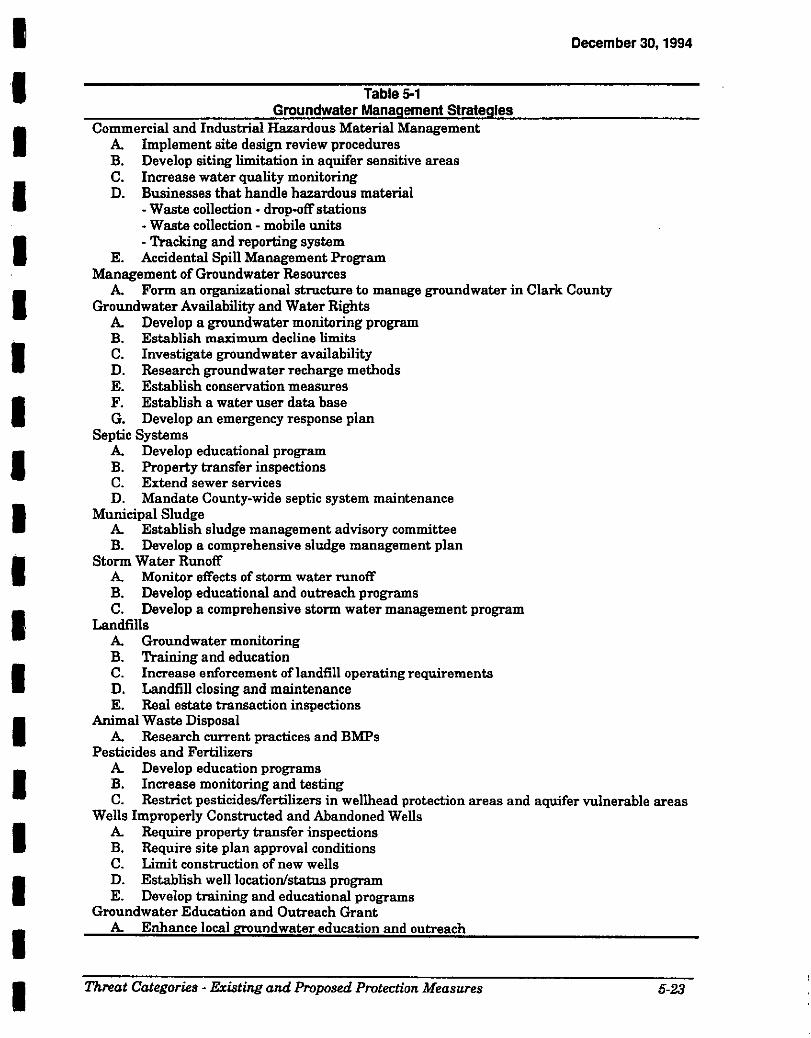
I I I I I I I I I I I I I I I I I I I
Table 5-1 Groundwater Management Strategies
Commercial and Industrial Hazardous Material Management A Implement site design review procedures B. Develop siting limitation in aquifer sensitive areas C. Increase water quality monitoring D. Businesses that handle hazardous material
- Waste collection - drop-off stations - Waste collection - mobile units - Tracking and reporting system
E. Accidental Spill Management Program Management of Groundwater Resources
December 30, 1994
A Form an organizational structure to manage groundwater in Clark County Groundwater Availability and Water Rights
A Develop a groundwater monitoring program B. Establish maximum decline limits C. Investigate groundwater availability D. Research groundwater recharge methods E. Establish conservation measures F. Establish a water user data base G. Develop an emergency response plan
Septic Systems A Develop educational program B. Property transfer inspections C. Extend sewer services D. Mandate County-wide septic system maintenance
Municipal Sludge A Establish sludge management advisory committee B. Develop a comprehensive sludge management plan
Storm Water Runoff A Monitor effects of storm water runoff B. Develop educational and outreach programs C. Develop a comprehensive storm water management program
Landfills A Groundwater monitoring B. Training and education C. Increase enforcement oflandfill operating requirements D. Landfill closing and maintenance E. Real estate transaction inspections
Animal Waste Disposal A Research current practices and BMPs
Pesticides and Fertilizers A Develop education programs B. Increase monitoring and testing C. Restrict pesticides/fertilizers in wellhead protection areas and aquifer vulnerable areas
Wells Improperly Constructed and Abandoned Wells A Require property transfer inspections B. Require site plan approval conditions C. Limit construction of new wells D. Establish well location/status program E. Develop training and educational programs
Groundwater Education and Outreach Grant A Enhance local groundwater education and outreach
Threat Categories - Existing and Proposed Protection Measures 5-23
December 30, 1994
Groundwater Levels and Groundwater Quality
In addition, CPU has analyzed data and samples collected from over 4,300 private wells for several key water quality parameters (nitrate, bacteria, iron, manganese, specific conductance) in 1989.
Surface Water and Stormwater Quality
The County Department of Trade and Economic Development also has stormwater and surface water sampling programs on-going throughout the County.
Threat Categories - Existing and Proposed Protection Measures 5-24
I I I I I I I I I I I I I I I I I I I
I I I I I I I I
Q.
I I I I I I I I I I
Section 6
I I I I I I I I I I I I I I I I I I I
6.1 Introduction
December 30, 1994
Section 6 Contingency Planning
Clark Public Utilities (CPU) updated its Water System Plan (WSP) in 1994. During that process, overall source and storage of the system was examined to assure that the minimum Department of Health (DOH) standards were met. This analysis involved:
Cl Identification of the maximum water system capacity in relation to source, distribution system, and water rights restrictions. (Assumes the loss of largest welllwellfield).
Cl Evaluation of the expansion options of the existing system's capacity to meet current water rights/availability.
The 1986 Amendments to the Safe Drinking Water Act (SDWA) specified that State programs require public water systems to develop contingency plans for the location and provision of alternate drinking water supplies for each public water system in the event of well or wellfield contamination. (Subsection 1428 (a)(5)). Consistent with that requirement and according to the "Proposed Wellhead Protection Program" prepared by DOH, additional contingency planning will be required as part of all WSPs pursuant to WAC 246-290-100 and the Small Water System Management Program under WAC 246-290-410. Further analysis to meet these and Wellhead requirements will necessarily include:
Cl Identification of existing or potential interties with other public water systems and evaluation of the ability to deliver water assuming loss of the largest welllwellfield.
Cl Evaluation of current procedures and development of recommendations on contingency plans for emergency events.
Cl Identification of future potential sources of drinking water and description of quality assurances and control methods to be applied to ensure protection of water quality prior to utilization as a drinking water supply.
CJ Maintenance of a current list of appropriate emergency phone numbers.
Contingency Planning 6-1
December 30, 1994
6.2 Water System Capacity (Water System Plan Discussion)
A drawing of the CPU's existing major facilities, including wells, storage tanks, booster pump stations, pressure reducing valve, interties, and transmission piping, is provided as Exhibits 6-1 and 6-2 (at the end of this section) for the Hazel Dell area and for the Hockinson/Lewis River area, respectively. A schematic of the different pressure zones in Hockinson/Lewis River area is also provided as Exhibit 6-3 (at the end of this section).
6.2.1 Source of Supply
CPU depends on groundwater for its primary source of supply. The wells are located throughout the area. See Exhibits 3-1, 6-1, and 6-2 for the location of the CPU's existing wells, and refer to Table 3-1 for detailed information on each well.
CPU has sixteen operating wells in its Hazel Dell area. The combined maximum capacity of all Hazel Dell wells is approximately 9,200 gpm (13.3 MGD).
There are six active wells in the Hockinson/Lewis River area. The combined capacity of all eight Hockinson wells is 2,062 gpm (2.97 MGD).
6.2.2 Storage
CPU's water system is comprised of six reservoirs in the Hazel Dell area, and eleven reservoirs, plus one pressure tank in the Hockinson and Lewis River areas (refer to Exhibits 6-1 and 6-2 for the location of each reservoir). General information, including location, site dimensions, year built, base and overflow elevations of reservoir, minimum operating level, and total storage volume, is listed in Table 6-1. Table 6-2 provides additional design and operating parameters, including dimensions of reservoir; gallons of water stored per foot of height; the maximum usable, operating, and total volume of reservoirs; and, type and size of altitude control valve. The maximum usable volume is based on the amount of water stored in the reservoir, capable of serving customers at the same elevations as base of reservoir at 30 psi. The maximum operating volume is based on the minimum operating level specified by the CPU in Table 6-1.
Contingency Planning 6-2
I I I I I I I I I I I I I I I I I I I
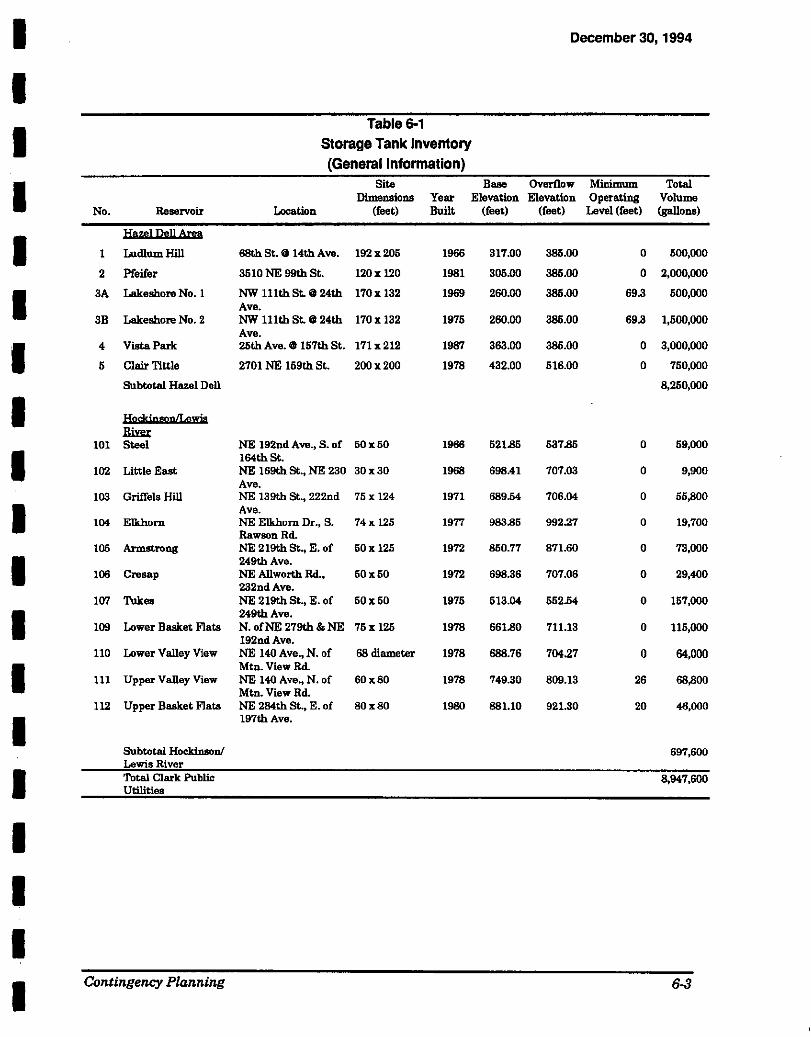
I December 30, 1994
I I
Table 6-1 Storage Tank Inventory (General Information)
I Site Base Overflow MiDimum Total
Dimensions Year Elevation Elevation Operating Volume No. Reservoir Location (feet) Built (feet) (feet) Level(feet) (gallons)
I liAR) Jli:Jl 61:1:1
1 Ludlum Hill 68th St.@ 14th Ave. 192x205 1955 317.00 385.00 0 500,000
2 Pfeifer 3510 NE 99th St. 120x 120 1981 305.00 385.00 0 2,000,000
I 3A Lakeshore No. I NW 11lth St.@ 24th 170x 132 1989 260.00 385.00 69.3 500,000 Ave.
3B Lakeshore No. 2 NW 111th St.@ 24th 170x 132 1975 260.00 385.00 69.8 1,500,000 Ave.
I 4 Vista Parle 25th Ave.@ !57th St. 171x212 1987 363.00 385.00 0 3,000,000
5 Clair Tittle 2701 NE !59th St. 200x200 1978 432.00 516.00 0 750,000
Subtotal Hazel Dell 8,250,000
I Ha!:ikia~mDLI&!lia Riw:
101 Steel NE 192nd Ave., S. of 50x50 1966 521.85 537.85 0 59,000
I !64th St. 102 Little East NE !69th St., NE 230 30x30 1968 698.41 707.03 0 9,900
Ave. 103 Griffels Hill NE !39th St., 222od 75 X 124 1971 689.54 706.04 0 55,800
I Ave. 104 Elkhorn NE Elkhorn Dr., S. 74x 125 1977 983.85 992.27 0 19,700
Rawson Rd. 105 Armstrong NE 219th St., E. of 50x 125 1972 850.77 871.60 0 73,000
I 249thAve. 106 Cresap NE Allworth Rd., 50x50 1972 698.86 707.06 0 29,400
232ndAve. 107 Tukea NE 219th St., E. of 50x50 1975 513.04 552.54 0 157,000
I 249thAve. 109 Lower Basket Flats N.ofNE279th&NE 75x 125 1978 661.80 711.13 0 115,000
192ndAve. 110 Lower Valley View NE 140 Ave., N. of 68 diameter 1978 688.76 704.27 0 64,000
I Mtn. View Rd.
Ill Upper Valley View NE 140 Ave., N. of 60x80 1978 749.30 809.13 26 68,800 Mtn. View Rd.
112 Upper Basket Flats NE 284th St, E. of 80x80 1980 881.10 921.30 20 46,000
I 197thAve.
Subtotal Hockinaonl 697,600 Lewis River
I Total Clark Public 8,947,600 Utilities
I I I I
Contingency Planning 6-3
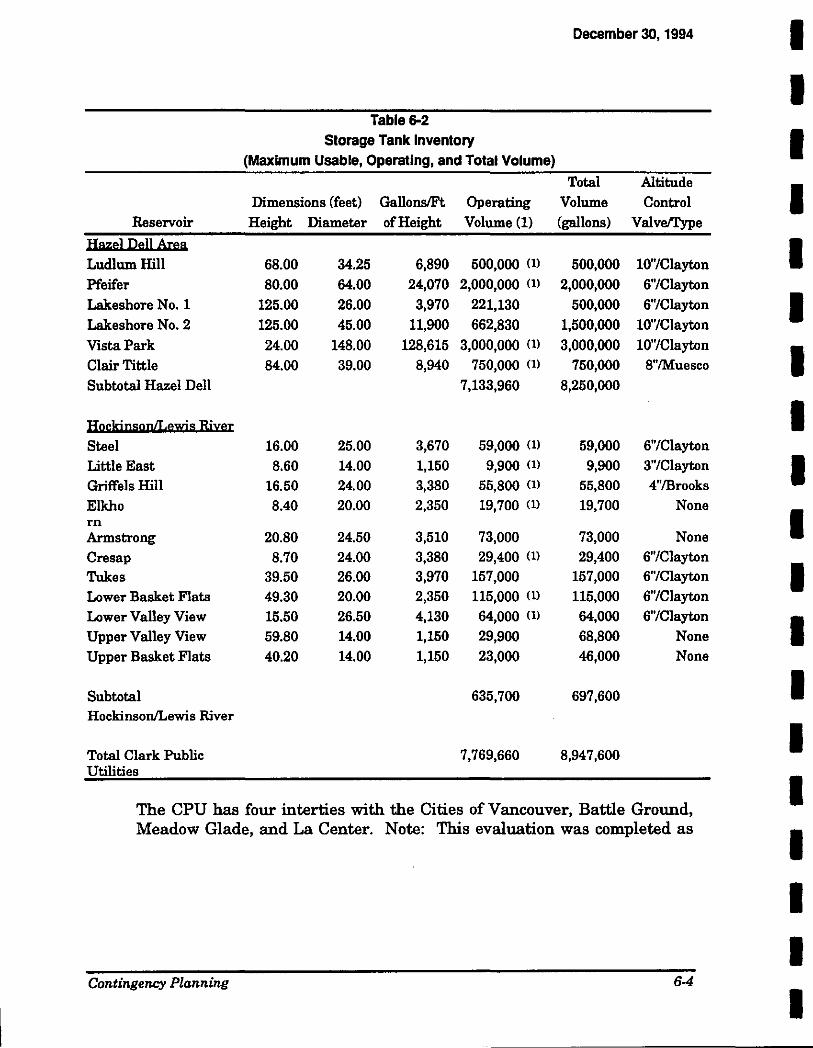
December 30, 1994 I I
Table 6-2 Storage Tank Inventory I {Maximum Usable, Operating, and Total Volume)
Total Altitude
I Dimensions (feet) Gallons/Ft Operating Volume Control Reservoir Height Diameter of Height Volume (1) (gallons) V alvefl'ype
Hazlll Dllll A,..,a I Ludlum Hill 68.00 34.25 6,890 500,000 (1) 500,000 10"/Clayton
Pfeifer 80.00 64.00 24,070 2,000,000 (1) 2,000,000 6"/Clayton Lakeshore No.1 125.00 26.00 3,970 221,130 500,000 6"/Clayton I Lakeshore No.2 125.00 45.00 11,900 662,830 1,500,000 10"/Clayton
Vista Park 24.00 148.00 128,615 3,000,000 (1) 3,000,000 10"/Clayton
I Clair Tittle 84.00 39.00 8,940 750,000 (1) 750,000 8"/Muesco
Subtotal Hazel Dell 7,133,960 8,250,000
Hack:i D~u~na~eE s BiJl:ei I Steel 16.00 25.00 3,670 59,000 (1) 59,000 6"/Clayton
Little East 8.60 14.00 1,150 9,900 (1) 9,900 3"/Clayton I Griffels Hill 16.50 24.00 3,380 55,800 (1) 55,800 4"/Brooks
Elkho 8.40 20.00 2,350 19,700 (1) 19,700 None
I rn Armstrong 20.80 24.50 3,510 73,000 73,000 None
Cresap 8.70 24.00 3,380 29,400 (1) 29,400 6"/Clayton
Tukes 39.50 26.00 3,970 157,000 157,000 6"/Clayton I Lower Basket Flats 49.30 20.00 2,350 115,000 (1) 115,000 6"/Clayton
Lower Valley View 15.50 26.50 4,130 64,000 (1) 64,000 6"/Clayton
I Upper Valley View 59.80 14.00 1,150 29,900 68,800 None Upper Basket Flats 40.20 14.00 1,150 23,000 46,000 None
Subtotal 635,700 697,600 I Hockinson/Lewis River
Total Clark Public 7,769,660 8,947,600 I Utilities
I The CPU has four interties with the Cities of Vancouver, Battle Ground, Meadow Glade, and La Center. Note: This evaluation was completed as
I I I
Contingency Planning 6-4
I
I I I I I I I I I I I I I I I I I I I
December 30, 1994
part of CPU's Water System Plan (1994). In the last few months, CPU as assumed operation of the water systems of LaCenter and Meadow Glade. Demand forecasts, therefore do not reflect these recent changes. Source, storage, and hydraulic analyses similarly do not reflect these additional system needs. However, together, both of these systems represent a small proportion of the total service area and customers of CPU. The following analysis should therefore be sufficient for the purposes of this wellhead plan and until such time as CPU's WSP can be updated (approximately 1996).
6.2.3 Booster Pumps and Pressure Reducing Valves
Due to the wide range of elevations in the CPU's service area, the CPU has a large number of booster pump stations (BPS) and pressure reducing valves (PRY), as shown in Exhibits 6-1 and 6-2. Tables 6-3 and 6-4 provide an inventory of all BPSs and PRVs in the Hazel Dell and Hockinson/Lewis River areas. As shown in Table 6-3, there are six BPSs with a total of eleven pumps in Hazel Dell, and fifteen BPSs with a total of eighteen pumps in Hockinson/Lewis River areas. The combined total pumping capacity of all BPSs is 8,860 gpm (12.76 MGD). As shown in Table 6-4, there are four PRVs in the Hazel Dell area, and nine PRVs in the Hockinson/Lewis River areas.
6.2.4 Transmission and Distribution
The CPU maintains over 300 miles of transmission and distribution piping. Listed in Table 6-5 are estimated pipe lengths ranging in size up to 20 inches in diameter. The predominant pipe material used in the system is PVC, although some AC and steel is also used. The inventory of pipe is from the hydraulic models and does not include some of the smaller diameter pipe. A program is underway to systematically remove AC pipe on a multi-year schedule.
6.3 Evaluation of System Expansion Options with Existing Sources
6.3.1 General
Projections of additional source requirements were based on projected customer growth and peak day demand projections, less existing source capacity. Table 6-6 details the projected source requirements for the Hazel Dell and Hockinson/Lewis River areas through the year 2010.
Contingency Planning 6-5
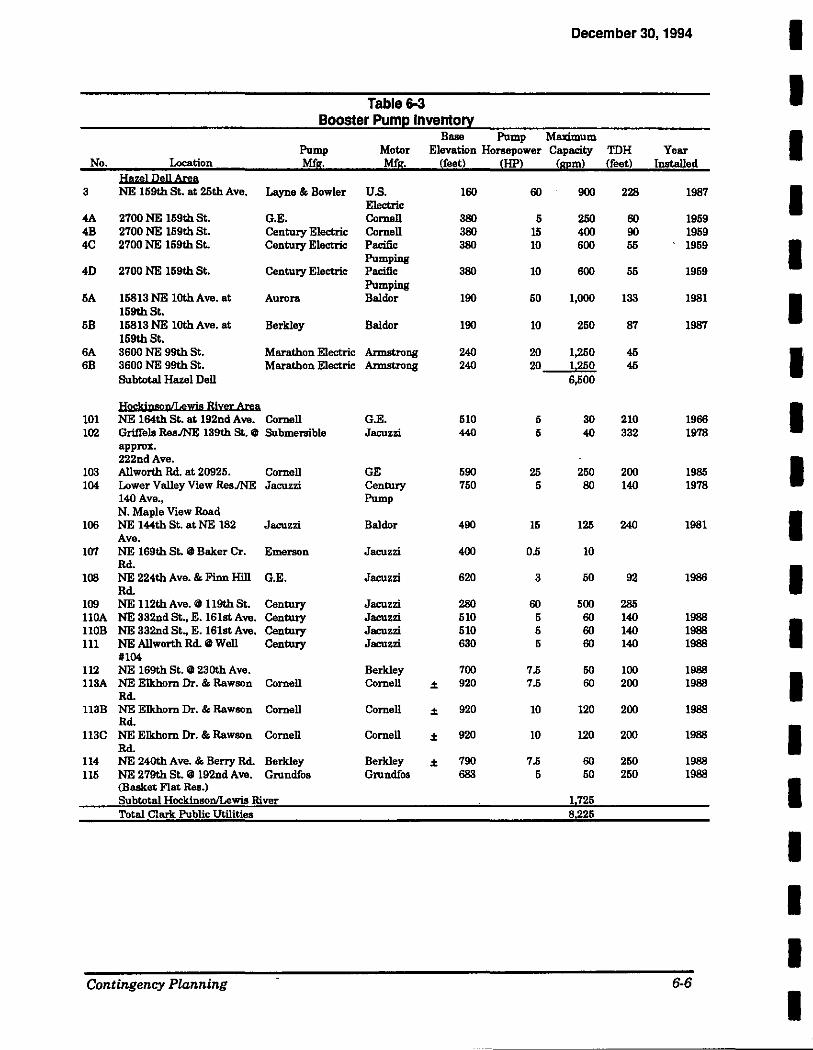
December 30, 1994 I Table6-3 I
Booster Pum~ lnvento!1 Base Pump Maximum I Pump Motor Elevation Horsepower Capacity TDH Year
No. Location Mfs;. Mf~. !feet) ~HPl <s;eml !feet) Installed
l:IDR] Il~ll 6D:I 3 NE !59th St. at 25th Ave. Layns & Bowler u.s. 160 60 900 228 1987 I Electric 4A 2700 NE !59th St. G.E. Cornell 380 5 250 60 1959 4B 2700 NE !59th St. Century Electric Cornell 380 15 400 90 1959 4C 2700 NE !59th St. Century Electric Pacific 380 10 600 55 1959 I Pumping 40 2700 NE !59th St. Century Electril: Pacific 380 10 600 55 1969
Pumping 5A 15813 NE lOth Ave. at Aurora Baldur 190 50 1,000 133 1981 I !59th St. 5B 15813 NE lOth Ave. at Berkley Baldur 190 10 250 67 1967
!59th St. SA 3600 NE 99th St. Marathon Electric Armetroog 240 20 1,250 45 I 6B 3600 NE 99th St. Marathon Electric Armetroog 240 20 1,250 45
Subtotal Hazel Dall 6,500
Has:Zh;um:all&l!il! Bi:m: AD:I I 101 NE !64th St. at 192ndAve. Cornell G.E. 610 6 30 210 1966 102 Gri!Iela Res.INE !39th St. e Submersible Jacuzzi 440 5 40 332 1978
approx. 222ndAve.
I 103 Allworth Rd. at 20925. Cornell GE 690 26 260 200 1966 104 Lower Valley View Res.INE Jacuzzi Century 760 5 80 140 1978
140Ave., Pump N. Maple View Road
I 106 NE 144th St. atNE 182 Jacuzzi Baldur 490 16 125 240 1981 Ave.
107 NE 169th St. @Baker Cr. Emerson Jacuzzi 400 0.5 10 Rd.
I 108 NE 224th Ave. & Finn Hill G.E. Jacuzzi 620 3 50 92 1966 Rd.
109 NE 112th Ave. lit U9th St. Century Jacuzzi 380 60 500 285 llOA NE 332nd St., E. 161st Ave. Century Jacuzzi 610 6 60 140 1988
I HOB NE 332nd St, E. 16lst Ave. Century Jacuzzi 610 5 60 140 1988 111 NE Allworth Rd. 0 Wall Century Jacuzzi 630 6 60 140 1988
#104 112 NE !69th St. 0 230th Ave. Berkley 700 7.6 50 100 1988
I 113A NE Elkhorn Dr. & Rawaon Cornell Cornell ± 920 7.6 60 200 1988 Rd.
U3B NE Elkhorn Dr. & Rawson Cornell Cornell ± 920 10 120 200 1988 Rd.
I 113C NE Elkhorn Dr. & Raweon Cornell Cornell ± 920 10 120 200 1988 Rd.
114 NE 240th Ave. & Berry Rd. Berkley Berkley ± 790 7.6 60 260 1988 115 NE 279th St.@ 192nd Ave. Gmndfos Grundfos 683 5 50 250 1988
I (Baakot Flat Reo.) Subtotal Hockinson/Lewis River 1725 Total Clark Public Utilities 8226
I I I
Contingency Planning 6-6
I
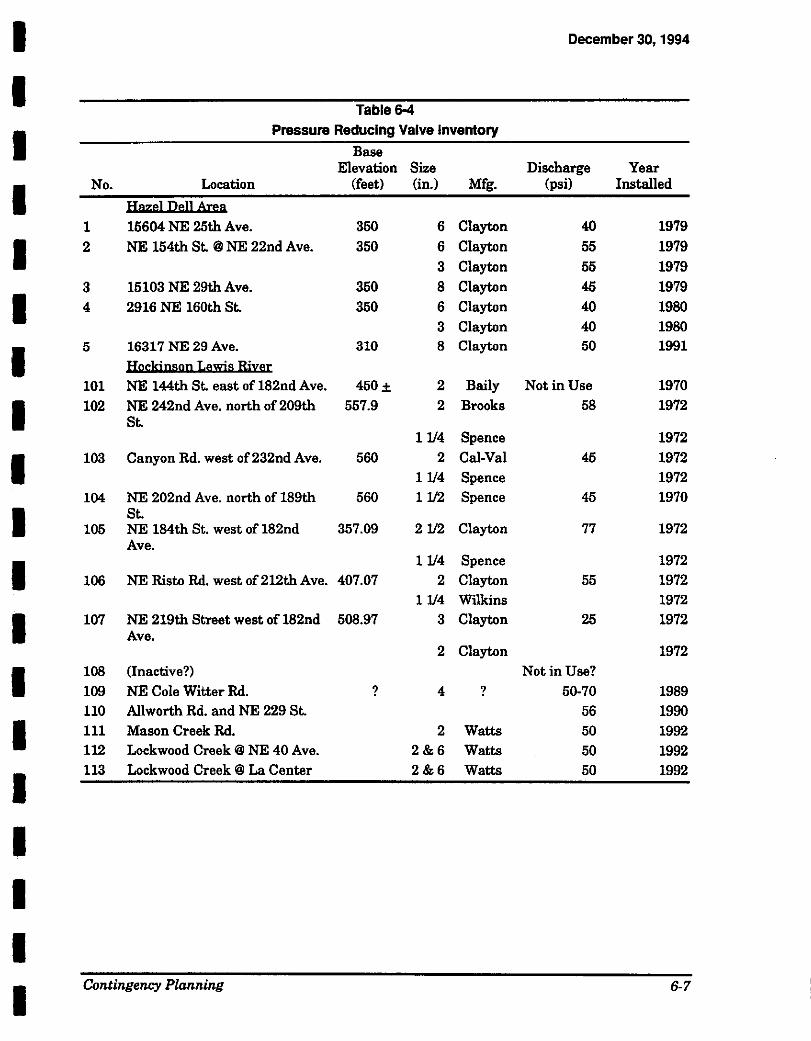
I December 30, 1994
I Table 6-4
I Pressure Reducing Valve Inventory
Base Elevation Size Discharge Year
I No. Location (feet) (in.) Mfg. (psi) Installed
Hazel DeU Area
1 16604 NE 25th Ave. 360 6 Clayton 40 1979
I 2 NE 154th St. @ NE 22nd Ave. 350 6 Clayton 55 1979 3 Clayton 55 1979
3 15103 NE 29th Ave. 360 8 Clayton 45 1979
I 4 2916 NE 160th St. 360 6 Clayton 40 1980 3 Clayton 40 1980
I 5 16317 NE 29 Ave. 310 8 Clayton 50 1991
Hacldnaan L~ms Bi~~I 101 NE 144th St. east of 182nd Ave. 450± 2 Baily Not in Use 1970
I 102 NE 242nd Ave. north of 209th 557.9 2 Brooks 58 1972 St.
11/4 Spence 1972
I 103 Canyon Rd. west of232nd Ave. 560 2 Cal-Val 45 1972 11/4 Spence 1972
104 NE 202nd Ave. north of 189th 560 11/2 Spence 45 1970
I St. 105 NE 184th St. west of 182nd 357.09 2112 Clayton 77 1972
Ave.
I 11/4 Spence 1972
106 NE Risto Rd. west of 212th Ave. 407.07 2 Clayton 55 1972 11/4 Wilkins 1972
I 107 NE 219th Street west of 182nd 508.97 3 Clayton 25 1972 Ave.
2 Clayton 1972
I 108 (Inactive?) Not in Use? 109 NE Cole Witter Rd. ? 4 ? 50-70 1989 110 All worth Rd. and NE 229 St. 56 1990
I 111 Mason Creek Rd. 2 Watts 50 1992 112 Lockwood Creek @ NE 40 Ave. 2&6 Watts 50 1992
I 113 Lockwood Creek @ La Center 2&6 Watts 50 1992
I I I I
Contingency Planning 6-7
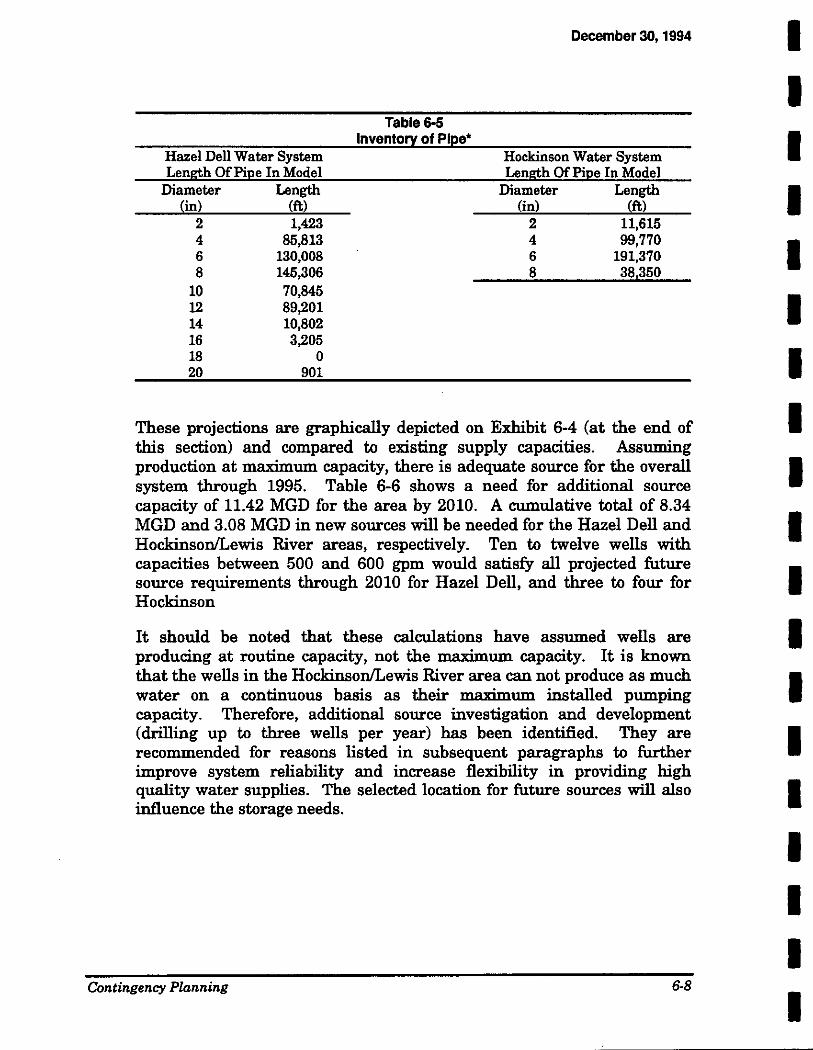
Hazel Dell Water System Length Of Pipe In Model
Diameter Length (in) (ft)
2 1,423 4 85,813 6 130,008 8 145,306
10 70,845 12 89,201 14 10,802 16 3,205 18 0 20 901
Table 6-5 Inventory of Pipe•
December 30, 1994
Hockinson Water System Length Of Pipe In Model
Diameter Length (in) (ft)
2 11,615 4 99,770 6 191,370 8 38 350
These projections are graphically depicted on Exhibit 6-4 (at the end of this section) and compared to existing supply capacities. Assuming production at maximum capacity, there is adequate source for the overall system through 1995. Table 6-6 shows a need for additional source capacity of 11.42 MGD for the area by 2010. A cumulative total of 8.34 MGD and 3.08 MGD in new sources will be needed for the Hazel Dell and Hockinson/Lewis River areas, respectively. Ten to twelve wells with capacities between 500 and 600 gpm would satisfy all projected future source requirements through 2010 for Hazel Dell, and three to four for Hockinson
It should be noted that these calculations have assumed wells are producing at routine capacity, not the maximum capacity. It is known that the wells in the Hockinson/Lewis River area can not produce as much water on a continuous basis as their maximum installed pumping capacity. Therefore, additional source investigation and development (drilling up to three wells per year) has been identified. They are recommended for reasons listed in subsequent paragraphs to further improve system reliability and increase flexibility in providing high quality water supplies. The selected location for future sources will also influence the storage needs.
Contingency Planning 6-8
I I I I I I I I I I I I I I I I I I I
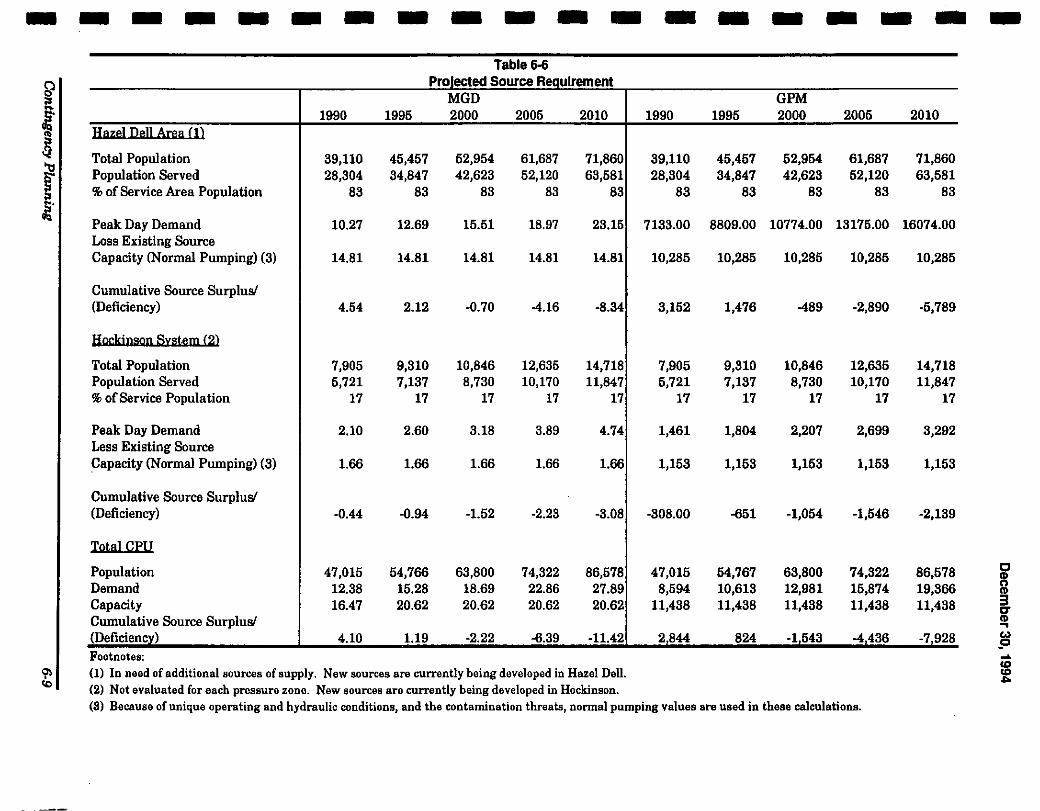
-------------------Haze) Dell Area (1)
Total Population Population Served % of Service Area Population
Peak Day Demand Loss Existing Source Capacity (Normal Pumping) (3)
Cumulative Source Surplus/ (Deficiency)
Hockinson Svstem (2)
Total Population Population Served % of Service Population
Peak Day Demand Less Existing Source Capacity (Normal Pumping) (3)
Cumulative Source Surplus/ (Deficiency)
Total CPU
Population Demand Capacity Cumulative Source Surplus/ (Deficiencv) Footnotes:
1990
39,110 28,304
83
10.27
14.81
4.54
7,905 5,721
17
2.10
1.66
-0.44
47,015 12.38 16.47
4.10
1995
45,457 34,847
83
12.69
14.81
2.12
9,310 7,137
17
2.60
1.66
-0.94
54,766 15.28 20.62
1.19
Table 6-6 ProJected Source Requirement
MGD 2000
52,954 42,623
83
15.51
14.81
-0.70
10,846 8,730
17
3.18
1.66
-1.52
63,800 18.69 20.62
-2.22
2005
61,687 52,120
83
18.97
14.81
-4.16
12,635 10,170
17
3.89
1.66
-2.23
74,322 22.86 20.62
-6.39
2010
71,860 63,581
83
23.15
14.81
-8.34
14,718 11,847
17
4.74
1.66
-3.08
86,578 27.89 20.62
-11.42
(1) In need of additional sources of supply. Now sources are currently being developed in Hazel Dell. (2) Not evaluated for each pressure zone. New sources are currently being developed in Hockinson.
1990
39,110 28,304
83
7133.00
10,285
3,152
7,905 5,721
17
1,461
1,153
-308.00
47,015 8,594
11,438
2844
1995
45,457 34,847
83
GPM 2000
52,954 42,623
83
2005
61,687 52,120
83
2010
71,860 63,581
83
8809.00 10774.00 13175.00 16074.00
10,285
1,476
9,310 7,137
17
1,804
1,153
-651
54,767 10,613 11,438
824
10,285
-489
10,846 8,730
17
2,207
1,153
-1,054
63,800 12,981 11,438
-1543
10,285
-2,890
12,635 10,170
17
2,699
1,153
-1,546
74,322 15,874 11,438
-4 436
10,285
-5,789
14,718 11,847
17
3,292
1,153
-2,139
86,578 19,366 11,438
-7 928
(8) Because of unique operating and hydraulic conditions, and the contamination threats, normal pumping values are used in these calculations.
December 30, 1994
6.3.2 Storage Improvements
As previously described, storage is generally based upon a system's ability to provide emergency volumes, equalizing storage, and adequate fire flow. It is appropriate to use. the total combined volume of these three components as CPU's storage goal.
CPU is currently provided storage from seventeen reservoirs. A total storage volume in these reservoirs is 8.9 MG. Of this, 8.2 MG is available in the Hazel Dell area and 0. 7 MG is available in the Hockinson/Lewis River areas.
CPU's water system has a total source capacity of 14,310 gpm or 20.62 MG assuming twenty-four hours of continuous pumping from current well supplies (WSP 1993). In accordance with DOH policy, a reduction in calculated standby storage is allowed providing the system has multiple sources, reliable power supplies, adequate hydraulic looping, and is adequately maintained. In calculating the credit, the largest producing well or wells on single electrical transformers must be considered out of. service. Therefore, a multi-well storage credit was calculated, assuming that the largest source(s) (1,200 gpm from Hazel Dell and 470 gpm from Hockinson) are unusable during peak usage conditions. Under this set of assumptions, CPU has 12,640 gpm or 18.20 MG of capacity, under emergency conditions for use during the peak summer period.
Because of unique operating conditions caused by the large number of sources and the operational restrictions caused by the hydrology of the area, normal pumping volumes were used for calculation of storage requirements. This is a more conservative approach than required and will result in an apparent need for more than the required storage. But more importantly, the result will be a more effectively operated system, meeting unique operating needs and fire and pressure requirements in all areas.
Given the peak day projections and the sizing criteria for peak day, equalizing, and fire flow demands, Table 6-7 was developed to show the existing and projected storage capacities needed for CPU's water system. It should be noted that these calculations include the recommendations from the Fire Survey and Rating Bureau, that up to 4,000 gpm for four hours of fire flow be provided for commercial/industrial areas.
Contingency Planning 6-10
I I I I I I I I I I I I I I I I I I I
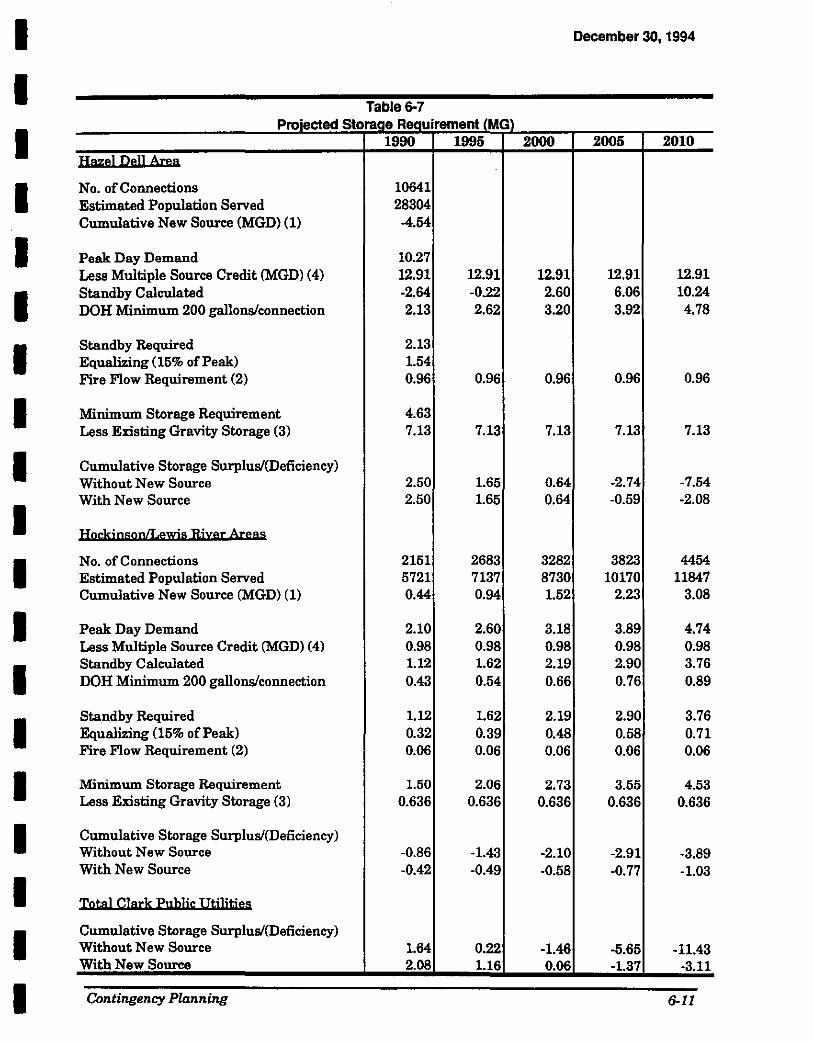
I I I I I I I I I I I I I I I I I I I
Table 6-7 Proiected Storaae Reauirement CMGl
1990 1995 Hazel DeU Area
No. of Connections 10641 Estimated Population Served 28304 Cumulative New Source (MGD) (1) -4.54
Peak Day Demand 10.27 Less Multiple Source Credit (MGDl (4) 12.91 12.91 Standby Calculated -2.64 -0.22 DOH Minimum 200 gallons/connection 2.13 2.62
Standby Required 2.13 Equalizing ( 15% of Peak) 1.54 Fire Flow Requirement (2) 0.96 0.96
Minimum Storage Requirement 4.63 Less Existing Gravity Storage (3) 7.13 7.13
Cumulative Storage Surplusi(Deficiency) Without New Source 2.50 1.65 With New Source 2.50 1.65
Ha,kio5aolL~E5 Rh::tt Atea5
No. of Connections 2151 2683 Estimated Population Served 5721 7137 Cumulative New Source (MGD) (1) 0.44 0.94
Peak Day Demand 2.10 2.60 Less Multiple Source Credit (MGD) (4) 0.98 0.98 Standby Calculated 1.12 1.62 DOH Minimum 200 gallons/connection 0.43 0.54
Standby Required 1.12 1.62 Equalizing (15% of Peak) 0.32 0.39 Fire Flow Requirement (2) 0.06 0.06
Minimum Storage Requirement 1.50 2.06 Less Existing Gravity Storage (3) 0.636 0.636
Cumulative Storage Surplusi(Deficiency) Without New Source -0.86 -1.43 With New Source -0.42 -0.49
lllt-al Ch1xk Enblh: IWUtiea
Cumulative Storage Surplusi(Deficiency) Without New Source 1.64 0.22 With New Source 2.08 1.16
Contmgency Plann'ng
December 30, 1994
2000 2005 2010
12.91 12.91 12.91 2.60 6.06 10.24 3.20 3.92 4.78
0.96 0.96 0.96
7.13 7.13 7.13
0.64 -2.74 -7.54 0.64 -0.59 -2.08
3282 3823 4454 8730 10170 11647 1.52 2.23 3.08
3.18 3.89 4.74 0.98 0.98 0.98 2.19 2.90 3.76 0.66 0.76 0.89
2.19 2.90 3.76 0.48 0.58 0.71 0.06 0.06 0.06
2.73 3.55 4.53 0.636 0.636 0.636
-2.10 -2.91 -3.89 ·0.58 -0.77 -1.03
-1.46 -5.65 -11.43 0.06 -1.37 -3.11
6-11
December 30, 1994
Table 6-7 illustrates that based upon the storage criteria and credits discussed above, the Hazel Dell area currently has adequate storage. There is a potential storage deficiency, however, by 2005. The Hockinson/Lewis River System requires some storage immediately.
6.4 Identification of Existing and Potentiallnterties
CPU has two interties with other water systems. These interties are with the Cities of Vancouver and Battle Ground.
The City of Vancouver's valved, unpumped, and unmetered intertie is located near the comer of NE 78th Street and NE 47th Avenue. The intertie is available for the exchange of water between the CPU's 8-inch PVC line and Vancouver's 10-inch ductile iron line during emergency conditions. Vancouver's normal maximum gradient is approximately 413 feet compared to 385 feet for CPU. Therefore, the normal exchange of water through the intertie would flow from the Vancouver's higher pressure into CPU's system. However, emergency conditions within either system would enable the exchange of water at minimum pressures in either direction. Use of this intertie is limited to emergency conditions and is not governed by contractual arrangement.
Future interties may be developed between CPU and the communities of Ridgefield and Yacolt.
6.5 Evaluation of Current (Contingency) Procedures and Recommendations
CPU water system is less vulnerable to source loss than many systems because of the comparatively large number of sources and their broad geographic and hydrogeologic distribution. In most cases, the loss of a source or even several sources can be compensated by increasing the pumping and distribution from elsewhere in the system. There is generally adequate storage and alternate source to meet pressure and demand in most areas of the system.
Nevertheless, there are places in the system where source loss could be a problem. Below we have generally described these areas, along with a recommended approach to improve the existing situation:
CJ Hazel Dell- Vista Park Area: Currently Well Nos. 9, 19, and 15 pump to this general area without the benefit of booster stations. Consequently, because of the location and distribution system configurations, source problems with these wells could cause distribution and delivery problems.
Contingency Planning 6-12
I I I I I I I I I I I I I I I I I I I
I I I I I I I I I I I I I I I I I I I
December 30, 1994
Recommendations: Future planning should include booster pump(s) or possible supply linkages from the North (Ridgefield area). New supply development in the Ridgefield area and a North-South distribution system is the preferred improvement.
CJ Hazel Dell- Northwestern Area: Water for this area is mainly supplied from the south. Loss of sources in the south could cause problems in delivery to the far northwestern extremes of the service area. Because of system configuration and needs to the east, valves have been closed to prevent water from flowing to this western (and lower ) area.
Recommendations: Future planning should include new supply and supply lines from the north (Ridgefield area). While that planning and development occurs, hydraulic modeling should be conducted to determine the worst case scenario for this region, and to develop specific contingency plans to supply water to this area (including opening valves from the east).
CJ Hockinson - Eastern Pressure Zones: Several eastern pressure zones rely solely on water from lower zones and booster pumps. Supply is from Well Nos. 103, 104, and 108. In the northern Hockinson system, there are no boosters to supply water from the Hazel Dell System to the west. Consequently, loss of Well Nos. 103 or 108 in the southern portion might be accommodated by source from Hazel Dell. Additionally, there are portions of the Hockinson system with 4-inch line which would inhibit transfer of water in the north/south directions. Loss of Well No. 104, consequently, would present a difficult situation because of the lack of supply from Hazel Dell
Recommendations: There is the need for new source in the northern Hockinson system, and existing source development plans to meet this need should be pursued. Additionally, distribution system improvements which are currently planned to replace 4-inch line and improve north/south flow should be implemented.
6.6 Identification of Future Potential Sources
Continued population growth in Clark County (County) will require that existing source of water supply be used to their fullest extent and that new sources of supply be developed. Historically, most of CPU's water supply development has been focused within the Lower Salmon Creek Basin (Hazel Dell vicinity) where well yields are relatively high and water quality is generally good. Groundwater development is distributed between the three principal aquifer systems which occur in the area including the Recent alluvial aquifer, the Upper Troutdale aquifer, and the Lower Troutdale aquifer. Most
Contingency Planning 6·13
December 30, 1994
groundwater development in the Hazel Dell vicinity is concentrated in two areas: a narrow corridor along the lower Salmon Creek Valley, and in vicinity of NE 78th Street. Well yields in these areas typically range between 500 and 1,000 gpm.
Several of the well sources that are completed within the Upper Troutdale aquifer in the vicinity of 78th Street, are threatened by groundwater contamination from nearby industrial facilities (Airco-Boomsnub). The contaminants include chromium and volatile organic compounds. The wells that are threatened include Well Nos. 5, 7, and 23, which account for approximately 30 percent of CPU total supply capacity. The potential risk to the water supply system is not well defined at this time. However, CPU has decided to proceed with the development of contingency plans that will address possible contamination of these sources. The contingency plans will consider treatment alternatives as well as new source development.
CPU operates a number of other production wells in other areas of the basin as well as other portions of the County. Well yields in these areas are quite variable and generally much lower than the yields found in the Hazel Dell vicinity.
Groundwater development in many areas is constrained by excessive levels of iron and manganese. Elevated manganese concentrations occur within many wells completed in the Lower Troutdale aquifer within the lower Salmon Creek Valley (e.g. Wells 21 and 90-03). Elevated iron concentrations have been identified within many localized areas of the Salmon Creek Basin as part of CPU's private well sampling program. Iron and manganese pose problems for public water supply development in many other areas of the County, such as along the East Fork of the Lewis River (CPU Well No. 110 and Well No. 93-02).
In addition to water quality, new sources of supply must be located to minimize impact to existing water users and instream flows. These impacts can be greatly minimized through proper placement of production wells and by targeting deeper water bearing zones. Impacts to streams can be reduced by locating wells at least 500 to 1,000 feet away from stream corridors. Impacts can be reduced further by developing deeper water bearing zones, such as the Lower Troutdale, where an overlying fine-grained confining unit limits the hydraulic continuity with the stream. In areas where continuity may be of concern, efforts should be made to distribute pumping centers as widely as possible.
Much of CPU's future groundwater development will focus on the Lower Troutdale aquifer system within areas outside the Hazel Dell vicinity. Recent exploratory drilling and testing in several areas of the Salmon Creek and East
Contingency Planning 6-14
I I I I I I I I I I I I I I I I I I I
I I I I I I I I I I I I I I I I I I I
December 30, 1994
Fork of the Lewis River drainage basins have identified two general areas of supply.
6.6.1 Lower Troutdale Outside Hazel Dell
Pioneer Area
The most promising area for future groundwater development is the along lOth Avenue NE and I-5 corridor area between approximately NE 230th Street and LaCenter Road. The area lies within the East Fork of the Lewis River drainage basin. Exploratory drilling and testing at several sites (CPU Well No. 93-04, Zimmerly, Port of Ridgefield) indicates that the Lower Troutdale aquifer is relatively productive (transmissive) in this area and has good water quality. The aquifer is unconfined with high storage characteristics and is as much as 150 to 200 feet thick. Because the aquifer is very thick and transmissive and the storage characteristics are high, the system will likely be able to support a number of production wells operating as a wellfield. Individual well yields will likely range between 400 and 700 gpm and the total capacity of the wellfield may be 5 MGD or more. Additional well drilling and testing coupled with longterm monitoring will be required to determine the ultimate yield of this area.
Surface water features in the Pioneer area should not be adversely impacted from the operation of a wellfield because the features are not hydraulically coupled to the supply aquifer (i.e. a thick unsaturated zone occurs between the aquifer and the surface water features). Groundwater in the area discharges to the lower portions of the East Fork of the Lewis River which is tidally influenced. River stage in this area is not controlled by groundwater discharge, but rather by the tidal response of the Columbia River.
Water quality in the area is generally good with low levels of iron and manganese. A relatively thick sequence of fine-grained alluvial deposits occur at land surface and improve protection to the source aquifer from land use impacts.
CPU is currently expanding their transmission network northward along NE lOth Avenue towards the Pioneer supply aquifer. Several test wells will be installed in advance of the pipeline to delineate areas with suitable quantity and quality for future development of supply wells.
Contingency Planning 6-15
December 30, 1994
Middle Salmon Creek VIcinity
A secondary area for development of additional water supply lies within the central portion of the Salmon Creek Basin. The area lies generally upstream of Mill Creek and downstream of Woodin Creek. The areal extent of this supply area is somewhat poorly defined. The targeted aquifer for supply is the Lower Troutdale which generally has moderately high well yield and good water quality. Test/production wells have been recently installed at the Laurin Middle School (CPU Test Well No. 92-02 and Production Well No. 25, south side of Salmon Creek) and at Salmon Woods (CPU Test Well No. 93-05, north side of Salmon Creek). Individual well yields generally range between 300 to 500 gpm.
Additional wells could likely be located in this area. However, because the aquifer is confined, pumping centers should be offset from one another by distances of 0.5 miles or more. Although the aquifer is not in direct hydraulic continuity with Salmon Creek, potential impacts to instream flows may be of some concern because the supply wells lie in relatively close proximity to the stream. The total capacity of this area may be on the order of2 to 3 MGD.
6.6.2 Within Hazel Dell VIcinity
In addition to the two areas described above, additional groundwater supplies will likely be developed in the near future within the Hazel Dell vicinity. Although groundwater production in this area is approaching the sustainable yield of the system, some additional production may be feasible from the three supply aquifers which occur in the area. Some of the potential source areas are discussed below:
Lower Salmon Creek Valley
An additional supply well will likely be installed in the Recent alluvial deposits that occur along the stream corridor of the lower Salmon Creek Valley. The preferred location for a new well would be midway between CPU Well Nos. 18 and 19. The anticipated depth of the well would be approximately 50 to 80 feet. The anticipated well yield would be comparable to that of Well Nos. 18 and 19 or approximately 800 to 1,000 gpm. Because the well will be situated very close to the Salmon Creek and will be relatively shallow, it will likely be in hydraulic continuity with the stream. Because of the hydraulic continuity, Ecology will likely restrict use of the well to the high flow months (i.e. October - May). The well will provide additional capacity to meet winter time water demand.
Contingency Planning 6-16
I I I I I I I I I I I I I I I I I I I
I I I I I I I I I I I I I I I I I I I
December 30, 1994
This will provide additional flexibility to seasonally manage pumpage stresses within the Hazel Dell vicinity (see discussion below). Water quality is expected to be quite good in this area; however, because of the shallow nature of the source, Groundwater Under the Influence (GWI) monitoring and possible treatment (filtration) may be an issue.
Deep Supply Well at NE 88th Street
CPU is currently planning on exploration and possible development of groundwater from a site located along 88th Street near 55th Avenue. Source development at this site would be largely used as a contingency supply in the event that the major supply sources along 78th Street (i.e. Well Nos. 5, 7, and 23) are effected by nearby contamination from the Airco-Boomsnub contaminated sites. The targeted aquifer would be the Lower Troutdale which has been encountered in several other nearby sites (e.g. Well Nos. 10, 14, 24, etc.). Alternatively, the Upper Troutdale may provide opportunity for development; however, impacts to neighboring wells (i.e. Vancouver Station 14) would have to be considered and evaluated in detail. The anticipated well yield from this site would be on the order of 500 gpm for the Lower Troutdale and 500 to as much as 1,500 gpm for the Upper Troutdale. Water quality is expected to be relatively good with respect to naturally occurring constituents. The site lies approximately two miles downgradient of the Leichner Landfill. Remedial investigations that are underway at the landfill should limit any water quality impacts to water supply in this area.
Upper Troutdale Well at CPU Well Site 14
Additional development of supplies may also be warranted from the Upper Troutdale aquifer near CPU Well No. 14. Well No. 14 was initially completed in both the Upper and Lower Troutdale aquifers. Testing of both zones indicated that the Upper Troutdale was relatively productive in this area and that water quality is good. The anticipated yield for the Upper Troutdale in this area. would be approximately 500 gpm.
Hazel Dell Wei/field Optimization
In addition to developing new groundwater sources, water-supply development in the Hazel Dell area will emphasize optimization of the well field sources. Well field optimization will involve the seasonal management of pumping stresses in order to maximize the groundwater yield from the system and to minimize impacts to Salmon Creek. Shifting
Contingency Planning 6-17
December 30, 1994
of pumping stress to the Salmon Creek corridor during the winter months provides an opportunity to shut down other wells in the system for periods of time to facilitate water level recovery. Allowing longer periods of recovery increases the overall storage capacity of the aquifer prior to entering into the dry season. The increased storage capacity results in greater well yield from the Hazel-Dell vicinity when peak water supply demand occurs. Increasing water level recovery and storage capacity also provides opportunity to add new sources in the Hazel-Dell area.
The net benefits that can be derived through wellfield optimization and seasonal management of pumpage stresses can only be rigorously assessed with a calibrated numerical flow model. Development of such a model would be relatively expensive. However, in addition to addressing water resource issues, a model of this nature could serve many other purposes such as evaluating contaminant transport in vicinity of the Airco-Boomsnub contaminated sites as well as the potential risks these contaminant problems pose to the public water supply sources. Therefore, given the potential usefulness of a numeric model, it may be prudent to consider development of such a tool in the future.
6. 7 Emergency Phone Numbers
See Spill Response Planning Section (Section 7)
6.8 Summary of Contingency Plan
Because of the geographic and hydrologic separation of sources, and the strategic location of storage in the CPU system, loss of any particular source can be accommodated. The current contingency plan calls for strategic pumping of various wells in the system, management of storage, and continued new source development.
In the long term, the current contingency measures could be enhanced by:
D Specific development of new source in the northern Hockinson area, and in the northern Hazel Dell area.
D Completion of a north/south pipeline from the Hazel Dell system north to the Ridgefield area.
D Completion of system improvements in the Hockinson area to remove distribution system impediments to north/south transfer (e.g. replacement of any 4-inch mains).
Contingency Planning 6-18
I I I I I I I I I I I I I I I I I I I
I I I I I I I I I I I I I I I I I I I
December 30, 1994
I:J A systematic hydraulic assessment of all areas of the system to assure detailed contingency plans are ready for loss of supply or storage in strategic areas.
I:J Update of the contingency plan every two years.
Contingency Planning 6-19
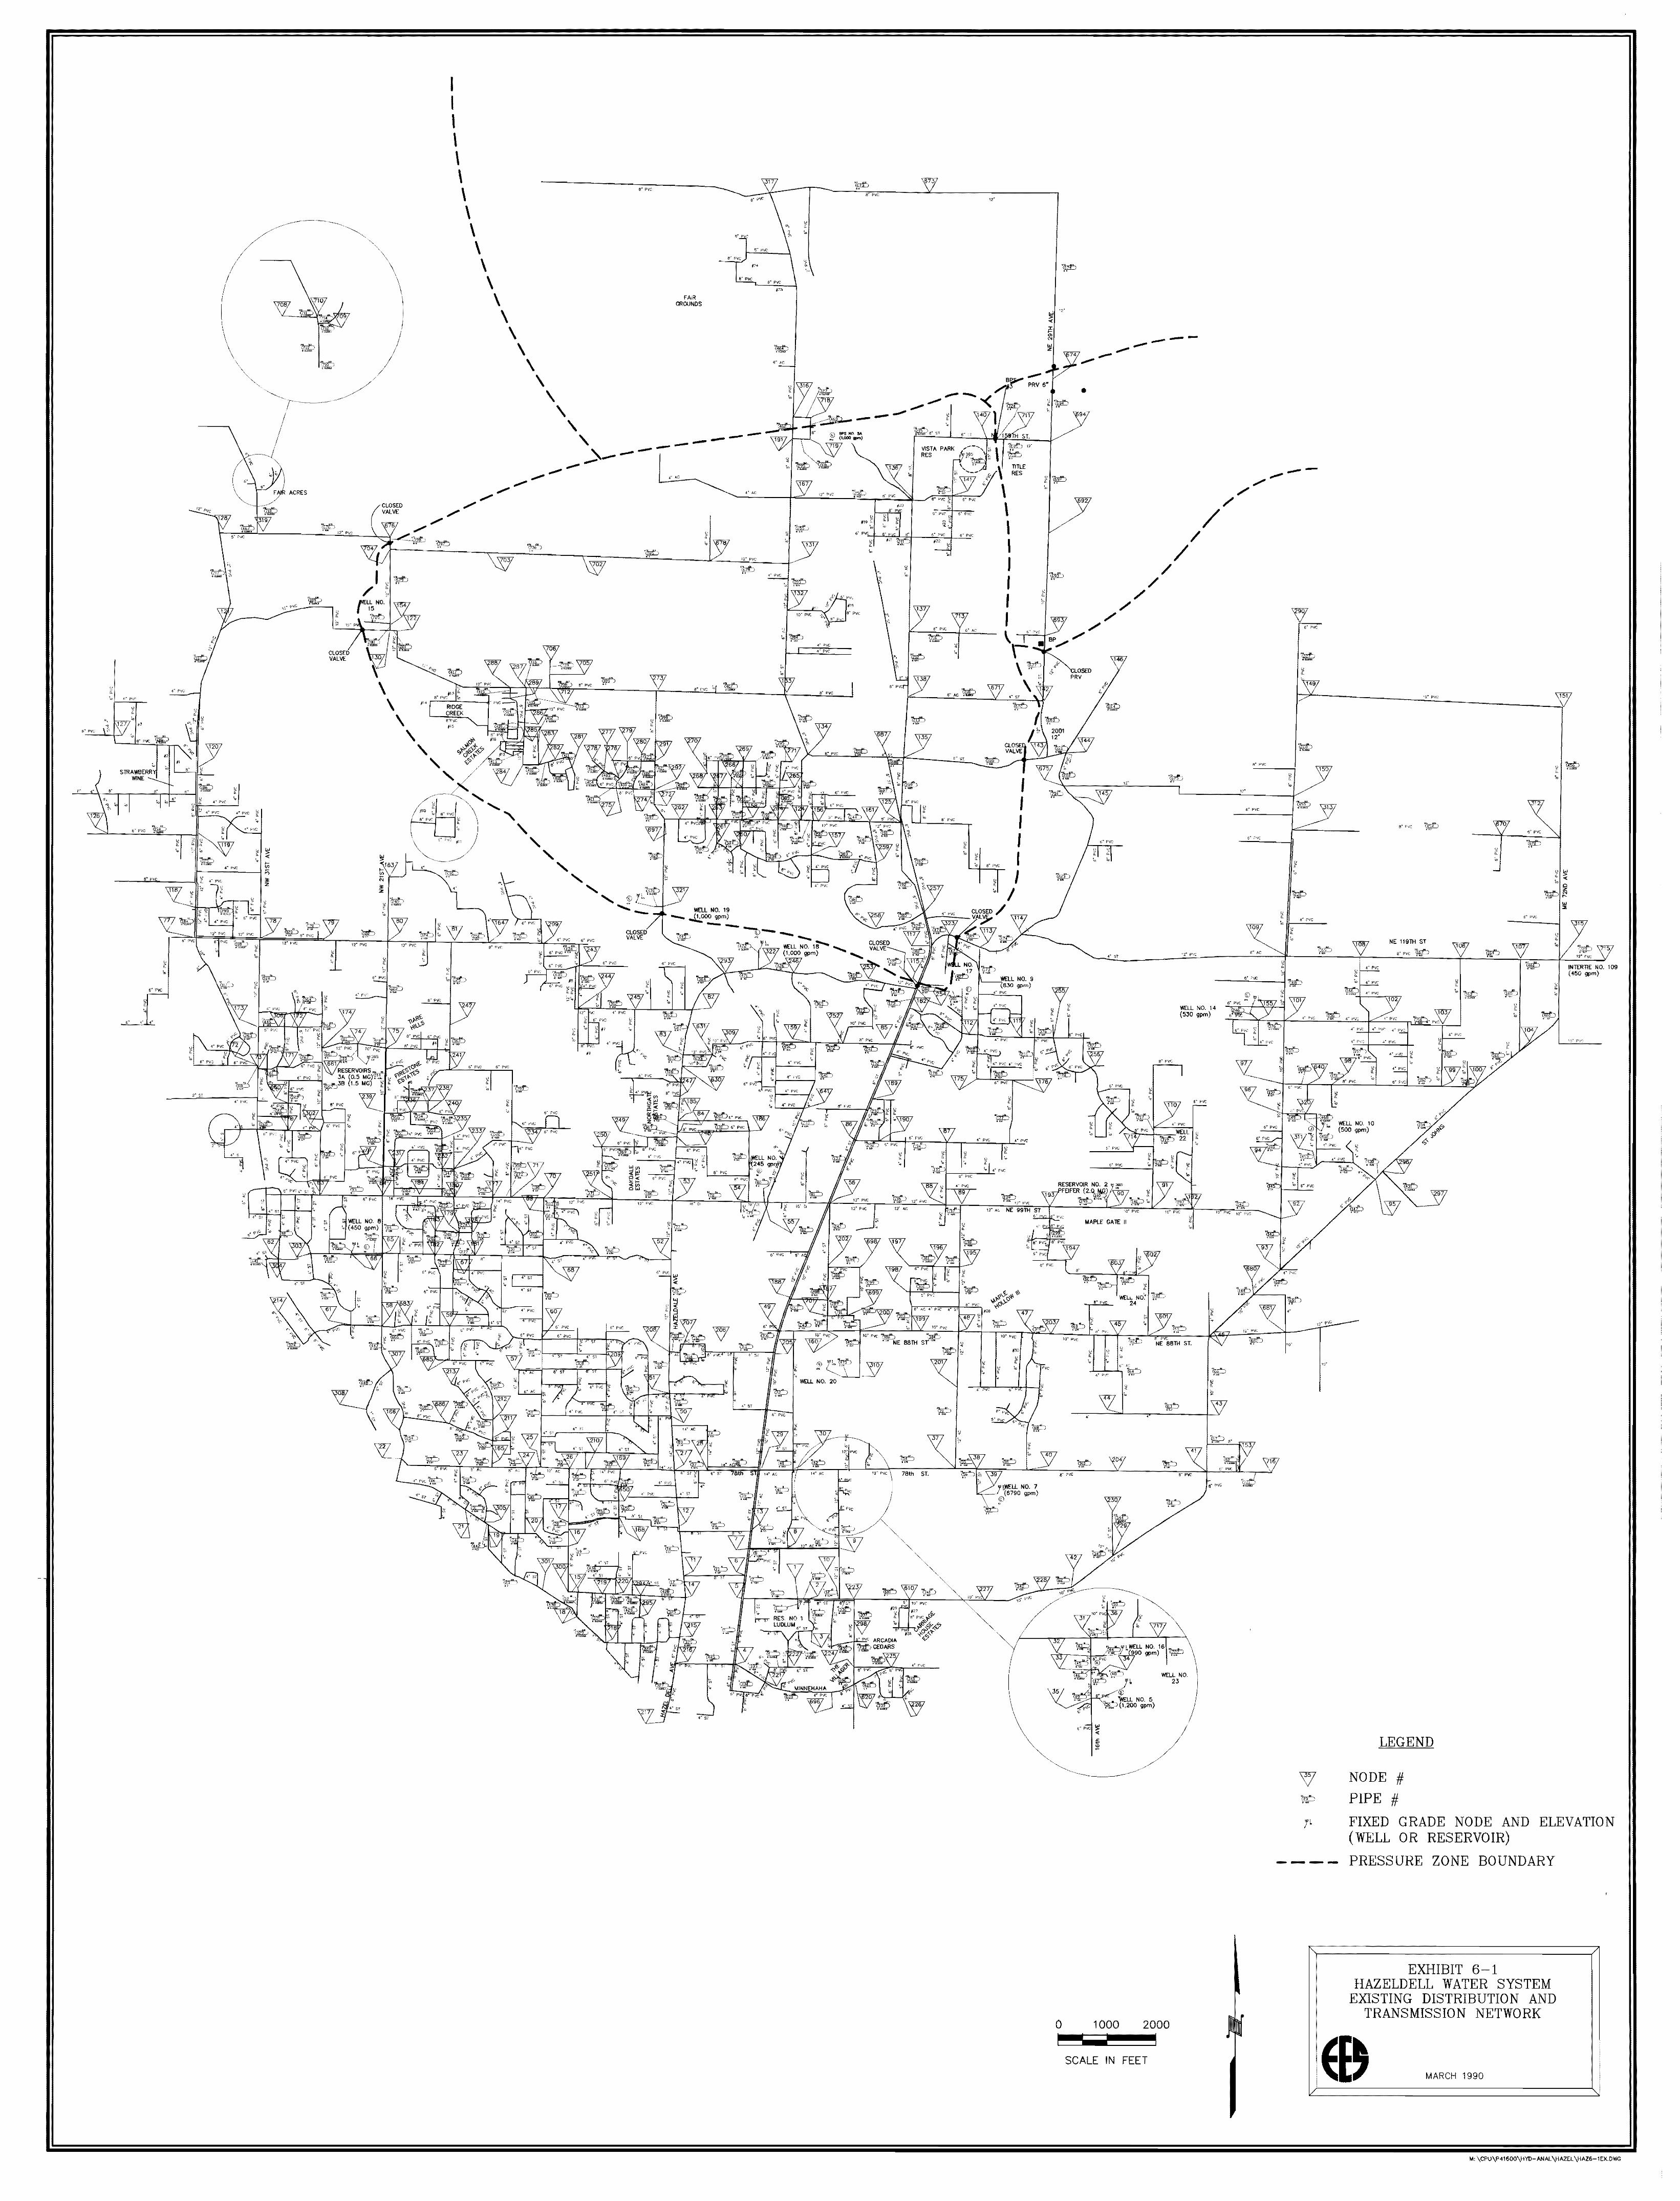
I I
/ ' i
I
' I ' \ \
\
/
/ /
... _,_
' i !
/ /
ACRES
/ /
I /
' \ \ \
\
,i I ' /
/ ' !
I
CLOSED VN..VE
'"""· ~
I I I \ \ \ \ \ \ \ \
\ \
\ \
' ' ' // ,,
/ f: / ~0 :_;, ~: P».:
,· '"·:..:.:.'·H ' "-" . •
\ \ \ \ \
\ \
\ \
\ \
- .>------.,.,...
"' ' ' ' ' ' ' '· --
-
fAIR GROUNDS
-----,.
WELL NO. 19 "-... ~000 qpm) --
' '
-
WElL NO. 20
--
" .
--.../ -- '
78th ST.
TITLE RES
I /
I I I I I I
,-,-
---•
/ /
/ /
/
MAPLE GATE !I
0 1000
----
/ /
/
/ / /
WEll. NO. 14 (:lJO gpm)
'ir;;"---"
WELL NO. 23
2000
(,l
'
SCALE IN FEET
/ /
/ ---
\357 v
----
,.._ ___ ... _
:< '/;;;;, \
WELL NO. 10 (500 •om)
NE 119TH ST
LEGEND
NODE
PIPE #
#
' >
tl; J<" "''"
INTERT!E NO. 109 (450 gpm}
FIXED (WELL
GRADE NODE AND OR RESERVOIR)
ELEVATION
PRESSURE ZONE BOUNDARY
EXHIBIT 6-1 HAZELDELL WATER SYSTEM
EXISTING DISTRIBUTION AND TRANSMISSION NETWORK
MARCH 1990
~: \CPU\P41600\HYD-ANA.l \HAZEl \HAZ6-1EK.OWG
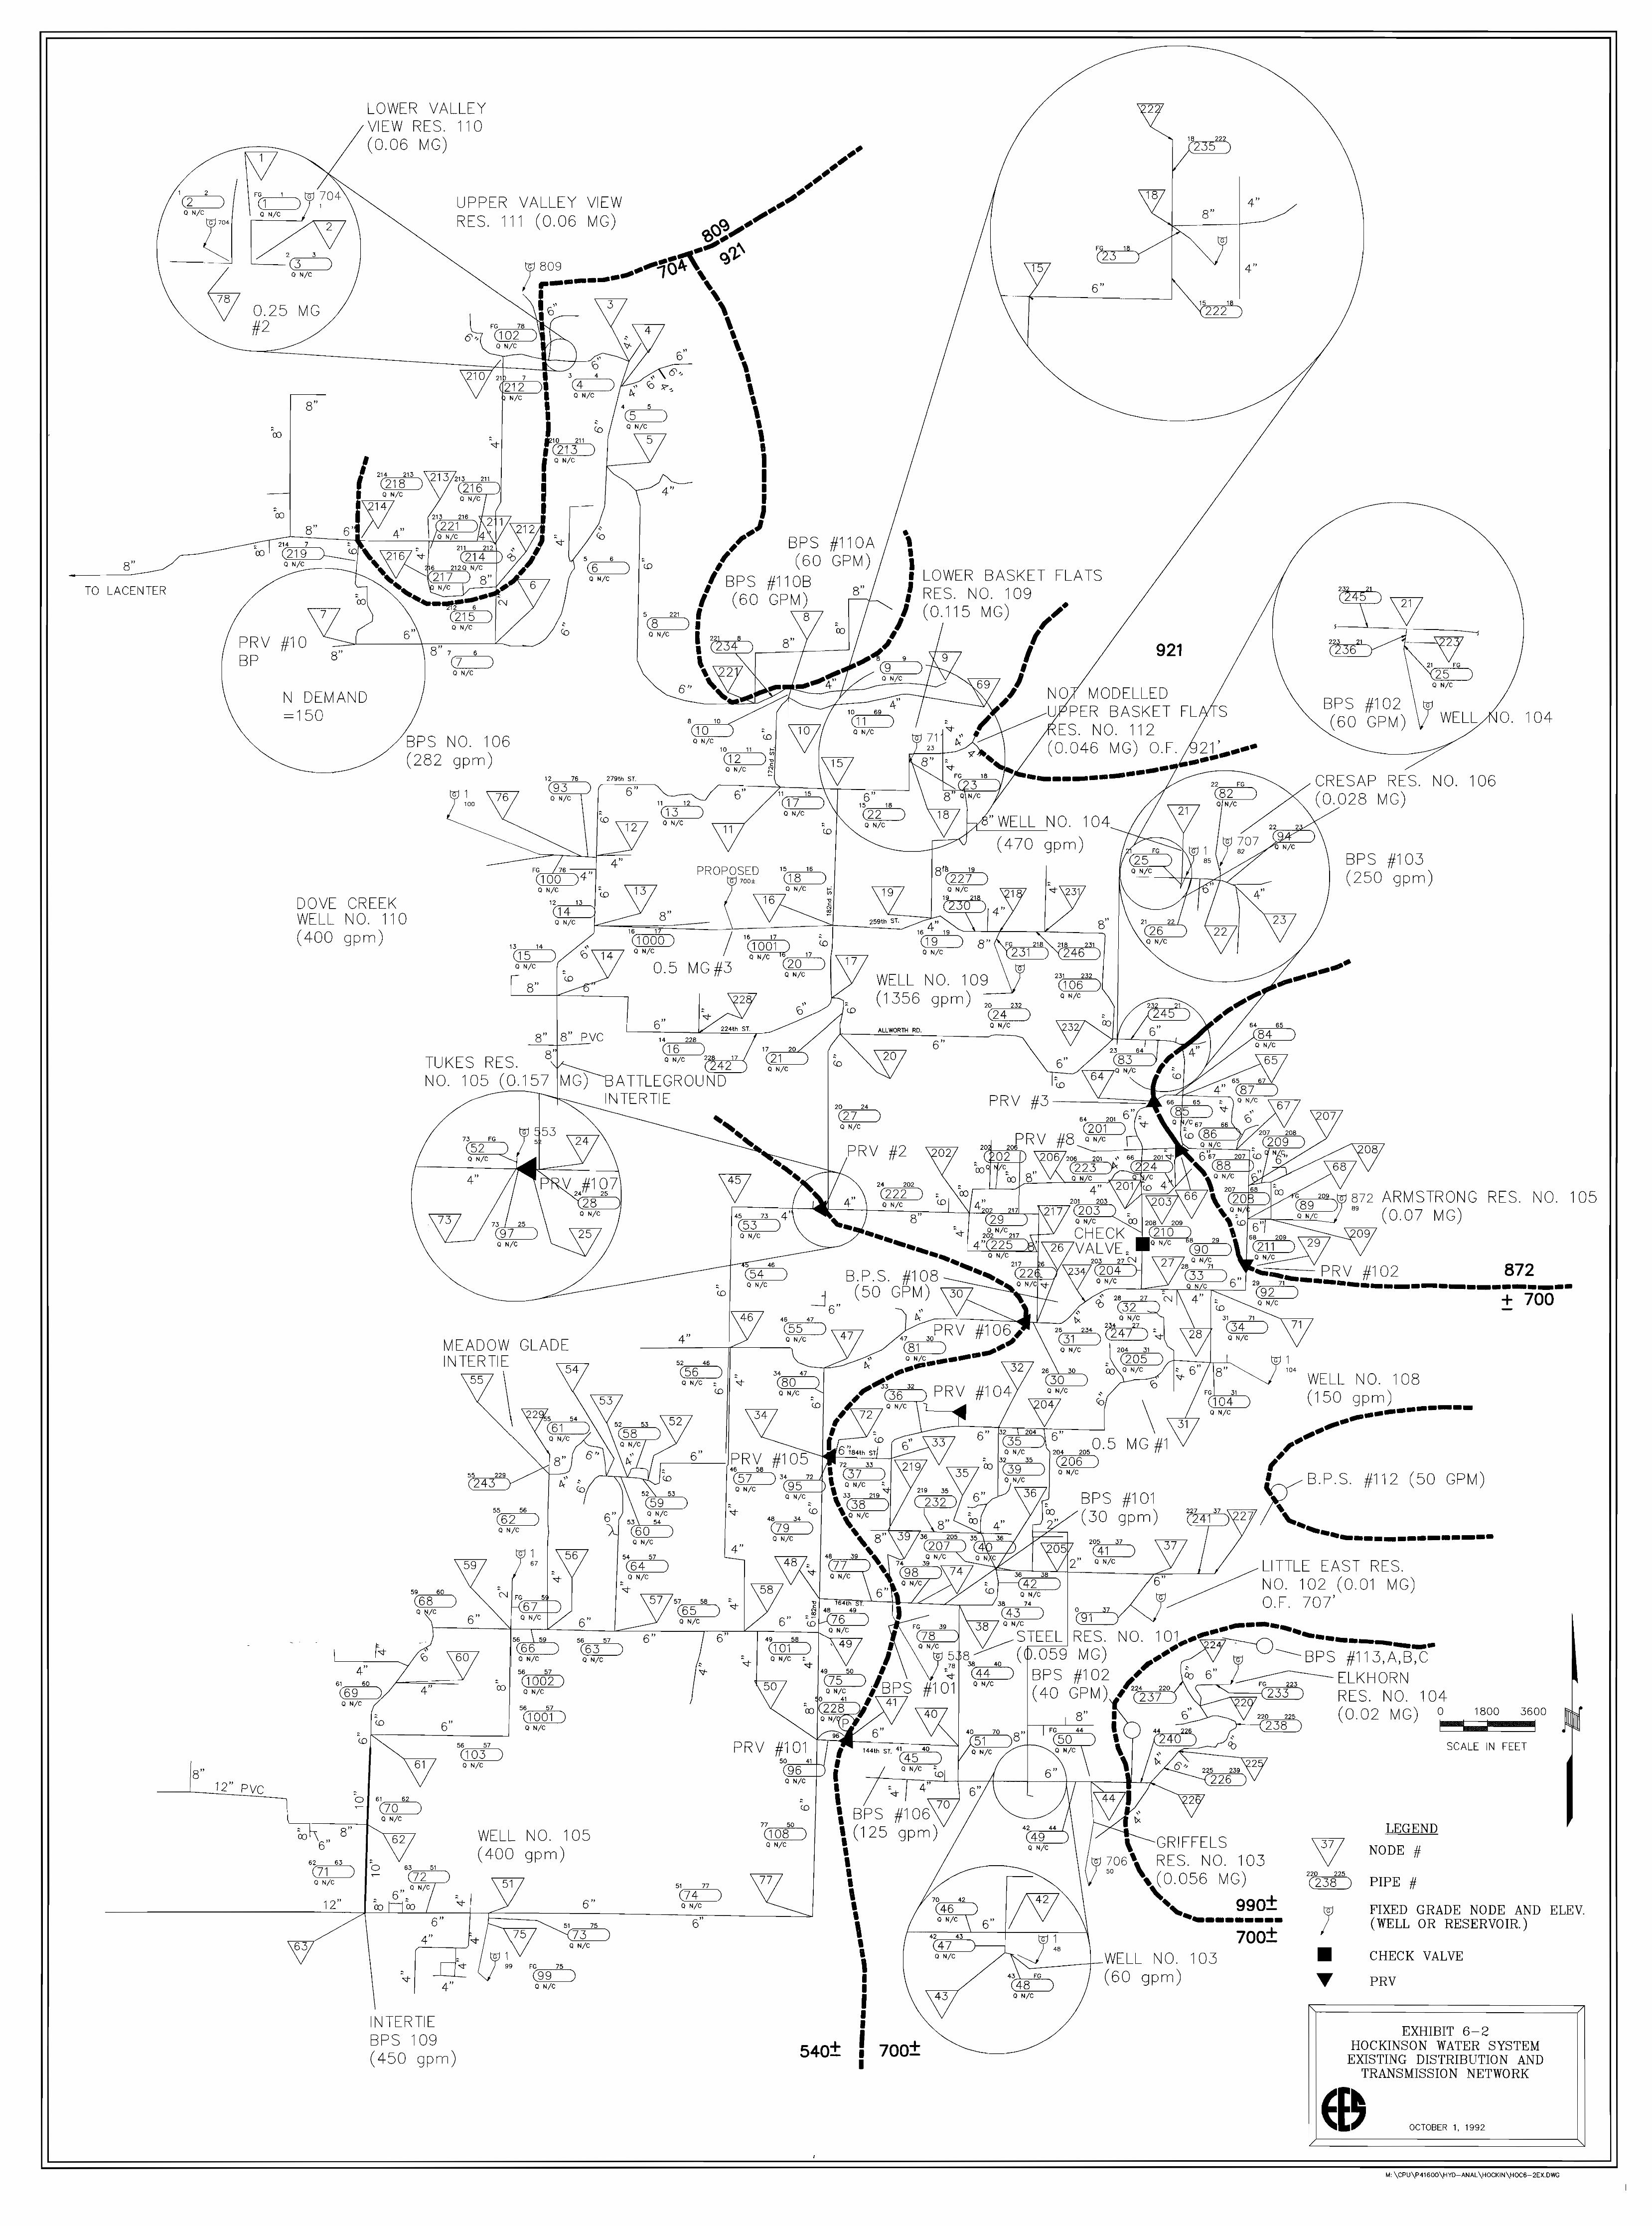
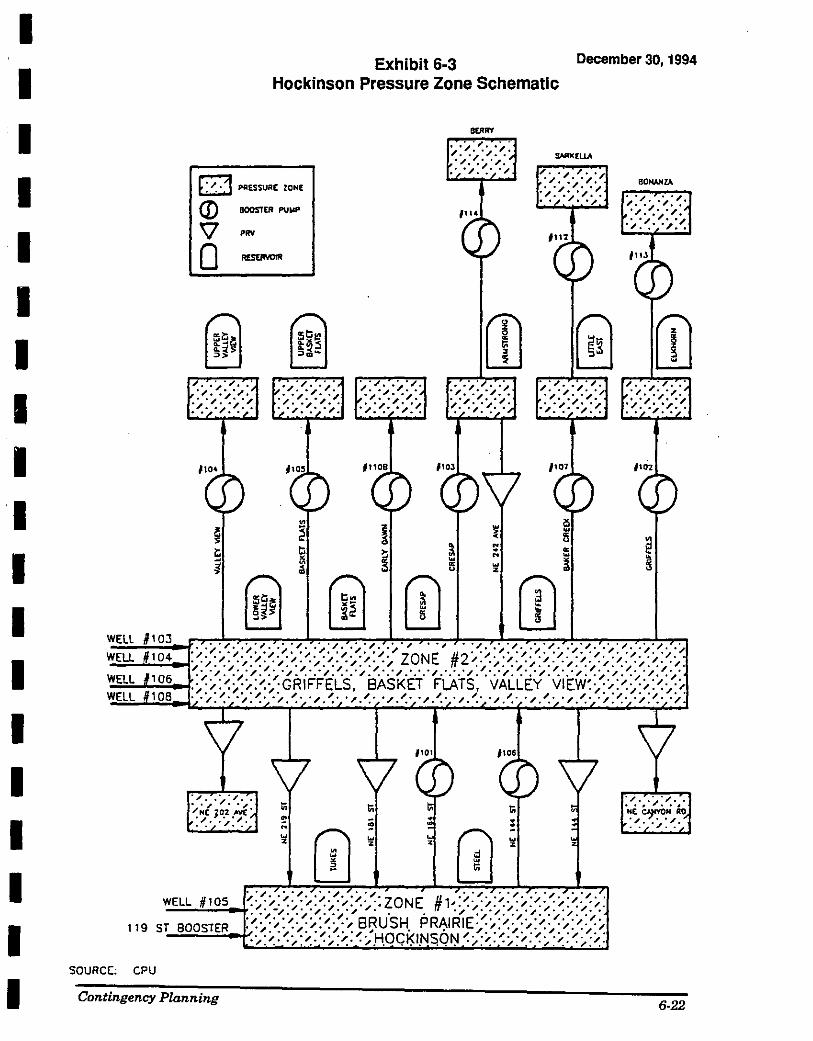
I I I I I I I I I I I I I I I I I I I
WELL
WEU 104
WELL 106
WELL 108
Exhibit 6-3 December 30, 1994
Hockinson Pressure Zone Schematic
D PfiESSUR£ ZONE
CD BOOSTER PVi&P
\1 PRY
0 .. ..-
f1108
"' ~ .! ~ s l:i t; ~ • $ "' ~ i!
~ a!) [) -s
m #107
i5 ~ w
5 ~ !: ~
w " w ~ w ~ u • ru
BONANZA
,:~- .:,:~· 0 ,_,_ •• "'· .· '/,":· ., "'·. '·.
"'· ·/"/, .· . / .... " . . ·'I','.·., . .-:· .,.~·.
#107
e ~
. ·/'"'· ·'/'· .;..· ..... ·/""'· . .,.,, .:,..·, .. , . '/, . .,.,, ·/'/, ·/'"· ·/""'· ·/'/, ·/ '/ .. · '/, ·· '/. ·· '/. ·· '/ .. · '/. ZONE #2. '/. ·· '/, ·· '/. ·· '/. ·· '/. ·· '/. .. /. '..· . /. '..· . /.-'. .. , /.· . / ."'.· . , -'. .. "'· "'. .. /. ". .. /. "'.· . /. ". .. /. '.· ., /,'I/, 01/, 'I/, 0 1/, 'I/, 0 1 o o 0 1° 0 'I/, 0 1 ,, 01/, 'I/, 'I/, 'I/o o ., ,, '/ ,, '/ ,, •• ,, •• "' •• '· •• ,, •• ,, 0. ,, • 0 '· •• ,, ., ,, '/ ,, '/
.;.·:..:-:;.·:..:-:;..·GRIFFELS, BASKET FLATS, VALLEY VIEW~;..·:..-:<;..·:.:<;..·:. •• /: ~- ·/: ': 0 • :, • ': •• /. ".. 0 ,_.,_ •• / .".· • ,/, • • /. -'.· • // •• • // •• • /. ". •• ;.. :". •• ;.. :-'. •• ;, •
1101 #106
: < ·,. /: '.·,. In In In :"'.·~·>>"'.·.· .IN( J02 ,t.V(' NE ~N A:D
:<· ·/:"".· ~ i1 • : "'. .. :.. : ".. " : w
GJ w
GJ w • • • •
WELL #105
119 ST BOOSTER
SOURCE; CPU
Contingency Planning 6-22
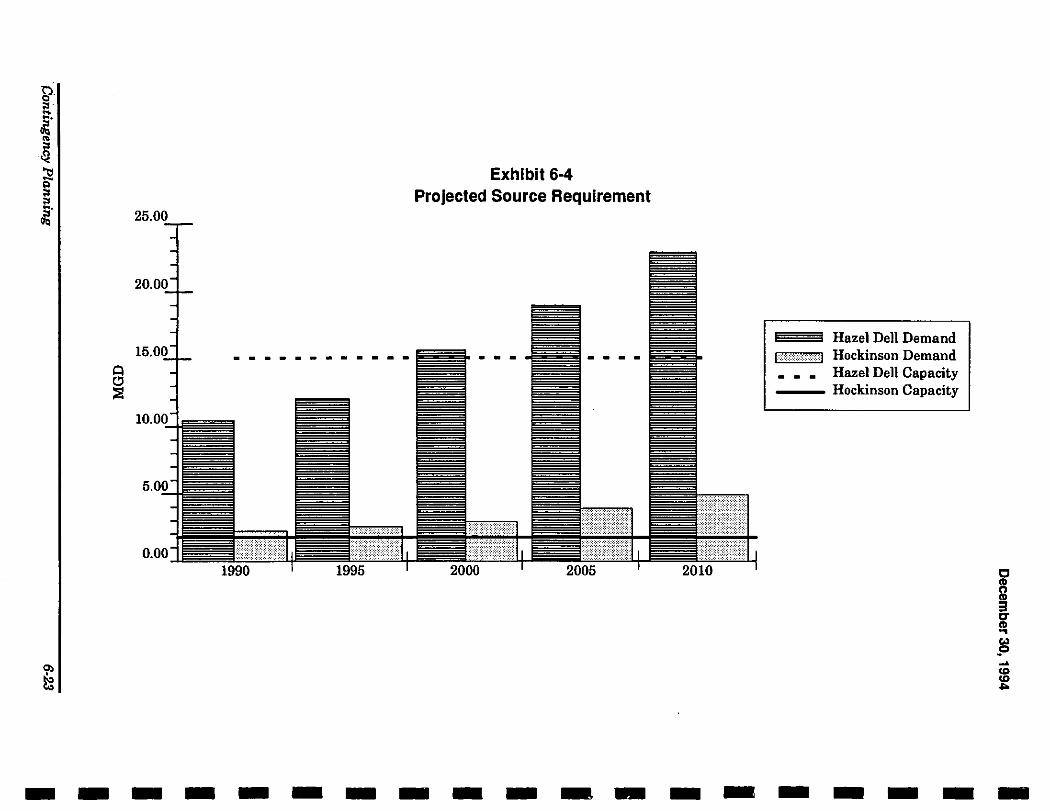
Exhibit 6-4 Projected Source Requirement
------. -----Hazel Dell Demand
,,,,,,,,,,,,,,,,,,,,J Hockinson Demand Hazel Dell Capacity
--- Hockinson Capacity
-------------------
I I I I I I Section 7
I I I I I I I I I I I I I
I I I I I I I I I I I I I I I I I I I
7.1 Introduction
December 30, 1994
Section 7 Spill Response Planning
The purpose of this section is to outline and evaluate spill response procedures. Spill response plans are developed for the purpose of improving coordination among federal, State, local agencies and private parties as they prepare and respond to spills or releases of hazardous substances or oil.
The systems and procedures of this section have as their basis, those of the "Statewide Master Oil and Hazardous Substance Spill Contingency Plan" (Master Plan - Department of Ecology, 1991) and the 'Washington State Comprehensive Emergency Management Plan" (Washington State Department of Community Development, 1987). Portions of these Plans have been condensed and modified for presentation in this section. Since many systems and procedures have been established for marine spills, various plan elements have been included, condensed, and/or modified to present this discussion of spill response in wellhead areas. The following is not intended to replace these Plans or any other plan which exists currently, but is intended to provide an overview of the structure, relationship, and necessary modifications necessary for, and applicable to, wellhead zones.
The term contingency plan, which is utilized in this section, should not be confused with the water supply contingency plan elsewhere in this document. Contingency planning for the purpose of this section should be construed to mean "spill response contingency" plans.
Also, in the various contingency plans applicable to the State, there are repeated references to an "Incident Commander (I C)" and an "On Scene (Site) Coordinator (OSC)." The following are clarifying comments on their relative roles in spill response. The IC is the person who is in command of an incident during its emergency phase while an OSC is the person who is in charge of spill or release management and clean-up. While there is an IC in charge of the situation, the OSC takes direction from this person. After the emergency response is complete, the site can be transferred to the authority of the OSC.
Spill Response Planning 7-1
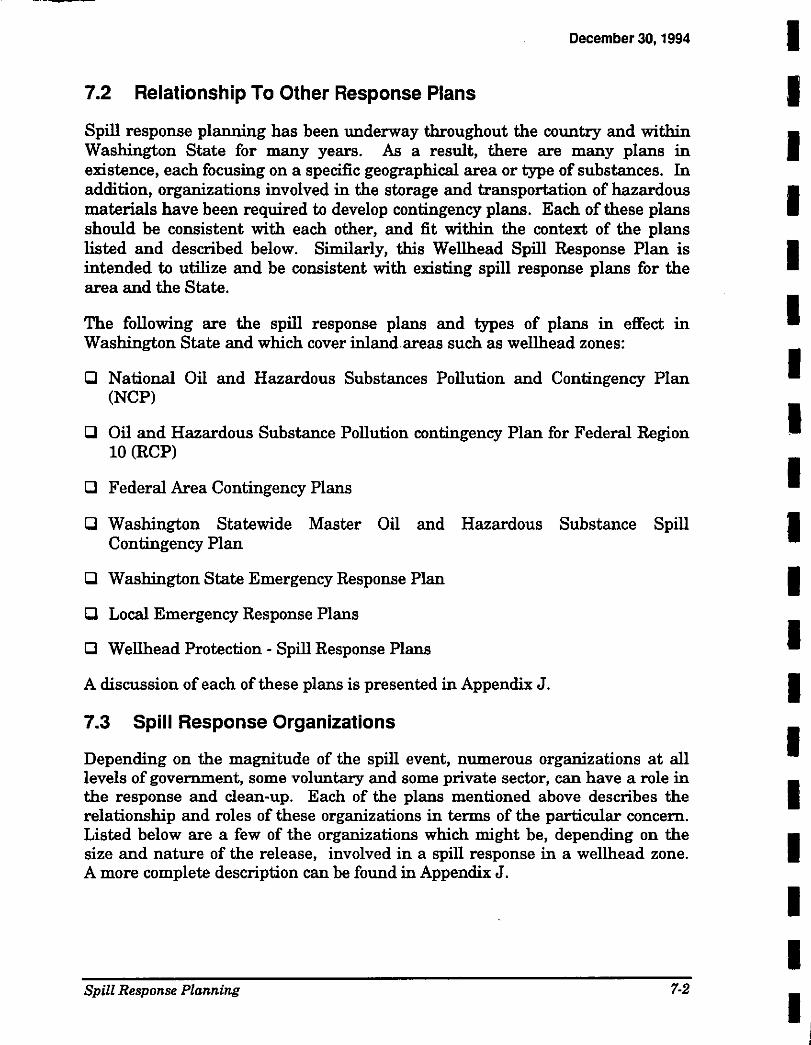
December 30, 1994
7.2 Relationship To Other Response Plans
Spill response planning has been underway throughout the country and within Washington State for many years. As a result, there are many plans in existence, each focusing on a specific geographical area or type of substances. In addition, organizations involved in the storage and transportation of hazardous materials have been required to develop contingency plans. Each of these plans should be consistent with each other, and fit within the context of the plans listed and described below. Similarly, this Wellhead Spill Response Plan is intended to utilize and be consistent with existing spill response plans for the area and the State.
The following are the spill response plans and types of plans in effect in Washington State and which cover inland areas such as wellhead zones:
CJ National Oil and Hazardous Substances Pollution and Contingency Plan (NCP)
CJ Oil and Hazardous Substance Pollution contingency Plan for Federal Region 10 (RCP)
CJ Federal Area Contingency Plans
CJ Washington Statewide Master Oil and Hazardous Substance Spill Contingency Plan
CJ Washington State Emergency Response Plan
CJ Local Emergency Response Plans
CJ Wellhead Protection- Spill Response Plans
A discussion of each of these plans is presented in Appendix J.
7.3 Spill Response Organizations
Depending on the magnitude of the spill event, numerous organizations at all levels of government, some voluntary and some private sector, can have a role in the response and clean-up. Each of the plans mentioned above describes the relationship and roles of these organizations in terms of the particular concern. Listed below are a few of the organizations which might be, depending on the size and nature of the release, involved in a spill response in a wellhead zone. A more complete description can be found in Appendix J.
Spill Response Planning 7-2
I I I I I I I I I I I I I I I I I I
II •
I I I I I I I I I I I I I I I I I I I
December 30, 1994
7.3.1 National Response Team
The National Response Team (NRT) consists of representatives from the various federal agencies. It serves as the national body for planning and preparedness actions prior to a spill and as an emergency advisory center when a spill occurs.
7.3.2 Regional Response Team
The Regional Response Team (RRT), consisting of representatives from selected federal and State agencies, performs functions similar to those performed nationally by the NRT. Essentially, the RRT is the regional body responsible for planning and preparedness before an oil spill occurs, and provides advice to the OSC following such incidents.
7.3.4 EPA Environmental Response Team
The Environmental Response Team (ERT), based in Edison, New Jersey, is established to advise the OSC and RRT on environmental issues surrounding spill containment, clean-up, and damage assessment, with personnel expertise in areas such as treatment technology, biology, chemistry, hydrology, geology, and engineering.
7.3.5 Technical Assistance Team
The Technical Assistance Team (TAT) is a contractor used by the EPA Region 10 Office to provide technical oversight at spills and uncontrolled hazardous waste sites. Requests for the TAT are made via the Environmental Protection Agency (EPA). Once on site, the TAT will report the situation to the EPA duty officer who then decides whether an EPA OSC needs to be on scene.
7.3.5 Ecology Spill Response Team
The Ecology Spill Response Team consists of Washington State Department of Ecology (Ecology) regional office personnel. This team is responsible for determining the source, cause, and responsible party, as well as initiating enforcement action, as appropriate. Additional responsibilities include ensuring containment, clean-up, and disposal are carried out adequately. The team coordinates its actions with other State, federal, and local agencies.
Spill Response Planning 7·3
December 30, 1994
7.3.6 Natural Resource Damage Assessment Team
Initially, the resource damage assessment program was an Ecology-led effort designed to organize the State natural resource trustee agencies into an effective resource damage assessment task force. The State Natural Resource Damage Assessment (NRDA) team consists of representatives from Ecology, the Department of Fish and Wildlife (DFW), the Parks and Recreation Commission, and the Department of Natural Resources (DNR). In the event of a major pollution event which damages natural resources, this committee's mission was to organize personnel, materials, and equipment necessary to conduct reconnaissance evaluations and initiate detailed assessments of natural resource damages.
7.3.7 Local Response Team
The Local Response Team (LRT) consists of State and local government agencies, industry personnel, academic organizations, and other private interests which may assist the OSC in pollution response and planning. The composition and level of participation in the LRT is dependent upon the area involved, hazard posed, and type of assistance required. Normally, the LRT will consist of State environmental response agency and clean-up contractors.
7.4 Roles and Responsibilities
7.4.1 Introduction
Spill response in Washington State may involve the active participation of a significant number of agencies, organizations, and private individuals. For spill response procedures to be effectively executed, each party must be fully aware of their specific roles and responsibilities. Moreover, there must be an understanding of the roles of other parties involved in response activities, as well as effective coordination, cooperation, and communication among responding agencies, organizations, and individuals.
This section describes the specific roles and responsibilities of the key parties which include:
CJ Responsible party or spiller, CJ Federal and State agencies, CJ Local government,
Spill Response Planning 7-4
I I I I I I I I I I I I I I I I I I I
I I I I I I I I I I I I I I I I I I I
December 30, 1994
[J Facility owners, and [J Contractors.
7.4.2 The Responsible Party
The primary responsibility for assessing, responding to, and containing an oil spill or discharge falls upon the individual, agency, and/or company responsible for the spill incident. The responsible party (RP), whether there is an approved contingency plan or not, is responsible for containment and clean-up of the spill, disposal of contaminated debris, restoration of the environment and payment of damages. State and federal law specifically require that the removal of a discharge of oil or hazardous substance should be immediate.
7.4.2 Environmental Protection Agency
The EPA has primary responsibility for spills that occur on inland U.S. waters not under United States Coast Guard (USCG) jurisdiction, and all land spills. As directed by the NCP, the EPA is pre-designated as OSC for spills occurring under its jurisdiction.
7 .4.3 Department of Ecology
Ecology is the lead State agency for environmental pollution response within the State of Washington. As such, it has pre-designated the OSC and the Incident Commander (IC) for many spills occurring in State jurisdiction. In the event of a spill occurring on a State highway, Ecology coordinates with the Washington State Patrol (State Patrol), which assumes responsibility as IC, and Ecology acts as the lead agency responsible for clean-up activities.
7.4.4 State Patrol
The State Patrol acts as the designated Incident Command agency for incidents on interstate and State highways, and other roads and jurisdictions as delegated. When a spill occurs on a State highway, Ecology joins the Unified Command and acts as the lead agency for cleanup response.
7.4.4 Washington State Department of Community DevelopmentEmergency Management Division
Washington State Emergency Management Division (EMD) is responsible for:
Spill Respon~ Planning 7-5
December 30, 1994
0 Developing and maintaining a State Comprehensive Emergency Management Plan.
0 Maintaining a 24-hour capability to receive notification of incidents and request for assistance and initial notification to local, State, federal response agencies.
0 Activating the State Emergency Operations Center (EOC) as needed to coordinate State resource identification and acquisition in support of Ecology response.
0 Providing Public Information Officer (PIO) support to the Incident Command.
0 Maintaining an updated list of NRDA team members submitted by participating agencies.
0 Maintaining and updating a notification list of local, State, and federal agencies involved in emergency response.
0 Coordinating the procurement of State resources for use by the OSC or as requested by local EMD or other designated local response agency or State response agencies.
0 Participating in the NRDA team.
7.4.7 Department of Fish and Wildlife
The DFW is a State agency with trustee responsibilities for food fish, shellfish and associated habitats, shellfish and associated structures and facilities, some beach access properties, and assorted equipment which may be affected by large spills of oil or other hazardous materials. Of special concern are near shore, high-value habitats which may be used as nursery grounds for salmonids and other juvenile fish and shellfish or spawning grounds for salmon, herring, smelt, and other fish and shellfish.
7.4.8 Department of Health (DOH)
The Department of Health (DOH) has the responsibility for beach closures for human health and safety purposes, utilization of contaminated food organisms, and general health-related matters for the safety of the public. In addition, DOH is to render all appropriate laboratory support and services to the OSC. DOH is a participant in the NRDA team.
Spill Response Planning 7-6
------------
I I I I I I I I I I I I I I I I I I I
I I I I I I I I I I I I I I I I I I I
December 30, 1994
7.4.9 Department of Transportation
The Washington State Department of Transportation (DOT) may provide traffic control, equipment, and personnel for non-hazardous clean-up activities on State and interstate highways. The DOT may provide and mobilize equipment necessary in a major spills incident.
7 .4.1 0 Department Fish and Wildlife
The DFW is a trustee agency responsible for all, wildlife, game fish, and non-game fish. Of special concern and responsibility in the event of an oil spill are water birds, marine mammals, aquatic fur bearers, anadromous game fish, wildlife habitat areas, hatcheries, launching ramps and related facilities, and assorted equipment.
7.4.11 Local Emergency Planning and Emergency Management
Local governments have a duty to be prepared for all disaster emergencies. The local Emergency Management Division (EMD) is charged with establishing Local Emergency Planning Districts (LEPD) and Local Emergency Planning Committees (LEPC) to facilitate planning efforts.
LEPCs have the responsibility to create local emergency response plans. General requirements for local response plans are contained in Title III of the Superfund Amendments and Re-authorization Act of 1986 (SARA). Generally, local agencies, particularly fire services and law enforcement agencies, can be activated to provide emergency response services when there is a threat to life and property. Emergency response services may include: fire and explosion controls investigation and documentation, perimeter control, evacuation, traffic controls and initial containment or even removal, depending on the nature of the incident.
7.5 Incident Response Management
7 .5.1 Notifications
The party responsible for a spill is required by State law to notify the following entities: (1) the National Response Center and (2) the Washington State Emergency Management Division. The responsible party is also encouraged to contact the nearest appropriate regional office of Ecology.
Spill Response Planning 7-7
December 30, 1994
Phone numbers for agency notification are as follows:
Environmental Protection Agency - Seattle National Response Center Washington State Emergency Management Division 24-hour Emergency Spill Response Washington State Department of Ecology 24-hour Emergency Spill Response Northwest Office- Bellevue Southwest Office - Olympia
7.5.2 State Incident Command System
Introduction
(206) 553-1263 1-800-424-8802 1-800-258-5990
(206) 649-7000 (360) 407-6300
The State of Washington's spill response is organized and managed under an Incident Command System (ICS). The ICS is a functional component of a larger program, the National Interagency Incident Management System (NIIMS), which was developed years ago for the interagency management of large forest fires. The ICS, although less complex than the NIIMS, is designed to allow for the day-to-day management of response efforts and resources for all oil and hazardous substance spill responses, from the very small or routine efforts to the largest catastrophic spills involving multi-agency jurisdictions.
Specifically, the system will operate in the following scenarios:
0 Single Jurisdiction/Single Agency 0 Single Jurisdiction/Multi-Agency 0 Multi Jurisdiction/Multi-Agency
The ICS concept is built upon teamwork coordination, and cooperation between all entities involved, or potentially involved, in a spill response. Teamwork is encouraged throughout all phases of incident management including the preparedness for, mitigation of, response to, and recovery from a spill of any type or size. Ecology has taken steps to ensure there is effective teamwork, coordination, and participation in the ICS by appropriate State and local agencies in addition to the USCG and the EPA. Industry is strongly encouraged to adopt ICS in order to participate effectively in the Unified Command Structure.
Spill Response Planning 7-8
I I I I I I I I I I I I I I I I I I I
I I I I I I I I I I I I I I I I I I I
December 30, 1994
Unified Command Structure
In Washington State, the ICS will operate using a Unified Command Structure involving representatives of the State (Ecology), federal government (USCG/EPA), industry, and in some circumstances local government. A Unified Command Structure is called for when the spill is multi-jurisdictional in nature, e.g., when public safety and welfare, as well as environmental damage, is imminent.
Under the Unified Command Structure, the three key On-Site Coordinators (OSC) -- federal, State, and industry -- will share decisionmaking authority in the command post and consult with each other regarding spill response and clean-up management issues. Participation in the Unified Command Structure does not mean that agencies such as the USCG, EPA, and Ecology, which have roles and responsibilities set by federal and State statute, are relinquishing or surrendering their authority by participating in a Unified Command Structure. Emergency situations, however, may require some actions to be taken outside of the normal permitting process.
The Unified Command Structure is a consistent, systematic means of organizing a variety of agencies, having jurisdictional responsibilities surrounding an incident into one concerted effort. The concept offers uniform and traclmble procedures that enable all emergency response agencies to perform their roles effectively, yet in unison. A Unified Command is intended to be located as close to the site of the spill as practicable, without interfering in the actual spill response activities.
Basic Principles of ICS
Organization and Staffing Principles - The ICS organization is functionally oriented around four major areas: Command, Planning, Logistics, and Administration. The flexibility to expand this organization as situations dictate is designed within the ICS, without the need to conduct major organizational changes or a cumbersome transition into a different operational system during a spill response, due to changing conditions or circumstances that frequently occur as a spill progresses. For example, in a minor incident, a single person may serve as the OSC and perform all functions. In a major incident, the command may consist of a united command with federal and State representatives, the responsible party, the OSC, a staff, and a group of sections and functional units. Participants in the Unified Command/Command Post and the
Spill Response Planning 7-9
December 30, 1994
OSCs are normally pre-designated, and the sections and function units are filled in as needed.
It is important for those parties and agencies participating in ICS to understand that the key to its effective operation is the acknowledgment that the IC is in charge of the entire operation, the OSC is in charge of spill clean-up during the incident, while the section chiefs and functional unit leaders are in charge of their units or sections. As a rule, sections should have a single individual in charge who has the authority to make decisions and to give orders. Without this authority, the system will fail. Accordingly, it is a maxim of ICS that section chiefs should be selected based on their experience and qualifications, not rank or seniority within their relative agency or organization.
The staffing requirements of the ICS should be viewed as a dynamic activity, not one based upon maintaining a precisely defined level. Flexibility is a key element of ICS, allowing the command structure to be as large and sophisticated or small and compact as the spill event requires. As long as common sense is used, the system can be modified to fit any incident. The size of the ICS will be determined by the IC on the scene of the spill.
Key Structural Principles and Attributes of ICS - The ICS provides for multi-agency, multi-jurisdictional response to a spill, if necessary. The circumstances requiring such a response will most likely involve a major and/or catastrophic spill. The following provides a basic description of the principles and key attributes of ICS which make the system so well-suited to spill response activities:
0 Common terminology for personnel, facilities, equipment, organizational positions, and operational procedures. Thus, all terminology is pre-defined and understood by all participants regardless of discipline or jurisdiction.
0 Common organizational structure that includes personnel of all participating State and federal agencies and special interest groups directly affected by the spill, operating as a unified team.
0 Defined and assigned responsibility and authority for accomplishing specific functions. All incidents under State jurisdiction will be managed by delegated responsibility and authority from the IC to functional positions within the organization. This delegation is from the top down and modular in nature so that only needed modules are
Spill Response Planning 7·10
I I I I I I I I I I I I I I I I I I I
I I I I I I I I I I I I I I I I I I I
December 30, 1994
activated. When the IC activates a position the assigned individual is responsible for accomplishing all corresponding subfunctions. If the workload increases he or she will further delegate portions of the function to subordinates. This procedure provides for smooth and rapid mobilization and demobilization to meet changing spill requirements.
CJ Written action plans to accomplish overall objectives as well as those of each operating unit. Written plans addressing response priorities and activities are developed immediately after an ICS is deemed appropriate for activation. These plans are intended to be dynamic fluid documents that are developed for each operation period and providing the specific tactics and strategy to be incorporated or directing emphasis on cleanup/response efforts for the period of time covered.
CJ Integrated emergency management facilities such as Emergency Operations Centers located throughout Washington.
CJ Integrated communications providing a managed interagency interjurisdictional communications capability.
CJ Standards for personnel qualifications, certification and training. Personnel must be trained in ICS and personnel to be assigned to each position must meet corresponding training and experience requirements.
CJ Manageable span-of-control. The span-of-control of any crisis manager should range from three to seven people with five being optimum. Anticipating change and preparing for it are vital to emergency managers. This is especially true during rapid build-up of an organization when good management is complicated by too many reporting elements.
CJ Evaluation of Performance. After the spill response is complete each person's ICS supervisor evaluates his/her performance, suggests improvements, and recognizes well-done tasks.
Spill Response Planning 7-11
December 30, 1994
7.6 Operational Response- Wellhead Applications
7.6.1 State Plans
Currently underway at the State level, is the continuing process of development of the State Master Oil and Hazardous Substance Spill Contingency Plan. The next major phase is production of a volume of the plan specifically focused on operational issues. This document, when completed, will provide spill responders and key agency staff with the information and procedural guidelines necessary to effectively respond to spill. These procedures will include such items as enforcement protocols and laboratory support procedures. As this process continues, the Washington State Environmentally Sensitive Areas Atlas could be updated to include local sensitive areas such as wellhead zones. Also specific State-local interfacing protocols could be enhanced.
7.6.2 Local Capabilities
Local Fire Districts - Local operational response to hazardous materials spill generally rests with local fire departments or districts. For this plan, this translates to the local fire districts of Clark County. All districts are trained in the Incident Command System and are pre-designated as Incident Command Agencies for events in their districts (with the exception of State highways).
Vancouver Fire Department (formerly Fire District Five)- One district, in particular, is a key to the area's spill response. Vancouver Fire Department is the area's hazardous materials response agency (HAZMAT). This district is well trained and equipped. Operationally, the district has pre-arranged contracts with the other fire districts to respond for HAZMAT incidents. The only exception, and one of concern, for Salmon Creek Wellheads, is that no agreement exists with the State Patrol for incidents on State Highways.
State Patrol - The State Patrol is the pre-designated Incident Command Agency for all incidents occurring on State highways. Without a prearranged agreement with Vancouver Fire Department for HAZMAT incidents, the State Patrol must contact an agency with jurisdiction and a contract with Vancouver Fire Department in order to secure a HAZMAT Team response. This situation may represent an unnecessary risk to the waterways and wellheads, particularly along Interstate 5.
Spill Response Planning 7-12
I I I I I I I I I I I I I I I I I I I
December 30, 1994
I 7.7 Future Plan Refinements For Wellhead Zones
I I I I I I I I I I I I I I I I I
7.7.1 Establish Responder Group
As part of the implementation of this plan, a spill responder group should be established to discuss spill response in wellhead zones. Once the wellheads are defined through this planning process, efforts should be made to communicate the extent of wellhead zones to the first responder organizations (and the public). This "forum" for discussion of wellhead issues could take the form of a sub-group of the LEPC or be developed independently.
7.7.2 Discuss Wellhead Precautions
Through a local "responders" group, discussion should focus not only on the locations of the wellheads, but also on specific protocols and procedures for response in wellhead zones. For example, certain types of responses may be more protective of wellheads than others depending on the chemical and location within the wellhead zone, and the tradeoffs affecting immediate public health and safety.
7.7.3 Develop Program
Over twelve to eighteen months, a specific program should be developed which outlines spill response procedures for CPU's wellhead area. This program should be complete with identification of specific notification procedures, response protocols, interface with local, State, and if necessary, federal agencies.
Spill Response Planning 7-13
I I I I I I Section 8
I I I I I I I I I I I I I ~-·
I I I I I I I I I I I I I I I I I I I
December 30, 1994
Section 8 Recommendations
8.1 Recommendations We have compared the priority threats to groundwater and the various programs which exist to mitigate risk to this resource. This comparison has resulted in the following recommendations. These recommendations include continuation and support for existing efforts, expansion of existing efforts, and development of new programs. Together, and in some focused and prioritized fashion, they will constitute Clark Public Utilities' (CPU) Wellhead Protection Program.
The nature of these programs dictate that they span multi-jurisdictional areas, and cover regulatory and non-regulatory efforts. Consequently, recommendations will include cooperative and necessarily independent actions for other entities besides CPU, including Clark County (County), Local Health, and others.
These programs have been categorized according to the type of program. In this manner, land use adjustments, regulatory programs, or voluntary/cooperative programs might be seen as a unit and better coordinated.
8.1.1 Land Use
Action - Establish Protective Zoning Regulations for Wellhead Areas
Lead Responsibility: Clark County
Description: Existing zoning needs to be modified (downzoning if necessary) to only allow land uses consistent with protection of the drinking water supply. For example, commercial and industrial classifications may not be appropriate within a wellhead zone, or only appropriate within or outside the five- or ten-year time-of-travel areas.
Action - Establish Protective Regulations Governing Activities within Wellhead Zones
Lead Responsibility: Clark County
Description: Given the opportunity (zoning) to use wellhead areas for specific types of uses (e.g. residential, commercial, or industrial), then specific restrictions should be placed on the type(s) of activity allowed in such areas. For example, dry cleaners or gas stations may not be
Recommendations 8-1
December 30, 1994
appropriate within certain areas within the wellhead capture zone, but may be appropriate in others.
8.1.2 Regulatory
Action • Underground and Above Ground Tank Regulation
Lead Responsibility: Clark County or Southwest Washington Health District
Description: A program should be established at the local level to regulate some of the currently unregulated storage tanks. Under State law, this type of program can be partially funded by the State fee system for regulated tanks. It may be possible to focus and prioritize efforts in the Wellhead zone or in parts of the zone.
Action - Implement a Septic Maintenance Program
Lead Responsibility: Southwest Washington Health District
Description: In December 1992, the Health District passed ordinance 92-01 requiring mandatory maintenance of septic systems in "areas of concern" Areas of concern are yet to be defined, but should include part or all of wellhead zones.
Action - Implement Mandatory Sewer Hook-up
Lead Responsibility: Southwest Washington Health District
Description: In 1993, the Health District established policy requiring mandatory sewer hook up if such service is readily available to the property. Used in conjunction with mandatory septic system maintenance, this ordinance will require property owners with failed or damaged septic systems to hook up to public sewer facilities if available.
Action • Implement Increased Stormwater Management Regulation
Lead Responsibility: Clark County
Description: Clark County has recently adopted a stormwater ordinance which will require complete control and containment of stormwater on the property boundary. While such control may be desirable, because of hydraulic or recharge considerations, the quality focus of stormwater
Recommendations 8-2
I I I I I I I I I I I I I I I I I I I
I I I I I I I I I I I I I I I I I I I
December 30, 1994
management in the proposed ordinance should receive special attention and priority for implementation.
Action - Implement a Dry Well (Injection Well) Inventory and Control Program
Lead Responsibility: Clark County
Description: Clark County is currently undertaking an inventory of all dry wells (injection wells) which might be used for stormwater, septic waste, or other wastewater disposal throughout the County. Following completion of this inventory, the County should remove high risk injection wells and conduct routine inspections on all others.
Action - Restrict Pesticide and Fertilizer Use In Wellhead Areas
Lead Responsibility: Clark County
Description: A program needs to be developed which restricts the use of certain pesticides/fertilizers or certain quantities of certain chemicals in wellhead zones. Enforcement of such a program will depend on the nature of the chemical regulated, the amount, and its availability. Regulatory help may be available from the Department of Ecology (Ecology) or the Department of Agriculture for restricting large quantity applications.
8.1.3 Cooperative I Voluntary
Action - Continue Streambank Stabilization Efforts
Lead Responsibility: CPU
Description: Over the last two years, CPU has cooperatively worked with local landowners, the Soil Conservation Service, the Departments of Fisheries and Wildlife, and others to implement Salmon Creek streambank stabilization. This effort not only enhances the water quality of Salmon Creek, but provides opportunities for improvement of overall land management and livestock management. Awareness of the water quality issues of the basin have increased along with the use of Best Management Practices (BMPs).
Action - Establish a Well Location I Status Program
Lead Responsibility: CPU
Description: In conjunction with the County, the Southwest Washington Health District and Ecology, an effort will be undertaken to locate and
Recommendations 8-3
December 30, 1994
deternrine the status of all wells in the wellhead area. Standard data protocols will be developed, and geophysical positioning devices used.
Action • Decommission All Abandoned Wells
Lead Responsibility: CPU
Description: Once abandoned wells are identified, immediate action will be taken to decommission the wells and seal them to prevent aquifer contamination.
Action • Establish a Low Cost or Free Septic Maintenance Service
Lead Responsibility CPU
Description In conjunction with the regulatory efforts of the local Health District, a low cost or free service of septic maintenance (pumping and inspection) will be considered for implementation by CPU in those areas where septic effluent might be of more significant concern.
Action • Continue Groundwater Monitoring Efforts
Lead Responsibility: CPU
Description: Although extensive monitoring has occurred in the area over the last few years, CPU will take the lead and continue groundwater monitoring to improve long-term data and trend analysis.
Action • Research Groundwater Recharge Methods
Lead Responsibility: CPU
Description: In conjunction with the County's stormwater management efforts and studies of dry wells in the County area, CPU will cooperatively investigate the feasibility of using various recharge methods to augment groundwater and help prevent possible groundwater declines.
Action • Implement Water Conservation
Lead Responsibility: CPU
Description: As a major water purveyor, CPU is obligated to pursue water conservation, and has prepared a Water Conservation Plan as part of its Water System Plan Update (1993). This plan will be updated as required, and implemented to achieve optimum levels of conservation.
Recommendations 8-4
I I I I I I I I I I I I I I I I I I I
I I I I I I I I ,I I I I I I I I I I I
Action - Develop Wellhead Spill Response Planning
Lead Responsibility: CPU
December 30, 1994
Description: With the cooperation of local fire districts, CPU will assure that local responders are informed about wellhead zones. In addition, CPU will arrange a forum for discussion and development of specific protocols for wellhead zone spill response. Included within this task would be assisting the State Patrol and Vancouver Fire Department in reaching agreement on spill response on State highways (currently available but cumbersome).
Action -Inventory Land Use within Wellhead Zones
Lead Responsibility: CPU
Description: The current land use survey information is dated, and although County parcel information is available, specific on-site verification of the data will be undertaken in wellhead zones with a focus on wellhead issues.
Action -Increase the Availability of Hazardous Material "Audits" to Small Businesses
Lead Responsibility: CPU I Southwest Washington Health District
Description: In conjunction with the Health District, CPU will consider providing professional consulting advice to small businesses in wellhead zones in order to encourage internal hazardous material audits, compliance with regulations, and wellhead protection. This service could be provided at a reduced cost or free depending on the location, type of business, etc. This program would be complementary to the Moderate Waste Program of the Health District.
Action- Continue Source Development- Determination of Availability
Lead Responsibility: CPU
Description: CPU will continue its efforts to determine where sources of groundwater exist and the limits to its availability. In this way, future supply can be assured and future demands met. Consistent with Wellhead Planning guidance, CPU will consider wellhead protection as part of new source location.
Recommendations 8-5
December 30, 1994
Action • Complete and Implement the Salmon Creek Water Resources Management Plan
Lead Responsibility: CPU
Description: CPU, in cooperation with Ecology, Clark County, and the Department of Health (DOH), is nearing completion of activity outlined under a Memorandum of Understanding (MOU) to develop a Water Resources Management Plan for the Salmon Creek Basin. This plan will outline criteria for granting future water rights in the basin. It will also cover such topics as streamflow enhancement, mitigation strategies, and data gathering and management.
Action • Contingency Planning Improvements
Lead Responsibility: CPU
Description: CPU will enhance its existing Contingency Plan by source development in the northern Hockinson and Hazel Dell areas, completion of a north/south pipeline from Hazel Dell to the Ridgefield area, completion of planned distribution system improvements, and worst case hydraulic assessments.
Action • Implement the Ground Water Management Plan
Lead Responsibility: Clark County
Description: This multi-year and multi-jurisdictional planning effort should be implemented to the extent possible. Where implementation does not seem practicable, the issue should be re-assessed, new approaches developed, and the plan revised for implementation.
8.1.4 Public Involvement /Information and Education I Planning
Action • Inform All residents within Wellhead Zones of Boundaries
Lead Responsibility: CPU
Description: A13 a key and initial component of a Wellhead Education Program, CPU will prepare and distribute to each resident or property owner within Wellhead zones, information on the extent of the wellhead area, and recommendations for individual actions to protect the groundwater resources.
Recommendations 8-6
I I I I I I I I I I I I I I I I I I I
I I I I I I I I I I I I I I I I I I I
December 30, 1994
Action - Develop a Comprehensive Wellhead Education Program
Lead Responsibility: CPU
Description: Currently there are many types of informational material readily available on subjects and issues of concern in wellhead zones. There is a need for a comprehensive program of delivery of this information within wellhead zones. CPU will undertake design and implementation of such a program and should include elements of:
l:l Septic maintenance, l:l Household chemical use, l:l Agricultural Chemical Use and Fertilizer Use, l:l Water Conservation, l:l Spill Notification, and l:l Wellhead Delineations.
Action - Continue Environmental Education Programs
Lead Responsibility: CPU
Description: CPU has been actively working with the Departments of Fish and Wildlife and Ecology as well as with State environmental education groups to provide tools, information, and assistance to area schools. This has included water quality test kits, fish rearing equipment, and various field trips (including fish release). These efforts will continue as they provide an opportunity to explore water resources and environmental quality issues with the future rate payers and tax payers of the region.
Action - Pursue Integrated Resource Planning and Management
Lead Responsibility: CPU
Description: CPU is in a key position to facilitate and promote integrated resource planning and management. CPU has involvement in virtually all resource issues in the unincorporated areas of the County. CPU can facilitate coordination among the various planning and regulatory agencies. For land use and several environmental regulatory areas, the County has the lead regulatory role. The City of Vancouver has a similar role within its boundaries. The Southwest Washington Health District has regulatory and technical assistance along with educational functions. Similar coordination and cooperation possibilities exist with the various
Recommendations 8-7
December 30, 1994
natural resource, fish and game, and ecology oriented State agencies. CPU can and will serve as a facilitator to move integrated approaches forward.
8.1.5 Data Gathering
Action -Continue Collection of Well Pumping Data
Lead Responsibility: CPU
Description: CPU will continue to gather as much information on pumping throughout their system. Similarly, all other major production wells in the area should be metered so that routine information can be gathered.
Action - Continue Water Level Monitoring
Lead Responsibility: CPU
Description: CPU will continue monitoring water levels throughout the CPU service area. To the extent possible, water levels in private wells and those of other purveyors will be included in the monitoring network.
Action - Water Quality Monitoring
Lead Responsibility: CPU
Description On-going monitoring of water quality is a vital part of managing the Wellhead Protection Area (WHPA). Nine monitoring wells were strategically placed between existing or potential water quality threats and CPU's public water supplies. The monitoring rounds conducted between November 1992 and May of 1993 served their intended purpose of providing baseline conditions within the one-year time of travel zone for the production wells. A fourth monitoring round was to be completed in the fall of 1993. Several types of contamination were identified, including VOCs, metals such as chromium and barium, and coliform bacteria. Review of Ecology data bases indicated that additional sources of contamination such as LUSTs or VOCs are present within the one year time-of-travel. Based on these findings, it would be in CPU's best interest to adopt a non-regulatory, long-term monitoring program to track the potential threats identified and discussed in Sections 3 and4.
Recommendations 8-8
I I I I I I I I I I I I I I I I I I I
I I I I I I I I I I I I I I ' I I I I I
December 30, 1994
Sampling Location - Water quality monitoring results have demonstrated that both the Shallow Alluvial aquifer and the Upper Troutdale aquifer are susceptible to contamination from land use activities. Although the majority of the public water supply is drawn from the Upper Troutdale aquifer, monitoring efforts will continue to focus on water quality conditions in both water bearing zones. Certain monitoring wells will be sampled more frequently than others based on known contamination sites and production well vulnerability.
CPU monitoring wells MW-1, MW-3, and MW-4, lie upgradient of the production wells and downgradient from trichloroethane, trichloroethylene, dichlorothylene, and methylene chloride contamination which has been measured in the past and during recent monitoring events. Once dissolved in the groundwater, these compounds can adversely impact water quality over large areas. The proximity of the well field to major transportation corridors also presents the threat of contamination from compounds associated with surface runoff as well as from chemical spills. Early detection of organic contamination will provide CPU with the option of altering its well operations, potentially avoiding a contamination plume altogether. A suggested monitoring plan for organic contaminants is outlined below.
0 Measure VOC levels from MW-1, MW-2 (when completed), MW-3, MW-4, and the Bennett Well. Samples should be collected from both the Shallow Alluvial aquifer and the upper Troutdale on a quarterly basis. MW-1 (and 2) are located just down-gradient from the AIRCOBoomsnub contaminated sites and will serve as an early warning for potential water quality degradation of CPU Well Nos. 7, 23, 5, and 16. Data will be used to assess changes in the contaminant plume as well as to monitor the effects of recharge on contaminant transport.
0 Resample Well Nos. 5 and 9 for dichorodifluoromethane. This compound was detected during the spring sampling round and its presence should be confirmed if contamination is verified, determine the contaminant source. This compound is also called Freon 12 and is commonly used as a refrigerant, aerosol propellant, solvent, and as a leak detection agent (Montgomery & Wilkom, 1991).
0 Additional VOC monitoring at CPU Well Nos. 5, 16, 23, and 7 may be warranted based on the threat of contamination originating up gradient.
Recommendations 8·9
December 30, 1994
lnorganics - Contamination from inorganics, such as heavy metals or nutrients has also been observed in the past. Although sources of heavy metals (such as the Boomsnub facility and the GSA site) have been identified, potential nitrate contamination from either point or non-point sources will be more difficult to identify.
Historically, elevated nitrate levels have been measured within the Wellhead Focus Area, however, recent monitoring within the one-, five-, and ten-year total-of-travel suggests that nitrate levels are below 5 mg/L (as N). Analysis of elevated nitrate levels versus sewered areas indicates that nitrate contamination is more likely where on-site sewage treatment is practiced.
Chromium and barium have been measured at MW-1, down-gradient of the Boomsnub Facility. The chromium plume migrating towards CPU Well Nos. 5, 7, 23, and 16 could serve as the largest threat to water quality within the WHPP Focus Area.
[J Measure levels of all regulated and additional inorganics from all monitoring wells on an annual basis, during periods of high recharge.
[J Measure chromium levels from CPU MW-1 through MW-4 and the Bennett Well on a quarterly basis. Ensure that the chelation/ extraction or comparable method is used during analysis so that a detection limit of 0.001 mg/L can be obtained.
Bacteria - The presence of total coliform in a water supply can indicate that conditions are suitable for the proliferation of pathogenic organisms responsible for out-breaks of water-borne disease. The presence of fecal coliform indicates that a source of sewage may be nearby or that the water supply is susceptible to contamination from human or animal waste occurring on the land surface. Coliform were measured at certain wells during WHPP monitoring events. No fecal coliform were detected.
Additional Monitoring - It is recommended that a monitoring program be established to evaluate the influence of surface water on CPU's Zone 1 Wells near Salmon Creek. This determination is integral to meeting the requirements of the Surface Water Treatment Rule (SWTR) recently adopted by the State as part of the Safe Drinking Water Act Amendments of 1986. The SWTR imposes the requirement that all water sources be defined as either surface water, groundwater under the direct influence of surface water, or groundwater (not under direct influence of surface water). Sources which fall under one of the first two categories would be
Recommendations 8-10
I I I I I I I I I I I I I I I I I I I
I I I I I I I I I I I I I I I I I I I
December 30, 1994
subject to the requirements of the SWTR, which will result in a significant difference in treatment, operation, and monitoring. The DOH is responsible for developing the criteria which will be used to make this classification. These criteria will most likely include:
!J Well construction and proximity to nearest surface water; !J Historical water quality records; and !J Particulate analysis characterization.
Historical water quality records which may be reviewed would include raw water total and fecal coliform samples, raw water turbidity data, and data on temperature and turbidity from the well and a nearby surface water. Particulate analysis is intended to identify organisms which occur only in surface waters as opposed to groundwaters, and whose presence in a groundwater would clearly indicate that at least some surface water has been mixed with it. Particulate analyses of well water may be the most critical assessment used in making the determination of direct surface water influence, however the evaluation technique has not yet been refined by the U.S. Environmental Protection Agency.
It is recommended that a future monitoring program be established for CPU's Zone 1 Wells (Well Nos. 9, 17, and 18) and Salmon Creek in the vicinity of these wells. Data collection would most likely include frequent turbidity, temperature, conductivity and coliform sampling and will provide background information necessary for determining whether these wells are under the direct influence of surface water. Particulate analysis should also be conducted for each of these wells once the evaluation technique has been determined.
Sampling Protocol - Sample collection procedures for the on-going monitoring program will be consistent with those already developed for the initial monitoring round. A detailed description of well purging procedures, sampling protocol, sample preservation, and holding times are provided in Appendix I.
In order to produce reliable results, it is imperative that duplicate samples be collected each day that sampling is performed, and that trip blanks are brought into the field and later analyzed. Trip blanks should be used to verify that VOCs and microbiological results have not been contaminated during sample bottle handling and transport. Additional information on sampling Quality Assurance/Quality Control (QA/QC) is available in Appendix C.
Recommendations 8-11
December 30, 1994
Analytical Protocol • A list of analytical methods used for each parameter was developed for the initial monitoring round and has been provided in Appendix I. It is essential that the same methods are used throughout the entire WHP program so that results obtained over time can be evaluated against one another. The list of desired parameters to be analyzed during each sampling event should be provided to the laboratory during each sampling event.
The primary objective of analytical quality control activities performed by the laboratory is to ensure the integrity of the analytical results. Analytical duplicates, blanks, and spikes will be performed during each day that samples are analyzed and QA/QC data will be used to evaluate the validity of the reported results.
8.2 Implementation Priorities
As attention and resources are given to implementation of the programs described above, priority needs to be given first to key wellhead areas if possible. This may mean focused programs which, at least in the initial stages, are implemented only in the one- or five-year time-of-travel.
Since CPU obtains its supply from two main aquifers in the region, priority attention will logically be given to those wells most vulnerable to contamination. This will likely point to those wellhead zones associated with shallow wells where transport from the surface to the aquifer is relatively uninhibited.
Priority also needs to be given to programs and efforts which reduce risk in those areas posing the highest risk to the aquifers. These areas were identified in Section 4 and are summarized as follows:
CJ Above and Below Ground Storage Tanks. CJ Transportation of Hazardous Materials and Spill Preparedness. CJ Clean-up of Existing Contaminated Sites.
The program and activities listed above can each, to some degree, help with risk reduction in these priority areas, either through regulation, coordination, education or other efforts. However, the programs which exist today and many which might be developed tend to be broad in geographic coverage for either ease of implementation or for fairness reasons. Every effort and mechanism available will be utilized to resist this broad coverage in order to have the resources to direct programs where they will do the most good (generally, near wellheads).
Recommendations 8-12
I I I I I I I I I I I I I I I I I I I

I I I I I I
Q
Section 9
I 0
I I I I I I I I I I I I
I I I I I I I I I I I I I I I I I I I
9.1 Introduction
December 30, 1994
Section 9 Implementation
Implementation of the recommendations for actions identified in Section 5 cannot be accomplished by Clark Public Utilities (CPU) alone. Wellhead protection will require a continuing coordinated effort by federal, State, and local entities as well as the general public. This section will summarize program elements and outline a recommended implementation schedule and estimated budget. CPU does not have land use or regulatory authority. Consequently, the focus of CPU activity will be voluntary, cooperative, and educational.
Specifically, CPU will be pursuing wellhead protection with a general approach that encourages wellhead protection by maldng property ownership and living in a wellhead zone desirable. CPU believes that this can most effectively be accomplished through incentive programs and by providing wellhead protection services to the public.
There is a time and place for controls and regulation. CPU fully supports a well rounded program which is supported and enforced, if necessary, through regulation.
9.2 Schedule and Budget
Outlined in Table 9-1 are the various activities proposed under this plan. Also included is an estimated schedule for implementation and budget.
According to this Table, the cost of this program could be between $200,000 and $600,000 in the first year, and about $600,000 annually. However, many of the activities covered under this plan are budgeted or otherwise covered by other programs planned or implemented by CPU. The impact of this program, therefore, will be significant, but not as large as indicated by these figures.
This Wellhead Plan will be incorporated in the CPU's planning for 1995 and beyond. At that time, the incremental impact due to the incremental increase in activity due to this effort and its effect on rates, if any, will be more apparent.
Implementation 9-1
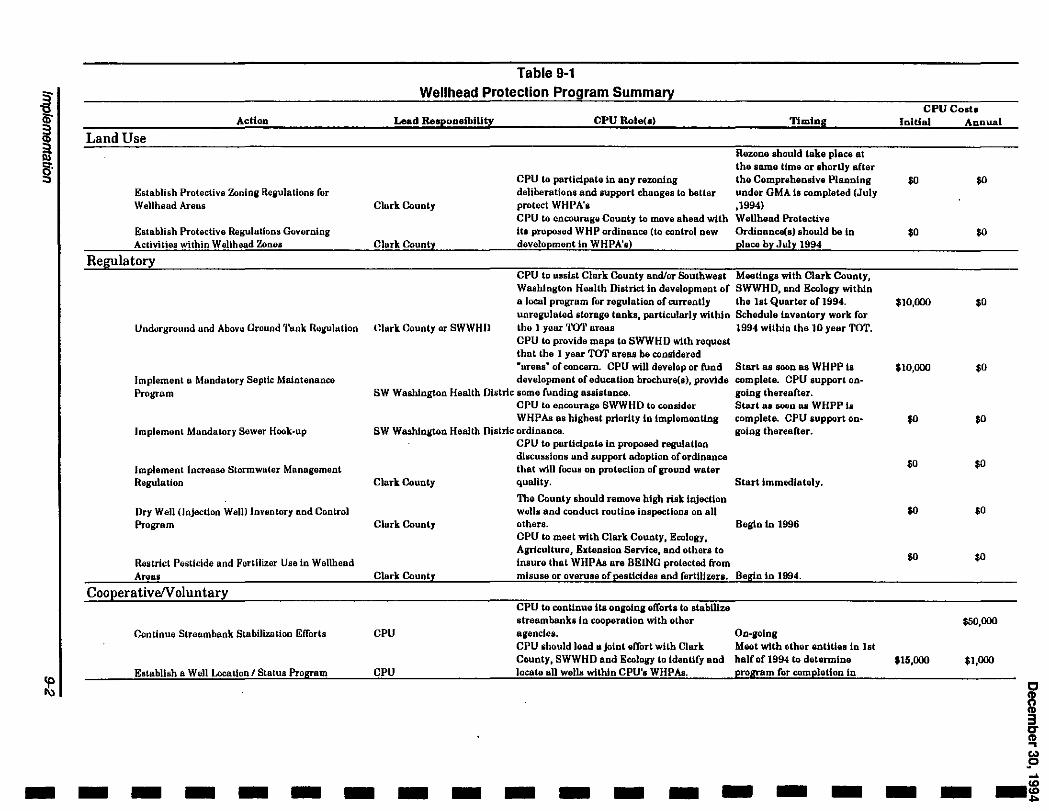
-
Action
Land Use
Re
Establish Protective Zoning Regulations ror WeUhead Areas
Establish Protective Regulations Governing Activities within Wellhead Zones
Undor~o"Tound und Abovu Ground 'l'unk Rllgulation
Implement a Mandatory Septic Maintenance Program
Implement Mandatory Sewer Hook-up
Implement Increase Storm water Management Regulation
Dry Well (Injection Well) Inventory and Control Program
Restrict Pesticide and Fortilizor Use in Wellhead Areas
CooperativelY oluntary
CCintlnue Streumbank Stabilization Efforts
Establish a Well Location I Status Program
Table 9-1 Wellhead Protection Program Summary
Lead Responeibilitr
Clark County
Clark County
CPU Role(o)
CPU to participate in any rezoning deliberations and support changes to better protect WHPA's CPU to encouragQ County to move ahead with ita proposed WHP ordinance (to control new development in WHPA's)
CPU to usist Clark County and/or Southwest Washington Health District in development of a local program for regulation of currently unregulated storage tanka, particularly within
Clttrk. County or SWWHIJ the 1 year '1'01' arcus CPU to provide maps to SWWHD with request that the 1 year TOT areas be considered ·areas• of concern. CPU will develop or fund development of education brochure(&), provide
SW Washington Health Distric some funding assistance. CPU to encourage SWWH D to consider WHPAs as highest priority in implementing
SW Washington Health Distric ordinance. CPU to participate in proposed regulation discussions and support adoption of ordinance that will focus on protection of ground water
Clark County quality.
The County should remove high risk injection wells and conduct routine inspections on all
Timing
Rezone should take place at the same time or shortly aCler the Comprehensive Planning under GMA is completed (July ,1994) Wellhead Protective Ordinance(a) should be in place by July 1994
Meetings with Clark County, SWWHD, and Ecology within the 1st Quarter of 1994. Schedule inventory work for 1994 within the 10 year 'OOT.
Start aa soon as WHPP is complete. CPU support ongoing thereafter, Start as won aa WHPP ia complete. CPU support ongoing thereaCler.
Start immediately.
Clark County others. Begin in 1996
Clark County
CPU
CPU
CPU to meet with Clark County, Ecology, Agriculture, Extension Service, and others to insure that WHPAa are BEING protected from misuse or overuse of pesticides and fertilizers. Begin in 1994.
CPU to continue ita ongoing efforia to stabilize atreambanka in cooperation with other agencies. CPU should lead a joint effort with Clark County, SWWHD and Ecology to identify and locate all wells wtthJn CPU's WHPAs.
On-going Meet with other enUtiea to 1st half of 1994 to determine program for completion in
- - - - - - - - - - - - - - -
CPU Cosh Initial Annual
$0
$0 $0
$10,000 $0
$10,000 $0
$0 $0
$0 $0
$0 $0
$0 $0
$50,000
$16,000 $1,000
- -
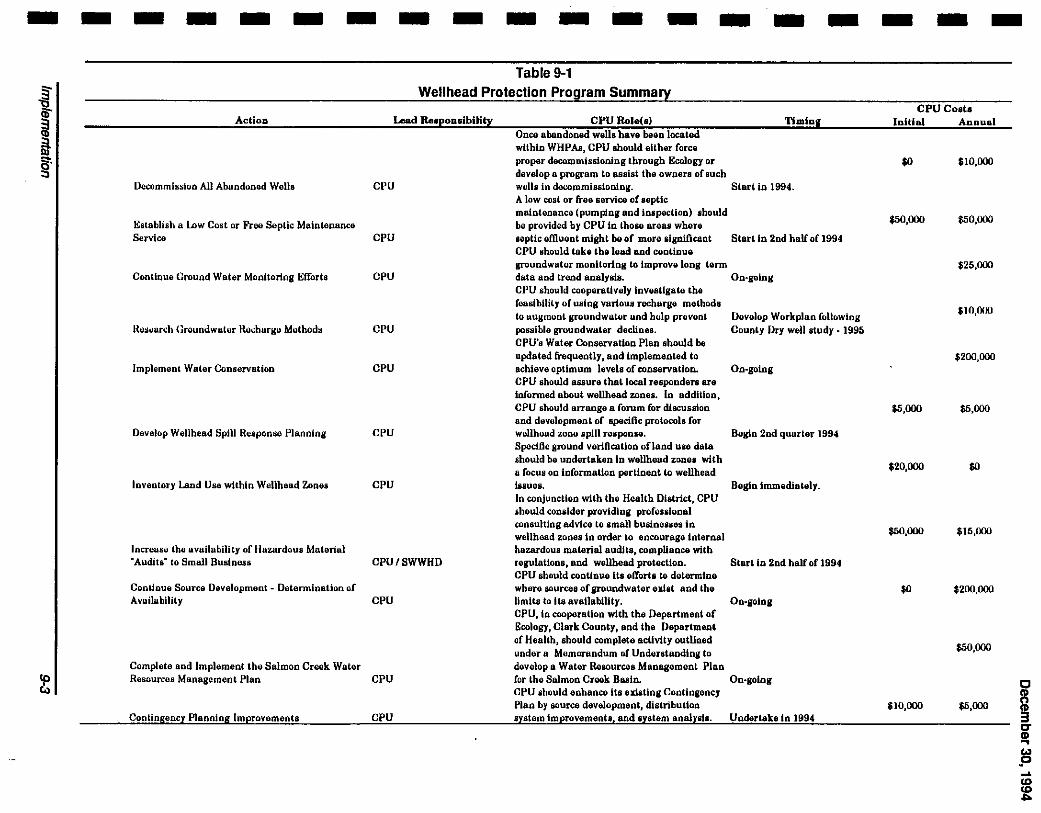
- - - - - - - - - - - - - - - - - - -Table 9-1
§" Wellhead Protection Program Summary 1:1 CPU Coat. CD'" Action Lead Reaeonaibili!l CPU Rolo(o) Timin1 Initial Annual ~ Once abandoned wells have been located
~ within WHPAa, CPU should either forCQ g-. proper decommissioning through Eco1ogy or $0 $10,000 :) develop a program to assist the owners of auch
Decommission All Abandoned Wells CPU wells in docommissiooing. Start in 1994. A low cost or free service of septic maintenance (pumping and inapection) should
$50,000 $50,000 Establish a Low Cost or Froo Septic Maintenance be provided by CPU in those areas where Service CPU septic effluent might be of more significant Start in 2nd half of 1994
CPU should take the lead and continue groundwater monitoring to improve long tenn $25,000
Continue Ground Water Monitorin11 Efforts CPU data and trend analysis. On-going CPU should cooperatively investigate the foasibility of using various recho.rg1.1 methods
$10,0<JO to o.ugmonl. Hf"OUndwo.tur und hulp provont Uovolop Workplan following
n~:iUUrch Groundwater H~chu.rgo Motbodlil CPU poslilibll.l groundwater declines. County Dry well study- 1995 CPU's Wat.er Conservation Phm should be updated frequently, and implement1.1d to $200,000
Implement Water Conservation CPU achieve optimum levels of conservation. On-going CPU should assure that. local responders are informed about wellhead zones. In addition, CPU should arrange a forum for discussion $5,000 $5,000 and development of specific protocola for
Dev1.1!op Wellhead Spill Response Planning CPU wellhead zone spill responH. Begin 2nd quarter 1994 Specific ground verification ofland use data .should be undertaken in wellhead zones with
$20,000 $0 a focus on information perUnent to wellhead Inventory Land Use within Wellhead Zones CPU issues. Begin immediat~.~Iy.
In conjunction with the Health District, CPU should consider providing professional consulting advice to small businesses in
$50,000 $15,000 wellhead zon1.1s in order to 1.1ncourag1.1 internal
Increase th1.1 availability of Hazardous Material hazardous material audJts, compliance with "Audits" to Small Business CPU/SWWHD regulations, and wellhead protection. Start in 2nd half of 1994
CPU should continue its efforts to determine Continue Source Development- Dotennination of wher1.1 sources of groundwater edst and the $0 $200,000 Avai111bi1ity CPU limits to its availability. On-going
CPU, in cooperation with the Department of Ecology, Clark County, and the Department cf H1.1ahh, should complete activity outUned
$50,000 under a Memorandum of Understanding to
Complete and Implement the Salmon Creek Water develop a Water Resources Management Plan
:!: Resources Management Plan CPU for the Salmon Creek Basin. On-going c CPU should enhance ita n:isting Contingency
~ Plan by source d1.1velopment, distribution $10,000 $5,000 Contingency Planning Improvements CPU systom tmprovl.lml.lntl. and system analysis. Und1.1rtake in 1994 3
cr CD ... Co> 9 ..... "' "' ~
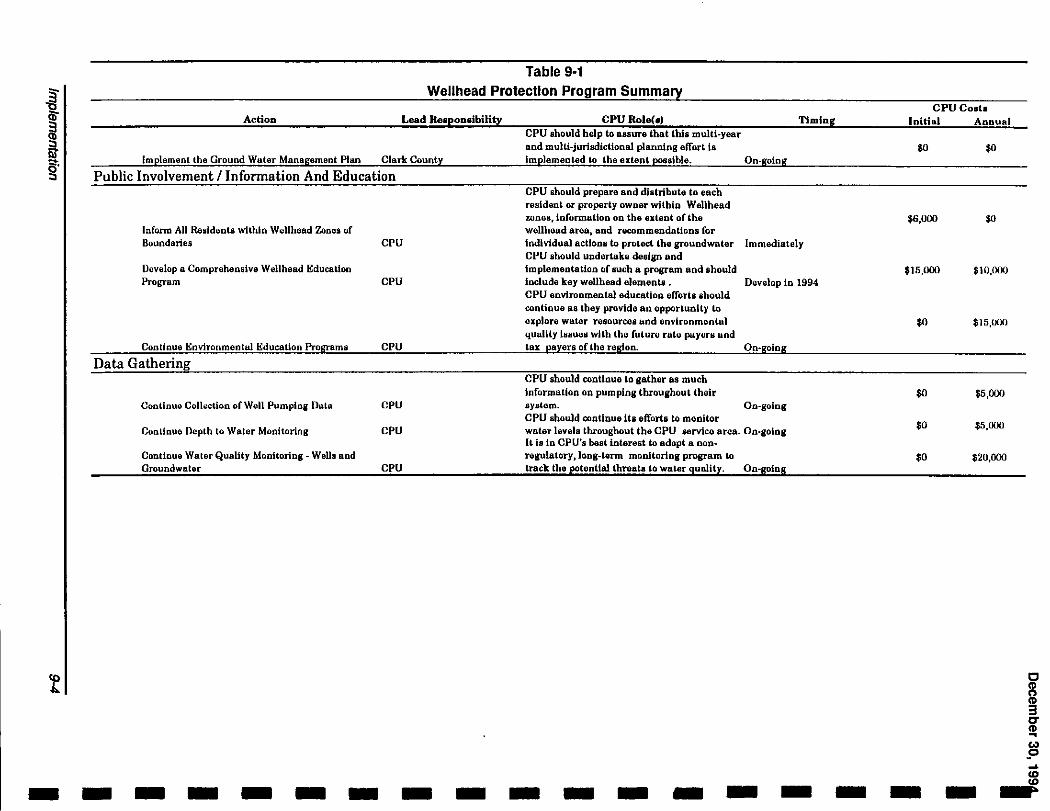
-
Table 9-1 Wellhead Protection Program Summary
Action Lead Reapondbility
Implement the Ground Water Management Phm Clark County
Public Involvement I Information And Education
Inform All Residents within Wellhead Zones of Boundaries CPU
Develop a Comprehensive Wellhead Education ~o~am CPU
Continue Environmental Education ~ograms CPU
Data Gathering
Continue Collection of Well Pumping Data CPU
Conlinue Depth to Water Monitoring CPU
Continue Water Quality Monitoring- Wells and Groundwater CPU
- - - - - - - -
CPU Role(o) CPU should help to aaaure that this multi-year and multi-jurisdictional planning effort is Implemented to the ntent possible.
CPU should prepare and distribute to each resident or property owner within Wellhead zones, information on the extent of the wellhead area, and recommendations for individual actions to protect the groundwater CPU should undertakQ design and implementation of such a program and should include key wellhead elements . CPU environmental education efforts should continua as they provide an opportunity to explore wutor resources und envtronmonlal quulUy lt~~:~uuaa with tho futuro rutu puyun und tax payers of the region.
CPU should continue to gather as much information on pumping throughout their system. CPU should continue its efforts to monitor
Timing
On-going
Immediately
Develop in 1994
On-going
On-going
water levels throughout the CPU service area. On-going It is in CPU's best interest to adopt a non-regulatory ,long-tenn monitoring program to track the potential threats to water quality. On-going
- - - - - -
CPUCoata Initial Annual
$0
$6,000 $0
$15,000 $10,000
$0 $15,000
$0 $5,000
$0 $5,000
$0 $20,000
- - -
I I I I I I I I I I I I I I I I I I I"
Appendices

I I I I I I I I I I I I I I I I I I I
Appendix A List of Commercial
and Agricultural Chemical Use Sites
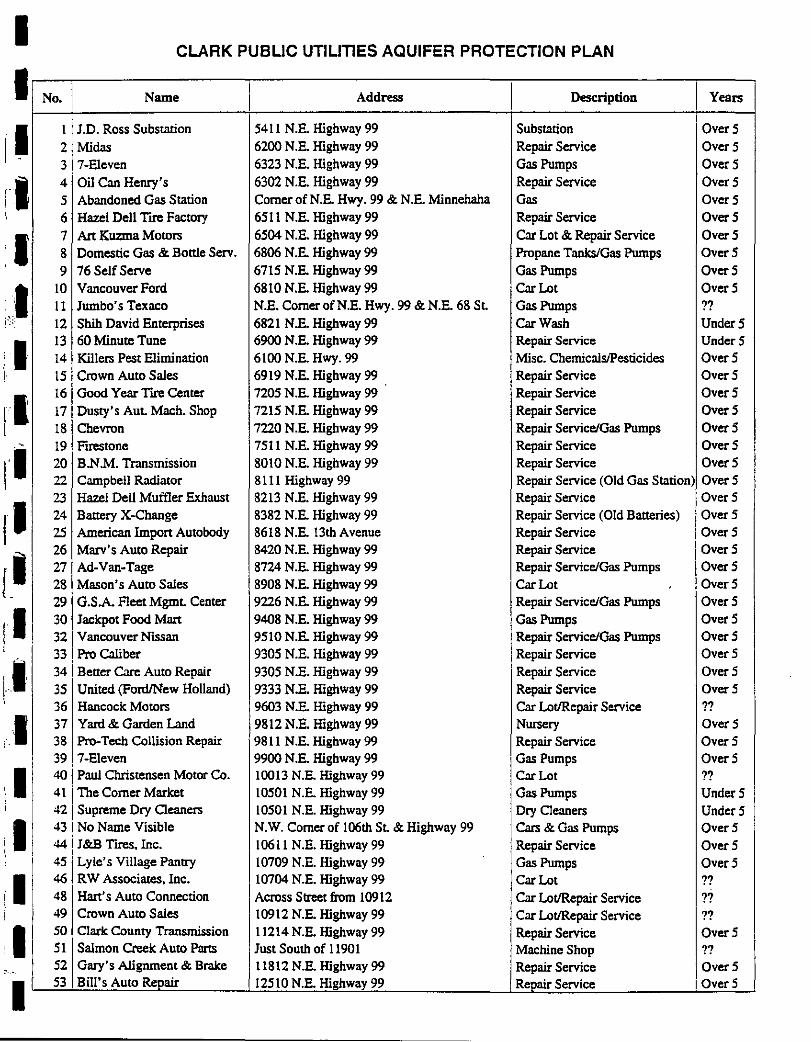
I I
:I I
' II I' I rl II II II II tl
'
I
tl rl f
!I :-._.
I
CLARK PUBLIC UTILITIES AQUIFER PROTECTION PLAN
i No. I Name Address I Description Years
I i J.D. Ross Substation 5411 N.E. Highway 99 Substation OverS
2 Midas 6200 N.E. Highway 99 Repair Service OverS
3 7-Eleven 6323 N.E. Highway 99 Gas Pumps OverS
4 Oil Can Henry's 6302 N.E. Highway 99 Repair Service OverS
s Abandoned Gas Station Corner of N.E. Hwy. 99 & N.E. Minnehaha Gas OverS
6 Hazel Dell Tue Factory 6511 N .E. Highway 99 Repair Service OverS
7 Art Kuzma Motors 6504 N.E. Highway 99 Car Lot & Repair Service OverS
8 Domestic Gas & Bottle Serv. 6806 N.E. Highway 99 Propane Tanks/Gas Pumps OverS
9 76 Self Serve 6715 N.E. Highway 99 Gas Pumps OverS
10 Vancouver Ford 6810 N.E. Highway 99 CarLot OverS
11 Jumbo's Texaco N.E. Corner ofN.E. Hwy. 99 & N.E. 68 SL Gas Pumps ?? 12 Shih David Enterprises 6821 N .E. Highway 99 Car Wash Under5 13 60 Minute Tune 6900 N.E. Highway 99 Repair Service Under5 14 Killers Pest Elimination 6100 N.E. Hwy. 99 Misc. Chemicals/Pesticides OverS
IS Crown Auto Sales 6919 N .E. Highway 99 Repair Service OverS 16 Good Year Tue Center 7205 N.E. Highway 99 Repair Service OverS
17 Dusty's Aut Mach. Shop 7215 N.E. Highway 99 Repair Service OverS
18 Chevron 7220 N.E. Highway 99 Repair Service/Gas Pumps OverS
19 Fuestone 7511 N.E. Highway 99 Repair Service OverS
20 B.N M. Transmission 8010 N.E. Highway 99 Repair Service OverS
22 Campbell Radiator 8111 Highway 99 Repair Service (Old Gas Station) OverS
23 Hazel Dell Muffler Exhaust 8213 N.E. Highway 99 Repair Service OverS
24 Battery X-Change 8382 N.E. Highway 99 Repair Service (Old Batteries) OverS
25 American Import Autobody 8618 N.E. 13th Avenue Repair Service OverS
26 Marv's Auto Repair 8420 N.E. Highway 99 Repair Service OverS
27 Ad-Van-Tage 8724 N.E. Highway 99 Repair Service/Gas Pumps OverS 28 Mason's Auto Sales 8908 N.E. Highway 99 CarLot OverS
29 G.S.A. Fleet MgmL Center 9226 N.E. Highway 99 Repair Service/Gas Pumps OverS
30 Jackpot Food Mart 9408 N .E. Highway 99 Gas Pumps OverS
32 Vancouver Nissan 9510 N.E. Highway 99 Repair Service/Gas Pumps OverS
33 Pro Caliber 930S N.E. Highway 99 Repair Service OverS
34 I Better Care Auto Repair 9305 N.E. Highway 99 Repair Service OverS 35
1 United (Ford/New Holland) 9333 N.E. Highway 99 Repair Service OverS
36 Hancock Motors 9603 N.E. Highway 99 Car Lot/Repair Service ?? 37 Yard & Garden Land 9812 N.E. Highway 99 Nursery OverS 38 Pro-Tech Collision Repair 9811 N .E. Highway 99 Repair Service OverS 39 7-Eleven 9900 N .E. Highway 99 I Gas Pumps OverS 40 j Paul Christensen Motor Co. 10013 N.E. Highway 99 CarLot ?? 41 j The Corner Market I 050 I N .E. Highway 99 I Gas Pumps Under S 42[ Supreme Dry Cleaners I 050 I N .E. Highway 99 ' Dry Cleaners Under5 43 I No Name Visible N.W. Corner of 106th SL & Highway 99 Cars & Gas Pumps OverS 44 j J&B Tues. Inc. I 0611 N .E. Highway 99 Repair Service OverS 451 Lyle's Village Pantry I 0709 N.E. Highway 99 Gas Pumps OverS 46 R W Associates, Inc. 10704 N.E. Highway 99 CarLot ?? 481 Hart's Auto Connection Across Street from 10912 Car Lot/Repair Service ?? 49 Crown Auto Sales 10912 N.E. Highway 99 Car Lot/Repair Service ?? 50 Clark County Transmission 11214 N.E. Highway 99 Repair Service OverS 51 Salmon Creek Auto Parts Just South of 11901 Machine Shop ?? 52 Gary's Alignment & Brake 11812 N.E. Highway 99 Repair Service OverS 53 Bill's Auto Repair 12510 N.E. Highway 99 Repair Service OverS
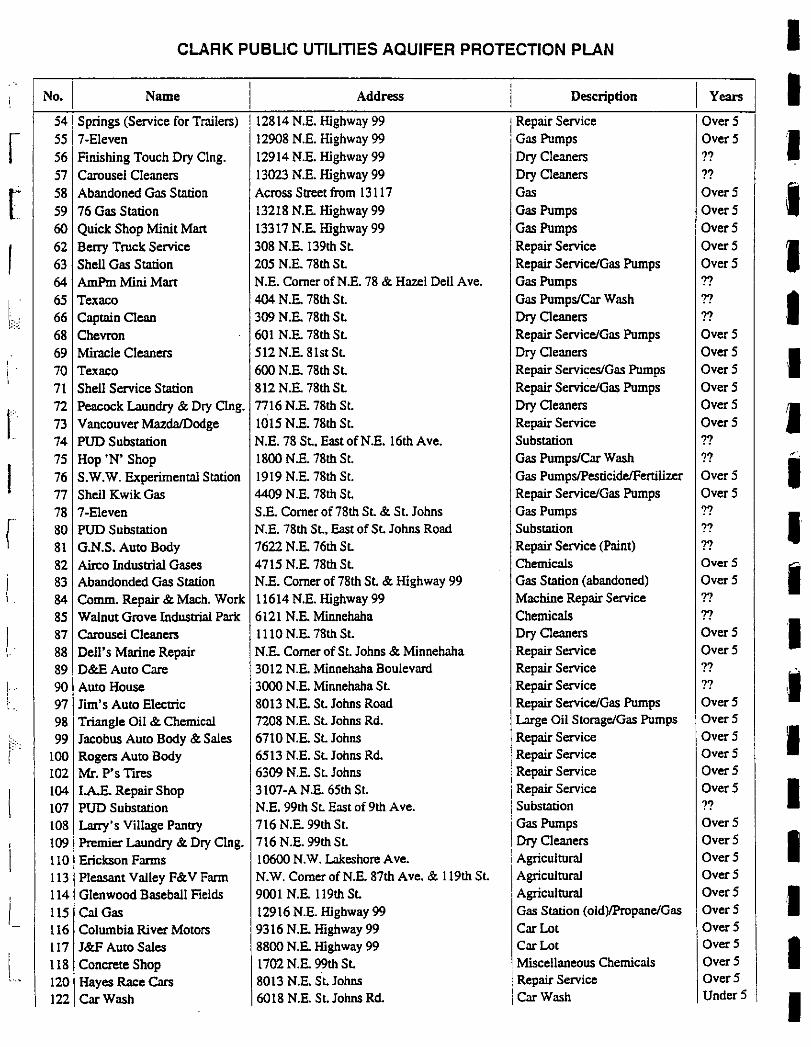
CLARK PUBLIC UTILITIES AQUIFER PROTECTION PLAN I No. I Name Address Description I Years I
54 ! Springs (Service for Trailers) I 12814 N.E. Highway 99 1 Repair Service OverS
r 55)7-Eleven 12908 N.E. Highway 99 j Gas Pumps OverS 'I 56 Finishing Touch Dry Clng. 12914 N.E. Highway 99 Dry Cleaners ?? 57 Carousel Cleaners 13023 N.E. Highway 99 Dry Cleaners ??
[ 58 Abandoned Gas Station Across Street from 13117 Gas OverS I 59 76 Gas Station 13218 N.E. Highway 99 Gas Pumps OverS
60 Quick Shop Minit Man 13317 N.E. Highway 99 Gas Pumps OverS
62 Berry Truck Service 308 N.E. !39th St. Repair Service OverS I 63 Shell Gas Station 205 N.E. 78th St. Repair Service/Gas Pumps OverS
64 AmPm Mini Man N.E. Comer ofN.E. 78 & Hazel Dell Ave. Gas Pumps ??
~'-65 Texaco 404 N.E. 78th St. Gas Pumps/Car Wash ?? I 66 Captain Clean 309 N.E. 78th St. Dry Cleaners ?? 68 Chevron 601 N.E. 78th St. Repair Service/Gas Pumps OverS
69 Miracle Cleaners 512 N.E. 8lst St. Dry Cleaners OverS I i 70 Texaco 600 N.E. 78th St. Repair Services/Gas Pumps OverS
71 Shell Service Station 812 N.E. 78th St. Repair Service/Gas Pumps OverS
[ 72 Peacock Laundry & Dry Clng. 7716 N.E. 78th St. Dry Cleaners OverS
I 73 "ancouverMazdanDodge 1015 N.E. 78th St. Repair Service OverS
74 PUD Substation N .E. 78 St. East of N .E. 16th Ave. Substation ?? 75 Hop 'N' Shop 1800 N.E. 78th St. Gas Pumps/Car Wash ?? ~'.
I 76 S.W.W. Experimental Station 1919 N.E. 78th St. Gas Pumps/Pesticide/Fertilizer OverS I 77 Shell K wik Gas 4409 N.E. 78th St. Repair Service/Gas Pumps OverS
78 7-Eleven S.E. Comer of 78th St. & St. Johns Gas Pumps ??
I r 80 PUD Substation N.E. 78th St., East of St. Johns Road Substation ??
81 G.N.S. Auto Body 7622 N.E. 76th St. Repair Service (Paint) ?? 82 Airco Industrial Gases 4715 N.E. 78th St. Chemicals OverS
I I 83 Abandonded Gas Station N.E. Comer of 78th St. & Highway 99 Gas Station (abandoned) OverS
84 Comm. Repair & Mach. Work 11614 N.E. Highway 99 Machine Repair Service ?? 8S Walnut Grove Industrial Park 6121 N.E. Minnehaha Chemicals ??
I I 87 Carousel Cleaners 1110 N.E. 78th St. Dry Cleaners OverS
88 Dell's Marine Repair N.E. Comer of St. Johns & Minnehaha Repair Service OverS
89 D&E Auto Care 3012 N .E. Minnehaha Boulevard Repair Service ??
I I 90 Auto House 3000 N.E. Minnehaha St Repair Service ?? L 97 nm• s Auto Electric 8013 N.E. St. Johns Road Repair Service/Gas Pumps OverS t.
98 Triangle Oil & Chemical 7208 N.E. St. Johns Rd. Large Oil Storage/Gas Pumps OverS
~~:'·: 99 Jacobus Auto Body & Sales 6710 N.E. St. Johns Repair Service OverS I ! 100 Rogers Auto Body 6S13 N.E. St. Johns Rd. I Repair Service OverS
102 Mr. P' s Trres 6309 N.E. St. Johns , Repair Service OverS
I.A.E. Repair Shop I
I 104 3107-A N.E. 65th St. i Repair Service OverS
107 PUD Substation N.E. 99th St. East of 9th Ave. i Substation ?? 108 Larry's "illage Pantry 716 N.E. 99th St. i Gas Pumps OverS
109 Premier Laundry & Dry Clog. 716 N.E. 99th St I Dry Cleaners OverS I 110 Erickson Farms I 0600 N. W. Lakeshore Ave. i Agricultural OverS
113 Pleasant "alley F&" Farm N.W. ComerofN.E. 87th Ave. & 119th St. I Agricultural OverS
114 Glenwood Baseball Fields 9001 N.E. I 19th St. , Agricultural OverS ,. 115 Cal Gas 12916 N.E. Highway 99 Gas Station (old)/Propane/Gas OverS
116 Columbia River Motors 9316 N.E. Highway 99 CarLot OverS
117 J&F Auto Sales 8800 N .E. Highway 99 CarLot OverS I ' l. 118 Concrete Shop 1702 N.E. 99th St , Miscellaneous Chemicals OverS
120 Hayes Race Cars 8013 N.E. St. Johns I Repair Service OverS
122 Car Wash 6018 N.E. St. Johns Rd. Car Wash Under S I
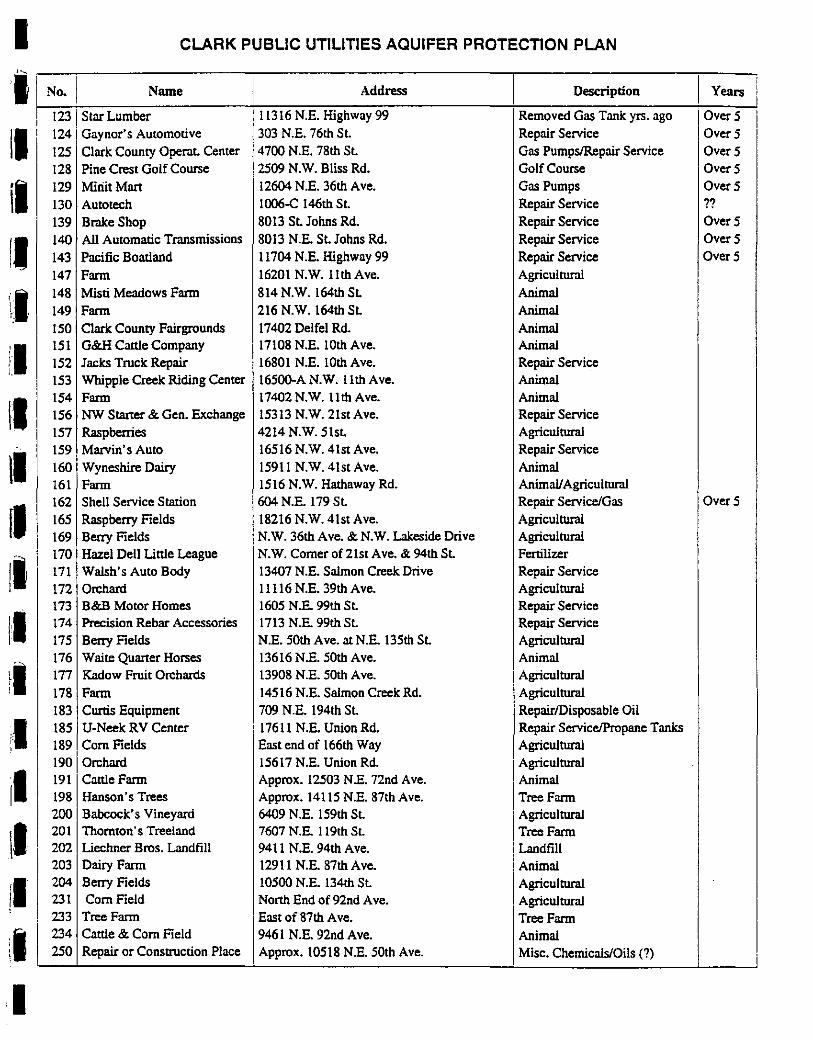
I CLARK PUBLIC UTILITIES AQUIFER PROTECTION PLAN
II No.I Name Address Description I
Years
I 1231 Star Lumber 11316 N.E. Highway 99 Removed Gas Tank yrs. ago Over5 I
II' 124 · Gaynor's Automotive 303 N.E. 76th St. Repair Service OverS
125 Clark County Operat. Center 4700 N.E. 78th St. Gas Pumps/Repair Service OverS 128 Pine Crest Golf Course 2509 N.W. Bliss Rd. Golf Course OverS
il 129 Miliit Mart 12604 N .E. 36th Ave. Gas Pumps OverS
130 Auto tech !006-C !46th St. Repair Service ??
139 Brake Shop 8013 St. Johns Rd. Repair Service OverS
fl 140 All Automatic Transmissions 8013 N.E. St. Johns Rd. Repair Service OverS
143 Pacific Boatland 11704 N.E. Highway 99 Repair Service OverS
147 Farm 16201 N.W. lith Ave. Agricultural
\I 148 Misti Meadows Farm 814 N.W. !64th St. Animal 149 Farm 216 N.W. !64th St. Animal r. ,
!50 Clark County Fairgrounds 17402 Delfel Rd. Animal
il 151 G&H Cattle Company 17108 N.E. lOth Ave. Animal !52 Jacks Truck Repair 16801 N.E. lOth Ave. Repair Service
I. !53 Whipple Creek Riding Center 16500-AN.W. lith Ave. Animal
II 154 Farm 17402N.W.llthAve. Animal !56 NW Starter & Gen. Exchange 15313 N.W. 21st Ave. Repair Service !57 Raspberries 4214 N.W. 51st. Agricultural
II !59 Marvin's Auto 16516 N.W. 41st Ave. Repair Service !60 Wyneshire Dairy 15911 N.W. 41st Ave. Animal 161 Farm 1516 N.W. Hathaway Rd. Animal/ Agricultural
!I 162 Shell Service Station 604 N.E. 179 St. Repair Service/Gas OverS
!65 Raspberry Fields 18216 N.W. 41st Ave. Agricultural 169 Berry Fields N.W. 36th Ave. &N.W. Lakeside Drive Agricultural
II 170 Hazel Dell Utt!e League N.W. Corner of 21st Ave. & 94th St. Fertilizer 171 Walsh's Auto Body 13407 N.E. Salmon Creek Drive Repair Service 172 Orchard 11116 N.E. 39th Ave. Agricultural
I' I 173 B&B Motor Homes 1605 N.E. 99th St. Repair Service 174 Precision Rebar Accessories 1713 N.E. 99th St. Repair Service 175 Berry Fields N.E. 50th Ave. at N.E. !35th St. Agricultural
tl 176 Waite Quarter Horses !3616 N.E. 50th Ave. Animal 177 Kadow Fruit Orchards 13908 N.E. 50th Ave. Agricultural
178 Farm 14516 N.E. Salmon Creek Rd. Agricultural !83 Curtis Equipment 709 N.E. !94th St. Repair/Disposable Oil
:I !85 U-Neek RV Center 176ll N.E. Union Rd. Repair Service/Propane Tanks !89 Corn Fields East end of !66th Way Agricultural 190 [ Orchard 15617 N.E. Union Rd. Agricultural
rl 1911 Cattle Farm Approx. 12503 N .E. 72nd Ave. Animal 198 Hanson's Trees Approx. 14115 N .E. 87th Ave. Tree Farm 200 Babcock's Vineyard 6409 N .E. !59th St. Agricultural
\I 201 Thornton· s Tree land 7607 N.E. !19th St. Tree Farm 202 Uechner Bros. Landfill 94ll N.E. 94th Ave. Landfill 203 Dairy Farm 12911 N.E. 87th Ave. Animal
II 204 Berry Fields 10500 N.E. !34th St. Agricultural 231 Com Field 1 North End of 92nd Ave. Agricultural 233 Tree Farm East of 87th Ave. Tree Farm
:I 234 Cattle & Corn Field 9461 N.E. 92nd Ave. Animal 250 J Repair or Construction Place Approx. !0518 N.E. 50th Ave. Misc. Chemicals/Oils (?)
I
I I I a.
I ·I I I I 'I I· I I I I I I I I
Appendix B Field Work Methods and Geologic Logs
I I rl rl L.
~·· ! ' '
II f!~·-
cl tl' II rl II ;
:I 1.~.
!
:I I I I I
Introduction
APPENDIX B
FIELD WORK METHODS SAlMON CREEK WELLHEAD PROTECTION PROGRAM
MONITORING WELLS
A total of 14 monitoring wells were installed at eight sites to fulfill objectives for Clark Public Utilities's (CPU's) Salmon Creek Wellhead Protection (WHP) program. The monitoring wells were drilled in areas where existing data were insufficient to adequately characterize the local hydrogeology. The new wells provide groundwater monitoring stations and further refine our understanding of the geology and groundwater flow patterns within the WHP Focus Area. Table m-3 summarizes construction details for the wells. A schematic diagram showing construction details and a geologic log for each well is presented in Figures B-1 through B-8. Well locations are presented on Figure m-3.
This Appendix describes drilling, logging, sampling, installation, and development procedures for each well. A general discussion of field procedures for drilling and installing the wells is presented below; this is followed by specific descriptions of field activities for each well.
General Field Procedures
The monitoring wells were drilled and installed during the period from May through October 1992. All wells were drilled and installed by Holt Drilling, Inc., of Puyallup, Washington using a cable tool rig. Chad Bring of Pacific Groundwater Group observed drilling operations and prepared a detailed log for each well. The drilling rig and equipment were inspected for leaks in hydraulic fluid, etc. prior to drilling and were found to be in satisfactory condition. Well designs and installation met requirements established by Washington Administrative Code (WAC) 173-160.
Bailed samples were visually classified in the field in accordance with ASTM 1288. Sample color, texture, moisture, and grain size distribution, as well as sample recovery, water levels, and changes in drilling conditions were recorded on the field boring logs.
The monitoring wells were drilled using a borehole diameter of eight inches. An eight-inch diameter steel casing was advanced through the borehole as drilling proceeded. In all cases, after the well had been drilled to its targeted depth, the eight -inch casing was cut above the drive shoe. The casing was then extracted, and the drive shoe was left at the bottom of the borehole. For wells MW-3, MW-4, MW-7, and MW-9, the bottom portion of the casing was perforated to accomodate aquifer testing prior to cutting the drive shoe. The boreholes for Wells MW-6 and MW-8 were completed with single wells; boreholes for Wells MW-1, MW-3, MW-4, MW-5, MW-7, and MW-9 were completed with two wells (one shallow and one deep completion). The targeted aquifers for the wells were the Upper Troutdale (for the deep installation) and the overlying Pleistocene Alluvial Deposits or Recent Alluvial Deposits (for the shallow installation).
I
f [
r
\ -
I ' .1.;
Single completions were installed where saturation was not encountered in deposits overlying the Upper Troutdale. The only exception to this strategy was at Well MW-5; at this location, MW-5S and MW-5D were both completed in the Upper Troutdale. In all double completion wells, a bentonite seal was installed between filter packs to prevent flow between the two completion zones.
The wells were constructed from two-inch diameter, flush threaded, Schedule 40, blank PVC with five feet of 20 slot, two-inch diameter PVC screen in the bottom of each well. A two-foot long tailpipe consisting of two-inch diameter blank PVC was attached to the bottom of each unit. No glues or solvents were used to fabricate the wells. Centering guides were used to center the monitoring wells within the boreholes. In addition, each well was equipped wih a 3/4" diameter, Schedule 80, PVC tube to facilitate water level measurement. The bottom five feet of each tube was slotted. The tubes were strapped to the wells. The well and tube assemblies were installed by telescoping them through the eight-inch diameter steel casing. As the eightinch casing was withdrawn, #8-12 Colorado Silica Sand filter pack was placed in the the annular space between the well screen and borehole; the filter pack extended to a few feet above the top of the well screen. A five-foot thick bentonite seal was placed immediately above the filter pack. The borehole was then backfilled using clean pea gravel alternating with bentonite seals to either 20 feet below ground surface (bgs) or to the depth of the second (shallow) installation. Bentonite seals were a minimum of five feet thick, and were constructed by pouring Hole PlugTM bentonite pellets into the annulus. If the borehole was completed with two wells, this sequence was then repeated. Prior to completing the well, a bentonite surface seal was poured to a depth of 20 feet.
Monitoring wells were developed from October 5, 1992, through October 7, 1992, by Holt Drilling of Puyallup, Washington. Each well was air-lifted for a period ranging from 30 minutes to 105 minutes, until the amount of sediment present in the discharged water had reached an acceptable level. Well MW-5S could not be successfully developed because the well did not contain enough water to be air-lifted.
Monitoring Well Installations
Wells MW-15 and MW-lD were installed on May 26, 1992. The borehole for Wells MW-lS and MW-lD was drilled using standard procedures to a depth of 261 feet below ground surface. Water was first encountered at about 20 feet in the Pleistocene Alluvial Deposits. A production zone was encountered in the Upper Troutdale, starting at a depth of about 180 feet. Well MWlS was screened from 50 to 55 feet in a slightly silty sand; Well MW-lD was screened from 185 to 190 feet, in a poorly cemented sand and gravel unit (Figure B-1). The depth to water was 9.8 feet bgs in Well MW-1S and 131.2 feet bgs on April 21, 1993, in Well MW-lD.
Wells MW-35 and MW-3D were installed on June 4, 1992. The borehole for Wells MW-3S and MW-3D was drilled using standard procedures to a depth of 227.5 feet below ground surface. Water was first encountered at about 15 feet in the Pleistocene Alluvial Deposits. A production zone was encountered in the Upper Troutdale, starting at a depth of about 205 feet.
B-2
I I I I I I I I I I I I I I I I I I I
I I rt [I ;I II ll I
II !I '
!I t.l rl : ..•
I
·I I ll
Well MW-35 was screened from 65 to 70 feet in a fine- to medium-grained sand; Well MW-3D was screened from 210 to 215 feet, in a sand and gravel unit (Figure B-2). The depth to water was 7.6 feet bgs in Well MW-35 and 133.5 feet bgs on April21, 1993, in Well MW-3D. Prior to installing the wells, the eight-inch steel casing for MW-3 was perforated from 202 feet to just above the drive shoe (227 feet) in order to facilitate aquifer testing. The perforated interval was then developed and an eight-hour pumping test was conducted. After testing was completed, the steel casing was cut at about 202 feet. The perforated casing and attached drive shoe were left in place, the remaining casing was extracted, and Well MW-3D was installed.
Wells MW-45 and MW-4D were installed on April 7, 1992. The borehole for Wells MW-45 and MW-4D was drilled using standard procedures to a depth of 273 feet below ground surface. Water was first encountered at about 20 feet in the Pleistocene Alluvial Deposits. A production zone was encountered in the Upper Troutdale, starting at a depth of about 185 feet Well MW-45 was screened from 60 to 65 feet in a silty sand; Well MW-4D was screened from 205 to 210 feet, in a sand and gravel unit (Figure B-3). The depth to water was 4.9 feet bgs in Well MW-45 and 129.7 feet bgs on April 21, 1993, in Well MW-4D. Prior to installing the wells, the eight-inch steel casing for MW-4 was perforated from 200 feet to 220 feet in order to facilitate aquifer testing. The perforated interval was then developed and an eight-hour pumping test was conducted. After testing was completed, the steel casing was cut at about 200 feet · The perforated casing and attached drive shoe were left in place, the remaining casing was extracted, and Well MW-4D was installed.
Wells MW-SS and MW-SD were installed on October 6, 1992. The borehole for Wells MW-55 and MW-SD was drilled using standard procedures to a depth of 204 feet below ground surface. Because significant quantities of water were not encountered in the Pleistocene Alluvial Deposits, Wells MW-55 and MW-SD were both completed in the Upper Troutdale. A production zone was encountered in the Upper Troutdale, starting at a depth of about 150 feet. Smaller quantities of water were encountered above 150 feet. Well MW-55 was screened from 125 to 130 feet in a sand and gravel unit; Well MW-SD was screened from 165 to 170 feet, in a medium- to coarse-grained sand unit (Figure B-4). The depth to water was 101.0 feet bgs in Well MW-55 and 104.7 feet bgs on April 21, 1993, in Well MW-5D.
Well MW-6 was installed on September 16, 1992. The borehole for Well MW-6 was drilled using standard procedures to a depth of 184 feet below ground surface. Because significant quantities of water were not encountered in the Pleistocene or Recent Alluvial Deposits, only one well was intsalled in the borehole. A production zone was encountered in the Upper Troutdale, starting at a depth of about 163 feet. Well MW-6 was screened from 170 to 175 feet in a sand and gravel unit (Figure B-5). The depth to water was 108.5 feet bgs in Well MW-6 on April 21, 1993.
Wells MW-7S and MW -7D were installed on August 19, 1992. The borehole for Wells MW-75 and MW-7D was initially drilled using standard procedures to a depth of 120 feet below ground surface. However, at this point the drive shoe became "crimped", and the eight-inch diameter steel casing could not be advanced further. The well was abandoned on August 4, 1992, in
B-3
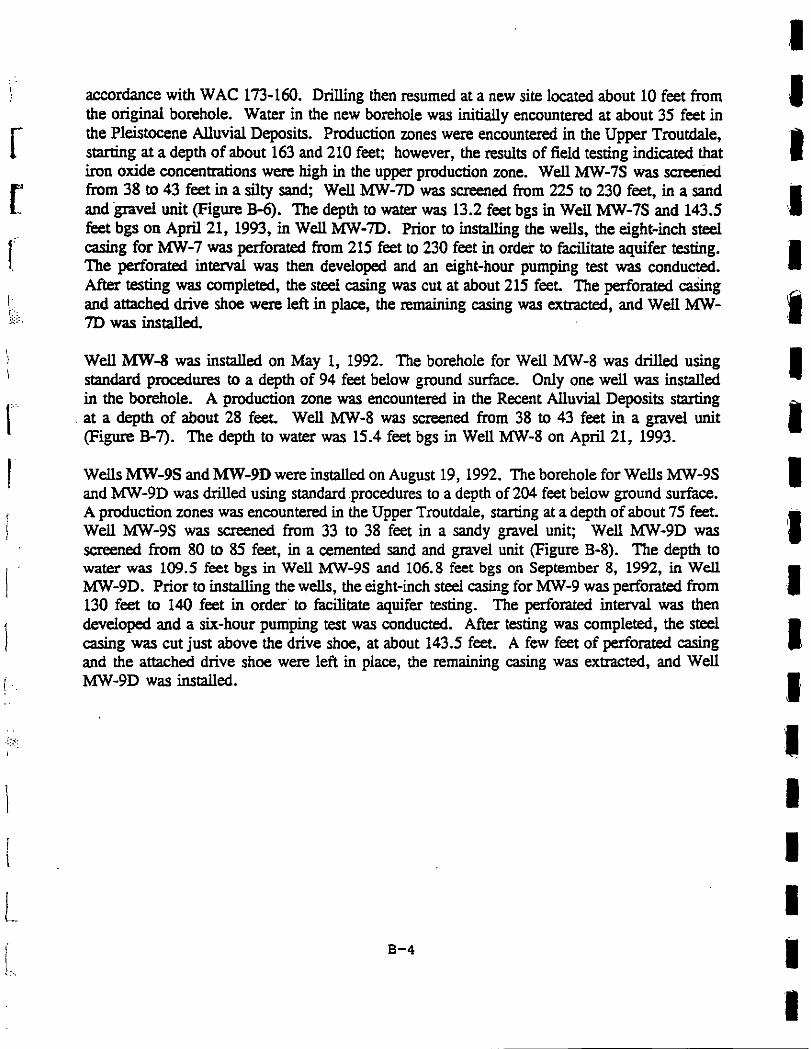
r [
r
L L
accordance with WAC 173-160. Drilling then resumed at a new site located about 10 feet from the original borehole. Water in the new borehole was initially encountered at about 35 feet in the Pleistocene Alluvial Deposits. Production zones were encountered in the Upper Troutdale, starting at a depth of about 163 and 210 feet; however, the results of field testing indicated that iron oxide concentrations were high in the upper production zone. Well MW-7S was screeried from 38 to 43 feet in a silty sand; Well MW-70 was screened from 225 to 230 feet, in a sand and gravel unit (Figure B-6). The depth to water was 13.2 feet bgs in Well MW-7S and 143.5 feet bgs on April 21, 1993, in Well MW-70. Prior to installing the wells, the eight-inch steel casing for MW-7 was perforated from 215 feet to 230 feet in order to facilitate aquifer testing. The perforated interval was then developed and an eight-hour pumping test was conducted. After testing was completed, the steel casing was cut at about 215 feet. The perforated caSing and attached drive shoe were left in place, the remaining casing was extracted, and Well MW-70 was installed.
Well MW-8 was installed on May 1, 1992. The borehole for Well MW-8 was drilled using standard procedures to a depth of 94 feet below ground surface. Only one well was installed in the borehole. A production zone was encountered in the Recent Alluvial Deposits starting
. at a depth of about 28 feet. Well MW-8 was screened from 38 to 43 feet in a gravel unit (Figure B-7). The depth to water was 15.4 feet bgs in Well MW-8 on April 21, 1993.
Wells MW-9S and MW-9D were installed on August 19, 1992. The borehole for Wells MW-9S and MW-90 was drilled using standard procedures to a depth of204 feet below ground surface. A production zones was encountered in the Upper Troutdale, starting at a depth of about 75 feet. Well MW-9S was screened from 33 to 38 feet in a sandy gravel unit; Well MW-9D was screened from 80 to 85 feet, in a cemented sand and gravel unit (Figure B-8). The depth to water was 109.5 feet bgs in Well MW-9S and 106.8 feet bgs on September 8, 1992, in Well MW-90. Prior to installing the wells, the eight-inch steel casing for MW-9 was perforated from 130 feet to 140 feet in order to facilitate aquifer testing. The perforated interval was then developed and a six-hour pumping test was conducted. After testing was completed, the steel casing was cut just above the drive shoe, at about 143.5 feet. A few feet of perforated casing and the attached drive shoe were left in place, the remaining casing was extracted, and Well MW-90 was installed.
B-4
I I I I I I I I I 'I I I, I 1 I I I I I
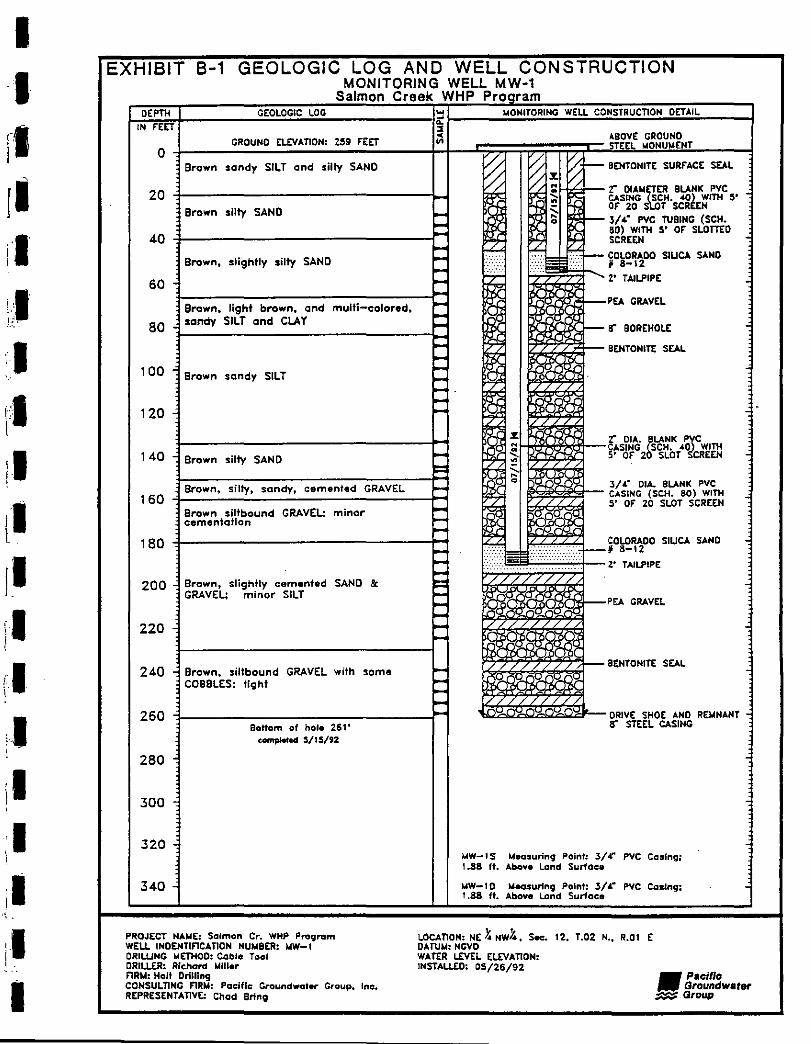
I ·I rl rl il I
'··I· I•
I;'. 1.· ••
·:I '.·'
rl il I
I I I L :I '·
rl !I I
il I
I
EXHIBIT B-1 GEOLOGIC LOG AND WELL CONSTRUCTION MONITORING WELL MW-1
~~~::::::::~~~~:s::al:m:o:n::c:r:ee=k~W~H=P==P~~~~~~~ ~DEPTH LOG i'"! WELL~§~~OETA~IIL ==~
IN f:UJ-----~G~R~O~UN~O~O£V~~·~n~ON~:~~~9~FE~ET~----~~~~--~~T=~~=;;;~~;~TB~EOngV~E~ GR~OUN~O[_----~
20
40
60
80
100
120
140
160
Brown sandy SILT and silty SAND
Brown silty SAND
Brown, slightly silty SAND
Brown, light brown. and multi-colored, sandy SilT and CLAY
Brown sandy SILT
Brown silty SAN 0
I Brown, silty, sondy, r.~AV~I
Brown siltbound GRAVEL: minor cementation
-::: :: ---:: -:: -:: --== -= -
~ ~ :E ~I-- BENTONITE SURFACE SEAL
// V / 't" DIAWruR BLANK PVC " .-. CASING SCH. 40) WITH ,. -:: ~ OF 20 S T SCREEN o ~;}--- 3/4" PVC TUBING (SCH.
80) WITH 5' Of SLOn£0 " SCREEN c
~:~-~1-- COLORADO SIUCA SAND t· .. · .. · , 8-12 L; r--- 2' TAILPIPE
GRAVEL
~ BOREHOLE
BENTONITE SEAL
'r DIA. §LANK ~C CASING SCH. 40 WITH 5' Of 2 SLOT CRtEN
3/ 4• CIA. BLANK PVC CASING (SCH. 80) WITH 5' or 20 SLOT SCREEN
180 -:1-------------H_
200 Brown, slightly cemented SAND 8c GRAVEL: minor SILT
-= --::
220- -
~---------------------1-240 c Brown, siltbound GRAVEl with some
COBBLES: tight
260
280
300
320
340 -
Bottom of hoi• 261' completed $/1S/92
PROJECT HAWE: Salmon Cr. WHP Program WELL INDENTinCATION NUMBER: WW-1 ORIWHG l.tETHOO: Cable Tool ORILL£R: Richard Will•r F1RN: Holt Drilling CONSULnNG F1RW: Pociftc Croundwat.,. Group, Inc. REPRESENTATIVE: Chad Bring
-=
,CJ..tj(
-BENTONITE SEAL
DRIVE SHOE AND RtwNANT c I!' STEEL CASING
MW-IS l.teasuring Point: 3/4 .. PVC Casing; 1.88 ft. Abon Land Surface
MW-1 0 Weosurtng Point: 3/ ,.. PVC Casing; 1 .88 ft. Above Land Surface
LOCATION: N( ~ NW', Sec:. DATUW: NGVO WATER LEVEL ELEVAnON: INSTALLED: 05/26/92
12, T.02 N., R.OI E
•P•clflc GroundwatfH'
.. .. • Group
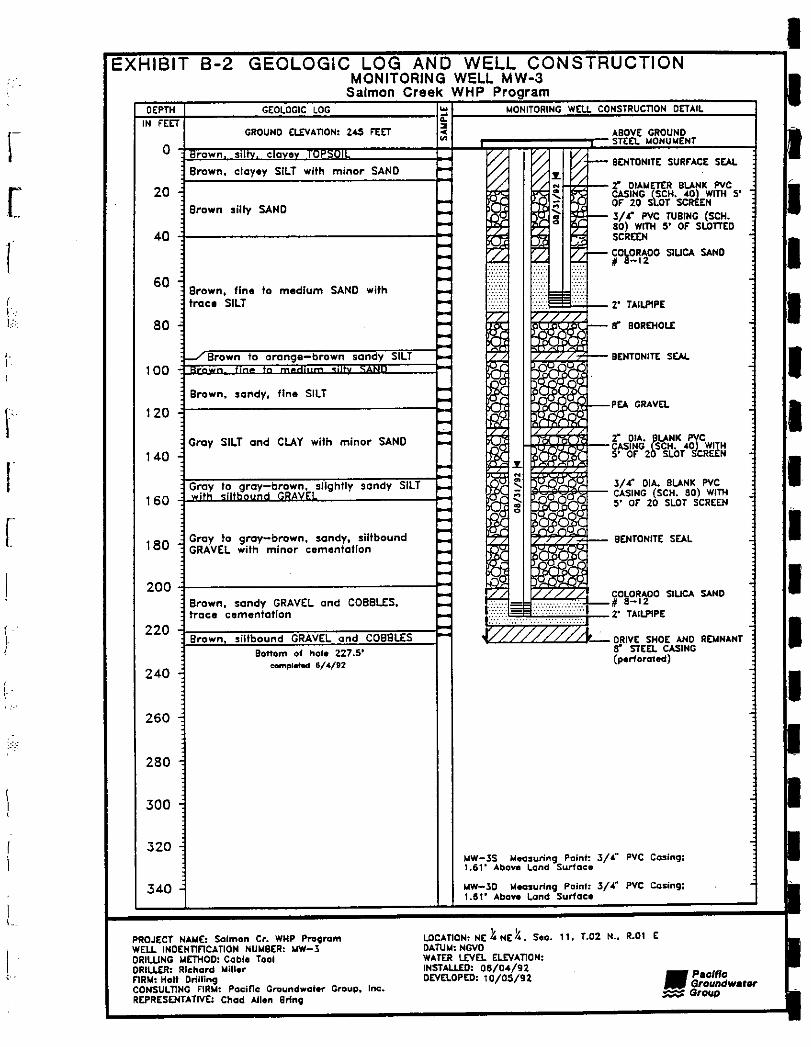
[
1
r r
. :··
I \ __
0
20
40
60
80
100
120
140
180
Brown >illy SAND
Brown, fine to medium SAND with trace SilT
Brown, sandy, ftne SILT
Gray SilT and CU Y with minor SAND
Gray to gray-brown, sandy, siltbound GRAVEL with minor cementation
rLl ~Hz:,t-- 1!' OIAWETER BLANK PVC CASING (SCH. •Dl WITH 5' Or 20 SLOT SCR£EN
i'P-:1- 3/ 4' PVC TUBING {SCH. 80) WITH 5' or SLOTTED SCREEN
COLORAOO SIUCA SAND * 8-12
BENTONITE SEAL
GRAVEL
BENTONITE SEAL
200+-----------------------~~ SIUCA SAND
220
240
260
280
300
320
340
Brown, sandy GRAVEl and COBBLES, trace cementation
Banom of note 227 .s• compl•ted 6/4/92
PROJECT NAUE: Salmon Cr. WHP ProQram WELL INOEHTIFlCATIOH NUMBER: MW-3 ORIWNG lriiETHOO: Cable Tool ORILLtR: Richard Miller nRW: Holt Drilling CONSULTING FIRM: PociOc Groundwater Group, Inc. REPRESENTATIVE: Chad Allen Bring
MW-35 Measuring Point: 3/ I.N PVC Casing; 1.61" Above Land Surface
WW-30 Measuring Point: 3/•" PVC Casing; 1.6t" Above Land Surface
LOCATION: NE .t HE .!{ , Sec. DATU.,.: NGVO WATER LEVEL ELEVATION: INSTALlED: 08/04/92 DEVELOPED: 10/05/92
11. T.D2 N., R.01 E
•Poclflc GroundwatiH'
.. • Group
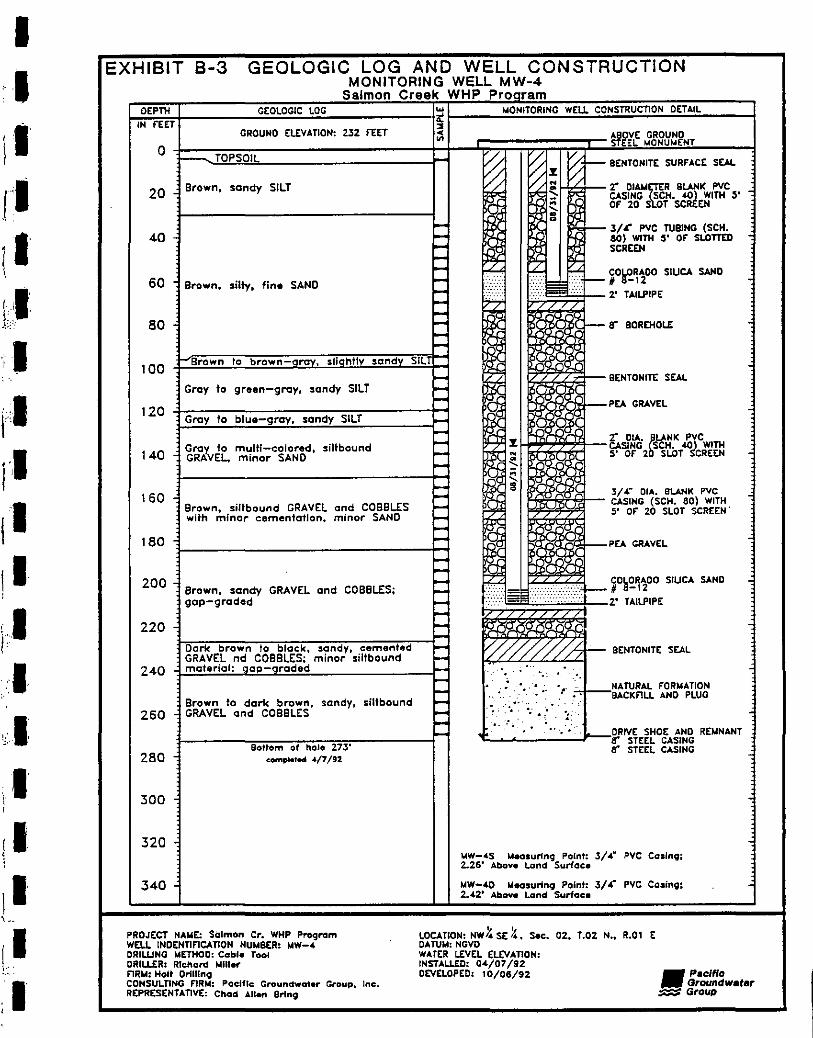
I
11 rl ll' til. il II
r• ,. II II :·I. ..
,: •. -·
•• I
EXHIBIT 8-3 GEOLOGIC LOG AND .• ,'~~~LL CONSTRUCTION S~I~~~T~~!~.G WHPL MW-.~
DEPTH LOG I"' WELl. DETAIL
IN FEET GROUND ELEVATION: 232 fEET I~
oL~~~==========fr-lr/~~-/~~~ t- v:: :%!.1: ~I-- BENTONITE SURFACE SEAL
~ :% '.{ X' OIA .. ~R BLANK PVC 20
Brown, sandy SILT
40
60 Brown, silly, fine SAND
80 "
100
Gray to green-gray, sandy SILT
120 Gray to sandy SILT
1 40 -= Gray to multi-colored, siltbound -: GRAVEL. minor SAND
160
180
200-
220 -
240
260
280
300
320
340
Brown, siltbound GRAVEL and COBBLES with minor cementation. minor SAND
Brown, sandy GRAVEL and COBBLES; gap-graded
Brown to doric brown, sandy, siltbound GRAVEL and COBBLES
Bottom of hole 273' .:ompMted •17 /92
PROJECT HAW£: Salmon Cr. WHP Pr"Ogram WEU. INDENTinCATION NUMBER: MW-4 ORIWNG METHOD: Cable Tool DRILLER: Richard hUller F'IRW: Holt Orilllng CONSULTING FlRM: Pociflc Groundwater Group. Inc. R£PR£S£NTAnVE: Chad Allen Bring
~
!: ---= = --= ------
e> CASING SCH. 40) WITH ~· OF 20 S OT SCREEN
l<"s+-- 3/•" PVC TUBING (SCH. 80) WITH 5' OF SLOTTED SCREEN
=. ':7' COLORADO SIUCA SAND i:::<:i=Ej :> - I 8- I 2
~i::::~::::~~i~-=: 2' TAILPIPE
8" BOREHOLE
~~~ BENTONITE SEAL
').; ~ :t'?v(t--PEA GRAVEL w ~~~·~~~~~-Z' DIA. ~LANK P~C CASING SCH. 40 WITH ! ~ 5' OF 2 SLOT CREEN
j 8 ~ lf 3/.- OIA. BLANK PVC ~ 'fi r- CASING (SCH. 80) WITH
5' OF 20 SLOT SCREEN'
PEA GRAVEL
.u.nnu. 1 FORUATION o• ·~AND PLUG
DOIV< SHOE AND REMNANT
~ ~~~t g~~:~~
MW-45 Measurfng Point: 3/4 .. PVC Casing; 2.26" Above Land Surface
MW-40 Measuring Point: 3/ ,.. PVC Casing; 2.42." Above Land Surface
LOCA.TION: NW~ SE ~. Sec. OA TUW: NGVD
02, T.02 N., R.01 E
WATER LEVEL ELEVATION: INSTALLED' 0•/07/92 DEVELOPED' 10/06/92
-
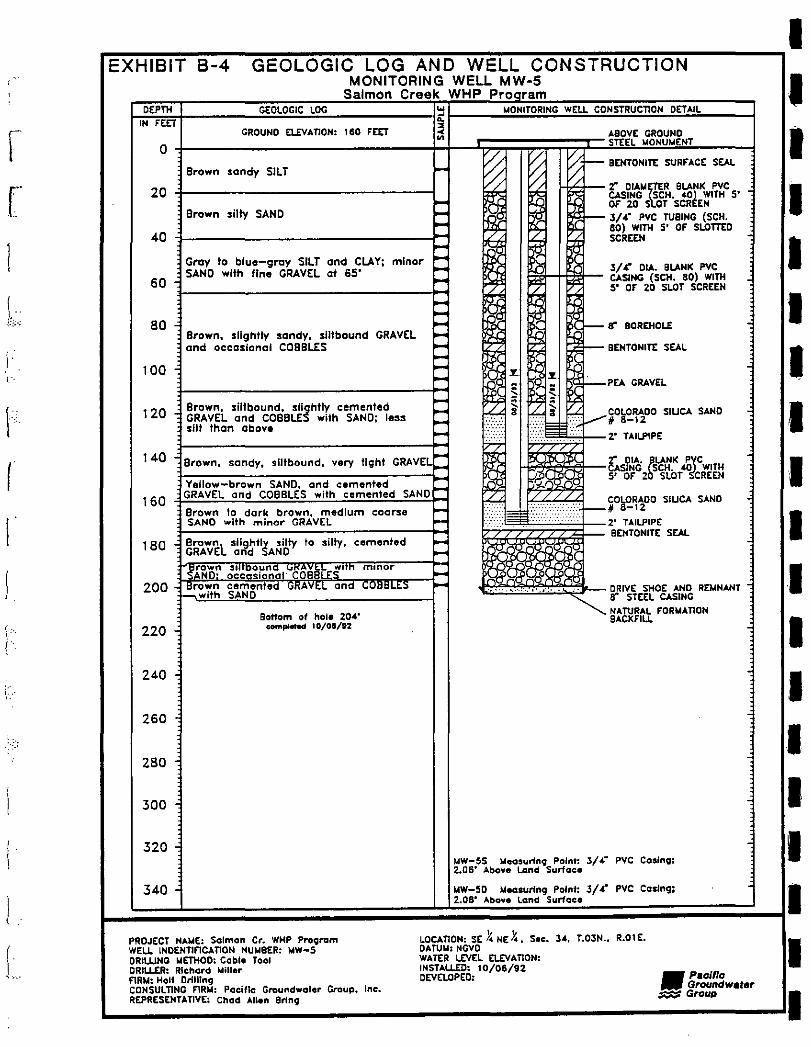
r
i
r
J
I I
L
EXHIBIT B-4 GEOLOGIC LOG AND WELL CONSTRUCTION MONITORING WELL MW-5
Salmon Creek WHP Program DEPTH GEOLOGIC LOG ... t.tONITORING WELL CONSTRUCTION DETAIL ....
IN FEET .. ::1
GROUND ruYAnON: 160 FEET "" ASOVE GROUND "' STEEL MONUWENT
0
Brown sandy SILT - ~ % 1/; - BENTONITE SURFACE SEAL v
~ /, 't' OIAWmR 8LANK PVC , 20 CASING SCH. 40t WITH 5' - OF 20 S OT SCR EN
Brown silly SAND - - 3/4" PVC TUBING (SCH. - ~ 80) WITH 5' OF SLOTTED 40 SCREEN
~ Gray to blue-gray SILT and CLAY; minor ~
3/11' CIA. BLANK PVC SAND with fine GRAVEL at 65' ~
CASING (SCH. 80) WITH 60 ~ 5' OF 20 SLOT SCREEN
~ 1 ~
80 ~ r a" BOREHOLE -: Brown, slightly sandy. siltbound GRAVEL and occaslonaJ COBBLES ~ ~ BENTONITE SEAL
100 .; ~ 1 ?< ~ j:f 1 .
~ !\1. : PEA GRAVEL
120 Brown, siltbound, sll~htly cemented ~ j~ ~~----~OLORAOO SIUCA SAND GRAVEL and COBBLE with SAND; less ~ * 8-12 silt than above ~ ... f-- 2' TAILPIPE r
~ 140 Brown, sandy, slltbound, very tight GRAVEL ~ f.s01A. *LANK P~C ~ lNG SCH. 40 WITH ~il f--k, OF 2 SLOT CREEN
Yellow-brown SAND, and cemented ~
-' GRAVEL and COBBLES with cemented SAND
0 COhORAOO SIUCA SAND 160 Brown to dark brown, medium coarse ~ I~ L Cf--# -12 SAND with minor GRAVEL r :-:·:<·>>>: 2' TAILPIPE
~ BENTONITE SEAL
180 Brownl slightiS silty to silty, cemented GRAVE and AND
I S'Afwn s!l!~~u~';l'"";:;; iRirS'nn mmor ~ NO· occasiona · COBB
200 c 1 Brown cemented GRAVtL and with SAND
~ '• .... ~---···· ··--···· . . · DRIVE SHO£ AND REMNANT 8" STEEL CASING
Bottom of hole 204' NATURAL FORWATION BACkFILL
220 c c::ompMted I 0/0IS/92 c
240 c '
260
280 c ~
300
320 t.tW-55 Weasuring Point: 3/ 4" 2.06' Above Land Surface
PVC Casing;
340 ' WW-50 hteasuring Point: 3/ 4.• PVC Casing; ' 2.08' Above Land Surface
PROJECT HAlitE: Salmon Cr. WHP Program LOCATION: SE )'. NE ~. Sec. 34, T.03N •• R.01 E. WELL INOENTinCATION NUt.tBER: MW-5 DATUM: NGVO DRIWNG WETHOO: Cable Tool WATER LEVEL ELEVATION: DRILLER: Richard Willer INSTALLED: 10/06/92
.Pacmo FlRN: Holt Drilling DEVELOPED: Groundwater CDNSULTlNG FIRl.t: Pociftc Groundwater Group, Inc. .. Group
REPRESENTATIVE: Chad Allen Sting
I I I I I I I I '
I I I I I I I I I I I
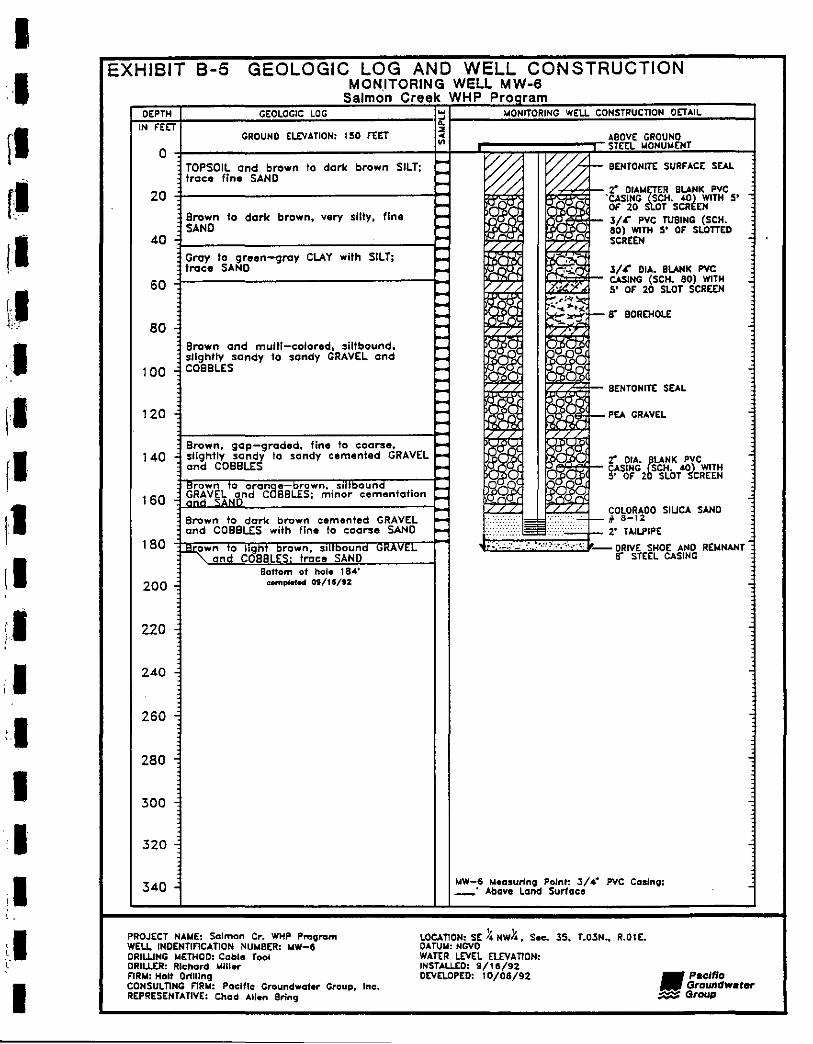
I ·I rl [I
tl I· I .[,,,.
I 11 !I ,. II '
;I ;I :I I
c.
I I
EXHIBIT 8-5 GEOLOGIC LOG AND WELL CONSTRUCTION MONITORING WELL MW-6
h~OE.-~ITH;+.:===:ill~[~LDG:::"=·=~~~~'"!W:H:P=~~~~ WEU~~~ !!§!i~D~ETAILc=~ IN FEET GROUND ELEVATION: ISO FEET I~ . ~¥~iC GROUNQ
O 4-T-O_P_S_O_IL __ a:n:d:=br:o~w=n~to~d~a~~~b~r-o=w~n-S_I_L-T:--~t::~--~~~;~;;~;;=TT~;~~;;;'?~;;~r-:JBffE~N~TO~N~rrt~S~U~R~FA~C-E--S~----~ trace fine SAND r-- //// //fi
~ LL '/ /... 2" DIA .. mR BlANK PVC 20 ..__ ~ 'CASING SCH. 40) WITH 5'
Brown to do~ brown, very silty, fine I:: r- 3/A" PVC TUSING (SCH. ,.-- li2r ~ OF 20 S OT SCR£EN
SAND L 80) WITH 5' OF SUOTTED 40
Groy to green-gray CLAY with SILT; trace SAND
r- ~~~ SCREEN - ~ .}-------------------H CASING (SCH. 80) WITH - ~~~t- 3/A" OIA. BLANK PVC
60 _ 5' OF 20 SLOT SCR£EN
80 Brown and multi-colored, siltbound, slightly sandy to sandy GRAVEL and
100 COBBLES
120 -
: ~ ~~ f- tr BOREHOUE
-: -: ::
f- BENTONITE SEAL
~ i9-
-140
Brown, gap-graded, fine to coarse, -slightly sandy to sandy cemented GRAVEL .... and COBBLES -
~~~--PEA GRAVEL
~~~t-- -r' OIA. *LANK PVC fr CASING SCH. 40) WITH
180
200-
220
240
260
280
300
320 c
340
Brown to dark brown cemented GRAVEL and COBBU:S with fine to coarse SAND
~· an~0 d~~~l ~~~wtr;;,co SAND Bottom of hole 184' ~pt.ted ot/16/92
PROJECT NAWE: Salman Cr. WHP PmCJram W£l.L INOENTIF'ICATION NUMBER: WW-6 ORIWNG I.IETHOO: Coble Tool DRILLER: Richard Miller
:: --
5' OF 2 SLOT S'CREEN
~~~- COLORADO SIUCA SANO ::.:.::: ._·j~:.:::::::::::: .. -::7 11 a-12 ItS: .i.:.>· .. I::~E;:L.>>::S:: :""'-'-:3~2' TAIUPIPE
1; ·. . DRIVE SHOE AND REMNANT 8" STEEL CASING
MW-6 Measuring Point! 3/ 4'" PVC Casing; _. Above l.and Surface
l.OCATION: SE ~ NW~, Sec. 35, T.03N., R.OlE. DATUM: NGVO WATtR UEVtl tLEVATION:
-
-
-
-
FlRM: Holt Or1111ng CONSUl.TING F'IRW: Pacific Groundwater Group, Inc. REPRESENTATIVE: Chad Allen Bring
INSTALI.£0: 9/115/92 OEVEUOPED: 10/06/92
•P•clflo Groundwater
:Group
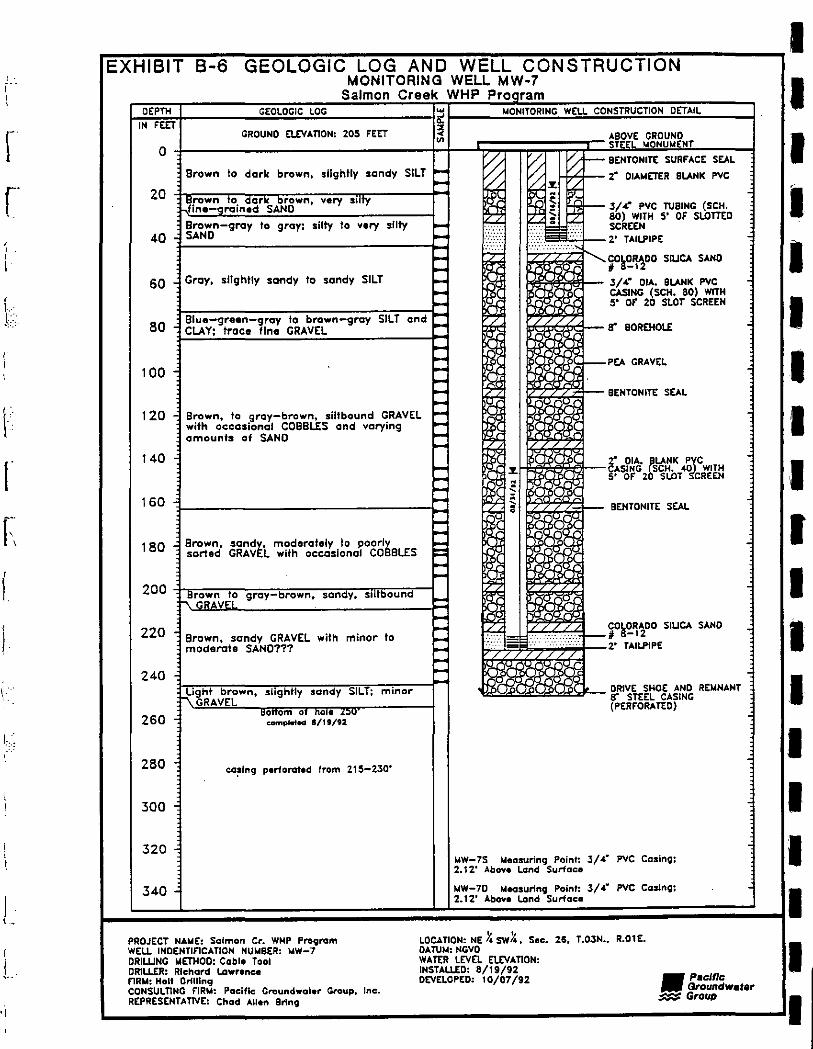
[
r
l 1,·:·
I \-
~~~~~~~~~~~~~--~~ EXHIBIT 8-6 GEOLOGIC LOG AND WELL CONSTRUCTION
~MONIT~RING WELL MW-7 m WHP •m
DEPTH I LOG Iii! W[L DETAIL
IN FEET GROUND ELLVAnoN: zos FEET ~~ o+------~~~~~-----~~~~~nc
~ v;; /:: f-- BENTONITE SURFACt SE:AL
GROUND
20
40
Brown to dark brown, slightly sandy SILT ~ ~
1 ~rown 1o._aa,r"sA~·l'8wn, very silty
Brown-gray to gray: silty to very silty SAND
--60 :: Gray, slightly sandy to sandy SILT -
100 "
120 -:
140
160
--•r SILT and _
-= -= Brown, to gray-brown, siltbound GRAVEL -
with occasional COBBLES and varying -amounts of SAND -
: .:
180 - Brown, sandy, moderately to poorly sorted GRAVEL with occasional COBBLES
220
260
280
300
320
Brown, sandy GRAVEL with minor to moderate SAND???
co~fng perloroted from 21S-230"
// V/1 /_ f-b":r- Z: OIAWETtR BLANK PVC .. ~~ f;i 3/-:' PVC TUBING (SCH. ':::; BO) WITH 5' OF SLOTTED
f'l~;j;;f::: SCRttN 1:::::~"':"+·:-:·:_2' TAILPIP[
~~~~~~ :~~2n"'~ nD:•;n~~n SIUCA SAND * 8-12 3/4" CIA. BLANK PVC CASING (SCH. 80) WITH 5' or 20 SLOT SCREEN
~ BOREHOlt
GRAVEL
BENTONITE SEAL
BtNTONITE SE:AL
IIIW-7S Measuring Point: 3/4"' PVC Casing: 2. 12• Above Land Surface
I I I I I I I I I I I I I I I
340 MW-70 .,.easuring Point: l/4" PVC Casing:
~~:::::::::::::::::::::::::::::::::::::::::::2.:1:2'::Ab:~:·::~:":d::Su:rl:o:c:•::::::::::::::::::::::~~~~ PROJECT NAW(: Salmon Cr. WHP Pro9ram WELL INOEtrnlnCATION NUWBER: WW-7 ORIWNG WETHOO: Cable Taol ORILLER: Richard Lawrence
LOCAT10N: NE ~ SW~. Soc. 26. T.03N •• R.01E. OATUM:NGVO WATtR LtvEL ELLVAnON: INSTALLED: B/19/92 DEVELOPtD: 10/07/92
I nRw: Holt Drlllfn9 • Peclnc CONSULTING FlRW: Pacif1c Groundwater Gt"Oup. Inc. Groundw•ter
L.--R-t-P-RE_s_t-NT_A_T_N_t_•_C_h•_• __ A_II•-"--Bri-"-g------------------------------------------------·--;_G_r_o_op--------.JII
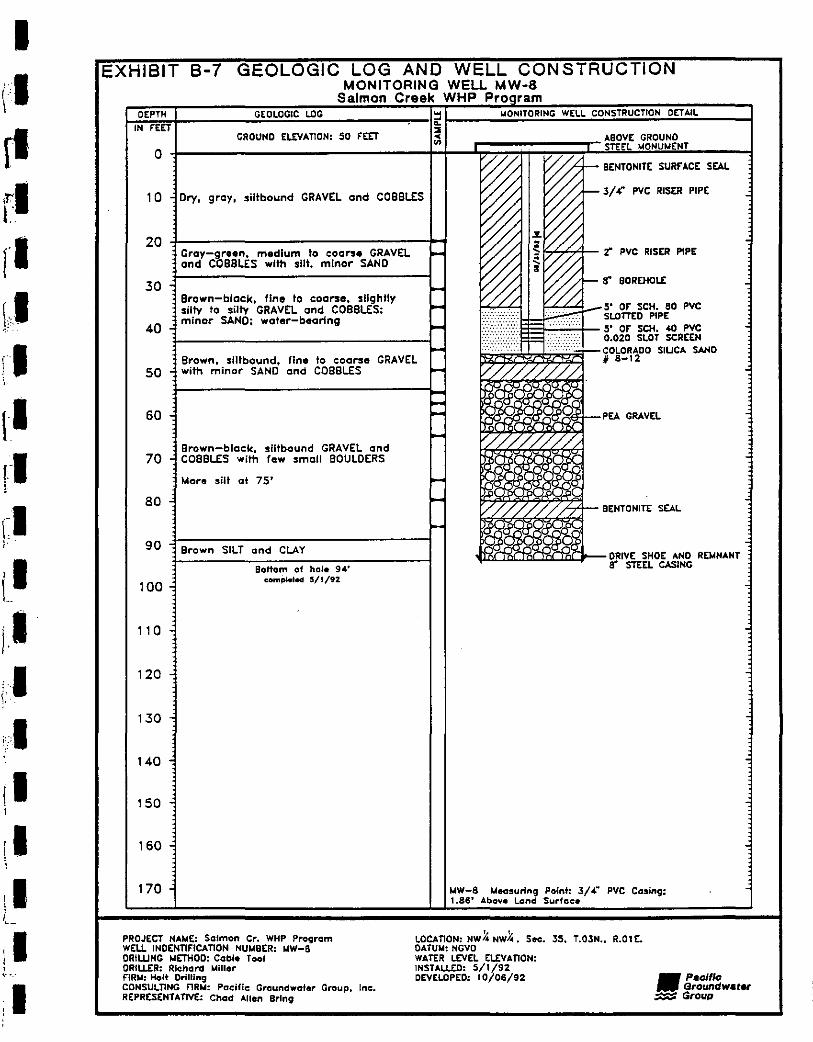
I (I rl ,!71 r
rl Ll .::
rl \.
EXHIBIT B-7 GEOLOGIC LOG AND WELL CONSTRUCTION MONITORING WELL MW-8
Salmon Creek WHP Program
10 Dry, gray, siltbound GRAVEL and COBBLES
20 Gray-%"een, medium to coarse GRAVEL -and C BBLES with slit, minor SAND
30 c -Brown-block, fine to coarse, slightly silty to silty GRAVEL and COBBLES: -
40 c minor SAND; water-bearing --Brown, siltbound, ftne to coarse GRAVEL 50 with minor SAND and COBBLES
60
Brown-black, siltbound GRAVEL and 70 c COBBLES with lew small BOULDERS
80 -
90
100
110
120
130 -
140
150
160 c
170
More silt at 75'
Brown SILT and CLAY
Bottom of hole 94• comP'-I.ct '/1/9'1
PROJECT NAWE: Salmon Cr. WHP Program WELL INDENTIFICAnON NUMBER: ~W-8 ORIWNC rrr.t£Tli00: Coble Tool DRILLER: Richard J.liller FIRM: Holt Drilling CONSULTING F'lRW: Pacific Groundwater Group, Inc. REPRESENTATIVE: Chad Allen Bring
-= --1-
- ,/;'/~/~'/%' /~/~' fo~~ BENTONITE SEAL
~ ~ "' -'t~~:£lj:3~~~--- DRIVE SHOE AND REMNANT , a· STEEL CASING
t.eW-8 J.leasuring Point: 3/4'" PVC Casing: 1.86' Abov• Lond Surface
LOCATION: NWi_t NW~, Sec. 35. T.03N •• R.01t. DATUM: NGVO WATER LEVEL oLEVAnON: INSTAL.Wl: 5/1/92 DEVELOPED' I 0/06/92
• Pacific Groundwat.,.
• .... Group
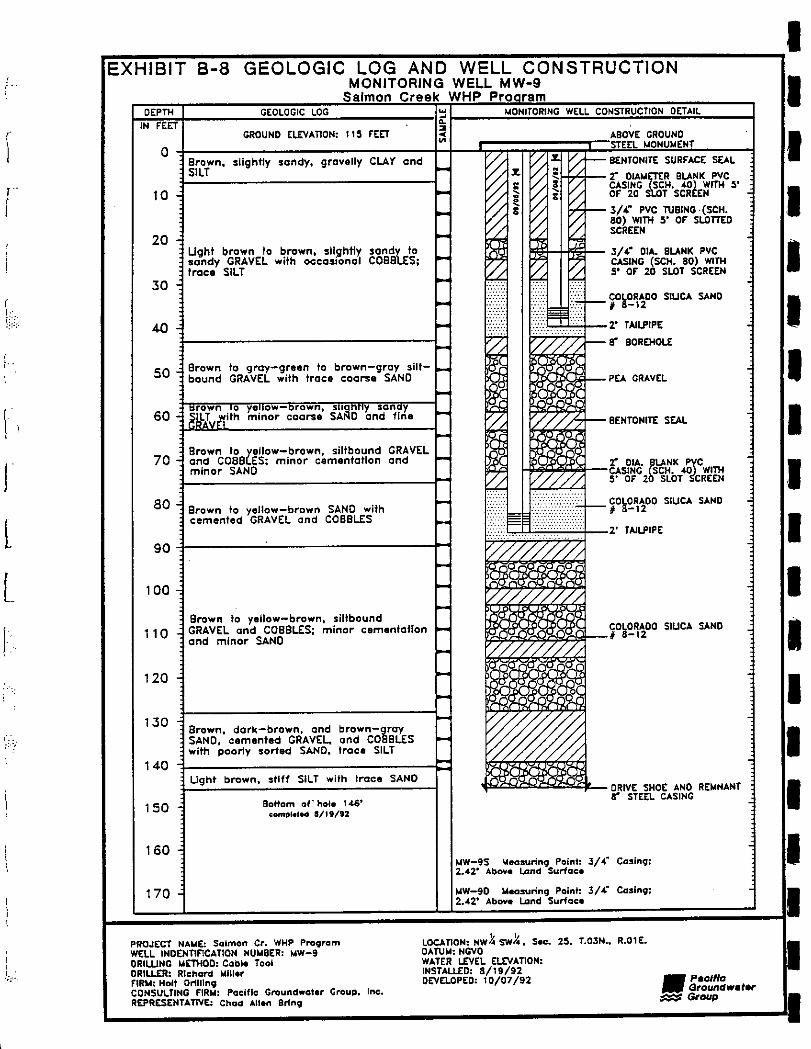
j
l L
~~~~~~~~~~~~--~~ EXHIBIT 8-8 GEOLOGIC LOG AND WELL CONSTRU N
MONITORING WELL MW-9
0
10
20
30
40
50
60
70
80
GROUND <UVAnON: 115 r<E:T
Brown. slightly sandy. gravelly CLAY and SILT
Ugh! brown Ia brown, slightly sandy _to sandy GRAVEL with occasional COBBLES; trace SILT
Brown to gray-green to brown-gray siltbound GRAVEL with trace coarse SAND
Brown to yellow-brown, siltbound and COBBLES: minor cementation minor SAND
Brown to yellow-brown SAND with cemented GRAVEL and COBBLES
GRAVEL and
90 4-----'----------4-;
100
110
120
130
140
150
160
170
Brown to yellow-brown, siltbound GRAVEL and COBBLES; minor cementation and minor SAND
Brown. dark-brown, and SAND, comonlod GRAVEL. with poorly sorted SAND,
Light brown,
brown-gray and COBBLES trace SILT
Bottom of· hole t .46' ~ompleted S/19/92
-r' OIAWiMR BLANK PVC CASING SCH. 40) WITH 5' or 20 S T SCR£~
I;.L*--3/ 4" PVC TUBING· (SCH. 80) W1TH 5' or SLOTTED SCREEN
-f.#.;;:)-- 3/ 4" OIA. BLANK PVC CASING (SCH. 80) W1TH 5' or 20 SLOT SCR<~
P£.4. GRAVEL
·:·:·:·,J...- COLORADO SIUCA SAND # 8-12
~¢;$!:;¢;;::;¢j'--2' T AllPIH
WW-95 Measuring Point: J/ -4- Casing: 2.42" Above Land Surface
WW-90 Weasuring Point: 3/4- Casing; 2.42" Above Land Surface
PROJECT NAWE: Salmon Cr. WHP Pro9rom WELL INOENTIFICATION NUWBER: MW-9 ORIWNG WETHOD: Coble Tool
LOCATIONt NW~ SW~. Sec. 2~. T.03N •• R.01E. OAT\JW: NGVO
DRILLER: Richard Wlll•r F'IRW: Holt Or1111ng CONSULTING F'IRW: Pacific Groundwater Group, Inc. REPRtsENTAnVE: Chad All•n Bring
WAT<R LEV<L .UVATION: INSTALLED: 8/19/92 OEV<LOP<D: 1 D/07 /92
•Paclllo C3rounefwater
.. ";Group
I
I I I I I I I
I I I I I I I I, I I I I I I I I I I I
Appendix C Quality Assurance/Quality Control Plan
I I I I I I I I I I I I I I I I I I I
. APPENDIX C- QUALITY ASSURANCE I QUALITY CONTROL
This section identifies the quality assurance and quality control procedures used to maintain consistent quality of project data. Quality assurance (QA) objectives for data are expressed as the accuracy, precision, completeness, representatives, and comparability that bear on its ability to satisfy the purposes of this study. The quality assurance objectives, assessment procedures, .and tolerance limits for this Work Plan are similar to those stated in the Washington Department of Ecology's (Ecology's) "Quality Assurance Interim Guidelines for Water Quality Sampling Analysis: Ground Water Management Areas" (Ecology, 1986) and the U. S. Environmental protection Agency's (EPA's) "Quality Assurance Manual for Drinking Water Programs Branch Investigations (USEPA Region 10, 1985). The following section contains quality assurance/quality control (QA/QC) protocol for:
• Sampling and Field Measurement Procedures • Laboratory Procedures • Data Reduction, Validation, and Reporting
A. Sampling and Field Measurement Procedures
This section describes routine procedures followed by field personnel. The procedures were designed to ensure that all samples collected are consistent with the following project objectives:
• samples are identified, preserved, and transported so that data are representative of the actual site conditions;
• information is not lost in sample transferal; and • laboratory data can be used for wellhead protection assessment and evaluation.
The analytical laboratory provided sample containers composed of appropriate materials and prepared by appropriate methods to preserve the integrity of the sample.
Volatile organic compounds (VOCs) were sampled in 40 mL glass vials and preserved with hydrochloric acid. Metals and inorganics samples were collected in 250 mL plastic bottles. Metals were filtered and acidified (using nitric acid) in the laboratory so that only the dissolved metal fraction was determined. Total and fecal coliform samples were collected in sterile 125 mL plastic bottles. All samples were stored on ice in coolers until delivery (within 24 hours of collection) to the laboratory.
The documents used to control and validate sample custody included sample identification numbers, Chain-of-Custody records, and custody seals. The following sections describe procedures to use these documents.
(1) Sample Identification Numbers
Samples were identified using a sequential numbering system so that data could be entered into the data base. Also, because two aquifer zones were sampled from many of the wells, samples were identified by aquifer as well. Identifiers for samples from the upper (shallow) aquifer were followed by an "S" (for example, "MW-lS"), and identifiers for samples from the regional (deep) aquifer were represented. by a "D" (for example, "MW-!D").
(2) Chain-of-Custody
The possession of samples must be traceable from the time the samples are collected until the results are reported by the laboratory. To maintain and document sample custody, the
·Chain-of-Custody procedures described here were followed.
Transfer of Custody and Samples. The field sampler was responsible for transferring the samples, and the individuals relinquishing and receiving signed, dated, and note the time on the Chain-of-Custody record. This record documents sample custody transfer.
Laboratory Custody. A designated laboratory sample custodian accepted custody of the shipped samples and verified that d1e information on the Sample Identification number matched that on the Chain-of-Custody Form.
The laboratory custodian used the sample identification number and ensured that all samples were transferred to the proper analyst or stored in the appropriate secure area. Laboratory personnel are responsible for the care and custody of samples from the time they are received until the sample is exhausted or stored for future analysis. All samples were analyzed within EPA-established holding times for each parameter.
(3) Field Quality Control
This section presents routine procedures conducted during field measurements and sample collection. These methods are conducted to ensure that field measurements and sample collection are similar and consistent for all individuals involved. The following types of QC samples will be collected in the field and shipped to the laboratories along with the other samples:
(a) Trip/Travel Blank
Trip blanks measure potential sample contamination due to the presence of contaminants in the reagent water source, preservative chemicals, and the sample bottles; as well as due to the contamination of the blank itself during the blank preparation, shipment of the prepared blank to the field and/or shipment from the tield to the laboratory. The trip blank was prepared using HPLC-grade, organic-free water with the addition of all appropriate preservative chemicals.
I I I I I I I I I I I I I I I I I I I
I I I I I I I I I I I I I I I I I I I
Trip blanks accompanied the sample shipping container to the fie.ld and were remain unopened until after receipt by the laboratory for all VOCs.
Although it was recommended that trip blanks be collected at a minimum frequency of one per shipment, only one true blank was submitted per monitoring round. This error will be corrected during future monitoring events. Contamination from VOCs was not measured in any of the trip blanks submitted.
(b) Field Duplicates
A field duplicates is a sample collected subsequent to the original sample using methods identical to those used for the original sample. The original and duplicate samples are collected over a minimum period of time. Field duplicates provide a measure of the total analytical bias (field and laboratory variance) including bias resulting from the heterogeneity of the duplicate sample set itself. Field duplicates were not collected at the recommended frequency of one per sampling day. Results of the duplicates which were collected indicate that field variability was minimal, i.e., results of all parameters were within 10% of each other. Additional efforts will be made to collect the necessary number of field duplicates in the future.
(c) Documentation of Activities - Field Log Books
Field personnel have maintained a field notebook to provide a daily record of significant events, observations, and measurements during field investigations. The field notebook contains information such as: personnel present, site conditions, sampling procedures, measurement procedures, calibration records, etc. All entries in the field notebooks and on logs have been signed and dated. The field notebooks will be kept as a permanent record.
(d) Equipment Calibration and Decontamination •
Specific conductivity, pH and temperature were measured in the field. Instruments were calibrated at least once daily, and calibration results were recorded in the field log book. Conductivity and pH were also analyzed in the laboratory, as part of the standard primary and secondary inorganic package.
All sampling equipment was scrubbed in a soapy water wash (Alconox ™ or equivalent laboratory grade detergent) between collection of each sample. The equipment was then rinsed with tap water three times and twice with deionized (DI) water.
B. Analytical Procedures
The primary objective of the analytical quality control activities is to ensure the integrity of analytical results. The analytical laboratory analyzed samples according to the quality control guidelines specified under the EPA Contract Laboratory Program (CLP). Analytical methods
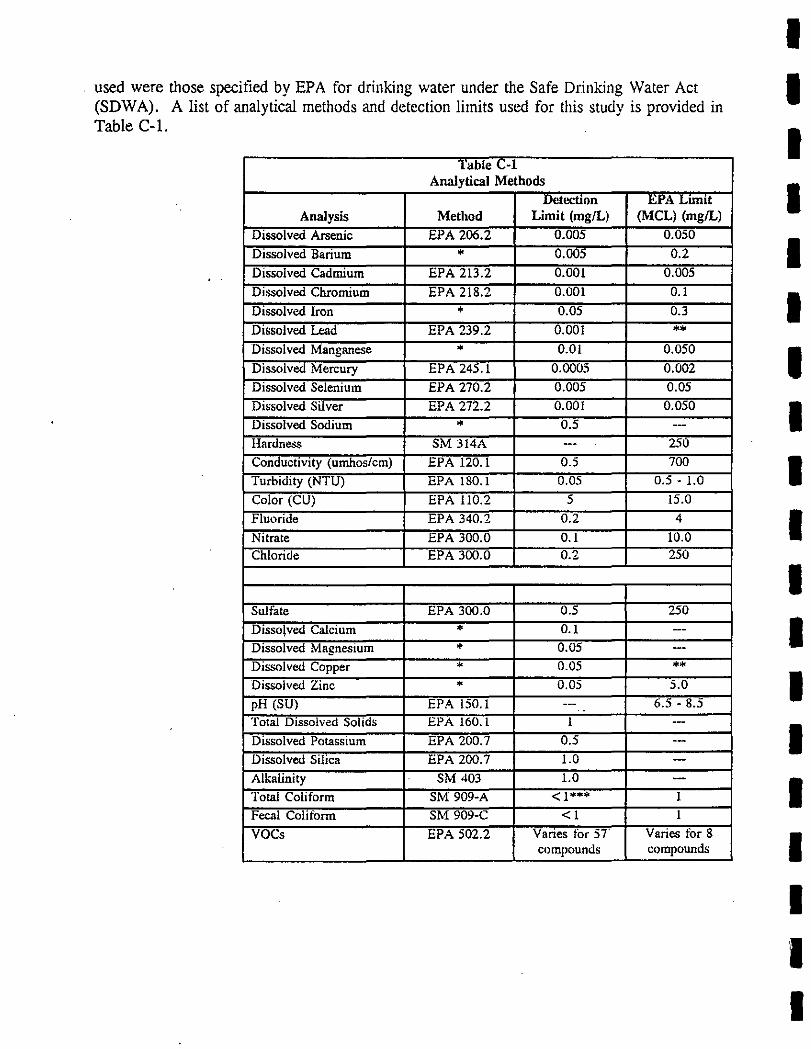
used were those specitied by EPA for drinking water under the Safe Drinking Water Act (SDWA). A list of analytical methods and detection limits used for this study is provided in Table C-1.
Table C-1 Analytical Methods
Detc'Ction EPA Lnmt Analysis Method Limit (mg/L) (MCL) (mg/L)
Dissolved Arsenic EPA 206.2 0.005 0.050
Dissolved Barium * 0.005 0.2
Dissolved Cadmium EPA 213.2 0.001 0.005
Dissolved Chromium EPA 218.2 0.001 0.1
Dissolved !ron * 0.05 0.3
Dissolved Lead EPA 239.2 0.001 ** Dissolved Manganese * 0.01 0.050
Dissolved Mercury EPA 245.1 0.0005 0.002 Dissolved Selenium EPA 270.2 0.005 0.05 Dissolved Silver EPA 272.2 0.001 0.050
Dissolved Sodium * 0.5 -Hardness SM 314A --- 250
Conductivity (umhos/cm) EPA 120.1 0.5 700
Turbidity (NTU) EPA 180.1 0.05 0.5 - 1.0
Color (CU) EPA 110.2 5 15.0
Fluoride EPA 340.2 0.2 4
Nitmte EPA 300.0 0.1 10.0 Chloride EPA 300.0 0.2 250
Sulfate EPA 300.0 0.5 250
Dissolved Calcium * 0.1 -Dissolved Magnesium • 0.05 ---Dissolved Copper * 0.05 ** Dissolved Zinc • 0.05 5.0
pH (SU) EPA 150.1 --- 6.5 - 8.5 .. Total Dissolved Solids EPA 160.1 I ---Dissolved Potassium EPA 200.7 0.5 -Dissolved Silica EPA 200.7 1.0
Alkalinity SM 403 1.0 -Total Coli form SM 909-A <1*** I
Fecal Coliform SM 909-c <I I
VOCs EPA 502.2 Varies for ST Varies for 8 compounds compounds
I I I I I I I I I I I I I I I I I I I
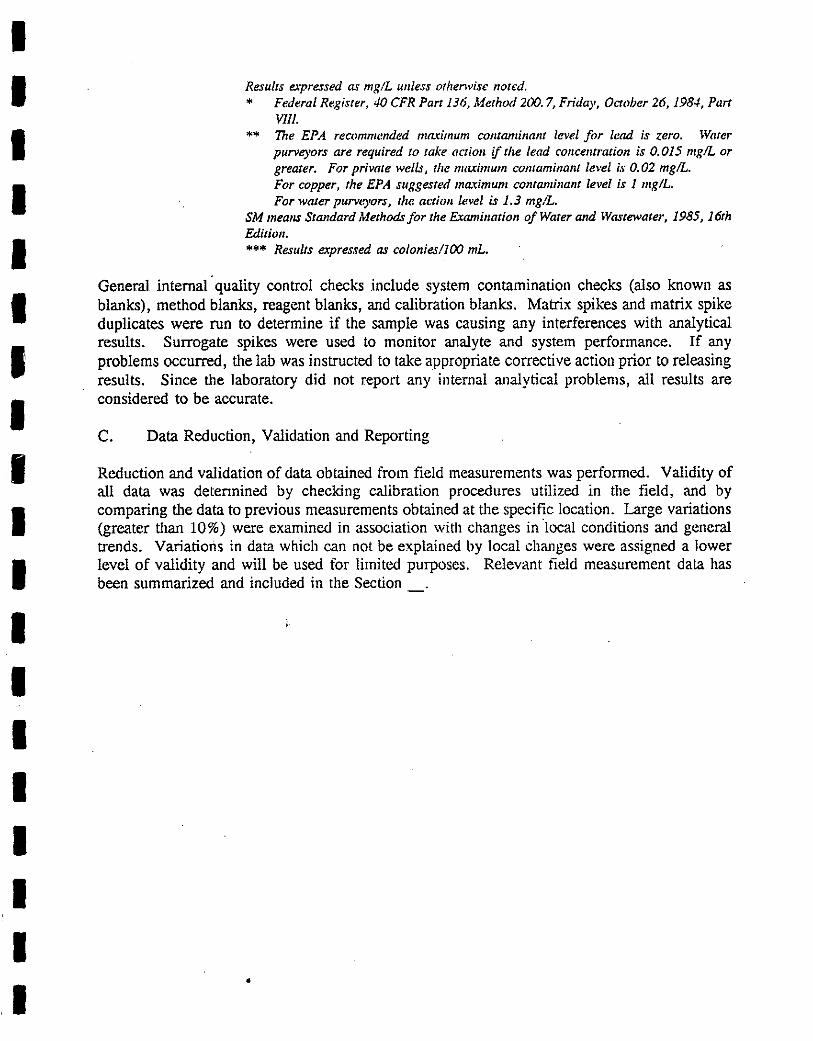
I I I I I I I I I I I I I I I I I I I
Results o.pressed as mg!L unless otherwise noted. * Federal Register, 40 CFR Part 136, Method 200. 7, Friday, October 26, 1.984, Part
V/Il. ** The EPA recomrrwnded mru:imum contaminant level for hm.d is zero. lVarer
purveyors are required to take action if the lead concemration is 0.015 mg/L or greater. For private wells, the maximum comaminallllevel is 0.02 mg!L. For copper, the EPA suggested maximum contaminant level is 1 mg/L. For WtUer purV<,yors, the acti<m level is 1.3 mg/L.
SM mea/IS Standard Methods for the Examination of Water and Wastewater, 1985, 16th Edition. *** Results expressed as colonies/100 mL.
General internal quality control checks include system contamination checks (also known as blanks), method blanks, reagent blanks, and calibration blanks. Matrix spikes and matrix spike duplicates were run to determine if the sample was causing any interferences with analytical results. Surrogate spikes were used to monitor analyte and system performance. If any problems occurred, the lab was instructed to take appropriate corrective action prior to releasing results. Since the laboratory did not report any internal analytical problems, all results are considered to be accurate.
C. Data Reduction, Validation and Reporting
Reduction and validation of data obtained from field measurements was performed. Validity of all data was detennined by checking calibration procedures utilized in the field, and by comparing the data to previous measurements obtained at the specific location. Large variations (greater than 10%) were examined in association with changes in ·local conditions and general trends. Variations in data which can not be explained by local changes were assigned a lower level of validity and will be used for limited purposes. Relevant field measurement data has been summarized and included in the Section _
•
I I Appendix D I Pumping Test Results
I I I I I I I I I I I I I I I I
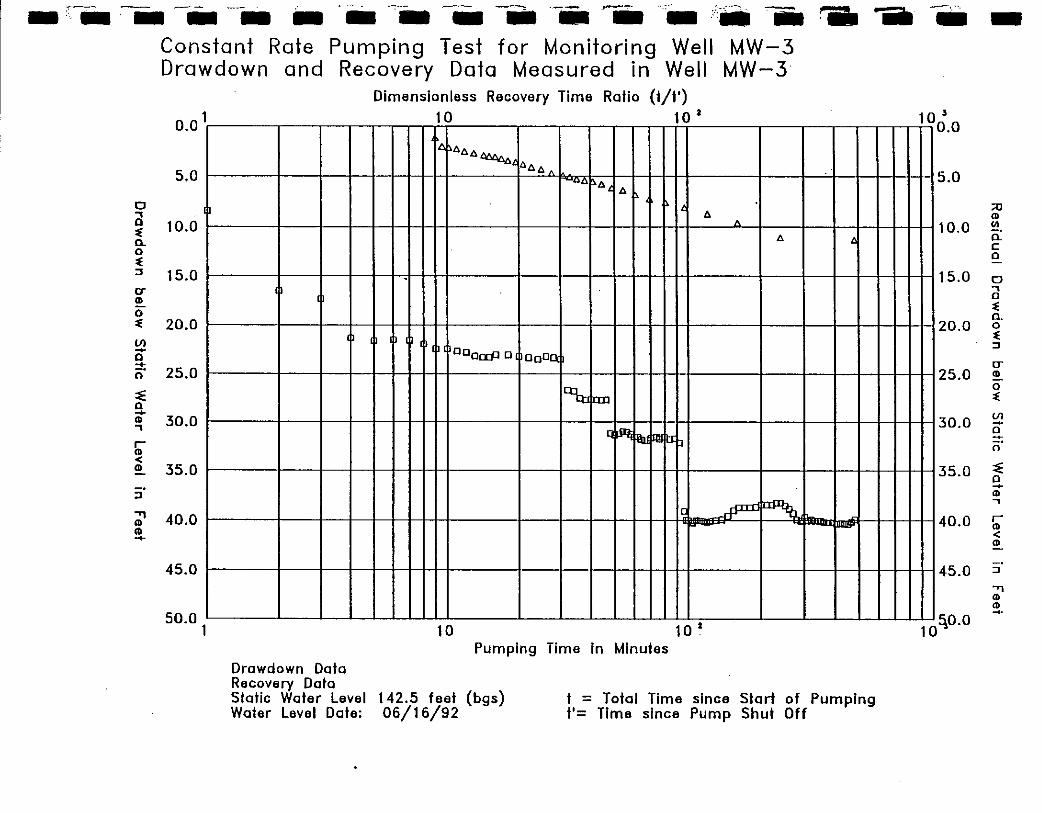
-····-·- ---- - -
0 , 0 :e a. 0 :e ::J
IT .. 0 :e Ill -0 -c;·
~ 0 -.. , r .. < .. ::J
"'1 .. .. -
Constant Rate Pumping Test for Monitoring Well MW-3 Drawdown and Recovery Data Measured in Well MW-3
Dimensionless Recovery Time Ratio (1/1')
0.01 10 102
5.0
AAA~ AAAA
,, -u,
>A, A
A
10.0 " A
15.0 .
20.0
Doaa:P o o 0oo 25.0
.DQ L{] p:m
30.0 ( Iii!
35.0
40.0 I~ ..m-
d±' ~
45.0
50.0 1 10
Pumping Time in Minutes
£
Drowdown Data Recovery Data Static Water Level Water Level Date;
142.5 feet (bgs) 06/16/92
t ::: Total Time since Start of Pumping t'= Time since Pump Shut Off
- -10~.0
5.0
;c (I)
10.0 "' a. c 0
15.0 0 ., 0 :e a.
20.0 0 :e :J
IT 25.0 CD
0 :e
30.0 Ul -0 :!; n
35.0 ~ 0 -CD .,
40.0 r (I)
< CD
45.0 :J ., CD
"' 10~0.0 -
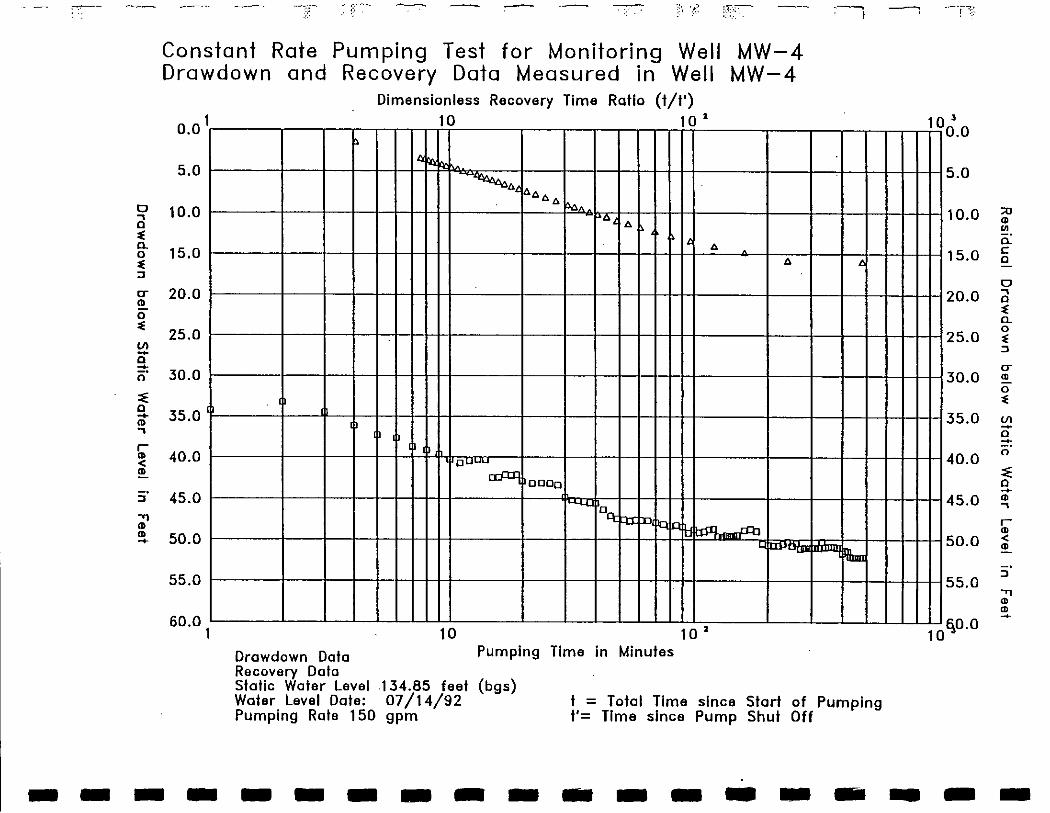
.-.. --
0 ., a :E a. 0 :E :l
o-m 0 :E
Ill -a .... c;·
::E a .... m ., r m < m
:;· ..., m m ....
~ .-.~--(· ::·. ·? - :'.!.-.;--
·-·-•.· ·.
Constant Rate Pumping Test for Monitoring Well MW-4 Drawdown and Recovery Data Measured in Well MW-4
Dimensionless Recovery Time Ratio (t/t')
0.0 1 10 10 l
~
5.0
10.0
C.f.i~
~""t """ " """ .,. ' " ~
15.0 " "
20.0
25.0
30.0
35.0
40.0 ouuucdliJ DODo
45.0 "'-U D
50.0 __r:e,
55.0
60.0 1 10 10 l
Drawdown Data Pumping Time in Minutes Recovery Dolo
ll
'1111111
Static Water Level 134.65 feet (bgs) Water Level Date: 07/14/92 t = Total Time since Start of Pumping Pumping Role 150 gpm I'= Time since Pump Shut Off
10~.0
5.0
10.0 :;o m
"' a. 15.0 c
D
D
20.0 ., D :E a.
25.0 0 :E :l
o-30.0 en
0 :E
35.0 Ill -0 -40.0 0
::E a ....
45.0 m ., r <II
50.0 < m
55.0 :l
..., en en ....
1 0 f\0.0
-------------------
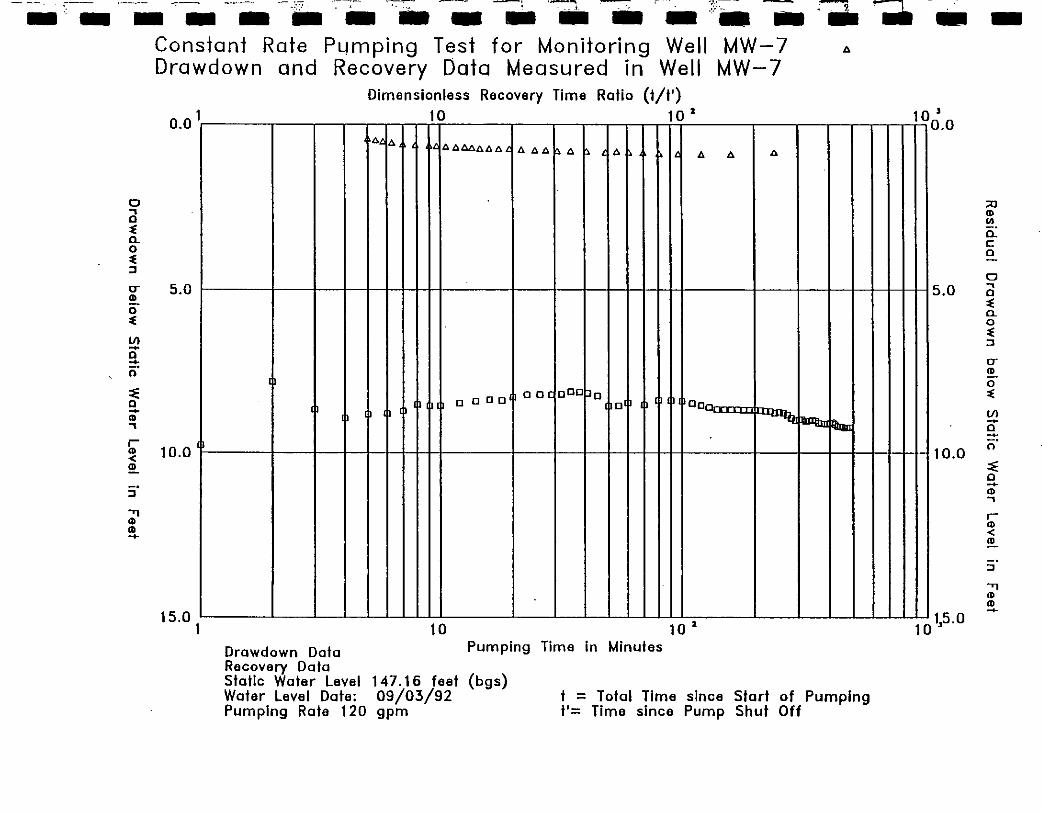
-··- ·-.-. -· ·--. '
. ~ .. .,-.--- - ... - ... - - - - - • ••
0
a ~ a. 0 ~ :I
0" CD 0 :1:
VI -0 .... n' ~ 0 .... CD .., !;" < ~
5'
~ CD ....
Constant Rate Pwmping Test for Monitoring Well MW-7 Drawdown and Recovery Data Measured in Well MW-7
Dimensionless Recovery Time Ratio (t/t')
0_0 1 10 10'
5.0
10.0
15.0 1
A' A AAAAAA/H A At> I'" A A , ,
0 0 0 0 0 0 ( oOO Po
0 oa
Drawdown Data Recovery Data
10 10 • Pumping Time in Minutes
Static Water Level 147.16 feet (bgs) Water Level Date: 09/03/92 Pumping Rate 120 gpm
t = Total Time since Start of Pumping t'= Time since Pump Shut Off
-10~.0
5.0
10.0
-
;o CD
"' a. c 0
0 .., 0 ~ a. 0 ~ :I
0" (1)
0 :1: (/)
a -;:;· ~ 0 -(1) .., r (1)
< (1)
:I
"T) (1) (1) -
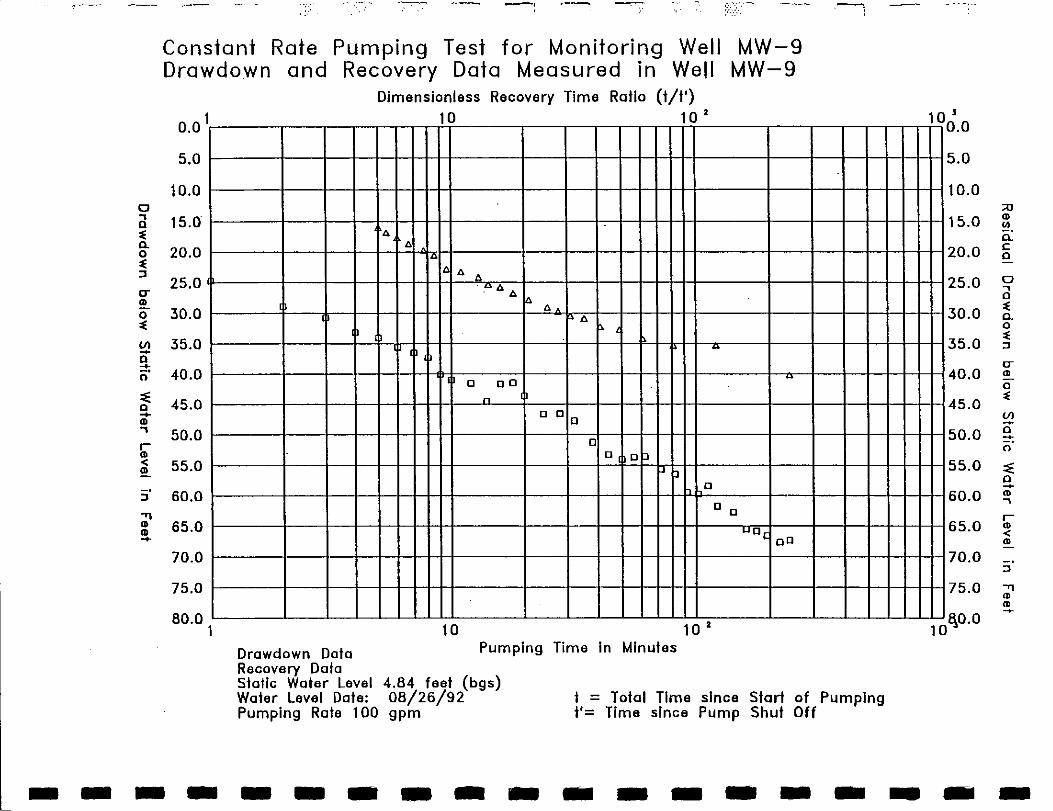
0 ., 0 ~ a. 0 ~ :I
IT .. 0 ~
VI -0 -+ c;·
~ 0 -+ .. ., !;' < !!.
5' '"'I .. .. -+
Constant Rate Pumping Test for Monitoring Well MW-9 Drawdown and Recovery Data Measured in Well MW-9
Dimensionless Recovery Time Ratio (t/1')
0.0 1 10 10 •
5.0
10.0
15.0 A
20.0 A
25.0 A
6 .. ~6 6
6
30.0 6 6 ,
35.0 "
40.0 0 oo
45.0 n 0 0
0
50.0 0
55.0 0 0[)
f" p 0
60.0 0 0
65.0 wo, oo
70.0
75.0
80.0 1 10 10.
Drawdown Dola Pumping Time in Minutes Recovery Data Static Water Level 4.84 feel (bgs) Water Level Dale: 08/26/92 I = Total Time since Start of Pumping Pumping Rate 100 gpm I'= Time since Pump Shut Off
10~.0
5.0
10.0 ;o
15.0 (I) .. a.
20.0 c 0
25.0 0 ., 0
30.0 ~ a. 0
35.0 ~ :I
IT 40.0 (I)
0
45.0 ~
VI
50.0 0 -c;· 55.0 ~
0 -60.0 m .,
65.0 r m < (I)
70.0 :I
75.0 -., "' "'
10~0.0 -
-------------------
I I I I I I I I I I I I I I I I I I I
Appendix E Trilinear Diagrams for Groundwater Samples
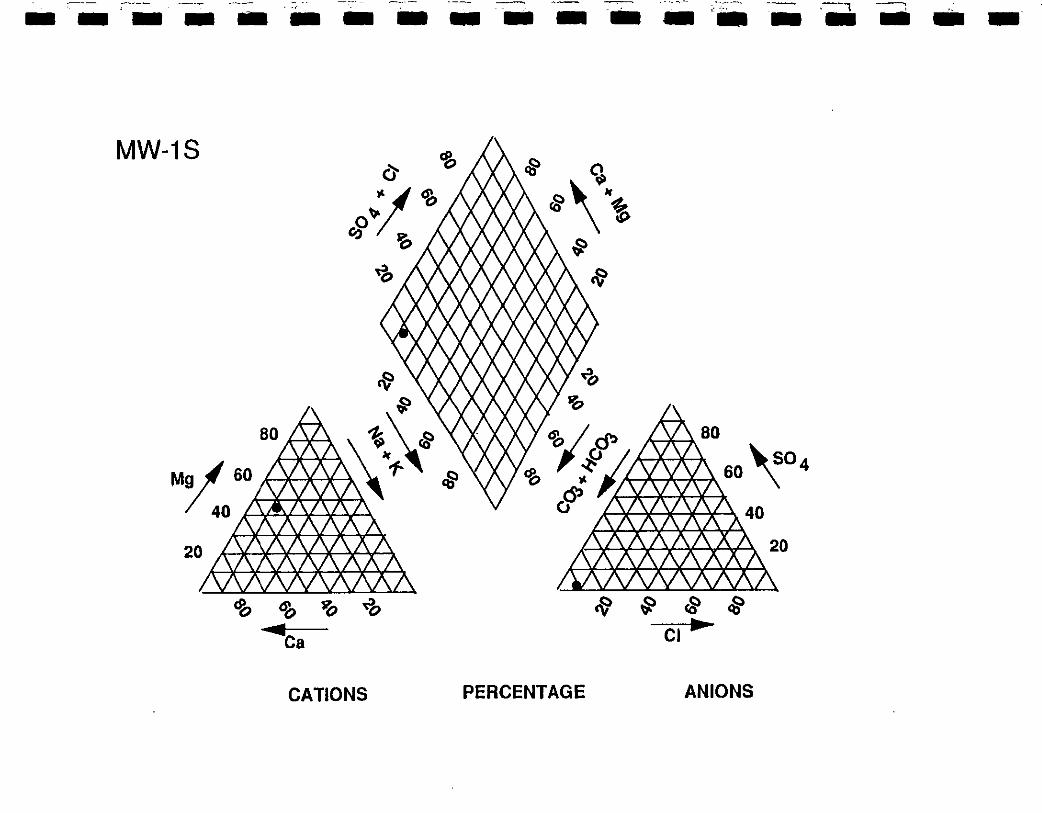
-- .. ,• ------- ,-, -- .• - ,. -- -~
IIIIi- -MW-18
20
CATIONS PERCENTAGE ANIONS
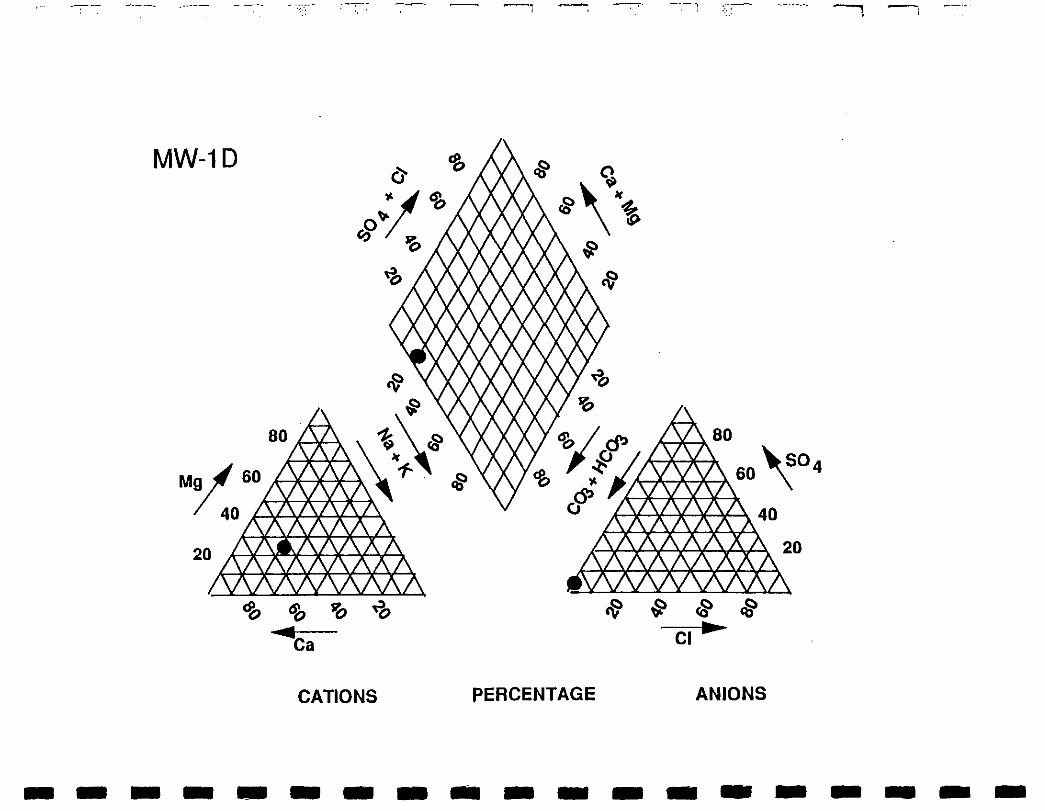
·~···
MW-10
CATIONS
- - .. <·:
PERCENTAGE
,1,----;~ 80
h'.c-1.:--k--J... 60 '\0 4
ANIONS
-------------------
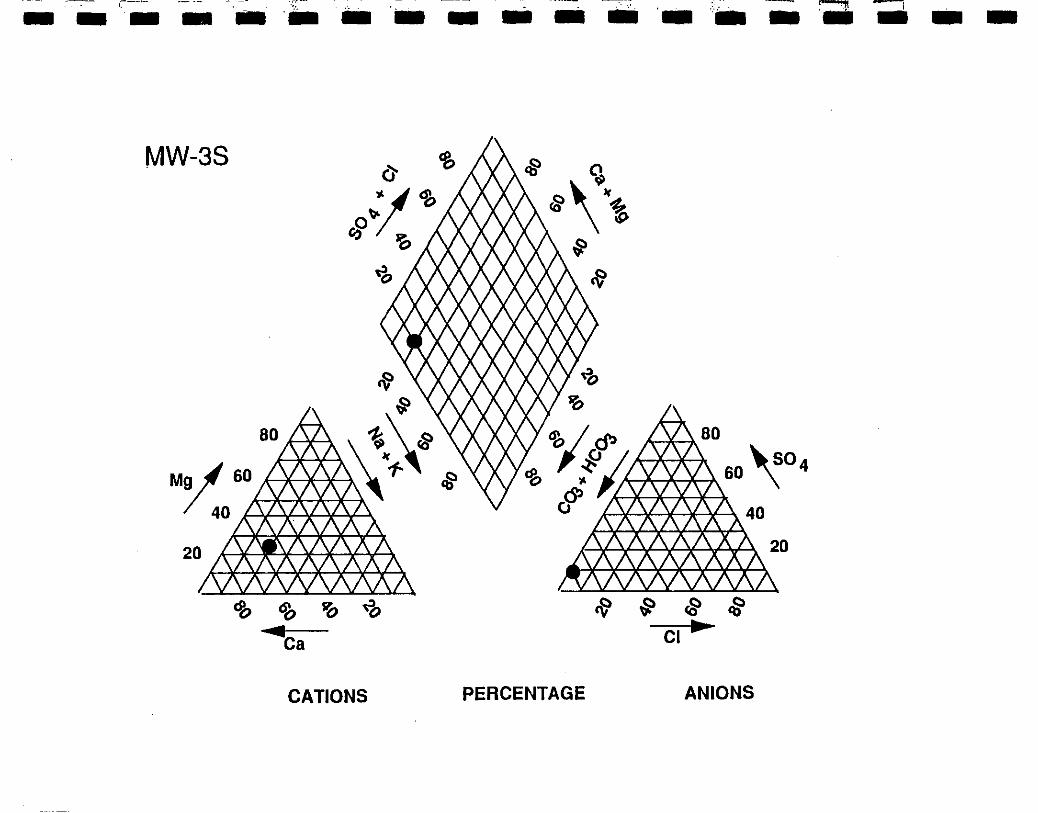
,---- ..... - - ·- - - ·- ... - -MW-38
-____ < __ _
A-;~80
1---,1,,.---k~~ 60 '\0 4
CATIONS PERCENTAGE ANIONS
- -

MW-30
CATIONS
-· ' .. -- -.-.. .-.. -·
PERCENTAGE
J..--.;~ 80
~---*-*--J\ 60 '\0 4
ANIONS
-------------------

-~,--~-- - - .. - - - - ... -- -- : ... --r .. -J - -
MW-48
CATIONS PERCENTAGE ANIONS
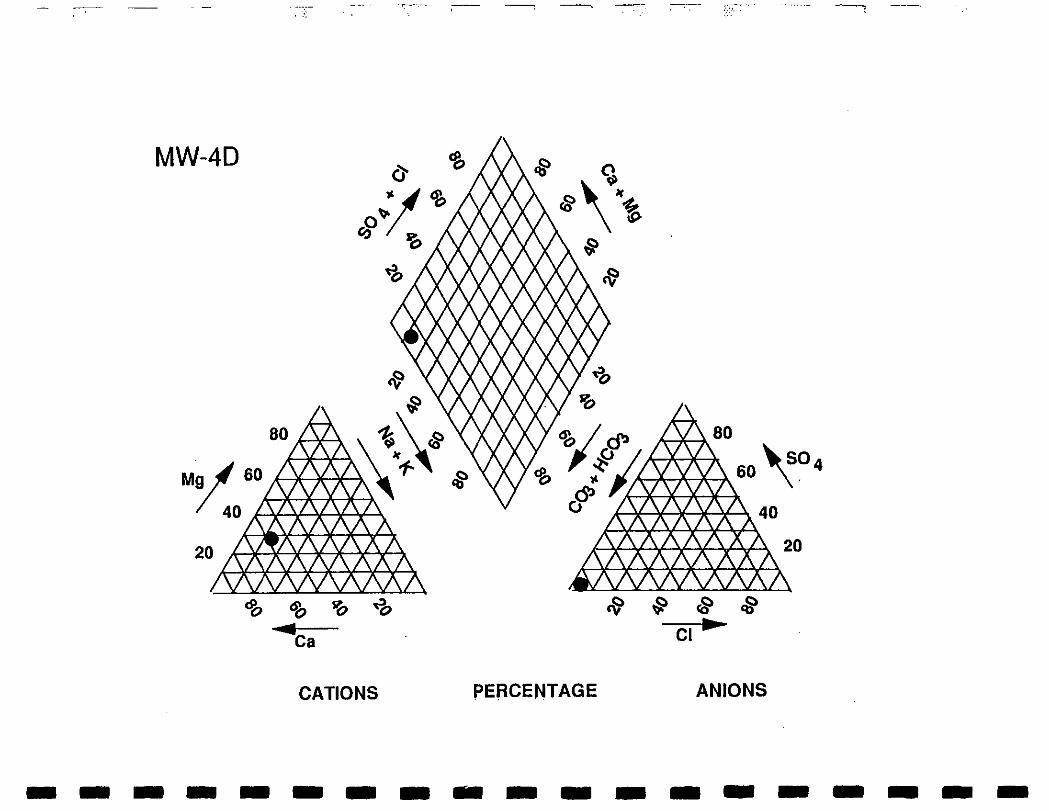
MW-40
CATIONS
~ -·. .. .....
PERCENTAGE
,1,----;~ 80
1:-}\~---,11:--J.,. 60 '\0 4
ANIONS
-------------------

-~~------~----~- ~--
MW-50
CATIONS PERCENTAGE ANIONS
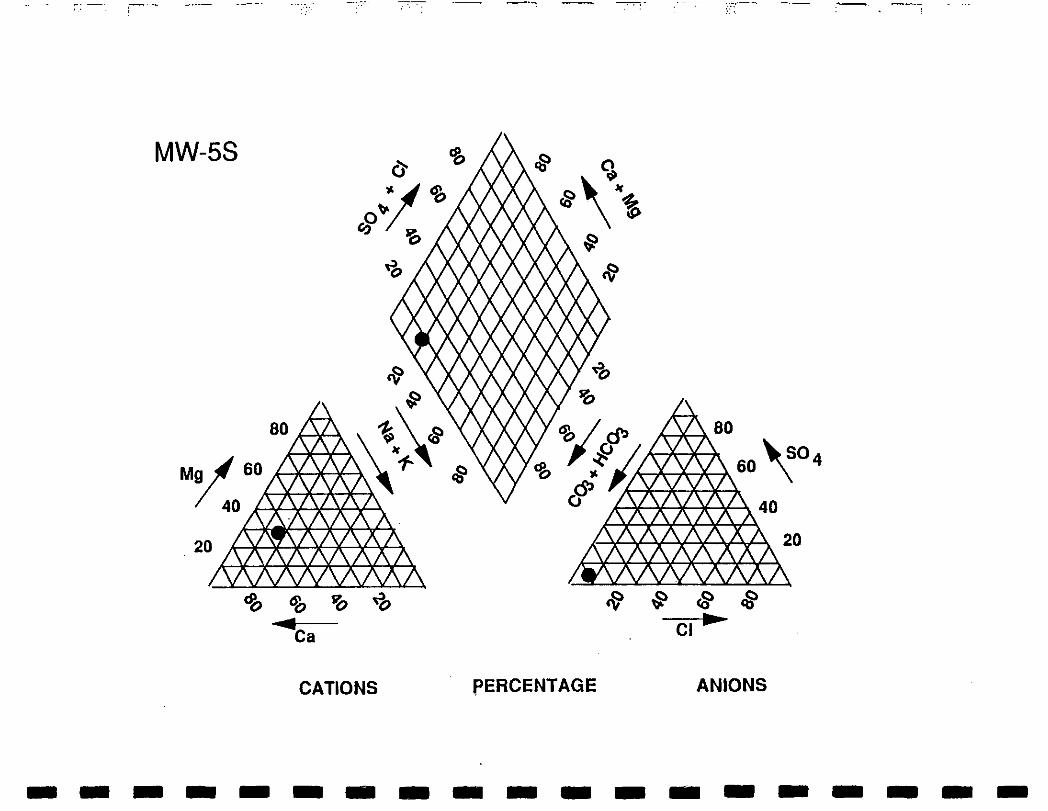
1-. ·-
MW-58
20
CATIONS PERCENTAGE ANIONS
-------------------
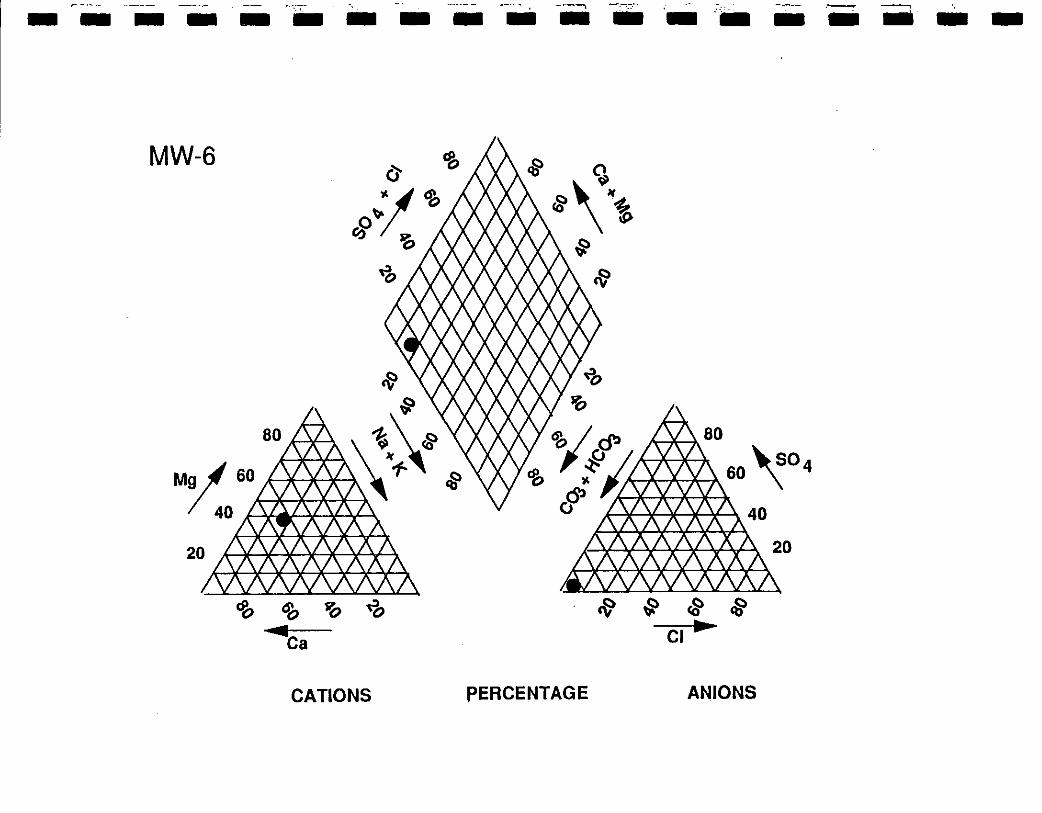
---.:-;-- ........ -,. ·- ----, ----------- ... ------ .. --MW-6
20
CATIONS PERCENTAGE ANIONS
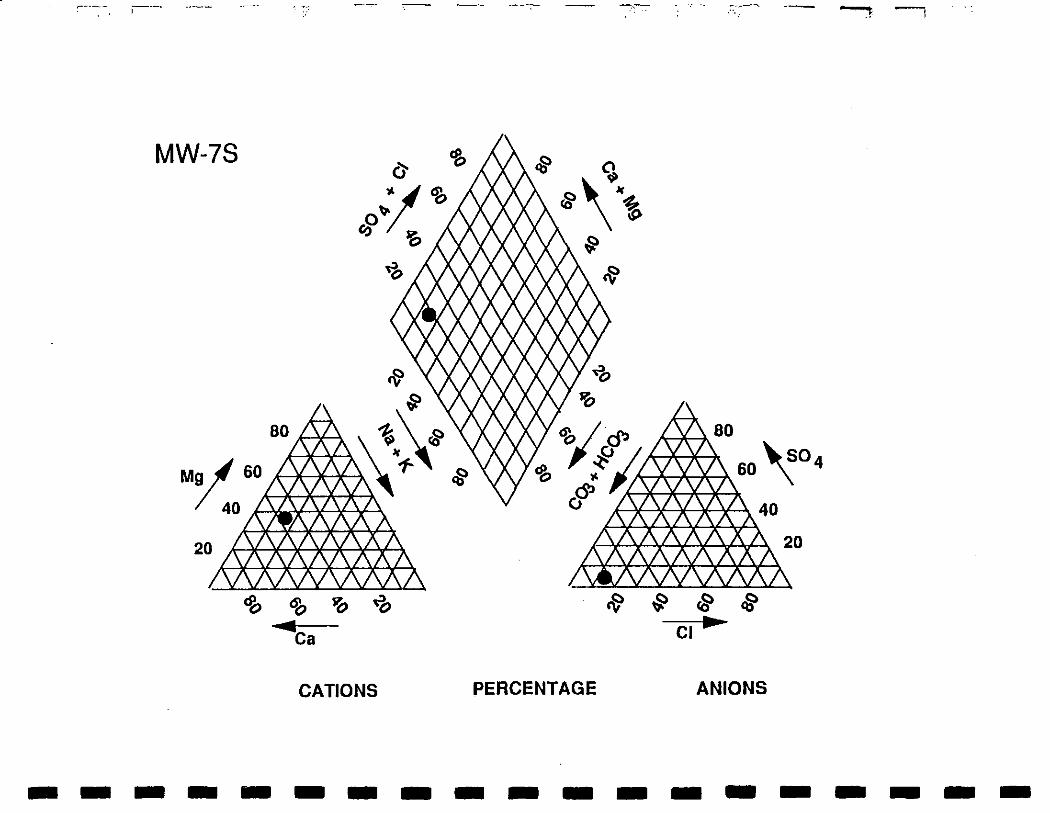
,--
MW-7S
20
CATIONS PERCENTAGE ANIONS
-------------------

... - ,... - - - - - ·- - - lllliil - 'llii .. -
MW-70
CATIONS PERCENTAGE
A---;~80
~~--*~ 60 '\0 4
ANIONS
.. -- -
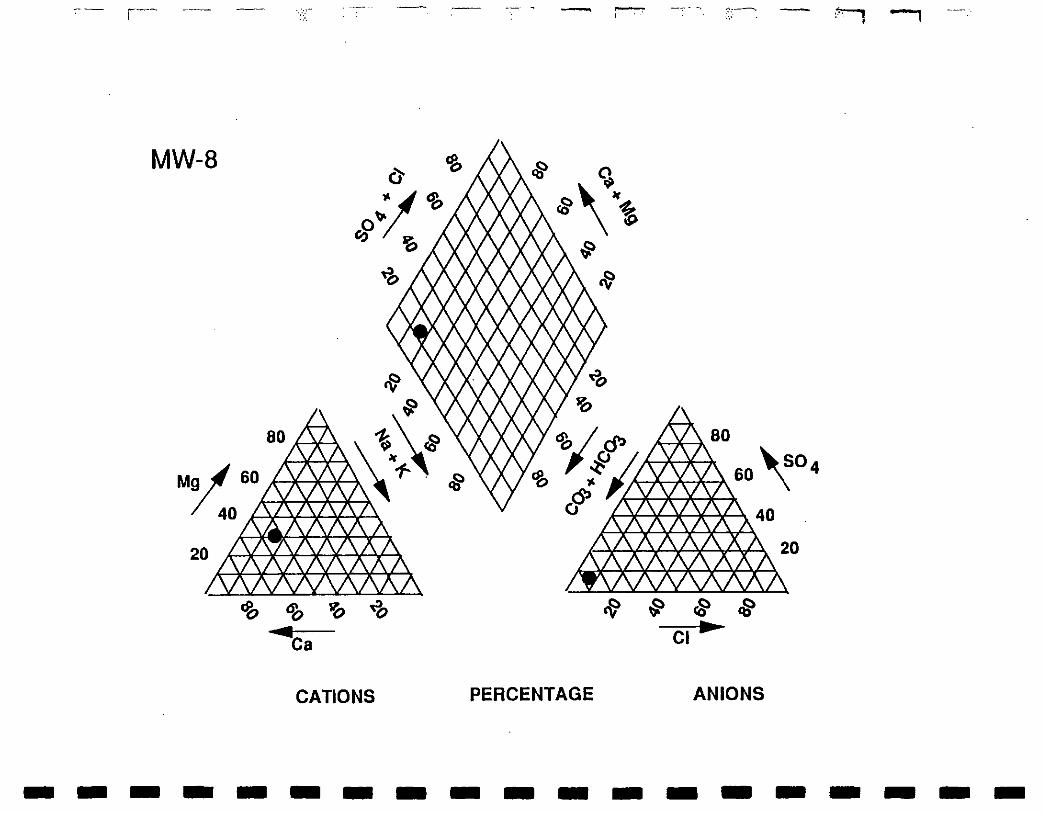
·.-.·
MW-8
CATIONS PERCENTAGE ANIONS
-------------------

- •- I- - - - - - ·- - - p- liill .-.. ~ - iii - - -
MW-9D
CATIONS PERCENTAGE ANIONS
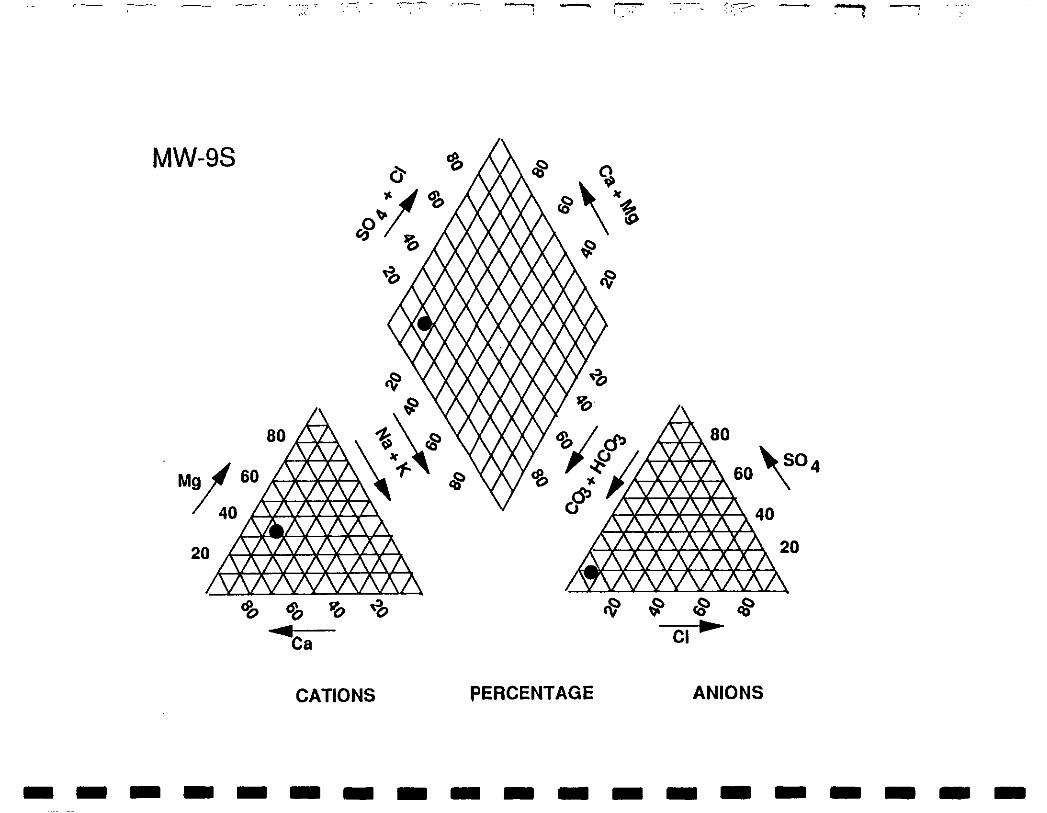
-
MW-98
CATIONS PERCENTAGE ANIONS
-------------------

-----~-----~-~-----
Felter-D
CATIONS PERCENTAGE ANIONS

Bennett-D
CATIONS PERCENTAGE
- .. ..:· ~-
A--i~ao
~c-!r-lr--J\ 60 '\0 4
k--'~~f----ll'--¥-4 40
ANIONS
---, I
-------------------
I I Appendix F I Solid Waste Facilities in Clark County I I I I I I I I I I 0
I I I I I I
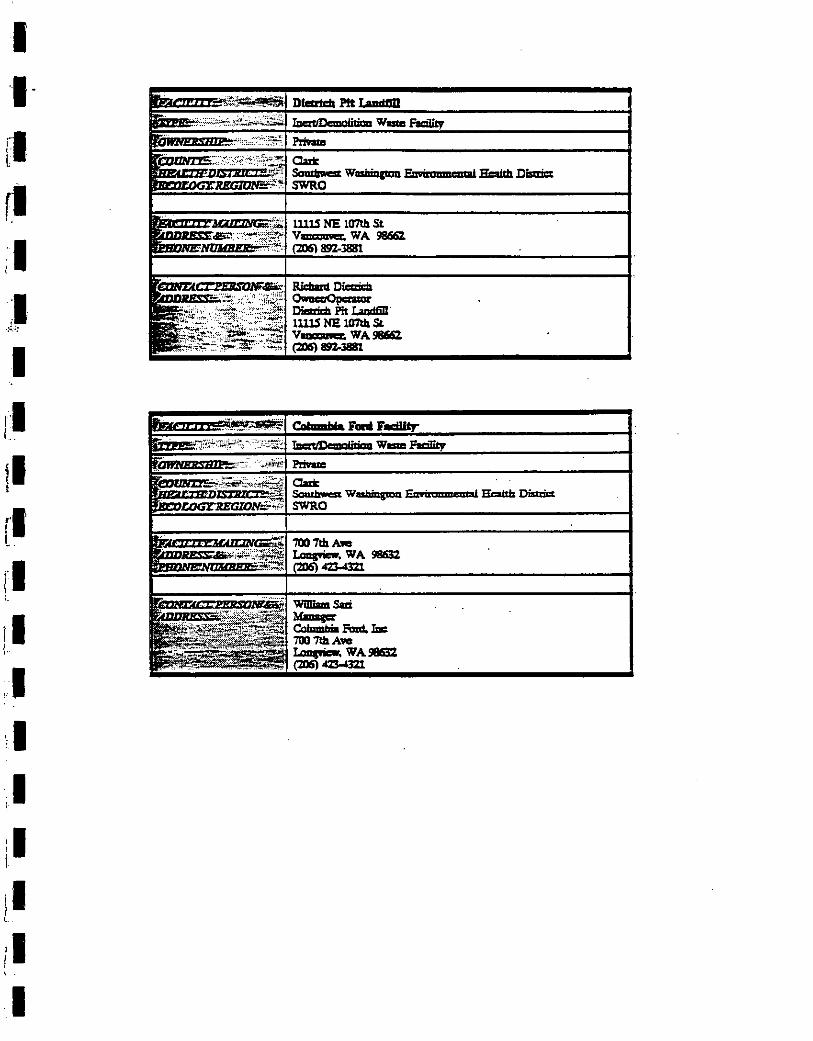
----------
I
··-rl t
rl :I '
:I -~.::
I ~·I 1..
ll l
rl l.
rl !I I
,I ·,I
,I :I I
il L
II ' .
I
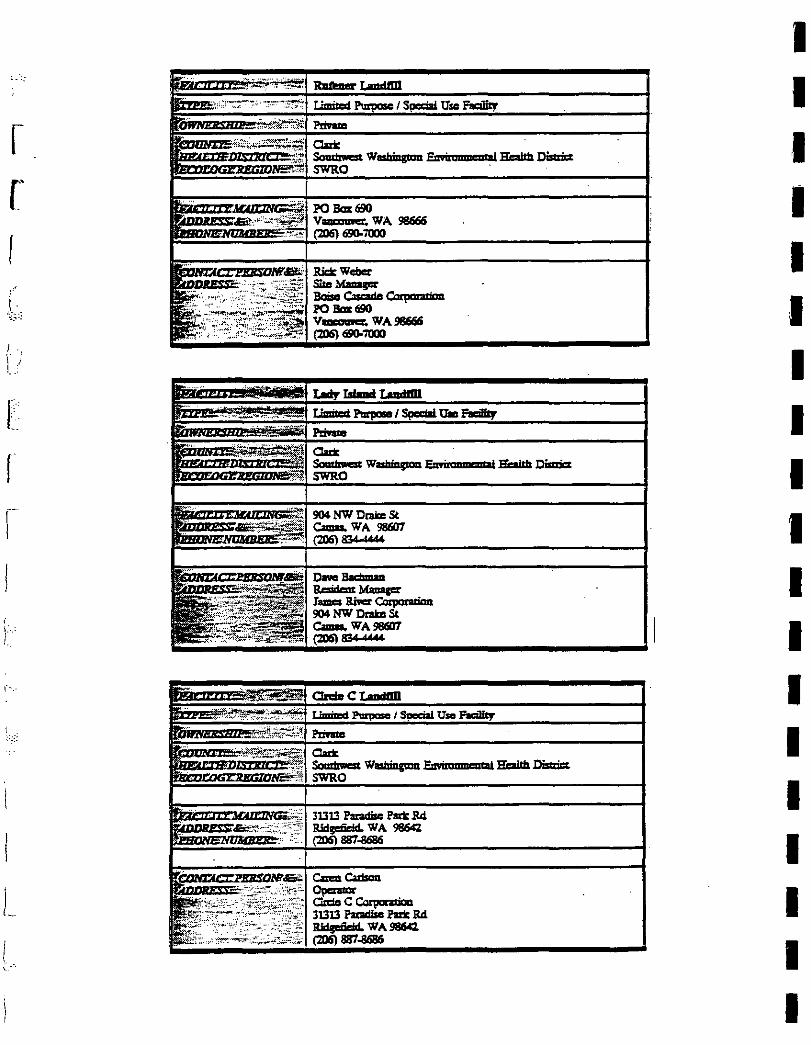
I ... ' I r
r I lJalth .District ,I [ I I I ; I I 1.· ... • ·::o·:
I .
I .\.
1 .. ·
E I l , t B'ailb Disl:ric I r- I
DaveB-+-a I pesjrimr M.auager r ...... River Coqloraliml
i 904 NW Draloo St
) c.m., WA 9IW1T I 834UU
1"• ... I ~:::: I
I I
L I '. I
I
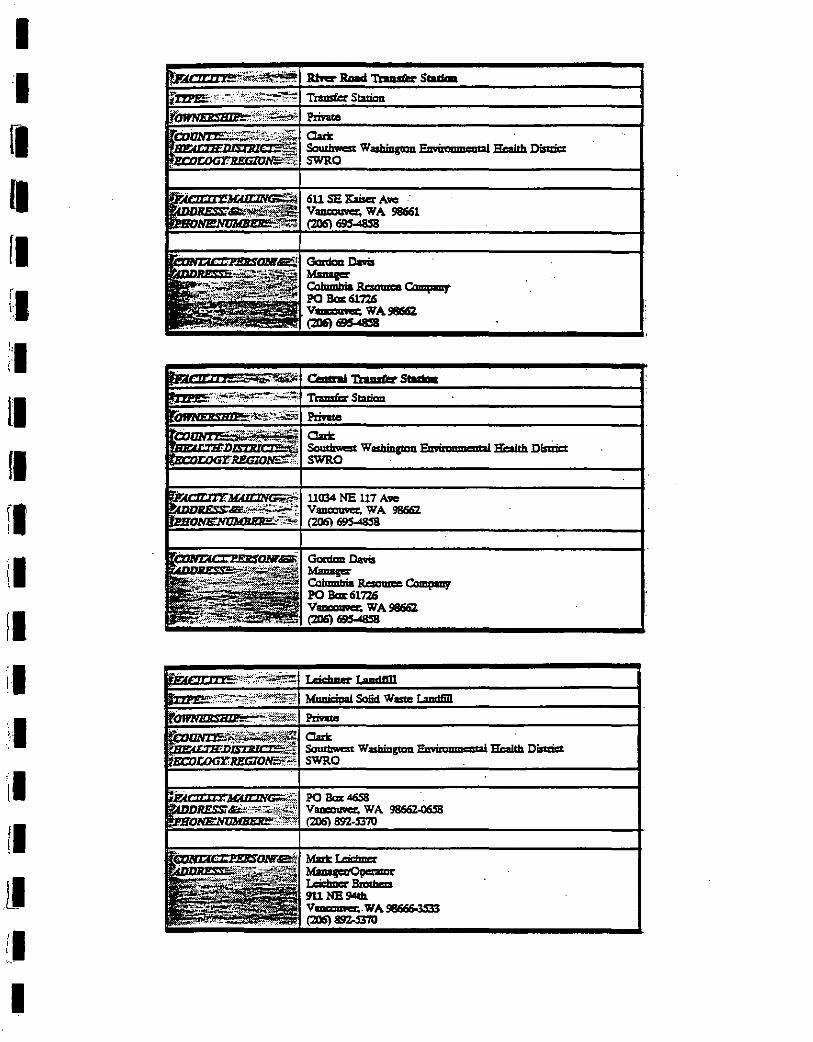
I I II fl
fl f:l !,I i
ll fl
11034 NE 117 A,..
fl . . Vam:auver. WA 98662 ~
II ll il tJ ill II Ll II I
I I I I I I I I I I I I I I I I I I I
Appendix G Leaking Underground Storage Tank Site List
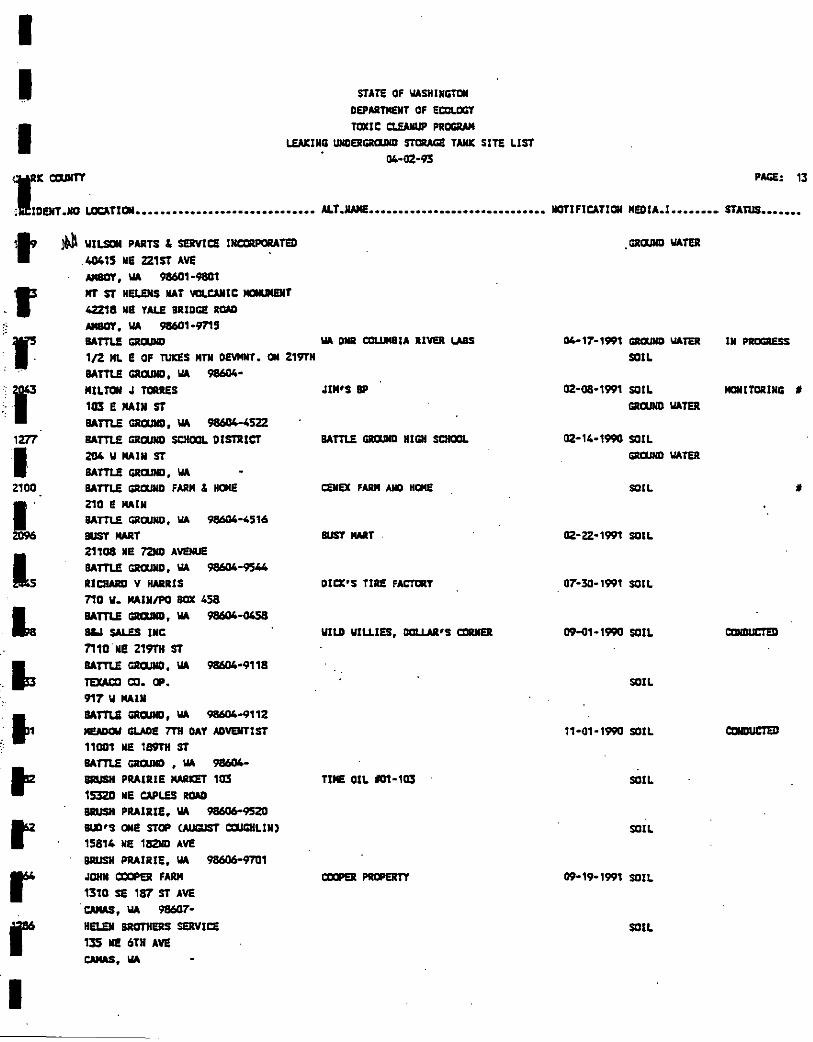
I I I
STATE OF IIASHINGTCII
DEPAIITMENT OF EalUXIT
TOXIC CI.EAIIUP PRCIGRNI
LEAICING UNDEIIGIIIUIII STDIIAGI! TANK SITE LIST 04•02·93
IK COJIITT PAGE: 13
DENT.XO UOCATIOM •••••••••••••••••••••••••••••• ALT.&AME •••••••••••••••••••••••••••••• NOTIFJCATIDN MEDIA.l •••••••• STAtuS •••••••
t Jllll IIILSCII PAIITS & SERVICE INCCRPCRATED GRIJJIIII \lATER
. 40415 liE 221ST AVE
-· \lA
986111·9801
_f In' ST HELENS IIAT 'IQLCAIIIC _.JMENT
42%18 liE TALE BRIDGI! RQNI .,
-· \lA
986111-ms ;: ,r IIATTU GRaJIIII IIA DNR c:au..aiA RIVER LABS 04-17·1991 GRaJIID \lATER
1/2 ML E OF 1\JICES MTN DevMNT. 011 219TH SOIL IIATTU GRIJJIIII, \lA 98604·
IN PIIOGRESS
:·f MILTON J TORRES JIM'S BP 02·08•1991 SOIL
103 E MAIN ST GRIJJIIII \lATER
IIATTU GRIJJIIII, \lA 98604-4522
1277 IIATTU GRaJIIII SCHOOL DISTRICT IIATn£ GRaJIIII HIGH SCHOOL 02·14•1990 SOIL
I 204 II MAIN ST GRl1JIID \lA TEll
IIATTU GRIJJIIII, 11A 2100 IIATTU GllaJIIII FAIIM & HOME CEifEX FARM AND HOME SOIL
•• 210 E MAIN BATTl..E GROJND, WA 98604·4516
Z096 BUST MART BUST MAIIT 02·22·1991 SOIL
l 21108 NE 72NO AVEIAJE
IIATTU GllaJIIII, IIA 98604·9544
liCIWIII V HAIIRIS DICK'S TIRE FACTllRT 07·30•1991 SOIL 710 II. MAIN/PO BOX 45a
L IIATTU GRIJJIIII, 11A 98604-0458
K.l SALES INC IIILD IIILLIES, DaLUII'S CDRIIER 09-(11•1990 SOIL
7110 Nl! 219TH ST
~ IIATTU GRIJJIIII, \lA 98604•9118
TEXACD CD. OP. SOIL 917 II MAIN
IIATTU GRIJJIIII, 11A 98604-9112
~ GLADE 7TH OAT ADVENTIST 11•01•1990 SOIL :•.
11 11001 liE 189TH ST
t IIATTU GRaJIIII , IIA 98604-BRUSH PIIAIRII! MARlCET 103 TIME OIL 101•103 SOIL 153211 Nl! CAPLES RQNI
BRUSH PIIAIRII!, IIA 98606-9520 r Bill'S ONE STOP (AUGUST IXIUGIILIN) SOIL 15814 NE 182ND AVE
BRUSH PIIAIRIE, 11A 98606-97111
r JDIIII COOPER FARM CDOPER PlOPERTY 09-19•1991 SOIL 1310 SE 187 ST AVE
CAMAS, IIA 986117•
r HELEN IIROTliERS SERVICE SOIL 135 liE 6TH AVE
CAMAS, IIA
'
I
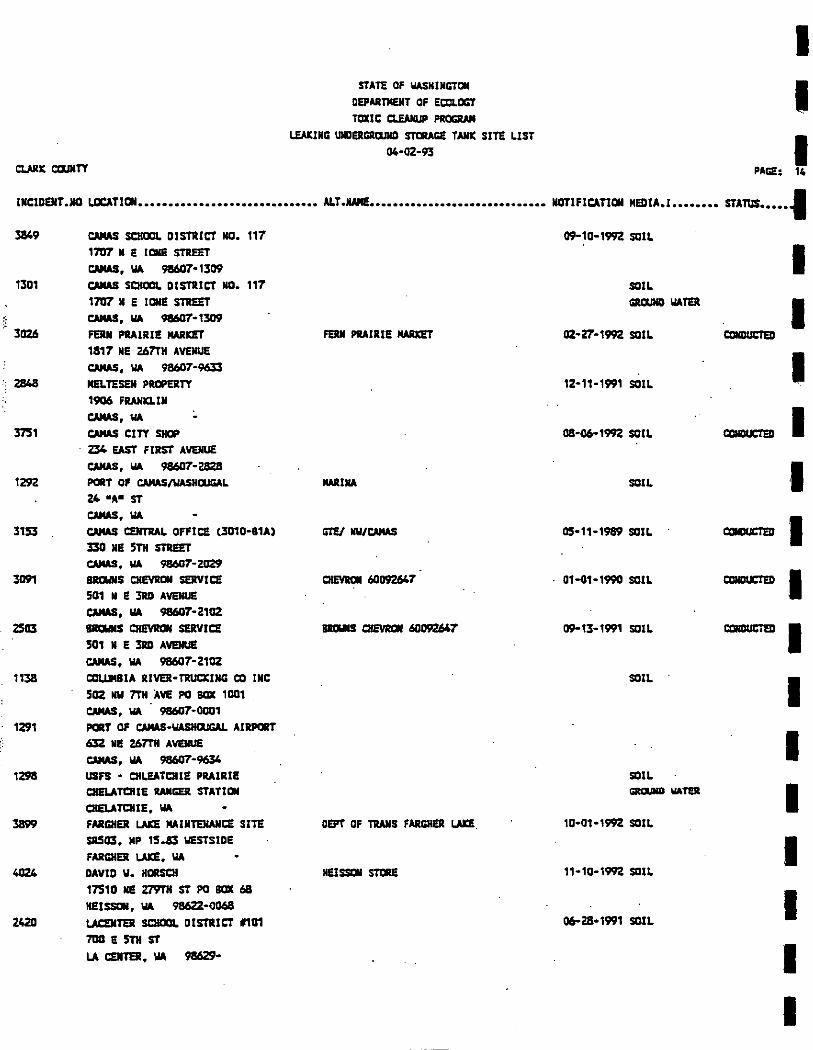
::
:;'.
:
~IC CIJJIITT
STATE OF WASHINGTCII
DEPART11£11T OF ECCI.CGT TOXIC CLEAiaJP PROGIINI
I.EAJ(ING UNDERGIIOJIID STCRAGE TANIC SITE ~1ST 04•02·93
I I I
PAGE: 14
INCIDENT.IO UOClTICN •••••••••••••••••••••••••••••• ALT.JAME •••••••••••••••••••••••••••••• NOTIFICATION MEDIA.! •••••••• STATUS ••••• ~
3849 CAllAS SCHOOl. DISTRICT NO. 117 09-10·1992 SOIL 1707 N E ICIIE STREET I CAMAS, IIA 98607•1309
1301 CAllAS SCHOOl. DISTRICT NO. 117 SOIL 1707 N E ICIIE STREET GRaDID WATER I CAMS, IIA 98607•1309
31126 FERN PRAIRIE HARICET FERII PRAIRIE HARICET 02·27·1992 SOIL CDIIIlUC!ED 1817 NE 261TH AVENUE
I CAMAS, IIA 98607·9633 MELTESEN PIIIPERTT 12•11·1991 SOIL 1906 FRANICLIN CAllAS, IIA I 3751 CAllAS CITT SHOP 08•06-1992 SOIL CDIIIlUC!ED
· 234 EAST FIRST AVEMUE CAMAS, WA 98607·2S2S
'I 1292 PORT OF CAMASI\IASHaiGAL MARINA SOIL 24 •A• ST CAMAS, IIA
I 3153 CAllAS CENTRAL OFFICE (3010·81A) rrrEI Nil/CAMAS 05•11·1989 SOIL CDIIIlUC!ED 330 NE 5TH STREET CAMAS, IIA 98607·2029
3091 BRQjll$ CHEYRCII SEliVICE CIIE'I1Ial 60092647 · 01-D1•1990 SOIL CDIIIlUC!ED I 501 N E 3RD AVENUE CAMAS, IIA 98607·2102
2503 IIIICIWIIS CHEYRCII SEliVICE 8lllliiiS t:IIEVRCII 60092647 09-13•1991 SOIL CDIIIlUC!ED I 501 I E 3RD AVENUE CAllAS, IIA 98607·2102
1138 ~lA RIVER•l'liUCI:IHG CO INC SOIL
I 502 1111 7TH AVE PO BOX 1001 CAMAS, IIA 98607·0001
1291 PORT OF CAIIAS•IIASifaiGAL AIRPORT
I 632 ME 261TH AVENUE CAMAS, IIA 98607·9634
1298 USFS • CHLEATCHIE PRAIRIE SOIL CHELATCHIE RANGER STATICII Gllalllll WATO I CHELATCHIE, IIA FARGHER I..A1CE MAINTENANCE SITE DEPT OF TRANS FARGHER I..AICE. 10•01•1992 SOIL
SRS03, MP 15 .S3 VESTS IDE I FARGHER I..AICE, IIA DAVID II. HORSCH HEISSON STORE 11•10·1992 SOIL
17510 NE Z7'9TH ST PO BOX 68
I HEISSCII, 11A 98622•0068 2420 LACEIITER SCHOOl. DISTRICT M101 06-28•1991 SDIL
700 E 5TH ST
I LA CENTER, IIA 98629·
I
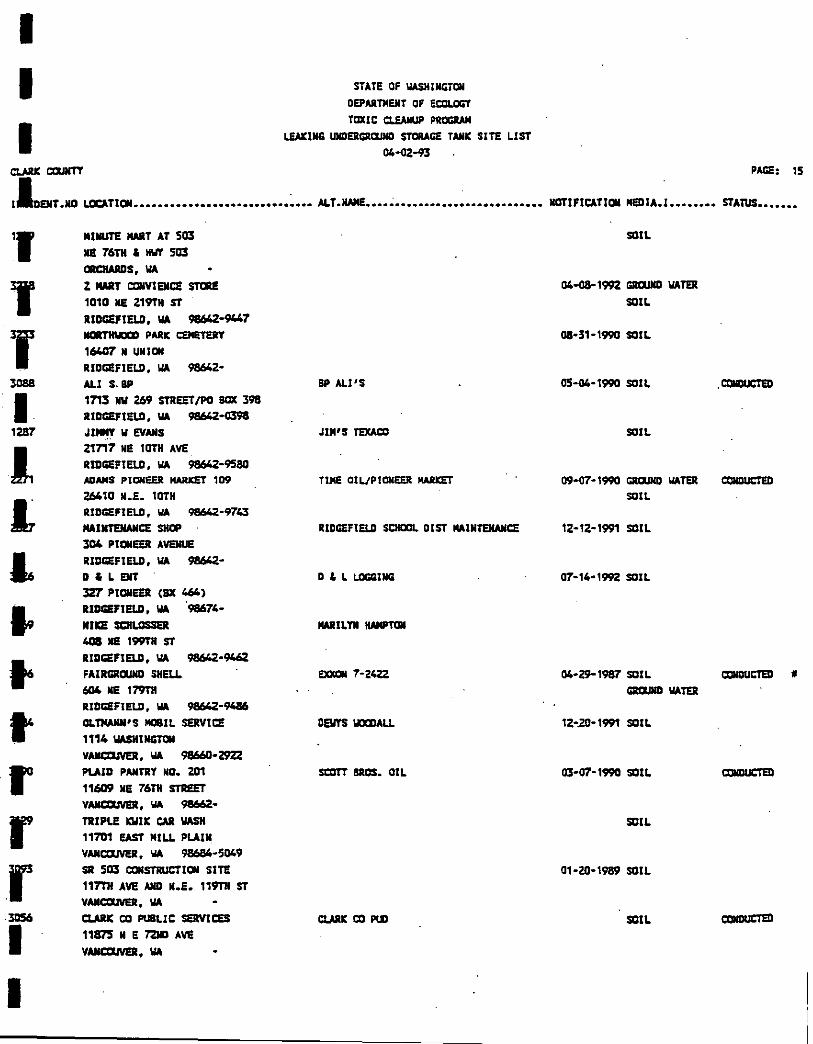
I I I
STATE OF ~HINGTOM
DEFARTMENT DF ECDLCCi'l TOXIC CUA11UP PIICGIWI
WICING UIIDERGRQJIID STCRAGE TANK SITE liST 04•0Z-93
CURl( CIJJIITT PAGE: 15
!JilaENT.NO ~TION •••••••••••••••••••••••••• ~ ••• ALT.NAME •••• ; ••••••••••••••••••••••••• NaTIFICATION MEDIA.! •••••••• STATUS ••••••• ,, IIIIIUTE IWIT AT 503
Ill! 76TH ' HVf 503 ORCIWUIS, \lA
' Z IWIT CDIIVIENCE STCR£ 1010 1111 Z19TH ST
RIDGI!FiaD, 11A 98642·91.47
' -™'«XXX PARK CEIII!TEIIT 16407 N UNION
RIDGEFIElD, \lA 9864Z• 3088 ALl s. BP
I 1713 11V Z69 STREET/PO BOX 398 RIDGEFiaD, \lA 98642·0391
1ZBT JIJIIIT W EVANS
1 Z1T17 NE 10TH AVE RIDGEFiaD, \lA 98642·9580 ADAMS PIONEER IWilCET 109
1 26410 N.E. 10TH RIDGEF!aD, \lA 98642·9743 IIAIIITEHAIIGE SHOP 304 PIONEER AVEIIUE
l RIDGEFIElD, \lA 9864Z· D & l ENT 3'Z1' PIONEER (BX 464)
~ RIDGEFiaD, \lA 98674·
IIIICI! SCIILOSSER 40S 1111 199TH ST
• RIDGI!FiaD, \lA 98642·946Z FAIRGROUND SHEU. 604 1111 179TH RIDGI!F!aD, \lA 98642·9486
t OLTIWIII'S -IL SERVICE 1114 WASHINGTON
YAMCaiVEI. WA 98661J.i!9ZZ
r P\.AID PANTRY NO. ZD1
11609 NE 76TH STREET VAMCaiVEI, WA 9866Z·
r TR I 1'\E ICIIIIC CAR \lASH
11701 EAST IIILL PLAIN VANcaJVEII, \lA 98684·5049
r SR 503 CDIISTRUCTION SITE 117TH AVE AND N.E. 119TH ST VMCDJVEI, WA
-3056 CI.ARIC CO PUBLIC SERVICES
I 11875 N E i'2JID AVE
VAMCaiVEI, \lA
I
BP ALl'S
Jill'S TEXACO
TillE 011./PICIIEER IWIICET
R!DGEFiaD SCHCDL. DIST IIAINTENANCE
D ' l LOGGING
IWIILTH HAMPTON
EXXON 7· 24ZZ
DEll\'$ WIXIlALL
SCOTT BROS. OIL
CLARK CD Pill
SOIL
04.Q8·199Z GRaJIIII WATER
SOIL
08•31·1990 SOIL
05·04·1990 SOIL
SOIL
.CONDUCTED
09•07·1990 GllllUND WATER CONDUCTED SOIL
1Z·1Z·1991 SOIL
07·14•199Z SOIL
04•29-1987 SOIL CONDUCTED t
GRIJJIID \lATER
1Z~20·1991 SOIL
03·07·1990 SOIL
SOIL
01·20•1989 SOIL
SOIL
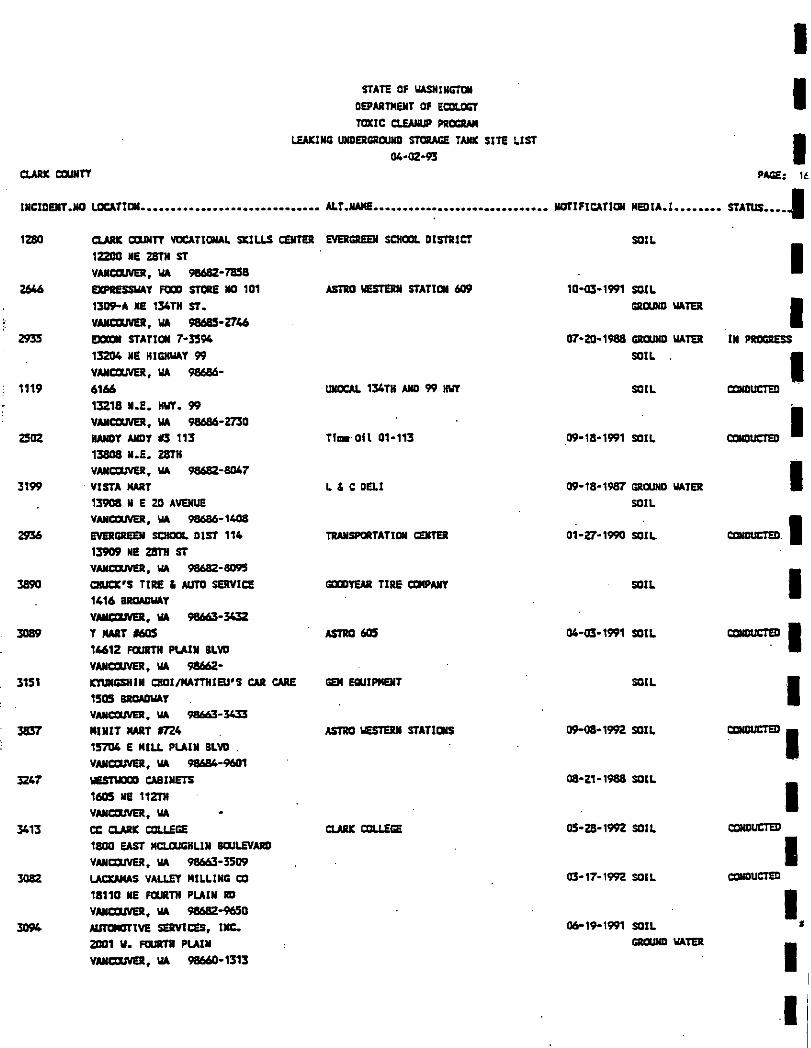
STATE OF IIASlUNGTIJI
DEPAIITMEIIT OF ECDI.OilT
TOXIC C1£AIIUP P11DGRAII
LEAKING UliDERGRaJliD STCI1IAGE TAIUC SITE ~1ST 04•02·93
I I I
CI.ARIC CCUIITT PAGE: 1t
INCIDENT.MO LOCATION •••••••••••••••••••••••••••••• ALT.MAME •••••••••• ~···•••••••••••••••• MOTIFICATION MEDIA.! •••••••• STATUS •••• ~ 1280 C1.AR1C CCUIITT 'lllCATI~ Sl:lU.S CENTER EVERGIIEEJI SCHOlL DISTRICT
1221l0 ME 28TH ST
VAIIcaiVER, \lA 98682·7858
EXPR!SSIIAT FalD STalE NO 101
13119-A ME 134TH ST.
VAIICIIIVEII, 11A 986115•2746 2935 1!D111 STATICII 7•3594
1119
2502
3199
3D89
3151
132114 ME KIGHIIAT 99
VAIIcaiVER, \lA 98686·
6166
13218 M.E. KilT. 99 VAIIcaiVER, 11A 98686·2730
KAIIDT AIIDT 10 113 13808 M.E. 28TH VAIIcaiVER, \lA 98682·8047
· VISTA MART
13908 N E 2D AVENUE VAIIcaiVER, \lA 98686•1408
EVERGIIEEII SC11DD1. DIST 114
13909 NE 28TH ST VAIICIIIVEII, \lA 98682·8095
CHUCIC'S TIRE & AUTII SERVICI! 1416 IIRIIADIIAT
VAIICIIIVEII, \lA 98663· 3432
T MART 111605 14612 FIJJIITII PI.AIN BLVD VAIIcaiVER, \lA 98662·
IC'IUliGSIII N CHDI /MA TTH 1 Bl' S CAR CARE 1505 IIRCIADIIAT VAIICIIIVEII, IIA 98663-3C3
IIINIT MART m4 15704 E MILL PI.AIN BLVD . VAIIcaiVER, \lA 98684·9601
3247 IES'I\IDCD CABINETS
1605 NE 112TH VAIICIIIVEII, WA
3413 CC CLARK CCLLEGE 18DD EAST MCLOUGHLIN BaJLEVAIID
VAIIcaiVER, \lA 98663·3509
3082 U'CIWIAS VALLET MI~LING CO 18110 ME FaJRTH PU'IN RD VAIICIIIVEII, 11A 98682-%50
3D94 AUTtiiOTIVE SERVICES, INC. Zllll1 II. FIJJIITII PI.AIN
VAIICIIIVEII, 11A 98660•1313
ASTRO WE5TERll STATION 609
U1IOCAl. 134TH AND 99 KilT
~ & coat
TRAIISPORTATION CENTER
GIXIITEAll TIRE CIJGIAIIT
ASTRO 605
GEM EGUIPIIEIIT
ASTRO WE5TERll STATIONS
SOIL
I 10•03•1991 SOIL
GRaJ1ID WATER I 07•20•1988 GRaJ1ID WATER IN PRDGRES$
SOIL I SOIL CONDUCTED
09·18•1991 SOl~ CONDUCTED I 09·18·1987 GRQJHD \lATER I
SOIL
01·27·1990 SOIL CONDUCTED I SOIL I
04·03•1991 SOIL CONDUCTED I
SOIL I ~-1992 SOIL CONDUCTED.
08•Z1·1988 SOIL
I DS•Z8·1992 SOIL CONDUCTED
I 03·17·1992 SOIL CONDUCTED
I 06-19-1991 SOIL •
GRaJ1ID WATER
I li
I
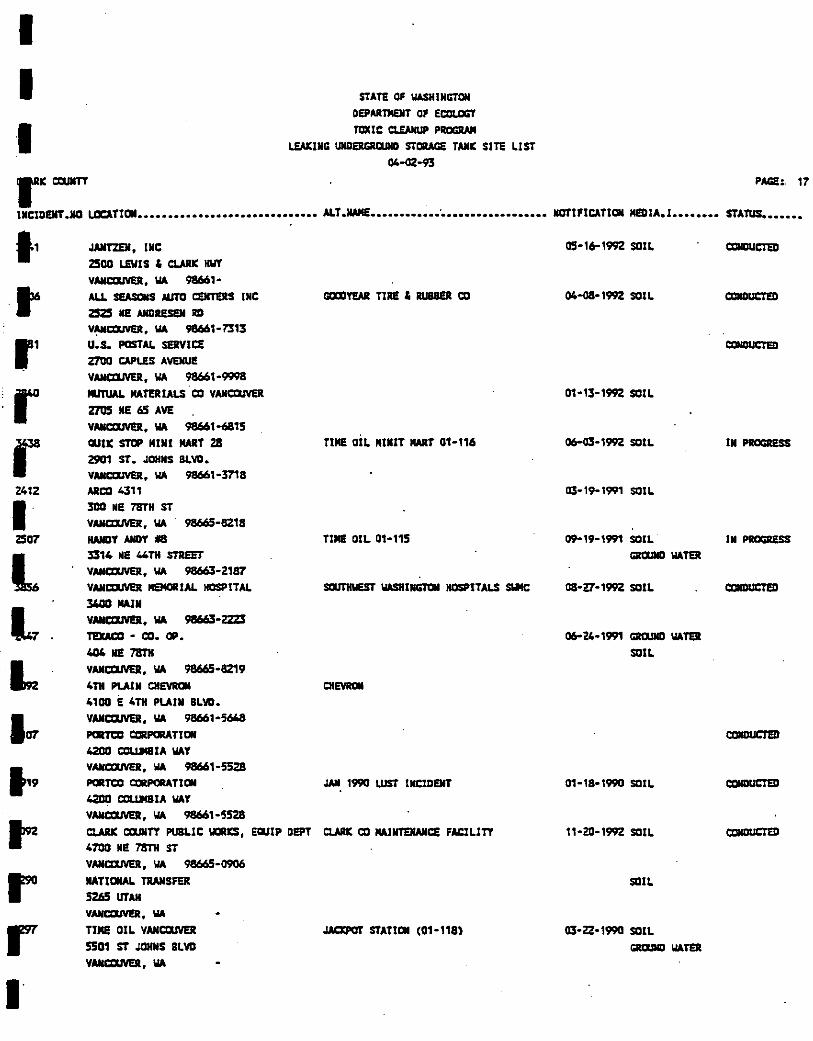
I I I
STATi OF IIASHINGTCII
DEPARTIWIT OF ECDI.CGT
TOXIC CI.EANUP PRDGRNI
L!AICING IJNDERGIDIND STOIIAGI! TAIIIC SITi ~1ST
04~-93
r~ . ~·17
lNClDEKT.ID UOCATtOM •••••••••••••••••••••••••••••• ALT.KaME •••••••••••• ~••••••••••••••••• NOTlflCATICN MEDJA.l •••••••• STATUS •••••••
11 J.UITZEII, INC 05•16-1992 SOIL CliiDUCTm
2500 LEVIS ' CURIC HWT
VAaiCDJVU:' \lA 98661•
t ALL SI!ASDIIS AUTO CI!IITERS INC GalDT1!M TIRI! ' IW88ER CD 04-o8•1992 SOIL CDIIDUCTED
2525 Ill! AIIDIIESSII RD
v~.WA 98661·7313 r1 U.S. POSTAL SERVICE
Z700 CAPU!S AVEIIUE
VANCilJVER, \lA 98661·9998
r III1IIAL MATERIALS CD VANCilJVER 01•13·1992 SOIL
2705 NE 65 AVE
YAIICCJJVO., WA 98661·6815
r CUIIC STeP MINI MART 28 TIME OiL MIMIT MART 01·116 06-C·1992 SOIL IN ptiOC!!!ESS
2901 ST. JaHNS BLVO.
VAIIcaJVER, \.lA 98661·3718
2412 ARCD 4311 03·19·1991 SOIL
I 3011 ME 78TH ST
VANIXXIIIER, \lA 98665·8218
2507 IWIIIT AllOT *II TIME OIL 01•115 09-19·1991 SOIL 11 paoc;pess
L 3314 NE 44TH STliST GIIQJIIII \lATER
VANCXXIIIER, 11A 98663·2187
VANCilJVER MEMORIAL HOSPITAL SOUT1IIIEST IIASRINGTQN HOSPITALS SII!C 08•27·1992 SOIL CliiDUCTm
l7 3400 MAIM
VAIICCJJVO.' \lA 98663·2223 TI!XACD • CD. CP. 06-24•1991 GIIQJIIII 11A TER
404 Ill! 78TH SOIL
L YANCCIIVER, \lA 98665·8219
4TH PLAIN CHEVRQN CHEVRIII
4100 E 4TH PLAIN BLVO.
107 VANCXXIIIER, 11A 98661•5648
PIIITCD CDRPCIIATIDII
4200 CDUIIIIIA IIAT
119 VAIICDUVER, WA 98661·5528
PORTCD CllllPORATIDII JAil 1990 WST INCIDENT 01·18•1990 SOIL CQNDUCTiD 4200 CDUJIIIIA \IAT
VAIICCJJVO.' \lA 98661·5528
tz CLARK caJIITT PUBLIC \IOIIJCS, ECUIP DEPT CLARK CD MAIIITEIWICE FAI:ILlTT 11·2D·1992 SOIL CQNDUCTEll
4700 NE 78TH ST
VAIICCIJVER' \lA 98665·0906 r IIATIDIIA~ TRANSFER SOIL
5265 UTAN
VAIICDUVER, WA
r TIICI! OIL VANCCIIVER JACZPOT STATION (01•118) 03•22•1990 SOIL
5501 ST JOHIIS BL VO GIIIIIIID \lATER
YAIICDUVER, \lA
••
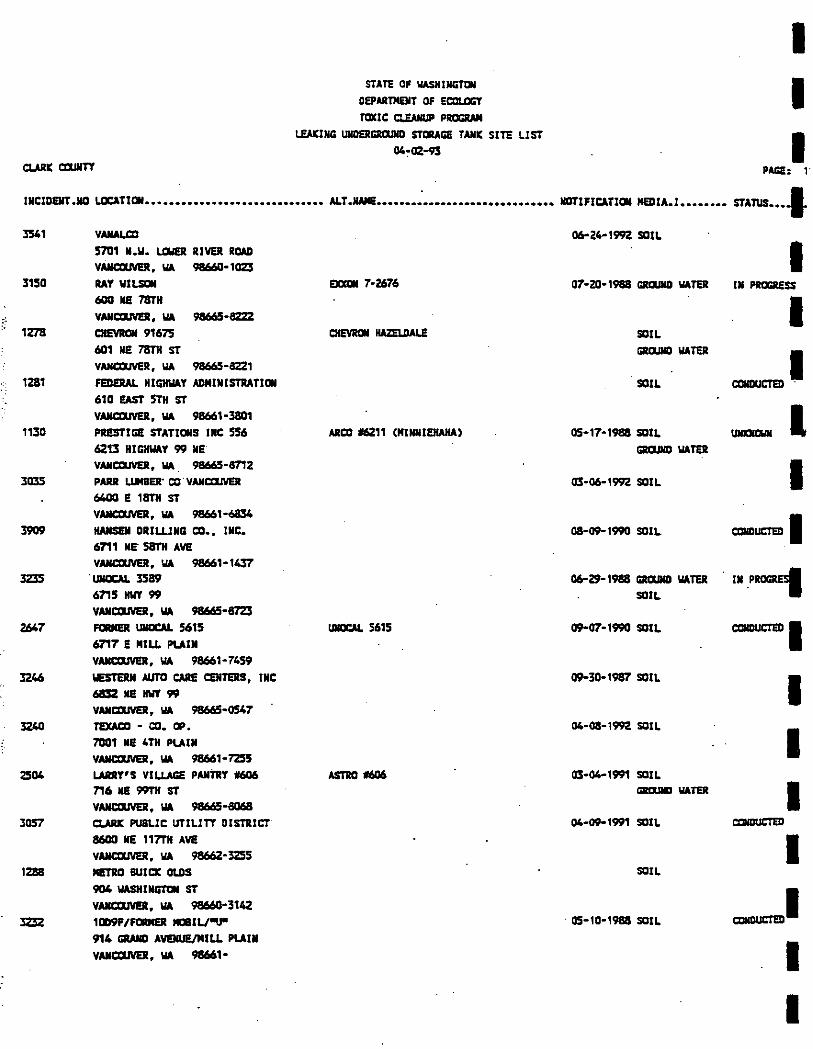
i:~
STATE OF IIASHINGTCII
DEPARTMEIIT OF ECCUJGT
TOXIC ~ PRCGRNI
WICING UNDERGRalllll STORAGE TANIC SITE ~1ST
04~0Z-93
I I I
PAGE: 1·
INCIDEIIT.JIO LDCATlOII ..... ~ •••••••••••••••••••••••• ALT.JIANE •••••••• · •••••••••••••••••••••• JIOIIFICATICII MEDIA.! •••••••• STATUS •••• f 3541
3150
1278
1281
1130
3035
ZH.7
3246
3Z40
2504
3057
12118
VAIIAI.CD
5701 N.W. L.cweR RIVER ROAD VAIICCUIIO, WA 98660•1023
RAf WII.SCII
600 Nl 78TH
VAIIIXIIVEII, WA 98665·82ZZ CHEV11011 91675
601 Nl 78TH ST
VANClUVER, WA 98665·8221
FED~ HIGHWAf AOMINISTRATlOII
610 EAST 5TH ST
VAIIIXIIVEII, WA 98661·3801
PRESTIGE STATlCIIS INC 556 6213 HIGHWAf 99 NE VAIIIXIIVEII, WA. 98665·8712 PARR UMBER' CD. VANIXIIVEII
64011 E 18TH ST
VAIIIXIIVEII, WA 98661·6834
IWISEJI DRILLING CD., INC.
6711 liE' 58TH AVE VAIICCUIIO, WA 98661•1437
. IJIIIXAL 3589
6715 HWf 99 VAIIIXIIVEII, WA 98665•8723
FClRIIER IJIIIXAL 5615 6717 E MILL PUIN
VAIIIXIIVEII, WA 98661·7459
~ AUTO CARE CEMTERS, INC
6II3Z Nl HWf 99 VAIIIXIIVEII, WA 98665•0547 TEXACO • CD. OP. 7001 NE 4TH PLAIN
VAIIIXIIVEII, WA 98661· 7255 ~f'S VILLAGE PANTRf 11606
716 Nl 99TH ST
VAIICCUIIO, WA 98665·8068 CLA1U1: PUBLIC UTILITT DISTRICT
8600 NE 117TH AVE VANIXIIVEII, WA 98662·3255 METIIO BIIICIC OLDS
904 \IASIIINGTCII ST
VAIIIXIIVEII, WA 98660•3142
10D9FIFDIIIIER -ILJ"U" 914 GRAND AVENUE/MILL PLAIN
VAIIIXIIVEII, WA 98661 •
ARCD 16211 (MINNIEHAHAl
UlllCAI. 5615
06-Z4•1992 SOIL
07•Z0•1988 GRI1JIIO WATER
SOIL
GRaJND WATER
SOIL
05•17·1988 SOIL
G1111111D WATER
03•06-1992 SOIL
08·09-1990 SOIL
06-i!9·1988 GRaJND WATER SOIL
09-07·1990 SOIL
09-30• 1987 SOIL
04·08·1992 SOIL
03•04-1991 SOIL GIII1IIID IIA TER
04·09-1991 SOIL
SOIL
· 05•10·1988 SOIL
I INPRCGII£SS
I CDNOUCTED I
I I
CDNOUCTEDI
IN_P~
CDNOUCTED I
I I I I
I I
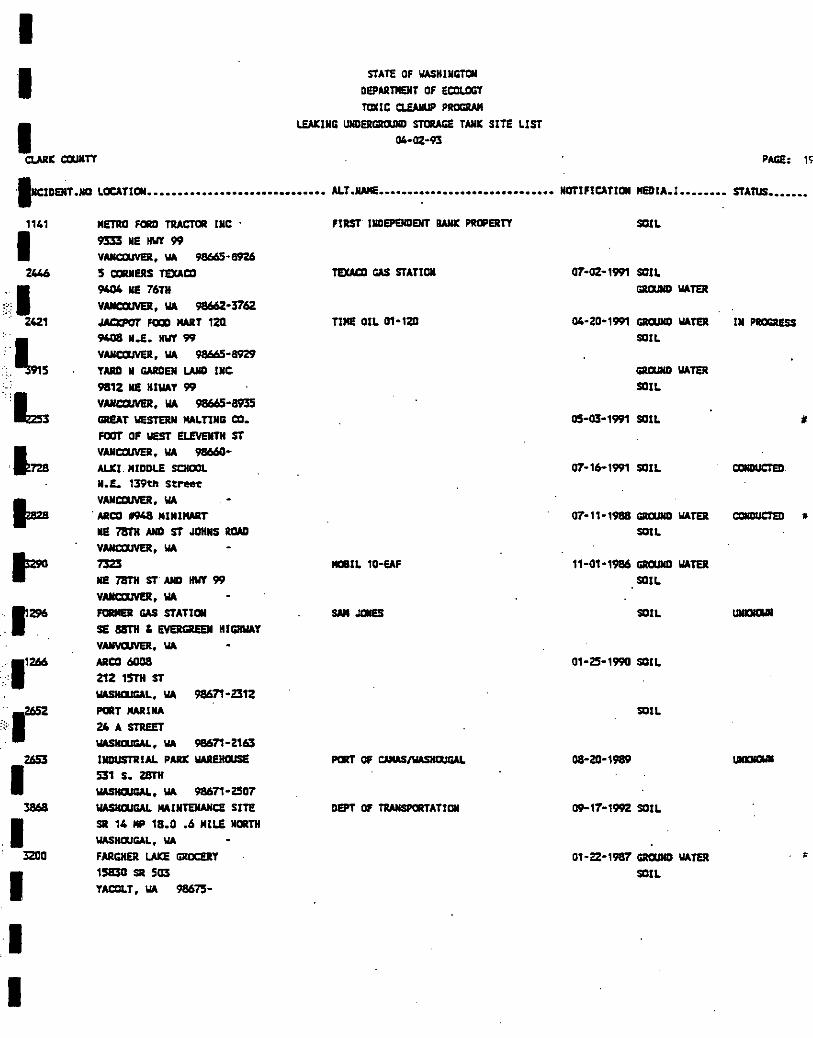
I STATE OF IIASHINGTQI
DEPARTIEIIT OF ECCI.CGT
TaXIC C1.EANUP PRDClWI
WICING UNDERGllllJIID STORAGE TANJ: SITE LIST 04·0Z·93
PAGE: 1~
11-CIDEMT.»D LOCATION •••••••••••••••••••••••••••••• ALT.XAME ••••••• :•••••••••••••••••••••• NOTIFICATION MEDIA.! ••••••• ~ STATUS •••••••
1141
I 2446
;; 12421
.l5 ._;
L
.·.r~
.. 265Z
"~I 12653
I 321l0
I I I
METRO FCRO TRACTOR INC ·
9333 liE M 99 VAIICDJVER, WA 98665·8926
5 aJRIIERS TEXACD 9404 liE 76TH VAIIcaJVER, WA 9866Z•376Z
JACI:PaT FalD MART 120 9408 M.E. M 99 VAIIcaJVER, WA 98665·8929
TARD M GAIIDEM LAIID INC
981Z liE HIIIAT 99 VAIIcaJVER, WA 9866!H1935 GREAT WESTERN MALTING CD. FOOl' OF WEST ELE'1E11T11 ST VANcaJVER, WA 98660•
ALICI MIDDI.E SCIDCI. M.E. 139~ Street YANCCIIVEI, WA
. ARCD 19411 MIIIIMART
liE 78T1I AND ST JDIINS ROAD VANcaJVER, WA
7323 liE 78T1I ST. AND M 99
VANcaJVER, WA
FIIIIIER GAS STATION
SE 8IITH ' EVERGREEN HIGHIIAT VMVa.IVER, WA
ARCD 60118
Z1Z 15TH ST WASMD'G•L, 11A 98671•2312 PORT MARINA
Z4 A STREET lll"'l!t!'G•L, WA 98671·2163 IIIIIIISTRIAL PARI: IIAREHaiSE
531 s. 28T1I \IASIIQIGAL, WA 98671•2507
\IASICaJGAL IIAINTEMAIICE SITE SR 14 liP 18.0 .6 MilE NORTH
WASHQJGAL., WA
FARGIIER LAKE GRCCEl!T
151130 SR 503 TACDlT, WA 98675·
FIRST INDEPEIIDEMT BAliK PIHPERTT
TEXACO GAS STATION
TIME OIL 01• 120
JGIIL10·e1F
DEPT 01 TRANSPORTATION
SOIL
07•0Z· 1991 SOIL GaaJIIll WATER
04·20•1991 GaQJIIll WATER
SOIL
GRaiiiD IIATER
SOIL
05·03•1991 SOIL
07·16•1991 SOIL
07·11· 1988 GaQJIIll IIATER SOIL
11·01•1986 GaQJIIll IIATER
SOIL
SOIL
01•25•1990 SOIL
SOIL
08·20·1989
119-17•1992 SOIL
01· 22· 1987 GaQJIIll IIATER
SOIL
IN PRCGRE5S
CDIIDUC1ED •
I I Appendix H I Toxic Release Quantities
I I I I I I I I I I I I I I I I
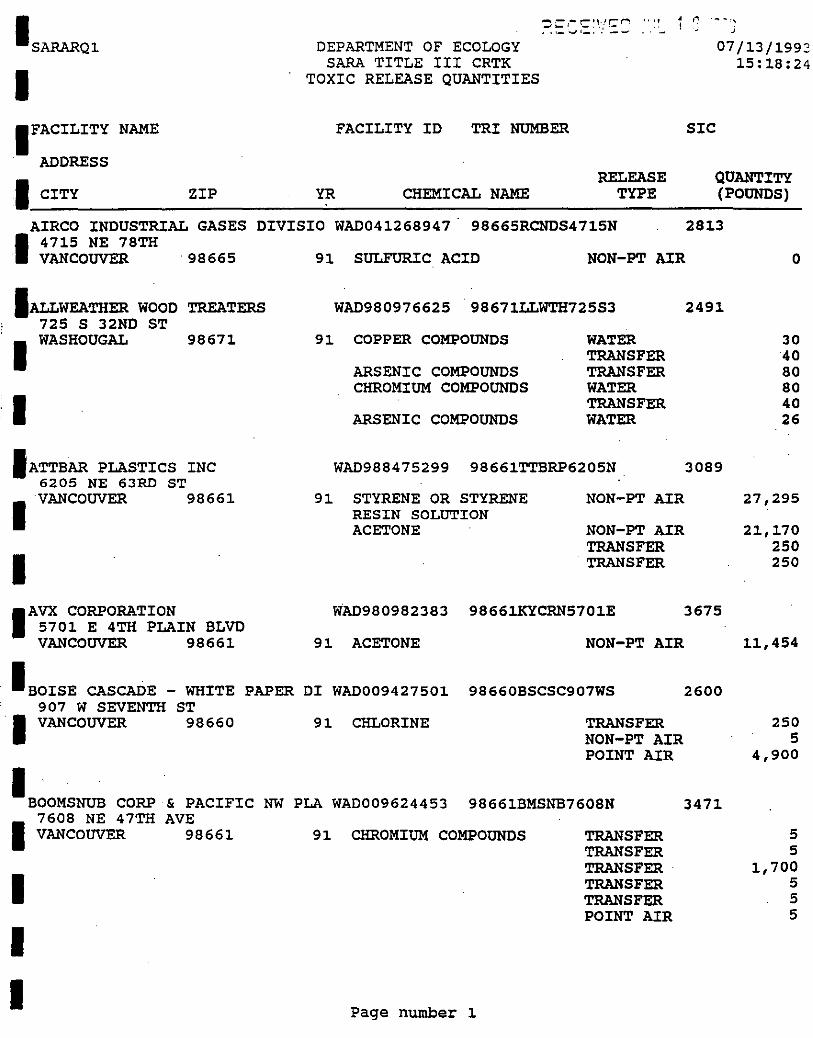
I I FACILITY
ADDRESS
I CITY
NAME
ZIP
AIRCO INDUSTRIAL GASES
I 4715 NE 78TH . VANCOUVER · 98665
- .. -- r-•\·'r~""' .-. ;:, '_, ;::. ~ '... ·.:. ~ , "' 1 r: j
DEPARTMENT OF ECOLOGY SARA TITLE III CRTK
TOXIC RELEASE QUANTITIES
FACILITY ID TRI NUMBER
'lR CHEMICAL NAME RELEASE
TYPE
DIVISIO WAD041268947 98665RCNOS4715N
91 SULFURIC ACID NON-PT AIR
SIC
07/13/1993 15:18:24
QUANTITY (POUNDS)
2813
0
IALLWEATHER WOOD 725 S 32ND ST I WASHOUGAL
TREATERS WAD980976625 98671LLWTH725S3 2491
98671
I IATTBAR PLASTICS INC
6205 NE 63RD ST I VANCOUVER 98661
I I AVX CORPORATION
5701 E 4TH PLAIN BLVD VANCOUVER 98661
91 COPPER COMPOUNDS
ARSENIC COMPOUNDS CHROMIUM COMPOUNDS
ARSENIC COMPOUNDS
WATER TRANSFER TRANSFER WATER TRANSFER WATER
WAD988475299 98661TTBRP6205N
91 STYRENE OR STYRENE RESIN SOLUTION ACETONE
NON-PT AIR
NON-PT AIR TRANSFER TRANSFER
3089
WAD980982383 98661KYCRN5701E 3675
30 40 80 80 40 26
27,295
21,170 250 250
91 ACETONE NON-PT AIR 11,454
.BOISE CASCADE - WHITE PAPER DI WAD009427501 98660BSCSC907WS 2600 907 W SEVENTH ST
.• VANCOUVER 98660
IBOOMSNUB CORP & PACIFIC
I
7608 NE 47TH AVE VANCOUVER 98661
I I I
91 CHLORINE TRANSFER NON-PT AIR POINT AIR
NW PLA WAD009624453 98661BMSNB7608N
91 CHROMIUM COMPOUNDS
Page number 1
TRANSFER TRANSFER TRANSFER· TRANSFER TRANSFER POINT AIR
250 5
4,900
3471
5 5
1,700 5 5 5
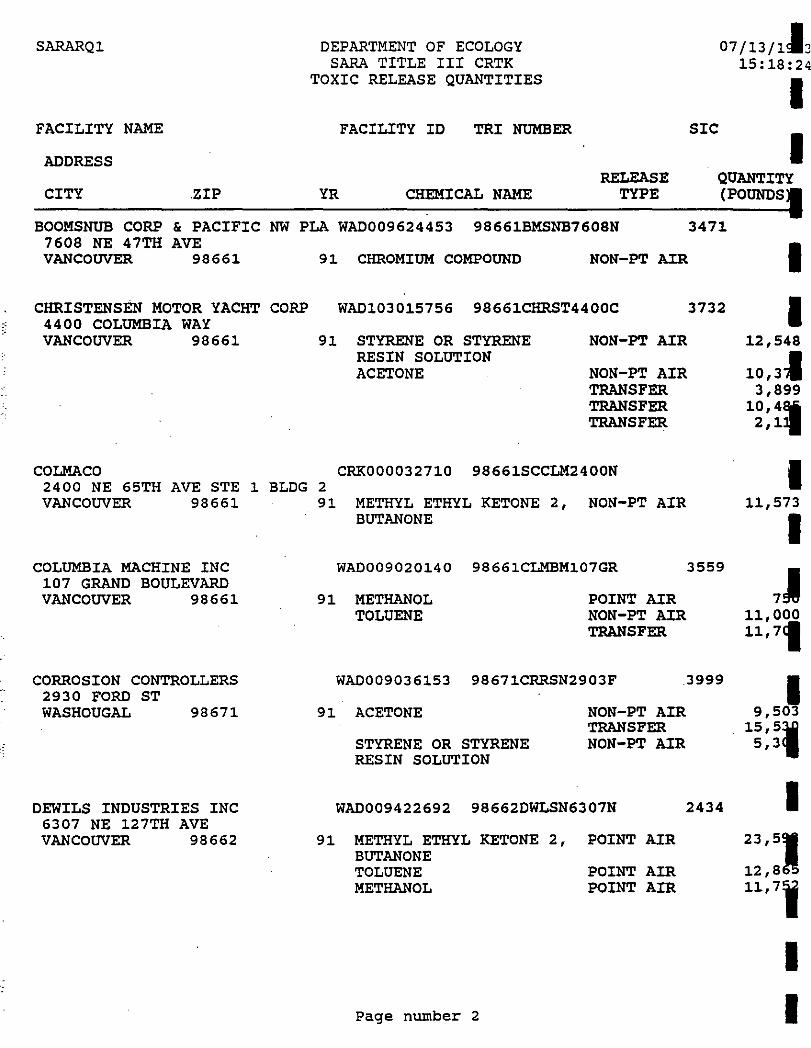
:-.
SARARQ1
FACILITY NAME
ADDRESS
CITY ZIP
BOOMSNUB CORP & PACIFIC 7608 NE 47TH AVE VANCOUVER 98661
CHRISTENSEN MOTOR YACHT 4400 COLUMBIA WAY VANCOUVER 98661
COLMA CO
DEPARTMENT OF ECOLOGY SARA TITLE III CRTK
TOXIC RELEASE QUANTITIES
FACILITY ID TRI NUMBER
YR CHEMICAL NAME RELEASE
TYPE
NW PLA WAD009624453 98661BMSNB7608N
SIC
07/13/113 15:18:24
I I
QUANTITY (POUNDS I
3471
91 CHROMIUM COMPOUND NON-PT AIR I I CORP
91
WAD103015756 98661CHRST4400C
STYRENE OR STYRENE RESIN SOLUTION ACETONE
NON-PT AIR
NON-PT AIR TRANSFER TRANSFER TRANSFER
CRK000032710 98661SCCLM2400N
3732
12,548
10,3 .. 3,899
10,48j 2,1.
2400 NE 65TH AVE STE 1 BLDG 2 I VANCOUVER 98661 91
COLUMBIA MACHINE INC 107 GRAND BOULEVARD VANCOUVER 98661 91
CORROSION CONTROLLERS 2930 FORD ST WASHOUGAL 98671
DEWILS INDUSTRIES INC 6307 NE 127TH AVE
91
METHYL ETHYL KETONE 2, NON-PT AIR BUTANONE
WAD009020140 98661CLMBM107GR 3559
METHANOL POINT AIR TOLUENE NON-PT AIR
TRANSFER
WAD009036153 98671CRRSN2903F .3999
ACETONE
STYRENE OR STYRENE RESIN SOLUTION
NON-PT AIR TRANSFER NON-PT AIR
WAD009422692 98662DWLSN6307N 2434
VANCOUVER 98662 91 METHYL ETHYL KETONE 2, POINT AIR BUTANONE TOLUENE POINT AIR METHANOL POINT AIR
Page number 2
11,573
I 7J
11,000 11,7, I
9,503 15,51 5,3
I 23,51
12,8 11,71
I I
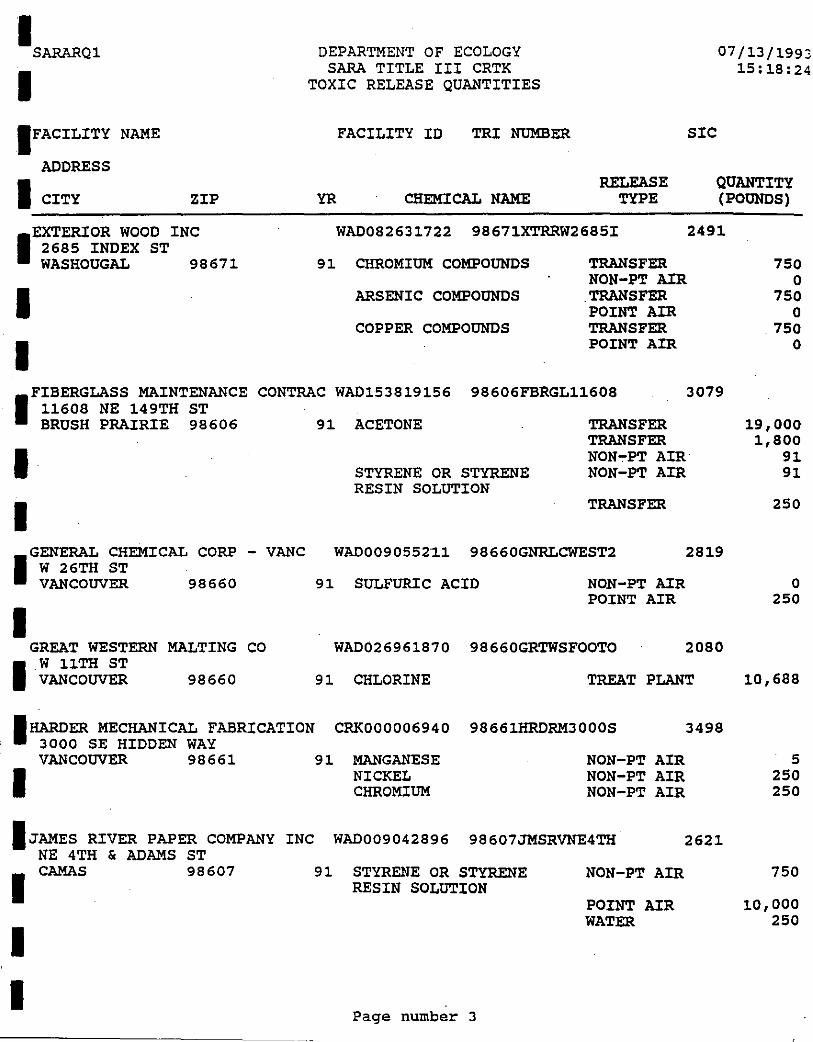
I SARARQ1
I DEPARTMENT OF ECOLOGY
SARA TITLE III CRTK TOXIC RELEASE QUANTITIES
07/13/1993 15:18:24
NAME FACILITY ID TRI NUMBER SIC .FACILITY
ADDRESS
I CITY ZIP YR CHEMICAL NAME RELEASE
TYPE QUANTITY (POUNDS)
•
EXTERIOR WOOD INC 2685 INDEX ST WASHOUGAL 98671
I I
91
WAD082631722 98671XTRRW2685I
CHROMIUM COMPOUNDS
ARSENIC COMPOUNDS
COPPER COMPOUNDS
TRANSFER NON-PT AIR
.TRANSFER POINT AIR TRANSFER POINT AIR
2491
I FIBERGLASS MAINTENANCE
11608 NE 149TH ST BRUSH PRAIRIE 98606
CONTRAC WAD153819156 98606FBRGL11608 3079
I I
CORP - VANC
•
GENERAL CHEMICAL W 26TH ST VANCOUVER 98660
I GREAT WESTERN
I .W 11TH ST VANCOUVER
MALTING CO
98660
•HARDER MECHANICAL FABRICATION
3000 SE HIDDEN WAY
91 ACETONE TRANSFER TRANSFER NON.,-PT AIR NON-PT AIR
91
STYRENE OR STYRENE RESIN SOLUTION
TRANSFER
WAD0090552~1 98660GNRLCWEST2
SULFURIC ACID NON-PT AIR POINT AIR
2819
WAD026961870 98660GRTWSFOOTO 2080
91 CHLORINE TREAT PLANT
CRK000006940 98661HRDRM3000S 3498
VANCOUVER 98661 91 MANGANESE NICKEL CHROMIUM
NON-PT AIR NON-PT AIR NON-PT AIR I
I JAMES RIVER PAPER COMPANY NE 4TH & ADAMS ST I CAMAS 98607
I I
INC
91
WAD009042896 98607JMSRVNE4TH
STYRENE OR STYRENE RESIN SOLUTION
Page number 3
NON-PT AIR
POINT AIR WATER
2621
750 0
750 0
. 750 0
19,000 1,800
91 91
250
0 250
10,688
5 250 250
750
10,000 250
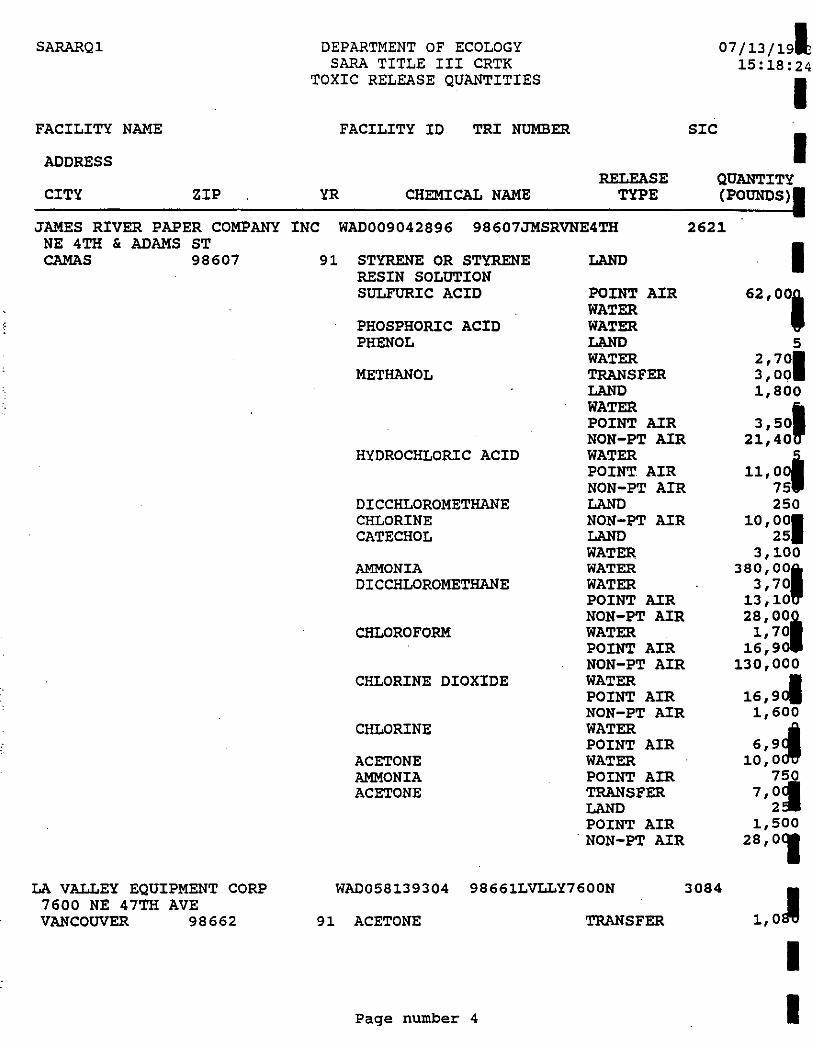
SARARQ1
FACILITY NAME
ADDRESS
CITY ZIP
JAMES RIVER PAPER COMPANY NE 4TH & ADAMS ST CAMAS 98607
LA VALLEY EQUIPMENT CORP 7600 NE 47TH AVE VANCOUVER 98662
DEPARTMENT OF ECOLOGY SARA TITLE III CRTK
TOXIC RELEASE QUANTITIES
FACILITY ID TRI NUMBER
YR CHEMICAL NAME RELEASE
TYPE
INC WAD009042896 98607JMSRVNE4TH
91 STYRENE OR STYRENE RESIN SOLUTION SULFURIC ACID
PHOSPHORIC ACID PHENOL
METHANOL
HYDROCHLORIC ACID
DICCHLOROMETHANE CHLORINE CATECHOL
AMMONIA DICCHLOROMETHANE
CHLOROFORM
CHLORINE DIOXIDE
CHLORINE
ACETONE AMMONIA ACETONE
LAND
POINT AIR WATER WATER LAND WATER TRANSFER LAND WATER POINT AIR NON-PT AIR WATER POINT AIR NON-PT AIR LAND NON-PT AIR LAND WATER WATER WATER POINT AIR NON-PT AIR WATER POINT AIR NON-PT AIR WATER POINT AIR NON-PT AIR WATER POINT AIR WATER POINT AIR TRANSFER LAND POINT AIR
. NON-PT AIR
SIC
07/13/191 15:18!24
I I
QUANTITY (POUNDS).
2621
I 62,001
5 2,701 3,0Q 1,800
3,50' 21,40
11, ooj 75 250
10,001 25
3,100 380,00,
3,70 13,10 28,001 1,70
16,90 130,000
16,9<1 1,600
6,9..i 1o,o:l 750
7,~~ 1,500
28,01
WAD058139304 98661LVLLY7600N 3084
1,01 91 ACETONE TRANSFER
Page number 4
I I
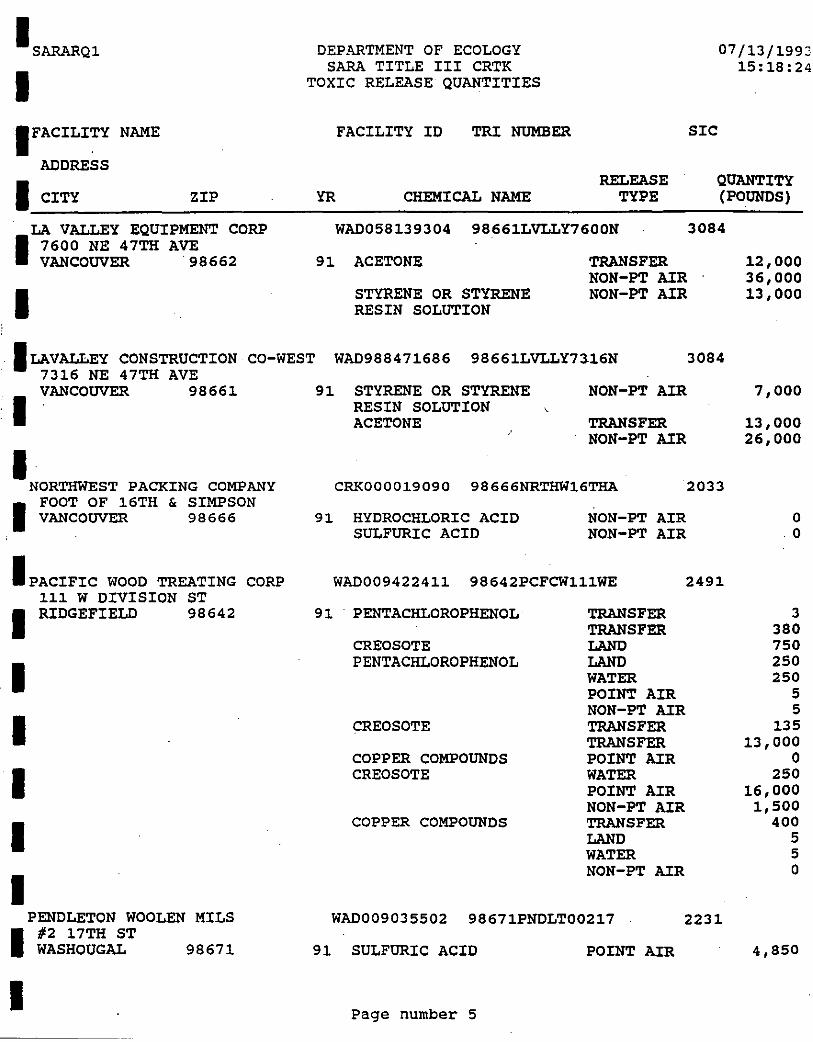
I I FACILITY
ADDRESS
I CITY
NAME
ZIP
LA VALLEY EQUIPMENT CORP
I 7600 NE 47TH AVE VANCOUVER 98662
I
DEPARTMENT OF ECOLOGY SARA TITLE III CRTK
TOXIC RELEASE QUANTITIES
FACILITY ID TRI NUMBER
YR CHEMICAL NAME RELEASE
TYPE
WAD058139304 98661LVLLY7600N
91 ACETONE
STYRENE OR STYRENE RESIN SOLUTION
TRANSFER NON-PT AIR NON-PT AIR
SIC
07/13/1993 15:18:24
QUANTITY (POUNDS)
3084
12,000 36,000 13,000
.• LAVALLEY CONSTRUCTION CO-WEST WAD988471686 7316 NE 47TH AVE
98661LVLLY73.16N 3084
I VANCOUVER 98661
I NORTHWEST PACKING COMPANY
I FOOT OF 16TH & SIMPSON VANCOUVER 98666
I PACIFIC WOOD TREATING 111 W DIVISION ST I RIDGEFIELD 98642
I I I I I
PENDLETON WOOLEN MILS
I #2 17TH ST WASHOUGAL 98671
I
CORP
91
91
STYRENE OR STYRENE RESIN SOLUTION ACETONE
NON-PT AIR
TRANSFER NON-PT AIR
CRK000019090 98666NRTHW16THA
HYDROCHLORIC ACID SULFURIC ACID
NON-PT AIR NON-PT AIR
2033
WAD009422411 98642PCFCW111WE 2491
91 . PENTACHLOROPHENOL TRANSFER TRANSFER
CREOSOTE LAND PENTACHLOROPHENOL LAND
WATER POINT AIR NON-PT AIR
CREOSOTE TRANSFER TRANSFER
COPPER COMPOUNDS POINT AIR CREOSOTE WATER
POINT AIR NON-PT AIR
COPPER COMPOUNDS TRANSFER LAND WATER NON-PT AIR
WAD009035502 98671PNDLT00217 2231
91 SULFURIC ACID POINT AIR
Page number 5
7,000
13,000 26,000
0 .o
3 380 750 250 250
5 5
135 13,000
0 250
16,000 1,500
400 5 5 0
4,850
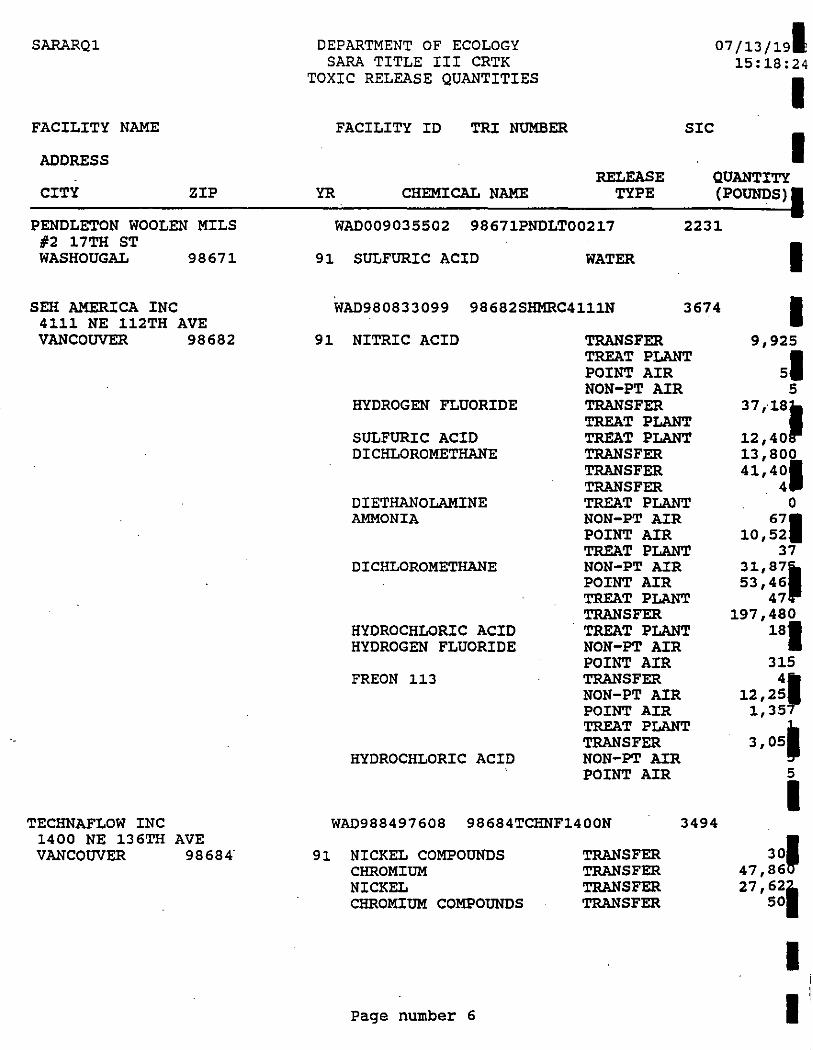
SARARQl
FACILITY NAME
ADDRESS
CITY ZIP
PENDLETON WOOLEN MILS #2 17TH ST WASHOUGAL 98671
SEH AMERICA INC 4111 NE 112TH AVE VANCOUVER 98682
TECHNAFLOW INC 1400 NE 136TH VANCOUVER
AVE 98684.
DEPARTMENT OF ECOLOGY SARA TITLE III CRTK
TOXIC RELEASE QUANTITIES
FACILITY ID TRI NUMBER
YR CHEMICAL NAME RELEASE
TYPE
SIC
07/13/191 15:18:24
I I
QUANTITY (PoUNDs) I
WAD009035502 98671PNDLT00217 2231
91 SULFURIC ACID WATER
WAD980833099 98682SHMRC4111N 3674
91 NITRIC ACID
HYDROGEN FLUORIDE
SULFURIC ACID DICHLOROMETHANE
DIETHANOLAMINE AMMONIA
DICHLOROMETHANE
HYDROCHLORIC ACID HYDROGEN FLUORIDE
FREON 113
HYDROCHLORIC ACID
TRANSFER TREAT PLANT POINT AIR NON-PT AIR TRANSFER TREAT PLANT TREAT PLANT TRANSFER TRANSFER TRANSFER TREAT PLANT NON-PT AIR POINT AIR TREAT PLANT NON-PT AIR POINT AIR TREAT PLANT TRANSFER TREAT PLANT NON-PT AIR POINT AIR TRANSFER NON-PT AIR POINT AIR TREAT PLANT TRANSFER NON-PT AIR POINT AIR
WAD988497608 98684TCHNF1400N 3494
91 NICKEL COMPOUNDS CHROMIUM NICKEL CHROMIUM COMPOUNDS
Page number 6
TRANSFER TRANSFER TRANSFER TRANSFER
I I
9,925
sl 5
37 ,18.
12,40. 13,800 41,4~1
0 671 10,52
37 31,87' 53,46
47 197,480 181
315
12,2~· 1,35 ..
3,05'
5
I 30,
47,86 271 62i.
sol
I I
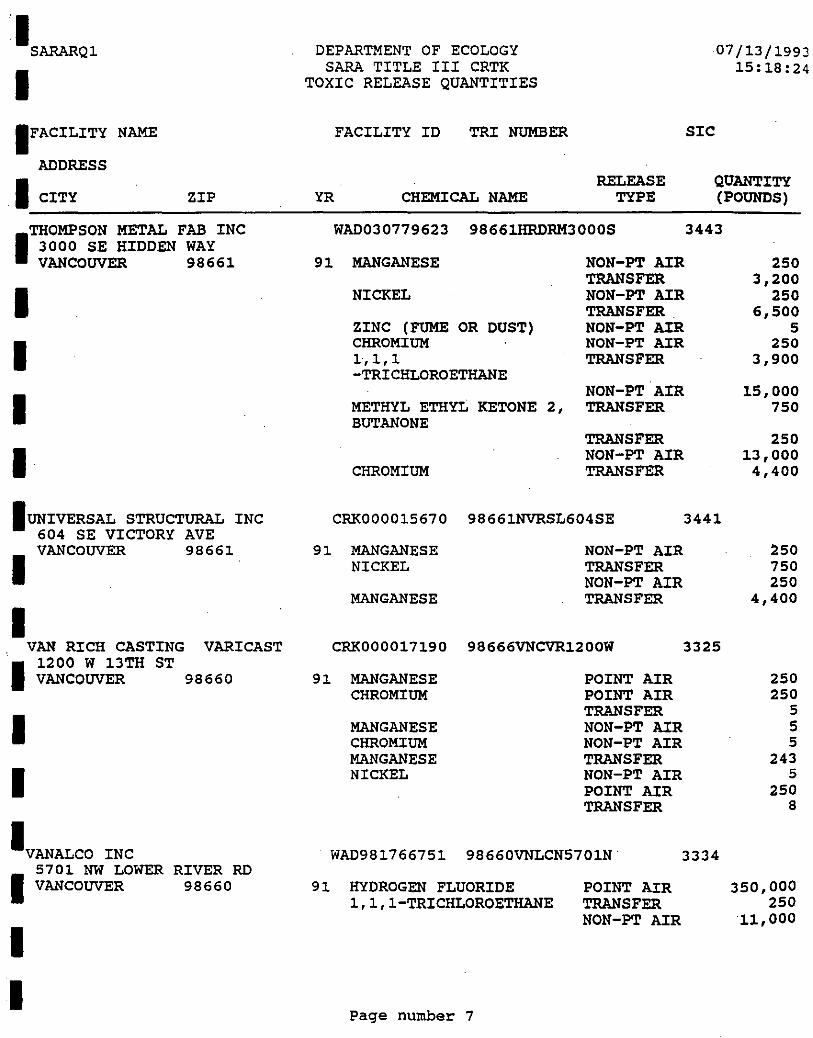
I SARARQ1
I I FACILITY
ADDRESS
.I CITY
NAME
ZIP
THOMPSON METAL FAB INC
I 3000 SE HIDDEN WAY VANCOUVER 98661
I I I I .UNIVERSAL STRUCTURAL INC
604 SE VICTORY AVE I VANCOUVER 98661
I VAN RICH CASTING
I 1200 W 13TH ST VANCOUVER
I I
IVANALCO INC
VARICAST
98660
I 5701 NW LOWER VANCOUVER
RIVER RD 98660
I I
DEPARTMENT OF ECOLOGY SARA TITLE III CRTK
TOXIC RELEASE QUANTITIES
FACILITY ID TRI NUMBER
YR CHEMICAL NAME RELEASE
TYPE
WAD030779623 9866~RM3000S
91 MANGANESE
NICKEL
ZINC (FUME OR DUST) CHROMIUM 1·, 1,1 -TRICHLOROETHANE
NON-PT AIR TRANSFER NON-PT AIR TRANSFER. NON-PT AIR NON-PT AIR TRANSFER
NON-PT AIR METHYL ETHYL KETONE 2 1 TRANSFER BUTANONE
TRANSFER NON-PT AIR
CHROMIUM TRANSFER
07/13/1993 15:18:24
SIC
QUANTITY (POUNDS)
3443
250 3,200
250 6,500
5 250
3,900
15,000 750
250 13,000
4,400
CRK000015670 98661NVRSL604SE 3441
91 MANGANESE NON-PT AIR NICKEL TRANSFER
NON-PT AIR MANGANESE TRANSFER
CRK000017190 98666VNCVR1200W 3325
91 MANGANESE POINT AIR CHROMIUM POINT AIR
TRANSFER MANGANESE NON-PT AIR CHROMIUM NON-PT AIR MANGANESE TRANSFER NICKEL NON-PT AIR
POINT AIR TRANSFER
. WAD981766751 98660VNLCN5701N. 3334
91 HYDROGEN FLUORIDE 1,1,1-TRICHLOROETHANE
Page number 7
POINT AIR TRANSFER NON-PT AIR
:!SO 750 250
4,400
250 250
5 5 5
243 5
250 8
350,000 250
11,000
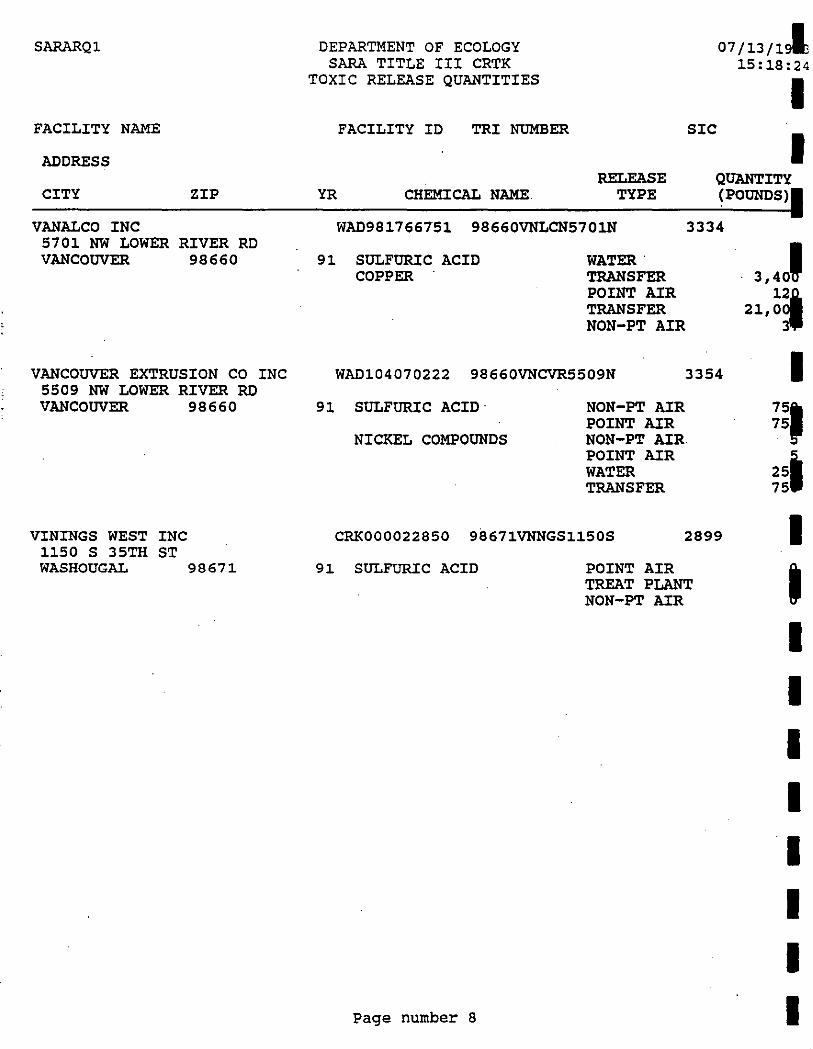
SARARQl
FACILITY NAME
ADDRESS
CITY
VANALCO INC 5701 NW LOWER VANCOUVER
ZIP
RIVER RD 98660
VANCOUVER EXTRUSION CO INC 5509 NW LOWER RIVER RD VANCOUVER 98660
VININGS WEST 1150 S 35TH WASHOUGAL
INC ST
98671
DEPARTMENT OF ECOLOGY SARA TITLE III CRTK
TOXIC RELEASE QUANTITIES
FACILITY ID TRI NUMBER
YR CHEMICAL NAME. RELEASE
TYPE
SIC
07/13/191 15:18:24
I I
QUANTITY (POUNDS).
WAD981766751 98660VNLCN5701N 3334
91 SULFURIC ACID COPPER .
WATER. TRANSFER POINT AIR TRANSFER NON-PT AIR
WAD104070222 98660VNCVR5509N 3354
91
91
SULFURIC ACID·
NICKEL COMPOUNDS
NON-PT AIR POINT AIR NON-PT AIR POINT AIR WATER TRANSFER
CRK000022850 9S671VNNGS1150S 2899
SULFURIC ACID
Page number 8
POINT AIR TREAT PLANT NON-PT AIR
I
' I I I I I I I I
I I I I I I I I I I I I I I I I I I I
Appendix I Analytical Protocol
for CPU Wellhead Protection Program
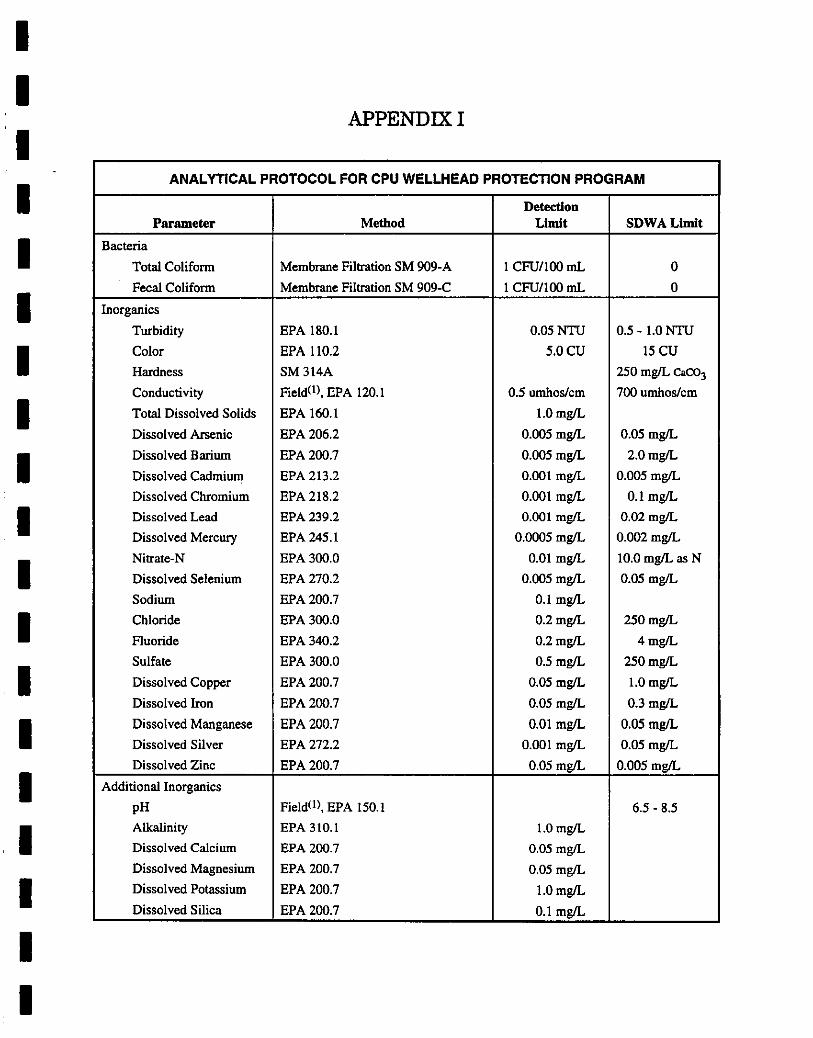
I I I I I I I I I I I I I I I I I I I
APPENDIX!
ANALYTICAL PROTOCOL FOR CPU WELLHEAD PROTECTION PROGRAM
Detection Parameter Method Limit SDWALimit
Bacteria
Total Coliform Membrane Filtration SM 909-A I CFU/!OOml 0
Fecal Coliform Membrane Filtration SM 909-C I CFU/IOOml 0
Inorganics
Turbidity EPA 180.1 0.05NTU 0.5- 1.0 NTU
Color EPA 110.2 5.0CU 15CU
Hardness SM314A 250 mg/L eaco3 Conductivity Fie!d0l, EPA 120.1 0.5 umbos/em 700 umhos/cm
Total Dissolved Solids EPA 160.1 l.Omg!L
Dissolved Arsenic EPA206.2 0.005 mg!L 0.05 mg!L
Dissolved Barium EPA200.7 0.005 mg!L 2.0mg/L
Dissolved Cadmium EPA213.2 0.001 mg/L 0.005 mg!L
Dissolved Chromium EPA218.2 0.001 mg!L 0.1 mg/L
Dissolved Lead EPA239.2 0.001 mg/L 0.02 mg/L
Dissolved Mercury EPA245.1 0.0005 mg/L 0.002mg/L
Nitrate-N EPA300.0 0.01 mg!L 10.0 mg!L as N
Dissolved Selenium EPA270.2 0.005 mg!L 0.05 mg!L
Sodium EPA200.7 0.1 mg!L
Chloride EPA300.0 0.2mg/L 250mg/L
Fluoride EPA340.2 0.2mg!L 4mg!L
Sulfate EPA 300.0 0.5 mg!L 250mg!L
Dissolved Copper EPA200.7 0.05 mg/L l.Omg/L
Dissolved Iron EPA200.7 0.05 mg!L 0.3 mg!L
Dissolved Manganese EPA 200.7 O.Dl mg!L 0.05 mg!L
Dissolved Silver EPA 272.2 0.001 mg!L 0.05 mg!L
Dissolved Zinc EPA 200.7 0.05 mg!L 0.005 mg!L
Additional Inorganics
pH Field0l, EPA 150.1 6.5- 8.5
Alkalinity EPA 310.1 l.Omg/L
Dissolved Calcium EPA 200.7 0.05 mg/L
Dissolved Magnesium EPA200.7 0.05 mg!L
Dissolved Potassium EPA200.7 l.Omg!L
Dissolved Silica EPA200.7 0.1 mg/L
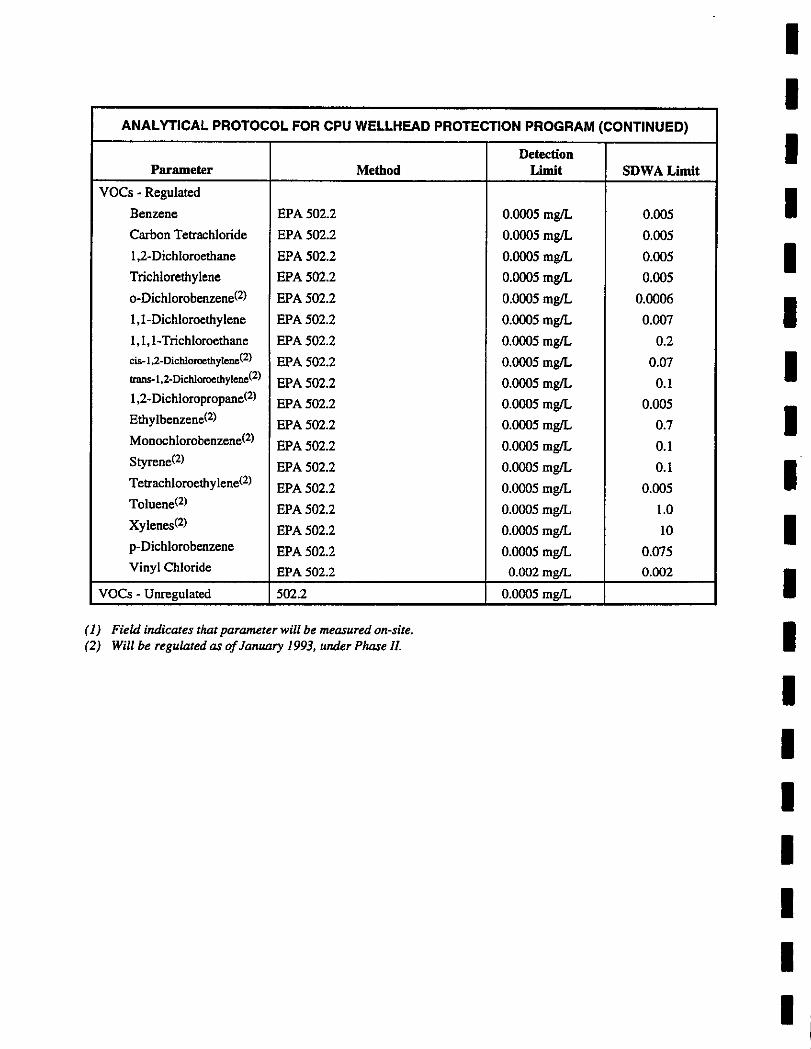
ANALYTICAL PROTOCOL FOR CPU WELLHEAD PROTECTION PROGRAM (CONTINUED)
Parameter Method
VOCs - Regulated
Benzene EPA 502.2
Carbon Tetrachloride EPA 502.2
1,2-Dichloroethane EPA 502.2
Trichlorethylene EPA 502.2
o-Dichlorobenzene(2) EPA502.2
1,1-Dichloroethylene EPA 502.2
1,1,1-Trichloroethane EPA502.2
cis-1,2-Dichloroethylene(2} EPA 502.2 trans-1,2-Dichlorocthylcnc<2) EPA502.2 1,2-Dichloropropane(2) EPA 502.2 Ethylbenzene(2) EPA502.2 Monochlorobenzene(2) EPA502.2 Styrene(2) EPA502.2 Tetrachloroethylene(2) EPA 502.2 Toluene<2> EPA 502.2 Xylenes<2> EPA 502.2 p-Dichlorobenzene EPA 502.2 Vinyl Chloride EPA 502.2
VOCs- Unregulated 502.2
( 1) Field indicates that parameter will be measured on-site. (2) Will be regulated as of January 1993, under Phase 11.
Detection Limit SDWALimit
0.0005 mg/L 0.005
0.0005 mg/L 0.005
0.0005 mg/L 0.005
0.0005 mg/L 0.005
0.0005 mg/L 0.0006
0.0005 mg/L 0.007
0.0005 mg/L 0.2
0.0005 mg/L 0.07
0.0005 mg/L 0.1
0.0005 mg/L 0.005
0.0005 mg/L 0.7
0.0005 mg/L 0.1
0.0005 mg/L 0.1
0.0005 mg/L 0.005
0.0005 mg/L 1.0
0.0005 mg/L 10
0.0005 mg/L O.Q75
0.002mg/L 0.002
0.0005 mg/L
I I I I I I I I I I I I I I I I I I I ,
I
I I Appendix J I Spill Response Planning
I I I I I I I I I I I I I I I I
I I I I I I I I I I I I I I I I I I I
APPENDIXJ
SPILL RESPONSE PLANNING
PLAN DESCRIPTIONS. ROLES. AND RESPONSIBIL TIES
A. OIL AND HAZARDOUS SUBSTANCES ·SPILL CONTINGENCY PLANS
1. National Oil and Hazardous Substances Pollution and Contingency Plan
The purpose of the National Oil and Hazardous Substances Pollution and Contingency Plan (NCP) is to execute the response powers and responsibilities created by the Comprehensive Environmental Response, Compensation, and Liability Act of 1980 (CERCLA) and the authorities established by Section 311 of the Clean Water Act (CWA) as amended.
The NCP operates as the plan for federal actions, which centers on the On-Site Coordinator (OSC) for response to oil spills. Rather than dictating specific actions for the federal On-Site Coordinators (FOSC) or the elements of their support system, the NCP provides a framework of federal responsibilities. The NCP also describes the circumstances under which the federal government will take over and manage response activities for oil spills.
Under the NCP, federal agencies are required to:
• Plan for emergencies and develop procedures for addressing oil discharges and releases of hazardous substances, pollutants, or contaminants.
• Coordinate their planning, preparedness, and response activities with one another.
Page 1 of33 SPILJ.APP.DOC
• Coordinate their planning preparedness and response activities with affected states and local governments and private entities.
• Make available those resources that may be useful in a response situation, consistent with agency authorities and capabilities. In the event of a spill that poses a "substantial threat to public health and welfare," the FOSC is required to direct the response.
National planning and coordination under the NCP is accomplished through the National Response Team (NRT). The NRT is chaired by the Environmental Protection Agency (EPA), and the United States Coast Guard (USCG) serves as vice chair. The NRT membership consists of federal agencies who may be impacted by spill response activities.
2. Oil and Hazardous Substance Pollution Contingency Plan for Federal Region 10
The purpose of the the Regional Contingency Plan (RCP) is coordination of timely, effective response by various federal agencies and other organizations to discharges of oil and releases of hazardous substances, pollutants or contaminants. The primary focus of the plan is to provide guidance for emergency response and removal actions under the provisions of the Clean Water Act, for response actions under provisions of CERCLA, and for regional contingency planning under the provisions of the Superfund Amendments and Reauthorization Act (SARA).
The RCP applies to Washington, Oregon, and Idaho. It is effective for all waters of the U.S. within Region 10, adjoining shorelines, the contiguous zone, and the high seas where a threat exists to U.S. waters, shoreline or bottom. It places responsibility for overseeing the containment, disposal, removal, enforcement and related activities on the predesignated OSC.
Page 2 of33 SPIU.APP.OOC
I I I I I I I I I I I I I I I I I I I
I I I I I I I I I I I I I I I I I I I
This plan is required by the NCP and operates as part of the NCP. Regional contingency plans contain information on regional facilities and resources, and are required by federal law to coordinate with State plans and federal local plans (Puget Sound and Columbia River) to the greatest extent possible.
The plan provides:
• Division of responsibilities among federal, state, and local governments in response actions.
• Procedures for establishing federal, local contingency plans
• Procedures for undertaking response actions in accordance with the CWA and CERCLA.
3. Federal Area Contingency Plans
The purpose of these proposed plans, as authorized by the Oil Poltution Act of 1990 (OPA), is to improve preparedness and response capabilities among federal, state, and local agencies in addition to private industry and responsible parties. The OPA was instituted to strengthen spill planning and prevention activities by providing for the establishment of interagency spill contingency plans for areas of the U.S. mandating the development of response plans for individual vessels and facilities, and requiring the inspection of spill removal equipment.
The OPA requires the establishment of Area Committees under the direction of an OSC. These committees, to be composed of qualified federal, state, and local officials, industry, and citizen groups, will develop Area Contingency Plans specifically addressing potential discharges in that locale. Participants in this process are also responsible for defining the composition and role of the Area Committee in relation to other existing planning and response organizations such as the Regional Response Team (RRT).
Page 3 of33 SPQ.LAPP.DOC
The plans, which have yet to be developed in Washington state, and were scheduled to be reviewed and approved by the EPA and the USCG by August 18, 1992. The Area Contingency Plans are to consider:
• Past spill history in the area.
• Environmentally sensitive areas.
• Concentration of facilities, pipelines and vessels.
• Location of potable water supplies.
• Location of existing planning or response entities.
4. Washington State Emergency Response Plan
5. Washington Statewide Master Oil and Hazardous Substance Spill Contingency Plan (RCW 90.48)
The purpose of the Washington Statewide Master Oil and Hazardous Substance Spill Contingency Plan is to provide a means for effective, efficient, and coordinated statewide response to spills by the Department of Ecology (Ecology) and other state agency spill response personnel. It promotes coordination of the efforts of the entire spill response community including federal, state, local and private entities. The plan (Master Plan) employs a modified Incident Command System (ICS) for spill response. While the Master Plan does not carry the force of law, it does reflect state policy and its terms and responsibilities are intended to be carried out by state agencies and other responding entities.
The Master Plan, as authorized by RCW 90.48, serves to define and describe the roles and responsibilities of state, federal, and local agencies, as well as facility and vessel operators, responsible parties.
Page 4 of33 SPILLAPP.OOC
I I I I I I I I I I I I I I I I I I I
I I I I I I I I I I I I I I I I I I I
private landowners, and interested parties required (or volunteering) to engage in oil spill response procedures. The statewide Master Plan details the specific responsibilities of agencies and other parties in the assessment, containment, and clean-up of various types and sizes of spills.
For purposes of organization and clarity, the Statewide Master Plan has been divided into two documents: (1) a Statewide Master Plan addressing the key policy, statutory, and regulatory requirements of Ecology, other agencies, and the responsible party and (2) an operations document which provides state spill responders and other key agency staff with the necessary hands-on guidelines and information to effectively respond to spill incidents. Both documents recognize that flexibility is required in order to ensure adequate response to a variety of spill circumstances.
Washington state law has established the Department of Ecology as the predesignated state OSC and Incident Commander (IC) for state emergency spill responses in all areas except for those incidents on interstate and state highways where the Washington State Patrol is the IC. Also, in designated areas, where the State Patrol, local law enforcement, or fire district has pre-established IC authority, Ecology will defer. Under Washington state law, Ecology is directed to: (1) identify actions necessary to reduce the likelihood of catastrophic and/or substaritial oil spills (2) identify and obtain mapping of environmentally sensitive areas at particular risk to oil spills: (3) review and approve industry contingency plans (4) establish standards for clean-up contractors (5) establish standards for waste oil disposal (6) establish dispersant use criterion: and (7) establish rules and procedures for conducting practice drills to test the effectiveness of the plan.
The Statewide Master Plan has been written to take into consideration and coordinate the elements of oil spill and hazardous substance contingency plans developed pursuant to other state or federal laws and/or prepared by federal agencies and regional entities. Specifically, the state plan has been written to be in accordance with the federal statute SARA sections 301 and 303, and consistent with both the NCP
Page 5 of33 SPIUAPP.DOC
and the RCP. In addition, the Governor, in accordance with the NCP, has designated Ecology to represent the state on the Region 1 0 RRT.
Ecology has been designated by the Governor, in accordance with the NCP, as the state agency that will direct state-led operations. As such, Ecology is responsible under the state plan for designating the OSC for state-led response action, designating Support Agency Coordinators (SAC} for federal-led response actions, and coordinating and communicating with other state agencies, as appropriate.
To ensure coordination and consistency, the Master Plan has been developed in close cooperation with the state of Oregon. In light of the common environmental and water resources shared by Washington and Oregon, consistency of spill classifications is one way to ensure coordinated and effective responses to the range of spill incidents that occur in the Columbia River.
6. Local Emergency Response Plans
The purpose of Local Emergency Response Plans is to ensure that local governments are prepared for local emergencies involving the spilling of oil or hazardous substances, and to ensure local coordination within the context of federal and state response efforts. Development of these plans are required by the NCP.
Local emergency planning districts are established to facilitate the preparation and implementation of emergency plans. Each Local Emergency Planning Committee (LEPC} is to prepare a local emergency response plan for the emergency planning district and establish procedures for receiving and processing requests from the public for information generated by SARA Title Ill reporting requirements.
Page 6 of33 SPIUAPP.DOC
I I I I I I I I -1
I I I I I I I I I I
-----------------------------------------------------------------------------
I I I I I I I I I I I I I I I I I I I
State policy encourages that the ICS used by the state also be used by the LEPC's. This will facilitate coordination between state and local entities during an oil spill or hazardous substance discharge when the local government provides a first response to protect public safety.
7. Wellhead Protection- Spill Response Plans
In June 1993, the Department of Health issued its "Proposed Wellhead Protection Program" as required by the 1986 Safe Drinking Water Act (SDWA). Under this guidance, the public water system must coordinate with local first responders (e.g. police, fire departments), Ecology's Spill Response Program, the Department of Community Development's Emergency Management Program, and any local emergency planning committee. The water system must evaluate whether changes in incidenUspill response measures are needed to better protect groundwater quality within wellhead protection areas. If a public water system's source is determined to be vulnerable to surface activities, special procedures may need to be incorporated into the local first response plans.
Changes in response may be as simple as ensuring that sufficient quantities of absorbents are on hand to respond to a large transportation spill, or recognition that in the event of a fire, it may be best to allow certain facilities or structures to bum rather than have contaminated runoff pollute the community water supply.
B. SPILL RESPONSE ORGANIZATIONS
1. National Response Team
The National Response Team (NRT) consists of representatives from the various federal agencies. It serves as the national body for planning and preparedness actions prior to a spill and as an emergency advisory center when a spill occurs. The NRT may be activated when requested by an agency representative or when an accident:
• Exceeds the response capability of the region in which it occurs.
Page 7 of33 SPIUAPP.OOC
• Transects regional boundaries .
When activated for a response, the NRT may:
• Monitor and evaluate reports from the OSC and recommend corrective actions to combat the incident.
• Request other federal, state, and local governments or private agencies to provide resources to help combat a discharge or release, or to monitor response operations.
• Coordinate the supply of equipment, personnel, or technical advice to the affected region from other regions or districts.
2. Regional Response Team
The Regional Response Team (RRT), consisting of representatives from selected federal and state agencies, performs functions similar to those performed nationally by the NRT. Essentially, the RRT is the regional body responsible for planning and preparedness before an oil spill occurs, and provides advice to the OSC following such incidents.
The RRT is activated by the occurrence of a major and/or substantial spill as defined by the NCP. the RRT may also be activated by the determination of the FOSC or SOSC that a spill constitutes a substantial threat to the public health and welfare of the United States.
A primary function of the RRT is to ensure that the agencies in its region are prepared to provide assistance. The RRT accomplishes this goal by acting as a coordinating body that brings together federal agency field offices and state and local governments. When an RRT is activated during an incident, its main role is to provide access to member agency resources. Working together, the RRT members fulfills the following roles within their region.
Page 8 of33 SPII.LAPP.DOC
I I I I I I I I I I I I I I I I I I ll
l
I I I I I I I I I I I I I I I I I I I
• Planning - The RRrs have developed regional contingency plans to ensure that response roles and responsibilities of the agencies and states are clear. The plan ensures that in an emergency the governments will be able to respond effectively and efficiently if called upon. The RRrs conduct simulation exercises of plans to test response capabilities. They also review the reports of the OSC's to identify response capability problems in the region. the RRrs may, if requested, review and provide advice on local emergency plans.
• Technical Assistance - If called upon by the OSC, an RRT will provide technical advice and assistance during a response action. The assistance usually takes the form of access to member agency resources and expertise.
• Coordination - The RRT identifies what resources are available from each agency and state in the region, and what existing resources and equipment and what resources are being unnecessarily duplicated. By bringing the agencies and states together, the RRT provides a mechanism for discovering and solving these problems.
The Region 10 RRT is a group of twelve federal agencies and three states (Washington, Oregon, and Idaho) responsible on a region-wide basis for communications, planning, coordination, training evaluation, and preparedness. Ecology coordinates actively with the team and serves as a designated member of the standing RRT.
While the RRT is ongoing and meets quarterly, the committees addressing issues such as dispersant use, oily waste disposal, and insitu burning may meet more often depending on need.
Page 9 of33 SPIL.LAPP.OOC
3. EPA Environmental Response Team
The Enviromnental Response Team (ERT), based in Edison, New Jersey, is established to advise the OSC and RRT on environmental issues surrounding spill containment, clean-up, and damage assessment, with personnel expertise in areas such as treatment technology, biology, chemistry, hydrology, geology, and engineering. The ERTcan:
• Provide access to special decontamination equipment for chemical releases.
• Advise the OSC on hazard evaluation, risk assessment, sampling and analysis, on-site safety, clean-up techniques and priorities, water supply decontamination and protection, application of dispersants, environmental assessment, degree of clean-up required and the disposal of contaminated material.
Reqests for the ERT support should be made to the EPA representative of the RRT: (Director, Emergency Response Division, EPA Headquarters), or the appropriate EPA regional emergency coordinator.
4. Technical Assistance Team
The Technical Assistance Team (TAT) is a contractor used by the EPA Region 10 Office to provide technical oversight at spills and uncontrolled hazardous waste sites. Requests for the TAT are made via the EPA. Once on site, the TAT will report the situation to the EPA duty officer who then decides whether an EPA OSC needs to be on scene.
5. Ecology Spill Response Team
Page 10 of33 SPILLAPP.DOC
I I I I I I I I I I I I I I I I I I I
I I ,I
I I I I I I I I I I I I I I I I
The Ecology Sjpill Response Team consists of Washington State Department of Ecology regional office personnel. This team is responsible for determining the source, cause, and responsible party, as well as initiating enforcement action as appropriate. Additional responsibilities include ensuring containment, clean-up, and disposal are carried out adequately The team coordinates its actions with other state, federal, and local agencies.
6. Natural Resource Damage Assessment Team
Initially, the resource damage assessment program was an Ecologyled effort designed to organize the state natural resource trustee agencies into an effective resource damage assessment task force. The state Natural Resource Damage Assessment (NRDA) team consists of representatives from Ecology, the Department of Fisheries (WDF), the Department of Wildlife (WOW), the Parks & Recreation Commission (PRC), and the Department of Natural Resources (DNR). In the event of a major pollution event which damages natural resources, this committee's mission was to organize personnel, materials, and equipment necessary to conduct reconnaissance evaluations and initiate detailed assessments of natural resource damages.
Recently, due to the complex multi jurisdictional nature of natural resource management, the NRDA team has expanded its membership to include representatives of both federal and tribal trustees. The outcome will be a single, comprehensive resource damage assessment compiled by the team. Damages collected from the responsible party are deposited in the Ecology Coastal Protection Fund for marine oil spills and the Toxics Control Account for inland hazardous substance releases. The NRDA team then authorizes spending from the Coastal Protection Fund for the following purposes:
• Environmental restoration and enhancement projects intended to restore and/or enhance environmental, recreational, or aesthetic resources for the benefit of Washington's citizens.
Page 11 of33 SPIUAPP.DOC
• Investigation of the long-term effects of the discharges, including sewer sludge, on state resources.
• Reimbursement of agencies for reasonable reconnaissance and damage assessment costs.
The assessments performed are conducted pursuant to Chapter 90.48.142 RCW for Oil spills and Chapter 70.1050 for hazardous substances spills. Each of these statutes provides for the recovery of damages in amounts equal to the sum of money necessary to restock the stream, replenish the resource, and otherwise restore the watercourse to its condition prior to injury. Ecology usually conducts the early reconnaissance investigation and then assumes a support role when the trustee agency arrives, normally the WDF or WOW. Any monies recovered as a result of resource damage litigation are transferred to the appropriate account as established by statute.
The major role of Ecology in resource damage assessment is as primary advisor on natural resource issues during a response. Once an incident has been stabilized and resource damages have been mutually assessed Ecology and trustee agencies jointly decide whether to engage the NRDA team and launch a detailed assessment. If it is determined to continue the investigation, Ecology delegates follow up natural resource assessments to the appropriate resource trustee. In situations where a number of trustee agencies are involved, Ecolgoy frequenlty coordinates joint assessments.
The NRDA team is alerted whenever the Ecology Spill Response Center is activated. Response occurs whenever significant resource damages are reported by the Ecology regional staff or one of the cooperating response agencies The NRDA team can also be activated:
• At the request of a state government executive.
• At the request of the Federal RRT member.
Page 12 of33 SPILl.APP.DOC
I I I I I I I I I I I I I I I I I I I
I I I I I I I I I I I I I I I I I I I
• At the request of the OSC.
7. Local Response Team
The Local Response Team (LRT) consists of state and local government agencies, industry personnel, academic organizations, and other private interests which may assist the OSC in pollution response and planning The composition and level of participation in the LRT is dependent upon the area involved, hazard posed, and type of assistance required. Normally, the LRT will consist of state environmental response agency and clean-up contractors.
C. ROLES OF THE RESPONSIBLE PARTY AND ORGANIZATIONS
1. Introduction
Spill response in Washington state may involve the active participation of a significant number of agencies, organizations, and private individuals. For spill response procedures to be effectively executed, each party must be fully aware of their specific roles and responsibilities. Moreover, there must be an understanding of the roles of other parties involved in response activities, as well as effective coordination, cooperation, and communication among responding agencies, organizations, and individuals.
This section describes the specific roles and responsibilities of the key parties which include:
• Responsible party or spiller
• Federal and state agencies
• Local government
Page 13 of 33 SPIUAPP.DOC
• Facility owners
• Contractors
2. The Responsible Party
The primary responsibility for assessing, responding to, and containing an oil spill or discharge falls upon the individual, agency, and/or company responsible for the spill incident. The responsible party (RP), whether there is an approved contingency plan or not, is responsible for containment and clean-up of the spill, disposal of contaminated debris, restoration of the environment and payment of damages. State and federal law specifically require that the removal of a discharge of oil or hazardous substance should be immediate.
Under Washington state law, the responsible party is required to immediately notify the Emergency Management Division (EMD) and the National Response Center. The responsible party is also encouraged to contact the appropriate regional office of the department of Ecology (Ecology). If a hazardous substance is spilled, the RP must follow the procedures of 173.303.145 WAC notification requirements.
The specific responsibilities of the RP are as follows:
• Assessment of spill.
• Establishment of a command post, in concurrence with the OnScene Coordinator(OSC).
• Documentation/identification of type and quantity of oil spilled.
• Containment of the oil spilled and protection of the environment, with a particular emphasis on sensitive areas.
Page 14 of33 SPILI.APP.DOC
I I I I I I I I I I I I I I I I I I I
I I I I I I I I I I I I I I I I I I I
·---------------- ---
• Provision of input relative to clean-up priorities.
• Timely and effective clean-up.
• Disposal of oil and oily waste.
• Restoration of damaged environment/natural resources.
• Communication with local, state, and national response agencies and organizations.
• Communication with media.
• Payment for damages.
• Undertaking steps to prevent reoccurrence of spills
• Wildlife collection and care in conjunction with responsible state, local, and federal agencies.
The RP has the option to conduct damage assessment when required by the state and/or when appropriate given the RP's available resources.
If the spiller is unknown, fails to respond, or if the response is considered to be inadequate by the state OSC (SOSC) or the federal OSC (FOSC), the state or federal agency having jurisdiction may exercise the authority to take over the response and recover expenses from the spiller (RCW 90.48.335).
Under the RCW 90.48.335, 90.48.336, and 90.48.142, Washington state has no limit on the liability of the responsible party for clean-up of the spill or damages caused by the spill. In addition, any party owning oil or having control over oil that enters the waters of the state in violation of RCW 90.48.320 shall be strictly liable, without regard to fault, for the damages to persons or property, public or private, caused by such entry.
Page 15 of33 SPIUAPP.OOC
Under the federal Oil Pollution Act of 1990 (OPA), the RP is liable for:
• Damages to natural resources, including loss of use and reasonable cost of assessing the resource damages.
• The cost of restoring, rehabilitating, or acquiring the equivalent of the damaged resource.
• Damages for injury to or economic loss resulting from damage or destruction of real or personal property.
• Loss of subsistence use of natural resources.
• Damages equal to the net loss of taxes, royalties, etc, due to the damage of property (recoverable by governmental entities only).
• Damages equal to the loss of profits or damage.
• Damages for the net cost of providing discharge incident.
• Interest due on a claim.
Under the MTCA, the RP is similarly liable for all costs of clean-up and damage, including interest (WAC 173-340-550).
3. Environmental Protection Agency
The EPA has primary responsibility for spills that occur on inland U.S. waters not under USCG jurisdiction, and all landspills. As directed by the NCP, the EPA is predesignated as OSC for spills occurring under its jurisdiction.
Specific responsibilities of the EPA include:
• Co-chairing the federal RRT.
Page 16 of33 Sl'lU.AP!'.DOC
I I I I I I I I I I I I I I I I I I I
I I I I I I I I I I I I I I I I I I I
• Providing predesignated OSC for the inland zone if federal oversight or response as required.
• Providing a scientific support coordinator (SAC) for responses in inland areas.
• Providing expertise on environmental effects of oil discharges or releases of hazardous substances, pollutants or contaminants and environmental pollution control techniques.
• Dispatching a Technical Assistance Team (TAT) to spill sites.
• Acting as advisor to the NRDA learn.
• Approving dispersant use and in situ burning in conjunction with the State and the RRT.
In the past, EPA has delegated authority for certain spill response activities to Ecology. Efforts are presently underway to more fully determine the relative roles and responsibilities of EPA and Ecology in spill response. The EPNEcology relationship will be detailed in a Memorandum of Agreement between the two agencies that is currently under development. Both the Memorandum of Agreement (MOA) and a description of its contents will be included in the Statewide Master Plan upon completion.
4. Department of Ecology
Ecology is the lead state agency for environmental pollution response within the State of Washington. As such, it has predesignated the SOSC and the Incident Commander (IC) for many spills occurring in state jurisdiction. In the event of a spill occurring on a state highway, Ecology coordinates with the Washington State Patrol (WSP), which assumes responsibility as IC, and Ecology acts as the lead agency responsible for clean-up activities. The key responsibilities of Ecology include:
Page 17 of33 SPILLAPP.OOC
• Providing 24-hour emergency response to reported spill incidents.
• Notifying the EMD.
• Notifying the United States Coast Guard (USCG) and the Environmental Protection Agency (EPA).
• Determining the source, cause, and responsible party.
• Assuming responsibilities of responsible party if spiller cannot be located or is unresponsive.
• Ensuring that containment, clean-up, and disposal are carried out in a timely and adequate manner
• Monitoring the safety of Ecology spill response personnel.
• Initiating enforcement action as appropriate.
• Effectively coordinating spill response efforts with other state, local agencies.
• Establishing joint information management system with federal, state, and local agencies, and the responsible party.
• Activating and coordinating the Natural Resource Damage Assessment (NRDA) team.
• Participating in the Washington Wildlife Rescue Coalition.
• Notifying the appropriate resource trustee agency if injuq to fish, shellfish, habitat, or wildlife is noted or suspected as a result of a spill.
• Requesting from the National Guard, local fire crews, and lkrison facilities personnel and support equipment for response purposes if necessary via EMD.
Additional responsibilities include:
• Acting as head of the state ICS (a role for the Director or designated representative of Ecology).
Page 18of33 Sl'llLAP!' .DOC
I I I I I I I I I I I I I I I I I I I
I I I I I I I I I I I I I I I I I I I
• Maintaining a list of clean-up contractors.
• Approving industry facility prevention and contingency plans.
• Developing certification procedures for key oil facility personnel.
• Serving as state lead agency under the National Contingenqy Plan (NCP).
• Serving as state representative on the Regional Response Team (RRT).
• Coordinating information management with federal agencies and the RP.
• Providing funding as appropriate for spill response activities.
• Coordinating and documenting the recover of costs incurred by the State during a spill incident.
• Advising parties on the use of dispersants and coordinating their use with appropriate federal agencies.
• Initiating (where Ecology is sole trust agent) a detailed resource damage assessment
• Approving primary response contractors.
• Evaluating and developing clean-up and disposal options.
• Assisting in notification of state agencies.
• Notifying interested parties such as:
Local government
Tribes
Environmental groups
Volunteer organizations
State legislators
Oregon/British Columbia
Page 19 of 33 SPILLAPP.OOC
Ecology will work with public and private parties whose land and other property may be affected by an oil or hazardous substance discharge and assume the following responsibilities:
• Identifying the RP (if known) and explain the role of the RP in responding to the incident.
• Identifying any hazards which exist or might exist as a result of the spill.
• Explaining the activities which Ecology can and cannot do in monitoring or responding to the incident.
• Providing technical assistance, if requested, on issues of clean-up, waste disposal, and other incident related activities.
• Identifying any necessary permits required for clean-up activities.
Although EPA bears primary responsibility for inland spill incidents that occur within the inland zone of Washington, authority for certain spill response activities has been delegated to Ecology. These are to be detailed in a EPA/State Memorandum of Understanding currently under development.
Ecology is divided into four distinct regions across the state. Each region has pre-designated OSC's, and it is this OSC that carries Ecology's primary responsibility in spill response activities within the region in which the incident occurs.
Once alerted to a spill, the SOSC/Ecology may engage in either a monitoring role or a response role, depending on the circumstances of the spill and ongoing response efforts (in the event the spill occurs upon federal lands, the SOSC will respond and assist in clean-up as time and personnel allow, but only after federal agencies have exhausted their clean-up responsibility options.)
Page 20 of33 SP!Ll..APP.OOC
I I I I I I I I I I I I I I I I I I I
I I I I I I I I I I I I I I I I I I I
In a monitoring capacity, the SOSC is responsible for ensuring that the spiller properly manages the initial response and containment effort, clean-up, disposal of contaminated debris and restoration of the environment in a manner that is acceptable to the state, the local jurisdictions, and the public. In addition, the SOSC/Ecology is responsible for coordinating clean-up efforts and representing other state agencies on the RRT.
In the event the SOSC/Ecology determines that the spiler's response is inadequate, or no spiller/responsible party can be located, it may take over response efforts and assume a clean-up role. In this role, Ecology effectively assumes the responsibilities of the responsible party including containment, clean-up, disposal of oily waste and debris, and the restoration of the environment.
5. State Patrol
The Washington State Patrol (WSP) acts as the designated Incident Command agency for incidents on interstate and state highways, and other roads and jurisdictions as delegated. When a spill occurs on a state highway, Ecology joins the Unified Command and acts as the lead agency for clean-up response.
Specifically, the WSP:
• Assists local authorities with local law enforcement operations and evacuations of all persons and property.
• Coordinates and maintains liaison with the State Department of Corrections, WOW, Licensing Commission, Military, DNR, Liquor Control Board, PERC, and the Utilities and Transportation Commission for use of their available personnel and equipment, for reinforcement and special emergency assignments.
• Assists the EMD receive and disseminate warning information to state and local government.
Page 21 of33 SPILL.APP.OOC
• Provides communication resources in support of statewide emergency operational needs.
• Coordinates law enforcement and emergency traffic control throughout the state. Enforces emergency highway regulations.
• Assumes the role of IC on all state, and inter-state highways, and a variety of political subdivisions:
- Currently IC in over 400 political subdivisions, including cities, towns, Ports, counties, and fire districts.
- The WSP is required to provide supervisory assistance to other IC agencies when requested.
• Provides radiological monitoring.
• Provides security at the state Emergency Operations Center (EOC) during disaster operations.
• Provides aircraft for reconnaissance of disaster impacted areas.
• Serves as the lead agency in the state EOC for coordinating disaster law enforceraent activities.
• Provides PIO support to the office of the Governor and the EMD during an emergency, and during recovery operations.
• Serves as Chair of the Emergency Response sub-Committee of the State Hazardous Materials Advisory Committee.
6. Department of Community Development - Emergency Management Division
Washington State Emergency Management Division (EMD) is responsible for:
• Developing and maintaining a hazardous material plan appendix which is part of the State Comprehensive Emergency Managemen Plan.
• Developing and maintaining a State Comprehensive Emergency Management Plan.
Page 22 of33 SPU..LAPP.DOC
I I I I I I I I I I I I I I I I I I I
I I I I I I I I I I I I I I I I I I I
• Maintaining a 24-hour capability to receive notificaiton of incidents and request for assistance and initial notification to local, state, federal response agencies.
• Activating the state Emergency Operations Center (EOC) as needed to coordinate state resource identification and acquisition in support of Ecology response.
• Deploying EMD liaison/coordinator to the Ecology Command Post to support Ecology response activities.
• Providing Public Information Officer (PIO) support to the JIC.
• Maintaining an updated list of NRDA team members submitted by participating agencies.
• Maintaining and updating a notification list of local, state, and federal agencies involved in emergency response.'
• Coordinating the procurement of stae resources for use by the OSC or as requested by local EMD or other designated local response agency or state response agencies.
• Coordinating and participating in emergency exercises and drills.
• Participating in the NRDA team.
7. Department of Fisheries
The Washington State Department of Fisheries (WDF) is a state agency with trustee responsibilities for food fish, shellfish and associated habitats, shellfish and associated structures and facilities, some beach access properties, and assorted equipment which may be affected by large spills of oil or other hazardous materials. Of special concem are near shore, high-value habitats which may be used as nursery grounds for salmonids and other juvenile fish and shellfish or spawning grounds for salmon, herring, smelt, and other fish and shellfish. Additional responsibilities include:
• Identifying sensitive resource areas and habitats.
Page 23 of33 SPIUAPP.DOC
• Assisting in the identification of natural resource injuries.
• Participating in the NRDA team.
• Acting as trustee over food fish resources.
• Issuing (in coordination with WOW) Hydraulic Project Approvals for clean-up and restoration activities.
• Conducting resource damage assessments, enviromnental investigations, and pursue litigation for resources sustaining injury that WDF manages and for which it serves as trustee.
8. Department of Health
The Washington State Department of Health (DOH) has the responsibility for beach closures for human health and safety purposes, utilization of contaminated food organisms, and general health-related matters for the safety of the public. In addition, DOH is to render all appropriate laboratory support and services to the SOSC. DOH is a participant in the NRDA team.
9. Department of Transportation
The Washington State Department of Transportation (DOT) may provide traffic control, equipment, and personnel for non-hazardous clean-up activities on state and interstate highways. The DOT may provide and mobilize equipment necessary in a major spills incident.
10. Department of Wildlife
The Washington State Department of Wildlife (WOW) is a trustee agency responsible for all, wildlife, game fish, and non-game fish. Of special concern and responsibility in the event of an oil spill are water
Page 24 of33 SPILLAPP.DOC
I I I I I I I I I I I I I I I I I I I
I I I I I I I I I I I I I I I I I I I
birds, marine mammals, aquatic furbearers, anadromous game fish, wildlife habitat areas, hatcheries, launching ramps and related facilities, and assorted equipment. Additional responsibilities include:
• Acting as the lead agency responsible for establishing, implementing, and chairing the Washington Wildlife Rescue Coalition which is responsible for coordinating the rescue and rehabilitabon of wildlife injured or endangered by the release of hazardous substances into the environment.
• Specifying and helping to prioritize high value resources for protection.
• Assisting in the determination of clean-up methods and levels consistent with fish and wildlife habitat.
• Assisting in initial reconnaissances of damage assessment efforts.
• Participating in the NRDA team.
• Conducting Resource Damage Assessments, environmental investigations, and pursuing litigtigation (on behalf of resources which WOW manages and for which its serves as trustee).
11. Local Emergency Planning and Emergency Management
Local governments have a duty to be prepared for all disaster emergencies. The EMD is charged with establishing Local Emergency Planning Districts (LEPD) and Local Emergency Planning Committees (LEPC) to facilitate planning efforts.
LEPC's have the responsibility to create local emergency response plans. General requirements for local response plans are contained in Title Ill of the Superfund Amendments and Reauthorization Act of 1986 (SARA). Generally, local agencies, particularly fire services and law enforcement agencies, can be activated to provide emergency
Page 25 of33 SPIL.l.APP.OOC
response services when there is a threat to life and property. Emergency response services may include: fire and explosion controls investigation and documentation, perimeter control, evacuation, traffic controls and initial containment or even removal, depending on the nature of the incident.
The responsibilities of local government's Emergency Management Unit includes:
• Developing and maintaining a hazardous materials "annex" (supplement or appendix) to the State Comprehensive Emergency Management Plan. Local agency responsibilities and actions should be defined with respect to each other, as well as those of participating state and federal agencies.
• Assisting local agencies in preparing their standing operating procedures for hazardous materials incidents.
• Acting as the coordinator for the various local emergency organizations and as the local liaison to Washington State EMD when that agency is involved.
• Contacting local landowners (may also be performed by local Health Department).
• Developing training programs and conducting exercises for local response agencies.
• Participating as a member of the Washington Wildlife Rescue Coalition.
• Establishing a Joint Information Center, (JIC).
• Coordinating and maintaining liaison with local government units (fire, medical, public works, sheriff- law enforcement).
• Providing communications with local government and industry.
The Size of the local government, its resources, and available personnel will greatly influence the existence and scope of local plans. Plans that are developed or updated are to be reviewed by the regional OSC of Ecology.
Page 26 of33 SPil.I..APP.OOC
I I I I I I I I I I I I I I I I I I I
I I I I I I I I I I I I I I I I I I I
D. INCIDENT RESPONSE MANAGEMENT
1. NOTIFICATIONS
The party responsible for a spill is required by state law to notify the following entitles: (1) the National Response Center (NRC) and (2) the Washington State Emergency Management Division (EMD). The responsible party (RP) is also encouraged to contact the nearest appropriate regional office of Ecology.
Phone numbers for agency notification are as follows:
2. FEDERAL NOTIFICATION
Inland spills should be reported to the EPA. The EPA is the predesignated federal On-Site Coordinator (FOSS) for Inland spills under the National Contingency Plan (NCP). All spills of oil or hazardous material into navigable waters must be immediately reported by the spiller to the NRC which is operated by the U.S. Coast Guard (USCG). The NRC will contact appropriate local USCG or Enviromnental Protection Agency (EPA) offices.
Phone numbers for agency notification are as follows:
Environmental Protection Agency -Seattle
National Response Center
3. STATE NOTIFICATION
(206) 553-1263
1-800-424-8802
All spills of oil into waters of the state must be immediately reported to the EMD, which maintains a 24-hour emergency hot line for
Page 27 of33 SPIUAPP.OOC
emergency response. Parties are also encouraged to notify the nearest regional office of Ecology.
For spills of hazardous substances, the spiller is required to notify the nearest regional office of Ecology (consult Chapter 173.303.145 WAC Spills and Discharges for further information on state and local government notification requirements).
Washington State Emergency Managemen Division - 24hour Emergency Spill Response
1-800-258-5990
Once notified, appropriate local, state, and federal entities will be contacted by EMD.
Washington State Department of Ecology - 24hour Emergency Spill Response
Northwest Office - Bellevue
Southwest Office - Olympia
(206)649-7000
(206)753-2353
Notifying EMD or Ecology does not relieve the Responsible Party from also notifying the National Response Center.
4. STATE INCIDENT COMMAND SYSTEM
a. Introduction
Page 28 of33 SPIUAPP.OOC
I I I I I I I I I I I I I I I I I I I
I I I I I I I I I I I I I I I I I I I
The state of Washington's spill response is organized and managed under an Incident Command System (ICS). The ICS is a functional component of a larger program, the National Interagency Incident Management System (NIIMS), which was developed years ago for the interagency management of large forest fires. The ICS, although less complex than the NIIMS, is designed to allow for the day-to-day management of response efforts and resources for all oil and hazardous substance spill responses, from the very small or routine efforts to the largest catastrophic spills involving multi-agency jurisdictions.
Specifically, the system will operate in the following scenarios:
• •
•
Single Jurisdiction/Single Agency
Single Jurisdiction/Multi-Agency
Multi Jurisdiction/Multi-Agency
The ICS concept is built upon teamwork coordination, and cooperation between all entities involved, or potentially involved, in a spill response. Teamwork is encouraged throughout all phases of incident management including the preparedness for, mitigation of, response to, and recovery from a spill of any type or size. Ecology has taken steps to ensure there is effective teamwork, coordination, and participation in the ICS by appropriate state and local agencies in addition to
·the USCG and the EPA. Industry is strongly encouraged to adopt ICS in order to participate effectively in the Unified Command Structure.
b. Unified Command Structure
In Washington state, the ICS will operate using a Unified Command Structure involving representatives of the state
Page 29 of33 SPILlAPP.DOC
(Ecology), federal government (USCG/EPA), industry, and in some circumstances local government. A Unified Command Structure is called for when the spill is multi-jurisdictional in nature, e.g., when public safety and welfare, as well as environmental damage, is imminent.
Under the Unified Command Structure, the three key On-Site Coordinators (OSC) - federal, state, and industry - will share decision-making authority in the command post and consult with each other regarding spill response and clean-up management issues. Participation in the Unified Command Structure does not mean that agencies such as the USCG, EPA, and Ecology, which have roles and responsibilities set by federal and state Statute, are relinquishing or surrendering their authority by participating in a Unified Command Structure. Emergency situations, however, may require some actions to be taken outside of the normal permitting process.
The Unified Command Structure is a consistent, systematic means of organizing a variety of agencies, having jurisdictional responsibilities surrounding an incident into one concerted effort. The concept offers uniform and trackable procedures that enable all emergency response agencies to perform their roles effectively, yet in unison. A Unified Command is intended to be located as close to the site of the spill as practicable, without interfering in the actual spill response activities.
c. Basic Principles of ICS
(1) Organization and Staffing Principles
The ICS organization is functionally oriented around four major areas: Command, Planning, Logistics, and Administration. The flexibility to expand this organization
Page 30 of33 SPUAPP.OOC
I I I I I I I I I I I I I I I I I I I
I I I I I I I I I I I I I I I I I I I
--------------- ------------ --------------------- -----------------------
as situations dictate is designed within the ICS, without the need to conduct major organizational changes or a cumbersome transition into a different operational system during a spill response, due to changing conditions or circumstances that frequently occur as a spill progresses. For example, in a minor incident, a single person may serve as the OSC and perform all functions. In a major incident, the command may consist of a united command with federal and state representatives, the responsible party (RP), the OSC, a staff, and a group of sections and functional units. Participants in the Unified Command/Command Post and the OSC's are normally predesignated, and the sections and function units are filled in as needed.
It is important for those parties and agencies participating in ICS to understand that the key to its effective operation is the acknowledgement that the IC is in charge of the entire operation, the OSC is in charge of spill clean-up during the incident, while the section chiefs and functional unit leaders are in charge of their units or sections. As a rule, sections should have a single individual in charge who has the authority to make decisions and to give orders. Without this authority, the system will fail. Accordingly, it is a maxim of ICS that section chiefs should be selected based on their experience and qualifications, not rank or seniority within their relative agency or organization.
The staffing requirements of the ICS should be viewed as a dynamic activity, not one based upon maintaining a precisely defined level. Flexibility is a key element of ICS, allowing the command structure to be as large and sophisticated or small and compact as the spill event requires. As long as common sense is used, the system can be modified to fit any incident. The size of the ICS will be determined by the IC on the scene of the spill.
Page 31 of33 SPill.APP.OOC
(2) Key Structural Principles and Attributes Of ICS
The ICS provides for multi-agency, multi jurisdictional response to a spill, if necessary. The circumstances requiring such a response will most likely involve a major and/or catastrophic spill. The following provides a basic description of the principles and key attributes of ICS which make the system so well-suited to spill response activities:
• Common terminology for personnel, facilities, equipment, organizational positions, and operational procedures. Thus, all terminology is predefined and understood by all participants regardless of discipline or jurisdiction.
• Common organizational structure that includes personnel of all participating state and federal agencies and special interest groups directly affected by the spill, operating as a unified team.
• Defined and assigned responsibility and authority for accomplishing specific functions. All incidents under State jurisdiction will be managed by delegated responsibility and authority from the IC to functional positions within the organization. This delegation is from the top down and modular in nature so that only needed modules are activated. When the IC activates a position the assigned individual is responsible for accomplishing all corresponding subfunctions. If the workload increases he or she will further delegate portions of the function to subordinates. This procedure provides for smooth and rapid mobilization and demobilization to meet changing spill requirements.
• Written action plans to accomplish overall objectives as well as those of each operating unit. Written plans addressing response priorities and activities are developed immediately after an ICS is deemed
Page 32 of33 SPILLAPP.OOC
I I I I I I I I I I I I I I I I I I I
I I I I I I I I
,. '
I li I I I I I I I I I
appropriate for activation. These plans are intended to be dynamic fluid documents that are developed for each operation period and providing the specific tactics and strategy to be incorporated or directing emphasis on cleanup/response efforts for the period of time covered.
• Integrated emergency management facilities such as Emergency Operations Centers located throughout Washington.
• Integrated communications providing a managed interagency interjurisdictionai communications capability
• Standards for personnel quaiifications, certification and training. Personnel must be trained in ICS and personnel to be assigned to each position must meet corresponding training and experience requirements.
• Manageabie span-of-control. The span-Of-control of any crisis manager should range from three to seven people with five being optimum. Anticipating change and preparing for it are vital to emergency managers. This is especially true during rapid build-up of an organization when good management is complicated by too many reporting elements.
• Evaluation of Performance. After the spill response is complete each person's ICS supervisor evaluates his/her performance, suggests improvements, and recognizes well-done tasks.
Page 33 of33 SPfl.LAPP.DOC


