Embed Size (px)
Citation preview
Serial No. N6469 NAFO SCS Doc. 15-12 (Revised)
Northwest Atlantic Fisheries Organization
Report of the Scientific Council Meeting
29 May-11 June 2015 Halifax, Nova Scotia
NAFO Dartmouth, Nova Scotia, Canada
2015
SC 29 May – 11 June 2015 2
www.nafo.int
Report of the Scientific Council Meeting
29 May-11 June 2015 Halifax, Nova Scotia
I. Plenary Sessions ...................................................................................................................................................................................... 6
II. Review of Scientific Council Recommendations in 2014 ...................................................................................................... 6
III. Fisheries Environment ......................................................................................................................................................................... 7
IV. Publications ............................................................................................................................................................................................... 7
V. Research Coordination ......................................................................................................................................................................... 7
VI. Fisheries Science ..................................................................................................................................................................................... 7
VII. Management Advice and Responses to Special Requests ..................................................................................................... 7
1. Fisheries Commission ......................................................................................................................................................... 7
a) Request for Advice on TACs and Other Management Measures ................................................................... 8 Cod in Division 3M ................................................................................................................................................................ 9 Redfish in Division 3M ..................................................................................................................................................... 12 White Hake in Divisions 3NO ........................................................................................................................................ 14 Cod in Divisions 3NO ........................................................................................................................................................ 16 Yellowtail Flounder in Divisions 3LNO ..................................................................................................................... 18 Capelin in Divisions 3NO ................................................................................................................................................. 22
b) Monitoring of Stocks for which Multi-year Advice was Provided in 2014 ............................................ 23 c) Special Requests for Management Advice ............................................................................................................ 24
Witch Flounder in Divisions 3NO ................................................................................................................................ 33
2. Coastal States ....................................................................................................................................................................... 45
a) Request by Denmark (on behalf of Greenland) for Advice on Management in 2015-2017 ........... 45 b) Request by Canada and Denmark (Greenland) for Advice on Management in 2016 ....................... 46
Greenland halibut in SA 0 + Div. 1A Offshore and Divs. 1B-1F ...................................................................... 47 c) Request by Canada for Advice on Management ................................................................................................. 49
VIII. Review of Future Meetings Arrangements ............................................................................................................................... 50
1. Scientific Council, (in conjunction with NIPAG), 9 – 16 Sep 2015 ................................................................ 50
2. Scientific Council, 21 – 25 Sep 2015 .......................................................................................................................... 50
3. Scientific Council, June 2016 ......................................................................................................................................... 50
4. Scientific Council (in conjunction with NIPAG), Sep 2016 ............................................................................... 50
5. Scientific Council, Sep 2016 ........................................................................................................................................... 50
6. Scientific Council, June 2017 ......................................................................................................................................... 50
7. NAFO/ICES Joint Groups ................................................................................................................................................. 50
a) NIPAG, 9-16 Sep 2015 ................................................................................................................................................... 50 b) NIPAG, 7 – 14 Sep 2016 ................................................................................................................................................ 50 c) WG-DEC, 15 – 19 February 2016 .............................................................................................................................. 50 d) WG-ESA, 17- 26 Nov, 2015 .......................................................................................................................................... 51 e) WG-HARP, August 2016 ............................................................................................................................................... 51
IX. Arrangements for Special Sessions .............................................................................................................................................. 51
1. Proposals for Future Special Sessions ...................................................................................................................... 51
X. Meeting Reports ................................................................................................................................................................................... 51
3 SC 29 May – 11 June 2015
www.nafo.int
1. Working Group on Ecosystem Science and Assessment ................................................................................... 51
2. ICES-NAFO Working Group on Deepwater Ecosystems (WGDEC) .............................................................. 63
3. Joint FC-SC Working Group on Risk Based Management Strategies (WG-RBMS) ................................. 65
4. Report from ad hoc Joint Working Group on Catch Reporting (WG-CR)................................................... 65
5. Meetings attended by the Secretariat........................................................................................................................ 66
a) Coordinating Working Party on Fishery Statistics (CWP) ............................................................................ 66 b) Fisheries and Resources Monitoring System Steering Committee (FIRMS) ......................................... 67 c) FAO VME Practices and Processes ........................................................................................................................... 68
XI. Review of Scientific Council Working Procedures/Protocol ............................................................................................ 68
1. General Plan of Work for September 2015 Annual Meeting ........................................................................... 68
2. Other matters ....................................................................................................................................................................... 68
XII. Other Matters ......................................................................................................................................................................................... 69
1. Designated Experts ............................................................................................................................................................ 69
2. Stock Assessment Spreadsheets .................................................................................................................................. 69
3. Scientific Merit Awards.................................................................................................................................................... 69
4. Budget Items......................................................................................................................................................................... 69
5. Other Business ..................................................................................................................................................................... 69
a) Election of Chairs ............................................................................................................................................................. 69
XIII. Adoption of Committee Reports .................................................................................................................................................... 69
XIV. Scientific Council Recommendations to General Council and Fisheries Commission.......................................... 70
XV. Adoption of Scientific Council Report ......................................................................................................................................... 74
XVI. Adjournment .......................................................................................................................................................................................... 74
Appendix I. Report of the Standing Committee on Fisheries Environment (STACFEN) ............................................... 75
1. Opening ................................................................................................................................................................................... 79
2. Appointment of Rapporteur .......................................................................................................................................... 79
3. Adoption of the Agenda ................................................................................................................................................... 79
4. Review of Recommendations in 2014 ...................................................................................................................... 79
5. Invited Speaker ................................................................................................................................................................... 79
6. Oceanography and Science Data (OSD) Report for 2014 (SCR Doc. 15/14) ............................................ 79
7. Results of Ocean Climate and Physical, Biological and Chemical Oceanographic Studies in the NAFO Convention Area .................................................................................................................................................... 80
8. Interdisciplinary Studies ................................................................................................................................................. 83
9. An Update of the On-Line Annual Ocean Climate and Environmental Status Summary for the NAFO Convention Area .................................................................................................................................................... 86
10. The Formulation of Recommendations Based on Environmental Conditions ........................................ 86
11. National Representatives ................................................................................................................................................ 86
12. Other Matters ....................................................................................................................................................................... 86
13. Adjournment ........................................................................................................................................................................ 87
Appendix II. Report of the Standing Committee on Publications (STACPUB) ................................................................... 88
1. Opening ................................................................................................................................................................................... 88
2. Appointment of Rapporteur .......................................................................................................................................... 88
3. Adoption of Agenda ........................................................................................................................................................... 88
4. Review of Recommendations in 2014 ...................................................................................................................... 88
SC 29 May – 11 June 2015 4
www.nafo.int
5. Review of Publications ..................................................................................................................................................... 89
6. Other Matters ....................................................................................................................................................................... 90
a) Journal of the Northwest Atlantic Fisheries Organization – Instructions for authors ..................... 90 b) JNAFS Symposium Volumes........................................................................................................................................ 90 c) Electronic Mailing List and Communication ....................................................................................................... 90
7. Adjournment ........................................................................................................................................................................ 90
Appendix III. Report of the Standing Committee on Research Coordination (STACREC) ............................................ 91
1. Opening ................................................................................................................................................................................... 91
2. Appointment of Rapporteur .......................................................................................................................................... 91
3. Review of Recommendations in 2014 ...................................................................................................................... 91
4. Fishery Statistics ................................................................................................................................................................. 91
5. Research Activities ............................................................................................................................................................ 92
6. Review of SCR and SCS Documents ............................................................................................................................ 96
7. Other Matters ....................................................................................................................................................................... 96
8. Adjournment ........................................................................................................................................................................ 97
Appendix IV. Report of the Standing Committee on Fisheries Science (STACFIS) .......................................................... 98
I. Opening .................................................................................................................................................................................................... 98
II. General Review ..................................................................................................................................................................................... 98
1. Review of Recommendations in 2014 ...................................................................................................................... 98
2. General Review of Catches and Fishing Activity................................................................................................... 98
III. Stock Assessments .............................................................................................................................................................................100
A. STOCKS OFF GREENLAND AND IN DAVIS STRAIT: SA0 AND SA1 .........................................................................100
1. Greenland Halibut (Reinhardtius hippoglossoides) in SA 0, Div. 1A offshore and Divs. 1B-F .........101
2. Greenland Halibut (Reinhardtius hippoglossoides) Div. 1A inshore ...........................................................108
3. Roundnose Grenadier (Coryphaenoides rupestris) in SAs 0 and 1 ..............................................................112
4. Demersal Redfish (Sebastes spp.) in SA 1 ..............................................................................................................113
5. Other Finfish in SA 1 .......................................................................................................................................................117
5a. Wolffish in SA 1 ................................................................................................................................................................117
5b. American plaice (Hippoglossoides platessoides) in SA 1 ..................................................................................120
B. STOCKS ON THE FLEMISH CAP: SA 3 AND DIV. 3M ......................................................................................................122
6. Cod (Gadus morhua) in Div. 3M..................................................................................................................................124
7. Redfish (Sebastes mentella and Sebastes fasciatus) in Div. 3M .....................................................................135
8. American plaice (Hippoglossoides platessoides) in Div. 3M ...........................................................................146
C. STOCKS ON THE GRAND BANK: SA 3 AND DIVS. 3LNO ...............................................................................................148
9. Cod (Gadus morhua) in NAFO Divs. 3NO ................................................................................................................149
10. Redfish (Sebastes mentella and Sebastes fasciatus) in Divs. 3L and 3N ....................................................158
11. American Plaice (Hippoglossoides platessoides) in Divs. 3LNO ....................................................................160
12. Yellowtail flounder (Limanda ferruginea) in Divs. 3LNO ...............................................................................163
13. Witch Flounder (Glyptocephalus cynoglossus) in Divs. 3NO ..........................................................................172
14. Capelin (Mallotus villosus) in Divs. 3NO .................................................................................................................181
15. Redfish (Sebastes mentella and Sebastes fasciatus) in Divs. 3O ...................................................................183
16. Thorny skate (Amblyraja radiata) in Divs. 3LNO and Subdiv. 3Ps .............................................................186
17. White Hake (Urophycis tenuis) in Divs. 3NO and Subdiv. 3Ps ......................................................................191
5 SC 29 May – 11 June 2015
www.nafo.int
D. WIDELY DISTRIBUTED STOCKS: SA 2, SA 3 AND SA 4 ................................................................................................199
18. Roughhead Grenadier (Macrourus berglax) in SAs 2 and 3 ...........................................................................201
19. Witch Flounder (Glyptocephalus cynoglossus) in Divs. 2J+3KL ....................................................................203
20. Greenland Halibut (Reinhardtius hippoglossoides) in SA 2 + Divs. 3KLMNO .........................................204
21. Northern Shortfin Squid (Illex illecebrosus) in SAs 3+4 ..................................................................................210
IV. Stocks Under a Management Strategy Evaluation ..............................................................................................................213
1. Greenland halibut in SA2 and Divs. 3KLMNO ......................................................................................................213
V. OTHER MATTERS ..............................................................................................................................................................................213
1. FIRMS Classification for NAFO Stocks ....................................................................................................................213
2. Other Business ...................................................................................................................................................................214
VI. Adjournment ........................................................................................................................................................................................214
Appendix V. Agenda, Scientific Council 29 May – 11 June 2015 ...................................................................................215
Appendix VI. List of SCR and SCS Documents, 29 May – 11 June 2015 ......................................................................227
Appendix VII. List of Particpants, 29 May – 11 June 2015 ...............................................................................................231
SC 29 May – 11 June 2015 6
www.nafo.int
REPORT OF SCIENTIFIC COUNCIL MEETING 29 May-11 June 2015
Chair: Don Stansbury Rapporteur: Neil Campbell
I. PLENARY SESSIONS
The Scientific Council met at the Sobey Building, Saint Mary’s University, Halifax, NS, Canada, during 29 May – 11 June 2015, to consider the various matters in its Agenda. Representatives attended from Canada, Denmark (Faroes and Greenland), the European Union (France, Germany, Portugal, Spain and the United Kingdom), Japan, Norway, the Russian Federation and the United States of America. Observers from WWF, Ecology Action Centre and Dalhousie University were also present. The Executive Secretary, Scientific Council Coordinator and other members of the Secretariat were in attendance.
The Executive Committee met prior to the opening session of the Council to discuss the provisional agenda and plan of work.
The Council was called to order at 1000 hours on 29 May 2015. The provisional agenda was adopted with modification. The Scientific Council Coordinator was appointed the rapporteur.
The Council was informed that the meeting was quorate and authorization had been received by the Executive Secretary for proxy votes from EU, Iceland, Japan, Norway, the Russian Federation and USA.
Scientific Council discussed the change in its working procedures introduced in 2014 whereby interim monitoring reports (IMRs) are drafted by the respective Designated Expert, and then subjected to a review process first by a ‘Designated Reviewer’, and finally, by the chair of STACFIS, and are examined in plenary only in situations where the interim monitoring update points to a potential re-opening of the full assessment. It was felt that this change had been beneficial to the work of the council, and this process would be used again.
The opening session was adjourned at 1000 hours on 29 May 2015. Several sessions were held throughout the course of the meeting to deal with specific items on the agenda. The Council considered adopted the STACFEN report on 9 June 2015, and the STACPUB, STACFIS and STACREC reports on 11 June 2015.
The concluding session was called to order at 1300 hours on 11 June 2015.
The Council considered and adopted the report the Scientific Council Report of this meeting of 29 May-11 June 2015. The Chair received approval to leave the report in draft form for about two weeks to allow for minor editing and proof-reading on the usual strict understanding there would be no substantive changes.
The meeting was adjourned at 1400 hours on 11 June 2015.
The Reports of the Standing Committees as adopted by the Council are appended as follows: Appendix I - Report of the Standing Committee on Fisheries Environment (STACFEN), Appendix II - Report of Standing Committee on Publications (STACPUB), Appendix III - Report of Standing Committee on Research Coordination (STACREC), and Appendix IV - Report of Standing Committee on Fisheries Science (STACFIS).
The Agenda, List of Research (SCR) and Summary (SCS) Documents, and List of Representatives, Advisers and Experts, are given in Appendix V-VII.
The Council’s considerations on the Standing Committee Reports, and other matters addressed by the Council follow in Sections II-XV.
II. REVIEW OF SCIENTIFIC COUNCIL RECOMMENDATIONS IN 2014
There were no recommendations to Scientific Council in 2014.
Recommendations were received by Scientific Council from the FC-SC Working Groups on Catch Reporting (WG-CR) and on Risk-based Management Strategies (WG-RBMS). Due to the timing of these working groups, close to the SC meeting, the final draft of the RBMS report was not available for circulation, however it was agreed that the recommendations were finalised, and these were reviewed by the Council during this meeting. These were addressed under Scientific Council Recommendations to General Council and Fisheries Commission (Section XIV).
7 SC 29 May – 11 June 2015
www.nafo.int
III. FISHERIES ENVIRONMENT
The Council adopted the Report of the Standing Committee on Fisheries Environment (STACFEN), as presented by the Chair, Andrew Cogswell. The full report of STACFEN is in Appendix I.
The recommendations made by STACFEN for the work of the Scientific Council as endorsed by the Council, are as follows:
a) STACFEN recommends consideration of support for one invited speaker to address emerging issues and concerns for the NAFO Convention Area during the 2015 STACFEN Meeting.
b) STACFEN recommends that a sub-committee of STACFEN members be formed to discuss and draft a plan towards the reconfiguration and/or amalgamation of STACFEN and WGESA to be presented at the 2015 STACFEN Meeting.
c) STACFEN recommends that a sub-committee of STACFEN members be formed to discuss the current state of Fisheries and Oceans Canada (DFO) Oceanographic Services (formerly ISDM and MEDS) data management responsibilities to NAFO and related mechanisms for the reporting of oceanographic data by member states and the subsequent means of accessing these data.
IV. PUBLICATIONS
The Council adopted the Report of the Standing Committee on Publication (STACPUB) as presented by the Chair, Margaret Treble. The full report of STACPUB is in Appendix II.
The recommendations made by STACPUB for the work of the Scientific Council as endorsed by the Council, are as follows:
d) STACPUB recommends that the Secretariat contact WGESA for further instruction on the VME Guides in order to publish it for September 2015.
e) STACPUB recommends that Scientific Council consider holding another symposium and that a list of potential topics and themes be put forward.
f) STACPUB recommends that the NAFO Secretariat look into this matter, update their current list of SC members and create a forum for the electronic exchange of ideas that is accessible to SC members.
V. RESEARCH COORDINATION
The Council adopted the Report of the Standing Committee on Research Coordination (STACREC) as presented by the Chair, Katherine Sosebee. The full report of STACREC is in Appendix III.
The recommendations made by STACREC for the work of the Scientific Council as endorsed by the Council, are as follows:
STACREC recommends that the NAFO Secretariat develop a framework for communicating tagging study information to vessels from Contracting Parties and Coastal States fishing in the Convention Area (e.g., via a link to this information on the NAFO website homepage).
STACREC recommends that the Scientific Council support the EU H2020-BG02-2015 proposal “Predicting consequences of climate change on Aquatic FOOD production (AFOOD)” and agrees to serve on the external advisory board.
VI. FISHERIES SCIENCE
The Council adopted the Report of the Standing Committee on Fisheries Science (STACFIS) as presented by the Chair, Brian Healey. The full report of STACFIS is in Appendix IV.
There were no general recommendations arising from STACFIS. The Council endorsed recommendations specific to each stock and they are highlighted under the relevant stock considerations in the STACFIS report (Appendix IV).
VII. MANAGEMENT ADVICE AND RESPONSES TO SPECIAL REQUESTS
1. Fisheries Commission
The Fisheries Commission requests are given in Annex 1 of Appendix V.
SC 29 May – 11 June 2015 8
www.nafo.int
The Scientific Council noted the Fisheries Commission requests for advice on Northern shrimp (Northern shrimp in Div. 3M and Divs. 3LNO (Item 1)) will be undertaken during the Scientific Council meeting on 9-16 September 2015.
a) Request for Advice on TACs and Other Management Measures
The Fisheries Commission at its meeting of September 2010 reviewed the assessment schedule of the Scientific Council and with the concurrence of the Coastal State agreed to request advice for certain stocks on either a two-year or three-year rotational basis. In recent years, thorough assessments of certain stocks have been undertaken outside of the assessment cycle either at the request of Fisheries Commission or by the Scientific Council given recent stock developments.
9 SC 29 May – 11 June 2015
www.nafo.int
Cod in Division 3M Advice June 2015
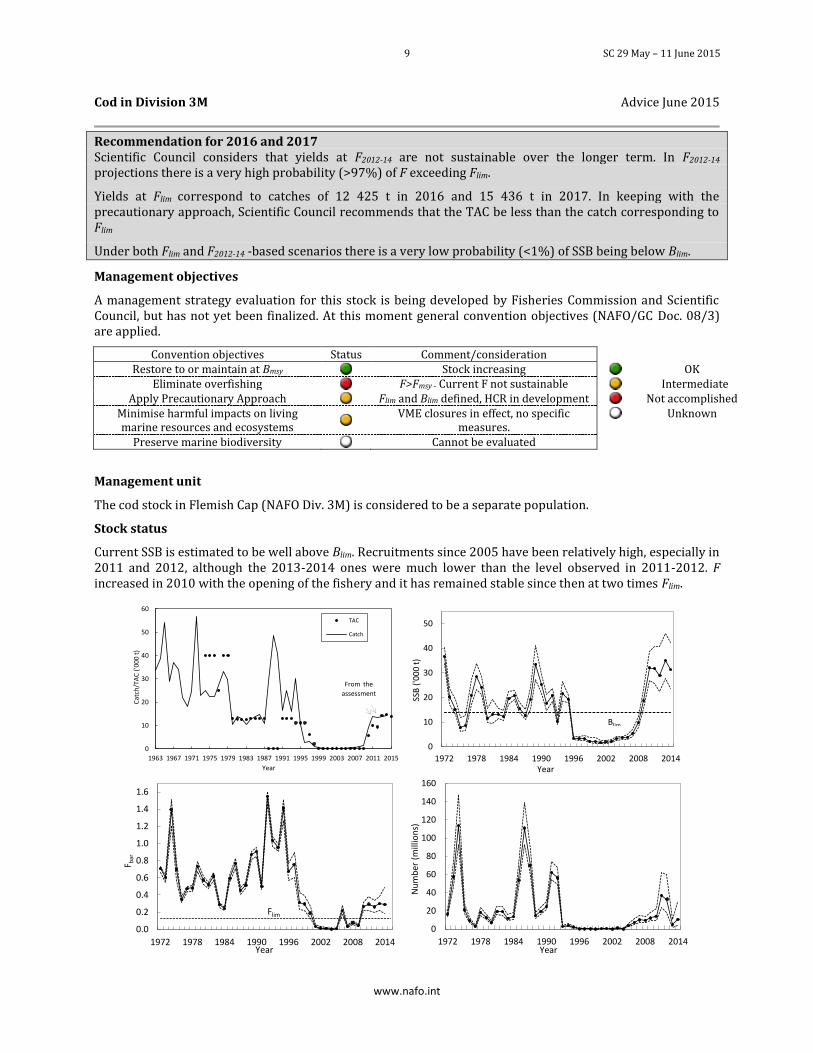
Recommendation for 2016 and 2017 Scientific Council considers that yields at F2012-14 are not sustainable over the longer term. In F2012-14 projections there is a very high probability (>97%) of F exceeding Flim.
Yields at Flim correspond to catches of 12 425 t in 2016 and 15 436 t in 2017. In keeping with the precautionary approach, Scientific Council recommends that the TAC be less than the catch corresponding to Flim
Under both Flim and F2012-14 -based scenarios there is a very low probability (<1%) of SSB being below Blim.
Management objectives
A management strategy evaluation for this stock is being developed by Fisheries Commission and Scientific Council, but has not yet been finalized. At this moment general convention objectives (NAFO/GC Doc. 08/3) are applied.
Convention objectives Status Comment/consideration Restore to or maintain at Bmsy
Stock increasing
OK Eliminate overfishing
F>Fmsy - Current F not sustainable
Intermediate Apply Precautionary Approach
Flim and Blim defined, HCR in development
Not accomplished Minimise harmful impacts on living marine resources and ecosystems
VME closures in effect, no specific measures.
Unknown
Preserve marine biodiversity
Cannot be evaluated
Management unit
The cod stock in Flemish Cap (NAFO Div. 3M) is considered to be a separate population.
Stock status
Current SSB is estimated to be well above Blim. Recruitments since 2005 have been relatively high, especially in 2011 and 2012, although the 2013-2014 ones were much lower than the level observed in 2011-2012. F increased in 2010 with the opening of the fishery and it has remained stable since then at two times Flim.
0
10
20
30
40
50
60
1963 1967 1971 1975 1979 1983 1987 1991 1995 1999 2003 2007 2011 2015
Cat
ch/T
AC
('0
00 t
)
Year
TAC
Catch
From the
assessment
0
10
20
30
40
50
1972 1978 1984 1990 1996 2002 2008 2014
SSB
('0
00 t
)
Year
Blim
0.0
0.2
0.4
0.6
0.8
1.0
1.2
1.4
1.6
1972 1978 1984 1990 1996 2002 2008 2014
F bar
Year
Flim
0
20
40
60
80
100
120
140
160
1972 1978 1984 1990 1996 2002 2008 2014
Nu
mb
er (
mill
ion
s)
Year
SC 29 May – 11 June 2015 10
www.nafo.int
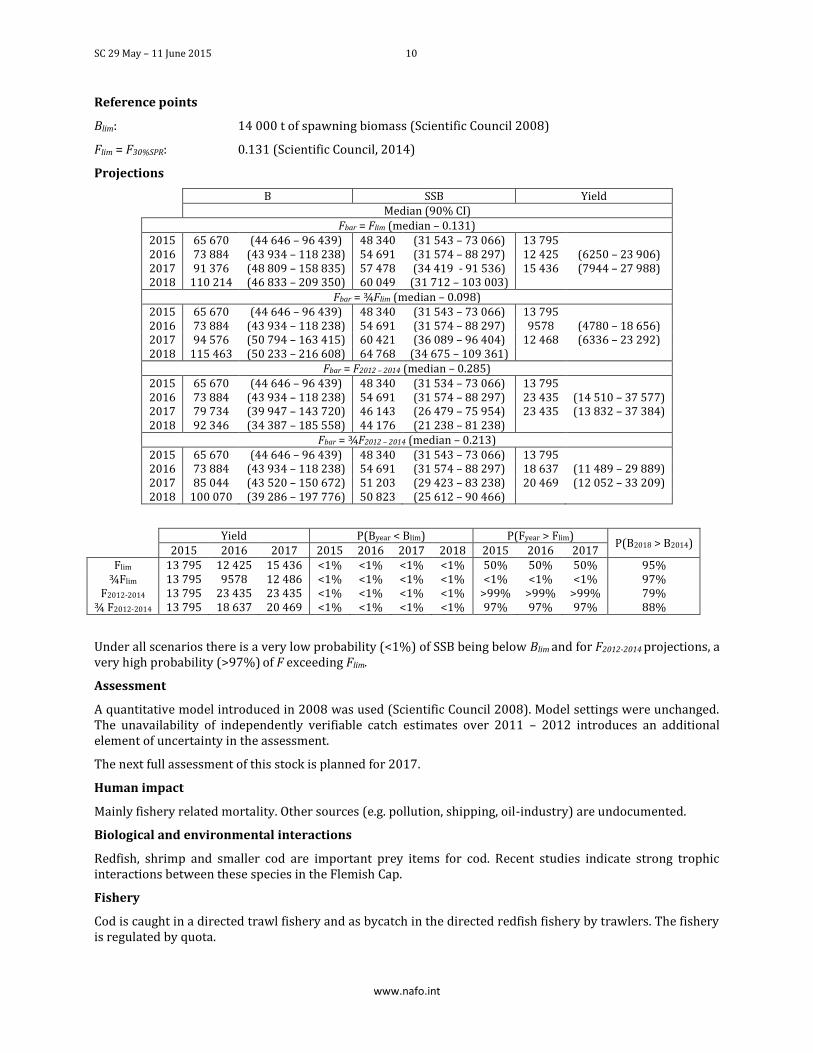
Reference points
Blim: 14 000 t of spawning biomass (Scientific Council 2008)
Flim = F30%SPR: 0.131 (Scientific Council, 2014)
Projections
B SSB Yield Median (90% CI)
Fbar = Flim (median – 0.131) 2015 65 670 (44 646 – 96 439) 48 340 (31 543 – 73 066) 13 795 2016 73 884 (43 934 – 118 238) 54 691 (31 574 – 88 297) 12 425 (6250 – 23 906) 2017 91 376 (48 809 – 158 835) 57 478 (34 419 - 91 536) 15 436 (7944 – 27 988) 2018 110 214 (46 833 – 209 350) 60 049 (31 712 – 103 003)
Fbar = ¾Flim (median – 0.098) 2015 65 670 (44 646 – 96 439) 48 340 (31 543 – 73 066) 13 795 2016 73 884 (43 934 – 118 238) 54 691 (31 574 – 88 297) 9578 (4780 – 18 656) 2017 94 576 (50 794 – 163 415) 60 421 (36 089 – 96 404) 12 468 (6336 – 23 292) 2018 115 463 (50 233 – 216 608) 64 768 (34 675 – 109 361)
Fbar = F2012 – 2014 (median – 0.285) 2015 65 670 (44 646 – 96 439) 48 340 (31 534 – 73 066) 13 795 2016 73 884 (43 934 – 118 238) 54 691 (31 574 – 88 297) 23 435 (14 510 – 37 577) 2017 79 734 (39 947 – 143 720) 46 143 (26 479 – 75 954) 23 435 (13 832 – 37 384) 2018 92 346 (34 387 – 185 558) 44 176 (21 238 – 81 238)
Fbar = ¾F2012 – 2014 (median – 0.213) 2015 65 670 (44 646 – 96 439) 48 340 (31 543 – 73 066) 13 795 2016 73 884 (43 934 – 118 238) 54 691 (31 574 – 88 297) 18 637 (11 489 – 29 889) 2017 85 044 (43 520 – 150 672) 51 203 (29 423 – 83 238) 20 469 (12 052 – 33 209) 2018 100 070 (39 286 – 197 776) 50 823 (25 612 – 90 466)
Yield P(Byear < Blim) P(Fyear > Flim)
P(B2018 > B2014) 2015 2016 2017 2015 2016 2017 2018 2015 2016 2017
Flim 13 795 12 425 15 436 <1% <1% <1% <1% 50% 50% 50% 95% ¾Flim 13 795 9578 12 486 <1% <1% <1% <1% <1% <1% <1% 97%
F2012-2014 13 795 23 435 23 435 <1% <1% <1% <1% >99% >99% >99% 79% ¾ F2012-2014 13 795 18 637 20 469 <1% <1% <1% <1% 97% 97% 97% 88%
Under all scenarios there is a very low probability (<1%) of SSB being below Blim and for F2012-2014 projections, a very high probability (>97%) of F exceeding Flim.
Assessment
A quantitative model introduced in 2008 was used (Scientific Council 2008). Model settings were unchanged. The unavailability of independently verifiable catch estimates over 2011 – 2012 introduces an additional element of uncertainty in the assessment.
The next full assessment of this stock is planned for 2017.
Human impact
Mainly fishery related mortality. Other sources (e.g. pollution, shipping, oil-industry) are undocumented.
Biological and environmental interactions
Redfish, shrimp and smaller cod are important prey items for cod. Recent studies indicate strong trophic interactions between these species in the Flemish Cap.
Fishery
Cod is caught in a directed trawl fishery and as bycatch in the directed redfish fishery by trawlers. The fishery is regulated by quota.
11 SC 29 May – 11 June 2015
www.nafo.int
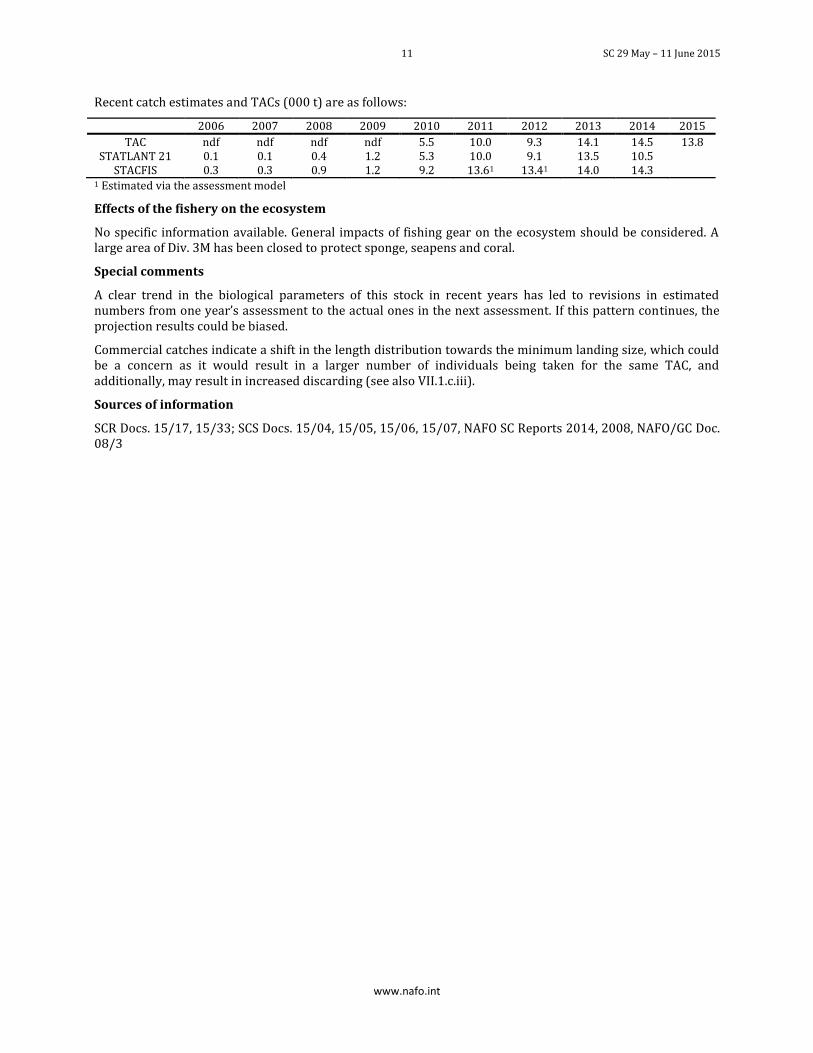
Recent catch estimates and TACs (000 t) are as follows:
2006 2007 2008 2009 2010 2011 2012 2013 2014 2015
TAC ndf ndf ndf ndf 5.5 10.0 9.3 14.1 14.5 13.8 STATLANT 21 0.1 0.1 0.4 1.2 5.3 10.0 9.1 13.5 10.5
STACFIS 0.3 0.3 0.9 1.2 9.2 13.61 13.41 14.0 14.3 1 Estimated via the assessment model
Effects of the fishery on the ecosystem
No specific information available. General impacts of fishing gear on the ecosystem should be considered. A large area of Div. 3M has been closed to protect sponge, seapens and coral.
Special comments
A clear trend in the biological parameters of this stock in recent years has led to revisions in estimated numbers from one year’s assessment to the actual ones in the next assessment. If this pattern continues, the projection results could be biased.
Commercial catches indicate a shift in the length distribution towards the minimum landing size, which could be a concern as it would result in a larger number of individuals being taken for the same TAC, and additionally, may result in increased discarding (see also VII.1.c.iii).
Sources of information
SCR Docs. 15/17, 15/33; SCS Docs. 15/04, 15/05, 15/06, 15/07, NAFO SC Reports 2014, 2008, NAFO/GC Doc. 08/3
SC 29 May – 11 June 2015 12
www.nafo.int
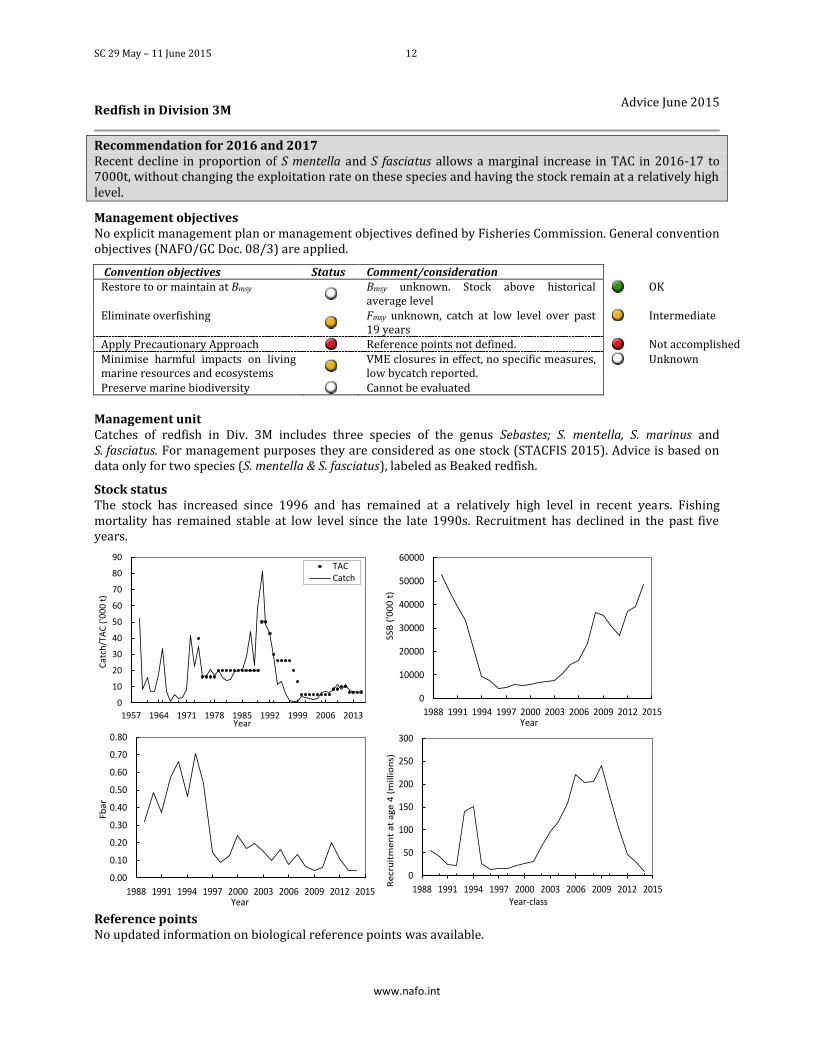
Redfish in Division 3M Advice June 2015
Recommendation for 2016 and 2017 Recent decline in proportion of S mentella and S fasciatus allows a marginal increase in TAC in 2016-17 to 7000t, without changing the exploitation rate on these species and having the stock remain at a relatively high level.
Management objectives No explicit management plan or management objectives defined by Fisheries Commission. General convention objectives (NAFO/GC Doc. 08/3) are applied.
Convention objectives Status Comment/consideration Restore to or maintain at Bmsy
Bmsy unknown. Stock above historical average level
OK
Eliminate overfishing
Fmsy unknown, catch at low level over past 19 years
Intermediate
Apply Precautionary Approach
Reference points not defined.
Not accomplished Minimise harmful impacts on living marine resources and ecosystems
VME closures in effect, no specific measures, low bycatch reported.
Unknown
Preserve marine biodiversity
Cannot be evaluated
Management unit Catches of redfish in Div. 3M includes three species of the genus Sebastes; S. mentella, S. marinus and S. fasciatus. For management purposes they are considered as one stock (STACFIS 2015). Advice is based on data only for two species (S. mentella & S. fasciatus), labeled as Beaked redfish.
Stock status The stock has increased since 1996 and has remained at a relatively high level in recent years. Fishing mortality has remained stable at low level since the late 1990s. Recruitment has declined in the past five years.
Reference points No updated information on biological reference points was available.
0
10
20
30
40
50
60
70
80
90
1957 1964 1971 1978 1985 1992 1999 2006 2013
Cat
ch/T
AC
('0
00
t)
Year
TACCatch
0
10000
20000
30000
40000
50000
60000
1988 1991 1994 1997 2000 2003 2006 2009 2012 2015
SSB
('0
00
t)
Year
0.00
0.10
0.20
0.30
0.40
0.50
0.60
0.70
0.80
1988 1991 1994 1997 2000 2003 2006 2009 2012 2015
Fba
r
Year
0
50
100
150
200
250
300
1988 1991 1994 1997 2000 2003 2006 2009 2012 2015
Re
cru
itm
en
t a
t a
ge
4 (
mil
lio
ns)
Year-class
13 SC 29 May – 11 June 2015
www.nafo.int
Assessment Input data comes from EU Flemish Cap bottom trawl survey and the fishery (STACFIS 2015) and is considered good quality. A quantitative model (XSA) introduced in 2003 was used (STACFIS 2013). Model settings were in general kept unchanged from last assessment, with a natural mortality at 0.4 through 2006-2010, declining on 2011 and 2012 to 0.125. The magnitude of beaked redfish natural mortality (M) between 2013 and 2014 has been analysed on the sensitivity analysis of the present assessment, pointing out to a marginal increase of M to 0.14.
The next full assessment of this stock will be in 2017.
Projections Given the uncertainty about the actual level of current natural mortality (see STACFIS, 2015) and its impact on short term model projections, Scientific Council decided not to use model predictions as a basis for the recommendation.
Human impact Mainly fishery related mortality. Other sources (e.g. pollution, shipping, oil-industry) are undocumented.
Biology and Environmental Interactions Since 2004 a rapid increase was observed on survey biomass both of golden (Sebastes marinus) and Acadian (Sebastes fasciatus) redfish stocks. Due to their shallower depth distributions these two redfish species overlap with cod to an extent greater than deep sea redfish (Sebastes mentella). Since 2006, the cod stock started to recover, while those two redfish stocks declined sharply. Redfish is an important component in the diet of cod, especially on those years when successful recruitment events were observed in redfish stocks.
Fishery Redfish is caught primarily in bottom trawl fisheries, but some landings are reported from fisheries with mid-water trawl. Cod is the main bycatch species in shallower waters, and Greenland halibut in deeper waters. In turn, redfish are also caught as bycatch in fisheries directed for cod and Greenland halibut. The fishery in NAFO Div. 3M is regulated by minimum mesh size and quota.
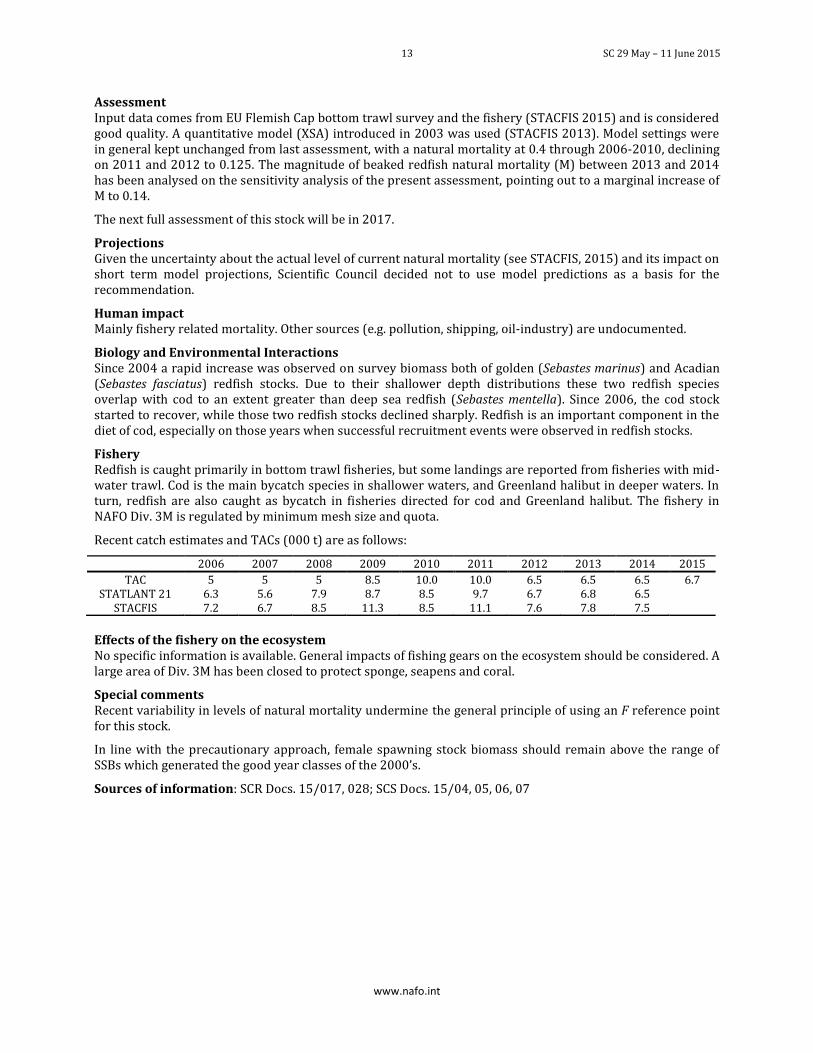
Recent catch estimates and TACs (000 t) are as follows:
2006 2007 2008 2009 2010 2011 2012 2013 2014 2015
TAC 5 5 5 8.5 10.0 10.0 6.5 6.5 6.5 6.7 STATLANT 21 6.3 5.6 7.9 8.7 8.5 9.7 6.7 6.8 6.5
STACFIS 7.2 6.7 8.5 11.3 8.5 11.1 7.6 7.8 7.5
Effects of the fishery on the ecosystem No specific information is available. General impacts of fishing gears on the ecosystem should be considered. A large area of Div. 3M has been closed to protect sponge, seapens and coral.
Special comments Recent variability in levels of natural mortality undermine the general principle of using an F reference point for this stock.
In line with the precautionary approach, female spawning stock biomass should remain above the range of SSBs which generated the good year classes of the 2000’s.
Sources of information: SCR Docs. 15/017, 028; SCS Docs. 15/04, 05, 06, 07
SC 29 May – 11 June 2015 14
www.nafo.int
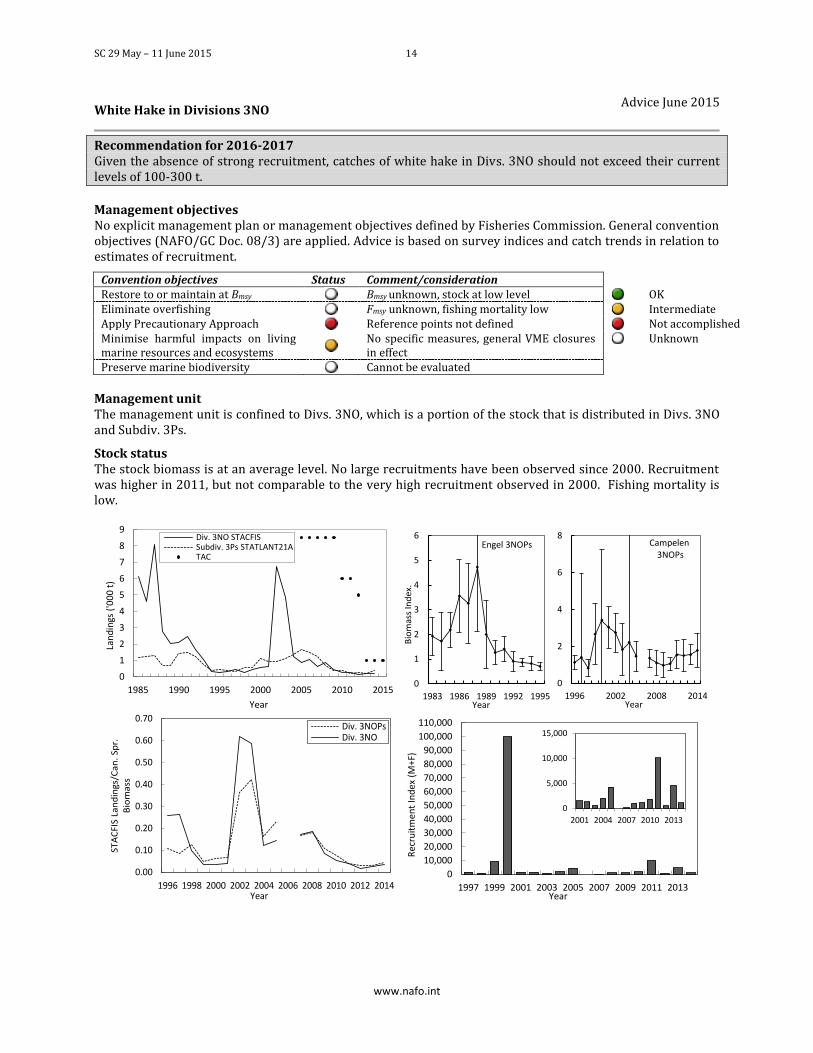
White Hake in Divisions 3NO Advice June 2015
Recommendation for 2016-2017 Given the absence of strong recruitment, catches of white hake in Divs. 3NO should not exceed their current levels of 100-300 t.
Management objectives No explicit management plan or management objectives defined by Fisheries Commission. General convention objectives (NAFO/GC Doc. 08/3) are applied. Advice is based on survey indices and catch trends in relation to estimates of recruitment.
Convention objectives Status Comment/consideration Restore to or maintain at Bmsy
Bmsy unknown, stock at low level
OK Eliminate overfishing
Fmsy unknown, fishing mortality low
Intermediate Apply Precautionary Approach
Reference points not defined
Not accomplished Minimise harmful impacts on living marine resources and ecosystems
No specific measures, general VME closures in effect
Unknown
Preserve marine biodiversity
Cannot be evaluated Management unit The management unit is confined to Divs. 3NO, which is a portion of the stock that is distributed in Divs. 3NO and Subdiv. 3Ps.
Stock status The stock biomass is at an average level. No large recruitments have been observed since 2000. Recruitment was higher in 2011, but not comparable to the very high recruitment observed in 2000. Fishing mortality is low.
0
1
2
3
4
5
6
7
8
9
1985 1990 1995 2000 2005 2010 2015
Lan
din
gs (
'00
0 t
)
Year
Div. 3NO STACFISSubdiv. 3Ps STATLANT21ATAC
0
1
2
3
4
5
6
1983 1986 1989 1992 1995
Bio
mas
s In
dex
.
Year
Engel 3NOPs
0
2
4
6
8
1996 2002 2008 2014Year
Campelen 3NOPs
0.00
0.10
0.20
0.30
0.40
0.50
0.60
0.70
1996 1998 2000 2002 2004 2006 2008 2010 2012 2014
STA
CFI
S La
nd
ings
/Ca
n.
Spr.
B
iom
ass
Year
Div. 3NOPsDiv. 3NO
0
10,000
20,000
30,000
40,000
50,000
60,000
70,000
80,000
90,000
100,000
110,000
1997 1999 2001 2003 2005 2007 2009 2011 2013
Rec
ruit
men
t In
dex
(M
+F)
Year
0
5,000
10,000
15,000
2001 2004 2007 2010 2013
15 SC 29 May – 11 June 2015
www.nafo.int
Reference points Not defined. Attempts were made to define reference points in 2015 (STACFIS, 2015) but were not successful.
Assessment Based upon a qualitative evaluation of stock biomass trends and recruitment indices. The assessment is considered data limited and as such associated with a relatively high uncertainty. Input data are research survey indices and fishery data (STACFIS 2015). The next full assessment of this stock will be in 2017.
Human impact Mainly fishery related mortality has been documented. Mortality from other human sources (e.g. pollution, shipping, oil-industry) are undocumented.
Biology and Environmental interactions On the Grand Bank, white hake are near the northern limit of their range, concentrating along the southwest slope of the Grand Bank at temperatures above 5°C. The major spawning area is located on the shelf-edge on the Grand Bank. Weaker ocean currents on the continental slope during the spawning period are hypothesized to reduce potential losses of eggs and larvae due to entrainment in the Labrador Current and increase recruitment potential.
White hake feed mostly on crustaceans and fish. Larger individuals are reported to be cannibalistic and to feed upon eggs and juveniles. In nearshore areas, white hake are also thought to predate on smaller juvenile cod. Predators of white hake include Atlantic cod, other fish species, Atlantic puffins, Arctic terns, other seabirds and seals.
Fishery White hake is caught in directed gillnet, trawl and long-line fisheries. In directed white hake fisheries, Atlantic cod, black dogfish, monkfish and other species are landed as bycatch. In turn, white hake are also caught as bycatch in gillnet, trawl and long-line fisheries directing for other species. The fishery in NAFO Divs. 3NO is regulated by quota.
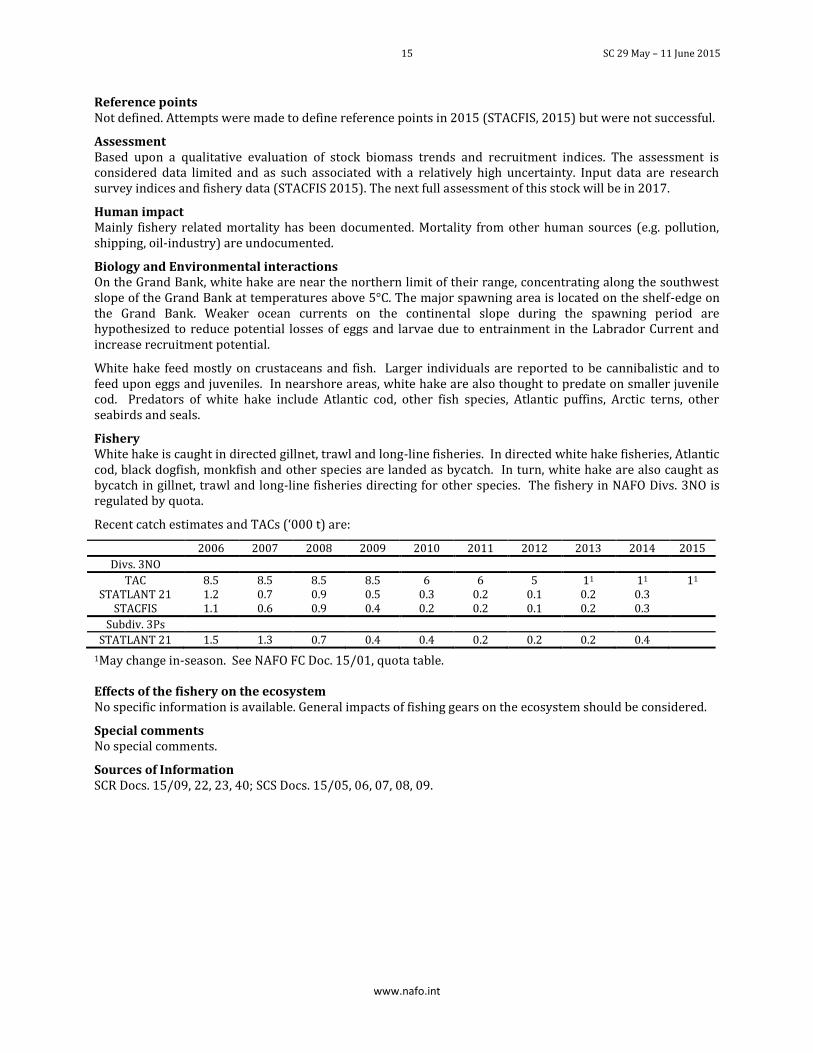
Recent catch estimates and TACs (‘000 t) are:
2006 2007 2008 2009 2010 2011 2012 2013 2014 2015
Divs. 3NO
TAC 8.5 8.5 8.5 8.5 6 6 5 11 11 11 STATLANT 21 1.2 0.7 0.9 0.5 0.3 0.2 0.1 0.2 0.3
STACFIS 1.1 0.6 0.9 0.4 0.2 0.2 0.1 0.2 0.3
Subdiv. 3Ps
STATLANT 21 1.5 1.3 0.7 0.4 0.4 0.2 0.2 0.2 0.4
1May change in-season. See NAFO FC Doc. 15/01, quota table. Effects of the fishery on the ecosystem No specific information is available. General impacts of fishing gears on the ecosystem should be considered.
Special comments No special comments.
Sources of Information SCR Docs. 15/09, 22, 23, 40; SCS Docs. 15/05, 06, 07, 08, 09.
SC 29 May – 11 June 2015 16
www.nafo.int
Cod in Divisions 3NO Advice June 2015
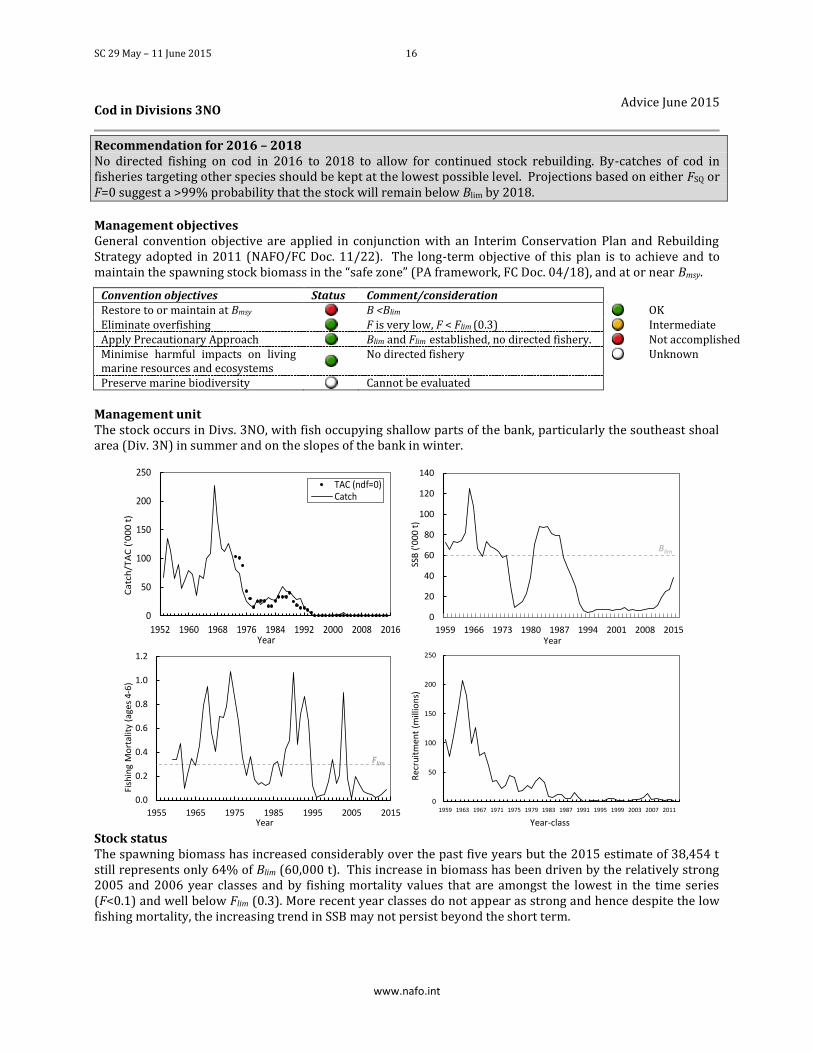
Recommendation for 2016 – 2018 No directed fishing on cod in 2016 to 2018 to allow for continued stock rebuilding. By-catches of cod in fisheries targeting other species should be kept at the lowest possible level. Projections based on either FSQ or F=0 suggest a >99% probability that the stock will remain below Blim by 2018.
Management objectives General convention objective are applied in conjunction with an Interim Conservation Plan and Rebuilding Strategy adopted in 2011 (NAFO/FC Doc. 11/22). The long-term objective of this plan is to achieve and to maintain the spawning stock biomass in the “safe zone” (PA framework, FC Doc. 04/18), and at or near Bmsy.
Convention objectives Status Comment/consideration Restore to or maintain at Bmsy
B <Blim
OK Eliminate overfishing
F is very low, F < Flim (0.3)
Intermediate Apply Precautionary Approach
Blim and Flim established, no directed fishery.
Not accomplished Minimise harmful impacts on living marine resources and ecosystems
No directed fishery
Unknown
Preserve marine biodiversity
Cannot be evaluated Management unit The stock occurs in Divs. 3NO, with fish occupying shallow parts of the bank, particularly the southeast shoal area (Div. 3N) in summer and on the slopes of the bank in winter.
Stock status The spawning biomass has increased considerably over the past five years but the 2015 estimate of 38,454 t still represents only 64% of Blim (60,000 t). This increase in biomass has been driven by the relatively strong 2005 and 2006 year classes and by fishing mortality values that are amongst the lowest in the time series (F<0.1) and well below Flim (0.3). More recent year classes do not appear as strong and hence despite the low fishing mortality, the increasing trend in SSB may not persist beyond the short term.
0
50
100
150
200
250
1952 1960 1968 1976 1984 1992 2000 2008 2016
Ca
tch
/TA
C (
'00
0 t
)
Year
TAC (ndf=0)Catch
0
20
40
60
80
100
120
140
1959 1966 1973 1980 1987 1994 2001 2008 2015
SSB
('0
00
t)
Year
Blim
0.0
0.2
0.4
0.6
0.8
1.0
1.2
1955 1965 1975 1985 1995 2005 2015
Fish
ing
Mo
rtal
ity
(age
s 4-
6)
Year
Flim
0
50
100
150
200
250
1959 1963 1967 1971 1975 1979 1983 1987 1991 1995 1999 2003 2007 2011
Rec
ruit
men
t (m
illio
ns)
Year-class
17 SC 29 May – 11 June 2015
www.nafo.int
Reference points Blim : 60 000 t of spawning biomass (SC, 1999)
Flim (=Fmsy): 0.3 (SC, 2011).
Projections SSB is projected to remain below Blim for both scenarios, increasing initially but then decreasing.
Fishing Mortality
Yield P (Byear < Blim) P(B2018 > B2015)
2016 2017 2016 2017 2018
F = 0 - - >99% >99% >99% 46%
Fsq 1348 1178 >99% >99% >99% 22%
Assessment A sequential population analysis model was used, and the results were consistent with the previous assessment. Input data from 2011-2014 comes from research surveys and commercial removals (STACFIS 2015).
The next assessment is planned for 2018.
Human impact Mainly bycatch related fishery mortality has been documented. Other sources (e.g. pollution, shipping, oil-industry) are undocumented.
Biology and Environmental interactions Productivity of this stock was above average during the warm 1960s. During the cold 1990s, productivity was very low and surplus production was near zero.
Fishery A moratorium was implemented in 1994. Catches since that time are by-catch in other fisheries.
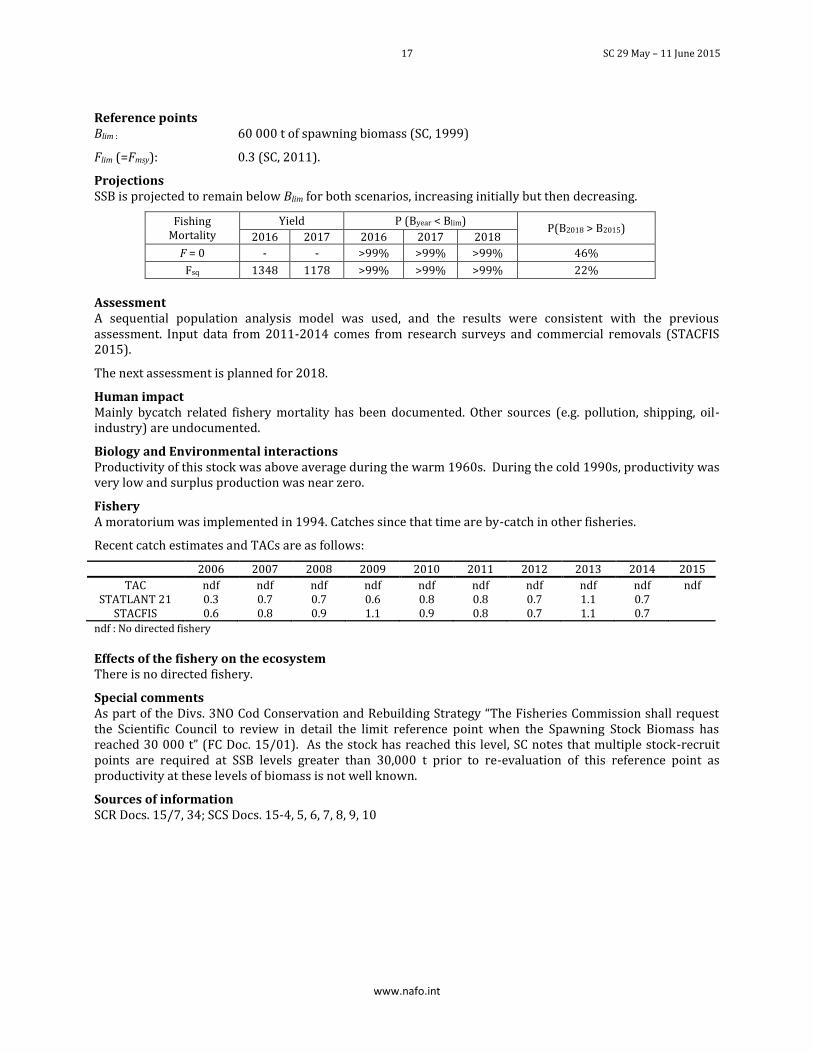
Recent catch estimates and TACs are as follows:
2006 2007 2008 2009 2010 2011 2012 2013 2014 2015
TAC ndf ndf ndf ndf ndf ndf ndf ndf ndf ndf STATLANT 21 0.3 0.7 0.7 0.6 0.8 0.8 0.7 1.1 0.7
STACFIS 0.6 0.8 0.9 1.1 0.9 0.8 0.7 1.1 0.7 ndf : No directed fishery
Effects of the fishery on the ecosystem There is no directed fishery.
Special comments As part of the Divs. 3NO Cod Conservation and Rebuilding Strategy “The Fisheries Commission shall request the Scientific Council to review in detail the limit reference point when the Spawning Stock Biomass has reached 30 000 t” (FC Doc. 15/01). As the stock has reached this level, SC notes that multiple stock-recruit points are required at SSB levels greater than 30,000 t prior to re-evaluation of this reference point as productivity at these levels of biomass is not well known.
Sources of information SCR Docs. 15/7, 34; SCS Docs. 15-4, 5, 6, 7, 8, 9, 10
SC 29 May – 11 June 2015 18
www.nafo.int
Yellowtail Flounder in Divisions 3LNO Advice June 2015
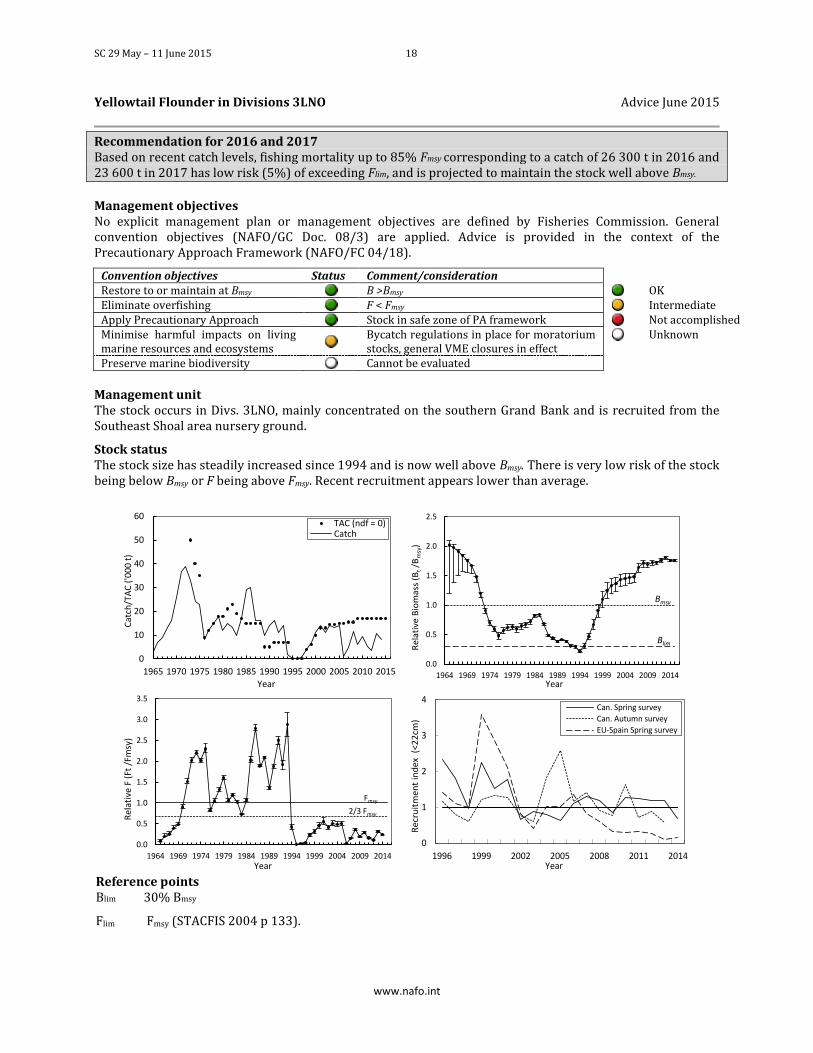
Recommendation for 2016 and 2017 Based on recent catch levels, fishing mortality up to 85% Fmsy corresponding to a catch of 26 300 t in 2016 and 23 600 t in 2017 has low risk (5%) of exceeding Flim, and is projected to maintain the stock well above Bmsy.
Management objectives No explicit management plan or management objectives are defined by Fisheries Commission. General convention objectives (NAFO/GC Doc. 08/3) are applied. Advice is provided in the context of the Precautionary Approach Framework (NAFO/FC 04/18).
Convention objectives Status Comment/consideration Restore to or maintain at Bmsy
B >Bmsy
OK Eliminate overfishing
F < Fmsy
Intermediate Apply Precautionary Approach
Stock in safe zone of PA framework
Not accomplished Minimise harmful impacts on living marine resources and ecosystems
Bycatch regulations in place for moratorium stocks, general VME closures in effect
Unknown
Preserve marine biodiversity
Cannot be evaluated Management unit The stock occurs in Divs. 3LNO, mainly concentrated on the southern Grand Bank and is recruited from the Southeast Shoal area nursery ground.
Stock status The stock size has steadily increased since 1994 and is now well above Bmsy. There is very low risk of the stock being below Bmsy or F being above Fmsy. Recent recruitment appears lower than average.
Reference points Blim 30% Bmsy
Flim Fmsy (STACFIS 2004 p 133).
0
10
20
30
40
50
60
1965 1970 1975 1980 1985 1990 1995 2000 2005 2010 2015
Cat
ch/T
AC
('0
00
t)
Year
TAC (ndf = 0)Catch
0.0
0.5
1.0
1.5
2.0
2.5
1964 1969 1974 1979 1984 1989 1994 1999 2004 2009 2014
Re
lati
ve B
iom
ass
(Bt/B
msy
)
Year
Bmsy
Blim
0.0
0.5
1.0
1.5
2.0
2.5
3.0
3.5
1964 1969 1974 1979 1984 1989 1994 1999 2004 2009 2014
Rel
ativ
e F
(Ft
/Fm
sy)
Year
Fmsy
2/3 Fmsy
0
1
2
3
4
1996 1999 2002 2005 2008 2011 2014
Re
cru
itm
en
t in
de
x (
<2
2cm
)
Year
Can. Spring survey
Can. Autumn survey
EU-Spain Spring survey
19 SC 29 May – 11 June 2015
www.nafo.int
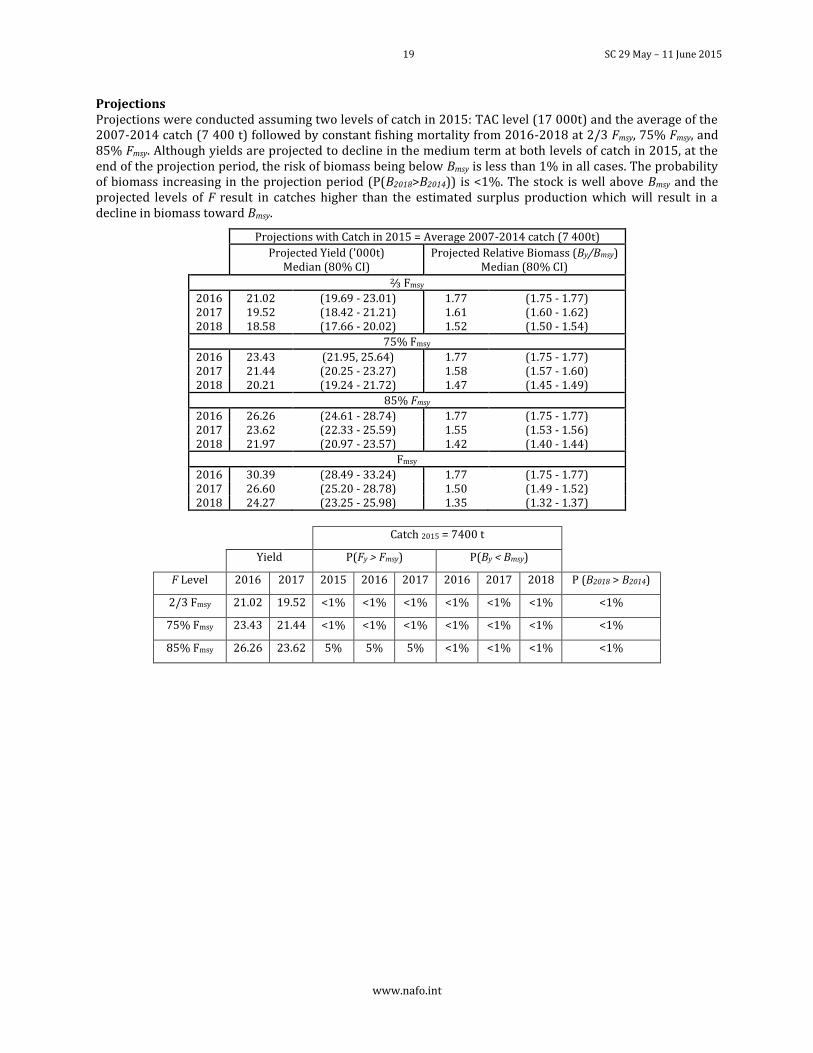
Projections Projections were conducted assuming two levels of catch in 2015: TAC level (17 000t) and the average of the 2007-2014 catch (7 400 t) followed by constant fishing mortality from 2016-2018 at 2/3 Fmsy, 75% Fmsy, and 85% Fmsy. Although yields are projected to decline in the medium term at both levels of catch in 2015, at the end of the projection period, the risk of biomass being below Bmsy is less than 1% in all cases. The probability of biomass increasing in the projection period (P(B2018>B2014)) is <1%. The stock is well above Bmsy and the projected levels of F result in catches higher than the estimated surplus production which will result in a decline in biomass toward Bmsy.
Projections with Catch in 2015 = Average 2007-2014 catch (7 400t)
Projected Yield ('000t) Median (80% CI)
Projected Relative Biomass (By/Bmsy) Median (80% CI)
⅔ Fmsy
2016 21.02 (19.69 - 23.01) 1.77 (1.75 - 1.77) 2017 19.52 (18.42 - 21.21) 1.61 (1.60 - 1.62) 2018 18.58 (17.66 - 20.02) 1.52 (1.50 - 1.54)
75% Fmsy
2016 23.43 (21.95, 25.64) 1.77 (1.75 - 1.77) 2017 21.44 (20.25 - 23.27) 1.58 (1.57 - 1.60) 2018 20.21 (19.24 - 21.72) 1.47 (1.45 - 1.49)
85% Fmsy
2016 26.26 (24.61 - 28.74) 1.77 (1.75 - 1.77) 2017 23.62 (22.33 - 25.59) 1.55 (1.53 - 1.56) 2018 21.97 (20.97 - 23.57) 1.42 (1.40 - 1.44)
Fmsy
2016 30.39 (28.49 - 33.24) 1.77 (1.75 - 1.77) 2017 26.60 (25.20 - 28.78) 1.50 (1.49 - 1.52) 2018 24.27 (23.25 - 25.98) 1.35 (1.32 - 1.37)
Catch 2015 = 7400 t
Yield P(Fy > Fmsy) P(By < Bmsy)
F Level 2016 2017 2015 2016 2017 2016 2017 2018 P (B2018 > B2014)
2/3 Fmsy 21.02 19.52 <1% <1% <1% <1% <1% <1% <1%
75% Fmsy 23.43 21.44 <1% <1% <1% <1% <1% <1% <1%
85% Fmsy 26.26 23.62 5% 5% 5% <1% <1% <1% <1%
SC 29 May – 11 June 2015 20
www.nafo.int
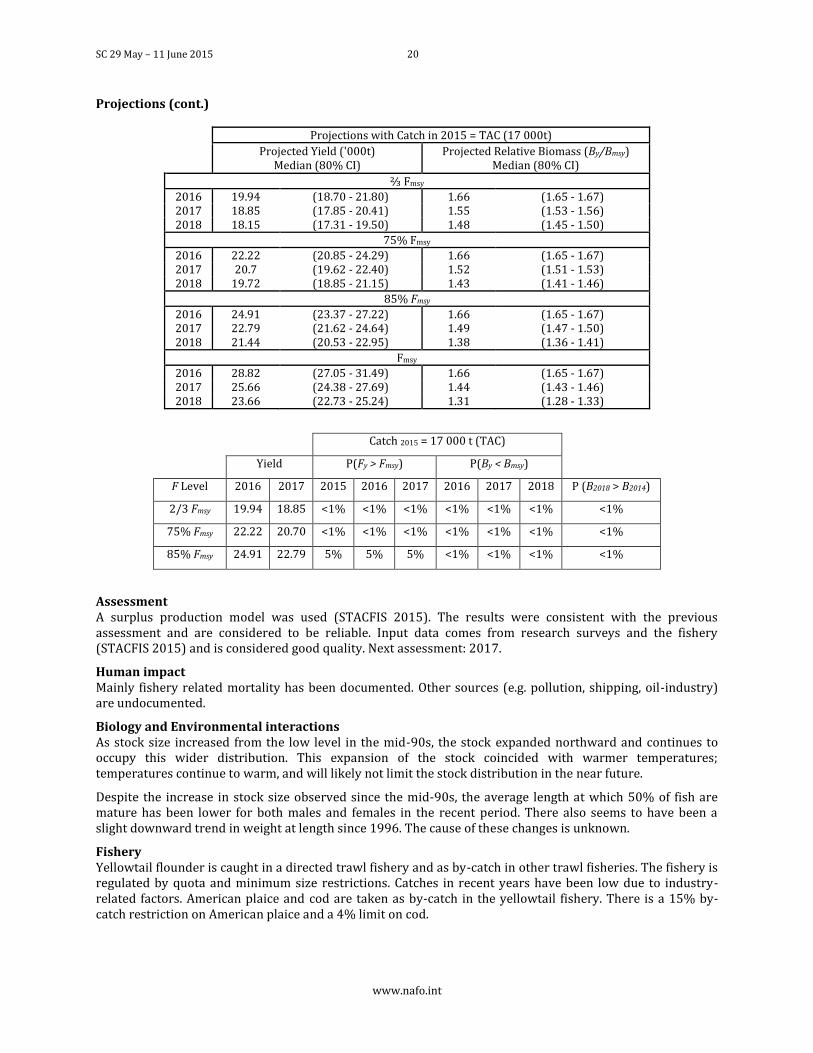
Projections (cont.)
Projections with Catch in 2015 = TAC (17 000t)
Projected Yield ('000t) Median (80% CI)
Projected Relative Biomass (By/Bmsy) Median (80% CI)
⅔ Fmsy
2016 19.94 (18.70 - 21.80) 1.66 (1.65 - 1.67) 2017 18.85 (17.85 - 20.41) 1.55 (1.53 - 1.56) 2018 18.15 (17.31 - 19.50) 1.48 (1.45 - 1.50)
75% Fmsy
2016 22.22 (20.85 - 24.29) 1.66 (1.65 - 1.67) 2017 20.7 (19.62 - 22.40) 1.52 (1.51 - 1.53) 2018 19.72 (18.85 - 21.15) 1.43 (1.41 - 1.46)
85% Fmsy
2016 24.91 (23.37 - 27.22) 1.66 (1.65 - 1.67) 2017 22.79 (21.62 - 24.64) 1.49 (1.47 - 1.50) 2018 21.44 (20.53 - 22.95) 1.38 (1.36 - 1.41)
Fmsy
2016 28.82 (27.05 - 31.49) 1.66 (1.65 - 1.67) 2017 25.66 (24.38 - 27.69) 1.44 (1.43 - 1.46) 2018 23.66 (22.73 - 25.24) 1.31 (1.28 - 1.33)
Catch 2015 = 17 000 t (TAC)
Yield P(Fy > Fmsy) P(By < Bmsy)
F Level 2016 2017 2015 2016 2017 2016 2017 2018 P (B2018 > B2014)
2/3 Fmsy 19.94 18.85 <1% <1% <1% <1% <1% <1% <1%
75% Fmsy 22.22 20.70 <1% <1% <1% <1% <1% <1% <1%
85% Fmsy 24.91 22.79 5% 5% 5% <1% <1% <1% <1%
Assessment A surplus production model was used (STACFIS 2015). The results were consistent with the previous assessment and are considered to be reliable. Input data comes from research surveys and the fishery (STACFIS 2015) and is considered good quality. Next assessment: 2017.
Human impact Mainly fishery related mortality has been documented. Other sources (e.g. pollution, shipping, oil-industry) are undocumented.
Biology and Environmental interactions As stock size increased from the low level in the mid-90s, the stock expanded northward and continues to occupy this wider distribution. This expansion of the stock coincided with warmer temperatures; temperatures continue to warm, and will likely not limit the stock distribution in the near future.
Despite the increase in stock size observed since the mid-90s, the average length at which 50% of fish are mature has been lower for both males and females in the recent period. There also seems to have been a slight downward trend in weight at length since 1996. The cause of these changes is unknown.
Fishery Yellowtail flounder is caught in a directed trawl fishery and as by-catch in other trawl fisheries. The fishery is regulated by quota and minimum size restrictions. Catches in recent years have been low due to industry-related factors. American plaice and cod are taken as by-catch in the yellowtail fishery. There is a 15% by-catch restriction on American plaice and a 4% limit on cod.
21 SC 29 May – 11 June 2015
www.nafo.int
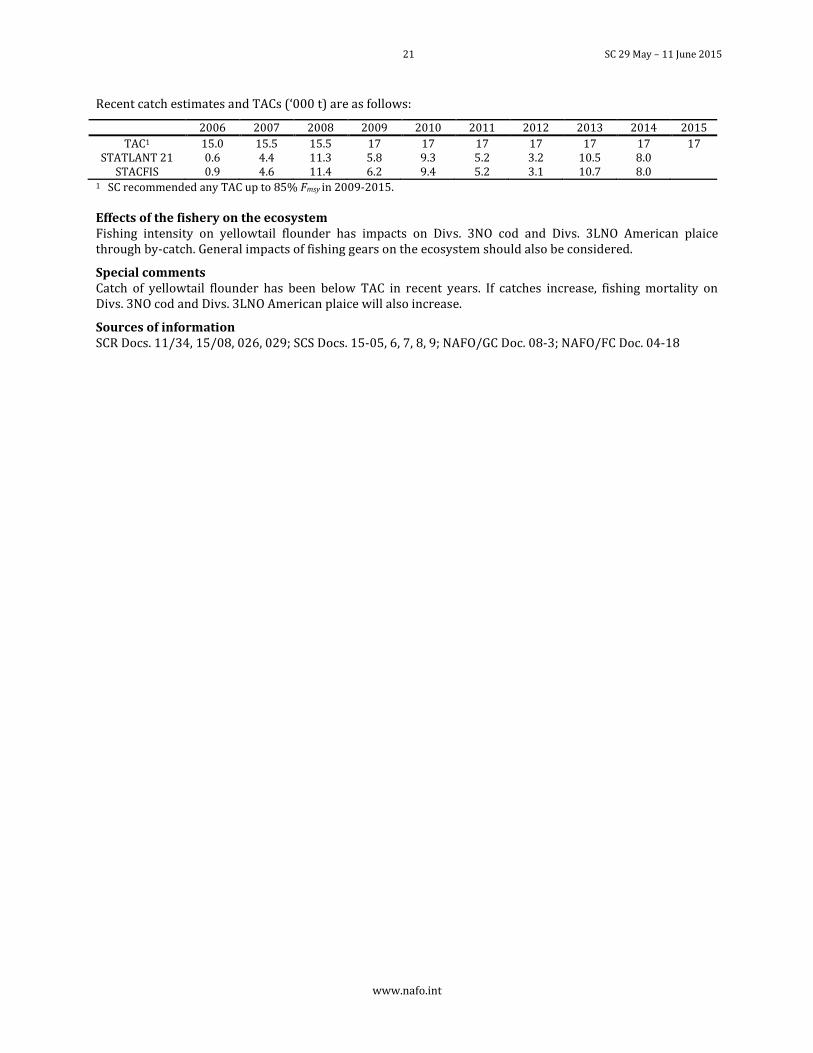
Recent catch estimates and TACs (‘000 t) are as follows:
2006 2007 2008 2009 2010 2011 2012 2013 2014 2015
TAC1 15.0 15.5 15.5 17 17 17 17 17 17 17 STATLANT 21 0.6 4.4 11.3 5.8 9.3 5.2 3.2 10.5 8.0
STACFIS 0.9 4.6 11.4 6.2 9.4 5.2 3.1 10.7 8.0 1 SC recommended any TAC up to 85% Fmsy in 2009-2015.
Effects of the fishery on the ecosystem Fishing intensity on yellowtail flounder has impacts on Divs. 3NO cod and Divs. 3LNO American plaice through by-catch. General impacts of fishing gears on the ecosystem should also be considered.
Special comments Catch of yellowtail flounder has been below TAC in recent years. If catches increase, fishing mortality on Divs. 3NO cod and Divs. 3LNO American plaice will also increase.
Sources of information SCR Docs. 11/34, 15/08, 026, 029; SCS Docs. 15-05, 6, 7, 8, 9; NAFO/GC Doc. 08-3; NAFO/FC Doc. 04-18
SC 29 May – 11 June 2015 22
www.nafo.int
Capelin in Divisions 3NO
Scientific Council deferred its advice on this stock to its September meeting to facilitate the involvement of the Designated Expert.
23 SC 29 May – 11 June 2015
www.nafo.int
b) Monitoring of Stocks for which Multi-year Advice was Provided in 2014
The assessments (interim monitoring) found nothing to indicate a significant change in the status of the seven stocks for which multi-year advice was provided in 2014.
Accordingly, Scientific Council reiterates its previous advice as follows:
Recommendation for Redfish in Divs. 3LN (2014): For 2015 and 2016: Fishing mortality up to 1/3 Fmsy corresponding to a catch of 10 200 t in 2015 and 2016 has low risk (<10%) of exceeding Flim, and is projected to maintain the stock at or above Bmsy. Fishing mortality up to 2/3 Fmsy also has low risk of exceeding Flim, and maintaining the stock at or above Bmsy. However given the uncertainties in the assessment, a higher TAC should be reached by a stepwise increase from the current catch level..
Recommendation for Redfish in Div. 3O (2013): For 2014, 2015 and 2016: Catches have averaged about 13 000 t since the 1960s and over the long term, catches at this level appear to have been sustainable.
Recommendation for American plaice in Div. 3M (2014): For 2015, 2016 and 2017: There should be no directed fishery on American plaice in Div. 3M in 2015, 2016 and 2017. Bycatch should be kept at the lowest possible level
Recommendation for American plaice in Divs. 3LNO (2014): For 2015 and 2016: SSB remains below Blim, therefore Scientific Council recommends that, in accordance with the rebuilding plan, there should be no directed fishing on American plaice in Divs. 3LNO in 2015 and 2016. Bycatches of American plaice should be kept to the lowest possible level and restricted to unavoidable bycatch in fisheries directing for other species.
Recommendation for Thorny skate in Divs. 3LNO (2014): For 2015 and 2016: The stock has shown little improvement at recent catch levels (approximately 5 000 t, over 2006 - 2013), therefore Scientific Council advises no increase in catches.
Recommendation for Witch flounder in Divs. 2J + 3KL (2013): For 2014, 2015 and 2016: No directed fishery to allow for stock rebuilding. By-catches of witch flounder in other fisheries should be kept at the lowest possible level.
Recommendation for Northern short-finned squid (Illex) in SA 3+4 (2013): For 2014, 2015 and 2016: During 2012, the northern stock component remained in a state of low productivity. Therefore, Scientific Council recommends a TAC of no more than 34 000 t/yr.
SC 29 May – 11 June 2015 24
www.nafo.int
c) Special Requests for Management Advice
i) Greenland Halibut TAC
The Fisheries Commission adopted in 2010 an MSE approach for Greenland halibut stock in Subarea 2 + Divs. 3KLMNO (FC Doc. 10/12). This approach considers a survey based harvest control rule (HCR) to set a TAC for this stock on an annual basis. The Fisheries Commission requests the Scientific Council to:
a) Monitor and update the survey slope and to compute the TAC according to HCR adopted by the Fisheries Commission according to Annex 1 of FC Doc. 10/12.
Scientific Council responded:
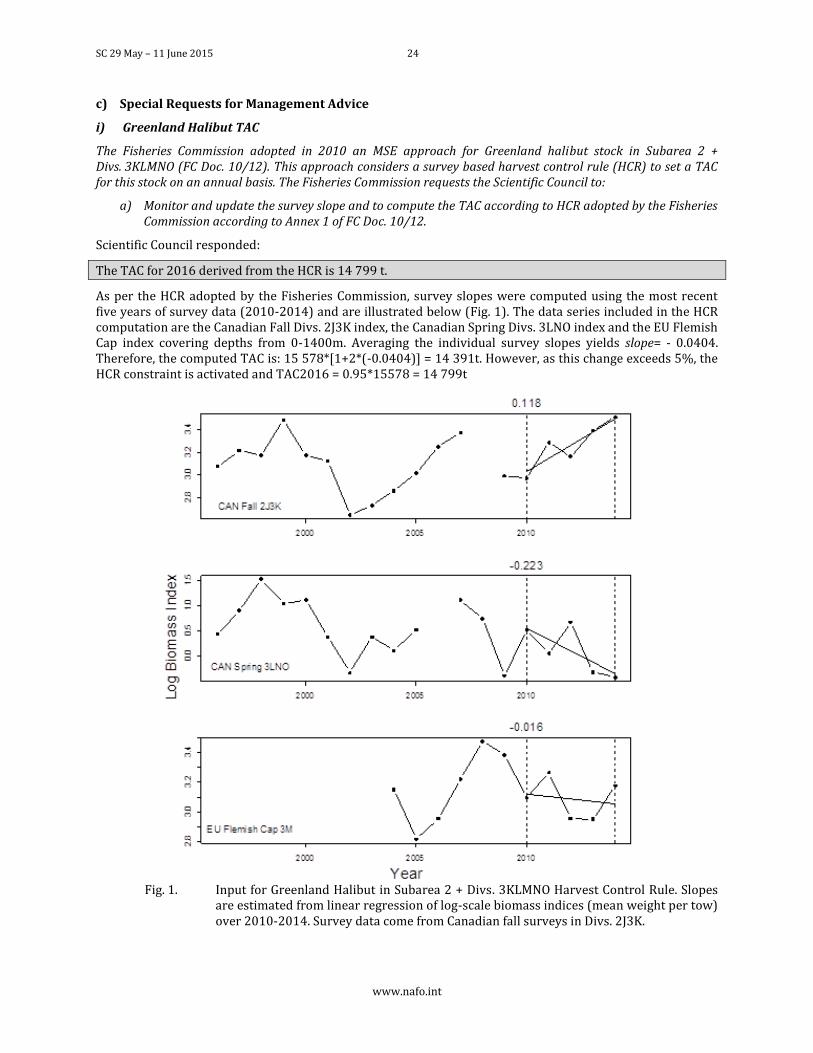
The TAC for 2016 derived from the HCR is 14 799 t.
As per the HCR adopted by the Fisheries Commission, survey slopes were computed using the most recent five years of survey data (2010-2014) and are illustrated below (Fig. 1). The data series included in the HCR computation are the Canadian Fall Divs. 2J3K index, the Canadian Spring Divs. 3LNO index and the EU Flemish Cap index covering depths from 0-1400m. Averaging the individual survey slopes yields slope= - 0.0404. Therefore, the computed TAC is: 15 578*[1+2*(-0.0404)] = 14 391t. However, as this change exceeds 5%, the HCR constraint is activated and TAC2016 = 0.95*15578 = 14 799t
Fig. 1. Input for Greenland Halibut in Subarea 2 + Divs. 3KLMNO Harvest Control Rule. Slopes
are estimated from linear regression of log-scale biomass indices (mean weight per tow) over 2010-2014. Survey data come from Canadian fall surveys in Divs. 2J3K.
25 SC 29 May – 11 June 2015
www.nafo.int
ii) Greenland Halibut Exceptional Circumstances
a) Advise on whether or not an exceptional circumstance is occurring.
According to the indicator based on surveys, exceptional circumstances occurred in 2013 and 2014. One survey observation in each of 2013 and 2014 was below the 5th percentile of the simulated distributions, and one survey observation in 2014 was above the 95th percentile of the simulated distributions. Due to the unavailability of STACFIS catch estimates in 2011, 2012, 2013, and 2014, SC is unable to determine whether recent catches constitute an exceptional circumstance nor does it allow evaluation for some of the secondary indicators.
The fact that one of the surveys in 2014 is above the simulated distributions from one suite of operating models does not constitute a conservation concern. However, the fact that one of the surveys in 2013 and 2014 is below the simulated distributions of one suite of operating models is a conservation concern.
The “primary indicators” used to determine if exceptional circumstances are occurring are catch and surveys. The observed values are compared to the simulated distributions from both SCAA-based operating models and XSA-based operating models. If the observed values are outside of the 90% confidence interval (i.e. outside 5th-95th percentiles) from the simulations presented to WGMSE during September 2010, then SC shall advise FC that exceptional circumstances are occurring.
STACFIS catch estimates for 2011, 2012, 2013 and 2014 are not available. Therefore, SC cannot compare observed catches to the simulated distributions, and is unable to determine if exceptional circumstances are occurring in respect to this indicator. SC notes the management strategy for Greenland halibut assumed that the simulated catches would exactly equal the TACs generated from the HCR. The 90% confidence intervals for the simulated 2014 catches range from 14389 to 18606 t in the XSA based OMs and in SCAA based OMs, from 14731 to 16175 t. The STATLANT 21 catches for 2014 were 15 615 t, against a TAC of 15578 t.
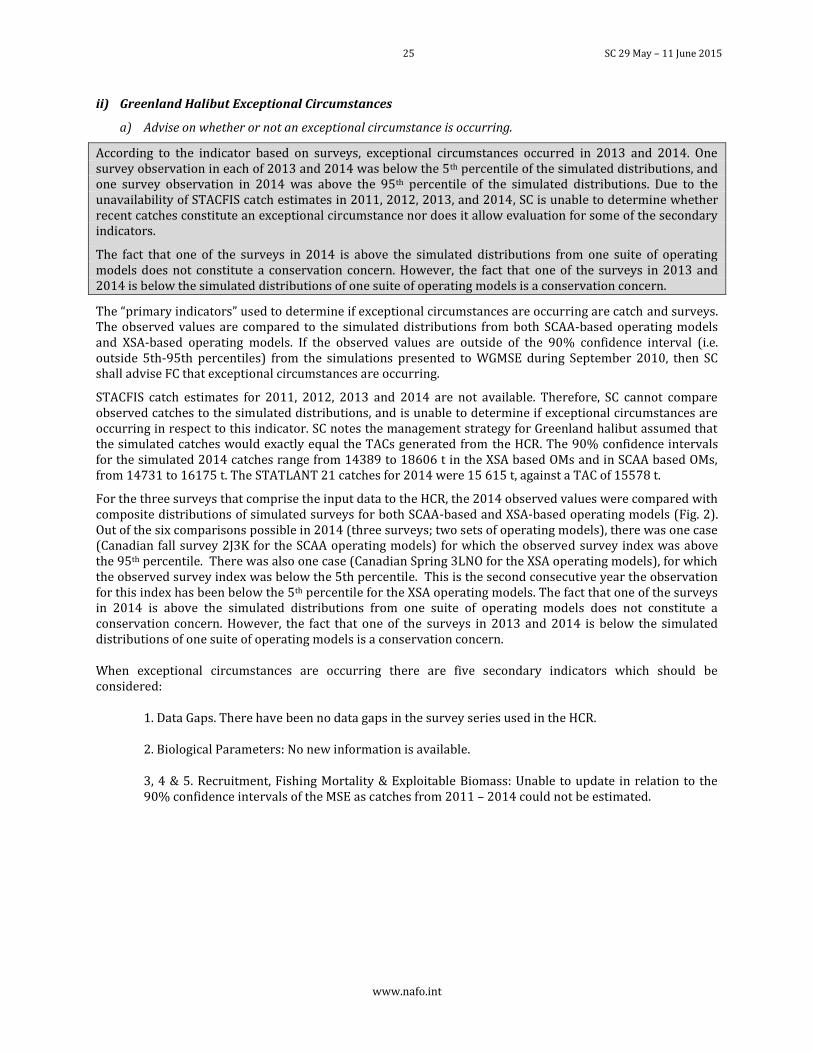
For the three surveys that comprise the input data to the HCR, the 2014 observed values were compared with composite distributions of simulated surveys for both SCAA-based and XSA-based operating models (Fig. 2). Out of the six comparisons possible in 2014 (three surveys; two sets of operating models), there was one case (Canadian fall survey 2J3K for the SCAA operating models) for which the observed survey index was above the 95th percentile. There was also one case (Canadian Spring 3LNO for the XSA operating models), for which the observed survey index was below the 5th percentile. This is the second consecutive year the observation for this index has been below the 5th percentile for the XSA operating models. The fact that one of the surveys in 2014 is above the simulated distributions from one suite of operating models does not constitute a conservation concern. However, the fact that one of the surveys in 2013 and 2014 is below the simulated distributions of one suite of operating models is a conservation concern.
When exceptional circumstances are occurring there are five secondary indicators which should be considered:
1. Data Gaps. There have been no data gaps in the survey series used in the HCR.
2. Biological Parameters: No new information is available.
3, 4 & 5. Recruitment, Fishing Mortality & Exploitable Biomass: Unable to update in relation to the 90% confidence intervals of the MSE as catches from 2011 – 2014 could not be estimated.
SC 29 May – 11 June 2015 26
www.nafo.int
Fig. 2. Observed surveys (lines with dots) and upper and lower 90% confidence intervals of
surveys simulated (solid lines) in the MSE for Greenland Halibut in Subarea 2 + Divs. 3KLMNO. The panels on the left give the simulated surveys from the XSA operating models, and on the right from the SCAA operating models.
iii) Selectivity of cod and redfish in Div. 3M
The Fisheries Commission requests the Scientific Council to analyse and provide advice on management measures that could improve selectivity in the Div. 3M cod and Div. 3M redfish fisheries in the Flemish Cap in order to reduce possible by catches and discards.
The Scientific Council responded:
The implementation of sorting-grids in the Div. 3M cod fishery gear will reduce catch of small and immature individuals of cod. These devices would to a large extent prevent catches of individuals less than MLS (41 cm) and have the advantage also of reducing redfish by-catches and thereby reduce discards. It is estimated that by introducing sorting grids, the actual Fmsy value and the equilibrium yield (catches) would increase but it should have a small impact in the equilibrium SSB. To quantify these improvements more precisely, selectivity experiments with the modified gears needs to be performed in the Flemish Cap area.
SC has reviewed some possible technical measures that could be applied in NAFO Div. 3M cod in order to reduce possible by-catches and discards based on studies carried out in the Barents Sea.
2000 2005 2010
010
20
30
CAN Fall 2J3K XSA
2000 2005 2010
01
23
45
CAN Spring 3LNO XSA
2000 2005 2010
010
20
30
40
EU Flemish Cap 3M XSA
2000 2005 2010
010
20
30
CAN Fall 2J3K SCAA
2000 2005 2010
01
23
45
CAN Spring 3LNO SCAA
2000 2005 2010
010
20
30
40
EU Flemish Cap 3M SCAA
Year
Bio
mass I
ndex (
MW
PT
)
27 SC 29 May – 11 June 2015
www.nafo.int
SC noted that in the Div. 3M cod fishery there has been decrease in the mean size of the catches observed in 2013 compared with previous years. The mode observed in the length distribution of catches in the 2013 fishery was very close to the Minimum Landing Size (MLS) approved for this species (41 cm) and it was quite different from 2012, when it was around 54 cm. In 2013, 32% of cod individuals caught were below the MLS while in 2012 it was only 10%.
SC reviewed the implementation of the 135 mm codend with 55 mm sorting-grid in the current gear that could be applied in NAFO 3M cod in order to reduce by-catch and discards based on studies carried out in the Barents Sea. Considering the selectivity parameters of the 135 mm codend mesh size and the Div. 3M cod biology, the mesh size used in the NAFO cod fishery (130 mm) is not the most appropriate as in its catches a large proportion of immature fish below MLS resulting in discarding. The L50 (length at which 50% of cod entering the net are retained) of the 135 mm codend with 55 mm sorting-grid was estimated to increase to around 55 cm. In addition to reducing the catch of small cod and with that discards, this alternative also has the advantage of reducing redfish by-catch. Sorting grids seem to have a greater survival rate of the selected fish than the diamond meshes and the exit windows.
The implementation of a selection pattern similar to the 135 mm codend with sorting grids would increase the actual Fmsy value and the equilibrium catches but it should have a small impact in the equilibrium SSB. To quantify these improvements more precisely, selectivity experiments with the modified gears needs to be performed in the actual fishing area i.e. in the Flemish Cap area.
Other measures to avoid excessive catch of juveniles could be considered, e.g. the closure of the areas at less than 400 meters depth where these fish are more abundant. The effect in the exploitation pattern of this technical measure should be similar to the implementation of the 135 mm codend with sorting grids. However, this measure could increase the by-catch of redfish as this species is more abundant in depths more than 400 meters. Another problem of implementing these closures would be the effort concentration in small areas.
iv) Risk assessment for SAI on VME elements and species
The Fisheries Commission requests the Scientific Council to continue to develop work on Significant Adverse Impacts in support of the reassessment of NAFO bottom fishing activities required in 2016, specifically an assessment of the risk associated with bottom fishing activities on known and predicted VME species and elements in the NRA.
The Scientific Council responded:
The programme of work to deliver the assessment of bottom fishing activities by 2016 is progressing as intended. Recent developments have included the design of a template for the assessment report, the start of compilation of background ecological information, a description of the fisheries operating in the NRA, and further advances on the approach to be used for assessing the risk of Significant Adverse Impacts on VMEs.
The programme of work to deliver the assessment of bottom fishing activities by 2016 is progressing as intended. Recent developments have included a) the design of a template for the assessment report (see below), as well as guidelines for its content, b) the start of the compilation of background ecological information, and description of the fisheries operating in the NRA, and c) further advances on the approach to be used for assessing the risk of Significant Adverse Impacts on VMEs.
A template for the structure and content of the report to assess bottom fisheries has been defined (see NAFO Scientific Council Reports, 2014, 66 – 68; FC Doc. 15/01, Annex I.E), including which assessment task corresponds to which section of the report; e.g.:
SC 29 May – 11 June 2015 28
www.nafo.int
Section 1: Introduction Task No 2. “Existing baseline information on the ecosystems, habitats, and communities in the fishing area, against which future changes can be compared” Approach to the section: This section is intended to be a summary of the environmental and general ecosystem background; detailed VME descriptions will be provided in Task 3. This section is envisioned as a brief introduction to the larger ecosystems where the VMEs are located. If pertinent, references to other more detailed sources can be made in this section, but the section itself should be kept short and to the point. Template for the section: 1. NRA Footprint
a. General oceanographic processes: currents, water masses, temperature, salinity, bathymetry, etc for the entire region.
b. Ecosystem Production units: general description, productivity, biological oceanography.
i. Grand Bank
ii. Flemish Cap c. Fish communities: Species, fish functional groups, community trends.
i. Grand Bank
ii. Flemish Cap d. Benthic communities: ecoregions, habitats, species assemblages (VME and non-VMEs; the detailed VMEs description will be provided in a separate section).
i. Grand Bank
ii. Flemish Cap 2. NRA Seamounts.
Only general information. Refer to detailed VME section (Tasks 3 and 5) where seamounts are described as VME elements, unless some broader features are amenable and worthy of a general description.
Section 2: description of VME and VME elements Tasks No 3 and 5. “Identification, description and mapping of VMEs , and VME elements” Approach to the section: This section is intended to be a summary of all VMEs and VME elements in the NRA. It should provide a concise summary of the types, and locations of VMEs and VME elements identified in the NRA. Noting the caveats, this section is expected to heavily rely on the work already done for the evaluation of closures in 2014. Template for the section: 1. NRA Footprint
2. NRA Seamounts
Section 3: Description of the Fisheries Task No 1. “Description of fisheries” Approach to the section: This section is intended to be a summary of all fisheries operating in the NRA, including their gear types, target species, areas of operation, etc.
Section 4: Impact analysis Task No 4. “Analysis of likely impacts on VMEs” Approach to the section: This section is expected to be focused on likely impacts on VMEs and, whenever possible, to discriminate likely impacts by fisheries. Depending on how the work develops, this section could be merged with Section 5.
29 SC 29 May – 11 June 2015
www.nafo.int
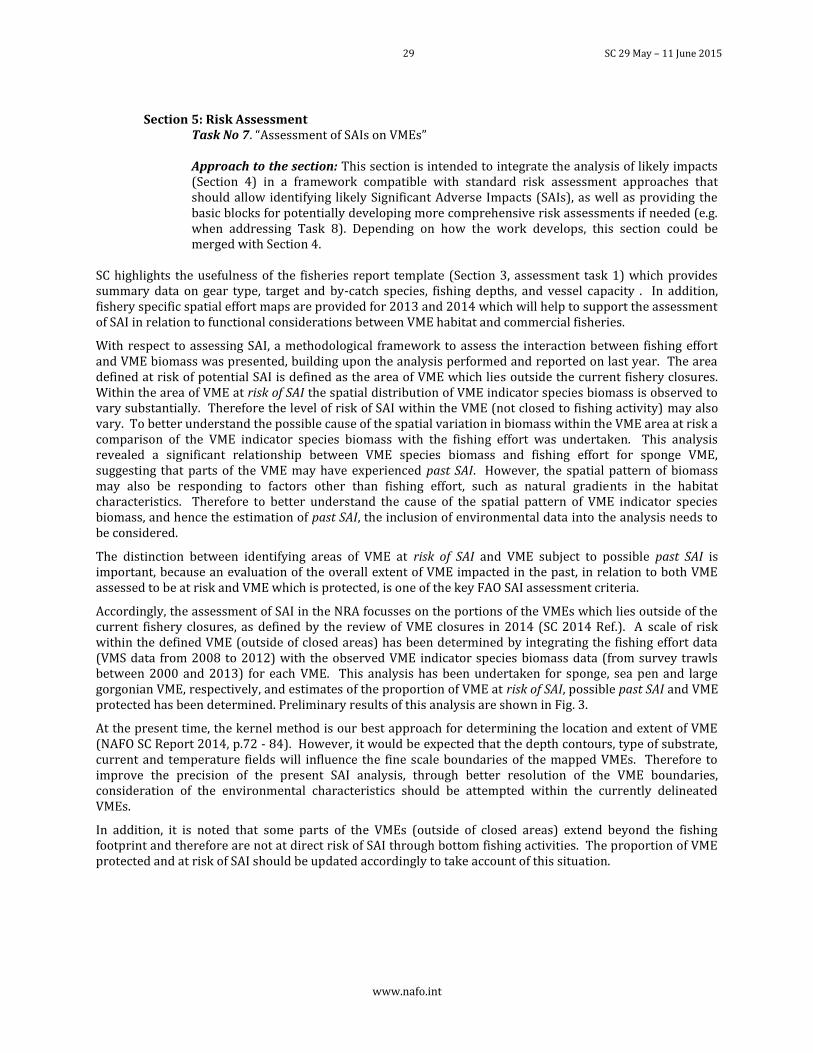
Section 5: Risk Assessment
Task No 7. “Assessment of SAIs on VMEs”
Approach to the section: This section is intended to integrate the analysis of likely impacts (Section 4) in a framework compatible with standard risk assessment approaches that should allow identifying likely Significant Adverse Impacts (SAIs), as well as providing the basic blocks for potentially developing more comprehensive risk assessments if needed (e.g. when addressing Task 8). Depending on how the work develops, this section could be merged with Section 4.
SC highlights the usefulness of the fisheries report template (Section 3, assessment task 1) which provides summary data on gear type, target and by-catch species, fishing depths, and vessel capacity . In addition, fishery specific spatial effort maps are provided for 2013 and 2014 which will help to support the assessment of SAI in relation to functional considerations between VME habitat and commercial fisheries.
With respect to assessing SAI, a methodological framework to assess the interaction between fishing effort and VME biomass was presented, building upon the analysis performed and reported on last year. The area defined at risk of potential SAI is defined as the area of VME which lies outside the current fishery closures. Within the area of VME at risk of SAI the spatial distribution of VME indicator species biomass is observed to vary substantially. Therefore the level of risk of SAI within the VME (not closed to fishing activity) may also vary. To better understand the possible cause of the spatial variation in biomass within the VME area at risk a comparison of the VME indicator species biomass with the fishing effort was undertaken. This analysis revealed a significant relationship between VME species biomass and fishing effort for sponge VME, suggesting that parts of the VME may have experienced past SAI. However, the spatial pattern of biomass may also be responding to factors other than fishing effort, such as natural gradients in the habitat characteristics. Therefore to better understand the cause of the spatial pattern of VME indicator species biomass, and hence the estimation of past SAI, the inclusion of environmental data into the analysis needs to be considered.
The distinction between identifying areas of VME at risk of SAI and VME subject to possible past SAI is important, because an evaluation of the overall extent of VME impacted in the past, in relation to both VME assessed to be at risk and VME which is protected, is one of the key FAO SAI assessment criteria.
Accordingly, the assessment of SAI in the NRA focusses on the portions of the VMEs which lies outside of the current fishery closures, as defined by the review of VME closures in 2014 (SC 2014 Ref.). A scale of risk within the defined VME (outside of closed areas) has been determined by integrating the fishing effort data (VMS data from 2008 to 2012) with the observed VME indicator species biomass data (from survey trawls between 2000 and 2013) for each VME. This analysis has been undertaken for sponge, sea pen and large gorgonian VME, respectively, and estimates of the proportion of VME at risk of SAI, possible past SAI and VME protected has been determined. Preliminary results of this analysis are shown in Fig. 3.
At the present time, the kernel method is our best approach for determining the location and extent of VME (NAFO SC Report 2014, p.72 - 84). However, it would be expected that the depth contours, type of substrate, current and temperature fields will influence the fine scale boundaries of the mapped VMEs. Therefore to improve the precision of the present SAI analysis, through better resolution of the VME boundaries, consideration of the environmental characteristics should be attempted within the currently delineated VMEs.
In addition, it is noted that some parts of the VMEs (outside of closed areas) extend beyond the fishing footprint and therefore are not at direct risk of SAI through bottom fishing activities. The proportion of VME protected and at risk of SAI should be updated accordingly to take account of this situation.
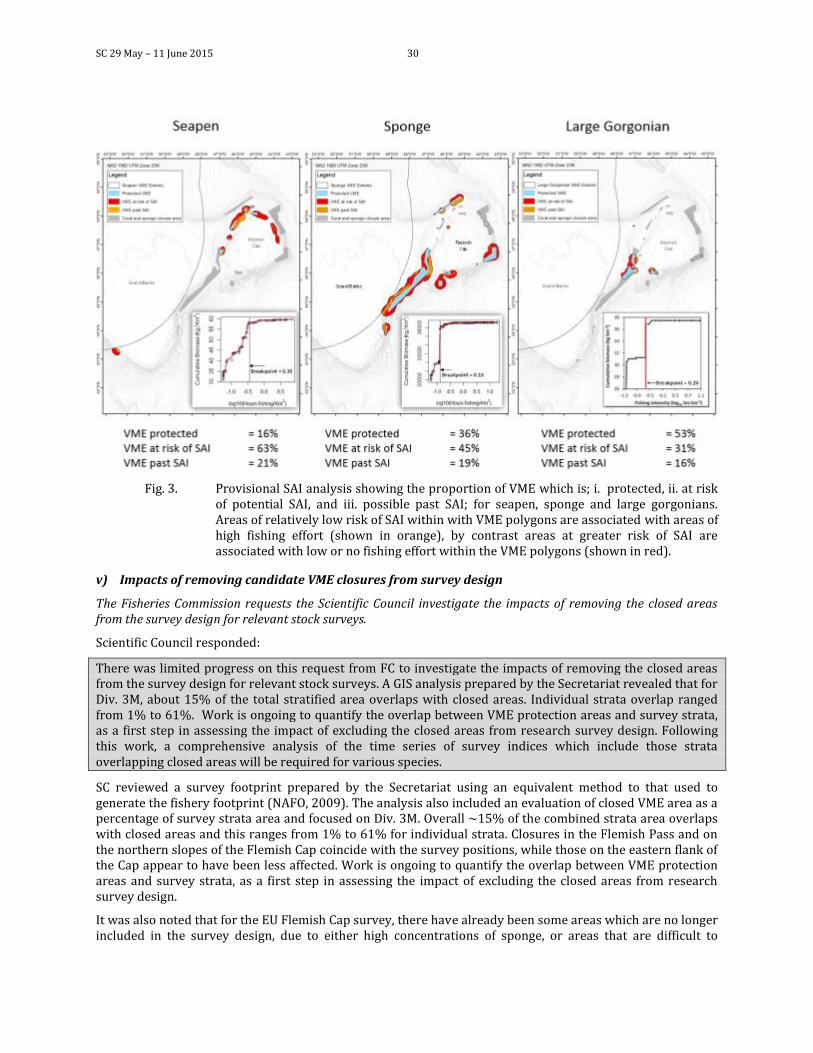
SC 29 May – 11 June 2015 30
Fig. 3. Provisional SAI analysis showing the proportion of VME which is; i. protected, ii. at risk
of potential SAI, and iii. possible past SAI; for seapen, sponge and large gorgonians. Areas of relatively low risk of SAI within with VME polygons are associated with areas of high fishing effort (shown in orange), by contrast areas at greater risk of SAI are associated with low or no fishing effort within the VME polygons (shown in red).
v) Impacts of removing candidate VME closures from survey design
The Fisheries Commission requests the Scientific Council investigate the impacts of removing the closed areas from the survey design for relevant stock surveys.
Scientific Council responded:
There was limited progress on this request from FC to investigate the impacts of removing the closed areas from the survey design for relevant stock surveys. A GIS analysis prepared by the Secretariat revealed that for Div. 3M, about 15% of the total stratified area overlaps with closed areas. Individual strata overlap ranged from 1% to 61%. Work is ongoing to quantify the overlap between VME protection areas and survey strata, as a first step in assessing the impact of excluding the closed areas from research survey design. Following this work, a comprehensive analysis of the time series of survey indices which include those strata overlapping closed areas will be required for various species.
SC reviewed a survey footprint prepared by the Secretariat using an equivalent method to that used to generate the fishery footprint (NAFO, 2009). The analysis also included an evaluation of closed VME area as a percentage of survey strata area and focused on Div. 3M. Overall ~15% of the combined strata area overlaps with closed areas and this ranges from 1% to 61% for individual strata. Closures in the Flemish Pass and on the northern slopes of the Flemish Cap coincide with the survey positions, while those on the eastern flank of the Cap appear to have been less affected. Work is ongoing to quantify the overlap between VME protection areas and survey strata, as a first step in assessing the impact of excluding the closed areas from research survey design.
It was also noted that for the EU Flemish Cap survey, there have already been some areas which are no longer included in the survey design, due to either high concentrations of sponge, or areas that are difficult to
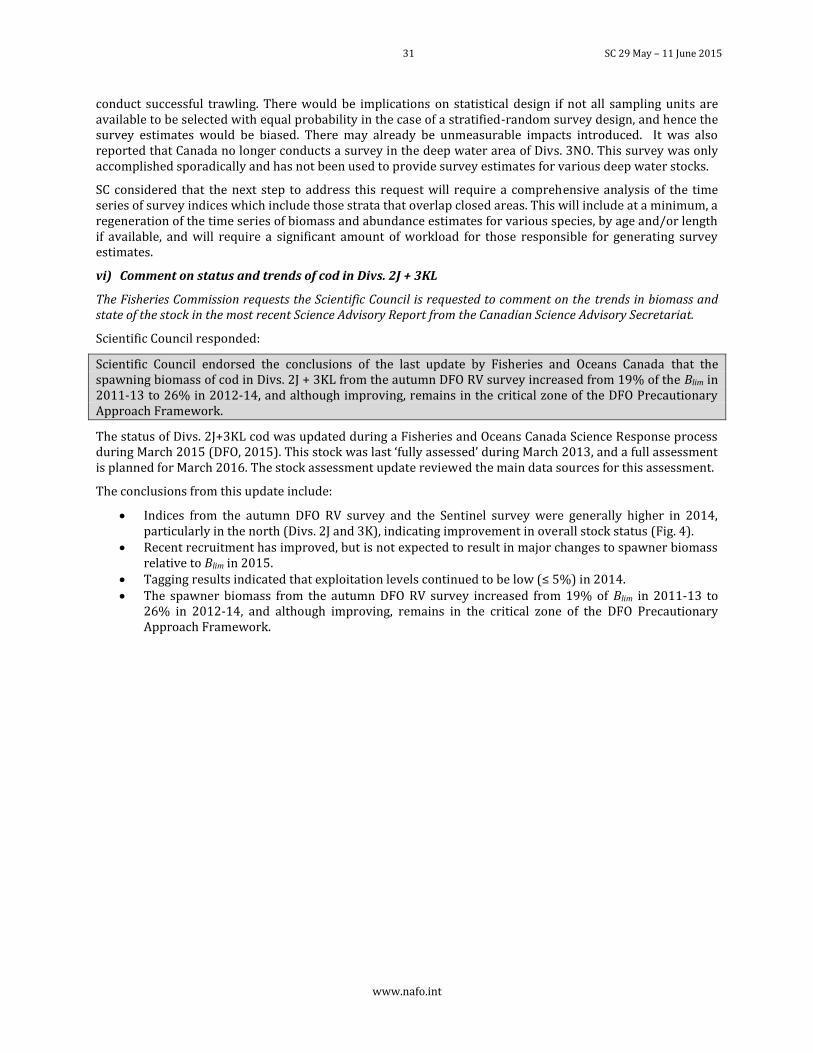
31 SC 29 May – 11 June 2015
www.nafo.int
conduct successful trawling. There would be implications on statistical design if not all sampling units are available to be selected with equal probability in the case of a stratified-random survey design, and hence the survey estimates would be biased. There may already be unmeasurable impacts introduced. It was also reported that Canada no longer conducts a survey in the deep water area of Divs. 3NO. This survey was only accomplished sporadically and has not been used to provide survey estimates for various deep water stocks.
SC considered that the next step to address this request will require a comprehensive analysis of the time series of survey indices which include those strata that overlap closed areas. This will include at a minimum, a regeneration of the time series of biomass and abundance estimates for various species, by age and/or length if available, and will require a significant amount of workload for those responsible for generating survey estimates.
vi) Comment on status and trends of cod in Divs. 2J + 3KL
The Fisheries Commission requests the Scientific Council is requested to comment on the trends in biomass and state of the stock in the most recent Science Advisory Report from the Canadian Science Advisory Secretariat.
Scientific Council responded:
Scientific Council endorsed the conclusions of the last update by Fisheries and Oceans Canada that the spawning biomass of cod in Divs. 2J + 3KL from the autumn DFO RV survey increased from 19% of the Blim in 2011-13 to 26% in 2012-14, and although improving, remains in the critical zone of the DFO Precautionary Approach Framework.
The status of Divs. 2J+3KL cod was updated during a Fisheries and Oceans Canada Science Response process during March 2015 (DFO, 2015). This stock was last ‘fully assessed’ during March 2013, and a full assessment is planned for March 2016. The stock assessment update reviewed the main data sources for this assessment.
The conclusions from this update include:
Indices from the autumn DFO RV survey and the Sentinel survey were generally higher in 2014, particularly in the north (Divs. 2J and 3K), indicating improvement in overall stock status (Fig. 4).
Recent recruitment has improved, but is not expected to result in major changes to spawner biomass relative to Blim in 2015.
Tagging results indicated that exploitation levels continued to be low (≤ 5%) in 2014. The spawner biomass from the autumn DFO RV survey increased from 19% of Blim in 2011-13 to
26% in 2012-14, and although improving, remains in the critical zone of the DFO Precautionary Approach Framework.
SC 29 May – 11 June 2015 32
www.nafo.int
Fig. 4. SSB index from autumn DFO RV surveys in Divs. 2J3KL. The dashed line is the Limit
Reference Point (Blim) which is defined as the average SSB during the 1980s These conclusions were endorsed by Scientific Council.
References.
DFO. 2015. Northern (NAFO Divs. 2J3KL) Cod Stock Update. DFO Can. Sci. Advis. Sec. Sci. Resp. 2015/018. http://www.dfo-mpo.gc.ca/csas-sccs/publications/scr-rs/2015/2015_018-eng.html. Accessed May 28, 2015.
vii) Full assessment of witch flounder in Divs. 3NO
The Fisheries Commission requests the Scientific Council to conduct a full assessment of witch flounder in Divs. 3NO.
Scientific Council responded:
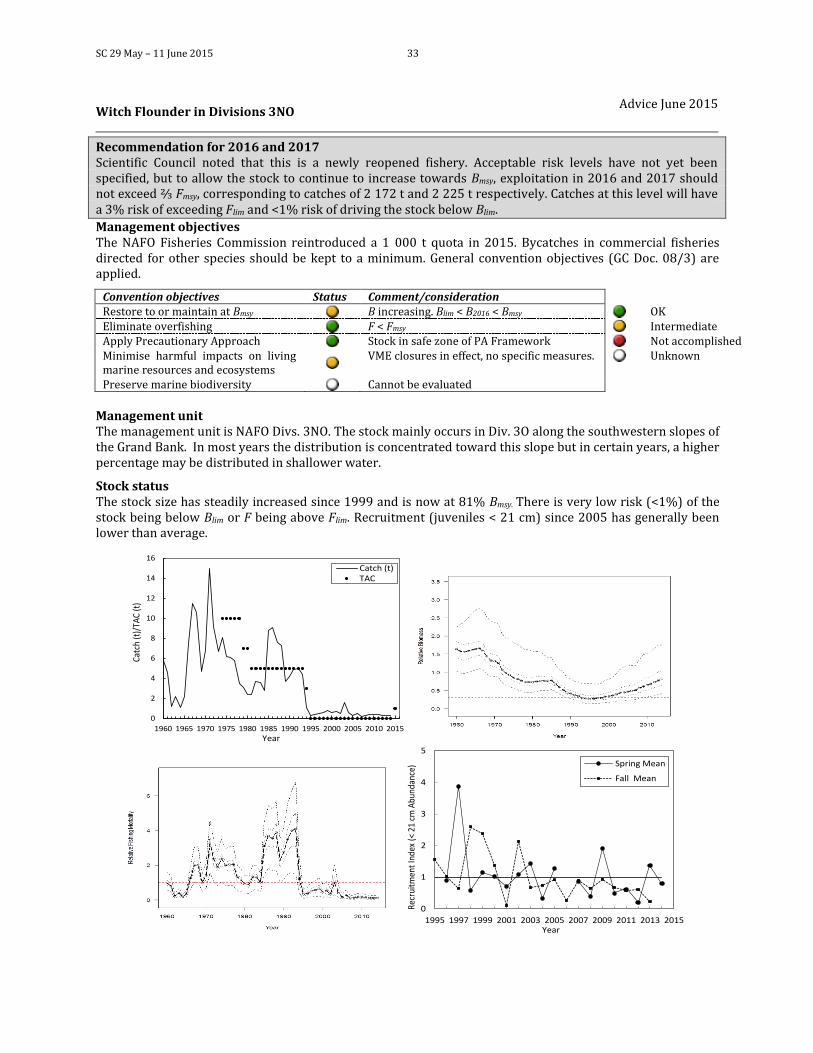
SC 29 May – 11 June 2015 33
Witch Flounder in Divisions 3NO Advice June 2015
Recommendation for 2016 and 2017 Scientific Council noted that this is a newly reopened fishery. Acceptable risk levels have not yet been specified, but to allow the stock to continue to increase towards Bmsy, exploitation in 2016 and 2017 should not exceed ⅔ Fmsy, corresponding to catches of 2 172 t and 2 225 t respectively. Catches at this level will have a 3% risk of exceeding Flim and <1% risk of driving the stock below Blim.
Management objectives The NAFO Fisheries Commission reintroduced a 1 000 t quota in 2015. Bycatches in commercial fisheries directed for other species should be kept to a minimum. General convention objectives (GC Doc. 08/3) are applied.
Convention objectives Status Comment/consideration Restore to or maintain at Bmsy
B increasing. Blim < B2016 < Bmsy
OK Eliminate overfishing
F < Fmsy
Intermediate Apply Precautionary Approach
Stock in safe zone of PA Framework
Not accomplished Minimise harmful impacts on living marine resources and ecosystems
VME closures in effect, no specific measures.
Unknown
Preserve marine biodiversity
Cannot be evaluated
Management unit The management unit is NAFO Divs. 3NO. The stock mainly occurs in Div. 3O along the southwestern slopes of the Grand Bank. In most years the distribution is concentrated toward this slope but in certain years, a higher percentage may be distributed in shallower water.
Stock status The stock size has steadily increased since 1999 and is now at 81% Bmsy. There is very low risk (<1%) of the stock being below Blim or F being above Flim. Recruitment (juveniles < 21 cm) since 2005 has generally been lower than average.
0
2
4
6
8
10
12
14
16
1960 1965 1970 1975 1980 1985 1990 1995 2000 2005 2010 2015
Catc
h (t
)/TA
C (t
)
Year
Catch (t)TAC
0
1
2
3
4
5
1995 1997 1999 2001 2003 2005 2007 2009 2011 2013 2015
Recr
uitm
ent
Inde
x (<
21
cm A
bund
ance
)
Year
Spring Mean
Fall Mean
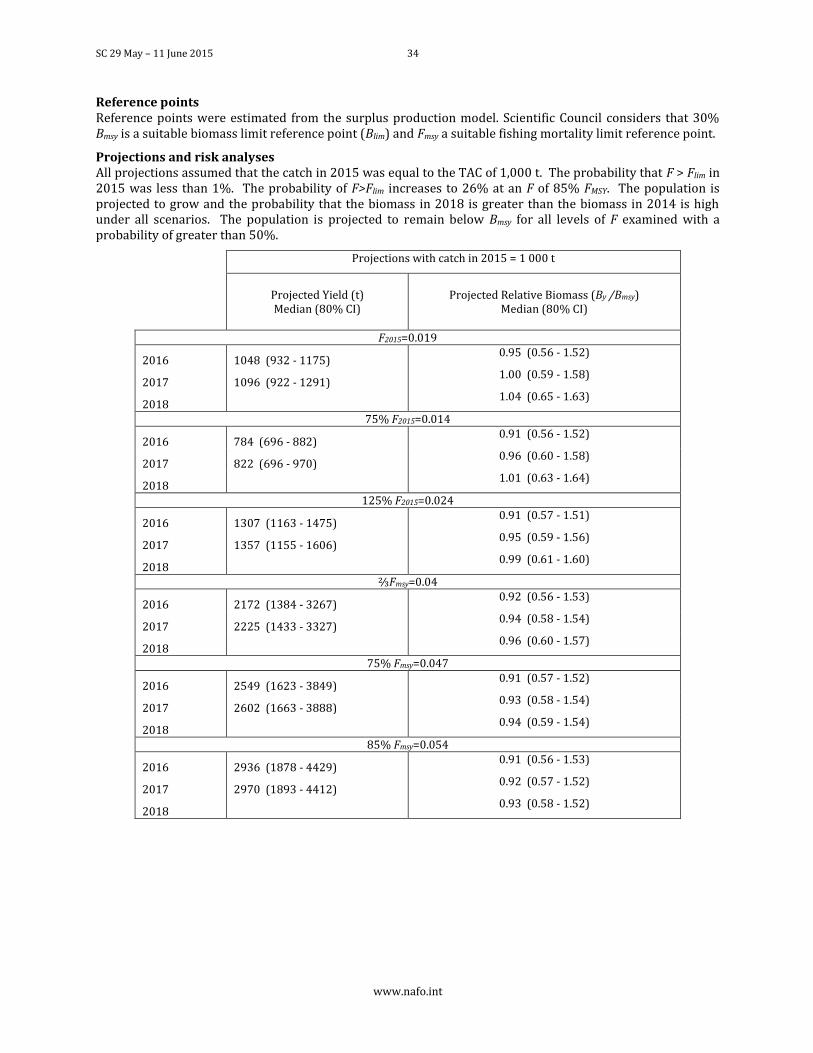
SC 29 May – 11 June 2015 34
www.nafo.int
Reference points Reference points were estimated from the surplus production model. Scientific Council considers that 30% Bmsy is a suitable biomass limit reference point (Blim) and Fmsy a suitable fishing mortality limit reference point.
Projections and risk analyses All projections assumed that the catch in 2015 was equal to the TAC of 1,000 t. The probability that F > Flim in 2015 was less than 1%. The probability of F>Flim increases to 26% at an F of 85% FMSY. The population is projected to grow and the probability that the biomass in 2018 is greater than the biomass in 2014 is high under all scenarios. The population is projected to remain below Bmsy for all levels of F examined with a probability of greater than 50%.
Projections with catch in 2015 = 1 000 t
Projected Yield (t) Median (80% CI)
Projected Relative Biomass (By /Bmsy)
Median (80% CI)
F2015=0.019
2016 1048 (932 - 1175) 0.95 (0.56 - 1.52)
2017 1096 (922 - 1291) 1.00 (0.59 - 1.58)
2018 1.04 (0.65 - 1.63)
75% F2015=0.014
2016 784 (696 - 882) 0.91 (0.56 - 1.52)
2017 822 (696 - 970) 0.96 (0.60 - 1.58)
2018 1.01 (0.63 - 1.64)
125% F2015=0.024
2016 1307 (1163 - 1475) 0.91 (0.57 - 1.51)
2017 1357 (1155 - 1606) 0.95 (0.59 - 1.56)
2018 0.99 (0.61 - 1.60)
⅔Fmsy=0.04
2016 2172 (1384 - 3267) 0.92 (0.56 - 1.53)
2017 2225 (1433 - 3327) 0.94 (0.58 - 1.54)
2018 0.96 (0.60 - 1.57)
75% Fmsy=0.047
2016 2549 (1623 - 3849) 0.91 (0.57 - 1.52)
2017 2602 (1663 - 3888) 0.93 (0.58 - 1.54)
2018 0.94 (0.59 - 1.54)
85% Fmsy=0.054
2016 2936 (1878 - 4429) 0.91 (0.56 - 1.53)
2017 2970 (1893 - 4412) 0.92 (0.57 - 1.52)
2018 0.93 (0.58 - 1.52)
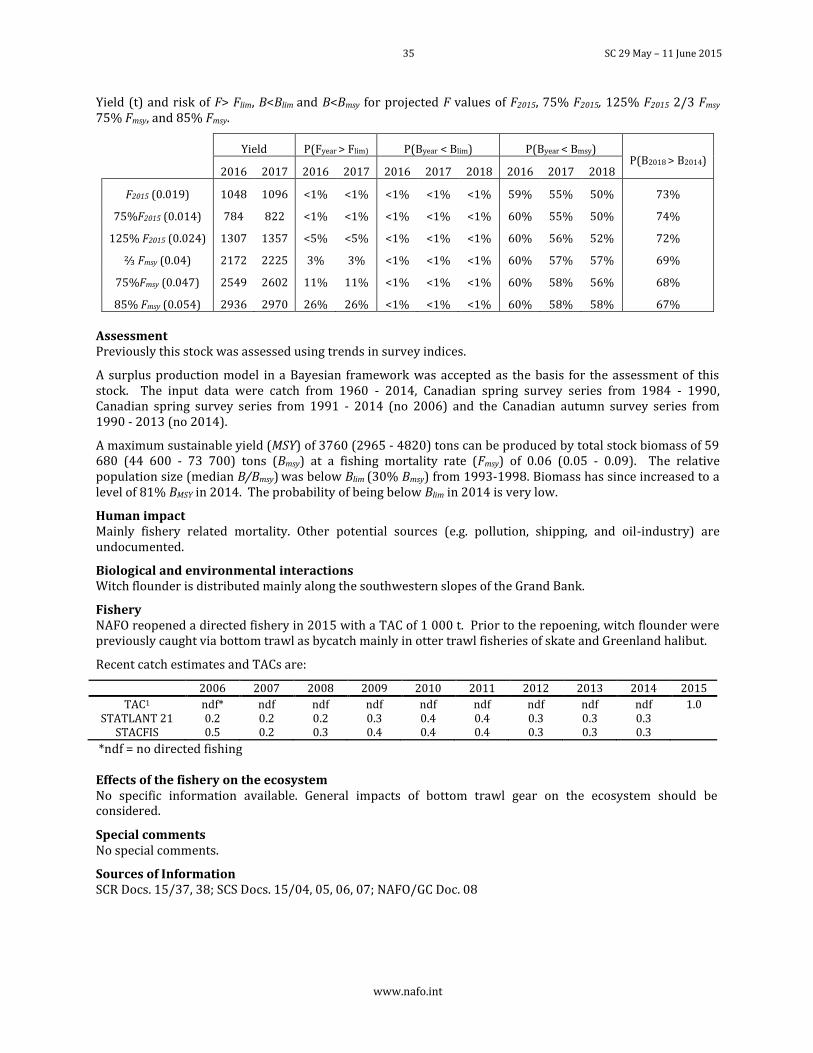
35 SC 29 May – 11 June 2015
www.nafo.int
Yield (t) and risk of F> Flim, B<Blim and B<Bmsy for projected F values of F2015, 75% F2015, 125% F2015 2/3 Fmsy 75% Fmsy, and 85% Fmsy.
Yield P(Fyear > Flim) P(Byear < Blim) P(Byear < Bmsy) P(B2018 > B2014)
2016 2017 2016 2017 2016 2017 2018 2016 2017 2018
F2015 (0.019) 1048 1096 <1% <1% <1% <1% <1% 59% 55% 50% 73%
75%F2015 (0.014) 784 822 <1% <1% <1% <1% <1% 60% 55% 50% 74%
125% F2015 (0.024) 1307 1357 <5% <5% <1% <1% <1% 60% 56% 52% 72%
⅔ Fmsy (0.04) 2172 2225 3% 3% <1% <1% <1% 60% 57% 57% 69%
75%Fmsy (0.047) 2549 2602 11% 11% <1% <1% <1% 60% 58% 56% 68%
85% Fmsy (0.054) 2936 2970 26% 26% <1% <1% <1% 60% 58% 58% 67%
Assessment Previously this stock was assessed using trends in survey indices.
A surplus production model in a Bayesian framework was accepted as the basis for the assessment of this stock. The input data were catch from 1960 - 2014, Canadian spring survey series from 1984 - 1990, Canadian spring survey series from 1991 - 2014 (no 2006) and the Canadian autumn survey series from 1990 - 2013 (no 2014).
A maximum sustainable yield (MSY) of 3760 (2965 - 4820) tons can be produced by total stock biomass of 59 680 (44 600 - 73 700) tons (Bmsy) at a fishing mortality rate (Fmsy) of 0.06 (0.05 - 0.09). The relative population size (median B/Bmsy) was below Blim (30% Bmsy) from 1993-1998. Biomass has since increased to a level of 81% BMSY in 2014. The probability of being below Blim in 2014 is very low.
Human impact Mainly fishery related mortality. Other potential sources (e.g. pollution, shipping, and oil-industry) are undocumented.
Biological and environmental interactions Witch flounder is distributed mainly along the southwestern slopes of the Grand Bank.
Fishery NAFO reopened a directed fishery in 2015 with a TAC of 1 000 t. Prior to the repoening, witch flounder were previously caught via bottom trawl as bycatch mainly in otter trawl fisheries of skate and Greenland halibut.
Recent catch estimates and TACs are:
2006 2007 2008 2009 2010 2011 2012 2013 2014 2015
TAC1 ndf* ndf ndf ndf ndf ndf ndf ndf ndf 1.0 STATLANT 21 0.2 0.2 0.2 0.3 0.4 0.4 0.3 0.3 0.3
STACFIS 0.5 0.2 0.3 0.4 0.4 0.4 0.3 0.3 0.3
*ndf = no directed fishing Effects of the fishery on the ecosystem No specific information available. General impacts of bottom trawl gear on the ecosystem should be considered.
Special comments No special comments.
Sources of Information SCR Docs. 15/37, 38; SCS Docs. 15/04, 05, 06, 07; NAFO/GC Doc. 08
SC 29 May – 11 June 2015 36
www.nafo.int
viii) Assessment and advice for Splendid alfonsino (Beryx splendens)
The Fisheries Commission requests the Scientific Council to provide a stock assessment for Alfonsino, and recommendation.
Scientific Council responded:
Recommendation for 2016
Due to lack of abundance or exploitation data, no reliable stock assessment can be conducted.
To prevent extirpation of entire subpopulations of Alfonsino, fishing should not be allowed to expand above current levels on Kükenthal Peak (Div. 6G, part of the Corner Rise seamount chain) unless it can be demonstrated that such exploitation is sustainable, and fisheries on other seamounts should not be authorized.
In the absence of a stock assessment TAC recommendation is based on recent catch history (2009 – 2014). Scientific Council recommends exploitation should not exceed recent average levels of approximately 200 t or 16 days-on-ground on Kükenthal Peak, and no Alfonsino fishery on all other seamounts in the NRA. The sustainability of this level of removals is unknown.
Scientific Council also reiterates its advice provided in 2013 in the context of the Sargasso Sea and the protection of seamounts. (SC Report 2013, p310-315).
Management objectives
No management objectives defined by Fisheries Commission.
Management unit
Stock structure is unknown. Until more complete data on stock structure is obtained it is considered that separate populations live on each seamount. Stock status Unknown Reference points Not defined. Assessment
No reliable assessment can be presented for this stock. The latest estimate of biomass is based on surveys dating back to 1995. Since then, only data on catches and effort are available. Due to lack of abundance or exploitation information, an analytical or survey based assessment was not possible. Based on the ICES protocol for data-limited stocks (ICES, 2012) recent average catches during 2009-2014, either 200 t or 16 days on the fishing grounds (whichever is reached first), are recommended as the TAC for the 2016 Kukenthal Peak alfonsino fishery.
Period Mean Catch (t) Mean Effort
(days on the Kukenthal Peak fishing grounds )
2012-2014 178 18
2009-2014 203 16
2005-2014 287 16
Human impact
Mainly fishery related mortality has been documented. Mortality from other human sources (e.g. pollution, shipping, oil-industry) are undocumented.
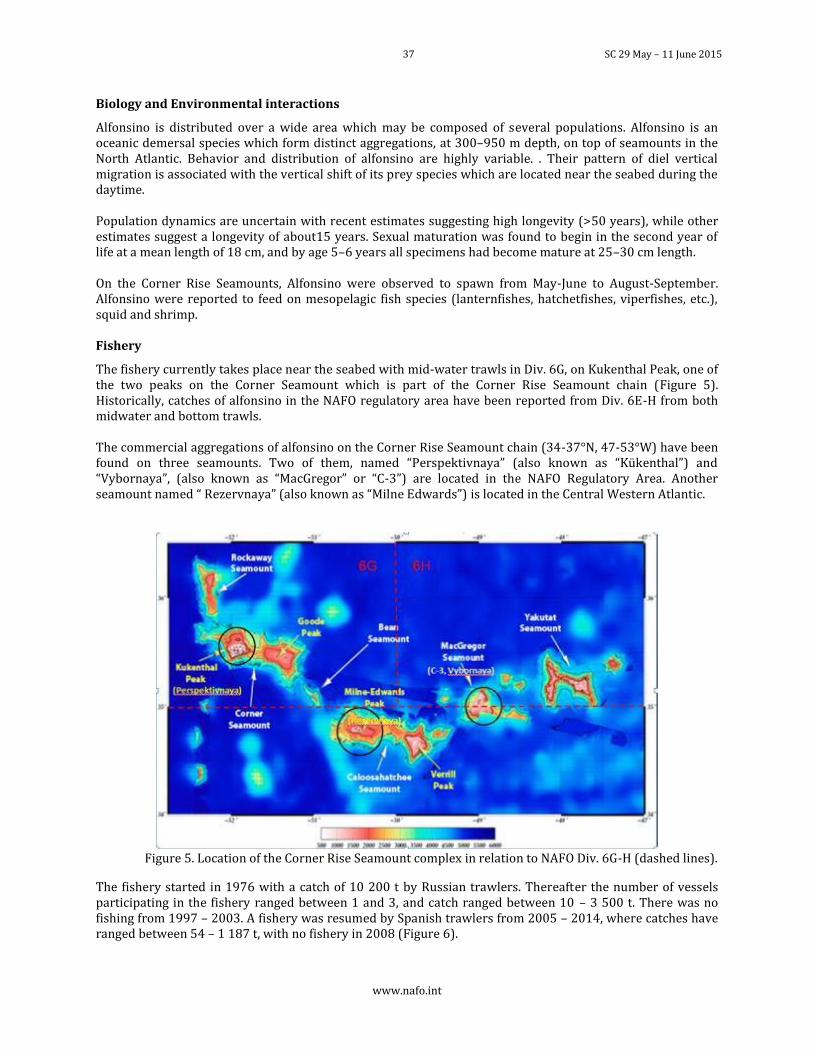
37 SC 29 May – 11 June 2015
www.nafo.int
Biology and Environmental interactions
Alfonsino is distributed over a wide area which may be composed of several populations. Alfonsino is an oceanic demersal species which form distinct aggregations, at 300–950 m depth, on top of seamounts in the North Atlantic. Behavior and distribution of alfonsino are highly variable. . Their pattern of diel vertical migration is associated with the vertical shift of its prey species which are located near the seabed during the daytime. Population dynamics are uncertain with recent estimates suggesting high longevity (>50 years), while other estimates suggest a longevity of about15 years. Sexual maturation was found to begin in the second year of life at a mean length of 18 cm, and by age 5–6 years all specimens had become mature at 25–30 cm length. On the Corner Rise Seamounts, Alfonsino were observed to spawn from May-June to August-September. Alfonsino were reported to feed on mesopelagic fish species (lanternfishes, hatchetfishes, viperfishes, etc.), squid and shrimp. Fishery
The fishery currently takes place near the seabed with mid-water trawls in Div. 6G, on Kukenthal Peak, one of the two peaks on the Corner Seamount which is part of the Corner Rise Seamount chain (Figure 5). Historically, catches of alfonsino in the NAFO regulatory area have been reported from Div. 6E-H from both midwater and bottom trawls. The commercial aggregations of alfonsino on the Corner Rise Seamount chain (34-37°N, 47-53°W) have been found on three seamounts. Two of them, named “Perspektivnaya” (also known as “Kükenthal”) and “Vybornaya”, (also known as “MacGregor” or “С-3”) are located in the NAFO Regulatory Area. Another seamount named “ Rezervnaya” (also known as “Milne Edwards”) is located in the Central Western Atlantic.
Figure 5. Location of the Corner Rise Seamount complex in relation to NAFO Div. 6G-H (dashed lines).
The fishery started in 1976 with a catch of 10 200 t by Russian trawlers. Thereafter the number of vessels participating in the fishery ranged between 1 and 3, and catch ranged between 10 – 3 500 t. There was no fishing from 1997 – 2003. A fishery was resumed by Spanish trawlers from 2005 – 2014, where catches have ranged between 54 – 1 187 t, with no fishery in 2008 (Figure 6).
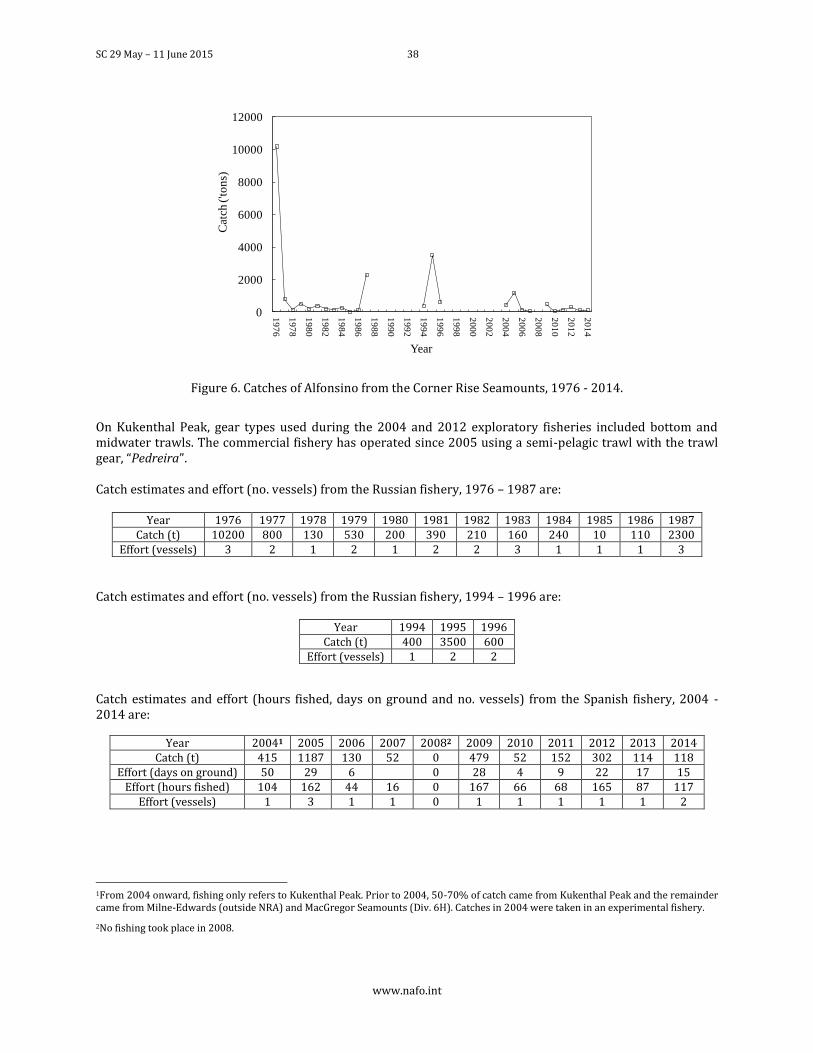
SC 29 May – 11 June 2015 38
www.nafo.int
Figure 6. Catches of Alfonsino from the Corner Rise Seamounts, 1976 - 2014.
On Kukenthal Peak, gear types used during the 2004 and 2012 exploratory fisheries included bottom and midwater trawls. The commercial fishery has operated since 2005 using a semi-pelagic trawl with the trawl gear, “Pedreira”. Catch estimates and effort (no. vessels) from the Russian fishery, 1976 – 1987 are:
Year 1976 1977 1978 1979 1980 1981 1982 1983 1984 1985 1986 1987 Catch (t) 10200 800 130 530 200 390 210 160 240 10 110 2300
Effort (vessels) 3 2 1 2 1 2 2 3 1 1 1 3
Catch estimates and effort (no. vessels) from the Russian fishery, 1994 – 1996 are:
Year 1994 1995 1996 Catch (t) 400 3500 600
Effort (vessels) 1 2 2
Catch estimates and effort (hours fished, days on ground and no. vessels) from the Spanish fishery, 2004 - 2014 are:
Year 20041 2005 2006 2007 20082 2009 2010 2011 2012 2013 2014 Catch (t) 415 1187 130 52 0 479 52 152 302 114 118
Effort (days on ground) 50 29 6 0 28 4 9 22 17 15 Effort (hours fished) 104 162 44 16 0 167 66 68 165 87 117
Effort (vessels) 1 3 1 1 0 1 1 1 1 1 2
1From 2004 onward, fishing only refers to Kukenthal Peak. Prior to 2004, 50-70% of catch came from Kukenthal Peak and the remainder came from Milne-Edwards (outside NRA) and MacGregor Seamounts (Div. 6H). Catches in 2004 were taken in an experimental fishery.
2No fishing took place in 2008.
0
2000
4000
6000
8000
10000
12000
19
76
19
78
19
80
19
82
19
84
19
86
19
88
19
90
19
92
19
94
19
96
19
98
20
00
20
02
20
04
20
06
20
08
20
10
20
12
20
14
Cat
ch ('to
ns)
Year
39 SC 29 May – 11 June 2015
www.nafo.int
Effects of the fishery on the ecosystem
Midwater trawls (pelagic and semi-pelagic) can produce significant adverse impacts (SAI) on VME communities, as per information provided by the Scientific Council in 2010 and further addressed in the Scientific Council 2015. Such impacts are typically associated with: 1.) habitat destruction or direct contact with VMEs by the gear when it is fished near the seafloor and 2.) lost gear that becomes entangled in VMEs. Given the slow growth/reproductive rates that characterize VME-forming species, these impacts to VMEs can cumulatively result in Significant Adverse Impact (SAIs).
Special comments
As a consequence of alfonsino spatial distribution associated with seamounts, their life-history, and their aggregation behavior, this species is easily overexploited and can only sustain low rates of exploitation. Minority statement by Russia.
The Scientific Council noted difficulty in reaching consensus on the basis for provision of advice on alfonsino due to a dissenting view from Russia. The position of the Russian representative was that a TAC of 400 t for each of the three seamounts in the chain (for a total of 1200 t) would be more appropriate.
Sources of Information
SCS Docs. 13/21, 14/23; SCR Docs. 15/06 and 15/18; Vinnichenko, 1997, Russian Investigations and Deep Water Fishery on the Corner Rising Seamount in Subarea 6. NAFO Sci. Coun. Studies, 30: 41–49; ICES CM 2012/ACOM 68.
ix) The potential for acoustic surveys for Capelin
The Fisheries Commission requests the Scientific Council to liaise with the national institutes of the different CPs to see if – as recommended by STACFIS – acoustic surveys for capelin can be carried out.
The Scientific Council responded:
There are no plans for institutes of Contracting Parties to conduct acoustic surveys for capelin in Divs. 3NO.
The SC was not informed of any acoustic surveys planned for Divs. 3NO capelin. However, it was noted that acoustic data is being collected on Canadian spring and autumn surveys along the cruise track and during fishing sets, but the quality and value of this data is still being assessed. This data exists from the autumn surveys since 2008 and the spring surveys since 2012 and because it is collected along the survey track, and therefore not optimally designed for capelin distribution, it may only be useful to provide an estimate of availability of capelin to the bottom trawl rather than produce a reliable acoustic estimate of abundance.
x) Depth distribution of Greenland halibut
There are some spatial and depth coverage deficiencies in the Greenland Halibut survey. It is suspected that there is a component of the Greenland Halibut stock of age-class 14+ that lives in depths under 1 500 meters and is therefore inaccessible to scientific trawling. The Fisheries Commission requests the Scientific Council to:
a) comment on this hypothesis; b) indicate if information on this part of the stock would be useful for the stock assessment and the
understanding of the stock dynamics; c) indicate if there are techniques available to assess the biomass below 1 500 meters, and; d) if useful and possible, implement such techniques in view of the next stock assessment.
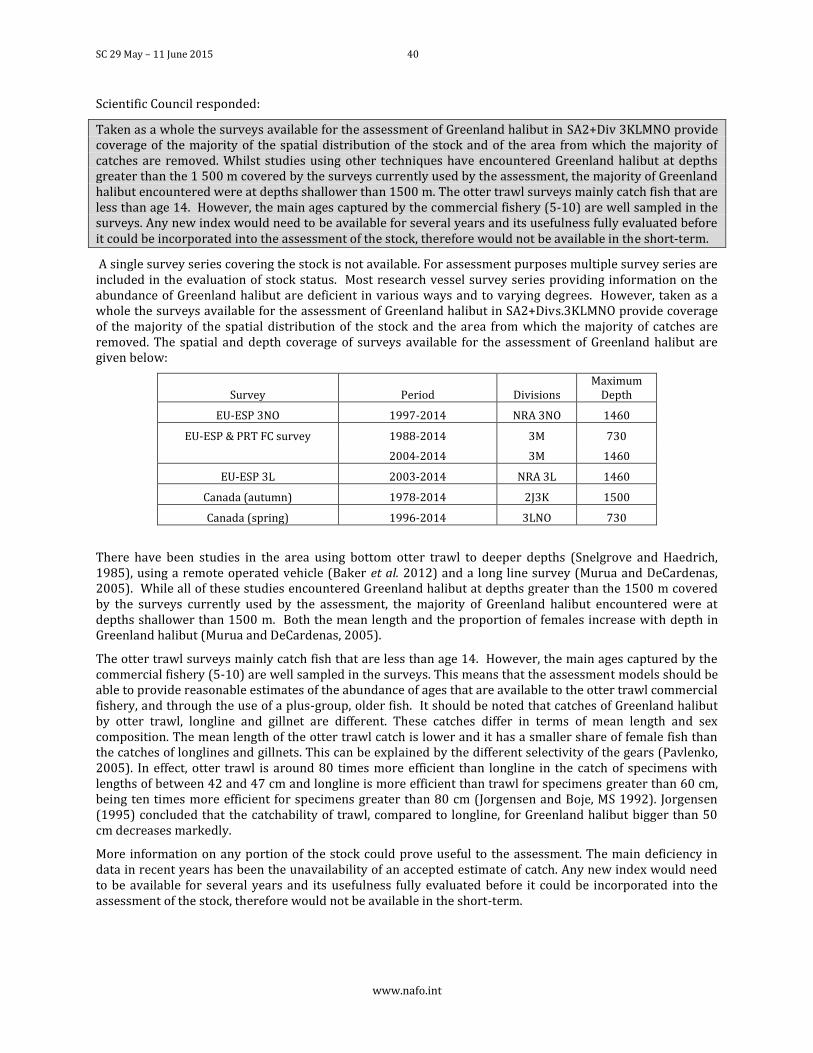
SC 29 May – 11 June 2015 40
www.nafo.int
Scientific Council responded:
Taken as a whole the surveys available for the assessment of Greenland halibut in SA2+Div 3KLMNO provide coverage of the majority of the spatial distribution of the stock and of the area from which the majority of catches are removed. Whilst studies using other techniques have encountered Greenland halibut at depths greater than the 1 500 m covered by the surveys currently used by the assessment, the majority of Greenland halibut encountered were at depths shallower than 1500 m. The otter trawl surveys mainly catch fish that are less than age 14. However, the main ages captured by the commercial fishery (5-10) are well sampled in the surveys. Any new index would need to be available for several years and its usefulness fully evaluated before it could be incorporated into the assessment of the stock, therefore would not be available in the short-term.
A single survey series covering the stock is not available. For assessment purposes multiple survey series are included in the evaluation of stock status. Most research vessel survey series providing information on the abundance of Greenland halibut are deficient in various ways and to varying degrees. However, taken as a whole the surveys available for the assessment of Greenland halibut in SA2+Divs.3KLMNO provide coverage of the majority of the spatial distribution of the stock and the area from which the majority of catches are removed. The spatial and depth coverage of surveys available for the assessment of Greenland halibut are given below:
Survey Period Divisions Maximum
Depth
EU-ESP 3NO 1997-2014 NRA 3NO 1460
EU-ESP & PRT FC survey 1988-2014 3M 730
2004-2014 3M 1460
EU-ESP 3L 2003-2014 NRA 3L 1460
Canada (autumn) 1978-2014 2J3K 1500
Canada (spring) 1996-2014 3LNO 730
There have been studies in the area using bottom otter trawl to deeper depths (Snelgrove and Haedrich, 1985), using a remote operated vehicle (Baker et al. 2012) and a long line survey (Murua and DeCardenas, 2005). While all of these studies encountered Greenland halibut at depths greater than the 1500 m covered by the surveys currently used by the assessment, the majority of Greenland halibut encountered were at depths shallower than 1500 m. Both the mean length and the proportion of females increase with depth in Greenland halibut (Murua and DeCardenas, 2005).
The otter trawl surveys mainly catch fish that are less than age 14. However, the main ages captured by the commercial fishery (5-10) are well sampled in the surveys. This means that the assessment models should be able to provide reasonable estimates of the abundance of ages that are available to the otter trawl commercial fishery, and through the use of a plus-group, older fish. It should be noted that catches of Greenland halibut by otter trawl, longline and gillnet are different. These catches differ in terms of mean length and sex composition. The mean length of the otter trawl catch is lower and it has a smaller share of female fish than the catches of longlines and gillnets. This can be explained by the different selectivity of the gears (Pavlenko, 2005). In effect, otter trawl is around 80 times more efficient than longline in the catch of specimens with lengths of between 42 and 47 cm and longline is more efficient than trawl for specimens greater than 60 cm, being ten times more efficient for specimens greater than 80 cm (Jorgensen and Boje, MS 1992). Jorgensen (1995) concluded that the catchability of trawl, compared to longline, for Greenland halibut bigger than 50 cm decreases markedly.
More information on any portion of the stock could prove useful to the assessment. The main deficiency in data in recent years has been the unavailability of an accepted estimate of catch. Any new index would need to be available for several years and its usefulness fully evaluated before it could be incorporated into the assessment of the stock, therefore would not be available in the short-term.
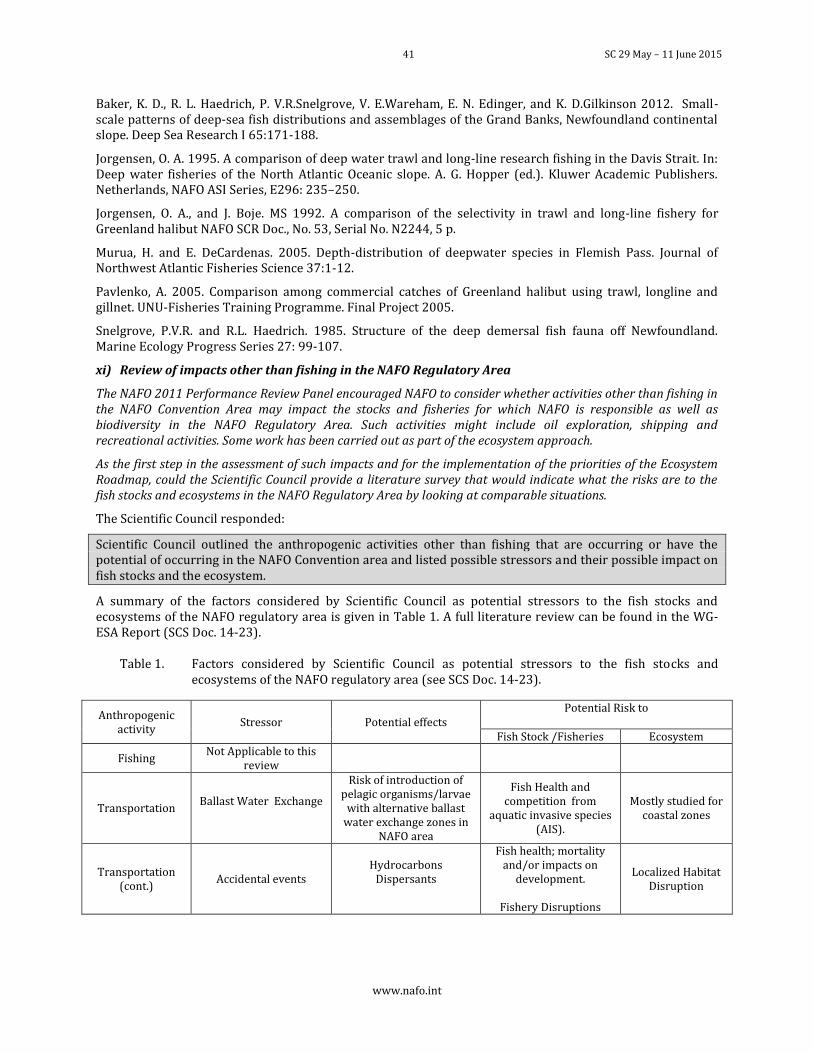
41 SC 29 May – 11 June 2015
www.nafo.int
Baker, K. D., R. L. Haedrich, P. V.R.Snelgrove, V. E.Wareham, E. N. Edinger, and K. D.Gilkinson 2012. Small-scale patterns of deep-sea fish distributions and assemblages of the Grand Banks, Newfoundland continental slope. Deep Sea Research I 65:171-188.
Jorgensen, O. A. 1995. A comparison of deep water trawl and long-line research fishing in the Davis Strait. In: Deep water fisheries of the North Atlantic Oceanic slope. A. G. Hopper (ed.). Kluwer Academic Publishers. Netherlands, NAFO ASI Series, E296: 235–250.
Jorgensen, O. A., and J. Boje. MS 1992. A comparison of the selectivity in trawl and long-line fishery for Greenland halibut NAFO SCR Doc., No. 53, Serial No. N2244, 5 p.
Murua, H. and E. DeCardenas. 2005. Depth-distribution of deepwater species in Flemish Pass. Journal of Northwest Atlantic Fisheries Science 37:1-12.
Pavlenko, A. 2005. Comparison among commercial catches of Greenland halibut using trawl, longline and gillnet. UNU-Fisheries Training Programme. Final Project 2005.
Snelgrove, P.V.R. and R.L. Haedrich. 1985. Structure of the deep demersal fish fauna off Newfoundland. Marine Ecology Progress Series 27: 99-107.
xi) Review of impacts other than fishing in the NAFO Regulatory Area
The NAFO 2011 Performance Review Panel encouraged NAFO to consider whether activities other than fishing in the NAFO Convention Area may impact the stocks and fisheries for which NAFO is responsible as well as biodiversity in the NAFO Regulatory Area. Such activities might include oil exploration, shipping and recreational activities. Some work has been carried out as part of the ecosystem approach.
As the first step in the assessment of such impacts and for the implementation of the priorities of the Ecosystem Roadmap, could the Scientific Council provide a literature survey that would indicate what the risks are to the fish stocks and ecosystems in the NAFO Regulatory Area by looking at comparable situations.
The Scientific Council responded:
Scientific Council outlined the anthropogenic activities other than fishing that are occurring or have the potential of occurring in the NAFO Convention area and listed possible stressors and their possible impact on fish stocks and the ecosystem.
A summary of the factors considered by Scientific Council as potential stressors to the fish stocks and ecosystems of the NAFO regulatory area is given in Table 1. A full literature review can be found in the WG-ESA Report (SCS Doc. 14-23).
Table 1. Factors considered by Scientific Council as potential stressors to the fish stocks and ecosystems of the NAFO regulatory area (see SCS Doc. 14-23).
Anthropogenic activity
Stressor Potential effects Potential Risk to
Fish Stock /Fisheries Ecosystem
Fishing Not Applicable to this
review
Transportation Ballast Water Exchange
Risk of introduction of pelagic organisms/larvae
with alternative ballast water exchange zones in
NAFO area
Fish Health and competition from
aquatic invasive species (AIS).
Mostly studied for coastal zones
Transportation (cont.)
Accidental events Hydrocarbons
Dispersants
Fish health; mortality and/or impacts on
development.
Fishery Disruptions
Localized Habitat Disruption
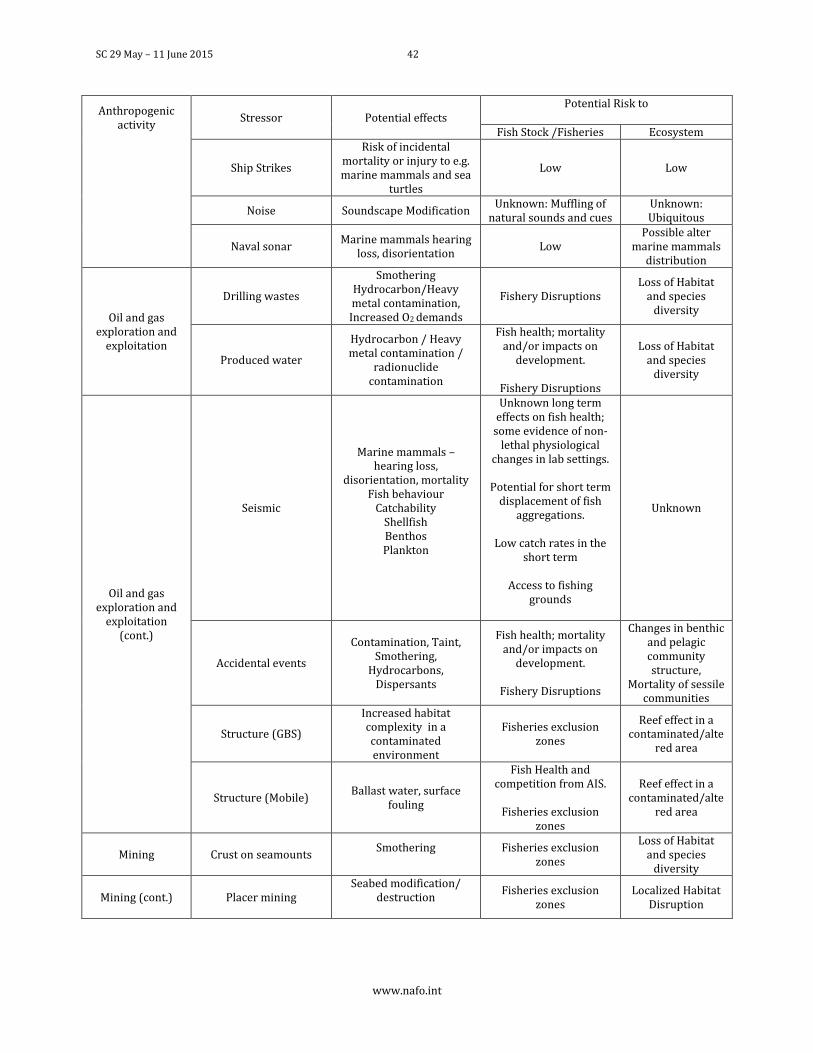
SC 29 May – 11 June 2015 42
www.nafo.int
Anthropogenic activity
Stressor Potential effects Potential Risk to
Fish Stock /Fisheries Ecosystem
Ship Strikes
Risk of incidental mortality or injury to e.g. marine mammals and sea
turtles
Low Low
Noise Soundscape Modification Unknown: Muffling of
natural sounds and cues Unknown: Ubiquitous
Naval sonar Marine mammals hearing
loss, disorientation Low
Possible alter marine mammals
distribution
Oil and gas exploration and
exploitation
Drilling wastes
Smothering Hydrocarbon/Heavy metal contamination, Increased O2 demands
Fishery Disruptions Loss of Habitat
and species diversity
Produced water
Hydrocarbon / Heavy metal contamination /
radionuclide contamination
Fish health; mortality and/or impacts on
development.
Fishery Disruptions
Loss of Habitat and species
diversity
Oil and gas exploration and
exploitation (cont.)
Seismic
Marine mammals – hearing loss,
disorientation, mortality Fish behaviour
Catchability Shellfish Benthos Plankton
Unknown long term effects on fish health;
some evidence of non-lethal physiological
changes in lab settings.
Potential for short term displacement of fish
aggregations.
Low catch rates in the short term
Access to fishing
grounds
Unknown
Accidental events
Contamination, Taint, Smothering,
Hydrocarbons, Dispersants
Fish health; mortality and/or impacts on
development.
Fishery Disruptions
Changes in benthic and pelagic community structure,
Mortality of sessile communities
Structure (GBS)
Increased habitat complexity in a contaminated environment
Fisheries exclusion zones
Reef effect in a contaminated/alte
red area
Structure (Mobile) Ballast water, surface
fouling
Fish Health and competition from AIS.
Fisheries exclusion
zones
Reef effect in a contaminated/alte
red area
Mining Crust on seamounts Smothering
Fisheries exclusion
zones
Loss of Habitat and species
diversity
Mining (cont.) Placer mining Seabed modification/
destruction
Fisheries exclusion zones
Localized Habitat Disruption
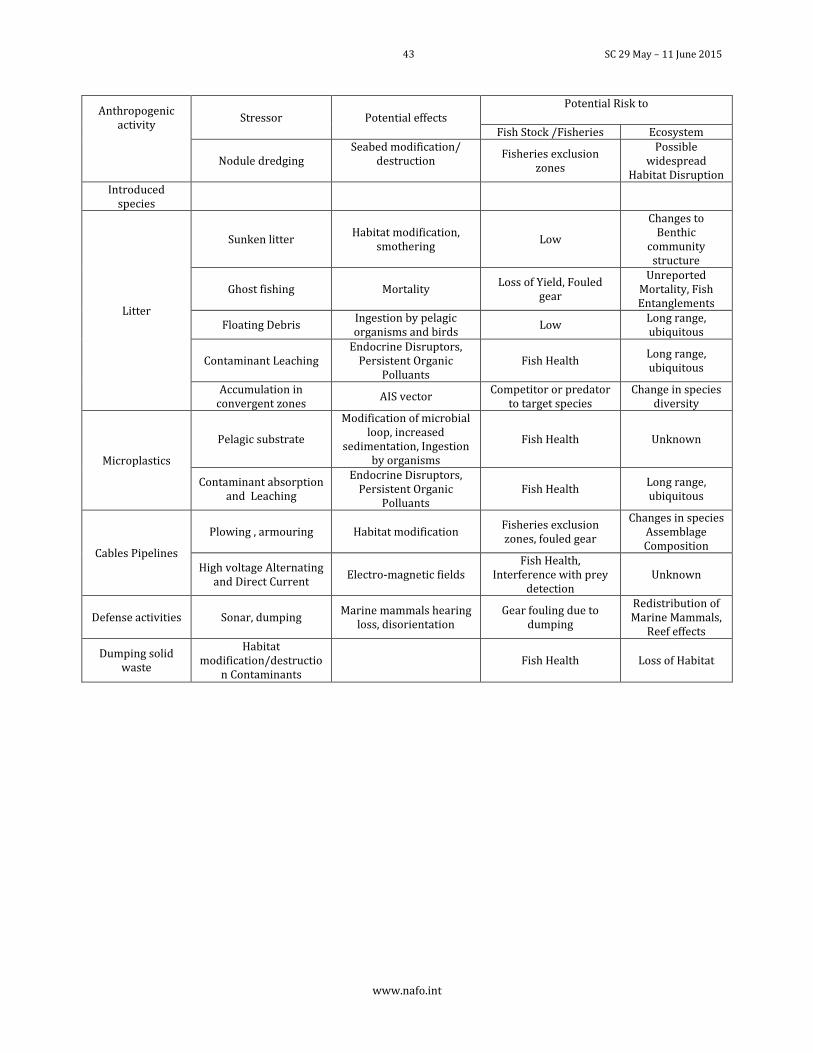
43 SC 29 May – 11 June 2015
www.nafo.int
Anthropogenic activity
Stressor Potential effects Potential Risk to
Fish Stock /Fisheries Ecosystem
Nodule dredging Seabed modification/
destruction
Fisheries exclusion zones
Possible widespread
Habitat Disruption Introduced
species
Litter
Sunken litter Habitat modification,
smothering Low
Changes to Benthic
community structure
Ghost fishing Mortality Loss of Yield, Fouled
gear
Unreported Mortality, Fish Entanglements
Floating Debris Ingestion by pelagic organisms and birds
Low Long range, ubiquitous
Contaminant Leaching Endocrine Disruptors,
Persistent Organic Polluants
Fish Health Long range, ubiquitous
Accumulation in convergent zones
AIS vector Competitor or predator
to target species Change in species
diversity
Microplastics
Pelagic substrate
Modification of microbial loop, increased
sedimentation, Ingestion by organisms
Fish Health Unknown
Contaminant absorption and Leaching
Endocrine Disruptors, Persistent Organic
Polluants Fish Health
Long range, ubiquitous
Cables Pipelines
Plowing , armouring Habitat modification Fisheries exclusion zones, fouled gear
Changes in species Assemblage Composition
High voltage Alternating and Direct Current
Electro-magnetic fields Fish Health,
Interference with prey detection
Unknown
Defense activities Sonar, dumping Marine mammals hearing
loss, disorientation Gear fouling due to
dumping
Redistribution of Marine Mammals,
Reef effects
Dumping solid waste
Habitat modification/destructio
n Contaminants Fish Health Loss of Habitat
SC 29 May – 11 June 2015 44
www.nafo.int
xii) Impacts of mid-water trawls on VME indicator species
The Fisheries Commission requests the Scientific Council to evaluate the impact of mid-water trawls on VME indicator species in those instances when the gear makes contact with or is lost on the bottom.
The Scientific Council responded:
Midwater trawls (pelagic and semi-pelagic) can produce significant adverse impacts (SAI) on VME communities, as per information provided by the Scientific Council in 2010 and further addressed here. Such impacts are typically associated with: 1.) habitat destruction or direct contact with VMEs by the gear when it is fished near the seafloor and 2.) lost gear that becomes entangled in VMEs. Given the slow growth/reproductive rates that characterize VME-forming species, these impacts to VMEs can cumulatively result in Significant Adverse Impact (SAIs).
The definition of a midwater trawl is not described in the CEM except for Article 13 2 (f), the description for redfish midwater trawls. ‘Bottom fishing activities’ are described in Article 1 of the CEM as “bottom fishing activities where the fishing gear is likely to contact the seafloor during the normal course of fishing operations”. Fishermen are able to deploy midwater trawls anywhere in the water column and studies have shown that midwater trawl fishing meets this definition. Inadvertent bottom contact can occur when fishing with midwater trawls on seamounts due to strong gyres associated with the topography of these geologic features and as a result of fishing midwater trawls close to the bottom.
Scientific Council recommends that, midwater trawl fisheries on seamounts record all VME indicator bycatch, regardless of the amount caught.
Midwater trawls are typically used to fish in the upper water column to catch schooling fish such as sardines, anchovies, herring, hake and mackerel. However, in some fisheries midwater trawls are deployed near the seafloor where the behavior of the target species offers increased CPUE. For example, southern blue whiting (Micromesistius australis), orange roughy (Hoplostethus atlanticus) and alfonsino (Beryx spp.) are all fished within meters of the seafloor and may also be fished with bottom trawls. Unequivocal evidence of bottom contact with midwater trawls by New Zealand vessels fishing alfonsino in the South Pacific Regional Fisheries Management Organisation (SPRFMO) Convention Area was documented for 10% on average (range 6-12%) of 238 midwater trawl tows during each of three years (2011–2013) and an average of 16% (range 13-19%) of midwater trawl tow had strong evidence for having had bottom contact (Tingley, 2014). In certain areas, the incidence of strong evidence for bottom contact was as high as 25% due to local bottom topography interacting with midwater trawl gear. These results are higher than expected and may be due to the development of stronger nets that can be deployed both on the bottom and in midwater without gear loss (e.g., Vónin Super Height3), because no gear was lost in the New Zealand study, although the net was torn in a few cases (Tingley 2014). These results led the SPRFMO Scientific Council (SC) to conclude that “mid-water trawling for bentho-pelagic species (e.g., alfonsino) falls under the description of ‘bottom fishing’ as defined in paragraph 4 of CMM 2.03”. The SPRFMO SC also recommended that the Commission modify their CMM (Conservation and Management Measure) 2.03 to “take into account the relative impact on VMEs of different fishing methods and practices, and to specifically address midwater trawling for bentho-pelagic species” (SPRFMO 2014).
Interaction between midwater trawls and VMEs on seamounts is expected to be higher because on seamounts the gear is more likely to inadvertently contact the bottom. Midwater trawls are difficult to control and often fish erratically in the deep waters overlying seamounts and their steep slopes because such areas are known to have strong, complex gyres and current patterns as a result of their protruding geological features. Consequently, direct contact between the midwater trawls and the sessile VME communities inhabiting seamounts is generally unavoidable (Clark et al. 2006). This is consistent with Murillo et al. (2008) who reported that 6.5% of midwater trawl hauls conducted during Exploratory Fishing on the Corner Rise Seamounts contained coral bycatch. On the New England Seamount complex only 3 hauls were conducted but all contained coral bycatch. While these figures are high, they may represent only a portion of the total
3 http://www.vonin.com/en/fishing/semi-pelagic-trawls/vonin-super-height-semi-pelagic-trawls
45 SC 29 May – 11 June 2015
www.nafo.int
number of hauls which contacted the bottom because only hauls with coral bycatch were reported. In New Zealand, strict regulations exist to monitor and control the use of midwater trawls on seamounts in order to avoid any bottom contact and consequent impacts on VMEs. To ensure that there is little risk of midwater trawls touching the bottom, a buffer zone of 100 m from the seafloor has been set has been set for midwater trawl fishing and this is enforced through mandatory submittal of vessel data collected from electronic net monitoring sensors that record the height of the footrope above the seabed during at least every 15 seconds4.
Since 2005, an alfonsino fishery using midwater and bottom trawls has been conducted by Spain on the Corner Rise seamounts. Catches for this fishery ranged from about 50 to 1 200 t and effort ranged from 4 days to 50 days. There is no information on the degree of bottom contact during this fishery. No notifications of encounters above thresholds (currently 7kg of seapen, 60kg corals and 300kg sponges, per set) have been received by the NAFO Secretariat [for any fishery] since the measures were introduced in 2007.
With respect to the impacts of lost fishing gear on VME indicator species, midwater trawl gear can become snagged on the bottom or deposited on the bottom if burdened with catch which weighs it down after it is lost, in which case it may cause damage to the benthos, including VMEs (Donaldson et al. 2010).
2. Coastal States
a) Request by Denmark (on behalf of Greenland) for Advice on Management in 2015-2017
i) Roundnose grenadier in SA 0+1
For Roundnose grenadier in Subarea 0 + 1 advice was in 2014 given for 2015-2017. Denmark (on behalf of Greenland) requests the Scientific Council to continue to monitor the status of Roundnose grenadier in Subareas 0 and 1 annually, and should significant changes in the stock status be observed (e.g. from surveys) the Scientific Council is requested to provide updated advice as appropriate.
Scientific Council responded:
The assessments (interim monitoring) found nothing to indicate a significant change in the status of these stocks. Accordingly, Scientific Council therefore did not change the advice. The next full assessment of this stock will take place in 2017.
ii) Golden redfish, Demersal Deep-sea redfish, Atlantic wolfish, Spotted wolfish and American plaice in Subarea 1
Advice for golden redfish (Sebastes marinus), demersal deep-sea redfish (Sebastes mentella) American plaice (Hippoglossoides platessoides), Atlantic wolffish (Anarhichas lupus) and spotted wolffish (A. minor) in Subarea 1 was in 2014 given for 2015-2017. Denmark (on behalf of Greenland) requests the Scientific Council to continue to monitor the status of these species annually, and should significant changes in stock status be observed the Scientific Council is requested to provide updated advice as appropriate.
Scientific Council responded:
The assessments (interim monitoring) found nothing to indicate a significant change in the status of these stocks. Accordingly, Scientific Council therefore did not change the advice. The next full assessment of this stock will take place in 2017.
iii) Greenland halibut in Div. 1A (inshore)
Advice for Greenland halibut in Div. 1A (inshore) was in 2014 given for 2015-2016. Denmark (on behalf of Greenland) requests the Scientific Council to continue to monitor the status of Greenland halibut in Div. 1A (inshore) annually, and should significant changes in stock status be observed, the Scientific Council is requested to provide updated advice as appropriate.
4 http://www.fish.govt.nz/en-nz/Environmental/Seabed+Protection+and+Research/Benthic+Protection+Areas.htm
SC 29 May – 11 June 2015 46
www.nafo.int
Scientific Council responded:
The assessments (interim monitoring) found nothing to indicate a significant change in the status of these stocks. Accordingly, Scientific Council therefore did not change the advice. The next full assessment of this stock will take place in 2016.
iv) Pandalus borealis east of Greenland and in the Denmark Strait (in conjunction with ICES)
Furthermore, the Scientific Council is in cooperation with ICES requested to provide advice on the scientific basis for management of Northern shrimp (Pandalus borealis) in Denmark Strait and adjacent waters east of southern Greenland in 2016 and for as many years ahead as data allows for.
The Scientific Council deferred responding to this request to the September SC/NIPAG meeting.
b) Request by Canada and Denmark (Greenland) for Advice on Management in 2016
i) Greenland halibut in Div. 0A and the offshore areas of Div. 1A, plus Div. 1B
The Scientific Council is requested, subject to the concurrence of Denmark (on behalf of Greenland) as regards Subarea 1, to provide an overall assessment of status and trends in the total stock area throughout its range and to specifically advise on TAC levels for 2016, separately, for Greenland halibut in Divs. 0A+1A (offshore) and 1B, and Divs. 0B+1C-F. The Scientific Council is also asked to provide advice on any other management measures it deems appropriate to ensure the sustainability of these resources.
The Scientific Council responded:
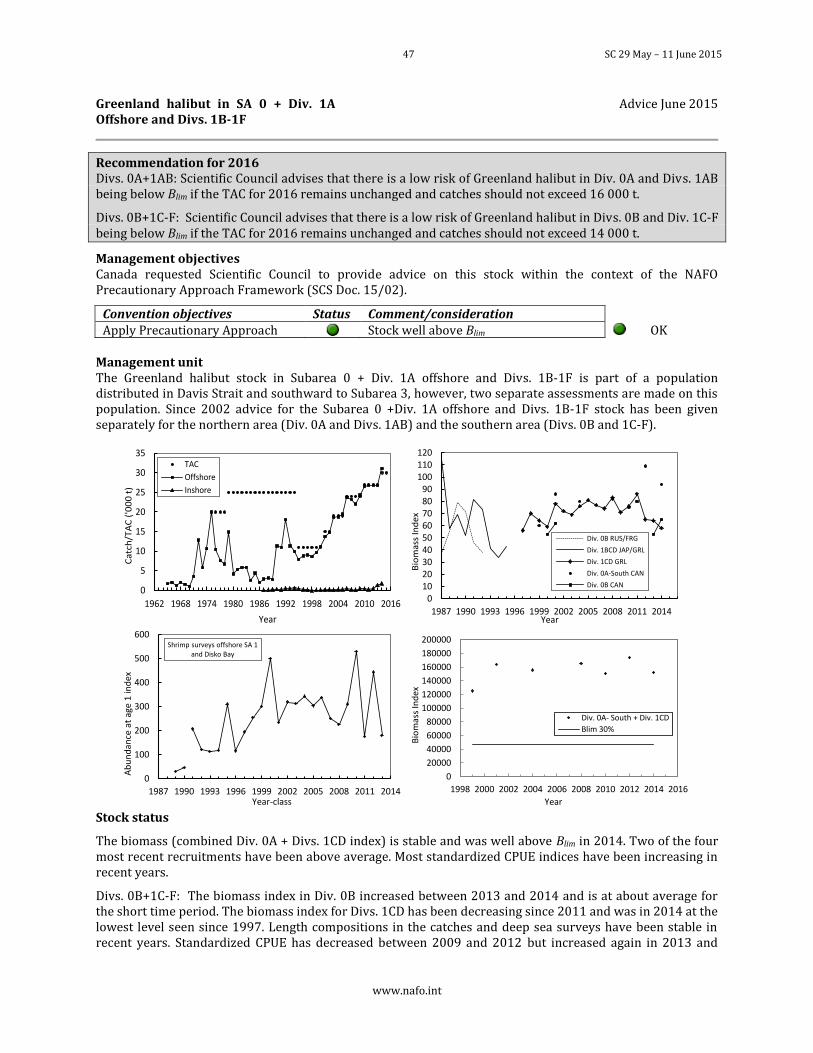
47 SC 29 May – 11 June 2015
www.nafo.int
Greenland halibut in SA 0 + Div. 1A Offshore and Divs. 1B-1F
Advice June 2015
Recommendation for 2016 Divs. 0A+1AB: Scientific Council advises that there is a low risk of Greenland halibut in Div. 0A and Divs. 1AB being below Blim if the TAC for 2016 remains unchanged and catches should not exceed 16 000 t.
Divs. 0B+1C-F: Scientific Council advises that there is a low risk of Greenland halibut in Divs. 0B and Div. 1C-F being below Blim if the TAC for 2016 remains unchanged and catches should not exceed 14 000 t.
Management objectives Canada requested Scientific Council to provide advice on this stock within the context of the NAFO Precautionary Approach Framework (SCS Doc. 15/02).
Convention objectives Status Comment/consideration Apply Precautionary Approach
Stock well above Blim
OK Management unit The Greenland halibut stock in Subarea 0 + Div. 1A offshore and Divs. 1B-1F is part of a population distributed in Davis Strait and southward to Subarea 3, however, two separate assessments are made on this population. Since 2002 advice for the Subarea 0 +Div. 1A offshore and Divs. 1B-1F stock has been given separately for the northern area (Div. 0A and Divs. 1AB) and the southern area (Divs. 0B and 1C-F).
Stock status
The biomass (combined Div. 0A + Divs. 1CD index) is stable and was well above Blim in 2014. Two of the four most recent recruitments have been above average. Most standardized CPUE indices have been increasing in recent years.
Divs. 0B+1C-F: The biomass index in Div. 0B increased between 2013 and 2014 and is at about average for the short time period. The biomass index for Divs. 1CD has been decreasing since 2011 and was in 2014 at the lowest level seen since 1997. Length compositions in the catches and deep sea surveys have been stable in recent years. Standardized CPUE has decreased between 2009 and 2012 but increased again in 2013 and
0
5
10
15
20
25
30
35
1962 1968 1974 1980 1986 1992 1998 2004 2010 2016
Ca
tch
/TA
C (
'00
0 t
)
Year
TAC
Offshore
Inshore
0102030405060708090
100110120
1987 1990 1993 1996 1999 2002 2005 2008 2011 2014
Bio
mas
s In
de
x
Year
Div. 0B RUS/FRG
Div. 1BCD JAP/GRL
Div. 1CD GRL
Div. 0A-South CAN
Div. 0B CAN
0
100
200
300
400
500
600
1987 1990 1993 1996 1999 2002 2005 2008 2011 2014
Ab
un
dan
ce a
t ag
e 1
ind
ex
Year-class
Shrimp surveys offshore SA 1and Disko Bay
0
20000
40000
60000
80000
100000
120000
140000
160000
180000
200000
1998 2000 2002 2004 2006 2008 2010 2012 2014 2016
Bio
mas
s In
dex
Year
Div. 0A- South + Div. 1CD
Blim 30%
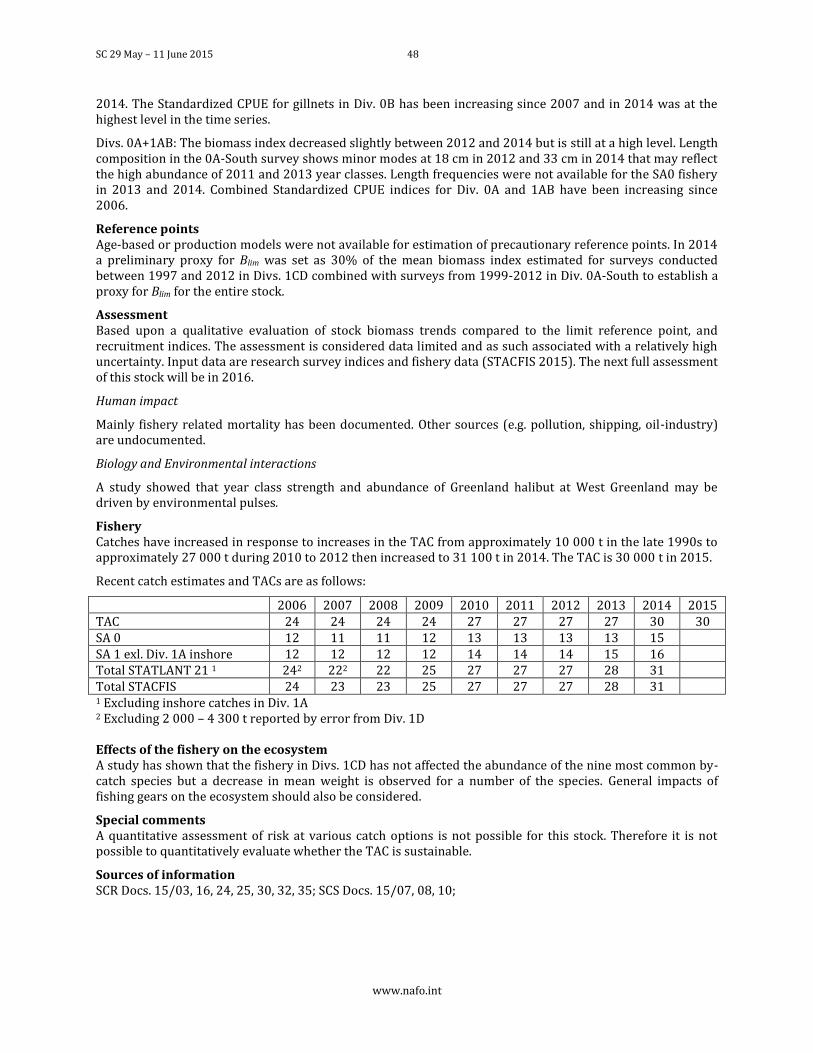
SC 29 May – 11 June 2015 48
www.nafo.int
2014. The Standardized CPUE for gillnets in Div. 0B has been increasing since 2007 and in 2014 was at the highest level in the time series.
Divs. 0A+1AB: The biomass index decreased slightly between 2012 and 2014 but is still at a high level. Length composition in the 0A-South survey shows minor modes at 18 cm in 2012 and 33 cm in 2014 that may reflect the high abundance of 2011 and 2013 year classes. Length frequencies were not available for the SA0 fishery in 2013 and 2014. Combined Standardized CPUE indices for Div. 0A and 1AB have been increasing since 2006.
Reference points Age-based or production models were not available for estimation of precautionary reference points. In 2014 a preliminary proxy for Blim was set as 30% of the mean biomass index estimated for surveys conducted between 1997 and 2012 in Divs. 1CD combined with surveys from 1999-2012 in Div. 0A-South to establish a proxy for Blim for the entire stock.
Assessment Based upon a qualitative evaluation of stock biomass trends compared to the limit reference point, and recruitment indices. The assessment is considered data limited and as such associated with a relatively high uncertainty. Input data are research survey indices and fishery data (STACFIS 2015). The next full assessment of this stock will be in 2016.
Human impact
Mainly fishery related mortality has been documented. Other sources (e.g. pollution, shipping, oil-industry) are undocumented.
Biology and Environmental interactions
A study showed that year class strength and abundance of Greenland halibut at West Greenland may be driven by environmental pulses.
Fishery Catches have increased in response to increases in the TAC from approximately 10 000 t in the late 1990s to approximately 27 000 t during 2010 to 2012 then increased to 31 100 t in 2014. The TAC is 30 000 t in 2015.
Recent catch estimates and TACs are as follows:
2006 2007 2008 2009 2010 2011 2012 2013 2014 2015 TAC 24 24 24 24 27 27 27 27 30 30 SA 0 12 11 11 12 13 13 13 13 15 SA 1 exl. Div. 1A inshore 12 12 12 12 14 14 14 15 16 Total STATLANT 21 1 242 222 22 25 27 27 27 28 31 Total STACFIS 24 23 23 25 27 27 27 28 31 1 Excluding inshore catches in Div. 1A 2 Excluding 2 000 – 4 300 t reported by error from Div. 1D Effects of the fishery on the ecosystem A study has shown that the fishery in Divs. 1CD has not affected the abundance of the nine most common by-catch species but a decrease in mean weight is observed for a number of the species. General impacts of fishing gears on the ecosystem should also be considered.
Special comments A quantitative assessment of risk at various catch options is not possible for this stock. Therefore it is not possible to quantitatively evaluate whether the TAC is sustainable.
Sources of information SCR Docs. 15/03, 16, 24, 25, 30, 32, 35; SCS Docs. 15/07, 08, 10;
49 SC 29 May – 11 June 2015
www.nafo.int
i) Pandalus borealis in Subareas 0 and 1
Subject to the concurrence of Canada as regards Subarea 0 and 1, Denmark (on behalf of Greenland) further requests the Scientific Council before December 2015 to provide advice on the scientific basis for management of Northern shrimp (Pandalus borealis) in Subarea 0 and 1 in 2015 and for as many years ahead as data allows for.
Scientific Council deferred this advice to the September Scientific Council/NIPAG meeting.
c) Request by Canada for Advice on Management
i) Requirements for risk-based advice on Greenland halibut in Divs. 0A, 1A (offshore) and 1B
Recognizing that this is a data poor fishery, and that no model exists at this time to provide risk-based advice to inform management options, the Scientific Council is also asked to identify what would be required in order to provide risk based advice in the future.
Scientific Council responded:
A quantitative assessment of risk at various catch options is not possible for this stock. Until there is a successful quantitative model fit to the stock trends it will not be possible to provide risk based advice for this stock. Both age-structured and biomass models have been explored for the assessment of this stock. Research on age determination continues but is not expected to be resolved in the near future so it is not possible to apply age-based models (e.g. XSA) to the stock at this time. There is little variation in the biomass and abundance indices and the time series is short which are likely the main factors limiting previous attempts to apply production models (e.g. ASPIC and Schaefer).
ii) Harvest control rules for Harp seals
Canada requests the Scientific Council to explore the impact of proposed harvest strategies that would maintain the North Atlantic harp seal population at a precautionary level of a PA framework, using the Canadian levels as a case study, and that would have a low risk of decreasing below the critical level.
Scientific Council endorsed the findings of the working group, and noted that this is ongoing work:
A MSE provides an approach for addressing both policy and process conflicts in harvest co-management. It is explicitly designed to identify to examine ongoing or potential harvest strategies that are robust to uncertainty and natural variation, and that balance biological and socio-economic objectives. The management strategy evaluation process involves defining a set of operational objectives, identification of candidate management procedures (i.e. data collection, stock assessment, and harvest control rules), and evaluates the performance procedures of the procedures against the objectives. In contrast to the earlier traditional approach to management, it does not necessarily identify an optimal strategy or decision. Instead it seeks to explicitly identify some of the trade-offs that may be necessary to achieve different management objectives. The key components of this approach include: a clearly defined set of management objectives; fisheries data and stock assessment models; harvest control rule(s), a simulation framework that allows testing of the different management objectives taking into account different levels of uncertainty; and a means of calculating and presenting how the management objectives performed during the simulations, expressed in terms of conservation, socio-economic or other criteria (performance indicators).
The request received by the working group was to:
1) Identify the catches necessary to reduce the population to 5.4M animals assuming:
i ) Catches consisting of 90% YOY and 50% YOY
ii ) Over periods of 5, 10,and 15 years
2) Identify the catches necessary to reduce the population to 6.8M assuming:
iii ) Catches consisting of 90% YOY and 50% YOY
iv ) Over periods of 5, 10,and 15 years
SC 29 May – 11 June 2015 50
www.nafo.int
3) What would be the sustainable future catches possible with a reduced population and assuming there is a 95% probability of remaining above the Limit Reference Point (defined as the current N30).
The WG discussed how these scenarios might be examined within a MSE environment. Since there are two models currently being used in the assessments of harp seals, one in the NE Atlantic and another for the NW Atlantic population it was suggested that initially, the behaviour of the NE Atlantic model would be examined using the NW Atlantic assessment data to see how the model behaved when annual reproductive rate data were available. At the same time, the NW Atlantic model would examine the impacts of the different catch options on the population. Additional considerations included: updating the projections every 5 years, by assuming a new survey was flown to estimate pup production; assuming two different future trends in reproductive rates. One set of projections would assume that reproductive rates varied in a density-dependent manner, while a second series would assume that future reproductive rates would vary in a manner that has been observed over the last 5 years.
The model comparisons and projections will be carried out over the coming year, and reviewed by correspondence. Further work on a MSE will be examined after this initial request has been addressed.
VIII. REVIEW OF FUTURE MEETINGS ARRANGEMENTS
1. Scientific Council, (in conjunction with NIPAG), 9 – 16 Sep 2015
Scientific Council noted that the Scientific Council shrimp advice meeting will be held at the Northwest Atlantic Fisheries Centre, Newfoundland, 9-16 September in advance of the 2015 Annual Meeting. The Council noted the NAFO stocks will be addressed first so that the advice will be available to NAFO Contracting Parties on Monday, 14 September, a week in advance of the Annual Meeting.
2. Scientific Council, 21 – 25 Sep 2015
Scientific Council noted the Scientific Council meeting will be held at the Westin Hotel in Halifax, Nova Scotia, 21-25 September 2015.
3. Scientific Council, June 2016
Scientific Council agreed that its June meeting will be held on 3 – 16 June 2016, at St Mary’s University, Halifax.
4. Scientific Council (in conjunction with NIPAG), Sep 2016
This meeting will be held ICES Headquarters, Copenhagen, around 7 – 14 September 2016.
5. Scientific Council, Sep 2016
Scientific Council noted that the Annual meeting will be held in September in Halifax, Nova Scotia, unless an invitation to host the meeting is extended by a Contracting Party.
6. Scientific Council, June 2017
Scientific Council agreed that its June meeting will be held on 2 - 15 June 2017.
7. NAFO/ICES Joint Groups
a) NIPAG, 9-16 Sep 2015
Scientific Council noted the NIPAG meeting will be held at the Northwest Atlantic Fisheries Centre in St. John’s, Newfoundland, 9-16 September 2015.
b) NIPAG, 7 – 14 Sep 2016
This meeting will be held at the ICES Headquarters, Copenhagen, 7 – 14 September 2016.
c) WG-DEC, 15 – 19 February 2016
The next meeting of the ICES – NAFO Working Group on Deepwater Ecosystems is scheduled to take place at ICES Headquarters, during 15 – 19 February 2016.
51 SC 29 May – 11 June 2015
www.nafo.int
d) WG-ESA, 17- 26 Nov, 2015
The Working Group on Ecosystem Science and Assessment will meet at the NAFO Secretariat, Dartmouth, Nova Scotia, Canada, 17 - 26 November, 2015.
e) WG-HARP, August 2016
WG-HARP will continue its work by correspondence. The next meeting of the ICES – NAFO Working Group on Harp and Hooded Seals is scheduled to take place in during August 2017.
IX. ARRANGEMENTS FOR SPECIAL SESSIONS
1. Proposals for Future Special Sessions
There were five proposals for symposia. These will be circulated and discussed in September.
X. MEETING REPORTS
1. Working Group on Ecosystem Science and Assessment
The Scientific Council Working Group on Ecosystem Science and Assessment (WGESA), formerly known as Working Group on Ecosystem Approaches to Fisheries Management (WGEAFM), met at the NAFO Headquarters, Dartmouth, Canada, on November 18-27, 2014. The detailed outcomes of this meeting are reported in SCS 14/023.
WGESA currently operates within a set of long-term Themes and Terms of Reference (ToR) which are being systematically addressed by the group over several meetings. These Themes and ToRs build on the “Roadmap for Developing an Ecosystem Approach to Fisheries for NAFO” (Roadmap).
Following a request by the SC chair, WGESA organized its work for this meeting so to provide input towards addressing 3 ecosystem-related Fisheries Commission requests (FC Requests # 4, 11, and 12). These FC requests were integrated into the long-term ToRs.
The final form of the ToRs addressed at the 7th WGESA meeting were:
Theme 1: Spatial considerations
ToR 1. Update on identification and mapping of sensitive species and habitats in the NAFO area.
ToR 1.1. Update on Vulnerable Marine Ecosystem (VME) data analyses and VME distribution analyses in relation to ecoregions and VME elements.
ToR 2. Based on available biogeographic and ecological information, identify appropriate ecosystem-based management areas.
ToR 2.1. Final results on integrated Northwest Atlantic ecoregions analysis
Theme 2: Status, functioning and dynamics of NAFO marine ecosystems.
ToR 3. Update on recent and relevant research related to status, functioning and dynamics of ecosystems in the NAFO area.
ToR 3.1. Analysis on benthic communities in Flemish Cap and NL
ToR 3.2. Progress on expanded single species, multispecies and ecosystem production potential modelling
ToR 3.3. Progress on multispecies and ecosystem analyses
Theme 3: Practical application of ecosystem knowledge to fisheries management
ToR 4. Update on recent and relevant research related to the application of ecosystem knowledge for fisheries management in the NAFO area.
SC 29 May – 11 June 2015 52
www.nafo.int
ToR 4.1. [FC Request #4] Work towards the development of assessments of bottom fishing activities (e.g. distribution modelling, classification of fisheries, ecosystem background, template for risk analysis, and advance on assessment of significant adverse impacts on VMEs).
ToR 4.2. [FC Request #11] Review of existing information on the potential impacts of activities other than fishing (e.g. oil and gas, shipping, recreation), and the risks they may pose, for the stocks and fisheries for which NAFO is responsible as well as biodiversity in the NAFO Regulatory Area.
ToR 4.3. [FC Request #12] Review of information and analyses on the impact of mid-water trawls on VME indicator species in those instances when the gear makes contact with or is lost on the bottom.
ToR 5. Methods for the long-term monitoring of VME status and functioning.
ToR 5.1. Update of the NAFO Guide of the Identification of Vulnerable Marine Ecosystem (VME) indicator taxa.
Theme 4: Specific requests
ToRs 6+. As generic ToRs, these are place-holders intended to be used when addressing expected additional requests from Scientific Council.
ToR 6.1. Evaluation of Research Vessel (RV) surveys footprint on VME closures.
In addressing ToR 1, WGESA continued the analysis of data emerging from the NEREIDA program, and updated VME information from the EU survey. The NEREIDA-based studies included the analyses of box-core data, which involved the identification of species assemblages, and the analysis of relationships between these assemblages and environmental variables. These studies identified VME and non-VME assemblages, and further confirmed the presence of VME assemblages within the areas currently protected through closures.
In addressing ToR 2, WGESA carried out an integrated ecoregion analysis at the scale of the East coast of North America (Newfoundland and Labrador Shelves, Flemish Cap, Scotian Shelf, and US northeast continental Shelf -Gulf of Maine, Georges Bank, and Mid-Atlantic Bight-) Northwest Atlantic, and review the results in the context of previous regional ecoregion analyses and other ecological studies. As part of this work, WGESA identified three nested spatial scales (bioregion, ecosystem production unit, and ecoregion) considered relevant and useful for the development of ecosystem summaries and management plans, and proposed the intermediate scale, the Ecosystem Production Unit (EPU), as the focal spatial scale for defining Ecosystem-based Management units. Using results from these analyses, as well as expert opinion, WGESA defined and put forward a set of consensus EPUs as candidate areas for the implementation of the Roadmap.
In addressing ToR 3, WGESA made progress on the analysis of epibenthic invertebrate megafaunal communities in the tail of the Grand Bank and Flemish Cap, the development of Ecosystem Production Potential (EPP) models and estimation of Fisheries Production Potential (FPP), as well as on several modelling and ecosystem analyses and updates, which included status reports on the modelling work on Greenland halibut in Greenland, multispecies modelling in the Flemish Cap, the use of ecosystem indicators to define ecosystem state, and updates on ecosystem and community trends, diets of key fish species, stable-isotope studies, and marine mammal studies in the Newfoundland and Labrador (NL) shelves. Within this ToR, the work on EPP models and FPP estimates derived from them was deemed mature enough to be used for the proposal of guidelines for Total Catch Ceilings in some EPUs where stocks are managed by NAFO (Northeast Newfoundland shelf, Grand Bank and Flemish Cap). Although refined versions of the EPP models are being developed, current estimates of FPP were considered adequate to start the conversation with fisheries managers about the implementation of Tier-1 (Total Catch Ceilings at the ecosystem level) in the context of the Roadmap.
In addressing ToR 4, WGESA developed the material required by Scientific Council (SC) to address three Fisheries Commission (FC) requests. The work towards addressing FC Request #4 involved the continuation of the development of tools and approaches required to do the reassessment of bottom fishing activities pertaining their impact on VMEs; this included the development of a template for the assessment, the definition and description of fisheries in the NRA, the compilation of information to describe the marine community, the further development of the approach to evaluate risk of Significant Adverse Impact (SAI) on
53 SC 29 May – 11 June 2015
www.nafo.int
VMEs, and the consideration of this approach in the context of formal Risk Assessments frameworks. The work towards FC Request #11 involved a literature review and summary aimed to identify potential risks to fish stocks and ecosystems in the NRA from activities other than fishing. With regard to FC Request # 12, WGESA work summarized available information on the impact of midwater trawls on VMEs; results corroborated earlier advice provided by SC in 2010 which indicated that midwater trawls can have an impact on VMEs, especially in seamounts.
In addressing ToR 5, WGESA worked collaboratively with the NAFO Secretariat to produce a second version of the NAFO Guide for the identification of VME indicator taxa, and agreed on which taxa should be added to the new edition of the guide.
In addressing ToR 6, evaluation of research vessel (RV) surveys footprint on VME closures, WGESA encountered unexpected problems with data formats which prevented the WG to fully engage this work. Due to time limitations, WGESA referred the treatment of this topic back to Scientific Council for its assessment during SC June meeting in 2015.
Following the ongoing cross-attendance practice, the co-chair of the ICES Working Group on the Northwest Atlantic Regional Sea (WGNARS), Robin Anderson, attended the 7th WGESA meeting, presenting a summary of the work done by ICES WGNARS in its 2014 meeting, as well as recent progress in the implementation of the Galway Statement within Canada.
WGESA also discussed next step and future activities. It was proposed that the 8th WGESA meeting to take place in November 17-26, 2015, at the NAFO Secretariat in Dartmouth, Canada. WGESA proposed to continue addressing its long-term ToRs, focusing the work during the 8th meeting as follows:
Theme 1: Spatial considerations
ToR 1. Update on identification and mapping of sensitive species and habitats in the NAFO area.
Update on VME data and VME distribution analyses.
ToR 2. Based on available biogeographic and ecological information, identify appropriate ecosystem-based management areas.
No expected work on this ToR.
Theme 2: Status, functioning and dynamics of NAFO marine ecosystems.
ToR 3. Update on recent and relevant research related to status, functioning and dynamics of ecosystems in the NAFO area.
Analysis on benthic communities Progress on expanded single species, multispecies and ecosystem production potential
modelling Progress on multispecies and ecosystem analyses
Theme 3: Practical application of ecosystem knowledge to fisheries management
ToR 4. Update on recent and relevant research related to the application of ecosystem knowledge for fisheries management in the NAFO area.
Assessment of bottom fishing activities pertaining to the impacts on VMEs
ToR 5. Methods for the long-term monitoring of VME status and functioning.
Preliminary results on the use of non-destructive sampling to monitor VMEs
Theme 4: Specific requests
ToRs 6+. As generic ToRs, these are place-holders intended to be used when addressing expected additional requests from Scientific Council.
WGESA co-chairs informed SC of their intention of stepping down from their positions at the SC September meeting in 2016. By this date, both co-chairs would have been in their position for eight years.
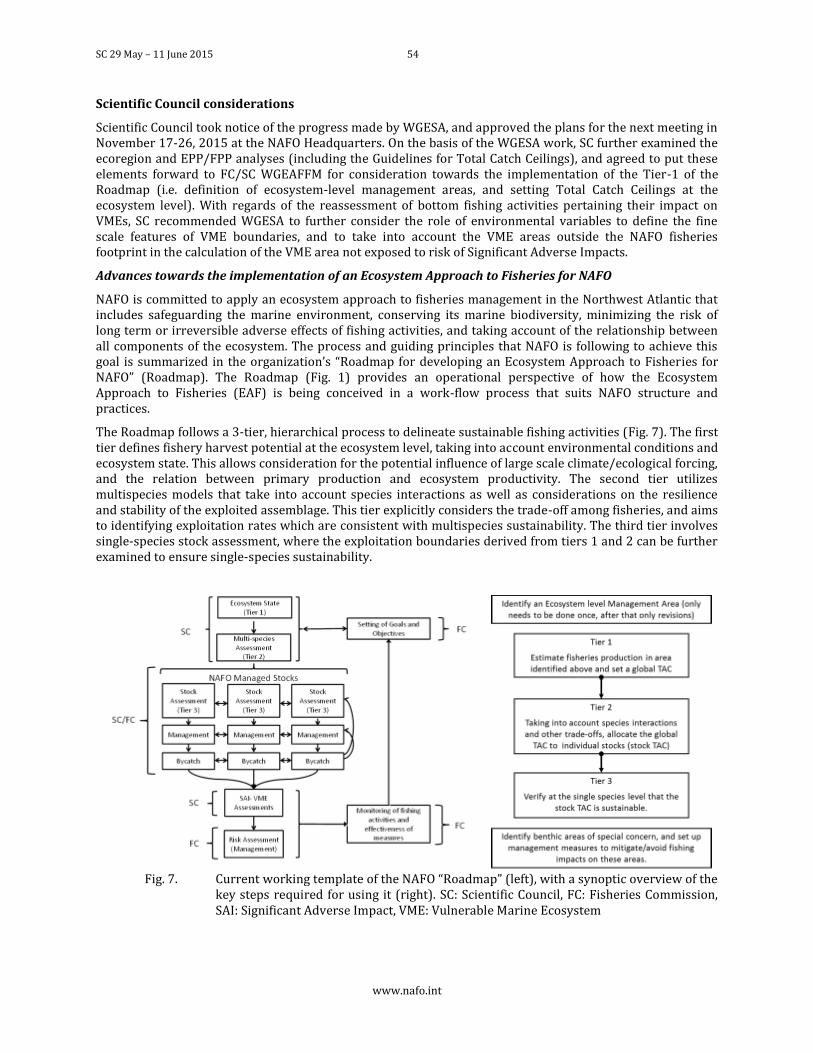
SC 29 May – 11 June 2015 54
www.nafo.int
Scientific Council considerations
Scientific Council took notice of the progress made by WGESA, and approved the plans for the next meeting in November 17-26, 2015 at the NAFO Headquarters. On the basis of the WGESA work, SC further examined the ecoregion and EPP/FPP analyses (including the Guidelines for Total Catch Ceilings), and agreed to put these elements forward to FC/SC WGEAFFM for consideration towards the implementation of the Tier-1 of the Roadmap (i.e. definition of ecosystem-level management areas, and setting Total Catch Ceilings at the ecosystem level). With regards of the reassessment of bottom fishing activities pertaining their impact on VMEs, SC recommended WGESA to further consider the role of environmental variables to define the fine scale features of VME boundaries, and to take into account the VME areas outside the NAFO fisheries footprint in the calculation of the VME area not exposed to risk of Significant Adverse Impacts.
Advances towards the implementation of an Ecosystem Approach to Fisheries for NAFO
NAFO is committed to apply an ecosystem approach to fisheries management in the Northwest Atlantic that includes safeguarding the marine environment, conserving its marine biodiversity, minimizing the risk of long term or irreversible adverse effects of fishing activities, and taking account of the relationship between all components of the ecosystem. The process and guiding principles that NAFO is following to achieve this goal is summarized in the organization’s “Roadmap for developing an Ecosystem Approach to Fisheries for NAFO” (Roadmap). The Roadmap (Fig. 1) provides an operational perspective of how the Ecosystem Approach to Fisheries (EAF) is being conceived in a work-flow process that suits NAFO structure and practices.
The Roadmap follows a 3-tier, hierarchical process to delineate sustainable fishing activities (Fig. 7). The first tier defines fishery harvest potential at the ecosystem level, taking into account environmental conditions and ecosystem state. This allows consideration for the potential influence of large scale climate/ecological forcing, and the relation between primary production and ecosystem productivity. The second tier utilizes multispecies models that take into account species interactions as well as considerations on the resilience and stability of the exploited assemblage. This tier explicitly considers the trade-off among fisheries, and aims to identifying exploitation rates which are consistent with multispecies sustainability. The third tier involves single-species stock assessment, where the exploitation boundaries derived from tiers 1 and 2 can be further examined to ensure single-species sustainability.
Fig. 7. Current working template of the NAFO “Roadmap” (left), with a synoptic overview of the
key steps required for using it (right). SC: Scientific Council, FC: Fisheries Commission, SAI: Significant Adverse Impact, VME: Vulnerable Marine Ecosystem
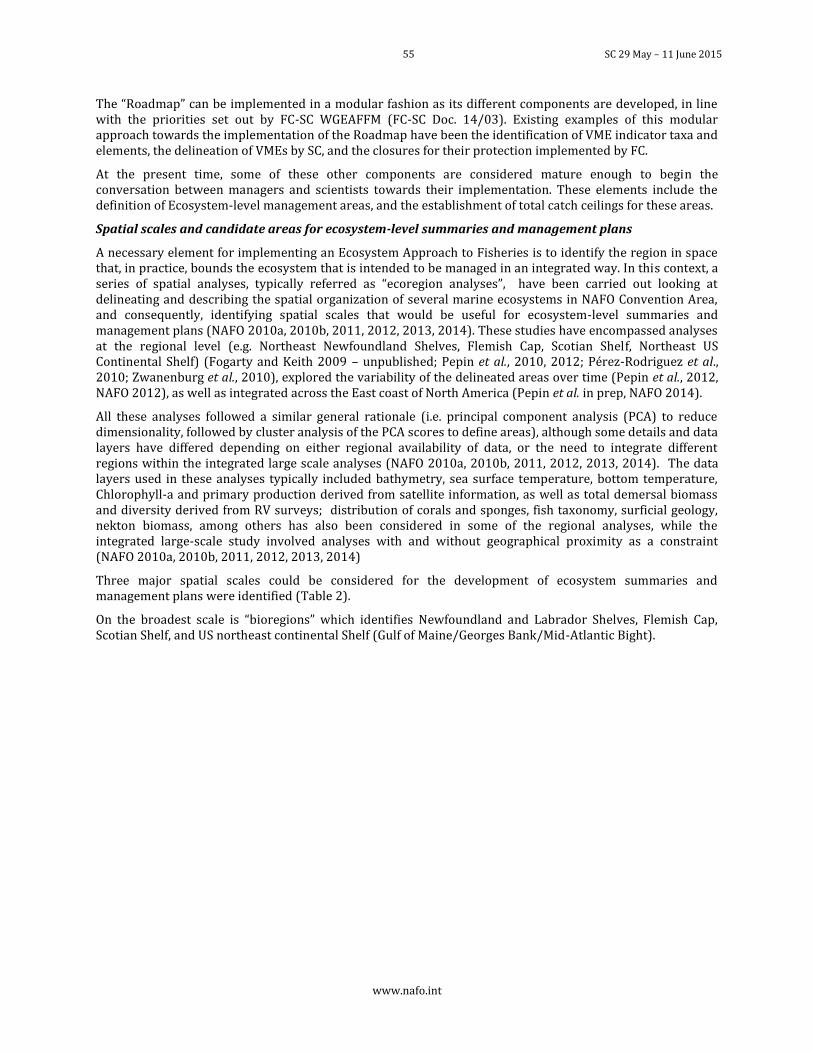
55 SC 29 May – 11 June 2015
www.nafo.int
The “Roadmap” can be implemented in a modular fashion as its different components are developed, in line with the priorities set out by FC-SC WGEAFFM (FC-SC Doc. 14/03). Existing examples of this modular approach towards the implementation of the Roadmap have been the identification of VME indicator taxa and elements, the delineation of VMEs by SC, and the closures for their protection implemented by FC.
At the present time, some of these other components are considered mature enough to begin the conversation between managers and scientists towards their implementation. These elements include the definition of Ecosystem-level management areas, and the establishment of total catch ceilings for these areas.
Spatial scales and candidate areas for ecosystem-level summaries and management plans
A necessary element for implementing an Ecosystem Approach to Fisheries is to identify the region in space that, in practice, bounds the ecosystem that is intended to be managed in an integrated way. In this context, a series of spatial analyses, typically referred as “ecoregion analyses”, have been carried out looking at delineating and describing the spatial organization of several marine ecosystems in NAFO Convention Area, and consequently, identifying spatial scales that would be useful for ecosystem-level summaries and management plans (NAFO 2010a, 2010b, 2011, 2012, 2013, 2014). These studies have encompassed analyses at the regional level (e.g. Northeast Newfoundland Shelves, Flemish Cap, Scotian Shelf, Northeast US Continental Shelf) (Fogarty and Keith 2009 – unpublished; Pepin et al., 2010, 2012; Pérez-Rodriguez et al., 2010; Zwanenburg et al., 2010), explored the variability of the delineated areas over time (Pepin et al., 2012, NAFO 2012), as well as integrated across the East coast of North America (Pepin et al. in prep, NAFO 2014).
All these analyses followed a similar general rationale (i.e. principal component analysis (PCA) to reduce dimensionality, followed by cluster analysis of the PCA scores to define areas), although some details and data layers have differed depending on either regional availability of data, or the need to integrate different regions within the integrated large scale analyses (NAFO 2010a, 2010b, 2011, 2012, 2013, 2014). The data layers used in these analyses typically included bathymetry, sea surface temperature, bottom temperature, Chlorophyll-a and primary production derived from satellite information, as well as total demersal biomass and diversity derived from RV surveys; distribution of corals and sponges, fish taxonomy, surficial geology, nekton biomass, among others has also been considered in some of the regional analyses, while the integrated large-scale study involved analyses with and without geographical proximity as a constraint (NAFO 2010a, 2010b, 2011, 2012, 2013, 2014)
Three major spatial scales could be considered for the development of ecosystem summaries and management plans were identified (Table 2).
On the broadest scale is “bioregions” which identifies Newfoundland and Labrador Shelves, Flemish Cap, Scotian Shelf, and US northeast continental Shelf (Gulf of Maine/Georges Bank/Mid-Atlantic Bight).
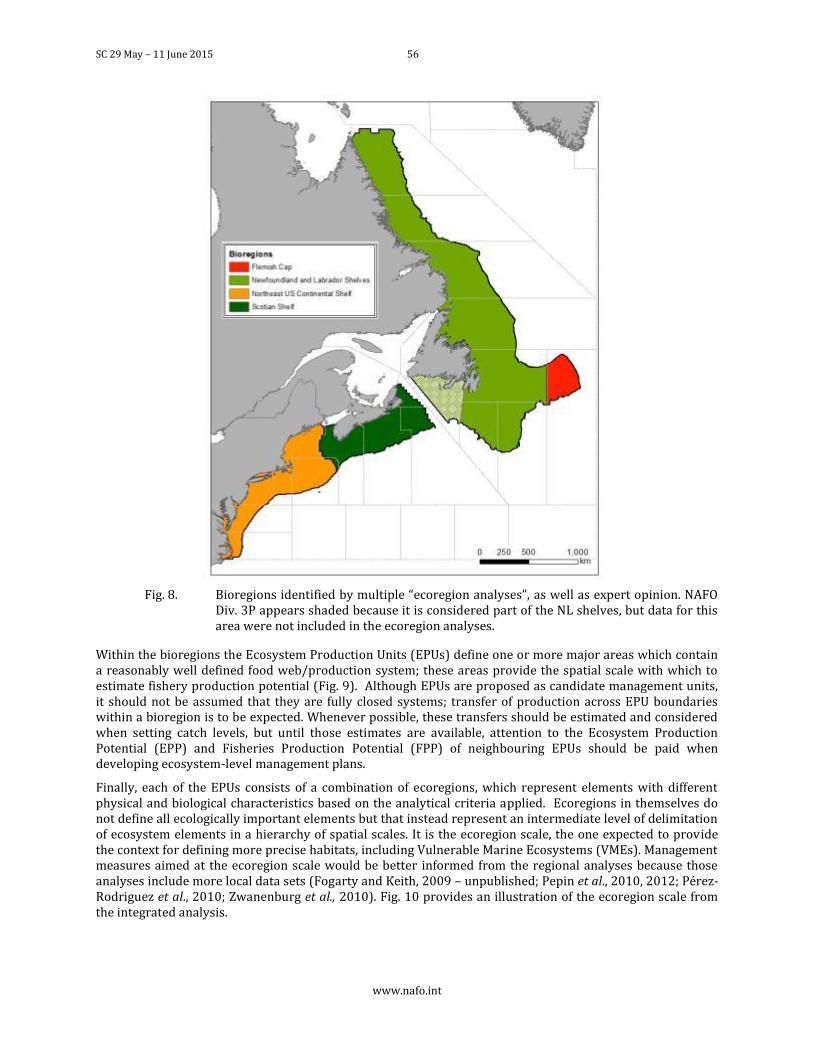
SC 29 May – 11 June 2015 56
www.nafo.int
Fig. 8. Bioregions identified by multiple “ecoregion analyses”, as well as expert opinion. NAFO
Div. 3P appears shaded because it is considered part of the NL shelves, but data for this area were not included in the ecoregion analyses.
Within the bioregions the Ecosystem Production Units (EPUs) define one or more major areas which contain a reasonably well defined food web/production system; these areas provide the spatial scale with which to estimate fishery production potential (Fig. 9). Although EPUs are proposed as candidate management units, it should not be assumed that they are fully closed systems; transfer of production across EPU boundaries within a bioregion is to be expected. Whenever possible, these transfers should be estimated and considered when setting catch levels, but until those estimates are available, attention to the Ecosystem Production Potential (EPP) and Fisheries Production Potential (FPP) of neighbouring EPUs should be paid when developing ecosystem-level management plans.
Finally, each of the EPUs consists of a combination of ecoregions, which represent elements with different physical and biological characteristics based on the analytical criteria applied. Ecoregions in themselves do not define all ecologically important elements but that instead represent an intermediate level of delimitation of ecosystem elements in a hierarchy of spatial scales. It is the ecoregion scale, the one expected to provide the context for defining more precise habitats, including Vulnerable Marine Ecosystems (VMEs). Management measures aimed at the ecoregion scale would be better informed from the regional analyses because those analyses include more local data sets (Fogarty and Keith, 2009 – unpublished; Pepin et al., 2010, 2012; Pérez-Rodriguez et al., 2010; Zwanenburg et al., 2010). Fig. 10 provides an illustration of the ecoregion scale from the integrated analysis.
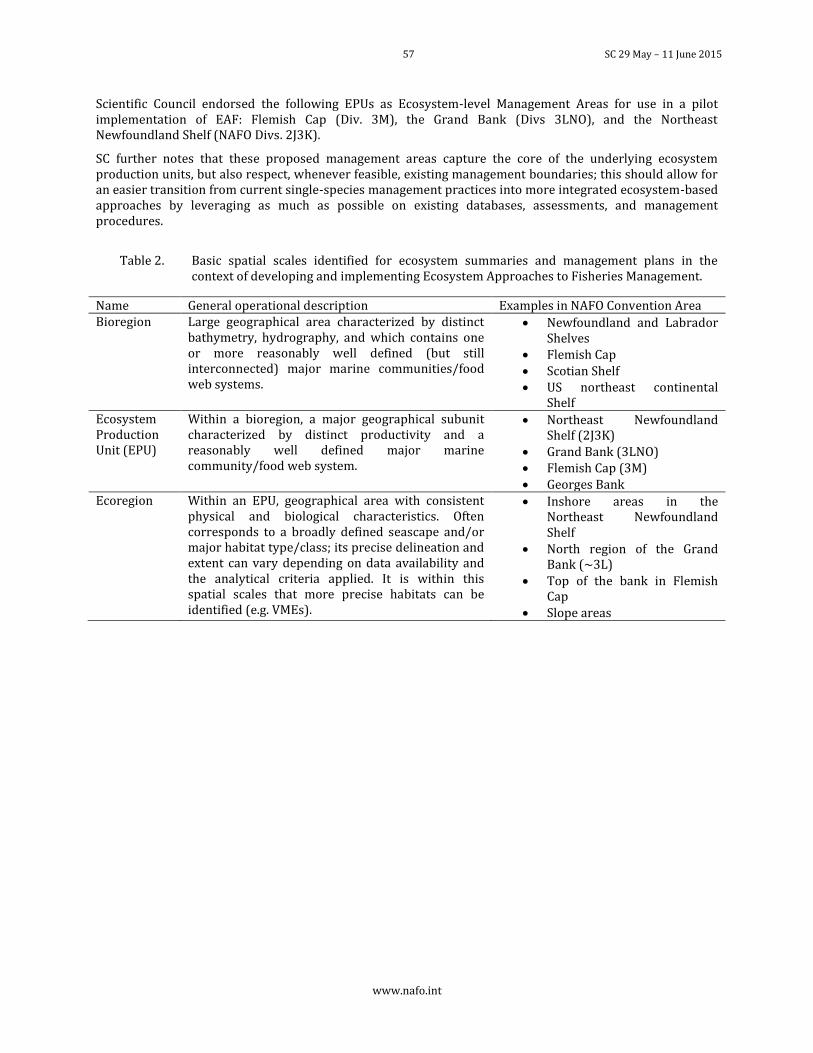
57 SC 29 May – 11 June 2015
www.nafo.int
Scientific Council endorsed the following EPUs as Ecosystem-level Management Areas for use in a pilot implementation of EAF: Flemish Cap (Div. 3M), the Grand Bank (Divs 3LNO), and the Northeast Newfoundland Shelf (NAFO Divs. 2J3K).
SC further notes that these proposed management areas capture the core of the underlying ecosystem production units, but also respect, whenever feasible, existing management boundaries; this should allow for an easier transition from current single-species management practices into more integrated ecosystem-based approaches by leveraging as much as possible on existing databases, assessments, and management procedures.
Table 2. Basic spatial scales identified for ecosystem summaries and management plans in the context of developing and implementing Ecosystem Approaches to Fisheries Management.
Name General operational description Examples in NAFO Convention Area Bioregion Large geographical area characterized by distinct
bathymetry, hydrography, and which contains one or more reasonably well defined (but still interconnected) major marine communities/food web systems.
Newfoundland and Labrador Shelves
Flemish Cap Scotian Shelf US northeast continental
Shelf Ecosystem Production Unit (EPU)
Within a bioregion, a major geographical subunit characterized by distinct productivity and a reasonably well defined major marine community/food web system.
Northeast Newfoundland Shelf (2J3K)
Grand Bank (3LNO) Flemish Cap (3M) Georges Bank
Ecoregion Within an EPU, geographical area with consistent physical and biological characteristics. Often corresponds to a broadly defined seascape and/or major habitat type/class; its precise delineation and extent can vary depending on data availability and the analytical criteria applied. It is within this spatial scales that more precise habitats can be identified (e.g. VMEs).
Inshore areas in the Northeast Newfoundland Shelf
North region of the Grand Bank (~3L)
Top of the bank in Flemish Cap
Slope areas
SC 29 May – 11 June 2015 58
www.nafo.int
Fig. 9. Ecosystem Production Units (EPUs) identified as a result of multiple “ecoregion
analyses” and expert opinion. These areas are proposed as candidate Ecosystem-level Management Areas.
Fig. 10. Ecoregions from the integrated analysis. Each colour represents a different cluster, and
illustrates the spatial scale associated with the ecoregion level as described in Table 2. These ecoregions are for illustrative purposes only, management measures aimed at the ecoregion scales are recommended to rely on regional analyses.
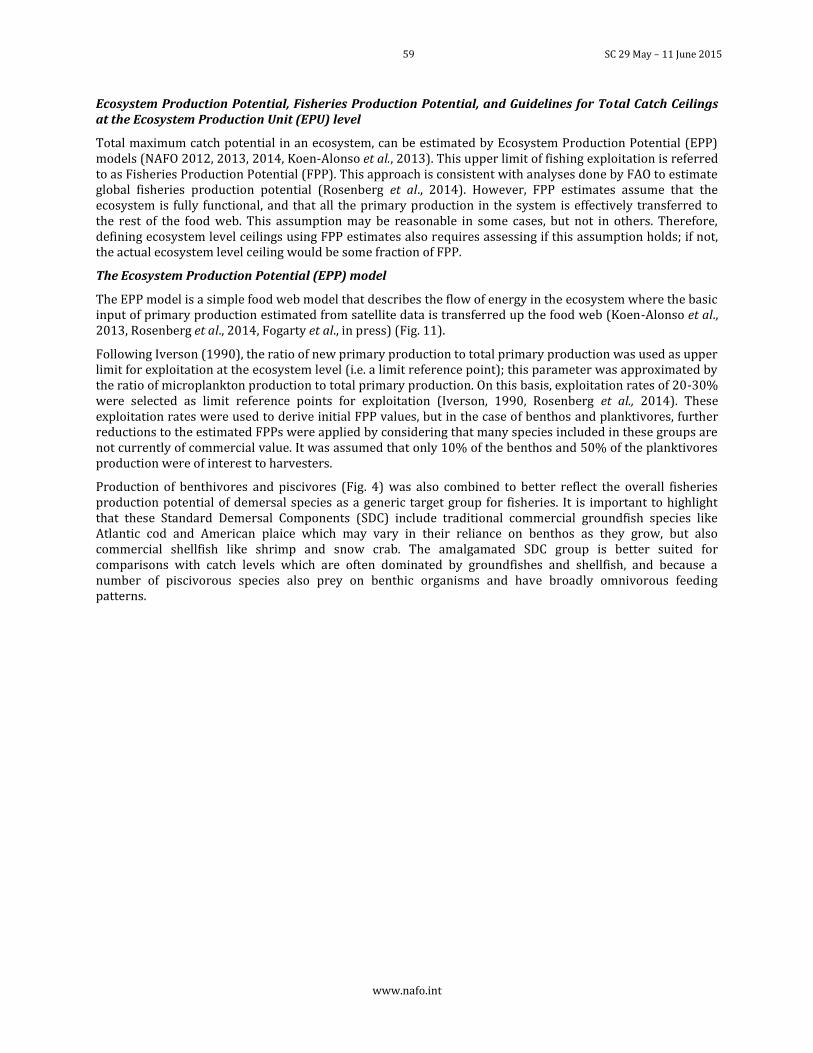
59 SC 29 May – 11 June 2015
www.nafo.int
Ecosystem Production Potential, Fisheries Production Potential, and Guidelines for Total Catch Ceilings at the Ecosystem Production Unit (EPU) level
Total maximum catch potential in an ecosystem, can be estimated by Ecosystem Production Potential (EPP) models (NAFO 2012, 2013, 2014, Koen-Alonso et al., 2013). This upper limit of fishing exploitation is referred to as Fisheries Production Potential (FPP). This approach is consistent with analyses done by FAO to estimate global fisheries production potential (Rosenberg et al., 2014). However, FPP estimates assume that the ecosystem is fully functional, and that all the primary production in the system is effectively transferred to the rest of the food web. This assumption may be reasonable in some cases, but not in others. Therefore, defining ecosystem level ceilings using FPP estimates also requires assessing if this assumption holds; if not, the actual ecosystem level ceiling would be some fraction of FPP.
The Ecosystem Production Potential (EPP) model
The EPP model is a simple food web model that describes the flow of energy in the ecosystem where the basic input of primary production estimated from satellite data is transferred up the food web (Koen-Alonso et al., 2013, Rosenberg et al., 2014, Fogarty et al., in press) (Fig. 11).
Following Iverson (1990), the ratio of new primary production to total primary production was used as upper limit for exploitation at the ecosystem level (i.e. a limit reference point); this parameter was approximated by the ratio of microplankton production to total primary production. On this basis, exploitation rates of 20-30% were selected as limit reference points for exploitation (Iverson, 1990, Rosenberg et al., 2014). These exploitation rates were used to derive initial FPP values, but in the case of benthos and planktivores, further reductions to the estimated FPPs were applied by considering that many species included in these groups are not currently of commercial value. It was assumed that only 10% of the benthos and 50% of the planktivores production were of interest to harvesters.
Production of benthivores and piscivores (Fig. 4) was also combined to better reflect the overall fisheries production potential of demersal species as a generic target group for fisheries. It is important to highlight that these Standard Demersal Components (SDC) include traditional commercial groundfish species like Atlantic cod and American plaice which may vary in their reliance on benthos as they grow, but also commercial shellfish like shrimp and snow crab. The amalgamated SDC group is better suited for comparisons with catch levels which are often dominated by groundfishes and shellfish, and because a number of piscivorous species also prey on benthic organisms and have broadly omnivorous feeding patterns.
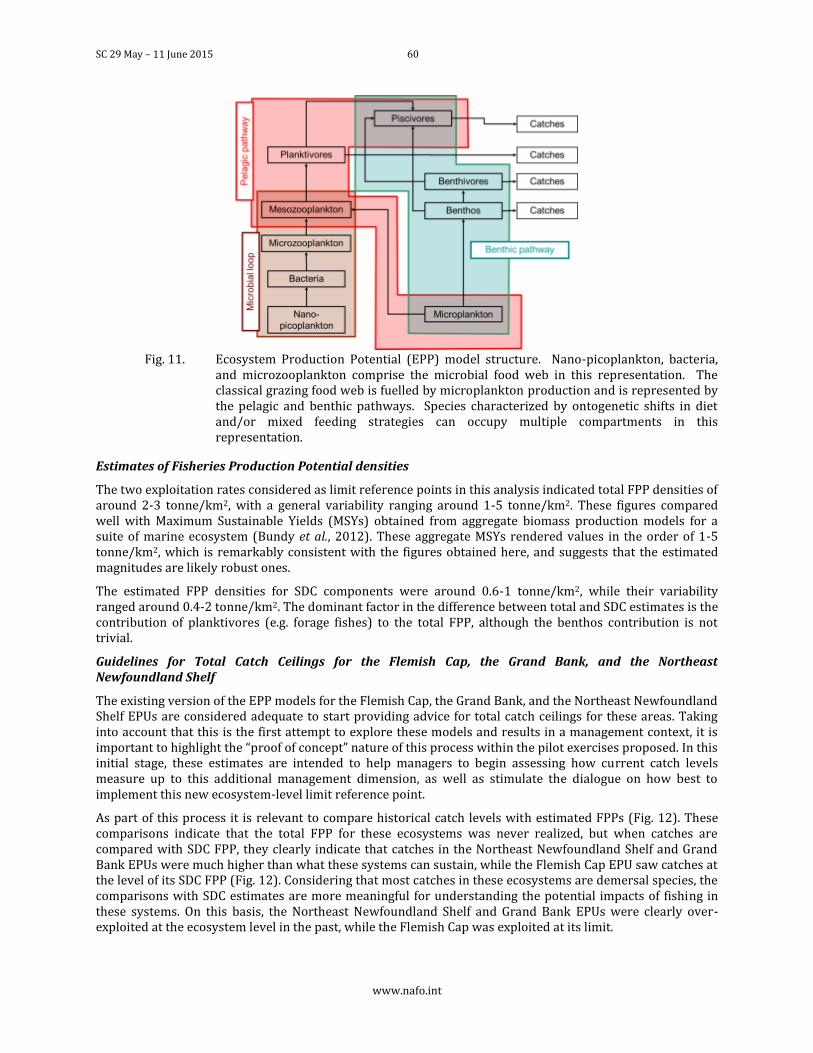
SC 29 May – 11 June 2015 60
www.nafo.int
Fig. 11. Ecosystem Production Potential (EPP) model structure. Nano-picoplankton, bacteria,
and microzooplankton comprise the microbial food web in this representation. The classical grazing food web is fuelled by microplankton production and is represented by the pelagic and benthic pathways. Species characterized by ontogenetic shifts in diet and/or mixed feeding strategies can occupy multiple compartments in this representation.
Estimates of Fisheries Production Potential densities
The two exploitation rates considered as limit reference points in this analysis indicated total FPP densities of around 2-3 tonne/km2, with a general variability ranging around 1-5 tonne/km2. These figures compared well with Maximum Sustainable Yields (MSYs) obtained from aggregate biomass production models for a suite of marine ecosystem (Bundy et al., 2012). These aggregate MSYs rendered values in the order of 1-5 tonne/km2, which is remarkably consistent with the figures obtained here, and suggests that the estimated magnitudes are likely robust ones.
The estimated FPP densities for SDC components were around 0.6-1 tonne/km2, while their variability ranged around 0.4-2 tonne/km2. The dominant factor in the difference between total and SDC estimates is the contribution of planktivores (e.g. forage fishes) to the total FPP, although the benthos contribution is not trivial.
Guidelines for Total Catch Ceilings for the Flemish Cap, the Grand Bank, and the Northeast Newfoundland Shelf
The existing version of the EPP models for the Flemish Cap, the Grand Bank, and the Northeast Newfoundland Shelf EPUs are considered adequate to start providing advice for total catch ceilings for these areas. Taking into account that this is the first attempt to explore these models and results in a management context, it is important to highlight the “proof of concept” nature of this process within the pilot exercises proposed. In this initial stage, these estimates are intended to help managers to begin assessing how current catch levels measure up to this additional management dimension, as well as stimulate the dialogue on how best to implement this new ecosystem-level limit reference point.
As part of this process it is relevant to compare historical catch levels with estimated FPPs (Fig. 12). These comparisons indicate that the total FPP for these ecosystems was never realized, but when catches are compared with SDC FPP, they clearly indicate that catches in the Northeast Newfoundland Shelf and Grand Bank EPUs were much higher than what these systems can sustain, while the Flemish Cap EPU saw catches at the level of its SDC FPP (Fig. 12). Considering that most catches in these ecosystems are demersal species, the comparisons with SDC estimates are more meaningful for understanding the potential impacts of fishing in these systems. On this basis, the Northeast Newfoundland Shelf and Grand Bank EPUs were clearly over-exploited at the ecosystem level in the past, while the Flemish Cap was exploited at its limit.
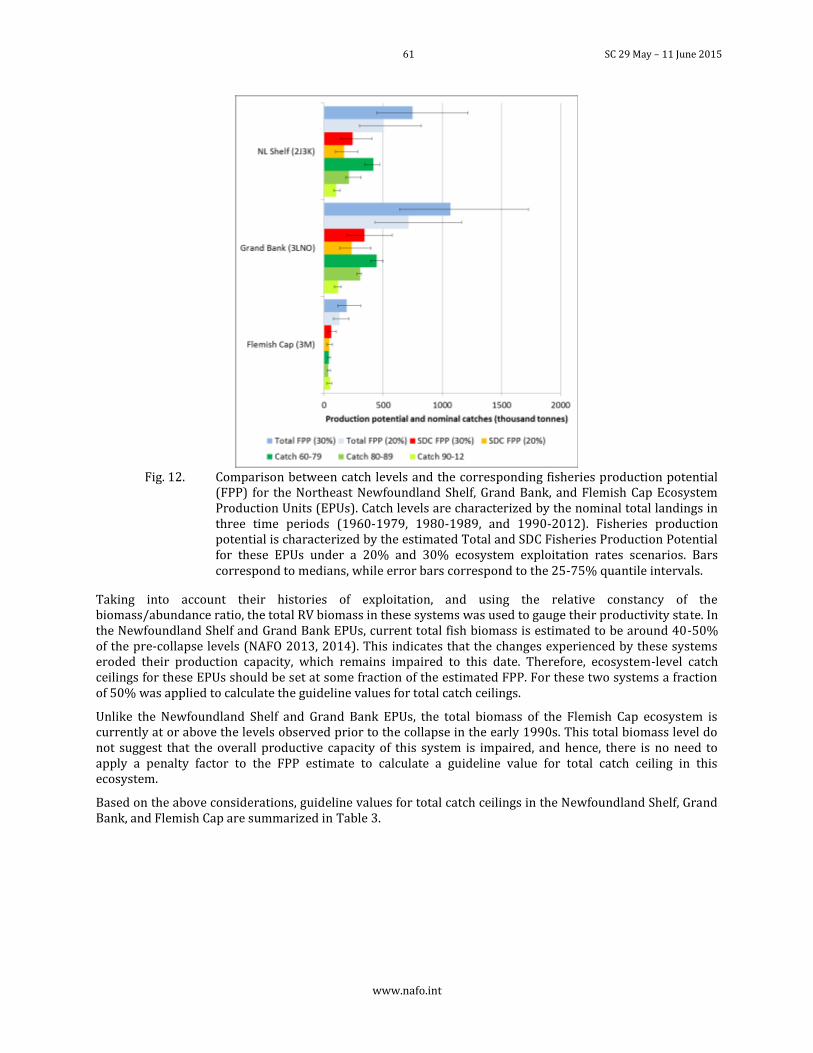
61 SC 29 May – 11 June 2015
www.nafo.int
Fig. 12. Comparison between catch levels and the corresponding fisheries production potential
(FPP) for the Northeast Newfoundland Shelf, Grand Bank, and Flemish Cap Ecosystem Production Units (EPUs). Catch levels are characterized by the nominal total landings in three time periods (1960-1979, 1980-1989, and 1990-2012). Fisheries production potential is characterized by the estimated Total and SDC Fisheries Production Potential for these EPUs under a 20% and 30% ecosystem exploitation rates scenarios. Bars correspond to medians, while error bars correspond to the 25-75% quantile intervals.
Taking into account their histories of exploitation, and using the relative constancy of the biomass/abundance ratio, the total RV biomass in these systems was used to gauge their productivity state. In the Newfoundland Shelf and Grand Bank EPUs, current total fish biomass is estimated to be around 40-50% of the pre-collapse levels (NAFO 2013, 2014). This indicates that the changes experienced by these systems eroded their production capacity, which remains impaired to this date. Therefore, ecosystem-level catch ceilings for these EPUs should be set at some fraction of the estimated FPP. For these two systems a fraction of 50% was applied to calculate the guideline values for total catch ceilings.
Unlike the Newfoundland Shelf and Grand Bank EPUs, the total biomass of the Flemish Cap ecosystem is currently at or above the levels observed prior to the collapse in the early 1990s. This total biomass level do not suggest that the overall productive capacity of this system is impaired, and hence, there is no need to apply a penalty factor to the FPP estimate to calculate a guideline value for total catch ceiling in this ecosystem.
Based on the above considerations, guideline values for total catch ceilings in the Newfoundland Shelf, Grand Bank, and Flemish Cap are summarized in Table 3.
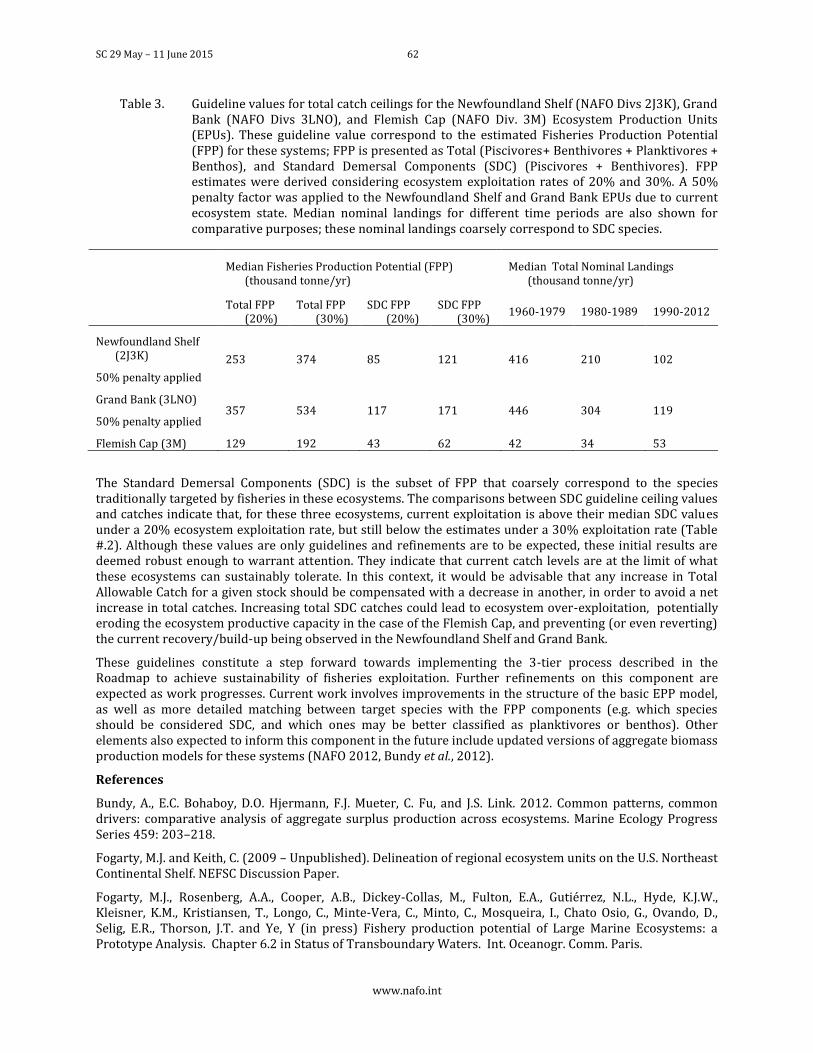
SC 29 May – 11 June 2015 62
www.nafo.int
Table 3. Guideline values for total catch ceilings for the Newfoundland Shelf (NAFO Divs 2J3K), Grand Bank (NAFO Divs 3LNO), and Flemish Cap (NAFO Div. 3M) Ecosystem Production Units (EPUs). These guideline value correspond to the estimated Fisheries Production Potential (FPP) for these systems; FPP is presented as Total (Piscivores+ Benthivores + Planktivores + Benthos), and Standard Demersal Components (SDC) (Piscivores + Benthivores). FPP estimates were derived considering ecosystem exploitation rates of 20% and 30%. A 50% penalty factor was applied to the Newfoundland Shelf and Grand Bank EPUs due to current ecosystem state. Median nominal landings for different time periods are also shown for comparative purposes; these nominal landings coarsely correspond to SDC species.
Median Fisheries Production Potential (FPP) (thousand tonne/yr)
Median Total Nominal Landings (thousand tonne/yr)
Total FPP (20%)
Total FPP (30%)
SDC FPP (20%)
SDC FPP (30%)
1960-1979 1980-1989 1990-2012
Newfoundland Shelf (2J3K)
50% penalty applied
253 374 85 121 416 210 102
Grand Bank (3LNO)
50% penalty applied 357 534 117 171 446 304 119
Flemish Cap (3M) 129 192 43 62 42 34 53
The Standard Demersal Components (SDC) is the subset of FPP that coarsely correspond to the species traditionally targeted by fisheries in these ecosystems. The comparisons between SDC guideline ceiling values and catches indicate that, for these three ecosystems, current exploitation is above their median SDC values under a 20% ecosystem exploitation rate, but still below the estimates under a 30% exploitation rate (Table #.2). Although these values are only guidelines and refinements are to be expected, these initial results are deemed robust enough to warrant attention. They indicate that current catch levels are at the limit of what these ecosystems can sustainably tolerate. In this context, it would be advisable that any increase in Total Allowable Catch for a given stock should be compensated with a decrease in another, in order to avoid a net increase in total catches. Increasing total SDC catches could lead to ecosystem over-exploitation, potentially eroding the ecosystem productive capacity in the case of the Flemish Cap, and preventing (or even reverting) the current recovery/build-up being observed in the Newfoundland Shelf and Grand Bank.
These guidelines constitute a step forward towards implementing the 3-tier process described in the Roadmap to achieve sustainability of fisheries exploitation. Further refinements on this component are expected as work progresses. Current work involves improvements in the structure of the basic EPP model, as well as more detailed matching between target species with the FPP components (e.g. which species should be considered SDC, and which ones may be better classified as planktivores or benthos). Other elements also expected to inform this component in the future include updated versions of aggregate biomass production models for these systems (NAFO 2012, Bundy et al., 2012).
References
Bundy, A., E.C. Bohaboy, D.O. Hjermann, F.J. Mueter, C. Fu, and J.S. Link. 2012. Common patterns, common drivers: comparative analysis of aggregate surplus production across ecosystems. Marine Ecology Progress Series 459: 203–218.
Fogarty, M.J. and Keith, C. (2009 – Unpublished). Delineation of regional ecosystem units on the U.S. Northeast Continental Shelf. NEFSC Discussion Paper.
Fogarty, M.J., Rosenberg, A.A., Cooper, A.B., Dickey-Collas, M., Fulton, E.A., Gutiérrez, N.L., Hyde, K.J.W., Kleisner, K.M., Kristiansen, T., Longo, C., Minte-Vera, C., Minto, C., Mosqueira, I., Chato Osio, G., Ovando, D., Selig, E.R., Thorson, J.T. and Ye, Y (in press) Fishery production potential of Large Marine Ecosystems: a Prototype Analysis. Chapter 6.2 in Status of Transboundary Waters. Int. Oceanogr. Comm. Paris.
63 SC 29 May – 11 June 2015
www.nafo.int
Iverson, R.I. 1990. Control of marine fish production. Limn,. Oceanogr. 35: 1593-1604.
Koen-Alonso, M., P. Pepin, and F. Mowbray. 2010. Exploring the role of environmental and anthropogenic drivers in the trajectories of core fish species of Newfoundland-Labrador marine community. NAFO SCR Doc. 10/037.
Koen-Alonso, M., Fogarty, M., Pepin, P., Hyde, K., and Gamble, R. 2013. Ecosystem production potential in the Northwest Atlantic. NAFO SCR Doc. 13/075, Serial No. N6273
NAFO. 2010a. Report of the NAFO Scientific Council Working Group on Ecosystem Approaches to Fisheries Management (WGEAFM). 1-5 February, 2010, Vigo, Spain. NAFO Scientific Council Summary (SCS) Doc. 10/19. Serial No. N5815.
NAFO. 2010b. Report of the 3rd Meeting of the NAFO Scientific Council Working Group on Ecosystem Approaches to Fisheries Management (WGEAFM). 1-10 December, 2010, Dartmouth, Canada. NAFO Scientific Council Summary (SCS) Doc. 10/24. Serial No. N5868.
NAFO. 2011. Report of the 4th Meeting of the NAFO Scientific Council Working Group on Ecosystem Approaches to Fisheries Management (WGEAFM). 30 November -10 December, 2011, Dartmouth, Canada. NAFO Scientific Council Summary (SCS) Doc. 11/22. Serial No. N6006.
NAFO. 2012. Report of the 5th Meeting of the NAFO Scientific Council Working Group on Ecosystem Approaches to Fisheries Management (WGEAFM). 21-30 November 2012, Dartmouth, Canada. NAFO Scientific Council Summary (SCS) Doc. 12/26. Serial No. N6137.
NAFO. 2013. Report of the 6th Meeting of the NAFO Scientific Council Working Group on Ecosystem Science and Assessment (WGESA) [Formerly SC WGEAFM]. 19- 29 November 2013, Dartmouth, Canada. NAFO Scientific Council Summary (SCS) Doc. 13/24. Serial No. N6277.
NAFO. 2014. Report of the 7th Meeting of the NAFO Scientific Council Working Group on Ecosystem Science and Assessment (WGESA) [Formerly SC WGEAFM]. 18- 27 November 2013, Dartmouth, Canada. NAFO Scientific Council Summary (SCS) Doc. 14/23. Serial No. N6410.
Pepin, P., Cuff, A., Koen-Alonso, M. and Ollerhead, N. 2010. Preliminary analysis for the delineation of marine ecoregions on the Newfoundland and Labrador Shelves. NAFO SCR Doc. 10/72, 24p.
Pepin, P., Koen-Alonso, M., Higdon, J., Ollerhead, N. 2012. Robustness in the delineation of ecoregions on the Newfoundland and Labrador continental shelf. NAFO SCR Doc. 12/67, 29p.
Pepin, P., Higdon, J., Koen-Alonso, M., Fogarty, M., and Ollerhead. in prep. Application of ecoregion analysis to the identification of ecosystem production units in the NAFO Regulatory Area. NAFO SCR Doc.14/069.
Rosenberg, A.A., Fogarty, M.J., Cooper, A.B., Dickey-Collas, M., Fulton, E.A., Gutiérrez, N.L., Hyde, K.J.W., Kleisner, K.M., Kristiansen, T., Longo, C., Minte-Vera, C., Minto, C., Mosqueira, I., Chato Osio, G., Ovando, D., Selig, E.R., Thorson, J.T. & Ye, Y. (2014). Developing new approaches to global stock status assessment and fishery production potential of the seas. FAO Fisheries and Aquaculture Circular No. 1086. Rome, FAO.
Zwanenburg, K., Horsman, T., and Kenchington, E. (2010). Preliminary analysis of biogeographic units on the Scotian Shelf. NAFO Scientific Report Doc. 10/06, 30p.
2. ICES-NAFO Working Group on Deepwater Ecosystems (WGDEC)
On 16th February 2015, the joint ICES/NAFO WGDEC, chaired by Neil Golding (UK) and attended by fourteen members (eleven in person, three via WebEx) met in Horta, Faial, Azores. WGDEC was requested to provide all new information on the distribution of vulnerable marine ecosystems (VMEs) in the North Atlantic.
A total of 510 new records were brought to the group this year and appended to the VME database. The new data were from a range of sources including fisheries surveys and seabed imagery surveys. No recommendations were made for the modification of existing, or creation of new bottom fishing closures.
SC 29 May – 11 June 2015 64
www.nafo.int
Within the NEAFC regulatory area, the following areas were considered:
Rockall Bank: new VME indicator records from two scientific fish stock assessment surveys were made available. In addition, new information was provided from a commercial fishery but no bycatch was recorded.
Within the EEZs of various countries the following areas were considered:
Rockall Bank: new VME indicator records from two scientific fish stock assessment surveys were made available.
Rosemary Bank: The group considered new VME indicator bycatch records from a scientific trawl survey. Towed video imagery from the same survey also showed evidence of the VME habitat type ‘deep-sea sponge aggregations.’
Faroe-Shetland Channel: new VME indicator records from a scientific trawl survey were presented to WGDEC.
Bill Baileys Bank and Lousy Bank: New information on VME indicator bycatch records was provided from a commercial fishery.
Greenland: The group considered a new record of the habitat type ‘cold water coral reef’, verified by drop down video.
Portugal: WGDEC 2015 was made aware of new VME indicator records from within Azorean waters published in a scientific paper. Data from this scientific paper were not provided to WGDEC and are not currently within the VME database.
Within the Northwest Atlantic (NAFO regulated) the following areas were considered:
Flemish Cap Bank, Grand Banks and Flemish Pass Basin: New information on VME indicator bycatch records was provided from a commercial fishery.
WGDEC used VMS-data for 2014 to analyse the spatial distribution of bottom fishing activity in the NEAFC Regulatory Area. Speed filtering for bottom fishing gear types was improved from last year using vessel speed histograms. WGDEC examined the general data distribution and also looked at some areas in greater detail, such as Hatton and Rockall Banks, Mid-Atlantic Ridge and Josephine seamount. WGDEC sought to further develop the system developed in 2014 to weight the reliability and significance of VME indicator records. The main advance this year was to move from viewing individual points in the VME indicator database to a spatially gridded data format, which also combined the geographical locations of VMEs in close proximity to each other. The new system captured the fact that not all ‘VME indicator species’ within the VME database have the same vulnerability to human impacts. Additionally, to account for data quality issues, a ‘data uncertainty’ index was developed. A proposal for a novel methodology for combining isolated occurrences of VME indicator records into a single bottom fishing closure was submitted to WGDEC 2015; this proposal needs further consideration at WGDEC 2016. WGDEC also recommend that in 2016, the work achieved under this ToR (b) is consolidated with previous work undertaken by WGDEC with respect to buffer zones in order to develop a set of guiding principles for delineating bottom fishing closure boundaries. WGDEC discussed progress with developing the VME database. This database provides an essential resource for the some of the core work of WGDEC. The large number of ‘restricted’ records within the database was discussed and proposals made to address this issue. Developments with the ICES VME data portal made since WGDEC 2014 were also discussed. Some clarifications to the VME database guidance were discussed and agreed. Finally, WGDEC discussed and agreed to progress a VME data call pilot, in conjunction with the ICES Data Centre. The VME Data Call would invite ICES Member Countries to submit new data on occurrences of VME indicators or VME habitat types for use in WGDECs work. WGDEC discussed the potential impacts of deep-sea mining on vulnerable deepwater habitats. WGDEC reassessed the Pressures List developed through the OSPAR Intercessional Correspondence Group on Cumulative Effects (ICG-C), a subgroup of the Environmental Impacts of Human Activities (EIHA) committee, and suggested some modifications to ensure that the pressures associated with deep-sea mining activities were adequately covered. WGDEC noted that as deep-sea mining has not begun and many of the potential impacts, such as extent of plumes and toxicity levels, remain unknown. It is therefore very difficult to predict the sensitivity of vulnerable marine habitats to these potential impacts and so fully address this Terms of Reference at this time. WGDEC reviewed new evidence of ecosystem functioning on VME indicators in the North Atlantic in relation to the CORALfish project and other
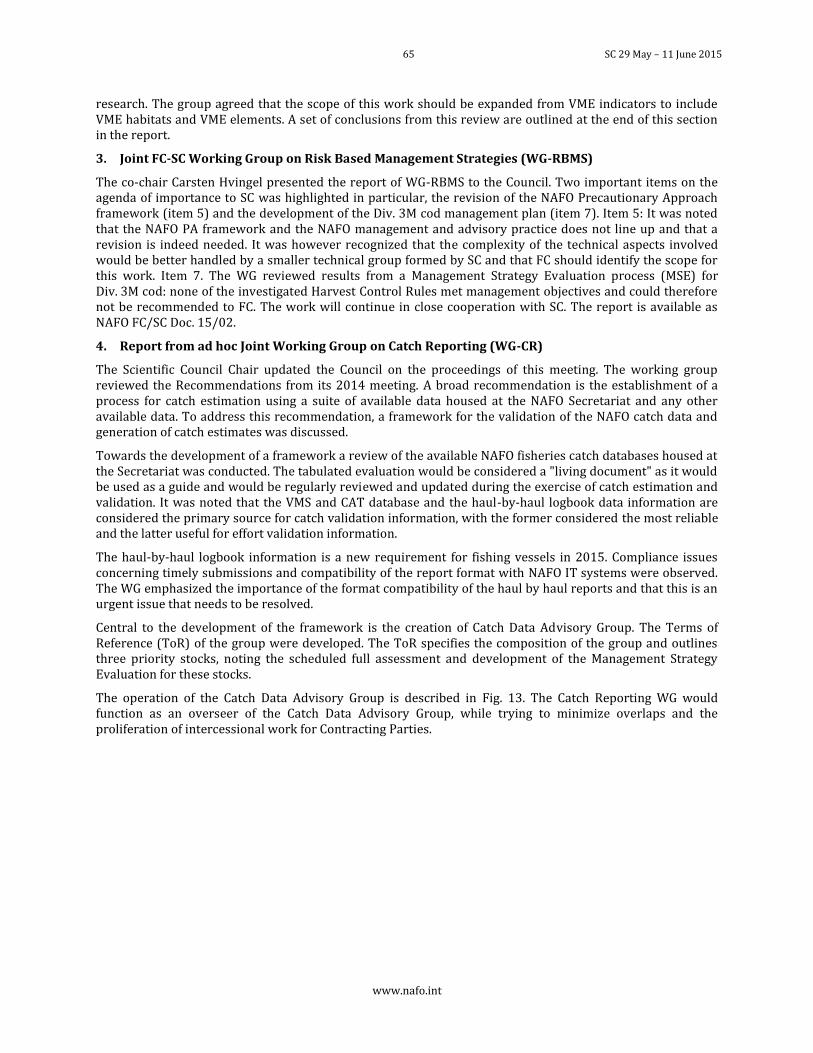
65 SC 29 May – 11 June 2015
www.nafo.int
research. The group agreed that the scope of this work should be expanded from VME indicators to include VME habitats and VME elements. A set of conclusions from this review are outlined at the end of this section in the report.
3. Joint FC-SC Working Group on Risk Based Management Strategies (WG-RBMS)
The co-chair Carsten Hvingel presented the report of WG-RBMS to the Council. Two important items on the agenda of importance to SC was highlighted in particular, the revision of the NAFO Precautionary Approach framework (item 5) and the development of the Div. 3M cod management plan (item 7). Item 5: It was noted that the NAFO PA framework and the NAFO management and advisory practice does not line up and that a revision is indeed needed. It was however recognized that the complexity of the technical aspects involved would be better handled by a smaller technical group formed by SC and that FC should identify the scope for this work. Item 7. The WG reviewed results from a Management Strategy Evaluation process (MSE) for Div. 3M cod: none of the investigated Harvest Control Rules met management objectives and could therefore not be recommended to FC. The work will continue in close cooperation with SC. The report is available as NAFO FC/SC Doc. 15/02.
4. Report from ad hoc Joint Working Group on Catch Reporting (WG-CR)
The Scientific Council Chair updated the Council on the proceedings of this meeting. The working group reviewed the Recommendations from its 2014 meeting. A broad recommendation is the establishment of a process for catch estimation using a suite of available data housed at the NAFO Secretariat and any other available data. To address this recommendation, a framework for the validation of the NAFO catch data and generation of catch estimates was discussed.
Towards the development of a framework a review of the available NAFO fisheries catch databases housed at the Secretariat was conducted. The tabulated evaluation would be considered a "living document" as it would be used as a guide and would be regularly reviewed and updated during the exercise of catch estimation and validation. It was noted that the VMS and CAT database and the haul-by-haul logbook data information are considered the primary source for catch validation information, with the former considered the most reliable and the latter useful for effort validation information.
The haul-by-haul logbook information is a new requirement for fishing vessels in 2015. Compliance issues concerning timely submissions and compatibility of the report format with NAFO IT systems were observed. The WG emphasized the importance of the format compatibility of the haul by haul reports and that this is an urgent issue that needs to be resolved.
Central to the development of the framework is the creation of Catch Data Advisory Group. The Terms of Reference (ToR) of the group were developed. The ToR specifies the composition of the group and outlines three priority stocks, noting the scheduled full assessment and development of the Management Strategy Evaluation for these stocks.
The operation of the Catch Data Advisory Group is described in Fig. 13. The Catch Reporting WG would function as an overseer of the Catch Data Advisory Group, while trying to minimize overlaps and the proliferation of intercessional work for Contracting Parties.
SC 29 May – 11 June 2015 66
www.nafo.int
Fig. 13. Proposed workflow for Catch Data Advisory Group.
The WG agreed to operate for another year under the same goals and objectives as it did for this inaugural year. The WG went on to make a number of recommendations to the Fisheries Commission and Scientific Council. The report is available as NAFO FC/SC Doc. 15/01.
5. Meetings attended by the Secretariat
a) Coordinating Working Party on Fishery Statistics (CWP)
The intersessional meeting of the Coordinating Working Party on Fishery Statistics (CWP), Capture Fishery Subject Group meeting (CWP-FS) was held on 25-27 February 2015 in Swakopmund, Namibia. George Campanis (SEAFO), the Coordinator of the Fishery Subject Group, chaired the meeting, which was attended by seven experts from four CWP participating organizations (Eurostat represented by DG Mare, FAO, NAFO, SEAFO) and additional three participants from the Benguela Current Commission (BCC), Western Central Atlantic Fishery Commission (WECAFC) and South Pacific Regional Fisheries Management Organization (SPRFMO). The CWP participating organizations briefly reported their recent activities relating to fishery statistics. NAFO was represented by Neil Campbell (SC Coordinator) and Barbara Marshall (Senior Information Officer).
NAFO indicated it had made progress in four areas in addition to the regular update of statistics. First it has convened a joint science/management working group to review and make recommendations on the procedure for catch estimation, focused on Greenland halibut, cod and American plaice. Secondly, NAFO is reviewing its conversion factors to harmonize values across Contracting Parties. NAFO and EU have agreed on the harmonization of STATLANT reporting dates. NAFO has made vessel-transmitted information (daily catch reports) available to its Scientific Council. This was used to provide catch figures for scientific assessments in 2014 as a full set of STATLANT 21A was not available at the time of the meeting.
67 SC 29 May – 11 June 2015
www.nafo.int
The CWP Secretariat summarized progress towards the revision of CWP Handbook. The importance of establishing global standards was outlined. The CWP has played an important role in establishing and maintaining global standards in fisheries statistics that are well accepted and utilized. By contrast, the contribution by CWP in setting standards in some areas, e.g. management data collection and scientific observer data, has been limited, even though the need to standardize have been consistently raised in previous CWP discussions. Despite different views on the extent of the CWP mandate to cover setting standards, the meeting agreed that the CWP should provide a forum for communication and a place to coordinate the harmonization amongst interested parties.
The meeting discussed the 2017 revision process of Harmonized Commodity Description and Coding System, commonly referred to as the Harmonized System (HS), of the World Custom Organizations was completed recently, and the revision of the Central Product Classification of the United Nations (CPC), an international classification of commodities and services delivered. The version 2.1 would include separation of wild and farmed products for primary fish products, taxonomic groups as comparable to HS, and distinction of products for non-food uses.
FAO summarized the current situation and remaining issues related to the fleet and fishing operation, including a description of fisheries. Coupled with this is the issue of identification of fisheries. The FAO explained that this agenda item had been proposed as tentative, awaiting the outcome of FIRMS FSC9. The initiative of developing Unique Identifiers (UIDs) for fish stocks and fisheries is documented in the FIRMS FSC9 report including document FIRMS/FSC9/2015/4a and received the support of FSC9. These UIDs will enable the creation of a registry of distinct stocks and fisheries as part of a Global record which will facilitate federation of, and reliable reference to, reported status and trends of stocks and fisheries across various sources.
The FAO explained that COFI had made a request for FAO to develop a general guideline to establish global traceability of fish and fishery products, FAO considers the landing as a unique opportunity to allocate unique product identifiers. FAO has made previous attempts to develop standards for trade certificates without success and it was recognized that the requirements of already existing systems may mean that only relatively loose guidelines would be possible for the near future. The meeting noted that only few organizations, including CCAMLR, CCSBT and ICCAT, currently implement a catch documentation scheme (CDS). The group agreed that establishment of a working group would be useful.
Items for Scientific Council
The FAO informed its intention to conduct a questionnaire survey to collect data on conversion factors during 2015. This is the first survey since 1992-1993 and is aiming to collect the conversion factors on different stages of production, including those for landed weight. The group recommended that the FAO dispatch the questionnaire to regional organizations. Recognizing the wide variability of conversion factors according to processing methods, areas and species, it was considered important to keep all of the details on products together with conversion factors, in particular, for the case of standardized conversion factors. The meeting felt it was not pragmatic to develop a set of standard conversion factors corresponding to global standard classification of fish and fishery commodities.
Scientific Council noted that work on the standardization of conversion factors was reviewed in 2014, and agreed to forward the outcomes of this work to the CWP Secretariat.
1. The FAO sought opinions on maintaining FishStatJ, a stand-alone data extraction and aggregation tool, or replacing it with an equivalent web based application. Members indicated a general need for an on-line data extraction tool, and requested more time to consult.
The general consensus within Scientific Council was that, while some individuals may make use of this tool in other fora, the use of FishStat has been largely superseded as a platform in NAFO by the development of the STATLANT 21 web extraction tool.
b) Fisheries and Resources Monitoring System Steering Committee (FIRMS)
The ninth session of the Fisheries and Resources Monitoring System (FIRMS) Steering Committee (FSC9) was held at the Southeast Atlantic Fisheries Organisation (SEAFO) headquarters in Swakopmund, Namibia, 23–24 February 2015. The meeting was opened by Marc Taconet, FIRMS Secretary, and Barbara Marshall (NAFO),
SC 29 May – 11 June 2015 68
www.nafo.int
the chairperson. NAFO was represented by the SC Coordinator, Neil Campbell. The chair welcomed FIRMS members, NAFO, SEAFO and the FAO and associate members and observers from the Western Central Atlantic Fisheries Commission (WECAFC), Benguela Current Commission (BCC), the South Pacific Regional Fisheries Management Organisation (SPRFMO) and Western Indian Oceans Fisheries Database (WIOFish).
The issues focused on by the group were:
Increased membership: the meeting acknowledged SPRFMO’s intention to join the partnership, as well as WIOFish’s willingness to initiate discussions with the Southwest Indian Ocean Fisheries Commission (SWIOFC) towards a statute of associate partner. Strategic collaboration with large marine ecosystem (LME) initiatives and programmes is seen as a way to strengthen national reporting in FIRMS, and the Committee encouraged the developing of experience with the Caribbean and North Brazil Shelf Large Marine Ecosystems (CLME+) and Bay of Bengal Large Marine Ecosystem (BOBLME) (where the focus is on positioning FIRMS as tool to support adaptive fisheries management), and welcomed BCC’s intention to follow a similar process.
FIRMS support to the proposed project of a Global record of stocks and fisheries (a component of BlueBRIDGE), which will federate knowledge on status/trends of stocks and fisheries across various sources, and as such is expected to offer key services to stakeholders involved in “regional/global state of stocks indicators”, as well as public and private actors involved in ecolabelling, traceability and sustainable fisheries.
The renewal of the FIRMS website, which is expected to better serve expectations of the general public, in particular through the proposed stocks and fisheries maps viewer.
The incoming chairperson is Dr Neil Campbell (NAFO) and vice chairperson Ms Nancy Cummings (WECAFC). FSC10 will be held in Rome in 2017, and a technical working group (TWG) might be organized in connection with the twenty-fifth session of the Coordinating Working Party on Fishery Statistics (CWP25) in February 2016.
c) FAO VME Practices and Processes
A workshop on VME Processes and Practices was organized by the FAO in Swakopmund, Namibia, 2 – 4 March 2015. Participants were drawn from the FAO, NEAFC, NAFO, SEAFO, SPRFMO, GCFM, SPC, SPRFMO and SIODFA. NAFO was represented by the SC Coordinator, Neil Campbell.
To facilitate understanding of the work that has been done globally in RFMOs, enable the sharing of experience among the regions and assist with the upcoming UNGA review on bottom fisheries in 2016 (UNGA Res. 66/68, para. 137), FAO is compiling a publication entitled VME Processes and Practices in ABNJ detailing the development of the assessment and management of VMEs in each region to date. This will form a sister volume to the Worldwide Review of Bottom Fisheries in the High Seas that was published by FAO in 2009. FAO also plans to update the latter publication using information covering the period 2007-2013.
The objectives of the workshop were: To present and discuss draft regional chapters on the VME process and practices, To outline revisions required for each chapter, and, To agree on a plan of work for completing the drafts and a deadline for publishing the document.
A draft of each chapter had been prepared by the FAO prior to the meeting, which was passed to the Secretariat and/or representative of the participating RFMOs to review, provide references and return to the FAO.
XI. REVIEW OF SCIENTIFIC COUNCIL WORKING PROCEDURES/PROTOCOL
1. General Plan of Work for September 2015 Annual Meeting
No new issues were raised that will affect the regular work plan for the September meeting.
2. Other matters
Issues surrounding the timing of STACFEN were raised. It was felt that the current scheduling of the standing committee on the first Monday of the Scientific Council meeting delayed the start of STACFIS. It was noted that the merging of STACFEN and WG-ESA has been discussed. Pending any decision on this, it was proposed
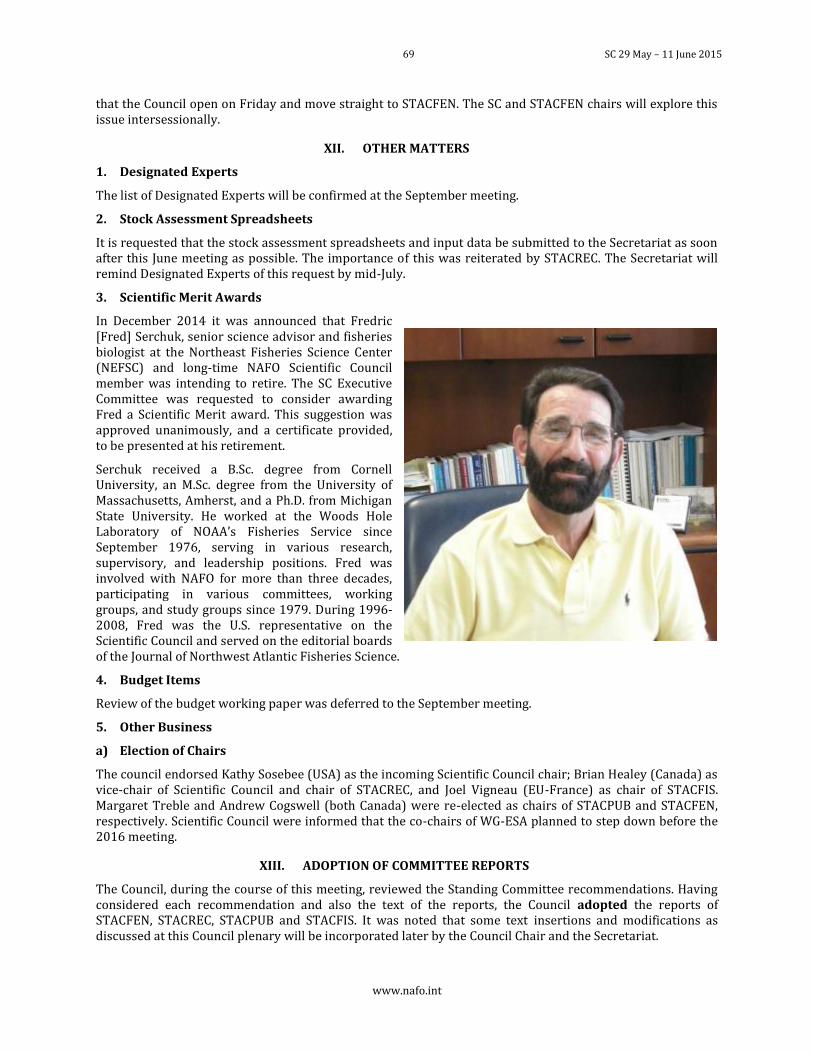
69 SC 29 May – 11 June 2015
www.nafo.int
that the Council open on Friday and move straight to STACFEN. The SC and STACFEN chairs will explore this issue intersessionally.
XII. OTHER MATTERS
1. Designated Experts
The list of Designated Experts will be confirmed at the September meeting.
2. Stock Assessment Spreadsheets
It is requested that the stock assessment spreadsheets and input data be submitted to the Secretariat as soon after this June meeting as possible. The importance of this was reiterated by STACREC. The Secretariat will remind Designated Experts of this request by mid-July.
3. Scientific Merit Awards
In December 2014 it was announced that Fredric [Fred] Serchuk, senior science advisor and fisheries biologist at the Northeast Fisheries Science Center (NEFSC) and long-time NAFO Scientific Council member was intending to retire. The SC Executive Committee was requested to consider awarding Fred a Scientific Merit award. This suggestion was approved unanimously, and a certificate provided, to be presented at his retirement.
Serchuk received a B.Sc. degree from Cornell University, an M.Sc. degree from the University of Massachusetts, Amherst, and a Ph.D. from Michigan State University. He worked at the Woods Hole Laboratory of NOAA’s Fisheries Service since September 1976, serving in various research, supervisory, and leadership positions. Fred was involved with NAFO for more than three decades, participating in various committees, working groups, and study groups since 1979. During 1996-2008, Fred was the U.S. representative on the Scientific Council and served on the editorial boards of the Journal of Northwest Atlantic Fisheries Science.
4. Budget Items
Review of the budget working paper was deferred to the September meeting.
5. Other Business
a) Election of Chairs
The council endorsed Kathy Sosebee (USA) as the incoming Scientific Council chair; Brian Healey (Canada) as vice-chair of Scientific Council and chair of STACREC, and Joel Vigneau (EU-France) as chair of STACFIS. Margaret Treble and Andrew Cogswell (both Canada) were re-elected as chairs of STACPUB and STACFEN, respectively. Scientific Council were informed that the co-chairs of WG-ESA planned to step down before the 2016 meeting.
XIII. ADOPTION OF COMMITTEE REPORTS
The Council, during the course of this meeting, reviewed the Standing Committee recommendations. Having considered each recommendation and also the text of the reports, the Council adopted the reports of STACFEN, STACREC, STACPUB and STACFIS. It was noted that some text insertions and modifications as discussed at this Council plenary will be incorporated later by the Council Chair and the Secretariat.
SC 29 May – 11 June 2015 70
www.nafo.int
XIV. SCIENTIFIC COUNCIL RECOMMENDATIONS TO GENERAL COUNCIL AND FISHERIES COMMISSION
The Council Chair undertook to address the recommendations from this meeting and to submit relevant ones to the General Council and Fisheries Commission.
Specifically, Scientific Council discussed the recommendations of the joint Fisheries Commission – Scientific Council Working Groups Catch Reporting and on Risk-Based Management Strategies to provide feedback in order that these groups can continue to develop their work.
From the Working Group on Catch Reporting (FC-SC Doc. 15/01).
The Working Group recommends:
1. that SC and FC give consideration to the establishment of the Catch Data Advisory Group and adopt its Terms of Reference (Annex 3);
3. that SC and FC or an appropriate subsidiary body review the utility of data collection more generally, noting that some newer data sets provide more reliable and/ or timely information, making others redundant.
The Scientific Council responded:
The Council endorses the establishment of the Catch Data Advisory Group and its Terms of Reference,
From the Working Group on Risk Based Management Strategies (FC-SC Doc. 15/02).
The Working Group recommends:
1. Scientific Council convenes a technical working group which could explore the revision of the precautionary approach.
Scientific Council discussed the need for a revision to the PA framework and agreed in principle that the framework should be developed to incorporate more recent thinking on precautionary reference points. A core group was nominated to begin a discussion on terms of reference. Feedback on this issue will be sought from Fisheries Commission in September.
3. Scientific Council to give a high priority to development of reference points for all stocks which lack them.
The table presented in 2014 was updated in light of the most recent assessment, details of current work provided and timelines for future work.
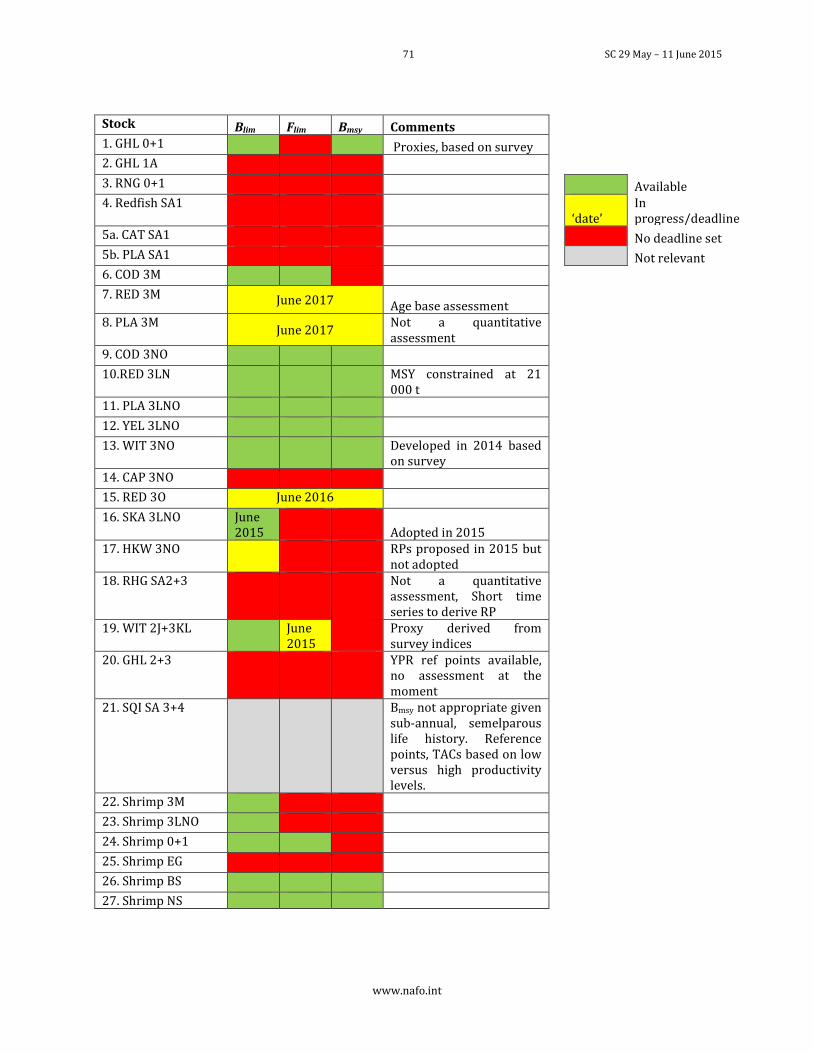
71 SC 29 May – 11 June 2015
www.nafo.int
Stock Blim Flim Bmsy Comments 1. GHL 0+1 Proxies, based on survey 2. GHL 1A 3. RNG 0+1
Available 4. Redfish SA1
‘date’ In progress/deadline
5a. CAT SA1
No deadline set 5b. PLA SA1
Not relevant
6. COD 3M 7. RED 3M June 2017 Age base assessment 8. PLA 3M
June 2017 Not a quantitative assessment
9. COD 3NO 10.RED 3LN
MSY constrained at 21 000 t
11. PLA 3LNO 12. YEL 3LNO 13. WIT 3NO Developed in 2014 based
on survey 14. CAP 3NO 15. RED 3O June 2016 16. SKA 3LNO June
2015
Adopted in 2015 17. HKW 3NO RPs proposed in 2015 but
not adopted 18. RHG SA2+3 Not a quantitative
assessment, Short time series to derive RP
19. WIT 2J+3KL June 2015
Proxy derived from survey indices
20. GHL 2+3 YPR ref points available, no assessment at the moment
21. SQI SA 3+4 Bmsy not appropriate given sub-annual, semelparous life history. Reference points, TACs based on low versus high productivity levels.
22. Shrimp 3M 23. Shrimp 3LNO 24. Shrimp 0+1 25. Shrimp EG 26. Shrimp BS 27. Shrimp NS
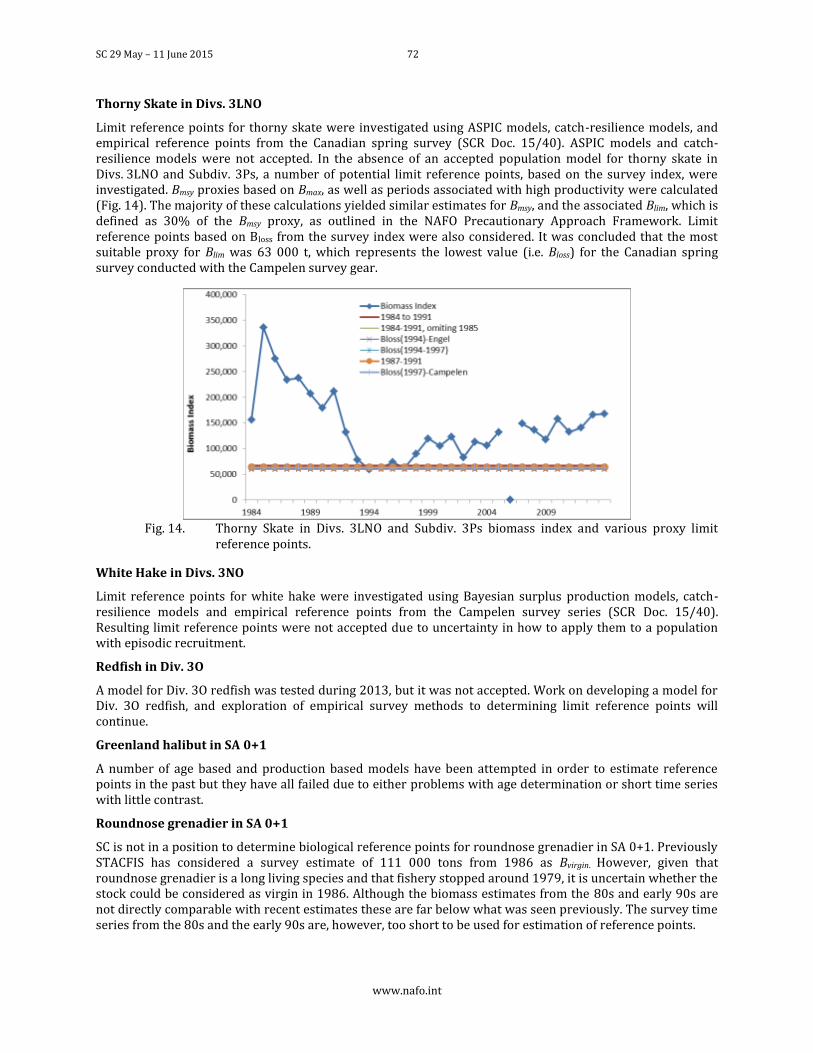
SC 29 May – 11 June 2015 72
www.nafo.int
Thorny Skate in Divs. 3LNO
Limit reference points for thorny skate were investigated using ASPIC models, catch-resilience models, and empirical reference points from the Canadian spring survey (SCR Doc. 15/40). ASPIC models and catch-resilience models were not accepted. In the absence of an accepted population model for thorny skate in Divs. 3LNO and Subdiv. 3Ps, a number of potential limit reference points, based on the survey index, were investigated. Bmsy proxies based on Bmax, as well as periods associated with high productivity were calculated (Fig. 14). The majority of these calculations yielded similar estimates for Bmsy, and the associated Blim, which is defined as 30% of the Bmsy proxy, as outlined in the NAFO Precautionary Approach Framework. Limit reference points based on Bloss from the survey index were also considered. It was concluded that the most suitable proxy for Blim was 63 000 t, which represents the lowest value (i.e. Bloss) for the Canadian spring survey conducted with the Campelen survey gear.
Fig. 14. Thorny Skate in Divs. 3LNO and Subdiv. 3Ps biomass index and various proxy limit
reference points.
White Hake in Divs. 3NO
Limit reference points for white hake were investigated using Bayesian surplus production models, catch-resilience models and empirical reference points from the Campelen survey series (SCR Doc. 15/40). Resulting limit reference points were not accepted due to uncertainty in how to apply them to a population with episodic recruitment.
Redfish in Div. 3O
A model for Div. 3O redfish was tested during 2013, but it was not accepted. Work on developing a model for Div. 3O redfish, and exploration of empirical survey methods to determining limit reference points will continue.
Greenland halibut in SA 0+1
A number of age based and production based models have been attempted in order to estimate reference points in the past but they have all failed due to either problems with age determination or short time series with little contrast.
Roundnose grenadier in SA 0+1
SC is not in a position to determine biological reference points for roundnose grenadier in SA 0+1. Previously STACFIS has considered a survey estimate of 111 000 tons from 1986 as Bvirgin. However, given that roundnose grenadier is a long living species and that fishery stopped around 1979, it is uncertain whether the stock could be considered as virgin in 1986. Although the biomass estimates from the 80s and early 90s are not directly comparable with recent estimates these are far below what was seen previously. The survey time series from the 80s and the early 90s are, however, too short to be used for estimation of reference points.
73 SC 29 May – 11 June 2015
www.nafo.int
Greenland halibut in SA2 + Divs. 3KLMNO
There was an attempt to set reference points for Greenland halibut in SA 2+ Divs. 3KLMNO using Fmax as a proxy for Fmsy, however, this was not accepted at the time because of the stock history relative to Fmax. There have been no attempts at development of Blim for this stock. At present, the lack of an agreed catch and subsequently, an assessment, prevents further development of reference points.
Redfish in Div. 3M
Limit reference points can be derived from available YPR analysis, however recent changes in natural mortality and the uncertainty of its level in the long term prevent the use of such analysis to establish LRP's for this stock.
Roughead grenadier in SA2+3
The main reason for the lack of approved limit reference points for this stock is the absence of an approved quantitative assessment, and the available survey series are relatively short for such a long live species.
1) 4. Scientific Council perform a review of the Div. 3M cod MSE.
The working group recommends Scientific Council discuss the following HCR options for Div. 3M cod:
Starting points
Fstatus quo
40% reduction [SC interpreted this as “…in catches, for 2015”]
An HCR which meets management objectives 1 and 2 within five years, and within ten years, with:
risk calculated for each year in the time series
risk calculated for the end of the periods (final year)
risk averaged over the periods
Scientific Council responded:
SC is not in the position to recommend any of the HCRs tested for the Div. 3M cod because the HCRs tested do not meet the established management objectives. SC reviewed the MSE procedure and noted that it is necessary to better document how the uncertainty enters into the model and proposed some improvements to the estimation of risk in the Performance Statistics (PS) and to introduce uncertainty for the biological parameters. SC recommends some changes for the starting points, time periods, levels of F target and number of scenarios to be tested in the continuing work on the Div. 3M cod MSE.
SC reviewed the 3M Cod MSE results and concluded that differences in the results come mainly from the assumed stock recruitment relationship and, to a much lesser extent, the assumed natural mortality (M) and the different Ftarget levels tested. The impact on the results of the assumed variability of the biological parameters for the projection period could be important. None of the tested HCR reached the established performance objectives in the 2016-2020 period but most of the scenarios met the performance objectives at the end of the 2021-2025 period. The main reasons for not achieving these objectives are the high initial F and catch levels combined with the 20% catch constraint. The results show that for both HCR it is very difficult to achieve the approved risk levels for different management objectives while maintaining stability in catches (catch constraint).
Following the recommendations of the FC-SC WG on Risk-Based Management Strategies (RBMS), SC performed a review of the Div. 3M cod MSE and recommended that it is necessary better document how the uncertainties enters into the model and proposed some improvements to estimate the risk of the Performance Statistics and the introduction of uncertainty in the biological parameters for future runs. SC proposed to estimate the “real” limits and targets for the different OMs based on the suggested Stock/Recruitment relationships to measure the risk to be below the true simulated Blim and Flim. SC also proposed including in the analysis the annual variability in the mean weights at age.
SC 29 May – 11 June 2015 74
www.nafo.int
SC endorsed the FC SC RBMS WG recommendations to test different starting points levels as well as measures the management objectives 1 and 2 in a five and ten years periods with three different PS: by year, at the end of the periods and the mean of the periods.
Scientific Council recommends that the SC-FC WG-RBMS continue the MSE evaluation of HCRs for Div. 3M cod, incorporating the following:
1. Remove the 20% TAC constraint from the HCR and measure the TAC stability as a Performance Statistic.
2. To use the last approved assessment and management measures as starting point and make the projections for ten years.
3. Remove the Natural Mortality variable OM from the Div. 3M Cod MSE analyses based on the small impact of this OM in the final results compare with the fixed Natural Mortality OM.
4. To test only two Ftarget levels in the Model Based HCR (probabilities of 20% and 40% of exceeding Fmsy) based on the NAFO PA framework, taking into account the small differences in F for the different probability levels of exceeding Fmsy, to reduce the number of the scenarios to be tested to about a third.
From the Working Group on Risk-Based Management Strategies in 2014 (FC-SC Doc. 14/02).
5. The WG recommends SC comment on likely by-catch levels associated with the implementation of the proposed HCR for 3LN Redfish (Annex 7).
A preliminary working paper was reviewed and further analysis will be carried out in advance of the September meeting. All countries involved in the fishery were encouraged to attempt complimentary analysis of their bycatches.
XV. ADOPTION OF SCIENTIFIC COUNCIL REPORT
At its concluding session on 11 June 2015, the Council considered the draft report of this meeting, and adopted the report with the understanding that the Chair and the Secretariat will incorporate later the text insertions related to plenary sessions of 29 May-11 June 2015 and other modifications as discussed at plenary.
XVI. ADJOURNMENT
The Chair thanked the participants for their hard work and cooperation, noting particularly the efforts of the Designated Experts and the Standing Committee Chairs. The Chair thanked the Secretariat for their valuable support and St Mary’s University for the excellent facilities. There being no other business the meeting was adjourned at 1400 hours on 11 June 2015.
75 STACFEN 29 May – 11 June 2015
www.nafo.int
APPENDIX I. REPORT OF THE STANDING COMMITTEE ON FISHERIES ENVIRONMENT (STACFEN)
Chair: Andrew Cogswell Rapporteur: Gary Maillet
The Committee met at the Sobey School of Business (Unilever Lounge), Saint Mary's University, 903 Robie St., Halifax, NS, Canada, on June 1st, 2015, to consider environment-related topics and report on various matters referred to it by the Scientific Council. Representatives attended from Canada, Denmark (in respect of Greenland), Greenland, European Union (Germany (via WebEx), Portugal, and Spain), Russian Federation, USA and Japan.
Highlights of Climate and Environmental Conditions in the NAFO Convention Area for 2014
a) Meteorological and ice conditions
The North Atlantic Oscillation index (NAO), a key indicator of climate conditions over the North Atlantic returned to a strongly positive phase in 2014 (anomaly of 11.5 mbars or 1.3 Standard Deviations (SD) above normal) resulting in strong arctic air outflow in the northwest Atlantic during the winter months and consequently lower than normal winter air temperatures.
The annual mean air temperature at Nuuk Weather Station in West Greenland was -0.6°C in 2014, 0.8°C above the long term mean (1981-2010).
During the winter convection season, surface air temperatures in the Labrador Sea were 1-3°C above normal but late winter was below normal.
There was a significant decrease in winter air temperatures (-0.6 to -1.0 SD below normal) over much of the NL region compared to 2013.
Annual air temperatures over Labrador (at Cartwright) were near normal and slightly above normal (0.4 SD) over Newfoundland (at St. John’s).
2014 was ranked as the 15th warmest year (air temperature) for the 115 year time series for the Scotian Shelf and Gulf of Maine. With the exception of Boston (-0.3°C and 0.4 SD) all other sites experienced warmer annual temperatures than normal, from just slightly positive in Saint John (<0.1°C and <0.1 SD) to +1.2°C (+1.7 SD) at Sable Island.
Air temperatures were cooler than average during the winter and spring (1981 – 2010) over the North-eastern United States (NEUS) continental shelf, with enhanced positive anomalies in summer and fall suggesting a larger seasonal range in 2014.
Most of the Labrador Shelf experienced above normal ice concentrations during the winter months. The northern part of the Labrador Sea experienced ice concentrations ~25% below normal in January but ~25% above normal in March.
Sea ice extent on the NL shelf increased substantially during the winter of 2014, with the first positive (higher than normal extent) anomaly observed in 16 years.
There were 1546 icebergs detected south of 48°N on the Northern Grand Bank in 2014 (1.2 SD above normal), the 6th highest count since 1900.
Ice coverage and volume on the Scotian Shelf in 2014 were slightly above the 1981 – 2010 average, unlike the preceding four years which had extremely low coverage and volume.
STACFEN 29 May – 11 June 2015 76
www.nafo.int
b) Temperature and salinity conditions
The annual sea surface temperature (SST) anomalies for 2014 indicate positive anomalies in the Northwestern Atlantic around Greenland, with the highest values occurring northeast of Iceland and lowest values observed in the central area of the North Atlantic.
Irminger Sea Water (ISW - 75-200 m) at Cape Desolation station 3 was 6.27°C and 34.89, which was 0.55°C and -0.03 below the long-term mean, respectively. This continues the long term warming trend observed in ISW at Cape Desolation starting in 1983.
North Atlantic Deep Water (NADW – 2000 m) at Cape Desolation Station 3 also continues a warming trend with correspondingly more saline waters that began in the late 1990’s.
The temperature and salinity of water between 0 and 50 m depth at Fyllas Bank Station 4 (monitoring the variability of the fresh Polar Water component of the West Greenland current) was 0.74°C above and 0.22 P.S.U above the long-term mean (1981 – 2010) in the spring and 0.76°C and 0.42 above the long term mean in the fall.
During the winter convection season, the sea surface temperature anomalies in the Labrador Sea showed a mixed sea surface temperature (SST) pattern, with both negative and positive anomalies.
Triggered by winter time cooling, Labrador Sea convection in 2014 reached at least 1600 m and possibly as deep as 1800 m, significantly deeper than convective mixing observed in 2013.
Considerable seasonal variability in SST was observed at Station 27, with a strong negative anomaly during the spring and strong positive anomalies observed from June to late November.
Annual vertically averaged temperature at Station 27 off Southeastern NL was slightly below normal in 2014. This is a continuation of a trend in declining temperatures from the record high experienced in 2011 (+2.7 SD)
Station 27 bottom temperatures were 0.6 SD (-0.2°C) below normal in 2014, a continuation of a trend of declining bottom temperatures from the record high experienced in 2011 (+3.6 SD) and the lowest since 1995.
The area of the cold intermediate layer (CIL) water mass (<0°C) on the NL Shelf along standard sections during the spring, summer were above normal, the highest level since 1985 on the Ground Bank during the spring and the highest since 1991 off eastern Newfoundland during the summer. In fall, CIL area was only slightly above normal on the Grand Bank and approximately normal along the Bonavista and Southeast Grand Bank sections.
Spring bottom temperatures in NAFO Div. 3P were ~1 SD above normal in 2014, similar to 2013 but less than the maximum experienced in 2012. Divs. 3LNO bottom temperatures were slightly below normal in 2014 (-0.1 SD), a continuation of a decline in bottom temperatures beginning after a high in 2011 (1.9 SD).
Autumn bottom temperatures in 2J and 3K were slightly above normal by 0.7 and 0.3 SD in 2014. This is a continuation of a decline in bottom temperatures beginning after a high of 2.0 and 2.7 SD in 2011. The 2014 value for bottom temperature for 3LNO was not available.
A composite climate index derived from 28 meteorological, ice and ocean temperature and salinity time series for the NL region show a declining trend since the peak in 2010. 2014 represents the 11th lowest composite climate index for the NL region in the last 65 years and the lowest since 1994.
During 2014, temperatures along the Flemish Cap section were mostly below normal during all seasons but particularly during spring when upper layer values reached 1-2°C below normal. These anomalies penetrated to the bottom over the Cap with a striking cold anomaly persisting at depth over the Cap during the fall.
A well-defined cold-intermediate layer (CIL) with a temperature < 3°C over the Flemish Cap was evident in the summer and fall of 2014.
SST annual anomalies on the Scotian Shelf were positive during 2014, ranging from 0.5°C (+0.4 SD) in Cabot Strait to +1.8°C (+1.5 SD) on the Western Bank. This is a continuation of increasing temperature trends over the length of the records over the entire Scotian Shelf.
The 2014 annual temperature anomaly at Prince 5 (0-90 m) was +0.7°C (+1.4 SD) and the salinity anomaly was +0.1 (+0.4 SD), slightly warmer and less saline than 2013. The partial
77 STACFEN 29 May – 11 June 2015
www.nafo.int
density at Prince 5 continues to trend downwards in response to increasing water temperatures (1924 – present).
The CIL volume on the Scotian Shelf in 2014 was 3300 km3, 1.9 SD less than the 1981 – 2010 mean. This was almost as small as the minimum value seen in 2012, the smallest volume in the 41 years of surveys.
The climate index, a composite of 18 selected, normalized time series on the Scotian Shelf, averaged +1.6 SD, making 2014 the second warmest year in the last 45 years.
Relative to historical values, regional ocean temperatures across the NEUS shelf were uniformly warmer and saltier during 2014. Of the seasons sampled, warming was most pronounced during late-summer/early-fall, with regional temperature anomalies reaching nearly 2°C all the way to the bottom. The large regional salinity anomalies observed in the Middle Atlantic Bight are reflective of a large swath of positive anomalies extending from the shelf edge toward shore between Cape Cod, MA and Cape Hatteras, NC.
Extreme temperature and salinity anomalies observed over the NEUS during summer and fall of 2014 were likely caused by a procession of Gulf Stream warm core rings, whose interaction with the topography at the shelf break drove an incursion of Gulf Stream water onto the inner shelf between spring and fall of 2014.
Winter mixed layers along the NEUS shelf during 2014 were four times as deep and 2°C colder than those observed in 2012.
STACFEN 29 May – 11 June 2015 78
www.nafo.int
c) Biological and chemical conditions
pH in the central part of the Labrador Basin continues to show a sustained rate of decline (0.0032/year) since 1996 in the newly ventilated water masses of the central part of the Labrador Basin (150 – 500 m).
Silicate concentrations in the newly ventilated layer of the central Labrador Basin (150 – 500 m) continue to decrease since 1991 (0.07 µmol kg-1 y-1), following the same trend as has been observed over the rest of the North-western Atlantic.
Winter conditions and deep convection in the Labrador Sea delayed the phytoplankton bloom by almost a month with cascading effects on the lower trophic levels, thus delaying and supressing the production of Calanus finmarchicus and other mezooplankton taxa, with all taxa exhibiting lower abundance than normal.
Continuing a trend beginning in 2008, deeper nitrate inventories (>50 m) remain below average over the northern transects (Grand Bank and Labrador/NL shelf), approaching 4- 5 SD below normal in 2014.
The chlorophyll a inventories inferred from the seasonal AZMP oceanographic surveys and fixed stations were variable throughout the Subareas in 2014 with below normal conditions over the northern transects (2J to 3LNO), generally above average in the Gulf of St. Lawrence, and near-normal throughout the Scotian Shelf.
The magnitude (integral of chla biomass) and amplitude (peak intensity) of the spring bloom inferred from remote sensing was typically below normal across most of the northwest Atlantic in 2014 with 18/19 of 24 sub-regions showing negative anomalies respectively.
The initiation and duration of the spring bloom was later on average and limited in 2014 with predominately positive (delayed) and negative (reduced) anomalies.
The zooplankton abundance anomalies for a dominant small grazing copepod were generally positive over much of the survey transects and fixed stations in 2014 with the highest abundance levels observed over the Grand Bank (3LM) and Gulf of St. Lawrence.
In contrast, the abundance for a dominant large grazing copepod was lower throughout the Subareas with the largest decline observed over the eastern Scotian Shelf.
In general, the total number of copepod taxa increased from 2013 levels but, approached nearly 4 standard deviation units above normal at the fixed sampling station in the Gulf of St. Lawrence in 2014.
The non-copepod taxa, characterized by carnivorous zooplankton, gelatinous invertebrates, and meroplankton, have increased substantially in recent years throughout the northeast Newfoundland Shelf and eastern Gulf of St. Lawrence, in some cases approaching 5-20 SD above normal.
79 STACFEN 29 May – 11 June 2015
www.nafo.int
1. Opening
The Chair opened the meeting by welcoming participants to this June 2015 Meeting of STACFEN.
The Committee adopted the agenda and discussed the work plan and noted the following documents would be reviewed: SCR Docs. 15/01, 02, 04, 05, 10, 11, 12, 13, 14, 15, 24, 25.
2. Appointment of Rapporteur
Gary Maillet (Canada) was appointed rapporteur.
3. Adoption of the Agenda
The provisional agenda was adopted with no further modifications.
4. Review of Recommendations in 2014
STACFEN recommended Secretariat support for one invited speaker to address emerging environmental issues and concerns for the NAFO Convention Area during the Annual June Meeting.
STATUS: An invited speaker was supported in 2015, discussing the incorporation of environmental variability in a fishery stock assessment. As well, there were 3 interdisciplinary presentations: the first by Dr. Pierre Pepin on preliminary results from a study of the delineation of ocean acidification and calcium carbonate saturation state of the Atlantic zone, and the other 2 presented by Dr. Aldo Solari on environmental forcing effects on Greenland halibut dynamics and the use of radio-isotopes in otolith analysis as an identifier of life history changes.
5. Invited Speaker
The Chair introduced this year's invited speaker Dr. Jae Choi.
The following is an abstract of Dr. Choi’s presentation entitled “A case study in the incorporation of environmental variability in a fishery stock assessment: 4VWX snow crab (Chionoecetes opilio)”
There has been long-standing awareness and interest in incorporating the role of environmental and ecosystem variability to make stock assessments more precise. With increasing awareness of rapid climate (and ecosystem) change and their potential ramifications upon fishery status and viability, management discussions and decisions require guidance. The fishery stock assessment of NAFO Divs. 4VWX snow crab (Chionocetes oplio) attempts to incorporate this information in providing stock assessment advice to fishery managers and industry. The approaches adopted in this fishery are identified and the associated costs and benefits are highlighted.
6. Oceanography and Science Data (OSD) Report for 2014 (SCR Doc. 15/14)
Since 1975, Oceanographic Services (OS) (formerly ODS, ISDM and MEDS) has been the regional environmental data centre for ICNAF and subsequently NAFO and as such is required to provide an inventory of all environmental data collected annually by contracting countries of NAFO within the convention area. A review of the OSD Report for 2014 was provided in SCR Doc. 15/14. OS is the Regional Environmental Data Center for NAFO and is required to provide an annual inventory of environmental data collected in the NAFO regulatory area to the NAFO Standing Committee on Fisheries Environment (STACFEN). In order for OSD to carry out its responsibility of reporting to the Scientific Council, the Designated National Representatives are requested to provide OSD with all marine environmental data collected in the Northwest Atlantic for the preceding years. Provision of a meaningful report to the Council for its meeting in June required the submission to OS of a completed oceanographic inventory form for data collected in 2014, and oceanographic data pertinent to the NAFO area, for all stations occupied in the year prior to 2014. The data of highest priority are those from the standard sections and stations. Inventories and maps of physical oceanographic observations such as ocean profiles, surface thermosalinographs, drifting buoys, currents, waves, tides and water level measurements for the calendar year 2014 are included. This report also provides an update on other OS activities during 2014. Data that have been formatted and archived at OS are available to all NAFO member states upon request. Requests can be made by telephone (613) 990-6065, by e-mail to [email protected], by completing an on-line order form on the OS web site at http://www.meds-sdmm.dfo-
STACFEN 29 May – 11 June 2015 80
www.nafo.int
mpo.gc.ca/isdm-gdsi/request-commande/form-eng.asp or by writing to Oceanographic Services (OS), Fisheries and Oceans Canada, 12th Floor, 200 Kent St., Ottawa, Ont. Canada K1A 0E6.
Highlights of Oceanographic Services (OS formerly ODS, ISDM and MEDS) Report for 2014:
The following is the inventory of oceanographic data obtained by ISDM during 2014:
Data Type Platform Type Counts/Duration
Oceanographic profiles
autonomous platforms 18783* profiles from 133
platforms
ship 2271 profiles (1508 +763* real-time) from 23 ships
moored ADCP 3 sites, 290 days each
Surface/near-surface observations
ship (thermosalinograph) 11316* obs. from 2 ships
drifting buoys 368514* obs. from 161
buoys
moored buoys temp/waves 53520* obs. from 9 buoys
moored buoys temp/salt 114280* obs. from 16
buoys
fixed platforms 84591* obs. from 5
platforms
water level gauges 21 sites, average of 12
months each
*Data formatted for real-time transmission
The following were data observed prior to 2014 in NAFO Convention Area and acquired in 2014:
Data Type Platform Type Counts/Duration
Oceanographic profiles
ship 7694 profiles from 31
ships
moored ADCP 3 sites, 70 days each
Moored thermistor 210 time series at 87 sites, average of 181 days each
7. Results of Ocean Climate and Physical, Biological and Chemical Oceanographic Studies in the NAFO Convention Area
A key indicator of ocean climate conditions, the North Atlantic Oscillation (NAO) index, returned to a strongly positive phase in 2014 which contributed to strong arctic air outflow in the northwest Atlantic during the winter months and consequently lower than normal winter air temperatures at most locations. As a result, sea ice extent increased substantially during the winter of 2014, with the first positive anomaly (higher-than-normal extent) observed in 16 years on the NL Shelf.
Subareas 0 and 1. Reviews of meteorological, sea ice and hydrographic conditions in West Greenland in 2014 were presented in SCR Docs. 15/01 and 15/02.
Despite a strongly positive NAO phase in 2014, the annual mean air temperature at the Nuuk weather station was -0.6°C, 0.8°C above the long-term mean (1981-2010). The annual sea surface temperature (NOAA OI SST) anomalies for 2014 indicate positive anomalies of the SST in the Northwestern Atlantic around Greenland, with the highest values occurring northeast of Iceland and lowest values observed in the central area of the North Atlantic. The time series of June/July near-surface temperatures on Fyllas Bank (0-50 m), while lower than in 2013, were still 0.76°C higher than the long-term mean (1981-2010), and corresponding salinity values continued their positive trend (starting around 1970) and were 0.22 above the long-term mean. The temperature and salinity of the Irminger Sea Water (ISW) component of the West Greenland Current at Cape Desolation Station 3 was 5.41°C and 34.89, which was 0.76°C and 0.01 above the long-term
81 STACFEN 29 May – 11 June 2015
www.nafo.int
mean (1992-2010), respectively. Pure ISW did not appear to be present on the west coast off Greenland in June/July 2014, but diluted ISW could be followed from the Cape Farwell section (60°N) to the Sisimiut section in the north (67°N). North of the Sisimiut section, this water becomes increasingly colder and fresher with distance. By Upernavik (~73°N), the core properties of this water were 3.17°C and 34.57 for potential temperature and salinity respectively.
In October/November 2014, the hydrographic conditions of two oceanographic NAFO/ICES sections, which span across the western shelf and continental slope of Greenland near Cape Desolation and Fyllas Bank were monitored. The temperature and salinity of the ISW component of the West Greenland Current at Cape Desolation Station 3 was 6.27°C and 34.89, which was 0.55°C above and -0.03 below the long-term mean (1983-2010), respectively. The properties of the North Atlantic Deep Water in the deep boundary current west of Greenland are monitored at 2000 m depth at Cape Desolation Station 3. After slightly above-average temperature and salinity observed in 2013, the temperature increased in 2014 and was 0.17°C above the long-term mean while salinity decreased from the 2013 value but was still 0.007 above the long-term mean. The water properties between 0 and 50 m depth at Fyllas Bank Station 4 are used to monitor the variability of the fresh Polar Water component of the West Greenland current. In 2014, the temperature of this water mass was 0.74°C - 0.76°C above its long-term mean and salinity was 0.22 - 0.42 above its long-term mean.
Subareas 1 and 2. A review of physical, chemical and biological oceanographic conditions over the Labrador Sea in 2014 was presented in SCR Doc. 15/15.
The NCEP reanalysis of surface air temperature indicated above normal temperature conditions with an anomaly ranging between 1 – 3°C in the Labrador Sea during the winter period; ~ 1°C below normal for the most of Labrador Sea during spring; ~1°C above normal for the summer period; and with an anomaly of 0 – 2°C during the fall. Sea surface temperature (SST) anomalies in the Labrador Sea mostly followed the patterns observed in the air temperature except in winter when there was a mixed SST pattern, with negative and positive anomalies in the Labrador Sea, while for other seasons, positive anomalies were the dominant feature as for the air temperature. Most of the Labrador Shelf ice concentration was above normal in the winter months of 2014 (reference period: 1979-2000). But in the northern part of the Labrador Sea, the sea ice concentration was ~25% below normal in January, and interestingly, the same region had ~25% above the normal ice concentration in March. Wintertime convection in 2014 reached 1800 m, which is significantly deeper than the 1000 m seen in the previous year. The deeper part of the intermediate layer (1800-2500 m) of the central Labrador Sea has been gradually warming since the mid-1990s. DIC and pH are following their usual inverted pattern yielding a sustained decline rate in pH of 0.0032 per year since 1996. Silicate concentration in the newly ventilated layer is also decreasing, following the same trend as has been observed in the rest of the North-western Atlantic. Winter conditions and deep convection delayed the phytoplankton bloom by almost a month with a cascading effect on the lower trophic levels thus delaying production by Calanus finmarchicus and most of the mezooplankton taxa with all taxa exhibiting lower abundance than normal. In May, the C. finmarchicus community was still exhibiting the characteristic of a population slowly emerging from their overwintering condition.
Subareas 2 and 3. A description of environmental information collected in the Newfoundland and Labrador (NL) Region during 2014 was presented in SCR Doc. 15/11 and SCS Doc. 15-08.
The North Atlantic Oscillation index, a key indicator of climate conditions on the Newfoundland and Labrador Shelf, returned to a strong positive phase in 2014 at 1.3 SD above normal. This resulted in increased Arctic air outflow during the winter (over the previous year) causing a significant decrease in winter air temperatures (-0.6 to -1.0 SD below normal) over much of the NL region. As a result, the sea ice extent on the NL Shelf returned to slightly above normal conditions (0.4 SD during winter), the first positive anomaly in 16 years. As well, 1546 icebergs were detected south of 48oN on the Northern Grand Bank, compared to only 13 in 2013, 1.2 SD above the 1981-2010 mean of 767. Despite overall regional cooling in 2014, annual air temperatures were near normal over Labrador (at Cartwright) and slightly above normal by 0.4 SD over Newfoundland (at St. John’s).
Despite cool winter condition in 2014, annual sea-surface temperatures (SST) remained above normal in most areas across the Newfoundland and Labrador Shelf; however, values have declined from record-highs observed in 2012. The annual bottom (176 m) water temperature at the inshore monitoring station (Station 27) was below normal in 2014 by -0.6 SD, a significant decrease from the record high in 2011. The cold-
STACFEN 29 May – 11 June 2015 82
www.nafo.int
intermediate layer (CIL; volume of < 0° C) in 2014 was at its highest level since 1985 on the Grand Bank during the spring and the highest since 1991 off eastern Newfoundland during the summer. Spring bottom temperatures in 3Ps remained above normal by about +0.5 SD but were slightly below normal on the Grand Banks by -0.3 SD. Fall bottom temperatures in 2J and 3K decreased from 2 and 2.7 SD above normal in 2011 to 0.7 and 0.3 above normal in 2014, respectively, a significant decrease in the past 3 years. As a result, the area of bottom habitat covered by water <2OC increased to near-normal values in 2014 during both spring and fall. A standardized climate index derived from 28 meteorological, ice and ocean temperature and salinity time series declined for the 3rd consecutive year, reaching the 11th lowest in 65 years and the lowest since 1994.
A description of physical oceanographic condition on the Flemish Cap during 2014 was presented in SCR Doc. 15/13.
Oceanographic observations from seasonal surveys in Div. 3M during 2014 are presented referenced to their long-term (1981-2010) means. An analysis of infrared satellite imagery around the Flemish Cap indicates that annual sea-surface temperatures (SST) decreased to about -0.6oC below normal in 2014, while water column temperatures decreased to -0.8oC, -0.4oC and -0.7oC below normal at 10, 50 and 100 m depth, respectively. The results from seasonal surveys along the standard Flemish Cap section show the development of a well-defined cold-intermediate layer (CIL) with T<3oC over the Cap during the summer and fall of 2014. Temperatures along the section were predominately below normal during spring, summer and fall but particularly during the spring survey when upper layer values reached between 1oC - 2oC below normal. The cold water penetrated to the bottom directly over the Cap with a cold anomaly persisting at depth over the Cap during the fall survey. The corresponding salinity cross-sections show relatively fresh upper layer shelf water with some areas <33.5, corresponding to generally fresher than normal conditions in most areas of the water column over the Cap. The spatial extent and average thickness of the CIL observed in 2014 was close to that observed during the cold period of early-mid 1990s. In 2014, bottom temperatures ranged from 2.7°C - 3°C over the centre of the Cap which was up to -0.6°C below the long-term average. Nonetheless, it appears that the below normal temperatures only impacted the bottom area over the shallow portions of the Cap during the summer but expanded deeper into the water column by late fall. In general, there was a significant decrease in bottom temperatures in 2014 compared to the previous year (by >1°C) thus reversing the decade long warm trend in the waters of the Flemish Cap.
An investigation of the biological and chemical oceanographic conditions in subareas 2 to 5 in 2014 was presented in SCR Doc. 15/10 and SCS Doc. 15-08.
Biological and chemical variables collected in 2014 from coastal high frequency monitoring stations, semi-annual oceanographic transects, and ships of opportunity ranging from the Labrador-Newfoundland and Grand Banks Shelf (Subareas 2 and 3), extending west into the Gulf of St. Lawrence (Subarea 4) and further south along the Scotian Shelf and the Bay of Fundy (Subarea 4) and into the Gulf of Maine (Subarea 5) are presented and referenced to previous information from earlier periods when available. We review the inter-annual variations in inventories of nitrate, chlorophyll a and indices of the spring bloom inferred from satellite ocean colour imagery, as well as the abundance of major functional taxa of zooplankton collected as part of the 2014 Atlantic Zone Monitoring Program (AZMP) and Continuous Plankton Recorder (CPR) Survey to 2013. In general, nitrate inventories in the upper (0-50m) water-column were near normal (within ± 0.5 standard deviation (SD) units of the 1999-2010 climatology) throughout the northwest Atlantic in 2014. The deeper (50-150m) nitrate inventories continue to remain well below normal with levels approaching 4-5 SD units lower along the northern transects, an ongoing decline that began in 2008. In contrast, deep nitrate levels have recovered from lower levels observed in 2010-2011 across the Gulf of St. Lawrence and near-normal along the Scotian Shelf in recent years (2012-2014). The chlorophyll a inventories inferred from the seasonal AZMP oceanographic surveys and fixed stations were variable throughout the Subareas, with below normal conditions over the northern transects (2J to 3LNO), generally above average in the Gulf of St. Lawrence, and near-normal throughout the Scotian Shelf. Satellite ocean colour imagery indicated lower biomass and weaker spring blooms over the NW Atlantic in 2014. The initiation and duration of the spring bloom was later on average and limited in 2014 with predominately positive (delayed) and negative (reduced) anomalies respectively. Peak timing of the spring bloom varied across the different Subarea’s with earlier production cycles in the northern regions while delayed on the Newfoundland and Scotian Shelf in 2014. The zooplankton abundance anomalies for a dominant small grazing copepod were generally positive
83 STACFEN 29 May – 11 June 2015
www.nafo.int
over many of the survey transects and fixed stations with the highest abundance levels observed over the Grand Bank (3LM) and Gulf of St. Lawrence. In contrast, the abundance for a dominant large grazing copepod was lower throughout the Subareas with the largest decline observed over the eastern Scotian Shelf in 2014. In general, the total number of copepod taxa increased from 2013 levels throughout the northwest Atlantic in 2014. The non-copepod taxa, characterized by carnivorous zooplankton, gelatinous invertebrates, and meroplankton, have increased substantially in recent years throughout the northeast Newfoundland Shelf and eastern Gulf of St. Lawrence.
Subarea 4. A description of environmental information collected on the Scotian Shelf and in the eastern Gulf of Maine and adjacent offshore areas during 2014 was presented in SCR Doc. 15/05.
A review of the 2014 physical oceanographic conditions on the Scotian Shelf and in the eastern Gulf of Maine and adjacent offshore areas indicates that above normal conditions prevailed. The climate index, a composite of 18 selected, normalized time series, averaged +1.6 standard deviations (SD), marking 2014 as the second warmest year in the last 45 years. The anomalies did not show a strong spatial variation. Bottom temperatures were above normal with anomalies for Divs. 4Vn, 4Vs, 4W, 4X of +1.2°C (+2.8 SD), +1.1°C (+1.6 SD), +2.0°C (+2.6 SD), and +1.7°C (+2.4 SD) respectively. Compared to 2012, the year where record or near record bottom temperatures were observed, bottom temperatures were different by +0.7°C, -0.2°C, +0.2°C and -0.4°C in Divs. 4Vn, 4Vs, 4W and 4X, respectively.
Subareas 5 and 6. A description of environmental information collected on the Northeast United States Continental Shelf during 2014 was presented in SCR Doc. 15/04.
The analysis utilizes hydrographic observations collected by the operational oceanography programs of NOAA Fisheries Service, Northeast Fisheries Science Center (NEFSC), which represents the most comprehensive consistently sampled ongoing environmental record within the region. Overall, 2014 was characterized by continued warming throughout the water column, an increase in the seasonal range of temperature and generally more saline conditions across the region. Deep (slope) waters entering the Gulf of Maine were warmer and saltier than average and their temperature and salinity suggest a subtropical source. Mixed layers in the western Gulf of Maine were anomalously deep during the winter of 2014, presumably a consequence of anomalously cold air temperatures that persisted over the northeastern United States during winter. The vigorous mixing led to the formation of an anomalously thick layer of cold intermediate water in the following spring. Finally, observations reveal a significant intrusion of Gulf Stream water in the Middle Atlantic Bight during late summer. The intrusion encompassed the width of the shelf, leading to profound changes in the water mass distributions. Such episodic events have the potential to cause significant changes in the ecosystem, including changes in nutrient loading on the shelf, the seasonal elimination of critical habitats such as the cold pool and shelf-slope front, disruption of seasonal migration cues, and an increase in the concentration of offshore larval fish on the shelf.
8. Interdisciplinary Studies
An important role of STACFEN, in addition to providing climate and environmental summaries for the NAFO Convention Area, is to determine the response of fish and invertebrate stocks to the changes in the physical and biological oceanographic environment. It is felt that a greater emphasis should be placed on these activities within STACFEN and the committee recommends that further studies be directed toward integration of environmental information with changes in the distribution and abundance of resource populations.
The following interdisciplinary studies were presented at the June 2015 Meeting along with relevant abstracts:
Preliminary Results of an ACCASP Funded Study of the Delineation of Ocean Acidification and Calcium Carbonate Saturation State of the Atlantic Zone. Authors: P. Pepin, K. Azetsu-Scott, M. Starr, S. Punshon and G. Maillet. Presented in SCR Doc. 15/12.
Ocean acidification, a consequence of rising anthropogenic CO2 emissions, is poised to change marine ecosystems profoundly by increasing dissolved CO2 and decreasing ocean pH, carbonate ion concentration, and calcium carbonate mineral saturation state (CaCO3) worldwide. The Northwest Atlantic is one of the most important sites for sequestering atmospheric CO2 and contains the largest inventory of anthropogenic CO2 in
STACFEN 29 May – 11 June 2015 84
www.nafo.int
the world. Waters from the Labrador Sea impact continental shelves throughout the Atlantic Zone. In the St. Lawrence Estuary, acidification is closely related to hypoxia, caused by the multi-decadal changes in water mass composition combined with in-situ respiration during the slow estuarine transport of deep waters towards the heads of the channels. The Atlantic Basin Impacts and Vulnerability Assessment identified the lack of information on the state of calcium carbonate mineral saturation and ocean acidity for the continental shelves as an important limitation in evaluating the potential risk of anticipated increase in ocean acidification to shellfish (e.g. mussels, scallops, clams) and invertebrate (e.g. crabs, shrimp, lobsters) fisheries, as well as organisms that are critical to maintaining ecosystem function (e.g. corals, sea pens, sea urchins and various zooplankton) (Shackell et al. 2014).
In this study, we aimed to establish the baseline conditions of the saturation state of seawater and pH to assess the potential of future changes on the Canadian continental shelves in the northwest Atlantic, based on a series of oceanographic surveys of the Scotian Shelf, Gulf of St. Lawrence and Newfoundland and Labrador Shelves during the fall of 2014. The in situ pHtotal ranged from 7.87 to 8.33 on the Newfoundland Shelf, 7.56 to 8.09 in the Gulf of St. Lawrence and 7.80 to 8.11 on the Scotian Shelf. On both the Newfoundland and Scotian shelves pHtotal demonstrated a general positive relationship with temperature but there was differing degrees of variability around the relationship in each region. However, the pattern of variation in pHtotal was more complex in the Gulf of St. Lawrence and the causes are still being investigated. Aragonite saturation states (Ωarg) at the bottom (5-10 m from bottom down to 1000 m in offshore areas) demonstrate a considerable degree of spatial variation, with most of the Gulf of St. Lawrence and Laurentian Channel being below saturation (Ωarg < 1) throughout most of the region. Low (Ωarg range 1-1.1) and relatively low (Ωarg range 1.1-1.2) saturation states are present in the eastern Scotian Shelf as well as on portions of the northern Grand Banks. Samples with low aragonite saturation states, either near the bottom or in the water column) tended to be associated with water masses in the cold intermediate layer and/or areas with low oxygen concentrations. Further analyses will be carried out to determine whether there are significant regional differences in carbonate chemistry that would reflect contrasting influences of freshwater input, biological production, and water mass characteristics and residence times.
References
Cooley, S.R., Doney, S.C., 2009. Anticipating Ocean Acidification’s Economic Consequences for Commercial Fisheries. Environmental Research Letters 4. 10.1088/1748-9326/4/2/024007.
Shackell, N.L., Greenan, B.J.W., Pepin, P., Chabot, D., Warburton, A. 2013. Editors. Climate Change Impact, Vulnerabilities and Opportunities Analysis of the Marine Atlantic Basin. Can. Manuscr. Rep. Fish. Aquat. Sci. 2012: xvi + 366 p.
On Greenland Halibut Dynamics: Update on Environmental Forcing. Author: A. Solari. Presented in SCR Doc. 15/24
Currently, we develop a “top down systems approach” on Greenland Halibut (WGH) dynamics in order both to understand and describe the causal mechanisms of the spatio-temporal evolution of the stock, link the off-shore and in-shore systems and propose fishing mortality ranges (Fi) adapted to life history aspects (derived from survey data and otolith biochemistry analysis), based upon variable population reference points (Ki, ri, Mi), environmental and multi-species interactions, by-catches from the shrimp fishery and estimated short term (≈ 6 years) trends thereof. Numerical, spatial and geometric system approaches for management proposals are in focus. Description of the systems are to be carried out through a matrix of GAMs (difference delayed equations) and polygon based on overlappings between densities and environmental iso-lines (aimed to managers). Sustainable harvesting strategies and conservation are the core of this line of work. There are several highlights from our results (April, 2015) which are both useful for development of models for sustainable spatio-temporal harvesting strategies: (i) Both linear and non-linear analysis showed that the GH stock has been underestimated/underexploited (during periods of higher abundances) and –what is most important- overestimated/overfished (during periods of lower abundances, when the stock is most vulnerable): this was due to the lack of analysis and an appropriate operational model, basing the assessment in series of mean values and omitting the variability in the data, lags and memories, minima and maxima (typical features for dynamical systems and population processes); (ii) Age 1 and abundance lagged 6 years (1997-2011) may be related (p<.05) to (a) the variability of the SST in the area of the early life drift (mixing layer) and (b) recruitment and the fishable stock can be estimated from age class 1 (lagged 5 years); (iii)
85 STACFEN 29 May – 11 June 2015
www.nafo.int
Abundance and CPUE were found to follow cycles at two levels of numbers and (iv) the relationships appeared to respond mainly to trends in temperature minima. A priori estimations of abundance as the inverse of the SST variation were validated for years 2012-2014, as well. Further details can be found in Solari et al. (2013, 2014, 2015).
Otolith Data Analysis: an ID to Life History Changes. Author: A. Solari. Presented in SCR Doc. 15/25 Authors: Solari, A., S. Rodríguez, R. Nygaard, S. Jeremiasen, J. Sethsen (2015).
The task is part (a sub-system) of a "top-down" system dynamics modelling (described by a non-linear GAM) on Greenland Halibut (GH) based on both variable population parameters (carrying capacity, Ki; intrinsic rate of increase, ri and natural mortality, Mi) and responses to the combined effects from both the environmental forcing and past fishing mortality. The main goal of this work is to produce a framework for both sustainability and conservation. The (laser ablation, spectrometrical) analysis of trace element series may allow for the inference of life history and environmental factors which affect the spatio-temporal evolution of the population: stepwise recruitment from age class 0-1, age at recruitment to the population, timings, feeding and habitat/depth changes and speed of growth, among others. In the first stage of this task, we attempted to estimate the age (without the need for isotope marked otoliths) and recruitment process out the series from the trace elements Magnesium (Mg, a proxy for feeding, probably biased by predation on shrimps) and Barium (Ba, a proxy for salinity) series (N=2059). To comply with both the Central Limit Theorem and conditions for statistical normality, we sampled 39 out of 144 otolith series and showed what we considered a "typical" example of an adult, large individual (a 94 cm, female, captured within the Davis Strait area at 1189 mts of depth). We worked on the raw, log transformed and standardized data. Also, we assumed that there would be (i) periodic peaks in Mg accumulation and (ii) we could infere the timing for the recruitment process, age and different life history aspects from splitting up the series using smoothers (simple regressions, cubic splines, locally weighted scatterplot smoothings (LOWESS) and B-splines) and R programming to determine maxima, minima, zero slopes, inflection points, spectrum and frequencies of processes from the multi-resolution decomposition (MRD, a wavelet analysis) of the data. By exclusion of frequencies, we could determine (D6 processes in the wavelet analysis): (i) yearly processes in Mg accumulation and age (24 years old); (ii) five discrete life history stages (2 for pre-recruits aged 0-6 and 3 for adults aged 7-12, 13-20 and 21-24 years); (iii) age-at-recruitment to the population (during the 6th year) and several migration patterns linked thereby. The knowledge acquired by this method may be translated to major improvements both in modelling, management and sustainable (short term, six years) exploitation strategies. However, there are processes and patterns of higher resolution in the signals which remain to be investigated.
While not specifically designated as an “Interdisciplinary Study” during the meeting proceedings, following the overview of the “Physical Oceanographic Conditions on the Scotian Shelf and in the eastern Gulf of Maine” Dr. Dave Hebert provided an overview of recent activities pertaining to:
The ‘Overturning in the Subpolar North Atlantic Program’ (OSNAP) within the NAFO Convention Area:
OSNAP is an international program (USA, UK, Germany, Netherlands, France, Canada and China) designed to provide a continuous record of the full-water column, trans-basin fluxes of heat, mass and freshwater in the subpolar North Atlantic. The OSNAP observing system consists of two legs: one extending from southern Labrador to the southwestern tip of Greenland across the mouth of the Labrador Sea (OSNAP West), and the second from the southeastern tip of Greenland to Scotland (OSNAP East). The observing system also includes subsurface floats (OSNAP Floats) in order to trace the pathways of overflow waters in the basin and to assess the connectivity of currents crossing the OSNAP line.
The initial deployment of the observing system was carried out in the summer of 2014. The Canadian contribution to OSNAP includes moorings on the Labrador Shelf and shelf break in the vicinity of Belle Isle Bank, which is referred to as the 53N Line. The mooring array at 53N is a joint collaboration between Germany, Canada and the USA. The Labrador Sea eastern boundary array was deployed by the USA in August 2014 in the area of Cape Farewell, Greenland. The majority of the OSNAP moorings will be recovered and redeployed in 2016 with the program presently funded through 2018.
STACFEN 29 May – 11 June 2015 86
www.nafo.int
9. An Update of the On-Line Annual Ocean Climate and Environmental Status Summary for the NAFO Convention Area
In 2003 STACFEN began production of an annual climate status report to describe environmental conditions during the previous year. This web-based annual summary for the NAFO area includes an overview that summarizes the overall general climate changes for the previous year and a regional overview that provided climate indices from each of the Subareas. The climate summary is updated by the NAFO Secretariat on an annual basis with contributions from each contracting country. Information for 2014 will be made available from Subarea 1, West Greenland , Subareas 2-3, Grand Banks and Labrador Sea / Shelf , Subareas 4-5, Scotian Shelf and Gulf of Maine , and Subareas 5-6, Georges Bank and Gulf of Maine.
10. The Formulation of Recommendations Based on Environmental Conditions
STACFEN recommends consideration of support for one invited speaker to address emerging issues and concerns for the NAFO Convention Area during the 2016 STACFEN Meeting.
STACFEN recommends that a sub-committee of STACFEN members be formed to discuss and draft a plan towards the reconfiguration and/or amalgamation of STACFEN and WGESA to be presented at the 2016 STACFEN Meeting.
STACFEN recommends that a sub-committee of STACFEN members be formed to discuss the current state of Fisheries and Oceans Canada (DFO) Oceanographic Services (formerly ISDM and MEDS) data management responsibilities to NAFO and related mechanisms for the reporting of oceanographic data by member states and the subsequent means of accessing these data. It is recommended that the findings of these discussions be tabled at the 2016 STACFEN meeting and should represent a reasonable “road map” for data providers, data users, data managers and the NAFO Secretariat, given current requirements and in respect of the current human resource limitations to manage these requirements.
11. National Representatives
Currently, the National Representatives for hydrographic data submissions are: E. Valdes (Cuba), S. Demargerie (Canada), E. Buch (Denmark), Vacant (France), F. Nast (Germany), Vacant (Japan), H. Sagen (Norway), J. Janusz (Poland), Vacant (Portugal), M. J. Garcia (Spain), L. J. Rickards (United Kingdom), and K. J. Schnebele (USA; retired; temporary USA contact P, Fratantoni). B.F. Prischepa from Russia was replaced by K.V. Drevetniak.
The Secretariat will contact the countries where there are currently no National Representatives in order to fill these positions.
12. Other Matters
It was noted that an ongoing issue carried over from previous STACFEN meetings, is the relative ability of the Standing Council to fulfil one of its mandates that “STACFEN shall: provide reviews of environmental conditions and advise the Scientific Council on the effects of the environment on fish stocks and fisheries in the Convention Area”. While there are significant hurdles (e.g., meeting timing, slightly differing mandates, etc…) there is a continued interest from NAFO SC to better integrate the activities of WGESA and STACFEN. In addition, there is also a continued interest to better utilize environmental data in single stock assessments. In response, a sub-committee was struck to manage these interests by initially drafting a “road-map” document with the ultimate goal of enhancing STACFEN’s ability to facilitate FC/SC requests, better integrate oceanographic data into single species stock assessments and reduce redundancy by working with WGESA and/or merging overlapping activities. It is proposed that the results of this sub-committee can be used to create a draft document of this group’s findings to be presented at the 2016 STACFEN meeting.
Management of NAFO Oceanographic data has become increasingly complex in recent years. With an ever increasing volume of data being submitted from automated and traditional systems to Fisheries and Oceans Canada - Oceanographic Services (OS), a corresponding decline in the financial and human resources for managing these data and a myriad of international databases for submitting/accessing similar data; there is currently a requirement to create a sub-committee to examine NAFO expectations for managing and accessing these data, the ability and willingness of DFO OS to continue to compile, manage, store and serve these data, and whether some of these efforts are duplicated by other international efforts. It is proposed that
87 STACFEN 29 May – 11 June 2015
www.nafo.int
the results of this sub-committee can be used to draft a “road map” for oceanographic data management for NAFO to be presented at the 2016 STACFEN meeting.
Finally, Dr. Dave Hebert and Eugene Colbourne were consulted concerning the partial merger of reporting on physical oceanographic conditions for the Newfoundland and Labrador Shelves (subareas 2 & 3) and the Scotian Shelf (subarea 4) in advance of the 2016 STACFEN meeting. In the short-term it was agreed that Dr. Hebert would continue to prepare the SRC document summarizing physical oceanographic conditions in subarea 4, but that the presentation of the results would be combined with those for subareas 2 and 3 on the NL shelf at the 2016 STACFEN meeting.
13. Adjournment
Upon completing the agenda, the Chair thanked the STACFEN members for their excellent contributions, the Secretariat and the rapporteur for their support and contributions. Special thanks were again given to the invited speaker Dr. Jae Choi (Bedford Institute of Oceanography, Dartmouth, NS, Canada), and contributions to the interdisciplinary session by Dr. Pierre Pepin (Northwest Atlantic Fisheries Centre, St. John’s, NL, Canada) and Dr. Aldo Solari (Greenland Institute of Natural Resources, Nuuk, Greenland).
The meeting was adjourned at 16:30 hours. on 1 June 2015.
STACPUB 29 May – 11 June 2015 88
www.nafo.int
APPENDIX II. REPORT OF THE STANDING COMMITTEE ON PUBLICATIONS (STACPUB)
Chair: Margaret Treble Rapporteur: Alexis Pacey
The Committee met at the Sobey School of Business at St. Mary’s University, 903 Robie St. Halifax, NS, Canada, on the 29 May and 11 June 2015, to consider publication-related topics and report on various matters referred to it by the Scientific Council. Representatives attended from Canada, Denmark (in respect of Greenland), European Union (France, Germany, Portugal and Spain), Norway, Russian Federation, Japan and the United States of America. The Scientific Council Coordinator was in attendance as were other members of the Secretariat staff.
1. Opening
The Chair opened the meeting at 10:00 a.m. by welcoming the participants.
2. Appointment of Rapporteur
Alexis Pacey (NAFO Secretariat) was appointed rapporteur.
3. Adoption of Agenda
The Agenda as given in the Provisional Agenda distributed prior to the meeting was adopted with the addition of items 6a) Review of JNAFS instructions for authors (manuscript preparation).
4. Review of Recommendations in 2014
STACPUB recommended that in order for authors to receive an SCR number they must submit a Title, Author and Abstract or Description of the document.
STATUS: This has been implemented.
STACPUB recommended that the Coral and Sponge Guides be updated to include the additional VME species that are listed in the CEM.
STATUS: In progress. See Review of Publications 5.vi) for an update on the VME guides.
STACPUB recommended that an excerpt from the Scientific Council meeting report that contains the advice and answers to the Fisheries Commission and coastal States requests be prepared and placed in a prominent place on the public website for easy accessibility.
STATUS: This is now available on the Science tab on the NAFO website. A direct link to Scientific Advice is found at the top of the Science webpage.
STACPUB recommended that the Secretariat work on providing direct links to key pages of the NAFO website and continue to provide easier access to documents and other information. STACPUB asked that these tasks be given a high priority by the Secretariat.
STATUS: The homepage of the NAFO website underwent some changes to improve access to documents and information. The homepage includes direct links to the main tabs of the website, a ‘What’s New’ section was added, more visual images that have direct links to key areas, and a search button is now fully functional on the Publications tab. The search function is found on the left vertical menu. It searches for NAFO and ICNAF documents only.
Preliminary planning has started within the Secretariat to replace the framesets with a content management system (CMS). Considering the scale of the project and the resources available, this initiative will take considerable time, but still remains a priority.
STACPUB recommended that the NAFO Secretariat investigate options to promote the Journal using social media.
STATUS: This has been implemented. A Facebook share link is available at the top of each article.
89 STACPUB 29 May – 11 June 2015
www.nafo.int
STACPUB recommended that the NAFO Secretariat improve the visibility of the Journal by placing a prominent link directly on the NAFO websites homepage.
STATUS: This has been implemented.
5. Review of Publications
a) Journal of Northwest Atlantic Fishery Science (JNAFS)
Volume 46, Regular issue, was printed in December 2014 and mailed out in Jan. 2014. It was 45 pages and 140 copies were made. 20 CDs were made. A total of four articles were published. This year the printed copy was saddle-stitched.
Volume 47, Regular issue, has a total of seven papers that have been submitted for publication. One has been published (online); one is in production; five remaining are in the review process.
b) NAFO Scientific Council Studies
No Scientific Council Studies were published in 2014.
c) NAFO Scientific Council Reports
The NAFO Scientific Council Reports 2014 (Redbook) volume (421 pages) was produced in January 2015. A limited number of Reports have been printed and coil-bound as per the STACPUB recommendation from 2013. (Approx. 30 copies).
d) Meeting Documentation CD
STACPUB was informed that approximately 10 copies of the Meeting Documentation CD 2014 were produced. The CD contains:
GC/FC Proceedings 13-14 GC/FC Reports Sep 14 SC Reports 2014 NAFO Convention NCEM 2015 Rules of Procedure Annual Report 2014
These reports and documents were also available on memory sticks as an alternative to a CD.
e) ASFA
Most science publications and documents have been submitted to ASFA as of May 30, 2015. This includes The Journal of the Northwest Atlantic Fisheries, SC Reports, and SC Research Documents for 2014. Any documents not yet submitted will be uploaded to ASFA once they are published online.
The NAFO Secretariat plans to co-host with Dalhousie University, Environmental Use and Influence, the ASFA Board Meeting being held in Halifax, 5-9 October, 2015.
f) VME Guides - New Coral and Sponge Guide 2015
STACPUB was informed that the SC Working Group on Ecosystem Science and Assessment (WGESA) discussed updating the existing NAFO coral and sponge identification guides (Kenchington et al. 2009, Best et al. 2010) to include the new VME indicator taxa (Murillo et al. 2011). WGESA decided that a second edition of the guide should be produced with the support of the NAFO Secretariat. The second edition should include all of the VME taxa, including the new taxa which are not in the current guides (i.e., erect bryozoans, stalked crinoids, large sea squirts and tube dwelling anemones). This would result in one book rather than 3 and would allow for updating of the corals and sponges at the same time as the new VME taxa.
The new book is currently in progress. Some discussion needs to take place to determine how the book will be sectioned. The new format will be in a poly binder with water resistant paper, as before, and there will be tabs to separate the different sections of taxa. This should be resolved soon so that production can take place
STACPUB 29 May – 11 June 2015 90
www.nafo.int
and the new book be made available for the NAFO Annual Meeting, which takes place between 21-25 September, 2015.
STACPUB recommends that the Secretariat contact WGESA for further instruction on the VME Guides in order to publish it for September 2015.
6. Other Matters
The Chair noted that Hans-Joachim Rätz resigned as Associate Editor for the Journal this past January, 2015. His field of expertise was in vertebrate fisheries. Lisa Hendrickson (USA) has agreed to join the journal’s editorial board. Her knowledge of invertebrate biology and stock assessment are a welcome addition to the editorial board.
a) Journal of the Northwest Atlantic Fisheries Organization – Instructions for authors
Our new associate editor, Lisa Hendrickson, has taken a closer look at the information in the JNAFS webpages, particularly the instructions to authors and proposed changes to that could clarify what is needed and improve functionality of the website. Lisa described some of her ideas and STACPUB supported making these changes.
STACPUB recommends that a committee (comprised of STACPUB chair, the General Editor and those Associate Editors who are available) be created to review and update the JNAFS website and that the NAFO Secretariat will implement the changes requested.
b) JNAFS Symposium Volumes
STACPUB discussed the possibility of holding another symposium. NAFO SC has not hosted a symposium for several years. They often provide a place for scientists and researchers to share information, with the added benefit of generating additional submissions to JNAFS. It was noted that this was a topic for SC to consider and that the ideas discussed during STACPUB should be compiled and presented to SC later in the meeting.
STACPUB recommends that Scientific Council consider holding another symposium and that a list of potential topics and themes would be put forward.
c) Electronic Mailing List and Communication
Some members commented that there was a need for increased communication amongst SC members in order to exchange ideas amongst colleagues and to share information in an informal manner. It was suggested that a group mailing list be created and made available to members. SharePoint could provide a possible solution by having a group distribution list and a notification alert put in place. A future blog or community forum could be created on the new NAFO website for scientists, with a link to an email distribution list. A login would be required for this.
STACPUB recommends that the NAFO Secretariat look into this matter, update their current list of SC members and create a forum for the electronic exchange of ideas that is accessible to SC members.
7. Adjournment
The Chair thanked the participants for their valuable contributions, the rapporteur for taking the minutes and the Secretariat for their support. The meeting was adjourned at 10:00 on 11 June 2015.
91 STACREC 29 May – 11 June 2015
www.nafo.int
APPENDIX III. REPORT OF THE STANDING COMMITTEE ON RESEARCH COORDINATION (STACREC)
Chair: Kathy Sosebee Rapporteur: Lisa Hendrickson
The Committee met at Sobey School of Business, Saint Mary’s University, Halifax, NS, Canada, on various occasions throughout the meeting to discuss matters pertaining to statistics and research referred to it by the Scientific Council. Representatives attended from Canada, Denmark (Faroes & Greenland), European Union (Germany, Portugal and Spain), France (in respect of St. Pierre et Miquelon), Japan, Russian Federation and United States of America. The Scientific Council Coordinator and other members of the Secretariat were in attendance.
1. Opening
The Chair opened the meeting at 1115 hours on 30 May 2015, welcomed all the participants and thanked the Secretariat for providing support for the meeting. The Committee also met on 3 June 2015 and 9 June 2015 to review unfinished agenda items. The report was reviewed and adopted on 11 June.
2. Appointment of Rapporteur
Lisa Hendrickson was appointed as rapporteur.
3. Review of Recommendations in 2014
There were no recommendations from 2014.
4. Fishery Statistics
a) Progress report on Secretariat activities in 2014/2015
i) STATLANT 21A and 21B
In accordance with Rule 4.4 of the Rules of Procedure of the Scientific Council, as amended by Scientific Council in June 2006, the deadline dates for this year’s submission of STATLANT 21A data and 21B data for the preceding year are 1 May and 31 August, respectively. The Secretariat produced a compilation of the countries that have submitted to STATLANT and made this available to the meeting (Table 4).
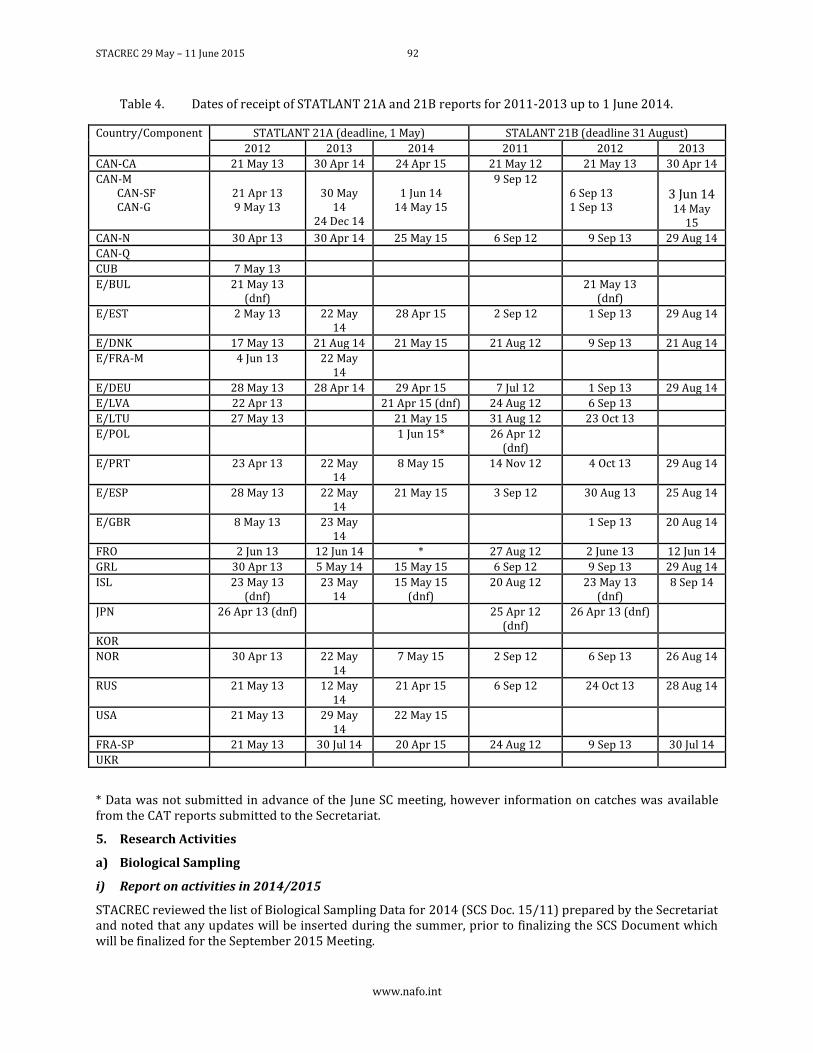
STACREC 29 May – 11 June 2015 92
www.nafo.int
Table 4. Dates of receipt of STATLANT 21A and 21B reports for 2011-2013 up to 1 June 2014.
Country/Component STATLANT 21A (deadline, 1 May) STALANT 21B (deadline 31 August)
2012 2013 2014 2011 2012 2013
CAN-CA 21 May 13 30 Apr 14 24 Apr 15 21 May 12 21 May 13 30 Apr 14
CAN-M CAN-SF CAN-G
21 Apr 13 9 May 13
30 May
14 24 Dec 14
1 Jun 14
14 May 15
9 Sep 12 6 Sep 13 1 Sep 13
3 Jun 14 14 May
15 CAN-N 30 Apr 13 30 Apr 14 25 May 15 6 Sep 12 9 Sep 13 29 Aug 14
CAN-Q
CUB 7 May 13
E/BUL 21 May 13 (dnf)
21 May 13 (dnf)
E/EST 2 May 13 22 May 14
28 Apr 15 2 Sep 12 1 Sep 13 29 Aug 14
E/DNK 17 May 13 21 Aug 14 21 May 15 21 Aug 12 9 Sep 13 21 Aug 14
E/FRA-M 4 Jun 13 22 May 14
E/DEU 28 May 13 28 Apr 14 29 Apr 15 7 Jul 12 1 Sep 13 29 Aug 14
E/LVA 22 Apr 13 21 Apr 15 (dnf) 24 Aug 12 6 Sep 13
E/LTU 27 May 13 21 May 15 31 Aug 12 23 Oct 13
E/POL 1 Jun 15* 26 Apr 12 (dnf)
E/PRT 23 Apr 13 22 May 14
8 May 15 14 Nov 12 4 Oct 13 29 Aug 14
E/ESP 28 May 13 22 May 14
21 May 15 3 Sep 12 30 Aug 13 25 Aug 14
E/GBR 8 May 13 23 May 14
1 Sep 13 20 Aug 14
FRO 2 Jun 13 12 Jun 14 * 27 Aug 12 2 June 13 12 Jun 14
GRL 30 Apr 13 5 May 14 15 May 15 6 Sep 12 9 Sep 13 29 Aug 14
ISL 23 May 13 (dnf)
23 May 14
15 May 15 (dnf)
20 Aug 12 23 May 13 (dnf)
8 Sep 14
JPN 26 Apr 13 (dnf) 25 Apr 12 (dnf)
26 Apr 13 (dnf)
KOR
NOR 30 Apr 13 22 May 14
7 May 15 2 Sep 12 6 Sep 13 26 Aug 14
RUS 21 May 13 12 May 14
21 Apr 15 6 Sep 12 24 Oct 13 28 Aug 14
USA 21 May 13 29 May 14
22 May 15
FRA-SP 21 May 13 30 Jul 14 20 Apr 15 24 Aug 12 9 Sep 13 30 Jul 14
UKR
* Data was not submitted in advance of the June SC meeting, however information on catches was available from the CAT reports submitted to the Secretariat.
5. Research Activities
a) Biological Sampling
i) Report on activities in 2014/2015
STACREC reviewed the list of Biological Sampling Data for 2014 (SCS Doc. 15/11) prepared by the Secretariat and noted that any updates will be inserted during the summer, prior to finalizing the SCS Document which will be finalized for the September 2015 Meeting.
93 STACREC 29 May – 11 June 2015
www.nafo.int
ii) Report by National Representatives on commercial sampling conducted
Canada-Newfoundland (SCS Doc. 15-08, 15-11, 14-08 plus information various SC assessment documents): Information was obtained from the various fisheries taking place in all areas from Subareas 0, 2, 3 and portions of Subarea 4. Information was included on fisheries and associated sampling for the following stocks/species: Greenland halibut (SA 0 + 1 (except Div. 1A inshore), SA 2 + Divs. 3KLMNO), Atlantic salmon (SA 2+3+4), Arctic charr (SA 2), Atlantic cod (Divs. 2GH, Divs. 2J+3KL, Divs. 3NO, Subdiv. 3Ps), American plaice (SA 2 + Div. 3K, Divs. 3LNO, Subdiv. 3Ps), witch flounder (Divs. 2J3KL, 3NO, 3Ps), yellowtail flounder (Divs. 3LNO), redfish (Subarea 2 + Divs. 3K, 3LN, 3O, 3P4V), northern shrimp (Subarea 2 + Divs. 3KLMNO), Iceland scallop (Divs. 2HJ, Divs. 3LNO, Subdiv. 3Ps, Div. 4R), sea scallop (Div. 3L, Subdiv. 3Ps), snow crab (Divs. 2J+3KLNO, Subdiv. 3Ps, Div. 4R), squid (SA 3), thorny skate (Divs. 3LNOPs), white hake (Divs. 3NOPs), lobster (SA 2+3+4), capelin (SA 2 + Divs. 3KL), and marine mammals (SA 2-4). A provisional sampling report was submitted to the Secretariat noting sampling of catches for length distribution and age for Cod, Redfish, Haddock, American plaice, Greenland halibut, Witch flounder and White Hake. These data are provisional due to data formatting and quality control issues as a result of implementing a new process for delivery of the Observer Program on April 1, 2013. This provisional status applies to and the 2014 sampling (SCS Doc. 15-11) and also the 2013 sampling (SCS Doc. 14-08). Once these data are finalized, the inventory will be updated.
Denmark/Greenland (SCS Doc. 15-10): Length frequencies were available from the Greenland trawl fishery in Div. 1A and 1D. CPUE data were available from the Greenland trawl fishery in Divs. 1AB and 1CD.
EU-Estonia (SCS Doc. 15-04): Estonia collected length frequencies for Greenland halibut in Divs. 3L and 3N, Northern shrimp in Div. 3L, redfish in Divs. 3L, 3M, 3N and 3O, cod in Div. 3M, American plaice in Div. 3M and 3N, and yellowtail flounder in Div. 3N. Samples were done on both directed species and discards.
EU-Portugal (SCS Doc. 15-006): Data on catch rates were obtained from trawl catches for redfish (Divs. 3LMNO), Greenland halibut (Divs. 3LMN), cod (Div. 3M) Thorny skate (Div. 3N), roughhead grenadier (Div. 3N) and white hake (Div. 3O). Data on length composition of the catch were obtained for Cod (Divs. 3LMNO), redfish S. mentella (Divs. 3LMNO) American plaice (Divs. 3LMNO), Greenland halibut (Divs. 3LMN), witch flounder (Divs. 3MNO), roughhead grenadier (Divs. 3LM), redfish S. marinus (Div. 3M), thorny skate (Div. 3M) and white hake (Div. 3O).
EU-Spain (SCS Doc. 15-005): A total of 12 Spanish trawlers operated in Divs. 3LMNO NAFO Regulatory Area during 2014, amounting to 1,205 days (18,271 hours) of fishing effort. Table 3 presents the Spanish effort (fishing hours) since 2003 in NAFO Regulatory Area (NRA) Subarea 3. Total catches for all species combined in Divs. 3LMNO were 14 318 t in 2014. In addition to NAFO observers (NAFO Observers Program), 8 IEO scientific observers were onboard Spanish vessels, comprising a total of 303 observed fishing days, around 25% coverage of the total Spanish effort. Besides recording catches, discards and effort, these observers carried out biological sampling of the main species taken in the catch. For Greenland halibut, roughhead grenadier, American plaice and cod this includes recording weight at length, sex-ratio, maturity stages, performing stomach contents analyses and collecting material for reproductive studies. Otoliths of these four species were also taken for age determination. In 2014, 582 length samples were taken, with 65,437 individuals of different species examined to obtain the length distributions.
Two Spanish trawlers operated in NAFO Regulatory Area, Div. 6G using a midwater trawl gear, during 2014, amounting to 15 days (117 hours) of fishing effort. The most important species in catches was the Beryx splendens. Other species present in catches were Ruvettus pretiosus. There were not available Spanish catches length distribution in Div. 6G in 2014.
Russia (SCS 15/07): Biological data on Greenland halibut from Divs. 1A and 1D were collected by observers aboard Russian fishing vessels. Biological data were collected by NAFO observers on fishing vessels for these species: Greenland halibut (Reinhardtius hippoglossoides) Divs. 3L, 3M and 3L, , Acadian redfish (Sebastes fasciatus) Div. 3N, Deep-sea redfish (Sebastes mentella)Divs. 3L, 3M, 3N, 3O, Golden redfish (Sebastes marinus) Divs. 3L and 3M, Roughhead grenadier (Macrourus berglax) Divs. 3L and 3M, Roundnose grenadier (Coryphaenoides rupestris) Div. 3L, American plaice (Hippoglossoides platessoides) Divs. 3L, 3M 3N and 3O, Witch flounder (Glyptocephalus cynoglossus) Divs. 3L, 3M, 3N and 3O, Cod (Gadus morhua)Disv. 3L, 3M, 3N, and 3O, White hake (Urophycis
STACREC 29 May – 11 June 2015 94
www.nafo.int
tenuis)Divs. 3N and 3O, Thorny skate (Amblyraja radiata) Div. 3L, Black dogfish (Centroscyllium fabricii)Subarea 3, Northern wolffish (Anarhichas denticulatus) Divs. 3L and 3M, Atlantic wolffish (Anarhichas lupus) Div. 3M, Spotted wolffish (Anarhichas minor) Div. 3M, Blue hake (Antimora rostrata) Div. 3L, Marlin-spine grenadier (Nezumia bairdii) Div. 3L, Atlantic halibut (Hippoglossus hippoglossus) Divs. 3LMN.
b) Biological Surveys
i) Review of survey activities in 2014 (by National Representatives and Designated Experts)
Canada-Newfoundland (SCR Doc. 15/22): Research survey activities carried out by Canada (N) were summarized, and stock-specific details were provided in various research documents associated with the stock assessments. The major multispecies surveys carried out by Canada in 2014 include a spring survey of Divs. 3LNO, and an autumn survey of Divs. 2HJ3KL.
The spring survey in Divs. 3LNO was conducted from late March to late June, and consisted of 254 successful tows (300 planned) covering all 84 planned strata to a maximum depth of 732m with the Campelen 1800 trawl, by the research vessel CCGS Alfred Needler. This survey continued a time series begun in 1971. The 46 set reduction was required primarily due to mechanical issues and completion of the reduced survey also required the deployment of CCGS Teleost which is not the usual vessel conducting the spring surveys. In addition, Divs. 3NO was covered about two weeks later than normal.
The autumn survey was conducted from early October and extended to January 2015 in Divs. 2HJ3KL, and consisted of 503 tows (674 planned) covering 147 of 208 planned strata to a maximum depth of 1500m in 2HJ3KL and 732m in 3NO with the Campelen 1800 trawl. The reduction was due to the unavailability of CCGS Alfred Needler because of mechanical issues, requiring the apriori elimination of Divs. 3NO and deep water strata in 2H for a total of 161 stations. The vessel CCGS Teleost conducted the Divs. 2HJ3KL survey, which continued a time series begun in 1977.
Denmark/Greenland (SCR Docs. 15/01, 03, 16, 31; SCS Doc. 15/10): The West Greenland standard oceanographic stations were surveyed in 2014 as in previous years (SCR Doc. 15/01).
A series of annual stratified-random bottom trawl surveys, mainly aimed at shrimps, initiated in 1988 was continued in 2014. The gear was changed in this survey in 2005. No correction for this gear change has been made and the 2005 - 2012 time series is hence not directly comparable with 1988-2004 time series. In July-August 211 research trawl hauls were made in the main distribution area of the West Greenland shrimp stock, including areas in Subarea 0 and the inshore areas in Disko Bay and Vaigat. The surveys also provide information on Greenland halibut, cod, demersal redfish, American plaice, Atlantic and spotted wolffish and thorny skate (SCR Doc. 15/16).
A Greenland deep sea trawl survey series for Greenland halibut was initiated in 1997. The survey is a continuing of the joint Japanese/Greenland survey carried out in the period 1987-95. In 1997-2014 the survey covered Divs. 1C and 1D between the 3 nautical mile line and the 200 nautical mile line or the midline against Canada at depths between 400 and 1 500 m. In 2013 only Div. 1D was covered by 27 hauls and the survey is and the survey is not considered reliable for estimating indices for stock status . In 2014 58 valid hauls were made (SCR Doc. 15/03).
A longline survey for Greenland halibut in the inshore areas of Disko Bay, Uummannaq and Upernavik was initiated in 1993. In 2014 the longline survey was conducted in Uummannaq (23 sets) and Upernavik (16 set). In connection to the longline survey 4 and 13 gill net were set in Uummannaq and Upernavik, respectively. Each gillnet was composed of four panels with different mesh size (46, 55, 60 and 70 mm stretch meshes) as in Disko Bay (SCR Doc. 15/31).
Since 2001 a gillnet survey has been conducted annually in the Disko Bay area. In 2014 a total of 37 gillnet settings were made along 4 transect. No gill net survey in 2009 (SCR Doc. 15/31).
EU-Spain and Portugal (SCR Doc. 15/17): The EU bottom trawl survey in Flemish Cap (Div. 3M) was carried out on board R/V Vizconde de Eza using the usual survey gear (Lofoten) from June 25th to July 23th 2014. The area surveyed was Flemish Cap Bank to depths up to 800 fathoms (1460 m) following the same procedure as in previous years. The number of hauls was 183 and two of them were nulls. Survey results including abundance indices of the main commercial species and age distributions for cod, redfish, American
95 STACREC 29 May – 11 June 2015
www.nafo.int
plaice, roughhead grenadier and Greenland halibut are presented as Scientific Council Research documents. Flemish Cap survey results for northern shrimp (Pandalus borealis) were presented in SCR Doc. 14/49. Samples for histological assessment of sexual maturity of cod, redfish, Greenland halibut and roughhead grenadier were taken. Oceanography studies continued to take place.
NEREIDA Project: New data on deep-water corals and sponges were presented based on Spanish/EU bottom trawl groundfish surveys for 2014 in order to make these data available to the NAFO WGESA and improve the mapping of sensitive species in the NAFO Regulatory area (Divs. 3LMNO).
“Significant” catches (according to the NAFO definition from groundfish surveys) of deep-water corals and sponges were provided and mapped together with the closed areas. A total number of 411 bottom trawl hauls surveys were analyzed. Distribution maps of presence and catches above threshold for RV data of sponges, large gorgonians, small gorgonians and sea pens following the thresholds were presented.
Sponges were recorded in 198 of the total tows (48% of the total Spain/UE tows analyzed). Catches above the identification threshold for RV data (≥ 75 kg/tow) were found in 8 tows. Of the total 8 tows, only 1was recorded outside of the closed areas. Large gorgonians were recorded in 4 tows (1% of the total tows analyzed). One catch above the identification threshold for RV data (> 0.6 kg/tow) was found with a weight of 34.3 kg; small gorgonians were recorded in 39 tows (9% of the total tows analyzed). No catches above the identification threshold for RV data (> 0.15 kg/tow) were recorded and finally, sea pens were recorded in 151 tows (37 % of the total tows analyzed). Catches above the identification threshold for RV data (> 1.4 kg/tow) were found in 2 tows located inside closed areas 9 and 10.
In addition, and as part of the NEREIDA project, biological samples collected using mega box-core were analyzed and processed for the extraction and identification of benthic fauna. Analysis of the extracted data revealed the presence of benthic assemblages that were indicative of Vulnerable Marine Ecosystems (VME). VME indicative assemblages were present mostly outside of the fishing footprint in the area of study. A simple habitat suitability model has been performed to ascertain areas that are likely to accommodate VME indicative assemblages. Areas with the greatest potential to accommodate VME assemblages closely correspond with areas already managed for the protection of VME, where bottom-contact fishing practices are presently excluded.
USA (SCS Doc. 15/09): The USA conducted a spring survey in 2014 covering NAFO Subareas 4, 5 and 6 aboard the FSV Henry B. Bigelow. In 2014, the spring survey did not cover a large portion of the Mid-Atlantic region and this has impacted the survey indices for summer flounder, southern red hake, Atlantic mackerel, Atlantic herring, spiny dogfish and little skate. The US conducted an autumn survey in 2014 covering NAFO Subareas 4, 5 and 6 aboard the FSV Henry B. Bigelow. All planned strata were covered. Biomass indices were presented for many stocks and abundance for the two squid stocks.
ii) Surveys planned for 2014 and early 2015
Information was presented and representatives were requested to review and update before finalization of an SCS document in September.
iii) Report on data availability for stock assessments (by Designated Experts)
Designated Experts were reminded to provide available stock assessment data from commercial fisheries and research surveys to the Secretariat. It was agreed to store the files on the meeting SharePoint under a folder entitled “DATA”.
c) Tagging Activities
STACREC recommends that the NAFO Secretariat develop a framework for communicating tagging study information to vessels from Contracting Parties and Coastal States fishing in the Convention Area (e.g., via a link to this information on the NAFO website homepage).
d) Other Research Activities
There were no other research activities presented during the STACREC meeting.
STACREC 29 May – 11 June 2015 96
www.nafo.int
6. Review of SCR and SCS Documents
USA (SCS Doc. 15-009): The report described catches and survey indices of 37 stocks of groundfish, invertebrates and elasmobranchs. It was noted that the fishery for shrimp in the Gulf of Maine was closed in 2014. Research on the environment, plankton, finfishes, marine mammals, and apex predators were described. A description of cruises to map deep sea corals in canyons off the southern edge of George Bank was given. Other studies included age and growth, food habits, and tagging studies. The number of observer trips by fishery was discussed as well as cooperative research with the industry. A description of the method for estimating catches in the observer program used both in US waters and in the NRA was given.
7. Other Matters
a) Stock Assessment Spreadsheets
Designated Experts were reminded to include their spreadsheets under the DATA tab on the SharePoint. It was agreed to at least start with the stocks that were fully assessed.
b) OBIS
Bob Branton (Dalhousie University, Canada) gave a brief overview of OBIS and requested those with historic datasets to consider submitting them. An abstract of the presentation is printed below:
The Ocean Biogeographic Information System (OBIS), originally created by the Census of Marine Life, is now part of the Intergovernmental Oceanographic Commission (IOC) of UNESCO, under its International Oceanographic Data and Information Exchange (IODE) programme. Previous OBIS Canada presentations to Northwest Atlantic Fisheries Organization (NAFO) scientists (STACFEN 2012, STACREC 2014) were generally focused on: What is OBIS?; What can NAFO do for OBIS?; What can OBIS do for NAFO?; and Data management best practices & tools. As of April, 2015, OBIS is providing unrestricted public access to five NAFO data collections (Table 4). Using one of these collections (OBISid 3460), an ArcGIS Online Map of ‘NAFO: Historical collection of annual fisheries catch statistics for cod, haddock and redfish …’ is now publicly available. In May 2015, OBIS Canada presented a poster to the Oceans Past V Conference in Tallinn Estonia, titled ‘A public Geographic Information System for historic Canadian groundfish and small pelagic tagging studies conducted west of Newfoundland in the years 1953- 1999’. By way of these recent developments we wish to generally promote ongoing OBIS Canada/NAFO cooperation and to particularly encourage contribution of any and all, past and present Northwest Atlantic groundfish and small pelagic tag releases and recaptures to the nearest Regional OBIS Node.
Table 5. NAFO data resources on OBIS as of April 2015.
Resource Name Records Species Temporal
Scope NAFO/ICNAF - Environmental Surveys - NORWESTLANT 1-3, 1963:
Fish eggs and larvae. 1642 6 1963 - 1963
NAFO/ICNAF - Environmental Surveys - NORWESTLANT 1-3, 1963: Marine mammals observations.
70 12 1963 - 1963
NAFO: Cod fisheries at Greenland: catch statistics, 1911-1995. 706 1 1911 - 1993
NAFO: Historical collection of annual fisheries catch statistics for cod, haddock and redfish in the Northwest Atlantic during the period 1893-
1959. 1951 3 1893 - 1959
NAFO: Historical collection of annual fisheries catch statistics for flatfish in the Northwest Atlantic during the period 1893-1959.
614 8 1893 - 1959
97 STACREC 29 May – 11 June 2015
www.nafo.int
c) Involvement of NAFO Scientific Council in a Horizon 2020 proposal (“AFOOD”)
Scientific Council discussed the request from the proponents of an EU H2020-BG02-2015 proposal “Predicting consequences of climate change on Aquatic FOOD production (AFOOD)”. The proposal is within the call BG2 about "Forecasting and anticipating effects of climate change on fisheries and aquaculture". The proponents request Scientific Council of NAFO to participate in an external advisory board to monitor the progress of the project, provide advice when the members of the Board find necessary, and produce short interim reports evaluating the results of the project.
AFOOD will study the impacts of climate change on both capture fisheries and aquaculture. The proposals aims to model how environmental changes and exploitation have affected production dynamics of aquatic species and communities over the past decades and use this information in the forecasting of future climate change impacts. Two of the proposed case studies involve NAFO managed stocks.
STACREC discussed the request and concluded that if successful the project could provide information that could be useful in the provision of scientific advice on NAFO managed stocks and recommended that the Scientific Council support EU H2020-BG02-2015 proposal “Predicting consequences of climate change on Aquatic FOOD production (AFOOD)” and agree to serve on the external advisory board. Ricardo Alpoim (EU-Portugal) was proposed as the SC representative on this external advisory board.
8. Adjournment
The Chair thanked the participants for their presentations to the Committee. Special thanks were extended to the rapporteur and the Scientific Council Coordinator and all other staff of the NAFO Secretariat for their invaluable assistance in preparation and distribution of documents. There being no other business the Chair adjourned the meeting at 1300 hours on 11 June 2015.
STACFIS 29 May-11 June 2015 98
www.nafo.int
APPENDIX IV. REPORT OF THE STANDING COMMITTEE ON FISHERIES SCIENCE (STACFIS)
Chair: Brian Healey Rapporteurs: Various
I. OPENING
The Committee met at the Sobey School of Business, Saint Mary’s University, Halifax, NS, Canada, from 29 May to 11 June 2015, to consider and report on matters referred to it by the Scientific Council, particularly those pertaining to the provision of scientific advice on certain fish stocks. Representatives attended from Canada, Denmark (in respect of the Faroe Islands and Greenland), the European Union (France, Portugal, Spain and the United Kingdom), Japan, Norway, the Russian Federation, and the United States of America. Various members of the Committee, notably the designated stock experts, were significant in the preparation of the report considered by the Committee.
The Chair, Brian Healey (Canada), opened the meeting by welcoming participants. The agenda was reviewed and a plan of work developed for the meeting. In accordance with the Scientific Council plan of work, designated reviewers were assigned for each stock for which an interim monitoring update was scheduled (see SC Report). The provisional agenda was adopted with minor changes.
II. GENERAL REVIEW
1. Review of Recommendations in 2014
STACFIS agreed that relevant stock-by-stock recommendations from previous years would be reviewed during the presentation of a stock assessment or noted within interim monitoring report as the case may be and the status presented in the relevant sections of the STACFIS report.
2. General Review of Catches and Fishing Activity
STACFIS conducted a general review of catches in the NAFO SA 0–4 in 2014. In contrast to most recent years, there was no ad-hoc working group convened to consider catch estimates before the meeting, as there was no indication that any new sources of data or methods for catch estimation were available. NAFO Scientific Council (STACFIS) has estimated catch for its stock assessments for many years since the 1980s when large discrepancies were observed between various sources of catch information. The goal of this exercise was to use the best information available to provide the best possible assessments and advice. STACFIS has had available estimates from different sources, but not for all fleets or from all Contracting Parties. These various sources of data have in many years led STACFIS to the conclusion that catch estimates from STATLANT have been unreliable for a number of stocks. Lack of catch estimates is hindering provision of advice for many stocks, and for other cases, the accuracy of assessment results and management advice rely on the assumption that the STATLANT data equals the annual landings, an assumption which can no longer be independently verified. STACFIS noted that the Ad hoc FC-SC Working Group on Catch Reporting (WG-CR) continues its mandate and that more detailed reporting requirements have been implemented within NAFO (e.g. catch reporting on a tow-by-tow basis introduced as of Jan 1 2015).
Key sources of other data have not been available to evaluate STATLANT data since 2011.
During the June 2015 SC meeting, the only sources of catch information for 2014 were national research reports, STATLANT 21A data and Daily Catch Records (DCR) for fleets which operated in the NRA. It was noted that STATLANT 21A data was not available for all contracting parties by the start of the meeting, therefore only data available as of 30 May was considered. Data on effort from both STATLANT 21B and the VMS reporting were also available, and considered as a means to evaluate the plausibility of trends in recent catches reported within STATLANT21. STACFIS agreed to a general procedure whereby STATLANT21A data were accepted to estimate catch where available. For those countries which had not reported STATLANT21A, the DCR were used to estimate the 2014 catches. There were two exceptions to this procedure: American Plaice in Divs. 3LNO and Greenland Halibut in SA2+Divs. 3KLNO. The 2014 assessment of American Plaice in Divs. 3LNO used an assumption of constant CPUE over 2011-2013 to estimate catch of some fleets. At that time it was noted this procedure was unlikely to be useful in future. Consideration was given to estimating 2014 catches as there was new information presented on catch and effort, but STACFIS was unable to continue using the effort method used to derive catch for 2014 without further investigation. Therefore it
99 STACFIS 29 May-11 June 2015
www.nafo.int
was agreed to consider catch estimation options for this stock during the next assessment. For Greenland Halibut, STACFIS examined trends in effort over 2010-2014 as estimated from VMS data. Considering that catch per unit effort has remained relatively high over this period, the observed declines in effort from 2010 to 2014 were not sufficient to explain the apparent decline in the catch estimated by STACFIS in 2010 relative to that reported in the STATLANT catch for 2014. Therefore STATLANT catch was not accepted as an estimate of catch on this stock in 2014. There are no estimates of catch for this stock over 2011-2014, preventing updated estimates of stock size and reevaluation of the management strategy.
Unavailability of accurate catch data also has implications on the potential to provide quantitative assessments for stocks that are currently assessed qualitatively. Several classes of population dynamics models will have poor diagnostics if the removals data are biased and are inconsistent with changes in survey trends. Consequently, estimation of population size and any resulting management options using biased catch data will be inaccurate.
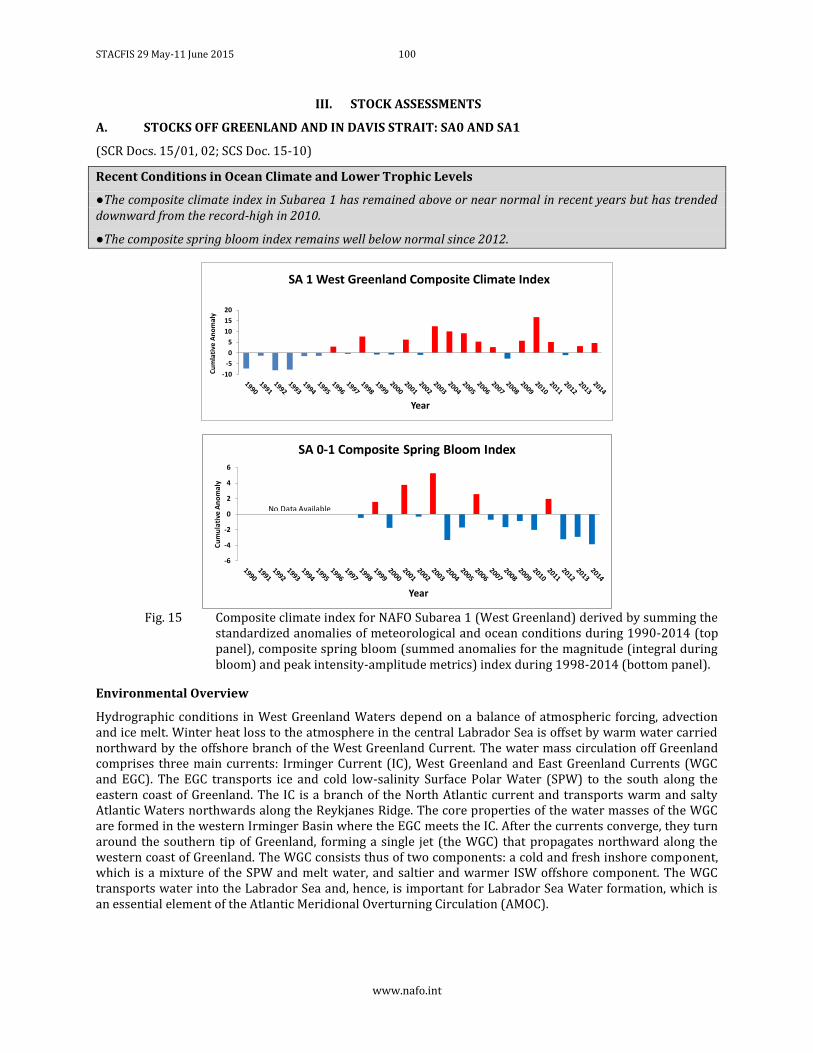
STACFIS 29 May-11 June 2015 100
www.nafo.int
III. STOCK ASSESSMENTS
A. STOCKS OFF GREENLAND AND IN DAVIS STRAIT: SA0 AND SA1
(SCR Docs. 15/01, 02; SCS Doc. 15-10)
Recent Conditions in Ocean Climate and Lower Trophic Levels
●The composite climate index in Subarea 1 has remained above or near normal in recent years but has trended downward from the record-high in 2010.
●The composite spring bloom index remains well below normal since 2012.
Fig. 15 Composite climate index for NAFO Subarea 1 (West Greenland) derived by summing the
standardized anomalies of meteorological and ocean conditions during 1990-2014 (top panel), composite spring bloom (summed anomalies for the magnitude (integral during bloom) and peak intensity-amplitude metrics) index during 1998-2014 (bottom panel).
Environmental Overview
Hydrographic conditions in West Greenland Waters depend on a balance of atmospheric forcing, advection and ice melt. Winter heat loss to the atmosphere in the central Labrador Sea is offset by warm water carried northward by the offshore branch of the West Greenland Current. The water mass circulation off Greenland comprises three main currents: Irminger Current (IC), West Greenland and East Greenland Currents (WGC and EGC). The EGC transports ice and cold low-salinity Surface Polar Water (SPW) to the south along the eastern coast of Greenland. The IC is a branch of the North Atlantic current and transports warm and salty Atlantic Waters northwards along the Reykjanes Ridge. The core properties of the water masses of the WGC are formed in the western Irminger Basin where the EGC meets the IC. After the currents converge, they turn around the southern tip of Greenland, forming a single jet (the WGC) that propagates northward along the western coast of Greenland. The WGC consists thus of two components: a cold and fresh inshore component, which is a mixture of the SPW and melt water, and saltier and warmer ISW offshore component. The WGC transports water into the Labrador Sea and, hence, is important for Labrador Sea Water formation, which is an essential element of the Atlantic Meridional Overturning Circulation (AMOC).
-10
-5
0
5
10
15
20
Cu
mla
tive
An
om
aly
Year
SA 1 West Greenland Composite Climate Index
-6
-4
-2
0
2
4
6
Cu
mu
lati
ve A
no
mal
y
Year
SA 0-1 Composite Spring Bloom Index
No Data Available
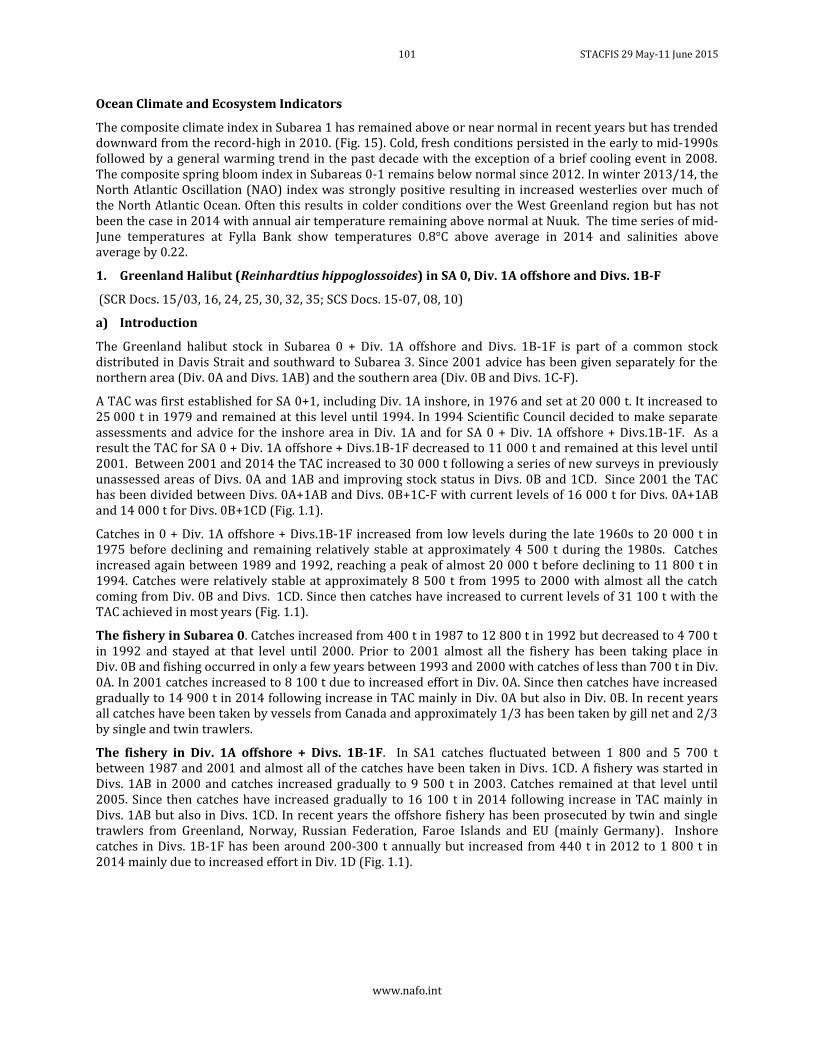
101 STACFIS 29 May-11 June 2015
www.nafo.int
Ocean Climate and Ecosystem Indicators
The composite climate index in Subarea 1 has remained above or near normal in recent years but has trended downward from the record-high in 2010. (Fig. 15). Cold, fresh conditions persisted in the early to mid-1990s followed by a general warming trend in the past decade with the exception of a brief cooling event in 2008. The composite spring bloom index in Subareas 0-1 remains below normal since 2012. In winter 2013/14, the North Atlantic Oscillation (NAO) index was strongly positive resulting in increased westerlies over much of the North Atlantic Ocean. Often this results in colder conditions over the West Greenland region but has not been the case in 2014 with annual air temperature remaining above normal at Nuuk. The time series of mid-June temperatures at Fylla Bank show temperatures 0.8°C above average in 2014 and salinities above average by 0.22.
1. Greenland Halibut (Reinhardtius hippoglossoides) in SA 0, Div. 1A offshore and Divs. 1B-F
(SCR Docs. 15/03, 16, 24, 25, 30, 32, 35; SCS Docs. 15-07, 08, 10)
a) Introduction
The Greenland halibut stock in Subarea 0 + Div. 1A offshore and Divs. 1B-1F is part of a common stock distributed in Davis Strait and southward to Subarea 3. Since 2001 advice has been given separately for the northern area (Div. 0A and Divs. 1AB) and the southern area (Div. 0B and Divs. 1C-F).
A TAC was first established for SA 0+1, including Div. 1A inshore, in 1976 and set at 20 000 t. It increased to 25 000 t in 1979 and remained at this level until 1994. In 1994 Scientific Council decided to make separate assessments and advice for the inshore area in Div. 1A and for SA 0 + Div. 1A offshore + Divs.1B-1F. As a result the TAC for SA 0 + Div. 1A offshore + Divs.1B-1F decreased to 11 000 t and remained at this level until 2001. Between 2001 and 2014 the TAC increased to 30 000 t following a series of new surveys in previously unassessed areas of Divs. 0A and 1AB and improving stock status in Divs. 0B and 1CD. Since 2001 the TAC has been divided between Divs. 0A+1AB and Divs. 0B+1C-F with current levels of 16 000 t for Divs. 0A+1AB and 14 000 t for Divs. 0B+1CD (Fig. 1.1).
Catches in 0 + Div. 1A offshore + Divs.1B-1F increased from low levels during the late 1960s to 20 000 t in 1975 before declining and remaining relatively stable at approximately 4 500 t during the 1980s. Catches increased again between 1989 and 1992, reaching a peak of almost 20 000 t before declining to 11 800 t in 1994. Catches were relatively stable at approximately 8 500 t from 1995 to 2000 with almost all the catch coming from Div. 0B and Divs. 1CD. Since then catches have increased to current levels of 31 100 t with the TAC achieved in most years (Fig. 1.1).
The fishery in Subarea 0. Catches increased from 400 t in 1987 to 12 800 t in 1992 but decreased to 4 700 t in 1992 and stayed at that level until 2000. Prior to 2001 almost all the fishery has been taking place in Div. 0B and fishing occurred in only a few years between 1993 and 2000 with catches of less than 700 t in Div. 0A. In 2001 catches increased to 8 100 t due to increased effort in Div. 0A. Since then catches have increased gradually to 14 900 t in 2014 following increase in TAC mainly in Div. 0A but also in Div. 0B. In recent years all catches have been taken by vessels from Canada and approximately 1/3 has been taken by gill net and 2/3 by single and twin trawlers.
The fishery in Div. 1A offshore + Divs. 1B-1F. In SA1 catches fluctuated between 1 800 and 5 700 t between 1987 and 2001 and almost all of the catches have been taken in Divs. 1CD. A fishery was started in Divs. 1AB in 2000 and catches increased gradually to 9 500 t in 2003. Catches remained at that level until 2005. Since then catches have increased gradually to 16 100 t in 2014 following increase in TAC mainly in Divs. 1AB but also in Divs. 1CD. In recent years the offshore fishery has been prosecuted by twin and single trawlers from Greenland, Norway, Russian Federation, Faroe Islands and EU (mainly Germany). Inshore catches in Divs. 1B-1F has been around 200-300 t annually but increased from 440 t in 2012 to 1 800 t in 2014 mainly due to increased effort in Div. 1D (Fig. 1.1).
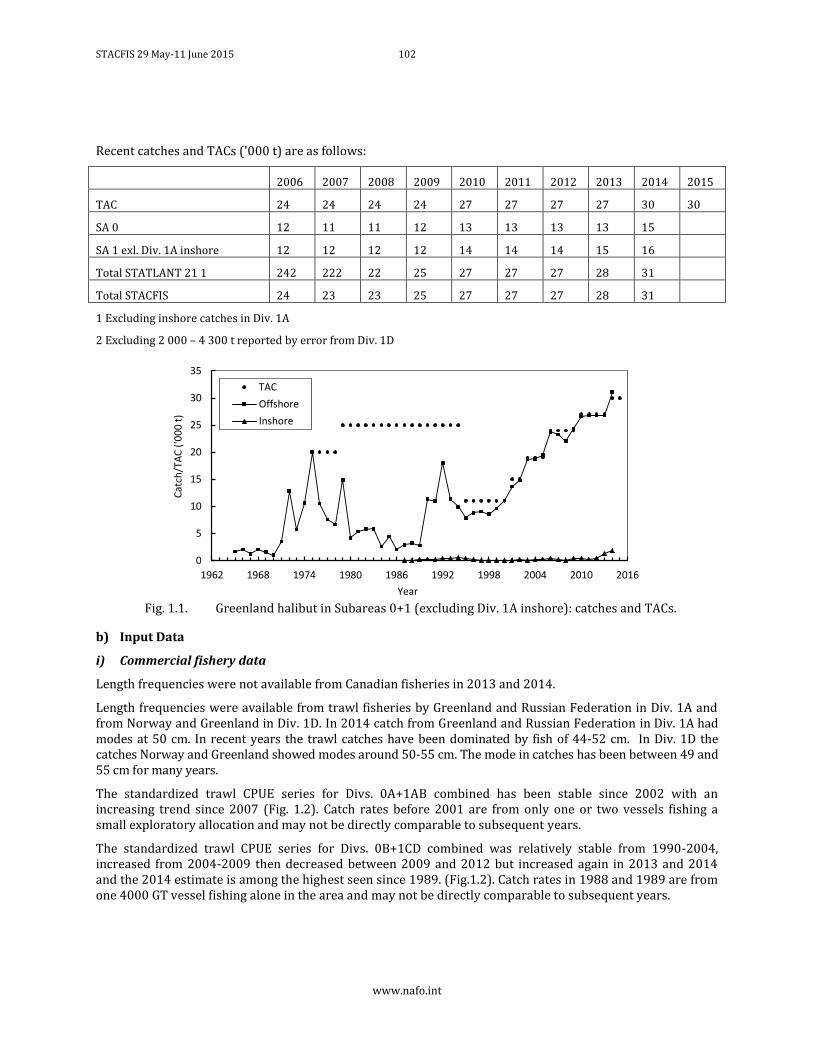
STACFIS 29 May-11 June 2015 102
www.nafo.int
Recent catches and TACs ('000 t) are as follows:
2006 2007 2008 2009 2010 2011 2012 2013 2014 2015
TAC 24 24 24 24 27 27 27 27 30 30
SA 0 12 11 11 12 13 13 13 13 15
SA 1 exl. Div. 1A inshore 12 12 12 12 14 14 14 15 16
Total STATLANT 21 1 242 222 22 25 27 27 27 28 31
Total STACFIS 24 23 23 25 27 27 27 28 31
1 Excluding inshore catches in Div. 1A
2 Excluding 2 000 – 4 300 t reported by error from Div. 1D
Fig. 1.1. Greenland halibut in Subareas 0+1 (excluding Div. 1A inshore): catches and TACs.
b) Input Data
i) Commercial fishery data
Length frequencies were not available from Canadian fisheries in 2013 and 2014.
Length frequencies were available from trawl fisheries by Greenland and Russian Federation in Div. 1A and from Norway and Greenland in Div. 1D. In 2014 catch from Greenland and Russian Federation in Div. 1A had modes at 50 cm. In recent years the trawl catches have been dominated by fish of 44-52 cm. In Div. 1D the catches Norway and Greenland showed modes around 50-55 cm. The mode in catches has been between 49 and 55 cm for many years.
The standardized trawl CPUE series for Divs. 0A+1AB combined has been stable since 2002 with an increasing trend since 2007 (Fig. 1.2). Catch rates before 2001 are from only one or two vessels fishing a small exploratory allocation and may not be directly comparable to subsequent years.
The standardized trawl CPUE series for Divs. 0B+1CD combined was relatively stable from 1990-2004, increased from 2004-2009 then decreased between 2009 and 2012 but increased again in 2013 and 2014 and the 2014 estimate is among the highest seen since 1989. (Fig.1.2). Catch rates in 1988 and 1989 are from one 4000 GT vessel fishing alone in the area and may not be directly comparable to subsequent years.
0
5
10
15
20
25
30
35
1962 1968 1974 1980 1986 1992 1998 2004 2010 2016
Cat
ch/T
AC
('0
00
t)
Year
TAC
Offshore
Inshore
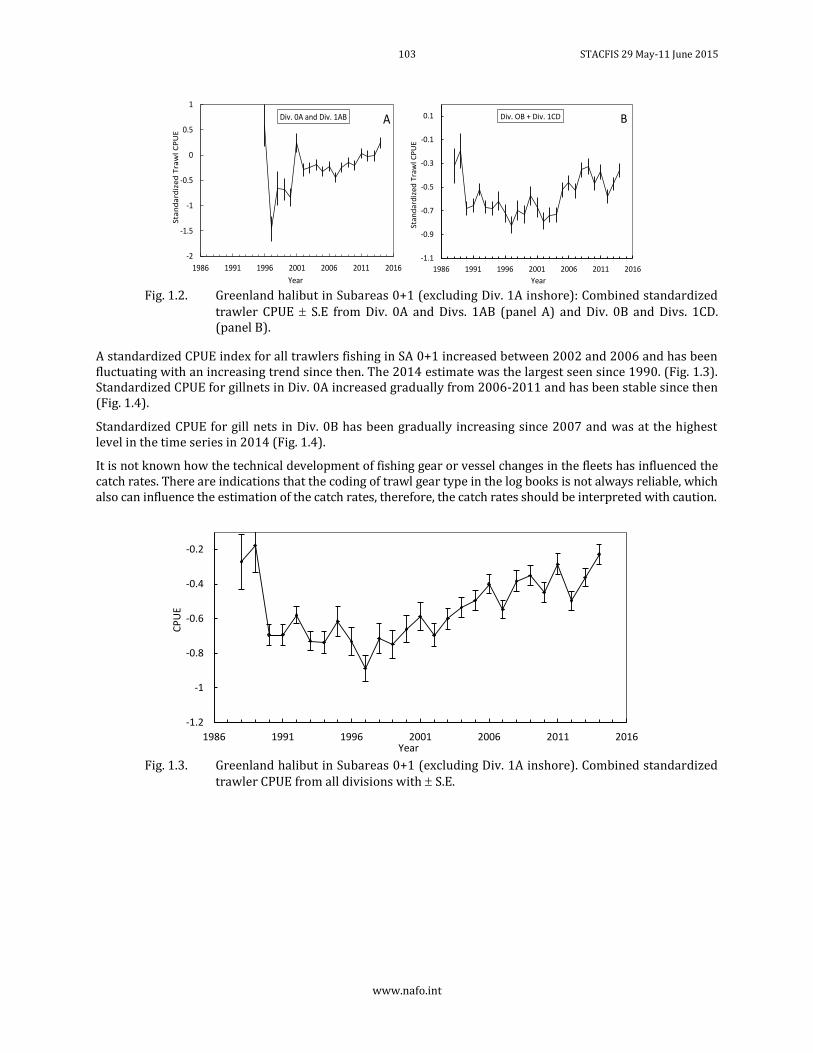
103 STACFIS 29 May-11 June 2015
www.nafo.int
Fig. 1.2. Greenland halibut in Subareas 0+1 (excluding Div. 1A inshore): Combined standardized
trawler CPUE S.E from Div. 0A and Divs. 1AB (panel A) and Div. 0B and Divs. 1CD. (panel B).
A standardized CPUE index for all trawlers fishing in SA 0+1 increased between 2002 and 2006 and has been fluctuating with an increasing trend since then. The 2014 estimate was the largest seen since 1990. (Fig. 1.3). Standardized CPUE for gillnets in Div. 0A increased gradually from 2006-2011 and has been stable since then (Fig. 1.4).
Standardized CPUE for gill nets in Div. 0B has been gradually increasing since 2007 and was at the highest level in the time series in 2014 (Fig. 1.4).
It is not known how the technical development of fishing gear or vessel changes in the fleets has influenced the catch rates. There are indications that the coding of trawl gear type in the log books is not always reliable, which also can influence the estimation of the catch rates, therefore, the catch rates should be interpreted with caution.
Fig. 1.3. Greenland halibut in Subareas 0+1 (excluding Div. 1A inshore). Combined standardized
trawler CPUE from all divisions with S.E.
-2
-1.5
-1
-0.5
0
0.5
1
1986 1991 1996 2001 2006 2011 2016
Sta
nd
ard
ize
d T
raw
l C
PU
E
Year
Div. 0A and Div. 1AB A
-1.1
-0.9
-0.7
-0.5
-0.3
-0.1
0.1
1986 1991 1996 2001 2006 2011 2016
Stan
dar
diz
ed
Tra
wl C
PU
E
Year
Div. OB + Div. 1CD B
-1.2
-1
-0.8
-0.6
-0.4
-0.2
1986 1991 1996 2001 2006 2011 2016
CP
UE
Year
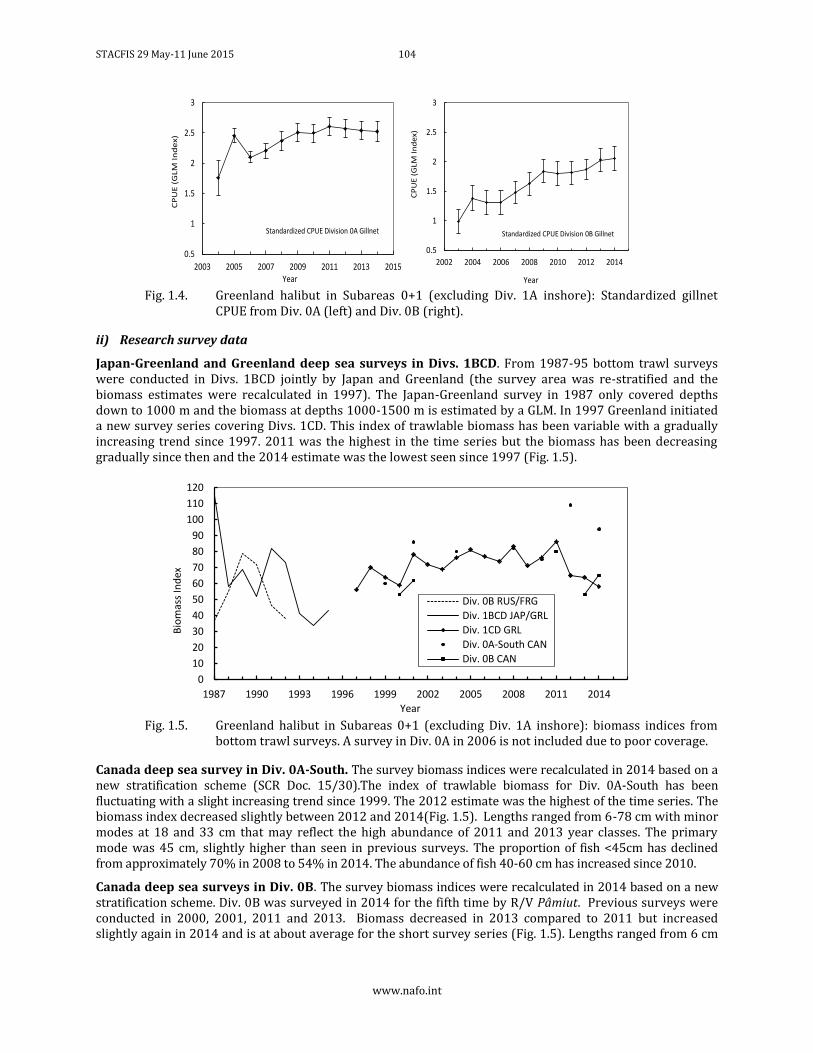
STACFIS 29 May-11 June 2015 104
www.nafo.int
Fig. 1.4. Greenland halibut in Subareas 0+1 (excluding Div. 1A inshore): Standardized gillnet
CPUE from Div. 0A (left) and Div. 0B (right).
ii) Research survey data
Japan-Greenland and Greenland deep sea surveys in Divs. 1BCD. From 1987-95 bottom trawl surveys were conducted in Divs. 1BCD jointly by Japan and Greenland (the survey area was re-stratified and the biomass estimates were recalculated in 1997). The Japan-Greenland survey in 1987 only covered depths down to 1000 m and the biomass at depths 1000-1500 m is estimated by a GLM. In 1997 Greenland initiated a new survey series covering Divs. 1CD. This index of trawlable biomass has been variable with a gradually increasing trend since 1997. 2011 was the highest in the time series but the biomass has been decreasing gradually since then and the 2014 estimate was the lowest seen since 1997 (Fig. 1.5).
Fig. 1.5. Greenland halibut in Subareas 0+1 (excluding Div. 1A inshore): biomass indices from
bottom trawl surveys. A survey in Div. 0A in 2006 is not included due to poor coverage.
Canada deep sea survey in Div. 0A-South. The survey biomass indices were recalculated in 2014 based on a new stratification scheme (SCR Doc. 15/30).The index of trawlable biomass for Div. 0A-South has been fluctuating with a slight increasing trend since 1999. The 2012 estimate was the highest of the time series. The biomass index decreased slightly between 2012 and 2014(Fig. 1.5). Lengths ranged from 6-78 cm with minor modes at 18 and 33 cm that may reflect the high abundance of 2011 and 2013 year classes. The primary mode was 45 cm, slightly higher than seen in previous surveys. The proportion of fish <45cm has declined from approximately 70% in 2008 to 54% in 2014. The abundance of fish 40-60 cm has increased since 2010.
Canada deep sea surveys in Div. 0B. The survey biomass indices were recalculated in 2014 based on a new stratification scheme. Div. 0B was surveyed in 2014 for the fifth time by R/V Pâmiut. Previous surveys were conducted in 2000, 2001, 2011 and 2013. Biomass decreased in 2013 compared to 2011 but increased slightly again in 2014 and is at about average for the short survey series (Fig. 1.5). Lengths ranged from 6 cm
0.5
1
1.5
2
2.5
3
2003 2005 2007 2009 2011 2013 2015
CP
UE
(G
LM
In
de
x)
Year
Standardized CPUE Division 0A Gillnet
0.5
1
1.5
2
2.5
3
2002 2004 2006 2008 2010 2012 2014
CP
UE
(G
LM I
nd
ex)
Year
Standardized CPUE Division 0B Gillnet
0
10
20
30
40
50
60
70
80
90
100
110
120
1987 1990 1993 1996 1999 2002 2005 2008 2011 2014
Bio
mas
s In
dex
Year
Div. 0B RUS/FRG
Div. 1BCD JAP/GRL
Div. 1CD GRL
Div. 0A-South CAN
Div. 0B CAN
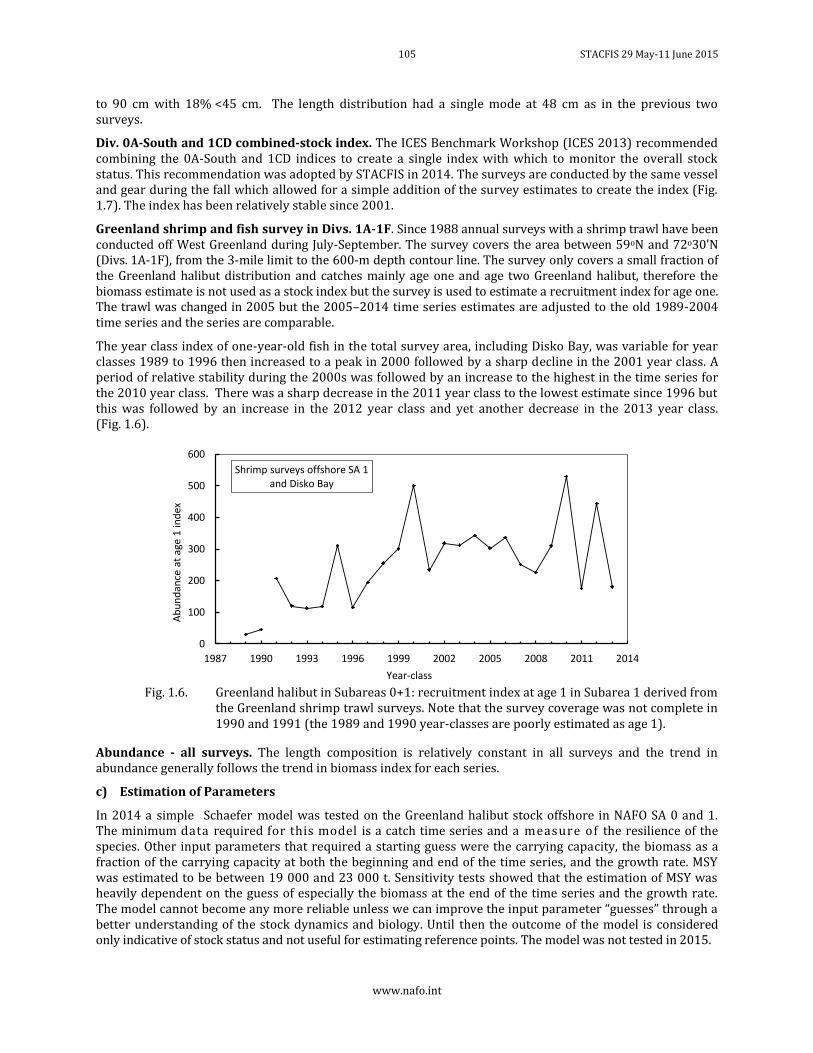
105 STACFIS 29 May-11 June 2015
www.nafo.int
to 90 cm with 18% <45 cm. The length distribution had a single mode at 48 cm as in the previous two surveys.
Div. 0A-South and 1CD combined-stock index. The ICES Benchmark Workshop (ICES 2013) recommended combining the 0A-South and 1CD indices to create a single index with which to monitor the overall stock status. This recommendation was adopted by STACFIS in 2014. The surveys are conducted by the same vessel and gear during the fall which allowed for a simple addition of the survey estimates to create the index (Fig. 1.7). The index has been relatively stable since 2001.
Greenland shrimp and fish survey in Divs. 1A-1F. Since 1988 annual surveys with a shrimp trawl have been conducted off West Greenland during July-September. The survey covers the area between 59oN and 72o30'N (Divs. 1A-1F), from the 3-mile limit to the 600-m depth contour line. The survey only covers a small fraction of the Greenland halibut distribution and catches mainly age one and age two Greenland halibut, therefore the biomass estimate is not used as a stock index but the survey is used to estimate a recruitment index for age one. The trawl was changed in 2005 but the 2005–2014 time series estimates are adjusted to the old 1989-2004 time series and the series are comparable.
The year class index of one-year-old fish in the total survey area, including Disko Bay, was variable for year classes 1989 to 1996 then increased to a peak in 2000 followed by a sharp decline in the 2001 year class. A period of relative stability during the 2000s was followed by an increase to the highest in the time series for the 2010 year class. There was a sharp decrease in the 2011 year class to the lowest estimate since 1996 but this was followed by an increase in the 2012 year class and yet another decrease in the 2013 year class. (Fig. 1.6).
Fig. 1.6. Greenland halibut in Subareas 0+1: recruitment index at age 1 in Subarea 1 derived from
the Greenland shrimp trawl surveys. Note that the survey coverage was not complete in 1990 and 1991 (the 1989 and 1990 year-classes are poorly estimated as age 1).
Abundance - all surveys. The length composition is relatively constant in all surveys and the trend in abundance generally follows the trend in biomass index for each series.
c) Estimation of Parameters
In 2014 a simple Schaefer model was tested on the Greenland halibut stock offshore in NAFO SA 0 and 1. The minimum data required for this model is a catch time series and a measure of the resilience of the species. Other input parameters that required a starting guess were the carrying capacity, the biomass as a fraction of the carrying capacity at both the beginning and end of the time series, and the growth rate. MSY was estimated to be between 19 000 and 23 000 t. Sensitivity tests showed that the estimation of MSY was heavily dependent on the guess of especially the biomass at the end of the time series and the growth rate. The model cannot become any more reliable unless we can improve the input parameter “guesses” through a better understanding of the stock dynamics and biology. Until then the outcome of the model is considered only indicative of stock status and not useful for estimating reference points. The model was not tested in 2015.
0
100
200
300
400
500
600
1987 1990 1993 1996 1999 2002 2005 2008 2011 2014
Ab
un
dan
ce a
t ag
e 1
ind
ex
Year-class
Shrimp surveys offshore SA 1and Disko Bay
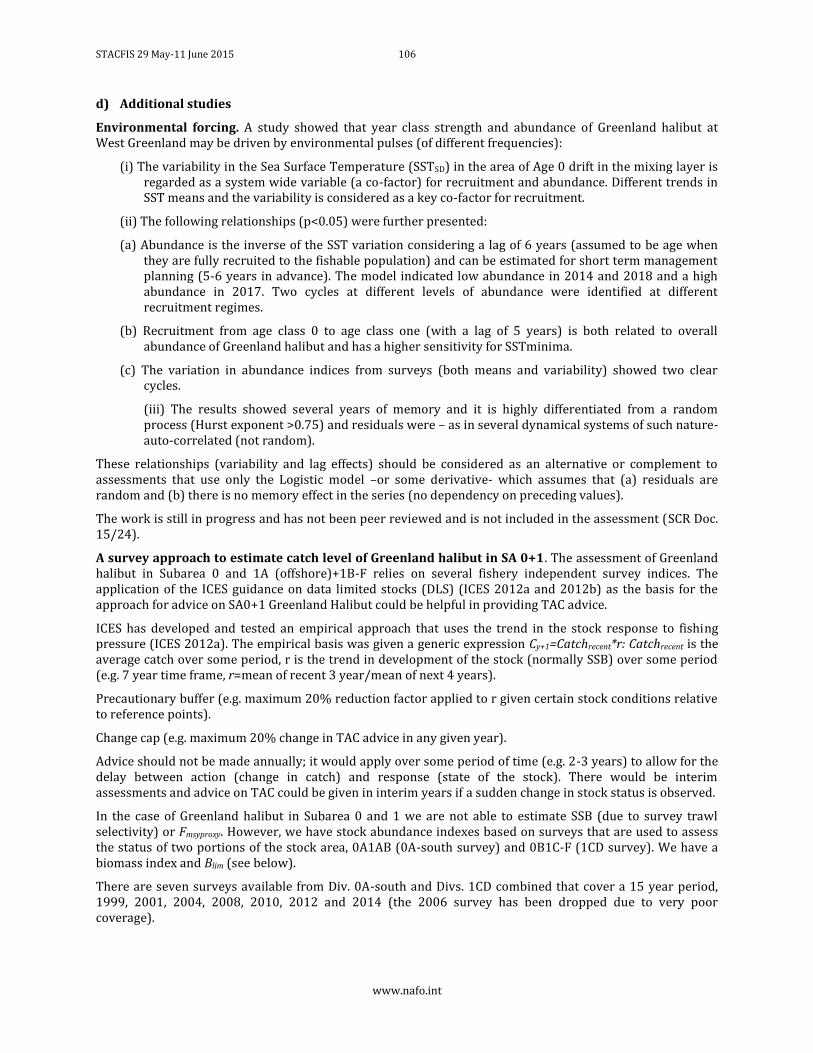
STACFIS 29 May-11 June 2015 106
www.nafo.int
d) Additional studies
Environmental forcing. A study showed that year class strength and abundance of Greenland halibut at West Greenland may be driven by environmental pulses (of different frequencies):
(i) The variability in the Sea Surface Temperature (SSTSD) in the area of Age 0 drift in the mixing layer is regarded as a system wide variable (a co-factor) for recruitment and abundance. Different trends in SST means and the variability is considered as a key co-factor for recruitment.
(ii) The following relationships (p<0.05) were further presented:
(a) Abundance is the inverse of the SST variation considering a lag of 6 years (assumed to be age when they are fully recruited to the fishable population) and can be estimated for short term management planning (5-6 years in advance). The model indicated low abundance in 2014 and 2018 and a high abundance in 2017. Two cycles at different levels of abundance were identified at different recruitment regimes.
(b) Recruitment from age class 0 to age class one (with a lag of 5 years) is both related to overall abundance of Greenland halibut and has a higher sensitivity for SSTminima.
(c) The variation in abundance indices from surveys (both means and variability) showed two clear cycles.
(iii) The results showed several years of memory and it is highly differentiated from a random process (Hurst exponent >0.75) and residuals were – as in several dynamical systems of such nature- auto-correlated (not random).
These relationships (variability and lag effects) should be considered as an alternative or complement to assessments that use only the Logistic model –or some derivative- which assumes that (a) residuals are random and (b) there is no memory effect in the series (no dependency on preceding values).
The work is still in progress and has not been peer reviewed and is not included in the assessment (SCR Doc. 15/24).
A survey approach to estimate catch level of Greenland halibut in SA 0+1. The assessment of Greenland halibut in Subarea 0 and 1A (offshore)+1B-F relies on several fishery independent survey indices. The application of the ICES guidance on data limited stocks (DLS) (ICES 2012a and 2012b) as the basis for the approach for advice on SA0+1 Greenland Halibut could be helpful in providing TAC advice.
ICES has developed and tested an empirical approach that uses the trend in the stock response to fishing pressure (ICES 2012a). The empirical basis was given a generic expression Cy+1=Catchrecent*r: Catchrecent is the average catch over some period, r is the trend in development of the stock (normally SSB) over some period (e.g. 7 year time frame, r=mean of recent 3 year/mean of next 4 years).
Precautionary buffer (e.g. maximum 20% reduction factor applied to r given certain stock conditions relative to reference points).
Change cap (e.g. maximum 20% change in TAC advice in any given year).
Advice should not be made annually; it would apply over some period of time (e.g. 2-3 years) to allow for the delay between action (change in catch) and response (state of the stock). There would be interim assessments and advice on TAC could be given in interim years if a sudden change in stock status is observed.
In the case of Greenland halibut in Subarea 0 and 1 we are not able to estimate SSB (due to survey trawl selectivity) or Fmsyproxy. However, we have stock abundance indexes based on surveys that are used to assess the status of two portions of the stock area, 0A1AB (0A-south survey) and 0B1C-F (1CD survey). We have a biomass index and Blim (see below).
There are seven surveys available from Div. 0A-south and Divs. 1CD combined that cover a 15 year period, 1999, 2001, 2004, 2008, 2010, 2012 and 2014 (the 2006 survey has been dropped due to very poor coverage).
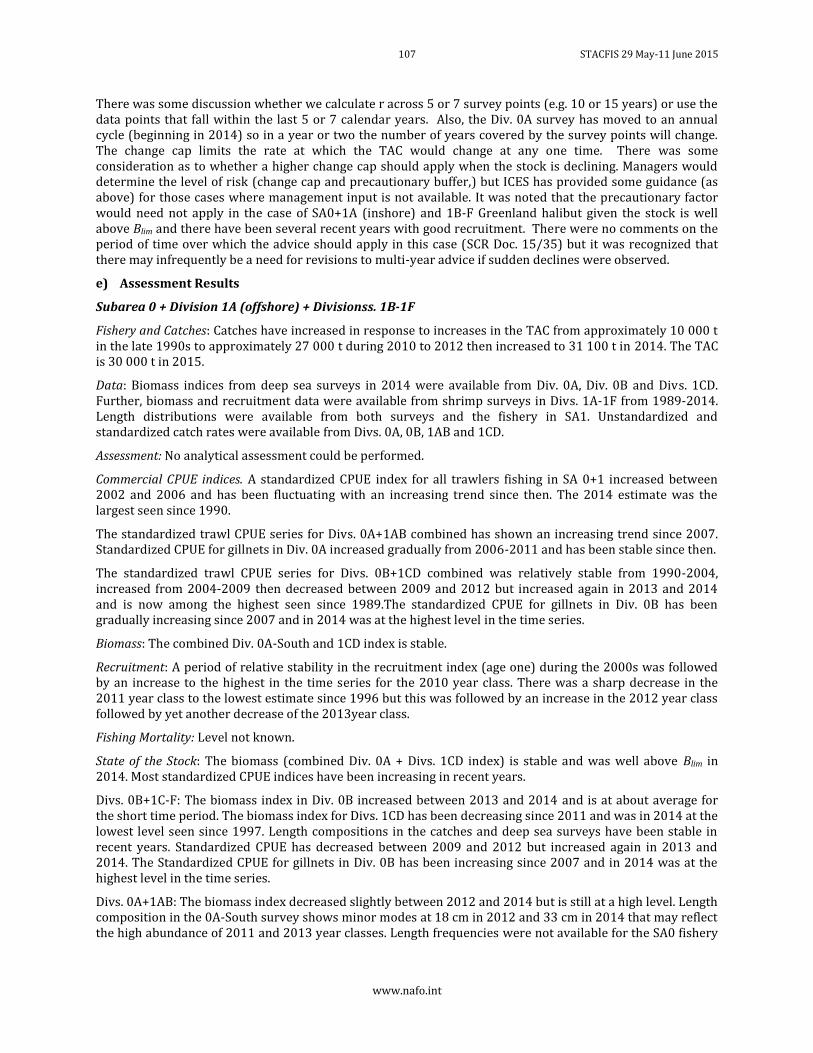
107 STACFIS 29 May-11 June 2015
www.nafo.int
There was some discussion whether we calculate r across 5 or 7 survey points (e.g. 10 or 15 years) or use the data points that fall within the last 5 or 7 calendar years. Also, the Div. 0A survey has moved to an annual cycle (beginning in 2014) so in a year or two the number of years covered by the survey points will change. The change cap limits the rate at which the TAC would change at any one time. There was some consideration as to whether a higher change cap should apply when the stock is declining. Managers would determine the level of risk (change cap and precautionary buffer,) but ICES has provided some guidance (as above) for those cases where management input is not available. It was noted that the precautionary factor would need not apply in the case of SA0+1A (inshore) and 1B-F Greenland halibut given the stock is well above Blim and there have been several recent years with good recruitment. There were no comments on the period of time over which the advice should apply in this case (SCR Doc. 15/35) but it was recognized that there may infrequently be a need for revisions to multi-year advice if sudden declines were observed.
e) Assessment Results
Subarea 0 + Division 1A (offshore) + Divisionss. 1B-1F
Fishery and Catches: Catches have increased in response to increases in the TAC from approximately 10 000 t in the late 1990s to approximately 27 000 t during 2010 to 2012 then increased to 31 100 t in 2014. The TAC is 30 000 t in 2015.
Data: Biomass indices from deep sea surveys in 2014 were available from Div. 0A, Div. 0B and Divs. 1CD. Further, biomass and recruitment data were available from shrimp surveys in Divs. 1A-1F from 1989-2014. Length distributions were available from both surveys and the fishery in SA1. Unstandardized and standardized catch rates were available from Divs. 0A, 0B, 1AB and 1CD.
Assessment: No analytical assessment could be performed.
Commercial CPUE indices. A standardized CPUE index for all trawlers fishing in SA 0+1 increased between 2002 and 2006 and has been fluctuating with an increasing trend since then. The 2014 estimate was the largest seen since 1990.
The standardized trawl CPUE series for Divs. 0A+1AB combined has shown an increasing trend since 2007. Standardized CPUE for gillnets in Div. 0A increased gradually from 2006-2011 and has been stable since then.
The standardized trawl CPUE series for Divs. 0B+1CD combined was relatively stable from 1990-2004, increased from 2004-2009 then decreased between 2009 and 2012 but increased again in 2013 and 2014 and is now among the highest seen since 1989.The standardized CPUE for gillnets in Div. 0B has been gradually increasing since 2007 and in 2014 was at the highest level in the time series.
Biomass: The combined Div. 0A-South and 1CD index is stable.
Recruitment: A period of relative stability in the recruitment index (age one) during the 2000s was followed by an increase to the highest in the time series for the 2010 year class. There was a sharp decrease in the 2011 year class to the lowest estimate since 1996 but this was followed by an increase in the 2012 year class followed by yet another decrease of the 2013year class.
Fishing Mortality: Level not known.
State of the Stock: The biomass (combined Div. 0A + Divs. 1CD index) is stable and was well above Blim in 2014. Most standardized CPUE indices have been increasing in recent years.
Divs. 0B+1C-F: The biomass index in Div. 0B increased between 2013 and 2014 and is at about average for the short time period. The biomass index for Divs. 1CD has been decreasing since 2011 and was in 2014 at the lowest level seen since 1997. Length compositions in the catches and deep sea surveys have been stable in recent years. Standardized CPUE has decreased between 2009 and 2012 but increased again in 2013 and 2014. The Standardized CPUE for gillnets in Div. 0B has been increasing since 2007 and in 2014 was at the highest level in the time series.
Divs. 0A+1AB: The biomass index decreased slightly between 2012 and 2014 but is still at a high level. Length composition in the 0A-South survey shows minor modes at 18 cm in 2012 and 33 cm in 2014 that may reflect the high abundance of 2011 and 2013 year classes. Length frequencies were not available for the SA0 fishery
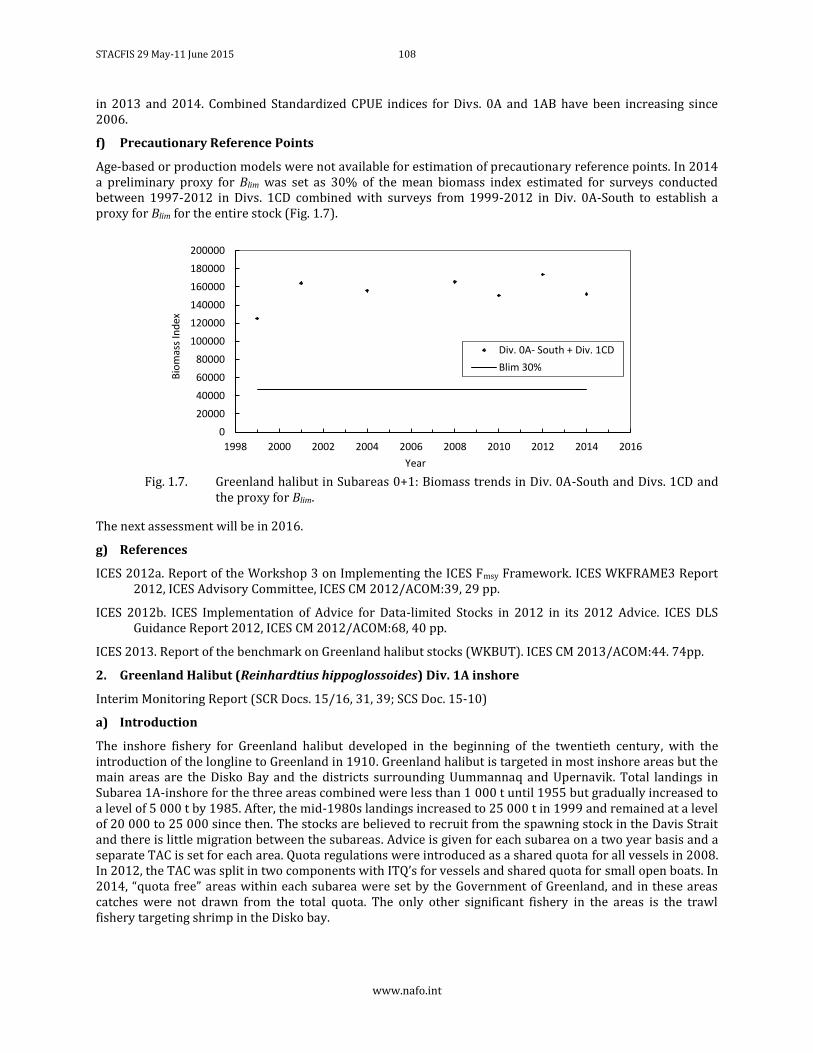
STACFIS 29 May-11 June 2015 108
www.nafo.int
in 2013 and 2014. Combined Standardized CPUE indices for Divs. 0A and 1AB have been increasing since 2006.
f) Precautionary Reference Points
Age-based or production models were not available for estimation of precautionary reference points. In 2014 a preliminary proxy for Blim was set as 30% of the mean biomass index estimated for surveys conducted between 1997-2012 in Divs. 1CD combined with surveys from 1999-2012 in Div. 0A-South to establish a proxy for Blim for the entire stock (Fig. 1.7).
Fig. 1.7. Greenland halibut in Subareas 0+1: Biomass trends in Div. 0A-South and Divs. 1CD and
the proxy for Blim.
The next assessment will be in 2016.
g) References
ICES 2012a. Report of the Workshop 3 on Implementing the ICES Fmsy Framework. ICES WKFRAME3 Report 2012, ICES Advisory Committee, ICES CM 2012/ACOM:39, 29 pp.
ICES 2012b. ICES Implementation of Advice for Data-limited Stocks in 2012 in its 2012 Advice. ICES DLS Guidance Report 2012, ICES CM 2012/ACOM:68, 40 pp.
ICES 2013. Report of the benchmark on Greenland halibut stocks (WKBUT). ICES CM 2013/ACOM:44. 74pp.
2. Greenland Halibut (Reinhardtius hippoglossoides) Div. 1A inshore
Interim Monitoring Report (SCR Docs. 15/16, 31, 39; SCS Doc. 15-10)
a) Introduction
The inshore fishery for Greenland halibut developed in the beginning of the twentieth century, with the introduction of the longline to Greenland in 1910. Greenland halibut is targeted in most inshore areas but the main areas are the Disko Bay and the districts surrounding Uummannaq and Upernavik. Total landings in Subarea 1A-inshore for the three areas combined were less than 1 000 t until 1955 but gradually increased to a level of 5 000 t by 1985. After, the mid-1980s landings increased to 25 000 t in 1999 and remained at a level of 20 000 to 25 000 since then. The stocks are believed to recruit from the spawning stock in the Davis Strait and there is little migration between the subareas. Advice is given for each subarea on a two year basis and a separate TAC is set for each area. Quota regulations were introduced as a shared quota for all vessels in 2008. In 2012, the TAC was split in two components with ITQ’s for vessels and shared quota for small open boats. In 2014, “quota free” areas within each subarea were set by the Government of Greenland, and in these areas catches were not drawn from the total quota. The only other significant fishery in the areas is the trawl fishery targeting shrimp in the Disko bay.
0
20000
40000
60000
80000
100000
120000
140000
160000
180000
200000
1998 2000 2002 2004 2006 2008 2010 2012 2014 2016
Bio
mas
s In
dex
Year
Div. 0A- South + Div. 1CD
Blim 30%
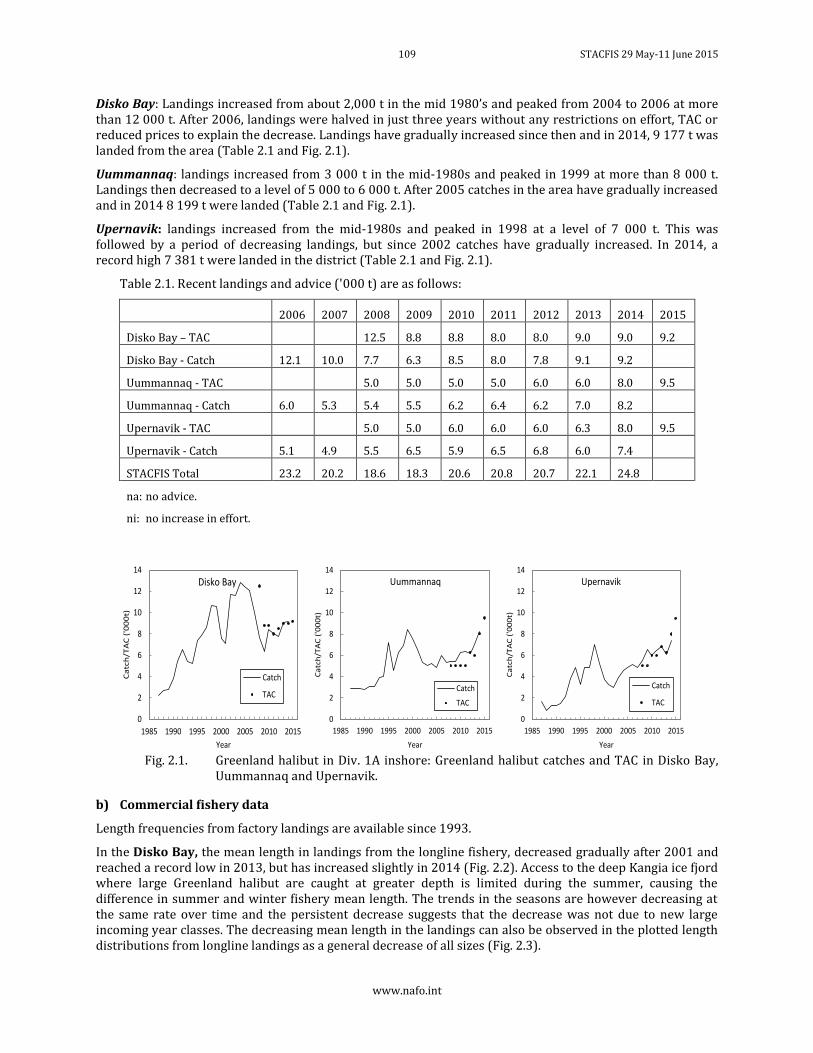
109 STACFIS 29 May-11 June 2015
www.nafo.int
Disko Bay: Landings increased from about 2,000 t in the mid 1980’s and peaked from 2004 to 2006 at more than 12 000 t. After 2006, landings were halved in just three years without any restrictions on effort, TAC or reduced prices to explain the decrease. Landings have gradually increased since then and in 2014, 9 177 t was landed from the area (Table 2.1 and Fig. 2.1).
Uummannaq: landings increased from 3 000 t in the mid-1980s and peaked in 1999 at more than 8 000 t. Landings then decreased to a level of 5 000 to 6 000 t. After 2005 catches in the area have gradually increased and in 2014 8 199 t were landed (Table 2.1 and Fig. 2.1).
Upernavik: landings increased from the mid-1980s and peaked in 1998 at a level of 7 000 t. This was followed by a period of decreasing landings, but since 2002 catches have gradually increased. In 2014, a record high 7 381 t were landed in the district (Table 2.1 and Fig. 2.1).
Table 2.1. Recent landings and advice ('000 t) are as follows:
2006 2007 2008 2009 2010 2011 2012 2013 2014 2015
Disko Bay – TAC 12.5 8.8 8.8 8.0 8.0 9.0 9.0 9.2
Disko Bay - Catch 12.1 10.0 7.7 6.3 8.5 8.0 7.8 9.1 9.2
Uummannaq - TAC 5.0 5.0 5.0 5.0 6.0 6.0 8.0 9.5
Uummannaq - Catch 6.0 5.3 5.4 5.5 6.2 6.4 6.2 7.0 8.2
Upernavik - TAC 5.0 5.0 6.0 6.0 6.0 6.3 8.0 9.5
Upernavik - Catch 5.1 4.9 5.5 6.5 5.9 6.5 6.8 6.0 7.4
STACFIS Total 23.2 20.2 18.6 18.3 20.6 20.8 20.7 22.1 24.8
na: no advice.
ni: no increase in effort.
Fig. 2.1. Greenland halibut in Div. 1A inshore: Greenland halibut catches and TAC in Disko Bay,
Uummannaq and Upernavik.
b) Commercial fishery data
Length frequencies from factory landings are available since 1993.
In the Disko Bay, the mean length in landings from the longline fishery, decreased gradually after 2001 and reached a record low in 2013, but has increased slightly in 2014 (Fig. 2.2). Access to the deep Kangia ice fjord where large Greenland halibut are caught at greater depth is limited during the summer, causing the difference in summer and winter fishery mean length. The trends in the seasons are however decreasing at the same rate over time and the persistent decrease suggests that the decrease was not due to new large incoming year classes. The decreasing mean length in the landings can also be observed in the plotted length distributions from longline landings as a general decrease of all sizes (Fig. 2.3).
0
2
4
6
8
10
12
14
1985 1990 1995 2000 2005 2010 2015
Ca
tch
/TA
C (
'00
0t)
Year
Disko Bay
Catch
TAC
0
2
4
6
8
10
12
14
1985 1990 1995 2000 2005 2010 2015
Ca
tch
/TA
C (
'00
0t)
Year
Uummannaq
Catch
TAC
0
2
4
6
8
10
12
14
1985 1990 1995 2000 2005 2010 2015
Ca
tch
/TA
C (
'00
0t)
Year
Upernavik
Catch
TAC
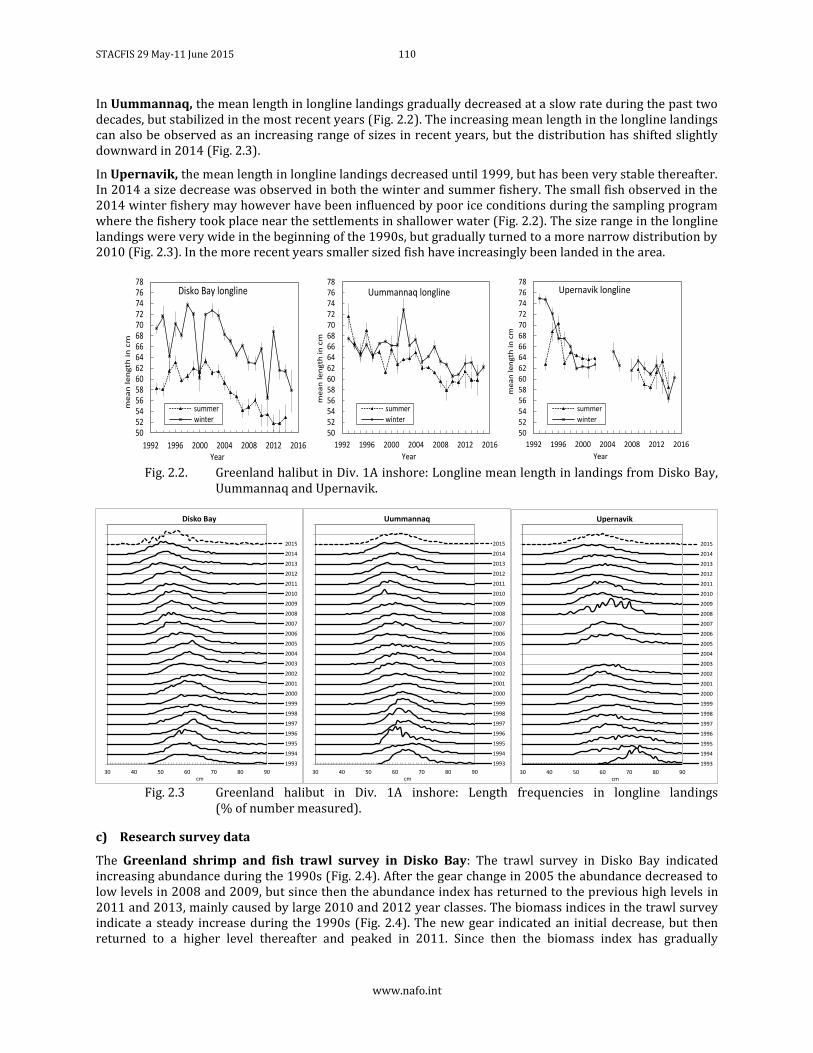
STACFIS 29 May-11 June 2015 110
www.nafo.int
In Uummannaq, the mean length in longline landings gradually decreased at a slow rate during the past two decades, but stabilized in the most recent years (Fig. 2.2). The increasing mean length in the longline landings can also be observed as an increasing range of sizes in recent years, but the distribution has shifted slightly downward in 2014 (Fig. 2.3).
In Upernavik, the mean length in longline landings decreased until 1999, but has been very stable thereafter. In 2014 a size decrease was observed in both the winter and summer fishery. The small fish observed in the 2014 winter fishery may however have been influenced by poor ice conditions during the sampling program where the fishery took place near the settlements in shallower water (Fig. 2.2). The size range in the longline landings were very wide in the beginning of the 1990s, but gradually turned to a more narrow distribution by 2010 (Fig. 2.3). In the more recent years smaller sized fish have increasingly been landed in the area.
Fig. 2.2. Greenland halibut in Div. 1A inshore: Longline mean length in landings from Disko Bay,
Uummannaq and Upernavik.
Fig. 2.3 Greenland halibut in Div. 1A inshore: Length frequencies in longline landings
(% of number measured).
c) Research survey data
The Greenland shrimp and fish trawl survey in Disko Bay: The trawl survey in Disko Bay indicated increasing abundance during the 1990s (Fig. 2.4). After the gear change in 2005 the abundance decreased to low levels in 2008 and 2009, but since then the abundance index has returned to the previous high levels in 2011 and 2013, mainly caused by large 2010 and 2012 year classes. The biomass indices in the trawl survey indicate a steady increase during the 1990s (Fig. 2.4). The new gear indicated an initial decrease, but then returned to a higher level thereafter and peaked in 2011. Since then the biomass index has gradually
505254565860626466687072747678
1992 1996 2000 2004 2008 2012 2016
me
an
le
ng
th i
n c
m
Year
Disko Bay longline
summerwinter
505254565860626466687072747678
1992 1996 2000 2004 2008 2012 2016
me
an
le
ng
th i
n c
m
Year
Uummannaq longline
summerwinter
505254565860626466687072747678
1992 1996 2000 2004 2008 2012 2016
me
an
le
ng
th i
n c
m
Year
Upernavik longline
summer
winter
30 40 50 60 70 80 90cm
Disko Bay
2015
2014
2013
2012
2011
2010
2009
2008
2007
2006
2005
2004
2003
2002
2001
2000
1999
1998
1997
1996
1995
1994
1993
30 40 50 60 70 80 90cm
Uummannaq
2015
2014
2013
2012
2011
2010
2009
2008
2007
2006
2005
2004
2003
2002
2001
2000
1999
1998
1997
1996
1995
1994
1993
30 40 50 60 70 80 90cm
Upernavik
2015
2014
2013
2012
2011
2010
2009
2008
2007
2006
2005
2004
2003
2002
2001
2000
1999
1998
1997
1996
1995
1994
1993
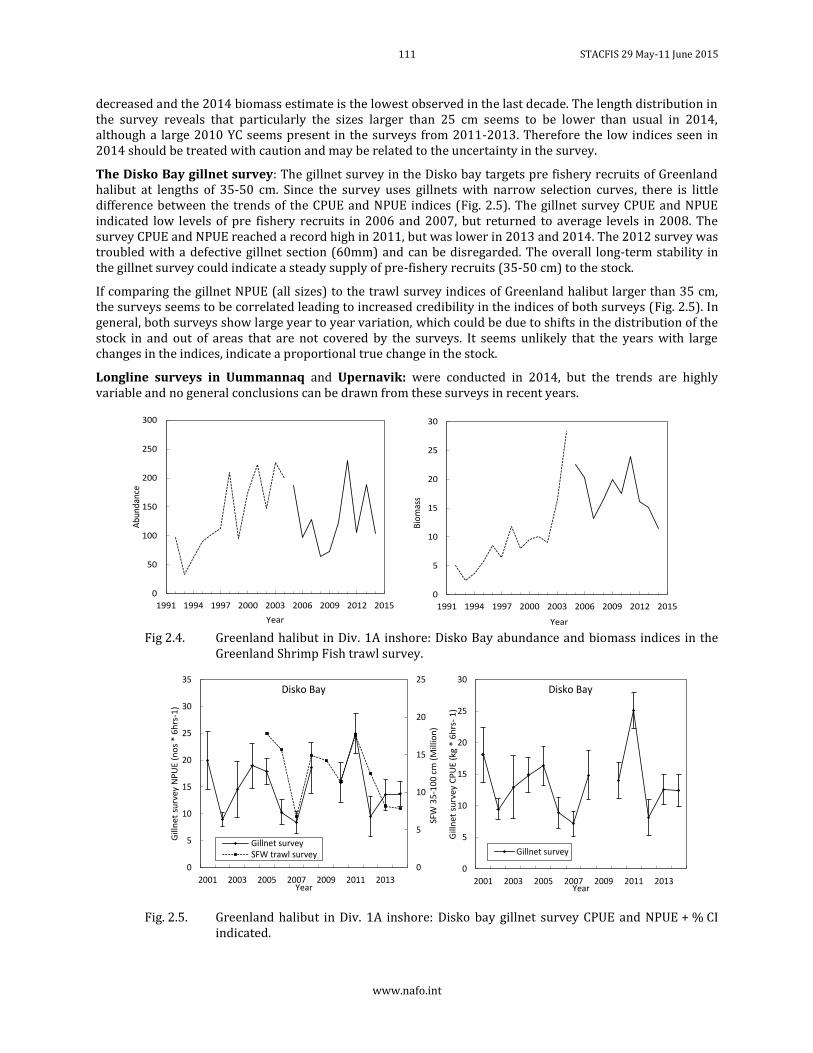
111 STACFIS 29 May-11 June 2015
www.nafo.int
decreased and the 2014 biomass estimate is the lowest observed in the last decade. The length distribution in the survey reveals that particularly the sizes larger than 25 cm seems to be lower than usual in 2014, although a large 2010 YC seems present in the surveys from 2011-2013. Therefore the low indices seen in 2014 should be treated with caution and may be related to the uncertainty in the survey.
The Disko Bay gillnet survey: The gillnet survey in the Disko bay targets pre fishery recruits of Greenland halibut at lengths of 35-50 cm. Since the survey uses gillnets with narrow selection curves, there is little difference between the trends of the CPUE and NPUE indices (Fig. 2.5). The gillnet survey CPUE and NPUE indicated low levels of pre fishery recruits in 2006 and 2007, but returned to average levels in 2008. The survey CPUE and NPUE reached a record high in 2011, but was lower in 2013 and 2014. The 2012 survey was troubled with a defective gillnet section (60mm) and can be disregarded. The overall long-term stability in the gillnet survey could indicate a steady supply of pre-fishery recruits (35-50 cm) to the stock.
If comparing the gillnet NPUE (all sizes) to the trawl survey indices of Greenland halibut larger than 35 cm, the surveys seems to be correlated leading to increased credibility in the indices of both surveys (Fig. 2.5). In general, both surveys show large year to year variation, which could be due to shifts in the distribution of the stock in and out of areas that are not covered by the surveys. It seems unlikely that the years with large changes in the indices, indicate a proportional true change in the stock.
Longline surveys in Uummannaq and Upernavik: were conducted in 2014, but the trends are highly variable and no general conclusions can be drawn from these surveys in recent years.
Fig 2.4. Greenland halibut in Div. 1A inshore: Disko Bay abundance and biomass indices in the
Greenland Shrimp Fish trawl survey.
Fig. 2.5. Greenland halibut in Div. 1A inshore: Disko bay gillnet survey CPUE and NPUE + % CI indicated.
0
50
100
150
200
250
300
1991 1994 1997 2000 2003 2006 2009 2012 2015
Abu
ndan
ce
Year
0
5
10
15
20
25
30
1991 1994 1997 2000 2003 2006 2009 2012 2015
Bio
mas
s
Year
0
5
10
15
20
25
0
5
10
15
20
25
30
35
2001 2003 2005 2007 2009 2011 2013
SFW
35
-10
0 c
m (
Mill
ion
)
Gill
ne
t su
rve
y N
PU
E (
no
s *
6h
rs-1
)
Year
Disko Bay
Gillnet surveySFW trawl survey
0
5
10
15
20
25
30
2001 2003 2005 2007 2009 2011 2013
Gill
ne
t su
rve
y C
PU
E (
kg *
6h
rs-
1)
Year
Disko Bay
Gillnet survey
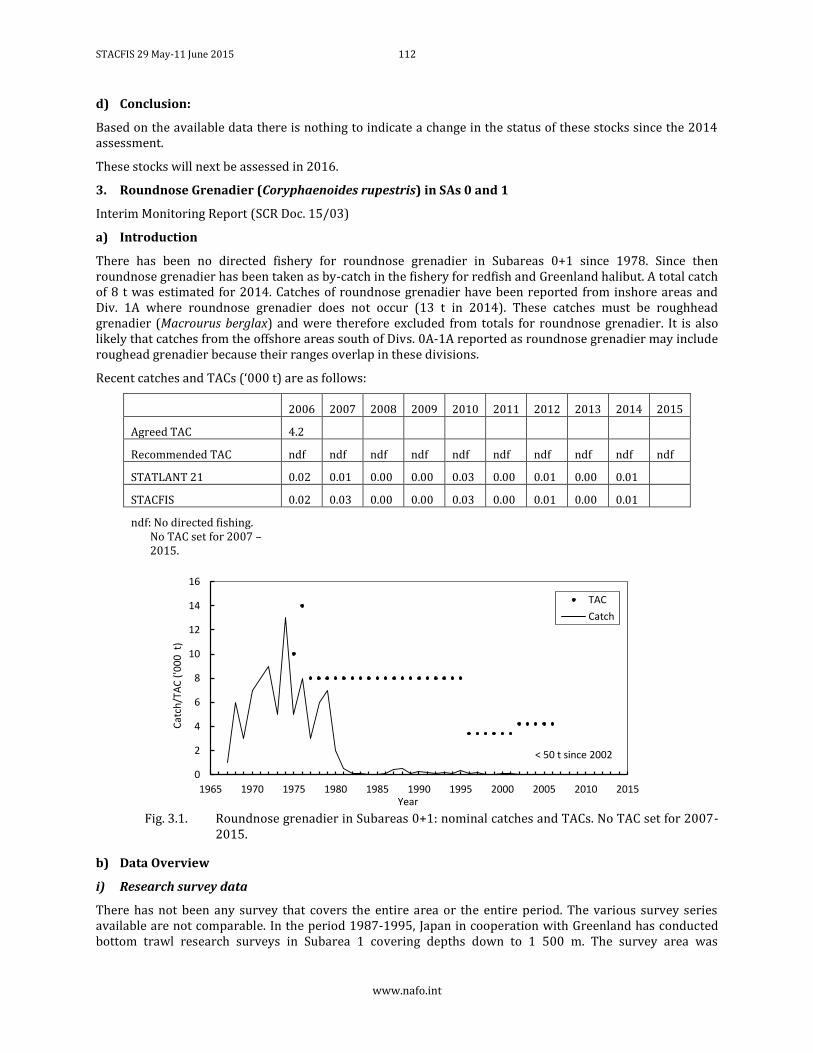
STACFIS 29 May-11 June 2015 112
www.nafo.int
d) Conclusion:
Based on the available data there is nothing to indicate a change in the status of these stocks since the 2014 assessment.
These stocks will next be assessed in 2016.
3. Roundnose Grenadier (Coryphaenoides rupestris) in SAs 0 and 1
Interim Monitoring Report (SCR Doc. 15/03)
a) Introduction
There has been no directed fishery for roundnose grenadier in Subareas 0+1 since 1978. Since then roundnose grenadier has been taken as by-catch in the fishery for redfish and Greenland halibut. A total catch of 8 t was estimated for 2014. Catches of roundnose grenadier have been reported from inshore areas and Div. 1A where roundnose grenadier does not occur (13 t in 2014). These catches must be roughhead grenadier (Macrourus berglax) and were therefore excluded from totals for roundnose grenadier. It is also likely that catches from the offshore areas south of Divs. 0A-1A reported as roundnose grenadier may include roughead grenadier because their ranges overlap in these divisions.
Recent catches and TACs (‘000 t) are as follows:
2006 2007 2008 2009 2010 2011 2012 2013 2014 2015
Agreed TAC 4.2
Recommended TAC ndf ndf ndf ndf ndf ndf ndf ndf ndf ndf
STATLANT 21 0.02 0.01 0.00 0.00 0.03 0.00 0.01 0.00 0.01
STACFIS 0.02 0.03 0.00 0.00 0.03 0.00 0.01 0.00 0.01
ndf: No directed fishing. No TAC set for 2007 – 2015.
Fig. 3.1. Roundnose grenadier in Subareas 0+1: nominal catches and TACs. No TAC set for 2007-
2015.
b) Data Overview
i) Research survey data
There has not been any survey that covers the entire area or the entire period. The various survey series available are not comparable. In the period 1987-1995, Japan in cooperation with Greenland has conducted bottom trawl research surveys in Subarea 1 covering depths down to 1 500 m. The survey area was
0
2
4
6
8
10
12
14
16
1965 1970 1975 1980 1985 1990 1995 2000 2005 2010 2015
Cat
ch/T
AC
('0
00
t)
Year
TAC
Catch
< 50 t since 2002
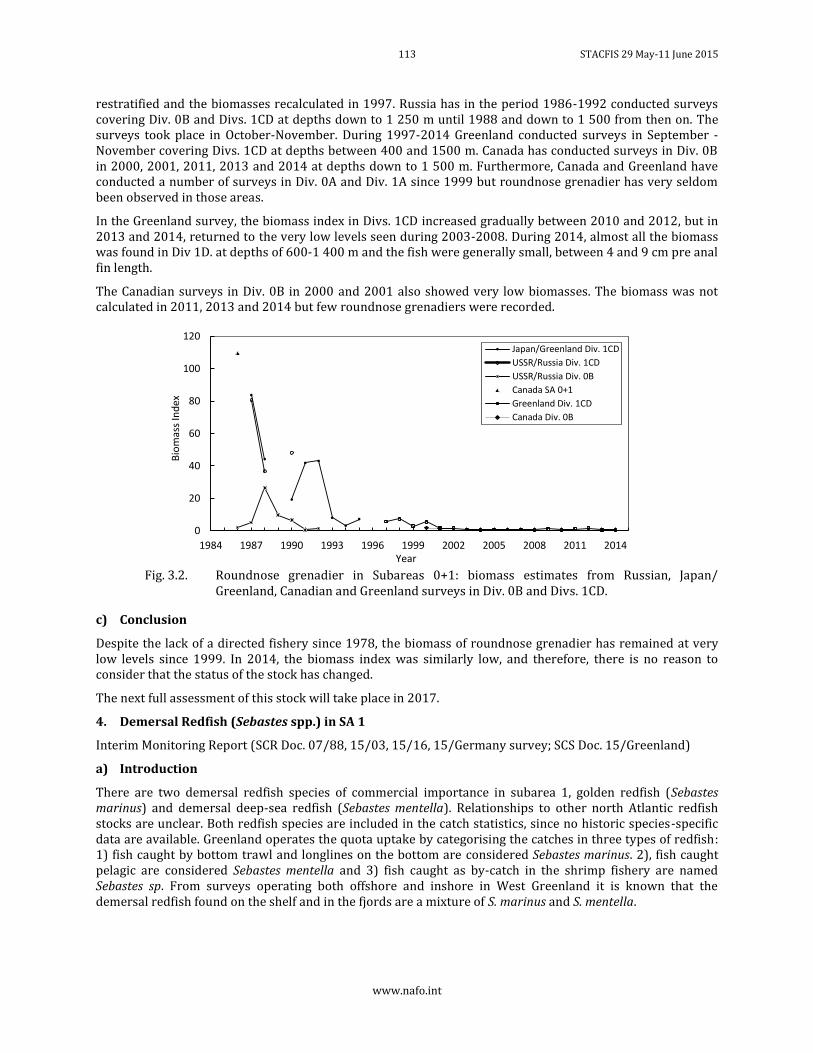
113 STACFIS 29 May-11 June 2015
www.nafo.int
restratified and the biomasses recalculated in 1997. Russia has in the period 1986-1992 conducted surveys covering Div. 0B and Divs. 1CD at depths down to 1 250 m until 1988 and down to 1 500 from then on. The surveys took place in October-November. During 1997-2014 Greenland conducted surveys in September - November covering Divs. 1CD at depths between 400 and 1500 m. Canada has conducted surveys in Div. 0B in 2000, 2001, 2011, 2013 and 2014 at depths down to 1 500 m. Furthermore, Canada and Greenland have conducted a number of surveys in Div. 0A and Div. 1A since 1999 but roundnose grenadier has very seldom been observed in those areas.
In the Greenland survey, the biomass index in Divs. 1CD increased gradually between 2010 and 2012, but in 2013 and 2014, returned to the very low levels seen during 2003-2008. During 2014, almost all the biomass was found in Div 1D. at depths of 600-1 400 m and the fish were generally small, between 4 and 9 cm pre anal fin length.
The Canadian surveys in Div. 0B in 2000 and 2001 also showed very low biomasses. The biomass was not calculated in 2011, 2013 and 2014 but few roundnose grenadiers were recorded.
Fig. 3.2. Roundnose grenadier in Subareas 0+1: biomass estimates from Russian, Japan/
Greenland, Canadian and Greenland surveys in Div. 0B and Divs. 1CD.
c) Conclusion
Despite the lack of a directed fishery since 1978, the biomass of roundnose grenadier has remained at very low levels since 1999. In 2014, the biomass index was similarly low, and therefore, there is no reason to consider that the status of the stock has changed.
The next full assessment of this stock will take place in 2017.
4. Demersal Redfish (Sebastes spp.) in SA 1
Interim Monitoring Report (SCR Doc. 07/88, 15/03, 15/16, 15/Germany survey; SCS Doc. 15/Greenland)
a) Introduction
There are two demersal redfish species of commercial importance in subarea 1, golden redfish (Sebastes marinus) and demersal deep-sea redfish (Sebastes mentella). Relationships to other north Atlantic redfish stocks are unclear. Both redfish species are included in the catch statistics, since no historic species-specific data are available. Greenland operates the quota uptake by categorising the catches in three types of redfish: 1) fish caught by bottom trawl and longlines on the bottom are considered Sebastes marinus. 2), fish caught pelagic are considered Sebastes mentella and 3) fish caught as by-catch in the shrimp fishery are named Sebastes sp. From surveys operating both offshore and inshore in West Greenland it is known that the demersal redfish found on the shelf and in the fjords are a mixture of S. marinus and S. mentella.
0
20
40
60
80
100
120
1984 1987 1990 1993 1996 1999 2002 2005 2008 2011 2014
Bio
mas
s In
dex
Year
Japan/Greenland Div. 1CD
USSR/Russia Div. 1CD
USSR/Russia Div. 0B
Canada SA 0+1
Greenland Div. 1CD
Canada Div. 0B
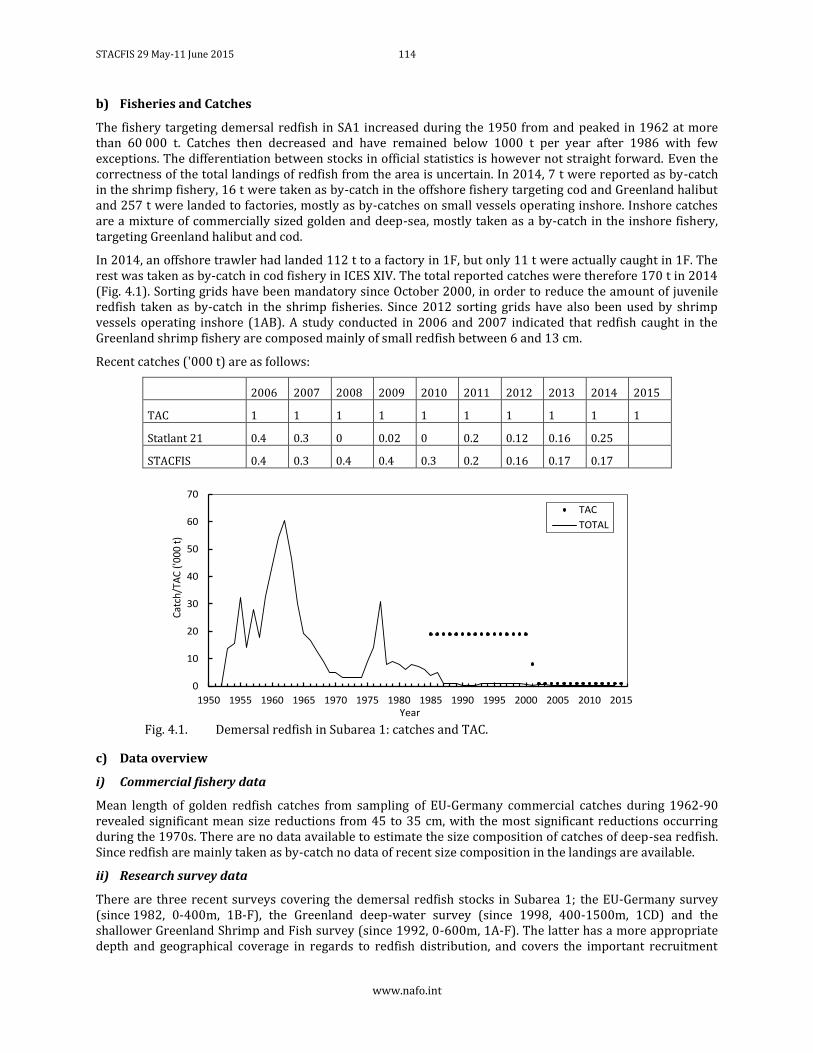
STACFIS 29 May-11 June 2015 114
www.nafo.int
b) Fisheries and Catches
The fishery targeting demersal redfish in SA1 increased during the 1950 from and peaked in 1962 at more than 60 000 t. Catches then decreased and have remained below 1000 t per year after 1986 with few exceptions. The differentiation between stocks in official statistics is however not straight forward. Even the correctness of the total landings of redfish from the area is uncertain. In 2014, 7 t were reported as by-catch in the shrimp fishery, 16 t were taken as by-catch in the offshore fishery targeting cod and Greenland halibut and 257 t were landed to factories, mostly as by-catches on small vessels operating inshore. Inshore catches are a mixture of commercially sized golden and deep-sea, mostly taken as a by-catch in the inshore fishery, targeting Greenland halibut and cod.
In 2014, an offshore trawler had landed 112 t to a factory in 1F, but only 11 t were actually caught in 1F. The rest was taken as by-catch in cod fishery in ICES XIV. The total reported catches were therefore 170 t in 2014 (Fig. 4.1). Sorting grids have been mandatory since October 2000, in order to reduce the amount of juvenile redfish taken as by-catch in the shrimp fisheries. Since 2012 sorting grids have also been used by shrimp vessels operating inshore (1AB). A study conducted in 2006 and 2007 indicated that redfish caught in the Greenland shrimp fishery are composed mainly of small redfish between 6 and 13 cm.
Recent catches ('000 t) are as follows:
2006 2007 2008 2009 2010 2011 2012 2013 2014 2015
TAC 1 1 1 1 1 1 1 1 1 1
Statlant 21 0.4 0.3 0 0.02 0 0.2 0.12 0.16 0.25
STACFIS 0.4 0.3 0.4 0.4 0.3 0.2 0.16 0.17 0.17
Fig. 4.1. Demersal redfish in Subarea 1: catches and TAC.
c) Data overview
i) Commercial fishery data
Mean length of golden redfish catches from sampling of EU-Germany commercial catches during 1962-90 revealed significant mean size reductions from 45 to 35 cm, with the most significant reductions occurring during the 1970s. There are no data available to estimate the size composition of catches of deep-sea redfish. Since redfish are mainly taken as by-catch no data of recent size composition in the landings are available.
ii) Research survey data
There are three recent surveys covering the demersal redfish stocks in Subarea 1; the EU-Germany survey (since 1982, 0-400m, 1B-F), the Greenland deep-water survey (since 1998, 400-1500m, 1CD) and the shallower Greenland Shrimp and Fish survey (since 1992, 0-600m, 1A-F). The latter has a more appropriate depth and geographical coverage in regards to redfish distribution, and covers the important recruitment
0
10
20
30
40
50
60
70
1950 1955 1960 1965 1970 1975 1980 1985 1990 1995 2000 2005 2010 2015
Cat
ch/T
AC
('0
00 t
)
Year
TAC
TOTAL
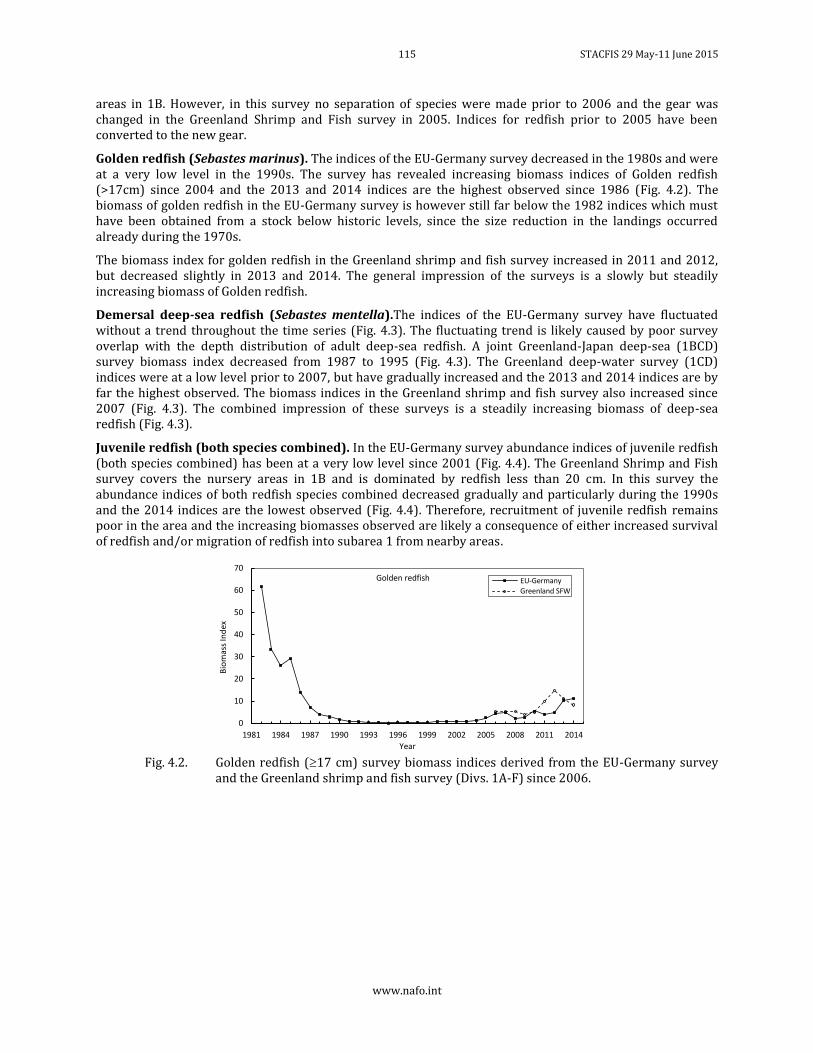
115 STACFIS 29 May-11 June 2015
www.nafo.int
areas in 1B. However, in this survey no separation of species were made prior to 2006 and the gear was changed in the Greenland Shrimp and Fish survey in 2005. Indices for redfish prior to 2005 have been converted to the new gear.
Golden redfish (Sebastes marinus). The indices of the EU-Germany survey decreased in the 1980s and were at a very low level in the 1990s. The survey has revealed increasing biomass indices of Golden redfish (>17cm) since 2004 and the 2013 and 2014 indices are the highest observed since 1986 (Fig. 4.2). The biomass of golden redfish in the EU-Germany survey is however still far below the 1982 indices which must have been obtained from a stock below historic levels, since the size reduction in the landings occurred already during the 1970s.
The biomass index for golden redfish in the Greenland shrimp and fish survey increased in 2011 and 2012, but decreased slightly in 2013 and 2014. The general impression of the surveys is a slowly but steadily increasing biomass of Golden redfish.
Demersal deep-sea redfish (Sebastes mentella).The indices of the EU-Germany survey have fluctuated without a trend throughout the time series (Fig. 4.3). The fluctuating trend is likely caused by poor survey overlap with the depth distribution of adult deep-sea redfish. A joint Greenland-Japan deep-sea (1BCD) survey biomass index decreased from 1987 to 1995 (Fig. 4.3). The Greenland deep-water survey (1CD) indices were at a low level prior to 2007, but have gradually increased and the 2013 and 2014 indices are by far the highest observed. The biomass indices in the Greenland shrimp and fish survey also increased since 2007 (Fig. 4.3). The combined impression of these surveys is a steadily increasing biomass of deep-sea redfish (Fig. 4.3).
Juvenile redfish (both species combined). In the EU-Germany survey abundance indices of juvenile redfish (both species combined) has been at a very low level since 2001 (Fig. 4.4). The Greenland Shrimp and Fish survey covers the nursery areas in 1B and is dominated by redfish less than 20 cm. In this survey the abundance indices of both redfish species combined decreased gradually and particularly during the 1990s and the 2014 indices are the lowest observed (Fig. 4.4). Therefore, recruitment of juvenile redfish remains poor in the area and the increasing biomasses observed are likely a consequence of either increased survival of redfish and/or migration of redfish into subarea 1 from nearby areas.
Fig. 4.2. Golden redfish (17 cm) survey biomass indices derived from the EU-Germany survey
and the Greenland shrimp and fish survey (Divs. 1A-F) since 2006.
0
10
20
30
40
50
60
70
1981 1984 1987 1990 1993 1996 1999 2002 2005 2008 2011 2014
Bio
mas
s In
dex
Year
Golden redfish EU-Germany
Greenland SFW
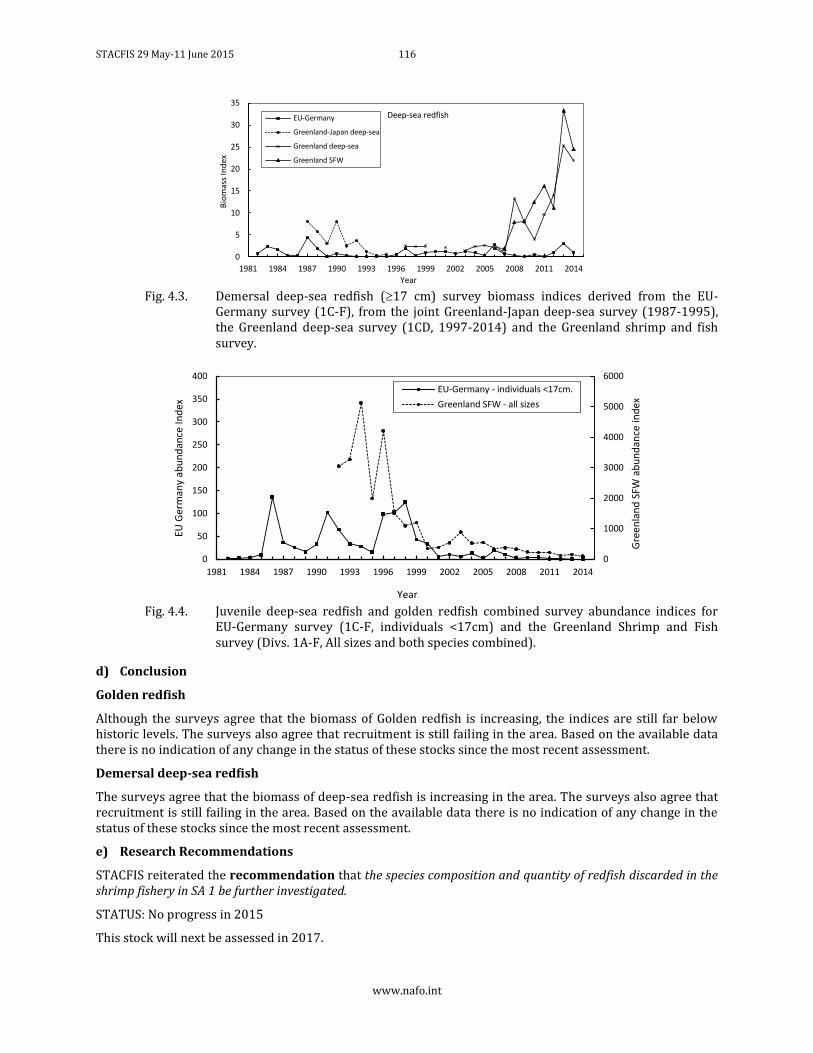
STACFIS 29 May-11 June 2015 116
www.nafo.int
Fig. 4.3. Demersal deep-sea redfish (17 cm) survey biomass indices derived from the EU-
Germany survey (1C-F), from the joint Greenland-Japan deep-sea survey (1987-1995), the Greenland deep-sea survey (1CD, 1997-2014) and the Greenland shrimp and fish survey.
Fig. 4.4. Juvenile deep-sea redfish and golden redfish combined survey abundance indices for
EU-Germany survey (1C-F, individuals <17cm) and the Greenland Shrimp and Fish survey (Divs. 1A-F, All sizes and both species combined).
d) Conclusion
Golden redfish
Although the surveys agree that the biomass of Golden redfish is increasing, the indices are still far below historic levels. The surveys also agree that recruitment is still failing in the area. Based on the available data there is no indication of any change in the status of these stocks since the most recent assessment.
Demersal deep-sea redfish
The surveys agree that the biomass of deep-sea redfish is increasing in the area. The surveys also agree that recruitment is still failing in the area. Based on the available data there is no indication of any change in the status of these stocks since the most recent assessment.
e) Research Recommendations
STACFIS reiterated the recommendation that the species composition and quantity of redfish discarded in the shrimp fishery in SA 1 be further investigated.
STATUS: No progress in 2015
This stock will next be assessed in 2017.
0
5
10
15
20
25
30
35
1981 1984 1987 1990 1993 1996 1999 2002 2005 2008 2011 2014
Bio
mas
s In
de
x
Year
Deep-sea redfishEU-Germany
Greenland-Japan deep-sea
Greenland deep-sea
Greenland SFW
0
1000
2000
3000
4000
5000
6000
0
50
100
150
200
250
300
350
400
1981 1984 1987 1990 1993 1996 1999 2002 2005 2008 2011 2014
Gre
enla
nd
SFW
ab
un
dan
ce in
dex
EU G
erm
any
abu
nd
ance
In
dex
Year
EU-Germany - individuals <17cm.
Greenland SFW - all sizes
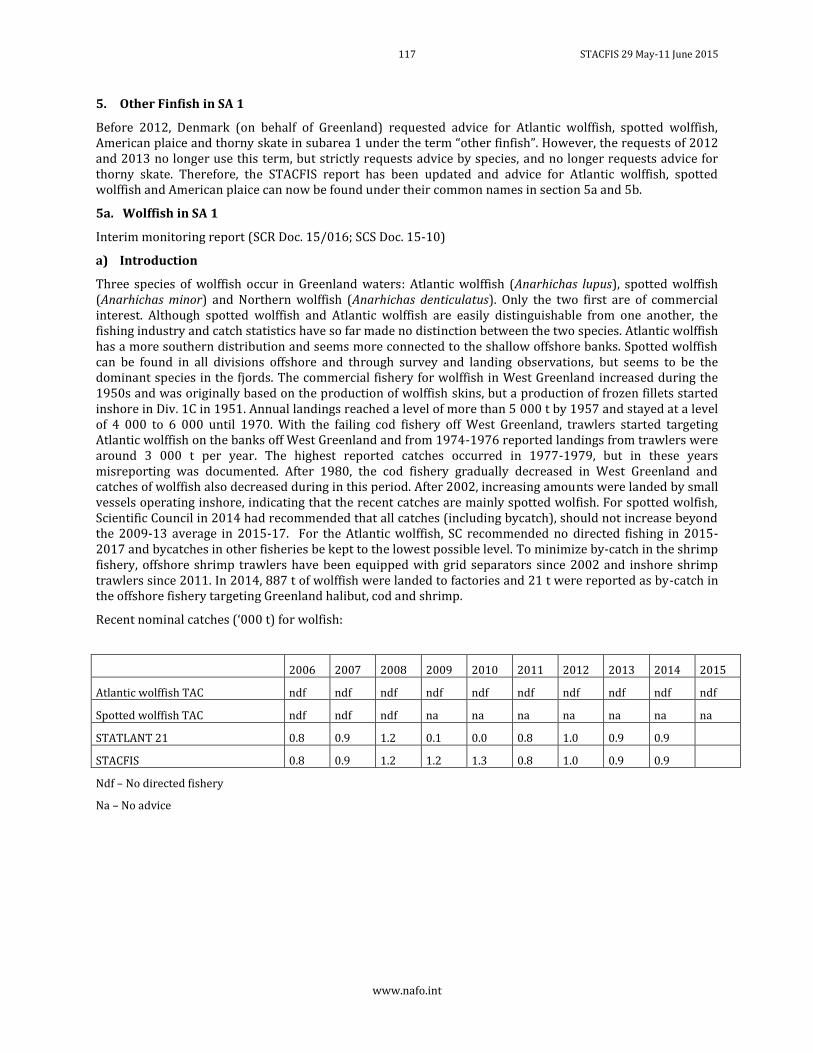
117 STACFIS 29 May-11 June 2015
www.nafo.int
5. Other Finfish in SA 1
Before 2012, Denmark (on behalf of Greenland) requested advice for Atlantic wolffish, spotted wolffish, American plaice and thorny skate in subarea 1 under the term “other finfish”. However, the requests of 2012 and 2013 no longer use this term, but strictly requests advice by species, and no longer requests advice for thorny skate. Therefore, the STACFIS report has been updated and advice for Atlantic wolffish, spotted wolffish and American plaice can now be found under their common names in section 5a and 5b.
5a. Wolffish in SA 1
Interim monitoring report (SCR Doc. 15/016; SCS Doc. 15-10)
a) Introduction
Three species of wolffish occur in Greenland waters: Atlantic wolffish (Anarhichas lupus), spotted wolffish (Anarhichas minor) and Northern wolffish (Anarhichas denticulatus). Only the two first are of commercial interest. Although spotted wolffish and Atlantic wolffish are easily distinguishable from one another, the fishing industry and catch statistics have so far made no distinction between the two species. Atlantic wolffish has a more southern distribution and seems more connected to the shallow offshore banks. Spotted wolffish can be found in all divisions offshore and through survey and landing observations, but seems to be the dominant species in the fjords. The commercial fishery for wolffish in West Greenland increased during the 1950s and was originally based on the production of wolffish skins, but a production of frozen fillets started inshore in Div. 1C in 1951. Annual landings reached a level of more than 5 000 t by 1957 and stayed at a level of 4 000 to 6 000 until 1970. With the failing cod fishery off West Greenland, trawlers started targeting Atlantic wolffish on the banks off West Greenland and from 1974-1976 reported landings from trawlers were around 3 000 t per year. The highest reported catches occurred in 1977-1979, but in these years misreporting was documented. After 1980, the cod fishery gradually decreased in West Greenland and catches of wolffish also decreased during in this period. After 2002, increasing amounts were landed by small vessels operating inshore, indicating that the recent catches are mainly spotted wolfish. For spotted wolfish, Scientific Council in 2014 had recommended that all catches (including bycatch), should not increase beyond the 2009-13 average in 2015-17. For the Atlantic wolffish, SC recommended no directed fishing in 2015-2017 and bycatches in other fisheries be kept to the lowest possible level. To minimize by-catch in the shrimp fishery, offshore shrimp trawlers have been equipped with grid separators since 2002 and inshore shrimp trawlers since 2011. In 2014, 887 t of wolffish were landed to factories and 21 t were reported as by-catch in the offshore fishery targeting Greenland halibut, cod and shrimp.
Recent nominal catches (‘000 t) for wolfish:
2006 2007 2008 2009 2010 2011 2012 2013 2014 2015
Atlantic wolffish TAC ndf ndf ndf ndf ndf ndf ndf ndf ndf ndf
Spotted wolffish TAC ndf ndf ndf na na na na na na na
STATLANT 21 0.8 0.9 1.2 0.1 0.0 0.8 1.0 0.9 0.9
STACFIS 0.8 0.9 1.2 1.2 1.3 0.8 1.0 0.9 0.9
Ndf – No directed fishery
Na – No advice
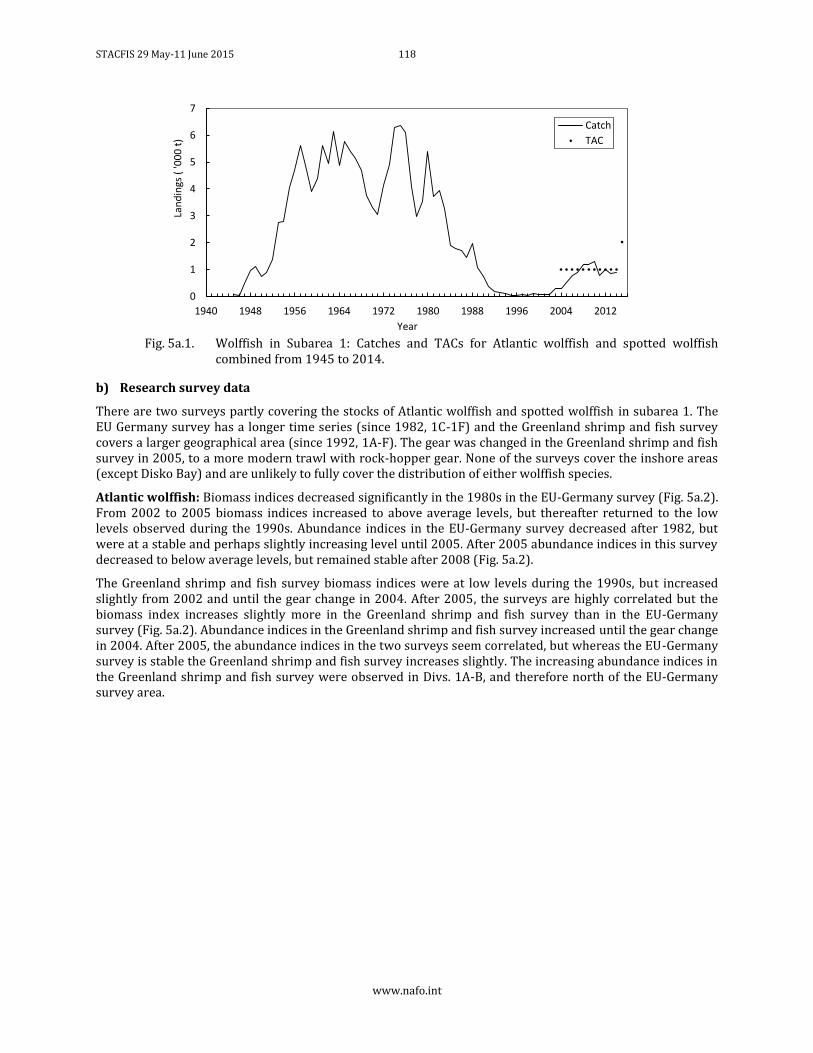
STACFIS 29 May-11 June 2015 118
www.nafo.int
Fig. 5a.1. Wolffish in Subarea 1: Catches and TACs for Atlantic wolffish and spotted wolffish
combined from 1945 to 2014.
b) Research survey data
There are two surveys partly covering the stocks of Atlantic wolffish and spotted wolffish in subarea 1. The EU Germany survey has a longer time series (since 1982, 1C-1F) and the Greenland shrimp and fish survey covers a larger geographical area (since 1992, 1A-F). The gear was changed in the Greenland shrimp and fish survey in 2005, to a more modern trawl with rock-hopper gear. None of the surveys cover the inshore areas (except Disko Bay) and are unlikely to fully cover the distribution of either wolffish species.
Atlantic wolffish: Biomass indices decreased significantly in the 1980s in the EU-Germany survey (Fig. 5a.2). From 2002 to 2005 biomass indices increased to above average levels, but thereafter returned to the low levels observed during the 1990s. Abundance indices in the EU-Germany survey decreased after 1982, but were at a stable and perhaps slightly increasing level until 2005. After 2005 abundance indices in this survey decreased to below average levels, but remained stable after 2008 (Fig. 5a.2).
The Greenland shrimp and fish survey biomass indices were at low levels during the 1990s, but increased slightly from 2002 and until the gear change in 2004. After 2005, the surveys are highly correlated but the biomass index increases slightly more in the Greenland shrimp and fish survey than in the EU-Germany survey (Fig. 5a.2). Abundance indices in the Greenland shrimp and fish survey increased until the gear change in 2004. After 2005, the abundance indices in the two surveys seem correlated, but whereas the EU-Germany survey is stable the Greenland shrimp and fish survey increases slightly. The increasing abundance indices in the Greenland shrimp and fish survey were observed in Divs. 1A-B, and therefore north of the EU-Germany survey area.
0
1
2
3
4
5
6
7
1940 1948 1956 1964 1972 1980 1988 1996 2004 2012
Lan
din
gs (
'00
0 t
)
Year
Catch
TAC
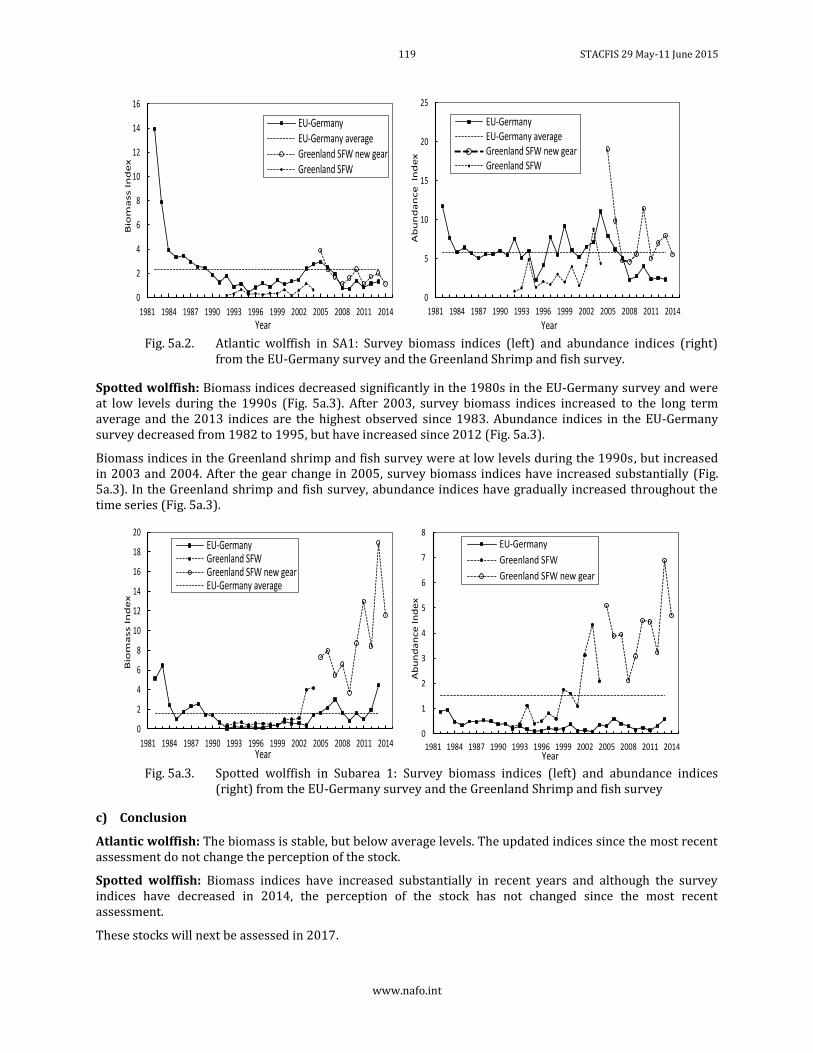
119 STACFIS 29 May-11 June 2015
www.nafo.int
Fig. 5a.2. Atlantic wolffish in SA1: Survey biomass indices (left) and abundance indices (right)
from the EU-Germany survey and the Greenland Shrimp and fish survey.
Spotted wolffish: Biomass indices decreased significantly in the 1980s in the EU-Germany survey and were at low levels during the 1990s (Fig. 5a.3). After 2003, survey biomass indices increased to the long term average and the 2013 indices are the highest observed since 1983. Abundance indices in the EU-Germany survey decreased from 1982 to 1995, but have increased since 2012 (Fig. 5a.3).
Biomass indices in the Greenland shrimp and fish survey were at low levels during the 1990s, but increased in 2003 and 2004. After the gear change in 2005, survey biomass indices have increased substantially (Fig. 5a.3). In the Greenland shrimp and fish survey, abundance indices have gradually increased throughout the time series (Fig. 5a.3).
Fig. 5a.3. Spotted wolffish in Subarea 1: Survey biomass indices (left) and abundance indices
(right) from the EU-Germany survey and the Greenland Shrimp and fish survey
c) Conclusion
Atlantic wolffish: The biomass is stable, but below average levels. The updated indices since the most recent assessment do not change the perception of the stock.
Spotted wolffish: Biomass indices have increased substantially in recent years and although the survey indices have decreased in 2014, the perception of the stock has not changed since the most recent assessment.
These stocks will next be assessed in 2017.
0
2
4
6
8
10
12
14
16
1981 1984 1987 1990 1993 1996 1999 2002 2005 2008 2011 2014
Bio
ma
ss I
nd
ex
Year
EU-GermanyEU-Germany averageGreenland SFW new gearGreenland SFW
0
5
10
15
20
25
1981 1984 1987 1990 1993 1996 1999 2002 2005 2008 2011 2014
Ab
un
da
nce
In
de
x
Year
EU-GermanyEU-Germany averageGreenland SFW new gearGreenland SFW
0
2
4
6
8
10
12
14
16
18
20
1981 1984 1987 1990 1993 1996 1999 2002 2005 2008 2011 2014
Bio
ma
ss I
nd
ex
Year
EU-GermanyGreenland SFWGreenland SFW new gearEU-Germany average
0
1
2
3
4
5
6
7
8
1981 1984 1987 1990 1993 1996 1999 2002 2005 2008 2011 2014
Ab
un
da
nce
In
de
x
Year
EU-Germany
Greenland SFW
Greenland SFW new gear
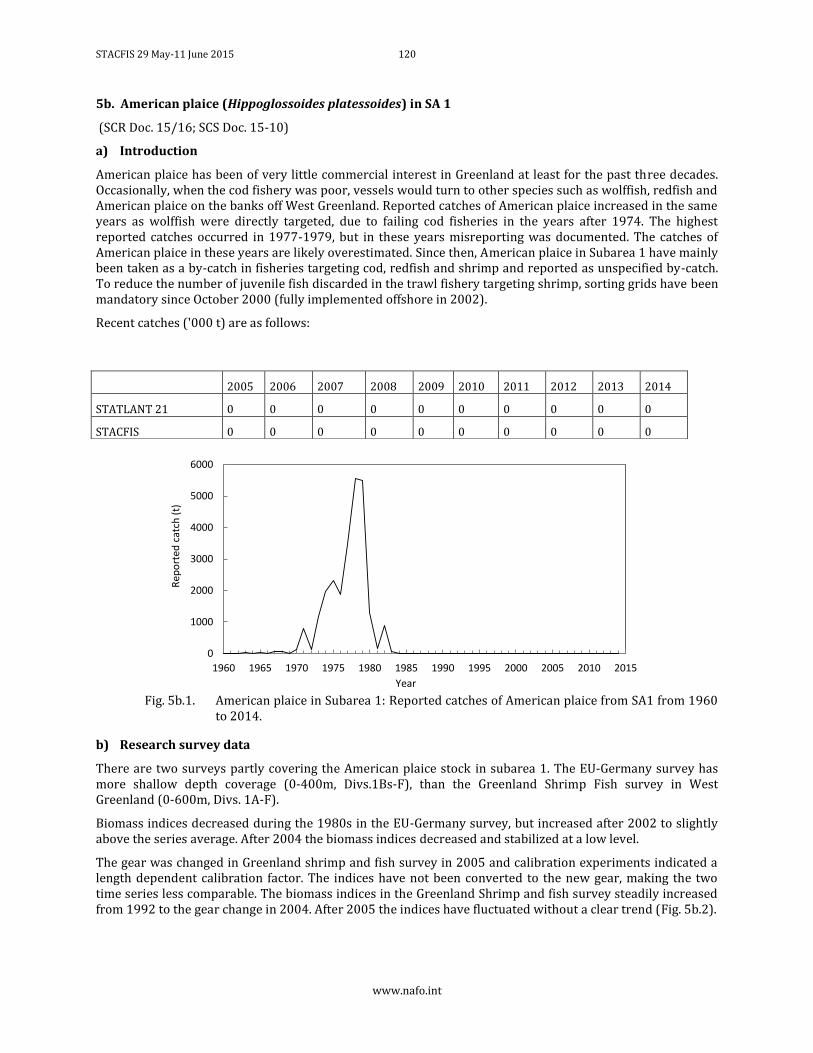
STACFIS 29 May-11 June 2015 120
www.nafo.int
5b. American plaice (Hippoglossoides platessoides) in SA 1
(SCR Doc. 15/16; SCS Doc. 15-10)
a) Introduction
American plaice has been of very little commercial interest in Greenland at least for the past three decades. Occasionally, when the cod fishery was poor, vessels would turn to other species such as wolffish, redfish and American plaice on the banks off West Greenland. Reported catches of American plaice increased in the same years as wolffish were directly targeted, due to failing cod fisheries in the years after 1974. The highest reported catches occurred in 1977-1979, but in these years misreporting was documented. The catches of American plaice in these years are likely overestimated. Since then, American plaice in Subarea 1 have mainly been taken as a by-catch in fisheries targeting cod, redfish and shrimp and reported as unspecified by-catch. To reduce the number of juvenile fish discarded in the trawl fishery targeting shrimp, sorting grids have been mandatory since October 2000 (fully implemented offshore in 2002).
Recent catches ('000 t) are as follows:
Fig. 5b.1. American plaice in Subarea 1: Reported catches of American plaice from SA1 from 1960
to 2014.
b) Research survey data
There are two surveys partly covering the American plaice stock in subarea 1. The EU-Germany survey has more shallow depth coverage (0-400m, Divs.1Bs-F), than the Greenland Shrimp Fish survey in West Greenland (0-600m, Divs. 1A-F).
Biomass indices decreased during the 1980s in the EU-Germany survey, but increased after 2002 to slightly above the series average. After 2004 the biomass indices decreased and stabilized at a low level.
The gear was changed in Greenland shrimp and fish survey in 2005 and calibration experiments indicated a length dependent calibration factor. The indices have not been converted to the new gear, making the two time series less comparable. The biomass indices in the Greenland Shrimp and fish survey steadily increased from 1992 to the gear change in 2004. After 2005 the indices have fluctuated without a clear trend (Fig. 5b.2).
0
1000
2000
3000
4000
5000
6000
1960 1965 1970 1975 1980 1985 1990 1995 2000 2005 2010 2015
Rep
ort
ed c
atch
(t)
Year
2005 2006 2007 2008 2009 2010 2011 2012 2013 2014
STATLANT 21 0 0 0 0 0 0 0 0 0 0
STACFIS 0 0 0 0 0 0 0 0 0 0
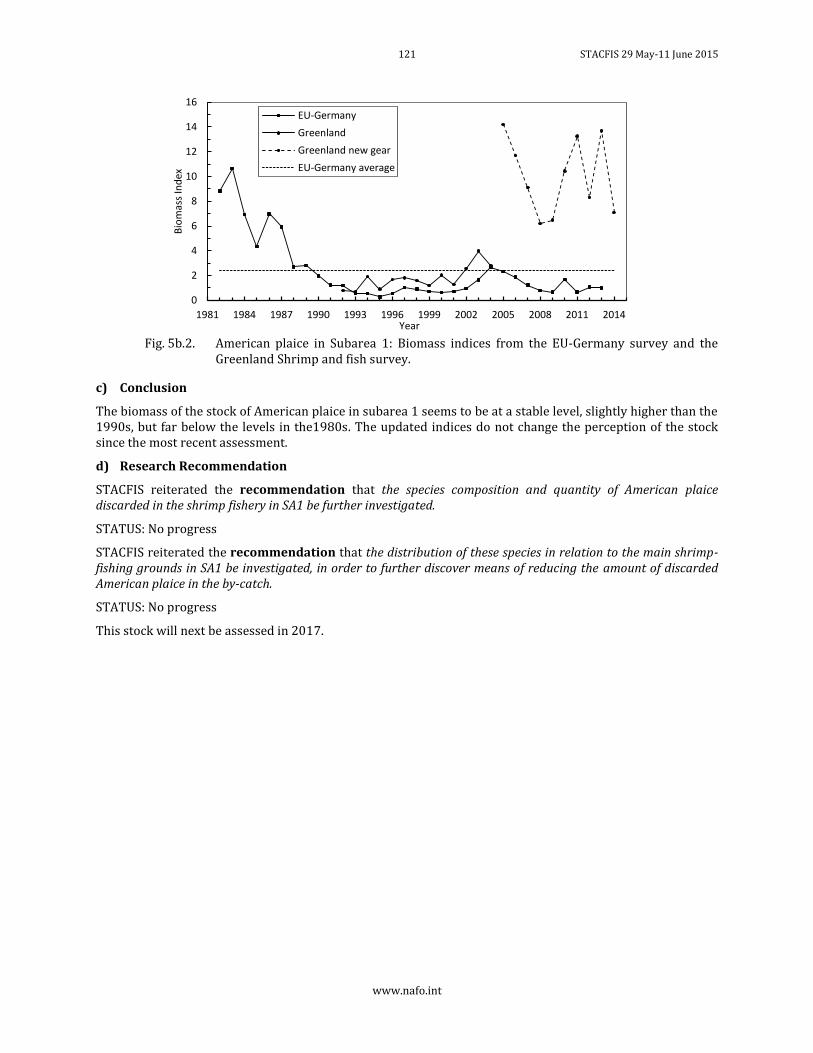
121 STACFIS 29 May-11 June 2015
www.nafo.int
Fig. 5b.2. American plaice in Subarea 1: Biomass indices from the EU-Germany survey and the
Greenland Shrimp and fish survey.
c) Conclusion
The biomass of the stock of American plaice in subarea 1 seems to be at a stable level, slightly higher than the 1990s, but far below the levels in the1980s. The updated indices do not change the perception of the stock since the most recent assessment.
d) Research Recommendation
STACFIS reiterated the recommendation that the species composition and quantity of American plaice discarded in the shrimp fishery in SA1 be further investigated.
STATUS: No progress
STACFIS reiterated the recommendation that the distribution of these species in relation to the main shrimp-fishing grounds in SA1 be investigated, in order to further discover means of reducing the amount of discarded American plaice in the by-catch.
STATUS: No progress
This stock will next be assessed in 2017.
0
2
4
6
8
10
12
14
16
1981 1984 1987 1990 1993 1996 1999 2002 2005 2008 2011 2014
Bio
mas
s In
dex
Year
EU-Germany
Greenland
Greenland new gear
EU-Germany average
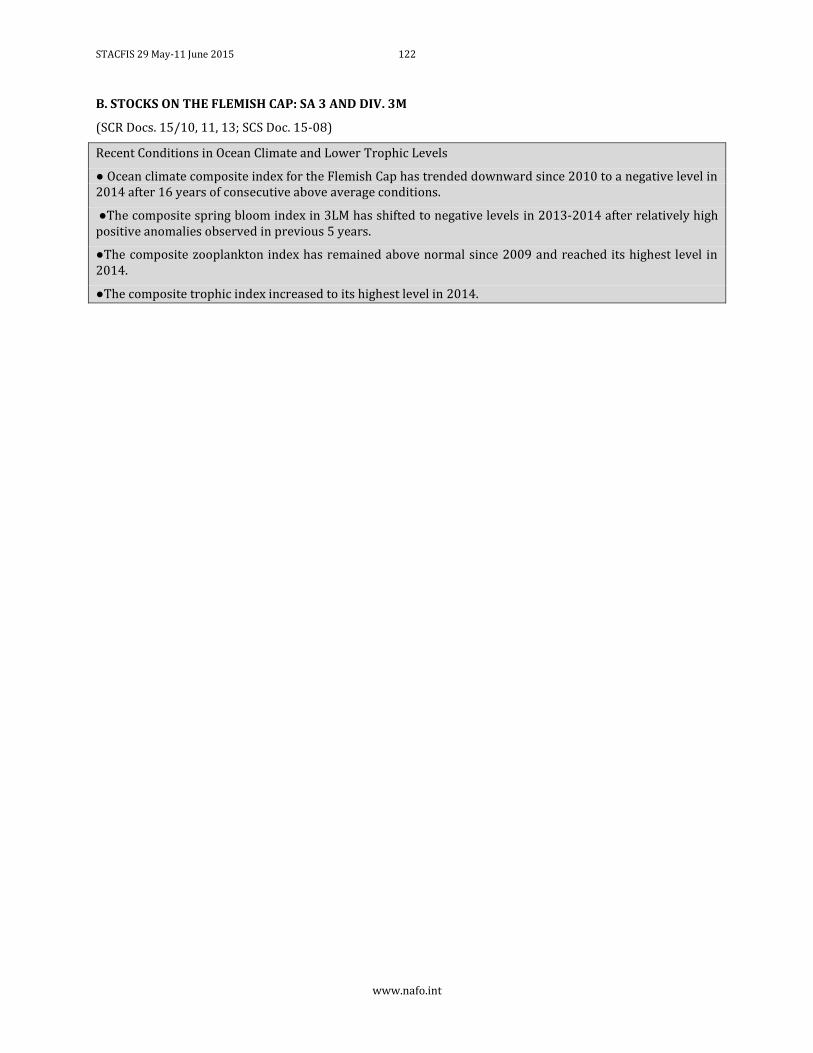
STACFIS 29 May-11 June 2015 122
www.nafo.int
B. STOCKS ON THE FLEMISH CAP: SA 3 AND DIV. 3M
(SCR Docs. 15/10, 11, 13; SCS Doc. 15-08)
Recent Conditions in Ocean Climate and Lower Trophic Levels
● Ocean climate composite index for the Flemish Cap has trended downward since 2010 to a negative level in 2014 after 16 years of consecutive above average conditions.
●The composite spring bloom index in 3LM has shifted to negative levels in 2013-2014 after relatively high positive anomalies observed in previous 5 years.
●The composite zooplankton index has remained above normal since 2009 and reached its highest level in 2014.
●The composite trophic index increased to its highest level in 2014.
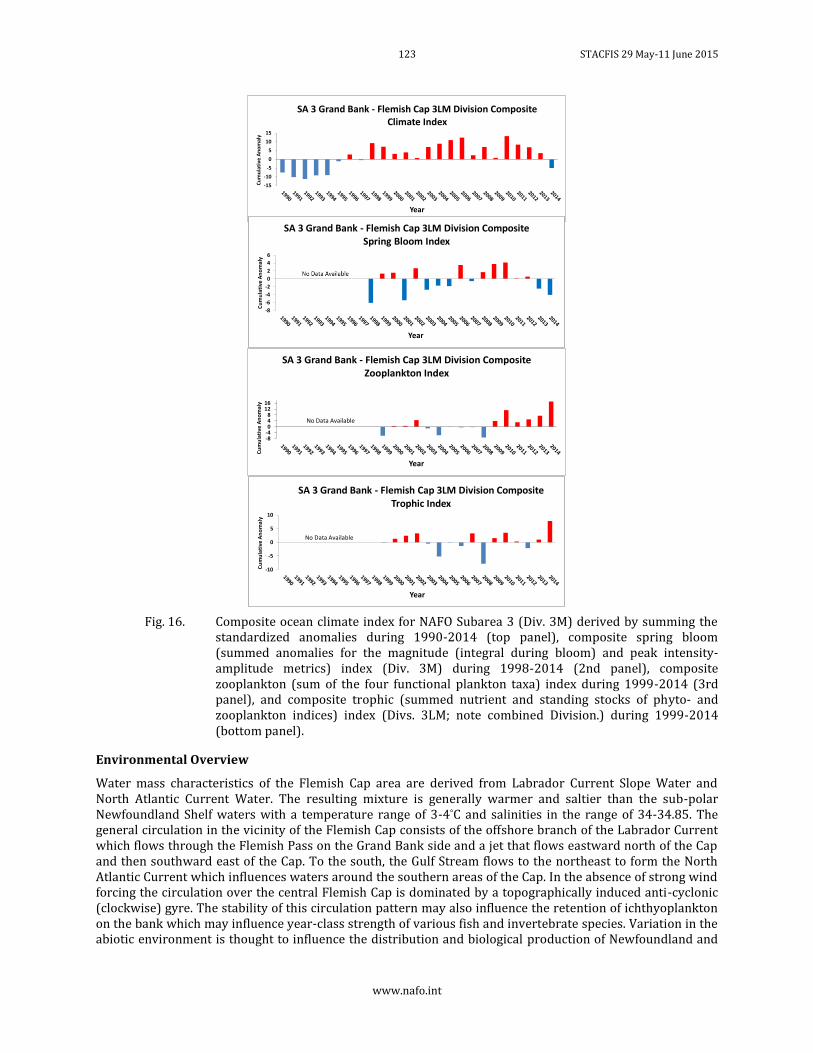
123 STACFIS 29 May-11 June 2015
www.nafo.int
Fig. 16. Composite ocean climate index for NAFO Subarea 3 (Div. 3M) derived by summing the
standardized anomalies during 1990-2014 (top panel), composite spring bloom (summed anomalies for the magnitude (integral during bloom) and peak intensity-amplitude metrics) index (Div. 3M) during 1998-2014 (2nd panel), composite zooplankton (sum of the four functional plankton taxa) index during 1999-2014 (3rd panel), and composite trophic (summed nutrient and standing stocks of phyto- and zooplankton indices) index (Divs. 3LM; note combined Division.) during 1999-2014 (bottom panel).
Environmental Overview
Water mass characteristics of the Flemish Cap area are derived from Labrador Current Slope Water and North Atlantic Current Water. The resulting mixture is generally warmer and saltier than the sub-polar Newfoundland Shelf waters with a temperature range of 3-4°C and salinities in the range of 34-34.85. The general circulation in the vicinity of the Flemish Cap consists of the offshore branch of the Labrador Current which flows through the Flemish Pass on the Grand Bank side and a jet that flows eastward north of the Cap and then southward east of the Cap. To the south, the Gulf Stream flows to the northeast to form the North Atlantic Current which influences waters around the southern areas of the Cap. In the absence of strong wind forcing the circulation over the central Flemish Cap is dominated by a topographically induced anti-cyclonic (clockwise) gyre. The stability of this circulation pattern may also influence the retention of ichthyoplankton on the bank which may influence year-class strength of various fish and invertebrate species. Variation in the abiotic environment is thought to influence the distribution and biological production of Newfoundland and
-15
-10
-5
0
5
10
15
Cu
mu
lati
ve A
no
mal
y
Year
SA 3 Grand Bank - Flemish Cap 3LM Division Composite Climate Index
-8
-6
-4
-2
0
2
4
6C
um
ula
tive
An
om
aly
Year
SA 3 Grand Bank - Flemish Cap 3LM Division Composite Spring Bloom Index
-8-4048
1216
Cu
mu
lati
ve A
no
mal
y
Year
SA 3 Grand Bank - Flemish Cap 3LM Division Composite Zooplankton Index
No Data Available
-10
-5
0
5
10
Cu
mu
lati
ve A
no
ma
ly
Year
SA 3 Grand Bank - Flemish Cap 3LM Division Composite Trophic Index
No Data Available
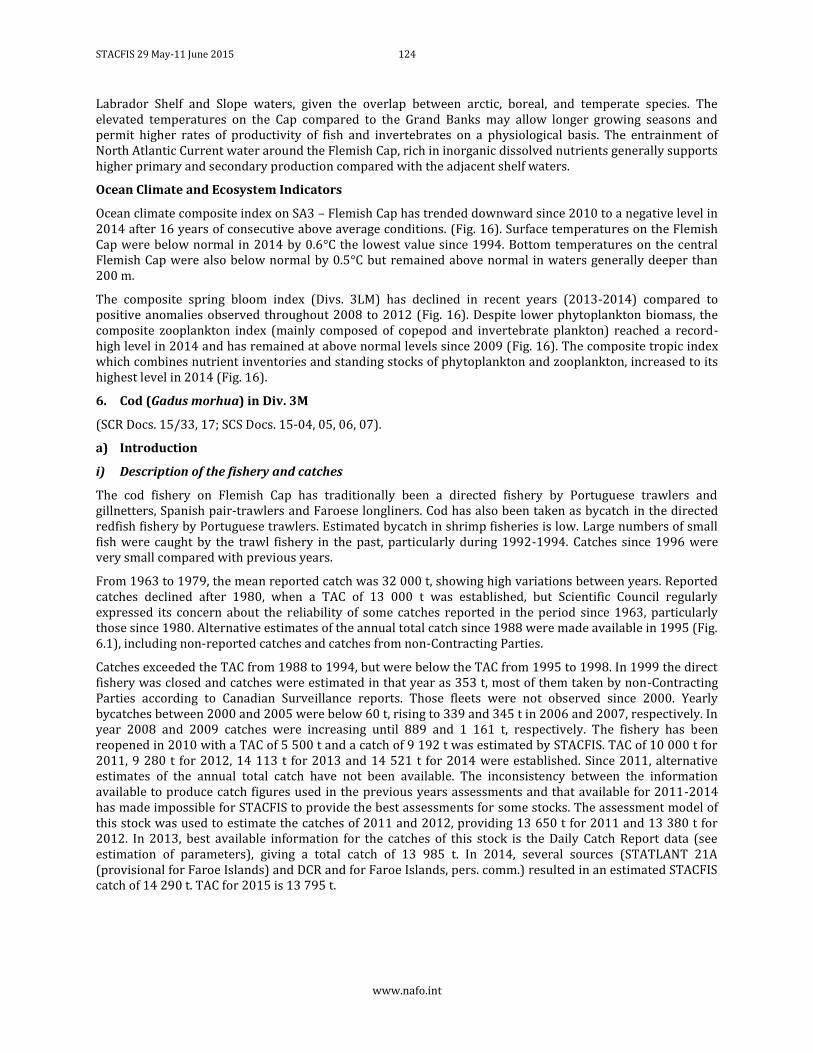
STACFIS 29 May-11 June 2015 124
www.nafo.int
Labrador Shelf and Slope waters, given the overlap between arctic, boreal, and temperate species. The elevated temperatures on the Cap compared to the Grand Banks may allow longer growing seasons and permit higher rates of productivity of fish and invertebrates on a physiological basis. The entrainment of North Atlantic Current water around the Flemish Cap, rich in inorganic dissolved nutrients generally supports higher primary and secondary production compared with the adjacent shelf waters.
Ocean Climate and Ecosystem Indicators
Ocean climate composite index on SA3 – Flemish Cap has trended downward since 2010 to a negative level in 2014 after 16 years of consecutive above average conditions. (Fig. 16). Surface temperatures on the Flemish Cap were below normal in 2014 by 0.6°C the lowest value since 1994. Bottom temperatures on the central Flemish Cap were also below normal by 0.5°C but remained above normal in waters generally deeper than 200 m.
The composite spring bloom index (Divs. 3LM) has declined in recent years (2013-2014) compared to positive anomalies observed throughout 2008 to 2012 (Fig. 16). Despite lower phytoplankton biomass, the composite zooplankton index (mainly composed of copepod and invertebrate plankton) reached a record-high level in 2014 and has remained at above normal levels since 2009 (Fig. 16). The composite tropic index which combines nutrient inventories and standing stocks of phytoplankton and zooplankton, increased to its highest level in 2014 (Fig. 16).
6. Cod (Gadus morhua) in Div. 3M
(SCR Docs. 15/33, 17; SCS Docs. 15-04, 05, 06, 07).
a) Introduction
i) Description of the fishery and catches
The cod fishery on Flemish Cap has traditionally been a directed fishery by Portuguese trawlers and gillnetters, Spanish pair-trawlers and Faroese longliners. Cod has also been taken as bycatch in the directed redfish fishery by Portuguese trawlers. Estimated bycatch in shrimp fisheries is low. Large numbers of small fish were caught by the trawl fishery in the past, particularly during 1992-1994. Catches since 1996 were very small compared with previous years.
From 1963 to 1979, the mean reported catch was 32 000 t, showing high variations between years. Reported catches declined after 1980, when a TAC of 13 000 t was established, but Scientific Council regularly expressed its concern about the reliability of some catches reported in the period since 1963, particularly those since 1980. Alternative estimates of the annual total catch since 1988 were made available in 1995 (Fig. 6.1), including non-reported catches and catches from non-Contracting Parties.
Catches exceeded the TAC from 1988 to 1994, but were below the TAC from 1995 to 1998. In 1999 the direct fishery was closed and catches were estimated in that year as 353 t, most of them taken by non-Contracting Parties according to Canadian Surveillance reports. Those fleets were not observed since 2000. Yearly bycatches between 2000 and 2005 were below 60 t, rising to 339 and 345 t in 2006 and 2007, respectively. In year 2008 and 2009 catches were increasing until 889 and 1 161 t, respectively. The fishery has been reopened in 2010 with a TAC of 5 500 t and a catch of 9 192 t was estimated by STACFIS. TAC of 10 000 t for 2011, 9 280 t for 2012, 14 113 t for 2013 and 14 521 t for 2014 were established. Since 2011, alternative estimates of the annual total catch have not been available. The inconsistency between the information available to produce catch figures used in the previous years assessments and that available for 2011-2014 has made impossible for STACFIS to provide the best assessments for some stocks. The assessment model of this stock was used to estimate the catches of 2011 and 2012, providing 13 650 t for 2011 and 13 380 t for 2012. In 2013, best available information for the catches of this stock is the Daily Catch Report data (see estimation of parameters), giving a total catch of 13 985 t. In 2014, several sources (STATLANT 21A (provisional for Faroe Islands) and DCR and for Faroe Islands, pers. comm.) resulted in an estimated STACFIS catch of 14 290 t. TAC for 2015 is 13 795 t.
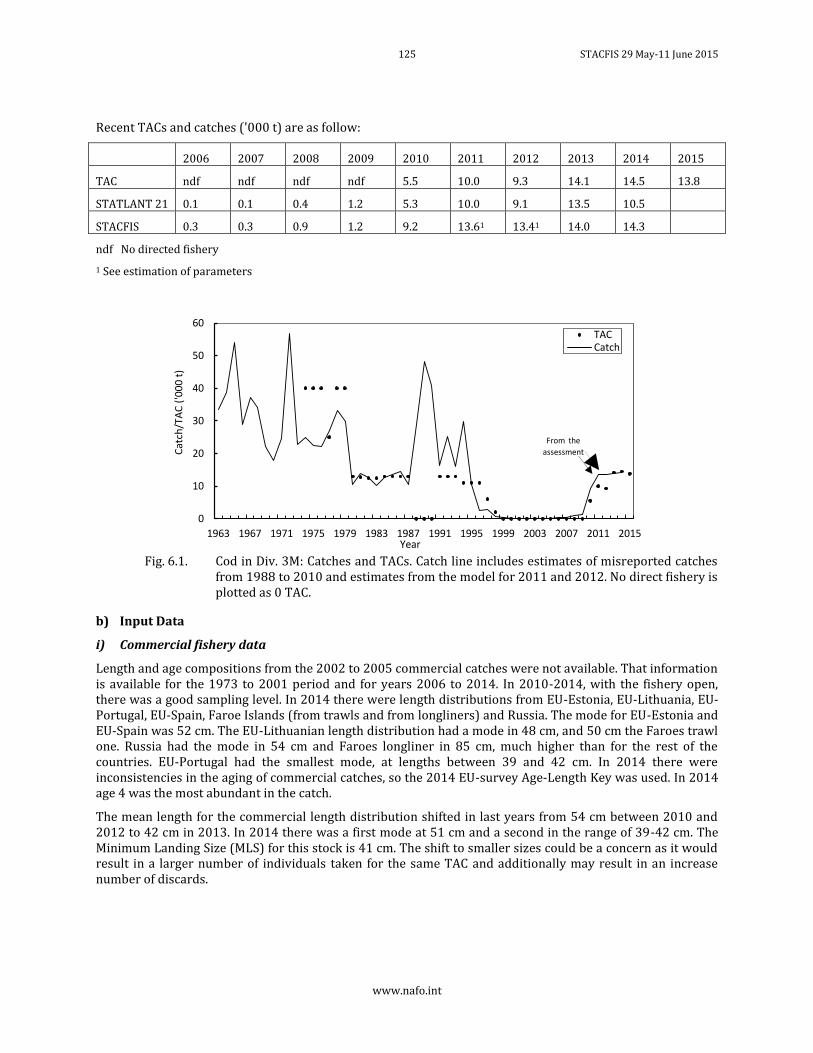
125 STACFIS 29 May-11 June 2015
www.nafo.int
Recent TACs and catches ('000 t) are as follow:
2006 2007 2008 2009 2010 2011 2012 2013 2014 2015
TAC ndf ndf ndf ndf 5.5 10.0 9.3 14.1 14.5 13.8
STATLANT 21 0.1 0.1 0.4 1.2 5.3 10.0 9.1 13.5 10.5
STACFIS 0.3 0.3 0.9 1.2 9.2 13.61 13.41 14.0 14.3
ndf No directed fishery
1 See estimation of parameters
Fig. 6.1. Cod in Div. 3M: Catches and TACs. Catch line includes estimates of misreported catches
from 1988 to 2010 and estimates from the model for 2011 and 2012. No direct fishery is plotted as 0 TAC.
b) Input Data
i) Commercial fishery data
Length and age compositions from the 2002 to 2005 commercial catches were not available. That information is available for the 1973 to 2001 period and for years 2006 to 2014. In 2010-2014, with the fishery open, there was a good sampling level. In 2014 there were length distributions from EU-Estonia, EU-Lithuania, EU-Portugal, EU-Spain, Faroe Islands (from trawls and from longliners) and Russia. The mode for EU-Estonia and EU-Spain was 52 cm. The EU-Lithuanian length distribution had a mode in 48 cm, and 50 cm the Faroes trawl one. Russia had the mode in 54 cm and Faroes longliner in 85 cm, much higher than for the rest of the countries. EU-Portugal had the smallest mode, at lengths between 39 and 42 cm. In 2014 there were inconsistencies in the aging of commercial catches, so the 2014 EU-survey Age-Length Key was used. In 2014 age 4 was the most abundant in the catch.
The mean length for the commercial length distribution shifted in last years from 54 cm between 2010 and 2012 to 42 cm in 2013. In 2014 there was a first mode at 51 cm and a second in the range of 39-42 cm. The Minimum Landing Size (MLS) for this stock is 41 cm. The shift to smaller sizes could be a concern as it would result in a larger number of individuals taken for the same TAC and additionally may result in an increase number of discards.
0
10
20
30
40
50
60
1963 1967 1971 1975 1979 1983 1987 1991 1995 1999 2003 2007 2011 2015
Cat
ch/T
AC
('0
00
t)
Year
TACCatch
From the
assessment
STACFIS 29 May-11 June 2015 126
www.nafo.int
ii) Research survey data
Canadian survey. Canada conducted research vessel surveys on Flemish Cap from 1978-1985. Surveys were done with the R/V Gadus Atlantica, fishing with a lined Engels 145 otter trawl. The surveys were conducted in January-February of each year from 1978 to 1985 covered depths between130 and 728 m.
From a high value in 1978, a general decrease in abundance can be seen until 1985, reaching the lowest level in 1982 (Fig. 6.2).
Abundance at age indices were available from the Canadian survey. For this survey, indices of recruitment at age 1 were low in all the years except in 1982 and 1983 (Fig. 6.3).
EU survey. The EU Flemish Cap survey has been conducted since 1988 in summer with a Lofoten type gear. The survey indices showed a general decline in biomass going from a peak value in 1989 to the lowest observed level in 2003. Biomass index increased since then until 2012, especially from 2006. The growth of the strong year classes since 2005 has contributed to the increase in biomass. In 2013 a substantial decrease in biomass can be seen, reaching the level of 2010, although remaining at high level. In 2014 the biomass increased again reaching the maximum observed in the time series. Abundance has generally increased since 2005. The pattern, and difference between biomass and abundance, over 2011-2014 is driven by the very large 2010 and 2011 year classes (Fig. 6.2).
Fig. 6.2. Cod in Div. 3M: Survey abundance and biomass estimates from Canadian survey (1978-
1985) and EU-Flemish Cap survey (1998-2014).
Abundance at age indices were available from the EU Flemish Cap survey. After several series of above average recruitments (age 1) during 1988-1992, the EU Flemish Cap survey indicates poor recruitments during 1996-2004, even obtaining observed zero values in 2002 and 2004. From 2005 to 2012 increased recruitments were observed. In particular, the age 1 index in 2011 is by far the largest in the EU series (Fig. 6.3; note that the level of both surveys is different in the two y-axis). In 2013 and 2014 the recruitment index dropped to the level at the beginning of the recovery of the stock.
0
100
200
300
400
500
600
0
20
40
60
80
100
120
140
160
180
1978 1982 1986 1990 1994 1998 2002 2006 2010 2014
Abun
danc
e In
dex
Biom
ass I
ndex
Year
Canada Biomass
EU Biomass
Canada Abundance
EU Abundance
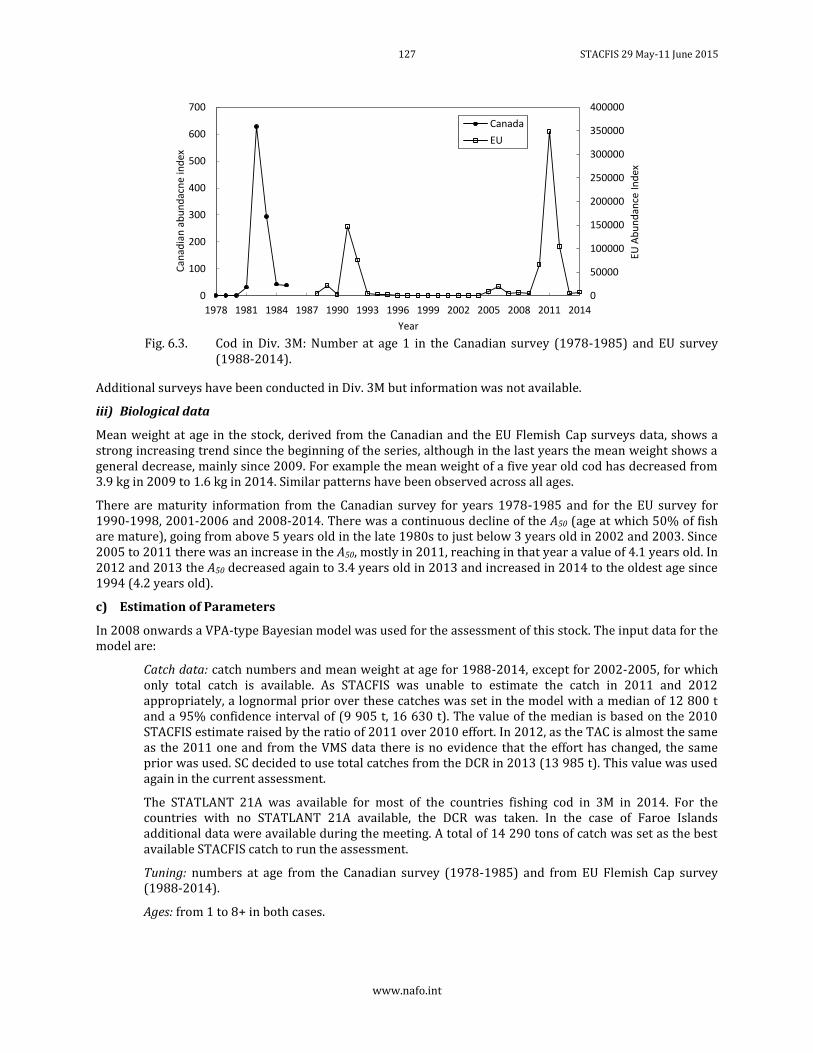
127 STACFIS 29 May-11 June 2015
www.nafo.int
Fig. 6.3. Cod in Div. 3M: Number at age 1 in the Canadian survey (1978-1985) and EU survey
(1988-2014).
Additional surveys have been conducted in Div. 3M but information was not available.
iii) Biological data
Mean weight at age in the stock, derived from the Canadian and the EU Flemish Cap surveys data, shows a strong increasing trend since the beginning of the series, although in the last years the mean weight shows a general decrease, mainly since 2009. For example the mean weight of a five year old cod has decreased from 3.9 kg in 2009 to 1.6 kg in 2014. Similar patterns have been observed across all ages.
There are maturity information from the Canadian survey for years 1978-1985 and for the EU survey for 1990-1998, 2001-2006 and 2008-2014. There was a continuous decline of the A50 (age at which 50% of fish are mature), going from above 5 years old in the late 1980s to just below 3 years old in 2002 and 2003. Since 2005 to 2011 there was an increase in the A50, mostly in 2011, reaching in that year a value of 4.1 years old. In 2012 and 2013 the A50 decreased again to 3.4 years old in 2013 and increased in 2014 to the oldest age since 1994 (4.2 years old).
c) Estimation of Parameters
In 2008 onwards a VPA-type Bayesian model was used for the assessment of this stock. The input data for the model are:
Catch data: catch numbers and mean weight at age for 1988-2014, except for 2002-2005, for which only total catch is available. As STACFIS was unable to estimate the catch in 2011 and 2012 appropriately, a lognormal prior over these catches was set in the model with a median of 12 800 t and a 95% confidence interval of (9 905 t, 16 630 t). The value of the median is based on the 2010 STACFIS estimate raised by the ratio of 2011 over 2010 effort. In 2012, as the TAC is almost the same as the 2011 one and from the VMS data there is no evidence that the effort has changed, the same prior was used. SC decided to use total catches from the DCR in 2013 (13 985 t). This value was used again in the current assessment.
The STATLANT 21A was available for most of the countries fishing cod in 3M in 2014. For the countries with no STATLANT 21A available, the DCR was taken. In the case of Faroe Islands additional data were available during the meeting. A total of 14 290 tons of catch was set as the best available STACFIS catch to run the assessment.
Tuning: numbers at age from the Canadian survey (1978-1985) and from EU Flemish Cap survey (1988-2014).
Ages: from 1 to 8+ in both cases.
0
50000
100000
150000
200000
250000
300000
350000
400000
0
100
200
300
400
500
600
700
1978 1981 1984 1987 1990 1993 1996 1999 2002 2005 2008 2011 2014
EU A
bu
nd
ance
In
dex
Can
adia
n a
bu
nd
acn
e in
dex
Year
Canada
EU
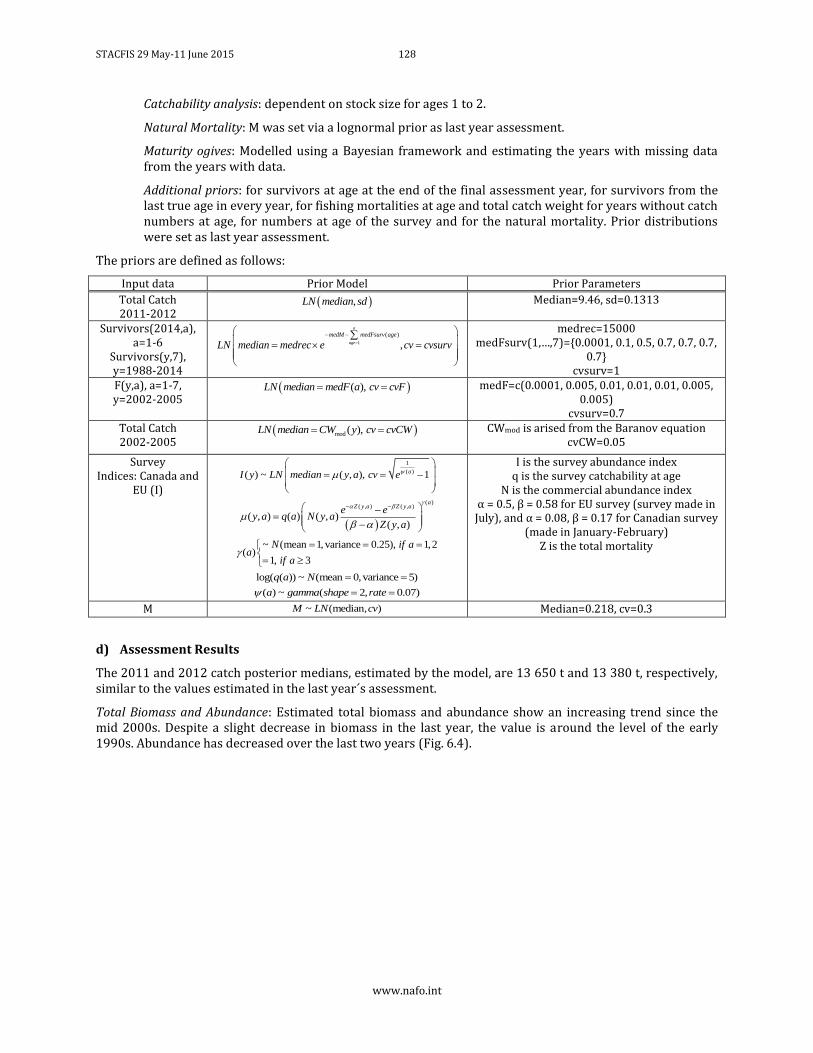
STACFIS 29 May-11 June 2015 128
www.nafo.int
Catchability analysis: dependent on stock size for ages 1 to 2.
Natural Mortality: M was set via a lognormal prior as last year assessment.
Maturity ogives: Modelled using a Bayesian framework and estimating the years with missing data from the years with data.
Additional priors: for survivors at age at the end of the final assessment year, for survivors from the last true age in every year, for fishing mortalities at age and total catch weight for years without catch numbers at age, for numbers at age of the survey and for the natural mortality. Prior distributions were set as last year assessment.
The priors are defined as follows:
Input data Prior Model Prior Parameters
Total Catch 2011-2012
,LN median sd
Median=9.46, sd=0.1313
Survivors(2014,a), a=1-6
Survivors(y,7), y=1988-2014
1
( )
,
a
age
medM medFsurv age
LN median medrec e cv cvsurv
medrec=15000 medFsurv(1,…,7)={0.0001, 0.1, 0.5, 0.7, 0.7, 0.7,
0.7} cvsurv=1
F(y,a), a=1-7, y=2002-2005
( ),LN median medF a cv cvF
medF=c(0.0001, 0.005, 0.01, 0.01, 0.01, 0.005, 0.005)
cvsurv=0.7 Total Catch 2002-2005
mod ( ),LN median CW y cv cvCW
CWmod is arised from the Baranov equation cvCW=0.05
Survey Indices: Canada and
EU (I)
1
( )( ) ~ ( , ), 1aI y LN median y a cv e
( )( , ) ( , )
( , ) ( ) ( , )( , )
aZ y a Z y ae e
y a q a N y aZ y a
~ (mean 1, variance 0.25), 1,2( )
1, 3
N if aa
if a
log( ( )) ~ (mean 0,variance 5)q a N ( ) ~ ( 2, 0.07)a gamma shape rate
I is the survey abundance index q is the survey catchability at age
N is the commercial abundance index α = 0.5, β = 0.58 for EU survey (survey made in
July), and α = 0.08, β = 0.17 for Canadian survey (made in January-February)
Z is the total mortality
M ~ (median, )M LN cv Median=0.218, cv=0.3
d) Assessment Results
The 2011 and 2012 catch posterior medians, estimated by the model, are 13 650 t and 13 380 t, respectively, similar to the values estimated in the last year´s assessment.
Total Biomass and Abundance: Estimated total biomass and abundance show an increasing trend since the mid 2000s. Despite a slight decrease in biomass in the last year, the value is around the level of the early 1990s. Abundance has decreased over the last two years (Fig. 6.4).
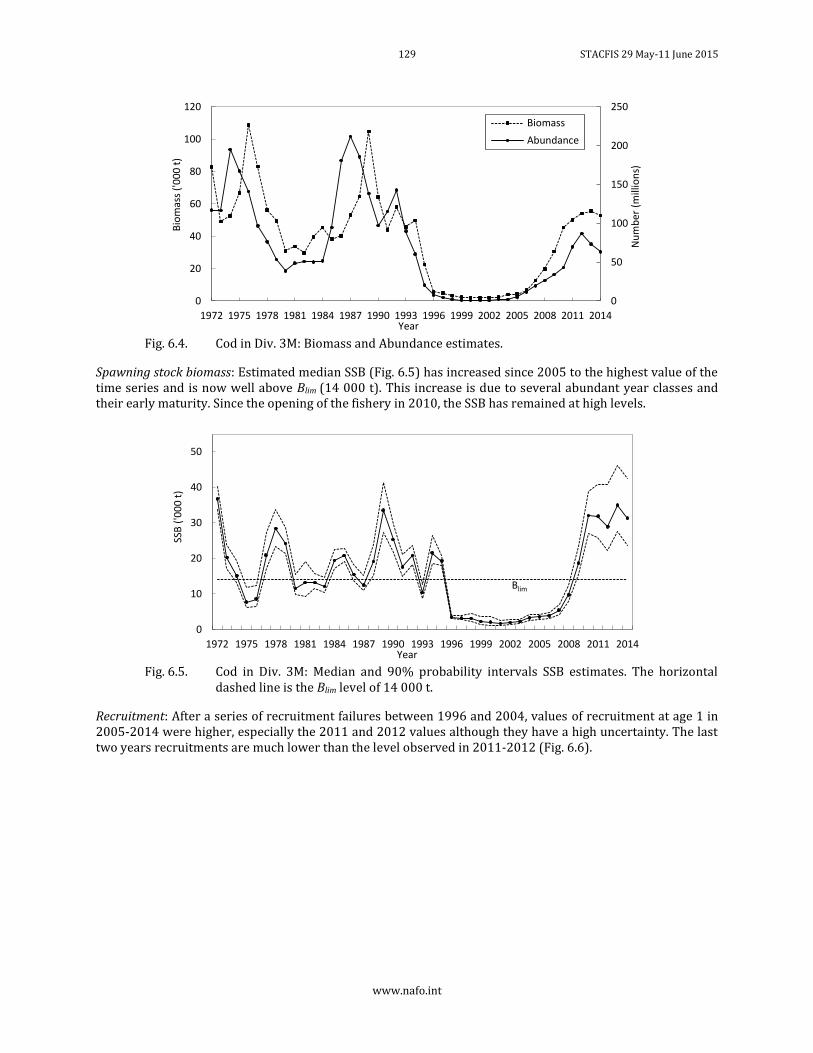
129 STACFIS 29 May-11 June 2015
www.nafo.int
Fig. 6.4. Cod in Div. 3M: Biomass and Abundance estimates.
Spawning stock biomass: Estimated median SSB (Fig. 6.5) has increased since 2005 to the highest value of the time series and is now well above Blim (14 000 t). This increase is due to several abundant year classes and their early maturity. Since the opening of the fishery in 2010, the SSB has remained at high levels.
Fig. 6.5. Cod in Div. 3M: Median and 90% probability intervals SSB estimates. The horizontal
dashed line is the Blim level of 14 000 t.
Recruitment: After a series of recruitment failures between 1996 and 2004, values of recruitment at age 1 in 2005-2014 were higher, especially the 2011 and 2012 values although they have a high uncertainty. The last two years recruitments are much lower than the level observed in 2011-2012 (Fig. 6.6).
0
50
100
150
200
250
0
20
40
60
80
100
120
1972 1975 1978 1981 1984 1987 1990 1993 1996 1999 2002 2005 2008 2011 2014
Nu
mb
er (
mill
ion
s)
Bio
mas
s ('
00
0 t
)
Year
Biomass
Abundance
0
10
20
30
40
50
1972 1975 1978 1981 1984 1987 1990 1993 1996 1999 2002 2005 2008 2011 2014
SSB
('0
00
t)
Year
Blim
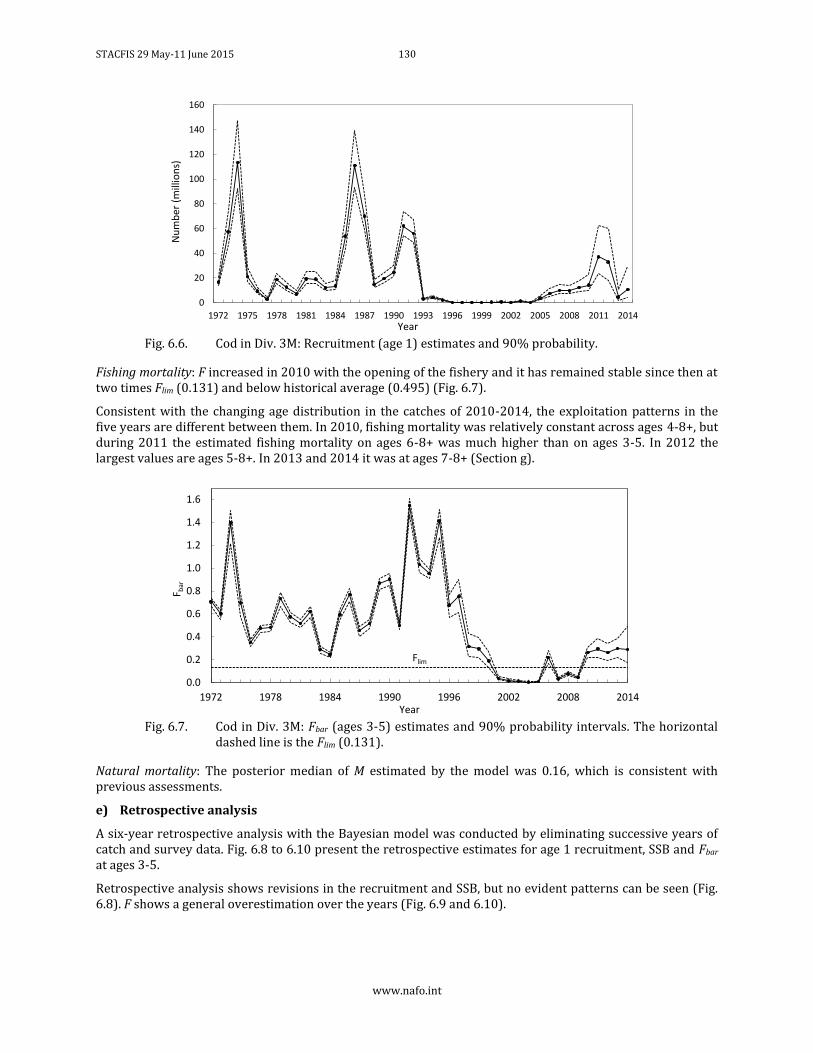
STACFIS 29 May-11 June 2015 130
www.nafo.int
Fig. 6.6. Cod in Div. 3M: Recruitment (age 1) estimates and 90% probability.
Fishing mortality: F increased in 2010 with the opening of the fishery and it has remained stable since then at two times Flim (0.131) and below historical average (0.495) (Fig. 6.7).
Consistent with the changing age distribution in the catches of 2010-2014, the exploitation patterns in the five years are different between them. In 2010, fishing mortality was relatively constant across ages 4-8+, but during 2011 the estimated fishing mortality on ages 6-8+ was much higher than on ages 3-5. In 2012 the largest values are ages 5-8+. In 2013 and 2014 it was at ages 7-8+ (Section g).
Fig. 6.7. Cod in Div. 3M: Fbar (ages 3-5) estimates and 90% probability intervals. The horizontal
dashed line is the Flim (0.131).
Natural mortality: The posterior median of M estimated by the model was 0.16, which is consistent with previous assessments.
e) Retrospective analysis
A six-year retrospective analysis with the Bayesian model was conducted by eliminating successive years of catch and survey data. Fig. 6.8 to 6.10 present the retrospective estimates for age 1 recruitment, SSB and Fbar at ages 3-5.
Retrospective analysis shows revisions in the recruitment and SSB, but no evident patterns can be seen (Fig. 6.8). F shows a general overestimation over the years (Fig. 6.9 and 6.10).
0
20
40
60
80
100
120
140
160
1972 1975 1978 1981 1984 1987 1990 1993 1996 1999 2002 2005 2008 2011 2014
Nu
mb
er (
mill
ion
s)
Year
0.0
0.2
0.4
0.6
0.8
1.0
1.2
1.4
1.6
1972 1978 1984 1990 1996 2002 2008 2014
F bar
Year
Flim
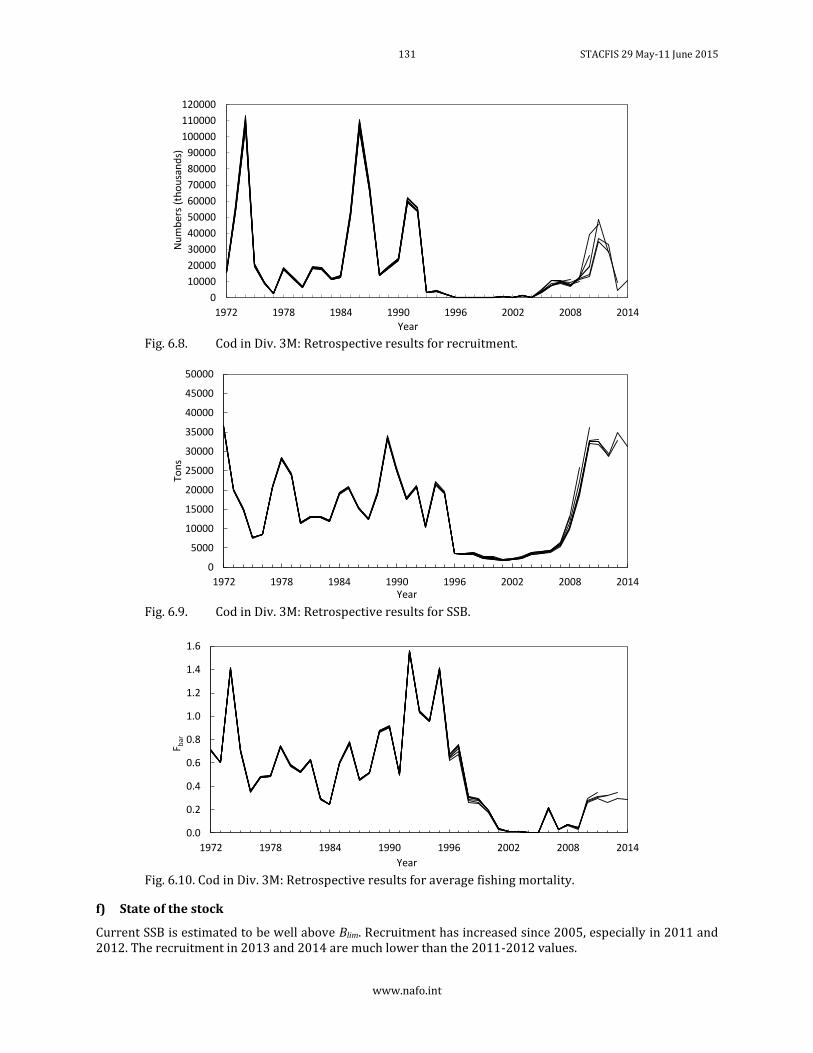
131 STACFIS 29 May-11 June 2015
www.nafo.int
Fig. 6.8. Cod in Div. 3M: Retrospective results for recruitment.
Fig. 6.9. Cod in Div. 3M: Retrospective results for SSB.
Fig. 6.10. Cod in Div. 3M: Retrospective results for average fishing mortality.
f) State of the stock
Current SSB is estimated to be well above Blim. Recruitment has increased since 2005, especially in 2011 and 2012. The recruitment in 2013 and 2014 are much lower than the 2011-2012 values.
0
10000
20000
30000
40000
50000
60000
70000
80000
90000
100000
110000
120000
1972 1978 1984 1990 1996 2002 2008 2014
Nu
mb
ers
(th
ou
san
ds)
Year
0
5000
10000
15000
20000
25000
30000
35000
40000
45000
50000
1972 1978 1984 1990 1996 2002 2008 2014
Ton
s
Year
0.0
0.2
0.4
0.6
0.8
1.0
1.2
1.4
1.6
1972 1978 1984 1990 1996 2002 2008 2014
F bar
Year
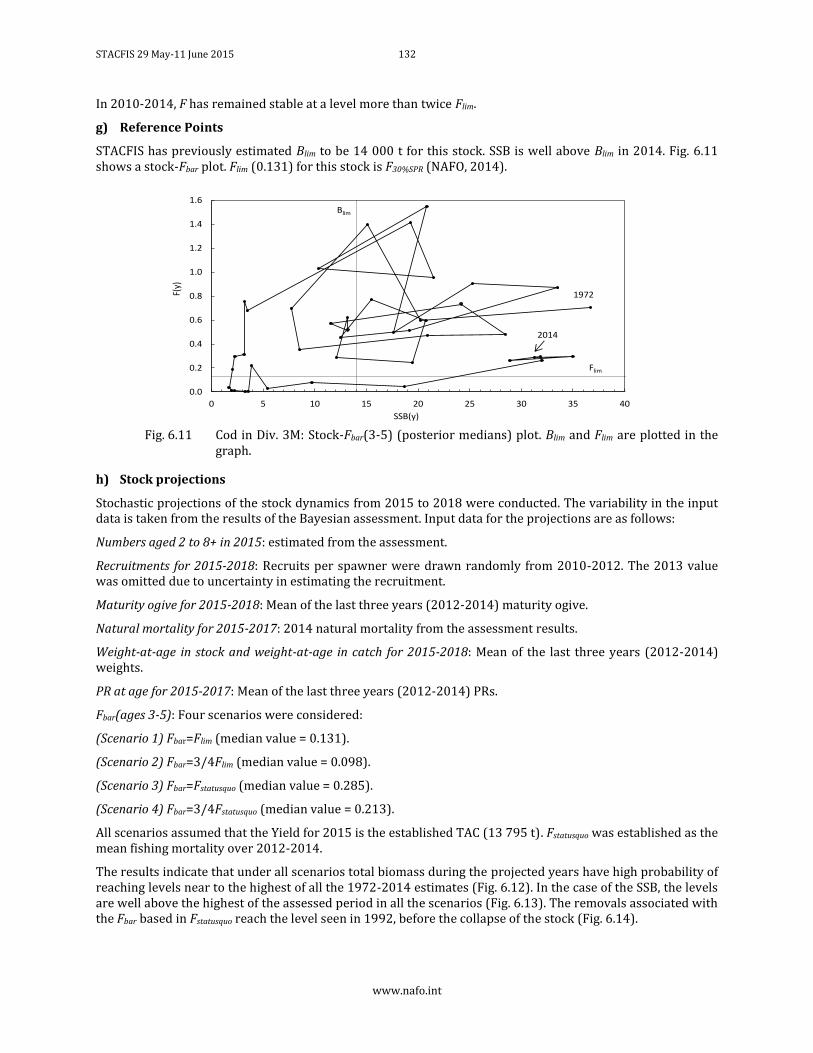
STACFIS 29 May-11 June 2015 132
www.nafo.int
In 2010-2014, F has remained stable at a level more than twice Flim.
g) Reference Points
STACFIS has previously estimated Blim to be 14 000 t for this stock. SSB is well above Blim in 2014. Fig. 6.11 shows a stock-Fbar plot. Flim (0.131) for this stock is F30%SPR (NAFO, 2014).
Fig. 6.11 Cod in Div. 3M: Stock-Fbar(3-5) (posterior medians) plot. Blim and Flim are plotted in the
graph.
h) Stock projections
Stochastic projections of the stock dynamics from 2015 to 2018 were conducted. The variability in the input data is taken from the results of the Bayesian assessment. Input data for the projections are as follows:
Numbers aged 2 to 8+ in 2015: estimated from the assessment.
Recruitments for 2015-2018: Recruits per spawner were drawn randomly from 2010-2012. The 2013 value was omitted due to uncertainty in estimating the recruitment.
Maturity ogive for 2015-2018: Mean of the last three years (2012-2014) maturity ogive.
Natural mortality for 2015-2017: 2014 natural mortality from the assessment results.
Weight-at-age in stock and weight-at-age in catch for 2015-2018: Mean of the last three years (2012-2014) weights.
PR at age for 2015-2017: Mean of the last three years (2012-2014) PRs.
Fbar(ages 3-5): Four scenarios were considered:
(Scenario 1) Fbar=Flim (median value = 0.131).
(Scenario 2) Fbar=3/4Flim (median value = 0.098).
(Scenario 3) Fbar=Fstatusquo (median value = 0.285).
(Scenario 4) Fbar=3/4Fstatusquo (median value = 0.213).
All scenarios assumed that the Yield for 2015 is the established TAC (13 795 t). Fstatusquo was established as the mean fishing mortality over 2012-2014.
The results indicate that under all scenarios total biomass during the projected years have high probability of reaching levels near to the highest of all the 1972-2014 estimates (Fig. 6.12). In the case of the SSB, the levels are well above the highest of the assessed period in all the scenarios (Fig. 6.13). The removals associated with the Fbar based in Fstatusquo reach the level seen in 1992, before the collapse of the stock (Fig. 6.14).
0.0
0.2
0.4
0.6
0.8
1.0
1.2
1.4
1.6
0 5 10 15 20 25 30 35 40
F(y)
SSB(y)
Blim
1972
2014
Flim
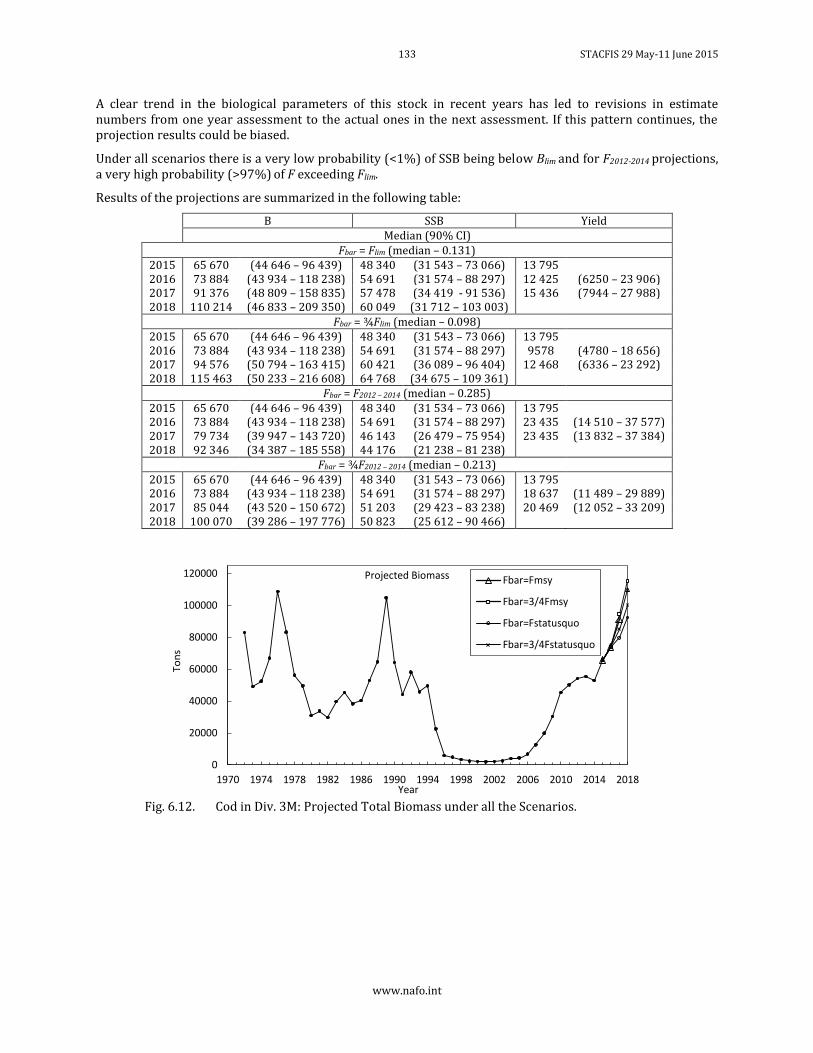
133 STACFIS 29 May-11 June 2015
www.nafo.int
A clear trend in the biological parameters of this stock in recent years has led to revisions in estimate numbers from one year assessment to the actual ones in the next assessment. If this pattern continues, the projection results could be biased.
Under all scenarios there is a very low probability (<1%) of SSB being below Blim and for F2012-2014 projections, a very high probability (>97%) of F exceeding Flim.
Results of the projections are summarized in the following table:
B SSB Yield Median (90% CI)
Fbar = Flim (median – 0.131) 2015 65 670 (44 646 – 96 439) 48 340 (31 543 – 73 066) 13 795 2016 73 884 (43 934 – 118 238) 54 691 (31 574 – 88 297) 12 425 (6250 – 23 906) 2017 91 376 (48 809 – 158 835) 57 478 (34 419 - 91 536) 15 436 (7944 – 27 988) 2018 110 214 (46 833 – 209 350) 60 049 (31 712 – 103 003)
Fbar = ¾Flim (median – 0.098) 2015 65 670 (44 646 – 96 439) 48 340 (31 543 – 73 066) 13 795 2016 73 884 (43 934 – 118 238) 54 691 (31 574 – 88 297) 9578 (4780 – 18 656) 2017 94 576 (50 794 – 163 415) 60 421 (36 089 – 96 404) 12 468 (6336 – 23 292) 2018 115 463 (50 233 – 216 608) 64 768 (34 675 – 109 361)
Fbar = F2012 – 2014 (median – 0.285) 2015 65 670 (44 646 – 96 439) 48 340 (31 534 – 73 066) 13 795 2016 73 884 (43 934 – 118 238) 54 691 (31 574 – 88 297) 23 435 (14 510 – 37 577) 2017 79 734 (39 947 – 143 720) 46 143 (26 479 – 75 954) 23 435 (13 832 – 37 384) 2018 92 346 (34 387 – 185 558) 44 176 (21 238 – 81 238)
Fbar = ¾F2012 – 2014 (median – 0.213) 2015 65 670 (44 646 – 96 439) 48 340 (31 543 – 73 066) 13 795 2016 73 884 (43 934 – 118 238) 54 691 (31 574 – 88 297) 18 637 (11 489 – 29 889) 2017 85 044 (43 520 – 150 672) 51 203 (29 423 – 83 238) 20 469 (12 052 – 33 209) 2018 100 070 (39 286 – 197 776) 50 823 (25 612 – 90 466)
Fig. 6.12. Cod in Div. 3M: Projected Total Biomass under all the Scenarios.
0
20000
40000
60000
80000
100000
120000
1970 1974 1978 1982 1986 1990 1994 1998 2002 2006 2010 2014 2018
To
ns
Year
Projected Biomass Fbar=Fmsy
Fbar=3/4Fmsy
Fbar=Fstatusquo
Fbar=3/4Fstatusquo
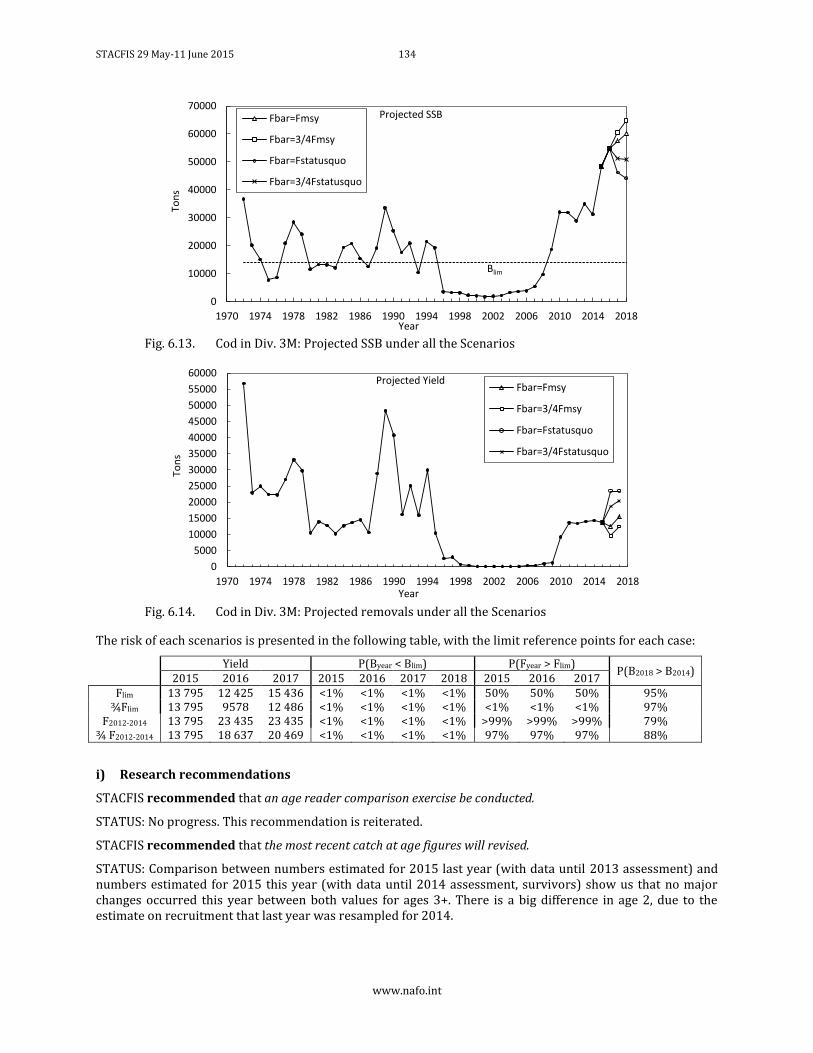
STACFIS 29 May-11 June 2015 134
www.nafo.int
Fig. 6.13. Cod in Div. 3M: Projected SSB under all the Scenarios
Fig. 6.14. Cod in Div. 3M: Projected removals under all the Scenarios
The risk of each scenarios is presented in the following table, with the limit reference points for each case:
Yield P(Byear < Blim) P(Fyear > Flim)
P(B2018 > B2014) 2015 2016 2017 2015 2016 2017 2018 2015 2016 2017
Flim 13 795 12 425 15 436 <1% <1% <1% <1% 50% 50% 50% 95% ¾Flim 13 795 9578 12 486 <1% <1% <1% <1% <1% <1% <1% 97%
F2012-2014 13 795 23 435 23 435 <1% <1% <1% <1% >99% >99% >99% 79% ¾ F2012-2014 13 795 18 637 20 469 <1% <1% <1% <1% 97% 97% 97% 88%
i) Research recommendations
STACFIS recommended that an age reader comparison exercise be conducted.
STATUS: No progress. This recommendation is reiterated.
STACFIS recommended that the most recent catch at age figures will revised.
STATUS: Comparison between numbers estimated for 2015 last year (with data until 2013 assessment) and numbers estimated for 2015 this year (with data until 2014 assessment, survivors) show us that no major changes occurred this year between both values for ages 3+. There is a big difference in age 2, due to the estimate on recruitment that last year was resampled for 2014.
0
10000
20000
30000
40000
50000
60000
70000
1970 1974 1978 1982 1986 1990 1994 1998 2002 2006 2010 2014 2018
Ton
s
Year
Projected SSBFbar=Fmsy
Fbar=3/4Fmsy
Fbar=Fstatusquo
Fbar=3/4Fstatusquo
Blim
0
5000
10000
15000
20000
25000
30000
35000
40000
45000
50000
55000
60000
1970 1974 1978 1982 1986 1990 1994 1998 2002 2006 2010 2014 2018
Ton
s
Year
Projected YieldFbar=Fmsy
Fbar=3/4Fmsy
Fbar=Fstatusquo
Fbar=3/4Fstatusquo
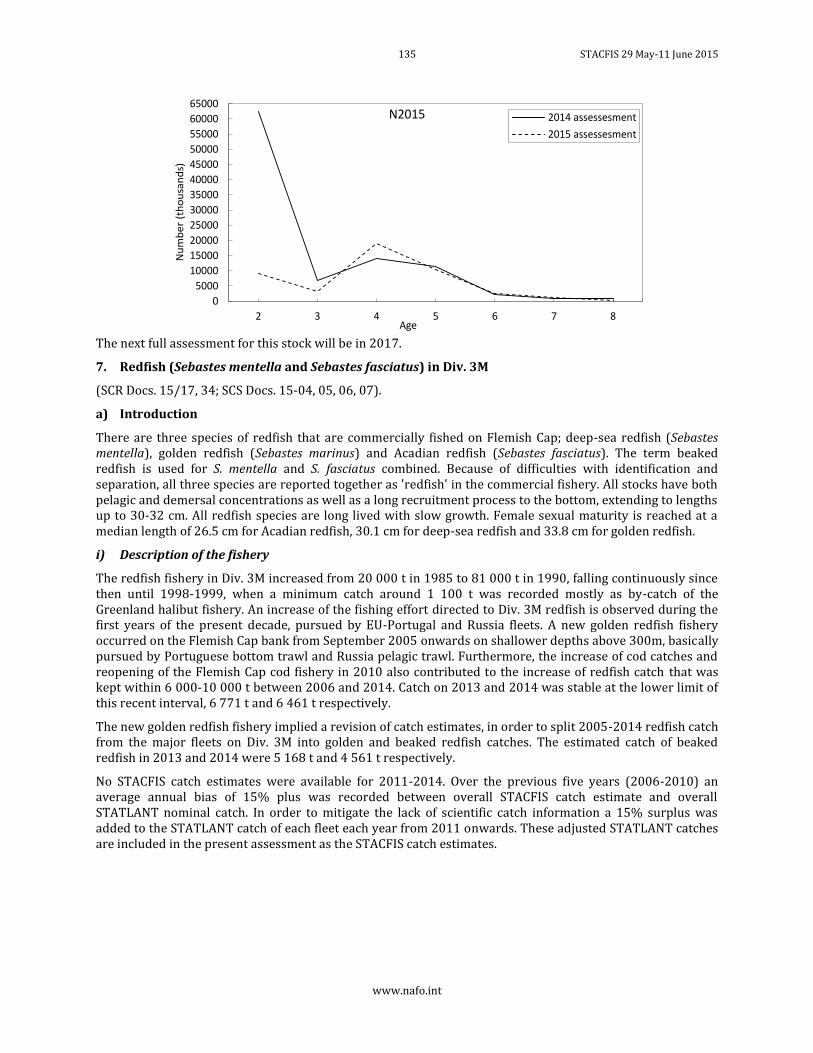
135 STACFIS 29 May-11 June 2015
www.nafo.int
The next full assessment for this stock will be in 2017.
7. Redfish (Sebastes mentella and Sebastes fasciatus) in Div. 3M
(SCR Docs. 15/17, 34; SCS Docs. 15-04, 05, 06, 07).
a) Introduction
There are three species of redfish that are commercially fished on Flemish Cap; deep-sea redfish (Sebastes mentella), golden redfish (Sebastes marinus) and Acadian redfish (Sebastes fasciatus). The term beaked redfish is used for S. mentella and S. fasciatus combined. Because of difficulties with identification and separation, all three species are reported together as 'redfish' in the commercial fishery. All stocks have both pelagic and demersal concentrations as well as a long recruitment process to the bottom, extending to lengths up to 30-32 cm. All redfish species are long lived with slow growth. Female sexual maturity is reached at a median length of 26.5 cm for Acadian redfish, 30.1 cm for deep-sea redfish and 33.8 cm for golden redfish.
i) Description of the fishery
The redfish fishery in Div. 3M increased from 20 000 t in 1985 to 81 000 t in 1990, falling continuously since then until 1998-1999, when a minimum catch around 1 100 t was recorded mostly as by-catch of the Greenland halibut fishery. An increase of the fishing effort directed to Div. 3M redfish is observed during the first years of the present decade, pursued by EU-Portugal and Russia fleets. A new golden redfish fishery occurred on the Flemish Cap bank from September 2005 onwards on shallower depths above 300m, basically pursued by Portuguese bottom trawl and Russia pelagic trawl. Furthermore, the increase of cod catches and reopening of the Flemish Cap cod fishery in 2010 also contributed to the increase of redfish catch that was kept within 6 000-10 000 t between 2006 and 2014. Catch on 2013 and 2014 was stable at the lower limit of this recent interval, 6 771 t and 6 461 t respectively.
The new golden redfish fishery implied a revision of catch estimates, in order to split 2005-2014 redfish catch from the major fleets on Div. 3M into golden and beaked redfish catches. The estimated catch of beaked redfish in 2013 and 2014 were 5 168 t and 4 561 t respectively.
No STACFIS catch estimates were available for 2011-2014. Over the previous five years (2006-2010) an average annual bias of 15% plus was recorded between overall STACFIS catch estimate and overall STATLANT nominal catch. In order to mitigate the lack of scientific catch information a 15% surplus was added to the STATLANT catch of each fleet each year from 2011 onwards. These adjusted STATLANT catches are included in the present assessment as the STACFIS catch estimates.
0
5000
10000
15000
20000
25000
30000
35000
40000
45000
50000
55000
60000
65000
2 3 4 5 6 7 8
Nu
mb
er
(th
ou
san
ds)
Age
N2015 2014 assessesment
2015 assessesment
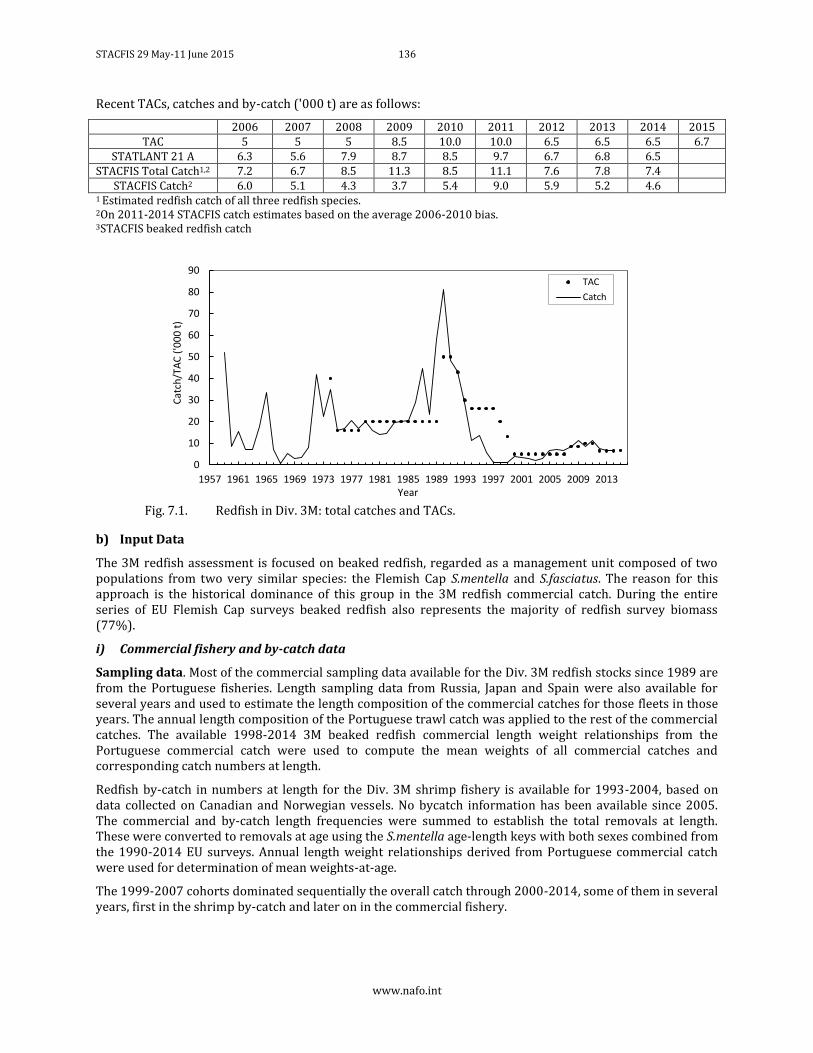
STACFIS 29 May-11 June 2015 136
www.nafo.int
Recent TACs, catches and by-catch ('000 t) are as follows:
2006 2007 2008 2009 2010 2011 2012 2013 2014 2015 TAC 5 5 5 8.5 10.0 10.0 6.5 6.5 6.5 6.7
STATLANT 21 A 6.3 5.6 7.9 8.7 8.5 9.7 6.7 6.8 6.5 STACFIS Total Catch1,2 7.2 6.7 8.5 11.3 8.5 11.1 7.6 7.8 7.4
STACFIS Catch2 6.0 5.1 4.3 3.7 5.4 9.0 5.9 5.2 4.6 1 Estimated redfish catch of all three redfish species. 2On 2011-2014 STACFIS catch estimates based on the average 2006-2010 bias. 3STACFIS beaked redfish catch
Fig. 7.1. Redfish in Div. 3M: total catches and TACs.
b) Input Data
The 3M redfish assessment is focused on beaked redfish, regarded as a management unit composed of two populations from two very similar species: the Flemish Cap S.mentella and S.fasciatus. The reason for this approach is the historical dominance of this group in the 3M redfish commercial catch. During the entire series of EU Flemish Cap surveys beaked redfish also represents the majority of redfish survey biomass (77%).
i) Commercial fishery and by-catch data
Sampling data. Most of the commercial sampling data available for the Div. 3M redfish stocks since 1989 are from the Portuguese fisheries. Length sampling data from Russia, Japan and Spain were also available for several years and used to estimate the length composition of the commercial catches for those fleets in those years. The annual length composition of the Portuguese trawl catch was applied to the rest of the commercial catches. The available 1998-2014 3M beaked redfish commercial length weight relationships from the Portuguese commercial catch were used to compute the mean weights of all commercial catches and corresponding catch numbers at length.
Redfish by-catch in numbers at length for the Div. 3M shrimp fishery is available for 1993-2004, based on data collected on Canadian and Norwegian vessels. No bycatch information has been available since 2005. The commercial and by-catch length frequencies were summed to establish the total removals at length. These were converted to removals at age using the S.mentella age-length keys with both sexes combined from the 1990-2014 EU surveys. Annual length weight relationships derived from Portuguese commercial catch were used for determination of mean weights-at-age.
The 1999-2007 cohorts dominated sequentially the overall catch through 2000-2014, some of them in several years, first in the shrimp by-catch and later on in the commercial fishery.
0
10
20
30
40
50
60
70
80
90
1957 1961 1965 1969 1973 1977 1981 1985 1989 1993 1997 2001 2005 2009 2013
Cat
ch/T
AC
('0
00
t)
Year
TAC
Catch
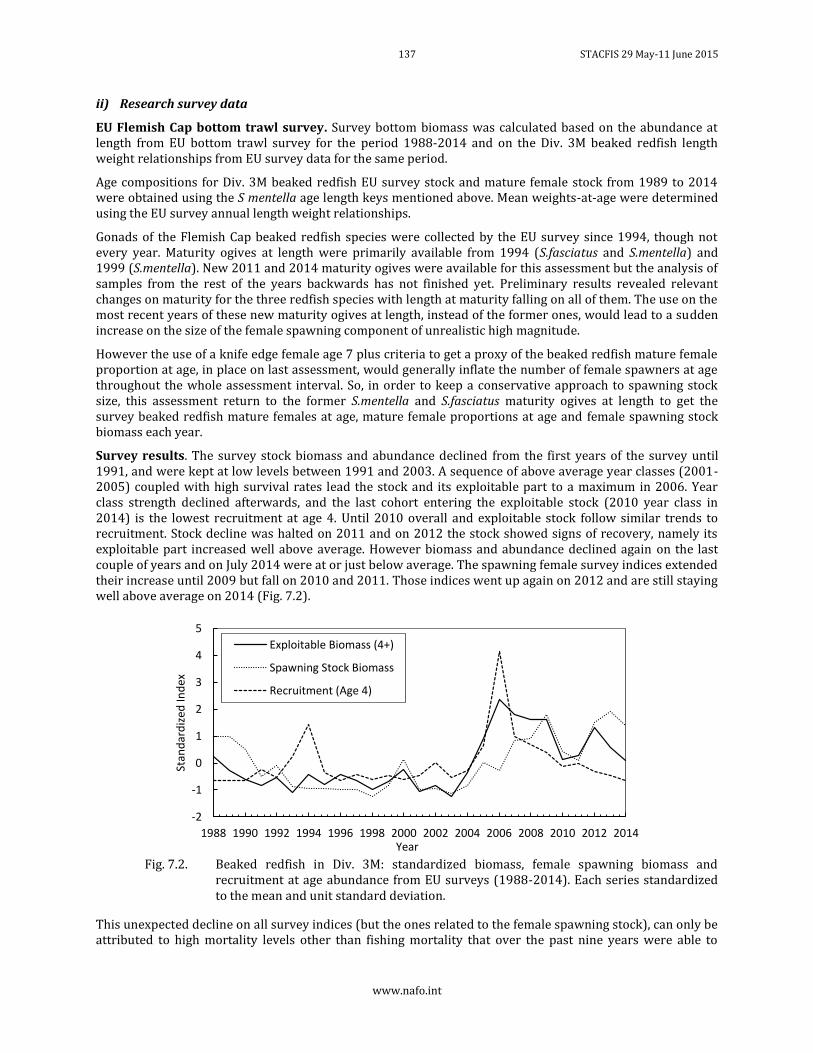
137 STACFIS 29 May-11 June 2015
www.nafo.int
ii) Research survey data
EU Flemish Cap bottom trawl survey. Survey bottom biomass was calculated based on the abundance at length from EU bottom trawl survey for the period 1988-2014 and on the Div. 3M beaked redfish length weight relationships from EU survey data for the same period.
Age compositions for Div. 3M beaked redfish EU survey stock and mature female stock from 1989 to 2014 were obtained using the S mentella age length keys mentioned above. Mean weights-at-age were determined using the EU survey annual length weight relationships.
Gonads of the Flemish Cap beaked redfish species were collected by the EU survey since 1994, though not every year. Maturity ogives at length were primarily available from 1994 (S.fasciatus and S.mentella) and 1999 (S.mentella). New 2011 and 2014 maturity ogives were available for this assessment but the analysis of samples from the rest of the years backwards has not finished yet. Preliminary results revealed relevant changes on maturity for the three redfish species with length at maturity falling on all of them. The use on the most recent years of these new maturity ogives at length, instead of the former ones, would lead to a sudden increase on the size of the female spawning component of unrealistic high magnitude.
However the use of a knife edge female age 7 plus criteria to get a proxy of the beaked redfish mature female proportion at age, in place on last assessment, would generally inflate the number of female spawners at age throughout the whole assessment interval. So, in order to keep a conservative approach to spawning stock size, this assessment return to the former S.mentella and S.fasciatus maturity ogives at length to get the survey beaked redfish mature females at age, mature female proportions at age and female spawning stock biomass each year.
Survey results. The survey stock biomass and abundance declined from the first years of the survey until 1991, and were kept at low levels between 1991 and 2003. A sequence of above average year classes (2001-2005) coupled with high survival rates lead the stock and its exploitable part to a maximum in 2006. Year class strength declined afterwards, and the last cohort entering the exploitable stock (2010 year class in 2014) is the lowest recruitment at age 4. Until 2010 overall and exploitable stock follow similar trends to recruitment. Stock decline was halted on 2011 and on 2012 the stock showed signs of recovery, namely its exploitable part increased well above average. However biomass and abundance declined again on the last couple of years and on July 2014 were at or just below average. The spawning female survey indices extended their increase until 2009 but fall on 2010 and 2011. Those indices went up again on 2012 and are still staying well above average on 2014 (Fig. 7.2).
Fig. 7.2. Beaked redfish in Div. 3M: standardized biomass, female spawning biomass and
recruitment at age abundance from EU surveys (1988-2014). Each series standardized to the mean and unit standard deviation.
This unexpected decline on all survey indices (but the ones related to the female spawning stock), can only be attributed to high mortality levels other than fishing mortality that over the past nine years were able to
-2
-1
0
1
2
3
4
5
1988 1990 1992 1994 1996 1998 2000 2002 2004 2006 2008 2010 2012 2014
Stan
dar
diz
ed In
dex
Year
Exploitable Biomass (4+)
Spawning Stock Biomass
Recruitment (Age 4)
STACFIS 29 May-11 June 2015 138
www.nafo.int
depress the stock size, from historical highs to the actual average level of the assessment interval. There is a strong possibility that recent higher levels on redfish natural mortality are associated to the increase of the Div. 3M cod stock from 2006 onwards.
Since 2004 a rapid increase was observed on survey biomass both of golden (Sebastes marinus) and Acadian (Sebastes fasciatus) redfish stocks. Due to their shallower depth distributions these two redfish species overlap with cod to an extent greater than deep sea redfish (Sebastes mentella). Since 2006, the cod stock started to recover, while those two redfish stocks declined sharply. Redfish is an important component in the diet of cod, especially on those years when abundant year classes enter successfully into redfish stocks.
c) Estimation of Parameters
The Extended Survivors Analysis (XSA) (Shepherd, 1999)5 was used to estimate stock size. The month of
peak spawning (larval extrusion) for Div. 3M S.mentella, was taken to be February, and was used for the estimate of the proportion of fishing mortality and natural mortality before spawning. EU survey abundance at age was used for calibration. The XSA model specifications are given below:
Catch data from 1989 to 2014, ages 4 to 19+ Fleets First
year Last year
First age
Last age
EU summer survey (Div. 3M) 1989 2014 4 18
Tapered time weighting not applied
Catchability independent of stock size for all ages
Catchability independent of age for all ages
Terminal year survivor estimates not shrunk towards a mean F
Oldest age survivor estimates not shrunk towards the mean F of previous ages
Minimum standard error for population estimates from each cohort age = 0.5
In years before 2006 natural mortality (M) remained at 0.1. The rational to select the best options for natural mortality between 2006 and 2012 are thoroughly explained in the sensitivity analysis sections of last assessments. A natural mortality of 0.4 was adopted for ages 4-6 through 2006-2010 interval, extended to all ages in 2009-2010. Since then natural mortality was assumed to be a time dependent/age independent parameter and on 2011-2012 declined to 0.125, a level much closer to what is usually considered the magnitude of natural mortality on redfish stocks (0.1).
Under such scenario one should expect that during the last nine years in general, and on 2013-2014 in particular
M may vary but should continue to be above 0.1, F should be below to well below M, and therefore the closer is the relation between survey and total abundance at age the better is the fit of natural mortality, the major component within total mortality that is driven abundance at each age since 2006.
On the sensitivity analysis of the present assessment eleven options regarding 2013-2014 natural mortality have been considered, from 0.1 to 0.4, with a closer look to the 0.1-0.2 interval. A set of eleven XSA runs have been performed and labelled according to the natural mortality adopted on each run on the last couple of years:
Each XSA 2015 run M0.1 M0.125 M0.13 M0.14 M0.15 M0.16 M0.17 M0.18 M0.20 M0.30 M0.40 With a 2012-14 M
option 0.1 0.125 0.13 0.14 0.15 0.16 0.17 0.18 0.2 0.3 0.4
All XSA 2015 runs M = 0.4 on ages 4 – 6 in 2006 – 2008, and on all age groups in 2009 – 2010
M = 0.125 on all age groups in 2011 – 2012 (XSA 2013 assessment framework)
5 SHEPHERD, J. G. 1999. Extended survivors analysis: an improved method for the analysis of catch-at-age data and
abundance indices. ICES J. Mar. Sci., 56(5): 584-591.
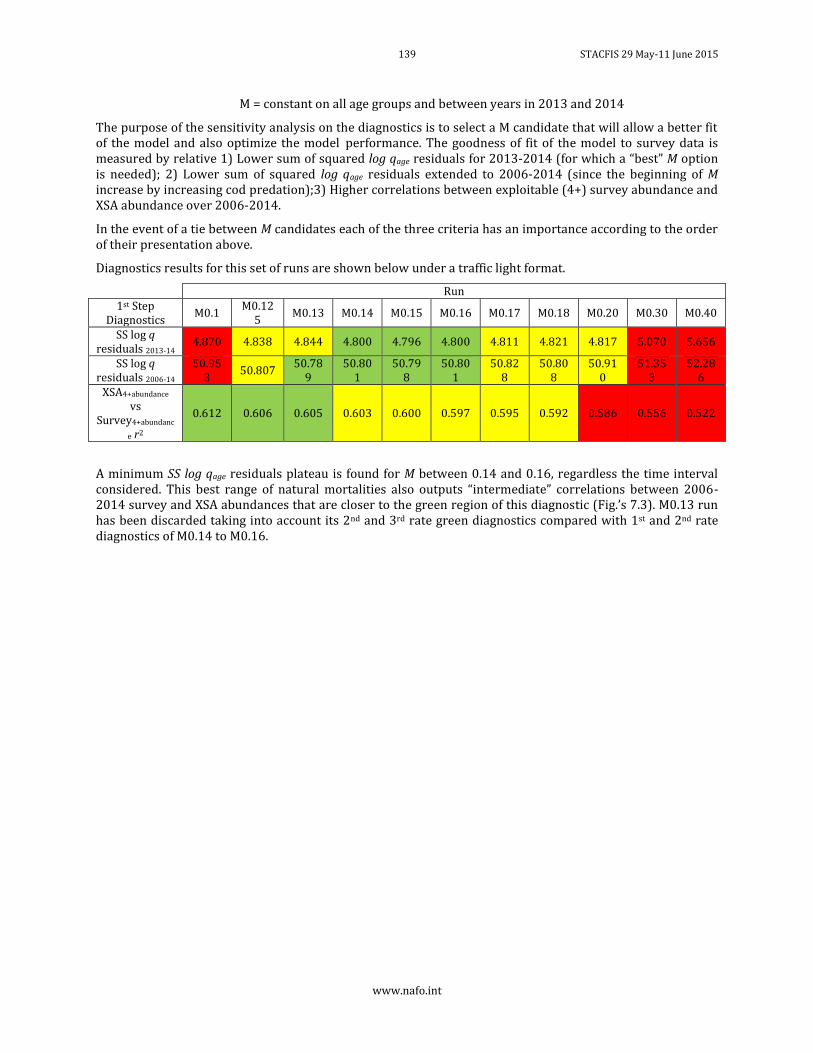
139 STACFIS 29 May-11 June 2015
www.nafo.int
M = constant on all age groups and between years in 2013 and 2014
The purpose of the sensitivity analysis on the diagnostics is to select a M candidate that will allow a better fit of the model and also optimize the model performance. The goodness of fit of the model to survey data is measured by relative 1) Lower sum of squared log qage residuals for 2013-2014 (for which a “best” M option is needed); 2) Lower sum of squared log qage residuals extended to 2006-2014 (since the beginning of M increase by increasing cod predation);3) Higher correlations between exploitable (4+) survey abundance and XSA abundance over 2006-2014.
In the event of a tie between M candidates each of the three criteria has an importance according to the order of their presentation above.
Diagnostics results for this set of runs are shown below under a traffic light format.
Run 1st Step
Diagnostics M0.1
M0.125
M0.13 M0.14 M0.15 M0.16 M0.17 M0.18 M0.20 M0.30 M0.40
SS log q residuals 2013-14
4.870 4.838 4.844 4.800 4.796 4.800 4.811 4.821 4.817 5.070 5.656
SS log q residuals 2006-14
50.953
50.807 50.78
9 50.80
1 50.79
8 50.80
1 50.82
8 50.80
8 50.91
0 51.35
3 52.28
6 XSA4+abundance
vs Survey4+abundanc
e r2
0.612 0.606 0.605 0.603 0.600 0.597 0.595 0.592 0.586 0.556 0.522
A minimum SS log qage residuals plateau is found for M between 0.14 and 0.16, regardless the time interval considered. This best range of natural mortalities also outputs “intermediate” correlations between 2006-2014 survey and XSA abundances that are closer to the green region of this diagnostic (Fig.’s 7.3). M0.13 run has been discarded taking into account its 2nd and 3rd rate green diagnostics compared with 1st and 2nd rate diagnostics of M0.14 to M0.16.
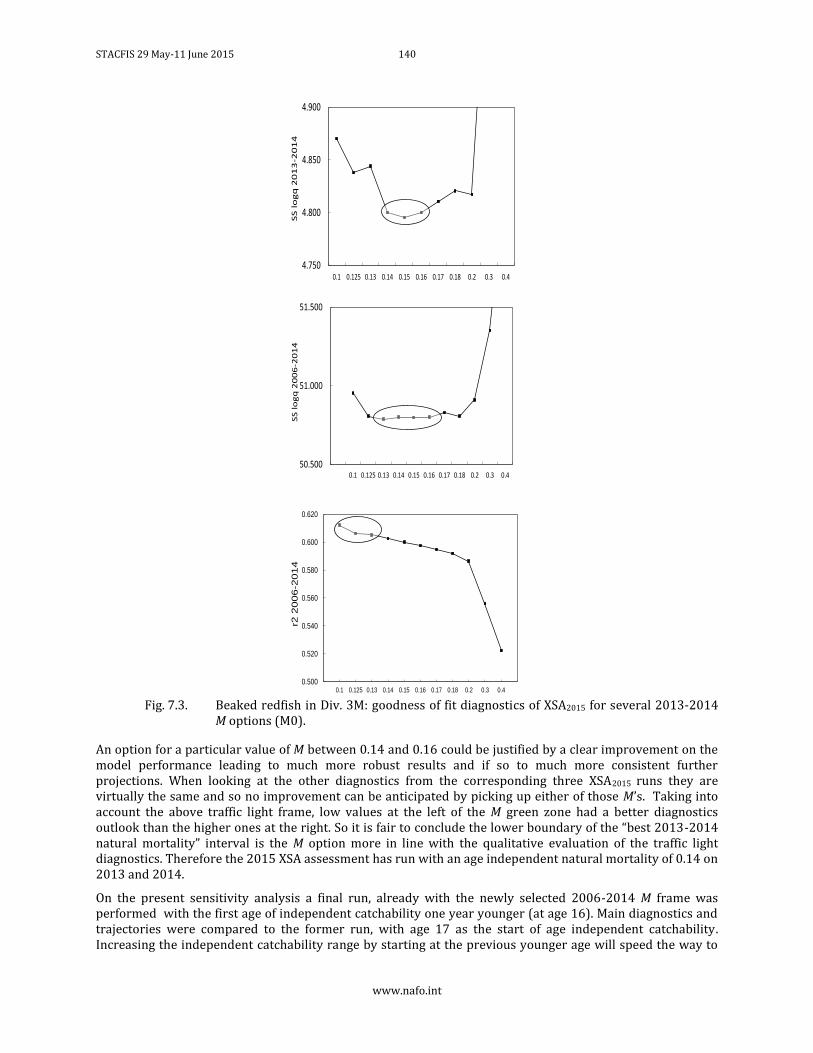
STACFIS 29 May-11 June 2015 140
www.nafo.int
Fig. 7.3. Beaked redfish in Div. 3M: goodness of fit diagnostics of XSA2015 for several 2013-2014
M options (M0).
An option for a particular value of M between 0.14 and 0.16 could be justified by a clear improvement on the model performance leading to much more robust results and if so to much more consistent further projections. When looking at the other diagnostics from the corresponding three XSA2015 runs they are virtually the same and so no improvement can be anticipated by picking up either of those M’s. Taking into account the above traffic light frame, low values at the left of the M green zone had a better diagnostics outlook than the higher ones at the right. So it is fair to conclude the lower boundary of the “best 2013-2014 natural mortality” interval is the M option more in line with the qualitative evaluation of the traffic light diagnostics. Therefore the 2015 XSA assessment has run with an age independent natural mortality of 0.14 on 2013 and 2014.
On the present sensitivity analysis a final run, already with the newly selected 2006-2014 M frame was performed with the first age of independent catchability one year younger (at age 16). Main diagnostics and trajectories were compared to the former run, with age 17 as the start of age independent catchability. Increasing the independent catchability range by starting at the previous younger age will speed the way to
4.750
4.800
4.850
4.900
0.1 0.125 0.13 0.14 0.15 0.16 0.17 0.18 0.2 0.3 0.4
SS
lo
gq
20
13
-20
14
50.500
51.000
51.500
0.1 0.125 0.13 0.14 0.15 0.16 0.17 0.18 0.2 0.3 0.4
SS
lo
gq
20
06
-20
14
0.500
0.520
0.540
0.560
0.580
0.600
0.620
0.1 0.125 0.13 0.14 0.15 0.16 0.17 0.18 0.2 0.3 0.4
r2 2
006-2
014
141 STACFIS 29 May-11 June 2015
www.nafo.int
convergence by an important decline from 52 to 34 iterations, with opposite (but discrete) signals as regards the diagnostics used in the sensitive analysis. Mean catchabilities at age shown slight increases that turn into minimal increases in fishing mortality and minimal declines in abundance and biomass. In overall terms having age 16 as the start of the age independent catchability interval result on a slightly more conservative picture of the stock given by a more robust assessment, and so this option was adopted in the 2015 XSA framework.
d) Assessment Results
The 2015 XSA diagnostics kept the main features from past assessments: high variability associated with mean catchabilities and survivors, namely at younger ages, together with a familiar patchwork of log q@age residuals that remains with only small changes from its predecessors.
A 2015-2011 retrospective XSA was carried out (Fig 7.4). As regards exploitable biomass the retrospective XSA show no clear retrospective pattern, being the present assessment very much in line with their immediate predecessors. Reverse retrospective patterns are observed on the female spawning biomass (under estimate) and average fishing mortality (over estimate) but with small associated biases, even for recent years. Recruitment at age 4 of the most abundant year class (2002 year class in 2006) has been clearly over estimated on previous assessments.
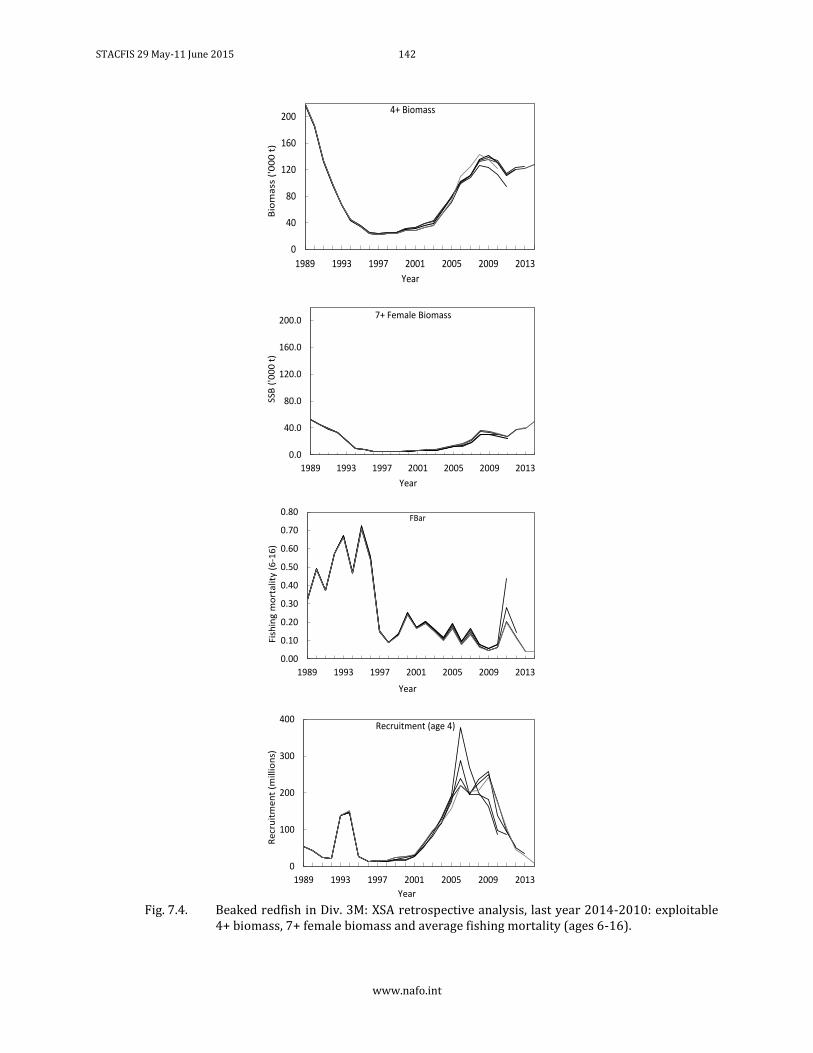
STACFIS 29 May-11 June 2015 142
www.nafo.int
Fig. 7.4. Beaked redfish in Div. 3M: XSA retrospective analysis, last year 2014-2010: exploitable
4+ biomass, 7+ female biomass and average fishing mortality (ages 6-16).
0
40
80
120
160
200
1989 1993 1997 2001 2005 2009 2013B
iom
ass
('0
00
t)
Year
4+ Biomass
0.0
40.0
80.0
120.0
160.0
200.0
1989 1993 1997 2001 2005 2009 2013
SSB
('0
00
t)
Year
7+ Female Biomass
0.00
0.10
0.20
0.30
0.40
0.50
0.60
0.70
0.80
1989 1993 1997 2001 2005 2009 2013
Fish
ing
mo
rta
lity
(6-1
6)
Year
FBar
0
100
200
300
400
1989 1993 1997 2001 2005 2009 2013
Re
cru
itm
en
t (m
illio
ns)
Year
Recruitment (age 4)
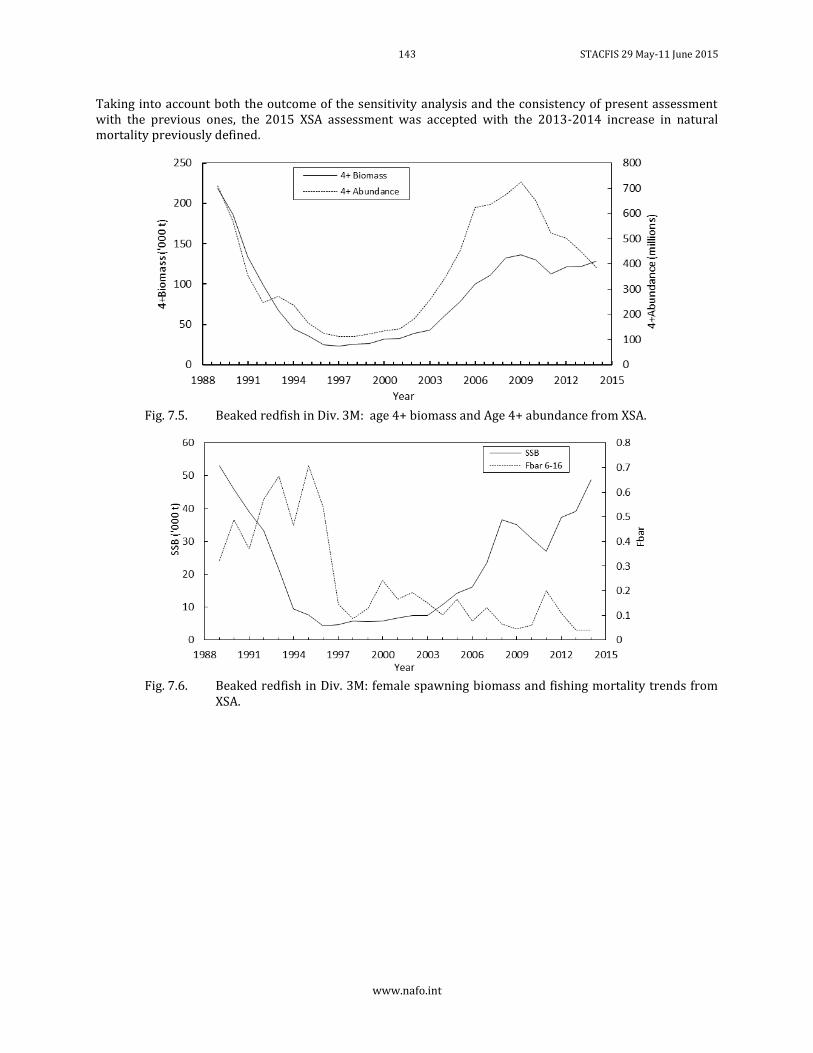
143 STACFIS 29 May-11 June 2015
www.nafo.int
Taking into account both the outcome of the sensitivity analysis and the consistency of present assessment with the previous ones, the 2015 XSA assessment was accepted with the 2013-2014 increase in natural mortality previously defined.
Fig. 7.5. Beaked redfish in Div. 3M: age 4+ biomass and Age 4+ abundance from XSA.
Fig. 7.6. Beaked redfish in Div. 3M: female spawning biomass and fishing mortality trends from
XSA.
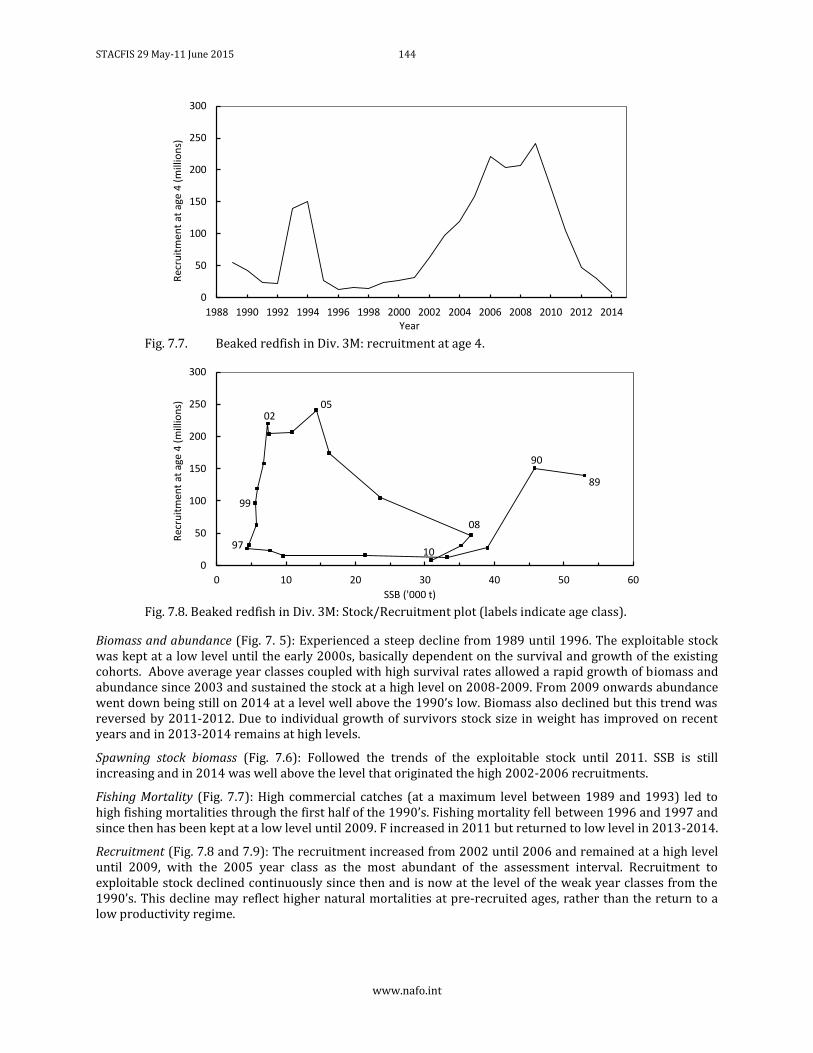
STACFIS 29 May-11 June 2015 144
www.nafo.int
Fig. 7.7. Beaked redfish in Div. 3M: recruitment at age 4.
Fig. 7.8. Beaked redfish in Div. 3M: Stock/Recruitment plot (labels indicate age class).
Biomass and abundance (Fig. 7. 5): Experienced a steep decline from 1989 until 1996. The exploitable stock was kept at a low level until the early 2000s, basically dependent on the survival and growth of the existing cohorts. Above average year classes coupled with high survival rates allowed a rapid growth of biomass and abundance since 2003 and sustained the stock at a high level on 2008-2009. From 2009 onwards abundance went down being still on 2014 at a level well above the 1990’s low. Biomass also declined but this trend was reversed by 2011-2012. Due to individual growth of survivors stock size in weight has improved on recent years and in 2013-2014 remains at high levels.
Spawning stock biomass (Fig. 7.6): Followed the trends of the exploitable stock until 2011. SSB is still increasing and in 2014 was well above the level that originated the high 2002-2006 recruitments.
Fishing Mortality (Fig. 7.7): High commercial catches (at a maximum level between 1989 and 1993) led to high fishing mortalities through the first half of the 1990’s. Fishing mortality fell between 1996 and 1997 and since then has been kept at a low level until 2009. F increased in 2011 but returned to low level in 2013-2014.
Recruitment (Fig. 7.8 and 7.9): The recruitment increased from 2002 until 2006 and remained at a high level until 2009, with the 2005 year class as the most abundant of the assessment interval. Recruitment to exploitable stock declined continuously since then and is now at the level of the weak year classes from the 1990’s. This decline may reflect higher natural mortalities at pre-recruited ages, rather than the return to a low productivity regime.
0
50
100
150
200
250
300
1988 1990 1992 1994 1996 1998 2000 2002 2004 2006 2008 2010 2012 2014
Rec
ruit
men
t at
age
4 (
mill
ion
s)
Year
0
50
100
150
200
250
300
0 10 20 30 40 50 60
Rec
ruit
men
t at
age
4 (
mill
ion
s)
SSB ('000 t)
89
90
97
99
0205
10
08
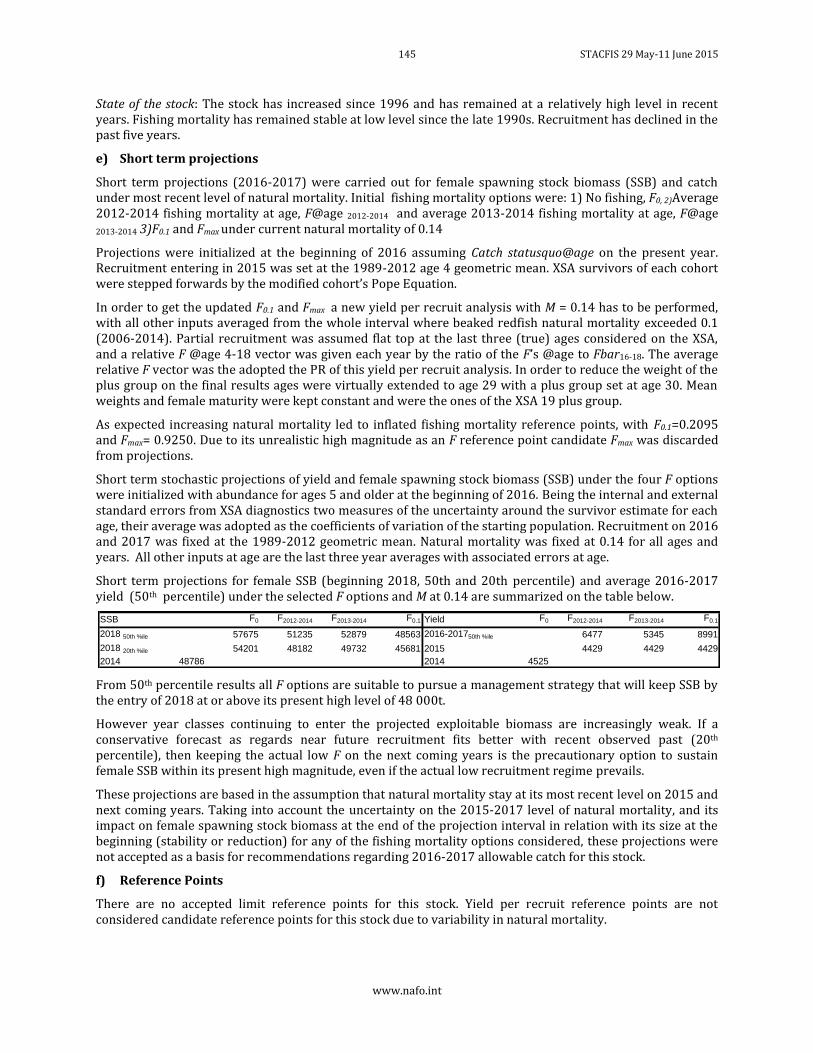
145 STACFIS 29 May-11 June 2015
www.nafo.int
State of the stock: The stock has increased since 1996 and has remained at a relatively high level in recent years. Fishing mortality has remained stable at low level since the late 1990s. Recruitment has declined in the past five years.
e) Short term projections
Short term projections (2016-2017) were carried out for female spawning stock biomass (SSB) and catch under most recent level of natural mortality. Initial fishing mortality options were: 1) No fishing, F0, 2)Average 2012-2014 fishing mortality at age, F@age 2012-2014 and average 2013-2014 fishing mortality at age, F@age
2013-2014 3)F0.1 and Fmax under current natural mortality of 0.14
Projections were initialized at the beginning of 2016 assuming Catch statusquo@age on the present year. Recruitment entering in 2015 was set at the 1989-2012 age 4 geometric mean. XSA survivors of each cohort were stepped forwards by the modified cohort’s Pope Equation.
In order to get the updated F0.1 and Fmax a new yield per recruit analysis with M = 0.14 has to be performed, with all other inputs averaged from the whole interval where beaked redfish natural mortality exceeded 0.1 (2006-2014). Partial recruitment was assumed flat top at the last three (true) ages considered on the XSA, and a relative F @age 4-18 vector was given each year by the ratio of the F’s @age to Fbar16-18. The average relative F vector was the adopted the PR of this yield per recruit analysis. In order to reduce the weight of the plus group on the final results ages were virtually extended to age 29 with a plus group set at age 30. Mean weights and female maturity were kept constant and were the ones of the XSA 19 plus group.
As expected increasing natural mortality led to inflated fishing mortality reference points, with F0.1=0.2095 and Fmax= 0.9250. Due to its unrealistic high magnitude as an F reference point candidate Fmax was discarded from projections.
Short term stochastic projections of yield and female spawning stock biomass (SSB) under the four F options were initialized with abundance for ages 5 and older at the beginning of 2016. Being the internal and external standard errors from XSA diagnostics two measures of the uncertainty around the survivor estimate for each age, their average was adopted as the coefficients of variation of the starting population. Recruitment on 2016 and 2017 was fixed at the 1989-2012 geometric mean. Natural mortality was fixed at 0.14 for all ages and years. All other inputs at age are the last three year averages with associated errors at age.
Short term projections for female SSB (beginning 2018, 50th and 20th percentile) and average 2016-2017 yield (50th percentile) under the selected F options and M at 0.14 are summarized on the table below.
From 50th percentile results all F options are suitable to pursue a management strategy that will keep SSB by the entry of 2018 at or above its present high level of 48 000t.
However year classes continuing to enter the projected exploitable biomass are increasingly weak. If a conservative forecast as regards near future recruitment fits better with recent observed past (20th percentile), then keeping the actual low F on the next coming years is the precautionary option to sustain female SSB within its present high magnitude, even if the actual low recruitment regime prevails.
These projections are based in the assumption that natural mortality stay at its most recent level on 2015 and next coming years. Taking into account the uncertainty on the 2015-2017 level of natural mortality, and its impact on female spawning stock biomass at the end of the projection interval in relation with its size at the beginning (stability or reduction) for any of the fishing mortality options considered, these projections were not accepted as a basis for recommendations regarding 2016-2017 allowable catch for this stock.
f) Reference Points
There are no accepted limit reference points for this stock. Yield per recruit reference points are not considered candidate reference points for this stock due to variability in natural mortality.
SSB F0 F2012-2014 F2013-2014 F0.1 Yield F0 F2012-2014 F2013-2014 F0.1
2018 50th %ile 57675 51235 52879 48563 2016-201750th %ile 6477 5345 8991
2018 20th %ile 54201 48182 49732 45681 2015 4429 4429 4429
2014 48786 2014 4525
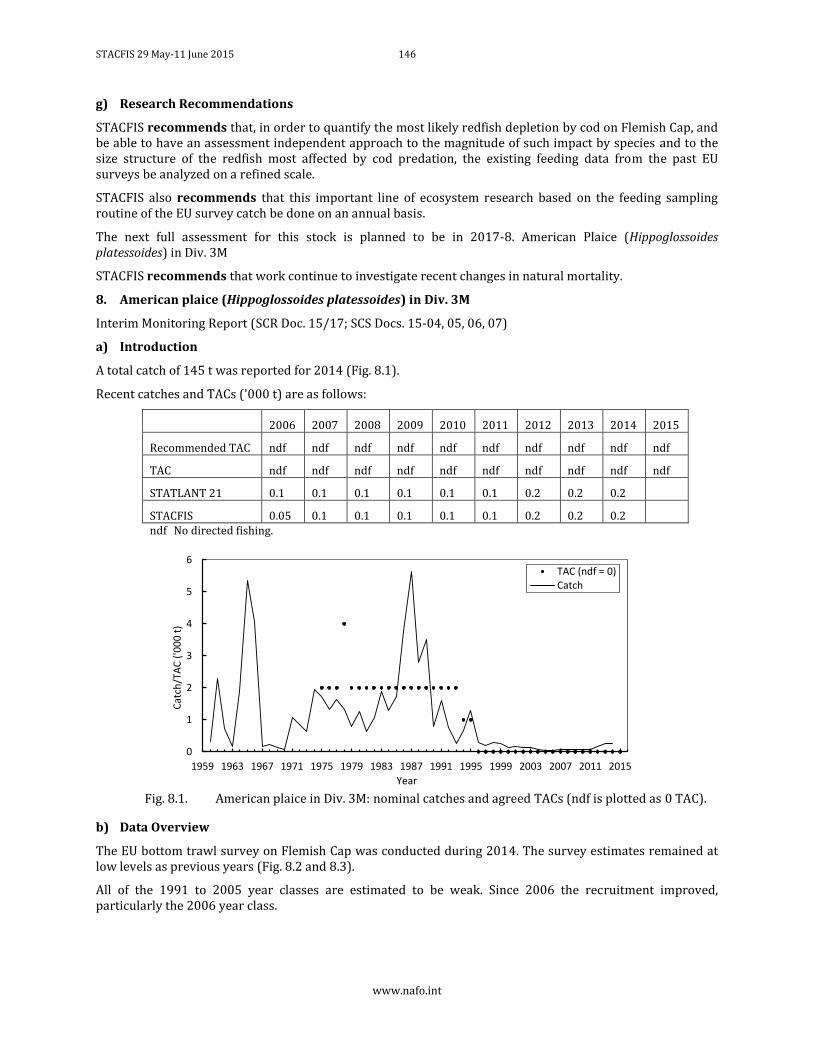
STACFIS 29 May-11 June 2015 146
www.nafo.int
g) Research Recommendations
STACFIS recommends that, in order to quantify the most likely redfish depletion by cod on Flemish Cap, and be able to have an assessment independent approach to the magnitude of such impact by species and to the size structure of the redfish most affected by cod predation, the existing feeding data from the past EU surveys be analyzed on a refined scale.
STACFIS also recommends that this important line of ecosystem research based on the feeding sampling routine of the EU survey catch be done on an annual basis.
The next full assessment for this stock is planned to be in 2017-8. American Plaice (Hippoglossoides platessoides) in Div. 3M
STACFIS recommends that work continue to investigate recent changes in natural mortality.
8. American plaice (Hippoglossoides platessoides) in Div. 3M
Interim Monitoring Report (SCR Doc. 15/17; SCS Docs. 15-04, 05, 06, 07)
a) Introduction
A total catch of 145 t was reported for 2014 (Fig. 8.1).
Recent catches and TACs ('000 t) are as follows:
2006 2007 2008 2009 2010 2011 2012 2013 2014 2015
Recommended TAC ndf ndf ndf ndf ndf ndf ndf ndf ndf ndf
TAC ndf ndf ndf ndf ndf ndf ndf ndf ndf ndf
STATLANT 21 0.1 0.1 0.1 0.1 0.1 0.1 0.2 0.2 0.2
STACFIS 0.05 0.1 0.1 0.1 0.1 0.1 0.2 0.2 0.2 ndf No directed fishing.
Fig. 8.1. American plaice in Div. 3M: nominal catches and agreed TACs (ndf is plotted as 0 TAC).
b) Data Overview
The EU bottom trawl survey on Flemish Cap was conducted during 2014. The survey estimates remained at low levels as previous years (Fig. 8.2 and 8.3).
All of the 1991 to 2005 year classes are estimated to be weak. Since 2006 the recruitment improved, particularly the 2006 year class.
0
1
2
3
4
5
6
1959 1963 1967 1971 1975 1979 1983 1987 1991 1995 1999 2003 2007 2011 2015
Cat
ch/T
AC
('0
00
t)
Year
TAC (ndf = 0)Catch
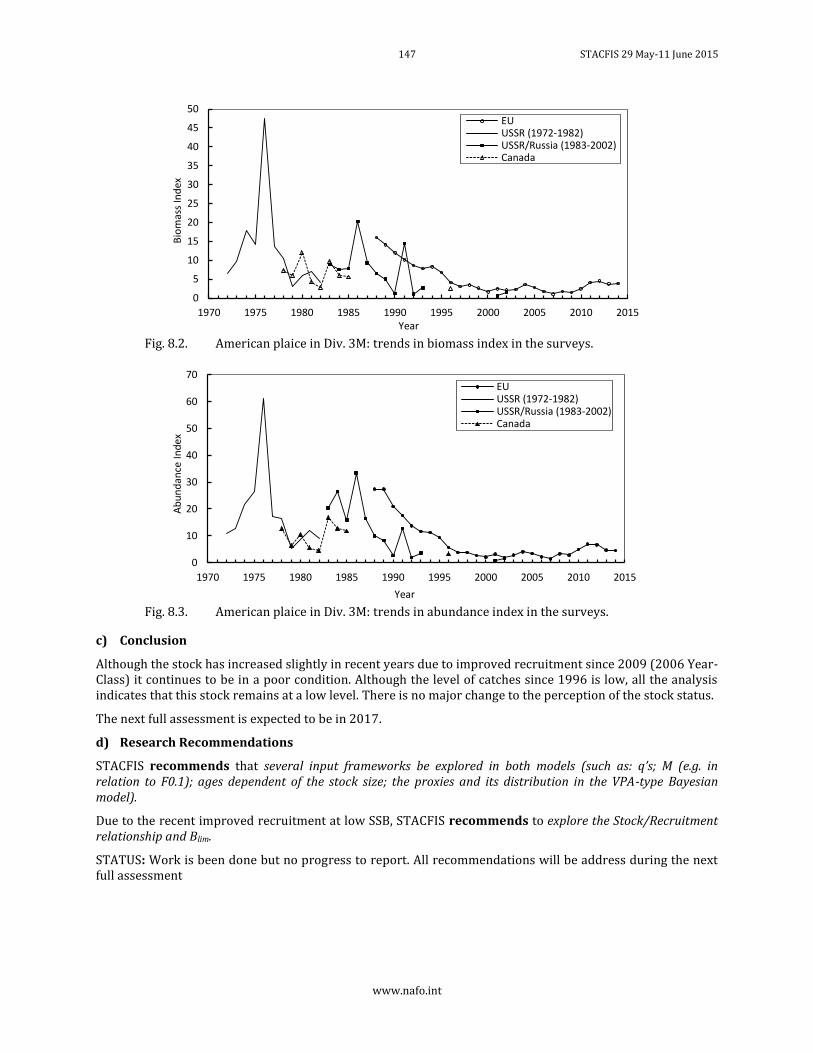
147 STACFIS 29 May-11 June 2015
www.nafo.int
Fig. 8.2. American plaice in Div. 3M: trends in biomass index in the surveys.
Fig. 8.3. American plaice in Div. 3M: trends in abundance index in the surveys.
c) Conclusion
Although the stock has increased slightly in recent years due to improved recruitment since 2009 (2006 Year-Class) it continues to be in a poor condition. Although the level of catches since 1996 is low, all the analysis indicates that this stock remains at a low level. There is no major change to the perception of the stock status.
The next full assessment is expected to be in 2017.
d) Research Recommendations
STACFIS recommends that several input frameworks be explored in both models (such as: q’s; M (e.g. in relation to F0.1); ages dependent of the stock size; the proxies and its distribution in the VPA-type Bayesian model).
Due to the recent improved recruitment at low SSB, STACFIS recommends to explore the Stock/Recruitment relationship and Blim.
STATUS: Work is been done but no progress to report. All recommendations will be address during the next full assessment
0
5
10
15
20
25
30
35
40
45
50
1970 1975 1980 1985 1990 1995 2000 2005 2010 2015
Bio
mas
s In
dex
Year
EUUSSR (1972-1982)USSR/Russia (1983-2002)Canada
0
10
20
30
40
50
60
70
1970 1975 1980 1985 1990 1995 2000 2005 2010 2015
Ab
un
dan
ce I
nd
ex
Year
EUUSSR (1972-1982)USSR/Russia (1983-2002)Canada
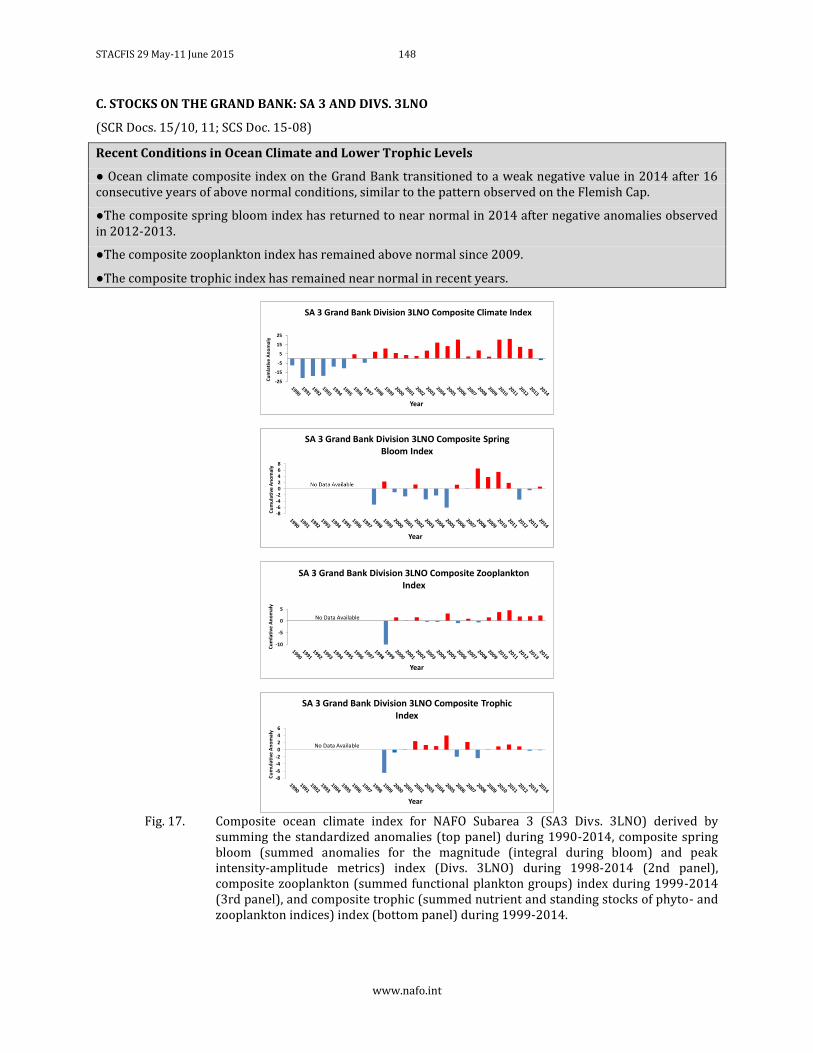
STACFIS 29 May-11 June 2015 148
www.nafo.int
C. STOCKS ON THE GRAND BANK: SA 3 AND DIVS. 3LNO
(SCR Docs. 15/10, 11; SCS Doc. 15-08)
Recent Conditions in Ocean Climate and Lower Trophic Levels
● Ocean climate composite index on the Grand Bank transitioned to a weak negative value in 2014 after 16 consecutive years of above normal conditions, similar to the pattern observed on the Flemish Cap.
●The composite spring bloom index has returned to near normal in 2014 after negative anomalies observed in 2012-2013.
●The composite zooplankton index has remained above normal since 2009.
●The composite trophic index has remained near normal in recent years.
Fig. 17. Composite ocean climate index for NAFO Subarea 3 (SA3 Divs. 3LNO) derived by
summing the standardized anomalies (top panel) during 1990-2014, composite spring bloom (summed anomalies for the magnitude (integral during bloom) and peak intensity-amplitude metrics) index (Divs. 3LNO) during 1998-2014 (2nd panel), composite zooplankton (summed functional plankton groups) index during 1999-2014 (3rd panel), and composite trophic (summed nutrient and standing stocks of phyto- and zooplankton indices) index (bottom panel) during 1999-2014.
-25
-15
-5
5
15
25
Cu
mla
tive
An
om
aly
Year
SA 3 Grand Bank Division 3LNO Composite Climate Index
-8-6-4-202468
Cu
mu
lati
ve A
no
mal
y
Year
SA 3 Grand Bank Division 3LNO Composite Spring Bloom Index
-10
-5
0
5
Cu
mla
tive
An
om
aly
Year
SA 3 Grand Bank Division 3LNO Composite Zooplankton Index
No Data Available
-8
-6
-4
-2
0
2
4
6
Cu
mu
lati
ve A
no
mal
y
Year
SA 3 Grand Bank Division 3LNO Composite Trophic Index
No Data Available
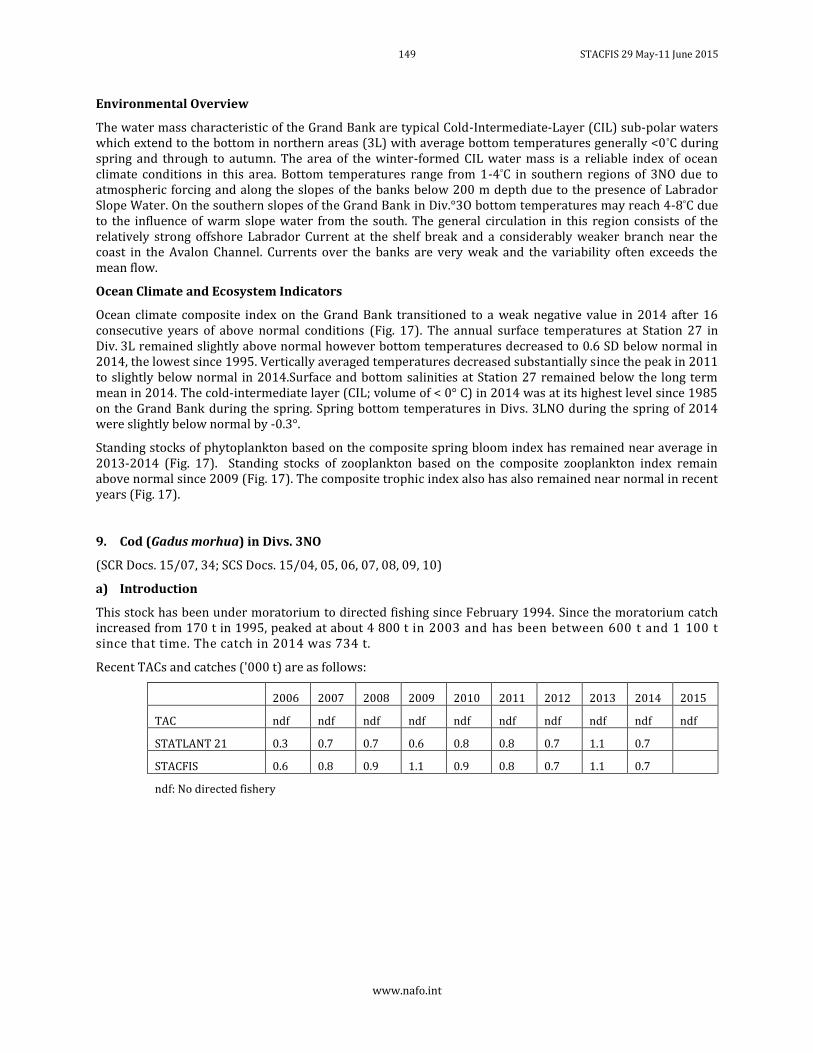
149 STACFIS 29 May-11 June 2015
www.nafo.int
Environmental Overview
The water mass characteristic of the Grand Bank are typical Cold-Intermediate-Layer (CIL) sub-polar waters which extend to the bottom in northern areas (3L) with average bottom temperatures generally <0°C during spring and through to autumn. The area of the winter-formed CIL water mass is a reliable index of ocean climate conditions in this area. Bottom temperatures range from 1-4°C in southern regions of 3NO due to atmospheric forcing and along the slopes of the banks below 200 m depth due to the presence of Labrador Slope Water. On the southern slopes of the Grand Bank in Div.°3O bottom temperatures may reach 4-8°C due to the influence of warm slope water from the south. The general circulation in this region consists of the relatively strong offshore Labrador Current at the shelf break and a considerably weaker branch near the coast in the Avalon Channel. Currents over the banks are very weak and the variability often exceeds the mean flow.
Ocean Climate and Ecosystem Indicators
Ocean climate composite index on the Grand Bank transitioned to a weak negative value in 2014 after 16 consecutive years of above normal conditions (Fig. 17). The annual surface temperatures at Station 27 in Div. 3L remained slightly above normal however bottom temperatures decreased to 0.6 SD below normal in 2014, the lowest since 1995. Vertically averaged temperatures decreased substantially since the peak in 2011 to slightly below normal in 2014.Surface and bottom salinities at Station 27 remained below the long term mean in 2014. The cold-intermediate layer (CIL; volume of < 0° C) in 2014 was at its highest level since 1985 on the Grand Bank during the spring. Spring bottom temperatures in Divs. 3LNO during the spring of 2014 were slightly below normal by -0.3°.
Standing stocks of phytoplankton based on the composite spring bloom index has remained near average in 2013-2014 (Fig. 17). Standing stocks of zooplankton based on the composite zooplankton index remain above normal since 2009 (Fig. 17). The composite trophic index also has also remained near normal in recent years (Fig. 17).
9. Cod (Gadus morhua) in Divs. 3NO
(SCR Docs. 15/07, 34; SCS Docs. 15/04, 05, 06, 07, 08, 09, 10)
a) Introduction
This stock has been under moratorium to directed fishing since February 1994. Since the moratorium catch increased from 170 t in 1995, peaked at about 4 800 t in 2003 and has been between 600 t and 1 100 t since that time. The catch in 2014 was 734 t.
Recent TACs and catches ('000 t) are as follows:
2006 2007 2008 2009 2010 2011 2012 2013 2014 2015
TAC ndf ndf ndf ndf ndf ndf ndf ndf ndf ndf
STATLANT 21 0.3 0.7 0.7 0.6 0.8 0.8 0.7 1.1 0.7
STACFIS 0.6 0.8 0.9 1.1 0.9 0.8 0.7 1.1 0.7
ndf: No directed fishery
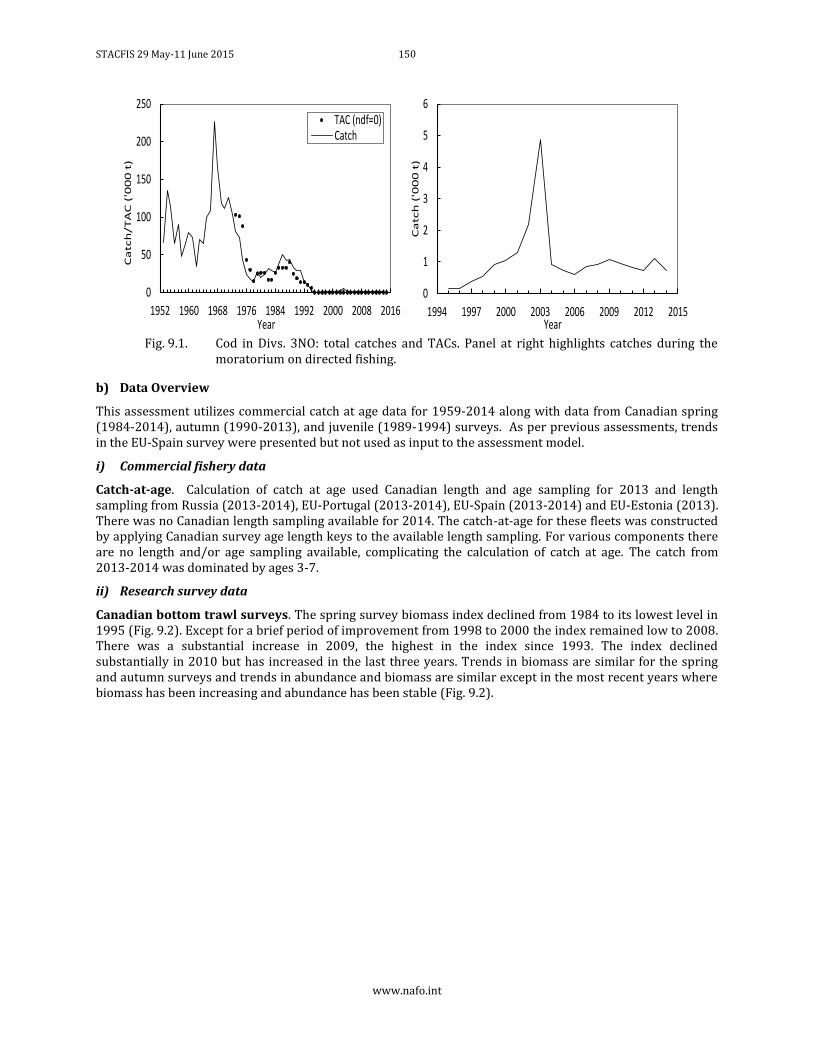
STACFIS 29 May-11 June 2015 150
www.nafo.int
Fig. 9.1. Cod in Divs. 3NO: total catches and TACs. Panel at right highlights catches during the
moratorium on directed fishing.
b) Data Overview
This assessment utilizes commercial catch at age data for 1959-2014 along with data from Canadian spring (1984-2014), autumn (1990-2013), and juvenile (1989-1994) surveys. As per previous assessments, trends in the EU-Spain survey were presented but not used as input to the assessment model.
i) Commercial fishery data
Catch-at-age. Calculation of catch at age used Canadian length and age sampling for 2013 and length sampling from Russia (2013-2014), EU-Portugal (2013-2014), EU-Spain (2013-2014) and EU-Estonia (2013). There was no Canadian length sampling available for 2014. The catch-at-age for these fleets was constructed by applying Canadian survey age length keys to the available length sampling. For various components there are no length and/or age sampling available, complicating the calculation of catch at age. The catch from 2013-2014 was dominated by ages 3-7.
ii) Research survey data
Canadian bottom trawl surveys. The spring survey biomass index declined from 1984 to its lowest level in 1995 (Fig. 9.2). Except for a brief period of improvement from 1998 to 2000 the index remained low to 2008. There was a substantial increase in 2009, the highest in the index since 1993. The index declined substantially in 2010 but has increased in the last three years. Trends in biomass are similar for the spring and autumn surveys and trends in abundance and biomass are similar except in the most recent years where biomass has been increasing and abundance has been stable (Fig. 9.2).
0
50
100
150
200
250
1952 1960 1968 1976 1984 1992 2000 2008 2016
Ca
tch
/T
AC
('0
00
t)
Year
TAC (ndf=0)Catch
0
1
2
3
4
5
6
1994 1997 2000 2003 2006 2009 2012 2015
Ca
tch
('0
00
t)
Year
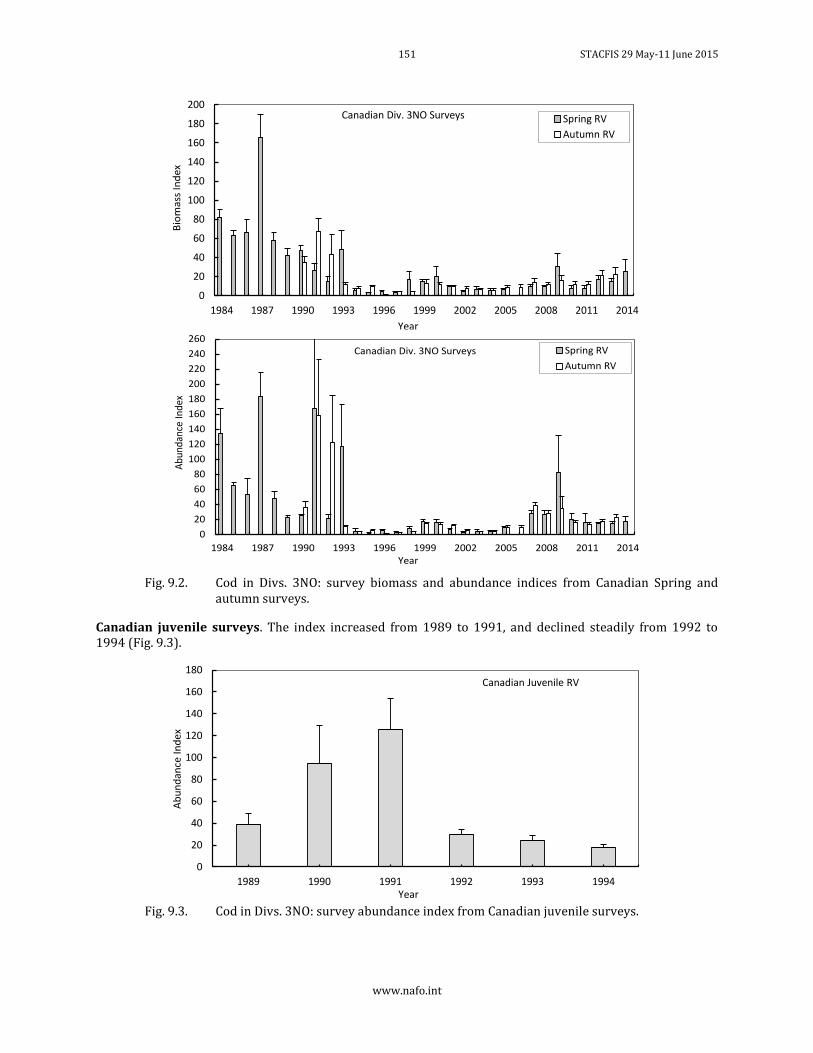
151 STACFIS 29 May-11 June 2015
www.nafo.int
Fig. 9.2. Cod in Divs. 3NO: survey biomass and abundance indices from Canadian Spring and
autumn surveys.
Canadian juvenile surveys. The index increased from 1989 to 1991, and declined steadily from 1992 to 1994 (Fig. 9.3).
Fig. 9.3. Cod in Divs. 3NO: survey abundance index from Canadian juvenile surveys.
0
20
40
60
80
100
120
140
160
180
200
1984 1987 1990 1993 1996 1999 2002 2005 2008 2011 2014
Bio
mas
s In
dex
Year
Canadian Div. 3NO Surveys Spring RV
Autumn RV
0
20
40
60
80
100
120
140
160
180
200
220
240
260
1984 1987 1990 1993 1996 1999 2002 2005 2008 2011 2014
Abu
ndan
ce In
dex
Year
Canadian Div. 3NO Surveys Spring RV
Autumn RV
0
20
40
60
80
100
120
140
160
180
1989 1990 1991 1992 1993 1994
Ab
un
dan
ce I
nd
ex
Year
Canadian Juvenile RV
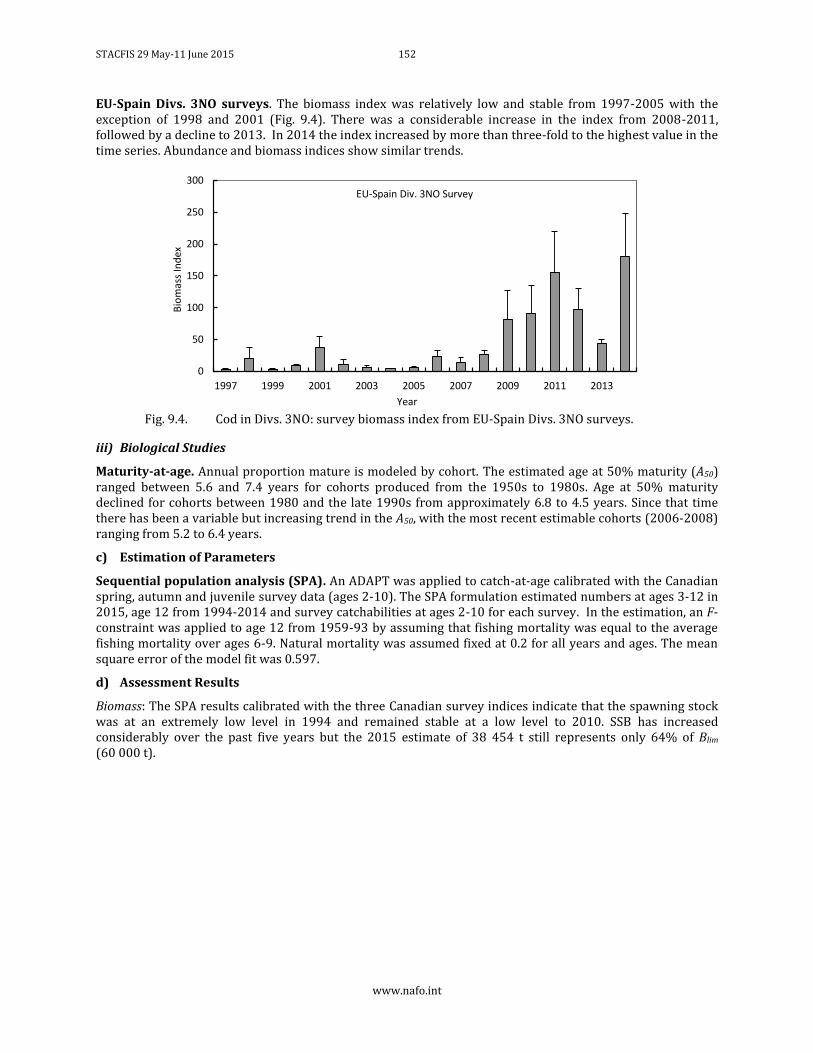
STACFIS 29 May-11 June 2015 152
www.nafo.int
EU-Spain Divs. 3NO surveys. The biomass index was relatively low and stable from 1997-2005 with the exception of 1998 and 2001 (Fig. 9.4). There was a considerable increase in the index from 2008-2011, followed by a decline to 2013. In 2014 the index increased by more than three-fold to the highest value in the time series. Abundance and biomass indices show similar trends.
Fig. 9.4. Cod in Divs. 3NO: survey biomass index from EU-Spain Divs. 3NO surveys.
iii) Biological Studies
Maturity-at-age. Annual proportion mature is modeled by cohort. The estimated age at 50% maturity (A50) ranged between 5.6 and 7.4 years for cohorts produced from the 1950s to 1980s. Age at 50% maturity declined for cohorts between 1980 and the late 1990s from approximately 6.8 to 4.5 years. Since that time there has been a variable but increasing trend in the A50, with the most recent estimable cohorts (2006-2008) ranging from 5.2 to 6.4 years.
c) Estimation of Parameters
Sequential population analysis (SPA). An ADAPT was applied to catch-at-age calibrated with the Canadian spring, autumn and juvenile survey data (ages 2-10). The SPA formulation estimated numbers at ages 3-12 in 2015, age 12 from 1994-2014 and survey catchabilities at ages 2-10 for each survey. In the estimation, an F-constraint was applied to age 12 from 1959-93 by assuming that fishing mortality was equal to the average fishing mortality over ages 6-9. Natural mortality was assumed fixed at 0.2 for all years and ages. The mean square error of the model fit was 0.597.
d) Assessment Results
Biomass: The SPA results calibrated with the three Canadian survey indices indicate that the spawning stock was at an extremely low level in 1994 and remained stable at a low level to 2010. SSB has increased considerably over the past five years but the 2015 estimate of 38 454 t still represents only 64% of Blim (60 000 t).
0
50
100
150
200
250
300
1997 1999 2001 2003 2005 2007 2009 2011 2013
Bio
mas
s In
dex
Year
EU-Spain Div. 3NO Survey
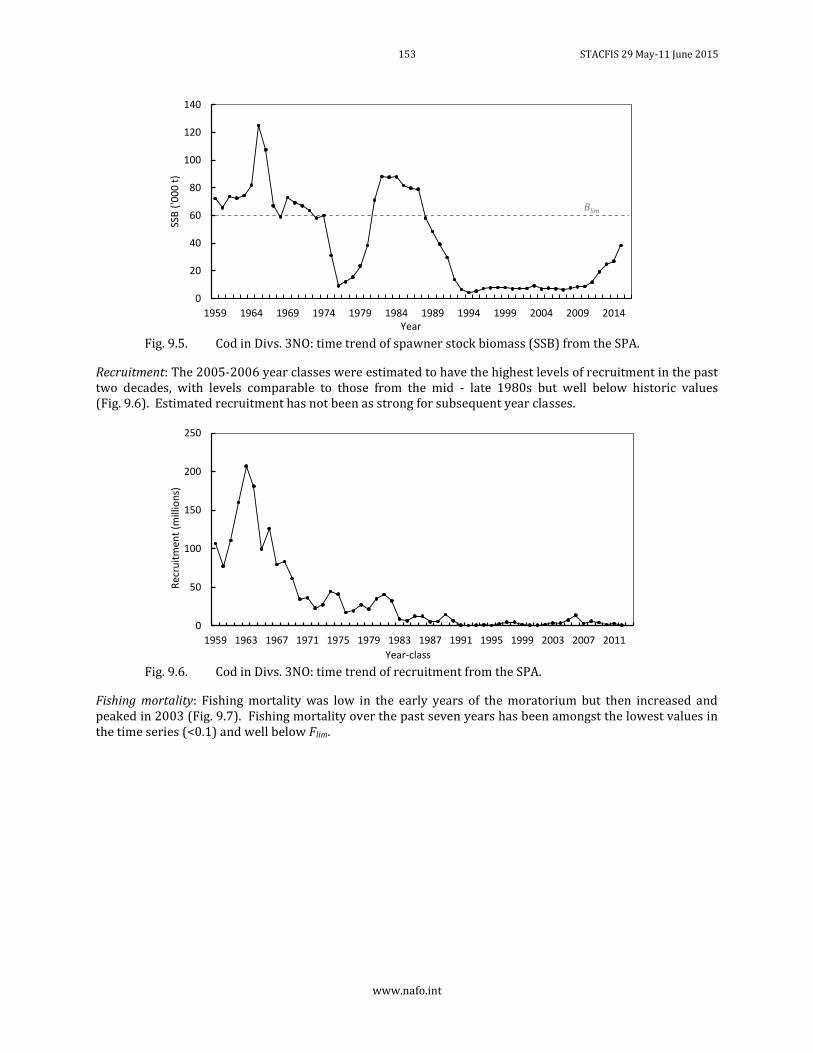
153 STACFIS 29 May-11 June 2015
www.nafo.int
Fig. 9.5. Cod in Divs. 3NO: time trend of spawner stock biomass (SSB) from the SPA.
Recruitment: The 2005-2006 year classes were estimated to have the highest levels of recruitment in the past two decades, with levels comparable to those from the mid - late 1980s but well below historic values (Fig. 9.6). Estimated recruitment has not been as strong for subsequent year classes.
Fig. 9.6. Cod in Divs. 3NO: time trend of recruitment from the SPA.
Fishing mortality: Fishing mortality was low in the early years of the moratorium but then increased and peaked in 2003 (Fig. 9.7). Fishing mortality over the past seven years has been amongst the lowest values in the time series (<0.1) and well below Flim.
0
20
40
60
80
100
120
140
1959 1964 1969 1974 1979 1984 1989 1994 1999 2004 2009 2014
SSB
('0
00
t)
Year
Blim
0
50
100
150
200
250
1959 1963 1967 1971 1975 1979 1983 1987 1991 1995 1999 2003 2007 2011
Rec
ruit
men
t (m
illio
ns)
Year-class
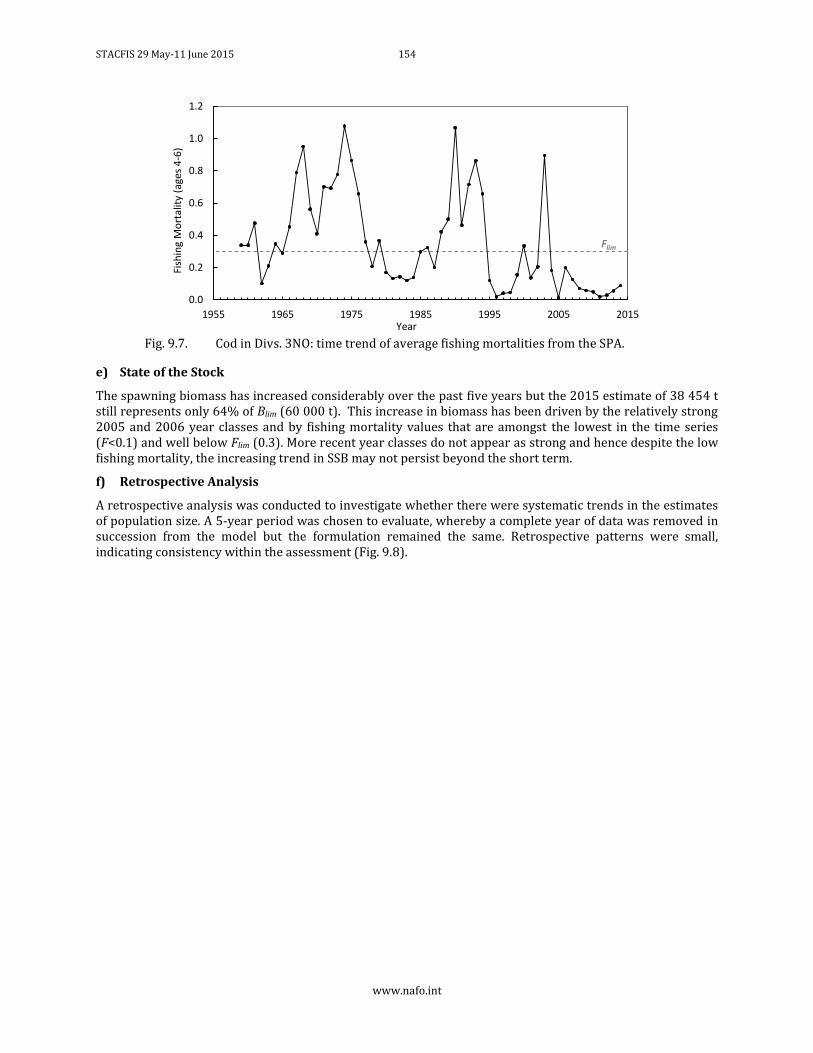
STACFIS 29 May-11 June 2015 154
www.nafo.int
Fig. 9.7. Cod in Divs. 3NO: time trend of average fishing mortalities from the SPA.
e) State of the Stock
The spawning biomass has increased considerably over the past five years but the 2015 estimate of 38 454 t still represents only 64% of Blim (60 000 t). This increase in biomass has been driven by the relatively strong 2005 and 2006 year classes and by fishing mortality values that are amongst the lowest in the time series (F<0.1) and well below Flim (0.3). More recent year classes do not appear as strong and hence despite the low fishing mortality, the increasing trend in SSB may not persist beyond the short term.
f) Retrospective Analysis
A retrospective analysis was conducted to investigate whether there were systematic trends in the estimates of population size. A 5-year period was chosen to evaluate, whereby a complete year of data was removed in succession from the model but the formulation remained the same. Retrospective patterns were small, indicating consistency within the assessment (Fig. 9.8).
0.0
0.2
0.4
0.6
0.8
1.0
1.2
1955 1965 1975 1985 1995 2005 2015
Fish
ing
Mo
rtal
ity
(age
s 4
-6)
Year
Flim
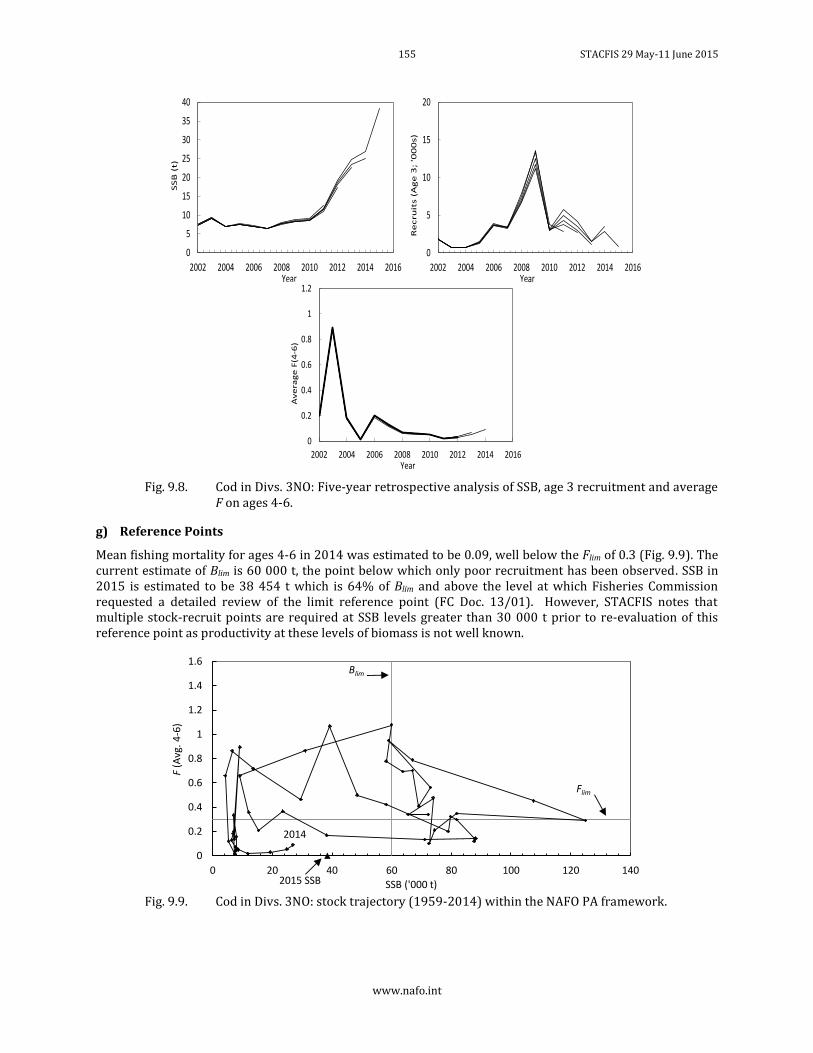
155 STACFIS 29 May-11 June 2015
www.nafo.int
Fig. 9.8. Cod in Divs. 3NO: Five-year retrospective analysis of SSB, age 3 recruitment and average
F on ages 4-6.
g) Reference Points
Mean fishing mortality for ages 4-6 in 2014 was estimated to be 0.09, well below the Flim of 0.3 (Fig. 9.9). The current estimate of Blim is 60 000 t, the point below which only poor recruitment has been observed. SSB in 2015 is estimated to be 38 454 t which is 64% of Blim and above the level at which Fisheries Commission requested a detailed review of the limit reference point (FC Doc. 13/01). However, STACFIS notes that multiple stock-recruit points are required at SSB levels greater than 30 000 t prior to re-evaluation of this reference point as productivity at these levels of biomass is not well known.
Fig. 9.9. Cod in Divs. 3NO: stock trajectory (1959-2014) within the NAFO PA framework.
0
5
10
15
20
25
30
35
40
2002 2004 2006 2008 2010 2012 2014 2016
SS
B (
t)
Year
0
5
10
15
20
2002 2004 2006 2008 2010 2012 2014 2016
Re
cru
its (
Ag
e 3
; '0
00
s)
Year
0
0.2
0.4
0.6
0.8
1
1.2
2002 2004 2006 2008 2010 2012 2014 2016
Av
era
ge
F(4
-6)
Year
0
0.2
0.4
0.6
0.8
1
1.2
1.4
1.6
0 20 40 60 80 100 120 140
F(A
vg. 4
-6)
SSB ('000 t)
2014
Blim
2015 SSB
Flim
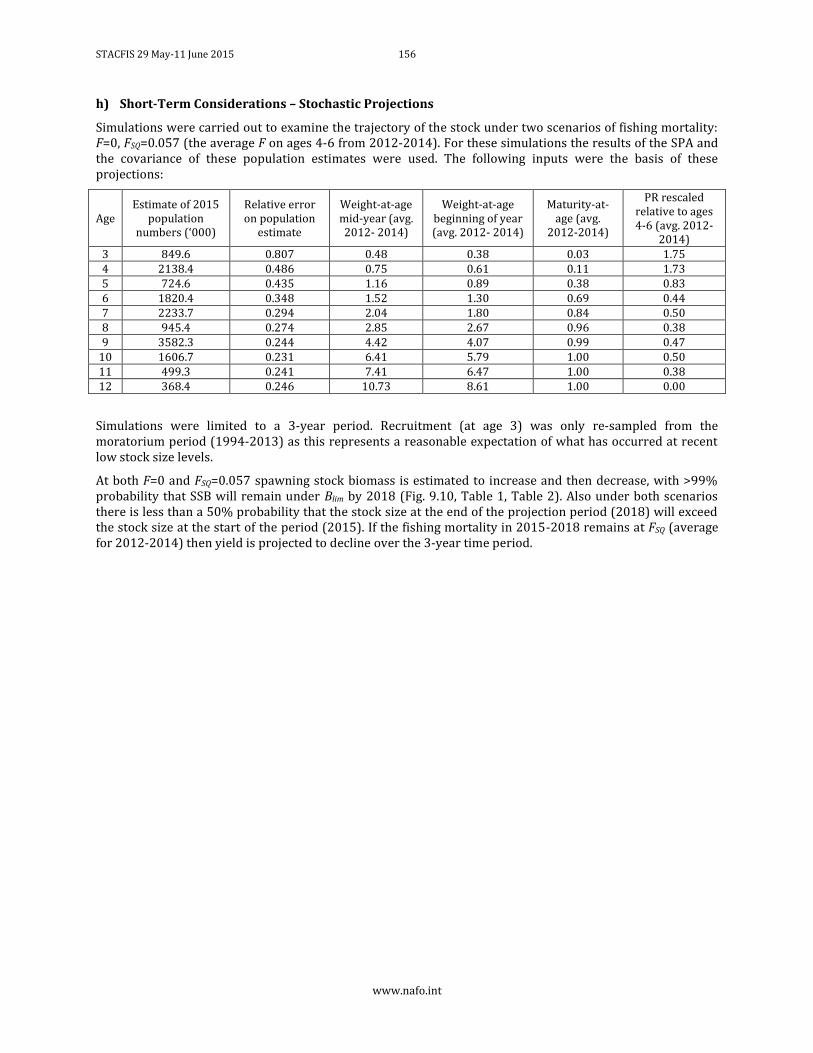
STACFIS 29 May-11 June 2015 156
www.nafo.int
h) Short-Term Considerations – Stochastic Projections
Simulations were carried out to examine the trajectory of the stock under two scenarios of fishing mortality: F=0, FSQ=0.057 (the average F on ages 4-6 from 2012-2014). For these simulations the results of the SPA and the covariance of these population estimates were used. The following inputs were the basis of these projections:
Age Estimate of 2015
population numbers (‘000)
Relative error on population
estimate
Weight-at-age mid-year (avg. 2012- 2014)
Weight-at-age beginning of year (avg. 2012- 2014)
Maturity-at-age (avg.
2012-2014)
PR rescaled relative to ages 4-6 (avg. 2012-
2014) 3 849.6 0.807 0.48 0.38 0.03 1.75 4 2138.4 0.486 0.75 0.61 0.11 1.73 5 724.6 0.435 1.16 0.89 0.38 0.83 6 1820.4 0.348 1.52 1.30 0.69 0.44 7 2233.7 0.294 2.04 1.80 0.84 0.50 8 945.4 0.274 2.85 2.67 0.96 0.38 9 3582.3 0.244 4.42 4.07 0.99 0.47
10 1606.7 0.231 6.41 5.79 1.00 0.50 11 499.3 0.241 7.41 6.47 1.00 0.38 12 368.4 0.246 10.73 8.61 1.00 0.00
Simulations were limited to a 3-year period. Recruitment (at age 3) was only re-sampled from the moratorium period (1994-2013) as this represents a reasonable expectation of what has occurred at recent low stock size levels.
At both F=0 and FSQ=0.057 spawning stock biomass is estimated to increase and then decrease, with >99% probability that SSB will remain under Blim by 2018 (Fig. 9.10, Table 1, Table 2). Also under both scenarios there is less than a 50% probability that the stock size at the end of the projection period (2018) will exceed the stock size at the start of the period (2015). If the fishing mortality in 2015-2018 remains at FSQ (average for 2012-2014) then yield is projected to decline over the 3-year time period.
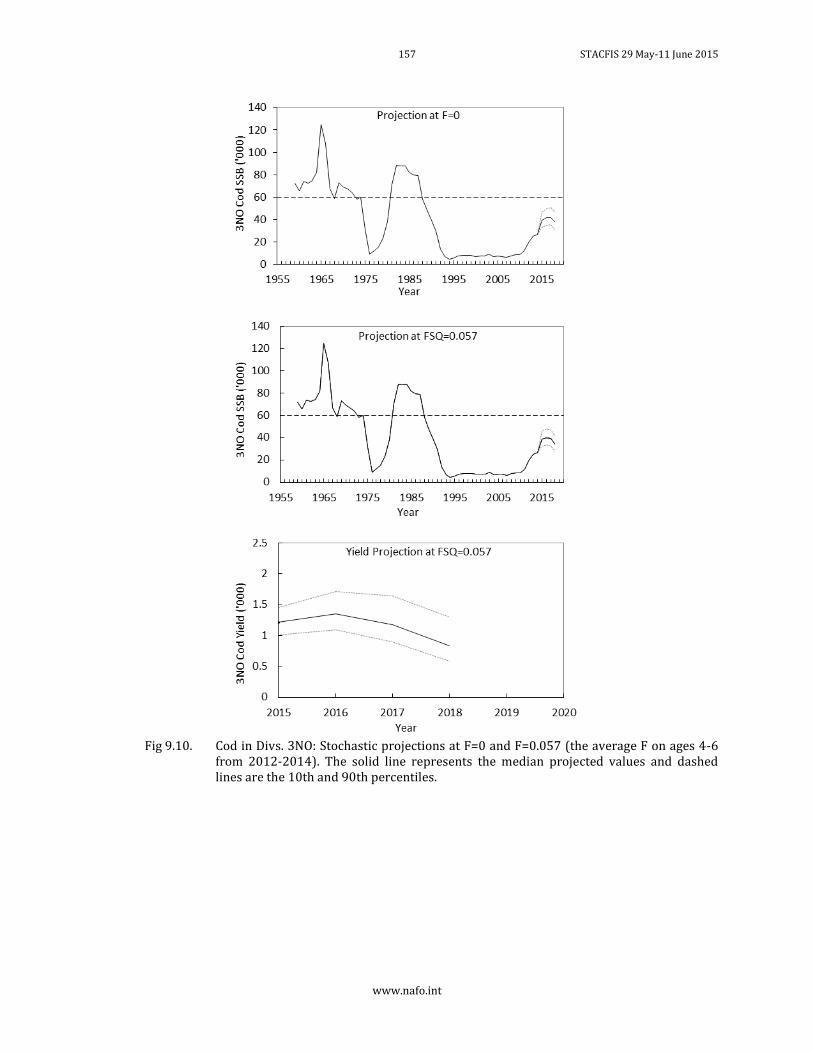
157 STACFIS 29 May-11 June 2015
www.nafo.int
Fig 9.10. Cod in Divs. 3NO: Stochastic projections at F=0 and F=0.057 (the average F on ages 4-6
from 2012-2014). The solid line represents the median projected values and dashed lines are the 10th and 90th percentiles.
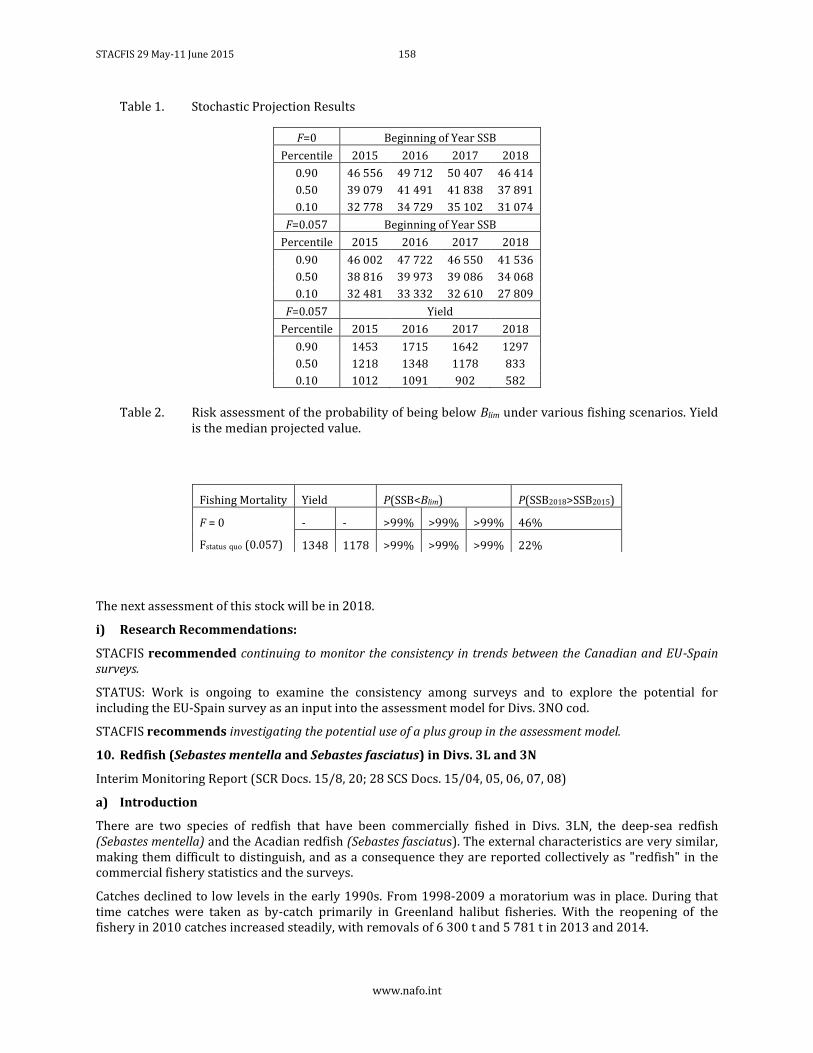
STACFIS 29 May-11 June 2015 158
www.nafo.int
Table 1. Stochastic Projection Results
F=0 Beginning of Year SSB
Percentile 2015 2016 2017 2018
0.90 46 556 49 712 50 407 46 414
0.50 39 079 41 491 41 838 37 891
0.10 32 778 34 729 35 102 31 074
F=0.057 Beginning of Year SSB
Percentile 2015 2016 2017 2018
0.90 46 002 47 722 46 550 41 536
0.50 38 816 39 973 39 086 34 068
0.10 32 481 33 332 32 610 27 809
F=0.057 Yield
Percentile 2015 2016 2017 2018
0.90 1453 1715 1642 1297
0.50 1218 1348 1178 833
0.10 1012 1091 902 582
Table 2. Risk assessment of the probability of being below Blim under various fishing scenarios. Yield is the median projected value.
The next assessment of this stock will be in 2018.
i) Research Recommendations:
STACFIS recommended continuing to monitor the consistency in trends between the Canadian and EU-Spain surveys.
STATUS: Work is ongoing to examine the consistency among surveys and to explore the potential for including the EU-Spain survey as an input into the assessment model for Divs. 3NO cod.
STACFIS recommends investigating the potential use of a plus group in the assessment model.
10. Redfish (Sebastes mentella and Sebastes fasciatus) in Divs. 3L and 3N
Interim Monitoring Report (SCR Docs. 15/8, 20; 28 SCS Docs. 15/04, 05, 06, 07, 08)
a) Introduction
There are two species of redfish that have been commercially fished in Divs. 3LN, the deep-sea redfish (Sebastes mentella) and the Acadian redfish (Sebastes fasciatus). The external characteristics are very similar, making them difficult to distinguish, and as a consequence they are reported collectively as "redfish" in the commercial fishery statistics and the surveys.
Catches declined to low levels in the early 1990s. From 1998-2009 a moratorium was in place. During that time catches were taken as by-catch primarily in Greenland halibut fisheries. With the reopening of the fishery in 2010 catches increased steadily, with removals of 6 300 t and 5 781 t in 2013 and 2014.
Fishing Mortality Yield P(SSB<Blim) P(SSB2018>SSB2015)
F = 0
Fstatus quo (0.057)
- - >99% >99% >99% 46%
1348 1178 >99% >99% >99% 22%
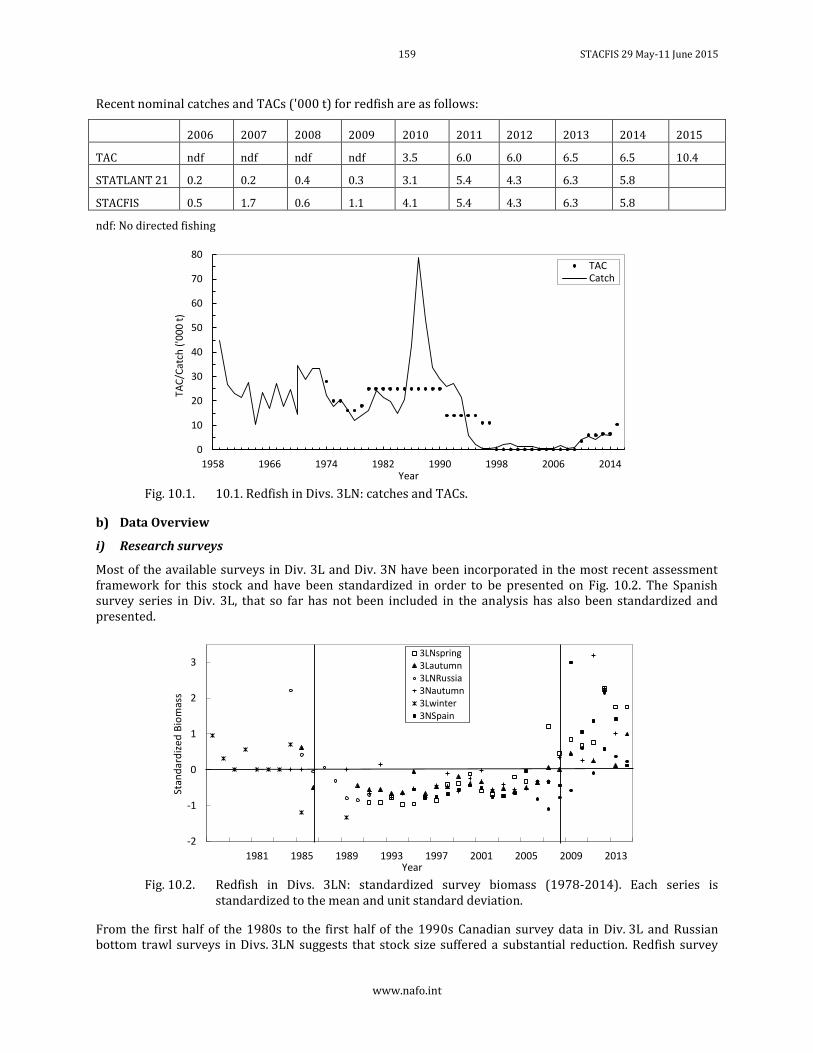
159 STACFIS 29 May-11 June 2015
www.nafo.int
Recent nominal catches and TACs ('000 t) for redfish are as follows:
2006 2007 2008 2009 2010 2011 2012 2013 2014 2015
TAC ndf ndf ndf ndf 3.5 6.0 6.0 6.5 6.5 10.4
STATLANT 21 0.2 0.2 0.4 0.3 3.1 5.4 4.3 6.3 5.8
STACFIS 0.5 1.7 0.6 1.1 4.1 5.4 4.3 6.3 5.8
ndf: No directed fishing
Fig. 10.1. 10.1. Redfish in Divs. 3LN: catches and TACs.
b) Data Overview
i) Research surveys
Most of the available surveys in Div. 3L and Div. 3N have been incorporated in the most recent assessment framework for this stock and have been standardized in order to be presented on Fig. 10.2. The Spanish survey series in Div. 3L, that so far has not been included in the analysis has also been standardized and presented.
Fig. 10.2. Redfish in Divs. 3LN: standardized survey biomass (1978-2014). Each series is
standardized to the mean and unit standard deviation.
From the first half of the 1980s to the first half of the 1990s Canadian survey data in Div. 3L and Russian bottom trawl surveys in Divs. 3LN suggests that stock size suffered a substantial reduction. Redfish survey
0
10
20
30
40
50
60
70
80
1958 1966 1974 1982 1990 1998 2006 2014
TAC
/Cat
ch (
'00
0 t
)
Year
TACCatch
-2
-1
0
1
2
3
1981 1985 1989 1993 1997 2001 2005 2009 2013
Stan
dar
diz
ed B
iom
ass
Year
3LNspring3Lautumn3LNRussia3Nautumn3Lwinter3NSpain
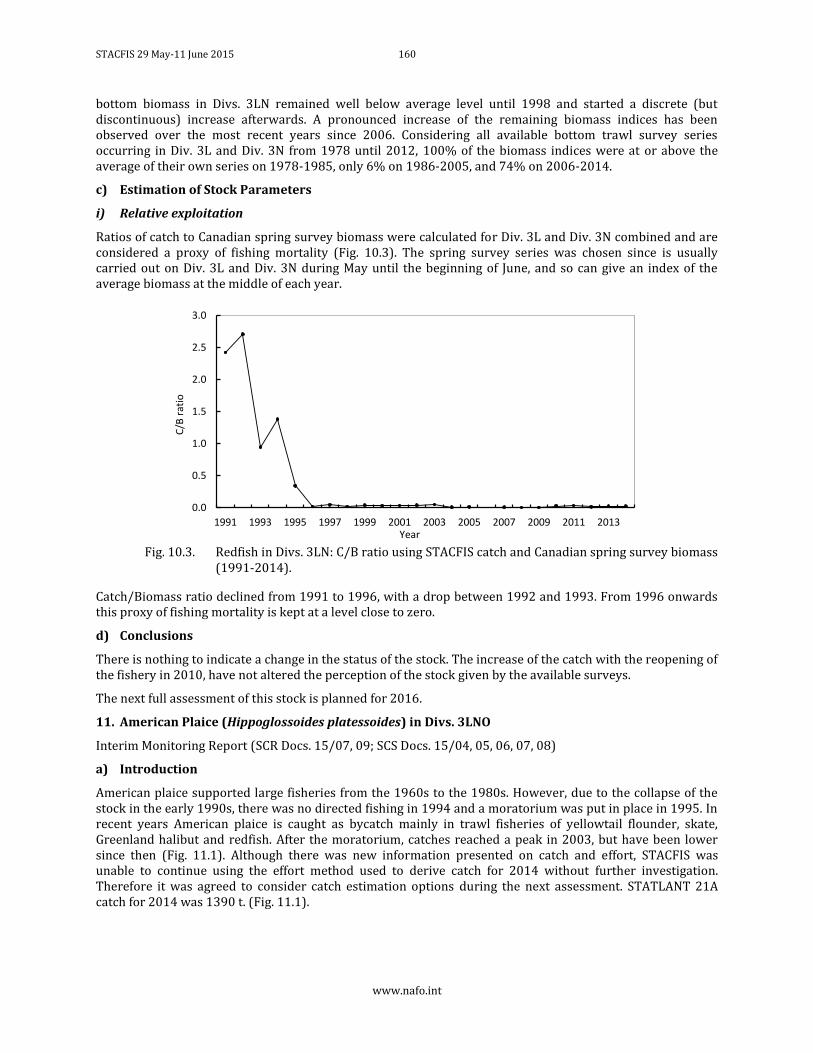
STACFIS 29 May-11 June 2015 160
www.nafo.int
bottom biomass in Divs. 3LN remained well below average level until 1998 and started a discrete (but discontinuous) increase afterwards. A pronounced increase of the remaining biomass indices has been observed over the most recent years since 2006. Considering all available bottom trawl survey series occurring in Div. 3L and Div. 3N from 1978 until 2012, 100% of the biomass indices were at or above the average of their own series on 1978-1985, only 6% on 1986-2005, and 74% on 2006-2014.
c) Estimation of Stock Parameters
i) Relative exploitation
Ratios of catch to Canadian spring survey biomass were calculated for Div. 3L and Div. 3N combined and are considered a proxy of fishing mortality (Fig. 10.3). The spring survey series was chosen since is usually carried out on Div. 3L and Div. 3N during May until the beginning of June, and so can give an index of the average biomass at the middle of each year.
Fig. 10.3. Redfish in Divs. 3LN: C/B ratio using STACFIS catch and Canadian spring survey biomass
(1991-2014).
Catch/Biomass ratio declined from 1991 to 1996, with a drop between 1992 and 1993. From 1996 onwards this proxy of fishing mortality is kept at a level close to zero.
d) Conclusions
There is nothing to indicate a change in the status of the stock. The increase of the catch with the reopening of the fishery in 2010, have not altered the perception of the stock given by the available surveys.
The next full assessment of this stock is planned for 2016.
11. American Plaice (Hippoglossoides platessoides) in Divs. 3LNO
Interim Monitoring Report (SCR Docs. 15/07, 09; SCS Docs. 15/04, 05, 06, 07, 08)
a) Introduction
American plaice supported large fisheries from the 1960s to the 1980s. However, due to the collapse of the stock in the early 1990s, there was no directed fishing in 1994 and a moratorium was put in place in 1995. In recent years American plaice is caught as bycatch mainly in trawl fisheries of yellowtail flounder, skate, Greenland halibut and redfish. After the moratorium, catches reached a peak in 2003, but have been lower since then (Fig. 11.1). Although there was new information presented on catch and effort, STACFIS was unable to continue using the effort method used to derive catch for 2014 without further investigation. Therefore it was agreed to consider catch estimation options during the next assessment. STATLANT 21A catch for 2014 was 1390 t. (Fig. 11.1).
0.0
0.5
1.0
1.5
2.0
2.5
3.0
1991 1993 1995 1997 1999 2001 2003 2005 2007 2009 2011 2013
C/B
rat
io
Year
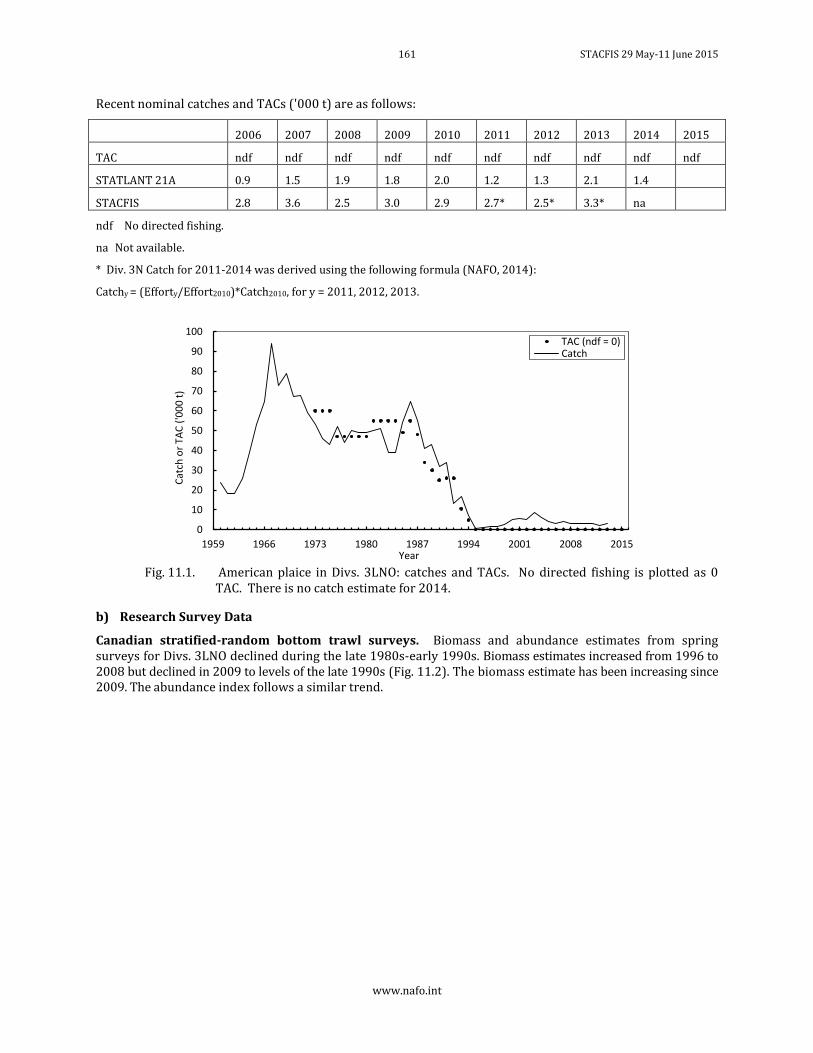
161 STACFIS 29 May-11 June 2015
www.nafo.int
Recent nominal catches and TACs ('000 t) are as follows:
2006 2007 2008 2009 2010 2011 2012 2013 2014 2015
TAC ndf ndf ndf ndf ndf ndf ndf ndf ndf ndf
STATLANT 21A 0.9 1.5 1.9 1.8 2.0 1.2 1.3 2.1 1.4
STACFIS 2.8 3.6 2.5 3.0 2.9 2.7* 2.5* 3.3* na
ndf No directed fishing.
na Not available.
* Div. 3N Catch for 2011-2014 was derived using the following formula (NAFO, 2014):
Catchy = (Efforty/Effort2010)*Catch2010, for y = 2011, 2012, 2013.
Fig. 11.1. American plaice in Divs. 3LNO: catches and TACs. No directed fishing is plotted as 0
TAC. There is no catch estimate for 2014.
b) Research Survey Data
Canadian stratified-random bottom trawl surveys. Biomass and abundance estimates from spring surveys for Divs. 3LNO declined during the late 1980s-early 1990s. Biomass estimates increased from 1996 to 2008 but declined in 2009 to levels of the late 1990s (Fig. 11.2). The biomass estimate has been increasing since 2009. The abundance index follows a similar trend.
0
10
20
30
40
50
60
70
80
90
100
1959 1966 1973 1980 1987 1994 2001 2008 2015
Cat
ch o
r TA
C (
'00
0 t
)
Year
TAC (ndf = 0)Catch
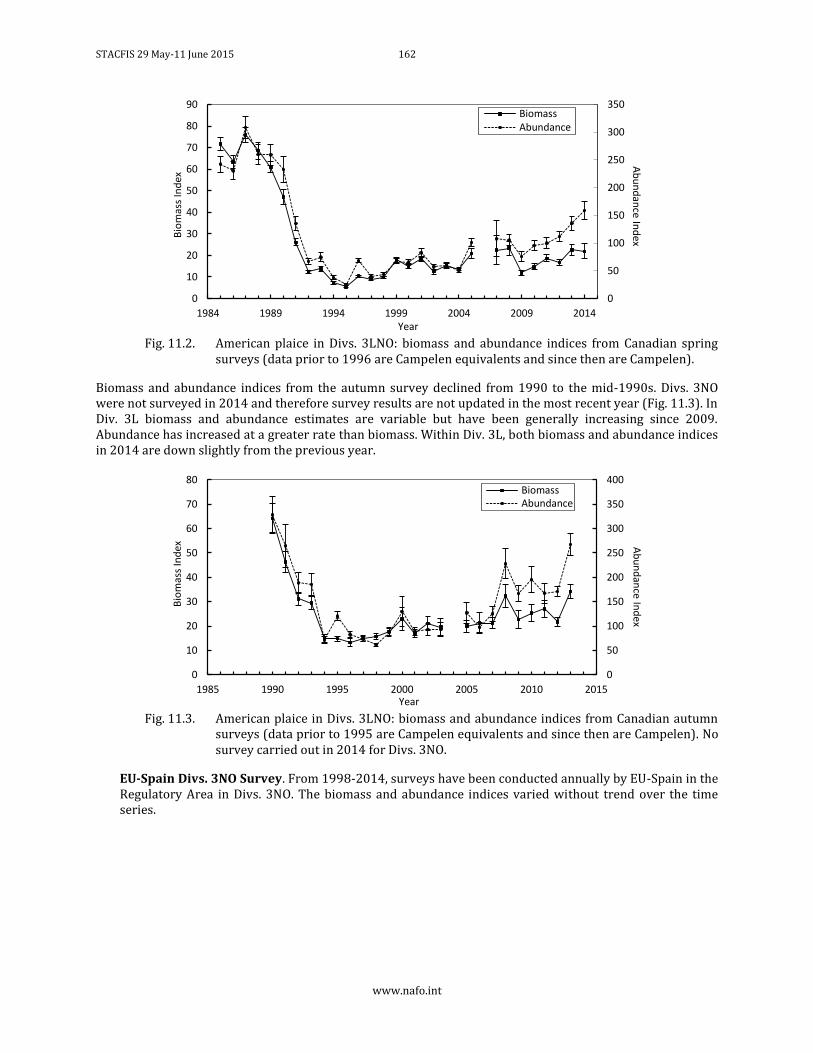
STACFIS 29 May-11 June 2015 162
www.nafo.int
Fig. 11.2. American plaice in Divs. 3LNO: biomass and abundance indices from Canadian spring
surveys (data prior to 1996 are Campelen equivalents and since then are Campelen).
Biomass and abundance indices from the autumn survey declined from 1990 to the mid-1990s. Divs. 3NO were not surveyed in 2014 and therefore survey results are not updated in the most recent year (Fig. 11.3). In Div. 3L biomass and abundance estimates are variable but have been generally increasing since 2009. Abundance has increased at a greater rate than biomass. Within Div. 3L, both biomass and abundance indices in 2014 are down slightly from the previous year.
Fig. 11.3. American plaice in Divs. 3LNO: biomass and abundance indices from Canadian autumn
surveys (data prior to 1995 are Campelen equivalents and since then are Campelen). No survey carried out in 2014 for Divs. 3NO.
EU-Spain Divs. 3NO Survey. From 1998-2014, surveys have been conducted annually by EU-Spain in the Regulatory Area in Divs. 3NO. The biomass and abundance indices varied without trend over the time series.
0
50
100
150
200
250
300
350
0
10
20
30
40
50
60
70
80
90
1984 1989 1994 1999 2004 2009 2014
Ab
un
dan
ce In
dex
Bio
mas
s In
dex
Year
BiomassAbundance
0
50
100
150
200
250
300
350
400
0
10
20
30
40
50
60
70
80
1985 1990 1995 2000 2005 2010 2015
Ab
un
dan
ce Ind
ex B
iom
ass
Ind
ex
Year
BiomassAbundance
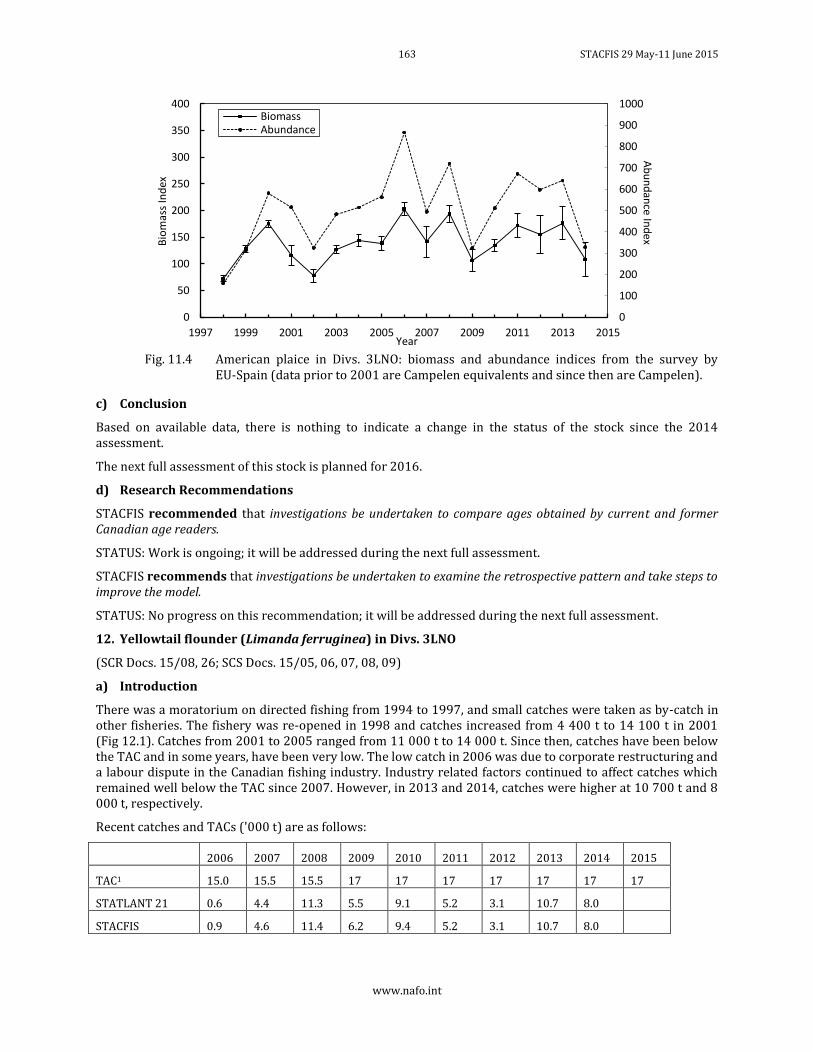
163 STACFIS 29 May-11 June 2015
www.nafo.int
Fig. 11.4 American plaice in Divs. 3LNO: biomass and abundance indices from the survey by
EU-Spain (data prior to 2001 are Campelen equivalents and since then are Campelen).
c) Conclusion
Based on available data, there is nothing to indicate a change in the status of the stock since the 2014 assessment.
The next full assessment of this stock is planned for 2016.
d) Research Recommendations
STACFIS recommended that investigations be undertaken to compare ages obtained by current and former Canadian age readers.
STATUS: Work is ongoing; it will be addressed during the next full assessment.
STACFIS recommends that investigations be undertaken to examine the retrospective pattern and take steps to improve the model.
STATUS: No progress on this recommendation; it will be addressed during the next full assessment.
12. Yellowtail flounder (Limanda ferruginea) in Divs. 3LNO
(SCR Docs. 15/08, 26; SCS Docs. 15/05, 06, 07, 08, 09)
a) Introduction
There was a moratorium on directed fishing from 1994 to 1997, and small catches were taken as by-catch in other fisheries. The fishery was re-opened in 1998 and catches increased from 4 400 t to 14 100 t in 2001 (Fig 12.1). Catches from 2001 to 2005 ranged from 11 000 t to 14 000 t. Since then, catches have been below the TAC and in some years, have been very low. The low catch in 2006 was due to corporate restructuring and a labour dispute in the Canadian fishing industry. Industry related factors continued to affect catches which remained well below the TAC since 2007. However, in 2013 and 2014, catches were higher at 10 700 t and 8 000 t, respectively.
Recent catches and TACs ('000 t) are as follows:
2006 2007 2008 2009 2010 2011 2012 2013 2014 2015
TAC1 15.0 15.5 15.5 17 17 17 17 17 17 17
STATLANT 21 0.6 4.4 11.3 5.5 9.1 5.2 3.1 10.7 8.0
STACFIS 0.9 4.6 11.4 6.2 9.4 5.2 3.1 10.7 8.0
0
100
200
300
400
500
600
700
800
900
1000
0
50
100
150
200
250
300
350
400
1997 1999 2001 2003 2005 2007 2009 2011 2013 2015
Bio
mas
s In
dex
Year
BiomassAbundance
Ab
un
dan
ce Ind
ex
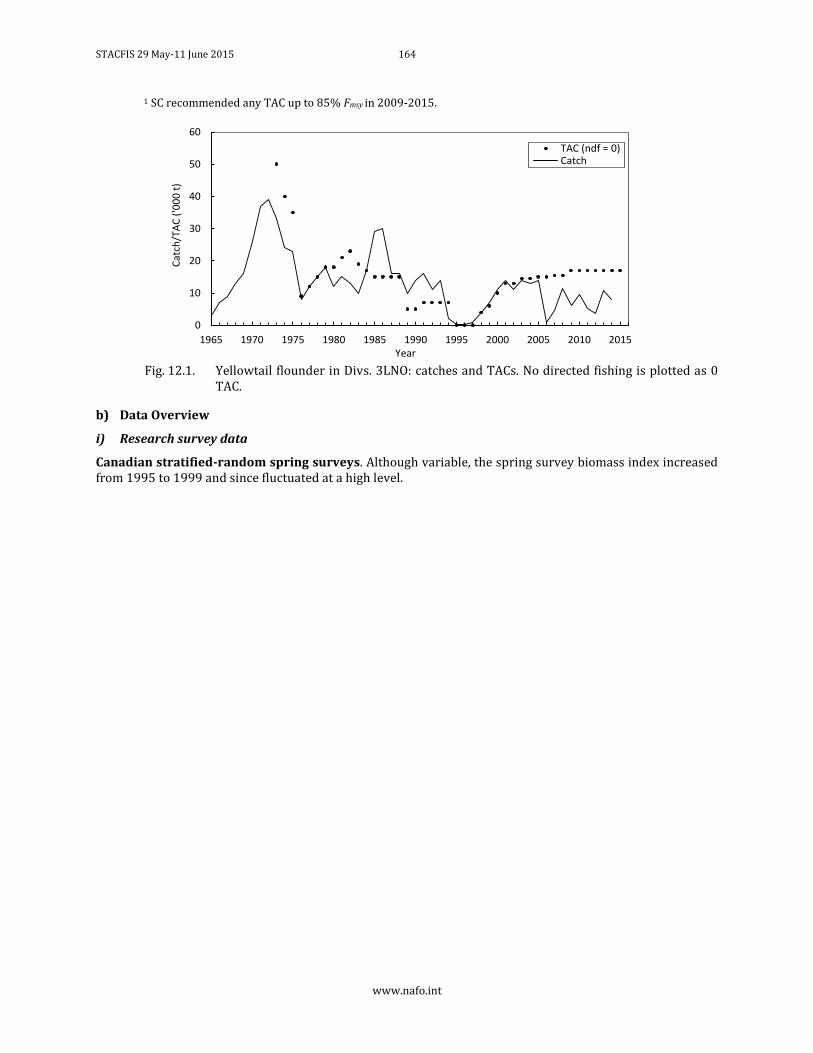
STACFIS 29 May-11 June 2015 164
www.nafo.int
1 SC recommended any TAC up to 85% Fmsy in 2009-2015.
Fig. 12.1. Yellowtail flounder in Divs. 3LNO: catches and TACs. No directed fishing is plotted as 0
TAC.
b) Data Overview
i) Research survey data
Canadian stratified-random spring surveys. Although variable, the spring survey biomass index increased from 1995 to 1999 and since fluctuated at a high level.
0
10
20
30
40
50
60
1965 1970 1975 1980 1985 1990 1995 2000 2005 2010 2015
Cat
ch/T
AC
('0
00
t)
Year
TAC (ndf = 0)Catch
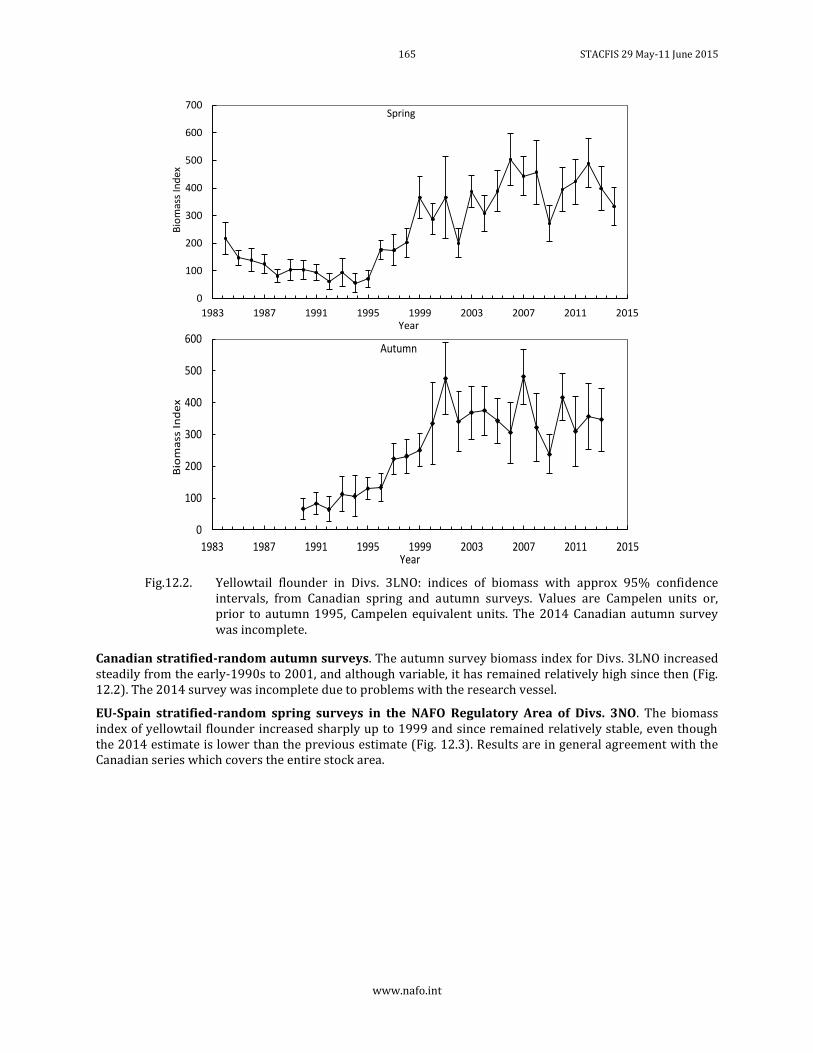
165 STACFIS 29 May-11 June 2015
www.nafo.int
Fig.12.2. Yellowtail flounder in Divs. 3LNO: indices of biomass with approx 95% confidence
intervals, from Canadian spring and autumn surveys. Values are Campelen units or, prior to autumn 1995, Campelen equivalent units. The 2014 Canadian autumn survey was incomplete.
Canadian stratified-random autumn surveys. The autumn survey biomass index for Divs. 3LNO increased steadily from the early-1990s to 2001, and although variable, it has remained relatively high since then (Fig. 12.2). The 2014 survey was incomplete due to problems with the research vessel.
EU-Spain stratified-random spring surveys in the NAFO Regulatory Area of Divs. 3NO. The biomass index of yellowtail flounder increased sharply up to 1999 and since remained relatively stable, even though the 2014 estimate is lower than the previous estimate (Fig. 12.3). Results are in general agreement with the Canadian series which covers the entire stock area.
0
100
200
300
400
500
600
700
1983 1987 1991 1995 1999 2003 2007 2011 2015
Bio
mas
s In
dex
Year
Spring
0
100
200
300
400
500
600
1983 1987 1991 1995 1999 2003 2007 2011 2015
Bio
ma
ss I
nd
ex
Year
Autumn
STACFIS 29 May-11 June 2015 166
www.nafo.int
Fig.12.3. Yellowtail flounder in Divs. 3LNO: index of biomass from the EU-Spain spring surveys in
the Regulatory Area of Divs. 3NO ±1SD. Values are Campelen units or, prior to 2001, Campelen equivalent units.
Stock distribution. In all surveys, yellowtail flounder were most abundant in Div. 3N, in strata on the Southeast Shoal and those immediately to the west (360, 361, 375 & 376), which straddle the Canadian 200 mile limit. Yellowtail flounder appeared to be more abundant in the Regulatory Area of Div. 3N in the 1999-2014 surveys than from 1984-1995, and the stock has continued to occupy the northern portion of its range in Div. 3L, similar to the mid-1980s when overall stock size was also relatively large. The vast majority of the stock is found in waters shallower than 93 m in both seasons.
c) Estimation of Parameters.
The previous assessment for this stock used a non-equilibrium surplus production model, ASPIC version 5.34. A major revision to the software (version7.02; Prager 2015) was examined using the previous assessment (2013) formulation in the new version to compare model estimates and fit criteria. No substantial differences in parameter estimation or model fit were noticed, and the current assessment proceeded with the most recent version of ASPIC. Model runs to explore other designations in the model (convergence criteria and penalty for B1>K) were also presented, and it was decided to proceed with the 2015 assessment using ASPIC version 7.02, with the recommended convergence criteria and with the penalty term for initial biomass being higher than the carrying capacity, K, set to 1. The input data for 2015 were: Catch data (1965-2014, with catch set to the average catch 2007-2014 (7 400t) in 2015), Russian spring surveys (1984-91), Canadian spring (Yankee) surveys (1971-82), Canadian spring (1984-2014 omitting 2006) surveys, Canadian autumn (1990-2013) surveys and the EU-Spain spring (1995-2014) surveys.
d) Assessment Results
Recruitment Total numbers of juveniles (<22 cm) from spring and autumn surveys by Canada and spring surveys by EU-Spain are given in Fig. 12.4 scaled to each series mean. High catches of juveniles seen in the autumn of 2004 and 2005 were not evident in either the Canadian or EU-Spain spring series. Although no clear trend in recruitment is evident, the number of small fish was above the 1996-2014 average in the Canadian surveys of 2010, and the 2011-2013 Canadian spring surveys. The spring survey by EU-Spain has shown lower than average numbers of small fish in the last eight surveys. Overall, recent recruitment appears to be lower than average.
0
50
100
150
200
250
1994 1998 2002 2006 2010 2014
Bio
mas
s In
dex
Year
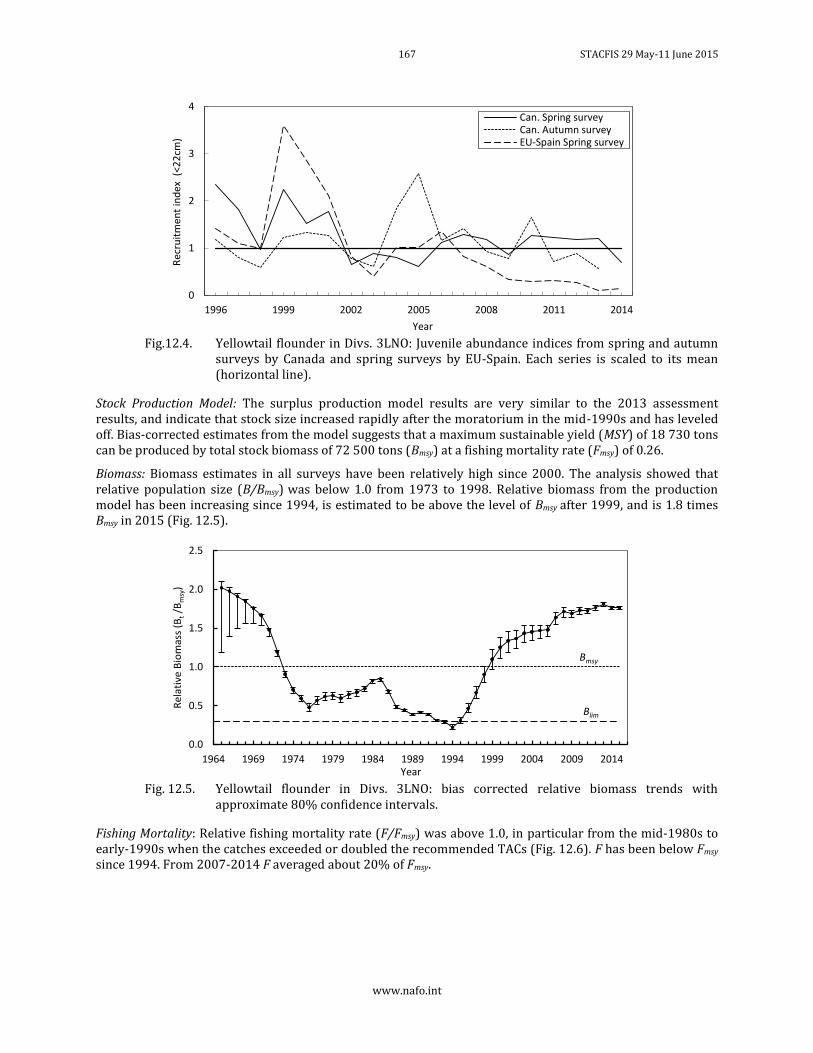
167 STACFIS 29 May-11 June 2015
www.nafo.int
Fig.12.4. Yellowtail flounder in Divs. 3LNO: Juvenile abundance indices from spring and autumn
surveys by Canada and spring surveys by EU-Spain. Each series is scaled to its mean (horizontal line).
Stock Production Model: The surplus production model results are very similar to the 2013 assessment results, and indicate that stock size increased rapidly after the moratorium in the mid-1990s and has leveled off. Bias-corrected estimates from the model suggests that a maximum sustainable yield (MSY) of 18 730 tons can be produced by total stock biomass of 72 500 tons (Bmsy) at a fishing mortality rate (Fmsy) of 0.26.
Biomass: Biomass estimates in all surveys have been relatively high since 2000. The analysis showed that relative population size (B/Bmsy) was below 1.0 from 1973 to 1998. Relative biomass from the production model has been increasing since 1994, is estimated to be above the level of Bmsy after 1999, and is 1.8 times Bmsy in 2015 (Fig. 12.5).
Fig. 12.5. Yellowtail flounder in Divs. 3LNO: bias corrected relative biomass trends with
approximate 80% confidence intervals.
Fishing Mortality: Relative fishing mortality rate (F/Fmsy) was above 1.0, in particular from the mid-1980s to early-1990s when the catches exceeded or doubled the recommended TACs (Fig. 12.6). F has been below Fmsy since 1994. From 2007-2014 F averaged about 20% of Fmsy.
0
1
2
3
4
1996 1999 2002 2005 2008 2011 2014
Rec
ruit
men
t in
dex
(<2
2cm
)
Year
Can. Spring surveyCan. Autumn surveyEU-Spain Spring survey
0.0
0.5
1.0
1.5
2.0
2.5
1964 1969 1974 1979 1984 1989 1994 1999 2004 2009 2014
Rel
ativ
e B
iom
ass
(Bt/B
msy
)
Year
Bmsy
Blim
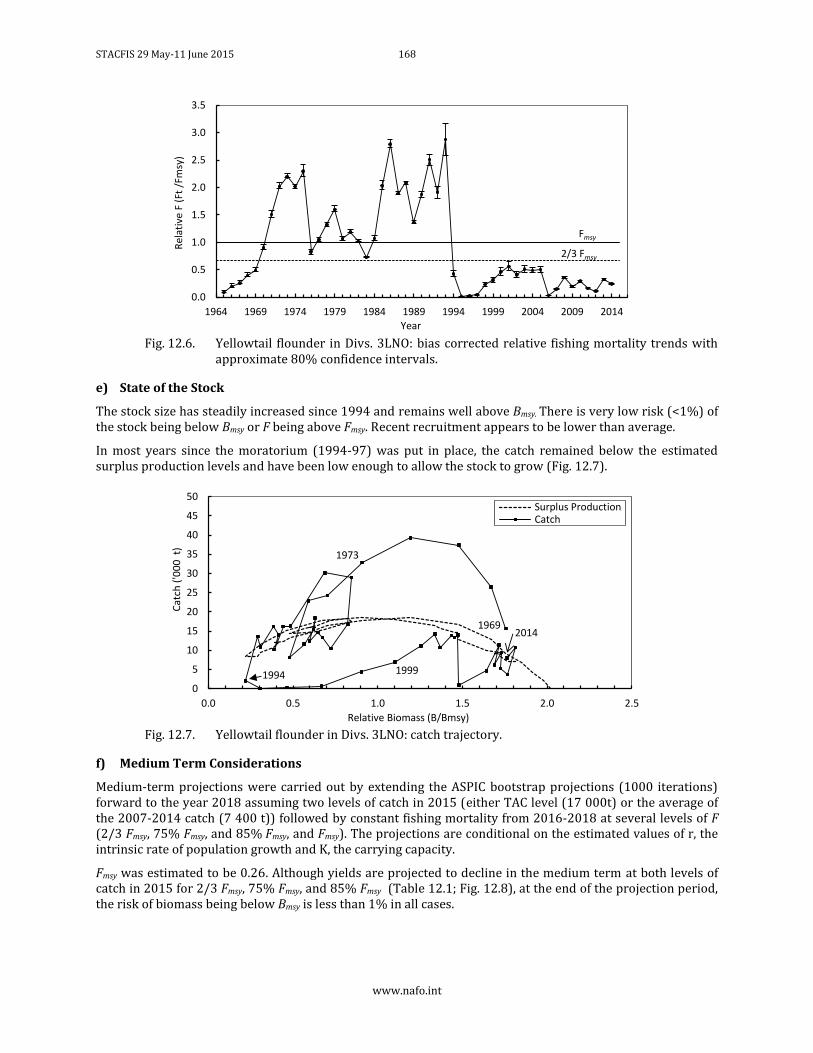
STACFIS 29 May-11 June 2015 168
www.nafo.int
Fig. 12.6. Yellowtail flounder in Divs. 3LNO: bias corrected relative fishing mortality trends with
approximate 80% confidence intervals.
e) State of the Stock
The stock size has steadily increased since 1994 and remains well above Bmsy. There is very low risk (<1%) of the stock being below Bmsy or F being above Fmsy. Recent recruitment appears to be lower than average.
In most years since the moratorium (1994-97) was put in place, the catch remained below the estimated surplus production levels and have been low enough to allow the stock to grow (Fig. 12.7).
Fig. 12.7. Yellowtail flounder in Divs. 3LNO: catch trajectory.
f) Medium Term Considerations
Medium-term projections were carried out by extending the ASPIC bootstrap projections (1000 iterations) forward to the year 2018 assuming two levels of catch in 2015 (either TAC level (17 000t) or the average of the 2007-2014 catch (7 400 t)) followed by constant fishing mortality from 2016-2018 at several levels of F (2/3 Fmsy, 75% Fmsy, and 85% Fmsy, and Fmsy). The projections are conditional on the estimated values of r, the intrinsic rate of population growth and K, the carrying capacity.
Fmsy was estimated to be 0.26. Although yields are projected to decline in the medium term at both levels of catch in 2015 for 2/3 Fmsy, 75% Fmsy, and 85% Fmsy (Table 12.1; Fig. 12.8), at the end of the projection period, the risk of biomass being below Bmsy is less than 1% in all cases.
0.0
0.5
1.0
1.5
2.0
2.5
3.0
3.5
1964 1969 1974 1979 1984 1989 1994 1999 2004 2009 2014
Rel
ativ
e F
(Ft
/Fm
sy)
Year
Fmsy
2/3 Fmsy
0
5
10
15
20
25
30
35
40
45
50
0.0 0.5 1.0 1.5 2.0 2.5
Cat
ch (
'00
0 t
)
Relative Biomass (B/Bmsy)
Surplus ProductionCatch
19692014
1994
1973
1999
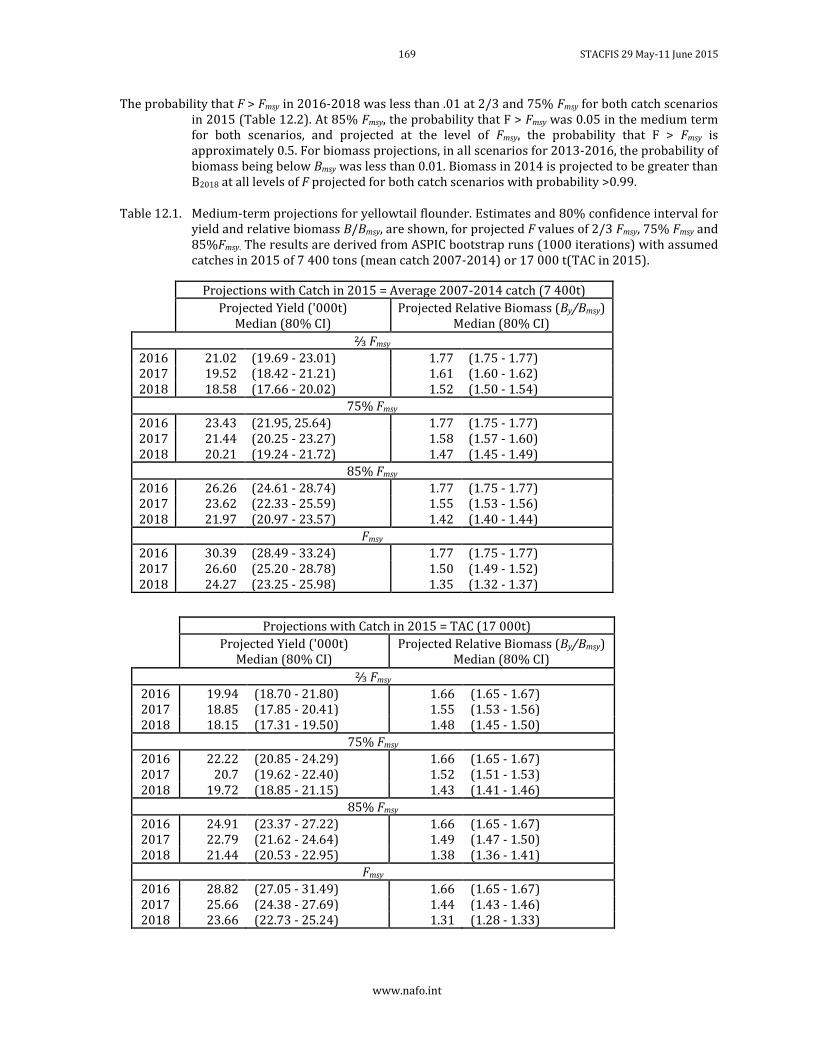
169 STACFIS 29 May-11 June 2015
www.nafo.int
The probability that F > Fmsy in 2016-2018 was less than .01 at 2/3 and 75% Fmsy for both catch scenarios in 2015 (Table 12.2). At 85% Fmsy, the probability that F > Fmsy was 0.05 in the medium term for both scenarios, and projected at the level of Fmsy, the probability that F > Fmsy is approximately 0.5. For biomass projections, in all scenarios for 2013-2016, the probability of biomass being below Bmsy was less than 0.01. Biomass in 2014 is projected to be greater than B2018 at all levels of F projected for both catch scenarios with probability >0.99.
Table 12.1. Medium-term projections for yellowtail flounder. Estimates and 80% confidence interval for yield and relative biomass B/Bmsy, are shown, for projected F values of 2/3 Fmsy, 75% Fmsy and 85%Fmsy. The results are derived from ASPIC bootstrap runs (1000 iterations) with assumed catches in 2015 of 7 400 tons (mean catch 2007-2014) or 17 000 t(TAC in 2015).
Projections with Catch in 2015 = Average 2007-2014 catch (7 400t)
Projected Yield ('000t) Median (80% CI)
Projected Relative Biomass (By/Bmsy) Median (80% CI)
⅔ Fmsy
2016 21.02 (19.69 - 23.01) 1.77 (1.75 - 1.77) 2017 19.52 (18.42 - 21.21) 1.61 (1.60 - 1.62) 2018 18.58 (17.66 - 20.02) 1.52 (1.50 - 1.54)
75% Fmsy
2016 23.43 (21.95, 25.64) 1.77 (1.75 - 1.77) 2017 21.44 (20.25 - 23.27) 1.58 (1.57 - 1.60) 2018 20.21 (19.24 - 21.72) 1.47 (1.45 - 1.49)
85% Fmsy
2016 26.26 (24.61 - 28.74) 1.77 (1.75 - 1.77) 2017 23.62 (22.33 - 25.59) 1.55 (1.53 - 1.56) 2018 21.97 (20.97 - 23.57) 1.42 (1.40 - 1.44)
Fmsy
2016 30.39 (28.49 - 33.24) 1.77 (1.75 - 1.77) 2017 26.60 (25.20 - 28.78) 1.50 (1.49 - 1.52) 2018 24.27 (23.25 - 25.98) 1.35 (1.32 - 1.37)
Projections with Catch in 2015 = TAC (17 000t)
Projected Yield ('000t) Median (80% CI)
Projected Relative Biomass (By/Bmsy) Median (80% CI)
⅔ Fmsy
2016 19.94 (18.70 - 21.80) 1.66 (1.65 - 1.67) 2017 18.85 (17.85 - 20.41) 1.55 (1.53 - 1.56) 2018 18.15 (17.31 - 19.50) 1.48 (1.45 - 1.50)
75% Fmsy
2016 22.22 (20.85 - 24.29) 1.66 (1.65 - 1.67) 2017 20.7 (19.62 - 22.40) 1.52 (1.51 - 1.53) 2018 19.72 (18.85 - 21.15) 1.43 (1.41 - 1.46)
85% Fmsy
2016 24.91 (23.37 - 27.22) 1.66 (1.65 - 1.67) 2017 22.79 (21.62 - 24.64) 1.49 (1.47 - 1.50) 2018 21.44 (20.53 - 22.95) 1.38 (1.36 - 1.41)
Fmsy
2016 28.82 (27.05 - 31.49) 1.66 (1.65 - 1.67) 2017 25.66 (24.38 - 27.69) 1.44 (1.43 - 1.46) 2018 23.66 (22.73 - 25.24) 1.31 (1.28 - 1.33)
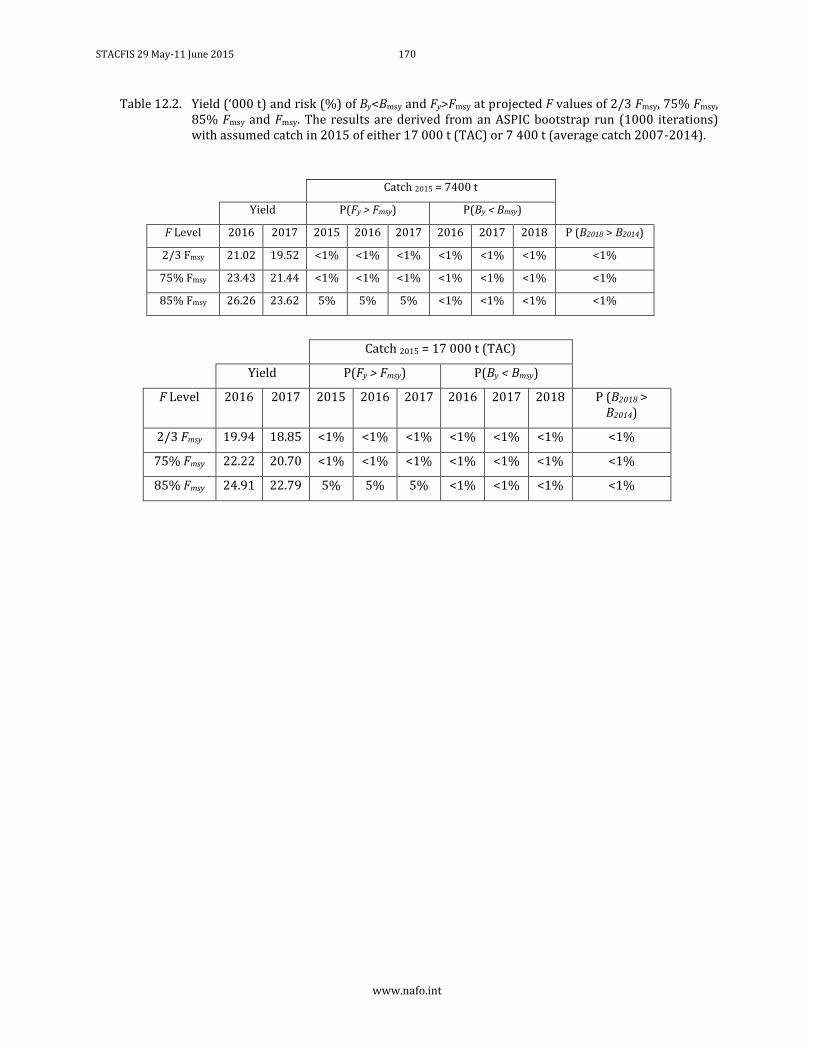
STACFIS 29 May-11 June 2015 170
www.nafo.int
Table 12.2. Yield (‘000 t) and risk (%) of By<Bmsy and Fy>Fmsy at projected F values of 2/3 Fmsy, 75% Fmsy, 85% Fmsy and Fmsy. The results are derived from an ASPIC bootstrap run (1000 iterations) with assumed catch in 2015 of either 17 000 t (TAC) or 7 400 t (average catch 2007-2014).
Catch 2015 = 7400 t
Yield P(Fy > Fmsy) P(By < Bmsy)
F Level 2016 2017 2015 2016 2017 2016 2017 2018 P (B2018 > B2014)
2/3 Fmsy 21.02 19.52 <1% <1% <1% <1% <1% <1% <1%
75% Fmsy 23.43 21.44 <1% <1% <1% <1% <1% <1% <1%
85% Fmsy 26.26 23.62 5% 5% 5% <1% <1% <1% <1%
Catch 2015 = 17 000 t (TAC)
Yield P(Fy > Fmsy) P(By < Bmsy)
F Level 2016 2017 2015 2016 2017 2016 2017 2018 P (B2018 > B2014)
2/3 Fmsy 19.94 18.85 <1% <1% <1% <1% <1% <1% <1%
75% Fmsy 22.22 20.70 <1% <1% <1% <1% <1% <1% <1%
85% Fmsy 24.91 22.79 5% 5% 5% <1% <1% <1% <1%
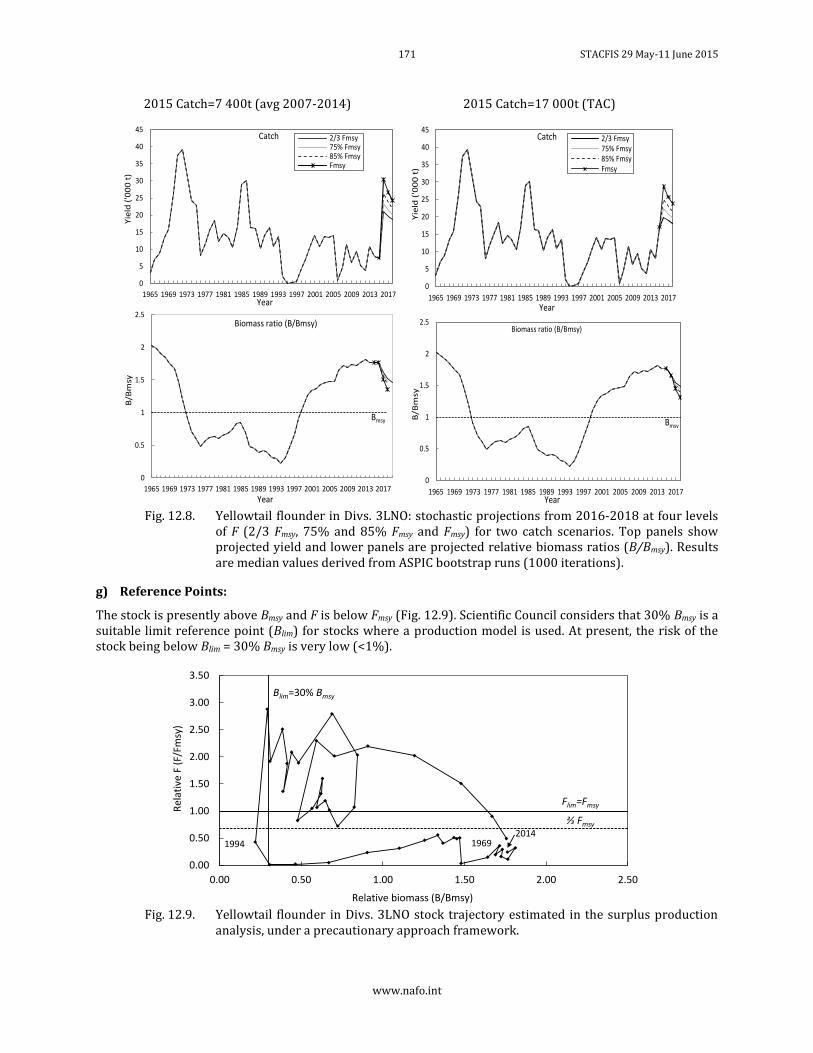
171 STACFIS 29 May-11 June 2015
www.nafo.int
2015 Catch=7 400t (avg 2007-2014) 2015 Catch=17 000t (TAC)
Fig. 12.8. Yellowtail flounder in Divs. 3LNO: stochastic projections from 2016-2018 at four levels
of F (2/3 Fmsy, 75% and 85% Fmsy and Fmsy) for two catch scenarios. Top panels show projected yield and lower panels are projected relative biomass ratios (B/Bmsy). Results are median values derived from ASPIC bootstrap runs (1000 iterations).
g) Reference Points:
The stock is presently above Bmsy and F is below Fmsy (Fig. 12.9). Scientific Council considers that 30% Bmsy is a suitable limit reference point (Blim) for stocks where a production model is used. At present, the risk of the stock being below Blim = 30% Bmsy is very low (<1%).
Fig. 12.9. Yellowtail flounder in Divs. 3LNO stock trajectory estimated in the surplus production
analysis, under a precautionary approach framework.
0
5
10
15
20
25
30
35
40
45
1965 1969 1973 1977 1981 1985 1989 1993 1997 2001 2005 2009 2013 2017
Yie
ld (
'00
0 t
)
Year
Catch 2/3 Fmsy75% Fmsy85% FmsyFmsy
0
0.5
1
1.5
2
2.5
1965 1969 1973 1977 1981 1985 1989 1993 1997 2001 2005 2009 2013 2017
B/B
msy
Year
Biomass ratio (B/Bmsy)
Bmsy
0
5
10
15
20
25
30
35
40
45
1965 1969 1973 1977 1981 1985 1989 1993 1997 2001 2005 2009 2013 2017
Yie
ld (
'00
0 t
)
Year
Catch 2/3 Fmsy75% Fmsy85% FmsyFmsy
0
0.5
1
1.5
2
2.5
1965 1969 1973 1977 1981 1985 1989 1993 1997 2001 2005 2009 2013 2017
B/B
msy
Year
Biomass ratio (B/Bmsy)
Bmsy
0.00
0.50
1.00
1.50
2.00
2.50
3.00
3.50
0.00 0.50 1.00 1.50 2.00 2.50
Rel
ativ
e F
(F/F
msy
)
Relative biomass (B/Bmsy)
Blim=30% Bmsy
Flim=Fmsy
196919942014
⅔ Fmsy
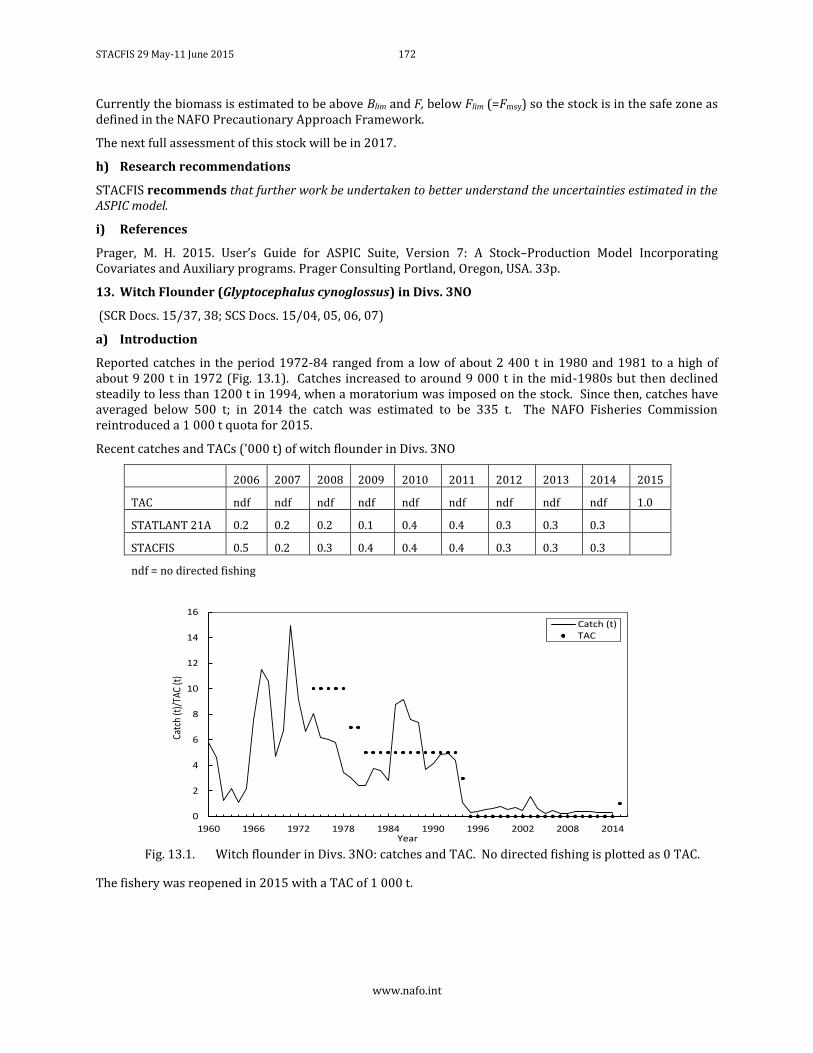
STACFIS 29 May-11 June 2015 172
www.nafo.int
Currently the biomass is estimated to be above Blim and F, below Flim (=Fmsy) so the stock is in the safe zone as defined in the NAFO Precautionary Approach Framework.
The next full assessment of this stock will be in 2017.
h) Research recommendations
STACFIS recommends that further work be undertaken to better understand the uncertainties estimated in the ASPIC model.
i) References
Prager, M. H. 2015. User’s Guide for ASPIC Suite, Version 7: A Stock–Production Model Incorporating Covariates and Auxiliary programs. Prager Consulting Portland, Oregon, USA. 33p.
13. Witch Flounder (Glyptocephalus cynoglossus) in Divs. 3NO
(SCR Docs. 15/37, 38; SCS Docs. 15/04, 05, 06, 07)
a) Introduction
Reported catches in the period 1972-84 ranged from a low of about 2 400 t in 1980 and 1981 to a high of about 9 200 t in 1972 (Fig. 13.1). Catches increased to around 9 000 t in the mid-1980s but then declined steadily to less than 1200 t in 1994, when a moratorium was imposed on the stock. Since then, catches have averaged below 500 t; in 2014 the catch was estimated to be 335 t. The NAFO Fisheries Commission reintroduced a 1 000 t quota for 2015.
Recent catches and TACs ('000 t) of witch flounder in Divs. 3NO
2006 2007 2008 2009 2010 2011 2012 2013 2014 2015
TAC ndf ndf ndf ndf ndf ndf ndf ndf ndf 1.0
STATLANT 21A 0.2 0.2 0.2 0.1 0.4 0.4 0.3 0.3 0.3
STACFIS 0.5 0.2 0.3 0.4 0.4 0.4 0.3 0.3 0.3
ndf = no directed fishing
Fig. 13.1. Witch flounder in Divs. 3NO: catches and TAC. No directed fishing is plotted as 0 TAC.
The fishery was reopened in 2015 with a TAC of 1 000 t.
0
2
4
6
8
10
12
14
16
1960 1966 1972 1978 1984 1990 1996 2002 2008 2014
Catc
h (t
)/TA
C (t
)
Year
Catch (t)TAC
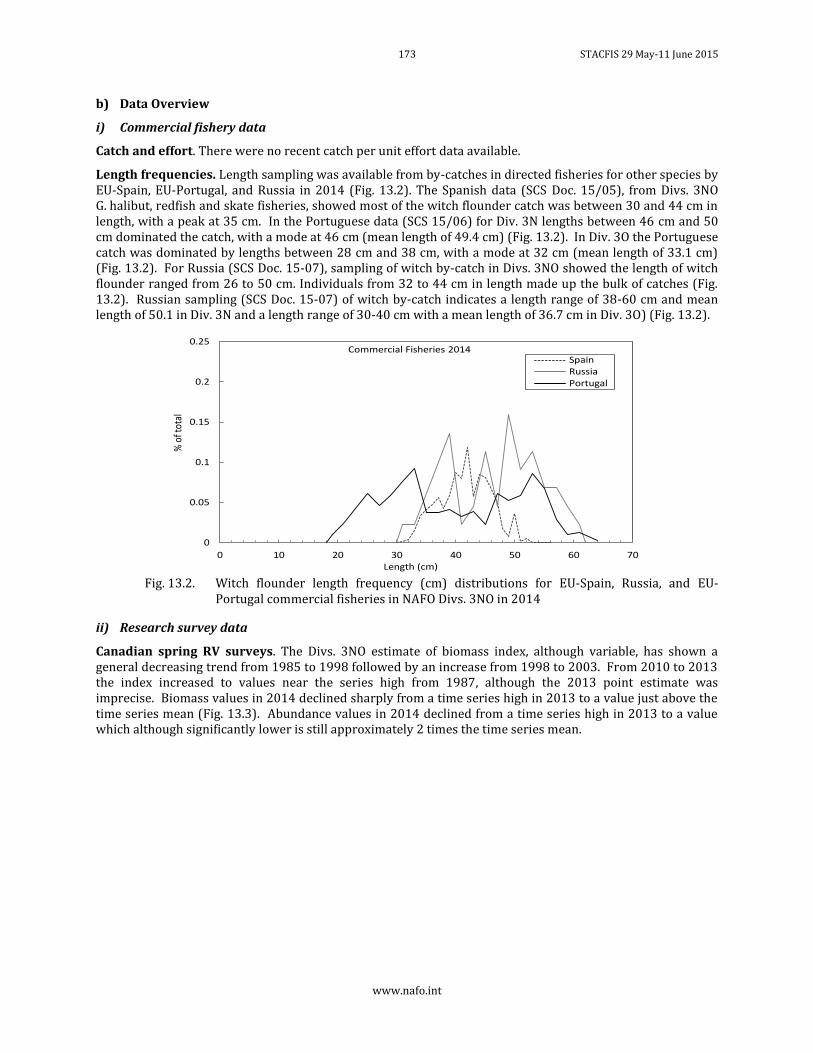
173 STACFIS 29 May-11 June 2015
www.nafo.int
b) Data Overview
i) Commercial fishery data
Catch and effort. There were no recent catch per unit effort data available.
Length frequencies. Length sampling was available from by-catches in directed fisheries for other species by EU-Spain, EU-Portugal, and Russia in 2014 (Fig. 13.2). The Spanish data (SCS Doc. 15/05), from Divs. 3NO G. halibut, redfish and skate fisheries, showed most of the witch flounder catch was between 30 and 44 cm in length, with a peak at 35 cm. In the Portuguese data (SCS 15/06) for Div. 3N lengths between 46 cm and 50 cm dominated the catch, with a mode at 46 cm (mean length of 49.4 cm) (Fig. 13.2). In Div. 3O the Portuguese catch was dominated by lengths between 28 cm and 38 cm, with a mode at 32 cm (mean length of 33.1 cm) (Fig. 13.2). For Russia (SCS Doc. 15-07), sampling of witch by-catch in Divs. 3NO showed the length of witch flounder ranged from 26 to 50 cm. Individuals from 32 to 44 cm in length made up the bulk of catches (Fig. 13.2). Russian sampling (SCS Doc. 15-07) of witch by-catch indicates a length range of 38-60 cm and mean length of 50.1 in Div. 3N and a length range of 30-40 cm with a mean length of 36.7 cm in Div. 3O) (Fig. 13.2).
Fig. 13.2. Witch flounder length frequency (cm) distributions for EU-Spain, Russia, and EU-
Portugal commercial fisheries in NAFO Divs. 3NO in 2014
ii) Research survey data
Canadian spring RV surveys. The Divs. 3NO estimate of biomass index, although variable, has shown a general decreasing trend from 1985 to 1998 followed by an increase from 1998 to 2003. From 2010 to 2013 the index increased to values near the series high from 1987, although the 2013 point estimate was imprecise. Biomass values in 2014 declined sharply from a time series high in 2013 to a value just above the time series mean (Fig. 13.3). Abundance values in 2014 declined from a time series high in 2013 to a value which although significantly lower is still approximately 2 times the time series mean.
0
0.05
0.1
0.15
0.2
0.25
0 10 20 30 40 50 60 70
% o
f tot
al
Length (cm)
Commercial Fisheries 2014 SpainRussiaPortugal
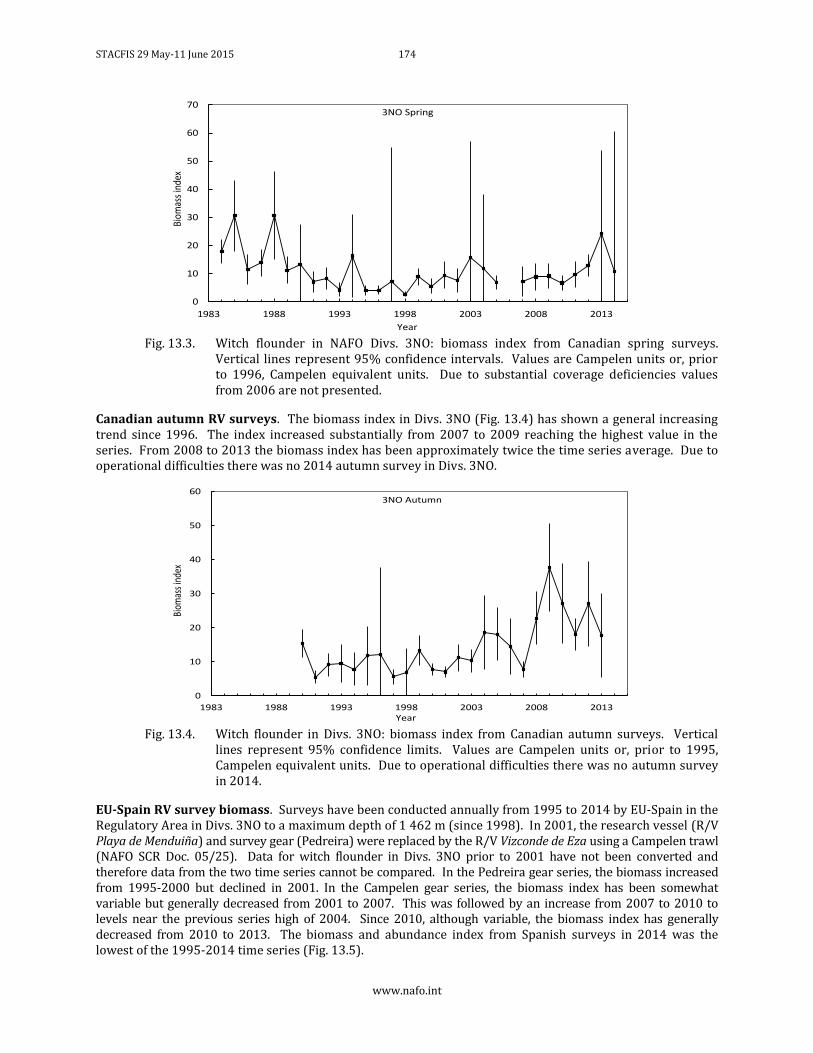
STACFIS 29 May-11 June 2015 174
www.nafo.int
Fig. 13.3. Witch flounder in NAFO Divs. 3NO: biomass index from Canadian spring surveys.
Vertical lines represent 95% confidence intervals. Values are Campelen units or, prior to 1996, Campelen equivalent units. Due to substantial coverage deficiencies values from 2006 are not presented.
Canadian autumn RV surveys. The biomass index in Divs. 3NO (Fig. 13.4) has shown a general increasing trend since 1996. The index increased substantially from 2007 to 2009 reaching the highest value in the series. From 2008 to 2013 the biomass index has been approximately twice the time series average. Due to operational difficulties there was no 2014 autumn survey in Divs. 3NO.
Fig. 13.4. Witch flounder in Divs. 3NO: biomass index from Canadian autumn surveys. Vertical
lines represent 95% confidence limits. Values are Campelen units or, prior to 1995, Campelen equivalent units. Due to operational difficulties there was no autumn survey in 2014.
EU-Spain RV survey biomass. Surveys have been conducted annually from 1995 to 2014 by EU-Spain in the Regulatory Area in Divs. 3NO to a maximum depth of 1 462 m (since 1998). In 2001, the research vessel (R/V Playa de Menduiña) and survey gear (Pedreira) were replaced by the R/V Vizconde de Eza using a Campelen trawl (NAFO SCR Doc. 05/25). Data for witch flounder in Divs. 3NO prior to 2001 have not been converted and therefore data from the two time series cannot be compared. In the Pedreira gear series, the biomass increased from 1995-2000 but declined in 2001. In the Campelen gear series, the biomass index has been somewhat variable but generally decreased from 2001 to 2007. This was followed by an increase from 2007 to 2010 to levels near the previous series high of 2004. Since 2010, although variable, the biomass index has generally decreased from 2010 to 2013. The biomass and abundance index from Spanish surveys in 2014 was the lowest of the 1995-2014 time series (Fig. 13.5).
0
10
20
30
40
50
60
70
1983 1988 1993 1998 2003 2008 2013
Biom
ass
inde
x
Year
3NO Spring
0
10
20
30
40
50
60
1983 1988 1993 1998 2003 2008 2013
Biom
ass i
ndex
Year
3NO Autumn
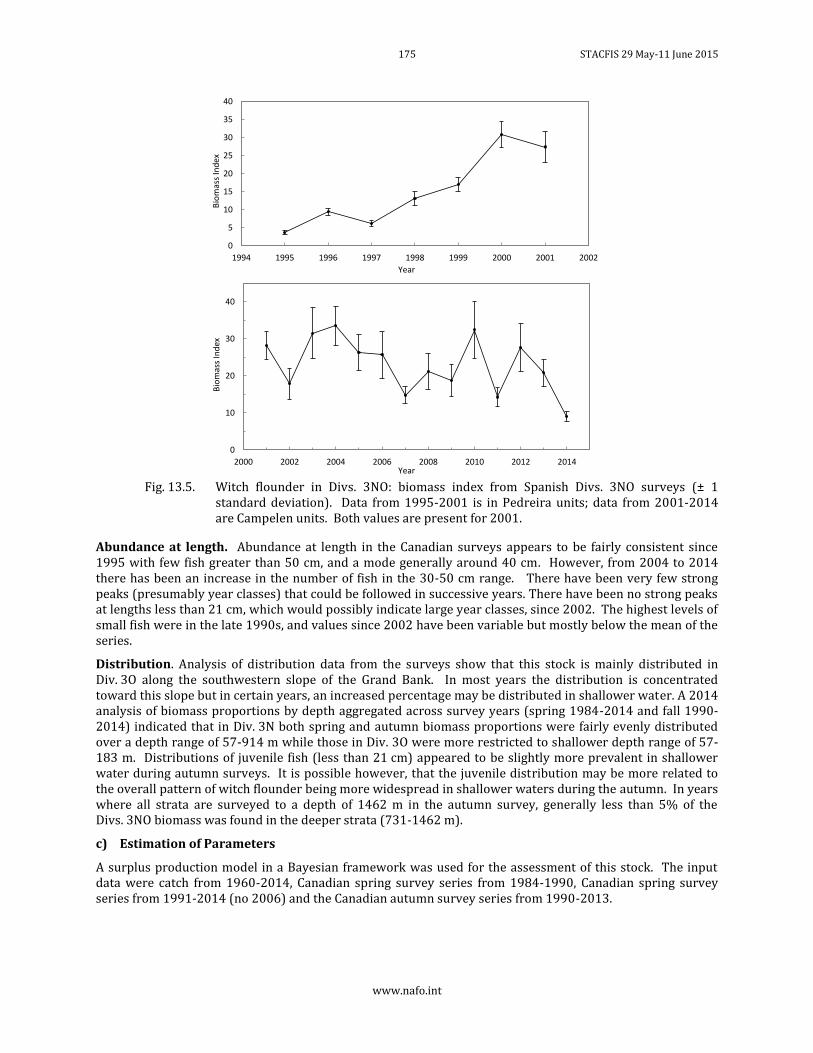
175 STACFIS 29 May-11 June 2015
www.nafo.int
Fig. 13.5. Witch flounder in Divs. 3NO: biomass index from Spanish Divs. 3NO surveys (± 1
standard deviation). Data from 1995-2001 is in Pedreira units; data from 2001-2014 are Campelen units. Both values are present for 2001.
Abundance at length. Abundance at length in the Canadian surveys appears to be fairly consistent since 1995 with few fish greater than 50 cm, and a mode generally around 40 cm. However, from 2004 to 2014 there has been an increase in the number of fish in the 30-50 cm range. There have been very few strong peaks (presumably year classes) that could be followed in successive years. There have been no strong peaks at lengths less than 21 cm, which would possibly indicate large year classes, since 2002. The highest levels of small fish were in the late 1990s, and values since 2002 have been variable but mostly below the mean of the series.
Distribution. Analysis of distribution data from the surveys show that this stock is mainly distributed in Div. 3O along the southwestern slope of the Grand Bank. In most years the distribution is concentrated toward this slope but in certain years, an increased percentage may be distributed in shallower water. A 2014 analysis of biomass proportions by depth aggregated across survey years (spring 1984-2014 and fall 1990-2014) indicated that in Div. 3N both spring and autumn biomass proportions were fairly evenly distributed over a depth range of 57-914 m while those in Div. 3O were more restricted to shallower depth range of 57-183 m. Distributions of juvenile fish (less than 21 cm) appeared to be slightly more prevalent in shallower water during autumn surveys. It is possible however, that the juvenile distribution may be more related to the overall pattern of witch flounder being more widespread in shallower waters during the autumn. In years where all strata are surveyed to a depth of 1462 m in the autumn survey, generally less than 5% of the Divs. 3NO biomass was found in the deeper strata (731-1462 m).
c) Estimation of Parameters
A surplus production model in a Bayesian framework was used for the assessment of this stock. The input data were catch from 1960-2014, Canadian spring survey series from 1984-1990, Canadian spring survey series from 1991-2014 (no 2006) and the Canadian autumn survey series from 1990-2013.
0
5
10
15
20
25
30
35
40
1994 1995 1996 1997 1998 1999 2000 2001 2002
Bio
mas
s In
dex
Year
0
10
20
30
40
2000 2002 2004 2006 2008 2010 2012 2014
Bio
mas
s In
dex
Year
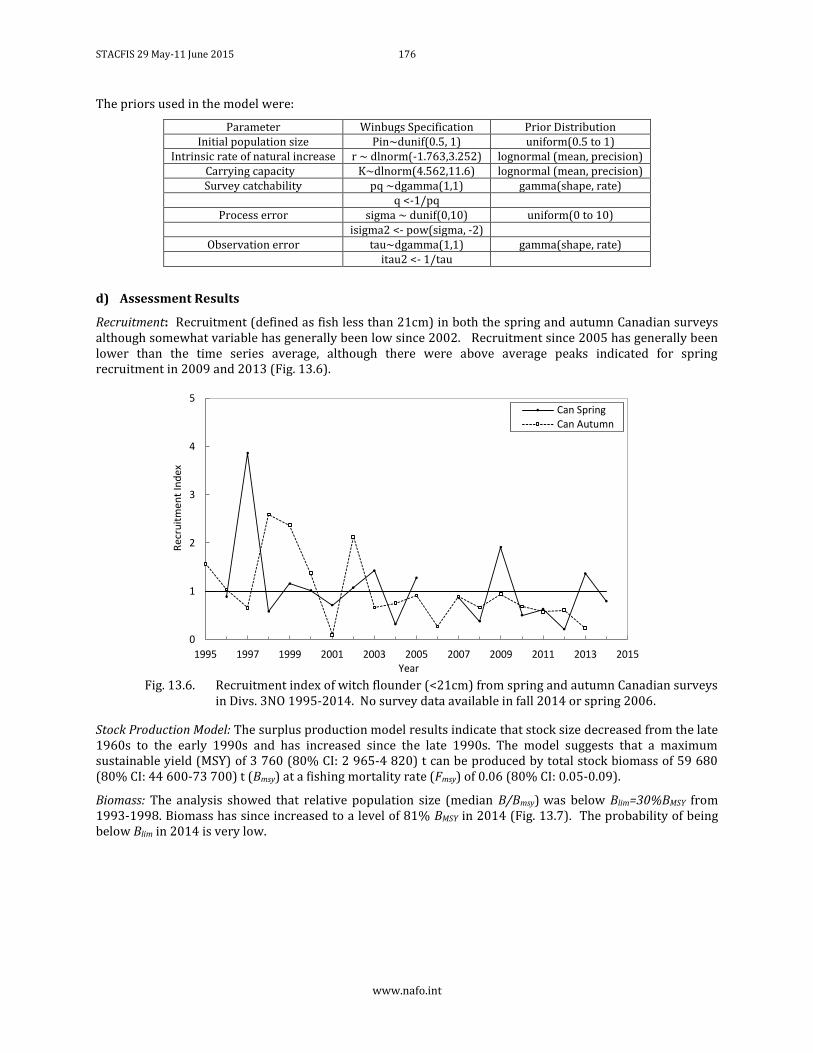
STACFIS 29 May-11 June 2015 176
www.nafo.int
The priors used in the model were:
Parameter Winbugs Specification Prior Distribution Initial population size Pin~dunif(0.5, 1) uniform(0.5 to 1)
Intrinsic rate of natural increase r ~ dlnorm(-1.763,3.252) lognormal (mean, precision) Carrying capacity K~dlnorm(4.562,11.6) lognormal (mean, precision) Survey catchability pq ~dgamma(1,1) gamma(shape, rate)
q <-1/pq Process error sigma ~ dunif(0,10) uniform(0 to 10)
isigma2 <- pow(sigma, -2) Observation error tau~dgamma(1,1) gamma(shape, rate)
itau2 <- 1/tau
d) Assessment Results
Recruitment: Recruitment (defined as fish less than 21cm) in both the spring and autumn Canadian surveys although somewhat variable has generally been low since 2002. Recruitment since 2005 has generally been lower than the time series average, although there were above average peaks indicated for spring recruitment in 2009 and 2013 (Fig. 13.6).
Fig. 13.6. Recruitment index of witch flounder (<21cm) from spring and autumn Canadian surveys
in Divs. 3NO 1995-2014. No survey data available in fall 2014 or spring 2006.
Stock Production Model: The surplus production model results indicate that stock size decreased from the late 1960s to the early 1990s and has increased since the late 1990s. The model suggests that a maximum sustainable yield (MSY) of 3 760 (80% CI: 2 965-4 820) t can be produced by total stock biomass of 59 680 (80% CI: 44 600-73 700) t (Bmsy) at a fishing mortality rate (Fmsy) of 0.06 (80% CI: 0.05-0.09).
Biomass: The analysis showed that relative population size (median B/Bmsy) was below Blim=30%BMSY from 1993-1998. Biomass has since increased to a level of 81% BMSY in 2014 (Fig. 13.7). The probability of being below Blim in 2014 is very low.
0
1
2
3
4
5
1995 1997 1999 2001 2003 2005 2007 2009 2011 2013 2015
Re
cru
itm
en
t In
de
x
Year
Can SpringCan Autumn
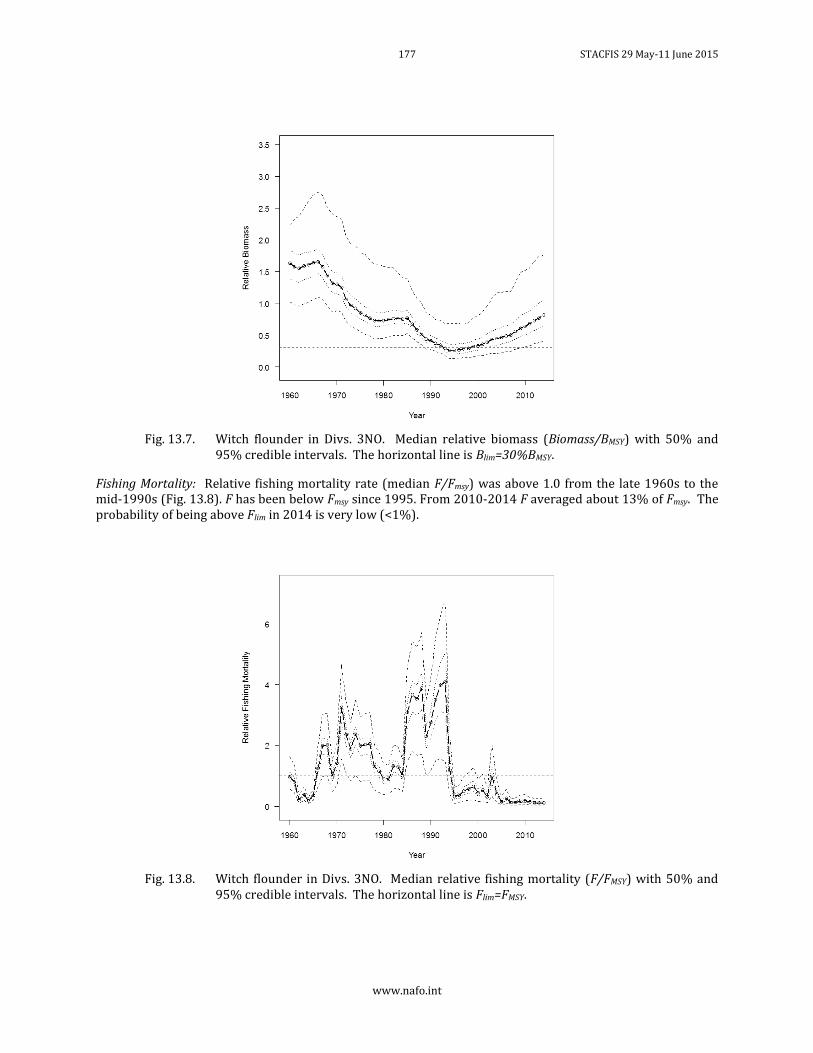
177 STACFIS 29 May-11 June 2015
www.nafo.int
Fig. 13.7. Witch flounder in Divs. 3NO. Median relative biomass (Biomass/BMSY) with 50% and
95% credible intervals. The horizontal line is Blim=30%BMSY.
Fishing Mortality: Relative fishing mortality rate (median F/Fmsy) was above 1.0 from the late 1960s to the mid-1990s (Fig. 13.8). F has been below Fmsy since 1995. From 2010-2014 F averaged about 13% of Fmsy. The probability of being above Flim in 2014 is very low (<1%).
Fig. 13.8. Witch flounder in Divs. 3NO. Median relative fishing mortality (F/FMSY) with 50% and
95% credible intervals. The horizontal line is Flim=FMSY.
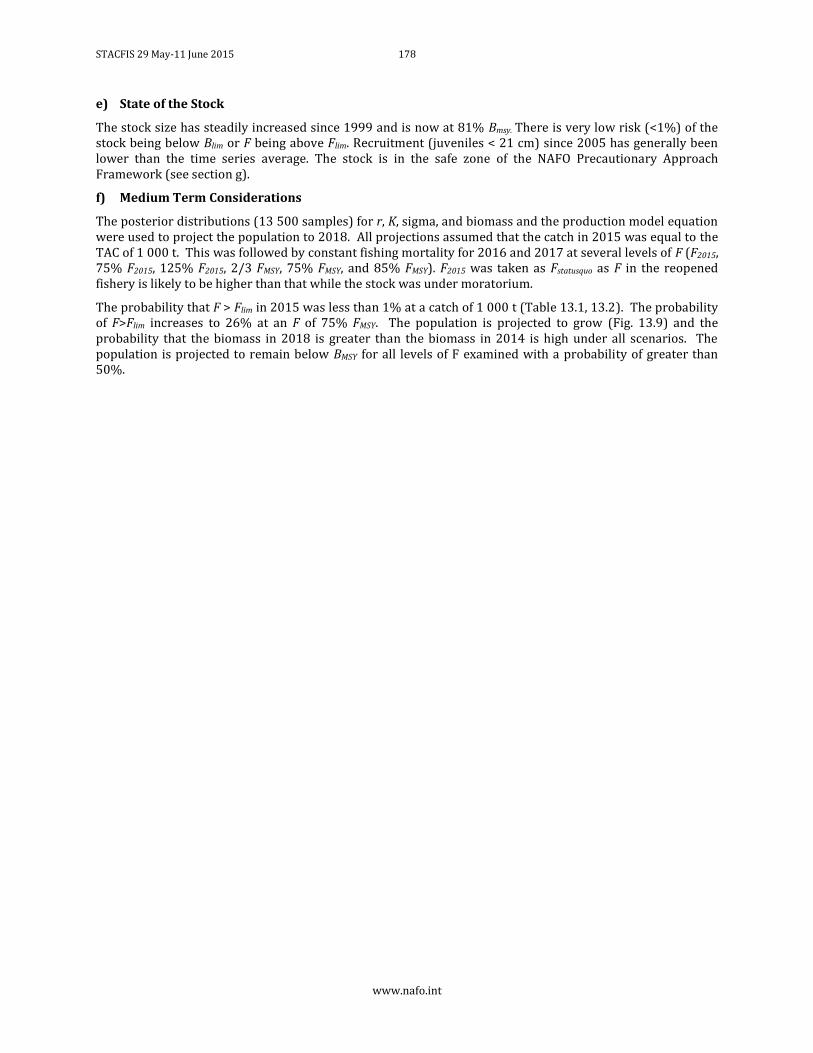
STACFIS 29 May-11 June 2015 178
www.nafo.int
e) State of the Stock
The stock size has steadily increased since 1999 and is now at 81% Bmsy. There is very low risk (<1%) of the stock being below Blim or F being above Flim. Recruitment (juveniles < 21 cm) since 2005 has generally been lower than the time series average. The stock is in the safe zone of the NAFO Precautionary Approach Framework (see section g).
f) Medium Term Considerations
The posterior distributions (13 500 samples) for r, K, sigma, and biomass and the production model equation were used to project the population to 2018. All projections assumed that the catch in 2015 was equal to the TAC of 1 000 t. This was followed by constant fishing mortality for 2016 and 2017 at several levels of F (F2015, 75% F2015, 125% F2015, 2/3 FMSY, 75% FMSY, and 85% FMSY). F2015 was taken as Fstatusquo as F in the reopened fishery is likely to be higher than that while the stock was under moratorium.
The probability that F > Flim in 2015 was less than 1% at a catch of 1 000 t (Table 13.1, 13.2). The probability of F>Flim increases to 26% at an F of 75% FMSY. The population is projected to grow (Fig. 13.9) and the probability that the biomass in 2018 is greater than the biomass in 2014 is high under all scenarios. The population is projected to remain below BMSY for all levels of F examined with a probability of greater than 50%.
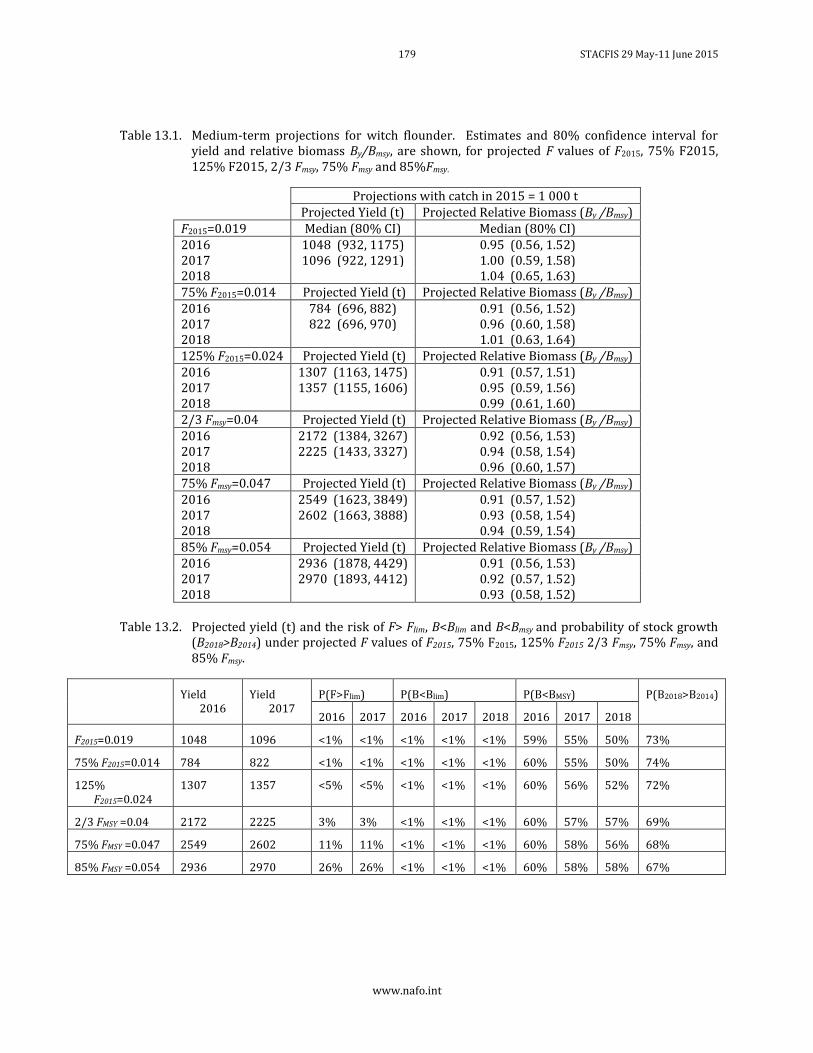
179 STACFIS 29 May-11 June 2015
www.nafo.int
Table 13.1. Medium-term projections for witch flounder. Estimates and 80% confidence interval for yield and relative biomass By/Bmsy, are shown, for projected F values of F2015, 75% F2015, 125% F2015, 2/3 Fmsy, 75% Fmsy and 85%Fmsy.
Projections with catch in 2015 = 1 000 t Projected Yield (t) Projected Relative Biomass (By /Bmsy) F2015=0.019 Median (80% CI) Median (80% CI) 2016 1048 (932, 1175) 0.95 (0.56, 1.52) 2017 1096 (922, 1291) 1.00 (0.59, 1.58) 2018 1.04 (0.65, 1.63) 75% F2015=0.014 Projected Yield (t) Projected Relative Biomass (By /Bmsy) 2016 784 (696, 882) 0.91 (0.56, 1.52) 2017 822 (696, 970) 0.96 (0.60, 1.58) 2018 1.01 (0.63, 1.64) 125% F2015=0.024 Projected Yield (t) Projected Relative Biomass (By /Bmsy) 2016 1307 (1163, 1475) 0.91 (0.57, 1.51) 2017 1357 (1155, 1606) 0.95 (0.59, 1.56) 2018 0.99 (0.61, 1.60) 2/3 Fmsy=0.04 Projected Yield (t) Projected Relative Biomass (By /Bmsy) 2016 2172 (1384, 3267) 0.92 (0.56, 1.53) 2017 2225 (1433, 3327) 0.94 (0.58, 1.54) 2018 0.96 (0.60, 1.57) 75% Fmsy=0.047 Projected Yield (t) Projected Relative Biomass (By /Bmsy) 2016 2549 (1623, 3849) 0.91 (0.57, 1.52) 2017 2602 (1663, 3888) 0.93 (0.58, 1.54) 2018 0.94 (0.59, 1.54) 85% Fmsy=0.054 Projected Yield (t) Projected Relative Biomass (By /Bmsy) 2016 2936 (1878, 4429) 0.91 (0.56, 1.53) 2017 2970 (1893, 4412) 0.92 (0.57, 1.52) 2018 0.93 (0.58, 1.52)
Table 13.2. Projected yield (t) and the risk of F> Flim, B<Blim and B<Bmsy and probability of stock growth (B2018>B2014) under projected F values of F2015, 75% F2015, 125% F2015 2/3 Fmsy, 75% Fmsy, and 85% Fmsy.
Yield 2016
Yield 2017
P(F>Flim) P(B<Blim) P(B<BMSY) P(B2018>B2014)
2016 2017 2016 2017 2018 2016 2017 2018
F2015=0.019 1048 1096 <1% <1% <1% <1% <1% 59% 55% 50% 73%
75% F2015=0.014 784 822 <1% <1% <1% <1% <1% 60% 55% 50% 74%
125% F2015=0.024
1307 1357 <5% <5% <1% <1% <1% 60% 56% 52% 72%
2/3 FMSY =0.04 2172 2225 3% 3% <1% <1% <1% 60% 57% 57% 69%
75% FMSY =0.047 2549 2602 11% 11% <1% <1% <1% 60% 58% 56% 68%
85% FMSY =0.054 2936 2970 26% 26% <1% <1% <1% 60% 58% 58% 67%
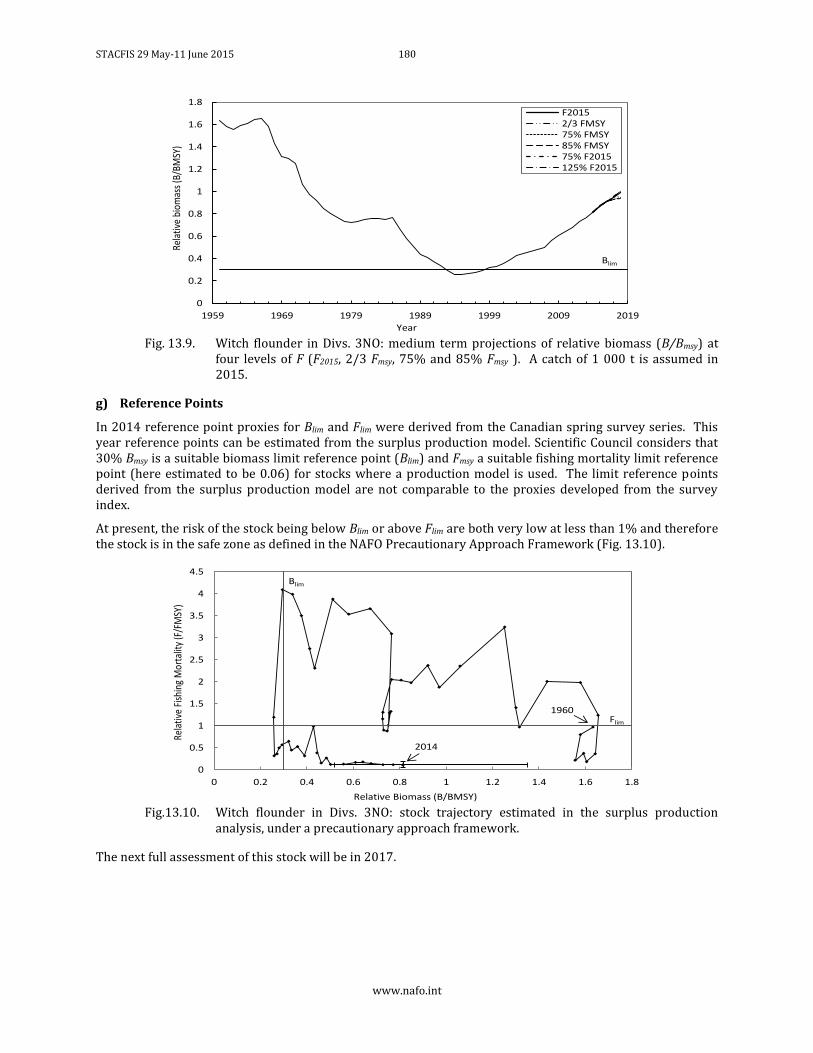
STACFIS 29 May-11 June 2015 180
www.nafo.int
Fig. 13.9. Witch flounder in Divs. 3NO: medium term projections of relative biomass (B/Bmsy) at
four levels of F (F2015, 2/3 Fmsy, 75% and 85% Fmsy ). A catch of 1 000 t is assumed in 2015.
g) Reference Points
In 2014 reference point proxies for Blim and Flim were derived from the Canadian spring survey series. This year reference points can be estimated from the surplus production model. Scientific Council considers that 30% Bmsy is a suitable biomass limit reference point (Blim) and Fmsy a suitable fishing mortality limit reference point (here estimated to be 0.06) for stocks where a production model is used. The limit reference points derived from the surplus production model are not comparable to the proxies developed from the survey index.
At present, the risk of the stock being below Blim or above Flim are both very low at less than 1% and therefore the stock is in the safe zone as defined in the NAFO Precautionary Approach Framework (Fig. 13.10).
Fig.13.10. Witch flounder in Divs. 3NO: stock trajectory estimated in the surplus production
analysis, under a precautionary approach framework.
The next full assessment of this stock will be in 2017.
0
0.2
0.4
0.6
0.8
1
1.2
1.4
1.6
1.8
1959 1969 1979 1989 1999 2009 2019
Rela
tive
biom
ass
(B/B
MSY
)
Year
F20152/3 FMSY75% FMSY85% FMSY75% F2015125% F2015
Blim
0
0.5
1
1.5
2
2.5
3
3.5
4
4.5
0 0.2 0.4 0.6 0.8 1 1.2 1.4 1.6 1.8
Rela
tive
Fish
ing
Mor
talit
y (F
/FM
SY)
Relative Biomass (B/BMSY)
Flim
Blim
2014
1960
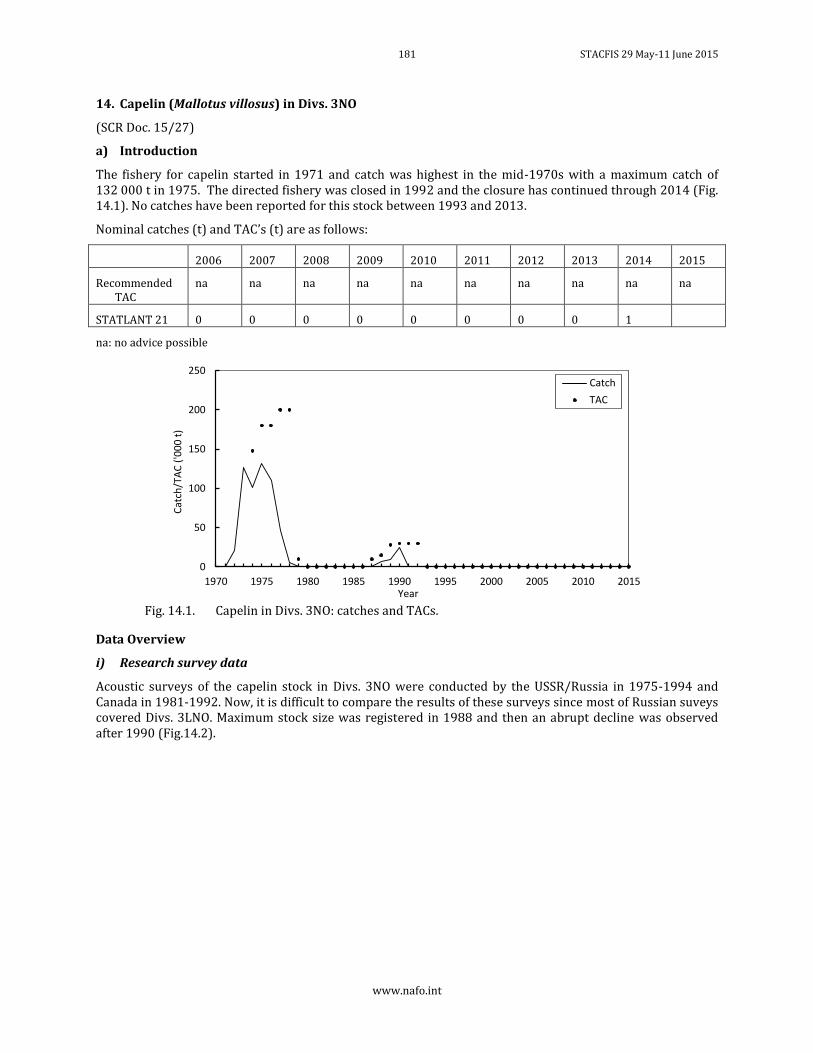
181 STACFIS 29 May-11 June 2015
www.nafo.int
14. Capelin (Mallotus villosus) in Divs. 3NO
(SCR Doc. 15/27)
a) Introduction
The fishery for capelin started in 1971 and catch was highest in the mid-1970s with a maximum catch of 132 000 t in 1975. The directed fishery was closed in 1992 and the closure has continued through 2014 (Fig. 14.1). No catches have been reported for this stock between 1993 and 2013.
Nominal catches (t) and TAC’s (t) are as follows:
2006 2007 2008 2009 2010 2011 2012 2013 2014 2015
Recommended TAC
na na na na na na na na na na
STATLANT 21 0 0 0 0 0 0 0 0 1
na: no advice possible
Fig. 14.1. Capelin in Divs. 3NO: catches and TACs.
Data Overview
i) Research survey data
Acoustic surveys of the capelin stock in Divs. 3NO were conducted by the USSR/Russia in 1975-1994 and Canada in 1981-1992. Now, it is difficult to compare the results of these surveys since most of Russian suveys covered Divs. 3LNO. Maximum stock size was registered in 1988 and then an abrupt decline was observed after 1990 (Fig.14.2).
0
50
100
150
200
250
1970 1975 1980 1985 1990 1995 2000 2005 2010 2015Year
Catch
TAC
Cat
ch/T
AC
('0
00
t)
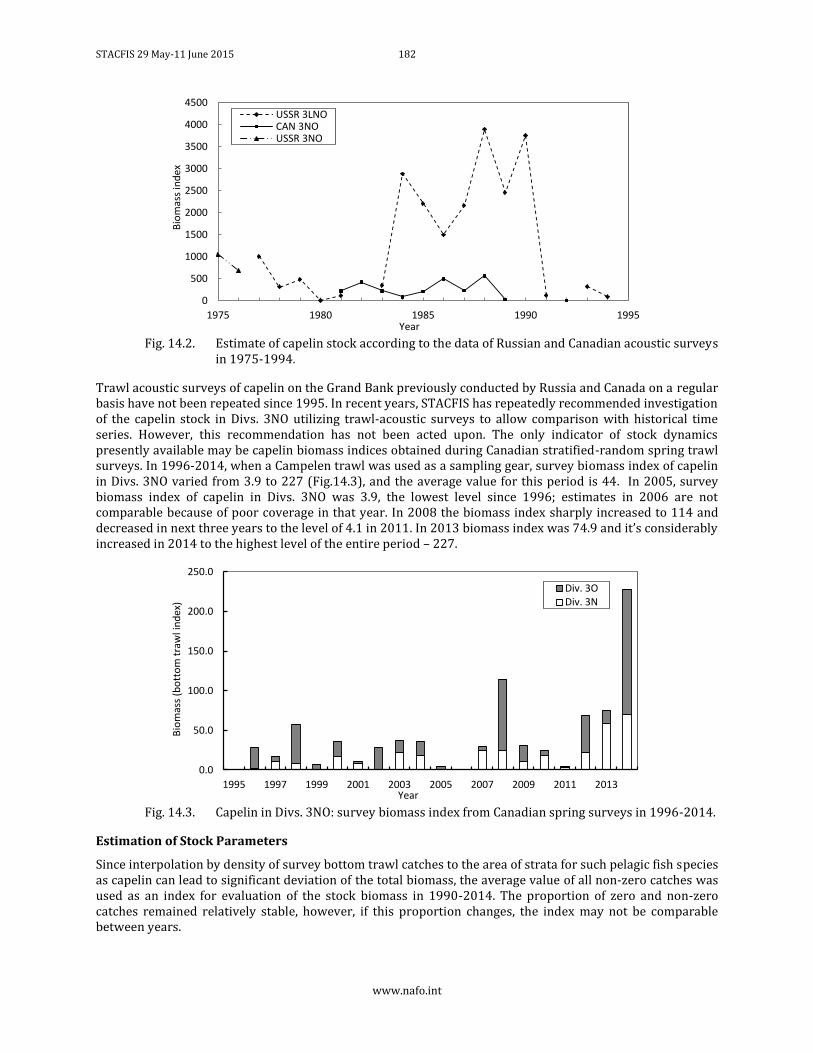
STACFIS 29 May-11 June 2015 182
www.nafo.int
Fig. 14.2. Estimate of capelin stock according to the data of Russian and Canadian acoustic surveys
in 1975-1994.
Trawl acoustic surveys of capelin on the Grand Bank previously conducted by Russia and Canada on a regular basis have not been repeated since 1995. In recent years, STACFIS has repeatedly recommended investigation of the capelin stock in Divs. 3NO utilizing trawl-acoustic surveys to allow comparison with historical time series. However, this recommendation has not been acted upon. The only indicator of stock dynamics presently available may be capelin biomass indices obtained during Canadian stratified-random spring trawl surveys. In 1996-2014, when a Campelen trawl was used as a sampling gear, survey biomass index of capelin in Divs. 3NO varied from 3.9 to 227 (Fig.14.3), and the average value for this period is 44. In 2005, survey biomass index of capelin in Divs. 3NO was 3.9, the lowest level since 1996; estimates in 2006 are not comparable because of poor coverage in that year. In 2008 the biomass index sharply increased to 114 and decreased in next three years to the level of 4.1 in 2011. In 2013 biomass index was 74.9 and it’s considerably increased in 2014 to the highest level of the entire period – 227.
Fig. 14.3. Capelin in Divs. 3NO: survey biomass index from Canadian spring surveys in 1996-2014.
Estimation of Stock Parameters
Since interpolation by density of survey bottom trawl catches to the area of strata for such pelagic fish species as capelin can lead to significant deviation of the total biomass, the average value of all non-zero catches was used as an index for evaluation of the stock biomass in 1990-2014. The proportion of zero and non-zero catches remained relatively stable, however, if this proportion changes, the index may not be comparable between years.
0
500
1000
1500
2000
2500
3000
3500
4000
4500
1975 1980 1985 1990 1995
Bio
mas
s in
dex
Year
USSR 3LNOCAN 3NOUSSR 3NO
0.0
50.0
100.0
150.0
200.0
250.0
1995 1997 1999 2001 2003 2005 2007 2009 2011 2013
Bio
mas
s (b
ott
om
tra
wl i
nd
ex)
Year
Div. 3ODiv. 3N
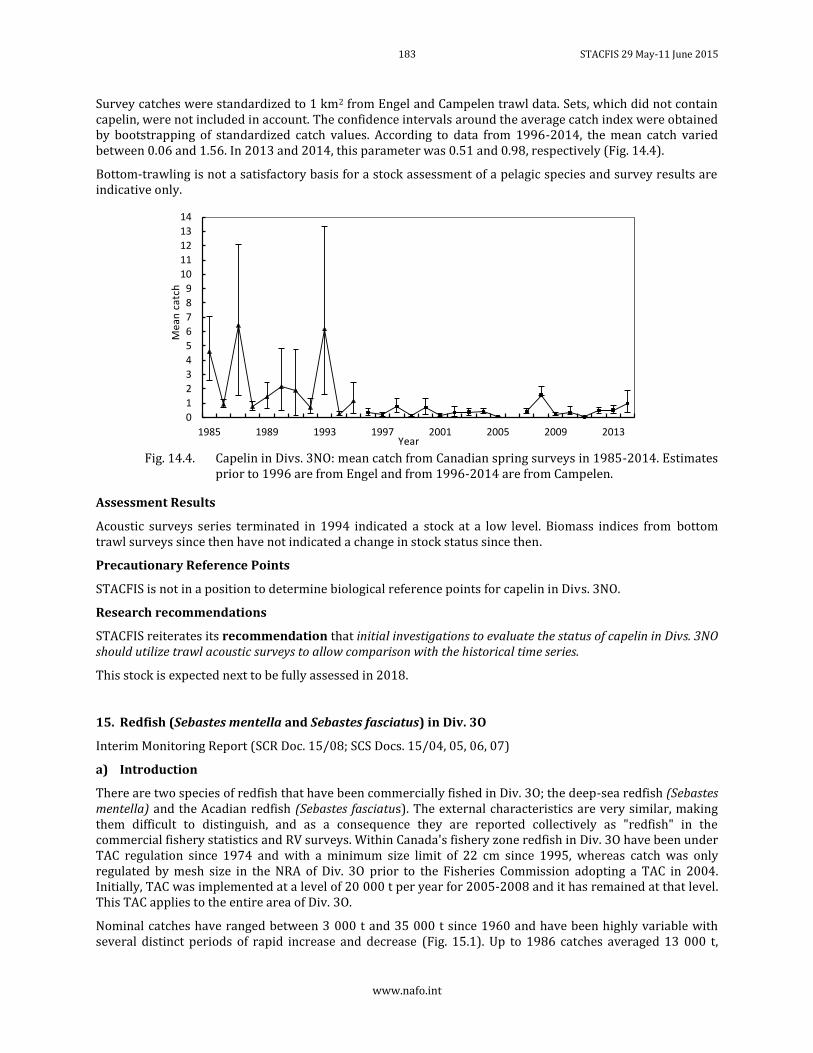
183 STACFIS 29 May-11 June 2015
www.nafo.int
Survey catches were standardized to 1 km2 from Engel and Campelen trawl data. Sets, which did not contain capelin, were not included in account. The confidence intervals around the average catch index were obtained by bootstrapping of standardized catch values. According to data from 1996-2014, the mean catch varied between 0.06 and 1.56. In 2013 and 2014, this parameter was 0.51 and 0.98, respectively (Fig. 14.4).
Bottom-trawling is not a satisfactory basis for a stock assessment of a pelagic species and survey results are indicative only.
Fig. 14.4. Capelin in Divs. 3NO: mean catch from Canadian spring surveys in 1985-2014. Estimates
prior to 1996 are from Engel and from 1996-2014 are from Campelen.
Assessment Results
Acoustic surveys series terminated in 1994 indicated a stock at a low level. Biomass indices from bottom trawl surveys since then have not indicated a change in stock status since then.
Precautionary Reference Points
STACFIS is not in a position to determine biological reference points for capelin in Divs. 3NO.
Research recommendations
STACFIS reiterates its recommendation that initial investigations to evaluate the status of capelin in Divs. 3NO should utilize trawl acoustic surveys to allow comparison with the historical time series.
This stock is expected next to be fully assessed in 2018.
15. Redfish (Sebastes mentella and Sebastes fasciatus) in Div. 3O
Interim Monitoring Report (SCR Doc. 15/08; SCS Docs. 15/04, 05, 06, 07)
a) Introduction
There are two species of redfish that have been commercially fished in Div. 3O; the deep-sea redfish (Sebastes mentella) and the Acadian redfish (Sebastes fasciatus). The external characteristics are very similar, making them difficult to distinguish, and as a consequence they are reported collectively as "redfish" in the commercial fishery statistics and RV surveys. Within Canada's fishery zone redfish in Div. 3O have been under TAC regulation since 1974 and with a minimum size limit of 22 cm since 1995, whereas catch was only regulated by mesh size in the NRA of Div. 3O prior to the Fisheries Commission adopting a TAC in 2004. Initially, TAC was implemented at a level of 20 000 t per year for 2005-2008 and it has remained at that level. This TAC applies to the entire area of Div. 3O.
Nominal catches have ranged between 3 000 t and 35 000 t since 1960 and have been highly variable with several distinct periods of rapid increase and decrease (Fig. 15.1). Up to 1986 catches averaged 13 000 t,
0
1
2
3
4
5
6
7
8
9
10
11
12
13
14
1985 1989 1993 1997 2001 2005 2009 2013
Me
an c
atch
Year
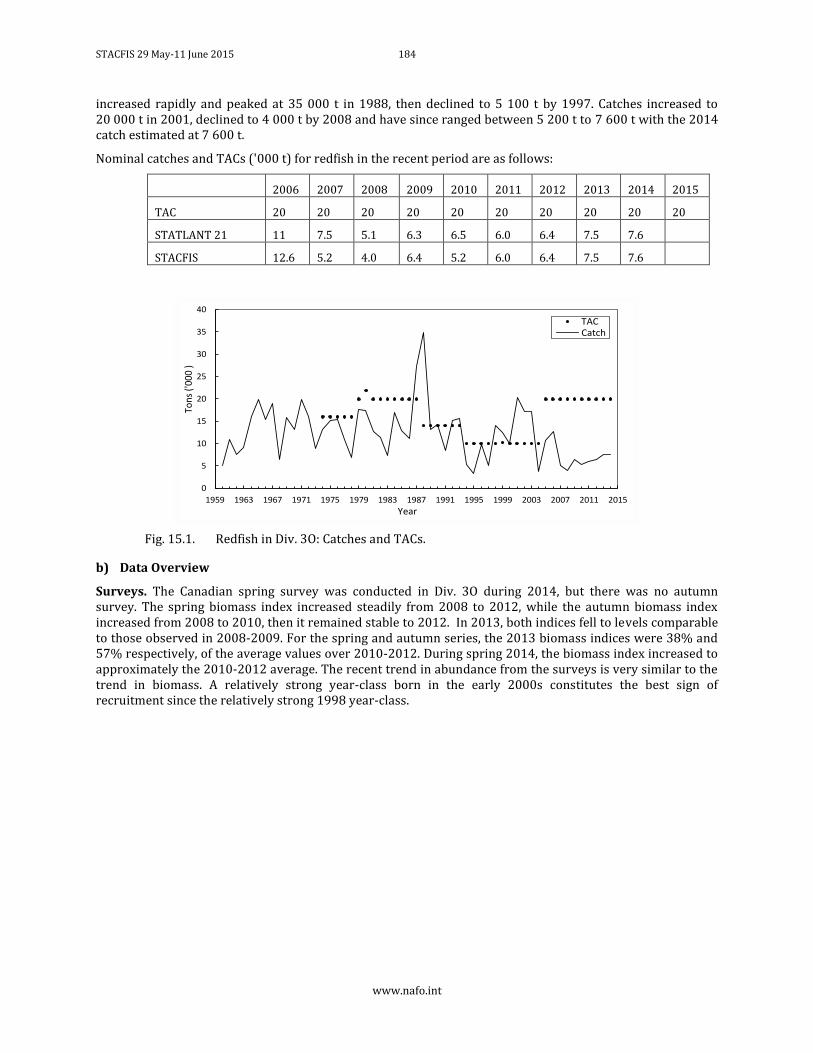
STACFIS 29 May-11 June 2015 184
www.nafo.int
increased rapidly and peaked at 35 000 t in 1988, then declined to 5 100 t by 1997. Catches increased to 20 000 t in 2001, declined to 4 000 t by 2008 and have since ranged between 5 200 t to 7 600 t with the 2014 catch estimated at 7 600 t.
Nominal catches and TACs ('000 t) for redfish in the recent period are as follows:
2006 2007 2008 2009 2010 2011 2012 2013 2014 2015
TAC 20 20 20 20 20 20 20 20 20 20
STATLANT 21 11 7.5 5.1 6.3 6.5 6.0 6.4 7.5 7.6
STACFIS 12.6 5.2 4.0 6.4 5.2 6.0 6.4 7.5 7.6
Fig. 15.1. Redfish in Div. 3O: Catches and TACs.
b) Data Overview
Surveys. The Canadian spring survey was conducted in Div. 3O during 2014, but there was no autumn survey. The spring biomass index increased steadily from 2008 to 2012, while the autumn biomass index increased from 2008 to 2010, then it remained stable to 2012. In 2013, both indices fell to levels comparable to those observed in 2008-2009. For the spring and autumn series, the 2013 biomass indices were 38% and 57% respectively, of the average values over 2010-2012. During spring 2014, the biomass index increased to approximately the 2010-2012 average. The recent trend in abundance from the surveys is very similar to the trend in biomass. A relatively strong year-class born in the early 2000s constitutes the best sign of recruitment since the relatively strong 1998 year-class.
0
5
10
15
20
25
30
35
40
1959 1963 1967 1971 1975 1979 1983 1987 1991 1995 1999 2003 2007 2011 2015
Tons
('0
00 )
Year
TACCatch
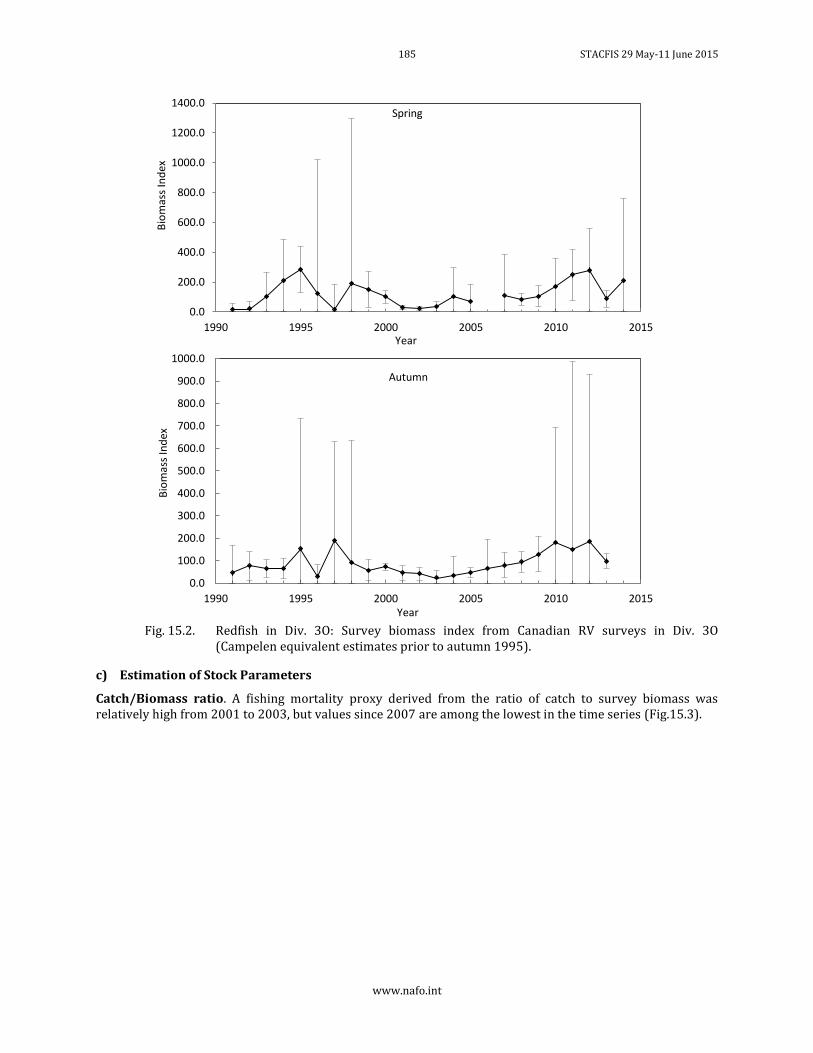
185 STACFIS 29 May-11 June 2015
www.nafo.int
Fig. 15.2. Redfish in Div. 3O: Survey biomass index from Canadian RV surveys in Div. 3O
(Campelen equivalent estimates prior to autumn 1995).
c) Estimation of Stock Parameters
Catch/Biomass ratio. A fishing mortality proxy derived from the ratio of catch to survey biomass was relatively high from 2001 to 2003, but values since 2007 are among the lowest in the time series (Fig.15.3).
0.0
200.0
400.0
600.0
800.0
1000.0
1200.0
1400.0
1990 1995 2000 2005 2010 2015
Bio
mas
s In
dex
Year
Spring
0.0
100.0
200.0
300.0
400.0
500.0
600.0
700.0
800.0
900.0
1000.0
1990 1995 2000 2005 2010 2015
Bio
mas
s In
dex
Year
Autumn
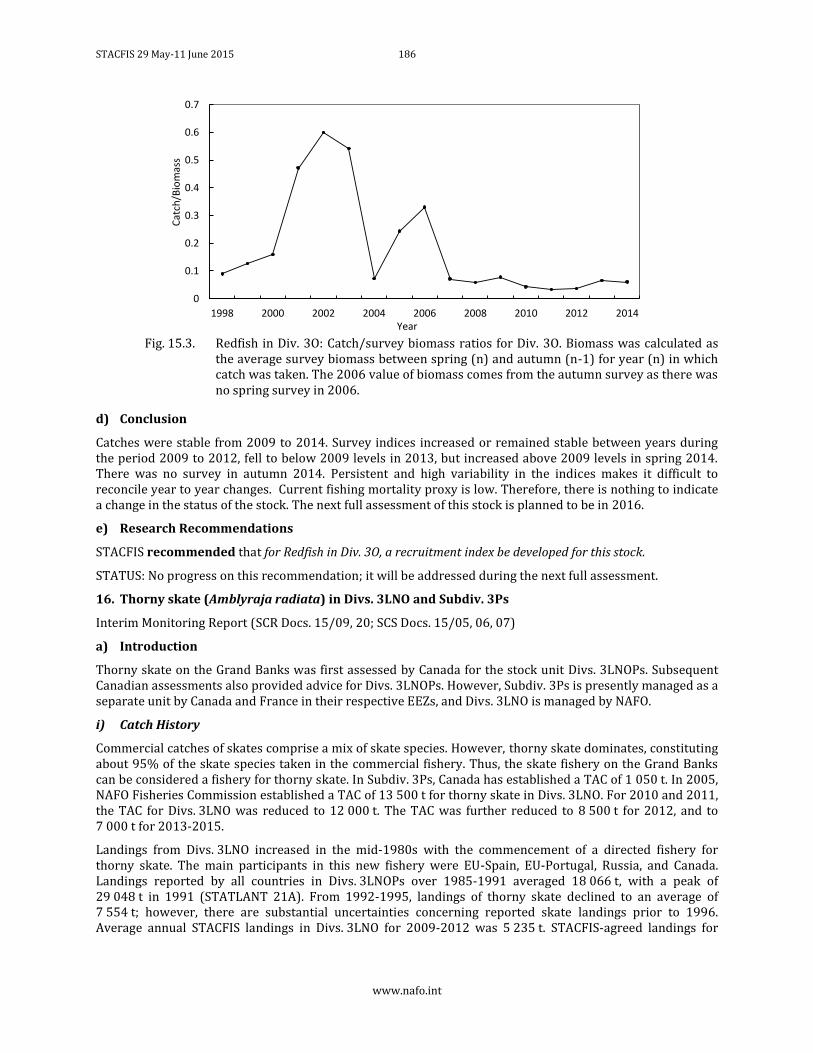
STACFIS 29 May-11 June 2015 186
www.nafo.int
Fig. 15.3. Redfish in Div. 3O: Catch/survey biomass ratios for Div. 3O. Biomass was calculated as
the average survey biomass between spring (n) and autumn (n-1) for year (n) in which catch was taken. The 2006 value of biomass comes from the autumn survey as there was no spring survey in 2006.
d) Conclusion
Catches were stable from 2009 to 2014. Survey indices increased or remained stable between years during the period 2009 to 2012, fell to below 2009 levels in 2013, but increased above 2009 levels in spring 2014. There was no survey in autumn 2014. Persistent and high variability in the indices makes it difficult to reconcile year to year changes. Current fishing mortality proxy is low. Therefore, there is nothing to indicate a change in the status of the stock. The next full assessment of this stock is planned to be in 2016.
e) Research Recommendations
STACFIS recommended that for Redfish in Div. 3O, a recruitment index be developed for this stock.
STATUS: No progress on this recommendation; it will be addressed during the next full assessment.
16. Thorny skate (Amblyraja radiata) in Divs. 3LNO and Subdiv. 3Ps
Interim Monitoring Report (SCR Docs. 15/09, 20; SCS Docs. 15/05, 06, 07)
a) Introduction
Thorny skate on the Grand Banks was first assessed by Canada for the stock unit Divs. 3LNOPs. Subsequent Canadian assessments also provided advice for Divs. 3LNOPs. However, Subdiv. 3Ps is presently managed as a separate unit by Canada and France in their respective EEZs, and Divs. 3LNO is managed by NAFO.
i) Catch History
Commercial catches of skates comprise a mix of skate species. However, thorny skate dominates, constituting about 95% of the skate species taken in the commercial fishery. Thus, the skate fishery on the Grand Banks can be considered a fishery for thorny skate. In Subdiv. 3Ps, Canada has established a TAC of 1 050 t. In 2005, NAFO Fisheries Commission established a TAC of 13 500 t for thorny skate in Divs. 3LNO. For 2010 and 2011, the TAC for Divs. 3LNO was reduced to 12 000 t. The TAC was further reduced to 8 500 t for 2012, and to 7 000 t for 2013-2015.
Landings from Divs. 3LNO increased in the mid-1980s with the commencement of a directed fishery for thorny skate. The main participants in this new fishery were EU-Spain, EU-Portugal, Russia, and Canada. Landings reported by all countries in Divs. 3LNOPs over 1985-1991 averaged 18 066 t, with a peak of 29 048 t in 1991 (STATLANT 21A). From 1992-1995, landings of thorny skate declined to an average of 7 554 t; however, there are substantial uncertainties concerning reported skate landings prior to 1996. Average annual STACFIS landings in Divs. 3LNO for 2009-2012 was 5 235 t. STACFIS-agreed landings for
0
0.1
0.2
0.3
0.4
0.5
0.6
0.7
1998 2000 2002 2004 2006 2008 2010 2012 2014
Cat
ch/B
iom
ass
Year
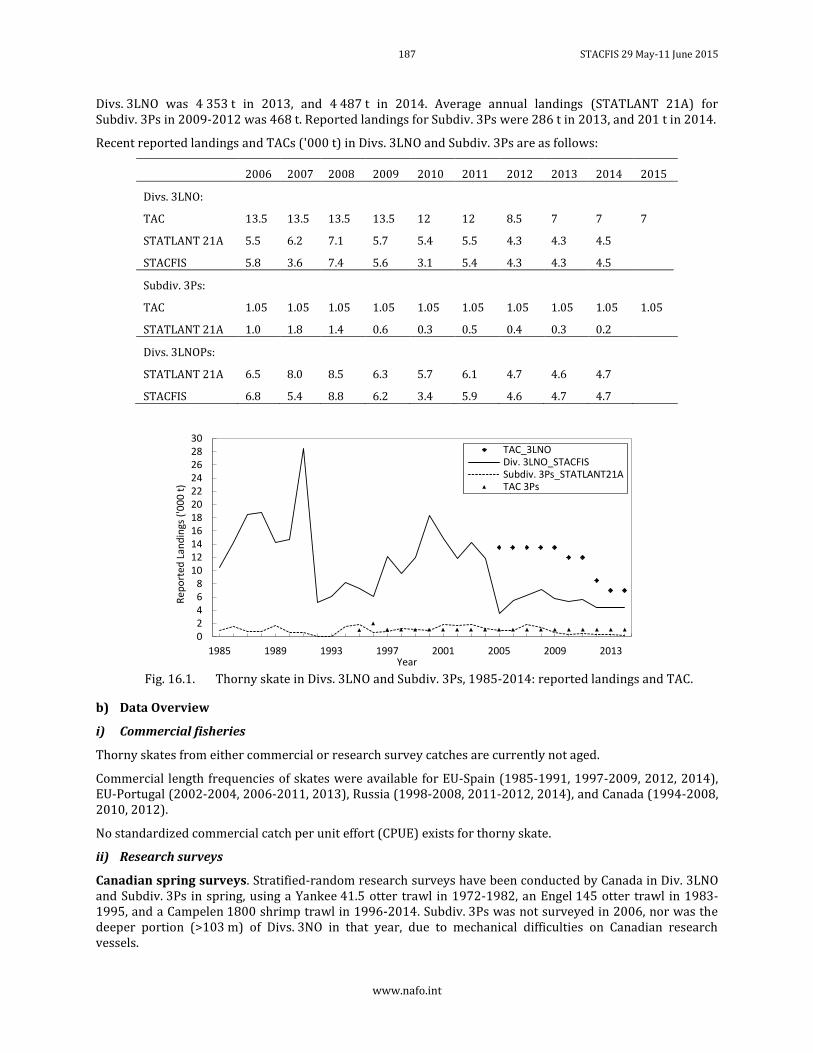
187 STACFIS 29 May-11 June 2015
www.nafo.int
Divs. 3LNO was 4 353 t in 2013, and 4 487 t in 2014. Average annual landings (STATLANT 21A) for Subdiv. 3Ps in 2009-2012 was 468 t. Reported landings for Subdiv. 3Ps were 286 t in 2013, and 201 t in 2014.
Recent reported landings and TACs ('000 t) in Divs. 3LNO and Subdiv. 3Ps are as follows:
2006 2007 2008 2009 2010 2011 2012 2013 2014 2015
Divs. 3LNO:
TAC 13.5 13.5 13.5 13.5 12 12 8.5 7 7 7
STATLANT 21A 5.5 6.2 7.1 5.7 5.4 5.5 4.3 4.3 4.5
STACFIS 5.8 3.6 7.4 5.6 3.1 5.4 4.3 4.3 4.5
Subdiv. 3Ps:
TAC 1.05 1.05 1.05 1.05 1.05 1.05 1.05 1.05 1.05 1.05
STATLANT 21A 1.0 1.8 1.4 0.6 0.3 0.5 0.4 0.3 0.2
Divs. 3LNOPs:
STATLANT 21A 6.5 8.0 8.5 6.3 5.7 6.1 4.7 4.6 4.7
STACFIS 6.8 5.4 8.8 6.2 3.4 5.9 4.6 4.7 4.7
Fig. 16.1. Thorny skate in Divs. 3LNO and Subdiv. 3Ps, 1985-2014: reported landings and TAC.
b) Data Overview
i) Commercial fisheries
Thorny skates from either commercial or research survey catches are currently not aged.
Commercial length frequencies of skates were available for EU-Spain (1985-1991, 1997-2009, 2012, 2014), EU-Portugal (2002-2004, 2006-2011, 2013), Russia (1998-2008, 2011-2012, 2014), and Canada (1994-2008, 2010, 2012).
No standardized commercial catch per unit effort (CPUE) exists for thorny skate.
ii) Research surveys
Canadian spring surveys. Stratified-random research surveys have been conducted by Canada in Div. 3LNO and Subdiv. 3Ps in spring, using a Yankee 41.5 otter trawl in 1972-1982, an Engel 145 otter trawl in 1983-1995, and a Campelen 1800 shrimp trawl in 1996-2014. Subdiv. 3Ps was not surveyed in 2006, nor was the deeper portion (>103 m) of Divs. 3NO in that year, due to mechanical difficulties on Canadian research vessels.
02468
1012141618202224262830
1985 1989 1993 1997 2001 2005 2009 2013
Rep
ort
ed L
and
ings
('0
00
t)
Year
TAC_3LNODiv. 3LNO_STACFISSubdiv. 3Ps_STATLANT21ATAC 3Ps
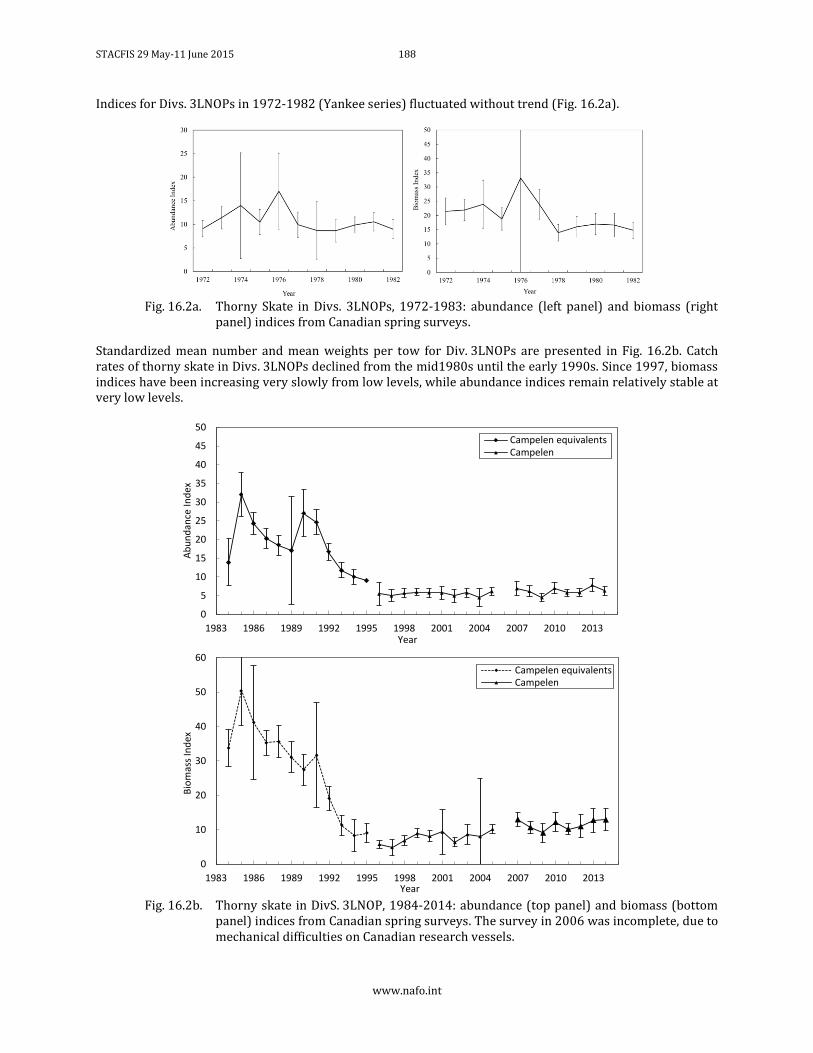
STACFIS 29 May-11 June 2015 188
www.nafo.int
Indices for Divs. 3LNOPs in 1972-1982 (Yankee series) fluctuated without trend (Fig. 16.2a).
Fig. 16.2a. Thorny Skate in Divs. 3LNOPs, 1972-1983: abundance (left panel) and biomass (right
panel) indices from Canadian spring surveys.
Standardized mean number and mean weights per tow for Div. 3LNOPs are presented in Fig. 16.2b. Catch rates of thorny skate in Divs. 3LNOPs declined from the mid1980s until the early 1990s. Since 1997, biomass indices have been increasing very slowly from low levels, while abundance indices remain relatively stable at very low levels.
Fig. 16.2b. Thorny skate in DivS. 3LNOP, 1984-2014: abundance (top panel) and biomass (bottom
panel) indices from Canadian spring surveys. The survey in 2006 was incomplete, due to mechanical difficulties on Canadian research vessels.
0
5
10
15
20
25
30
35
40
45
50
1983 1986 1989 1992 1995 1998 2001 2004 2007 2010 2013
Ab
un
dan
ce I
nd
ex
Year
Campelen equivalentsCampelen
0
10
20
30
40
50
60
1983 1986 1989 1992 1995 1998 2001 2004 2007 2010 2013
Bio
mas
s In
dex
Year
Campelen equivalentsCampelen
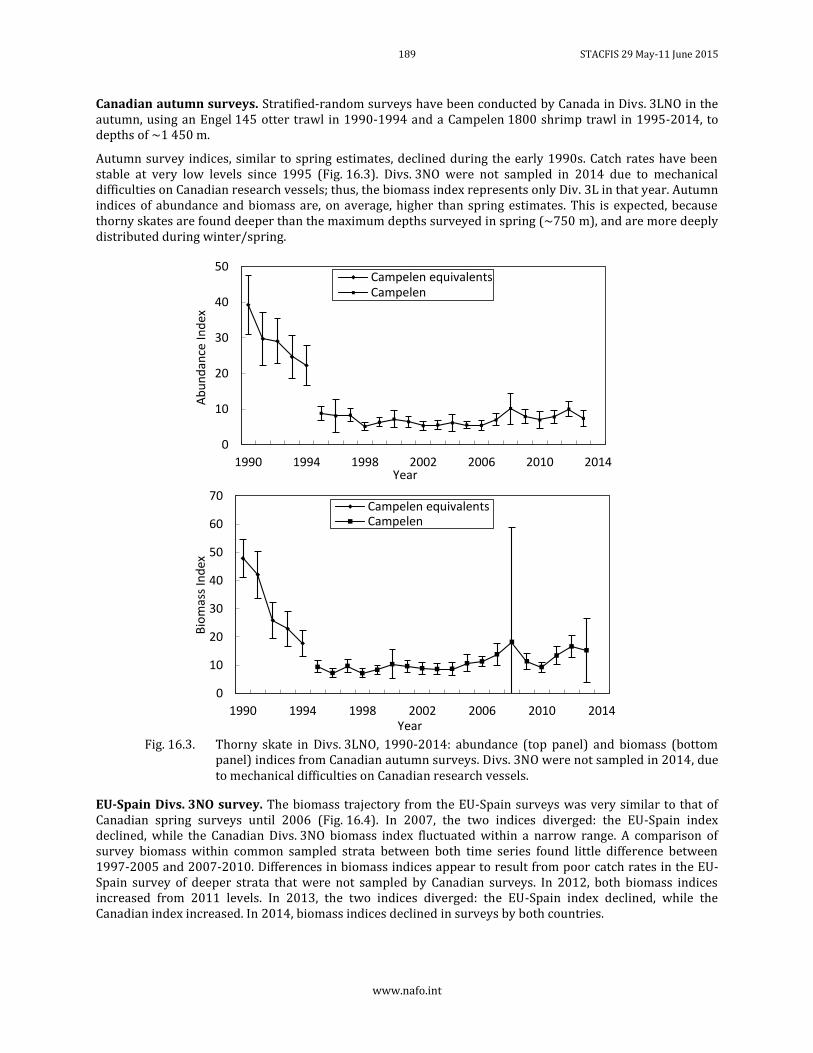
189 STACFIS 29 May-11 June 2015
www.nafo.int
Canadian autumn surveys. Stratified-random surveys have been conducted by Canada in Divs. 3LNO in the autumn, using an Engel 145 otter trawl in 1990-1994 and a Campelen 1800 shrimp trawl in 1995-2014, to depths of ~1 450 m.
Autumn survey indices, similar to spring estimates, declined during the early 1990s. Catch rates have been stable at very low levels since 1995 (Fig. 16.3). Divs. 3NO were not sampled in 2014 due to mechanical difficulties on Canadian research vessels; thus, the biomass index represents only Div. 3L in that year. Autumn indices of abundance and biomass are, on average, higher than spring estimates. This is expected, because thorny skates are found deeper than the maximum depths surveyed in spring (~750 m), and are more deeply distributed during winter/spring.
Fig. 16.3. Thorny skate in Divs. 3LNO, 1990-2014: abundance (top panel) and biomass (bottom
panel) indices from Canadian autumn surveys. Divs. 3NO were not sampled in 2014, due to mechanical difficulties on Canadian research vessels.
EU-Spain Divs. 3NO survey. The biomass trajectory from the EU-Spain surveys was very similar to that of Canadian spring surveys until 2006 (Fig. 16.4). In 2007, the two indices diverged: the EU-Spain index declined, while the Canadian Divs. 3NO biomass index fluctuated within a narrow range. A comparison of survey biomass within common sampled strata between both time series found little difference between 1997-2005 and 2007-2010. Differences in biomass indices appear to result from poor catch rates in the EU-Spain survey of deeper strata that were not sampled by Canadian surveys. In 2012, both biomass indices increased from 2011 levels. In 2013, the two indices diverged: the EU-Spain index declined, while the Canadian index increased. In 2014, biomass indices declined in surveys by both countries.
0
10
20
30
40
50
1990 1994 1998 2002 2006 2010 2014
Ab
un
dan
ce I
nd
ex
Year
Campelen equivalentsCampelen
0
10
20
30
40
50
60
70
1990 1994 1998 2002 2006 2010 2014
Bio
mas
s In
dex
Year
Campelen equivalentsCampelen
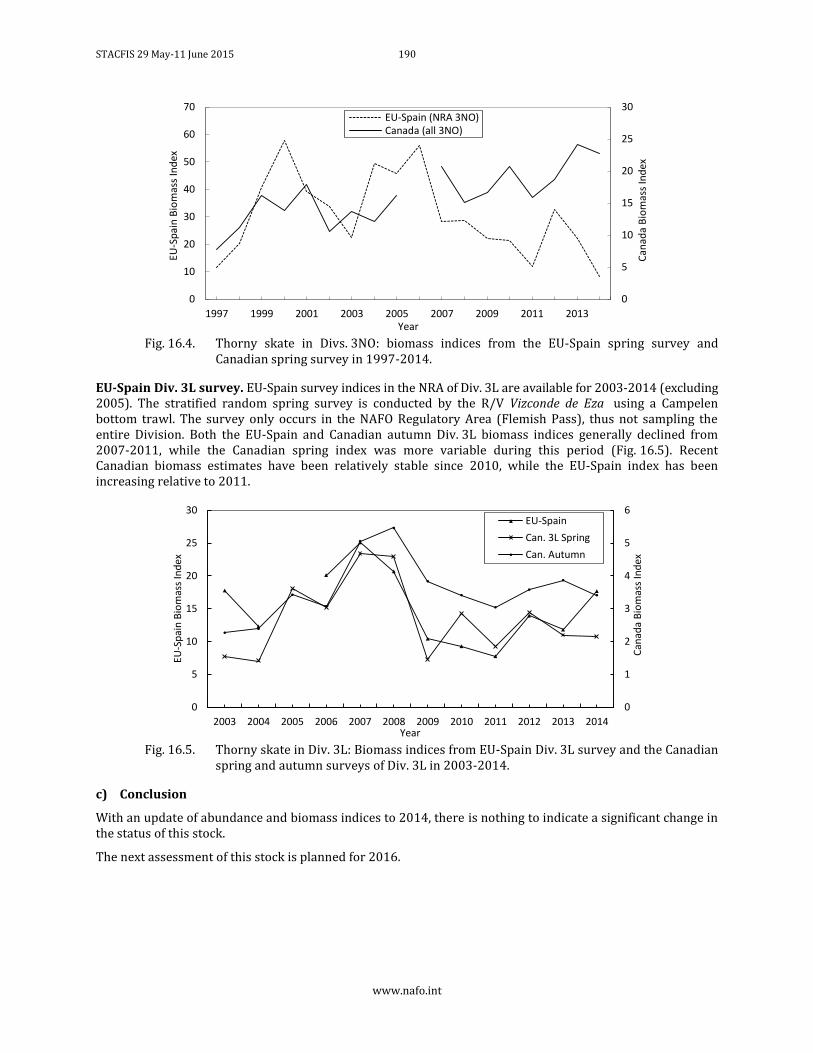
STACFIS 29 May-11 June 2015 190
www.nafo.int
Fig. 16.4. Thorny skate in Divs. 3NO: biomass indices from the EU-Spain spring survey and
Canadian spring survey in 1997-2014.
EU-Spain Div. 3L survey. EU-Spain survey indices in the NRA of Div. 3L are available for 2003-2014 (excluding 2005). The stratified random spring survey is conducted by the R/V Vizconde de Eza using a Campelen bottom trawl. The survey only occurs in the NAFO Regulatory Area (Flemish Pass), thus not sampling the entire Division. Both the EU-Spain and Canadian autumn Div. 3L biomass indices generally declined from 2007-2011, while the Canadian spring index was more variable during this period (Fig. 16.5). Recent Canadian biomass estimates have been relatively stable since 2010, while the EU-Spain index has been increasing relative to 2011.
Fig. 16.5. Thorny skate in Div. 3L: Biomass indices from EU-Spain Div. 3L survey and the Canadian
spring and autumn surveys of Div. 3L in 2003-2014.
c) Conclusion
With an update of abundance and biomass indices to 2014, there is nothing to indicate a significant change in the status of this stock.
The next assessment of this stock is planned for 2016.
0
5
10
15
20
25
30
0
10
20
30
40
50
60
70
1997 1999 2001 2003 2005 2007 2009 2011 2013
Can
ada
Bio
mas
s In
dex
EU-S
pai
n B
iom
ass
Ind
ex
Year
EU-Spain (NRA 3NO)Canada (all 3NO)
0
1
2
3
4
5
6
0
5
10
15
20
25
30
2003 2004 2005 2006 2007 2008 2009 2010 2011 2012 2013 2014
Can
ada
Bio
mas
s In
dex
EU-S
pai
n B
iom
ass
Ind
ex
Year
EU-Spain
Can. 3L Spring
Can. Autumn
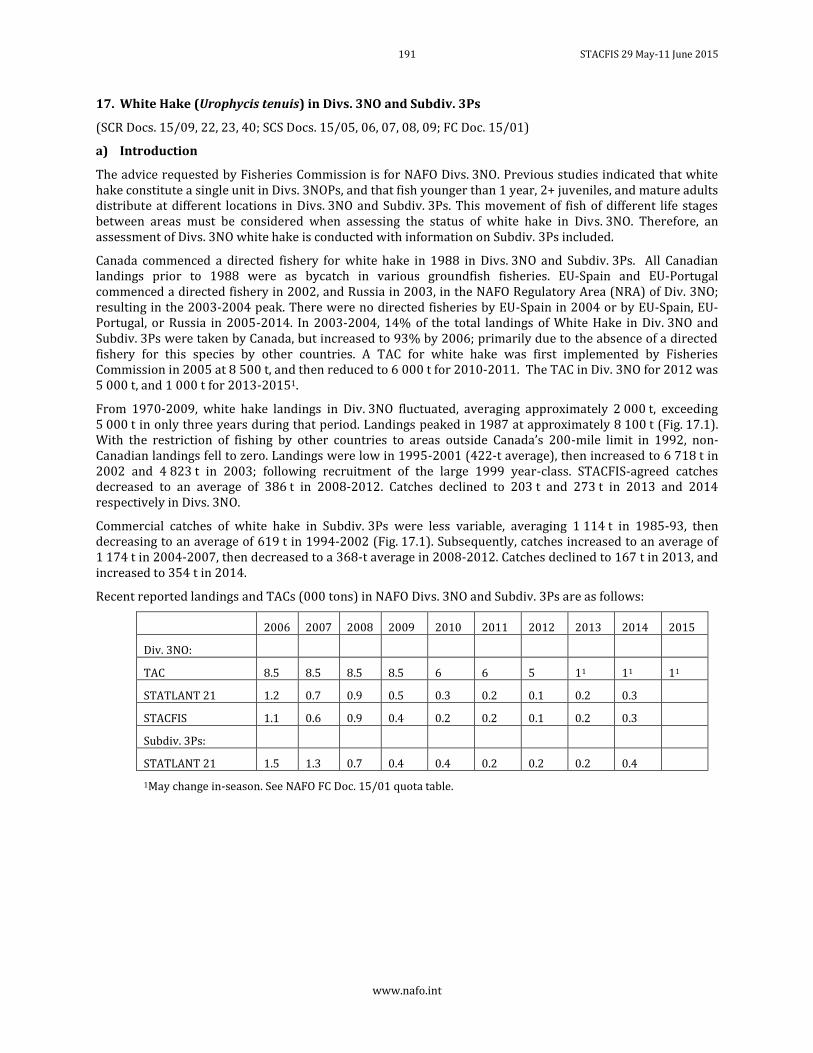
191 STACFIS 29 May-11 June 2015
www.nafo.int
17. White Hake (Urophycis tenuis) in Divs. 3NO and Subdiv. 3Ps
(SCR Docs. 15/09, 22, 23, 40; SCS Docs. 15/05, 06, 07, 08, 09; FC Doc. 15/01)
a) Introduction
The advice requested by Fisheries Commission is for NAFO Divs. 3NO. Previous studies indicated that white hake constitute a single unit in Divs. 3NOPs, and that fish younger than 1 year, 2+ juveniles, and mature adults distribute at different locations in Divs. 3NO and Subdiv. 3Ps. This movement of fish of different life stages between areas must be considered when assessing the status of white hake in Divs. 3NO. Therefore, an assessment of Divs. 3NO white hake is conducted with information on Subdiv. 3Ps included.
Canada commenced a directed fishery for white hake in 1988 in Divs. 3NO and Subdiv. 3Ps. All Canadian landings prior to 1988 were as bycatch in various groundfish fisheries. EU-Spain and EU-Portugal commenced a directed fishery in 2002, and Russia in 2003, in the NAFO Regulatory Area (NRA) of Div. 3NO; resulting in the 2003-2004 peak. There were no directed fisheries by EU-Spain in 2004 or by EU-Spain, EU-Portugal, or Russia in 2005-2014. In 2003-2004, 14% of the total landings of White Hake in Div. 3NO and Subdiv. 3Ps were taken by Canada, but increased to 93% by 2006; primarily due to the absence of a directed fishery for this species by other countries. A TAC for white hake was first implemented by Fisheries Commission in 2005 at 8 500 t, and then reduced to 6 000 t for 2010-2011. The TAC in Div. 3NO for 2012 was 5 000 t, and 1 000 t for 2013-20151.
From 1970-2009, white hake landings in Div. 3NO fluctuated, averaging approximately 2 000 t, exceeding 5 000 t in only three years during that period. Landings peaked in 1987 at approximately 8 100 t (Fig. 17.1). With the restriction of fishing by other countries to areas outside Canada’s 200-mile limit in 1992, non-Canadian landings fell to zero. Landings were low in 1995-2001 (422-t average), then increased to 6 718 t in 2002 and 4 823 t in 2003; following recruitment of the large 1999 year-class. STACFIS-agreed catches decreased to an average of 386 t in 2008-2012. Catches declined to 203 t and 273 t in 2013 and 2014 respectively in Divs. 3NO.
Commercial catches of white hake in Subdiv. 3Ps were less variable, averaging 1 114 t in 1985-93, then decreasing to an average of 619 t in 1994-2002 (Fig. 17.1). Subsequently, catches increased to an average of 1 174 t in 2004-2007, then decreased to a 368-t average in 2008-2012. Catches declined to 167 t in 2013, and increased to 354 t in 2014.
Recent reported landings and TACs (000 tons) in NAFO Divs. 3NO and Subdiv. 3Ps are as follows:
2006 2007 2008 2009 2010 2011 2012 2013 2014 2015
Div. 3NO:
TAC 8.5 8.5 8.5 8.5 6 6 5 11 11 11
STATLANT 21 1.2 0.7 0.9 0.5 0.3 0.2 0.1 0.2 0.3
STACFIS 1.1 0.6 0.9 0.4 0.2 0.2 0.1 0.2 0.3
Subdiv. 3Ps:
STATLANT 21 1.5 1.3 0.7 0.4 0.4 0.2 0.2 0.2 0.4
1May change in-season. See NAFO FC Doc. 15/01 quota table.
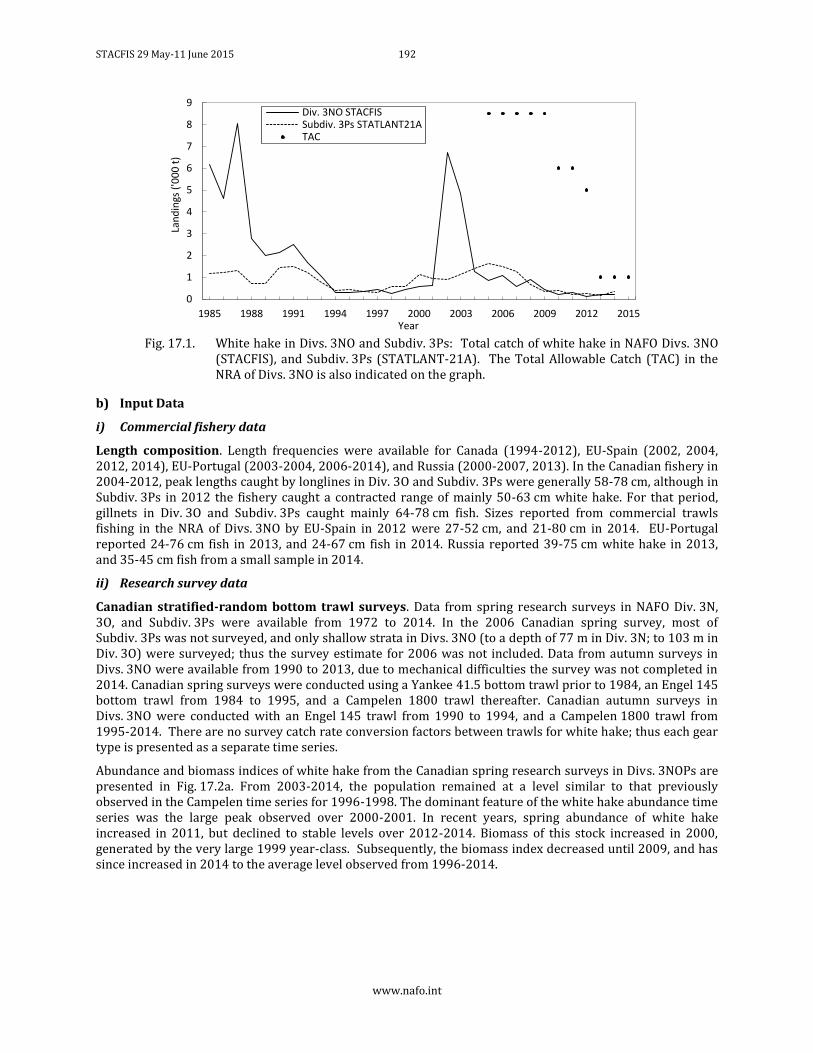
STACFIS 29 May-11 June 2015 192
www.nafo.int
Fig. 17.1. White hake in Divs. 3NO and Subdiv. 3Ps: Total catch of white hake in NAFO Divs. 3NO
(STACFIS), and Subdiv. 3Ps (STATLANT-21A). The Total Allowable Catch (TAC) in the NRA of Divs. 3NO is also indicated on the graph.
b) Input Data
i) Commercial fishery data
Length composition. Length frequencies were available for Canada (1994-2012), EU-Spain (2002, 2004, 2012, 2014), EU-Portugal (2003-2004, 2006-2014), and Russia (2000-2007, 2013). In the Canadian fishery in 2004-2012, peak lengths caught by longlines in Div. 3O and Subdiv. 3Ps were generally 58-78 cm, although in Subdiv. 3Ps in 2012 the fishery caught a contracted range of mainly 50-63 cm white hake. For that period, gillnets in Div. 3O and Subdiv. 3Ps caught mainly 64-78 cm fish. Sizes reported from commercial trawls fishing in the NRA of Divs. 3NO by EU-Spain in 2012 were 27-52 cm, and 21-80 cm in 2014. EU-Portugal reported 24-76 cm fish in 2013, and 24-67 cm fish in 2014. Russia reported 39-75 cm white hake in 2013, and 35-45 cm fish from a small sample in 2014.
ii) Research survey data
Canadian stratified-random bottom trawl surveys. Data from spring research surveys in NAFO Div. 3N, 3O, and Subdiv. 3Ps were available from 1972 to 2014. In the 2006 Canadian spring survey, most of Subdiv. 3Ps was not surveyed, and only shallow strata in Divs. 3NO (to a depth of 77 m in Div. 3N; to 103 m in Div. 3O) were surveyed; thus the survey estimate for 2006 was not included. Data from autumn surveys in Divs. 3NO were available from 1990 to 2013, due to mechanical difficulties the survey was not completed in 2014. Canadian spring surveys were conducted using a Yankee 41.5 bottom trawl prior to 1984, an Engel 145 bottom trawl from 1984 to 1995, and a Campelen 1800 trawl thereafter. Canadian autumn surveys in Divs. 3NO were conducted with an Engel 145 trawl from 1990 to 1994, and a Campelen 1800 trawl from 1995-2014. There are no survey catch rate conversion factors between trawls for white hake; thus each gear type is presented as a separate time series.
Abundance and biomass indices of white hake from the Canadian spring research surveys in Divs. 3NOPs are presented in Fig. 17.2a. From 2003-2014, the population remained at a level similar to that previously observed in the Campelen time series for 1996-1998. The dominant feature of the white hake abundance time series was the large peak observed over 2000-2001. In recent years, spring abundance of white hake increased in 2011, but declined to stable levels over 2012-2014. Biomass of this stock increased in 2000, generated by the very large 1999 year-class. Subsequently, the biomass index decreased until 2009, and has since increased in 2014 to the average level observed from 1996-2014.
0
1
2
3
4
5
6
7
8
9
1985 1988 1991 1994 1997 2000 2003 2006 2009 2012 2015
Lan
din
gs (
'00
0 t
)
Year
Div. 3NO STACFISSubdiv. 3Ps STATLANT21ATAC
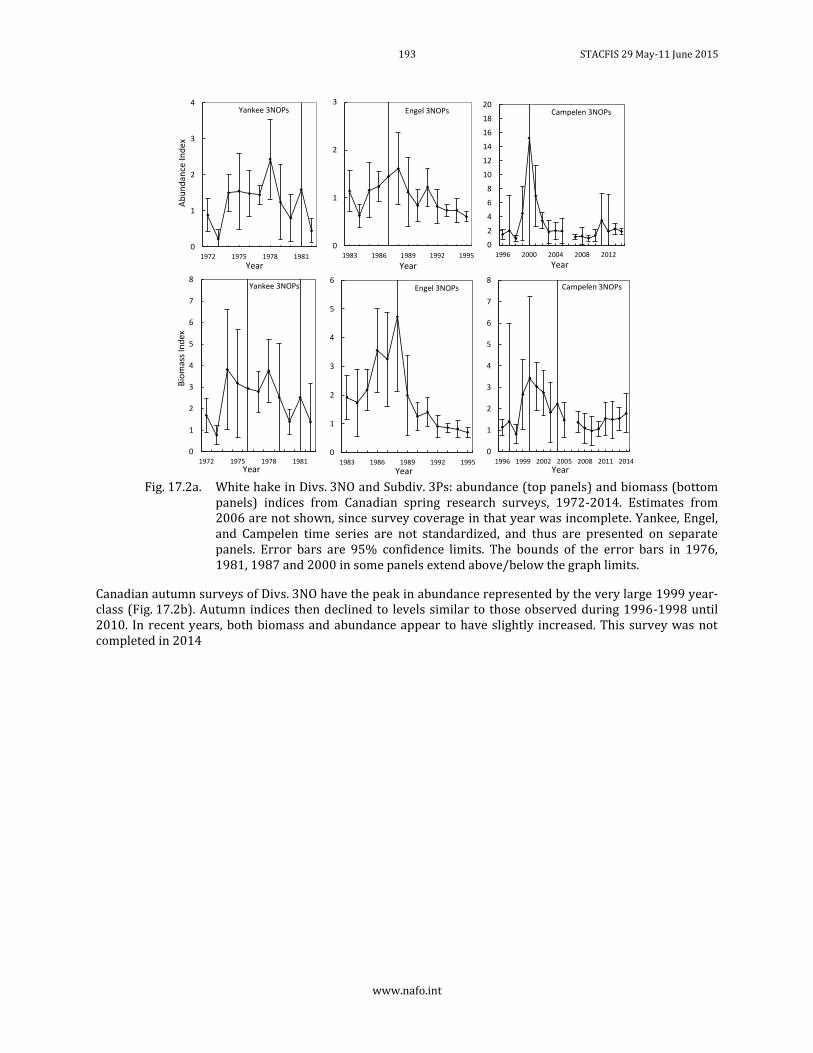
193 STACFIS 29 May-11 June 2015
www.nafo.int
Fig. 17.2a. White hake in Divs. 3NO and Subdiv. 3Ps: abundance (top panels) and biomass (bottom
panels) indices from Canadian spring research surveys, 1972-2014. Estimates from 2006 are not shown, since survey coverage in that year was incomplete. Yankee, Engel, and Campelen time series are not standardized, and thus are presented on separate panels. Error bars are 95% confidence limits. The bounds of the error bars in 1976, 1981, 1987 and 2000 in some panels extend above/below the graph limits.
Canadian autumn surveys of Divs. 3NO have the peak in abundance represented by the very large 1999 year-class (Fig. 17.2b). Autumn indices then declined to levels similar to those observed during 1996-1998 until 2010. In recent years, both biomass and abundance appear to have slightly increased. This survey was not completed in 2014
0
1
2
3
4
1972 1975 1978 1981
Ab
un
dan
ce I
nd
ex
Year
Yankee 3NOPs
0
1
2
3
1983 1986 1989 1992 1995
Year
Engel 3NOPs
0
2
4
6
8
10
12
14
16
18
20
1996 2000 2004 2008 2012
Year
Campelen 3NOPs
0
1
2
3
4
5
6
7
8
1972 1975 1978 1981
Bio
mas
s In
dex
Year
Yankee 3NOPs
0
1
2
3
4
5
6
1983 1986 1989 1992 1995
Year
Engel 3NOPs
0
1
2
3
4
5
6
7
8
1996 1999 2002 2005 2008 2011 2014Year
Campelen 3NOPs
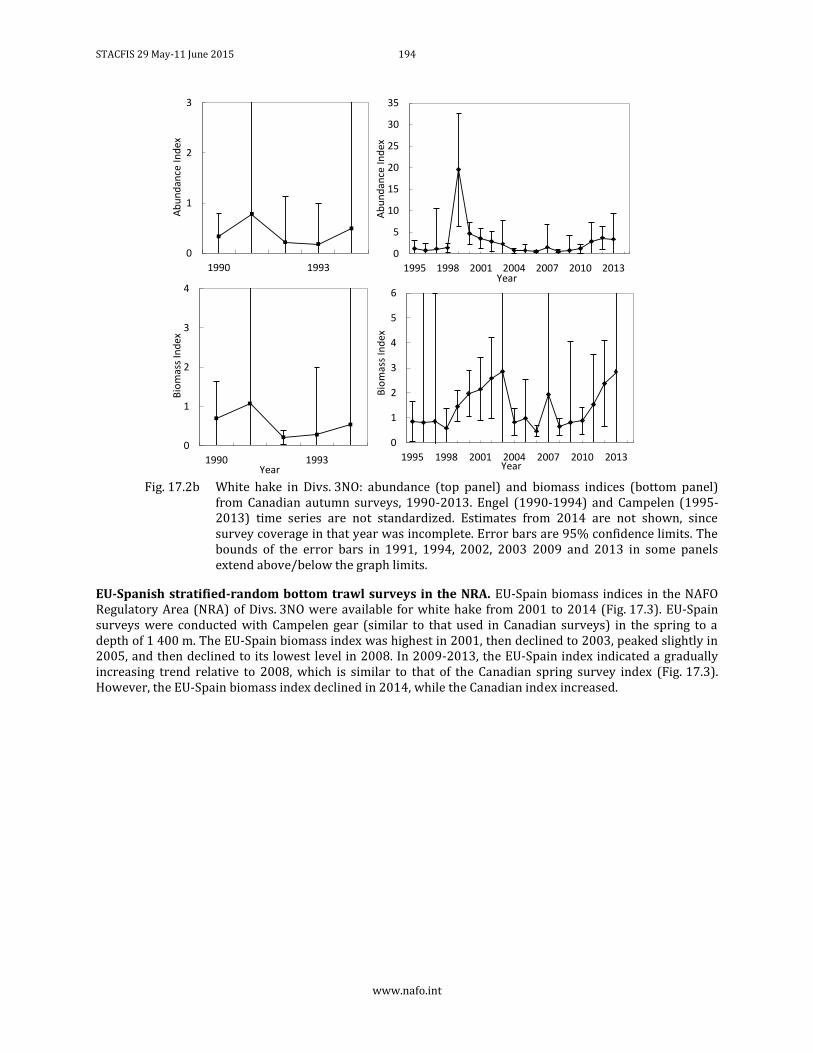
STACFIS 29 May-11 June 2015 194
www.nafo.int
Fig. 17.2b White hake in Divs. 3NO: abundance (top panel) and biomass indices (bottom panel)
from Canadian autumn surveys, 1990-2013. Engel (1990-1994) and Campelen (1995-2013) time series are not standardized. Estimates from 2014 are not shown, since survey coverage in that year was incomplete. Error bars are 95% confidence limits. The bounds of the error bars in 1991, 1994, 2002, 2003 2009 and 2013 in some panels extend above/below the graph limits.
EU-Spanish stratified-random bottom trawl surveys in the NRA. EU-Spain biomass indices in the NAFO Regulatory Area (NRA) of Divs. 3NO were available for white hake from 2001 to 2014 (Fig. 17.3). EU-Spain surveys were conducted with Campelen gear (similar to that used in Canadian surveys) in the spring to a depth of 1 400 m. The EU-Spain biomass index was highest in 2001, then declined to 2003, peaked slightly in 2005, and then declined to its lowest level in 2008. In 2009-2013, the EU-Spain index indicated a gradually increasing trend relative to 2008, which is similar to that of the Canadian spring survey index (Fig. 17.3). However, the EU-Spain biomass index declined in 2014, while the Canadian index increased.
0
1
2
3
1990 1993
Ab
un
dan
ce I
nd
ex
0
1
2
3
4
1990 1993
Bio
mas
s In
dex
Year
0
5
10
15
20
25
30
35
1995 1998 2001 2004 2007 2010 2013
Ab
un
dan
ce I
nd
ex
Year
0
1
2
3
4
5
6
1995 1998 2001 2004 2007 2010 2013
Bio
mas
s In
dex
Year
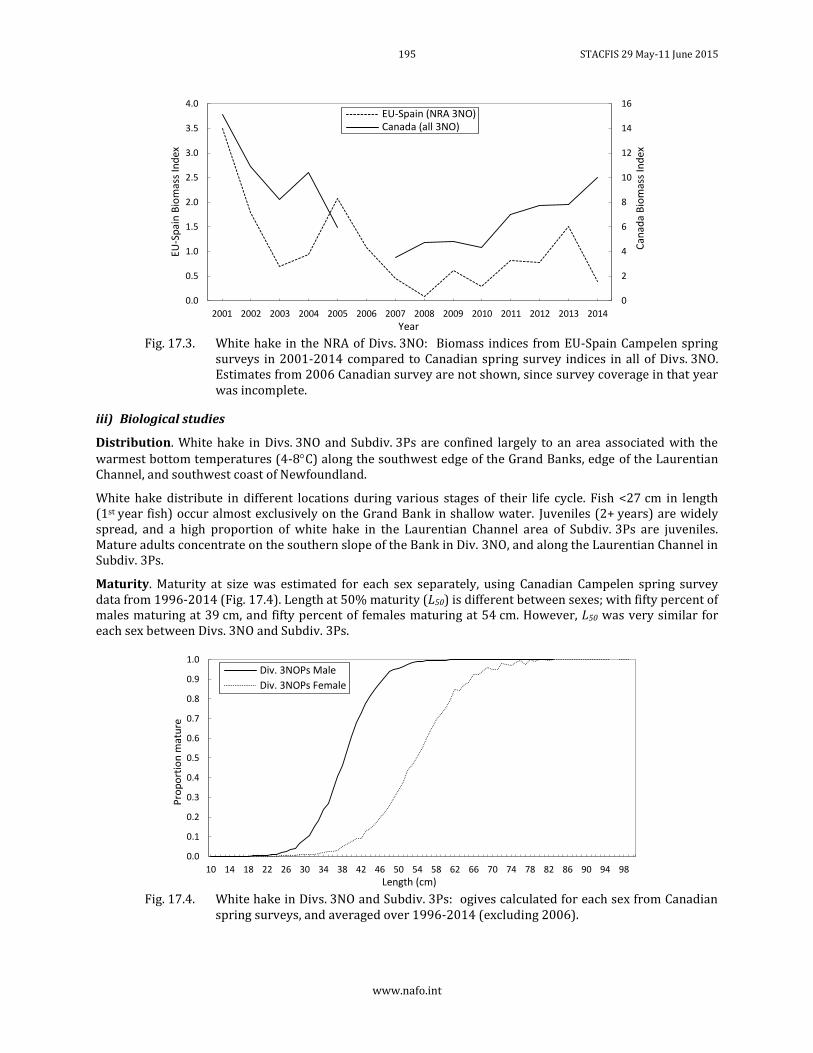
195 STACFIS 29 May-11 June 2015
www.nafo.int
Fig. 17.3. White hake in the NRA of Divs. 3NO: Biomass indices from EU-Spain Campelen spring
surveys in 2001-2014 compared to Canadian spring survey indices in all of Divs. 3NO. Estimates from 2006 Canadian survey are not shown, since survey coverage in that year was incomplete.
iii) Biological studies
Distribution. White hake in Divs. 3NO and Subdiv. 3Ps are confined largely to an area associated with the warmest bottom temperatures (4-8C) along the southwest edge of the Grand Banks, edge of the Laurentian Channel, and southwest coast of Newfoundland.
White hake distribute in different locations during various stages of their life cycle. Fish <27 cm in length (1st year fish) occur almost exclusively on the Grand Bank in shallow water. Juveniles (2+ years) are widely spread, and a high proportion of white hake in the Laurentian Channel area of Subdiv. 3Ps are juveniles. Mature adults concentrate on the southern slope of the Bank in Div. 3NO, and along the Laurentian Channel in Subdiv. 3Ps.
Maturity. Maturity at size was estimated for each sex separately, using Canadian Campelen spring survey data from 1996-2014 (Fig. 17.4). Length at 50% maturity (L50) is different between sexes; with fifty percent of males maturing at 39 cm, and fifty percent of females maturing at 54 cm. However, L50 was very similar for each sex between Divs. 3NO and Subdiv. 3Ps.
Fig. 17.4. White hake in Divs. 3NO and Subdiv. 3Ps: ogives calculated for each sex from Canadian
spring surveys, and averaged over 1996-2014 (excluding 2006).
0
2
4
6
8
10
12
14
16
0.0
0.5
1.0
1.5
2.0
2.5
3.0
3.5
4.0
2001 2002 2003 2004 2005 2006 2007 2008 2009 2010 2011 2012 2013 2014
Can
ada
Bio
mas
s In
dex
EU-S
pai
n B
iom
ass
Ind
ex
Year
EU-Spain (NRA 3NO)Canada (all 3NO)
0.0
0.1
0.2
0.3
0.4
0.5
0.6
0.7
0.8
0.9
1.0
10 14 18 22 26 30 34 38 42 46 50 54 58 62 66 70 74 78 82 86 90 94 98
Pro
po
rtio
n m
atu
re
Length (cm)
Div. 3NOPs Male
Div. 3NOPs Female
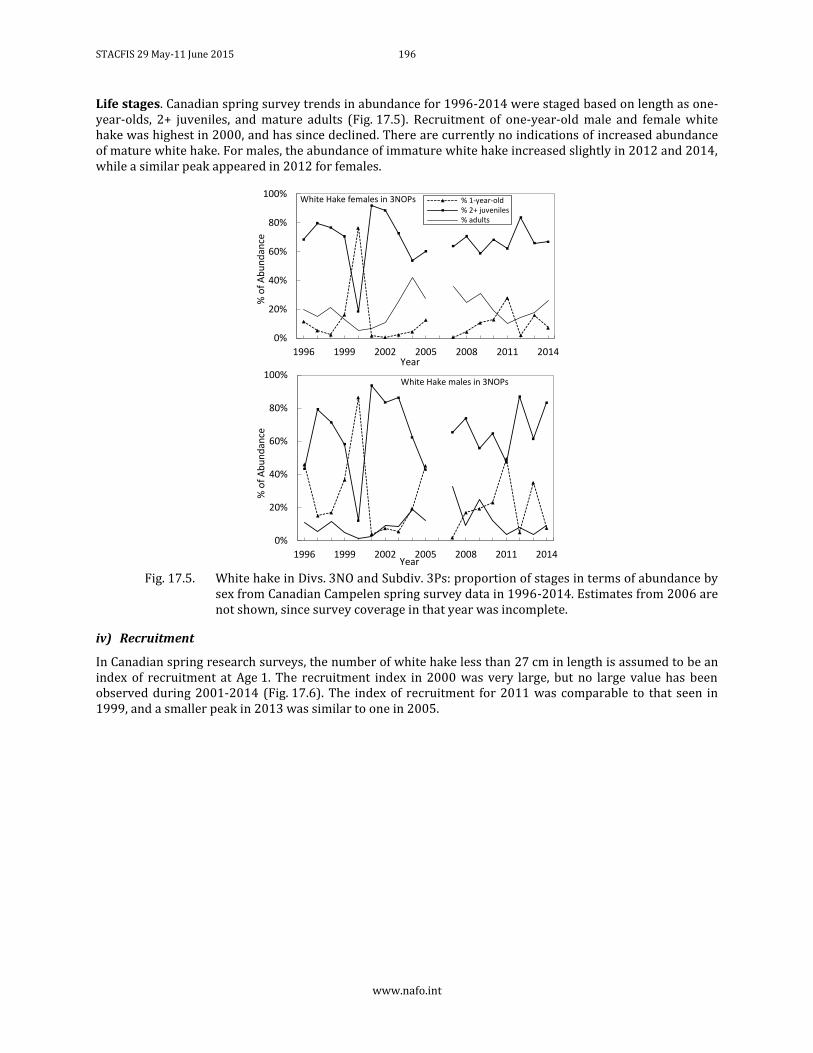
STACFIS 29 May-11 June 2015 196
www.nafo.int
Life stages. Canadian spring survey trends in abundance for 1996-2014 were staged based on length as one-year-olds, 2+ juveniles, and mature adults (Fig. 17.5). Recruitment of one-year-old male and female white hake was highest in 2000, and has since declined. There are currently no indications of increased abundance of mature white hake. For males, the abundance of immature white hake increased slightly in 2012 and 2014, while a similar peak appeared in 2012 for females.
Fig. 17.5. White hake in Divs. 3NO and Subdiv. 3Ps: proportion of stages in terms of abundance by
sex from Canadian Campelen spring survey data in 1996-2014. Estimates from 2006 are not shown, since survey coverage in that year was incomplete.
iv) Recruitment
In Canadian spring research surveys, the number of white hake less than 27 cm in length is assumed to be an index of recruitment at Age 1. The recruitment index in 2000 was very large, but no large value has been observed during 2001-2014 (Fig. 17.6). The index of recruitment for 2011 was comparable to that seen in 1999, and a smaller peak in 2013 was similar to one in 2005.
0%
20%
40%
60%
80%
100%
1996 1999 2002 2005 2008 2011 2014
% o
f A
bu
nd
ance
Year
White Hake females in 3NOPs % 1-year-old% 2+ juveniles% adults
0%
20%
40%
60%
80%
100%
1996 1999 2002 2005 2008 2011 2014
% o
f A
bu
nd
ance
Year
White Hake males in 3NOPs
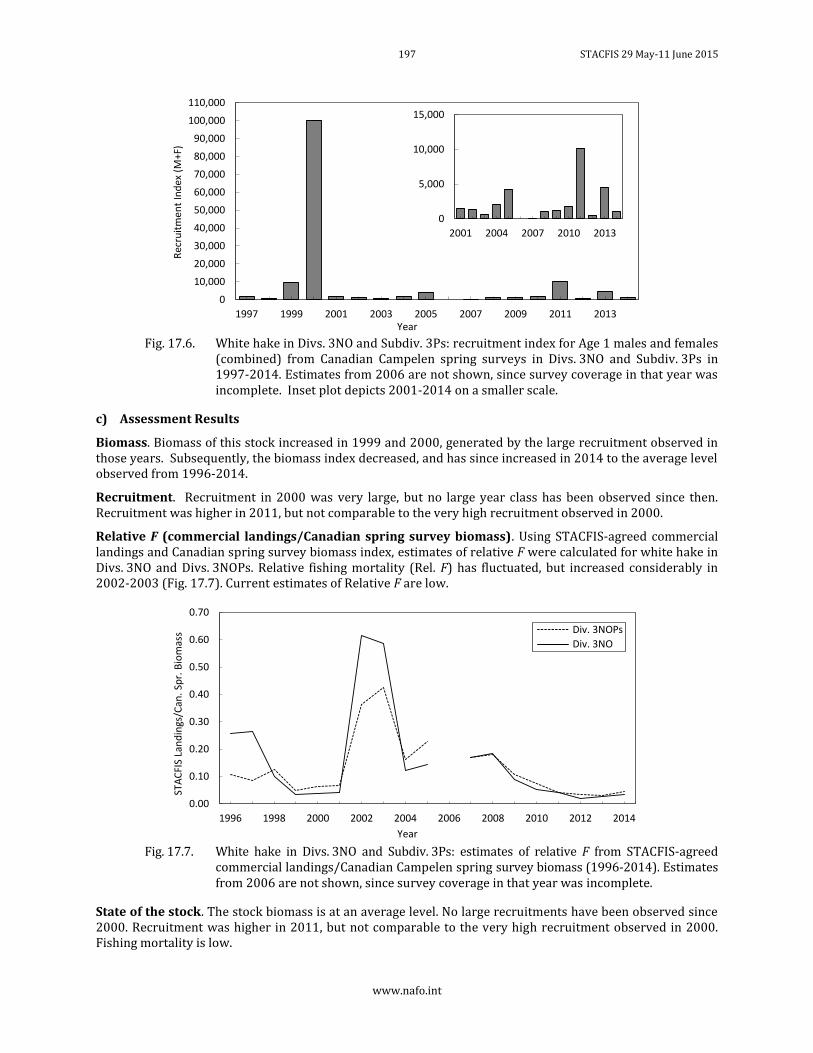
197 STACFIS 29 May-11 June 2015
www.nafo.int
Fig. 17.6. White hake in Divs. 3NO and Subdiv. 3Ps: recruitment index for Age 1 males and females
(combined) from Canadian Campelen spring surveys in Divs. 3NO and Subdiv. 3Ps in 1997-2014. Estimates from 2006 are not shown, since survey coverage in that year was incomplete. Inset plot depicts 2001-2014 on a smaller scale.
c) Assessment Results
Biomass. Biomass of this stock increased in 1999 and 2000, generated by the large recruitment observed in those years. Subsequently, the biomass index decreased, and has since increased in 2014 to the average level observed from 1996-2014.
Recruitment. Recruitment in 2000 was very large, but no large year class has been observed since then. Recruitment was higher in 2011, but not comparable to the very high recruitment observed in 2000.
Relative F (commercial landings/Canadian spring survey biomass). Using STACFIS-agreed commercial landings and Canadian spring survey biomass index, estimates of relative F were calculated for white hake in Divs. 3NO and Divs. 3NOPs. Relative fishing mortality (Rel. F) has fluctuated, but increased considerably in 2002-2003 (Fig. 17.7). Current estimates of Relative F are low.
Fig. 17.7. White hake in Divs. 3NO and Subdiv. 3Ps: estimates of relative F from STACFIS-agreed
commercial landings/Canadian Campelen spring survey biomass (1996-2014). Estimates from 2006 are not shown, since survey coverage in that year was incomplete.
State of the stock. The stock biomass is at an average level. No large recruitments have been observed since 2000. Recruitment was higher in 2011, but not comparable to the very high recruitment observed in 2000. Fishing mortality is low.
0
10,000
20,000
30,000
40,000
50,000
60,000
70,000
80,000
90,000
100,000
110,000
1997 1999 2001 2003 2005 2007 2009 2011 2013
Rec
ruit
men
t In
dex
(M
+F)
Year
0
5,000
10,000
15,000
2001 2004 2007 2010 2013
0.00
0.10
0.20
0.30
0.40
0.50
0.60
0.70
1996 1998 2000 2002 2004 2006 2008 2010 2012 2014
STA
CFI
S La
nd
ings
/Can
. Sp
r. B
iom
ass
Year
Div. 3NOPs
Div. 3NO
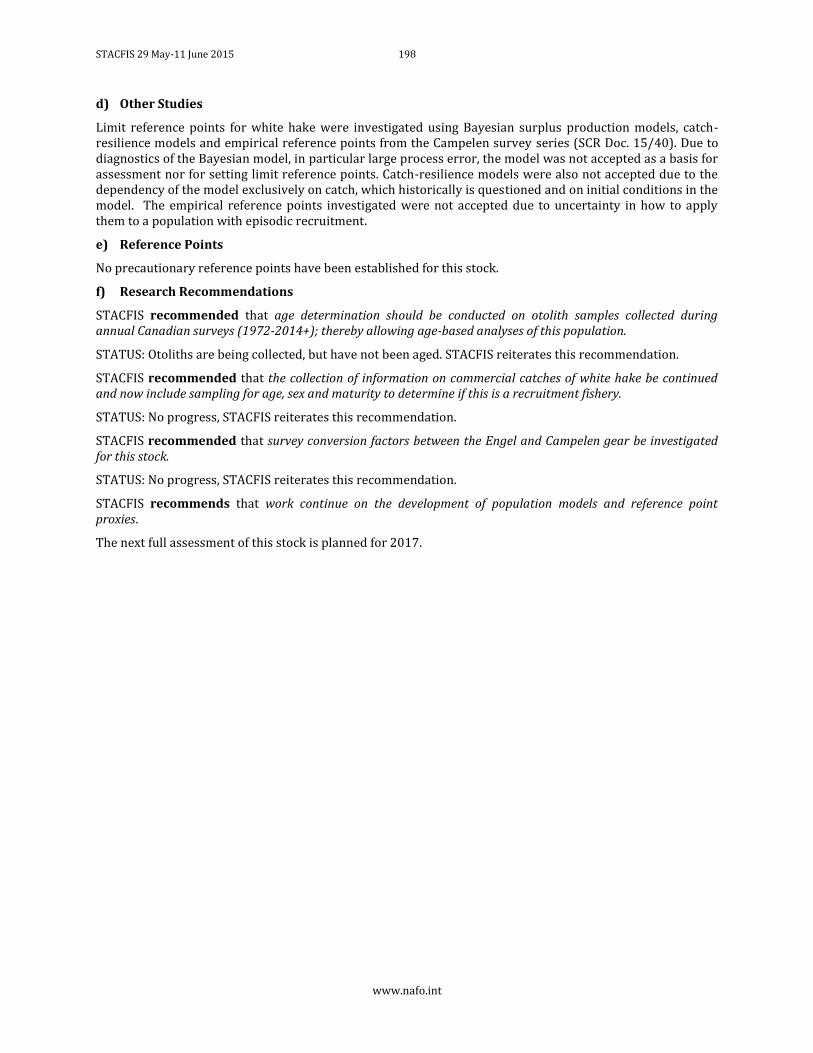
STACFIS 29 May-11 June 2015 198
www.nafo.int
d) Other Studies
Limit reference points for white hake were investigated using Bayesian surplus production models, catch-resilience models and empirical reference points from the Campelen survey series (SCR Doc. 15/40). Due to diagnostics of the Bayesian model, in particular large process error, the model was not accepted as a basis for assessment nor for setting limit reference points. Catch-resilience models were also not accepted due to the dependency of the model exclusively on catch, which historically is questioned and on initial conditions in the model. The empirical reference points investigated were not accepted due to uncertainty in how to apply them to a population with episodic recruitment.
e) Reference Points
No precautionary reference points have been established for this stock.
f) Research Recommendations
STACFIS recommended that age determination should be conducted on otolith samples collected during annual Canadian surveys (1972-2014+); thereby allowing age-based analyses of this population.
STATUS: Otoliths are being collected, but have not been aged. STACFIS reiterates this recommendation.
STACFIS recommended that the collection of information on commercial catches of white hake be continued and now include sampling for age, sex and maturity to determine if this is a recruitment fishery.
STATUS: No progress, STACFIS reiterates this recommendation.
STACFIS recommended that survey conversion factors between the Engel and Campelen gear be investigated for this stock.
STATUS: No progress, STACFIS reiterates this recommendation.
STACFIS recommends that work continue on the development of population models and reference point proxies.
The next full assessment of this stock is planned for 2017.
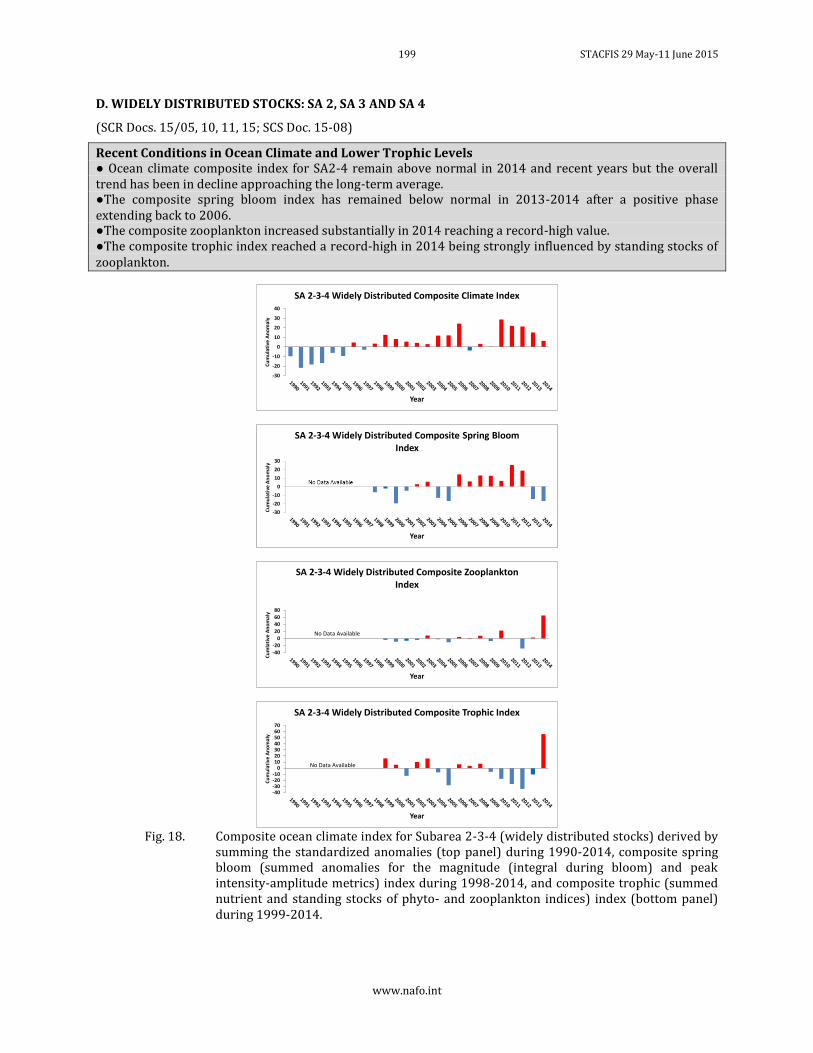
199 STACFIS 29 May-11 June 2015
www.nafo.int
D. WIDELY DISTRIBUTED STOCKS: SA 2, SA 3 AND SA 4
(SCR Docs. 15/05, 10, 11, 15; SCS Doc. 15-08)
Recent Conditions in Ocean Climate and Lower Trophic Levels ● Ocean climate composite index for SA2-4 remain above normal in 2014 and recent years but the overall trend has been in decline approaching the long-term average. ●The composite spring bloom index has remained below normal in 2013-2014 after a positive phase extending back to 2006. ●The composite zooplankton increased substantially in 2014 reaching a record-high value. ●The composite trophic index reached a record-high in 2014 being strongly influenced by standing stocks of zooplankton.
Fig. 18. Composite ocean climate index for Subarea 2-3-4 (widely distributed stocks) derived by
summing the standardized anomalies (top panel) during 1990-2014, composite spring bloom (summed anomalies for the magnitude (integral during bloom) and peak intensity-amplitude metrics) index during 1998-2014, and composite trophic (summed nutrient and standing stocks of phyto- and zooplankton indices) index (bottom panel) during 1999-2014.
-30
-20
-10
0
10
20
30
40
Cu
mu
lati
ve A
no
mal
y
Year
SA 2-3-4 Widely Distributed Composite Climate Index
-30
-20
-10
0
10
20
30
Cu
mu
lati
ve A
no
mal
y
Year
SA 2-3-4 Widely Distributed Composite Spring Bloom Index
-40-20
020406080
Cu
mla
tive
An
om
aly
Year
SA 2-3-4 Widely Distributed Composite Zooplankton Index
No Data Available
-40-30-20-10
010203040506070
Cu
mu
lati
ve A
no
mal
y
Year
SA 2-3-4 Widely Distributed Composite Trophic Index
No Data Available
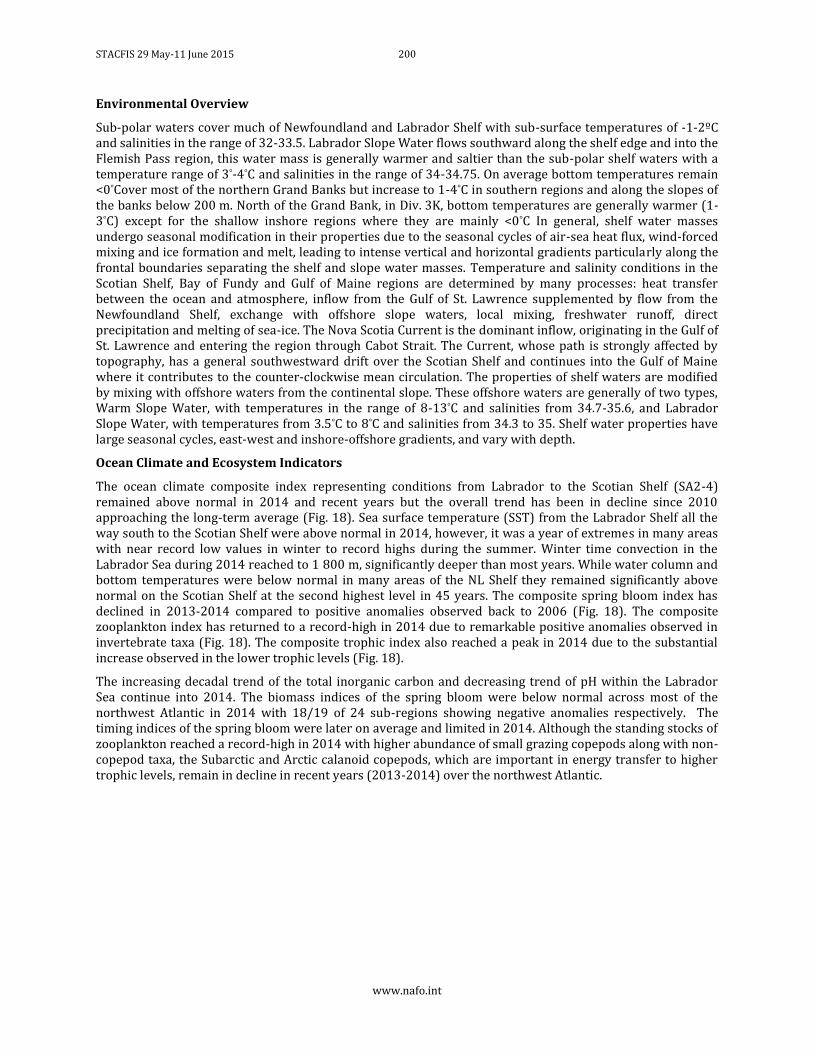
STACFIS 29 May-11 June 2015 200
www.nafo.int
Environmental Overview
Sub-polar waters cover much of Newfoundland and Labrador Shelf with sub-surface temperatures of -1-2ºC and salinities in the range of 32-33.5. Labrador Slope Water flows southward along the shelf edge and into the Flemish Pass region, this water mass is generally warmer and saltier than the sub-polar shelf waters with a temperature range of 3°-4°C and salinities in the range of 34-34.75. On average bottom temperatures remain <0°Cover most of the northern Grand Banks but increase to 1-4°C in southern regions and along the slopes of the banks below 200 m. North of the Grand Bank, in Div. 3K, bottom temperatures are generally warmer (1-3°C) except for the shallow inshore regions where they are mainly <0°C In general, shelf water masses undergo seasonal modification in their properties due to the seasonal cycles of air-sea heat flux, wind-forced mixing and ice formation and melt, leading to intense vertical and horizontal gradients particularly along the frontal boundaries separating the shelf and slope water masses. Temperature and salinity conditions in the Scotian Shelf, Bay of Fundy and Gulf of Maine regions are determined by many processes: heat transfer between the ocean and atmosphere, inflow from the Gulf of St. Lawrence supplemented by flow from the Newfoundland Shelf, exchange with offshore slope waters, local mixing, freshwater runoff, direct precipitation and melting of sea-ice. The Nova Scotia Current is the dominant inflow, originating in the Gulf of St. Lawrence and entering the region through Cabot Strait. The Current, whose path is strongly affected by topography, has a general southwestward drift over the Scotian Shelf and continues into the Gulf of Maine where it contributes to the counter-clockwise mean circulation. The properties of shelf waters are modified by mixing with offshore waters from the continental slope. These offshore waters are generally of two types, Warm Slope Water, with temperatures in the range of 8-13°C and salinities from 34.7-35.6, and Labrador Slope Water, with temperatures from 3.5°C to 8°C and salinities from 34.3 to 35. Shelf water properties have large seasonal cycles, east-west and inshore-offshore gradients, and vary with depth.
Ocean Climate and Ecosystem Indicators
The ocean climate composite index representing conditions from Labrador to the Scotian Shelf (SA2-4) remained above normal in 2014 and recent years but the overall trend has been in decline since 2010 approaching the long-term average (Fig. 18). Sea surface temperature (SST) from the Labrador Shelf all the way south to the Scotian Shelf were above normal in 2014, however, it was a year of extremes in many areas with near record low values in winter to record highs during the summer. Winter time convection in the Labrador Sea during 2014 reached to 1 800 m, significantly deeper than most years. While water column and bottom temperatures were below normal in many areas of the NL Shelf they remained significantly above normal on the Scotian Shelf at the second highest level in 45 years. The composite spring bloom index has declined in 2013-2014 compared to positive anomalies observed back to 2006 (Fig. 18). The composite zooplankton index has returned to a record-high in 2014 due to remarkable positive anomalies observed in invertebrate taxa (Fig. 18). The composite trophic index also reached a peak in 2014 due to the substantial increase observed in the lower trophic levels (Fig. 18).
The increasing decadal trend of the total inorganic carbon and decreasing trend of pH within the Labrador Sea continue into 2014. The biomass indices of the spring bloom were below normal across most of the northwest Atlantic in 2014 with 18/19 of 24 sub-regions showing negative anomalies respectively. The timing indices of the spring bloom were later on average and limited in 2014. Although the standing stocks of zooplankton reached a record-high in 2014 with higher abundance of small grazing copepods along with non-copepod taxa, the Subarctic and Arctic calanoid copepods, which are important in energy transfer to higher trophic levels, remain in decline in recent years (2013-2014) over the northwest Atlantic.
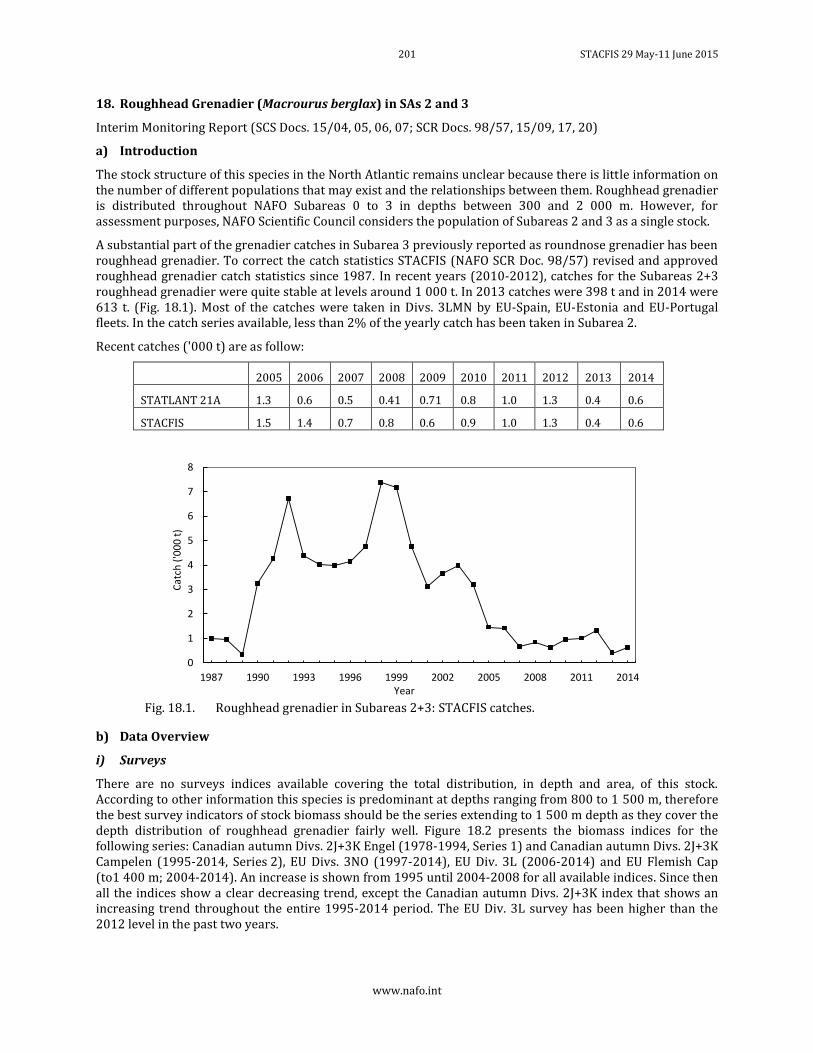
201 STACFIS 29 May-11 June 2015
www.nafo.int
18. Roughhead Grenadier (Macrourus berglax) in SAs 2 and 3
Interim Monitoring Report (SCS Docs. 15/04, 05, 06, 07; SCR Docs. 98/57, 15/09, 17, 20)
a) Introduction
The stock structure of this species in the North Atlantic remains unclear because there is little information on the number of different populations that may exist and the relationships between them. Roughhead grenadier is distributed throughout NAFO Subareas 0 to 3 in depths between 300 and 2 000 m. However, for assessment purposes, NAFO Scientific Council considers the population of Subareas 2 and 3 as a single stock.
A substantial part of the grenadier catches in Subarea 3 previously reported as roundnose grenadier has been roughhead grenadier. To correct the catch statistics STACFIS (NAFO SCR Doc. 98/57) revised and approved roughhead grenadier catch statistics since 1987. In recent years (2010-2012), catches for the Subareas 2+3 roughhead grenadier were quite stable at levels around 1 000 t. In 2013 catches were 398 t and in 2014 were 613 t. (Fig. 18.1). Most of the catches were taken in Divs. 3LMN by EU-Spain, EU-Estonia and EU-Portugal fleets. In the catch series available, less than 2% of the yearly catch has been taken in Subarea 2.
Recent catches ('000 t) are as follow:
2005 2006 2007 2008 2009 2010 2011 2012 2013 2014
STATLANT 21A 1.3 0.6 0.5 0.41 0.71 0.8 1.0 1.3 0.4 0.6
STACFIS 1.5 1.4 0.7 0.8 0.6 0.9 1.0 1.3 0.4 0.6
Fig. 18.1. Roughhead grenadier in Subareas 2+3: STACFIS catches.
b) Data Overview
i) Surveys
There are no surveys indices available covering the total distribution, in depth and area, of this stock. According to other information this species is predominant at depths ranging from 800 to 1 500 m, therefore the best survey indicators of stock biomass should be the series extending to 1 500 m depth as they cover the depth distribution of roughhead grenadier fairly well. Figure 18.2 presents the biomass indices for the following series: Canadian autumn Divs. 2J+3K Engel (1978-1994, Series 1) and Canadian autumn Divs. 2J+3K Campelen (1995-2014, Series 2), EU Divs. 3NO (1997-2014), EU Div. 3L (2006-2014) and EU Flemish Cap (to1 400 m; 2004-2014). An increase is shown from 1995 until 2004-2008 for all available indices. Since then all the indices show a clear decreasing trend, except the Canadian autumn Divs. 2J+3K index that shows an increasing trend throughout the entire 1995-2014 period. The EU Div. 3L survey has been higher than the 2012 level in the past two years.
0
1
2
3
4
5
6
7
8
1987 1990 1993 1996 1999 2002 2005 2008 2011 2014
Cat
ch (
'00
0 t
)
Year
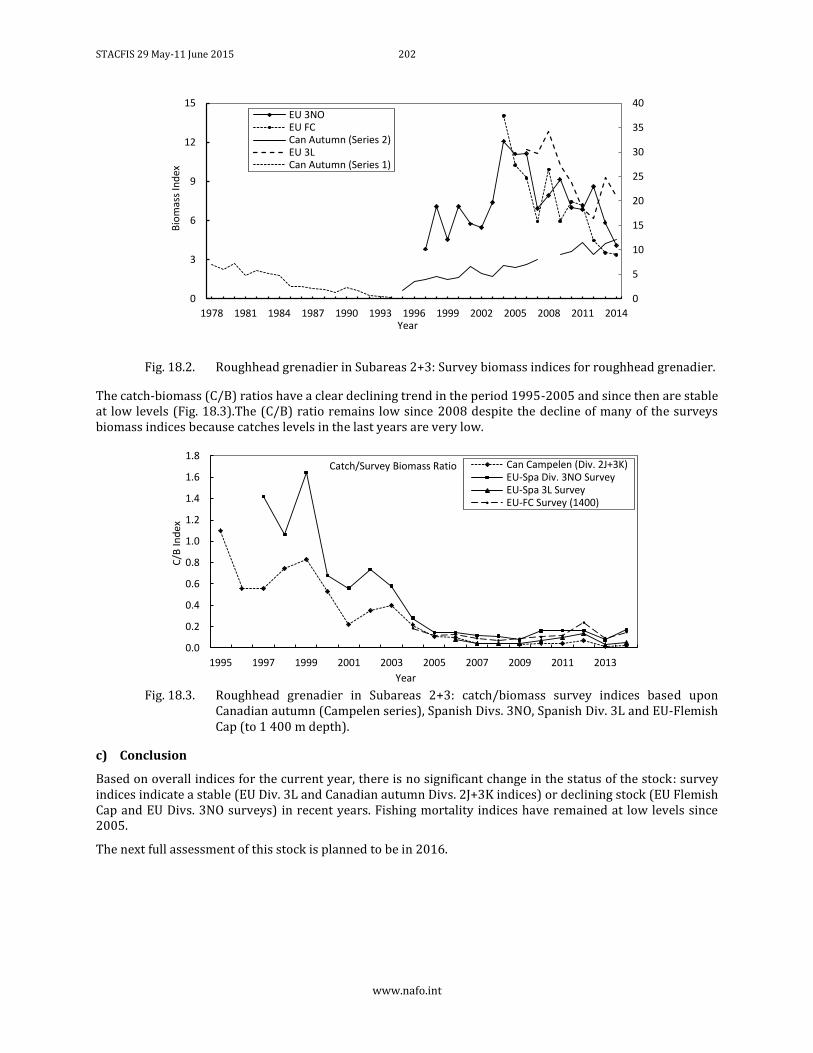
STACFIS 29 May-11 June 2015 202
www.nafo.int
Fig. 18.2. Roughhead grenadier in Subareas 2+3: Survey biomass indices for roughhead grenadier.
The catch-biomass (C/B) ratios have a clear declining trend in the period 1995-2005 and since then are stable at low levels (Fig. 18.3).The (C/B) ratio remains low since 2008 despite the decline of many of the surveys biomass indices because catches levels in the last years are very low.
Fig. 18.3. Roughhead grenadier in Subareas 2+3: catch/biomass survey indices based upon
Canadian autumn (Campelen series), Spanish Divs. 3NO, Spanish Div. 3L and EU-Flemish Cap (to 1 400 m depth).
c) Conclusion
Based on overall indices for the current year, there is no significant change in the status of the stock: survey indices indicate a stable (EU Div. 3L and Canadian autumn Divs. 2J+3K indices) or declining stock (EU Flemish Cap and EU Divs. 3NO surveys) in recent years. Fishing mortality indices have remained at low levels since 2005.
The next full assessment of this stock is planned to be in 2016.
0
5
10
15
20
25
30
35
40
0
3
6
9
12
15
1978 1981 1984 1987 1990 1993 1996 1999 2002 2005 2008 2011 2014
Bio
mas
s In
dex
Year
EU 3NOEU FCCan Autumn (Series 2)EU 3LCan Autumn (Series 1)
0.0
0.2
0.4
0.6
0.8
1.0
1.2
1.4
1.6
1.8
1995 1997 1999 2001 2003 2005 2007 2009 2011 2013
C/B
Ind
ex
Year
Catch/Survey Biomass Ratio Can Campelen (Div. 2J+3K)EU-Spa Div. 3NO SurveyEU-Spa 3L SurveyEU-FC Survey (1400)
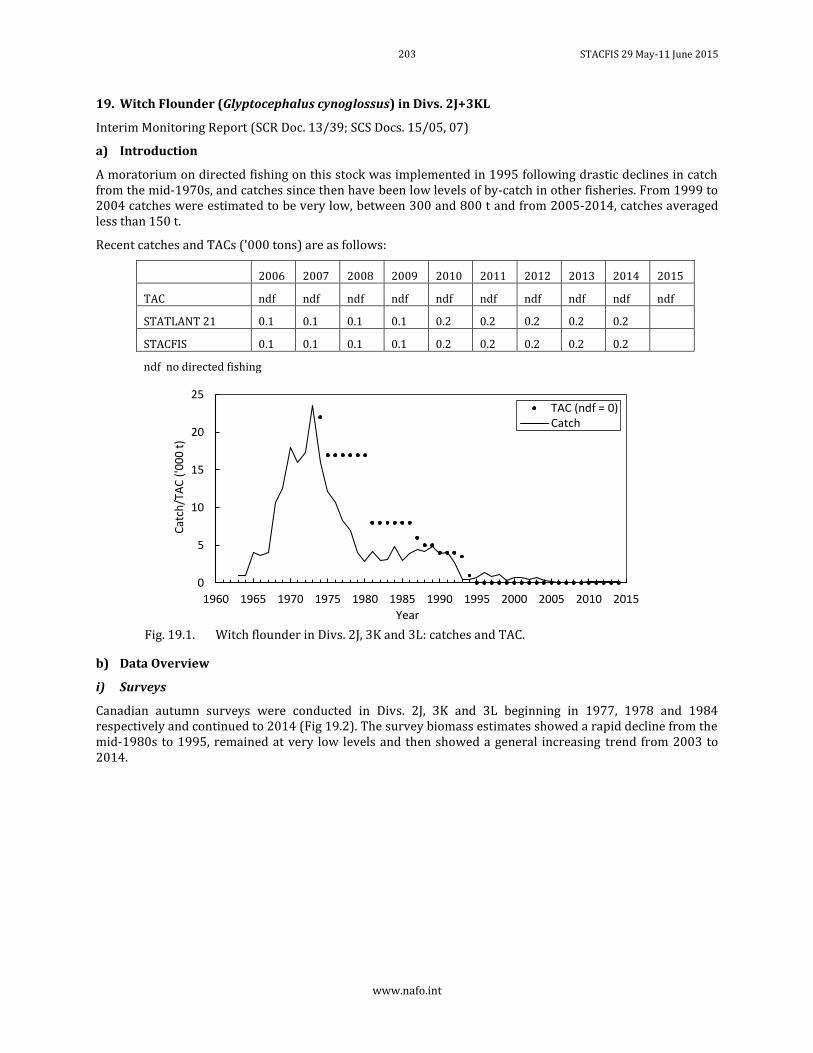
203 STACFIS 29 May-11 June 2015
www.nafo.int
19. Witch Flounder (Glyptocephalus cynoglossus) in Divs. 2J+3KL
Interim Monitoring Report (SCR Doc. 13/39; SCS Docs. 15/05, 07)
a) Introduction
A moratorium on directed fishing on this stock was implemented in 1995 following drastic declines in catch from the mid-1970s, and catches since then have been low levels of by-catch in other fisheries. From 1999 to 2004 catches were estimated to be very low, between 300 and 800 t and from 2005-2014, catches averaged less than 150 t.
Recent catches and TACs ('000 tons) are as follows:
2006 2007 2008 2009 2010 2011 2012 2013 2014 2015
TAC ndf ndf ndf ndf ndf ndf ndf ndf ndf ndf
STATLANT 21 0.1 0.1 0.1 0.1 0.2 0.2 0.2 0.2 0.2
STACFIS 0.1 0.1 0.1 0.1 0.2 0.2 0.2 0.2 0.2
ndf no directed fishing
Fig. 19.1. Witch flounder in Divs. 2J, 3K and 3L: catches and TAC.
b) Data Overview
i) Surveys
Canadian autumn surveys were conducted in Divs. 2J, 3K and 3L beginning in 1977, 1978 and 1984 respectively and continued to 2014 (Fig 19.2). The survey biomass estimates showed a rapid decline from the mid-1980s to 1995, remained at very low levels and then showed a general increasing trend from 2003 to 2014.
0
5
10
15
20
25
1960 1965 1970 1975 1980 1985 1990 1995 2000 2005 2010 2015
Cat
ch/T
AC
('0
00 t
)
Year
TAC (ndf = 0)Catch
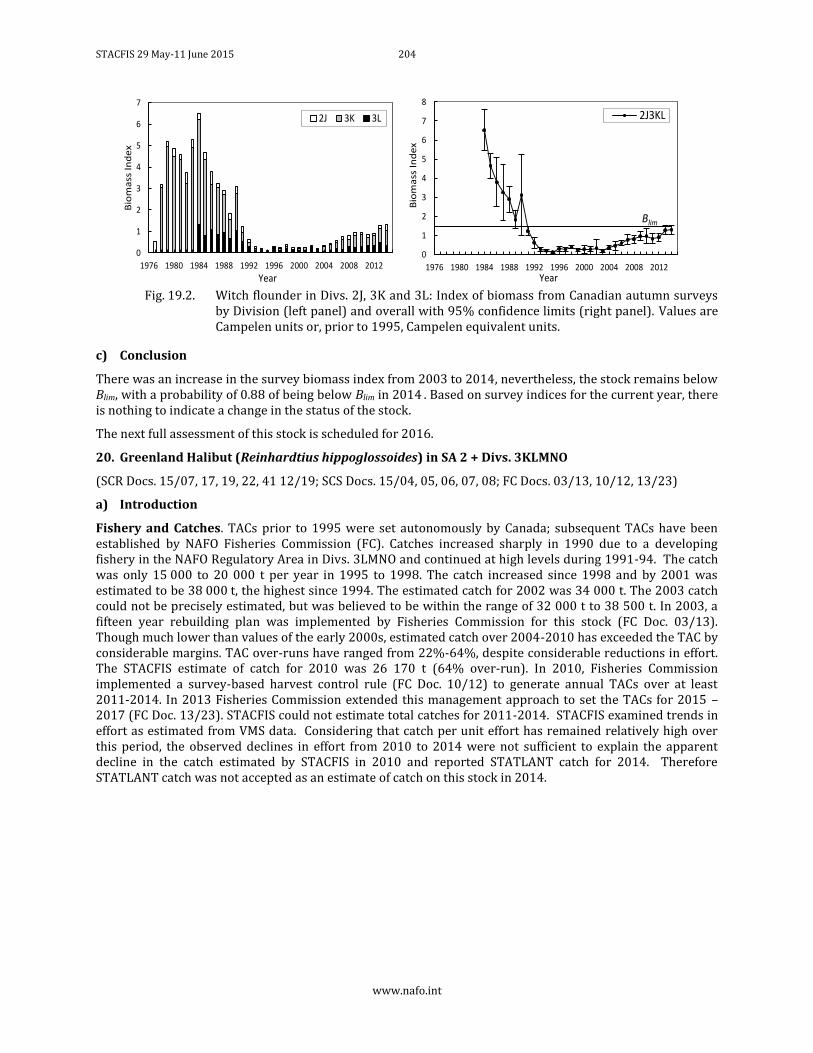
STACFIS 29 May-11 June 2015 204
www.nafo.int
Fig. 19.2. Witch flounder in Divs. 2J, 3K and 3L: Index of biomass from Canadian autumn surveys
by Division (left panel) and overall with 95% confidence limits (right panel). Values are Campelen units or, prior to 1995, Campelen equivalent units.
c) Conclusion
There was an increase in the survey biomass index from 2003 to 2014, nevertheless, the stock remains below Blim, with a probability of 0.88 of being below Blim in 2014 . Based on survey indices for the current year, there is nothing to indicate a change in the status of the stock.
The next full assessment of this stock is scheduled for 2016.
20. Greenland Halibut (Reinhardtius hippoglossoides) in SA 2 + Divs. 3KLMNO
(SCR Docs. 15/07, 17, 19, 22, 41 12/19; SCS Docs. 15/04, 05, 06, 07, 08; FC Docs. 03/13, 10/12, 13/23)
a) Introduction
Fishery and Catches. TACs prior to 1995 were set autonomously by Canada; subsequent TACs have been established by NAFO Fisheries Commission (FC). Catches increased sharply in 1990 due to a developing fishery in the NAFO Regulatory Area in Divs. 3LMNO and continued at high levels during 1991-94. The catch was only 15 000 to 20 000 t per year in 1995 to 1998. The catch increased since 1998 and by 2001 was estimated to be 38 000 t, the highest since 1994. The estimated catch for 2002 was 34 000 t. The 2003 catch could not be precisely estimated, but was believed to be within the range of 32 000 t to 38 500 t. In 2003, a fifteen year rebuilding plan was implemented by Fisheries Commission for this stock (FC Doc. 03/13). Though much lower than values of the early 2000s, estimated catch over 2004-2010 has exceeded the TAC by considerable margins. TAC over-runs have ranged from 22%-64%, despite considerable reductions in effort. The STACFIS estimate of catch for 2010 was 26 170 t (64% over-run). In 2010, Fisheries Commission implemented a survey-based harvest control rule (FC Doc. 10/12) to generate annual TACs over at least 2011-2014. In 2013 Fisheries Commission extended this management approach to set the TACs for 2015 – 2017 (FC Doc. 13/23). STACFIS could not estimate total catches for 2011-2014. STACFIS examined trends in effort as estimated from VMS data. Considering that catch per unit effort has remained relatively high over this period, the observed declines in effort from 2010 to 2014 were not sufficient to explain the apparent decline in the catch estimated by STACFIS in 2010 and reported STATLANT catch for 2014. Therefore STATLANT catch was not accepted as an estimate of catch on this stock in 2014.
0
1
2
3
4
5
6
7
1976 1980 1984 1988 1992 1996 2000 2004 2008 2012
Bio
ma
ss I
nd
ex
Year
2J 3K 3L
0
1
2
3
4
5
6
7
8
1976 1980 1984 1988 1992 1996 2000 2004 2008 2012
Bio
ma
ss I
nd
ex
Year
2J3KL
Blim
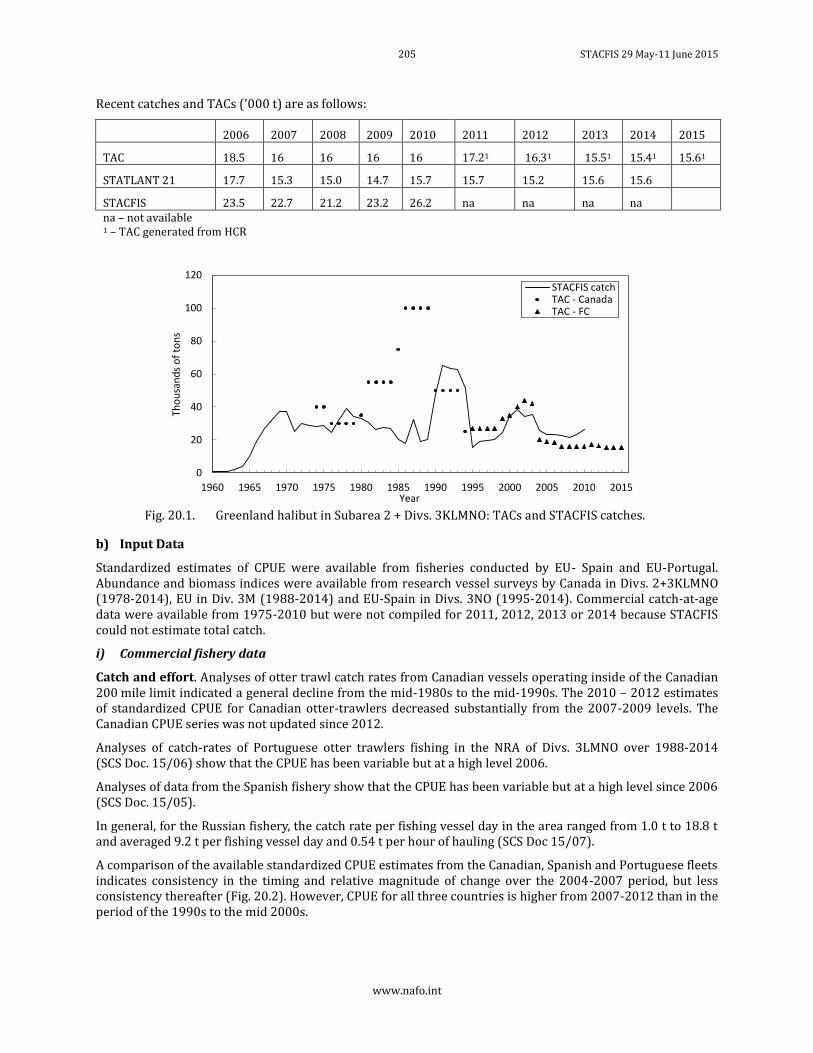
205 STACFIS 29 May-11 June 2015
www.nafo.int
Recent catches and TACs ('000 t) are as follows:
2006 2007 2008 2009 2010 2011 2012 2013 2014 2015
TAC 18.5 16 16 16 16 17.21 16.31 15.51 15.41 15.61
STATLANT 21 17.7 15.3 15.0 14.7 15.7 15.7 15.2 15.6 15.6
STACFIS 23.5 22.7 21.2 23.2 26.2 na na na na na – not available 1 – TAC generated from HCR
Fig. 20.1. Greenland halibut in Subarea 2 + Divs. 3KLMNO: TACs and STACFIS catches.
b) Input Data
Standardized estimates of CPUE were available from fisheries conducted by EU- Spain and EU-Portugal. Abundance and biomass indices were available from research vessel surveys by Canada in Divs. 2+3KLMNO (1978-2014), EU in Div. 3M (1988-2014) and EU-Spain in Divs. 3NO (1995-2014). Commercial catch-at-age data were available from 1975-2010 but were not compiled for 2011, 2012, 2013 or 2014 because STACFIS could not estimate total catch.
i) Commercial fishery data
Catch and effort. Analyses of otter trawl catch rates from Canadian vessels operating inside of the Canadian 200 mile limit indicated a general decline from the mid-1980s to the mid-1990s. The 2010 – 2012 estimates of standardized CPUE for Canadian otter-trawlers decreased substantially from the 2007-2009 levels. The Canadian CPUE series was not updated since 2012.
Analyses of catch-rates of Portuguese otter trawlers fishing in the NRA of Divs. 3LMNO over 1988-2014 (SCS Doc. 15/06) show that the CPUE has been variable but at a high level 2006.
Analyses of data from the Spanish fishery show that the CPUE has been variable but at a high level since 2006 (SCS Doc. 15/05).
In general, for the Russian fishery, the catch rate per fishing vessel day in the area ranged from 1.0 t to 18.8 t and averaged 9.2 t per fishing vessel day and 0.54 t per hour of hauling (SCS Doc 15/07).
A comparison of the available standardized CPUE estimates from the Canadian, Spanish and Portuguese fleets indicates consistency in the timing and relative magnitude of change over the 2004-2007 period, but less consistency thereafter (Fig. 20.2). However, CPUE for all three countries is higher from 2007-2012 than in the period of the 1990s to the mid 2000s.
0
20
40
60
80
100
120
1960 1965 1970 1975 1980 1985 1990 1995 2000 2005 2010 2015
Tho
usa
nd
s o
f to
ns
Year
STACFIS catchTAC - CanadaTAC - FC
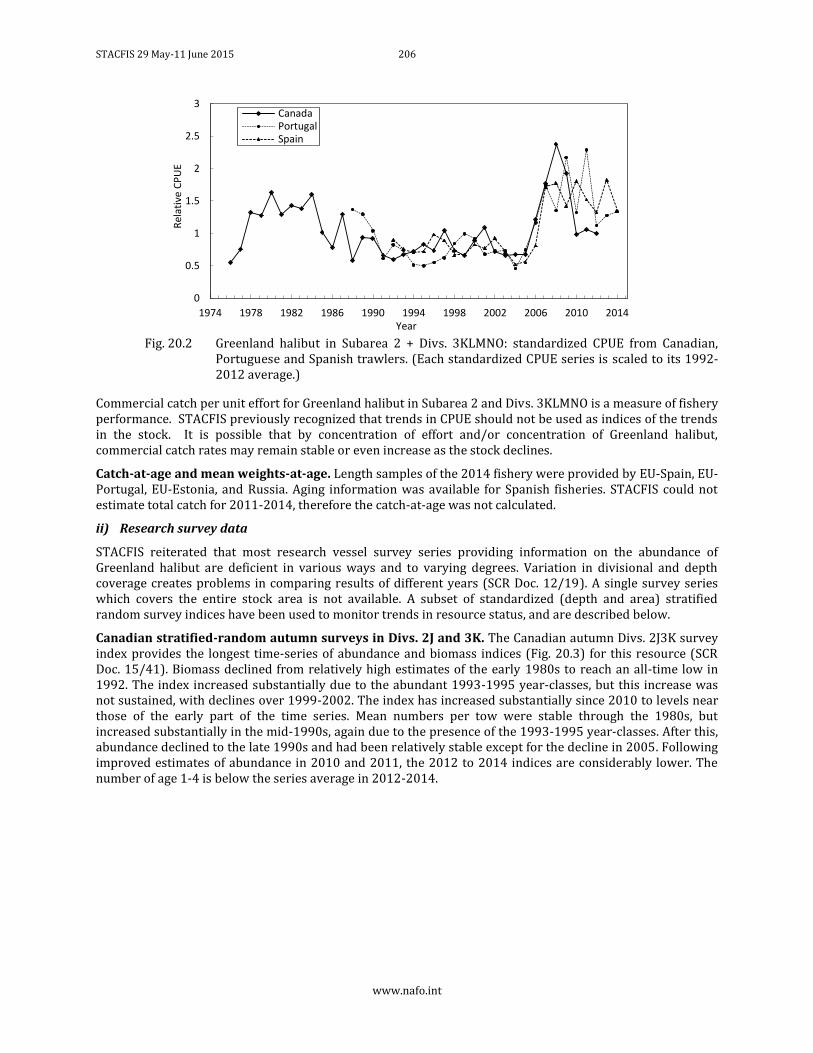
STACFIS 29 May-11 June 2015 206
www.nafo.int
Fig. 20.2 Greenland halibut in Subarea 2 + Divs. 3KLMNO: standardized CPUE from Canadian,
Portuguese and Spanish trawlers. (Each standardized CPUE series is scaled to its 1992-2012 average.)
Commercial catch per unit effort for Greenland halibut in Subarea 2 and Divs. 3KLMNO is a measure of fishery performance. STACFIS previously recognized that trends in CPUE should not be used as indices of the trends in the stock. It is possible that by concentration of effort and/or concentration of Greenland halibut, commercial catch rates may remain stable or even increase as the stock declines.
Catch-at-age and mean weights-at-age. Length samples of the 2014 fishery were provided by EU-Spain, EU-Portugal, EU-Estonia, and Russia. Aging information was available for Spanish fisheries. STACFIS could not estimate total catch for 2011-2014, therefore the catch-at-age was not calculated.
ii) Research survey data
STACFIS reiterated that most research vessel survey series providing information on the abundance of Greenland halibut are deficient in various ways and to varying degrees. Variation in divisional and depth coverage creates problems in comparing results of different years (SCR Doc. 12/19). A single survey series which covers the entire stock area is not available. A subset of standardized (depth and area) stratified random survey indices have been used to monitor trends in resource status, and are described below.
Canadian stratified-random autumn surveys in Divs. 2J and 3K. The Canadian autumn Divs. 2J3K survey index provides the longest time-series of abundance and biomass indices (Fig. 20.3) for this resource (SCR Doc. 15/41). Biomass declined from relatively high estimates of the early 1980s to reach an all-time low in 1992. The index increased substantially due to the abundant 1993-1995 year-classes, but this increase was not sustained, with declines over 1999-2002. The index has increased substantially since 2010 to levels near those of the early part of the time series. Mean numbers per tow were stable through the 1980s, but increased substantially in the mid-1990s, again due to the presence of the 1993-1995 year-classes. After this, abundance declined to the late 1990s and had been relatively stable except for the decline in 2005. Following improved estimates of abundance in 2010 and 2011, the 2012 to 2014 indices are considerably lower. The number of age 1-4 is below the series average in 2012-2014.
0
0.5
1
1.5
2
2.5
3
1974 1978 1982 1986 1990 1994 1998 2002 2006 2010 2014
Rel
ativ
e C
PU
E
Year
CanadaPortugalSpain
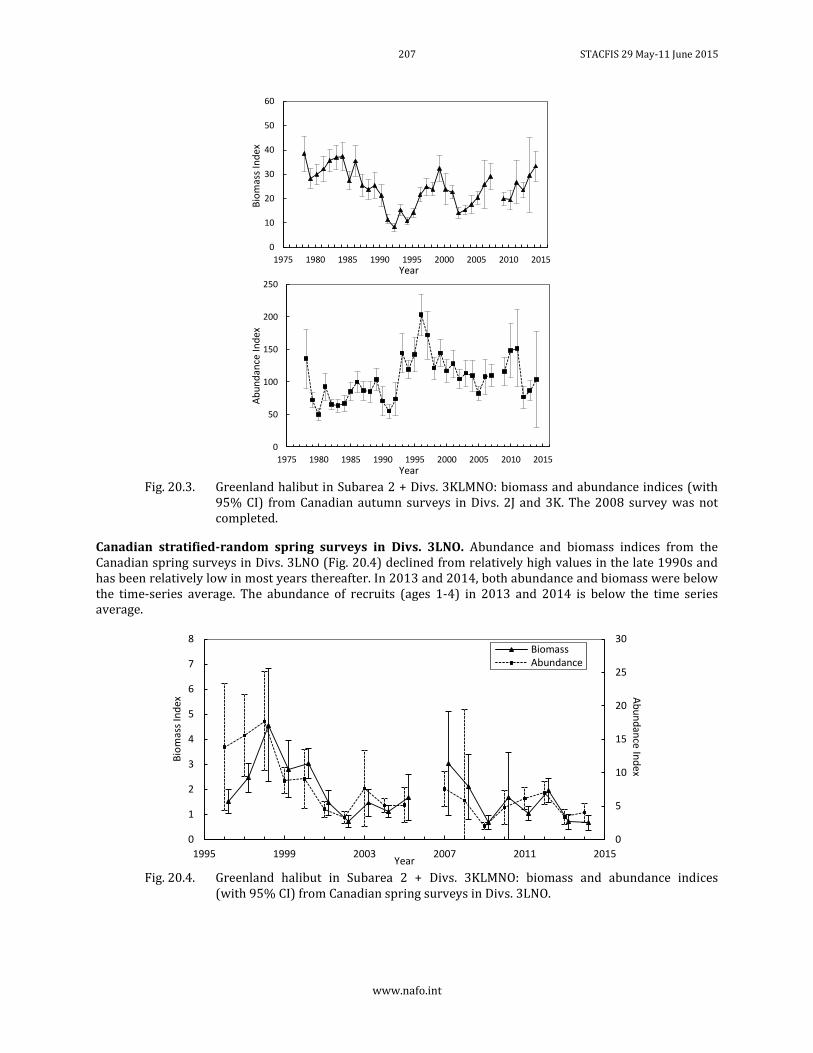
207 STACFIS 29 May-11 June 2015
www.nafo.int
Fig. 20.3. Greenland halibut in Subarea 2 + Divs. 3KLMNO: biomass and abundance indices (with
95% CI) from Canadian autumn surveys in Divs. 2J and 3K. The 2008 survey was not completed.
Canadian stratified-random spring surveys in Divs. 3LNO. Abundance and biomass indices from the Canadian spring surveys in Divs. 3LNO (Fig. 20.4) declined from relatively high values in the late 1990s and has been relatively low in most years thereafter. In 2013 and 2014, both abundance and biomass were below the time-series average. The abundance of recruits (ages 1-4) in 2013 and 2014 is below the time series average.
Fig. 20.4. Greenland halibut in Subarea 2 + Divs. 3KLMNO: biomass and abundance indices
(with 95% CI) from Canadian spring surveys in Divs. 3LNO.
0
10
20
30
40
50
60
1975 1980 1985 1990 1995 2000 2005 2010 2015B
iom
ass
Ind
ex
Year
0
50
100
150
200
250
1975 1980 1985 1990 1995 2000 2005 2010 2015
Ab
un
dan
ce I
nd
ex
Year
0
5
10
15
20
25
30
0
1
2
3
4
5
6
7
8
1995 1999 2003 2007 2011 2015
Ab
un
dan
ce Ind
ex B
iom
ass
Ind
ex
Year
BiomassAbundance
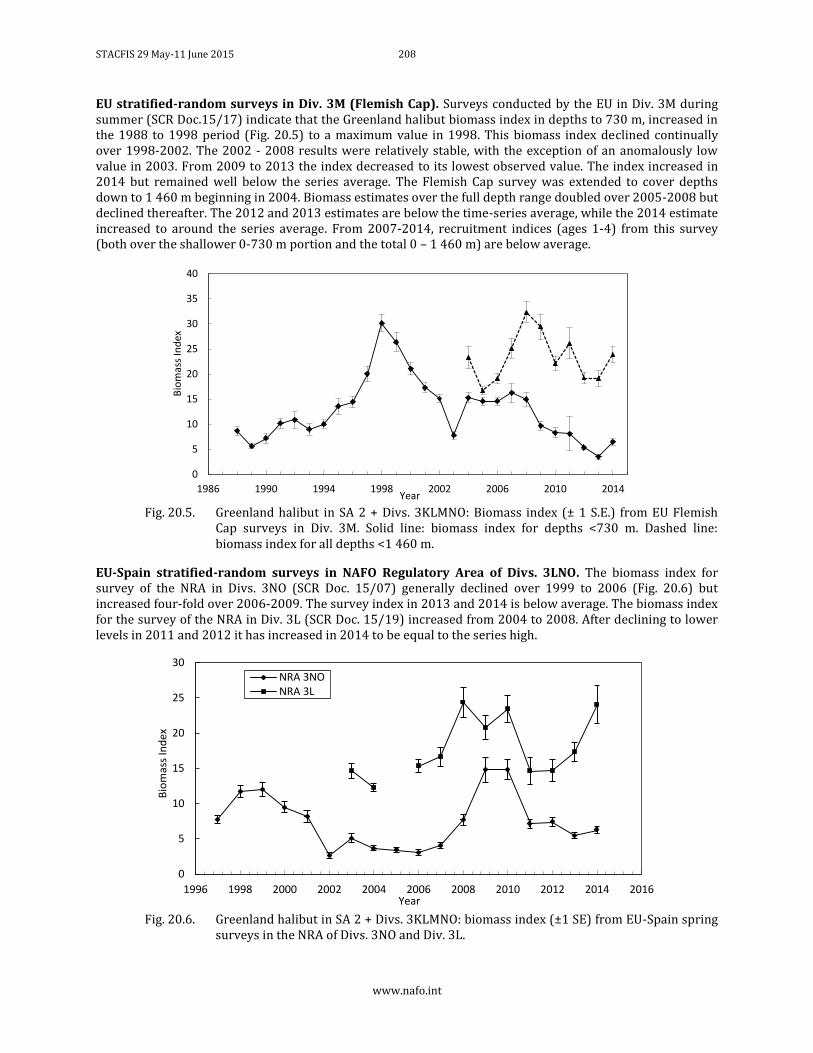
STACFIS 29 May-11 June 2015 208
www.nafo.int
EU stratified-random surveys in Div. 3M (Flemish Cap). Surveys conducted by the EU in Div. 3M during summer (SCR Doc.15/17) indicate that the Greenland halibut biomass index in depths to 730 m, increased in the 1988 to 1998 period (Fig. 20.5) to a maximum value in 1998. This biomass index declined continually over 1998-2002. The 2002 - 2008 results were relatively stable, with the exception of an anomalously low value in 2003. From 2009 to 2013 the index decreased to its lowest observed value. The index increased in 2014 but remained well below the series average. The Flemish Cap survey was extended to cover depths down to 1 460 m beginning in 2004. Biomass estimates over the full depth range doubled over 2005-2008 but declined thereafter. The 2012 and 2013 estimates are below the time-series average, while the 2014 estimate increased to around the series average. From 2007-2014, recruitment indices (ages 1-4) from this survey (both over the shallower 0-730 m portion and the total 0 – 1 460 m) are below average.
Fig. 20.5. Greenland halibut in SA 2 + Divs. 3KLMNO: Biomass index (± 1 S.E.) from EU Flemish
Cap surveys in Div. 3M. Solid line: biomass index for depths <730 m. Dashed line: biomass index for all depths <1 460 m.
EU-Spain stratified-random surveys in NAFO Regulatory Area of Divs. 3LNO. The biomass index for survey of the NRA in Divs. 3NO (SCR Doc. 15/07) generally declined over 1999 to 2006 (Fig. 20.6) but increased four-fold over 2006-2009. The survey index in 2013 and 2014 is below average. The biomass index for the survey of the NRA in Div. 3L (SCR Doc. 15/19) increased from 2004 to 2008. After declining to lower levels in 2011 and 2012 it has increased in 2014 to be equal to the series high.
Fig. 20.6. Greenland halibut in SA 2 + Divs. 3KLMNO: biomass index (±1 SE) from EU-Spain spring
surveys in the NRA of Divs. 3NO and Div. 3L.
0
5
10
15
20
25
30
35
40
1986 1990 1994 1998 2002 2006 2010 2014
Bio
mas
s In
dex
Year
0
5
10
15
20
25
30
1996 1998 2000 2002 2004 2006 2008 2010 2012 2014 2016
Bio
mas
s In
dex
Year
NRA 3NONRA 3L
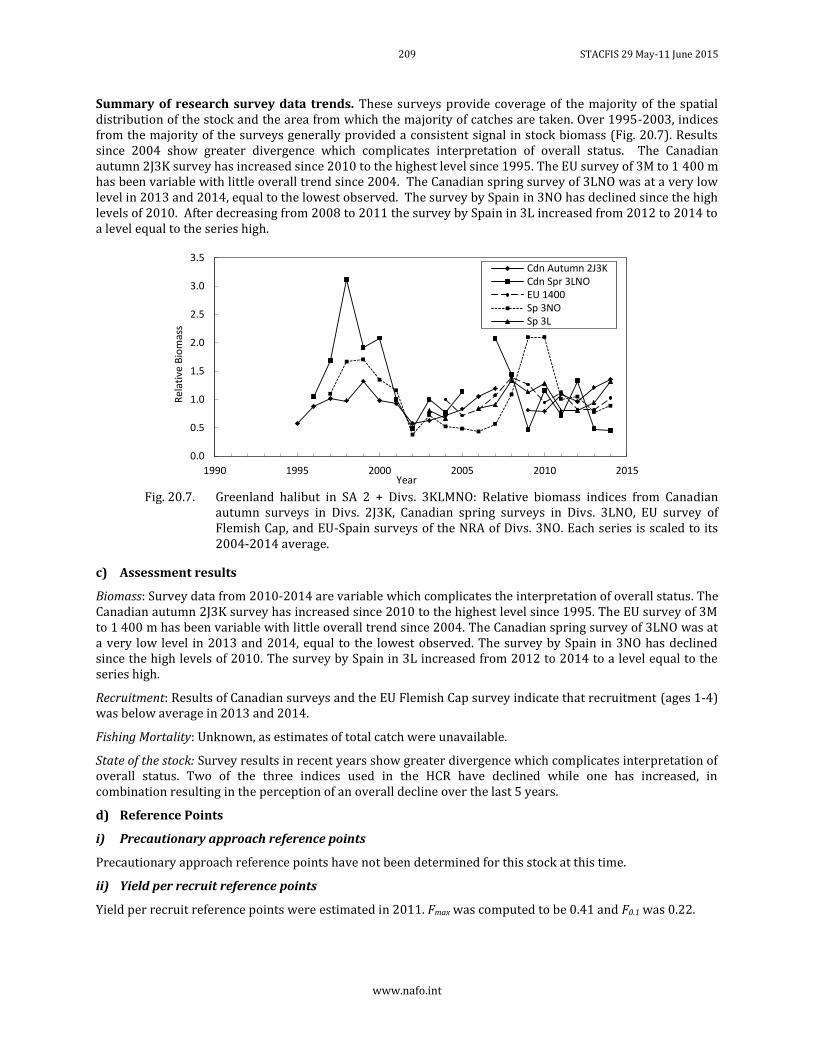
209 STACFIS 29 May-11 June 2015
www.nafo.int
Summary of research survey data trends. These surveys provide coverage of the majority of the spatial distribution of the stock and the area from which the majority of catches are taken. Over 1995-2003, indices from the majority of the surveys generally provided a consistent signal in stock biomass (Fig. 20.7). Results since 2004 show greater divergence which complicates interpretation of overall status. The Canadian autumn 2J3K survey has increased since 2010 to the highest level since 1995. The EU survey of 3M to 1 400 m has been variable with little overall trend since 2004. The Canadian spring survey of 3LNO was at a very low level in 2013 and 2014, equal to the lowest observed. The survey by Spain in 3NO has declined since the high levels of 2010. After decreasing from 2008 to 2011 the survey by Spain in 3L increased from 2012 to 2014 to a level equal to the series high.
Fig. 20.7. Greenland halibut in SA 2 + Divs. 3KLMNO: Relative biomass indices from Canadian
autumn surveys in Divs. 2J3K, Canadian spring surveys in Divs. 3LNO, EU survey of Flemish Cap, and EU-Spain surveys of the NRA of Divs. 3NO. Each series is scaled to its 2004-2014 average.
c) Assessment results
Biomass: Survey data from 2010-2014 are variable which complicates the interpretation of overall status. The Canadian autumn 2J3K survey has increased since 2010 to the highest level since 1995. The EU survey of 3M to 1 400 m has been variable with little overall trend since 2004. The Canadian spring survey of 3LNO was at a very low level in 2013 and 2014, equal to the lowest observed. The survey by Spain in 3NO has declined since the high levels of 2010. The survey by Spain in 3L increased from 2012 to 2014 to a level equal to the series high.
Recruitment: Results of Canadian surveys and the EU Flemish Cap survey indicate that recruitment (ages 1-4) was below average in 2013 and 2014.
Fishing Mortality: Unknown, as estimates of total catch were unavailable.
State of the stock: Survey results in recent years show greater divergence which complicates interpretation of overall status. Two of the three indices used in the HCR have declined while one has increased, in combination resulting in the perception of an overall decline over the last 5 years.
d) Reference Points
i) Precautionary approach reference points
Precautionary approach reference points have not been determined for this stock at this time.
ii) Yield per recruit reference points
Yield per recruit reference points were estimated in 2011. Fmax was computed to be 0.41 and F0.1 was 0.22.
0.0
0.5
1.0
1.5
2.0
2.5
3.0
3.5
1990 1995 2000 2005 2010 2015
Rel
ativ
e B
iom
ass
Year
Cdn Autumn 2J3KCdn Spr 3LNOEU 1400Sp 3NOSp 3L
STACFIS 29 May-11 June 2015 210
www.nafo.int
e) Research recommendations
STACFIS recommended that methods for estimating catch for 2011-2014 be explored for Greenland Halibut in SA 2 + Divs. 3KLMNO, including where ever possible the utility of using effort in conjunction with estimates of catch per unit effort.
This stock will next be assessed in June 2016.
21. Northern Shortfin Squid (Illex illecebrosus) in SAs 3+4
Interim Monitoring Report (SCR Docs. 98/59; 98/75; 02/56; 13/31; SCS Docs. 15/08, 09)
a) Introduction
The species has a lifespan of less than one year and is considered a single stock throughout Subareas 3 through 6. However, the Subareas 3+4 and Subareas 5+6 stock components are assessed and managed separately by NAFO and the U.S. Mid-Atlantic Fishery Management Council, respectively. Distribution, growth rates and recruitment of this highly migratory species are primarily influenced by oceanographic conditions which, when favorable, may lead to high productivity periods. The stock assessment is data-poor. Indices of relative biomass and mean body size, computed using data from the Divs. 4VWX surveys conducted during July by Canada, were used to assess whether the Subareas 3+4 stock component was at a low or high productivity level during the previous year. Stock biomass projections are not currently possible. Relative fishing mortality indices, computed as the Subareas 3+4 nominal catch divided by the Divs. 4VWX biomass ratio, are also used to assess stock status. Based on the trends in these indices, the Subareas 3+4 stock component was in a low productivity period during 1982-2013.
Since 1999, there has been no directed fishery for Illex in Subarea 4 and most of the catches from Subareas 3+4, during 1999-2011, were from the Subarea 3 inshore jig fishery. There were no catches from Subarea 3 during 2013 and 2014. During 2004-2011, catches from Subareas 3+4 were low during most years (average = 1 485 t), compared to catches during 1976-1981 (average = 80 645 t), and ranged between about 120 t in 2010 to about 7 000 t in 2006 (Fig. 21.1). Catches in Subareas 3+4 have been less than 50 t since 2012 and reached the lowest level in the time series (since 1953) during 2014 (21 t).
Recent catches and TACs ('000 t) are as follows:
2006 2007 2008 2009 2010 2011 2012 2013 2014 2015
TAC SA 3+4 34 34 34 34 34 34 34 34 34 34
STATLANT 21 SA 3+4 7.01 0.21 0.5 0.7 0.11 0.11 <0.11 <0.11 0
STATLANT 21 SA 5+62
STACFIS SA 3+4 7.0 0.2 0.5 0.7 0.1 0.1 <0.1 <0.1 <0.1
STACFIS SA 5+6 14.0 9.0 15.9 18.4 15.8 18.8 11.7 3.8 8.8
STACFIS Total SA 3-6 21.0 9.2 16.4 19.1 15.9 18.9 11.7 3.8 8.8
1 Includes amounts (< 0.1 t to 22 t during 2006-2011 and 0.2 t to 5 t during 2012-2014) reported as ‘Unspecified Squid’ from Subarea 4 which were likely I. illecebrosus.
2 Catches from Subareas 5+6 are included because there is no basis for considering separate stocks in Subareas 3+4 and Subareas 5+6.
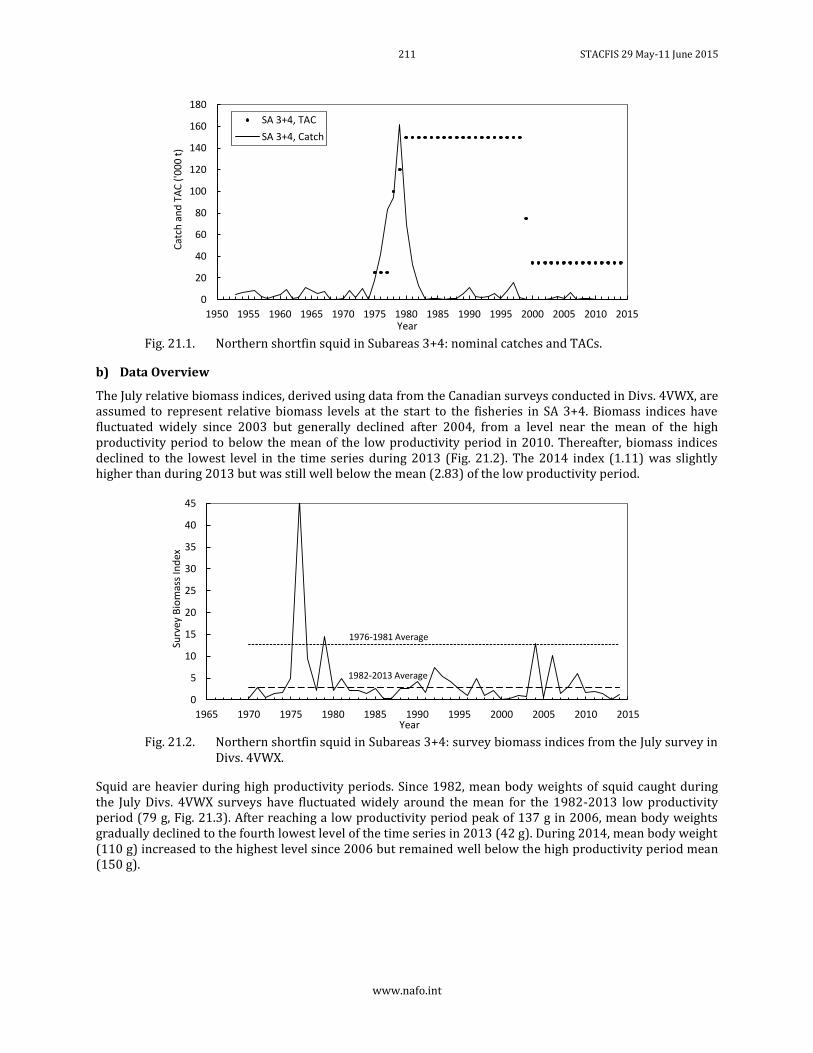
211 STACFIS 29 May-11 June 2015
www.nafo.int
Fig. 21.1. Northern shortfin squid in Subareas 3+4: nominal catches and TACs.
b) Data Overview
The July relative biomass indices, derived using data from the Canadian surveys conducted in Divs. 4VWX, are assumed to represent relative biomass levels at the start to the fisheries in SA 3+4. Biomass indices have fluctuated widely since 2003 but generally declined after 2004, from a level near the mean of the high productivity period to below the mean of the low productivity period in 2010. Thereafter, biomass indices declined to the lowest level in the time series during 2013 (Fig. 21.2). The 2014 index (1.11) was slightly higher than during 2013 but was still well below the mean (2.83) of the low productivity period.
Fig. 21.2. Northern shortfin squid in Subareas 3+4: survey biomass indices from the July survey in
Divs. 4VWX.
Squid are heavier during high productivity periods. Since 1982, mean body weights of squid caught during the July Divs. 4VWX surveys have fluctuated widely around the mean for the 1982-2013 low productivity period (79 g, Fig. 21.3). After reaching a low productivity period peak of 137 g in 2006, mean body weights gradually declined to the fourth lowest level of the time series in 2013 (42 g). During 2014, mean body weight (110 g) increased to the highest level since 2006 but remained well below the high productivity period mean (150 g).
0
20
40
60
80
100
120
140
160
180
1950 1955 1960 1965 1970 1975 1980 1985 1990 1995 2000 2005 2010 2015
Cat
ch a
nd
TA
C (
'00
0 t
)
Year
SA 3+4, TAC
SA 3+4, Catch
0
5
10
15
20
25
30
35
40
45
1965 1970 1975 1980 1985 1990 1995 2000 2005 2010 2015
Surv
ey B
iom
ass
Ind
ex
Year
1976-1981 Average
1982-2013 Average
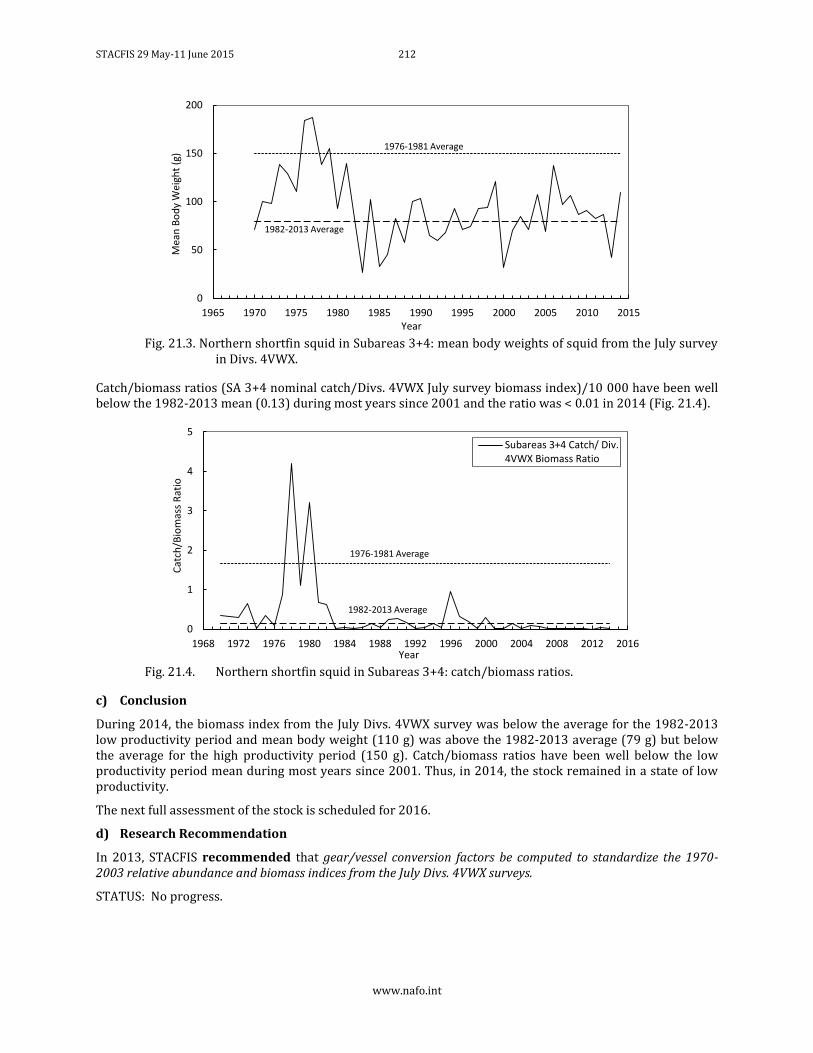
STACFIS 29 May-11 June 2015 212
www.nafo.int
Fig. 21.3. Northern shortfin squid in Subareas 3+4: mean body weights of squid from the July survey
in Divs. 4VWX.
Catch/biomass ratios (SA 3+4 nominal catch/Divs. 4VWX July survey biomass index)/10 000 have been well below the 1982-2013 mean (0.13) during most years since 2001 and the ratio was < 0.01 in 2014 (Fig. 21.4).
Fig. 21.4. Northern shortfin squid in Subareas 3+4: catch/biomass ratios.
c) Conclusion
During 2014, the biomass index from the July Divs. 4VWX survey was below the average for the 1982-2013 low productivity period and mean body weight (110 g) was above the 1982-2013 average (79 g) but below the average for the high productivity period (150 g). Catch/biomass ratios have been well below the low productivity period mean during most years since 2001. Thus, in 2014, the stock remained in a state of low productivity.
The next full assessment of the stock is scheduled for 2016.
d) Research Recommendation
In 2013, STACFIS recommended that gear/vessel conversion factors be computed to standardize the 1970-2003 relative abundance and biomass indices from the July Divs. 4VWX surveys.
STATUS: No progress.
0
50
100
150
200
1965 1970 1975 1980 1985 1990 1995 2000 2005 2010 2015
Mea
n B
od
y W
eigh
t (g
)
Year
1976-1981 Average
1982-2013 Average
0
1
2
3
4
5
1968 1972 1976 1980 1984 1988 1992 1996 2000 2004 2008 2012 2016
Cat
ch/B
iom
ass
Rat
io
Year
Subareas 3+4 Catch/ Div.4VWX Biomass Ratio
1982-2013 Average
1976-1981 Average
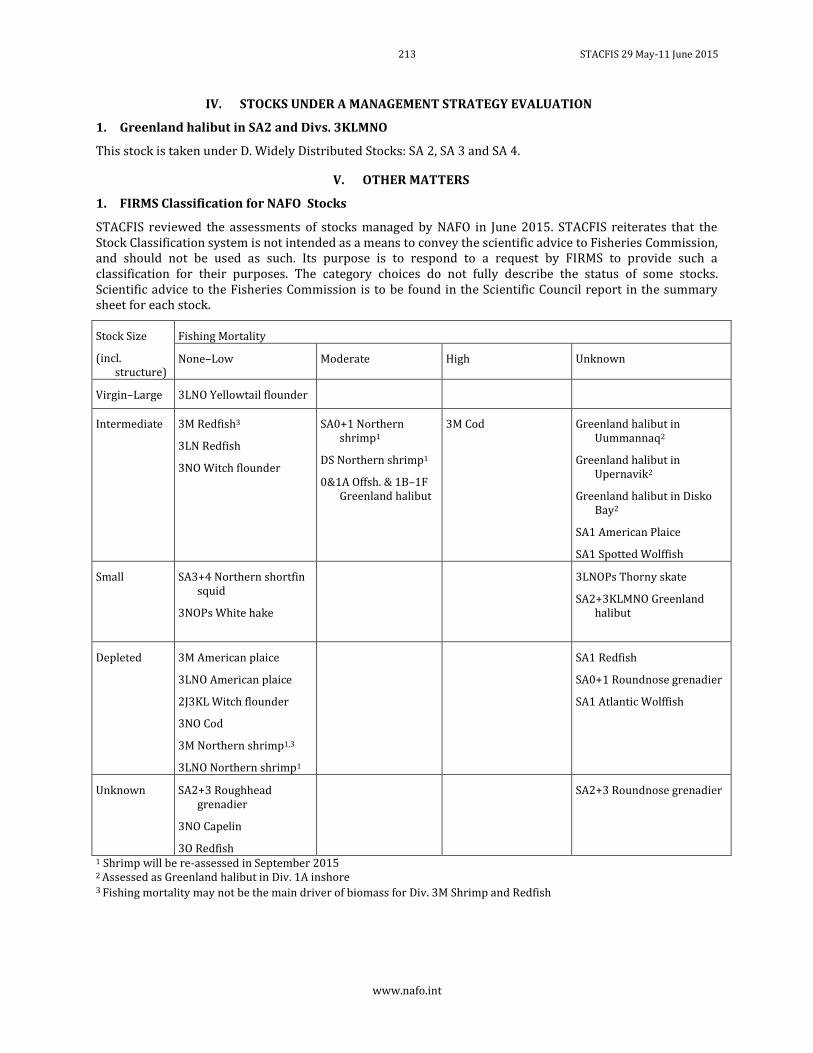
213 STACFIS 29 May-11 June 2015
www.nafo.int
IV. STOCKS UNDER A MANAGEMENT STRATEGY EVALUATION
1. Greenland halibut in SA2 and Divs. 3KLMNO
This stock is taken under D. Widely Distributed Stocks: SA 2, SA 3 and SA 4.
V. OTHER MATTERS
1. FIRMS Classification for NAFO Stocks
STACFIS reviewed the assessments of stocks managed by NAFO in June 2015. STACFIS reiterates that the Stock Classification system is not intended as a means to convey the scientific advice to Fisheries Commission, and should not be used as such. Its purpose is to respond to a request by FIRMS to provide such a classification for their purposes. The category choices do not fully describe the status of some stocks. Scientific advice to the Fisheries Commission is to be found in the Scientific Council report in the summary sheet for each stock.
Stock Size
(incl. structure)
Fishing Mortality
None–Low Moderate High Unknown
Virgin–Large 3LNO Yellowtail flounder
Intermediate 3M Redfish3
3LN Redfish
3NO Witch flounder
SA0+1 Northern shrimp1
DS Northern shrimp1
0&1A Offsh. & 1B–1F Greenland halibut
3M Cod Greenland halibut in Uummannaq2
Greenland halibut in Upernavik2
Greenland halibut in Disko Bay2
SA1 American Plaice
SA1 Spotted Wolffish
Small
SA3+4 Northern shortfin squid
3NOPs White hake
3LNOPs Thorny skate
SA2+3KLMNO Greenland halibut
Depleted 3M American plaice
3LNO American plaice
2J3KL Witch flounder
3NO Cod
3M Northern shrimp1,3
3LNO Northern shrimp1
SA1 Redfish
SA0+1 Roundnose grenadier
SA1 Atlantic Wolffish
Unknown SA2+3 Roughhead grenadier
3NO Capelin
3O Redfish
SA2+3 Roundnose grenadier
1 Shrimp will be re-assessed in September 2015 2 Assessed as Greenland halibut in Div. 1A inshore 3 Fishing mortality may not be the main driver of biomass for Div. 3M Shrimp and Redfish
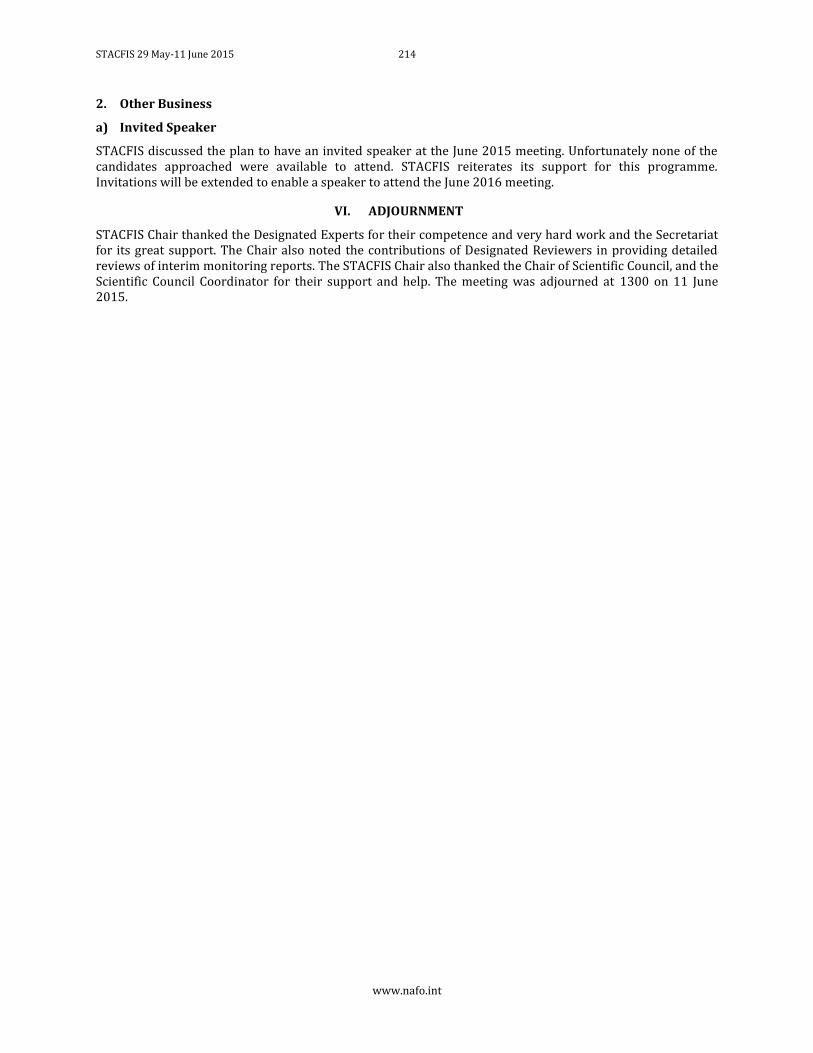
STACFIS 29 May-11 June 2015 214
www.nafo.int
2. Other Business
a) Invited Speaker
STACFIS discussed the plan to have an invited speaker at the June 2015 meeting. Unfortunately none of the candidates approached were available to attend. STACFIS reiterates its support for this programme. Invitations will be extended to enable a speaker to attend the June 2016 meeting.
VI. ADJOURNMENT
STACFIS Chair thanked the Designated Experts for their competence and very hard work and the Secretariat for its great support. The Chair also noted the contributions of Designated Reviewers in providing detailed reviews of interim monitoring reports. The STACFIS Chair also thanked the Chair of Scientific Council, and the Scientific Council Coordinator for their support and help. The meeting was adjourned at 1300 on 11 June 2015.
215 SC 29 May-11 June 2015
www.nafo.int
APPENDIX V. AGENDA, SCIENTIFIC COUNCIL 29 MAY – 11 JUNE 2015
I. Opening (Scientific Council Chair: Don Stansbury) 1. Appointment of Rapporteur 2 Presentation and Report of Proxy Votes 3. Adoption of Agenda 4. Attendance of Observers 5. Appointment of Designated Experts 6. Plan of Work a. General Discussion b. Stock Assessment Review and Assignment of Reviewers 7. Housekeeping issues II. Review of Scientific Council Recommendations in 2014 and 2015 III. Fisheries Environment (STACFEN Chair: Andrew Cogswell) 1. Opening 2. Appointment of Rapporteur 3. Adoption of Agenda 4. Review of Recommendations in 2014 5. Invited speaker 6. Integrated Science Data Management (ISDM) Report for 2014 7. Review of physical, biological and chemical environment in the NAFO Convention Area during
2014 8. Interdisciplinary studies 9. Aquatic Climate Change Adaptation Services Program 10. Formulation of recommendations based on environmental conditions during 2014 11. National Representatives 12. Other Matters 13. Adjournment IV. Publications (STACPUB Chair: Margaret Treble) 1. Opening 2. Appointment of Rapporteur 3. Adoption of Agenda 4. Review of Recommendations in 2014 5. Review of Publications a) Annual Summary i) Journal of Northwest Atlantic Fishery Science (JNAFS) ii) Scientific Council Studies iii) Scientific Council Reports 6. Other Matters a) Progress on revised sponge/coral guide b) Update to JNAFS Website c) Changes to JNAFS Editorial Board 7. Adjournment V. Research Coordination (STACREC Chair: Kathy Sosebee) 1. Opening 2. Appointment of Rapporteur 3. Review of Recommendations in 2014 4. Fishery Statistics a) Progress report on Secretariat activities in 2014/2015 i) STATLANT 21A and 21B 5. Research Activities
SC 29 May-11 June 2015 216
www.nafo.int
a) Biological sampling i) Report on activities in 2014/2015 ii) Report by National Representatives on commercial sampling conducted iii) Report on data availability for stock assessments (by Designated Experts) b) Biological surveys i) Review of survey activities in 2014 (by National Representatives and Designated Experts) ii) Surveys planned for 2015 and early 2016 c) Tagging activities d) Other research activities 6. Review of SCR and SCS Documents 7. Other Matters a) Summary of progress on previous recommendations b) Stock Assessment Spreadsheets c) Participation in H2020 Project 8. Adjournment VI. Fisheries Science (STACFIS Chair: Brian Healey) 1. Opening 2. General Review of Catches and Fishing Activity 3. Invited speaker 4. Stock Assessments 1. Greenland Halibut (Reinhardtius hippoglossoides) in SA 0, Div. 1A offshore and Divs. 1B-F (fully
assessed) 2. Greenland Halibut (Reinhardtius hippoglossoides) Div. 1A inshore (monitor) 3. Roundnose Grenadier (Coryphaenoides rupestris) in Subareas 0 and 1 (monitor) 4. Demersal Redfish (Sebastes spp.) in SA 1 (monitor) 5a. Wolffish in Subarea 1 (monitor) 5b. American plaice (Hippoglossoides platessoides) in Subarea 1 (monitor) 6. Cod (Gadus morhua) in Div. 3M (fully assessed) 7. Redfish (Sebastes mentella and Sebastes fasciatus) in Div. 3M (fully assessed) 8. American Plaice (Hippoglossoides platessoides) in Div. 3M (monitor) 9. Cod (Gadus morhua) in NAFO Div. 3NO (fully assessed) 10. Redfish (Sebastes mentella and Sebastes fasciatus) in Divs. 3L and 3N (monitor) 11. American Plaice (Hippoglossoides platessoides) in Divs. 3LNO (monitor) 12. Yellowtail flounder (Limanda ferruginea) in Divs. 3LNO (fully assessed) 13. Witch Flounder (Glyptocephalus cynoglossus) in Divs. 3NO (fully assessed – special request) 14. Capelin (Mallotus villosus) in Divs. 3NO (fully assessed) 15. Redfish (Sebastes mentella and Sebastes fasciatus) in Div. 3O (monitor) 16. Thorny skate (Amblyraja radiata) in Div. 3LNO and Subdiv. 3Ps (monitor) 17. White Hake (Urophycis tenuis) in Div. 3NO and Subdiv. 3Ps (fully assessed) 18. Roughhead Grenadier (Macrourus berglax) in Subareas 2 and 3 (monitor) 19. Witch Flounder (Glyptocephalus cynoglossus) in Divs. 2J+3KL (monitor) 20. Greenland Halibut (Reinhardtius hippoglossoides) in SA 2 + Divs. 3KLMNO (management strategy) 21. Northern Shortfin Squid (Illex illecebrosus) in Subareas 3+4 (monitor) 5. Stocks under a Management Strategy Evaluation (FC Item 3a) a) Greenland halibut in SA 2 and Divs. 3KLMNO 6. Other Matters a) FIRMS Classification for NAFO Stocks b) Other Business 7. Adjournment VII. Management Advice and Responses to Special Requests 1. Fisheries Commission (Annex 1) a) Request for Advice on TACs and Other Management Measures (Item 1, Annex 1)) For 2016 and 2017
217 SC 29 May-11 June 2015
www.nafo.int
- Cod in Div. 3M - Redfish in Div. 3M - White hake in Divs. 3NO For 2016, 2017 and 2018 - Cod in Divs. 3NO - Yellowtail flounder in Divs. 3LNO - Capelin in Divs. 3NO b) Monitoring of Stocks for which Multi-year Advice was provided in 2013 or 2014 (Item 1) - Redfish in Divs. 3LN - Redfish in Div. 3O - American plaice in Div. 3M - American plaice in Divs. 3LNO - Thorny skate in Divs. 3LNO - Witch flounder in Divs. 2J + 3KL - Northern Short-finned Squid (Illex) in SA 3+4 c) Special Requests for Management Advice i) TAC calculation for Greenland halibut in SA2 + Divs. 3KLMNO (Item 2a) ii) Exceptional circumstances in Greenland halibut MSE (Item 2b) iii) Selectivity of cod and redfish in Div. 3M (Item 3) iv) Risk assessment for SAI on VME elements and species (Item 4) v) Impacts of removing candidate VME closures from survey design (Item 5) vi) Comment on status and trends of cod in Divs. 2J + 3KL (Item 6) vii) Full assessment of witch flounder in Divs. 3NO (Item 7) viii) Assessment and advice for Splendid alfonsino (Beryx splendens) (Item 8) ix) The potential for acoustic surveys for Capelin (Item 9) x) Depth distribution of Greenland halibut (Item 10) xi) Review of impacts other than fishing in the NAFO Regulatory Area (Item 11) xii) Impacts of mid-water trawls on VME indicator species (Item 12) 2. Coastal States a) Request by Denmark (Greenland) for Advice on Management in 2015 (Annex 2) i) Roundnose grenadier in SA 0+1 (Item 1) ii) Redfish, Atlantic wolfish, Spotted wolfish and American plaice in SA 1 (Item 2) iii) Greenland halibut in inshore areas of Div. 1A (Item 4) iv) Pandalus borealis east of Greenland and in the Denmark Strait (in conjunction with ICES).
(Item 6) b) Request by Canada and Greenland for Advice on Management in 2015 (Annex 2, Annex 3) i) Greenland halibut in Div. 0A and the offshore area of Div. 1A, plus Div. 1B (Annex 2, Item 4;
Annex 3, Item 1) ii) Greenland halibut in Div. 0B + Divs. 1C-1F (Annex 2, Item 4, Annex 3, Item 1) iii) Pandalus borealis in SA 0+1 (Annex 2, Item 5; Annex 3, Item 2) VIII. Review of Future Meetings Arrangements 1. Scientific Council (in conjunction with NIPAG), 9 – 16 Sep 2015 2. Scientific Council, 21 – 25 Sep 2015 3. Scientific Council, Jun 2016 4. Scientific Council (in conjunction with NIPAG), Sep 2016 5. Scientific Council, Sep 2016 6. NAFO/ICES Joint Groups a) NIPAG, 9 – 16 Sep 2015 b) NIPAG, 2016 c) WGDEC 7. WGESA
SC 29 May-11 June 2015 218
www.nafo.int
8. WGHARP IX. Arrangements for Special Sessions 1. Topics for future Special Sessions X. Meeting Reports 1. Working Group on Ecosystem Science and Assessment (WGESA), Nov 2014 2. Report from ICES-NAFO Working Group on Deepwater Ecosystems (WGDEC), Mar 2015 3. Report from Joint FC-SC Working Group on Risk Based Management Strategies (WG-RBMS),
Apr 2015 4. Report from ad hoc Joint Working Group on Catch Reporting (WG-CR), Apr 2015 5. Meetings attended by the Secretariat: a) CWP b) FIRMS c) FAO VME Practices and Processes XI. Review of Scientific Council Working Procedures/Protocol 1. General Plan of Work for September 2015 Annual Meeting 2. Other Matters XII. Other Matters 1. Designated Experts 2. Stock Assessment spreadsheets 3. Scientific Merit Awards 4. Budget items 5. Other Business XIII. Adoption of Committee Reports 1. STACFEN 2. STACREC 3. STACPUB 4. STACFIS XIV. Scientific Council Recommendations to General Council and Fisheries Commission XV. Adoption of Scientific Council Report XVI. Adjournment
219 SC 29 May-11 June 2015
www.nafo.int
Annex 1. Fisheries Commission's Request for Scientific Advice on Management in 2016 and Beyond of Certain Stocks in Subareas 2, 3 and 4 and Other Matters
1. Fisheries Commission requests that the Scientific Council provide advice for the management of the fish stocks below according to the assessment frequency presented below. The advice should be provided as a range of management options and a risk analysis for each option (rather than a single TAC recommendation).
Yearly basis
Northern shrimp in Divs. 3LNO
Two year basis American plaice in Divs. 3LNO Cod in Div. 3M Redfish in Divs. 3LN Redfish in Div. 3M Northern Shrimp in Div. 3M Thorny skate in Divs. 3LNO White hake in Divs. 3NO Witch flounder in Divs. 3NO
Three year basis American plaice in Div. 3M Capelin in Divs. 3NO Cod in Divs. 3NO Northern shortfin squid in SA 3+4 Redfish in Div. 3O Witch flounder in Divs. 2J+3KL Yellowtail flounder in Divs. 3LNO
To implement this schedule of assessments, the Scientific Council is requested to conduct the assessment of these stocks as follows:
In 2015, advice should be provided for 2016 for Northern Shrimp in NAFO Divs. 3LNO
In 2015, advice should be provided for 2016 and 2017 for Cod in Div. 3M and Redfish in Div. 3M, White hake in Divs. 3NO.
In 2015, advice should be provided for 2016, 2017 and 2018 for Cod in Div. 3NO, Yellowtail Flounder in 3LNO and Capelin in Divs. 3NO.
Advice should be provided using the guidance provided in Annexes A or B as appropriate, or using the predetermined Harvest Control Rules in the cases where they exist.
The Fisheries Commission also requests the Scientific Council to continue to monitor the status of all these stocks annually and, should a significant change be observed in stock status (e.g. from surveys) or in by-catches in other fisheries, provide updated advice as appropriate.
2. The Fisheries Commission adopted in 2010 an MSE approach for Greenland halibut stock in Subarea 2 + Divs. 3KLMNO (FC Doc. 10/12). This approach considers a survey based harvest control rule (HCR) to set a TAC for this stock on an annual basis. The Fisheries Commission requests the Scientific Council to:
a. Monitor and update the survey slope and to compute the TAC according to HCR adopted by the Fisheries Commission according to Annex 1 of FC Doc. 10/12.
b. Advise on whether or not an exceptional circumstance is occurring. 3. The Fisheries Commission requests the Scientific Council to analyze and provide advice on
management measures that could improve selectivity in the Div. 3M cod and Div. 3M redfish fisheries in the Flemish Cap in order to reduce possible by catches and discards. The objective is to reduce the mixed fisheries between cod and redfish, the by-catch of non-targeted stocks and to analyze if the selectivity pattern could be improved to reduce the catch of undersized fish.
4. The Fisheries Commission requests the Scientific Council to continue to develop work on Significant Adverse Impacts in support of the reassessment of NAFO bottom fishing activities required in 2016, specifically an assessment of the risk associated with bottom fishing activities on known and predicted VME species and elements in the NRA.
5. Recognizing the work done in NAFO to prevent significant adverse impacts to vulnerable marine ecosystems, and the need for effective stock assessments;
Further recognizing that modifications to survey designs occur on regular basis in fisheries surveys in many cases,
SC 29 May-11 June 2015 220
www.nafo.int
FC requests that SC investigate the impacts of removing the closed areas from the survey design for relevant stock surveys.
6. For the cod stock in Divs. 2J+3KL, the Scientific Council is requested to comment on the trends in biomass and state of the stock in the most recent Science Advisory Report from the Canadian Science Advisory Secretariat.
7. The Fisheries Commission requests the Scientific Council to conduct a full assessment of witch flounder in Divs. 3NO.
8. Please provide a stock assessment for Alfonsino, and recommendation. 9. Could the SC liaise with the national institutes of the different CPs to see if – as recommended by
STACFIS – acoustic surveys for capelin can be carried out? 10. There are some spatial and depth coverage deficiencies in the Greenland Halibut survey. It is
suspected that there is a component of the Greenland Halibut stock of age-class 14+ that lives in depths under 1 500 meters and is therefore inaccessible to scientific trawling. Please:
a. comment on this hypothesis; b. indicate if information on this part of the stock would be useful for the stock assessment and the
understanding of the stock dynamics; c. indicate if there are techniques available to assess the biomass below 1 500 meters, and; d. if useful and possible, implement such techniques in view of the next stock assessment. 11. The NAFO 2011 Performance Review Panel encouraged NAFO to consider whether activities other
than fishing in the NAFO Convention Area may impact the stocks and fisheries for which NAFO is responsible as well as biodiversity in the NAFO Regulatory Area. Such activities might include oil exploration, shipping and recreational activities. Some work has been carried out as part of the ecosystem approach.
As the first step in the assessment of such impacts and for the implementation of the priorities of the Ecosystem Roadmap, could the Scientific Council provide a literature survey that would indicate what the risks are to the fish stocks and ecosystems in the NAFO Regulatory Area by looking at comparable situations.
12. The Fisheries Commission requests the Scientific Council to evaluate the impact of mid-water trawls on VME indicator species in those instances when the gear makes contact with or is lost on the bottom.
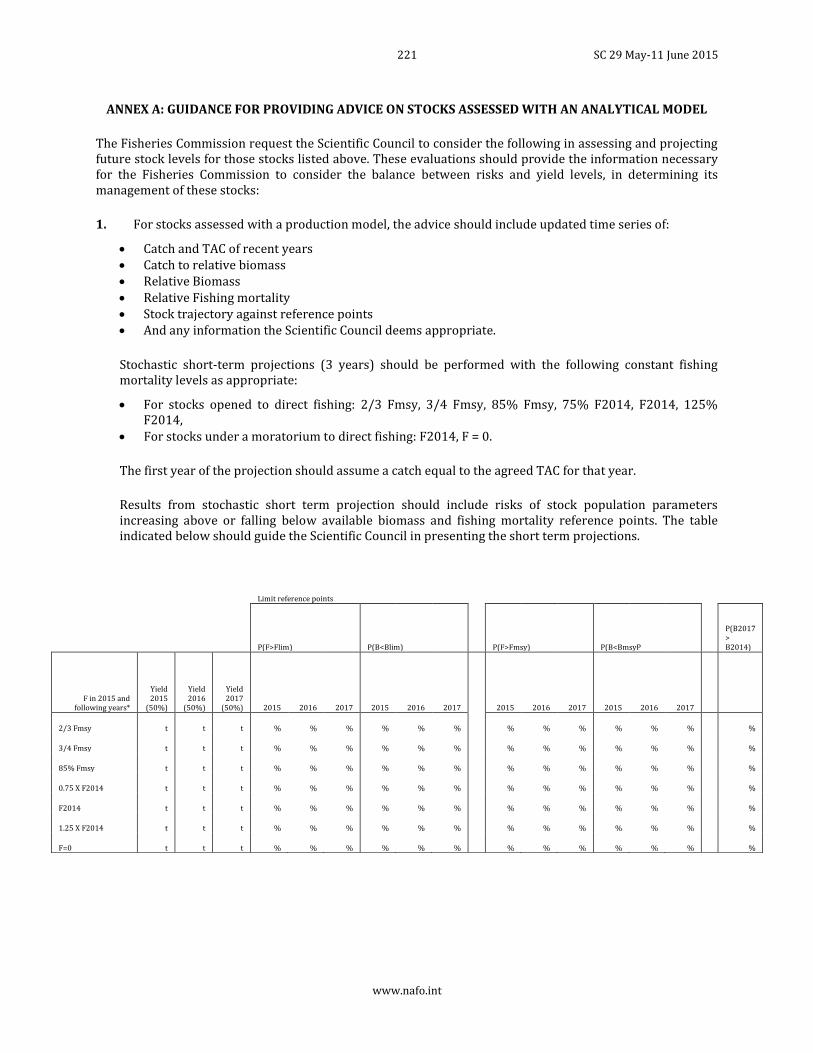
221 SC 29 May-11 June 2015
www.nafo.int
ANNEX A: GUIDANCE FOR PROVIDING ADVICE ON STOCKS ASSESSED WITH AN ANALYTICAL MODEL
The Fisheries Commission request the Scientific Council to consider the following in assessing and projecting future stock levels for those stocks listed above. These evaluations should provide the information necessary for the Fisheries Commission to consider the balance between risks and yield levels, in determining its management of these stocks:
1. For stocks assessed with a production model, the advice should include updated time series of:
Catch and TAC of recent years Catch to relative biomass Relative Biomass Relative Fishing mortality Stock trajectory against reference points And any information the Scientific Council deems appropriate.
Stochastic short-term projections (3 years) should be performed with the following constant fishing mortality levels as appropriate:
For stocks opened to direct fishing: 2/3 Fmsy, 3/4 Fmsy, 85% Fmsy, 75% F2014, F2014, 125% F2014,
For stocks under a moratorium to direct fishing: F2014, F = 0.
The first year of the projection should assume a catch equal to the agreed TAC for that year.
Results from stochastic short term projection should include risks of stock population parameters increasing above or falling below available biomass and fishing mortality reference points. The table indicated below should guide the Scientific Council in presenting the short term projections.
Limit reference points
P(F>Flim) P(B<Blim) P(F>Fmsy) P(B<BmsyP
P(B2017 > B2014)
F in 2015 and following years*
Yield 2015
(50%)
Yield 2016
(50%)
Yield 2017
(50%) 2015 2016 2017 2015 2016 2017 2015 2016 2017 2015 2016 2017
2/3 Fmsy t t t % % % % % % % % % % % % %
3/4 Fmsy t t t % % % % % % % % % % % % %
85% Fmsy t t t % % % % % % % % % % % % %
0.75 X F2014 t t t % % % % % % % % % % % % %
F2014 t t t % % % % % % % % % % % % %
1.25 X F2014 t t t % % % % % % % % % % % % %
F=0 t t t % % % % % % % % % % % % %
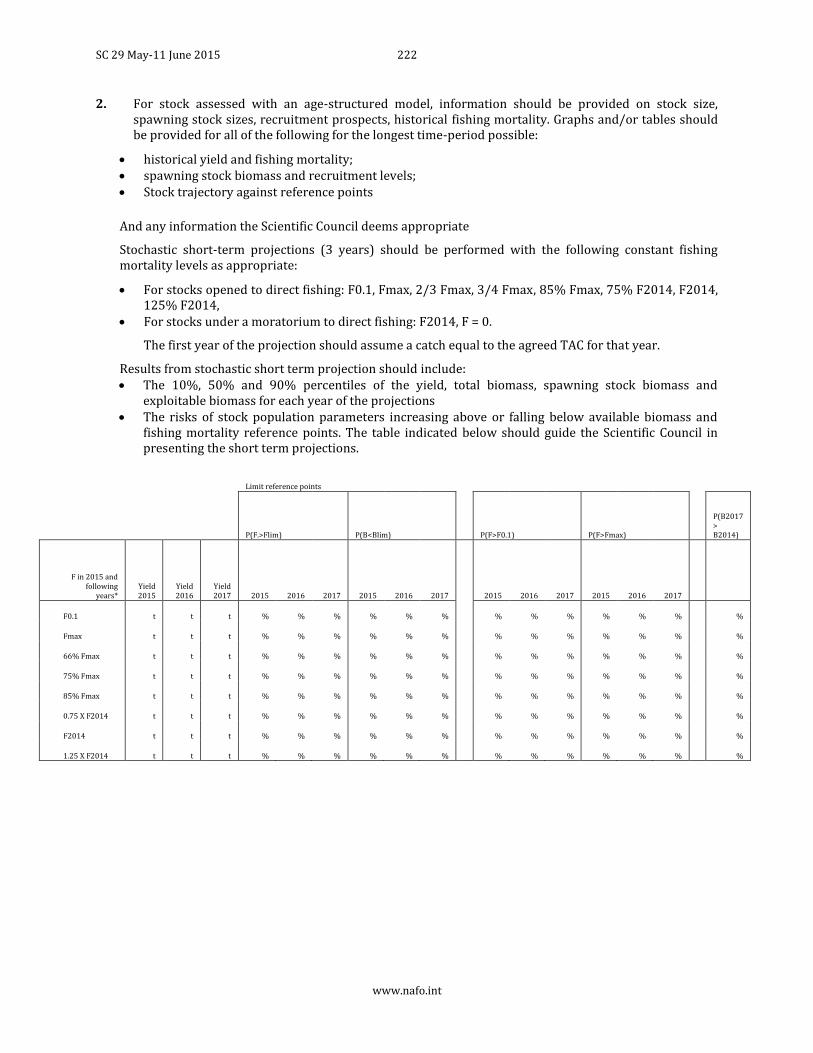
SC 29 May-11 June 2015 222
www.nafo.int
2. For stock assessed with an age-structured model, information should be provided on stock size, spawning stock sizes, recruitment prospects, historical fishing mortality. Graphs and/or tables should be provided for all of the following for the longest time-period possible:
historical yield and fishing mortality; spawning stock biomass and recruitment levels; Stock trajectory against reference points
And any information the Scientific Council deems appropriate
Stochastic short-term projections (3 years) should be performed with the following constant fishing mortality levels as appropriate:
For stocks opened to direct fishing: F0.1, Fmax, 2/3 Fmax, 3/4 Fmax, 85% Fmax, 75% F2014, F2014, 125% F2014,
For stocks under a moratorium to direct fishing: F2014, F = 0.
The first year of the projection should assume a catch equal to the agreed TAC for that year.
Results from stochastic short term projection should include: The 10%, 50% and 90% percentiles of the yield, total biomass, spawning stock biomass and
exploitable biomass for each year of the projections The risks of stock population parameters increasing above or falling below available biomass and
fishing mortality reference points. The table indicated below should guide the Scientific Council in presenting the short term projections.
Limit reference points
P(F.>Flim) P(B<Blim) P(F>F0.1) P(F>Fmax)
P(B2017 > B2014)
F in 2015 and following
years* Yield 2015
Yield 2016
Yield 2017 2015 2016 2017 2015 2016 2017 2015 2016 2017 2015 2016 2017
F0.1 t t t % % % % % % % % % % % % %
Fmax t t t % % % % % % % % % % % % %
66% Fmax t t t % % % % % % % % % % % % %
75% Fmax t t t % % % % % % % % % % % % %
85% Fmax t t t % % % % % % % % % % % % %
0.75 X F2014 t t t % % % % % % % % % % % % %
F2014 t t t % % % % % % % % % % % % %
1.25 X F2014 t t t % % % % % % % % % % % % %
223 SC 29 May-11 June 2015
www.nafo.int
ANNEX B: GUIDANCE FOR PROVIDING ADVICE ON STOCKS ASSESSED WITHOUT A POPULATION MODEL
For those resources for which only general biological and/or catch data are available, few standard criteria exist on which to base advice. The stock status should be evaluated in the context of management requirements for long-term sustainability and the advice provided should be consistent with the precautionary approach.
The following graphs should be presented, for one or several surveys, for the longest time-period possible:
a) time trends of survey abundance estimates b) an age or size range chosen to represent the spawning population c) an age or size-range chosen to represent the exploited population d) recruitment proxy or index for an age or size-range chosen to represent the recruiting population. e) fishing mortality proxy, such as the ratio of reported commercial catches to a measure of the
exploited population. f) Stock trajectory against reference points
And any information the Scientific Council deems appropriate.
SC 29 May-11 June 2015 224
www.nafo.int
ANNEX 2. DENMARK (ON BEHALF OF GREENLAND) REQUEST FOR SCIENTIFIC ADVICE ON MANAGEMENT IN 2015 OF CERTAIN STOCKS IN SUBAREAS 0 AND 1
1. For Roundnose grenadier in Subarea 0 + 1 advice was in 2014 given for 2015-2017. Denmark (on behalf
of Greenland) requests the Scientific Council to continue to monitor the status of Roundnose grenadier in Subareas 0 and 1 annually, and should significant changes in the stock status be observed (e.g. from surveys) the Scientific Council is requested to provide updated advice as appropriate.
2. Advice for golden redfish (Sebastes marinus), demersal deep-sea redfish (Sebastes mentella) American
plaice (Hippoglossoides platessoides), Atlantic wolffish (Anarhichas lupus) and spotted wolffish (A. minor) in Subarea 1 was in 2014 given for 2015-2017. Denmark (on behalf of Greenland) requests the Scientific Council to continue to monitor the status of these species annually, and should significant changes in stock status be observed the Scientific Council is requested to provide updated advice as appropriate.
3. Subject to the concurrence of Canada as regards Subareas 0 and 1, the Scientific Council is requested to
provide advice on appropriate TAC levels for 2016 separately for Greenland halibut in 1) the offshore areas of NAFO Div. 0A and Div. 1A plus Divs. 1B and 2) NAFO Div. 0B plus Divs. 1C-1F. The Scientific Council is also asked to advice on any other management measures it deems appropriate to ensure the sustainability of these resources.
4. Advice for Greenland halibut in Div. 1A (inshore) was in 2014 given for 2015-2016. Denmark (on behalf
of Greenland) requests the Scientific Council to continue to monitor the status of Greenland halibut in Div. 1A (inshore) annually, and should significant changes in stock status be observed, the Scientific Council is requested to provide updated advice as appropriate.
5. Subject to the concurrence of Canada as regards Subarea 0 and 1, Denmark (on behalf of Greenland)
further requests the Scientific Council before December 2015 to provide advice on the scientific basis for management of Northern shrimp (Pandalus borealis) in Subarea 0 and 1 in 2015 and for as many years ahead as data allows for.
6. Furthermore, the Scientific Council is in cooperation with ICES requested to provide advice on the
scientific basis for management of Northern shrimp (Pandalus borealis) in Denmark Strait and adjacent waters east of southern Greenland in 2016 and for as many years ahead as data allows for.
225 SC 29 May-11 June 2015
www.nafo.int
ANNEX 3. REQUESTS FOR ADVICE FROM CANADA
e) The Scientific Council is requested, subject to the concurrence of Denmark (on behalf of Greenland) as regards Subarea 1, to provide an overall assessment of status and trends in the total stock area throughout its range and to specifically advise on TAC levels for 2016, separately, for Greenland halibut in Divs. 0A+1A (offshore) and 1B, and Divs. 0B+1C-F.6 The Scientific Council is also asked to provide advice on any other management measures it deems appropriate to ensure the sustainability of these resources.
a) It is noted that at this time only general biological advice and/or catch data are available, few standard criteria exist on which to base advice. The stock status should be evaluated in the context of management requirements for long-term sustainability and the advice provided should be consistent with the precautionary approach and include likely risk considerations and implications as much as possible, including risks of maintaining current TAC levels and any risks and available details of observations that would support an increase or decrease in the TACs.
b) Recognizing that this is a data poor fishery, and that no model exists at this time to provide risk-based advice to inform management options, the Scientific Council is also asked to identify what would be required in order to provide risk based advice in the future.
The following graphs should be presented, for one or several surveys, for the longest time-period possible:
i) historical catches; ii) abundance and biomass indices; iii) an age or size range chosen to represent the spawning population; iv) an age or size range chosen to represent the exploited population; v) recruitment proxy or index for an age or size-range chosen to represent the recruiting
population; vi) fishing mortality proxy, such as the ratio of reported commercial catches to a measure of the
exploited population; vii) stock trajectory against reference points
Any other information the Scientific Council feels is relevant should also be provided.
6 The Scientific Council has noted previously that there is no biological basis for conducting separate assessments for Greenland halibut throughout Subareas 0-3, but has advised that separate TACs be maintained for different areas of the distribution of Greenland halibut.
SC 29 May-11 June 2015 226
www.nafo.int
f) Canada requests the Scientific Council to consider the following options in assessing and projecting future stock levels for Shrimp in Subareas 0 and 1:
c) The status of the stock should be reviewed and management options evaluated in terms of their implications for fishable stock size, spawning stock size, recruitment prospect, catch rate and catch over the next 5 years. The implications of catch options ranging from 30,000 t to the catch corresponding to Z MSY, in 5,000 t increments, should be forecast for 2016 through 2020 if possible, and evaluated in relation to precautionary reference points of both mortality and fishable stock biomass. Results should include a partitioning of the future estimable removals between catches and estimable predation for the various catch options requested. The present stock size and fishable stock size should be described in relation to those observed historically and those to be expected in the next 5 years under the various catch options requested, and any other options Scientific Council feels worthy of consideration.
d) Management options should be provided within the Northwest Atlantic Fisheries Organization Precautionary Approach Framework. Uncertainties in the assessment should be evaluated and presented in the form of risk analyses related to the limit reference points of Blim and ZMSY.
e) Presentation of the results should include the following: i) a graph and table of historical yield and fishing mortality for the longest time period possible; ii) a graph of biomass relative to B MSY, and recruitment levels for the longest time period possible. iii) a graph of the stock trajectory compared to Blim and/or B MSY and Z MSY.; iv) graphs and tables of total mortality (Z) and fishable biomass for a range of projected catch
options (as noted in 2 a) for the years 2016 to 2020 if possible. Projections should include both catch options and a range of cod biomass levels considered appropriate by SC. Results should include risk analyses of falling below BMSY and Blim, and of exceeding Z MSY.;
v) a graph of the total area fished for the longest time period possible; and vi) any other graph or table the Scientific Council feels is relevant.
g) Canada requests the Scientific Council to explore the impact of proposed harvest strategies that would maintain the North Atlantic harp seal population at a precautionary level of a PA framework, using the Canadian levels as a case study, and that would have a low risk of decreasing below the critical level. (Received July 7 2014)
227 SC 29 May-11 June 2015
www.nafo.int
APPENDIX VI. LIST OF SCR AND SCS DOCUMENTS, 29 MAY – 11 JUNE 2015
SCR Documents
Doc No. Serial No Author(s) Title SCR Doc. 15/01 N6416 John Mortensen Report on hydrographic conditions off Southwest
Greenland June/July 2014 SCR Doc. 15/02 N6417 Boris Cisewski Hydrographic conditions off West Greenland in 2014
SCR Doc. 15/03 N6421 O.A. Jørgensen Survey for Greenland Halibut in NAFO Divisions 1C-1D, 2014
SCR Doc. 15/04 N6422 Paula Fratantoni Hydrographic Conditions on the Northeast United States Continental Shelf in 2014 – NAFO Subareas 5 and 6
SCR Doc. 15/05 N6424 D. Hebert & R. G. Pettipas Physical Oceanographic Conditions on the Scotian Shelf and in the eastern Gulf of Maine (NAFO Divisions 4V, W, X) during 2014
SCR Doc. 15/06 N6425 V.I. Vinnichenko On stock size and fishery management of splendid alfonsino (Beryx splendens) on the Corner Rise Seamount
SCR Doc. 15/07 N6427 Diana González-Troncoso, Esther Román, Nair Vilas & Adriana Nogueira
Results for Greenland halibut, American plaice and Atlantic cod of the Spanish survey in NAFO Divs. 3NO for the period 1997-2014
SCR Doc. 15/08 N6428 Diana González-Troncoso, Adriana Nogueira & Nair Vilas
Yellowtail flounder, redfish (Sebastes spp)and witch flounder indices from the Spanish Survey conducted in Divisions 3NO of the NAFO Regulatory Area
SCR Doc. 15/09 N6429 Diana González-Troncoso, Nair Vilas & Adriana Nogueira
Biomass and length distribution for roughhead grenadier, thorny skate and white hake from the surveys conducted by Spain in NAFO 3NO
SCR Doc. 15/10 N6430 G. Maillet, P. Pepin, B. Casault, C. Johnson, S. Plourde, M. Starr, E. Head, C. Caverhill, H. Maass, J. Spry, A. Cogswell, S. Fraser, C. Porter, G. Redmond, & T. Shears
Ocean Productivity Trends in the Northwest Atlantic During 2014
SCR Doc. 15/11 N6431 E. Colbourne, J. Holden, D. Senciall, W. Bailey, J. Craig and S. Snook
Physical Oceanographic Environment on the Newfoundland and Labrador Shelf in NAFO Subareas 2 and 3 during 2014
SCR Doc. 15/12 N6432 P. Pepin, K. Azetsu-Scott, M. Starr, S. Punshon, G. Maillet, J. Chassé, P. Galbraith, B. Greenan, D. Lavoie, & C. Johnson
Preliminary Results of an ACCASP Funded Study of the Delineation of Ocean Acidification and Calcium Carbonate Saturation State of the Atlantic Zone
SCR Doc. 15/13 N6434 E. Colbourne and A. Perez-Rodriguez
Physical Oceanographic Conditions on the Flemish Cap in NAFO Subdivision 3M during 2014
SCR Doc. 15/14 N6435 M. Ouellet Oceanography and Scientific Data, NAFO Report 2014
SC 29 May-11 June 2015 228
www.nafo.int
SCR Doc. 15/15 N6436 I. Yashayaev, E.J.H. Head, K. Azetsu-Scott, M. Ringuette, Z. Wang, J. Anning and S. Punshon
Environmental Conditions in the Labrador Sea during 2014
SCR Doc. 15/16 N6437 Rasmus Nygaard & Ole A. Jørgensen
Biomass and Abundance of Demersal Fish Stocks off West and East Greenland estimated from the Greenland Institute of Natural resources Shrimp Fish Survey, 1988-2014.
SCR Doc. 15/17 N6438 José Miguel Casas and Diana González Troncoso
Results from Bottom Trawl Survey on Flemish Cap of June-July 2014
SCR Doc. 15/18 N6439 Fernando González-Costas Assessment of Splendid alfonsino (Beryx splendens) in NAFO Subarea 6
SCR Doc. 15/19 N6440 Esther Román, Concepción González-Iglesias and Diana González-Troncoso
Results for the Spanish Survey in the NAFO Regulatory Area of Division 3L for the period 2003-2014
SCR Doc. 15/20 N6441 Esther Román, Ángeles Armesto and Diana González-Troncoso
Results for the Atlantic cod, roughhead grenadier, redfish, thorny skate and black dogfish of the Spanish Survey in the NAFO Divs. 3L for the period 2003-2014
SCR Doc. 15/21 N6442 Fernando González-Costas, Ane Iriondo, Diana González-Troncoso and Agurtzane Urtizberea
Possible technical measures that could be applied in NAFO 3M cod.
SCR Doc. 15/22 N6444 D. Power, B.P. Healey, and D.W. Ings
Performance and description of Canadian multi-species bottom trawl surveys in NAFO subarea 2 + Divisions 3KLMNO, with emphasis on 2012-2014
SCR Doc. 15/23 N6447 M.R. Simpson, C.M. Miri, and R.K. Collins
An Assessment of White Hake (Urophycis tenuis, Mitchill 1815) in NAFO Divisions 3N, 3O, and Subdivision 3Ps
SCR Doc. 15/24 N6448 Solari et al. System dynamics: Analysis and modelling: West Greenland Halibut (WGH)
SCR Doc. 15/25 N6449 Solari et al. On West Greenland Halibut Dynamic: Environmental Forcing
SCR Doc. 15/26 N6450 D. Maddock Parsons and Rick Rideout
Divisions 3LNO Yellowtail Flounder (Limanda ferruginea) in the 2013 and 2014 Canadian Stratified Bottom Trawl Surveys (Abstract)
SCR Doc. 15/27 N6451 I. S. Tretyakov Capelin Stock Assessment in NAFO Divisions 3NO Based on Data from Trawl Surveys
SCR Doc. 15/28 N6452 A. Ávila de Melo, R. Dominguez-Petit, M. Casas, D. González Troncoso, F. González-Costas, K. Fromin, N. Brites, R. Alpoim and F. Saborido-Rey
An Assessment of Beaked Redfish (S. mentella and S. fasciatus) in NAFO Division 3M (at times when natural mortality is driven stock dynamics and fishing mortality reference points are useless to scientific advice)
SCR Doc. 15/29 N6453 Dawn Maddock Parsons, Joanne Morgan & Don Power
Assessment of NAFO Divs. 3LNO Yellowtail Flounder
SCR Doc. 15/30 N6454 M. A. Treble Report on Greenland halibut caught during the 2014 trawl survey in Divisions 0A and 0B
229 SC 29 May-11 June 2015
www.nafo.int
SCR Doc. 15/31 N6456 R. Nygaard Trawl, gillnet and longline survey results from surveys conducted by the Greenland Institute og Natural Resources in NAFO Division 1A Inshore
SCR Doc. 15/32 N6457 O.A. Jørgensen & M.A. Treble
Assessment of the Greenland Halibut Stock Component in NAFO Subarea 0 +Division 1A Offshore + Divisions 1B-1F
SCR Doc. 15/33 N6458 Diana González-Troncoso Assessment of the Cod Stock in NAFO Division 3M
SCR Doc. 15/34 N6460 R.M. Rideout, D.W. Ings, J. Brattey, and K. Dwyer
An Assessment of the Cod Stock in NAFO Divisions 3NO
SCR Doc. 15/35 N6462 M.A. Treble & O.A. Jorgensen
Implementation of advice for data-limited stocks: A survey approach for Greenland halibut in SA 0+1
SCR Doc. 15/36 N6463 Diana González-Troncoso, Agurtzane Urtizberea, Fernando González-Costas, David Miller, Ane Iriondo and Dorleta García
Results of the 3M Cod MSE
SCR Doc. 15/37 N6464 M. Joanne Morgan, C. Hvingel, and M. Koen-Alonso
Surplus production models in a Bayesian framework applied to witch flounder in NAFO Divs. 3NO
SCR Doc. 15/38 N6465 E. Lee, J. Morgan, R. M. Rideout
An assessment of the witch flounder resource in NAFO Divisions 3NO
SCR Doc. 15/39 N6466 Rasmus Nygaard Fisheries and catches of Greenland Halibut Stock Component in NAFO Division 1A Inshore in 2014.
SCR Doc. 15/40 N6467 M.R. Simpson, J.A. Bailey, R.K. Collins, C.M. Miri, and L.G.S. Mello
Limit reference points for Divs. 3LNO Thorny Skate (Amblyraja radiata Donovan, 1808) and Divs. 3NOPs White Hake (Urophycis tenuis, Mitchill 1815
SCR Doc. 15/41 N6468 M.J. Morgan Greenland halibut (Reinhardtius hippoglossoides) in NAFO Subarea 2 and Divisions 3KLMNO: stock trends based on annual Canadian research vessel survey results.
SC 29 May-11 June 2015 230
www.nafo.int
SCS Documents
Doc No. Serial No
Author Title
SCS Doc. 15-01 N6411 FC Requests to SC
SCS Doc. 15-02 N6418 Canada Canada’s Request for Coastal State Advice
SCS Doc. 15-03 N6419 Greenland Denmark (on behalf of Greenland) Request for Scientific Advice on Management in 2016 of Certain Stocks in Subarea 0 and 1
SCS Doc. 15-04 N6420 T.Tõrra & S.Sirp Estonian Research Report for 2014
SCS Doc. 15-05 N6423 F. González-Costas, , A. Gago, G.
Ramilo, E. Román, D. González-Troncoso, M.
Casas, M. Sacau, E. Guijarro and. J.
Lorenzo
Spanish Research Report for 2014
SCS Doc. 15-06 N6426 J. Vargas, R. Alpoim, E. Santos and A. M. Ávila de Melo
Portuguese Research Report for 2014
SCS Doc. 15-07 N6433 Russia Russian Research Report for 2014
SCS Doc. 15-08 N6443 Canada Canadian Research Report for 2014 Newfoundland and Labrador Region
SCS Doc. 15-09 N6445 K. A. Sosebee United States Research Report for 2014
SCS Doc. 15-10 N6446 Greenland Denmark/Greenland Research Report for 2014
SCS Doc. 15-11 N6461 NAFO Secretariat Biological Sampling 2014
SC Participants 29 May-11 June 2015 231
APPENDIX VII. LIST OF PARTICPANTS, 29 MAY – 11 JUNE 2015
CANADA
Morgan, M. Joanne Science Branch, Fisheries & Oceans Canada, P. O. Box 5667, St. John's, NL A1C 5X1 Phone: +709-772-2261 – E-mail: [email protected]
Power, Don
Science Br., Fisheries & Oceans Canada, P.O. Box 5667, St. John's, NL. A1C 5X1 Phone: +709-772-4935 – E-mail: [email protected]
Choi, Jae Research Scientist, Fisheries & Oceans Canada, BIO, P. O. Box 1006, Dartmouth, N.S. B2Y 4A2 E-mail: [email protected]
Cogswell, Andrew Fisheries & Oceans Canada, BIO, P. O. Box 1006, Dartmouth, N.S. B2Y 4A2 Phone: +902-426-1700 – E-mail: [email protected]
Colbourne, Eugene B. Science Branch, Fisheries & Oceans Canada, P.O. Box 5667, St. John's, NL. A1C 5X1 Phone: +709-772-6106 – E-mail: [email protected]
Collins, Roanne K. Biologist, Fisheries and Oceans Canada PO Box 5667 St. John’s, NL A1C 5X1 Tel: (709) 772-5948 Email: [email protected]
Couture, Estelle Senior Science Adviser, Fish Population Science, Fisheries and Oceans Canada, 200 Kent Street (Stn. 12S53), Ottawa, ON K1A 0E6 Phone: +613-990-0259 - Email: [email protected]
Dwyer, Karen
Science Branch, Fisheries & Oceans Canada, P.O. Box 5667, St. John's, NL. A1C 5X1 Phone: +709-772-0573 – E-mail: [email protected]
Healey, Brian P.
Science Branch, Fisheries & Oceans Canada, P.O. Box 5667, St. John's, NL. A1C 5X1 Phone: +709-772-8674 – E-mail: [email protected]
Hebert, Dave Fisheries & Oceans Canada, BIO, P. O. Box 1006, Dartmouth, N.S. B2Y 4A2 Phone: +902-426-1216 – E-mail: [email protected]
Ings, Danny Science Branch, Fisheries & Oceans Canada, P.O. Box 5667, St. John's, NL. A1C 5X1 E-mail: [email protected]
Koen-Alonso, Mariano
Science Branch, Fisheries & Oceans Canada, P.O. Box 5667, St. John's, NL. A1C 5X1 Phone: +709-772-2047 – E-mail: [email protected]
Lee, Eugene Science Branch, Fisheries & Oceans Canada, P.O. Box 5667, St. John's, NL. A1C 5X1 Phone: +709-772-8888 – E-mail: [email protected]
Maddock Parsons, Dawn
Science Branch, Fisheries & Oceans Canada, P.O. Box 5667, St. John's, NL. A1C 5X1 Phone: +709-772-7703 – E-mail: [email protected]
Maillet, Gary Science Branch, Fisheries & Oceans Canada, P.O. Box 5667, St. John's, NL. A1C 5X1 Phone +709-772-7675 - E-mail: [email protected]
Ouellet, Mathieu Oceanography and Scientific Data branch (OSD) Fisheries and Oceans Canada (DFO) 200 Kent Street, Ottawa, ON, Canada K1A0E6 e-mail: [email protected]
Pepin, Pierre Fisheries and Oceans Canada, Northwest Atlantic Fisheries Centre, P.O. Box 5667, St. John’s, Newfoundland, Canada, A1C 5X1
Rideout, Rick Science Branch, Fisheries & Oceans Canada, P.O. Box 5667, St. John's, NL. A1C 5X1 Phone: +709-772-6975 – E-mail: [email protected]
Ringuette, Marc Fisheries & Oceans Canada, BIO, P. O. Box 1006, Dartmouth, N.S. B2Y 4A2 Phone: +902-426-1700 – E-mail: [email protected]
Sheton, Peter Science Branch, Fisheries & Oceans Canada, P.O. Box 5667, St. John's, NL. A1C 5X1 Phone: +709-772-2341 – E-mail: [email protected]
Simpson, Mark R.
Science Branch, Fisheries & Oceans Canada, P.O. Box 5667, St. John's, NL. A1C 5X1 Phone: +709-772-4841 – E-mail: [email protected]
Stansbury, Don
Science Branch, Fisheries & Oceans Canada, P.O. Box 5667, St. John's, NL. A1C 5X1 Phone: +709-772-0559 – E-mail: [email protected]
Treble, Margaret Fisheries & Oceans Canada, Freshwater Inst., 501 University Cres., Winnipeg, MT R3T 2N6 Phone: +204-984-0985 – E-mail: [email protected]
SC Participants 30 May-12 June 2014 232
www.nafo.int
Whalen, Julie PO Box 2050 Stn B, Goose Bay, NL, A0P 1E0
DENMARK (IN RESPECT OF FAROE ISLANDS + GREENLAND)
Jørgensen, Ole DTU-AQUA Technical University of Denmark, Charlottenlund Slot, DK-2920 Charlottenlund, Denmark Phone : +45 3588 3300 – E-mail : [email protected]
Solari, Aldo Greenland Institute of Natural Resources, P.O. Box 570, DK-3900 Nuuk, Greenland Phone : +299 361200 – E-mail : [email protected]
Luis Ridao Cruz Faroe Marine Research Institute, Nóatún 1, P.O. Box 3051, FO-110 Tórshavn,, Faroe Islands Phone: (+298) 353900 – E-mail: [email protected]
EUROPEAN UNION
Alpoim, Ricardo Instituto Portugues do Mar e da Atmosfera, I.P., Av. de Brasilia, 1449-006 Lisbon, Portugal Phone: +351 21 302 7000 – E-mail: [email protected]
Avila de Melo, Antonio Instituto Portugues do Mar e da Atmosfera, I.P., Av. de Brasilia, 1449-006 Lisbon, Portugal Phone: +351 21 302 7000 – E-mail: [email protected]
Boris Cisewski Thünen Institute of Sea Fisheries, Bundesallee 50, 38116 Braunschweig, Germany – Email: [email protected]
Gonzalez-Troncoso, Diana
Instituto Español de Oceanografia, Aptdo 1552, E-36280 Vigo (Pontevedra), Spain Phone: +34 9 86 49 2111 – E-mail: [email protected]
Gonzalez-Costas, Fernando
Instituto Español de Oceanografia, Aptdo 1552, E-36280 Vigo (Pontevedra), Spain Phone: +34 9 86 49 2111 – E-mail: [email protected]
Kenny, Andy CEFAS, Lowestoft Laboratory, Lowestoft, UK E-mail : [email protected]
Rodriguez-Alfaro, Sebastian
Scientific Officer, International Affairs, Law of the Sea and Regional Fisheries Organizations, European Commission, Directorate General for Fisheries and Maritime Affairs (DG MARE.B.1), Rue Joseph II, 99, 1000 Brussels, Belgium Tel: +32 2 29 570 43 – Email: [email protected]
Vigneau, Joel IFREMER, Station de Port-en-Bessin, P. O. Box 32, 14520 Port-en-Bessin, France Phone : +33 231 515 600 – E-mail : [email protected]
JAPAN
Nishida, Tom National Research Institue of Far Seas Fisheries, 5-7-1, Orido, Shimizu-ward, Shizuoka City, 424-8633 Phone: +81 54 336-6000 – E-mail: [email protected]
Yonezaki, Shiroh National Research Institute of Far Seas Fisheries, 2-12-4 Fukuura, Kanazawam 236-8684 Phone: +81 45 788-7501 – E-mail: [email protected]
NORWAY
Hvingel, Carsten Institute of Marine Reaserach, P.O. Box 1870, N-5817 Bergen, Norway Phone: +47 77609750 – E-mail: [email protected]
RUSSIAN FEDERATION
Babayan, Vladimir Russian Federal Research Institute of Fisheries & Oceanography (VNIRO), K. 17, V. Krasnoselskaya, Moscow, 107140 Phone: +499 264 9078 – Fax: +499 264 8974 - E-mail: [email protected]
Fomin, Konstantin Knipovich Polar Research Institute of Marine Fisheries and Oceanography (PINRO), 6 Knipovich St., Murmansk 183763 Phone: +7 8152 436 177 –– E-mail:[email protected]
Tretiakov, Ivan Knipovich Polar Research Institute of Marine Fisheries and Oceanography (PINRO), 6 Knipovich St., Murmansk 183763 Phone: +7 8152 47 2469 –– E-mail: [email protected]
Savchenko, Igor Representative of Russian Federation in Canada
233 SC Participants 29 May-11 June 2015
www.nafo.int
UNITED STATES OF AMERICA
Sosebee, Kathy National Marine Fisheries Service, NEFSC, 166 Water St., Woods Hole, MA 02543 Phone: +508-495-2372 – E-mail: [email protected]
Hendrickson, Lisa National Marine Fisheries Service, NEFSC, 166 Water St., Woods Hole, MA 02543 E-mail: [email protected]
OBSERVERS
Branton, Bob Chair, Canadian National Committee for CODATA, Dalhousie University, University Avenue, Halifax, Nova Scotia, Canada. Tel: 902 225-5447; Email: [email protected]
Diz, Daniela Ocean’s Specialist, WWF-Canada, Atlantic Region, 5251 Duke St. Suite 1202, Halifax, NS, Canada B3J 1P3. Phone: +902 482-1105 ext. 23 E-mail: [email protected]
Fuller, Susanna Ecology Action Centre, 2705 Fern Lane, Halifax, NS, B3K 4L3 Phone: +902 446-4840 E-mail: [email protected]
MacDonald, Bertrum Environment Information: Use & Influence Research Initiative, Dalhousie University, Rowe Building, School of Information Management, University Avenue, Halifax, Nova Scotia, Canada. Phone: +902 494 2472 – E-mail: [email protected]
Schleit, Katie Ecology Action Centre, 2705 Fern Lane, Halifax, NS, B3K 4L3 Phone: +902 446-4840 E-mail: [email protected]
Soomai, Suzuette Environment Information: Use & Influence Research Initiative, Dalhousie University, Rowe Building, School of Information Management, University Avenue, Halifax, Nova Scotia, Canada. E-mail: [email protected]
NAFO SECRETARIAT
Fred Kingston Executive Secretary [email protected] Neil Campbell Scientific Council Coordinator [email protected] Ricardo Federizon Senior Fisheries Commission Coordinator [email protected] Dayna Bell Scientific Information Administrator [email protected] Alexis Pacey Publications Manager [email protected] Matthew Kendall IT Manager [email protected] Mark Harley Database Manager [email protected] Sarah Burton Office Administrator [email protected] Jana Aker Fisheries Information Administrator [email protected] Barb Marshall Consultant